Survey Research in HCI - Sunyoung Kim
38
229 J.S. Olson and W.A. Kellogg (eds.), Ways of Knowing in HCI, DOI 10.1007/978-1-4939-0378-8_10, © Springer Science+Business Media New York 2014 Short Description of the Method A survey is a method of gathering information by asking questions to a subset of people, the results of which can be generalized to the wider target population. There are many different types of surveys, many ways to sample a population, and many ways to collect data from that population. Traditionally, surveys have been admin- istered via mail, telephone, or in person. The Internet has become a popular mode for surveys due to the low cost of gathering data, ease and speed of survey adminis- tration, and its broadening reach across a variety of populations worldwide. Surveys in human–computer interaction (HCI) research can be useful to: • Gather information about people’s habits, interaction with technology, or behavior • Get demographic or psychographic information to characterize a population • Get feedback on people’s experiences with a product, service, or application • Collect people’s attitudes and perceptions toward an application in the context of usage • Understand people’s intents and motivations for using an application • Quantitatively measure task success with specific parts of an application • Capture people’s awareness of certain systems, services, theories, or features • Compare people’s attitudes, experiences, etc. over time and across dimensions Survey Research in HCI Hendrik Müller, Aaron Sedley, and Elizabeth Ferrall-Nunge H. Müller (*) Google Australia Pty Ltd., Level 5, 48 Pirrama Road, Pyrmont, NSW 2009, Australia e-mail: [email protected] A. Sedley Google, Inc., 1600 Amphitheatre Parkway, Mountain View, CA 94043, USA e-mail: [email protected] E. Ferrall-Nunge Twitter, Inc., 1355 Market Street, Suite 900, San Francisco, CA 94103, USA e-mail: [email protected]
-
Upload
khangminh22 -
Category
Documents
-
view
0 -
download
0
Transcript of Survey Research in HCI - Sunyoung Kim

229J.S. Olson and W.A. Kellogg (eds.), Ways of Knowing in HCI, DOI 10.1007/978-1-4939-0378-8_10, © Springer Science+Business Media New York 2014
Short Description of the Method
A survey is a method of gathering information by asking questions to a subset of people, the results of which can be generalized to the wider target population. There are many different types of surveys, many ways to sample a population, and many ways to collect data from that population. Traditionally, surveys have been admin-istered via mail, telephone, or in person. The Internet has become a popular mode for surveys due to the low cost of gathering data, ease and speed of survey adminis-tration, and its broadening reach across a variety of populations worldwide. Surveys in human–computer interaction (HCI) research can be useful to:
• Gather information about people’s habits, interaction with technology, or behavior
• Get demographic or psychographic information to characterize a population • Get feedback on people’s experiences with a product, service, or application • Collect people’s attitudes and perceptions toward an application in the context of
usage • Understand people’s intents and motivations for using an application • Quantitatively measure task success with specifi c parts of an application • Capture people’s awareness of certain systems, services, theories, or features • Compare people’s attitudes, experiences, etc. over time and across dimensions
Survey Research in HCI
Hendrik Müller , Aaron Sedley , and Elizabeth Ferrall-Nunge
H. Müller (*) Google Australia Pty Ltd. , Level 5, 48 Pirrama Road , Pyrmont , NSW 2009 , Australia e-mail: [email protected]
A. Sedley Google, Inc. , 1600 Amphitheatre Parkway , Mountain View , CA 94043 , USA e-mail: [email protected]
E. Ferrall-Nunge Twitter, Inc. , 1355 Market Street, Suite 900 , San Francisco , CA 94103 , USA e-mail: [email protected]

230
While powerful for specifi c needs, surveys do not allow for observation of the respondents’ context or follow-up questions. When conducting research into pre-cise behaviors, underlying motivations, and the usability of systems, then other research methods may be more appropriate or needed as a complement.
This chapter reviews the history of surveys and appropriate uses of surveys and focuses on the best practices in survey design and execution.
History, Intellectual Tradition, Evolution
Since ancient times, societies have measured their populations via censuses for food planning, land distribution, taxation, and military conscription. Beginning in the nineteenth century, political polling was introduced in the USA to project election results and to measure citizens’ sentiment on a range of public policy issues. At the emergence of contemporary psychology, Francis Galton pioneered the use of ques-tionnaires to investigate the nature vs. nurture debate and differences between humans, the latter of which evolved into the fi eld of psychometrics (Clauser, 2007 ). More recently, surveys have been used in HCI research to help answer a variety of questions related to people’s attitudes, behaviors, and experiences with technology.
Though nineteenth-century political polls amplifi ed public interest in surveys, it was not until the twentieth century that meaningful progress was made on survey- sampling methods and data representativeness. Following two incorrect predictions of the US presidential victors by major polls (Literary Digest for Landon in 1936 and Gallup for Dewey in 1948), sampling methods were assailed for misrepresent-ing the US electorate. Scrutiny of these polling failures; persuasive academic work by statisticians such as Kiaer, Bowley, and Neyman; and extensive experimentation by the US Census Bureau led to the acceptance of random sampling as the gold standard for surveys (Converse, 1987 ).
Roughly in parallel, social psychologists aimed to minimize questionnaire biases and optimize data collection. For example, in the 1920s and 1930s, Louis Thurstone and Rensis Likert demonstrated reliable methods for measuring attitudes (Edwards & Kenney, 1946 ); Likert’s scaling approach is still widely used by survey practitio-ners. Stanley Payne’s, 1951 classic “The Art of Asking Questions” was an early study of question wording. Subsequent academics scrutinized every aspect of survey design. Tourangeau ( 1984 ) articulated the four cognitive steps to survey responses, noting that people have to comprehend what is asked, retrieve the appropriate infor-mation, judge that information according to the question, and map the judge ment onto the provided responses. Krosnick & Fabrigar ( 1997 ) studied many components of questionnaire design, such as scale length, text labels, and “no opinion” responses. Groves ( 1989 ) identifi ed four types of survey-related error: coverage, sampling, measurement, and non-response. As online surveys grew in popularity, Couper ( 2008 ) and others studied bias from the visual design of Internet questionnaires.
The use of surveys for HCI research certainly predates the Internet, with efforts to understand users’ experiences with computer hardware and software. In 1983, researchers at Carnegie Mellon University conducted an experiment comparing
H. Müller et al.

231
computer-collected survey responses with those from a printed questionnaire, fi nding less socially desirable responses in the digital survey and longer open-ended responses than in the printed questionnaire (Kiesler & Sproull, 1986 ). With the popularization of graphical user interfaces in the 1980s, surveys joined other methods for usability research. Several standardized questionnaires were devel-oped to assess usability (e.g., SUS, QUIS, SUMI, summarized later in this chap-ter). Surveys are a direct means of measuring satisfaction; along with effi ciency and effectiveness, satisfaction is a pillar of the ISO 9241, part 11, defi nition of usability (Abran et al., 2003 ). User happiness is fundamental to Google’s HEART framework for user-centric measurement of Web applications (Rodden, Hutchinson, & Fu, 2010 ). In 1994, the Georgia Institute of Technology started annual online surveys to understand Internet usage and users and to explore Web-based survey research (Pitkow & Recker, 1994 ). As the Internet era progressed, online applica-tions widely adopted surveys to measure users’ satisfaction, unaddressed needs, and problems experienced, in addition to user profi ling. See a summary of key stages in survey history in Fig. 1 .
What Questions the Method Can Answer
When used appropriately, surveys can help inform application and user research strategies and provide insights into users’ attitudes, experiences, intents, demo-graphics, and psychographic characteristics. However, surveys are not the most appropriate method for many other HCI research goals. Ethnographic interviews, log data analysis, card sorts, usability studies, and other methods may be more appropriate. In some cases, surveys can be used with other research methods to holistically inform HCI development. This section explains survey appropriateness, when to avoid using surveys, as well as how survey research can complement other research methods.
Ancient civilizationcensuses for food planning
& land distributions, etc.
Straw polls forUS Presidential
election
US Presidential pollsincorrectly predict victory for Landon
US Presidential Pollsincorrectly predict victory for Dewey
Statisticians presentarguments in favor of
random sampling
Social psychologists proposescaling methods to reliably measure attitudes (Likert)
Payne publishes "The Art of AskingQuestions", the first comprehensive
study of survey question wording
Tourangeau identifiesfour cognitive steps for
question response
Standardized questionnaires toassess usability are developed
(e.g., SUS, SUMI, QUIS)
Georgia Tech starts annual online surveys to
study Internet usage
Groves publishestaxonomy study of
survey errors
Krosnick publishes onquestionnaire design validity and reliability
Couper publishescompilation on web survey visual design
1824
1936Ancient times
19481920s-30s
195119th century
1989
1994
Carnegie Mellon Universityconducts first survey with a
computer interface
198419831876
Galton conductsfirst psychology
survey
1980s
1990s
2008
Fig. 1 Summary of the key stages in survey history
Survey Research in HCI

232
When Surveys Are Appropriate
Overall, surveys are appropriate when needing to represent an entire population, to measure differences between groups of people, and to identify changes over time in people’s attitudes and experiences. Below are examples of how survey data can be used in HCI research.
Attitudes. Surveys can accurately measure and reliably represent attitudes and perceptions of a population. While qualitative studies are able to gather attitudinal data, surveys provide statistically reliable metrics, allowing researchers to bench-mark attitudes toward an application or an experience, to track changes in attitudes over time, and to tie self-reported attitudes to actual behavior (e.g., via log data). For example, surveys can be used to measure customer satisfaction with online banking immediately following their experiences.
Intent . Surveys can collect peoples’ reasons for using an application at a specifi c time, allowing researchers to gauge the frequency across different objectives. Unlike other methods, surveys can be deployed while a person is actually using an applica-tion (i.e., an online intercept survey), minimizing the risk of imperfect recall on the respondent’s part. Note that specifi c details and the context of one’s intent may not be fully captured in a survey alone. For example, “Why did you visit this website?” could be answered in a survey, but qualitative research may be more appropriate in determining how well one understood specifi c application elements and what users’ underlying motivations are in the context of their daily lives.
Task success . Similar to measuring intent, while HCI researchers can qualita-tively observe task success through a lab or a fi eld study, a survey can be used to reliably quantify levels of success. For example, respondents can be instructed to perform a certain task, enter results of the task, and report on their experiences while performing the task.
User experience feedback . Collecting open-ended feedback about a user’s expe-rience can be used to understand the user’s interaction with technology or to inform system requirements and improvements. For example, by understanding the relative frequency of key product frustrations and benefi ts, project stakeholders can make informed decisions and trade-offs when allocating resources.
User characteristics . Surveys can be used to understand a system’s users and to better serve their needs. Researchers can collect users’ demographic informa-tion, technographic details such as system savviness or overall tech savviness, and psychographic variables such as openness to change and privacy orienta-tion. Such data enables researchers to discover natural segments of users who may have different needs, motivations, attitudes, perceptions, and overall user experiences.
Interactions with technology . Surveys can be used to understand more broadly how people interact with technology and how technology infl uences social interactions with others by asking people to self-report on social, psychological, and demographic
H. Müller et al.

233
variables while capturing their behaviors. Through the use of surveys, HCI researchers can glean insights into the effects technology has on the general population.
Awareness . Surveys can also help in understanding people’s awareness of existing technologies or specifi c application features. Such data can, for example, help researchers determine whether low usage with an application is a result of poor awareness or other factors, such as usability issues. By quantifying how aware or unaware people are, researchers can decide whether efforts (e.g., marketing cam-paigns) are needed to increase overall awareness and thus use.
Comparisons . Surveys can be used to compare users’ attitudes, perceptions, and experiences across user segments, time, geographies, and competing applications and between experimental and control versions. Such data enable researchers to explore whether user needs and experiences vary across geographies, assess an application’s strengths and weaknesses among competing technologies and how each compares with their competitors’ applications, and evaluate potential application improvements while aiding decision making between a variety of proposed designs.
When to Avoid Using a Survey
Because surveys are inexpensive and easy to deploy compared to other methods, many people choose survey research even when it is inappropriate for their needs. Such surveys can produce invalid or unreliable data, leading to an inaccurate understanding of a population and poor user experiences. Below are some HCI research needs that are better addressed with other methods.
Precise behaviors . While respondents can be asked to self-report their behaviors, gathering this information from log data, if available, will always be more accurate. This is particularly true when trying to understand precise user behaviors and fl ows, as users will struggle to recall their exact sequence of clicks or specifi c pages visited. For behaviors not captured in log data, a diary study, observational study, or experience sampling may gather more accurate results than a survey.
Underlying motivations . People often do not understand or are unable to explain why they take certain actions or prefer one thing over another. Someone may be able to report their intent in a survey but may not be aware of their subconscious motivations for specifi c actions. Exploratory research methods such as ethnography or contextual inquiry may be more appropriate than directly asking about underlying motivations in a survey.
Usability evaluations . Surveys are inappropriate for testing specifi c usability tasks and understanding of tools and application elements. As mentioned above, surveys can measure task success but may not explain why people cannot use a particular application, why they do not understand some aspect of a product, or why they do not identify missteps that caused the task failure. Furthermore, a user may still be able to complete a given task even though he or she encountered several confusions, which could not be uncovered through a survey. Task-based observational research and inter-view methods, such as usability studies, are better suited for such research goals.
Survey Research in HCI

234
Using Surveys with Other Methods
Survey research may be especially benefi cial when used in conjunction with other research methods (see Fig. 2 ). Surveys can follow previous qualitative studies to help quantify specifi c observations. For many surveys, up-front qualitative research may even be required to inform its content if no previous research exists. On the other hand, surveys can also be used to initially identify high-level insights that can be followed by in-depth research through more qualitative (meaning smaller sam-ple) methods.
For example, if a usability study uncovers a specifi c problem, a survey can quantify the frequency of that problem across the population. Or a survey can be used fi rst to identify the range of frustrations or goals, followed by qualitative interviews and observational research to gain deeper insights into self-reported behaviors and sources of frustration. Researchers may interview survey respon-dents to clarify responses (e.g., Yew, Shamma, & Churchill, 2011 ), interview another pool of participants in the same population for comparison (e.g., Froelich et al., 2012 ), or interview both survey respondents and new participants (e.g., Archambault & Grudin, 2012 ).
Surveys can also be used in conjunction with A/B experiments to aid compara-tive evaluations. For example, when researching two different versions of an appli-cation, the same survey can be used to assess both. By doing this, differences in variables such as satisfaction and self-reported task success can be measured and analyzed in parallel with behavioral differences observed in log data. Log data may show that one experimental version drives more traffi c or engagement, but the sur-vey may show that users were less satisfi ed or unable to complete a task. Moreover, log data can further validate insights from a previously conducted survey. For exam-ple, a social recommendation study by Chen, Geyer, Dugan, Muller, and Guy ( 2009 ) tested the quality of recommendations fi rst in a survey and then through logging in a large fi eld deployment. Psychophysiological data may be another objective accompaniment to survey data. For example, game researchers have combined sur-veys with data such as facial muscle and electrodermal activity (Nacke, Grimshaw, & Lindley, 2010 ) or attention and meditation as measured with EEG sensors (Schild, LaViola, & Masuch, 2012 ).
Survey research
Small-samplequalitative method
Is the data just anecdotalor representative?
What are the reasons fortrends or distributions?
Fig. 2 Employing survey research either before or after research using other methods
H. Müller et al.
235
How to Do It: What Constitutes Good Work
This section breaks down survey research into the following six stages:
1. Research goals and constructs 2. Population and sampling 3. Questionnaire design and biases 4. Review and survey pretesting 5. Implementation and launch 6. Data analysis and reporting
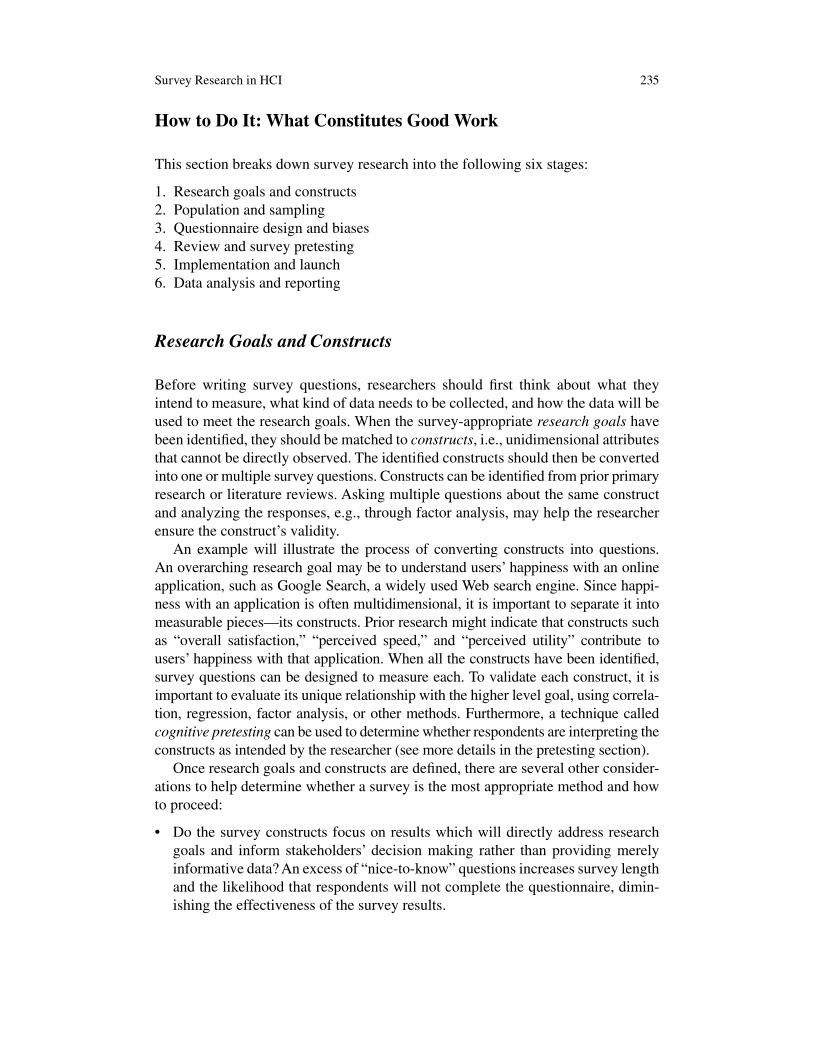
Research Goals and Constructs
Before writing survey questions, researchers should fi rst think about what they intend to measure, what kind of data needs to be collected, and how the data will be used to meet the research goals. When the survey-appropriate research goals have been identifi ed, they should be matched to constructs , i.e., unidimensional attributes that cannot be directly observed. The identifi ed constructs should then be converted into one or multiple survey questions. Constructs can be identifi ed from prior primary research or literature reviews. Asking multiple questions about the same construct and analyzing the responses, e.g., through factor analysis, may help the researcher ensure the construct’s validity.
An example will illustrate the process of converting constructs into questions. An overarching research goal may be to understand users’ happiness with an online application, such as Google Search, a widely used Web search engine. Since happi-ness with an application is often multidimensional, it is important to separate it into measurable pieces—its constructs. Prior research might indicate that constructs such as “overall satisfaction,” “perceived speed,” and “perceived utility” contribute to users’ happiness with that application. When all the constructs have been identifi ed, survey questions can be designed to measure each. To validate each construct, it is important to evaluate its unique relationship with the higher level goal, using correla-tion, regression, factor analysis, or other methods. Furthermore, a technique called cognitive pretesting can be used to determine whether respondents are interpreting the constructs as intended by the researcher (see more details in the pretesting section).
Once research goals and constructs are defi ned, there are several other consider-ations to help determine whether a survey is the most appropriate method and how to proceed:
• Do the survey constructs focus on results which will directly address research goals and inform stakeholders’ decision making rather than providing merely informative data? An excess of “nice-to-know” questions increases survey length and the likelihood that respondents will not complete the questionnaire, dimin-ishing the effectiveness of the survey results.
Survey Research in HCI

236
• Will the results be used for longitudinal comparisons or for one-time decisions? For longitudinal comparisons, researchers must plan on multiple survey deploy-ments without exhausting available respondents.
• What is the number of responses needed to provide the appropriate level of preci-sion for the insights needed? By calculating the number of responses needed (as described in detail in the following section), the researcher will ensure that key metrics and comparisons are statistically reliable. Once the target number is determined, researchers can then determine how many people to invite.
Population and Sampling
Key to effective survey research is determining who and how many people to survey. In order to do this, the survey’s population , or set of individuals that meet certain criteria, and to whom researchers wish to generalize their results must fi rst be defi ned. Reaching everyone in the population (i.e., a census) is typically impossible and unnecessary. Instead, researchers approximate the true population by creating a sampling frame , i.e., the set of people who the researcher is able to contact for the survey. The perfect sampling frame is identical to the population, but often a survey’s sampling frame is only a portion of the population. The people from the sampling frame who are invited to take the survey are the sample , but only those who answer are respondents . See Fig. 3 illustrating these different groups.
For example, a survey can be deployed to understand the satisfaction of a prod-uct’s or an application’s users. In this case, the population includes everyone that uses the application, and the sampling frame consists of users that are actually reachable. The sampling frame may exclude those who have abandoned the applica-tion, anonymous users, and users who have not opted in to being contacted for research. Though the sampling frame may exclude many users, it could still include far more people than are needed to collect a statistically valid number of responses. However, if the sampling frame systematically excludes certain types of people (e.g., very dissatisfi ed or disengaged users), the survey will suffer from coverage error and its responses will misrepresent the population.
Population Sampling frame Sample Respondents
Fig. 3 The relationship between population, sampling frame, sample, and respondents
H. Müller et al.

237
Probability Versus Non-probability Sampling
Sampling a population can be accomplished through probability- and non-probability- based methods. Probability or random sampling is considered the gold standard because every person in the sampling frame has an equal, nonzero chance of being chosen for the sample; essentially, the sample is selected completely ran-domly. This minimizes sampling bias , also known as selection bias , by randomly drawing the sample from individuals in the sampling frame and by inviting every-one in the sample in the same way. Examples of probability sampling methods include random digit telephone dialing, address-based mail surveys utilizing the US Postal Service Delivery Sequence File (DSF), and the use of a panel recruited through random sampling, those who have agreed in advance to receive surveys. For Internet surveys in particular, methods allowing for random sampling include inter-cept surveys for those who use a particular product (e.g., pop-up surveys or in- product links), list-based samples (e.g., for e-mail invitations), and pre-recruited probability-based panels (see Couper, 2000 , for a thorough review). Another way to ensure probability sampling is to use a preexisting sampling frame, i.e., a list of candidates previously assembled using probability sampling methods. For example, Shklovski, Kraut, and Cummings’ ( 2008 ) study of the effect of residential moves on communication with friends was drawn from a publicly available, highly relevant sampling frame, the National Change of Address (NCOA) database. Another approach is to analyze selected subsets of data from an existing representative survey like the General Social Survey (e.g., Wright & Randall, 2012 ).
While probability sampling is ideal, it is often impossible to reach and randomly select from the entire target population, especially when targeting small populations (e.g., users of a specialized enterprise product or experts in a particular fi eld) or investigating sensitive or rare behavior. In these situations, researchers may use non-probability sampling methods such as volunteer opt-in panels, unrestricted self-selected surveys (e.g., links on blogs and social networks), snowball recruiting (i.e., asking for friends of friends), and convenience samples (i.e., targeting people readily available, such as mall shoppers) (Couper, 2000 ). However, non-probability methods are prone to high sampling bias and hence reduce representativeness compared to random sampling. One way representativeness can be assessed is by comparing key characteristics of the target population with those from the actual sample (for more details, refer to the analysis section).
Many academic surveys use convenience samples from an existing pool of the university’s psychology students. Although not representative of most Americans, this type of sample is appropriate for investigating technology behavior among young people such as sexting (Drouin & Landgraff, 2012 ; Weisskirch & Delevi, 2011 ), instant messaging (Anandarajan, Zaman, Dai, & Arinze, 2010 ; Junco & Cotten, 2011 ; Zaman et al., 2010 ), and mobile phone use (Auter, 2007 ; Harrison, 2011 ; Turner, Love, & Howell, 2008 ). Convenience samples have also been used to identify special populations. For example, because identifying HIV and tuberculosis patients through offi cial lists of names is diffi cult because of patient confi dentiality, one study about the viability of using cell phones and text messages in HIV and tuberculosis education handed out surveys to potential respondents in health clinic
Survey Research in HCI

238
waiting rooms (Person, Blain, Jiang, Rasmussen, & Stout, 2011 ). Similarly, a study of Down’s syndrome patients’ use of computers invited participation through spe-cial interest listservs (Feng, Lazar, Kumin, & Ozok, 2010 ).
Determining the Appropriate Sample Size
No matter which sampling method is used, it is important to carefully determine the target sample size for the survey, i.e., the number of survey responses needed. If the sample size is too small, fi ndings from the survey cannot be accurately generalized to the population and may fail to detect generalizable differences between groups. If the sample is larger than necessary, too many individuals are burdened with tak-ing the survey, analysis time for the researcher may increase, or the sampling frame is used up too quickly. Hence, calculating the optimal sample size becomes crucial for every survey.
First, the researcher needs to determine approximately how many people make up the population being studied. Second, as the survey does not measure the entire population, the required level of precision must be chosen, which consists of the margin of error and the confi dence level. The margin of error expresses the amount of sampling error in the survey, i.e., the range of uncertainty around an estimate of a population measure, assuming normally distributed data. For example, if 60 % of the sample claims to use a tablet computer, a 5 % margin of error would mean that actu-ally 55–65 % of the population use tablet computers. Commonly used margin of errors are 5 and 3 %, but depending on the goals of the survey anywhere between 1 and 10 % may be appropriate. Using a margin of error higher than 10 % is not recommended, unless a low level of precision can meet the survey’s goals. The con-fi dence level indicates how likely the reported metric falls within the margin of error if the study were repeated. A 95 % confi dence level, for example, would mean that 95 % of the time, observations from repeated sampling will fall within the interval defi ned by the margin of error. Commonly used confi dence levels are 99, 95, and 90 %; using less than 90 % is not recommended.
There are various formulas for calculating the target sample size. Figure 4 , based on Krejcie and Morgan’s formula (1970), shows the appropriate sample size, given the population size, as well as the chosen margin of error and confi dence level for your survey. Note that the table is based on a population proportion of 50 % for the response of interest, the most cautious estimation (i.e., when higher or lower than 50 %, the required sample size declines to achieve the same margin of error). For example, for a population larger than 100,000, a sample size of 384 is required to achieve a confi dence level of 95 % and a margin of error of 5 %. Note that for popu-lation sizes over about 20,000, the required sample size does not signifi cantly increase. Researchers may set the sample size to 500 to estimate a single population parameter, which yields a margin of error of about ±4.4 % at a 95 % confi dence level for large populations.
After having determined the target sample size for the survey, the researcher now needs to work backwards to estimate the number of people to actually invite to the
H. Müller et al.

239
survey, taking into account the estimated size for each subgroup and the expected response rate. If a subgroup’s incidence is very small, the total number of invitations must be increased to ensure the desired sample size for this subgroup. The response rate of a survey describes the percentage of those who completed the survey out of all those that were invited (for more details, see the later sections on monitoring survey paradata and maximizing response rates). If a similar survey has been conducted before, then its response rate is a good reference point for calculating the required sample size. If there is no prior response rate information, the survey can be sent out to a small number of people fi rst to measure the response rate, which is then used to deter-mine the total number of required invitations.
For example, assuming a 30 % response rate, a 50 % incidence rate for the group of interest, and the need for 384 complete responses from that group, 2,560 people should be invited to the survey. At this point, the calculation may determine that the researcher may require a sample that is actually larger than the sampling frame; hence, the researcher may need to consider more qualitative methods as an alternative.
Mode and Methods of Survey Invitation
To reach respondents, there are four basic survey modes: mail or written surveys, phone surveys, face-to-face or in-person surveys, and Internet surveys. Survey modes may also be used in combination. The survey mode needs to be chosen care-fully as each mode has its own advantages and disadvantages, such as differences in typical response rates, introduced biases (Groves, 1989 ), required resources and costs, audience that can be reached, and respondents’ level of anonymity.
Today, many HCI-related surveys are Internet based, as benefi ts often outweigh their disadvantages. Internet surveys have the following major advantages:
• Easy access to large geographic regions (including international reach) • Simplicity of creating a survey by leveraging easily accessible commercial tools
10% 5% 3% 1% 10% 5% 3% 1% 10% 5% 3% 1%
10 9 10 10 10 9 10 10 10 9 10 10 10
100 41 73 88 99 49 80 92 99 63 87 95 99
1000 63 213 429 871 88 278 516 906 142 399 648 943
10,000 67 263 699 4035 95 370 964 4899 163 622 1556 6239
100,000 68 270 746 6335 96 383 1056 8762 166 659 1810 14227
1,000,000 68 270 751 6718 96 384 1066 9512 166 663 1840 16317
100,000,000 68 271 752 6763 96 384 1067 9594 166 663 1843 16560
99%95%90%
Size of population
Margin oferror
Confidence level
Fig. 4 Sample size as a function of population size and accuracy (confi dence level and margin of error)
Survey Research in HCI

240
• Cost savings during survey invitation (e.g., no paper and postage, simple implementation, insignifi cant cost increase for large sample sizes) and analysis (e.g., returned data is already in electronic format)
• Short fi elding periods, as the data is collected immediately • Lower bias due to respondent anonymity, as surveys are self-administered with
no interviewer present • Ability to customize the questionnaire to specifi c respondent groups using skip
logic (i.e., asking respondents a different set of questions based on the answer to a previous question)
Internet surveys also have several disadvantages. The most discussed downside is the introduction of coverage error , i.e., a potential mismatch between the target population and the sampling frame (Couper, 2000 ; Groves, 1989 ). For example, online surveys fail to reach people without Internet or e-mail access. Furthermore, those invited to Internet surveys may be less motivated to respond or to provide accurate data because such surveys are less personal and can be ignored more easily. This survey mode also relies on the respondents’ ability to use a computer and may only provide the researcher with minimal information about the survey respondents. (See chapter on “Crowdsourcing in HCI Research.”)
Questionnaire Design and Biases
Upon establishing the constructs to be measured and the appropriate sampling method, the fi rst iteration of the survey questionnaire can be designed. It is important to care-fully think through the design of each survey question (fi rst acknowledged by Payne, 1951 ), as it is fairly easy to introduce biases that can have a substantial impact on the reliability and validity of the data collected. Poor questionnaire design may introduce measurement error , defi ned as the deviation of the respondents’ answers from their true values on the measure. According to Couper ( 2000 ), measurement error in self-administered surveys can arise from the respondent (e.g., lack of motivation, compre-hension problems, deliberate distortion) or from the instrument (e.g., poor wording or design, technical fl aws). In most surveys, there is only one opportunity to deploy, and unlike qualitative research, no clarifi cation or probing is possible. For these reasons, it is crucial that the questions accurately measure the constructs of interest.
Going forward, this section covers different types of survey questions, common questionnaire biases, questions to avoid, visual design considerations, reuse of established questionnaires, as well as visual survey design considerations.
Types of Survey Questions
There are two categories of survey questions—open- and closed-ended questions. Open-ended questions (Fig. 5 ) ask survey respondents to write in their own answers, whereas closed-ended questions (Fig. 6 ) provide a set of predefi ned answers to choose from.
H. Müller et al.

241
Open-ended questions are appropriate when:
• The universe of possible answers is unknown, e.g., “What is your favorite smart-phone application?”. However, once the universe of possible answers is identifi ed, it may be appropriate to create a closed-ended version of the same question.
• There are so many options in the full list of possible answers that they cannot be easily displayed, e.g., “Which applications have you used on your smartphone in the last week?”.
• Measuring quantities with natural metrics (i.e., a construct with an inherent unit of measurement, such as age, length, or frequency), when being unable to access information from log data, such as time, frequency, and length, e.g., “How many times do you use your tablet in a typical week?” (using a text fi eld that is restricted to numeric input, the answers to which can later be bucketed fl exibly).
• Measuring qualitative aspects of a user’s experience, e.g., “What do you fi nd most frustrating about using your smartphone?”.
Closed-ended questions are appropriate when:
• The universe of possible answers is known and small enough to be easily provided, e.g., “Which operating system do you use on your smartphone?” (with answer options including “Android” and “iOS”).
• Rating a single object on a dimension, e.g., “Overall, how satisfi ed or dissatisfi ed are you with your smartphone?” (on a 7-point scale from “Extremely dissatisfi ed” to “Extremely satisfi ed”).
• Measuring quantities without natural metrics, such as importance, certainty, or degree, e.g., “How important is it to have your smartphone within reach 24 h a day?” (on a 5-point scale from “Not at all important” to “Extremely important”).
What, if anything, do you find frustrating about your smartphone?
Fig. 5 Example of a typical open-ended question
Overall, how satisfied or dissatisfied are you with your smartphone?
Extremely dissatisfied
Very dissatisfied
Slightly dissatisfied
Slightly satisfied
Neither satisfied nordissatisfied
Very satisfied
Extremelysatisfied
Fig. 6 Example of a typical closed-ended question, a bipolar rating question in particular
Survey Research in HCI

242
Types of Closed-Ended Survey Questions
There are four basic types of closed-ended questions: single-choice, multiple- choice, rating, and ranking questions.
1. Single-choice questions work best when only one answer is possible for each respondent in the real world (Fig. 7 ) .
2. Multiple-choice questions are appropriate when more than one answer may apply to the respondent. Frequently, multiple-choice questions are accompanied by “select all that apply” help text. The maximum number of selections may also be specifi ed to force users to prioritize or express preferences among the answer options (Fig. 8 ) .
3. Ranking questions are best when respondents must prioritize their choices given a real-world situation (Fig. 9 ) .
4. Rating questions are appropriate when the respondent must judge an object on a continuum. To optimize reliability and minimize bias, scale points need to be
What is the highest level of education you have completed?
Less than High School
High School
Some College
2-year College Degree (Associates)
4-year College Degree (BA, BS)
Master's Degree
Doctoral Degree
Professional Degree (MD, JD)
Fig. 7 Example of a single-choice question
Which of the following apps do you use daily on your smartphone?
Gmail
Maps
Calendar
Hangouts
Drive
Select all that apply.
Fig. 8 Example of a multiple-choice question
H. Müller et al.

243
fully labeled instead of using numbers (Groves et al., 2004 ), and each scale point should be of equal width to avoid bias toward visually bigger response options (Tourangeau, Couper, & Conrad, 2004 ). Rating questions should use either a unipolar or a bipolar scale, depending on the construct being measured (Krosnick & Fabrigar, 1997 ; Schaeffer & Presser, 2003 ).
Unipolar constructs range from zero to an extreme amount and do not have a natural midpoint. They are best measured with a 5-point rating scale (Krosnick & Fabrigar, 1997 ), which optimizes reliability while minimizing respondent burden, and with the following scale labels, which have been shown to be semantically equidistant from each other (Rohrmann, 2003 ): “Not at all …,” “Slightly …,” “Moderately …,” “Very …,” and “Extremely ….” Such constructs include impor-tance (see Fig. 10 ), interest, usefulness, and relative frequency. Bipolar constructs range from an extreme negative to an extreme positive with a natural midpoint. Unlike unipolar constructs, they are best measured with a 7-point rating scale to maximize reliability and data differentiation (Krosnick & Fabrigar, 1997 ). Bipolar constructs may use the following scale labels: “Extremely …,” “Moderately …,” “Slightly …,” “Neither … nor …,” “Slightly …,” “Moderately …,” and “Extremely ….” Such constructs include satisfaction (see Fig. 6 , from dissatisfi ed to satisfi ed), perceived speed (from slow to fast), ease of use (from diffi cult to easy), and visual appeal (from unappealing to appealing).
When using a rating scale, the inclusion of a midpoint should be considered. While some may argue that including a midpoint provides an easy target for res-pondents who shortcut answering questions, others argue that the exclusion of a
Rank the following smartphone manufacturers in order of your preference:
Apple
Samsung
Motorola
Nokia
Add a number to each row, 1 being the least preferred, 5 being the most preferred.
HTC
Fig. 9 Example of a ranking question
How important is it to you to make phone calls from your smartphone?
Not at all important
Slightly important
Moderately important
Very important
Extremely important
Fig. 10 Example of a rating question, for a unipolar construct in particular
Survey Research in HCI

244
midpoint forces people who truly are in the middle to choose an option that does not refl ect their actual opinion. O’Muircheartaigh, Krosnick, and Helic ( 2001 ) found that having a midpoint on a rating scale increases reliability, has no effect on valid-ity, and does not result in lower data quality. Additionally, people who look for shortcuts (“shortcutters”) are not more likely to select the midpoint when present. Omitting the midpoint, on the other hand, increases the amount of random measure-ment error, resulting in those who actually feel neutral to end up making a random choice on either side of the scale. These fi ndings suggest that a midpoint should be included when using a rating scale.
Questionnaire Biases
After writing the fi rst survey draft, it is crucial to check the phrasing of each ques-tion for potential biases that may bias the responses. The following section covers fi ve common questionnaire biases: satisfi cing, acquiescence bias, social desirability, response order bias, and question order bias.
Satisfi cing
Satisfi cing occurs when respondents use a suboptimal amount of cognitive effort to answer questions. Instead, satisfi cers will typically pick what they consider to be the fi rst acceptable response alternative (Krosnick, 1991 ; Simon, 1956 ). Satisfi cers compromise one or more of the following four cognitive steps for survey response as identifi ed by Tourangeau ( 1984 ):
1. Comprehension of the question, instructions, and answer options 2. Retrieval of specifi c memories to aid with answering the question 3. Judgement of the retrieved information and its applicability to the question 4. Mapping of judgement onto the answer options
Satisfi cers shortcut this process by exerting less cognitive effort or by skipping one or more steps entirely; satisfi cers use less effort to understand the question, to thoroughly search their memories, to carefully integrate all retrieved information, or to accurately pick the proper response choice (i.e., they pick the next best choice).
Satisfi cing can take weak and strong forms (Krosnick, 1999 ). Weak satisfi cers make an attempt to answer correctly yet are less than thorough, while strong satisfi -cers may not at all search their memory for relevant information and simply select answers at random in order to complete the survey quickly. In other words, weak satisfi cers carelessly process all four cognitive steps, while strong satisfi cers typi-cally skip the retrieval and judgement steps.
Respondents are more likely to satisfi ce when (Krosnick, 1991 ):
• Cognitive ability to answer is low. • Motivation to answer is low. • Question diffi culty is high at one of the four stages, resulting in cognitive exertion.
H. Müller et al.

245
To minimize satisfi cing, the following may be considered:
• Complex questions that require an inordinate amount of cognitive exertion should be avoided.
• Answer options such as “no opinion,” “don’t know,” “not applicable,” or “unsure” should be avoided, since respondents with actual opinions will be tempted and select this option ( Krosnick, 2002 ; Schaeffer & Presser, 2003 ). Instead, respondents should fi rst be asked whether they have thought about the proposed question or issue enough to have an opinion; those that haven’t should be screened out.
• Using the same rating scale in a series of back-to-back questions should be avoided. Potential satisfi ers may pick the same scale point for all answer options. This is known as straight-lining or item non-differentiation (Herzog & Bachman, 1981 ; Krosnick & Alwin, 1987 , 1988 ).
• Long questionnaires should be avoided, since respondents will be less likely to optimally answer questions when they become increasingly fatigued and unmo-tivated (Cannell & Kahn, 1968 ; Herzog & Bachman, 1981 ).
• Respondent motivation can be increased by explaining the importance of the survey topic and that their responses are critical to the researcher (Krosnick, 1991 ).
• Respondents may be asked to justify their answer to the question that may exhibit satisfi cing.
• Trap questions (e.g., “Enter the number 5 in the following text box:”) can iden-tify satisfi cers and fraudulent survey respondents.
Acquiescence Bias
When presented with agree/disagree, yes/no, or true/false statements, some respon-dents are more likely to concur with the statement independent of its substance. This tendency is known as acquiescence bias (Smith, 1967 ).
Respondents are more likely to acquiescence when:
• Cognitive ability is low (Krosnick, Narayan, & Smith, 1996 ) or motivation is low.
• Question diffi culty is high (Stone, Gage, & Leavitt, 1957 ). • Personality tendencies skew toward agreeableness (Costa & McCrae, 1988 ;
Goldberg, 1990 ; Saris, Revilla, Krosnick, & Shaeffer, 2010 ). • Social conventions suggest that a “yes” response is most polite (Saris et al.,
2010 ). • The respondent satisfi ces and only thinks of reasons why the statement is true,
rather than expending cognitive effort to consider reasons for disagreement (Krosnick, 1991 ).
• Respondents with lower self-perceived status assume that the survey admini-strator agrees with the posed statement, resulting in deferential agreement bias (Saris et al., 2010 ).
Survey Research in HCI

246
To minimize acquiescence bias, the following may be considered:
• Avoid questions with agree/disagree, yes/no, true/false, or similar answer options (Krosnick & Presser, 2010 ).
• Where possible, ask construct-specifi c questions (i.e., questions that ask about the underlying construct in a neutral, non-leading way) instead of agreement statements (Saris et al., 2010 ).
• Use reverse-keyed constructs; i.e., the same construct is asked positively and negatively in the same survey. The raw scores of both responses are then com-bined to correct for acquiescence bias.
Social Desirability
Social desirability occurs when respondents answer questions in a manner they feel will be positively perceived by others ( Goffman, 1959 ; Schlenker & Weigold, 1989 ). Favorable actions may be overreported, and unfavorable actions or views may be underreported. Topics that are especially prone to social desirability bias include voting behavior, religious beliefs, sexual activity, patriotism, bigotry, intel-lectual capabilities, illegal acts, acts of violence, and charitable acts.
Respondents are inclined to provide socially desirable answers when:
• Their behavior or views go against the social norm (Holbrook & Krosnick, 2010 ). • Asked to provide information on sensitive topics, making the respondent feel
uncomfortable or embarrassed about expressing their actual views (Holbrook & Krosnick, 2010 ).
• They perceive a threat of disclosure or consequences to answering truthfully (Tourangeau, Rips, & Rasinski, 2000 ).
• Their true identity (e.g., name, address, phone number) is captured in the survey (Paulhus, 1984 ).
• The data is directly collected by another person (e.g., in-person or phone surveys).
To minimize social desirability bias, respondents should be allowed to answer anonymously or the survey should be self-administered (Holbrook & Krosnick, 2010 ; Tourangeau & Smith, 1996 ; Tourangeau & Yan, 2007 ).
Response Order Bias
Response order bias is the tendency to select the items toward the beginning (i.e., primacy effect) or the end (i.e., recency effect) of an answer list or scale (Chan, 1991 ; Krosnick & Alwin, 1987 ; Payne, 1971 ). Respondents unconsciously interpret the ordering of listed answer options and assume that items near each other are related, top or left items are interpreted to be “fi rst,” and middle answers in a scale without a natural order represent the typical value (Tourangeau et al., 2004 ). Primacy and recency effects are the strongest when the list of answer options is long (Schuman & Presser, 1981 ) or when they cannot be viewed as a whole (Couper et al., 2004 ).
H. Müller et al.

247
To minimize response order effects, the following may be considered:
• Unrelated answer options should be randomly ordered across respondents (Krosnick & Presser, 2010 ).
• Rating scales should be ordered from negative to positive, with the most negative item fi rst.
• The order of ordinal scales should be reversed randomly between respondents, and the raw scores of both scale versions should be averaged using the same value for each scale label. That way, the response order effects cancel each other out across respondents (e.g., Villar & Krosnick, 2011 ), unfortunately, at the cost of increasing variability.
Question Order Bias
Order effects also apply to the order of the questions in surveys. Each question in a survey has the potential to bias each subsequent question by priming respondents (Kinder & Iyengar, 1987 ; Landon, 1971 ).
The following guidelines may be considered:
• Questions should be ordered from broad to more specifi c (i.e., a funnel approach) to ensure that the survey follows conversational conventions.
• Early questions should be easy to answer and directly related to the survey topic (to help build rapport and engage respondents) (Dillman, 1978 ).
• Non-critical, complex, and sensitive questions should be included toward the end of the survey to avoid early drop-off and to ensure collection of critical data.
• Related questions need to be grouped to reduce context switching so that respon-dents can more easily and quickly access related information from memory, as opposed to disparate items.
• The questionnaire should be divided into multiple pages with distinct sections labeled for easier cognitive processing.
Other Types of Questions to Avoid
Beyond the fi ve common questionnaire biases mentioned above, there are additional question types that can result in unreliable and invalid survey data. These include broad, leading, double-barreled, recall, prediction, hypothetical, and prioritization questions.
Broad questions lack focus and include items that are not clearly defi ned or those that can be interpreted in multiple ways. For example, “Describe the way you use your tablet computer” is too broad, as there are many aspects to using a tablet such as the purpose, applications being used, and its locations of use. Instead of relying on the respondent to decide on which aspects to report, the research goal as well as core construct(s) should be determined beforehand and asked about in a focused manner. A more focused set of questions for the example above could be “Which apps did you use on your tablet computer over the last week?” and “Describe the locations in which you used your tablet computer last week?”.
Survey Research in HCI

248
Leading questions manipulate respondents into giving a certain answer by providing biasing content or suggesting information the researcher is looking to have confi rmed. For example, “This application was recently ranked as number one in customer satisfaction. How satisfi ed are you with your experience today?”. Another way that questions can lead the respondent toward a certain answer includes those that ask the respondent to agree or disagree with a given statement, as for example in “Do you agree or disagree with the following statement: I use my smartphone more often than my tablet computer.” Note that such questions can additionally result in acquiescence bias (as discussed above). To minimize the effects of leading ques-tions, questions should be asked in a fully neutral way without any examples or additional information that may bias respondents toward a particular response.
Double-barreled questions ask about multiple items while only allowing for a single response, resulting in less reliable and valid data. Such questions can usually be detected by the existence of the word “and.” For example, when asked “How satis-fi ed or dissatisfi ed are you with your smartphone and tablet computer?”, a respondent with differing attitudes toward the two devices will be forced to pick an attitude that either refl ects just one device or the average across both devices. Questions with multiple items should be broken down into one question per construct or item.
Recall questions require the respondent to remember past attitudes and behav-iors, leading to recall bias (Krosnick & Presser, 2010 ) and inaccurate recollections. When a respondent is asked “How many times did you use an Internet search engine over the past 6 months?”, they will try to rationalize a plausible number, because recalling a precise count is diffi cult or impossible. Similarly, asking questions that compare past attitudes to current attitudes, as in “Do you prefer the previous or current version of the interface?”, may result in skewed data due to diffi culty remembering past attitudes. Instead, questions should focus on the present, as in “How satisfi ed or dissatisfi ed are you with your smartphone today?”, or use a recent time frame, for example, “In the past hour, how many times did you use an Internet search engine?”. If the research goal is to compare attitudes or behaviors across different product versions or over time, the researcher should fi eld separate surveys for each product version or time period and make the comparison themselves.
Prediction questions ask survey respondents to anticipate future behavior or atti-tudes, resulting in biased and inaccurate responses. Such questions include “Over the next month, how frequently will you use an Internet search engine?”. Even more cognitively burdensome are hypothetical questions, i.e., asking the respondent to imagine a certain situation in the future and then predicting their attitude or behav-ior in that situation. For example, “Would you purchase more groceries if the store played your favorite music?” and “How much would you like this Website if it used blue instead of red for their color scheme?” are hypothetical questions. Other fre-quently used hypothetical questions are those that ask the respondent to prioritize a future feature set, as in “Which of the following features would make you more satisfi ed with this product?”. Even though the respondent may have a clear answer to this question, their response does not predict actual future usage of or satisfaction with the product if that feature was added. Such questions should be entirely excluded from surveys.
H. Müller et al.
249
Leveraging Established Questionnaires
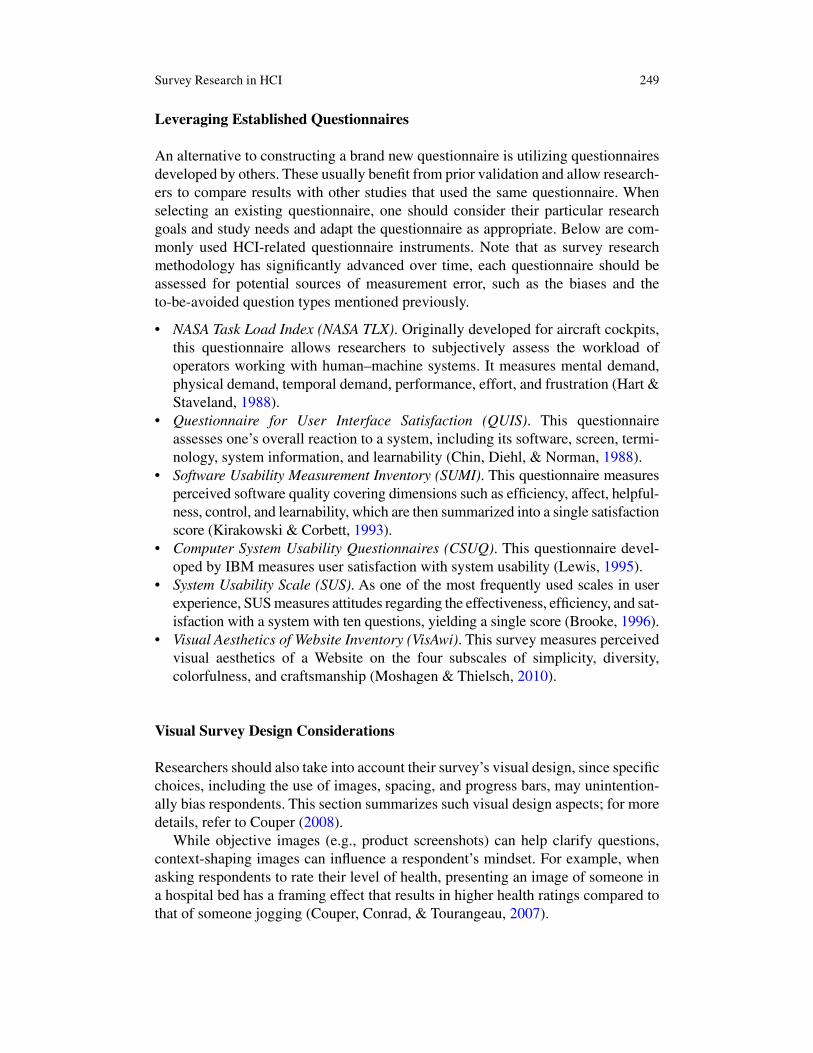
An alternative to constructing a brand new questionnaire is utilizing questionnaires developed by others. These usually benefi t from prior validation and allow research-ers to compare results with other studies that used the same questionnaire. When selecting an existing questionnaire, one should consider their particular research goals and study needs and adapt the questionnaire as appropriate. Below are com-monly used HCI-related questionnaire instruments. Note that as survey research methodology has signifi cantly advanced over time, each questionnaire should be assessed for potential sources of measurement error, such as the biases and the to-be- avoided question types mentioned previously.
• NASA Task Load Index (NASA TLX) . Originally developed for aircraft cockpits, this questionnaire allows researchers to subjectively assess the workload of operators working with human–machine systems. It measures mental demand, physical demand, temporal demand, performance, effort, and frustration (Hart & Staveland, 1988 ).
• Questionnaire for User Interface Satisfaction (QUIS) . This questionnaire assesses one’s overall reaction to a system, including its software, screen, termi-nology, system information, and learnability (Chin, Diehl, & Norman, 1988 ).
• Software Usability Measurement Inventory (SUMI) . This questionnaire measures perceived software quality covering dimensions such as effi ciency, affect, helpful-ness, control, and learnability, which are then summarized into a single satisfaction score (Kirakowski & Corbett, 1993 ).
• Computer System Usability Questionnaires (CSUQ) . This questionnaire devel-oped by IBM measures user satisfaction with system usability (Lewis, 1995 ).
• System Usability Scale (SUS) . As one of the most frequently used scales in user experience, SUS measures attitudes regarding the effectiveness, effi ciency, and sat-isfaction with a system with ten questions, yielding a single score (Brooke, 1996 ).
• Visual Aesthetics of Website Inventory (VisAwi) . This survey measures perceived visual aesthetics of a Website on the four subscales of simplicity, diversity, colorfulness, and craftsmanship (Moshagen & Thielsch, 2010 ).
Visual Survey Design Considerations
Researchers should also take into account their survey’s visual design, since specifi c choices, including the use of images, spacing, and progress bars, may unintention-ally bias respondents. This section summarizes such visual design aspects; for more details, refer to Couper ( 2008 ).
While objective images (e.g., product screenshots) can help clarify questions, context-shaping images can infl uence a respondent’s mindset. For example, when asking respondents to rate their level of health, presenting an image of someone in a hospital bed has a framing effect that results in higher health ratings compared to that of someone jogging (Couper, Conrad, & Tourangeau, 2007 ).
Survey Research in HCI

250
The visual treatment of response options also matters. When asking closed- ended questions, uneven spacing between horizontal scale options results in a higher selection rate for scale points with greater spacing; evenly spaced scale options are recommended (Tourangeau, Couper, & Conrad, 2004 ). Drop-down lists, compared to radio buttons, have been shown to be harder and slower to use and to result in more accidental selections (Couper, 2011 ). Lastly, larger text fi elds increase the amount of text entered (Couper, 2011 ) but may intimidate respondents, potentially causing higher break-offs (i.e., drop-out rates).
Survey questions can be presented one per page, multiple per page, or all on one page. Research into pagination effects on completion rates is inconclusive (Couper, 2011 ). However, questions appearing on the same page may have higher correlations with each other, a sign of measurement bias (Peytchev, Couper, McCabe, & Crawford, 2006 ). In practice, most Internet surveys with skip logic use multiple pages, whereas very short questionnaires are often presented on a single page.
While progress bars are generally preferred by respondents and are helpful for short surveys, their use in long surveys or surveys with skip logic can be misleading and intimidating. Progress between pages in long surveys may be small, resulting in increased break-off rates (Callegaro, Villar, & Yang, 2011 ). On the other hand, progress bars are likely to increase completion rates for short surveys, where sub-stantial progress is shown between pages.
Review and Survey Pretesting
At this point in the survey life cycle, it is appropriate to have potential respondents take and evaluate the survey in order to identify any remaining points of confusion. For example, the phrase “mobile device” may be assumed to include mobile phones, tab-lets, and in-car devices by the researcher, while survey respondents may interpret it to be mobile phones only. Or, when asking for communication tools used by the respon-dent, the provided list of answer choices may not actually include all possible options needed to properly answer the question. Two established evaluation methods used to improve survey quality are cognitive pretesting and fi eld testing the survey by launching it to a subset of the actual sample, as described more fully in the remainder of this sec-tion. By evaluating surveys early on, the researcher can identify disconnects between their own assumptions and how respondents will read, interpret, and answer questions.
Cognitive Pretesting
To conduct a cognitive pretest, a small set of potential respondents is invited to participate in an in-person interview where they are asked to take the survey while using the think-aloud protocol (similar to a usability study). A cognitive pretest assesses question interpretation, construct validity, and comprehension of survey
H. Müller et al.

251
terminology and calls attention to missing answer options or entire questions ( Bolton & Bronkhorst, 1995 ; Collins, 2003 ; Drennan, 2003 ; Presser et al., 2004 ). However, note that due to the testing environment, a cognitive pretest does not allow the researcher to understand contextual infl uences that may result in break-off or not fi lling out the survey in the fi rst place.
As part of a pretest, participants are asked the following for each question:
1. “Read the entire question and describe it in your own words.” 2. “Select or write an answer while explaining your thought process.” 3. “Describe any confusing terminology or missing answer choices.”
During the interview, the researcher should observe participant reactions; identify misinterpretations of terms, questions, answer choices, or scale items; and gain insight into how respondents process questions and come up with their answers. The researcher then needs to analyze the collected information to improve problem-atic areas before fi elding the fi nal questionnaire. A questionnaire could go through several rounds of iteration before reaching the desired quality.
Field Testing
Piloting the survey with a small subset of the sample will help provide insights that cognitive pretests alone cannot (Collins, 2003 ; Presser et al., 2004 ). Through fi eld testing, the researcher can assess the success of the sampling approach, look for common break-off points and long completion times, and examine answers to open- ended questions. High break-off rates and completion times may point to fl aws in the survey design (see the following section), while unusual answers may suggest a disconnect between a question’s intention and respondents’ interpretation. To yield additional insights from the fi eld test, a question can be added at the end of each page or at the end of the entire survey where respondents can provide explicit feed-back on any points of confusion. Similar to cognitive pretests, fi eld testing may lead to several rounds of questionnaire improvement as well as changes to the sampling method. Finally, once all concerns are addressed, the survey is ready to be fi elded to the entire sample.
Implementation and Launch
When all questions are fi nalized, the survey is ready to be fi elded based on the chosen sampling method. Respondents may be invited through e-mails to specifi cally named persons (e.g., respondents chosen from a panel), intercept pop-up dialogs while using a product or a site, or links placed directly in an application (see the sampling section for more details; Couper, 2000 ).
Survey Research in HCI

252
There are many platforms and tools that can be used to implement Internet surveys, such as Confi rmIt, Google Forms, Kinesis, LimeSurvey, SurveyGizmo, SurveyMonkey, UserZoom, Wufoo, and Zoomerang, to name just a few. When deciding on the appropriate platform, functionality, cost, and ease of use should be taken into consideration. The questionnaire may require a survey tool that supports functionality such as branching and conditionals, the ability to pass URL parame-ters, multiple languages, and a range of question types. Additionally, the researcher may want to customize the visual style of the survey or set up an automatic reporting dashboard, both of which may only be available on more sophisticated platforms.
Piping Behavioral Data into Surveys
Some platforms support the ability to combine survey responses with other log data, which is referred to as piping. Self-reported behaviors, such as frequency of use, feature usage, tenure, and platform usage, are less valid and reliable compared to generating the same metrics through log data. By merging survey responses with behavioral data, the researcher can more accurately understand the relationship between respondent characteristics and their behaviors or attitudes. For example, the researcher may fi nd that certain types of users or the level of usage may correlate with higher reported satisfaction. Behavioral data can either be passed to the results database as a parameter in the survey invitation link or combined later via a unique identifi er for each respondent.
Monitoring Survey Paradata
With the survey’s launch, researchers should monitor the initial responses as well as survey paradata to identify potential mistakes in the survey design. Survey paradata is data collected about the survey response process, such as the devices from which the survey was accessed, time to survey completion, and various response-related rates. By monitoring such metrics, the survey researcher can quickly apply improvements before the entire sample has responded to the survey. The American Association for Public Opinion Research specifi ed a set of defi nitions for commonly used paradata metrics (AAPOR, 2011 ):
• Click-through rate: Of those invited, how many opened the survey. • Completion rate: Of those who opened the survey, how many fi nished the survey. • Response rate: Of those invited, how many fi nished the survey. • Break-off rate: Of those who started, how many dropped off on each page. • Completion time: The time it took respondents to fi nish the entire survey.
Response rates are dependent on a variety of factors, the combination of which makes it diffi cult to specify an acceptable response rate in HCI survey research. A meta-analysis of 31 e-mail surveys from 1986 to 2000 showed that average response rates for e-mail surveys typically fall between 30 and 40 %, with follow-up
H. Müller et al.

253
reminders signifi cantly increasing response rates (Sheehan, 2001 ). Another review of 69 e-mail surveys showed that response rates averaged around 40 % (Cook, Heath, & Thompson, 2000 ). When inviting respondents through Internet intercept surveys (e.g., pop-up surveys or in-product links), response rates may be 15 % or lower (Couper, 2000 ). Meta-analyses of mailed surveys showed that their response rates are 40–50 % (Kerlinger, 1986 ) or 55 % (Baruch, 1999 ). In experimental com-parisons to mailed surveys, response rates to Internet e-mail surveys were about 10 % lower (Kaplowitz, Hadlock, & Levine, 2004 ; Manfreda et al., 2008 ). Such meta reviews also showed that overall response rates have been declining over several decades (Baruch, 1999 ; Baruch & Holtom, 2008 ; Sheehan, 2001 ); however, this decline seems to have stagnated around 1995 (Baruch & Holtom, 2008 ).
Maximizing Response Rates
In order to gather enough responses to represent the target population with the desired level of precision, response rates should be maximized. Several factors affect response rates, including the respondents’ interest in the subject matter, the perceived impact of responding to the survey, questionnaire length and diffi culty, the presence and nature of incentives, and researchers’ efforts to encourage response (Fan & Yan, 2010 ).
Based on experimentation with invitation processes for mail surveys, Dillman ( 1978 ) developed the “Total Design Method” to optimize response rates. This method, consistently achieving response rates averaging 70 % or better, consists of a timed sequence of four mailings: the initial request with the survey on week one, a reminder postcard on week two, a replacement survey to non-respondents on week four, and a second replacement survey to non-respondents by certifi ed mail on week seven. Dillman incorporates social exchange theory into the Total Design Method by person-alizing the invitation letters, using offi cial stationery to increase trust in the survey’s sponsorship, explaining the usefulness of the survey research and the importance of responding, assuring the confi dentiality of respondents’ data, and beginning the ques-tionnaire with items directly related to the topic of the survey (1991). Recognizing the need to cover Internet and mixed-mode surveys, Dillman extended his prior work with the “Tailored Design Method.” With this update, he emphasized customizing processes and designs to fi t each survey’s topic, population, and sponsorship (2007).
Another component of optimizing response rates is getting as many complete responses as possible from those who start the survey. According to Peytchev ( 2009 ), causes of break-off may fall into the following three categories:
• Respondent factors (survey topic salience and cognitive ability) • Survey design factors (length, progress indicators, and incentives) • Question design factors (fatigue and intimidation from open-ended questions
and lengthy grid questions)
The questionnaire design principles mentioned previously may help minimize break-off, such as making surveys as short as possible, having a minimum of required questions, using skip logic, and including progress bars for short surveys.
Survey Research in HCI

254
Providing an incentive to encourage survey responses may be advantageous in certain cases. Monetary incentives tend to increase response rates more than non- monetary incentives (Singer, 2002 ). In particular, non-contingent incentives, which are offered to all people in the sample, generally outperform contingent incentives, given only upon completion of the survey (Church, 1993 ). This is true even when a non-contingent incentive is considerably smaller than a contingent incentive. One strategy to maximize the benefi t of incentives is to offer a small non-contingent award to all invitees, followed by a larger contingent award to initial non- respondents (Lavrakas, 2011 ). An alternate form of contingent incentive is a lottery, where a drawing is held among respondents for a small number of monetary awards or other prizes. However, the effi cacy of such lotteries is unclear (Stevenson, Dykema, Cyffka, Klein, & Goldrick-Rab, 2012 ). Although incentives will typically increase response rates, it is much less certain whether they increase the representativeness of the results. Incentives are likely most valuable when facing a small population or sampling frame, and high response rates are required for suffi ciently precise mea-surements. Another case where incentives may help is when some groups in the sample have low interest in the survey topic (Singer, 2002 ). Furthermore, when there is a cost to contact each potential respondent, as with door-to-door interview-ing, incentives will decrease costs by lowering the number of people that need to be contacted.
Data Analysis and Reporting
Once all the necessary survey responses have been collected, it is time to start making sense of the data by:
1. Preparing and exploring the data 2. Thoroughly analyzing the data 3. Synthesizing insights for the target audience of this research
Data Preparation and Cleaning
Cleaning and preparing survey data before conducting a thorough analysis are essential to identify low-quality responses that may otherwise skew the results. When taking a pass through the data, survey researchers should look for signs of poor-quality responses. Such survey data can either be left as is, removed, or presented separately from trusted data. If the researcher decides to remove poor data, they must cautiously decide whether to remove data on the respondent level (i.e., listwise deletion), an individual question level (i.e., pairwise deletion), or only beyond a certain point in the survey where respondents’ data quality is declined. The following are signals that survey researchers should look out for at the survey response level:
H. Müller et al.

255
• Duplicate responses . In a self-administered survey, a respondent might be able to fi ll out the survey more than once. If possible, respondent information such as name, e-mail address, or any other unique identifi er should be used to remove duplicate responses.
• Speeders . Respondents that complete the survey faster than possible, speeders, may have carelessly read and answered the questions, resulting in arbitrary responses. The researcher should examine the distribution of response times and remove any respondents that are suspiciously fast.
• Straight-liners and other questionable patterns . Respondents that always, or almost always, pick the same answer option across survey questions are referred to as straight-liners. Grid-style questions are particularly prone to respondent straight-lining (e.g., by always picking the fi rst answer option when asked to rate a series of objects). Respondents may also try to hide the fact that they are ran-domly choosing responses by answering in a fi xed pattern (e.g., by alternating between the fi rst and second answer options across questions). If a respondent straight-lines through the entire survey, the researcher may decide to remove the respondent’s data entirely. If a respondent starts straight-lining at a certain point, the researcher may keep data up until that point.
• Missing data and break-offs . Some respondents may fi nish a survey but skip sev-eral questions. Others may start the survey but break off at some point. Both result in missing data. It should fi rst be determined whether those who did not respond to certain questions are different from those who did. A non-response study should be conducted to assess the amount of non-response bias for each survey question. If those who did not answer certain questions are not meaningfully different from those who did, the researcher can consider leaving the data as is; however, if there is a difference, the researcher may choose to impute plausible values based on similar respondents’ answers (De Leeuw, Hox, & Huisman, 2003 ).
Furthermore, the following signals may need to be assessed at a question-by-question level:
• Low inter-item reliability . When multiple questions are used to measure a single construct, respondents’ answers to these questions should be associated with each other. Respondents that give inconsistent or unreliable responses (e.g., selecting “very fast” and “very slow” for separate questions assessing the construct of speed) may not have carefully read the set of questions and should be considered for removal.
• Outliers . Answers that signifi cantly deviate from the majority of responses are considered outliers and should be examined. For questions with numeric values, some consider outliers as the top and bottom 2 % of responses, while others calculate outliers as anything outside of two or three standard deviations from the mean. Survey researchers should determine how much of a difference keeping or removing the outliers has on variables’ averages. If the impact is signifi cant, the researcher may either remove such responses entirely or replace them with a value that equals two or three standard deviations from the mean. Another way to describe the central tendency while minimizing the effect of outliers is to use the median, rather than the mean.
Survey Research in HCI

256
• Inadequate open-ended responses . Due to the amount of effort required, open- ended questions may lead to low-quality responses. Obvious garbage and irrelevant answers, such as “asdf,” should be removed, and other answers from the same respondent should be examined to determine whether all their survey responses warrant removal.
Analysis of Closed-Ended Responses
To get an overview of what the survey data shows, descriptive statistics are funda-mental. By looking at measures such as the frequency distribution, central tendency (e.g., mean or median), and data dispersion (e.g., standard deviation), emerging patterns can be uncovered. The frequency distribution shows the propor-tion of responses for each answer option. The central tendency measures the “central” position of a frequency distribution and is calculated using the mean, median, and mode. Dispersion examines the data spread around the central position through calculations such as standard deviation, variance, range, and interquartile range.
While descriptive statistics only describe the existing data set, inferential statis-tics can be used to draw inferences from the sample to the overall population in question. Inferential statistics consists of two areas: estimation statistics and hypoth-esis testing. Estimation statistics involves using the survey’s sample in order to approximate the population’s value. Either the margin of error or the confi dence interval of the sample’s data needs to be determined for such estimation. To calcu-late the margin of error for an answer option’s proportion, only the sample size, the proportion, and a selected confi dence level are needed. However, to determine the confi dence interval for a mean, the standard error of the mean is required addition-ally. A confi dence interval thus represents the estimated range of a population’s mean at a certain confi dence level.
Hypothesis testing determines the probability of a hypothesis being true when comparing groups (e.g., means or proportions being the same or different) through the use of methods such as t -test, ANOVA, or Chi-square. The appropriate test is determined by the research question, type of prediction by the researcher, and type of variable (i.e., nominal, ordinal, interval, or ratio). An experienced quantita-tive researcher or statistician should be involved.
Inferential statistics can also be applied to identify connections among variables:
• Bivariate correlations are widely used to assess linear relationships between variables. For example, correlations can indicate which product dimensions (e.g., ease of use, speed, features) are most strongly associated with users’ over-all satisfaction.
• Linear regression analysis indicates the proportion of variance in a continuous dependent variable that is explained by one or more independent variables and the amount of change explained by each unit of an independent variable.
H. Müller et al.

257
• Logistic regression predicts the change in probability of getting a particular value in a binary variable, given a unit change in one or more independent variables.
• Decision trees assess the probabilities of reaching specifi c outcomes, considering relationships between variables.
• Factor analysis identifi es groups of covariates and can be useful to reduce a large number of variables into a smaller set.
• Cluster analysis looks for related groups of respondents and is often used by market researchers to identify and categorize segments within a population.
There are many packages available to assist with survey analysis. Software such as Microsoft Excel, and even certain survey platforms such as SurveyMonkey or Google Forms, can be used for basic descriptive statistics and charts. More advanced packages such as SPSS, R, SAS, or Matlab can be used for complex modeling, calculations, and charting. Note that data cleaning often needs to be a precursor to conducting analysis using such tools.
Analysis of Open-Ended Comments
In addition to analyzing closed-ended responses, the review of open-ended com-ments contributes a more holistic understanding of the phenomena being studied. Analyzing a large set of open-ended comments may seem like a daunting task at fi rst; however, if done correctly, it reveals important insights that cannot otherwise be extracted from closed-ended responses. The analysis of open-ended survey responses can be derived from the method of grounded theory (Böhm, 2004 ; Glaser & Strauss, 1967 ) (see chapter on “Grounded Theory Methods”).
An interpretive method, referred to as coding (Saldaña, 2009 ), is used to organize and transform qualitative data from open-ended questions to enable further quanti-tative analysis (e.g., preparing a frequency distribution of the codes or comparing the responses across groups). The core of such qualitative analysis is to assign one or several codes to each comment; each code consists of a word or a short phrase summarizing the essence of the response with regard to the objective of that survey question (e.g., described frustrations, behavior, sentiment, or user type). Available codes are chosen from a coding scheme, which may already be established by the community or from previous research or may need to be created by the researchers themselves. In most cases, as questions are customized to each individual survey, the researcher needs to establish the coding system using a deductive or an inductive approach.
When employing a deductive approach, the researcher defi nes the full list of possible codes in a top-down fashion; i.e., all codes are defi ned before reviewing the qualitative data and assigning those codes to comments. On the other hand, when using an inductive approach to coding, the codes are generated and constantly revised in a bottom-up approach; i.e., the data is coded according to categories
Survey Research in HCI

258
identifi ed by reading and re-reading responses to the open-ended question. Bottom-up, inductive coding is recommended, as it has the benefi t of capturing categories the researcher may not have thought of before reading the actual comments; however, it requires more coordination if multiple coders are involved. (See “Grounded Theory Method” chapter for an analogous discussion.)
To measure the reliability of both the developed coding system and the coding of the comments, either the same coder should partially repeat the coding or a second coder should be involved. Intra-rater reliability describes the degree of agreement when the data set is reanalyzed by the same researcher. Inter-rater reliability (Armstrong, Gosling, Weinman, & Marteau, 1997 ; Gwet, 2001 ) determines the agree-ment level of the coding results from at least two independent researchers (using correlations or Cohen’s kappa). If there is low agreement, the coding needs to be reviewed to identify the pattern behind the disagreement, coder training needs to be adjusted, or changes to codes need to be agreed upon to achieve consistent categoriza-tion. If the data set to be coded is too large and coding needs to be split up between researchers, inter-rater consistency can be measured by comparing results from coding an overlapping set of comments, by comparing the coding to a preestablished standard, or by including another researcher to review overlapping codes from the main coders.
After having analyzed all comments, the researcher may prepare descriptive statistics such as a frequency distribution of codes, conduct inferential statistical tests, summarize key themes, prepare necessary charts, and highlight specifi cs through the use of representative quotes. To compare results across groups, infer-ential analysis methods can be used as described above for closed-ended data (e.g., t -tests, ANOVA, or Chi-square).
Assessing Representativeness
A key criterion in any survey’s quality is the degree to which the results accurately represent the target population. If a survey’s sampling frame fully covers the popu-lation and the sample is randomly drawn from the sampling frame, a response rate of 100 % would ensure that the results are representative at a level of precision based on the sample size.
If, however, a survey has less than a 100 % response rate, those not responding might have provided a different answer distribution than those who did respond.
An example is a survey intended to measure attitudes and behaviors regarding a technology that became available recently. Since people who are early adopters of new technologies are usually very passionate about providing their thoughts and feedback, surveying users of this technology product would overestimate responses from early adopters (as compared to more occasional users) and the incidence of favorable attitudes toward that product. Thus, even a modest level of non-response can greatly affect the degree of non-response bias.
With response rates to major longitudinal surveys having decreased over time, much effort has been devoted to understanding non- response and its impact on data
H. Müller et al.

259
quality as well as methods of adjusting results to mitigate non-response error. Traditional survey assumptions held that maximizing response rates minimized non-response bias (Groves, 2006 ). Therefore, the results of Groves’ 2006 meta-analysis were both surprising and seminal, fi nding no meaningful correlation between response rates and non-response error across mail, telephone, and face-to-face surveys.
Reporting Survey Findings
Once the question-by-question analysis is completed, the researcher needs to synthesize fi ndings across all questions to address the goals of the survey. Larger themes may be identifi ed, and the initially defi ned research questions are answered, which are in turn translated into recommendations and broader HCI implications as appropriate. All calculations used for the data analysis should be reported with the necessary statistical rigor (e.g., sample sizes, p -values, margins of error, and confi dence levels). Furthermore, it is important to list the survey’s paradata and include response and break-off rates (see section on monitoring survey paradata).
Similar to other empirical research, it is important to not only report the results of the survey but also describe the original research goals and the used survey methodology. A detailed description of the survey methodology will explain the population being studied, sampling method, survey mode, survey invitation, fi eld-ing process, and response paradata. It should also include screenshots of the actual survey questions and explain techniques used to evaluate data quality. Furthermore, it is often necessary to include a discussion on how the respondents compare to the overall population. Lastly, any potential sources of survey bias, such as sampling biases or non-response bias, should be outlined.
Exercises
1. What are the differences between a survey and a questionnaire, both in concept and design?
2. In your own research area, create a survey and test it with fi ve classmates. How long do you think it will take a classmate to fi ll it out? How long did it take them?
Acknowledgements We would like to thank our employers Google, Inc. and Twitter, Inc. for making it possible for us to work on this chapter. There are many that contributed to this effort, and we would like to call out the most signifi cant ones: Carolyn Wei for identifying published papers that used survey methodology for their work, Sandra Lozano for her insights on analysis, Mario Callegaro for inspiration, Ed Chi and Robin Jeffries for reviewing several drafts of this document, and Professors Jon Krosnick from Stanford University and Mick Couper from the University of Michigan for laying the foundation of our survey knowledge and connecting us to the broader survey research community.
Survey Research in HCI

260
References
Overview Books
Couper, M. (2008). Designing effective Web surveys . Cambridge, UK: Cambridge University Press. Fowler, F. J., Jr. (1995). Improving survey questions: Design and evaluation (Vol. 38). Thousand
Oaks, CA: Sage. Incorporated. Groves, R. M. (1989). Survey errors and survey costs . Hoboken, NJ: Wiley. Groves, R. M. (2004). Survey errors and survey costs (Vol. 536). Hoboken, NJ: Wiley-Interscience. Groves, R. M., Fowler, F. J., Couper, M. P., Lepkowski, J. M., Singer, E., & Tourangeau, R. (2004).
Survey methodology . Hoboken, NJ: Wiley. Marsden, P. V., & Wright, J. (Eds.). (2010). Handbook of survey research (2nd ed.). Bingley, UK:
Emerald Publishing Group Limited.
Sampling Methods
Aquilino, W. S. (1994). Interview mode effects in surveys of drug and alcohol use: A fi eld experiment. Public Opinion Quarterly., 58 (2), 210–240.
Cochran, W. G. (1977). Sampling techniques (3rd ed.). New York, NY: Wiley. Couper, M. P. (2000). Web surveys: A review of issues and approaches. Public Opinion Quarterly,
64 , 464–494. Kish, L. (1965). Survey sampling . New York, NY: Wiley. Krejcie, R. V., & Morgan, D. W. (1970). Determining sample size for research activities.
Educational and Psychological Measurement, 30 , 607–610. Lohr, S. L. (1999). Sampling: Design and analysis . Pacifi c Grove, CA: Duxbury Press.
Questionnaire Design
Bradburn, N. M., Sudman, S., & Wansink, B. (2004). Asking questions: The defi nitive guide to questionnaire design – for market research, political polls, and social and health question-naires . San Francisco, CA: Jossey-Bass. Revised.
Cannell, C. F., & Kahn, R. L. (1968). Interviewing. The Handbook of Social Psychology, 2 , 526–595.
Chan, J. C. (1991). Response-order effects in Likert-type scales. Educational and Psychological Measurement, 51 (3), 531–540.
Costa, P. T., & McCrae, R. R. (1988). From catalog to classifi cation: Murray’s needs and the fi ve- factor model. Journal of Personality and Social Psychology, 55 (2), 258.
Couper, M. P., Tourangeau, R., Conrad, F. G., & Crawford, S. D. (2004). What they see is what we get response options for web surveys. Social Science Computer Review, 22 (1), 111–127.
Edwards, A. L., & Kenney, K. C. (1946). A comparison of the Thurstone and Likert techniques of attitudes scale construction. Journal of Applied Psychology, 30 , 72–83.
Goffman, E. (1959). The presentation of self in everyday life, 1–17. Garden City, NY Goldberg, L. R. (1990). An alternative description of personality: The big-fi ve factor structure.
Journal of Personality and Social Psychology, 59 (6), 1216.
H. Müller et al.

261
Herzog, A. R., & Bachman, J. G. (1981). Effects of questionnaire length on response quality. Public Opinion Quarterly, 45 (4), 549–559.
Holbrook, A. L., & Krosnick, J. A. (2010). Social desirability bias in voter turnout reports tests using the item count technique. Public Opinion Quarterly, 74 (1), 37–67.
Kinder, D. R., & Iyengar, S. (1987). News That Matters: Television and American Opinion . Chicago: University of Chicago Press.
Krosnick, J. A. (1991). Response strategies for coping with the cognitive demands of attitude measures in surveys. Applied Cognitive Psychology, 5 , 213–236.
Krosnick, J. A. (1999). Survey research. Annual review of psychology, 50 (1), 537–567. Krosnick, J. A. (2002). The causes of no-opinion responses to attitude measures in surveys: They
are rarely what they appear to be. In R. Groves, D. Dillman, J. Eltinge, & R. Little (Eds.), Survey non-response (pp. 87–100). New York: Wiley.
Krosnick, J. A., & Alwin, D. F. (1987). Satisfi cing: A strategy for dealing with the demands of survey questions . Columbus, OH: Ohio State University.
Krosnick, J. A., & Alwin, D. F. (1988). A test of the form-resistant correlation hypothesis ratings, rankings, and the measurement of values. Public Opinion Quarterly, 52 (4), 526–538.
Krosnick, J. A., & Fabrigar, L. A. (1997). Designing rating scales for effective measurement in surveys. In L. Lyberg et al. (Eds.), Survey measurement and process quality (pp. 141–164). New York: Wiley.
Krosnick, J. A., Narayan, S., & Smith, W. R. (1996). Satisfi cing in surveys: Initial evidence. New Directions for Evaluation, 1996 (70), 29–44.
Krosnick, J. A., & Presser, S. (2010). Question and questionnaire design. In P. V. Marsden & J. D. Wright (Eds.), Handbook of survey research (pp. 263–314). Bingley, UK: Emerald Group Publishing Limited.
Landon, E. L. (1971). Order bias, the ideal rating, and the semantic differential. Journal of Marketing Research, 8 (3), 375–378.
O’Muircheartaigh, C. A., Krosnick, J. A., & Helic, A. (2001). Middle alternatives, acquiescence, and the quality of questionnaire data. In B. Irving (Ed.), Harris Graduate School of Public Policy Studies . Chicago, IL: University of Chicago.
Paulhus, D. L. (1984). Two-component models of socially desirable responding. Journal of Personality and Social Psychology, 46 (3), 598.
Payne, S. L. (1951). The art of asking questions . Princeton, NJ: Princeton University Press. Payne, J. D. (1971). The effects of reversing the order of verbal rating scales in a postal survey.
Journal of the Marketing Research Society, 14 , 30–44. Rohrmann, B. (2003). Verbal qualifi ers for rating scales: Sociolinguistic considerations and
psychometric data. Project Report. Australia: University of Melbourne Saris, W. E., Revilla, M., Krosnick, J. A., & Shaeffer, E. M. (2010). Comparing questions with
agree/disagree response options to questions with construct-specifi c response options. Survey Research Methods, 4 (1), 61–79.
Schaeffer, N. C., & Presser, S. (2003). The science of asking questions. Annual Review of Sociology, 29 , 65–88.
Schlenker, B. R., & Weigold, M. F. (1989). Goals and the self-identifi cation process: Constructing desired identities. In L. Pervin (Ed.), Goal concepts in personality and social psychology (pp. 243–290). Hillsdale, NJ: Erlbaum.
Schuman, H., & Presser, S. (1981). Questions and answers in attitude surveys . New York: Academic Press.
Simon, H. A. (1956). Rational choice and the structure of the environment. Psychological Review, 63 (2), 129–138.
Smith, D. H. (1967). Correcting for social desirability response sets in opinion-attitude survey research. Public Opinion Quarterly, 31 , 87–94.
Stone, G. C., Gage, N. L., & Leavitt, G. S. (1957). Two kinds of accuracy in predicting another’s responses. The Journal of Social Psychology, 45 (2), 245–254.
Survey Research in HCI

262
Tourangeau, R. (1984). Cognitive science and survey methods. Cognitive aspects of survey methodology: Building a bridge between disciplines (pp. 73–100). Washington, DC: National Academy Press.
Tourangeau, R., Couper, M. P., & Conrad, F. (2004). Spacing, position, and order: Interpre tive heuristics for visual features of survey questions. Public Opinion Quarterly, 68 (3), 368–393.
Tourangeau, R., Rips, L. J., & Rasinski, K. (2000). The psychology of survey response . Cambridge, UK: Cambridge University Press.
Tourangeau, R., & Smith, T. W. (1996). Asking sensitive questions the impact of data collection mode, question format, and question context. Public Opinion Quarterly, 60 (2), 275–304.
Tourangeau, R., & Yan, T. (2007). Sensitive questions in surveys. Psychological Bulletin, 133 (5), 859.
Villar, A., & Krosnick, J. A. (2011). Global warming vs. climate change, taxes vs. prices: Does word choice matter? Climatic change, 105 (1), 1–12.
Visual Survey Design
Callegaro, M., Villar, A., & Yang, Y. (2011). A meta-analysis of experiments manipulating progress indicators in Web surveys. Annual Meeting of the American Association for Public Opinion Research , Phoenix
Couper, M. (2011). Web survey methodology: Interface design, sampling and statistical inference. Presentation at EUSTAT-The Basque Statistics Institute , Vitoria-Gasteiz
Couper, M. P., Conrad, F. G., & Tourangeau, R. (2007). Visual context effects in Web surveys. Public Opinion Quarterly, 71 (4), 623–634.
Peytchev, A., Couper, M. P., McCabe, S. E., & Crawford, S. D. (2006). Web survey design paging versus scrolling. Public Opinion Quarterly, 70 (4), 596–607.
Yan, T., Conrad, F. G., Tourangeau, R., & Couper, M. P. (2011). Should I stay or should I go: The effects of progress feedback, promised task duration, and length of questionnaire on completing Web surveys. International Journal of Public Opinion Research, 23 (2), 131–147.
Established Questionnaire Instruments
Brooke, J. (1996). SUS-A quick and dirty usability scale. Usability Evaluation in Industry, 189 , 194.
Chin, J. P., Diehl, V. A., & Norman, K. L. (1988, May). Development of an instrument measuring user satisfaction of the human-computer interface. In Proceedings of the SIGCHI Conference on Human factors in computing systems (pp. 213–218). New York, NY: ACM
Hart, S. G., & Staveland, L. E. (1988). Development of NASA-TLX (Task Load Index): Results of empirical and theoretical research. Human Mental Workload, 1 , 139–183.
Kirakowski, J., & Corbett, M. (1993). SUMI: The software usability measurement inventory. British Journal of Educational Technology, 24 (3), 210–212.
Lewis, J. R. (1995). IBM computer usability satisfaction questionnaires: Psychometric evalua-tion and instructions for use. International Journal of Human‐Computer Interaction, 7 (1), 57–78.
Moshagen, M., & Thielsch, M. T. (2010). Facets of visual aesthetics. International Journal of Human-Computer Studies, 68 (10), 689–709.
H. Müller et al.

263
Questionnaire Evaluation
Bolton, R. N., & Bronkhorst, T. M. (1995). Questionnaire pretesting: Computer assisted coding of concurrent protocols. In N. Schwarz & S. Sudman (Eds.), Answering questions (pp. 37–64). San Francisco: Jossey-Bass.
Collins, D. (2003). Pretesting survey instruments: An overview of cognitive methods. Quality of Life Research an International Journal of Quality of Life Aspects of Treatment Care and Rehabilitation, 12 (3), 229–238.
Drennan, J. (2003). Cognitive interviewing: Verbal data in the design and pretesting of question-naires. Journal of Advanced Nursing, 42 (1), 57–63.
Presser, S., Couper, M. P., Lessler, J. T., Martin, E., Martin, J., Rothgeb, J. M., et al. (2004). Methods for testing and evaluating survey questions. Public Opinion Quarterly, 68 (1), 109–130.
Survey Response Rates and Non-response
American Association for Public Opinion Research, AAPOR. (2011). Standard defi nitions: Final dispositions of case codes and outcome rates for surveys . (7th ed). http://aapor.org/Content/NavigationMenu/AboutAAPOR/StandardsampEthics/StandardDefinitions/StandardDefi nitions2011.pdf
Baruch, Y. (1999). Response rates in academic studies: A comparative analysis. Human Relations, 52 , 421–434.
Baruch, Y., & Holtom, B. C. (2008). Survey response rate levels and trends in organizational research. Human Relations, 61 (8), 1139–1160.
Church, A. H. (1993). Estimating the effect of incentives on mail survey response rates: A meta- analysis. Public Opinion Quarterly, 57 , 62–79.
Cook, C., Heath, F., & Thompson, R. L. (2000). A meta-analysis of response rates in Web- or Internet-based surveys. Educational and Psychological Measurement, 60 (6), 821–836.
Dillman, D. A. (1978). Mail and telephone surveys: The total design method . New York: Wiley. Dillman, D. A. (1991). The design and administration of mail surveys. Annual Review of Sociology,
17 , 225–249. Dillman, D. A. (2007). Mail and Internet surveys: The tailored design method (2nd ed.). Hoboken,
NJ: Wiley. Fan, W., & Yan, Z. (2010). Factors affecting response rates of the web survey: A systematic review.
Computers in Human Behavior, 26 (2), 132–139. Groves, R. M. (2006). Non-response rates and non-response bias in household surveys. Public
Opinion Quarterly, 70 , 646–75. Groves, R. M., Presser, S., & Dipko, S. (2004). The role of topic interest in survey participation
decisions. Public Opinion Quarterly, 68 (1), 2–31. Kaplowitz, M. D., Hadlock, T. D., & Levine, R. (2004). A comparison of web and mail survey
response rates. Public Opinion Quarterly, 68 (1), 94–101. Kerlinger, F. N. (1986). Foundations of behavioral research (3rd ed.). New York: Holt, Rinehart &
Winston. Kiesler, S., & Sproull, L. S. (1986). Response effects in the electronic survey. Public Opinion
Quarterly, 50 , 402–413. Lavrakas, P. J. (2011). The use of incentives in survey research. 66th Annual Conference of the
American Association for Public Opinion Research Lin, I., & Schaeffer, N. C. (1995). Using survey participants to estimate the impact of nonparticipation.
Public Opinion Quarterly, 59 (2), 236–258.
Survey Research in HCI

264
Lu, H., & Gelman, A. (2003). A method for estimating design-based sampling variances for surveys with weighting, poststratifi cation, and raking. Journal of Offi cial Statistics, 19 (2), 133–152.
Manfreda, K. L., Bosnjak, M., Berzelak, J., Haas, I., Vehovar, V., & Berzelak, N. (2008). Web surveys versus other survey modes: A meta-analysis comparing response rates. Journal of the Market Research Society, 50 (1), 79.
Olson, K. (2006). Survey participation, non-response bias, measurement error bias, and total bias. Public Opinion Quarterly, 70 (5), 737–758.
Peytchev, A. (2009). Survey breakoff. Public Opinion Quarterly, 73 (1), 74–97. Schonlau, M., Van Soest, A., Kapteyn, A., & Couper, M. (2009). Selection bias in web surveys and
the use of propensity scores. Sociological Methods & Research, 37 (3), 291–318. Sheehan, K. B. (2001). E-mail survey response rates: A review. Journal of Computer Mediated
Communication, 6 (2), 1–16. Singer, E. (2002). The use of incentives to reduce non-response in household surveys. In R.
Groves, D. Dillman, J. Eltinge, & R. Little (Eds.), Survey non-response (pp. 87–100). New York: Wiley. 163–177.
Stevenson, J., Dykema, J., Cyffka, C., Klein, L., & Goldrick-Rab, S. (2012). What are the odds? Lotteries versus cash incentives. Response rates, cost and data quality for a Web survey of low- income former and current college students. 67th Annual Conference of the American Association for Public Opinion Research
Survey Analysis
Armstrong, D., Gosling, A., Weinman, J., & Marteau, T. (1997). The place of inter-rater reliability in qualitative research: An empirical study. Sociology, 31 (3), 597–606.
Böhm, A. (2004). Theoretical coding: Text analysis in grounded theory. In A companion to qualita-tive research , London: SAGE. pp. 270–275.
De Leeuw, E. D., Hox, J. J., & Huisman, M. (2003). Prevention and treatment of item nonresponse. Journal of Offi cial Statistics, 19 (2), 153–176.
Glaser, B. G., & Strauss, A. L. (1967). The discovery of grounded theory: Strategies for qualitative research . Hawthorne, NY: Aldine de Gruyter.
Gwet, K. L. (2001). Handbook of inter-rater reliability . Gaithersburg, MD: Advanced Analytics, LLC.
Heeringa, S. G., West, B. T., & Berglund, P. A. (2010). Applied survey data analysis . Boca Raton, FL: Chapman & Hall/CRC.
Lee, E. S., Forthofer, R. N., & Lorimor, R. J. (1989). Analyzing complex survey data . Newbury Park, CA: Sage.
Saldaña, J. (2009). The coding manual for qualitative researchers . Thousand Oaks, CA: Sage Publications Limited.
Other References
Abran, A., Khelifi , A., Suryn, W., & Seffah, A. (2003). Usability meanings and interpretations in ISO standards. Software Quality Journal, 11 (4), 325–338.
Anandarajan, M., Zaman, M., Dai, Q., & Arinze, B. (2010). Generation Y adoption of instant messaging: An examination of the impact of social usefulness and media richness on use richness. IEEE Transactions on Professional Communication, 53 (2), 132–143.
H. Müller et al.

265
Archambault, A., & Grudin, J. (2012). A longitudinal study of facebook, linkedin, & twitter use. In Proceedings of the 2012 ACM Annual Conference on Human Factors in Computing Systems (CHI '12) (pp. 2741–2750). New York: ACM
Auter, P. J. (2007). Portable social groups: Willingness to communicate, interpersonal communication gratifi cations, and cell phone use among young adults. International Journal of Mobile Communications, 5 (2), 139–156.
Calfee, J. E., & Ringold, D. J. (1994). The 70 % majority: Enduring consumer beliefs about adver-tising. Journal of Public Policy & Marketing, 13 (2).
Chen, J., Geyer, W., Dugan, C., Muller, M., & Guy, I. (2009). Make new friends, but keep the old: Recommending people on social networking sites. In Proceedings of the 27th International Conference on Human Factors in Computing Systems (CHI '09) , (pp. 201–210). New York: ACM
Clauser, B. E. (2007). The life and labors of Francis Galton: A review of four recent books about the father of behavioral statistics. Journal of Educational and Behavioral Statistics, 32 (4), 440–444.
Converse, J. (1987). Survey research in the United States: Roots and emergence 1890–1960 . Berkeley, CA: University of California Press.
Drouin, M., & Landgraff, C. (2012). Texting, sexting, and attachment in college students’ romantic relationships. Computers in Human Behavior, 28 , 444–449.
Feng, J., Lazar, J., Kumin, L., & Ozok, A. (2010). Computer usage by children with down syndrome: Challenges and future research. ACM Transactions on Accessible Computing, 2 (3), 35–41.
Froelich, J., Findlater, L., Ostergren, M., Ramanathan, S., Peterson, J., Wragg, I., et al. (2012). The design and evaluation of prototype eco-feedback displays for fi xture-level water usage data. In Proceedings of the 2012 ACM Annual Conference on Human Factors in Computing Systems (CHI '12) (pp. 2367–2376). New York: ACM
Harrison, M. A. (2011). College students’ prevalence and perceptions of text messaging while driving. Accident Analysis and Prevention, 43 , 1516–1520.
Junco, R., & Cotten, S. R. (2011). Perceived academic effects of instant messaging use. Computers & Education, 56 , 370–378.
Katosh, J. P., & Traugott, M. W. (1981). The consequences of validated and self-reported voting measures. Public Opinion Quarterly, 45 (4), 519–535.
Nacke, L. E., Grimshaw, M. N., & Lindley, C. A. (2010). More than a feeling: Measurement of sonic user experience and psychophysiology in a fi rst-person shooter game. Interacting with Computers, 22 (5), 336–343.
Obermiller, C., & Spangenberg, E. R. (1998). Development of a scale to measure consumer skepti-cism toward advertising. Journal of Consumer Psychology, 7 (2), 159–186.
Obermiller, C., & Spangenberg, E. R. (2000). On the origin and distinctiveness of skepticism toward advertising. Marketing Letters, 11 , 311–322.
Person, A. K., Blain, M. L. M., Jiang, H., Rasmussen, P. W., & Stout, J. E. (2011). Text messaging for enhancement of testing and treatment for tuberculosis, human immunodefi ciency virus, and syphilis: A survey of attitudes toward cellular phones and healthcare. Telemedicine Journal and e-Health, 17 (3), 189–195.
Pitkow, J. E., & Recker, M. (1994). Results from the fi rst World-Wide web user survey. Computer Networks and ISDN Systems, 27 (2), 243–254.
Rodden, R., Hutchinson, H., & Fu, X. (2010). Measuring the user experience on a large scale: User-centered metrics for web applications. In Proceedings of the 28th International Conference on Human Factors in Computing Systems (CHI '10) (pp. 2395–2398) ACM, New York, NY, USA
Schild, J., LaViola, J., & Masuch, M. (2012). Understanding user experience in stereoscopic 3D games. In Proceedings of the 2012 ACM Annual Conference on Human Factors in Computing Systems (CHI '12) (pp. 89–98). New York: ACM
Shklovski, I., Kraut, R., & Cummings, J. (2008). Keeping in touch by technology: Maintaining friendships after a residential move. In Proceedings of the 26th Annual SIGCHI Conference on Human Factors in Computing Systems (CHI '08) (pp. 807–816). New York: ACM
Survey Research in HCI

266
Turner, M., Love, S., & Howell, M. (2008). Understanding emotions experienced when using a mobile phone in public: The social usability of mobile (cellular) telephones. Telematics and Informatics, 25 , 201–215.
Weisskirch, R. S., & Delevi, R. (2011). “Sexting” and adult romantic attachment. Computers in Human Behavior, 27 , 1697–1701.
Wright, P. J., & Randall, A. K. (2012). Internet pornography exposure and risky sexual behavior among adult males in the United States. Computers in Human Behavior, 28 , 1410–1416.
Yew, J., Shamma, D. A., & Churchill, E. F. (2011). Knowing funny: Genre perception and catego-rization in social video sharing. In Proceedings of the 2011 Annual Conference on Human Factors in Computing Systems (CHI '11) (pp. 297–306). New York: ACM
Zaman, M., Rajan, M. A., & Dai, Q. (2010). Experiencing fl ow with instant messaging and its facilitating role on creative behaviors. Computers in Human Behavior, 26 , 1009–1018.
H. Müller et al.