In the heartland of Eurasia: the multilocus genetic landscape of Central Asian populations
35
In the heartland of Eurasia: the multilocus genetic landscape of 1 Central Asian populations 2 3 Begoña Martínez-Cruz 1,2,10 , Renaud Vitalis 1,3,10 , Laure Ségurel 1,4 , Frédéric Austerlitz 5 , 4 Myriam Georges 1 , Sylvain Théry 1 , Lluis Quintana-Murci 6 , Tatyana Hegay 7 , Almaz 5 Aldashev 8 , Firuza Nasyrova 9 , Evelyne Heyer *,1 6 7 1 Muséum National d’Histoire Naturelle – Centre National de la Recherche Scientifique 8 Université Paris 7, UMR 7206, « Éco-Anthropologie et Ethnobiologie », CP 139, 57 rue 9 Cuvier, 75231 Paris Cedex 05, France 10 2 Current address: Evolutionary Biology Institute, Pompeu Fabra University – CSIC – PRBB, 11 Dr. Aiguader 88, 08003 Barcelona, Spain 12 3 Current address: Centre National de la Recherche Scientifique – Institut National de la 13 Recherche Agronomique, UMR CBGP (INRA – IRD – CIRAD – Montpellier SupAgro), 14 Campus International de Baillarguet, CS 30016, 34988 Montferrier-sur-Lez, France 15 4 Current address: Department of Human Genetics, 920 East 58th Street, University of 16 Chicago, IL 60637, USA 17 5 Université Paris Sud, CNRS UMR 8079, Laboratoire Écologie, Systématique et Évolution, 18 91405 Orsay, France 19 6 Human Evolutionary Genetics, CNRS URA3012, Institut Pasteur, 75015 Paris, France 20 7 Uzbek Academy of Sciences, Institute of Immunology, Tashkent 100060, Uzbekistan 21 8 National Center of Cardiology and Internal Medicine, Bishkek 720040, Kyrgyzstan 22 9 Tajik Academy of Sciences, Institute of Plant Physiology and Genetics, Dushanbe 734063, 23 Tajikistan 24
-
Upload
independent -
Category
Documents
-
view
3 -
download
0
Transcript of In the heartland of Eurasia: the multilocus genetic landscape of Central Asian populations

In the heartland of Eurasia: the multilocus genetic landscape of 1
Central Asian populations 2
3
Begoña Martínez-Cruz1,2,10, Renaud Vitalis1,3,10, Laure Ségurel1,4, Frédéric Austerlitz5, 4
Myriam Georges1, Sylvain Théry1, Lluis Quintana-Murci6, Tatyana Hegay7, Almaz 5
Aldashev8, Firuza Nasyrova9, Evelyne Heyer*,1 6
7
1Muséum National d’Histoire Naturelle – Centre National de la Recherche Scientifique 8
Université Paris 7, UMR 7206, « Éco-Anthropologie et Ethnobiologie », CP 139, 57 rue 9
Cuvier, 75231 Paris Cedex 05, France 10
2Current address: Evolutionary Biology Institute, Pompeu Fabra University – CSIC – PRBB, 11
Dr. Aiguader 88, 08003 Barcelona, Spain 12
3Current address: Centre National de la Recherche Scientifique – Institut National de la 13
Recherche Agronomique, UMR CBGP (INRA – IRD – CIRAD – Montpellier SupAgro), 14
Campus International de Baillarguet, CS 30016, 34988 Montferrier-sur-Lez, France 15
4Current address: Department of Human Genetics, 920 East 58th Street, University of 16
Chicago, IL 60637, USA 17
5Université Paris Sud, CNRS UMR 8079, Laboratoire Écologie, Systématique et Évolution, 18
91405 Orsay, France 19
6Human Evolutionary Genetics, CNRS URA3012, Institut Pasteur, 75015 Paris, France 20
7Uzbek Academy of Sciences, Institute of Immunology, Tashkent 100060, Uzbekistan 21
8National Center of Cardiology and Internal Medicine, Bishkek 720040, Kyrgyzstan 22
9Tajik Academy of Sciences, Institute of Plant Physiology and Genetics, Dushanbe 734063, 23
Tajikistan 24

2
10These authors contributed equally to the present study 25
26
*Correspondence: 27
Evelyne Heyer 28
e-mail: [email protected] 29
Phone: +33 (0)1 40 79 81 58 30
Fax: +33 (0)1 40 79 32 31 31
32
Running title: Multilocus genetic landscape in Central Asia 33
Keywords: admixture; Central Asia; ethnic groups; genetic diversity; microsatellites; 34
population genetics 35
36

3
Abstract 37
Located in the Eurasian heartland, Central Asia has played a major role in both the early 38
spread of modern humans out of Africa and the more recent settlements of differentiated 39
populations across Eurasia. A detailed knowledge of the peopling in this vast region would 40
therefore greatly improve our understanding of range expansions, colonizations, and recurrent 41
migrations, including the impact of the historical expansion of eastern nomadic groups that 42
occurred in Central Asia. However, despite its presumable importance, little is known about 43
the level and the distribution of genetic variation in this region. We genotyped 26 Indo-44
Iranian- and Turkic-speaking populations, belonging to six different ethnic groups, at 27 45
autosomal microsatellite loci. The analysis of genetic variation reveals that Central Asian 46
diversity is mainly shaped by linguistic affiliation, with Turkic-speaking populations forming 47
a cluster more closely related to East Asian populations and Indo-Iranian speakers forming a 48
cluster closer to Western Eurasians. The scattered position of Uzbeks across Turkic- and 49
Indo-Iranian speaking populations may reflect their origins from the union of different tribes. 50
We propose that the complex genetic landscape of Central Asian populations results from the 51
movements of eastern, Turkic-speaking groups during historical times, into a long lasting 52
group of settled populations, which may be represented nowadays by Tajiks and Turkmen. 53
Contrary to what is generally thought, our results suggest that the recurrent expansions of 54
eastern nomadic groups did not result in the complete replacement of local populations but 55
rather into partial admixture. 56
57

4
Introduction 58
The evolutionary history of modern humans has been characterized by range expansions, 59
colonizations and recurrent migrations over the last 100,000 years.1 Some regions of the 60
world that have served as natural corridors between landmasses are of particular importance 61
in the history of human migrations. Central Asia is probably at the crossroads of such 62
migration routes.1,2 Located in the Eurasian heartland, it encompasses a vast territory, limited 63
to the east by the Pamir and Tien-Shan mountains, to the west by the Caspian Sea, to the north 64
by the Russian taiga and to the south by the Iranian deserts and Afghan mountains. The role 65
of Central Asia in both the early spread of modern humans out of Africa and the more recent 66
settlement of differentiated populations3 is not precisely known.4-6 For example, it remains 67
unclear whether this region harbored a Palaeolithic "maturation phase" of modern humans 68
before giving rise to waves of migration resulting in colonization of the Eurasian continent6 or 69
whether it has served as a meeting place for previously differentiated Asian and European 70
populations following their initial expansions.3,7 71
Central Asia entered the historical records about 1300 B.C., when Aryan tribes 72
invaded the Iranian territory from what is nowadays Turkmenistan and established the Persian 73
Empire in the 7th Century B.C.8 A branch of those, the Scythians, described in ancient 74
Chinese texts and in Herodotus’ Histories as having European morphological traits and 75
speaking Indo-Iranian languages, expanded north into the steppes. Thereafter, Central Asia 76
was faced with multiple waves of Turkic migrations, although it is difficult to know precisely 77
when these westward expansions began. Between the second and the first century B.C., Huns 78
brought the East-Asian anthropological phenotype to Central Asia.8 At the same period, the 79
Chinese established a trade route (the Silk Road), which connected the Mediterranean Basin 80
and Eastern Asia for more than 16 centuries. In the 13th century A.D. the Turco-Mongol 81
Empire lead by Genghis Khan became the largest of all time, from Mongolia to the Black Sea. 82

5
All these movements of populations resulted in a considerable ethnic diversity in Central 83
Asia, with Indo-Iranian speakers living as sedentary agriculturalists and Turkic speakers 84
mainly living as traditionally nomadic herders. 85
Together with the ancient peopling of Central Asia, this intricate demographic history 86
shaped patterns of genetic variability in a complex manner. Most previous studies, based on 87
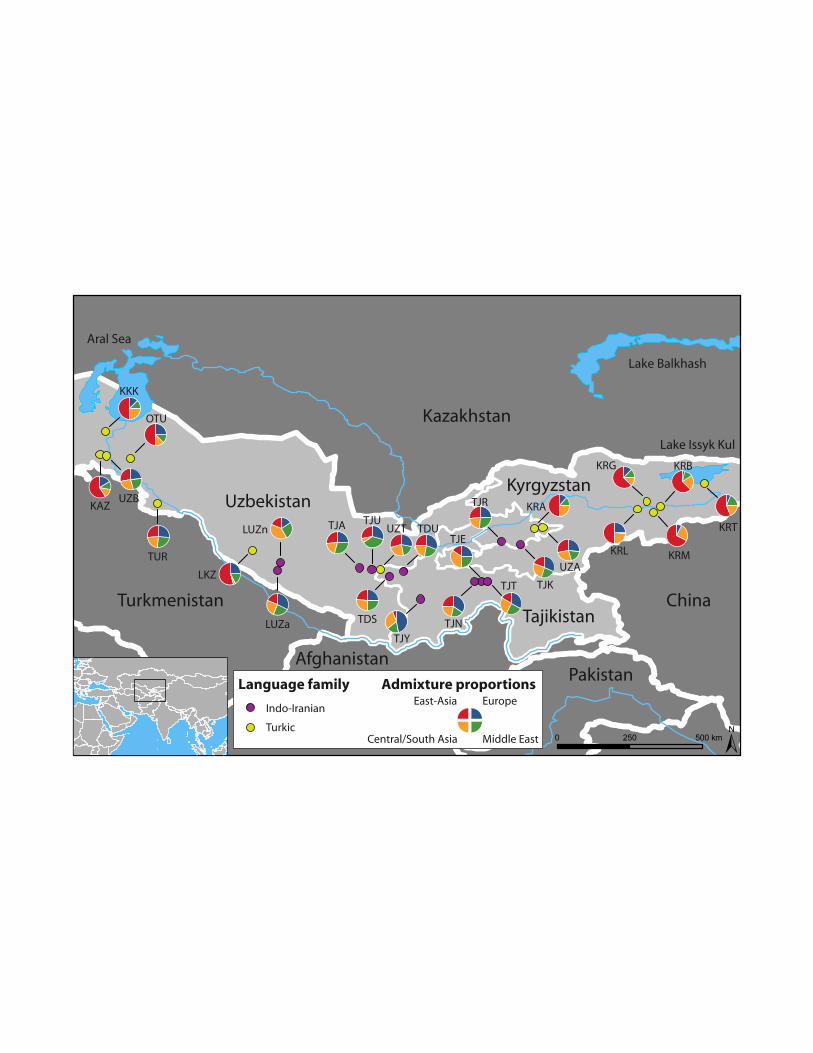
classical markers,1 mitochondrial DNA (mtDNA)3,9-13 or the non-recombining portion of the 88
Y-chromosome (NRY),6,14-16 have shown that genetic diversity in Central Asia is among the 89
highest in Eurasia.3,6,15 NRY studies suggest an early settlement of Central Asia by modern 90
humans, followed by subsequent colonization waves in Eurasia,6 while some mtDNA studies 91
point to an admixed origin from previously differentiated Eastern and Western Eurasian 92
populations.11 Furthermore, a recent analysis of mtDNA data suggests east-to-west 93
expansions waves across Eurasia.14 However, inferring more accurately the impact of 94
population movements, including the expansion of eastern nomadic groups, requires 95
additional, fast-evolving molecular markers. Here we report on the first multilocus autosomal 96
genetic survey of Central Asian populations. Twenty-six populations from six ethnic groups 97
were genotyped at 27 autosomal unlinked microsatellite markers. We aimed to shed light on 98
the genetic origins of Central Asian populations, and to investigate how the recurrent 99
westward expansions of eastern nomadic groups during historical times have shaped the 100
Central Asian genetic landscape. 101
102

6
Materials and methods 103
DNA samples 104
We sampled 767 men belonging to 26 populations from western Uzbekistan to eastern 105
Kyrgyzstan (Table 1 and Figure 1) representative of the ethnological diversity in Central 106
Asia: Tajiks, which are Indo-Iranian speakers (a branch of the Indo-European language 107
family) and Kazakhs, Turkmen, Karakalpaks, Kyrgyz and Uzbeks, which are Turkic speakers 108
(a branch of the Altaic language family). In two Uzbek populations from the Bukhara area 109
(LUZa and LUZn), an extensive linguistic survey showed that individuals were bilingual, 110
speaking both Tajik and Uzbek. Since their home language was Tajik (an Indo-Iranian 111
language), we further classified these two populations into the Indo-Iranian group for 112
subsequent analyses. We collected individuals unrelated for at least two generations back in 113
time. All individuals gave informed consent for their participation in this study. Total 114
genomic DNA was isolated from blood samples by a standard salting out procedure17 115
followed by a phenol-chloroform extraction.18 116
117
Genotyping 118
We selected 27 microsatellite markers19 from the set of 377 markers used in the worldwide 119
study by Rosenberg et al.20 The choice and description of markers, PCR and electrophoresis 120
conditions are given in Ségurel et al.19 We further genotyped 20 individuals from the HGDP-121
CEPH Human Genome Diversity Cell Line Panel20-22 at the 27 microsatellite loci, in order to 122
standardize the original Central Asian data presented here with the worldwide HGDP-CEPH 123
data. 124
125
Data analyses 126
Genetic diversity 127

7
In each population and for each locus, we calculated the allelic richness (AR) using the 128
rarefaction method proposed by El Mousadik et al.23 with the software package FSTAT.24 129
Unbiased estimates of expected heterozygosity (He)25 were computed in each population for 130
each locus with GENETIX.26 Both AR and He estimates were averaged over loci in each 131
population. We tested heterogeneity in both AR and He among populations using the Kruskal-132
Wallis test, with locus-specific estimates taken as replicate observations. Locus-specific 133
allelic richness and expected heterozygosity were also estimated for populations pooled into 134
Indo-Iranian- and Turkic-speaking groups, and averaged over loci within groups. We tested 135
between-group differences in both AR and He using the Wilcoxon's signed-rank test, with 136
locus-specific estimates taken as replicate observations. We further estimated AR and He for 137
each locus over the pooled data from Central Asia and over the pooled data for Central/South 138
Asia, East Asia, Europe and the Middle-East from the HGDP-CEPH Panel, and calculated the 139
averages over loci within groups. We tested heterogeneity in both AR and He across the five 140
groups of Eurasian populations using the Kruskal-Wallis test, taking locus-specific estimates 141
as replicate observations. When significant differences among groups were found, we ran the 142
Tukey range test to find which group statistics were significantly different from one another. 143
All statistical analyses were performed with the software package JMP5.1 (SAS Institute 144
Inc.). 27 145
146
Genetic structure 147
Population differentiation (FST) was calculated overall and between pairs of Central Asian 148
populations with GENEPOP 4.0.28 Exact tests of differentiation were performed with 149
FSTAT,24 adjusting p-values with Bonferroni correction for multiple tests. We performed a 150
correspondence analysis (CA) based on tables of allele counts using GENETIX.26 The 151
population structure was also inferred by means of a hierarchical analysis of molecular 152

8
variance (AMOVA29), with populations pooled into ethnic or linguistic groups. For ethnic 153
grouping, populations were pooled as Tajiks (TJA, TDS, TJT, TJK, TJR, TJN, TDU, TJE, 154
TJY and TJU), Karakalpaks (KKK and OTU), Kazakhs (KAZ and LKZ), Kyrgyz (KRA, 155
KRG, KRL, KRB, KRT and KRM), Uzbeks (UZA, UZB, LUZa, LUZn and UZT) and 156
Turkmen (TUR). For linguistic grouping, populations were pooled as Indo-Iranian speakers 157
(Tajiks and the two Uzbek populations LUZa and LUZn) and Turkic speakers (all other 158
populations). These analyses were performed with ARLEQUIN 3.11.30 Isolation-by-distance 159
(IBD) was tested with GENEPOP 4.0.28 We used PATHMATRIX31 to compute the matrix of 160
effective geographical distances, based on a least-cost path algorithm. The least-cost 161
distances, which account for the cost of the movement through the slopes in the landscape, 162
were calculated from the digital elevation model GTOPO30 of the Earth Resources 163
Observation and Science (EROS) Center. 164
165
Clustering analyses 166
We performed a clustering analysis with STRUCTURE32 on the Central Asian populations 167
together with all the Eurasian and African populations from the HGDP-CEPH Panel H952 168
corrected dataset.33,34 We used the latest version of STRUCTURE35 (version 2.3), which 169
allows structure to be detected at lower levels of divergence than the original model. Each 170
Markov chain was run for 106 steps, after a 105-step burn-in period. In each case, the results 171
were checked to ensure consistency over forty independent runs. Potential distinct modes 172
among the 40 runs were identified using the Greedy algorithm implemented in CLUMP36. We 173
varied the hypothetical number of clusters (K) from 1 to 8 for all analyses. All chains were 174
run using the F model for correlations of allele frequencies across clusters.37 175
176

9
Admixture analyses 177
The Central Asian genetic pool may be more than just the result of admixture from Eurasian 178
populations, but we were nonetheless interested in investigating the potential origins of 179
Central Asian populations among all Eurasian populations. We used LEADMIX38 to calculate 180
maximum likelihood estimates (MLE) of the admixture proportions for each Central Asian 181
population. We ran the program independently for each of them, considering four putative 182
parental groups from the HGDP-CEPH Panel: Central/South Asia, East Asia, Europe and 183
Middle East. For the Central/South Asian group, we chose a pool of Balochi (n = 25) and 184
Makrani (n = 25) individuals, both populations being non-significantly differentiated (FST = -185
0.002; exact test p = 0.34). We chose the Han Chinese (n = 44) for the East Asian parental 186
group, and we further considered a pool of French (n = 28), Bergamo (n = 13) and Tuscan (n 187
= 21) individuals for the European group, these three populations being non-significantly 188
differentiated (FST < -0.006; p > 0.42). Last, we chose the Palestinians (n = 46) for the Middle 189
Eastern group.39 190
191

10
Results 192
Genetic diversity 193
Average allelic richness and expected heterozygosity for each of the 26 Central Asian 194
populations and across regions are given in Table 2. We found a significant difference in 195
allelic richness (Kruskal-Wallis test, χ2 = 105,29, d.f. = 25, p < 0.0001) and in expected 196
heterozygosity (Kruskal-Wallis test, χ2 = 67.98, d.f. = 25, p < 0.0001) among populations. We 197
found no significant difference in allelic richness between Indo-Iranian (AR = 13.8) and 198
Turkic speakers (AR = 13.7, Wilcoxon signed rank test, Z = -0.69, p = 0.49), although the 199
expected heterozygosity was significantly higher in Indo-Iranian as compared to Turkic 200
speakers (He = 0.818 and He = 0.787, respectively, Wilcoxon signed rank test, Z = -4.55, p < 201
0.0001). We found a significant difference in allelic richness across Central Asia, Europe, 202
Central/South Asia, Middle East and East Asia (Kruskal-Wallis test, K = 36.46, d.f. = 4, p < 203
0.0001), as well as in expected heterozygosity (Kruskal-Wallis test, K = 52.94, d.f. = 4, p < 204
0.0001). Yet, these differences were rather due to a lower heterozygosity in East Asia and also 205
slightly higher allelic richness in Middle East (Tukey’s test, p < 0.0001 for both AR and He). 206
Central Asia therefore showed neither higher nor lower diversity than the rest of Eurasia. 207
208
Population differentiation 209
The 26 Central Asian populations were slightly but significantly differentiated (FST = 0.015, 210
CI99% = [0.011-0.018], p < 0.01). Pairwise FST estimates ranged from -0.004 to 0.056, with 211
205 out of 325 pairs of populations (i.e., 63.1%) being significantly differentiated after 212
Bonferroni correction for multiple tests (see Supplementary Table 1). These significant 213
estimates mainly corresponded to pairwise comparisons between one Turkic and one Indo-214
Iranian population, as well as to comparisons between two Indo-Iranian populations. The 215
apportionment of genetic variation among linguistic or ethnic groups of populations (Table 3) 216

11
showed that more than 98% of the total variation lay within populations (p < 0.0001). Yet, 217
both ethnicity and linguistic affiliation accounted significantly for the observed variation (FCT 218
= 0.007, p < 0.0001 and FCT = 0.011, p < 0.0001, respectively). We found no evidence of 219
isolation-by-distance within each of Turkic and Indo-Iranian group of populations (p = 0.363 220
and p = 0.772, respectively). 221
The correspondence analysis (CA) based on the table of allele counts in Central Asia 222
separated Turkic- and Indo-Iranian-speaking populations on the first axis (Figure 2a). The 223
first two factorial components (FC) accounted for 20.5 % of the total inertia. There were some 224
exceptions, though: two Turkic-speaking populations, TUR and UZA, were clearly clustered 225
with Indo-Iranian-speaking populations. Interestingly, the Uzbek populations (LUZa, LUZn, 226
UZA and UZT) showed a scattered pattern on the CA which overlapped the Turkic-speaking 227
and the Indo-Iranian-speaking groups of populations. The CA based on the table of allele 228
counts in Eurasia placed Central Asian populations in an intermediate position between a 229
group of European population, a group of Middle Eastern populations, a group of 230
Central/South Asian populations, and a group of East Asian populations (Figure 2b). The first 231
two factorial components accounted for 22.4 % of the total inertia. Turkic- and Indo-Iranian-232
speaking populations were separated on the first axis, with Turkic-speaking populations being 233
closer to East Asian populations, and Indo-Iranian-speaking populations being closer to 234
Central/South Asian, European and Middle Eastern populations. It is noteworthy that Central 235
Asian and Central/South Asian populations were more scattered than any other group of 236
populations in Eurasia (Figure 2b). Interestingly, the Hazaras from Pakistan, who claim to be 237
direct male-line descendants of Genghis Khan,40,41 as well as the Uygurs, clustered together 238
with the Turkic-speaking populations of Central Asia. 239
240
Cluster analyses 241

12
Analyzing the Eurasian plus the African populations altogether, we found that the highest 242
average posterior probability of the data (D), across 40 runs, was obtained for K = 7 putative 243
clusters, with Log[P(K = 7 | D)] = -167565.4 (SD = 22.8), although the average posterior 244
probability for K = 6 was only slightly lower, with Log[P(K = 6 | D)] = -167653.8 (SD = 245
10.6). The symmetric similarity coefficients computed with CLUMPP across independent 246
runs were all larger than 0.99 for K varying from 2 to 5, and larger than 0.87 for K = 6, which 247
suggests the absence of genuine multimodality across runs. As seen in Figure 3, at K = 2, we 248
observed a clear east-west cline. Central Asia seemed to be intermediate between one cluster 249
made of European, Middle Eastern, Central/South Asian and African populations on the one 250
hand and one cluster of East Asian populations on the other hand, which is consistent with the 251
CA (Figure 2b). There was no individual assigned exclusively to one cluster, with Turkic-252
speaking individuals having a higher membership coefficient in the East Asian cluster, and 253
Indo-Iranian-speaking individuals having a higher membership coefficient in the cluster made 254
of Europe, Middle East, Central/South Asia and Africa. At K = 3, the six African populations 255
clustered together. At K = 4, the European and Middle Eastern populations clustered together, 256
with Central/South Asian and Central Asian populations (mostly Indo-Iranian speakers) 257
showing a small contribution from this European/Middle Eastern cluster (represented in green 258
in Figure 3). At K = 5, the Turkic-speaking populations from Central Asia showed a large 259
contribution from a fifth cluster (in orange in Figure 3). At K = 6, the Indo-Iranian speaking 260
populations from Central Asia show a large contribution from a sixth cluster (in light blue in 261
Figure 3). The two latter clusters were found almost exclusively in Central Asian populations. 262
Most Turkic-speaking populations showed a contribution from the East Asian cluster (in red), 263
and most Indo-Iranian populations showed a contribution from Europe and Middle East (in 264
green). It is noteworthy that Uygur and Hazara populations showed the same pattern as the 265
Turkic-speaking populations from Central Asia. At K = 7, all Eurasian populations (but 266

13
mostly Turkic-speaking populations) had a variable proportion of the new component. Yet, no 267
run at K = 7 resulted in a new cluster of populations, as compared to K = 6, which is the 268
reason why the output for K = 7 is not represented in Figure 3. 269
270
Admixture analyses 271
The maximum likelihood estimates (MLE) of admixture proportions obtained with 272
LEADMIX for each Central Asian population are given in Figure 1 and Table 4. Most Turkic-273
speaking populations had a large East Asian ancestral contribution, which represented in 274
general 49.5%, or more, of the total contribution. There were four notable exceptions, though, 275
with the Turkmen (TUR) and three Uzbek populations (UZA, UZB and UZT) showing a 276
lower contribution from East Asian populations (respectively, 27.2%, 28.6%, 28.1% and 277
28.7%). Indo-Iranian-speaking populations had a large western Eurasian contribution 278
(Central/South Asia, Europe and Middle-East), which represented 72.7% to 94.5% of the total 279
contribution, although the relative contributions from these three parental groups differ across 280
Indo-Iranian-speaking populations. It is noteworthy that, in general, many geographically 281
close populations that speak different languages showed contrasted admixture proportions 282
(see, e.g., UZT and TJU in Table 4), which supports the idea that language is a major 283
determinant of population differentiation in Central Asia. 284
285

14
Discussion 286
Central Asia in the heartland of Eurasia 287
We found a high level of autosomal genetic diversity in Central Asia, consistent with previous 288
observations,3,16 and similar in extent to other major regions in Eurasia (Table 2). Population 289
differentiation among Central Asian populations was similar, or even stronger, than that 290
measured among populations within other regions in Eurasia: the pairwise FST estimates 291
ranged from -0.004 to 0.056 in Central Asia, a range which should be compared to that found 292
in the European group [-0.011; 0.015], the Middle-Eastern group [0.008; 0.021], the 293
Central/South Asian group [-0.002; 0.062] and in the East Asian group [-0.011; 0.046], based 294
on the same set of 27 microsatellite loci as we used in our study. This pattern is also apparent 295
in the correspondence analysis (Figure 2b), where Central Asian and Central/South Asian 296
populations were more scattered than each of the East Asian, European and Middle-Eastern 297
groups, which suggests a higher diversification within Central Asia and Central/South Asia. 298
Most importantly, the observed diversity was mainly due to the differentiation into two main 299
groups of populations (Figure 3): on the one hand, Indo-Iranian-speaking populations (which 300
include Tajiks and three Uzbek populations) that are genetically closer to populations from 301
Western Eurasia; on the other hand, Turkic-speaking populations (which include Karakalpaks, 302
Kazakhs, Kyrgyz, and two other Uzbek populations) that are closer to Eastern Asian 303
populations (with the exception of the Turkmen). This pattern was also apparent in the 304
correspondence analysis (Figure 2b), and consistent with the significant differentiation of 305
almost all pairwise comparisons between an Indo-Iranian-speaking and a Turkic-speaking 306
population (Supplementary Table 1). 307
Although several studies have shown that geography is, in general, a better predictor 308
of genetic differentiation than ethnicity and linguistics,42,43 language affiliation appears as the 309
most important factor explaining the distribution of genetic diversity in Central Asia (Table 310

15
3). We found indeed that, although most (98%) of the variation lay within Central Asian 311
populations (p < 0.0001), a significant part of the total variation (1.09%; p < 0.0001) lay 312
among linguistic groups, which provides an estimate of differentiation among groups equal to 313
FCT = 0.011. For comparison purpose, the differentiation among Central/South Asia, East 314
Asia, Europe and Middle East was found to be FCT = 0.044, with 94.1% of the total variation 315
found within populations (p < 0.0001) and 4.4% found among groups, based on the same set 316
of 27 microsatellite loci as we used in our study. We found no evidence of a correlation 317
between geography and genetics within each of the Indo-Iranian or Turkic groups of Central 318
Asian populations. For the Turkic-speaking populations, this may be explained by their recent 319
arrival in the region and/or their nomadic life-style. However, more striking is the fact that no 320
geographic pattern of genetic variation was found among sedentary Indo-Iranian speakers 321
either. 322
323
Putative origins of Indo-Iranian- and Turkic-speaking populations 324
The clustering analysis showed that most individuals from the Indo-Iranian-speaking 325
populations had large membership coefficients into two clusters (light blue and beige in 326
Figure 3) that were found mostly in these populations. Altogether, the significant pairwise FST 327
estimates between almost all pairs of Indo-Iranian-speaking populations (Supplementary 328
Table 1), the high level of diversity across Indo-Iranian populations (Table 2) and the variable 329
level of admixture from the putative parental populations (Table 4) seem consistent with the 330
premise that Indo-Iranian speakers are long term settled populations in the area. This latter 331
hypothesis is strongly supported by archaeological evidence.44 Conversely, we found a lower 332
genetic differentiation among Turkic-speaking populations despite their wide geographic 333
distribution (Figure 1), which suggests a more recent common origin of these populations as 334
compared to Indo-Iranian-speaking populations, in consistence with historical records. 335

16
Our study further shed some light on the origins of the Turkic-speaking populations in 336
Central Asia. The clustering analyses showed indeed that most individuals from the Turkic-337
speaking populations had large membership coefficients into one Central Asian cluster (in 338
orange in Figure 3) and smaller membership coefficients into the East-Asian cluster (in red in 339
Figure 3) thus confirming the result of Li et al45 based on a small central Asian cluster for 340
Uygur, Kazakh and Khanty. This pattern likely reflects the existence of an ancestral group of 341
Turkic-speakers (orange cluster in Figure 3), which popular Turkic culture considers as 342
originating from the Altai region. The East-Asian ancestry of Turkic-speaking populations 343
(red cluster in Figure 3) may then correspond to the westward expansions of nomadic groups 344
form East Asia during historical times. 345
The Westernized view of westward invasions usually emphasizes the extreme violence 346
and cruelty of the hordes led by Attila the Hun (A.D. 406-453), or that from the Mongolian 347
empire led by Genghis Khan. However, our results somehow challenge this view and rather 348
suggest that these more recent expansions did not lead to the massacre and complete 349
replacement of the locally settled populations but rather to partial admixture. We found 350
almost no eastern ancestry in Indo-Iranian speaking populations (see Figure 3), which 351
suggests that the group of people from which the current-day Tajik and Turkmen populations 352
would be the descendants, did not suffer from the westward expansions of eastern nomadic 353
groups. This is consistent with Zerjal et al’s study16, which showed the absence of the 354
“Genghis Khan lineage” in the Tajik and Turkmen populations they studied. Furthermore, the 355
present finding that the partial admixture with eastern nomadic groups concerned almost 356
exclusively the Turkic-speaking populations is consistent with the fact that Turks and 357
Mongols share cultural traditions and life-style, which may have facilitated inter-groups 358
marriages. 359

17
Our study also contradicts the claim that these westward invasions resulted in founder 360
effects.16 The high level of autosomal diversity observed in all Turkic-speaking populations 361
(Table 2) contrasts indeed with the low level of Y-chromosome diversity found in some 362
populations of the region.10,16 Our recent studies based on the analysis of uni-parental markers 363
in Central Asia already showed that the low level Y-chromosome diversity is only found in 364
the Turkic-speaking group46, which may therefore be explained by the social organization of 365
Turkic-speaking populations, that is based on patrilineal descent groups.10, 18 366
Overall, our results are partly consistent with Comas et al.’s hypothesis11 that Central 367
Asia has been a contact zone between two differentiated groups. Our study suggests that one 368
of these groups is a long lasting group of settled populations, now represented by Tajiks and 369
Turkmen, although the origin of this group is difficult to infer; the second of these groups is 370
likely to have a more recent origin, resulting from the movements of eastern nomadic Turkic-371
speaking groups. Interestingly, we found almost no African ancestry in the genetic pool of 372
Central Asian population from clustering analyses (Figure 3). Yet, with the same level of 373
clustering, we found no African ancestry either in Europe or in East-Asia. Further work is 374
therefore required to infer the more ancient peopling of Central Asia, after the spread of 375
modern humans out of Africa. 376
We found that the Uzbek populations were scattered across Turkic- and Indo-Iranian 377
speaking populations (Figure 2b). Some Uzbek populations (LUZa, LUZn, UZA) were closer 378
to Indo-Iranian speaking populations, while other populations (UZB, UZT) clearly clustered 379
with Turkic-speaking populations. This is consistent with the fact that Uzbek populations 380
include the 17th century Uzbeks, which were nomadic herders before they sedentarized 381
around the 16th Century,10 and the former Chagatai Turk groups who were already settled in 382
Uzbekistan.47 Uzbeks therefore result from the union of different tribes, some of recent origin 383

18
clustering with Turkic-speaking populations, and some tracing back to Chagatai Turks who 384
were strongly admixed with Iranian dwellers of Central Asia. 385
386
Evidence for linguistic replacements 387
We found two presumable cases of linguistic replacements in Central Asia. The Turkic-388
speaking populations, TUR (Turkmen) and UZA (Uzbek) were found to cluster together with 389
Indo-Iranian-speaking populations (Figure 2). The Uzbek population UZA, a currently 390
Turkic-speaking population, is indeed genetically more similar to Indo-Iranian speakers, 391
which suggests a linguistic shift in this population. Concerning the Turkmen, their genetic 392
similarity with Tajiks (see also Table 4) is consistent with the hypothesis that they may be the 393
present-day descendants of populations established over long periods of time. The indigenous 394
cultural history of the Turkmen in Turkmenistan can indeed be dated back to 10,000 years 395
B.C. and similarities between the cultures and technologies found in the archaeological record 396
suggest that this region has been continually occupied since 6,000 B.C. A recent linguistic 397
replacement in the TUR population would then explain the observed pattern of a Turkic-398
speaking population clustering with Indo-Iranian speakers. 399
400
A Central Asian origin of the Hazaras? 401
Our study confirms the results of Li et al.’s study48 that cluster the Hazara population with 402
Central Asian populations, rather than Mongolian populations, which is consistent with 403
ethnological studies.49 Our results further extend these findings, since we show that the 404
Hazaras are closer to Turkic-speaking populations from Central-Asia, than to East-Asian or 405
Indo-Iranian populations. 406
407

19
408
Acknowledgements 409
We are indebted to everyone who volunteered to participate to this study. We also thank R. 410
Leblois and P. Verdu for insightful discussions on previous versions of this paper, H. Cann 411
for providing CEPH samples, the Service de Systématique Moléculaire (SSM) at the Museum 412
national d'Histoire naturelle (MNHN) for making facilities available, and J.A. Godoy for 413
technical assistance. We are very grateful to CESGA (Supercomputational Centre of Galicia) 414
and to the Computational Biology Service Unit from the Museum national d'Histoire 415
naturelle (MNHN – CNRS UMS 2700) where the computational analyses were performed. 416
This work was supported by the Centre National de la Recherche Scientifique (CNRS) ATIP 417
program (to E.H.), by the CNRS interdisciplinary program "Origines de l'Homme du Langage 418
et des Langues" (OHLL), the European Science Foundation (ESF) EUROCORES program 419
"The Origin of Man, Language and Languages" (OMLL) and the ANR grant 420
“NUTGENEVOL” (07-BLAN-0064). 421
422

20
References 423
1 Cavalli-Sforza LL, Menozzi P, Piazza A: The History and Geography of Human 424
Genes. Princeton, University Press, 1994. 425
2 Nei M, Roychoudhury AK: Evolutionary relationships of human populations on a 426
global scale. Molecular Biology and Evolution 1993; 10: 927-943. 427
3 Comas D, Calafell F, Mateu E et al: Trading genes along the silk road: mtDNA 428
sequences and the origin of central Asian populations. American Journal of Human 429
Genetics 1998; 63: 1824-1838. 430
4 Cordaux R, Deepa E, Vishwanathan H, Stoneking M: Genetic evidence for the demic 431
diffusion of agriculture to India. Science 2004; 304: 1125-1125. 432
5 Karafet T, Xu LP, Du RF et al: Paternal population history of east Asia: Sources, 433
patterns, and microevolutionary processes. American Journal of Human Genetics 434
2001; 69: 615-628. 435
6 Wells RS, Yuldasheva N, Ruzibakiev R et al: The Eurasian Heartland: A continental 436
perspective on Y-chromosome diversity. Proceedings of the National Academy of 437
Sciences of the United States of America 2001; 98: 10244-10249. 438
7 Bowles G. The peoples of Asia; in: Nicolson Wa (ed). London, 1977. 439
8 Гумилев ЛНДтАСИ-тнА-МН, 1967. - 504 с.. с карт. - 4800. 1967. 440
9 Chaix R, Austerlitz F, Khegay T et al: The genetic or mythical ancestry of descent 441
groups: Lessons from the Y chromosome. American Journal of Human Genetics 2004; 442
75: 1113-1116. 443
10 Chaix R, Quintana-Murci L, Hegay T et al: From social to genetic structures in central 444
Asia. Current Biology 2007; 17: 43-48. 445

21
11 Comas D, Plaza S, Wells RS et al: Admixture, migrations, and dispersals in Central 446
Asia: evidence from maternal DNA lineages. European Journal of Human Genetics 447
2004; 12: 495-504. 448
12 Lalueza-Fox C, Sampietro ML, Gilbert MTP et al: Unravelling migrations in the 449
steppe: mitochondrial DNA sequences from ancient Central Asians. Proceedings of 450
the Royal Society of London Series B-Biological Sciences 2004; 271: 941-947. 451
13 Perez-Lezaun A, Calafell F, Comas D et al: Sex-specific migration patterns in central 452
Asian populations, revealed by analysis of Y-chromosome short tandem repeats and 453
mtDNA. American Journal of Human Genetics 1999; 65: 208-219. 454
14 Chaix R, Austerlitz F, Hegay T, Quintana-Murci L, Heyer E: Genetic traces of east-to-455
west human expansion waves in Eurasia. American Journal of Physical Anthropology 456
2008; 136: 309-317. 457
15 Hammer MF, Karafet TM, Redd AJ et al: Hierarchical patterns of global human Y-458
chromosome diversity. Molecular Biology and Evolution 2001; 18: 1189-1203. 459
16 Zerjal T, Wells RS, Yuldasheva N, Ruzibakiev R, Tyler-Smith C: A genetic landscape 460
reshaped by recent events: Y-chromosomal insights into Central Asia. American 461
Journal of Human Genetics 2002; 71: 466-482. 462
17 Ausubel FM, Brent R, Kingston RE et al: Current Protocols in Molecular Biology. 463
New York, 2001. 464
18 Maniatis T, Fritsch EF, Sambrook J: Molecular Cloning. A Laboratory Manual. New 465
York, Cold Spring Harbor, 1982. 466
19 Segurel L, Martinez-Cruz B, Quintana-Murci L et al: Sex-specific genetic structure 467
and social organization in Central Asia: insights from a multi-locus study. PLoS Genet 468
2008; 4: e1000200. 469

22
20 Rosenberg NA, Pritchard JK, Weber JL et al: Genetic structure of human populations. 470
Science 2002; 298: 2381-2385. 471
21 Cann HM, de Toma C, Cazes L et al: A human genome diversity cell line panel. 472
Science 2002; 296: 261-262. 473
22 Zhivotovsky LA, Rosenberg NA, Feldman MW: Features of evolution and expansion 474
of modern humans, inferred from genomewide microsatellite markers. American 475
Journal of Human Genetics 2003; 72: 1171-1186. 476
23 ElMousadik A, Petit RJ: High level of genetic differentiation for allelic richness 477
among populations of the argan tree Argania spinosa (L) Skeels endemic to Morocco. 478
Theoretical and Applied Genetics 1996; 92: 832-839. 479
24 Goudet J: FSTAT (Version 1.2): A computer program to calculate F-statistics. Journal 480
of Heredity 1995; 86: 485-486. 481
25 Nei M: Estimation of Average Heterozygosity and Genetic Distance from a Small 482
Number of Individuals. Genetics 1978; 89: 583-590. 483
26 Belkhir K, Borsa P, Chikhi L, Raufaste N, Bonhomme F: GENETIX 4.05, logiciel 484
sous Windows TM pour la génétique des populations. Laboratoire Génome, 485
Populations, Interactions, CRNS UMS 5171, Université de Montpellier II, Montpellier 486
(France) 1996-2004. 487
27 Inc. SI: JMP Statistics and Graphics Guide, Version 5.1. Cary, NC: SAS Institute Inc. 488
2003. 489
28 Rousset F: GENEPOP ' 007: a complete re-implementation of the GENEPOP software 490
for Windows and Linux. Molecular Ecology Resources 2008; 8: 103-106. 491
29 Excoffier L, Smouse PE, Quattro JM: Analysis of molecular variance inferred from 492
metric distances among DNA haplotypes - Application to human mitochondrial -DNA 493
restriction data Genetics 1992; 131: 479-491. 494

23
30 Excoffier L, Laval LG, Schneider S: Arlequin ver. 3.0: An integrated software 495
package for population genetics data analysis. Evolutionary Bioinformatics Online 496
2005; 1: 47-50. 497
31 Ray N: PATHMATRIX: a geographical information system tool to compute effective 498
distances among samples. Molecular Ecology Notes 2005; 5: 177-180. 499
32 Pritchard JK, Stephens M, Donnelly P: Inference of population structure using 500
multilocus genotype data. Genetics 2000; 155: 945-959. 501
33 Rosenberg NA: Standardized subsets of the HGDP-CEPH human genome diversity 502
cell line panel, accounting for atypical and duplicated samples and pairs of close 503
relatives. Annals of Human Genetics 2006; 70: 841-847. 504
34 Rosenberg NA, Mahajan S, Gonzalez-Quevedo C et al: Low levels of genetic 505
divergence across geographically and linguistically diverse populations from India. 506
Plos Genetics 2006; 2: 2052-2061. 507
35 Hubisz MJ, Falush D, Stephens M, Pritchard JK: Inferring weak population structure 508
with the assistance of sample group information. Molecular Ecology Resources 2009; 509
9: 1322-1332. 510
36 Jakobsson M, Rosenberg NA: CLUMPP: a cluster matching and permutation program 511
for dealing with label switching and multimodality in analysis of population structure. 512
Bioinformatics 2007; 23: 1801-1806. 513
37 Falush D, Stephens M, Pritchard JK: Inference of population structure using 514
multilocus genotype data: Linked loci and correlated allele frequencies. Genetics 515
2003; 164: 1567-1587. 516
38 Wang JL: Maximum-likelihood estimation of admixture proportions from genetic 517
data. Genetics 2003; 164: 747-765. 518

24
39 Belle EMS, Landry PA, Barbujani G: Origins and evolution of the Europeans' 519
genome: evidence from multiple microsatellite loci. Proceedings of the Royal Society 520
B-Biological Sciences 2006; 273: 1595-1602. 521
40 Qamar R, Ayub Q, Mohyuddin A et al: Y-chromosomal DNA variation in Pakistan. 522
American Journal of Human Genetics 2002; 70: 1107-1124. 523
41 Zerjal T, Xue YL, Bertorelle G et al: The genetic legacy of the mongols. American 524
Journal of Human Genetics 2003; 72: 717-721. 525
42 Bosch E, Calafell F, Gonzalez-Neira A et al: Paternal and maternal lineages in the 526
Balkans show a homogeneous landscape over linguistic barriers, except for the 527
isolated Aromuns. Annals of Human Genetics 2006; 70: 459-487. 528
43 Manica A, Prugnolle F, Balloux F: Geography is a better determinant of human 529
genetic differentiation than ethnicity. Human Genetics 2005; 118: 366-371. 530
44 Brunet F: La Néolithisation en Asie Centrale: un état de la question. Paléorient 1999; 531
24: 27-48. 532
45 Li H, Cho K, Kidd JR, Kidd KK: Genetic Landscape of Eurasia and "Admixture" in 533
Uyghurs. American Journal of Human Genetics 2009; 85: 934-937. 534
46 Heyer E, Balaresque P, Jobling MA et al: Genetic diversity and the emergence of 535
ethnic groups in Central Asia. Bmc Genetics 2009; 10: 8. 536
47 Soucek S. A history of Inner Asia. Cambridge, Cambridge University Press, 2000. 537
48 Li JZ, Absher DM, Tang H et al: Worldwide human relationships inferred from 538
genome-wide patterns of variation. Science 2008; 319: 1100-1104. 539
49 Dupaine B: L'artisanat Hazâra; in CEREDAF: Paysage du centre de l'Afghanistan - 540
Paysages Naturels, paysages culturels. Paris, 2010, pp 212-222. 541
542 543

25
Figure legends 544
545
Figure 1 Geographic location of the 26 Central Asian populations sampled. Linguistic 546
affiliation, as well as admixture proportions from putative parental origins (Central/South 547
Asia, East Asia, Europe and Middle East) are also indicated. See Table 1 for acronyms. 548
549
Figure 2 Correspondence analysis (CA) based on the table of allele counts in Central Asia 550
(a). The first two factorial components (FC) are represented, and their relative contribution to 551
the total inertia are indicated. Colors indicate language affiliation; blue: Indo-Iranian 552
speakers; orange: Turkic speakers. CA based on the table of allele counts in Eurasian 553
populations (b). Colors represent major geographic regions; purple: Europe; grey: Middle 554
East; green: Central/South Asia; red: East Asia. 555
556
Figure 3 Population structure inferred from microsatellite data using the software package 557
STRUCTURE. K represents the number of putative clusters. Each individual is represented by 558
a vertical line, divided into up to K colored segments, each of which represents the 559
individual’s estimated membership fraction to that cluster. Each output represents the matrix 560
of membership coefficients averaged over 40 independent runs with CLUMPP. The data 561
consisted in 767 individuals from 26 Central Asian populations genotyped at 27 microsatellite 562
loci, plus 869 individuals from 44 African and Eurasian populations from the HGDP-CEPH 563
Human Genome Diversity Cell Line Panel. See Table 1 for acronyms. 564

26
Table 1 Description of the 26 Central Asian studied populations
Sampled populations (area) Acronym Location Language family Long. Lat. n
Tajiks (Samarkand) TJA Uzbekistan / Tajikistan border Indo-Iranian 39.54 66.89 31
Tajiks (Samarkand) TJU Uzbekistan / Tajikistan border Indo-Iranian 39.50 67.27 29
Tajiks (Ferghana) TJR Tajikistan / Kyrgyzstan border Indo-Iranian 40.36 71.28 29
Tajiks (Ferghana) TJK Tajikistan / Kyrgyzstan border Indo-Iranian 40.25 71.87 26
Tajiks (Gharm) TJE Northern Tajikistan Indo-Iranian 39.12 70.67 25
Tajiks (Gharm) TJN Northern Tajikistan Indo-Iranian 38.09 68.81 24
Tajiks (Gharm) TJT Northern Tajikistan Indo-Iranian 39.11 70.86 25
Tajiks (Penjikent) TDS Uzbekistan / Tajikistan border Indo-Iranian 39.28 67.81 25
Tajiks (Penjikent) TDU Uzbekistan / Tajikistan border Indo-Iranian 39.44 68.26 25
Tajiks (Yagnobs from Dushanbe) TJY Western Tajikistan Indo-Iranian 38.57 68.78 25
Uzbeks (Ferghana) UZA Uzbekistan / Kyrgyzstan border Turkic 40.77 72.31 25
Uzbeks (Penjikent) UZT Northern Tajikistan Turkic 39.49 67.54 25
Uzbeks (Bukhara) LUZn Central Uzbekistan Indo-Iranian 39.70 64.38 20
Uzbeks (Bukhara) LUZa Central Uzbekistan Indo-Iranian 39.73 64.27 20

27
Uzbeks (Karakalpakia) UZB Western Uzbekistan Turkic 43.04 58.84 35
Karakalpaks (Qongrat from Karakalpakia) KKK Western Uzbekistan Turkic 43.77 59.02 45
Karakalpaks (On Tört Uruw from Karakalpakia) OTU Western Uzbekistan Turkic 42.94 59.78 45
Kazaks (Karakalpakia) KAZ Western Uzbekistan Turkic 43.04 58.84 49
Kazaks (Bukhara) LKZ Central Uzbekistan Turkic 40.08 63.56 25
Kyrgyz (Andijan) KRA Uzbekistan / Kyrgyzstan border Turkic 40.77 72.31 45
Kyrgyz (Narin) KRG Eastern Kyrgyzstan Turkic 41.60 75.80 18
Kyrgyz (Narin) KRM Eastern Kyrgyzstan Turkic 41.45 76.22 21
Kyrgyz (Narin) KRL Eastern Kyrgyzstan Turkic 41.36 75.50 22
Kyrgyz (Narin) KRB Eastern Kyrgyzstan Turkic 41.25 76.00 24
Kyrgyz (Issyk Kul) KRT Eastern Kyrgyzstan Turkic 42.16 77.57 37
Turkmen (Karakalpakia) TUR Western Uzbekistan Turkic 41.55 60.63 47
Long., longitude; Lat., latitude. n, sample size.

Table 2 Genetic diversity in the studied populations and in Eurasia 1
World Area Population AR He
Central Asia KAZ 7.9 0.784
Central Asia KKK 7.8 0.782
Central Asia KRA 7.5 0.769
Central Asia KRB 7.3 0.757
Central Asia KRG 7.7 0.779
Central Asia KRL 7.8 0.778
Central Asia KRM 7.6 0.752
Central Asia KRT 7.7 0.761
Central Asia LKZ 7.8 0.778
Central Asia LUZa 8.3 0.817
Central Asia LUZn 8.6 0.821
Central Asia OTU 8.0 0.784
Central Asia TDS 7.7 0.784
Central Asia TDU 7.9 0.805
Central Asia TJA 8.0 0.806
Central Asia TJE 8.4 0.814
Central Asia TJK 8.6 0.820
Central Asia TJN 8.4 0.811
Central Asia TJR 8.6 0.812
Central Asia TJT 8.5 0.812
Central Asia TJU 8.5 0.811
Central Asia TJY 7.9 0.799
Central Asia TUR 8.5 0.812

29
Central Asia UZA 9.0 0.817
Central Asia UZB 8.5 0.774
Central Asia UZT 8.4 0.795
Central Asia (pooled populations) 12.58 0.803
Central/South Asia 12.66 0.819
East Asia 11.4 0.705
Europe 11.83 0.808
Middle East 13.17 0.827
AR, allelic richness; He, expected heterozygosity. AR was calculated using a common sample 2
size of n = 13 diploid individuals for the Central Asian samples, and a common samples size 3
of n = 123 diploid individuals for the regional samples. These sample sizes correspond to the 4
smallest number of genes sampled at a locus, including missing data. 5

Table 3 AMOVA of the 26 Central Asian studied populations 6
Grouping Source of variation Percentage of
variation FST FSC FCT
Linguistic affiliation Among groups 1.09 0.010***
Among populations within groups 0.91 0.009***
Within populations 98.0 0.020***
Ethnicity Among groups 0.69 0.007***
Among populations within groups 0.91 0.009***
Within populations 98.39 0.016***
*p < 0.01, **p < 0.001, ***p < 0.0001. 7
8

31
Table 4 Maximum-likelihood estimates of admixture proportions in the 26 Central Asian populations 9
Putative parental group
Population
Ethnic group Europe Middle East Central/South Asia East Asia
KAZ Kazakh 0.166 0.125 0.126 0.583
LKZ Kazakh 0.252 0.166 0.033 0.549
KKK Karakalpak 0.126 0.127 0.250 0.497
OTU Karakalpak 0.250 0.128 0.125 0.497
KRA Kyrgyz 0.125 0.126 0.250 0.499
KRB Kyrgyz 0.031 0.125 0.218 0.625
KRG Kyrgyz 0.124 0.126 0.129 0.621
KRL Kyrgyz 0.250 0.004 0.250 0.495
KRM Kyrgyz 0.072 0.000 0.250 0.678
KRT Kyrgyz 0.066 0.184 0.184 0.566
TUR Turkmen 0.271 0.236 0.221 0.272
UZA Uzbek 0.271 0.192 0.250 0.286

32
UZB Uzbek 0.235 0.234 0.250 0.281
UZT Uzbek 0.271 0.192 0.250 0.287
LUZa Uzbek 0.330 0.229 0.254 0.187
LUZn Uzbek 0.160 0.257 0.395 0.188
TDS Tajik 0.250 0.249 0.258 0.242
TDU Tajik 0.310 0.219 0.220 0.251
TJA Tajik 0.250 0.298 0.190 0.262
TJE Tajik 0.250 0.248 0.358 0.145
TJK Tajik 0.327 0.219 0.260 0.194
TJN Tajik 0.345 0.184 0.221 0.250
TJR Tajik 0.256 0.256 0.226 0.262
TJT Tajik 0.324 0.244 0.274 0.158
TJU Tajik 0.290 0.366 0.071 0.273
TJY Tajik 0.462 0.179 0.303 0.055
10 Shaded cells correspond to Turkic-speaking populations, and non-shaded cells to Indo-Iranian-speakers. 11 12 13
Iran
0 250 500 km
Uzbekistan
Kazakhstan
Afghanistan
TurkmenistanTajikistan
China
Lake Balkhash
Aral Sea
Lake Issyk Kul
Pakistan
KKK
KRA
KRG
KRM
KAZ
OTU
TUR
TJA
TJK
TJR
TJU
LKZ
TDS
TDU
TJYTJN
TJE
TJT
KRB
KRL
KRT
Indo-Iranian
Turkic
Language family
Kyrgyzstan
LUZa
LUZn UZT
UZA
UZB
Europe
Middle East
East-Asia
Central/South Asia
Admixture proportions

KAZ
KKK
KRA
KRB
KRG
KRL
KRM
KRT
LKZ
OTU
TUR
UZA
UZB
UZT
LUZa
LUZn
TDS
TDU
TJA
TJE
TJK
TJN
TJR
TJT
TJU
TJY
Cambodian
Dai
Daur
Han
Hezhen
Lahu
Miaozu
Mongola
Naxi
Oroqen
She
Tu
Tujia
Xibo
Uygur
Balochi
Brahui
Burusho
Hazara
Kalash
Makrani
Pathan
Sindhi
Basque
French
Bergamo
Sardinian
Tuscan
Orcadian
Russian
Adygei
Druze
Palestinian
Bedouin
Mozabite
●
Yizu
Japanese
Yakut
Central Asia
(Turkic language) Europe East AsiaMiddle EastCentral/South Asia
Central Asia
(Indo-Iranian language)
ba
●
−0.6 −0.4 −0.2 0.0 0.2 0.4 0.6 0.8
−0.
6−
0.4
−0.
20.
00.
20.
40.
6
Axis 1 (18.03%)
Axi
s 2
(4.3
6%)
−0.6 −0.4 −0.2 0.0 0.2 0.4
−0.
8−
0.6
−0.
4−
0.2
0.0
0.2
0.4
Axis 1 (14.65%)
Axi
s 2
(6.8
4%)
UZA
TUR

K =
2
K =
3
K = 4
K =
5
Ce
ntra
l Asia
Eu
rop
e
Ea
st Asia
Mid
dle
Ea
stC
en
tral/S
ou
th A
sia
KRA
KRBKRGKRL
KRM
KRT
LKZ
KAZ
KKK
OTU
UZA
UZB
UZT
LUZaLUZn
TJR
TJU
TUR
TDS
TDU
TJA
TJT
TJN
TJE
TJY
TJKUygur
Hazara
Balochi
Brahui
Burushi
Makrani
Pathan
SindhiKalash
Druze
Palestinian
Mozabite
Bedouin
Basque
French
Bergamo
Sardinian
Tuscan
Orcadian
Russian
Adygei
K =
6
Tu
CambodianDai
DaurHan
HezhenLahu
MiaozuMongola
Naxi0roqen
She
TujiaXiboYizu
JapaneseYakut
Biaka
Mbuti
San
Bantu
Mandeka
Yoruba
Africa