In situ measurements of capillary-gravity wave spectra using a scanning laser slope gauge and...
10
JOURNAL OF GEOPHYSICAL RESEARCH, VOL. 99, NO. C6, PAGES 12,593-12,602, JUNE 15, 1994 In situ measurementsof capillary-gravity wave spectra using a scanning laser slope gauge and microwave radars Tetsu Hara Graduate School of Oceanography, Universityof RhodeIsland,Narragansett Erik J. Bock WoodsHole Oceanographic Institution, WoodsHole, Massachusetts David Lyzenga Department of Naval Architecture and Marine Engineering, Universityof Michigan, Ann Arbor Abstract. Capillary-gravity wave spectra are measured usinga scanning laser slopegauge (SLSG), and simultaneously by X and K bandDopplerradars off the Chemotaxis Dock at the Quissett campus of the WoodsHole Oceanographic Institution at WoodsHole, Massa- chusetts. Wave spectral densities estimated from the radarmeasurements usingthe Bragg theoryagree with those measured usingthe SLSG at the Bragg wavenumber to within a few decibels, suggesting that Braggscattering theory is valid for the conditions of this ex- periment. The observed degree of saturation of capillary-gravity wavesis in reasonable agreement with measurements by J•ihne and Riemer (1990) obtained from measurements in a large wind-wave flume at intermediate wind speeds, but our data indicatea higher de- greeof saturation at very low wind speeds. The rate at which the slope-frequency spectrum falls off, however, is much lower in the field than in laboratories, even at moderate winds, suggesting long wavesare responsible for a large Doppler shift of capillary-gravity waves. Close examination of combined wavenumber-frequency slopespectra also revealssignifi- cant smearing of the spectra in the frequency domain due to long waves. Theseobserva- tionsconfirm that spatial measurements (wavenumber spectra measurements) are essential for characterizing short capillary-gravity waves, since this strong Doppler shift will dramat- ically change apparent frequency spectra. 1. Introduction Dynamics of wind-generated capillary-gravitywaves have been investigated extensively in the last decade be- cause of their relevance to the interpretation of remotely sensed data of the ocean surface by microwave radars. The presence of capillary-gravity wavesmay also influence the air-seagas exchange process according to the recentlabo- ratory studies [Jiihne et al., 1987] (also, E. J. Bock and N. M. Frew, manuscripts in preparation, 1994), although the mechanism of gas transport at the air-seainterface is still poorly understood. Capillary-gravity wavesalso contribute to the effectivesurface roughness for the turbulent air flow above. The mechanism by which these small wavesimpact the mean wind profile has been theoretically studied only in idealized conditions [Hara and Mei, 1994]. The parameterization of the surface roughness in practical conditions still relies heavily on empirical observations [e.g., Charnock, 1955]. Many theoretical, as well as experimental, studies are available on the generation, the nonlinear wave-wave inter- action, and the dissipation of the capillary-gravity waves Copyright 1994 by the American Geophysical Union. Paper number 94JC00531. 0148-0227/94/94JC-00531 $05.00 separately. In particular, recent numerical [Ruvinsky et al., 1991], theoretical [Longuet-Higgins, 1992], and experi- mental [Perlin et al., 1993] studies have advanced our understanding of the interaction between steep gravity waves and parasitic capillary waves neartheir crests. How- ever,studies of the combined effects of the three forcing mechanisms, namely, wind input, wave interaction, and wave dissipation, are still scarce either theoretically [Janssen, 1986, 1987;Hara and Mei, 1994] or experimen- tally.As a result, theoretical modeling of capillary-gravity waves in a field environment has been limited to the sim- ple approach based on the conservation of wave action with the abovethree mechanisms addedindependently. Further progress of theoretical modeling is hindered partly because reliable direct ob'servations of capillary-gravity waves in a field environment arealmost nonexistent except for the manyradarbackscatter measurements that come with their own uncertainties owing to the lack of knowl- edge regarding the mechanism of microwave reflection at the air-sea interface. Conventional single-point wave-height or wave-slope measurements are not appropriate to characterize capillary- gravity waves for two reasons. One is that wind-generated capillary-gravity waves always propagate in two dimen- sions except for thebriefperiod of the initiallinear growth stage [Kawai, 1979]. Measurements at one locationdo not yield information on the directional propagation of the 12,593
Transcript of In situ measurements of capillary-gravity wave spectra using a scanning laser slope gauge and...

JOURNAL OF GEOPHYSICAL RESEARCH, VOL. 99, NO. C6, PAGES 12,593-12,602, JUNE 15, 1994
In situ measurements of capillary-gravity wave spectra using a scanning laser slope gauge and microwave radars
Tetsu Hara
Graduate School of Oceanography, University of Rhode Island, Narragansett
Erik J. Bock
Woods Hole Oceanographic Institution, Woods Hole, Massachusetts
David Lyzenga Department of Naval Architecture and Marine Engineering, University of Michigan, Ann Arbor
Abstract. Capillary-gravity wave spectra are measured using a scanning laser slope gauge (SLSG), and simultaneously by X and K band Doppler radars off the Chemotaxis Dock at the Quissett campus of the Woods Hole Oceanographic Institution at Woods Hole, Massa- chusetts. Wave spectral densities estimated from the radar measurements using the Bragg theory agree with those measured using the SLSG at the Bragg wavenumber to within a few decibels, suggesting that Bragg scattering theory is valid for the conditions of this ex- periment. The observed degree of saturation of capillary-gravity waves is in reasonable agreement with measurements by J•ihne and Riemer (1990) obtained from measurements in a large wind-wave flume at intermediate wind speeds, but our data indicate a higher de- gree of saturation at very low wind speeds. The rate at which the slope-frequency spectrum falls off, however, is much lower in the field than in laboratories, even at moderate winds, suggesting long waves are responsible for a large Doppler shift of capillary-gravity waves. Close examination of combined wavenumber-frequency slope spectra also reveals signifi- cant smearing of the spectra in the frequency domain due to long waves. These observa- tions confirm that spatial measurements (wavenumber spectra measurements) are essential for characterizing short capillary-gravity waves, since this strong Doppler shift will dramat- ically change apparent frequency spectra.
1. Introduction
Dynamics of wind-generated capillary-gravity waves have been investigated extensively in the last decade be- cause of their relevance to the interpretation of remotely sensed data of the ocean surface by microwave radars. The presence of capillary-gravity waves may also influence the air-sea gas exchange process according to the recent labo- ratory studies [Jiihne et al., 1987] (also, E. J. Bock and N. M. Frew, manuscripts in preparation, 1994), although the mechanism of gas transport at the air-sea interface is still poorly understood. Capillary-gravity waves also contribute to the effective surface roughness for the turbulent air flow above. The mechanism by which these small waves impact the mean wind profile has been theoretically studied only in idealized conditions [Hara and Mei, 1994]. The parameterization of the surface roughness in practical conditions still relies heavily on empirical observations [e.g., Charnock, 1955].
Many theoretical, as well as experimental, studies are available on the generation, the nonlinear wave-wave inter- action, and the dissipation of the capillary-gravity waves
Copyright 1994 by the American Geophysical Union.
Paper number 94JC00531. 0148-0227/94/94JC-00531 $05.00
separately. In particular, recent numerical [Ruvinsky et al., 1991], theoretical [Longuet-Higgins, 1992], and experi- mental [Perlin et al., 1993] studies have advanced our understanding of the interaction between steep gravity waves and parasitic capillary waves near their crests. How- ever, studies of the combined effects of the three forcing mechanisms, namely, wind input, wave interaction, and wave dissipation, are still scarce either theoretically [Janssen, 1986, 1987; Hara and Mei, 1994] or experimen- tally. As a result, theoretical modeling of capillary-gravity waves in a field environment has been limited to the sim-
ple approach based on the conservation of wave action with the above three mechanisms added independently. Further progress of theoretical modeling is hindered partly because reliable direct ob'servations of capillary-gravity waves in a field environment are almost nonexistent except for the many radar backscatter measurements that come with their own uncertainties owing to the lack of knowl- edge regarding the mechanism of microwave reflection at the air-sea interface.
Conventional single-point wave-height or wave-slope measurements are not appropriate to characterize capillary- gravity waves for two reasons. One is that wind-generated capillary-gravity waves always propagate in two dimen- sions except for the brief period of the initial linear growth stage [Kawai, 1979]. Measurements at one location do not yield information on the directional propagation of the
12,593

12,594 HARA ET AL.' IN SITU MEASUREMENTS OF CAPILLARY-GRAVITY WAVES
waves. The other reason is the strong Doppler frequency shift of capillary-gravity waves by long waves and/or by near-surface currents, especially in a field environment. This may produce a significantly altered apparent frequen- cy spectrum. To overcome these problems, spatial mea- surements of capillary-gravity waves have been recently at- tempted. Banner et al. [1989] used stereophotogrammetry from an offshore rese.•ch platform to obtain wavenumber spectra for waves between 0.2 and 1.6 m. For shorter waves, a scanning laser slope gauge (SLSG) has been used by Barter et al. [1990], Lee et al. [1992], and Li et al. [1993]. Jiihne and Riemer [1990] have conducted exten- sive measurements of wavenumber spectra in the capillary- gravity range using a digital image processing technique at a large wind-wave flume. Although the experimental con- ditions may not necessarily be relevant to the real ocean surface, their results produced the first spatial information obtained with reasonable quantitative accuracy. Among their new findings are a steep decline of the spectrum at wavenumbers around 100-200 rad/m at lower wind stress-
es, and the presence of a cutoff wavenumber around 800 rad/m, above which the spectrum falls off quickly. Al- though this tech.nique is very effective in laboratories, it cannot be practically applied to field measurements owing to the physical constraints of the optical system involved.
Recently, a SLSG has been developed at Woods Hole Oceanographic Institution. The instrument is designed mainly fo r field deployment as a part of the instrumenta- tion package on a research catamaran LADAS (Laser slope gauge, Acoustic Doppler current profiler, Attitude measur- ing unit, Sonic anemometer). The instrument is capable of measuring the three-dimensional wavenumber-frequency slope spectrum of capillary-gravity waves with wavenum- bers between 31 and 990 rad/m and frequencies up to 31.5 Hz. The instrument has been successfully tested in a laboratory experiment, and the associated instrumental errors have been fully analyzed [Bock and Hara, 1994]. As a first attempt to deploy the instrument under field condi- tions, the research catamaran was moored off the Chemo- taxis Dock at the Quissett campus of the Woods Hole Oceanographic Institution on November 20 and 21, 1992. Three-dimensional spectra were obtained with the SLSG, along with radar backscatter measurements at two radar wavelengths, meteorological parameters, and an indepen- dent observation of long waves obtained with a wire gauge. Here we report the results from these experiments and examine, in particular, the validity of the Bragg reso- nant theory of microwave signals, the Doppler effects by long waves, and the difference between our measurements and the laboratory measurement by Jiihne and Riemer [19901.
In this paper we first describe the experimental method in section 2. After a brief overview in section 2.1, the de- sign, the calibration, and the error analysis of SLSG are summarized in section 2.2 based on a separate paper [Bock and Hara, 1994]. The radar measurements and calibration are explained in detail in sections 2.3 and 2.4, followed by the descriptions of meteorological and long wave measure- ments. Experimental results are presented in section 3. An overview of the 2-day period of measurements is given, and the three-dimensional wavenumber-frequency slope spectra and the degree of saturation of capillary-gravity waves are discussed in sections 3.2 and 3.3, respectively, followed by the long wave measurements in section 3.4.
Extensive comparisons are made with the results obtained in the large wind-wave tank experiments by Jiihne and Riemer [1990]. In section 3.5 the normalized cross sections of the radar backscatter at two different radar frequencies are compared with the simultaneous measurement of the wavenumber spectra at the Bragg resonant wavenumbers by the SLSG, and the applicability of the Bragg scattering theory of radar signals at the air-sea interface is examined. Section 4 summarizes this study and discusses extensions of the study to be conducted.
2. Experimental Methods
2.1. Overview
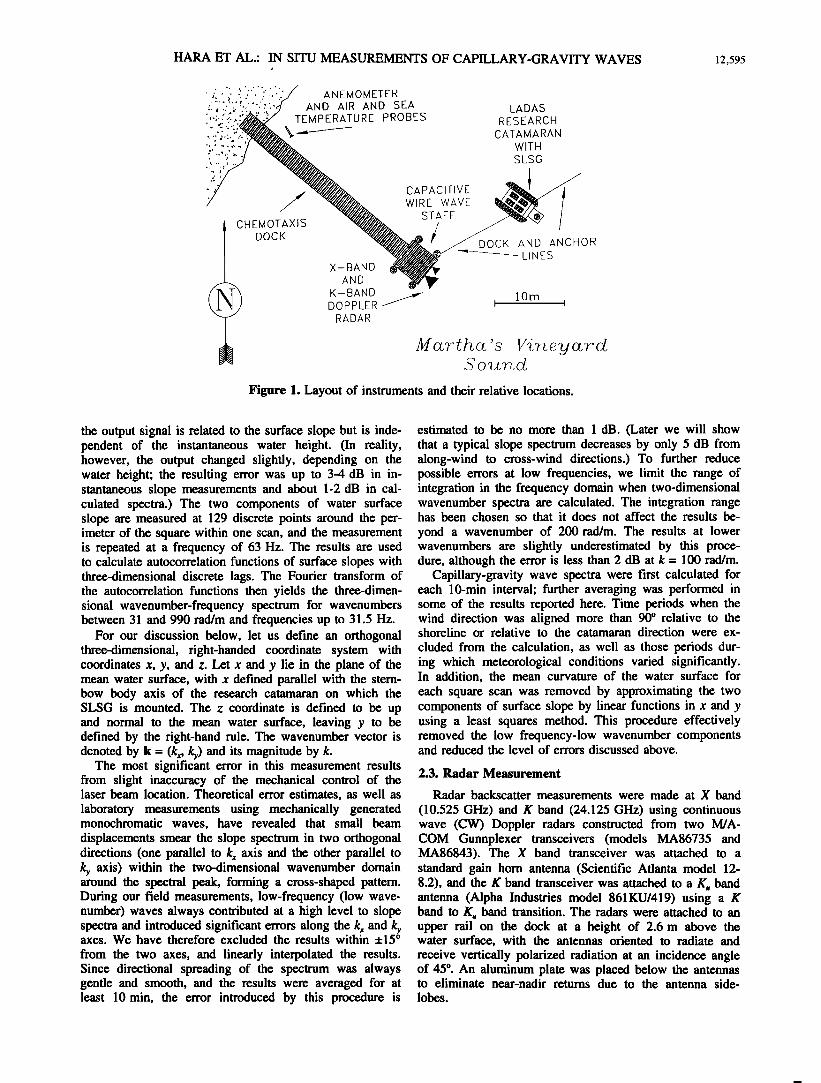
Experiments were performed in Martha's Vineyard Sound from the Chemotaxis Dock at the Quissett campus of the Woods Hole Oceanographic Institution in Woods Hole, Massachusetts, on November 20 and 21, 1992. Mea- surements were obtained about 30 m offshore, and at a mean water depth of 2 m. Capillary-gravity wave spectra were acquired using the SLSG, long waves were recorded from measurements obtained from a capacitive wire wave gauge, wind speed and direction were obtained from an R. M. Young Gill propeller-vane anemometer, and air and sea temperatures were monitored with Analog Devices monolithic semiconductor sensors (AD590). Microwave backscatter was measured simultaneously in both X and K bands with solid-state Doppler radars. Figure 1 shows the layout of the instruments and their relative locations. In- cluded in the figure i s an arrow pointing north for refer- ence. The dock extends out into the sound at about 130 ø
southeast of north. Since the experimental site is surround- ed by peninsulas and islands, the maximum fetch was about 7 km when wind was from the southeast.
2.2. Scanning Laser Slope Gauge
Three-dimensional frequency-wavenumber spectra of capillary-gravity waves were measured using a SLSG developed at Woods Hole Oceanographic Institution. The SLSG was mounted on the LADAS research catamaran, which was moored between an offshore anchor and the dock. The direction of the catamaran was adjusted during the course of the experiment so as to keep the wind within _+90 ø relative to the bow of the catamaran. This was nec-
essary to avoid the influence of flow distortion introduced by the pontoons of the catamaran, which affects adversely the capillary-gravity wave field at the location of measure- ment.
Since details of the instrument design, the calculation of 3-D spectra, as well as the error analyses are all reported in a separate paper [Bock and Hara, 1994], here we briefly summarize them. The instrument consists of a laser pod and a head unit. The former is fixed beneath the water
surface and emits a laser beam upward that draws a square pattern (!0 cm x 10 cm) within 10 ms. The beam is re- fracted at the water surface following Snell's law, by the local, instantaneous surface slope, and the angular dis- placement of the beam is measured by the head unit. The head unit consists of a large aperture aspheric lens, a diffuser, and an array of silicon photodiodes that sense the intensity of the laser beam. The intensities at each of the photodiodes are used to determine beam location and obtain slope estimates. The head unit is designed so that
HARA ET AL.: IN SITU MEASUREMENTS OF CAPILLARY-GRAVITY WAVES
?i-]i.::•i•i.':)..":•i:,i:•....?i:/i:• AND AIR AND SEA LADAS :.ii!!.:}/i:!i"-. •.:i ;) - "• TEMPERATURE PROBES RESEARCH
'!j'ii:?,;"?.!!.::;/ •.•/• WITH
'/'•" CAPACITIVE ß .. WIRE WAVE
DOCK '•½:7• _• '/ .....
K-BAND .• lorn DOPPLER J I
RADAR
M h cc ' s
Figure 1. Layout of instruments and their relative locations.
12,595
the output signal is related to the surface slope but is inde- pendent of the instantaneous water height. (In reality, however, the output changed slightly, depending on the water height; the resulting error was up to 3-4 dB in in- stantaneous slope measurements and about 1-2 dB in cal- culated spectra.) The two components of water surface slope are measured at 129 discrete points around the per- imeter of the square within one scan, and the measurement is repeated at a frequency of 63 Hz. The results are used to calculate autocorrelation functions of surface slopes with three-dimensional discrete lags. The Fourier transform of the autocorrelation functions then yields the three-dimen- sional wavenumber-frequency spectrum for wavenumbers between 31 and 990 rad/m and frequencies up to 31.5 Hz.
For our discussion below, let us define an orthogonal three-dimensional, right-handed coordinate system with coordinates x, y, and z. Let x and y lie in the plane of the mean water surface, with x defined parallel with the stem- bow body axis of the research catamaran on which the SLSG is mounted. The z coordinate is defined to be up and normal to the mean water surface, leaving y to be defined by the right-hand rule. The wavenumber vector is denoted by k = (kx, ky) and its magnitude by k.
The most significant error in this measurement results from slight inaccuracy of the mechanical control of the laser beam location. Theoretical error estimates, as well as laboratory measurements using mechanically generated monochromatic waves, have revealed that small beam displacements smear the slope spectrum in two orthogonal directions (one parallel to kx axis and the other parallel to ky axis) within the two-dimensional wavenumber domain around the spectral peak, forming a cross-shaped pattern. During our field measurements, low-frequency (low wave- number) waves always contributed at a high level to slope spectra and introduced significant errors along the k• and ky axes. We have therefore excluded the results within ñ15 ø
from the two axes, and linearly interpolated the results. Since directional spreading of the spectrum was always gentle and smooth, and the results were averaged for at least 10 min, the error introduced by this procedure is
estimated to be no more than 1 dB. (Later we will show that a typical slope spectrum decreases by only 5 dB from along-wind to cross-wind directions.) To further reduce possible errors at low frequencies, we limit the range of integration in the frequency domain when two-dimensional wavenumber spectra are calculated. The integration range has been chosen so that it does not affect the results be-
yond a wavenumber of 200 rad/m. The results at lower wavenumbers are slightly underestimated by this proce- dure, although the error is less than 2 dB at k = 100 rad/m.
Capillary-gravity wave spectra were first calculated for each 10-min interval; further averaging was performed in some of the results reported here. Time periods when the wind direction was aligned more than 90 ø relative to the shoreline or relative to the catamaran direction were ex-
cluded from the calculation, as well as those periods dur- ing which meteorological conditions varied significantly. In addition, the mean curvature of the water surface for each square scan was removed by approximating the two components of surface slope by linear functions in x and y using a least squares method. This procedure effectively removed the low frequency-low wavenumber components and reduced the level of errors discussed above.
2.3. Radar Measurement
Radar backscatter measurements were made at X band
(10.525 GHz) and K band (24.125 GHz) using continuous wave (CW) Doppler radars constructed from two M/A- COM Gunnplexer transceivers (models MA86735 and MA86843). The X band transceiver was attached to a standard gain horn antenna (Scientific Atlanta model 12- 8.2), and the K band transceiver was attached to a K, band antenna (Alpha Industries model 861KU/419) using a K band to K, band transition. The radars were attached to an upper rail on the dock at a height of 2.6 m above the water surface, with the antennas oriented to radiate and receive vertically polarized radiation at an incidence angle of 45 ø . An aluminum plate was placed below the antennas to eliminate near-nadir returns due to the antenna side- lobes.

12,596 HARA ET AL.: IN SITU MEASUREMENTS OF CAPILLARY-GRAVITY WAVES
Each transceiver consists of a Gunn diode oscillator and
a pair of Schottky diode mixers mounted so as to detect the sum of the outgoing (transmitted) and incoming (re- ceived) fields with a nominal phase difference of 90 ø be- tween the two mixers. The output signals from the two mixers were both sampled at a rate of 512 samples per second using a Metrabyte DAS-8 A/D board installed in an Intel 486-based computer. To reduce the data volume, the average backscattered power was computed over l-s inter- vals and recorded on disk. However, the raw data were also recorded for l-s intervals once every 10 s for diag- nostic purposes and to investigate the Doppler characteris- tics of the backscattered signals.
The voltages on each of the mixer diodes may be repre- sented by the sum of a constant or bias voltage Vbi plus a fluctuating component vi, i.e.,
Vi = Vbi + v i (1)
where V•i is typically of the order of 1/2 V and v• is typi- cally on the order of a few millivolts. The bias voltage was removed from each of the four radar channels and the
fluctuating component was amplified by a factor of 1000 prior to recording. The received power was then calculated as
where the sum was carried out over the set of 512 samples collected during each 1-s interval. The Doppler spectrum is formed by assigning v• and v 2 to the real and imaginary parts of a complex array, after equalizing their variances so as to correct for gain differences between channels, and computing the Fourier transform of each set of 512 record- ed samples.
For comparison with measurements of the surface eleva- tion spectrum, an additional averaging of the !-s samples of backscattered power was done over 600 of these record- ed samples. These values were then converted into esti- mates of the radar cross section per unit area using the calibration procedure described in the next section. 2.4. Radar Calibration
This section describes the procedure used to estimate the radar cross section per unit area of the ocean surface from measurements of the backscattered power. The proce- dure involves the use of an aluminum sphere with a radius a = 7.5 cm as a reference reflector. The sphere was sus- pended at a distance of 2.18 m from the radar antenna and allowed to swing slightly, so as to produce a Doppler shift in the backscattered signal, which is used to distinguish this signal from extraneous reflections from other objects in the room. Signals were recorded with the sphere located approximately at the center of the antenna pattern and at equally spaced angles on either side of this location.
The received power from the calibration sphere can be written as
G,(0,•) G,(0,•) Pc = P, . )•2Oc (3)
(4a:)3Q 4
where p, is the transmitted power, G,(O,•) is the trans- mitting antenna gain, and Gr(0,•) is the receiver antenna
gain at the location of the sphere, • is the radar wave- length, r c is the distance between the sphere and the an- tenna, and c• c-- r•a 2 is the radar cross section of the sphere.
On the other hand, the received power from the ocean surface is given by
z' I'f ?, aoZ' =Pt d d (4/I;) 3r4 C•o dA = C•oA i (4) (4;r)3ro 4
where G,o and Gro are the peak transmitting and receiver antenna gains, r o is the mean distance to the surface, A i is the illuminated area, and c• o is the radar cross section per unit area of the surface.
These two equations can be combined to yield an ex- pression for the radar cross section per unit area of the surface as
"ø=•ii (rc,J P o where Po is the backscattered power received from a refer- ence reflector of cross section •c located at the center of the antenna pattern.
If we approximate the two-way antenna patterns by the Gaussian functions,
G 2(0,{)= Gt(O, {)G,.(O,{)= Go2e -,(O-,o)'O•-,(,-,o)'/ol (6)
and assume that the beamwidths [• and [• are sufficiently narrow that variations in range and incidence angle within the illuminated area may be neglected, the illuminated area can be written as
2
rø f f G 2(O,• )dOd• rø• l•'• * (7) Ai= Go 2 cos0 cos0 The beamwidths were estimated by fitting the logarithm of the calibration signals to a quadratic function in each plane, i.e.,
ln(Pc)= a. b(X-Xo )2 (8)
where x is the azimuth or elevation angle and Pc is the corresponding backscattered power. From a total of five measurements, including one on either side of the nominal beam center in each (azimuth or elevation) plane, the two beamwidths I• and I•, the center angles 0o and •o, and the peak power Po can be determined.
Using this procedure, the beamwidths for the X band antenna were estimated to be 8.5 ø in the E plane and 8.9 ø in the H plane, and the corresponding values for the K band antenna were found to be 6.2 ø and 9.3 ø . Thus the
illuminated areas for an antenna height of 2.6 m above the water surface and an incidence angle of 45 ø, were 0.44 m 2 for the X band and 0.34 m 2 for the K band. The peak backscattered power for the aluminum sphere at a distance of 2.18 m was 4.4x10 • counts 2 at the X band and 4.0x10 • counts 2 at the K band. The radar cross section per unit area (in decibels) is therefore given by

HARA ET AL.' IN SITU MEASUREMENTS OF CAPILLARY-GRAVITY WAVES 12,597
-13
Oo -- 10log(P)- 91.3 dB (9) 2xlo for the X band and
log(P,,) - 89.8 dB (1 O)
for the K band, where P`, is the variance of the received signal, in units of digital counts.
2.5. Meteorological Measurement
The anemometer was mounted on a 5-m mast, about
25 m away from the platform. Wind speed, wind direction, air temperature, and water temperature were sampled at 11.2 Hz, and the mean values were computed for 10-min periods. Additionally, the variance of the wind speed was calculated for each 10-min period.
The wind stress was calculated by a bulk method [Smith, 1988] from the measured wind speed and the air- sea temperature difference. The Charnock constant was chosen to be 0.017, which was appropriate for coastal areas. We included stability corrections, but since the air- sea temperature differences were small during the course of our experiments, the corrections were insignificant. Both the measured wind speed and the calculated wind stress throughout the experiment are shown in Figure 2.
2.6. Long Wave Measurement
Long waves were measured using a capacitance wire wave gauge. The wave height was sampled at 30 Hz, and the frequency spectra and the mean square slope were calculated for representative 10-min periods on the 2 days during which measurements took place. The direction of long waves near the spectral peak was visually determined, and they were always in the direction of the wind, except during wind direction transitions.
3. Results and Discussion
3.1. General Conditions
Meteorological conditions and capillary-gravity wave spectra (Bragg wave spectral densities measured directly by SLSG and those estimated from radar measurements
0.40
0.30
0.20
0.10
0.00
13
/'
I I
HOUR OF DAY
360
270
180'-1
- 90
0
13
Figure 2a. Wind speed (U, dashed line), friction velocity (u., solid line), and wind direction (0w, dotted line) during the experiment. Data are averaged over 10 min.
-14 2x10
E 2x10 -15
-16 2x10 -
-17 2x10
13
+ +
D
ø% oo* øo•
i i i
o ?• +"ø %o00-
I I I I I I I I I I I I
15 17 19 9 11
•/zo/•z •/Zl/•Z HOUR OF DAY
13
Figure 2b. Bragg wave spectral densities measured by SLSG (times signs, X band Bragg wavenumber; crosses, K band Bragg wavenumber) and estimated from radar mea- surements using the theoretical linear coefficients shown in section 3.5 (squares, X band; diamonds, K band). Data are averaged over 10 min.
using the theoretical linear coefficients shown in section 2.5) are shown in Figure 2 for the entire period. Note that Figure 2a is in a linear scale, while Figure 2b is in a loga- rithmic scale; the time variability in Figure 2a is empha- sized. On the first day (November 20), wind was weak and the wind direction was initially normal to the shore but shifted about 90 ø toward the evening. Bragg wavenumber spectra decreased corresponding to the wind shift. On the second day (November 21), wind was moderate and nearly steady. Throughout the experiment the air-sea interface was neutral to slightly unstable.
3.2. Three-Dimensional Wavenumber-Frequency Spectra of Capillary-Gravity Waves
In Figure 3, typical wavenumber-frequency spectra of the surface slope (S(k,to)) are shown for 1-hour average between 1055 and 1155 on November 21. The mean wind
direction (0w) was 210 ø and the mean wind friction veloc- ity (u.) was 0.22 m/s. The full three-dimensional spectrum was sliced along two different wave directions (0 ø and 90 ø ) relative to the mean wind direction. The darkest area at low wavenumbers (k < 100 rad/m) is the result of re- moving the mean curvature of water surface at each square scan. The dispersion relationship of capillary-gravity waves at surface tension 73 mN/m is included as a solid line, and for reference purposes, a dotted line shows the dispersion relation for surface tension of 50 mN/m to represent a slicked sea surface. The dislocation of spectral variance relative to these dispersion relations is a result of Doppler shifts owing to two influences. The first influence is that of steady surface currents, which shifts the variance in one direction in the frequency domain (either upward or down- ward in Figure 3). The second influence is that of oscillat- ing currents, the orbital motions of longer waves, and smears the variance in both directions around the disper- sion relation in the frequency domain. Based on observa- tions of small near-surface drifters and small bubbles, surface currents were estimated to be no more than 0.01-
0.02 m/s during the experiment. The calculated spectra indeed show almost symmetric Doppler shift effects

12,598 HARA ET AL.: IN SITU MEASUREMENTS OF CAPILLARY-GRAVITY WAVES
200
-60 -40 -20 0
Relative Power (dB) i i i
i -, , i
I i i i ,
.:
, , , ,
..
, , , ,
I .
-500 0 500
e
-60 -40 -20 0
Relative Power (dB)
::•:• ......... :L•.. ' ' ' 7-:•_::,i¾..•.-.:.,,.-....:.•;::•:•: "::-•:.-:.•::•:..••'4.' ........... :.:...-...• ...... •.::•.:..•;. . ::.:..;•:f•: .5.-..': i:5: ::i::-- -•.:i: ..-!:!. 5,5.. •,'..s •:.::..• .... -:.:'i.::!:!:: :':. :...:.r •. ::i'•: :!'"';;': •,"-;f.•,?.-5.': :!.-.-'.-.:.':::-' .... '" :'::::":::'*::"-':"•,,'-.."•-•i::::.:"•'• -:' ...... ' ............ :':::' ...... '.:! ....... ' :-::.:-.:..•.•[•'-:::•:: 'i:i: •: :::':.:. v :!:i' i:::i:i' •0•. "._ _-•!' •::'"• ":'!'i':'i:i:ii:i-'..•; ::::::::::::::::::::::::: ::::'"':
. •,. •.•.•: . .'.-::..:.:: .•: ....;•,-..-..,.,.•::.?:•?:.•.,-..•;2•: ......... ,•,-::.
---:- •-•i•-' :":':':., ,?•" ::r - -.;:.'-.•i• .i: :"-•'..•.:,:.• .' ,•,.::i:f•-•:•-.•:-•;•'.'.•.,,•'• .';•.-:' ß , •.::,i:.•xs ..i .......... •.:: x•.•:.',.' • . .- '..•;,;?..-.!..•$•::(,•'<•:•-" .. •.'.. ...... ,•:•.•5• ..... .:. ...... e,!,!.,..:....•,•??,-T•..,.::•:,:.,•..'..•...•,...:.•,•:::•: . ß ].•:....'.' .....:. '.:. ..::•:5' ...- - ..-..x ..:.•..•.,•...•:• .. • ..... '... ,•.. • <._-:z:...:.:'::'•i• .... •:•...: .•:'•i•i.:..•::.'.'•:•:::•.5•.•:•-:::.,;x:,:5:i:.• ........ •::,•,. -.::.•.:.-',.:.::•. ..'•:::..'.:..:::::::::•.:•:,..•: .... .. :::•::::-y:::::::::•:'.• ..•:•'•::::::•::.':•..::>.•......,.e•- •': .,•..:::'.:..:. .: •,•'.. S;,y::,:•.:- k.'.,: ..... ':..-'.•,,.'•: .......... :....:•?.-2,...x•:•5:.,-.•.,-•:•,?•.• •: • '. .... ..,• !•;.-::-.:;.•......:•-, -:...-.. .... -:...:...:..... •. •..:•:. :,.•,.::•,,:.:.:- .•:.:•.,• ;•... :,,•:' ß . .•..•... ..... ..::.. ....... .•.•.,:•';•'•.::...:,•:•,•.::::•...'•:.•:.: .....
:.! ...... .,,.•e-p.'•:::'•.•i.•:?'. •.•.."•. ,....:•::-'?•?.?..'•?::'•'.,'.i•:•:.:•. ::'
•:,:•:'•"":-':'-'•::;':. ......... ....::•.• •-*•-•••.,,:,•.•:e..: ......... ,.:.::.:•.,
ß *•.1,.'•5.'.."5:5:• 'i½ sl3- ..'i/•i: 5iii .:.:55:. '•...•2.•,•.•...•..... •-: i-:-:: ..' ::-i.i: ;"•-• ;' •?•f:.:' .::K':i- ::i:.':i:• ' ß !.4:: .:::- ..•::. e ':.- ..... , ;• ....... ""'"' :.•..•-..'. ................... , t ...... :::: '•'•---.-":••.•i•;..'. .... ...-•..'•:' •'":•:•::•-:'"',
-500 0 500
e
Figure 3. Wavenumber-frequency slope spectrum of capil- lary gravity waves averaged between 1055 and 1155 on November 21. Mean wind friction velocity is 0.22 m/s. Mean wind direction is 210 ø. Relative power 0 dB corre- sponds to 10 'a (m • s). Dispersion relations-at surface ten- sion 73 mN/m and 50 mN/m are shown by solid line and dotted line. (a)Along-wind direction; negative k corre- sponds to waves propagating in wind direction. (b)Cross- wind direction.
around the dispersion relation, indicating insignificant surface currents. The Doppler effect of long waves is so strong that the slope spectral variance of wavenumbers larger than 600 rad/m spreads over almost the entire fre- quency domain. The apparent dislocation of variance at very low wavenumbers is mainly due to the low wavenum- ber resolution, which is only 31 rad/m.
The variance in the cross-wind direction is roughly 5 dB lower than that in the along-wind direction up to wave- number 700-800rad/m. Beyond this wavenumber the spectrum level becomes comparable to the noise level. Although waves propagating against the wind are lower than cross-wind waves at low wavenumbers, they appear to be comparable or even higher at higher wavenumbers. Further study is needed to confirm this last observation, however.
3.3. Degree of Saturation of Capillary-Gravity Waves
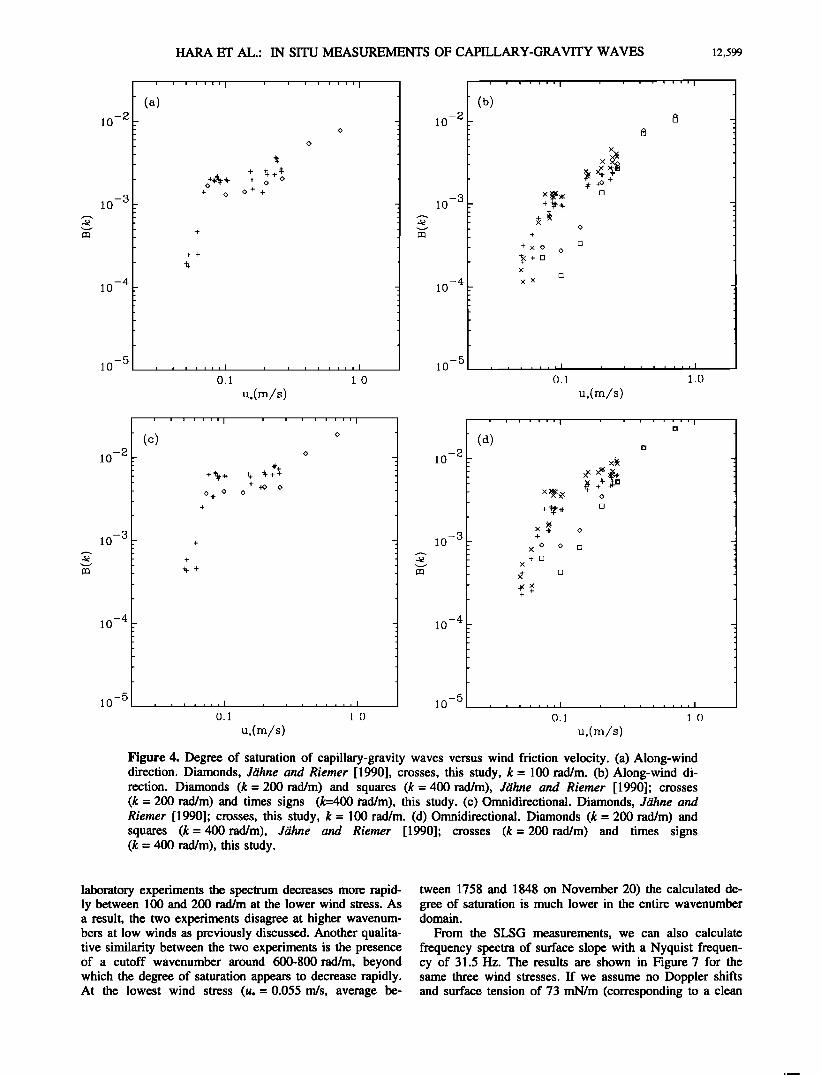
Here we present the degree of saturation B(k) which was originally proposed by Phillips [1985]. We first inte- grate the three-dimensional slope spectra S(k,t0) in the fre- quency domain to obtain the two-dimensional slope wave- number spectra S(k), and the results are multiplied by 2k 2, where the factor 2 is introduced because B(k) is defined for the wave directions between +90 ø from the wind direc-
tion. The results are plotted against friction velocities at three different wavenumbers in Figure 4. All the results are averages over 10 min. For comparison, laboratory measurements by Jiihne and Rierner [1990] are also shown. At moderate wind stresses (u. > 0.15 m/s) both results are reasonably consistent. As the stress decreases (0.07 rrds < u. < 0.15 m/s), the spectral values at the low- est wavenumber (k = 100 tad/m) remain steady in both experiments, while at higher wavenumbers the laboratory results decrease with friction velocity faster than our field measurements. The reason for this discrepancy may be partly attributed to the fact that wind stress was more variable in the field environment than in laboratories, in particular at low wind stresses. At wind stresses below 0.07 m/s our results continue to decrease, where no other experimental data are available for comparison even in laboratories. Although the results at such low winds are close to the noise level of the instrument, the comparison with radar measurements in the next section suggests that wavenumber spectra are indeed small.
Next we show the degree of saturation at three different wind stresses as a function of wavenumber 'in Figure 5 (along-wind) and Figure 6 (omnidirectional, i.e., integrated over all the wave angles). It should be noted that the val- ues at wavenumbers less than 100 rad/m are artificially decreased due to removal of the mean curvature in the
spectrum calculation. This effect is no more than 1-2 dB at wavenumber 100rad/m. On the other hand, beyond 800 rad/m the measured spectrum becomes comparable to the instrument noise level, and the calculated degree of saturation increases rapidly because of the multiplied factor k 2. At u. = 0.22 m/s (average between 1055 and 1155 on November 21) the degree of saturation remains almost constant, while at u. = 0.096 m/s (average between 1510 and 1550 on November 20) it decreases at wavenumbers between 100 and 200 rad/m and remains steady at higher wavenumbers. These features are similar to the laboratory observations by Jiihne and Riemer [1990]. However, in
HARA ET AL.' IN SITU MEASUREMENTS OF CAPILLARY-GRAVITY WAVES 12,599
-3 10
-4 10
-5 10
+ o ø+ +
+ +
i i i
u,(m/s)
-2 10
-3 10
-4 10
-5 10
i
(b)
, , , , , , [ [ ,
+x o o :+m
x
, i , [ , , [
, , , , • I , [ I I I I I ] I I I I I I
1.0 0.1 1.0
u,(m/s)
-2 10
-3 10
-4 10
-5 10
i ! ! [ ' I
+'•., •_ •++'-• + -•o o
04 ' 0 0
i i i i i i i I i I i
0.!
i , i , , [
io
io
io
IO
-2
-3
-4
-5
' [ [ ' [ ' ' I ' [ ] ' ' ' [ ' [
x•
o o x
+ [] x
-4-
x•
u,(m/s) u,(m/s)
Figure 4. Degree of saturation of capillary-gravity waves versus wind friction velocity. (a) Along-wind direction. Diamonds, Jiihne and Riemer [1990], crosses, this study, k = 100 rad/m. (b) Along-wind di- rection. Diamonds (k = 200 rad/m) and squares (k = 400 rad/m), Jiihne and Riemer [1990]; crosses (k = 200 rad/m) and times signs (k=400 rad/m), this study. (c) Omnidirectional. Diamonds, Jiihne and Riemer [1990]; crosses, this study, k = 100 rad/m. (d) Omnidirectional. Diamonds (k = 200 rad/m) and squares (k=400rad/m), Jiihne and Riemer [1990]; crosses (k= 200rad/m) and times signs (k = 400 rad/m), this study.
laboratory experiments the spectrum decreases more rapid- ly between 100 and 200 rad/m at the lower wind stress. As a result, the two experiments disagree at higher wavenum- bers at low winds as previously discussed. Another qualita- tive similarity between the two experiments is the presence of a cutoff wavenumber around 600-800 rad/m, beyond which the degree of saturation appears to decrease rapidly. At the lowest wind stress (u. = 0.055 m/s, average be-
tween 1758 and 1848 on November 20) the calculated de- gree of saturation is much lower in the entire wavenumber domain.
From the SLSG measurements, we can also calculate frequency spectra of surface slope with a Nyquist frequen- cy of 31.5 Hz. The results are shown in Figure 7 for the same three wind stresses. If we assume no Doppler shifts and surface tension of 73 mN/m (corresponding to a clean

12,600 HARA ET AL.' IN SITU MEASUREMENTS OF CAPILLARY-GRAVITY WAVES
10
10
l0
10
-2
-3
-4
-5
i i i I I i I i i I i i i
_• u.=0.09•
100 1000
k(rad/m)
Figure 5. Degree of saturation of capillary-gravity waves versus wavenumber at three wind stresses. Along-wind direction.
surface), it is possible to estimate the omnidirectional de- gree of saturation from these frequency spectra using the dispersion relations. The results are plotted in Figure 6 by dotted lines. It is evident that the Doppler effects by long waves cause a significant difference between the degree of saturation estimated from the frequency spectra and the direct measurements, in particular, at higher wavenumbers. For example, the significant drop of B(k) between wave- numbers 100 and 200 rad/m at the wind stress 0.096 m/s
10
10
10
-2
-3
-4
_ u.=0.22m/s .•-'
, ß
-5 10 , , , ,I ........
100 1000
•(•d/rn)
Figure 6. Degree of saturation of capillary-gravity waves versus wavenumber at three wind stresses. Omnidirection-
al. Solid lines, direct measurement; dotted lines, estimate from frequency slope spectrum. Both are measured by SLSG.
-2 10
-3 10
-4 10
-5 10
u.= O.067m(:..:; • ß u.=O.O55m/s
i i I i i i i i I i i l
I io
/(Hz)
Figure 7. Frequency slope spectrum (S(D) of capillary- gravity waves. Solid lines, direct measurement by SLSG; dotted lines, estimate from wave height spectrum measured by wire gauge.
disappears if B(k) is estimated from the frequency spec- trum. We also note that the discrepancy of the frequency slope spectra between our measurements and the laboratory measurements by Jiihne and Riemer [1990] is more dis- tinct compared with that of wavenumber slope spectra, suggesting that a stronger Doppler shift was present in the field environment than the laboratory environment.
3.4. Long Wave Measurement
Long waves were measured independently using a ca- pacitance wire wave gauge. Calculated wave height fre- quency spectra for two 10-min periods are presented in Figure 8. The result at u, = 0.25 m/s was obtained between 1136 and 1146 on November 21, and that at u, = 0.067 m/s was the average between 1749 and 1759 on November 20. Again assuming no Doppler shifts and a clean surface, the frequency slope spectra can be estimated from these height spectrum measurements, and the results are shown in Figure 7 by dotted lines. The direct slope measurement at u, = 0.22 m/s is consistent with the esti-
mate from the height spectrum at u, = 0.25 m/s, except for the higher end of frequencies. This suggests that the Dopp- ler shift is significant only at high frequencies. (Note that frequency 10 Hz corresponds to wavenumber 265 rad/m.) On the other hand, the slope spectrum estimate from the height measurement at the lower wind stress (u, = 0.067 m/s) 'is entirely different from the direct slope mea- surements. While the discrepancy at higher frequencies is attributed to a strong Doppler shift, that at lower frequen- cies cannot be easily explained. One of the likely reasons is that low-frequency oscillations of the research catamaran (and hence the SLSG) contributed low-frequency compo- nents to slope estimates.

HARA ET AL.: IN SITU MEASUREMENTS OF CAPILLARY-GRAVITY WAVES 12,601
10
10
10
10
10
19
-4
-5
-6
-7
-8
-9
1 lO
f(HJ) Figure 8. Frequency wave height spectrum (W(])) mea- sured by wire gauge.
3.5. Comparison With Radar Measurement According to the Bragg scattering theory of the micro-
wave signal at slightly disturbed air-sea interface, the normalized cross section of the return signal at intermedi- ate radar incidence angle and vertical polarization is pro- portional to the wavenumber spectrum of surface waves at the resonant Bragg wavenumber [Plant, 1990], and is ex- pressed as
those estimated from the radar cross section. Throughout the experiment, agreement between these two measure- ments is satisfactory. In Figure 9 we plot the Bragg wave- number spectra against corresponding radar cross section as well as the theoretical linear coefficients. Again a strong correlation between the two measurements is confirmed, In
particular, the agreement is excellent at higher wind stress- es and longer wavelengths (X band). This comparison is the first strong evidence reported in a field environment that the Bragg scattering theory is applicable for the esti- mate of the radar backscatter at an intermediate incidence
angle with vertical polarization.
4. Concluding Remarks
A newly developed scanning laser slope gauge was used for the first time in a field environment to measure the
three-dimensional wavenumber-frequency slope spectrum of capillary-gravity waves. Although the experimental site was close to the shore with a relatively low level of long waves, and the range of meteorological conditions was limited, this measurement was one of the first of its kind and the results revealed many interesting features of wind. generated capillary-gravity waves. At moderate wind stresses, our results agree reasonable well with laboratory measurements in a large wind-wave tank by Jahne and Riemer [1990]. However, at low wind stresses our field measurements show much higher values of the degree of saturation than Jahne and Riemer's, possibly because of the larger variability of the wind stress in our case. On the other hand, the degree of saturation estimated from the frequency slope spectra without including the Doppler shift effect differs significantly from that obtained in the labora- tory experiment even at moderate winds, because of much stronger Doppler shifts by long waves in the field. The
0o=16;rko 4 •gv(0o)• •(2kosinOo,O) (11)
where Oo is the normalized cross section, ko is the radar wavenumber, •P is the two-dimensional wavenumber vari- ance spectrum of surface displacement, and 0o is the radar incidence angle. The Bragg scattering geometric coefficient gv is given as
(• - 1)[e(1 +sin20o) -sin20o]COS•0 o gv(0o)= (12)
[ecOS0o+•]e-sin•0o ] • where e = e•/eo, and ew, eo are the complex •rmittivi- ties of seawater and air, respectively. We have used g = 44+35i for X band (10.5 GHz) and g = 20+27i for K band (24 GHz), both at 10øC. Then the normalized cross section is calculated to be
•'o
for the X band and
-- 1.3x I O-Sx•(31 O, O) (13)
0o=3.1xlO-•x•(710,0) (14) for the K band, where •P has units of m 4 and the wave- number has units of rad/m. In Figure 2 we show the Bragg wave spectral densities measured directly by SLSG and
0.0100
0.0010'
o
0.0001 ........ i ........ I ........ -I[5 -1• -14
10 10 10 10
+(m n) ß
Figure 9. Comparison between Bragg wavenumber spec- trum and normalized cross section. Squares, X band; dia- monds, K band; solid line, theoretical ratio at X band; dot- ted line, theoretical ratio at K band.

12,602 HARA ET AL.' IN SITU MEASUREMENTS OF CAPILLARY-GRAVITY WAVES
wavenumber-frequency spectra also exhibit strong Doppler smearing due to long waves. The direct comparison be- tween the microwave radar backscatter and the wavenum-
ber spectrum at the resonant Bragg wavenumber shows reasonable agreement throughout the experiment; their values span over 1 order of magnitud e. In particular, they compare remarkably well at moderate winds and at the X band. These results strongly support the validity of the Bragg scattering theory of microwave signal at the air-sea interface at least within the range of meteorological condi- tions reported in this experiment.
Further measurements of capillary-gravity wave spectra at different environmental conditions are definitely worth- while. The mean spectrum level can be influenced not only by the wind stress, but also by the stability of the air-sea interface, by the presence of surface films, as well as de- pending on the condition of long waves. Direct measure- ment of the capillary-gravity wave spectra such as this study will contribute to further understanding of the dy- namics of wind-generated capillary-gravity waves, as well as of the microwave radar backscatter at the ocean surface.
In addition the instrument can be Used to observe directly the modulation of capillary-gravity wave spectra by long waves. Although numerous measurements of the modula- tion of radar backscatter by long waves (modulation trans- fer function) are available, the modulation of the Bragg wave spectrum by long waves (hydrodynamic modulation transfer function) is still poorly understood because of the complex geometrical effects associated With radar measure- ments which significantly changes the apparent modulation of the radar backscatter [e.g., Plant, 1989]. Further under- standing of the modulation mechanism of capillary-gravity waves by long waves is essential for the improved inter- pre•ation of remote sensing data by synthetic aperture radar, real aperture radar, and other radar measurements.
Since the experiments reported here, the SLSG has been further improved to increase the resolution and to reduce the error level. The instrument was deployed in the field experiments off Cape Hatteras in June 1993, and numerous data were accumulated in an open ocean environment under various meteorological and long wave conditions. The results will be analyzed and reported in the near fu- ture. In particular, it is of great interest to investigate whether the results obtained at the near-shore site might show any systematic differences from those obtained at a site further offshore. In addition, the data obtained by the improved syste m are of such quality that it may be possi- ble to investigate the spatial/tem'poral variability of the surface capillary-gravity wave field in response to the variable environmental forcing, and its effect on the radar backscatter, including radar sea spikes.
Acknowledgements. This work was supported as part of the Office of Naval Research's High Resolution Accelerated Re- search initiative, by grant N00014-91-J-1770. Woods Hole Oceanographic Institution contribution 8496.
References
Banner, M. L., I. S. F. Jones, and J. C. Trinder, Wavenumber spectra of short gravity waves, J. Fluid Mech., 198, 321- 344, 1989.
Barter, J., K. Beach, D. Kwoh, M. Ludwig, H. Rungaldier, J. Schatzman, I. Stonich, R. Wagner, and A. Williams, TRW
surface truth measurement system, TRW Internal Rep. 53563-6005, TRW, Redondo Beach, Calif., 1990.
Bock, E. J., and T. Hara, Optical measurements of capillary- gravity wave spectra using a scanning laser slope gauge, J. Atm. Ocean Tech., in press, 1994.
Charnock, H., Wind stress on a water surface, Q. J. R. Mete- orol. Soc., 81, 639-640, 1955.
Hara, T., and C. C. Mei, Wind effect on the nonlinear evolu- tion of slowly varying gravity-capillary waves, J. Fluid Mech., in press, 1994.
J•.hne, B. K., and K. S. Riemer, Two-dimensional wave num- ber spectra of small-scale water surface waves, J. Geophys, Res., 95, 11,531-11,546, 1990.
J•ihne, B. K., O. Miinnich, R. B•Ssinger, A. Dutzi, W. Huber, and P. Libner, On the parameters influencing air-water gas exchange, J. Geophys, Res., 92, 1937-1949, 1987.
Janssen, P. A. E. M., The period doubling of gravity-capillary waves, J. Fluid Mech., 172, 531-546, 1986.
Janssen, P. A. E. M., The initial evolution of gravity-capillary waves, J. Fluid Mech., 184, 581-597, 1987.
Kawai, S., Generation of initial wavelet• by instability of a coupled shear fl0w and their evolution to wind waves, J. Fluid Mech., 93, 661-703, 1979.
Lee, P. H. Y. et al., Recent advances in ocean surface charac- terization by a scanning laser slope gauge, Proc. SPIE lnt. Soc. Opt. Eng., 1749, 234-244, 1992.
Li, Q., M. Zhao, S. Tang,. S. Sun, and J. Wu, Two-dimen- sional scanning laser slope gauge: Measurements of ocean- ripple structures, Appl. Opt., 32, 4590-4597, 1993.
Longuet-Higgins, M. S., Capillary rollers and bores, J. Fluid Mech., 240, 659-679, 1992.
Perlin, M., H. Lin, and C. Ting, On parasitic capillary waves generated by steep gravity waves: An eX•pefimental investi- gation with spatial and temporal measurements, J. Fluid Mech., 255, 597-620, 1993. •
PhilliPs, O. M., Spectral and statistical properties of the equi- librium range in wind-generated gravity waves, J. Fluid Mech., 156, 505-531, 1985.
Plant, W. J., The modulation transfer function: Concept and applications, in Radar Scattering From Modulated Wind Waves, edited by G. J. Komen and W. A. Oost, pp. 155- 172, Kluwer, Dordrecht, Netherlands, 1989.
Plant, W. J., Bragg scattering of electromagnetic waves from the air/sea interface, in Surface Waves and Fluxes, vol. 11, edited by G. L. Geernae•t and W. J. Plant, pp. 41-i08, Kluwer,.Dordrecht, Netherlands, 1990.
Ruvinsky, K. D., F. I. Feidstein, and G.I. Freidman, Numeri- cal simulation of the quasi-statiOnary stage of ripple excita- tion by steep gravity-capillary waves, J. Fluid MeCh., 230, 339-353, 1991.
Smith, S. D., Coefficients for sea surface wind stress, hear flux, and wind profiles as a function of wind speed and temperature, J. Geophys, Res., 93, 15,467-15,472, 1988.
E. J. Bock, Woods Hole Oceanographic Institution, Woods Hole, MA 02543. (e-mail: [email protected])
T. Hara• Graduate School of Oceanography, University of Rhode Island, Narragansett, R1 02882. (e-mail: tetsu@ripples. gso.uri.edu)
D. Lyzenga, Department of Naval Architecture and Marine Engineering, University of Michigan, Ann Arbor, MI 48109. (e-mail: [email protected])
(Received September 30, 1993; revised February 21, 1994; accepted February 21, 1994.)