IMTC Steering Committee Meeting Agenda
22
International Mobility & Trade Corridor Program www.theimtc.com IMTC Steering Committee Meeting Agenda Thursday, May 16, 2019 9:00am – 12:00pm Blaine Boating Center, Blaine, WA Map: https://goo.gl/maps/EpotoBo7Cfk 1. Introductions and current event updates 2. Communications Protocol March 21 Tabletop Exercise follow-up a. After Action Report and next steps b. Additional observations and feedback following May 2 incident at Peace Arch/Douglas 3. U.S. Federal Highway Administration funding for Border Data Warehouse 3.0 – Strategies for match funding 4. Review of scope of work for an Aldergrove/Lynden and Abbotsford- Huntingdon/Sumas traffic study 5. Updates to the RFID Business Case and additional scenarios for Pacific Highway traffic analyses 6. Discussion of Cascade Innovation Corridor initiatives – what elements align with IMTC stakeholders’ work and objectives Remote Access https://www.gotomeet.m e/wcog/imtc-steering- committee-meeting-4 You can also dial in using your phone. United States: (571) 317-3129 Canada: (647) 497-9391 Access Code: 145-465-021
-
Upload
khangminh22 -
Category
Documents
-
view
6 -
download
0
Transcript of IMTC Steering Committee Meeting Agenda

International Mobility & Trade Corridor Program www.theimtc.com
IMTC Steering Committee Meeting Agenda Thursday, May 16, 2019
9:00am – 12:00pm Blaine Boating Center, Blaine, WA
Map: https://goo.gl/maps/EpotoBo7Cfk
1. Introductions and current event updates
2. Communications Protocol March 21 Tabletop Exercise follow-up
a. After Action Report and next steps
b. Additional observations and feedback following May 2 incident at Peace Arch/Douglas
3. U.S. Federal Highway Administration funding for Border Data Warehouse 3.0 – Strategies for match funding
4. Review of scope of work for an Aldergrove/Lynden and Abbotsford-Huntingdon/Sumas traffic study
5. Updates to the RFID Business Case and additional scenarios for Pacific Highway traffic analyses
6. Discussion of Cascade Innovation Corridor initiatives – what elements align with IMTC stakeholders’ work and objectives
Remote Access https://www.gotomeet.me/wcog/imtc-steering-committee-meeting-4
You can also dial in using your phone.
United States: (571) 317-3129
Canada: (647) 497-9391
Access Code: 145-465-021

IMTC INTERNATIONAL MOBILITY & TRADE CORRIDOR PROGRAM
REVISED 2019 MEETING SCHEDULE
MONTH DAY TYPE COUNTRY LOCATION
January 17 Steering USA Blaine Boating Center, Blaine, WA
February 14 Steering Canada CBSA Douglas Port-of-Entry, Surrey, BC
March 21 Steering USA WCOG Office, Bellingham, WA
April 18 Core Group Canada Hazelmere Country Club, Surrey, BC
May 16 Steering USA Blaine Boating Center, Blaine, WA
June 20 Steering Canada CBSA Aldergrove Port-of-Entry, Aldergrove
July 18 Steering USA CBSA Aldergrove Port-of-Entry, Aldergrove?
September 19 Steering Canada CBSA Douglas Port-of-Entry, Surrey
October 17 Core Group U.S.A. Bellingham Cruise Terminal, Bellingham, WA
November 21 Steering Canada Hazelmere Country Club, Surrey, BC
Meetings occur between 9:00am – 12:00pm
Most meetings are held the third Thursday of the month, with locations alternating between the United States and Canada. There are no meetings scheduled for August or December. Meeting agendas are e-mailed a week before the event. All meeting dates, locations, and topics of focus are subject to change. To receive meeting notifications and agendas, please email: [email protected].
DRAFT FOR DISCUSSION

2018 IMTCPERFORMANCEREVIEW
THE INTERNATIONAL MOBILITY & TRADE CORRIDOR PROGRAM

2
IMTC 2018 PERFORMANCE REVIEW
1. IntroductionThe International Mobility & Trade Corridor Program (IMTC) is an award-winning binational multi-agency coalition that works to identify and promote improvements to mobility and security for the border crossings that make up the Cascade Gateway.
The Cascade Gateway consists of five land border ports-of-entry between Whatcom County, Washington State and the Lower Mainland of British Columbia.
The goals of the IMTC program are to:
— Coordinate planning
— Improve regional, cross-border trade and transportation data
— Support infrastructure improvements
— Support coordinated implementation of U.S. and Canadian border policy
— Improve operations
IMTC stakeholders have been meeting since 1997 and have funded over $42 million (USD) of regional border projects.
IMTC is administered by the Whatcom Council of Governments (WCOG).
Establishing performancePerformance measurements provide periodic indicators of effectiveness relative to goals and are an important part of the IMTC program. For the past four years WCOG has tracked performance of the IMTC coalition using measures described here.
The challenge of measuring the performance of a forum is that many of the outcomes the stakeholders strive towards - a reduction in border wait time, an increase in the safe movement of cargo, etc. - are difficult to directly attribute to a single agency’s actions. Border operations are managed by multiple agencies and are affectced by numerous external variables.
Therefore the measures used in this review were selected to broadly assess the effectiveness of IMTC and to answer the following questions:
1 How well is IMTC fulfilling its objectives and the expectations of participating agencies?
2 How should WCOG spend its resources to provide the greatest public benefit?
3 How can results from IMTC validate funding, involvement, and staff time of participating agencies?
4 What accomplishments are worthy of celebrating?
5 What can be done differently to improve the program?
Actions undertaken as part of IMTC have been broken into four areas: meetings; data collection, analysis, and distribution; collaboration; and project management.
2019 Feedback SurveyEvery three years WCOG conducts a feedback survey of IMTC participants to evaluate how the program is meeting agency needs and what opportunities there are for improvements. The survey conducted in March of 2019 was completed by thirty IMTC participants from a varying range of organizations. Data from this survey is used throughout this report.
2. MeetingsIMTC meets monthly except August and December. Locations alternate between Canada and the United States. Occasionally meetings are cancelled if there is a conflict with other border-related events.
Steering Committee members include six key organizational areas: transportation and inspection agencies, regional municipalities, state department representatives, academic institutions, and local, regional, and federal planning agencies. Industry representatives may attend based on topic.
Steering members advise the Core Group that meets every fourth IMTC meeting. The Core Group expands to include industry representatives, chambers of commerce, non-governmental organizations, and other stakeholder organizations.
Measure 1: Meeting attendanceParticipation at meetings is shown by agency in Exhibit 1. WCOG strives for participation from each of the six key organizational areas at every meeting. In 2018, Steering Committee meeting attendance increased by seven percent, although Core Group meetings had lower attendance compared to 2017. All but one meeting included participants from all six key organizational areas.

3
IMTC 2018 PERFORMANCE REVIEW
Meeting Date 1/18/2018 2/15/2018 3/15/2018 4/19/2018 5/17/2018 6/14/2018 9/13/2018 10/18/2018 11/15/2018Meeting Type Steering Core Steering Steering Steering Core Steering Steering Core
Country Canada USA USA Canada USA Canada USA Canada USAAttendance 23 31 16 25 19 23 24 21 23
6 67% 4 44%
9 100% 8 89%
9 100% 9 100%
6 67%City of Sumas 2 22%
1 11%0 0%
Port of Bellingham 6 67%0 0%
9 100%U.S. Federal legislative offices 3 33%
6 67% 3 33%
4 44%Pacific Corridor Enterprise Council 8 89%
8 89%
Average Attendance 23 5 60%
Academic OrganizationsBorder Policy Research Institute - WWU
To
tal
Whatcom Council of Governments
U.S. Consulate
Non-Government Organizations
City of Blaine
City of SurreyCity of Lynden
Township of Langley
Other Government Agencies
B.C. Ministry of Transportation
Inspection AgenciesU.S. Customs & Border ProtectionCanada Border Services Agency
Municipalities
WA State Dept. of Transportation
BC Trucking Association
% o
f M
tgs
Transportation AgenciesU.S. Federal Highway AdministrationTransport Canada
Canada Consulate
Exhibit 1: 2018 Meeting attendance
Data from the 2019 Feedback Survey show 78 percent of respondents found IMTC meetings either valuable or extremely valuable (see Exhibit 5).
Measure 2: Meeting topicsIMTC meeting agendas are designed to provide regular updates on continuing initiatives and regional efforts, balanced with new, relevant information every month. In addition to current event updates at each meeting, 2018 agendas included the following topics:
— 2018 Project list
— 2018/2019 IMTC Cross-Border Passenger Vehicle Intercept Survey
— Border Master Planning
— Amtrak Cascades
— WSDOT High Speed Rail Study
— Evaluating vehicle probe data for cross-border trip patterns
— 2018 Cascade Gateway construction schedule
— IMTC Performance Review
— Cascade Gateway transportation operations and assessment
— Trusted traveler and trader programs
— Advanced cargo information/ACE/E-manifest
— Border wait time systems
— Incidence response protocol
— Dynamic booth management
— FAST-first metered release to primary inspection
— Bus advanced manifests
— Dynamic lane assignment
— Roadway incident response
— Communication between transportation management centres
— Applications of real-time probe data
— Vye Road/BC Highway 11 project update
— IMTC Purpose, Goals & Strategies refresh
— Cross-border travel implications of legalized cannabis in Canada
— NEXUS wait times on variable message signs

4
IMTC 2018 PERFORMANCE REVIEW
— Quick response stalled-truck towing arrangements
— U.S. BTS cross-border trade and vehicle crossing visualization tools
— Transportation Border Working Group (TBWG) updates
— Pilot testing of commercial vehicle "pre-arrival readiness evaluation"
— U.S. Pacific Highway port expansion update
— WCOG traffic counts and border locations
— IMTC Pedestrian Plan
— Cross-border gasoline price and sales trends
— FHWA National Economic Partnerships for Innovative Approaches to Multijurisdictional Coordination
— Impacts from trade policy changes on regional freight traffic
— B.C. Highway 13 project update
— Tabletop exercise for the IMTC Communications Protocol
— Cascade Gateway Border Data Warehouse funding
— 2018 Border data review
— Current U.S. - Canada border policy plans and initiatives
Measure 3: National focusIn addition to organizing regional IMTC meetings, IMTC staff at WCOG also participate in national-level border planning symposia and workshops. In 2018 staff presented and participated in the following national level planning forums:
— U.S. - Canada Transportation Border Working Group (TBWG) meeting: April 2018 in Minneapolis, MN
— TBWG meeting: November 2018 in Halifax, NS
— BPRI Forum: Regional Cross-Border Collaboration between the U.S. and Canada: October 2018 in Bellingham, WA
3. Data collection, analysis and distribution
Measure 4: Current dataCollecting and disseminating current cross-border trade and travel data is a key function of the IMTC
program and a critical output for the coalition. Since its establishment in 1997 IMTC has guided over a dozen independent research projects to provide stakeholders with current statistics and feedback on system performance. IMTC partners strive to provide timely updates to all data sets. Exhibit 2 shows key areas of data used by stakeholders and when the most recent data were collected. Those marked by exclamations are considered outdated.
In 2018 the IMTC Cross-Border Passenger Vehicle Intercept Survey refreshed passenger data last collected in 2014.
Data typeMost recent
datasetCross-border pedestrian data 2018Monthly passenger vehicle volumes 2018Monthly commercial vehicle volumes 2018Commodity data 2018NEXUS vs. passenger vehicle volumes 2018Passenger vehicle wait time estimates 2018Commercial vehicle wait time estimates 2018Passenger vehicle trip characteristics 2018Cross-border bus data 2018FAST vs. general purpose truck volumes 2018Commercial vehicle operations 2016Cross-border rail data 2003 !Cross-border marine freight data 2003 !
Exhibit 2: Data freshness
All other datasets have been refreshed in the past three years with the exception of rail and marine data. Because these datasets require substantial investments to update they prove more challenging to keep current.
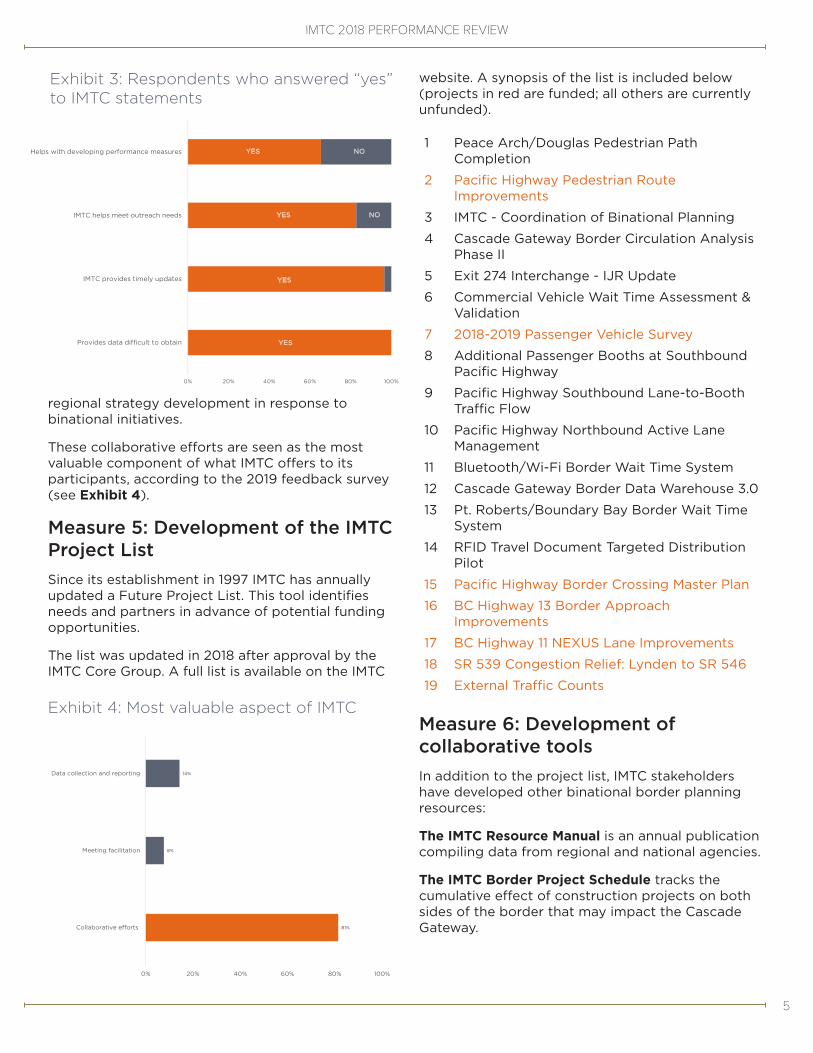
As part of the 2019 Feedback Survey, respondents were asked if certain statements were true, in their experience, regarding the IMTC program. Exhibit 3 shows the percentage of respondents that said “yes” to questions of how IMTC assists them.
As shown in the exhibit, every single person who responded to the survey replied that IMTC provides data that would be difficult to obtain without the existence of IMTC.
4. CollaborationAlthough most IMTC accomplishments could be considered a collaborative effort, specific projects and initiatives highlight the value of the coalition more than others - specifically the production of prioritized project lists, research reports, and
5
IMTC 2018 PERFORMANCE REVIEW
website. A synopsis of the list is included below (projects in red are funded; all others are currently unfunded).
1 Peace Arch/Douglas Pedestrian Path Completion
2 Pacific Highway Pedestrian Route Improvements
3 IMTC - Coordination of Binational Planning
4 Cascade Gateway Border Circulation Analysis Phase II
5 Exit 274 Interchange - IJR Update
6 Commercial Vehicle Wait Time Assessment & Validation
7 2018-2019 Passenger Vehicle Survey
8 Additional Passenger Booths at Southbound Pacific Highway
9 Pacific Highway Southbound Lane-to-Booth Traffic Flow
10 Pacific Highway Northbound Active Lane Management
11 Bluetooth/Wi-Fi Border Wait Time System
12 Cascade Gateway Border Data Warehouse 3.0
13 Pt. Roberts/Boundary Bay Border Wait Time System
14 RFID Travel Document Targeted Distribution Pilot
15 Pacific Highway Border Crossing Master Plan
16 BC Highway 13 Border Approach Improvements
17 BC Highway 11 NEXUS Lane Improvements
18 SR 539 Congestion Relief: Lynden to SR 546
19 External Traffic Counts
Measure 6: Development of collaborative toolsIn addition to the project list, IMTC stakeholders have developed other binational border planning resources:
The IMTC Resource Manual is an annual publication compiling data from regional and national agencies.
The IMTC Border Project Schedule tracks the cumulative effect of construction projects on both sides of the border that may impact the Cascade Gateway.
0% 20% 40% 60% 80% 100%
Provides data difficult to obtain
IMTC provides timely updates
IMTC helps meet outreach needs
Helps with developing performance measures YES
YES
YES
YES
NO
NO
Exhibit 3: Respondents who answered “yes” to IMTC statements
regional strategy development in response to binational initiatives.
These collaborative efforts are seen as the most valuable component of what IMTC offers to its participants, according to the 2019 feedback survey (see Exhibit 4).
Measure 5: Development of the IMTC Project ListSince its establishment in 1997 IMTC has annually updated a Future Project List. This tool identifies needs and partners in advance of potential funding opportunities.
The list was updated in 2018 after approval by the IMTC Core Group. A full list is available on the IMTC
Exhibit 4: Most valuable aspect of IMTC
81%
8%
14%
0% 20% 40% 60% 80% 100%
Collaborative efforts
Meeting facilitation
Data collection and reporting

6
IMTC 2018 PERFORMANCE REVIEW
1 This chart does not include $24,557,500 from U.S. FHWA for I-5 improvements at Exit 276 related to the 20016 Peace Arch re-design.
78%
83%
82%
75%
93%
89%
85%
61%
46%
64%
0% 20% 40% 60% 80% 100%
Steering/Core meetings
Meeting summaries
Website/online data
IMTC Resource Manual
Studies & data products
Communication with partner agencies
Info about regional/national initiatives
IMTC project list
Communications Protocol
Cascacde Gateway construction schedule
NO
NO
Exhibit 5: Percent of respondents describing IMTC products as “Valuable/Extremely Valuable”
The IMTC Communications Protocol establishes an integrated standard operating procedure in the event an incident closes a border approach road or port-of-entry.
The 2019 Feedback Survey had respondents rank the value of IMTC collaborative tools as well as other deliverables of the IMTC program. Exhibit 5 shows what percentage of respondents considered each IMTC deliverable either “valuable” or “extremely valuable.”
In addition to the deliverables listed above, WCOG has worked with regional partners to develop a collaborative plan for pedestrian movements at the border crossings between Blaine, WA and Surrey B.C. This additional collaborative plan is port- and mode-specific, so is not added to the above list. However it serves as a good example of the type of effort IMTC engages in on a regular basis.
Measure 7: Project funding partnershipsNone of the projects identified by the IMTC forum would be accomplished without funding. IMTC participants have worked together to combine funding sources for nearly all of the projects on the
Exhibit 6: Funding for IMTC projects, 1999-2018
$9,726
$2,832
$2,548
$1,926
$719
$0 $2,000 $4,000 $6,000 $8,000 $10,000 $12,000
U.S. Federal
Canadian Federal
BC Province
WA State
Other
(In thousands, USD)
IMTC Project List. Between 1999 and 2018, over $17 million (USD) has been contributed by multiple agencies to complete IMTC-identified projects (see Exhibit 6).1
5. Project managementAnother main focus of IMTC participants is oversight of IMTC-identified projects. While project funding is often a partnership, projects are typically delivered by a single agency. In keeping with the objective of optimizing cooperation, IMTC establishes advisory teams for certain projects. In addition, any project that WCOG undertakes either as a separately funded effort, or within the scope of IMTC research, WCOG works with an advisory team of IMTC participants to coordinate the activities and to facilitate consensus on methodology.
Measure 8: Projects undertakenThe following IMTC projects began or were worked on in 2018:
— IMTC Passenger Vehicle Intercept Survey
— Peace Arch-Douglas / Pacific Highway Pedestrian Plan
— External Traffic Counts - Whatcom County Borders
— Commercial Vehicle Towing Analysis
Measure 9: Project assistance

7
IMTC 2018 PERFORMANCE REVIEW
requestsIMTC stakeholders often ask WCOG to develop datasets, analyses, or other specific products for their own use. In 2018 the following reports were completed by WCOG staff for IMTC partner agencies:
— Assistance in finding details regarding culvert crossing as part of the new B.C. Highway 13 design
— Coordinated conversations with agencies regarding sidewalk at Peace Arch
— Cross-border commodity data
— Annual wait time averages
— Rail container and truck volumes
6. Determining effectivenessBased on the measurements of the performance areas listed above, the questions in the next section of the survey were asked to determine whether IMTC is fulfilling its purpose, goals, and strategies.
Measure 10: Work relating to IMTC purpose, goals and strategiesHow well is IMTC fulfilling the purpose, goals, and strategies of the forum and the expectations of participating agencies?
Exhibit 7: Work related to purpose, goals, and strategies
Goal Work in 2018
S1.1 Regularly convene representatives of the agencies that own and operate regional border crossing transportation and inspection facilities.
S1.2 Develop and maintain cross-border, interagency, cross-sector relationships that are essential for efficient and effective communication, trust-based decision making, and advancing improvements through partnership.
S1.3 Facilitate involvement and dialogue with representatives of industries that depend on cross-border connections as well as stakeholders from non-governmental organizations and academia.
S1.4 Develop and periodically update a list of projects. S1.5 Support operations and improvements to the Cascade Gateway as a system rather than as five individual ports-
of-entry. S1.6 To plan for future capacity of Cascade Gateway land border facilities as trade and travel volumes grow,
periodically update estimates of how all modes (road, rail, marine, and air) could be optimally used to serve international transportation demand on the corridor.
S1.7 Engage with other regional, cross-border coalitions and participate in the border-wide Canada-U.S.
Transportation Border Working Group (TBWG). S1.8 Conduct near-term and long-term planning for the Cascade Gateway. S2.1 Collect and share transportation and trade data. S2.2 Maintain and improve border wait time systems. S2.3 Maintain and improve data products including border wait time data archives, booth-status data, and periodic
sample surveys of cross-border trucks and passenger vehicles. S3.1 Improve border crossing approach roads. S3.2 Improve cross-border rail.
S3.3 Improve corridor connections of trade and travel routes. S3.4 Integrate Intelligent Transportation Systems (ITS). S3.5 Encourage harmonization of cross-border ITS systems, standards, and products. S4.1 Coordinate improvements, operations, and communications in accordance with the goals of federal policies. S4.2 Complement, as appropriate, border related initiatives of British Columbia and Washington State including
memoranda of cooperation and the Joint Transportation Executive Council (JTEC).S4.3 Explore options for funding future Cascade Gateway improvements including binational financing mechanisms. S5.1 Improve traffic management at all Cascade Gateway ports-of-entry. S5.2 Support ongoing effectiveness of the NEXUS program.
S5.3 Support optimal operations of the FAST (Free and Secure Trade) programs. S5.4 Coordinate support for adequate staffing of border inspection facilities.
S5.5 Use data-based tools to evaluate operational alternatives such as transportation demand modeling and facility simulation modeling.
S5.6 Support integration of information systems when appropriate including intelligent transportation systems (ITS). S5.7 Support identification of consistent funding for maintenance of ITS (wait time, traffic management, etc.)
S5.8 Support the implementation of pre-clearance for passenger rail.
S5.9 Support consideration of alternatives enabled by a pre-clearance agreement such as shared border operations zones at ports-of-entry and off-border inspection functions.
S5.10 Support optimal adoption and application of radio frequency identification (RFID) technology (for both NEXUS and non-NEXUS travel documents).
5. I
mp
rove
op
erat
ion
s
Strategy
1. C
oo
rdin
ate
Pla
nn
ing
2. I
mp
rove
d
ata
3. S
up
po
rt
infr
astr
uct
ure
im
pro
vem
ents
4. S
up
po
rt
coo
rdin
ated
im
ple
men
tat
ion
of
po
licy

8
IMTC 2018 PERFORMANCE REVIEW
The Purpose, Goals, and Strategies document (PGS) guides the work of the IMTC forum and defines its priorities and objectives. Every few years the Core Group reviews and updates the document to reflect current priorities.
In 2018 the PGS was revised and updated. The IMTC forum made progress on or discussed 21 out of the 29 strategies (72 percent). The strategies that were worked on in 2018 are marked in Exhibit 7.
One of the bigger changes this year has been the lack of continued work on the Beyond the Border Action Plan adopted by the previous U.S. and Canadian federal administrations. There has not been a replacement initiative developed to date.
Regardless, IMTC participants continue to move forward on the issues that are of most value to regional stakeholders, with a strong focus on collaborative projects and infrastructure improvements at ports-of-entry.
Measure 11: Resource allocationHow should WCOG spend its resources to provide the greatest public benefit?
Since 2014 WCOG staff have billed IMTC hours to specific work categories based on performance areas: meetings; data collection, analysis, and distribution; collaboration, and project management.
Exhibit 8 shows a comparison of performance area billing for 2015 - 2018.
Exhibit 9: Greatest benefit of IMTC participation
17
9
3
1
1
Networking/communication with other agencies
Awareness of cross-border issues and traffic impacts
Collection of data and monitoring of the border
Be involved in decision making
Understand technical operations of the border
As part of the 2019 Feedback Survey, participants were asked to prioritize these categories of expenditure based on their importance to their agencies. Respondent replied are shown in Exhibit 4. WCOG’s spending continues to fit well with these prioritites. Meetings took more of a percentage of time in 2018 than in prior years, but still was less than the time alloted to data collection and analysis (32 percent) and collaborative efforts (43 percent).
Measure 12: Validating outcomesHow can results from IMTC validate the involvement and staff time of participating agencies?
The partnerships established through the IMTC forum have helped leverage U.S. and Canadian funding, provided in-kind match for projects, and prepared research prior to the implementation of operational or infrastructure changes.
Funding is one method of validating the involvement of agencies. Since its beginning in 1997 the IMTC coalition has secured over $17 million (USD) for projects from federal, provincial, state, and local agencies.
Other benefits also accrue to agencies that participate. In the 2019 Feedback Survey participants were asked, in their own words, to provide the single-most important reason their agency participates in IMTC. The answers to the question can be summarized into the four categories shown in Exhibit 9, along with the
Exhibit 8: Billing by performance area
Data collection & analysis, 34%
Data collection & analysis, 33%
Data collection & analysis, 27%
Data collection & analysis, 32%
Collaboration, 41%
Collaboration, 52%
Collaboration, 57%
Collaboration, 43%
Meetings, 19%
Meetings, 13%
Meetings, 13%
Meetings, 22%
Projectmgmt,
5%
2%
3%
3%
0% 10% 20% 30% 40% 50% 60% 70% 80% 90% 100%
2015
2016
2017
2018

9
IMTC 2018 PERFORMANCE REVIEW
number of respondents who said the same/similar thing.
What accomplishments are worthy of celebrating?
Participants were asked to share their experiences with IMTC and what they feel are the reasons why IMTC should continue its efforts. Comments received in 2019 include the following:
— “We are very impressed with the work of all the support people participating in IMTC.”
— “Best binational planning initiative in North America.”
capability maturity model (CMM) assessment conducted in 2014.
The assessment determined the level of maturity for four focus areas as defined by the CMM. 2 The dimensions reviewed included business processes, systems and technology, performance measurement, culture, organization and staffing, and collaboration. This 2014 analysis helped identify ways to improve the effectiveness and overall performance of the IMTC program.
In 2016 WCOG reported updates to each of the dimensions. An internal assessment using the CMM was conducted in 2018 and saw improvements only in the use of systems and technology sincce 2016 (see Exhibit 10). Further improvements should be incorporated into the 2019 work plan. A description of each dimension follows.
Business processes: The primary change that occurred in 2015 is that IMTC is now a core function of WCOG’s activities and integrated with the Unified Planning Work Program (UPWP). The IMTC project list now also incorporates both unfunded and funded, ongoing projects, as well as project investments that impact IMTC.
Systems and technologies: IMTC participants continue to make significant system improvements, including roadway alignments at key crossings, the booth status data integration system, and FAST first program implementation northbound at Pacific Highway.
Performance measurement: As mentioned at the beginning of this report under Establishing Performance, it is challenging to develop and implement performance measures that address the needs of multiple agency missions. However this is the third year of documenting IMTC program performance through this document and it will continue forward, with feedback surveys offered every two years to guage program value to stakeholders.
Culture: IMTC partners have an understanding of transportation systems management and operations (TSM&O) and are incorporating this into aspects of work pursued among IMTC partners.
Collaboration: Collaboration was assessed to be very strong.
Staffing and organization: WCOG secured funding for IMTC through the important contributions of partner agencies who are able to support the program financially. 60 percent of funding needed to keep IMTC staffing and activities running for 2 https://ops.fhwa.dot.gov/docs/cmmexesum/sec1.htm
59%
21%
10%
7%
3%
Very valuable
Valuable
Somewhat valuable
Neutral
Not valuable
Exhibit 10: How valuable is IMTC to your organization?
— “It is an excellent organization overall. Keep up the good work!”
In addition to the comments above, participants were asked to determine the value of IMTC as a whole. 80 percent of respondents determined that IMTC is either a valuable or extremely valuable forum for their agency (see Exhibit 10).
Measure 13: CMM assessmentWhat can be done differently to improve the effectiveness of the program and overall performance?
In 2016 WCOG conducted a webinar with FHWA to update progress made with implementing the

10
IMTC 2018 PERFORMANCE REVIEW
three years has been provided. The remaining funding needs continue to be sought in 2019.
More details on these reports are available in the Capability Maturity Model Implementation Plan, and the 2017 update, available on the IMTC website.
7. Performance summaryA summary of each measurement used for comparing annual performance is shown in Exhibit 11.
On multiple measurements, IMTC performance decreased in 2018. There may be a few reasons for this:
— Insecure IMTC funding: due to the lack of long-term funding for IMTC, outreach efforts to national level meetings, additional work items, and other tasks that have a cost associated with them were done sparingly.
— No national focus on borders: As discussed above, the Beyond the Border Action Plan provided one important source of high-level strategy for binational initiatives to be pursued at the regional level. Until a similar, shared framework is reestablished, some agency decisions may take more time.
— Budget cuts amongst IMTC participating agencies: Several agencies have not been able to send participants to meetings due to cost and travel constraints.
As part of the 2019 Feedback Survey, respondents were asked what they thought could be done differently with IMTC. Answers included the following:
— “Re-establish the rail subcommittee.”
— “Secure match funding to WA state contributions.”
— “Focus on a broader region, including marine ports-of-entry.”
— Because of limited travel budgets it would be useful to have a webinar approach (good phone system in each place and online availability.”
— “More conference type events to promote a broader audience and engaging senior political stakeholders.”
— “Keep discussions to a higher level - ‘weedier’ topics could be discussed in subgroup meetings.”
— “Bimonthly meetings instead of monthly.”
— “IMTC is not designed to address policy matters...and it is not the right forum to address community rail concerns...what is needed is a Lower Mainland/Whatcom policy forum with state, provincial and local leaders to address issues.”
2014 2016 2018 CommentsCMM Score CMM Score CMM Score
2 2.5 2.52.5 2.75 3 Border crossings require a
regional focus and systems and technologies may not support statewide activities
˗ Border operations 2 3 3˗ IMTC program management 2 4 4
2.5 2.5 2.5 There is support for TSMO but the challenge is integrating multiple agencies with differing missions.
3 3 3 Identifying a long-term source of funding is the key issue.
4 4 4
Culture
Organization & staffing
Collaboration
Dimensions
Business processesSystems and technology
Performance measurements:
Rankings:Level 1: Performed; Level 2: Managed; Level 3: Integrated; Level 4: Optimized
Exhibit 10: IMTC Capability Maturity Model assessment

11
IMTC 2018 PERFORMANCE REVIEW
Improvement areasAs IMTC partners move forward in 2019 it will be important to look at the following performance areas and see if changes can be made:
— Re-evaluate the outdated data sets to see if it is worth continuing to have them on the data list, or if they can be updated in the near future.
— Identify specific solutions for the performance areas that have dropped in 2018 and see if something can be done with available resources to make improvements.
— Consider the meeting structure for the next year to determine if less frequent meetings, and more webinar-style meetings, with a focus on subcommittees for detailed topics, would benefit the group as a whole.
These results will be shared with the IMTC Core Group and Steering Committee to discuss successes of 2018 and strategies for 2019.
Exhibit 11: Annual comparison of measures
Measure Quantification 2015 2016 2017 2018
Measure 1 : Meeting attendance
% of meetings attended by 6 core agency types
70% 63% 62% 60%
Measure 2 : Meeting topics # varied topics discussed at meetings
20 37 43 39
Measure 3 : National focus # national-level meetings attended by IMTC staff
7 3 4 2
Measure 4: Current data #datasets out of date 2 2 2 2
Measure 5 : Development of IMTC project list
IMTC project list approved by Core Group?
Yes Yes Yes Yes
Measure 6 : Development of collaborative tools
IMTC collaborative tools updated?
Yes Yes Yes Yes
Measure 7 : Establishment of funding partnerships
Funds identified and matched $187,500 $78,050 $430,000 $120,290
Measure 8 : Projects undertaken
# independent IMTC-related projects underway
4 3 6 4
Measure 9 : Project assistance requests
# project assistance requests 7 15 12 5
Measure 10 : Work relating to IMTC objectives
# objectives addressed in 2015 56% 68% 71% 72%
Measure 11 : Resource allocation
Staff allocation to performance areas (mtgs, data,
19/34/41/5 13/33/52/2 13/27/57/3 22/32/43/3
Measure 12 : Validating elements
# accomplishments identified by stakeholders
NA 7 NA 3
Measure 13 : CMM assessment
Level changes in capability model
0 3 0 1

IMTC Communications Protocol Tabletop Exercise Executive Summary – 1
Executive Summary
IMTC Communications Protocol Tabletop Exercise
Background
The Whatcom Council of Governments (WCOG), lead agency for the International Mobility & Trade Corridor Program (IMTC) coordinated an IMTC Communications Protocol Tabletop Exercise on March 21, 2019 at the U.S. Customs & Border Protection (CBP) Peace Arch Port-of-Entry in Blaine, Washington. Participation included key stakeholders at agencies responsible for the land ports-of-entry between the Lower Mainland of British Columbia and Whatcom County in Washington State, and the transportation and law enforcement agencies responsible for the border approach roads.
BC – WA Regional Protocol for Binational, Interagency Communication about Highway and Border Station Incidents
The BC – WA Regional Protocol for Binational, Interagency Communication about Highway and Border Station Incidents, (referred to hereafter as the “Protocol”), was developed in late 2005 after IMTC member agencies identified a need to outline a procedure to inform impacted agencies when a border-approach highway or port-of-entry is either closed or impacted.
The Protocol is a document detailing optimal sequences of interagency communication in the case of an emergency closure/blockage. It was collaboratively developed for the purposes of increasing the speed and effectiveness of border-related incident management, the accuracy and timeliness of information delivered to affected entities and the public, and the use of the most current information technology for traveler information.
Aim, scope, objectives and methodology
The aim of the exercise was to provide a mechanism for members of the IMTC to discuss and confirm the efficacy of the Protocol in an emergency scenario using a realistic series of simulated events.
Objectives of the exercise included the following:
- Test the efficacy and capabilities of current communication structures in terms of notification and exchange of information between all participating agencies during an international traffic closure event.
- Identify gaps in communication and stakeholders not included in the current Protocol communications plan.
- Identify vulnerabilities within the current communication structure/network.
- Provide an After Action Report (AAR) to address business continuity considerations.
The key initiating event was a multi-vehicle accident on Interstate 5 northbound, just south of the Exist 275 interchange. The incident occurred on a typical Wednesday morning at 10:00 AM in August. Because no vehicles could proceed past the accident scene, the incident blocked all I-5

IMTC Communications Protocol Tabletop Exercise Executive Summary – 2
traffic north of exit 274 and closed off the primary access route to both CBSA’s Douglas Port-of-Entry and the Pacific Highway Port-of-Entry.
Recommendations
The following recommendations for next steps and alterations to the Protocol are based on discussions during the exercise:
Changes to the Protocol
1. Make sure BCMOTI RTMC and WSDOT TMC are the primary binational contact points.
2. BCMOTI RTMC and WSDOT TMC to offer reciprocal ATIS sign changes in a large incident.
3. BCMOTI RTMC should contact CBP in the case of a southbound event.
4. WSDOT TMC should contact CBSA in the case of a northbound event.
5. Address municipal law enforcement agency outreach with E-Comm911 for incidents in Canada and WhatComm for incidents in Whatcom County.
6. Other possible connections and communications may include: RCMP to CBP; Sheriff’s Department to Whatcom School District; CBP Command Center to US Border Patrol
7. Add that CBSA contacts the US CBP Command Center.
Follow-on update from May 2
On May 2, 2019 around noon a motor vehicle crashed into another car in the northbound lanes of B.C. Highway 99 as the road approaches the CBSA Douglas Port-of-Entry. The incident included a fatality, a long-duration closure of I-5 northbound at Exit 275, and a short-duration closure of southbound access to the U.S. Peace Arch Port-of-Entry via B.C. Highway 99.
On May 8, a week after the incident, several participants in the original tabletop exercise convened a conference call to discuss what worked and what needed improvement when it came to real-time communication between agencies in the incident. Key observations include:
The location of this incident, between U.S. and Canadian inspection stations, created initial concerns about protocol relative to jurisdiction. TMCs decided that timely information was more important. The BC TMC and WSDOT TMC should update procedures to initiate calls to each other based on evident impact to transportation systems regardless of the location of the incident. Confirm BC TMC and WSDOT both have appropriate contact info.
Contact should be made with the CBP Command Center to request that they contact WSDOT TMC and/or BC TMC.
WSDOT is currently testing a possible deployment of the ReadyOp system for developing a contact list that pushes out notifications. This may be helpful in the future.
For more information
The full After Action Report is available by contacting Melissa Fanucci, Principal Planner, Whatcom Council of Governments at [email protected] or by calling (360) 685-8385.

Border Data Warehouse 3.0 Proposal Page 1
Cascade Gateway Border Data Warehouse 3.0 Proposal for funding
Introduction The Whatcom Council of Governments (WCOG) seeks funding for the Border Data Warehouse 3.0 project.
This project will build on the investments made in 2016 to integrate U.S. Customs & Border Protection’s (CBP) booth status data system into southbound wait time calculations by upgrading the existing Cascade Gateway Border Data Warehouse (BDW) located at www.CascadeGatewayData.com. This database stores passenger and commercial vehicle wait time, volume, freight value, and other data relating to the four land border crossings between the Lower Mainland of British Columbia and Whatcom County, Washington State. The objective of the BDW is to provide timely, accurate, and accessible border wait time data to a broad range of stakeholders.
This project will:
1. Incorporate booth status data into its data feeds 2. Improve warehouse performance and output 3. Upgrade commercial datasets 4. Improve regional freight value data reporting
The BDW is a proven data solution that provides critical metrics to multiple border stakeholders including federal and regional transportation agencies, inspection agencies at the border crossings, planning organizations, and municipal governments.
Why this project is needed The applications using these data are numerous and include regional traffic models, border throughput simulation models, staffing allocations by inspection agencies, reporting by agencies on delays, transportation agencies for performance metrics of improvements, comparisons for academic research, and more.
The existing archive was completed in 2010. It needs upgrading for the following reasons
Data accuracy – In 2016 the archive began to collect data CBP booth status data system that provides vehicle processing type (NEXUS, standard, Ready Lane), vehicle passenger counts, province or state of vehicle, and processing time data. Because the current version of the archive doesn’t tie to the booth status data, it is erroneously reporting wait times for NEXUS since it doesn’t dynamically change what lanes are processed as NEXUS.

Border Data Warehouse 3.0 Proposal Page 2
Increasing hosting expense – because the booth status data is archived in raw format (a data field for every car) and not binned, it is growing at a much higher rate than necessary.
Loss of U.S. Bureau of Transportation Statistics (BTS) compatibility – since the BTS converted its transborder freight data query tool to Tableau it no longer allows for the BDW to “screen scrape” the relevant regional data for local queries.
End of maintenance funding – This project is the only ongoing archive of five-minute increment border wait times going back to 2007. Keeping this resource maintained and hosted is paramount to regional stakeholders.
No way to access new data sets – the booth status data and archived commercial wait times are not currently accessible on the existing website, even though the data are being saved.
Building on prior investments
Rather than installing new hardware or new systems, BDW 3.0 leverages investments made by B.C. Ministry of Transportation & Infrastructure (BCMOTI), Transport Canada, U.S. Customs & Border Protection (CBP), U.S. Federal Highway Administration (FHWA), and WA State Department of Transportation (WSDOT) by ensuring continuing benefits from systems that provide multiple products. The bulk of system investments are for real-time wait time estimates; the BDW 3.0 ensures continued availability of valuable data byproducts for analysis, modeling, and forecasting.
Prior investments in Cascade Gateway border wait time systems and archives include:
2001: WCOG received FHWA grant funding to assist BCMOTI in building a southbound traveler information system. The project match was provided by Transport Canada. A parallel northbound system was installed by WSDOT.
2005: WCOG received Transport Canada, BCMOTI, and WSDOT grant funding to implement the Cascade Gateway Border Data Warehouse (version 1.0) to archive data coming from BCMOTI and WSDOT systems. The system went live Jan. 1 2007.
2010: WCOG received Transport Canada, WSDOT and FHWA grant funding to integrate the Border Information Flow Architecture (BIFA) into its Cascade Gateway Border Data Warehouse (version 2.0) to improve the existing database and better connect data to partner agencies.
2012: WCOG received Transport Canada and FHWA grant funding to develop the U.S. – Canada Border Data Warehouse, a national-level archive of cross-border delay data that currently includes the Cascade Gateway and Buffalo-Niagara regional systems but is designed to expand to incorporate other wait time systems as they come online.
2016: WCOG received a FHWA grant to partner with BCMOTI in integrating new CBP data and upgrading the software that improved the southbound traveler information system.
Scope of work The project includes the following tasks:
Task 1: Scoping and contracting – develop a scope of work for the consultant and systems engineering documentation, then contract with the consultant through the RFP process.

Border Data Warehouse 3.0 Proposal Page 3
Task 2: Project design – work with the developers and stakeholders through an advisory team to add new features and simplify system architecture.
Task 3: Update and modernize website – Complete general updates to the web user interface, add a booth status feed layer to categorized collected data using the dynamic booth configuration, make all data feeds accessible to end users through reports, and develop a report interface using Tableau to support the generation of ad hoc reports.
Task 4: Set up and configure for maintenance – Simplify the detector and sensor configuration in the archive; simplify the data collection process and how the archive completes back fills and backs up data; and configure the dynamic feed to the BTS transborder freight database for a seamless end-user experience.
Task 5: Verification and validation – complete systems engineering reporting and finalize all tasks of the project as per specifications outlined in the final scope of work.
Task 6: Reporting – complete documentation, outreach, and maintenance plan.
Timeline The project is estimated to take one year for completion following a reward of U.S. and Canadian funding.
Cost The project will cost an estimated $200,000 USD. Costs by entity and task are broken out below:
Estimated Costs by Task Consultant WCOG TOTAL Task 1: Scoping and Contracting $0 $16,262 $16,262 Task 2: Project design $8,000 $648 $8,648 Task 3: Update and modernize website $125,000 $5,444 $130,444 Task 4: Set up and configure for maintenance $15,000 $864 $15,864 Task 5: Verification and validation $0 $4,955 $4,955 Task 6: Reporting $0 $12,165 $12,165
TOTAL $148,000 $40,338 $188,338
Note that this does not include maintenance funding. The project is estimated to cost approximately $30,000 annually to maintain. Funding to maintain the project will be sought separately.
More information A full proposal and more details are available by contacting Melissa Fanucci at (360) 685-8385 or by email at [email protected].

IMTC Aldergrove-Lynden / Abbotsford-Huntingdon–Sumas Traffic Study DRAFT May 16, 2019
1
Issue Recently completed improvements (CBSA Aldergrove, BC Hwy 13, WA State Route 539 at the border) coupled with related, planned facility improvements at various stages of study and implementation (BC Hwy 11, CBP Sumas, CBP Lynden, WA State Route 539 through the City of Lynden) create a heightened interest in updated information about cross-border travel and trade moving through the current system and what trends upcoming investments should be responsive to.
Research objective
This research would be conducted to address the following questions: What is the current travel and trade demand profile these two cross-border routes?
o Volumes (by day of week, by hour). o Modes. o Origin-Destination. o Crossing location & routes. o Trip purpose, commodity.
What are estimated future (20 year) capacity needs? o Population based forecast ranges for personal vehicles. o Generalized estimates of freight growth. o What do O-D patterns and land-use expectations indicate about future route-specific
demand estimates? o Land use (population, employment, transportation system development) expectations of
Whatcom County, Greater Vancouver Regional District, Fraser Valley Regional District. How do current and future demand profiles fit with current and alternative operations strategies?
o What do freight trip-ends and commodities indicate about the ongoing fit for permit-port operations?
o What is the current and future feasibility of NEXUS operations (at Lynden). o Considering freight trip characteristics at Pacific Highway and Sumas–Abbotsford-
Huntingdon, what trends would indicate approaching need for 24-hr operation at Lynden-Aldergrove?
What emerging technologies and/or operations requirements might impact estimates of travel and trade demand or estimates of transportation and inspection systems capacity?
Scope and methods
1) Develop current demand profiles. Data and information sources will include: a) Monthly data from U.S. BTS border-crossing entry data (vehicle counts, mode, commodity). b) Monthly data from Statistics Canada (vehicle counts, mode). c) Truck origin-destination (inferred routes) with commodity from IMTC 2015/16 Border Freight
Study. d) Personal vehicle origin-destination (inferred routes) with trip purpose from IMTC 2018 Passenger
Vehicle Study. 2) Develop estimates of future capacity needs.
a) Estimate ranges (high, low, current straight line) of future personal vehicle volume based on 10 years of historical data and Washington State and British Columbia population forecasts.
b) Estimate ranges of future truck traffic based on 10 years of historical data, agency freight growth estimates as available (FHWA, Transport Canada), scenario based evaluation of high-end estimates, and industry perspectives on regional freight flow and market trends (as available).

IMTC Aldergrove-Lynden / Abbotsford-Huntingdon–Sumas Traffic Study DRAFT May 16, 2019
2
c) Consult with regional land-use planners regarding known (near & medium term) development plans that would likely change local trip generation, cross-border shipping activity, consumer behavior, and labor mobility.
d) Evaluate volumes, trends, and agency expectations about potential medium term changes in volumes of buses and pedestrians/bicycles.
3) Estimate the degree to which cross-border truck and personal vehicle trips are using the crossing location that best fits trip origin-destinations. For trips that would be most directly served by Lynden-Aldergove but are using other crossings (primarily Sumas–Abbottsford-Huntingdon), estimate the proportion of route shift attributable to: a) Hours of operation. b) Permit-port restrictions. c) Other possible reasons (commercial buses, entry documents/broker designations, congestion
avoidance, NEXUS operations). 4) Consult with IMTC stakeholders to confirm/select benefit-cost measures of capacity increases
(facility and operations based). Examples include: a) Shipper, carrier, and public benefits of a more direct route option (e.g. time, fuel, GHG
emissions). b) Cost estimates of adding a third shift (24:00 to 08:00) at Lynden & Aldergrove ports of entry. c) Cost estimates of infrastructure-based capacity including corresponding staffing. (To the extent
possible, costs of needed facility modernization would be kept separate). d) Simulation model estimates of NEXUS operations.
5) Consult with IMTC stakeholders to evaluate envisioned technology applications and expectations for cost, timelines, and impact on throughput capacity.
6) Application of chosen benefit-cost measures – technical memo. 7) Draft report with proposed, near and medium term strategies and review with IMTC stakeholders. 8) Final report. Estimated schedule The above scope of work could start in May of 2019.
Estimated level of effort & cost The above scope of work is estimated to require around 315 hours at an estimated, all-inclusive staff cost of $29,000. This work is intended to be done as part of WCOG’s normal work on IMTC data collection, analysis, and regional border master planning.
Scope Elements
1 Curent demand profiles
1a,b Vehicle counts, mode commodity
1c Truck O, D, routing
1d Personal Vehicle O, D, routing
2 Future capacity needs (20 yrs)
2a Personal vehicles
2b Trucks
2c Land use plans, changes
2d Other modes
3 Current routing fit / optimality & est. attributions
3a,b,c Hours of opperations, permit port, other
4 Benefit-cost measures
4a,b,c,d Collaborative development and selection.
5 Technology deployment scenarios
6 Application of b‐c measures & memo
7 Draft report & IMTC review
8 Final report
Jul Aug Sep Oct Nov DecMay Jun

Cascadia Innovation Corridor (CIC)
Committee on Efficient Cross-border Movement of People & Goods
IDEA DEVELOPMENT BRIEF
1
DRAFT 12Apr2019
Increasing facilitation of trusted trader and traveler programs The Efficient Cross-border Movement committee is using four issue areas to frame its development of innovative strategies. This brief covers one of the issues areas: facilitation of trusted trader and traveler programs.
Goals Ideas are intended to address one or both of two goals. 1) Improve the efficiency (speed) of people and goods crossing the Canada-U.S. border. 2) Improve mobility (options and quality) for person-trips and goods movement along the Portland, OR-Seattle, WA, -Vancouver, BC corridor
Ideas A ROBUST NEXUS MEDIA CAMPAIGN Description: The NEXUS program already exemplifies a big idea that has been very successful. Today, approximately 50 percent of vehicles crossing at Peace Arch-Douglas and Pacific Highway go through NEXUS-dedicated primary inspection booths. While NEXUS enrollment and use has grown significantly over the past decade, data suggest that significant, additional growth could be generated by a new and robust communications effort. Rationale: The International Mobility and Trade Corridor Project’s (IMTC) 2018 Cascade Gateway Cross-border Passenger Vehicle Survey asked motorists who were not using the NEXUS lane, “Why not?” Of the approximately 3,000 respondents in this grouping, 58 percent were in the tough-sell category – they had a clear reason based on a benefit-cost assessment. But 33 percent fell into the potential applicant category – reporting that they had no reason, they’d been meaning to, or were unfamiliar with the program. Further narrowing this segment to those travelers who also reported crossing the border six or more times per year (where benefits of reduced travel time are estimated to exceed program costs), the data suggest that attraction of this population to the NEXUS program would increase the share of NEXUS traffic by 15 percent – from 50 to 65 percent. Next steps: 1) Discuss with Canada Border Services Agency (CBSA) and U.S. Customs and Border Protection to confirm support for such a strategy and any needed refinements to a proposal. 2) Estimate cost and identify potential funding sources. 3) Estimate travel-time reduction and benefit-cost.
SUPPORT INCREASED USE OF RADIO FREQUENCY ENABLED TRAVEL DOCUMENTS (RFID) Description: While NEXUS (which uses the same RF technology discussed here) is the first choice when promoting alternatives to passports, a significant number of regular cross-border travelers are not interested in, or eligible for, NEXUS. This idea entails a subsidized, targeted distribution of RF travel documents to regular cross-border travelers who already possess a passport. (Currently available non-NEXUS RF documents include U.S. Passport Cards, WA and BC enhanced drivers’ licenses (EDLs), FAST commercial driver cards, and others). Rationale: A regional RFID business case was completed by the IMTC coalition in 2015 which detailed an operational analysis, estimated potential wait-time reductions (up to 65 percent), and benefit-cost relative to infrastructure-based capacity improvements. The fundamental ingredients that give rise to this idea include: • US CBP has RF readers at every booth and CBSA continues to increase the number of RF-capable booths. • RF documents are read while travelers are next-in-line for primary inspection and thus reduce inspection time by
an average of 20 seconds. While not a meaningful amount of time for individual travelers, the potential compounding effect of reduced border wait-times (experienced by everyone) is large.
• 2015 analysis showed that 40 percent of the annual, non-NEXUS trips through the Peace Arch-Douglas and Pacific Highway border crossings were made by just 75,000 individuals. Federal inspection and passport agencies can use recent travel data to implement an RF document promotion in a targeted and cost-effective way.
• The basic objective of increasing the use of RF documents by cross-border travelers was listed by Canada and the U.S. in the 2014 Beyond the Border (BTB) Forward Plan. While BTB is a policy guide of former administrations, there is no indication that CBSA and CBP have changed their view of RF technology’s potential.
Next steps: 1) Revisit discussions with Canada Border Services Agency (CBSA) and U.S. Customs and Border Protection to verify continued support and any needed refinements to a refreshed proposal. 2) Update cost estimates, and travel-time reduction and benefit-cost.
Hugh
Highlight
Hugh
Highlight

Cascadia Innovation Corridor (CIC)
Committee on Efficient Cross-border Movement of People & Goods
IDEA DEVELOPMENT BRIEF
2
DRAFT 12Apr2019
INCREASE THE ATTRACTIVENESS AND MODE SHARE OF CASCADIA CORRIDOR BUS TRAVEL Description: The Portland – Vancouver corridor is congested and growth in travel and trade continues. High-speed rail is an exciting strategy for providing important alternatives to highway and air travel but will not be available for many years. Nearer term options for providing attractive alternatives to driving between the corridor’s major metropolitan areas could include bus service. Existing bus service along the corridor is provided by both private and public operators. Services that cross the U.S.-Canada border include private operators (BoltBus, Greyhound, & QuickShuttle) and publicly operators (Amtrak Thruway). This idea envisions strategies to increase the attractiveness (travel time, convenience, frequency) of regional, cross-border bus travel so that a significant share of travelers would choose it over driving. Strategies could include improving the border inspection experience in both directions; improving pre-arrival information and trusted-traveler options for bus travelers; state, provincial, and regional improvements for bus operations along increasingly congested corridors roadways; and terminal & intermodal connection strategies. Rationale: In 2017, Cascade Gateway travelers’ percentage mode distribution was 95.5 car, 3.4 bus, and 1.1 rail.1 The primary origin-destination pair for current bus travelers through the Cascade Gateway is Vancouver BC & Seattle, WA2. Focusing on supporting bus service improvements between these metro centers would be a logical first step. According to the IMTC 2018 Passenger Vehicle Survey, of car travelers at Peace Arch-Douglas and Pacific Highway, 12 percent of U.S. residents and 2.5 percent of Canadian residents had Vancouver-Seattle trip ends – indicating a combined, annual Seattle-Vancouver round-trip volume of 215,000. If 40 percent of this potential market were attracted to travel by bus, the mode share would rise to 4.4% – approximately 64,000 fewer annual one-way car trips on the highway. Next steps: Discuss what if any improvements CBP and CBSA are considering for bus inspection operations (facilities, pre-arrival processing, etc.). Confer with bus carrier firms about their sense of growth and feasible service levels. Check on potentially complementary state and provincial strategies for facilitating mode-competitive regional bus travel. Check with CBP and CBSA on whether any current assessments of technology (RFID, facial recognition, app-based links to travel documents, etc.) include or could include cross-border bus travelers.
INCREASE FREIGHT & CORRIDOR EFFICIENCY BY REDUCING EMPTY TRUCK TRIPS Description: This idea is to identify current approaches, and possibly develop new strategies, for application to regional cross-border truck traffic with the goal of reducing the amount of miles trucks drive empty on the Cascadia Corridor. Rationale: This idea is based on the perspective that minimizing empty-truck miles serves corridor freight transportation demand with fewer vehicles on the highway (addresses capacity), lowers GHG emissions, and improves safety. Of the trucks crossing the U.S.-Canada border at Pacific Highway, 35 percent are driving the 120 kilometers (100 miles) between West Lower Mainland, B.C. and Washington’s Puget Sound region – essentially, Vancouver-Seattle3. Of the truck movements between these locations, 22 percent of northbound trips and 37 percent of southbound trips are empty.4 These observed proportions of empty truck trips are not atypical but even modest success in shifting loads to well-matched, unused capacity, could result in serving our shared economy’s goods-movement needs with an overall reduction of vehicle traffic. Next steps: Assess what impact that recently emerged load-matching companies (e.g. Seattle’s Convoy, Uber Freight, etc.) have had on cross-border carriers’ empty-loaded numbers. Research what current laws and regulations would impact access to back-haul loads and the feasibility of various load-maximization strategies for cross-border movements.
For questions or feedback please contact: Hugh Conroy Whatcom Council of Governments (WCOG) [email protected]
1 U.S. Bureau of Transportation Statistics. 2 IMTC 2018/19 Cascade Gateway Passenger Vehicle Survey. 3 IMTC 2016 Commercial Vehicle Survey. 4 IMTC 2016 Commercial Vehicle Survey.
Hugh
Highlight
Hugh
Highlight
Hugh
Highlight
Hugh
Highlight