TRANSPORTATION COMMITTEE MEETING AGENDA - FRIDAY ...
457
TRANSPORTATION COMMITTEE AGENDA Friday, July 16, 2010 9 a.m. to 12 noon SANDAG Board Room 401 B Street, 7th Floor San Diego AGENDA HIGHLIGHTS • 2050 REGIONAL TRANSPORTATION PLAN: DRAFT UNCONSTRAINED TRANSPORTATION NETWORK • MID-COAST CORRIDOR TRANSIT PROJECT – FINAL COMPARATIVE EVALUATION OF ALTERNATIVES REPORT • TransNet ENVIRONMENTAL MITIGATION PROGRAM: FY 2010 LAND MANAGEMENT GRANTS PLEASE TURN OFF CELL PHONES DURING THE MEETING YOU CAN LISTEN TO THE TRANSPORTATION COMMITTEE MEETING BY VISITING OUR WEB SITE AT WWW.SANDAG.ORG MISSION STATEMENT The 18 cities and county government are SANDAG serving as the forum for regional decision-making. SANDAG builds consensus, makes strategic plans, obtains and allocates resources, plans, engineers, and builds public transit, and provides information on a broad range of topics pertinent to the region's quality of life. San Diego Association of Governments ⋅ 401 B Street, Suite 800, San Diego, CA 92101-4231 (619) 699-1900 ⋅ Fax (619) 699-1905 ⋅ www.sandag.org Members Jack Dale, Chair Councilmember, Santee (Representing East County) Matt Hall, Vice Chair Councilmember, Carlsbad (Representing North County Coastal) Jim Desmond Mayor, San Marcos (Representing North County Inland) Carrie Downey Mayor Pro Tem, Coronado (Representing South County) Anthony Young, Councilmember City of San Diego Ron Roberts, Supervisor County of San Diego Harry Mathis, Chairman Metropolitan Transit System Bob Campbell, Chairman North County Transit District Tom Smisek San Diego County Regional Airport Authority Alternates Art Madrid Mayor, La Mesa (Representing East County) Carl Hilliard Councilmember, Del Mar (Representing North County Coastal) Judy Ritter Mayor Pro Tem, Vista (Representing North County Inland) Jim King Mayor Pro Tem, Imperial Beach (Representing South County) Todd Gloria, Councilmember City of San Diego Marti Emerald, Councilmember City of San Diego Greg Cox, Supervisor County of San Diego Bill Horn, Vice-Chairman County of San Diego Pam Slater-Price, Chairwoman County of San Diego Jerry Rindone, Vice Chair Metropolitan Transit System Dave Roberts / Carl Hilliard North County Transit District Jim Panknin San Diego County Regional Airport Authority Advisory Members Laurie Berman / Bill Figge District 11 Director, Caltrans David Toler (San Pasqual) Albert Phoenix (Barona) Francine Kupsch (Los Coyotes) Southern California Tribal Chairmen’s Association Gary L. Gallegos Executive Director, SANDAG
-
Upload
khangminh22 -
Category
Documents
-
view
0 -
download
0
Transcript of TRANSPORTATION COMMITTEE MEETING AGENDA - FRIDAY ...

TRANSPORTATION
COMMITTEE AGENDA
Friday, July 16, 2010 9 a.m. to 12 noon
SANDAG Board Room 401 B Street, 7th Floor
San Diego
AGENDA HIGHLIGHTS
• 2050 REGIONAL TRANSPORTATION PLAN: DRAFT UNCONSTRAINED TRANSPORTATION NETWORK
• MID-COAST CORRIDOR TRANSIT PROJECT – FINAL
COMPARATIVE EVALUATION OF ALTERNATIVES REPORT
• TransNet ENVIRONMENTAL MITIGATION PROGRAM:
FY 2010 LAND MANAGEMENT GRANTS
PLEASE TURN OFF CELL PHONES DURING THE MEETING
YOU CAN LISTEN TO THE TRANSPORTATION COMMITTEE MEETING BY VISITING OUR WEB SITE AT WWW.SANDAG.ORG
MISSION STATEMENT The 18 cities and county government are SANDAG serving as the forum for regional decision-making.
SANDAG builds consensus, makes strategic plans, obtains and allocates resources, plans, engineers,
and builds public transit, and provides information on a broad range of topics pertinent to the
region's quality of life.
San Diego Association of Governments ⋅ 401 B Street, Suite 800, San Diego, CA 92101-4231
(619) 699-1900 ⋅ Fax (619) 699-1905 ⋅ www.sandag.org
Members
Jack Dale, Chair Councilmember, Santee (Representing East County)
Matt Hall, Vice Chair Councilmember, Carlsbad (Representing North County Coastal)
Jim Desmond Mayor, San Marcos (Representing North County Inland)
Carrie Downey Mayor Pro Tem, Coronado (Representing South County)
Anthony Young, Councilmember City of San Diego
Ron Roberts, Supervisor County of San Diego
Harry Mathis, Chairman Metropolitan Transit System
Bob Campbell, Chairman North County Transit District
Tom Smisek San Diego County Regional Airport Authority
Alternates
Art Madrid Mayor, La Mesa (Representing East County)
Carl Hilliard Councilmember, Del Mar (Representing North County Coastal)
Judy Ritter Mayor Pro Tem, Vista (Representing North County Inland)
Jim King Mayor Pro Tem, Imperial Beach (Representing South County)
Todd Gloria, Councilmember City of San Diego
Marti Emerald, Councilmember City of San Diego
Greg Cox, Supervisor County of San Diego
Bill Horn, Vice-Chairman County of San Diego
Pam Slater-Price, Chairwoman County of San Diego
Jerry Rindone, Vice Chair Metropolitan Transit System
Dave Roberts / Carl Hilliard North County Transit District
Jim Panknin San Diego County Regional Airport Authority
Advisory Members
Laurie Berman / Bill Figge District 11 Director, Caltrans
David Toler (San Pasqual) Albert Phoenix (Barona) Francine Kupsch (Los Coyotes) Southern California Tribal Chairmen’s Association
Gary L. Gallegos Executive Director, SANDAG

Welcome to SANDAG. Members of the public may speak to the Transportation Committee on any item at the time the Committee is considering the item. Please complete a Speaker’s Slip, which is located in the rear of the room, and then present the slip to Committee staff. Also, members of the public are invited to address the Committee on any issue under the agenda item entitled Public Comments/Communications/Member Comments. Speakers are limited to three minutes. The Transportation Committee may take action on any item appearing on the agenda. This agenda and related staff reports can be accessed at www.sandag.org under meetings on SANDAG’s Web site. Public comments regarding the agenda can be forwarded to SANDAG via the e-mail comment form also available on the Web site. E-mail comments should be received no later than noon, two working days prior to the Transportation Committee meeting. Any handouts, presentations, or other materials from the public intended for distribution at the Transportation Committee meeting should be received by the Clerk of the Board no later than 12 noon, two working days prior to the meeting. In compliance with the Americans with Disabilities Act (ADA), SANDAG will accommodate persons who require assistance in order to participate in SANDAG meetings. If such assistance is required, please contact SANDAG at (619) 699-1900 at least 72 hours in advance of the meeting. To request this document or related reports in an alternative format, please call (619) 699-1900, (619) 699-1904 (TTY), or fax (619) 699-1905.
SANDAG offices are accessible by public transit. Phone 511 or see 511sd.com for route information.
2 Rev 051810

TRANSPORTATION COMMITTEE Friday, July 16, 2010
ITEM # RECOMMENDATION
3
+1. APPROVAL OF JULY 2, 2010, MEETING MINUTES APPROVE
2. PUBLIC COMMENTS/COMMUNICATIONS/MEMBER COMMENTS Members of the public will have the opportunity to address the Transportation
Committee on any issue within the jurisdiction of the Committee that is not on this agenda. Speakers are limited to three minutes each and shall reserve time by completing a “Request to Speak” form and giving it to the Clerk prior to speaking. Committee members also may provide information and announcements under this agenda item.
CONSENT (3 through 4)
+3. OVERVIEW OF CLIMATE CHANGE ADAPTATION AND THE 2050 REGIONAL TRANSPORTATION PLAN (RTP) (Ron Saenz)
INFORMATION
An overview of climate change adaptation policies and its potential role in the 2050
RTP will be provided. This discussion includes efforts being made by federal, state, and local governments.
+4. SOCIAL SERVICES TRANSPORTATION ADVISORY COUNCIL MEMBERSHIP
AND CHARTER AMENDMENT (Danielle Kochman) APPROVE
The Social Services Transportation Advisory Council (SSTAC) has proposed charter
amendments to streamline membership and to clarify voting rules. Several citizen members have withdrawn from the SSTAC and replacement candidates have been nominated. It also is necessary to reappoint certain existing social service agencies whose term has expired. The Transportation Committee is asked to approve (1) The reappointment of four members to the Social Services Transportation Advisory Council (SSTAC) for additional three-year terms; (2) The appointment of five new alternate citizen members; and (3) The restructuring of SSTAC membership and amendment of the SSTAC Charter.

REPORTS (5 through 13)
+5. 2008 REGIONAL TRANSPORTATION IMPROVEMENT PROGRAM: AMENDMENT NO. 23 AND AIR QUALITY CONFORMITY ANALYSIS (Sookyung Kim)
RECOMMEND
At its meeting on July 25, 2008, the Board of Directors adopted the 2008 Regional
Transportation Improvement Program (RTIP), including the air quality conformity determination. The RTIP is the five-year program of major transportation projects in the San Diego region covering the period from FY 2009 to FY 2013. SANDAG processes amendments to the RTIP on a quarterly basis based on requests from member agencies. One project for the City of San Marcos requires SANDAG to re-run air quality conformity. The Transportation Committee is asked to recommend that the Board of Directors approve Resolution No. 2011-02 (Attachment 1), including Amendment No. 23 to the 2008 RTIP as well as a finding of conformity and the redetermination of the 2030 RTP.
+6. 2008 REGIONAL TRANSPORTATION IMPROVEMENT PROGRAM:
AMENDMENT NO. 25 (Sookyung Kim) APPROVE
At its meeting on July 25, 2008, the Board of Directors adopted the 2008 RTIP, the
five-year program of major transportation projects in the San Diego region covering the period from FY 2007 to FY 2011. SANDAG processes amendments to the RTIP on a quarterly basis based on requests from member agencies. The Transportation Committee is asked to approve Resolution No. 2011-03 including Amendment No. 25 to the 2008 RTIP.
+7. FY 2011 TRANSPORTATION DEVELOPMENT ACT CLAIM AMENDMENTS
(Sookyung Kim) APPROVE
At its June 25, 2010, meeting the Board of Directors approved the FY 2011
Transportation Development Act (TDA) allocations and associated claims. The Metropolitan Transit System (MTS) is requesting an amendment to its Article 4 claim. The Transportation Committee is asked to approve Resolution No. 2011-04 relating to 2011 TDA claim amendments in substantially the same form as shown in Attachment 1; and (2) direct staff to provide instructions to the County Office of Auditor Controller to revise these claims.
4

+8. DRAFT 2010 REGIONAL TRANSPORTATION IMPROVEMENT PROGRAM,
INCLUDING THE DRAFT AIR QUALITY CONFORMITY DETERMINATION (Sookyung Kim)
RECOMMEND
SANDAG, as the Metropolitan Planning Organization (MPO), is required by state and
federal laws to develop and adopt a RTIP, a multiyear program of proposed major highway, arterial, transit, and nonmotorized projects, including the TransNet Early Action Program of projects. The 2010 RTIP covers Fiscal Years 2011 to 2015, and is due to the state by October 1, 2010. The Transportation Committee is asked to recommend that the Board of Directors: (1) accept for review and distribution the Draft 2010 Regional Transportation Improvement Program, including its air quality conformity analysis and the draft air quality conformity redetermination of the 2030 Revenue Constrained Regional Transportation Plan: Pathways for the Future for a 30-day public comment period; and (2) schedule a public hearing for the September 3, 2010, Transportation Committee meeting.
+9. 2050 REGIONAL TRANSPORTATION PLAN: DRAFT UNCONSTRAINED
TRANSPORTATION NETWORK (Heather Werdick and Carolina Gregor) RECOMMEND
Defining the Unconstrained Transportation Network is an important step in developing
a Regional Transportation Plan (RTP), because it establishes the broadest network from which funding scenarios will be identified. Once the Unconstrained Network is identified, staff will prioritize all of the future projects using the updated transportation project evaluation criteria approved by the Board of Directors. Based on input from SANDAG working groups and the public, Policy Advisory Committees, and the Board of Directors, staff has developed a draft Unconstrained Transportation Network. The Transportation Committee is asked to recommend that the Board of Directors accept the draft Unconstrained Transportation Network for use in the development of the 2050 Regional Transportation Plan. The Board of Directors will be asked to accept the Unconstrained Transportation Network at its July 23, 2010, meeting.
+10. TIGER II DISCRETIONARY GRANT SUBMITTALS (Victoria Stackwick) APPROVE
The FY 2010 Appropriations Act included $600 million for a discretionary National
Infrastructure Investments program, which the U.S. Department of Transportation (USDOT) has dubbed “TIGER II Discretionary Grants.” The USDOT will award TIGER II grant funds on a competitive basis to projects that have a significant impact on the nation, a metropolitan area, or a region; final applications are due August 23, 2010. The Transportation Committee is asked to approve the list of proposed regional project submittals for the TIGER II Discretionary Grants program and authorize the Executive Director to provide support letters for other local agency projects that are consistent with SANDAG policies and programs.
5

+11. MID-COAST CORRIDOR TRANSIT PROJECT - FINAL COMPARATIVE EVALUATION OF ALTERNATIVES REPORT (Leslie Blanda)
RECOMMEND
The Final Comparative Evaluation of Alternatives Report presents a summary of the
comments received during the scoping period for the Mid-Coast Corridor Transit Project Draft Supplemental Environmental Impact Statement/Subsequent Environmental Impact Report (SEIS/SEIR). The Final Report additionally presents responses to the scoping comments and a recommendation on a Locally Preferred Alternative, or alternatives, to carry forward for detailed analysis in the Draft SEIS/SEIR. The Transportation Committee is asked to recommend that the Board of Directors reconfirm the previously adopted Locally Preferred Alternative (LPA), as refined to include direct service to UCSD and University Towne Centre, by selecting Light Rail Transit (LRT) Alternative 1 (combines 1, 4, and 5) as the LPA. The Transportation Committee is further asked to recommend that the Board of Directors approve LRT Alternative 1 and the No-Build Alternative for evaluation in the Mid-Coast Corridor Transit Project Draft SEIS/SEIR. The Transportation Committee also is asked to recommend that the Board of Directors approve the final Public Involvement Plan.
+12. TransNet ENVIRONMENTAL MITIGATION PROGRAM: FY 2010 LAND
MANAGEMENT GRANTS (Keith Greer) RECOMMEND
On September 25, 2009, the Board of Directors approved a process and criteria for
funding land management projects under the TransNet Environmental Mitigation Program. Of the 24 applications received, 10 have been recommended for funding by the technical panel that has reviewed the applications. The Transportation Committee is asked to recommend that the Board of Directors (1) approve the prioritized list of land management projects and funding allocations (Attachment 2), and (2) authorize the Executive Director to enter into agreements for the selected grants in the proposed allocations totaling $2.085 million under the fourth cycle of this grant program.
+13. 2010 TransNet PLAN OF FINANCE UPDATE (Kim Kawada) RECOMMEND
Staff will update the Transportation Committee on work to date on the Plan of
Finance, including updated program-level analysis of the current TransNet Early Action Program of projects and possible financial scenarios for consideration. The Transportation Committee is asked to recommend that the Board of Directors (1) approve the 2010 TransNet Plan of Finance update, which incorporates the proposed projects in the revised Robust scenario (Attachment 4); (2) authorize the Executive Director to amend the FY 2011 SANDAG Budget to incorporate the new capital projects; and (3) approve revision to the set-aside of federal and state discretionary funding for the TransNet Early Action Program from 94 percent to 90 percent. These actions will support the pending issuance of $300-$350 million in long-term fixed rate debt.
6

7
14. UPCOMING MEETINGS INFORMATION The next meeting of the Transportation Committee is scheduled for Friday,
September 3, 2010, at 9 a.m.
15. ADJOURNMENT
+ next to an agenda item indicates an attachment

San Diego Association of Governments
TRANSPORTATION COMMITTEE
July 16, 2010 AGENDA ITEM NO.: 1Action Requested: APPROVE
TRANSPORTATION COMMITTEE DISCUSSION AND ACTIONS MEETING OF JULY 2, 2010
The meeting of the Transportation Committee was called to order by Chair Jack Dale (East County) at 9:06 a.m. See the attached attendance sheet for Transportation Committee member attendance. 1. APPROVAL OF MEETING MINUTES Action: Upon a motion by Chairman Bob Campbell (North County Transit District [NCTD]) and a second by Vice Chairman Jerry Rindone (Metropolitan Transit System [MTS]), the Transportation Committee approved the minutes from the June 18, 2010, meeting.
2. PUBLIC COMMENTS/COMMUNICATIONS/MEMBER COMMENTS Bill Figge, Caltrans District 11, commented that the draft environmental document for the Interstate 5 (I-5) North Coast project was released for public review.
CONSENT (3 through 4)
3. CALIFORNIA HIGH-SPEED TRAIN SYSTEM: LOS ANGELES TO SAN DIEGO VIA INLAND EMPIRE SECTION QUARTERLY UPDATE (INFORMATION)
The California High-Speed Rail Authority (CHSRA) is the state agency responsible for planning, constructing, and operating a high-speed train system serving California's major metropolitan areas. The proposed system stretches over 800 miles and would connect San Diego, Los Angeles, the Central Valley, San Francisco, and Sacramento using a state-of-the-art electrified system capable of speeds in excess of 200 miles per hour. SANDAG continues to monitor the work on the CHSRA. This report is the regular quarterly update to the Transportation Committee. 4. FEDERAL SECTION 5310 PROGRAM AWARDS (INFORMATION) A state review committee has released the recommendations of projects to be funded through the Elderly and Disabled Transit Program to be considered by the California Transportation Commission. This report summarized the projects recommended for funding in San Diego County. Action: These items were presented for information.

REPORTS (5 through 9) 5. 2010 TransNet PLAN OF FINANCE UPDATE (DISCUSSION) Kim Kawada, TransNet and Legislative Affairs Program Director, updated the Transportation Committee on work to date on the Plan of Finance (POF), including updated program-level analysis of the current TransNet Early Action Program (EAP) of projects and possible financial scenarios for future consideration. The Transportation Committee is asked to discuss the initial scenarios that have been run for the 2010 POF and provide direction to staff. Marney Cox, SANDAG Chief Economist, presented information on the current state of the economy and its impact on sales tax revenues and the TransNet POF and EAP. Action: This item was presented for discussion. 6. DESTINATION LINDBERGH – INTERMODAL TRANSPORTATION CENTER UPDATE (INFORMATION) Staff has been developing site plan concepts for the Intermodal Transportation Center based on the Destination Lindbergh Master Plan that would shift the airport terminal location to the north side of Lindbergh Field. The report highlighted the long-range and phase site plan options, coordination with the San Diego County Regional Airport Authority's north side improvements and long-range planning efforts, and next step actions. Dave Schumacher, Principal Regional Planner, presented the item. Nathan Batchelder, Move San Diego, submitted written comments, which he read into the record. Action: This item was presented for information. 7. MID-COAST CORRIDOR TRANSIT PROJECT – UPDATE ON SCOPING PERIOD AND SUMMARY OF SCOPING COMMENTS (INFORMATION) Leslie Blanda, Project Development Program Manager, provided a report on the scoping period for the Mid-Coast Corridor Transit Project Draft Supplemental Environmental Impact Statement/Subsequent Environmental Impact Report. The report included a summary of the outreach activities for scoping, scoping meetings, and comments received during the scoping period. Clive Richard, a member of the public, spoke in favor of this item. Deborah Knight, Executive Director-Friends of Rose Canyon, spoke in opposition of this item. Action: This item was presented for information. 8. FY 2010 STATE TRANSIT ASSISTANCE ALLOCATION (RECOMMEND) The State Transit Assistance (STA) is a state program administered locally that provides support for public transit services. Although the FY 2010 state budget included a provision that eliminated this
2

fund source for three years, in March of this year the Governor signed into law ABx86 and ABx89, which restores the STA program. The State Controller’s Office transmitted the final STA allocations in a letter dated June 22, 2010. NCTD approved this item at its May meeting in anticipation of this action and has submitted a claim to seek the payment. José A. Nuncio, Manager of Financial Programming and Project Control, presented the item. Action: Upon a motion by Chairman Campbell and a second by Councilmember Todd Gloria (City of San Diego), the Transportation Committee recommended that the Board of Directors approve Resolution No. 2011-01, approving the FY 2010 STA claim for NCTD in substantially the same form as attached to the report. 9. 2008 REGIONAL TRANSPORTATION IMPROVEMENT PROGRAM AMENDMENT NO. 27
(APPROVE) The 2008 Regional Transportation Improvement Program (RTIP) is the multiyear program of proposed major highway, arterial, transit, and bikeway projects in the San Diego region covering the period FY 2009 to FY 2013. SANDAG processes amendments to the RTIP generally on a quarterly basis and occasionally on a more frequent basis as circumstances arise. SANDAG is processing Amendment No. 27 on an urgent basis. The state notified SANDAG that additional federal funds (Regional Surface Transportation Program [RSTP]) are available for FY 2010 but that it must be obligated in the current year. SANDAG worked with Caltrans to exchange TransNet with RSTP in order to ensure that the region does not lose this funding. Michele Merino, Financial Programming Analyst II, presented the item. Action: Upon a motion by Mayor Desmond and a second by Vice Chair Rindone, the Transportation Committee approved Amendment No. 27 to the 2008 RTIP. 10. UPCOMING MEETINGS The next meeting of the Transportation Committee is scheduled for Friday, July 16, 2010, at 9 a.m.
11. ADJOURNMENT Chair Dale adjourned the meeting at 10:40 a.m.
Attachment: Attendance Sheet
3

4
CONFIRMED ATTENDANCE SANDAG TRANSPORTATION COMMITTEE MEETING
JULY 2, 2010
GEOGRAPHICAL AREA/
ORGANIZATION
JURISDICTION NAME MEMBER/
ALTERNATE ATTENDING
City of Carlsbad Matt Hall (Vice Chair) Member Yes North County Coastal
City of Del Mar Carl Hilliard Alternate Yes
City of San Marcos Jim Desmond Member Yes North County Inland
City of Vista Judy Ritter Alternate Yes
City of Santee Jack Dale (Chair) Member Yes East County
City of La Mesa Art Madrid Alternate Yes
City of Coronado Carrie Downey Member No South County
City of Imperial Beach Jim King Alternate Yes
---- Anthony Young Member No
---- Todd Gloria Alternate Yes
City of San Diego
---- Marti Emerald Alternate No
---- Ron Roberts Member Yes
---- Greg Cox Alternate No
County of San Diego
---- Slater-Price Alternate Yes
MTS Harry Mathis Member No Metropolitan Transit System
MTS Jerry Rindone Alternate Yes
NCTD Bob Campbell Member Yes
NCTD Dave Roberts Alternate No
North County Transit District
NCTD Carl Hilliard Alternate No
Tom Smisek Member Yes San Diego County Regional
Airport Authority Jim Panknin Alternate No
---- Laurie Berman Member No ADVISORY/LIAISON Caltrans
___ Bill Figge Alternate Yes
Albert Phoenix Member Yes
Dave Toler Member No
SCTCA _____
Francine Kupsch Alternate No
Jerome Stocks Vice Chair
BOD
No

San Diego Association of Governments
TRANSPORTATION COMMITTEE July 16, 2010
AGENDA ITEM NO.: 3Action Requested: INFORMATION
OVERVIEW OF CLIMATE CHANGE ADAPTATION AND THE 2050 REGIONAL TRANSPORTATION PLAN File Number 3100500 Introduction The White Paper, Overview of Climate Change Adaptation and the 2050 Regional Transportation Plan (RTP), provides an overview of potential impacts to transportation infrastructure due to climate change and the potential role of adaptation strategies in the 2050 RTP. Issues and policy implications are identified as well as recommendations on next steps. Discussion This White Paper was developed primarily to assess the California Transportation Commission 2010 Regional Transportation Plan (RTP) Guidelines regarding best practices for addressing climate adaptation, to identify strategies included in the 2009 California Climate Adaptation Strategy related to transportation infrastructure, and to evaluate adaptation efforts by transportation agencies across the country. To ensure that the most important areas of focus have been included in this White Paper, SANDAG staff solicited input from the Regional Planning Stakeholders Working Group at its February 16, 2010, meeting and from the Energy Working Group at its April 22, 2010, meeting. In addition, the Regional Planning Committee discussed this White Paper at its meeting on July 2, 2010. Comments received were incorporated in the White Paper (Attachment 1) as appropriate.
CHARLES “MUGGS” STOLL Director of Land Use and Transportation Planning Attachment: 1. Overview of Climate Change Adaptation and the 2050 Regional Transportation Plan-
White Paper
Key Staff Contact: Ron Saenz, (619) 699-1922, [email protected]

Attachment 1
OVERVIEW OF CLIMATE CHANGE ADAPTATION AND THE 2050 REGIONAL TRANSPORTATION PLAN – WHITE PAPER
INTRODUCTION
Adaptation is defined by the California Natural Resources Agency as: Efforts that respond to the impacts of climate change – adjustments in natural or human systems to actual or expected climate changes to minimize harm or take advantage of beneficial opportunities.1 Mitigation is defined as actions to reduce greenhouse gas emissions. Mitigation alone will not prevent climate change from having serious impacts on the San Diego region. The current concentration of greenhouse gases in our atmosphere – without considering continued and accelerated pace of emissions – will continue to change the climate for the next 30 to 40 years.2 Adaptation to the changes that have already been set in motion is essential to maintain the region’s economy, ecosystems, and public health. The following discussion is an overview of potential impacts to transportation infrastructure due to climate change and the proposed climate change adaptation strategies to deal with these impacts for consideration in the 2050 Regional Transportation Plan (RTP). This discussion includes efforts being made by federal, state, and local governments. While some strategies may not ultimately prove viable for the San Diego region, they are presented in this White Paper to provide decision-makers with a broad range of options for consideration. Also included are recommendations focused on the San Diego region that if implemented would require a more detailed study and analysis prior to implementation. Objectives for the 2050 RTP
The objectives of this White Paper for the 2050 RTP are threefold. They include:
1. Assessing the 2010 California RTP Guidelines regarding best practices for addressing climate adaptation in RTPs.
2. Identifying strategies included in the 2009 California Climate Adaptation Strategy related to transportation Infrastructure.
3. Evaluating adaptation efforts by transportation agencies across the country.
Background
Climate change is happening now and its impacts are readily apparent, with temperatures increasing, Arctic sea ice disappearing, and sea levels rising beyond climate scientists’ worst-case estimates. Recently it was reported that January 2000 to December 2009 was the warmest decade on record.3 Recent atmospheric measurements of carbon dioxide and methane (two important
1 2009 California Climate Adaptation Strategy, California Natural Resources Agency, p.4 2 2009 California Climate Adaptation Strategy, California Natural Resources Agency, p.14 3 National Aeronautics and Space Administration. 2010. NASA Research Finds Last Decade was Warmest on Record, 2009 One
of Warmest Years. Available at: www.nasa.gov/home/hqnews/2010/jan/HQ_10- 017_Warmest_temps.html.
2

greenhouse gases) exceed the natural range over the last 650,000 years.4 The predicted rate of temperature change by 2050 as a result of these greenhouse gas levels is 10-50 times faster than the temperature changes that occurred when the ice ages receded.5 Most significantly, the results of greenhouse gases produced by the fossil fuel energy we burn to power our society are a major contributor to climate change. We are largely dependent on fossil fuels to generate electricity, drive our vehicles, transport goods, heat and cool our homes, produce and deliver food, convey and treat water, and provide power to our businesses and industries.6 The most significant climate impacts to California’s transportation infrastructure are predicted to be from higher temperatures and extreme weather events across the state, reduced and shifting precipitation patterns throughout California, and sea-level rise. The largest projected damages will come from sea-level rise threatening large portions of California’s coastal transportation, housing, and energy-related infrastructure.7 The San Diego region is not immune to these threats. Temperature extremes will impact the transportation sector. It is expected less extreme cold days will reduce road damage related to frost and other cold weather conditions, but extreme hot days (including prolonged periods of very hot days), are likely to become more frequent, increasing the risk of buckling of highways and railroad tracks and premature deterioration or failure of transportation.8 Based on scenarios that do not assume explicit climate policies to reduce greenhouse gas emissions, global average temperature is projected to rise by 2 to 11.5°F by the end of this century (relative to the 1980-1999 time period).9 By 2050, the San Diego region is expected to experience a rise in average annual temperatures between 1.5 and 4.5 degrees Fahrenheit. Greater increases will occur in summer, with peak temperatures consistently reaching the upper 80s and low 90s. Larger temperature increases are expected in inland areas as compared to the coastal zone (within 50 km). Though precipitation is expected to maintain the existing Mediterranean pattern with dry summers and most rainfall happening in the winter months, rainfall amounts will likely vary widely from year to year, leaving the region highly vulnerable to drought.10 The combination of a generally drier climate in the future, which will increase the chance of drought and wildfires, and the occasional extreme downpour, is likely to cause more mud- and landslides during winter months. Specifically, researchers and the California Department of Transportation (Caltrans) expect increased damage of transportation infrastructure such as coastal
4 Intergovernmental Panel on Climate Change. 2007. IPCC Fourth Assessment Report: Climate Change 2007. Working Group I:
The Physical Science Basis. Available at: www.ipcc-wg1.unibe.ch/publications/wg1- ar4/wg1-ar4.html 5 The San Diego Foundation. 2008. Summary of The San Diego Foundation Regional Focus 2050 Study: San Diego, California.
Available at: www.sdfoundation.org/communityimpact/environment/Initiative-Climate2050.html 6 SANDAG 2010 Climate Action Strategy – Final, p. 1 7 2009 California Climate Adaptation Strategy, California Natural Resources Agency, p.124 8 2009 California Climate Adaptation Strategy, California Natural Resources Agency, p. 122 9 Observations: Oceanic Climate Change and Sea Level. in: Climate Change 2007: The Physical Science Basis,
Intergovernmental Panel on Climate Change 10 SANDAG 2010 Climate Action Strategy – Final, p. 14 and The San Diego Foundation’s Focus 2050 Study: San Diego’s
Changing Climate – A Regional Wakeup Call, p. 6
3

and inland highways, railways, and associated business interruptions. The related debris impacts are historically well known to California, but if they become more frequent, they will create greater costs for the state and require more frequent repairs.11 The largest projected damages will come from sea-level rise up to 12-18 inches higher in San Diego.12 This threatens large portions of California’s coastal transportation, housing, and energy-related infrastructure.13 Sea-level rise Impacts on transportation infrastructure will include flooding of roads, railways, transit systems, and airport runways in coastal areas. A substantial amount of this ground transportation infrastructure is predicted to be at risk from sea-level rise by 2100, including 2,500 miles of roads and rails. Such infrastructure is vital to the state’s economy for both the movement of commercial freight and the ability of Californians to get to work and school. In the San Francisco Bay Area, the major airports of San Francisco and Oakland are near sea level and would require additional elevation, protection, or relocation to remain functional.14 Evidence of sea level rising is already apparent. After at least 2,000 years of little change, sea level rose by roughly 8 inches over the past century. Satellite data available over the past 15 years show sea level rising at a rate roughly double the rate observed over the past century.15 A report cited in the 2009 California Climate Adaptation Strategy estimates that the cost of no action in California would be on the order of “tens of billions of dollars in direct costs” and would “expose trillions of dollars of assets to collateral risk.” The San Diego region also would likely have to bear its share of the cost climate change impacts will produce. State of the Planning Practice
In general, transportation agencies nationwide are not yet incorporating climate change adaptation measures into long-range planning. The large uncertainty in the location and magnitude of impacts makes agencies reluctant to take major action on adaptation, given the multitude of other pressing demands for Departments of Transportation (DOTs) and Metropolitan Planning Organizations (MPOs), and their funding limitations.16 As a result, agencies that are considering adaptation are typically focusing on building awareness of the issues and on research. However, there are recent examples summarized in this report where this focus is beginning to change and that more agencies are recognizing the value of taking action earlier.
11 Navai, R. (2008). Climate Adaptation and California’s Transportation Infrastructure. Staff White Paper, California
Department of Transportation. Sacramento, CA 12 The San Diego Foundation’s Focus 2050 Study: San Diego’s Changing Climate – A Regional Wakeup Call, p. 4 13 2009 California Climate Adaptation Strategy, California Natural Resources Agency, p. 119 14 2009 California Climate Adaptation Strategy, California Natural Resources Agency, p. 68 15 Observations: Oceanic Climate Change and Sea Level. in: Climate Change 2007: The Physical Science Basis,
Intergovernmental Panel on Climate Change 16 Gallivan, Ang-Olson, and Turchetta (2009). Integrating Climate Change into State and Regional Transportation Plans,
Federal Highway Administration. itre.ncsu.edu/adc10/PDFs/2009_Winter_Conference/Turchetta_Session530_paper.pdf
4

Identification of Problems
The states’ transportation infrastructure faces potential risk from climate change impacts stemming from changes in temperature, sea-level rise and precipitation. To summarize the changing risks that California’s transportation infrastructure may be facing from climate change, the likelihood of occurrence of the projected consequences was qualitatively assessed. The economic cost associated with the required alteration, fortification, or relocation of existing infrastructure is likely to be in the tens of billions.17 The resulting risk profile for California’s transportation infrastructure can be characterized as follows: Temperature extremes can increase the risk of road and railroad tracks buckling, decreasing
transportation safety and creating higher maintenance costs. Winter storms, especially if coinciding with earlier snowmelt and high runoff, can cause
flooding and physical damage to culverts, canals, tunnels, coastal highways, runways, and railways, and associated business interruptions.
More drought, fires, and intense rainfall events will produce more mud- and landslides, which can disrupt major roadways and rail lines. These impacts will likely be felt in the San Diego region.
Sea-level rise is likely to cause the greatest impacts on California’s and on the San Diego region’s infrastructure, including more frequent storm-related flooding of airports, seaports, roads, and railways in floodplains due to higher sea levels.
As sea level rises at a faster pace and coastal storm surges increase, existing fortifications will be increasingly inadequate and need to be raised, and areas previously not at-risk will become at risk.
DISCUSSION
The following section focuses on efforts being made by federal, state, and local governments. Their different approaches to climate change adaptation provide insight and background to the policy and issues section in this paper. Potential Solutions and Alternatives Federal Interagency Climate Change Adaptation Task Force18 In the Fall of 2009, in response to President Obama’s Executive Order 13514, the U.S. Global Change Research Program (USGCRP), the White House Council on Environmental Quality (CEQ), the White House Office of Science and Technology Policy (OSTP), and the National Oceanic and Atmospheric Administration (NOAA) convened the Interagency Climate Change Adaptation Task Force to begin the development of federal recommendations for adapting to climate change impacts both domestically and internationally. More than twenty federal agencies, departments, and offices are participating in this Task Force and contributing their operational capabilities and expertise through
17 2009 California Climate Adaptation Strategy, California Natural Resources Agency, p. 128 18 Interagency Climate Change Adaptation Task Force www.whitehouse.gov/sites/default/files/microsites/ceq/20100315-
interagency-adaptation-progress-report.pdf
5

a series of workgroups, coordinated with USGCRP, on specific topics related to climate change adaptation.19 Goals of the interagency adaptation work include: • Forming recommendations toward a national adaptation strategy that uses a set of best
practices derived from the best available science and the experience and knowledge of governments and stakeholder groups across the United States and abroad.
• Integrating climate change resilience and adaptive capacity into federal government operations, and coordinating interagency preparations for climate change impacts with domestic and international activities.
• Broadening the understanding of vulnerability to climate impacts, equipping communities with information to use in local adaptation policies, and learning from communities who have taken steps to adapt.
The Task Force has found that there already is substantial U.S. government and non-government activity towards adapting and building resilience to climate change risks. Current activities include landscape conservation cooperatives supported by the Department of the Interior, to a comprehensive risk assessment of Gulf Coast transportation infrastructure by the Department of Transportation, and the Environmental Protection Agency’s efforts to support local decision-makers through Climate Ready Estuaries. As required by Executive Order 13514, the Interagency Climate Change Adaptation Task Force will deliver a report to the President in the fall of 2010. The report will detail the development of domestic and international dimensions of a U.S. strategy for adaptation to climate change, agency actions in support of that strategy development process, and recommendations for any further measures to advance towards a national strategy. The Task Force will not, however, deliver a complete U.S. adaptation strategy to the President. Over the next several months, the Interagency Climate Change Adaptation Task Force may refine recommendations around structural issues such as improving and integrating science results in developing policy and a framework for federal agency adaptation, as well as cross-cutting topics, including water resources management and international adaptation. The Task Force also may establish additional workgroups, in cooperation with USGCRP, including those to inform the development of a national strategy in the areas of communications and capacity-building, coordination and collaboration across government and with partners, evaluation and learning, and other priority issues. Through a series of regional outreach meetings and pilot activities, the Task Force will continue moving towards recommendations on the development of a national strategy on climate change adaptation. In tandem with these efforts, the U.S. Department of Transportation’s Federal Highway Administration (FHWA) and the U.S. Army Corps of Engineers (USACE) are in the beginning stages of engaging in climate change adaptation issues. FHWA’s approaches to climate change are being looked at as a Surface Transportation Safety and Operations issue. In this context, FHWA will be
19 Global Climate Change Impacts in the United States, Thomas R. Karl, Jerry M. Melillo, and Thomas c. Peterson, (eds.).
Cambridge University Press, 2009.
6
engaging state and local agencies or projects that require FHWA preliminary engineering and NEPA reviews. In the area of outreach and education, FHWA has established peer exchanges, a Transportation & Climate Change Clearinghouse, and a FHWA Adaptation Working Group. It also is providing technical assistance in the areas of modeling, adaptation, and research.20 Also at the federal level, the USACE is working towards addressing climate change adaptation. In its circular published in July 2009, guidance is provided for incorporating the direct and indirect effects of projected future sea level change in managing, planning, engineering, designing, constructing, operating, and maintaining USACE projects and systems of projects.21 State of California 2009 California Climate Adaptation Strategy (CAS) The changes necessary to protect the state’s transportation infrastructure will require collaboration between multiple state, regional, and local agencies. In an effort to begin protecting these assets, Governor Schwarzenegger signed Executive Order (EO) S-13-08. This order provides direction on developing California’s first statewide adaptation effort. It requires the California Natural Resources Agency to develop the CAS as the state’s first comprehensive guide on climate adaptation. The CAS was developed with the input of numerous stakeholders including state agencies and seven climate adaptation working groups.22 Although the CAS focuses on state level efforts, climate change vulnerability assessment planning tools, policies, and strategies will be integrated at the local level (MPOs, RTPAs) in conjunction with Caltrans.23 The CAS states that impacts of climate change on infrastructure will vary at the local level, but it is certain they will be widespread and costly in human and economic terms, and will require significant changes in the planning, design, construction, operation, and maintenance of California’s infrastructure.24 The CAS has identified the following priorities in addressing climate adaptation for California state agencies. The near-term actions referenced below are those actions that have been identified and which can be initiated or completed by November 2011. The long-term actions include those recommended actions that will require support from California and collaboration with multiple state agencies.25
20 Summary Report: Peer Workshop on Adaptation to Climate Change Impacts Appendix A - Adaptation of Transportation
Infrastructure to Global Climate Change (GCC) Effects: Implications for Design and Implementation, U.S. Department of
Transportation, Federal Highway Administration 21 United States Army Corps of Engineers (USACE) circular: Water Resource Policies and Authorities Incorporating Sea Level
Change Considerations in Civil Works Programs 22 2010 California Regional Transportation Plan Guidelines (Final Draft, February 8, 2010), p. 136 23 2010 California Regional Transportation Plan Guidelines (Final Draft, February 8, 2010), p. 137 24 2009 California Climate Adaptation Strategy, California Natural Resources Agency, p. 132-134 25 2009 California Climate Adaptation Strategy, California Natural Resources Agency, p. 127
7

Strategy 5 – TRANSPORTATION: Develop a detailed climate vulnerability assessment and adaptation plan for California’s transportation infrastructure. Near-Term and Long-Term Actions: a. Vulnerability and Adaptation Planning – Business, Transportation and Housing Agency (BTH)
and Caltrans will develop a climate vulnerability plan that will assess how California’s transportation infrastructure facilities are vulnerable to future climate impacts, assess climate adaptation options, prioritize for implementation, and select adaptation strategies to adopt in coordination with stakeholders. This plan will be coordinated with an updated climate mitigation plan that will act as BTH’s and Caltrans’ overall transportation climate policy.
i. Develop a transportation use “hot-spot” map – Caltrans will research and identify
transportation “hot spots” to identify across the state where the mixture of climate change impacts, population increases, and transportation demand increases will make communities most vulnerable to climate change impacts. Caltrans will include in this analysis how the lowest-income communities in hot spot areas will be impacted.
b. Economic Impacts Assessment – Complete an overall economic assessment for projected
climate impacts on the state’s infrastructure under a ”do nothing” scenario and under climate policy scenarios identified by BTH/Caltrans.
i. Prepare a list of transportation adaptation strategies or measures based on the “hot
spot” map and prepare an economic assessment and cost-benefit analysis for these strategies vs. a do nothing scenario.
Strategy 6 – TRANSPORTATION: Incorporate climate change vulnerability assessment planning tools, policies, and strategies into existing transportation and investment decisions. Near-Term and Long-Term Actions: a. Integrate Mitigation and Adaptation System-wide – Caltrans will develop and incorporate
climate change mitigation and adaptation policies and strategies throughout state strategic, system and regional planning efforts. These will be included in key phases of the following planning and project development phases when appropriate:
i. Strategic Planning (Governor’s Strategic Growth Plan and California Transportation
Plan) ii. System Planning (i.e., District System Management Plan, Interregional Strategic Plan,
Corridor System Management Plan, and Transportation Concept Report) iii. Regional Transportation Planning (RTP Guidelines and Regional Blueprint Planning) iv. Project planning (Project Development Procedures Manual, Project Initiation Document,
Project Report, Environmental Guidelines) v. Programming (State Transportation Improvement Program, State Highway Operations
and Protection Program, California Transportation Commission State Transportation Improvement Program Guidelines)
8

Strategy 7 – TRANSPORTATION: Develop transportation design and engineering standards to minimize climate change risks to vulnerable transportation infrastructure. Near-Term and Long-Term Actions: a. Transportation infrastructure assessment - Caltrans will assess existing transportation design
standards as to their adequacy to withstand climate forces from sea-level rise and extreme weather events beyond those considered.
b. Buffer zone guidelines - Develop guidelines to establish buffer areas and set backs to avoid
risks to structures within projected “high” future sea-level rise or flooding inundation zones. c. Stormwater quality - Assess how climate changes could alter size and design requirements for
stormwater quality best management practices. Strategy 8 – TRANSPORTATION: Incorporate climate change impact considerations into disaster preparedness planning for all transportation modes. Near-Term and Long-Term Actions: a. Emergency Preparedness – Caltrans provides significant emergency preparedness abilities for
all transportation modes across the state. The transportation system is sensitive to rapid increases in precipitation, storm severity, wave run-up, and other extreme weather events. Caltrans will assess the type of climate-induced impact information necessary to respond to district emergencies. Results will be incorporated into existing operations management plans.
b. Decision Support (Near-Term) – Caltrans will identify how climate impact information can be
integrated into existing Intelligent Transportation Systems and Transportation Management Center operations.
2010 California Regional Transportation Plan Guidelines Subsequent to the passage of California Assembly Bill (AB) 32 (California Global Warming Solutions Act of 2006), the California Transportation Commission (CTC) adopted an addendum to the 2007 RTP Guidelines in May 2008 to address a request from the California Legislature to ensure climate change issues were incorporated in the RTP process. 26 On April 7, 2010, the CTC approved the 2010 RTP Guidelines which incorporate new planning requirements as a result of Senate Bill (SB) 375 and also incorporate the addendum to the 2007 RTP Guidelines. SANDAG staff has been participating in this update process. SB 375 requires MPOs to identify a forecasted development pattern and transportation network that will meet greenhouse gas emission reduction targets specified by the California Air Resources Board (ARB) through their RTP planning processes.27
26 2010 California Regional Transportation Plan Guidelines (Final Draft, February 8, 2010), p. 14 27 2010 California Regional Transportation Plan Guidelines (Final Draft, February 8, 2010), p. 14
9

In addition, the CTC references the transportation adaptation strategies contained in the 2009 CAS for guidance on addressing Climate Change Adaptation. The CTC also endorses the CAS’ position on the need for significant changes in the planning, design, construction, operation, and maintenance of California’s infrastructure. The changes necessary to protect the state’s transportation infrastructure will require collaboration between multiple state, regional and local agencies. Regional planning agencies should incorporate these practices in the implementation of transportation strategies in conjunction with Caltrans, to the extent that they are feasible.28 Best Practices The 2010 California Regional Transportation Plan Guidelines states that notwithstanding a lack of reliable information on the future impacts of sea-level rise, precipitation changes, or extreme heat events, MPOs and RTPAs should begin to address climate change in their long-range transportation plans. There are numerous ways planning agencies can begin preparing for climate change adaptation on the transportation infrastructure including preliminary mapping of infrastructure that is vulnerable to changes in precipitation, heat, and sea-level rise. It is also recommended that design and planning standards be re-evaluated to accommodate potential changes. It is important to ensure that planned infrastructure is engineered and built in locations that can withstand future climate change impacts. The California Environmental Quality Act (CEQA) On December 30, 2009, the Resources Agency adopted an amendment to the CEQA Guidelines, Section 15126.2 Consideration and Discussion of Significant Environmental Impacts now requires an Environmental Impact Report (EIR) to evaluate the effects of climate change on the locating of a project in areas susceptible to hazardous conditions, e.g. floodplains, coastlines, wildfire risk areas as identified in authoritative hazard maps, risk assessments or in land use plans addressing such hazards areas. This Amendment became effective on March 18, 2010, and is now included in the California Code of Regulations.29 Other Agencies City of Chula Vista
In 2009, the City of Chula Vista began developing its Climate Change Adaptation Strategy (CCAS).30 The development of the CCAS also coincides with its participation in the International Conference on Climate Adaptation held in Seville, Spain in May 2009 and the resulting adaptation planning priorities (known as the “Seville Declaration”) agreed upon by various California and Spanish government entities. This cross continent exchange was held because of the similar climates the Andalusia region of Spain and Southern California share and potentially similar adaptation strategies they would likely need to implement. Participants of this event representing cities in California and Spain will continue an information exchange on climate adaptation best practices as both regions develop their adaptation strategies.
28 2010 California Regional Transportation Plan Guidelines (Final Draft, February 8, 2010), p. 137 29 California Environmental Quality Act (CEQA) Proposed Guidelines Amendments & Related Materials
ceres.ca.gov/ceqa/docs/Adopted_and_Transmitted_Text_of_SB97_CEQA_Guidelines_Amendments.pdf 30 City of Chula Vista: Climate Change Adaptation Strategy – Roadmap for Development, 2009.
10

In addition, the City of Chula Vista established a Climate Change Working Group (CCWG), which is comprised of Chula Vista residents, businesses, and community group representatives to assist in developing climate adaptation strategies suitable for Chula Vista. The Climate Change Working Group will be asked to use the following guiding principles to evaluate and prioritize possible adaptation options:
1. Seek out the best available science to understand local climate change impacts and their relative risks;
2. Give priority to policies that can build on existing work rather than policies which require new sources of funding or staffing;
3. Ensure that the legitimate interests of all City stakeholders are considered in evaluating options;
4. Develop policies flexible enough for future incorporation of new science or improved modeling, but defined well enough for staff to implement;
5. Ensure that adaptation strategies complement climate protection measures already in place in Chula Vista;
6. Consider strategies to adapt to both short- and long-term impacts from climate change, but only in areas where the group decides there is enough evidence to support the work;
7. Prioritize strategies in accordance with the degree of risk that different climate impacts pose to Chula Vista, its residents, and businesses;
8. Recommend adaptation strategies that address the most immediate risk in the most financially feasible way (i.e., require the least General Fund support);
9. The strategies chosen should not cause a significant adverse economic and/or environmental impact to the community;
10. Reach consensus on a preferred list of final recommended adaptation strategies which best meets all City stakeholders’ needs.
Following these guiding principles and through a community-based process, the development of a local CCAS would be incorporated into the City’s current Climate Action Plan, for City Council review and consideration by the end of 2010. The CCAS would address the following sectors projected to be adversely affected by climate change:
• Water Management • Energy Management • Infrastructure & Resources • Public Health • Wildfires • Ecosystems & Biodiversity • Business & Economy
11

City of Solana Beach The City Council has recently formed a Council Ad-Hoc subcommittee on Environmental Sustainability to work closely with the Clean and Green committee and provide direction to City staff on developing a Climate Protection Plan. This Plan is currently being developed in consultation with ICLEI (International Council for Local Environmental Initiatives). It would eventually be presented to the City Council for its approval and adoption into the City of Solana Beach’s revised General Plan. San Francisco Bay Area The Bay Conservation and Development Commission (BCDC) is dedicated to the protection and enhancement of San Francisco Bay and to the encouragement of the Bay's responsible use.31 The BCDC has taken a lead role in adaptation planning for the Bay Area. The BCDC will consider an amendment to the San Francisco Bay Plan, which regulates development within the 100-year floodplain of the Bay, to address climate change including adaptation strategies. The following are proposed amendments: 32 1. Proposed additions to Bay Plan findings and policies a. Create a climate change policy section of the Bay Plan that addresses the following:
(1) Updating sea-level rise scenarios and using them in the permitting process (2) Developing a long-term strategy to address sea-level rise and storm activity and
other Bay-related impacts of climate change in a way that protects the shoreline and the Bay; and
(3) Working with the Joint Policy Committee (JPC) and other agencies to integrate regional mitigation and adaptation strategies and adaptation responses of multiple government agencies, to analyze and support environmental justice issues, and to support research that provides useful climate change information and tools.
2. Proposed changes to existing Bay Plan findings and policies a. Amend findings and policies on public access to provide public access that is sited,
designed and managed to avoid significant adverse impacts from sea-level rise and ensure long-term maintenance of public access areas.
b. Amend findings and policies on tidal marshes and tidal flats to ensure that buffer zones
are incorporated into restoration projects where feasible and sediment issues related to sustaining tidal marshes are addressed.
31 The San Francisco Bay Area Bay Conservation and Development Commission’s website: www.bcdc.ca.gov/mission.shtml 32 Living with a Rising Bay: Vulnerability and Adaptation in San Francisco Bay and on its Shoreline. San Francisco Bay
Conservation and Development Commission, p. 7
12

c. Amend the policies on safety of fills by updating the findings and policies on sea-level rise and moving some to the new climate change section of the Bay Plan.
d. Amend the policies on protection of the shoreline to address protection from future
flooding. 3. The Metropolitan Transportation Commission (MTC) included the following actions to combat
global warming and help clean Bay Area air in its Transportation 2035 Plan:33
• Commits $400 million to fund a multi-agency Transportation Climate Action Campaign to reduce our carbon footprint, complementing MTC’s Transportation for Livable Communities Program, Regional Bicycle Program, Regional Rideshare Program, and other Transportation 2035 bicycle and pedestrian investments.
King County, Washington King County Climate Plan proposes to protect the integrity and safe operation of regional transportation infrastructure from climate change impacts.34 King County Road Services Division will incorporate climate change impacts information into construction, operations, and maintenance of infrastructure projects. Actions already underway by King County Road Services Division include: • Evaluation of higher flows on bridge and culvert design as well as seawall modifications; • Participation in King County’s interdepartmental climate change adaptation team; and • Initiation of educational efforts to facilitate the sharing of information among staff on the
projected impacts of climate change. In the near term, King County Road Services Division will incorporate climate change into its own planning and design documents, and comments on others’ planning and design documents, as they come up for revision. King County Road Services Division also plans to identify and expand policies and plans that adjust transportation infrastructure improvements and maintenance to ongoing and anticipated climate and weather changes. Additionally, the division is looking at ways to incorporate climate changes predicted in the future into current transportation project designs. For example, the Road Services Division is currently rebuilding over 57 bridges and 40 culverts that will need to be designed to improve streamflows and endure the most significant impacts of climate change. In the long-term, some strategies that are being considered by Road Services Division include: • Replacing or rehabilitating bridges in order to improve floodwaters conveyance and to avoid
scour during high flows; • Using pervious pavement and other low impact development methodologies to manage
stormwater through reduced runoff and onsite flow control; • Modifying existing seawalls to avoid failures in transportation facilities. 33 Transportation 2035 Plan Draft Environmental Impact Report. Metropolitan Transportation Commission, p. 14 34 2007 King County Climate Plan (February 2007). King County Departments and Divisions on Climate Change Impacts, p. 118
13

Issues and Policy Implications
One of the goals identified in the SANDAG 2010 Climate Action Strategy is to protect transportation infrastructure from climate change (Goal 4). This Strategy acknowledges that in addition to being the number one source of climate change emissions in our region, the transportation sector is threatened by the impacts of climate change. Adapting transportation infrastructure to prepare for climate change is emerging as a new concern for designing future projects as well as maintaining our current system. As such, the tools and methodologies for evaluating and adapting to impacts are still in the early stages of development. The Strategy outlines the following objectives and potential policy measures:35 Objective 4a. Protect transportation infrastructure from damage due to extreme heat Policy Measures • Direct research at developing materials for transportation infrastructure that is better suited
to withstand high temperatures. • Accelerate inspections schedules and prepare for increased maintenance and costs. • Utilize adaptive management and monitoring to determine which, if any, adaptive strategies
should be incorporated in transportation planning. • Address adaptation issues in the design of new projects and when improvements are made to
existing infrastructure. Objective 4b. Protect transportation infrastructure from sea-level rise and associated higher storm surges Policy Measures • Develop a climate vulnerability plan that will identify areas in San Diego at high risk of
damage from sea-level rise and storm surges. • Modify standards for project design and construction to account for increased potential storm
surge elevations and frequency. • Engage a multi-disciplinary team of climate change and coastal experts along with hydraulics
and bridge design specialists during scoping process of coastal bridge projects. • Utilize adaptive management and monitoring to determine which, if any, adaptive strategies
should be incorporated in transportation planning. • Address adaptation issues in the design of new projects and when improvements are made to
existing infrastructure.
35 SANDAG’s 2010 Climate Action Strategy - Final, p. 28
14

Objective 4c. Protect transportation infrastructure from wildfire-associated mudslides Policy Measures • Improve bank stabilization and erosion control measures near important transportation lines
after wildfire. • Address adaptation issues in the design of new projects and when improvements are made to
existing infrastructure. A main issue of concern is the lack of quantitative data on vulnerability available to begin to make concrete policy decisions and conduct economic impact assessments. The 2050 RTP is likely to produce a qualitative assessment of potential risks and preliminary evaluation of climate change adaptation strategies. At the project level, environmental clearance documents would conduct further evaluation related to climate change. Currently, DOTs and their partner agencies are evolving toward "risk management" approaches to asset management and investment programs. In a limited resource environment, a process that seeks to understand and manage the risks to the transportation system from climate change, rather than continuing with a "worst first" approach, is key to ensuring the most critical infrastructure continues to function adequately. Facilitation of cross-disciplinary collaboration (e.g., Design and Planning) within Caltrans and between local agencies is recommended. 36 RECOMMENDATIONS
1. SANDAG staff will continue to monitor the implementation of strategies in the CAS and evaluate which ones should be incorporated into the 2050 RTP.
2. The 2010 California RTP Guidelines suggest several ways to begin to address climate change adaptation issues. Following these Guidelines, SANDAG will evaluate the feasibility of developing preliminary mapping of infrastructure that is vulnerable to changes in precipitation, heat, and sea level rise in preparation for climate change adaptation on the transportation infrastructure.37
3. Staff will monitor the implementation of Executive Order S-13-08 which states that the California Resources Agency, in cooperation with the California Department of Water Resources (DWR), California Energy Commission (CEC), California's coastal management agencies, and the California Ocean Protection Council (OPC), shall request that the National Academy of Sciences (NAS) convene an independent panel to complete the first California Sea-level Rise Assessment Report. This report will guide state agencies that are planning construction projects in areas vulnerable to future sea-level rise shall, for the purposes of planning, consider a range of sea-level rise scenarios for the years 2050 and 2100 in order to
36 Summary Report: Peer Workshop on Adaptation to Climate Change Impacts Appendix A - Adaptation of Transportation
Infrastructure to Global Climate Change (GCC) Effects: Implications for Design and Implementation, U.S. Department of
Transportation, Federal Highway Administration Key Workshop Themes: December 2008. 37 United States Army Corps of Engineers (USACE) circular: Water Resource Policies and Authorities Incorporating Sea-Level
Change Considerations in Civil Works Programs
15

assess project vulnerability and, to the extent feasible, reduce expected risks and increase resiliency to sea-level rise. This report would be completed by March 2011.
4. The SANDAG 2010 Climate Action Strategy acknowledges that climate changes and their associated impacts vary greatly from location to location. Although national and international action is essential, many important decisions about how best to manage systems affected by climate change are made at the local and regional levels. The Strategy recommends that regional and local planning should reinforce and complement the recommendations given at the state and federal levels.38 Therefore, climate change adaptation recommendations from state and federal agencies will continue to be monitored and evaluated.
5. Staff will evaluate crossborder climate change adaptation strategies.
For Future Analysis
1. To develop an adaptation strategy tailored to the San Diego region, SANDAG would seek funding at the state or federal level to partner with other regional agencies to conduct a vulnerability analysis. However, before conducting this analysis, the NAS California Sea-level Rise Assessment Report and any similar research would be analyzed to assess whether additional vulnerability analysis would be necessary for the San Diego region. Understanding vulnerability to the extent feasible within the limitations of available science and resources is critical to developing adaptation strategies. This analysis would include the latest projections on sea-level rise scenarios and identify existing and planned vulnerable transportation infrastructure. Adaptation strategies could be individually tailored to each of these.
In this context, vulnerability occurs over a long timeframe and affects people differently in
the near-term and the long-term. Therefore, both short-term and long-term adaptation strategies should be identified. In the long-term, a variety of adaptation strategies involving many potential partners will be needed to deal effectively with sea-level rise in San Diego.
2. As Caltrans and BTH advance on the implementation of transportation strategies identified in
the 2009 California Climate Adaptation Strategy, evaluate data and findings that could be applicable to future RTP updates and infrastructure projects.
3. In order to avoid duplicating research efforts, existing and planned research will be assessed
for its applicability to better understand the impact of changes in sea level in other areas of strategic and economic importance, such as San Diego Naval Air Station North Island, San Diego International Airport, and the Port of San Diego. This analysis should provide the basis for further analysis of coastline vulnerabilities and the development of risk management strategies involving the public and private sectors. This analysis should also be conducted in the context that sea-level rise is expected to accelerate in decades following 2050.39
38 SANDAG’s 2010 Climate Action Strategy - Final, p. 14 39 Climate Change-Related Impacts in the San Diego Region by 2050, p. 38
16

17
BIBLIOGRAPHY
2008 Summary Report: Peer Workshop on Adaptation to Climate Change Impacts Appendix A - Adaptation of Transportation Infrastructure to Global Climate Change (GCC) Effects: Implications for Design and Implementation, U.S. Department of Transportation, Federal Highway Administration: www.fhwa.dot.gov/planning/statewide/pwsacci.htm
2007 Bindoff, N.L., J. Willebrand, V. Artale, A. Cazenave, J. Gregory, S. Gulev, K. Hanawa, C. Le Quéré, S. Levitus, Y. Nojiri, C.K. Shum, L.D. Talley, and A. Unnikrishnan, 2007: Observations: Oceanic Climate Change and Sea Level. In: Climate Change 2007: The Physical Science Basis. Contribution of Working Group I to the Fourth Assessment Report of the Intergovernmental Panel on Climate Change [Solomon, S., D. Qin, M. Manning, Z. Chen, M. Marquis, K.B. Averyt, M. Tignor, and H.L. Miller (eds.)]. Cambridge University Press, Cambridge, UK, and New York, pp. 385-432.
2009 California Climate Adaptation Strategy, California Natural Resources Agency
2009 Climate Change-Related Impacts in the San Diego Region by 2050
2009 Climate Change Adaptation Strategy – Roadmap for Development; City of Chula Vista, www.chulavistaca.gov/clean/PDFs/ClimateAdaptationRoadmap_FINAL.pdf
2008 Narvai, R. Climate Adaptation and California’s Transportation Infrastructure. Staff White Paper, California Department of Transportation. Sacramento, CA
2009 Integrating Climate Change into State and Regional Transportation Plans, Federal Highway Administration; Gallivan, Ang-Olson, and Turchetta Federal Highway Administration: itre.ncsu.edu/adc10/PDFs/2009_Winter_Conference/Turchetta_Session530_paper.pdf
2010 California Regional Transportation Plan Guidelines
2008 Living with a Rising Bay: Vulnerability and Adaptation in San Francisco Bay and on its Shoreline. San Francisco Bay Conservation and Development Commission
2009 Transportation 2035 Plan Draft Environmental Impact Report. Metropolitan Transportation Commission
2007 King County Climate Plan King County Departments and Divisions on Climate Change Impacts
2009 United States Army Corps of Engineers circular: Water Resource Policies and Authorities Incorporating Sea-Level Change Considerations in Civil Works Programs
2009 The San Francisco Bay Area Bay Conservation and Development Commission’s Web site: www.bcdc.ca.gov/mission.shtml
2010 SANDAG 2010 Climate Action Strategy – Final
2008 The San Diego Foundation’s Focus 2050 Study: San Diego’s Changing Climate – A Regional Wakeup Call

San Diego Association of Governments
TRANSPORTATION COMMITTEE
July 16, 2010 AGENDA ITEM NO.: 4
Action Requested: APPROVE
File Number 3320100 Introduction The California Public Utilities Code (PUC) Section 99238 requires that a Social Services Transportation Advisory Council (SSTAC) be created and maintained in each county to provide advice on social service transportation issues. The SSTAC for San Diego County was created in 2006. SANDAG also had a Transit Accessibility Advisory Committee (TAAC) that provided advice on physical accessibility issues for new transit equipment and construction projects. In order to reduce potential for overlap and the number of advisory committees, TAAC was merged into SSTAC in 2008.
SOCIAL SERVICES TRANSPORTATION ADVISORY COUNCIL MEMBERSHIP AND CHARTER AMENDMENT
Recommendation
The Transportation Committee is asked to approve (1) The reappointment of four members to the Social Services Transportation Advisory Council (SSTAC) for additional three-year terms; (2) The appointment of five new alternate citizen members; and (3) The restructuring of SSTAC membership and amendment of the SSTAC Charter.
When the two committees were merged, a new combined membership roster was created. The PUC requires one-third of the members of SSTAC to be appointed each year. On May 17, 2010, the SSTAC accepted a proposed amendment to its charter, which includes conditions for attendance and voting to better facilitate member participation at the meetings. This report recommends restructuring the membership structure of SSTAC, reappointing four out of the six members whose term expires this year for an additional three-year term, appointing five new citizen members to act as alternates, and approving the proposed amendment to the SSTAC Charter. Discussion Committee Restructuring Based on PUC requirements, the initial appointments to the new SSTAC were set up such that one-third of the members were appointed for a one-year term, one-third for a two-year term, and one-third for a three-year term. After these initial appointments, the term for reappointed members is three years.

Staff proposes splitting the citizen member category into two subcategories:
1. Two of the citizen members would be aligned to the membership requirements called for in the PUC that one member represent the interests of potential transit users who are 60 years of age or older, and that one member represent the interests of potential transit users who are disabled.
2. The remaining three citizen members would be designated as at-large voting members.
This proposed membership structure would satisfy the different roles being fulfilled by this committee by ensuring conformance with the PUC and achieving a diverse membership that will provide valuable insight into transportation issues and ensure a high-level knowledge of the Americans with Disabilities Act and Title 24 requirements. Alternate members would also be appointed for each of the five citizen members. Committee Appointments Of the 18 members that are currently appointed to SSTAC, six members’ terms will expire on August 1, 2010. SANDAG staff recommends the reappointment of four of the six SSTAC members whose terms are expiring. These members have exhibited a continued interest in promoting social service transportation, advocating for improving the accessibility of the transit system, and a commitment to attending regular meetings. The remaining two members whose terms are expiring are not recommended for reappointment due to their poor attendance records.
To fill the remaining vacancies, SANDAG issued a notice asking for interested individuals to submit a letter of consideration. This was accomplished through an announcement at a Transportation Committee Meeting, an e-mail sent to all subscribers of the Social Services Transportation listserve, and posting on the SANDAG Web page. On July 1, 2010, SANDAG staff met with the SSTAC Chairman to review the submissions. Six submissions were received, of which five are recommended to be included as alternate members based on qualifications and the current membership needs of the committee. The alternate members match the qualifications of the citizen members; however, they may only vote in the absence of a regular citizen member. The alternate members will provide an experienced pool to draw from as we need to fill openings from the citizen positions in the future.
The following tables show the recommended reappointments, new appointments, and those not recommended for reappointments: Recommended Reappointments
Member/Agency with Expiring Terms Existing Category Clive Richard At-Large Citizen Member Beth Butler-Arreola Two Representatives of Social Service Providers for
Persons with Disabilities (PUC Requirement) Full Access & Coordinated Transportation Two Representatives from the Consolidated
Transportation Service Agency (PUC Requirement) MTS Paratransit Two Representatives from each of the Transit
Operators
2

3
Recommended New Appointments New Member New Category
Clytie Koehler Special Interest Alternate Citizen Member (PUC Requirement) Tamara Airhart Special Interest Alternate Citizen Member (PUC Requirement) Judy Stern At-Large Alternate Citizen Member Erick Asero At-Large Alternate Citizen Member Hong Tran At-Large Alternate Citizen Member Charter Amendment Additionally, a proposed charter amendment is included as an attachment to this report. This amendment includes changes consistent with the new proposed membership structure, and additional changes that will allow the Chairperson to declare a position as vacant in circumstances of poor attendance. This will encourage improved attendance and also facilitate better member participation.
CHARLES “MUGGS” STOLL Director of Land Use and Transportation Planning Attachments: 1. SSTAC Membership and Terms Including Proposed Reappointments and New Appointments
2. SSTAC Proposed Charter Amendment Key Staff Contact: Daniel Levy, (619) 699-6942, [email protected]

Member Term (yrs.) Term Exp.* Member Term (yrs.) Term Exp.*
Clive Richard1 3 2013 Clytie Koehler2 2 2012
Sharlene Ornelas 1 2011 Tamara Airhart2 3 2013
Jackson Alexander 1 2011 Judy Stern2 3 2013
David Jackson 2 2012 Erick Asero2 2 2012
Chuck Lungerhausen 1 2011 Hong Tran2 3 2013
Floyd Willis 2 2012 County of San Diego, Aging and Independence Services
Brenda Bothel 1 2011 Jewish Family Services
Beth Butler-Arreola 3 2013 Deaf Community Services1
Anthony Ferguson 2 2012 San Diego Regional Center
Mac McGee 2 2012 All Congregations Together
Alane Haynes 3 2013 Full Access & Coordinated Transportation1
Arun Prem 1 2011 Full Access & Coordinated Transportation
Brent Boyd 2 2012 Metropolitan Transit System (MTS) Fixed Route
Dan McCaslin 3 2013 MTS Paratransit1
Bill Olszanicky 1 2011 North County Transit District (NCTD) Fixed Route
Scott Transue 2 2012 NCTD Paratransit
1 These citizen members/agencies are recommended for reappointment;approval by the Transportation Committee2 These members are recommended for appointment
Two (2) Representatives of Social Service Providers for Persons with Disabilities
One (1) Representative of Social Service Providers for Persons of Limited Means
Two (2) Representatives from the Consolidated Transportation Services Agency
Agency Members
Two (2) Representatives from Each of the Transit Operators
Attachment 1 Social Services Transportation Advisory Council Membership and Terms
Including Proposed Reappointments and New Appointments
Citizen Members
Two (2) Representatives of Social Service Providers for Seniors
At-Large AlternatesAt-Large Voting Members
Special Interest Voting Members Special Interest Alternates
Attachment 1
4
sgr
Rectangle

Revision 1: 8/1/08 Revision 2: 5/17/10
Attachment 2
COMMITTEE/WORKING GROUP CHARTER SOCIAL SERVICES TRANSPORTATION ADVISORY COUNCIL (SSTAC)
PURPOSE
The mission of the Social Services Transportation Advisory Council (SSTAC) is to review, recommend and encourage the use of accessible transportation services through:
• Promoting the coordination of transportation serving seniors, individuals with disabilities, and persons of limited means;
• Advising staff on transit facilities compliance with the requirements of the Americans with Disability Act (ADA) and Title 24; and
• Advising staff on the accessibility and usability of transit facilities beyond strict interpretation of regulations based on actual experience and knowledge.
LINE OF REPORTING
The Social Services Transportation Advisory Council Subcommittee is the successor group to the Subcommittee on Accessible Transportation (SCAT) that was formed by SANDAG in 1979 in response to federal and state requirements and increased local interest and involvement in accessibility issues. SSTAC advises SANDAG on regional planning issues regarding accessible transportation in the public and nonprofit sectors. SSTAC reports to the SANDAG Transportation Committee, which in turn reports to the SANDAG Board of Directors.
RESPONSIBILITIES
SSTAC advises the SANDAG Board of Directors and its Transportation Committee regarding regional issues of accessible transportation provided by the public and private sector. These activities include the following:
• Provide input on accessible transportation issues for SANDAG's Regional Transportation Plan (RTP), and other relevant SANDAG plans and programs;
• Provide input for the key activities required for the development of the Coordinated Public Transit Human Services Transportation Plan (Coordinated Plan). This includes assistance with the following activities: assessing current available services; identifying areas of duplicative service and gaps in service; identifying the transportation needs of individuals with disabilities, senior citizens, and persons of limited means; developing strategies for addressing the service gaps, and minimizing the duplication of services; prioritizing transportation services for funding and implementation based on resources, time, and feasibility for implementing the specific strategies identified; and reviewing the draft document for content and language;
• Serve as the Local Review Committee (LRC) and Appeals Board for the Section 5310 federal grant program administered by the State Department of Transportation (Caltrans), which provides
Attachment 2
5
sgr
Rectangle

5 Revision 1: 8/1/08 Revision 2: 5/17/10
partial funding for vehicles for nonprofit agencies;
• Serve as the region’s Social Service Transportation Advisory Council to advise SANDAG on the unmet transit needs of senior citizens and individuals with disabilities, as required by the State’s Transportation Development Act (TDA);
• Oversee the annual unmet needs process and make a determination of unmet needs as a recommendation to the Transportation Committee per Public Utilities Code 99238(c)(2);
• Provide input on the progress of the region's transit operators in providing accessible transportation to senior citizens and individuals with disabilities;
• Provide input regarding the legal and practical requirements of transit access to be analyzed by staff and as legally required and practically feasible, incorporated into the design and construction of transit facilities;
• Provide input on the progress of the region’s Coordinated Transportation Service Agency (CTSA) in assisting nonprofit agencies to coordinate their transportation services;
• Provide input and proposals to SANDAG on legislation and regulations concerning transportation for seniors and individuals with disabilities;
• Fulfill the requirement in the Public Utilities Code of California Section 99238.5 that the Transportation Planning Agency (SANDAG) establish and implement a citizen participation process to solicit the input of transit dependent, and transit disadvantaged persons, including the elderly, handicapped and persons of limited means;
• Assist transit operators in programs that promote use of existing transportation programs to better serve seniors and individuals with disabilities; and
• Comment on regional issues brought before the Committee, which are relevant to the implementation of accessible transportation services under federal and state legislation.
• SSTAC discusses issues of a regional nature, not specific to individual transit operators or to individual events or circumstances. Issues not appropriate to SSTAC discussion are referred to the appropriate transit operator or other organization with authority to resolve the issue.
MEMBERSHIP
Membership on SSTAC is defined designed to fulfill the requirements ofby the Public Utilities Code Section 99238, of the State of California. SANDAG shall strive to attain geographic and minority representation among the membership from a broad representation of providers and the public. Membership is divided into two categories:
CITIZEN MEMBERS:
1. One at-large citizen representative of potential transit users who is a senior 60 years or older
2. One at-large citizen representative of potential transit users who is disabled
1.3. ThreewoFour at-large citizen representatives of the interests of seniors, persons with limited means, or disabled transit users who are well versed in the ADA and Title 24 regulations;
AGENCY MEMBERS
6
sgr
Rectangle

6 Revision 1: 8/1/08 Revision 2: 5/17/10
2.4. Two representatives of the local social service providers for seniors, including one representative of a social service transportation provider, if one exists;
3.5. Two representatives of local social service providers for individuals with disabilities, including one representatives of a social service transportation provider, if one exists;
4.6. One representative of a local social service provider for persons of limited means;
5.7. Two representatives from the local consolidated transportation service agency, designated pursuant to subdivision (a) of Section 15975 of the Government Code, if one exists, including one representative from a transportation service provider, if one exists;
6.8. One representative from NCTD representing fixed-route service;
7.9. One representative from NCTD representing ADA Paratransit service;
8.10. One representative from MTS representing fixed-route service;
9.11. One representative from MTS representing ADA Paratransit service.
The term of appointment shall be for three years. Initial appointments shall be equally divided among members serving one-, two-, or three-year terms.
ALTERNATES Each of the first two citizen members shall be appointed an alternate. For the subcategory of at-large citizen members, up to three alternates shall be appointed. Agency members may appoint their own voting members to represent their agency on the council, and may also appoint alternates to fill that role when the primary voting is unable to attend the meeting. VOTING
The four at-large voting citizen members shall be drawn from a pool of senior and disabled transit users who are well versed in the ADA and Title 24 regulations. The following sequence shall determine which members of the pool will be voting members and which will act as alternates. Initially the sequence will be based on alphabetical order by first name, and subsequently will rotate every six months with the last person on the list moving to the head of the list.
ATTENDANCE AND VOTING In the circumstance of an absence of a voting citizen member, the Chairperson will choose an alternate to participate as a voting member based on attendance record or the current needs of SSTAC. Any voting or alternate (non-voting) at-large citizen member absent for three (3) consecutive meetings without having such absences excused by the Chairperson in advance of the meetings shall have their membership revoked. The Chairperson may assignwill choose an alternate with the most frequent attendance relative to the current needs of SSTAC to complete the remainder of the revoked member’s term. If the Chairperson does not assign an alternate, then the first citizen member alternate in alphabetical order by first name shall be the replacement to complete the remainder of the revoked member’s term. A voting at-large citizen member whose membership is revoked for non-attendance may be reinstated instead as an alternate at-large citizen member upon a majority vote of the council. If an agency representative of a social service provider is absent for three (3) consecutive meetings without having such absences excused by the Chairperson in advance of the meetings, the position shall
7
sgr
Rectangle

7 Revision 1: 8/1/08 Revision 2: 5/17/10
be declared vacant. The Chairperson may then assign an agency within the same category of social service providers to complete the remainder of the term. MEETING TIME AND LOCATION
Meetings are usually held on the third Monday of every other month from 10:00 a.m. to 12:00 p.m. in a location that is accessible by public transit and in facilities accessible to individuals with disabilities. . Meetings are usually held in San Diego, either at the Caltrans District 11 Office or at SANDAG but may be held in other locations within San Diego County, depending on the agenda and availability of meeting space. Additional meetings or time and date adjustments may be made by the Chairperson when necessary. ANNUAL PUBLIC HEARING
SSTAC shall hold a minimum of one public hearing for the purposes of receiving public comment on public transit services from the transit dependent, elderly and persons of limited means. The hearing(s) shall be scheduled to ensure broad community participation and should be rotated among the various communities within San Diego County. UNMET NEEDS PUBLIC HEARING
The Transportation Development Act (TDA) of the State of California requires the SSTAC to hold Public Hearings in any year if any TDA funds for that year are not fully expended on public transit. The purpose of the hearings is to provide an opportunity for the public to identify potential transit needs that are not being met and are reasonable to be met with the unspent TDA funds. If there are TDA funds that are not expended for public transit in San Diego County the SSTAC shall hold a minimum of one public hearing for the purposes of receiving public comment on unmet transit needs from the transit dependent seniors and persons of limited means. The hearing(s) shall be scheduled to ensure broad community participation and should be rotated among the various communities within San Diego County. SELECTION OF THE CHAIR
A Chairperson and Vice Chairperson, or Co-Chairpersons, are nominated and elected annually by the membership to serve one-year terms. The Chairperson conducts meetings. The Vice Chair-person shall conduct the meetings in the absence of the Chairperson. A voting or alternate at-large citizen member may be elected Chair or Vice-Chair, but would retain their status as voting or non-voting member during his/her tenure.
STAFF LIAISON
SANDAG shall provide staff support for SSTAC. The services to be provided by SANDAG shall include, but not be limited to assisting the Chairman in preparing the agenda, sending out meeting notices, and preparing records of meetings. DURATION OF EXISTENCE
SSTAC is a standing working group that fulfills a state mandate and shall continue to function unless dissolved by the SANDAG Board of Directors or Transportation Committee.
8
sgr
Rectangle

San Diego Association of Governments
TRANSPORTATION COMMITTEE
July 16, 2010 AGENDA ITEM NO.: 5
Action Requested: RECOMMEND
2008 REGIONAL TRANSPORTATION IMPROVEMENT PROGRAM: File Number 1500300 AMENDMENT NO. 23 AND AIR QUALITY CONFORMITY ANALYSIS
Introduction
SANDAG, as the Metropolitan Planning Organization (MPO), is responsible for the adoption of the Regional Transportation Improvement Program (RTIP). The 2008 RTIP must conform to the State Implementation Plan (SIP) for air quality. Conformity to the SIP means that transportation activities in the 2008 RTIP will not create new air quality violations, worsen existing violations, or delay the attainment of the national ambient air quality standards. The SANDAG Board adopted the 2008 RTIP including the regional emissions analysis at its meeting on July 25, 2008. The 2009 Federal State Transportation Improvement Program (FSTIP), which includes the SANDAG 2008 RTIP, received federal approval on November 17, 2008.
Recommendation
The Transportation Committee is asked to recommend that the Board of Directors approve Resolution No. 2011-02 (Attachment 1), including Amendment No. 23 to the 2008 RTIP as well as a finding of conformity and the redetermination of the 2030 RTP.
SANDAG has received a request from the City of San Marcos to add one new capacity-increasing project to the 2008 RTIP in order to advertise the project for construction this summer. The addition of this new capacity-increasing project to the RTIP requires a new regional emissions analysis. SANDAG has updated the regional emissions analysis that incorporates this new project, and a draft report was presented to the Conformity Working Group at its May 5, 2010, meeting. The draft 2008 RTIP including the draft Air Quality Conformity was distributed for a 30-day review and public comment on June 9, 2010. To date, no comments have been received in regard to the updated air quality emissions analysis or to the new project.
Discussion
The 2008 RTIP is the multiyear program of proposed major highway, arterial, transit, and bikeway projects in the San Diego region covering the period FY 2009 to FY 2013. SANDAG processes amendments to the RTIP generally on a quarterly basis and occasionally on a more frequent basis as circumstances arise. Amendment No. 23 represents a special amendment to add one new capacity-increasing project and conduct a new Air Quality Emissions Analysis incorporating the new project. Attachment 2 updates the relevant sections for the 2008 RTIP related to Amendment No. 23. Below summarizes the change proposed in this amendment, with additional details included in Chapter 2 of Attachment 2.
2
San Marcos
• Eastbound State Route 78 (SR 78) Auxiliary Lanes (SM44): This amendment proposes to add a new project which will construct two auxiliary lanes along eastbound SR 78 between Woodland Parkway and Nordahl Interchanges in the city of San Marcos. Total project is $14,500,000.
Fiscal Constraint Analysis
Federal regulations require the 2008 RTIP to be a revenue-constrained document with programmed projects based upon available or committed funding and/or reasonable estimates of future funding. Chapter 2 of Attachment 2 provides updated program summaries including a comparison from the prior approved amendment. Based upon the analysis, the projects contained within the 2008 RTIP, including Amendment No. 23, are reasonable when considering available funding sources.
Air Quality Analysis
On July 25, 2008, SANDAG found the 2008 RTIP in conformance with the Regional Air Quality Strategy/State Implementation Plan (SIP) for the San Diego region in accordance with the provisions of 40 Code of Federal Regulations (CFR) Parts 51 and 93. All of the required regionally significant capacity-increasing projects were included in the quantitative emissions analysis conducted for the 2030 San Diego Regional Transportation Plan: Pathways for the Future (2030 RTP) and the
2008 RTIP. The Federal Highway Administration (FHWA) and the FTA jointly approved the conformity determination for the 2008 RTIP and the conformity redetermination for the 2030 RTP on November 17, 2008. SANDAG updated the air quality conformity analysis as part of Amendment No. 16 to the 2008 RTIP (SANDAG approval on January 22, 2010; FHWA/FTA approval on February 19, 2010). This amendment again updates the conformity analysis.
The project in RTIP Amendment No. 23 meets the conformity provisions of the Transportation Conformity Rule (40 CFR §93.122(g)). An additional Air Quality analysis was conducted for the SM44 capacity-increasing project in Amendment No. 23 through a quantitative emissions analysis included in Chapter 3 of Attachment 2. SANDAG followed interagency consultation procedures. Amendment No. 23 does not interfere with the timely implementation of Transportation Control Measures. The 2008 RTIP, including Amendment No. 23, remains in conformance with the SIP.
LAUREN WARREM Director of Finance
Attachments: 1. Draft Resolution No. 2011-02: Approving Amendment No. 23 to the 2008 RTIP 2. Draft 2008 Regional Transportation Improvement Program (RTIP) Amendment
No. 23 Including Air Quality Conformity
Key Staff Contact: Sookyung Kim, (619) 699-6909, [email protected]

Attachment 1
3
401 B Street, Suite 800 San Diego, CA 92101 Phone (619) 699-1900 • Fax (619) 699-1905 www.sandag.org
RESOLUTION NO. 2011-02
APPROVING AMENDMENT NO. 23 TO THE 2008 REGIONAL TRANSPORTATION IMPROVEMENT PROGRAM
WHEREAS, on July 25, 2008, SANDAG adopted the 2008 Regional Transportation Improvement Program (RTIP) and found the 2008 RTIP in conformance with the 1998 Regional Air Quality Strategy (RAQS) and the applicable State Implementation Plans (SIP); and
WHEREAS, on November 17, 2008, the United States Department of Transportation (USDOT) determined the 2008 RTIP and 2030 San Diego Regional Transportation Plan: Pathways for the Future (2030 RTP) conform to the applicable SIPs in accordance with the provisions of 40 Code of Federal Regulations (CFR) Parts 51 and 93; and
WHEREAS, on January 22, 2010, SANDAG approved Amendment No. 16 to the 2008 RTIP and found it in conformance with the 1998 Regional Air Quality Strategy (RAQS) and the applicable State Implementation Plans (SIP); and
WHEREAS, on February 19, 2010, the United States Department of Transportation (USDOT) determined Amendment No. 16 to the 2008 RTIP and 2030 RTP to conform to the applicable SIPs in accordance with the provisions of 40 Code of Federal Regulations (CFR) Parts 51 and 93; and
WHEREAS, the City of San Marcos requested the addition of one new capacity-increasing project for inclusion in the 2008 RTIP as shown in Chapter 2 of Attachment 2; and
WHEREAS, the amendment is consistent with the metropolitan transportation planning regulations per 23 CFR Part 450; and
WHEREAS, this amendment is consistent with the 2030 RTP which conforms to the 2003 and 2006 SIP and to the emissions budgets from the Eight-Hour Ozone Attainment Plan for San Diego County, which were found adequate for transportation conformity purposes by the U.S. Environmental Protection Agency in 2008; and
WHEREAS, the updated Air Quality Conformity report for Amendment No. 23 to the 2008 RTIP as shown in Chapter 3 of Attachment 2 has been found to be in conformance with the 1998 Regional Air Quality Strategy (RAQS)/1982 State Implementation Plan (SIP); and
WHEREAS, Amendment No. 23 to the 2008 RTIP continues to provide for timely implementation of transportation control measures contained in the adopted RAQS/SIP for air quality and a quantitative emissions analysis demonstrates that the implementation of the RTIP projects and programs meet all the federally required emissions budget targets; and

RESOLUTION NO. 2011-02 Page 2
WHEREAS, projects in Amendment No. 23 satisfy the transportation conformity provisions of 40 CFR 93.122(g) and all applicable transportation planning requirements per 23 CFR Part 450; and
WHEREAS, all other projects in Amendment No. 23 are either noncapacity increasing or exempt from the requirements to determine conformity; and
WHEREAS, the 2008 RTIP Amendment No. 23 is fiscally constrained as shown in Tables 2-1a through 2-1c (Chapter 2 of Attachment 2); and
NOW THEREFORE
BE IT RESOLVED, that SANDAG finds the 2008 RTIP, including Amendment No. 23, is consistent with the 2030 RTP, is in conformance with the applicable SIPs and 1998 RAQS for the San Diego region, is consistent with SANDAG Intergovernmental Review Procedures, and is consistent with SANDAG Public Participation Policy, as amended.
BE IT FURTHER RESOLVED, that all regionally significant capacity-increasing projects included in Amendment No. 23 to the 2008 RTIP are included in the 2030 RTP;
PASSED AND ADOPTED this 23rd day of July 2010.
________________________________________ ATTEST: ________________________________________
CHAIRPERSON SECRETARY
MEMBER AGENCIES: Cities of Carlsbad, Chula Vista, Coronado, Del Mar, El Cajon, Encinitas, Escondido, Imperial Beach, La Mesa, Lemon Grove, National City, Oceanside, Poway, San Diego, San Marcos, Santee, Solana Beach, Vista, and County of San Diego.
ADVISORY MEMBERS: California Department of Transportation, Metropolitan Transit System, North County Transit District, Imperial County, U.S. Department of Defense, San Diego Unified Port District, San Diego County Water Authority,
Southern California Tribal Chairmen’s Association, and Mexico.
4

DRAFT 2008
REGIONAL TRANSPORTATION IMPROVEMENT PROGRAM (RTIP)
AMENDMENT NO. 23
July 23, 2010
401 B Street, Suite 800 • San Diego, CA 92101-4231 • (619) 699-1900
Attachment 2


iii
TABLE OF CONTENTS
Chapter 1 – EXECUTIVE SUMMARY Overview .................................................................................................................................3 Consistency with the 2030 RTP ..................................................................................3 Financial Capacity Analysis .........................................................................................3 Air Quality Conformity Determination ........................................................................4 Public Participation .....................................................................................................4 Chapter 2 – FINANCIAL CAPACITY ANALYSIS Program and Revenues ............................................................................................................9 Chapter 3 – AIR QUALITY CONFORMITY ANALYSIS Demonstration of Fiscal Constraint ........................................................................................14 Development of Transportation Control Measures.................................................................15 Air Quality Conformity Requirements ....................................................................................15 Quantitative Emissions Analysis .............................................................................................17 Emissions Budget Analysis .....................................................................................................17 Conclusion ............................................................................................................................20 Appendix A – Projects Exempt from Air Quality Conformity Determination Appendix B – Regional Emissions Analysis and Modeling Procedures Appendix C – Public Participation Policy Appendix D – Glossary of Terms and Acronyms

LIST OF TABLES
Chapter 1 – EXECUTIVE SUMMARY
Table 1-1 2008 RTIP Transportation Control Measure Projects ............................................................ 6
Table 1-2 2008 RTIP Amendment No. 23............................................................................................ 7
Chapter 2 – FINANCIAL CAPACITY ANALYSIS Table 2-1a 2008 RTIP Revenue Summary............................................................................................ 10
Table 2-1b 2008 RTIP Program Summary............................................................................................ 11
Table 2-1c 2008 RTIP Program Capacity ............................................................................................. 12
CHAPTER 3 – AIR QUALITY CONFORMITY ANALYSIS Table 3-1 San Diego Region Transportation Control Measure Projects .............................................. 18
Table 3-2 Air Quality Conformity Analysis (Eight Hour Ozone) .......................................................... 19
Table 3-3 Air Quality Conformity Analysis (CO)................................................................................. 19
iv

Chapter 1
EXECUTIVE SUMMARY


3
(Insert blank page)
Chapter 1
EXECUTIVE SUMMARY
OVERVIEW
The 2008 Regional/Federal Transportation Improvement Program (RTIP) is a multi-billion dollar, five-year program of major highway, transit arterial, and nonmotorized projects funded by federal, state, TransNet local sales tax, and other local and private funding covering the years FY 2008/09 to FY 2012/13. The 2008 RTIP, which includes the air quality emissions analysis for all regionally significant projects, requires approval by the Federal Highway Administration (FHWA) and the Federal Transit Administration (FTA).
The 2008 RTIP is a prioritized program designed to implement the region’s overall strategy for providing mobility and improving the efficiency and safety of the transportation system, while reducing transportation related air pollution in support of efforts to attain federal and state air quality standards for the region. The 2008 RTIP also incrementally implements the Regional Transportation Plan (RTP), the long-range transportation plan for the San Diego region.
Amendment No. 23 to the 2008 RTIP adds one new capacity increasing project. The 2008 RTIP document, published in July 2008, fully documents the RTIP development process, project listings, financial capacity analysis, and the air quality conformity analysis. This report focuses on updated fiscal capacity analysis and new regional air quality emissions analysis for conformity purposes. The Final 2008 RTIP document as well as all subsequent amendments is available on the SANDAG Web site.
Consistency with the 2030 RTP
On December 10, 2007, FHWA and FTA issued a finding that the SANDAG 2030 revenue constrained RTP entitled, San Diego 2030 Regional Transportation Plan: Pathways for the Future (2030 RTP), was in conformance with federal air quality and planning regulations. On January 22, 2010, the SANDAG Board adopted the 2008 RTIP Amendment No. 16 and its conformity finding including the redetermination of the 2030 RTP. The U.S. DOT made a finding of conformity for the amendment on February 19, 2010. The 2008 RTIP, including Amendment No. 23, remains consistent with the 2030 RTP. As a financially-constrained document, the 2008 RTIP contains only those major transportation projects listed in the revenue-constrained plan of the 2030 RTP.
Financial Capacity Analysis
Federal regulations require the 2008 RTIP to be a revenue-constrained document with programmed projects based upon available or committed funding and/or reasonable estimates of future funding. Funding assumptions are generally based upon: (1) authorized or appropriated levels of federal and state fundingfrom current legislation; (2) conservative projections of future federal and state funding based upon a
continuation of current funding levels; (3) the most current revenue forecasts for the TransNet program; and (4) the planning and programming documents of the local transportation providers.
Chapter 4 of the Final 2008 RTIP discusses in detail the financial capacity analysis of major program areas including discussion of available revenues. Table 1-2 includes the project proposed for Amendment No. 23. Tables 2-1a to 2-1c of Chapter 2 demonstrate that the 2008 RTIP is fiscally constrained. Based upon this analysis, the projects contained within the 2008 RTIP, including the project in Amendment No. 23, are reasonable when considering available funding sources.
Air Quality Conformity Determination
Federal metropolitan planning and air quality regulations prescribe the process for determining air quality conformity. These regulations require that the proposed RTIP: (1) provide for the timely implementation of transportation control measures (TCMs); (2) include a quantitative emissions analysis of projects programmed in the RTIP, including all regionally significant projects; and (3) be within the region’s emissions budgets (targets) included in the approved State Implementation Plan (SIP).
The 2008 RTIP programs substantial funds for the implementation of the four TCMs (identified as “T-tactics”) adopted in the 1982 Regional Air Quality Strategy (RAQS)/1982 SIP for air quality improvement. As shown in Table 1-1, the TCMs/T-tactic projects programmed for implementation total approximately $3.1 billion, or approximately 31 percent of the total funds programmed. Included are $23.9 million for Ridesharing, $2.9 billion for Transit Improvements, $108.6 million for Bicycle Facilities and Programs, and $121.6 million for Traffic Flow Improvements. Based upon this analysis, the 2008 RTIP including Amendment No. 23 provides for the expeditious implementation of the four existing TCMs in the 1982 Revised RAQS, which remain the federally approved TCMs for the San Diego region.
Quantitative air quality emissions analyses were conducted for the years 2008, 2010, 2020, and 2030 revenue constrained transportation scenarios, as shown in Chapter 3. A draft report that discusses the results of this analysis, including Amendment No. 23, was reviewed by the San Diego Region Conformity Working Group (CWG) at its meeting on May 5, 2010 and is scheduled to be released for public comment on June 9, 2010. The 2008 RTIP Amendment No. 23 meets the conditions for determining conformity with the applicable SIP for air quality. A detailed description of the regional emissions analysis and modeling procedures conducted for the 2008 RTIP is included in Appendix C of the Final 2008 RTIP. Chapter 3 of this report summarizes the air quality conformity analysis for Amendment No. 23.
Public Participation
It is the policy of SANDAG to encourage public participation in the development of agency planning and programming activities. SANDAG has various working groups made up of stakeholders and other members of the public. The public is provided opportunities to participate through comment at SANDAG Board and committee meetings, SANDAG public notices of document availability and public hearings, and through the SANDAG public communications program. Pursuant to 23 U.S.C. 134(i), the draft RTIP was released for public review and comment for a minimum of 30 days and a public hearing was held on July 18, 2008. Appendix B contains the portion of the Public Participation Policy, which refers to the RTIP process of public involvement. The Policy, in its entirety, can be found on the SANDAG website at www.sandag.org.
Examples of public outreach efforts and ongoing participation include:
4

Independent Taxpayer Oversight Committee (ITOC): In conformance with 2004 TransNet measure, a citizen advisory committee, the ITOC, oversees projects funded through the TransNet program. As the document through which SANDAG identifies TransNet projects, the RTIP is reviewed by the ITOC, and their comments on the TransNet Program of Projects are conveyed to the SANDAG Transportation Committee, and ultimately, to the Board of Directors.
Tribes: In addition to sending out notices to local tribal governments regarding the development of the RTIP, SANDAG actively solicited participation from the 17 tribal governments, along with the Reservation Transportation Authority in San Diego County. SANDAG hosted a tribal forum made up of elected officials from each of the tribes. SANDAG also held a workshop specifically to seek involvement in the regional planning and programming processes.
Public Workshops: SANDAG provided information for the 2008 RTIP and sought comments during a special workshop developed for the 2030 San Diego RTP: Pathways for the Future. Five workshops were held in various parts of the county. The outreach effort for the RTP included an extensive public involvement program and was conducted as part of the RTP update process. The goal of the program was to secure participation from a broad range of groups and individuals in the RTP development and decision-making process. Activities included a community-based outreach program, updates through the rEgion electronic newsletter, public speaking engagements, among other efforts.
Expansion of Electronic Notifications: In addition to the current list of external industry professionals, SANDAG continually strives to expand the notifications to other citizen-involved working groups.
Appendix A in the 2008 RTIP describes the SANDAG public participation process and includes a copy of the latest the Public Participation Policy which contains the section specifically addressing the RTIP development and amendment process.
At its meeting on December 18, 2009, the SANDAG Board of Directors adopted an updated Public Participation Plan (PPP). The updated PPP reflects the SANDAG commitment to public participation and involvement to include all residents and stakeholders in the regional planning and decision-making process. The development of the PPP was a six-month collaborative process from June to December 2009 that included development, input, and feedback from the SANDAG Policy Advisory Committees, Regional Planning Stakeholders Working Group, community and business groups, residents, and other stakeholders.
The PPP was developed in accordance with guidelines established by Federal Highway Administration for metropolitan transportation planning (23 CFR 450.316). It addresses Title VI, related nondiscrimination requirements, and reflects the principles of social equity and environmental justice. Included in the PPP are procedures, strategies, and outcomes associated with the ten requirements listed in 23 CFR 450.316. The PPP also fulfills various state and federal public involvement requirements.
5

Table 1-1
2008 RTIP - SAN DIEGO REGION (IN $000s) TRANSPORTATION CONTROL MEASURE PROJECTS RIDESHARING Other - Transportation Demand Management (TDM) $23,930 Subtotal $23,930 TRANSIT IMPROVEMENTS Transit - Bus/Rail Infrastructure $625,984 Transit - Bus/Rail Intermodal Stations $178,875 Transit - Bus/Rail Vehicle Purchase $433,001 Transit - I-15 BRT $107,660 Transit - Mid-Coast $122,023 Transit - Other BRT $191,667 Transit - Other Bus/Rail (Operations/Planning) $777,619 Transit - Sprinter $460,266 Subtotal $2,882,588 BICYCLE FACILITIES PROJECTS Other - Bicycle/Pedestrian Projects $108,619 Subtotal $108,619 TRAFFIC FLOW IMPROVEMENTS Other - Transportation Management System/Intelligent Transportation System $89,775 Local Streets and Roads - Traffic Signal Projects $31,819 Subtotal $121,594 Total All Transportation Control Measure Projects in 2008 RTIP TCM Total : $3,136,731 Total All Transportation Projects in 2008 RTIP: $10,149,846 Share of Transportation Control Measure Projects in 2008 RTIP: 30.9%
6

Table 1-2
San Diego Region (in $000s)
2008 Regional Transportation Improvement Program
Amendment No. 23
MPO ID:TITLE:
SM44Eastbound SR-78 Auxiliary lane
San Marcos, City of
Capacity Status: CI 08-23RTIP #:
From Woodland Parkway to Nordahl Road - construct auxiliary lanes along eastbound SR-78 between
Woodland Parkway Interchange and Nordahl Road Interchange; includes widening of Mission Road
undercrossing.
DESCRIPTION:
CHANGE REASON: New project
EST TOTAL COST: $14,500
CONRWPEPRIORTOTAL 08/09 09/10 10/11 11/12 12/13
Local Funds $750 $3,250 $1,250 $2,750 $4,000
SHOPP Augmentation - Mobility $10,500 $10,500 $10,500
TOTAL $14,500 $750 $13,750 $1,250 $13,250
Thursday, May 27, 2010
7

Chapter 2
FINANCIAL CAPACITY ANALYSIS

Chapter 2
FINANCIAL CAPACITY ANALYSIS
This chapter provides an update to the analysis of the financial capacity of the region's programmed transportation projects. Financial capacity is measured by a comparison of the total cost of the proposed projects against the available revenues and a test of the reasonableness of the revenue assumptions.
Overview of the program and available revenues by funding sources is provided for all projects included in Chapter 4 of the Final 2008 RTIP. The assumptions used in the forecasts of available funding are based upon information in the Final 2008 State Transportation Improvement Program (STIP) adopted by the California Transportation Commission (CTC) in November 2007, forecasts provided by the California Department of Transportation, and other forecasts of ongoing transportation funding programs. For the local transportation sales tax program (TransNet), the forecast was updated which takes into account the recent economic trend.
PROGRAM AND REVENUES
Table 2-1a summarizes the revenues available by major funding source (i.e., federal, state, and local), Table 2-1b summaries the program using the revenues, and Table 2-1c provides the remaining revenues available for additional programming. Tables 2-1a to 2-1c include all costs and revenues for all projects in the 2008 RTIP including Amendment No. 23.
Note: the fiscal constraint analysis is through Amendment No. 24, which was approved by the state on April 20, 2010 as an administrative amendment to the 2008 RTIP.
9

Previous Current Previous Current Previous Current Previous CurrentCURRENT
TOTALSales Tax $457,000 $456,994 $535,184 $534,497 $465,615 $465,615 $421,399 $421,399 $1,878,505
City $0 $0 $0 $0 $0 $0 $0 $0 $0County $424,840 $424,834 $516,459 $515,771 $449,538 $449,538 $405,092 $405,092 $1,795,235Other (Transportation Development Act) $32,160 $32,160 $18,725 $18,726 $16,077 $16,077 $16,307 $16,307 $83,270
Other Local Funds $115,872 $115,892 $284,719 $285,469 $225,921 $229,171 $152,440 $152,440 $782,972City General Funds $92,335 $92,355 $87,309 $88,059 $84,984 $88,234 $64,440 $64,440 $333,088Street Taxes and Developer Fees $23,537 $23,537 $197,410 $197,410 $140,937 $140,937 $88,000 $88,000 $449,884Other (registration fees (AB434) and Prop 42) $0 $0 $0 $0 $0 $0 $0 $0 $0
Transit** $35,637 $35,637 $30,534 $30,534 $36,589 $36,589 $74,884 $74,884 $177,644Other Transit (e.g., parcel/property taxes, parking revenue, etc) $35,637 $35,637 $30,534 $30,534 $36,589 $36,589 $74,884 $74,884 $177,644
Local Total $608,509 $608,523 $850,437 $850,500 $728,125 $731,375 $648,723 $648,723 $2,839,121State Highway Operations and Protection Program (SHOPP $40,628 $40,628 $72,284 $72,284 $200,524 $211,024 $114,637 $114,367 $438,303
SHOPP (Including Augmentation) $40,628 $40,628 $47,088 $47,088 $200,524 $211,024 $114,637 $114,367 $413,107SHOPP Prior $0 $0 $25,196 $25,196 $0 $0 $0 $0 $25,196
State Transportation Improvement Program (STIP) $27,134 $27,134 $7,323 $7,323 $58,141 $58,141 $34,728 $34,728 $127,326STIP (Including Augmentation) $22,134 $22,134 $7,323 $7,323 $58,141 $58,141 $34,728 $34,728 $122,326STIP Prior $5,000 $5,000 $0 $0 $0 $0 $0 $0 $5,000Proposition 1B $17,291 $17,291 $18,157 $18,157 $13,720 $13,720 $98,060 $98,060 $147,228STP Enhancement $2,855 $2,855 $625 $625 $186 $186 $519 $519GARVEE Bonds $21,835 $21,835 $21,835 $21,835 $21,835 $21,835 $21,835 $21,835 $87,340Highway Maintenance - State Cash $0 $0 $2,851 $2,851 $0 $0 $0 $0 $2,851Traffic Congestion Relief Program $6,850 $6,850 $10,002 $10,002 $0 $0 $0 $0 $16,852State Transit Assistance (STA) $0 $0 $0 $0 $0 $0 $0 $0 $0Other (FSP, Prop 116, R&I) $3,400 $3,400 $3,396 $3,396 $4,356 $4,356 $2,895 $2,895 $14,047
State Total $119,993 $119,993 $136,473 $136,473 $298,762 $309,262 $272,674 $272,404 $838,132Federal Transit Administration
Bus and Bus Related Grants (5309c) $3,151 $3,151 $778 $778 $0 $0 $0 $0 $3,929Clean Fuel Formula Program (5308) $0 $0 $0 $0 $0 $0 $0 $0 $0Elderly & Persons with Disabilities Formula Program (5310) $874 $874 $0 $0 $0 $0 $0 $0 $874Fixed Guideway Modernization (5309a) $22,881 $22,881 $22,532 $22,532 $20,956 $20,956 $21,813 $21,813 $88,182Intercity Bus (5311f) $0 $0 $0 $0 $0 $0 $0 $0 $0Job Access and Reverse Commute Program (5316) $2,065 $2,065 $1,687 $1,687 $1,754 $1,754 $1,825 $1,825 $7,331Metropolitan Planning (5303) $0 $0 $0 $0 $0 $0 $0 $0 $0New and Small Starts (Capital Investment Grants) (5309b) $19,500 $19,500 $5,700 $5,700 $0 $0 $0 $0 $25,200New Freedom (SAFETEA-LU) $1,708 $1,708 $827 $827 $868 $868 $865 $865 $4,268Nonurbanized Area Formula Program (5311) $976 $975 $651 $651 $677 $677 $704 $704 $3,007Public Transportation on Indian Reservation (5311c) $0 $0 $0 $0 $0 $0 $0 $0 $0Transit in the Parks (5320) $0 $0 $0 $0 $0 $0 $0 $0 $0Urbanized Area Formula Program (5307) $63,361 $63,361 $68,260 $68,260 $63,127 $63,127 $64,460 $64,460 $259,208CMAQ/5307 Transfer $0 $0 $0 $0 $0 $0 $0 $0 $0ARRA - FTA 5307 $76,799 $76,799 $4,000 $4,000 $0 $0 $0 $0 $80,799ARRA - FTA 5309 $2,873 $2,873 $0 $0 $0 $0 $0 $0 $2,873ARRA - FTA 5311 $980 $980 $0 $0 $0 $0 $0 $0 $980ARRA - FTA Transit Investment for Greenhouse Gas Energy Red $0 $0 $2,000 $2,000 $0 $0 $0 $0 $2,000ARRA - FRA TIGER Discretionary Grant $0 $0 $0 $0 $20,200 $20,200 $0 $0 $20,200Other (TSGP) $1,744 $1,744 $0 $0 $0 $0 $0 $0 $1,744
Federal Transit Total $196,912 $196,911 $106,435 $106,435 $107,582 $107,582 $89,667 $89,667 $500,595Federal Highway Non-Discretionary
Congestion Mitigation and Air Quality (CMAQ) $31,352 $31,352 $30,702 $30,702 $31,254 $31,254 $31,817 $31,817 $125,125Surface Transportation Program (Regional) $35,578 $35,578 $32,147 $32,147 $32,726 $32,726 $33,316 $33,316 $133,767Highway Bridge Program (HBP) $10,678 $10,678 $35,174 $35,174 $13,874 $13,874 $0 $0 $59,726Highway Safety Improvement Program (HSIP) $1,807 $1,807 $943 $943 $3,137 $3,137 $2,753 $2,753 $8,640Railway (Section 130) $0 $0 $0 $0 $0 $0 $0 $0 $0Safe Routes to School (SRTS) (SAFETEA-LU) $2,057 $2,057 $1,515 $1,515 $2,354 $2,354 $522 $522 $6,448Safe Routes to School (SR2S) $0 $0 $0 $0 $0 $0 $0 $0 $0Transportation Improvements (TI) $0 $0 $0 $0 $0 $0 $0 $0 $0Federal Lands Highway $0 $0 $0 $0 $0 $0 $0 $0 $0ARRA - SHOPP $13,100 $13,100 $0 $0 $0 $0 $0 $0 $13,100ARRA - STIP $0 $0 $0 $0 $0 $0 $0 $0 $0ARRA - Highway Maintenance (HM) $0 $0 $0 $0 $0 $0 $0 $0 $0ARRA - TE $4,002 $4,002 $0 $0 $0 $0 $0 $0 $4,002ARRA - RSTP* $75,311 $75,311 $52,119 $52,119 $0 $0 $0 $0 $127,430ARRA - STP $74,081 $74,081 $0 $0 $0 $0 $0 $0 $74,081ARRA - Federal Lands Highway $0 $0 $0 $0 $0 $0 $0 $0 $0Other (RITA) $200 $200 $0 $0 $0 $0 $0 $0 $200
Subtotal $248,166 $248,166 $152,600 $152,600 $83,345 $83,345 $68,408 $68,408 $552,519 Federal Highway Discretionary Programs $0
Bridge Discretionary Program $0 $0 $0 $0 $0 $0 $0 $0 $0Corridor Infrastructure Improvement Program (SAFETEA-LU Sec $0 $0 $0 $0 $0 $0 $0 $0 $0Coordinated Border Infrastructure (SAFETEA-LU Sec.1303) $13,901 $13,901 $5,500 $5,500 $0 $0 $0 $0 $19,401Ferry Boat Discretionary $0 $0 $0 $0 $0 $0 $0 $0 $0High Priority Projects (HPP) $26,914 $26,914 $28,899 $28,899 $2,858 $2,858 $0 $0 $58,671High Risk Rural Road (HRRR) $0 $0 $130 $130 $0 $0 $0 $0 $130Highway Maintenance - National Highway System $0 $0 $22,006 $22,006 $0 $0 $0 $0 $22,006National Scenic Byways Program $0 $0 $0 $0 $0 $0 $0 $0 $0Projects of National/Regional Significance (SAFETEA-LU Sec. 13 $0 $0 $0 $0 $0 $0 $0 $0 $0Public Lands Highway Discretionary $0 $0 $0 $0 $0 $0 $0 $0 $0Recreational Trails $175 $175 $0 $0 $0 $0 $0 $0 $175Transportation & Community and System Preservation Program $490 $490 $1,332 $1,332 $0 $0 $0 $0 $1,822Other (ITS, IM, Sec 112/117, value pricing, STP) $9,064 $9,064 $429 $429 $1,025 $1,025 $0 $0 $10,518
Subtotal $50,544 $50,544 $58,296 $58,296 $3,883 $3,883 $0 $0 $112,723 Federal Highway Total $298,710 $298,710 $210,896 $210,896 $87,228 $87,228 $68,408 $68,408 $665,242FEDERAL TOTAL $495,622 $495,621 $317,331 $317,331 $194,810 $194,810 $158,075 $158,075 $1,165,837
$1,224,124 $1,224,137 $1,304,241 $1,304,304 $1,221,697 $1,235,447 $1,079,472 $1,079,202 $4,843,090
Fund Estimate - Unprogrammed Capacity1 $2,678,972 $9,089,040 $7,974,288 $19,742,3001 Fund Estimate - Unprogrammed Capacity: Difference between Obligation Authority level and Apportionment level, these funds can not be used for programming projects*A portion of the ARRA Funds were deobligated and re-obligated to FY2010**Programmed under City General Funds in previous amendment
FUNDING SOURCE
Table 2-1a
2008 Regional Transportation Improvement Program (RTIP)San Diego Region - Through Amendment No. 24 (in $000s)
REVENUES
2008/09 2009/10 2010/11 2011/12
FED
ERA
L H
IGH
WA
Y
REVENUE TOTAL
LOC
AL
STA
TEFE
DER
AL
TRA
NSI
T
10
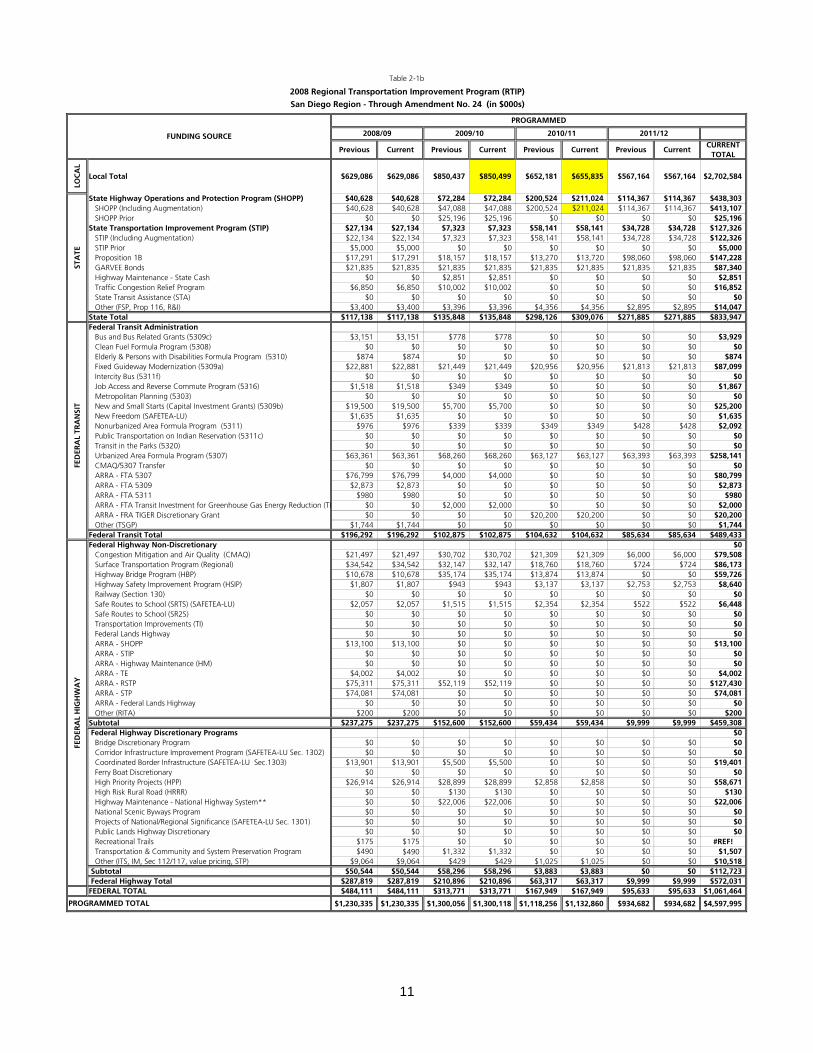
Previous Current Previous Current Previous Current Previous CurrentCURRENT
TOTAL
Local Total $629,086 $629,086 $850,437 $850,499 $652,181 $655,835 $567,164 $567,164 $2,702,584
State Highway Operations and Protection Program (SHOPP) $40,628 $40,628 $72,284 $72,284 $200,524 $211,024 $114,367 $114,367 $438,303SHOPP (Including Augmentation) $40,628 $40,628 $47,088 $47,088 $200,524 $211,024 $114,367 $114,367 $413,107SHOPP Prior $0 $0 $25,196 $25,196 $0 $0 $0 $0 $25,196
State Transportation Improvement Program (STIP) $27,134 $27,134 $7,323 $7,323 $58,141 $58,141 $34,728 $34,728 $127,326STIP (Including Augmentation) $22,134 $22,134 $7,323 $7,323 $58,141 $58,141 $34,728 $34,728 $122,326STIP Prior $5,000 $5,000 $0 $0 $0 $0 $0 $0 $5,000Proposition 1B $17,291 $17,291 $18,157 $18,157 $13,270 $13,720 $98,060 $98,060 $147,228GARVEE Bonds $21,835 $21,835 $21,835 $21,835 $21,835 $21,835 $21,835 $21,835 $87,340Highway Maintenance - State Cash $0 $0 $2,851 $2,851 $0 $0 $0 $0 $2,851Traffic Congestion Relief Program $6,850 $6,850 $10,002 $10,002 $0 $0 $0 $0 $16,852State Transit Assistance (STA) $0 $0 $0 $0 $0 $0 $0 $0 $0Other (FSP, Prop 116, R&I) $3,400 $3,400 $3,396 $3,396 $4,356 $4,356 $2,895 $2,895 $14,047
State Total $117,138 $117,138 $135,848 $135,848 $298,126 $309,076 $271,885 $271,885 $833,947Federal Transit Administration
Bus and Bus Related Grants (5309c) $3,151 $3,151 $778 $778 $0 $0 $0 $0 $3,929Clean Fuel Formula Program (5308) $0 $0 $0 $0 $0 $0 $0 $0 $0Elderly & Persons with Disabilities Formula Program (5310) $874 $874 $0 $0 $0 $0 $0 $0 $874Fixed Guideway Modernization (5309a) $22,881 $22,881 $21,449 $21,449 $20,956 $20,956 $21,813 $21,813 $87,099Intercity Bus (5311f) $0 $0 $0 $0 $0 $0 $0 $0 $0Job Access and Reverse Commute Program (5316) $1,518 $1,518 $349 $349 $0 $0 $0 $0 $1,867Metropolitan Planning (5303) $0 $0 $0 $0 $0 $0 $0 $0 $0New and Small Starts (Capital Investment Grants) (5309b) $19,500 $19,500 $5,700 $5,700 $0 $0 $0 $0 $25,200New Freedom (SAFETEA-LU) $1,635 $1,635 $0 $0 $0 $0 $0 $0 $1,635Nonurbanized Area Formula Program (5311) $976 $976 $339 $339 $349 $349 $428 $428 $2,092Public Transportation on Indian Reservation (5311c) $0 $0 $0 $0 $0 $0 $0 $0 $0Transit in the Parks (5320) $0 $0 $0 $0 $0 $0 $0 $0 $0Urbanized Area Formula Program (5307) $63,361 $63,361 $68,260 $68,260 $63,127 $63,127 $63,393 $63,393 $258,141CMAQ/5307 Transfer $0 $0 $0 $0 $0 $0 $0 $0 $0ARRA - FTA 5307 $76,799 $76,799 $4,000 $4,000 $0 $0 $0 $0 $80,799ARRA - FTA 5309 $2,873 $2,873 $0 $0 $0 $0 $0 $0 $2,873ARRA - FTA 5311 $980 $980 $0 $0 $0 $0 $0 $0 $980ARRA - FTA Transit Investment for Greenhouse Gas Energy Reduction (TI $0 $0 $2,000 $2,000 $0 $0 $0 $0 $2,000ARRA - FRA TIGER Discretionary Grant $0 $0 $0 $0 $20,200 $20,200 $0 $0 $20,200Other (TSGP) $1,744 $1,744 $0 $0 $0 $0 $0 $0 $1,744
Federal Transit Total $196,292 $196,292 $102,875 $102,875 $104,632 $104,632 $85,634 $85,634 $489,433Federal Highway Non-Discretionary $0
Congestion Mitigation and Air Quality (CMAQ) $21,497 $21,497 $30,702 $30,702 $21,309 $21,309 $6,000 $6,000 $79,508Surface Transportation Program (Regional) $34,542 $34,542 $32,147 $32,147 $18,760 $18,760 $724 $724 $86,173Highway Bridge Program (HBP) $10,678 $10,678 $35,174 $35,174 $13,874 $13,874 $0 $0 $59,726Highway Safety Improvement Program (HSIP) $1,807 $1,807 $943 $943 $3,137 $3,137 $2,753 $2,753 $8,640Railway (Section 130) $0 $0 $0 $0 $0 $0 $0 $0 $0Safe Routes to School (SRTS) (SAFETEA-LU) $2,057 $2,057 $1,515 $1,515 $2,354 $2,354 $522 $522 $6,448Safe Routes to School (SR2S) $0 $0 $0 $0 $0 $0 $0 $0 $0Transportation Improvements (TI) $0 $0 $0 $0 $0 $0 $0 $0 $0Federal Lands Highway $0 $0 $0 $0 $0 $0 $0 $0 $0ARRA - SHOPP $13,100 $13,100 $0 $0 $0 $0 $0 $0 $13,100ARRA - STIP $0 $0 $0 $0 $0 $0 $0 $0 $0ARRA - Highway Maintenance (HM) $0 $0 $0 $0 $0 $0 $0 $0 $0ARRA - TE $4,002 $4,002 $0 $0 $0 $0 $0 $0 $4,002ARRA - RSTP $75,311 $75,311 $52,119 $52,119 $0 $0 $0 $0 $127,430ARRA - STP $74,081 $74,081 $0 $0 $0 $0 $0 $0 $74,081ARRA - Federal Lands Highway $0 $0 $0 $0 $0 $0 $0 $0 $0Other (RITA) $200 $200 $0 $0 $0 $0 $0 $0 $200
Subtotal $237,275 $237,275 $152,600 $152,600 $59,434 $59,434 $9,999 $9,999 $459,308 Federal Highway Discretionary Programs $0
Bridge Discretionary Program $0 $0 $0 $0 $0 $0 $0 $0 $0Corridor Infrastructure Improvement Program (SAFETEA-LU Sec. 1302) $0 $0 $0 $0 $0 $0 $0 $0 $0Coordinated Border Infrastructure (SAFETEA-LU Sec.1303) $13,901 $13,901 $5,500 $5,500 $0 $0 $0 $0 $19,401Ferry Boat Discretionary $0 $0 $0 $0 $0 $0 $0 $0 $0High Priority Projects (HPP) $26,914 $26,914 $28,899 $28,899 $2,858 $2,858 $0 $0 $58,671High Risk Rural Road (HRRR) $0 $0 $130 $130 $0 $0 $0 $0 $130Highway Maintenance - National Highway System** $0 $0 $22,006 $22,006 $0 $0 $0 $0 $22,006National Scenic Byways Program $0 $0 $0 $0 $0 $0 $0 $0 $0Projects of National/Regional Significance (SAFETEA-LU Sec. 1301) $0 $0 $0 $0 $0 $0 $0 $0 $0Public Lands Highway Discretionary $0 $0 $0 $0 $0 $0 $0 $0 $0Recreational Trails $175 $175 $0 $0 $0 $0 $0 $0 #REF!Transportation & Community and System Preservation Program $490 $490 $1,332 $1,332 $0 $0 $0 $0 $1,507Other (ITS, IM, Sec 112/117, value pricing, STP) $9,064 $9,064 $429 $429 $1,025 $1,025 $0 $0 $10,518
Subtotal $50,544 $50,544 $58,296 $58,296 $3,883 $3,883 $0 $0 $112,723 Federal Highway Total $287,819 $287,819 $210,896 $210,896 $63,317 $63,317 $9,999 $9,999 $572,031FEDERAL TOTAL $484,111 $484,111 $313,771 $313,771 $167,949 $167,949 $95,633 $95,633 $1,061,464
$1,230,335 $1,230,335 $1,300,056 $1,300,118 $1,118,256 $1,132,860 $934,682 $934,682 $4,597,995
FUNDING SOURCE
Table 2-1b
2008 Regional Transportation Improvement Program (RTIP)
San Diego Region - Through Amendment No. 24 (in $000s)
PROGRAMMED
2008/09 2009/10 2010/11 2011/12
FED
ERA
L H
IGH
WA
Y
PROGRAMMED TOTAL
LOC
AL
STA
TEFE
DER
AL
TRA
NSI
T
11

Previous Current Previous Current Previous Current Previous CurrentCURRENT
TOTAL
Local Total $0 $0 $30,534 $1 $75,944 $75,540 $81,559 $81,559 $157,100
State Highway Operations and Protection Program (SHOPP) $0 $0 $0 $0 $0 $0 $0 $0 $0SHOPP (Including Augmentation) $0 $0 $0 $0 $0 $0 $0 $0 $0SHOPP Prior $0 $0 $0 $0 $0 $0 $0 $0 $0
State Transportation Improvement Program (STIP) $0 $0 $0 $0 $0 $0 $0 $0 $0STIP (Including Augmentation) $0 $0 $0 $0 $0 $0 $0 $0 $0STIP Prior $0 $0 $0 $0 $0 $0 $0 $0 $0Proposition 1B $0 $0 $0 $0 $0 $0 $0 $0 $0GARVEE Bonds $0 $0 $0 $0 $0 $0 $0 $0 $0Highway Maintenance - State Cash $0 $0 $0 $0 $0 $0 $0 $0 $0Traffic Congestion Relief Program $0 $0 $0 $0 $0 $0 $0 $0 $0State Transit Assistance (STA) $0 $0 $0 $0 $0 $0 $0 $0 $0Other (Please specify) $0 $0 $0 $0 $0 $0 $0 $0 $0
State Total $2,855 $2,855 $625 $625 $636 $186 $789 $519 $4,185Federal Transit Administration
Bus and Bus Related Grants (5309c) $0 $0 $0 $0 $0 $0 $0 $0 $0Clean Fuel Formula Program (5308) $0 $0 $0 $0 $0 $0 $0 $0 $0Elderly & Persons with Disabilities Formula Program (5310) $0 $0 $0 $0 $0 $0 $0 $0 $0Fixed Guideway Modernization (5309a) $0 $0 $1,083 $1,083 $0 $0 $0 $0 $1,083Intercity Bus (5311f) $0 $0 $0 $0 $0 $0 $0 $0 $0Job Access and Reverse Commute Program (5316) $547 $547 $1,338 $1,338 $1,754 $1,754 $1,825 $1,825 $5,464Metropolitan Planning (5303) $0 $0 $0 $0 $0 $0 $0 $0 $0New and Small Starts (Capital Investment Grants) (5309b) $0 $0 $0 $0 $0 $0 $0 $0 $0New Freedom (SAFETEA-LU) $73 $73 $827 $827 $868 $868 $865 $865 $2,633Nonurbanized Area Formula Program (5311) $0 $0 $312 $312 $328 $328 $276 $276 $916Public Transportation on Indian Reservation (5311c) $0 $0 $0 $0 $0 $0 $0 $0 $0Transit in the Parks (5320) $0 $0 $0 $0 $0 $0 $0 $0 $0Urbanized Area Formula Program (5307) $0 $0 $0 $0 $0 $0 $1,067 $1,067 $1,067CMAQ/5307 Transfer $0 $0 $0 $0 $0 $0 $0 $0 $0ARRA - FTA 5307 $4,000 $0 $0 $0 $0 $0 $0 $0 $0ARRA - FTA 5309 $0 $0 $0 $0 $0 $0 $0 $0 $0ARRA - FTA 5311 $0 $0 $0 $0 $0 $0 $0 $0 $0ARRA - FTA Transit Investment for Greenhouse Gas Energy Reduction $0 $0 $0 $0 $0 $0 $0 $0 $0Other (TSGP) $0 $0 $0 $0 $0 $0 $0 $0 $0
Federal Transit Total $620 $619 $3,560 $3,560 $2,950 $2,950 $4,033 $4,033 $11,162Federal Highway Non-Discretionary
Congestion Mitigation and Air Quality (CMAQ) $9,855 $9,855 $0 $0 $9,945 $9,945 $25,817 $25,817 $45,617Surface Transportation Program (Regional) $1,036 $1,036 $0 $0 $13,966 $13,966 $32,592 $32,592 $47,594Highway Bridge Program (HBP) $0 $0 $0 $0 $0 $0 $0 $0 $0Highway Safety Improvement Program (HSIP) $0 $0 $0 $0 $0 $0 $0 $0 $0Railway (Section 130) $0 $0 $0 $0 $0 $0 $0 $0 $0Safe Routes to School (SRTS) (SAFETEA-LU) $0 $0 $0 $0 $0 $0 $0 $0 $0Safe Routes to School (SR2S) $0 $0 $0 $0 $0 $0 $0 $0 $0Transportation Improvements (TI) $0 $0 $0 $0 $0 $0 $0 $0 $0Federal Lands Highway $0 $0 $0 $0 $0 $0 $0 $0 $0ARRA - SHOPP $0 $0 $0 $0 $0 $0 $0 $0 $0ARRA - STIP $0 $0 $0 $0 $0 $0 $0 $0 $0ARRA - Highway Maintenance (HM) $0 $0 $0 $0 $0 $0 $0 $0 $0ARRA - TE $0 $0 $0 $0 $0 $0 $0 $0 $0ARRA - RSTP $0 $0 $0 $0 $0 $0 $0 $0 $0ARRA - STP $0 $0 $0 $0 $0 $0 $0 $0 $0ARRA - Federal Lands Highway $0 $0 $0 $0 $0 $0 $0 $0 $0Other (RITA) $0 $0 $0 $0 $0 $0 $0 $0 $0
Subtotal $10,891 $10,891 $0 $0 $23,911 $23,911 $58,409 $58,409 $93,211 Federal Highway Discretionary Programs $0
Bridge Discretionary Program $0 $0 $0 $0 $0 $0 $0 $0 $0Corridor Infrastructure Improvement Program (SAFETEA-LU Sec. 1302) $0 $0 $0 $0 $0 $0 $0 $0 $0Coordinated Border Infrastructure (SAFETEA-LU Sec.1303) $0 $0 $0 $0 $0 $0 $0 $0 $0Ferry Boat Discretionary $0 $0 $0 $0 $0 $0 $0 $0 $0High Priority Projects (HPP) $0 $0 $0 $0 $0 $0 $0 $0 $0High Risk Rural Road (HRRR) $0 $0 $0 $0 $0 $0 $0 $0 $0Highway Maintenance - National Highway System $0 $0 $0 $0 $0 $0 $0 $0 $0National Scenic Byways Program $0 $0 $0 $0 $0 $0 $0 $0 $0Projects of National/Regional Significance (SAFETEA-LU Sec. 1301) $0 $0 $0 $0 $0 $0 $0 $0 $0Public Lands Highway Discretionary $0 $0 $0 $0 $0 $0 $0 $0 $0Recreational Trails $0 $0 $0 $0 $0 $0 $0 $0 $0Transportation and Community and System Preservation Program $0 $0 $0 $0 $0 $0 $0 $0 $0Other (ITS, IM, Sec 112/117, value pricing, STP) $0 $0 $0 $0 $0 $0 $0 $0 $0
Subtotal $0 $0 $0 $0 $0 $0 $0 $0 $0 Federal Highway Total $10,891 $10,891 $0 $0 $23,911 $23,911 $58,409 $58,409 $93,211FEDERAL TOTAL $11,511 $11,510 $3,560 $3,560 $26,861 $26,861 $62,442 $62,442 $104,373
$14,366 $14,365 $34,719 $4,186 $103,441 $102,587 $144,790 $144,520 $265,658REVENUE VS. PROGRAMMED TOTAL
Table 2-1c
2008 Regional Transportation Improvement Program (RTIP)
San Diego Region - Through Amendment No. 24 (in $000s)
REVENUES VS. PROGRAMMED
2008/09 2009/10 2010/11 2011/12FUNDING SOURCE
FED
ERA
L H
IGH
WA
YLO
CA
LST
ATE
FED
ERA
L TR
AN
SIT
12

Chapter 3
AIR QUALITY CONFORMITY ANALYSIS

Chapter 3
DRAFT AIR QUALITY CONFORMITY ANALYSIS
On April 15, 2004, the EPA designated the San Diego air basin as nonattainment for the new Eight-Hour Ozone Standard. This designation took effect on June 15, 2004. Several areas that are tribal lands in eastern San Diego County were excluded from the nonattainment designation. The air basin was initially classified as a basic nonattainment area under Subpart 1 of the Clean Air Act and the maximum statutory attainment date for the Eight-Hour Ozone Standard was set as June 15, 2009. However, EPA in response to a court decision, on January 16, 2009, proposed that, among other areas of the country, the San Diego basic nonattainment area be reclassified as a Subpart 2 moderate nonattainment area, with a maximum statutory attainment date of June 15, 2010. Final EPA action on this proposed reclassification is still pending.
In cooperation with the San Diego Air Pollution Control District (APCD) and SANDAG, the California Air Resources Board (ARB) developed an Eight-Hour Ozone Attainment Plan which was submitted to the U.S. EPA on June 15, 2007. The budgets in the Eight-Hour Ozone Attainment Plan for San Diego County were found adequate for transportation conformity purposes by the U.S. EPA, effective June 9, 2008.
The SANDAG Board of Directors made a finding of conformity of the 2030 Regional Transportation Plan: Pathways for the Future (2030 RTP) and 2006 RTIP, as amended, on November 30, 2007. The U.S. Department of Transportation (DOT) issued its conformity finding on December 10, 2007. On July 25, 2008, a conformity determination for the 2008 RTIP and conformity redetermination for the 2030 RTP was made by the SANDAG Board of Directors. The U.S. DOT issued its conformity finding on November 17, 2008. On January 22, 2010, the SANDAG Board adopted the 2008 RTIP Amendment No. 16 and its conformity finding. The U.S. DOT made a finding of conformity for the amendment on February 19, 2010.
Also, the U.S. EPA designated the San Diego region as a federal maintenance area for the Carbon Monoxide (CO) standard. On January 30, 2006, the U.S. EPA approved the 2004 Revision to the California State Implementation Plan for Carbon Monoxide or CO Maintenance Plan as a State Implementation Plan (SIP) revision.
DEMONSTRATION OF FISCAL CONSTRAINT
The 2008 RTIP, including Amendment No. 23, is consistent with the 2030 RTP. As a financially constrained document, the 2008 RTIP contains only those major transportation projects listed in the revenue-constrained 2030 RTP. Chapter 4 of the 2008 RTIP includes detailed discussion on fiscal constraint and overall financial capacity to carry out projects included in the RTIP.
14

DEVELOPMENT OF TRANSPORTATION CONTROL MEASURES
In 1982, SANDAG adopted four Transportation Tactics as elements of the 1982 Revised Regional Air Quality Strategy (RAQS). These Transportation Tactics are ridesharing, transit improvements, traffic flow improvements, and bicycle facilities and programs.
These four Transportation Tactics were subsequently approved by the San Diego Air Pollution Control Board (APCB) and are included in the 1982 SIP for Air Quality as Transportation Control Measures (TCMs). The U.S. EPA approved this State Implementation Plan (SIP) revision for the San Diego Air Basin in 1983. However, the four TCMs have been fully implemented.
The California Clean Air Act required the preparation of a 1991 RAQS, including TCMs. During 1991 and 1992, SANDAG, in cooperation with local agencies, transit agencies, and the APCD developed a TCM Plan. SANDAG approved the TCM Plan on March 27, 1992.
On June 30, 1992, the APCD amended the TCM Plan and adopted the 1991 RAQS, including the amended TCM Plan. TCMs included in the 1991 RAQS include the four Transportation Tactics described above, as well as a transportation demand management (TDM) program, vanpools, high-occupancy-vehicle (HOV) lanes, and park and ride facilities. On November 12, 1992, the Air Resources Board (ARB) gave approval to the 1991 RAQS, including the TCMs.
The 1995 Triennial RAQS Update subsequently deleted the Employee Commute Travel Reduction Program contained in the TDM program because the program was no longer required under federal law. Assembly Bill 3048 (Statutes of 1996, Chapter 777) eliminated all state requirements for mandatory trip reduction programs. As a result, the Student Travel Reduction Program, the Non-Commute Travel Reduction Program, and the Goods Movement/Truck Operation Program proposed in the 1991 RAQS were no longer statutorily mandated and were deleted from the RAQS in 1998. The 2001, 2004, and 2009 Triennial RAQS Revisions did not make changes to measures related to mobile sources or the TCM Plan.
AIR QUALITY CONFORMITY REQUIREMENTS
SANDAG, as the Metropolitan Planning Organization (MPO), and the U.S. DOT must make a determination that the 2008 RTIP, as amended, and the 2030 RTP conform to the applicable SIP. Conformity to the SIP means that transportation activities will not create new air quality violations, worsen existing violations, or delay the attainment of the National Ambient Air Quality Standards (NAAQS).
Based upon the U.S. EPA’s Transportation Conformity Rule, as amended, conformity of transportation plans and programs, including the 2008 RTIP, as amended, is determined according to the 1990 Clean Air Act Amendments (CAAA) [Section 176(c)(3)(A)] if the following is demonstrated:
• The 2008 RTIP as amended provides for the timely implementation of the Transportation Tactics contained in the 1991 RAQS. These tactics are also included as TCMs in the 1982 SIP, but have been fully implemented.
• A quantitative analysis is conducted on the cumulative emissions of projects programmed within the 2008 RTIP as amended, including all regionally significant, capacity-increasing projects. Further, implementation of the projects and programs must meet the motor vehicle emissions budget developed by local and state air quality agencies and approved by the U.S. EPA. The 2008 RTIP as
15
amended must meet the applicable emission budgets prescribed in the Eight-Hour Ozone Attainment Plan for San Diego County, which were found adequate for transportation conformity purposes by the U.S. EPA, effective June 9, 2008. Also, the 2008 RTIP as amended must meet the CO emissions budget established in the CO Maintenance Plan (approved by the U.S. EPA in January 2006).
• In addition to the required emissions tests, consultation with transportation and air quality agencies is required. The consultation process followed to prepare the air quality conformity analysis complies with the San Diego Transportation Conformity Procedures adopted in July 1998.
• Interagency consultation involves SANDAG, the SDAPCD, Caltrans, ARB, the U.S. DOT, and the U.S. EPA, which form the San Diego Region Conformity Working Group (CWG).
Consultation is a three-tier process that:
1. formulates and reviews drafts through a conformity working group;
2. provides local agencies and the public with opportunities for input through existing regional advisory committees and workshops; and
3. seeks comments from affected federal and state agencies through participation in the development of draft documents and circulation of supporting materials prior to formal adoption.
SANDAG consulted with the CWG for the preparation of the new air quality analysis of the 2008 RTIP as amended. Conformity of the 2030 Regional Transportation Plan: Pathways for the Future also is being re-determined for consistency purposes.
The schedule for the development of the 2008 RTIP Amendment No. 23 and criteria and procedures for determining conformity were presented to the CWG on April 7, 2010. The capacity increasing project was provided to the CWG on April 29, 2010.
The quantitative emissions analyses for the 2008 RTIP Amendment No. 23 and 2030 RTP redetermination were initiated in April 2010 and the results distributed on April 29, 2010 to the CWG for an initial review and comment period. The CWG reviewed the draft air quality conformity analysis at its May 5, 2010 meeting. The draft 2008 RTIP Amendment No. 23 and its conformity analysis and the 2030 RTP conformity re-determination are scheduled to be released for public review and comment on June 9, 2010. The results of the draft and final regional emissions analysis indicate that the 2008 RTIP, as amended, and 2030 RTP meet the air quality conformity requirements.
The SANDAG Board of Directors will be asked to make a conformity finding for the 2008 RTIP as amended and 2030 RTP re-determination and approve the 2008 RTIP Amendment No. 23 at its July 23, 2010 meeting.
The following sections provide a summary of the air quality conformity analysis of the 2008 RTIP as amended and 2030 RTP in relation to the above conformity requirements.
The first requirement of the air quality conformity finding is to provide for the expeditious implementation of adopted TCMs, which are also the Transportation Tactics included in the 1991 RAQS. These tactics are ridesharing, transit service improvements, traffic flow improvements, and bicycle facilities and programs.
The 1982 SIP established the TCMs, which identified general objectives and implementing actions for each tactic. Due to substantial investments since 1982, SANDAG has fully implemented the TCMs. Ridesharing, transit, bicycling, and traffic flow improvements continue to be funded, although the level of implementation established in the SIP has been surpassed. No TCMs have been removed or substituted from the SIP.
16

17
The 2008 RTIP as amended makes substantial progress in programming funds for implementation of the four adopted Transportation Tactics for the San Diego region contained in the 1991 RAQS. Table 3-1 shows that Transportation Tactics programmed for implementation total approximately $3.1 billion, or approximately 31 percent of the total funds programmed. Included are $23.9 million for Ridesharing, $2.9 billion for Transit Improvements, $108.6 million for Bicycle Facilities and Programs, and $121.6 million for Traffic Flow Improvements.
Based upon this analysis, the 2008 RTIP as amended continues to provide for the expeditious implementation of the four Transportation Tactics approved in the 1991 RAQS.
QUANTITATIVE EMISSIONS ANALYSIS
The second requirement of the conformity finding is to conduct a quantitative emissions analysis on the 2008 RTIP as amended. The emissions analysis must show that implementation of the 2008 RTIP as amended and 2030 RTP meet the emissions budgets established in the 2004 CO Maintenance Plan and in the Eight-Hour Ozone Attainment Plan for San Diego County.
A quantitative emissions analysis was conducted according to the requirements established in the Transportation Conformity Rule under Section 93.122(b). Motor vehicle emissions forecasts were produced for the following analysis years: 2010, 2020, and 2030.
SANDAG's regional growth forecasts and transportation models, as well as ARB’s emissions model, were used to generate the emissions forecasts. Transportation forecasts were developed using the TransCAD 5.0 transportation planning computer package. The four-step transportation modeling process includes trip generation, trip distribution, mode split, and trip assignment. The quantitative emissions analysis was conducted using the EMFAC 2007 model.
All of the proposed capacity-increasing improvements identified in the 2008 RTIP as amended that are on the Regional Arterial System (as defined in the RTP) or the FHWA functional classification system (other principal arterials and higher classifications) were modeled.
EMISSIONS BUDGET ANALYSIS
Tables 3-2 and 3-3 provide a summary of the results of the quantitative emissions analysis conducted for the 2008 RTIP as amended and 2030 RTP.
The analysis shown in Table 3-2 demonstrates that the 2008 RTIP as amended and the 2030 Regional Transportation Plan: Pathways for the Future meet the applicable budgets for the Eight-Hour Ozone standard. Projected reactive organic gas (ROG) and nitrogen oxide (NOx) emissions for 2010, 2020, and 2030 are below the established SIP budgets. Table 3-3 shows that projected CO emissions from the 2008 RTIP as amended and the 2030 Regional Transportation Plan: Pathways for the Future are below the 2003 CO budget of 730 tons per day.

Table 3-1
2008 RTIP - SAN DIEGO REGION (IN $000s) TRANSPORTATION CONTROL MEASURE PROJECTS RIDESHARING Other - Transportation Demand Management (TDM) $23,930 Subtotal $23,930 TRANSIT IMPROVEMENTS Transit - Bus/Rail Infrastructure $625,984 Transit - Bus/Rail Intermodal Stations $178,875 Transit - Bus/Rail Vehicle Purchase $433,001 Transit - I-15 BRT $107,660 Transit - Mid-Coast $122,023 Transit - Other BRT $191,667 Transit - Other Bus/Rail (Operations/Planning) $777,619 Transit - Sprinter $460,266 Subtotal $2,882,588 BICYCLE FACILITIES PROJECTS Other - Bicycle/Pedestrian Projects $108,619 Subtotal $108,619 TRAFFIC FLOW IMPROVEMENTS Other - Transportation Management System/Intelligent Transportation System $89,775 Local Streets and Roads - Traffic Signal Projects $31,819 Subtotal $121,594 Total All Transportation Control Measure Projects in 2008 RTIP TCM Total : $3,136,731 Total All Transportation Projects in 2008 RTIP: $10,149,846 Share of Transportation Control Measure Projects in 2008 RTIP: 30.9%
18

Table 3-2 2008 RTIP Amendment No. 23 and 2030 Regional Transportation Plan: Pathways to the Future
Air Quality Conformity Analysis for Eight-Hour Ozone
ROG NOx
Year
Average Weekday Vehicle Starts
(1,000s)
Average Weekday Vehicle Miles
(1,000s)
SIP Emissions
Budget Tons/Day
ROG Emissions Tons/Day
SIP Emissions
Budget Tons/Day
NOx Emissions Tons/Day
2010 13,021 81,010 53 37 98 71
2020 14,567 89,216 53 24 98 40
2030 15,968 101,689 53 19 98 32
Note: Emissions budgets from Eight Hour Ozone Attainment Plan for San Diego County, found adequate for transportation conformity purposes by the U.S. EPA, effective June 9, 2008.
Table 3-3 2008 RTIP Amendment No. 23 and 2030 Regional Transportation Plan: Pathways to the Future
Air Quality Conformity Analysis for Carbon Monoxide
CO
Year
Average Weekday
Vehicle Starts (1,000s)
Average Weekday
Vehicle Miles (1,000s)
SIP Emissions Budget
Tons/Day
CO Emissions Tons/Day
2010 13,021 81,010 730 391
2018 14,258 87,575 730 245
2020 14,567 89,216 730 209
2030 15,968 101,689 730 160
Note: Emissions budgets for the San Diego region from 2004 Revision to California State Implementation Plan for Carbon Monoxide, Updated Maintenance Plan for Ten Federal Planning Areas (Approved as SIP revision in January 2006).
19

20
CONCLUSION
Based upon an evaluation of projects and funds programmed and a quantitative emissions analysis, the 2008 RTIP as amended and 2030 RTP meet the U.S. EPA transportation conformity regulations contained within the federal guidelines published on August 15, 1997, and subsequent amendments, as well as the requirements of the federal Clean Air Act amendments of 1990.

21
2030 Regional Transportation Plan E-17

APPENDICES

(Insert blank page) (Insert blank page)
Appendix A
PROJECTS EXEMPT FROM AIR QUALITY CONFORMITY DETERMINATION


APPENDIX A
PROJECTS EXEMPT FROM AIR QUALITY CONFORMITY DETERMINATION*
SAFETY - Railroad/highway crossing. - Hazard elimination program. - Safer non-Federal-aid systems roads. - Shoulder improvements. - Increasing sight distance. - Safety Improvement program. - Traffic control devices and operating assistance other - Railroad/highway crossing warning devices. than signalization projects. - Guardrails, median barriers, crash cushions. - Pavement resurfacing and/or rehabilitation. - Pavement marking demonstration. - Emergency relief (23 U.S.C. 125). - Fencing. - Skid treatments. - Safety roadside rest areas. - Adding medians. - Truck climbing lanes outside the urbanized area. - Lighting improvements. - Widening narrow pavements or reconstructing bridges - Emergency truck pullovers. (no additional travel lanes).
MASS TRANSIT - Operating assistance to transit agencies. - Purchase of support vehicles. - Rehabilitation of transit vehicles. - Purchase of office, shop, and operating equipment for - Purchase of operating equipment for vehicles existing facilities. (e.g., radios, fareboxes, lifts, etc.). - Construction or renovation of power, signal, and - Construction of small passenger shelters and communications systems. information kiosks. - Reconstruction or renovation of transit buildings and - Rehabilitation or reconstruction of track structures, structures (e.g., rail or bus buildings, storage and track, and trackbed in existing rights-of-way. maintenance facilities, stations, terminals, and ancillary - Purchase of new buses and rail cars to replace structures). existing vehicles or for minor expansions of fleet. - Construction of new bus or rail storage/maintenance facilities categorically excluded in 23 CFR part 771.
AIR QUALITY - Continuation of ride-sharing and van-pooling - Bicycle and pedestrian facilities. promotion activities at current levels.
OTHER - Specific activities which do not involve or directly lead - Engineering to assess social, economic, and environmental to construction, such as: effects of the proposed action or alternatives to that action. Planning and technical studies. - Noise attenuation. Grants for training and research programs. - Emergency or hardship advance land acquisitions (23 CFR Planning activities conducted pursuant to titles 23 710.204(d)). and 49 U.S.C. - Acquisition of scenic easements. Federal-aid systems revisions. - Plantings, landscaping, etc. - Sign removal. - Directional and informational signs. - Transportation enhancement activities (except - Repair of damage caused by natural disasters, civil unrest, rehabilitation and operation of historic transportation or terrorist acts, except projects involving substantial buildings, structures, or facilities). functional, locational or capacity changes.
ALL PROJECTS - Intersection channelization projects. - Intersection signalization projects at individual intersections. - Interchange reconfiguration projects. - Changes in vertical and horizontal alignment. - Truck size and weight inspection stations. - Bus terminal and transfer points. *Source: Part II Environmental Protection Agency 40 CFR Parts 51 & 93 Transportation Conformity Rule, as amended, July 1, 2004.
25

Appendix B
REGIONAL EMISSIONS ANALYSIS AND MODELING PROCEDURES


Appendix B
2008 REGIONAL TRANSPORTATION IMPROVEMENT PROGRAM (RTIP) AMENDMENT NO. 23 REGIONAL EMISSIONS ANALYSIS AND MODELING PROCEDURES
BACKGROUND
The federal Clean Air Act (CAA), which was last amended in 1990, requires the United States Environmental Protection Agency (U.S. EPA) to set National Ambient Air Quality Standards (NAAQS) for pollutants considered harmful to public health and the environment. California has adopted state air quality standards that are more stringent than the NAAQS. Areas with levels that exceed the standard for specified pollutants are designated as non-attainment areas.
The U.S. EPA requires that each state containing non-attainment areas develop plans to attain the NAAQS by a specified attainment deadline. These attainment plans are called State Implementation Plans (SIP). The San Diego County Air Pollution Control District (APCD) prepares the San Diego portion of the California SIP. Once the standards are attained, further plans—called Maintenance Plans—are required to demonstrate continued maintenance of the NAAQS.
SANDAG and the U.S. Department of Transportation (DOT) must make a determination that the Regional Transportation Plan (RTP) and the Regional Transportation Improvement Program (RTIP) conform to the SIP for air quality. Conformity to the SIP means that transportation activities will not create new air quality violations, worsen existing violations, or delay the attainment of the national ambient air quality standards.
On November 30, 2007, the SANDAG Board made a finding of conformity of the 2030 RTP: Pathways for the Future and the 2006 RTIP Amendment No. 9 and adopted the plan. The U.S. DOT made its conformity determination on December 10, 2007.
On July 25, 2008, the SANDAG Board adopted the 2008 RTIP. On November 17, 2008, the U.S. DOT made a finding of conformity for the 2008 RTIP and a conformity redetermination for the 2030 Regional Transportation Plan: Pathways for the Future.
On January 22, 2010, the SANDAG Board adopted the 2008 RTIP Amendment No. 16 and its conformity finding. The U.S. DOT made a finding of conformity for this amendment on February 19, 2010.
SANDAG was requested to amend the 2008 RTIP to incorporate the addition of a project in the City of San Marcos (SM44) which is described in detail in Attachment 2.
The San Diego region attained the federal One-Hour Ozone Standard in 2001. The U.S. EPA redesignated the San Diego air basin as attainment/maintenance and approved the One-Hour Ozone Maintenance Plan as a SIP
28

revision, effective on July 28, 2003. On June 15, 2005, the U.S. EPA revoked the federal One-Hour Ozone Standard after the Eight-Hour Ozone Standard became applicable for conformity.
On April 15, 2004, the EPA designated the San Diego air basin as nonattainment for the 1997 Eight-Hour Ozone Standard. This designation took effect on June 15, 2004. Several areas that are tribal lands in eastern San Diego County were excluded from the nonattainment designation. As shown in Figure 2, La Posta Areas #1 and #2, Cuyapaipe, Manzanita, and Campo Areas #1 and #2 are attainment areas for the 8-Hour Ozone NAAQS.
The air basin was initially classified as a basic nonattainment area under Subpart 1 of the Clean Air Act and the maximum statutory attainment date for the Eight-Hour Ozone Standard was set as June 15, 2009. However, EPA, in response to a court decision, on January 16, 2009, proposed that, among other areas of the country, the San Diego basic nonattainment area will be reclassified as a Subpart 2 moderate nonattainment area, with a maximum statutory attainment date of June 15, 2010. Final EPA action on this proposed reclassification is yet to be taken.
In cooperation with the San Diego APCD and SANDAG, the California Air Resources Board (ARB) developed an Eight-Hour Ozone Attainment Plan which was submitted to the U.S. EPA on June 15, 2007. The budgets in the Eight-Hour Ozone Attainment Plan for San Diego County were found adequate for transportation conformity purposes by the U.S. EPA, effective June 9, 2008.
The San Diego region also has been designated by the U.S. EPA as a federal maintenance area for the Carbon Monoxide (CO) standard. On November 8, 2004, the ARB submitted the 2004 revision to the California SIP for CO to the U.S. EPA. Effective January 30, 2006, the U.S. EPA has approved this maintenance plan as a SIP revision.
TRANSPORTATION CONFORMITY: MODELING PROCEDURES
Introduction
The 2008 RTIP, including Amendment No. 23, is consistent with the 2030 RTP: Pathways for the Future. As a financially constrained plan, the 2008 RTIP only contains those major transportation projects listed in the Revenue Constrained 2030 RTP. Chapter 4 of the 2008 RTIP includes a detailed discussion on fiscal constraint. Conformity of the 2030 RTP expires on December 10, 2011. However, to comply with the transportation conformity rule standards which require a redetermination of conformity within two years of new budgets, the SANDAG Board of Directors approved a redetermination of conformity of the 2030 RTP: Pathways for the Future in conjunction with the 2008 RTIP on July 25, 2008. The 2008 RTIP is being amended to include an additional capacity increasing project and the SANDAG Board of Directors will be asked to approve the 2008 RTIP Amendment No. 23 and make a conformity determination for the RTIP and re-determination for the RTP on July 23, 2010. Table 3 to Table 5 include the conformity analysis for both the 2008 RTIP as amended and the 2030 Revenue Constrained RTP.
Growth Forecasts
Every three to five years, SANDAG produces a long-range forecast of population, housing, and employment growth for the San Diego region. The most recent is the 2050 Regional Growth Forecast, which was accepted by the SANDAG Board on February 26, 2010 for planning purposes. The 2050 Regional Growth
29

Forecast also will be utilized in the development of the 2050 RTP which is anticipated to be adopted in summer 2011.
The forecast process relies on three integrated forecasting models. The first one, the Demographic and Economic Forecasting Model (DEFM), provides a detailed econometric and demographic forecast for the entire region. The second one, the Interregional Commuting Model, provides a forecast of commuting between the San Diego region, Orange County, southwest Riverside County, Imperial County, and Tijuana/Northern Baja California. The third one, the Urban Development Model, allocates the results of the first two models to subregional areas based upon the current plans and policies of the jurisdictions.
In April 2010, SANDAG consulted with the San Diego Region Conformity Working Group (CWG) on the use of the 2050 Regional Growth Forecast for the air quality conformity analysis of the 2008 RTIP as amended and 2030 RTP conformity redetermination. Previously, both U.S. DOT and U.S. EPA concurred that approved plans should be used as input in the air quality conformity process. Figure 1 and Table 1 show the regional population, jobs and housing growth forecast for the San Diego region through 2050.
Figure 1—San Diego Regional Population, Jobs, and Housing Forecast
0.0
1.0
2.0
3.0
4.0
5.0
1970 1975 1980 1985 1990 1995 2000 2005 2010 2015 2020 2025 2030 2035 2040 2045 2050
Popu
latio
n, J
obs,
and
Hou
sing
(m
illio
ns)
Population Housing Jobs
Source: SANDAG, February 2010
Table 1—San Diego Regional Population and Employment Forecast
2050 Regional Growth Forecast Year Population Employment 2008 3,131,552 1,501,080 2020 3,535,000 1,619,615 2030 3,870,000 1,751,630 2040 4,163,688 1,877,668 2050 4,384,867 2,003,038
Source: SANDAG, February 2010
The 2050 Regional Growth Forecast is based largely on the adopted general plans and community plans and policies of the 18 cities, and in some cases includes draft plans which are nearing completion. Because many
30

of the local general plans have horizon years of 2030 –twenty years before the 2050 Growth Forecast horizon year- the later part of the Forecast was developed in collaboration with each of the local jurisdictions through an iterative process that allowed each city to provide their projections for land uses in those later years. For the unincorporated area, the forecast is based on the County’s Referral Alternative draft of the General Plan update, with additional constraints included for sensitive habitat areas.
The 2050 Growth Forecast incorporates new data from the recent economic downturn and is the first forecast to be prepared under the guidelines of Senate Bill (SB) 375. SB 375 calls for housing all of the region’s population within the region, rather than relying on interregional commuting patterns to help accommodate future growth. Current economic conditions have resulted in lower projected population and employment numbers as compared to the previous forecast (Table 2).
Table 2—2030 and 2050 Regional Growth Forecast Comparison
Regional Growth Forecast Comparison Year Population Employment
2030 Regional Growth Forecast
2050 Regional Growth Forecast % Change
2030 Regional Growth Forecast
2050 Regional Growth Forecast % Change
2020 3,635,855 3,535,000 -3% 1,741,033 1,619,615 -7%
2030 3,984,753 3,870,000 -3% 1,913,682 1,751,630 -8%
Transportation Modeling
SANDAG follows a widely used, four-step transportation modeling process of trip generation, trip distribution, mode choice, and assignment to forecast travel activity in the San Diego region. After a first pass through the four steps, a feedback process is used to pass congested travel conditions back into trip distribution and through to assignment. After several feedback iterations, a final pass is made through the mode choice and assignment steps to reflect congested travel conditions in mode decision making. Travel model results then are combined with additional post-process input and output functions to form the complete modeling chain. For the first time, a truck model is run parallel to the four-step model and truck origin-destination trip tables are merged with vehicle trip tables for highway assignment and air quality procedures.
The estimates of regional transportation-related emissions analysis meet the requirements established in the Transportation Conformity Rule, Sections 93.122(b) and 93.122(c). These requirements relate to the procedures to determine regional transportation-related emissions, including the use of network-based travel models, methods to estimate traffic speeds and delays, and the estimation of vehicle miles of travel.
TransCAD 5.0 is the transportation planning computer package used by SANDAG to provide a framework for performing much of the computer processing involved with modeling and is used for the trip distribution and assignment steps. Another software package used extensively in the modeling process is ArcInfo. This geographic information system (GIS) maintains, manipulates, and displays transportation, land use, and demographic data. SANDAG has written numerous programs that provide a linkage between TransCAD and ArcInfo. Other custom programs perform some modeling functions such as trip generation and mode choice.
A number of data files and surveys are used to calibrate the transportation models. These include:
31

1995 and 2006 Travel Behavior Surveys
2001 Caltrans Statewide Travel Survey
2001-2003 San Diego Regional Transit Survey
External Trip Surveys (2006 Interregional Travel Behavior Survey)
Traffic Generation Studies
1991 San Diego Visitor Survey
2000 Census Transportation Planning Package
2010 Gateway Forecast; 2002 Freight Analysis Framework
In addition to model parameters derived from these surveys, there are three major inputs to the transportation models:
Growth forecast inputs used to describe existing and planned land use patterns and demographic characteristics;
Highway networks used to describe existing roadway facilities and planned improvements to the roadway system; and
Transit networks used to describe existing and planned public transit service.
Highway Networks
The regional highway networks in the 2008 RTIP as amended and 2030 RTP include all roads classified by local jurisdictions in their general plan circulation elements. These roads include freeways, expressways, conventional state highways, prime arterials, and selected major streets. In addition, some local streets are included in the networks for connectivity between zones.
The route improvements and additions in the 2008 RTIP as amended and 2030 RTP are developed to provide adequate travel service that is compatible with adopted regional policies for land use and population growth. All regionally significant projects are included in the quantitative emissions analysis. These include all state highways, all proposed national highway system routes, all regionally significant arterials, and all Federal Highway Administration functionally classified "Other Principal Arterials."
The networks also account for programs intended to improve the operation of the highway system, including high occupancy vehicle (HOV) lanes and ramp metering. Existing and proposed toll facilities also are modeled to reflect time, cost, and capacity effects of these facilities. The State Route (SR) 125 South, SR 11, and SR 241 are the only modeled toll facilities included in Revenue Constrained Plan for the San Diego region.
In addition, several managed/HOV lanes are included in the Revenue Constrained Plan. Facilities with proposed managed lanes include Interstate 5 (I-5), I-15, I-805, and SR 52. Managed lanes are defined as reversible HOV routes and HOV routes with two or more lanes in the peak direction. It is assumed that the excess capacity not utilized by carpools and transit on these facilities would be managed so that single occupant vehicles could use these lanes under a pricing mechanism. Traffic flows would be managed so that the facility would operate at level of service D or better.
Based on the networks and programs described above, the transportation forecasts of the 2008 RTIP as amended and 2030 RTP differentiate between eight highway modes:
drive alone non-toll
32

drive alone toll
shared-ride non-HOV/non-toll
shared-ride HOV/non-toll
shared-ride HOV/Toll
light heavy duty
medium heavy duty
heavy heavy duty SANDAG maintains a master highway network from which a specific year network, between the years 2008 (the 2050 Regional Growth Forecast base year) and 2030, can be built. Three networks were built and verified (2010, 2020, and 2030) for air quality conformity analyses of the 2008 RTIP as amended and 2030 RTP. A list of the major highway and near-term regional arterial projects included in the conformity analysis, and their implementation phasing is included with the draft Air Quality Conformity Determination. The Transportation Project Evaluation Criteria and Rankings are included in the 2030 RTP. Locally funded, regionally significant projects also have been included in the air quality conformity analysis. These projects are funded with TransNet funds, a 20-year, half-cent local sales tax for transportation that expires in 2008; TransNet Extension funds, a 40-year, half-cent local sales tax extension approved by voters in 2004 that expires in 2048; and other local revenue sources.
Transit Networks
SANDAG also maintains transit network datasets for existing and proposed transit systems. Most transit routes run over the same streets, freeways, HOV lanes, and ramps used in the highway networks. As a result the only additional facilities that are added to the transportation coverage for transit modeling purposes are:
trolley and commuter rail lines
streets used by buses that are not part of local general plan circulation elements
There are seven transit modes, which group routes with similar operating characteristics. They are:
commuter rail
trolley
bus rapid transit (BRT)
rapid bus
limited-express bus
express bus
local bus
BRT service would have stations similar to commuter rail and trolleys, and operating characteristics midway between rail and bus service. BRT service would be provided by advanced design buses operating on HOV lanes, some grade-separated transit ways, and surface streets with priority transit treatments. Once TransCAD transit networks have been built, TransCAD finds minimum time paths between transit access points (TAP). TAPs are selected transit stops that are used to represent walk and auto access to the transit system. The following four sets of paths are created for modes:
33

a.m. peak-period local bus
a.m. peak-period premium service
mid-day local bus
mid-day premium service
Bus speeds assumed in the transit networks are derived from modeled highway speeds and reflect the effects of congestion. Regional and express transit routes on surface streets are assumed to operate out of congestion due to priority transit treatments. Higher bus speeds may result for transit vehicles operating on highways with HOV lanes and HOV bypass lanes at ramp meters, compared to those routes that operate on highways where these facilities do not exist.
In addition to transit travel times, transit fares are required as input to the mode choice model. TransCAD procedures replicate the San Diego region’s complicated fare policies which differ between:
buses which collect a flat fare of between $1.00 and $4.00, depending on the type of service
trolleys which, in 2008 charge $1.25 for internal downtown trips and $2.50 for all other trips, and $2.50 for all trolley trips after 2008
SPRINTER which charges $2.00
commuter rail (COASTER) which has a zone-based fare of between $5.00 and $6.50
proposed BRT routes which are assumed to charge $4.00
proposed Rapid Bus routes, which are assumed to charge $2.50
Fares are converted to 1999 dollars (consistent with household incomes from the growth forecast) and are assumed to remain constant in inflation-adjusted dollars over the forecast period.
Near-term transit route changes are drawn from the Regional Short-Range Transit Plan produced in coopera-tion with the region’s transit agencies. Longer-range improvements are proposed as a part of the RTP development and other transit corridor studies. In addition to federal and state funded projects, locally funded regionally significant transit projects have been included in the air quality conformity analysis of the 2008 RTIP as amended and 2030 RTP. These transit projects also are funded with TransNet funds or other local revenue sources. Once network coding is completed, the transportation models are run for the applicable scenarios (2010, 2020, and 2030). The air quality conformity document contains the list of major regional transit projects included in the analysis and their implementation phasing.
Trip Generation
Trip generation is the first step in the transportation modeling process. Average weekday trip ends by all forms of transportation starting and ending in each zone are estimated for ten trip types.
1. home-work 6. work-other
2. home-college 7. other-other
3. home-school 8. serve passenger
4. home-shop 9. visitor
5. home-other 10. airport
34
The model computes person trips, which account for all forms of transportation including automobiles, light duty trucks, taxicabs, motorcycles, public transit, bicycling, and walking.
The trip generation model works by applying trip rates to zone-level growth forecasts. The model calculates each of the trip ends separately, as trip productions and attractions. Trip production rates are expressed as trips per household, while trip production rates vary by trip type and structure type. Trip attractions are expressed as trips per acre of nonresidential land use or trips per household. Trip attraction rates vary by trip type and land use category. The 2050 Regional Growth Forecast was used to produce trip generation forecasts for the years 2010, 2020, and 2030. Trip generation rates were established by utilizing data from traffic generator studies and expanding rates from the 1995 and 2006 Travel Behavior Surveys and 2001 Caltrans Statewide Travel Survey.
The SANDAG regional transportation model uses a relatively high trip generation rate for households (8.1 vehicle trips per day), which may account for possible increases in trip-making as new facilities are built. Also, the model accounts for travel diversion among facilities.
The model reduces future year person trips by a small amount to reflect increased use of teleworking and e-commerce. Reduction factors of 1, 3, or 5 percent were applied to selected trip purposes and land uses. Telework reduction factors depend on the likelihood the land use type would have employee categories that could feasibly telecommute. Reduction factors start in year 2020.
The truck model follows a similar process as the person model. The model computes truck vehicle trips for heavy duty trucks including light heavy duty, medium heavy duty, and heavy heavy duty trucks. The truck classifications correspond to the California Air Resources Board truck classifications used in the air quality model EMFAC. Trip production and attraction rates are expressed as trips per employee and the rates vary by employee industry category.
Trip Distribution
After trip generation, trip movements between zones are determined using a doubly-constrained, gamma-function gravity model form of the trip distribution model. Inputs to the trip distribution model include zone-level trip generation forecasts by trip type, zone-to-zone impedances, and gamma function parameters by trip type and 4D category. 4D index categories attempt to define locations by their density, diversity, and urban design characteristics. A high 4D index value represents areas that would be considered smart growth and would result in shortened trip lengths. In this way the model is designed to reflect changing trip patterns in response to the types of new development in land use scenarios. The model also modifies trip patterns as new roadways are added.
Truck trip distribution is performed in a similar manner but is used to distribute vehicle trips rather than person trips by purpose as in the person model. The truck model also uses different distribution parameters by vehicle type which are not segmented by 4D category.
The model is calibrated to match observed trip length frequencies from the 2006 Travel Behavior Survey and 2001 Caltrans Statewide Travel Survey. Zone-to-zone impedances are a composite measure of peak and off-peak travel times and costs by highway, transit, and non-motorized modes.
35

Mode Choice
At this point in the modeling process, total person trip movements between zones are split into different forms of transportation by highway, transit, and non-motorized modes (bicycling and walking). Highway modes include drive alone non-toll, drive alone toll, shared-ride non-HOV/non-toll, shared-ride HOV/non-toll, and shared-ride HOV/Toll. Nine transit modes differentiate transit trips by three ride modes (rail, BRT, and bus) and three access modes (walk, drive, and drop-off). The mode choice model is designed to link mode use to demographic assumptions, highway network conditions, transit system configuration, land use alternatives, parking costs, transit fares, and auto operating costs. Trips between zone pairs are allocated to modes based on the cost and time of traveling by a particular mode compared to the cost and time of traveling by other modes. For example, vehicle trips on a congested route would be more likely to be diverted to light rail than vehicle trips on an uncongested freeway.
Income level also is considered since lower-income households tend to own fewer automobiles, and therefore, make more trips by transit and carpooling. People in higher-income households tend to choose modes based on time and convenience rather than cost. The mode choice model is calibrated using 1995 and 2006 Travel Behavior Survey trip tables by mode and income and 2001-2003 Regional Transit Survey transit trip characteristics. Regional-level Census 2000 work trip mode shares also were used to fine tune mode share estimates.
Highway and transit travel times reflect highway congestion effects from the final iteration of the feedback loop. The model produces a.m. peak, p.m. peak, and off-peak period trip tables for vehicles and transit riders. The a.m. peak period is from 6:00 to 9:00 in the morning and the p.m. peak period is from 3:00 to 6:00 in the afternoon. The off-peak period covers the remaining 18 hours of the day.
Highway and Transit Assignment
Highway assignment produces traffic volume estimates for all roadway segments in the system. These traffic volumes are an important input to emissions modeling. Similarly, transit trips are assigned to transit routes and segments.
Highway
SANDAG loads traffic using the TransCAD “Multi-Modal Multi-Class Assignment” function. Before loading the traffic onto the network, the three truck modes are combined with the five passenger vehicle modes. Multi-class assignment allows SANDAG to assign the eight vehicle modes (as defined in the Highway Network section) in one combined procedure.
The highway assignment model works by finding roads that provide the shortest travel impedance between each zone pair. Trips between zone pairs are then accumulated on road segments making up minimum paths. Highway impedances consider posted speed limits, signal delays, congestion delays, and costs. The model computes congestion delays for each segment based on the ratio of the traffic volume to roadway capacity. Motorists may choose different paths during peak hours when congestion can be heavy and off-peak hours when roadways are typically free flowing. For this reason, traffic is assigned separately for a.m. peak, p.m. peak, and off-peak periods. Vehicle trip tables for each scenario reflect increased trip-making due to population growth and variations in travel patterns due to the alternative transportation facilities/networks proposed.
36

Model accuracy is assessed by comparing model estimated traffic volumes with actual traffic counts obtained through the SANDAG traffic monitoring program and Highway Performance Monitoring System (HPMS) estimates of vehicle miles of travel (VMT).
After completing the highway assignments, additional processing is needed. Adjustments are made for calibration error volume, HOV/managed lane volume, bus volumes, hourly distribution factors, level of service (LOS), and travel time.
Transit
For transit assignment, TransCAD software assigns TAP-to-TAP transit trips to the network. Eight separate transit assignments are produced for peak and off-peak periods; walk and auto access; and local bus and premium service. These individual assignments are summed to obtain total transit ridership forecasts.
Before assigning transit trips, external transit trips coming into San Diego from outside the region need to be added to the internal transit trips estimated by the mode choice model. Currently, few transit trips enter from the north or east, however, over 20,000 transit trips cross the Mexican border each day. An external transit trip table for the base year is developed from on-board transit ridership surveys and factored to future years based on border crossing trends to account for these trips.
For accuracy, transit ridership forecasts from the transit assignment model are compared with transit counts from the SANDAG transit passenger counting program to determine whether transit modeling parameters need to be adjusted.
Some of these comparisons of model-estimated boardings with actual boardings include:
System-level boardings, which may reveal transfer rate problems and lead to changes to the transfer wait time factor in the mode choice model;
Boardings by mode, which may reveal modal biases and lead to changes in mode choice modal constants;
Boardings by frequency of service, which may show biases that lead to changes in the first wait factor in the mode choice model; and
Centre City screenline crossings, which may lead to changes in parking costs, and boardings by stop location, which may indicate problems with specific generators such as a university.
Post-TransCAD Processing
Standard TransCAD output needs to be reformatted and adjusted to be useful for emissions modeling. Several routines and computer programs have been written to accomplish the following major functions:
Correcting link-specific traffic volume forecasts for calibration error;
Adding in estimated travel on roads not in the transportation modeling process;
Computing link speeds based on corrected link volumes, highway capacity manual relationships between congestion, and speed (or signal delay);
Splitting link volumes into heavy-duty truck and other traffic to obtain speed distributions by vehicle class; and
37

Preparing a data set that contains total VMT, number of trip starts, and VMT by speed category by time of day for each vehicle class.
The travel demand modeling procedures used for the 2008 RTIP and 2030 RTP differ from previous modeling procedures in three key ways. First, a truck model is being run parallel to the four-step model for the first time. Truck origin-destination trip tables are merged with vehicle trip tables for highway assignment and air quality procedures. Second, new inputs were used, including the recently completed 2010 Gateway Forecast (a forecast of freight traffic in the region,) 2002 Freight Analysis Framework data, and the 2050 Regional Growth Forecast projections. The third difference is a 4D (density, diversity, urban design characteristics) category was used as inputs into the trip distribution model. These new inputs and procedures have contributed to changes in emissions modeling output.
Motor Vehicle Emissions Modeling
Emissions Model
In November 2006, ARB released EMission FACtors (EMFAC) 2007, an emissions inventory model that calculates emissions for motor vehicles operating in California. It is an integrated model that combines emission rate data with vehicle activity to calculate regional emissions. The U.S. EPA approved EMFAC 2007 for use in conformity determinations on January 18, 2008.
The EMFAC 2007 model supports calculation of emissions for the Burden mode. The Burden mode is used for calculating regional emission inventories. In this mode, the model reports total emissions as tons per day for each pollutant, by vehicle class, and the total vehicle fleet. The Burden mode uses emission factors that have been corrected for ambient conditions and speeds combined with vehicle activity to calculate emissions in tons per day. Vehicle activity includes the number of vehicles, daily vehicle miles traveled, and the number of daily trips.
The air quality analysis of the 2008 RTIP as amended and 2030 RTP was conducted using EMFAC 2007’s Burden mode. Projections of daily regional emissions were prepared for reactive organic gases (ROG), nitrogen oxides (NOx), and CO.
On-road motor vehicle emissions are attributed to several different processes:
Starting exhaust
Running exhaust
Idle exhaust (calculated for heavy-duty trucks only)
Resting and diurnal evaporation
Running losses
Hot soak evaporation
Emission factors vary by vehicle class, fuel usage, and technology. The fuels modeled are gasoline, diesel, and electrically powered vehicles. Technology categories can be grouped into catalyst, noncatalyst, and diesel. Thirteen vehicle classes are modeled:
passenger car line-haul vehicle
two types of light-duty trucks urban bus
medium-duty truck school bus
38

two types of light-heavy-duty trucks motorcycle
medium-heavy-duty truck motor home
heavy-heavy-duty truck Emission factors for processes that vary by temperature (i.e., starting exhaust, hot soak, and running exhaust) are broken down further by specified temperature ranges. Exhaust emission factors also are broken down by speed range.
Regional Emissions Forecasts
Regional transportation forecasts were initiated in April 2010. Output from the TransCAD model was then reformatted and adjusted to be useful for emissions modeling.
Eight-Hour Ozone Standard
Effective June 9, 2008, the U.S. EPA found the eight-hour ozone budgets included in the Eight-Hour Ozone Attainment Plan for San Diego County adequate for transportation conformity purposes. In April 2010 SANDAG prepared countywide forecasts of average weekday ROG and NOx emissions for 2010, 2020, and 2030 using the EMFAC 2007 model. ROG and NOx emissions are based on the summer season.
The analysis years were selected to comply with Sections 93.106(a) (1) and 93.118 (a) of the Transportation Conformity Rule. According to these sections, the first horizon year (2010) must be within ten years from the base year used to validate the regional transportation model (2008), the last horizon year must be the last year of the transportation plan’s forecast period (2030), and the horizon years may be no more than ten years apart (2020).
CO Standard
CO regional emissions were projected for 2010, 2018, 2020, and 2030 for the conformity determination of the 2008 RTIP as amended and 2030 RTP conformity redetermination. CO emissions are based on the winter season. Regional emissions for 2018 are interpolated.
Emissions Modeling Results
An emissions budget is the part of the SIP that identifies emissions levels necessary for meeting emissions reduction milestones, attainment, or maintenance demonstrations.
To determine conformity of the 2008 RTIP as amended and 2030 RTP, the plan must comply with the emission analysis described in the Regional Emissions Forecast section. Table 3 shows that the projected ROG and NOx emissions from the 2008 RTIP as amended and 2030 RTP are below the 2008 ROG and NOx budgets.
39

Table 3—2008 RTIP Amendment No. 23 and 2030 Revenue Constrained RTP Air Quality Conformity Analysis for Eight-Hour Ozone
ROG NOx
Year
Average Weekday Vehicle Starts
(1,000s)
Average Weekday Vehicle Miles
(1,000s)
SIP Emissions
Budget Tons/Day
ROG Emissions Tons/Day
SIP Emissions
Budget Tons/Day
NOx Emissions Tons/Day
2010 13,021 81,010 53 37 98 71
2020 14,567 89,216 53 24 98 40
2030 15,968 101,689 53 19 98 32
Note: Emissions budgets are from the Eight-Hour Ozone Attainment Plan for San Diego County, which were found adequate for transportation conformity purposes by the U.S. EPA, effective June 9, 2008.
Adjustment factors for ROG and NOx were provided by ARB to account for recently adopted emission control programs not reflected in EMFAC 2007 and other corrections. Table 4 includes the adjustment factors by analysis year.
Table 4—EMFAC 2007 Adjustment Factors
Year ROG Adjustment Factor (tons/day)
NOx Adjustment Factor (tons/day)
2010 0.04 2.37
2020 0.33 2.40
2030 0.71 2.80
Note: Adjustment factors were provided by ARB. The tons listed are subtracted from the EMFAC 2007 output of tons per day for ROG and NOx.
Table 5 shows that projected CO emissions from the 2008 RTIP as amended and 2030 RTP are below the 2003 CO budget of 730 tons per day.
40

Table 5—2008 RTIP Amendment No. 23 and 2030 Revenue Constrained RTP Air Quality Conformity Analysis for Carbon Monoxide
CO
Year
Average Weekday
Vehicle Starts (1,000s)
Average Weekday Vehicle Miles
(1,000s)
SIP Emissions Budget
Tons/Day
CO Emissions Tons/Day
2010 13,021 81,010 730 391
2018 14,258 87,575 730 245
2020 14,567 89,216 730 209
2030 15,968 101,689 730 160
Note: Emissions budgets for the San Diego region from 2004 Revision to California State Implementation Plan for Carbon Monoxide, Updated Maintenance Plan for Ten Federal Planning Areas (Approved as SIP revision in January 2006).
Exempt Projects
Section 93.126 of the Transportation Conformity Rule exempts certain highway and transit projects from the requirement to determine conformity. The categories of exempt projects include safety, mass transit, air quality (ridesharing and bicycle and pedestrian facilities), and other (such as planning studies).
Table 6 illustrates the exempt projects considered in the 2008 RTIP as amended and 2030 Revenue Constrained RTP. This table shows short-term exempt projects. Additional unidentified projects could be funded with revenues expected to be available from the continuation of existing state and federal programs.
41

Table 6—Exempt Projects*
Project/Program Description
Bikeway, Rail Trail and Pedestrian Projects
Bayshore Bikeway
Cliff Street Pedestrian/Bicycle Bridge
Coastal Rail Trail
Escondido Creek Bike Path Bridge
Inland Rail Trail
Lake Hodges Bicycle-Pedestrian Bridge
Plaza Bonita Class I Bikeway
Regional Bike Locker Program
SR 56/Black Mountain Road Bikeway Interchange
Various Bicycle Master Plans
Regionwide Traffic Incident Management
Freeway Service Patrol
Safety Improvement Program
Bridge Rehabilitation/Preservation
Collision Reduction
High Risk Roads Program
Highway Safety Improvement Program
Noise Barrier Program
Roadway/Roadside Preservation
Transportation Demand Management
Regional Vanpool Program
RideLink Regional Rideshare Program
Transportation Management Systems
Joint Transportation Operations Center (JTOC)
ITS Operations
Ramp Meters (I-5/I-805, SR 94)
Regional Fare Technology
Smart Parking Pilot Program
Traffic Management System (I-805, SR 94) Vehicle Assist and Automation
42

Implementation of Transportation Control Measures
There are four federally-approved Transportation Control Measures (TCM) that must be implemented in San Diego, which the SIP refers to as Transportation Tactics. They include ridesharing, transit service improvements, traffic flow improvements, and bicycle facilities and programs.
These TCMs were established in the 1982 SIP, which identified general objectives and implementing actions for each tactic. The TCMs have been fully implemented. Ridesharing, transit, bicycling, and traffic flow improvements continue to be funded, although the level of implementation established in the SIP has been surpassed. The list of actions that implemented the TCMs is available at SANDAG.
Interagency Consultation Process and Public Input
The consultation process followed to prepare the air quality conformity analysis for the 2008 RTIP as amended and 2030 RTP complies with the San Diego Transportation Conformity Procedures adopted in July 1998. In turn, these procedures comply with federal requirements under 40 CFR 93. Interagency consultation involves SANDAG (as the MPO for San Diego County), the APCD, Caltrans, ARB, U.S. DOT, and U.S. EPA.
Consultation is a three-tier process that: 1. formulates and reviews drafts through a conformity working group
2. provides local agencies and the public with opportunities for input through existing regional advisory committees and workshops
3. seeks comments from affected federal and state agencies through participation in the development of draft documents and circulation of supporting materials prior to formal adoption
SANDAG consulted on the development of the air quality conformity analysis of the 2008 RTIP as amended and 2030 RTP at meetings of the CWG, as follows:
On April 7, 2010, SANDAG staff presented the schedule for the preparation of the 2008 RTIP Amendment No. 23 and criteria and procedures to be followed for its conformity analysis. Staff confirmed that a redetermination of conformity would be done for the 2030 RTP, in conjunction with the 2008 RTIP Amendment No. 23 for consistency purposes. Staff presented information on the 2050 Regional Growth Forecast, Transportation Control Measures, the Revenue Constrained financial assumptions, latest emissions model, and public involvement and outreach.
On April 28, 2010, SANDAG released the draft air quality conformity analysis of the 2008 RTIP Amendment No. 23 to the San Diego Region CWG for a 30-day review-and-comment period. On May 5, 2010, the draft air quality analysis will be discussed at the meeting of the San Diego Region CWG, and applicable comments will be incorporated into the report.
On June 9, 2010, the draft 2008 RTIP Amendment No. 23 and its conformity determination and the 2030 RTP conformity redetermination will be released for a public review period, which will close on July 16, 2010.
The 2008 RTIP Amendment No. 23 will be presented to the TransNet Independent Taxpayers Oversight Committee on July 14, 2010 for input.
The SANDAG Transportation Committee will be asked to recommend approval of the 2008 RTIP Amendment No. 23 and its conformity determination to the Board of Directors on July 16, 2010.
43

44
The SANDAG Board will be asked to approve the 2008 RTIP Amendment No. 23 and its conformity determination at its July 23, 2010, meeting.
Members of the public are welcomed to provide comments at meetings of the CWG, the Transportation Committee, and the SANDAG Board of Directors.

Appendix C
PUBLIC PARTICIPATION POLICY

Appendix C
PUBLIC PARTICIPATION POLICY
Excerpt from PUBLIC PARTICIPATION/INVOLVEMENT POLICY as it pertains to the RTIP: B. Short Range Program – Regional Transportation Improvement Program (RTIP) – document
updated every two years outlining major transportation projects to be implemented during a five-year period.
1. SANDAG shall follow the latest federal and state regulations regarding participation by interested
parties. 2. As the document that implements the long range plan, the RTIP shall be incorporated as part of the
Board adopted public involvement process established for the Regional Transportation Plan (October 27, 2006) including participating in public outreach efforts, providing adequate public notice (legal notice publications), employing visualization techniques, holding public meetings at convenient and accessible locations.
3. SANDAG shall respond to any significant public input or comment received during the development of the biennial update and/or during the amendment cycle as part of its report to the Board or Transportation Committee (as appropriate).
4. The biennial RTIP update will be noticed in newspapers of general circulation including in alternate
languages and a public hearing shall be held prior to final adoption by the Board of Directors. 5. During the amendment cycle, SANDAG will provide a draft of the amendment to all
interested parties for a 15-day comment period.
47

Appendix D
GLOSSARY OF TERMS AND ACRONYMS


Appendix D
GLOSSARY OF TERMS AND ACRONYMS
A AC Advanced Construction ADA Americans with Disabilities Act APCB/APCD San Diego Air Pollution Control Board District ARRA American Recovery and Reinvestment Act (Federal Stimulus Program) B BIA Bureau of Indian Affairs BIP Border Infrastructure Program BTA Bicycle Transportation Account C CAAA 1990 Clean Air Act, as amended Caltrans California Department of Transportation CARB California Air Resources Board CBI Corridors and Borders Infrastructure CDBG Community Development Block Grant (Federal) CI Capacity Increasing CMAQ Congestion Mitigation and Air Quality Program CMIA Corridor Mobility Improvement Account CMP Congestion Management Program CO Carbon Monoxide CON Construction Phase CTC California Transportation Commission CWG Conformity Working Group D
DEMO ISTEA Special Projects/TEA-2/SAFETEA-LU 1 High-Priority Demonstration DOT U.S. Department of Transportation
E
EMFAC Emissions Factors Model EPA U.S. Environmental Protection Agency
F
FHWA Federal Highway Administration FSP Freeway Service Patrol (and FSP Act) FTA Federal Transit Administration
50
H HES/SR2S Hazard Elimination Safety/Safe Routes to School program HOV High Occupancy Vehicle HUD Housing and Urban Development
I
IM Interstate Maintenance IRR Indian Reservation Road ISTEA Intermodal Surface Transportation Efficiency Act of 1991 ITOC Independent Taxpayer Oversight Committee ITS Intelligent Transportation Systems
L LRT Light Rail Transit M
MPO Metropolitan Planning Organization MTDB/MTS San Diego Metropolitan Transit Development Board/Metropolitan Transit System
N
NAAQS National Ambient Air Quality Standards NCI Non Capacity Increasing NCPD National Corridor Planning and Development NCTD North County Transit District NHS National Highway System NOx Nitrogen Oxide
P
P/PE Preliminary Engineering Phase PPNO Project Number (Caltrans) PM Particulate Matter
R
RAQS Regional Air Quality Strategy ROG Reactive Organic Gas RW/ROW Right-of-Way phase RTIP Regional Transportation Improvement Program RTP Regional Transportation Plan RSTP Regional Surface Transportation Program
S
SAFETEA-LU Safe, Accountable, Flexible and Efficient Transportation Equity Act: a Legacy for Users SANDAG San Diego Association of Governments SBTA State Bicycle Transportation Account SDTC San Diego Transit Corporation SDTI San Diego Trolley, Incorporated SHOPP State Highway Operation and Protection Program SIP State Implementation Plan (for air quality)
51
52
SLTPP State-Local Transportation Partnership Program/SB300 SR State Route (as in SR 52 - State Route 52) STA State Transit Assistance STIP State Transportation Improvement Program STIP-IIP State Transportation Improvement Program - Interregional Program STIP-RIP State Transportation Improvement Program – Regional Improvement Program
(SANDAG) STP Surface Transportation Program
T
TEA Transportation Enhancement Activities TEA-21 Transportation Equity Act for the 21st Century TCI Transit Capital Improvement TCM Transportation Control Measure TCRP Traffic Congestion Relief Program TDA Transportation Development Act TDM Transportation Demand Management TIP Transportation Improvement Program TMA Transportation Management Agency TP&D Transportation Planning and Development TransCAD Transportation Panning Computer Package TransNet San Diego Region 1/2% Local Transportation Sales Tax Program TSM Traffic Systems Management T-1 Transportation T-tactic: Ridesharing T-2 Transportation T-tactic: Transit T-3 Transportation T-tactic: Bicycle T-5 Transportation T-tactic: Traffic Improvement
V VOC Volatile Organic Compounds

San Diego Association of Governments
TRANSPORTATION COMMITTEE
July 16, 2010 AGENDA ITEM NO.:6
Action Requested: APPROVE
2008 REGIONAL TRANSPORTATION IMPROVEMENT PROGRAM: File Number 1500300 AMENDMENT NO. 25 Introduction
On July 25, 2008, the Board of Directors adopted the 2008 Regional Transportation Improvement Program (RTIP), the multiyear program of proposed major highway, arterial, transit, and bikeway projects in the San Diego region covering the period FY 2009 to FY 2013. The 2009 Federal State Transportation Improvement Program (FSTIP), which includes the SANDAG 2008 RTIP, received federal approval on November 17, 2008.
Recommendation
The Transportation Committee is asked to approve Resolution No. 2011-03 (Attachment 1), including Amendment No. 25 to the 2008 RTIP.
Discussion
SANDAG processes amendments to the RTIP generally on a quarterly basis and occasionally on a more frequent basis as circumstances arise. Amendment No. 25 represents the quarterly amendment that includes changes as requested by member agencies.
Independent Taxpayer Oversight Committee
The Independent Taxpayer Oversight Committee (ITOC) is the independent citizen oversight committee that reviews TransNet-funded projects. The ITOC is scheduled to review Amendment No. 25 at its July 14, 2010, meeting, focusing its review on the TransNet-funded projects. Any significant comments will be presented to the Transportation Committee.
Public Notice/Resolutions
SANDAG transmitted the draft Amendment No. 25 to interested parties for a 15-day public review. The comment period ended on July 2, 2010, and no comments were received.
The changes in this amendment are summarized below with additional details included in Table 1 (Attachment 2).
Caltrans
• State Route 52 Freeway (E&F) (CAL26): This amendment proposes to revise funding between fiscal years and reduce TransNet – Major Corridor (MC) and federal Regional Surface
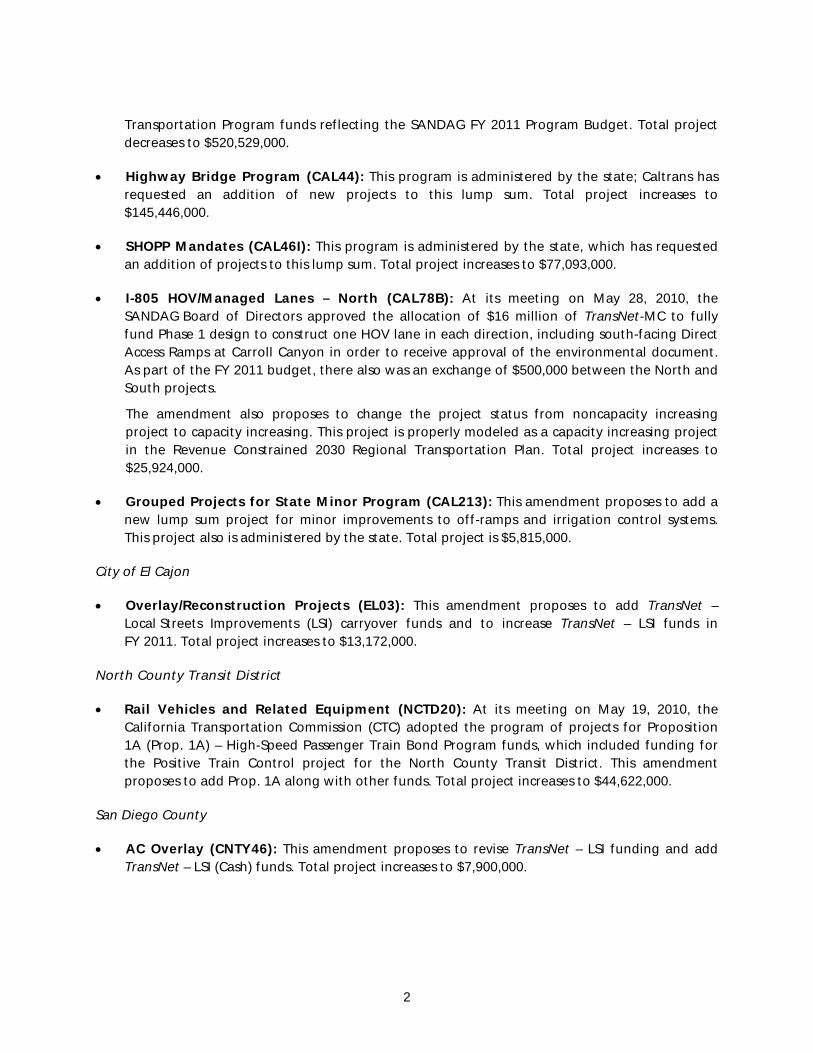
Transportation Program funds reflecting the SANDAG FY 2011 Program Budget. Total project decreases to $520,529,000.
• Highway Bridge Program (CAL44): This program is administered by the state; Caltrans has requested an addition of new projects to this lump sum. Total project increases to $145,446,000.
• SHOPP Mandates (CAL46I): This program is administered by the state, which has requested an addition of projects to this lump sum. Total project increases to $77,093,000.
• I-805 HOV/Managed Lanes – North (CAL78B): At its meeting on May 28, 2010, the SANDAG Board of Directors approved the allocation of $16 million of TransNet-MC to fully fund Phase 1 design to construct one HOV lane in each direction, including south-facing Direct Access Ramps at Carroll Canyon in order to receive approval of the environmental document. As part of the FY 2011 budget, there also was an exchange of $500,000 between the North and South projects.
The amendment also proposes to change the project status from noncapacity increasing project to capacity increasing. This project is properly modeled as a capacity increasing project in the Revenue Constrained 2030 Regional Transportation Plan. Total project increases to $25,924,000.
• Grouped Projects for State Minor Program (CAL213): This amendment proposes to add a new lump sum project for minor improvements to off-ramps and irrigation control systems. This project also is administered by the state. Total project is $5,815,000.
City of El Cajon
• Overlay/Reconstruction Projects (EL03): This amendment proposes to add TransNet – Local Streets Improvements (LSI) carryover funds and to increase TransNet – LSI funds in FY 2011. Total project increases to $13,172,000.
North County Transit District
• Rail Vehicles and Related Equipment (NCTD20): At its meeting on May 19, 2010, the California Transportation Commission (CTC) adopted the program of projects for Proposition 1A (Prop. 1A) – High-Speed Passenger Train Bond Program funds, which included funding for the Positive Train Control project for the North County Transit District. This amendment proposes to add Prop. 1A along with other funds. Total project increases to $44,622,000.
San Diego County
• AC Overlay (CNTY46): This amendment proposes to revise TransNet – LSI funding and add TransNet – LSI (Cash) funds. Total project increases to $7,900,000.
2

San Diego Association of Governments/Metropolitan Transit System (MTS)
Provisions included in two previous federal transportation authorizations – Intermodal Surface Transportation Efficiency Act (ISTEA) and Transportation Equity Act of the 21st Century (TEA-21) – allow for the use of certain toll revenues as a match to federal funds. In May 2010, the Federal Highway Administration (FHWA) approved a conditional use of toll credits toward federally funded projects. In June 2010, guidance was issued for use of toll credits for Federal Transit Administration (FTA) funded programs. The toll credits do not represent additional or new funding, but it does allow the agencies to receive 100 percent reimbursement of federal funds, by using the toll credits as a soft match to the federal funds. It also means that the project would have to be fully funded with the federal share only or reprioritize projects so that the overall federal appropriations are not increased. The benefit derived is to free up Transportation Development Act funding currently used as a match to the federal funds in order to create flexibility in future projects by using 100 percent of this local funding source, thereby eliminating federal contract provisions. Due to the recent decision by the federal agencies and Caltrans to allow for TDCs, MTS and SANDAG are the first agencies to apply TDCs to specific projects. SANDAG is currently working with Caltrans and local agencies to determine applicability of TDCs for other projects.
With the flexibility allowed under the toll credit, formally known as Transportation Development Credit (TDC) provisions, as well as factors that arose after the approval of the FY 2011 Capital Improvement Program (CIP), MTS has revised its CIP (including SANDAG-implemented projects). In addition to TDCs, other factors include the award of $233,150 from the California Energy Commission on May 17, 2010, to be used for compressed natural gas (CNG) station improvements; $2.2 million approved by the SANDAG Board at its May 28, 2010, meeting for Mission Valley East capital expenses; and the final apportionment for the FTA Section 5307 and FTA Section 5309 programs was lower than the amount assumed to develop the FY 2011 CIP. A detailed list of the project changes are shown in Attachment 2. The proposed changes are scheduled to be approved by the MTS Board at its July 15, 2010, meeting. MTS staff anticipates requesting an additional RTIP amendment in the coming months in order to replenish the local funding on the capital projects that SANDAG is implementing on behalf of MTS.
The changes due to the above factors are included in the below list of projects proposed to be amended: Bus and Rail Stock Purchase and Rehabilitation (MTS28), Preventive Maintenance (MTS32A), Bus Signal and Communications Equipment (MTS34), Rail Electrification and Power Distribution (SAN39), East County Bus Maintenance Facility (SAN52), Bus and Fixed Guideway Support Equipment (SAN55), Fixed Guideway Transitways/Lines (SAN57), and Bus and Fixed Guideway Station Stops and Terminals (SAN63).
• FTA Section 5310 Elderly and Disabled (SAN125): At its meeting on April 19, 2010, the CTC approved the allocation of funds under this program. Seventeen projects from the San Diego region were awarded funding from this program, which is allocated to nonprofit agencies. This amendment reflects that approval. Total project is $1,088,000.
3

• Transit Service Operations (MTS23A): Due to the reduced federal apportionment for FY 2010, the amount available for these specialized services is reduced. The total project is reduced to $132,596,000.
• Bus/Rail Support Facilities and Equipment (MTS30): The proposed change includes the addition of a new project, ADA Land and Facility for $19.2 million, previously approved by the MTS Board. Including other adjustments described above, the total project is increased to $67,905,000.
• Fixed Guideway Transitways/Lines (MTS35): With the additional local funds available due to the use of TDCs on other projects, this amendment proposes to increase the local funds and reduce like amount of federal funds. Total project remains $21,770,000.
City of San Diego
• State Route (SR) 163/Friars Road Interchange Modification (SD83): This amendment proposes to change the project description to add phases to different segments of the project. The change (bolded) is from “widen and improve Friars Road and overcrossing; reconstruct interchange, including improved ramp intersections and new connector roadways; and construct auxiliary lanes along northbound and southbound SR 163" to “widen and improve Friars Road and overcrossing; reconstruct interchange, including improvements to ramp intersections (Phase 1). Construct new connector roadways and structures (Phase 2). Construct auxiliary lanes along northbound and southbound SR 163 (Phase 3).” Total project remains at $58,818,000.
• Otay Truck Route Widening (Phase 4) (SD102A): This amendment proposes to move federal High Priority Project (HPP) funds and local funds from FY 2010 to FY 2011 and FY 2012. Total project remains at $6,968,000.
• Skyline Drive – 58th Street to Sears Avenue (SD130): This amendment proposes to revise HPP and local funds from FY 2010 to FY 2011. This amendment also proposes to revise the project description (change in bold) from “Skyline Drive from 58th Street to Sears Street - in San Diego, installation of new medians for safety improvements, intersection lighting, traffic signal upgrades, and other street improvements to enhance pedestrian and vehicular movement” to “Skyline Drive from 58th Street to Sears Avenue - in San Diego, installation of new medians for safety improvements, intersection lighting, traffic signal upgrades, and other street improvements to enhance pedestrian and vehicular movement.” Total project remains at $2,705,000.
4

City of San Marcos
• San Marcos Creek Bridge at State Route 78 (SM45): This new project would construct a culvert on SR 78 between Twin Oaks Valley Road and San Marcos Boulevard interchange. Total project is $21,400,000.
Fiscal Constraint Analysis
Federal regulations require the 2008 RTIP to be a revenue-constrained document with programmed projects based upon available or committed funding and/or reasonable estimates of future funding. Funding assumptions are generally based upon: (1) authorized or appropriated levels of federal and state funding from current legislation; (2) conservative projections of future federal and state funding based upon a continuation of current funding levels; (3) the most current revenue forecasts for the TransNet program; and (4) the planning and programming documents of the local transportation providers.
Tables 2a through 2c (Attachment 3) provide updated program summaries, including a comparison from the prior approved version (Chapter 4 of the Final 2008 RTIP discusses, in detail, the financial capacity analysis of major program areas, including discussion of available revenues). Based upon the analysis, the projects contained within the 2008 RTIP, including Amendment No. 25, are reasonable when considering available funding sources.
Air Quality Analysis
On July 25, 2008, SANDAG found the 2008 RTIP in conformance with the Regional Air Quality Strategy/State Implementation Plan (SIP) for the San Diego region in accordance with the provisions of 40 Code of Federal Regulations (CFR) Parts 51 and 93. All of the required regionally significant capacity increasing projects were included in the quantitative emissions analysis conducted for the 2030 San Diego Regional Transportation Plan: Pathways for the Future (2030 RTP) and the
2008 RTIP. The FHWA and the FTA jointly approved the conformity determination for the 2008 RTIP and the conformity redetermination for the 2030 RTP on November 17, 2008. SANDAG updated the air quality conformity analysis as part of Amendment No. 16 to the 2008 RTIP; FHWA/FTA approved the redetermination on February 19, 2010.
Projects in RTIP Amendment No. 25 meet the conformity provisions of the Transportation Conformity Rule (40 CFR §93.122(g)) and all applicable transportation planning requirements per 23 CFR Part 450. All capacity increasing projects in Amendment No. 25 were included in the quantitative emissions analysis conducted for the 2030 RTP and 2008 RTIP. All other projects not included in the air quality conformity analysis are either noncapacity increasing or are exempt from the requirement to determine conformity according to the Transportation Conformity Rule (40 CFR §93.126) and because all other projects are exempt, no further conformity determination is required. SANDAG followed interagency consultation procedures to determine
5

6
which projects are exempt. Amendment No. 25 does not interfere with the timely implementation of Transportation Control Measures. The 2008 RTIP, including Amendment No. 25, remain in conformance with the SIP.
LAUREN WARREM Director of Finance
Attachments: 1. Resolution No. 2011-03: Approving Amendment No. 25 to the 2008 RTIP 2. Table 1: 2008 RTIP – Amendment No. 25 3. Tables 2a, 2b, and 2c: Fiscal Constraint Analysis 4. MTS FY 2011 Capital Improvement Program-Revised July 2010
Key Staff Contact: Sookyung Kim, (619) 699-6909, [email protected]

7
401 B Street, Suite 800 San Diego, CA 92101 Phone (619) 699-1900 • Fax (619) 699-1905 www.sandag.org
RESOLUTION NO. 2011-03
Attachment 1
APPROVING AMENDMENT NO. 25 TO THE 2008 REGIONAL TRANSPORTATION IMPROVEMENT PROGRAM
WHEREAS, on July 25, 2008, SANDAG adopted the 2008 Regional Transportation Improvement Program (RTIP) and found the 2008 RTIP in conformance with the 1998 Regional Air Quality Strategy (RAQS) and the applicable State Implementation Plans (SIP); and
WHEREAS, on November 17, 2008, the United States Department of Transportation (USDOT) determined the 2008 RTIP and 2030 San Diego Regional Transportation Plan: Pathways for the Future (2030 RTP) conform to the applicable SIPs in accordance with the provisions of 40 Code of Federal Regulations (CFR) Parts 51 and 93; and
WHEREAS, on January 22, 2010, SANDAG approved Amendment No. 16 to the 2008 RTIP and found it in conformance with the 1998 Regional Air Quality Strategy (RAQS) and the applicable State Implementation Plans (SIP); and
WHEREAS, on February 19, 2010, the United States Department of Transportation (USDOT) determined Amendment No. 16 to the 2008 RTIP and 2030 RTP to conform to the applicable SIPs in accordance with the provisions of 40 CFR Parts 51 and 93; and
WHEREAS, member agencies have requested various changes to existing projects for inclusion into the 2008 RTIP as shown in Attachment 2; and
WHEREAS, the amendments are consistent with the metropolitan transportation planning regulations per 23 CFR Part 450; and
WHEREAS, this amendment is consistent with the 2030 RTP, which conforms to the 2003 and 2006 SIP and to the emissions budgets from the Eight-Hour Ozone Attainment Plan for San Diego County, which were found adequate for transportation conformity purposes by the U.S. Environmental Protection Agency in 2008; and
WHEREAS, the regionally significant capacity increasing projects have been incorporated into the quantitative air quality emissions analysis and conformity findings conducted for the 2030 RTP and the 2008 RTIP; and
WHEREAS, Amendment No. 25 to the 2008 RTIP continues to provide for timely implementation of transportation control measures contained in the adopted RAQS/SIP for air quality and a quantitative emissions analysis demonstrates that the implementation of the RTIP projects and programs meet all the federally required emissions budget targets; and

RESOLUTION NO. 2011-03 Page 2
8
WHEREAS, projects in Amendment No. 25 satisfy the transportation conformity provisions of 40 CFR 93.122(g) and all applicable transportation planning requirements per 23 CFR Part 450; and
WHEREAS, all other projects in Amendment No. 25 are either noncapacity increasing or exempt from the requirements to determine conformity; and
WHEREAS, the 2008 RTIP Amendment No. 25 is fiscally constrained as shown in Tables 2a through 2c (Attachment 3); and
WHEREAS, the amendments are consistent with the Public Participation Policy adopted by the SANDAG Board of Directors; and
WHEREAS, the SANDAG Board of Directors has delegated the approval of RTIP amendments to the Transportation Committee;
NOW THEREFORE
BE IT RESOLVED that the Transportation Committee does hereby approve Amendment No. 25 to the 2008 RTIP; and
BE IT FURTHER RESOLVED that SANDAG finds the 2008 RTIP, including Amendment No. 25, is consistent with the 2030 RTP, is in conformance with the applicable SIPs and 1998 RAQS for the San Diego region, is consistent with SANDAG Intergovernmental Review Procedures, and is consistent with SANDAG Public Participation Policy, as amended.
PASSED AND ADOPTED this 16th day of July 2010.
________________________________________ ATTEST: ________________________________________
CHAIRPERSON SECRETARY
MEMBER AGENCIES: Cities of Carlsbad, Chula Vista, Coronado, Del Mar, El Cajon, Encinitas, Escondido, Imperial Beach, La Mesa, Lemon Grove, National City, Oceanside, Poway, San Diego, San Marcos, Santee, Solana Beach, Vista, and County of San Diego.
ADVISORY MEMBERS: California Department of Transportation, Metropolitan Transit System, North County Transit District, Imperial County, U.S. Department of Defense, San Diego Unified Port District, San Diego County Water Authority,
Southern California Tribal Chairmen’s Association, and Mexico.

Table 1
San Diego Region (in $000s)
2008 Regional Transportation Improvement Program
Amendment No. 25
MPO ID:TITLE:
CAL26State Route 52 Freeway (E&F)
Caltrans
Capacity Status: CI 08-25RTIP #:
In San Diego, Santee and Lakeside, from SR 125 to Cuyamaca Street to SR 67 - construct 4 lane
freeway
DESCRIPTION:
CHANGE REASON: Reduce funding, Revise funding between fiscal years
EST TOTAL COST: $520,529
CONRWPEPRIORTOTAL 08/09 09/10 10/11 11/12 12/13
DEMO $2,250 $2,250 $2,250
HPP $8,000 $1,737 $278 $10,015 $10,015
RSTP $22,438 $23,761 $7,839 $22,438 $31,600 $54,038
STIP-IIP NHS $3,010 $2,125 $885 $3,010
STIP-IIP State Cash $5,355 $4,732 $623 $5,355
STIP-RIP NHS $26,558 $5,848 $20,710 $26,558
STIP-RIP Prior NHS $16,375 $16,375 $16,375
STIP-RIP Prior State Cash $802 $802 $802
STIP-RIP State Cash $192,669 $11,140 $26,205 $155,324 $192,669
TCRP $45,000 $45,000 $45,000
TCSP $1,000 $228 $1,228 $1,228
TransNet - H $44,340 $671 $43,669 $44,340
TransNet - MC $61,498 $10,135 $16,348 $4,558 $15,696 $9,054 $14,781 $53,969 $50,139 $118,889
TOTAL $520,529 $429,295 $35,633 $16,576 $12,675 $15,696 $9,054 $39,297 $234,154 $247,078
PE RW CONPRIORTOTAL
PROJECT PRIOR TO AMENDMENT
08/09 09/10 10/11 11/12 12/13
DEMO $2,250 $2,250 $2,250
HPP $10,000 $8,000 $2,000 $10,000
RSTP $48,040 $22,438 $23,761 $1,841 $22,438 $25,602
RSTP - Conversion $11,930 $11,930 $11,930
STIP-IIP NHS $3,010 $3,010 $2,125 $885
STIP-IIP State Cash $5,355 $5,355 $4,732 $623
STIP-RIP NHS $26,558 $26,558 $5,848 $20,710
STIP-RIP Prior NHS $16,375 $16,375 $16,375
STIP-RIP Prior State Cash $802 $802 $802
STIP-RIP State Cash $192,669 $192,669 $11,140 $26,205 $155,324
TCRP $45,000 $45,000 $45,000
TCSP $1,228 $1,000 $228 $1,228
TransNet - H $44,340 $44,340 $671 $43,669
TransNet - MC $141,348 $54,784 $15,549 $20,885 $18,380 $3,194 $28,556 $13,372 $53,969 $74,007
TransNet - MC AC $11,930 $(11,930)
$548,905 $422,581 $41,310 $33,043 $20,221 $3,194 $28,556 $37,888 $234,154 $276,863 TOTAL
1Page Tuesday, June 29, 2010
9
adi
Text Box
Attachment 2

San Diego Region (in $000s)
2008 Regional Transportation Improvement Program
Amendment No. 25
MPO ID:TITLE:
CAL44Highway Bridge Program
Caltrans
Capacity Status: NCI 08-25RTIP #:
Safety - Non capacity widening or bridge
reconstruction
Exempt Category:
Countywide - projects are consistent with 40 CFR Part 93.126 Exempt Table 2 categories – widen narrow
pavements or reconstructing bridges (no additional travel lanes)
DESCRIPTION:
CHANGE REASON: Increase funding
EST TOTAL COST: $145,446
CONRWPEPRIORTOTAL 08/09 09/10 10/11 11/12 12/13
HBP $6,825 $9,140 $32,555 $4,356 $675 $5,735 $134,285 $134,285
Local Bridge Seismic Retrofit Acct $3,599 $743 $5,294 $5,294
Local Funds $1,629 $1,291 $755 $297 $75 $4,192 $5,867 $5,867
Local Funds AC $2,000 $(2,000) $32,354 $0
TOTAL $145,446 $8,454 $10,431 $38,909 $2,653 $750 $43,024 $145,446
Project includes funding in Fiscal Years 2014 and 2015*
PE RW CONPRIORTOTAL
PROJECT PRIOR TO AMENDMENT
08/09 09/10 10/11 11/12 12/13
HBP $54,907 $6,820 $9,159 $34,854 $4,074 $54,907
Local Bridge Seismic Retrofit Acct $3,901 $3,901 $3,901
Local Funds $4,265 $1,634 $1,272 $1,039 $320 $4,266
Local Funds AC $1,771 $(1,771)
$63,073 $8,454 $10,431 $41,565 $2,623 $63,074 TOTAL
MPO ID:TITLE:
CAL46ISHOPP Mandates
Capacity Status: NCI 08-25RTIP #:Other - Noise attenuationExempt Category:
Various - projects are consistent with 40 CFR Parts 93.126 and 93.127 Exempt Tables 2 and 3 categories
-railroad/highway crossing, safer non-federal-aid system roads, shoulder improvements, traffic control
devices and operating assistance other than signalization projects, intersection signalization projects at
individual intersections, pavement marking demonstration, truck climbing lanes outside the urbanized
area, lighting improvements, emergency truck pullovers
DESCRIPTION:
CHANGE REASON: Increase funding
EST TOTAL COST: $77,093
CONRWPEPRIORTOTAL 08/09 09/10 10/11 11/12 12/13
SHOPP (AC) $532 $1,272 $10,339 $24,359 $28,170 $210 $64,462 $64,672
SHOPP - State Cash $4,110 $165 $1,340 $3,156 $3,650 $1,624 $10,797 $12,421
TOTAL $77,093 $4,642 $1,437 $11,679 $27,515 $31,820 $1,834 $75,259
PE RW CONPRIORTOTAL
PROJECT PRIOR TO AMENDMENT
08/09 09/10 10/11 11/12 12/13
SHOPP (AC) $63,324 $532 $1,272 $10,339 $23,011 $28,170 $210 $63,114
SHOPP - State Cash $12,246 $4,110 $165 $1,340 $2,981 $3,650 $1,624 $10,622
$75,570 $4,642 $1,437 $11,679 $25,992 $31,820 $1,834 $73,736 TOTAL
2Page Tuesday, June 29, 2010
10

San Diego Region (in $000s)
2008 Regional Transportation Improvement Program
Amendment No. 25
MPO ID:TITLE:
CAL78BI-805 HOV/Managed Lanes - North
Caltrans
Capacity Status: CI 08-25RTIP #:
On I-805 from the I-805/SR 52 to Sorrento Valley, on SR 52 at the I-805/SR 52 separation - preliminary
engineering for future construction of managed lanes; design Phase 1: one HOV lane in each direction
including the south-facing Direct Access Ramps at Carroll Canyon Rd
DESCRIPTION:
CHANGE REASON: Increase funding, Revise funding between fiscal years, Revise project description
EST TOTAL COST: $25,924
CONRWPEPRIORTOTAL 08/09 09/10 10/11 11/12 12/13
RSTP $1,775 $1,775 $1,775
TransNet - MC $184 $2,921 $4,544 $13,212 $3,288 $23,349 $800 $24,149
TOTAL $25,924 $1,959 $2,921 $4,544 $13,212 $3,288 $25,124 $800
PE RW CONPRIORTOTAL
PROJECT PRIOR TO AMENDMENT
08/09 09/10 10/11 11/12 12/13
RSTP $1,775 $1,775 $1,775
TransNet - MC $7,649 $3,379 $3,760 $510 $7,649
$9,424 $5,154 $3,760 $510 $9,424 TOTAL
MPO ID:TITLE:
CAL213Grouped Projects for the State Minor
Program
Capacity Status: NCI 08-25RTIP #:
Safety - Pavement resurfacing and/or
rehabilitation
Exempt Category:
Projects are consistent with 40 CFR Part 93.126 Exempt Tables 2 and Table 3 - railroad/highway
crossing, safer non-federal-aid system roads, shoulder improvements, traffic control devices and operating
assistance other than signalization projects, intersection signalization projects at individual intersections,
pavement marking demonstration, truck climbing lanes outside the urbanized area, lighting improvements,
emergency truck pullovers
DESCRIPTION:
CHANGE REASON: New project
EST TOTAL COST: $5,815
CONRWPEPRIORTOTAL 08/09 09/10 10/11 11/12 12/13
Minor Program $5,148 $1,925 $3,223 $5,148
Minor Program - St Cash $667 $249 $418 $667
TOTAL $5,815 $5,815 $2,174 $3,641
3Page Tuesday, June 29, 2010
11

San Diego Region (in $000s)
2008 Regional Transportation Improvement Program
Amendment No. 25
MPO ID:TITLE:
EL03Overlay/Reconstruction Projects
El Cajon, City of
Capacity Status: NCI 08-25RTIP #:
Safety - Pavement resurfacing and/or
rehabilitation
Exempt Category: (CR)
Washington Ave., from Avocado to City limits, Fletcher Parkway from Hacienda to SR67, Cuyamaca,
Weld Blvd. to Fletcher Pkwy., East Main Street, Third Street and Johnson Ave. , Mollison St. from Main
St. to Washington in Fletcher Hills area - street reconstruction and overlays of 2" - 3" thick, including
collectors, thoroughfares & residential streets
DESCRIPTION:
CHANGE REASON: Increase funding
EST TOTAL COST: $13,172
CONRWPEPRIORTOTAL 08/09 09/10 10/11 11/12 12/13
TransNet - L $4,947 $1,700 $6,647 $6,647
TransNet - L (Cash) $600 $1,900 $2,500 $2,500
TransNet - LSI $1,125 $100 $2,000 $3,225 $3,225
TransNet - LSI Carry Over $800 $800 $800
TOTAL $13,172 $5,547 $4,725 $100 $2,800 $13,172
PE RW CONPRIORTOTAL
PROJECT PRIOR TO AMENDMENT
08/09 09/10 10/11 11/12 12/13
TransNet - L $6,647 $4,947 $1,700 $6,647
TransNet - L (Cash) $2,500 $600 $1,900 $2,500
TransNet - LSI $3,025 $1,125 $900 $1,000 $3,025
$12,172 $5,547 $4,725 $900 $1,000 $12,172 TOTAL
4Page Tuesday, June 29, 2010
12

San Diego Region (in $000s)
2008 Regional Transportation Improvement Program
Amendment No. 25
MPO ID:TITLE:
NCTD20Rail Vehicles & Related Equipment
North County Transit District
Capacity Status: NCI 08-25RTIP #:
Mass Transit - Purchase new buses and rail cars
to replace existing vehicles or minor expansions
of fleet
Exempt Category:
NCTD service area - locomotive purchase/overhaul, revenue vehicles, misc. support equipment including
vehicles, spare components and signal equipment upgrade/replacement and PTC
DESCRIPTION:
CHANGE REASON: Increase funding; Add new funding sourceEST TOTAL COST: $44,622
CONRWPEPRIORTOTAL 08/09 09/10 10/11 11/12 12/13
FTA 5307 $2,125 $45 $3,668 $4,429 $10,268 $10,268
FTA 5309 (FG) $476 $476 $476
Local Funds $840 $11 $628 $247 $1,725 $1,725
Prop 1A - High Speed Rail $8,500 $14,000 $22,500 $22,500
STA $452 $1,003 $1,454 $1,454
STIP-IIP PTA $1,000 $500 $500 $1,000
TCRP $129 $129 $129
TransNet - MC $4,000 $4,000 $4,000
TransNet - Transit (Cash) $1,349 $1,349 $1,349
Transit Sec Grant Prg (Prop1B) $860 $860 $1,721 $1,721
TOTAL $44,622 $4,570 $56 $15,457 $24,539 $500 $44,122
PE RW CONPRIORTOTAL
PROJECT PRIOR TO AMENDMENT
08/09 09/10 10/11 11/12 12/13
FTA 5307 $10,267 $2,125 $45 $3,668 $4,429 $10,268
FTA 5309 (FG) $476 $476 $476
Local Funds $1,215 $840 $11 $117 $247 $1,215
STIP-IIP PTA $1,000 $1,000 $500 $500
TCRP $129 $129 $129
TransNet - MC $4,000 $1,000 $3,000 $4,000
Transit Sec Grant Prg (Prop1B) $1,720 $860 $860 $1,721
$18,807 $4,570 $56 $5,645 $8,536 $500 $18,309 TOTAL
5Page Tuesday, June 29, 2010
13

San Diego Region (in $000s)
2008 Regional Transportation Improvement Program
Amendment No. 25
MPO ID:TITLE:
SAN39Rail Electrification & Power Distribution
125-00
San Diego Association of Governments
Capacity Status: NCI 08-25RTIP #:
Mass Transit - Track rehabilitation in existing
right of way
Exempt Category:
MTS service area - cantenary improvements, substation standardization, and improvements related to
fixed guideway electrification and power distribution. Transportation Development Credit of $981,175 will
used used to match FY10 federal funds for the construction phase
DESCRIPTION:
CHANGE REASON: Reduce funding, Use of TDC
EST TOTAL COST: $20,498
CONRWPEPRIORTOTAL 08/09 09/10 10/11 11/12 12/13
FTA 5307 $640 $300 $3,925 $4,865 $4,865
FTA 5309 (FG) $2,682 $2,682 $2,682
FTA Funds - AR-5307 $12,000 $12,000 $12,000
Local Funds $876 $75 $951 $951
TOTAL $20,498 $4,198 $12,375 $3,925 $20,498
PE RW CONPRIORTOTAL
PROJECT PRIOR TO AMENDMENT
08/09 09/10 10/11 11/12 12/13
FTA 5307 $5,571 $640 $300 $3,591 $520 $520 $5,571
FTA 5309 (FG) $6,182 $2,682 $1,750 $1,750 $6,182
FTA Funds - AR-5307 $12,000 $12,000 $12,000
Local Funds $2,985 $876 $75 $898 $568 $568 $2,984
$26,738 $4,198 $12,375 $4,489 $2,838 $2,838 $26,737 TOTAL
6Page Tuesday, June 29, 2010
14

San Diego Region (in $000s)
2008 Regional Transportation Improvement Program
Amendment No. 25
MPO ID:TITLE:
SAN52East County Bus Maintenance Facility
San Diego Association of Governments
Capacity Status: NCI 08-25RTIP #:
Mass Transit - Const of new bus or rail
storage/maint facilities excluded in 23 CFR part
771
Exempt Category:
In El Cajon - construction of new bus facility to provide capacity for operation and maintenance for 100-150
vehicles. Transportation Development Credit of $194,400 will used used to match FY10 federal funds for
the construction phase
DESCRIPTION:
CHANGE REASON: Reduce funding, Use of TDC
EST TOTAL COST: $13,970
CONRWPEPRIORTOTAL 08/09 09/10 10/11 11/12 12/13
CMAQ $50 $50 $50
FTA 5307 $5,595 $4,910 $685 $5,595
FTA 5309 (Bus) $3,145 $1,097 $778 $5,020 $5,020
FTA 5311 $200 $200 $200
Local Funds $2,136 $274 $194 $1,628 $977 $2,605
STA $500 $500 $500
TOTAL $13,970 $11,626 $1,371 $972 $6,538 $7,432
PE RW CONPRIORTOTAL
PROJECT PRIOR TO AMENDMENT
08/09 09/10 10/11 11/12 12/13
CMAQ $50 $50 $50
FTA 5307 $6,513 $5,595 $918 $4,910 $1,603
FTA 5309 (Bus) $5,020 $3,145 $1,097 $778 $5,020
FTA 5311 $200 $200 $200
Local Funds $2,834 $2,136 $274 $424 $1,628 $1,207
STA $500 $500 $500
$15,117 $11,626 $1,371 $2,120 $6,538 $8,580 TOTAL
MPO ID:TITLE:
SAN55Bus & Fixed Guideway Support Equipment
and Facilities 114-00 / 124-00
Capacity Status: NCI 08-25RTIP #:
Mass Transit - Purchase of office, shop and
operating equipment for existing facilities
Exempt Category:
MTS service area - provide for support equipment and facilities work related to bus and rail operations
such as roof renovations, shop equipment, LRV car wash replacement, building repairs, IT infrastructure,
servers, and storage, non-revenue vehicles, and safety and security equipment. Transportation
Development credit of $506,425 will be used to match FY10 federal funds for the construction phase
DESCRIPTION:
CHANGE REASON: Increase funding, Use of TDC
EST TOTAL COST: $3,826
CONRWPEPRIORTOTAL 08/09 09/10 10/11 11/12 12/13
FTA 5307 $480 $960 $2,026 $3,466 $3,466
Local Funds $120 $240 $360 $360
TOTAL $3,826 $600 $1,200 $2,026 $3,826
PE RW CONPRIORTOTAL
PROJECT PRIOR TO AMENDMENT
08/09 09/10 10/11 11/12 12/13
FTA 5307 $1,994 $480 $960 $394 $80 $80 $1,994
Local Funds $499 $120 $240 $99 $20 $20 $499
$2,493 $600 $1,200 $493 $100 $100 $2,493 TOTAL
7Page Tuesday, June 29, 2010
15

San Diego Region (in $000s)
2008 Regional Transportation Improvement Program
Amendment No. 25
MPO ID:TITLE:
SAN57Fixed Guideway Transitways/Lines 122-00
San Diego Association of Governments
Capacity Status: NCI 08-25RTIP #:
Mass Transit - Track rehabilitation in existing
right of way
Exempt Category:
MTS service area - provide for work on transitways and transit lines including but not limited to, drainage
work, tie replacement, grade crossing improvements, switches, rail straightening and grinding.
Transportation Development Credit of $50,000 will used used to match FY10 federal funds for the
construction phase
DESCRIPTION:
CHANGE REASON: Reduce funding, Use of TDC
EST TOTAL COST: $1,663
CONRWPEPRIORTOTAL 08/09 09/10 10/11 11/12 12/13
FTA 5307 $350 $720 $200 $1,270 $1,270
FTA 5309 (FG) $100 $100 $100
Local Funds $113 $180 $293 $293
TOTAL $1,663 $563 $900 $200 $1,663
PE RW CONPRIORTOTAL
PROJECT PRIOR TO AMENDMENT
08/09 09/10 10/11 11/12 12/13
FTA 5307 $3,790 $350 $720 $2,720 $3,790
FTA 5309 (FG) $300 $100 $100 $100 $300
Local Funds $1,023 $113 $180 $680 $25 $25 $1,023
$5,113 $563 $900 $3,400 $125 $125 $5,113 TOTAL
MPO ID:TITLE:
SAN63Bus and Fixed Guideway Stations Stops and
Terminals 113-00 / 123-00
Capacity Status: NCI 08-25RTIP #:
Mass Transit - Construction of small passenger
shelters and information kiosks
Exempt Category:
MTS service area - provide for station stops and terminals including construction, rehabilitation,
equipment, and support items (station platform. Transportation Development Credit of $56,000 will used
used to match FY10 federal funds for the construction phase
DESCRIPTION:
CHANGE REASON: Reduce funding, Use of TDC
EST TOTAL COST: $883
CONRWPEPRIORTOTAL 08/09 09/10 10/11 11/12 12/13
FTA 5307 $333 $226 $559 $559
FTA 5309 (Bus) $113 $113 $113
FTA 5309 (FG) $80 $80 $80
Local Funds $20 $111 $131 $131
TOTAL $883 $100 $557 $226 $883
PE RW CONPRIORTOTAL
PROJECT PRIOR TO AMENDMENT
08/09 09/10 10/11 11/12 12/13
FTA 5307 $5,533 $333 $4,400 $400 $400 $5,533
FTA 5309 (Bus) $113 $113 $113
FTA 5309 (FG) $80 $80 $80
Local Funds $1,431 $20 $111 $1,100 $100 $100 $1,431
$7,157 $100 $557 $5,500 $500 $500 $7,157 TOTAL
8Page Tuesday, June 29, 2010
16

San Diego Region (in $000s)
2008 Regional Transportation Improvement Program
Amendment No. 25
MPO ID:TITLE:
SAN125FTA Section 5310 Elderly and Disabled
Transit Program
San Diego Association of Governments
Capacity Status: NCI 08-25RTIP #:
Mass Transit - Purchase new buses and rail cars
to replace existing vehicles or minor expansions
of fleet
Exempt Category:
San Diego County - purchase of modified vans/buses by various non-profit organizations for purposes of
transporting elderly and disabled
DESCRIPTION:
CHANGE REASON: New project
EST TOTAL COST: $1,088
CONRWPEPRIORTOTAL 08/09 09/10 10/11 11/12 12/13
FTA 5310 $963 $963 $963
Local Funds $125 $125 $125
TOTAL $1,088 $1,088 $1,088
9Page Tuesday, June 29, 2010
17

San Diego Region (in $000s)
2008 Regional Transportation Improvement Program
Amendment No. 25
MPO ID:TITLE:
CNTY46AC Overlay
San Diego County
Capacity Status: NCI 08-25RTIP #:
Safety - Pavement resurfacing and/or
rehabilitation
Exempt Category: (CR)
Avocado Blvd, Paradise Valley Rd, San Miguel Rd, Spring St, Alpine Blvd, Ballantyne St, Graves Ave,
Pino Dr, Posthill Rd, Riverside Dr, Valle Vista Rd, Woodside Ave, Black Canyon Rd, Haverford Rd, Old
Julian Hwy, Pamo Rd, Pile St, Wildcat Canyon Rd, Fallbrook St, Green Canyon Rd, Olive Hill Rd,
Osborne St, Buena Creek Rd, Del Dios Hwy, El Camino del Norte, El canino Real, South Santa Fe Ave,
Via de la Valle, Cole Grade Rd, and Lilac Rd. (More or fewer roads may be resurfaced depending on bid
results) - Roadway rehabilitation and resurfacing along several miles of County Maintained Roads.
Pavement overlays applied will be between 2" and 4" in thickness.
DESCRIPTION:
CHANGE REASON: Increase funding
EST TOTAL COST: $7,900
CONRWPEPRIORTOTAL 08/09 09/10 10/11 11/12 12/13
TransNet - LSI $75 $7,270 $7,345 $7,345
TransNet - LSI (Cash) $555 $555 $555
TOTAL $7,900 $75 $7,270 $555 $7,900
PE RW CONPRIORTOTAL
PROJECT PRIOR TO AMENDMENT
08/09 09/10 10/11 11/12 12/13
TransNet - LSI $7,345 $7,345 $7,345
$7,345 $7,345 $7,345 TOTAL
10Page Tuesday, June 29, 2010
18

San Diego Region (in $000s)
2008 Regional Transportation Improvement Program
Amendment No. 25
MPO ID:TITLE:
MTS23ATransit Service Operations
San Diego Metropolitan Transit System
Capacity Status: NCI 08-25RTIP #:Mass Transit - Transit operating assistanceExempt Category:
MTS service area - Operating support for existing services including urban, ADA, and rural bus serviceDESCRIPTION:
CHANGE REASON: Reduce funding
EST TOTAL COST: $132,596
CONRWPEPRIORTOTAL 08/09 09/10 10/11 11/12 12/13
FTA 5307 $7,200 $3,870 $3,600 $3,600 $3,600 $21,870 $21,870
FTA 5311 $443 $257 $700 $700
FTA Funds - AR-5307 $5,656 $5,656 $5,656
TDA $2,517 $900 $900 $900 $5,217 $5,217
TransNet - TSI $18,213 $16,629 $20,574 $21,294 $22,444 $99,153 $99,153
TOTAL $132,596 $443 $33,843 $20,499 $25,074 $25,794 $26,944 $132,596
PE RW CONPRIORTOTAL
PROJECT PRIOR TO AMENDMENT
08/09 09/10 10/11 11/12 12/13
FTA 5307 $22,090 $7,200 $4,090 $3,600 $3,600 $3,600 $22,090
FTA 5311 $700 $443 $257 $700
FTA Funds - AR-5307 $5,656 $5,656 $5,656
TDA $5,217 $2,517 $900 $900 $900 $5,217
TransNet - TSI $99,154 $18,213 $16,629 $20,574 $21,294 $22,444 $99,153
$132,817 $443 $33,843 $20,719 $25,074 $25,794 $26,944 $132,816 TOTAL
11Page Tuesday, June 29, 2010
19

San Diego Region (in $000s)
2008 Regional Transportation Improvement Program
Amendment No. 25
MPO ID:TITLE:
MTS28Bus & Rail Rolling Stock purchases and
Rehabilitations
San Diego Metropolitan Transit System
Capacity Status: NCI 08-25RTIP #:
Mass Transit - Purchase new buses and rail cars
to replace existing vehicles or minor expansions
of fleet
Exempt Category:
MTS service area - purchase replacement buses, replacement Light Rail Vehicles, procurement of
materials and services for the rehabilitation or retrofit of mechanical components, electrical components,
and coach bodies of Light Rail Vehicles and buses. Transportation Development Credit of $952,200 will
used used to match FY10 federal funds for the construction phase
DESCRIPTION:
CHANGE REASON: Reduce funding
EST TOTAL COST: $171,337
CONRWPEPRIORTOTAL 08/09 09/10 10/11 11/12 12/13
ARRA FTA 5311(f) $49 $49 $49
FTA 5307 $33,415 $4,040 $3,809 $15,799 $16,434 $18,713 $92,209 $92,209
FTA 5307_TR $63 $63 $63
FTA 5309 (Bus) $985 $475 $1,460 $1,460
FTA 5309 (FG) $5,880 $5,880 $5,880
FTA Funds - AR-5311 $402 $402 $402
PTMISEA (Prop1B) $27,788 $15,654 $43,442 $43,442
TDA $10,092 $1,453 $1,350 $3,950 $4,108 $4,678 $25,632 $25,632
TransNet - Transit $2,200 $2,200 $2,200
TOTAL $171,337 $78,272 $22,024 $7,359 $19,749 $20,542 $23,391 $171,337
PE RW CONPRIORTOTAL
PROJECT PRIOR TO AMENDMENT
08/09 09/10 10/11 11/12 12/13
ARRA FTA 5311(f) $49 $49 $49
FTA 5307 $93,390 $33,415 $4,040 $4,989 $15,799 $16,434 $18,713 $93,389
FTA 5307_TR $63 $63 $63
FTA 5309 (Bus) $1,460 $985 $475 $1,460
FTA 5309 (FG) $5,880 $5,880 $5,880
FTA Funds - AR-5311 $402 $402 $402
PTMISEA (Prop1B) $43,442 $27,788 $15,654 $43,442
TDA $26,653 $10,092 $1,453 $2,372 $3,950 $4,108 $4,678 $26,653
$171,339 $78,272 $22,024 $7,361 $19,749 $20,542 $23,391 $171,338 TOTAL
12Page Tuesday, June 29, 2010
20

San Diego Region (in $000s)
2008 Regional Transportation Improvement Program
Amendment No. 25
MPO ID:TITLE:
MTS30Bus/Rail Support Facilities and Equipment
San Diego Metropolitan Transit System
Capacity Status: NCI 08-25RTIP #:
Mass Transit - Purchase of office, shop and
operating equipment for existing facilities
Exempt Category:
MTS facilities throughout the MTS service area - install security cameras on bus/rail rolling stock and at
bus/rail facilities and stations; Southbay and East County bus maintenance facility expansions and
upgrades including: land acquisition, Site development plans, building demolition and remodeling, fencing,
lot paving, and storm water pollution prevention program compliance; other misc capital equipment for
transit maintenance; design and procurement of materials and services for support equipment.
Transportation Development Credit of $2,557,351 will used used to match FY10 federal funds for the const. phase
DESCRIPTION:
CHANGE REASON: Increase funding, Use of TDC
EST TOTAL COST: $67,905
CONRWPEPRIORTOTAL 08/09 09/10 10/11 11/12 12/13
FTA 5307 $4,743 $10,630 $10,029 $400 $400 $400 $26,602 $26,602
FTA 5309 (FG) $259 $259 $259
FTA 5316 - JARC $63 $63 $63
Local Funds $1,747 $151 $1,898 $1,898
PTMISEA (Prop1B) $7,478 $7,478 $7,478
STA $3,074 $168 $3,242 $3,242
TDA $533 $3,173 $16,236 $100 $100 $100 $20,243 $20,243
TransNet - Transit $7,224 $7,224 $7,224
Transit Security (TSGP) $896 $896 $896
TOTAL $67,905 $17,580 $14,913 $33,911 $500 $500 $500 $67,905
PE RW CONPRIORTOTAL
PROJECT PRIOR TO AMENDMENT
08/09 09/10 10/11 11/12 12/13
FTA 5307 $21,722 $4,743 $10,630 $5,149 $400 $400 $400 $21,721
FTA 5309 (FG) $259 $259 $259
FTA 5316 - JARC $63 $63 $63
Local Funds $1,898 $1,747 $151 $1,898
PTMISEA (Prop1B) $5,479 $5,479 $5,479
STA $3,074 $3,074 $3,074
TDA $7,791 $533 $3,173 $3,785 $100 $100 $100 $7,791
TransNet - Transit $7,224 $7,224 $7,224
Transit Security (TSGP) $896 $896 $896
$48,406 $17,580 $14,913 $14,413 $500 $500 $500 $48,405 TOTAL
13Page Tuesday, June 29, 2010
21

San Diego Region (in $000s)
2008 Regional Transportation Improvement Program
Amendment No. 25
MPO ID:TITLE:
MTS32APreventive Maintenance
San Diego Metropolitan Transit System
Capacity Status: NCI 08-25RTIP #:Mass Transit - Transit operating assistanceExempt Category:
MTS service area - Maintenance of equipment, rolling stock, and facilities for bus and rail systems.
Transportation Development Credit of $2,529,084 will used used to match FY10 federal funds for the preliminaryengineering phase
DESCRIPTION:
CHANGE REASON: Reduce funding
EST TOTAL COST: $285,250
CONRWPEPRIORTOTAL 08/09 09/10 10/11 11/12 12/13
FTA 5307 $43,890 $16,848 $10,116 $18,524 $19,787 $19,177 $128,343 $128,343
FTA 5309 (FG) $24,345 $15,221 $15,390 $14,676 $13,413 $14,023 $97,068 $97,068
Local Funds $7,383 $7,383 $7,383
TDA $11,239 $8,017 $8,300 $8,300 $8,300 $8,300 $52,456 $52,456
TOTAL $285,250 $86,857 $40,086 $33,806 $41,500 $41,500 $41,500 $285,250
PE RW CONPRIORTOTAL
PROJECT PRIOR TO AMENDMENT
08/09 09/10 10/11 11/12 12/13
FTA 5307 $133,289 $43,890 $16,848 $15,063 $18,524 $19,787 $19,177 $133,290
FTA 5309 (FG) $96,847 $24,345 $15,221 $15,169 $14,676 $13,413 $14,023 $96,846
Local Funds $7,383 $7,383 $7,383
TDA $52,456 $11,239 $8,017 $8,300 $8,300 $8,300 $8,300 $52,456
$289,975 $86,857 $40,086 $38,532 $41,500 $41,500 $41,500 $289,975 TOTAL
14Page Tuesday, June 29, 2010
22

San Diego Region (in $000s)
2008 Regional Transportation Improvement Program
Amendment No. 25
MPO ID:TITLE:
MTS34Bus Signal and Communications Equipments
San Diego Metropolitan Transit System
Capacity Status: NCI 08-25RTIP #:
Mass Transit - Reconstruction or renovation of
transit structures
Exempt Category:
MTS service area - Rehabilitation of light rail vehicles (LRV), electronic control circuit (U2), LRV HVAC
retrofit, rehabilitate traction motor phase II and pilot motor control unit drive, LRV tires; design and
implement new ITS to replace failing radio/CAD and scheduling system. Transportation Development
Credit of $200,000 will used used to match FY10 federal funds for the construction phase
DESCRIPTION:
CHANGE REASON: Add new funding source, Reduce funding, Use of TDC
EST TOTAL COST: $4,924
CONRWPEPRIORTOTAL 08/09 09/10 10/11 11/12 12/13
FTA 5307 $3,116 $3,116 $3,116
FTA 5309 (Bus) $800 $800 $800
FTA 5309 (FG) $120 $120 $120
Local Funds $765 $765 $765
STA $60 $60 $60
TDA $44 $19 $63 $63
TOTAL $4,924 $4,105 $819 $4,924
PE RW CONPRIORTOTAL
PROJECT PRIOR TO AMENDMENT
08/09 09/10 10/11 11/12 12/13
FTA 5307 $4,731 $3,116 $1,615 $4,731
FTA 5309 (FG) $120 $120 $120
Local Funds $765 $765 $765
STA $60 $60 $60
TDA $448 $44 $404 $447
$6,124 $4,105 $2,019 $6,123 TOTAL
15Page Tuesday, June 29, 2010
23

San Diego Region (in $000s)
2008 Regional Transportation Improvement Program
Amendment No. 25
MPO ID:TITLE:
MTS35Fixed Guideway Transitways/Lines
San Diego Metropolitan Transit System
Capacity Status: NCI 08-25RTIP #:
Mass Transit - Track rehabilitation in existing
right of way
Exempt Category:
MTS service area - rail infrastructure maintenance and upgrades including rail tie replacement, WYE
switch indicator standardization, rail file grinding, and transtion motor disconnects.
DESCRIPTION:
CHANGE REASON: Revise FFY 2010 funding between sources
EST TOTAL COST: $21,770
CONRWPEPRIORTOTAL 08/09 09/10 10/11 11/12 12/13
FTA 5307 $1,324 $504 $504 $504 $2,836 $2,836
FTA 5309 (FG) $1,426 $1,426 $1,426
Local Funds $121 $2,800 $2,921 $2,921
STA $34 $34 $34
TDA $236 $13,115 $825 $126 $126 $126 $14,553 $14,553
TOTAL $21,770 $1,817 $17,239 $825 $630 $630 $630 $21,770
PE RW CONPRIORTOTAL
PROJECT PRIOR TO AMENDMENT
08/09 09/10 10/11 11/12 12/13
FTA 5307 $3,496 $1,324 $660 $504 $504 $504 $3,496
FTA 5309 (FG) $1,426 $1,426 $1,426
Local Funds $2,921 $121 $2,800 $2,921
STA $34 $34 $34
TDA $13,894 $236 $13,115 $165 $126 $126 $126 $13,893
$21,770 $1,817 $17,239 $825 $630 $630 $630 $21,770 TOTAL
16Page Tuesday, June 29, 2010
24

San Diego Region (in $000s)
2008 Regional Transportation Improvement Program
Amendment No. 25
MPO ID:TITLE:
SD83SR 163/Friars Road Interchange Modification
San Diego, City of
Capacity Status: CI 08-25RTIP #:
(CR)
Friars Road from Avenida de las Tiendas to Mission Center Road - widen and improve Friars Road and
overcrossing; reconstruct interchange including improvements to ramp intersections (Phase 1). Construct
new connector roadways and structures (Phase 2). Construct auxilliary lanes along northbound and
southbound SR163 (Phase 3). (CIP Legacy#52-455.0) (WBS# S-00851)
DESCRIPTION:
CHANGE REASON: Revise project description
EST TOTAL COST: $58,818
CONRWPEPRIORTOTAL 08/09 09/10 10/11 11/12 12/13
Local Funds $673 $3,600 $38,000 $1,153 $3,120 $38,000 $42,273
RSTP $2,240 $2,240 $2,240
TransNet - L $2,207 $2,207 $2,207
TransNet - LSI $2,000 $2,500 $2,452 $2,927 $2,219 $2,000 $3,500 $6,598 $12,098
TOTAL $58,818 $5,120 $2,000 $6,100 $2,452 $2,927 $40,219 $7,600 $6,620 $44,598
PE RW CONPRIORTOTAL
PROJECT PRIOR TO AMENDMENT
08/09 09/10 10/11 11/12 12/13
Local Funds $42,273 $673 $3,600 $38,000 $1,153 $3,120 $38,000
RSTP $2,240 $2,240 $2,240
TransNet - L $2,207 $2,207 $2,207
TransNet - LSI $12,098 $2,000 $2,500 $2,452 $2,927 $2,219 $2,000 $3,500 $6,598
$58,818 $5,120 $2,000 $6,100 $2,452 $2,927 $40,219 $7,600 $6,620 $44,598 TOTAL
MPO ID:TITLE:
SD102AOtay Truck Route Widening (Ph. 4)
Capacity Status: CI 08-25RTIP #:
(CR)
on Otay Truck Route - in San Diego, from Drucker Lane to La Media, add one lane (total 3 lanes) for
trucks; from Britannia to La Media, add one lane for trucks and one lane for emergency vehicles (Border
Patrol/fire department access); along Britannia from Britannia Court to the Otay Truck Route - add one
lane for trucks(CIP 52-682.1)
DESCRIPTION:
CHANGE REASON: Revise funding between fiscal years
EST TOTAL COST: $6,968
CONRWPEPRIORTOTAL 08/09 09/10 10/11 11/12 12/13
HPP $800 $1,000 $2,400 $1,800 $2,400 $4,200
Local Funds $118 $200 $200 $650 $518 $650 $1,168
TransNet - L $100 $100 $100
TransNet - LSI $250 $1,250 $250 $1,250 $1,500
TOTAL $6,968 $218 $1,000 $250 $2,450 $3,050 $2,668 $4,300
PE RW CONPRIORTOTAL
PROJECT PRIOR TO AMENDMENT
08/09 09/10 10/11 11/12 12/13
HPP $4,200 $1,000 $3,200 $1,000 $3,200
Local Funds $1,168 $118 $200 $850 $318 $850
TransNet - L $100 $100 $100
TransNet - LSI $1,500 $250 $1,250 $250 $1,250
$6,968 $218 $1,200 $4,300 $1,250 $1,668 $5,300 TOTAL
17Page Tuesday, June 29, 2010
25

San Diego Region (in $000s)
2008 Regional Transportation Improvement Program
Amendment No. 25
MPO ID:TITLE:
SD130Skyline Drive - 58th Street to Sears Avenue
San Diego, City of
Capacity Status: NCI 08-25RTIP #:Other - Intersection channelization projectsExempt Category: (CR)
Skyline Drive from 58th St. to Sears Avenue - Skyline Drive from 58th Street to Sears Avenue - in San
Diego, installation of new medians for safety improvements, intersection lighting, traffic signal upgrades
and other street improvements to enhance pedestrian and vehicular movement (CIP 52-763.0)(WBS#
S-00912)
DESCRIPTION:
CHANGE REASON: Revise funding between fiscal years, Revise project description
EST TOTAL COST: $2,705
CONRWPEPRIORTOTAL 08/09 09/10 10/11 11/12 12/13
HPP $800 $800 $800
Local Funds $325 $325 $325
TransNet - L $305 $305 $305
TransNet - LSI $950 $325 $345 $930 $1,275
TOTAL $2,705 $305 $950 $325 $1,125 $650 $2,055
PE RW CONPRIORTOTAL
PROJECT PRIOR TO AMENDMENT
08/09 09/10 10/11 11/12 12/13
HPP $800 $800 $800
Local Funds $325 $325 $325
TransNet - L $305 $305 $305
TransNet - LSI $1,275 $950 $325 $345 $930
$2,705 $305 $1,275 $1,125 $650 $2,055 TOTAL
18Page Tuesday, June 29, 2010
26

San Diego Region (in $000s)
2008 Regional Transportation Improvement Program
Amendment No. 25
MPO ID:TITLE:
SM45San Marcos Creek Bridge at State Route 78
San Marcos, City of
Capacity Status: NCI 08-25RTIP #:
Safety - Non capacity widening or bridge
reconstruction
Exempt Category:
From San Marcos Blvd to Twin Oaks Valley Rd - in San Marcos, on SR-78 at San Marcos Creek between
Twin Oaks Valley Road and San Marcos Boulevard Interchange, construct a culvert
DESCRIPTION:
CHANGE REASON: New project
EST TOTAL COST: $21,400
CONRWPEPRIORTOTAL 08/09 09/10 10/11 11/12 12/13
Local Funds $1,380 $2,020 $15,000 $3,000 $1,400 $20,000 $21,400
TOTAL $21,400 $1,380 $2,020 $15,000 $3,000 $1,400 $20,000
19Page Tuesday, June 29, 2010
27

San Diego Region (in $000s)
2008 Regional Transportation Improvement Program
Amendment No. 25
RTIP Fund Types
AC = Advanced Construction
ARRA = American Recovery and Reinvestment Act (Federal Stimulus Program)
BIP = Border Infrastructure Program (Federal under SAFETEA-LU)
BTA = Bicycle Transportation Account (State)
CBI = Corridors and Borders Infrastructure Program (Federal under TEA-21)
CMAQ = Congestion Mitigation and Air Quality (Federal formula)
CMIA = Corridor Mobility Improvement Account (Prop. 1B)
DEMO = High Priority Demonstration Program under TEA-21 (Federal discretionary)
DEMO-Sec 115 = High Priority Demonstration Program under FY 2004 Appropriations
DEMO-Sec 117/STP = Surface Transportation Program under FHWA Administrative Program (congressionally
directed appropriations)
FSP = Freeway Service Patrol (State legislation)
GARVEE = Grant Anticipated Revenue Vehicles (FHWA bonds)
HBP = Highway Bridge Program under SAFETEA-LU (Federal)
HBRR = Highway Bridge Repair and Rehabilitation under TEA-21 (Federal)
HES = Hazard Elimination System (Federal administered by Caltrans)
HPP = High Priority Program under SAFETEA-LU (Federal discretionary)
HSIP = Highway Safety Improvement Program (Administered by Caltrans)
HUD = Housing and Urban Development (Federal)
IM = Interstate Maintenance Discretionary (Federal)
IRI = Intercity Rail Improvement (Prop 1B)
IRR = Indian Reservation Roads program (Federal)
ITS = Intelligent Transportation System (Federal)
NHS = National Highway System
PTA = Public Transportation Account (State)
PTMISEA = Public Transportation Modernization, Improvement, and Service Enhancement (Prop. 1B state
bond)
Prop 1A - High Speed Rail = High Speed Passenger Bond Program (Prop 1A)
RSTP = Regional Surface Transportation Program (Federal)
RTCIP = Regional Transportation Congestion Improvement Program (Local)
RTP = Recreational Trails Program (Federal)
SHOPP = State Highway Operation & Protection Program
SLPP = State Local Partnership Program (Prop. 1B)
SRTS = Safe Routes to School (Federal program administered by Caltrans)
STIP-IIP = State Transportation Improvement Program - Interregional Program (State)
STIP-RIP = State Transportation Improvement Program - Regional Improvement Program (State)
Section 5307 = Federal Transit Administration Urbanized Area Formula Program (Federal including ARRA)
20Page Tuesday, June 29, 2010
28

San Diego Region (in $000s)
2008 Regional Transportation Improvement Program
Amendment No. 25
Section 5309 (Bus) = Federal Transit Administration Discretionary Program (Federal)
Section 5309 (FG) = Federal Transit Administration Fixed Guideway Modernization Formula program (Federal
including ARRA)
Section 5309 (NS) = Federal Transit Administration Discretionary - New Starts Program (Federal)
Section 5310 = Federal Transit Administration Elderly & Disabled Program (Allocated by CTC)
Section 5311 = Federal Transit Administration Rural Program (Federal including ARRA)
Section 5316 (JARC) = Federal Transit Administration Jobs Access Reverse Commute (Federal)
Section 5317 (NF) = Federal Transit Administration New Freedom (Federal)
TCRP = Traffic Congestion Relief Program (State)
TCSP = Transportation & Community & System Preservation (Federal)
TDA = Transportation Development Act (Local)
TDA-B = Transportation Development Act-Bicycle & Pedestrian Facilities (Local)
TEA/TE = Transportation Enhancement Activities Program (Federal)
TIGER (ARRA) = Transportation Investment Generating Economic Recovery (Federal Stimulus)
TIGGER (ARRA) = Transit Investment for Greenhouse Gas and Energy Reduction (Federal Stimulus)
TLSP = Traffic Light Synchronization Program (Prop. 1B)
TSGP = Transit Security Grant Program (Federal Homeland Security Office and State)
TSM = Transportation Systems Management (State)
TransNet-78 = Prop. A Local Transportation Sales Tax - SR 78 (Local)
TransNet-ADA = Prop. A Local Transportation Sales Tax - Transit (Local)
TransNet-B = Prop. A Local Transportation Sales Tax - Bike (Local)
TransNet-BPNS = Prop. A Local Transportation Sales Tax extension - Bicycle, Pedestrian and Neighborhood
Safety Program
TransNet-BRT/Ops = Prop. A Extension Local Transportation Sales Tax - Bus Rapid Transit/New Service
TransNet-Border = Prop. A Extension Local Transportation Sales Tax - Border
TransNet-CP = Prop. A Local Transportation Sales Tax - Commercial Paper
TransNet-H = Prop. A Local Transportation Sales Tax - Highway
TransNet-L = Prop. A Local Transportation Sales Tax - Local Streets & Roads
TransNet-LSG = Prop. A Extension Local Transportation Sales Tax - Local Smart Growth
TransNet-LSI = Prop. A Extension Local Transportation Sales Tax - Local System Improvements
TransNet-MC = Prop. A Extension Local Transportation Sales Tax - Major Corridors
TransNet-REMP = Prop. A Extension Local Transportation Sales Tax - Regional Environmental Mitigation Program
TransNet-SMIP = Prop. A Extension Local Transportation Sales Tax - Regional Smart Growth Incentive Program
TransNet-SS = Prop. A Extension Local Transportation Sales Tax - Senior Services
TransNet-T = Prop. A Local Transportation Sales Tax - Transit
TransNet-TSI = Prop. A Extension Local Transportation Sales Tax- Transit System Improvements
21Page Tuesday, June 29, 2010
29
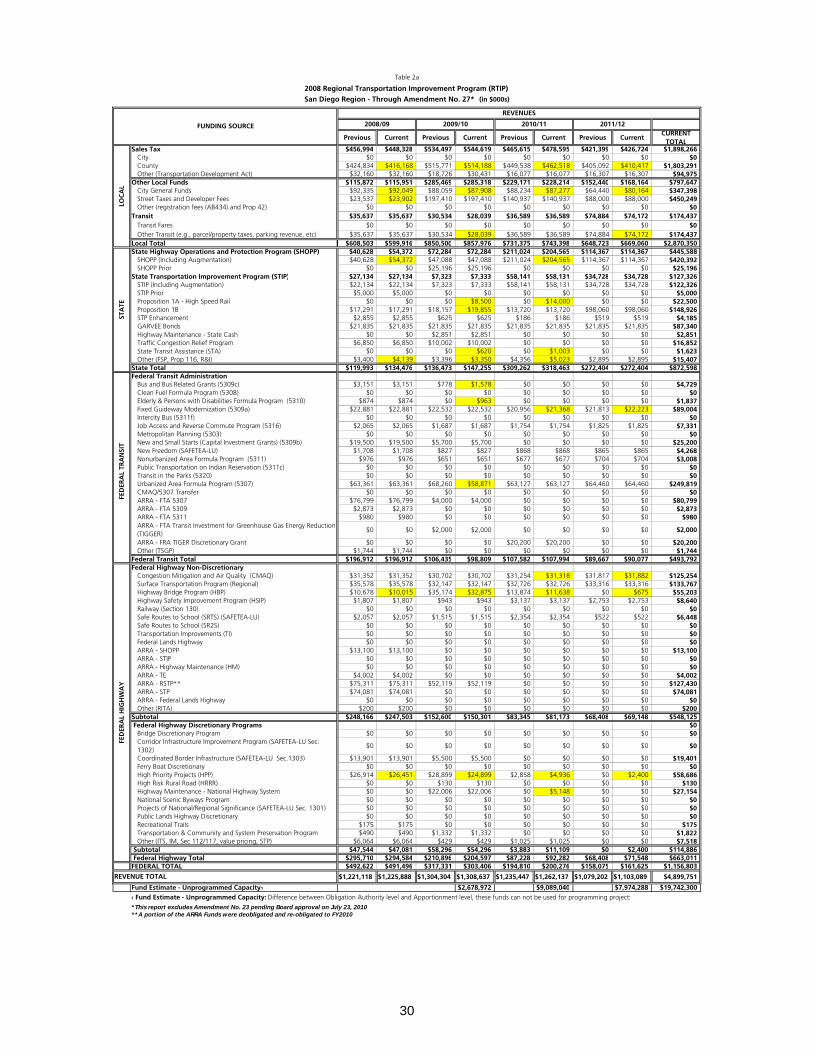
Previous Current Previous Current Previous Current Previous CurrentCURRENT
TOTALSales Tax $456,994 $448,328 $534,497 $544,619 $465,615 $478,595 $421,399 $426,724 $1,898,266
City $0 $0 $0 $0 $0 $0 $0 $0 $0County $424,834 $416,168 $515,771 $514,188 $449,538 $462,518 $405,092 $410,417 $1,803,291Other (Transportation Development Act) $32,160 $32,160 $18,726 $30,431 $16,077 $16,077 $16,307 $16,307 $94,975
Other Local Funds $115,872 $115,951 $285,469 $285,318 $229,171 $228,214 $152,440 $168,164 $797,647City General Funds $92,335 $92,049 $88,059 $87,908 $88,234 $87,277 $64,440 $80,164 $347,398Street Taxes and Developer Fees $23,537 $23,902 $197,410 $197,410 $140,937 $140,937 $88,000 $88,000 $450,249Other (registration fees (AB434) and Prop 42) $0 $0 $0 $0 $0 $0 $0 $0 $0
Transit $35,637 $35,637 $30,534 $28,039 $36,589 $36,589 $74,884 $74,172 $174,437Transit Fares $0 $0 $0 $0 $0 $0 $0 $0 $0Other Transit (e.g., parcel/property taxes, parking revenue, etc) $35,637 $35,637 $30,534 $28,039 $36,589 $36,589 $74,884 $74,172 $174,437
Local Total $608,503 $599,916 $850,500 $857,976 $731,375 $743,398 $648,723 $669,060 $2,870,350State Highway Operations and Protection Program (SHOPP) $40,628 $54,372 $72,284 $72,284 $211,024 $204,565 $114,367 $114,367 $445,588
SHOPP (Including Augmentation) $40,628 $54,372 $47,088 $47,088 $211,024 $204,565 $114,367 $114,367 $420,392SHOPP Prior $0 $0 $25,196 $25,196 $0 $0 $0 $0 $25,196
State Transportation Improvement Program (STIP) $27,134 $27,134 $7,323 $7,333 $58,141 $58,131 $34,728 $34,728 $127,326STIP (Including Augmentation) $22,134 $22,134 $7,323 $7,333 $58,141 $58,131 $34,728 $34,728 $122,326STIP Prior $5,000 $5,000 $0 $0 $0 $0 $0 $0 $5,000Proposition 1A - High Speed Rail $0 $0 $0 $8,500 $0 $14,000 $0 $0 $22,500Proposition 1B $17,291 $17,291 $18,157 $19,855 $13,720 $13,720 $98,060 $98,060 $148,926STP Enhancement $2,855 $2,855 $625 $625 $186 $186 $519 $519 $4,185GARVEE Bonds $21,835 $21,835 $21,835 $21,835 $21,835 $21,835 $21,835 $21,835 $87,340Highway Maintenance - State Cash $0 $0 $2,851 $2,851 $0 $0 $0 $0 $2,851Traffic Congestion Relief Program $6,850 $6,850 $10,002 $10,002 $0 $0 $0 $0 $16,852State Transit Assistance (STA) $0 $0 $0 $620 $0 $1,003 $0 $0 $1,623Other (FSP, Prop 116, R&I) $3,400 $4,139 $3,396 $3,350 $4,356 $5,023 $2,895 $2,895 $15,407
State Total $119,993 $134,476 $136,473 $147,255 $309,262 $318,463 $272,404 $272,404 $872,598Federal Transit Administration
Bus and Bus Related Grants (5309c) $3,151 $3,151 $778 $1,578 $0 $0 $0 $0 $4,729Clean Fuel Formula Program (5308) $0 $0 $0 $0 $0 $0 $0 $0 $0Elderly & Persons with Disabilities Formula Program (5310) $874 $874 $0 $963 $0 $0 $0 $0 $1,837Fixed Guideway Modernization (5309a) $22,881 $22,881 $22,532 $22,532 $20,956 $21,368 $21,813 $22,223 $89,004Intercity Bus (5311f) $0 $0 $0 $0 $0 $0 $0 $0 $0Job Access and Reverse Commute Program (5316) $2,065 $2,065 $1,687 $1,687 $1,754 $1,754 $1,825 $1,825 $7,331Metropolitan Planning (5303) $0 $0 $0 $0 $0 $0 $0 $0 $0New and Small Starts (Capital Investment Grants) (5309b) $19,500 $19,500 $5,700 $5,700 $0 $0 $0 $0 $25,200New Freedom (SAFETEA-LU) $1,708 $1,708 $827 $827 $868 $868 $865 $865 $4,268Nonurbanized Area Formula Program (5311) $976 $976 $651 $651 $677 $677 $704 $704 $3,008Public Transportation on Indian Reservation (5311c) $0 $0 $0 $0 $0 $0 $0 $0 $0Transit in the Parks (5320) $0 $0 $0 $0 $0 $0 $0 $0 $0Urbanized Area Formula Program (5307) $63,361 $63,361 $68,260 $58,871 $63,127 $63,127 $64,460 $64,460 $249,819CMAQ/5307 Transfer $0 $0 $0 $0 $0 $0 $0 $0 $0ARRA - FTA 5307 $76,799 $76,799 $4,000 $4,000 $0 $0 $0 $0 $80,799ARRA - FTA 5309 $2,873 $2,873 $0 $0 $0 $0 $0 $0 $2,873ARRA - FTA 5311 $980 $980 $0 $0 $0 $0 $0 $0 $980ARRA - FTA Transit Investment for Greenhouse Gas Energy Reduction (TIGGER)
$0 $0 $2,000 $2,000 $0 $0 $0 $0 $2,000
ARRA - FRA TIGER Discretionary Grant $0 $0 $0 $0 $20,200 $20,200 $0 $0 $20,200Other (TSGP) $1,744 $1,744 $0 $0 $0 $0 $0 $0 $1,744
Federal Transit Total $196,912 $196,912 $106,435 $98,809 $107,582 $107,994 $89,667 $90,077 $493,792Federal Highway Non-Discretionary
Congestion Mitigation and Air Quality (CMAQ) $31,352 $31,352 $30,702 $30,702 $31,254 $31,318 $31,817 $31,882 $125,254Surface Transportation Program (Regional) $35,578 $35,578 $32,147 $32,147 $32,726 $32,726 $33,316 $33,316 $133,767Highway Bridge Program (HBP) $10,678 $10,015 $35,174 $32,875 $13,874 $11,638 $0 $675 $55,203Highway Safety Improvement Program (HSIP) $1,807 $1,807 $943 $943 $3,137 $3,137 $2,753 $2,753 $8,640Railway (Section 130) $0 $0 $0 $0 $0 $0 $0 $0 $0Safe Routes to School (SRTS) (SAFETEA-LU) $2,057 $2,057 $1,515 $1,515 $2,354 $2,354 $522 $522 $6,448Safe Routes to School (SR2S) $0 $0 $0 $0 $0 $0 $0 $0 $0Transportation Improvements (TI) $0 $0 $0 $0 $0 $0 $0 $0 $0Federal Lands Highway $0 $0 $0 $0 $0 $0 $0 $0 $0ARRA - SHOPP $13,100 $13,100 $0 $0 $0 $0 $0 $0 $13,100ARRA - STIP $0 $0 $0 $0 $0 $0 $0 $0 $0ARRA - Highway Maintenance (HM) $0 $0 $0 $0 $0 $0 $0 $0 $0ARRA - TE $4,002 $4,002 $0 $0 $0 $0 $0 $0 $4,002ARRA - RSTP** $75,311 $75,311 $52,119 $52,119 $0 $0 $0 $0 $127,430ARRA - STP $74,081 $74,081 $0 $0 $0 $0 $0 $0 $74,081ARRA - Federal Lands Highway $0 $0 $0 $0 $0 $0 $0 $0 $0Other (RITA) $200 $200 $0 $0 $0 $0 $0 $0 $200
Subtotal $248,166 $247,503 $152,600 $150,301 $83,345 $81,173 $68,408 $69,148 $548,125 Federal Highway Discretionary Programs $0
Bridge Discretionary Program $0 $0 $0 $0 $0 $0 $0 $0 $0Corridor Infrastructure Improvement Program (SAFETEA-LU Sec. 1302)
$0 $0 $0 $0 $0 $0 $0 $0 $0
Coordinated Border Infrastructure (SAFETEA-LU Sec.1303) $13,901 $13,901 $5,500 $5,500 $0 $0 $0 $0 $19,401Ferry Boat Discretionary $0 $0 $0 $0 $0 $0 $0 $0 $0High Priority Projects (HPP) $26,914 $26,451 $28,899 $24,899 $2,858 $4,936 $0 $2,400 $58,686High Risk Rural Road (HRRR) $0 $0 $130 $130 $0 $0 $0 $0 $130Highway Maintenance - National Highway System $0 $0 $22,006 $22,006 $0 $5,148 $0 $0 $27,154National Scenic Byways Program $0 $0 $0 $0 $0 $0 $0 $0 $0Projects of National/Regional Significance (SAFETEA-LU Sec. 1301) $0 $0 $0 $0 $0 $0 $0 $0 $0Public Lands Highway Discretionary $0 $0 $0 $0 $0 $0 $0 $0 $0Recreational Trails $175 $175 $0 $0 $0 $0 $0 $0 $175Transportation & Community and System Preservation Program $490 $490 $1,332 $1,332 $0 $0 $0 $0 $1,822Other (ITS, IM, Sec 112/117, value pricing, STP) $6,064 $6,064 $429 $429 $1,025 $1,025 $0 $0 $7,518
Subtotal $47,544 $47,081 $58,296 $54,296 $3,883 $11,109 $0 $2,400 $114,886 Federal Highway Total $295,710 $294,584 $210,896 $204,597 $87,228 $92,282 $68,408 $71,548 $663,011FEDERAL TOTAL $492,622 $491,496 $317,331 $303,406 $194,810 $200,276 $158,075 $161,625 $1,156,803
$1,221,118 $1,225,888 $1,304,304 $1,308,637 $1,235,447 $1,262,137 $1,079,202 $1,103,089 $4,899,751
Fund Estimate - Unprogrammed Capacity1 $2,678,972 $9,089,040 $7,974,288 $19,742,3001 Fund Estimate - Unprogrammed Capacity: Difference between Obligation Authority level and Apportionment level, these funds can not be used for programming projects
*This report excludes Amendment No. 23 pending Board approval on July 23, 2010**A portion of the ARRA Funds were deobligated and re-obligated to FY2010
FUNDING SOURCE
Table 2a
2008 Regional Transportation Improvement Program (RTIP)San Diego Region - Through Amendment No. 27* (in $000s)
REVENUES
2008/09 2009/10 2010/11 2011/12FE
DER
AL
HIG
HW
AY
REVENUE TOTAL
LOC
AL
STA
TEFE
DER
AL
TRA
NSI
T
30
adi
Text Box
Attachment 3

Previous Current Previous Current Previous Current Previous CurrentCURRENT
TOTAL
Local Total $589,213 $572,971 $850,499 $852,896 $655,835 $681,561 $567,164 $587,133 $2,694,561
State Highway Operations and Protection Program (SHOPP) $40,628 $54,372 $72,284 $72,284 $211,024 $204,565 $114,367 $114,367 $445,588SHOPP (Including Augmentation) $40,628 $54,372 $47,088 $47,088 $211,024 $204,565 $114,367 $114,367 $420,392SHOPP Prior $0 $0 $25,196 $25,196 $0 $0 $0 $0 $25,196
State Transportation Improvement Program (STIP) $27,134 $27,134 $7,323 $7,333 $58,141 $58,131 $34,728 $34,728 $127,326STIP (Including Augmentation) $22,134 $22,134 $7,323 $7,333 $58,141 $58,131 $34,728 $34,728 $122,326STIP Prior $5,000 $5,000 $0 $0 $0 $0 $0 $0 $5,000Proposition 1A - High Speed Rail $0 $0 $0 $8,500 $0 $14,000 $0 $0 $22,500Proposition 1B $17,291 $17,291 $18,157 $19,855 $13,720 $13,720 $98,060 $98,060 $148,926STP Enchacement $2,855 $2,855 $625 $625 $186 $186 $519 $519 $4,185GARVEE Bonds $21,835 $21,835 $21,835 $21,835 $21,835 $21,835 $21,835 $21,835 $87,340Highway Maintenance - State Cash $0 $0 $2,851 $2,851 $0 $0 $0 $0 $2,851Traffic Congestion Relief Program $6,850 $6,850 $10,002 $10,002 $0 $0 $0 $0 $16,852State Transit Assistance (STA) $0 $0 $0 $620 $0 $1,003 $0 $0 $1,623Other (FSP, Prop 116, R&I) $3,400 $4,139 $3,396 $3,350 $4,356 $5,023 $2,895 $2,895 $15,407
State Total $119,993 $134,476 $136,473 $147,255 $309,262 $318,463 $272,404 $272,404 $872,598Federal Transit Administration
Bus and Bus Related Grants (5309c) $3,151 $3,151 $778 $1,578 $0 $0 $0 $0 $4,729Clean Fuel Formula Program (5308) $0 $0 $0 $0 $0 $0 $0 $0 $0Elderly & Persons with Disabilities Formula Program (5310) $874 $874 $0 $963 $0 $0 $0 $0 $1,837Fixed Guideway Modernization (5309a) $22,881 $22,881 $21,449 $21,670 $20,956 $20,956 $21,813 $19,963 $85,470Intercity Bus (5311f) $0 $0 $0 $0 $0 $0 $0 $0 $0Job Access and Reverse Commute Program (5316) $1,518 $1,518 $349 $349 $0 $0 $0 $0 $1,867Metropolitan Planning (5303) $0 $0 $0 $0 $0 $0 $0 $0 $0New and Small Starts (Capital Investment Grants) (5309b) $19,500 $19,500 $5,700 $5,700 $0 $0 $0 $0 $25,200New Freedom (SAFETEA-LU) $1,635 $1,635 $0 $0 $0 $0 $0 $0 $1,635Nonurbanized Area Formula Program (5311) $976 $976 $339 $339 $349 $349 $428 $428 $2,092Public Transportation on Indian Reservation (5311c) $0 $0 $0 $0 $0 $0 $0 $0 $0Transit in the Parks (5320) $0 $0 $0 $0 $0 $0 $0 $0 $0Urbanized Area Formula Program (5307) $63,361 $63,361 $68,260 $58,871 $63,127 $63,127 $63,393 $62,393 $247,752CMAQ/5307 Transfer $0 $0 $0 $0 $0 $0 $0 $0 $0ARRA - FTA 5307 $76,799 $76,799 $4,000 $4,000 $0 $0 $0 $0 $80,799ARRA - FTA 5309 $2,873 $2,873 $0 $0 $0 $0 $0 $0 $2,873ARRA - FTA 5311 $980 $980 $0 $0 $0 $0 $0 $0 $980ARRA - FTA Transit Investment for Greenhouse Gas Energy Reduction (TIGGER)
$0 $0 $2,000 $2,000 $0 $0 $0 $0 $2,000
ARRA - FRA TIGER Discretionary Grant $0 $0 $0 $0 $20,200 $20,200 $0 $0 $20,200Other (TSGP) $1,744 $1,744 $0 $0 $0 $0 $0 $0 $1,744
Federal Transit Total $196,292 $196,292 $102,875 $95,470 $104,632 $104,632 $85,634 $82,784 $479,178Federal Highway Non-Discretionary $0
Congestion Mitigation and Air Quality (CMAQ) $21,497 $21,497 $30,702 $30,702 $21,309 $21,309 $6,000 $6,000 $79,508Surface Transportation Program (Regional) $34,542 $34,542 $32,147 $32,147 $18,760 $12,828 $724 $11,246 $90,763Highway Bridge Program (HBP) $10,678 $10,015 $35,174 $32,875 $13,874 $11,638 $0 $675 $55,203Highway Safety Improvement Program (HSIP) $1,807 $1,807 $943 $943 $3,137 $3,137 $2,753 $2,753 $8,640Railway (Section 130) $0 $0 $0 $0 $0 $0 $0 $0 $0Safe Routes to School (SRTS) (SAFETEA-LU) $2,057 $2,057 $1,515 $1,515 $2,354 $2,354 $522 $522 $6,448Safe Routes to School (SR2S) $0 $0 $0 $0 $0 $0 $0 $0 $0Transportation Improvements (TI) $0 $0 $0 $0 $0 $0 $0 $0 $0Federal Lands Highway $0 $0 $0 $0 $0 $0 $0 $0 $0ARRA - SHOPP $13,100 $13,100 $0 $0 $0 $0 $0 $0 $13,100ARRA - STIP $0 $0 $0 $0 $0 $0 $0 $0 $0ARRA - Highway Maintenance (HM) $0 $0 $0 $0 $0 $0 $0 $0 $0ARRA - TE $4,002 $4,002 $0 $0 $0 $0 $0 $0 $4,002ARRA - RSTP $75,311 $75,311 $52,119 $52,119 $0 $0 $0 $0 $127,430ARRA - STP $74,081 $74,081 $0 $0 $0 $0 $0 $0 $74,081ARRA - Federal Lands Highway $0 $0 $0 $0 $0 $0 $0 $0 $0Other (RITA) $200 $200 $0 $0 $0 $0 $0 $0 $200
Subtotal $237,275 $236,612 $152,600 $150,301 $59,434 $51,266 $9,999 $21,196 $459,375 Federal Highway Discretionary Programs $0
Bridge Discretionary Program $0 $0 $0 $0 $0 $0 $0 $0 $0
Corridor Infrastructure Improvement Program (SAFETEA-LU Sec. 1302) $0 $0 $0 $0 $0 $0 $0 $0 $0
Coordinated Border Infrastructure (SAFETEA-LU Sec.1303) $13,901 $13,901 $5,500 $5,500 $0 $0 $0 $0 $19,401Ferry Boat Discretionary $0 $0 $0 $0 $0 $0 $0 $0 $0High Priority Projects (HPP) $26,914 $26,451 $28,899 $24,899 $2,858 $4,936 $0 $2,400 $58,686High Risk Rural Road (HRRR) $0 $0 $130 $130 $0 $0 $0 $0 $130Highway Maintenance - National Highway System** $0 $0 $22,006 $22,006 $0 $5,148 $0 $0 $27,154National Scenic Byways Program $0 $0 $0 $0 $0 $0 $0 $0 $0Projects of National/Regional Significance (SAFETEA-LU Sec. 1301) $0 $0 $0 $0 $0 $0 $0 $0 $0Public Lands Highway Discretionary $0 $0 $0 $0 $0 $0 $0 $0 $0Recreational Trails $175 $175 $0 $0 $0 $0 $0 $0 $175Transportation & Community and System Preservation Program $490 $490 $1,332 $1,332 $0 $0 $0 $0 $1,507Other (ITS, IM, Sec 112/117, value pricing, STP) $6,064 $6,064 $429 $429 $1,025 $1,025 $0 $0 $7,518
Subtotal $47,544 $47,081 $58,296 $54,296 $3,883 $11,109 $0 $2,400 $114,886 Federal Highway Total $284,819 $283,693 $210,896 $204,597 $63,317 $62,375 $9,999 $23,596 $574,261FEDERAL TOTAL $481,111 $479,985 $313,771 $300,067 $167,949 $167,007 $95,633 $106,380 $1,053,439
$1,190,317 $1,187,432 $1,300,743 $1,300,218 $1,133,046 $1,167,031 $935,201 $965,917 $4,620,598
*This report excludes Amendment No. 23 pending Board approval on July 23, 2010**A portion of the ARRA Funds were deobligated and re-obligated to FY2010
FUNDING SOURCE
Table 2b
2008 Regional Transportation Improvement Program (RTIP)
San Diego Region - Through Amendment No. 27* (in $000s)
PROGRAMMED
2008/09 2009/10 2010/11 2011/12
FED
ERA
L H
IGH
WA
Y
PROGRAMMED TOTAL
LOC
AL
STA
TEFE
DER
AL
TRA
NSI
T
31

Previous Current Previous Current Previous Current Previous CurrentCURRENT
TOTAL
Local Total $19,310 $26,945 $1 $5,080 $75,540 $61,837 $81,559 $81,927 $175,789
State Highway Operations and Protection Program (SHOPP) $0 $0 $0 $0 $0 $0 $0 $0 $0SHOPP (Including Augmentation) $0 $0 $0 $0 $0 $0 $0 $0 $0SHOPP Prior $0 $0 $0 $0 $0 $0 $0 $0 $0
State Transportation Improvement Program (STIP) $0 $0 $0 $0 $0 $0 $0 $0 $0STIP (Including Augmentation) $0 $0 $0 $0 $0 $0 $0 $0 $0STIP Prior $0 $0 $0 $0 $0 $0 $0 $0 $0Proposition 1A - High Speed Rail $0 $0 $0 $0 $0 $0 $0 $0 $0Proposition 1B $0 $0 $0 $0 $0 $0 $0 $0 $0STP Enhancement $0 $0 $0 $0 $0 $0 $0 $0 $0GARVEE Bonds $0 $0 $0 $0 $0 $0 $0 $0 $0Highway Maintenance - State Cash $0 $0 $0 $0 $0 $0 $0 $0 $0Traffic Congestion Relief Program $0 $0 $0 $0 $0 $0 $0 $0 $0State Transit Assistance (STA) $0 $0 $0 $0 $0 $0 $0 $0 $0Other (Please specify) $0 $0 $0 $0 $0 $0 $0 $0 $0
State Total $0 $0 $0 $0 $0 $0 $0 $0 $0Federal Transit Administration
Bus and Bus Related Grants (5309c) $0 $0 $0 $0 $0 $0 $0 $0 $0Clean Fuel Formula Program (5308) $0 $0 $0 $0 $0 $0 $0 $0 $0Elderly & Persons with Disabilities Formula Program (5310) $0 $0 $0 $0 $0 $0 $0 $0 $0Fixed Guideway Modernization (5309a) $0 $0 $1,083 $862 $0 $412 $0 $2,260 $3,534Intercity Bus (5311f) $0 $0 $0 $0 $0 $0 $0 $0 $0Job Access and Reverse Commute Program (5316) $547 $547 $1,338 $1,338 $1,754 $1,754 $1,825 $1,825 $5,464Metropolitan Planning (5303) $0 $0 $0 $0 $0 $0 $0 $0 $0New and Small Starts (Capital Investment Grants) (5309b) $0 $0 $0 $0 $0 $0 $0 $0 $0New Freedom (SAFETEA-LU) $73 $73 $827 $827 $868 $868 $865 $865 $2,633Nonurbanized Area Formula Program (5311) $0 $0 $312 $312 $328 $328 $276 $276 $916Public Transportation on Indian Reservation (5311c) $0 $0 $0 $0 $0 $0 $0 $0 $0Transit in the Parks (5320) $0 $0 $0 $0 $0 $0 $0 $0 $0Urbanized Area Formula Program (5307) $0 $0 $0 $0 $0 $0 $1,067 $2,067 $2,067CMAQ/5307 Transfer $0 $0 $0 $0 $0 $0 $0 $0 $0ARRA - FTA 5307 $0 $0 $0 $0 $0 $0 $0 $0 $0ARRA - FTA 5309 $0 $0 $0 $0 $0 $0 $0 $0 $0ARRA - FTA 5311 $0 $0 $0 $0 $0 $0 $0 $0 $0ARRA - FTA Transit Investment for Greenhouse Gas Energy Reduction (TIGGER)
$0 $0 $0 $0 $0 $0 $0 $0 $0
Other (TSGP) $0 $0 $0 $0 $0 $0 $0 $0 $0Federal Transit Total $620 $620 $3,560 $3,339 $2,950 $3,362 $4,033 $7,293 $14,614Federal Highway Non-Discretionary
Congestion Mitigation and Air Quality (CMAQ) $9,855 $9,855 $0 $0 $9,945 $10,009 $25,817 $25,882 $45,746Surface Transportation Program (Regional) $1,036 $1,036 $0 $0 $13,966 $19,898 $32,592 $22,070 $43,004Highway Bridge Program (HBP) $0 $0 $0 $0 $0 $0 $0 $0 $0Highway Safety Improvement Program (HSIP) $0 $0 $0 $0 $0 $0 $0 $0 $0Railway (Section 130) $0 $0 $0 $0 $0 $0 $0 $0 $0Safe Routes to School (SRTS) (SAFETEA-LU) $0 $0 $0 $0 $0 $0 $0 $0 $0Safe Routes to School (SR2S) $0 $0 $0 $0 $0 $0 $0 $0 $0Transportation Improvements (TI) $0 $0 $0 $0 $0 $0 $0 $0 $0Federal Lands Highway $0 $0 $0 $0 $0 $0 $0 $0 $0ARRA - SHOPP $0 $0 $0 $0 $0 $0 $0 $0 $0ARRA - STIP $0 $0 $0 $0 $0 $0 $0 $0 $0ARRA - Highway Maintenance (HM) $0 $0 $0 $0 $0 $0 $0 $0 $0ARRA - TE $0 $0 $0 $0 $0 $0 $0 $0 $0ARRA - RSTP $0 $0 $0 $0 $0 $0 $0 $0 $0ARRA - STP $0 $0 $0 $0 $0 $0 $0 $0 $0ARRA - Federal Lands Highway $0 $0 $0 $0 $0 $0 $0 $0 $0Other (RITA) $0 $0 $0 $0 $0 $0 $0 $0 $0
Subtotal $10,891 $10,891 $0 $0 $23,911 $29,907 $58,409 $47,952 $88,750 Federal Highway Discretionary Programs $0
Bridge Discretionary Program $0 $0 $0 $0 $0 $0 $0 $0 $0Corridor Infrastructure Improvement Program (SAFETEA-LU Sec. 1302)
$0 $0 $0 $0 $0 $0 $0 $0 $0
Coordinated Border Infrastructure (SAFETEA-LU Sec.1303) $0 $0 $0 $0 $0 $0 $0 $0 $0Ferry Boat Discretionary $0 $0 $0 $0 $0 $0 $0 $0 $0High Priority Projects (HPP) $0 $0 $0 $0 $0 $0 $0 $0 $0High Risk Rural Road (HRRR) $0 $0 $0 $0 $0 $0 $0 $0 $0Highway Maintenance - National Highway System $0 $0 $0 $0 $0 $0 $0 $0 $0National Scenic Byways Program $0 $0 $0 $0 $0 $0 $0 $0 $0Projects of National/Regional Significance (SAFETEA-LU Sec. 1301) $0 $0 $0 $0 $0 $0 $0 $0 $0Public Lands Highway Discretionary $0 $0 $0 $0 $0 $0 $0 $0 $0Recreational Trails $0 $0 $0 $0 $0 $0 $0 $0 $0Transportation and Community and System Preservation Program $0 $0 $0 $0 $0 $0 $0 $0 $0Other (ITS, IM, Sec 112/117, value pricing, STP) $0 $0 $0 $0 $0 $0 $0 $0 $0
Subtotal $0 $0 $0 $0 $0 $0 $0 $0 $0 Federal Highway Total $10,891 $10,891 $0 $0 $23,911 $29,907 $58,409 $47,952 $88,750FEDERAL TOTAL $11,511 $11,511 $3,560 $3,339 $26,861 $33,269 $62,442 $55,245 $103,364
$30,821 $38,456 $3,561 $8,419 $102,401 $95,106 $144,001 $137,172 $279,153REVENUE VS. PROGRAMMED TOTAL
Table 2c
2008 Regional Transportation Improvement Program (RTIP)
San Diego Region - Through Amendment No. 27* (in $000s)
REVENUES VS. PROGRAMMED
2008/09 2009/10 2010/11 2011/12FUNDING SOURCE
FED
ERA
L H
IGH
WA
YLO
CA
LST
ATE
FED
ERA
L TR
AN
SIT
32

Attachment 4
MTS FY 2011 CAPITAL IMPROVEMENT PROGRAMREVISED - JULY 2010 (in $000s)
Project Number
DescriptionFY11
ApprovedFY11 Revised Change
MTS PROJECTSPM FY09 PREVENTATIVE MAINTENANCE 41,500.000 41,500.000 0.000
ADA FY09 ADA CAPITAL EXPENSES 4,089.500 3,869.693 (219.807)10426 Mission Valley East 0.000 2,200.000 2,200.00011167 LRV Tires- multi yr contract 750.000 750.000 0.00011183 System Cross Ties & Ballast- multi yr contract 225.000 225.000 0.00011184 Bus Video Cameras (533) & Back office (4)- multi yr contract 800.000 1,235.660 435.66011200 Misc. Capital Non Federal 500.000 500.000 0.00011206 Rail Profile grinding - multi yr contract 325.000 325.000 0.00011214 LRV HVAC Overhaul- multi yr contract 1,325.000 1,200.000 (125.000)11216 LRV Electronic Components- multi yr contract 250.000 250.000 0.00011223 LRV Station CCTV Components (Phase 2) 0.000 398.000 398.00011224 Crane Truck/Platform Truck 665.000 665.000 0.00011251 Gearbox Overhaul- multi yr. contract 500.000 500.000 0.00011254 LRV Brake Overhaul 450.000 450.000 0.00011271 LRV On Board CCTV 398.000 2,700.000 2,302.00011275 SD100 Traction Motor Disconnects 275.000 275.000 0.00011276 SDTI Ticket Vending Equipment- multi yr contract 500.000 1,375.000 875.00011280 MTS CNG Station Improvements- IAD, KMD, SB 3,000.000 3,233.000 233.00011286 IAD Bus Wash Replacement 450.000 450.000 0.00011287 Body Hoist Overhaul (C4&C5) 400.000 400.000 0.00011288 Security Fiber optics (orange & green line) 0.000 3,381.790 3,381.79011289 Service Trucks (3- F450's) 335.000 335.000 0.00011290 South Bay Radio, Dispatch equipmnt,AVL,& APC's 2,000.000 1,000.000 (1,000.000)11294 Building A- roll up door replacement 50.000 50.000 0.00011295 Fiber Optic Equipment 25.000 25.000 0.00011296 Radio Communications Recorder 19.000 19.000 0.00011297 Multifunction Color Copier 12.960 12.960 0.00011298 Multifunction Welder 6.900 6.900 0.00011299 Escalator and Elevator Capital expenses 125.000 125.000 0.00011300 Transit Center Signage Project 100.000 100.000 0.00011301 Building A- A/C and heating replacement 125.000 125.000 0.00011302 SD-100 Main Breaker Replacement 650.000 650.000 0.00011303 ADA Land & Facility Purchase 0.000 19,200.000 19,200.00011304 Buffer/ Coupler Overhaul (SD-100) 960.000 960.000 0.00011306 Para-Transit Vehicles 1,351.000 1,351.000 0.00011307 NEW IT System 1,000.000 1,000.000 0.00011309 New Wheel Truing Machine/ Wheel scan 1,800.000 1,800.000 0.000NEW Bus Replacement 1,124.387 0.000 (1,124.387)
Total MTS Capital Project - FY 11 CIP 66,086.747 92,643.003 26,556.256
SANDAG PROJECTSN/A SANDAG Planning Study 933.006 705.273 (227.733)
1048500 SBMF Expansion 5,500.000 1,817.000 (3,683.000)1128100 Mainline drainage- Palm to Hill in El Cajon 143.000 143.000 0.0001142100 Substation Rehabilitation (Substation Standardization) 3,200.000 1,599.674 (1,600.326)1049600 East County Facility Redevelopment 2,120.000 972.150 (1,147.850)1128300 ADA Station Improvement- Old Town handrail / fence repair 98.000 98.000 0.0001128000 High Voltage Breaker Replacement 350.000 350.000 0.0001128600 LRV Carwash -Construction 850.000 850.000 0.0001129200 Overhead Catenary System Standardization (Head spans) 975.000 975.000 0.0001129600 Direct fixation track repair on Fletcher bridge 200.000 200.000 0.0001143900 IAD HVAC and Roof Repairs 1,438.000 208.685 (1,229.315)1129700 Spring Street Transit Center- retaining wall and platform repair 128.000 128.000 0.0001144000 Substation SCADA design CTC integration (MVW/Orange) 1,000.000 1,000.000 0.000
Total SANDAG Projects - FY 11 CIP 16,935.006 9,046.782 (7,888.224)
Total MTS and SANDAG Projects - FY 11 CIP 83,021.753 101,689.785 18,668.032
33

San Diego Association of Governments
TRANSPORTATION COMMITTEE
July 16, 2010 AGENDA ITEM NO.: 7
Action Requested: APPROVE
FY 2011 TRANSPORTATION DEVELOPMENT ACT CLAIM AMENDMENTS File Number 1500300 Introduction
At the June 25, 2010, meeting the SANDAG Board of Directors approved the FY 2011 Transportation Development Act (TDA) allocations and associated claims for Metropolitan Transit System (MTS), North County Transit District (NCTD), SANDAG, and the Consolidated Transportation Services Agency (CTSA). Amendment No. 25 to the 2008 Regional Transportation Improvement Program (RTIP), Agenda Item No. 6, includes a revision to certain capital projects for MTS and SANDAG.
Recommendation
The Transportation Committee is asked to (1) Approve Resolution No. 2011-04 relating to 2011 Transportation Development Act claim amendments in substantially the same form as shown in Attachment 1; and (2) direct staff to provide instructions to the County Office of Auditor Controller to revise these claims.
Discussion
Provisions included in two previous federal transportation authorizations – Intermodal Surface Transportation Efficiency Act (ISTEA) and Transportation Equity Act of the 21st Century (TEA-21) – allow for the use of certain toll revenues as a match to federal funds. In May 2010, the Federal Highway Administration approved a conditional use of toll credits toward federally funded projects. In June 2010, guidance was issued for use of toll credits for Federal Transit Administration funded programs. The toll credits do not represent additional or new funding, but it does allow the agencies to receive 100 percent reimbursement of federal funds, by using the toll credits as a soft match to the federal funds. It also means that the project would have to be fully funded with the federal share only or reprioritize projects so that the overall federal appropriations are not increased. The benefit derived is to free up TDA funding currently used as a match to the federal funds in order to create flexibility in future projects by using 100 percent of this local funding source, thereby eliminating federal contract provisions.
SANDAG has notified Caltrans, local agencies, and the two transit agencies, NCTD and MTS, to determine if any agency wished to pursue the use of toll credits. To date, only MTS is pursuing to take advantage of this program. With the flexibility allowed under the toll credits otherwise known as Transportation Development Credit (TDC) provisions, MTS has reviewed its FY 2011 Capital Improvement Program (approved by

2
SANDAG in April 2010), which includes regional projects that SANDAG implements on behalf of MTS. One of the outcomes from this reprioritization is the reduction in the capital transfer line under TDA. When SANDAG implements capital projects on behalf of MTS, the funding is transferred from MTS, including both the federal amount as well as the local match. For FY 2011, MTS had identified approximately $3.4 million of TDA to use as a local match to capital projects. With the change, the local match is reduced to $194,430. This reduction to the TDA match for the SANDAG capital projects of $3.2 million will be used to fund MTS capital projects using 100 percent TDA. This action requires an amendment to the FY 2011 TDA claim (Attachment 1). MTS staff anticipates requesting an additional RTIP amendment in the coming months in order to replenish the local funding on the capital projects that SANDAG is implementing on behalf of MTS. The MTS Board of Directors is scheduled to consider this item at its July 15, 2010, meeting.
LAUREN WARREM Director of Finance Attachment: 1. Resolution No. 2011-04: Approving Revisions to FY 2011 TDA Funds Key Staff Contact: Sookyung Kim, (619) 699-6909, [email protected]

3
401 B Street, Suite 800 San Diego, CA 92101 Phone (619) 699-1900 • Fax (619) 699-1905 www.sandag.org
RESOLUTION NO. 2011-04
Attachment 1
APPROVING REVISIONS TO
FY 2011 TRANSPORTATION DEVELOPMENT ACT FUNDS ARTICLE 4 FIXED ROUTE GENERAL PUBLIC TRANSIT SERVICE
WHEREAS, the Transportation Development Act (TDA) claims pursuant to Chapter 4, Article 4 of the California Public Utilities Code (PUC) listed below require revisions; and
WHEREAS, the SANDAG Board of Directors delegated the authority for TDA claim amendments to the SANDAG Transportation Committee; and
WHEREAS, SANDAG has analyzed the allocations and found that the revisions are warranted pursuant to Section 6659(c) of Title 21 of the California Code of Regulations (CCR);
NOW THEREFORE
BE IT RESOLVED by the Transportation Committee as follows:
1. That the Transportation Committee, pursuant to Section 6659(c) does hereby approve revisions to the claims as shown below:
Claim No. Claimant
Original Allocation
Adjustment +(-)
Revised Allocation
11031000 Metropolitan Transit System
Operating $49,897,106 $0 $49,897,106
Capital $6,419,635 $3,192,571 $9,612,206
Total $68,421,566 $3,192,571 $59,509,31211031004 SANDAG
Capital Transfer from MTS $3,387,001 ($3,192,571) $194,430
2. That the Transportation Committee does hereby authorize the Executive Director to
prepare and transmit instructions and payment schedules to the San Diego County Auditor as are necessary and legal for the adjustments of these claims.
PASSED AND ADOPTED this 16th day of July 2011.
________________________________________ ATTEST: ________________________________________
CHAIRPERSON SECRETARY
MEMBER AGENCIES: Cities of Carlsbad, Chula Vista, Coronado, Del Mar, El Cajon, Encinitas, Escondido, Imperial Beach, La Mesa, Lemon Grove, National City, Oceanside, Poway, San Diego, San Marcos, Santee, Solana Beach, Vista, and County of San Diego.
ADVISORY MEMBERS: California Department of Transportation, Metropolitan Transit System, North County Transit District, Imperial County, U.S. Department of Defense, San Diego Unified Port District, San Diego County Water Authority,
Southern California Tribal Chairmen’s Association, and Mexico.

San Diego Association of Governments
TRANSPORTATION COMMITTEE
July 16, 2010 AGENDA ITEM NO.: 8Action Requested: RECOMMEND
DRAFT 2010 REGIONAL TRANSPORTATION IMPROVEMENT PROGRAM, INCLUDING THE DRAFT AIR QUALITY CONFORMITY DETERMINATION File Number 1500300
Introduction
SANDAG, serving as the region’s Metropolitan Planning Organization (MPO), is required by state and federal laws to develop and adopt a Regional Transportation Improvement Program (RTIP). The RTIP is a multi-year program of proposed major highway, arterial, transit, and nonmotorized projects, including the TransNet Program of Projects. The current 2008 RTIP, adopted by the Board of Directors on July 25, 2008, covers the five-year period FY 2009 through FY 2013. This Draft 2010 RTIP, covering the period FY 2011 through FY 2015, is a $10 billion program consisting of major highway, transit, local streets and roads, and other capital projects. The final 2010 RTIP is due to the state by October 1, 2010.
Recommendation
The Transportation Committee is asked to recommend that the Board of Directors: (1) accept for review and distribution the Draft 2010 Regional Transportation Improvement Program, including its air quality conformity analysis and the draft air quality conformity redetermination of the 2030 Revenue Constrained Regional Transportation Plan: Pathways for the Future for a 30-day public comment period; and (2) schedule a public hearing for the September 3, 2010, Transportation Committee meeting.
Attachment 1 provides an overview of the Draft 2010 RTIP by the different modes. Of the $10 billion program total, $5.5 billion is allocated for highway projects, $2.7 billion is programmed toward transit projects, $1.2 billion for Local Street and Road projects, and $540 million is programmed toward other projects such as Bicycle/Pedestrian Facilities, Transportation Demand Management, and Transportation Systems Management. Federal and state funds account for about 46.2 percent of the total Draft 2010 RTIP. One of the major components of the RTIP includes the state and federally funded transportation projects that are programmed in the State Transportation Improvement Program (STIP) and State Highway Operation and Protection Program (SHOPP). At its February and May meetings, the California Transportation Commission (CTC) adopted the 2010 SHOPP and STIP, respectively. This Draft 2010 RTIP includes the CTC-adopted 2010 STIP- and SHOPP-funded projects for the San Diego region. State funds from Proposition 1B: Highway Safety, Traffic Reduction, Air Quality, and Port Security Bond Act of 2006, passed by voters in November 2006, also are included.

Discussion
RTIP Content Federal and state regulations identify the process and required content of the RTIP. In general, the RTIP must include all major projects receiving certain categories of federal or state transportation funding, projects needing federal project approval, and/or projects identified as being regionally significant. This includes projects funded by the federal Regional Surface Transportation Program (RSTP), Congestion Mitigation and Air Quality (CMAQ) program, Federal Transit Administration (FTA) formula and discretionary programs and other federal sources, as well as projects funded by the STIP and SHOPP. As prescribed by the TransNet Extension Ordinance, the RTIP also includes the TransNet Program of Projects. Background On January 29, 2010, SANDAG transmitted a memorandum to all local agencies requesting project submittals for the 2010 RTIP. Submittals were to include new projects, project deletions, or changes to existing programmed project scopes, funding, or phasing. The project listings were due to SANDAG by April 2, 2010. Staff has reviewed the projects and conducted the required air quality conformity analysis for the projects included in the 2010 RTIP. In addition, SANDAG is required to redetermine conformity of the 2030 Revenue Constrained Regional Transportation Plan: Pathways for the Future (2030 RTP) to ensure consistency between the long-range transportation plan and the transportation improvement program. Federal funds programmed are based on the federal authorizing legislation, Safe, Accountable, Flexible and Efficient Transportation Equity Act: A Legacy for Users (SAFETEA-LU). SAFETEA-LU expired September 30, 2009, but was extended through December 31, 2010, via HR 2847, the Hiring Incentives to Restore Employment Act, signed by the President on March 18, 2010. For the subsequent years (FY 2011 to FY 2015), continuation of the formula programs (for both FTA and Federal Highway Administration) is assumed. No assumptions are made with regard to any new discretionary program funding. The list of projects proposed for the 2010 RTIP is listed in Table 1 (Attachment 2). This list includes projects submitted by local agencies, transit agencies, Caltrans, and SANDAG, as well as other agencies that have transportation projects in the San Diego region. Pursuant to Board Policy No. 031, local agencies are required to submit documentation by June 30, 2010 (in the form of a resolution) attesting to the approval by the local governing body for projects included in the RTIP. This process ensures that interested public parties and the local governing body are aware of the projects proposed to be included in the RTIP. The Cities of Lemon Grove and National City are in the process of completing the required documentation and it is anticipated that both cities will seek council approval prior to the scheduled July 23, 2010, Board action. Upon receipt of the signed resolutions, the projects from both cities will be incorporated into the Draft 2010 RTIP.
2

3
Independent Taxpayer Oversight Committee (ITOC) The ITOC is scheduled to review the Draft 2010 RTIP at its meeting on July 14, 2010, focusing its review on the TransNet Program of Projects including compliance with the TransNet Extension Ordinance and requirements of Board Policy No. 031, “TransNet Ordinance and Expenditure Plan Rules.” Any comments from the ITOC will be presented to the Transportation Committee. Air Quality Conformity Requirements Federal regulations require that SANDAG conduct an air quality conformity analysis of all regionally significant projects that increase the transportation system capacity. This includes major local and privately funded projects and any other state or federally funded projects that might not otherwise appear in the RTIP, as well as new projects or major changes in the project scope for existing programmed project.
The draft quantitative emissions analyses for the 2010 RTIP and for the conformity redetermination for the 2030 RTP have been conducted, and the draft results indicate that they meet the air quality conformity requirements (Attachment 3). The San Diego Region Conformity Working Group (CWG) reviewed the draft air quality conformity assessment at its June 9, 2010, meeting. There were no comments at that meeting. The CWG will be providing comments throughout the RTIP process. Schedule Pending Transportation Committee action, the Board of Directors will be asked at its July 23, 2010, meeting to release the Draft 2010 RTIP for distribution for public review and comment, and schedule a public hearing at the September 3, 2010, Transportation Committee meeting. Pending the Transportation Committee’s recommendation, the Board of Directors will be requested to adopt the final 2010 RTIP and make its air quality conformity determination at its September 24, 2010, meeting.
LAUREN WARREM Director of Finance
Attachments: 1. Summary of Major Projects by Mode 2. Table 1, List of Proposed Projects 3. Draft Air Quality Conformity Analysis
Key Staff Contact: Sookyung Kim, (619) 699-6909, [email protected]
Note: Full copies of the Draft 2010 Regional Transportation Improvement Program report will be available via SANDAG’s Web site at www.sandag.org\2010RTIP prior to the meeting. Hard copies may also be obtained by contacting the SANDAG Publications Hotline at (888) 707-7827.

Attachment 1
DESCRIPTION FEDERAL STATE TRANSNET TOTAL
Highway Projects
I-5 (HOV/Managed Lanes/Lomas Santa Fe) $48,474 $48,826 $78,304 $24,800 $200,404
I-15 (Managed Lanes including Debt Service) $242,919 $892,863 $224,524 $18,262 $720,121
SR 52 (HOV Managed Lanes/Auxiliary Lanes) $67,531 $291,769 $204,474 $1,000 $564,774
SR 76 (East and Middle) $99,853 $0 $229,603 $30,000 $359,456
I-805 (HOV/Managed Lanes/DAR at Carroll Canyon) $59,253 $0 $88,750 $180 $16,890
SR 905 (I-805 to Otay Mesa POE) $256,958 $187,673 $1,582 $0 $19,146
SR 78 $500 $18,463 $1,000 $30,400 $50,363
SR 11 $5,700 $88,001 $0 $626,420 $44,863
SR 241 TCA Toll $0 $0 $0 $442,663 $71,000
Highway Bridge Program/Other State Administered Programs $143,947 $5,294 $0 $7,334 $156,575
State Highway Operations Protection Program (SHOPP) $0 $262,505 $0 $0 $262,505
Other Highway Projects $148,476 $70,000 $41,279 $342,597 $602,352
Subtotal Highway Projects $1,089,351 $1,952,422 $869,516 $1,629,321 $5,540,610
Transit Projects
Mid-Coast $15,159 $43,293 $578,088 $0 $636,540
I-15 BRT $24,920 $13,043 $73,245 $36 $111,244
Other BRT $24,928 $0 $159,802 $355 $185,085
Bus/Rail Infrastructure $266,970 $224,655 $84,272 $54,885 $630,782
Bus/Rail Intermodal Stations $12,026 $123,960 $15,460 $683 $152,129
Bus/Rail Vehicle Purchase $63,446 $201,805 $34,442 $19,912 $319,605
Other Bus/Rail (Operations/Planning) $302,171 $0 $229,448 $178,816 $710,435
Subtotal Transit Projects $709,620 $606,756 $1,174,757 $254,687 $2,745,820
Local Streets & Roads Projects
Highway Bridge Replacement/Rehabilitation $147,523 $0 $14,090 $18,503 $180,116
Regional Arterial System $19,059 $0 $269,976 $164,285 $453,320
Roadway Maintenance & Rehabilitation $15,928 $0 $127,513 $218,846 $362,287
Traffic Signal Projects $0 $0 $107,209 $34,355 $141,564
Other Local Street & Road $200 $0 $30,217 $1,850 $32,267
Subtotal Local Streets & Roads Projects $182,710 $1,150 $549,005 $437,839 $1,169,554
Other Projects
Bicycle/Pedestrian Projects $1,285 $5,903 $15,163 $17,296 $39,647
Miscellaneous* $0 $3,771 $402,419 $0 $406,190
Transportation Demand Management (TDM) $19,685 $0 $0 $0 $19,685
Transportation Enhancement Activities (TE) $0 $5,867 $6,795 $280 $12,942
Transportation Management System/Intelligent Transportation System $22,411 $14,063 $22,009 $2,744 $61,227
Subtotal Other Projects $43,381 $29,604 $446,386 $20,320 $539,691
GRAND TOTAL $2,025,062 $2,589,932 $3,039,664 $2,342,167 $9,995,675*Includes SANDAG planning and the TransNet Environmental Mitigation Program
LOCAL/ PRIVATE
DRAFT 2010 RTIP Program SummarySummary of Major Projects by Mode (in $000s)
Attachment 1
4
sgr
Rectangle

Table 1
San Diego Region (in $000s)DRAFT 2010 Regional Transportation Improvement Program
MPO ID:
Project Title: Interstate 5 - HOV Managed Lanes
CAL09
Caltrans
ADOPTION: 10-00
Project Description:
EA NO: 235800
PPNO: 0615
RTP PG NO: A-5
SANDAG ID: 1200501, 1200504
From La Jolla Village Dr. to Harbor Dr. - construct HOV/Managed Lanes on I-5
Exempt Category: Non-ExemptCapacity Status: CIRT:5
Est Total Cost: $89,782 Open to Traffic: Jul 2016
CONRWPEPRIORTOTAL 10/11 11/12 12/13 13/14 14/15
CBI $500 $500 $500
IM $4,000 $4,000 $4,000
RSTP $29,121 $29,121 $29,121
STIP-RIP NHS $1,831 $1,831 $1,831
STIP-RIP State Cash $628 $628 $628
STP $2,000 $2,000 $2,000
TransNet - MC $28,283 $22,840 $579 $44,025 $7,677 $51,702
TOTAL $89,782 $66,363 $22,840 $579 $7,677 $82,105
MPO ID:
Project Title: I-5 Lomas Santa Fe Interchange/HOV lanes
CAL09A ADOPTION: 10-00
Project Description:
EA NO: 2358U
PPNO: 0701
RTP PG NO: A-5
SANDAG ID: 1200502
From Via De La Valle to San Elijo Lagoon - construct interchange and HOV Lane
Exempt Category: Non-ExemptCapacity Status: CIRT:5
Est Total Cost: $55,408 Open to Traffic: Mar 2009
CONRWPEPRIORTOTAL 10/11 11/12 12/13 13/14 14/15
Corridor Mobility Program $24,500 $24,500 $24,500
TCRP $6,000 $6,000 $6,000
TransNet - MC $19,955 $1,689 $1,574 $1,690 $2,518 $210 $22,180 $24,908
TOTAL $55,408 $50,455 $1,689 $1,574 $1,690 $210 $52,680 $2,518
MPO ID:
Project Title: I-805 Direct Access Ramp and HOV at Carroll Canyon
CAL09C ADOPTION: 10-00
Project Description:
EA NO: 2T040
PPNO: 0716
RTP PG NO: A-5, A22, A-39
SANDAG ID: 1280505
RAS (TA 9-5)
From Carroll Canyon Road to I- 5 - on I-805, construct Direct Access Ramps (DARs)
and HOV lanes to Carroll Canyon Road
Exempt Category: Non-ExemptCapacity Status: CIRT:805
Est Total Cost: $86,743 Open to Traffic: Jun 2012
CONRWPEPRIORTOTAL 10/11 11/12 12/13 13/14 14/15
Other Fed - ARRA-RSTP $51,817 $51,817 $51,817
TransNet - MC $16,928 $2,563 $2,430 $935 $935 $635 $15,625 $1,500 $7,301 $24,426
TOTAL $76,243 $68,745 $2,563 $2,430 $935 $935 $635 $1,500 $59,118 $15,625
Additional local contribution programmed in SD32*
1Page Thursday, July 8, 2010
Attachment 2
5

San Diego Region (in $000s)DRAFT 2010 Regional Transportation Improvement Program
MPO ID:
Project Title: I-15 Managed Lanes (Middle)
CAL18
Caltrans
ADOPTION: 10-00
Project Description:
EA NO: 064811
PPNO: 0672
RTP PG NO: A-5
SANDAG ID: 1201502
EARMARK NO: 3783, CA707
From SR56 to Centre City Pkwy - construct managed lanes including 3 Direct Access
Ramps (DARs)
Exempt Category: Non-ExemptCapacity Status: CIRT:15
Est Total Cost: $471,115 Open to Traffic: Mar 2009
CONRWPEPRIORTOTAL 10/11 11/12 12/13 13/14 14/15
CMAQ $35,586 $974 $34,612 $35,586
DEMO - Sec 115 $1,000 $1,000 $1,000
HPP $5,000 $5,000 $5,000
Local Funds $15,810 $15,810 $15,810
RSTP $57,153 $57,153 $57,153
SHOPP - State Cash $4,136 $4,136 $4,136
STIP-IIP NHS $36,032 $36,032 $36,032
STIP-IIP NHS GARVEE $49,250 $49,250 $49,250
STIP-IIP State Cash $4,668 $4,668 $4,668
STIP-RIP NHS $3,984 $3,984 $3,984
STIP-RIP NHS GARVEE $147,750 $147,750 $147,750
STIP-RIP State Cash $516 $516 $516
TCRP $64,300 $24,963 $9,337 $30,000 $64,300
TransNet - MC $14,504 $10,220 $10,220 $10,986 $984 $126 $44,820 $45,930
TransNet - MC AC $0
TOTAL $471,115 $439,689 $10,220 $10,220 $10,986 $10,437 $430,231 $30,447
MPO ID:
Project Title: I-15 Managed Lanes-North Segment
CAL18A ADOPTION: 10-00
Project Description:
EA NO: 081001
PPNO: 0672F
RTP PG NO: A-5
SANDAG ID: 1201503
From Clarence Lane to SR 78 - construct managed lanes
Exempt Category: Non-ExemptCapacity Status: CIRT:15
Est Total Cost: $190,231 Open to Traffic: Dec 2011
CONRWPEPRIORTOTAL 10/11 11/12 12/13 13/14 14/15
CMAQ $64,803 $4,050 $5,432 $55,321 $64,803
RSTP $56,654 $1,505 $55,149 $56,654
STIP-RIP NHS $4,426 $4,426 $4,426
STIP-RIP State Cash $574 $574 $574
TransNet - MC $33,122 $12,653 $13,112 $4,372 $210 $305 $17,482 $704 $45,588 $63,774
TOTAL $190,231 $159,579 $12,653 $13,112 $4,372 $210 $305 $6,136 $156,058 $28,037
2Page Thursday, July 8, 2010
6

San Diego Region (in $000s)DRAFT 2010 Regional Transportation Improvement Program
MPO ID:
Project Title: I-15 Managed Lanes- South Segment and Mira Mesa Transit Center
CAL18B
Caltrans
ADOPTION: 10-00
Project Description:
EA NO: 081501
PPNO: 0672G
RTP PG NO: A-5
SANDAG ID: 1201501
From SR 163 to I-15/SR 56 Separation - construct managed lanes, south segment
including Direct Access Ramps: construct auxiliary lane along northbound I-15 from
Pomerado Rd. overcrossing to Carroll Canyon Rd. overcrossing, construct transit
center at Miramar College near Hillery Dr.
Exempt Category: Non-ExemptCapacity Status: CIRT:15
Est Total Cost: $442,324 Open to Traffic: Dec 2012
CONRWPEPRIORTOTAL 10/11 11/12 12/13 13/14 14/15
CMAQ $11,744 $11,744 $11,744
Corridor Mobility Program $286,482 $40,200 $326,682 $326,682
Local Funds $2,315 $2,315 $2,315
STIP-RIP NHS $8,853 $8,853 $8,853
STIP-RIP State Cash $1,147 $1,147 $1,147
TransNet - MC $43,875 $17,699 $15,861 $7,835 $4,970 $1,343 $41,009 $18,937 $31,637 $91,583
TOTAL $442,324 $354,416 $57,899 $15,861 $7,835 $4,970 $1,343 $18,937 $360,634 $62,753
MPO ID:
Project Title: State Route 52 Freeway (E&F)
CAL26 ADOPTION: 10-00
Project Description:
EA NO: 010611
PPNO: 0260
RTP PG NO: A-5
SANDAG ID: 1205203
EARMARK NO: CA424/604, HPP
1134/2735
In San Diego, Santee and Lakeside, from SR 125 to Cuyamaca Street to SR 67 -
construct 4 lane freeway
Exempt Category: Non-ExemptCapacity Status: CIRT:52
Est Total Cost: $520,529 Open to Traffic: Dec 2010
CONRWPEPRIORTOTAL 10/11 11/12 12/13 13/14 14/15
DEMO $2,250 $2,250 $2,250
HPP $9,737 $278 $10,015 $10,015
RSTP $46,199 $7,839 $22,438 $31,600 $54,038
STIP-IIP NHS $3,010 $2,125 $885 $3,010
STIP-IIP State Cash $5,355 $4,732 $623 $5,355
STIP-RIP NHS $26,558 $5,848 $20,710 $26,558
STIP-RIP Prior NHS $16,375 $16,375 $16,375
STIP-RIP Prior State Cash $802 $802 $802
STIP-RIP State Cash $192,669 $11,140 $26,205 $155,324 $192,669
TCRP $45,000 $45,000 $45,000
TCSP $1,228 $1,228 $1,228
TransNet - H $44,340 $671 $43,669 $44,340
TransNet - MC $87,981 $4,558 $15,696 $9,054 $1,600 $14,781 $53,969 $50,139 $118,889
TOTAL $520,529 $481,504 $12,675 $15,696 $9,054 $1,600 $234,154 $247,078 $39,297
3Page Thursday, July 8, 2010
7

San Diego Region (in $000s)DRAFT 2010 Regional Transportation Improvement Program
MPO ID:
Project Title: SR 52 Auxiliary Lanes, Truck Lane and Inside Widening
CAL26B
Caltrans
ADOPTION: 10-00
Project Description:
EA NO: 267300, 2T020X, 2T061X
PPNO: 0698, 0702, 0706B
RTP PG NO: A-5
SANDAG ID: 1205202
From SR 52/I-15 to Mast Blvd. Undercrossing (7.4/13.3) (Aux Lanes); from Mast Blvd.
Undercrossing to SR 52/SR 125 separation(13.3/14.9) (IW); and from west of Santo
Road Overcrossing to west of Oak Canyon Bridge (truck lanes) - in San Diego, Phase
1: construct eastbound and westbound auxiliary lanes and truck lanes; Phase 2: add
one mixed flow lane in each direction, widen two structures and install a ramp meter at
Mission Gorge Road (PE only) and widen existing roadway
Exempt Category: Non-ExemptCapacity Status: CIRT:52
Est Total Cost: $44,245 Open to Traffic: Jun 2013
CONRWPEPRIORTOTAL 10/11 11/12 12/13 13/14 14/15
Local Funds $1,000 $1,000 $1,000
SHOPP - State Cash $2,000 $2,000 $2,000
TransNet - MC $34,287 $6,958 $4,292 $10 $36,943 $41,245
TOTAL $44,245 $37,287 $6,958 $10 $38,943 $5,292
MPO ID:
Project Title: SR 76 Middle
CAL29 ADOPTION: 10-00
Project Description:
EA NO: 08010
PPNO: 0759
RTP PG NO: A-6
SANDAG ID: 1207602
EARMARK NO: CA603/2719
From Melrose Dr. to So. Mission Rd. - in San Diego County in and near Oceanside -
widen from 2 to 4 lanes
Exempt Category: Non-ExemptCapacity Status: CIRT:76
Est Total Cost: $171,359 Open to Traffic: Dec 2012
CONRWPEPRIORTOTAL 10/11 11/12 12/13 13/14 14/15
DEMO - TEA 21 $5,519 $5,519 $5,519
HPP $4,000 $4,000 $4,000
Other Fed - ARRA-RSTP $75,613 $75,613 $75,613
RSTP $6,285 $6,285 $6,285
STP $1,000 $1,000 $1,000
TransNet - MC $45,663 $9,409 $6,678 $3,740 $9,434 $37,362 $18,694 $65,490
TOTAL $157,907 $138,080 $9,409 $6,678 $3,740 $46,881 $94,307 $16,719
The state contributed $13M for environmental support outside of the STIP or RTIP*
4Page Thursday, July 8, 2010
8

San Diego Region (in $000s)DRAFT 2010 Regional Transportation Improvement Program
MPO ID:
Project Title: SR 76 East
CAL29B
Caltrans
ADOPTION: 10-00
Project Description:
EA NO: 25711
RTP PG NO: A-6
SANDAG ID: 1207606From Mission Rd. to I-15 - In and near Oceanside from Mission Rd to I-15, widen from
2 to 4 lanes
Exempt Category: Non-ExemptCapacity Status: CIRT:76
Est Total Cost: $201,549 Open to Traffic: Jul 2014
CONRWPEPRIORTOTAL 10/11 11/12 12/13 13/14 14/15
Local Funds $30,000 $30,000 $30,000
RSTP $7,436 $7,436 $7,436
TransNet - MC $6,351 $15,394 $38,596 $49,367 $37,834 $15,146 $12,677 $16,201 $133,810 $162,688
TransNet - MC AC $1,425 $1,425 $1,425
TOTAL $201,549 $15,212 $15,394 $38,596 $49,367 $67,834 $15,146 $16,201 $163,810 $21,538
MPO ID:
Project Title: SR 125 (Toll, Gap, Connector)
CAL31 ADOPTION: 10-00
Project Description:
EA NO: 00300
RTP PG NO: A-6From SR 905 to SR 54 - construct 4-lane facility and 6-lane freeway with interchange
and HOV provisions
Exempt Category: Non-ExemptCapacity Status: CIRT:125
Est Total Cost: $492,244 Open to Traffic: Jan 2012
CONRWPEPRIORTOTAL 10/11 11/12 12/13 13/14 14/15
Local Funds $332,946 $24,850 $40,075 $268,021 $332,946
RSTP $136,702 $44,116 $92,586 $136,702
TransNet - H $9,903 $12,693 $2,103 $20,493 $22,596
TOTAL $492,244 $479,551 $12,693 $86,294 $381,100 $24,850
5Page Thursday, July 8, 2010
9
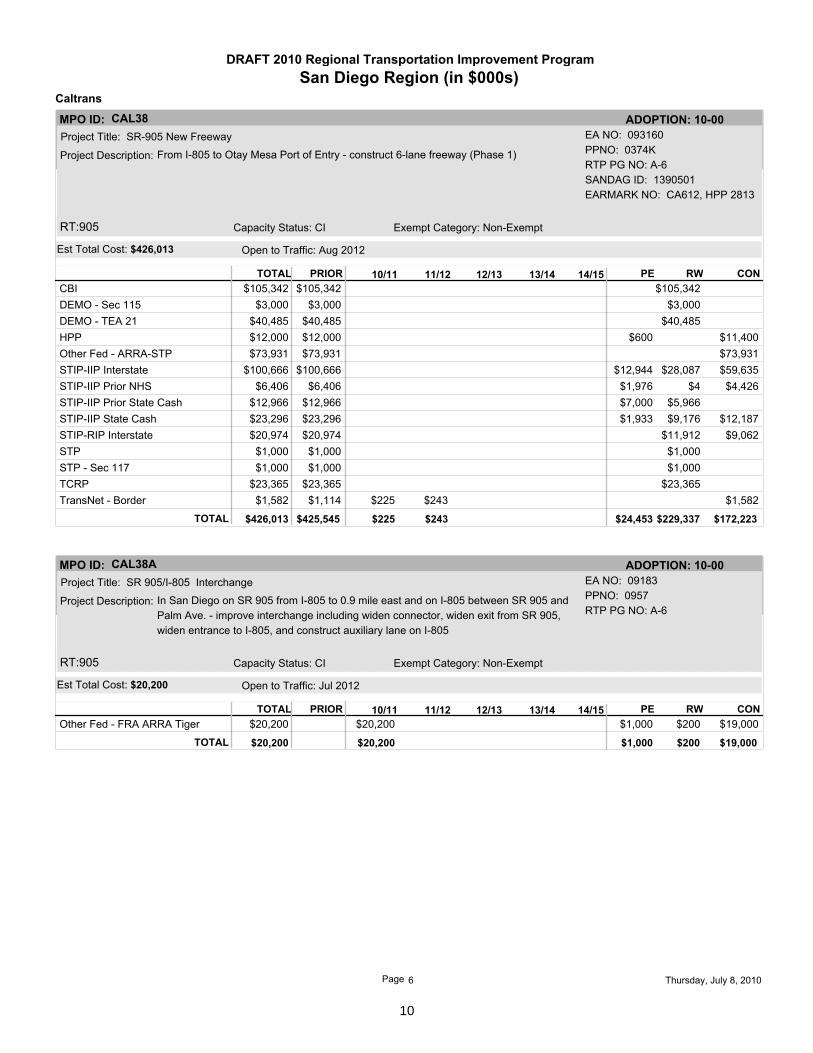
San Diego Region (in $000s)DRAFT 2010 Regional Transportation Improvement Program
MPO ID:
Project Title: SR-905 New Freeway
CAL38
Caltrans
ADOPTION: 10-00
Project Description:
EA NO: 093160
PPNO: 0374K
RTP PG NO: A-6
SANDAG ID: 1390501
EARMARK NO: CA612, HPP 2813
From I-805 to Otay Mesa Port of Entry - construct 6-lane freeway (Phase 1)
Exempt Category: Non-ExemptCapacity Status: CIRT:905
Est Total Cost: $426,013 Open to Traffic: Aug 2012
CONRWPEPRIORTOTAL 10/11 11/12 12/13 13/14 14/15
CBI $105,342 $105,342 $105,342
DEMO - Sec 115 $3,000 $3,000 $3,000
DEMO - TEA 21 $40,485 $40,485 $40,485
HPP $12,000 $600 $11,400 $12,000
Other Fed - ARRA-STP $73,931 $73,931 $73,931
STIP-IIP Interstate $100,666 $12,944 $28,087 $59,635 $100,666
STIP-IIP Prior NHS $6,406 $1,976 $4 $4,426 $6,406
STIP-IIP Prior State Cash $12,966 $7,000 $5,966 $12,966
STIP-IIP State Cash $23,296 $1,933 $9,176 $12,187 $23,296
STIP-RIP Interstate $20,974 $11,912 $9,062 $20,974
STP $1,000 $1,000 $1,000
STP - Sec 117 $1,000 $1,000 $1,000
TCRP $23,365 $23,365 $23,365
TransNet - Border $1,114 $225 $243 $1,582 $1,582
TOTAL $426,013 $425,545 $225 $243 $229,337 $172,223 $24,453
MPO ID:
Project Title: SR 905/I-805 Interchange
CAL38A ADOPTION: 10-00
Project Description:
EA NO: 09183
PPNO: 0957
RTP PG NO: A-6In San Diego on SR 905 from I-805 to 0.9 mile east and on I-805 between SR 905 and
Palm Ave. - improve interchange including widen connector, widen exit from SR 905,
widen entrance to I-805, and construct auxiliary lane on I-805
Exempt Category: Non-ExemptCapacity Status: CIRT:905
Est Total Cost: $20,200 Open to Traffic: Jul 2012
CONRWPEPRIORTOTAL 10/11 11/12 12/13 13/14 14/15
Other Fed - FRA ARRA Tiger $20,200 $1,000 $200 $19,000 $20,200
TOTAL $20,200 $20,200 $200 $19,000 $1,000
6Page Thursday, July 8, 2010
10

San Diego Region (in $000s)DRAFT 2010 Regional Transportation Improvement Program
MPO ID:
Project Title: Grouped Projects for Emergency Repair - SHOPP Emergency Response Program
CAL42
Caltrans
ADOPTION: 10-00
Project Description: Projects are consistent with 40 CFR Part 93.126 Exempt Table 2 categories - repair
damage caused by natural disasters, civil unrest, or terrorist acts; this applies to
damages that do not qulalify for Federal Emergency Relief funds or to damages that
qualify for federal Emergency Relief funds but extend beyond the Federally declaired
disaster period
Exempt Category: Safety - Emergency Relief (23 U.S.C. 125)Capacity Status: NCI
Est Total Cost: $1,023
CONRWPEPRIORTOTAL 10/11 11/12 12/13 13/14 14/15
SHOPP (AC) $906 $140 $27 $738 $905
SHOPP - State Cash $117 $18 $4 $96 $118
TOTAL $1,023 $1,023 $31 $834 $158
MPO ID:
Project Title: Highway Bridge Program
CAL44 ADOPTION: 10-00
Project Description: Countywide - projects are consistent with 40 CFR Part 93.126 Exempt Table 2
categories – widen narrow pavements or reconstructing bridges (no additional travel
lanes)
Exempt Category: Safety - Non capacity widening or bridge reconstructionCapacity Status: NCI
Est Total Cost: $145,446
CONRWPEPRIORTOTAL 10/11 11/12 12/13 13/14 14/15
HBP $48,519 $4,356 $675 $5,735 $11,259 $63,739 $134,285 $134,285
Local Bridge Seismic Retrofit Acct $3,599 $743 $21 $931 $5,294 $5,294
Local Funds $3,675 $297 $75 $4,192 $(2,372) $5,867 $5,867
Local Funds AC $2,000 $(2,000) $32,354 $(32,354)$0
TOTAL $145,446 $57,793 $2,653 $750 $43,024 $11,280 $29,944 $145,446
MPO ID:
Project Title: Grouped Projects for Safety Improvements - SHOPP Mobility Program
CAL46A ADOPTION: 10-00
Project Description: Projects are consistent with 40 CFR Parts 93.126 and 93.127 Exempt Tables 2 and 3
categories -railroad/highway crossing, safer non-federal-aid system roads, shoulder
improvements, traffic control devices and operating assistance other than signalization
projects, intersection signalization projects at individual intersections, pavement
marking demonstration, truck climbing lanes outside the urbanized area, lighting
improvements, emergency truck pullovers
Exempt Category: Safety - Shoulder ImprovementsCapacity Status: NCI
Est Total Cost: $16,065
CONRWPEPRIORTOTAL 10/11 11/12 12/13 13/14 14/15
SHOPP (AC) $825 $10,247 $1,984 $1,746 $24 $11,287 $13,057
SHOPP - State Cash $107 $1,328 $1,574 $736 $5 $2,267 $3,008
TOTAL $16,065 $932 $11,575 $3,558 $29 $13,554 $2,482
7Page Thursday, July 8, 2010
11

San Diego Region (in $000s)DRAFT 2010 Regional Transportation Improvement Program
MPO ID:
Project Title: Grouped Projects for Safety Improvements - SHOPP Collision Reduction Program
CAL46B
Caltrans
ADOPTION: 10-00
Project Description: Projects are consistent with 40 CFR Parts 93.126 and 93.127 Exempt Tables 2 and 3
categories -railroad/highway crossing, safer non-federal-aid system roads, shoulder
improvements, traffic control devices and operating assistance other than signalization
projects, intersection signalization projects at individual intersections, pavement
marking demonstration, truck climbing lanes outside the urbanized area, lighting
improvements, emergency truck pullovers
Exempt Category: Safety - Pavement marking demonstrationCapacity Status: NCI
Est Total Cost: $40,833
CONRWPEPRIORTOTAL 10/11 11/12 12/13 13/14 14/15
SHOPP - Collision Reduction - National Hwy System (AC) $4,218 $761 $10 $3,447 $4,218
SHOPP - Collision Reduction - Surface Transportation Program (AC)$18,316 $6,717 $6,897 $4,176 $475 $27,280 $31,931
SHOPP - State Cash $2,373 $1,417 $894 $640 $63 $3,981 $4,684
TOTAL $40,833 $20,689 $12,352 $7,791 $548 $34,708 $5,577
MPO ID:
Project Title: Grouped Projects for Bridge Rehabilitation and Reconstruction - SHOPP Program
CAL46D ADOPTION: 10-00
Project Description: Projects are consistent with 40 CFR Part 93.126 Exempt Table 2 categories – widen
narrow pavements or reconstructing bridges (no additional travel lanes)
Exempt Category: Safety - Non capacity widening or bridge reconstructionCapacity Status: NCI
Est Total Cost: $9,820
CONRWPEPRIORTOTAL 10/11 11/12 12/13 13/14 14/15
SHOPP (AC) $2,518 $6,176 $2,049 $12 $6,634 $8,695
SHOPP - State Cash $326 $800 $265 $1 $859 $1,125
TOTAL $9,820 $2,844 $6,976 $13 $7,493 $2,314
MPO ID:
Project Title: Grouped Projects for Pavement Resurfacing and/or Rehabilitation - SHOPP Roadway Pres
CAL46E ADOPTION: 10-00
Project Description: Projects are consistent with 40 CFR Part 93.126 Exempt Table 2 categories –
pavement resurfacing and/or rehabilitation, emergency relief (23 USC 125), widening
narrow pavements or reconstructing bridges (no additional travel lanes)
Exempt Category: Safety - Pavement resurfacing and/or rehabilitationCapacity Status: NCI
Est Total Cost: $130,912
CONRWPEPRIORTOTAL 10/11 11/12 12/13 13/14 14/15
SHOPP (AC) $63,172 $9,601 $43,123 $8,656 $817 $106,424 $115,897
SHOPP - State Cash $8,185 $1,244 $5,587 $1,121 $106 $13,788 $15,015
TOTAL $130,912 $71,357 $10,845 $48,710 $923 $120,212 $9,777
8Page Thursday, July 8, 2010
12

San Diego Region (in $000s)DRAFT 2010 Regional Transportation Improvement Program
MPO ID:
Project Title: Group Projects for Safety Improvements - SHOPP Mandates Program
CAL46I
Caltrans
ADOPTION: 10-00
Project Description: Projects are consistent with 40 CFR Parts 93.126 and 93.127 Exempt Tables 2 and 3
categories -railroad/highway crossing, safer non-federal-aid system roads, shoulder
improvements, traffic control devices and operating assistance other than signalization
projects, intersection signalization projects at individual intersections, pavement
marking demonstration, truck climbing lanes outside the urbanized area, lighting
improvements, emergency truck pullovers
Exempt Category: Other - Plantings, landscaping, etcCapacity Status: NCI
Est Total Cost: $63,853
CONRWPEPRIORTOTAL 10/11 11/12 12/13 13/14 14/15
SHOPP (AC) $1,348 $736 $27,262 $27,183 $5,298 $259 $50,973 $56,530
SHOPP - State Cash $175 $95 $3,532 $3,522 $686 $33 $6,604 $7,323
TOTAL $63,853 $1,523 $831 $30,794 $30,705 $292 $57,577 $5,984
MPO ID:
Project Title: State Route 11
CAL66 ADOPTION: 10-00
Project Description:
EA NO: 05631
PPNO: 0999
RTP PG NO: A-6; B-5
EARMARK NO: CA393/740
From Border of Mexico east of SR 905/Otay Mesa Border Crossing to future SR 125/905
junction - From Britannia Blvd. on SR 905 to the Border of Mexico east of SR 905 / Otay
Mesa Border Crossing - construction of 4-lane freeway.
Exempt Category: Non-ExemptCapacity Status: CIRT:11
Est Total Cost: $720,121 Open to Traffic: Dec 2014
CONRWPEPRIORTOTAL 10/11 11/12 12/13 13/14 14/15
CBI $4,900 $4,900 $4,900
HPP $800 $800 $800
Local Funds $123,070 $503,350 $42,690 $80,380 $503,350 $626,420
STIP-IIP NHS $6,882 $6,882 $6,882
STIP-IIP Prior State Cash $5,200 $5,200 $5,200
STIP-IIP State Cash $919 $919 $919
Trade Corridor Program $75,000 $75,000 $75,000
TOTAL $720,121 $141,771 $578,350 $80,380 $578,350 $61,391
MPO ID:
Project Title: SR 94 Widening
CAL67 ADOPTION: 10-00
Project Description:
EA NO: 28710
PPNO: T0770
SANDAG ID: 1280508In San Diego on Route 94 between I-805 and Downtown for the South Bay Bus Rapid
Transit - environmental studies and future construction of HOV lanes; also includes
environmental clearance for 2 HOV lanes in the median of SR94 and direct connectors
at the I-805/SR94 interchange
Exempt Category: Other - Engineering studiesCapacity Status: NCIRT:94
Est Total Cost: $11,000
CONRWPEPRIORTOTAL 10/11 11/12 12/13 13/14 14/15
TCRP $10,000 $10,000 $10,000
TransNet - MC $934 $33 $33 $1,000 $1,000
TOTAL $11,000 $10,934 $33 $33 $11,000
9Page Thursday, July 8, 2010
13

San Diego Region (in $000s)DRAFT 2010 Regional Transportation Improvement Program
MPO ID:
Project Title: SR 94/125 Widening
CAL68
Caltrans
ADOPTION: 10-00
Project Description:
EA NO: 14665
PPNO: 0356
RTP PG NO: A-6From SR 94 to SR125 - Near La Mesa and Lemon Grove on SR 125 from Mariposa St
to SR 94 and on SR 94 from SR 125 to Bancroft Dr. Construct freeway connector,
replace and widen bridges
Exempt Category: Non-ExemptCapacity Status: CIRT:94
Est Total Cost: $60,000 Open to Traffic: Jan 2018
CONRWPEPRIORTOTAL 10/11 11/12 12/13 13/14 14/15
TCRP $6,196 $47,268 $6,536 $12,732 $47,268 $60,000
TOTAL $60,000 $6,196 $47,268 $6,536 $47,268 $12,732
MPO ID:
Project Title: I-5/SR 78
CAL71 ADOPTION: 10-00
Project Description:
EA NO: 07890K
EARMARK NO: 210 (2003), 275
(2005)In Carlsbad, on I-5 from Carlsbad Village Drive (formally Elm Street) undercrossing to
California Street overcrossing, on SR 78 from I-5/SR 78 separation to Jefferson Street
overcrossing - modify interchange, future construction of auxiliary lanes and direct
connectors
Exempt Category: Other - Engineering studiesCapacity Status: NCIRT:5
Est Total Cost: $1,000
CONRWPEPRIORTOTAL 10/11 11/12 12/13 13/14 14/15
STP $500 $500 $500
STP - Sec 117 $500 $500 $500
TOTAL $1,000 $500 $500 $1,000
MPO ID:
Project Title: Balboa Park Historic Preservation
CAL73 ADOPTION: 10-00
Project Description: From Richmond to 6th - landscaping, lighting and fencing; rehabiiltate and preservation
of the architectual features
Exempt Category: Other - Transportation enhancement activitiesCapacity Status: NCI
Est Total Cost: $5,867
CONRWPEPRIORTOTAL 10/11 11/12 12/13 13/14 14/15
STIP-IIP STP TE $3,197 $73 $219 $1,705 $607 $27 $4,560 $5,194
STIP-IIP State Cash $414 $10 $28 $221 $78 $4 $591 $673
TOTAL $5,867 $3,611 $83 $247 $1,926 $31 $5,151 $685
10Page Thursday, July 8, 2010
14

San Diego Region (in $000s)DRAFT 2010 Regional Transportation Improvement Program
MPO ID:
Project Title: I-5 Sorrento Valley Auxiliary Lane
CAL75
Caltrans
ADOPTION: 10-00
Project Description:
EA NO: 06500
PPNO: 0129P
RAS (TA 7-48)From Genesee Avenue to Sorrento Valley Overhead - in San Diego from Genesee Ave.
OC to Roselle St., realignment and widening of the existing Genesse Ave. SB off-ramp
to provide for a 2-lane exit configuration and additional left turn storage
Exempt Category: Non-ExemptCapacity Status: CIRT:5
Est Total Cost: $12,987 Open to Traffic: Jun 2015
CONRWPEPRIORTOTAL 10/11 11/12 12/13 13/14 14/15
SHOPP (AC) $11,497 $2,184 $443 $8,871 $11,498
SHOPP - State Cash $1,490 $283 $57 $1,149 $1,489
TOTAL $12,987 $12,987 $500 $10,020 $2,467
MPO ID:
Project Title: I-5/I-8 Connector
CAL77 ADOPTION: 10-00
Project Description:
EA NO: 00270
EARMARK NO: CA643/3120On I-5 from 0.1 km south of junction with I-8 and on the right lanes through the Sea
World Drive interchange, On I-8 from I-8/I-5 separation to 0.6 km east of Morena Blvd.
undercrossing - construction of auxiliary lanes and widening of connectors
Exempt Category: Non-ExemptCapacity Status: CIRT:5
Est Total Cost: $4,033 Open to Traffic: Apr 2014
CONRWPEPRIORTOTAL 10/11 11/12 12/13 13/14 14/15
HPP $1,038 $1,038 $1,038
IM $1,025 $1,025 $1,025
SHOPP - State Cash $1,970 $1,970 $1,970
TOTAL $4,033 $1,970 $2,063 $4,033
MPO ID:
Project Title: I-805 HOV/Managed Lanes - North
CAL78B ADOPTION: 10-00
Project Description:
EA NO: 08163
PPNO: 0732
RTP PG NO: A-5; A-10
SANDAG ID: 1280503
On I-805 from the I-805/SR 52 to Sorrento Valley, on SR 52 at the I-805/SR 52
separation - Preliminary engineering for future construction of managed lanes; design
Phase 1 - one HOV lane in each direction including the south facing Direct Access
Ramps at Carroll Canyon Rd
Exempt Category: Non-ExemptCapacity Status: CIRT:805
Est Total Cost: $25,924 Open to Traffic: Jan 2016
CONRWPEPRIORTOTAL 10/11 11/12 12/13 13/14 14/15
RSTP $1,775 $1,775 $1,775
TransNet - MC $7,649 $13,212 $3,288 $23,349 $800 $24,149
TOTAL $25,924 $9,424 $13,212 $3,288 $800 $25,124
11Page Thursday, July 8, 2010
15

San Diego Region (in $000s)DRAFT 2010 Regional Transportation Improvement Program
MPO ID:
Project Title: I-805 HOV/Managed Lanes - South
CAL78C
Caltrans
ADOPTION: 10-00
Project Description:
EA NO: 08161
PPNO: 0730
RTP PG NO: G-2, F-6
SANDAG ID: 1280501/510
From Palomar Street to Landis Street - preliminary engineering for future construction
of managed lanes including design of 2 HOV lanes in the median of I-805 for the South
Bay Rapid Transit project including DAR at Palomar Street
Exempt Category: Non-ExemptCapacity Status: CIRT:805
Est Total Cost: $46,016 Open to Traffic: Dec 2021
CONRWPEPRIORTOTAL 10/11 11/12 12/13 13/14 14/15
Local Funds $180 $180 $180
RSTP $4,113 $1,548 $5,661 $5,661
TransNet - MC $21,621 $16,856 $1,656 $40,133 $40,133
TransNet - Transit $42 $42 $42
TOTAL $46,016 $25,956 $18,404 $1,656 $46,016
MPO ID:
Project Title: Grouped Projects for Safety Improvements - Safe Routes to School (SRTS) Program
CAL104 ADOPTION: 10-00
Project Description: Projects are consistent with 40 CFR Parts 93.126 and 127 Exempt Tables 2 and 3
categories - railroad/highway crossing, safer non-federal-aid system roads, shoulder
improvements, traffic control devices and operating assistance other than signalization
projects, intersection signalization projects at individual intersections, pavement
marking demonstration, truck climbing lanes outside the urbanized area, lighting
improvements, emergency truck pullovers
Exempt Category: Safety - Lighting improvementsCapacity Status: NCI
Est Total Cost: $3,751
CONRWPEPRIORTOTAL 10/11 11/12 12/13 13/14 14/15
Local Funds $259 $100 $359 $359
Safe Routes to School (SR2S) $371 $450 $1,842 $730 $3,392 $3,392
TOTAL $3,751 $371 $709 $1,842 $830 $3,751
MPO ID:
Project Title: Grouped Projects for Highway Safety Improvement - HSIP Program
CAL105 ADOPTION: 10-00
Project Description: Projects are consistent with 40 CFR Parts 93.126 and 93.127 Exempt Tables 2 and 3
categories - railroad/highway crossing, safer non-federal-aid system roads, shoulder
improvements, traffic control devices and operating assistance other than signalization
projects, intersection signalization projects at individual intersections, pavement
marking demonstration, truck climbing lanes outside the urbanized area, lighting
improvements, emergency truck pullovers
Exempt Category: Safety - Safety Improvement ProgramCapacity Status: NCI
Est Total Cost: $8,450
CONRWPEPRIORTOTAL 10/11 11/12 12/13 13/14 14/15
HSIP $443 $334 $3,705 $2,753 $7,235 $7,235
Local Funds $50 $860 $306 $1,215 $1,215
TOTAL $8,450 $443 $384 $4,565 $3,059 $8,450
12Page Thursday, July 8, 2010
16

San Diego Region (in $000s)DRAFT 2010 Regional Transportation Improvement Program
MPO ID:
Project Title: 32nd Street - Grade Separation
CAL107
Caltrans
ADOPTION: 10-00
Project Description:
EA NO: 29321
RTP PG NO: B-5
SANDAG ID: 1300702
EARMARK NO: CA380/618
From 32nd Street to Harbor Drive - in San Diego, grade separation
Exempt Category: Safety - Railroad/highway crossingCapacity Status: NCI
Est Total Cost: $118,460
CONRWPEPRIORTOTAL 10/11 11/12 12/13 13/14 14/15
HPP $800 $800 $800
Local Funds $3,600 $20,860 $42,535 $11,350 $13,110 $42,535 $66,995
Trade Corridor Program $50,665 $50,665 $50,665
TOTAL $118,460 $4,400 $20,860 $93,200 $13,110 $93,200 $12,150
MPO ID:
Project Title: At Civic Center Drive, Harbor Drive, and I-5
CAL110 ADOPTION: 10-00
Project Description:
EA NO: 29760
PPNO: 0859
SANDAG ID: 1300703
EARMARK NO: CA560/2340
I-5, Harbor Drive, and Civic Center Drive - in National City, at-grade improvements and
construct truck ramp linking I-5 to National City Marine Cargo terminal
Exempt Category: Other - Intersection channelization projectsCapacity Status: NCI
Est Total Cost: $3,950
CONRWPEPRIORTOTAL 10/11 11/12 12/13 13/14 14/15
HPP $20 $20 $20
Local Funds $1,206 $1,574 $1,106 $100 $1,574 $2,780
Trade Corridor Program $1,150 $1,150 $1,150
TOTAL $3,950 $1,226 $2,724 $100 $2,724 $1,126
MPO ID:
Project Title: Grade Separation At 10th Ave Marine Terminal/Cesar Chavez Blvd.
CAL111 ADOPTION: 10-00
Project Description:
EA NO: 297700
RTP PG NO: B-5, B-1
SANDAG ID: 1300701
EARMARK NO: CA588/2618
10th Avenue and Harbor Drive from 10th Ave./Ceasar Chavez - Marine Terminal to
Harbor Drive - Port of San Diego Access Improvement and Truck Route to I-5 and I-15
Exempt Category: Safety - Railroad/highway crossingCapacity Status: NCI
Est Total Cost: $67,200
CONRWPEPRIORTOTAL 10/11 11/12 12/13 13/14 14/15
HPP $400 $400 $400
Local Funds $1,750 $12,750 $21,390 $5,510 $8,990 $21,390 $35,890
Trade Corridor Program $30,910 $30,910 $30,910
TOTAL $67,200 $2,150 $12,750 $52,300 $8,990 $52,300 $5,910
13Page Thursday, July 8, 2010
17

San Diego Region (in $000s)DRAFT 2010 Regional Transportation Improvement Program
MPO ID:
Project Title: Bay Marina Drive at I-5 At-Grade Improvements
CAL115
Caltrans
ADOPTION: 10-00
Project Description:
EA NO: 29761
PPNO: 0855
SANDAG ID: 1300704
EARMARK NO: CA560/2340
Bay Marina/I-5 Intersection - in National City, at-grade intersection improvements,
construction of truck ramp linking I-5 to National City Marine Cargo terminal
Exempt Category: All Projects - Intersection channelization projectsCapacity Status: NCIRT:5
Est Total Cost: $3,290
CONRWPEPRIORTOTAL 10/11 11/12 12/13 13/14 14/15
HPP $535 $375 $1,470 $875 $35 $1,470 $2,380
Trade Corridor Program $910 $910 $910
TOTAL $3,290 $535 $375 $2,380 $35 $2,380 $875
MPO ID:
Project Title: Tecate International Border Crossing, Pedestrian Facilities
CAL116 ADOPTION: 10-00
Project Description:
EA NO: 29490
PPNO: 0743From Tecate International Border Crossing to Thing Road - in San Diego County -
improve pedestrian facilities
Exempt Category: Air Quality - Bicycle and pedestrian facilitiesCapacity Status: NCI
Est Total Cost: $2,383
CONRWPEPRIORTOTAL 10/11 11/12 12/13 13/14 14/15
STIP-IIP STP TE $97 $311 $1,702 $399 $9 $1,702 $2,110
STIP-IIP State Cash $13 $40 $220 $52 $1 $220 $273
TOTAL $2,383 $110 $351 $1,922 $10 $1,922 $451
MPO ID:
Project Title: Otay POE Pedestrian/Bicycle Facilities - Paseo De La Amistad International Border Cross
CAL117 ADOPTION: 10-00
Project Description:
EA NO: 26630
PPNO: 0962From Otay Mesa IBC to Siempre Viva Road Overcrossing South - in San Ysidro, on SR
905 from the Otay Mesa International Border Crossing into Mexico to Siempre Viva
Road Overcrossing South - improve pedestrian and bicycle aesthetics, accessibility,
and safety
Exempt Category: Air Quality - Bicycle and pedestrian facilitiesCapacity Status: NCI
Est Total Cost: $2,060
CONRWPEPRIORTOTAL 10/11 11/12 12/13 13/14 14/15
STIP-IIP STP TE $89 $208 $1,527 $284 $13 $1,527 $1,824
STIP-IIP State Cash $11 $27 $198 $36 $2 $198 $236
TOTAL $2,060 $100 $235 $1,725 $15 $1,725 $320
14Page Thursday, July 8, 2010
18

San Diego Region (in $000s)DRAFT 2010 Regional Transportation Improvement Program
MPO ID:
Project Title: SR 78 Auxiliary Lanes
CAL120
Caltrans
ADOPTION: 10-00
Project Description:
EA NO: 29310
RTP PG NO: A-5
SANDAG ID: 1201510From I-15 to Nordahl Road - cities of Escondido and San Marcos, widen southbound
I-15 to westbound SR78 ramp; construct westbound auxiliary lane on SR78; widen
westbound SR78 offramp to Nordahl Road
Exempt Category: Non-ExemptCapacity Status: CIRT:78
Est Total Cost: $8,963 Open to Traffic: Sep 2011
CONRWPEPRIORTOTAL 10/11 11/12 12/13 13/14 14/15
SHOPP - State Cash $200 $200 $200
SHOPP Augmentation - Mobility $7,763 $90 $7,673 $7,763
TransNet - MC $840 $134 $26 $1,000 $1,000
TOTAL $8,963 $840 $8,097 $26 $290 $7,673 $1,000
MPO ID:
Project Title: Grouped Projects for Pavement Resurfacing and/or Rehabilitation on the State Highway S
CAL194 ADOPTION: 10-00
Project Description: Projects are consistent with 40 CFR Parts 93.126 and 93.127 Exempt Tables 2 and 3
categories -pavement resurfacing and/or rehabilitation - Project listing for Pavement
resurfacing and/or rehabilitation on the State Highway System - Highway Maintenance
Exempt Category: Safety - Pavement resurfacing and/or rehabilitationCapacity Status: NCI
Est Total Cost: $13,422
CONRWPEPRIORTOTAL 10/11 11/12 12/13 13/14 14/15
Highway Maintenance - NHS $9,738 $9,738 $9,738
Highway Maintenance - State Cash $3,684 $1,200 $22 $2,462 $3,684
TOTAL $13,422 $13,422 $22 $12,200 $1,200
MPO ID:
Project Title: Grouped Projects for the State Minor Program
CAL213 ADOPTION: 10-00
Project Description: Projects are consistent with 40 CFR Part 93.126 Exempt Tables 2 and Table 3 -
railroad/highway crossing, safer non-federal-aid system roads, shoulder
improvements, traffic control devices and operating assistance other than signalization
projects, intersection signalization projects at individual intersections, pavement
marking demonstration, truck climbing lanes outside the urbanized area, lighting
improvements, emergency truck pullovers
Exempt Category: Safety - Pavement resurfacing and/or rehabilitationCapacity Status: NCI
Est Total Cost: $5,402
CONRWPEPRIORTOTAL 10/11 11/12 12/13 13/14 14/15
Minor Program $4,782 $1,830 $2,952 $4,782
Minor Program - St Cash $620 $237 $383 $620
TOTAL $5,402 $5,402 $3,335 $2,067
15Page Thursday, July 8, 2010
19
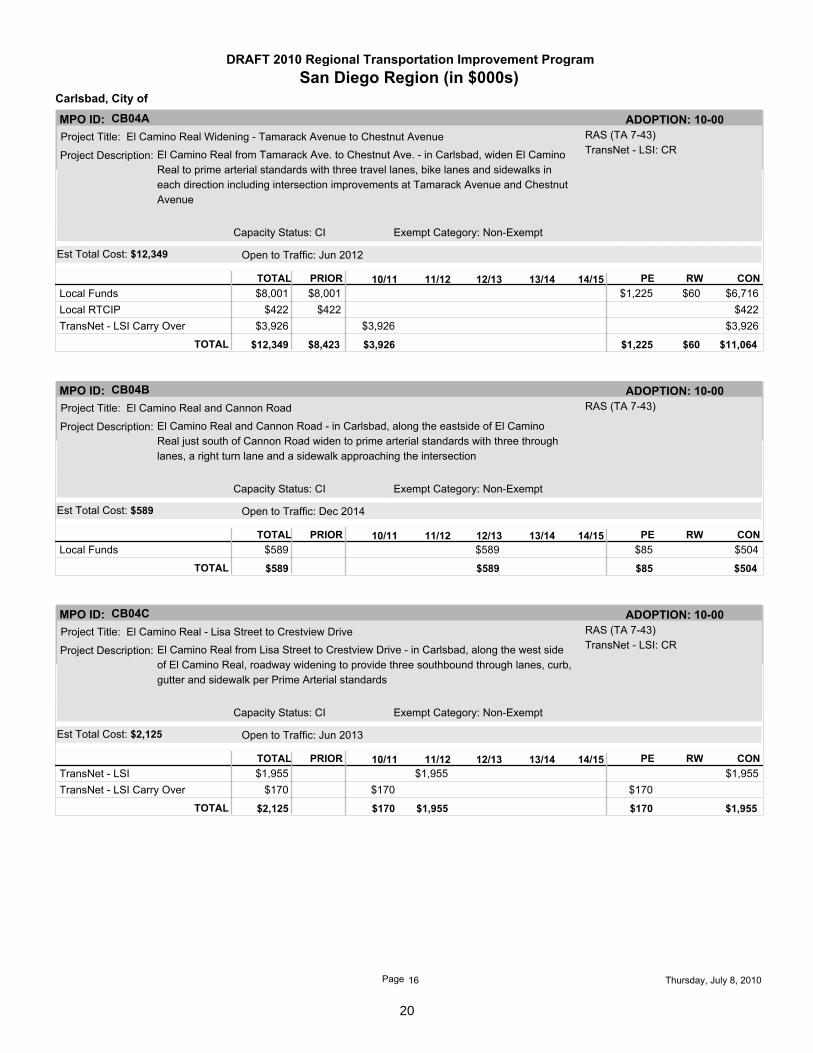
San Diego Region (in $000s)DRAFT 2010 Regional Transportation Improvement Program
MPO ID:
Project Title: El Camino Real Widening - Tamarack Avenue to Chestnut Avenue
CB04A
Carlsbad, City of
ADOPTION: 10-00
Project Description:
RAS (TA 7-43)
TransNet - LSI: CREl Camino Real from Tamarack Ave. to Chestnut Ave. - in Carlsbad, widen El Camino
Real to prime arterial standards with three travel lanes, bike lanes and sidewalks in
each direction including intersection improvements at Tamarack Avenue and Chestnut
Avenue
Exempt Category: Non-ExemptCapacity Status: CI
Est Total Cost: $12,349 Open to Traffic: Jun 2012
CONRWPEPRIORTOTAL 10/11 11/12 12/13 13/14 14/15
Local Funds $8,001 $1,225 $60 $6,716 $8,001
Local RTCIP $422 $422 $422
TransNet - LSI Carry Over $3,926 $3,926 $3,926
TOTAL $12,349 $8,423 $3,926 $60 $11,064 $1,225
MPO ID:
Project Title: El Camino Real and Cannon Road
CB04B ADOPTION: 10-00
Project Description:
RAS (TA 7-43)
El Camino Real and Cannon Road - in Carlsbad, along the eastside of El Camino
Real just south of Cannon Road widen to prime arterial standards with three through
lanes, a right turn lane and a sidewalk approaching the intersection
Exempt Category: Non-ExemptCapacity Status: CI
Est Total Cost: $589 Open to Traffic: Dec 2014
CONRWPEPRIORTOTAL 10/11 11/12 12/13 13/14 14/15
Local Funds $589 $85 $504 $589
TOTAL $589 $589 $504 $85
MPO ID:
Project Title: El Camino Real - Lisa Street to Crestview Drive
CB04C ADOPTION: 10-00
Project Description:
RAS (TA 7-43)
TransNet - LSI: CREl Camino Real from Lisa Street to Crestview Drive - in Carlsbad, along the west side
of El Camino Real, roadway widening to provide three southbound through lanes, curb,
gutter and sidewalk per Prime Arterial standards
Exempt Category: Non-ExemptCapacity Status: CI
Est Total Cost: $2,125 Open to Traffic: Jun 2013
CONRWPEPRIORTOTAL 10/11 11/12 12/13 13/14 14/15
TransNet - LSI $1,955 $1,955 $1,955
TransNet - LSI Carry Over $170 $170 $170
TOTAL $2,125 $170 $1,955 $1,955 $170
16Page Thursday, July 8, 2010
20

San Diego Region (in $000s)DRAFT 2010 Regional Transportation Improvement Program
MPO ID:
Project Title: Poinsettia Lane Reach E
CB13
Carlsbad, City of
ADOPTION: 10-00
Project Description:
EARMARK NO: CA366, CA517
RAS (TA 7-43)Poinsettia Lane from Cassia Drive to Skimmer Court - in Carlsbad, from Cassia Drive
to Skimmer Court, construct a new 4-lane roadway with median, bike lanes, and
sidewalks/trails to major arterial standards
Exempt Category: Non-ExemptCapacity Status: CI
Est Total Cost: $13,450 Open to Traffic: Jun 2014
CONRWPEPRIORTOTAL 10/11 11/12 12/13 13/14 14/15
HPP $1,436 $1,436 $1,436
Local Funds $1,260 $10,754 $1,260 $1,900 $8,854 $12,014
TOTAL $13,450 $1,260 $12,190 $1,900 $10,290 $1,260
MPO ID:
Project Title: Carlsbad Blvd. Bridge over Encina Power Station
CB17 ADOPTION: 10-00
Project Description:
RTP PG NO: A-6
RAS (TA 7-43)Carlsbad Blvd. from Encina Power Plant to Warm water outfall channel - in Carlsbad,
on the Carlsbad Blvd bridge over the Encina Power Plant warm water discharge,
upgrade bridge railings on the bridge, (local match to HBP, part of CAL44)
Exempt Category: Safety - Guardrails, median barriers, crash cushionsCapacity Status: NCI
Est Total Cost: $158
CONRWPEPRIORTOTAL 10/11 11/12 12/13 13/14 14/15
TransNet - L (Cash) $8 $150 $57 $101 $158
TOTAL $158 $8 $150 $101 $57
MPO ID:
Project Title: Carlsbad Blvd. Bridge over SDNR Railroad
CB18 ADOPTION: 10-00
Project Description:
RTP PG NO: A-6
RAS (TA 7-43)Carlsbad Blvd. from Mountain View to State - in Carlsbad 0.6 miles NW of Carlsbad
Village Drive, upgrade the bridge railings on the Carlsbad Blvd. Bridge over the San
Diego Northern Railway (SDNR) railroad (local match to HBP, part of CAL44)
Exempt Category: Safety - Guardrails, median barriers, crash cushionsCapacity Status: NCI
Est Total Cost: $44
CONRWPEPRIORTOTAL 10/11 11/12 12/13 13/14 14/15
TransNet - L (Cash) $12 $32 $44 $44
TOTAL $44 $12 $32 $44
17Page Thursday, July 8, 2010
21

San Diego Region (in $000s)DRAFT 2010 Regional Transportation Improvement Program
MPO ID:
Project Title: Pavement Management - Overlay
CB20
Carlsbad, City of
ADOPTION: 10-00
Project Description:
TransNet - LSI: CR
Street locations by year as follows: FY10/11 roadways - Palomar Airport Road, College
Blvd., Cannon Blvd., Faraday Ave., Paseo del Norte, Carslbad Blvd., FY 11/12 roadways
- La Costa Ave., Calle Barcelona, El Camino Real, Levante Street, Rancho Santa Fe,
Los Coches and FY 12/13 roadways - Carlsbad Blvd., Carlsbad Village Drive, Grand
Avenue, Jefferson Street, State Street, Chestnut Avenue, Basswood Ave., Las Flores,
and Kelly Dr., FY 13/14 roadways - Avenida Encinas, Paseo Del Norte, Poinsettia, El
Camino Real, Alicante, and El Fuerte, FY 14/15 roadways - El Camino Real, Faraday
Avenue, El Fuerte, Palmer Wary, Melrose Drive, Palomar Airport Road, Cannon Road
and College Blvd. - in Carlsbad, pavement overlay and roadway repairs; to be
implemented in a series of zones throughout the city
Exempt Category: Safety - Pavement resurfacing and/or rehabilitationCapacity Status: NCI
Est Total Cost: $22,620
CONRWPEPRIORTOTAL 10/11 11/12 12/13 13/14 14/15
Local Funds $3,715 $2,120 $1,260 $1,310 $1,370 $1,625 $11,400 $11,400
TransNet - L (Cash) $946 $946 $946
TransNet - LSI $1,990 $2,030 $1,875 $5,895 $5,895
TransNet - LSI Carry Over $329 $1,940 $2,269 $2,269
TOTAL $20,510 $4,990 $2,120 $3,200 $3,300 $3,400 $3,500 $20,510
MPO ID:
Project Title: Pavement Management -Seal
CB21 ADOPTION: 10-00
Project Description: Various minor/local roadways within each zone as noted on the project diagram - in
Carlsbad, street sealing and roadway repairs
Exempt Category: Safety - Pavement resurfacing and/or rehabilitationCapacity Status: NCI
Est Total Cost: $3,300
CONRWPEPRIORTOTAL 10/11 11/12 12/13 13/14 14/15
Local Funds $800 $500 $500 $500 $500 $500 $3,300 $3,300
TOTAL $3,300 $800 $500 $500 $500 $500 $500 $3,300
MPO ID:
Project Title: Avenida Encinas - Widen from PAR to EWPCF
CB22 ADOPTION: 10-00
Project Description: Avenida Encinas from Palomar Airport Rd. to EWPCF - in Carlsbad; Avenida Encinas
from Palomar Airport Road southerly to existing improvements adjacent to the Encina
Water Pollution Control Facility; roadway widening to Secondary Arterial standards
Exempt Category: Non-ExemptCapacity Status: CI
Est Total Cost: $3,041 Open to Traffic: Dec 2015
CONRWPEPRIORTOTAL 10/11 11/12 12/13 13/14 14/15
Local Funds $2,605 $436 $400 $30 $2,611 $3,041
TOTAL $3,041 $2,605 $436 $30 $2,611 $400
18Page Thursday, July 8, 2010
22

San Diego Region (in $000s)DRAFT 2010 Regional Transportation Improvement Program
MPO ID:
Project Title: College Boulevard and Palomar Airport Road - Intersection Improvements
CB24
Carlsbad, City of
ADOPTION: 10-00
Project Description:
RAS (TA 7-43)
From College Boulevard to Palomar Airport Road - in Carlsbad, at the intersection of
College Blvd. and Palomar Airport Raod, roadway widening along southbound College
Blvd. to provide dual left turns, one thru lane, one shared thru/right turn lane and one
right turn lane and to lengthen right turn lanes on the other approaches to the
intersection
Exempt Category: Non-ExemptCapacity Status: CI
Est Total Cost: $838 Open to Traffic: Jun 2012
CONRWPEPRIORTOTAL 10/11 11/12 12/13 13/14 14/15
Local Funds $838 $193 $645 $838
TOTAL $838 $838 $645 $193
MPO ID:
Project Title: Melrose and Palomar Airport Road
CB26 ADOPTION: 10-00
Project Description:
RAS (TA 7-43)
From Melrose Drive to Palomar Airport Road - in Carlsbad, at the intersection of
Palomar Airport Road and Melrose Drive, roadway widening along southbound Melrose
to provide an additional right turn lane to westbound Palomar Airport Road
Exempt Category: Non-ExemptCapacity Status: CI
Est Total Cost: $410 Open to Traffic: Jan 2012
CONRWPEPRIORTOTAL 10/11 11/12 12/13 13/14 14/15
Local Funds $410 $50 $360 $410
TOTAL $410 $410 $360 $50
MPO ID:
Project Title: El Camino Real Left Turn Lane to westbound Tamarack Ave.
CB30 ADOPTION: 10-00
Project Description:
RAS (TA 7-43)
From El Camino Real to Tamarack Avenue - in Carlsbad at the intersection of El
Camino Real and Tamarack Avenue construct a second left turn lane from El Camino
Real to westbound Tamarack
Exempt Category: Non-ExemptCapacity Status: CI
Est Total Cost: $286 Open to Traffic: Jun 2014
CONRWPEPRIORTOTAL 10/11 11/12 12/13 13/14 14/15
Local Funds $286 $70 $216 $286
TOTAL $286 $286 $216 $70
19Page Thursday, July 8, 2010
23

San Diego Region (in $000s)DRAFT 2010 Regional Transportation Improvement Program
MPO ID:
Project Title: El Camino Real Widening - La Costa Avenue to Arenal Road
CB31
Carlsbad, City of
ADOPTION: 10-00
Project Description:
RAS (TA 7-43)
El Camino Real from La Costa Ave, to Arenal Rd. - in Carlsbad, along El Camino Real
from 700 feet north of La Costa Avenue to Arenal Road, widening along the southbound
side of the roadway to provide three travel lanes and a bike lane in accordance with
Prime Arterial Standards
Exempt Category: Non-ExemptCapacity Status: CI
Est Total Cost: $2,400 Open to Traffic: Mar 2017
CONRWPEPRIORTOTAL 10/11 11/12 12/13 13/14 14/15
Local Funds $625 $625 $625
Local RTCIP $1,775 $1,775 $1,775
TOTAL $2,400 $2,400 $1,775 $625
MPO ID:
Project Title: El Camino Real Widening - Cassia to Camino Vida Roble
CB32 ADOPTION: 10-00
Project Description:
RAS (TA 7-43)
TransNet - LSI: CREl Camino Real from Cassia Road to Camino Vida Roble - in Carlsbad, widen El
Camino Real from 900 feet north of Cassia Road to Camino Vida Roble, along the
northbound side of the roadway to provide three travel lanes and a bike lane in
accordance with Prime Arterial standards
Exempt Category: Non-ExemptCapacity Status: CI
Est Total Cost: $2,650 Open to Traffic: Mar 2014
CONRWPEPRIORTOTAL 10/11 11/12 12/13 13/14 14/15
TransNet - LSI Carry Over $215 $2,435 $315 $1,350 $985 $2,650
TOTAL $2,650 $215 $2,435 $1,350 $985 $315
MPO ID:
Project Title: Palomar Airport Road and El Camino Real Right Turn Lane
CB33 ADOPTION: 10-00
Project Description:
RAS (TA 7-43)
From Palomar Airport Road to El Camino Real - in Carlsbad, widening along
eastbound Palomar Airport Road to provide a dedicated right turn lane to southbound
El Camino Real
Exempt Category: Non-ExemptCapacity Status: CI
Est Total Cost: $590 Open to Traffic: Jun 2016
CONRWPEPRIORTOTAL 10/11 11/12 12/13 13/14 14/15
Local Funds $590 $90 $500 $590
TOTAL $590 $590 $500 $90
20Page Thursday, July 8, 2010
24

San Diego Region (in $000s)DRAFT 2010 Regional Transportation Improvement Program
MPO ID:
Project Title: Palomar Airport Road and Paseo Del Norte Right Turn Lane
CB34
Carlsbad, City of
ADOPTION: 10-00
Project Description:
RAS (TA 7-43)
From Palomar Aiport Road to Paseo Del Norte - in Carlsbad, widening along
eastbound Palomar Airport Road to provide a dedicated right turn lane to southbound
Paseo Del Norte
Exempt Category: Non-ExemptCapacity Status: CI
Est Total Cost: $563 Open to Traffic: Jun 2013
CONRWPEPRIORTOTAL 10/11 11/12 12/13 13/14 14/15
Local Funds $563 $63 $500 $563
TOTAL $563 $563 $500 $63
MPO ID:
Project Title: Palomar Airport Road and Paseo Del Norte Left Turn Lane
CB35 ADOPTION: 10-00
Project Description:
RAS (TA 7-43)
From Palomar Airport Road to Paseo Del Norte - in Carlsbad, lengthen the left turn
pocket along eastbound Palomar Airport Road to northbound Paseo Del Norte
Exempt Category: Non-ExemptCapacity Status: CI
Est Total Cost: $232 Open to Traffic: Jun 2013
CONRWPEPRIORTOTAL 10/11 11/12 12/13 13/14 14/15
Local Funds $232 $30 $202 $232
TOTAL $232 $232 $202 $30
MPO ID:
Project Title: Carlsbad Boulevard Realignment
CB36 ADOPTION: 10-00
Project Description:
RAS (TA 7-43)
TransNet - LSI: CRCarlsbad Boulevard from Palomar Airport Road to Avenida Encinas - in Carlsbad,
realign the southbound lanes of Carlsbad Blvd and future construction completion of
roadway to major arterial standards with enhanced parkways
Exempt Category: Other - Engineering studiesCapacity Status: NCI
Est Total Cost: $3,250
CONRWPEPRIORTOTAL 10/11 11/12 12/13 13/14 14/15
Local Funds $250 $250 $250
TransNet - L Carry Over $346 $346 $346
TransNet - LSI $1,967 $1,967 $1,967
TransNet - LSI Carry Over $687 $687 $687
TOTAL $3,250 $250 $3,000 $3,250
21Page Thursday, July 8, 2010
25

San Diego Region (in $000s)DRAFT 2010 Regional Transportation Improvement Program
MPO ID:
Project Title: Pavement Rehabilitation Program
CHV06
Chula Vista, City of
ADOPTION: 10-00
Project Description:
TransNet - LSI: Maint
Citywide - AC overlay, chip seals and slurry seal rehabilitation
Exempt Category: Safety - Pavement resurfacing and/or rehabilitationCapacity Status: NCI
Est Total Cost: $27,588
CONRWPEPRIORTOTAL 10/11 11/12 12/13 13/14 14/15
Local Funds $1,000 $160 $840 $1,000
TransNet - L $15,900 $3,250 $12,650 $15,900
TransNet - L (Cash) $6,900 $1,300 $5,600 $6,900
TransNet - LSI $250 $400 $280 $920 $820 $690 $1,980 $2,670
TransNet - LSI Carry Over $613 $106 $507 $613
TOTAL $27,083 $23,800 $863 $400 $280 $920 $820 $21,577 $5,506
MPO ID:
Project Title: Willow Street Bridge Project
CHV08 ADOPTION: 10-00
Project Description: Willow Street from Bonita Road to Sweetwater Road - replace and widen bridge
including shoulders
Exempt Category: Non-ExemptCapacity Status: CI
Est Total Cost: $17,057 Open to Traffic: Dec 2014
CONRWPEPRIORTOTAL 10/11 11/12 12/13 13/14 14/15
HBP $1,320 $240 $12,821 $1,320 $240 $12,821 $14,381
HBRR $500 $500 $500
Local Funds $236 $1,661 $236 $1,661 $1,897
Local RTCIP $219 $60 $219 $60 $279
TOTAL $17,057 $2,275 $300 $14,482 $300 $14,482 $2,275
MPO ID:
Project Title: Sidewalk Rehabilitation/Installation Program
CHV18 ADOPTION: 10-00
Project Description: Citywide - sidewalk construction, replacements, installation in areas along school
routes, around senior citizen centers and in areas of high pedestrian traffic
Exempt Category: Air Quality - Bicycle and pedestrian facilitiesCapacity Status: NCI
Est Total Cost: $3,339
CONRWPEPRIORTOTAL 10/11 11/12 12/13 13/14 14/15
Local Funds $1,289 $1,289 $1,289
TransNet - L $1,950 $1,950 $1,950
TransNet - LSI Carry Over $100 $100 $100
TOTAL $3,339 $3,239 $100 $3,339
22Page Thursday, July 8, 2010
26

San Diego Region (in $000s)DRAFT 2010 Regional Transportation Improvement Program
MPO ID:
Project Title: North Broadway Reconstruction
CHV19
Chula Vista, City of
ADOPTION: 10-00
Project Description:
TransNet - LSI: CR
North Broadway from C Street to D Street - pavement reconstruction and associated
drainage
Exempt Category: Safety - Pavement resurfacing and/or rehabilitationCapacity Status: NCI
Est Total Cost: $2,957
CONRWPEPRIORTOTAL 10/11 11/12 12/13 13/14 14/15
Local Funds $324 $324 $324
TransNet - L (Cash) $2,368 $300 $2,068 $2,368
TransNet - LSI Carry Over $265 $265 $265
TOTAL $2,957 $2,692 $265 $2,657 $300
MPO ID:
Project Title: North Fourth Avenue and Brisbane St
CHV20 ADOPTION: 10-00
Project Description:
TransNet - LSI: CR
Fourth Ave. from Brisbane St. to SR54 - add additional lane on east side of Fourth Ave.
Exempt Category: Non-ExemptCapacity Status: CI
Est Total Cost: $750 Open to Traffic: Dec 2011
CONRWPEPRIORTOTAL 10/11 11/12 12/13 13/14 14/15
TransNet - L $500 $100 $400 $500
TransNet - LSI $250 $75 $175 $250
TOTAL $750 $500 $250 $575 $175
MPO ID:
Project Title: Advance Planning Studies
CHV22 ADOPTION: 10-00
Project Description:
TransNet - LSI: Maint
Citywide - study GIS-based infrastructure deficiency database for pavement and street
improvements; planning rehabilitation programs; prepare Capital Improvement
Program related to street improvements
Exempt Category: Other - Engineering studiesCapacity Status: NCI
Est Total Cost: $1,303
CONRWPEPRIORTOTAL 10/11 11/12 12/13 13/14 14/15
Local Funds $585 $585 $585
TransNet - L $375 $375 $375
TransNet - L (Cash) $82 $82 $82
TransNet - LSI $45 $39 $40 $42 $46 $49 $261 $261
TOTAL $1,303 $1,087 $39 $40 $42 $46 $49 $1,303
23Page Thursday, July 8, 2010
27

San Diego Region (in $000s)DRAFT 2010 Regional Transportation Improvement Program
MPO ID:
Project Title: Pedestrian Master Plan
CHV26
Chula Vista, City of
ADOPTION: 10-00
Project Description:
TransNet - LSI: Maint
Citywide - master plan will identify missing pedestrian improvements, establish
priorities and program capital improvement projects that will increase connectivity
among existing facilities
Exempt Category: Air Quality - Bicycle and pedestrian facilitiesCapacity Status: NCI
Est Total Cost: $281
CONRWPEPRIORTOTAL 10/11 11/12 12/13 13/14 14/15
TDA - Bicycles $150 $150 $150
TransNet - L (Cash) $45 $45 $45
TransNet - L Carry Over $61 $61 $61
TransNet - LSI $25 $25 $25
TOTAL $281 $195 $86 $281
MPO ID:
Project Title: I-5 Multi-Modal Corridor Improvement Study
CHV30 ADOPTION: 10-00
Project Description:
PPNO: 09CA013
EARMARK NO: CA3482, CA677
TransNet - LSI: CROn I-5 between SR 54 and Main Street interchange - conduct a study to examine
multi-modal improvements to the I-5 corridor between the Main Street Interchange and
State Route 54
Exempt Category: Other - Engineering studiesCapacity Status: NCI
Est Total Cost: $2,765
CONRWPEPRIORTOTAL 10/11 11/12 12/13 13/14 14/15
HPP $800 $1,187 $1,987 $1,987
TCSP $222 $222 $222
TransNet - L $50 $50 $50
TransNet - L (Cash) $16 $16 $16
TransNet - LSI $100 $100 $100
TransNet - LSI Carry Over $390 $390 $390
TOTAL $2,765 $950 $1,815 $2,765
MPO ID:
Project Title: School Zone Traffic Calming Program
CHV33 ADOPTION: 10-00
Project Description:
TransNet - LSI: Maint
Citywide - field identification and installation/ construction of traffic calming devices in
public school zones, such as traffic control devices (for example, flashing beacons),
signs, striping and minor street improvements
Exempt Category: Safety - Non signalization traffic control and operatngCapacity Status: NCI
Est Total Cost: $1,200
CONRWPEPRIORTOTAL 10/11 11/12 12/13 13/14 14/15
Local Funds $50 $50 $50
TransNet - L $280 $280 $280
TransNet - L (Cash) $97 $97 $97
TransNet - LSI $240 $270 $510 $510
TransNet - LSI Carry Over $130 $130 $130
TOTAL $1,067 $427 $130 $240 $270 $1,067
24Page Thursday, July 8, 2010
28

San Diego Region (in $000s)DRAFT 2010 Regional Transportation Improvement Program
MPO ID:
Project Title: Neighborhood Traffic and Pedestrian Safety Program
CHV34
Chula Vista, City of
ADOPTION: 10-00
Project Description:
TransNet - LSI: Maint
Citywide - provide community outreach and education regarding traffic/ safety hazards;
install and construct traffic calming and pedestrian safety measures
Exempt Category: Safety - Non signalization traffic control and operatngCapacity Status: NCI
Est Total Cost: $1,400
CONRWPEPRIORTOTAL 10/11 11/12 12/13 13/14 14/15
Local Funds $70 $70 $70
TransNet - L $280 $280 $280
TransNet - LSI $230 $230 $460 $460
TransNet - LSI Carry Over $320 $320 $320
TOTAL $1,130 $350 $320 $230 $230 $1,130
MPO ID:
Project Title: Traffic Signing, Studies and Signal Upgrade
CHV35 ADOPTION: 10-00
Project Description:
TransNet - LSI: Maint
Upgrade of signals located at Fourth Ave. and Beyer Blvd., Fourth Ave. and Main Street
and at Third Avenue and Montgomery Street - annual program to prioritize Traffic
Signing and Striping CIP projects including upgrading and maintaining traffic signal
and streetlight systems
Exempt Category: Other - Intersection signalization projectsCapacity Status: NCI
Est Total Cost: $3,661
CONRWPEPRIORTOTAL 10/11 11/12 12/13 13/14 14/15
Local Funds $571 $571 $571
TransNet - L $135 $135 $135
TransNet - LSI $20 $1,075 $160 $160 $150 $150 $240 $1,475 $1,715
TransNet - LSI Carry Over $1,240 $590 $650 $1,240
TOTAL $3,661 $726 $2,315 $160 $160 $150 $150 $2,125 $1,536
MPO ID:
Project Title: Heritage Road Bridge Studies
CHV36 ADOPTION: 10-00
Project Description:
EARMARK NO: CA356, CA450
Heritage Road from Main Street to Entertainment Circle - preliminary engineering,
environmental analysis for future widening of bridge
Exempt Category: Other - Engineering studiesCapacity Status: NCI
Est Total Cost: $4,620
CONRWPEPRIORTOTAL 10/11 11/12 12/13 13/14 14/15
HPP $1,995 $805 $2,800 $2,800
Local Funds $1,820 $1,820 $1,820
TOTAL $4,620 $3,815 $805 $4,620
25Page Thursday, July 8, 2010
29
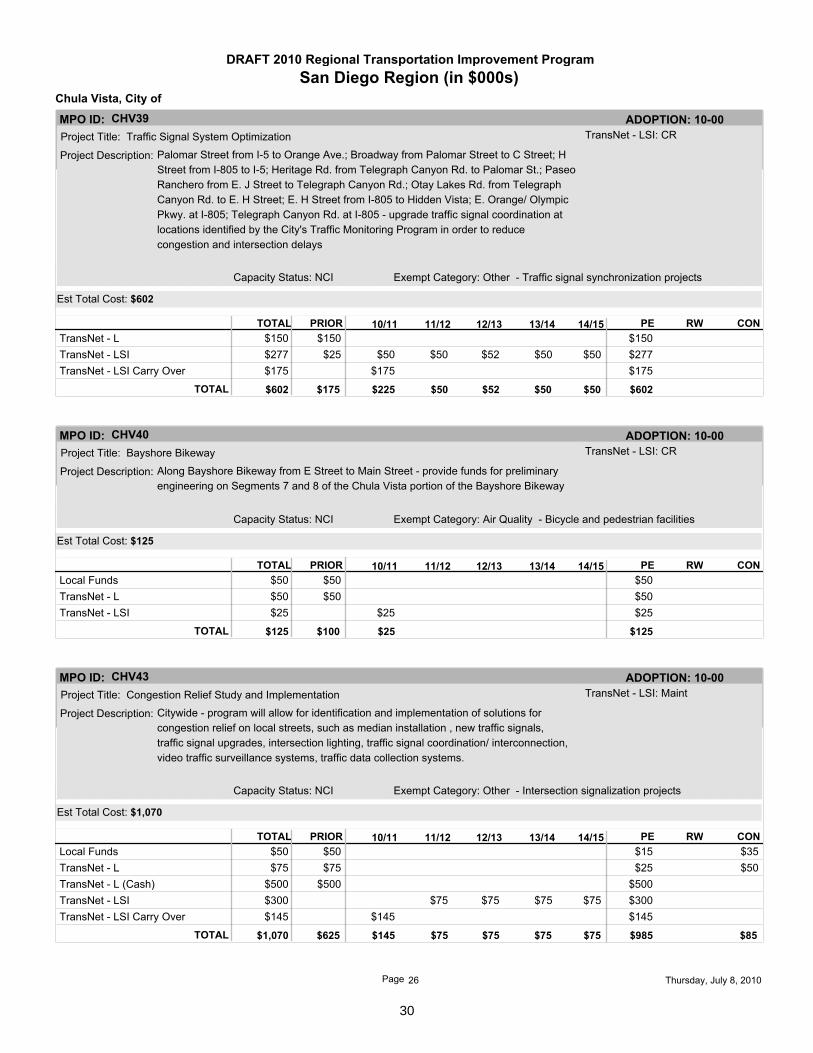
San Diego Region (in $000s)DRAFT 2010 Regional Transportation Improvement Program
MPO ID:
Project Title: Traffic Signal System Optimization
CHV39
Chula Vista, City of
ADOPTION: 10-00
Project Description:
TransNet - LSI: CR
Palomar Street from I-5 to Orange Ave.; Broadway from Palomar Street to C Street; H
Street from I-805 to I-5; Heritage Rd. from Telegraph Canyon Rd. to Palomar St.; Paseo
Ranchero from E. J Street to Telegraph Canyon Rd.; Otay Lakes Rd. from Telegraph
Canyon Rd. to E. H Street; E. H Street from I-805 to Hidden Vista; E. Orange/ Olympic
Pkwy. at I-805; Telegraph Canyon Rd. at I-805 - upgrade traffic signal coordination at
locations identified by the City's Traffic Monitoring Program in order to reduce
congestion and intersection delays
Exempt Category: Other - Traffic signal synchronization projectsCapacity Status: NCI
Est Total Cost: $602
CONRWPEPRIORTOTAL 10/11 11/12 12/13 13/14 14/15
TransNet - L $150 $150 $150
TransNet - LSI $25 $50 $50 $52 $50 $50 $277 $277
TransNet - LSI Carry Over $175 $175 $175
TOTAL $602 $175 $225 $50 $52 $50 $50 $602
MPO ID:
Project Title: Bayshore Bikeway
CHV40 ADOPTION: 10-00
Project Description:
TransNet - LSI: CR
Along Bayshore Bikeway from E Street to Main Street - provide funds for preliminary
engineering on Segments 7 and 8 of the Chula Vista portion of the Bayshore Bikeway
Exempt Category: Air Quality - Bicycle and pedestrian facilitiesCapacity Status: NCI
Est Total Cost: $125
CONRWPEPRIORTOTAL 10/11 11/12 12/13 13/14 14/15
Local Funds $50 $50 $50
TransNet - L $50 $50 $50
TransNet - LSI $25 $25 $25
TOTAL $125 $100 $25 $125
MPO ID:
Project Title: Congestion Relief Study and Implementation
CHV43 ADOPTION: 10-00
Project Description:
TransNet - LSI: Maint
Citywide - program will allow for identification and implementation of solutions for
congestion relief on local streets, such as median installation , new traffic signals,
traffic signal upgrades, intersection lighting, traffic signal coordination/ interconnection,
video traffic surveillance systems, traffic data collection systems.
Exempt Category: Other - Intersection signalization projectsCapacity Status: NCI
Est Total Cost: $1,070
CONRWPEPRIORTOTAL 10/11 11/12 12/13 13/14 14/15
Local Funds $50 $15 $35 $50
TransNet - L $75 $25 $50 $75
TransNet - L (Cash) $500 $500 $500
TransNet - LSI $75 $75 $75 $75 $300 $300
TransNet - LSI Carry Over $145 $145 $145
TOTAL $1,070 $625 $145 $75 $75 $75 $75 $85 $985
26Page Thursday, July 8, 2010
30
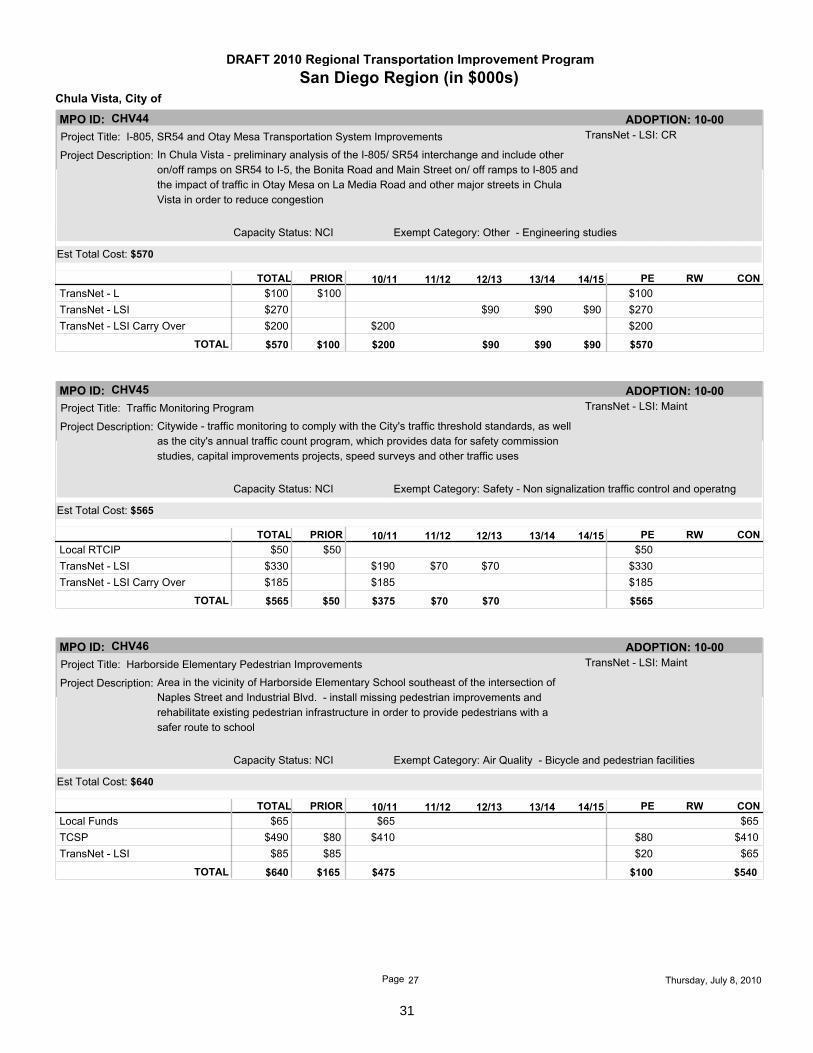
San Diego Region (in $000s)DRAFT 2010 Regional Transportation Improvement Program
MPO ID:
Project Title: I-805, SR54 and Otay Mesa Transportation System Improvements
CHV44
Chula Vista, City of
ADOPTION: 10-00
Project Description:
TransNet - LSI: CR
In Chula Vista - preliminary analysis of the I-805/ SR54 interchange and include other
on/off ramps on SR54 to I-5, the Bonita Road and Main Street on/ off ramps to I-805 and
the impact of traffic in Otay Mesa on La Media Road and other major streets in Chula
Vista in order to reduce congestion
Exempt Category: Other - Engineering studiesCapacity Status: NCI
Est Total Cost: $570
CONRWPEPRIORTOTAL 10/11 11/12 12/13 13/14 14/15
TransNet - L $100 $100 $100
TransNet - LSI $90 $90 $90 $270 $270
TransNet - LSI Carry Over $200 $200 $200
TOTAL $570 $100 $200 $90 $90 $90 $570
MPO ID:
Project Title: Traffic Monitoring Program
CHV45 ADOPTION: 10-00
Project Description:
TransNet - LSI: Maint
Citywide - traffic monitoring to comply with the City's traffic threshold standards, as well
as the city's annual traffic count program, which provides data for safety commission
studies, capital improvements projects, speed surveys and other traffic uses
Exempt Category: Safety - Non signalization traffic control and operatngCapacity Status: NCI
Est Total Cost: $565
CONRWPEPRIORTOTAL 10/11 11/12 12/13 13/14 14/15
Local RTCIP $50 $50 $50
TransNet - LSI $190 $70 $70 $330 $330
TransNet - LSI Carry Over $185 $185 $185
TOTAL $565 $50 $375 $70 $70 $565
MPO ID:
Project Title: Harborside Elementary Pedestrian Improvements
CHV46 ADOPTION: 10-00
Project Description:
TransNet - LSI: Maint
Area in the vicinity of Harborside Elementary School southeast of the intersection of
Naples Street and Industrial Blvd. - install missing pedestrian improvements and
rehabilitate existing pedestrian infrastructure in order to provide pedestrians with a
safer route to school
Exempt Category: Air Quality - Bicycle and pedestrian facilitiesCapacity Status: NCI
Est Total Cost: $640
CONRWPEPRIORTOTAL 10/11 11/12 12/13 13/14 14/15
Local Funds $65 $65 $65
TCSP $80 $410 $80 $410 $490
TransNet - LSI $85 $20 $65 $85
TOTAL $640 $165 $475 $540 $100
27Page Thursday, July 8, 2010
31

San Diego Region (in $000s)DRAFT 2010 Regional Transportation Improvement Program
MPO ID:
Project Title: Urban Core Level of Service Thresholds Study
CHV47
Chula Vista, City of
ADOPTION: 10-00
Project Description:
TransNet - LSI: Maint
Area is generally bounded by the northern City limits, the Bayfront, L Street to the south
and Hilltop Drive to the east - update the traffic threshold standards established for the
Urban Core Specific Plan area based on the General Plan update adopted by Council
in late 2005; these standards need to take into account alternative modes of
transportation emphasized in the General Plan
Exempt Category: Other - Engineering studiesCapacity Status: NCI
Est Total Cost: $125
CONRWPEPRIORTOTAL 10/11 11/12 12/13 13/14 14/15
Local RTCIP $75 $75 $75
TransNet - LSI $20 $20 $20
TransNet - LSI Carry Over $30 $30 $30
TOTAL $125 $95 $30 $125
MPO ID:
Project Title: Pavement Major Rehabilitation
CHV48 ADOPTION: 10-00
Project Description:
TransNet - LSI: CR
Various locations (see list of specific locations) - ongoing program of pavement
rehabilitation and reconstruction which includes overlays (one-inch thick and greater)
and street reconstruction
Exempt Category: Safety - Pavement resurfacing and/or rehabilitationCapacity Status: NCI
Est Total Cost: $19,921
CONRWPEPRIORTOTAL 10/11 11/12 12/13 13/14 14/15
TransNet - LSI $1,268 $2,752 $2,966 $3,245 $3,650 $2,070 $11,811 $13,881
TransNet - LSI Carry Over $6,040 $910 $5,130 $6,040
TOTAL $19,921 $7,308 $2,752 $2,966 $3,245 $3,650 $16,941 $2,980
MPO ID:
Project Title: Third Avenue Bicycle and Pedestrian Access
CHV49 ADOPTION: 10-00
Project Description:
EARMARK NO: CA635/3067
Within the Chula Vista Urban Core Specific Plan Area, which is bordered by SR54, I-5,
H Street and I-805 - study to determine ways to develop more bikeways and pedestrian
access to the downtown Third Avenue area; construction of improvements
recommended by the study
Exempt Category: Air Quality - Bicycle and pedestrian facilitiesCapacity Status: NCI
Est Total Cost: $3,150
CONRWPEPRIORTOTAL 10/11 11/12 12/13 13/14 14/15
HPP $240 $240 $240
Local Funds $60 $850 $60 $850 $910
TransNet - SMIP $2,000 $325 $1,675 $2,000
TOTAL $3,150 $300 $2,850 $2,525 $625
28Page Thursday, July 8, 2010
32

San Diego Region (in $000s)DRAFT 2010 Regional Transportation Improvement Program
MPO ID:
Project Title: Naples and Oleander Cross Gutter
CHV51
Chula Vista, City of
ADOPTION: 10-00
Project Description:
TransNet - LSI: CR
Naples St. from Oleander Ave. to Oasis Ave. - reconstruct the steep cross gutter at the
intersection of Naples St. and Oleander Ave. in order to increase vehicle safety and
reduce congestion caused by vehicles slowing down; ADA-compliant pedestrian
improvements will also be constructed
Exempt Category: Safety - Safer non-Federal-aid system roadsCapacity Status: NCI
Est Total Cost: $205
CONRWPEPRIORTOTAL 10/11 11/12 12/13 13/14 14/15
TransNet - L Carry Over $205 $45 $160 $205
TOTAL $205 $205 $160 $45
MPO ID:
Project Title: Industrial Blvd. Bicycle and Pedestrian Facilities
CHV52 ADOPTION: 10-00
Project Description:
TransNet - LSI: CR
Industrial Blvd. from L Street to Palomar Street - construct bike lanes on both sides of
Industrial Blvd. from L Street to Palomar Street; construct curb, gutter and sidewalk on
Industrial Blvd. from Naples Street to Palomar Street
Exempt Category: Air Quality - Bicycle and pedestrian facilitiesCapacity Status: NCI
Est Total Cost: $465
CONRWPEPRIORTOTAL 10/11 11/12 12/13 13/14 14/15
TransNet - LSI Carry Over $181 $181 $181
TransNet - SMIP $284 $39 $245 $284
TOTAL $465 $465 $245 $220
MPO ID:
Project Title: Bikeway Master Plan Update
CHV53 ADOPTION: 10-00
Project Description: Citywide - update the Citywide Bikeway Master Plan
Exempt Category: Air Quality - Bicycle and pedestrian facilitiesCapacity Status: NCI
Est Total Cost: $200
CONRWPEPRIORTOTAL 10/11 11/12 12/13 13/14 14/15
TDA - Bicycles $150 $150 $150
TransNet - L (Cash) $50 $50 $50
TOTAL $200 $50 $150 $200
29Page Thursday, July 8, 2010
33

San Diego Region (in $000s)DRAFT 2010 Regional Transportation Improvement Program
MPO ID:
Project Title: South Broadway Improvements South of Main Street
CHV54
Chula Vista, City of
ADOPTION: 10-00
Project Description:
TransNet - LSI: CR
Broadway from Main Street to Southern City Limits - overlay and reconstruction of the
pavement on Broadway, construction of curb, gutter and sidewalk and installation of
bike lanes
Exempt Category: Safety - Pavement resurfacing and/or rehabilitationCapacity Status: NCI
Est Total Cost: $2,200
CONRWPEPRIORTOTAL 10/11 11/12 12/13 13/14 14/15
TransNet - LSI Carry Over $500 $500 $500
TOTAL $500 $500 $500
MPO ID:
Project Title: Castle Park Sidewalk Improvements
CHV55 ADOPTION: 10-00
Project Description:
TransNet - LSI: CR
Oxford Street between Third Avenue and Alpine Avenue, First avenue between Palomar
Street and Naples Street, Second Avenue between Naples Street and Palomar Street,
Glenhaven Way to Amy Street (cul-de-sac) - construction (Phase 1) of missing street
improvements, primarily curb, gutter, sidewalk and ADA-compliant pedestrian ramps,
on four streets in the Montgomery area of Chula Vista
Exempt Category: Air Quality - Bicycle and pedestrian facilitiesCapacity Status: NCI
Est Total Cost: $2,838
CONRWPEPRIORTOTAL 10/11 11/12 12/13 13/14 14/15
Local Funds $717 $200 $517 $717
TransNet - LSI Carry Over $70 $70 $70
TOTAL $787 $717 $70 $517 $270
MPO ID:
Project Title: New Sidewalk Construction
CHV58 ADOPTION: 10-00
Project Description:
TransNet - LSI: CR
C Street from Fifth Ave. to 350 feet west of Fourth Ave.; Moss Street from Broadway to
Fourth Ave.; Oxford Street from Broadway to Fifth Ave., Palomar Street from Broadway to
Fifth Ave. - design and future construction of sidewalk and other pedestrian
improvements in areas without existing sidewalk - design phase only
Exempt Category: Air Quality - Bicycle and pedestrian facilitiesCapacity Status: NCI
Est Total Cost: $338
CONRWPEPRIORTOTAL 10/11 11/12 12/13 13/14 14/15
TransNet - LSI $338 $338 $338
TOTAL $338 $338 $338
30Page Thursday, July 8, 2010
34

San Diego Region (in $000s)DRAFT 2010 Regional Transportation Improvement Program
MPO ID:
Project Title: Naples Street New Sidewalk Construction
CHV59
Chula Vista, City of
ADOPTION: 10-00
Project Description:
TransNet - LSI: CR
South side of Naples Street between Broadway and Fifth Ave. and areas with missing
infrastructure on Naples Street between Fifth Ave. and Third Ave. - design phase of
future construction of missing curb, gutter, sidewalk and other pedestrian infrastucture
on Naples Street
Exempt Category: Air Quality - Bicycle and pedestrian facilitiesCapacity Status: NCI
Est Total Cost: $1,500
CONRWPEPRIORTOTAL 10/11 11/12 12/13 13/14 14/15
TransNet - LSI $182 $182 $182
TOTAL $182 $182 $182
MPO ID:
Project Title: Traffic Signal Upgrades
CHV60 ADOPTION: 10-00
Project Description:
TransNet - LSI: CR
Fourth Ave. and G Street; Second Ave. and Quintard St. - traffic signals will be upgraded
and modified in order to reduce the frequency of collisions
Exempt Category: All Projects - Intersection signalization projects at
individual intersections
Capacity Status: NCI
Est Total Cost: $745
CONRWPEPRIORTOTAL 10/11 11/12 12/13 13/14 14/15
Local Funds $175 $175 $175
TransNet - LSI $34 $34 $34
TransNet - LSI Carry Over $265 $265 $265
TOTAL $474 $175 $299 $474
MPO ID:
Project Title: Bonita Road/ Allen School Road Drainage Structure
CHV61 ADOPTION: 10-00
Project Description:
TransNet - LSI: Maint
Bonita Road from Allen School Road to Allen School Road - repair sections of the top
and side of the existing reinforced concrete box culvert, which carries flow from Bonita
Road, in order to eliminate the potential for failure and damage to Bonita Road and
eliminate a potential hazard to the public
Exempt Category: Safety - Safer non-Federal-aid system roadsCapacity Status: NCI
Est Total Cost: $150
CONRWPEPRIORTOTAL 10/11 11/12 12/13 13/14 14/15
TransNet - LSI $150 $150 $150
TOTAL $150 $150 $150
31Page Thursday, July 8, 2010
35

San Diego Region (in $000s)DRAFT 2010 Regional Transportation Improvement Program
MPO ID:
Project Title: Street and Road Preventive Maintenance; Minor Drainage Repair
COR04
Coronado, City of
ADOPTION: 10-00
Project Description:
TransNet - LSI: Maint
All streets in Coronado Cays - preventive maintenance such as slurry seal, crack
sealing, and minor drainage repair
Exempt Category: Safety - Pavement resurfacing and/or rehabilitationCapacity Status: NCI
Est Total Cost: $3,856
CONRWPEPRIORTOTAL 10/11 11/12 12/13 13/14 14/15
Local Funds $306 $268 $260 $327 $260 $260 $103 $1,578 $1,681
TransNet - L $1,581 $138 $1,443 $1,581
TransNet - LSI $70 $100 $100 $15 $255 $270
TransNet - LSI Carry Over $176 $115 $33 $24 $300 $324
TOTAL $3,856 $1,957 $444 $375 $360 $360 $360 $3,576 $280
MPO ID:
Project Title: SR 75 Tunnel
COR05 ADOPTION: 10-00
Project Description:
EARMARK NO: CA397/713,
HPP866/3789From Glorietta to Alameda - from San Diego-Coronado Bridge plaza westerly 1.4 miles
beneath Fourth Street with egress onto NAS North Island - SR 75 Tunnel EIS to provide
analysis of a tunnel - this project is included as informational purposes for NEPA
clearance only, future phases are outside of TIP cycle but included in the long range
plan
Exempt Category: Other - Engineering studiesCapacity Status: NCIRT:75
Est Total Cost: $19,146
CONRWPEPRIORTOTAL 10/11 11/12 12/13 13/14 14/15
CBI $500 $500 $500
HPP $9,000 $9,000 $9,000
Local Funds $8,337 $8,337 $8,337
STP $745 $745 $745
TCSP $564 $564 $564
TOTAL $19,146 $19,146 $19,146
32Page Thursday, July 8, 2010
36

San Diego Region (in $000s)DRAFT 2010 Regional Transportation Improvement Program
MPO ID:
Project Title: Street and Road Major Rehabilitation; Major Drainage; Reconstruction; Traffic Operations
COR07
Coronado, City of
ADOPTION: 10-00
Project Description:
TransNet - LSI: CR
First Street (D Avenue to east end cul-de-sac approximately 1,900 feet), Second Street
(Orange Avenue to A Avenue, 1,400 feet), Aruba Bend ( 850 feet), St.Christopher Lane
(800 feet), Park Place (Star Park Circle to Isabella Avenue, 600 feet), Star Park Circle
(740 feet), Encino Row, 570 feet) and Kingston Court (all three legs, 1,430 feet). -
rehabilitation of roadways including removal and replacement of severely damaged
areas, grinding and overlays of 1 1/2"
Exempt Category: Safety - Pavement resurfacing and/or rehabilitationCapacity Status: NCI
Est Total Cost: $7,154
CONRWPEPRIORTOTAL 10/11 11/12 12/13 13/14 14/15
Local Funds $109 $912 $136 $353 $323 $75 $1,758 $1,833
TransNet - L $1,665 $165 $1,500 $1,665
TransNet - L Carry Over $400 $20 $380 $400
TransNet - LSI $180 $427 $441 $463 $397 $427 $145 $2,190 $2,335
TransNet - LSI Carry Over $461 $309 $151 $51 $870 $921
TOTAL $7,154 $1,954 $2,200 $750 $750 $750 $750 $6,698 $456
33Page Thursday, July 8, 2010
37

San Diego Region (in $000s)DRAFT 2010 Regional Transportation Improvement Program
MPO ID:
Project Title: Resurfacing & Drainage Projects
DM01
Del Mar, City of
ADOPTION: 10-00
Project Description:
TransNet - LSI: Maint
Citywide - resurface and/or rehabilitate roadways
Exempt Category: Safety - Pavement resurfacing and/or rehabilitationCapacity Status: NCI
Est Total Cost: $1,776
CONRWPEPRIORTOTAL 10/11 11/12 12/13 13/14 14/15
Local Funds $590 $590 $590
TransNet - L $831 $831 $831
TransNet - LSI $98 $48 $49 $50 $54 $56 $355 $355
TOTAL $1,776 $1,519 $48 $49 $50 $54 $56 $1,776
MPO ID:
Project Title: Local Match to Bridge Retrofit Projects
DM02 ADOPTION: 10-00
Project Description:
TransNet - LSI: CR
At N. Torrey Pines Bridge, CDM Bridge over San Dieguito River - local match to federal
Highway Bridge Program providing for seismic retrofit (part of CAL44); project will
undertake full replacement of bridge upper deck, full depth pavement repair, and
seismic upgrades
Exempt Category: Safety - Non capacity widening or bridge reconstructionCapacity Status: NCI
Est Total Cost: $294
CONRWPEPRIORTOTAL 10/11 11/12 12/13 13/14 14/15
TransNet - LSI $182 $12 $100 $294 $294
TOTAL $294 $182 $12 $100 $294
MPO ID:
Project Title: Jimmy Durante Blvd. Northbound lane
DM03 ADOPTION: 10-00
Project Description:
TransNet - LSI: CR
Jimmy Durante Blvd. from Camino Del Mar to South of San Dieguito Drive - grind and 2"
overlay
Exempt Category: Safety - Pavement resurfacing and/or rehabilitationCapacity Status: NCI
Est Total Cost: $140
CONRWPEPRIORTOTAL 10/11 11/12 12/13 13/14 14/15
TransNet - LSI $20 $120 $140 $140
TOTAL $140 $20 $120 $140
34Page Thursday, July 8, 2010
38

San Diego Region (in $000s)DRAFT 2010 Regional Transportation Improvement Program
MPO ID:
Project Title: Camino Del Mar Major Rehabilitation Projects
DM04
Del Mar, City of
ADOPTION: 10-00
Project Description:
TransNet - LSI: CR
From 11th to 9th Street and from 13th to 15th Street - on Camino Del Mar, grind and 2"
overlay
Exempt Category: Safety - Pavement resurfacing and/or rehabilitationCapacity Status: NCI
Est Total Cost: $583
CONRWPEPRIORTOTAL 10/11 11/12 12/13 13/14 14/15
TransNet - LSI $230 $112 $83 $26 $132 $583 $583
TOTAL $583 $230 $112 $83 $26 $132 $583
35Page Thursday, July 8, 2010
39

San Diego Region (in $000s)DRAFT 2010 Regional Transportation Improvement Program
MPO ID:
Project Title: Overlay/Reconstruction Projects
EL03
El Cajon, City of
ADOPTION: 10-00
Project Description:
TransNet - LSI: CR
Mollison from Main Street to Washington, Mollison from Broadway to Greenfield,
Greenfield, Third Street from Lexington to Washington, Jamacha Road from
Washington to south city limits, 2nd Street/I8 overpass, Main Street from I8 to
Travelodge - street reconstruction and overlays of 2" - 3" thick, including collectors,
thoroughfares & residential streets
Exempt Category: Safety - Pavement resurfacing and/or rehabilitationCapacity Status: NCI
Est Total Cost: $16,447
CONRWPEPRIORTOTAL 10/11 11/12 12/13 13/14 14/15
TransNet - L $6,747 $6,747 $6,747
TransNet - L (Cash) $2,500 $2,500 $2,500
TransNet - LSI $400 $200 $1,000 $1,000 $1,000 $1,000 $4,600 $4,600
TransNet - LSI Carry Over $2,600 $2,600 $2,600
TOTAL $16,447 $9,647 $2,800 $1,000 $1,000 $1,000 $1,000 $16,447
MPO ID:
Project Title: Traffic Signals Projects
EL06 ADOPTION: 10-00
Project Description:
TransNet - LSI: Maint
Replacement of interconnect cable at various streets including Jamacha, Washington
Avenue and Chase Avenue. Modification of existing traffic signal to improve traffic flow
and safety at Main Street and Ballard Street. - new, upgrade or modification of traffic
signals and Traffic Management Center, including rewire, modifications, replacement
of signal interconnect cable, wireless video monitoring cameras and other necessary
equipment; matching funds for Proposition 1B Traffic Light Synchronization Program
Grant
Exempt Category: Other - Traffic signal synchronization projectsCapacity Status: NCI
Est Total Cost: $1,652
CONRWPEPRIORTOTAL 10/11 11/12 12/13 13/14 14/15
TransNet - L $580 $580 $580
TransNet - L (Cash) $300 $300 $300
TransNet - LSI $100 $272 $100 $100 $100 $100 $772 $772
TOTAL $1,652 $980 $272 $100 $100 $100 $100 $1,652
MPO ID:
Project Title: Sidewalk and other Repairs
EL11 ADOPTION: 10-00
Project Description:
TransNet - LSI: Maint
Various locations - repair broken sidewalk, driveway, ramps, etc.
Exempt Category: Air Quality - Bicycle and pedestrian facilitiesCapacity Status: NCI
Est Total Cost: $1,350
CONRWPEPRIORTOTAL 10/11 11/12 12/13 13/14 14/15
TransNet - L $450 $150 $300 $450
TransNet - L (Cash) $150 $150 $150
TransNet - LSI $150 $150 $150
TransNet - LSI Carry Over $150 $150 $150 $150 $600 $600
TOTAL $1,350 $600 $150 $150 $150 $150 $150 $1,200 $150
36Page Thursday, July 8, 2010
40

San Diego Region (in $000s)DRAFT 2010 Regional Transportation Improvement Program
MPO ID:
Project Title: Street Light Installation Projects
EL18
El Cajon, City of
ADOPTION: 10-00
Project Description:
TransNet - LSI: CR
Broadway from Main Street to City Limits - provide for new street lights which include
removing wooden pole mounted lights with utility underground
Exempt Category: Safety - Lighting improvementsCapacity Status: NCI
Est Total Cost: $266
CONRWPEPRIORTOTAL 10/11 11/12 12/13 13/14 14/15
TransNet - LSI $25 $100 $25 $25 $25 $200 $200
TransNet - LSI Carry Over $66 $66 $66
TOTAL $266 $66 $25 $100 $25 $25 $25 $266
MPO ID:
Project Title: Traffic Signal LED Light Bulb Replacement
EL20 ADOPTION: 10-00
Project Description:
TransNet - LSI: Maint
Citywide - replace led lights on all signals
Exempt Category: Other - Traffic signal synchronization projectsCapacity Status: NCI
Est Total Cost: $135
CONRWPEPRIORTOTAL 10/11 11/12 12/13 13/14 14/15
TransNet - LSI $135 $135 $135
TOTAL $135 $135 $135
MPO ID:
Project Title: Street Resurfacing with slurry seals and ARAM products
EL21 ADOPTION: 10-00
Project Description:
TransNet - LSI: Maint
Downtown El Cajon and surrounding areas. - street resurfacing with slurry seals and
asphalt rubber aggregate membrane (ARAM)
Exempt Category: Safety - Pavement resurfacing and/or rehabilitationCapacity Status: NCI
Est Total Cost: $2,500
CONRWPEPRIORTOTAL 10/11 11/12 12/13 13/14 14/15
TransNet - L Carry Over $341 $341 $341
TransNet - LSI $400 $159 $400 $400 $400 $1,759 $1,759
TransNet - LSI Carry Over $400 $400 $400
TOTAL $2,500 $400 $500 $400 $400 $400 $400 $2,500
37Page Thursday, July 8, 2010
41

San Diego Region (in $000s)DRAFT 2010 Regional Transportation Improvement Program
MPO ID:
Project Title: Traffic Signal Maintenance
EL23
El Cajon, City of
ADOPTION: 10-00
Project Description:
TransNet - LSI: Maint
All City Traffic Signals - repainting of traffic signal heads and other minor traffic signal
maintenance
Exempt Category: Other - Intersection signalization projectsCapacity Status: NCI
Est Total Cost: $135
CONRWPEPRIORTOTAL 10/11 11/12 12/13 13/14 14/15
TransNet - L (Cash) $15 $15 $15
TransNet - LSI $40 $40 $80 $80
TransNet - LSI Carry Over $40 $40 $40
TOTAL $135 $15 $40 $40 $40 $135
MPO ID:
Project Title: Jamacha Road Traffic Signals
EL24 ADOPTION: 10-00
Project Description:
RAS (TA 7-8)
TransNet - LSI: CRJamacha Road from Washington Avenue to Gustavo Avenue - upgrading of traffic
signals on Jamacha at the intersection of Lexington Avenue, Washington Avenue and
Granite Hills Drive
Exempt Category: Other - Traffic signal synchronization projectsCapacity Status: NCI
Est Total Cost: $204
CONRWPEPRIORTOTAL 10/11 11/12 12/13 13/14 14/15
TransNet - LSI $204 $204 $204
TOTAL $204 $204 $204
38Page Thursday, July 8, 2010
42

San Diego Region (in $000s)DRAFT 2010 Regional Transportation Improvement Program
MPO ID:
Project Title: Street Overlay Program
ENC14A
Encinitas, City of
ADOPTION: 10-00
Project Description:
TransNet - LSI: CR
Orpheus Ave-Leucadia Blvd. to Glaucus St , Eolus Ave-Leucadia Blvd to Glaucus St ,
Falcon Hill Ct-Nolbey St to end , San Andrade Dr.-Balour Dr to San Clemente , San
Abella Dr.-Balour Dr to San Clemente , Guadalajara Dr-Balour Dr to San Clemente ,
San Clemente-Guadalajara to end , Fulvia St.-Leucadia Blvd to Orpheus Ave , Leucadia
Blvd.-Hermes Ave to Hymettus Ave , Monterey Vista Way-Santa Fe Dr to end , Monterey
Vista Pl-Monterey Vista Way to end , Village View Rd-Wandering Rd to end , Tres
Hermanas-Wandering Rd to Village View Rd , Avenida La Posta- Wandering Rd to
Village View Rd , Summerdawn Pl-Village View Rd to end , Mountain Vista-Village Park
to El Camino Real , Hummock Lane-Gardendale Rd to end , Lone Jack Rd-Rancho
Santa Fe Rd to Fortuna Ranch Rd , Cerro St-Willowsprings to El Camino Real , Avenida
De Las Adelsas-El Camino Real Cerro St , Elva Ct-Oakbranch Dr to end , Elva
Terrace-Oakbranch Dr to end , Delage Dr-Oakbranch Dr to Pegaso St , Pegaso
St-Delage Dr to Oakbranch Dr , Avenida De Las Rosas-Avenida De Las Adelsas to
Willowsprings , Calle Narcisos-Avenida De Las Rosas to end , Pensa Mientos-Avenida
De Las Rosas to end , Calle Tulipanes- Avenida De Las Rosas to end , - asphalt
grinding, 6" dig outs, and 1-1/2" polymer modified asphalt overlay
Exempt Category: Safety - Pavement resurfacing and/or rehabilitationCapacity Status: NCI
Est Total Cost: $10,331
CONRWPEPRIORTOTAL 10/11 11/12 12/13 13/14 14/15
Local Funds $2,516 $850 $850 $850 $800 $750 $6,616 $6,616
TransNet - L $600 $600 $600
TransNet - L (Cash) $240 $240 $240
TransNet - LSI $665 $300 $350 $410 $520 $630 $2,875 $2,875
TOTAL $10,331 $4,021 $1,150 $1,200 $1,260 $1,320 $1,380 $10,331
MPO ID:
Project Title: Safe Routes to School Sidewalk Program
ENC17 ADOPTION: 10-00
Project Description:
TransNet - LSI: Maint
Sidewalks on Westminster/Summit from Verdi to Montgomery (Cardiff Elementary
School), Hygeia Ave. from Leucadia Blvd. to 380' south, Hygeia from Cereus St. to 220'
north of Cereus, Cereus Street from Hermes Ave. to Hygeia, Union St. from the Paul
Ecke School driveway to the SE corner of Union/Vulcan, and Vulcan Ave. from Union to
260' south (Paul Ecke Elementary School), Melba Rd. from Nardo to Bonita, south side
of Santa Fe from I-5 to MacKinnon, Balour Drive from Santa Fe to Melba Road,
Encinitas Blvd from Balour westerly 600', a citywide sidewalk replacement program and
matching funds for a TDA grant to complete a study for sidewalks on Vulcan Avenue. -
installation of pathways to include curb, gutter, drainage improvements and
landscaping where appropriate
Exempt Category: Air Quality - Bicycle and pedestrian facilitiesCapacity Status: NCI
Est Total Cost: $3,408
CONRWPEPRIORTOTAL 10/11 11/12 12/13 13/14 14/15
Local Funds $1,212 $1,212 $1,212
TransNet - L $900 $900 $900
TransNet - L (Cash) $296 $296 $296
TransNet - LSI $200 $200 $200 $200 $200 $1,000 $1,000
TOTAL $3,408 $2,408 $200 $200 $200 $200 $200 $3,408
39Page Thursday, July 8, 2010
43

San Diego Region (in $000s)DRAFT 2010 Regional Transportation Improvement Program
MPO ID:
Project Title: Traffic Safety/Calming
ENC19
Encinitas, City of
ADOPTION: 10-00
Project Description:
TransNet - LSI: CR
On Rubenstein Avenue, Summit Avenue and Westminster Drive;, Via Cantebria
between Garden View Road and Town Center;, Gardendale Road - install horizontal
and vertical traffic safety and calming improvements such as speed cushions,
chicanes, narrowing roadway, landscaped pop-outs and stop signs; develop Traffic
Calming Plan for local neighborhoods
Exempt Category: Safety - Safer non-Federal-aid system roadsCapacity Status: NCI
Est Total Cost: $1,426
CONRWPEPRIORTOTAL 10/11 11/12 12/13 13/14 14/15
Local Funds $180 $180 $180
TransNet - L $450 $450 $450
TransNet - L (Cash) $87 $87 $87
TransNet - L Carry Over $150 $20 $130 $150
TransNet - LSI $150 $150 $150 $50 $59 $559 $559
TOTAL $1,426 $867 $150 $150 $150 $50 $59 $1,406 $20
MPO ID:
Project Title: North Coast Highway 101 Beautification
ENC20 ADOPTION: 10-00
Project Description:
TransNet - LSI: CR
N. Coast Hwy. 101 from A Street to La Costa Avenue - design/construct comprehensive
streetscape improvements: new curb, gutter, sidewalk and landscaping - the preferred
design may include pedestrian and bicycle improvements, lane reconfiguration, and
five traffic circles to facilitate and ease traffic congestion and more efficiently move
vehicular traffic
Exempt Category: Air Quality - Bicycle and pedestrian facilitiesCapacity Status: NCI
Est Total Cost: $5,200
CONRWPEPRIORTOTAL 10/11 11/12 12/13 13/14 14/15
TransNet - L $500 $500 $500
TransNet - L (Cash) $100 $100 $100
TransNet - L Carry Over $320 $320 $320
TransNet - LSI $300 $300 $500 $1,000 $600 $600 $2,100 $2,700
TOTAL $3,620 $920 $300 $300 $500 $1,000 $600 $2,100 $1,520
40Page Thursday, July 8, 2010
44

San Diego Region (in $000s)DRAFT 2010 Regional Transportation Improvement Program
MPO ID:
Project Title: Traffic Signal Modifications
ENC28
Encinitas, City of
ADOPTION: 10-00
Project Description:
TransNet - LSI: Maint
on Highway 101/Chesterfield; Leucadia/101; El Camino Real/Manchester Ave.;
Manchester Ave./Mira Costa College; E Street/Hwy. 101; Balour Ave/Encinitas; Via
Cantebria/Encinitas, D-E Streets/Hwy. 101 and other circulation element roads within
the City - install radio communication to traffic signals, hard wiring system to traffic
signals, audible pedestrian signal; replace battery backup units; install pedestrian
countdown times; upgrade BiTrans Chip in signal controllers at various traffic signals
Exempt Category: Other - Traffic signal synchronization projectsCapacity Status: NCI
Est Total Cost: $882
CONRWPEPRIORTOTAL 10/11 11/12 12/13 13/14 14/15
TransNet - L $100 $100 $100
TransNet - L (Cash) $382 $382 $382
TransNet - L Carry Over $150 $150 $150
TransNet - LSI $50 $50 $50 $50 $50 $250 $250
TOTAL $882 $632 $50 $50 $50 $50 $50 $882
MPO ID:
Project Title: I-5/Encinitas Blvd. Interchange Modification
ENC31 ADOPTION: 10-00
Project Description:
RTP PG NO: A-5
RAS (TA 7-44)At I-5/Encinitas Blvd. Interchange - modify interchange to improve safety and alleviate
congestion (design only)
Exempt Category: Non-ExemptCapacity Status: CIRT:5
Est Total Cost: $1,330 Open to Traffic: Nov 2013
CONRWPEPRIORTOTAL 10/11 11/12 12/13 13/14 14/15
Local Funds $883 $200 $247 $1,330 $1,330
TOTAL $1,330 $883 $200 $247 $1,330
MPO ID:
Project Title: Encinitas Pedestrian Crossing
ENC32 ADOPTION: 10-00
Project Description:
SANDAG ID: 1143800
Along LOSSAN railroad (MP 235.1 to 239.5) from La Costa Avenue to Chesterfield Drive
- PE, PS&E for 4 grade separated crossings located at Montgomery Ave., Santa Fe
Drive, El Portal and Hillcrest; construction of Phase I at Santa Fe Drive
Exempt Category: Safety - Railroad/highway crossingCapacity Status: NCI
Est Total Cost: $25,000
CONRWPEPRIORTOTAL 10/11 11/12 12/13 13/14 14/15
Local Funds $425 $1,300 $1,725 $1,725
STIP-IIP PTA $1,248 $1,248 $1,248
TCRP $4,000 $1,248 $2,752 $4,000
TOTAL $6,973 $4,425 $2,548 $5,725 $1,248
41Page Thursday, July 8, 2010
45

San Diego Region (in $000s)DRAFT 2010 Regional Transportation Improvement Program
MPO ID:
Project Title: Downtown/Coaster Station Parking Lot
ENC44
Encinitas, City of
ADOPTION: 10-00
Project Description:
TransNet - LSI: CR
Southwest corner of Vulcan Avenue and E Street - includes the design and
construction of a parking lot to accommodate parking for downtown visitors/employees
and patrons of the Coaster; project will also include bike storage facilities, a sidewalk
and connection to the future Coastal Rail Trails project
Exempt Category: Other - Transportation enhancement activitiesCapacity Status: NCI
Est Total Cost: $1,320
CONRWPEPRIORTOTAL 10/11 11/12 12/13 13/14 14/15
TransNet - L (Cash) $40 $40 $40
TransNet - L Carry Over $640 $640 $1,280 $1,280
TOTAL $1,320 $680 $640 $1,280 $40
42Page Thursday, July 8, 2010
46

San Diego Region (in $000s)DRAFT 2010 Regional Transportation Improvement Program
MPO ID:
Project Title: East Valley/Valley Center
ESC02A
Escondido, City of
ADOPTION: 10-00
Project Description:
EARMARK NO: CA332/260
RAS (TA 7-44)
TransNet - LSI: CREast Valley Pkwy to Valley Center Dr, New Eureka Ranch St to E. Valley Pkwy - widen
roadway from 4 to 6 lanes with raised medians and left turn pockets; modify signal at
Lake Wohlford and Valley Center Road; widen bridge over Escondido Creek
Exempt Category: Non-ExemptCapacity Status: CI
Est Total Cost: $14,299 Open to Traffic: Jan 2012
CONRWPEPRIORTOTAL 10/11 11/12 12/13 13/14 14/15
HPP $1,600 $1,600 $1,600
Local Funds $1,342 $256 $1,086 $1,342
RSTP $7,969 $1,771 $6,198 $7,969
TransNet - L Carry Over $1,588 $229 $1,167 $192 $1,588
TransNet - LSI $400 $200 $200 $400
TransNet - LSI Carry Over $1,400 $1,400 $1,400
TOTAL $14,299 $11,311 $2,988 $7,621 $4,478 $2,200
MPO ID:
Project Title: Citracado Parkway
ESC03 ADOPTION: 10-00
Project Description:
RAS (TA 7-44)
TransNet - LSI: CRCitracado from Don Lee to Vineyard - widen from 2 to 4 lanes with left turn pockets and
new traffic signal at Aero Way and Citracado Parkway
Exempt Category: Non-ExemptCapacity Status: CI
Est Total Cost: $7,373 Open to Traffic: Dec 2009
CONRWPEPRIORTOTAL 10/11 11/12 12/13 13/14 14/15
Local Funds $2,400 $600 $1,800 $2,400
TransNet - L $3,200 $3,200 $3,200
TransNet - L (Cash) $173 $173 $173
TransNet - L Carry Over $100 $100 $100
TransNet - LSI Carry Over $1,500 $1,500 $1,500
TOTAL $7,373 $5,773 $1,600 $600 $6,673 $100
MPO ID:
Project Title: Citracado Parkway II
ESC04 ADOPTION: 10-00
Project Description:
RAS (TA 7-44)
TransNet - LSI: CRCitracado Parkway from West Valley to Harmony Grove - widen from 2 to 4 lanes with
raised medians, construct bridge over Escondido Creek
Exempt Category: Non-ExemptCapacity Status: CI
Est Total Cost: $19,547 Open to Traffic: Jul 2013
CONRWPEPRIORTOTAL 10/11 11/12 12/13 13/14 14/15
HUD $908 $908 $908
Local Funds $13,625 $425 $180 $180 $839 $1,000 $12,571 $14,410
TransNet - L $581 $581 $581
TransNet - LSI $527 $1,712 $1,409 $3,648 $3,648
TOTAL $19,547 $15,114 $952 $1,892 $1,589 $1,581 $16,219 $1,747
43Page Thursday, July 8, 2010
47

San Diego Region (in $000s)DRAFT 2010 Regional Transportation Improvement Program
MPO ID:
Project Title: El Norte Parkway Phase IV
ESC05
Escondido, City of
ADOPTION: 10-00
Project Description:
RAS (TA 7-44)
From La Honda Drive at citrus/Mission Avenue to e. Washington Avenue - widen from 2
to 4 lanes and construct missing section of El Norte Pkwy. with left turn pockets, raised
medians and new traffic signals
Exempt Category: Non-ExemptCapacity Status: CI
Est Total Cost: $4,586 Open to Traffic: Jan 2009
CONRWPEPRIORTOTAL 10/11 11/12 12/13 13/14 14/15
TransNet - L $700 $700 $700
TransNet - L (Cash) $351 $351 $351
TransNet - L Carry Over $3,535 $3,535 $3,535
TOTAL $4,586 $1,051 $3,535 $4,586
MPO ID:
Project Title: El Norte Parkway Bridge at Escondido Creek
ESC06 ADOPTION: 10-00
Project Description:
RAS (TA 7-44)
El Norte Parkway from Kaile Lane to Key Lime Way - construct missing two lane bridge
at Escondido Creek
Exempt Category: Non-ExemptCapacity Status: CI
Est Total Cost: $4,950 Open to Traffic: Jul 2009
CONRWPEPRIORTOTAL 10/11 11/12 12/13 13/14 14/15
Local Funds $650 $650 $650
TransNet - L $2,000 $50 $1,950 $2,000
TransNet - L (Cash) $1,950 $1,950 $1,950
TransNet - L Carry Over $350 $350 $350
TOTAL $4,950 $4,600 $350 $4,900 $50
MPO ID:
Project Title: Felicita Ave/Juniper Street
ESC08 ADOPTION: 10-00
Project Description: From Escondido Boulevard to Juniper Street and from Juniper Street to Chestnut Street
- widen from 2 to 4 lanes with left turn pockets, raised medians on Felicita; new traffic
signals at Juniper and Chestnut, Juniper and 13th Ave., Juniper and 15th Ave.; modify
traffic signal at Juniper and Felicita
Exempt Category: Non-ExemptCapacity Status: CI
Est Total Cost: $5,186 Open to Traffic: Apr 2012
CONRWPEPRIORTOTAL 10/11 11/12 12/13 13/14 14/15
Local Funds $3,500 $3,500 $3,500
TransNet - L (Cash) $330 $330 $330
TransNet - L Carry Over $1,356 $50 $1,306 $1,356
TOTAL $5,186 $3,830 $1,356 $5,136 $50
44Page Thursday, July 8, 2010
48

San Diego Region (in $000s)DRAFT 2010 Regional Transportation Improvement Program
MPO ID:
Project Title: Ninth Avenue
ESC09
Escondido, City of
ADOPTION: 10-00
Project Description:
TransNet - LSI: CR
Ninth Avenue from La Terraza to Spruce - widen from 2 to 4 lanes with raised median
and modify traffic signals at Ninth Ave and Tulip Street - design phase
Exempt Category: Non-ExemptCapacity Status: CI
Est Total Cost: $1,331 Open to Traffic: Jul 2014
CONRWPEPRIORTOTAL 10/11 11/12 12/13 13/14 14/15
TransNet - LSI Carry Over $161 $161 $161
TOTAL $161 $161 $161
MPO ID:
Project Title: Street Rehabilitation & Resurface
ESC11 ADOPTION: 10-00
Project Description:
TransNet - LSI: Maint
Citywide - reconstruction, resurfacing, chip sealing, crack filling, sidewalk repair
Exempt Category: Safety - Pavement resurfacing and/or rehabilitationCapacity Status: NCI
Est Total Cost: $15,804
CONRWPEPRIORTOTAL 10/11 11/12 12/13 13/14 14/15
Local Funds $6,569 $1,199 $300 $7,468 $7,768
TransNet - L $1,904 $1,904 $1,904
TransNet - L (Cash) $1,500 $1,500 $1,500
TransNet - L Carry Over $500 $500 $500
TransNet - LSI $3,043 $182 $3,225 $3,225
TransNet - LSI Carry Over $907 $907 $907
TOTAL $15,804 $13,016 $2,788 $15,504 $300
45Page Thursday, July 8, 2010
49

San Diego Region (in $000s)DRAFT 2010 Regional Transportation Improvement Program
MPO ID:
Project Title: Nordahl Road Bridge @ SR-78
ESC13
Escondido, City of
ADOPTION: 10-00
Project Description:
RAS (TA 7-44)
TransNet - LSI: CRNordahl Road from Mission Ave. to Montiel Road - replace the Nordahl Road
Overcrossing to increase the minimum vertical clearance from 14’-9” to the Caltrans
minimum vertical clearance of 16’-6”, and provide an additional 14-feet of structure
width necessary to facilitate the required construction staging of the project; the
additional width of the overcrossing will accommodate operational improvements
through left-turn storage at the ramp intersections; widen the eastbound and
westbound exit ramps to provide three lanes at the intersections; widen Nordahl Road
to provide a dedicated right-turn onto Montiel Road (no additional travel lanes)
Exempt Category: Safety - Non capacity widening or bridge reconstructionCapacity Status: NCI
Est Total Cost: $7,651
CONRWPEPRIORTOTAL 10/11 11/12 12/13 13/14 14/15
DEMO - TEA 21 $2,250 $1,100 $1,150 $2,250
RSTP $300 $300 $300
TransNet - L $424 $52 $372 $424
TransNet - L (Cash) $2,000 $2,000 $2,000
TransNet - L Carry Over $364 $191 $173 $364
TransNet - LSI $313 $313 $313
TransNet - MC $2,000 $2,000 $2,000
TOTAL $7,651 $4,974 $2,677 $4,008 $3,643
MPO ID:
Project Title: Neighborhood Projects
ESC17 ADOPTION: 10-00
Project Description: Citywide - curb & gutter, sidewalks, street lights and other misc. street improvements
Exempt Category: Safety - Pavement resurfacing and/or rehabilitationCapacity Status: NCI
Est Total Cost: $2,000
CONRWPEPRIORTOTAL 10/11 11/12 12/13 13/14 14/15
Local Funds $200 $200 $200
TransNet - L $350 $350 $350
TransNet - L (Cash) $50 $50 $50
TransNet - L Carry Over $1,400 $200 $1,200 $1,400
TOTAL $2,000 $400 $1,600 $1,800 $200
46Page Thursday, July 8, 2010
50

San Diego Region (in $000s)DRAFT 2010 Regional Transportation Improvement Program
MPO ID:
Project Title: Centre City Parkway
ESC24
Escondido, City of
ADOPTION: 10-00
Project Description:
RAS (TA 7-44)
TransNet - LSI: CRCentre City Parkway from Mission Road to SR 78 - widen 4 lanes to 6 lanes with
intersection improvements
Exempt Category: Non-ExemptCapacity Status: CI
Est Total Cost: $3,520 Open to Traffic: Jan 2011
CONRWPEPRIORTOTAL 10/11 11/12 12/13 13/14 14/15
Local Funds $846 $300 $100 $446 $846
TransNet - L $974 $974 $974
TransNet - L (Cash) $1,400 $1,400 $1,400
TransNet - LSI $300 $300 $300
TOTAL $3,520 $3,220 $300 $100 $3,120 $300
MPO ID:
Project Title: Citracado/Nordahl
ESC25 ADOPTION: 10-00
Project Description:
RAS (TA 7-44)
Citracado/Nordahl from Country Club Lane to SR 78 - widen from 4 lanes to 6 lanes
with double left turn lanes and exclusive right turn lanes
Exempt Category: Non-ExemptCapacity Status: CI
Est Total Cost: $3,776 Open to Traffic: Jul 2008
CONRWPEPRIORTOTAL 10/11 11/12 12/13 13/14 14/15
Local Funds $477 $25 $452 $477
TransNet - H (78) $2,154 $2,154 $2,154
TransNet - L $700 $175 $200 $325 $700
TransNet - L (Cash) $245 $245 $245
TransNet - L Carry Over $200 $200 $200
TOTAL $3,776 $3,576 $200 $200 $3,176 $400
MPO ID:
Project Title: Maple Street Pedestrian Plaza
ESC27 ADOPTION: 10-00
Project Description:
TransNet - LSI: CR
Maple from 2nd Ave to Valley Prkwy - reconstruct from 2-lane through street to a short
two-lane cul-de-sac ending in large pedestrian plaza - design phase
Exempt Category: Air Quality - Bicycle and pedestrian facilitiesCapacity Status: NCI
Est Total Cost: $1,230
CONRWPEPRIORTOTAL 10/11 11/12 12/13 13/14 14/15
Local Funds $230 $230 $230
TransNet - LSI $200 $200 $200
TransNet - LSI Carry Over $800 $800 $800
TOTAL $1,230 $230 $1,000 $1,230
47Page Thursday, July 8, 2010
51

San Diego Region (in $000s)DRAFT 2010 Regional Transportation Improvement Program
MPO ID:
Project Title: El Norte Parkway Medians and Landscaping
ESC30
Escondido, City of
ADOPTION: 10-00
Project Description:
RAS (TA 7-44)
TransNet - LSI: CREl Norte Parkway from Washington Avenue to Valley Parkway - construct stamped
concrete medians with landscape and irrigation
Exempt Category: Safety - Adding mediansCapacity Status: NCI
Est Total Cost: $1,109
CONRWPEPRIORTOTAL 10/11 11/12 12/13 13/14 14/15
TransNet - L (Cash) $271 $271 $271
TransNet - LSI $200 $200 $200
TransNet - LSI Carry Over $638 $100 $538 $638
TOTAL $1,109 $271 $838 $1,009 $100
MPO ID:
Project Title: Bear Valley Parkway North Contribution
ESC35 ADOPTION: 10-00
Project Description:
RAS (TA 7-39)
TransNet - LSI: CRBear Valley Parkway from San Pasqual Valley Road to Boyle Avenue - Bear Valley
Parkway from San Pasqual Valley Road to Boyle Avenue - widen from two lanes to four
lanes, with a center median, a bike lane and shoulder in each direction of travel
(CNTY39)
Exempt Category: Other - Non construction related activitiesCapacity Status: NCI
Est Total Cost: $100
CONRWPEPRIORTOTAL 10/11 11/12 12/13 13/14 14/15
TransNet - LSI $100 $100 $100
TOTAL $100 $100 $100
48Page Thursday, July 8, 2010
52
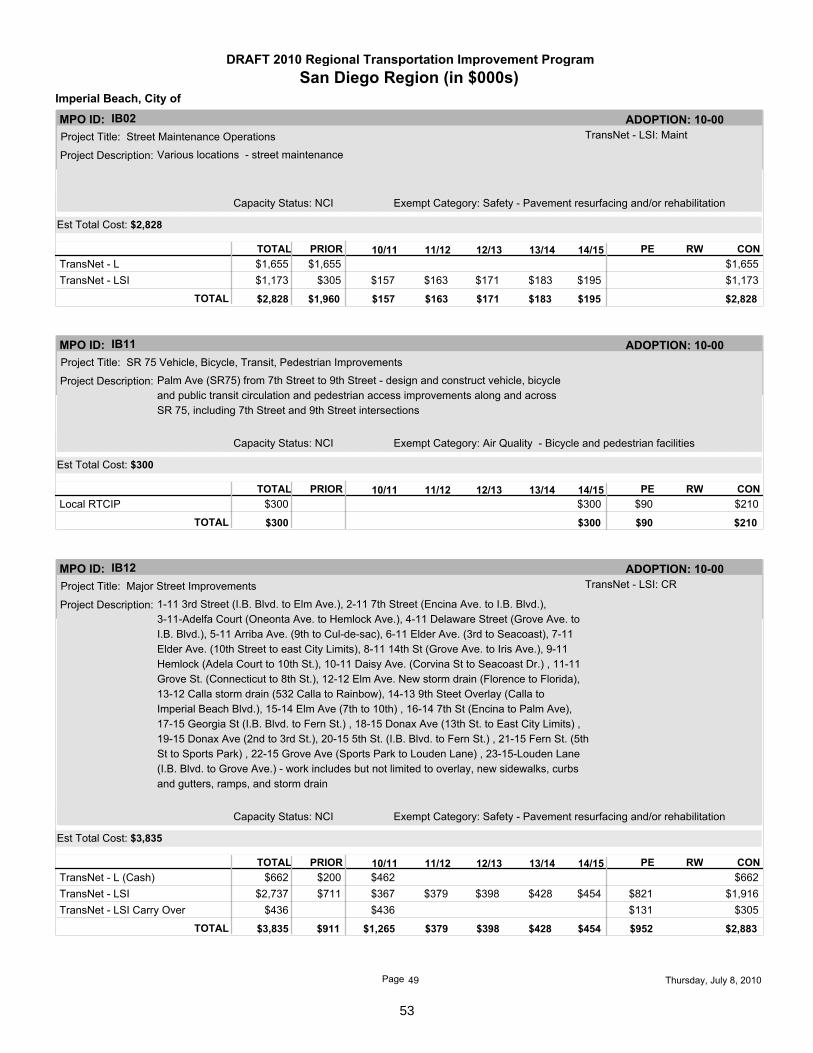
San Diego Region (in $000s)DRAFT 2010 Regional Transportation Improvement Program
MPO ID:
Project Title: Street Maintenance Operations
IB02
Imperial Beach, City of
ADOPTION: 10-00
Project Description:
TransNet - LSI: Maint
Various locations - street maintenance
Exempt Category: Safety - Pavement resurfacing and/or rehabilitationCapacity Status: NCI
Est Total Cost: $2,828
CONRWPEPRIORTOTAL 10/11 11/12 12/13 13/14 14/15
TransNet - L $1,655 $1,655 $1,655
TransNet - LSI $305 $157 $163 $171 $183 $195 $1,173 $1,173
TOTAL $2,828 $1,960 $157 $163 $171 $183 $195 $2,828
MPO ID:
Project Title: SR 75 Vehicle, Bicycle, Transit, Pedestrian Improvements
IB11 ADOPTION: 10-00
Project Description: Palm Ave (SR75) from 7th Street to 9th Street - design and construct vehicle, bicycle
and public transit circulation and pedestrian access improvements along and across
SR 75, including 7th Street and 9th Street intersections
Exempt Category: Air Quality - Bicycle and pedestrian facilitiesCapacity Status: NCI
Est Total Cost: $300
CONRWPEPRIORTOTAL 10/11 11/12 12/13 13/14 14/15
Local RTCIP $300 $90 $210 $300
TOTAL $300 $300 $210 $90
MPO ID:
Project Title: Major Street Improvements
IB12 ADOPTION: 10-00
Project Description:
TransNet - LSI: CR
1-11 3rd Street (I.B. Blvd. to Elm Ave.), 2-11 7th Street (Encina Ave. to I.B. Blvd.),
3-11-Adelfa Court (Oneonta Ave. to Hemlock Ave.), 4-11 Delaware Street (Grove Ave. to
I.B. Blvd.), 5-11 Arriba Ave. (9th to Cul-de-sac), 6-11 Elder Ave. (3rd to Seacoast), 7-11
Elder Ave. (10th Street to east City Limits), 8-11 14th St (Grove Ave. to Iris Ave.), 9-11
Hemlock (Adela Court to 10th St.), 10-11 Daisy Ave. (Corvina St to Seacoast Dr.) , 11-11
Grove St. (Connecticut to 8th St.), 12-12 Elm Ave. New storm drain (Florence to Florida),
13-12 Calla storm drain (532 Calla to Rainbow), 14-13 9th Steet Overlay (Calla to
Imperial Beach Blvd.), 15-14 Elm Ave (7th to 10th) , 16-14 7th St (Encina to Palm Ave),
17-15 Georgia St (I.B. Blvd. to Fern St.) , 18-15 Donax Ave (13th St. to East City Limits) ,
19-15 Donax Ave (2nd to 3rd St.), 20-15 5th St. (I.B. Blvd. to Fern St.) , 21-15 Fern St. (5th
St to Sports Park) , 22-15 Grove Ave (Sports Park to Louden Lane) , 23-15-Louden Lane
(I.B. Blvd. to Grove Ave.) - work includes but not limited to overlay, new sidewalks, curbs
and gutters, ramps, and storm drain
Exempt Category: Safety - Pavement resurfacing and/or rehabilitationCapacity Status: NCI
Est Total Cost: $3,835
CONRWPEPRIORTOTAL 10/11 11/12 12/13 13/14 14/15
TransNet - L (Cash) $200 $462 $662 $662
TransNet - LSI $711 $367 $379 $398 $428 $454 $821 $1,916 $2,737
TransNet - LSI Carry Over $436 $131 $305 $436
TOTAL $3,835 $911 $1,265 $379 $398 $428 $454 $2,883 $952
49Page Thursday, July 8, 2010
53

San Diego Region (in $000s)DRAFT 2010 Regional Transportation Improvement Program
MPO ID:
Project Title: Street Construction
LAM17
La Mesa, City of
ADOPTION: 10-00
Project Description:
TransNet - LSI: CR
Resurfacing Projects: FY10 - Boulder Drive, Chevy Chase, from Hillcrest Ave. to
Sunrise Ave., Colina Drive from Orchard Way to end of street, Crowder Lane from
Lemon Ave. to Hillcrest Ave., Grape Street from Lee Ave. to Normal Ave., Hillcrest Ave.,
Lee Aven. from University Ave. to Grape Street, Maiden Lane, Normal Ave. from Windsor
Dr. to Lemon Ave., Palm Ave. from University Ave. to Allison Ave., Spring Street from
Allison Ave. to La Mesa Blvd., Summit Drive; FY11 - Normal Ave. From Lowell St. to
Windsor Ave.; FY13 - Normal Avenue from Windsor Ave. to La Mesa Blvd. - rehabilitate
pavement of identified priority streets that are in poor condition and in need of major
reconstruction including removal of existing pavement greater than 1" in depth, and
construction of new structural pavement to provide a smooth travel surface
Exempt Category: Safety - Pavement resurfacing and/or rehabilitationCapacity Status: NCI
Est Total Cost: $5,000
CONRWPEPRIORTOTAL 10/11 11/12 12/13 13/14 14/15
TransNet - CP $2,500 $150 $2,350 $2,500
TransNet - L $1,100 $100 $1,000 $1,100
TransNet - LSI $100 $368 $200 $200 $200 $200 $140 $1,128 $1,268
TransNet - LSI Carry Over $132 $132 $132
TOTAL $5,000 $1,200 $3,000 $200 $200 $200 $200 $4,610 $390
MPO ID:
Project Title: Street Maintenance-Various
LAM18 ADOPTION: 10-00
Project Description:
TransNet - LSI: Maint
Citywide - minor repairs or maintenance based on Pavement Management System
Study
Exempt Category: Safety - Pavement resurfacing and/or rehabilitationCapacity Status: NCI
Est Total Cost: $1,260
CONRWPEPRIORTOTAL 10/11 11/12 12/13 13/14 14/15
TransNet - L $340 $340 $340
TransNet - LSI $170 $150 $150 $150 $150 $150 $920 $920
TOTAL $1,260 $510 $150 $150 $150 $150 $150 $1,260
MPO ID:
Project Title: Update Pavement Management Study
LAM19 ADOPTION: 10-00
Project Description:
TransNet - LSI: Maint
Citywide - updates to the existing Pavement Management System Study to determine
condition of city streets
Exempt Category: Other - Engineering studiesCapacity Status: NCI
Est Total Cost: $65
CONRWPEPRIORTOTAL 10/11 11/12 12/13 13/14 14/15
TransNet - L $35 $35 $35
TransNet - LSI $5 $5 $5 $5 $5 $5 $30 $30
TOTAL $65 $40 $5 $5 $5 $5 $5 $65
50Page Thursday, July 8, 2010
54

San Diego Region (in $000s)DRAFT 2010 Regional Transportation Improvement Program
MPO ID:
Project Title: Curb and Gutter and Sidewalk
LAM20
La Mesa, City of
ADOPTION: 10-00
Project Description:
TransNet - LSI: Maint
Citywide - remove and replace identified and prioritized tripping hazards
Exempt Category: Safety - Pavement resurfacing and/or rehabilitationCapacity Status: NCI
Est Total Cost: $825
CONRWPEPRIORTOTAL 10/11 11/12 12/13 13/14 14/15
TransNet - L $200 $200 $200
TransNet - LSI $125 $100 $100 $100 $100 $100 $625 $625
TOTAL $825 $325 $100 $100 $100 $100 $100 $825
MPO ID:
Project Title: Street Lights for Utility Undergrounding
LAM21 ADOPTION: 10-00
Project Description:
TransNet - LSI: CR
Parkway Dr. from Marengo to Lambda Ln., Spring St. from Park Ave. to southern city
limits, Orien Ave. from Lowell St. to 7463 Orien Ave., Normal Ave. from Lowell St. to
Windsor Ave., Waite Dr. from western city limit to High St., Massachusetts Ave. from
University Ave. to southern city limits - installation of new streetlights to bring
underground districts up to current city standards
Exempt Category: Safety - Lighting improvementsCapacity Status: NCI
Est Total Cost: $123
CONRWPEPRIORTOTAL 10/11 11/12 12/13 13/14 14/15
TransNet - L $63 $63 $63
TransNet - LSI $20 $20 $20 $60 $60
TOTAL $123 $83 $20 $20 $123
MPO ID:
Project Title: Traffic Signal Upgrades - Various
LAM22 ADOPTION: 10-00
Project Description:
TransNet - LSI: CR
Lake Murray @ El Paso, Lake Murray @ Baltimore - improve existing traffic signal and
intersection locations by providing safety improvements such as protected left turns,
overhead signals in lieu of island signals, and pedestrian ramps for improved
pedestrian access
Exempt Category: Other - Intersection signalization projectsCapacity Status: NCI
Est Total Cost: $470
CONRWPEPRIORTOTAL 10/11 11/12 12/13 13/14 14/15
TransNet - L $170 $20 $150 $170
TransNet - LSI $100 $100 $100 $30 $270 $300
TOTAL $470 $170 $100 $100 $100 $420 $50
51Page Thursday, July 8, 2010
55

San Diego Region (in $000s)DRAFT 2010 Regional Transportation Improvement Program
MPO ID:
Project Title: Pedestrian Ramps-Various
LAM23
La Mesa, City of
ADOPTION: 10-00
Project Description:
TransNet - LSI: Maint
Citywide - install pedestrian ramps in the sidewalk where there is no existing access,
in order to comply with the Americans with Disabilities Act
Exempt Category: Air Quality - Bicycle and pedestrian facilitiesCapacity Status: NCI
Est Total Cost: $408
CONRWPEPRIORTOTAL 10/11 11/12 12/13 13/14 14/15
TransNet - L $100 $100 $100
TransNet - LSI $58 $50 $50 $50 $50 $50 $308 $308
TOTAL $408 $158 $50 $50 $50 $50 $50 $408
MPO ID:
Project Title: Roadway Drainage Improvements
LAM24 ADOPTION: 10-00
Project Description:
TransNet - LSI: CR
Johnson St. from Garfield St. to 8975 Johnson St., Adams Avenue Drainage
improvement between Adams/Tower Avenues, Amaya Dr. from Water St to Primrose
Lane, Schuyler area - improvements to address inadequate street drainage by
constructing new or improving existing storm drain or surface improvements, reducing
congestion by improved vehicular and pedestrian flow all year around
Exempt Category: Safety - Pavement resurfacing and/or rehabilitationCapacity Status: NCI
Est Total Cost: $1,388
CONRWPEPRIORTOTAL 10/11 11/12 12/13 13/14 14/15
TransNet - L $160 $18 $142 $160
TransNet - LSI $528 $300 $100 $100 $100 $100 $100 $1,128 $1,228
TOTAL $1,388 $688 $300 $100 $100 $100 $100 $1,270 $118
MPO ID:
Project Title: Traffic Calming -Various
LAM25 ADOPTION: 10-00
Project Description:
TransNet - LSI: Maint
Citywide - implement traffic calming measures including signing and striping, speed
bumps and other similar measures
Exempt Category: Safety - Non signalization traffic control and operatngCapacity Status: NCI
Est Total Cost: $250
CONRWPEPRIORTOTAL 10/11 11/12 12/13 13/14 14/15
TransNet - L $100 $100 $100
TransNet - LSI $25 $25 $25 $25 $25 $25 $150 $150
TOTAL $250 $125 $25 $25 $25 $25 $25 $250
52Page Thursday, July 8, 2010
56

San Diego Region (in $000s)DRAFT 2010 Regional Transportation Improvement Program
MPO ID:
Project Title: Downtown Village Streetscape Improvement Project
LAM28
La Mesa, City of
ADOPTION: 10-00
Project Description:
TransNet - LSI: CR
La Mesa Blvd from Acacia Avenue to Grant Street - improvements to the downtown
village along La Mesa Boulevard inlcuding reconstruction of poor pavement sections,
replacement of pavement to accommodate alignment revisions/new medians/etc., new
curb & gutter to address alignment revisions and replace C&G in poor condition,
installation of new sidewalk to match alignment changes, replacement of sidewalk in
poor condition, lighting and landscape enhancements and replacement
Exempt Category: Other - Plantings, landscaping, etcCapacity Status: NCI
Est Total Cost: $991
CONRWPEPRIORTOTAL 10/11 11/12 12/13 13/14 14/15
TransNet - LSI Carry Over $991 $991 $991
TOTAL $991 $991 $991
53Page Thursday, July 8, 2010
57

San Diego Region (in $000s)DRAFT 2010 Regional Transportation Improvement Program
MPO ID:
Project Title: Bus Associated Capital Maintenance
NCTD01
North County Transit District
ADOPTION: 10-00
Project Description: NCTD service area - bus tire lease
Exempt Category: Mass Transit - Rehabilitation of transit vehiclesCapacity Status: NCI
Est Total Cost: $1,200
CONRWPEPRIORTOTAL 10/11 11/12 12/13 13/14 14/15
FTA 5307 $240 $240 $240 $240 $960 $960
Local Funds $60 $60 $60 $60 $240 $240
TOTAL $1,200 $300 $300 $300 $300 $1,200
MPO ID:
Project Title: Preventive Maintenance
NCTD02 ADOPTION: 10-00
Project Description: NCTD service area - fixed route, rail fleet and facility maintenance costs
Exempt Category: Mass Transit - Transit operating assistanceCapacity Status: NCI
Est Total Cost: $70,672
CONRWPEPRIORTOTAL 10/11 11/12 12/13 13/14 14/15
FTA 5307 $7,027 $7,408 $7,657 $7,777 $29,869 $29,869
FTA 5309 (FG) $6,280 $6,532 $6,793 $7,064 $26,669 $26,669
Local Funds $3,327 $3,485 $3,613 $3,710 $14,134 $14,134
TOTAL $70,672 $16,634 $17,425 $18,063 $18,551 $70,672
MPO ID:
Project Title: ADA Paratransit Services
NCTD03 ADOPTION: 10-00
Project Description: NCTD service area - operating cost associated with providing ADA/paratransit services
Exempt Category: Mass Transit - Transit operating assistanceCapacity Status: NCI
Est Total Cost: $13,260
CONRWPEPRIORTOTAL 10/11 11/12 12/13 13/14 14/15
FTA 5307 $1,500 $1,500 $1,500 $1,500 $6,000 $6,000
Local Funds $1,404 $1,495 $1,632 $1,711 $6,242 $6,242
TransNet - ADA $236 $245 $258 $279 $1,018 $1,018
TOTAL $13,260 $3,140 $3,240 $3,390 $3,490 $13,260
54Page Thursday, July 8, 2010
58

San Diego Region (in $000s)DRAFT 2010 Regional Transportation Improvement Program
MPO ID:
Project Title: Bus/ADA/ Revenue Vehicle Purchases & Related Equipment
NCTD05
North County Transit District
ADOPTION: 10-00
Project Description: NCTD service area - purchase replacement vehicles and related equipment; CNG
buses, ADA vans and shuttle vehicles
Exempt Category: Mass Transit - Purchase new buses and rail cars to
replace existing vehicles or minor expansions of fleet
Capacity Status: NCI
Est Total Cost: $34,580
CONRWPEPRIORTOTAL 10/11 11/12 12/13 13/14 14/15
FTA 5307 $9,243 $1,952 $2,415 $5,510 $19,120 $19,120
FTA 5311 $2,036 $2,036 $2,036
FTA Funds - AR-5311 $578 $578 $578
Local Funds $2,677 $488 $604 $1,378 $5,146 $5,146
TCRP $7,700 $7,700 $7,700
TOTAL $34,580 $22,234 $2,440 $3,019 $6,888 $34,580
MPO ID:
Project Title: Bus/Rail Support Equipment & Facility
NCTD06 ADOPTION: 10-00
Project Description: NCTD service area - facility and support equipment for fixed route and rail services
including radio equipment, buildings and structures, shop and garage equipment,
computer hardware & software, furnitures and fixtures, service vehicles and solar
installations
Exempt Category: Mass Transit - Purchase of office, shop and operating
equipment for existing facilities
Capacity Status: NCI
Est Total Cost: $5,618
CONRWPEPRIORTOTAL 10/11 11/12 12/13 13/14 14/15
FTA 5307 $1,329 $1,060 $1,253 $852 $4,494 $4,494
Local Funds $332 $265 $313 $213 $1,124 $1,124
TOTAL $5,618 $1,661 $1,325 $1,566 $1,065 $5,618
MPO ID:
Project Title: Oceanside to Escondido Rail Operations
NCTD16B ADOPTION: 10-00
Project Description: For Sprinter service - start-up operating cost; debt service payments on $34 million
COP's after construction is completed
Exempt Category: Mass Transit - Transit operating assistanceCapacity Status: NCI
Est Total Cost: $30,961
CONRWPEPRIORTOTAL 10/11 11/12 12/13 13/14 14/15
CMAQ $16,000 $16,000 $16,000
Local Funds $2,250 $2,250 $2,250
TransNet - TSI $2,945 $1,646 $2,720 $2,691 $2,709 $12,711 $12,711
TOTAL $30,961 $21,195 $1,646 $2,720 $2,691 $2,709 $30,961
55Page Thursday, July 8, 2010
59

San Diego Region (in $000s)DRAFT 2010 Regional Transportation Improvement Program
MPO ID:
Project Title: Rail - ROW Improvements
NCTD18
North County Transit District
ADOPTION: 10-00
Project Description: NCTD service area - cross-tie renewal program, street cross protection, rail structure
rehabilitation, rail replacement, storage tracks, rail lubricators, at-grade crossing
renewal, turnout renewal, other misc. improvements
Exempt Category: Mass Transit - Track rehabilitation in existing right of wayCapacity Status: NCI
Est Total Cost: $17,152
CONRWPEPRIORTOTAL 10/11 11/12 12/13 13/14 14/15
FTA 5307 $7,277 $650 $787 $798 $798 $10,310 $10,310
FTA 5309 (FG) $621 $621 $621
FTA Funds - AR-5307 $570 $570 $570
FTA Funds - AR-5309 $862 $862 $862
Local Funds $1,780 $163 $197 $200 $200 $2,538 $2,538
TransNet - Transit $2,251 $2,251 $2,251
TOTAL $17,152 $13,361 $813 $984 $998 $998 $17,152
MPO ID:
Project Title: Rail Vehicles & Related Equipment
NCTD20 ADOPTION: 10-00
Project Description: NCTD service area - locomotive purchase/overhaul, revenue vehicles, misc. support
equipment including vehicles, spare components and signal equipment
upgrade/replacement and PTC
Exempt Category: Mass Transit - Purchase new buses and rail cars to
replace existing vehicles or minor expansions of fleet
Capacity Status: NCI
Est Total Cost: $74,363
CONRWPEPRIORTOTAL 10/11 11/12 12/13 13/14 14/15
FTA 5307 $5,839 $4,429 $418 $420 $418 $11,524 $11,524
FTA 5309 (FG) $476 $476 $476
Local Funds $1,479 $247 $244 $902 $105 $2,976 $2,976
PTMISEA (Prop1B) $6,170 $6,170 $6,170
Prop 1A - High Speed Rail $8,500 $14,000 $11,010 $8,333 $41,843 $41,843
STA $452 $1,003 $1,454 $1,454
STIP-IIP PTA $1,000 $500 $500 $1,000
TCRP $129 $129 $129
TransNet - MC $4,000 $4,000 $4,000
TransNet - Transit (Cash) $1,349 $1,349 $1,349
Transit Sec Grant Prg (Prop1B) $860 $860 $860 $860 $3,442 $3,442
TOTAL $74,363 $20,084 $24,539 $18,702 $10,515 $523 $73,863 $500
56Page Thursday, July 8, 2010
60

San Diego Region (in $000s)DRAFT 2010 Regional Transportation Improvement Program
MPO ID:
Project Title: Planning
NCTD29
North County Transit District
ADOPTION: 10-00
Project Description: NCTD Service area - local short range and other transit planning studies
Exempt Category: Other - Non construction related activitiesCapacity Status: NCI
Est Total Cost: $1,000
CONRWPEPRIORTOTAL 10/11 11/12 12/13 13/14 14/15
FTA 5307 $200 $200 $200 $200 $800 $800
Local Funds $50 $50 $50 $50 $200 $200
TOTAL $1,000 $250 $250 $250 $250 $1,000
MPO ID:
Project Title: Expanded Transit Service
NCTD34 ADOPTION: 10-00
Project Description: NCTD service area - operating support for existing fixed route and rail transit service,
including intercity bus and rural services
Exempt Category: Mass Transit - Transit operating assistanceCapacity Status: NCI
Est Total Cost: $125,562
CONRWPEPRIORTOTAL 10/11 11/12 12/13 13/14 14/15
FTA 5311 $349 $359 $370 $381 $1,459 $1,459
Local Funds $21,650 $22,780 $24,777 $26,254 $95,462 $95,462
TransNet - TSI $7,270 $6,517 $7,046 $7,808 $28,641 $28,641
TOTAL $125,562 $29,269 $29,656 $32,193 $34,443 $125,562
MPO ID:
Project Title: Rail Station Improvements
NCTD40 ADOPTION: 10-00
Project Description: NCTD service area - Coaster & Sprinter station improvements including platform
extension; Convention Center/Padres stadium design; information display panel;
electronic signage
Exempt Category: Mass Transit - Reconstruction or renovation of transit
structures
Capacity Status: NCI
Est Total Cost: $3,039
CONRWPEPRIORTOTAL 10/11 11/12 12/13 13/14 14/15
FTA 5307 $589 $200 $200 $257 $200 $1,446 $1,446
Local Funds $149 $50 $50 $64 $50 $363 $363
TransNet - MC $1,230 $1,230 $1,230
TOTAL $3,039 $1,968 $250 $250 $321 $250 $3,039
57Page Thursday, July 8, 2010
61

San Diego Region (in $000s)DRAFT 2010 Regional Transportation Improvement Program
MPO ID:
Project Title: Bridge & Infrastructure Program. NCTD
NCTD42
North County Transit District
ADOPTION: 10-00
Project Description: Along coastal ROW from Orange County Line to downtown station at Santa Fe Depot
and along inland ROW from Oceanside Transit Center (Oceanside, CA) to Escondido
Transit Center (Escondido, CA). - bridges & other infrastructure improvements along
rail ROW to be implemented by NCTD
Exempt Category: Safety - Railroad/highway crossingCapacity Status: NCI
Est Total Cost: $40,351
CONRWPEPRIORTOTAL 10/11 11/12 12/13 13/14 14/15
FTA 5307 $2,840 $4,000 $6,632 $2,220 $15,692 $15,692
FTA 5309 (FG) $16,568 $3,120 $13,448 $16,568
Local Funds $4,878 $780 $4,098 $4,878
STA $1,000 $1,658 $555 $3,213 $3,213
TOTAL $40,351 $24,286 $5,000 $8,290 $2,775 $36,451 $3,900
58Page Thursday, July 8, 2010
62

San Diego Region (in $000s)DRAFT 2010 Regional Transportation Improvement Program
MPO ID:
Project Title: Melrose Drive Extension
O06
Oceanside, City of
ADOPTION: 10-00
Project Description:
RAS (TA 7-45)
TransNet - LSI: CRMelrose Drive from North Santa Fe Avenue to Spur Avenue - in Oceanside, future
construction of 4-lane arterial highway with medians, sidewalks and bike lanes
Exempt Category: Non-ExemptCapacity Status: CI
Est Total Cost: $13,025 Open to Traffic: Dec 2018
CONRWPEPRIORTOTAL 10/11 11/12 12/13 13/14 14/15
Local Funds $1,000 $1,000 $1,000
Local RTCIP $3,000 $4,000 $4,000 $3,000 $8,000 $11,000
TransNet - L $1,000 $1,000 $1,000
TransNet - L Carry Over $25 $25 $25
TOTAL $13,025 $1,000 $1,025 $3,000 $4,000 $4,000 $8,000 $5,025
MPO ID:
Project Title: El Camino Real Bridge
O09 ADOPTION: 10-00
Project Description: At SR 78 - reconstruct to accommodate increased lane/shoulder width - Design Phase
Exempt Category: Safety - Non capacity widening or bridge reconstructionCapacity Status: NCI
Est Total Cost: $1,397
CONRWPEPRIORTOTAL 10/11 11/12 12/13 13/14 14/15
Local Funds $275 $275 $275
Local RTCIP $250 $250 $250
TransNet - L $872 $872 $872
TOTAL $1,397 $1,147 $250 $1,397
MPO ID:
Project Title: Bridge Rehabilitation
O14 ADOPTION: 10-00
Project Description: North Coast Highway bridge over the San Luis Rey River, Douglas Drive bridge over the
San Luis Rey River - seismic retrofit of highway bridges over the San Luis Rey River
Exempt Category: Safety - Non capacity widening or bridge reconstructionCapacity Status: NCI
Est Total Cost: $3,900
CONRWPEPRIORTOTAL 10/11 11/12 12/13 13/14 14/15
Local Funds $50 $50 $50
TransNet - L $3,850 $3,850 $3,850
TOTAL $3,900 $3,850 $50 $3,900
59Page Thursday, July 8, 2010
63

San Diego Region (in $000s)DRAFT 2010 Regional Transportation Improvement Program
MPO ID:
Project Title: Loma Alta Creek/Sprinter Detention Basin
O17
Oceanside, City of
ADOPTION: 10-00
Project Description:
TransNet - LSI: CR
Loma Alta Creek and Sprinter right-of-way east of El Camino Real and east of Rancho
del Oro Blvd. - construction of flood control walls
Exempt Category: Mass Transit - Track rehabilitation in existing right of wayCapacity Status: NCI
Est Total Cost: $10,200
CONRWPEPRIORTOTAL 10/11 11/12 12/13 13/14 14/15
TransNet - L $7,000 $7,000 $7,000
TransNet - L Carry Over $700 $700 $700
TransNet - LSI Carry Over $2,000 $500 $2,500 $2,500
TOTAL $10,200 $7,000 $700 $2,000 $500 $10,200
MPO ID:
Project Title: Neighborhood Sidewalk/ADA/Traffic Improvements
O18 ADOPTION: 10-00
Project Description:
TransNet - LSI: Maint
Citywide - in Oceanside, slurry sealing of streets, completion of missing segments of
sidewalks, new access ramps and shoulder improvements for pedestrian accessibility
and road safety, parkway trees, streetlights
Exempt Category: Safety - Pavement resurfacing and/or rehabilitationCapacity Status: NCI
Est Total Cost: $7,550
CONRWPEPRIORTOTAL 10/11 11/12 12/13 13/14 14/15
TransNet - L $1,150 $1,150 $1,150
TransNet - L (Cash) $600 $600 $600
TransNet - LSI $500 $1,000 $1,000 $1,000 $1,100 $4,600 $4,600
TransNet - LSI Carry Over $1,200 $1,200 $1,200
TOTAL $7,550 $1,750 $1,700 $1,000 $1,000 $1,000 $1,100 $7,550
MPO ID:
Project Title: Oceanside Boulevard Bus Stop ADA Upgrades
O20 ADOPTION: 10-00
Project Description:
RAS (TA 7-45)
Oceanside Boulevard from I-5 to El Camino Real - acquire right-of-way and construct
wider sidewalk and bus stop waiting pads to allow NCTD buses to deploy wheelchair
lifts
Exempt Category: Mass Transit - Construction of small passenger
shelters and information kiosks
Capacity Status: NCI
Est Total Cost: $180
CONRWPEPRIORTOTAL 10/11 11/12 12/13 13/14 14/15
TransNet - LSI Carry Over $180 $50 $50 $80 $180
TOTAL $180 $180 $50 $80 $50
60Page Thursday, July 8, 2010
64
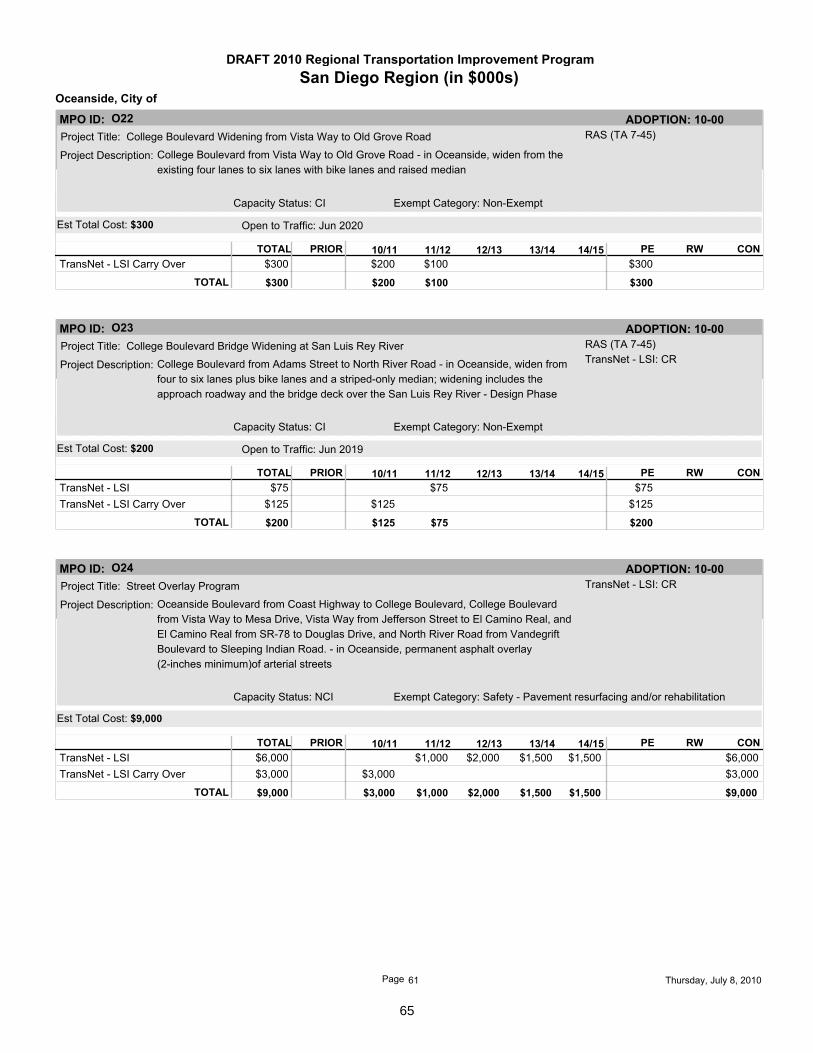
San Diego Region (in $000s)DRAFT 2010 Regional Transportation Improvement Program
MPO ID:
Project Title: College Boulevard Widening from Vista Way to Old Grove Road
O22
Oceanside, City of
ADOPTION: 10-00
Project Description:
RAS (TA 7-45)
College Boulevard from Vista Way to Old Grove Road - in Oceanside, widen from the
existing four lanes to six lanes with bike lanes and raised median
Exempt Category: Non-ExemptCapacity Status: CI
Est Total Cost: $300 Open to Traffic: Jun 2020
CONRWPEPRIORTOTAL 10/11 11/12 12/13 13/14 14/15
TransNet - LSI Carry Over $200 $100 $300 $300
TOTAL $300 $200 $100 $300
MPO ID:
Project Title: College Boulevard Bridge Widening at San Luis Rey River
O23 ADOPTION: 10-00
Project Description:
RAS (TA 7-45)
TransNet - LSI: CRCollege Boulevard from Adams Street to North River Road - in Oceanside, widen from
four to six lanes plus bike lanes and a striped-only median; widening includes the
approach roadway and the bridge deck over the San Luis Rey River - Design Phase
Exempt Category: Non-ExemptCapacity Status: CI
Est Total Cost: $200 Open to Traffic: Jun 2019
CONRWPEPRIORTOTAL 10/11 11/12 12/13 13/14 14/15
TransNet - LSI $75 $75 $75
TransNet - LSI Carry Over $125 $125 $125
TOTAL $200 $125 $75 $200
MPO ID:
Project Title: Street Overlay Program
O24 ADOPTION: 10-00
Project Description:
TransNet - LSI: CR
Oceanside Boulevard from Coast Highway to College Boulevard, College Boulevard
from Vista Way to Mesa Drive, Vista Way from Jefferson Street to El Camino Real, and
El Camino Real from SR-78 to Douglas Drive, and North River Road from Vandegrift
Boulevard to Sleeping Indian Road. - in Oceanside, permanent asphalt overlay
(2-inches minimum)of arterial streets
Exempt Category: Safety - Pavement resurfacing and/or rehabilitationCapacity Status: NCI
Est Total Cost: $9,000
CONRWPEPRIORTOTAL 10/11 11/12 12/13 13/14 14/15
TransNet - LSI $1,000 $2,000 $1,500 $1,500 $6,000 $6,000
TransNet - LSI Carry Over $3,000 $3,000 $3,000
TOTAL $9,000 $3,000 $1,000 $2,000 $1,500 $1,500 $9,000
61Page Thursday, July 8, 2010
65

San Diego Region (in $000s)DRAFT 2010 Regional Transportation Improvement Program
MPO ID:
Project Title: Traffic Management Center and Adaptive Traffic Signals
O25
Oceanside, City of
ADOPTION: 10-00
Project Description:
TransNet - LSI: CR
College Boulevard and El Camino Real, College Boulevard and SR-78, El Camino
Real and SR-78, Oceanside Boulevard and El Camino Real, College Boulevard and
North River Road, Mission Avenue and El Camino Real, Coast Highway and Mission
Avenue, Coast Highway and Oceanside Boulevard - in the City of Oceanside,
installation of a new traffic management center (TMC) to conduct real time traffic
monitoring and demand-based adaptive control of traffic signals
Exempt Category: Other - Traffic signal synchronization projectsCapacity Status: NCI
Est Total Cost: $1,850
CONRWPEPRIORTOTAL 10/11 11/12 12/13 13/14 14/15
Other Fed - Economy Recovery $200 $200 $200
TransNet - LSI $400 $400 $400 $1,200 $1,200
TransNet - LSI Carry Over $450 $450 $450
TOTAL $1,850 $650 $400 $400 $400 $1,850
MPO ID:
Project Title: SR76 Widening at Rancho del Oro Boulevard
O26 ADOPTION: 10-00
Project Description:
RAS (TA 7-45)
TransNet - LSI: CRFrom W. of Rancho del Oro to East of Rancho del Oro - widen SR76 for one additional
lane width 1500 feet west and east of Rancho del Oro Boulevard
Exempt Category: Non-ExemptCapacity Status: CI
Est Total Cost: $3,100 Open to Traffic: Dec 2017
CONRWPEPRIORTOTAL 10/11 11/12 12/13 13/14 14/15
TransNet - LSI $250 $1,000 $1,600 $250 $2,600 $2,850
TransNet - LSI Carry Over $250 $250 $250
TOTAL $3,100 $250 $250 $1,000 $1,600 $2,600 $500
MPO ID:
Project Title: Coast Highway and SR-76 Roundabout
O27 ADOPTION: 10-00
Project Description:
TransNet - LSI: CR
North Coast Highway from SR-76 to SR-76 - in Oceanside, construction of a traffic
circle at the intersection of North Coast Highway and State Route 76. The traffic circle
will be unsignalized; free traffic flow at all approaches
Exempt Category: Non-ExemptCapacity Status: CI
Est Total Cost: $1,050 Open to Traffic: Jun 2016
CONRWPEPRIORTOTAL 10/11 11/12 12/13 13/14 14/15
Local Funds $1,000 $1,000 $1,000
TransNet - LSI $50 $50 $50
TOTAL $1,050 $50 $1,000 $1,000 $50
62Page Thursday, July 8, 2010
66
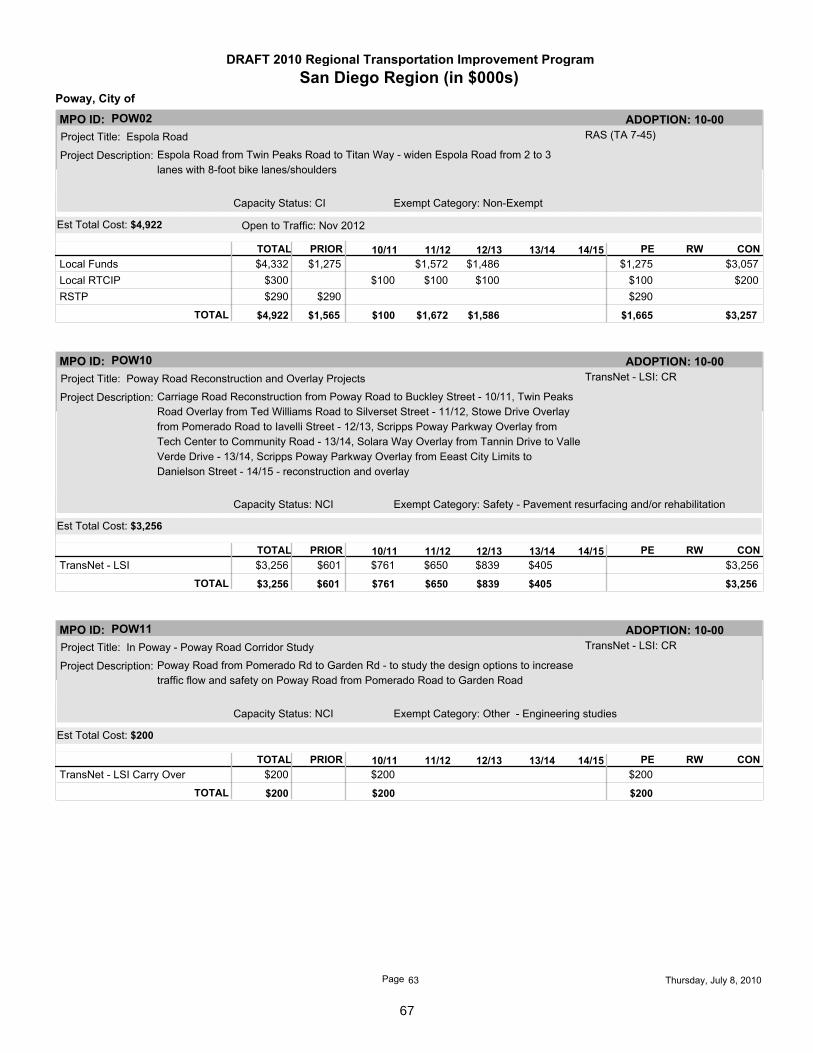
San Diego Region (in $000s)DRAFT 2010 Regional Transportation Improvement Program
MPO ID:
Project Title: Espola Road
POW02
Poway, City of
ADOPTION: 10-00
Project Description:
RAS (TA 7-45)
Espola Road from Twin Peaks Road to Titan Way - widen Espola Road from 2 to 3
lanes with 8-foot bike lanes/shoulders
Exempt Category: Non-ExemptCapacity Status: CI
Est Total Cost: $4,922 Open to Traffic: Nov 2012
CONRWPEPRIORTOTAL 10/11 11/12 12/13 13/14 14/15
Local Funds $1,275 $1,572 $1,486 $1,275 $3,057 $4,332
Local RTCIP $100 $100 $100 $100 $200 $300
RSTP $290 $290 $290
TOTAL $4,922 $1,565 $100 $1,672 $1,586 $3,257 $1,665
MPO ID:
Project Title: Poway Road Reconstruction and Overlay Projects
POW10 ADOPTION: 10-00
Project Description:
TransNet - LSI: CR
Carriage Road Reconstruction from Poway Road to Buckley Street - 10/11, Twin Peaks
Road Overlay from Ted Williams Road to Silverset Street - 11/12, Stowe Drive Overlay
from Pomerado Road to Iavelli Street - 12/13, Scripps Poway Parkway Overlay from
Tech Center to Community Road - 13/14, Solara Way Overlay from Tannin Drive to Valle
Verde Drive - 13/14, Scripps Poway Parkway Overlay from Eeast City Limits to
Danielson Street - 14/15 - reconstruction and overlay
Exempt Category: Safety - Pavement resurfacing and/or rehabilitationCapacity Status: NCI
Est Total Cost: $3,256
CONRWPEPRIORTOTAL 10/11 11/12 12/13 13/14 14/15
TransNet - LSI $601 $761 $650 $839 $405 $3,256 $3,256
TOTAL $3,256 $601 $761 $650 $839 $405 $3,256
MPO ID:
Project Title: In Poway - Poway Road Corridor Study
POW11 ADOPTION: 10-00
Project Description:
TransNet - LSI: CR
Poway Road from Pomerado Rd to Garden Rd - to study the design options to increase
traffic flow and safety on Poway Road from Pomerado Road to Garden Road
Exempt Category: Other - Engineering studiesCapacity Status: NCI
Est Total Cost: $200
CONRWPEPRIORTOTAL 10/11 11/12 12/13 13/14 14/15
TransNet - LSI Carry Over $200 $200 $200
TOTAL $200 $200 $200
63Page Thursday, July 8, 2010
67

San Diego Region (in $000s)DRAFT 2010 Regional Transportation Improvement Program
MPO ID:
Project Title: Intersection Improvement Projects
POW12
Poway, City of
ADOPTION: 10-00
Project Description:
TransNet - LSI: CR
Poway Rd from Millards Rd to Millards Rd - redesign intersection to increase traffic flow
and safety
Exempt Category: Other - Intersection channelization projectsCapacity Status: NCI
Est Total Cost: $250
CONRWPEPRIORTOTAL 10/11 11/12 12/13 13/14 14/15
TransNet - LSI $250 $40 $210 $250
TOTAL $250 $250 $210 $40
MPO ID:
Project Title: Intersection Signalization Projects
POW13 ADOPTION: 10-00
Project Description:
TransNet - LSI: CR
Intersections of Stowe Drive and Danielson Street (11/12) and Kirkham Drive and
Community Road (13/14) - signalization of intersections
Exempt Category: Other - Intersection signalization projectsCapacity Status: NCI
Est Total Cost: $430
CONRWPEPRIORTOTAL 10/11 11/12 12/13 13/14 14/15
TransNet - LSI $180 $250 $90 $340 $430
TOTAL $430 $180 $250 $340 $90
MPO ID:
Project Title: Poway Annual Street Maintenance Program
POW14 ADOPTION: 10-00
Project Description:
TransNet - LSI: Maint
Zone 1 - 10/11, Zone 2 - 11/12, Zone 3 - 12/13, Zone 4 - 13/14, Zone 5 - 14/15 - street
resurfacing and rehabilitation of the local City streets by maintenance zones
Exempt Category: Safety - Pavement resurfacing and/or rehabilitationCapacity Status: NCI
Est Total Cost: $1,811
CONRWPEPRIORTOTAL 10/11 11/12 12/13 13/14 14/15
TransNet - LSI $330 $310 $360 $388 $413 $1,801 $1,801
TransNet - LSI Carry Over $10 $10 $10
TOTAL $1,811 $340 $310 $360 $388 $413 $1,811
64Page Thursday, July 8, 2010
68

San Diego Region (in $000s)DRAFT 2010 Regional Transportation Improvement Program
MPO ID:
Project Title: Freeway Service Patrol
SAN03A
San Diego Association of Governments
ADOPTION: 10-00
Project Description: Countywide - provides rapid removal of disabled vehicles; joint project between
SANDAG, Caltrans and CHP to alleviate traffic congestion associated with
non-recurring incidents
Exempt Category: Safety - Non signalization traffic control and operatngCapacity Status: NCI
Est Total Cost: $17,903
CONRWPEPRIORTOTAL 10/11 11/12 12/13 13/14 14/15
FSP $2,483 $2,895 $2,895 $2,895 $2,895 $14,063 $14,063
Local Funds $325 $325 $325
RSTP $621 $723 $723 $724 $724 $3,515 $3,515
TOTAL $17,903 $3,429 $3,618 $3,618 $3,619 $3,619 $17,903
MPO ID:
Project Title: I-15 FasTrak
SAN04 ADOPTION: 10-00
Project Description:
RTP PG NO: A-5
SANDAG ID: 1201504From SR 163 to SR 78 - implementation and expansion of FasTrak system along I-15
corridor
Exempt Category: Safety - Non signalization traffic control and operatngCapacity Status: NCIRT:15
Est Total Cost: $25,464
CONRWPEPRIORTOTAL 10/11 11/12 12/13 13/14 14/15
CMAQ $234 $234 $234
Local Funds $17 $17 $17
RSTP $250 $250 $250
Toll - Managed Lanes $120 $120 $120
TransNet - MC $17,838 $2,445 $1,688 $1,266 $5,022 $18,215 $23,237
Value Pricing Program $1,606 $1,606 $1,606
TOTAL $25,464 $20,065 $2,445 $1,688 $1,266 $18,215 $7,249
MPO ID:
Project Title: Plan, Program & Monitor
SAN07A ADOPTION: 10-00
Project Description:
SANDAG ID: 11091
Regionwide - planning, programming and monitoring activities related to transportation
funding
Exempt Category: Other - Non construction related activitiesCapacity Status: NCI
Est Total Cost: $3,771
CONRWPEPRIORTOTAL 10/11 11/12 12/13 13/14 14/15
STIP-RIP State Cash $2,115 $705 $317 $317 $317 $3,771 $3,771
TOTAL $3,771 $2,115 $705 $317 $317 $317 $3,771
65Page Thursday, July 8, 2010
69

San Diego Region (in $000s)DRAFT 2010 Regional Transportation Improvement Program
MPO ID:
Project Title: Regional Rideshare Program
SAN11A
San Diego Association of Governments
ADOPTION: 10-00
Project Description:
SANDAG ID: 60001
Countywide - Component of overall regional Transportation Demand Management
Exempt Category: Air Quality - Ride-sharing and van-pooling programCapacity Status: NCI
Est Total Cost: $19,685
CONRWPEPRIORTOTAL 10/11 11/12 12/13 13/14 14/15
CMAQ $4,031 $4,283 $5,547 $5,824 $19,685 $19,685
TOTAL $19,685 $4,031 $4,283 $5,547 $5,824 $19,685
MPO ID:
Project Title: Joint Transit Operations Center
SAN13 ADOPTION: 10-00
Project Description:
SANDAG ID: 1142600
EARMARK NO:
E2008-BUSP-0111Regionwide - operations facility/control center to coordinate and integrate several ITS
deployments; part of ITS regional architecture
Exempt Category: Mass Transit - Construction or renovation of power,
signal, and communications systems
Capacity Status: NCI
Est Total Cost: $2,631
CONRWPEPRIORTOTAL 10/11 11/12 12/13 13/14 14/15
FTA 5309 (Bus) $1,668 $1,668 $1,668
TransNet - H $15 $948 $963 $963
TOTAL $2,631 $1,668 $15 $948 $2,631
MPO ID:
Project Title: GARVEE Debt Service
SAN19 ADOPTION: 10-00
Project Description:
RTP PG NO: A-5
From SR 56 to Centre City Pkwy - Debt service for issue of GARVEE bonds for the I-15
ML (CAL18) project
Exempt Category: Other - Non construction related activitiesCapacity Status: NCIRT:15
Est Total Cost: $238,283
CONRWPEPRIORTOTAL 10/11 11/12 12/13 13/14 14/15
STIP-IIP NHS GARVEE $31,987 $5,459 $5,459 $5,459 $5,459 $5,459 $59,282 $59,282
STIP-RIP NHS GARVEE $97,121 $16,376 $16,376 $16,376 $16,376 $16,376 $179,001 $179,001
TOTAL $238,283 $129,108 $21,835 $21,835 $21,835 $21,835 $21,835 $238,283
66Page Thursday, July 8, 2010
70

San Diego Region (in $000s)DRAFT 2010 Regional Transportation Improvement Program
MPO ID:
Project Title: Grouped Projects for Bicycle and Pedestrian Facilities
SAN21
San Diego Association of Governments
ADOPTION: 10-00
Project Description: Projects are consistent with 40 CFR Part 93.126 Exempt Table 2 categories - bicycle
and pedestrian facilities (both motorized and non-motorized)
Exempt Category: Air Quality - Bicycle and pedestrian facilitiesCapacity Status: NCI
Est Total Cost: $18,331
CONRWPEPRIORTOTAL 10/11 11/12 12/13 13/14 14/15
Local Funds $9,144 $755 $1,750 $8,149 $9,899
TDA - Bicycles $4,436 $116 $1,090 $3,462 $4,552
TransNet - B $1,449 $347 $75 $1,720 $1,795
TransNet - BPNS $873 $847 $1,719 $1,719
TransNet - L (Cash) $16 $14 $2 $16
TransNet - LSI $250 $250 $250
TransNet - LSI Carry Over $100 $100 $100
TOTAL $18,331 $15,902 $2,431 $15,402 $2,929
MPO ID:
Project Title: Mid-Coast Corridor Project
SAN23 ADOPTION: 10-00
Project Description:
PPNO: 7307
RTP PG NO: A-5
SANDAG ID: 1041501From Old Town Transit Center to University City - 11-mile trolley line with new transit
stations proposed at Tecolote Road, Clairemont Drive, Balboa Avenue, University
Center Lanes, UCSD West, UCSD East, Executive Drive, and the UTC transit center
Exempt Category: Non-ExemptCapacity Status: CI
Est Total Cost: $1,246,292 Open to Traffic: Dec 2014
CONRWPEPRIORTOTAL 10/11 11/12 12/13 13/14 14/15
FTA 5307 $519 $519 $519
FTA 5309 (NS) $14,640 $14,640 $14,640
PTA $537 $537 $537
STIP-RIP PTA $28,756 $28,756 $28,756
STIP-RIP State Cash $4,000 $4,000 $4,000
TCRP $10,000 $10,000 $10,000
TransNet - MC $14,747 $39 $255,980 $164,879 $141,783 $14,786 $562,642 $577,428
TransNet - Transit $660 $660 $660
TOTAL $636,540 $30,356 $14,747 $28,795 $255,980 $164,879 $141,783 $562,642 $73,898
Total cost assumes Full Funding Grant Agreement with FTA*
67Page Thursday, July 8, 2010
71

San Diego Region (in $000s)DRAFT 2010 Regional Transportation Improvement Program
MPO ID:
Project Title: I-15 BRT Transit Stations @Rancho Bernardo, Sabre Springs, and Del Lago
SAN26
San Diego Association of Governments
ADOPTION: 10-00
Project Description:
RTP PG NO: A-5
SANDAG ID: 1201505From SR 163 to SR 78 - construct transit stations along the at Del Lago, Rancho
Bernardo Road, and Sabre Springs Parkway for I-15 BRT service including surface
parking, bus staging, bike lockers and station amenities
Exempt Category: Non-ExemptCapacity Status: CI
Est Total Cost: $46,170 Open to Traffic: Mar 2009
CONRWPEPRIORTOTAL 10/11 11/12 12/13 13/14 14/15
CMAQ $12,012 $12,012 $12,012
FTA 5309 (Bus) $2,788 $2,788 $2,788
STIP-RIP PTA $7,327 $7,327 $7,327
TCRP $5,716 $5,716 $5,716
TransNet - MC $4,273 $4,058 $2,210 $686 $11,227 $11,227
TransNet - Transit $7,100 $7,100 $7,100
TOTAL $46,170 $39,216 $4,058 $2,210 $686 $5,716 $40,454
MPO ID:
Project Title: I-15 BRT Operations and Vehicles
SAN26A ADOPTION: 10-00
Project Description:
SANDAG ID: 1201508
From Escondido to San Diego - planning, operations and vehicle acquisition for the
BRT service along I-15 corridor
Exempt Category: Non-ExemptCapacity Status: CI
Est Total Cost: $34,470 Open to Traffic: Dec 2012
CONRWPEPRIORTOTAL 10/11 11/12 12/13 13/14 14/15
CMAQ $10,120 $10,120 $10,120
Local Funds $36 $36 $36
TransNet - MC $1,576 $7,283 $14,673 $425 $357 $1,576 $22,738 $24,314
TOTAL $34,470 $11,732 $7,283 $14,673 $425 $357 $32,858 $1,612
MPO ID:
Project Title: Transit Stations Upgrades
SAN26B ADOPTION: 10-00
Project Description:
SANDAG ID: 1201509
Broadway corridor, Kettner and India Streets - upgrade transit stations in downtown
San Diego for BRT services
Exempt Category: Non-ExemptCapacity Status: CI
Est Total Cost: $9,154 Open to Traffic: Mar 2012
CONRWPEPRIORTOTAL 10/11 11/12 12/13 13/14 14/15
TransNet - MC $633 $3,830 $4,691 $1,400 $803 $6,951 $9,154
TOTAL $9,154 $633 $3,830 $4,691 $803 $6,951 $1,400
68Page Thursday, July 8, 2010
72

San Diego Region (in $000s)DRAFT 2010 Regional Transportation Improvement Program
MPO ID:
Project Title: I-15 BRT Mid-City In-Line Bus Rapid Transit Stations
SAN26C
San Diego Association of Governments
ADOPTION: 10-00
Project Description:
SANDAG ID: 1201507
At University Avenue and at El Cajon Blvd. (mid-city area of San Diego) - construct
transit stations
Exempt Category: Mass Transit - Reconstruction or renovation of transit
structures
Capacity Status: NCI
Est Total Cost: $21,450
CONRWPEPRIORTOTAL 10/11 11/12 12/13 13/14 14/15
TransNet - MC $1,303 $1,862 $1,674 $6,046 $10,410 $155 $6,372 $52 $15,026 $21,450
TOTAL $21,450 $1,303 $1,862 $1,674 $6,046 $10,410 $155 $52 $15,026 $6,372
MPO ID:
Project Title: San Ysidro Intermodal Freight Facility/South Line Rail
SAN27 ADOPTION: 10-00
Project Description:
RTP PG NO: A-5
SANDAG ID: 1300601, 1300602From Commercial St. to International Border - SD&AE freight facility and South Line
Mainline in San Ysidro - environmental studies, design, site planning, and construction
for an international freight facility; signal installation for the track and rail cars
Exempt Category: Mass Transit - Track rehabilitation in existing right of wayCapacity Status: NCI
Est Total Cost: $149,090
CONRWPEPRIORTOTAL 10/11 11/12 12/13 13/14 14/15
CBI $600 $600 $600
DEMO - TEA 21 $9,980 $2,055 $7,925 $9,980
Local Funds $320 $320 $320
Trade Corridor Program $107,360 $107,360 $107,360
Trade Corridor Program Conversion $16,600 $16,600 $16,600
TransNet - Border $1,725 $5,900 $3,888 $500 $700 $1,517 $14,230 $14,230
TransNet - MC AC $1,700 $14,900 $(16,600)$0
TOTAL $149,090 $14,325 $20,800 $111,248 $500 $700 $1,517 $7,925 $123,960 $17,205
MPO ID:
Project Title: Del Mar Bluff Stabilization
SAN28 ADOPTION: 10-00
Project Description:
EA NO: R550SB
PPNO: 7300
SANDAG ID: 1143000From MP 244.1 in Del Mar to MP 245.7 in Del Mar - stabilize bluff areas
Exempt Category: Mass Transit - Track rehabilitation in existing right of wayCapacity Status: NCI
Est Total Cost: $14,237
CONRWPEPRIORTOTAL 10/11 11/12 12/13 13/14 14/15
FTA 5309 (NS) $4,386 $405 $3,981 $4,386
STIP-GF IIP State Cash $4,500 $4,500 $4,500
STIP-IIP PTA $1,200 $3,397 $1,200 $3,397 $4,597
STIP-IIP State Cash $754 $754 $754
TOTAL $14,237 $10,840 $3,397 $12,632 $1,605
69Page Thursday, July 8, 2010
73

San Diego Region (in $000s)DRAFT 2010 Regional Transportation Improvement Program
MPO ID:
Project Title: Sorrento to Miramar Double Track/Realign
SAN29
San Diego Association of Governments
ADOPTION: 10-00
Project Description:
EA NO: R690SA
PPNO: 7301
RTP PG NO: A-5
SANDAG ID: 1142200, 1239801
Phase 1: CP Pines (MP 249,8) to CP Miramar (MP 251), Phase 2: CP Miramar (MP 251)
to CP Cumbres (MP 252.9) - realign curve and construct second main track; fully funds
PE and design for both Phase 1 and Phase 2; construction for Phase 1 only
Exempt Category: Mass Transit - Track rehabilitation in existing right of wayCapacity Status: NCI
Est Total Cost: $26,800
CONRWPEPRIORTOTAL 10/11 11/12 12/13 13/14 14/15
STIP-IIP PTA $3,900 $3,900 $3,900
STIP-IIP State Cash $1,300 $1,300 $1,300
Trade Corridor Program $10,800 $10,800 $10,800
TransNet - MC $371 $1,090 $540 $7,669 $1,130 $2,381 $8,419 $10,800
TOTAL $26,800 $5,571 $11,890 $540 $7,669 $1,130 $19,219 $7,581
MPO ID:
Project Title: Metropolitan Planning
SAN40 ADOPTION: 10-00
Project Description: Region-wide - ongoing regional transportation planning
Exempt Category: Other - Non construction related activitiesCapacity Status: NCI
Est Total Cost: $16,249
CONRWPEPRIORTOTAL 10/11 11/12 12/13 13/14 14/15
FTA 5307 $873 $873 $873
Local Funds $194 $218 $412 $412
TOTAL $1,285 $194 $1,091 $1,285
MPO ID:
Project Title: Super Loop
SAN46 ADOPTION: 10-00
Project Description:
RTP PG NO: A-5
SANDAG ID: 1041502University City in San Diego - design and construction of transit priority treatments, que
jumper lanes, street modifications, new and modified transit stations, and acquisition
of 12 expansion shuttles
Exempt Category: Non-ExemptCapacity Status: CI
Est Total Cost: $36,349 Open to Traffic: Jun 2009
CONRWPEPRIORTOTAL 10/11 11/12 12/13 13/14 14/15
FTA 5309 (NS) $617 $617 $617
TransNet - MC $13,023 $12,923 $9,088 $6,873 $752 $27,408 $35,033
TransNet - Transit $699 $699 $699
TOTAL $36,349 $14,339 $12,923 $9,088 $752 $27,408 $8,189
70Page Thursday, July 8, 2010
74
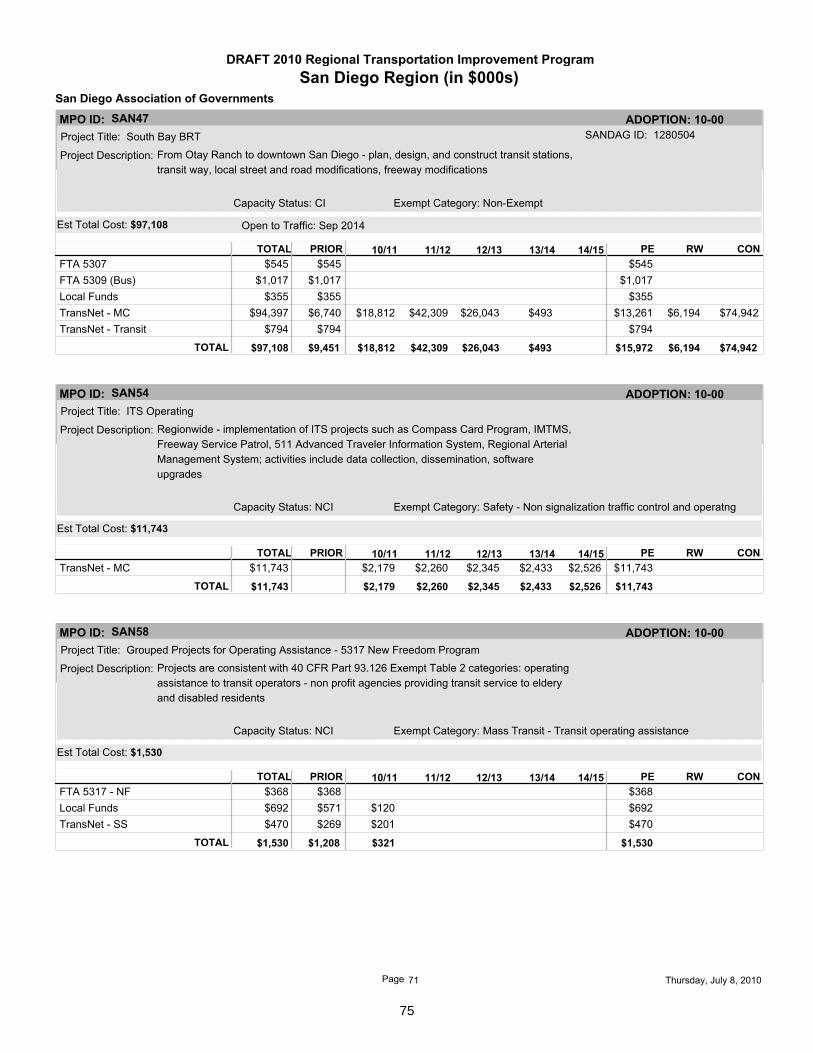
San Diego Region (in $000s)DRAFT 2010 Regional Transportation Improvement Program
MPO ID:
Project Title: South Bay BRT
SAN47
San Diego Association of Governments
ADOPTION: 10-00
Project Description:
SANDAG ID: 1280504
From Otay Ranch to downtown San Diego - plan, design, and construct transit stations,
transit way, local street and road modifications, freeway modifications
Exempt Category: Non-ExemptCapacity Status: CI
Est Total Cost: $97,108 Open to Traffic: Sep 2014
CONRWPEPRIORTOTAL 10/11 11/12 12/13 13/14 14/15
FTA 5307 $545 $545 $545
FTA 5309 (Bus) $1,017 $1,017 $1,017
Local Funds $355 $355 $355
TransNet - MC $6,740 $18,812 $42,309 $26,043 $493 $13,261 $6,194 $74,942 $94,397
TransNet - Transit $794 $794 $794
TOTAL $97,108 $9,451 $18,812 $42,309 $26,043 $493 $6,194 $74,942 $15,972
MPO ID:
Project Title: ITS Operating
SAN54 ADOPTION: 10-00
Project Description: Regionwide - implementation of ITS projects such as Compass Card Program, IMTMS,
Freeway Service Patrol, 511 Advanced Traveler Information System, Regional Arterial
Management System; activities include data collection, dissemination, software
upgrades
Exempt Category: Safety - Non signalization traffic control and operatngCapacity Status: NCI
Est Total Cost: $11,743
CONRWPEPRIORTOTAL 10/11 11/12 12/13 13/14 14/15
TransNet - MC $2,179 $2,260 $2,345 $2,433 $2,526 $11,743 $11,743
TOTAL $11,743 $2,179 $2,260 $2,345 $2,433 $2,526 $11,743
MPO ID:
Project Title: Grouped Projects for Operating Assistance - 5317 New Freedom Program
SAN58 ADOPTION: 10-00
Project Description: Projects are consistent with 40 CFR Part 93.126 Exempt Table 2 categories: operating
assistance to transit operators - non profit agencies providing transit service to eldery
and disabled residents
Exempt Category: Mass Transit - Transit operating assistanceCapacity Status: NCI
Est Total Cost: $1,530
CONRWPEPRIORTOTAL 10/11 11/12 12/13 13/14 14/15
FTA 5317 - NF $368 $368 $368
Local Funds $571 $120 $692 $692
TransNet - SS $269 $201 $470 $470
TOTAL $1,530 $1,208 $321 $1,530
71Page Thursday, July 8, 2010
75

San Diego Region (in $000s)DRAFT 2010 Regional Transportation Improvement Program
MPO ID:
Project Title: San Luis Rey Bridge Replacement & Second Track
SAN64
San Diego Association of Governments
ADOPTION: 10-00
Project Description:
PPNO: 2074
From MP 225.3 to MP 225.9 - in Oceanside, adds a new 0.6 mile section of double
track and replace the 700-foot long San Luis Rey River Bridge just north of the
Oceanside Transit Center on the San Diego Subdivision of the SDNR
Exempt Category: Other - Engineering studiesCapacity Status: NCI
Est Total Cost: $3,000
CONRWPEPRIORTOTAL 10/11 11/12 12/13 13/14 14/15
STIP-IIP PTA $3,000 $3,000 $3,000
TOTAL $3,000 $3,000 $3,000
MPO ID:
Project Title: Blue Line Upgrade
SAN66 ADOPTION: 10-00
Project Description:
SANDAG ID: 1210010-70
From 12th/Imperial to San Ysidro - design and construction for Trolley wayside and
trackway modifications including stations to support new low-floor vehicle operations
on the Blue Line
Exempt Category: Mass Transit - Reconstruction or renovation of transit
structures
Capacity Status: NCI
Est Total Cost: $219,304
CONRWPEPRIORTOTAL 10/11 11/12 12/13 13/14 14/15
FTA 5307 $1,313 $4,000 $8,000 $10,000 $3,000 $1,000 $25,313 $26,313
FTA Funds - AR-5307 $42,904 $6,786 $36,118 $42,904
FTA Funds - AR-5309 $2,011 $2,011 $2,011
PTMISEA (Prop1B) $6,134 $3,627 $17,425 $10,750 $37,936 $37,936
Prop 1A - High Speed Rail $6,351 $17,690 $25,450 $8,364 $57,855 $57,855
SLPP (Prop1B) $1,313 $592 $15,845 $17,750 $17,750
TransNet - MC $1,885 $10,064 $13,215 $7,489 $1,186 $696 $1,885 $32,650 $34,535
TOTAL $219,304 $48,113 $17,511 $27,785 $66,449 $47,386 $12,060 $209,633 $9,671
MPO ID:
Project Title: Blue Line Vehicles
SAN67 ADOPTION: 10-00
Project Description:
SANDAG ID: 1210002
Along Blue Line service - low-floor vehicle procurement and existing light rail vehicle
rehabilitation for the San Diego Trolley system sufficient to run low floor service on the
Blue Line
Exempt Category: Mass Transit - Purchase new buses and rail cars to
replace existing vehicles or minor expansions of fleet
Capacity Status: NCI
Est Total Cost: $233,000
CONRWPEPRIORTOTAL 10/11 11/12 12/13 13/14 14/15
Local Funds $4,453 $4,453 $4,453
PTMISEA (Prop1B) $25,558 $81,620 $55,830 $163,008 $163,008
SLPP (Prop1B) $31,097 $31,097 $31,097
TransNet - MC $3 $5,830 $13,952 $3,010 $11,647 $3 $34,439 $34,442
TransNet - MC AC $46,000 $(46,000)$0
TOTAL $233,000 $50,456 $62,485 $81,620 $23,782 $3,010 $11,647 $228,544 $4,456
72Page Thursday, July 8, 2010
76

San Diego Region (in $000s)DRAFT 2010 Regional Transportation Improvement Program
MPO ID:
Project Title: Vehicle Assist and Automation/Bus on Shoulder Service
SAN68
San Diego Association of Governments
ADOPTION: 10-00
Project Description:
SANDAG ID: 1280507
Between Chula Vista and Sorrento Valley along I-805 corridor - new buses equipped
with lane-keeping and adaptive cruise control technology; freeway median lane
restriping and signing (MTS to procure vehicles)
Exempt Category: Other - Non construction related activitiesCapacity Status: NCI
Est Total Cost: $22,500
CONRWPEPRIORTOTAL 10/11 11/12 12/13 13/14 14/15
FTA 5309 (Bus) $15,000 $660 $14,340 $15,000
ITS $3,000 $3,000 $3,000
TransNet - MC $1,098 $1,502 $1,900 $2,438 $1,300 $762 $4,500
TOTAL $22,500 $16,098 $4,502 $1,900 $1,300 $15,102 $6,098
MPO ID:
Project Title: Cardiff to Craven Double Track
SAN73 ADOPTION: 10-00
Project Description: From MP 239.6 to MP 241.1 - in the Cities of Encinitas and Solana Beach, preliminary
engineering to double track 1.5 miles between Control Point (CP) Cardiff and CP
Craven
Exempt Category: Other - Engineering studiesCapacity Status: NCI
Est Total Cost: $4,397
CONRWPEPRIORTOTAL 10/11 11/12 12/13 13/14 14/15
STIP-IIP PTA $2,200 $2,197 $4,397 $4,397
TOTAL $4,397 $2,200 $2,197 $4,397
MPO ID:
Project Title: Escondido Bus Rapid Transit
SAN74 ADOPTION: 10-00
Project Description:
SANDAG ID: 1143300
Route 350, a six-mile local bus route in the City of Escondido - improvements include
bus stop consolidation and enhancements, queue jumper, and transit signal priority;
improve transit travel times and reliability
Exempt Category: Mass Transit - Reconstruction or renovation of transit
structures
Capacity Status: NCI
Est Total Cost: $4,301
CONRWPEPRIORTOTAL 10/11 11/12 12/13 13/14 14/15
TransNet - MC $2,353 $1,948 $1,425 $2,876 $4,301
TOTAL $4,301 $2,353 $1,948 $2,876 $1,425
STIP/SLPP for TransNet exchange*
73Page Thursday, July 8, 2010
77
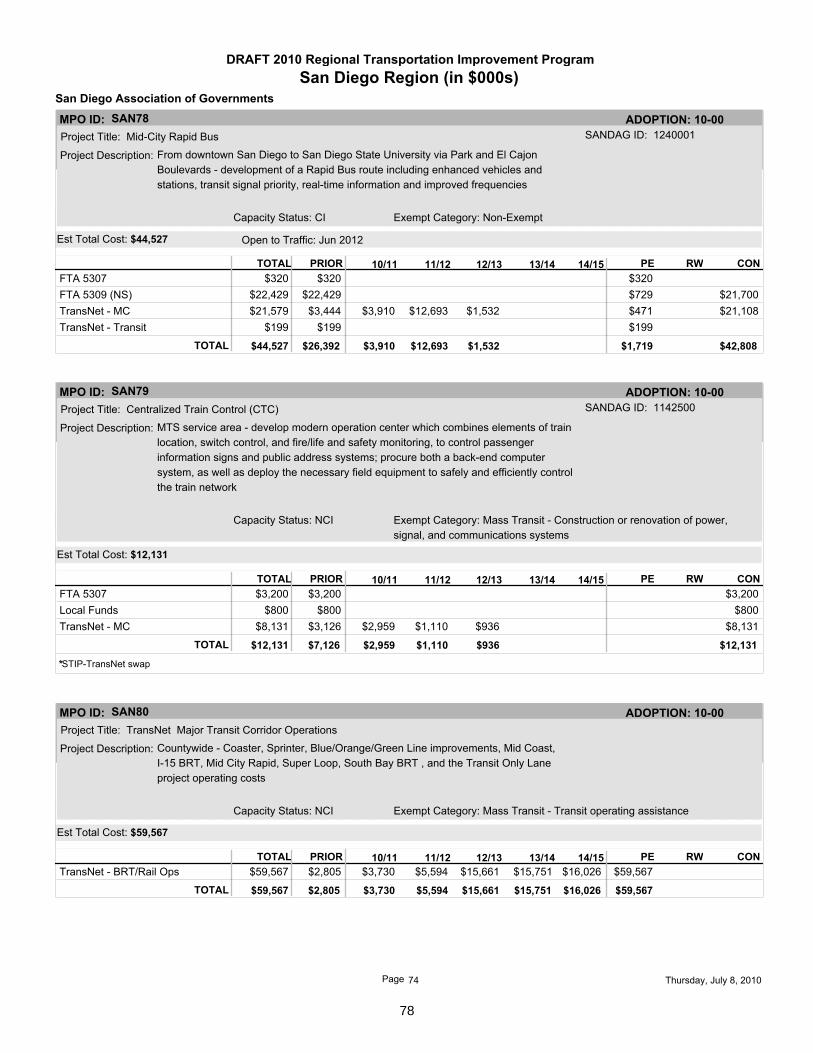
San Diego Region (in $000s)DRAFT 2010 Regional Transportation Improvement Program
MPO ID:
Project Title: Mid-City Rapid Bus
SAN78
San Diego Association of Governments
ADOPTION: 10-00
Project Description:
SANDAG ID: 1240001
From downtown San Diego to San Diego State University via Park and El Cajon
Boulevards - development of a Rapid Bus route including enhanced vehicles and
stations, transit signal priority, real-time information and improved frequencies
Exempt Category: Non-ExemptCapacity Status: CI
Est Total Cost: $44,527 Open to Traffic: Jun 2012
CONRWPEPRIORTOTAL 10/11 11/12 12/13 13/14 14/15
FTA 5307 $320 $320 $320
FTA 5309 (NS) $22,429 $729 $21,700 $22,429
TransNet - MC $3,444 $3,910 $12,693 $1,532 $471 $21,108 $21,579
TransNet - Transit $199 $199 $199
TOTAL $44,527 $26,392 $3,910 $12,693 $1,532 $42,808 $1,719
MPO ID:
Project Title: Centralized Train Control (CTC)
SAN79 ADOPTION: 10-00
Project Description:
SANDAG ID: 1142500
MTS service area - develop modern operation center which combines elements of train
location, switch control, and fire/life and safety monitoring, to control passenger
information signs and public address systems; procure both a back-end computer
system, as well as deploy the necessary field equipment to safely and efficiently control
the train network
Exempt Category: Mass Transit - Construction or renovation of power,
signal, and communications systems
Capacity Status: NCI
Est Total Cost: $12,131
CONRWPEPRIORTOTAL 10/11 11/12 12/13 13/14 14/15
FTA 5307 $3,200 $3,200 $3,200
Local Funds $800 $800 $800
TransNet - MC $3,126 $2,959 $1,110 $936 $8,131 $8,131
TOTAL $12,131 $7,126 $2,959 $1,110 $936 $12,131
STIP-TransNet swap*
MPO ID:
Project Title: TransNet Major Transit Corridor Operations
SAN80 ADOPTION: 10-00
Project Description: Countywide - Coaster, Sprinter, Blue/Orange/Green Line improvements, Mid Coast,
I-15 BRT, Mid City Rapid, Super Loop, South Bay BRT , and the Transit Only Lane
project operating costs
Exempt Category: Mass Transit - Transit operating assistanceCapacity Status: NCI
Est Total Cost: $59,567
CONRWPEPRIORTOTAL 10/11 11/12 12/13 13/14 14/15
TransNet - BRT/Rail Ops $2,805 $3,730 $5,594 $15,661 $15,751 $16,026 $59,567 $59,567
TOTAL $59,567 $2,805 $3,730 $5,594 $15,661 $15,751 $16,026 $59,567
74Page Thursday, July 8, 2010
78

San Diego Region (in $000s)DRAFT 2010 Regional Transportation Improvement Program
MPO ID:
Project Title: Grouped Projects for Operating Assistance - TransNet Senior Mini-Grant Program
SAN84
San Diego Association of Governments
ADOPTION: 10-00
Project Description: Projects are consistent with 40 CFR Part 93.126 Exempt Table 2 categories: operating
assistance to transit operators - non profit agencies providing transportation programs
specializing in services for seniors
Exempt Category: Mass Transit - Transit operating assistanceCapacity Status: NCI
Est Total Cost: $3,761
CONRWPEPRIORTOTAL 10/11 11/12 12/13 13/14 14/15
Local Funds $585 $319 $905 $905
TransNet - SS $1,537 $1,320 $2,856 $2,856
TOTAL $3,761 $2,122 $1,639 $3,761
MPO ID:
Project Title: I-15 Integrated Corridor Management Project
SAN94 ADOPTION: 10-00
Project Description: From SR 52 to SR 78 - I-15 Corridor in San Diego region is one of eight pioneer sites
selected throughout the nation by USDOT for the the ICM initiative; I-15 ICM project
establishes an operational platform that will allow the transportation network to be
operated in a more coordinated and integrated manner; project includes the integration
of existing ITS system platforms, development of a Decision Support System, and
upgrades to the traffic signal syncrhonization network to a responsive system; provide
for better management of traffic conditions along the I-15 corridor
Exempt Category: Other - Non construction related activitiesCapacity Status: NCIRT:15
Est Total Cost: $11,151
CONRWPEPRIORTOTAL 10/11 11/12 12/13 13/14 14/15
STA $100 $100 $100
State Bond - TLSP $2,162 $2,162 $2,162
USDOTs $200 $3,218 $3,694 $1,777 $8,889 $8,889
TOTAL $11,151 $2,462 $3,218 $3,694 $1,777 $11,151
75Page Thursday, July 8, 2010
79

San Diego Region (in $000s)DRAFT 2010 Regional Transportation Improvement Program
MPO ID:
Project Title: Coastal Rail Corridor - Grouped Projects for Rehabilitation and Reconstruction of Track St
SAN114
San Diego Association of Governments
ADOPTION: 10-00
Project Description: From Camp Pendleton to City of San Diego along the LOSSAN Corridor; design track
improvements; SANDAG ID 1239802 to 1239808 - projects are consistent with 40 CFR
Parts 93.126 and 93.127 Exempt Tables 2 and 3 categories: rehabilitation or
reconstruction of track structures, track, and trackbed in existing right-of-way
(non-capacity increasing) -
Exempt Category: Mass Transit - Track rehabilitation in existing right of wayCapacity Status: NCI
Est Total Cost: $36,004
CONRWPEPRIORTOTAL 10/11 11/12 12/13 13/14 14/15
Other Fed - ARRA - Federal railroad Administration $11,800 $11,800 $11,800
Prop. 116 $501 $501 $501
RSTP $11,738 $11,738 $11,738
State Bond - HRCSA $3,146 $3,146 $3,146
TCRP $1,000 $1,000 $1,000
TransNet - MC $2,901 $4,718 $200 $7,819 $7,819
TOTAL $36,004 $16,140 $19,664 $200 $11,800 $24,204
MPO ID:
Project Title: South Bay BRT: West Guideway
SAN122 ADOPTION: 10-00
Project Description:
SANDAG ID: 1280509
From Heritage Road to I-805 - design extension of transit guideway for the South Bay
Bus Rapid Transit service along East Palomar
Exempt Category: Mass Transit - Track rehabilitation in existing right of wayCapacity Status: NCI
Est Total Cost: $2,800
CONRWPEPRIORTOTAL 10/11 11/12 12/13 13/14 14/15
TransNet - MC $700 $2,100 $2,800 $2,800
TOTAL $2,800 $700 $2,100 $2,800
MPO ID:
Project Title: University Town Center (UTC) Transit Center
SAN123 ADOPTION: 10-00
Project Description:
SANDAG ID: 1143200
Within the parking area of the UTC Shopping mall area - off street transit center for
existing Metropolitan Transit System (MTS) and North County Transit District (NCTD) for
local and express service for SuperLoop, Mid-Coast and BRT
Exempt Category: Mass Transit - Reconstruction or renovation of transit
structures
Capacity Status: NCI
Est Total Cost: $5,700
CONRWPEPRIORTOTAL 10/11 11/12 12/13 13/14 14/15
TransNet - MC $5 $855 $1,335 $3,505 $550 $5,150 $5,700
TOTAL $5,700 $5 $855 $1,335 $3,505 $5,150 $550
76Page Thursday, July 8, 2010
80

San Diego Region (in $000s)DRAFT 2010 Regional Transportation Improvement Program
MPO ID:
Project Title: FTA Section 5310 Elderly and Disabled Transit Program
SAN125
San Diego Association of Governments
ADOPTION: 10-00
Project Description: San Diego County - purchase of modified vans/buses by various non-profit
organizations for purposes of transporting elderly and disabled
Exempt Category: Mass Transit - Purchase new buses and rail cars to
replace existing vehicles or minor expansions of fleet
Capacity Status: NCI
Est Total Cost: $1,088
CONRWPEPRIORTOTAL 10/11 11/12 12/13 13/14 14/15
FTA 5310 $963 $963 $963
Local Funds $125 $125 $125
TOTAL $1,088 $1,088 $1,088
77Page Thursday, July 8, 2010
81

San Diego Region (in $000s)DRAFT 2010 Regional Transportation Improvement Program
MPO ID:
Project Title: Channel Road Equestrian Crossing
CNTY05
San Diego County
ADOPTION: 10-00
Project Description:
TransNet - LSI: CR
Between Lakeside Avenue and Mapleview Street;, in the vicinity of Channel Rd Bridge -
in Lakeside, design an equestrian trail crossing at the San Diego River
Exempt Category: Air Quality - Bicycle and pedestrian facilitiesCapacity Status: NCI
Est Total Cost: $215
CONRWPEPRIORTOTAL 10/11 11/12 12/13 13/14 14/15
TransNet - L $87 $87 $87
TransNet - L (Cash) $1 $1 $1
TransNet - LSI $35 $92 $127 $127
TOTAL $215 $88 $35 $92 $215
MPO ID:
Project Title: South Santa Fe Avenue North
CNTY14 ADOPTION: 10-00
Project Description:
RAS (TA 7-50)
TransNet - LSI: CRSouth Santa Fe Avenue from Montgomery Dr to 700 ft South of Woodland Ave - Vista
City limits to 700 feet south of Woodland - reconstruct and widen from 2 to 4 lanes
including bicycle lane
Exempt Category: Non-ExemptCapacity Status: CI
Est Total Cost: $22,066 Open to Traffic: Apr 2014
CONRWPEPRIORTOTAL 10/11 11/12 12/13 13/14 14/15
Local Funds $200 $200 $200
TransNet - H $8,836 $500 $8,336 $8,836
TransNet - H (78) $4,512 $3,670 $843 $4,513
TransNet - L $611 $12 $599 $611
TransNet - L (Cash) $671 $671 $671
TransNet - LSI $12 $2,791 $262 $12 $3,053 $3,065
TransNet - LSI Carry Over $4,170 $300 $3,870 $4,170
TOTAL $22,066 $14,842 $4,170 $2,791 $262 $9,679 $7,522 $4,865
MPO ID:
Project Title: South Santa Fe Avenue South
CNTY14A ADOPTION: 10-00
Project Description:
RAS (TA 7-50)
TransNet - LSI: CRSouth Santa Fe from 700 ft south of Woodland Dr to Smilax Rd - widening of South
Santa Fe Avenue to a five-lane major road with a center left turn lane, curb, gutter,
sidewalk, bike lanes, and drainage improvements from 700 ft south of Woodland Dr to
Smilax Road
Exempt Category: Non-ExemptCapacity Status: CI
Est Total Cost: $1,500 Open to Traffic: Jun 2019
CONRWPEPRIORTOTAL 10/11 11/12 12/13 13/14 14/15
RSTP $61 $61 $61
TransNet - L $175 $175 $175
TransNet - L (Cash) $36 $36 $36
TransNet - LSI $433 $669 $1,102 $1,102
TransNet - LSI Carry Over $98 $98 $98
TOTAL $1,472 $644 $828 $1,472
78Page Thursday, July 8, 2010
82

San Diego Region (in $000s)DRAFT 2010 Regional Transportation Improvement Program
MPO ID:
Project Title: SR 54/94 Phase II & III
CNTY17
San Diego County
ADOPTION: 10-00
Project Description:
TransNet - LSI: CR
Ph 2: on SR94 extend Jamacha Blvd; Ph 3: on SR54 extend from Cuyamaca College
east to Braham - previously CI and widened from 4 to 6 lanes with intersection
improvements, raised median and left turn pockets; current money allocated is NCI for
plant establishment and environmental mitigation
Exempt Category: Non-ExemptCapacity Status: CIRT:54
Est Total Cost: $16,890 Open to Traffic: Sep 2008
CONRWPEPRIORTOTAL 10/11 11/12 12/13 13/14 14/15
Local Funds $1,207 $1,207 $1,207
TransNet - L $15,410 $200 $15,210 $15,410
TransNet - L Carry Over $40 $40 $40
TransNet - LSI $211 $22 $233 $233
TOTAL $16,890 $16,868 $22 $16,690 $200
MPO ID:
Project Title: Bradley Avenue Overpass at SR 67
CNTY21 ADOPTION: 10-00
Project Description:
RAS (TA 7-49)
TransNet - LSI: CRBradley Avenue from Magnolia Ave. to Mollison Ave. - widen of Bradley Ave. including the
SR-67 overpass from 2 to 4 lanes plus sidewalks
Exempt Category: Non-ExemptCapacity Status: CI
Est Total Cost: $34,000 Open to Traffic: Dec 2017
CONRWPEPRIORTOTAL 10/11 11/12 12/13 13/14 14/15
RSTP $750 $750 $750
TransNet - L $195 $195 $195
TransNet - LSI $914 $332 $206 $106 $109 $3,114 $1,197 $3,584 $4,781
TransNet - LSI Carry Over $69 $69 $69
TOTAL $5,795 $1,859 $401 $206 $106 $109 $3,114 $3,584 $2,211
MPO ID:
Project Title: Cole Grade Road
CNTY24 ADOPTION: 10-00
Project Description:
RAS (TA 7-49)
TransNet - LSI: CRCole Grade Road from N. of Horse Creek Trail to South of Pauma Heights Road -
widen to accommodate 14-ft traffic lane in both direction, 12-ft center 2-way left turn, 6-ft
bike lane & 10-ft pathway
Exempt Category: Non-ExemptCapacity Status: CI
Est Total Cost: $1,474 Open to Traffic: Dec 2018
CONRWPEPRIORTOTAL 10/11 11/12 12/13 13/14 14/15
TransNet - L $350 $350 $350
TransNet - L (Cash) $288 $142 $430 $430
TransNet - LSI $143 $26 $80 $109 $336 $249 $445 $694
TOTAL $1,474 $638 $285 $26 $80 $109 $336 $445 $1,029
79Page Thursday, July 8, 2010
83
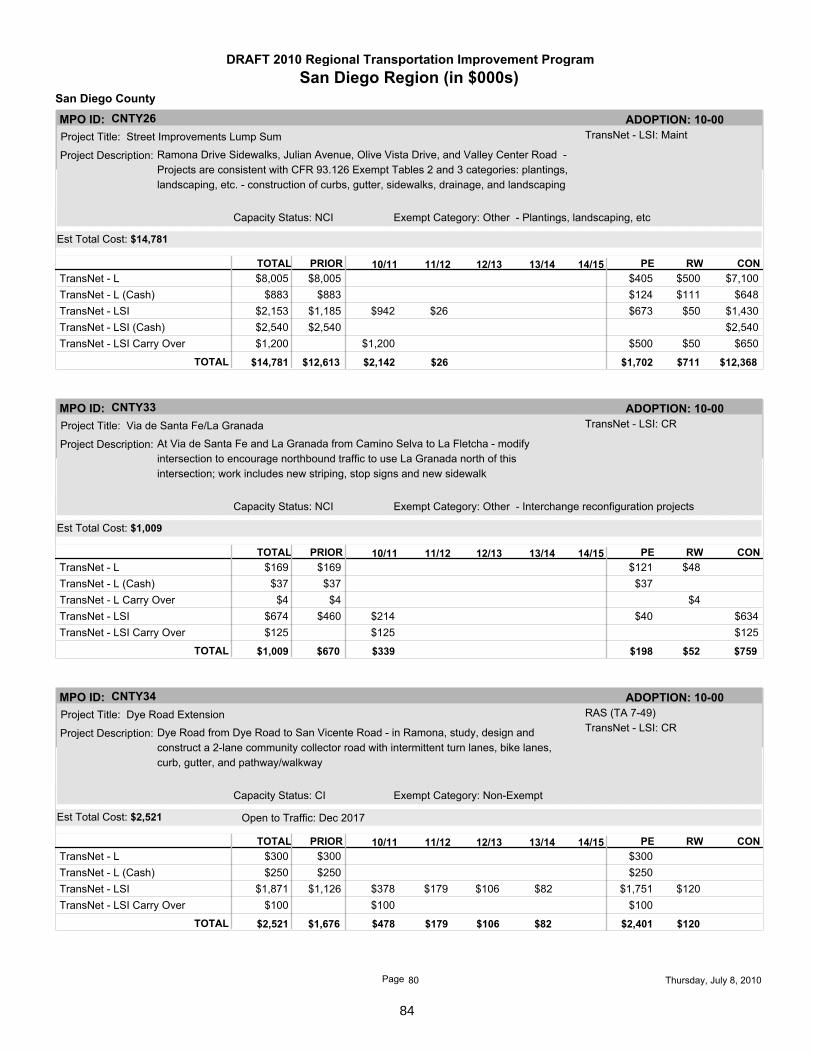
San Diego Region (in $000s)DRAFT 2010 Regional Transportation Improvement Program
MPO ID:
Project Title: Street Improvements Lump Sum
CNTY26
San Diego County
ADOPTION: 10-00
Project Description:
TransNet - LSI: Maint
Ramona Drive Sidewalks, Julian Avenue, Olive Vista Drive, and Valley Center Road -
Projects are consistent with CFR 93.126 Exempt Tables 2 and 3 categories: plantings,
landscaping, etc. - construction of curbs, gutter, sidewalks, drainage, and landscaping
Exempt Category: Other - Plantings, landscaping, etcCapacity Status: NCI
Est Total Cost: $14,781
CONRWPEPRIORTOTAL 10/11 11/12 12/13 13/14 14/15
TransNet - L $8,005 $405 $500 $7,100 $8,005
TransNet - L (Cash) $883 $124 $111 $648 $883
TransNet - LSI $1,185 $942 $26 $673 $50 $1,430 $2,153
TransNet - LSI (Cash) $2,540 $2,540 $2,540
TransNet - LSI Carry Over $1,200 $500 $50 $650 $1,200
TOTAL $14,781 $12,613 $2,142 $26 $711 $12,368 $1,702
MPO ID:
Project Title: Via de Santa Fe/La Granada
CNTY33 ADOPTION: 10-00
Project Description:
TransNet - LSI: CR
At Via de Santa Fe and La Granada from Camino Selva to La Fletcha - modify
intersection to encourage northbound traffic to use La Granada north of this
intersection; work includes new striping, stop signs and new sidewalk
Exempt Category: Other - Interchange reconfiguration projectsCapacity Status: NCI
Est Total Cost: $1,009
CONRWPEPRIORTOTAL 10/11 11/12 12/13 13/14 14/15
TransNet - L $169 $121 $48 $169
TransNet - L (Cash) $37 $37 $37
TransNet - L Carry Over $4 $4 $4
TransNet - LSI $460 $214 $40 $634 $674
TransNet - LSI Carry Over $125 $125 $125
TOTAL $1,009 $670 $339 $52 $759 $198
MPO ID:
Project Title: Dye Road Extension
CNTY34 ADOPTION: 10-00
Project Description:
RAS (TA 7-49)
TransNet - LSI: CRDye Road from Dye Road to San Vicente Road - in Ramona, study, design and
construct a 2-lane community collector road with intermittent turn lanes, bike lanes,
curb, gutter, and pathway/walkway
Exempt Category: Non-ExemptCapacity Status: CI
Est Total Cost: $2,521 Open to Traffic: Dec 2017
CONRWPEPRIORTOTAL 10/11 11/12 12/13 13/14 14/15
TransNet - L $300 $300 $300
TransNet - L (Cash) $250 $250 $250
TransNet - LSI $1,126 $378 $179 $106 $82 $1,751 $120 $1,871
TransNet - LSI Carry Over $100 $100 $100
TOTAL $2,521 $1,676 $478 $179 $106 $82 $120 $2,401
80Page Thursday, July 8, 2010
84

San Diego Region (in $000s)DRAFT 2010 Regional Transportation Improvement Program
MPO ID:
Project Title: Ramona Street Extension
CNTY35
San Diego County
ADOPTION: 10-00
Project Description:
TransNet - LSI: CR
Ramona Street from Boundary Ave. to Warnock Dr. - in the community of Ramona,
construct new road extension, 2 lanes with intermittent turn lanes, bike lanes and
walkway/pathway
Exempt Category: Non-ExemptCapacity Status: CI
Est Total Cost: $4,507 Open to Traffic: Jun 2013
CONRWPEPRIORTOTAL 10/11 11/12 12/13 13/14 14/15
TransNet - L $287 $233 $54 $287
TransNet - LSI $396 $240 $3,054 $530 $1,081 $105 $3,034 $4,220
TOTAL $4,507 $683 $240 $3,054 $530 $159 $3,034 $1,314
MPO ID:
Project Title: San Vicente Road Improvements
CNTY36 ADOPTION: 10-00
Project Description:
TransNet - LSI: CR
San Vicente Road from Warnock Drive to Wildcat Canyon Road - in Ramona, design
and reconstruct road improvements, including 2-lane community collector road with
intermittent turn lanes, bike lanes, asphalt concrete dike, and pathway/walkway
Exempt Category: Non-ExemptCapacity Status: CI
Est Total Cost: $27,242 Open to Traffic: Jan 2015
CONRWPEPRIORTOTAL 10/11 11/12 12/13 13/14 14/15
TransNet - L $790 $790 $790
TransNet - L (Cash) $591 $591 $591
TransNet - LSI $1,081 $981 $618 $8,268 $7,358 $7,095 $2,797 $983 $21,621 $25,401
TransNet - LSI Carry Over $460 $381 $79 $460
TOTAL $27,242 $2,462 $1,441 $618 $8,268 $7,358 $7,095 $1,062 $21,621 $4,559
MPO ID:
Project Title: Rancho Santa Fe Roundabouts
CNTY38 ADOPTION: 10-00
Project Description:
TransNet - LSI: CR
At intersections of Via De La Valle/Paseo Delicias, El Montevideo/Paseo Delicias/La
Valle Plateada, and El Camino Del Norte/El Escondido Del Dios Highway - in Rancho
Santa Fe, replace existing stop sign control with roundabouts at several intersections
including ADA compliant pathways to accommodate bicycles in the traffic lane or on
walked on the pedestrian paths
Exempt Category: Other - Interchange reconfiguration projectsCapacity Status: NCI
Est Total Cost: $612
CONRWPEPRIORTOTAL 10/11 11/12 12/13 13/14 14/15
RSTP $96 $96 $96
TransNet - LSI $503 $13 $512 $4 $516
TOTAL $612 $503 $109 $4 $608
81Page Thursday, July 8, 2010
85

San Diego Region (in $000s)DRAFT 2010 Regional Transportation Improvement Program
MPO ID:
Project Title: Bear Valley Parkway North
CNTY39
San Diego County
ADOPTION: 10-00
Project Description:
RAS (TA 7-49)
TransNet - LSI: CRBear Valley Parkway from San Pasqual Valley Road to Boyle Avenue - widen from two to
four lanes, with a center median, a bike lane and shoulder in each direction of travel
Exempt Category: Non-ExemptCapacity Status: CI
Est Total Cost: $13,151 Open to Traffic: Dec 2015
CONRWPEPRIORTOTAL 10/11 11/12 12/13 13/14 14/15
TransNet - L $6 $6 $6
TransNet - L (Cash) $6 $6 $6
TransNet - LSI $783 $10 $2,237 $4,505 $3,924 $1,680 $1,041 $1,729 $10,369 $13,139
TOTAL $13,151 $795 $10 $2,237 $4,505 $3,924 $1,680 $1,729 $10,369 $1,053
MPO ID:
Project Title: Otay Mesa Road Widening
CNTY42 ADOPTION: 10-00
Project Description:
RAS (T A7-50)
TransNet - LSI: CROtay Mesa Road from SR 125 to Enrico Fermi Drive - future widening of Otay Mesa
Exempt Category: Other - Engineering studiesCapacity Status: NCI
Est Total Cost: $220
CONRWPEPRIORTOTAL 10/11 11/12 12/13 13/14 14/15
TransNet - LSI $198 $10 $2 $210 $210
TransNet - LSI Carry Over $10 $10 $10
TOTAL $220 $198 $10 $10 $2 $220
MPO ID:
Project Title: AC Overlay
CNTY46 ADOPTION: 10-00
Project Description:
RAS (TA 7-49 and 50)
TransNet - LSI: CRAvocado Blvd, Paradise Valley Rd, San Miguel Rd, Spring St, Alpine Blvd, Ballantyne St,
Graves Ave, Pino Dr, Posthill Rd, Riverside Dr, Valle Vista Rd, Woodside Ave, Black
Canyon Rd, Haverford Rd, Old Julian Hwy, Pamo Rd, Pile St, Wildcat Canyon Rd,
Fallbrook St, Green Canyon Rd, Olive Hill Rd, Osborne St, Buena Creek Rd, Del Dios
Hwy, El Camino del Norte, El canino Real, South Santa Fe Ave, Via de la Valle, Cole
Grade Rd, and Lilac Rd. (More or fewer roads may be resurfaced depending on bid
results) - roadway rehabilitation and resurfacing along several miles of county
maintained roads; pavement overlays applied will be between 2" and 4" in thickness
Exempt Category: Safety - Pavement resurfacing and/or rehabilitationCapacity Status: NCI
Est Total Cost: $7,900
CONRWPEPRIORTOTAL 10/11 11/12 12/13 13/14 14/15
TransNet - LSI $7,345 $7,345 $7,345
TransNet - LSI (Cash) $555 $555 $555
TOTAL $7,900 $7,345 $555 $7,900
82Page Thursday, July 8, 2010
86

San Diego Region (in $000s)DRAFT 2010 Regional Transportation Improvement Program
MPO ID:
Project Title: Lonestar Road
CNTY66
San Diego County
ADOPTION: 10-00
Project Description:
RTP PG NO: TA 7A - 49
EARMARK NO: CA475
RAS (TA 7A-49)
TransNet - LSI: CR
Lonestar Road from Alta Road to SR 125 - in Otay, future construction of 4-lane Major
Road (Alta Road to Enrico Fermi Drive) and 6-lane Prime Arterial (Enrico Fermi Drive to
SR125) with bike lanes and sidewalks
Exempt Category: Other - Engineering studiesCapacity Status: NCI
Est Total Cost: $30,000
CONRWPEPRIORTOTAL 10/11 11/12 12/13 13/14 14/15
HPP $400 $400 $400
TransNet - LSI $100 $67 $167 $167
TOTAL $567 $500 $67 $567
MPO ID:
Project Title: City of San Diego Funding Swap
CNTY75 ADOPTION: 10-00
Project Description:
TransNet - LSI: CR
See Project CNTY38 RSF Roundabouts and CNTY14A South Santa Fe South - transfer
of funds to the City of San Diego in exchange for RSTP with City of SD project El
Camino Real (SD34) project
Exempt Category: Other - Non construction related activitiesCapacity Status: NCI
Est Total Cost: $157
CONRWPEPRIORTOTAL 10/11 11/12 12/13 13/14 14/15
TransNet - LSI $157 $157 $157
TOTAL $157 $157 $157
MPO ID:
Project Title: Jamacha Blvd (Phase 1 and 2)
CNTY76 ADOPTION: 10-00
Project Description:
RAS (TA 7-49)
TransNet - LSI: CRJamacha Blvd from Omega St to Sweetwater Springs Blvd - in unincorporated Spring
Valley, the current funds programmed are for Phase 1 - between Omega Street and
Spring Valley Glen, widen from two lane to four lane roadway with bicycle and
pedestrian improvements
Exempt Category: Non-ExemptCapacity Status: CI
Est Total Cost: $7,038 Open to Traffic: Jan 2012
CONRWPEPRIORTOTAL 10/11 11/12 12/13 13/14 14/15
Local Funds $2,654 $2,654 $2,654
TransNet - LSI $1,550 $657 $2,207 $2,207
TransNet - LSI Carry Over $2,177 $2,177 $2,177
TOTAL $7,038 $4,204 $2,177 $657 $7,038
83Page Thursday, July 8, 2010
87

San Diego Region (in $000s)DRAFT 2010 Regional Transportation Improvement Program
MPO ID:
Project Title: Inland Rail Trail
CNTY78
San Diego County
ADOPTION: 10-00
Project Description:
RTP PG NO: 6-55; E-14
TransNet - LSI: CRNCTD RIGHT OF WAY from City of San Marcos/County border to City of Vista/County
border - In unincorporated North County Metro: the current funds programmed are for
the segment from City of San Marcos/County border to City of Vista/County border;
construct bicycle/pedestrian trail within NCTD right of way
Exempt Category: Air Quality - Bicycle and pedestrian facilitiesCapacity Status: NCI
Est Total Cost: $2,323
CONRWPEPRIORTOTAL 10/11 11/12 12/13 13/14 14/15
BTA $1,461 $1,461 $1,461
TransNet - LSI $25 $555 $282 $25 $80 $757 $862
TOTAL $2,323 $25 $2,016 $282 $80 $2,218 $25
84Page Thursday, July 8, 2010
88

San Diego Region (in $000s)DRAFT 2010 Regional Transportation Improvement Program
MPO ID:
Project Title: Transit Service Operations
MTS23A
San Diego Metropolitan Transit System
ADOPTION: 10-00
Project Description: MTS service area - Operating support for existing services including urban, ADA, and
rural bus service
Exempt Category: Mass Transit - Transit operating assistanceCapacity Status: NCI
Est Total Cost: $143,553
CONRWPEPRIORTOTAL 10/11 11/12 12/13 13/14 14/15
FTA 5307 $4,253 $4,423 $4,600 $4,784 $18,061 $18,061
TDA $1,063 $1,106 $1,150 $1,196 $4,515 $4,515
TransNet - TSI $21,733 $22,517 $23,734 $25,636 $27,357 $120,977 $120,977
TOTAL $143,553 $27,049 $28,046 $29,484 $31,616 $27,357 $143,553
MPO ID:
Project Title: Bus & Rail Rolling Stock purchases and Rehabilitations
MTS28 ADOPTION: 10-00
Project Description: MTS service area - purchase replacement buses, replacement Light Rail Vehicles,
procurement of materials and services for the rehabilitation or retrofit of mechanical
components, electrical components, and coach bodies of Light Rail Vehicles and
buses. Transportation Development Credit of $952,200 will used used to match FY10
federal funds for the constructin phase
Exempt Category: Mass Transit - Purchase new buses and rail cars to
replace existing vehicles or minor expansions of fleet
Capacity Status: NCI
Est Total Cost: $50,936
CONRWPEPRIORTOTAL 10/11 11/12 12/13 13/14 14/15
FTA 5307 $8,568 $9,318 $8,224 $14,639 $40,749 $40,749
TDA $2,142 $2,330 $2,056 $3,660 $10,187 $10,187
TOTAL $50,936 $10,710 $11,648 $10,280 $18,299 $50,936
85Page Thursday, July 8, 2010
89

San Diego Region (in $000s)DRAFT 2010 Regional Transportation Improvement Program
MPO ID:
Project Title: Bus/Rail Support Facilities and Equipment
MTS30
San Diego Metropolitan Transit System
ADOPTION: 10-00
Project Description: MTS facilities throughout the MTS service area - install security cameras on bus/rail
rolling stock and at bus/rail facilities and stations; Southbay and East County bus
maintenance facility expansions and upgrades including: land acquisition, Site
development plans, building demolition and remodeling, fencing, lot paving, and storm
water pollution prevention program compliance; other misc capital equipment for
transit maintenance; design and procurement of materials and services for support
equipment. Transportation Development Credit of $2,557,351 will used used to match
FY10 federal funds for the construction phase
Exempt Category: Mass Transit - Purchase of office, shop and operating
equipment for existing facilities
Capacity Status: NCI
Est Total Cost: $74,055
CONRWPEPRIORTOTAL 10/11 11/12 12/13 13/14 14/15
FTA 5307 $25,402 $2,445 $1,225 $1,225 $1,225 $31,522 $31,522
FTA 5309 (FG) $259 $259 $259
FTA 5316 - JARC $63 $63 $63
Local Funds $1,898 $1,898 $1,898
PTMISEA (Prop1B) $7,478 $7,478 $7,478
STA $3,242 $3,242 $3,242
TDA $19,943 $611 $306 $306 $306 $21,473 $21,473
TransNet - Transit $7,224 $7,224 $7,224
Transit Security (TSGP) $896 $896 $896
TOTAL $74,055 $66,405 $3,056 $1,531 $1,531 $1,531 $74,055
MPO ID:
Project Title: Rail Electrification and Power
MTS31 ADOPTION: 10-00
Project Description: Along Blue Line ROW - Blue Line tie replacement, rail profile grinding
Exempt Category: Mass Transit - Track rehabilitation in existing right of wayCapacity Status: NCI
Est Total Cost: $2,800
CONRWPEPRIORTOTAL 10/11 11/12 12/13 13/14 14/15
FTA 5307 $1,400 $280 $280 $280 $2,240 $2,240
TDA $350 $70 $70 $70 $560 $560
TOTAL $2,800 $1,750 $350 $350 $350 $2,800
86Page Thursday, July 8, 2010
90

San Diego Region (in $000s)DRAFT 2010 Regional Transportation Improvement Program
MPO ID:
Project Title: Preventive Maintenance
MTS32A
San Diego Metropolitan Transit System
ADOPTION: 10-00
Project Description: MTS service area - Maintenance of equipment, rolling stock, and facilities for bus and
rail systems. Transportation Development Credit of $2,529,084 will used used to
match FY10 federal funds for the preliminary engineering phase
Exempt Category: Mass Transit - Transit operating assistanceCapacity Status: NCI
Est Total Cost: $326,750
CONRWPEPRIORTOTAL 10/11 11/12 12/13 13/14 14/15
FTA 5307 $70,854 $19,089 $18,525 $17,938 $17,327 $143,734 $143,734
FTA 5309 (FG) $54,956 $14,111 $14,675 $15,262 $15,873 $114,877 $114,877
Local Funds $7,383 $7,383 $7,383
TDA $27,556 $8,300 $8,300 $8,300 $8,300 $60,756 $60,756
TOTAL $326,750 $160,749 $41,500 $41,500 $41,500 $41,500 $326,750
MPO ID:
Project Title: Senior Disabled Program
MTS33A ADOPTION: 10-00
Project Description: MTS service area - Subsidy for senior and disabled as required by TransNet
Exempt Category: Mass Transit - Transit operating assistanceCapacity Status: NCI
Est Total Cost: $3,208
CONRWPEPRIORTOTAL 10/11 11/12 12/13 13/14 14/15
TransNet - ADA $576 $597 $630 $680 $725 $3,208 $3,208
TOTAL $3,208 $576 $597 $630 $680 $725 $3,208
MPO ID:
Project Title: Fixed Guideway Transitways/Lines
MTS35 ADOPTION: 10-00
Project Description: MTS service area - Rail infrastructure maintenance and upgrades including rail tie
replacement, WYE switch indicator standardization, rail file grinding, and traction motor
disconnects
Exempt Category: Mass Transit - Track rehabilitation in existing right of wayCapacity Status: NCI
Est Total Cost: $11,894
CONRWPEPRIORTOTAL 10/11 11/12 12/13 13/14 14/15
FTA 5307 $2,561 $2,149 $1,321 $3,324 $9,355 $9,355
TDA $840 $537 $330 $831 $2,539 $2,539
TOTAL $11,894 $3,401 $2,686 $1,651 $4,155 $11,894
87Page Thursday, July 8, 2010
91

San Diego Region (in $000s)DRAFT 2010 Regional Transportation Improvement Program
MPO ID:
Project Title: Alvarado Canyon Road Realignment
SD01
San Diego, City of
ADOPTION: 10-00
Project Description:
TransNet - LSI: CR
Alvarado Canyon Road from Fairmount Ave./Camino del Rio N to Fairmount
Ave./Mission Gorge Road - in San Diego, roadway realignment and improvements to
include traffic signal modifications to improve traffic flow at the interchange of I-8,
Fairmount Avenue and Mission Gorge Road. (CIP: 52-713.0)
Exempt Category: Other - Intersection signalization projectsCapacity Status: NCI
Est Total Cost: $1,550
CONRWPEPRIORTOTAL 10/11 11/12 12/13 13/14 14/15
Local Funds $1,000 $1,000 $1,000
TransNet - L $450 $450 $450
TransNet - LSI $100 $100 $100
TOTAL $1,550 $550 $1,000 $1,550
MPO ID:
Project Title: Aldine Drive and Fairmont Avenue Slope Restoration
SD06 ADOPTION: 10-00
Project Description:
RAS (TA7-47)
TransNet - LSI: CRFairmount Avenue between Meade Avenue and Aldine Drive, Aldine Drive between
Fairmount Avenue and Adams Avenue - in San Diego, provides for road restoration and
slope stability improvements for the purpose of improving capacity impeding conditions
as a result of slope failure and related drainage conditions (CIP 52-592.0)
Exempt Category: Safety - Guardrails, median barriers, crash cushionsCapacity Status: NCI
Est Total Cost: $4,135
CONRWPEPRIORTOTAL 10/11 11/12 12/13 13/14 14/15
Local Funds $1,110 $1,110 $1,110
TransNet - L $500 $300 $200 $500
TransNet - LSI $1,825 $700 $2,525 $2,525
TOTAL $4,135 $3,435 $700 $3,835 $300
88Page Thursday, July 8, 2010
92

San Diego Region (in $000s)DRAFT 2010 Regional Transportation Improvement Program
MPO ID:
Project Title: Sidewalks - Citywide
SD09
San Diego, City of
ADOPTION: 10-00
Project Description:
TransNet - LSI: CR
Genesee Ave. & Marlesta Dr.: new sidewalk, curb ramps, railings, Satellite Blvd.: new
sidewalk northside between Thermal & Saturn, Hollister St & Ilex St.: new sidewalk &
curb ramps where missing, 28th St. from Treat St. to 115'north: new sidewalk, La Jolla
Shores Dr. n/o Cam del Collado: new sidewalk where missing Nimitz Blvd. at W. Pt.
Loma: new sidewalk on southside, Juniper St. from Felton St. to Westland Ave.: new
sidewalk northside 67th St. from El Cajon Blvd. to Amherst: new sidewalk where
missing including curb and gutter: install new 5 foot wide sidewalk Green Bay from Iris
to Rimbey: new sidewalk and curb ramps: east and west side of Viewridge Ave from
Balboa Ave to Ridgehaven Court: east and west side of Candlelight Dr from Candlelight
Pl to Van Nuys: north and south side of Euclid Ave between Dwight St and Isla Vista Dr:
Genesee Ave from Derrick Dr to Mt. Herbert Ave: SD Mission Rd from Fairmount Ave to
Rancho Mission Rd: 54th from Santa Margarita to Imperial and from Naranja to
Imperial: Montezuma Road: 5922 El Cajon Blvd: - install new sidewalks (CIP
52-700/715, 59-002.0,37-064.0)
Exempt Category: Air Quality - Bicycle and pedestrian facilitiesCapacity Status: NCI
Est Total Cost: $7,880
CONRWPEPRIORTOTAL 10/11 11/12 12/13 13/14 14/15
TransNet - L $2,150 $2,150 $2,150
TransNet - LSI $3,264 $1,041 $375 $350 $350 $350 $5,730 $5,730
TOTAL $7,880 $5,414 $1,041 $375 $350 $350 $350 $7,880
MPO ID:
Project Title: SR 15 Bikeway
SD14 ADOPTION: 10-00
Project Description:
TransNet - LSI: CR
State Route 15 from Landis Street to Adams Avenue - in San Diego, Pedestrian and
bicycle right-of-way improvements along I-15 corridor including widened pedestrian
paths, lighting, signage, striping and signal improvements (581270) Funding for
construction of this project is programmed in V04, Smart Growth Incentive Program
Exempt Category: Air Quality - Bicycle and pedestrian facilitiesCapacity Status: NCI
Est Total Cost: $912
CONRWPEPRIORTOTAL 10/11 11/12 12/13 13/14 14/15
CMAQ $645 $525 $120 $645
TransNet - B $57 $57 $57
TransNet - LSI $160 $50 $160 $50 $210
TOTAL $912 $862 $50 $170 $742
89Page Thursday, July 8, 2010
93

San Diego Region (in $000s)DRAFT 2010 Regional Transportation Improvement Program
MPO ID:
Project Title: Street Lights
SD15
San Diego, City of
ADOPTION: 10-00
Project Description:
TransNet - LSI: CR
Install new street lights:, Donahue St @ Friars Rd, southside, Fifth Ave @ Brookes Ave,
ne corner & @ Anderson Pl, se corner, 43rd @ Keeler Ave, (1)east side (1) sw corner,
Abalone Pl @ Chelsea Ave, east side, Brookhaven Rd @ S Meadowbrook Dr(1) nw
corner (1)se corner, Buena Vista St @ Ingraham St, ne corner, Carmel Ridge Rd @ Ted
Williams Pkwy, ne corner, Carroll Road at Carroll Way (1) nw corner (1) se corner,
Chatsworth Blvd @ Tennyson St, Chickasaw Ct @ Genesee Ave, nw corner, Chollas
Station Rd @ Winlow St, nw corner, El Camino Real @ San Raphael Driveway (east)
(nw corner), Fay Ave @ Rushville St, east side, Genesee Ave @ Sauk Ave, se corner,
Imperial Ave @ Rainbow St (1) ne corner, (1) se corner, La Jolla Scenic Dr N @ Via
Posada, sw corner, Mesa Way @ Via Maria, south side, Sixth Ave @ Anderson Pl (1)
east side (1) nw corner, Sixth Ave @ Ivy Lane, nw corner, Federal Blvd @ Pentacost Way
(1) ne corner (1) nw corner, Coast Blvd @ Girard Ave (1) sw corner (1) nw corner, 18th
St @ Coronado Ave SB (1) ne corner (1) nw corner (1)south side, Candida St @ Via
Pasar, south side, Chatsworth Blvd @ Tennyson St, - in San Diego, install new street
lights (CIP 52-293.0, 61-201.0, 68-012.0)
Exempt Category: Safety - Lighting improvementsCapacity Status: NCI
Est Total Cost: $2,311
CONRWPEPRIORTOTAL 10/11 11/12 12/13 13/14 14/15
Local Funds $400 $400 $400
TransNet - L $1,100 $1,100 $1,100
TransNet - LSI $311 $100 $100 $100 $100 $100 $811 $811
TOTAL $2,311 $1,811 $100 $100 $100 $100 $100 $2,311
MPO ID:
Project Title: Traffic Signals Citywide
SD16A ADOPTION: 10-00
Project Description:
TransNet - LSI: CR
New traffic signal installation locations:, 31st Street @ Imperial Avenue; El Cajon Blvd
@ Dayton St; 29th St @ Oceanview Blvd, Traffic signal upgrades/modernization
locations:, El Cajon @ Texas St, Coronado Blvd @ Saturn Blvd, Euclid Ave @ Imperial
Ave, 9th Ave @ E St, 10th Ave @ F St, 16th St @ Market St, Alvardo Canyon Rd @
Paradise Valley Rd, Moore St & Old Town Ave, Interconnect Systems:, Hardware,
Software upgrades to centrally controlled traffic signal optimization system, Traffic
signal controller replacement:, 75 downtown locations, Clairemont Mesa Bvd @
Clairemont Mesa Drive , Clairemont Mesa Bvd @ Diane Ave, Clairemont Mesa Bvd @
Limerick Ave, Clairemont Mesa Bvd @ Doliva Dr, Santo Rd @ Shields St, Bannock Ave
@ Genesee Ave, - install new traffic signals with intersection street lighting systems,
upgrade/modernize traffic signals, install passive/permissive traffic signal systems;
traffic signal interconnect systems (CIP 62-001/002/210, 63-002/043, 68-001/010/011,
62-275/292, 62-331.0)
Exempt Category: Other - Intersection signalization projectsCapacity Status: NCI
Est Total Cost: $14,780
CONRWPEPRIORTOTAL 10/11 11/12 12/13 13/14 14/15
TransNet - L $4,280 $4,280 $4,280
TransNet - LSI $2,745 $1,655 $1,525 $1,525 $1,525 $1,525 $10,500 $10,500
TOTAL $14,780 $7,025 $1,655 $1,525 $1,525 $1,525 $1,525 $14,780
90Page Thursday, July 8, 2010
94

San Diego Region (in $000s)DRAFT 2010 Regional Transportation Improvement Program
MPO ID:
Project Title: Traffic Control Measures
SD18
San Diego, City of
ADOPTION: 10-00
Project Description:
TransNet - LSI: CR
In Smart Growth Areas of San Diego: Park Blvd. @ City College; lighted crosswalk and
pop-outs, Park Blvd. @ Essex St; lighted crosswalk, Rimbey Ave. @ school location
mid-block: crosswalk and pop-outs, 5th Ave. @ Nutmeg St.; lighted crosswalk, Thermal
Ave. @ Hermes St.; pop-outs, Park Blvd. @ Cypress Ave.; lighted crosswalk and
pop-outs, Girard between Pearl St. and Gentner; pop-outs and lighted sidewalk, Adams
Ave. @ Hamilton St.; pop-outs, Saturn Ave. @ Hermes St.; pop-outs, La Jolla Mesa @
Van Nuys; pop outs, La Jolla Blvd at Marine St; pop outs and crosswalk. Traffic calming
measures at; Landale Drive, Leon Avenue, Washington Place, Cardeno Drive, Lotus
Drive, Calle Cristobal, Park Village Road, Villa Mallorca - traffic control and traffic
calming measures (CIP 61-001.0)
Exempt Category: Safety - Non signalization traffic control and operatngCapacity Status: NCI
Est Total Cost: $3,471
CONRWPEPRIORTOTAL 10/11 11/12 12/13 13/14 14/15
Local Funds $371 $371 $371
TransNet - L $1,600 $1,600 $1,600
TransNet - LSI $400 $300 $200 $200 $200 $200 $1,500 $1,500
TOTAL $3,471 $2,371 $300 $200 $200 $200 $200 $3,471
MPO ID:
Project Title: Streamview Drive
SD19 ADOPTION: 10-00
Project Description:
TransNet - LSI: CR
Streamview Drive from 54th Street to College Avenue - in San Diego, installation of new
raised median, new sidewalk including curb & gutter, and traffic circles to improve the
flow of traffic and increase safety (CIP 52-588.0)
Exempt Category: Safety - Adding mediansCapacity Status: NCI
Est Total Cost: $1,975
CONRWPEPRIORTOTAL 10/11 11/12 12/13 13/14 14/15
TransNet - L $350 $350 $350
TransNet - LSI $180 $200 $200 $795 $250 $380 $1,245 $1,625
TOTAL $1,975 $530 $200 $200 $795 $250 $1,245 $730
MPO ID:
Project Title: Storm Drains - Roadway Drainage Improvements
SD23 ADOPTION: 10-00
Project Description:
TransNet - LSI: CR
Ransom/Darwin , Glen Curtis Drain, Ingulf Place , Riviera Drive at 3663, Wenrich Drive,
Fashion Valley Road, - roadway drainage projects for the purpose of improving traffic
impeding conditions and alleviate significant and frequent flooding (CIP 13-005.0,
13-502.0, 11-3020/3060/3070)
Exempt Category: Other - Intersection channelization projectsCapacity Status: NCI
Est Total Cost: $8,008
CONRWPEPRIORTOTAL 10/11 11/12 12/13 13/14 14/15
Local Funds $1,605 $1,605 $1,605
TransNet - L $3,302 $3,302 $3,302
TransNet - LSI $477 $185 $600 $633 $606 $600 $3,101 $3,101
TOTAL $8,008 $5,384 $185 $600 $633 $606 $600 $8,008
91Page Thursday, July 8, 2010
95

San Diego Region (in $000s)DRAFT 2010 Regional Transportation Improvement Program
MPO ID:
Project Title: Carmel Valley Road
SD31
San Diego, City of
ADOPTION: 10-00
Project Description:
RAS (TA7-46)
TransNet - LSI: CRCarmel Valley Road from 300 feet east of Portofino Drive to Via Mar Valle (Del Mar limit)
- in San Diego, modify existing 2-lane collector street by adding Class II bike path (CIP
52-517.0)
Exempt Category: Air Quality - Bicycle and pedestrian facilitiesCapacity Status: NCI
Est Total Cost: $6,004
CONRWPEPRIORTOTAL 10/11 11/12 12/13 13/14 14/15
Local Funds $562 $562 $562
TransNet - L $5,197 $5,197 $5,197
TransNet - LSI $195 $25 $25 $245 $245
TOTAL $6,004 $5,954 $25 $25 $6,004
MPO ID:
Project Title: El Camino Real
SD34 ADOPTION: 10-00
Project Description:
RAS (TA7-47)
TransNet - LSI: CREl Camino Real from San Dieguito Road to Via de la Valle - in San Diego on El Camino
Real from San Dieguito Road to Via de la Valle - reconstruct & widen from 2 to 4 lanes
and extend transition lane and additional grading to avoid biological impacts (CIP
52-479.0)
Exempt Category: Non-ExemptCapacity Status: CI
Est Total Cost: $33,805 Open to Traffic: Jun 2015
CONRWPEPRIORTOTAL 10/11 11/12 12/13 13/14 14/15
HBP $320 $1,992 $20,696 $2,312 $20,696 $23,008
HBRR $1,708 $1,700 $8 $1,708
Local Funds $1,472 $157 $1,128 $501 $1,629
Local Funds AC $20,696 $(20,696)$0
RSTP $2,560 $2,560 $2,560
TransNet - LSI $600 $500 $2,100 $1,700 $1,100 $3,800 $4,900
TOTAL $33,805 $4,100 $25,905 $2,100 $1,700 $2,821 $27,056 $3,928
MPO ID:
Project Title: Georgia St Bridge/University Ave
SD38 ADOPTION: 10-00
Project Description:
TransNet - LSI: CR
On Georgia Street over University Avenue - in San Diego, provides for bridge
replacement, retaining walls and guardrails along bridge walls (CIP 52-555)
Exempt Category: Safety - Guardrails, median barriers, crash cushionsCapacity Status: NCI
Est Total Cost: $2,652
CONRWPEPRIORTOTAL 10/11 11/12 12/13 13/14 14/15
Local Funds $421 $421 $421
TransNet - L $631 $631 $631
TransNet - LSI $1,600 $1,600 $1,600
TOTAL $2,652 $631 $421 $1,600 $2,652
92Page Thursday, July 8, 2010
96

San Diego Region (in $000s)DRAFT 2010 Regional Transportation Improvement Program
MPO ID:
Project Title: Median Improvements Citywide
SD49
San Diego, City of
ADOPTION: 10-00
Project Description:
TransNet - LSI: CR
El Cajon Blvd. (CIP 39-234.0), Navajo (CIP 52-668.0), Normal St. (CIP 52-769.0) and
Thorn (52-406.0), Balboa Ave @ Hathaway, Camino Ruiz @ Capricorn Way, Balboa Ave
@ Mt. Culebra, (52-808) - safety improvements and/or left turn movements
Exempt Category: Safety - Pavement marking demonstrationCapacity Status: NCI
Est Total Cost: $3,902
CONRWPEPRIORTOTAL 10/11 11/12 12/13 13/14 14/15
Local Funds $1,327 $1,102 $225 $1,327
TransNet - L (Cash) $641 $641 $641
TransNet - LSI $510 $400 $297 $327 $200 $200 $1,934 $1,934
TOTAL $3,902 $2,478 $400 $297 $327 $200 $200 $2,800 $1,102
MPO ID:
Project Title: North Torrey Pines Road Bridge
SD51 ADOPTION: 10-00
Project Description:
RAS (T7-48)
TransNet - LSI: CRNorth Torrey Pines Road from Carmel Valley Road to Torrey Pines Park Road - in San
Diego, replace North Torrey Pines Road bridge over Los Penasquitos Creek (CIP
53-050.0)
Exempt Category: Safety - Non capacity widening or bridge reconstructionCapacity Status: NCI
Est Total Cost: $1,606
CONRWPEPRIORTOTAL 10/11 11/12 12/13 13/14 14/15
Local Funds $243 $243 $243
TransNet - L $1,035 $100 $935 $1,035
TransNet - LSI $75 $88 $65 $50 $50 $328 $328
TOTAL $1,606 $1,353 $88 $65 $50 $50 $1,506 $100
MPO ID:
Project Title: West Mission Bay Drive Bridge
SD70 ADOPTION: 10-00
Project Description:
RAS (T7-49)
TransNet - LSI: CRWest Mission Bay Drive bridge over San Diego River - in San Diego, replace bridge
and increase from 4 to 6-lane bridge including Class II bike lane (52-643)
Exempt Category: Non-ExemptCapacity Status: CI
Est Total Cost: $120,600 Open to Traffic: Dec 2015
CONRWPEPRIORTOTAL 10/11 11/12 12/13 13/14 14/15
HBP $5,560 $97,206 $4,040 $1,520 $97,206 $102,766
HBRR $2,600 $2,600 $2,600
Local Funds $1,390 $12,594 $1,010 $380 $12,594 $13,984
Local Funds AC $97,206 $(97,206)$0
TransNet - L $650 $650 $650
TransNet - LSI $200 $100 $100 $200 $600 $600
TOTAL $120,600 $3,450 $7,050 $100 $200 $109,800 $1,900 $109,800 $8,900
93Page Thursday, July 8, 2010
97
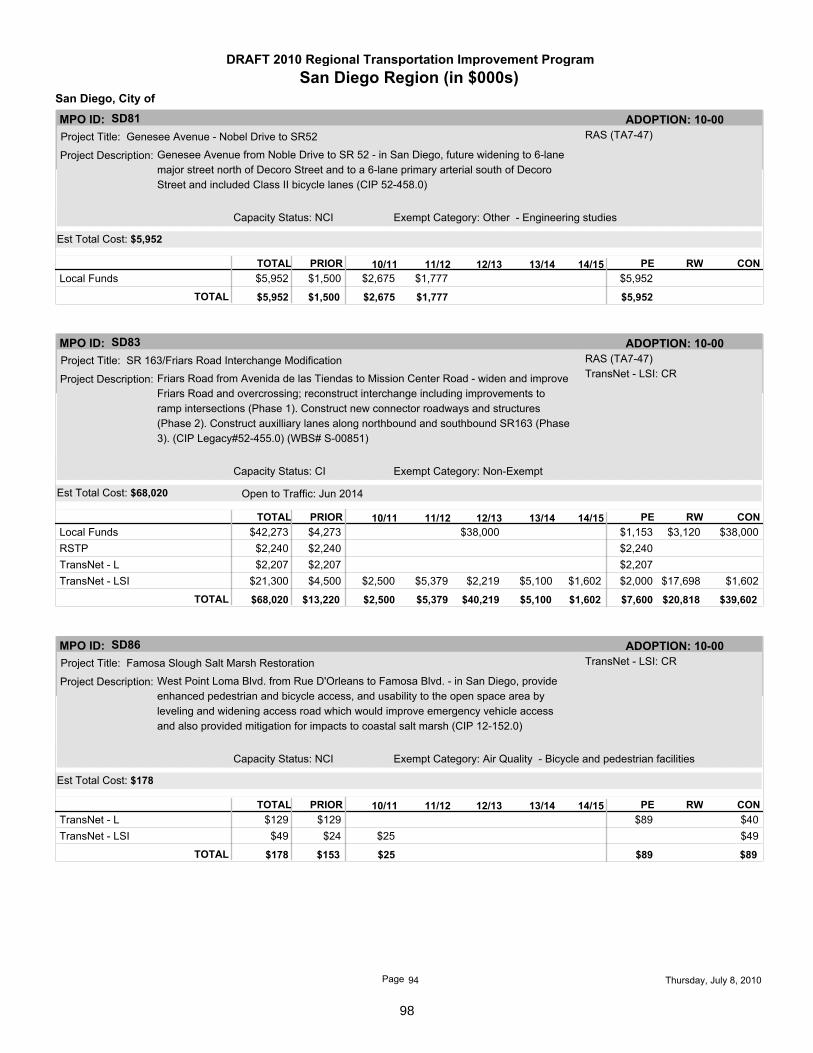
San Diego Region (in $000s)DRAFT 2010 Regional Transportation Improvement Program
MPO ID:
Project Title: Genesee Avenue - Nobel Drive to SR52
SD81
San Diego, City of
ADOPTION: 10-00
Project Description:
RAS (TA7-47)
Genesee Avenue from Noble Drive to SR 52 - in San Diego, future widening to 6-lane
major street north of Decoro Street and to a 6-lane primary arterial south of Decoro
Street and included Class II bicycle lanes (CIP 52-458.0)
Exempt Category: Other - Engineering studiesCapacity Status: NCI
Est Total Cost: $5,952
CONRWPEPRIORTOTAL 10/11 11/12 12/13 13/14 14/15
Local Funds $1,500 $2,675 $1,777 $5,952 $5,952
TOTAL $5,952 $1,500 $2,675 $1,777 $5,952
MPO ID:
Project Title: SR 163/Friars Road Interchange Modification
SD83 ADOPTION: 10-00
Project Description:
RAS (TA7-47)
TransNet - LSI: CRFriars Road from Avenida de las Tiendas to Mission Center Road - widen and improve
Friars Road and overcrossing; reconstruct interchange including improvements to
ramp intersections (Phase 1). Construct new connector roadways and structures
(Phase 2). Construct auxilliary lanes along northbound and southbound SR163 (Phase
3). (CIP Legacy#52-455.0) (WBS# S-00851)
Exempt Category: Non-ExemptCapacity Status: CI
Est Total Cost: $68,020 Open to Traffic: Jun 2014
CONRWPEPRIORTOTAL 10/11 11/12 12/13 13/14 14/15
Local Funds $4,273 $38,000 $1,153 $3,120 $38,000 $42,273
RSTP $2,240 $2,240 $2,240
TransNet - L $2,207 $2,207 $2,207
TransNet - LSI $4,500 $2,500 $5,379 $2,219 $5,100 $1,602 $2,000 $17,698 $1,602 $21,300
TOTAL $68,020 $13,220 $2,500 $5,379 $40,219 $5,100 $1,602 $20,818 $39,602 $7,600
MPO ID:
Project Title: Famosa Slough Salt Marsh Restoration
SD86 ADOPTION: 10-00
Project Description:
TransNet - LSI: CR
West Point Loma Blvd. from Rue D'Orleans to Famosa Blvd. - in San Diego, provide
enhanced pedestrian and bicycle access, and usability to the open space area by
leveling and widening access road which would improve emergency vehicle access
and also provided mitigation for impacts to coastal salt marsh (CIP 12-152.0)
Exempt Category: Air Quality - Bicycle and pedestrian facilitiesCapacity Status: NCI
Est Total Cost: $178
CONRWPEPRIORTOTAL 10/11 11/12 12/13 13/14 14/15
TransNet - L $129 $89 $40 $129
TransNet - LSI $24 $25 $49 $49
TOTAL $178 $153 $25 $89 $89
94Page Thursday, July 8, 2010
98

San Diego Region (in $000s)DRAFT 2010 Regional Transportation Improvement Program
MPO ID:
Project Title: SR 163/Clairemont Mesa Blvd. Interchange
SD90
San Diego, City of
ADOPTION: 10-00
Project Description:
RAS (TA7-46)
TransNet - LSI: CRClairemont Mesa Blvd. from Kearny Villa Road to Kearny Mesa - in San Diego, widen
from 4 to 6 lane prime arterial; Phase II of the project - west ramps (CIP 52-745.0)
Exempt Category: Non-ExemptCapacity Status: CI
Est Total Cost: $22,200 Open to Traffic: Dec 2015
CONRWPEPRIORTOTAL 10/11 11/12 12/13 13/14 14/15
Local Funds $10,462 $2,535 $7,927 $10,462
RSTP $5,238 $5,238 $5,238
TransNet - L $500 $500 $500
TransNet - LSI $1,000 $3,920 $1,080 $1,000 $5,000 $6,000
TOTAL $22,200 $17,200 $3,920 $1,080 $18,665 $3,535
MPO ID:
Project Title: School Traffic Safety Improvements
SD97 ADOPTION: 10-00
Project Description:
TransNet - LSI: CR
Willow Elementary located in San Ysidro on Willow Road, Joyner Elementary located
on Myrtle Ave, Nestor Elementary School, Southwest High School, Mar Vista Middle
School - in San Diego, provide traffic control devices (CIP 68-017,62-266.0,62-337.0)
Exempt Category: Other - Intersection signalization projectsCapacity Status: NCI
Est Total Cost: $2,100
CONRWPEPRIORTOTAL 10/11 11/12 12/13 13/14 14/15
Local Funds $150 $150 $150
TransNet - L $620 $620 $620
TransNet - LSI $330 $200 $200 $200 $200 $200 $1,330 $1,330
TOTAL $2,100 $1,100 $200 $200 $200 $200 $200 $2,100
MPO ID:
Project Title: Bridge Rehabilitation
SD99 ADOPTION: 10-00
Project Description:
TransNet - LSI: CR
Citywide - in San Diego, bridge retrofit or replacement projects citywide(CIP 525190)
including Voltaire Street Bridge over Nimitz Blvd. rehabilitation (CIP 525233) and
Barnett Ave. Bridge over Pacific Highway (CIP 525231)
Exempt Category: Safety - Non capacity widening or bridge reconstructionCapacity Status: NCI
Est Total Cost: $670
CONRWPEPRIORTOTAL 10/11 11/12 12/13 13/14 14/15
TransNet - L $300 $300 $300
TransNet - LSI $100 $270 $370 $370
TOTAL $670 $400 $270 $670
95Page Thursday, July 8, 2010
99

San Diego Region (in $000s)DRAFT 2010 Regional Transportation Improvement Program
MPO ID:
Project Title: Otay Truck Route
SD102
San Diego, City of
ADOPTION: 10-00
Project Description:
TransNet - LSI: CR
Otay Truck Route from Drucker Lane to Point of Entry - in San Diego, add emergency
lane primarily for Border Patrol use and fire department access (Phase 3) (CIP
52-682.1)
Exempt Category: Safety - Emergency truck pulloversCapacity Status: NCI
Est Total Cost: $4,602
CONRWPEPRIORTOTAL 10/11 11/12 12/13 13/14 14/15
Local Funds $1,202 $442 $760 $1,202
STP - Sec 117 $2,000 $2,000 $2,000
TransNet - LSI $150 $200 $300 $750 $500 $900 $1,400
TOTAL $4,602 $3,352 $200 $300 $750 $500 $3,660 $442
MPO ID:
Project Title: Otay Truck Route Widening (Ph. 4)
SD102A ADOPTION: 10-00
Project Description:
EARMARK NO: CA596/2655,
CA700/3776
TransNet - LSI: CRon Otay Truck Route - in San Diego, from Drucker Lane to La Media, add one lane
(total 3 lanes) for trucks; from Britannia to La Media, add one lane for trucks and one
lane for emergency vehicles (Border Patrol/fire department access); along Britannia
from Britannia Court to the Otay Truck Route - add one lane for trucks(CIP 52-682.1)
Exempt Category: Non-ExemptCapacity Status: CI
Est Total Cost: $5,718 Open to Traffic: Dec 2009
CONRWPEPRIORTOTAL 10/11 11/12 12/13 13/14 14/15
HPP $800 $1,000 $2,400 $1,800 $2,400 $4,200
Local Funds $318 $200 $650 $518 $650 $1,168
TransNet - L $100 $100 $100
TransNet - LSI $250 $250 $250
TOTAL $5,718 $1,468 $1,200 $3,050 $3,050 $2,668
MPO ID:
Project Title: I-5/Genesee Ave Interchange
SD103 ADOPTION: 10-00
Project Description:
RTP PG NO: A-5
RAS (TA7-41)Along I- 5 from Sorrento Valley Road to Genesee Avenue - in San Diego, replace
Genesee Ave. over crossing from 4-lane bridge with 6-lane bridge; construct auxiliary
lanes and replace Voight Drive bridge; add additional lane at on/off ramp to Sorrento
Valley Rd.; add one carpool lane and one general purpose lane to on ramp from
Sorrento Valley Road to southbound I-5; install ramp meters at on ramp and construct
a southbound auxiliary lane between Sorrento Valley Road and Genesee Avenue
Exempt Category: Non-ExemptCapacity Status: CI
Est Total Cost: $27,363 Open to Traffic: Oct 2012
CONRWPEPRIORTOTAL 10/11 11/12 12/13 13/14 14/15
HPP $1,600 $1,600 $1,600
Local Funds $9,200 $15,600 $9,940 $3,960 $10,900 $24,800
TransNet - MC $963 $963 $963
TOTAL $27,363 $10,800 $16,563 $3,960 $11,863 $11,540
96Page Thursday, July 8, 2010
100

San Diego Region (in $000s)DRAFT 2010 Regional Transportation Improvement Program
MPO ID:
Project Title: I-5/Sorrento Valley Road
SD113
San Diego, City of
ADOPTION: 10-00
Project Description:
RAS (TA7-41)
TransNet - LSI: CRInterstate 5 from Sorrento Valley Rd to Sorrento Valley Rd - in San Diego, future new
freeway access interchange including ramp (CIP 52-765.0) (S-00914)
Exempt Category: Other - Engineering studiesCapacity Status: NCI
Est Total Cost: $3,775
CONRWPEPRIORTOTAL 10/11 11/12 12/13 13/14 14/15
DEMO - Sec 115 $1,500 $1,500 $1,500
STP - Sec 112 $600 $600 $600
STP - Sec 117 $1,500 $1,500 $1,500
TransNet - LSI $175 $175 $175
TOTAL $3,775 $3,600 $175 $175 $3,600
MPO ID:
Project Title: La Jolla Village Drive/I-805 Interchange Ramps
SD115 ADOPTION: 10-00
Project Description:
RAS (TA7-47)
I 805 from La Jolla Village to La Jolla Village - in San Diego on I-805 at La Jolla Village
Drive - reconfigure interchange and add 220 meters of acceleration lane (CIP 524850)
Exempt Category: Other - Interchange reconfiguration projectsCapacity Status: NCI
Est Total Cost: $28,975
CONRWPEPRIORTOTAL 10/11 11/12 12/13 13/14 14/15
Local Funds $23,975 $5,000 $3,055 $25,920 $28,975
TOTAL $28,975 $23,975 $5,000 $25,920 $3,055
MPO ID:
Project Title: San Diego River Multi-Use Bicycle and Pedestrian Path
SD120 ADOPTION: 10-00
Project Description:
EARMARK NO: CA 317/90
TransNet - LSI: CRHazard Center Drive from 400' west of SR163 to 600' east of SR163 - in San Diego on
Hazard Center Drive under SR 163 - construct bicycle and pedestrian path on north
side of San Diego River (CIP 58-191.0)
Exempt Category: Air Quality - Bicycle and pedestrian facilitiesCapacity Status: NCI
Est Total Cost: $2,040
CONRWPEPRIORTOTAL 10/11 11/12 12/13 13/14 14/15
HPP $400 $400 $400
TransNet - B $180 $180 $180
TransNet - LSI $320 $1,140 $320 $1,140 $1,460
TOTAL $2,040 $900 $1,140 $1,540 $500
97Page Thursday, July 8, 2010
101

San Diego Region (in $000s)DRAFT 2010 Regional Transportation Improvement Program
MPO ID:
Project Title: University Avenue Mobility Project Phase 2
SD129
San Diego, City of
ADOPTION: 10-00
Project Description:
RAS (TA7-48)
TransNet - LSI: CRUniversity Avenue from Florida Street to Boundary Street - in San Diego, environmental
studies for improvements to University Avenue transit corridor in North Park (CIP
52-766.0), improvements include installation of new medians for safety improvements,
restriping, pedestrian popouts, new traffic signal, enhanced pedestrian crossings, and
new bike racks (augments Smart Growth Funding for this project in V04)
Exempt Category: Other - Transportation enhancement activitiesCapacity Status: NCI
Est Total Cost: $3,675
CONRWPEPRIORTOTAL 10/11 11/12 12/13 13/14 14/15
TransNet - L $175 $175 $175
TransNet - LSI $200 $300 $200 $2,800 $200 $500 $2,800 $3,500
TOTAL $3,675 $375 $300 $200 $2,800 $500 $2,800 $375
MPO ID:
Project Title: Skyline Drive - 58th Street to Sears Avenue
SD130 ADOPTION: 10-00
Project Description:
EARMARK NO: CA574/2479
TransNet - LSI: CRSkyline Drive from 58th St. to Sears Avenue - Skyline Drive from 58th Street to Sears
Avenue - in San Diego, installation of new medians for safety improvements,
intersection lighting, traffic signal upgrades and other street improvements to enhance
pedestrian and vehicular movement (CIP 52-763.0)(WBS# S-00912)
Exempt Category: Other - Intersection channelization projectsCapacity Status: NCI
Est Total Cost: $1,755
CONRWPEPRIORTOTAL 10/11 11/12 12/13 13/14 14/15
HPP $800 $800 $800
Local Funds $325 $325 $325
TransNet - L $305 $305 $305
TransNet - LSI $325 $325 $325
TOTAL $1,755 $630 $1,125 $1,125 $630
MPO ID:
Project Title: Mira Sorrento Place
SD133 ADOPTION: 10-00
Project Description:
TransNet - LSI: CR
Mira Sorrento Place from Scranton Rd. to Vista Sorrento Pkwy. - in San Diego, widen
the existing two-lane 560' portion of Mira Sorrento Place (40' road width, 55' right of way)
to a four-lane collector (72' road width, 92' right of way), and extend the road to intersect
with Vista Sorrento Parkway at the existing on/off ramps to I-805 (CIP 52-676.0)
Exempt Category: Non-ExemptCapacity Status: CI
Est Total Cost: $12,875 Open to Traffic: May 2008
CONRWPEPRIORTOTAL 10/11 11/12 12/13 13/14 14/15
Local Funds $11,885 $2,600 $1,500 $7,785 $11,885
TransNet - L $810 $810 $810
TransNet - LSI $120 $60 $180 $180
TOTAL $12,875 $12,815 $60 $1,500 $8,775 $2,600
98Page Thursday, July 8, 2010
102

San Diego Region (in $000s)DRAFT 2010 Regional Transportation Improvement Program
MPO ID:
Project Title: Palm Avenue Roadway Improvements
SD137
San Diego, City of
ADOPTION: 10-00
Project Description:
RAS (TA7-48)
TransNet - LSI: CRPalm Ave from I-805 to Beyer Blvd - in San Diego, install traffic improvements to include
raised medians with turn pockets, traffic signals, pedestrian refuge areas, etc (CIP
52-764.0)
Exempt Category: Other - Non construction related activitiesCapacity Status: NCI
Est Total Cost: $3,754
CONRWPEPRIORTOTAL 10/11 11/12 12/13 13/14 14/15
TransNet - L $300 $300 $300
TransNet - LSI $569 $630 $2,255 $569 $2,885 $3,454
TOTAL $3,754 $869 $630 $2,255 $2,885 $869
MPO ID:
Project Title: 25th Street Renaissance
SD153 ADOPTION: 10-00
Project Description:
TransNet - LSI: CR
25th Street from F Street to Russ Boulevard (Balboa Park) including adjacent
intersecting streets along 25th Street from F Street to Russ Boulevard. - in San Diego,
augments existing Smart Growth projects (V04) related infrastructure improvements to
include the construction of amenities to improve pedestrian safety and provide traffic
calming, including the installation of a roundabout at the intersection of 25th and B
Streets; the roundabout will replace a four-way stop controlled intersection and will
provide continuous flow and reduce delay; congestion will be reduced as vehicles will
no longer stop and queue at the stop signs; the improvements will promote and
improve pedestrian safety at intersection crossings and create a more walkable
neighborhood; streetscape and parking improvements may also be provided (CIP
62-332.0)
Exempt Category: Other - Interchange reconfiguration projectsCapacity Status: NCI
Est Total Cost: $1,025
CONRWPEPRIORTOTAL 10/11 11/12 12/13 13/14 14/15
TransNet - LSI $200 $125 $700 $200 $125 $700 $1,025
TOTAL $1,025 $200 $125 $700 $125 $700 $200
MPO ID:
Project Title: Old Otay Mesa Road
SD155 ADOPTION: 10-00
Project Description: Old Otay Mesa Road from Hawkin Dr. to 1,100 feet west of Crescent Bay Dr. - in San
Diego, widen road by approximately 20 feet for the purpose of installing new sidewalk
with concrete curb and gutter, and to allow for the installation of bike lanes, guardrails,
fence, minor drainage facilities and retaining walls. This project will not increase traffic
lanes (CIP 52-775.0/52-642.0)
Exempt Category: Air Quality - Bicycle and pedestrian facilitiesCapacity Status: NCI
Est Total Cost: $7,600
CONRWPEPRIORTOTAL 10/11 11/12 12/13 13/14 14/15
Local Funds $3,900 $3,500 $2,400 $1,500 $3,500 $7,400
TransNet - L $200 $200 $200
TOTAL $7,600 $4,100 $3,500 $1,500 $3,500 $2,600
99Page Thursday, July 8, 2010
103

San Diego Region (in $000s)DRAFT 2010 Regional Transportation Improvement Program
MPO ID:
Project Title: 34th and 35th at Madison Avenue Improvements
SD156
San Diego, City of
ADOPTION: 10-00
Project Description:
TransNet - LSI: CR
On 34th and 35th Streets from Adams to Madison, on from Felton to 35th Street - in San
Diego, construction of new sidewalk and drainage improvements including curbs and
gutters (CIP 52-774.0)
Exempt Category: Safety - Pavement resurfacing and/or rehabilitationCapacity Status: NCI
Est Total Cost: $1,734
CONRWPEPRIORTOTAL 10/11 11/12 12/13 13/14 14/15
TransNet - L $60 $60 $60
TransNet - LSI $120 $251 $303 $1,000 $120 $251 $1,303 $1,674
TOTAL $1,734 $180 $251 $303 $1,000 $251 $1,303 $180
MPO ID:
Project Title: Cherokee Street Improvements
SD157 ADOPTION: 10-00
Project Description:
TransNet - LSI: CR
Cherokee St from Monroe Ave to E Mountain View - in San Diego, construction of
sidewalk and drainage improvements including curb and gutter; drainage
improvements will reduce frequent flooding problems (CIP 52-773.0)
Exempt Category: Safety - Pavement resurfacing and/or rehabilitationCapacity Status: NCI
Est Total Cost: $2,060
CONRWPEPRIORTOTAL 10/11 11/12 12/13 13/14 14/15
TransNet - L $30 $30 $30
TransNet - LSI $70 $480 $1,480 $70 $480 $1,480 $2,030
TOTAL $2,060 $100 $480 $1,480 $480 $1,480 $100
MPO ID:
Project Title: Preliminary Engineering for Congestion Relief Projects
SD161 ADOPTION: 10-00
Project Description:
TransNet - LSI: CR
Various locations: Balboa Avenue from I-5 to I-15, Rosecrans St from I-8 to Kellog
Street, University Avenue from 54th St to 68th St - in San Diego, perform preliminary
design work for future congestion relief project development (CIP 59-023.0); project
types include roadway realignment, roadway widening for bike lanes, new or widened
sidewalks, new traffic signals and traffic signal upgrades including intersection
lighting, traffic calming measures
Exempt Category: Other - Engineering studiesCapacity Status: NCI
Est Total Cost: $1,426
CONRWPEPRIORTOTAL 10/11 11/12 12/13 13/14 14/15
TransNet - L $600 $600 $600
TransNet - LSI $576 $50 $50 $50 $50 $50 $826 $826
TOTAL $1,426 $1,176 $50 $50 $50 $50 $50 $1,426
100Page Thursday, July 8, 2010
104

San Diego Region (in $000s)DRAFT 2010 Regional Transportation Improvement Program
MPO ID:
Project Title: Prospect Street/Silverado Street Roundabout
SD163
San Diego, City of
ADOPTION: 10-00
Project Description:
TransNet - LSI: CR
Prospect Street and Silverado Street - in San Diego, install intersection improvements
to include a roundabout which provide continuous flow and reduce delay; the
improvements will promote and improve pedestrian safety at the intersection crossing
(CIP 52-776.0)
Exempt Category: Other - Intersection channelization projectsCapacity Status: NCI
Est Total Cost: $1,811
CONRWPEPRIORTOTAL 10/11 11/12 12/13 13/14 14/15
Local Funds $891 $891 $891
TransNet - L $150 $150 $150
TransNet - LSI $770 $770 $770
TOTAL $1,811 $920 $891 $1,661 $150
MPO ID:
Project Title: Minor Bicycle Facilities
SD166 ADOPTION: 10-00
Project Description:
TransNet - LSI: CR
Citywide including , Park Blvd, Adams Ave, Aldine Dr, Monroe Ave, & El Cajon Blvd -
install Class II bike lanes or Class II bike routes (CIP 58-204.0)
Exempt Category: Air Quality - Bicycle and pedestrian facilitiesCapacity Status: NCI
Est Total Cost: $465
CONRWPEPRIORTOTAL 10/11 11/12 12/13 13/14 14/15
TransNet - L $15 $15 $15
TransNet - LSI $290 $100 $15 $15 $15 $15 $175 $275 $450
TOTAL $465 $305 $100 $15 $15 $15 $15 $290 $175
MPO ID:
Project Title: Transportation Grant Matches
SD172 ADOPTION: 10-00
Project Description:
TransNet - LSI: CR
various locations citywide including West Mission Bay Drive Bridge Seismic Retrofit
project, and Desert View Drive Alley Repair (CIP 52-805.1) grant funding provided
through FHWA and OES R-304725, and the At-Grade Crossing and Traffic
Synchronization Improvement Project (TSLP)(CIP 59-021.0) - in San Diego; the City's
share of TLSP Grant (R-304384); match to Safe Routes to School - Florence Griffith
Joyner Elementary (CIP 62-337.0)(R-303994)
Exempt Category: Safety - Pavement resurfacing and/or rehabilitationCapacity Status: NCI
Est Total Cost: $4,565
CONRWPEPRIORTOTAL 10/11 11/12 12/13 13/14 14/15
TransNet - L $458 $458 $458
TransNet - L Carry Over $108 $108 $108
TransNet - LSI $399 $755 $700 $900 $610 $635 $3,999 $3,999
TOTAL $4,565 $857 $863 $700 $900 $610 $635 $4,565
list of approved grants available*
101Page Thursday, July 8, 2010
105
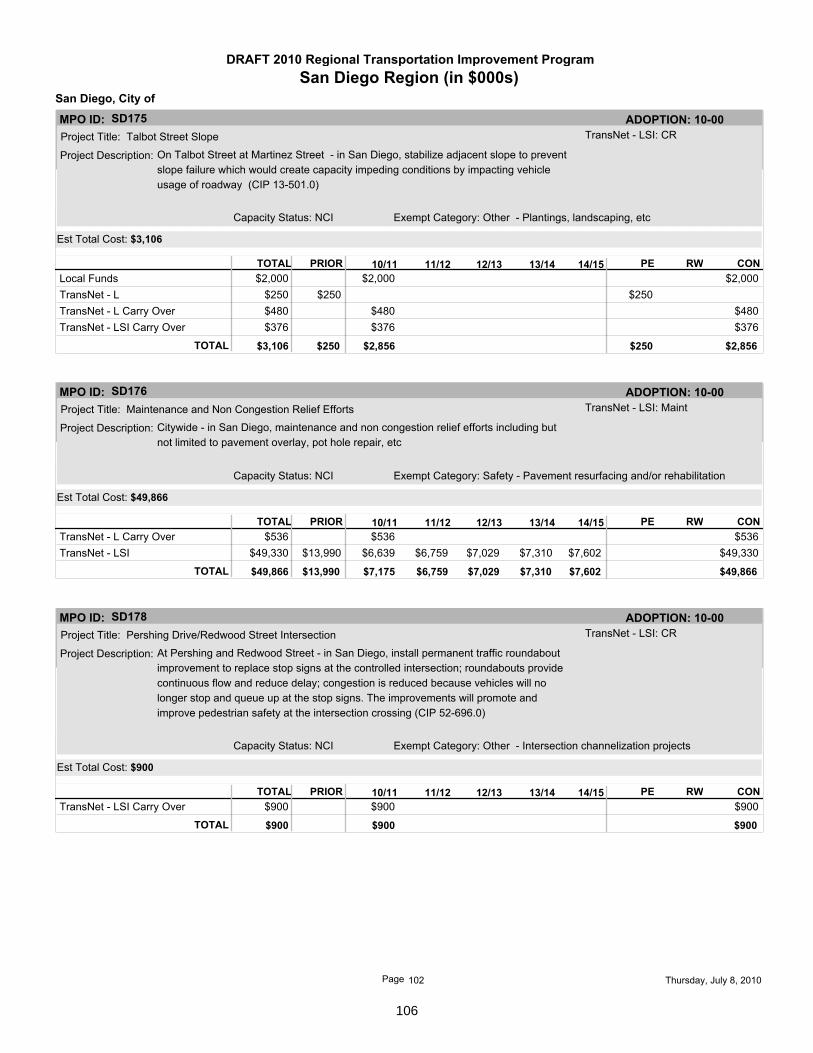
San Diego Region (in $000s)DRAFT 2010 Regional Transportation Improvement Program
MPO ID:
Project Title: Talbot Street Slope
SD175
San Diego, City of
ADOPTION: 10-00
Project Description:
TransNet - LSI: CR
On Talbot Street at Martinez Street - in San Diego, stabilize adjacent slope to prevent
slope failure which would create capacity impeding conditions by impacting vehicle
usage of roadway (CIP 13-501.0)
Exempt Category: Other - Plantings, landscaping, etcCapacity Status: NCI
Est Total Cost: $3,106
CONRWPEPRIORTOTAL 10/11 11/12 12/13 13/14 14/15
Local Funds $2,000 $2,000 $2,000
TransNet - L $250 $250 $250
TransNet - L Carry Over $480 $480 $480
TransNet - LSI Carry Over $376 $376 $376
TOTAL $3,106 $250 $2,856 $2,856 $250
MPO ID:
Project Title: Maintenance and Non Congestion Relief Efforts
SD176 ADOPTION: 10-00
Project Description:
TransNet - LSI: Maint
Citywide - in San Diego, maintenance and non congestion relief efforts including but
not limited to pavement overlay, pot hole repair, etc
Exempt Category: Safety - Pavement resurfacing and/or rehabilitationCapacity Status: NCI
Est Total Cost: $49,866
CONRWPEPRIORTOTAL 10/11 11/12 12/13 13/14 14/15
TransNet - L Carry Over $536 $536 $536
TransNet - LSI $13,990 $6,639 $6,759 $7,029 $7,310 $7,602 $49,330 $49,330
TOTAL $49,866 $13,990 $7,175 $6,759 $7,029 $7,310 $7,602 $49,866
MPO ID:
Project Title: Pershing Drive/Redwood Street Intersection
SD178 ADOPTION: 10-00
Project Description:
TransNet - LSI: CR
At Pershing and Redwood Street - in San Diego, install permanent traffic roundabout
improvement to replace stop signs at the controlled intersection; roundabouts provide
continuous flow and reduce delay; congestion is reduced because vehicles will no
longer stop and queue up at the stop signs. The improvements will promote and
improve pedestrian safety at the intersection crossing (CIP 52-696.0)
Exempt Category: Other - Intersection channelization projectsCapacity Status: NCI
Est Total Cost: $900
CONRWPEPRIORTOTAL 10/11 11/12 12/13 13/14 14/15
TransNet - LSI Carry Over $900 $900 $900
TOTAL $900 $900 $900
102Page Thursday, July 8, 2010
106

San Diego Region (in $000s)DRAFT 2010 Regional Transportation Improvement Program
MPO ID:
Project Title: Linda Vista Road at Genesee Avenue
SD179
San Diego, City of
ADOPTION: 10-00
Project Description:
RAS (TA7-47)
TransNet - LSI: CRon Linda Vista Road at Genesee Avenue - in San Diego, roadway improvements to
include extension of medians for left turn lanes and the widening of Linda Vista Road
for the creation of exclusive right turn lanes (CIP 52-754.0)
Exempt Category: Other - Intersection channelization projectsCapacity Status: NCI
Est Total Cost: $1,003
CONRWPEPRIORTOTAL 10/11 11/12 12/13 13/14 14/15
Local Funds $53 $53 $53
TransNet - LSI $70 $150 $150 $580 $70 $300 $580 $950
TOTAL $1,003 $123 $150 $150 $580 $300 $580 $123
MPO ID:
Project Title: Soledad Mountain Road Emergency Repair
SD181 ADOPTION: 10-00
Project Description: Soledad Mountain Road from Desert View Dr. to Palomino Circle - in San Diego,
reconstruct roadway lost as result of landslide (CIP 52-805.0); grant match provided for
Soledad Mountain Road (CIP 52-805.0) grant funding provided through FHWA and OES
R-304725.
Exempt Category: Other - Damage repair caused by unusual disastersCapacity Status: NCI
Est Total Cost: $26,919
CONRWPEPRIORTOTAL 10/11 11/12 12/13 13/14 14/15
Local Funds $26,090 $26,090 $26,090
TransNet - L Carry Over $829 $829 $829
TOTAL $26,919 $26,090 $829 $26,919
MPO ID:
Project Title: Division Street - Bryanview to 61st - Reconstruction
SD183 ADOPTION: 10-00
Project Description:
TransNet - LSI: CR
Division Street from Bryanview to 61st - in San Diego, major roadway reconstruction;
improvements may include installation of curb, gutter and sidewalks, retaining walls,
drainage, landscaping and property acquisition (CIP 52-813.0)
Exempt Category: Safety - Pavement resurfacing and/or rehabilitationCapacity Status: NCI
Est Total Cost: $500
CONRWPEPRIORTOTAL 10/11 11/12 12/13 13/14 14/15
TransNet - LSI $500 $300 $200 $500
TOTAL $500 $500 $300 $200
103Page Thursday, July 8, 2010
107

San Diego Region (in $000s)DRAFT 2010 Regional Transportation Improvement Program
MPO ID:
Project Title: Saturn Boulevard Westside
SD184
San Diego, City of
ADOPTION: 10-00
Project Description:
TransNet - LSI: CR
Saturn Blvd from Coronado to Grove - in San Diego, roadway reconstruction to include
installation of new sidewalk, curb and gutter; new paving and retaining walls, drainage
improvements (CIP 52-814.0)
Exempt Category: Other - Intersection channelization projectsCapacity Status: NCI
Est Total Cost: $2,350
CONRWPEPRIORTOTAL 10/11 11/12 12/13 13/14 14/15
TransNet - LSI $100 $150 $700 $1,400 $250 $2,100 $2,350
TOTAL $2,350 $100 $150 $700 $1,400 $250 $2,100
MPO ID:
Project Title: Administrative Expenses
SD186 ADOPTION: 10-00
Project Description: Citywide - City of San Diego 1% administrative costs
Exempt Category: Other - Non construction related activitiesCapacity Status: NCI
Est Total Cost: $1,726
CONRWPEPRIORTOTAL 10/11 11/12 12/13 13/14 14/15
TransNet - LSI $348 $224 $228 $237 $246 $256 $1,538 $1,538
TransNet - LSI Carry Over $188 $188 $188
TOTAL $1,726 $348 $412 $228 $237 $246 $256 $1,726
MPO ID:
Project Title: Congestion Relief/Traffic Operations
SD188 ADOPTION: 10-00
Project Description:
TransNet - LSI: CR
Various locations - studies to provide congestion relief efforts to include intersection
lighting, traffic signal coordination, centrally controlled traffic signal optimization system,
traffic data collection for performance monitoring; traffic calming in Smart Growth areas;
and project development/preliminary engineering/Corridor studies
Exempt Category: Other - Engineering studiesCapacity Status: NCI
Est Total Cost: $13,558
CONRWPEPRIORTOTAL 10/11 11/12 12/13 13/14 14/15
TransNet - LSI $3,400 $2,032 $2,032 $2,032 $2,032 $2,032 $13,558 $13,558
TOTAL $13,558 $3,400 $2,032 $2,032 $2,032 $2,032 $2,032 $13,558
104Page Thursday, July 8, 2010
108

San Diego Region (in $000s)DRAFT 2010 Regional Transportation Improvement Program
MPO ID:
Project Title: Sea World Drive Widening and I- 5 Interchange Improvements
SD189
San Diego, City of
ADOPTION: 10-00
Project Description:
RAS (TA 7-48)
Sea World Drive from Friars Road to Morena Boulevard - in San Diego, replace existing
4-lane bridge with an 8-lane bridge with new on/off ramps; widen approachways to add
right turn lanes to improve access to I-5 (CIP 52-706.0)
Exempt Category: Non-ExemptCapacity Status: CI
Est Total Cost: $20,249 Open to Traffic: Jul 2019
CONRWPEPRIORTOTAL 10/11 11/12 12/13 13/14 14/15
Local Funds $3,175 $472 $5,616 $10,986 $9,263 $10,986 $20,249
TOTAL $20,249 $3,175 $472 $5,616 $10,986 $10,986 $9,263
MPO ID:
Project Title: Palm Avenue/Interstate 805 Interchange
SD190 ADOPTION: 10-00
Project Description:
RAS (TA 7-48)
On Palm Avenue at Interstate 805 - in San Diego, future widening of Palm Avenue
Bridge including providing for repairs to the bridge approaches and abutments,
installing sidewalks, signals, striping and • Phase I was work pertaining to re-striping
to reconfigure travel lanes. No actual modifications to the physical geometry of the
bridge took place.
• Phase II of the project will widen the bridge on the north side. In addition to this the
scope of work will also contain restriping of the lanes and modifications to the on/off
ramps.
• Phase III of the project will widen the bridge on the south side. In addition to this
the scope of work will also contain restriping of the lanes and modifications to the
on/off ramps.
• Both Phase II & III will have environmental documentation prepared and all
technical studies performed before entering into full design.
signage modifications: also modify freeway on and off ramps (CIP 52-640.0)
Exempt Category: Non-ExemptCapacity Status: CI
Est Total Cost: $6,000 Open to Traffic: Jun 2019
CONRWPEPRIORTOTAL 10/11 11/12 12/13 13/14 14/15
Local Funds $2,000 $2,000 $1,380 $620 $5,750 $250 $6,000
TOTAL $6,000 $2,000 $2,000 $1,380 $620 $250 $5,750
MPO ID:
Project Title: Torrey Pines Road Improvements, Phase 2
SD196 ADOPTION: 10-00
Project Description:
RAS (115)
TransNet - LSI: CRTorrey Pines Road from Prospect Place to La Jolla Shores Drive - improvements to
include guardrails, medians, a new traffic signal, bike lanes and sidewalks. (WBS
S-00613)
Exempt Category: Other - Transportation enhancement activitiesCapacity Status: NCI
Est Total Cost: $1,670
CONRWPEPRIORTOTAL 10/11 11/12 12/13 13/14 14/15
TransNet - LSI $500 $300 $870 $500 $1,170 $1,670
TOTAL $1,670 $500 $300 $870 $1,170 $500
105Page Thursday, July 8, 2010
109

San Diego Region (in $000s)DRAFT 2010 Regional Transportation Improvement Program
MPO ID:
Project Title: Cherokee Traffic Calming
SD198
San Diego, City of
ADOPTION: 10-00
Project Description:
TransNet - LSI: CR
Cherokee Avenue from Madison Avenue to Cherokee Avenue - this project provides for
reconstruction of the intersection of Madison Avenue and Cherokee Avenue for
pedestrian safety. (Sublet of 58-127.0)
Exempt Category: Safety - Safety Improvement ProgramCapacity Status: NCI
Est Total Cost: $240
CONRWPEPRIORTOTAL 10/11 11/12 12/13 13/14 14/15
TransNet - LSI $240 $240 $240
TOTAL $240 $240 $240
MPO ID:
Project Title: Market Street - Euclid to 54th Roadway Improvements
SD199 ADOPTION: 10-00
Project Description:
TransNet - LSI: CR
Market Street from Euclid Avenue to 54th Street - in San Diego, this project provides for
roadway reconstruction improvement of Market Street - Euclid Avenue to 54th Street
Exempt Category: Safety - Pavement resurfacing and/or rehabilitationCapacity Status: NCI
Est Total Cost: $240
CONRWPEPRIORTOTAL 10/11 11/12 12/13 13/14 14/15
TransNet - LSI $240 $240 $240
TOTAL $240 $240 $240
MPO ID:
Project Title: SR94/Euclid Avenue Interchange Improvements
SD200 ADOPTION: 10-00
Project Description:
TransNet - LSI: CR
Euclid Avenue from Euclid Avenue to SR-94 Off-Ramp - study of the feasibility for
constructing an SR-94 Eastbound off-Ramp at Euclid Avenue to facilitate community
access to the freeway
Exempt Category: Other - Engineering studiesCapacity Status: NCI
Est Total Cost: $2,000
CONRWPEPRIORTOTAL 10/11 11/12 12/13 13/14 14/15
TransNet - LSI $2,000 $2,000 $2,000
TOTAL $2,000 $2,000 $2,000
106Page Thursday, July 8, 2010
110

San Diego Region (in $000s)DRAFT 2010 Regional Transportation Improvement Program
MPO ID:
Project Title: Grand Avenue Bridge
SM19
San Marcos, City of
ADOPTION: 10-00
Project Description: From Discovery Street to San Marcos Boulevard - in San Marcos, construct 4-lane
arterial; between Bent Ave to Discovery Street construct 6-lane arterial
Exempt Category: Non-ExemptCapacity Status: CI
Est Total Cost: $12,524 Open to Traffic: Jun 2013
CONRWPEPRIORTOTAL 10/11 11/12 12/13 13/14 14/15
Local Funds $2,424 $4,600 $5,500 $2,044 $680 $9,800 $12,524
TOTAL $12,524 $2,424 $4,600 $5,500 $680 $9,800 $2,044
MPO ID:
Project Title: South Santa Fe from Bosstick to Smilax
SM22 ADOPTION: 10-00
Project Description:
RAS (TA 7-50)
From Bosstick to Smilax - widen and realign existing road to 4-lane secondary arterial
standards
Exempt Category: Non-ExemptCapacity Status: CI
Est Total Cost: $5,435 Open to Traffic: Jun 2014
CONRWPEPRIORTOTAL 10/11 11/12 12/13 13/14 14/15
Local Funds $3,335 $320 $600 $600 $335 $3,320 $1,200 $4,855
TransNet - H (78) $580 $580 $580
TOTAL $5,435 $3,915 $320 $600 $600 $3,900 $1,200 $335
MPO ID:
Project Title: Woodland Parkway Interchange Improvements
SM24 ADOPTION: 10-00
Project Description:
RAS (TA 7-51)
TransNet - LSI: CRFrom La Moree Road to Rancheros Drive - modify existing ramps at Woodland Parkway
and Barham Drive; widen and realign SR 78 undercrossing and associated work
Exempt Category: Non-ExemptCapacity Status: CI
Est Total Cost: $48,550 Open to Traffic: Jun 2015
CONRWPEPRIORTOTAL 10/11 11/12 12/13 13/14 14/15
Local Funds $1,980 $4,170 $700 $4,500 $35,600 $1,850 $5,000 $40,100 $46,950
TransNet - L $600 $600 $600
TransNet - LSI $1,000 $1,000 $1,000
TOTAL $48,550 $2,580 $4,170 $700 $5,500 $35,600 $5,000 $41,100 $2,450
107Page Thursday, July 8, 2010
111

San Diego Region (in $000s)DRAFT 2010 Regional Transportation Improvement Program
MPO ID:
Project Title: Borden Road Street Improvements and Bridge Construction
SM25
San Marcos, City of
ADOPTION: 10-00
Project Description:
RAS (TA 7-50)
TransNet - LSI: CRFrom Twin Oaks to Woodward Street - construction of approximately 700 lineal feet of a
new 4-lane secondary arterial including a bridge
Exempt Category: Non-ExemptCapacity Status: CI
Est Total Cost: $10,800 Open to Traffic: Apr 2013
CONRWPEPRIORTOTAL 10/11 11/12 12/13 13/14 14/15
Local Funds $1,090 $910 $1,500 $3,300 $800 $1,200 $4,800 $6,800
TransNet - LSI Carry Over $4,000 $4,000 $4,000
TOTAL $10,800 $1,090 $910 $5,500 $3,300 $1,200 $8,800 $800
MPO ID:
Project Title: McMahr Street Improvements
SM27 ADOPTION: 10-00
Project Description: From San Marcos Boulevard to Main Street - reconstruct road to arterial street
standards
Exempt Category: Safety - Pavement resurfacing and/or rehabilitationCapacity Status: NCI
Est Total Cost: $3,670
CONRWPEPRIORTOTAL 10/11 11/12 12/13 13/14 14/15
Local Funds $470 $200 $1,500 $1,500 $470 $200 $3,000 $3,670
TOTAL $3,670 $470 $200 $1,500 $1,500 $200 $3,000 $470
MPO ID:
Project Title: San Marcos Boulevard Street Improvements
SM30 ADOPTION: 10-00
Project Description:
RAS (TA 4-50)
TransNet - LSI: CRFrom Rancho Santa Fe to Bent Avenue - widen road to a 6-lane prime arterial
Exempt Category: Non-ExemptCapacity Status: CI
Est Total Cost: $5,930 Open to Traffic: Jul 2016
CONRWPEPRIORTOTAL 10/11 11/12 12/13 13/14 14/15
Local Funds $290 $270 $700 $870 $800 $650 $2,060 $220 $2,930
TransNet - L (Cash) $70 $118 $188 $188
TransNet - LSI $112 $1,718 $412 $1,418 $1,830
TransNet - LSI Carry Over $982 $982 $982
TOTAL $5,930 $360 $270 $700 $1,100 $3,500 $2,660 $2,620 $650
108Page Thursday, July 8, 2010
112

San Diego Region (in $000s)DRAFT 2010 Regional Transportation Improvement Program
MPO ID:
Project Title: Discovery Street Improvements
SM31
San Marcos, City of
ADOPTION: 10-00
Project Description:
RAS (TA 7-50)
From McMahr Rd to Bent Ave/Craven Rd - widen roadway to four lane secondary arterial
Exempt Category: Non-ExemptCapacity Status: CI
Est Total Cost: $4,100 Open to Traffic: Jul 2012
CONRWPEPRIORTOTAL 10/11 11/12 12/13 13/14 14/15
Local Funds $500 $2,000 $1,600 $200 $300 $3,600 $4,100
TOTAL $4,100 $500 $2,000 $1,600 $300 $3,600 $200
MPO ID:
Project Title: Via Vera Cruz Bridge and Street Improvements
SM32 ADOPTION: 10-00
Project Description: From San Marcos Boulevard to Discovery Street - widen to four lane secondary arterial
and construct a bridge at San Marcos Creek
Exempt Category: Non-ExemptCapacity Status: CI
Est Total Cost: $11,500 Open to Traffic: Jul 2013
CONRWPEPRIORTOTAL 10/11 11/12 12/13 13/14 14/15
Local Funds $9,000 $2,500 $11,500 $11,500
TOTAL $11,500 $9,000 $2,500 $11,500
MPO ID:
Project Title: Street Maintenance Operations
SM38 ADOPTION: 10-00
Project Description:
TransNet - LSI: Maint
Various Locations - roadway, street lighting, traffic signal, signage maintenance
Exempt Category: Safety - Pavement resurfacing and/or rehabilitationCapacity Status: NCI
Est Total Cost: $1,100
CONRWPEPRIORTOTAL 10/11 11/12 12/13 13/14 14/15
TransNet - LSI $430 $430 $430
TransNet - LSI Carry Over $670 $670 $670
TOTAL $1,100 $1,100 $1,100
MPO ID:
Project Title: Street Improvements: Discovery Street; Craven Road to West of Twin Oaks Valley Road
SM42 ADOPTION: 10-00
Project Description:
RAS (TA 7-51)
From Craven Road to Twin Oaks Valley Road - in the City of San Marcos, on Discovery
Street from Craven Road to west of Twin Oaks Valley Road, construct approximately
5,100 lineal feet of a new 6-lane roadway.
Exempt Category: Non-ExemptCapacity Status: CI
Est Total Cost: $12,500 Open to Traffic: Jun 2013
CONRWPEPRIORTOTAL 10/11 11/12 12/13 13/14 14/15
Local Funds $2,500 $3,300 $6,700 $500 $2,000 $10,000 $12,500
TOTAL $12,500 $2,500 $3,300 $6,700 $2,000 $10,000 $500
109Page Thursday, July 8, 2010
113

San Diego Region (in $000s)DRAFT 2010 Regional Transportation Improvement Program
MPO ID:
Project Title: Street Improvements and Widening
SM43
San Marcos, City of
ADOPTION: 10-00
Project Description:
RAS (TA 7-51)
Barham Drive from Twin Oaks Valley Road to La Moree Road - in the City of San
Marcos, on Barham Drive between Twin Oaks Valley Road and La Moree Road, widen
and reconstruct the north side of Barham Drive to a 6-lane prime arterial and
associated work
Exempt Category: Non-ExemptCapacity Status: CI
Est Total Cost: $3,580 Open to Traffic: May 2014
CONRWPEPRIORTOTAL 10/11 11/12 12/13 13/14 14/15
Local Funds $350 $2,680 $550 $350 $1,600 $1,630 $3,580
TOTAL $3,580 $350 $2,680 $550 $1,600 $1,630 $350
MPO ID:
Project Title: Eastbound SR-78 Auxiliary lane
SM44 ADOPTION: 10-00
Project Description:
RTP PG NO: A-19
From Woodland Parkway to Nordahl Road - construct auxiliary lanes along eastbound
SR-78 between Woodland Parkway Interchange and Nordahl Road Interchange;
includes widening of Mission Road undercrossing
Exempt Category: Non-ExemptCapacity Status: CIRT:78
Est Total Cost: $14,500 Open to Traffic: Aug 2011
CONRWPEPRIORTOTAL 10/11 11/12 12/13 13/14 14/15
Local Funds $750 $3,250 $1,250 $2,750 $4,000
SHOPP Augmentation - Mobility $10,500 $10,500 $10,500
TOTAL $14,500 $750 $13,750 $13,250 $1,250
MPO ID:
Project Title: San Marcos Creek Bridge at State Route 78
SM45 ADOPTION: 10-00
Project Description: From San Marcos Blvd to Twin Oaks Valley Rd - in San Marcos, on SR-78 at San
Marcos Creek between Twin Oaks Valley Road and San Marcos Boulevard
Interchange, construct a culvert
Exempt Category: Safety - Non capacity widening or bridge reconstructionCapacity Status: NCIRT:78
Est Total Cost: $21,400
CONRWPEPRIORTOTAL 10/11 11/12 12/13 13/14 14/15
Local Funds $1,380 $2,020 $15,000 $3,000 $1,400 $20,000 $21,400
TOTAL $21,400 $1,380 $2,020 $15,000 $3,000 $20,000 $1,400
110Page Thursday, July 8, 2010
114

San Diego Region (in $000s)DRAFT 2010 Regional Transportation Improvement Program
MPO ID:
Project Title: Bent Avenue Bridge between San Marcos Blvd and Discovery Street
SM46
San Marcos, City of
ADOPTION: 10-00
Project Description: From San Marcos Blvd to Discovery Street - in San Marcos, widen existing roadway and
construct bridge to a 4-lane arterial road including sidewalks and bicycle facilities
Exempt Category: Non-ExemptCapacity Status: CI
Est Total Cost: $13,000 Open to Traffic: Dec 2014
CONRWPEPRIORTOTAL 10/11 11/12 12/13 13/14 14/15
Local Funds $1,000 $500 $500 $11,000 $1,000 $1,000 $11,000 $13,000
TOTAL $13,000 $1,000 $500 $500 $11,000 $1,000 $11,000 $1,000
MPO ID:
Project Title: Nordahl Road Bridge @ SR-78
SM47 ADOPTION: 10-00
Project Description:
RAS (TA 7-44)
Nordahl Road from Mission Road to Montiel Road - Nordahl Road from Mission Road
to Montiel Road - replace the Nordahl Road Overcrossing to increase clearance and
provide additional 14-feet of structure width necessary to facilitate the required
construction staging of the project; the additional width of the overcrossing will
accommodate operational improvements through left-turn storage at the ramp
intersections; widen Nordahl Road to provide a dedicated right-turn onto Montiel Road
(no additional travel lanes) - joint project with City of Escondido and Caltrans
Exempt Category: Safety - Non capacity widening or bridge reconstructionCapacity Status: NCI
Est Total Cost: $5,500
CONRWPEPRIORTOTAL 10/11 11/12 12/13 13/14 14/15
Local Funds $500 $4,500 $500 $4,500 $5,000
TCSP $500 $500 $500
TOTAL $5,500 $500 $5,000 $500 $5,000
111Page Thursday, July 8, 2010
115

San Diego Region (in $000s)DRAFT 2010 Regional Transportation Improvement Program
MPO ID:
Project Title: Santee Rehabilitation and Major Repair Work
SNT04
Santee, City of
ADOPTION: 10-00
Project Description:
TransNet - LSI: CR
FY 2010/2011 - Residential Zone CE:, Iverness Road - Carlton Oaks Drive to Carlton
Oaks Drive, Wethersfield Road - Carlton Oaks Drive to Iverness Road, Massot Avenue,
Lomker Way, Lomket Court, Allano Way, Pine Valley Drive, Dunwoodie Road -
Residential Zone BG:, Caretta Drive - El Nopal to Second Street, Cleary Street - Holborn
Street to Second Street, Trigal Way, Montura Court, Montura Avenue, Holborn Street,
Holborn Court, Valor Place, Valor Lane, Sayers Court, Melanie Court, Delia Court -
Residential Zone DD:, Heartly road, Isacc Street, Abraham Way, Stevens Street, ,
Wheatlands Avenue, Wheatlands Court, Wheatlands Road - Residential Zone EA: -
Bushy Hill Drive, Simeon Drive, Wahl Street - Other: Tamberly Way - Mission Gorge
Road to end of cul-de-sac Los Ranchitos Road - Mast Boulevard to north City limits -
reconstruction and rehabilitation in the form of removal and replacement of existing
pavement section 2 inches minimum, 3 inches typical, edge grind with 1.5 inch
minimum overlay, complete reconstruction with 6 inches base and 2 inch surface
course
Exempt Category: Safety - Pavement resurfacing and/or rehabilitationCapacity Status: NCI
Est Total Cost: $16,535
CONRWPEPRIORTOTAL 10/11 11/12 12/13 13/14 14/15
Local Funds $1,186 $500 $500 $500 $500 $500 $90 $3,596 $3,686
TransNet - L $7,729 $7,729 $7,729
TransNet - LSI $287 $937 $974 $475 $582 $679 $190 $3,744 $3,934
TransNet - LSI Carry Over $1,186 $50 $1,136 $1,186
TOTAL $16,535 $10,388 $1,437 $1,474 $975 $1,082 $1,179 $16,205 $330
112Page Thursday, July 8, 2010
116

San Diego Region (in $000s)DRAFT 2010 Regional Transportation Improvement Program
MPO ID:
Project Title: Highway 101 Streetscape and Traffic Calming Project
SB07
Solana Beach, City of
ADOPTION: 10-00
Project Description:
RAS (TA 7-51)
TransNet - LSI: CRFrom Dahlia Dr to Ocean St - construct street and parkway improvements to increase
pedestrian safety and enhance pedestrian parkways; complement and connect to the
recently constructed Coastal Rail Trail providing a pedestrian friendly environment
along the Highway 101 corridor
Exempt Category: Air Quality - Bicycle and pedestrian facilitiesCapacity Status: NCI
Est Total Cost: $930
CONRWPEPRIORTOTAL 10/11 11/12 12/13 13/14 14/15
TransNet - L (Cash) $787 $400 $387 $787
TransNet - LSI $143 $143 $143
TOTAL $930 $787 $143 $530 $400
MPO ID:
Project Title: Marine View Avenue Curb, Gutter & Sidewalk
SB08 ADOPTION: 10-00
Project Description:
TransNet - LSI: CR
From San Andres Drive to Solana Drive - add pedestrian facilities along existing 2-lane
road; construct approximately 590 lineal feet of curb, gutter and sidewalk and retaining
walls along east side of road, as well as restoring highly eroded slope above proposed
sidewalk
Exempt Category: Air Quality - Bicycle and pedestrian facilitiesCapacity Status: NCI
Est Total Cost: $419
CONRWPEPRIORTOTAL 10/11 11/12 12/13 13/14 14/15
TransNet - LSI $185 $185 $185
TransNet - LSI Carry Over $234 $234 $234
TOTAL $419 $234 $185 $419
113Page Thursday, July 8, 2010
117

San Diego Region (in $000s)DRAFT 2010 Regional Transportation Improvement Program
MPO ID:
Project Title: Foothill Transportation Corridor South
TCA01
Transportation Corridor Agencies
ADOPTION: 10-00
Project Description: On SR 241 from Orange/San Diego County line to Cristianitos interchange - construct 3
general purpose toll lanes; from Cristianitos interchange to I-5 - construct 2 general
purpose toll lanes (program funding for Phase 1 only)
Exempt Category: Non-ExemptCapacity Status: CIRT:241
Est Total Cost: $442,663 Open to Traffic: Dec 2030
CONRWPEPRIORTOTAL 10/11 11/12 12/13 13/14 14/15
Local Funds $83,275 $2,658 $11,730 $115,000 $115,000 $115,000 $82,333 $15,330 $345,000 $442,663
TOTAL $442,663 $83,275 $2,658 $11,730 $115,000 $115,000 $115,000 $15,330 $345,000 $82,333
Funding Source = Foothill/Eastern Tansportation Corridor Agency*
114Page Thursday, July 8, 2010
118

San Diego Region (in $000s)DRAFT 2010 Regional Transportation Improvement Program
MPO ID:
Project Title: Grouped Projects for Transportation Enhancement Activities - Smart Growth Incentive Prog
V04
Various Agencies
ADOPTION: 10-00
Project Description: Projects are consistent with CFR Parts 93.126 and 93.127 Exempt Tables 2 and 3
categories: transportation enhancement activities (except rehabilitation and operation
of historic transportaion buildings, structures, or facilities)
Exempt Category: Other - Transportation enhancement activitiesCapacity Status: NCI
Est Total Cost: $705
CONRWPEPRIORTOTAL 10/11 11/12 12/13 13/14 14/15
Local Funds $280 $280 $280
TransNet - LSI $425 $425 $425
TOTAL $705 $280 $425 $705
MPO ID:
Project Title: Biological Mitigation Program
V07 ADOPTION: 10-00
Project Description:
SANDAG ID: 1200200
Countywide - habitat acquisition, restoration, creation, enhancement, management and
monitoring necessary for meeting project mitigation requirements; mitigation efforts
will focus on TransNet Early Action Program projects, then Regional Transportation
Plan (RTP) Revenue Constrained projects, then the remaining RTP projects in this
order
Exempt Category: Other - Advance land acquisitionsCapacity Status: NCI
Est Total Cost: $428,000
CONRWPEPRIORTOTAL 10/11 11/12 12/13 13/14 14/15
TransNet - REMP $85,862 $60,150 $59,100 $53,600 $58,100 $53,100 $4,510 $220,350 $145,052 $369,912
TOTAL $369,912 $85,862 $60,150 $59,100 $53,600 $58,100 $53,100 $220,350 $145,052 $4,510
Project completion outside of programming cycle*
MPO ID:
Project Title: Regional Habitat Conservation Fund
V08 ADOPTION: 10-00
Project Description:
SANDAG ID: 1200300
Countywide - regional habitat management and monitoring
Exempt Category: Other - Plantings, landscaping, etcCapacity Status: NCI
Est Total Cost: $44,906
CONRWPEPRIORTOTAL 10/11 11/12 12/13 13/14 14/15
TransNet - REMP $7,882 $4,519 $4,699 $4,886 $5,081 $5,283 $8,232 $24,118 $32,350
TOTAL $32,350 $7,882 $4,519 $4,699 $4,886 $5,081 $5,283 $24,118 $8,232
Project completion outside of programming cycle*
115Page Thursday, July 8, 2010
119

San Diego Region (in $000s)DRAFT 2010 Regional Transportation Improvement Program
MPO ID:
Project Title: West Vista Way Widening Design, CIP 7741
VISTA08
Vista, City of
ADOPTION: 10-00
Project Description:
RAS (TA 7-51)
From Melrose Dr to Thunder Dr - realign West Vista Way including providing preliminary
improvement plans, final right-of-way maps, and a metes and bounds legal description
anticipated to provide congestion relief with future widening of West Vista Way from 2 to
4 lanes
Exempt Category: Other - Engineering studiesCapacity Status: NCI
Est Total Cost: $1,981
CONRWPEPRIORTOTAL 10/11 11/12 12/13 13/14 14/15
Local Funds $35 $35 $35
RSTP $990 $990 $990
TCSP $570 $570 $570
TransNet - L $386 $386 $386
TOTAL $1,981 $1,411 $570 $1,981
MPO ID:
Project Title: W. Vista Way Widening Construction - Phase I, CIP 8191
VISTA08A ADOPTION: 10-00
Project Description:
EARMARK NO: CA028
RAS (TA 7-51)
TransNet - LSI: CRFrom Emerald Dr to Grapevine Rd - the scope of this project is to provide Right-of-Way
acquistion and construction for the widening of W. Vista Way a distance of 1,500 feet
from the intersection with Emerald Drive to the intersection with Grapevine Road
Exempt Category: Non-ExemptCapacity Status: CI
Est Total Cost: $2,908 Open to Traffic: Dec 2010
CONRWPEPRIORTOTAL 10/11 11/12 12/13 13/14 14/15
HPP $245 $245 $245
STP $250 $250 $250
TransNet - L Carry Over $705 $705 $705
TransNet - LSI $1,708 $50 $200 $1,458 $1,708
TOTAL $2,908 $2,203 $705 $445 $2,413 $50
MPO ID:
Project Title: Grapevine Road Street Improvement Project CIP 8018
VISTA17 ADOPTION: 10-00
Project Description:
TransNet - LSI: Maint
From Olive Ave to Date St - reconstruct pavement and install curb, gutter, sidewalk, and
bike lanes to provide a safe route to school
Exempt Category: Other - Plantings, landscaping, etcCapacity Status: NCI
Est Total Cost: $1,604
CONRWPEPRIORTOTAL 10/11 11/12 12/13 13/14 14/15
Local Funds $1,304 $180 $190 $934 $1,304
TransNet - L $230 $230 $230
TransNet - L Carry Over $25 $25 $25
TransNet - LSI $45 $45 $45
TOTAL $1,604 $1,559 $45 $190 $1,234 $180
116Page Thursday, July 8, 2010
120

San Diego Region (in $000s)DRAFT 2010 Regional Transportation Improvement Program
MPO ID:
Project Title: Roadway Rehabilitation/Curbs and Gutters CIP 7650
VISTA25
Vista, City of
ADOPTION: 10-00
Project Description:
TransNet - LSI: Maint
Citywide - repair/replace sidewalks, curbs, and gutters
Exempt Category: Safety - Pavement resurfacing and/or rehabilitationCapacity Status: NCI
Est Total Cost: $546
CONRWPEPRIORTOTAL 10/11 11/12 12/13 13/14 14/15
Local Funds $371 $371 $371
TransNet - LSI $75 $25 $25 $25 $25 $175 $175
TOTAL $546 $446 $25 $25 $25 $25 $546
MPO ID:
Project Title: Foothill Overlay and Improvements CIP 8141
VISTA27 ADOPTION: 10-00
Project Description:
TransNet - LSI: CR
Foothill Drive including improvements between Beverly Drive and Vale Terrace Drive
and from east of Bonair Road to Elm Drive. - overlay various portions of Foothill Drive
including improvements between Beverly Drive and Vale Terrace Drive and from east of
Bonair Road to Elm Drive.
Exempt Category: Safety - Pavement resurfacing and/or rehabilitationCapacity Status: NCI
Est Total Cost: $1,900
CONRWPEPRIORTOTAL 10/11 11/12 12/13 13/14 14/15
Local Funds $118 $118 $118
TransNet - L $382 $382 $382
TransNet - L Carry Over $527 $527 $527
TransNet - LSI $873 $873 $873
TOTAL $1,900 $1,027 $873 $1,900
MPO ID:
Project Title: Street Rehabilitation and Maintenance Annual Project 07/08, CIP 8154
VISTA30 ADOPTION: 10-00
Project Description:
TransNet - LSI: Maint
S. Melrose Dr. from South City Limit to W. Vista Way; N. Melrose Dr. from Copper to
North City Limit; Bobier Dr. from West City Limit to Lynette Circle; North Dr. from West
City Limit to Melrose Dr.; and N. Santa Fe Ave from Osborne to Bobier. - FY2006/07 and
FY2007/08, repair/rehabilitate distressed pavement areas and overlay streets with
asphalt concrete where identified as priorities in street inventory
Exempt Category: Safety - Pavement resurfacing and/or rehabilitationCapacity Status: NCI
Est Total Cost: $7,995
CONRWPEPRIORTOTAL 10/11 11/12 12/13 13/14 14/15
Local Funds $3,017 $300 $2,717 $3,017
TransNet - L $1,242 $1,242 $1,242
TransNet - L Carry Over $1,723 $1,723 $1,723
TransNet - LSI $1,957 $56 $2,013 $2,013
TOTAL $7,995 $7,939 $56 $7,695 $300
117Page Thursday, July 8, 2010
121

San Diego Region (in $000s)DRAFT 2010 Regional Transportation Improvement Program
MPO ID:
Project Title: Signal - E. Vista Way at Oak Drive CIP 8127
VISTA32
Vista, City of
ADOPTION: 10-00
Project Description: From Oak Dr to East Vista Way - install new traffic signal, curb and gutter, and ADA
improvements at the intersection
Exempt Category: Other - Traffic signal synchronization projectsCapacity Status: NCI
Est Total Cost: $245
CONRWPEPRIORTOTAL 10/11 11/12 12/13 13/14 14/15
Local Funds $241 $241 $241
TransNet - L Carry Over $4 $4 $4
TOTAL $245 $241 $4 $245
MPO ID:
Project Title: Signal - N. Santa Fe at East Drive CIP 8128
VISTA33 ADOPTION: 10-00
Project Description: From East Dr to N. Santa Fe - install a new traffic signal and ADA improvements
Exempt Category: Other - Traffic signal synchronization projectsCapacity Status: NCI
Est Total Cost: $215
CONRWPEPRIORTOTAL 10/11 11/12 12/13 13/14 14/15
Local Funds $212 $212 $212
TransNet - L Carry Over $3 $3 $3
TOTAL $215 $212 $3 $215
MPO ID:
Project Title: Street Rehabilitation and Maintenance CIP8155
VISTA34 ADOPTION: 10-00
Project Description:
TransNet - LSI: CR
University Dr from Sycamore Ave. to Wal-Mart driveway; Business Park Dr. from
Sycamore Ave to Poinsettia Ave.; Hacienda Dr. from West city limit to Emerald Dr.;
Hacienda Dr. from La Tortuga Dr. to 1475 west of La Tortuga Dr.; Crescent Dr. from
Escondido Ave. to Eucalyptus Ave.; Arcadia Ave. from Oak Dr. to Bonair Road; Osborne
St. from N. Santa Fe Ave. to Guajome Lake Rd.; Townsite Dr. from Wellpot Pl. to Indian
Rock Rd.; Alta Vista Dr. from Escondido Ave. to Verdant Pl.; and Beaumont Dr. from
Eucalyptus Ave. to Coventry Rd. - repair/rehabilitate distressed pavement areas and
overlay streets with asphalt concrete where identified as priorities in street inventory,
including all preparation work such as dig-outs, skin patching, shoulder grading, traffic
loops, raising manholes, striping, and traffic safety control, as well as survey
monument preservation
Exempt Category: Safety - Pavement resurfacing and/or rehabilitationCapacity Status: NCI
Est Total Cost: $6,630
CONRWPEPRIORTOTAL 10/11 11/12 12/13 13/14 14/15
Local Funds $2,679 $2,679 $2,679
TransNet - L Carry Over $50 $23 $73 $73
TransNet - LSI $3,313 $564 $3,878 $3,878
TOTAL $6,630 $6,042 $587 $6,630
118Page Thursday, July 8, 2010
122

San Diego Region (in $000s)DRAFT 2010 Regional Transportation Improvement Program
MPO ID:
Project Title: Pedestrian Improvements, CIP 8187
VISTA39
Vista, City of
ADOPTION: 10-00
Project Description: Longhorn Dr at Promontory Ridge Way - install curb pop-outs and medians at the
intersection of Longhorn Drive at Promontory Ridge Way
Exempt Category: Safety - Safety Improvement ProgramCapacity Status: NCI
Est Total Cost: $66
CONRWPEPRIORTOTAL 10/11 11/12 12/13 13/14 14/15
Local Funds $15 $15 $15
TDA - Bicycles $51 $51 $51
TOTAL $66 $15 $51 $66
MPO ID:
Project Title: Bobier Dr. Storm Drain & Street Rehabilitation, CIP 8218
VISTA42 ADOPTION: 10-00
Project Description:
TransNet - LSI: Maint
From North Santa Fe to Melrose Dr - install storm drain from N. Santa Fe to 1,500 ft
west to address groundwater problems; rehabilitate pavement from N. Santa Fe and
Melrose Drive
Exempt Category: Safety - Pavement resurfacing and/or rehabilitationCapacity Status: NCI
Est Total Cost: $55
CONRWPEPRIORTOTAL 10/11 11/12 12/13 13/14 14/15
TransNet - LSI $55 $55 $55
TOTAL $55 $55 $55
MPO ID:
Project Title: Pavement and Sidewalk Management Systems
VISTA43 ADOPTION: 10-00
Project Description: City wide from North South to East West - update to the City's Pavement and Sidewalk
Management System
Exempt Category: Other - Engineering studiesCapacity Status: NCI
Est Total Cost: $90
CONRWPEPRIORTOTAL 10/11 11/12 12/13 13/14 14/15
TransNet - LSG $90 $90 $90
TOTAL $90 $90 $90
119Page Thursday, July 8, 2010
123

San Diego Region (in $000s)DRAFT 2010 Regional Transportation Improvement Program
RTIP Fund Types
AC = Advanced Construction
ARRA = American Recovery and Reinvestment Act (Federal Stimulus Program)
BIP = Border Infrastructure Program (Federal under SAFETEA-LU)
BTA = Bicycle Transportation Account (State)
CBI = Corridors and Borders Infrastructure Program (Federal under TEA-21)
CMAQ = Congestion Mitigation and Air Quality (Federal formula)
CMIA = Corridor Mobility Improvement Account (Prop. 1B)
DEMO = High Priority Demonstration Program under TEA-21 (Federal discretionary)
DEMO-Sec 115 = High Priority Demonstration Program under FY 2004 Appropriations
DEMO-Sec 117/STP = Surface Transportation Program under FHWA Administrative Program (congressionally
directed appropriations)
FSP = Freeway Service Patrol (State legislation)
GARVEE = Grant Anticipated Revenue Vehicles (FHWA bonds)
HBP = Highway Bridge Program under SAFETEA-LU (Federal)
HBRR = Highway Bridge Repair and Rehabilitation under TEA-21 (Federal)
HES = Hazard Elimination System (Federal administered by Caltrans)
HPP = High Priority Program under SAFETEA-LU (Federal discretionary)
HSIP = Highway Safety Improvement Program (Administered by Caltrans)
HUD = Housing and Urban Development (Federal)
IM = Interstate Maintenance Discretionary (Federal)
IRI = Intercity Rail Improvement (Prop 1B)
IRR = Indian Reservation Roads program (Federal)
ITS = Intelligent Transportation System (Federal)
NHS = National Highway System
PTA = Public Transportation Account (State)
PTMISEA = Public Transportation Modernization, Improvement, and Service Enhancement (Prop. 1B state
bond)
Prop 1A - High Speed Rail = High Speed Passenger Bond Program (Prop 1A)
RSTP = Regional Surface Transportation Program (Federal)
RTCIP = Regional Transportation Congestion Improvement Program (Local)
RTP = Recreational Trails Program (Federal)
SHOPP = State Highway Operation & Protection Program
SLPP = State Local Partnership Program (Prop. 1B)
SRTS = Safe Routes to School (Federal program administered by Caltrans)
STIP-IIP = State Transportation Improvement Program - Interregional Program (State)
STIP-RIP = State Transportation Improvement Program - Regional Improvement Program (State)
Section 5307 = Federal Transit Administration Urbanized Area Formula Program (Federal including ARRA)
120Page Thursday, July 8, 2010
124

San Diego Region (in $000s)DRAFT 2010 Regional Transportation Improvement Program
Section 5309 (Bus) = Federal Transit Administration Discretionary Program (Federal)
Section 5309 (FG) = Federal Transit Administration Fixed Guideway Modernization Formula program (Federal
including ARRA)
Section 5309 (NS) = Federal Transit Administration Discretionary - New Starts Program (Federal)
Section 5310 = Federal Transit Administration Elderly & Disabled Program (Allocated by CTC)
Section 5311 = Federal Transit Administration Rural Program (Federal including ARRA)
Section 5316 (JARC) = Federal Transit Administration Jobs Access Reverse Commute (Federal)
Section 5317 (NF) = Federal Transit Administration New Freedom (Federal)
TCRP = Traffic Congestion Relief Program (State)
TCSP = Transportation & Community & System Preservation (Federal)
TDA = Transportation Development Act (Local)
TDA-B = Transportation Development Act-Bicycle & Pedestrian Facilities (Local)
TEA/TE = Transportation Enhancement Activities Program (Federal)
TIGER (ARRA) = Transportation Investment Generating Economic Recovery (Federal Stimulus)
TIGGER (ARRA) = Transit Investment for Greenhouse Gas and Energy Reduction (Federal Stimulus)
TLSP = Traffic Light Synchronization Program (Prop. 1B)
TSGP = Transit Security Grant Program (Federal Homeland Security Office and State)
TSM = Transportation Systems Management (State)
TransNet-78 = Prop. A Local Transportation Sales Tax - SR 78 (Local)
TransNet-ADA = Prop. A Local Transportation Sales Tax - Transit (Local)
TransNet-B = Prop. A Local Transportation Sales Tax - Bike (Local)
TransNet-BPNS = Prop. A Local Transportation Sales Tax extension - Bicycle, Pedestrian and Neighborhood
Safety Program
TransNet-BRT/Ops = Prop. A Extension Local Transportation Sales Tax - Bus Rapid Transit/New Service
TransNet-Border = Prop. A Extension Local Transportation Sales Tax - Border
TransNet-CP = Prop. A Local Transportation Sales Tax - Commercial Paper
TransNet-H = Prop. A Local Transportation Sales Tax - Highway
TransNet-L = Prop. A Local Transportation Sales Tax - Local Streets & Roads
TransNet-LSG = Prop. A Extension Local Transportation Sales Tax - Local Smart Growth
TransNet-LSI = Prop. A Extension Local Transportation Sales Tax - Local System Improvements
TransNet-MC = Prop. A Extension Local Transportation Sales Tax - Major Corridors
TransNet-REMP = Prop. A Extension Local Transportation Sales Tax - Regional Environmental Mitigation Program
TransNet-SMIP = Prop. A Extension Local Transportation Sales Tax - Regional Smart Growth Incentive Program
TransNet-SS = Prop. A Extension Local Transportation Sales Tax - Senior Services
TransNet-T = Prop. A Local Transportation Sales Tax - Transit
TransNet-TSI = Prop. A Extension Local Transportation Sales Tax- Transit System Improvements
121Page Thursday, July 8, 2010
125

Attachment 3
DRAFT AIR QUALITY CONFORMITY ANALYSIS
On April 15, 2004, the U.S. Environmental Protection Agency (EPA) designated the San Diego air basin as nonattainment for the new Eight-Hour Ozone Standard. This designation took effect on June 15, 2004. Several areas that are tribal lands in eastern San Diego County were excluded from the nonattainment designation. The air basin was initially classified as a basic nonattainment area under Subpart 1 of the Clean Air Act and the maximum statutory attainment date for the Eight-Hour Ozone Standard was set as June 15, 2009. However, U.S. EPA in response to a court decision, on January 16, 2009, proposed that, among other areas of the country, the San Diego basic nonattainment area be reclassified as a Subpart 2 moderate nonattainment area, with a maximum statutory attainment date of June 15, 2010. Final U.S. EPA action on this proposed reclassification is still pending.
In cooperation with the San Diego Air Pollution Control District (APCD) and SANDAG, the California Air Resources Board (ARB) developed an Eight-Hour Ozone Attainment Plan which was submitted to the U.S. EPA on June 15, 2007. The budgets in the Eight-Hour Ozone Attainment Plan for San Diego County were found adequate for transportation conformity purposes by the U.S. EPA, effective June 9, 2008.
The SANDAG Board of Directors made a finding of conformity of the 2030 Regional Transportation Plan: Pathways for the Future (2030 RTP) and 2006 RTIP, as amended, on November 30, 2007. The U.S. Department of Transportation (DOT) issued its conformity finding on December 10, 2007. On July 25, 2008, a conformity determination for the 2008 RTIP and conformity redetermination for the 2030 RTP was made by the SANDAG Board of Directors. The U.S. DOT issued its conformity finding on November 17, 2008. On January 22, 2010 the SANDAG Board adopted the 2008 RTIP Amendment No. 16 and its conformity finding. The U.S. DOT made a finding of conformity for the amendment on February 19, 2010. On July 23, 2010 the SANDAG Board of Directors will be asked to make a finding of conformity for the 2008 RTIP Amendment No. 23 and a conformity redetermination for the 2030 RTP.
Also, the U.S. EPA designated the San Diego region as a federal maintenance area for the Carbon Monoxide (CO) standard. On January 30, 2006, the U.S. EPA approved the 2004 Revision to the California State Implementation Plan for Carbon Monoxide or CO Maintenance Plan as a State Implementation Plan (SIP) revision.
DEMONSTRATION OF FISCAL CONSTRAINT
The Draft 2010 RTIP is consistent with the 2030 RTP. As a financially constrained document, the Draft 2010 RTIP contains only those major transportation projects listed in the revenue-constrained 2030 RTP. Chapter 4 of the Draft 2010 RTIP includes detailed discussion on fiscal constraint and overall financial capacity to carry out projects included in the RTIP.
DEVELOPMENT OF TRANSPORTATION CONTROL MEASURES
In 1982, SANDAG adopted four Transportation Tactics as elements of the 1982 Revised Regional Air Quality Strategy (RAQS). These Transportation Tactics are ridesharing, transit improvements, traffic flow improvements, and bicycle facilities and programs.
126

These four Transportation Tactics were subsequently approved by the San Diego Air Pollution Control Board (APCB) and are included in the 1982 SIP for Air Quality as Transportation Control Measures (TCMs). The U.S. EPA approved this State Implementation Plan (SIP) revision for the San Diego Air Basin in 1983. However, the four TCMs have been fully implemented.
The California Clean Air Act required the preparation of a 1991 RAQS, including TCMs. During 1991 and 1992, SANDAG, in cooperation with local agencies, transit agencies, and the APCD developed a TCM Plan. SANDAG approved the TCM Plan on March 27, 1992.
On June 30, 1992, the APCD amended the TCM Plan and adopted the 1991 RAQS, including the amended TCM Plan. TCMs included in the 1991 RAQS include the four Transportation Tactics described above, as well as a transportation demand management (TDM) program, vanpools, high-occupancy-vehicle (HOV) lanes, and park and ride facilities. On November 12, 1992, the Air Resources Board (ARB) gave approval to the 1991 RAQS, including the TCMs.
The 1995 Triennial RAQS Update subsequently deleted the Employee Commute Travel Reduction Program contained in the TDM program because the program was no longer required under federal law. Assembly Bill 3048 (Statutes of 1996, Chapter 777) eliminated all state requirements for mandatory trip reduction programs. As a result, the Student Travel Reduction Program, the Non-Commute Travel Reduction Program, and the Goods Movement/Truck Operation Program proposed in the 1991 RAQS were no longer statutorily mandated and were deleted from the RAQS in 1998. The 2001, 2004, and 2009 Triennial RAQS Revisions did not make changes to measures related to mobile sources or the TCM Plan.
AIR QUALITY CONFORMITY REQUIREMENTS
SANDAG, as the Metropolitan Planning Organization (MPO), and the U.S. DOT must make a determination that the 2010 RTIP and the 2030 RTP conform to the applicable SIP. Conformity to the SIP means that transportation activities will not create new air quality violations, worsen existing violations, or delay the attainment of the National Ambient Air Quality Standards (NAAQS).
Based upon the U.S. EPA’s Transportation Conformity Rule, as amended, conformity of transportation plans and programs, including the 2010 RTIP is determined according to the 1990 Clean Air Act Amendments (CAAA) [Section 176(c)(3)(A)] if the following is demonstrated:
The Draft 2010 RTIP provides for the timely implementation of the Transportation Tactics contained in the 1991 RAQS. These tactics are also included as TCMs in the 1982 SIP, but have been fully implemented.
A quantitative analysis is conducted on the cumulative emissions of projects programmed within the Draft 2010 RTIP including all regionally significant, capacity-increasing projects. Further, implementation of the projects and programs must meet the motor vehicle emissions budget developed by local and state air quality agencies and approved by the U.S. EPA. The 2010 RTIP must meet the applicable emission budgets prescribed in the Eight-Hour Ozone Attainment Plan for San Diego County which were found adequate for transportation conformity purposes by the U.S. EPA, effective June 9, 2008. Also, the 2010 RTIP must meet the CO emissions budget established in the CO Maintenance Plan (approved by the U.S. EPA in January 2006).
127

In addition to the required emissions tests, consultation with transportation and air quality agencies is required. The consultation process followed to prepare the air quality conformity analysis complies with the San Diego Transportation Conformity Procedures adopted in July 1998.
Interagency consultation involves SANDAG, the SDAPCD, Caltrans, ARB, the U.S. DOT, and the U.S. EPA, which form the San Diego Region Conformity Working Group (CWG).
Consultation is a three-tier process that:
1. formulates and reviews drafts through a conformity working group;
2. provides local agencies and the public with opportunities for input through existing regional advisory committees and workshops; and
3. seeks comments from affected federal and state agencies through participation in the development of draft documents and circulation of supporting materials prior to formal adoption.
SANDAG consulted with the CWG for the preparation of the new air quality analysis of the Draft 2010 RTIP. Conformity of the 2030 Regional Transportation Plan: Pathways for the Future also is being redetermined for consistency purposes.
The schedule for the development for the Draft 2010 RTIP and criteria and procedures for determining conformity were presented to the CWG on March 3, 2010. The draft list of non-capacity increasing projects was provided to the CWG on April 26, 2010 and the draft list of capacity increasing project was provided to the CWG on May 5, 2010. Comments from the CWG were incorporated into the final exempt projects list.
The quantitative emissions analyses for the Draft 2010 RTIP conformity determination and 2030 RTP redetermination were initiated in April, 2010 and the results distributed on June 1, 2010 to the CWG for an initial review and comment period. The San Diego Region CWG reviewed the draft air quality conformity analysis at its June 9, 2010 meeting. The Draft 2010 RTIP and its conformity analysis and the 2030 RTP conformity redetermination are scheduled to be released for public review and comment on July 23, 2010. The results of the regional emissions analysis indicate that the Draft 2010 RTIP and 2030 RTP meet the air quality conformity requirements.
The SANDAG Board of Directors will be asked to make a conformity finding for the 2010 RTIP and redetermination of conformity for the 2030 RTP and approve the 2010 RTIP at its September 24, 2010 meeting. The following sections provide a summary of the air quality conformity analysis of the Draft 2010 RTIP and 2030 RTP in relation to the above conformity requirements.
The first requirement of the air quality conformity finding is to provide for the expeditious implementation of adopted TCMs, which are also the Transportation Tactics included in the 1991 RAQS. These tactics are ridesharing, transit service improvements, traffic flow improvements, and bicycle facilities and programs.
The 1982 SIP established the TCMs, which identified general objectives and implementing actions for each tactic. Due to substantial investments since 1982, SANDAG has fully implemented the TCMs. Ridesharing, transit, bicycling, and traffic flow improvements continue to be funded, although the level of implementation established in the SIP has been surpassed. No TCMs have been removed or substituted from the SIP. The Draft 2010 RTIP makes substantial progress in programming funds for implementation of the four adopted Transportation Tactics for the San Diego region contained in the 1991 RAQS. Table 5-1 shows that
128

129
Transportation Tactics programmed for implementation total approximately $2.9 billion, or 29 percent of the total funds programmed. Included are $19.7 million for Ridesharing, $2.7 billion for Transit Improvements, $39.6 million for Bicycle Facilities and Programs, and $94.6 million for Traffic Flow Improvements. Based upon this analysis, the Draft 2010 RTIP continues to provide for the expeditious implementation of the four Transportation Tactics approved in the 1991 RAQS.
QUANTITATIVE EMISSIONS ANALYSIS
The second requirement of the conformity finding is to conduct a quantitative emissions analysis on the Draft 2010 RTIP. The emissions analysis must show that implementation of the Draft 2010 RTIP and 2030 RTP meet the emissions budgets established in the 2004 CO Maintenance Plan and in the Eight-Hour Ozone Attainment Plan for San Diego County.
A quantitative emissions analysis was conducted according to the requirements established in the Transportation Conformity Rule under Section 93.122(b). Motor vehicle emissions forecasts were produced for the following analysis years: 2010, 2020, and 2030.
SANDAG's regional growth forecasts and transportation models, as well as ARB’s emissions model, were used to generate the emissions forecasts. Transportation forecasts were developed using the TransCAD 5.0 transportation planning computer package. The four-step transportation modeling process includes trip generation, trip distribution, mode split, and trip assignment. The quantitative emissions analysis was conducted using the EMFAC 2007 model.
All of the proposed capacity-increasing improvements identified in theDraft 2010 RTIP that are on the Regional Arterial System (as defined in the RTP) or the FHWA functional classification system (other principal arterials and higher classifications) were modeled.
EMISSIONS BUDGET ANALYSIS
Tables 5-2 and 5-3 provide a summary of the results of the quantitative emissions analysis conducted for the Draft 2010 RTIP and 2030 RTP. The analysis shown in Table 5-2 demonstrates that the Draft 2010 RTIP and the 2030 Regional Transportation Plan: Pathways for the Future meet the applicable budgets for the Eight-Hour Ozone standard. Projected reactive organic gas (ROG) and nitrogen oxide (NOx) emissions for 2010, 2020, and 2030 are below the established SIP budgets. Table 5-3 shows that projected CO emissions from the Draft 2010 RTIP and the 2030 Regional Transportation Plan: Pathways for the Future are below the 2003 CO budget of 730 tons per day.

Table 5-1
DRAFT 2010 RTIP - SAN DIEGO REGION (IN $000s)
TRANSPORTATION CONTROL MEASURE PROJECTS
RIDESHARING
Transportation Demand Management (TDM) $19,685
Subtotal: $19,685
TRANSIT IMPROVEMENTS
Transit - Bus/Rail Infrastructure $630,782
Transit - Bus/Rail Intermodal Stations $152,129
Transit - Bus/Rail Vehicle Purchase $319,605
Transit - I-15 BRT $111,244
Transit - Mid-Coast $636,540
Transit - Other BRT $185,085
Transit - Other Bus/Rail (Operations/Planning) $710,435
Subtotal: $2,745,820
BICYCLE FACILITIES PROJECTS
Bicycle/Pedestrian Projects $39,647
Subtotal: $39,647
TRAFFIC FLOW IMPROVEMENTS
Transportation Management System/Intelligent Transportation System $61,227
Traffic Management/Signal Projects $33,339
Subtotal: $94,566
Total Transportation Tactics in the Draft 2010 RTIP: $2,899,718
Total All Transportation Projects in the Draft 2010 RTIP: $9,995,675
Share of T-Tactics Projects in the Draft 2010 RTIP: 29.0%
130

Table 5-2 Draft 2010 RTIP and 2030 Regional Transportation Plan: Pathways to the Future
Air Quality Conformity Analysis for Eight-Hour Ozone
ROG NOx
Year
Average Weekday Vehicle Starts
(1,000s)
Average Weekday Vehicle Miles
(1,000s)
SIP Emissions
Budget Tons/Day
ROG Emissions Tons/Day
SIP Emissions
Budget Tons/Day
NOx Emissions Tons/Day
2010 13,470 82,599 53 38 98 72
2020 15,066 90,819 53 24 98 40
2030 16,511 103,449 53 20 98 32
Note: Emissions budgets from Eight Hour Ozone Attainment Plan for San Diego County, found adequate for transportation conformity purposes by the U.S. EPA, effective June 9, 2008.
Table 5-3 Draft 2010 RTIP and 2030 Regional Transportation Plan: Pathways to the Future
Air Quality Conformity Analysis for Carbon Monoxide
CO
Year
Average Weekday
Vehicle Starts (1,000s)
Average Weekday
Vehicle Miles (1,000s)
SIP Emissions Budget
Tons/Day
CO Emissions Tons/Day
2010 13,470 81,599 730 399
2018 14,747 89,175 730 250
2020 15,066 90,819 730 213
2030 16,511 103,449 730 163
Note: Emissions budgets for the San Diego region from 2004 Revision to California State Implementation Plan for Carbon Monoxide, Updated Maintenance Plan for Ten Federal Planning Areas (Approved as SIP revision in January 2006).
131

132
CONCLUSION
Based upon an evaluation of projects and funds programmed and a quantitative emissions analysis, the Draft 2010 RTIP and 2030 RTP meet the U.S. EPA transportation conformity regulations contained within the federal guidelines published on August 15, 1997, and subsequent amendments, as well as the requirements of the federal Clean Air Act amendments of 1990.

San Diego Association of Governments
TRANSPORTATION COMMITTEE July 16, 2010
AGENDA ITEM NO.: 9Action Requested: RECOMMEND
2050 REGIONAL TRANSPORTATION PLAN (RTP): DRAFT UNCONSTRAINED TRANSPORTATION NETWORK File Number 3100500 Introduction During the past few months, staff presented the initial 2050 RTP Unconstrained Highway and Transit networks to the Board of Directors, Policy Committees, various SANDAG working groups, and at other public meetings for input. The basis of the draft 2050 Unconstrained Transportation Network presented in this report includes the “hybrid” transit scenario from the Urban Area Transit Strategy, highway improvements to serve people and goods, local streets and roads improvements, bicycle projects within the regional network, rail grade separations, and other management strategies.
Recommendation
The Transportation Committee is asked to recommend that the Board of Directors accept the draft Unconstrained Transportation Network for use in the development of the 2050 RTP.
Discussion Draft Unconstrained Transportation Network In developing the 2050 RTP, the Unconstrained Transportation Network represents the region’s vision for transit, highway, and arterial improvements and operations to meet travel demand in 2050. Defining the Unconstrained Network is an important step in developing an updated RTP, because it establishes the broadest multimodal network from which revenue constrained network scenarios will be developed. Once the Unconstrained Network is defined, staff will prioritize all of the future projects in this network, using the Board approved transportation project evaluation criteria. Based on revenue projections to 2050, various Revenue Constrained transportation network scenarios will be developed using this prioritized project list and other factors. The Revenue Constrained network scenarios will attempt to build and operate as much of the Unconstrained Network as possible, given revenue availability and flexibility, and project priorities. These scenarios will be evaluated using performance measures leading to the eventual selection of a preferred Revenue Constrained Scenario by the Board of Directors. The draft Unconstrained Network totals approximately $95 to $115 billion through 2050. Costs will be refined as staff continues the development of the 2050 RTP.

Transit Network As described in previous reports, the Urban Area Transit Strategy has served as the basis for development of the regional transit network to be included in the 2050 RTP. Through the planning process, three transit network alternatives with a focus on the urban areas of the San Diego region were developed and tested. The alternatives were based on the following themes: Transit Propensity” (expanding transit in the most urbanized areas), “Commuter Point-to-Point” (emphasizing quick access to work), and “Many Centers” (connecting local smart growth areas and activity centers). The overarching goal is to create a world-class transit system for the San Diego region in 2050 that significantly increases the use of transit, walking, and biking in the urbanized areas of the region, makes transit more time-competitive with the automobile, maximizes the use of transit during peak periods, and reduces greenhouse gas emissions and vehicle miles traveled in the region. The best transit system strategies from each of the three alternatives, as well as ideas received from the SANDAG Working Groups, Policy Advisory Committees, and through the public outreach process, have been combined into a “Hybrid” 2050 Unconstrained Transit Network. The Unconstrained Transit Network is based on the following strategies and network assumptions: • Strengthen the current transit network in communities that already have strong transit/land use
integration. Improvements focus on:
o Including local transit routes and service frequencies called for in the Comprehensive Operational Analysis of the two transit agencies and further enhancing most local bus frequencies in the urban areas to 10-minute or better all-day,
o Developing Rapid Bus services along major arterial corridors with 10-minute all-day frequencies, and
o Adding streetcar and/or other shuttle/circulator services with 10-minute all-day frequencies to help improve intra-community circulation within smart growth centers.
• Interconnect the existing, most highly-urbanized areas and future smart growth centers to each other and to major employment areas. Improvements focus on:
o Double tracking the COASTER and completing the Del Mar and UTC COASTER tunnels to provide 15-minute all-day and peak period frequencies,
o Extending the SPRINTER to North County Fair and double tracking the SPRINTER to provide 10-minute peak period frequencies and 15-minute off-peak frequencies,
o Providing “Express” SPRINTER service to the Oceanside, Vista, and Escondido transit centers with 10-minute peak period frequencies and 15-minute off-peak frequencies,
o Building a Trolley tunnel in downtown San Diego between Smart Corner and One America Plaza to support enhanced operations of the Blue and Orange Trolley lines,
o Increasing frequencies along the Orange, Blue, and Green Trolley lines to 7.5-minutes all-day,
o Completing the Mid-Coast Light Rail Transit (LRT) extension to University City,
2

o Adding new LRT service and express LRT service with 10-minute or better all-day frequencies to better serve high-demand corridors, such as Mira Mesa, Kearny Mesa, Chula Vista, Pacific Beach, and Mid-City/Southeastern San Diego communities,
o Adding a system of high-frequency, high-speed Bus Rapid Transit (BRT) services with 10- or 15-minute peak and/or off-peak frequencies that will facilitate easy and convenient access across the region along freeway/Managed Lanes corridors, and
o Adding select peak commuter BRT bus services with 10- or 15-minute peak directional frequencies that offer high-speed, one-seat ride travel to facilitate access to key regional employment centers.
• Integrate High-Speed Rail (HSR) from Riverside County to the San Diego/Tijuana international border and add a commuter rail overlay service (similar to existing COASTER service) into the transit network. Improvements focus on:
o Providing HSR stations in downtown Escondido and at Lindbergh Field, as assumed in the most recent High-Speed Rail Authority alignment (subject to change), and
o Adding commuter rail overlay stations along the Interstate (I-15) and I-5 corridors at the following locations: Temecula, State Route (SR) 76, Escondido Transit Center, Mira Mesa, University City, Lindbergh Field, 8th Street in National City, H Street in Chula Vista, the San Ysidro border crossing, the proposed cross-border terminal, and the Otay Mesa Border crossing. Service frequencies would be 15-minute peak and 60-minute off-peak.
• Emphasize improvements to the pedestrian environment in and around rail and bus station areas to maximize convenient and safe walking access to transit, and create interconnections between transit and the Regional Bike Plan as a means to facilitate access to transit stations from areas outside a walking distance and create new last-mile solutions.
A “subway-style” map illustrating the “Hybrid” Draft 2050 Unconstrained Transit Network is included as Attachment 1. Attachment 2 contains the list of transit routes and headways for the Draft 2050 Unconstrained Transit Network. The following table summarizes existing and additional miles of transit service by mode included in this Unconstrained Transit Network:
Mode Existing Miles Additional Miles* Total Miles
Commuter Rail/High-
Speed Rail (HSR)
41 miles (COASTER) 78 miles (HSR and
commuter rail overlay
service)
119 miles
Light Rail Transit (LRT) 86 miles
(Trolley and
SPRINTER)
100 miles 186 miles
Bus Rapid Transit (BRT) None today 240 miles 240 miles
Rapid Bus None today 250 miles 250 miles
Streetcar / Shuttle None today 36 miles 36 miles
*Assumed in Hybrid Unconstrained Transit Network
3
Initial cost estimates for the Unconstrained Transit Network total approximately $31 to $37 billion. This range is based on an estimated range of $26 to $30 billion for capital costs and $5 to $7 billion for operating costs.
SANDAG staff met with staff from the Metropolitan Transit System (MTS) and the North County Transit District (NCTD) to review the Hybrid Unconstrained Transit Network. MTS and NCTD staff provided the following comments.
• Consider substituting the HSR extension from Lindbergh Field to South Bay with third track improvements that would allow for Express Trolley service along the Blue Line.
• Consider express trolley service on other existing and future LRT lines.
• Include a bus tunnel alongside the proposed Trolley tunnel in downtown San Diego between Smart Corner and One America Plaza to support capacity needs for the extensive network of proposed BRT routes that would serve downtown San Diego. Underground layover terminals would be included.
• Add streetcar / shuttle in Mission Bay.
• Add a COASTER station at the Convention Center at Harbor Drive in downtown San Diego and a permanent COASTER station at the Del Mar Fairgrounds.
• Test a BRT line along the future SR 78 high-occupancy vehicle (HOV) corridor.
• Test the extension of the SPRINTER line into eastern Escondido along Grand Avenue.
• Explore the concept of interoperable trains for “one-seat ride” rail service in the region to minimize the need for transfers, for example, between COASTER and SPRINTER services. (This would be explored as a vehicle technology improvement in the RTP.)
SANDAG staff supports these additions/modifications and proposes incorporating them into the Unconstrained Transit Network that is scheduled to be presented to the SANDAG Board at its July 23, 2010, meeting. Updated maps, cost estimates, and mode share figures would be incorporated into the Board report to reflect the suggested changes.
Transit Mode Share Goals
In June, the Board accepted home-to-work peak period transit mode share goals for 14 geographic subareas within the urban area. The current transit mode share (2008) for the overall combined urban area is five percent. The mode share goal accepted by the Board for the urban area in 2050 is a range of 10-15 percent. Attachment 3 provides a map that illustrates the mode share goal ranges for each geographic subarea. Attachment 4 provides a table that delineates the mode share goal ranges for each subarea along with projected mode shares in 2050 under the Transit Propensity, Commuter Point-to-Point, Many Centers, and the new “Hybrid” Unconstrained Transit Network scenarios.1
1 Staff is in the process of refining the transportation model to more accurately assign transit trips originating and/or
ending at the international U.S./Mexico border, the San Diego/Riverside County border, and the region’s military
facilities, which may have an effect on the mode share projections. Any significant differences in mode share
projections will be posted to the SANDAG Web site, and will be used to further refine the Unconstrained Transit
Network.
4

Initial analysis of the “Hybrid” Unconstrained Transit Network shows that the unconstrained network results in a 12 percent home-to-work peak period transit mode share in the urban area, coming in at the mid-point of the goal range accepted by the Board. Other mode share data of interest include a projected 29 percent transit mode share in Downtown San Diego under the Unconstrained Transit Network, compared to the goal of 30+ percent, a 16 percent projected mode share in the University City area compared to the goal range of 15-20 percent, and a 19 percent projected mode share in the central core area compared to the goal range of 20-25 percent (see Attachment 3 map for definition of areas).
Initial analysis also indicates that the “Hybrid” Unconstrained Transit Network more than doubles daily transit trips compared to the existing transit network, and increases transit trips beyond the Many Centers scenario (overall highest performing scenario of the three initial scenarios). Regional population during the same time period is projected to increase 40 percent.
The data also indicates that a higher percentage of people are accessing transit stations by walking/biking than by park and ride.
Over the next several weeks, staff will conduct a series of sensitivity tests to see how various operating plan and policy options could further affect home-to-work peak period transit mode share and system performance. These may include options such as increasing transit frequencies, increasing transit travel speeds, decreasing fares, testing a regional parking pricing policy, and adjusting land use assumptions around key transit corridors. Results from the sensitivity tests, as well as feedback from the Transportation Committee on network suggestions by MTS and NCTD staff, will help staff formulate and refine the transit networks to attempt to meet the mode share goals by geographic subarea. Indications from other peer cities that were evaluated as part of the Urban Area Transit Strategy show these factors can have a significant impact on transit usage.
Highway Network Similarly to the process being proposed for the transit network, SANDAG and Caltrans staffs are analyzing potential modifications to the 2030 RTP Unconstrained highway network. These modifications are based on supporting proposed transit investments in key corridors and communities while providing an adequate level of service for the overall transportation system. It is important to note that the 2030 RTP Unconstrained highway network includes an extensive Managed Lanes system that provides tremendous flexibility in serving transit and HOVs by maximizing the available rights-of-way in several of the region’s major highway corridors. The goal in reviewing the highway network is to build upon this existing plan by integrating the revised transit network into it, thereby creating the most efficient and balanced transportation system. Modifications to the 2030 RTP Unconstrained Highway Network include: • Removal of the SR 54 outer loop extension from SR 125 to Interstate 8 (I-8)2
• Removal of two HOV lanes from SR 52 from I-5 to I-805 and SR 94 from SR 125 to Avocado Boulevard
2 The City of El Cajon and County of San Diego concur with SANDAG and Caltrans’ findings that the expansion
of the SR 54 freeway between SR 125 and I-8 is not needed.
5

• Additional operational improvements to I-5 from SR 15 to I-8 and I-8 from I-5 to SR 67 and removal of two HOV lanes on I-5 and I-8 from I-5 to Los Coches3
• Removal of general purpose lane widening (two lanes) on I-5 from I-8 to La Jolla Village Drive, I-805 from Telegraph Canyon Road to I-8 and SR 52 to La Jolla Village Drive, and SR 125 from I-8 to SR 52
• Additional operational improvements on SR 76 east of I-15
Remaining congested corridors that are proposed for further study include: • SR 78 from I-5 to I-154
• I-8 from I-5 to College Avenue
Initial cost estimates for the draft 2050 RTP Unconstrained Highway network total approximately $26 to $30 billion. A map of the draft 2050 Unconstrained Highway Network is included as Attachment 5. Goods Movement The draft unconstrained goods movement system consists primarily of road and truckway projects (accommodating over 90 percent of freight by volume) that comprise the backbone of the freight distribution network. The unconstrained system outlined in the draft 2050 Goods Movement Strategy (GMS) also includes several maritime, rail, border, air cargo, and pipeline related projects. The cost to implement the unconstrained goods movement project list is estimated at $28 billion, including approximately $22 billion in highway projects already identified in the Unconstrained Highway network. Projects included in the GMS will be evaluated using updated evaluation criteria approved by the Board of Directors in June 2010. Local Streets and Roads The draft unconstrained network also includes improvements to the local streets and roads. The cost estimates for improvements to local streets and roads are currently being developed to incorporate into the 2050 RTP. San Diego Regional Bicycle Plan The San Diego Regional Bicycle Plan proposes a vision for a diverse regional bicycle system of interconnected bicycle corridors, support facilities, and programs to make bicycling more practical and desirable to a broader range of people in our region. The San Diego Regional Bicycle Plan was approved by the Board of Directors in May 2010. The cost to implement the Regional Bicycle Network is estimated at $419 million. The projects will be prioritized, using previously approved evaluation criteria, for inclusion in the 2050 RTP. The San Diego Regional Bicycle Network is included as Attachment 6.
3 In the Central I-5 and I-8 corridors, SANDAG and Caltrans staffs believe that operational improvements will
work as well or better than HOV lane improvements. The overall HOV system will still operate satisfactorily
without these segments. 4 The SR 78 Corridor Study will be initiated in late July 2010. 6

Intermodal Transportation Center The draft unconstrained network also includes improvements to intermodal transportation centers, such as Destination Lindbergh and San Ysidro. The cost estimates are currently being developed to incorporate into the 2050 RTP. Rail Grade Separations The Transportation Committee approved the Rail Grade Separation evaluation criteria in October 2009. The criteria will be used to create a prioritized list of potential grade separation projects for the COASTER, SPRINTER, and Trolley corridors within the San Diego region for incorporation into the 2050 RTP. The cost estimates for the rail grade separations are being developed. Transportation Demand Management The Transportation Demand Management (TDM) program at SANDAG, known as iCommute, provides sustainable and flexible transportation options that reduce peak period traffic congestion. These programs include: vanpool, carpool, buspool, SchoolPool, Guaranteed Ride Home, telework, and bike programs, in addition to employer outreach, public education and marketing. While transportation infrastructure, land use and smart growth development patterns can take many years and resources to implement, TDM strategies are cost effective, proven methods for reducing environmental pollutants and alleviating congestion more immediately. Consequently, TDM programs are likely to play a larger role in achieving the near-term goals of the 2050 RTP. The cost of the TDM program is estimated at approximately $730 million to 2050. The iCommute Strategic Plan will refine and prioritize the implementation of the various TDM programs. Transportation System Management Our existing transportation system represents a major investment of resources over the past several decades. While the RTP identifies additional infrastructure investments needed to meet future transportation needs, it is critical that the region place an increased focus on maximizing the efficiency of the facilities already in place. SANDAG is developing a multimodal and integrated strategy for the comprehensive management of the transit, arterial, and highway networks serving both people and goods. Through a combination of programs, such as signal and ramp metering coordination and optimization; improved performance monitoring and micro-simulation; and advanced vehicle/roadside communication platforms, the delivered tools and services will increase monitoring capabilities, enhance management, and improve system efficiency. The initial estimate for the programs total approximately $700 million through 2050 and will be further refined and prioritized through the ITS Strategic Plan currently under development.
7
8
Next Steps Staff will prioritize all of the future projects in the Unconstrained Network, using Board approved evaluation criteria. Based on revenue projections, various Revenue Constrained transportation scenarios will be developed using this prioritized project list and other factors. The Revenue Constrained transportation scenarios will attempt to build and operate as much of the Unconstrained Network as possible, given revenue availability and flexibility, and project priorities. Alternative Revenue Constrained transportation scenarios will be brought back in the fall for discussion.
CHARLES “MUGGS” STOLL Director of Land Use and Transportation Planning Attachments: 1. Draft 2050 Unconstrained Transit Network
2. Draft 2050 Unconstrained Transit Routes and Headways
3. 2050 Transit Mode Share Goal Ranges
4. Transit Mode Share Goal Ranges and Projected Transit Mode Shares for Initial Transit Network Alternatives and Draft 2050 Unconstrained Transit Network
5. Draft 2050 Unconstrained Highway Network
6. Regional Bicycle Plan Network
Key Staff Contacts: Heather Werdick, (619) 699-6967, [email protected] Carolina Gregor, (619) 699-1989, [email protected] Dave Schumacher, (619) 699-6906, [email protected]

San Ysidro
Imperial Beach
Chula Vista OtayRanch
Otay Mesa
NationalCity
Coronado
Downtown
Santee
El Cajon
LaMesa
LemonGrove
Paci�cBeach
OldTown
Mid City
MissionValley
Kearny Mesa
Mira Mesa
Escondido
Oceanside
UTC
ˆ Riverside County
Carlsbad
San Marcos
Ocean Beach
PointLoma
Encinitas
Carmel Valley
Camp Pendleton
Vista
Sorrento Mesa
SolanaBeach
Poway
Legend
High Speed and Commuter Rail
COASTER Rail
Light Rail Transit
Bus Rapid Transit
Peak Bus Rapid Transit Commuter
Rapid Bus
Streetcar/Shuttle-Circulator
High Frequency Local Bus Services
Hybrid Scenario
9
adi
Text Box
Attachment 1

Attachment 2
Draft 2050 Unconstrained Transit Routes and Headways
Route Mode Description Peak Frequencies Off-Peak Frequencies
398 Commuter Rail Coaster with Del Mar and UTC Tunnels 15 15
598 Commuter Rail High Speed Rail - Commuter Rail Service 15 60
399 Light Rail Sprinter with Extension to North County Fair 10 15
510 Light Rail Blue Line w/ Mid-Coast Extension and downtown tunnel 7.5 7.5
520 Light Rail Orange Line with Extension to Airport and downtown tunnel 7.5 7.5
530 Light Rail Green Line with Extension to 12th/Imperial 7.5 7.5
550 Light Rail SDSU to San Ysidro via East San Diego, SE San Diego, National City 7.5 10
560 Light Rail SDSU to Downtown via El Cajon Blvd/Mid-City 7.5 7.5
561 Light Rail UTC to Mira Mesa via Sorrento Mesa 7.5 10
562 Light Rail UTC to Chula Vista via Kearny Mesa, Mission Vly, Mid-City, Nat'l City 7.5 10
563 Light Rail Pacific Beach to El Cajon via Kearny Mesa, Mission Valley, SDSU 7.5 10
564 Light Rail Otay Mesa to Chula Vista via Otay Ranch/Millenium 7.5 10
588 Light Rail Sprinter Express (Oceanside, Vista, Escondido only) 10 15
90 BRT Santee/El Cajon to Downtown San Diego via SR 94 10 10
607 BRT Rancho Bernardo to Downtown via Sabre Springs/Kearny Mesa 10 peak direction 0
608 BRT Escondido to Downtown via South Escondido, Kearny Mesa 10 peak direction 0
610 BRT Temecula/Escondido to Downtown via I-15, Kearny Mesa Guideway 10 10
640 BRT San Ysidro to Kearny Mesa via South Bay, D'town, Hillcrest, Mission Vly 10 10
650 BRT Otay Ranch/Chula Vista to Palomar Airport Bus Park via I-805/I-5 15 0
652 BRT San Ysidro to UTC via South Bay, Downtown, Hillcrest, Mission Valley 10 10
653 BRT SE San Diego/Mid-City to Palomar Airport Road Bus Park via I-805/I-5 15 0
688 BRT Millenium/Otay Ranch to Sorrento Mesa via Chula Vista, I-805 15 peak direction 0
689 BRT Millenium/Otay Ranch to UTC via Chula Vista, I-805 15 peak direction 0
692 BRT El Cajon to Otay Mesa via Spring Valley, SR125, Millenium 10 15
870 BRT El Cajon to UTC via Santee, SR 52, Kearny Mesa 10 peak direction 0
890 BRT El Cajon to Sorrento Mesa via Santee, SR 52 10 peak direction 0
940 BRT Oceanside to Sorrento Mesa via I-5, Carlsbad, Encinitas 10 peak direction 0
10

Draft 2050 Unconstrained Transit Routes and Headways
Route Mode Description Peak Frequencies Off-Peak Frequencies
2 Rapid Bus 30th Ave to Downtown via North Park 10 10
10 Rapid Bus La Mesa to Ocean Beach via Mid-City, Hillcrest, Old Town 10 10
11 Rapid Bus Spring Valley to SDSU via SE San Diego, Downtown, Hillcrest, Mid-City 10 10
28 Rapid Bus Point Loma to Kearny Mesa via Old Town, Linda Vista 10 10
30 Rapid Bus Old Town to Sorrento Mesa via Pacific Beach, La Jolla, UTC 10 10
41 Rapid Bus Old Town to UTC via Linda Vista, Clairemont 10 10
120 Rapid Bus Kearny Mesa to Downtown via Sharp Hospital, Mission Valley, Hillcrest 10 10
350 Rapid Bus Escondido to North County Fair via South Escondido 10 10
440 Rapid Bus Carlsbad to San Marcos via Palomar Airport Rd Corridor 10 10
471 Rapid Bus Downtown Escondido to East Escondido 10 10
473 Rapid Bus Oceanside to UTC via Hwy 101 coastal communities, Carmel Valley 10 10
474 Rapid Bus Oceanside to Vista via Mission Ave/Santa Fe Rd corridor 10 10
477 Rapid Bus Camp Pendleton to Carlsbad Village via College Blvd, Plaza Cam Real 10 10
635 Rapid Bus Millienum to Palomar Trolley via Main St corridor 10 10
636 Rapid Bus SDSU to Spring Valley via East San Diego, Lemon Grove, Skyline 10 10
637 Rapid Bus North Park to 32nd St Trolley via Golden Hill, SE San Diego 10 10
638 Rapid Bus San Ysidro to Otay Mesa via Otay, SR 905 corridor 10 10
639 Rapid Bus Otay to North Island via Imperial Beach, Silver Strand, Coronado 10 10
709 Rapid Bus H St Trolley to Millenium via H St corridor, Southwestern College 10 10
910 Rapid Bus Coronado to Downtown via Coronado Bridge 10 10
448/449 Streetcar/Shuttle San Marcos Downtown 10 10
551 Streetcar/Shuttle Chula Vista Downtown 10 10
552 Streetcar/Shuttle National City Downtown 10 10
553 Streetcar/Shuttle San Diego Downtown - Little Italy to East Village 10 10
554 Streetcar/Shuttle Hillcrest/Balboa Park/ Downtown San Diego Loop 10 10
555 Streetcar/Shuttle 30th Ave to Downtown San Diego via North Park/Golden Hill 10 10
557 Streetcar/Shuttle El Cajon Downtown 10 10
558 Streetcar/Shuttle Escondido Downtown 10 10
559 Streetcar/Shuttle Oceanside Downtown 10 10
11

%&s(
!"̂$
AÀ
A©
!"̂$
%&s(!"_$
?z
!"a$
!"_$
!"̂$
A×
?@5 6
A©
!"a$
?h
10% - 15%
5% - 10%
20%-25%
10% - 15%
10% - 15%
5% - 10%
5% - 10%
10% - 15%
15% - 20%
5% - 10%
2050 TransitMode Share Goal Ranges
Values represent peak period home-to-worktransit mode share for destination districts.
0 2 4 6Miles±
Mode Share (%)Under 5%
5% to 10%
10% to 15%
15% to 20%
20% to 25%
25% to 30%
Over 30% 30%+
July 16, 2010
Attachment 3
12

Attachment 4
Urban Area Transit Strategy
Peak-Period, Home-to-Work Trips1
GoalsProjected Performance
of Unconstrained Network
2008 Existing Transit
2050 Peak-Period Transit Mode Share
Goal Ranges
Transit Propensity
Commuter Point-to-Point
Many Centers2050 Unconstrained
Transit Network
Major Employment Areas
Downtown San Diego 24% 30% + 28% 26% 28% 29%
University City 3% 15%-20% 14% 15% 17% 16%
Sorrento Mesa 2% 10%-15% 9% 12% 12% 12%
Kearny Mesa 3% 10%-15% 11% 11% 15% 15%
Otay Mesa/ Otay Ranch 3% 5%-10% 6% 4% 7% 9%
Palomar Airport 1% 5%-10% 5% 5% 7% 6%
High Activity Areas
Central Core 12% 20%-25% 18% 16% 18% 19%
Oceanside/Escondido Corridor 3% 10%-15% 7% 7% 8% 8%
Other Urbanized Areas
North I-15 Corridor 1% 5%-10% 4% 6% 7% 7%
North Central Coastal Area 2% 10%-15% 9% 9% 9% 9%
Central Coastal Area 5% 10%-15% 11% 11% 13% 14%
Coastal South Bay 8% 10%-15% 13% 11% 13% 14%
East County/El Cajon 4% 10%-15% 9% 8% 10% 11%
East County/Santee 3% 5%-10% 7% 6% 8% 8%
Urban Area Transit Strategy Study Area 5% 10%-15% 11% 10% 12% 12%
1 Values represent peak period home-to-work trip transit mode-share for destination districts.
Transit Mode Share Goal Ranges and Projected Transit Mode Shares for Initial Transit Network Alternatives and Draft 2050 Unconstrained Transit Network
Peak-Period, Home-to-Work Transit Mode Share
Identified Corridors/Areas
BaselineData
Projected Performance of Initial Transit Network Alternatives
13

P A C I F I C O C E A N
P A C I F I C O C E A N
Oceanside
Carlsbad
Encinitas
DelMar
Solana Beach
Poway
SanDiego
Coronado
ImperialBeach
LemonGrove
LaMesa
Santee
El Cajon
Escondido
Vista
SanMarcos
ChulaVista
Tijuana, B.C.
UNITED STATES
MEXICO
NationalCity
CampPendleton
County of San Diego
76
1-D
905 11
5
125
54
805
805
8055
5
5
282
16394
6752
52
15
56
78
78
78
76
67
8
8
15
125
125
75
94
15
54
8F+4T6E
4C
6F+2HOV
10F+4ML/MB
10F+4ML/MB
4C
6F6F+3ML/MB
6F
6F+2HOV
10F+4ML
10F+4ML
8F+4ML
8F/10F+
2HOV
8F+2HOV
10F+2HOV
6F
8T
4T
10F+2HOV
10F+2HOV
8F+4ML
8F+2HOV
4C
6F
6F+2HOV
8F+4T
2C
2C
2C
8F+4ML
8F+2HOV
8F
2C
10F
4F
8F+4T
8F
14F+4ML
8F
6C+2TU
6F+2HOV
8F+2HOV
4C
8F
8F+4ML
10F+4ML
8F
10F+4ML
6C
2C
6F6F
8F
8F/10F+4ML
4F
2C
6F
8F+4ML
Draft 2050Unconstrained
Highway NetworkJuly 2010
Managed/HOV Lanes
General Purpose Lanes
Toll Lanes
Operational Improvements
Freeway Connectors
HOV Connectors
Freeway & HOV Connectors
0 3 6
0 4.83 9.6
MILES
KILOMETERS
C =
E =
F =
HOV =
MB =
ML =
T =
TU =
Conventional Highway
Expressway
Freeway
High Occupancy Vehicle
Movable Barrier
Managed Lanes
Toll Road
Tunnel
OrangeCounty
0 3 6
MILES
RiversideCounty
San DiegoCounty
NorthernExtent
5
4T/6T
241
14
adi
Text Box
Attachment 5

0 2 41 Miles
1 2
3
4
5
6
7
8
9
10
11
12
13
14
15
16
17
18
19
20
21
22
24
25
23 26
28
29
30
31
32
3436
37
38
39
33
35
27
REGIONAL BICYCLE CORRIDORS1 - Bayshore Bikeway2 - Bay to Ranch Bikeway3 - Border Access Corridor4 - Camp Pendleton Trail5 - Carlsbad-San Marcos Corridor6 - Central Coast Corridor7 - Centre City-La Mesa Corridor8 - Chula Vista Greenbelt9 - City Heights-Old Town Corridor10 - Clairemont-Centre City Corridor11 - Coastal Rail Trail12 - East County Northern Loop13 - East County Southern Loop14 - El Camino Real15 - Encinitas-San Marcos Corridor16 - Escondido Creek Bikeway17 - Gilman Connector18 - Hillcrest-El Cajon Corridor19 - Imperial Beach Connector20 - Inland Rail Trail21 - Kearny Mesa-Beaches Corridor22 - Kensington-Balboa Park Corridor23 - North Park-Centre City Corridor24 - Mid-County Bikeway25 - Mira Mesa Corridor26 - Mission Valley-Chula Vista Corridor27 - Park Boulevard Connector28 - Poway Loop29 - San Diego River Bikeway30 - San Luis Rey River Trail31 - Santee-El Cajon Corridor32 - Sweetwater River Bikeway33 - Vista Way Connector34 - I-8 Corridor35 - I-15 Bikeway36 - SR-52 Bikeway37 - SR-56 Bikeway38 - SR-125 Corridor39 - SR-905 Corridor
Pacific
Ocean
San DiegoSantee
Poway
ChulaVista
El Cajon
LaMesa
Coronado
ImperialBeach
EscondidoCarlsbad
Vista
Encinitas
San Marcos
Oceanside
SolanaBeach
DelMar
San Diego
Alta P
lannin
g + D
esign
, Mar
ch 20
09
FIGURE 3-3UPDATED REGIONALBICYCLE NETWORK
SAN DIEGO REGIONAL BICYCLE PLAN
NOTE:Colors do not represent facility type.The color variations are intended todifferentiate start and end of allcorridors.
15
adi
Text Box
Attachment 6

San Diego Association of Governments
TRANSPORTATION COMMITTEE
July 16, 2010 AGENDA ITEM NO.: 10
Action Requested: APPROVE
TIGER II DISCRETIONARY GRANT SUBMITTALS File Number 7300400
Introduction
On December 16, 2009, President Obama signed into law P.L. 111-117, the Transportation, Housing and Urban Development, and Related Agencies Appropriation Act for 2010 (FY 2010 Appropriations Act). The FY 2010 Appropriations Act allocated $600 million to be awarded by the United States Department of Transportation (USDOT) for National Infrastructure Investments. These grants are allocated on a competitive basis for surface transportation projects that will have a significant impact on the nation, a metropolitan area, or a region. This appropriation is similar but not identical to the Transportation Investment Generating Economic Recovery (TIGER) Discretionary Grants allocated last year as part of the American Recovery and Reinvestment Act of 2009. Because of the similarity of the two programs, USDOT is referring to the FY 2010 National Infrastructure Investments program as “TIGER II Discretionary Grants.” Of the $600 million available, USDOT is permitted to use up to $35 million for planning grants for the TIGER II program.
Recommendation
The Transportation Committee is asked to approve the list of proposed regional project submittals for the TIGER II Discretionary Grants Program and authorize the Executive Director to provide support letters for other local agency projects that are consistent with SANDAG policies and programs.
This item summarizes the federal program and includes a list of proposed regional project submittals for Transportation Committee approval. Applications for the TIGER II Discretionary Grants program are due by August 23, 2010. The application process is expected to be highly competitive; proposals that can be implemented quickly and that best meet the program selection criteria outlined below will have the best opportunity for continuing through the USDOT evaluation process.
Discussion
TIGER II Discretionary Grant Program Guidelines and Criteria
In accordance with the notice of funding availability published on June 1, 2010, eligible applicants for TIGER II discretionary grants include state and local governments, tribal governments, transit agencies, port authorities, and metropolitan planning organizations (MPOs), among others. Eligible projects include highway or bridge projects eligible under title 23 of the United States Code (USC), public transportation projects eligible under chapter 23 of title 49 USC, passenger and freight rail transportation projects, and port infrastructure investments. Pre-applications for the TIGER II program are due by July 26, 2010, and final applications must be submitted to USDOT by August 23, 2010.
The guidelines specify that grants may be no less than $10 million and no more than $200 million. However, USDOT has discretion to waive the $10 million minimum grant size requirement for significant projects in smaller cities, regions, or states. No more than 25 percent (or $150 million) of the funds made available may be awarded to projects in a single state. Proposals may request funding for up to 80 percent of the project costs. TIGER II funds are available to the USDOT for obligation through September 30, 2012.
Project Selection Criteria
In accordance with the notice of funding availability, TIGER II Discretionary Grants will be awarded based on two categories of selection criteria, Primary Selection Criteria and Secondary Selection Criteria. The Primary Selection Criteria aim at fostering long-term outcomes, which include:
• State of Good Repair: Improving the condition of the existing transportation facilities and systems, with particular emphasis on projects that minimize life-cycle costs
• Economic Competitiveness: Contributing to the economic competitiveness of the United States over the medium to long-term
• Livability: Improving the quality of living and working environments and the experience for people in communities across the United States
• Sustainability: Improving energy efficiency, reducing dependence on oil, reducing greenhouse gas emissions and benefiting the environment
• Safety: Improving the safety of the United States transportation facilities and systems
The Secondary Selection Criteria include:
• Innovation: USDOT will give priority to projects that use innovative strategies to pursue the long-term outcomes outlined above
• Partnership: USDOT will give priority to projects that demonstrate strong collaboration among a broad range of participants and/or integration of transportation with other public service efforts
Job creation and economic stimulus continue to remain a top priority of this Administration; therefore, USDOT also will give priority to projects that are expected to quickly create and preserve jobs and stimulate rapid increases in economic activity, particularly jobs and activity that benefit economically distressed areas.
USDOT will give more weight to the Primary Selection Criteria than the Secondary Selection Criteria. Projects that are unable to demonstrate a likelihood of significant long-term benefits in any of the five long-term outcomes will not proceed in the evaluation process.
2
Cost-Benefit Analysis
In addition to the project selection criteria, projects seeking a grant must include in its application estimates of the project’s expected benefits in the five long-term outcomes listed above. Larger projects must complete a more detailed cost-benefit analysis, including a calculation of net benefits, qualitative and quantitative measurements, and consideration of externalities.
TIGER II Planning Grants and Community Challenge Grants
The FY 2010 Appropriations Act permits USDOT to use up to $35 million of the available $600 million for “TIGER II Planning Grants” and provides an additional $40 million for a separate Department of Housing and Urban Development (HUD) Community Challenge Grants program. USDOT and HUD expect to award these two grant programs jointly in an effort to better align transportation, housing, economic development, and land use planning.
Specifically, the TIGER II Planning Grants may be used for planning, preparation, or design of eligible TIGER II projects. The Community Challenge Grant Program aims at reducing barriers to achieving affordable, economically vital, and sustainable communities through efforts such as amending or replacing local master plans, zoning codes and building codes, and other similar activities.
For both the Community Challenge Planning Grants and the TIGER II Planning Grants, eligible applicants must be able to provide the minimum 20 percent non-federal match of funds, and be able to initiate eligible planning activities within 120 days of the effective date of the grant award. There is no minimum grant size, but the maximum award for any project is $3 million. Pre- applications are due July 26, 2010. Final applications must be submitted to USDOT by August 23, 2010.
Proposed Regional Project Submittals
TIGER II Discretionary Grants
Based on the criteria and guidelines set forth in the TIGER II Discretionary Grant program, with special attention given to the stringent project delivery timelines, staff recommends submitting two proposals for consideration by USDOT. Two regional project submittals are proposed (not in order of priority):
Barrio Logan Port Access Improvements Project – This project would improve goods movement between the Port of San Diego marine terminals and the adjacent highway system. The proposed project would include improvements at two separate sites. Site 1 (Vesta Street) would include operational improvements to the Harbor Drive/32nd Street, 32nd Street/Wabash Boulevard/Norman Scott Road, and the Main Street/State Route 15 ramp improvements. Site 2 (10th Avenue) would include improvements to the 10th Avenue Marine Terminal/Cesar E. Chavez Parkway intersection within the Barrio Logan Community and operational improvements on 10th Avenue where it intersects with the rail line and the Marine Terminal. The construction on Vesta Street to improve access to Naval Base San Diego would result in reduced delay time along this truck route. The Barrio
3

Logan improvements would help address the freight and related air quality impacts in the community in a context-sensitive manner as well as would improve truck flows to the marine terminal facilities. ($60 million)
Los Peñasquitos Bridge Replacements – This proposed project would replace three aging timber trestle railway bridges owned by the North County Transit District (NCTD) in the Los Angeles-San Diego-San Luis Obispo (LOSSAN) rail corridor that have reached the end of their useful life. Replacement of these bridges, which were built in the 1920s and 1930s, is necessary to support intercity, commuter, and freight rail services on the corridor. These single-track bridges must be replaced in order to maintain the railroad's reliability and safety while planning for future intercity passenger increases. These bridges currently carry an average of 44 passenger trains and four to six freight trains per day. ($19.8 million)
TIGER II Planning Grants Convention Center Platform – NCTD has envisioned a new commuter/intercity rail passenger platform to serve San Diego’s Petco Park and Convention Center for the LOSSAN rail corridor since the inception of commuter rail service in the 1990s. A feasibility study was completed in 2002 identifying preliminary locations, necessary track and signal work required, and service considerations. This proposed project would be coordinated closely with NCTD, the City of San Diego, Centre City Development Corporation, Burlington Northern Santa Fe Railway, Metropolitan Transit System, and other stakeholders to update the planning level concepts for the proposed platform, detail the rail improvements needed, identify potential multimodal connections with trolley, bus, and pedestrian improvement plans for the area, develop capital and operating cost estimates, and complete design to a 60 percent level. ($2.5 million)
Statewide Project Submittals
In addition to the regional project submittals, Caltrans has initiated a statewide application to support the implementation of positive train control (PTC). Both NCTD and SANDAG are working with Caltrans to include the LOSSAN rail corridor in the state’s PTC application.
Local Project Submittals
As described above, applicants other than MPOs are eligible to submit directly to USDOT their own proposals for TIGER II Discretionary Grants. Several local entities have expressed interest in submitting their own local applications. For projects seeking a letter of support from SANDAG, the Transportation Committee is asked to authorize the Executive Director to provide support letters for other local agency TIGER II project submittals that are consistent with SANDAG policies and programs. At a minimum (and consistent with the direction provided in the TIGER II guidelines), staff recommends that local project submittals be in the adopted Regional Transportation Plan and the Regional Transportation Improvement Program or be able to demonstrate a realistic schedule for inclusion.
4

5
Next Steps
Following Transportation Committee approval of the proposed list of regional projects, staff will initiate the necessary steps to submit the regional TIGER II Discretionary Grants project proposals to USDOT, including participating in efforts to submit statewide applications and providing letters of support for local projects upon request.
KIM KAWADA TransNet and Legislative Affairs Program Director
Key Staff Contact: Victoria Stackwick, (619) 699-6926, [email protected]

San Diego Association of Governments
TRANSPORTATION COMMITTEE
July 16, 2010 AGENDA ITEM NO.: 11
Action Requested: RECOMMEND
MID-COAST CORRIDOR TRANSIT PROJECT – FINAL COMPARATIVE EVALUATION OF ALTERNATIVES REPORT File Number 1041501
Introduction
At its July 2, 2010, meeting the Transportation Committee received a report on the Mid-Coast Corridor Transit Project that summarized the outreach activities for public scoping, scoping meetings, and comments received during the scoping period for the Draft Supplemental Environmental Impact Statement/Subsequent Environmental Impact Report (SEIS/SEIR). This report presents a summary of the analysis of the scoping comments and provides the basis for the recommendation on selection of a Locally Preferred Alternative (LPA) and alternatives for evaluation in the Mid-Coast Corridor Transit Project Draft SEIS/SEIR. A map of the alternatives carried forward for consideration at scoping is included as Attachment 1.
Recommendation
The Transportation Committee is asked to recommend that the Board of Directors reconfirm the previously adopted Locally Preferred Alternative (LPA), as refined to include direct service to UCSD and University Towne Centre, by selecting Light Rail Transit (LRT) Alternative 1 (combines 1, 4, and 5) as the LPA. The Transportation Committee is further asked to recommend that the Board of Directors approve LRT Alternative 1 and the No-Build Alternative for evaluation in the Mid-Coast Corridor Transit Project Draft SEIS/SEIR. The Transportation Committee also is asked to recommend that the Board of Directors approve the final Public Involvement Plan.
Discussion The Final Comparative Evaluation of Alternatives Report has been completed. In addition to the information provided in the Draft Comparative Evaluation of Alternatives Report, the Final Report includes a summary of the process for selection of alternatives for scoping, a summary and analysis of scoping comments, and a recommendation on selection of a Locally Preferred Alternative (LPA) refined from the LPA adopted by the SANDAG Board of Directors on December 19, 2003, and alternatives for review in the Mid-Coast Corridor Transit Project Draft SEIS/SEIR. Sections 8 and 9 of the Final Comparative Evaluation Report are included as Attachment 2. Section 8 presents a summary of the scoping process and a summary and analysis of scoping comments. Section 9 presents the recommended LPA and alternatives for evaluation in the Draft SEIS/SEIR.

Scoping Comment Analysis As noted at the July 2 Transportation Committee meeting, more than 700 individual scoping comments were received. Each comment received was reviewed and considered. Comments related to the scope of the Draft SEIS/SEIR, including purpose and need, the evaluation process, costs and funding, and environmental impacts, will be addressed in the Draft SEIS/SEIR. Scoping comments regarding alternatives are addressed in the Final Comparative Evaluation of Alternatives Report. These include comments supporting or opposing one of the three LRT alignments carried forward into scoping; supporting evaluation of a Bus Rapid Transit (BRT) alternative in the Draft SEIS/SEIR; suggesting new or revised alternatives; and supporting additional LRT stations. As noted at the July 2 meeting, approximately 100 comments supported LRT Alternative 1, while slightly more than 100 comments opposed LRT Alternative 3. There were three comments received opposing LRT Alternative 6 and no comments received specifically supporting LRT Alternative 6. There were three comments supporting evaluation of a BRT alternative in the Draft SEIS/SEIR. Four BRT alternatives were evaluated in the Draft Comparative Evaluation of Alternatives Report. The BRT alternatives evaluated were less effective than the LRT alternatives in improving mobility and accessibility. In addition, the BRT alternatives were far less cost-effective and financially feasible than the LRT alternatives. At its April 23 meeting, the SANDAG Board of Directors did not approve moving any of the BRT alternatives forward into scoping. As the BRT alternatives were found to be less effective than the LRT alternatives, it is not recommended that a BRT alternative be evaluated in the Draft SEIS/SEIR. There were four comments suggesting new or revised alternatives received during the scoping period. Each of these alternatives was reviewed and considered. The evaluation concluded that none of the proposed new or revised alternatives would satisfy the purpose and need for the project at less cost, with greater effectiveness, or less environmental or community impacts. As a result, none of the new or revised alternatives are recommended for further evaluation in the Draft SEIS/SEIR. There were several comments suggesting that stations be added at State Route 52, Gilman Drive, Jutland Drive, and the VA Medical Center. Each of these station locations was reviewed and considered. The station locations at SR 52, Jutland Drive, and Gilman Drive were either previously considered and eliminated or are not functional due to topography and location. For these reasons, the addition of the three station sites is not recommended. The original LPA included a station at the VA Medical Center; however, the subsequently adopted LPA eliminated this station and added the University of California, San Diego (UCSD) West station. The VA Medical Center has not been previously evaluated as an additional station, and it is recommended that the VA Medical Center station location be evaluated as an additional station location in the Draft SEIS/SEIR.
2

3
Project Working Group and Independent Taxpayer Oversight Committee Review The Project Working Group (PWG) is scheduled to review the Final Comparative Evaluation of Alternatives Report and its recommendations at the working group’s July 14 meeting. Staff will provide the recommendation of the PWG to the Transportation Committee on July 16. The Independent Taxpayer Oversight Committee (ITOC) is scheduled to review the Final Comparative Evaluation of Alternatives Report at its July 14 meeting. Any significant comments received from the ITOC also will be provided to the Transportation Committee on July 16. Public Involvement Plan The draft Mid-Coast Corridor Transit Project Public Involvement Plan (PIP) was released for public review and comment on May 22, 2009. The Mid-Coast Corridor Transit Project Working Group reviewed and commented on the draft PIP at its September, October, and December 2009 meetings. The final PIP (Attachment 3) has been revised based on all comments received. All comments and responses are included in Appendix E of the final PIP. The PIP will continue to guide public involvement efforts through the development of the Draft SEIS/SEIR and other project activities. The PIP will be updated as needed. Next Steps The Final Comparative Evaluation of Alternatives Report is scheduled to be presented to the Board of Directors at its July 23 meeting. Should the Board adopt an LPA, the Preliminary Engineering Application would be prepared and submitted to the Federal Transit Administration (FTA) for approval in the fall of 2010. The Preliminary Engineering Application would address the FTA New Starts Criteria and allow the project to be rated by FTA. FTA approval of the Preliminary Engineering application by November 2010 would allow the Mid-Coast Corridor Transit Project to be included in the FTA February 2011 Annual Report on New Starts to Congress. Preliminary Engineering would proceed once FTA approval is gained. Should the Board approve Alternative 1 and the No-Build Alternatives for review in the Draft SEIS/SEIR on July 23, development of the Draft SEIS/SEIR would proceed. The Draft document would be anticipated to be completed in the summer of 2011.
JIM LINTHICUM Director of Mobility Management and Project Implementation
Attachments: 1. Map of Alternatives for Consideration During Scoping 2. Sections 8 and 9 from the Final Comparative Evaluation of Alternatives Report 3. Final Public Involvement Plan
Key Staff Contact: Leslie Blanda, (619) 699-6907, [email protected]

MissionBay
Miramar Rd
Miramar Rd
Sorrento Valley Rd
N Torrey Pines Rd
N Torrey Pines Rd
Genesee Ave
Nobel Dr
Torre
y Pine
s Rd
Governor Dr
Gilman Dr
La Jolla Pkwy
Soledad Mtn. Rd
FoothillBlvdBeryl St Balboa Ave
BalboaAveMorena Blvd
Clairemont Dr
Grand AveGarnet Ave
Via Capri
La Jolla Village Dr
Carmel Mountain RdEl CaminoReal
Sorrento Valley Blvd
Carroll Rd
Mira Mesa Blvd
Camino Ruiz
Clairemont Mesa BlvdClairemont Mesa Blvd
Jutland Dr
Regents Rd
Mt Ac
adia
Blvd
Linda Vista Rd
Aero Dr
Convoy St
Kearn
y Villa
Rd
Camino Santa Fe
Calle Cristobal
Genesee Ave
Genesee AveUlric St
Friars Rd
Washington StUniversity Ave
5thAve
ParkBlvd
Rosecra
nsSt
NimitzBlvd
Point Loma Blvd
Sunset
Cliffs Blvd
Sea World Dr
More
na B
lvd
Sports ArenaBlvd
Ingraham St
Mission Bay Dr
Mission Bay Dr
PacificHwy
Miss
ion C
enter
Rd
SORRENTO VALLEY
UNIVERSITYCITY
CLAIREMONT
LINDAVISTA
MISSIONVALLEY
Old TownTransit Center
Trolley – Green Line
Trolley – Blue Line
COASTER Line
Trolley Station
COASTER Station
Transit Center
April 2010
Mid-Coast Corridor Transit Project
Alternatives for Scoping
Existing Rail
10 Miles 2
LRT – Alternative 1(Combines 1, 4, and 5)
LRT – Alternative 3
LRT – Alternative 6
Trolley Station*UCSD East location differs by alignment
Transit CenterStations are for illustrative purposes;locations are not exact
LA JOLLA
PKWY
UniversityTowne Centre(Future Transit Center)
UCSD East*UCSDWest
NobelDrive
Executive Drive
Gilm
an D
r
Rege
nts R
d
Governor Dr
Nobel Dr
Voigt Dr
Genesee AveEastgate Mall
La Jolla Village Dr
Balboa
Clairemont
Tecolote
Attachment 1
4

Comparative Evaluation of Alternatives Chapter 8.0 - Public Outreach, Scoping Process, and Scoping Comments
M I D - C O A S T C O R R I D O R T R A N S I T P R O J E C T 8-1 July 2010
8.0 PUBLIC OUTREACH, SCOPING PROCESS, AND SCOPING COMMENTS This chapter describes public outreach and agency coordination undertaken by the San Diego Association of Governments (SANDAG) prior to and during the California Environmental Quality Act (CEQA) scoping process and summary and analysis of the comments received from the public and agencies during scoping. Through the scoping process, SANDAG invited all interested individuals and organizations, public agencies, and Native American Tribes to comment on the scope of the Draft Supplemental Environmental Impact Statement/Subsequent Environmental Impact Report (SEIS/SEIR), including the project's purpose and need, the alternatives to be studied, the impacts to be evaluated, and the evaluation methods to be used in preparation of the Draft SEIS/SEIR.
8.1 PUBLIC OUTREACH Public outreach activities were conducted before and during the scoping process for the Mid-Coast Corridor Transit Project to ensure public awareness of opportunities to review and comment on the project. The activities included the following:
• Project briefings and presentations for key stakeholders and other interested parties in the corridor, including elected/agency officials, community groups, employers/institutions, environmental organizations, transportation advocates, and business/trade organizations;
• Developing and implementing the Draft Mid-Coast Corridor Transit Project Public Involvement Plan (PIP) and developing a stakeholder database;
• Establishing the Mid-Coast Corridor Transit Project Working Group (PWG) to provide input on the project purpose and need, alternatives for consideration in the environmental review process, the Draft SEIS/SEIR, and the Draft PIP;
• Placing scoping meeting notices in newspapers of general circulation;
• Providing key documents and public information materials in both English and Spanish;
• Posting up-to-date project information on the www.sandag.org/midcoast and www.keepsandiegomoving.com SANDAG Web sites, and publicizing via e-mail and telephone communications; and,
• Recording comments that were received at, and subsequent to, the scoping meetings through mail and email correspondence during the scoping period.
8.1.1 City of San Diego Planning Groups Informational presentations providing a summary of the Draft Comparative Evaluation of Alternatives Report and findings for the Mid-Coast Corridor Transit Project were presented to community planning groups prior to and during the scoping period. The informational presentation included a review of alternatives considered, purpose and need, analysis and findings, a video of alternatives recommended for scoping, and information on the scoping period. This informational presentation was presented to University Community Planning Group on April 13, 2010. After hearing comments from the public at the meeting, the group
Attachment 2
5

Comparative Evaluation of Alternatives Chapter 8.0 - Public Outreach, Scoping Process, and Scoping Comments
M I D - C O A S T C O R R I D O R T R A N S I T P R O J E C T July 2010 8-2
unanimously passed a motion to strongly support Light Rail Transit (LRT) Alternative 1 and to eliminate LRT Alternatives 3 and 6.
This informational presentation for the Mid-Coast Corridor Transit Project was presented to the Linda Vista Planning Group on April 26, 2010. After receiving the report on the project, the Linda Vista Planning Group heard comments from the public at the meeting, but took no action on the project.
During the scoping period, the informational presentation for the Mid-Coast Corridor Transit Project was presented to the Clairemont Community Planning Group on May 18, 2010 as an information item.
8.2 SCOPING PROCESS SANDAG issued a Notice of Preparation (NOP) for a SEIR to 120 agencies and tribes on April 28, 2010. The NOP was posted with the State Clearinghouse and the San Diego County Office of the County Clerk. All business and residential addresses located within one-half mile of the alternative alignments under consideration were sent a postcard notification of the scoping meetings. The scoping meeting invitation postcard was mailed to a total of 24,959 addresses. The project team delivered scoping meeting invitation fliers to the offices of elected officials, cities, community planning groups, and other groups located within the corridor, to increase community awareness of the project and to promote participation at the scoping meetings. Meeting notices/advertisements were published in local newspapers to announce the scoping meetings.
Five scoping meetings were conducted in the Mid-Coast Corridor, in compliance with CEQA guidelines. In total, 215 people attended the scoping meetings.
The meetings were conducted in an open house style with several stations providing information about the project. The stations included: Check-In, Project and Process Overview, Draft Comparative Evaluation of Alternatives, Alternatives for Scoping, Public Involvement, and Comments. Project team members staffed the stations, making themselves available to answer questions about the project. A Spanish translator and materials in Spanish were also available (no attendees required translation).
In addition to the staffed stations, a video presentation ran on a loop throughout the entire open house period. The video included information and graphics about the location and characteristics of the Mid-Coast Corridor, an animated map showing the three alternatives for scoping, and a “flyover” of each alternative using GoogleEarth satellite images of the corridor.
Following are the scoping meeting dates and locations, including the number of attendees at each meeting:
Downtown San Diego Wednesday, May 5, 2010 SANDAG Board Room 401 B Street, 7th Floor San Diego, CA 92101 Number of attendees: 13
Clairemont Thursday, May 20, 2010 Clairemont High School Cafeteria 4150 Ute Drive San Diego, CA 92117 Number of attendees: 35
6
Comparative Evaluation of Alternatives Chapter 8.0 - Public Outreach, Scoping Process, and Scoping Comments
M I D - C O A S T C O R R I D O R T R A N S I T P R O J E C T 8-3 July 2010
University of California, San Diego (UCSD) Campus Tuesday, May 11, 2010 Price Center East Ballroom 9500 Gilman Drive La Jolla, CA 92093 Number of attendees: 101 University City Wednesday, May 12, 2010 Lawrence Family Jewish Community Center Garfield Theater 4126 Executive Drive La Jolla, CA 92037 Number of attendees: 43
Old Town Tuesday, May 25, 2010 Caltrans District 11 Gallegos Conference Room 4050 Taylor Street San Diego, CA 92110 Number of attendees: 23
8.3 Scoping Comments Comments on the Mid-Coast Corridor Transit Project were received during the scoping period through the following methods: verbal testimony or written comment cards at the scoping meetings; and via e-mail, postal mail, and telephone correspondence. The comments covered a variety of topics and were submitted by various parties, including: agencies, community organizations, elected officials, and members of the general public.
The 30-day scoping period began on May 3, 2010 and closed on June 1, 2010. Scoping comments were accepted for one week after the close of the scoping period to account for any comments that were in the mail. In all, 244 comment submissions were received. Comment submissions included any letters, e-mails, phone calls, comment forms, or verbal comments given by an individual or an organization. In most cases, each submission included multiple comments.
The Mid-Coast Corridor Transit Project Scoping Report (SANDAG 2010) includes all agency and public comments received during scoping. Comments were related to purpose and need, alternatives considered, the evaluation of the alternatives, costs and funding, and issues to be studied in the Draft SEIS/SEIR. Comments were categorized into six major categories and 21 sub-categories (or topics). A brief analysis of the comments by category, and their respective topics, is provided below.
8.3.1 General Comments General comments identified an overall need for improved transit service, not limited to the Mid-Coast Corridor. Suggestions included expanding transit operating hours and developing a transit policy/system that would eliminate the need for individual automobiles in the San Diego area. Other comments suggested a need for transit system improvements/features, including bathrooms and increased public art.
Several general comments pertained to the Mid-Coast Corridor. Some comments advocated for enhanced transit services to areas within the Mid-Coast Corridor not served by the proposed alternatives, including: La Jolla, Miramar, Pacific Beach, Ocean Beach, Sorrento Mesa, Sorrento Valley, Torrey Pines, the San Diego International
7

Comparative Evaluation of Alternatives Chapter 8.0 - Public Outreach, Scoping Process, and Scoping Comments
M I D - C O A S T C O R R I D O R T R A N S I T P R O J E C T July 2010 8-4
Airport, Interstate 805 (I-805), I-8, and State Route 163 (SR 163). Other comments suggested serving entirely different corridors, such as I-15 or I-5 north of I-805. One comment suggested a connection between the Poway area and UCSD.
There were also several suggestions for other projects in the Mid-Coast Corridor, including: COASTER enhancements, such as double track, a tunnel, and additional stations; roadway improvements, such as a Regents Road bridge; and, pedestrian and bicycle projects at various locations. One suggestion was to add pricing to existing freeways rather than provide additional transit capacity. Another comment suggested following a systemwide approach to San Diego County’s transportation problems rather than developing an individual project.
8.3.2 Comments Related to Purpose and Need Five comments specifically were related to the project purpose and need. The comments focused on the need for connecting transit service to the project, on clarifying the nature of transit-supportive land uses identified in the purpose and need, expanding the definition of need to include additional travel markets, and clarifying what would constitute a competitive trip time. One comment questioned the need for the project and suggested the resources be directed to upgrade existing light rail transit (LRT) lines, including new elevators and the addition of restrooms.
8.3.3 Comments Related to Alternatives Comments related to the alternatives were analyzed by each of the individual topics listed below. Of the 244 comment submissions received, 177 (over 70 percent) included comments related to the technology of the alternatives. In addition to the topics listed below, there were questions about the type and location of supporting facilities and other project features, such as station parking, and the interface of the project with shuttles and other transit services. One comment noted that any alternative must meet the Americans with Disabilities Act (ADA) requirements. Other comments questioned using LRT in favor of heavy rail transit (powered by an electrified third-rail) or diesel single-unit vehicles.
8.3.3.1 Bus Rapid Transit Three comment submissions by one organization requested the inclusion of a bus rapid transit (BRT) alternative in the SEIS/SEIR.
8.3.3.2 Light Rail Transit Alignments/Routes Most of the comments received for alignments/routes were supportive of LRT Alternative 1. A total of 97 comment submissions specifically supported LRT Alternative 1, while 12 comment submissions were supportive of any LRT alternative, three comment submissions supported LRT Alternative 1 or 6, and two comment submissions supported LRT Alternative 3. One-hundred and seven comment submissions were opposed to LRT Alternative 3, three were opposed to LRT Alternative 6, and two were opposed to LRT Alternative 1.
Concerns with LRT Alternative 1 were related to looping back to the south, complicating a potential future extension north. The comments that objected to LRT Alternative 3 cited the proximity to Rose Canyon Open Space Park, potential environmental effects of
8

Comparative Evaluation of Alternatives Chapter 8.0 - Public Outreach, Scoping Process, and Scoping Comments
M I D - C O A S T C O R R I D O R T R A N S I T P R O J E C T 8-5 July 2010
the project on Rose Canyon Open Space Park and adjacent areas, and concerns with tunnel construction. The limited support for LRT Alternative 3 identified advantages associated with a potential future extension north. Other comments opposed LRT Alternative 6 because of its design or potential environmental and transportation impacts on the Lawrence Family Jewish Community Center.
Several alternative alignments or project configurations were suggested, including:
• A design option to LRT Alternative 1 that would replace the UCSD West Station with a Veterans Administration (VA) Medical Center Station, crossing I-5 south of Voigt Drive.
• An alignment following LRT Alternative 1, but terminating in the vicinity of the Gilman Drive/Voigt Drive intersection, along with the construction of a separate dedicated right-of way loop for rubber-tired transit that would connect UCSD, University Towne Centre (UTC), and the COASTER Sorrento Valley Station.
• An alignment following LRT Alternative 1, but extending north from the UCSD West Station through the UCSD Park north of Voigt Drive to Genesee Avenue.
• An alignment serving Pacific Beach by crossing Mission Bay on Ingram Street, rather than using the existing Metropolitan Transit System (MTS)/San Diego Northern Railway (SDNR) right-of-way.
8.3.3.3 Light Rail Transit Stations Thirty-four of the comment submissions discussed stations. Many supported proposed station locations. Others suggested either eliminating or adding stations. The Executive Drive, UCSD West, and Clairemont Drive Stations were suggested for elimination. Additional stations were suggested for State Route 52 (SR 52), Gilman Drive, Jutland Drive, and the VA Medical Center. Seven comment submissions supported a station at the VA Medical Center and the SR 52, Gilman Drive, and Jutland Drive locations were each identified as potential station locations in two submissions.
Other comments related to stations included providing good non-motorized transportation access, good bus connections, park-and-ride facilities, secure bike parking, and a design that supports redevelopment in station vicinities. One comment suggested a major roadway grade-separated connection from Grand Avenue to Morena Boulevard near the Balboa Avenue Station. Increased crime and public safety near stations also was identified as a concern.
8.3.4 Comments Related to Evaluation Five comments related to the evaluation of the alternatives. The comments requested additional details on how the preliminary analysis was completed and the process used by the Federal Transit Administration (FTA) to evaluate New Starts projects. There were requests to change the presentation of findings, including using highly detailed maps for planning-level analysis. One comment requested that the SEIS/SEIR evaluate the competitiveness of transit travel times to drive times, another indicated concern that standard FTA user benefit calculations over-estimate the effect of transfers. One comment noted the need for complete documentation of travel forecasting methods and assumptions.
9

Comparative Evaluation of Alternatives Chapter 8.0 - Public Outreach, Scoping Process, and Scoping Comments
M I D - C O A S T C O R R I D O R T R A N S I T P R O J E C T July 2010 8-6
8.3.5 Costs and Funding Twenty-four submissions included comments related to costs and funding. Several comments observed cost differences between the alternatives evaluated. Multiple comments suggested reduced-rate or free fares. Highway and other funds were suggested to be redirected to transit. Other comments requested that no University of California funds be used to support the project and that the dedicated TransNet funds be redirected to other transit improvements. Other comments were concerned with the long-term project costs, considering the current economic recession. One recommendation was to accelerate the project to seek Federal funds earlier.
8.3.6 Comments Related to the Environmental Impacts Analyses Sixty-eight comment submissions included comments related to the topics listed below.
8.3.6.1 Traffic and Parking Twenty-two comments were related to traffic and parking effects during construction and operation. Comments noted the need for park-and-ride facilities to serve local demand and to intercept southbound I-5 traffic. Some comments stated that students and workers already park in residential neighborhoods and take transit to their destinations; and they were concerned that the project would increase this occurrence. Several comments related to how the system will integrate with and affect the existing bus system.
Traffic concerns included increased general traffic and congestion, loss of travel lanes, the need for transit signal priority for transit, conflicts between transit and roadway traffic in the UCSD area, and increased traffic around stations. One comment noted that local street infrastructure needs should be determined prior to selection of alternatives. Also, the need for an interface with Caltrans and project coordination with other transportation projects was noted. Comments noted that mitigation needs to be considered to facilities where the project would result in an impact.
8.3.6.2 Non-motorized Transportation Numerous comments were related to providing good pedestrian and bicycle access to the stations. Other comments requested recreational trail improvements near the project.
8.3.6.3 Land Use Land use comments included concerns with density, if it would be sufficient to support the system, and recommendations to consider transit-oriented development (TOD) potential. One comment noted an “urban farm” at UCSD for consideration during evaluation. One comment stated that general plan and municipal code requirements should be reviewed and any planned smart-growth centers should be identified.
8.3.6.4 Neighborhoods Neighborhood concerns included parking pressure from residents outside of the neighborhoods using the system, and an increase in neighborhood crime.
10
Comparative Evaluation of Alternatives Chapter 8.0 - Public Outreach, Scoping Process, and Scoping Comments
M I D - C O A S T C O R R I D O R T R A N S I T P R O J E C T 8-7 July 2010
8.3.6.5 Safety and Security One comment requested analyzing any correlation between transit and crime and noted the San Diego Police Department’s large coverage area. Safety concerns about at-grade pedestrian track crossings, especially by students in the UCSD and University City areas also were noted.
8.3.6.6 Economic Development Comments on economic development were related to redevelopment of areas around stations. One comment noted that the long-term economic benefits of transit should be presented.
8.3.6.7 Right-of-Way Acquisitions and Relocations Opposition was voiced to the acquisition of parkland for the project.
8.3.6.8 Environmental Justice Comments included the need to consider transit access for and impacts to low-income and minority populations. One comment noted that the SEIS/SEIR should identify whether the proposed alternatives may disproportionately and/or adversely affect low-income or minority populations and document the process for community involvement.
8.3.6.9 Visual Comments included a request for renderings showing how the project will look in the UCSD area and lighting effects on surrounding uses, including wildlife. One comment related to visual effects of vehicles, guideway infrastructure, and stations and mitigation of effects on views from commercial and residential properties.
8.3.6.10 Air Quality One comment noted that the project would help reduce greenhouse gas emissions. The project is located in an ozone nonattainment and a carbon monoxide maintenance area. One comment noted that mobile source air toxins should be addressed.
8.3.6.11 Geology One comment was received on the need to study fault crossings near proposed major structures. An assessment of the potential for earthquakes and the extent of damage to structures also was requested. Another comment was received on what other hazards would be studied and what mitigation would be required.
8.3.6.12 Noise and Vibration Several comments were related to the noise and vibration analyses. An explanation of acoustics science was requested. Other requests included measuring existing levels, and evaluating construction and future project noise generation to interior and exterior areas, including wheel squeal, track maintenance effects, and cumulative effects for at-grade and elevated guideway sections and for supporting facilities. The Balboa/Morena, La Jolla Colony, La Jolla Village Square, and University City areas were areas of concern and noise effects on wildlife in open-space areas was also a concern. Other comments were related to bus and road noise from other projects.
11

Comparative Evaluation of Alternatives Chapter 8.0 - Public Outreach, Scoping Process, and Scoping Comments
M I D - C O A S T C O R R I D O R T R A N S I T P R O J E C T July 2010 8-8
8.3.6.13 Solid Waste and Hazardous Materials An analysis of solid waste impacts was requested. One comment asked that the project consider green infrastructure and material reuse and recycling. One comment requested evaluating toxins and human health impacts.
8.3.6.14 Ecosystems Comments noted a need to evaluate the project as a barrier to wildlife, especially if fencing is introduced. The evaluation of habitat loss, lighting, and noise effects on wildlife was requested. One comment noted a concern that invasive species could be introduced by Trolley operations. Potential mitigation sites were noted in the Rose Creek Watershed Opportunities Assessment, if the project would result in impacts that would require mitigation. The analysis of potential temporary and long-term impacts to Least Bell’s Vireo was requested.
8.3.6.15 Water Resources Comments identified concerns with flood control, hydrology, runoff from on-site contamination, water supply, and hydraulic modeling. A stormwater impacts analysis was requested. Comments stated that functional conditions of waters and riparian areas should be evaluated. One comment noted that Section 404 of the Clean Water Act will be applicable to the project and that measures to avoid, minimize, and mitigate impacts to waters should be incorporated into the project.
8.3.6.16 Parks A total of 109 comment submissions, more than for any other environmental topic, were related to parks and parklands. The comments focused on protecting and analyzing potential effects on Mandell-Weiss Eastgate City Park, Marian Bear Memorial Park, and Rose Canyon Open Space Park. Comments noted a need to address project compatibility with relevant park plans, including the Marian Bear Memorial Park Natural Resources Management Plan, the San Diego River Master Plan, and the Rose Creek Watershed Opportunities Assessment. Several comments were related to existing uses of, and resources within, the parks, including the current frequent practice of accessing the parks by illegal trespass and crossing of the existing MTS/SDNR right-of-way. Opposition to the use of the parkland was noted. The potential to affect the Mission Valley Preserve was also noted.
8.3.6.17 Historic/Cultural Resources The Native American Heritage Commission identified Native American cultural resources within the Area of Potential Effect (APE) for the project and commented that cultural landscapes should be considered along with other resources evaluated. Avoiding significant cultural resources, when discovered during project planning and implementation, also was suggested.
8.3.6.18 Construction Impacts Several comments noted that construction effects related to traffic, noise, access, water quality, and jobs should be evaluated.
8.3.6.19 Indirect and Cumulative Effects Comments identified a need to consider the cumulative effects of various planned projects, including the planned I-5 improvements, on the environmental topics discussed
12

Comparative Evaluation of Alternatives Chapter 8.0 - Public Outreach, Scoping Process, and Scoping Comments
M I D - C O A S T C O R R I D O R T R A N S I T P R O J E C T 8-9 July 2010
above. One comment suggested that previous comments on the “UC North/South Transportation Corridor Project EIR” should be reviewed.
8.4 Analysis of Scoping Comments All comments received during scoping were reviewed and considered. The comments related to the scope of the Draft SEIS/SEIR, including purpose and need, evaluation process, costs and funding, and environmental impacts will be addressed in the Draft SEIS/SEIR. The comments related to alternatives under consideration are addressed in this Final Comparative Evaluation of Alternatives Report. The comments included a request to evaluate a BRT alternative in the Draft SEIS/SEIR and comments on LRT alignments and station locations. Following are the responses to the comments related to alternatives.
8.4.1 Bus Rapid Transit Comments were received on the need to include a BRT alternative in the Draft SEIS/SEIR. BRT was evaluated in the Draft Comparative Evaluation of Alternatives Report and the SANDAG Board eliminated it as an alternative for scoping at their April 23, 2010 meeting. The SANDAG Board decision was based on the SANDAG staff recommendation and findings that the BRT alternatives evaluated were less effective than the LRT alternatives in improving mobility and accessibility and are also less cost effective and financially feasible than the LRT alternatives. BRT also was evaluated in the Mid-Coast Light Rail Transit Extension Locally Preferred Alternative Update Summary (SANDAG 2004b), which concluded that LRT was more appropriate for the Mid-Coast Corridor. The Draft Comparative Evaluation of Alternatives Report findings support the prior decision and do not indicate that changed conditions would alter the prior decision. Thus, BRT has been eliminated from further consideration in the Draft SEIS/SEIR.
8.4.2 Light Rail Transit Alignments Several comments included new LRT alignment options for consideration. The alternatives, including recommendations to carry them forward or eliminate them from further consideration, are discussed below.
• Proposed design option to LRT Alternative 1, with an I-5 crossing at Gilman Drive and a station at the VA Medical Center – This proposed design option to LRT Alternative 1, with a station near the UCSD West Campus just east of the VA Medical Center, is the alignment adopted as the Locally Preferred Alternative (LPA) in 1995. Alternative alignments to the LPA and alternative station locations at the VA Medical Center and in Pepper Canyon on the UCSD West Campus were previously evaluated in the Mid-Coast Corridor UCSD Alignment Evaluation (MTDB 2000). The Metropolitan Transit Development Board concluded that the alignments with a station in Pepper Canyon on the UCSD West Campus should be advanced for further consideration and the alignments with a station at the VA Medical Center should be eliminated. In 2004, the SANDAG Board adopted an LPA that refined the 1995 LPA with an alignment along Voigt Drive and a station in Pepper Canyon. This station location is consistent with the UCSD Long Range Development Plan (UCSD 2004a) and is included in the University Center/Six College Neighborhood Planning Study
13

Comparative Evaluation of Alternatives Chapter 8.0 - Public Outreach, Scoping Process, and Scoping Comments
M I D - C O A S T C O R R I D O R T R A N S I T P R O J E C T July 2010 8-10
(UCSD 2004b) adopted by UCSD in 2004. LRT Alternative 1 includes the following design measures to minimize impacts to UCSD: a below-grade alignment at Gilman Drive, an at-grade or grade separated alignment in the vicinity of the Gilman Drive/Voigt Drive intersection, and an above-grade alignment or below-grade alignment to avoid possible impacts to existing and planned sports facilities east of I-5. As a result of these considerations, the proposed alignment option is recommended for elimination as an alternative for further consideration. The addition of a station at the VA Medical Center is addressed separately under the Light Rail Transit Stations section.
• Proposed alternative to terminate the LRT line in the vicinity of the Gilman Drive/Voigt Drive intersection and construct a separate dedicated right-of way circulator loop for rubber-tired transit that would connect UCSD, UTC, and the COASTER Sorrento Valley Station – This proposed alternative (referenced by the commenter as the Blue and Gold Alternatives) would provide LRT service to a terminus station on the UCSD West Campus. It would then use a rubber-tired transit circulator system to provide connecting service via an exclusive guideway instead of mixed-traffic operations to UTC and the COASTER Sorrento Valley Station. The proposed alternative does not meet the project purpose and need because it does not provide direct service to the UCSD East Campus or UTC. The alternative requires a transfer from the LRT system to the transit circulator system. The existing SuperLoop service, which is planned for upgrade and expansion, includes transit priority at intersections and provides some of the benefits of the proposed alternative for the area south of Voigt Drive. While the proposed exclusive right-of-way loop for local transit service would provide connectivity benefits in the UCSD and UTC communities, it would require using open space and constructing elevated structures through the UCSD campus, which would be larger and more extensive than those proposed as part of some of the LRT alternatives. Furthermore, the exclusive right-of-way loop would be considered a separate project outside the Mid-Coast Corridor Project purpose and need. As a result, the proposed alternative is recommended for elimination from further consideration.
• Proposed alternative to follow LRT Alternative 1, but extend north from the UCSD West Station through UCSD Park to Genesee Avenue – This alternative proposed a station and parking facility on Genesee Avenue west of I-5 to accommodate vehicles on southbound I-5. The alternative also proposed alignment variations branching off the main alignment for service to the Sorrento Valley COASTER Station. The LPA the SANDAG Board adopted in 2003 provides for improving transit service to University City. The analysis of changed conditions did not identify a need to extend the project limits to the north of University City because a future extension to the north of University City is included as a separate project in the Reasonably Expected Revenue Scenario of the 2030 San Diego Regional Transportation Plan: Pathways for the Future (RTP) (SANDAG 2007). Furthermore, the project travel market analysis did not identify the area north of University City as a major travel market for the project. Extending the project north from the UCSD West Station to Genesee Avenue would require use of land from the UCSD Park. UCSD Park is identified in the UCSD Long Range Development Plan (UCSD 2004a) and is comprised of ecological reserve, grove reserve, and restoration land areas. The canyons north of Voigt Drive lie within an ecological reserve area. The UCSD
14

Comparative Evaluation of Alternatives Chapter 8.0 - Public Outreach, Scoping Process, and Scoping Comments
M I D - C O A S T C O R R I D O R T R A N S I T P R O J E C T 8-11 July 2010
Long Range Development Plan identifies the ecological reserve resources within the park as being biologically sensitive, further stating that no buildings, roads, or driveways are permitted in such areas of the park. As such, the alternative would require using a resource protected by Section 4(f) of the U.S. Department of Transportation (USDOT) Act of 1966, Title 49 U.S. Code (now 23 CFR 774). Such use is only permitted if there is no feasible and prudent alternative to the use. Secondly, the proposed alternative would add almost a mile of alignment, including substantial tunnel sections and elevated structure. As a result, the proposed alternative is recommended for elimination from further consideration.
• Proposed alternative to serve Pacific Beach by crossing Mission Bay on Ingram Street rather than using the existing MTS/SDNR right-of-way – This alternative proposes an alternative alignment to using the existing MTS/SDNR right-of-way and service to Pacific Beach instead of Clairemont. Because there is no existing available right-of-way, the proposed LRT alignment would have to be constructed across Mission Bay on an elevated structure for approximately 3 miles. Compared to using the MTS/SDNR right-of-way under the LRT Alternatives 1, 3, and 6, this alternative would result in additional impacts to Mission Bay Park, the San Diego River, and the surrounding residential neighborhoods. The alternative would also increase the project cost. As a result, the proposed alternative is recommended for elimination from further consideration.
8.4.3 Light Rail Transit Stations In addition to comments recommending LRT alignments for consideration, stations at SR 52, Gilman Drive, Jutland Drive, and the VA Medical Center were identified for consideration.
Adding a station at SR 52 was proposed; however, there would be no walk access to the station because all development within one-half mile of the station would have restricted access because of the area topography. Open space near SR 52 is parkland and any non de minimis use is precluded by Section 4(f), unless there is no feasible and prudent alternative. Therefore, it would not be possible to construct a park-and-ride in the area to serve auto commuters. Because of grade differences, it would be difficult to serve a station with buses at this location. Bus service would require widening the freeway ramp structures to provide bus stops that would be connected by elevators and stairs to a station below the ramps. Because the stops would be on freeway ramps, it would not be possible to turn-around bus service at the station. For these reasons, the proposed station location is not recommended for further consideration.
Stations at Jutland Drive and Gilman Drive were previously considered in the Mid-Coast Corridor Alternatives Analysis/Draft Environmental Impact Statement/Draft Environmental Impact Report (MTDB 1995). The SANDAG Board’s adoption of the LPA in 2003 resulted in these stations being eliminated. Pages 20 to 22 of the Mid-Coast Light Rail Transit Extension Locally Preferred Alternative Update Summary identified the changed station locations between the 1995 and 2003 LPA decisions. Because there has been no change in land use or development that would change the conditions under which they were eliminated, the stations at Jutland Drive and Gilman Drive are not recommended for further consideration.
15

Comparative Evaluation of Alternatives Chapter 8.0 - Public Outreach, Scoping Process, and Scoping Comments
M I D - C O A S T C O R R I D O R T R A N S I T P R O J E C T July 2010 8-12
As identified above in the alternative alignments discussion, an alternative station location at VA Medical Center was identified for consideration. Although alternative alignments to the current LPA and an alternative station location at the VA Medical Center were previously evaluated in the Mid-Coast Corridor UCSD Alignment Evaluation (MTDB 2000) and eliminated in favor of a station location in Pepper Canyon on the UCSD West Campus, the VA Medical Center Station was not evaluated as an additional station with the UCSD West Station. Therefore, it is recommended that a station location at the VA Medical Center be considered during preparation of the Draft SEIS/SEIR.
16

Comparative Evaluation of Alternatives Chapter 9.0 - Recommended Locally Preferred Alternative and
Alternatives for Evaluation in Draft SEIS/SEIR
M I D - C O A S T C O R R I D O R T R A N S I T P R O J E C T 9-1 July 2010
9.0 RECOMMENDED LOCALLY PREFERRED ALTERNATIVE AND ALTERNATIVES FOR EVALUATION IN DRAFT SEIS/SEIR This chapter summarizes the comparative evaluation of alternatives and scoping process results and presents the recommended Locally Preferred Alternative (LPA) and alternatives to be evaluated in the Mid-Coast Corridor Transit Project Draft Supplemental Environmental Impact Statement/Environmental Impact Report (SEIS/SEIR).
9.1 Summary of Results The comparative evaluation of alternatives conducted for the Mid-Coast Corridor Transit Project considered a Transportation Systems Management (TSM) Alternative, seven light rail transit (LRT) alternatives, four bus rapid transit (BRT) alternatives, and a Commuter Rail Alternative. Based on the evaluation results described in Chapter 6.0 of this Final Comparative Evaluation of Alternatives Report, three alternatives were recommended to the San Diego Association of Governments (SANDAG) Board of Directors (Board) for presentation at California Environmental Quality Act (CEQA) scoping: LRT Alternatives 1 (combined LRT Alternatives 1, 4, and 5), 3, and 6. The three LRT alternatives effectively meet project goals, improve regional mobility, are cost effective or near cost effective, and are anticipated to be competitive for Federal Transit Administration (FTA) New Starts funding.
The remaining LRT alternatives (LRT Alternatives 2 and 7) were recommended for elimination from scoping. While similar, LRT Alternative 2 was found to be higher in capital costs, lower in user benefits, and lower in cost effectiveness than LRT Alternative 1. LRT Alternative 7 was found not to be as effective as the other LRT alternatives, as evidenced by ridership, user benefits, and travel time savings, and would not provide direct service to the University of California, San Diego (UCSD) West Campus, which is an important project goal.
It also was recommended that the TSM Alternative, all four of the BRT alternatives, and the Commuter Rail Alternative be eliminated from further consideration as build alternatives. Compared to the LRT alternatives, these alternatives were not as effective in meeting the project goals or in improving regional mobility and accessibility. Also, they were not cost effective and were unlikely to be competitive for FTA New Starts funds.
On April 23, 2010, the SANDAG Board approved LRT Alternatives 1 (combining LRT Alternatives 1, 4, and 5), 3, and 6 to be carried forward for consideration at scoping for the Draft SEIS/SEIR. The scoping period extended from May 3 through June 1, 2010.
As identified in Chapter 8.0 of this report, public comments during the scoping period were overwhelmingly in favor of LRT Alternative 1 (combined LRT Alternatives 1, 4, and 5) and opposed to LRT Alternative 3, with an alignment along the Metropolitan Transit System (MTS)/San Diego Northern Railway (SDNR) railroad right-of-way through Rose Canyon. Less than five comments supported LRT Alternatives 3 and 6, the BRT alternatives, or some other alternative not previously evaluated. The consideration of alternatives not previously considered included a qualitative review, which concluded that
17

Comparative Evaluation of Alternatives Chapter 9.0 - Recommended Locally Preferred Alternative and Alternatives for Evaluation in Draft SEIS/SEIR
M I D - C O A S T C O R R I D O R T R A N S I T P R O J E C T July 2010 9-2
none of the new alternatives proposed during scoping would satisfy the project purpose and need at less cost, with greater effectiveness, or less environmental or community impacts. The only refinement to the alternatives suggested during scoping, and recommended to carry forward for further study during preparation of the Draft SEIS/SEIR, is the consideration of an additional LRT station at the Veterans Administration (VA) Medical Center.
The findings of the Draft Comparative Evaluation of Alternatives Report and information provided by the public or agencies during CEQA scoping support reconfirmation of the previously selected LPA, as revised.
9.2 Recommended LPA and Alternatives for Evaluation in the Draft SEIS/SEIR Based on the results of the comparative evaluation of alternatives and consideration of comments received during scoping, it is recommended that the previously adopted LPA, as refined to include direct service to UCSD and University Towne Centre (UTC), be reconfirmed by selecting LRT Alternative 1 as the LPA for the Mid-Coast Corridor Transit Project. It also is recommended that LRT Alternative 1 and the No-Build Alternative be carried forward for evaluation in the Draft SEIS/SEIR. LRT Alternative 1 received strong public support during the scoping process and the MTS Board voted unanimously to support the alternative. LRT Alternative 1 includes three alignment options in the vicinity of Voigt Drive, which will allow for the selection of a specific alignment to avoid potential environmental impacts that may be discovered during the environmental review process.
Elimination of LRT Alternatives 3 and 6 from further consideration is recommended based on the additional information and comments received during the scoping period. Elimination of LRT Alternative 3 is recommended because of public opposition and comments about potential environmental impacts to Rose Canyon. Although this alternative would maximize using the MTS/SDNR right-of-way and provide more direct service to UTC, LRT Alternative 3 had the highest potential for significant biological impacts. Further, LRT Alternative 3 was analyzed in the previously adopted Mid-Coast Corridor Alternatives Analysis/Draft Environmental Impact Statement/Draft Environmental Impact Report (AA/DEIS/DEIR) (MTDB 1995a) and it was eliminated after completion of the environmental review process due to concern regarding many of the same potential impacts identified during the recent scoping process. In addition, the California Department of Fish and Game raised concerns during scoping regarding the potential for LRT Alternative 3 to adversely impact California gnatcatcher habitat located within the canyon near Thornton Hospital on the UCSD East Campus. Based on these reasons, elimination of LRT Alternative 3 is recommended.
Elimination of LRT Alternative 6 is recommended because its performance is not significantly distinguishable from LRT Alternative 1 and its impacts are potentially greater. MTS raised concerns regarding the tight curves through an alignment section that could result in noise and additional maintenance. The California Department of Fish and Game raised concerns regarding potential adverse impacts on California gnatcatcher habitat located within the canyon near Thornton Hospital. In addition to these concerns, LRT Alternative 6 would result in elimination of a through-traffic lane on Executive Drive and potential impacts to access to private property. The Lawrence Family Jewish Community Center, which has its main entrance on Executive Drive, raised this concern. The primary benefit of LRT Alternative 6 is the avoidance of impacts to Voigt Drive. However, an
18

Comparative Evaluation of Alternatives Chapter 9.0 - Recommended Locally Preferred Alternative and
Alternatives for Evaluation in Draft SEIS/SEIR
M I D - C O A S T C O R R I D O R T R A N S I T P R O J E C T 9-3 July 2010
alternative that avoids affecting Voigt Drive is incorporated into LRT Alternative 1 and its variations (LRT Alternatives 1, 4, and 5). Based on the concerns raised during scoping, the similarities in environmental consequences and performance of LRT Alternatives 1 and 6, and the strong support for LRT Alternative 1, elimination of LRT Alternative 6 from further consideration is recommended.
The No-Build Alternative is required to be included in the SEIS/SEIR in compliance with National Environmental Policy Act (NEPA) and CEQA requirements. The No-Build Alternative will serve as a baseline in assessing the environmental impacts of the build alternatives evaluated in the SEIS/SEIR.
9.3 Description of Alternatives for Evaluation in the Draft SEIS/SEIR The No-Build Alternative and recommended LPA are described in this section. This alternatives description is subject to refinements during preliminary engineering and Draft SEIS/SEIR evaluation.
9.3.1 No-Build Alternative The No-Build Alternative includes all of the highway and transit facilities identified in the Revenue Constrained Scenario of the 2030 San Diego Regional Transportation Plan: Pathways for the Future (RTP) (SANDAG 2007). Figure 9-1 shows the following major projects included in the RTP Revenue Constrained Scenario that are located within the Mid-Coast Corridor and are part of the No-Build Alternative background transportation network. The major RTP improvements that are included in the No-Build Alternative are:
• Double tracking of SDNR railroad and other rail improvements with an increase in frequency of service of the COASTER to 20 minutes during peak and 60 minutes during off-peak periods.
• High-occupancy vehicle (HOV) lanes on Interstate 5 (I-5) from I-8 north to Oceanside, with direct access ramps (DARs) at various locations, of which the DAR at Voigt Drive would be located within the Mid-Coast Corridor. The HOV lanes would be restricted to vehicles with two or more occupants.
• Combination of HOV and Managed Lanes on I-805 from I-5 to South Bay, with DARs at Carroll Canyon Road and Nobel Drive.
The Mid-Coast Corridor No-Build Alternative transit system is shown in Figure 9-2. The regional transit system consists of MTS and North County Transit District bus, light rail, and commuter rail services that are projected to be operating in 2030. UCSD operated shuttle services also are included in the No-Build Alternative transit system.
The Mid-Coast Corridor LRT project included in the RTP Revenue Constrained Scenario is excluded from the No-Build Alternative in order to represent conditions in the corridor without the LRT project. Excluding the Mid-Coast Corridor LRT project from the No-Build Alternative would require more direct transit service between Downtown San Diego, Old Town Transit Center (OTTC), and University City.
19

Comparative Evaluation of Alternatives Chapter 9.0 - Recommended Locally Preferred Alternative and Alternatives for Evaluation in Draft SEIS/SEIR
M I D - C O A S T C O R R I D O R T R A N S I T P R O J E C T July 2010 9-4
Figure 9-1. No-Build Alternative Transportation Improvements
20

Comparative Evaluation of Alternatives Chapter 9.0 - Recommended Locally Preferred Alternative and
Alternatives for Evaluation in Draft SEIS/SEIR
M I D - C O A S T C O R R I D O R T R A N S I T P R O J E C T 9-5 July 2010
Figure 9-2. No-Build Alternative Transit System
21

Comparative Evaluation of Alternatives Chapter 9.0 - Recommended Locally Preferred Alternative and Alternatives for Evaluation in Draft SEIS/SEIR
M I D - C O A S T C O R R I D O R T R A N S I T P R O J E C T July 2010 9-6
To replace the loss of service under the No-Build Alternative, the existing transit Route 150, operating between Downtown San Diego, OTTC, and University City, is included in the alternative. The existing Route 150 was eliminated in the RTP Revenue Constrained Scenario with the inclusion of the Mid-Coast Corridor LRT line. Under the No-Build Alternative, the route would be modified to operate within the proposed HOV lanes on I-5 from OTTC north to Nobel Drive. This HOV lane operation modification would improve travel times over the existing Route 150 operation in the I-5 general-purpose lanes north to Gilman Drive. The modification of the route to exit the HOV lanes at Nobel Drive instead of at Gilman Drive would increase the route’s utilization of the HOV lanes and improve travel times over the Gilman Drive routing. The new Route 150 would operate at 15-minute intervals during peak periods (i.e., 6:00 to 9:00 a.m. and 3:00 to 6:00 p.m.) and 30-minute intervals during the off-peak and the midday period (i.e., 9:00 a.m. to 3:00 p.m.). Articulated buses would be used in the operation of the service. The route assumes a fixed fare of $2.50 per one-way trip.
The No-Build Alternative also includes improvements to the Trolley system. As shown in Figure 9-3, the Trolley Green Line would be extended from OTTC to the 12th and Imperial Transit Center via the Convention Center. Other changes to the Trolley system include terminating the Trolley Blue Line at Santa Fe Depot and the Trolley Orange Line at America Plaza. All Trolley lines would be operated at 7.5-minute frequencies all day except the Trolley Orange Line, which would operate at 7.5 minutes during peak and 15 minutes during off-peak periods.
9.3.2 Recommended LPA The recommended LPA is a refinement of the LPA options the SANDAG Board adopted in 2003. The recommended LPA (Figure 9-4) would extend the Trolley system from OTTC north via the existing MTS/SDNR right-of-way and I-5 corridor to the UCSD West Campus, and then east along one of the following three alignment options to a terminus at the UTC Transit Center:
• An at-grade alignment on Voigt Drive and an aerial alignment on Genesee Avenue;
• An aerial alignment along the south side of Voigt Drive and on Genesee Avenue; or,
• An at- and below-grade alignment south of Voigt Drive and an aerial alignment on Genesee Avenue.
The recommended LPA would add eight new LRT stations located at Tecolote Road, Clairemont Drive, Balboa Avenue, Nobel Drive, UCSD West, UCSD East, Executive Drive, and the UTC Transit Center. An additional station location at the VA Medical Center also will be considered during the Draft SEIS/SEIR.
9.3.2.1 Alignment and Station Locations The recommended LPA proposes the use of the existing LRT tracks from Santa Fe Depot north to a point just south of San Diego River where the alignment would cross the San Diego River on a new LRT bridge located parallel to and east of the existing railroad bridge and west of the existing Trolley Green Line LRT bridge. After crossing the river, the LRT alignment would continue north next to the existing SDNR tracks to the proposed at-grade station at Tecolote Road (under the existing Tecolote Road overcrossing). The
22

Comparative Evaluation of Alternatives Chapter 9.0 - Recommended Locally Preferred Alternative and
Alternatives for Evaluation in Draft SEIS/SEIR
M I D - C O A S T C O R R I D O R T R A N S I T P R O J E C T 9-7 July 2010
Figure 9-3. No-Build Alternative Trolley System
23
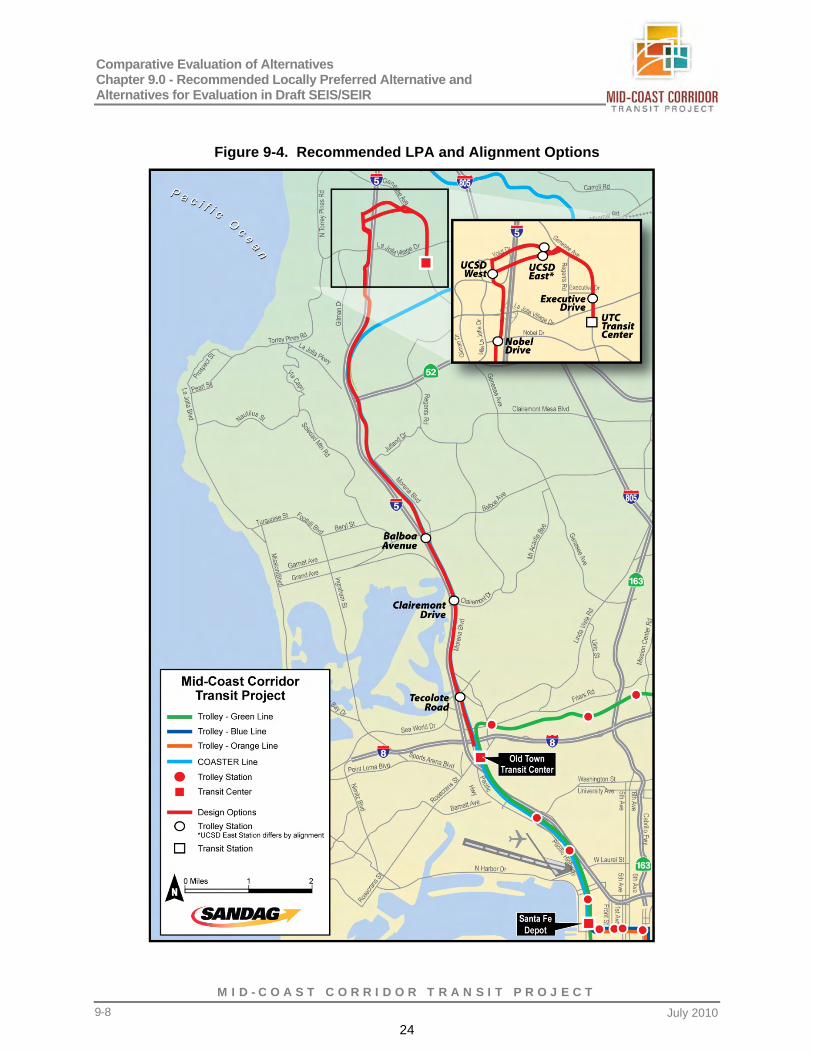
Comparative Evaluation of Alternatives Chapter 9.0 - Recommended Locally Preferred Alternative and Alternatives for Evaluation in Draft SEIS/SEIR
M I D - C O A S T C O R R I D O R T R A N S I T P R O J E C T July 2010 9-8
Figure 9-4. Recommended LPA and Alignment Options
24

Comparative Evaluation of Alternatives Chapter 9.0 - Recommended Locally Preferred Alternative and
Alternatives for Evaluation in Draft SEIS/SEIR
M I D - C O A S T C O R R I D O R T R A N S I T P R O J E C T 9-9 July 2010
Tecolote Road Station would be located on City of San Diego right-of-way, directly under the Tecolote Road overcrossing, just south of Tecolote Road and west of West Morena Boulevard. The station would include a parking lot.
North of the Tecolote Road Station, the LRT alignment would continue along the east side of the existing SDNR tracks to the proposed at-grade station at Clairemont Drive, which would be partially located below the Clairemont Drive overcrossing. A joint-use parking facility on the east side of Morena Boulevard is being considered.
The LRT alignment would then continue north to the proposed Balboa Avenue Station, which would be at grade south of Balboa Avenue. This station would include transfer facilities for feeder bus routes and a parking lot located immediately east of the station.
North of Balboa Avenue, the alignment would be located along the east side of the existing SDNR tracks, generally within the existing MTS/SDNR right-of-way. South of the SR 52, the LRT alignment would transition to an aerial structure in order to cross over to the west side of the SDNR tracks, allowing the LRT alignment to continue north along I-5, while the SDNR tracks head east to Genesee Avenue.
North of SR 52, the LRT alignment would leave the MTS/SDNR right-of-way and travel along the east side of I-5, crossing under La Jolla Colony Drive in a cut-and-cover tunnel. North of the cut-and-cover tunnel, the LRT alignment would continue along the east side of I-5, generally within or adjacent to the California Department of Transportation (Caltrans) right-of-way and transition to an aerial structure in order to cross I-5 south of Nobel Drive. The aerial structure would continue north along the west side of I-5 to an aerial station at La Jolla Village Square (Nobel Drive Station). A joint-use parking structure is proposed at this station, which would replace the parking spaces lost with the aerial guideway and transit station. Continuing north from the Nobel Drive Station, the alignment would remain in an aerial configuration along the west side of I-5 until returning to grade just north of the I-5/La Jolla Village Drive interchange.
North of La Jolla Village Drive interchange, the alignment would proceed at grade along the west side of I-5 and east side of the VA Medical Center. The recommended LPA includes consideration of a station at the VA Medical Center. North of the VA Medical Center, the LRT alignment would enter a cut-and-cover tunnel and cross under Gilman Drive and the surface parking lot located north of Gilman Drive. North of the tunnel, the alignment would enter Pepper Canyon and continue at grade along the bottom of the canyon to the UCSD West Station, which would be at grade.
At-Grade Alignment Option on Voigt Drive After exiting the UCSD West Station, the LRT alignment would enter a short tunnel, turn east, and surface in the median of Voigt Drive. Currently, Voigt Drive does not have a median. In order to accommodate the LRT in the median, Voigt Drive would be widened and realigned. Once on Voigt Drive, the alignment would run at grade in the center of the roadway, crossing over I-5 on the reconstructed Voigt Drive overcrossing that is being proposed as part of the I-5 North Coast Project. The I-5 North Coast Project proposes to lower the elevation of the Voigt Drive overcrossing, add north facing DARs in the center of the overcrossing, realign Voigt Drive to connect to Genesee Avenue, and realign Campus Point Drive to connect to Voigt Drive. The at-grade UCSD East Station
25

Comparative Evaluation of Alternatives Chapter 9.0 - Recommended Locally Preferred Alternative and Alternatives for Evaluation in Draft SEIS/SEIR
M I D - C O A S T C O R R I D O R T R A N S I T P R O J E C T July 2010 9-10
is proposed to be located in the median of Voigt Drive, just west of the realigned Campus Point Drive.
The LRT alignment would continue at grade to Genesee Avenue, where it would turn south and transition to an aerial structure just before the intersection of Genesee Avenue and Regents Road. The LRT movements through the Voigt Drive intersections with realigned Campus Point Drive and Genesee Avenue would be traffic signal controlled. The LRT alignment would continue south in an aerial configuration to the proposed Executive Drive Station and UTC Transit Center Station. The Executive Drive Station would provide drop-off and pick-up access only, while the UTC Transit Center Station would include opportunities for a shared parking facility with the Westfield UTC shopping center. Both stations would have aerial platforms. This option would have a total length of 10.94 miles.
Aerial Alignment Option along the South Side of Voigt Drive From the UCSD West Station, the LRT alignment would enter a cut-and-cover tunnel segment just north of the station and exit the tunnel along the south side of Voigt Drive. The alignment would immediately transition to an aerial structure along the south side of Voigt Drive and travel adjacent to the eastbound lanes of Voigt Drive, crossing over Gilman Drive, I-5, and the proposed future Voigt Drive DAR. The aerial alignment would continue east to the aerial UCSD East Station. The UCSD East Station would be located east of the realigned Campus Point Drive.
From the UCSD East Station, the LRT alignment would continue in an aerial configuration crossing the UCSD East Campus parking lots, Regents Road, and southbound lanes of Genesee Avenue. The aerial LRT alignment would then continue south in the median of Genesee Avenue to aerial stations at Executive Drive Station and UTC Transit Center. This option would have a total length of 10.88 miles.
Alignment Option South of Voigt Drive The UCSD West Station would be located slightly south of the station site described for the other options. After exiting the UCSD West Station, the LRT alignment would enter a short tunnel, turn east, and quickly ascend to grade and then onto an aerial structure to cross both Gilman Drive and I-5. The LRT alignment would descend back to grade near the south end of the existing baseball diamond parking lot and continue east, where the alignment would transition to a cut-and-cover configuration to cross the planned future soccer fields and the realigned Campus Point Drive, as proposed by the I-5 North Coast Project.
East of the realigned Campus Point Drive, the LRT alignment would transition to an at-grade configuration and enter the UCSD East Station, which is proposed to be located in the southeast quadrant of the re-aligned Voigt Drive and Genesee Avenue intersection, but outside of the Voigt Drive right-of-way.
After exiting the UCSD East Station, the LRT alignment would travel parallel to Genesee Avenue and transition to an aerial configuration prior to crossing Regents Road and entering the median of Genesee Avenue. The aerial alignment would then continue south in the median of Genesee Avenue to the Executive Drive and UTC Transit Center Stations. This option would have a total length of 10.82 miles.
26

Comparative Evaluation of Alternatives Chapter 9.0 - Recommended Locally Preferred Alternative and
Alternatives for Evaluation in Draft SEIS/SEIR
M I D - C O A S T C O R R I D O R T R A N S I T P R O J E C T 9-11 July 2010
9.3.2.2 Operating Plan A conceptual operating plan has been developed for the recommended LPA for ridership forecasting and capital and operating cost estimating purposes. Hours of service would be similar to those operated on the existing Trolley Blue, Green, and Orange Lines. Weekday LRT service in 2030 would operate every 7.5 minutes during peak periods (i.e., 6:00 to 9:00 a.m. and 3:00 to 6:00 p.m.) and the off-peak midday period (i.e., 9:00 a.m. to 3:00 p.m.). The fare structure would be the same as the No-Build Alternative.
The proposed recommended LPA operating plan for the recommended LPA provides for the extension of the Trolley Blue Line to University City (Figure 9-5). The plan provides for the operation of a single line operating from the existing San Ysidro/International Border Station on the south to the proposed UTC Transit Center Station in University City, with stops at all 29 intermediate stations. By extending the Trolley Blue Line to University City, LRT would be able to connect the major travel markets in University City with Downtown San Diego and South San Diego and South Bay without a transfer in downtown. This direct connection is particularly important in serving home-to-college trips because UCSD is located in University City and a large percentage of the trips to the university originate in the travel markets to the south of Downtown San Diego. The recommended LPA would also provide direct service between University City and Uptown, as well as areas of Mission Bay to the west and Clairemont to the east. The major travel market of Mission Valley would be served by a transfer to the Trolley Green Line at OTTC.
With the new LRT service, the service provided by Route 150 operating between Downtown San Diego and University City would be duplicated and therefore, eliminated. In addition to these modifications, several other routes would be modified to improve access to the proposed LRT stations. The frequency of service for the connecting bus routes would also be modified to improve the transfer of passengers between the bus and LRT system.
27

Comparative Evaluation of Alternatives Chapter 9.0 - Recommended Locally Preferred Alternative and Alternatives for Evaluation in Draft SEIS/SEIR
M I D - C O A S T C O R R I D O R T R A N S I T P R O J E C T July 2010 9-12
Figure 9-5. 2030 Recommended LPA Operating Plan
28

Final Draft Mid-Coast Corridor Transit Project
Public Involvement Plan
July 16, 2010
sgr
Text Box
Attachment 3

M I D - C O A S T C O R R I D O R T R A N S I T P R O J E C T July 16, 2010
Table of Contents 1.0 Introduction ..............................................................................................................................1 1.1 Project Overview and Background
1.2 Key Issues to Consider 1.3 Purpose of the Public Involvement Plan 1.4 Statutory Requirements and Policies for Public Involvement 1.4.1 Federal and State Guidelines and Requirements for Public Involvement 1.4.2 Environmental Justice
2.0 Mid-Coast Corridor Communities, Demographics and Public
Stakeholder Categories ..........................................................................................................8 2.1 Mid-Coast Corridor Communities 2.2 Mid-Coast Corridor Demographics 2.3 Mid-Coast Corridor Public Stakeholder Categories
3.0 Key Information about the Mid-Coast Corridor Transit Project ........................................11 4.0 Public Involvement Plan Structure and Implementation ...................................................13 4.1 Public Involvement Goals and Objectives 4.2 Public Involvement Strategies 4.3 Public Involvement Process 4.3.1 Early Public Involvement 4.3.2 Public Involvement During Scoping 4.3.3 Public Involvement Prior to Circulation of the Draft SEIS/SEIR 4.3.4 Public Involvement During Draft SEIS/SEIR Public Review
4.3.5 Public Involvement Leading up to the Certification/Approval of the Final SEIS/SEIR and Record of Decision
4.3.6 Public Involvement Subsequent to the Record of Decision 4.3.7 Plan Assessment Appendices A: Stakeholders List .................................................................................................................26 B: Project Working Group Charter and Summary of Activities ................................................31 C: Project Working Group Application Form............................................................................33 D: Media List ............................................................................................................................35 E: Public Involvement Plan Comments....................................................................................36
M I D - C O A S T C O R R I D O R T R A N S I T P R O J E C T July 16, 2010 DRAFT 1
1.0 INTRODUCTION
The Federal Transit Administration (FTA) and the San Diego Association of Governments (SANDAG) have initiated the preparation of a Supplemental Environmental Impact Statement/Subsequent Environmental Impact Report (SEIS/SEIR) for the Mid-Coast Corridor Transit Project in San Diego, California. The FTA is serving as lead agency for purposes of National Environmental Policy Act (NEPA) environmental clearance and SANDAG is serving as lead agency for purposes of California Environmental Quality Act (CEQA) environmental clearance. The requirements and guidance for public involvement during the development of the environmental document are described in the NEPA and CEQA guidelines. Additional public involvement guidance is provided in the Federal Highway Administration/Federal Transit Administration Interim Policy on Public Involvement. The SEIS/SEIR will build upon previous transit planning, engineering, and environmental studies completed for the Mid-Coast Corridor Transit Project. These studies will be incorporated, by reference, into the SEIS/SEIR. Coordination with the agencies responsible for approving or permitting the project and public involvement have been an on-going part of the planning and environmental review process since the inception of the Mid-Coast Corridor project planning. The goal of the Mid-Coast Corridor Public Involvement Plan is to foster a public involvement process that will support the development of the Mid-Coast Corridor Transit Project. This public involvement plan will build upon the coordination and public involvement that was initiated during the previous planning and environmental review for the Mid-Coast Corridor Transit Project conducted in 1995 and 2001. In addition to the public involvement addressed in this plan, the project will also include public agency coordination as part of the environmental process, as outlined in the Final Agency Involvement Plan.
1.1 Project Overview and Background The Mid-Coast Corridor starts at Downtown San Diego, extending to the existing Old Town Transit Center (OTTC) north to North University City, as shown in Figure 1-1. The corridor is entirely within the City of San Diego and includes the following communities: University City, including North University City and South University City; La Jolla; Clairemont Mesa; Pacific Beach; Mission Beach; Linda Vista; Old Town; Midway; Middletown; Little Italy and Downtown San Diego. The Mid-Coast Corridor features a variety of physical terrains. A narrow coastal beach extends the entire length of the corridor. Mission Bay Park lies immediately north of the Interstate 8 (I-8) freeway and west of the Interstate 5 (I-5) freeway, at the southern end of the corridor. Many inland areas, particularly in the northern portion

M I D - C O A S T C O R R I D O R T R A N S I T P R O J E C T July 16, 2010 2
Figure 1-1. Mid-Coast Corridor Transit Project
Source: Parsons Brinckerhoff, 2008

M I D - C O A S T C O R R I D O R T R A N S I T P R O J E C T July 16, 2010 3
of the corridor (north of State Route 52 or SR-52), have steep hillsides and narrow canyons. A number of large, environmentally sensitive lands are also present within the corridor, including: the Rose Canyon Open Space Park, Mission Bay Park, San Diego River Park and the Marian Bear Memorial Park. The corridor is characterized by a variety of land uses, including commercial, office, residential, recreational, and educational land uses. Major employment and retail centers are located in University City and Clairemont. Light industrial uses are located along the I-5 Freeway corridor, and single- and multi-family housing units are found throughout the corridor. Key employment and activity centers, located within or adjacent to the corridor include: • The Golden Triangle; • The University of California San Diego (UCSD), the University of San Diego (USD), and
Mesa College;
• Westfield University Towne Centre (UTC), La Jolla Square Shopping Center, Mission Valley shopping centers, the Fashion Valley Mall and Horton Plaza;
• The Veterans Administration, Scripps Memorial, Scripps Green, and UCSD Thornton
Hospitals;
• The Space and Naval Warfare Systems Command, Gateway, Qualcomm, General Atomics, the Neurosciences Institute, Novartis, and the Scripps Institution of Oceanography;
• Sea World, Old Town State Park, and Mission Bay Park; and
• Downtown San Diego. The original Locally Preferred Alternative (LPA), which was adopted by the Metropolitan Transit Development Board (MTDB) in 1995, combined with revisions that were approved by the SANDAG Board in 2003, comprise the current LPA, which extends the existing trolley system from downtown to the existing OTTC north to UCSD and the Westfield UTC shopping center, in North University City. The LPA would provide connections to other high capacity transit and commuter lines. Connections to the San Diego Trolley Blue and Orange Lines would be provided at Santa Fe Depot in Downtown San Diego. The LPA connection to the San Diego Trolley Green Line, which serves population and employment centers east of the OTTC in Mission Valley, would be provided at OTTC and stops between OTTC and Santa Fe Depot. Connections to the Coaster would also be provided at OTTC and Santa Fe Depot. The LPA and possible variations identified in response to changed conditions in the Mid-Coast Corridor will be considered in the SEIS/SEIR. These variations may consist of alternative light rail transit (LRT) alignments, station locations, and operating plans. Modal alternatives to the LPA will also be considered following a review of changed conditions in the corridor (since the publication of the 1995 Alternatives Analysis/Draft Environmental Impact Statement/Draft Environmental Impact Report or AA/DEIS/DEIR). These alternatives will be considered and will be presented at the Scoping meetings at the beginning of the environmental review process.

M I D - C O A S T C O R R I D O R T R A N S I T P R O J E C T July 16, 2010 4
In addition to the LPA and LRT variations, alternatives that will be developed and evaluated, leading up to Scoping for the SEIS/SEIR, are summarized below: • No-Build Alternative – This alternative will include committed highway and transit projects
that are part of the Revenue Constrained Scenario of the 2007 update to the 2030 San Diego Regional Transportation Plan (RTP).
• Transportation System Management (TSM) Alternative – The TSM Alternative would
enhance the No-Build Alternative, by emphasizing relatively low-cost transportation system upgrades.
• Commuter Rail Alternative – This alternative would use the existing COASTER commuter
rail line in the corridor. Capital investments and operational improvements will be identified.
• Bus Rapid Transit (BRT) Alternative – This alternative will use BRT or Rapid Bus to serve
activity centers along the north-south axis of the corridor. To compete successfully for the FTA New Starts funding, SANDAG will have to select a cost effective and financially strong Locally Preferred Alternative and continue to advance supportive land use policies. It will be important for the Board as well as stakeholders to use the FTA criteria when considering project alternatives.
1.2 Key Issues to Consider As the environmental review process gets underway, there are a number of issues to consider and be aware of, including: • Issues raised during prior environmental reviews
During prior environmental review processes, a number of comments were made by public agencies, community groups, interested organizations and individuals. These comments and responses are included in their entirety in the 1995 Final EIR for the Mid-Coast Corridor and the 2001 Mid-Coast Balboa Segment Final EIS. An awareness and understanding of the comments made in prior reviews is important for the current stage of the Mid-Coast Corridor Transit Project’s development, since similar concerns may be raised during the public review of the Draft SEIS/SEIR. The issues raised in comments made in prior environmental review processes include the following:
- Other modal alternatives were not considered - Competition for service with the COASTER - Business centers along the corridor are not adequately served - Impacts to parks and open space preserves (Rose Canyon, Marian Bear Natural
Park, Tecolote Park, Mandell Weiss Eastgate City Park) - Public safety impacts - Physical impacts to neighborhoods and facilities along the route (reduced access to
facilities, noise, visual impacts) - Impacts to sensitive biological habitat and wetlands - Impacts to bicycle facilities - Impacts to vehicular traffic circulation - Impacts to public utilities - Beach communities are not served by the project - Concerns about station locations

M I D - C O A S T C O R R I D O R T R A N S I T P R O J E C T July 16, 2010 5
- Cost effectiveness of the project • Varying levels of awareness about the project
A number of stakeholders in the corridor will have participated in past public involvement efforts associated with prior environmental reviews for the Mid-Coast Corridor Transit Project. There may be expectations about the project or assumptions based on information from these prior efforts that need to be taken into consideration. On the other hand, some members of the public will not have the same history of participation, and will need to be educated about the current process and how it relates to past efforts. Efforts will be made to communicate the current alternatives being considered and the environmental review process and how past efforts have informed the current analysis.
• Significant public interest in SANDAG’s process for development and evaluation of
design and modal alternatives Since the approval of the LPA in 1995, there has been increased public interest in and awareness of BRT. Supporters of BRT will want to ensure that it is given fair consideration in comparison to the LPA and other modal alternatives. In addition, the Independent Transit Planning Review committee recommended that a COASTER (Commuter Rail) alternative be considered in the alternatives evaluation.
• Project cost Because this is a significant public infrastructure project projected to cost more than $1 billion, the public likely will have a high interest in the project. This interest will be heightened due to current economic conditions.
• Physical impacts of project As was the case with prior environmental reviews, the public will be concerned about potential impacts from the project such as noise, visual impacts, changes to community character, station locations and access.
• Compatibility with existing and future plans The public will want to ensure that the project is compatible with existing and future plans, including existing land uses, general and community plans, and I-5 expansion plans.
• Relationship to recent State legislation State legislation addressing climate change recently has gone into effect. Most relevant to the Mid-Coast Corridor Transit Project, SB 375 aims to limit urban sprawl and support urban, walkable developments. The Mid-Coast Corridor Transit Project may help achieve the goals of SB 375 by providing reliable transit that can support existing and new development patterns in the corridor.
• Biological impacts and mitigation Potential impacts to biological resources including habitat, watershed, and wetlands, as well as proposed mitigations will be of concern to the public. Areas of particular interest will include environmentally sensitive lands within the corridor, including: Rose Canyon Open Space Park, Mission Bay Park, the Marian Bear Memorial Natural Park and the San Diego River Park.
1.3 Purpose of the Public Involvement Plan
SANDAG intends to embark on a comprehensive public involvement effort to communicate information to the public and to provide opportunities for public input during the environmental review process for the Mid-Coast Corridor Transit Project. This project is a high priority for

M I D - C O A S T C O R R I D O R T R A N S I T P R O J E C T July 16, 2010 6
SANDAG and the region, and is included in the TransNet Early Action Program. This public involvement plan outlines the means by which SANDAG will provide the public with timely information about the project, and identify issues important to the general public and stakeholders. The public involvement program for the Mid-Coast Corridor Transit Project will be wide reaching and thorough, helping SANDAG communicate important information to the public, identify and address issues throughout the process, and incorporate relevant input from affected and interested audiences. The goal of the Mid-Coast Corridor Public Involvement Plan is to foster a public involvement process that will support the development of the Mid-Coast Corridor Transit Project. This will be achieved by ensuring that the public is provided with timely and useful information about the project, given opportunities to provide public input on draft plans and environmental documents, and made aware of how their comments have been responded to and utilized in the decision-making process. These efforts will help to build and enhance public trust, understanding and confidence in the SANDAG decision making process. This public involvement plan is intended to be a “living” document. Because of the fluid nature of the public involvement process, this plan may be adjusted to respond to issues and circumstances that arise throughout the process and will also be updated at major milestones in the planning and development process.
1.4 STATUTORY REQUIREMENTS AND POLICIES FOR PUBLIC
INVOLVEMENT 1.4.1 Federal and State Guidelines and Requirements for Public Involvement
This Public Involvement Plan has been designed to meet all requirements and guidelines of the various Federal and State statutes addressing public involvement for transportation projects. These statutes include the National Environmental Policy Act (NEPA) Section 1506.6, Public Involvement, the California Environmental Quality Act (CEQA), and the Federal Highway Administration/Federal Transit Authority (FHWA/FTA) Interim Policy on Public Involvement. Table 1-1 below summarizes the guidelines and requirements included in each statute or policy:
Table 1-1 Public Involvement Guidelines and Requirements
Statute Public Involvement Guidelines and Requirements
NEPA • Publish Notice of Availability of Draft SEIS • 45-day public comment period for Draft SEIS • Conduct public hearing during Draft SEIS public
comment period • Publish Notice of Availability of Final SEIS with
EPA in Federal Register • Project Record of Decision by FTA 30 days after
filing notice with EPA for Federal Register in availability of Final SEIS
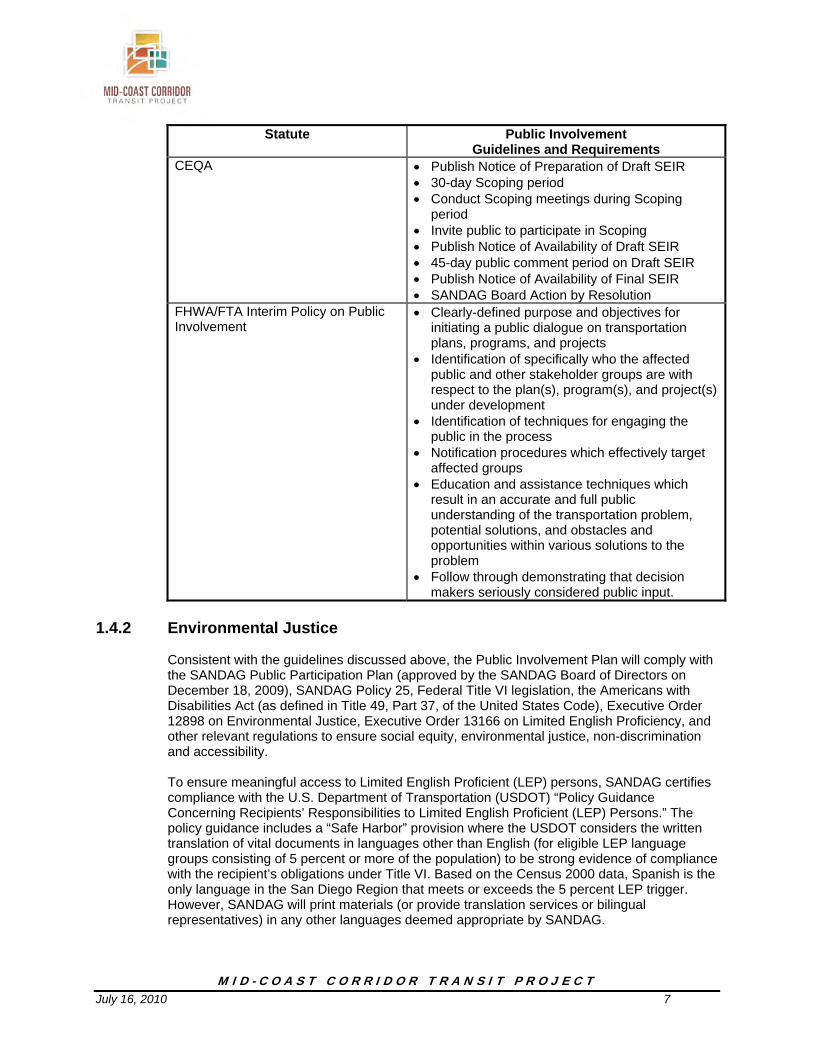
M I D - C O A S T C O R R I D O R T R A N S I T P R O J E C T July 16, 2010 7
Statute Public Involvement Guidelines and Requirements
CEQA • Publish Notice of Preparation of Draft SEIR • 30-day Scoping period • Conduct Scoping meetings during Scoping
period • Invite public to participate in Scoping • Publish Notice of Availability of Draft SEIR • 45-day public comment period on Draft SEIR • Publish Notice of Availability of Final SEIR • SANDAG Board Action by Resolution
FHWA/FTA Interim Policy on Public Involvement
• Clearly-defined purpose and objectives for initiating a public dialogue on transportation plans, programs, and projects
• Identification of specifically who the affected public and other stakeholder groups are with respect to the plan(s), program(s), and project(s) under development
• Identification of techniques for engaging the public in the process
• Notification procedures which effectively target affected groups
• Education and assistance techniques which result in an accurate and full public understanding of the transportation problem, potential solutions, and obstacles and opportunities within various solutions to the problem
• Follow through demonstrating that decision makers seriously considered public input.
1.4.2 Environmental Justice
Consistent with the guidelines discussed above, the Public Involvement Plan will comply with the SANDAG Public Participation Plan (approved by the SANDAG Board of Directors on December 18, 2009), SANDAG Policy 25, Federal Title VI legislation, the Americans with Disabilities Act (as defined in Title 49, Part 37, of the United States Code), Executive Order 12898 on Environmental Justice, Executive Order 13166 on Limited English Proficiency, and other relevant regulations to ensure social equity, environmental justice, non-discrimination and accessibility. To ensure meaningful access to Limited English Proficient (LEP) persons, SANDAG certifies compliance with the U.S. Department of Transportation (USDOT) “Policy Guidance Concerning Recipients’ Responsibilities to Limited English Proficient (LEP) Persons.” The policy guidance includes a “Safe Harbor” provision where the USDOT considers the written translation of vital documents in languages other than English (for eligible LEP language groups consisting of 5 percent or more of the population) to be strong evidence of compliance with the recipient’s obligations under Title VI. Based on the Census 2000 data, Spanish is the only language in the San Diego Region that meets or exceeds the 5 percent LEP trigger. However, SANDAG will print materials (or provide translation services or bilingual representatives) in any other languages deemed appropriate by SANDAG.

M I D - C O A S T C O R R I D O R T R A N S I T P R O J E C T July 16, 2010 8
In addition, proactive efforts will be made to ensure that audiences that may not traditionally participate in the transportation planning process are given the opportunity to participate. These audiences include, but are not limited to, minority groups, non-English speakers, lower income households, individuals with disabilities, the elderly, and transit riders. To reach these audiences, organizations and media outlets representing these communities will be approached to provide project information, solicit participation and input, and provide a means for communicating back with members of these communities. Participation will be encouraged via presentations to these organizations, participation in events sponsored by these organizations or targeted at these audiences, publishing articles in organizational newsletters, and publishing notices and articles in ethnic media outlets. SANDAG has identified a number of local organizations that work with or represent underserved populations in the project area. SANDAG will work with these groups to identify opportunities to communicate with or solicit input from their constituents to meet their transportation needs. Groups that will be contacted include, but are not limited to: • Asian Business Association • San Diego Hispanic Chamber of Commerce • Filipino-American Chamber of Commerce of San Diego County • Bayside Community Center • MAAC Project • Urban League • San Diego Workforce Partnership • SANDAG Accessibility Committee • Access to Independence of San Diego • City of San Diego Disabled Services Advisory Committee • AARP • Elder housing complexes • San Diego Organizing Project • Area students • Transit riders • Ethnic media • Others as identified

M I D - C O A S T C O R R I D O R T R A N S I T P R O J E C T July 16, 2010 9
2.0 MID-COAST CORRIDOR COMMUNITIES, DEMOGRAPHICS AND PUBLIC
STAKEHOLDER CATEGORIES 2.1 Mid-Coast Corridor Communities
The Mid-Coast Corridor is primarily located along the Interstate 5 corridor and extends from Downtown San Diego to the University City community. The study area includes approximately 250,000 residents in the following communities: • Downtown San Diego • Little Italy • Middletown • Old Town • Midway • Linda Vista • Clairemont • Bay Park • Beach communities (Mission Bay, Pacific Beach) • La Jolla • University City/Golden Triangle (Source: SANDAG 2008 Census Estimates)
2.2 Mid-Coast Corridor Demographics
The residents in the Mid-Coast Corridor study area are predominantly Caucasian. The Hispanic population in the corridor is approximately 15 percent, the Asian population is approximately 10%, and the Black population is approximately 3%. Other ethnicities (American Indian, Hawaiian, other) comprise approximately 1 percent of the population. Three percent of the corridor population identifies themselves as more than one race. (Source: SANDAG 2008 Census Estimates) According to 2000 census data, nearly 2 percent of the population in the corridor speaks only Spanish, less than 1 percent are Asian Pacific Islanders who speak no English, and less than 1 percent are of other ethnicities who speak no English.
The majority of residents in the Mid-Coast Corridor are between 20 and 64 years of age (66 percent). Those aged 65 and older comprise 15 percent of the population in the corridor, higher than the percentage citywide (11 percent) and region-wide (11 percent). (Source: SANDAG 2008 Census Estimates) The average median household income in the Mid-Coast Corridor is $53,304, slightly higher than the citywide median household income of $51,808 and the region-wide median household income of $47,268. (Source: SANDAG 2008 Census Estimates) The Mid-Coast Corridor supports more than 300,000 jobs. On either end of the Mid-Coast Corridor are two of San Diego’s largest employment centers. Downtown San Diego employs more than 80,000 people in a number of employment sectors, most of whom commute from various areas of the county. At the north end of the corridor, the University City/Golden Triangle area supports more than 100,000 jobs. It is home to three major medical facilities – UCSD Thornton Hospital, the VA Medical Center and Scripps Memorial Hospital La Jolla – a thriving business district, several hotels and Westfield UTC, a major retail destination. UCSD

M I D - C O A S T C O R R I D O R T R A N S I T P R O J E C T July 16, 2010 10
also is located in the northern portion of the corridor, and supports thousands of jobs along with a student population of approximately 28,000. In the central corridor, Caltrans, the University of San Diego, SeaWorld, Old Town State Park and Costco are sources of employment. (Source: SANDAG 2008 Census Estimates)
2.3 Mid-Coast Corridor Public Stakeholder Categories There are a number of public groups — each with a unique perspective — that will be interested in the Mid-Coast Corridor Transit Project development process. These include organizations and individuals representing the following interests:
- Accessibility Challenged - Business Organizations - Community Planning Groups - Community Services - Employers/Businesses - Environmental Groups - General Public - Industry Peers & Associations - Neighborhoods/Residential - Commercial & retail - Students - Taxpayer advocates - Labor interests - Tourism - Transit riders - Transportation advocates
The focus of this public involvement plan is on public stakeholders. A separate Agency Involvement Plan addresses how SANDAG will coordinate with the various public agencies throughout the development process. A stakeholders list is included in Appendix A.

M I D - C O A S T C O R R I D O R T R A N S I T P R O J E C T July 16, 2010 11
3.0 KEY INFORMATION AND GOALS FOR THE MID-COAST CORRIDOR TRANSIT PROJECT The following provides key information about and goals for the Mid-Coast Corridor Transit Project development process: • The Mid-Coast Corridor Transit Project will expand the value of the existing
transit system and increase mobility within the region.
- The project will expand transportation capacity in the corridor. - The project will provide high quality, high speed, reliable transit service that will be
attractive to all riders. - The project will increase mobility choices, providing a reliable and user-friendly
alternative to auto travel. - The project will provide connections to many of the area’s major attractions and
destinations, including Petco Park, the Gaslamp Quarter, Old Town State Park, SDSU, La Jolla, UCSD, and Qualcomm Stadium.
- The project will connect business centers in downtown, Mission Valley and the Golden Triangle.
• The Mid-Coast Corridor Transit Project will have a positive impact on the
San Diego region and the communities within the Corridor.
- The Mid-Coast Corridor Transit Project will help achieve state and regional planning and transportation goals.
- The Mid-Coast Corridor Transit Project will be a benefit to San Diego’s economy by creating jobs through construction and providing a transit system that facilitates a stable workforce and helps expand consumer access throughout the region.
- Transit is beneficial to the environment by providing an alternative to traffic congestion, increasing transportation capacity, and reducing air pollution, including greenhouse gases.
- Ensuring the public’s safety will be a top priority in the design and implementation of the Mid-Coast Corridor Transit Project.
• The development process for the Mid-Coast Corridor Transit Project has
included significant technical analysis and public input.
- The current evaluation of alternatives and environmental review will analyze changed conditions that have occurred since prior alternatives analysis and environmental reviews were completed in 1995 and 2001.
- The Mid-Coast Corridor Transit Project analysis has been thorough and gave consideration to a number of mode alternatives that compared the feasibility, cost and ridership for providing transit service in the Mid-Coast Corridor.
- SANDAG will implement a comprehensive public involvement plan to ensure that up-to-date information is provided to stakeholders, ample opportunities are provided for interested members of the public to participate, and information is provided back to the public about how their input will be used in the decision making process.
• The Mid-Coast Corridor Transit Project has a guaranteed source of local
funding through TransNet that will help attract additional federal funding.
- 100 percent of operational subsidies for the project are covered through 2048.

M I D - C O A S T C O R R I D O R T R A N S I T P R O J E C T July 16, 2010 12
- San Diego’s transit system is a leader in farebox recovery (Source: National Transit Database. Current MTS farebox recovery is 43% and national average is 35%)
- The project is being evaluated based on Federal Transit Administration (FTA) criteria to ensure that it can successfully compete for FTA New Starts funding.
• The Mid-Coast Corridor Transit Project has been supported by decision
makers and the public.
- The Mid-Coast Corridor Transit Project was supported by voters in the 2004 TransNet reauthorization.
- The SANDAG Board of Directors identified the Mid-Coast Corridor Transit Project as one of the top regional transit priorities and included it in the TransNet Early Action Program.

M I D - C O A S T C O R R I D O R T R A N S I T P R O J E C T July 16, 2010 13
4.0 PUBLIC INVOLVEMENT PLAN STRUCTURE AND IMPLEMENTATION 4.1 Public Involvement Goals and Objectives
The goals for the Mid-Coast Corridor Transit Project Public Involvement Plan are as follows: • Build awareness about the Mid-Coast Corridor Transit Project and its importance to
regional mobility among the public, including those that the project will serve (transit riders, residents, students and businesses), and the general public.
• Conduct an open and transparent public process that provides up-to-date public
information, opportunities for interested members of the public to comment, and provide input to the decision-making process for the project.
• Meet public involvement requirements of California Environmental Quality Act
(CEQA), National Environmental Policy Act (NEPA) and the Federal Transit Administration (FTA) New Starts Program.
• Seek opportunities to involve a broad range of stakeholders throughout the Mid-
Coast Corridor, including non-traditional groups, to ensure that SANDAG understands the issues from all those who may be impacted by the project and to help guide the decision making process
• Address social equity and environmental justice issues, to provide information to
comply with relevant regulations, including SANDAG Policy 25, Title VI, Executive Order 12898 on Environmental Justice, Executive Order 13166 on Limited English Proficiency and the Americans with Disabilities Act.
Achieving the following measurable objectives during the environmental review process will help demonstrate that the goals have been met: • Increase hits on project Web site by 10 percent from the baseline of 2,380 hits • Display project information at five high-traffic locations in the corridor • Make 30 presentations through speakers bureau program • Distribute three issues of Mid-Coast eBlast • Participate in three community events • Issue three news releases • Conduct 15 stakeholder briefings • Conduct three meetings of the Mid-Coast Corridor Transit Project Working Group • Conduct five scoping meetings during the Scoping period • Conduct four public hearings/meetings during the Draft Supplemental Environmental
Impact Study/Subsequent Environmental Impact Report (SEIS/SEIR) public review period
4.2 Public Involvement Strategies
The following strategies will be implemented to achieve the objectives discussed above. • Establish a clear project identity and convey consistent messages about the Mid-
Coast Corridor Transit Project, its importance to increasing mobility in the region, and its benefits to the community and region.

M I D - C O A S T C O R R I D O R T R A N S I T P R O J E C T July 16, 2010 14
• Involve public stakeholders in the process on a regular basis to foster understanding
and agreement on issues related to the development of the Mid-Coast Corridor Transit Project.
• Use a variety of communication methods to reach audiences including presentations, one-on-one/small group meetings, public workshops, written materials, online and media communication.
• Provide the public with up-to-date information about the Mid-Coast Corridor Transit
Project on a regular basis through presentations, the Web site and online communications, written materials and news updates.
• Document public comments received during the public involvement process.
• Provide information to the public about the environmental review process and opportunities for review of public documents and opportunities for comments.
• Provide information to decision makers regarding comments received throughout the public involvement process.
• Utilize traditional and new media to convey project information to a broad audience.
• Assess the effectiveness of the Public Involvement Plan at the conclusion of each phase to evaluate how the strategies and tactics worked and what enhancements could be made for future phases.
4.3 Public Involvement Process
Implementing the strategies listed above will involve a number of coordinated tactics executed in conjunction with key project development milestones. These tactics will involve face-to-face communication with stakeholders, written and online communications, and media relations. Public involvement tactics that will be employed are described below in a sequential manner associated with the following phases of the public involvement process:
1. Early Public Involvement 2. Public Involvement During Scoping 3. Public Involvement Prior to Circulation of the Draft SEIS/SEIR 4. Public Involvement During Draft SEIS/SEIR Public Review 5. Public Involvement Prior to the Final SEIS/SEIR and Record of Decision 6. Public Involvement Subsequent to the Record of Decision 7. Plan Assessment
4.3.1 Early Public Involvement Early public involvement activities provide the opportunity to introduce the public to the Mid-Coast Corridor Transit Project and its development process, gain initial feedback about how they would like to be involved, and to prepare for the Scoping period. Public involvement tactics during this period include:

M I D - C O A S T C O R R I D O R T R A N S I T P R O J E C T July 16, 2010 15
• Prepare informational materials to help educate the public about the Mid-Coast Corridor Transit Project Informational materials to support the Mid-Coast Corridor Transit Project Public Involvement Plan will be posted at www.sandag.org/midcoast as well as on www.keepsandiegomoving.com/midcoast. These materials include project information, project map, fact sheet, Frequently Asked Questions, and multimedia presentations, videos, and other information. These materials will provide information about the project, the development process, and information and/or referrals about how to get involved in the process. These materials will be updated as needed throughout the process. The Web site will provide an opportunity to learn about the project online and the ability to register for future e-mail newsletters and updates. It also will provide access to project materials and documents, including fact sheets, news releases, project documents (NOP, Draft SEIS/SEIR), and images to download. The Web site also will provide interactive and other multimedia materials.
• Conduct stakeholder briefings
Conducting briefings with a representative group of key stakeholders prior to the beginning of the Scoping period will provide an opportunity to introduce the Mid-Coast Corridor Transit Project, the development process and the upcoming opportunities for public involvement. These briefings will help SANDAG assess the level of awareness about the project and identify issues to address through public involvement activities.
Topics to be covered during the briefings include:
- Preliminary project information - Understanding of the process and how they can provide input - Input on proposed means of public involvement - Recommendations on other stakeholders to involve
The following groups/individuals will be approached for briefings:
- SANDAG Accessibility Committee - Access 2 Independence - San Diego County Taxpayers Association - San Diego Regional Chamber of Commerce - San Diego Convention & Visitors Bureau - Golden Triangle Chamber of Commerce - Downtown San Diego Partnership - University Community Planning Group - Clairemont Community Planning Group - Linda Vista Planning Group - Centre City Advisory Committee - Scripps Memorial Hospital La Jolla - VA Medical Center - Costco - Friends of Rose Canyon - San Diego River Foundation - La Jolla Village Square - Lawrence Family Jewish Community Center - San Diego Mormon Temple - La Jolla Country Day School - Move San Diego - San Diego County Bicycle Coalition - San Diego Workforce Partnership

M I D - C O A S T C O R R I D O R T R A N S I T P R O J E C T July 16, 2010 16
- Bayside Community Center - Goodwill Industries of San Diego County - UCSD - UCSD Thornton Hospital
Additional briefings will be conducted, as deemed appropriate by SANDAG.
• Convene Mid-Coast Corridor Transit Project Working Group
The Mid-Coast Corridor comprises a large geographical area, and there are a number of stakeholders that are interested in the project. To help manage the effort to provide regular project updates, seek input from these numerous stakeholders, and provide regular feedback about how their input is used, a Mid-Coast Corridor Transit Project Working Group will be convened.
The Working Group will serve as a forum for the exchange of information throughout the project’s development. Working with this group will provide SANDAG with an opportunity to engage in dialog with and gain input from these stakeholders at key milestones in the environmental review process. Members of the Working Group can help convey project information to a wider audience by reporting back to the constituencies they represent. While the Working Group will have no decision-making authority, it provides a venue for regular communication with the public throughout the environmental review process. All meetings will be open to the public, and meeting summaries will be documented. The Working Group Charter and Summary of Activities are attached as Appendix B.
The Working Group will be composed of members representing key stakeholder groups, and members will be identified through a nomination process. A sample application form is attached as Appendix C. Nominations will be sought from groups in specific categories. In addition, individual nominations can be submitted to SANDAG. A SANDAG committee composed of two members of the Transportation Committee and SANDAG staff will select members from the nominations received based on a number of criteria, including regional representation, community served and the commitment to regularly attend meetings. Table 4-1 summarizes the proposed membership categories and the number of Working Group seats in each category. The number of seats for each member category was chosen to provide balanced representation from the various entities and organizations in the corridor. It is recommended that the chair of the Working Group be an elected official and co-chair be a Working Group member. The chair will be selected by the SANDAG Board Chair and the Working Group co-chair will be selected by the Working Group participants. To ensure continuity, Working Group participants will be asked to commit to attend meetings throughout the environmental review process.
Table 4-1
Composition of Mid-Coast Corridor Transit Project Working Group
MEMBER CATEGORY NUMBER OF SEATS Access advocate 1 Business community 2 Community representatives 4 Community services 2 Employers 2 Environmental 2 Retail 1

M I D - C O A S T C O R R I D O R T R A N S I T P R O J E C T July 16, 2010 17
MEMBER CATEGORY NUMBER OF SEATS Student representative 1 Taxpayers advocate 1 Transportation advocate 2 Transit rider representative 1 At-large members 3
• Prepare Draft Notice of Preparation Distribution List
SANDAG will prepare a comprehensive distribution list for the draft Notice of Preparation. This list will include community groups, business organizations, environmental groups, transportation advocates, accessibility advocates, and residents, businesses, schools, churches, and community facilities in the corridor. Public agencies that have an interest in the project will also be included on the distribution list, as outlined in the Agency Coordination Plan. This list also will be used for distribution of future notices related to the environmental review process (i.e., Notice of Availability of the Draft SEIS/SEIR).
• Make advance preparations to conduct scoping meetings SANDAG will make all advance preparations to conduct four Scoping meetings in various locations along the corridor (Downtown San Diego, Old Town/Morena, Clairemont, University City/Golden Triangle). All meetings will be scheduled in locations that meet ADA requirements and are accessible by transit. Meetings will be scheduled at various times of the day to maximize opportunities for public participation.
4.3.2 Public Involvement During Scoping The process of determining the focus and content of the SEIR/SEIS is known as environmental scoping. Scoping helps to identify the range of actions, alternatives, environmental effects, and mitigation measures to be analyzed in depth, and eliminates from detailed study those issues that are not pertinent to the final decision on the Proposed Project. The scoping process is not intended to resolve differences of opinion regarding the Proposed Project or evaluate its merits. Instead, the process allows the public to express their concerns regarding the Proposed Project and thereby provides an opportunity for input to the environmental analysis. Scoping is an effective way to bring together and address the concerns of the public, affected agencies, and other interested parties. Members of the public, relevant Federal, State, regional and local agencies, interests groups, community organizations, and other interested parties may participate in the scoping process by providing comments or recommendations regarding alternatives to carry forward for environmental review and the range of environmental issues to be analyzed in the SEIR/SEIS. A number of efforts will be implemented during this period to expand communication about the project: • Provide public notice of the Scoping period
The public will be provided notice of the commencement of the 30-day Scoping period, opportunities for providing public comment and dates and locations of Scoping meetings in the following ways: - Public notices will run in local publications - The Notice of Preparation will be mailed to the individuals and organizations on the
distribution list and sent to the State Clearinghouse - Notices/invitations will be prepared to distribute to stakeholder groups in the corridor
so that they can share the information with their members

M I D - C O A S T C O R R I D O R T R A N S I T P R O J E C T July 16, 2010 18
- A news release will be prepared and distributed to the San Diego Union-Tribune, community newspapers and ethnic media outlets (as detailed in the media list attached as Appendix D)
• Make Scoping Documents Available to the Public
The Notice of Preparation, Draft Public Involvement Plan, Draft Purpose and Need statement and information about the evaluation of alternatives (including those eliminated from further analysis) will be made available to the public during the Scoping period. These documents will be posted on the project Web site and made available at other public venues (SANDAG offices and public libraries in the corridor) at the commencement of the Scoping period to allow the public the opportunity to review them and provide comments during the Scoping period. Public information documents such as fact sheets, advertisements, and presentation materials will be prepared in English and Spanish.
• Schedule and conduct briefings with media To promote awareness among the media and foster accurate news coverage, one-on-one briefings with reporters covering the project will be conducted at the beginning of the Scoping period. Reporters will be briefed on the Mid-Coast Corridor Transit Project and provided an overview of the project development milestones. A media kit also will be provided to each of the reporters.
• Issue first Mid-Coast e-blast
A Mid-Coast e-blast will be kicked-off to provide a regular vehicle for sharing new information about the project. This first issue will be distributed following the Board of Directors decision on alternatives to take into scoping and will focus on introducing the project, announcing the commencement of the Scoping period, schedule of Scoping meetings, and providing information about opportunities to provide public input on project alternatives, the scope of the environmental document and the Public Involvement Plan.
• Provide news updates for rEgion and other newsletters
A number of organizations along the Mid-Coast Corridor publish newsletters to keep their constituencies informed about issues of interest. Regular news updates about the Mid-Coast Corridor Transit Project will be provided for publication in these organizational newsletters. Examples of newsletters to target are rEgion (SANDAG’s electronic newsletter) and publications of homeowners associations, churches, community groups and others. The first of regular news updates will be prepared during this stage to provide an introduction to the project, announce the commencement of the Scoping period, schedule of Scoping meetings, and information about opportunities to provide public input.
• Conduct Scoping meetings
SANDAG will conduct five Scoping meetings to provide information about the Project Alternatives, Purpose and Need for the project and the environmental review process. Scoping also provides an opportunity for public input on the identification of issues to be studied in the Draft SEIR. The meetings will be held in communities along the Mid-Coast Corridor: Downtown San Diego, Old Town/Morena, Clairemont, UCSD, and University City/Golden Triangle. Comment cards and a court reporter will be used at each meeting to formally record comments. All comments will be collected following the meetings and catalogued for inclusion in the Scoping summary report. SANDAG will establish protocol for how meetings, comments, and contacts are to be recorded.

M I D - C O A S T C O R R I D O R T R A N S I T P R O J E C T July 16, 2010 19
• Prepare Scoping summary report At the conclusion of all Scoping meetings, a report including all comments received at the meetings will be prepared. Comments received will be used by SANDAG to help determine the scope of the environmental review and alternatives to be studied. This report will be made available to the public so they can review the extent of all public comments received.
A report also will be prepared with comments received on the Draft Public Involvement Plan. This summary of comments received will be used by SANDAG to update the Public Involvement Plan. This report, including responses to comments, will be made available to the public so they can be made aware about how their comments were addressed in the Public Involvement Plan. The Public Involvement Plan will be updated as needed to respond to comments received.
4.3.3 Public Involvement Prior to Circulation of the Draft SEIS/SEIR
After completion of the Scoping period, SANDAG will decide which alternatives to carry forward for detailed environmental review and will initiate the preparation of the Draft SEIS/SEIR. It also is anticipated that Preliminary Engineering on the project will begin during this period. Public Involvement efforts will focus on continued work with the Working Group, as well as efforts to communicate information about the project through community organizations and events. The following tactics will be employed during this stage to continue working with the public: • Update Informational Materials
All project informational materials will be updated to reflect any new or changed information resulting from the Scoping period. This will include updates to the project fact sheet, Frequently Asked Questions, Web site, multimedia presentation and any other materials that provide project information.
• Continue working with Working Group
Meetings will be held as needed to update the Working Group. • Begin Speakers Bureau program
To keep the local community and larger regional interests informed about the project throughout the process, a speakers bureau will be established to provide presentations to interested organizations. These presentations will serve to share information about the project and the planning and development process.
Groups that will be approached for presentations include, but are not limited to (specific stakeholders in each category are listed in Appendix A):
- Community planning groups - Community and town councils - Business organizations (e.g., San Diego Regional Chamber of Commerce, Golden
Triangle Chamber of Commerce) - UCSD campus groups - Major employers - Transportation Advocates (e.g., Move San Diego, San Diego Bicycle Coalition) - Environmental groups (e.g., Sierra Club, San Diego River Coalition) - Local schools

M I D - C O A S T C O R R I D O R T R A N S I T P R O J E C T July 16, 2010 20
- Area churches - Others as identified The schedule of presentations will be recorded in the Public Involvement Contacts Database. The Contacts Database will include the date, time, place, presenter, and audience of each presentation. SANDAG will proactively seek to make presentations to interested organizations in the corridor. SANDAG also will make presentations upon request from members of the community.
• Participate in community events
To reach a wider audience, project information will be provided and community input sought through participation in community events and festivals. These events may be sponsored by community groups, or could be targeted toward a specific audience, i.e., minority groups. A portable informational booth will be taken to various festivals, street fairs, etc., to share information about the project and its benefits to the Mid-Coast Corridor and the San Diego region and seek feedback from members of the public through comment cards, surveys and other means. These events also will provide an opportunity for event attendees to opt into the Mid-Coast e-blast list. In addition to community events, the portable information booth can be used at Westfield UTC and other community gathering places. The information booth will be staffed by members of the speakers bureau and/or appropriate SANDAG staff and consultant team members. All events will be recorded in the Public Involvement Contacts Database.
• Seek locations to display project information
SANDAG will seek locations in the Mid-Coast Corridor that are willing to allow the placement of project information displays to reach a wide audience with project information. Attractive table-top displays will be created that contain project brochures and other useful information for the general public. The following locations will be targeted to display project information:
- Westfield UTC - Costa Verde Shopping Center - La Jolla Village Square - Scripps Memorial Hospital La Jolla - VA Medical Center - UCSD Thornton Hospital - UCSD - Lawrence Family Jewish Community Center - Transit vehicles and transit centers - Libraries within the Corridor - Others, as deemed appropriate
• Continue Mid-Coast e-blast
SANDAG will continue to write and distribute the Mid-Coast Corridor e-blast on a regular basis to provide a regular source of updated project information.
• Continue regular news updates
SANDAG will continue to provide news updates for rEgion and other relevant newsletters in the Mid-Coast Corridor to report newsworthy information.
• Update Informational Materials
All project informational materials will be updated to reflect any updated or changed information that occurred during the preparation of the Draft SEIS/SEIR. This will include

M I D - C O A S T C O R R I D O R T R A N S I T P R O J E C T July 16, 2010 21
updates to the project fact sheet, Frequently Asked Questions, Web site, multimedia presentation and any other materials that provide project information.
• Update distribution list for Notice of Availability of Draft SEIS/SEIR
SANDAG will update the distribution list for the Notice of Availability of the Draft SEIS/SIER to include all those who participated in the Scoping process and/or who have indicated that they would like to be added to the distribution list.
• Make advance preparations to conduct public hearings/meetings for the Draft SEIS/SEIR SANDAG will make all advance preparations to conduct four public hearings/meetings in various locations along the corridor (Downtown San Diego, Old Town/Morena, Clairemont, University City/Triangle). All meetings will be scheduled in locations that meet ADA requirements and are accessible by transit. Meetings will be scheduled at various times of the day to maximize opportunities for public participation.
4.3.4 Public Involvement During Draft SEIS/SEIR Public Review The release of the Draft SEIS/SEIR for public review and comment marks the beginning of a 45-day period where the public is provided the opportunity to review and provide comments on the Draft SEIS/SEIR. SANDAG will make efforts during this period to ensure that the public is aware of opportunities to comment and also to continue to convey project information to a broad audience throughout the corridor and region. The following efforts will be implemented during this period to expand and continue communication about the project: • Public notice of the Draft SEIS/SEIR public comment period
The public will be provided notice of the availability of the Draft SEIS/SEIR, opportunities for providing public comment and dates and locations of public hearings/meetings in the following ways: - The Notice of Availability will be sent to the Federal Register, the State
Clearinghouse, and the County Clerk’s office - Public notices will run in local publications - Notices of Availability will be mailed to the individuals and organizations on the
distribution list, including all adjacent property owners along the project corridor - Notices/invitations will be prepared to distribute to stakeholder groups in the corridor
so that they can share the information with their members - Notice will be provided on the project Web site - A news release will be prepared and distributed to the San Diego Union-Tribune,
community newspapers and ethnic media outlets (as detailed in the media list attached as Appendix D)
• Make the Draft SEIS/SEIR Available to the Public
The Draft SEIS/SEIR will be made available to the public for review and comment during the 45-day public review period. This document will be posted on the project Web site and made available at other public venues (SANDAG offices and public libraries in the corridor) at the commencement of the public review period to allow the public the opportunity to review it and provide comments during the public review period. CDs of the Draft SEIS/SEIR will be available upon request.

M I D - C O A S T C O R R I D O R T R A N S I T P R O J E C T July 16, 2010 22
• Schedule and conduct briefings with reporters SANDAG will schedule and conduct one-on-one briefings with reporters covering the Mid-Coast Corridor Transit Project to provide information about the Draft SEIS/SEIR and the public review process. Reporters will be briefed on the findings of the environmental document, and any significant mitigation measures that may be proposed as a result of the project.
• Continue Mid-Coast e-blast
SANDAG will continue to write and distribute the Mid-Coast Corridor e-blast on a regular basis to provide a regular source of updated project information, including the release of the Draft SEIS/SEIR for public review, schedule of public hearings/meetings and information about other opportunities to provide public input.
• Continue regular news updates
SANDAG will continue to provide news updates for rEgion and other relevant newsletters in the Mid-Coast corridor to report newsworthy information, including the release of the Draft SEIS/SEIR for public review, schedule of public hearings/meetings and information about other opportunities to provide public input.
• Conduct public hearings/meetings
Four public hearings/meetings will be conducted to provide an opportunity for stakeholders to learn more about the Draft SEIS/SEIR and provide public comment. These meetings will be held in Downtown San Diego, Old Town/Morena, Clairemont and University City/Golden Triangle. Comment cards and a court reporter will be used to formally record comments received.
• Prepare public hearing/meeting summary report
At the conclusion of the Draft SEIS/SEIR public review period, a summary report of all comments received at the meetings will be prepared. This report will include a record of all comments received at the public hearings/meetings and by direct mail to SANDAG and will be responded to by SANDAG in the Final SEIS/SEIR. The public will be informed that the final public comment report has been published and it will be made available upon request and posted on the project Web site so they can review the extent of public comments received. It will also serve as a resource for decision makers so they are aware of issues raised by the public during the environmental review process.
• Continue working with Working Group Meetings will be held as needed to update the Working Group.
• Continue Speakers Bureau program
SANDAG will continue to seek opportunities to present project information to interested community and regional organizations. Speaking engagements will be tracked in the Public Involvement Contacts Database and will include information about presentation date, time, presenter, audience and comments received.
• Continue to participate in community events
SANDAG will continue to seek opportunities to participate in community events throughout the corridor.
• Provided updated information for display at public locations
SANDAG will provide updated project information at all locations where project information displays are located.

M I D - C O A S T C O R R I D O R T R A N S I T P R O J E C T July 16, 2010 23
4.3.5 Public Involvement Leading up to the Certification/Approval of the Final SEIS/SEIR and Record of Decision
During the stage when SANDAG is responding to comments made on the Draft SEIS/SEIR, the following activities will be conducted: • Prepare the Public Involvement Section for the Final SEIS/SEIR
SANDAG will draft a Public Involvement section for inclusion in the Final SEIS/SEIR. This section will include a summary of all efforts made to involve the public during the development of the environmental document.
• Continue working with Working Group
Meetings with the Working Group will continue throughout this stage, as needed, and at a frequency determined by SANDAG in conjunction with the Working Group.
• Continue Speakers Bureau program
SANDAG will continue to seek opportunities to present project information to interested community and regional organizations. A record of these presentations will be maintained that will include information about presentation date, time, presenter, and audience.
• Continue to participate in community events
SANDAG will continue to seek opportunities to participate in community events throughout the Corridor.
• Continue Mid-Coast e-blast
SANDAG will continue to write and distribute the Mid-Coast Corridor e-blast on a regular basis to provide a regular source of updated project information.
• Continue regular news updates
SANDAG will continue to provide news updates for rEgion and other relevant newsletters in the Mid-Coast corridor to report newsworthy information.
• Update Informational Materials
All project informational materials will be updated to reflect any updated or changed information that occurred as a result of the response to comments made on the Draft SEIS/SEIR. This will include updates to the project fact sheet, Frequently Asked Questions, Web site, multimedia presentation and any other materials that provide project information.
• Update distribution list for Notice of Availability of Final SEIS/SEIR
SANDAG will update the distribution list for the Notice of Availability of the Final SEIS/SIER to include all those who participated in the public review of the Draft SEIS/SEIR and/or who indicated that they would like to be added to the distribution list.
• Public notice of the availability of the Final SEIS/SEIR The release of the Final SEIS/SEIR is the final step before the SANDAG Board of Directors will be asked to certify the Final SEIR and the FTA will be asked to issue a Record of Decision (ROD) for the Final SEIS. The public will be provided notice of the availability of the Final SEIS/SEIR in the following ways: - A Notice of Availability of the Final SEIS will be filed with the Environmental
Protection Agency (EPA) Office of Federal Activities for publication in the Federal Register

M I D - C O A S T C O R R I D O R T R A N S I T P R O J E C T July 16, 2010 24
- Public notices will run in local publications - Notices of Availability will be mailed to the individuals and organizations on the
distribution list - Notices will be prepared to distribute to stakeholder groups in the corridor so that
they can share the information with their members - Notice will be provided on the project Web site - A news release will be prepared and distributed to the San Diego Union-Tribune,
community newspapers and ethnic media outlets (as detailed in the media list attached as Appendix D)
• Schedule and conduct briefings with reporters
SANDAG will schedule and conduct one-on-one briefings with reporters covering the project to provide information about the Final SEIS/SEIR and the remaining steps until the document is certified by the SANDAG Board and a Record of Decision is issued by the FTA. Reporters will be briefed on responses provided to significant public comments, the expected timeline for certification and approval of the document and the next steps in the project development process.
• Continue Speakers Bureau program SANDAG will continue to seek opportunities to present project information to interested community and regional organizations. A record of these presentations will be maintained that will include information about presentation date, time, presenter, and audience.
• Continue to participate in community events
SANDAG will continue to seek opportunities to participate in community events throughout the Corridor.
• Provide updated information for display at public locations
SANDAG will provide updated project information at all locations where project information displays are located.
• Continue Mid-Coast e-blast
SANDAG will continue to write and distribute the Mid-Coast Corridor e-blast on a regular basis to provide a regular source of updated project information.
• Continue regular news updates
SANDAG will continue to provide news updates for rEgion and other relevant newsletters in the Mid-Coast corridor to report newsworthy information.
4.3.6 Public Involvement Subsequent to the Record of Decision
After SANDAG certifies the Final SEIR and adopts the Findings of Effect and Mitigation Monitoring and Reporting Plan, the Board can approve the project. The FTA will issue a Record of Decision on the Final SEIS 45 days after the Federal Register notice of the availability of the Final SEIS. SANDAG will notify the public of the decisions and provide information about the next steps in the process (Final Design, leading eventually to Construction) in the following manner: • Issue news release announcing the certification of the Final SEIR and FTA’s Record of
Decision on the Final SEIS SANDAG will issue a news release to the appropriate media outlets, including ethnic media, announcing the certification of the Final SEIR, and project approval and Record of

M I D - C O A S T C O R R I D O R T R A N S I T P R O J E C T July 16, 2010 25
Decision on the Final SEIS. The news release will include information about the approved project and the next steps in the project development and public involvement processes.
• Final Mid-Coast e-blast (for this phase)
SANDAG will issue the final Mid-Coast e-blast for the Environmental/Preliminary Engineering stage. The e-blast will focus on the certification of the Final SEIR and Record of Decision on the Final SEIS, and the next steps in the project development and public involvement processes.
• Final news update (for this phase)
A final news update for the Environmental/Preliminary Engineering stage will be issued to provide information about the certification of the Final SEIR and Record of Decision on the Final SEIS, and next steps in the project development and public involvement process. This news update will be used for an article in rEgion and other relevant newsletters in the Mid-Coast Corridor.
• Update informational materials
Informational materials for the project will be updated to reflect the certification of the Final SEIR and Record of Decision of the Final SEIS. These materials include the Web site, fact sheet, Frequently Asked Question and multimedia presentation.
• Provided updated information for display at public locations SANDAG will provide updated project information at all locations where project information displays are located.
4.3.7 Plan Assessment
In order to assess the effectiveness of the public involvement efforts, SANDAG will assess the effectiveness of the Public Involvement Plan at key milestones in the project development process. These reports will help SANDAG to evaluate public involvement strategies and tactics and make adjustments along the way, and will inform future public involvement outreach phases of the Mid-Coast Transit Corridor project. These reports will include: • A summary of all outreach efforts and input received • A qualitative assessment of how effective the efforts to obtain input were, i.e., audiences
reached, level of agreement on project issues, input incorporated into project design • A quantitative assessment of the public involvement plan including the number
meetings/presentations/events participated in, Web site hits, approximate number of people reached, number of comments received, and number of media contacts along with the resulting media coverage
• The Public Involvement Plan will be revised and strategies/tactics adjusted based on assessments at key milestones

M I D - C O A S T C O R R I D O R T R A N S I T P R O J E C T July 16, 2010 26
APPENDIX A
MID-COAST CORRIDOR TRANSIT PROJECT STAKEHOLDERS LIST
Category Organization
Accessibility Advocates AARP San Diego Accessibility Advocates Access to Independence of San Diego Accessibility Advocates City of San Diego Disabled Services Advisory Council Business Groups Biocom Business Groups Building Owners and Managers Association Business Groups Discover Pacific Beach Business Groups Downtown San Diego Partnership Business Groups Golden Triangle Chamber of Commerce Business Groups Greater Clairemont Chamber of Commerce Business Groups Old Town San Diego Chamber of Commerce Business Groups Promote La Jolla Inc. BID Business Groups San Diego BID Council Business Groups San Diego Coastal Chamber of Commerce Business Groups San Diego North Chamber of Commerce Business Groups San Diego Regional Chamber of Commerce Business Groups San Diego Regional Economic Development Corporation Civic Associations La Jolla Golden Triangle Rotary Club Civic Associations Linda Vista Civic Association Civic Associations Linda Vista Community Collaborative Civic Associations Mission Bay Rotary Club Civic Associations Old Mission Rotary Club Civic Associations University City Community Association Civic Associations League of Women Voters Community Groups Balboa Avenue Citizens Advisory Group Community Groups Carmel Valley Community Planning Board Community Groups Centre City Advisory Committee (CCAC) Community Groups Clairemont Planning Committee Community Groups Clairemont Town Council Community Groups La Jolla Community Planning Association Community Groups La Jolla Shores Association Community Groups La Jolla Town Council Community Groups Linda Vista Community Planning Committee Community Groups Little Italy Association Community Groups Little Italy Residents Association Community Groups Midway Community Planning Advisory Committee (North Bay
Planning Committee) Community Groups Mission Beach Precise Planning Board Community Groups Mission Beach Town Council Community Groups Mission Valley Community Planning Group

M I D - C O A S T C O R R I D O R T R A N S I T P R O J E C T July 16, 2010 27
Category Organization Community Groups North Bay Redevelopment PAC Community Groups Old Town Community Planning Committee Community Groups Pacific Beach Community Planning Committee Community Groups Pacific Beach Town Council Community Groups Torrey Hills Community Planning Board Community Groups Torrey Pines Community Planning Group Community Groups UC Golden Community Groups University City Community Association Community Groups University City Community Planning Group Community Services All Saints Lutheran Church Community Services Braille Institute Community Services Church of the Good Samaritan Episcopal School Community Services Congregation Adat Yeshurun Community Services Curie Elementary School Community Services Doyle Elementary School Community Services La Jolla Country Day School Community Services La Jolla Country Day School Community Services Lawrence Jewish Family Community Center Community Services Mission Bay Montessori Academy Community Services San Diego California Temple - Church of Jesus Christ of Latter
Day Saints Community Services Spreckles Elementary School Community Services St Anthony Antiochian Orthodox Church Community Services Standley Middle School Community Services Torrey Pines Christian Church Community Services Torrey Pines Elementary School Community Services University City High School Community Services University City United Church of Christ Community Services University Lutheran Church Community Services University Lutheran Church Employers Biogen IDEC Employers Costco Employers Evans Hotels Employers Genesee Executive Plaza Employers La Jolla Hyatt at Aventine Employers La Jolla Institute for Allergy and Immunology Employers La Jolla Spine Institute Employers La Jolla Village Professional Center Employers Ligand Pharmaceuticals Employers Nobel Corporate Plaza Center / Equity Properties Employers Pfizer Employers Sheraton La Jolla (formerly Radisson) Employers Regents Square Business Park Employers Residence Inn by Marriott - La Jolla

M I D - C O A S T C O R R I D O R T R A N S I T P R O J E C T July 16, 2010 28
Category Organization Employers San Diego Sports Arena Employers Scripps Memorial Hospital La Jolla Employers SeaWorld Employers Skye Pharmaceuticals Employers UCSD Employers UCSD, Thornton Hospital Employers USD Employers Veteran Affairs San Diego Healthcare System Environmental Org. Association of Environmental Professionals Environmental Org. California Coastal Coalition Environmental Org. California Native Plant Society San Diego (CNPSSD) Environmental Org. Endangered Habitats League Environmental Org. Environmental Health Coalition Environmental Org. Friends of Rose Canyon Environmental Org. Friends of Rose Creek Environmental Org. Friends of Tecolote Canyon Environmental Org. Friends of the San Diego River Mouth Environmental Org. I Love A Clean San Diego Environmental Org. Industrial Environmental Association Environmental Org. League of Conservation Voters, San Diego Environmental Org. Rose Creek Watershed Alliance Environmental Org. San Diego Archaeological Society Environmental Org. San Diego Audubon Society Environmental Org. San Diego Canyonlands Environmental Org. San Diego Coastkeeper Environmental Org. San Diego River Conservancy Environmental Org. San Diego River Coalition Environmental Org. San Diego River Park Foundation Environmental Org. San Diego Sierra Club Environmental Org. Southwest Wetlands Interpretative Association (SWIA) Environmental Org. Surfrider, San Diego Chapter Labor San Diego-Imperial Counties Labor Council Military MCAS Miramar Minority Org. Asian Business Association Interest Groups The Urban Land Institute Interest Groups NAIOP Interest Groups Building Industry Association Interest Groups San Diego Housing Federation Minority Org. Bayside Community Center Minority Org. Filipino-American Chamber of Commerce of San Diego County Minority Org. MAAC Project Minority Org. San Diego County Hispanic Chamber of Commerce Minority Org. San Diego Organizing Project (SDOP) Minority Org. San Diego Urban League

M I D - C O A S T C O R R I D O R T R A N S I T P R O J E C T July 16, 2010 29
Category Organization Minority Org. San Diego Workforce Partnership Park Committee Marian Bear Memorial Park Recreation Council Park Committee Mission Bay Park Committee Park Committee Rose Canyon Recreation Council Park Committee Tecolote Canyon CAC (Citizen's Advisory Committee) Neighborhoods/Residential Andria HOA Neighborhoods/Residential Avanti HOA Neighborhoods/Residential Cambridge Park Apartments Neighborhoods/Residential Capri HOA Neighborhoods/Residential Casa Bella HOA Neighborhoods/Residential Canyon Park Apartments Neighborhoods/Residential Costa Verde Apartments - North and South Neighborhoods/Residential Costa Verde Towers Neighborhoods/Residential Garden Communities Neighborhoods/Residential La Florentine HOA Neighborhoods/Residential La Jolla Canyon Apartments Neighborhoods/Residential La Jolla Colony Neighborhoods/Residential La Jolla Crossroads Neighborhoods/Residential La Jolla International Garden Apartments Neighborhoods/Residential La Jolla Vista Townhouses Neighborhoods/Residential La Scala Luxury Villas Neighborhoods/Residential Lucera at University Towne Centre Neighborhoods/Residential Pacific Garden Apartments - UTC Neighborhoods/Residential Playmor Terrace West Homeowners Association Neighborhoods/Residential Regency Villas Senior Complex Neighborhoods/Residential Regents Court La Jolla Neighborhoods/Residential Renaissance La Jolla Homeowners Association Neighborhoods/Residential Southcoast Homeowners Association Neighborhoods/Residential The Villas of Renaissance Apartments Neighborhoods/Residential Toscana HOA Neighborhoods/Residential Trieste Apartment Villas Neighborhoods/Residential University Towne Square Homeowners Association Neighborhoods/Residential Valentia HOA Neighborhoods/Residential Venetian Condominiums Homeowners Association/ JJN Neighborhoods/Residential Villa Vicenza Condominiums Neighborhoods/Residential Village Apartments on the Square Neighborhoods/Residential Villas HOA Neighborhoods/Residential Windemere Homeowners Association Commercial & Retail Costa Verde Shopping Center/ Regency Property Management Commercial & Retail La Jolla Village Square Shopping Center - Madison Marquette Commercial & Retail Renaissance Towne Centre Commercial & Retail Westfield Shoppingtown, University Towne Centre Students UCSD Associate Students

M I D - C O A S T C O R R I D O R T R A N S I T P R O J E C T July 16, 2010 30
Category Organization Students UCSD Graduate Student Government Students USD Associate Students Taxpayer Advocate San Diego County Taxpayers Association Tourism San Diego Convention & Visitors Bureau Tourism San Diego Convention Center Corporation Transportation Advocate COMPACT Transportation Advocate La Jolla Traffic & Transportation Board Transportation Advocate Move San Diego Transportation Advocate San Diego Bicycle Coalition Transportation Advocate Transit Alliance for a Better North County (TABNC) Transportation Advocate Walk San Diego

M I D - C O A S T C O R R I D O R T R A N S I T P R O J E C T July 16, 2010 31
APPENDIX B
Charter for Mid-Coast Corridor Transit Project Working Group Purpose The purpose of the Mid-Coast Corridor Transit Project Working Group (PWG) is to receive information from SANDAG about the project and provide input into key activities associated with the development of the Mid-Coast Corridor Transit Project. The PWG will lay the foundation for public involvement in future phases of the Mid-Coast Corridor Transit Project’s implementation.
Line of Reporting The PWG will provide input to SANDAG staff on specific activities related to the development of the Mid-Coast Corridor Transit Project, as discussed in the next section. Staff will consider input from the PWG in making recommendations to the Transportation Committee. The SANDAG Board will make final decisions on the Mid-Coast Corridor Transit Project, its components, and the certification of the Subsequent Environmental Impact Report (SEIR).
Responsibilities The PWG will review the project purpose and need, consideration of alternatives for the Mid-Coast Corridor Transit Project, and the Public Involvement Plan. The PWG will have an opportunity to review and comment on the public Draft Supplemental Environmental Impact Statement (SEIS)/SEIR, including impacts and mitigation measures, when it is available. The information that will be presented to the PWG includes, but is not limited to, the draft Public Involvement Plan, Federal Transit Administration evaluation criteria and review process, and SANDAG evaluation of various alternatives. The PWG also will assist with associated public outreach and help inform and encourage active public participation by outside groups with which they are affiliated. The PWG will provide input to SANDAG staff and the Transportation Committee.
Membership The PWG will have up to 23 members, representing the geographic areas of the corridor and the diverse perspectives of stakeholders interested in the project. The primary membership, as well as a membership waiting list, will be approved by the SANDAG Board. The members are selected based on the review of applications submitted to SANDAG that assessed their qualifications and affiliations with representative organizations and interests in the Mid-Coast Corridor. Members do not have alternates. If a member misses three meetings in a row or four meetings over the course of one year, s/he will be replaced.
In the event that any members need to be replaced, new members will be selected from the approved waiting list by a majority vote of the PWG.
Meeting Time and Location The PWG will meet on a monthly basis, or as determined by the members of the PWG, in coordination with SANDAG staff. Meetings typically will be held on the first Wednesday of the month from 3:30 to 5 p.m. at the SANDAG offices at 401 B Street in San Diego. The PWG will hold some of its meetings at other locations in the corridor.
Working Group Leadership The Chair of the PWG is appointed by the Chair of the SANDAG Board. The PWG will elect a Vice Chair from its membership by a majority vote.
Duration of Existence The PWG will complete its work with the certification of the SEIR by the SANDAG Board and the approval of the SEIS by the FTA (anticipated in summer 2011).
Brown Act and Conflict Of Interest Consistent with Government Code Section 54952(b), the PWG is subject to the Ralph M. Brown Act.

M I D - C O A S T C O R R I D O R T R A N S I T P R O J E C T July 16, 2010 32
Mid-Coast Corridor Transit Project Working Group (PWG)
Summary of Activities
Public Involvement Plan In accordance with state and federal guidelines, a draft Public Involvement Plan has been prepared to actively involve the public in the planning and development process for the Mid-Coast Corridor Transit Project. There will be a series of public meetings and other means for involving the public by providing information on the project and receiving input at key milestones in the planning and development process for the project. The PWG will be asked to review and provide input on the draft plan to ensure that it effectively provides opportunities to involve the public in the process. Review Draft Purpose and Need Statement A draft Purpose and Need Statement has been prepared by SANDAG for presentation at the SEIS Scoping meetings. This statement will be provided to the PWG at the initial meeting. Any comments from PWG members or from the Group would need to be submitted at the official Scoping meetings. Review of Alternatives Evaluation SANDAG is currently in the process of evaluating a number of project alternatives for the Mid-Coast Corridor Transit Project. These alternatives are being evaluated against FTA cost effectiveness criteria defined in the New Starts Program. SANDAG will provide information to the PWG on the various alternatives under evaluation to fully understand how alternatives were evaluated and screened from further consideration. Review of environmental findings and proposed mitigation SANDAG will begin the environmental review process for the project with the initiation of project scoping in Spring 2010 and will prepare a draft Supplemental Environmental Impact Statement/Subsequent Environmental Impact Report (SEIS/SEIR) over the following year. Information regarding the scope of the Draft SEIS/SEIR and methods of analysis will be shared with the PWG during the development of the SEIR/SEIS and comments from the PWG will be made after the public Draft SEIR/SEIS is available for review.

M I D - C O A S T C O R R I D O R T R A N S I T P R O J E C T July 16, 2010 33
APPENDIX C
APPLICATION FORM FOR THE SANDAG 2009-2011 MID-COAST CORRIDOR TRANSIT PROJECT WORKING GROUP
(due June 22, 2009) Name: _____________________________________________________________________________ Address:____________________________________________________________________________ Phone: _____________________________________________________________________________ E-mail: _____________________________________________________________________________ Return to: Anne Steinberger, Marketing Manager San Diego Association of Governments 401 B St., Suite 800 San Diego, CA 92101 [email protected] (619) 699-1937 Please check the membership category you are applying for (please check all that apply): � Access advocate � Business community � Community representative � Community services (schools, churches, community facilities) � Employer � Environmental � Retail � Student � Taxpayer advocate � Transportation advocate � Transit rider � At-large member (resident or business owner in the Mid-Coast Corridor) Please answer the following questions: (Please make responses as concise as possible; applications will not be judged on length of response) 1. Why are you interested in serving on the Mid-Coast Corridor Transit Project Working Group? 2. What skills and abilities would you bring to the Project Working Group?

M I D - C O A S T C O R R I D O R T R A N S I T P R O J E C T July 16, 2010 34
3. Which of the following topics are of most interest to you as they relate to the Mid-Coast Corridor Transit Project? (please select no more than two) � Environmental review � Alternatives evaluation � Design elements � Community impacts � Social Equity & Environmental Justice � Other ___________________________________________ 4. Have you participated in any activities related to the areas of interest selected in Question 3? If so, briefly describe the activity/ies. 5. What would you hope to accomplish by your participation? 6. What ZIP code(s) do you work in and/or live in? 7. List any civic organizations to which you belong now, or have in the past. The Mid-Coast Corridor Transit Project Working Group will meet the first Wednesday of each month from 3:30 to 5 p.m. at the SANDAG offices in downtown San Diego. Members of the working group will be replaced if they miss three consecutive meetings or five over the course of one year. Please only apply if you can make this commitment to the process.

M I D - C O A S T C O R R I D O R T R A N S I T P R O J E C T July 16, 2010 35
APPENDIX D
MID-COAST CORRIDOR TRANSIT PROJECT MEDIA LIST
ASIA KPBS FM Asian Journal KPBS TV Beach & Bay Press KUSI TV Chinese News La Jolla Light Clairemont Community News La Jolla Village News Coast News La Prensa San Diego Coastal Sun North County Times Corridor News Peninsula Beacon CTN County Television Network Philippine Mabuhay News Fox 5 News / KSWB Philippines Today Daily Transcript, The Pomerado Newspapers Del Mar Times Presidio Sentinel Del Mar Village Voice San Diego Business Journal Diamond Gateway Signature San Diego City Beat Diario San Diego San Diego Community Newspaper Group East County Californian San Diego Ranch Coast Newspaper Group El Latino San Diego Downtown News Enlace San Diego Metropolitan Filipino Press San Diego Newsline Hispanos Unidos San Diego Reader Imperial Beach Eagle & Times San Diego Union-Tribune KBNT TV Channel 17 San Diego Voice & Viewpoint KFMB TV Star News KGTV Channel 10 Tieng Viet San Diego KNSD TV (NBC 7/39) Voice of San Diego KOGO AM XETV 6 The CW

M I D - C O A S T C O R R I D O R T R A N S I T P R O J E C T July 16, 2010 36
APPENDIX E
MID-COAST CORRIDOR TRANSIT PROJECT PUBLIC INVOLVEMENT PLAN COMMENTS
Commenter Comment Response William Beck, UCPG Can SANDAG create a shorter
“Cliff’s Notes” version of the plan that is easier for the public to understand?
SANDAG prepared a summary of the elements of the Public Involvement Plan for public distribution during scoping.
Ann Van Leer, Land Conservation Brokerage, Inc.
The mission statement or objective of the plan should be more prominently displayed in the document.
The goals/purpose of the Public Involvement Plan are currently outlined in Section 1.3; however a brief sentence referencing the goals/purpose will also be added to the Introduction, Section 1.0.
Anette Blatt, Scripps Health I would like more information presented about the structure of the speakers’ bureau.
This comment has been noted and information on how to schedule presentations will be posted on the Mid-Coast Web site.
Rob Hutsel, San Diego River Park Foundation
Mission Valley Community Planning Group should be added as a stakeholder.
The Mission Valley Community Planning Group was added to the list of stakeholders in Appendix A, on page 27, under “Community Groups”.
Rob Hutsel, San Diego River Park Foundation
The Mission Bay Park Committee should also be added as a stakeholder.
Mission Bay Park Committee was included among the list of stakeholders in Appendix A, on page 29, under “Park Committee”.
Chris Westling, UCSD Student UCSD graduate student government should be added to the list of stakeholders.
UCSD Graduate Student Government was added to the list of stakeholders in Appendix A, on page 30 under “Students”.
Chris Westling, UCSD Student USD should also be added to the list of stakeholders.
USD was added to the list of stakeholders in Appendix A, on page 28, under “Employers”.
Debbie Knight, Friends of Rose Canyon
The scoping comment period should be extended to 60 days from the required 30 days.
A formal request to extend the Scoping period should be made to the SANDAG Executive Director/Chairman of Transportation Committee/Chairman of the SANDAG Board in advance of scoping.
Debbie Knight, Friends of Rose Canyon
The comment period for the draft EIR should also be extended from the required 45 days to 60 days.
A formal request to extend the Scoping period should be made to the SANDAG Executive Director/Chairman of Transportation Committee/Chairman of the SANDAG Board in advance of scoping.

M I D - C O A S T C O R R I D O R T R A N S I T P R O J E C T July 16, 2010 37
Commenter Comment Response Debbie Knight, Friends of Rose Canyon
The results of the alternatives evaluation should be made available to the public and 60-day public comment period should be provided.
Information on the alternatives evaluation will be presented and available for comment during the scoping process.
Debbie Knight, Friends of Rose Canyon
The Rose Creek Watershed Alliance and the Friends of Rose Creek should be added to the list of stakeholders.
Rose Creek Watershed Alliance and Friends of Rose Creek have been added to the list of stakeholders in Appendix A, on page 28, under “Environmental Org.”.
Ann Van Leer, Land Conservation Brokerage, Inc.
The purpose of the project and what is driving it should be made clear.
This will be addressed in the Statement of Purpose & Need and will be available for review and comment during the Scoping period.
Lani Lutar, San Diego County Taxpayers Association
The results of the alternatives evaluation should be presented objectively.
This comment has been noted.
Brooke Peterson, Clairemont Mesa Planning Committee
Add Clairemont News to the list of media publications.
Clairemont News has been added to the list of media publications in Appendix D, beginning on page 35.
Rob Hutsel, San Diego River Park Foundation
Property owners along the selected alternative should be notified of the project.
This comment has been noted. Notification procedures are outlined on page 17, under Section 4.3.2, and will meet all necessary noticing requirements.
Greg Fitchitt, Westfield Corporation
The Urban Land Institute, NAIOP, Building Industry Association and San Diego Housing Federation should be added to the list of stakeholders.
The Urban Land Institute, NAIOP and Building Industry Association and San Diego Housing Federation have been added to the list of stakeholders in Appendix A, on page 28, under “Interest Groups”.
Joe LaCava, La Jolla Community Planning Association
The Pacific Beach Planning Group and La Jolla Community Planning Association should be added to the list of stakeholders.
Pacific Beach Planning Group and La Jolla Community Planning Association have been added to the list of stakeholders in Appendix A, on pages 26 and 27, under “Community Groups”.
Joe LaCava, La Jolla Community Planning Association
Libraries within the Corridor should be added as places to post public information about the project.
“Libraries within the Corridor” has been added on page 18, under the 2nd bullet point.
Joe LaCava, La Jolla Community Planning Association
The title of section 3 should be changed from “Key Information About the Project” to “Goals for the Project.”
The first two bullets of Section 3.0 on page 11 are more goal-oriented but the last three bullets are more factual in nature. The title of Section 3.0 has been revised to “Key Information and Goals for the Project”.
Rob Hutsel, San Diego River Park Foundation
Mission Valley Community Planning Group should be added to the list of stakeholders
Mission Valley Community Planning Group has been added to the list of stakeholders in Appendix A, on page 26, under “Community Groups”.

M I D - C O A S T C O R R I D O R T R A N S I T P R O J E C T July 16, 2010 38
Commenter Comment Response Daniel Allen, La Jolla Resident Several of the employers listed in
the Corridor are outside of the Corridor. SANDAG should consider whether these employers would really be users of the system if they are so far away.
This comment has been noted.
Evan McLaughlin, San Diego-Imperial Counties Labor Council
The requirements of CEQA should be clearly stated in the plan.
A list of federal/state requirements for public involvement under both NEPA/CEQA are outlined on page 6, under Section 1.4.
Evan McLaughlin, San Diego-Imperial Counties Labor Council
Employee groups (labor unions) should be added to the list of stakeholders, since many of these people will be the ones using the transit system.
San Diego-Imperial Counties Labor Council has been added to the list of stakeholders in Appendix A, on page 28, under “Labor”.
Daniel Allen, La Jolla Resident In Section 3, La Jolla should be listed as a “Visitor Serving Center.”
La Jolla has been added to the list of area attractions under the first bullet point on page 11.
Rob Hutsel, San Diego River Park Foundation
The Sports Arena should be added to the list of stakeholders.
The San Diego Sports Arena has been added to the list of stakeholders in Appendix A, on page 28, under “Employers”.
Joe La Cava, La Jolla Community Planning Association
Some thought should be given to how you will assess the effectiveness of the plan.
On page 25, Section 4.3.7, outlines the measures necessary to gauge the effectiveness of the plan.
Rob Hutsel, San Diego River Park Foundation
In Appendix B, the times of the Project Working Group meetings are listed incorrectly.
The frequency of the Project Working Group meetings has been corrected to 1st Wednesday of the month at 3:30 p.m. in Appendix B.
Brian Gregory, UCSD Should the Coastal Commission be listed as a stakeholder in the document?
This comment has been noted and this will be addressed in a separate Agency Coordination Plan.
Brian Gregory, UCSD
On Page 11, UCSD’s student population should be listed as 28,000.
The figure for UCSD’s student population has been corrected to 28,000 on page 10.
Brian Gregory, UCSD On page 14, you mention that you would like to achieve a 10 percent increase in Web site hits. It would be helpful to know the baseline figure.
This comment has been noted and SANDAG will add the baseline figure of 2,380 for Web site hits on page 13.
Brian Gregory, UCSD MCAS Miramar should be added to the stakeholder list.
MCAS Miramar has been added to the list of stakeholders in Appendix A, on page 28, under “Military”.

M I D - C O A S T C O R R I D O R T R A N S I T P R O J E C T July 16, 2010 39
Commenter Comment Response Brian Gregory, UCSD On Page 17, UCSD and UCSD
Thornton Hospital should be listed separately.
UCSD and UCSD Thornton Hospital have been listed separately, on page 16.
Brian Gregory, UCSD Under Employers, I would propose to standardize how UCSD is referenced, by eliminating UCSD, Government and Community Relations, Student Human Relations; add UCSD and leave remaining UCSD Thornton Hospital.
References to UCSD have been corrected in the list of stakeholders in Appendix A, on page 28, under “Employers”.
William Beck, UCPG Suggestion to add HOAs in La Jolla Colony: La Florentine, Casa Bella, Avanti, Toscana, Andria, Capri, Valentia, Villas
These HOAs have been added to the list of stakeholders in Appendix A, on page 29, under “Neighborhoods/Residential”.

San Diego Association of Governments
TRANSPORTATION COMMITTEE
July 16, 2010 AGENDA ITEM NO.: 12
Action Requested: RECOMMEND TransNet ENVIRONMENTAL MITIGATION PROGRAM: FY 2010 LAND MANAGEMENT GRANTS File Number 3002700 Introduction The TransNet Extension Ordinance contains a provision for funding to assist land managers in the region to maintain the existing habitat to help implement regional habitat conservation planning. As part of this effort, the SANDAG Board of Directors has established a competitive grant program for land managers wishing to implement eligible habitat management activities as determined by the SANDAG Board. On September 25, 2009, the Board of Directors approved a process and criteria for funding eligible land management activities under the TransNet Environmental Mitigation Program (EMP) for FY 2010. A copy of the process and ranking criteria is provided as Attachment 1. The process and criteria did not significantly change from the past three grant cycles. A total of $2.085 million was made available for land management activities related to: (1) invasive species control, (2) post-fire wildfire recovery, (3) habitat restoration, and/or (4) access and litter control.
Recommendation
The Transportation Committee is asked to recommend that the Board of Directors (1) approve the prioritized list of land management projects and funding allocations (Attachment 2), and (2) authorize the Executive Director to enter into agreements for the selected grants in the proposed allocations totaling $2.085 million under the fourth cycle of this grant program.
Discussion Pursuant to Board approval, a “call for projects” was issued on November 27, 2009, and on February 5, 2010, 24 applications totaling more than $7.085 million were received. All of the projects’ proposed activities related to one or more of the four eligible activities. The call for projects stated that projects that are not ready to start within 12 months of approval by the SANDAG Board would not be eligible for this funding cycle. The work proposed under one of the applications had already received funds from a previous TransNet EMP grant, and the work is currently underway by the County of San Diego. This application was dropped from consideration due to the proposed duplication of effort.
The remaining 23 projects have been discussed and ranked in priority by an ad hoc evaluation committee made up of members from the EMP Working Group (EMPWG) and three outside advisory members consisting of two SANDAG consultants working on regional coordination of land
management and monitoring, and Commissioner Scott Peters, Vice Chair of the Port of San Diego, who provided oversight on the process and discussion.
The ad hoc evaluation committee recommendations were discussed and supported by the EMPWG on May 11, 2010, and the Regional Planning Committee on June 4, 2010. The list of grant applications will be reviewed by the Independent Taxpayer Oversight Committee (ITOC) on September 8, 2010, to review the projects for consistency with the TransNet Environmental Mitigation Program eligibility requirements as established by the Board of Directors.
Projects that are not recommended for funding, or that have been recommended for less funding than the requested amount, will be encouraged to resubmit for the FY 2011 grant funding cycle. The prioritization and recommendations are provided as Attachment 1. All of the applications are available in PDF format on the SANDAG FTP site, which is located at ftp://ftpx.sandag.org/sandag/pub/EMP_FY2010/.
Next Steps
The recommendation of the Transportation Committee will be forwarded to the SANDAG Board of Directors for consideration on September 24, 2010. The ITOC will discuss the grants at its September 8, 2010, meeting. If approved by the SANDAG Board, the Executive Director would be authorized to enter into grant agreements to begin funding projects.
CHARLES “MUGGS” STOLL Director of Land Use and Transportation Planning
Attachments: 1. EMP FY 2010 Land Management Grants – Program Overview and Instructions 2. Funding Recommendations for Proposed FY 2010 Land Management Grant Projects Key Staff Contact: Keith Greer, (619) 699-7390, [email protected]
2

Attachment 1
ENVIRONMENTAL MITIGATION PROGRAM (EMP) FY 2010 LAND MANAGEMENT GRANTS –
PROGRAM OVERVIEW AND INSTRUCTIONS
Program Description
The TransNet Extension Ordinance and Expenditure Plan, as approved by the voters on November 2, 2004, includes an Environmental Mitigation Program (EMP). The EMP is a funding allocation category for the costs to mitigate habitat impacts for regional transportation projects. The EMP is a unique component of the TransNet Extension in that it goes beyond traditional mitigation for transportation projects by including a funding allocation for habitat acquisition, management, and monitoring activities as needed to help implement regional habitat conservation plans. On September 25, 2009, the SANDAG Board of Directors approved land management and monitoring activities and a budget for FY 2010. The Board approved $2.085 million for land management projects related to (1) Invasive Control, (2) Fire Recovery, (3) Habitat Restoration, and (4) Access Control/Management and Garbage Removal. Eligible Projects SANDAG has allocated $2.085 million to address invasive species control, recovery and protection of resources damaged by the recent wildland fires, restoration of degraded habitat areas, and management to preclude damage caused by human use. This is especially critical due to the potential for the establishment of invasive species in areas burned by the 2007 wildland fires, and the need for protection of areas during the period in which they naturally recover from the burns. It is envisioned that the $2.085 million would be part of a multi-year strategic approach that includes one or more of the following activities:
1. Invasive Control – Projects that reduce existing or emerging invasive species that threaten
endangered and/or other sensitive species.
2. Fire Recovery – Projects that promote natural recovery of post-burn areas such as erosion control features (e.g., silt fences), fiber rolls or straw wattles, straw or wood chip mulching, hydro-seeding and hydro-mulching, the strategic identification of potential target areas for restoration efforts, and preparing plant materials for current and future restoration activities.
3. Habitat Restoration – Projects that engage in active habitat restoration on post-burn and
other degraded habitat lands to promote recovery of native vegetation communities and/or threatened, endangered, and other sensitive species habitat.
4. Access Control/Management and Garbage Removal – Projects that control access to
managed trails and enforce legal use of the open space areas to allow these areas to recover as soon as possible to their pre-burn conditions. This includes signage (both interpretive and cautionary), education, patrolling public use, and law enforcement. In addition, efforts to remove garbage in existing preserve systems to allow habitat areas to recover would also be eligible activities.
3

Projects that are not ready to start within 12 months of submission of the application to SANDAG will not be eligible for this funding cycle. Projects approved by the SANDAG Board of Directors for funding, that do not start within one year, will be at risk of losing their funding. Process for Allocating the Funds SANDAG will accept project proposals from land managers in San Diego County that will benefit regional conservation planning under the Natural Communities Conservation Planning Program. The applicant must own the land, or be designated to manage the land by the land owner by contract or other written form of legal documentation. The land must be conserved as open space for natural resources. Representatives of the land owner and land manager must be identified on the application form and be authorized in writing to enter into a contract agreement with SANDAG. Applicants must complete a Grant Submission application (Attachment 2) that does not exceed 12 pages. The proposal will include the purpose of the project, the scope of work, timeline, and costs. Applicants must clearly identify their proposed tasks in the scope of work, funding requested for each task, start and end dates of the tasks, and deliverables. Applicants are encouraged to identify phasing in their proposal in case full-funding for the project is not available. All project proposals will be reviewed for eligibility, ranked, and prioritized as described below. A list of recommended projects will be submitted for consideration to the Environmental Mitigation Program (EMP) Working Group and the Regional Planning Committee (RPC), and the projects are subject to approval by the SANDAG Board of Directors. Successful applicants will then be required to enter into a contract with SANDAG for grant funding. Successful applicants will be required to submit quarterly reports on their progress and a final summary report of the project’s contribution to promote habitat conservation in the region along with the final invoice. Who Will Score The Projects? An evaluation committee will be made up of EMP Working Group members and/or other qualified individuals who do not have an affiliation with any of the proposed projects. The committee will include people with knowledge of the regional preserve system and land management.
4

5
Project Evaluation and Ranking
The following evaluation and ranking criteria will be used by the evaluation committee.
Project Evaluation Criteria Point Range Weight
Maximum Score
Possible Total Score
Lack of management on site may affect protection of covered species 0-5 5 25
Site supports rare vegetation types, populations of narrow endemics, or species at risk of extirpation (e.g., Tier 1 habitat, vernal pools, cactus wren) 0-5 4 20
Critical linkage parcels or in regional wildlife corridor 0-5 4 20
Long term success of management activities is likely with clear measurable positive results which will reduce future land management costs (High Cost-Effectiveness) 0-5 4 20
Urgent action is needed to address a problem or else the site would degrade further 0-5 4 20
Dedicated staff (agency, jurisdiction, non-government organization) willing to assume long-term management 0-5 3 15
Project part of a larger strategic effort which covers a large area with multiple partners and multiple benefits? High Economy-of-Scale 0-5 3 15
Sufficient matching funds available to complete the project 0-5 2 10
Project promotes public awareness of sustainable land management through public outreach and participation 0-5 2 10
Total 155

Attachment 2
Funding Recommendations for Proposed FY 2010 Land Management Grant Projects
RPC Prioritization
Project Name Applicant
Requested Funding
Recommended Funding
Average Evaluation
Score Activities Proposed
SANDAG Staff Evaluation of Eligible
Activity
1 4_SDRC_River Habitat San Diego River Conservancy $682,962 $527,739 127.3
Invasive control & restoration on 216 acres. Installation of 1.59 miles of protective fencing and fence repair on over 2 miles of fence. Increased park patrol and landowner outreach. Three years of funding proposed.
Invasive Control and Access Control
2 20_County_Daley Preserve County of San Diego $169,180 $169,180 121.7
Invasive control along 9,000 feet of Dulzura Creek. Development of site-specific restoration plan. Permit acquisitions. One year of funding proposed. Invasive Control
3 2_CBI_Southcrest_Crestridge Conservation Biology Institute
$225,930 $225,930 120.7
GIS layers of invasive species and MSCP covered plant species. Invasive control and garbage removal. Increased security and public outreach. One year of funding proposed.
Invasive Control, Access Control and Litter
Removal
4 19_County_Lusardi Creek County of San Diego
$107,060 $107,060 119.4
Invasive control on 194.5 acres of riparian and uplands burned in the 2007 wildfires. Restoration of ecological and hydrological functions of the creek. Three years of funding proposed.
Invasive Control and Post Wildfire Recovery
5 10_SDPUD_San Pasqual Valley City of San Diego $184,623 $184,623 119.4
Integrated Weed Management Plan and invasive control on 30 acres along Santa Maria Creek. Three years of funding proposed. Invasive Control
6 1_CBI_SouthCounty_Grassland Conservation Biology Institute $699,000 $283,292 119.1
Detailed habitat assessment of 3,000 acres of grassland & standardized invasive species removal protocols and prioritizing management actions. Determine cost per acre of alternative invasive control and restoration techniques. Two years of funding proposed to include $100,000 of start-up money for restoration on 30 acres. Invasive Control and
Habitat Restoration
7 18_County_Lakeside Linkage County of San Diego
$200,824 $200,824 118.6 Coast prickly pear cactus planting on 5 acres for adjacent cactus wren populations. Invasive control. Five years of funding proposed. Post Wildfire Recovery
8 22_CityCV_Tarplant_Thornmint City of Chula Vista
$323,605 $268,428 114.4
Restoration and enhancement for San Diego thornmint and Otay tarplant. Invasive control, dethatching, and fencing. Three years of funding proposed plus $30,000 for fencing.
Invasive Control and Access Control
9 13_RBC_Crest Canyon Rocks Biological Consultants $74,480 $74,480 111.7
Invasive species map and invasive control. Public outreach and closure of 50-70% of unauthorized trails. Three years of funding proposed.
Invasive Control and Access Control
Gray shaded rows are recommended for funding 6

RPC Prioritization
Project Name Average SANDAG Staff Requested Recommended Evaluation Activities Proposed Evaluation of Eligible Applicant Funding Funding Score Activity
10 16_SDWMA_Invasive Control
San Diego Weed Management Area
$108,000 $43,444 111.0
Project "A" reduction of perennial pepperweed and yellow starthistle infestations throughout the County. Project "B" treatment of Canary Island St. John's wort in Florida Canyon in Balboa Park. Two year of partial funding proposed to work on Project "A".
Invasive Control
11 11_SWIA_Invasive Control
Southwestern Interpretative Association
$820,000 $0 110.4
Invasive control and restoration on 212 acres of riparian habitat in the Tijuana River Valley. Monitoring of treatment effectiveness and public outreach. Invasive Control
12 15_CitySD_Vernal Pools City of San Diego
$373,300 $0 107.0
Restoration and management of vernal pools and plantago populations for Quino checkerspot butterfly. Fencing of Otay Lakes and Proctor Valley vernal complexes. Habitat Restoration
13 5_LPLF_Mouth Maintenance
Los Penasquitos Lagoon Foundation
$119,800 $0 105.6
Restoration of 469 acres of coastal salt marsh and sandy habitats. Improvement of tidal mixing by removal of 30,000 - 45,000 cubic yards of sand and cobble from lagoon entrance. Placement of that sand and cobble for beach restoration. Habitat Restoration
14 21_CityCV_Central Preserve City of Chula Vista
$289,879 $0 103.1
Creation of Preserve Habitat Manager position to expand and initiate programs directed by the Area Specific Management Directives in the City of Chula Vista. Programs include trash removal, access control, and invasive control.
Invasive Control, Access Control and Litter
Removal
15 12_CLC_Carmel Mountain Chaparral Lands Conservancy
$466,206 $0 103.0
Restoration of 7.5 acres of vernal pools and 1.5 acres of short-leaved Dudley habitat. Installation of 3,645 feet of fencing and interpretive boardwalk. Community outreach.
Habitat Restoration and Access Control
16 7_BLF_Restoration Bataquitos Lagoon Foundation
$755,017 $0 102.4
Annual preparation and maintenance of 5 least tern nesting sites. Monitoring and surveillance of least tern nesting sites. Habitat restoration and community outreach. Habitat Restoration
17 8_22Ag_Least Tern 22nd Agricultural District
$92,946 $0 101.7
Access control on least tern nesting sites through patrols and video surveillance. Educational signage and opportunities for outreach through video monitoring.
Habitat Restoration and Access Control
18 14_RBC_ Mission Bay Rocks Biological Consultants
$85,936 $0 99.0 Invasive species map of four locations in Mission Bay. Invasive control and distribution of brochures. Invasive Control
Gray shaded rows are recommended for funding 7

Gray shaded rows are recommended for funding 8
RPC Prioritization
Project Name Applicant
Requested Funding
Recommended Funding
Average Evaluation
Score Activities Proposed
SANDAG Staff Evaluation of Eligible
Activity
19 6_SELC_Econdido Creek San Elijo Lagoon Conservancy
$311,908 $0 91.6
Cowbird trapping and least Bell's vireo monitoring along 1.3 miles of Escondido Creek. Restoration of 13 acres of southern willow scrub focusing on removal of Eucalyptus.
Invasive Control and Habitat Restoration
20 17_Canyonlands Canyonlands $324,920 $0 91.4
Invasive control and planting of maritime chaparral and coastal sage scrub species in Florida Canyon in Balboa Park. Coordination with community volunteer groups.
Invasive Control and Habitat Restoration
21 3_BCLT_Wright's Field Back Country Land Trust
$18,250 $0 90.9
Repair 100-foot erosion ditch. Control of erosion and run-off and increased retention of groundwater in native grassland. Surveys for Quino checkerspot butterfly, Hermes copper butterfly, and San Diego Thornmint along with associated host plants and pollinator species.
Habitat Restoration
22 9_SDRP_Pamo_Santa Ysabel San Dieguito River Valley Park
$351,280 $0 82.6
Bullfrog eradication at Santa Ysabel Creek Gorge. Creation of 2 staging areas for vehicles to protect arroyo toad habitat along Pamo Road. Designated trail and educational signage. Invasive Control
23 24_Klemm Ranch Klemm Ranch $40,000 $0 80.1 Invasive control of pepperweed and salt cedar in San Pasqual River Valley. Arundo and tamarisk removal funded in 2009. Invasive Control
n/a 23_CityCV_Cactus Wren City of Chula Vista
$260,032 $0 Restoration of cactus wren habitat in Salt Creek. County of San Diego already under contract to complete this work.
Post Wildfire Recovery and Habitat Restoration
Total: $7,085,138 $2,085,000

San Diego Association of Governments
TRANSPORTATION COMMITTEE
July 16, 2010 AGENDA ITEM NO.: 13
Action Requested: RECOMMEND
2010 TransNet PLAN OF FINANCE UPDATE File Number 1500100
Introduction
The TransNet Plan of Finance is updated on an annual basis, or more frequently as circumstances arise. The Board of Directors approved the last Plan of Finance update in March 2009. On July 2, 2010, staff updated the Transportation Committee on the major revenue, budget, and cash flow assumptions used in the 2010 TransNet Plan of Finance update, noting any significant differences from 2009. Staff also reported on the results of two initial scenarios: (1) a Baseline scenario that addresses the near-term cash flow needs to keep the existing TransNet Early Action Program (EAP) projects on their current schedules; and (2) an initial Robust scenario that would advance to construction (prior to FY 2018) several projects currently under development in key EAP corridors and prepare new “shovel-ready” projects. The Transportation Committee discussed these two initial scenarios and supported moving forward with a Robust scenario that would enable advancing additional projects in the EAP corridors.
Recommendation
The Transportation Committee is asked to recommend that the Board of Directors (1) approve the 2010 TransNet Plan of Finance update, which incorporates the proposed projects in the revised Robust scenario (Attachments 4); (2) authorize the Executive Director to amend the FY 2011 SANDAG Budget to incorporate the new capital projects; and (3) approve revision to the set-aside of federal and state discretionary funding for the TransNet Early Action Program from 94 percent to 90 percent. These actions will support the pending issuance of $300-$350 million in long-term fixed rate debt.
Since the July 2 meeting, staff has made refinements to the “Robust” scenario, and this report includes a summary of the projects proposed to be advanced along with the additional bonding that would be needed during FY 2011 to meet projected cash flow needs. This item will be presented to the TransNet Independent Taxpayer Oversight Committee (ITOC) on July 14, 2010. Any comments received from the ITOC will be presented to the Transportation Committee on July 16, 2010. Discussion
TransNet Early Action Program
The current TransNet EAP (Attachment 1) includes the development of the Interstate 15 (I-15) Managed Lanes and Bus Rapid Transit (BRT) service; widening of State Route 76 (SR 76);

State Route 52 (SR 52) widening and extension; implementation of the Mid-Coast Corridor, SuperLoop, and Mid-City Rapid transit projects; and Trolley vehicle and station upgrades along the Blue and Orange Lines. The EAP also includes environmental efforts for the Interstate 5 (I-5) North Coast Corridor, including high-occupancy vehicle (HOV) lanes, and environmental and design efforts for the Interstate 805 (I-805) corridor and implementation of the South Bay BRT service. In July 2009, the Board of Directors approved programming $70.4 million of TransNet funds for the design of seven projects in the Los Angeles-San Diego-San Luis Obispo (LOSSAN) coastal rail corridor, design of HOV lanes in the I-5 North Coast corridor, and design of guideway, a direct-access ramp and station, and HOV lanes on I-805 and along State Route 94 to support the South Bay BRT service. The objective was to replenish the number of shovel-ready projects, to enable the region to capitalize on future funding opportunities.
Analysis of 2010 Plan of Finance Update
The last Plan of Finance update approved in March 2009 enabled SANDAG to meet the near-term cash flow needs of the TransNet EAP and the Board’s objectives to make early progress on constructing major corridor projects and to develop the next list of ready-to-go projects. The 2009 update enabled completion of all EAP construction projects by FY 2016. As part of the 2010 Plan of Finance update, staff has evaluated a Baseline scenario that would keep all existing EAP projects on their current schedules and an additional scenario that would advance several additional projects in the EAP corridors. More details about the major assumptions used for the 2010 update are provided in Attachment 3, which includes a summary of projected sales tax revenues, state and federal matching revenues, program costs, and the proposed revision to cost assumptions for the I-5 North Coast Corridor (discussed with the Transportation Committee on July 2). With the 2010 update, we have continued to see declines in construction costs, which have led to significantly lower bid prices on several key EAP project construction contracts. In addition to cost adjustments to the current EAP projects, these trends have led to a substantial revision to the cost escalation assumptions for this 2010 Plan of Finance update and present the Board with a unique opportunity. The decline in project costs has helped offset the reduction in sales tax revenue. The chart shown in Attachment 2 indexes the costs and revenues to 2005 and tracks their cumulative growth rates through 2017. In addition to these recent trends (costs falling more rapidly than revenues), the chart shows that staff is expecting the cumulative rate of growth in sales tax revenue to outpace the increase in construction costs. This general trend (revenues rising faster than costs) is not unusual coming out of a recession as price pressures are kept at bay while the economy struggles to put idle resources back to work and get back above prerecession levels of economic production and output. The chart suggests that for a short period of time (about five years) the purchasing power of the TransNet program would increase, providing an opportunity to advance the planning and construction schedule of additional projects without jeopardizing the financial feasibility of the remaining projects.
2

Baseline and Revised Robust Scenarios Working with our financial advisor, staff has evaluated two Plan of Finance scenarios – a Baseline scenario and a revised Robust scenario: Baseline Scenario – The Baseline scenario evaluated in the 2010 Plan of Finance update would enable the current EAP projects to be completed by FY 2016 (same as 2009 update). To meet near-term cash flow needs for the Baseline scenario, SANDAG would need to obtain bond financing of approximately $100-$110 million in FY 2012 and $160-$170 million in FY 2014. The program balance at the end of the 40-year program is projected to be approximately $400 million (in 2009 dollars). For comparison purposes, the 2009 Plan of Finance update projected a negative cash flow would occur in FY 2036, resulting in the assumption that $1.3 billion in additional funding (in 2008 dollars) would need to be identified to keep the 40-year TransNet program whole. The substantial decline in construction costs, as reflected in the 2010 Plan of Finance update, presents a unique opportunity. Based on the analysis to date, the TransNet program would have the capacity to advance additional EAP projects to construction, while keeping the 40-year program whole (without the need to identify additional matching funds in the future). Revised Robust Scenario – Staff also has evaluated a revised “Robust” scenario, which would advance additional projects to construction as well as prepare the next list of shovel-ready projects – allowing the region to capitalize on opportunities presented by the current financial and construction market conditions. The additional projects included in this scenario continue to focus on the approved EAP corridors, and they reflect the Board’s priorities for project readiness – putting resources on projects that are “ready to go” to construction, funding the next phase of work for corridor projects the region has started, and thinking longer-term by starting environmental and design work for future opportunities. The proposed projects also are consistent with the current 2030 Regional Transportation Plan (RTP), reflecting progress on the projects the RTP anticipated would be completed by the interim year 2020. Like the Baseline, the revised Robust scenario would enable the current EAP projects to be completed by FY 2016. This scenario also would advance to construction several projects under development in the LOSSAN rail corridor and allow for the completion of the environmental phases and design of other LOSSAN corridor projects. Also proposed would be various construction projects in the I-15 Corridor to support the I-15 BRT service and replacement of the Nordahl Bridge; construction of HOV lanes in the I-805 Corridor (North and South segments); and construction of HOV lanes and related improvements in the I-5 North Coast Corridor (Attachment 4). To take advantage of the low cost of construction marketplace, the revised Robust scenario would advance nearly $1.2 billion in project costs prior to FY 2018 in comparison with the Baseline scenario. To meet near-term cash flow needs for this revised Robust scenario, SANDAG would need to obtain bond financing of approximately $300-$350 million in FY 2011 and $900-$950 million in FY 2013. The analysis shows that at the end of the 40 years, the TransNet program would be kept whole, demonstrating that all the Major Corridor projects included in the Extension Ordinance could be completed by the program’s end.
3

Sensitivity Analysis for I-5 North Coast Corridor – As discussed with the Transportation Committee on July 2, when compared with other potential EAP projects that could be advanced to construction, the I-5 North Coast Corridor project has significant risks that could impact the project delivery schedule; these schedule risks include the improvements needed across multiple coastal lagoons and securing necessary permits from the California Coastal Commission. Caltrans released the draft environmental document for the I-5 North Coast Corridor on July 9, and the construction schedule should be better detailed once the environmental phase is complete. While there are potential risks as the project moves through the environmental process, with funding and permits it is estimated the initial two HOV lane construction phase could be opened to the public by 2014. In addition to serving commuter and local trips in the region, the I-5 corridor is a lifeline for the Southern California/Baja California region, providing a critical link for commercial vehicles traveling between the U.S./Mexico border area and the greater Los Angeles basin. To identify the possible effects a schedule delay could have on near-term financing needs, staff conducted a sensitivity analysis that assumes completion of construction of the I-5 North Coast Corridor HOV lanes and related improvements after FY 2018. This analysis shows that a project schedule delay would reduce the FY 2011 borrowing need from $300-$350 million to $250-$300 million. To take advantage of historically low fixed rate borrowing costs and current construction market conditions, staff recommends sizing the FY 2011 bond issuance in the $300-$350 million range. If delays to project schedules occur that would affect the cash flow assumed in the 2010 Plan of Finance update, additional design projects could be advanced similar to the Board’s action in July 2009 to prepare the next round of ready-to-go projects. In addition, the annual updates to the Plan of Finance provide the opportunity to review the ongoing project budget and cash flow needs and adjust any future financing plans. ITOC Comments – At its June 28, 2010, meeting, the ITOC supported moving forward with the Robust scenario, noting that the current financial and construction market conditions provided a unique opportunity to advance projects at lower costs. The ITOC focused its comments on the capacity for project delivery; the Committee requested that SANDAG and Caltrans evaluate using design-build, design-sequencing, and private sector staffing as necessary to help deliver projects under the aggressive delivery schedules for the Robust scenario. SANDAG and Caltrans District 11 have had a long history of using consultants in the development of major TransNet projects and have had experience with alternative project delivery methods, including the use of design sequencing on the I-15 and SR 76 corridors. Both agencies are continuing to work together to evaluate which TransNet projects would make good design-build candidates.
4

5
Next Steps If the Transportation Committee recommends approval of the 2010 TransNet Plan of Finance update, final action would be scheduled for the July 23, 2010, Board of Directors meeting. Upon Board action on the 2010 update, staff would amend the FY 2011 Budget to incorporate the new capital projects in the revised Robust scenario, including detailing the multi-year revenues, expenses, and schedule by phase. Draft and final bond documents would be presented to the ITOC, Transportation Committee, and Board of Directors in the fall to enable a bond issuance by the end of the calendar year. In addition, an amendment to the Regional Transportation Improvement Program would be brought to the ITOC and Transportation Committee in the fall to program the TransNet funding and federal and state matching funds for the approved projects.
KIM KAWADA TransNet and Legislative Affairs Program Director Attachments: 1. TransNet Early Action Projects - May 2010 (map) 2. Comparison of TransNet Revenues and Construction Index – Cumulative Escalation
Indexed to 2005 3. 2010 TransNet Plan of Finance Update – Major Assumptions 4. TransNet Early Action Program Baseline and Revised Robust Scenarios Key Staff Contacts: Kim Kawada, (619) 699-6994, [email protected] Richard Chavez, (619) 699-6989, [email protected] Marney Cox, (619) 699-1930, [email protected]

Countyof
San Diego
Camp Pendleton
SR 76: Widen highway
SR 52: Widen and extend highway
Mid-Coast: Transit: Old Town-UCSD Transit: UTC SuperLoop
I-15: HOV/Express Lanes Transit: Escondido-Downtown Transit: Escondido-Sorrento Valley
I-805: HOV/Express Lanes Transit: Otay-Downtown Transit: Otay-Sorrento Valley
North Coast: I-5 HOV/Express Lanes Coastal rail double-tracking
SPRINTER: Oceanside-Escondido light rail
Blue and Orange Line Trolley: Low-floor vehicles Station upgrades
Mid-City: Transit: Downtown-SDSU
Goods Movement: South Line rail upgrades SR 905
EARLY ACTION PROJECTS May 2010 www.KeepSanDiegoMoving.com
1
7
4
4
4
9
8
8
5
2 2
10
108
3
5
3
6
Highway Projects Completed Under Construction Preliminary Engineering
Transit Projects Completed Under Construction Preliminary Engineering
Light Rail Line
Attachment 1
6

-30%
-20%
-10%
0%
10%
20%
30%
2005 2006 2007 2008 2009 2010 2011 2012 2013 2014 2015 2016 2017
Construction Index TransNet Revenues
ProjectedActual
Comparison of TransNet Revenues and Construction IndexCumulative Escalation Indexed to FY2005
Attachment 2
7

Attachment 3
2010 TransNet Plan of Finance Update Major Assumptions
Projected Sales Tax Revenues – The recession that began in December 2007 resulted in downward trends in taxable retail sales from which TransNet revenues are derived. In January 2010, the Board of Directors approved a 10 percent reduction to the FY 2010 TransNet sales tax revenue estimates, compared to actual FY 2009 receipts, making it the third year in a row of revenue declines. For FY 2011, a 1.87 percent increase in TransNet revenue is projected.
SANDAG staff expects a modest economic recovery over the next few years, with net job growth of 0.5 percent to 1.0 percent (an increase of approximately 6,000 to 12,000 local jobs). The unemployment rate is expected to begin to decline slowly beginning in the second quarter of 2010, reducing by one percentage point by the end of 2010. The anticipated slow rate of economic growth nationally and locally during the year, setting the pace of the recovery for the next few years, is reflected in our local sales tax revenue forecasts. During FY 2015, our sales tax revenue estimates are expected to exceed the level reached during 2007 prior to the start of the recession. The overall revenue growth rates assumed in the 2009 and 2010 Plan of Finance updates are summarized in Table 1, below.
Table 1. Plan of Finance (POF) – Projected TransNet Revenue Annual Rates of Change, FY 2009 through FY 2048
Revenue
Growth
Rate
FY
2009
FY
2010
FY
2011
FY
2012
FY
2013
FY
2014
FY
2015
FY
2016
FY
2017
FY 2018-
FY 2048
2009 POF -9.00% 2.00% 3.50% 3.50% 5.40% 4.50% 6.30% 6.37% 5.54% 4.91% to
6.43%
2010 POF
update
-9.17%
(actual)
-10.00% 1.87% 3.64% 5.39% 8.00% 6.70% 5.18% 4.84% 3.83% to
5.18%
State and Federal Matching Revenues – The amount of state and federal funds assumed for the Early Action Program (EAP) are based on committed funds to date, including the current Regional Transportation Improvement Program period (FY 2009 to FY 2013). For future years, SANDAG estimated federal, state, and local transportation funds based on historic experience. The 2010 Plan of Finance revenue assumptions for future years are consistent with the draft 2050 Regional Transportation Plan (2050 RTP) revenue estimates that are currently under development. Current Board policy directs 94 percent of all discretionary state and federal formula funds1 to support the TransNet EAP, and the remaining 6 percent of these funds for non-EAP projects, such as the transportation demand management (TDM) and transportation systems management (TSM) programs.
1 These revenue sources include the State Transportation Improvement Program, Proposition 1B State-Local Partnership
Program, Regional Surface Transportation Program, and Congestion Mitigation and Air Quality funding program. The
American Recovery and Reinvestment Act of 2009 funding also has been dedicated to fund EAP projects.
8

As required by Senate Bill 375 (Steinberg, 2008), SANDAG must develop a Sustainable Communities Strategy (SCS) as part of the 2050 RTP. The SCS must meet certain greenhouse gas emission targets established by the California Air Resources Board (CARB), or SANDAG must prepare an Alternative Planning Strategy to meet the CARB targets. The initial greenhouse gas target-setting scenarios tested to date have shown that TDM and TSM measures could help reduce greenhouse gas emissions in the region. With the 2010 Plan of Finance update, staff evaluated other funding ratios that could continue to provide sufficient funds to support the TransNet EAP as well as provide opportunities to advance the region’s TDM and TSM programs. Staff recommends revising the commitment of discretionary state and federal funds for the TransNet program from 94 percent to 90 percent, thereby increasing the state and federal funds available for the region’s TDM and TSM programs. The draft 2010 Plan of Finance assumes 90 percent of all discretionary state and federal revenues for the TransNet program. Program Costs – For TransNet EAP projects, SANDAG works with our project partners to update the Capital Improvement Program project costs and schedules as part of the annual SANDAG Budget. These revised and more detailed costs and schedules are used for the EAP projects, while the non-EAP project costs use the rates of change in costs shown below in Table 2. With the approval of the FY 2011 Budget in May 2010, the Board of Directors approved several budget changes, which are reflected in this year’s Plan of Finance update. After a period of unprecedented high rates of growth in construction costs from 2004 to 2007, we have seen an equally unprecedented decline in construction costs during the last two years (see Caltrans Construction Index chart below). This decline has resulted in lower costs for several EAP projects. Going forward, additional declines in construction costs are anticipated during FY 2011, and then costs are expected to begin to escalate and return to typical annual escalation rates of 3 percent by FY 2015. The escalation rates assumed in the 2009 and 2010 Plan of Finance updates are shown in Table 2, below:
Table 2. Plan of Finance (POF) – Projected TransNet Construction Costs Annual Rates of Change, FY 2009 through FY 2048
Construction
Escalation
Rate
FY
2009
FY
2010
FY
2011
FY
2012
FY
2013
FY
2014
FY
2015
FY
2016
FY
2017
FY 2018-
FY 2048
2009 POF -3.00% 0.00% 2.00% 3.00% 3.00% 3.00% 3.00% 3.00% 3.00% 3.00%
2010 POF
update
--- -8.00% -1.00% 0.00% 1.00% 2.00% 3.00% 3.00% 3.00% 3.00%
Proposed Revision to Cost Assumptions for the I-5 North Coast Corridor – Except for construction projects currently underway, costs for typical TransNet projects are based on the original budget contained in the TransNet Extension Ordinance, updated to current year dollars, and then escalated to the year of construction based on projected construction escalation rates. As a project progresses from planning and environmental stages to preliminary engineering and design, cost estimates are updated as additional information is gathered and the project’s scope is refined. These updated estimates are evaluated as part of the annual budget and Plan of Finance updates.
9

10
At the June 18 Transportation Committee meeting, Caltrans provided a status report on the I-5 North Coast Corridor project, which extends 27 miles from La Jolla Village Drive in San Diego to Vandegrift Boulevard in Oceanside. Caltrans is finalizing the project’s draft environmental document and expects to release it in early July. The draft document includes four possible build alternatives, all of which would include the construction of a four-Managed Lane (ML) facility in the median of I-5. The alternatives differ in their assumptions for additional general purpose lane widening, and whether they include either a concrete barrier separating the ML from the general purpose lanes or a four-foot painted buffer separation.2 For the I-5 North Coast Corridor, the TransNet Extension Ordinance assumed a $1.2 billion cost (in 2002 dollars), which when escalated to 2009 would result in a $1.7 billion cost estimate. As part of the environmental phase, Caltrans has prepared updated project cost estimates, and due to the complexity of the proposed improvements in the coastal corridor, the updated estimates are significantly higher than the original 2002 estimates. The four build alternatives range between $3.3 billion and $4.4 billion in estimated costs. To reflect these more up-to-date estimates in the 2010 Plan of Finance, staff proposes to assume a $3.3 billion cost estimate for the I-5 North Coast Corridor project, which is consistent with the lowest cost of the four build alternatives included in the draft environmental document. This higher project cost estimate has been assumed in both the Baseline and revised Robust scenarios. The initial evaluation shows that the higher estimate would not significantly impact the affordability of the overall TransNet program.
2 The four alternatives include: (1) 8 general purpose lanes plus 4 buffer-separated 4 ML; (2) 8 general purpose lanes plus
4 barrier-separated ML; (3) 10 general purpose lanes plus 4 buffer-separated 4 ML; and (4) 10 general purpose lanes plus
4 barrier-separated ML.

225
250
275
300
325
350
Caltrans Construction Index (12-Month Average)
125
150
175
200
Attachment 4
11
sgr
Rectangle

TransNet Early Action Program ($thousands)Baseline and Revised Robust Scenarios
BaselineRevised Robust Increase
1 I-15 2 I-15 South 4ML $361,937 $361,937 $03 I-15 Middle 4ML $471,115 $471,115 $04 I-15 North 4ML $215,427 $215,427 $05 I-15 FasTrak® $24,122 $24,122 $06 I-15 BRT Stations RB,SS,Del Lago $46,170 $46,170 $07 I-15 Mira Mesa DAR & BRT Station $79,557 $79,557 $08 I-15 Mid-City In-Line BRT Stations $21,631 $21,631 $09 I-15 BRT Vehicles & Planning $34,608 $34,608 $0
10 Downtown Stations $9,154 $9,154 $011 Nordahl Bridge Replacement $13,000 $37,042 $24,04212 Mira Mesa Blvd Queue Jumpers $0 $14,000 $14,00013 I-15 BRT Parking Structures $0 $39,000 $39,00014 BRT Maintenance Facility $0 $50,900 $50,90015 BRT Layover Facility $0 $16,000 $16,00016 $1,276,721 $1,420,663 $143,9421718 I-80519 I-805 South 4ML $31,516 $31,516 $020 I-805 North 4ML $9,424 $9,424 $021 South Bay BRT $97,108 $97,108 $022 I-805 2HOV/Carroll Cyn DAR $86,743 $86,743 $023 Bus on Shoulder $22,500 $22,500 $024 SR 94 2HOV (I-5 to I-805) $11,000 $11,000 $025 BRT Guideway (Heritage to I-805) $2,800 $2,800 $026 I-805 South 2HOV $15,000 $200,000 $185,00027 I-805 North 2HOV $16,000 $165,000 $149,00028 $292,091 $626,091 $334,0002930 I-5 South/ SR 94/ SR 12531 Mid-Coast LRT $1,246,292 $1,246,292 $032 SuperLoop Transit $36,349 $36,349 $033 Blue-Orange Line PM $23,019 $23,019 $034 Blue Line Crossovers $29,270 $29,270 $035 Blue Line Stations $64,400 $64,400 $036 Blue Line New Rail $56,600 $56,600 $037 Blue Line Slope Repair $2,725 $2,725 $038 Blue Line Substation Rehab $1,390 $1,390 $039 Blue-Orange Line Platform Upgrades $43,290 $43,290 $040 Blue-Orange Line New Vehicles $233,000 $233,000 $041 SR 94/ SR 125 South to East Connector $0 $1,000 $1,00042 $1,736,335 $1,737,335 $1,00043
12 July 9, 2010
Attachment 4

TransNet Early Action Program ($thousands)Baseline and Revised Robust Scenarios
BaselineRevised Robust Increase
44 I-5 North 45 I-5 North Coast 4ML $57,282 $57,282 $046 I-5 2HOV/Lomas Interchange $71,759 $71,759 $047 I-5 2HOV (Manchester to SR 78) $32,500 $32,500 $048 I-5 Soundwalls (Manchester to SR 78) $0 $41,500 $41,50049 I-5 McKinnon Bridge Replacement $0 $12,000 $12,00050 I-5 2HOV (Manchester to SR 78) $0 $216,000 $216,00051 Fiber Optic Line $0 $13,500 $13,50052 I-5 San Elijo Brige $0 $180,500 $180,50053 $161,541 $625,041 $463,5005455 COASTER/LOSSAN56 Sorrento-Miramar (Phase 1) $23,700 $23,700 $057 Oceanside Stub Tracks $3,058 $18,000 $14,94258 Carlsbad Double Track $1,600 $1,900 $30059 Poinsettia Run-Through $1,700 $15,500 $13,80060 Cardiff - Craven (San Elijo) $4,600 $93,200 $88,60061 Sorrento Valley Double Track $3,700 $33,700 $30,00062 Tecolote Crossovers $9,400 $10,200 $80063 Eastbrook to Shell Double Track $0 $7,000 $7,00064 Carlsbad Village Double Track $0 $6,000 $6,00065 Elvira to Morena Double Track $0 $80,000 $80,00066 Sorrento-Miramar (Phase 2) $0 $5,000 $5,00067 San Dieguito Double Track $0 $5,000 $5,00068 LOSSAN PE $0 $1,000 $1,00069 $47,758 $300,200 $252,4427071 SR 5272 SR 52 Widening (I-15 to Mast) $44,425 $44,425 $073 SR 52 Extension $520,529 $520,529 $074 $564,954 $564,954 $075 SR 7876 SPRINTER $65,870 $65,870 $07778 SR 7679 SR 76 Middle $171,359 $171,359 $080 SR 76 East $201,549 $201,549 $081 $372,908 $372,908 $082 Mid-City 83 Mid-City Rapid $44,526 $44,526 $08485 Goods Movement86 San Ysidro Yard $40,460 $40,460 $087 South Line Improvements $107,030 $107,030 $088 SR 905 (I-805 to Britannia) $77,646 $77,646 $089 $225,136 $225,136 $09091 TOTAL $4,787,839 $5,982,723 $1,194,884
13 July 9, 2010

Appendix B
REGIONAL EMISSIONS ANALYSIS AND MODELING PROCEDURES
adi
Text Box
This Relates to Agenda Item #5 Transportation Committee July 16, 2010

Appendix B
2008 REGIONAL TRANSPORTATION IMPROVEMENT PROGRAM (RTIP) AMENDMENT NO. 23 REGIONAL EMISSIONS ANALYSIS AND MODELING PROCEDURES
BACKGROUND
The federal Clean Air Act (CAA), which was last amended in 1990, requires the United States Environmental Protection Agency (U.S. EPA) to set National Ambient Air Quality Standards (NAAQS) for pollutants considered harmful to public health and the environment. California has adopted state air quality standards that are more stringent than the NAAQS. Areas with levels that exceed the standard for specified pollutants are designated as non-attainment areas.
The U.S. EPA requires that each state containing non-attainment areas develop plans to attain the NAAQS by a specified attainment deadline. These attainment plans are called State Implementation Plans (SIP). The San Diego County Air Pollution Control District (APCD) prepares the San Diego portion of the California SIP. Once the standards are attained, further plans—called Maintenance Plans—are required to demonstrate continued maintenance of the NAAQS.
SANDAG and the U.S. Department of Transportation (DOT) must make a determination that the Regional Transportation Plan (RTP) and the Regional Transportation Improvement Program (RTIP) conform to the SIP for air quality. Conformity to the SIP means that transportation activities will not create new air quality violations, worsen existing violations, or delay the attainment of the national ambient air quality standards.
On November 30, 2007, the SANDAG Board made a finding of conformity of the 2030 RTP: Pathways for the Future and the 2006 RTIP Amendment No. 9 and adopted the plan. The U.S. DOT made its conformity determination on December 10, 2007.
On July 25, 2008, the SANDAG Board adopted the 2008 RTIP. On November 17, 2008, the U.S. DOT made a finding of conformity for the 2008 RTIP and a conformity redetermination for the 2030 Regional Transportation Plan: Pathways for the Future.
On January 22, 2010, the SANDAG Board adopted the 2008 RTIP Amendment No. 16 and its conformity finding. The U.S. DOT made a finding of conformity for this amendment on February 19, 2010.
SANDAG was requested to amend the 2008 RTIP to incorporate the addition of a project in the City of San Marcos (SM44) which is described in detail in Attachment 2.
The San Diego region attained the federal One-Hour Ozone Standard in 2001. The U.S. EPA redesignated the San Diego air basin as attainment/maintenance and approved the One-Hour Ozone Maintenance Plan as a SIP
28

revision, effective on July 28, 2003. On June 15, 2005, the U.S. EPA revoked the federal One-Hour Ozone Standard after the Eight-Hour Ozone Standard became applicable for conformity.
On April 15, 2004, the EPA designated the San Diego air basin as nonattainment for the 1997 Eight-Hour Ozone Standard. This designation took effect on June 15, 2004. Several areas that are tribal lands in eastern San Diego County were excluded from the nonattainment designation. As shown in Figure 2, La Posta Areas #1 and #2, Cuyapaipe, Manzanita, and Campo Areas #1 and #2 are attainment areas for the 8-Hour Ozone NAAQS.
The air basin was initially classified as a basic nonattainment area under Subpart 1 of the Clean Air Act and the maximum statutory attainment date for the Eight-Hour Ozone Standard was set as June 15, 2009. However, EPA, in response to a court decision, on January 16, 2009, proposed that, among other areas of the country, the San Diego basic nonattainment area will be reclassified as a Subpart 2 moderate nonattainment area, with a maximum statutory attainment date of June 15, 2010. Final EPA action on this proposed reclassification is yet to be taken.
In cooperation with the San Diego APCD and SANDAG, the California Air Resources Board (ARB) developed an Eight-Hour Ozone Attainment Plan which was submitted to the U.S. EPA on June 15, 2007. The budgets in the Eight-Hour Ozone Attainment Plan for San Diego County were found adequate for transportation conformity purposes by the U.S. EPA, effective June 9, 2008.
The San Diego region also has been designated by the U.S. EPA as a federal maintenance area for the Carbon Monoxide (CO) standard. On November 8, 2004, the ARB submitted the 2004 revision to the California SIP for CO to the U.S. EPA. Effective January 30, 2006, the U.S. EPA has approved this maintenance plan as a SIP revision.
TRANSPORTATION CONFORMITY: MODELING PROCEDURES
Introduction
The 2008 RTIP, including Amendment No. 23, is consistent with the 2030 RTP: Pathways for the Future. As a financially constrained plan, the 2008 RTIP only contains those major transportation projects listed in the Revenue Constrained 2030 RTP. Chapter 4 of the 2008 RTIP includes a detailed discussion on fiscal constraint. Conformity of the 2030 RTP expires on December 10, 2011. However, to comply with the transportation conformity rule standards which require a redetermination of conformity within two years of new budgets, the SANDAG Board of Directors approved a redetermination of conformity of the 2030 RTP: Pathways for the Future in conjunction with the 2008 RTIP on July 25, 2008. The 2008 RTIP is being amended to include an additional capacity increasing project and the SANDAG Board of Directors will be asked to approve the 2008 RTIP Amendment No. 23 and make a conformity determination for the RTIP and re-determination for the RTP on July 23, 2010. Table 3 to Table 5 include the conformity analysis for both the 2008 RTIP as amended and the 2030 Revenue Constrained RTP.
Growth Forecasts
Every three to five years, SANDAG produces a long-range forecast of population, housing, and employment growth for the San Diego region. The most recent is the 2050 Regional Growth Forecast, which was accepted by the SANDAG Board on February 26, 2010 for planning purposes. The 2050 Regional Growth
29

Forecast also will be utilized in the development of the 2050 RTP which is anticipated to be adopted in summer 2011.
The forecast process relies on three integrated forecasting models. The first one, the Demographic and Economic Forecasting Model (DEFM), provides a detailed econometric and demographic forecast for the entire region. The second one, the Interregional Commuting Model, provides a forecast of commuting between the San Diego region, Orange County, southwest Riverside County, Imperial County, and Tijuana/Northern Baja California. The third one, the Urban Development Model, allocates the results of the first two models to subregional areas based upon the current plans and policies of the jurisdictions.
In April 2010, SANDAG consulted with the San Diego Region Conformity Working Group (CWG) on the use of the 2050 Regional Growth Forecast for the air quality conformity analysis of the 2008 RTIP as amended and 2030 RTP conformity redetermination. Previously, both U.S. DOT and U.S. EPA concurred that approved plans should be used as input in the air quality conformity process. Figure 1 and Table 1 show the regional population, jobs and housing growth forecast for the San Diego region through 2050.
Figure 1—San Diego Regional Population, Jobs, and Housing Forecast
0.0
1.0
2.0
3.0
4.0
5.0
1970 1975 1980 1985 1990 1995 2000 2005 2010 2015 2020 2025 2030 2035 2040 2045 2050
Popu
latio
n, J
obs,
and
Hou
sing
(m
illio
ns)
Population Housing Jobs
Source: SANDAG, February 2010
Table 1—San Diego Regional Population and Employment Forecast
2050 Regional Growth Forecast Year Population Employment 2008 3,131,552 1,501,080 2020 3,535,000 1,619,615 2030 3,870,000 1,751,630 2040 4,163,688 1,877,668 2050 4,384,867 2,003,038
Source: SANDAG, February 2010
The 2050 Regional Growth Forecast is based largely on the adopted general plans and community plans and policies of the 18 cities, and in some cases includes draft plans which are nearing completion. Because many
30
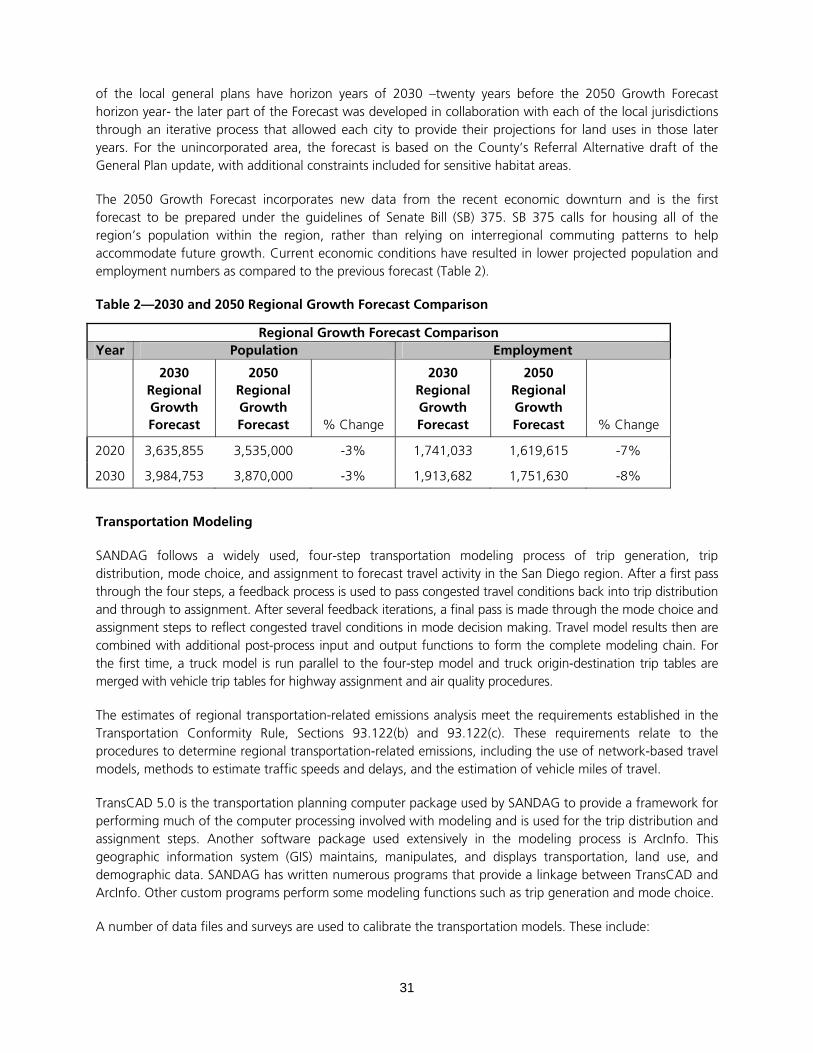
of the local general plans have horizon years of 2030 –twenty years before the 2050 Growth Forecast horizon year- the later part of the Forecast was developed in collaboration with each of the local jurisdictions through an iterative process that allowed each city to provide their projections for land uses in those later years. For the unincorporated area, the forecast is based on the County’s Referral Alternative draft of the General Plan update, with additional constraints included for sensitive habitat areas.
The 2050 Growth Forecast incorporates new data from the recent economic downturn and is the first forecast to be prepared under the guidelines of Senate Bill (SB) 375. SB 375 calls for housing all of the region’s population within the region, rather than relying on interregional commuting patterns to help accommodate future growth. Current economic conditions have resulted in lower projected population and employment numbers as compared to the previous forecast (Table 2).
Table 2—2030 and 2050 Regional Growth Forecast Comparison
Regional Growth Forecast Comparison Year Population Employment
2030 Regional Growth Forecast
2050 Regional Growth Forecast % Change
2030 Regional Growth Forecast
2050 Regional Growth Forecast % Change
2020 3,635,855 3,535,000 -3% 1,741,033 1,619,615 -7%
2030 3,984,753 3,870,000 -3% 1,913,682 1,751,630 -8%
Transportation Modeling
SANDAG follows a widely used, four-step transportation modeling process of trip generation, trip distribution, mode choice, and assignment to forecast travel activity in the San Diego region. After a first pass through the four steps, a feedback process is used to pass congested travel conditions back into trip distribution and through to assignment. After several feedback iterations, a final pass is made through the mode choice and assignment steps to reflect congested travel conditions in mode decision making. Travel model results then are combined with additional post-process input and output functions to form the complete modeling chain. For the first time, a truck model is run parallel to the four-step model and truck origin-destination trip tables are merged with vehicle trip tables for highway assignment and air quality procedures.
The estimates of regional transportation-related emissions analysis meet the requirements established in the Transportation Conformity Rule, Sections 93.122(b) and 93.122(c). These requirements relate to the procedures to determine regional transportation-related emissions, including the use of network-based travel models, methods to estimate traffic speeds and delays, and the estimation of vehicle miles of travel.
TransCAD 5.0 is the transportation planning computer package used by SANDAG to provide a framework for performing much of the computer processing involved with modeling and is used for the trip distribution and assignment steps. Another software package used extensively in the modeling process is ArcInfo. This geographic information system (GIS) maintains, manipulates, and displays transportation, land use, and demographic data. SANDAG has written numerous programs that provide a linkage between TransCAD and ArcInfo. Other custom programs perform some modeling functions such as trip generation and mode choice.
A number of data files and surveys are used to calibrate the transportation models. These include:
31

1995 and 2006 Travel Behavior Surveys
2001 Caltrans Statewide Travel Survey
2001-2003 San Diego Regional Transit Survey
External Trip Surveys (2006 Interregional Travel Behavior Survey)
Traffic Generation Studies
1991 San Diego Visitor Survey
2000 Census Transportation Planning Package
2010 Gateway Forecast; 2002 Freight Analysis Framework
In addition to model parameters derived from these surveys, there are three major inputs to the transportation models:
Growth forecast inputs used to describe existing and planned land use patterns and demographic characteristics;
Highway networks used to describe existing roadway facilities and planned improvements to the roadway system; and
Transit networks used to describe existing and planned public transit service.
Highway Networks
The regional highway networks in the 2008 RTIP as amended and 2030 RTP include all roads classified by local jurisdictions in their general plan circulation elements. These roads include freeways, expressways, conventional state highways, prime arterials, and selected major streets. In addition, some local streets are included in the networks for connectivity between zones.
The route improvements and additions in the 2008 RTIP as amended and 2030 RTP are developed to provide adequate travel service that is compatible with adopted regional policies for land use and population growth. All regionally significant projects are included in the quantitative emissions analysis. These include all state highways, all proposed national highway system routes, all regionally significant arterials, and all Federal Highway Administration functionally classified "Other Principal Arterials."
The networks also account for programs intended to improve the operation of the highway system, including high occupancy vehicle (HOV) lanes and ramp metering. Existing and proposed toll facilities also are modeled to reflect time, cost, and capacity effects of these facilities. The State Route (SR) 125 South, SR 11, and SR 241 are the only modeled toll facilities included in Revenue Constrained Plan for the San Diego region.
In addition, several managed/HOV lanes are included in the Revenue Constrained Plan. Facilities with proposed managed lanes include Interstate 5 (I-5), I-15, I-805, and SR 52. Managed lanes are defined as reversible HOV routes and HOV routes with two or more lanes in the peak direction. It is assumed that the excess capacity not utilized by carpools and transit on these facilities would be managed so that single occupant vehicles could use these lanes under a pricing mechanism. Traffic flows would be managed so that the facility would operate at level of service D or better.
Based on the networks and programs described above, the transportation forecasts of the 2008 RTIP as amended and 2030 RTP differentiate between eight highway modes:
drive alone non-toll
32

drive alone toll
shared-ride non-HOV/non-toll
shared-ride HOV/non-toll
shared-ride HOV/Toll
light heavy duty
medium heavy duty
heavy heavy duty SANDAG maintains a master highway network from which a specific year network, between the years 2008 (the 2050 Regional Growth Forecast base year) and 2030, can be built. Three networks were built and verified (2010, 2020, and 2030) for air quality conformity analyses of the 2008 RTIP as amended and 2030 RTP. A list of the major highway and near-term regional arterial projects included in the conformity analysis, and their implementation phasing is included with the draft Air Quality Conformity Determination. The Transportation Project Evaluation Criteria and Rankings are included in the 2030 RTP. Locally funded, regionally significant projects also have been included in the air quality conformity analysis. These projects are funded with TransNet funds, a 20-year, half-cent local sales tax for transportation that expires in 2008; TransNet Extension funds, a 40-year, half-cent local sales tax extension approved by voters in 2004 that expires in 2048; and other local revenue sources.
Transit Networks
SANDAG also maintains transit network datasets for existing and proposed transit systems. Most transit routes run over the same streets, freeways, HOV lanes, and ramps used in the highway networks. As a result the only additional facilities that are added to the transportation coverage for transit modeling purposes are:
trolley and commuter rail lines
streets used by buses that are not part of local general plan circulation elements
There are seven transit modes, which group routes with similar operating characteristics. They are:
commuter rail
trolley
bus rapid transit (BRT)
rapid bus
limited-express bus
express bus
local bus
BRT service would have stations similar to commuter rail and trolleys, and operating characteristics midway between rail and bus service. BRT service would be provided by advanced design buses operating on HOV lanes, some grade-separated transit ways, and surface streets with priority transit treatments. Once TransCAD transit networks have been built, TransCAD finds minimum time paths between transit access points (TAP). TAPs are selected transit stops that are used to represent walk and auto access to the transit system. The following four sets of paths are created for modes:
33

a.m. peak-period local bus
a.m. peak-period premium service
mid-day local bus
mid-day premium service
Bus speeds assumed in the transit networks are derived from modeled highway speeds and reflect the effects of congestion. Regional and express transit routes on surface streets are assumed to operate out of congestion due to priority transit treatments. Higher bus speeds may result for transit vehicles operating on highways with HOV lanes and HOV bypass lanes at ramp meters, compared to those routes that operate on highways where these facilities do not exist.
In addition to transit travel times, transit fares are required as input to the mode choice model. TransCAD procedures replicate the San Diego region’s complicated fare policies which differ between:
buses which collect a flat fare of between $1.00 and $4.00, depending on the type of service
trolleys which, in 2008 charge $1.25 for internal downtown trips and $2.50 for all other trips, and $2.50 for all trolley trips after 2008
SPRINTER which charges $2.00
commuter rail (COASTER) which has a zone-based fare of between $5.00 and $6.50
proposed BRT routes which are assumed to charge $4.00
proposed Rapid Bus routes, which are assumed to charge $2.50
Fares are converted to 1999 dollars (consistent with household incomes from the growth forecast) and are assumed to remain constant in inflation-adjusted dollars over the forecast period.
Near-term transit route changes are drawn from the Regional Short-Range Transit Plan produced in coopera-tion with the region’s transit agencies. Longer-range improvements are proposed as a part of the RTP development and other transit corridor studies. In addition to federal and state funded projects, locally funded regionally significant transit projects have been included in the air quality conformity analysis of the 2008 RTIP as amended and 2030 RTP. These transit projects also are funded with TransNet funds or other local revenue sources. Once network coding is completed, the transportation models are run for the applicable scenarios (2010, 2020, and 2030). The air quality conformity document contains the list of major regional transit projects included in the analysis and their implementation phasing.
Trip Generation
Trip generation is the first step in the transportation modeling process. Average weekday trip ends by all forms of transportation starting and ending in each zone are estimated for ten trip types.
1. home-work 6. work-other
2. home-college 7. other-other
3. home-school 8. serve passenger
4. home-shop 9. visitor
5. home-other 10. airport
34

The model computes person trips, which account for all forms of transportation including automobiles, light duty trucks, taxicabs, motorcycles, public transit, bicycling, and walking.
The trip generation model works by applying trip rates to zone-level growth forecasts. The model calculates each of the trip ends separately, as trip productions and attractions. Trip production rates are expressed as trips per household, while trip production rates vary by trip type and structure type. Trip attractions are expressed as trips per acre of nonresidential land use or trips per household. Trip attraction rates vary by trip type and land use category. The 2050 Regional Growth Forecast was used to produce trip generation forecasts for the years 2010, 2020, and 2030. Trip generation rates were established by utilizing data from traffic generator studies and expanding rates from the 1995 and 2006 Travel Behavior Surveys and 2001 Caltrans Statewide Travel Survey.
The SANDAG regional transportation model uses a relatively high trip generation rate for households (8.1 vehicle trips per day), which may account for possible increases in trip-making as new facilities are built. Also, the model accounts for travel diversion among facilities.
The model reduces future year person trips by a small amount to reflect increased use of teleworking and e-commerce. Reduction factors of 1, 3, or 5 percent were applied to selected trip purposes and land uses. Telework reduction factors depend on the likelihood the land use type would have employee categories that could feasibly telecommute. Reduction factors start in year 2020.
The truck model follows a similar process as the person model. The model computes truck vehicle trips for heavy duty trucks including light heavy duty, medium heavy duty, and heavy heavy duty trucks. The truck classifications correspond to the California Air Resources Board truck classifications used in the air quality model EMFAC. Trip production and attraction rates are expressed as trips per employee and the rates vary by employee industry category.
Trip Distribution
After trip generation, trip movements between zones are determined using a doubly-constrained, gamma-function gravity model form of the trip distribution model. Inputs to the trip distribution model include zone-level trip generation forecasts by trip type, zone-to-zone impedances, and gamma function parameters by trip type and 4D category. 4D index categories attempt to define locations by their density, diversity, and urban design characteristics. A high 4D index value represents areas that would be considered smart growth and would result in shortened trip lengths. In this way the model is designed to reflect changing trip patterns in response to the types of new development in land use scenarios. The model also modifies trip patterns as new roadways are added.
Truck trip distribution is performed in a similar manner but is used to distribute vehicle trips rather than person trips by purpose as in the person model. The truck model also uses different distribution parameters by vehicle type which are not segmented by 4D category.
The model is calibrated to match observed trip length frequencies from the 2006 Travel Behavior Survey and 2001 Caltrans Statewide Travel Survey. Zone-to-zone impedances are a composite measure of peak and off-peak travel times and costs by highway, transit, and non-motorized modes.
35

Mode Choice
At this point in the modeling process, total person trip movements between zones are split into different forms of transportation by highway, transit, and non-motorized modes (bicycling and walking). Highway modes include drive alone non-toll, drive alone toll, shared-ride non-HOV/non-toll, shared-ride HOV/non-toll, and shared-ride HOV/Toll. Nine transit modes differentiate transit trips by three ride modes (rail, BRT, and bus) and three access modes (walk, drive, and drop-off). The mode choice model is designed to link mode use to demographic assumptions, highway network conditions, transit system configuration, land use alternatives, parking costs, transit fares, and auto operating costs. Trips between zone pairs are allocated to modes based on the cost and time of traveling by a particular mode compared to the cost and time of traveling by other modes. For example, vehicle trips on a congested route would be more likely to be diverted to light rail than vehicle trips on an uncongested freeway.
Income level also is considered since lower-income households tend to own fewer automobiles, and therefore, make more trips by transit and carpooling. People in higher-income households tend to choose modes based on time and convenience rather than cost. The mode choice model is calibrated using 1995 and 2006 Travel Behavior Survey trip tables by mode and income and 2001-2003 Regional Transit Survey transit trip characteristics. Regional-level Census 2000 work trip mode shares also were used to fine tune mode share estimates.
Highway and transit travel times reflect highway congestion effects from the final iteration of the feedback loop. The model produces a.m. peak, p.m. peak, and off-peak period trip tables for vehicles and transit riders. The a.m. peak period is from 6:00 to 9:00 in the morning and the p.m. peak period is from 3:00 to 6:00 in the afternoon. The off-peak period covers the remaining 18 hours of the day.
Highway and Transit Assignment
Highway assignment produces traffic volume estimates for all roadway segments in the system. These traffic volumes are an important input to emissions modeling. Similarly, transit trips are assigned to transit routes and segments.
Highway
SANDAG loads traffic using the TransCAD “Multi-Modal Multi-Class Assignment” function. Before loading the traffic onto the network, the three truck modes are combined with the five passenger vehicle modes. Multi-class assignment allows SANDAG to assign the eight vehicle modes (as defined in the Highway Network section) in one combined procedure.
The highway assignment model works by finding roads that provide the shortest travel impedance between each zone pair. Trips between zone pairs are then accumulated on road segments making up minimum paths. Highway impedances consider posted speed limits, signal delays, congestion delays, and costs. The model computes congestion delays for each segment based on the ratio of the traffic volume to roadway capacity. Motorists may choose different paths during peak hours when congestion can be heavy and off-peak hours when roadways are typically free flowing. For this reason, traffic is assigned separately for a.m. peak, p.m. peak, and off-peak periods. Vehicle trip tables for each scenario reflect increased trip-making due to population growth and variations in travel patterns due to the alternative transportation facilities/networks proposed.
36

Model accuracy is assessed by comparing model estimated traffic volumes with actual traffic counts obtained through the SANDAG traffic monitoring program and Highway Performance Monitoring System (HPMS) estimates of vehicle miles of travel (VMT).
After completing the highway assignments, additional processing is needed. Adjustments are made for calibration error volume, HOV/managed lane volume, bus volumes, hourly distribution factors, level of service (LOS), and travel time.
Transit
For transit assignment, TransCAD software assigns TAP-to-TAP transit trips to the network. Eight separate transit assignments are produced for peak and off-peak periods; walk and auto access; and local bus and premium service. These individual assignments are summed to obtain total transit ridership forecasts.
Before assigning transit trips, external transit trips coming into San Diego from outside the region need to be added to the internal transit trips estimated by the mode choice model. Currently, few transit trips enter from the north or east, however, over 20,000 transit trips cross the Mexican border each day. An external transit trip table for the base year is developed from on-board transit ridership surveys and factored to future years based on border crossing trends to account for these trips.
For accuracy, transit ridership forecasts from the transit assignment model are compared with transit counts from the SANDAG transit passenger counting program to determine whether transit modeling parameters need to be adjusted.
Some of these comparisons of model-estimated boardings with actual boardings include:
System-level boardings, which may reveal transfer rate problems and lead to changes to the transfer wait time factor in the mode choice model;
Boardings by mode, which may reveal modal biases and lead to changes in mode choice modal constants;
Boardings by frequency of service, which may show biases that lead to changes in the first wait factor in the mode choice model; and
Centre City screenline crossings, which may lead to changes in parking costs, and boardings by stop location, which may indicate problems with specific generators such as a university.
Post-TransCAD Processing
Standard TransCAD output needs to be reformatted and adjusted to be useful for emissions modeling. Several routines and computer programs have been written to accomplish the following major functions:
Correcting link-specific traffic volume forecasts for calibration error;
Adding in estimated travel on roads not in the transportation modeling process;
Computing link speeds based on corrected link volumes, highway capacity manual relationships between congestion, and speed (or signal delay);
Splitting link volumes into heavy-duty truck and other traffic to obtain speed distributions by vehicle class; and
37

Preparing a data set that contains total VMT, number of trip starts, and VMT by speed category by time of day for each vehicle class.
The travel demand modeling procedures used for the 2008 RTIP and 2030 RTP differ from previous modeling procedures in three key ways. First, a truck model is being run parallel to the four-step model for the first time. Truck origin-destination trip tables are merged with vehicle trip tables for highway assignment and air quality procedures. Second, new inputs were used, including the recently completed 2010 Gateway Forecast (a forecast of freight traffic in the region,) 2002 Freight Analysis Framework data, and the 2050 Regional Growth Forecast projections. The third difference is a 4D (density, diversity, urban design characteristics) category was used as inputs into the trip distribution model. These new inputs and procedures have contributed to changes in emissions modeling output.
Motor Vehicle Emissions Modeling
Emissions Model
In November 2006, ARB released EMission FACtors (EMFAC) 2007, an emissions inventory model that calculates emissions for motor vehicles operating in California. It is an integrated model that combines emission rate data with vehicle activity to calculate regional emissions. The U.S. EPA approved EMFAC 2007 for use in conformity determinations on January 18, 2008.
The EMFAC 2007 model supports calculation of emissions for the Burden mode. The Burden mode is used for calculating regional emission inventories. In this mode, the model reports total emissions as tons per day for each pollutant, by vehicle class, and the total vehicle fleet. The Burden mode uses emission factors that have been corrected for ambient conditions and speeds combined with vehicle activity to calculate emissions in tons per day. Vehicle activity includes the number of vehicles, daily vehicle miles traveled, and the number of daily trips.
The air quality analysis of the 2008 RTIP as amended and 2030 RTP was conducted using EMFAC 2007’s Burden mode. Projections of daily regional emissions were prepared for reactive organic gases (ROG), nitrogen oxides (NOx), and CO.
On-road motor vehicle emissions are attributed to several different processes:
Starting exhaust
Running exhaust
Idle exhaust (calculated for heavy-duty trucks only)
Resting and diurnal evaporation
Running losses
Hot soak evaporation
Emission factors vary by vehicle class, fuel usage, and technology. The fuels modeled are gasoline, diesel, and electrically powered vehicles. Technology categories can be grouped into catalyst, noncatalyst, and diesel. Thirteen vehicle classes are modeled:
passenger car line-haul vehicle
two types of light-duty trucks urban bus
medium-duty truck school bus
38

two types of light-heavy-duty trucks motorcycle
medium-heavy-duty truck motor home
heavy-heavy-duty truck Emission factors for processes that vary by temperature (i.e., starting exhaust, hot soak, and running exhaust) are broken down further by specified temperature ranges. Exhaust emission factors also are broken down by speed range.
Regional Emissions Forecasts
Regional transportation forecasts were initiated in April 2010. Output from the TransCAD model was then reformatted and adjusted to be useful for emissions modeling.
Eight-Hour Ozone Standard
Effective June 9, 2008, the U.S. EPA found the eight-hour ozone budgets included in the Eight-Hour Ozone Attainment Plan for San Diego County adequate for transportation conformity purposes. In April 2010 SANDAG prepared countywide forecasts of average weekday ROG and NOx emissions for 2010, 2020, and 2030 using the EMFAC 2007 model. ROG and NOx emissions are based on the summer season.
The analysis years were selected to comply with Sections 93.106(a) (1) and 93.118 (a) of the Transportation Conformity Rule. According to these sections, the first horizon year (2010) must be within ten years from the base year used to validate the regional transportation model (2008), the last horizon year must be the last year of the transportation plan’s forecast period (2030), and the horizon years may be no more than ten years apart (2020).
CO Standard
CO regional emissions were projected for 2010, 2018, 2020, and 2030 for the conformity determination of the 2008 RTIP as amended and 2030 RTP conformity redetermination. CO emissions are based on the winter season. Regional emissions for 2018 are interpolated.
Emissions Modeling Results
An emissions budget is the part of the SIP that identifies emissions levels necessary for meeting emissions reduction milestones, attainment, or maintenance demonstrations.
To determine conformity of the 2008 RTIP as amended and 2030 RTP, the plan must comply with the emission analysis described in the Regional Emissions Forecast section. Table 3 shows that the projected ROG and NOx emissions from the 2008 RTIP as amended and 2030 RTP are below the 2008 ROG and NOx budgets.
39

Table 3—2008 RTIP Amendment No. 23 and 2030 Revenue Constrained RTP Air Quality Conformity Analysis for Eight-Hour Ozone
ROG NOx
Year
Average Weekday Vehicle Starts
(1,000s)
Average Weekday Vehicle Miles
(1,000s)
SIP Emissions
Budget Tons/Day
ROG Emissions Tons/Day
SIP Emissions
Budget Tons/Day
NOx Emissions Tons/Day
2010 13,021 81,010 53 37 98 71
2020 14,567 89,216 53 24 98 40
2030 15,968 101,689 53 19 98 32
Note: Emissions budgets are from the Eight-Hour Ozone Attainment Plan for San Diego County, which were found adequate for transportation conformity purposes by the U.S. EPA, effective June 9, 2008.
Adjustment factors for ROG and NOx were provided by ARB to account for recently adopted emission control programs not reflected in EMFAC 2007 and other corrections. Table 4 includes the adjustment factors by analysis year.
Table 4—EMFAC 2007 Adjustment Factors
Year ROG Adjustment Factor (tons/day)
NOx Adjustment Factor (tons/day)
2010 0.04 2.37
2020 0.33 2.40
2030 0.71 2.80
Note: Adjustment factors were provided by ARB. The tons listed are subtracted from the EMFAC 2007 output of tons per day for ROG and NOx.
Table 5 shows that projected CO emissions from the 2008 RTIP as amended and 2030 RTP are below the 2003 CO budget of 730 tons per day.
40

Table 5—2008 RTIP Amendment No. 23 and 2030 Revenue Constrained RTP Air Quality Conformity Analysis for Carbon Monoxide
CO
Year
Average Weekday
Vehicle Starts (1,000s)
Average Weekday Vehicle Miles
(1,000s)
SIP Emissions Budget
Tons/Day
CO Emissions Tons/Day
2010 13,021 81,010 730 391
2018 14,258 87,575 730 245
2020 14,567 89,216 730 209
2030 15,968 101,689 730 160
Note: Emissions budgets for the San Diego region from 2004 Revision to California State Implementation Plan for Carbon Monoxide, Updated Maintenance Plan for Ten Federal Planning Areas (Approved as SIP revision in January 2006).
Exempt Projects
Section 93.126 of the Transportation Conformity Rule exempts certain highway and transit projects from the requirement to determine conformity. The categories of exempt projects include safety, mass transit, air quality (ridesharing and bicycle and pedestrian facilities), and other (such as planning studies).
Table 6 illustrates the exempt projects considered in the 2008 RTIP as amended and 2030 Revenue Constrained RTP. This table shows short-term exempt projects. Additional unidentified projects could be funded with revenues expected to be available from the continuation of existing state and federal programs.
41

Table 6—Exempt Projects*
Project/Program Description
Bikeway, Rail Trail and Pedestrian Projects
Bayshore Bikeway
Cliff Street Pedestrian/Bicycle Bridge
Coastal Rail Trail
Escondido Creek Bike Path Bridge
Inland Rail Trail
Lake Hodges Bicycle-Pedestrian Bridge
Plaza Bonita Class I Bikeway
Regional Bike Locker Program
SR 56/Black Mountain Road Bikeway Interchange
Various Bicycle Master Plans
Regionwide Traffic Incident Management
Freeway Service Patrol
Safety Improvement Program
Bridge Rehabilitation/Preservation
Collision Reduction
High Risk Roads Program
Highway Safety Improvement Program
Noise Barrier Program
Roadway/Roadside Preservation
Transportation Demand Management
Regional Vanpool Program
RideLink Regional Rideshare Program
Transportation Management Systems
Joint Transportation Operations Center (JTOC)
ITS Operations
Ramp Meters (I-5/I-805, SR 94)
Regional Fare Technology
Smart Parking Pilot Program
Traffic Management System (I-805, SR 94) Vehicle Assist and Automation
42

Implementation of Transportation Control Measures
There are four federally-approved Transportation Control Measures (TCM) that must be implemented in San Diego, which the SIP refers to as Transportation Tactics. They include ridesharing, transit service improvements, traffic flow improvements, and bicycle facilities and programs.
These TCMs were established in the 1982 SIP, which identified general objectives and implementing actions for each tactic. The TCMs have been fully implemented. Ridesharing, transit, bicycling, and traffic flow improvements continue to be funded, although the level of implementation established in the SIP has been surpassed. The list of actions that implemented the TCMs is available at SANDAG.
Interagency Consultation Process and Public Input
The consultation process followed to prepare the air quality conformity analysis for the 2008 RTIP as amended and 2030 RTP complies with the San Diego Transportation Conformity Procedures adopted in July 1998. In turn, these procedures comply with federal requirements under 40 CFR 93. Interagency consultation involves SANDAG (as the MPO for San Diego County), the APCD, Caltrans, ARB, U.S. DOT, and U.S. EPA.
Consultation is a three-tier process that: 1. formulates and reviews drafts through a conformity working group
2. provides local agencies and the public with opportunities for input through existing regional advisory committees and workshops
3. seeks comments from affected federal and state agencies through participation in the development of draft documents and circulation of supporting materials prior to formal adoption
SANDAG consulted on the development of the air quality conformity analysis of the 2008 RTIP as amended and 2030 RTP at meetings of the CWG, as follows:
On April 7, 2010, SANDAG staff presented the schedule for the preparation of the 2008 RTIP Amendment No. 23 and criteria and procedures to be followed for its conformity analysis. Staff confirmed that a redetermination of conformity would be done for the 2030 RTP, in conjunction with the 2008 RTIP Amendment No. 23 for consistency purposes. Staff presented information on the 2050 Regional Growth Forecast, Transportation Control Measures, the Revenue Constrained financial assumptions, latest emissions model, and public involvement and outreach.
On April 28, 2010, SANDAG released the draft air quality conformity analysis of the 2008 RTIP Amendment No. 23 to the San Diego Region CWG for a 30-day review-and-comment period. On May 5, 2010, the draft air quality analysis will be discussed at the meeting of the San Diego Region CWG, and applicable comments will be incorporated into the report.
On June 9, 2010, the draft 2008 RTIP Amendment No. 23 and its conformity determination and the 2030 RTP conformity redetermination will be released for a public review period, which will close on July 16, 2010.
The 2008 RTIP Amendment No. 23 will be presented to the TransNet Independent Taxpayers Oversight Committee on July 14, 2010 for input.
The SANDAG Transportation Committee will be asked to recommend approval of the 2008 RTIP Amendment No. 23 and its conformity determination to the Board of Directors on July 16, 2010.
43

44
The SANDAG Board will be asked to approve the 2008 RTIP Amendment No. 23 and its conformity determination at its July 23, 2010, meeting.
Members of the public are welcomed to provide comments at meetings of the CWG, the Transportation Committee, and the SANDAG Board of Directors.

Appendix C
PUBLIC PARTICIPATION POLICY


Appendix C
PUBLIC PARTICIPATION POLICY
Excerpt from PUBLIC PARTICIPATION/INVOLVEMENT POLICY as it pertains to the RTIP: B. Short Range Program – Regional Transportation Improvement Program (RTIP) – document
updated every two years outlining major transportation projects to be implemented during a five-year period.
1. SANDAG shall follow the latest federal and state regulations regarding participation by interested
parties. 2. As the document that implements the long range plan, the RTIP shall be incorporated as part of the
Board adopted public involvement process established for the Regional Transportation Plan (October 27, 2006) including participating in public outreach efforts, providing adequate public notice (legal notice publications), employing visualization techniques, holding public meetings at convenient and accessible locations.
3. SANDAG shall respond to any significant public input or comment received during the development of the biennial update and/or during the amendment cycle as part of its report to the Board or Transportation Committee (as appropriate).
4. The biennial RTIP update will be noticed in newspapers of general circulation including in alternate
languages and a public hearing shall be held prior to final adoption by the Board of Directors. 5. During the amendment cycle, SANDAG will provide a draft of the amendment to all
interested parties for a 15-day comment period.
47

Appendix D
GLOSSARY OF TERMS AND ACRONYMS


Appendix D
GLOSSARY OF TERMS AND ACRONYMS
A AC Advanced Construction ADA Americans with Disabilities Act APCB/APCD San Diego Air Pollution Control Board District ARRA American Recovery and Reinvestment Act (Federal Stimulus Program) B BIA Bureau of Indian Affairs BIP Border Infrastructure Program BTA Bicycle Transportation Account C CAAA 1990 Clean Air Act, as amended Caltrans California Department of Transportation CARB California Air Resources Board CBI Corridors and Borders Infrastructure CDBG Community Development Block Grant (Federal) CI Capacity Increasing CMAQ Congestion Mitigation and Air Quality Program CMIA Corridor Mobility Improvement Account CMP Congestion Management Program CO Carbon Monoxide CON Construction Phase CTC California Transportation Commission CWG Conformity Working Group D
DEMO ISTEA Special Projects/TEA-2/SAFETEA-LU 1 High-Priority Demonstration DOT U.S. Department of Transportation
E
EMFAC Emissions Factors Model EPA U.S. Environmental Protection Agency
F
FHWA Federal Highway Administration FSP Freeway Service Patrol (and FSP Act) FTA Federal Transit Administration
50

H HES/SR2S Hazard Elimination Safety/Safe Routes to School program HOV High Occupancy Vehicle HUD Housing and Urban Development
I
IM Interstate Maintenance IRR Indian Reservation Road ISTEA Intermodal Surface Transportation Efficiency Act of 1991 ITOC Independent Taxpayer Oversight Committee ITS Intelligent Transportation Systems
L LRT Light Rail Transit M
MPO Metropolitan Planning Organization MTDB/MTS San Diego Metropolitan Transit Development Board/Metropolitan Transit System
N
NAAQS National Ambient Air Quality Standards NCI Non Capacity Increasing NCPD National Corridor Planning and Development NCTD North County Transit District NHS National Highway System NOx Nitrogen Oxide
P
P/PE Preliminary Engineering Phase PPNO Project Number (Caltrans) PM Particulate Matter
R
RAQS Regional Air Quality Strategy ROG Reactive Organic Gas RW/ROW Right-of-Way phase RTIP Regional Transportation Improvement Program RTP Regional Transportation Plan RSTP Regional Surface Transportation Program
S
SAFETEA-LU Safe, Accountable, Flexible and Efficient Transportation Equity Act: a Legacy for Users SANDAG San Diego Association of Governments SBTA State Bicycle Transportation Account SDTC San Diego Transit Corporation SDTI San Diego Trolley, Incorporated SHOPP State Highway Operation and Protection Program SIP State Implementation Plan (for air quality)
51

52
SLTPP State-Local Transportation Partnership Program/SB300 SR State Route (as in SR 52 - State Route 52) STA State Transit Assistance STIP State Transportation Improvement Program STIP-IIP State Transportation Improvement Program - Interregional Program STIP-RIP State Transportation Improvement Program – Regional Improvement Program
(SANDAG) STP Surface Transportation Program
T
TEA Transportation Enhancement Activities TEA-21 Transportation Equity Act for the 21st Century TCI Transit Capital Improvement TCM Transportation Control Measure TCRP Traffic Congestion Relief Program TDA Transportation Development Act TDM Transportation Demand Management TIP Transportation Improvement Program TMA Transportation Management Agency TP&D Transportation Planning and Development TransCAD Transportation Panning Computer Package TransNet San Diego Region 1/2% Local Transportation Sales Tax Program TSM Traffic Systems Management T-1 Transportation T-tactic: Ridesharing T-2 Transportation T-tactic: Transit T-3 Transportation T-tactic: Bicycle T-5 Transportation T-tactic: Traffic Improvement
V VOC Volatile Organic Compounds

Project Number
Description FY11
Approved FY11 Revised Change
MTS PROJECTSPM FY09 PREVENTATIVE MAINTENANCE 41,500 41,500 -
ADA FY09 ADA CAPITAL EXPENSES 4,090 3,870 (220) 10426 Mission Valley East - 2,200 2,200 11167 LRV Tires- multi yr contract 750 750 - 11183 System Cross Ties & Ballast- multi yr contract 225 225 - 11184 Bus Video Cameras (533) & Back office (4)- multi yr contract 800 1,236 436 11200 Misc. Capital Non Federal 500 500 - 11206 Rail Profile grinding - multi yr contract 325 325 - 11214 LRV HVAC Overhaul- multi yr contract 1,325 1,200 (125) 11216 LRV Electronic Components- multi yr contract 250 250 - 11223 LRV Station CCTV Components (Phase 2) - 398 398 11224 Crane Truck/Platform Truck 665 665 - 11251 Gearbox Overhaul- multi yr. contract 500 500 - 11254 LRV Brake Overhaul 450 450 - 11271 LRV On Board CCTV 398 2,700 2,302 11275 SD100 Traction Motor Disconnects 275 275 - 11276 SDTI Ticket Vending Equipment- multi yr contract 500 1,375 875 11280 MTS CNG Station Improvements- IAD, KMD, SB 3,000 3,233 233 11286 IAD Bus Wash Replacement 450 450 - 11287 Body Hoist Overhaul (C4&C5) 400 400 - 11288 Security Fiber optics (orange & green line) - 3,382 3,382 11289 Service Trucks (3- F450's) 335 335 - 11290 South Bay Radio, Dispatch equipmnt,AVL,& APC's 2,000 1,000 (1,000) 11294 Building A- roll up door replacement 50 50 - 11295 Fiber Optic Equipment 25 25 - 11296 Radio Communications Recorder 19 19 - 11297 Multifunction Color Copier 13 13 - 11298 Multifunction Welder 7 7 - 11299 Escalator and Elevator Capital expenses 125 125 - 11300 Transit Center Signage Project 100 100 - 11301 Building A- A/C and heating replacement 125 125 - 11302 SD-100 Main Breaker Replacement 650 650 - 11303 ADA Land & Facility Purchase - 19,200 19,200 11304 Buffer/ Coupler Overhaul (SD-100) 960 960 - 11306 Para-Transit Vehicles 1,351 1,351 - 11307 NEW IT System 1,000 1,000 - 11309 New Wheel Truing Machine/ Wheel scan 1,800 1,800 - NEW Bus Replacement 1,124 - (1,124)
Total MTS Capital Project - FY 11 CIP 66,087 92,643 26,556
SANDAG PROJECTSN/A SANDAG Planning Study 933 705 (228)
882 (51) 1048500 SBMF Expansion 5,500 1,817 (3,683) 1128100 Mainline drainage- Palm to Hill in El Cajon 143 143 - 1142100 Substation Rehabilitation (Substation Standardization) 3,200 1,600 (1,600)
1,423 (1,777) 1049600 East County Facility Redevelopment 2,120 972 (1,148) 1128300 ADA Station Improvement- Old Town handrail / fence repair 98 98 - 1128000 High Voltage Breaker Replacement 350 350 - 1128600 LRV Carwash -Construction 850 850 - 1129200 Overhead Catenary System Standardization (Head spans) 975 975 - 1129600 Direct fixation track repair on Fletcher bridge 200 200 - 1143900 IAD HVAC and Roof Repairs 1,438 209 (1,229) 1129700 Spring Street Transit Center- retaining wall and platform repair 128 128 - 1144000 Substation SCADA design CTC integration (MVW/Orange) 1,000 1,000 -
Total SANDAG Projects - FY 11 CIP 16,935 9,047 (7,888)
Total MTS and SANDAG Projects - FY 11 CIP 83,022 101,690 18,668
MTS FY 2011 CAPITAL IMPROVEMENT PROGRAMREVISED - JULY 2010
in '000'S
Attachment 4
33
adi
Text Box
REVISED This Relates to Agenda Item #6 Transportation Committee, 7/16/10

REVISED This relates to Agenda Item #7 Transportation Committee, 7/16/10
3
401 B Street, Suite 800 San Diego, CA 92101 Phone (619) 699-1900 • Fax (619) 699-1905 www.sandag.org
RESOLUTION NO. 2011-04
Attachment 1
APPROVING REVISIONS TO
FY 2011 TRANSPORTATION DEVELOPMENT ACT FUNDS ARTICLE 4 FIXED ROUTE GENERAL PUBLIC TRANSIT SERVICE
WHEREAS, the Transportation Development Act (TDA) claims pursuant to Chapter 4, Article 4 of the California Public Utilities Code (PUC) listed below require revisions; and
WHEREAS, the SANDAG Board of Directors delegated the authority for TDA claim amendments to the SANDAG Transportation Committee; and
WHEREAS, SANDAG has analyzed the allocations and found that the revisions are warranted pursuant to Section 6659(c) of Title 21 of the California Code of Regulations (CCR);
NOW THEREFORE
BE IT RESOLVED by the Transportation Committee as follows:
1. That the Transportation Committee, pursuant to Section 6659(c) does hereby approve revisions to the claims as shown below:
Claim No. Claimant
Original Allocation
Adjustment +(-)
Revised Allocation
11031000 Metropolitan Transit System
Operating $49,897,106 $0 $49,897,106
Capital $6,419,635 $3,192,571 $9,612,206
Total $68,421,566 $3,192,571 $59,509,312 $56,316,741
11031004 SANDAG
Capital Transfer from MTS $3,387,001 ($3,192,571) $194,430
2. That the Transportation Committee does hereby authorize the Executive Director to
prepare and transmit instructions and payment schedules to the San Diego County Auditor as are necessary and legal for the adjustments of these claims.
PASSED AND ADOPTED this 16th day of July 2011.
________________________________________ ATTEST: ________________________________________ CHAIRPERSON SECRETARY
MEMBER AGENCIES: Cities of Carlsbad, Chula Vista, Coronado, Del Mar, El Cajon, Encinitas, Escondido, Imperial Beach, La Mesa, Lemon Grove, National City, Oceanside, Poway, San Diego, San Marcos, Santee, Solana Beach, Vista, and County of San Diego.
ADVISORY MEMBERS: California Department of Transportation, Metropolitan Transit System, North County Transit District, Imperial County, U.S. Department of Defense, San Diego Unified Port District, San Diego County Water Authority,
Southern California Tribal Chairmen’s Association, and Mexico.

DESCRIPTION FEDERAL STATE TRANSNET TOTAL
Highway ProjectsI-5 (HOV/Managed Lanes/Lomas Santa Fe) $48,474 $48,826 $78,304 $24,800 $200,404I-15 (Managed Lanes including Debt Service) $242,919 $892,863 $224,524 $18,262 $720,121
$1,378,568SR 52 (HOV Managed Lanes/Auxiliary Lanes) $67,531 $291,769 $204,474 $1,000 $564,774SR 76 (East and Middle) $99,853 $0 $229,603 $30,000 $359,456I-805 (HOV/Managed Lanes/DAR at Carroll Canyon) $59,253 $0 $88,750 $180 $16,890
$148,183SR 905 (I-805 to Otay Mesa POE) $256,958 $187,673 $1,582 $0 $19,146
$446,213SR 78 $500 $18,463 $1,000 $30,400 $50,363SR 11 $5,700 $88,001 $0 $626,420 $44,863
$720,121SR 241 TCA Toll $0 $0 $0 $442,663 $71,000
$442,663Highway Bridge Program/Other State Administered Programs $143,947 $5,294 $0 $7,334 $156,575State Highway Operations Protection Program (SHOPP) $0 $262,505 $0 $0 $262,505Other Highway Projects $148,476 $70,000 $41,279 $342,597 $602,352
$164,217 $157,028 $448,262 $810,786Subtotal Highway Projects $1,089,351 $1,952,422 $869,516 $1,629,321 $5,540,610
Transit ProjectsMid-Coast $15,159 $43,293 $578,088 $0 $636,540I-15 BRT $24,920 $13,043 $73,245 $36 $111,244Other BRT $24,928 $0 $159,802 $355 $185,085Bus/Rail Infrastructure $266,970 $224,655 $84,272 $54,885 $630,782Bus/Rail Intermodal Stations $12,026 $123,960 $15,460 $683 $152,129Bus/Rail Vehicle Purchase $63,446 $201,805 $34,442 $19,912 $319,605Other Bus/Rail (Operations/Planning) $302,171 $0 $229,448 $178,816 $710,435
Subtotal Transit Projects $709,620 $606,756 $1,174,757 $254,687 $2,745,820Local Streets & Roads Projects
Highway Bridge Replacement/Rehabilitation $147,523 $0 $14,090 $18,503 $180,116Regional Arterial System $19,059 $0 $269,976 $164,285 $453,320Roadway Maintenance & Rehabilitation $15,928 $0 $127,513 $218,846 $362,287Other Local Street & Road $0 $0 $107,209 $34,355 $141,564Traffic Signal Projects $200 $0 $30,217 $1,850 $32,267
Subtotal Local Streets & Roads Projects $182,710 $1,150 $549,005 $437,839 $1,169,554$0
Other ProjectsBicycle/Pedestrian Projects $1,285 $5,903 $15,163 $17,296 $39,647Miscellaneous* $0 $3,771 $402,419 $0 $406,190Transportation Demand Management (TDM) $19,685 $0 $0 $0 $19,685Transportation Enhancement Activities (TE) $0 $5,867 $6,795 $280 $12,942Transportation Management System/Intelligent Transportation Sys $22,411 $14,063 $22,009 $2,744 $61,227
Subtotal Other Projects $43,381 $29,604 $446,386 $20,320 $539,691
GRAND TOTAL $2,025,062 $2,588,782 $3,039,664 $2,342,167 $9,995,675*Includes SANDAG planning and the TransNet Environmental Mitigation Program
LOCAL/ PRIVATE
DRAFT 2010 RTIP Program SummarySummary of Major Projects by Mode (in $000s)
4
adi
Text Box
REVISED This Relates to Agenda Item #8 Transportation Committee, 7/16/10 Attachment 1
1
Draft Unconstrained TransportationNetwork
July 16, 2010

2
3
UnconstrainedMultimodal
Network
HIGHWAYSBICYCLES/PEDESTRIAN
AIRPORTTRANSIT/RAIL GOODSMOVEMENT
Network Development
4
2050 RTP Process and Timeline
RevenueProjections
ProjectEvaluation
Criteria
NetworkDevelopment
All Modes
PlanPerformance
Measures
RankedProjects by Category
Apply Performance
Measures
Spring 2010Fall 2009 Summer 2010 Fall 2010 Early 2011
2050RegionalGrowth
Forecast
Goalsand
ObjectivesRevenue
Constrained/ SCS Preferred
Network Scenario
Draft2050 RTPand EIR
Revenue Constrained/SCS Network
Scenarios
Unconstrained Network

3
5
Draft 2050 UnconstrainedTransit Network Three scenarios developed and tested:
Transit Propensity, Commuter Point to Point, and Many Centers Integrate best elements from the initial scenarios and
public comments into “Hybrid” Unconstrained network:– Strengthen current transit network– Interconnect most highly urbanized areas, smart growth
centers, and major employment areas– Integrate HSR and add a commuter rail overlay– Emphasize pedestrian connections and bike
enhancements
6
Draft 2050UnconstrainedTransit Network

4
7
Miles of Transit Service – Existing/EAP, Additional, and Total Under Unconstrained Network
119
186
36
250240
41
97
78
89
158 226
360
50
100
150
200
250
300
CommuterRail/HSR
LRT BRT Rapid Bus Streetcar/Shuttle
Existing/EAP Miles Additional Miles
Mile
s
82
240
8
Comments by MTS and NCTD StaffHSR extension Express Trolley service Bus tunnel alongside Trolley tunnel Streetcar/shuttle in Mission BayCOASTER stations at Convention Center and
Del Mar Fairgrounds BRT along future SR 78 HOV corridor SPRINTER extension into eastern Escondido Interoperable trains for “one seat ride”
rail service

5
9
Transit Mode Share Goals
2050Goal for Urban Area: 10 – 15% Performance for Unconstrained:
– Urban Area: 12%– Downtown: 29%– University City: 16%– Central Core: 19%Doubling of daily transit ridershipMore access by walk/bike Attachment 4 includes goals
and performance of all networks
10
Draft 2050 UnconstrainedHighway Network Potential modifications to the 2030 RTP
unconstrained highway network Build upon existing plan to create an
efficient and balanced system Extensive HOV/Managed lane system
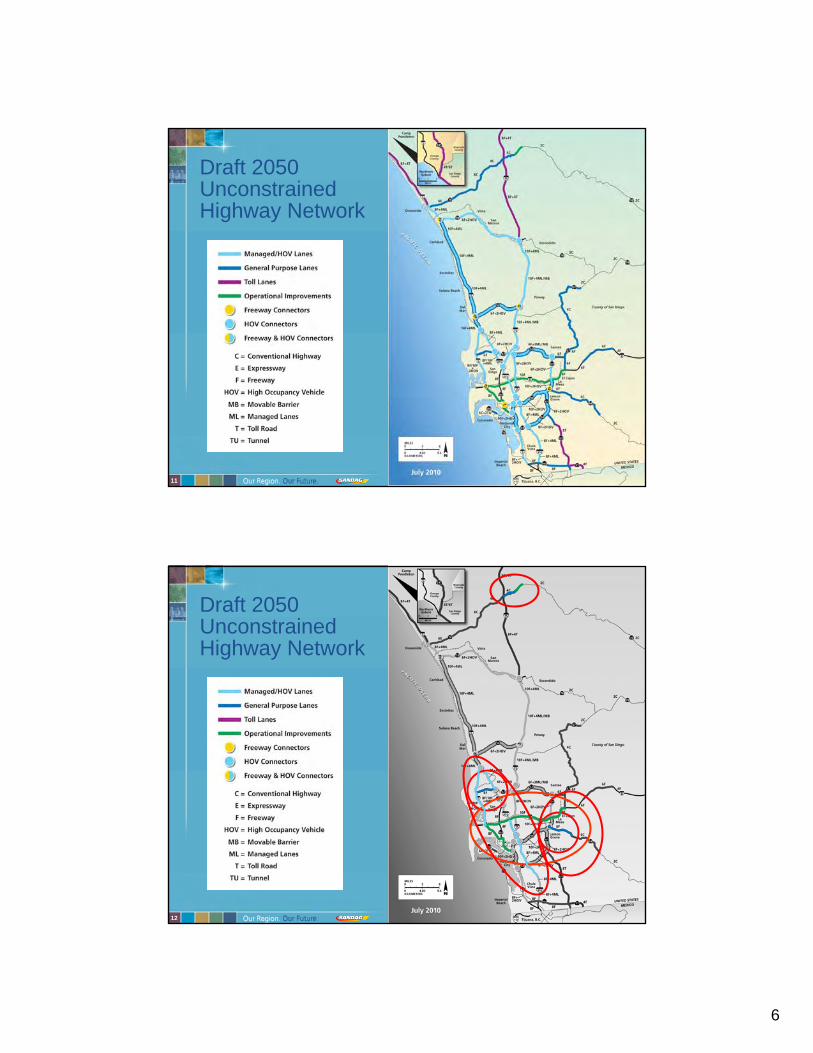
6
11
Draft 2050 UnconstrainedHighway Network
11
12
Draft 2050 UnconstrainedHighway Network
12
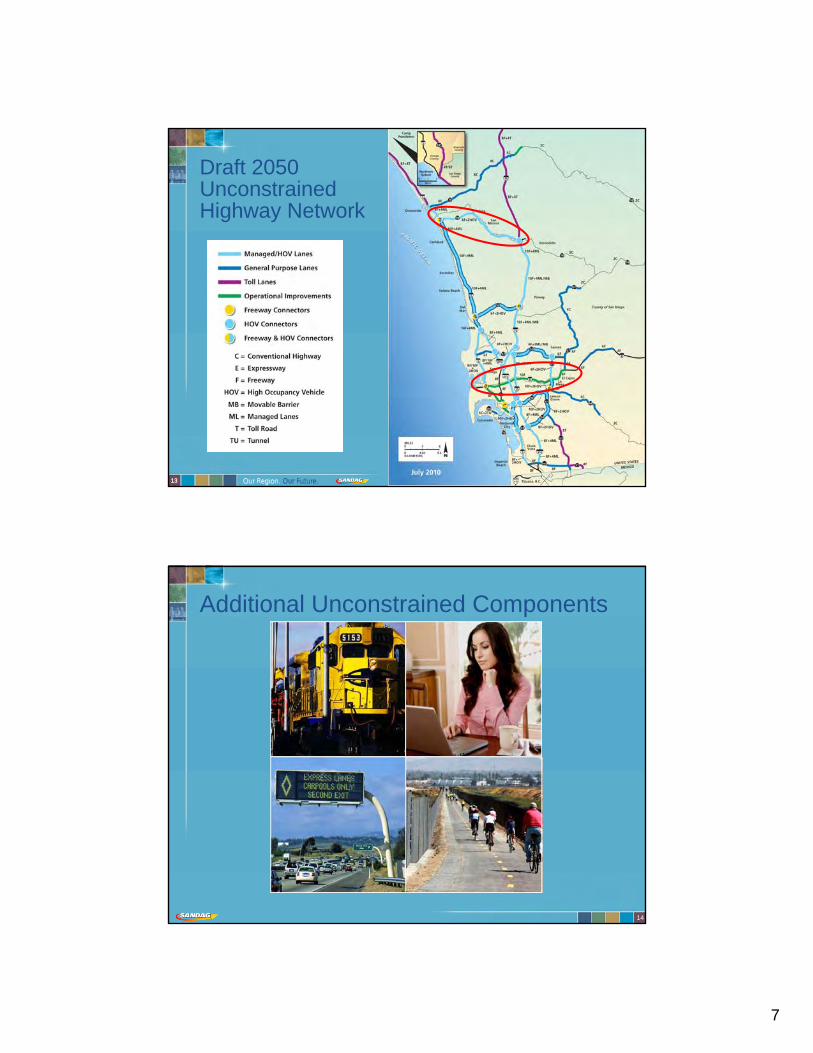
7
13
Draft 2050 UnconstrainedHighway Network
13
14
Additional Unconstrained Components
8
15
Scenario DevelopmentBased on Revenue Constraints
UnconstrainedMultimodal
Network
16
Next Steps
Prioritize projects in the Unconstrained NetworkDevelop alternative
Revenue Constrained scenarios Evaluate Revenue Constrained scenarios
using plan performance measures

9
17
Recommendation
The Transportation Committee is asked to recommend that theBoard of Directors accept theDraft Unconstrained Transportation Network for use in the development of the 2050 RTP.

P.O. Box 475 Descanso, CA 91916
www.sofar.org [email protected]
www.transitsandiego.org
July 14, 2010
San Diego Association of Governments
Transportation Committee
401 B Street, Suite 800
San Diego, CA 92101
Re: 2050 Regional Transportation Plan: Draft Unconstrained Transportation
Network
Dear Honorable Members of the Transportation Committee:
Save Our Forest and Ranchlands (“SOFAR”) and the Cleveland National Forest Foundation (“CNFF”),
two organizations dedicated to progressive land use planning and the protection of vital natural
resources, are submitting comments on the Draft Unconstrained Transportation Network
(“Unconstrained Network”) for the 2050 Regional Transportation Plan (“RTP”). After reviewing the
Draft Unconstrained Network, we believe that it lacks the necessary policies and investments to ensure
sustainability for the region’s long-term future. In addition, the 2050 RTP model unrealistically inflates
transit mode share projections that would occur with implementation of the 2050 RTP. Unless and until
SANDAG prioritizes transit and deemphasizes freeway and roadway projects, we must conclude that the
region will never achieve SANDAG’s purported goal of creating a “world class” transit system.
Modeling Errors
On June 23, 2010, transportation and planning experts submitted a letter to the California Air Resources
Board (“CARB”), which included an analysis of SANDAG’s proposed hybrid scenario for reducing
greenhouse gas (“GHG”) emissions for purposes of complying with Senate Bill 375 (“SB 375”).1
The CARB letter notes,
1 This letter, otherwise referred to as the “CARB letter” is attached for reference.
P.O. Box 779 Descanso, CA 91916
www.cnff.org [email protected]
This relates to Agenda Item #9 Transportation Committee July 16, 2010
1

“The ambitious transit results (of the hybrid scenario) are laudable and should be supported by
appropriate policies and investments. However based on the information presented we are concerned
that these transit goals may not be supported.”
The letter goes on to state,
“The problems noted here (within the letter) tend to overestimate auto travel and VMT, and
paradoxically may overestimate the shift to transit use. If fixed or adjusted, SANDAG would gain
confidence in its estimated GHG savings for the hybrid scenario, and better understanding of effects of
policy and investment choices on travel behavior. SANDAG could then verify its GHG reductions, and
learn more about effectiveness of current and more ambitious strategies.”
These experts make clear that deficiencies in SANDAG’s 2050 RTP modeling efforts cast doubt on the
reliability of the modeling results. Given this analysis, CNFF and SOFAR question the validity of
SANDAG’s modeling of transit mode share, cost predictions, and other results of the 2050 RTP
Unconstrained Network.
Land Use
On June 3, 2010, SOFAR and CNFF submitted a letter to SANDAG regarding the Urban Area Transit
Strategy. This letter described the importance of using appropriate land use and transportation
assumptions in order to capture the dynamic relationship between these factors. Our letter explained that
increasing densities in the urban core would change the amount and destination of transit trips which
would reduce vehicle miles traveled and further support higher density land uses. We expressed the
concern that by using the 2050 Regional Forecast as a constant in modeling land use for the Urban Area
Transit Study, SANDAG is ignoring important market shifts and demand changes that will rely on
transit infrastructure to properly function.
The CARB letter verifies this concern by questioning SANDAG’s 4-Step Model. The CARB letter
explains that the 4-Step Model, “cannot assess very well, or at all, policy questions of today.” Included
within the criticism of SANDAG’s 4-Step Model, the experts noted that it cannot answer vital questions
such as, “What do local land use details, particularly mixed uses, mean to travel behavior?”
Due to the fact that land use assumptions for the 2050 RTP cannot be properly modeled with the 4-Step
Model, we can conclude that SANDAG must change its model and modeling assumptions to ensure that
the land use and transportation factors are properly considered and that the modeling accurately reflects
the performance of the 2050 Unconstrained Network.
Furthermore, the CARB letter noted,
“For SANDAG, a fully ambitious land use would enhance its Urban and Town Center growth
strategy…to support the transit strategies discussed below and make them more realistic.”
CNFF and SOFAR concur with this conclusion, and have found that SANDAG should model more
intensive land use scenarios to enhance transit mode share. On July 13, 2010, CNFF released the
“Alternative Development Scenario for San Diego County” (“Infill Study”), which concluded that with
existing zoning there is sufficient development capacity to accommodate approximately 400,000 new
2

homes in the incorporated areas of San Diego County. The conclusions of the Infill Study are profound:
all of the region's projected housing needs for 2030 could take place as infill development (within the
incorporated cities of San Diego), and the cities would still have 170,000 additional units available for
development beyond 2030.2 The Infill Study’s conclusions are supported by current national trends in
the market demand for urban style housing in walkable neighborhoods.
If SANDAG were to use more intensive land use assumptions in its RTP modeling, the model results
would likely demonstrate increased transit use. Without increasing confidence in its modeling -- either
by using a different and up-to-date model, changing land use assumptions, or both --, key questions
about 2050 travel patterns will remain unanswered. In this regard, the CARB letter stated,
“If the shift (to transit) is overstated, SANDAG will need to concentrate more on its Urban Area Transit
Strategy in its next RTP, including redirecting or increasing revenues to expand its system.”
We cannot afford to wait for the next iteration of the RTP to fix these critical issues and make transit a
reality for the San Diego region. Given the magnitude of the financial investment and the scarcity of
funding, it is imperative that decisions pertaining to transportation infrastructure be based on sound
science. We must be accurately informed so that we can change course to ensure a more sustainable
future.
Baseline
In recent comment letters to SANDAG, SOFAR and CNFF have repeatedly noted that the “world class”
transit system proposed for the 2050 RTP will not be possible given SANDAG’s baseline (buildout of
the 2030 RTP). Transportation and planning experts have criticized SANDAG’s extensive highway
system, explaining that HOV and Managed Lanes are highway “solutions” to mobility, and that highway
expansion is known to have a direct negative impact on transit.
The CARB letter reinforces these assertions:
“SANDAG’s hybrid/ambitious scenario makes no changes to rein in suburban and interregional
highway expansion. A fully ambitious scenario would retract or scale back highway projects in
outlying areas, particularly those designed to serve interregional commuting, in favor of interior road,
transit, or walk and bicycle projects to improve accessibility to or within Urban and Town Centers.”
(Emphasis added).
Despite these conclusions, SANDAG’s staff report on the Unconstrained Network notes,
“It is important to note that the 2030 RTP Unconstrained highway network includes an extensive
Managed Lanes system that provides tremendous flexibility in serving transit and HOVs by maximizing
the available rights-of-way in several of the region’s major highway corridors. The goal in reviewing the
highway network is to build upon this existing plan by integrating the revised transit network into it,
thereby creating the most efficient and balanced transportation system.”
2 The full report is available here: http://www.transitsandiego.org/transitsandiego/pdf/Infill_Study.pdf
3

Although the staff report states that SANDAG may modify the 2030 RTP Unconstrained Highway
Network to reduce certain proposed freeway lane expansions, these changes are insufficient to ensure
that transit and transit oriented development will not be compromised by highway expansion, including
Managed Lanes projects. Indeed, the staff report finds that the Draft 2050 Unconstrained Transit
Network proposes an increase in 240 miles for the region’s Bus Rapid Transit (BRT) system, an
increase in 250 miles for Rapid Bus, yet only 78 and 100 miles for Commuter Rail/Highspeed Rail and
Light Rail Transit, respectively.
The Independent Transit Planning Review (“ITPR”) panel that reviewed the 2030 RTP noted,
“Smart Growth efforts will likely be weakened by managed lanes’ alleviation of congestion and its
encouragement of auto-oriented growth away from transit corridors.”
The CARB letter echoed this concern,
“Some of the suburban highway expansions would provide too much capacity to support more low
density, single use suburban development than SANDAG intends to be built, and might not be needed if
more of that growth were directed into Urban and Town Centers. The Route 241 toll road extension into
Orange County plus HOT lanes (Managed Lanes) on I-5 & I-15 to the north county line would promote
more interregional commuting and in no way fit with the spirit of SB 375.”
It is interesting to note that comments made by the ITPR panel nearly four years ago with regards to the
previous RTP are remarkably similar to recent transportation planning experts’ comments regarding the
2050 RTP. This demonstrates that regardless of changes that have occurred between the previous RTP
and now, the 2050 RTP currently contains many of the flaws and issues as did the previous RTP. While
the environmental review has not yet been completed for the 2050 RTP, it is likely that given its current
state, it will follow the same footsteps as the previous RTP and generate significant, unavoidable, and
unmitigable impacts in almost every environmental and social category. Despite the 2050 RTP’s many
flaws, it is not too late to amend the plan and its model, and help ensure a sustainable future for the San
Diego region.
Sincerely,
Duncan McFetridge
4

Page 1 of 19
June 23, 2010 Mary Nichols, Chair California Air Resources Board 1001 “I” Street Sacramento, CA 95814 Re: Analysis of SB 375 Target Scenarios prepared by SANDAG, SCAG, MTC and SACOG Dear Chairman Nichols, On behalf of ClimatePlan, please find enclosed our analyses of the SB 375 scenarios presented to ARB by the four largest Metropolitan Planning Organizations (MPOs). In order to aid the Air Resources Board in accomplishing its mandate to set regional targets, we evaluate the land use, transportation and pricing policies included in each of the MPOs’ scenarios and attempt to assess the degree to which these scenarios truly represent what is ambitious and achievable. Both ARB and the MPOs deserve to be commended for the hard work they have done over the past several months to inform this process and for their commitment to making so much detailed information about the scenarios available and accessible to the public. This rich assembly of information helps us all to assess what is possible, not just in California, but as federal energy and transportation laws are crafted, to gain a more in depth understanding of how improved transportation and land use planning can contribute to overall environmental goals. Indeed, as with so many environmental issues, California’s implementation of SB 375 will be closely watched and precedent setting. Most MPO Scenarios Underestimate Reductions, Particularly for 2035 We are encouraged by the scenarios that have been produced for this process, and they mark an historic step in envisioning a more prosperous and sustainable future. However, most of the MPO travel models do not fully account for the good work that cities and regions have already been doing, and their scenarios stop short of ARB’s ambitious achievable threshold for SB 375 targets. Most of the MPOs’ existing travel models simply were not designed to deal with GHG emissions, and they tend to underestimate the GHG reductions from smarter land use and transportation. The regions are working hard to transition to the next generation of travel models, but only SACOG’s model comes close to accounting for what is possible. Land use and transportation changes happen slowly, but the benefits accrue over time and add up to big savings in the longer term. Therefore we should see greater reductions in 2035 than 2020, and even greater reductions in 2050. The empirical evidence from across California and around the world supports this conclusion. We understand that all of the MPOs are continuing to learn what is possible as they create additional scenarios and
This relates to Agenda Item #9 Transportation Committee July 16, 2010

Page 2 of 19
refine their technical analyses over the next several months and we strongly encourage you to support this process through September. We offer these analyses to help inform your efforts in this precedent setting action. We encourage you to consider us as a resource throughout the process and we look forward to working closely with you to make sure California succeeds with implementation of SB 375. Sincerely,
David Ausherman Renaissance Planning Group
Peter Hathaway Transportation Planning Consultant
Norm Marshall Smart Mobility
Encl: biographies

Page 3 of 19
SANDAG (San Diego) Did SANDAG study a range of scenarios to inform what is ambitious and achievable? Summary: SANDAG’s hybrid/ambitious scenario is fairly ambitious in land use, TDM, and TSM strategies, and reports ambitious results for transit. With its hybrid scenario, SANDAG reports the potential to reduce GHGs by as much as 19% by 2035. The ambitious transit results are laudable and should be supported by appropriate policies and investments. However based on the information presented we are concerned that these transit goals may not be supported. More ambitious strategies for walk and bike, land use, and pricing, plus less road expansion in outer suburban areas, SANDAG should be able to show equal or even better GHG reductions. SANDAG examined three test scenarios, one focused on demand management (TDM), one on transit improvements, and one on pricing, each one in turn evaluated against two land use alternatives. SANDAG then created a hybrid scenario, with advice from its Board as to what to include, and this has de facto become SANDAG’s most ambitious scenario: Land Use: For SANDAG, a fully ambitious land use would enhance its Urban and Town Center growth strategy, at least for the outer years after the current housing recession has passed, to support the transit strategies discussed below and make them more realistic. San Diego’s current housing stock is comprised of about 35% attached units, with that percentage gradually increasing over time. In the past decade, attached housing units have comprised 46% of new construction. For the 2007 RTP, 71% of new housing would be attached units going out to 2020 and 80% from then until 2030 (and 91% for the decade beyond, to 2040), and ten designated Urban Centers and 34 designated Town Centers would build up by absorbing much of the new growth. This represents an ambitious assumption, and the market, land supply, and land prices seem to support these trends. SANDAG also examined an even more ambitious land use alternative, which would build out the existing eight Urban and 24 Town Centers to maximum density and put enough growth into ten designated new ones to reach at least minimum urban and town center density. This alternative would in effect accelerate attached housing unit trends and require more infill and redevelopment, and it would increase the amount of GHG reductions by about 8% for 2020 and 10% for 2035. Road Network: SANDAG’s hybrid/ambitious scenario makes no changes to rein in suburban and interregional highway expansion. A fully ambitious scenario would retract or scale back highway projects in outlying areas, particularly those designed to serve interregional commuting, in favor of interior road, transit, or walk and bicycle projects to improve accessibility to or within Urban and Town Centers. SANDAG plans to spend $21 billion for highway expansion, for 32 HOV lane, managed lane, mixed flow lane, HOT lane, toll road, and interchange projects, plus another $7 billion for arterial corridor projects, through its 2007 RTP. This represents a very aggressive highway expansion in size as well as early construction. While the Bay Area would spend more on transit than road expansion, and LA and Sacramento would spend 30%-40% more on road than transit expansion, SANDAG would spend 278% more on road expansion than transit expansion. With the addition of HOV and HOT lanes in many corridors, San Diego’s freeways will have from 14 to 18 lanes on I-5 and I-15 into North County, twelve lanes on three other freeways, and ten lanes on much of the rest of the network; in comparison, twelve-lane

Page 4 of 19
freeways are quite rare elsewhere in California, the standard for major urban freeways is eight lanes, and even the new Bay Bridge will have only ten lanes, so San Diego would build 20%-40% more capacity on its freeways than regions with much greater population. SANDAG’s county sales tax program (TransNet) expects to complete more than $7 billion of the $21 billion in highway expansion by 2014 using bonds. Arguably SANDAG would overbuild its freeways, but it does to some extent tend to locate its freeway expansion strategically in the right places, on corridors that connect its Urban and Town Centers. Nine of the HOV, managed lane, and mixed flow projects (on I-5, I-15, and Routes 56, 76, & 78 to the north, I-8 and Routes 52 & 67 to the east, and Route 125 toll road to the southeast, costing $11 billion) serve growth at the suburban edge; several of these projects are already committed, through Prop. 1B state bonds or the TransNet sales tax program, in particular the $2.5 billion managed lanes on I-5 to Oceanside and I-15 to Escondido. Some of the suburban highway expansions would provide too much capacity to support more low density, single use suburban development than SANDAG intends be built, and might not be needed if more of that growth were redirected into Urban and Town Centers. The Route 241 toll road extension into Orange County plus HOT lanes on I-5 & I-15 to the north county line (cost of $3.5 billion) would promote more interregional commuting and in no way fit with the spirit of SB375. Demand Management (TDM): The main concern about SANDAG’s TDM strategies is not how ambitious they are, but, as will be discussed below, whether SANDAG’s model would verify them as realistic if it had the capability to do so. SANDAG proposes TDM strategies that would yield 180,000 more carpool riders (144% increase), increase of 1150 vanpools (175% more than the RTP), and a 15% reduction in white-collar work trips (compared to 5% in the RTP) as part of its hybrid/ambitious scenario. These represent ambitious objectives, and would be easier to achieve with higher growth in Urban and Town Centers. System Management (TSM): SANDAG’s TSM improvements represent a reasonably ambitious TSM approach, through investments that ensure better access to areas of higher growth, and help bus as much as auto access. SANDAG lays out seventeen additional TSM improvements in the hybrid/ambitious scenario, beyond the $500 million designated for TSM improvements in its 2007 RTP, all to be built by 2020. All are auxiliary lanes or local improvements at congested locations. Four of the 17 are in suburban North County, but fifteen of the 17 directly serve Urban or Town Center access, where better accessibility and lower congestion would support compact growth. Walk & Bike: For SANDAG, a more ambitious walk and bike program would raise the overall investment in walk and bike projects to perhaps $2 billion (3.5% of the RTP), and change the focus to provide about $2 million per year for each Urban and Town Center, enough for one substantial project annually on a continuing basis (which could be supplemented with developer-built projects as well). SANDAG in its 2007 RTP proposes only $400 million investment in walk and bike projects, about 0.7% of the whole $57 billion financial plan. This is too modest an investment for walk and bike, which probably comprise at least 4% of all trips today. The hybrid/ambitious scenario would increase walk and bike trips to school by 30,000 (20%), using dedicated federal funds, and test full buildout of the regional bikeway network, which serves bicycle enthusiasts and recreational riding but does little to support more local travel by walk and bike. San Diego needs to foster walk and bike travel as real options, particularly for short local trips in Urban and Town Centers.

Page 5 of 19
Transit: If SANDAG’s model provided greater confidence that a large shift from auto to transit use were realistic, the hybrid scenario would represent a very ambitious scenario. SANDAG through its 2007 RTP would invest $9 billion for major transit expansion, for three new rail/guideway corridors, grade separations and double tracking on the four existing corridors, new bus rapid transit corridors, plus the existing 120-line express and local bus system, and then consume $11-12 billion more for operating costs for the whole system going out to 2035. The light rail lines plus fifteen bus lines would run at frequencies of 10-minutes or less. This represents substantial transit service, particularly given the extensive amount of low density, single use residential and office/light industrial park territory in San Diego. The hybrid/ambitious scenario proposes to add twelve new bus lines (10%), increase frequency of light rail trains, and add park-and-ride garages, and reports that daily transit ridership increases by 123%. This is a laudable goal, but the results are not supported by the information provided, for three reasons: no revenue stream exists to fund the additional operating costs, there may not be room for 123% more riders on a transit system that expands by less than 20%, and the apparent success in shifting trips to transit may not be all that it seems because of quirks in SANDAG’s model discussed below. If the shift is overstated, SANDAG will need to concentrate more on its Urban Area Transit Strategy in its next RTP, including redirecting or increasing revenues to expand its system. Pricing: SANDAG needs to consider a more realistic pricing scenario to achieve a fully ambitious approach, which could in addition provide funding for transit expansion. SANDAG in its 2007 RTP proposes to extend or add managed lanes on four corridors (I -5, I-15, I-805, & Route 52), and complete or widen three toll roads around the region (Routes 125, 241, & 11), within the framework of broader system expansion. In the hybrid/ambitious scenario, SANDAG would modify the RTP to build new HOV lanes as HOT lanes on three corridors (Routes 56, 78, & 94). Presumably all these toll facilities would use variable toll rates, and the extent of this toll system is more ambitious than in the other three major metro areas. To be consistent with SB 375, revenues generated by HOT lanes should be invested in transit, bicycle and pedestrian projects that reduce VMT. This is also an important equity consideration.
Does SANDAG’s modeling completely account for GHG reductions? Summary: The problems noted here tend to overestimate auto travel and VMT, and paradoxically may overestimate the shift to transit use. If fixed or adjusted, SANDAG would gain confidence in its estimated GHG savings for the hybrid scenario, and better understanding of effects of policy and investment choices on travel behavior. SANDAG could then verify its GHG reductions, and learn more about effectiveness of current and more ambitious strategies. SANDAG uses a traditional 4-Step Transportation Model, which represented the state-of-the-art from about 1960 to the mid-1990s. The 4-Step Model analyzes: 1) trip generation (what trips do people need or want to make?); 2) trip distribution (where do they go for those activities?); 3) mode choice (do they travel by driving, riding, taking transit, bicycling, or walking?); and 4) trip assignment (what route do they take, with feedback that considers other routes during congestion). The typical 4-Step Model is based on traffic analysis zones, which provide an

Page 6 of 19
average behavior for the people within them. The 4-Step Model was designed to assess mobility and forecast congestion, and it can do those things adequately. However, the 4-Step Model cannot assess very well, or at all, policy questions of today: How do demographics (age, income, household size) affect travel behavior? How do household size and land uses affect auto ownership and use? Why and how do people decide to chain activities together? To what extent do travel time and out-of-pocket cost affect travel choices? What would variable pricing of auto travel do to travel choices? How does people’s travel behavior respond to TDM signals for carpooling, walking, bicycling, and telecommuting? How does local geography affect walking, bicycling, and walk-to-transit? What do local land use details, particularly mixed uses, mean to travel behavior? The 4-Step Model must use a post-processor, typically involving extrapolation, to estimate answers to these kinds of questions. SANDAG’s 4-Step Model encounters at least four problems in looking at these issues, which limit RTP analysis and have become critical to SB375 planning:
• The model exaggerates the value of travel time. In assessing travel choices, the model trades off travel time versus out-of-pocket cost. This obviously affects whether a driver will use a HOT lane or toll road instead of free lanes, but it also affects the choice to travel by faster auto instead of slower but cheaper transit. SANDAG’s model allows for three values of travel time, for lower (<$39,200), middle ($39,200-$78,400), and higher (>$78,400) income households. The income ratio among these groups is about 1:2:3, but the ratio of value of travel time among the same groups is about 1:5:20. For the middle group, value of travel time is reasonable at $5-$11 per hour; that means that for the lower income group, value of travel time is way too low, resulting in artificially high use of transit, and for the higher income group, value of travel time is way too high, resulting in almost no use of transit and excessive willingness to pay road tolls. This may explain the why so many trips shift from driving to transit in the hybrid scenario. SANDAG should reexamine and adjust its coefficients for value of time in its model.
• The model assumes some results without calculating them. The 15% TDM reduction in white collar work trips, walk and bike trips, and carpooling are all predetermined inputs to the model rather than outputs based on travel behavior calculations. With no signal from the model about travel behavior choices, SANDAG does not really know whether its policies and investments are as effective as it thinks they are, and it appears that the model may not remove the auto trips that are no longer made because of TDM, thus overstating traffic and congestion levels. SANDAG cannot get its model to do things it is not capable of, but it should consider a post-processor to make appropriate adjustments.
• The model fails to replicate actual use of HOT lanes. SANDAG seems to have adjusted its value of travel time to get I-15 managed lane use results more in line with what it expected, but the revenue comes out six times higher for 2006-2009 than was actually collected. It is interesting to observe that revenue forecasts for the Route 125 toll road were three times actual receipts, leading the toll road owner to file for bankruptcy. The model also allows for unlimited use of managed lanes, rather than preferential use for HOVs, so the managed lanes de facto perform as mixed flow lanes. Adjusting the value of time should fix this issue too.
• The model uses employment by acre, rather than actual number of employees or workplace square footage in calculations. This seriously limits the ability to analyze higher density employment areas or mixed use areas, and misrepresents employment in

Page 7 of 19
certain zones such as Urban and Town Centers, which in turn implies continuance of single use medium density suburban land uses, contrary to the Urban and Town Center concept.

Page 8 of 19
San Francisco Bay Area (MTC)
Did MTC study a range of scenarios to inform what is ambitious and achievable? For years, MTC has been a state and national leader in developing innovative programs to link transportation and land use. MTC’s Regional Transportation Plan also has the largest share dedicated to public transportation. Yet, the scenarios that MTC staff have been using to assess potential greenhouse gas emission reduction targets for the Bay Area do not do justice to the good work that cities and the region have already been doing in terms of land use changes and progressive transportation policy. MTC’s targets should be higher, especially for 2035. MTC has been using three scenarios created for its previous Regional Transportation Plan (RTP). One followed a conservative approach, relying mostly on existing plans and current financial constraints. The other two scenarios each incorporated one specific change - automobile pricing and a shift in the location of housing units to infill areas, primarily described by an additional 200,000 homes in San Francisco - to show another possibility. These scenarios are insufficient for the following reasons:
• Neither scenario plans for a jobs/housing balance, as required by SB375 • Both scenarios assume an unrealistically high number of employed residents per
household – 15% higher than any other region, 35% higher than the Sacramento region, and above any historic jobs/housing ratio other than at the height of the dot-com boom. What this means is that not enough housing is realistically provided for the amount of projected job growth.
• The alternative scenario assumes an ambitious 200,000 new homes in San Francisco but actually decreases the number of homes in Santa Clara County, another major job center, and leaves housing growth constant in Alameda County, a transit-rich area, missing a readily available opportunity to reduce commuting and GHGs.
• The pricing scenario is being represented as more ambitious than it actually is. The largest part of the price increase, congestion pricing, was only applied to a small fraction of overall vehicle travel – most car trips would not experience this congestion pricing. MTC should either actually test the impacts of the scenario it describes publicly, or talk about this scenario more accurately.
• At the same time, some less politically or logistically challenging pricing policy changes may have been omitted. For example, it is not clear that bridge tolls were increased in either scenario to keep pace with inflation.
• Neither scenario reflects the Bay Area’s leadership in innovative transportation demand management programs, such as Safe Routes to Schools, Safe Routes to Transit, and the recent climate innovation grants.
• Both scenarios hold the transportation network relatively constant, especially regarding infrastructure investments. An ambitious scenario would revisit whether all projects in the transportation network, particularly those that facilitate additional interregional commuting, are necessary.
We applaud MTC staff for their commitment to study additional scenarios in the coming weeks that include some of the great work that is already happening in the region, including cities

Page 9 of 19
planning for smart growth and innovative programs to reduce driving like the Safe Routes to Schools program. In the coming weeks, MTC should study scenarios that:
• Achieve a jobs/housing balance by planning for enough homes in the region for all projected job growth, as required by SB375.
• Make realistic assumptions about the number of employed residents per household. A more realistic ratio would consider both historical trends in the region and future demographic shifts, such as an aging population, which would lead to fewer employed workers per household.
• Change land use patterns to show more growth in areas near job centers and along
transit networks, like in Silicon Valley and the inner East Bay, not just in San Francisco.
• Use a variety of different possible pricing mechanisms, for example, ensure that bridge tolls are increased to keep up with inflation.
• Build on and extend the innovative Transportation Demand Management (TDM) and non-motorized transportation strategies that already are underway in the region, such as ridesharing, vanpooling, Safe Routes to Schools, and the regional bike network.
Does MTC’s modeling completely account for GHG reductions? We commend MTC for their current efforts to update their scenario modeling software to a more modern model which uses up-to-date research and techniques, and will provide a more accurate measurement of the impacts of different policy choices on travel and emissions. Unfortunately, this model will not be ready in time to affect the target-setting process, and MTC’s current modeling software is outdated and significantly underestimates potential GHG reductions. Specifically:
• People in walkable neighborhoods near transit are more likely to choose to walk, bike, or take transit rather than drive than those in auto-oriented areas. The current model is not sufficiently sensitive to land use differences. It overestimates auto ownership, auto mode share, and trip length in transit-oriented, dense urban areas, and underestimates walk and bike trips.
• The model does not estimate emission reductions from Transportation Demand Management (TDM) measures such as Safe Routes to Schools.
• When the cost of a trip goes up, people are more likely to avoid the trip, link the trip with other travel, or choose another destination or mode of travel. Previous model runs failed to capture the impacts of pricing because the model did not allow trip lengths to change as a result of price, so the model did not accurately capture the GHG emission reductions that would likely result from pricing policies.
• When congestion goes down in a given area, more people are likely to drive in that area, eventually increasing total vehicle travel as well as congestion in the long term. The model notes short-term decreases in emissions due to congestion-reducing measures such

Page 10 of 19
as freeway ramp metering, but does not take into account the long term effects of induced traffic from short-term speed and capacity increases.
• People’s choices about where to live depend on how easily and conveniently they can get around from a given location – e.g. if an area has less traffic, more people are likely to move there. The land use and transportation models are not integrated so cannot take into account this interrelatedness.
CARB needs to make decisions based on the best, most up-to-date tools and data. In the absence of the best tools, we appreciate MTC’s commitments to: Be transparent about the shortcomings of the current model and clarify whether the
results the model is showing are really the most ambitious and achievable reductions.
Use off-model tools, including post-processors, to calculate benefits of land use changes, pricing changes, and Transportation Demand Management (TDM) measures.
Where off-model tools are not easily available, estimate emissions reductions using factors derived from the empirical literature.

Page 11 of 19
SACOG (Sacramento) Did SACOG study a range of scenarios to inform what is ambitious and achievable? Summary: SACOG’s RTP of 2008 presents a fairly ambitious scenario that is already adopted; it is the only RTP in the state that achieves even a modest reduction in per capita VMT. SACOG supports the spirit of SB375 by testing various ambitious strategies, demonstrating potential effectiveness for each strategy alone and in combination. With a hybrid scenario, SACOG reports the potential to reduce GHGs by as much as 8% by 2020 and 17.4% by 2035. SACOG admits publicly that even their most ambitious submitted scenario does not represent their most ambitious-achievable target since they intend to examine an improved land use scenario, but SACOG also needs to accept pricing as achievable as part of a fully ambitious scenario. SACOG examined six test scenarios, four of them focused individually on land use, demand and system management (TDM & TSM), transit improvements, and pricing, plus two combination scenarios that considered the first three factors together (excluding pricing) and then all four factors together. SACOG’s RTP from 2008 was already linked to a 2005 Blueprint land use plan and showed modest reduction in VMT per capita, and each test scenario would do more. Over the summer, SACOG intends to assemble another hybrid scenario representing the most ambitious measures that would be politically achievable: Land Use: SACOG’s current land use test scenario is admirably ambitious, and it intends to test another even more ambitious land use scenario this summer. This scenario alone would increase the amount of GHG reductions from 4% (RTP) to 5.9% for 2020 and from 12.6% (RTP) to 13.8% for 2035, and in combination with the other measures could get to 7.9% for 2020 and 17.4% for 2035. Sacramento’s current housing stock is comprised predominantly of detached housing, 67% on large lots and 3% on small lots, with 30% attached higher-density housing units. For the Blueprint and 2008 RTP, the mix of new housing would shift to 41% large-lot and 26% small-lot detached housing, with 34% attached units, in effect higher density suburbs with more mixed use and new town centers with only 36% of growth in transit priority areas. The Sacramento region’s housing construction market has already shifted nearly to the Blueprint mix in just five years, albeit in an atypical slow-growth economy. The Blueprint Plan represents quite an ambitious starting assumption, but the existing market seems to indicate that more could be achievable going out 25 years into the future. SACOG’s more ambitious SB375 land use scenario would shift the mix of new housing to 33% large-lot and 29% small-lot detached housing, with 38% attached units. This scenario would rely more on infill and redevelopment, yields 84% of new development at higher than current densities, and puts 46% of growth into transit priority areas, but Sacramento does contain extensive areas of aging post-World War II suburbs that would expect redevelopment by 2035. Road Network: SACOG proposes no changes in its road expansion in any of its scenarios, even for outer-edge suburban expressways and HOV lanes. A fully ambitious scenario with more infill would reconsider some of the far suburban road projects and substitute interior road, transit, or walk and bicycle improvements. SACOG in its 2008 RTP plans to spend just over $5 billion for road expansion, with $4 billion going for seven HOV lane projects, the Route 65 Lincoln bypass, three new long-distance cross-suburban arterial expressways, and two new bridges.

Page 12 of 19
SACOG’s RTP also contains nearly $6 billion for local access streets and arterial improvements built and funded as part of developments; no other RTPs include this category of road expansion. Not counting the developer-built projects, SACOG invests about 15% of its RTP in road expansion, compared to 33% for road maintenance, 11% for transit expansion, and 28% for transit operations. Work has started on all but two of the HOV lanes plus the Lincoln bypass and all should be complete before 2020; environmental work has begun for the three expressways, but they will be funded and built incrementally using federal and state funds, sales taxes, and development fees. Nearly half of SACOG’s road expansion investment goes to support infill development directly, for arterial widening, interchange, and freeway bottleneck projects plus four large HOV lane projects in interior areas. A couple of suburban edge HOV lane projects are already committed, through Prop. 1B state bonds and local funds, and the $300 million+ Lincoln bypass is under construction. Some of the suburban highway expansions would be funded by and provide access to greenfields development, but SACOG expects this development to be built as small-lot compact areas with mixed uses and new town centers rather than the traditional low density, single use suburban development. Demand Management (TDM): SACOG’s TDM measures go in the right direction, but it is unclear how ambitious they really are. Policies in SACOG’s 2008 RTP emphasize TDM, noting the varying effectiveness of strategies in different urban environments, and synergy between various strategies such as bike to transit and guaranteed ride home. The RTP, however, describes strategies indistinctly, with a focus to ensure that all employers come under a transportation management association (which promotes, manages, and sponsors TDM activities), and does not specify a level of investment. SACOG’s TDM/TSM test scenario proposes to increase TDM effort so that it expands faster than population growth and set up public car sharing programs in two communities infeasible for the private market alone; the car sharing proposal would be a good fit with redevelopment in transit priority areas, to enable less auto ownership. TDM programs offer promise in Sacramento, where the commute mode split today is 82% drive alone, 10% ride in carpools, 5% walk or bike, and 3% ride transit. System Management (TSM): SACOG’s TDM/TSM test scenario alone would increase the amount of GHG reductions from 4% (RTP) to 4.5% for 2020 and from 12.6% (RTP) to 13.1% for 2035, less effective than land use or pricing. SACOG lays out a TSM program in its 2008 RTP that centers on signal timing, incident response, and motorist information, costing an estimated $500 million. This represents a reasonably ambitious TSM approach, and does not add capacity for congestion relief in suburban edge areas that could support more growth there than SACOG wants. Walk & Bike: SACOG’s walk and bike commitment qualifies as fully ambitious, starting at the current RTP level. SACOG in its 2008 RTP proposes $1.4 billion investment in walk and bike projects, almost 4% of the whole $36 billion financial plan (excluding developer-built roads), and includes “complete streets” policies to ensure that arterial road expansion projects typically will also include bike and walk features beyond the $1.4 billion of direct investment. This represents a strong commitment for walk and bike, in line with walk and bike’s 7% mode share of all trips today, and proportionally much more than the other three major metro regions do. SACOG’s model estimates that 10% of trip growth for 2035 goes to walk and bike. None of the

Page 13 of 19
test scenarios propose to increase walk and bike trips specifically. Success with a more ambitious land use scenario will depend to some extent on ability to foster walk and bike travel as real options, particularly for short local trips in infill and compact development areas. Transit: SACOG’s transit scenario seems fairly ambitious given the context of the region and funding, and synergy with other strategies is important. Sacramento today starts with minimal transit service, offering mainly lifeline service for those without autos, with only two light rail and five bus lines offering better than half-hour frequency. It carries 1% of all trips, but 20% of commute trips to the denser, transit-friendlier central business district where it costs $8-$20 daily to park. SACOG through its 2008 RTP would invest $4 billion for major transit expansion, for four new rail corridors, 16 new bus rapid transit corridors, express bus expansion on HOV lanes, plus more frequent service on significant parts of the local bus system, and expands $10 billion more for operating costs for the whole system going out to 2035. The three main rail lines plus 24 bus lines would run at frequencies of 10-minutes or less. Overall transit ridership would triple by 2035. The amount of service the RTP can propose is capped by the amount of funding available to operate it, because 80% of operating cost must come from public funds beyond fares. The RTP represents substantial transit service that must evolve as a predominantly low density, single use residential and office/light industrial park region adds more compact, mixed use, town-center-oriented growth. The transit test scenario proposes to add 15% more transit service, mostly as higher frequency on lines in the RTP. The transit test scenario alone would increase the amount of GHG reductions from 4% (RTP) to 4.1% for 2020 and from 12.6% (RTP) to 12.7% for 2035, less effective in isolation than any other strategy, but in combination with the other measures could get to 7.9% for 2020 and 17.4% for 2035. Pricing: SACOG tests a very ambitious pricing proposal. The pricing scenario gets results, particularly in the longer horizon: the pricing test scenario alone would increase the amount of GHG reductions from 4% (RTP) to 4.7% for 2020 and from 12.6% (RTP) to 15.1% for 2035, and in combination with the other measures it provides more than half the boost to get to 7.9% for 2020 and 17.4% for 2035. Does SACOG’s modeling completely account for GHG reductions? Summary: SACOG’s model encounters shortcomings mainly around the margins, but it accounts for GHG reductions as well as any model can do today. In fact, SACOG’s model is powerful enough that it bumps up against the ability to provide accurate enough inputs for future year demographics, behavior, and land uses. In other words, model outputs are only as good as today’s limited ability to estimate location and timing of housing and job development or to understand behavior choices involving the cost of driving. SACOG has replaced its traditional 4-Step Transportation Model with a state-of-the-art Activity-Based Model. Activity-Based Models assess behavioral decisions about where to go and how and when to travel, the kinds of policy questions important to SB375 planning. In addition, SACOG's model estimates household travel demand based on 800,000 parcels, which eliminates much of the averaging that takes place in describing zone behavior and allows walk, bicycle, and walk-to-transit modes to be assessed on a more equal footing with drive, ride in auto, and ride on

Page 14 of 19
transit. SACOG can model better than anyone else key policy questions of today: How do demographics (age, income, household size) affect travel behavior? How do household size and land uses affect auto ownership and use? Why and how do people decide to chain activities together? To what extent do travel time and out-of-pocket cost affect travel choices? What would variable pricing of auto travel do to travel choices? How does people’s travel behavior respond to TDM signals for carpooling, walking, bicycling, and telecommuting? How does local geography affect walking, bicycling, and walk-to-transit? What do local land use details, particularly mixed uses, mean to travel behavior? SACOG’s model does not yet incorporate all behavioral decision factors that one might like, and so still must use a post-processor to estimate answers to some questions. SACOG’s Activity-Based Model needs further development or faces challenges in five areas:
• The model’s vehicle ownership module is not sophisticated enough to match the rest of the model’s capabilities. It needs to be able to assess not only total vehicle ownership by household but also what type(s) of vehicles people are likely to own, when to change those vehicles for other models, and who uses which vehicles for which trips. The model needs these capabilities for both SB375 analysis and to help CARB modernize the vehicle fleet mix component in its EMFAC emissions model to minimize fleet mix forecast variations from county to county.
• The model cannot assess variable pricing as a decision factor. It does consider both travel time and out-of-pocket trip cost (including VMT or parking fees) in choosing where and when to travel and what mode to use, but cannot adjust that choice once the trip starts. SACOG’s post-processor estimates pricing effects to a reasonable order of magnitude, but the model does not calculate behavior choices for variable congestion fees and HOT lanes.
• The model cannot yet estimate traffic queuing. Traffic queuing, particularly on a road network that depends on arterials with lots of turning moves, is a real world factor in driver route choice. In fact, in Sacramento traffic diversion through neighborhoods in response to traffic queuing delays has become an issue that hampers road improvements needed to reduce congestion, support infill development, and keep bus routes running on time.
• SACOG’s economic land use model is not ready to forecast interim year land uses, so that interim year data about pace and timing of development must be hand interpolated before the model can examine years such as 2020, 2025, and 2030 efficiently and with confidence.
• The model is data hungry. Data input and updating, particularly for land use parcels and transit service (where all stops must be geographically identified), requires considerable effort, and data needs will increase once a traffic queuing module comes on line.

Page 15 of 19
SCAG (Greater Los Angeles) Did SCAG study a range of scenarios to inform what is ambitious and achievable? Summary: Except possibly for TDM, SCAG’s most ambitious scenario is not particularly ambitious in land use, in customizing road, transit, walk and bike investment, and in pricing. Even so, SCAG reports the potential to reduce GHGs by 10% by 2020 and 12% by 2035. With more focused strategies designed to work together, and packages of strategies that get increasingly aggressive beyond 2020, SCAG should be able to show significantly better GHG reductions. The five SCAG scenarios combine seven elements: Land Use: In representing that its achievable scenario consists of nothing more than what is already going to happen and describing an ambitious scenario that allows current conditions to worsen, SCAG’s scenarios fall well short in both direction and result. SCAG modeled three land use scenarios ranging from achievable to ambitious. The most achievable and least ambitious is a business-as-usual land use package for its 2008 RTP. For the next three scenarios SCAG used its Compass Blueprint 1 package which represents “the expected growth distribution by applying current general plans and recent local land use policies,” and for its fifth scenario used a Blueprint 2 package built with densities around priority transit stations described as plausible but that “have not occurred in most parts of the SCAG region to date.” SCAG dismisses the fifth scenario as too ambitious to achieve, and settles on its expected growth distribution as its ambitious-achievable scenario. In all scenarios, SCAG distributes more than 2 million of population growth, about 40% of its total population growth by 2035, at or beyond the urban edge, in the High Desert, Coachella Valley, and the valleys southeast of Riverside. SCAG’s most ambitious scenario results in a decrease in the percentage of housing located in transit priority areas from 59% today to 58% in 2035. It also decreases the jobs/housing ratio in housing-rich Riverside and San Bernardino Counties, increases it in jobs-heavy Orange County by 5%, and decreases it by 6% in Los Angeles County, requiring more long distance commuting into areas where the opportunity for walk and transit access to work is less than in Los Angeles. SCAG should test a scenario that builds more housing into job-rich areas combined with transportation investment targeted to these areas. Road Network: SCAG’s road network, the same for all five scenarios, does not meet the test of ambitious-achievable. SCAG would invest $100 billion in highway expansion, for 55 HOV lane, mixed flow lane, HOT lane, toll road, and interchange projects, plus another $35 billion for 55 arterial corridor projects, through its 2008 RTP. Twelve of the HOV and mixed flow projects (on I-5, Route 14, & I-15 to the north, I-210, I-10, & Route 60 to the east, I-215 & I-15 to the southeast, and I-5 to the south, costing $15 billion) plus five new toll roads (in the High Desert and between Riverside & Orange Counties, to cost $25 billion) will fuel suburban growth in semi-rural areas in outlying parts of the region. The HOV lane, HOT lane, and interchange projects in the urban interior serve to connect missing links on a map rather than improve access specifically to transit priority areas. None of SCAG’s five scenarios change anything, let alone do anything ambitious, from its RTP road investment package. SCAG neither pulls back nor shifts its investment in any road

Page 16 of 19
expansion projects, even in the most ambitious scenario. Some of these projects are already committed, through Prop. 1B state bonds or county sales tax programs, but surely even part of $15 billion or more redirected to transit priority areas would improve accessibility and support more growth in places dense enough for frequent transit service connecting to multiple other areas. SCAG should test a scenario that focuses on interior road, transit, or walk and bicycle projects close to job centers and reconsiders growth-inducing suburban highway projects that are not yet committed, and customize its investment in the HOV and HOT lane system specifically for access to areas targeted for dense development. Demand Management (TDM): In its 2008 RTP, SCAG emphasizes TDM strategies, such as carpool programs, flexible work hours, telecommuting, and parking management. As a starting point, Los Angeles already has one of the highest work-from-home rates of any large metro area in the country. The RTP would spend $3 billion on TDM strategies, in addition to $18 billion to expand HOV lanes noted above. SCAG’s most ambitious scenario proposes to increase work-at-home rates by 2% of total employment, or 200,000 jobs. This represents an ambitious objective, but appears less ambitious because it does not include shifts to walk, bike, carpools, and transit that should follow higher growth in compact transit priority areas and that SCAG’s model cannot discern. In a region where 28% of non-work trips travel less than one mile and 50% less than three miles, more opportunity to reduce driving remains, and TDM should be able to realize better results. System Management (TSM): It is unclear whether SCAG’s TSM program will in fact reduce GHG emissions in the long term. SCAG lays out $22 billion in TSM improvements (not including HOV lanes) in its 2008 RTP, but then finds that $8 billion of those are lower priorities that need to be funded from new revenue sources such as road tolls. SCAG’s most ambitious scenario seeks a “7% speed and capacity increase” for the whole road system, with lesser increases of 5% and 3% for less ambitious scenarios, without explaining clearly how it intends to accomplish this. A global increase in road speed would be good for bus service but also for driving, but a widespread increase in road capacity, based on past experience, would eventually provide room for more VMT, helping to explain why VMT per capita in SCAG decreases by 2020 but then resumes its increase by 2035. A more ambitious TSM program would target investment to transit priority areas, to ensure that buses gain particular benefit rather than mostly autos, and to ensure better access to those areas that will take on more growth. Walk & Bike: Given the strong potential for walk and bike to play a major role in SCAG’s overall transportation strategy, its investments in non-motorized strategies fall short of ambitious. SCAG in its 2008 RTP proposes $1.8 billion investment in walk and bike projects, about 0.35% of the whole $530 billion financial plan. This is a modest investment at best where the mode split for walk and bike exceeds 12% today based on household travel surveys. The most ambitious scenario would increase this investment by $500 million, to 0.45% of the whole. SCAG notes that walk and bike investments give disproportionate benefits compared to road and transit, and much of the LA region is dense enough that walk and bike are real options for many non-work trips today, becoming truer with increased growth in transit priority areas. A more ambitious walk and bike program would shift investment from peripheral road expansion to interior walk and bike projects, in an amount of several billion dollars, and target those investments to support moderate to high density redevelopment and infill projects in transit priority areas.

Page 17 of 19
Transit: SCAG’s transit scenarios do not meet the test of strategically ambitious. SCAG through its 2008 RTP would invest $55 billion for major transit expansion, in 13 rail plus 14 bus rapid transit corridors, plus another $47 billion for a 5-line high speed rail system, and then consume $164 billion in operating costs for the whole system going out to 2035. This represents substantial transit service, but it is concentrated in urban Los Angeles County and is considerably thinner in suburban counties where most future growth is slated to go. The most ambitious scenarios propose to make up the current shortfalls and expand service to shorten headways by a further 20%, expressed as a global average. The ambitious scenarios are described by SCAG as unachievable, in this case because no revenue stream exists to fund the additional operating costs. SCAG should examine ways to shorten transit headways that would be more realistically fundable, focusing on transit priority areas where ridership should increase disproportionately. It could also consider using funds shifted from suburban road expansion to build one or more additional rail corridors connecting high-growth transit priority areas. Pricing: SCAG’s pricing scenarios are far from ambitious. SCAG in its 2008 RTP proposes expansion of four existing toll roads, four HOT lane projects, and four new toll roads around the region, seemingly chosen mainly as a way to fund large otherwise-unaffordable projects. In the most ambitious scenarios, SCAG would convert existing HOV lanes on I-10 and I-110 to HOT lanes (relatively easy from an engineering and cost standpoint) but the size of the fee does not contribute to the GHG performance of the more ambitious scenario. Does SCAG’s modeling completely account for GHG reductions? Summary: All of the problems noted below tend to overestimate auto travel and VMT, and underestimate walk, bike, and walk-to-transit trips. If fixed, SCAG would realize greater GHG savings in its baseline, and thus could reach a higher target. SCAG also would realize more GHG reductions from the seven types of measures discussed above, which would technically serve a higher GHG reduction target as well as politically demonstrate greater value from pursuing admittedly-difficult choices more aggressively. SCAG uses a traditional 4-Step Transportation Model, which represented the state-of-the-art from about 1960 to the mid-1990s. The 4-Step Model analyzes: 1) trip generation (what trips do people need or want to make?); 2) trip distribution (where do they go for those activities?); 3) mode choice (do they travel by driving, riding, taking transit, bicycling, or walking?); and 4) trip assignment (what route do they take, with feedback that considers other routes during congestion). The typical 4-Step Model is based on traffic analysis zones, which calculate and use average behavior for the people within them. The 4-Step Model was designed to assess mobility and forecast congestion, and it can do those things adequately. However, the 4-Step Model cannot assess very well, or at all, policy questions of today: How do demographics (age, income, household size) affect travel behavior? How do household size and land uses affect auto ownership and use? Why and how do people decide to chain activities together? To what extent do travel time and out-of-pocket cost affect travel choices? What would variable pricing of auto travel do to travel choices? How does people’s travel behavior respond to TDM signals for carpooling, walking, bicycling, and telecommuting? How does local

Page 18 of 19
geography affect walking, bicycling, and walk-to-transit? What do local land use details, particularly mixed uses, mean to travel behavior? The 4-Step Model must use a post-processor, typically involving extrapolation, to estimate answers to these kinds of questions. SCAG’s 4-Step Model encounters at least five problems in looking at these issues, which limit RTP analysis and have become critical to SB375 planning:
• The zone system is too coarse. SCAG uses about 4000 zones. In the urbanized area, that means a typical zone would contain nearly 5000 people and about a square mile of area. That is far too large to examine walk and bike travel effectively, and too much variation within a zone gets lost in the whole-zone average. SCAG needs to be able to discriminate and consider land uses, demographics, and zone behavior on a finer grain, such as via an internal grid or census blocks.
• The model is not sensitive enough to different kinds of land use patterns. It allows for two: a highly dense Central Business District, and everything else. The SCAG region is much more diverse than this, for example with multi-generational ethnic neighborhoods with low auto ownership, medium density apartment communities, and suburban towns designed for walk access. The model contains a 0-or-1 switch for the two allowed land uses. The model probably contains a field of code that would allow up to ten land uses (0-through-9), and SCAG needs to make use of this flexibility.
• The model is not sensitive to trip cost; it chooses and assigns trips based only on travel time. Thus it does not respond to pricing. The model could be coded to calculate based, say, on 80% travel time/20% out-of-pocket trip cost. SCAG should seek such a modification.
• The model is not sensitive to walk, bike, or walk-to-transit trips as a mode choice. This problem stems from the large zone structure, yet these mode choices are realistic options in many zones. The model actually chooses trip origins and destinations before mode choice, and if the trip chosen goes between two zones (> 1.5 miles), it will be too long for walk or bike. SCAG could work around the large zone problem by designating walk or bike as the mode of travel before choosing trip origin and destination, thus it would come up with an accurate number of walk and bike trips that would then stay within one zone.
• SCAG has no auto ownership feature for its model. Trip behavior varies significantly by number of autos in a household, so the model cannot accurately predict travel behavior without this key information. The transit priority areas presumably offer good enough transit access that some households could choose to own fewer autos, and thus travel differently, and some other areas already have lower auto ownership that SCAG’s zones do not pick up. SCAG could attach an auto ownership variable to its allowed land uses, and adjust to some extent for this shortcoming.

Page 19 of 19
Biographies
David Ausherman, Principal of Planning and Design Renaissance Planning Group David has extensive experience in large scale design, urban and regional planning and computer modeling. His experience includes both public and private sector design projects from site to regional scales. Most notably, David has been involved in several large-scale regional scenario planning and visioning initiatives including Region 2040, a plan for the Portland region that included land use, transportation and open space planning for a 50-year forecast, Envision Utah, Chicago Metropolis 2020, Envision Central Texas. David completed his master’s degree in Design Studies from Harvard University and his undergraduate degree in Landscape Architecture from the University of Florida. Peter Hathaway, Transportation Planning Consultant Peter Hathaway has a career in transportation planning and finance spanning 40 years. Most recently he was Director of Transportation Planning at the Sacramento Area Council of Governments (SACOG). Previously, Mr. Hathaway worked for 16 years at the California Transportation Commission (CTC), four years at the Governor’s Office of Planning and Research and seven years at the California Department of Transportation (Caltrans). A graduate of Union College, Schenectady, New York, he is a veteran of the United States Army. At SACOG, Hathaway managed transportation planning, programming and project delivery programs. He supervised two groundbreaking Metropolitan Transportation Plans: in 2002, the “Bold First Step” prepared by a broad-based Transportation Roundtable that included the establishment of four new regional funding programs including Community Design, and in 2008, “A Creative New Vision” directly linking the region’s Blueprint to transportation planning and setting new standards for congestion, vehicle miles traveled and air quality performance.
Norm Marshall, Principal Smart Mobility Inc. Norm Marshall is a founder and principal of Smart Mobility Inc, a consulting firm based in Norwich, Vermont that integrates transportation and land use modeling, engineering, and planning. Before co-founding SMI in 2001, Mr. Marshall worked at Resource Systems Group, Inc. from 1987-2001. During his 14 years at Resource Systems Group, Mr. Marshall developed a national reputation for innovative work in regional travel demand modeling and transportation/land use interactions. His experience includes developing travel demand models for Burlington Vermont, Portland Maine, Syracuse New York, the New Hampshire Seacoast region, and a statewide model for Georgia. He has completed many projects in Vermont covering areas including estimating traffic volumes, traffic operations, traffic impact studies parking, transit needs, and transit operations. Mr. Marshall received his B.S. in Mathematics at Worcester Polytechnic and completed his M.S. in Engineering Sciences at Dartmouth College.

1
Mid-Coast Corridor Transit Project BriefingJuly 16, 2010
July 2, 2010 meeting summarized:– scoping outreach activities – scoping meetings – scoping comments for Draft SEIS/SEIR
Introduction
2

2
Final Comparative Evaluation of Alternatives Report– Summary of scoping comments– Analysis and response to scoping
comments– Recommendation on selection of LPA
and alternatives for review in Draft SEIS/SEIR
Final Report
3
Scoping comments related to:– Purpose and need– The evaluation process– Costs and funding– Environmental impacts
To be addressed in Draft SEIS/SEIR
Scoping Comment Analysis
4

3
Scoping comments related to alternatives addressed in Final Comparative Evaluation of Alternatives Report Comments related to alternatives:
– Support or oppose LRT Alternatives – Support evaluation of BRT in Draft
SEIS/SEIR– Suggest new or revised alternatives– Support additional LRT stations
Scoping Comment Analysis
5
6
LRT Alternatives for Scoping
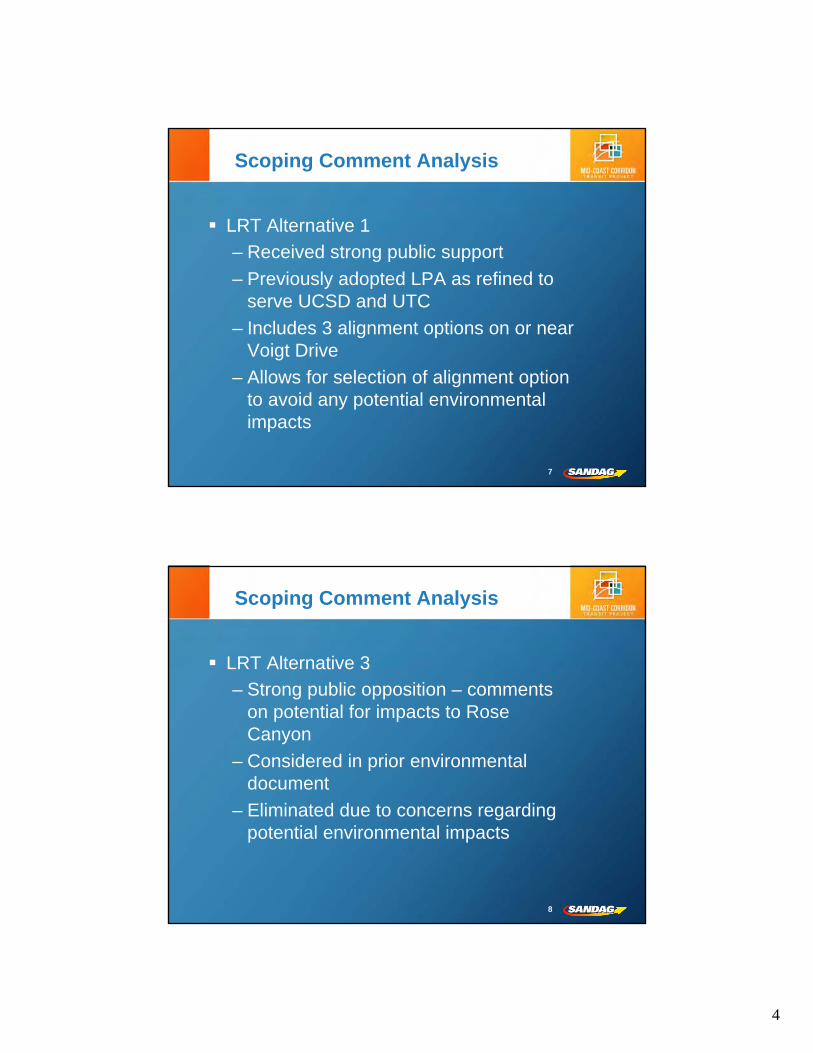
4
LRT Alternative 1– Received strong public support– Previously adopted LPA as refined to
serve UCSD and UTC– Includes 3 alignment options on or near
Voigt Drive– Allows for selection of alignment option
to avoid any potential environmental impacts
Scoping Comment Analysis
7
LRT Alternative 3– Strong public opposition – comments
on potential for impacts to Rose Canyon
– Considered in prior environmental document
– Eliminated due to concerns regarding potential environmental impacts
Scoping Comment Analysis
8

5
LPA Alternative 6– Performance similar to Alternative 1– Potential impacts are greater– MTS concerns regarding sharp curves
resulting in noise, additional maintenance
Scoping Comment Analysis
9
Comments support evaluation of BRT in Draft SEIS/SEIR 4 BRT alternatives evaluated
– less effective in improving mobility and accessibility
– far less cost effective and financially feasible
Evaluation of BRT in Draft SEIS/SEIR not recommended
Scoping Comment Analysis
10

6
New or revised alternatives suggested – None would satisfy purpose and need:
• At less cost• With greater effectiveness• With less environmental or
community impacts– Evaluation of new or revised
alternatives in Draft SEIS/SEIR not recommended
Scoping Comment Analysis
11
Comments support additional LRT stations at SR 52, Gilman Drive and Jutland Drive These stations either:
– previously considered and eliminated – not feasible due to topography and
location Addition of station sites not recommended
Scoping Comment Analysis
12

7
Comments support station at VA Hospital VA Hospital station not previously
considered as an additional station Evaluation of VA Hospital as additional
station in Draft SEIS/SEIR is recommended
Scoping Comment Analysis
13
Final Comparative Evaluation Report and Recommendation reviewed by – Project Working Group – July 14– Independent Taxpayer Oversight
Committee – July 14
PWG and ITOC Review
14
8
MTS Board of Directors received report on Mid-Coast Project – May 13, 2010
MTS Board of Directors voted unanimously to support LRT Alternative 1
MTS Board Action During Scoping
15
Released for public review May 2009 PWG and the public reviewed PIP and
provided comments Final PIP revised based on comments
received Final PIP will continue to guide public
involvement efforts PIP to be updated as needed
Public Involvement Plan (PIP)
16

9
Final Comparative Evaluation of Alternatives Report – Board of Directors - July 23, 2010
Should Board adopt LPA:– PE Application prepared and submitted
to FTA in fall 2010– FTA approval of PE Application by
November 2010 allows Project to be included in FTA February 2011 Annual Report on New Starts to Congress
Next Steps
17
Should Board approve LRT Alternative 1 and No-Build Alternative for review in Draft SEIS/SEIR– Draft SEIS/SEIR would be complete
Summer 2011
Next Steps
18

10
The Transportation Committee is asked to recommend that the Board of Directors reconfirm the previously adopted Locally Preferred Alternative (LPA), as refined to include direct service to UCSD and University Towne Centre, by selecting Light Rail Transit (LRT) Alternative 1 (combines 1, 4 and 5) as the LPA.
Recommendation
19
The Transportation Committee is further asked to recommend that the Board of Directors approve LRT Alternative 1 and the No-Build Alternative for evaluation in the Mid-Coast Corridor Transit Project Draft SEIS/SEIR. The Transportation Committee also is asked to recommend that the Board of Directors approve the final Public Involvement Plan.
Recommendation
20

1
Environmental Mitigation ProgramEnvironmental Mitigation Program
Transportation Committee Transportation Committee EMP Land Management GrantsEMP Land Management Grants
July 16, 2010July 16, 2010
Environmental Mitigation ProgramEnvironmental Mitigation Program
BackgroundBackground
•• SANDAG Board approved competitive process for SANDAG Board approved competitive process for land management grants on September 25, 2009land management grants on September 25, 2009
22

2
Environmental Mitigation ProgramEnvironmental Mitigation Program
BackgroundBackground
•• $2.085 million for eligible projects:$2.085 million for eligible projects:–– Invasive species controlInvasive species control–– PostPost--fire recoveryfire recovery–– Habitat restorationHabitat restoration–– Access control Access control
& litter removal& litter removal•• Projects must start one year Projects must start one year
from Board approvalfrom Board approval
33
Environmental Mitigation ProgramEnvironmental Mitigation Program
BackgroundBackground
SANDAG Board approved criteriaSANDAG Board approved criteria
44
155Total
1020-5Project promotes public awareness of sustainable land management through public outreach and participation
1020-5Sufficient matching funds available to complete the project
1530-5
Project part of a larger strategic effort which covers a large area with multiple partners and multiple benefits? High Economy-of-Scale
1530-5Dedicated staff (agency, jurisdiction, non-government organization) willing to assume long-term management
2040-5Urgent action is needed to address a problem or else the site would degrade further
2040-5
Long term success of management activities is likely with clear measurable positive results which will reduce future land management costs (High Cost-Effectiveness)
2040-5Critical linkage parcels or in regional wildlife corridor
2040-5
Site supports rare vegetation types, populations of narrow endemics, or species at risk of extirpation (e.g., Tier 1 habitat, vernal pools, cactus wren)
2550-5Lack of management on site may affect protection of covered species
Total ScoreMaximum Score
PossibleWeightPoint RangeProject Evaluation Criteria

3
Environmental Mitigation ProgramEnvironmental Mitigation Program
ResultsResults
•• 24 applications received 24 applications received -- $7.1 million$7.1 million•• Quality of proposals excellent Quality of proposals excellent •• Evaluation committee prioritized proposalsEvaluation committee prioritized proposals
–– Seven members of EMPWG and three outside Seven members of EMPWG and three outside nonnon--voting members to provide inputvoting members to provide input
•• EMPWG and RPC EMPWG and RPC –– Recommend funding 10 grantsRecommend funding 10 grants
55
Environmental Mitigation ProgramEnvironmental Mitigation Program
RecommendationRecommendation
The Transportation Committee is The Transportation Committee is asked to recommend that the asked to recommend that the Board of Directors:Board of Directors:
66
1.1. Approve the prioritized list of land management Approve the prioritized list of land management projects and funding allocations (Attachment 2), andprojects and funding allocations (Attachment 2), and
2.2. Authorize the Executive Director to enter into Authorize the Executive Director to enter into agreements for the selected grants in the proposed agreements for the selected grants in the proposed allocations totaling $2.085 million under the fourth allocations totaling $2.085 million under the fourth cycle of this grant program.cycle of this grant program.

4
Environmental Mitigation ProgramEnvironmental Mitigation Program
Transportation Committee Transportation Committee EMP Land Management GrantsEMP Land Management Grants
July 16, 2010July 16, 2010
Environmental Mitigation ProgramEnvironmental Mitigation Program
ResultsResults
24 Applications received

5
Environmental Mitigation ProgramEnvironmental Mitigation Program
ResultsResults
10 applications recommendedfor funding

11
TransNet Early Action Program Baseline and Revised Robust Proposed Scenarios
BaselineRevised Robust
• I-15• I-805• SR 94 / SR 125• I-5 North• LOSSAN
22
TransNet Early Action Program Baseline Scenario - Projected Open to Public
Baseline

33
TransNet Early Action Program Revised Robust Scenario - Projected Open to Public
Revised Robust
44
TransNet Early Action Program Baseline and Revised Robust Scenarios
Baseline
Robust

55
-30%
-20%
-10%
0%
10%
20%
30%
2005 2006 2007 2008 2009 2010 2011 2012 2013 2014 2015 2016 2017
Construction Index TransNet Revenues
ProjectedActual
Comparison of TransNet Revenues and Construction IndexCumulative Escalation Indexed to FY2005
66
The Transportation Committee is asked to recommend that the Board of Directors
1. approve the 2010 TransNet Plan of Finance update, which incorporates the proposed projects in the revised Robust scenario;
2. authorize the Executive Director to amend the FY 2011 SANDAG Budget to incorporate the new capital projects; and
3. approve revision to the set-aside of federal and state discretionary funding for the TransNetEarly Action Program from 94 to 90 percent.
These actions will support the pending issuance of $300-$350 million in long-term fixed rate debt.

SANDAG, July 13, 2010, Appendix A
July 16, 2010

Suite 710 660 Newport Center Drive Newport Beach, CA 92660
949 721-9422 949 721-9437 fax www.pfm.com Public Financial Management, Inc.
PFM Asset Management LLC
This relates to Agenda Item #13 Transportation Committee July 16, 2010
PFM Advisors
July 13, 2010
Memorandum
To: SANDAG Independent Taxpayer Oversight Committee (ITOC), Transportation Committee, and Board of Directors
From: Keith D. Curry, Public Financial Management
Re: Financial Plan and Next Financing
Public Financial Management (“PFM”) has worked with SANDAG staff to prepare the annual update for the TransNet Extension Plan of Finance. For the past several months, PFM and SANDAG staffs have been working to optimize SANDAG’s financing strategy to minimize program borrowing costs while maximizing the timing and advancement of TransNet Early Action Program (EAP) projects. Background With the initial planning of the TransNet Extension program, PFM created a multi-functional financial planning model that allows SANDAG to project its project delivery requirements, along with its funding availability constraints to optimize its financing strategy. The TransNet Extension model allows staff to modify assumptions to reflect changing project delivery readiness, increased or decreased project cost estimates, and changes in revenue trends and interest rates. Debt issuances are sized to meet the upcoming two years of construction and project activity. This is done to optimize bond sizing, reduce costs of issuance, and to best comply with Federal requirements related to issuance of debt.
Current Debt Portfolio In April of 2008, SANDAG issued $600 million in variable rate demand bonds, and by using interest rate swaps, established a “synthetic fixed” cost of funds of 3.681%. This borrowing enabled SANDAG to implement its “Early Action” Program and to send out for bid many projects in a favorable construction cost environment, thereby partially offsetting the impact of lower sales tax revenues. SANDAG staff indicates the agency is expected to fully expend its 2008 bond proceeds during the upcoming fiscal year. As of July 1st, the agency has approximately $150 million of bond proceeds from its previous issuance; however the agency’s short-term capital requests far exceed the amount available. Therefore, it is time to consider a second TransNet Extension borrowing. Upcoming Issuance A “Robust” scenario, which would advance additional TransNet projects to construction as well as prepare the next list of shovel-ready projects, is being recommended. After careful review of project delivery timetables and project readiness, it appears that a need to borrow between $300-350 million in the current fiscal year (FY 2011) exists. One of the most significant changes to the municipal bond market over the past year and half has been the introduction of the Build America Bonds (“BABs”) in the municipal market. BABs provide state and local governments with a new method of financing capital projects with the aid of a federal subsidy. The subsidy was intended to ease the burden state and local governments began experiencing with the financial crisis. The BABs program allows states and local governments to issue an unlimited amount of taxable debt through December 31, 2010. These bonds are intended to provide an additional source of market access to municipal issuers by expanding the current pool of U.S. municipal bond investors. The taxable market is a sizable global market driven by the underlying credit of its issuers, potentially making U.S. state and local government

SANDAG July 13, 2010
Page 2
bonds a desirable investment vehicle given their relative strength and stability versus global corporate issuers. BABs provide a way for large issuers to achieve potentially advantageous pricing versus traditional tax-exempt debt through a 35% subsidy paid by the U.S. Treasury on the interest due on the bonds in the form of a direct subsidy to the issuer or a tax credit to the investor. The BABs program is available for SANDAG to use if its pricing is advantageous at the time of issuance. Due to the successful 2008 financing, and receipt of additional federal and state funds, SANDAG has been able to accumulate substantial cash balances. This cash also is programmed for project needs. While it may be possible to delay the proposed 2010 financing one year by fully depleting SANDAG’s cash, we believe this is a good time to borrow for the following reasons:
1. Opportunities exist in the current financial markets to bring SANDAG’s all-in-cost of borrowing to below 4.00%. SANDAG, with the help of its financial advisor and underwriting pool have come up with a hybrid structure for the upcoming issuance using tax-exempt fixed rate bonds to capture savings on the short-end of the yield curve, and federal taxable BABs to capture savings on the long-end of the yield curve:
a. Tax- exempt fixed rates have rarely been lower historically since 1993. (Please see
Appendix A for graph)
b. The Federal BABs program allows SANDAG to sell taxable bonds and receive a Federal subsidy equal to 35% of the debt service payment. While the relationship of taxable BABs vs. tax exempt bonds will be monitored right up to the pricing date, in today’s market, BABs are expected to provide 55 basis points of benefit to SANDAG. This amounts to an annual savings of $1.8 million compared to tax exempt bonds. It is important to note that the Federal subsidy level is likely to fall to 31% in calendar year 2011 and to even lower levels in subsequent years. Therefore, in order to take advantage of the maximum Federal subsidy, the transaction must close before December 31, 2010.
2. When coupled with the 2008 issue, SANDAG will have hedged the cost of $900 million of its debt
program or 38% of its projected borrowing (assuming a $300 million debt issuance in 2010). This makes SANDAG less vulnerable to rising interest rates while reducing construction cost risk by funding projects now, during a period of low inflation.
3. Issuing fixed rate debt would be seen favorable by rating agencies, as it would diversify SANDAG’s debt portfolio, which includes approximately $600 million in variable rate demand bonds and a $100 million commercial paper program. It would assist in maintaining SANDAG’s strong credit rating of AAA by S&P and Aa1 by Moody’s.
4. Borrowing in 2010 allows an additional year of debt amortization, and thus slightly reduces the cash flow impact on the agency.
SANDAG's procurement office has recently completed a process to designate a pool of investment banking firms to serve SANDAG in a variety of financings in the upcoming years. These types of financings include SANDAG’s commercial paper program, senior manager and co-managers of typical bond issuances, as well as innovative financings. With the Board of Directors concurrence, a schedule has been identified to bring final bond documents through the ITOC and Transportation Committee structure, culminating with Board of Directors approval in October, 2010 and bond pricing and closing in November.
SANDAG July 13, 2010
Page 3
Recommendation Accordingly, PFM recommends that SANDAG proceed to sell approximately $300-350 million in senior lien TransNet sales tax revenue bonds in 2010. We further recommend that the hybrid structure of BABs and tax-exempt alternatives continue to be evaluated and the final choice be made immediately prior to bond pricing based on relative value to SANDAG. This recommendation allows your ongoing TransNet Extension program to remain fully funded over the next two years. Should you have any questions regarding this recommendation, please do not hesitate to call.