Agenda - Friday, January 22, 2016 - SANDAG
233
Members John Minto, Chair Vice Mayor, City of Santee (Representing East County) Greg Cox, Vice Chair Supervisor, County of San Diego David Alvarez Councilmember, City of San Diego John Renison Supervisor (Representing Imperial County) Lorraine Wood Councilmember, City of Carlsbad (Representing North County Coastal) Ed Gallo Councilmember, City of Escondido (Representing North County Inland) Serge Dedina Mayor, City of Imperial Beach (Representing South County) Alternates Ruth Sterling Councilmember, City of La Mesa (Representing East County) Dianne Jacob Supervisor, County of San Diego Mark Kersey Councilmember, City of San Diego VACANT (Representing Imperial County) Al Corti Councilmember, City of Del Mar (Representing North County Coastal) Jim Cunningham Deputy Mayor, City of Poway (Representing North County Inland) Bill Sandke Councilmember, City of Coronado (Representing South County) Advisory Members Laurie Berman District 11 Director, Caltrans Remedios Gómez-Arnau Consul General Consulate General of Mexico Jim Ferryman (Representing Orange County) Marsha Swanson City of Wildomar (Representing Riverside County) Elsa Saxod San Diego County Water Authority Michael Garcia (Ewiiaapaayp) Southern California Tribal Chairmen’s Association Naresh Amatya Southern California Association of Governments Gary L. Gallegos Executive Director, SANDAG BORDERS COMMITTEE AGENDA Friday, January 22, 2016 12:30 to 2:30 p.m. SANDAG Board Room 401 B Street, 7th Floor San Diego AGENDA HIGHLIGHTS • MINUTE 320, A UNITED STATES-MEXICO AGREEMENT FOR BINATIONAL COOPERATION ON TRANSBOUNDARY ISSUES IN THE TIJUANA RIVER BASIN • VEHICLE IDLING EMISSIONS STUDY AT CALEXICO EAST AND CALEXICO WEST PORTS OF ENTRY • COMPETITIVE BORDER COMMUNITIES: MAPPING AND DEVELOPING UNITED STATES- MEXICO TRANSBORDER INDUSTRIES PLEASE SILENCE ALL ELECTRONIC DEVICES DURING THE MEETING YOU CAN LISTEN TO THE BORDERS COMMITTEE MEETING BY VISITING OUR WEBSITE AT SANDAG.ORG MISSION STATEMENT The Borders Committee provides oversight for planning activities that impact the borders of the San Diego region (Orange, Riverside and Imperial Counties, and the Republic of Mexico) as well as government-to-government relations with tribal nations in San Diego County. The preparation and implementation of SANDAG’s Binational, Interregional, and Tribal Liaison Planning programs are included under this purview. It advises the SANDAG Board of Directors on major interregional planning policy-level matters. Recommendations of the Committee are forwarded to the Board of Directors for action. San Diego Association of Governments ⋅ 401 B Street, Suite 800, San Diego, CA 92101-4231 (619) 699-1900 ⋅ Fax (619) 699-1905 ⋅ sandag.org
-
Upload
khangminh22 -
Category
Documents
-
view
0 -
download
0
Transcript of Agenda - Friday, January 22, 2016 - SANDAG

Members
John Minto, Chair Vice Mayor, City of Santee (Representing East County) Greg Cox, Vice Chair Supervisor, County of San Diego David Alvarez Councilmember, City of San Diego John Renison Supervisor (Representing Imperial County) Lorraine Wood Councilmember, City of Carlsbad (Representing North County Coastal) Ed Gallo Councilmember, City of Escondido (Representing North County Inland) Serge Dedina Mayor, City of Imperial Beach (Representing South County)
Alternates
Ruth Sterling Councilmember, City of La Mesa (Representing East County) Dianne Jacob Supervisor, County of San Diego Mark Kersey Councilmember, City of San Diego VACANT (Representing Imperial County) Al Corti Councilmember, City of Del Mar (Representing North County Coastal) Jim Cunningham Deputy Mayor, City of Poway (Representing North County Inland) Bill Sandke Councilmember, City of Coronado (Representing South County)
Advisory Members
Laurie Berman District 11 Director, Caltrans Remedios Gómez-Arnau Consul General Consulate General of Mexico Jim Ferryman (Representing Orange County) Marsha Swanson City of Wildomar (Representing Riverside County) Elsa Saxod San Diego County Water Authority Michael Garcia (Ewiiaapaayp) Southern California Tribal Chairmen’s Association Naresh Amatya Southern California Association of Governments Gary L. Gallegos Executive Director, SANDAG
BORDERS COMMITTEE
AGENDA
Friday, January 22, 2016 12:30 to 2:30 p.m.
SANDAG Board Room 401 B Street, 7th Floor
San Diego
AGENDA HIGHLIGHTS
• MINUTE 320, A UNITED STATES-MEXICO AGREEMENT FOR BINATIONAL COOPERATION ON TRANSBOUNDARY ISSUES IN THE TIJUANA RIVER BASIN
• VEHICLE IDLING EMISSIONS STUDY AT
CALEXICO EAST AND CALEXICO WEST PORTS OF ENTRY
• COMPETITIVE BORDER COMMUNITIES:
MAPPING AND DEVELOPING UNITED STATES-MEXICO TRANSBORDER INDUSTRIES
PLEASE SILENCE ALL ELECTRONIC DEVICES DURING THE MEETING
YOU CAN LISTEN TO THE BORDERS COMMITTEE MEETING BY VISITING OUR WEBSITE AT SANDAG.ORG
MISSION STATEMENT
The Borders Committee provides oversight for planning activities that impact the borders of the San Diego region (Orange, Riverside and Imperial Counties, and the Republic of Mexico) as well as
government-to-government relations with tribal nations in San Diego County. The preparation and implementation of SANDAG’s Binational, Interregional, and Tribal Liaison Planning programs are included under this purview. It advises the SANDAG Board of Directors on major interregional
planning policy-level matters. Recommendations of the Committee are forwarded to the Board of Directors for action.
San Diego Association of Governments ⋅ 401 B Street, Suite 800, San Diego, CA 92101-4231
(619) 699-1900 ⋅ Fax (619) 699-1905 ⋅ sandag.org

2 Rev. 010816
Welcome to SANDAG. Members of the public may speak to the Borders Committee on any item at the time the Committee is considering the item. Please complete a Speaker’s Slip, which is located in the rear of the room, and then present the slip to the Committee Clerk seated at the front table. Members of the public may address the Committee on any issue under the agenda item entitled Public Comments/Communications/Member Comments. Public speakers are limited to three minutes or less per person. The Borders Committee may take action on any item appearing on the agenda. Public comments regarding the agenda can be sent to SANDAG via [email protected]. Please include the agenda item, your name, and your organization. Email comments should be received no later than 12 noon, two working days prior to the Borders Committee meeting. Any handouts, presentations, or other materials from the public intended for distribution at the Borders Committee meeting should be received by the Committee Clerk no later than 12 noon, two working days prior to the meeting. In order to keep the public informed in an efficient manner and facilitate public participation, SANDAG also provides access to all agenda and meeting materials online at www.sandag.org/meetings. Additionally, interested persons can sign up for e-notifications via our e-distribution list at either the SANDAG website or by sending an email request to [email protected]. SANDAG operates its programs without regard to race, color, and national origin in compliance with Title VI of the Civil Rights Act. SANDAG has developed procedures for investigating and tracking Title VI complaints and the procedures for filing a complaint are available to the public upon request. Questions concerning SANDAG nondiscrimination obligations or complaint procedures should be directed to SANDAG General Counsel, John Kirk, at (619) 699-1997 or [email protected]. Any person who believes himself or herself or any specific class of persons to be subjected to discrimination prohibited by Title VI also may file a written complaint with the Federal Transit Administration. In compliance with the Americans with Disabilities Act (ADA), SANDAG will accommodate persons who require assistance in order to participate in SANDAG meetings. If such assistance is required, please contact SANDAG at (619) 699-1900 at least 72 hours in advance of the meeting. To request this document or related reports in an alternative format, please call (619) 699-1900, (619) 699-1904 (TTY), or fax (619) 699-1905. SANDAG agenda materials can be made available in alternative languages. To make a request call (619) 699-1900 at least 72 hours in advance of the meeting.
Los materiales de la agenda de SANDAG están disponibles en otros idiomas. Para hacer una solicitud, llame al (619) 699-1900 al menos 72 horas antes de la reunión.
如有需要, 我们可以把SANDAG议程材料翻译成其他語言.
请在会议前至少 72 小时打电话 (619) 699-1900 提出请求.
SANDAG offices are accessible by public transit. Phone 511 or see 511sd.com for route information. Bicycle parking is available in the parking garage of the SANDAG offices.

3
BORDERS COMMITTEE
Friday, January 22, 2016
ITEM NO. RECOMMENDATION
+1.
APPROVAL OF MEETING MINUTES
APPROVE
+1A. October 23, 2015, Meeting Minutes +1B. November 20, 2015, Meeting Minutes
2.
PUBLIC COMMENTS/COMMUNICATIONS
Members of the public shall have the opportunity to address the Borders Committee on any issue within the jurisdiction of the Committee that is not on this agenda. Anyone desiring to speak shall reserve time by completing a “Request to Speak” form and giving it to the Borders Committee coordinator prior to speaking. Public speakers should notify the Borders Committee coordinator if they have a handout for distribution to Committee members. Public speakers are limited to three minutes or less per person. Committee members may provide information and announcements under Agenda Item No. 3.
REPORTS
3.
SUBREGIONAL REPORTS FROM BORDERS COMMITTEE MEMBERS
INFORMATION
Members of the Borders Committee may report issues and activities within their subregion that are of interest or within the purview of the Borders Committee.
4.
REPORT FROM THE CONSUL GENERAL OF MEXICO (Hon. Remedios Gómez-Arnau, Consulate General of Mexico in San Diego)
INFORMATION
Consul General Remedios Gómez-Arnau will report on binational activities.
+5. MINUTE 320, A UNITED STATES-MEXICO AGREEMENT FOR BINATIONAL COOPERATION ON TRANSBOUNDARY ISSUES IN THE TIJUANA RIVER BASIN (Steve Smullen, U.S. International Boundary and Water Commission, San Diego Office)
INFORMATION
This report provides an overview of the recent binational agreement, Minute 320, titled “General Framework for Binational Cooperation on Transboundary Issues in the Tijuana River Basin,” signed by the International Boundary and Water Commission, United States, and Mexico. The agreement provides for binational cooperation on issues of sediment, trash, and water quality in the Tijuana River Basin.
+6. VEHICLE IDLING EMISSIONS STUDY AT CALEXICO EAST AND CALEXICO WEST PORTS OF ENTRY (Tom Kear, T. Kear Transportation Planning and Management, Inc.)
INFORMATION
This report will provide an update on a study completed by the Imperial County Air Pollution Control District to estimate emissions at the Calexico East and Calexico West Ports of Entry due to idling vehicles waiting to cross into Imperial County.

4
+7. COMPETITIVE BORDER COMMUNITIES: MAPPING AND DEVELOPING UNITED STATES-MEXICO TRANSBORDER INDUSTRIES (Rick Van Schoik, North American Research Partnership)
INFORMATION
In 2015, the North American Research Partnership and the Woodrow Wilson Center’s Mexico Institute completed this study to identify, map, and analyze key industries operating within five binational subregions along the United States-Mexico border.
8.
CONTINUED PUBLIC COMMENT
If the five speaker limit for public comments was exceeded at the beginning of this agenda, other public comments will be taken at this time. Subjects of previous agenda items may not again be addressed under public comment.
9.
UPCOMING MEETINGS
INFORMATION
The next meeting of the Borders Committee is scheduled for Friday, February 26, 2016, at 12:30 p.m.
10.
ADJOURNMENT
+ next to an agenda item indicates an attachment

BORDERS COMMITTEE
AGENDA ITEM NO. 16-01-1A
JANUARY 22, 2016 ACTION REQUESTED – APPROVE
BORDERS COMMITTEE DISCUSSION AND ACTIONS
OCTOBER 23, 2015
The Borders Committee was called to order by Chair John Minto (East County) at 12:35 p.m. See the attached attendance sheet for Borders Committee member attendance. Chair Minto welcomed the Borders Committee and guests. Chair Minto introduced the new Borders Committee Tribal Advisory Member, Vice Chair Michael Garcia (Ewiiaapaayp), representing the Southern California Tribal Chairmen’s Association. Chair Minto announced that Remedios Gómez-Arnau, Consul General of Mexico in San Diego, would not be present. 4. REPORT FROM THE CONSUL GENERAL OF MEXICO (INFORMATION) The Consulate General of Mexico was unable to attend to present Item No. 4. 1. APPROVAL OF MEETING MINUTES (APPROVE) Action: Upon a motion by Councilmember Ed Gallo (North County Inland), and a second by Mayor Serge Dedina (South County), the Borders Committee approved the minutes from the September 25, 2015, meeting. Yes – Chair Minto, Councilmember David Alvarez (City of San Diego), Mayor Serge Dedina, Councilmember Gallo and Supervisor Greg Cox (County of San Diego). No – None. Abstain – None. Absent - Supervisor John Renison (Imperial County) and Councilmember Lorraine Wood (North County Coastal) 2. PUBLIC COMMENTS/COMMUNICATIONS
There were no additional public comments.
REPORTS
3. SUBREGIONAL REPORTS FROM BORDERS COMMITTEE MEMBERS (INFORMATION)
Members of the Borders Committee report on issues and activities within their subregion that are of interest or under the purview of the Borders Committee. Mark Baza, Imperial County Transportation Commission (ICTC), announced the upcoming ground-breaking ceremony for the Calexico West Port of Entry expansion project scheduled on Thursday, November 12, 2015.

2
Mayor Dedina provided an update on the recent hurricane off the coast of Mexico, in addition to storms off the coast of California. He mentioned that the latest Binational Committee meeting reports on El Niño planning in our region. Mayor Faulconer is working with the City of Imperial Beach and City of Tijuana on cross-border sewage, polluted water, waste, and Tijuana River Valley rescues. Laurie Berman, District 11 Director (Caltrans), announced the groundbreaking for State Route (SR) 905, SR 125, and SR 11 Northbound Connectors project scheduled on Monday, October 26, 2015. Chair Minto provided an update on the unanimous approval of San Diego Forward: The Regional Plan by the SANDAG Board of Directors. This decision is the culmination of four years of hard work by the talented staff of this agency. Tomas Oliva, Southern California Association of Governments (SCAG), congratulated SANDAG on the approval of San Diego Forward: The Regional Plan. Councilmember Jim Dahl (Orange County) announced that over the next few months, a tremendous amount of construction work will be conducted at night on Interstate 5 in Southern Orange County.
Action: This consent item was presented for information only. +5. CALIFORNIA’S INTEGRATED BORDER APPROACH STRATEGY: PHASE 1 FINAL REPORT
(INFORMATION)
Sergio Pallares, Caltrans, presented the final report for Phase I of the California Integrated Border Approach Strategy, a multi-agency initiative that seeks to improve mobility and the traveler experience at California’s border communities. Action: This item was presented for information only. Sergio Pallares, Caltrans, presented this item. 6. GO GLOBAL SAN DIEGO - GLOBAL TRADE INITIATIVE (INFORMATION)
Sean Barr, San Diego Regional Economic Development Corporation, provided an overview of Go Global San Diego, an initiative that seeks to maximize San Diego's economic competitiveness through increased global engagement. Sean Barr, San Diego Regional Economic Development Corporation, presented the item and responded to questions. Action: This item was presented for information only.

3
7. CONTINUED PUBLIC COMMENT (INFORMATION)
If the five speaker limit for public comments was exceeded at the beginning of this agenda, other public comments will be taken at this time. Subjects of previous agenda items may not again be addressed under public comment. There were no additional public comments. Action: This item was presented for information only.
8. UPCOMING MEETINGS (INFORMATION) The next meeting of the Borders Committee is scheduled for Friday, November 20, 2015, at 12:30 p.m. (Please note, this meeting will be held on the third Friday of the month due to the holiday schedule.)
9. ADJOURNMENT
Chair Minto adjourned the meeting at 1:38 p.m.

4
Meeting Start Time: 12:35 p.m. Meeting Adjourned Time: 1:38 p.m.
CONFIRMED ATTENDANCE SANDAG BORDERS COMMITTEE MEETING
OCTOBER 23, 2015 GEOGRAPHICAL
AREA/ ORGANIZATION
JURISDICTION NAME MEMBER/
ALTERNATE ATTENDING
South County City of Imperial Beach Serge Dedina Member Yes
City of Coronado Bill Sandke Alternate No
North County Coastal
City of Carlsbad Lorraine Wood Member No
City of Del Mar Dwight Worden Alternate No
North County Inland
City of Poway Jim Cunningham Member Yes
City of Escondido Ed Gallo Alternate Yes
East County City of Santee John Minto
(Chair) Member Yes
City of La Mesa Ruth Sterling Alternate Yes
City of San Diego ---- David Alvarez Member Yes
---- Mark Kersey Alternate No
County of San Diego
---- Greg Cox (Vice Chair)
Member Yes
---- Dianne Jacob Alternate No
Imperial County
Imperial County
John Renison Member Yes
--- Vacant Alternate ---
County of Riverside
City of Wildomar Marsha Swanson Member No
City of Hemet Shellie Milne Alternate No
Republic of Mexico Consul General of Mexico Remedios Gomez-
Arnau Member No
Deputy Consul of Mexico Fernando Vargas
Briones Alternate No
Southern California Tribal
Chairmen’s Association
Ewiiaapaayp Michael Garcia Member Yes
Jamul Cody Martinez Alternate No
Caltrans Laurie Berman Member Yes
Bill Figge Alternate Yes
San Diego County Water Authority
Elsa Saxod Member No
Ken Olson Alternate Yes
SCAG Naresh Amatya Member No
Tomás Oliva Alternate Yes
County of Orange
Costa Mesa Sanitary District Jim Ferryman
Member
Yes
County of Orange
Jim Dahl Alternate Yes

BORDERS COMMITTEE
AGENDA ITEM NO. 16-01-1B
JANUARY 22, 2016 ACTION REQUESTED – APPROVE
BORDERS COMMITTEE DISCUSSION AND ACTIONS
NOVEMBER 20, 2015
The meeting of the Borders Committee was called to order by Vice Chair Greg Cox (County of San Diego) at 12:42 p.m. Due to a lack of quorum, the meeting was informational only. See the attached attendance sheet for Borders Committee member attendance. 1. APPROVAL OF MEETING MINUTES (APPROVE) This item was deferred to the January 22, 2016, Borders Committee meeting. 2. PUBLIC COMMENTS/COMMUNICATIONS Manuel Medrano, City of Chula Vista, and Chair of San Diego Reuse and Repair Network Committee, spoke about the Committee’s binational efforts to promote the use and repair of durable goods and products as part of a waste reduction effort. Mr. Medrano asked the Borders Committee members to consider a meeting to discuss import and export guidance when transporting these goods across the border into Mexico, as well as the exploration of a resource fair to bring various organizations together. Vice Chair Cox announced November is Native American Heritage Month, and November 27, 2015, is declared National Native American Heritage Day. In honor of this theme, today’s agenda will include two items related to tribal projects.
REPORTS 3. SUBREGIONAL REPORTS FROM BORDERS COMMITTEE MEMBERS (INFORMATION) Mayor Serge Dedina (South County) provided an update on the Tijuana River Valley clean-up efforts related to sediment trash and waste water. Tomás Oliva (Southern California Association of Governments [SCAG]) announced the U.S. General Services Administration and U.S. Customs and Border Protection hosted a groundbreaking ceremony to commemorate the start of Phase 1 of the Calexico West Land Port of Entry modernization and expansion project on November 12, 2015. Action: This item was presented for information.

2
4. REPORT FROM THE CONSUL GENERAL OF MEXICO (INFORMATION) This item was deferred to the January 22, 2016, Borders Committee meeting. 5. INTRAREGIONAL TRIBAL TRANSPORTATION STRATEGY (INFORMATION) Jane Clough, Senior Regional Planner, provided an overview of the Intraregional Tribal Transportation Strategy. Action: This item was presented for information. 6. OVERVIEW OF ASSEMBLY BILL 52 (INFORMATION) Ebru Ozdil, Planning Specialist, Pechanga Band of Mission Indians, provided an overview of Assembly Bill 52 (Gatto, 2014), which took effect on July 1, 2015. Action: This item was presented for information. 7. UPDATE ON THE STATE ROUTE 11 AND OTAY MESA EAST PORT OF ENTRY PROJECT
(INFORMATION) Tina Casgar, Goods Movement Policy Manager, and Jacqueline Appleton-Deane, District 11, Caltrans, summarized progress to date, proposed next steps, and the project’s overall schedule. Mayra Vasquez, San Diego Regional Chamber of Commerce, spoke in support of the item. Action: This item was presented for information. 8. CONTINUED PUBLIC COMMENT (INFORMATION) There were no additional public comments. 9. UPCOMING MEETINGS (INFORMATION) The next meeting of the Borders Committee is scheduled for Friday, January 22, 2016, at 12:30 p.m. 10. ADJOURNMENT
Vice Chair Cox adjourned the meeting at 1:30 p.m.

3
Meeting Start Time: 12:42 p.m. Meeting Adjourned Time: 1:30 p.m.
CONFIRMED ATTENDANCE
SANDAG BORDERS COMMITTEE MEETING NOVEMBER 20, 2015
JURISDICTION NAME MEMBER/
ALTERNATE ATTENDING
South County Serge Dedina Member Yes
Bill Sandke Alternate No
North County Coastal Lorraine Wood Member No
Dwight Worden Alternate No
North County Inland Jim Cunningham Member No
Ed Gallo Alternate No
East County John Minto (Chair) Member No
Ruth Sterling Alternate Yes
City of San Diego David Alvarez Member No
Mark Kersey Alternate No
County of San Diego Greg Cox (Vice Chair) Member Yes
Dianne Jacob Alternate No
Imperial County
John Renison Member No
Vacant Alternate ---
ADVISORY MEMBERS
County of Riverside Marsha Swanson Member No
Shellie Milne Alternate Yes
Republic of Mexico Remedios Gomez-Arnau Member No
Ruth Alicia Lopez Alternate Yes
Southern California Tribal Chairmen’s Association
Michael Garcia Member Yes
Cody Martinez Alternate No
Caltrans Laurie Berman Member Yes
Bill Figge Alternate Yes
San Diego County Water Authority
Elsa Saxod Member No
Ken Olson Alternate Yes
SCAG Naresh Amatya Member No
Tomás Oliva Alternate Yes
County of Orange
Jim Ferryman Member Yes
Jim Dahl Alternate No

BORDERS COMMITTEE
AGENDA ITEM NO. 16-01-5
JANUARY 22, 2016 ACTION REQUESTED – INFORMATION
MINUTE 320, A UNITED STATES-MEXICO AGREEMENT File Number 3400200 FOR BINATIONAL COOPERATION ON TRANSBOUNDARY ISSUES IN THE TIJUANA RIVER BASIN
Introduction
The United States and Mexico International Boundary and Water Commission (IBWC) are one of the oldest of the four formally recognized binational institutions, sharing equal representation from both the United States and Mexico. The IBWC was first established in 1889 by the two countries to address boundary and water related issues along the United States-Mexico border produced by the 1848 Treaty of Guadalupe Hidalgo and the Gadsden Treaty of 1853. The IBWC emerged into its modern form as a result of the 1944 Water Treaty between the United States and Mexico. The treaty established that the IBWC shall in all respects have the status of an international body composed of two national sections and headed by an Engineer Commissioner, whom is appointed by the United States and Mexican presidents. Additionally, the Treaty provisions call for joint action or joint agreement by the two governments, which such matters would be handled by or through the U.S. Department of State and the Mexican Ministry of Foreign Affairs (Secretaría de Relaciones Exteriores or SRE in Spanish). IBWC’s mission is “to provide binational solutions to issues that arise during the application of United States-Mexico treaties regarding boundary demarcation, national ownership of waters, sanitation, water quality, and flood control in the border region.”
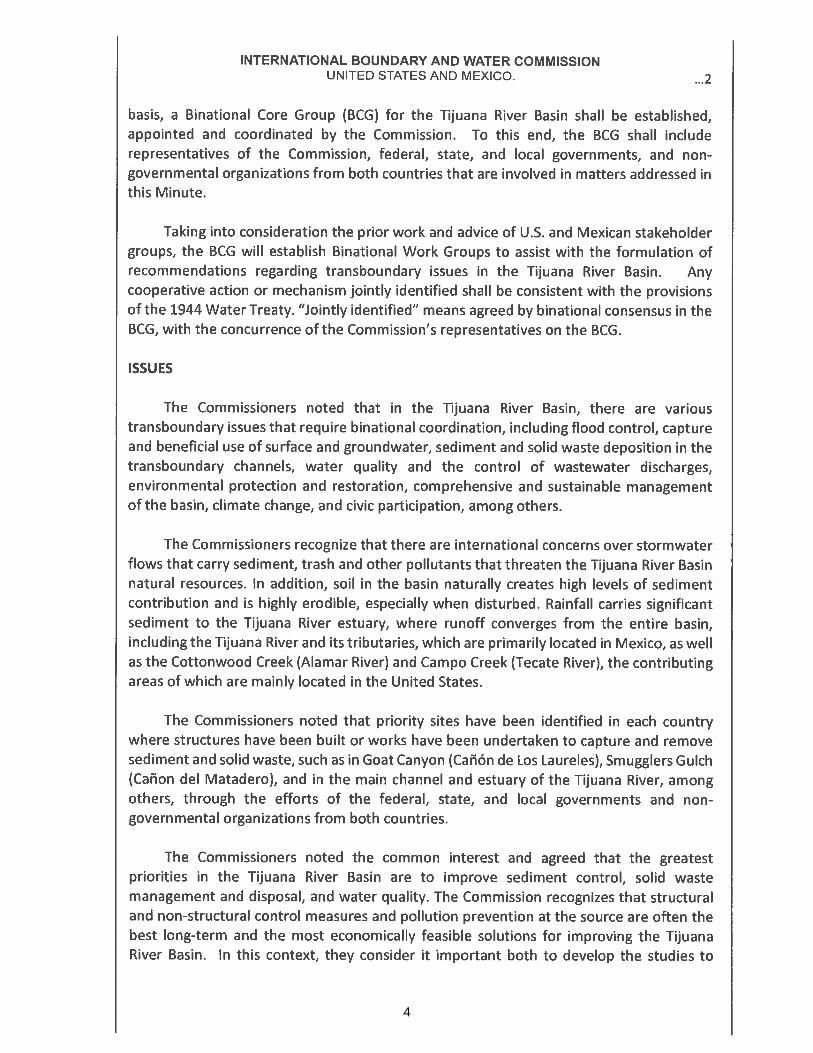
Discussion
The IBWC Minute 320 “General Framework for Binational Cooperation on Transboundary Issues in the Tijuana River Basin,” signed in Tijuana, Baja California, on October 15, 2015 (Attachment 1) refers to Article 16 of the United States-Mexico Treaty for Utilization of Waters of the Colorado and Tijuana Rivers and of the Rio Grande, dated February 3, 1944, which stipulates with respect to the Tijuana River, “In order to improve existing uses and to assure any feasible further development, the Commission shall study and investigate, and shall submit to the two governments for their approval: …(2) Plans for storage and flood control to promote and develop domestic, irrigation and other feasible uses of water of this system.” Minute 320 resolves among others, to establish an inclusive process “to obtain advice and recommendations from stakeholder groups on transboundary issues in the Tijuana River basin and coordinate the identification and implementation of cooperative measures that are jointly determined to be of common interest and benefit to residents on both sides of the border.” The process includes the establishment of the Binational Core Group, which will undertake activities such as Identifying cooperative measure of mutual interest, define short-term priorities and projects, propose studies, investigations,

2
inventories or maps needed to better understand matters of common interest, and to establish a monitoring program.
VICTORIA STACKWICK Principal Legislative Analyst
Attachment: 1. IBWC Minute 320 “General Framework for Binational Cooperation on Transboundary Issues in the Tijuana River Basin”
Key Staff Contact: Hector Vanegas, (619) 699-1972, [email protected]

Attachment 1
3
4

5

6

7

BORDERS COMMITTEE
AGENDA ITEM NO. 16-01-6
JANUARY 22, 2016 ACTION REQUESTED – INFORMATION
VEHICLE IDLING EMISSIONS STUDY File Number 3400100 AT CALEXICO EAST AND CALEXICO WEST PORTS OF ENTRY
Introduction
The Imperial County Air Pollution Control District was the successful grant recipient of a Border 2020 Program Grant in late 2013 to conduct the Vehicle Idling Emissions Study at Calexico East and Calexico West Ports of Entry (POEs). Under the Border 2020 Program led by the Border Environmental Cooperation Commission and the U.S. Environmental Protection Agency, the fundamental purpose of the grant is to promote environmental health in the California-Baja California border region. A preliminary report was presented to the Borders Committee on July 24, 2015. The study began in 2014 with an overall goal to estimate particulate matter, nitrous oxides, and reactive organic matter pollution caused by idling vehicles crossing northbound at the Calexico East and Calexico West POEs, in addition to evaluating strategies to reduce emissions at these border crossings. The Final Report was completed in October 2015.
CHARLES “MUGGS” STOLL Director of Land Use and Transportation Planning Attachment: 1. Vehicle Idling Emissions Study at Calexico East and Calexico West Ports of Entry –
Final Report, October 2015 Key Staff Contact: Marc Baza, (619) 699-6912, [email protected]

P13020
Vehicle Idling Emissions Study at Calexico East and Calexico West Ports-of-Entry
Final Report
Prepared for:
Imperial County Air Pollution Control District
Submitted By
2838 Zamora Lane Davis, CA 95616 www.tkearinc.com
Contact: Tom Kear, [email protected], (916) 340-4811
With:
October 2015
Attachment 1
2
(This page intentionally left blank.)
3

Vehicle Idling Emissions Study at Calexico East and Calexico West Ports-of-Entry October 2015, page i
PROJECT FACT SHEET/EXECUTIVE SUMMARY
GOAL: Border 2020 California/Baja California Goal 1: Reduce Air Pollution PROJECT: Vehicle Idling Emissions Study at Calexico East and Calexico West Ports-of-Entry
Border 2020 US-Mexico Environmental Program is a bi-national partnership that awards small grants to stakeholders aimed at improving the border environment by fulfilling the goals and objectives of the Border 2020 Program
Problem Statement Reducing emissions of particulate matter and nitrous oxides from idling vehicles at ports-of-entry is one of the most important air quality challenges facing the Imperial County and Mexicali region. Even with standards taking effect over the next decade for idling vehicles, millions of vehicles will continue to emit large amounts of nitrogen oxides, particulate matter, and air toxics, contributing to premature deaths, asthma attacks, loss of work days, and numerous other negative health impacts every year.
Organic carbon and ammonium nitrate are found in significantly higher concentrations near the border crossings in Calexico. These data support the California Air Resources Board’s view that emissions from Mexico impact Imperial County and overwhelmingly impact the city of Calexico.
In addition, Mexicali, Mexico is the capital of the northern state of Baja California and boasts a large population density with accelerating growth due to the constant migration. People moving into the region are not familiar with the characteristics and seriousness of the air pollution problem in the region. It is important to understand the impacts that idling vehicles at the Calexico ports-of-entry have due to the proximity of the emissions to the population on both sides of the border.
Accomplishments The first phase of this study focused on collection of real world data to better characterize and understand the emissions and causes of delay at the ports-of-entry.
• The completion of detailed spring, summer, and winter queueing and volume data collection for northbound cars and trucks at the Calexico West and Calexico East ports-of-entry documented conditions with border wait-times of up to three hours.
• The evaluation of vehicle fleet characteristics showed that the predominantly Mexicali domiciled fleet crossing the border is, on average, older than the fleet on the U.S. side of the border.
4

Vehicle Idling Emissions Study at Calexico East and Calexico West Ports-of-Entry October 2015, page ii
Wait-time and delay data documenting excessive queuing and long border waits that were observed are documented in the two following figures.
The second and third study phases focused on estimating seasonal emissions of fine particulate matter (PM2.5), reactive organic matter (ROG), and nitrous oxides (NOx) at the ports-of-entry under existing (2014) conditions and with several strategies to reduce those emissions. In addition to analysis of existing conditions and an idealized no port-of-entry delay scenario, seven emissions redetection scenarios were studied:
• Phase 1 of the Calexico West POE reconstruction project; • Phase 2 of the Calexico West POE reconstruction project; • Use of California fuel in Mexicali; • A reduction in empty general-purpose truck trips; • Replacing 10% of general-purpose truck trips to FAST truck trips; • Streamlining commercial crossing by combining the Aduanas and CBP primary inspections; and • The Section 559 Proposal to expand the Calexico East POE.
5

Vehicle Idling Emissions Study at Calexico East and Calexico West Ports-of-Entry October 2015, page iii
The results indicate that for United States and Mexican vehicles traveling northbound into the United States, border delay accounts for about 63% of the ROG emissions from both ports-of-entry, 46% of the NOx emissions from both ports-of-entry, and 53% of the PM2.5 emissions from both ports-of-entry. The emissions associated with border delay are equivalent1 to the TOG emissions from 2,700 passenger vehicles in Imperial County, the NOx emissions from 4,400 passenger vehicles in Imperial County, or the PM2.5 emissions from 3,450 passenger vehicles in Imperial County. Table ES-1 reports the emission reduction benefits and ranks each strategy. These results are shown as the equivalent number of privately owned vehicles in Imperial County that would need to be removed from the vehicle fleet to achieve a comparable air quality benefit.
Table ES-1. Number of privately owned Imperial County vehicles that would need to be removed from the vehicle fleet to achieve equivalent emissions reductions, by strategy and pollutant.
Best Management Practice – Emission Reduction Strategy
Number of Privately Owned Vehicles That Would Need to be Removed or Subjected
to a Scrappage Program To Achieve Similar Emission Reductions
Control Strategy Rank by Pollutant
NOx PM2.5 ROG
NOx and
PM2.5 ROG Calexico East Section 559 Proposal, with Calexico West Phase 1 POE Project 634 vehicles 469 vehicles 1371 vehicles 1 2
Combine Aduanas and CBP Primary 469 vehicles 366 vehicles 90 vehicles 2 5 Calexico West Phase 1 and 2POE Project 315 vehicles 229 vehicles 1310 vehicles 3 3
Calexico West Phase 1 POE Project 98 vehicles 68 vehicles 681 vehicles 4 4 Shift 10% of Commercial General-Purpose to FAST 80 vehicles 68 vehicles 19 vehicles 5 6
Reduction in Empty Commercial General-Purpose Volume 33 vehicles 26 vehicles 6 vehicles 6 7
California Fuel 0 vehicles 0 vehicles 1638 vehicles 7 1
For additional information about this project, please contact Belen Lopez at the Imperial County Air Pollution Control District (442) 265-1800 ([email protected]). For information about the Border 2020 Program, please visit www2.epa.gov/border2020
1 Based on EMFAC 2014 annual average daily emissions for the LDA, LDT1 and LDT2 vehicle classes for 2014.
6
Vehicle Idling Emissions Study at Calexico East and Calexico West Ports-of-Entry October 2015, page iv
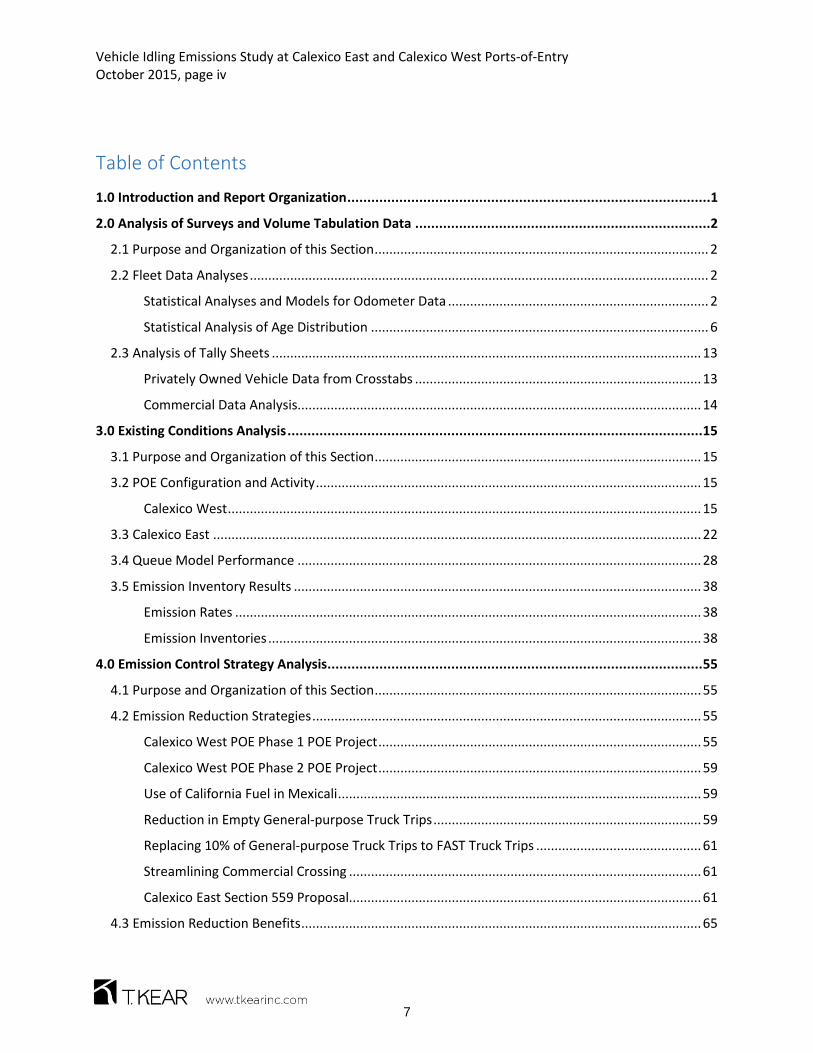
Table of Contents
1.0 Introduction and Report Organization ...........................................................................................1
2.0 Analysis of Surveys and Volume Tabulation Data ..........................................................................2
2.1 Purpose and Organization of this Section ........................................................................................... 2
2.2 Fleet Data Analyses ............................................................................................................................. 2
Statistical Analyses and Models for Odometer Data ....................................................................... 2
Statistical Analysis of Age Distribution ............................................................................................ 6
2.3 Analysis of Tally Sheets ..................................................................................................................... 13
Privately Owned Vehicle Data from Crosstabs .............................................................................. 13
Commercial Data Analysis.............................................................................................................. 14
3.0 Existing Conditions Analysis ........................................................................................................ 15
3.1 Purpose and Organization of this Section ......................................................................................... 15
3.2 POE Configuration and Activity ......................................................................................................... 15
Calexico West ................................................................................................................................. 15
3.3 Calexico East ..................................................................................................................................... 22
3.4 Queue Model Performance .............................................................................................................. 28
3.5 Emission Inventory Results ............................................................................................................... 38
Emission Rates ............................................................................................................................... 38
Emission Inventories ...................................................................................................................... 38
4.0 Emission Control Strategy Analysis .............................................................................................. 55
4.1 Purpose and Organization of this Section ......................................................................................... 55
4.2 Emission Reduction Strategies .......................................................................................................... 55
Calexico West POE Phase 1 POE Project ........................................................................................ 55
Calexico West POE Phase 2 POE Project ........................................................................................ 59
Use of California Fuel in Mexicali ................................................................................................... 59
Reduction in Empty General-purpose Truck Trips ......................................................................... 59
Replacing 10% of General-purpose Truck Trips to FAST Truck Trips ............................................. 61
Streamlining Commercial Crossing ................................................................................................ 61
Calexico East Section 559 Proposal................................................................................................ 61
4.3 Emission Reduction Benefits ............................................................................................................. 65
7

Vehicle Idling Emissions Study at Calexico East and Calexico West Ports-of-Entry October 2015, page v
Results ............................................................................................................................................ 65
Findings and Recommendations .................................................................................................. 163
Appendix A: Documentation of Data Collection .............................................................................. A-1
8

Vehicle Idling Emissions Study at Calexico East and Calexico West Ports-of-Entry October 2015, page vi
Table of Tables
Table 1. Test of Between-subject Effects for Odometer Reading (Full Model for POV Odometer Reading)3
Table 2. Test of Between-subject Effects for Odometer Reading (Reduced Model for POV Odometer Reading) ........................................................................................................................................................ 3
Table 3. Dependent Variable: MY, Tests of Between-subjects Effects ......................................................... 7
Table 4. Dependent Variable: MY, Tests of Between-subjects Effects for Reduced Model, Including Domicile ........................................................................................................................................................ 7
Table 5. Dependent Variable: Engine MY, Tests of Between-subjects Effects ............................................. 9
Table 6. Dependent Variable: Engine MY, Tests of Between-subjects Effects, Reduced Model .................. 9
Table 7. Calexico West POV Northbound Traffic Volumes and Booth Designations by Hour .................... 18
Table 8. Calexico East POV Northbound Traffic Volumes and Booth Designations by Hour ...................... 23
Table 9. Calexico East Commercial Northbound Traffic Volumes and Booth Designations by Hour ......... 27
Table 10. Calexico West POE Northbound Private Vehicle Spring 2014 Baseline Vehicle Activity & Emissions ..................................................................................................................................................... 40
Table 11. Calexico East POE Northbound Private Vehicle Spring 2014 Baseline Vehicle Activity & Emissions ..................................................................................................................................................... 41
Table 12. Calexico East POE Northbound Commercial Vehicle Spring 2014 Baseline Vehicle Activity & Emissions (1 of 2) ........................................................................................................................................ 42
Table 13. Calexico West POE Northbound Private Vehicle Summer 2014 Baseline Vehicle Activity & Emissions ..................................................................................................................................................... 44
Table 14. Calexico East POE Northbound Private Vehicle Summer 2014 Baseline Vehicle Activity & Emissions ..................................................................................................................................................... 45
Table 15. Calexico East POE Northbound Commercial Vehicle Summer 2014 Baseline Vehicle Activity & Emissions (1 of 2) ........................................................................................................................................ 46
9

Vehicle Idling Emissions Study at Calexico East and Calexico West Ports-of-Entry October 2015, page vii
Table 16. Calexico West POE Northbound Private Vehicle Winter 2014 Baseline Vehicle Activity & Emissions ..................................................................................................................................................... 48
Table 17. Calexico East POE Northbound Private Vehicle Winter 2014 Baseline Vehicle Activity & Emissions ..................................................................................................................................................... 49
Table 18. Calexico East POE Northbound Commercial Vehicle Winter 2014 Baseline Vehicle Activity & Emissions (1 of 2) ........................................................................................................................................ 50
Table 19. Calexico West POE Northbound Private Vehicle Spring 2014 Vehicle Activity & Emissions with No POE Delay .............................................................................................................................................. 52
Table 20. Calexico East POE Northbound Private Vehicle Spring 2014 Vehicle Activity & Emissions with No POE Delay .............................................................................................................................................. 52
Table 21. Calexico East POE Northbound Commercial Vehicle Spring 2014 Vehicle Activity & Emissions with No POE Delay ...................................................................................................................................... 52
Table 22. Calexico West POE Northbound Private Vehicle Summer 2014 Vehicle Activity & Emissions with No POE Delay .............................................................................................................................................. 53
Table 23. Calexico East POE Northbound Private Vehicle Summer 2014 Vehicle Activity & Emissions with No POE Delay .............................................................................................................................................. 53
Table 24. Calexico East POE Northbound Commercial Vehicle Summer 2014 Vehicle Activity & Emissions with No POE Delay ...................................................................................................................................... 53
Table 25. Calexico West POE Northbound Private Vehicle Winter 2014 Vehicle Activity & Emissions with No POE Delay .............................................................................................................................................. 54
Table 26. Calexico East POE Northbound Private Vehicle Winter 2014 Vehicle Activity & Emissions with No POE Delay .............................................................................................................................................. 54
Table 27. Calexico East POE Northbound Commercial Vehicle Winter 2014 Vehicle Activity & Emissions with No POE Delay ...................................................................................................................................... 54
Table 28. Emission Reduction Strategy Summary for Calexico West Privately Owned Vehicles (lb/day) .. 66
Table 29. Emission Reduction Strategy Summary for Calexico East Privately Owned Vehicles (lb/day) ... 68
Table 30. Emission Reduction Strategy Summary for Calexico East Commercial Vehicles (lb/day) ........... 69
Table 31. Calexico West POE Northbound Private Vehicle Spring 2014 Vehicle Activity & Emissions with Calexico West Phase 1 ................................................................................................................................ 79
10

Vehicle Idling Emissions Study at Calexico East and Calexico West Ports-of-Entry October 2015, page viii
Table 32. Calexico East POE Northbound Private Vehicle Spring 2014 Vehicle Activity & Emissions with Calexico West Phase 1 ................................................................................................................................ 80
Table 33. Calexico East POE Northbound CommercialåSpring 2014 Vehicle Activity & Emissions with Calexico West Phase 1 (1 of 2) .................................................................................................................... 81
Table 34. Calexico West POE Northbound Private Vehicle Summer 2014 Vehicle Activity & Emissions with Calexico West Phase 1 ................................................................................................................................ 83
Table 35. Calexico East POE Northbound Private Vehicle Summer 2014 Vehicle Activity & Emissions with Calexico West Phase 1 ................................................................................................................................ 84
Table 36. Calexico East POE Northbound Commercial Vehicle Summer 2014 Vehicle Activity & Emissions with Calexico West Phase 1 (1 of 2) ............................................................................................................ 85
Table 37. Calexico West POE Northbound Private Vehicle Winter 2014 Vehicle Activity & Emissions with Calexico West Phase 1 ................................................................................................................................ 87
Table 38. Calexico East POE Northbound Private Vehicle Winter 2014 Vehicle Activity & Emissions with Calexico West Phase 1 ................................................................................................................................ 88
Table 39. Calexico East POE Northbound Commercial Vehicle Winter 2014 Vehicle Activity & Emissions with Calexico West Phase 1 (1 of 2) ............................................................................................................ 89
Table 40. Calexico West POE Northbound Private Vehicle Spring 2014 Vehicle Activity & Emissions with Calexico West Phase 2 ................................................................................................................................ 91
Table 41. Calexico East POE Northbound Private Vehicle Spring 2014 Vehicle Activity & Emissions with Calexico West Phase 2 ................................................................................................................................ 92
Table 42. Calexico East POE Northbound Commercial Vehicle Spring 2014 Vehicle Activity & Emissions with Calexico West Phase 2 (1 of 2) ............................................................................................................ 93
Table 43. Calexico West POE Northbound Private Vehicle Summer 2014 Vehicle Activity & Emissions with Calexico West Phase 2 ................................................................................................................................ 95
Table 44. Calexico East POE Northbound Private Vehicle Summer 2014 Vehicle Activity & Emissions with Calexico West Phase 2 ................................................................................................................................ 96
Table 45. Calexico East POE Northbound Commercial Vehicle Summer 2014 Vehicle Activity & Emissions with Calexico West Phase 2 (1 of 2) ............................................................................................................ 97
Table 46. Calexico West POE Northbound Private Vehicle Winter 2014 Vehicle Activity & Emissions with Calexico West Phase 2 ................................................................................................................................ 99
11

Vehicle Idling Emissions Study at Calexico East and Calexico West Ports-of-Entry October 2015, page ix
Table 47. Calexico East POE Northbound Private Vehicle Winter 2014 Vehicle Activity & Emissions with Calexico West Phase 2 .............................................................................................................................. 100
Table 48. Calexico East POE Northbound Commercial Vehicle Winter 2014 Vehicle Activity & Emissions with Calexico West Phase 2 (1 of 2) .......................................................................................................... 101
Table 49. Calexico West POE Northbound Private Vehicle Spring 2014 Vehicle Activity & Emissions with Reduction in Empty General-purpose Commercial Trucks ....................................................................... 103
Table 50. Calexico East POE Northbound Private Vehicle Spring 2014 Vehicle Activity & Emissions with Reduction in Empty General-purpose Commercial Trucks ....................................................................... 104
Table 51. Calexico East POE Northbound Commercial Vehicle Spring 2014 Vehicle Activity & Emissions with Reduction in Empty General-purpose Commercial Trucks (1 of 2) .................................................. 105
Table 52. Calexico West POE Northbound Private Vehicle Summer 2014 Vehicle Activity & Emissions with Reduction in Empty General-purpose Commercial Trucks ....................................................................... 107
Table 53. Calexico East POE Northbound Private Vehicle Summer 2014 Vehicle Activity & Emissions with Reduction in Empty General-purpose Commercial Trucks ....................................................................... 108
Table 54. Calexico East POE Northbound Commercial Vehicle Summer 2014 Vehicle Activity & Emissions with Reduction in Empty General-purpose Commercial Trucks (1 of 2) .................................................. 109
Table 55. Calexico West POE Northbound Private Vehicle Winter 2014 Vehicle Activity & Emissions with Reduction in Empty General-purpose Commercial Trucks ....................................................................... 111
Table 56. Calexico East POE Northbound Private Vehicle Winter 2014 Vehicle Activity & Emissions with Reduction in Empty General-purpose Commercial Trucks ....................................................................... 112
Table 57. Calexico East POE Northbound Commercial Vehicle Winter 2014 Vehicle Activity & Emissions with Reduction in Empty General-purpose Commercial Trucks (1 of 2) .................................................. 113
Table 58. Calexico West POE Northbound Private Vehicle Spring 2014 Vehicle Activity & Emissions with Shift of Commercial General-purpose to FAST ......................................................................................... 115
Table 59. Calexico East POE Northbound Private Vehicle Spring 2014 Vehicle Activity & Emissions with Shift of Commercial General-purpose to FAST ......................................................................................... 116
Table 60. Calexico East POE Northbound Commercial Vehicle Spring 2014 Vehicle Activity & Emissions with Shift of Commercial General-purpose to FAST (1 of 2) ..................................................................... 117
Table 61. Calexico West POE Northbound Private Vehicle Summer 2014 Vehicle Activity & Emissions with Shift of Commercial General-purpose to FAST ......................................................................................... 119
12

Vehicle Idling Emissions Study at Calexico East and Calexico West Ports-of-Entry October 2015, page x
Table 62. Calexico East POE Northbound Private Vehicle Summer 2014 Vehicle Activity & Emissions with Shift of Commercial General-purpose to FAST ......................................................................................... 120
Table 63. Calexico East POE Northbound Commercial Vehicle Summer 2014 Vehicle Activity & Emissions with Shift of Commercial General-purpose to FAST (1 of 2) ..................................................................... 121
Table 64. Calexico West POE Northbound Private Vehicle Winter 2014 Vehicle Activity & Emissions with Shift of Commercial General-purpose to FAST ......................................................................................... 123
Table 65. Calexico East POE Northbound Private Vehicle Winter 2014 Vehicle Activity & Emissions with Shift of Commercial General-purpose to FAST ......................................................................................... 124
Table 66. Calexico East POE Northbound Commercial Vehicle Winter 2014 Vehicle Activity & Emissions with Shift of Commercial General-purpose to FAST (1 of 2) ..................................................................... 125
Table 67. Calexico West POE Northbound Private Vehicle Spring 2014 Vehicle Activity & Emissions with Combined U.S.-Mex. Commercial Inspections .......................................................................................... 127
Table 68. Calexico East POE Northbound Private Vehicle Spring 2014 Vehicle Activity & Emissions with Combined U.S.-Mex. Commercial Inspections .......................................................................................... 128
Table 69. Calexico East POE Northbound Commercial Vehicle Spring 2014 Vehicle Activity & Emissions with Combined U.S.-Mex. Commercial Inspections (1 of 2) ..................................................................... 129
Table 70. Calexico West POE Northbound Private Vehicle Summer 2014 Vehicle Activity & Emissions with Combined U.S.-Mex. Commercial Inspections .......................................................................................... 131
Table 71. Calexico East POE Northbound Private Vehicle Summer 2014 Vehicle Activity & Emissions with Combined U.S.-Mex. Commercial Inspections .......................................................................................... 132
Table 72. Calexico East POE Northbound Commercial Vehicle Summer 2014 Vehicle Activity & Emissions with Combined U.S.-Mex. Commercial Inspections (1 of 2) ..................................................................... 133
Table 73. Calexico West POE Northbound Private Vehicle Winter 2014 Vehicle Activity & Emissions with Combined U.S.-Mex. Commercial Inspections .......................................................................................... 135
Table 74. Calexico East POE Northbound Private Vehicle Winter 2014 Vehicle Activity & Emissions with Combined U.S.-Mex. Commercial Inspections .......................................................................................... 136
Table 75. Calexico East POE Northbound Commercial Vehicle Winter 2014 Vehicle Activity & Emissions with Combined U.S.-Mex. Commercial Inspections (1 of 2) ..................................................................... 137
Table 76. Calexico West POE Northbound Private Vehicle Spring 2014 Vehicle Activity & Emissions with California Fuel ........................................................................................................................................... 139
13

Vehicle Idling Emissions Study at Calexico East and Calexico West Ports-of-Entry October 2015, page xi
Table 77. Calexico East POE Northbound Private Vehicle Spring 2014 Vehicle Activity & Emissions with California Fuel ........................................................................................................................................... 140
Table 78. Calexico East POE Northbound Commercial Vehicle Spring 2014 Vehicle Activity & Emissions with California Fuel (1 of 2) ....................................................................................................................... 141
Table 79. Calexico West POE Northbound Private Vehicle Summer 2014 Vehicle Activity & Emissions with California Fuel ........................................................................................................................................... 143
Table 80. Calexico East POE Northbound Private Vehicle Summer 2014 Vehicle Activity & Emissions with California Fuel ........................................................................................................................................... 144
Table 81. Calexico East POE Northbound Commercial Vehicle Summer 2014 Vehicle Activity & Emissions with California Fuel (1 of 2) ....................................................................................................................... 145
Table 82. Calexico West POE Northbound Private Vehicle Winter 2014 Vehicle Activity & Emissions with California Fuel ........................................................................................................................................... 147
Table 83. Calexico East POE Northbound Private Vehicle Winter 2014 Vehicle Activity & Emissions with California Fuel ........................................................................................................................................... 148
Table 84. Calexico East POE Northbound Commercial Vehicle Winter 2014 Vehicle Activity & Emissions with California Fuel (1 of 2) ....................................................................................................................... 149
Table 85. Calexico West POE Northbound Private Vehicle Spring 2014 Vehicle Activity & Emissions with Calexico West Phase 1 & Calexico East Section 559 Proposal .................................................................. 151
Table 86. Calexico East POE Northbound Private Vehicle Spring 2014 Vehicle Activity & Emissions with Calexico West Phase 1 & Calexico East Section 559 Proposal .................................................................. 152
Table 87. Calexico East POE Northbound Commercial Vehicle Spring 2014 Vehicle Activity & Emissions with Calexico West Phase 1 & Calexico East Section 559 Proposal (1 of 2) ............................................. 153
Table 88. Calexico West POE Northbound Private Vehicle Summer 2014 Vehicle Activity & Emissions with Calexico West Phase 1 & Calexico East Section 559 Proposal .................................................................. 155
Table 89. Calexico East POE Northbound Private Vehicle Summer 2014 Vehicle Activity & Emissions with Calexico West Phase 1 & Calexico East Section 559 Proposal .................................................................. 156
Table 90. Calexico East POE Northbound Commercial Vehicle Summer 2014 Vehicle Activity & Emissions with Calexico West Phase 1 & Calexico East Section 559 Proposal (1 of 2) ............................................. 157
Table 91. Calexico West POE Northbound Private Vehicle Winter 2014 Vehicle Activity & Emissions with Calexico West Phase 1 & Calexico East Section 559 Proposal .................................................................. 159
14

Vehicle Idling Emissions Study at Calexico East and Calexico West Ports-of-Entry October 2015, page xii
Table 92. Calexico East POE Northbound Private Vehicle Winter 2014 Vehicle Activity & Emissions with Calexico West Phase 1 & Calexico East Section 559 Proposal .................................................................. 160
Table 93. Calexico East POE Northbound Commercial Vehicle Winter 2014 Vehicle Activity & Emissions with Calexico West Phase 1 & Calexico East Section 559 Proposal (1 of 2) ............................................. 161
15

Vehicle Idling Emissions Study at Calexico East and Calexico West Ports-of-Entry October 2015, page xiii
Table of Figures
Figure 1. Estimated Light Duty Automobile Odometer as a Function of Age ............................................... 4
Figure 2. Estimated Light Duty Truck Odometer as a Function of Age ........................................................ 4
Figure 3. Estimated Heavy Heavy Duty Truck Odometer as a Function of Age ........................................... 5
Figure 4. Light Duty Autos ........................................................................................................................... 11
Figure 5. Light Duty Trucks (0-3750 lbs.)..................................................................................................... 11
Figure 6 Light Duty Trucks (3751 – 5750 lbs.) ............................................................................................. 12
Figure 7. Medium Duty Vehicles (5,751-8,500 lbs.), Light Heavy Duty Trucks (8,501-10,000 lbs.), Light Heavy Duty Trucks (10,001-14,000 lbs.), and Medium Heavy Duty Trucks (14,001-33,000 Llbs.) ............. 12
Figure 8. Heavy Heavy Duty Trucks (33,000 lbs. or More) .......................................................................... 13
Figure 9. Calexico West Traffic Flow Schematic.......................................................................................... 17
Figure 10. Calexico East Traffic Flow Schematic (United States) ................................................................ 24
Figure 11. Calexico East Traffic Flow Schematic (Mexico) .......................................................................... 25
Figure 12. Estimated Calexico West Queueing and Delay During May, 2014, by Hour of the Day ............ 29
Figure 13. Estimated Calexico West Queueing and Delay During August, 2014, by Hour of the Day ........ 30
Figure 14. Estimated Calexico West Queueing and Delay During December, 2014, by Hour of the Day .. 31
Figure 15. Estimated Calexico East Queueing and Delay During May, 2014, by Hour of the Day .............. 32
Figure 16. Estimated Calexico East Queueing and Delay During August, 2014, by Hour of the Day .......... 33
Figure 17. Estimated Calexico East Queueing and Delay During December, 2014, by Hour of the Day .... 34
Figure 18. Estimated Calexico East Maximum Commercial Vehicle Queue Lengths During May 2014 ..... 35
Figure 19. Estimated Calexico East Maximum Commercial Vehicle Queue Lengths During August 2014 . 36
16

Vehicle Idling Emissions Study at Calexico East and Calexico West Ports-of-Entry October 2015, page xiv
Figure 20. Estimated Calexico East Maximum Commercial Vehicle Queue Lengths During December 2014 .................................................................................................................................................................... 37
Figure 21. Conceptual Layout for Phase 1 Improvements at the Calexico West POE ................................ 57
Figure 22. Conceptual Design for Mexican POE .......................................................................................... 58
Figure 23. Conceptual Layout for Phase 2 Improvements at the Calexico West POE ................................ 60
Figure 24. Estimated Calexico East Maximum Commercial Vehicle Queue Lengths During May 2014 ..... 62
Figure 25. Estimated Calexico East Maximum Commercial Vehicle Queue Lengths During August 2014 . 63
Figure 26. Estimated Calexico East Maximum Commercial Vehicle Queue Lengths During December 2014 .................................................................................................................................................................... 64
Figure 27. Comparison of Spring ROG Emissions ........................................................................................ 70
Figure 28. Comparison of Summer ROG Emissions .................................................................................... 71
Figure 29. Comparison of Winter ROG Emissions ....................................................................................... 72
Figure 30. Comparison of Spring NOx Emissions ........................................................................................ 73
Figure 31. Comparison of Summer NOx Emissions ..................................................................................... 74
Figure 32. Comparison of Winter NOx Emissions ....................................................................................... 75
Figure 33. Comparison of Spring PM2.5 Emissions ..................................................................................... 76
Figure 34. Comparison of Summer PM2.5 Emissions ................................................................................. 77
Figure 35. Comparison of Winter PM2.5 Emissions.................................................................................... 78
17

Vehicle Idling Emissions Study at Calexico East and Calexico West Ports-of-Entry October 2015, page 1
1.0 Introduction and Report Organization Reducing emissions of particulate matter (PM), reactive organic matter (ROG), and nitrous oxides (NOx) from idling vehicles at the POEs is one of the most important air quality challenges facing the Imperial County and Mexicali region. Even with standards taking effect over the next decade for idling vehicles, millions of vehicles will continue to emit large amounts of PM, NOx, and toxic air contaminates (a subset of the ROG emissions and PM emissions). Those emissions contribute to serious health problems, premature deaths, asthma attacks, loss of work, and numerous other negative health impacts every year.
This report documents current emissions from northbound vehicles at the Calexico West port-of-entry, the Calexico East privately owned vehicle port-of-entry, and the Calexico East commercial vehicle port-of-entry. Expected emission reductions from seven strategies are analyzed and reported.
The analysis utilizes methodologies developed by FHWA on behalf of the U.S. – Mexico Joint Working Committee (herein referred to as the “JWC template”) 2 along with information collected through three at-border surveys and data collection efforts during May, August, and December 2014. The at-border data collected specifically for this study was augmented with electronic traffic counts provided by Caltrans, and publicly available data from the Bureau of Transportation Statistics (BTS) Transborder Database.
Key sections of this report consist of:
• Analysis of Survey and Volume Tabulation Data – discussing statistical analysis of key information collected at the ports-of-entry to support subsequent analysis and modeling tasks;
• Existing Conditions Analysis – providing a snapshot of the existing delay and associated emissions from northbound traffic at the ports-of entry; and
• Emission Control Strategy Analysis – documenting the expected effectiveness of seven management and infrastructure strategies to reduce emissions form northbound traffic at the ports-of-entry.
2 FHWA (2012) United States-Mexico Land Ports of Entry Emissions and Border Wait-Time White Paper and Analysis Template, Federal Highway Administration, Washington DC.
18

Vehicle Idling Emissions Study at Calexico East and Calexico West Ports-of-Entry October 2015, page 2
2.0 Analysis of Surveys and Volume Tabulation Data 2.1 Purpose and Organization of this Section This section details analysis of data collected at the ports-of-entry. At-border surveys, and tabulations of vehicles by class, lane type and time of day, were performed during May, August, and December 2014, representing spring, summer, and winter conditions at the ports-of-entry. The original sampling plans and reports generated as part of the data collection task are provided as an appendix to this document. The Fleet Data Analyses section below describes the statistical analyses of the surveyed vehicle samples to support estimates of port-of-entry emissions.
Other parameters, such as vehicles class, country of domicile, gasoline-diesel splits, utilization of trusted-traveler lanes, and where fuel was purchased, were tabulated from the available data. The parameters used are reported in the Analysis of Tally Sheets section.
2.2 Fleet Data Analyses Vehicle odometer and age are important characteristics when modeling emission rates for specific geographic areas such as ports-of-entry. The statistical analyses of the odometer data and age data from the surveys are reported below.
Statistical Analyses and Models for Odometer Data Analysis of vehicle odometer data found that EMFAC2014 assumptions reasonably reflect the privately owned vehicle fleet odometers observed at the ports-of-entry. EMFAC2014 assumptions for commercial vehicles appear to overestimate observed commercial vehicle odometer data. Analyses of odometer data for privately own vehicles and commercial vehicles is presented separately below.
Privately Owned Vehicles Odometer For passenger vehicles, univariate general linear models were estimated to identify statistically significant variables and model the expected odometer reading as a function of vehicle age. The first model included the main effects for all variables of interest:
• Registration (Mexico, United States), • Vehicle class (autos, vs light duty trucks3) • Lane type (general-purpose and SENTRI), • Season (May, August, December), and • Age (modeled as a second order polynomial).
Based on the ANOVA shown in Table 1, we fail to reject the null hypothesis that odometer is not a function of lane type [F(1,427)=1.067, p > 5%] and that odometer is not a function of season [F(1,427)=0.002, p > 5%]. A review of statistical power and effect size was also done prior to eliminating these model parameters.
3 Based on preliminary analysis, LDT1 and LDT2 vehicle classes were aggregated for this analysis.
19

Vehicle Idling Emissions Study at Calexico East and Calexico West Ports-of-Entry October 2015, page 3
Table 1. Test of Between-subject Effects for Odometer Reading (Full Model for POV Odometer Reading)
Source Type III Sum of Squares df Mean Square F Sig.
Model 6765348.437a 7 966478.348 574.091 .000 Registration 13160.004 1 13160.004 7.817 .005 Class 8937.172 1 8937.172 5.309 .022 Lane Type 1796.648 1 1796.648 1.067 .302 Season 4.199 1 4.199 .002 .960 Age Squared 34064.695 1 34064.695 20.235 .000 Age 203880.072 1 203880.072 121.105 .000 Error 718851.563 427 1683.493 Total 7484200.000 434 a. R Squared = .904 (Adjusted R Squared = .902)
The reduced model estimation included effects for country of registration, vehicle class, age, and age squared. Table 2 summarizes the ANOVA results. Statistically significant effects exist for: country of registration [F(1,429)=7.739, p < 5%], vehicle class [F(1,429)=5.389, p < 5%], and age squared [F(1,429)=21.830, p < 5%], and Age [F(1,429)=133.08, p < 5%].
Table 2. Test of Between-subject Effects for Odometer Reading (Reduced Model for POV Odometer Reading)
Source Type III Sum of Squares df Mean Square F Sig.
Model 6763546.819a 5 1352709.364 805.259 .000 Registration 13000.793 1 13000.793 7.739 .006 Class 9052.549 1 9052.549 5.389 .021 Age Squared 36670.409 1 36670.409 21.830 .000 Age 223554.081 1 223554.081 133.080 .000 Error 720653.181 429 1679.844
Total 7484200.000 434 a. R Squared = .904 (Adjusted R Squared = .903)
Age specific estimates of POV odometer readings derived from the statistical analysis and shown in Figure 1 and Figure 2 below. The corresponding estimates for odometer readings assumed by EMFAC2011 for Imperial County in 2014 are also included. Note that the defaults from EMFAC2011 assume significantly higher odometer readings than what was actually observed in the vehicle survey data at the border crossing. Because emission control equipment on vehicles is assumed to degrade as a function of both age and odometer, the observation that vehicles at the border crossing have relatively low odometer readings for their ages is important.
20

Vehicle Idling Emissions Study at Calexico East and Calexico West Ports-of-Entry October 2015, page 4
Historic odometer assumptions in EMFAC for privately owned vehicles were not consistent with the odometer readings observed at the port-of-entry. Starting with EMFAC2014, odometer estimates in EMFAC for privately owned vehicles were revised to better match real world data. EMFAC’s improved odometer data provides a reasonable representation of the privately owned vehicle odometer readings at the port-of-entry. No modifications to the EMFAC2014 emission rates for privately owned vehicles were made to account for the port-of-entry specific odometer data.
Figure 1. Estimated Light Duty Automobile Odometer as a Function of Age
Figure 2. Estimated Light Duty Truck Odometer as a Function of Age
-
50
100
150
200
250
300
0 5 10 15 20 25 30
Odo
met
er/1
,000
(mile
s)
Age (years)
LDA Odometer vs Age EMFAC 2011 Assumption EMFAC 2014 Assumption US Survey Data (N=107) US Predicted US 95% CI Mex Survey Data (N=103) Mex Predicted Mex 95% CI
21

Vehicle Idling Emissions Study at Calexico East and Calexico West Ports-of-Entry October 2015, page 5
Commercial Vehicles With the smaller sample size (N=38) for commercial odometer readings, default EMFAC2014 odometer data was used for developing port-of-entry specific emissions. To determine the reasonableness of the EMFAC2014 assumptions and potential need to collect odometer data in future surveys, the available data was modeled using a generalized linear model for odometer as a second order polynomial function of vehicle age. Results of this check are shown below in Figure 3. Default EMFAC 2014 odometer data likely overestimate the degree of deterioration in the emissions control components on commercial vehicles. Continued collection of commercial odometer data during future studies could be used to improve EMFAC2014 emission estimates.
Figure 3. Estimated Heavy Heavy Duty Truck Odometer as a Function of Age
-
50
100
150
200
250
300
0 5 10 15 20 25
Odo
met
er/1
,000
(mile
s)
Age (years)
Aggregated LDT1 and LDT2 Odometer vs Age EMFAC 2011 Assumption EMFAC 2014 Assumption US Survey Data (N=118) US Predicted US 95% CI Mex Survey Data (N=106) Mex Predicted Mex 95% CI
22

Vehicle Idling Emissions Study at Calexico East and Calexico West Ports-of-Entry October 2015, page 6
Statistical Analysis of Age Distribution The analysis of vehicle age distribution found that the distribution of passenger vehicle ages is a function of the border crossing lane type, the vehicle class, and the country that the vehicle is domiciled in. Seasonal effects were not found to be statistically significant for describing passenger vehicle ages. For commercial vehicles the border crossing lane type and the vehicle class were found to be significant variables for characterizing the distribution of engine model year.
A description of the statistical analysis of the fleet age distribution for passenger vehicles and commercial vehicles is detailed below, followed by plots of how the observed age distributions differ from the default age distributions in EMFAC 2014.
Passenger Vehicles Significant parameters for characterizing the age of passenger vehicles were identified using ANOVA based on the application of univariate general linear models4. The first model tested included main effects and higher order effects for:
4 All of the models used to test for vehicle/engine age focus on how the parameters tested are associated with statistically significant variations in average vehicle ages. Thus the amount of variation explained by each model is relatively low, as depicted by the reported R squared and adjusted R squared values.
-
200
400
600
800
1,000
1,200
1,400
1,600
0 5 10 15 20 25 30 35 40 45 50
Odo
met
er/1
,000
(mile
s)
Age (years)
HHDT (Class 7 and 8) Odometer vs Age
EMFAC 2011 and EMFAC 2014 Assumption
Observed
Predicted
95% CI
23

Vehicle Idling Emissions Study at Calexico East and Calexico West Ports-of-Entry October 2015, page 7
• Vehicle class (autos, vs light duty trucks ≤ 3750 lbs., light duty trucks ≥ 3751 lbs.) • Lane type (general-purpose and SENTRI), and • Season (May, August, December).
The country of registration (domicile) was not included in the first model. Additionally, only six out of 1,111 passenger vehicles surveyed were diesel powered, so gasoline and diesel powered passenger vehicles are assumed to have the same age distribution.
Results of the 3(vehicle class) x 3(month) x 2(lane type) between-subjects factorial ANOVA are shown in Table 3. The main effect for lane type [F(1,992) = 52.112, p < 0.05] and vehicle class [F(2,992) = 7.014, p < 0.05] were found to be significant. The main effect for month [F(2,992) = 0.63, p > 0.05] was found to be insignificant. All two-way and three-way interaction terms were found to be insignificant. Analysis was conducted using the SPSS version 22 software General Linear Model (“UNIANOVA”) procedure.
Table 3. Dependent Variable: MY, Tests of Between-subjects Effects
Source Type III Sum of
Squares Df Mean Square F Sig. Corrected Model 2966.441a 17 174.497 6.042 .000 Intercept 2551348797.077 1 2551348797.077 88334125.360 .000 Lane Type 1505.309 1 1505.309 52.118 .000 Class 406.741 2 203.370 7.041 .001 Month 3.617 2 1.809 .063 .939 Lane Type * Class 4.130 2 2.065 .071 .931 Lane Type * Month 15.326 2 7.663 .265 .767 Class * Month 113.283 4 28.321 .981 .417 Lane Type * Class * Month 100.181 4 25.045 .867 .483 Error 28651.871 992 28.883 Total 4053995664.000 1010 Corrected Total 31618.313 1009
a. R Squared = .094 (Adjusted R Squared = .078)
The significance of vehicle domicile was checked through a refined model based on the main effects for lane type, vehicle class, month, and country of origin; all higher order terms were removed.
Results of the 3(vehicle class) x 3(month) x 2(lane type) x 2(country of domicile) between-subjects factorial ANOVA are shown in Table 4. The main effect for lane type [F(1,1003) = 62.710, p < 0.05], domicile [F(1,1003) = 142.490, p < 0.05], and vehicle class [F(2,1003) = 9.243, p < 0.05] were found to be significant. The main effect for month [F(2,1003) = 0.411, p > 0.05] was found to still be insignificant. Analysis was conducted using the SPSS version 22 software General Linear Model (“UNIANOVA”) procedure.
Table 4. Dependent Variable: MY, Tests of Between-subjects Effects for Reduced Model, Including Domicile
24

Vehicle Idling Emissions Study at Calexico East and Calexico West Ports-of-Entry October 2015, page 8
Source Type III Sum of
Squares df Mean Square F Sig. Corrected Model 2838.167a 6 473.028 16.485 .000 Intercept 2755023013.333 1 2755023013.333 96013693.328 .000 Lane Type 1799.414 1 1799.414 62.710 .000 Class 530.410 2 265.205 9.243 .000 Domicile 142.490 1 142.490 4.966 .026 Month 23.592 2 11.796 .411 .663 Error 28780.146 1003 28.694 Total 4053995664 1010 Corrected Total 31618.313 1009 a. R Squared = .090 (Adjusted R Squared = .084)
Commercial Vehicles Significant parameters for characterization of the age distributions for commercial vehicle engines was done using the same techniques as those for privately owned vehicles. The models tested considered main effects for the following characteristics. Higher order effects were not considered.
• Domicile (U.S., Mexico) • Season (May, December) • Lane (FAST, general-purpose) • Class (medium duty vehicle 5,751-8,500 lbs.; light heavy duty trucks 8,501-33,000 lbs.; and
heavy heavy duty trucks 33,000+ lbs.)
Results of the 3(vehicle class) x 2(month) x 2(lane type) x 2(country of domicile) between-subjects factorial ANOVA are shown in Table 5. The main effect for lane type [F(1,184) = 8.906, p < 0.05] and vehicle class [F(2,184) = 3.673, p < 0.05] were found to be significant. The main effect for month [F(1,184) = 0.395, p > 0.05], and domicile [F(1,184) = 2.360, p > 0.05] were found to be insignificant. Analysis was conducted using the SPSS version 22 software General Linear Model (“UNIANOVA”) procedure.
25

Vehicle Idling Emissions Study at Calexico East and Calexico West Ports-of-Entry October 2015, page 9
Table 5. Dependent Variable: Engine MY, Tests of Between-subjects Effects
Source Type III Sum of
Squares df Mean Square F Sig. Corrected Model 765.086a 5 153.017 3.679 .003 Intercept 90405833.483 1 90405833.483 2173872.321 .000 Domicile 98.149 1 98.149 2.360 .126 Month 16.445 1 16.445 .395 .530 Lane 370.388 1 370.388 8.906 .003 Class 305.507 2 152.754 3.673 .027 Error 7652.093 184 41.587 Total 762434350.000 190 Corrected Total 8417.179 189 a. R Squared = .091 (Adjusted R Squared = .066)
A reduced model was test based on lane type and vehicle class. Results of the 3(vehicle class) x 2(lane type) between-subjects factorial ANOVA are shown in Table 6. The main effect for lane type [F(1,187) = 6.753, p < 0.05], and vehicle class [F(2,187) = 3.056, p < 0.05] were found to be significant. Analysis was conducted using the SPSS version 22 software General Linear Model (“UNIANOVA”) procedure.
Table 6. Dependent Variable: Engine MY, Tests of Between-subjects Effects, Reduced Model
Source Type III Sum of
Squares df Mean Square F Sig.
Corrected Model 568.415a 3 189.472 4.074 .008 Intercept 135436249.181 1 135436249.181 2912329.984 .000 Lane 314.067 1 314.067 6.753 .010 Class 284.265 2 142.132 3.056 .049 Error 8696.329 187 46.504
Total 766331026.000 191
Corrected Total 9264.743 190 a. R Squared = .061 (Adjusted R Squared = .046)
Ultimately, the samples for medium duty vehicle 5,751-8,500 lbs., and light heavy duty trucks 8,501-33,000 lbs. were combined to estimate age distributions because of the relatively small sample sizes for commercial vehicles.
Age Distribution Plots Vehicle age distributions, as they were used for development of emission factors, are presented in the following figures:
• Figure 4. Light Duty Autos • Figure 5. Light Duty Trucks (0-3750 lbs.)
26

Vehicle Idling Emissions Study at Calexico East and Calexico West Ports-of-Entry October 2015, page 10
• Figure 6 Light Duty Trucks (3751 – 5750 lbs.) • Figure 7. Medium Duty Vehicles (5,751-8,500 lbs.), Light Heavy Duty Trucks (8,501-10,000 lbs.),
Light Heavy Duty Trucks (10,001-14,000 lbs.), and Medium Heavy Duty Trucks (14,001-33,000 Llbs.)
• Figure 8. Heavy Heavy Duty Trucks (33,000 lbs. or More)
Because age data for gasoline and diesel powered vehicles was aggregated to develop the age distributions, EMFAC 2014 results shown in the figures plotting the ag distributions are also aggregated. There are several interesting observations:
• New U.S. domiciled, privately owned vehicles, were not observed at the border crossing. An antidotal explanation for this is a preference for U.S. residents to use a slightly older, but reliable, vehicle for trips into Mexico (see Figure 4 through Figure 6). In general, the average age of privately owned vehicles crossing the border is older than the average age of privately owned vehicles in Imperial County.
• The average age of commercial vehicles crossing the border is older than the average age of commercial vehicles in Imperial County. The commercial fleet crossing the border has very few model year 2010 or later engines, which require selective catalytic reduction exhaust after-treatment to reduce NOx emissions. The California Air Resources Board in-use truck regulation5 came into effect in January 2015 for 1994 and older model year truck engines. Initially the in-use truck rule will only marginally impact the commercial fleet as relatively few of those oldest trucks are used to cross the border.
• Diesel powered commercial vehicles require ultra-low sulfur fuel starting with the 2007 engine model year. The majority of trucks crossing the border were observed to have 2007 or newer model year engines.
5 http://www.arb.ca.gov/msprog/onrdiesel/documents/tbfinalreg.pdf
27

Vehicle Idling Emissions Study at Calexico East and Calexico West Ports-of-Entry October 2015, page 11
Figure 4. Light Duty Autos
Figure 5. Light Duty Trucks (0-3750 lbs.)
28

Vehicle Idling Emissions Study at Calexico East and Calexico West Ports-of-Entry October 2015, page 12
Figure 6 Light Duty Trucks (3751 – 5750 lbs.)
Figure 7. Medium Duty Vehicles (5,751-8,500 lbs.), Light Heavy Duty Trucks (8,501-10,000 lbs.), Light Heavy Duty Trucks (10,001-14,000 lbs.), and Medium Heavy Duty Trucks (14,001-33,000 Llbs.)
29

Vehicle Idling Emissions Study at Calexico East and Calexico West Ports-of-Entry October 2015, page 13
Figure 8. Heavy Heavy Duty Trucks (33,000 lbs. or More)
2.3 Analysis of Tally Sheets Cross-tabulations were prepared to characterize a number of key parameters for analysis of traffic operations and emissions at the ports-of-entry. Privately owned vehicle and commercial data are presented below.
Privately Owned Vehicle Data from Crosstabs The observed vehicle class distribution is shown below. Vehicle classes were not found to differ significantly by the type of border crossing lane being used, country of domicile, or vehicle age.
• Light duty autos: observed 51%, assumed 50%. • Light duty trucks (0-3,750 lbs): observed 25%, assumed 25%. • Light duty trucks (3,751-5,750 lbs): observed 24%, assumed 25%. • Motorcycles: observed <1%, assumed 0%.
The U.S. and Mexico have different standards for the properties of transportation fuels, which in turn effect emissions. The country where fuel was last purchased was used identify what fuel was being utilized at the border. The observed source of fuel at the ports-of-entry was:
• Mexican domiciled vehicles: 25% running on U.S. fuel and 75% running on Mexico fuel. • U.S. domiciled vehicles: 75% running on U.S. fuel and 25% running on Mexico fuel.
The relative volume of vehicles utilizing each type of border crossing lane at the ports-of-entry effects the border wait-time and queue length. Observed lane utilization was:
• Spring: 55% general-purpose and 45% SENTRI;
30

Vehicle Idling Emissions Study at Calexico East and Calexico West Ports-of-Entry October 2015, page 14
• Summer: 46% general-purpose and 54% SENTRI; • Winter: 46% general-purpose and 54% SENTRI.
Emissions from vehicles domiciled in the U.S. and Mexico differ, and knowing the relative fraction of each countries’ vehicles crossing the border is required. The observed breakout of country of domicile by lane type was:
• SENTRI lanes: 55% U.S. domiciled vehicles and 45% Mexican domiciled vehicles; • Ready lanes: assumed to match SENTRI; • General-purpose lanes: 60% U.S. domiciled vehicles and 40% Mexican domiciled vehicles.
Commercial Data Analysis Observed vehicle class distributions for commercial vehicles is also important. Vehicle classes were not found to differ significantly by the type of border crossing lane being used, country of domicile, or vehicle age. The observed commercial vehicle class distribution was:
• Heavy heavy duty trucks (33,000 + lbs): observed 79%, assumed 80%; • Medium duty vehicles through light heavy duty trucks (5,751-33,000 lbs): observed 14%,
assumed 14%; • Light duty truck 2 (3,751-5,750 lbs): observed 6%, used 6%; • Other: observed 1%, assumed 0%.
Fuel used:
Differences between fuel standards for diesel fuel in the U.S. and Mexico will not dramatically impact emissions. However, it is an interesting parameter because the majority of the fuel is being purchased in Mexico.
• 30% of the fuel being used in commercial vehicles is purchased in the U.S. • 70% of the fuel being used in commercial vehicles is purchased in Mexico.
Utilization of trusted travel lanes effects the border wait-times and queues. Observed lane utilization was:
• 54% of commercial vehicles use the general-purpose lanes; • 46% of commercial vehicles use the FAST lanes.
Unladen commercial trucks are processed faster than laden trucks, and the proportion of unladen trucks in the fleet crossing the border effects wait-times and queues. The laden/unladen splits used are6:
• 54% of commercial vehicles are laden; • 46% of commercial vehicles are undaden; • 2/3rds. of the unladen vehicles are assumed to use the general-purpose lanes.
6 Laden/unladen data from Transborder data (http://transborder.bts.gov/programs/international/transborder/TBDR_QA.html), distribution of unladen vehicles in general purpose lanes is based on tally sheets from this study.
31

Vehicle Idling Emissions Study at Calexico East and Calexico West Ports-of-Entry October 2015, page 15
3.0 Existing Conditions Analysis 3.1 Purpose and Organization of this Section This section documents analysis of the existing delay and emissions at the Calexico West and Calexico East ports-of-entry (POEs). Reducing emissions of particulate matter (PM), reactive organic matter (ROG) and nitrous oxides (NOx) from idling vehicles at the POEs is one of the most important air quality challenges facing the Imperial County and Mexicali region. Even with standards taking effect over the next decade for idling vehicles, millions of vehicles will continue to emit large amounts of PM, NOx, and toxic air contaminates (a subset of the ROG emissions and PM emissions). Those emissions contribute to serious health problems, premature deaths, asthma attacks, loss of work, and numerous other negative health impacts every year.
The analysis presented here utilizes methodologies developed by FHWA on behalf of the U.S. – Mexico Joint Working Committee (herein referred to as the “JWC template”) 7 along with information collected through three at-border surveys and data collection efforts during May, August, and December 2014. The at-border data collected specifically for this study was augmented with electronic traffic counts provided by Caltrans, and the publicly available data previously described in the literature review.
Results of the analysis are presented in a series of tables that quantify vehicle activity and the associated emissions, along with a discussion summarizing that data. Background data and supporting information is presented first, to provide context for those results. Background data includes:
• POE Configuration and Activity – so that readers understand the physical layout and operations of the POEs;
• Queue Model Performance – describing the queue models used to derive detailed activity estimates in support of the emissions analysis.
3.2 POE Configuration and Activity This section describes each POE, with Calexico East broken out into the POV and commercial ports. Operational notes about incidents along the POE approaches that were observed by staff conducting the intercept surveys and on-site data collection is also included as “filed observations”.
Calexico West A schematic showing Calexico West is provided in Figure 9. Calexico West serves privately owned vehicles (POVs), including recreational vehicles and vehicles towing trailers. Buses and commercial vehicles exclusively use the Calexico East POE. The Calexico East POE is described later in this memorandum.
Calexico West has ten primary inspection booths and traffic through those booths is divided into three different streams, two of which are merged together just before the POE. The traffic streams are:
7 FHWA (2012) United States-Mexico Land Ports-of-Entry Emissions and Border Wait-Time White Paper and Analysis Template, Federal Highway Administration, Washington DC.
32

Vehicle Idling Emissions Study at Calexico East and Calexico West Ports-of-Entry October 2015, page 16
• Standard POV lanes;
• SENTRI lanes; and
• A medical lane which is managed by Ciudad de Mexicali to facilitate medical tourism by allowing eligible travelers to bypass most of the standard lane queue.
The inspection booths are typically configured so that up to three booths can service the SENTRI lane POVs, with the balance serving the standard lane POVs. Most traffic exits the Calexico West POE onto East 1st Street. POVs routed through secondary exit directly onto Imperial Avenue (SR 111). The secondary inspection area is located adjacent to the primary inspection booths. Table 7 provides a summary of the estimated hourly traffic volumes and booth configuration.
For security and operational reasons CBP does not disclose details about the number of secondary inspections performed, or the nature of those inspections. An assumption of 3% to 5% of the vehicles being diverted to secondary with an average dwell time of about a half hour has been utilized previously8 and is assumed here as well until better data becomes available.
8 FHWA (2012) United States-Mexico Land Ports-of-Entry Emissions and Border Wait-Time White Paper and Analysis Template, Federal Highway Administration, Washington DC. Note that this assumptions has been crosschecked for reasonableness through capacity analysis and informal personal communication with staff at POEs in Texas and Washington.
33

Vehicle Idling Emissions Study at Calexico East and Calexico West Ports-of-Entry October 2015, page 17
Figure 9. Calexico West Traffic Flow Schematic
34

Vehicle Idling Emissions Study at Calexico East and Calexico West Ports-of-Entry October 2015, page 18
Table 7. Calexico West POV Northbound Traffic Volumes and Booth Designations by Hour
Day and Hour
Standard POV Lane Volume SENTRI Lane Volume May Aug Dec Booths May Aug Dec Booths
Tues-0 245 223 261 8.0 155 141 166 2.0 Tues-1 196 178 209 8.0 124 113 133 2.0 Tues-2 198 180 212 8.0 126 114 134 2.0 Tues-3 198 180 212 8.0 126 114 134 2.0 Tues-4 259 236 276 8.0 164 149 175 2.0 Tues-5 285 259 304 8.0 180 164 193 2.0 Tues-6 305 278 326 8.0 194 176 207 2.0 Tues-7 333 303 356 8.0 211 192 225 2.0 Tues-8 274 249 293 7.0 298 271 318 3.0 Tues-9 358 326 382 7.0 259 236 277 2.0
Tues-10 346 315 369 8.0 219 200 234 2.0 Tues-11 293 266 312 8.0 185 169 198 2.0 Tues-12 271 247 290 8.0 172 156 184 2.0 Tues-13 270 246 289 6.0 343 312 366 3.0 Tues-14 236 215 252 6.6 273 248 291 3.0 Tues-15 247 225 264 6.5 290 264 309 3.0 Tues-16 345 314 368 8.0 218 199 233 2.0 Tues-17 320 291 341 7.5 216 197 231 2.0 Tues-18 292 265 312 7.0 264 240 282 2.5 Tues-19 348 317 372 7.5 236 214 252 2.0 Tues-20 236 215 252 6.5 231 210 246 2.5 Tues-21 234 213 250 6.5 275 250 293 3.0 Tues-22 176 160 188 7.0 159 145 170 2.5 Tues-23 341 310 364 8.5 102 93 109 1.0
The approach to Calexico West has four lanes to accommodate storage of vehicle queues. The two right most lanes are designated as the approaches for standard POVs, the left most lane is the SENTRI POV approach, and, the medical lane separates the standard and SENTRI POVs until those vehicles are blended back into the standard lane approximately 600 feet before the CBP primary inspection booths. To the left of the SENTRI POV lane, a local circulation lane accommodates local traffic that is not accessing the POE. Calexico West is open 24 hours per day, 365 days per year.
The following are observations noted by field crew during data collection activities. These observations are meant to identify possible areas of improvement both in infrastructure as well as port operations, to reduce congestion, improve traffic flow, or help plan for future port-of-entry (POE) designs that might reduce emissions.
35

Vehicle Idling Emissions Study at Calexico East and Calexico West Ports-of-Entry October 2015, page 19
• Calexico West Medical Tourism Lane & Traffic Conflicts: The Calexico West POE has a northbound segregated lane that has been designed to provide medical and health tourists to Mexicali with an “expedited” return back to the U.S. by allowing such verified tourists to enter the General northbound queue at the intersection of Calle Ayuntamiento and Cristobal Colon (adjacent to the Parque Niños Heroes – as seen in the photo at right). At this same location, the approach to SENTRI splits into the gated “Medical Lane” and a segregated SENTRI lane (which continues toward the Calexico West POE). Also at this location, “local” vehicles that either have been using the SENTRI approach, or that have turned onto Cristobal Colon from nearby streets and that may be picking up or dropping off pedestrians crossing the border, can enter and proceed northbound also in a segregated lane (next to the SENTRI lane). It was noted that when approximately 4-5 vehicles are in line waiting for verification at the Medical lane, this slows and can block northbound SENTRI vehicles (as well as “local” vehicles that have been using the SENTRI approach prior to the final lane segregation). This potentially could be resolved by a slight widening of the SENTRI lane approach at this intersection (which would require some modification of the sidewalks and corner infrastructure at Parque Niños Heroes), and/or moving lane dividers (barriers and gate) of the Medical lane up to accommodate 2-3 more cars.
36

Vehicle Idling Emissions Study at Calexico East and Calexico West Ports-of-Entry October 2015, page 20
• Overheating Cars & Vehicle Breakdowns: Another issue that potentially has applicability in other high-heat POE environments was the relatively common experience of vehicles overheating and impeding traffic. During the days Crossborder was in the field in August 2014 (with temperatures reaching over 120 degrees), multiple vehicles overheated and/or stopped working in queue each day, and had to be pushed (often by available local help from the nearby Parque Niños Heroes) toward the POE, or (alternatively) to the sides of the POE approach lanes – at times interfering with traffic. This might argue both for POE designs that incorporate “pull-out” areas for overheated vehicles (with appropriate access for repair services), as well as ways to attenuate extreme heat situations (given the impacts on individuals and on vehicles that may not have air conditioning, or that may be prone to breaking down). One potential option for future POE designs in high-heat environments would be to incorporate shading or even energy-generating photovoltaic (PV) shading in the right-of-way leading to and within the POEs – either with rigid structures (that might be sturdy) or newer tensile PV fabric structures (that might be lighter weight). Appropriate shading might not only reduce the need for vehicles running air conditioning (and overloading motors) but also avoid heat-related car problems in queues, and generate solar energy for public uses. Coincidentally, the PV car park project shown at right is a project done by a European-based sister company of a tensile membrane firm with a manufacturing facility in Baja California.
• Informal Vehicle Parking in POE Approach: Also seen in the northbound vehicle approach to the Calexico West POE were individuals parking for non-vehicle related reasons adjacent to traffic flows. In the photo below, three vehicles can be seen parked next to the barrier and next to General POV flows into the POE. Drivers reported doing this for a range of reasons (picking up someone after a long border queue, retrieving a forgotten passport/visa from a friend, etc.). While usually it was possible for cars to flow past “parked” vehicles, there was some occasional confusion as drivers queued up behind parked cars. Similar to the overheated/broken-down vehicles, no specific space exists for POVs to pull out to address these issues after a long
37

Vehicle Idling Emissions Study at Calexico East and Calexico West Ports-of-Entry October 2015, page 21
border delay.
• Traffic Conflicts in Northbound POV Approach: Another source of traffic conflict noted in the northbound POV approach at Calexico West POE are some local business driveways – including one for Mexico’s Postal Service – that periodically impede traffic in the “local” and SENTRI lanes. While these conflicts were only observed a few times during Crossborder’s field work, they did quickly create temporary queues in these lanes that built quickly (and quickly dispersed once vehicles related to these properties were no longer blocking traffic flows).
38

Vehicle Idling Emissions Study at Calexico East and Calexico West Ports-of-Entry October 2015, page 22
• Large Vehicles can Close Multiple POE Lanes: Field crew also reported seeing on multiple occasions that large RVs and truck/trailer combinations (such as the racing trailer in the photo below) could obstruct multiple lanes and POE inspection booths as they entered the Calexico West POE. While CBP does appear to recommend that such vehicles go to Calexico East, and CBP staff work to help drivers of such vehicles to get through the POE facility as best as possible, nonetheless blockages were seen (particularly on holiday/vacation time periods). As a general practice, having appropriately designed facilities would reduce such traffic impacts; having special lanes dedicated to such vehicles types or allowing them to use bus lanes (where available) might also avoid the emission impacts of larger vehicles (compared to other POVs, especially given their low proportions) rather than keeping them mixed with the General POVs.
3.3 Calexico East Commercial vehicles and POVs have separate crossing facilities at Calexico East. Figure 10 and Figure 11 provide a traffic flow schematic for both of the crossings at the POE. The schematic is split across two figures because it has a significantly larger footprint than Calexico West. POV and commercial facilities are described separately.
Calexico East POV facilities The POV crossing consists of eight inspection booths; traffic through those booths is divided into three different streams:
• SENTRI lane POVs typically use the left most primary inspection booths, though additional lanes can be assigned to serve the SENTRI traffic as warranted.
• Standard POV traffic utilizes from one to three of the right most primary inspection booths. All busses utilize the right most lane so that passengers can debus and be individually cleared for entry into the United States. The bus and standard POV traffic is intermixed.
• Ready Lane traffic is served by one to five of the available booths in between the SENTRI and standard POV booths.
Ready Lane POV processing is only available at Calexico East, which makes it the most utilized border crossing “program” at the Calexico East POE. The POV crossing is open from 3 AM till midnight on weekdays, and 6 AM till midnight on weekends. All of the POV traffic exits around the secondary inspection area onto SR-7. Table 8 below lists the estimated hourly traffic volume and booth configuration for the Calexico East POV crossing.
The assumption described for Calexico West POV traffic that 3% to 5% of the vehicles are diverted to secondary with an average dwell time of about a half hour is also utilized to analyze Calexico East. Traffic exits the Calexico East POE onto SR-7. The secondary inspection area is located adjacent to the primary inspection booths.
39

Vehicle Idling Emissions Study at Calexico East and Calexico West Ports-of-Entry October 2015, page 23
Approaching the primary inspection booths, there is a single SENTRI lane, a single Ready Lane, and two standard POV lanes.
Table 8. Calexico East POV Northbound Traffic Volumes and Booth Designations by Hour
Day and Hour
General-Purpose POV Lane Volume Ready Lane Volume SENTRI Lane Volume
May Aug Dec Booths May Aug Dec Booths May Aug Dec Booths Tues-0 - - - 3.0 - - - 3.5 - - - - Tues-1 - - - 1.0 - - - - - - - - Tues-2 1 1 1
6 6 6 - - - - -
Tues-3 41 40 44 1.0 171 167 181 2.0 - - - - Tues-4 56 55 60 1.0 234 229 248 2.0 - - - - Tues-5 51 50 54 1.0 213 208 226 2.0 - - - - Tues-6 81 80 87 2.0 422 414 451 5.0 106 103 113 1.0 Tues-7 77 75 82 2.0 320 314 342 4.0 200 196 214 2.0 Tues-8 68 67 73 2.0 284 278 304 4.0 177 174 190 2.0 Tues-9 73 71 78 2.0 321 315 344 4.5 94 93 101 1.0
Tues-10 84 82 90 2.0 392 385 420 4.5 109 107 117 1.0 Tues-11 84 82 90 2.0 349 342 374 4.0 109 107 117 1.0 Tues-12 99 98 107 2.0 413 406 445 4.0 129 127 139 1.0 Tues-13 96 94 103 2.0 399 392 430 4.0 125 123 134 1.0 Tues-14 99 97 106 2.0 461 453 495 4.5 128 126 138 1.0 Tues-15 93 91 100 2.0 386 380 416 4.0 121 119 130 1.0 Tues-16 97 95 105 2.0 403 397 435 4.0 126 124 136 1.0 Tues-17 107 105 115 2.0 502 493 539 4.5 140 137 150 1.0 Tues-18 88 86 94 2.0 410 403 441 4.5 114 112 122 1.0 Tues-19 77 76 83 2.0 362 355 388 4.5 101 99 108 1.0 Tues-20 73 71 77 2.0 378 370 402 4.5 - - - - Tues-21 49 48 52 2.0 257 252 273 4.5 - - - - Tues-22 53 51 56 2.0 274 267 290 4.5 - - - - Tues-23 92 90 97 3.0 255 249 270 3.5 - - - -
Calexico East Commercial Facilities Commercial border crossings require the driver, vehicle, and cargo to be cleared by multiple agencies spanning both sides of the border, and are therefore more complex to understand and model. As shown in Figure 10 and Figure 11, northbound trucks go through six different key clearance processes as they cross the border:
• Aduanas entrance booth;
• Aduanas cargo inspection area;
• CBP primary inspection booth;
40

Vehicle Idling Emissions Study at Calexico East and Calexico West Ports-of-Entry October 2015, page 24
Figure 10. Calexico East Traffic Flow Schematic (United States)
41

Vehicle Idling Emissions Study at Calexico East and Calexico West Ports-of-Entry October 2015, page 25
Figure 11. Calexico East Traffic Flow Schematic (Mexico)
42

Vehicle Idling Emissions Study at Calexico East and Calexico West Ports-of-Entry October 2015, page 26
• CBP cargo inspection area;
• CBP exit booth; and
• CHP scales and safety inspections.
Each booth that the commercial vehicle passes through, and at the scales, there is the potential for queueing and idling. The cargo inspection areas require the commercial vehicles to pass through a variety of radiation monitors, x-ray, and gamma-ray scanners (which are referred to by the acronym: VACIS , or, Vehicle and Cargo Inspection System). A portion of vehicles are also referred to loading docks for physical inspection of the vehicle and cargo requiring several hours at times.
Based on the survey data collected at the commercial crossing for this study, the average commercial vehicle spends about four minutes in Aduanas and 11 minutes in the CBP cargo inspection areas, outside of the time spent in queues and transiting the facilities. In addition, about one-third of the commercial vehicles appear to experience a delay of several hours relative to other trucks that entered the border at the same time. Those multi-hour delays are assumed to be vehicles sent to the loading docks; it is assumed that vehicles at the loading docks are shut off while they undergo multi-hour inspections.
Estimated hourly traffic volumes and booth configurations for the commercial POE are provided in Table 9. The commercial port-of-entry is open from 6 AM to 8 PM, Monday through Friday and 10 AM to 6 PM Saturdays. The commercial POE is closed on Sunday.
43
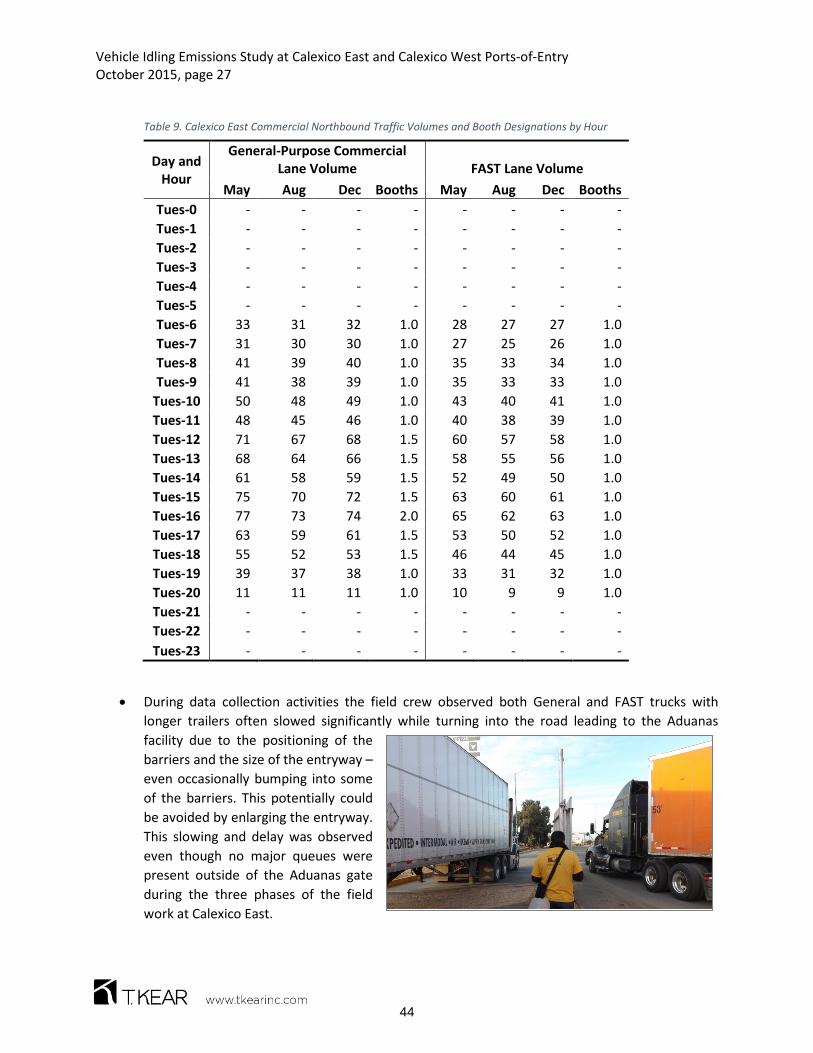
Vehicle Idling Emissions Study at Calexico East and Calexico West Ports-of-Entry October 2015, page 27
Table 9. Calexico East Commercial Northbound Traffic Volumes and Booth Designations by Hour
Day and Hour
General-Purpose Commercial Lane Volume FAST Lane Volume
May Aug Dec Booths May Aug Dec Booths Tues-0 - - - - - - - - Tues-1 - - - - - - - - Tues-2 - - - - - - - - Tues-3 - - - - - - - - Tues-4 - - - - - - - - Tues-5 - - - - - - - - Tues-6 33 31 32 1.0 28 27 27 1.0 Tues-7 31 30 30 1.0 27 25 26 1.0 Tues-8 41 39 40 1.0 35 33 34 1.0 Tues-9 41 38 39 1.0 35 33 33 1.0
Tues-10 50 48 49 1.0 43 40 41 1.0 Tues-11 48 45 46 1.0 40 38 39 1.0 Tues-12 71 67 68 1.5 60 57 58 1.0 Tues-13 68 64 66 1.5 58 55 56 1.0 Tues-14 61 58 59 1.5 52 49 50 1.0 Tues-15 75 70 72 1.5 63 60 61 1.0 Tues-16 77 73 74 2.0 65 62 63 1.0 Tues-17 63 59 61 1.5 53 50 52 1.0 Tues-18 55 52 53 1.5 46 44 45 1.0 Tues-19 39 37 38 1.0 33 31 32 1.0 Tues-20 11 11 11 1.0 10 9 9 1.0 Tues-21 - - - - - - - - Tues-22 - - - - - - - - Tues-23 - - - - - - - -
• During data collection activities the field crew observed both General and FAST trucks with longer trailers often slowed significantly while turning into the road leading to the Aduanas facility due to the positioning of the barriers and the size of the entryway – even occasionally bumping into some of the barriers. This potentially could be avoided by enlarging the entryway. This slowing and delay was observed even though no major queues were present outside of the Aduanas gate during the three phases of the field work at Calexico East.
44

Vehicle Idling Emissions Study at Calexico East and Calexico West Ports-of-Entry October 2015, page 28
3.4 Queue Model Performance First-in, first-out queueing models of each process described above were developed and calibrated using information about processing times, average delays, peak delays and observed queue lengths from the at-border data collection efforts9 to validate the models. Over the next nine pages, preliminary graphics showing the resulting queue and delay characteristics from the analysis are presented. The first six graphics represent the POV crossings, then the last three plot the longest predicted commercial queues on the aerial images of the POE.
Figure 12 – Figure 14 show the queue length and duration for Calexico West by hour of the day. The standard lanes are shown in red with the bar chart representing hours of delay and the line graph showing the length of the queue in feet. The same information is provided for the SENTRI lanes in yellow. Maximum queues for the standard POV lanes are anticipated to occur in May, with queues nearly 8,000 feet long and over 2.5 hours in duration. The longest SENTRI lane queues are expected in December, and are almost 4000 feet long, resulting in about 45 minutes of delay.
Figure 15 – Figure 17 provide the same types of information for the Calexico East POV port-of-entry. Once again red and yellow is used to show standard POV, and SENTRI lane queue length and delay. Data for the Ready Lanes are shown in blue. This study did not collect data at the Calexico East POV crossing, and was designed with the expectation of extrapolating Calexico West data to reflect Calexico East POVs. Processing times were assumed to be about 10% faster at Calexico East than they were at Calexico West, and the delays and queues were still estimated to be worse than what was observed at Calexico West. These Calexico East POV models may need more fine tuning as the study progresses. It is clear that Calexico East is operating very near it’s capacity during much of the day, particularly the Ready Lanes. Small perturbations in the flows and processing speeds can rapidly back traffic up onto Calzada Abelardo L Rodriguez; which can be verified though historical Google imagery.
Figure 18 – Figure 20 show the maximum expected commercial queues for each month to provide a graphical representation of the queue model performance. Because there are so many processes, the aggregated queue length and delay charts used above do not convey useful information for the commercial vehicles. May was found to have the worst queueing of the periods studied, peak hour queues from the VACIS scanners and CBP exit are likely making truck movements within the cargo inspection area difficult, and the queue from the CBP primary inspection booths for standard commercial vehicles is estimated to back up to the Aduanas entrance booth. This type of queueing is indicative of some of the historic satellite imagery, and consistent with the relative lack of queues that this study found south of the Aduanas entrance area.
9
45

Vehicle Idling Emissions Study at Calexico East and Calexico West Ports-of-Entry October 2015, page 29
Figure 12. Estimated Calexico West Queueing and Delay During May, 2014, by Hour of the Day
0 1 2 3 4 5 6 7 8 9 10 11 12 13 14 15 16 17 18 19 20 21 22 23 0.0
0.5
1.0
1.5
2.0
2.5
3.0
-
1,000
2,000
3,000
4,000
5,000
6,000
7,000
8,000
0 5 10 15 20
Dela
y (H
ours
)
Que
ue L
engt
h (F
eet)
Hour
Calexco West, May, Tues
Std. Queue (Hr.) SENTRI Queue (Hr.) Std. Queue (ft) SENTRI Queue (ft)
46

Vehicle Idling Emissions Study at Calexico East and Calexico West Ports-of-Entry October 2015, page 30
Figure 13. Estimated Calexico West Queueing and Delay During August, 2014, by Hour of the Day
0 1 2 3 4 5 6 7 8 9 10 11 12 13 14 15 16 17 18 19 20 21 22 23 0.0
0.2
0.4
0.6
0.8
1.0
1.2
1.4
1.6
-
500
1,000
1,500
2,000
2,500
3,000
3,500
4,000
4,500
0 5 10 15 20
Dela
y (H
ours
)
Que
ue L
engt
h (F
eet)
Hour
Calexco West, Aug, Tues
Std. Queue (Hr.) SENTRI Queue (Hr.) Std. Queue (ft) SENTRI Queue (ft)
47

Vehicle Idling Emissions Study at Calexico East and Calexico West Ports-of-Entry October 2015, page 31
Figure 14. Estimated Calexico West Queueing and Delay During December, 2014, by Hour of the Day
0 1 2 3 4 5 6 7 8 9 10 11 12 13 14 15 16 17 18 19 20 21 22 23 0.0
0.2
0.4
0.6
0.8
1.0
1.2
1.4
1.6
1.8
2.0
-
1,000
2,000
3,000
4,000
5,000
6,000
7,000
0 5 10 15 20
Dela
y (H
ours
)
Que
ue L
engt
h (F
eet)
Hour
Calexco West, Dec, Tues
Std. Queue (Hr.) SENTRI Queue (Hr.) Std. Queue (ft) SENTRI Queue (ft)
48

Vehicle Idling Emissions Study at Calexico East and Calexico West Ports-of-Entry October 2015, page 32
Figure 15. Estimated Calexico East Queueing and Delay During May, 2014, by Hour of the Day
0 1 2 3 4 5 6 7 8 9 10 11 12 13 14 15 16 17 18 19 20 21 22 23 0.0
0.5
1.0
1.5
2.0
2.5
3.0
-
1,000
2,000
3,000
4,000
5,000
6,000
7,000
8,000
0 5 10 15 20
Dela
y (H
ours
)
Que
ue L
engt
h (F
eet)
Hour
Calexco East, May, Tues
Std. Queue (Hr.) SENTRI Queue (Hr.) Ready Queue (Hr.)
Std. Queue (ft) SENTRI Queue (ft) Ready Queue (ft)
49

Vehicle Idling Emissions Study at Calexico East and Calexico West Ports-of-Entry October 2015, page 33
Figure 16. Estimated Calexico East Queueing and Delay During August, 2014, by Hour of the Day
0 1 2 3 4 5 6 7 8 9 10 11 12 13 14 15 16 17 18 19 20 21 22 23 0.0
0.5
1.0
1.5
2.0
2.5
3.0
3.5
-
1,000
2,000
3,000
4,000
5,000
6,000
0 5 10 15 20
Dela
y (H
ours
)
Que
ue L
engt
h (F
eet)
Hour
Calexco East, Aug, Tues
Std. Queue (Hr.) SENTRI Queue (Hr.) Ready Queue (Hr.)
Std. Queue (ft) SENTRI Queue (ft) Ready Queue (ft)
50

Vehicle Idling Emissions Study at Calexico East and Calexico West Ports-of-Entry October 2015, page 34
Figure 17. Estimated Calexico East Queueing and Delay During December, 2014, by Hour of the Day
0 1 2 3 4 5 6 7 8 9 10 11 12 13 14 15 16 17 18 19 20 21 22 23 0.0
0.5
1.0
1.5
2.0
2.5
3.0
-
1,000
2,000
3,000
4,000
5,000
6,000
7,000
0 5 10 15 20
Dela
y (H
ours
)
Que
ue L
engt
h (F
eet)
Hour
Calexco East, Dec, Tues
Std. Queue (Hr.) SENTRI Queue (Hr.) Ready Queue (Hr.)
Std. Queue (ft) SENTRI Queue (ft) Ready Queue (ft)
51

Vehicle Idling Emissions Study at Calexico East and Calexico West Ports-of-Entry October 2015, page 35
Figure 18. Estimated Calexico East Maximum Commercial Vehicle Queue Lengths During May 2014
52

Vehicle Idling Emissions Study at Calexico East and Calexico West Ports-of-Entry October 2015, page 36
Figure 19. Estimated Calexico East Maximum Commercial Vehicle Queue Lengths During August 2014
53
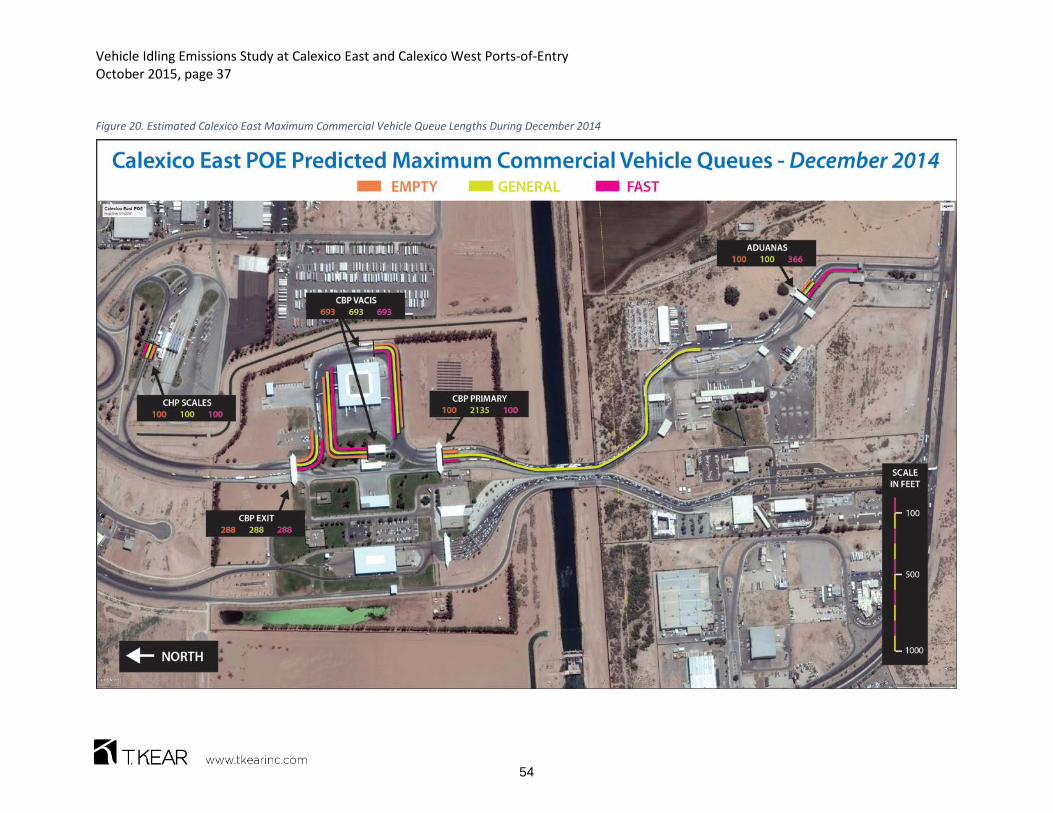
Vehicle Idling Emissions Study at Calexico East and Calexico West Ports-of-Entry October 2015, page 37
Figure 20. Estimated Calexico East Maximum Commercial Vehicle Queue Lengths During December 2014
54

Vehicle Idling Emissions Study at Calexico East and Calexico West Ports-of-Entry October 2015, page 38
3.5 Emission Inventory Results Emission Rates For purposes of estimating emissions, the JWC template defined three types of vehicle behavior, based on detailed modeling and analysis of POE traffic:
• Stop-and-go queueing: Dense, congested traffic in lanes located at, or immediately upstream of, the primary inspection booths. In practice, average speeds of less than 1 mile per hour.
• Creeping queues: Characteristic of vehicle behavior on congested roadway segments that feed multiple stop-and-go queue lanes. In practice, average speeds of about 5 miles per hour.
• Uncongested operation: Travel and roadway segments leading up to queue links. Average speeds of 25 to 35 miles per hour.
Truck idling rates and trip end rates (i.e., hot soaks and engine starts) are also taken into account. The queue models were used to develop the required activity estimates and EMFAC 2014 was applied to develop emission rates reflecting the vehicle fleet characteristics identified through the at-border data collection.
Several adjustment factors are required to account for conditions that EMFAC cannot directly analyze.
• A fuel correction was estimated for the formulation of Mexican gasoline. The adjustment was derived in MOVES, using fuel data from the San Diego and Tijuana regions that had been developed for a related study. For San Diego, the default EMFAC2014 fuel formulations were used; the Tijuana fuel formulation was determined using data from the Alliance of Automobile Manufacturer’s North American Fuel Survey10. The fuel formulations and the share from each country varied by season. The percentages of fuel last purchased in each country were obtained from the at-border surveys.
• An adjustment for lower odometer readings and age distributions is being derived from EMFAC 2011 and an adjustment for the Mexicali I/M program is being derived from EMFAC 2011. Once available the emissions inventory is likely to shift up or down by about 10% for some portions of the fleet (i.e., the results shown below are still preliminary).
Emission Inventories Inventories for the existing conditions are tabulated for ROG, NOx and PM2.5 by both process and crossing for May (Table 10 - Table 12), August (Table 13 - Table 15), and December (Table 16 - Table 18) below.
In order to identify excess emissions, and to set a floor for any emission reduction benefits that could be achieved through reducing border wait-times, an idealized emission inventory was also generated
10 Alliance_of_Automobile_Manufacturers, (07/2013, 01/2013, 01/2014, 07/2014) Alliance of Automobile Manufacturers North American Fuel Survey. 2014: http://www.autoalliance.org/index.cfm?objectid=6E64B9C0-40B5-11E3-8898000C296BA163.
55

Vehicle Idling Emissions Study at Calexico East and Calexico West Ports-of-Entry October 2015, page 39
(Table 19 - Table 27 below). These inventory estimates assume the same amount of VMT occurs, but with 100% of the operation as uncongested travel.
56

Vehicle Idling Emissions Study at Calexico East and Calexico West Ports-of-Entry October 2015, page 40
Table 10. Calexico West POE Northbound Private Vehicle Spring 2014 Baseline Vehicle Activity & Emissions
Process Activity Quantity Units Volume
ROG Rate
(g/mile) or (g/hour)
ROG Emissions (Lbs./Day)
NOx Rate
(g/mile) or
(g/hour)
NOx Emissions (Lbs./Day)
PM2.5 Rate
(g/mile) or (g/hour)
PM2.5 Emissions (Lbs./Day)
U.S. Primary, Standard Lane
Uncongested 9,133.8 VMT 6,606 0.56 11.20 0.62 12.45 0.021 0.43
Creeping Queue 3,953.9 VMT 6,606 3.86 33.62 1.16 10.11 0.040 0.35
Stop-and-Go Queue 125.1 VMT 6,606 7.71 2.13 2.32 0.64 0.080 0.02
Idle 174.3 Veh. Hours 6,606 19.29 7.41 5.80 2.23 0.201 0.08
U.S. Primary, SENTRI Lane
Uncongested 9,362.2 VMT 5,020 0.56 11.52 0.60 12.42 0.021 0.43
Creeping Queue - VMT 5,020 3.87 0.00 1.13 0.00 0.040 0.00
Stop-and-Go Queue 678.4 VMT 5,020 7.74 11.57 2.26 3.38 0.079 0.12
Idle 50.2 Veh. Hours 5,020 19.35 2.14 5.65 0.63 0.198 0.02
U.S. Secondary Creeping Queue (Standard Lane)
6.26 VMT 6,606 3.86 0.05 1.16 0.02 0.040 0.00
Creeping Queue (SENTRI Lane)
4.75 VMT 5,020 3.87 0.04 1.13 0.01 0.040 0.00
30 Min. Soak & Restart (Standard Lane)
330 Vehicles 6,606 1.54 1.12 0.71 0.52 0.002 0.00
30 Min. Soak & Restart (SENTRI Lane)
251 Vehicles 5.020 1.54 0.85 0.69 0.38 0.002 0.00
Subtotal, Calexico West POE, Northbound 81.67 42.79 1.45
57

Vehicle Idling Emissions Study at Calexico East and Calexico West Ports-of-Entry October 2015, page 41
Table 11. Calexico East POE Northbound Private Vehicle Spring 2014 Baseline Vehicle Activity & Emissions
Process Activity Quantity Units Volume
ROG Rate
(g/mile) or (g/hour)
ROG Emissions (Lbs./Day)
NOx Rate
(g/mile) or
(g/hour)
NOx Emissions (Lbs./Day)
PM2.5 Rate
(g/mile) or (g/hour)
PM2.5 Emissions (Lbs./Day)
U.S. Primary, Standard Lane
Uncongested 2,998.3 VMT 1,639 0.56 3.68 0.62 4.09 0.021 0.14
Creeping Queue 198.4 VMT 1,639 3.86 1.69 1.16 0.51 0.040 0.02
Stop-and-Go Queue 131.1 VMT 1,639 7.71 2.23 2.32 0.67 0.080 0.02
Idle 42.8 Veh. Hours 1,639 19.29 1.82 5.80 0.55 0.201 0.02
U.S. Primary, Ready Lane
Uncongested 12,381.8 VMT 7,211 0.56 15.24 0.60 16.43 0.021 0.57
Creeping Queue 2,409.7 VMT 7,211 3.87 20.56 1.13 6.00 0.040 0.21
Stop-and-Go Queue 141.4 VMT 7,211 7.74 2.41 2.26 0.70 0.079 0.02
Idle 75.1 Veh. Hours 7,211 19.35 3.20 5.65 0.94 0.198 0.03
U.S. Primary, SENTRI Lane
Uncongested 3,463.8 VMT 1,778 0.56 4.26 0.60 4.60 0.021 0.16
Creeping Queue 57.8 VMT 1,778 3.87 0.49 1.13 0.14 0.040 0.01
Stop-and-Go Queue 33.7 VMT 1,778 7.74 0.57 2.26 0.17 0.079 0.01
Idle 14.3 Veh. Hours 1,778 19.35 0.61 5.65 0.18 0.198 0.01
U.S. Secondary Creeping Queue (Standard Lane)
1.6 VMT 1,639 3.86 0.01 1.16 0.00 0.040 0.00
Creeping Queue (Ready Lane)
6.8 VMT 7,211 3.87 0.06 1.13 0.02 0.040 0.00
Creeping Queue (SENTRI Lane)
1.7 VMT 1,778 3.87 0.01 1.13 0.00 0.040 0.00
30 Min. Soak and Restart (Standard Lane)
81.9 Vehicles 1,639 1.54 0.28 0.71 0.13 0.002 0.00
30 Min. Soak and Restart (Ready Lane)
360.6 Vehicles 7,211 1.54 1.23 0.69 0.55 0.002 0.00
30 Min. Soak and Restart (SENTRI Lane)
88.9 Vehicles 1,778 1.54 0.30 0.69 0.14 0.002 0.00
Subtotal, Calexico East POE, Northbound 58.66 35.81 1.22
58

Vehicle Idling Emissions Study at Calexico East and Calexico West Ports-of-Entry October 2015, page 42
Table 12. Calexico East POE Northbound Commercial Vehicle Spring 2014 Baseline Vehicle Activity & Emissions (1 of 2)
Process Activity Quantity Units Volume
ROG Rate
(g/mile) or (g/hour)
ROG Emissions (Lbs./Day)
NOx Rate
(g/mile) or
(g/hour)
NOx Emissions (Lbs./Day)
PM2.5 Rate
(g/mile) or (g/hour)
PM2.5 Emissions (Lbs./Day)
MX Aduanas Entrance
Stop-and-Go Queue (Standard, Laden)
7.8 VMT 411 13.50 0.23 64.90 1.11 2.267 0.04
Stop-and-Go Queue (Standard, Unladen)
6.6 VMT 350 13.50 0.20 64.90 0.95 2.267 0.03
Stop-and-Go Queue (FAST, Laden)
16.1 VMT 467 13.50 0.48 64.90 2.31 2.267 0.08
Stop-and-Go Queue (FAST, Unladen)
3.4 VMT 182 13.50 0.10 64.90 0.49 2.267 0.02
Idle (Standard) 18.0 Veh. Hours 762 33.76 1.34 162.27 6.44 5.668 0.22
Idle (FAST) 15.3 Veh. Hours 649 33.76 1.14 162.27 5.48 5.668 0.19
MX Aduanas Cargo Inspection
Idle (Standard) 34.2 Veh. Hours 762 33.76 2.54 162.27 12.22 5.668 0.43
Idle (FAST) 33.6 Veh. Hours 649 33.76 2.50 162.27 12.02 5.668 0.42
U.S. CBP Primary
Stop-and-Go Queue (Standard, Laden)
126.4 VMT 411 13.50 3.76 64.90 18.08 2.267 0.63
Stop-and-Go Queue (Standard, Unladen)
4.1 VMT 350 13.50 0.12 64.90 0.58 2.267 0.02
Stop-and-Go Queue (FAST, Laden)
8.9 VMT 467 13.50 0.26 64.90 1.27 2.267 0.04
Stop-and-Go Queue (FAST, Unladen)
2.1 VMT 182 13.50 0.06 64.90 0.30 2.267 0.01
Idle (Standard) 12.7 Veh. Hours 762 33.76 0.95 162.27 4.54 5.668 0.16
Idle (FAST) 10.8 Veh. Hours 649 33.76 0.81 162.27 3.87 5.668 0.14
U.S. CBP Cargo Inspection
Stop-and-Go Queue (Standard, Laden)
22.8 VMT 411 13.50 0.68 64.90 3.27 2.267 0.11
Stop-and-Go Queue (Standard, Unladen)
19.5 VMT 350 13.50 0.58 64.90 2.78 2.267 0.10
Stop-and-Go Queue (FAST, Laden)
25.9 VMT 411 13.50 0.77 64.90 3.71 2.267 0.13
Stop-and-Go Queue (FAST, Unladen)
10.1 VMT 160 13.50 0.30 64.90 1.44 2.267 0.05
Idle (Standard) 76.1 Veh. Hours 762 33.76 5.66 162.27 27.21 5.668 0.95
Idle (FAST) 69.3 Veh. Hours 571 33.76 5.16 162.27 24.79 5.668 0.87
59

Vehicle Idling Emissions Study at Calexico East and Calexico West Ports-of-Entry October 2015, page 43
Table 12. Calexico East POE Northbound Commercial Vehicle Spring 2014 Baseline Vehicle Activity & Emissions (2 of 2)
Process Activity Quantity Units Volume
ROG Rate
(g/mile) or (g/hour)
ROG Emissions (Lbs./Day)
NOx Rate
(g/mile) or
(g/hour)
NOx Emissions (Lbs./Day)
PM2.5 Rate
(g/mile) or (g/hour)
PM2.5 Emissions (Lbs./Day)
U.S. CBP Exit Stop-and-Go Queue (Standard, Laden)
16.8 VMT 411 13.50 0.50 64.90 2.40 2.267 0.08
Stop-and-Go Queue (Standard, Unladen)
14.3 VMT 350 13.50 0.42 64.90 2.04 2.267 0.07
Stop-and-Go Queue (FAST, Laden)
19.0 VMT 467 13.50 0.57 64.90 2.72 2.267 0.10
Stop-and-Go Queue (FAST, Unladen)
7.4 VMT 182 13.50 0.22 64.90 1.06 2.267 0.04
Idle (Standard) 5.7 Veh. Hours 762 33.76 0.43 162.27 2.04 5.668 0.07
Idle (FAST) 4.9 Veh. Hours 649 33.76 0.36 162.27 1.74 5.668 0.06
California CHP Stop-and-Go Queue (Standard, Laden)
7.8 VMT 411 13.50 0.23 64.90 1.11 2.267 0.04
Stop-and-Go Queue (Standard, Unladen)
6.6 VMT 350 13.50 0.20 64.90 0.95 2.267 0.03
Stop-and-Go Queue (FAST, Laden)
8.9 VMT 467 13.50 0.26 64.90 1.27 2.267 0.04
Stop-and-Go Queue (FAST, Unladen)
3.4 VMT 182 13.50 0.10 64.90 0.49 2.267 0.02
Idle (Standard) 7.6 Veh. Hours 762 33.76 0.57 162.27 2.73 5.668 0.10
Idle (FAST) 6.5 Veh. Hours 649 33.76 0.48 162.27 2.32 5.668 0.08
Other Uncongested Movement (Standard)
2,053.2 VMT 762 0.76 3.43 12.36 55.94 0.276 1.25
Uncongested Movement (FAST)
1,841.9 VMT 649 0.76 3.08 12.36 50.19 0.276 1.12
Subtotal, Calexico East Commercial, Northbound 38.49 259.88 7.74
60

Vehicle Idling Emissions Study at Calexico East and Calexico West Ports-of-Entry October 2015, page 44
Table 13. Calexico West POE Northbound Private Vehicle Summer 2014 Baseline Vehicle Activity & Emissions
Process Activity Quantity Units Volume
ROG Rate
(g/mile) or (g/hour)
ROG Emissions (Lbs./Day)
NOx Rate
(g/mile) or
(g/hour)
NOx Emissions (Lbs./Day)
PM2.5 Rate
(g/mile) or (g/hour)
PM2.5 Emissions (Lbs./Day)
U.S. Primary, Standard Lane
Uncongested 10,375.8 VMT 6,012 0.62 14.20 0.65 14.87 0.021 0.48
Creeping Queue 1,630.9 VMT 6,012 4.30 15.47 1.22 4.39 0.040 0.14
Stop-and-Go Queue 114.8 VMT 6,012 8.61 2.18 2.44 0.62 0.080 0.02
Idle 168.7 Veh. Hours 6,012 21.52 8.00 6.10 2.27 0.201 0.07
U.S. Primary, SENTRI Lane
Uncongested 8,881.1 VMT 4,568 0.62 12.20 0.63 12.40 0.021 0.41
Creeping Queue - VMT 4,568 4.32 0.00 1.19 0.00 0.040 0.00
Stop-and-Go Queue 255.1 VMT 4,568 8.63 4.86 2.38 1.34 0.079 0.04
Idle 48.6 Veh. Hours 4,568 21.59 2.31 5.94 0.64 0.198 0.02
U.S. Secondary Creeping Queue (Standard Lane)
5.693182 VMT 6,012 4.30 0.05 1.22 0.02 0.040 0.00
Creeping Queue (SENTRI Lane)
4.325758 VMT 4,568 4.32 0.04 1.19 0.01 0.040 0.00
30 Min. Soak & Restart (Standard Lane)
301 Vehicles 6,012 1.70 1.12 0.77 0.51 0.002 0.00
30 Min. Soak & Restart (SENTRI Lane)
228 Vehicles 4,568 1.70 0.85 0.74 0.37 0.002 0.00
Subtotal, Calexico West POE, Northbound 61.29 37.43 1.20
61

Vehicle Idling Emissions Study at Calexico East and Calexico West Ports-of-Entry October 2015, page 45
Table 14. Calexico East POE Northbound Private Vehicle Summer 2014 Baseline Vehicle Activity & Emissions
Process Activity Quantity Units Volume
ROG Rate
(g/mile) or (g/hour)
ROG Emissions (Lbs./Day)
NOx Rate
(g/mile) or
(g/hour)
NOx Emissions (Lbs./Day)
PM2.5 Rate
(g/mile) or (g/hour)
PM2.5 Emissions (Lbs./Day)
U.S. Primary, Standard Lane
Uncongested 2,900.8 VMT 1,608 0.62 3.97 0.65 4.16 0.021 0.14
Creeping Queue 257.0 VMT 1,608 4.30 2.44 1.22 0.69 0.040 0.02
Stop-and-Go Queue 126.9 VMT 1,608 8.61 2.41 2.44 0.68 0.080 0.02
Idle 42.0 Veh. Hours 1,608 21.52 1.99 6.10 0.56 0.201 0.02
U.S. Primary, Ready Lane
Uncongested 13,064.0 VMT 7,075 0.62 17.94 0.63 18.23 0.021 0.61
Creeping Queue 1,444.9 VMT 7,075 4.32 13.75 1.19 3.79 0.040 0.13
Stop-and-Go Queue 138.7 VMT 7,075 8.63 2.64 2.38 0.73 0.079 0.02
Idle 73.7 Veh. Hours 7,075 21.59 3.51 5.94 0.97 0.198 0.03
U.S. Primary, SENTRI Lane
Uncongested 3,445.8 VMT 1,746 0.62 4.73 0.63 4.81 0.021 0.16
Creeping Queue 12.7 VMT 1,746 4.32 0.12 1.19 0.03 0.040 00.0
Stop-and-Go Queue 33.1 VMT 1,746 8.63 0.63 2.38 0.17 0.079 0.01
Idle 14.1 Veh. Hours 1,746 21.59 0.67 5.94 0.18 0.198 0.01
U.S. Secondary Creeping Queue (Standard Lane)
1.5 VMT 1,608 430 0.01 1.22 0.00 0.040 0.00
Creeping Queue (Ready Lane)
6.7 VMT 7,075 4.32 0.06 1.19 0.02 0.040 0.00
Creeping Queue (SENTRI Lane)
1.7 VMT 1,746 4.32 0.02 1.19 0.00 0.040 0.00
30 Min. Soak and Restart (Standard Lane)
80.4 Vehicles 1,608 1.70 0.30 0.77 0.14 0.002 0.00
30 Min. Soak and Restart (Ready Lane)
353.7 Vehicles 7,075 1.70 1.32 0.74 0.58 0.002 0.00
30 Min. Soak and Restart (SENTRI Lane)
87.3 Vehicles 1,746 1.70 0.33 0.74 0.14 0.002 0.00
Subtotal, Calexico East POE, Northbound 56.85 35.89 1.16
62

Vehicle Idling Emissions Study at Calexico East and Calexico West Ports-of-Entry October 2015, page 46
Table 15. Calexico East POE Northbound Commercial Vehicle Summer 2014 Baseline Vehicle Activity & Emissions (1 of 2)
Process Activity Quantity Units Volume
ROG Rate
(g/mile) or (g/hour)
ROG Emissions (Lbs./Day)
NOx Rate
(g/mile) or
(g/hour)
NOx Emissions (Lbs./Day)
PM2.5 Rate
(g/mile) or (g/hour)
PM2.5 Emissions (Lbs./Day)
MX Aduanas Entrance
Stop-and-Go Queue (Standard, Laden)
7.4 VMT 389 13.56 0.22 64.90 1.05 2.267 0.04
Stop-and-Go Queue (Standard, Unladen)
6.3 VMT 332 13.56 0.19 64.90 0.90 2.267 0.03
Stop-and-Go Queue (FAST, Laden)
9.4 VMT 442 13.56 0.28 64.90 1.35 2.267 0.05
Stop-and-Go Queue (FAST, Unladen)
3.3 VMT 172 13.56 0.10 64.90 0.47 2.267 0.02
Idle (Standard) 17.0 Veh. Hours 721 33.91 1.27 162.29 6.09 5.668 0.21
Idle (FAST) 14.5 Veh. Hours 614 33.91 1.08 162.29 5.19 5.668 0.18
MX Aduanas Cargo Inspection
Idle (Standard) 32.3 Veh. Hours 721 33.91 2.42 162.29 11.56 5.668 0.40
Idle (FAST) 31.8 Veh. Hours 614 33.91 2.38 162.29 11.37 5.668 0.40
U.S. CBP Primary
Stop-and-Go Queue (Standard, Laden)
55.0 VMT 389 13.56 1.64 64.90 7.87 2.267 0.27
Stop-and-Go Queue (Standard, Unladen)
3.9 VMT 332 13.56 0.12 64.90 0.55 2.267 0.02
Stop-and-Go Queue (FAST, Laden)
8.4 VMT 442 13.56 0.25 64.90 1.20 2.267 0.04
Stop-and-Go Queue (FAST, Unladen)
2.0 VMT 172 13.56 0.06 64.90 0.29 2.267 0.01
Idle (Standard) 12.0 Veh. Hours 721 33.91 0.90 162.29 4.30 5.668 0.15
Idle (FAST) 10.2 Veh. Hours 614 33.91 0.77 162.29 3.66 5.668 0.13
U.S. CBP Cargo Inspection
Stop-and-Go Queue (Standard, Laden)
10.7 VMT 389 13.56 0.32 64.90 1.53 2.267 0.05
Stop-and-Go Queue (Standard, Unladen)
9.1 VMT 332 13.56 0.27 64.90 1.31 2.267 0.05
Stop-and-Go Queue (FAST, Laden)
12.2 VMT 389 13.56 0.36 64.90 1.74 2.267 0.06
Stop-and-Go Queue (FAST, Unladen)
4.7 VMT 151 13.56 0.14 64.90 0.68 5,668 0.02
Idle (Standard) 72.0 Veh. Hours 721 33.91 5.38 162.29 25.74 5.668 0.90
Idle (FAST) 65.5 Veh. Hours 541 33.91 4.90 162.29 23.45 5.668 0.82
63

Vehicle Idling Emissions Study at Calexico East and Calexico West Ports-of-Entry October 2015, page 47
Table 15. Calexico East POE Northbound Commercial Vehicle Summer 2014 Baseline Vehicle Activity & Emissions (2 of 2)
Process Activity Quantity Units Volume
ROG Rate
(g/mile) or (g/hour)
ROG Emissions (Lbs./Day)
NOx Rate
(g/mile) or
(g/hour)
NOx Emissions (Lbs./Day)
PM2.5 Rate
(g/mile) or (g/hour)
PM2.5 Emissions (Lbs./Day)
U.S. CBP Exit Stop-and-Go Queue (Standard, Laden)
7.4 VMT 389 13.56 0.22 64.90 1.05 2.267 0.04
Stop-and-Go Queue (Standard, Unladen)
6.3 VMT 332 13.56 0.19 64.90 0.90 2.267 0.03
Stop-and-Go Queue (FAST, Laden)
8.4 VMT 442 13.56 0.25 64.90 1.20 2.267 0.04
Stop-and-Go Queue (FAST, Unladen)
3.3 VMT 172 13.56 0.10 64.90 0.47 2.267 0.02
Idle (Standard) 5.4 Veh. Hours 721 33.91 0.40 162.29 1.93 5.668 0.07
Idle (FAST) 4.6 Veh. Hours 614 33.91 0.34 162.29 1.65 5.668 0.06
California CHP Stop-and-Go Queue (Standard, Laden)
7.4 VMT 389 13.56 0.22 64.90 1.05 2.267 0.04
Stop-and-Go Queue (Standard, Unladen)
6.3 VMT 332 13.56 0.19 64.90 0.90 2.267 0.03
Stop-and-Go Queue (FAST, Laden)
8.4 VMT 442 13.56 0.25 64.90 1.20 2.267 0.04
Stop-and-Go Queue (FAST, Unladen)
3.3 VMT 172 13.56 0.10 64.90 0.47 2.267 0.02
Idle (Standard) 7.2 Veh. Hours 721 33.91 0.46 162.29 2.58 5.668 0.09
Idle (FAST) 6.1 Veh. Hours 614 33.91 0.46 162.29 2.20 5.668 0.08
Other Uncongested Movement (Standard)
2,042.7 VMT 721 0.76 3.44 12.36 55.67 0.276 1.24
Uncongested Movement (FAST)
1,778.8 VMT 614 0.76 2.99 12.36 48.48 0.276 1.08
Subtotal, Calexico East Commercial, Northbound 32.73 230.04 6.72
64

Vehicle Idling Emissions Study at Calexico East and Calexico West Ports-of-Entry October 2015, page 48
Table 16. Calexico West POE Northbound Private Vehicle Winter 2014 Baseline Vehicle Activity & Emissions
Process Activity Quantity Units Volume
ROG Rate
(g/mile) or (g/hour)
ROG Emissions (Lbs./Day)
NOx Rate
(g/mile) or
(g/hour)
NOx Emissions (Lbs./Day)
PM2.5 Rate
(g/mile) or (g/hour)
PM2.5 Emissions (Lbs./Day)
U.S. Primary, Standard Lane
Uncongested 11,043.8 VMT 7,055.0 0.44 10.78 0.73 17.73 0.021 0.51
Creeping Queue 3,061.5 VMT 7,055.0 3.07 20.75 1.37 9.24 0.040 0.27
Stop-and-Go Queue 134.8 VMT 7,055.0 6.15 1.83 2.74 0.81 0.080 0.02
Idle 170.5 Veh. Hours 7,055.0 15.37 5.78 6.84 2.57 0.201 0.08
U.S. Primary, SENTRI Lane
Uncongested 9,345.6 VMT 5,361.0 0.44 9.08 0.71 14.61 0.021 0.43
Creeping Queue - VMT 5,361.0 3.06 0.00 1.33 0.00 0.040 0.00
Stop-and-Go Queue 1,403.8 VMT 5,361.0 6.12 18.94 2.67 8.25 0.079 0.25
Idle 50.6 Veh. Hours 5,361.0 15.30 1.71 6.66 0.74 0.198 0.02
U.S. Secondary Creeping Queue (Standard Lane)
6.680871 VMT 7,055.0 3.07 0.05 1.37 0.02 0.040 0.00
Creeping Queue (SENTRI Lane)
5.076705 VMT 5,361.0 3.06 0.03 1.33 0.01 0.040 0.00
30 Min. Soak & Restart (Standard Lane)
353 Vehicles 7,055.0 1.17 0.91 0.90 0.70 0.002 0.00
30 Min. Soak & Restart (SENTRI Lane)
268 Vehicles 5,361.0 1.16 0.69 0.87 0.52 0.002 0.00
Subtotal, Calexico West POE, Northbound 70.55 55.21 1.59
65

Vehicle Idling Emissions Study at Calexico East and Calexico West Ports-of-Entry October 2015, page 49
Table 17. Calexico East POE Northbound Private Vehicle Winter 2014 Baseline Vehicle Activity & Emissions
Process Activity Quantity Units Volume
ROG Rate
(g/mile) or (g/hour)
ROG Emissions (Lbs./Day)
NOx Rate
(g/mile) or
(g/hour)
NOx Emissions (Lbs./Day)
PM2.5 Rate
(g/mile) or (g/hour)
PM2.5 Emissions (Lbs./Day)
U.S. Primary, Standard Lane
Uncongested 3,246.0 VMT 1,754 0.44 3.17 0.73 5.21 0.021 0.15
Creeping Queue 199.1 VMT 1,754 3.07 1.35 1.37 0.60 0.040 0.02
Stop-and-Go Queue 122.6 VMT 1,754 6.15 1.66 2.74 0.74 0.080 0.02
Idle 40.4 Veh. Hours 1,754 15.37 1.37 6.84 0.61 0.201 0.02
U.S. Primary, Ready Lane
Uncongested 13,732.1 VMT 7,719 0.44 13.35 0.71 21.47 0.021 0.64
Creeping Queue 2,183.0 VMT 7,719 3.06 14.73 1.33 6.41 0.040 0.19
Stop-and-Go Queue 152.2 VMT 7,719 6.12 2.05 2.67 0.89 0.079 0.03
Idle 74.0 Veh. Hours 7,719 15.30 2.49 6.66 1.09 0.198 0.03
U.S. Primary, SENTRI Lane
Uncongested 3,701.3 VMT 1,908 0.44 3.60 0.71 5.79 0.021 0.17
Creeping Queue 78.6 VMT 1,908 3.06 0.53 1.33 0.23 0.040 0.01
Stop-and-Go Queue 36.1 VMT 1,908 6.12 0.49 2.67 0.21 0.079 0.01
Idle 14.3 Veh. Hours 1,908 15.30 0.48 6.66 0.21 0.198 0.01
U.S. Secondary Creeping Queue (Standard Lane)
1.7 VMT 1,754 3.07 0.01 1.37 0.01 0.040 0.00
Creeping Queue (Ready Lane)
7.3 VMT 7,719 3.06 0.05 1.33 0.02 0.040 0.00
Creeping Queue (SENTRI Lane)
1.8 VMT 1,908 3.06 0.01 1.33 0.01 0.040 0.00
30 Min. Soak and Restart (Standard Lane)
87.7 Vehicles 1,754 1.17 0.23 0.90 0.17 0.002 0.00
30 Min. Soak and Restart (Ready Lane)
385.9 Vehicles 7,719 1.16 0.99 0.87 0.74 0.002 0.00
30 Min. Soak and Restart (SENTRI Lane)
95.4 Vehicles 1,908 1.16 0.24 0.87 0.18 0.002 0.00
Subtotal, Calexico East POE, Northbound 46.80 44.59 1.29
66

Vehicle Idling Emissions Study at Calexico East and Calexico West Ports-of-Entry October 2015, page 50
Table 18. Calexico East POE Northbound Commercial Vehicle Winter 2014 Baseline Vehicle Activity & Emissions (1 of 2)
Process Activity Quantity Units Volume
ROG Rate
(g/mile) or (g/hour)
ROG Emissions (Lbs./Day)
NOx Rate
(g/mile) or
(g/hour)
NOx Emissions (Lbs./Day)
PM2.5 Rate
(g/mile) or (g/hour)
PM2.5 Emissions (Lbs./Day)
MX Aduanas Entrance
Stop-and-Go Queue (Standard, Laden)
7.5 VMT 397 13.44 0.22 64.94 1.08 2.267 0.04
Stop-and-Go Queue (Standard, Unladen)
6.4 VMT 339 13.44 0.19 64.94 0.92 2.267 0.03
Stop-and-Go Queue (FAST, Laden)
11.1 VMT 451 13.44 0.33 64.94 1.59 2.267 0.06
Stop-and-Go Queue (FAST, Unladen)
3.3 VMT 176 13.44 0.10 64.94 0.48 2.267 0.02
Idle (Standard) 17.4 Veh. Hours 736 33.62 1.29 162.37 6.22 5.668 0.22
Idle (FAST) 14.8 Veh. Hours 627 33.62 1.10 162.37 5.30 5.668 0.18
MX Aduanas Cargo Inspection
Idle (Standard) 33.0 Veh. Hours 736 33.62 2.45 162.37 11.81 5.668 0.41
Idle (FAST) 32.4 Veh. Hours 627 33.62 2.41 162.37 11.62 5.668 0.41
U.S. CBP Primary
Stop-and-Go Queue (Standard, Laden)
80.6 VMT 397 13.4 2.39 64.94 11.54 2.267 0.40
Stop-and-Go Queue (Standard, Unladen)
3.9 VMT 339 13.44 0.12 64.94 0.56 2.267 0.02
Stop-and-Go Queue (FAST, Laden)
8.5 VMT 451 13.44 0.25 64.94 1.22 2.267 0.04
Stop-and-Go Queue (FAST, Unladen)
2.0 VMT 176 13.44 0.06 64.94 0.29 2.267 0.01
Idle (Standard) 12.3 Veh. Hours 736 33.62 0.91 162.37 4.39 5.668 0.15
Idle (FAST) 10.4 Veh. Hours 627 33.62 0.77 162.37 3.74 5.668 0.13
U.S. CBP Cargo Inspection
Stop-and-Go Queue (Standard, Laden)
13.7 VMT 397 13.44 0.41 64.94 1.97 2.267 0.07
Stop-and-Go Queue (Standard, Unladen)
11.7 VMT 339 13.44 0.35 64.94 1.68 2.267 0.06
Stop-and-Go Queue (FAST, Laden)
15.6 VMT 397 13.44 0.46 64.94 2.23 2.267 0.08
Stop-and-Go Queue (FAST, Unladen)
6.1 VMT 155 13.44 0.18 64.94 0.87 2.267 0.03
Idle (Standard) 73.5 Veh. Hours 736 33.62 5.45 162.37 26.30 5.668 0.92
Idle (FAST) 66.9 Veh. Hours 552 33.62 4.96 162.37 23.96 5.668 0.84
67

Vehicle Idling Emissions Study at Calexico East and Calexico West Ports-of-Entry October 2015, page 51
Table 18. Calexico East POE Northbound Commercial Vehicle Winter 2014 Baseline Vehicle Activity & Emissions (2 of 2)
Process Activity Quantity Units Volume
ROG Rate
(g/mile) or (g/hour)
ROG Emissions (Lbs./Day)
NOx Rate
(g/mile) or
(g/hour)
NOx Emissions (Lbs./Day)
PM2.5 Rate
(g/mile) or (g/hour)
PM2.5 Emissions (Lbs./Day)
U.S. CBP Exit Stop-and-Go Queue (Standard, Laden)
9.0 VMT 397 13.44 0.27 64.94 1.28 2.267 0.04
Stop-and-Go Queue (Standard, Unladen)
7.6 VMT 339 13.44 0.23 64.94 1.09 2.267 0.04
Stop-and-Go Queue (FAST, Laden)
10.2 VMT 451 13.44 0.30 64.94 1.46 2.267 0.05
Stop-and-Go Queue (FAST, Unladen)
4.0 VMT 176 13.44 0.12 64.94 0.57 2.267 0.02
Idle (Standard) 5.5 Veh. Hours 736 33.62 0.41 162.37 1.98 5.668 0.07
Idle (FAST) 4.7 Veh. Hours 627 33.62 0.35 162.37 1.68 5.668 0.06
California CHP Stop-and-Go Queue (Standard, Laden)
7.5 VMT 397 13.44 0.22 64.94 1.08 2.267 0.04
Stop-and-Go Queue (Standard, Unladen)
6.4 VMT 339 13.44 0.19 64.94 0.92 2.267 0.03
Stop-and-Go Queue (FAST, Laden)
8.5 VMT 451 13.44 0.25 64.94 1.22 2.267 0.04
Stop-and-Go Queue (FAST, Unladen)
3.3 VMT 176 13.44 0.10 64.94 0.48 2.267 0.02
Idle (Standard) 7.4 Veh. Hours 736 33.62 0.55 162.37 2.63 5.668 0.09
Idle (FAST) 6.3 Veh. Hours 627 33.62 0.46 162.37 2.24 5.668 0.08
Other Uncongested Movement (Standard)
2,053.7 VMT 736 0.75 3.41 12.37 56.01 0.276 1.25
Uncongested Movement (FAST)
1,808.3 VMT 627 0.75 3.00 12.37 49.31 0.276 1.10
Subtotal, Calexico East Commercial, Northbound 34.23 239.72 7.04
68

Vehicle Idling Emissions Study at Calexico East and Calexico West Ports-of-Entry October 2015, page 52
Table 19. Calexico West POE Northbound Private Vehicle Spring 2014 Vehicle Activity & Emissions with No POE Delay
Process Activity Quantity Units Volume
ROG Rate
(g/mile) or (g/hour)
ROG Emissions (Lbs./Day)
NOx Rate
(g/mile) or
(g/hour)
NOx Emissions (Lbs./Day)
PM2.5 Rate
(g/mile) or (g/hour)
PM2.5 Emissions (Lbs./Day)
Calexico West Private Vehicle
Uncongested Standard Lane
13,212 VMT 6,606 0.56 16.21 0.62 18.01 0.021 0.62
Uncongested SENTRI Lane 10,040 VMT 5,020 0.56 12.36 0.60 13.32 0.021 0.47
Subtotal, Calexico West POE, Northbound 28.56 31.33 1.08 Table 20. Calexico East POE Northbound Private Vehicle Spring 2014 Vehicle Activity & Emissions with No POE Delay
Process Activity Quantity Units Volume
ROG Rate
(g/mile) or (g/hour)
ROG Emissions (Lbs./Day)
NOx Rate
(g/mile) or
(g/hour)
NOx Emissions (Lbs./Day)
PM2.5 Rate
(g/mile) or (g/hour)
PM2.5 Emissions (Lbs./Day)
Calexico East Private Vehicle
Uncongested Standard Lane
3,278 VMT 1,639 0.56 4.02 0.62 4.47 0.021 0.15
Uncongested Ready Lane 14,423 VMT 7,211 0.56 17.75 0.60 19.14 0.021 0.67
Uncongested SENTRI Lane 3,555 VMT 1,778 0.56 4.38 0.60 4.72 0.021 0.16
Subtotal, Calexico West POE, Northbound 26.15 28.33 0.99 Table 21. Calexico East POE Northbound Commercial Vehicle Spring 2014 Vehicle Activity & Emissions with No POE Delay
Process Activity Quantity Units Volume
ROG Rate
(g/mile) or (g/hour)
ROG Emissions (Lbs./Day)
NOx Rate
(g/mile) or
(g/hour)
NOx Emissions (Lbs./Day)
PM2.5 Rate
(g/mile) or (g/hour)
PM2.5 Emissions (Lbs./Day)
Calexico East Commercial
Uncongested Movement (Standard)
2.285.82 VMT 762 0.76 3.82 12.36 62.28 0.276 1.39
Uncongested Movement (FAST)
1,947.18 VMT 649 0.76 3.25 12.36 53.06 0.276 1.19
Subtotal, Calexico West Commercial Baseline, Northbound 7.07 115.34 2.58
69

Vehicle Idling Emissions Study at Calexico East and Calexico West Ports-of-Entry October 2015, page 53
Table 22. Calexico West POE Northbound Private Vehicle Summer 2014 Vehicle Activity & Emissions with No POE Delay
Process Activity Quantity Units Volume
ROG Rate
(g/mile) or (g/hour)
ROG Emissions (Lbs./Day)
NOx Rate
(g/mile) or
(g/hour)
NOx Emissions (Lbs./Day)
PM2.5 Rate
(g/mile) or (g/hour)
PM2.5 Emissions (Lbs./Day)
Calexico West Private Vehicle
Uncongested Standard Lane
12,024 VMT 6,012 0.62 16.46 0.65 17.23 0.021 0.56
Uncongested SENTRI Lane 9,136 VMT 4,568 0.62 12.55 0.63 12.75 0.021 0.42
Subtotal, Calexico West POE, Northbound 29.00 29.98 0.98
Table 23. Calexico East POE Northbound Private Vehicle Summer 2014 Vehicle Activity & Emissions with No POE Delay
Process Activity Quantity Units Volume
ROG Rate
(g/mile) or (g/hour)
ROG Emissions (Lbs./Day)
NOx Rate
(g/mile) or
(g/hour)
NOx Emissions (Lbs./Day)
PM2.5 Rate
(g/mile) or (g/hour)
PM2.5 Emissions (Lbs./Day)
Calexico East Private Vehicle
Uncongested Standard Lane
3,215 VMT 1,608 0.62 4.40 0.65 4.61 0.021 0.15
Uncongested Ready Lane 14,150 VMT 7,075 0.62 19.43 0.63 19.75 0.021 0.66
Uncongested SENTRI Lane 3,492 VMT 1,746 0.62 4.80 0.63 4.87 0.021 0.16
Subtotal, Calexico West POE, Northbound 28.63 29.23 0.97
Table 24. Calexico East POE Northbound Commercial Vehicle Summer 2014 Vehicle Activity & Emissions with No POE Delay
Process Activity Quantity Units Volume
ROG Rate
(g/mile) or (g/hour)
ROG Emissions (Lbs./Day)
NOx Rate
(g/mile) or
(g/hour)
NOx Emissions (Lbs./Day)
PM2.5 Rate
(g/mile) or (g/hour)
PM2.5 Emissions (Lbs./Day)
Calexico East Commercial
Uncongested Movement (Standard)
2,162.39 VMT 721 0.76 3.64 12.36 58.93 0.276 1.32
Uncongested Movement (FAST)
1,842.03 VMT 614 0.76 3.10 12.36 50.20 0.276 1.12
Subtotal, Calexico West Commercial Baseline, Northbound 6.73 109.13 2.44
70

Vehicle Idling Emissions Study at Calexico East and Calexico West Ports-of-Entry October 2015, page 54
Table 25. Calexico West POE Northbound Private Vehicle Winter 2014 Vehicle Activity & Emissions with No POE Delay
Process Activity Quantity Units Volume
ROG Rate
(g/mile) or (g/hour)
ROG Emissions (Lbs./Day)
NOx Rate
(g/mile) or
(g/hour)
NOx Emissions (Lbs./Day)
PM2.5 Rate
(g/mile) or (g/hour)
PM2.5 Emissions (Lbs./Day)
Calexico West Private Vehicle
Uncongested Standard Lane
14,110 VMT 7,055 0.44 13.78 0.73 22.65 0.021 0.66
Uncongested SENTRI Lane 10,722 VMT 5,361 0.44 10.42 0.71 16.76 0.021 0.50
Subtotal, Calexico West POE, Northbound 24.20 39.31 1.15
Table 26. Calexico East POE Northbound Private Vehicle Winter 2014 Vehicle Activity & Emissions with No POE Delay
Process Activity Quantity Units Volume
ROG Rate
(g/mile) or (g/hour)
ROG Emissions (Lbs./Day)
NOx Rate
(g/mile) or
(g/hour)
NOx Emissions (Lbs./Day)
PM2.5 Rate
(g/mile) or (g/hour)
PM2.5 Emissions (Lbs./Day)
Calexico East Private Vehicle
Uncongested Standard Lane
3,508 VMT 1,754 0.44 3.43 0.73 5.63 0.021 0.16
Uncongested Ready Lane 15,437 VMT 7,719 0.44 15.00 0.71 24.13 0.021 0.72
Uncongested SENTRI Lane 3,816 VMT 1,908 0.44 3.71 0.71 5.97 0.021 0.18
Subtotal, Calexico West POE, Northbound 22.14 35.73 1.06
Table 27. Calexico East POE Northbound Commercial Vehicle Winter 2014 Vehicle Activity & Emissions with No POE Delay
Process Activity Quantity Units Volume
ROG Rate
(g/mile) or (g/hour)
ROG Emissions (Lbs./Day)
NOx Rate
(g/mile) or
(g/hour)
NOx Emissions (Lbs./Day)
PM2.5 Rate
(g/mile) or (g/hour)
PM2.5 Emissions (Lbs./Day)
Calexico East Commercial
Uncongested Movement (Standard)
2,208.10 VMT 736 0.75 3.66 12.37 60.22 0.276 1.34
Uncongested Movement (FAST)
1,880.98 VMT 627 0.75 3.12 12.37 51.30 0.276 1.14
Subtotal, Calexico West Commercial Baseline, Northbound 6.78 111.52 2.49
71

Vehicle Idling Emissions Study at Calexico East and Calexico West Ports-of-Entry October 2015, page 55
4.0 Emission Control Strategy Analysis 4.1 Purpose and Organization of this Section This section documents an analysis of seven potential emission reduction strategies at the Calexico West and Calexico East ports-of-entry (POEs). Summary tables and graphics compare the emission reductions across all seven strategies, followed by detailed results tables, showing emissions and daily traffic by process.
A description of the traffic and emissions modeling approach and data is provided in section 3.0 Existing Conditions Analysis. In general, delays and queues are estimated using calibrated queue models and observed traffic volumes. The resulting traffic activity data is then combined with emission factors from EMFAC2014 utilizing the analysis template created by the JWC template.
4.2 Emission Reduction Strategies The section 3.0 Existing Conditions Analysis described estimated vehicle emissions for baseline conditions representing the most congested spring, summer, and winter traffic conditions observed at the Calexico West and Calexico East ports-of-entry. Estimates of what the vehicle emissions would be without any ports-of-entry were also derived from the models. The difference between those emission inventories, with and without a port-of-entry, represents the excess emissions resulting from border delays.
This analysis considered seven strategies to reduce vehicle emissions at the ports-of entry:
• Phase 1 of the Calexico West POE reconstruction project; • Phase 2 of the Calexico West POE reconstruction project; • Use of California fuel in Mexicali; • A reduction in empty general-purpose truck trips; • Replacing 10% of general-purpose truck trips to FAST truck trips; • Streamlining commercial crossing by combining the Aduanas and CBP primary inspections; and • The Section 559 Proposal to expand the Calexico East POE.
A description of how each of these scenarios was assumed to operate is provided in the sections below.
Calexico West POE Phase 1 POE Project A layout showing the first phase of improvements at the Calexico West POE is shown in Figure 21.
• The first phase of improvements will construct ten new northbound primary inspection booths on the old commercial port-of-entry site, located west of the existing POE. It is assumed that the existing ten-booth port-of-entry will be abandoned and eventually demolished to allow for pedestrian POE improvements during phase 2 of the POE improvement project.
• Instrumented modern lanes are assumed to be more efficient, with processing times similar to those at the Calexico East port-of-entry. In addition to general-purpose and SENTRI lane traffic, the new port-of-entry is assumed to facilitate Ready Lane traffic.
72

Vehicle Idling Emissions Study at Calexico East and Calexico West Ports-of-Entry October 2015, page 56
• Traffic volumes between Calexico West and Calexico East were re-distributed based on the number of lanes open at each facility.
Northbound approaches in Mexico to the improved port-of-entry are shown in Figure 22. It was estimated that there would be up to four lanes for general-purpose lane traffic to access the port-of-entry, up to four lanes for Ready Lanes traffic, and up to two lanes for SENTRI lane traffic. Each booth was assumed to have approximately 500 feet of storage to accommodate northbound traffic prior to it backing up onto the access roads.
Opening of the Phase 1 improvements is anticipated to increase the daily volumes and peak-hour volumes through the Calexico West port-of-entry, and shorten border crossing delays. The emissions analysis presented later shows that those shorter delays reduce emissions for each vehicle crossing the border. However, shifting privately owned vehicle traffic from Calexico East to Calexico West could overwhelm the benefits from reduced vehicle delays at Calexico West, leading to localized increases in emissions. Though not studied, any such localized emission increases would be mitigated within the first several years by anticipated turnover of the regions vehicle fleet.
73

Vehicle Idling Emissions Study at Calexico East and Calexico West Ports-of-Entry October 2015, page 57
Figure 21. Conceptual Layout for Phase 1 Improvements at the Calexico West POE
Source: Calexico West POE FEIS (http://www.gsa.gov/portal/category/106439)
74

Vehicle Idling Emissions Study at Calexico East and Calexico West Ports-of-Entry October 2015, page 58
Figure 22. Conceptual Design for Mexican POE
Source: Calexico West POE FEIS (http://www.gsa.gov/portal/category/106439)
75

Vehicle Idling Emissions Study at Calexico East and Calexico West Ports-of-Entry October 2015, page 59
Calexico West POE Phase 2 POE Project A layout showing the second phase of improvements at the Calexico West POE is shown in Figure 23. The second phase of improvements will construct six additional northbound primary inspection booths for a total of 16. Traffic volumes between Calexico West and Calexico East were again re-distributed based on the number of lanes open at each facility. Northbound approaches accessing the port-of-entry in Mexico are anticipated to be consistent with those in place for the phase 1 improvements.
Opening of the phase 2 improvements is anticipated to further increase the daily volumes and peak-hour volumes through the Calexico West port-of-entry. Northbound delays are eliminated, generally resulting in lower emissions at both ports-of-entry.
Use of California Fuel in Mexicali Mexican fuel was modeled using data related work that looked at San Diego and Tijuana fuel and estimated the relative increase in emissions associated with the fuel formulations used in Tijuana. Fuel formulation data came from The Alliance of Automobile Manufacturer’s North American Fuel Survey11. Mexicali and Tijuana both receive fuel through the marine-terminal in Ensenada. Fuel correction factors developed to adjust and scale the emissions in prior work are applied to this study as well.
The fuel formulations and the share from each country vary by season. Correction factors were only applied to ROG emissions:
• Summer Mexican fuel adjustment factor = 3.7 • Winter Mexican fuel adjustment factor = 2.4
The fraction of US and Mexican registered vehicles running on Mexican fuel was taken from the intercept survey collected at Calexico West. To analyze the effect of selling California fuel in Mexicali, the fuel correction factors used to adjust average fleet emissions under all other scenarios were eliminated.
Reduction in Empty General-purpose Truck Trips This strategy reduces the volume of empty general-purpose trucks utilizing the Calexico East Commercial port-of-entry. The observed fraction of empty general-purpose trucks was 46%, and the observed empty fraction for FAST trucks was 28%. This strategy assumed A 39% reduction in empty commercial general-purpose traffic, so that the empty fraction would be matching the observed empty fraction for FAST trucks.
Strategies to manage empty back-haul trips include virtual truck and container yards to pool the truck fleet across shippers and improved logistics at individual firms. Additional review of the specific reasons for the differences in the empty truck crossing rates would need to be reviewed during the design of a pilot program.
11 Alliance_of_Automobile_Manufacturers, (07/2013, 01/2013, 01/2014, 07/2014) Alliance of Automobile Manufacturers North American Fuel Survey. 2014: http://www.autoalliance.org/index.cfm?objectid=6E64B9C0-40B5-11E3-8898000C296BA163.
76

Vehicle Idling Emissions Study at Calexico East and Calexico West Ports-of-Entry October 2015, page 60
Figure 23. Conceptual Layout for Phase 2 Improvements at the Calexico West POE
Source: Calexico West POE FEIS (http://www.gsa.gov/portal/category/106439)
77

Vehicle Idling Emissions Study at Calexico East and Calexico West Ports-of-Entry October 2015, page 61
Replacing 10% of General-purpose Truck Trips to FAST Truck Trips This strategy estimates the impact of shifting northbound truck trips from general-purpose trucks to FAST certified trucks to reduce delays and emissions. The emission analysis and comparisons are presented later. Figure 24 through Figure 26 summarize maximum queue lengths at the commercial port-of-entry with the redistribution of truck trips to FAST certified trucks.
Streamlining Commercial Crossing Emissions reduction benefits from combining processes at the commercial port-of-entry are considered. In this case, Aduanas and CBP primary inspections were assumed to be combined to reduce overall delay.
Calexico East Section 559 Proposal A proposed toll pilot project at Calexico East would add six privately owned vehicle lanes and three commercial vehicle lanes. The number of lanes northbound over the All American Canal would also be increased. The expanded facility would have 14 primary inspection booths for the privately owned vehicles, and 6 primary inspection booths for commercial vehicles. The proposed project would implemented through Section 559 of the Consolidated Appropriations Act, 2014,12. This scenario assumes that Phase 1 of the reconstruction of the Calexico West port-of-entry is also completed.
Private vehicle traffic is assumed to redistribute between Calexico East and Calexico West ports-of-entry based on the number of lanes at each facility. This has the effect of shifting border traffic that was attracted to the downtown by the reconstruction of the Calexico West POE back to the Calexico East POE. Queues and delay at CBP primary inspection booths are essentially eliminated for both private and commercial vehicle traffic. The benefit for commercial vehicles is limited however as the CBP cargo inspection processes create a bottleneck at times with the existing three commercial CBP primary inspection booths.
12 U.S. Customs and Border Protection, U.S. General Services Agency (2014) Section 559 Donation Acceptance Authority, available on-line at www.cbp.gov/sites/default/files/documents/DAA%20Proposal%20 Evaluation%20Procedures%20&%20Criteria%20Framework_Public%20FINAL.pdf.
78

Vehicle Idling Emissions Study at Calexico East and Calexico West Ports-of-Entry October 2015, page 62
Figure 24. Estimated Calexico East Maximum Commercial Vehicle Queue Lengths During May 2014
79

Vehicle Idling Emissions Study at Calexico East and Calexico West Ports-of-Entry October 2015, page 63
Figure 25. Estimated Calexico East Maximum Commercial Vehicle Queue Lengths During August 2014
80

Vehicle Idling Emissions Study at Calexico East and Calexico West Ports-of-Entry October 2015, page 64
Figure 26. Estimated Calexico East Maximum Commercial Vehicle Queue Lengths During December 2014
81

Vehicle Idling Emissions Study at Calexico East and Calexico West Ports-of-Entry October 2015, page 65
4.3 Emission Reduction Benefits Results Results for Calexico West privately owned vehicles are summarized in Table 28, Calexico East privately owned vehicles in Table 29, and Calexico East commercial vehicles in Table 30. Staked bar charts summarizing the information are provided as Figure 27 through Figure 35.
Detailed results and calculation tables for the Calexico West Phase 1 POE Project strategy are provided in:
• Spring: Table 31, Table 32, and Table 33. • Summer: Table 34, Table 35, and Table 36. • Winter: Table 37, Table 38, and Table 39.
Detailed results and calculation tables for the Calexico West Phase 2 POE Project strategy are provided in:
• Spring: Table 40, Table 41, and Table 42. • Summer: Table 43, Table 44, and Table 45. • Winter: Table 46, Table 47, and Table 48.
Detailed results and calculation tables for the Reduction in Empty Commercial General-purpose Volume strategy are provided in:
• Spring: Table 49, Table 50, and Table 51. • Summer: Table 52, Table 53, and Table 54. • Winter: Table 55, Table 56, and Table 57.
Detailed results and calculation tables for the Shift 10% of Commercial General-purpose to FAST strategy are provided in:
• Spring: Table 58, Table 59, and Table 60. • Summer: Table 61, Table 62, and Table 63. • Winter: Table 64, Table 65, and Table 66.
Detailed results and calculation tables for the Combine Aduanas and CBP Primary strategy are provided in:
• Spring: Table 67, Table 68, and Table 69. • Summer: Table 70, Table 71, and Table 72 • Winter: Table 73, Table 74, and Table 75
Detailed results and calculation tables for the California Fuel strategy are provided in:
• Spring: Table 76, Table 77, and Table 78 • Summer: Table 79, Table 80, and Table 81 • Winter: Table 82, Table 83, and Table 84
82

Vehicle Idling Emissions Study at Calexico East and Calexico West Ports-of-Entry October 2015, page 66
Detailed results and calculation tables for the Calexico East Section 559 Proposal strategy are provided in:
• Spring: Table 85, Table 86, and Table 87 • Summer: Table 88, Table 89, and Table 90 • Winter: Table 91, Table 92, and Table 93
Table 28. Emission Reduction Strategy Summary for Calexico West Privately Owned Vehicles (lb/day)
Calexico West POV
Season Scenario
Reactive Organic Gases (ROG
Oxides of Nitrogen
(NOx)
Fine Particulate
(PM2.5) Spring Without POE 28.6 31.3 1.1
Baseline 81.7 42.8 1.5 Calexico West Phase 1 POE Project 64.3 44.7 1.5 Calexico West Phase 2 POE Project 54.9 46.0 1.6 California Fuel 39.4 42.8 1.5 Reduction in Empty Commercial General-purpose Volume
81.7 42.8 1.5
Shift 10% of Commercial General-purpose to FAST
81.7 42.8 1.5
Combine Aduanas and CBP Primary 81.7 42.8 1.5 Calexico East Section 559 Proposal 33.3 27.9 1.0
Summer Without POE 29.0 30.0 1.0 Baseline 61.3 37.4 1.2 Calexico West Phase 1 POE Project 70.9 46.8 1.5 Calexico West Phase 2 POE Project 57.6 45.7 1.5 California Fuel 29.6 37.4 1.2 Reduction in Empty Commercial General-purpose Volume
61.3 37.4 1.2
Shift 10% of Commercial General-purpose to FAST
61.3 37.4 1.2
Combine Aduanas and CBP Primary 61.3 37.4 1.2 Calexico East Section 559 Proposal 34.9 27.7 0.9
Winter Without POE 24.2 39.4 1.2 Baseline 70.6 55.2 1.6 Calexico West Phase 1 POE Project 51.5 53.1 1.5 Calexico West Phase 2 POE Project 46.4 58.1 1.7 California Fuel 45.2 55.2 1.6 Reduction in Empty Commercial General-purpose Volume
70.6 55.2 1.6
Shift 10% of Commercial General-purpose to FAST
70.6 55.2 1.6
Combine Aduanas and CBP Primary 70.6 55.2 1.6
83

Vehicle Idling Emissions Study at Calexico East and Calexico West Ports-of-Entry October 2015, page 67
Calexico East Section 559 Proposal 28.2 35.2 1.0
84

Vehicle Idling Emissions Study at Calexico East and Calexico West Ports-of-Entry October 2015, page 68
Table 29. Emission Reduction Strategy Summary for Calexico East Privately Owned Vehicles (lb/day)
Calexico East POV
Season Scenario
Reactive Organic Gases (ROG
Oxides of Nitrogen
(NOx)
Fine Particulate
(PM2.5) Spring Without POE 26.2 28.3 1.0
Baseline 58.7 35.8 1.2 Calexico West Phase 1 POE Project 41.2 30.0 1.0 Calexico West Phase 2 POE Project 25.5 21.4 0.7 California Fuel 27.9 35.8 1.2 Reduction in Empty Commercial General-purpose Volume
58.7 35.8 1.2
Shift 10% of Commercial General- Purpose to FAST
58.7 35.8 1.2
Combine Aduanas and CBP Primary 58.7 35.8 1.2 Calexico East Section 559 Proposal 47.1 39.5 1.3
Summer Without POE 28.6 29.2 1.0 Baseline 56.9 35.9 1.2 Calexico West Phase 1 POE Project 39.1 29.1 0.9 Calexico West Phase 2 POE Project 26.9 21.3 0.7 California Fuel 27.0 35.9 1.2 Reduction in Empty Commercial General-purpose Volume
56.9 35.9 1.2
Shift 10% of Commercial General- Purpose to FAST
56.9 35.9 1.2
Combine Aduanas and CBP Primary 56.9 35.9 1.2 Calexico East Section 559 Proposal 49.5 39.3 1.3
Winter Without POE 22.1 35.7 1.1 Baseline 46.8 44.6 1.3 Calexico West Phase 1 POE Project 34.4 38.0 1.1 Calexico West Phase 2 POE Project 21.6 27.0 0.8 California Fuel 29.7 44.6 1.3 Reduction in Empty Commercial General-purpose Volume
46.8 44.6 1.3
Shift 10% of Commercial General- Purpose to FAST
46.8 44.6 1.3
Combine Aduanas and CBP Primary 46.8 44.6 1.3 Calexico East Section 559 Proposal 39.8 49.9 1.4
85

Vehicle Idling Emissions Study at Calexico East and Calexico West Ports-of-Entry October 2015, page 69
Table 30. Emission Reduction Strategy Summary for Calexico East Commercial Vehicles (lb/day)
Calexico East Commercial
Season Scenario
Reactive Organic Gases (ROG
Oxides of Nitrogen
(NOx)
Fine Particulate
(PM2.5) Spring Without POE 7.1 115.3 2.6
Baseline 38.5 259.9 7.7 Calexico West Phase 1 POE Project 38.5 259.9 7.7 Calexico West Phase 2 POE Project 38.5 259.9 7.7 California Fuel 37.8 259.9 7.7 Reduction in Empty Commercial General-purpose Volume
38.3 258.7 7.7
Shift 10% of Commercial General- Purpose to FAST
37.5 256.0 7.6
Combine Aduanas and CBP Primary 35.0 243.1 7.2 Calexico East Section 559 Proposal 35.1 243.5 7.2
Summer Without POE 6.7 109.1 2.4 Baseline 32.7 230.0 6.7 Calexico West Phase 1 POE Project 32.7 230.0 6.7 Calexico West Phase 2 POE Project 32.7 230.0 6.7 California Fuel 32.1 230.8 6.7 Reduction in Empty Commercial General-purpose Volume
32.5 228.9 6.7
Shift 10% of Commercial General- Purpose to FAST
32.3 228.4 6.7
Combine Aduanas and CBP Primary 29.6 215.0 6.2 Calexico East Section 559 Proposal 31.4 223.8 6.5
Winter Without POE 6.8 111.5 2.5 Baseline 34.2 239.7 7.0 Calexico West Phase 1 POE Project 34.2 239.7 7.0 Calexico West Phase 2 POE Project 34.2 239.7 7.0 California Fuel 33.9 239.7 7.0 Reduction in Empty Commercial General-purpose Volume
34.0 238.6 7.0
Shift 10% of Commercial General- Purpose to FAST
33.6 237.1 6.9
Combine Aduanas and CBP Primary 31.0 224.1 6.5 Calexico East Section 559 Proposal 32.2 229.8 6.7
86

Vehicle Idling Emissions Study at Calexico East and Calexico West Ports-of-Entry October 2015, page 70
Figure 27. Comparison of Spring ROG Emissions
33.4
81.7
81.7
81.7
39.4
54.9
64.3
81.7
28.6
47.1
58.7
58.7
58.7
27.9
25.5
41.2
58.7
26.2
35.1
35.0
37.5
38.3
37.8
38.5
38.5
38.5
7.1
0 20 40 60 80 100 120 140 160 180 200
Calexico East Section 559 Proposal, with
Calexico West Phase 1 POE Project
Combine Aduanas and CBP Primary
Shift 10% of Commercial General-Purpose to FAST
Reduction in Empty Commercial General-
Purpose Volume
California Fuel
Calexico West Phase 2 POE Project
Calexico West Phase 1 POE Project
Baseline
Without POE
Spring 2014 ROG (lb/day) Emission Reduction Strategy Comparison
Calexico West POV Calexico East POV Calexico East Commercial
87

Vehicle Idling Emissions Study at Calexico East and Calexico West Ports-of-Entry October 2015, page 71
Figure 28. Comparison of Summer ROG Emissions
34.9
61.3
61.3
61.3
29.6
57.6
70.9
61.3
29.0
49.5
56.9
56.9
56.9
27.0
26.9
39.1
56.9
28.6
31.4
29.6
32.3
32.5
32.1
32.7
32.7
32.7
6.7
0 20 40 60 80 100 120 140 160 180 200
Calexico East Section 559 Proposal, with
Calexico West Phase 1 POE Project
Combine Aduanas and CBP Primary
Shift 10% of Commercial General-Purpose to FAST
Reduction in Empty Commercial General-
Purpose Volume
California Fuel
Calexico West Phase 2 POE Project
Calexico West Phase 1 POE Project
Baseline
Without POE
Summer 2014 ROG (lb/day) Emission Reduction Strategy Comparison
Calexico West POV Calexico East POV Calexico East Commercial
88

Vehicle Idling Emissions Study at Calexico East and Calexico West Ports-of-Entry October 2015, page 72
Figure 29. Comparison of Winter ROG Emissions
28.2
70.6
70.6
70.6
45.2
46.4
51.5
70.6
24.2
39.8
46.8
46.8
46.8
29.7
21.6
34.4
46.8
22.1
32.2
31.0
33.6
34.0
33.9
34.2
34.2
34.2
6.8
0 20 40 60 80 100 120 140 160 180 200
Calexico East Section 559 Proposal, with
Calexico West Phase 1 POE Project
Combine Aduanas and CBP Primary
Shift 10% of Commercial General-Purpose to FAST
Reduction in Empty Commercial General-
Purpose Volume
California Fuel
Calexico West Phase 2 POE Project
Calexico West Phase 1 POE Project
Baseline
Without POE
Winter 2014 ROG (lb/day) Emission Reduction Strategy Comparison
Calexico West POV Calexico East POV Calexico East Commercial
89

Vehicle Idling Emissions Study at Calexico East and Calexico West Ports-of-Entry October 2015, page 73
Figure 30. Comparison of Spring NOx Emissions
27.9
42.8
42.8
42.8
42.8
46.0
44.7
42.8
31.3
39.5
35.8
35.8
35.8
35.8
21.4
30.0
35.8
28.3
243.5
243.1
256.0
258.7
259.9
259.9
259.9
259.9
115.3
0 50 100 150 200 250 300 350 400
Calexico East Section 559 Proposal, with
Calexico West Phase 1 POE Project
Combine Aduanas and CBP Primary
Shift 10% of Commercial General-Purpose to FAST
Reduction in Empty Commercial General-
Purpose Volume
California Fuel
Calexico West Phase 2 POE Project
Calexico West Phase 1 POE Project
Baseline
Without POE
Spring 2014 NOx (lb/day) Emission Reduction Strategy Comparison
Calexico West POV Calexico East POV Calexico East Commercial
90

Vehicle Idling Emissions Study at Calexico East and Calexico West Ports-of-Entry October 2015, page 74
Figure 31. Comparison of Summer NOx Emissions
27.7
37.4
37.4
37.4
37.4
45.7
46.8
37.4
30.0
39.3
35.9
35.9
35.9
35.9
21.3
29.1
35.9
29.2
223.8
215.0
228.4
228.9
230.8
230.0
230.0
230.0
109.1
0 50 100 150 200 250 300 350 400
Calexico East Section 559 Proposal, with
Calexico West Phase 1 POE Project
Combine Aduanas and CBP Primary
Shift 10% of Commercial General-Purpose to FAST
Reduction in Empty Commercial General-
Purpose Volume
California Fuel
Calexico West Phase 2 POE Project
Calexico West Phase 1 POE Project
Baseline
Without POE
Summer 2014 NOx (lb/day) Emission Reduction Strategy Comparison
Calexico West POV Calexico East POV Calexico East Commercial
91

Vehicle Idling Emissions Study at Calexico East and Calexico West Ports-of-Entry October 2015, page 75
Figure 32. Comparison of Winter NOx Emissions
35.2
55.2
55.2
55.2
55.2
58.1
53.1
55.2
39.4
49.9
44.6
44.6
44.6
44.6
27.0
38.0
44.6
35.7
229.8
224.1
237.1
238.6
239.7
239.7
239.7
239.7
111.5
0 50 100 150 200 250 300 350 400
Calexico East Section 559 Proposal, with
Calexico West Phase 1 POE Project
Combine Aduanas and CBP Primary
Shift 10% of Commercial General-Purpose to FAST
Reduction in Empty Commercial General-
Purpose Volume
California Fuel
Calexico West Phase 2 POE Project
Calexico West Phase 1 POE Project
Baseline
Without POE
Winter 2014 NOx(lb/day) Emission Reduction Strategy Comparison
Calexico West POV Calexico East POV Calexico East Commercial
92

Vehicle Idling Emissions Study at Calexico East and Calexico West Ports-of-Entry October 2015, page 76
Figure 33. Comparison of Spring PM2.5 Emissions
1
1.45
1.45
1.45
1.45
1.56
1.52
1.45
1.08
1.3
1.22
1.22
1.22
1.22
0.73
1.02
1.22
0.99
7.2
7.15
7.59
7.70
7.74
7.74
7.74
7.74
2.58
0 2 4 6 8 10 12
Calexico East Section 559 Proposal, with
Calexico West Phase 1 POE Project
Combine Aduanas and CBP Primary
Shift 10% of Commercial General-Purpose to FAST
Reduction in Empty Commercial General-
Purpose Volume
California Fuel
Calexico West Phase 2 POE Project
Calexico West Phase 1 POE Project
Baseline
Without POE
Spring 2014 PM2.5 (lb/day) Emission Reduction Strategy Comparison
Calexico West POV Calexico East POV Calexico East Commercial
93

Vehicle Idling Emissions Study at Calexico East and Calexico West Ports-of-Entry October 2015, page 77
Figure 34. Comparison of Summer PM2.5 Emissions
0.9
1.20
1.20
1.20
1.20
1.47
1.52
1.20
0.98
1.3
1.16
1.16
1.16
1.16
0.69
0.94
1.16
0.97
6.5
6.20
6.66
6.68
6.72
6.72
6.72
6.72
2.44
0 2 4 6 8 10 12
Calexico East Section 559 Proposal, with
Calexico West Phase 1 POE Project
Combine Aduanas and CBP Primary
Shift 10% of Commercial General-Purpose to FAST
Reduction in Empty Commercial General-
Purpose Volume
California Fuel
Calexico West Phase 2 POE Project
Calexico West Phase 1 POE Project
Baseline
Without POE
Summer 2014 PM2.5 (lb/day) Emission Reduction Strategy Comparison
Calexico West POV Calexico East POV Calexico East Commercial
94

Vehicle Idling Emissions Study at Calexico East and Calexico West Ports-of-Entry October 2015, page 78
Figure 35. Comparison of Winter PM2.5 Emissions
1.0
1.59
1.59
1.59
1.59
1.67
1.53
1.59
1.15
1.4
1.29
1.29
1.29
1.29
0.78
1.09
1.29
1.06
6.7
6.50
6.94
7.00
7.04
7.04
7.04
7.04
2.49
0 2 4 6 8 10 12
Calexico East Section 559 Proposal, with
Calexico West Phase 1 POE Project
Combine Aduanas and CBP Primary
Shift 10% of Commercial General-Purpose to FAST
Reduction in Empty Commercial General-
Purpose Volume
California Fuel
Calexico West Phase 2 POE Project
Calexico West Phase 1 POE Project
Baseline
Without POE
Winter 2014 PM2.5 (lb/day) Emission Reduction Strategy Comparison
Calexico West POV Calexico East POV Calexico East Commercial
95

Vehicle Idling Emissions Study at Calexico East and Calexico West Ports-of-Entry October 2015, page 79
Table 31. Calexico West POE Northbound Private Vehicle Spring 2014 Vehicle Activity & Emissions with Calexico West Phase 1
Process Activity Quantity Units Volume
ROG Rate
(g/mile) or (g/hour)
ROG Emissions (Lbs./Day)
NOx Rate
(g/mile) or
(g/hour)
NOx Emissions (Lbs./Day)
PM2.5 Rate
(g/mile) or (g/hour)
PM2.5 Emissions (Lbs./Day)
U.S. Primary, Standard Lane
Uncongested 8,853.2 VMT 4,861 0.56 10.86 0.62 12.07 0.021 0.41
Creeping Queue 331.3 VMT 4,861 3.86 2.82 1.16 0.85 0.040 0.03
Stop-and-Go Queue 311.2 VMT 4,861 7.71 5.29 2.32 1.59 0.080 0.06
Idle 131.0 Veh. Hours 4,861 19.29 5.57 5.80 1.68 0.201 0.06
U.S. Primary, Ready Lane
Uncongested 9,362.2 VMT 4,009 0.56 11.52 0.60 12.42 0.021 0.43
Creeping Queue - VMT 4,009 3.87 0.00 1.13 0.00 0.040 0.00
Stop-and-Go Queue 678.4 VMT 4,009 7.74 11.57 2.26 3.38 0.079 0.12
Idle 42.3 Veh. Hours 4,009 19.35 1.80 5.65 0.53 0.198 0.02
U.S. Primary, SENTRI Lane
Uncongested 7,794.3 VMT 3,954 0.56 9.59 0.60 10.34 0.021 0.36
Creeping Queue 38.4 VMT 3,954 3.87 0.33 1.13 0.10 0.040 0.00
Stop-and-Go Queue 74.9 VMT 3,954 7.74 1.28 2.26 0.37 0.079 0.01
Idle 31.9 Veh. Hours 3,954 19.35 1.36 5.65 0.40 0.198 0.01
U.S. Secondary Creeping Queue (Standard Lane)
4.6 VMT 4,861 3.86 0.04 1.16 0.01 0.040 0.00
Creeping Queue (Ready Lane)
4.6 VMT 4,009 3.87 0.04 1.13 0.01 0.040 0.00
Creeping Queue (SENTRI Lane)
3.7 VMT 3,954 3.87 0.03 1.13 0.01 0.040 0.00
30 Min. Soak and Restart (Standard Lane)
243.1 Vehicles 4,861 1.54 0.83 0.71 0.38 0.002 0.00
30 Min. Soak and Restart (Ready Lane)
200.5 Vehicles 4,009 1.54 0.68 0.69 0.30 0.002 0.00
30 Min. Soak and Restart (SENTRI Lane)
197.7 Vehicles 3,954 1.54 0.67 0.69 0.30 0.002 0.00
Subtotal, Calexico West POE, Northbound 64.29 44.74 1.52
96

Vehicle Idling Emissions Study at Calexico East and Calexico West Ports-of-Entry October 2015, page 80
Table 32. Calexico East POE Northbound Private Vehicle Spring 2014 Vehicle Activity & Emissions with Calexico West Phase 1
Process Activity Quantity Units Volume
ROG Rate
(g/mile) or (g/hour)
ROG Emissions (Lbs./Day)
NOx Rate
(g/mile) or
(g/hour)
NOx Emissions (Lbs./Day)
PM2.5 Rate
(g/mile) or (g/hour)
PM2.5 Emissions (Lbs./Day)
U.S. Primary, Standard Lane
Uncongested 6,106.8 VMT 3,384 0.56 7.49 0.62 8.32 0.021 0.28
Creeping Queue 408.2 VMT 3,384 3.86 3.47 1.16 1.04 0.040 0.04
Stop-and-Go Queue 252.5 VMT 3,384 7.71 4.29 2.32 1.29 0.080 0.04
Idle 91.2 Veh. Hours 3,384 19.29 3.88 5.80 1.17 0.201 0.04
U.S. Primary, Ready Lane
Uncongested 6,193.8 VMT 3,203 0.56 7,62 0.60 8.22 0.021 0.29
Creeping Queue 150.9 VMT 3,203 3.87 1.29 1.13 0.38 0.040 0.01
Stop-and-Go Queue 60.7 VMT 3,203 7.74 1.04 2.26 0.30 0.079 0.01
Idle 33.8 Veh. Hours 3,203 19.35 1.44 5.65 0.42 0.198 0.01
U.S. Primary, SENTRI Lane
Uncongested 5,605.2 VMT 2,844 0.56 6.90 0.60 7.44 0.021 0.26
Creeping Queue 28.4 VMT 2,844 3.87 0.24 1.13 0.07 0.040 0.00
Stop-and-Go Queue 53.9 VMT 2,844 7.74 0.92 2.26 0.27 0.079 0.01
Idle 22.9 Veh. Hours 2,844 19.35 0.98 5.65 0.29 0.198 0.01
U.S. Secondary Creeping Queue (Standard Lane)
3.2 VMT 3,384 3.86 0.03 1.16 0.01 0.040 0.00
Creeping Queue (Ready Lane)
3.0 VMT 3,203 3.87 0.03 1.13 0.01 0.040 0.00
Creeping Queue (SENTRI Lane)
2.7 VMT 2,844 3.87 0.02 1.13 0.01 0.040 0.00
30 Min. Soak and Restart (Standard Lane)
169.2 Vehicles 3,384 1.54 0.58 0.71 0.26 0.002 0.00
30 Min. Soak and Restart (Ready Lane)
160.2 Vehicles 3,203 1.54 0.54 0.69 0.24 0.002 0.00
30 Min. Soak and Restart (SENTRI Lane)
142.2 Vehicles 3,384 1.54 0.48 0.69 0.22 0.002 0.00
Subtotal, Calexico East POE, Northbound 41.24 29.95 1.02
97

Vehicle Idling Emissions Study at Calexico East and Calexico West Ports-of-Entry October 2015, page 81
Table 33. Calexico East POE Northbound CommercialåSpring 2014 Vehicle Activity & Emissions with Calexico West Phase 1 (1 of 2)
Process Activity Quantity Units Volume
ROG Rate
(g/mile) or (g/hour)
ROG Emissions (Lbs./Day)
NOx Rate
(g/mile) or
(g/hour)
NOx Emissions (Lbs./Day)
PM2.5 Rate
(g/mile) or (g/hour)
PM2.5 Emissions (Lbs./Day)
MX Aduanas Entrance
Stop-and-Go Queue (Standard, Laden)
7.8 VMT 411 13.50 0.23 64.90 1.11 2.267 0.04
Stop-and-Go Queue (Standard, Unladen)
6.6 VMT 350 13.50 0.20 64.90 0.95 2.267 0.03
Stop-and-Go Queue (FAST, Laden)
16.1 VMT 467 13.50 0.48 64.90 2.31 2.267 0.08
Stop-and-Go Queue (FAST, Unladen)
3.4 VMT 182 13.50 0.10 64.90 0.49 2.267 0.02
Idle (Standard) 18.0 Veh. Hours 762 33.76 1.34 162.27 6.44 5.668 0.22
Idle (FAST) 15.3 Veh. Hours 649 33.76 1.14 162.27 5.48 5.668 0.19
MX Aduanas Cargo Inspection
Idle (Standard) 34.2 Veh. Hours 762 33.76 2.54 162.27 12.22 5.668 0.43
Idle (FAST) 33.6 Veh. Hours 649 33.76 2.50 162.27 12.02 5.668 0.42
U.S. CBP Primary
Stop-and-Go Queue (Standard, Laden)
126.4 VMT 411 13.50 3.76 64.90 18.08 2.267 0.63
Stop-and-Go Queue (Standard, Unladen)
4.1 VMT 350 13.50 0.12 64.90 0.58 2.267 0.02
Stop-and-Go Queue (FAST, Laden)
8.9 VMT 467 13.50 0.26 64.90 1.27 2.267 0.04
Stop-and-Go Queue (FAST, Unladen)
2.1 VMT 182 13.50 0.06 64.90 0.30 2.267 0.01
Idle (Standard) 12.7 Veh. Hours 762 33.76 0.95 162.27 4.54 5.668 0.16
Idle (FAST) 10.8 Veh. Hours 649 33.76 0.81 162.27 3.87 5.668 0.14
U.S. CBP Cargo Inspection
Stop-and-Go Queue (Standard, Laden)
22.8 VMT 411 13.50 0.68 64.90 3.27 2.267 0.11
Stop-and-Go Queue (Standard, Unladen)
19.5 VMT 350 13.50 0.58 64.90 2.78 2.267 0.10
Stop-and-Go Queue (FAST, Laden)
25.9 VMT 411 13.50 0.77 64.90 3.71 2.267 0.13
Stop-and-Go Queue (FAST, Unladen)
10.1 VMT 160 13.50 0.30 64.90 1.44 2.267 0.05
Idle (Standard) 76.1 Veh. Hours 762 33.76 5.66 162.27 27.21 5.668 0.95
Idle (FAST) 69.3 Veh. Hours 571 33.76 5.16 162.27 24.79 5.668 0.87
98
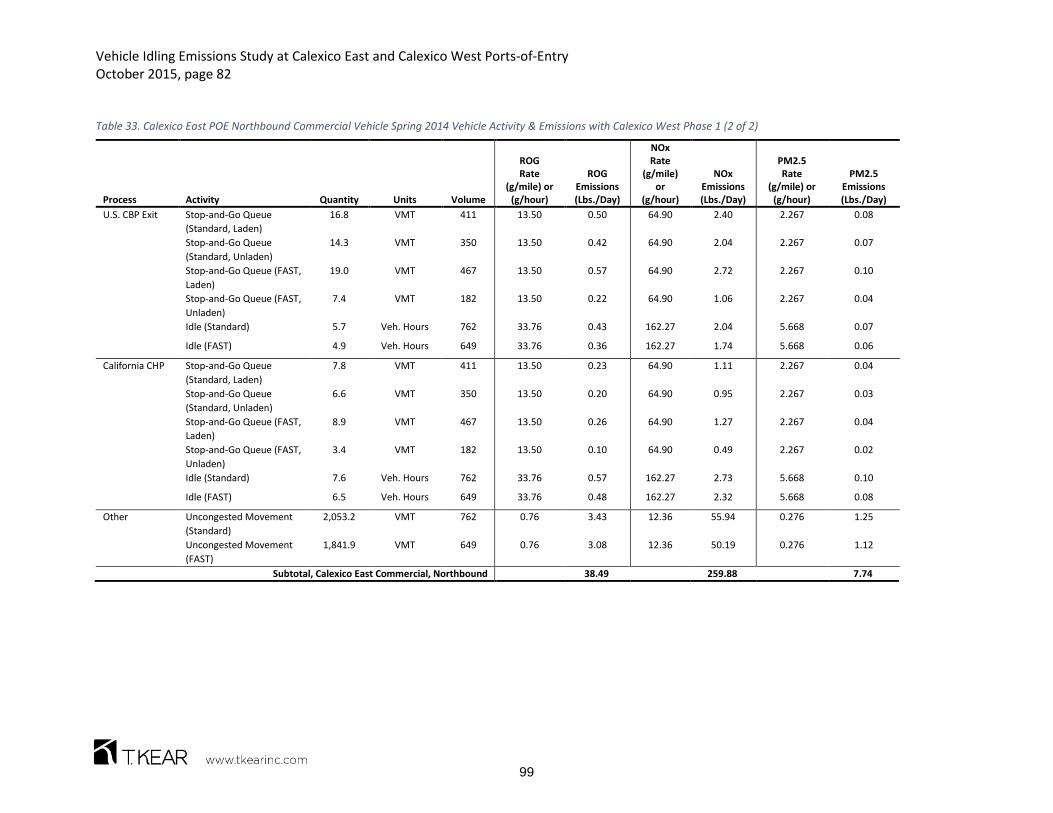
Vehicle Idling Emissions Study at Calexico East and Calexico West Ports-of-Entry October 2015, page 82
Table 33. Calexico East POE Northbound Commercial Vehicle Spring 2014 Vehicle Activity & Emissions with Calexico West Phase 1 (2 of 2)
Process Activity Quantity Units Volume
ROG Rate
(g/mile) or (g/hour)
ROG Emissions (Lbs./Day)
NOx Rate
(g/mile) or
(g/hour)
NOx Emissions (Lbs./Day)
PM2.5 Rate
(g/mile) or (g/hour)
PM2.5 Emissions (Lbs./Day)
U.S. CBP Exit Stop-and-Go Queue (Standard, Laden)
16.8 VMT 411 13.50 0.50 64.90 2.40 2.267 0.08
Stop-and-Go Queue (Standard, Unladen)
14.3 VMT 350 13.50 0.42 64.90 2.04 2.267 0.07
Stop-and-Go Queue (FAST, Laden)
19.0 VMT 467 13.50 0.57 64.90 2.72 2.267 0.10
Stop-and-Go Queue (FAST, Unladen)
7.4 VMT 182 13.50 0.22 64.90 1.06 2.267 0.04
Idle (Standard) 5.7 Veh. Hours 762 33.76 0.43 162.27 2.04 5.668 0.07
Idle (FAST) 4.9 Veh. Hours 649 33.76 0.36 162.27 1.74 5.668 0.06
California CHP Stop-and-Go Queue (Standard, Laden)
7.8 VMT 411 13.50 0.23 64.90 1.11 2.267 0.04
Stop-and-Go Queue (Standard, Unladen)
6.6 VMT 350 13.50 0.20 64.90 0.95 2.267 0.03
Stop-and-Go Queue (FAST, Laden)
8.9 VMT 467 13.50 0.26 64.90 1.27 2.267 0.04
Stop-and-Go Queue (FAST, Unladen)
3.4 VMT 182 13.50 0.10 64.90 0.49 2.267 0.02
Idle (Standard) 7.6 Veh. Hours 762 33.76 0.57 162.27 2.73 5.668 0.10
Idle (FAST) 6.5 Veh. Hours 649 33.76 0.48 162.27 2.32 5.668 0.08
Other Uncongested Movement (Standard)
2,053.2 VMT 762 0.76 3.43 12.36 55.94 0.276 1.25
Uncongested Movement (FAST)
1,841.9 VMT 649 0.76 3.08 12.36 50.19 0.276 1.12
Subtotal, Calexico East Commercial, Northbound 38.49 259.88 7.74
99

Vehicle Idling Emissions Study at Calexico East and Calexico West Ports-of-Entry October 2015, page 83
Table 34. Calexico West POE Northbound Private Vehicle Summer 2014 Vehicle Activity & Emissions with Calexico West Phase 1
Process Activity Quantity Units Volume
ROG Rate
(g/mile) or (g/hour)
ROG Emissions (Lbs./Day)
NOx Rate
(g/mile) or
(g/hour)
NOx Emissions (Lbs./Day)
PM2.5 Rate
(g/mile) or (g/hour)
PM2.5 Emissions (Lbs./Day)
U.S. Primary, Standard Lane
Uncongested 8,853.2 VMT 4,488 0.62 12.12 0.65 12.69 0.021 0.41
Creeping Queue 331.3 VMT 4,488 4.30 3.14 1.22 0.89 0.040 0.03
Stop-and-Go Queue 311.2 VMT 4,488 8.61 5.90 2.44 1.67 0.080 0.06
Idle 120.9 Veh. Hours 4,488 21.52 5.74 6.10 1.63 0.201 0.05
U.S. Primary, Ready Lane
Uncongested 9,362.2 VMT 3,933 0.62 12.86 0.63 13.07 0.021 0.43
Creeping Queue - VMT 3,933 4.32 0.00 1.19 0.00 0.040 0.00
Stop-and-Go Queue 678.4 VMT 3,933 8.63 12.91 2.38 3.55 0.079 0.12
Idle 41.5 Veh. Hours 3,933 21.59 1.98 5.94 0.54 0.198 0.02
U.S. Primary, SENTRI Lane
Uncongested 7,794.3 VMT 3,669 0.62 10.70 0.63 10.88 0.021 0.36
Creeping Queue 38.4 VMT 3,669 4.32 0.37 1.19 0.10 0.040 0.00
Stop-and-Go Queue 74.9 VMT 3,669 8.63 1.43 2.38 0.39 0.079 0.01
Idle 29.6 Veh. Hours 3,669 21.59 1.41 5.94 0.39 0.198 0.01
U.S. Secondary Creeping Queue (Standard Lane)
4.3 VMT 4,488 4.30 0.04 1.22 0.01 0.040 0.00
Creeping Queue (Ready Lane)
4.3 VMT 3,933 4.32 0.04 1.19 0.01 0.040 0.00
Creeping Queue (SENTRI Lane)
3.5 VMT 3,669 4.32 0.03 1.19 0.01 0.040 0.00
30 Min. Soak and Restart (Standard Lane)
224.4 Vehicles 4,488 1.70 0.84 0.77 0.38 0.002 0.00
30 Min. Soak and Restart (Ready Lane)
196.7 Vehicles 3,933 1.70 0.74 0.74 0.32 0.002 0.00
30 Min. Soak and Restart (SENTRI Lane)
183.5 Vehicles 3,669 1.70 0.69 0.74 0.30 0.002 0.00
Subtotal, Calexico West POE, Northbound 70.92 46.84 1.52
100

Vehicle Idling Emissions Study at Calexico East and Calexico West Ports-of-Entry October 2015, page 84
Table 35. Calexico East POE Northbound Private Vehicle Summer 2014 Vehicle Activity & Emissions with Calexico West Phase 1
Process Activity Quantity Units Volume
ROG Rate
(g/mile) or (g/hour)
ROG Emissions (Lbs./Day)
NOx Rate
(g/mile) or
(g/hour)
NOx Emissions (Lbs./Day)
PM2.5 Rate
(g/mile) or (g/hour)
PM2.5 Emissions (Lbs./Day)
U.S. Primary, Standard Lane
Uncongested 6,011.7 VMT 3,131 0.62 8.23 0.65 8.62 0.021 0.28
Creeping Queue 49.9 VMT 3,131 4.30 0.47 1.22 0.13 0.040 0.00
Stop-and-Go Queue 201.7 VMT 3,131 8.61 3.83 2.44 1.09 0.080 0.04
Idle 84.4 Veh. Hours 3,131 21.52 4.00 6.10 1.14 0.201 0.04
U.S. Primary, Ready Lane
Uncongested 6,172.9 VMT 3,142 0.62 8.48 0.63 8.62 0.021 0.29
Creeping Queue 51.6 VMT 3,142 4.32 0.49 1.19 0.14 0.040 0.00
Stop-and-Go Queue 59.5 VMT 3,142 8.63 1.13 2.38 0.31 0.079 0.01
Idle 33.2 Veh. Hours 3,142 21.59 1.58 5.94 0.43 0.198 0.01
U.S. Primary, SENTRI Lane
Uncongested 5,239.4 VMT 2,645 0.62 7.20 0.63 7.31 0.021 0.24
Creeping Queue - VMT 2,645 4.32 0.00 1.19 0.00 0.040 0.00
Stop-and-Go Queue 50.1 VMT 2,645 8.63 0.95 2.38 0.26 0.079 0.01
Idle 21.3 Veh. Hours 2,645 21.59 1.01 5.94 0.28 0.198 0.01
U.S. Secondary Creeping Queue (Standard Lane)
3.0 VMT 3,131 4.30 0.03 1.22 0.01 0.040 0.00
Creeping Queue (Ready Lane)
3.0 VMT 3,142 4.32 0.03 1.19 0.01 0.040 0.00
Creeping Queue (SENTRI Lane)
2.5 VMT 2,645 4.32 0.02 1.19 0.01 0.040 0.00
30 Min. Soak and Restart (Standard Lane)
156.6 Vehicles 3,131 1.70 0.59 0.77 0.26 0.002 0.00
30 Min. Soak and Restart (Ready Lane)
157.1 Vehicles 3,142 1.70 0.59 0.74 0.26 0.002 0.00
30 Min. Soak and Restart (SENTRI Lane)
132.3 Vehicles 3,131 1.70 0.50 0.74 0.22 0.002 0.00
Subtotal, Calexico East POE, Northbound 39.12 29.08 0.94
101

Vehicle Idling Emissions Study at Calexico East and Calexico West Ports-of-Entry October 2015, page 85
Table 36. Calexico East POE Northbound Commercial Vehicle Summer 2014 Vehicle Activity & Emissions with Calexico West Phase 1 (1 of 2)
Process Activity Quantity Units Volume
ROG Rate
(g/mile) or
(g/hour)
ROG Emissions (Lbs./Day)
NOx Rate
(g/mile) or (g/hour)
NOx Emissions (Lbs./Day)
PM2.5 Rate
(g/mile) or
(g/hour)
PM2.5 Emissions (Lbs./Day)
MX Aduanas Entrance
Stop-and-Go Queue (Standard, Laden)
7.4 VMT 389 13.56 0.22 64.90 1.05 2.267 0.04
Stop-and-Go Queue (Standard, Unladen)
6.3 VMT 332 13.56 0.19 64.90 0.90 2.267 0.03
Stop-and-Go Queue (FAST, Laden) 9.4 VMT 442 13.56 0.28 64.90 1.35 2.267 0.05
Stop-and-Go Queue (FAST, Unladen) 3.3 VMT 172 13.56 0.10 64.90 0.47 2.267 0.02
Idle (Standard) 17.0 Veh. Hours
721 33.91 1.27 162.29 6.09 5.668 0.21
Idle (FAST) 14.5 Veh. Hours
614 33.91 1.08 162.29 5.19 5.668 0.18
MX Aduanas Cargo Inspection
Idle (Standard) 32.3 Veh. Hours
721 33.91 2.42 162.29 11.56 5.668 0.40
Idle (FAST) 31.8 Veh. Hours
614 33.91 2.38 162.29 11.37 5.668 0.40
U.S. CBP Primary
Stop-and-Go Queue (Standard, Laden)
55.0 VMT 389 13.56 1.64 64.90 7.87 2.267 0.27
Stop-and-Go Queue (Standard, Unladen)
3.9 VMT 332 13.56 0.12 64.90 0.55 2.267 0.02
Stop-and-Go Queue (FAST, Laden) 8.4 VMT 442 13.56 0.25 64.90 1.20 2.267 0.04
Stop-and-Go Queue (FAST, Unladen) 2.0 VMT 172 13.56 0.06 64.90 0.29 2.267 0.01
Idle (Standard) 12.0 Veh. Hours
721 33.91 0.90 162.29 4.30 5.668 0.15
Idle (FAST) 10.2 Veh. Hours
614 33.91 0.77 162.29 3.66 5.668 0.13
U.S. CBP Cargo Inspection
Stop-and-Go Queue (Standard, Laden)
10.7 VMT 389 13.56 0.32 64.90 1.53 2.267 0.05
Stop-and-Go Queue (Standard, Unladen)
9.1 VMT 332 13.56 0.27 64.90 1.31 2.267 0.05
Stop-and-Go Queue (FAST, Laden) 12.2 VMT 389 13.56 0.36 64.90 1.74 2.267 0.06
Stop-and-Go Queue (FAST, Unladen) 4.7 VMT 151 13.56 0.14 64.90 0.68 2.267 0.02
Idle (Standard) 72.0 Veh. Hours
721 33.91 5.38 162.29 25.74 5.668 0.90
Idle (FAST) 65.5 Veh. Hours
541 33.91 4.90 162.29 23.45 5.668 0.82
102

Vehicle Idling Emissions Study at Calexico East and Calexico West Ports-of-Entry October 2015, page 86
Table 36. Calexico East POE Northbound Commercial Vehicle Summer 2014 Vehicle Activity & Emissions with Calexico West Phase 1 (2 of 2)
Process Activity Quantity Units Volume
ROG Rate
(g/mile) or (g/hour)
ROG Emissions (Lbs./Day)
NOx Rate
(g/mile) or
(g/hour)
NOx Emissions (Lbs./Day)
PM2.5 Rate
(g/mile) or (g/hour)
PM2.5 Emissions (Lbs./Day)
U.S. CBP Exit Stop-and-Go Queue (Standard, Laden)
7.4 VMT 389 13.56 0.22 64.90 1.05 2.267 0.04
Stop-and-Go Queue (Standard, Unladen)
6.3 VMT 332 13.56 019 64.90 0.90 2.267 0.03
Stop-and-Go Queue (FAST, Laden)
8.4 VMT 442 13.56 0.25 64.90 1.20 2.267 0.04
Stop-and-Go Queue (FAST, Unladen)
3.3 VMT 172 13.56 0.10 64.90 0.47 2.267 0.02
Idle (Standard) 5.4 Veh. Hours 721 33.91 0.40 162.29 1.93 5.668 0.07
Idle (FAST) 4.6 Veh. Hours 614 33.91 0.34 162.29 1.65 5.668 0.06
California CHP Stop-and-Go Queue (Standard, Laden)
7.4 VMT 389 13.56 0.22 64.90 1.05 2.267 0.04
Stop-and-Go Queue (Standard, Unladen)
6.3 VMT 332 13.56 0.19 64.90 0.90 2.267 0.03
Stop-and-Go Queue (FAST, Laden)
8.4 VMT 442 13.56 0.25 64.90 1.20 2.267 0.04
Stop-and-Go Queue (FAST, Unladen)
3.3 VMT 172 13.56 0.10 64.90 0.47 2.267 0.02
Idle (Standard) 7.2 Veh. Hours 721 33.91 0.54 162.29 2.58 5.668 0.09
Idle (FAST) 6.1 Veh. Hours 614 33.91 0.46 162.29 2.20 5.668 0.08
Other Uncongested Movement (Standard)
2,042.7 VMT 721 0.76 3.44 12.36 55.67 0.276 1.24
Uncongested Movement (FAST)
1,778.8 VMT 614 0.76 2.99 12.36 48.48 0.276 1.08
Subtotal, Calexico East Commercial, Northbound 32.73 230.04 6.72
103

Vehicle Idling Emissions Study at Calexico East and Calexico West Ports-of-Entry October 2015, page 87
Table 37. Calexico West POE Northbound Private Vehicle Winter 2014 Vehicle Activity & Emissions with Calexico West Phase 1
Process Activity Quantity Units Volume
ROG Rate
(g/mile) or (g/hour)
ROG Emissions (Lbs./Day)
NOx Rate
(g/mile) or
(g/hour)
NOx Emissions (Lbs./Day)
PM2.5 Rate
(g/mile) or (g/hour)
PM2.5 Emissions (Lbs./Day)
U.S. Primary, Standard Lane
Uncongested 8,853.2 VMT 5,193 0.44 8.64 0.73 14.21 0.021 0.41
Creeping Queue 331.3 VMT 5,193 3.07 2.25 1.37 1.00 0.040 0.03
Stop-and-Go Queue 311.2 VMT 5,193 6.15 4.22 2.74 1.88 0.080 0.06
Idle 139.9 Veh. Hours 5,193 15.37 4.74 6.84 2.11 0.201 0.06
U.S. Primary, Ready Lane
Uncongested 9,362.2 VMT 4,291 0.44 9.10 0.71 14.64 0.021 0.43
Creeping Queue - VMT 4,291 3.06 0.00 1.33 0.00 0.040 0.00
Stop-and-Go Queue 678.4 VMT 4,291 6.12 9.15 2.37 3.99 0.079 0.12
Idle 45.3 Veh. Hours 4,291 15.30 1.53 6.66 0.67 0.198 0.02
U.S. Primary, SENTRI Lane
Uncongested 7,794.3 VMT 4,228 0.44 7.58 0.71 12.18 0.021 0.36
Creeping Queue 38.4 VMT 4,228 3.06 0.26 1.33 0.11 0.040 0.00
Stop-and-Go Queue 74.9 VMT 4,228 6.12 1.01 2.67 0.44 0.079 0.01
Idle 34.1 Veh. Hours 4,228 15.30 1.15 6.66 0.50 0.198 0.01
U.S. Secondary Creeping Queue (Standard Lane)
4.9 VMT 5,193 3.07 0.03 1.37 0.01 0.040 0.00
Creeping Queue (Ready Lane)
4.9 VMT 4,291 3.06 0.03 1.33 0.01 0.040 0.00
Creeping Queue (SENTRI Lane)
4.0 VMT 4,228 3.06 0.03 1.33 0.01 0.040 0.00
30 Min. Soak and Restart (Standard Lane)
259.7 Vehicles 5,193 1.17 0.67 0.90 0.51 0.002 0.00
30 Min. Soak and Restart (Ready Lane)
214.6 Vehicles 4,291 1.16 0.55 0.87 0.41 0.002 0.00
30 Min. Soak and Restart (SENTRI Lane)
211.4 Vehicles 4,228 1.16 0.54 0.87 0.41 0.002 0.00
Subtotal, Calexico East POE, Northbound 51.48 53.10 1.53
104

Vehicle Idling Emissions Study at Calexico East and Calexico West Ports-of-Entry October 2015, page 88
Table 38. Calexico East POE Northbound Private Vehicle Winter 2014 Vehicle Activity & Emissions with Calexico West Phase 1
Process Activity Quantity Units Volume
ROG Rate
(g/mile) or (g/hour)
ROG Emissions (Lbs./Day)
NOx Rate
(g/mile) or
(g/hour)
NOx Emissions (Lbs./Day)
PM2.5 Rate
(g/mile) or (g/hour)
PM2.5 Emissions (Lbs./Day)
U.S. Primary, Standard Lane
Uncongested 6,674.5 VMT 3,616 0.44 6.52 0.73 10.72 0.021 0.31
Creeping Queue 404.9 VMT 3,616 3.07 2.74 1.37 1.22 0.040 0.04
Stop-and-Go Queue 273.9 VMT 3,616 6.15 3.71 2.74 1.65 0.080 0.05
Idle 97.4 Veh. Hours 3,616 15.37 3.30 6.84 1.47 0.201 0.04
U.S. Primary, Ready Lane
Uncongested 6,790.3 VMT 3,428 0.44 6.60 0.71 10.62 0.021 0.31
Creeping Queue 64.0 VMT 3,428 3.06 0.43 1.33 0.19 0.040 0.01
Stop-and-Go Queue 65.5 VMT 3,428 6.12 0.88 2.67 0.39 0.079 0.01
Idle 36.2 Veh. Hours 3,428 15.30 1.22 6.66 0.53 0.198 0.02
U.S. Primary, SENTRI Lane
Uncongested 5,994.5 VMT 3,041 0.44 5.83 0.71 9.37 0.021 0.28
Creeping Queue 30.6 VMT 3,041 3.06 0.21 1.33 0.09 0.040 0.00
Stop-and-Go Queue 57.6 VMT 3,041 6.12 0.78 2.67 0.34 0.079 0.01
Idle 24.5 Veh. Hours 3,041 15.30 0.83 6.66 0.36 0.198 0.01
U.S. Secondary Creeping Queue (Standard Lane)
3.4 VMT 3,616 3.07 0.02 1.37 0.01 0.040 0.00
Creeping Queue (Ready Lane)
3.2 VMT 3,428 3.06 0.02 1.33 0.01 0.040 0.00
Creeping Queue (SENTRI Lane)
2.9 VMT 3,041 3.06 0.02 1.33 0.01 0.040 0.00
30 Min. Soak and Restart (Standard Lane)
180.8 Vehicles 3,616 1.17 0.47 0.90 0.36 0.002 0.00
30 Min. Soak and Restart (Ready Lane)
171.4 Vehicles 3,428 1.16 0.44 0.87 0.33 0.002 0.00
30 Min. Soak and Restart (SENTRI Lane)
152.1 Vehicles 3,616 1.16 0.39 0.87 0.29 0.002 0.00
Subtotal, Calexico East POE, Northbound 34.41 37.95 1.09
105

Vehicle Idling Emissions Study at Calexico East and Calexico West Ports-of-Entry October 2015, page 89
Table 39. Calexico East POE Northbound Commercial Vehicle Winter 2014 Vehicle Activity & Emissions with Calexico West Phase 1 (1 of 2)
Process Activity Quantity Units Volume
ROG Rate
(g/mile) or (g/hour)
ROG Emissions (Lbs./Day)
NOx Rate
(g/mile) or
(g/hour)
NOx Emissions (Lbs./Day)
PM2.5 Rate
(g/mile) or (g/hour)
PM2.5 Emissions (Lbs./Day)
MX Aduanas Entrance
Stop-and-Go Queue (Standard, Laden)
7.5 VMT 397 13.44 0.23 64.94 1.08 2.267 0.04
Stop-and-Go Queue (Standard, Unladen)
6.4 VMT 339 13.44 0.19 64.94 0.92 2.267 0.03
Stop-and-Go Queue (FAST, Laden)
11.1 VMT 451 13.44 0.47 64.94 1.59 2.267 0.06
Stop-and-Go Queue (FAST, Unladen)
3.3 VMT 176 13.44 0.10 64.94 0.48 2.267 0.02
Idle (Standard) 17.4 Veh. Hours 736 33.62 1.32 162.37 6.22 5.668 0.22
Idle (FAST) 14.8 Veh. Hours 627 33.62 1.12 162.37 5.30 5.668 0.18
MX Aduanas Cargo Inspection
Idle (Standard) 33.0 Veh. Hours 736 33.62 2.50 162.37 11.81 5.668 0.41
Idle (FAST) 32.4 Veh. Hours 627 33.62 2.46 162.37 11.62 5.668 0.41
U.S. CBP Primary
Stop-and-Go Queue (Standard, Laden)
80.6 VMT 397 13.44 3.70 64.94 11.54 2.267 0.40
Stop-and-Go Queue (Standard, Unladen)
3.9 VMT 339 13.44 0.12 64.94 0.56 2.267 0.02
Stop-and-Go Queue (FAST, Laden)
8.9 VMT 451 13.44 0.26 64.94 1.22 2.267 0.04
Stop-and-Go Queue (FAST, Unladen)
2.0 VMT 176 13.44 0.06 64.94 0.29 2.267 0.01
Idle (Standard) 12.3 Veh. Hours 736 33.62 0.93 162.37 4.39 5.668 0.15
Idle (FAST) 10.4 Veh. Hours 627 33.62 0.79 162.37 3.74 5.668 0.13
U.S. CBP Cargo Inspection
Stop-and-Go Queue (Standard, Laden)
13.7 VMT 397 13.44 0.67 64.94 1.97 2.267 0.07
Stop-and-Go Queue (Standard, Unladen)
11.7 VMT 339 13.44 0.57 64.94 1.68 2.267 0.06
Stop-and-Go Queue (FAST, Laden)
15.6 VMT 397 13.44 0.76 64.94 2.23 2.267 0.08
Stop-and-Go Queue (FAST, Unladen)
6.1 VMT 155 13.44 0.30 64.94 0.87 2.267 0.03
Idle (Standard) 73.5 Veh. Hours 736 33.62 5.56 162.37 26.30 5.668 0.92
Idle (FAST) 66.9 Veh. Hours 552 33.62 5.07 162.37 23.96 5.668 0.84
106

Vehicle Idling Emissions Study at Calexico East and Calexico West Ports-of-Entry October 2015, page 90
Table 39. Calexico East POE Northbound Commercial Vehicle Winter 2014 Vehicle Activity & Emissions with Calexico West Phase 1 (2 of 2)
Process Activity Quantity Units Volume
ROG Rate
(g/mile) or (g/hour)
ROG Emissions (Lbs./Day)
NOx Rate
(g/mile) or
(g/hour)
NOx Emissions (Lbs./Day)
PM2.5 Rate
(g/mile) or (g/hour)
PM2.5 Emissions (Lbs./Day)
U.S. CBP Exit Stop-and-Go Queue (Standard, Laden)
9.0 VMT 397 13.44 0.27 64.94 1.28 2.267 0.04
Stop-and-Go Queue (Standard, Unladen)
7.6 VMT 339 13.44 0.23 64.94 1.09 2.267 0.04
Stop-and-Go Queue (FAST, Laden)
10.2 VMT 451 13.44 0.30 64.94 1.46 2.267 0.05
Stop-and-Go Queue (FAST, Unladen)
4.0 VMT 176 13.44 0.12 64.94 0.57 2.267 0.02
Idle (Standard) 5.5 Veh. Hours 736 33.62 0.41 162.37 1.98 5.668 0.07
Idle (FAST) 4.7 Veh. Hours 627 33.62 0.35 162.37 1.68 5.668 0.06
California CHP Stop-and-Go Queue (Standard, Laden)
7.5 VMT 397 13.44 0.22 64.94 1.08 2.267 0.04
Stop-and-Go Queue (Standard, Unladen)
6.4 VMT 339 13.44 0.19 64.94 0.92 2.267 0.03
Stop-and-Go Queue (FAST, Laden)
8.5 VMT 451 13.44 0.25 64.94 1.22 2.267 0.04
Stop-and-Go Queue (FAST, Unladen)
3.3 VMT 176 13.44 0.10 64.94 0.48 2.267 0.02
Idle (Standard) 7.4 Veh. Hours 736 33.62 0.55 162.37 2.63 5.668 0.09
Idle (FAST) 6.3 Veh. Hours 627 33.62 0.46 162.37 2.24 5.668 0.08
Other Uncongested Movement (Standard)
2,053.7 VMT 736 0.75 3.41 12.37 56.01 0.276 1.25
Uncongested Movement (FAST)
1,808.3 VMT 627 0.75 3.00 12.37 49.31 0.276 1.10
Subtotal, Calexico East Commercial, Northbound 34.23 239.72 7.04
107

Vehicle Idling Emissions Study at Calexico East and Calexico West Ports-of-Entry October 2015, page 91
Table 40. Calexico West POE Northbound Private Vehicle Spring 2014 Vehicle Activity & Emissions with Calexico West Phase 2
Process Activity Quantity Units Volume
ROG Rate
(g/mile) or (g/hour)
ROG Emissions (Lbs./Day)
NOx Rate
(g/mile) or
(g/hour)
NOx Emissions (Lbs./Day)
PM2.5 Rate
(g/mile) or (g/hour)
PM2.5 Emissions (Lbs./Day)
U.S. Primary, Standard Lane
Uncongested 11,303.4 VMT 5,706 0.56 13.87 0.62 15.41 0.021 0.53
Creeping Queue - VMT 5,706 3.86 0.00 1.16 0.00 0.040 0.00
Stop-and-Go Queue 108.1 VMT 5,706 7.71 1.84 2.32 0.55 0.080 0.02
Idle 153.7 Veh. Hours 5,706 19.29 6.54 5.80 1.97 0.201 0.07
U.S. Primary, Ready Lane
Uncongested 9,527.7 VMT 4,809 0.56 11.73 0.60 12.64 0.021 0.44
Creeping Queue - VMT 4,809 3.87 0.00 1.13 0.00 0.040 0.00
Stop-and-Go Queue 91.1 VMT 4,809 7.74 1.55 2.26 0.45 0.079 0.02
Idle 50.8 Veh. Hours 4,809 19.35 2.17 5.65 0.63 0.198 0.02
U.S. Primary, SENTRI Lane
Uncongested 9,239.7 VMT 4,664 0.56 11.37 0.60 12.26 0.021 0.43
Creeping Queue - VMT 4,664 3.87 0.00 1.13 0.00 0.040 0.00
Stop-and-Go Queue 88.3 VMT 4,664 7.74 1.51 2.26 0.44 0.079 0.02
Idle 37.6 Veh. Hours 4,664 19.35 1.60 5.65 0.47 0.198 0.02
U.S. Secondary Creeping Queue (Standard Lane)
5.4 VMT 5,706 3.86 0.05 1.16 0.01
0.040 0.00
Creeping Queue (Ready Lane)
5.4 VMT 4,809 3.87 0.05 1.13 0.01
0.040 0.00
Creeping Queue (SENTRI Lane)
4.4 VMT 4,664 3.87 0.04 1.13 0.01
0.040 0.00
30 Min. Soak and Restart (Standard Lane)
285.3 Vehicles 5,706 1.54 0.97 0.71 0.45
0.002 0.00
30 Min. Soak and Restart (Ready Lane)
240.5 Vehicles 4,809 1.54 0.82 0.69 0.37
0.002 0.00
30 Min. Soak and Restart (SENTRI Lane)
233.2 Vehicles 4,664 1.54 0.79 0.69 0.35
0.002 0.00
Subtotal, Calexico West POE, Northbound 54.88 46.03 1.56
108

Vehicle Idling Emissions Study at Calexico East and Calexico West Ports-of-Entry October 2015, page 92
Table 41. Calexico East POE Northbound Private Vehicle Spring 2014 Vehicle Activity & Emissions with Calexico West Phase 2
Process Activity Quantity Units Volume
ROG Rate
(g/mile) or (g/hour)
ROG Emissions (Lbs./Day)
NOx Rate
(g/mile) or
(g/hour)
NOx Emissions (Lbs./Day)
PM2.5 Rate
(g/mile) or (g/hour)
PM2.5 Emissions (Lbs./Day)
U.S. Primary, Standard Lane
Uncongested 5,030.2 VMT 2,539 0.56 6.17 0.62 6.86 0.021 0.23
Creeping Queue - VMT 2,539 3.86 0.00 1.16 0.00 0.040 0.00
Stop-and-Go Queue 48.1 VMT 2,539 7.71 0.82 2.32 0.25 0.080 0.01
Idle 68.4 Veh. Hours 2,539 19.29 2.91 5.80 0.88 0.201 0.03
U.S. Primary, Ready Lane
Uncongested 4,758.6 VMT 2,402 0.56 5.86 0.60 6.32 0.021 0.22
Creeping Queue - VMT 2,402 3.87 0.00 1.13 0.00 0.040 0.00
Stop-and-Go Queue 45.5 VMT 2,402 7.74 0.78 2.26 0.23 0.079 0.01
Idle 25.4 Veh. Hours 2,402 19.35 1.08 5.65 0.32 0.198 0.01
U.S. Primary, SENTRI Lane
Uncongested 4,226.6 VMT 2,133 0.56 5.20 0.60 5.61 0.021 0.20
Creeping Queue - VMT 2,133 3.87 0.00 1.13 0.00 0.040 0.00
Stop-and-Go Queue 40.4 VMT 2,133 7.74 0.69 2.26 0.20 0.079 0.01
Idle 17.2 Veh. Hours 2,133 19.35 0.73 5.65 0.21 0.198 0.01
U.S. Secondary Creeping Queue (Standard Lane)
2.4 VMT 2,539 3.86 0.02 1.16 0.01 0.040 0.00
Creeping Queue (Ready Lane)
2.3 VMT 2,402 3.87 0.02 1.13 0.01 0.040 0.00
Creeping Queue (SENTRI Lane)
2.0 VMT 2,133 3.87 0.02 1.13 0.01 0.040 0.00
30 Min. Soak and Restart (Standard Lane)
127.0 Vehicles 2,539 1.54 0.43 0.71 0.20 0.002 0.00
30 Min. Soak and Restart (Ready Lane)
120.1 Vehicles 2,402 1.54 0.41 0.69 0.18 0.002 0.00
30 Min. Soak and Restart (SENTRI Lane)
106.7 Vehicles 2,539 1.54 0.36 0.69 0.16 0.002 0.00
Subtotal, Calexico East POE, Northbound 25.50 21.42 0.73
109

Vehicle Idling Emissions Study at Calexico East and Calexico West Ports-of-Entry October 2015, page 93
Table 42. Calexico East POE Northbound Commercial Vehicle Spring 2014 Vehicle Activity & Emissions with Calexico West Phase 2 (1 of 2)
Process Activity Quantity Units Volume
ROG Rate
(g/mile) or (g/hour)
ROG Emissions (Lbs./Day)
NOx Rate
(g/mile) or
(g/hour)
NOx Emissions (Lbs./Day)
PM2.5 Rate
(g/mile) or (g/hour)
PM2.5 Emissions (Lbs./Day)
MX Aduanas Entrance
Stop-and-Go Queue (Standard, Laden)
7.8 VMT 411 13.50 0.23 64.90 1.11 2.267 0.04
Stop-and-Go Queue (Standard, Unladen)
6.6 VMT 350 13.50 0.20 64.90 0.95 2.267 0.03
Stop-and-Go Queue (FAST, Laden)
16.1 VMT 467 13.50 0.48 64.90 2.31 2.267 0.08
Stop-and-Go Queue (FAST, Unladen)
3.4 VMT 182 13.50 0.10 64.90 0.49 2.267 0.02
Idle (Standard) 18.0 Veh. Hours 762 33.76 1.64 162.27 6.44 5.668 0.22
Idle (FAST) 15.3 Veh. Hours 649 33.76 1.14 162.27 5.48 5.668 0.19
MX Aduanas Cargo Inspection
Idle (Standard) 34.2 Veh. Hours 762 33.76 2.54 162.27 12.22 5.668 0.43
Idle (FAST) 33.6 Veh. Hours 649 33.76 2.50 162.27 12.02 5.668 0.42
U.S. CBP Primary
Stop-and-Go Queue (Standard, Laden)
126.4 VMT 411 13.50 3.76 64.90 18.08 2.267 0.63
Stop-and-Go Queue (Standard, Unladen)
4.1 VMT 350 13.50 0.12 64.90 0.58 2.267 0.02
Stop-and-Go Queue (FAST, Laden)
8.9 VMT 467 13.50 0.26 64.90 1.27 2.267 0.04
Stop-and-Go Queue (FAST, Unladen)
2.1 VMT 182 13.50 0.06 64.90 0.30 2.267 0.01
Idle (Standard) 12.7 Veh. Hours 762 33.76 0.95 162.27 4.54 5.668 0.16
Idle (FAST) 10.8 Veh. Hours 649 33.76 0.81 162.27 3.87 5.668 0.14
U.S. CBP Cargo Inspection
Stop-and-Go Queue (Standard, Laden)
22.8 VMT 411 13.50 0.68 64.90 3.27 2.267 0.11
Stop-and-Go Queue (Standard, Unladen)
19.5 VMT 350 13.50 0.58 64.90 2.78 2.267 0.10
Stop-and-Go Queue (FAST, Laden)
25.9 VMT 411 13.50 0.77 64.90 3.71 2.267 0.13
Stop-and-Go Queue (FAST, Unladen)
10.1 VMT 160 13.50 0.30 64.90 1.44 2.267 0.05
Idle (Standard) 76.1 Veh. Hours 762 33.76 5.66 162.27 27.21 5.668 0.95
Idle (FAST) 69.3 Veh. Hours 571 33.76 5.16 162.27 24.79 5.668 0.87
110

Vehicle Idling Emissions Study at Calexico East and Calexico West Ports-of-Entry October 2015, page 94
Table 42. Calexico East POE Northbound Commercial Vehicle Spring 2014 Vehicle Activity & Emissions with Calexico West Phase 2 (2 of 2)
Process Activity Quantity Units Volume
ROG Rate
(g/mile) or (g/hour)
ROG Emissions (Lbs./Day)
NOx Rate
(g/mile) or
(g/hour)
NOx Emissions (Lbs./Day)
PM2.5 Rate
(g/mile) or (g/hour)
PM2.5 Emissions (Lbs./Day)
U.S. CBP Exit Stop-and-Go Queue (Standard, Laden)
16.8 VMT 411 13.50 0.50 64.90 2.40 2.267 0.08
Stop-and-Go Queue (Standard, Unladen)
14.3 VMT 350 13.50 0.42 64.90 2.04 2.267 0.07
Stop-and-Go Queue (FAST, Laden)
19.0 VMT 467 13.50 0.57 64.90 2.72 2.267 0.10
Stop-and-Go Queue (FAST, Unladen)
7.4 VMT 182 13.50 0.22 64.90 1.06 2.267 0.04
Idle (Standard) 5.7 Veh. Hours 762 33.76 0.43 162.27 2.04 5.668 0.07
Idle (FAST) 4.9 Veh. Hours 649 33.76 0.36 162.27 1.74 5.668 0.06
California CHP Stop-and-Go Queue (Standard, Laden)
7.8 VMT 411 13.50 0.23 64.90 1.11 2.267 0.04
Stop-and-Go Queue (Standard, Unladen)
6.6 VMT 350 13.50 0.20 64.90 0.95 2.267 0.03
Stop-and-Go Queue (FAST, Laden)
8.9 VMT 467 13.50 0.26 64.90 1.27 2.267 0.04
Stop-and-Go Queue (FAST, Unladen)
3.4 VMT 182 13.50 0.10 64.90 0.49 2.267 0.02
Idle (Standard) 7.6 Veh. Hours 762 33.76 0.57 162.27 2.73 5.668 1.10
Idle (FAST) 6.5 Veh. Hours 649 33.76 0.48 162.27 2.32 5.668 0.08
Other Uncongested Movement (Standard)
2,053.2 VMT 762 0.76 3.43 12.36 55.94 0.276 1.25
Uncongested Movement (FAST)
1,841.9 VMT 649 0.76 3.08 12.36 50.19 0.276 1.12
Subtotal, Calexico East Commercial, Northbound 38.49 259.88 7.74
111

Vehicle Idling Emissions Study at Calexico East and Calexico West Ports-of-Entry October 2015, page 95
Table 43. Calexico West POE Northbound Private Vehicle Summer 2014 Vehicle Activity & Emissions with Calexico West Phase 2
Process Activity Quantity Units Volume
ROG Rate
(g/mile) or (g/hour)
ROG Emissions (Lbs./Day)
NOx Rate
(g/mile) or
(g/hour)
NOx Emissions (Lbs./Day)
PM2.5 Rate
(g/mile) or (g/hour)
PM2.5 Emissions (Lbs./Day)
U.S. Primary, Standard Lane
Uncongested 10,440.0 VMT 5,270 0.62 14.29 0.65 14.96 0.021 0.49 Creeping Queue - VMT 5,270 4.30 0.00 1.22 0.00 0.040 0.00 Stop-and-Go Queue 99.8 VMT 5,270 8.61 1.89 2.44 0.54 0.080 0.02 Idle 142.0 Veh. Hours 5,270 21.52 6.74 6.10 1.91 0.201 0.06
U.S. Primary, Ready Lane
Uncongested 9,347.2 VMT 4,718 0.62 12.84 0.63 13.05 0.021 0.43
Creeping Queue - VMT 4,718 4.32 0.00 1.19 0.00 0.040 0.00
Stop-and-Go Queue 89.4 VMT 4,718 8.63 1.70 2.38 0.47 0.079 0.02
Idle 49.8 Veh. Hours 4,718 21.59 2.37 5.94 0.65 0.198 0.02
U.S. Primary, SENTRI Lane
Uncongested 8,577.4 VMT 4,330 0.62 11.78 0.63 11.97 0.021 0.40
Creeping Queue - VMT 4,330 4.32 0.00 1.19 0.00 0.040 0.00
Stop-and-Go Queue 82.0 VMT 4,330 8.63 1.56 2.38 0.43 0.079 0.01
Idle 34.9 Veh. Hours 4,330 21.59 1.66 5.94 0.46 0.198 0.02
U.S. Secondary Creeping Queue (Standard Lane)
5.0 VMT 5,270 4.30 0.05 1.22 0.01 0.040 0.00
Creeping Queue (Ready Lane)
5.0 VMT 4,718 4.32 0.05 1.19 0.01 0.040 0.00
Creeping Queue (SENTRI Lane)
4.1 VMT 4,330 4.32 0.04 1.19 0.01 0.040 0.00
30 Min. Soak and Restart (Standard Lane)
263.5 Vehicles 5,270 1.70 0.99 0.77 0.44 0.002 0.00
30 Min. Soak and Restart (Ready Lane)
235.9 Vehicles 4,718 1.70 0.88 0.74 0.39 0.002 0.00
30 Min. Soak and Restart (SENTRI Lane)
216.5 Vehicles 4,330 1.70 0.81 0.74 0.36 0.002 0.00
Subtotal, Calexico West POE, Northbound 57.64 45.66 1.47
112

Vehicle Idling Emissions Study at Calexico East and Calexico West Ports-of-Entry October 2015, page 96
Table 44. Calexico East POE Northbound Private Vehicle Summer 2014 Vehicle Activity & Emissions with Calexico West Phase 2
Process Activity Quantity Units Volume
ROG Rate
(g/mile) or (g/hour)
ROG Emissions (Lbs./Day)
NOx Rate
(g/mile) or
(g/hour)
NOx Emissions (Lbs./Day)
PM2.5 Rate
(g/mile) or (g/hour)
PM2.5 Emissions (Lbs./Day)
U.S. Primary, Standard Lane
Uncongested 4,654.3 VMT 2,349 0.62 6.37 0.65 6.67 0.021 0.22
Creeping Queue - VMT 2,349 4.30 0.00 1.22 0.00 0.040 0.00
Stop-and-Go Queue 44.5 VMT 2,349 8.61 0.84 2.44 0.24 0.080 0.01
Idle 63.3 Veh. Hours 2,349 21.52 3.00 6.10 0.85 0.201 0.03
U.S. Primary, Ready Lane
Uncongested 4,668.4 VMT 2,357 0.62 6.41 0.63 6.52 0.021 0.22
Creeping Queue - VMT 2,357 4.32 0.00 1.19 0.00 0.040 0.00
Stop-and-Go Queue 44.6 VMT 2,357 8.63 0.85 2.38 0.23 0.079 0.01
Idle 24.9 Veh. Hours 2,357 21.59 1.18 5.94 0.33 0.198 0.01
U.S. Primary, SENTRI Lane
Uncongested 3,930.8 VMT 1,984 0.62 5.40 0.63 5.49 0.021 0.18
Creeping Queue - VMT 1,984 4.32 0.00 1.19 0.00 0.040 0.00
Stop-and-Go Queue 37.6 VMT 1,984 8.63 0.72 2.38 0.20 0.079 0.01
Idle 16.0 Veh. Hours 1,984 21.59 0.76 5.94 0.21 0.198 0.01
U.S. Secondary Creeping Queue (Standard Lane)
2.2 VMT 2,349 4.30 0.02 1.22 0.01 0.040 0.00
Creeping Queue (Ready Lane)
2.2 VMT 2,357 4.32 0.02 1.19 0.01 0.040 0.00
Creeping Queue (SENTRI Lane)
1.9 VMT 1,984 4.32 0.02 1.19 0.00 0.040 0.00
30 Min. Soak and Restart (Standard Lane)
117.5 Vehicles 2,349 1.70 0.44 0.77 0.20 0.002 0.00
30 Min. Soak and Restart (Ready Lane)
117.9 Vehicles 2,357 1.70 0.44 0.74 0.19 0.002 0.00
30 Min. Soak and Restart (SENTRI Lane)
99.2 Vehicles 2,349 1.70 0.37 0.74 0.16 0.002 0.00
Subtotal, Calexico East POE, Northbound 26.85 21.30 0.69
113

Vehicle Idling Emissions Study at Calexico East and Calexico West Ports-of-Entry October 2015, page 97
Table 45. Calexico East POE Northbound Commercial Vehicle Summer 2014 Vehicle Activity & Emissions with Calexico West Phase 2 (1 of 2)
Process Activity Quantity Units Volume
ROG Rate
(g/mile) or (g/hour)
ROG Emissions (Lbs./Day)
NOx Rate
(g/mile) or
(g/hour)
NOx Emissions (Lbs./Day)
PM2.5 Rate
(g/mile) or (g/hour)
PM2.5 Emissions (Lbs./Day)
MX Aduanas Entrance
Stop-and-Go Queue (Standard, Laden)
7.4 VMT 389 13.56 0.22 64.90 1.05 2.267 0.04
Stop-and-Go Queue (Standard, Unladen)
6.3 VMT 332 13.56 0.19 64.90 0.90 2.267 0.03
Stop-and-Go Queue (FAST, Laden)
9.4 VMT 442 13.56 0.28 64.90 1.35 2.267 0.05
Stop-and-Go Queue (FAST, Unladen)
3.3 VMT 172 13.56 0.10 64.90 0.47 2.267 0.02
Idle (Standard) 17.0 Veh. Hours 721 33.91 1.27 162.29 6.09 5.668 0.21
Idle (FAST) 14.5 Veh. Hours 614 33.91 1.08 162.29 5.19 5.668 0.18
MX Aduanas Cargo Inspection
Idle (Standard) 32.3 Veh. Hours 721 33.91 2.42 162.29 11.56 5.668 0.40
Idle (FAST) 31.8 Veh. Hours 614 33.91 2.38 162.29 11.37 5.668 0.40
U.S. CBP Primary
Stop-and-Go Queue (Standard, Laden)
55.0 VMT 389 13.56 1.64 64.90 7.87 2.267 0.27
Stop-and-Go Queue (Standard, Unladen)
3.9 VMT 332 13.56 0.12 64.90 0.55 2.267 0.02
Stop-and-Go Queue (FAST, Laden)
8.4 VMT 442 13.56 0.25 64.90 1.20 2.267 0.04
Stop-and-Go Queue (FAST, Unladen)
2.0 VMT 172 13.56 0.06 64.90 0.29 2.267 0.01
Idle (Standard) 12.0 Veh. Hours 721 33.91 0.90 162.29 4.30 5.668 0.15
Idle (FAST) 10.2 Veh. Hours 614 33.91 0.77 162.29 3.66 5.668 0.13
114

Vehicle Idling Emissions Study at Calexico East and Calexico West Ports-of-Entry October 2015, page 98
Table 45. Calexico East POE Northbound Commercial Vehicle Summer 2014 Vehicle Activity & Emissions with Calexico West Phase 2 (2 of 2)
Process Activity Quantity Units Volume
ROG Rate
(g/mile) or (g/hour)
ROG Emissions (Lbs./Day)
NOx Rate
(g/mile) or
(g/hour)
NOx Emissions (Lbs./Day)
PM2.5 Rate
(g/mile) or (g/hour)
PM2.5 Emissions (Lbs./Day)
U.S. CBP Exit Stop-and-Go Queue (Standard, Laden)
7.4 VMT 389 13.56 0.22 64.90 1.05 2.267 0.04
Stop-and-Go Queue (Standard, Unladen)
6.3 VMT 332 13.56 0.19 64.90 0.90 2.267 0.03
Stop-and-Go Queue (FAST, Laden)
8.4 VMT 442 13.56 0.25 64.90 1.20 2.267 0.04
Stop-and-Go Queue (FAST, Unladen)
3.3 VMT 172 13.56 0.10 64.90 0.47 2.267 0.02
Idle (Standard) 5.4 Veh. Hours 721 33.91 0.40 162.29 1.93 5.668 0.07
Idle (FAST) 4.6 Veh. Hours 614 33.91 0.34 162.29 1.65 5.668 0.06
California CHP Stop-and-Go Queue (Standard, Laden)
7.4 VMT 389 13.56 0.22 64.90 1.05 2.267 0.04
Stop-and-Go Queue (Standard, Unladen)
6.3 VMT 332 13.56 0.19 64.90 0.90 2.267 0.03
Stop-and-Go Queue (FAST, Laden)
8.4 VMT 442 13.56 0.25 64.90 1.20 2.267 0.04
Stop-and-Go Queue (FAST, Unladen)
3.3 VMT 172 13.56 0.10 64.90 0.47 2.267 0.02
Idle (Standard) 7.2 Veh. Hours 721 33.91 0.54 162.29 2.58 5.668 0.09
Idle (FAST) 6.1 Veh. Hours 614 33.91 0.46 162.29 2.20 5.668 0.08
Other Uncongested Movement (Standard)
2,042.7 VMT 721 0.76 3.44 12.36 55.67 0.276 1.24
Uncongested Movement (FAST)
1,778.8 VMT 614 0.76 2.99 12.36 48.48 0.276 1.08
Subtotal, Calexico East Commercial, Northbound 32.73 230.04 6.72
115

Vehicle Idling Emissions Study at Calexico East and Calexico West Ports-of-Entry October 2015, page 99
Table 46. Calexico West POE Northbound Private Vehicle Winter 2014 Vehicle Activity & Emissions with Calexico West Phase 2
Process Activity Quantity Units Volume
ROG Rate
(g/mile) or (g/hour)
ROG Emissions (Lbs./Day)
NOx Rate
(g/mile) or
(g/hour)
NOx Emissions (Lbs./Day)
PM2.5 Rate
(g/mile) or (g/hour)
PM2.5 Emissions (Lbs./Day)
U.S. Primary, Standard Lane
Uncongested 12,077.1 VMT 6,096 0.44 11.79 0.73 19.39 0.021 0.56
Creeping Queue - VMT 6,096 3.07 0.00 1.37 0.00 0.040 0.00
Stop-and-Go Queue 115.5 VMT 6,096 6.15 1.57 2.74 0.70 0.080 0.02
Idle 164.3 Veh. Hours 6,096 15.37 5.57 6.84 2.48 0.201 0.07
U.S. Primary, Ready Lane
Uncongested 10,197.8 VMT 5,148 0.44 9.91 0.71 15.94 0.021 0.47
Creeping Queue - VMT 5,148 3.06 0.00 1.33 0.00 0.040 0.00
Stop-and-Go Queue 97.5 VMT 5,148 6.12 1.32 2.67 0.57 0.079 0.02
Idle 54.3 Veh. Hours 5,148 15.30 1.83 6.66 0.80 0.198 0.02
U.S. Primary, SENTRI Lane
Uncongested 9,880.6 VMT 4,988 0.44 9.60 0.71 15.45 0.021 0.46
Creeping Queue - VMT 4,988 3.06 0.00 1.33 0.00 0.040 0.00
Stop-and-Go Queue 94.5 VMT 4,988 6.12 1.27 2.67 0.56 0.079 0.02
Idle 40.2 Veh. Hours 4,988 15.30 1.36 6.66 0.59 0.198 0.02
U.S. Secondary Creeping Queue (Standard Lane)
5.8 VMT 6,096 3.07 0.04 1.37 0.02 0.040 0.00
Creeping Queue (Ready Lane)
5.8 VMT 5,148 3.06 0.04 1.33 0.02 0.040 0.00
Creeping Queue (SENTRI Lane)
4.7 VMT 4,988 3.06 0.03 1.33 0.01 0.040 0.00
30 Min. Soak and Restart (Standard Lane)
304.8 Vehicles 6,096 1.17 0.79 0.90 0.60 0.002 0.00
30 Min. Soak and Restart (Ready Lane)
257.4 Vehicles 5,148 1.16 0.66 0.87 0.50 0.002 0.00
30 Min. Soak and Restart (SENTRI Lane)
249.4 Vehicles 4,988 1.16 0.64 0.87 0.48 0.002 0.00
Subtotal, Calexico West POE, Northbound 46.42 58.10 1.67
116

Vehicle Idling Emissions Study at Calexico East and Calexico West Ports-of-Entry October 2015, page 100
Table 47. Calexico East POE Northbound Private Vehicle Winter 2014 Vehicle Activity & Emissions with Calexico West Phase 2
Process Activity Quantity Units Volume
ROG Rate
(g/mile) or (g/hour)
ROG Emissions (Lbs./Day)
NOx Rate
(g/mile) or
(g/hour)
NOx Emissions (Lbs./Day)
PM2.5 Rate
(g/mile) or (g/hour)
PM2.5 Emissions (Lbs./Day)
U.S. Primary, Standard Lane
Uncongested 5,374.8 VMT 2,713 0.44 5.25 0.73 8.63 0.021 0.25
Creeping Queue - VMT 2,713 3.07 0.00 1.37 0.00 0.040 0.00
Stop-and-Go Queue 51.4 VMT 2,713 6.15 0.70 2.74 0.31 0.080 0.01
Idle 73.1 Veh. Hours 2,713 15.37 2.48 6.84 1.10 0.201 0.03
U.S. Primary, Ready Lane
Uncongested 5,093.3 VMT 2,571 0.44 4.95 0.71 7.96 0.021 0.24
Creeping Queue - VMT 2,571 3.06 0.00 1.33 0.00 0.040 0.00
Stop-and-Go Queue 48.7 VMT 2,571 6.12 0.66 2.67 0.29 0.079 0.01
Idle 27.1 Veh. Hours 2,571 15.30 0.92 6.66 0.40 0.198 0.01
U.S. Primary, SENTRI Lane
Uncongested 4,520.3 VMT 2,282 0.44 4.39 0.71 7.07 0.021 0.21
Creeping Queue - VMT 2,282 3.06 0.00 1.33 0.00 0.040 0.00
Stop-and-Go Queue 43.2 VMT 2,282 6.12 0.58 2.67 0.25 0.079 0.01
Idle 18.4 Veh. Hours 2,282 15.30 0.62 6.66 0.27 0.198 0.01
U.S. Secondary Creeping Queue (Standard Lane)
2.6 VMT 2,713 3.07 0.02 1.37 0.01 0.040 0.00
Creeping Queue (Ready Lane)
2.4 VMT 2,571 3.06 0.02 1.33 0.01 0.040 0.00
Creeping Queue (SENTRI Lane)
2.2 VMT 2,282 3.06 0.01 1.33 0.01 0.040 0.00
30 Min. Soak and Restart (Standard Lane)
135.7 Vehicles 2,713 1.17 0.35 0.90 0.27 0.002 0.00
30 Min. Soak and Restart (Ready Lane)
128.6 Vehicles 2,571 1.16 0.33 0.87 0.25 0.002 0.00
30 Min. Soak and Restart (SENTRI Lane)
114.1 Vehicles 2,713 1.16 0.29 0.87 0.22 0.002 0.00
Subtotal, Calexico East POE, Northbound 21.56 27.04 0.78
117

Vehicle Idling Emissions Study at Calexico East and Calexico West Ports-of-Entry October 2015, page 101
Table 48. Calexico East POE Northbound Commercial Vehicle Winter 2014 Vehicle Activity & Emissions with Calexico West Phase 2 (1 of 2)
Process Activity Quantity Units Volume
ROG Rate
(g/mile) or (g/hour)
ROG Emissions (Lbs./Day)
NOx Rate
(g/mile) or
(g/hour)
NOx Emissions (Lbs./Day)
PM2.5 Rate
(g/mile) or (g/hour)
PM2.5 Emissions (Lbs./Day)
MX Aduanas Entrance
Stop-and-Go Queue (Standard, Laden)
7.5 VMT 397 13.44 0.22 64.94 1.08 2.267 0.04
Stop-and-Go Queue (Standard, Unladen)
6.4 VMT 339 13.44 0.19 64.94 0.92 2.267 0.03
Stop-and-Go Queue (FAST, Laden)
11.1 VMT 451 13.44 0.33 64.94 1.59 2.267 0.06
Stop-and-Go Queue (FAST, Unladen)
3.3 VMT 176 13.44 0.10 64.94 0.48 2.267 0.02
Idle (Standard) 17.4 Veh. Hours 736 33.62 1.29 162.37 6.22 5.668 0.22
Idle (FAST) 14.8 Veh. Hours 627 33.62 1.10 162.37 5.30 5.668 0.18
MX Aduanas Cargo Inspection
Idle (Standard) 33.0 Veh. Hours 736 33.62 2.45 162.37 11.81 5.668 0.41
Idle (FAST) 32.4 Veh. Hours 627 33.62 2.41 162.37 11.62 5.668 0.41
U.S. CBP Primary
Stop-and-Go Queue (Standard, Laden)
80.6 VMT 397 13.44 2.39 64.94 11.54 2.267 0.40
Stop-and-Go Queue (Standard, Unladen)
3.9 VMT 339 13.44 0.12 64.94 0.56 2.267 0.02
Stop-and-Go Queue (FAST, Laden)
8.5 VMT 451 13.44 0.25 64.94 1.22 2.267 0.04
Stop-and-Go Queue (FAST, Unladen)
2.0 VMT 176 13.44 0.06 64.94 0.29 2.267 0.01
Idle (Standard) 12.3 Veh. Hours 736 33.62 0.91 162.37 4.39 5.668 0.15
Idle (FAST) 10.4 Veh. Hours 627 33.62 0.77 162.37 3.74 5.668 0.13
U.S. CBP Cargo Inspection
Stop-and-Go Queue (Standard, Laden)
13.7 VMT 397 13.44 0.41 64.94 1.97 2.267 0.07
Stop-and-Go Queue (Standard, Unladen)
11.7 VMT 339 13.44 0.35 64.94 1.68 2.267 0.06
Stop-and-Go Queue (FAST, Laden)
15.6 VMT 397 13.44 0.46 64.94 2.23 2.267 0.08
Stop-and-Go Queue (FAST, Unladen)
6.1 VMT 155 13.44 0.18 64.94 0.87 2.267 0.03
Idle (Standard) 73.5 Veh. Hours 736 33.62 5.45 162.37 26.30 5.668 0.92
Idle (FAST) 66.9 Veh. Hours 552 33.62 4.96 162.37 23.96 5.668 0.84
118

Vehicle Idling Emissions Study at Calexico East and Calexico West Ports-of-Entry October 2015, page 102
Table 48. Calexico East POE Northbound Commercial Vehicle Winter 2014 Vehicle Activity & Emissions with Calexico West Phase 2 (2 of 2)
Process Activity Quantity Units Volume
ROG Rate
(g/mile) or (g/hour)
ROG Emissions (Lbs./Day)
NOx Rate
(g/mile) or
(g/hour)
NOx Emissions (Lbs./Day)
PM2.5 Rate
(g/mile) or (g/hour)
PM2.5 Emissions (Lbs./Day)
U.S. CBP Exit Stop-and-Go Queue (Standard, Laden)
9.0 VMT 397 13.44 0.27 64.94 1.28 2.267 0.04
Stop-and-Go Queue (Standard, Unladen)
7.6 VMT 339 13.44 0.23 64.94 1.09 2.267 0.04
Stop-and-Go Queue (FAST, Laden)
10.2 VMT 451 13.44 0.30 64.94 1.46 2.267 0.05
Stop-and-Go Queue (FAST, Unladen)
4.0 VMT 176 13.44 0.12 64.94 0.57 2.267 0.02
Idle (Standard) 5.5 Veh. Hours 736 33.62 0.41 162.37 1.98 5.668 0.07
Idle (FAST) 4.7 Veh. Hours 627 33.62 0.35 162.37 1.68 5.668 0.06
California CHP Stop-and-Go Queue (Standard, Laden)
7.5 VMT 397 13.44 0.22 64.94 1.08 2.267 0.04
Stop-and-Go Queue (Standard, Unladen)
6.4 VMT 339 13.44 0.19 64.94 0.92 2.267 0.03
Stop-and-Go Queue (FAST, Laden)
8.5 VMT 451 13.44 0.25 64.94 1.22 2.267 0.04
Stop-and-Go Queue (FAST, Unladen)
3.3 VMT 176 13.44 0.10 64.94 0.48 2.267 0.02
Idle (Standard) 7.4 Veh. Hours 736 33.62 0.55 162.37 2.63 5.668 0.09
Idle (FAST) 6.3 Veh. Hours 627 33.62 0.46 162.37 2.24 5.668 0.08
Other Uncongested Movement (Standard)
2,053.7 VMT 736 0.75 3.41 12.37 56.01 0.276 1.25
Uncongested Movement (FAST)
1,808.3 VMT 627 0.75 3.00 12.37 49.31 0.276 1.10
Subtotal, Calexico East Commercial, Northbound 34.23 239.72 7.04
119

Vehicle Idling Emissions Study at Calexico East and Calexico West Ports-of-Entry October 2015, page 103
Table 49. Calexico West POE Northbound Private Vehicle Spring 2014 Vehicle Activity & Emissions with Reduction in Empty General-purpose Commercial Trucks
Process Activity Quantity Units Volume
ROG Rate
(g/mile) or (g/hour)
ROG Emissions (Lbs./Day)
NOx Rate
(g/mile) or
(g/hour)
NOx Emissions (Lbs./Day)
PM2.5 Rate
(g/mile) or (g/hour)
PM2.5 Emissions (Lbs./Day)
U.S. Primary, Standard Lane
Uncongested 9,133.8 VMT 6,606 0.56 11.20 0.62 12.45 0.021 0.43
Creeping Queue 3,953.9 VMT 6,606 3.86 33.62 1.16 10.11 0.040 0.35
Stop-and-Go Queue 125.1 VMT 6,606 7.71 2.13 2.32 0.64 0.080 0.02
Idle 174.3 Veh. Hours 6,606 19.29 7.41 5.80 2.23 0.201 0.08
U.S. Primary, SENTRI Lane
Uncongested 9,362.2 VMT 5,020 0.56 11.52 0.60 12.42 0.021 0.43
Creeping Queue - VMT 5,020 3.87 0.00 1.13 0.00 0.040 0.00
Stop-and-Go Queue 678.4 VMT 5,020 7.74 11.57 2.26 3.38 0.079 0.12
Idle 50.2 Veh. Hours 5,020 19.35 2.14 5.65 0.63 0.198 0.02
U.S. Secondary Creeping Queue (Standard Lane)
6.26 VMT 6,606 3.86 0.05 1.16 0.02 0.040 0.00
Creeping Queue (SENTRI Lane)
4.75 VMT 5,020 3.87 0.04 1.13 0.01 0.040 0.00
30 Min. Soak & Restart (Standard Lane)
330 Vehicles 6,606 1.54 1.12 0.71 0.52 0.002 0.00
30 Min. Soak & Restart (SENTRI Lane)
251 Vehicles 5,020 1.54 0.85 0.69 0.38 0.002 0.00
Subtotal, Calexico West POE, Northbound 81.67 42.79 1.45
120

Vehicle Idling Emissions Study at Calexico East and Calexico West Ports-of-Entry October 2015, page 104
Table 50. Calexico East POE Northbound Private Vehicle Spring 2014 Vehicle Activity & Emissions with Reduction in Empty General-purpose Commercial Trucks
Process Activity Quantity Units Volume
ROG Rate
(g/mile) or (g/hour)
ROG Emissions (Lbs./Day)
NOx Rate
(g/mile) or
(g/hour)
NOx Emissions (Lbs./Day)
PM2.5 Rate
(g/mile) or (g/hour)
PM2.5 Emissions (Lbs./Day)
U.S. Primary, Standard Lane
Uncongested 2,998.3 VMT 1,639 0.56 3.68 0.62 4.09 0.021 0.14
Creeping Queue 198.4 VMT 1,639 3.86 1.69 1.16 0.51 0.040 0.02
Stop-and-Go Queue 131.1 VMT 1,639 7.71 2.23 2.32 0.67 0.080 0.02
Idle 42.8 Veh. Hours 1,639 19.29 1.82 5.80 0.55 0.201 0.02
U.S. Primary, Ready Lane
Uncongested 12,381.8 VMT 7,211 0.56 15.24 0.60 16.43 0.021 0.57
Creeping Queue 2,409.7 VMT 7,211 3.87 20.56 1.13 6.00 0.040 0.21
Stop-and-Go Queue 141.4 VMT 7,211 7.74 2.41 2.26 0.70 0.079 0.02
Idle 75.1 Veh. Hours 7,211 19.35 3.20 5.65 0.94 0.198 0.03
U.S. Primary, SENTRI Lane
Uncongested 3,463.8 VMT 1,778 0.56 4.26 0.60 4.60 0.021 0.16
Creeping Queue 57.8 VMT 1,778 3.87 0.49 1.13 0.14 0.040 0.01
Stop-and-Go Queue 33.7 VMT 1,778 7.74 0.57 2.26 0.17 0.079 0.01
Idle 14.3 Veh. Hours 1,778 19.35 0.61 5.65 0.18 0.198 0.01
U.S. Secondary Creeping Queue (Standard Lane)
1.6 VMT 1,639 3.86 0.01 1.16 0.00 0.040 0.00
Creeping Queue (Ready Lane)
6.8 VMT 7,211 3.87 0.06 1.13 0.02 0.040 0.00
Creeping Queue (SENTRI Lane)
1.7 VMT 1,778 3.87 0.01 1.13 0.00 0.040 0.00
30 Min. Soak and Restart (Standard Lane)
81.9 Vehicles 1,639 1.54 0.28 0.71 0.13 0.002 0.00
30 Min. Soak and Restart (Ready Lane)
360.6 Vehicles 7,211 1.54 1.23 0.69 0.55 0.002 0.00
30 Min. Soak and Restart (SENTRI Lane)
88.9 Vehicles 1,778 1.54 0.30 0.69 0.14 0.002 0.00
Subtotal, Calexico East POE, Northbound 58.66 35.81 1.22
121

Vehicle Idling Emissions Study at Calexico East and Calexico West Ports-of-Entry October 2015, page 105
Table 51. Calexico East POE Northbound Commercial Vehicle Spring 2014 Vehicle Activity & Emissions with Reduction in Empty General-purpose Commercial Trucks (1 of 2)
Process Activity Quantity Units Volume
ROG Rate
(g/mile) or (g/hour)
ROG Emissions (Lbs./Day)
NOx Rate
(g/mile) or
(g/hour)
NOx Emissions (Lbs./Day)
PM2.5 Rate
(g/mile) or (g/hour)
PM2.5 Emissions (Lbs./Day)
MX Aduanas Entrance
Stop-and-Go Queue (Standard, Laden)
7.8 VMT 411 13.50 0.23 64.90 1.11 2.267 0.04
Stop-and-Go Queue (Standard, Unladen)
6.6 VMT 214 13.50 0.20 64.90 0.95 2.267 0.03
Stop-and-Go Queue (FAST, Laden)
16.1 VMT 467 13.50 0.48 64.90 2.31 2.267 0.08
Stop-and-Go Queue (FAST, Unladen)
3.4 VMT 182 13.50 0.10 64.90 0.49 2.267 0.02
Idle (Standard) 14.8 Veh. Hours 625 33.76 1.10 162.27 5.28 5.668 0.18
Idle (FAST) 15.3 Veh. Hours 649 33.76 1.14 162.27 5.48 5.668 0.19
MX Aduanas Cargo Inspection
Idle (Standard) 34.2 Veh. Hours 625 33.76 2.54 162.27 12.22 5.668 0.43
Idle (FAST) 33.6 Veh. Hours 649 33.76 2.50 162.27 12.02 5.668 0.42
U.S. CBP Primary
Stop-and-Go Queue (Standard, Laden)
126.4 VMT 411 13.50 3.76 64.90 18.08 2.267 0.63
Stop-and-Go Queue (Standard, Unladen)
4.1 VMT 350 13.50 0.12 64.90 0.58 2.267 0.02
Stop-and-Go Queue (FAST, Laden)
8.9 VMT 467 13.50 0.26 64.90 1.27 2.267 0.04
Stop-and-Go Queue (FAST, Unladen)
2.1 VMT 182 13.50 0.06 64.90 0.30 2.267 0.01
Idle (Standard) 12.7 Veh. Hours 762 33.76 0.95 162.27 4.54 5.668 0.16
Idle (FAST) 10.8 Veh. Hours 649 33.76 0.81 162.27 3.87 5.668 0.14
U.S. CBP Cargo Inspection
Stop-and-Go Queue (Standard, Laden)
22.8 VMT 411 13.50 0.68 64.90 3.27 2.267 0.11
Stop-and-Go Queue (Standard, Unladen)
19.5 VMT 350 13.50 0.58 64.90 2.78 2.267 0.10
Stop-and-Go Queue (FAST, Laden)
25.9 VMT 411 13.50 0.77 64.90 3.71 2.267 0.13
Stop-and-Go Queue (FAST, Unladen)
10.1 VMT 160 13.50 0.30 64.90 1.44 2.267 0.05
Idle (Standard) 76.1 Veh. Hours 762 33.76 5.66 162.27 27.21 5.668 0.95
Idle (FAST) 69.3 Veh. Hours 571 33.76 5.16 162.27 24.79 5.668 0.87
122
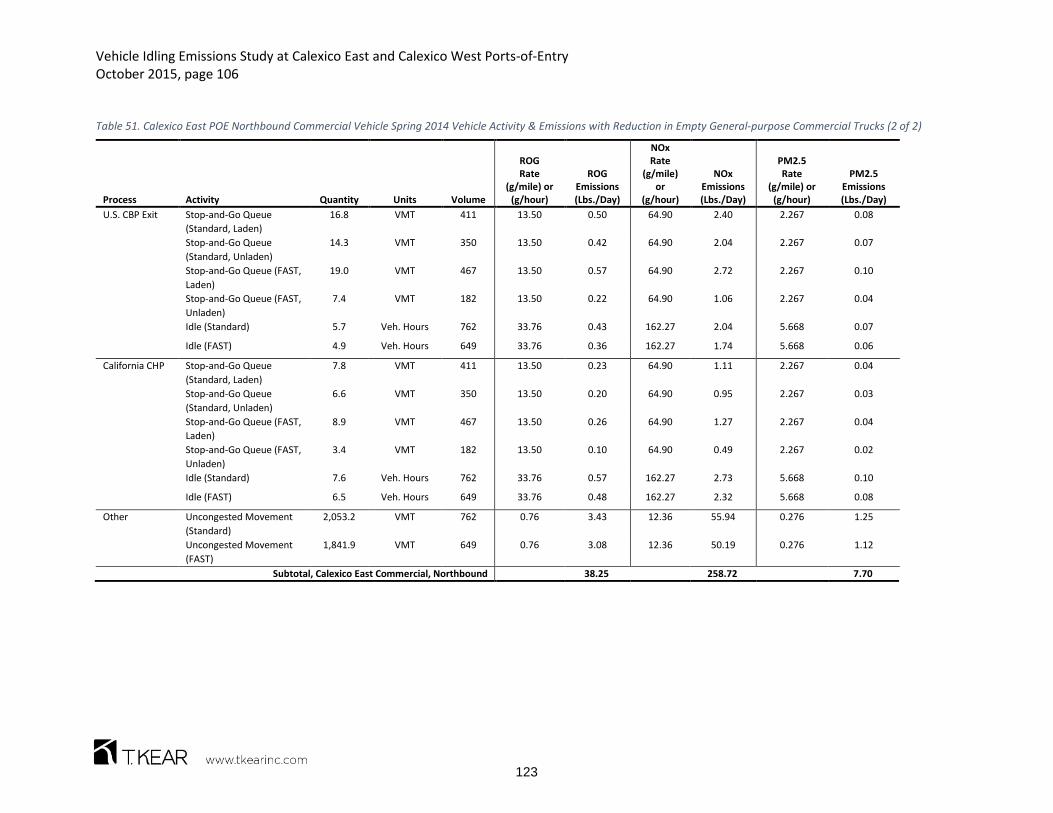
Vehicle Idling Emissions Study at Calexico East and Calexico West Ports-of-Entry October 2015, page 106
Table 51. Calexico East POE Northbound Commercial Vehicle Spring 2014 Vehicle Activity & Emissions with Reduction in Empty General-purpose Commercial Trucks (2 of 2)
Process Activity Quantity Units Volume
ROG Rate
(g/mile) or (g/hour)
ROG Emissions (Lbs./Day)
NOx Rate
(g/mile) or
(g/hour)
NOx Emissions (Lbs./Day)
PM2.5 Rate
(g/mile) or (g/hour)
PM2.5 Emissions (Lbs./Day)
U.S. CBP Exit Stop-and-Go Queue (Standard, Laden)
16.8 VMT 411 13.50 0.50 64.90 2.40 2.267 0.08
Stop-and-Go Queue (Standard, Unladen)
14.3 VMT 350 13.50 0.42 64.90 2.04 2.267 0.07
Stop-and-Go Queue (FAST, Laden)
19.0 VMT 467 13.50 0.57 64.90 2.72 2.267 0.10
Stop-and-Go Queue (FAST, Unladen)
7.4 VMT 182 13.50 0.22 64.90 1.06 2.267 0.04
Idle (Standard) 5.7 Veh. Hours 762 33.76 0.43 162.27 2.04 5.668 0.07
Idle (FAST) 4.9 Veh. Hours 649 33.76 0.36 162.27 1.74 5.668 0.06
California CHP Stop-and-Go Queue (Standard, Laden)
7.8 VMT 411 13.50 0.23 64.90 1.11 2.267 0.04
Stop-and-Go Queue (Standard, Unladen)
6.6 VMT 350 13.50 0.20 64.90 0.95 2.267 0.03
Stop-and-Go Queue (FAST, Laden)
8.9 VMT 467 13.50 0.26 64.90 1.27 2.267 0.04
Stop-and-Go Queue (FAST, Unladen)
3.4 VMT 182 13.50 0.10 64.90 0.49 2.267 0.02
Idle (Standard) 7.6 Veh. Hours 762 33.76 0.57 162.27 2.73 5.668 0.10
Idle (FAST) 6.5 Veh. Hours 649 33.76 0.48 162.27 2.32 5.668 0.08
Other Uncongested Movement (Standard)
2,053.2 VMT 762 0.76 3.43 12.36 55.94 0.276 1.25
Uncongested Movement (FAST)
1,841.9 VMT 649 0.76 3.08 12.36 50.19 0.276 1.12
Subtotal, Calexico East Commercial, Northbound 38.25 258.72 7.70
123

Vehicle Idling Emissions Study at Calexico East and Calexico West Ports-of-Entry October 2015, page 107
Table 52. Calexico West POE Northbound Private Vehicle Summer 2014 Vehicle Activity & Emissions with Reduction in Empty General-purpose Commercial Trucks
Process Activity Quantity Units Volume
ROG Rate
(g/mile) or (g/hour)
ROG Emissions (Lbs./Day)
NOx Rate
(g/mile) or
(g/hour)
NOx Emissions (Lbs./Day)
PM2.5 Rate
(g/mile) or (g/hour)
PM2.5 Emissions (Lbs./Day)
U.S. Primary, Standard Lane
Uncongested 10,375.8 VMT 6,012 0.62 14.20 0.65 14.87 0.021 0.48
Creeping Queue 1,630.9 VMT 6,012 4.30 15.47 1.22 4.39 0.040 0.14
Stop-and-Go Queue 114.8 VMT 6,012 8.61 2.18 2.44 0.62 0.080 0.02
Idle 168.7 Veh. Hours 6,012 21.52 8.00 6.10 2.27 0.201 0.07
U.S. Primary, SENTRI Lane
Uncongested 8,881.1 VMT 4,568 0.62 12.20 0.63 12.40 0.021 0.41
Creeping Queue - VMT 4,568 4.32 0.00 1.19 0.00 0.040 0.00
Stop-and-Go Queue 255.1 VMT 4,568 8.63 4.86 2.38 1.34 0.079 0.04
Idle 48.6 Veh. Hours 4,568 21.59 2.31 5.94 0.64 0.198 0.02
U.S. Secondary Creeping Queue (Standard Lane)
5.693182 VMT 6,012 4.30 0.05 1.22 0.02 0.040 0.00
Creeping Queue (SENTRI Lane)
4.325758 VMT 4,568 4.32 0.04 1.19 0.01 0.040 0.00
30 Min. Soak & Restart (Standard Lane)
301 Vehicles 6,012 1.70 1.12 0.77 0.51 0.002 0.00
30 Min. Soak & Restart (SENTRI Lane)
228 Vehicles 4,568 1.70 0.85 0.74 0.37 0.002 0.00
Subtotal, Calexico West POE, Northbound 61.29 37.43 1.20
124

Vehicle Idling Emissions Study at Calexico East and Calexico West Ports-of-Entry October 2015, page 108
Table 53. Calexico East POE Northbound Private Vehicle Summer 2014 Vehicle Activity & Emissions with Reduction in Empty General-purpose Commercial Trucks
Process Activity Quantity Units Volume
ROG Rate
(g/mile) or (g/hour)
ROG Emissions (Lbs./Day)
NOx Rate
(g/mile) or
(g/hour)
NOx Emissions (Lbs./Day)
PM2.5 Rate
(g/mile) or (g/hour)
PM2.5 Emissions (Lbs./Day)
U.S. Primary, Standard Lane
Uncongested 2,900.8 VMT 1,608 0.62 3.97 0.65 4.16 0.021 0.14
Creeping Queue 257.0 VMT 1,608 4.30 2.44 1.22 0.69 0.040 0.02
Stop-and-Go Queue 126.9 VMT 1,608 8.61 2.41 2.44 0.68 0.080 0.02
Idle 42.0 Veh. Hours 1,608 21.52 1.99 6.10 0.56 0.201 0.02
U.S. Primary, Ready Lane
Uncongested 13,064.0 VMT 7,075 0.62 17.94 0.63 18.23 0.021 0.61
Creeping Queue 1,444.9 VMT 7,075 4.32 13.75 1.19 3.79 0.040 0.13
Stop-and-Go Queue 138.7 VMT 7,075 8.63 2.64 2.38 0.73 0.079 0.02
Idle 73.7 Veh. Hours 7,075 21.59 3.51 5.94 0.97 0.198 0.03
U.S. Primary, SENTRI Lane
Uncongested 3,445.8 VMT 1,746 0.62 4.73 0.63 4.81 0.021 0.16
Creeping Queue 12.7 VMT 1,746 4.32 0.12 1.19 0.03 0.040 0.00
Stop-and-Go Queue 33.1 VMT 1,746 8.63 0.63 2.38 0.17 0.079 0.01
Idle 14.1 Veh. Hours 1,746 21.59 0.67 5.94 0.18 0.198 0.01
U.S. Secondary Creeping Queue (Standard Lane)
1.5 VMT 1,608 4.30 0.01 1.22 0.00 0.040 0.00
Creeping Queue (Ready Lane)
6.7 VMT 7,075 4.32 0.06 1.19 0.02 0.040 0.00
Creeping Queue (SENTRI Lane)
1.7 VMT 1,746 4.32 0.02 1.19 0.00 0.040 0.00
30 Min. Soak and Restart (Standard Lane)
80.4 Vehicles 1,608 1.70 0.30 0.77 0.14 0.002 0.00
30 Min. Soak and Restart (Ready Lane)
353.7 Vehicles 7,075 1.70 1.32 0.74 0.58 0.002 0.00
30 Min. Soak and Restart (SENTRI Lane)
87.3 Vehicles 1,746 1.70 0.33 0.74 0.14 0.002 0.00
Subtotal, Calexico East POE, Northbound 56.85 35.89 1.16
125

Vehicle Idling Emissions Study at Calexico East and Calexico West Ports-of-Entry October 2015, page 109
Table 54. Calexico East POE Northbound Commercial Vehicle Summer 2014 Vehicle Activity & Emissions with Reduction in Empty General-purpose Commercial Trucks (1 of 2)
Process Activity Quantity Units Volume
ROG Rate
(g/mile) or (g/hour)
ROG Emissions (Lbs./Day)
NOx Rate
(g/mile) or
(g/hour)
NOx Emissions (Lbs./Day)
PM2.5 Rate
(g/mile) or (g/hour)
PM2.5 Emissions (Lbs./Day)
MX Aduanas Entrance
Stop-and-Go Queue (Standard, Laden)
7.4 VMT 389 13.56 0.22 64.90 1.05 2.267 0.04
Stop-and-Go Queue (Standard, Unladen)
6.3 VMT 202 13.56 0.19 64.90 0.90 2.267 0.03
Stop-and-Go Queue (FAST, Laden)
9.4 VMT 442 13.56 0.28 64.90 1.35 2.267 0.05
Stop-and-Go Queue (FAST, Unladen)
3.3 VMT 172 13.56 0.10 64.90 0.47 2.267 0.02
Idle (Standard) 14.0 Veh. Hours 591 33.91 1.04 162.29 5.00 5.668 0.17
Idle (FAST) 14.5 Veh. Hours 614 33.91 1.08 162.29 5.19 5.668 0.18
MX Aduanas Cargo Inspection
Idle (Standard) 32.3 Veh. Hours 591 33.91 2.42 162.29 11.56 5.668 0.40
Idle (FAST) 31.8 Veh. Hours 614 33.91 2.38 162.29 11.37 5.668 0.40
U.S. CBP Primary
Stop-and-Go Queue (Standard, Laden)
55.0 VMT 389 13.56 1.64 64.90 7.87 2.267 0.27
Stop-and-Go Queue (Standard, Unladen)
3.9 VMT 332 13.56 0.12 64.90 0.55 2.267 0.02
Stop-and-Go Queue (FAST, Laden)
8.4 VMT 442 13.56 0.25 64.90 1.20 2.267 0.04
Stop-and-Go Queue (FAST, Unladen)
2.0 VMT 172 13.56 0.06 64.90 0.29 2.267 0.01
Idle (Standard) 12.0 Veh. Hours 721 33.91 0.90 162.29 4.30 5.668 0.15
Idle (FAST) 10.2 Veh. Hours 614 33.91 0.77 162.29 3.66 5.668 0.13
U.S. CBP Cargo Inspection
Stop-and-Go Queue (Standard, Laden)
10.7 VMT 389 13.56 0.32 64.90 1.53 2.267 0.05
Stop-and-Go Queue (Standard, Unladen)
9.1 VMT 332 13.56 0.27 64.90 1.31 2.267 0.05
Stop-and-Go Queue (FAST, Laden)
12.2 VMT 389 13.56 0.36 64.90 1.74 2.267 0.06
Stop-and-Go Queue (FAST, Unladen)
4.7 VMT 151 13.56 0.14 64.90 0.68 2.267 0.02
Idle (Standard) 72.0 Veh. Hours 721 33.91 5.38 162.29 25.74 5.668 0.90
Idle (FAST) 65.5 Veh. Hours 541 33.91 4.90 162.29 23.45 5.668 0.82
126

Vehicle Idling Emissions Study at Calexico East and Calexico West Ports-of-Entry October 2015, page 110
Table 54. Calexico East POE Northbound Commercial Vehicle Summer 2014 Vehicle Activity & Emissions with Reduction in Empty General-purpose Commercial Trucks (2 of 2)
Process Activity Quantity Units Volume
ROG Rate
(g/mile) or (g/hour)
ROG Emissions (Lbs./Day)
NOx Rate
(g/mile) or
(g/hour)
NOx Emissions (Lbs./Day)
PM2.5 Rate
(g/mile) or (g/hour)
PM2.5 Emissions (Lbs./Day)
U.S. CBP Exit Stop-and-Go Queue (Standard, Laden)
7.4 VMT 389 13.56 0.22 64.90 1.05 2.267 0.04
Stop-and-Go Queue (Standard, Unladen)
6.3 VMT 332 13.56 0.19 64.90 0.90 2.267 0.03
Stop-and-Go Queue (FAST, Laden)
8.4 VMT 442 13.56 0.25 64.90 1.20 2.267 0.04
Stop-and-Go Queue (FAST, Unladen)
3.3 VMT 172 13.56 0.10 64.90 0.47 2.267 0.02
Idle (Standard) 5.4 Veh. Hours 721 33.91 0.40 162.29 1.93 5.668 0.07
Idle (FAST) 4.6 Veh. Hours 614 33.91 0.34 162.29 1.65 5.668 0.06
California CHP Stop-and-Go Queue (Standard, Laden)
7.4 VMT 389 13.56 0.22 64.90 1.05 2.267 0.04
Stop-and-Go Queue (Standard, Unladen)
6.3 VMT 332 13.56 0.19 64.90 0.90 2.267 0.03
Stop-and-Go Queue (FAST, Laden)
8.4 VMT 442 13.56 0.25 64.90 1.20 2.267 0.04
Stop-and-Go Queue (FAST, Unladen)
3.3 VMT 172 13.56 0.10 64.90 0.47 2.267 0.02
Idle (Standard) 7.2 Veh. Hours 721 33.91 0.54 162.29 2.58 5.668 0.09
Idle (FAST) 6.1 Veh. Hours 614 33.91 0.46 162.29 2.20 5.668 0.08
Other Uncongested Movement (Standard)
2,042.7 VMT 721 0.76 3.44 12.36 55.67 0.276 1.24
Uncongested Movement (FAST)
1,778.8 VMT 614 0.76 2.99 12.36 48.48 0.276 1.08
Subtotal, Calexico East Commercial, Northbound 32.50 228.94 6.68
127

Vehicle Idling Emissions Study at Calexico East and Calexico West Ports-of-Entry October 2015, page 111
Table 55. Calexico West POE Northbound Private Vehicle Winter 2014 Vehicle Activity & Emissions with Reduction in Empty General-purpose Commercial Trucks
Process Activity Quantity Units Volume
ROG Rate
(g/mile) or (g/hour)
ROG Emissions (Lbs./Day)
NOx Rate
(g/mile) or
(g/hour)
NOx Emissions (Lbs./Day)
PM2.5 Rate
(g/mile) or (g/hour)
PM2.5 Emissions (Lbs./Day)
U.S. Primary, Standard Lane
Uncongested 11,043.8 VMT 7,055.0 0.44 10.78 0.73 17.73 0.021 0.51
Creeping Queue 3,061.5 VMT 7,055.0 3.07 20.75 1.37 9.24 0.040 0.27
Stop-and-Go Queue 134.8 VMT 7,055.0 6.15 1.83 2.74 0.81 0.080 0.02
Idle 170.5 Veh. Hours 7,055.0 15.37 5.78 6.84 2.57 0.201 0.08
U.S. Primary, SENTRI Lane
Uncongested 9,345.6 VMT 5,361.0 0.44 9.08 0.71 14.61 0.021 0.43
Creeping Queue - VMT 5,361.0 3.06 0.00 1.33 0.00 0.040 0.00
Stop-and-Go Queue 1,403.8 VMT 5,361.0 6.12 18.94 2.67 8.25 0.079 0.25
Idle 50.6 Veh. Hours 5,361.0 15.30 1.71 6.66 0.74 0.198 0.02
U.S. Secondary Creeping Queue (Standard Lane)
6.680871 VMT 7,055.0 3.07 0.05 1.37 0.02 0.040 0.00
Creeping Queue (SENTRI Lane)
5.076705 VMT 5,361.0 3.06 0.03 1.33 0.01 0.040 0.00
30 Min. Soak & Restart (Standard Lane)
353 Vehicles 7,055.0 1.17 0.91 0.90 0.70 0.002 0.00
30 Min. Soak & Restart (SENTRI Lane)
268 Vehicles 5,361.0 1.16 0.69 0.87 0.52 0.002 0.00
Subtotal, Calexico West POE, Northbound 70.55 55.21 1.59
128

Vehicle Idling Emissions Study at Calexico East and Calexico West Ports-of-Entry October 2015, page 112
Table 56. Calexico East POE Northbound Private Vehicle Winter 2014 Vehicle Activity & Emissions with Reduction in Empty General-purpose Commercial Trucks
Process Activity Quantity Units Volume
ROG Rate
(g/mile) or (g/hour)
ROG Emissions (Lbs./Day)
NOx Rate
(g/mile) or
(g/hour)
NOx Emissions (Lbs./Day)
PM2.5 Rate
(g/mile) or (g/hour)
PM2.5 Emissions (Lbs./Day)
U.S. Primary, Standard Lane
Uncongested 3,246.0 VMT 1,754 0.44 3.17 0.73 5.21 0.021 0.15
Creeping Queue 199.1 VMT 1,754 3.07 1.35 1.37 0.60 0.040 0.02
Stop-and-Go Queue 122.6 VMT 1,754 6.15 1.66 2.74 0.74 0.080 0.02
Idle 40.4 Veh. Hours 1,754 15.37 1.37 6.84 0.61 0.201 0.02
U.S. Primary, Ready Lane
Uncongested 13,732.1 VMT 7,719 0.44 13.35 0.71 21.47 0.021 0.64
Creeping Queue 2,183.0 VMT 7,719 3.06 14.73 1.33 6.41 0.040 0.19
Stop-and-Go Queue 152.2 VMT 7,719 6.12 2.05 2.67 0.89 0.079 0.03
Idle 74.0 Veh. Hours 7,719 15.30 2.49 6.66 1.09 0.198 0.03
U.S. Primary, SENTRI Lane
Uncongested 3,701.3 VMT 1,908 0.44 3.60 0.71 5.79 0.021 0.17
Creeping Queue 78.6 VMT 1,908 3.06 0.53 1.33 0.23 0.040 0.01
Stop-and-Go Queue 36.1 VMT 1,908 6.12 0.49 2.67 0.21 0.079 0.01
Idle 14.3 Veh. Hours 1,908 15.30 0.48 6.66 0.21 0.198 0.01
U.S. Secondary Creeping Queue (Standard Lane)
1.7 VMT 1,754 3.07 0.01 1.37 0.01 0.040 0.00
Creeping Queue (Ready Lane)
7.3 VMT 7,719 3.06 0.05 1.33 0.02 0.040 0.00
Creeping Queue (SENTRI Lane)
1.8 VMT 1,908 3.06 0.01 1.33 0.01 0.040 0.00
30 Min. Soak and Restart (Standard Lane)
87.7 Vehicles 1,754 1.17 0.23 0.90 0.17 0.002 0.00
30 Min. Soak and Restart (Ready Lane)
385.9 Vehicles 7,719 1.16 0.99 0.87 0.74 0.002 0.00
30 Min. Soak and Restart (SENTRI Lane)
95.4 Vehicles 1,908 1.16 0.24 0.87 0.18 0.002 0.00
Subtotal, Calexico East POE, Northbound 46.80 44.59 1.29
129

Vehicle Idling Emissions Study at Calexico East and Calexico West Ports-of-Entry October 2015, page 113
Table 57. Calexico East POE Northbound Commercial Vehicle Winter 2014 Vehicle Activity & Emissions with Reduction in Empty General-purpose Commercial Trucks (1 of 2)
Process Activity Quantity Units Volume
ROG Rate
(g/mile) or (g/hour)
ROG Emissions (Lbs./Day)
NOx Rate
(g/mile) or
(g/hour)
NOx Emissions (Lbs./Day)
PM2.5 Rate
(g/mile) or (g/hour)
PM2.5 Emissions (Lbs./Day)
MX Aduanas Entrance
Stop-and-Go Queue (Standard, Laden)
7.5 VMT 397 13.44 0.22 64.94 1.08 2.267 0.04
Stop-and-Go Queue (Standard, Unladen)
6.4 VMT 207 13.44 0.19 64.94 0.92 2.267 0.03
Stop-and-Go Queue (FAST, Laden)
11.1 VMT 451 13.44 0.33 64.94 1.59 2.267 0.06
Stop-and-Go Queue (FAST, Unladen)
3.3 VMT 176 13.44 0.10 64.94 0.48 2.267 0.02
Idle (Standard) 14.3 Veh. Hours 604 33.62 1.06 162.37 5.11 5.668 0.18
Idle (FAST) 14.8 Veh. Hours 627 33.62 1.10 162.37 5.30 5.668 0.18
MX Aduanas Cargo Inspection
Idle (Standard) 33.0 Veh. Hours 604 33.62 2.45 162.37 11.81 5.668 0.41
Idle (FAST) 32.4 Veh. Hours 627 33.62 2.41 162.37 11.62 5.668 0.41
U.S. CBP Primary
Stop-and-Go Queue (Standard, Laden)
80.6 VMT 397 13.44 2.39 64.94 11.54 2.267 0.40
Stop-and-Go Queue (Standard, Unladen)
3.9 VMT 339 13.44 0.12 64.94 0.56 2.267 0.02
Stop-and-Go Queue (FAST, Laden)
8.5 VMT 451 13.44 0.25 64.94 1.22 2.267 0.04
Stop-and-Go Queue (FAST, Unladen)
2.0 VMT 176 13.44 0.06 64.94 0.29 2.267 0.01
Idle (Standard) 12.3 Veh. Hours 736 33.62 0.91 162.37 4.39 5.668 0.15
Idle (FAST) 10.4 Veh. Hours 627 33.62 0.77 162.37 3.74 5.668 0.13
U.S. CBP Cargo Inspection
Stop-and-Go Queue (Standard, Laden)
13.7 VMT 397 13.44 0.41 64.94 1.97 2.267 0.07
Stop-and-Go Queue (Standard, Unladen)
11.7 VMT 339 13.44 0.35 64.94 1.68 2.267 0.06
Stop-and-Go Queue (FAST, Laden)
15.6 VMT 397 13.44 0.46 64.94 2.23 2.267 0.08
Stop-and-Go Queue (FAST, Unladen)
6.1 VMT 155 13.44 0.18 64.94 0.87 2.267 0.03
Idle (Standard) 73.5 Veh. Hours 736 33.62 5.45 162.37 26.30 5.668 0.92
Idle (FAST) 66.9 Veh. Hours 552 33.62 4.96 162.37 23.96 5.668 0.84
130

Vehicle Idling Emissions Study at Calexico East and Calexico West Ports-of-Entry October 2015, page 114
Table 57. Calexico East POE Northbound Commercial Vehicle Winter 2014 Vehicle Activity & Emissions with Reduction in Empty General-purpose Commercial Trucks (2 of 2)
Process Activity Quantity Units Volume
ROG Rate
(g/mile) or (g/hour)
ROG Emissions (Lbs./Day)
NOx Rate
(g/mile) or
(g/hour)
NOx Emissions (Lbs./Day)
PM2.5 Rate
(g/mile) or (g/hour)
PM2.5 Emissions (Lbs./Day)
U.S. CBP Exit Stop-and-Go Queue (Standard, Laden)
9.0 VMT 397 13.44 0.27 64.94 1.28 2.267 0.04
Stop-and-Go Queue (Standard, Unladen)
7.6 VMT 339 13.44 0.23 64.94 1.09 2.267 0.04
Stop-and-Go Queue (FAST, Laden)
10.2 VMT 451 13.44 0.30 64.94 1.46 2.267 0.05
Stop-and-Go Queue (FAST, Unladen)
4.0 VMT 176 13.44 0.12 64.94 0.57 2.267 0.02
Idle (Standard) 5.5 Veh. Hours 736 33.62 0.41 162.37 1.98 5.668 0.07
Idle (FAST) 4.7 Veh. Hours 627 33.62 0.35 162.37 1.68 5.668 0.06
California CHP Stop-and-Go Queue (Standard, Laden)
7.5 VMT 397 13.44 0.22 64.94 1.08 2.267 0.04
Stop-and-Go Queue (Standard, Unladen)
6.4 VMT 339 13.44 0.19 64.94 0.92 2.267 0.03
Stop-and-Go Queue (FAST, Laden)
8.5 VMT 451 13.44 0.25 64.94 1.22 2.267 0.04
Stop-and-Go Queue (FAST, Unladen)
3.3 VMT 176 13.44 0.10 64.94 0.48 2.267 0.02
Idle (Standard) 7.4 Veh. Hours 736 33.62 0.55 162.37 2.63 5.668 0.09
Idle (FAST) 6.3 Veh. Hours 627 33.62 0.46 162.37 2.24 5.668 0.08
Other Uncongested Movement (Standard)
2,053.7 VMT 736 0.75 3.41 12.37 56.01 0.276 1.25
Uncongested Movement (FAST)
1,808.3 VMT 627 0.75 3.00 12.37 49.31 0.276 1.10
Subtotal, Calexico East Commercial, Northbound 34.00 238.60 7.00
131

Vehicle Idling Emissions Study at Calexico East and Calexico West Ports-of-Entry October 2015, page 115
Table 58. Calexico West POE Northbound Private Vehicle Spring 2014 Vehicle Activity & Emissions with Shift of Commercial General-purpose to FAST
Process Activity Quantity Units Volume
ROG Rate
(g/mile) or (g/hour)
ROG Emissions (Lbs./Day)
NOx Rate
(g/mile) or
(g/hour)
NOx Emissions (Lbs./Day)
PM2.5 Rate
(g/mile) or (g/hour)
PM2.5 Emissions (Lbs./Day)
U.S. Primary, Standard Lane
Uncongested 9,133.8 VMT 6,606 0.56 11.20 0.62 12.45 0.021 0.43
Creeping Queue 3,953.9 VMT 6,606 3.86 33.62 1.16 10.11 0.040 0.35
Stop-and-Go Queue 125.1 VMT 6,606 7.71 2.13 2.32 0.64 0.080 0.02
Idle 174.3 Veh. Hours 6,606 19.29 7.41 5.80 2.23 0.201 0.08
U.S. Primary, SENTRI Lane
Uncongested 9,362.2 VMT 5,020 0.56 11.52 0.60 12.42 0.021 0.43
Creeping Queue - VMT 5,020 3.87 0.00 1.13 0.00 0.040 0.00
Stop-and-Go Queue 678.4 VMT 5,020 7.74 11.57 2.26 3.38 0.079 0.12
Idle 50.2 Veh. Hours 5,020 19.35 2.14 5.65 0.63 0.198 0.02
U.S. Secondary Creeping Queue (Standard Lane)
6.26 VMT 6,606 3.86 0.05 1.16 0.02 0.040 0.00
Creeping Queue (SENTRI Lane)
4.75 VMT 5,020 3.87 0.04 1.13 0.01 0.040 0.00
30 Min. Soak & Restart (Standard Lane)
330 Vehicles 6,606 1.54 1.12 0.71 0.52 0.002 0.00
30 Min. Soak & Restart (SENTRI Lane)
251 Vehicles 5,020 1.54 0.85 0.69 0.38 0.002 0.00
Subtotal, Calexico West POE, Northbound 81.67 42.79 1.45
132

Vehicle Idling Emissions Study at Calexico East and Calexico West Ports-of-Entry October 2015, page 116
Table 59. Calexico East POE Northbound Private Vehicle Spring 2014 Vehicle Activity & Emissions with Shift of Commercial General-purpose to FAST
Process Activity Quantity Units Volume
ROG Rate
(g/mile) or (g/hour)
ROG Emissions (Lbs./Day)
NOx Rate
(g/mile) or
(g/hour)
NOx Emissions (Lbs./Day)
PM2.5 Rate
(g/mile) or (g/hour)
PM2.5 Emissions (Lbs./Day)
U.S. Primary, Standard Lane
Uncongested 2,998.3 VMT 1,639 0.56 3.68 0.62 4.09 0.021 0.14
Creeping Queue 198.4 VMT 1,639 3.86 1.69 1.16 0.51 0.040 0.02
Stop-and-Go Queue 131.1 VMT 1,639 7.71 2.23 2.32 0.67 0.080 0.02
Idle 42.8 Veh. Hours 1,639 19.29 1.82 5.80 0.55 0.201 0.02
U.S. Primary, Ready Lane
Uncongested 12,381.8 VMT 7,211 0.56 15.24 0.60 16.43 0.021 0.57
Creeping Queue 2,409.7 VMT 7,211 3.87 20.56 1.13 6.00 0.040 0.21
Stop-and-Go Queue 141.4 VMT 7,211 7.74 2.41 2.26 0.70 0.079 0.02
Idle 75.1 Veh. Hours 7,211 19.35 3.20 5.65 0.94 0.198 0.03
U.S. Primary, SENTRI Lane
Uncongested 3,463.8 VMT 1,778 0.56 4.26 0.60 4.60 0.021 0.16
Creeping Queue 57.8 VMT 1,778 3.87 0.49 1.13 0.14 0.040 0.01
Stop-and-Go Queue 33.7 VMT 1,778 7.74 0.57 2.26 0.17 0.079 0.01
Idle 14.3 Veh. Hours 1,778 19.35 0.61 5.65 0.18 0.198 0.01
U.S. Secondary Creeping Queue (Standard Lane)
1.6 VMT 1,639 3.86 0.01 1.16 0.00 0.040 0.00
Creeping Queue (Ready Lane)
6.8 VMT 7,211 3.87 0.06 1.13 0.02 0.040 0.00
Creeping Queue (SENTRI Lane)
1.7 VMT 1,778 3.87 0.01 1.13 0.00 0.040 0.00
30 Min. Soak and Restart (Standard Lane)
81.9 Vehicles 1,639 1.54 0.28 0.71 0.13 0.002 0.00
30 Min. Soak and Restart (Ready Lane)
360.6 Vehicles 7,211 1.54 1.23 0.69 0.55 0.002 0.00
30 Min. Soak and Restart (SENTRI Lane)
88.9 Vehicles 1,778 1.54 0.30 0.69 0.14 0.002 0.00
Subtotal, Calexico East POE, Northbound 58.66 35.81 1.22
133

Vehicle Idling Emissions Study at Calexico East and Calexico West Ports-of-Entry October 2015, page 117
Table 60. Calexico East POE Northbound Commercial Vehicle Spring 2014 Vehicle Activity & Emissions with Shift of Commercial General-purpose to FAST (1 of 2)
Process Activity Quantity Units Volume
ROG Rate
(g/mile) or (g/hour)
ROG Emissions (Lbs./Day)
NOx Rate
(g/mile) or
(g/hour)
NOx Emissions (Lbs./Day)
PM2.5 Rate
(g/mile) or (g/hour)
PM2.5 Emissions (Lbs./Day)
MX Aduanas Entrance
Stop-and-Go Queue (Standard, Laden)
7.0 VMT 370 13.50 0.21 64.90 1.00 2.267 0.04
Stop-and-Go Queue (Standard, Unladen)
6.0 VMT 315 13.50 0.18 64.90 0.85 2.267 0.03
Stop-and-Go Queue (FAST, Laden)
89.4 VMT 522 13.50 2.66 64.90 12.79 2.267 0.45
Stop-and-Go Queue (FAST, Unladen)
3.8 VMT 203 13.50 0.11 64.90 0.55 2.267 0.02
Idle (Standard) 16.2 Veh. Hours 686 33.76 1.21 162.27 5.79 5.668 0.20
Idle (FAST) 17.1 Veh. Hours 725 33.76 1.27 162.27 6.13 5.668 0.21
MX Aduanas Cargo Inspection
Idle (Standard) 30.7 Veh. Hours 686 33.76 2.29 162.27 11.00 5.668 0.38
Idle (FAST) 37.5 Veh. Hours 725 33.76 2.79 162.27 13.43 5.668 0.47
U.S. CBP Primary
Stop-and-Go Queue (Standard, Laden)
16.6 VMT 370 13.50 0.49 64.90 2.37 2.267 0.08
Stop-and-Go Queue (Standard, Unladen)
3.7 VMT 315 13.50 0.11 64.90 0.53 2.267 0.02
Stop-and-Go Queue (FAST, Laden)
9.9 VMT 522 13.50 0.29 64.90 1.41 2.267 0.05
Stop-and-Go Queue (FAST, Unladen)
2.4 VMT 203 13.50 0.07 64.90 0.34 2.267 0.01
Idle (Standard) 11.4 Veh. Hours 686 33.76 0.85 162.27 4.09 5.668 0.14
Idle (FAST) 12.1 Veh. Hours 725 33.76 0.90 162.27 4.32 5.668 0.15
U.S. CBP Cargo Inspection
Stop-and-Go Queue (Standard, Laden)
20.6 VMT 370 13.50 0.61 64.90 2.94 2.267 0.10
Stop-and-Go Queue (Standard, Unladen)
17.5 VMT 315 13.50 0.52 64.90 2.50 2.267 0.09
Stop-and-Go Queue (FAST, Laden)
29.0 VMT 370 13.50 0.86 64.90 4.15 2.267 0.14
Stop-and-Go Queue (FAST, Unladen)
11.3 VMT 144 13.50 0.34 64.90 1.61 2.267 0.06
Idle (Standard) 68.5 Veh. Hours 686 33.76 5.10 162.27 24.49 5.668 0.86
Idle (FAST) 77.4 Veh. Hours 514 33.76 5.76 162.27 27.70 5.668 0.97
134

Vehicle Idling Emissions Study at Calexico East and Calexico West Ports-of-Entry October 2015, page 118
Table 60. Calexico East POE Northbound Commercial Vehicle Spring 2014 Vehicle Activity & Emissions with Shift of Commercial General-purpose to FAST (2 of 2)
Process Activity Quantity Units Volume
ROG Rate
(g/mile) or (g/hour)
ROG Emissions (Lbs./Day)
NOx Rate
(g/mile) or
(g/hour)
NOx Emissions (Lbs./Day)
PM2.5 Rate
(g/mile) or (g/hour)
PM2.5 Emissions (Lbs./Day)
U.S. CBP Exit Stop-and-Go Queue (Standard, Laden)
15.1 VMT 370 13.50 0.45 64.90 2.16 2.267 0.08
Stop-and-Go Queue (Standard, Unladen)
12.8 VMT 315 13.50 0.38 64.90 1.84 2.267 0.06
Stop-and-Go Queue (FAST, Laden)
21.3 VMT 522 13.50 0.63 64.90 3.04 2.267 0.11
Stop-and-Go Queue (FAST, Unladen)
8.3 VMT 203 13.50 0.25 64.90 1.18 2.267 0.04
Idle (Standard) 5.1 Veh. Hours 686 33.76 0.38 162.27 1.84 5.668 0.06
Idle (FAST) 5.4 Veh. Hours 725 33.76 0.40 162.27 1.95 5.668 0.07
California CHP Stop-and-Go Queue (Standard, Laden)
7.0 VMT 370 13.50 0.21 64.90 1.00 2.267 0.04
Stop-and-Go Queue (Standard, Unladen)
6.0 VMT 315 13.50 0.18 64.90 0.85 2.267 0.03
Stop-and-Go Queue (FAST, Laden)
9.9 VMT 522 13.50 0.29 64.90 1.41 2.267 0.05
Stop-and-Go Queue (FAST, Unladen)
3.8 VMT 203 13.50 0.11 64.90 0.55 2.267 0.02
Idle (Standard) 6.9 Veh. Hours 686 33.76 0.51 162.27 2.45 5.668 0.09
Idle (FAST) 7.3 Veh. Hours 725 33.76 0.54 162.27 2.59 5.668 0.09
Other Uncongested Movement (Standard)
1,945.0 VMT 686 0.76 3.25 12.36 53.00 0.276 1.18
Uncongested Movement (FAST)
1,986.7 VMT 725 0.76 3.32 12.36 54.13 0.276 1.21
Subtotal, Calexico East Commercial, Northbound 37.54 256.00 7.59
135
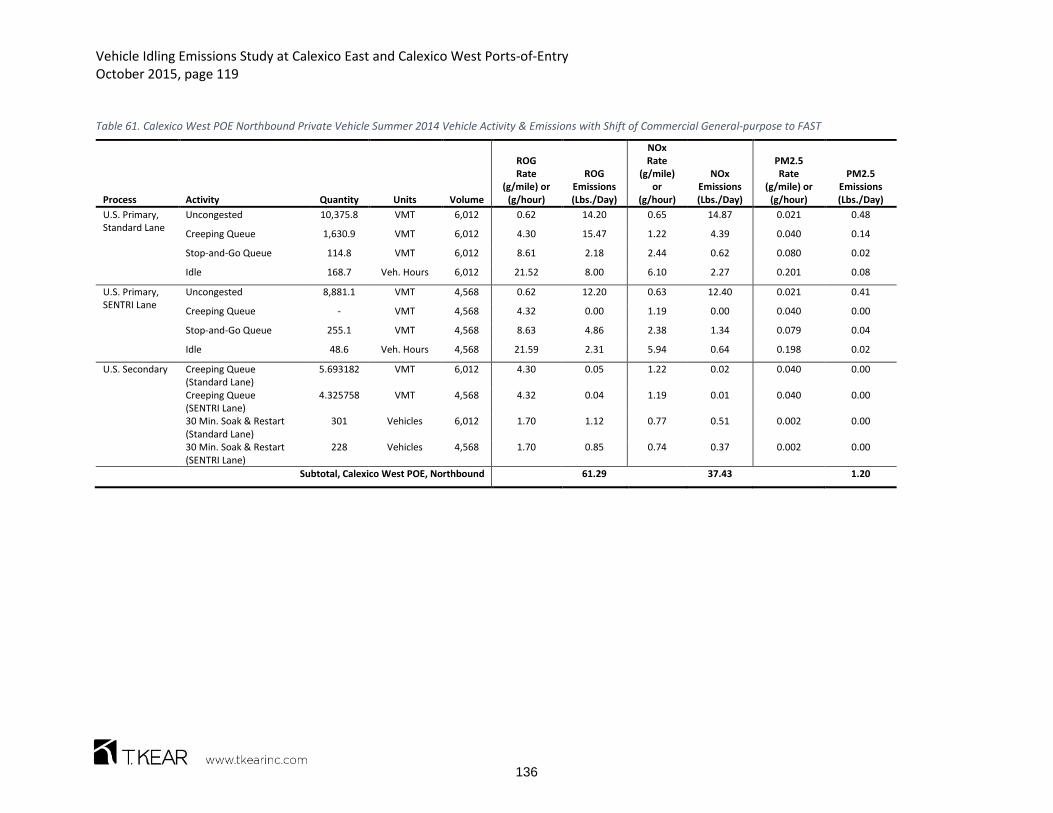
Vehicle Idling Emissions Study at Calexico East and Calexico West Ports-of-Entry October 2015, page 119
Table 61. Calexico West POE Northbound Private Vehicle Summer 2014 Vehicle Activity & Emissions with Shift of Commercial General-purpose to FAST
Process Activity Quantity Units Volume
ROG Rate
(g/mile) or (g/hour)
ROG Emissions (Lbs./Day)
NOx Rate
(g/mile) or
(g/hour)
NOx Emissions (Lbs./Day)
PM2.5 Rate
(g/mile) or (g/hour)
PM2.5 Emissions (Lbs./Day)
U.S. Primary, Standard Lane
Uncongested 10,375.8 VMT 6,012 0.62 14.20 0.65 14.87 0.021 0.48
Creeping Queue 1,630.9 VMT 6,012 4.30 15.47 1.22 4.39 0.040 0.14
Stop-and-Go Queue 114.8 VMT 6,012 8.61 2.18 2.44 0.62 0.080 0.02
Idle 168.7 Veh. Hours 6,012 21.52 8.00 6.10 2.27 0.201 0.08
U.S. Primary, SENTRI Lane
Uncongested 8,881.1 VMT 4,568 0.62 12.20 0.63 12.40 0.021 0.41
Creeping Queue - VMT 4,568 4.32 0.00 1.19 0.00 0.040 0.00
Stop-and-Go Queue 255.1 VMT 4,568 8.63 4.86 2.38 1.34 0.079 0.04
Idle 48.6 Veh. Hours 4,568 21.59 2.31 5.94 0.64 0.198 0.02
U.S. Secondary Creeping Queue (Standard Lane)
5.693182 VMT 6,012 4.30 0.05 1.22 0.02 0.040 0.00
Creeping Queue (SENTRI Lane)
4.325758 VMT 4,568 4.32 0.04 1.19 0.01 0.040 0.00
30 Min. Soak & Restart (Standard Lane)
301 Vehicles 6,012 1.70 1.12 0.77 0.51 0.002 0.00
30 Min. Soak & Restart (SENTRI Lane)
228 Vehicles 4,568 1.70 0.85 0.74 0.37 0.002 0.00
Subtotal, Calexico West POE, Northbound 61.29 37.43 1.20
136

Vehicle Idling Emissions Study at Calexico East and Calexico West Ports-of-Entry October 2015, page 120
Table 62. Calexico East POE Northbound Private Vehicle Summer 2014 Vehicle Activity & Emissions with Shift of Commercial General-purpose to FAST
Process Activity Quantity Units Volume
ROG Rate
(g/mile) or (g/hour)
ROG Emissions (Lbs./Day)
NOx Rate
(g/mile) or
(g/hour)
NOx Emissions (Lbs./Day)
PM2.5 Rate
(g/mile) or (g/hour)
PM2.5 Emissions (Lbs./Day)
U.S. Primary, Standard Lane
Uncongested 2,900.8 VMT 1,608 0.62 3.97 0.65 4.16 0.021 0.14
Creeping Queue 257.0 VMT 1,608 4.30 2.44 1.22 0.69 0.040 0.02
Stop-and-Go Queue 126.9 VMT 1,608 8.61 2.41 2.44 0.68 0.080 0.02
Idle 42.0 Veh. Hours 1,608 21.52 1.99 6.10 0.56 0.201 0.02
U.S. Primary, Ready Lane
Uncongested 13,064.0 VMT 7,075 0.62 17.94 0.63 18.23 0.021 0.61
Creeping Queue 1,444.9 VMT 7,075 4.32 13.75 1.19 3.79 0.040 0.13
Stop-and-Go Queue 138.7 VMT 7,075 8.63 2.64 2.38 0.73 0.079 0.02
Idle 73.7 Veh. Hours 7,075 21.59 3.51 5.94 0.97 0.198 0.01
U.S. Primary, SENTRI Lane
Uncongested 3,445.8 VMT 1,746 0.62 4.73 0.63 4.81 0.021 0.16
Creeping Queue 12.7 VMT 1,746 4.32 0.12 1.19 0.03 0.040 0.00
Stop-and-Go Queue 33.1 VMT 1,746 8.63 0.63 2.38 0.17 0.079 0.01
Idle 14.1 Veh. Hours 1,746 21.59 0.67 5.94 0.18 0.198 0.01
U.S. Secondary Creeping Queue (Standard Lane)
1.5 VMT 1,608 4.30 0.01 1.22 0.00 0.040 0.00
Creeping Queue (Ready Lane)
6.7 VMT 7,075 4.32 0.06 1.19 0.02 0.040 0.00
Creeping Queue (SENTRI Lane)
1.7 VMT 1,746 4.32 0.02 1.19 0.00 0.040 0.00
30 Min. Soak and Restart (Standard Lane)
80.4 Vehicles 1,608 1.70 0.30 0.77 0.14 0.002 0.00
30 Min. Soak and Restart (Ready Lane)
353.7 Vehicles 7,075 1.70 1.32 0.74 0.58 0.002 0.00
30 Min. Soak and Restart (SENTRI Lane)
87.3 Vehicles 1,746 1.70 0.33 0.74 0.14 0.002 0.00
Subtotal, Calexico East POE, Northbound 56.85 35.89 1.16
137

Vehicle Idling Emissions Study at Calexico East and Calexico West Ports-of-Entry October 2015, page 121
Table 63. Calexico East POE Northbound Commercial Vehicle Summer 2014 Vehicle Activity & Emissions with Shift of Commercial General-purpose to FAST (1 of 2)
Process Activity Quantity Units Volume
ROG Rate
(g/mile) or (g/hour)
ROG Emissions (Lbs./Day)
NOx Rate
(g/mile) or
(g/hour)
NOx Emissions (Lbs./Day)
PM2.5 Rate
(g/mile) or (g/hour)
PM2.5 Emissions (Lbs./Day)
MX Aduanas Entrance
Stop-and-Go Queue (Standard, Laden)
6.6 VMT 350 13.56 0.20 64.90 0.95 2.267 0.03
Stop-and-Go Queue (Standard, Unladen)
5.7 VMT 298 13.56 0.17 64.90 0.81 2.267 0.03
Stop-and-Go Queue (FAST, Laden)
39.2 VMT 494 13.56 1.17 64.90 5.61 2.267 0.20
Stop-and-Go Queue (FAST, Unladen)
3.6 VMT 192 13.56 0.11 64.90 0.52 2.267 0.02
Idle (Standard) 15.3 Veh. Hours 649 33.91 1.15 162.29 5.48 5.668 0.19
Idle (FAST) 16.2 Veh. Hours 686 33.91 1.21 162.29 5.80 5.668 0.20
MX Aduanas Cargo Inspection
Idle (Standard) 29.1 Veh. Hours 649 33.91 2.17 162.29 10.40 5.668 0.36
Idle (FAST) 35.5 Veh. Hours 686 33.91 2.65 162.29 12.70 5.668 0.44
U.S. CBP Primary
Stop-and-Go Queue (Standard, Laden)
7.9 VMT 350 13.56 0.24 64.90 1.13 2.267 0.04
Stop-and-Go Queue (Standard, Unladen)
3.5 VMT 298 13.27 0.10 64.90 0.50 2.267 0.02
Stop-and-Go Queue (FAST, Laden)
9.4 VMT 494 13.56 0.28 64.90 1.34 2.267 0.05
Stop-and-Go Queue (FAST, Unladen)
2.2 VMT 192 13.56 0.07 64.90 0.32 2.267 0.01
Idle (Standard) 10.8 Veh. Hours 649 33.91 0.81 162.29 3.87 5.668 0.14
Idle (FAST) 11.4 Veh. Hours 686 33.91 0.85 162.29 4.09 5.668 0.14
U.S. CBP Cargo Inspection
Stop-and-Go Queue (Standard, Laden)
9.6 VMT 350 13.56 0.29 64.90 1.38 2.267 0.05
Stop-and-Go Queue (Standard, Unladen)
8.2 VMT 298 13.56 0.25 64.90 1.18 2.267 0.04
Stop-and-Go Queue (FAST, Laden)
13.6 VMT 350 13.56 0.41 64.90 1.95 2.267 0.07
Stop-and-Go Queue (FAST, Unladen)
5.3 VMT 136 13.56 0.16 64.90 0.76 2.267 0.03
Idle (Standard) 64.8 Veh. Hours 649 33.91 4.84 162.29 23.17 5.668 0.81
Idle (FAST) 73.2 Veh. Hours 487 33.91 5.48 162.29 26.21 5.668 0.92
138

Vehicle Idling Emissions Study at Calexico East and Calexico West Ports-of-Entry October 2015, page 122
Table 63. Calexico East POE Northbound Commercial Vehicle Summer 2014 Vehicle Activity & Emissions with Shift of Commercial General-purpose to FAST (2 of 2)
Process Activity Quantity Units Volume
ROG Rate
(g/mile) or (g/hour)
ROG Emissions (Lbs./Day)
NOx Rate
(g/mile) or
(g/hour)
NOx Emissions (Lbs./Day)
PM2.5 Rate
(g/mile) or (g/hour)
PM2.5 Emissions (Lbs./Day)
U.S. CBP Exit Stop-and-Go Queue (Standard, Laden)
6.6 VMT 350 13.56 0.20 64.90 0.95 2.267 0.03
Stop-and-Go Queue (Standard, Unladen)
5.7 VMT 298 13.56 0.17 64.90 0.81 2.267 0.03
Stop-and-Go Queue (FAST, Laden)
9.4 VMT 494 13.56 0.28 64.90 1.34 2.267 0.05
Stop-and-Go Queue (FAST, Unladen)
3.6 VMT 192 13.56 0.11 64.90 0.52 2.267 0.02
Idle (Standard) 4.9 Veh. Hours 649 33.91 0.36 162.29 1.74 5.668 0.06
Idle (FAST) 5.1 Veh. Hours 686 33.91 0.38 162.29 1.84 5.668 0.06
California CHP Stop-and-Go Queue (Standard, Laden)
6.6 VMT 350 13.56 0.20 64.90 0.95 2.267 0.03
Stop-and-Go Queue (Standard, Unladen)
5.7 VMT 298 13.56 0.17 64.90 0.81 2.267 0.03
Stop-and-Go Queue (FAST, Laden)
9.4 VMT 494 13.56 0.28 64.90 1.34 2.267 0.05
Stop-and-Go Queue (FAST, Unladen)
3.6 VMT 192 13.56 0.11 64.90 0.52 2.267 0.02
Idle (Standard) 6.5 Veh. Hours 649 33.91 0.49 162.29 2.32 5.668 0.08
Idle (FAST) 6.9 Veh. Hours 686 33.91 0.51 162.29 2.45 5.668 0.09
Other Uncongested Movement (Standard)
1,880.1 VMT 649 0.76 3.16 12.36 51.24 0.276 1.14
Uncongested Movement (FAST)
1,959.0 VMT 686 0.76 3.29 12.36 53.39 0.276 1.19
Subtotal, Calexico East Commercial, Northbound 32.31 228.36 6.66
139

Vehicle Idling Emissions Study at Calexico East and Calexico West Ports-of-Entry October 2015, page 123
Table 64. Calexico West POE Northbound Private Vehicle Winter 2014 Vehicle Activity & Emissions with Shift of Commercial General-purpose to FAST
Process Activity Quantity Units Volume
ROG Rate
(g/mile) or (g/hour)
ROG Emissions (Lbs./Day)
NOx Rate
(g/mile) or
(g/hour)
NOx Emissions (Lbs./Day)
PM2.5 Rate
(g/mile) or (g/hour)
PM2.5 Emissions (Lbs./Day)
U.S. Primary, Standard Lane
Uncongested 11,043.8 VMT 7,055.0 0.44 10.78 0.73 17.73 0.021 0.51
Creeping Queue 3,061.5 VMT 7,055.0 3.07 20.75 1.37 9.24 0.040 0.27
Stop-and-Go Queue 134.8 VMT 7,055.0 6.15 1.83 2.74 0.81 0.080 0.02
Idle 170.5 Veh. Hours 7,055.0 15.37 5.78 6.84 2.57 0.201 0.08
U.S. Primary, SENTRI Lane
Uncongested 9,345.6 VMT 5,361.0 0.44 9.08 0.71 14.61 0.021 0.43
Creeping Queue - VMT 5,361.0 3.06 0.00 1.33 0.00 0.040 0.00
Stop-and-Go Queue 1,403.8 VMT 5,361.0 6.12 18.94 2.67 8.25 0.079 0.25
Idle 50.6 Veh. Hours 5,361.0 15.30 1.71 6.66 0.74 0.198 0.02
U.S. Secondary Creeping Queue (Standard Lane)
6.680871 VMT 7,055.0 3.07 0.05 1.37 0.02 0.040 0.00
Creeping Queue (SENTRI Lane)
5.076705 VMT 5,361.0 3.06 0.03 1.33 0.01 0.040 0.00
30 Min. Soak & Restart (Standard Lane)
353 Vehicles 7,055.0 1.17 0.91 0.90 0.70 0.002 0.00
30 Min. Soak & Restart (SENTRI Lane)
268 Vehicles 5,361.0 1.16 0.69 0.87 0.52 0.002 0.00
Subtotal, Calexico West POE, Northbound 70.55 55.21 1.59
140

Vehicle Idling Emissions Study at Calexico East and Calexico West Ports-of-Entry October 2015, page 124
Table 65. Calexico East POE Northbound Private Vehicle Winter 2014 Vehicle Activity & Emissions with Shift of Commercial General-purpose to FAST
Process Activity Quantity Units Volume
ROG Rate
(g/mile) or (g/hour)
ROG Emissions (Lbs./Day)
NOx Rate
(g/mile) or
(g/hour)
NOx Emissions (Lbs./Day)
PM2.5 Rate
(g/mile) or (g/hour)
PM2.5 Emissions (Lbs./Day)
U.S. Primary, Standard Lane
Uncongested 3,246.0 VMT 1,754 0.44 3.17 0.73 5.21 0.021 0.15
Creeping Queue 199.1 VMT 1,754 3.07 1.35 1.37 0.60 0.040 0.02
Stop-and-Go Queue 122.6 VMT 1,754 6.15 1.66 2.74 0.74 0.080 0.02
Idle 40.4 Veh. Hours 1,754 15.37 1.37 6.84 0.61 0.201 0.02
U.S. Primary, Ready Lane
Uncongested 13,732.1 VMT 7,719 0.44 13.35 0.71 21.47 0.021 0.64
Creeping Queue 2,183.0 VMT 7,719 3.06 14.73 1.33 6.41 0.040 0.19
Stop-and-Go Queue 152.2 VMT 7,719 6.12 2.05 2.67 0.89 0.079 0.03
Idle 74.0 Veh. Hours 7,719 15.30 2.49 6.66 1.09 0.198 0.03
U.S. Primary, SENTRI Lane
Uncongested 3,701.3 VMT 1,908 0.44 3.60 0.71 5.79 0.021 0.17
Creeping Queue 78.6 VMT 1,908 3.06 0.53 1.33 0.23 0.040 0.01
Stop-and-Go Queue 36.1 VMT 1,908 6.12 0.49 2.67 0.21 0.079 0.01
Idle 14.3 Veh. Hours 1,908 15.30 0.48 6.66 0.21 0.198 0.01
U.S. Secondary Creeping Queue (Standard Lane)
1.7 VMT 1,754 3.07 0.01 1.37 0.01 0.040 0.00
Creeping Queue (Ready Lane)
7.3 VMT 7,719 3.06 0.05 1.33 0.02 0.040 0.00
Creeping Queue (SENTRI Lane)
1.8 VMT 1,908 3.06 0.01 1.33 0.01 0.040 0.00
30 Min. Soak and Restart (Standard Lane)
87.7 Vehicles 1,754 1.17 0.23 0.90 0.17 0.002 0.00
30 Min. Soak and Restart (Ready Lane)
385.9 Vehicles 7,719 1.16 0.99 0.87 0.74 0.002 0.00
30 Min. Soak and Restart (SENTRI Lane)
95.4 Vehicles 1,908 1.16 0.24 0.87 0.18 0.002 0.00
Subtotal, Calexico East POE, Northbound 46.80 44.59 1.29
141

Vehicle Idling Emissions Study at Calexico East and Calexico West Ports-of-Entry October 2015, page 125
Table 66. Calexico East POE Northbound Commercial Vehicle Winter 2014 Vehicle Activity & Emissions with Shift of Commercial General-purpose to FAST (1 of 2)
Process Activity Quantity Units Volume
ROG Rate
(g/mile) or (g/hour)
ROG Emissions (Lbs./Day)
NOx Rate
(g/mile) or
(g/hour)
NOx Emissions (Lbs./Day)
PM2.5 Rate
(g/mile) or (g/hour)
PM2.5 Emissions (Lbs./Day)
MX Aduanas Entrance
Stop-and-Go Queue (Standard, Laden)
6.8 VMT 358 13.44 0.20 64.94 0.97 2.267 0.03
Stop-and-Go Queue (Standard, Unladen)
5.8 VMT 305 13.44 0.17 64.94 0.83 2.267 0.03
Stop-and-Go Queue (FAST, Laden)
56.2 VMT 504 13.44 1.67 64.94 8.04 2.267 0.28
Stop-and-Go Queue (FAST, Unladen)
3.7 VMT 196 13.44 0.11 64.94 0.53 2.267 0.02
Idle (Standard) 15.6 Veh. Hours 662 33.62 1.16 162.37 5.60 5.668 0.20
Idle (FAST) 16.5 Veh. Hours 701 33.62 1.23 162.37 5.92 5.668 0.21
MX Aduanas Cargo Inspection
Idle (Standard) 29.7 Veh. Hours 662 33.62 2.20 162.37 10.63 5.668 0.37
Idle (FAST) 36.3 Veh. Hours 701 33.62 2.69 162.37 12.98 5.668 0.45
U.S. CBP Primary
Stop-and-Go Queue (Standard, Laden)
9.7 VMT 358 13.44 0.29 64.94 1.39 2.267 0.05
Stop-and-Go Queue (Standard, Unladen)
3.5 VMT 305 13.44 0.11 64.94 0.51 2.267 0.02
Stop-and-Go Queue (FAST, Laden)
9.6 VMT 504 13.44 0.28 64.94 1.37 2.267 0.05
Stop-and-Go Queue (FAST, Unladen)
2.3 VMT 196 13.44 0.07 64.94 0.33 2.267 0.01
Idle (Standard) 11.0 Veh. Hours 662 33.62 0.82 162.37 3.95 5.668 0.14
Idle (FAST) 11.7 Veh. Hours 701 33.62 0.87 162.37 4.18 5.668 0.15
U.S. CBP Cargo Inspection
Stop-and-Go Queue (Standard, Laden)
12.4 VMT 358 13.44 0.37 64.94 1.77 2.267 0.06
Stop-and-Go Queue (Standard, Unladen)
10.5 VMT 305 13.44 0.31 64.94 1.51 2.267 0.05
Stop-and-Go Queue (FAST, Laden)
17.4 VMT 358 13.44 0.52 64.94 2.50 2.267 0.09
Stop-and-Go Queue (FAST, Unladen)
6.8 VMT 139 13.44 0.20 64.94 0.97 2.267 0.03
Idle (Standard) 66.1 Veh. Hours 662 33.62 4.90 162.37 23.67 5.668 0.83
Idle (FAST) 74.8 Veh. Hours 497 33.62 5.54 162.37 26.77 5.668 0.93
142

Vehicle Idling Emissions Study at Calexico East and Calexico West Ports-of-Entry October 2015, page 126
Table 66. Calexico East POE Northbound Commercial Vehicle Winter 2014 Vehicle Activity & Emissions with Shift of Commercial General-purpose to FAST (2 of 2)
Process Activity Quantity Units Volume
ROG Rate
(g/mile) or (g/hour)
ROG Emissions (Lbs./Day)
NOx Rate
(g/mile) or
(g/hour)
NOx Emissions (Lbs./Day)
PM2.5 Rate
(g/mile) or (g/hour)
PM2.5 Emissions (Lbs./Day)
U.S. CBP Exit Stop-and-Go Queue (Standard, Laden)
8.1 VMT 358 13.44 0.24 64.94 1.15 2.267 0.04
Stop-and-Go Queue (Standard, Unladen)
6.9 VMT 305 13.44 0.20 64.94 0.98 2.267 0.03
Stop-and-Go Queue (FAST, Laden)
11.4 VMT 504 13.44 0.34 64.94 1.63 2.267 0.06
Stop-and-Go Queue (FAST, Unladen)
4.4 VMT 196 13.44 0.13 64.94 0.63 2.267 0.02
Idle (Standard) 5.0 Veh. Hours 662 33.62 0.37 162.37 1.78 5.668 0.06
Idle (FAST) 5.3 Veh. Hours 701 33.62 0.39 162.37 1.88 5.668 0.07
California CHP Stop-and-Go Queue (Standard, Laden)
6.8 VMT 358 13.44 0.20 64.94 0.97 2.267 0.03
Stop-and-Go Queue (Standard, Unladen)
5.8 VMT 305 13.44 0.17 64.94 0.83 2.267 0.03
Stop-and-Go Queue (FAST, Laden)
9.6 VMT 504 13.44 0.28 64.94 1.37 2.267 0.05
Stop-and-Go Queue (FAST, Unladen)
3.7 VMT 196 13.44 0.11 64.94 0.53 2.267 0.02
Idle (Standard) 6.6 Veh. Hours 662 33.62 0.49 162.37 2.37 5.668 0.08
Idle (FAST) 7.0 Veh. Hours 701 33.62 0.52 162.37 2.51 5.668 0.09
Other Uncongested Movement (Standard)
1,911.1 VMT 662 0.75 3.17 12.37 52.12 0.276 1.16
Uncongested Movement (FAST)
1,976.8 VMT 701 0.75 3.28 12.37 53.91 0.276 1.20
Subtotal, Calexico East Commercial, Northbound 33.58 237.07 6.94
143

Vehicle Idling Emissions Study at Calexico East and Calexico West Ports-of-Entry October 2015, page 127
Table 67. Calexico West POE Northbound Private Vehicle Spring 2014 Vehicle Activity & Emissions with Combined U.S.-Mex. Commercial Inspections
Process Activity Quantity Units Volume
ROG Rate
(g/mile) or (g/hour)
ROG Emissions (Lbs./Day)
NOx Rate
(g/mile) or
(g/hour)
NOx Emissions (Lbs./Day)
PM2.5 Rate
(g/mile) or (g/hour)
PM2.5 Emissions (Lbs./Day)
U.S. Primary, Standard Lane
Uncongested 9,133.8 VMT 6,606 0.56 11.20 0.62 12.45 0.021 0.43
Creeping Queue 3,953.9 VMT 6,606 3.86 33.62 1.16 10.11 0.040 0.35
Stop-and-Go Queue 125.1 VMT 6,606 7.71 2.13 2.32 0.64 0.080 0.02
Idle 174.3 Veh. Hours 6,606 19.29 7.41 5.80 2.23 0.201 0.08
U.S. Primary, SENTRI Lane
Uncongested 9,362.2 VMT 5,020 0.56 11.52 0.60 12.42 0.021 0.43
Creeping Queue - VMT 5,020 3.87 0.00 1.13 0.00 0.040 0.00
Stop-and-Go Queue 678.4 VMT 5,020 7.74 11.57 2.26 3.38 0.079 0.12
Idle 50.2 Veh. Hours 5,020 19.35 2.14 5.65 0.63 0.198 0.02
U.S. Secondary Creeping Queue (Standard Lane)
6.26 VMT 6,606 3.86 0.05 1.16 0.02 0.040 0.00
Creeping Queue (SENTRI Lane)
4.75 VMT 5,020 3.87 0.04 1.13 0.01 0.040 0.00
30 Min. Soak & Restart (Standard Lane)
330 Vehicles 6,606 1.54 1.12 0.71 0.52 0.002 0.00
30 Min. Soak & Restart (SENTRI Lane)
251 Vehicles 5,020 1.54 0.85 0.69 0.38 0.002 0.00
Subtotal, Calexico West POE, Northbound 81.67 42.79 1.45
144

Vehicle Idling Emissions Study at Calexico East and Calexico West Ports-of-Entry October 2015, page 128
Table 68. Calexico East POE Northbound Private Vehicle Spring 2014 Vehicle Activity & Emissions with Combined U.S.-Mex. Commercial Inspections
Process Activity Quantity Units Volume
ROG Rate
(g/mile) or (g/hour)
ROG Emissions (Lbs./Day)
NOx Rate
(g/mile) or
(g/hour)
NOx Emissions (Lbs./Day)
PM2.5 Rate
(g/mile) or (g/hour)
PM2.5 Emissions (Lbs./Day)
U.S. Primary, Standard Lane
Uncongested 2,998.3 VMT 1,639 0.56 3.68 0.62 4.09 0.021 0.14
Creeping Queue 198.4 VMT 1,639 3.86 1.69 1.16 0.51 0.040 0.02
Stop-and-Go Queue 131.1 VMT 1,639 7.71 2.23 2.32 0.67 0.080 0.02
Idle 42.8 Veh. Hours 1,639 19.29 1.82 5.80 0.55 0.201 0.02
U.S. Primary, Ready Lane
Uncongested 12,381.8 VMT 7,211 0.56 15.24 0.60 16.43 0.021 0.57
Creeping Queue 2,409.7 VMT 7,211 3.87 20.56 1.13 6.00 0.040 0.21
Stop-and-Go Queue 141.4 VMT 7,211 7.74 2.41 2.26 0.70 0.079 0.02
Idle 75.1 Veh. Hours 7,211 19.35 3.20 5.65 0.94 0.198 0.03
U.S. Primary, SENTRI Lane
Uncongested 3,463.8 VMT 1,778 0.56 4.26 0.60 4.60 0.021 0.16
Creeping Queue 57.8 VMT 1,778 3.87 0.06 1.13 0.14 0.040 0.01
Stop-and-Go Queue 33.7 VMT 1,778 7.74 0.57 2.26 0.17 0.079 0.01
Idle 14.3 Veh. Hours 1,778 19.35 0.61 5.65 0.18 0.198 0.01
U.S. Secondary Creeping Queue (Standard Lane)
1.6 VMT 1,639 3.86 0.01 1.16 0.00 0.040 0.00
Creeping Queue (Ready Lane)
6.8 VMT 7,211 3.87 0.06 1.13 0.02 0.040 0.00
Creeping Queue (SENTRI Lane)
1.7 VMT 1,778 3.87 0.01 1.13 0.00 0.040 0.00
30 Min. Soak and Restart (Standard Lane)
81.9 Vehicles 1,639 1.54 0.28 0.71 0.13 0.002 0.00
30 Min. Soak and Restart (Ready Lane)
360.6 Vehicles 7,211 1.54 1.23 0.69 0.55 0.002 0.00
30 Min. Soak and Restart (SENTRI Lane)
88.9 Vehicles 1,778 1.54 0.30 0.69 0.14 0.002 0.00
Subtotal, Calexico East POE, Northbound 58.66 35.81 1.22
145

Vehicle Idling Emissions Study at Calexico East and Calexico West Ports-of-Entry October 2015, page 129
Table 69. Calexico East POE Northbound Commercial Vehicle Spring 2014 Vehicle Activity & Emissions with Combined U.S.-Mex. Commercial Inspections (1 of 2)
Process Activity Quantity Units Volume
ROG Rate
(g/mile) or (g/hour)
ROG Emissions (Lbs./Day)
NOx Rate
(g/mile) or
(g/hour)
NOx Emissions (Lbs./Day)
PM2.5 Rate
(g/mile) or (g/hour)
PM2.5 Emissions (Lbs./Day)
MX Aduanas Entrance
Stop-and-Go Queue (Standard, Laden)
- VMT 411 13.50 0.00 64.90 0.00 2.267 0.00
Stop-and-Go Queue (Standard, Unladen)
- VMT 350 13.50 0.00 64.90 0.00 2.267 0.00
Stop-and-Go Queue (FAST, Laden)
- VMT 467 13.50 0.00 64.90 0.00 2.267 0.00
Stop-and-Go Queue (FAST, Unladen)
- VMT 182 13.50 0.00 64.90 0.00 2.267 0.00
Idle (Standard) - Veh. Hours 762 33.76 0.00 162.27 0.00 5.668 0.00
Idle (FAST) - Veh. Hours 649 33.76 0.00 162.27 0.00 5.668 0.00
MX Aduanas Cargo Inspection
Idle (Standard) 34.2 Veh. Hours 762 33.76 2.54 162.27 12.22 5.668 0.43
Idle (FAST) 33.6 Veh. Hours 649 33.76 2.50 162.27 12.02 5.668 0.42
U.S. CBP Primary
Stop-and-Go Queue (Standard, Laden)
126.4 VMT 411 13.50 3.76 64.90 18.08 2.267 0.63
Stop-and-Go Queue (Standard, Unladen)
4.1 VMT 350 13.50 0.12 64.90 0.58 2.267 0.02
Stop-and-Go Queue (FAST, Laden)
8.9 VMT 467 13.50 0.26 64.90 1.27 2.267 0.04
Stop-and-Go Queue (FAST, Unladen)
2.1 VMT 182 13.50 0.06 64.90 0.30 2.267 0.01
Idle (Standard) 12.7 Veh. Hours 762 33.76 0.95 162.27 4.54 5.668 0.16
Idle (FAST) 10.8 Veh. Hours 649 33.76 0.81 162.27 3.87 5.668 0.14
U.S. CBP Cargo Inspection
Stop-and-Go Queue (Standard, Laden)
22.8 VMT 411 13.50 0.68 64.90 3.27 2.267 0.11
Stop-and-Go Queue (Standard, Unladen)
19.5 VMT 350 13.50 0.58 64.90 2.78 2.267 0.10
Stop-and-Go Queue (FAST, Laden)
25.9 VMT 411 13.50 0.77 64.90 3.71 2.267 0.13
Stop-and-Go Queue (FAST, Unladen)
10.1 VMT 160 13.50 0.30 64.90 1.44 2.267 0.05
Idle (Standard) 76.1 Veh. Hours 762 33.76 5.66 162.27 27.21 5.668 0.95
Idle (FAST) 69.3 Veh. Hours 571 33.76 5.16 162.27 24.79 5.668 0.87
146

Vehicle Idling Emissions Study at Calexico East and Calexico West Ports-of-Entry October 2015, page 130
Table 69. Calexico East POE Northbound Commercial Vehicle Spring 2014 Vehicle Activity & Emissions with Combined U.S.-Mex. Commercial Inspections (2 of 2)
Process Activity Quantity Units Volume
ROG Rate
(g/mile) or (g/hour)
ROG Emissions (Lbs./Day)
NOx Rate
(g/mile) or
(g/hour)
NOx Emissions (Lbs./Day)
PM2.5 Rate
(g/mile) or (g/hour)
PM2.5 Emissions (Lbs./Day)
U.S. CBP Exit Stop-and-Go Queue (Standard, Laden)
16.8 VMT 411 13.50 0.50 64.90 2.40 2.267 0.08
Stop-and-Go Queue (Standard, Unladen)
14.3 VMT 350 13.50 0.42 64.90 2.04 2.267 0.07
Stop-and-Go Queue (FAST, Laden)
19.0 VMT 467 13.50 0.57 64.90 2.72 2.267 0.10
Stop-and-Go Queue (FAST, Unladen)
7.4 VMT 182 13.50 0.22 64.90 1.06 2.267 0.04
Idle (Standard) 5.7 Veh. Hours 762 33.76 0.43 162.27 2.04 5.668 0.07
Idle (FAST) 4.9 Veh. Hours 649 33.76 0.36 162.27 1.74 5.668 0.06
California CHP Stop-and-Go Queue (Standard, Laden)
7.8 VMT 411 13.50 0.23 64.90 1.11 2.267 0.04
Stop-and-Go Queue (Standard, Unladen)
6.6 VMT 350 13.50 0.20 64.90 0.95 2.267 0.03
Stop-and-Go Queue (FAST, Laden)
8.9 VMT 467 13.50 0.26 64.90 1.27 2.267 0.04
Stop-and-Go Queue (FAST, Unladen)
3.4 VMT 182 13.50 0.10 64.90 0.49 2.267 0.02
Idle (Standard) 7.6 Veh. Hours 762 33.76 0.57 162.27 2.73 5.668 1.10
Idle (FAST) 6.5 Veh. Hours 649 33.76 0.48 162.27 2.32 5.668 0.08
Other Uncongested Movement (Standard)
2,053.2 VMT 762 0.76 3.43 12.36 55.94 0.276 1.25
Uncongested Movement (FAST)
1,841.9 VMT 649 0.76 3.08 12.36 50.19 0.276 1.12
Subtotal, Calexico East Commercial, Northbound 35.00 243.09 7.15
147

Vehicle Idling Emissions Study at Calexico East and Calexico West Ports-of-Entry October 2015, page 131
Table 70. Calexico West POE Northbound Private Vehicle Summer 2014 Vehicle Activity & Emissions with Combined U.S.-Mex. Commercial Inspections
Process Activity Quantity Units Volume
ROG Rate
(g/mile) or (g/hour)
ROG Emissions (Lbs./Day)
NOx Rate
(g/mile) or
(g/hour)
NOx Emissions (Lbs./Day)
PM2.5 Rate
(g/mile) or (g/hour)
PM2.5 Emissions (Lbs./Day)
U.S. Primary, Standard Lane
Uncongested 10,375.8 VMT 6,012 0.62 14.20 0.65 14.87 0.021 0.48
Creeping Queue 1,630.9 VMT 6,012 4.30 15.47 1.22 4.39 0.040 0.14
Stop-and-Go Queue 114.8 VMT 6,012 8.61 2.18 2.44 0.62 0.080 0.02
Idle 168.7 Veh. Hours 6,012 21.52 8.00 6.10 2.27 0.201 0.07
U.S. Primary, SENTRI Lane
Uncongested 8,881.1 VMT 4,568 0.62 12.20 0.63 12.40 0.021 0.41
Creeping Queue - VMT 4,468 4.32 0.00 1.19 0.00 0.040 0.00
Stop-and-Go Queue 255.1 VMT 4,568 8.63 4.86 2.38 1.34 0.079 0.04
Idle 48.6 Veh. Hours 4,568 21.59 2.31 5.94 0.64 0.198 0.02
U.S. Secondary Creeping Queue (Standard Lane)
5.693182 VMT 6,012 4.30 0.05 1.22 0.02 0.040 0.00
Creeping Queue (SENTRI Lane)
4.325758 VMT 4,568 4.32 0.04 1.19 0.01 0.040 0.00
30 Min. Soak & Restart (Standard Lane)
301 Vehicles 6,012 1.70 1.12 0.77 0.51 0.002 0.00
30 Min. Soak & Restart (SENTRI Lane)
228 Vehicles 4,568 1.70 0.85 0.74 0.37 0.002 0.00
Subtotal, Calexico West POE, Northbound 61.29 37.43 1.20
148

Vehicle Idling Emissions Study at Calexico East and Calexico West Ports-of-Entry October 2015, page 132
Table 71. Calexico East POE Northbound Private Vehicle Summer 2014 Vehicle Activity & Emissions with Combined U.S.-Mex. Commercial Inspections
Process Activity Quantity Units Volume
ROG Rate
(g/mile) or (g/hour)
ROG Emissions (Lbs./Day)
NOx Rate
(g/mile) or
(g/hour)
NOx Emissions (Lbs./Day)
PM2.5 Rate
(g/mile) or (g/hour)
PM2.5 Emissions (Lbs./Day)
U.S. Primary, Standard Lane
Uncongested 2,900.8 VMT 1,608 0.62 3.97 0.65 4.16 0.021 0.14
Creeping Queue 257.0 VMT 1,608 4.30 2.44 1.22 0.69 0.040 0.02
Stop-and-Go Queue 126.9 VMT 1,608 8.61 2.41 2.44 0.68 0.080 0.02
Idle 42.0 Veh. Hours 1,608 21.52 1.99 6.10 0.56 0.201 0.02
U.S. Primary, Ready Lane
Uncongested 13,064.0 VMT 7,075 0.62 17.94 0.63 18.23 0.021 0.61
Creeping Queue 1,444.9 VMT 7,075 4.32 13.75 1.19 3.79 0.040 0.13
Stop-and-Go Queue 138.7 VMT 7,075 8.63 2.64 2.38 0.73 0.079 0.02
Idle 73.7 Veh. Hours 7,075 21.59 3.51 5.94 0.97 0.198 0.03
U.S. Primary, SENTRI Lane
Uncongested 3.445.8 VMT 1,746 0.62 4.73 0.63 4.81 0.021 0.16
Creeping Queue 12.7 VMT 1.746 4.32 0.12 1.19 0.03 0.040 0.00
Stop-and-Go Queue 33.1 VMT 1,746 8.63 0.63 2.38 0.17 0.079 0.01
Idle 14.1 Veh. Hours 1,746 21.59 0.67 5.94 0.18 0.198 0.01
U.S. Secondary Creeping Queue (Standard Lane)
1.5 VMT 1,608 4.30 0.01 1.22 0.00 0.040 0.00
Creeping Queue (Ready Lane)
6.7 VMT 7,075 4.32 0.06 1.19 0.02 0.040 0.00
Creeping Queue (SENTRI Lane)
1.7 VMT 1,746 4.32 0.02 1.19 0.00 0.040 0.00
30 Min. Soak and Restart (Standard Lane)
80.4 Vehicles 1,608 1.70 0.30 0.77 0.14 0.002 0.00
30 Min. Soak and Restart (Ready Lane)
353.7 Vehicles 7,075 1.70 1.32 0.74 0.58 0.002 0.00
30 Min. Soak and Restart (SENTRI Lane)
87.3 Vehicles 1,746 1.70 0.33 0.74 0.14 0.002 0.00
Subtotal, Calexico East POE, Northbound 56.85 35.89 1.16
149

Vehicle Idling Emissions Study at Calexico East and Calexico West Ports-of-Entry October 2015, page 133
Table 72. Calexico East POE Northbound Commercial Vehicle Summer 2014 Vehicle Activity & Emissions with Combined U.S.-Mex. Commercial Inspections (1 of 2)
Process Activity Quantity Units Volume
ROG Rate
(g/mile) or (g/hour)
ROG Emissions (Lbs./Day)
NOx Rate
(g/mile) or
(g/hour)
NOx Emissions (Lbs./Day)
PM2.5 Rate
(g/mile) or (g/hour)
PM2.5 Emissions (Lbs./Day)
MX Aduanas Entrance
Stop-and-Go Queue (Standard, Laden)
- VMT 389 13.56 0.00 64.90 0.00 2.267 0.00
Stop-and-Go Queue (Standard, Unladen)
- VMT 332 13.56 0.00 64.90 0.00 2.267 0.00
Stop-and-Go Queue (FAST, Laden)
- VMT 442 13.56 0.00 64.90 0.00 2.267 0.00
Stop-and-Go Queue (FAST, Unladen)
- VMT 172 13.56 0.00 64.90 0.00 2.267 0.00
Idle (Standard) - Veh. Hours 721 33.91 0.00 162.29 0.00 5.668 0.00
Idle (FAST) - Veh. Hours 614 33.91 0.00 162.29 0.00 5.668 0.00
MX Aduanas Cargo Inspection
Idle (Standard) 32.3 Veh. Hours 721 33.91 2.42 162.29 11.56 5.668 0.40
Idle (FAST) 31.8 Veh. Hours 614 33.91 2.38 162.29 11.37 5.668 0.40
U.S. CBP Primary
Stop-and-Go Queue (Standard, Laden)
55.0 VMT 389 13.56 1.64 64.90 7.87 2.267 0.27
Stop-and-Go Queue (Standard, Unladen)
3.9 VMT 332 13.56 0.12 64.90 0.55 2.267 0.02
Stop-and-Go Queue (FAST, Laden)
8.4 VMT 442 13.56 0.25 64.90 1.20 2.267 0.04
Stop-and-Go Queue (FAST, Unladen)
2.0 VMT 172 13.56 0.06 64.90 0.29 2.267 0.01
Idle (Standard) 12.0 Veh. Hours 721 33.91 0.90 162.29 4.30 5.668 0.15
Idle (FAST) 10.2 Veh. Hours 614 33.91 0.77 162.29 3.66 5.668 0.13
U.S. CBP Cargo Inspection
Stop-and-Go Queue (Standard, Laden)
10.7 VMT 389 13.56 0.32 64.90 1.53 2.267 0.05
Stop-and-Go Queue (Standard, Unladen)
9.1 VMT 332 13.56 0.27 64.90 1.31 2.267 0.05
Stop-and-Go Queue (FAST, Laden)
12.2 VMT 389 13.56 0.36 64.90 1.74 2.267 0.06
Stop-and-Go Queue (FAST, Unladen)
4.7 VMT 151 13.56 0.14 64.90 0.68 2.267 0.02
Idle (Standard) 72.0 Veh. Hours 721 33.91 5.38 162.29 25.74 5.668 0.90
Idle (FAST) 65.5 Veh. Hours 541 33.91 4.90 162.29 23.45 5.668 0.82
150

Vehicle Idling Emissions Study at Calexico East and Calexico West Ports-of-Entry October 2015, page 134
Table 72. Calexico East POE Northbound Commercial Vehicle Summer 2014 Vehicle Activity & Emissions with Combined U.S.-Mex. Commercial Inspections (2 of 2)
Process Activity Quantity Units Volume
ROG Rate
(g/mile) or (g/hour)
ROG Emissions (Lbs./Day)
NOx Rate
(g/mile) or
(g/hour)
NOx Emissions (Lbs./Day)
PM2.5 Rate
(g/mile) or (g/hour)
PM2.5 Emissions (Lbs./Day)
U.S. CBP Exit Stop-and-Go Queue (Standard, Laden)
7.4 VMT 389 13.56 0.22 64.90 1.05 2.267 0.04
Stop-and-Go Queue (Standard, Unladen)
6.3 VMT 332 13.56 0.19 64.90 0.90 2.267 0.03
Stop-and-Go Queue (FAST, Laden)
8.4 VMT 442 13.56 0.25 64.90 1.20 2.267 0.04
Stop-and-Go Queue (FAST, Unladen)
3.3 VMT 172 13.56 0.10 64.90 0.47 2.267 0.02
Idle (Standard) 5.4 Veh. Hours 721 33.91 0.40 162.29 1.93 5.668 0.07
Idle (FAST) 4.6 Veh. Hours 614 33.91 0.34 162.29 1.65 5.668 0.06
California CHP Stop-and-Go Queue (Standard, Laden)
7.4 VMT 389 13.56 0.22 64.90 1.05 2.267 0.04
Stop-and-Go Queue (Standard, Unladen)
6.3 VMT 332 13.56 0.19 64.90 0.90 2.267 0.03
Stop-and-Go Queue (FAST, Laden)
8.4 VMT 442 13.56 0.25 64.90 1.20 2.267 0.04
Stop-and-Go Queue (FAST, Unladen)
3.3 VMT 172 13.56 0.10 64.90 0.47 2.267 0.02
Idle (Standard) 7.2 Veh. Hours 721 33.91 0.40 162.29 2.58 5.668 0.09
Idle (FAST) 6.1 Veh. Hours 614 33.91 0.46 162.29 2.20 5.668 0.08
Other Uncongested Movement (Standard)
2,042.7 VMT 721 0.76 3.44 12.36 55.67 0.276 1.24
Uncongested Movement (FAST)
1,778.8 VMT 614 0.76 2.99 12.36 48.48 0.276 1.08
Subtotal, Calexico East Commercial, Northbound 29.59 214.99 6.20
151

Vehicle Idling Emissions Study at Calexico East and Calexico West Ports-of-Entry October 2015, page 135
Table 73. Calexico West POE Northbound Private Vehicle Winter 2014 Vehicle Activity & Emissions with Combined U.S.-Mex. Commercial Inspections
Process Activity Quantity Units Volume
ROG Rate
(g/mile) or (g/hour)
ROG Emissions (Lbs./Day)
NOx Rate
(g/mile) or
(g/hour)
NOx Emissions (Lbs./Day)
PM2.5 Rate
(g/mile) or (g/hour)
PM2.5 Emissions (Lbs./Day)
U.S. Primary, Standard Lane
Uncongested 11,043.8 VMT 7,055.0 0.44 10.78 0.73 17.73 0.021 0.51
Creeping Queue 3,061.5 VMT 7,055.0 3.07 20.75 1.37 9.24 0.040 0.27
Stop-and-Go Queue 134.8 VMT 7,055.0 6.15 1.83 2.74 0.81 0.080 0.02
Idle 170.5 Veh. Hours 7,055.0 15.37 5.78 6.84 2.57 0.201 0.08
U.S. Primary, SENTRI Lane
Uncongested 9,345.6 VMT 5,361.0 0.44 9.08 0.71 14.61 0.021 0.43
Creeping Queue - VMT 5,361.0 3.06 0.00 1.33 0.00 0.040 0.00
Stop-and-Go Queue 1,403.8 VMT 5,361.0 6.12 18.94 2.67 8.25 0.079 0.25
Idle 50.6 Veh. Hours 5,361.0 15.30 1.71 6.66 0.74 0.198 0.02
U.S. Secondary Creeping Queue (Standard Lane)
6.680871 VMT 7,055.0 3.07 0.05 1.37 0.02 0.040 0.00
Creeping Queue (SENTRI Lane)
5.076705 VMT 5,361.0 3.06 0.00 1.33 0.01 0.040 0.00
30 Min. Soak & Restart (Standard Lane)
353 Vehicles 7,055.0 1.17 0.91 0.90 0.70 0.002 0.00
30 Min. Soak & Restart (SENTRI Lane)
268 Vehicles 5,361.0 1.16 0.69 0.87 0.52 0.002 0.00
Subtotal, Calexico West POE, Northbound 70.55 55.21 1.59
152

Vehicle Idling Emissions Study at Calexico East and Calexico West Ports-of-Entry October 2015, page 136
Table 74. Calexico East POE Northbound Private Vehicle Winter 2014 Vehicle Activity & Emissions with Combined U.S.-Mex. Commercial Inspections
Process Activity Quantity Units Volume
ROG Rate
(g/mile) or (g/hour)
ROG Emissions (Lbs./Day)
NOx Rate
(g/mile) or
(g/hour)
NOx Emissions (Lbs./Day)
PM2.5 Rate
(g/mile) or (g/hour)
PM2.5 Emissions (Lbs./Day)
U.S. Primary, Standard Lane
Uncongested 3,246.0 VMT 1,754 0.44 3.17 0.73 5.21 0.021 0.15
Creeping Queue 199.1 VMT 1,754 3.07 1.35 1.37 0.60 0.040 0.02
Stop-and-Go Queue 122.6 VMT 1,754 6.15 1.66 2.74 0.74 0.080 0.02
Idle 40.4 Veh. Hours 1,754 15.37 1.37 6.84 0.61 0.201 0.02
U.S. Primary, Ready Lane
Uncongested 13,732.1 VMT 7,719 0.44 13.35 0.71 21.47 0.021 0.64
Creeping Queue 2,183.0 VMT 7,719 3.06 14.73 1.33 6.41 0.040 0.19
Stop-and-Go Queue 152.2 VMT 7,719 6.12 2.05 2.67 0.89 0.079 0.03
Idle 74.0 Veh. Hours 7,719 15.30 2.49 6.66 1.09 0.198 0.03
U.S. Primary, SENTRI Lane
Uncongested 3,701.3 VMT 1,908 0.44 3.60 0.71 5.79 0.021 0.17
Creeping Queue 78.6 VMT 1,908 3.06 0.53 1.33 0.23 0.040 0.01
Stop-and-Go Queue 36.1 VMT 1,908 6.12 0.49 2.67 0.21 0.079 0.01
Idle 14.3 Veh. Hours 1,908 15.30 0.48 6.66 0.21 0.198 0.01
U.S. Secondary Creeping Queue (Standard Lane)
1.7 VMT 1,754 3.07 0.01 1.37 0.01 0.040 0.00
Creeping Queue (Ready Lane)
7.3 VMT 7,719 3.06 0.05 1.33 0.02 0.040 0.00
Creeping Queue (SENTRI Lane)
1.8 VMT 1,908 3.06 0.01 1.33 0.01 0.040 0.00
30 Min. Soak and Restart (Standard Lane)
87.7 Vehicles 1,754 1.17 0.23 0.90 0.17 0.002 0.00
30 Min. Soak and Restart (Ready Lane)
385.9 Vehicles 7,719 1.16 0.99 0.87 0.74 0.002 0.00
30 Min. Soak and Restart (SENTRI Lane)
95.4 Vehicles 1,908 1.16 0.24 0.87 0.18 0.002 0.00
Subtotal, Calexico East POE, Northbound 46.80 44.59 1.29
153

Vehicle Idling Emissions Study at Calexico East and Calexico West Ports-of-Entry October 2015, page 137
Table 75. Calexico East POE Northbound Commercial Vehicle Winter 2014 Vehicle Activity & Emissions with Combined U.S.-Mex. Commercial Inspections (1 of 2)
Process Activity Quantity Units Volume
ROG Rate
(g/mile) or (g/hour)
ROG Emissions (Lbs./Day)
NOx Rate
(g/mile) or
(g/hour)
NOx Emissions (Lbs./Day)
PM2.5 Rate
(g/mile) or (g/hour)
PM2.5 Emissions (Lbs./Day)
MX Aduanas Entrance
Stop-and-Go Queue (Standard, Laden)
- VMT 397 13.44 0.00 64.94 0.00 2.267 0.00
Stop-and-Go Queue (Standard, Unladen)
- VMT 339 13.44 0.00 64.94 0.00 2.267 0.00
Stop-and-Go Queue (FAST, Laden)
- VMT 451 13.44 0.00 64.94 0.00 2.267 0.00
Stop-and-Go Queue (FAST, Unladen)
- VMT 176 13.44 0.00 64.94 0.00 2.267 0.00
Idle (Standard) - Veh. Hours 736 33.62 0.00 162.37 0.00 5.668 0.00
Idle (FAST) - Veh. Hours 627 33.62 0.00 162.37 0.00 5.668 0.00
MX Aduanas Cargo Inspection
Idle (Standard) 33.0 Veh. Hours 736 33.62 2.45 162.37 11.81 5.668 0.41
Idle (FAST) 32.4 Veh. Hours 627 33.62 2.41 162.37 11.62 5.668 0.41
U.S. CBP Primary
Stop-and-Go Queue (Standard, Laden)
80.6 VMT 397 13.44 2.39 64.94 11.54 2.267 0.40
Stop-and-Go Queue (Standard, Unladen)
3.9 VMT 339 13.44 0.12 64.94 0.56 2.267 0.02
Stop-and-Go Queue (FAST, Laden)
8.5 VMT 451 13.44 0.25 64.94 1.22 2.267 0.04
Stop-and-Go Queue (FAST, Unladen)
2.0 VMT 176 13.44 0.06 64.94 0.29 2.267 0.01
Idle (Standard) 12.3 Veh. Hours 736 33.62 0.91 162.37 4.39 5.668 0.15
Idle (FAST) 10.4 Veh. Hours 627 33.62 0.77 162.37 3.74 5.668 0.13
U.S. CBP Cargo Inspection
Stop-and-Go Queue (Standard, Laden)
13.7 VMT 397 13.44 0.41 64.94 1.97 2.267 0.07
Stop-and-Go Queue (Standard, Unladen)
11.7 VMT 339 13.44 0.35 64.94 1.68 2.267 0.06
Stop-and-Go Queue (FAST, Laden)
15.6 VMT 397 13.44 0.46 64.94 2.23 2.267 0.08
Stop-and-Go Queue (FAST, Unladen)
6.1 VMT 155 13.44 0.18 64.94 0.87 2.267 0.03
Idle (Standard) 73.5 Veh. Hours 736 33.62 5.45 162.37 26.30 5.668 0.92
Idle (FAST) 66.9 Veh. Hours 552 33.62 4.96 162.37 23.96 5.668 0.84
154

Vehicle Idling Emissions Study at Calexico East and Calexico West Ports-of-Entry October 2015, page 138
Table 75. Calexico East POE Northbound Commercial Vehicle Winter 2014 Vehicle Activity & Emissions with Combined U.S.-Mex. Commercial Inspections (2 of 2)
Process Activity Quantity Units Volume
ROG Rate
(g/mile) or (g/hour)
ROG Emissions (Lbs./Day)
NOx Rate
(g/mile) or
(g/hour)
NOx Emissions (Lbs./Day)
PM2.5 Rate
(g/mile) or (g/hour)
PM2.5 Emissions (Lbs./Day)
U.S. CBP Exit Stop-and-Go Queue (Standard, Laden)
9.0 VMT 397 13.44 0.27 64.94 1.28 2.267 0.04
Stop-and-Go Queue (Standard, Unladen)
7.6 VMT 339 13.44 0.23 64.94 1.09 2.267 0.04
Stop-and-Go Queue (FAST, Laden)
10.2 VMT 451 13.44 0.30 64.94 1.46 2.267 0.05
Stop-and-Go Queue (FAST, Unladen)
4.0 VMT 176 13.44 0.12 64.94 0.57 2.267 0.02
Idle (Standard) 5.5 Veh. Hours 736 33.62 0.41 162.37 2.63 5.668 0.07
Idle (FAST) 4.7 Veh. Hours 627 33.62 0.35 162.37 1.68 5.668 0.06
California CHP Stop-and-Go Queue (Standard, Laden)
7.5 VMT 397 13.44 0.22 64.64 1.08 2.267 0.04
Stop-and-Go Queue (Standard, Unladen)
6.4 VMT 339 13.44 0.19 64.94 0.92 2.267 0.03
Stop-and-Go Queue (FAST, Laden)
8.5 VMT 451 13.44 0.25 64.94 1.22 2.267 0.04
Stop-and-Go Queue (FAST, Unladen)
3.3 VMT 176 13.44 0.10 64.94 0.48 2.267 0.02
Idle (Standard) 7.4 Veh. Hours 736 33.62 0.55 162.37 2.63 5.668 0.09
Idle (FAST) 6.3 Veh. Hours 627 33.62 0.46 162.37 2.24 5.668 0.08
Other Uncongested Movement (Standard)
2,053.7 VMT 736 0.75 3.41 12.37 56.01 0.276 1.25
Uncongested Movement (FAST)
1,808.3 VMT 627 0.75 3.00 12.37 49.31 0.276 1.10
Subtotal, Calexico East Commercial, Northbound 31.01 224.13 6.50
155

Vehicle Idling Emissions Study at Calexico East and Calexico West Ports-of-Entry October 2015, page 139
Table 76. Calexico West POE Northbound Private Vehicle Spring 2014 Vehicle Activity & Emissions with California Fuel
Process Activity Quantity Units Volume
ROG Rate
(g/mile) or (g/hour)
ROG Emissions (Lbs./Day)
NOx Rate
(g/mile) or
(g/hour)
NOx Emissions (Lbs./Day)
PM2.5 Rate
(g/mile) or (g/hour)
PM2.5 Emissions (Lbs./Day)
U.S. Primary, Standard Lane
Uncongested 9,133.8 VMT 6,606 0.27 5.45 0.62 12.45 0.021 0.43
Creeping Queue 3,953.9 VMT 6,606 1.88 16.36 1.16 10.11 0.040 0.35
Stop-and-Go Queue 125.1 VMT 6,606 3.75 1.04 2.32 0.64 0.080 0.02
Idle 174.3 Veh. Hours 6,606 9.39 3.61 5.80 2.23 0.201 0.08
U.S. Primary, SENTRI Lane
Uncongested 9,362.2 VMT 5,020 0.26 5.45 0.60 12.42 0.021 0.43
Creeping Queue - VMT 5,020 1.83 0.00 1.13 0.00 0.040 0.00
Stop-and-Go Queue 678.4 VMT 5,020 3.66 5.48 2.26 3.38 0.079 0.12
Idle 50.2 Veh. Hours 5,020 9.16 1.01 5.65 0.63 0.198 0.02
U.S. Secondary Creeping Queue (Standard Lane)
6.26 VMT 6,606 1.88 0.03 1.16 0.02 0.040 0.00
Creeping Queue (SENTRI Lane)
4.75 VMT 5,020 1.83 0.02 1.13 0.01 0.040 0.00
30 Min. Soak & Restart (Standard Lane)
330 Vehicles 6,606 0.75 0.55 0.71 0.52 0.002 0.00
30 Min. Soak & Restart (SENTRI Lane)
251 Vehicles 5,020 0.73 0.41 0.69 0.38 0.002 0.00
Subtotal, Calexico West POE, Northbound 39.40 42.79 1.45
156

Vehicle Idling Emissions Study at Calexico East and Calexico West Ports-of-Entry October 2015, page 140
Table 77. Calexico East POE Northbound Private Vehicle Spring 2014 Vehicle Activity & Emissions with California Fuel
Process Activity Quantity Units Volume
ROG Rate
(g/mile) or (g/hour)
ROG Emissions (Lbs./Day)
NOx Rate
(g/mile) or
(g/hour)
NOx Emissions (Lbs./Day)
PM2.5 Rate
(g/mile) or (g/hour)
PM2.5 Emissions (Lbs./Day)
U.S. Primary, Standard Lane
Uncongested 2,998.3 VMT 1,639 0.27 1.79 0.62 4.09 0.021 0.14
Creeping Queue 198.4 VMT 1,639 1.88 0.82 1.16 0.51 0.040 0.02
Stop-and-Go Queue 131.1 VMT 1,639 3.75 1.08 2.32 0.67 0.080 0.02
Idle 42.8 Veh. Hours 1,639 9.39 0.89 5.80 0.55 0.201 0.02
U.S. Primary, Ready Lane
Uncongested 12,381.8 VMT 7,211 0.26 7.21 0.60 16.43 0.021 0.57
Creeping Queue 2,409.7 VMT 7,211 1.83 9.73 1.13 6.00 0.040 0.21
Stop-and-Go Queue 141.4 VMT 7,211 3.66 1.14 2.26 0.70 0.079 0.02
Idle 75.1 Veh. Hours 7,211 9.16 1.52 5.65 0.94 0.198 0.03
U.S. Primary, SENTRI Lane
Uncongested 3,463.8 VMT 1,778 0.26 2.02 0.60 4.60 0.021 0.16
Creeping Queue 57.8 VMT 1,778 1.83 0.23 1.13 0.14 0.040 0.01
Stop-and-Go Queue 33.7 VMT 1,778 3.66 0.27 2.26 0.17 0.079 0.01
Idle 14.3 Veh. Hours 1,778 9.16 0.29 5.65 0.18 0.198 0.01
U.S. Secondary Creeping Queue (Standard Lane)
1.6 VMT 1,639 1.88 0.01 1.16 0.00 0.040 0.00
Creeping Queue (Ready Lane)
6.8 VMT 7,211 1.83 0.03 1.13 0.02 0.040 0.00
Creeping Queue (SENTRI Lane)
1.7 VMT 1,778 1.83 0.01 1.13 0.00 0.040 0.00
30 Min. Soak and Restart (Standard Lane)
81.9 Vehicles 1,639 0.75 0.14 0.71 0.13 0.002 0.00
30 Min. Soak and Restart (Ready Lane)
360.6 Vehicles 7,211 0.73 0.58 0.69 0.55 0.002 0.00
30 Min. Soak and Restart (SENTRI Lane)
88.9 Vehicles 1,778 0.73 0.14 0.69 0.14 0.002 0.00
Subtotal, Calexico East POE, Northbound 27.89 35.81 1.22
157

Vehicle Idling Emissions Study at Calexico East and Calexico West Ports-of-Entry October 2015, page 141
Table 78. Calexico East POE Northbound Commercial Vehicle Spring 2014 Vehicle Activity & Emissions with California Fuel (1 of 2)
Process Activity Quantity Units Volume
ROG Rate
(g/mile) or (g/hour)
ROG Emissions (Lbs./Day)
NOx Rate
(g/mile) or
(g/hour)
NOx Emissions (Lbs./Day)
PM2.5 Rate
(g/mile) or (g/hour)
PM2.5 Emissions (Lbs./Day)
MX Aduanas Entrance
Stop-and-Go Queue (Standard, Laden)
7.8 VMT 411 13.27 0.23 64.90 1.11 2.267 0.04
Stop-and-Go Queue (Standard, Unladen)
6.6 VMT 350 13.27 0.19 64.90 0.95 2.267 0.03
Stop-and-Go Queue (FAST, Laden)
16.1 VMT 467 13.27 0.47 64.90 2.31 2.267 0.08
Stop-and-Go Queue (FAST, Unladen)
3.4 VMT 182 13.27 0.10 64.90 0.49 2.267 0.02
Idle (Standard) 18.0 Veh. Hours 762 33.18 1.32 162.27 6.44 5.668 0.22
Idle (FAST) 15.3 Veh. Hours 649 33.18 1.12 162.27 5.48 5.668 0.19
MX Aduanas Cargo Inspection
Idle (Standard) 34.2 Veh. Hours 762 33.18 2.50 162.27 12.22 5.668 0.43
Idle (FAST) 33.6 Veh. Hours 649 33.18 2.46 162.27 12.02 5.668 0.42
U.S. CBP Primary
Stop-and-Go Queue (Standard, Laden)
126.4 VMT 411 13.27 3.70 64.90 18.08 2.267 0.63
Stop-and-Go Queue (Standard, Unladen)
4.1 VMT 350 13.27 0.12 64.90 0.58 2.267 0.02
Stop-and-Go Queue (FAST, Laden)
8.9 VMT 467 13.27 0.26 64.90 1.27 2.267 0.04
Stop-and-Go Queue (FAST, Unladen)
2.1 VMT 182 13.27 0.06 64.90 0.30 2.267 0.01
Idle (Standard) 12.7 Veh. Hours 762 33.18 0.93 162.27 4.54 5.668 0.16
Idle (FAST) 10.8 Veh. Hours 649 33.18 0.79 162.27 3.87 5.668 0.14
U.S. CBP Cargo Inspection
Stop-and-Go Queue (Standard, Laden)
22.8 VMT 411 13.27 0.67 64.90 3.27 2.267 0.11
Stop-and-Go Queue (Standard, Unladen)
19.5 VMT 350 13.27 0.57 64.90 2.78 2.267 0.10
Stop-and-Go Queue (FAST, Laden)
25.9 VMT 411 13.27 0.76 64.90 3.71 2.267 0.13
Stop-and-Go Queue (FAST, Unladen)
10.1 VMT 160 13.27 0.30 64.90 1.44 2.267 0.05
Idle (Standard) 76.1 Veh. Hours 762 33.18 5.56 162.27 27.21 5.668 0.95
Idle (FAST) 69.3 Veh. Hours 571 33.18 5.07 162.27 24.79 5.668 0.87
158

Vehicle Idling Emissions Study at Calexico East and Calexico West Ports-of-Entry October 2015, page 142
Table 78. Calexico East POE Northbound Commercial Vehicle Spring 2014 Vehicle Activity & Emissions with California Fuel (2 of 2)
Process Activity Quantity Units Volume
ROG Rate
(g/mile) or (g/hour)
ROG Emissions (Lbs./Day)
NOx Rate
(g/mile) or
(g/hour)
NOx Emissions (Lbs./Day)
PM2.5 Rate
(g/mile) or (g/hour)
PM2.5 Emissions (Lbs./Day)
U.S. CBP Exit Stop-and-Go Queue (Standard, Laden)
16.8 VMT 411 13.27 0.49 64.90 2.40 2.267 0.08
Stop-and-Go Queue (Standard, Unladen)
14.3 VMT 350 13.27 0.42 64.90 2.04 2.267 0.07
Stop-and-Go Queue (FAST, Laden)
19.0 VMT 467 13.27 0.56 64.90 2.72 2.267 0.10
Stop-and-Go Queue (FAST, Unladen)
7.4 VMT 182 13.27 0.22 64.90 1.06 2.267 0.04
Idle (Standard) 5.7 Veh. Hours 762 33.18 0.42 162.27 2.04 5.668 0.07
Idle (FAST) 4.9 Veh. Hours 649 33.18 0.36 162.27 1.74 5.668 0.06
California CHP Stop-and-Go Queue (Standard, Laden)
7.8 VMT 411 13.27 0.23 64.90 1.11 2.267 0.04
Stop-and-Go Queue (Standard, Unladen)
6.6 VMT 350 13.27 0.19 64.90 0.95 2.267 0.03
Stop-and-Go Queue (FAST, Laden)
8.9 VMT 467 13.27 0.26 64.90 1.27 2.267 0.04
Stop-and-Go Queue (FAST, Unladen)
3.4 VMT 182 13.27 0.10 64.90 0.49 2.267 0.02
Idle (Standard) 7.6 Veh. Hours 762 33.18 0.56 162.27 2.73 5.668 1.10
Idle (FAST) 6.5 Veh. Hours 649 33.18 0.47 162.27 2.32 5.668 0.08
Other Uncongested Movement (Standard)
2,053.2 VMT 762 0.74 3.34 12.36 55.94 0.276 1.25
Uncongested Movement (FAST)
1,841.9 VMT 649 0.74 3.00 12.36 50.19 0.276 1.12
Subtotal, Calexico East Commercial, Northbound 37.78 259.88 7.74
159

Vehicle Idling Emissions Study at Calexico East and Calexico West Ports-of-Entry October 2015, page 143
Table 79. Calexico West POE Northbound Private Vehicle Summer 2014 Vehicle Activity & Emissions with California Fuel
Process Activity Quantity Units Volume
ROG Rate
(g/mile) or (g/hour)
ROG Emissions (Lbs./Day)
NOx Rate
(g/mile) or
(g/hour)
NOx Emissions (Lbs./Day)
PM2.5 Rate
(g/mile) or (g/hour)
PM2.5 Emissions (Lbs./Day)
U.S. Primary, Standard Lane
Uncongested 10,375.8 VMT 6,012 0.30 6.90 0.65 14.87 0.021 0.48
Creeping Queue 1,630.9 VMT 6,012 2.09 7.53 1.22 4.39 0.040 0.14
Stop-and-Go Queue 114.8 VMT 6,012 4.19 1.06 2.44 0.62 0.080 0.02
Idle 168.7 Veh. Hours 6,012 10.47 3.89 6.10 2.27 0.201 0.07
U.S. Primary, SENTRI Lane
Uncongested 8,881.1 VMT 4.568 0.29 5.77 0.63 12.40 0.021 0.41
Creeping Queue - VMT 4,568 2.04 0.00 1.19 0.00 0.040 0.00
Stop-and-Go Queue 255.1 VMT 4,568 4.08 2.30 2.38 1.34 0.079 0.04
Idle 48.6 Veh. Hours 4,568 10.21 1.09 5.94 0.64 0.198 0.02
U.S. Secondary Creeping Queue (Standard Lane)
5.693182 VMT 6,012 2.09 0.03 1.22 0.02 0.040 0.00
Creeping Queue (SENTRI Lane)
4.325758 VMT 4.568 2.04 0.02 1.19 0.01 0.040 0.00
30 Min. Soak & Restart (Standard Lane)
301 Vehicles 6,012 0.83 0.55 0.77 0.51 0.002 0.00
30 Min. Soak & Restart (SENTRI Lane)
228 Vehicles 4,568 0.81 0.41 0.74 0.37 0.002 0.00
Subtotal, Calexico West POE, Northbound 29.55 37.43 1.20
160
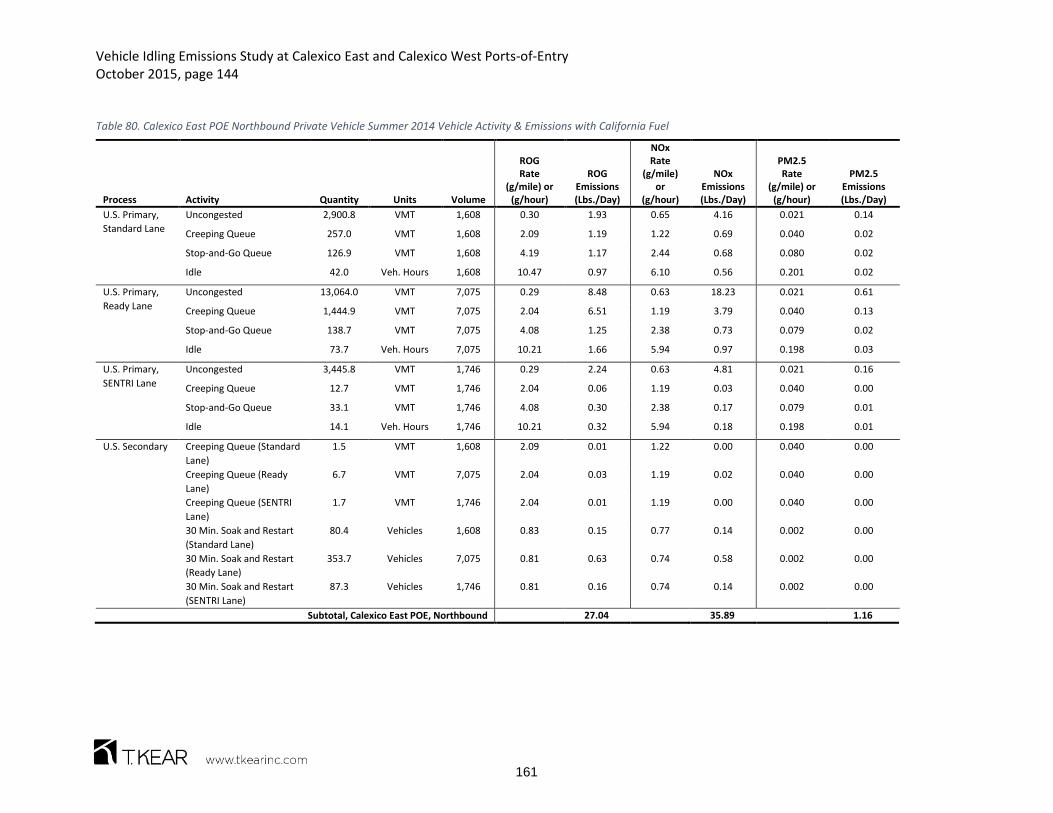
Vehicle Idling Emissions Study at Calexico East and Calexico West Ports-of-Entry October 2015, page 144
Table 80. Calexico East POE Northbound Private Vehicle Summer 2014 Vehicle Activity & Emissions with California Fuel
Process Activity Quantity Units Volume
ROG Rate
(g/mile) or (g/hour)
ROG Emissions (Lbs./Day)
NOx Rate
(g/mile) or
(g/hour)
NOx Emissions (Lbs./Day)
PM2.5 Rate
(g/mile) or (g/hour)
PM2.5 Emissions (Lbs./Day)
U.S. Primary, Standard Lane
Uncongested 2,900.8 VMT 1,608 0.30 1.93 0.65 4.16 0.021 0.14
Creeping Queue 257.0 VMT 1,608 2.09 1.19 1.22 0.69 0.040 0.02
Stop-and-Go Queue 126.9 VMT 1,608 4.19 1.17 2.44 0.68 0.080 0.02
Idle 42.0 Veh. Hours 1,608 10.47 0.97 6.10 0.56 0.201 0.02
U.S. Primary, Ready Lane
Uncongested 13,064.0 VMT 7,075 0.29 8.48 0.63 18.23 0.021 0.61
Creeping Queue 1,444.9 VMT 7,075 2.04 6.51 1.19 3.79 0.040 0.13
Stop-and-Go Queue 138.7 VMT 7,075 4.08 1.25 2.38 0.73 0.079 0.02
Idle 73.7 Veh. Hours 7,075 10.21 1.66 5.94 0.97 0.198 0.03
U.S. Primary, SENTRI Lane
Uncongested 3,445.8 VMT 1,746 0.29 2.24 0.63 4.81 0.021 0.16
Creeping Queue 12.7 VMT 1,746 2.04 0.06 1.19 0.03 0.040 0.00
Stop-and-Go Queue 33.1 VMT 1,746 4.08 0.30 2.38 0.17 0.079 0.01
Idle 14.1 Veh. Hours 1,746 10.21 0.32 5.94 0.18 0.198 0.01
U.S. Secondary Creeping Queue (Standard Lane)
1.5 VMT 1,608 2.09 0.01 1.22 0.00 0.040 0.00
Creeping Queue (Ready Lane)
6.7 VMT 7,075 2.04 0.03 1.19 0.02 0.040 0.00
Creeping Queue (SENTRI Lane)
1.7 VMT 1,746 2.04 0.01 1.19 0.00 0.040 0.00
30 Min. Soak and Restart (Standard Lane)
80.4 Vehicles 1,608 0.83 0.15 0.77 0.14 0.002 0.00
30 Min. Soak and Restart (Ready Lane)
353.7 Vehicles 7,075 0.81 0.63 0.74 0.58 0.002 0.00
30 Min. Soak and Restart (SENTRI Lane)
87.3 Vehicles 1,746 0.81 0.16 0.74 0.14 0.002 0.00
Subtotal, Calexico East POE, Northbound 27.04 35.89 1.16
161

Vehicle Idling Emissions Study at Calexico East and Calexico West Ports-of-Entry October 2015, page 145
Table 81. Calexico East POE Northbound Commercial Vehicle Summer 2014 Vehicle Activity & Emissions with California Fuel (1 of 2)
Process Activity Quantity Units Volume
ROG Rate
(g/mile) or (g/hour)
ROG Emissions (Lbs./Day)
NOx Rate
(g/mile) or
(g/hour)
NOx Emissions (Lbs./Day)
PM2.5 Rate
(g/mile) or (g/hour)
PM2.5 Emissions (Lbs./Day)
MX Aduanas Entrance
Stop-and-Go Queue (Standard, Laden)
7.4 VMT 389 13.30 0.22 64.90 1.05 2.267 0.04
Stop-and-Go Queue (Standard, Unladen)
6.3 VMT 332 13.30 0.18 64.90 0.90 2.267 0.03
Stop-and-Go Queue (FAST, Laden)
9.4 VMT 442 13.30 0.28 64.90 1.35 2.267 0.05
Stop-and-Go Queue (FAST, Unladen)
3.3 VMT 172 13.30 0.10 64.90 0.47 2.267 0.02
Idle (Standard) 17.0 Veh. Hours 721 33.27 1.25 162.29 6.09 5.668 0.21
Idle (FAST) 14.5 Veh. Hours 614 33.27 1.06 162.29 5.19 5.668 0.18
MX Aduanas Cargo Inspection
Idle (Standard) 32.3 Veh. Hours 721 33.27 2.37 162.29 11.56 5.668 0.40
Idle (FAST) 31.8 Veh. Hours 614 33.27 2.33 162.29 11.37 5.668 0.40
U.S. CBP Primary
Stop-and-Go Queue (Standard, Laden)
55.0 VMT 389 13.30 1.61 64.90 7.87 2.267 0.27
Stop-and-Go Queue (Standard, Unladen)
3.9 VMT 332 13.30 0.11 64.90 0.55 2.267 0.02
Stop-and-Go Queue (FAST, Laden)
8.4 VMT 442 13.30 0.25 64.90 1.20 2.267 0.04
Stop-and-Go Queue (FAST, Unladen)
2.0 VMT 172 13.30 0.06 64.90 0.29 2.267 0.01
Idle (Standard) 12.0 Veh. Hours 721 33.27 0.88 162.29 4.30 5.668 0.15
Idle (FAST) 10.2 Veh. Hours 614 33.27 0.75 162.29 3.66 5.668 0.13
U.S. CBP Cargo Inspection
Stop-and-Go Queue (Standard, Laden)
10.7 VMT 389 13.30 0.31 64.90 1.53 2.267 0.05
Stop-and-Go Queue (Standard, Unladen)
9.1 VMT 332 13.30 0.27 64.90 1.31 2.267 0.05
Stop-and-Go Queue (FAST, Laden)
12.2 VMT 389 13.30 0.36 64.90 1.74 2.267 0.06
Stop-and-Go Queue (FAST, Unladen)
4.7 VMT 151 13.30 0.14 64.90 0.68 2.267 0.02
Idle (Standard) 72.0 Veh. Hours 721 33.27 5.28 162.29 25.74 5.668 0.90
Idle (FAST) 65.5 Veh. Hours 541 33.27 4.81 162.29 23.45 5.668 0.82
162

Vehicle Idling Emissions Study at Calexico East and Calexico West Ports-of-Entry October 2015, page 146
Table 81. Calexico East POE Northbound Commercial Vehicle Summer 2014 Vehicle Activity & Emissions with California Fuel (2 of 2)
Process Activity Quantity Units Volume
ROG Rate
(g/mile) or (g/hour)
ROG Emissions (Lbs./Day)
NOx Rate
(g/mile) or
(g/hour)
NOx Emissions (Lbs./Day)
PM2.5 Rate
(g/mile) or (g/hour)
PM2.5 Emissions (Lbs./Day)
U.S. CBP Exit Stop-and-Go Queue (Standard, Laden)
7.4 VMT 389 13.30 0.22 64.90 1.05 2.267 0.04
Stop-and-Go Queue (Standard, Unladen)
6.3 VMT 332 13.30 0.18 64.90 0.90 2.267 0.03
Stop-and-Go Queue (FAST, Laden)
8.4 VMT 442 13.30 0.25 64.90 1.20 2.267 0.04
Stop-and-Go Queue (FAST, Unladen)
3.3 VMT 172 13.30 0.10 64.90 0.47 2.267 0.02
Idle (Standard) 5.4 Veh. Hours 721 33.27 0.40 162.29 1.93 5.668 0.07
Idle (FAST) 4.6 Veh. Hours 614 33.27 0.34 162.29 1.65 5.668 0.06
California CHP Stop-and-Go Queue (Standard, Laden)
7.4 VMT 389 13.30 0.22 64.90 1.05 2.267 0.04
Stop-and-Go Queue (Standard, Unladen)
6.3 VMT 332 13.30 0.18 64.90 0.90 2.267 0.03
Stop-and-Go Queue (FAST, Laden)
8.4 VMT 442 13.30 0.25 64.90 1.20 2.267 0.04
Stop-and-Go Queue (FAST, Unladen)
3.3 VMT 172 13.30 0.10 64.90 0.47 2.267 0.02
Idle (Standard) 7.2 Veh. Hours 721 33.27 0.53 162.29 2.58 5.668 0.09
Idle (FAST) 6.1 Veh. Hours 614 33.27 0.45 162.29 2.20 5.668 0.08
Other Uncongested Movement (Standard)
2,042.7 VMT 721 0.74 3.34 12.36 55.67 0.276 1.24
Uncongested Movement (FAST)
1,778.8 VMT 614 0.74 2.90 12.36 48.48 0.276 1.08
Subtotal, Calexico East Commercial, Northbound 32.05 230.04 6.72
163

Vehicle Idling Emissions Study at Calexico East and Calexico West Ports-of-Entry October 2015, page 147
Table 82. Calexico West POE Northbound Private Vehicle Winter 2014 Vehicle Activity & Emissions with California Fuel
Process Activity Quantity Units Volume
ROG Rate
(g/mile) or (g/hour)
ROG Emissions (Lbs./Day)
NOx Rate
(g/mile) or
(g/hour)
NOx Emissions (Lbs./Day)
PM2.5 Rate
(g/mile) or (g/hour)
PM2.5 Emissions (Lbs./Day)
U.S. Primary, Standard Lane
Uncongested 11,043.8 VMT 7,055.0 0.29 6.96 0.73 17.73 0.021 0.51
Creeping Queue 3,061.5 VMT 7,055.0 1.99 13.40 1.37 9.24 0.040 0.27
Stop-and-Go Queue 134.8 VMT 7,055.0 3.97 1.18 2.74 0.81 0.080 0.02
Idle 170.5 Veh. Hours 7,055.0 9.93 3.73 6.84 2.57 0.201 0.08
U.S. Primary, SENTRI Lane
Uncongested 9,345.6 VMT 5,361.0 0.28 5.75 0.71 14.61 0.021 0.43
Creeping Queue - VMT 5,361.0 1.94 0.00 1.33 0.00 0.040 0.00
Stop-and-Go Queue 1,403.8 VMT 5,361.0 3.88 11.99 2.67 8.25 0.079 0.25
Idle 50.6 Veh. Hours 5,361.0 9.69 1.08 6.66 0.74 0.198 0.02
U.S. Secondary Creeping Queue (Standard Lane)
6.680871 VMT 7,055.0 1.99 0.03 1.37 0.02 0.040 0.00
Creeping Queue (SENTRI Lane)
5.076705 VMT 5,361.0 1.94 0.02 1.33 0.01 0.040 0.00
30 Min. Soak & Restart (Standard Lane)
353 Vehicles 7,055.0 0.76 0.59 0.90 0.70 0.002 0.00
30 Min. Soak & Restart (SENTRI Lane)
268 Vehicles 5,361.0 0.74 0.44 0.87 0.52 0.002 0.00
Subtotal, Calexico West POE, Northbound 45.18 55.21 1.59
164

Vehicle Idling Emissions Study at Calexico East and Calexico West Ports-of-Entry October 2015, page 148
Table 83. Calexico East POE Northbound Private Vehicle Winter 2014 Vehicle Activity & Emissions with California Fuel
Process Activity Quantity Units Volume
ROG Rate
(g/mile) or (g/hour)
ROG Emissions (Lbs./Day)
NOx Rate
(g/mile) or
(g/hour)
NOx Emissions (Lbs./Day)
PM2.5 Rate
(g/mile) or (g/hour)
PM2.5 Emissions (Lbs./Day)
U.S. Primary, Standard Lane
Uncongested 3,246.0 VMT 1,754 0.29 2.05 0.73 5.21 0.021 0.15
Creeping Queue 199.1 VMT 1,754 1.99 0.87 1.37 0.60 0.040 0.02
Stop-and-Go Queue 122.6 VMT 1,754 3.97 1.07 2.74 0.74 0.080 0.02
Idle 40.4 Veh. Hours 1,754 9.93 0.88 6.84 0.61 0.201 0.02
U.S. Primary, Ready Lane
Uncongested 13,732.1 VMT 7,719 0.28 8.45 0.71 21.47 0.021 0.64
Creeping Queue 2,183.0 VMT 7,719 1.94 9.32 1.33 6.41 0.040 0.19
Stop-and-Go Queue 152.2 VMT 7,719 3.88 1.30 2.67 0.89 0.079 0.03
Idle 74.0 Veh. Hours 7,719 9.69 1.58 6.66 1.09 0.198 0.03
U.S. Primary, SENTRI Lane
Uncongested 3,701.3 VMT 1,908 0.28 2.28 0.71 5.79 0.021 0.17
Creeping Queue 78.6 VMT 1,908 1.94 0.34 1.33 0.23 0.040 0.01
Stop-and-Go Queue 36.1 VMT 1,908 3.88 0.31 2.67 0.21 0.079 0.01
Idle 14.3 Veh. Hours 1,908 9.69 0.31 6.66 0.21 0.198 0.01
U.S. Secondary Creeping Queue (Standard Lane)
1.7 VMT 1,754 1.99 0.01 1.37 0.01 0.040 0.00
Creeping Queue (Ready Lane)
7.3 VMT 7,719 1.94 0.03 1.33 0.02 0.040 0.00
Creeping Queue (SENTRI Lane)
1.8 VMT 1,908 1.94 0.01 1.33 0.01 0.040 0.00
30 Min. Soak and Restart (Standard Lane)
87.7 Vehicles 1,754 0.76 0.15 0.90 0.17 0.002 0.00
30 Min. Soak and Restart (Ready Lane)
385.9 Vehicles 7,719 0.74 0.63 0.87 0.74 0.002 0.00
30 Min. Soak and Restart (SENTRI Lane)
95.4 Vehicles 1,908 0.74 0.16 0.87 0.18 0.002 0.00
Subtotal, Calexico East POE, Northbound 29.74 44.59 1.29
165

Vehicle Idling Emissions Study at Calexico East and Calexico West Ports-of-Entry October 2015, page 149
Table 84. Calexico East POE Northbound Commercial Vehicle Winter 2014 Vehicle Activity & Emissions with California Fuel (1 of 2)
Process Activity Quantity Units Volume
ROG Rate
(g/mile) or (g/hour)
ROG Emissions (Lbs./Day)
NOx Rate
(g/mile) or
(g/hour)
NOx Emissions (Lbs./Day)
PM2.5 Rate
(g/mile) or (g/hour)
PM2.5 Emissions (Lbs./Day)
MX Aduanas Entrance
Stop-and-Go Queue (Standard, Laden)
7.5 VMT 397 13.31 0.22 64.94 1.08 2.267 0.04
Stop-and-Go Queue (Standard, Unladen)
6.4 VMT 339 13.31 0.19 64.94 0.92 2.267 0.03
Stop-and-Go Queue (FAST, Laden)
11.1 VMT 451 13.31 0.33 64.94 1.59 2.267 0.06
Stop-and-Go Queue (FAST, Unladen)
3.3 VMT 176 13.31 0.10 64.94 0.48 2.267 0.02
Idle (Standard) 17.4 Veh. Hours 736 33.28 1.28 162.37 6.22 5.668 0.22
Idle (FAST) 14.8 Veh. Hours 627 33.28 1.09 162.37 5.30 5.668 0.18
MX Aduanas Cargo Inspection
Idle (Standard) 33.0 Veh. Hours 736 33.28 2.42 162.37 11.81 5.668 0.41
Idle (FAST) 32.4 Veh. Hours 627 33.28 2.38 162.27 11.62 5.668 0.41
U.S. CBP Primary
Stop-and-Go Queue (Standard, Laden)
80.6 VMT 397 13.31 2.36 64.94 11.54 2.267 0.40
Stop-and-Go Queue (Standard, Unladen)
3.9 VMT 339 13.31 0.12 64.94 0.56 2.267 0.02
Stop-and-Go Queue (FAST, Laden)
8.5 VMT 451 13.31 0.25 64.94 1.22 2.267 0.04
Stop-and-Go Queue (FAST, Unladen)
2.0 VMT 176 13.31 0.06 64.90 0.29 2.267 0.01
Idle (Standard) 12.3 Veh. Hours 736 33.28 0.90 162.37 4.39 5.668 0.15
Idle (FAST) 10.4 Veh. Hours 627 33.28 0.77 162.37 3.74 5.668 0.13
U.S. CBP Cargo Inspection
Stop-and-Go Queue (Standard, Laden)
13.7 VMT 397 13.31 0.40 64.94 1.97 2.267 0.07
Stop-and-Go Queue (Standard, Unladen)
11.7 VMT 339 13.31 0.34 64.94 1.68 2.267 0.06
Stop-and-Go Queue (FAST, Laden)
15.6 VMT 397 13.31 0.46 64.94 2.23 2.267 0.08
Stop-and-Go Queue (FAST, Unladen)
6.1 VMT 155 13.31 0.18 64.90 0.87 2.267 0.03
Idle (Standard) 73.5 Veh. Hours 736 33.28 5.39 162.37 26.30 5.668 0.92
Idle (FAST) 66.9 Veh. Hours 552 33.28 4.91 162.37 23.96 5.668 0.84
166

Vehicle Idling Emissions Study at Calexico East and Calexico West Ports-of-Entry October 2015, page 150
Table 84. Calexico East POE Northbound Commercial Vehicle Winter 2014 Vehicle Activity & Emissions with California Fuel (2 of 2)
Process Activity Quantity Units Volume
ROG Rate
(g/mile) or (g/hour)
ROG Emissions (Lbs./Day)
NOx Rate
(g/mile) or
(g/hour)
NOx Emissions (Lbs./Day)
PM2.5 Rate
(g/mile) or (g/hour)
PM2.5 Emissions (Lbs./Day)
U.S. CBP Exit Stop-and-Go Queue (Standard, Laden)
9.0 VMT 397 13.31 0.26 64.94 1.28 2.267 0.04
Stop-and-Go Queue (Standard, Unladen)
7.6 VMT 339 13.31 0.22 64.94 1.09 2.267 0.04
Stop-and-Go Queue (FAST, Laden)
10.2 VMT 451 13.31 0.30 64.94 1.46 2.267 0.05
Stop-and-Go Queue (FAST, Unladen)
4.0 VMT 176 13.31 0.12 64.94 0.57 2.267 0.02
Idle (Standard) 5.5 Veh. Hours 736 33.28 0.41 162.37 1.98 5.668 0.07
Idle (FAST) 4.7 Veh. Hours 627 33.28 0.35 162.37 1.68 5.668 0.06
California CHP Stop-and-Go Queue (Standard, Laden)
7.5 VMT 397 13.31 0.22 64.94 1.08 2.267 0.04
Stop-and-Go Queue (Standard, Unladen)
6.4 VMT 339 13.31 0.19 64.94 0.92 2.267 0.03
Stop-and-Go Queue (FAST, Laden)
8.5 VMT 451 13.31 0.25 64.94 1.22 2.267 0.04
Stop-and-Go Queue (FAST, Unladen)
3.3 VMT 176 13.31 0.10 64.94 0.48 2.267 0.02
Idle (Standard) 7.4 Veh. Hours 736 33.28 0.54 162.37 2.63 5.668 0.09
Idle (FAST) 6.3 Veh. Hours 627 33.28 0.46 162.37 2.24 5.668 0.08
Other Uncongested Movement (Standard)
2,053.7 VMT 736 0.74 3.35 12.37 56.01 0.276 1.25
Uncongested Movement (FAST)
1,808.3 VMT 627 0.74 2.95 12.37 49.31 0.276 1.10
Subtotal, Calexico East Commercial, Northbound 33.86 239.72 7.04
167

Vehicle Idling Emissions Study at Calexico East and Calexico West Ports-of-Entry October 2015, page 151
Table 85. Calexico West POE Northbound Private Vehicle Spring 2014 Vehicle Activity & Emissions with Calexico West Phase 1 & Calexico East Section 559 Proposal
Process Activity Quantity Units Volume
ROG Rate
(g/mile) or (g/hour)
ROG Emissions (Lbs./Day)
NOx Rate
(g/mile) or
(g/hour)
NOx Emissions (Lbs./Day)
PM2.5 Rate
(g/mile) or (g/hour)
PM2.5 Emissions (Lbs./Day)
U.S. Primary, Standard Lane
Uncongested 7,054.2 VMT 3,561 0.56 8.65 0.62 9.61 0.021 0.33
Creeping Queue - VMT 3,561 3.86 0.00 1.16 0.00 0.040 0.00
Stop-and-Go Queue 67.4 VMT 3,561 7.71 1.15 2.32 0.35 0.080 0.01
Idle 95.9 Veh. Hours 3,561 19.29 4.08 5.80 1.23 0.201 0.04
U.S. Primary, Ready Lane
Uncongested 5,501.5 VMT 2,777 0.56 6.77 0.60 7.30 0.021 0.26
Creeping Queue - VMT 2,777 3.87 0.00 1.13 0.00 0.040 0.00
Stop-and-Go Queue 52.6 VMT 2,777 7.74 0.90 2.26 0.26 0.079 0.01
Idle 29.3 Veh. Hours 2,777 19.35 1.25 5.65 0.37 0.198 0.01
U.S. Primary, SENTRI Lane
Uncongested 5,667.9 VMT 2,861 0.56 6.98 0.60 7.52 0.021 0.26
Creeping Queue - VMT 2,861 3.87 0.00 1.13 0.00 0.040 0.00
Stop-and-Go Queue 54.2 VMT 2,861 7.74 0.92 2.26 0.27 0.079 0.01
Idle 23.0 Veh. Hours 2,861 19.35 0.98 5.65 0.29 0.198 0.01
U.S. Secondary Creeping Queue (Standard Lane)
3.4 VMT 3,561 3.86 0.03 1.16 0.01 0.040 0.00
Creeping Queue (Ready Lane)
3.4 VMT 2,777 3.87 0.03 1.13 0.01 0.040 0.00
Creeping Queue (SENTRI Lane)
2.7 VMT 2,861 3.87 0.02 1.13 0.01 0.040 0.00
30 Min. Soak and Restart (Standard Lane)
178.1 Vehicles 3,561 1.54 0.61 0.71 0.28 0.002 0.00
30 Min. Soak and Restart (Ready Lane)
138.9 Vehicles 2,777 1.54 0.47 0.69 0.21 0.002 0.00
30 Min. Soak and Restart (SENTRI Lane)
143.1 Vehicles 2,861 1.54 0.49 0.69 0.22 0.002 0.00
Subtotal, Calexico West POE, Northbound 33.33 27.92 0.95
168

Vehicle Idling Emissions Study at Calexico East and Calexico West Ports-of-Entry October 2015, page 152
Table 86. Calexico East POE Northbound Private Vehicle Spring 2014 Vehicle Activity & Emissions with Calexico West Phase 1 & Calexico East Section 559 Proposal
Process Activity Quantity Units Volume
ROG Rate
(g/mile) or (g/hour)
ROG Emissions (Lbs./Day)
NOx Rate
(g/mile) or
(g/hour)
NOx Emissions (Lbs./Day)
PM2.5 Rate
(g/mile) or (g/hour)
PM2.5 Emissions (Lbs./Day)
U.S. Primary, Standard Lane
Uncongested 9,279.4 VMT 4,684 0.56 11.38 0.62 12.65 0.021 0.43
Creeping Queue - VMT 4,684 3.86 0.00 1.16 0.00 0.040 0.00
Stop-and-Go Queue 88.7 VMT 4,684 7.71 1.51 2.32 0.45 0.080 0.02
Idle 126.2 Veh. Hours 4,684 19.29 5.37 5.80 1.61 0.201 0.06
U.S. Primary, Ready Lane
Uncongested 8,784.9 VMT 4,434 0.56 10.81 0.60 11.66 0.021 0.41
Creeping Queue - VMT 4,434 3.87 0.00 1.13 0.00 0.040 0.00
Stop-and-Go Queue 84.0 VMT 4,434 7.74 1.43 2.26 0.42 0.079 0.01
Idle 46.8 Veh. Hours 4,434 19.35 2.00 5.65 0.58 0.198 0.02
U.S. Primary, SENTRI Lane
Uncongested 7,798.4 VMT 3,936 0.56 9.60 0.60 10.35 0.021 0.36
Creeping Queue - VMT 3,936 3.87 0.00 1.13 0.00 0.040 0.00
Stop-and-Go Queue 74.6 VMT 3,936 7.74 1.27 2.26 0.37 0.079 0.01
Idle 31.7 Veh. Hours 3,936 19.35 1.35 5.65 0.39 0.198 0.01
U.S. Secondary Creeping Queue (Standard Lane)
4.4 VMT 4,684 3.86 0.04 1.16 0.01 0.040 0.00
Creeping Queue (Ready Lane)
4.2 VMT 4,434 3.87 0.04 1.13 0.01 0.040 0.00
Creeping Queue (SENTRI Lane)
3.7 VMT 3,936 3.87 0.03 1.13 0.01 0.040 0.00
30 Min. Soak and Restart (Standard Lane)
234.2 Vehicles 4,684 1.54 0.80 0.71 0.37 0.002 0.00
30 Min. Soak and Restart (Ready Lane)
221.7 Vehicles 4,434 1.54 0.75 0.69 0.34 0.002 0.00
30 Min. Soak and Restart (SENTRI Lane)
196.8 Vehicles 4,684 1.54 0.67 0.69 0.30 0.002 0.00
Subtotal, Calexico East POE, Northbound 47.05 39.52 1.34
169

Vehicle Idling Emissions Study at Calexico East and Calexico West Ports-of-Entry October 2015, page 153
Table 87. Calexico East POE Northbound Commercial Vehicle Spring 2014 Vehicle Activity & Emissions with Calexico West Phase 1 & Calexico East Section 559 Proposal (1 of 2)
Process Activity Quantity Units Volume
ROG Rate
(g/mile) or (g/hour)
ROG Emissions (Lbs./Day)
NOx Rate
(g/mile) or
(g/hour)
NOx Emissions (Lbs./Day)
PM2.5 Rate
(g/mile) or (g/hour)
PM2.5 Emissions (Lbs./Day)
MX Aduanas Entrance
Stop-and-Go Queue (Standard, Laden)
7.8 VMT 411 13.50 0.23 64.90 1.11 2.267 0.04
Stop-and-Go Queue (Standard, Unladen)
6.6 VMT 350 13.50 0.20 64.90 0.95 2.267 0.03
Stop-and-Go Queue (FAST, Laden)
16.1 VMT 467 13.50 0.48 64.90 2.31 2.267 0.08
Stop-and-Go Queue (FAST, Unladen)
3.4 VMT 182 13.50 0.10 64.90 0.49 2.267 0.02
Idle (Standard) 18.0 Veh. Hours 762 33.76 1.34 162.27 6.44 5.668 0.22
Idle (FAST) 15.3 Veh. Hours 649 33.76 1.14 162.27 5.48 5.668 0.19
MX Aduanas Cargo Inspection
Idle (Standard) 34.2 Veh. Hours 762 33.76 2.54 162.27 12.22 5.668 0.43
Idle (FAST) 33.6 Veh. Hours 649 33.76 2.50 162.27 12.02 5.668 0.42
U.S. CBP Primary
Stop-and-Go Queue (Standard, Laden)
7.8 VMT 411 13.50 0.23 64.90 1.11 2.267 0.04
Stop-and-Go Queue (Standard, Unladen)
6.6 VMT 350 13.50 0.20 64.90 0.95 2.267 0.03
Stop-and-Go Queue (FAST, Laden)
8.9 VMT 467 13.50 0.26 64.90 1.27 2.267 0.04
Stop-and-Go Queue (FAST, Unladen)
3.4 VMT 182 13.50 0.10 64.90 0.49 2.267 0.02
Idle (Standard) 12.7 Veh. Hours 762 33.76 0.95 162.27 4.54 5.668 0.16
Idle (FAST) 10.8 Veh. Hours 649 33.76 0.81 162.27 3.87 5.668 0.14
U.S. CBP Cargo Inspection
Stop-and-Go Queue (Standard, Laden)
22.8 VMT 411 13.50 0.68 64.90 3.27 2.267 0.11
Stop-and-Go Queue (Standard, Unladen)
19.5 VMT 350 13.50 0.58 64.90 2.78 2.267 0.10
Stop-and-Go Queue (FAST, Laden)
25.9 VMT 411 13.50 0.77 64.90 3.71 2.267 0.13
Stop-and-Go Queue (FAST, Unladen)
10.1 VMT 160 13.50 0.30 64.90 1.44 2.267 0.05
Idle (Standard) 76.1 Veh. Hours 762 33.76 5.66 162.27 27.21 5.668 0.95
Idle (FAST) 69.3 Veh. Hours 571 33.76 5.16 162.27 24.79 5.668 0.87
170

Vehicle Idling Emissions Study at Calexico East and Calexico West Ports-of-Entry October 2015, page 154
Table 87. Calexico East POE Northbound Commercial Vehicle Spring 2014 Vehicle Activity & Emissions with Calexico West Phase 1 & Calexico East Section 559 Proposal (2 of 2)
Process Activity Quantity Units Volume
ROG Rate
(g/mile) or (g/hour)
ROG Emissions (Lbs./Day)
NOx Rate
(g/mile) or
(g/hour)
NOx Emissions (Lbs./Day)
PM2.5 Rate
(g/mile) or (g/hour)
PM2.5 Emissions (Lbs./Day)
U.S. CBP Exit Stop-and-Go Queue (Standard, Laden)
16.8 VMT 411 13.50 0.50 64.90 2.40 2.267 0.08
Stop-and-Go Queue (Standard, Unladen)
14.3 VMT 350 13.50 0.42 64.90 2.04 2.267 0.07
Stop-and-Go Queue (FAST, Laden)
19.0 VMT 467 13.50 0.57 64.90 2.72 2.267 0.10
Stop-and-Go Queue (FAST, Unladen)
7.4 VMT 182 13.50 0.22 64.90 1.06 2.267 0.04
Idle (Standard) 5.7 Veh. Hours 762 33.76 0.43 162.27 2.04 5.668 0.07
Idle (FAST) 4.9 Veh. Hours 649 33.76 0.36 162.27 1.74 5.668 0.06
California CHP Stop-and-Go Queue (Standard, Laden)
7.8 VMT 411 13.50 0.23 64.90 1.11 2.267 0.04
Stop-and-Go Queue (Standard, Unladen)
6.6 VMT 350 13.50 0.20 64.90 0.95 2.267 0.03
Stop-and-Go Queue (FAST, Laden)
8.9 VMT 467 13.50 0.26 64.90 1.27 2.267 0.04
Stop-and-Go Queue (FAST, Unladen)
3.4 VMT 182 13.50 0.10 64.90 0.49 2.267 0.02
Idle (Standard) 7.6 Veh. Hours 762 33.76 0.57 162.27 2.73 5.668 0.10
Idle (FAST) 6.5 Veh. Hours 649 33.76 0.48 162.27 2.32 5.668 0.08
Other Uncongested Movement (Standard)
2,053.2 VMT 762 0.76 3.43 12.36 55.94 0.276 1.25
Uncongested Movement (FAST)
1,841.9 VMT 649 0.76 3.08 12.36 50.19 0.276 1.12
Subtotal, Calexico East Commercial, Northbound 35.08 243.47 7.17
171

Vehicle Idling Emissions Study at Calexico East and Calexico West Ports-of-Entry October 2015, page 155
Table 88. Calexico West POE Northbound Private Vehicle Summer 2014 Vehicle Activity & Emissions with Calexico West Phase 1 & Calexico East Section 559 Proposal
Process Activity Quantity Units Volume
ROG Rate
(g/mile) or (g/hour)
ROG Emissions (Lbs./Day)
NOx Rate
(g/mile) or
(g/hour)
NOx Emissions (Lbs./Day)
PM2.5 Rate
(g/mile) or (g/hour)
PM2.5 Emissions (Lbs./Day)
U.S. Primary, Standard Lane
Uncongested 6,508.2 VMT 3,285 0.62 8.91 0.65 9.33 0.021 0.30
Creeping Queue - VMT 3,285 4.30 0.00 1.22 0.00 0.040 0.00
Stop-and-Go Queue 62.2 VMT 3,285 8.61 1.18 2.44 0.33 0.080 0.01
Idle 88.5 Veh. Hours 3,285 21.52 4.20 6.10 1.19 0.201 0.04
U.S. Primary, Ready Lane
Uncongested 5,397.2 VMT 2,724 0.62 7.41 0.63 7.53 0.021 0.25
Creeping Queue - VMT 2,724 4.32 0.00 1.19 0.00 0.040 0.00
Stop-and-Go Queue 51.6 VMT 2,724 8.63 0.98 2.38 0.27 0.079 0.01
Idle 28.8 Veh. Hours 2,724 21.59 1.37 5.94 0.38 0.198 0.01
U.S. Primary, SENTRI Lane
Uncongested 5,255.4 VMT 2,653 0.62 7.22 0.63 7.33 0.021 0.24
Creeping Queue - VMT 2,653 4.32 0.00 1.19 0.00 0.040 0.00
Stop-and-Go Queue 50.2 VMT 2,653 8.63 0.96 2.38 0.26 0.079 0.01
Idle 21.4 Veh. Hours 2,653 21.59 1.02 5.94 0.28 0.198 0.01
U.S. Secondary Creeping Queue (Standard Lane)
3.1 VMT 3,285 4.30 0.03 1.22 0.01 0.040 0.00
Creeping Queue (Ready Lane)
3.1 VMT 2,724 4.32 0.03 1.19 0.01 0.040 0.00
Creeping Queue (SENTRI Lane)
2.5 VMT 2,653 4.32 0.02 1.19 0.01 0.040 0.00
30 Min. Soak and Restart (Standard Lane)
164.3 Vehicles 3,285 1.70 0.61 0.77 0.28 0.002 0.00
30 Min. Soak and Restart (Ready Lane)
136.2 Vehicles 2,724 1.70 0.51 0.74 0.22 0.002 0.00
30 Min. Soak and Restart (SENTRI Lane)
132.7 Vehicles 2,653 1.70 0.50 0.74 0.22 0.002 0.00
Subtotal, Calexico West POE, Northbound 34.94 27.65 0.89
172

Vehicle Idling Emissions Study at Calexico East and Calexico West Ports-of-Entry October 2015, page 156
Table 89. Calexico East POE Northbound Private Vehicle Summer 2014 Vehicle Activity & Emissions with Calexico West Phase 1 & Calexico East Section 559 Proposal
Process Activity Quantity Units Volume
ROG Rate
(g/mile) or (g/hour)
ROG Emissions (Lbs./Day)
NOx Rate
(g/mile) or
(g/hour)
NOx Emissions (Lbs./Day)
PM2.5 Rate
(g/mile) or (g/hour)
PM2.5 Emissions (Lbs./Day)
U.S. Primary, Standard Lane
Uncongested 8,586.1 VMT 4,334 0.62 11.75 0.65 12.31 0.021 0.40
Creeping Queue - VMT 4,334 4.30 0.00 1.22 0.00 0.040 0.00
Stop-and-Go Queue 82.1 VMT 4,334 8.61 1.56 2.44 0.44 0.080 0.01
Idle 116.8 Veh. Hours 4,334 21.52 5.54 6.10 1.57 0.201 0.05
U.S. Primary, Ready Lane
Uncongested 8,618.5 VMT 4,350 0.62 11.84 0.63 12.03 0.021 0.40
Creeping Queue - VMT 4,350 4.32 0.00 1.19 0.00 0.040 0.00
Stop-and-Go Queue 82.4 VMT 4,350 8.63 1.57 2.38 0.43 0.079 0.01
Idle 45.9 Veh. Hours 4,350 21.59 2.19 5.94 0.60 0.198 0.02
U.S. Primary, SENTRI Lane
Uncongested 7,252.7 VMT 3,661 0.62 9.96 0.63 10.12 0.021 0.34
Creeping Queue - VMT 3,661 4.32 0.00 1.19 0.00 0.040 0.00
Stop-and-Go Queue 69.3 VMT 3,661 8.63 1.32 2.38 0.36 0.079 0.01
Idle 29.5 Veh. Hours 3,661 21.59 1.40 5.94 0.39 0.198 0.01
U.S. Secondary Creeping Queue (Standard Lane)
4.1 VMT 4,334 4.30 0.04 1.22 0.01 0.040 0.00
Creeping Queue (Ready Lane)
4.1 VMT 4,350 4.32 0.04 1.19 0.01 0.040 0.00
Creeping Queue (SENTRI Lane)
3.5 VMT 3,661 4.32 0.03 1.19 0.01 0.040 0.00
30 Min. Soak and Restart (Standard Lane)
216.7 Vehicles 4,334 1.70 0.81 0.77 0.37 0.002 0.00
30 Min. Soak and Restart (Ready Lane)
217.5 Vehicles 4,350 1.70 0.81 0.74 0.36 0.002 0.00
30 Min. Soak and Restart (SENTRI Lane)
183.1 Vehicles 4,334 1.70 0.69 0.74 0.30 0.002 0.00
Subtotal, Calexico East POE, Northbound 49.54 39.31 1.27
173

Vehicle Idling Emissions Study at Calexico East and Calexico West Ports-of-Entry October 2015, page 157
Table 90. Calexico East POE Northbound Commercial Vehicle Summer 2014 Vehicle Activity & Emissions with Calexico West Phase 1 & Calexico East Section 559 Proposal (1 of 2)
Process Activity Quantity Units Volume
ROG Rate
(g/mile) or
(g/hour)
ROG Emissions (Lbs./Day)
NOx Rate
(g/mile) or (g/hour)
NOx Emissions (Lbs./Day)
PM2.5 Rate
(g/mile) or
(g/hour)
PM2.5 Emissions (Lbs./Day)
MX Aduanas Entrance
Stop-and-Go Queue (Standard, Laden)
7.4 VMT 389 13.56 0.22 64.90 1.05 2.267 0.04
Stop-and-Go Queue (Standard, Unladen)
6.3 VMT 332 13.56 0.19 64.90 0.90 2.267 0.03
Stop-and-Go Queue (FAST, Laden) 9.4 VMT 442 13.56 0.28 64.90 1.35 2.267 0.05
Stop-and-Go Queue (FAST, Unladen) 3.3 VMT 172 13.56 0.10 64.90 0.47 2.267 0.02
Idle (Standard) 17.0 Veh. Hours
721 33.91 1.27 162.29 6.09 5.668 0.21
Idle (FAST) 14.5 Veh. Hours
614 33.91 1.08 162.29 5.19 5.668 0.18
MX Aduanas Cargo Inspection
Idle (Standard) 32.3 Veh. Hours
721 33.91 2.42 162.29 11.56 5.668 0.40
Idle (FAST) 31.8 Veh. Hours
614 33.91 2.38 162.29 11.37 5.668 0.40
U.S. CBP Primary
Stop-and-Go Queue (Standard, Laden)
7.4 VMT 389 13.56 0.22 64.90 1.05 2.267 0.04
Stop-and-Go Queue (Standard, Unladen)
6.3 VMT 332 13.56 0.19 64.90 0.90 2.267 0.03
Stop-and-Go Queue (FAST, Laden) 8.4 VMT 442 13.56 0.25 64.90 1.20 2.267 0.04
Stop-and-Go Queue (FAST, Unladen) 3.3 VMT 172 13.56 0.10 64.90 0.47 2.267 0.02
Idle (Standard) 12.0 Veh. Hours
721 33.91 0.90 162.29 4.30 5.668 0.15
Idle (FAST) 10.2 Veh. Hours
614 33.91 0.77 162.29 3.66 5.668 0.13
U.S. CBP Cargo Inspection
Stop-and-Go Queue (Standard, Laden)
10.7 VMT 389 13.56 0.32 64.90 1.53 2.267 0.05
Stop-and-Go Queue (Standard, Unladen)
9.1 VMT 332 13.56 0.27 64.90 1.31 2.267 0.05
Stop-and-Go Queue (FAST, Laden) 12.2 VMT 389 13.56 0.36 64.90 1.74 2.267 0.06
Stop-and-Go Queue (FAST, Unladen) 4.7 VMT 151 13.56 0.14 64.90 0.68 2.267 0.02
Idle (Standard) 72.0 Veh. Hours
721 33.91 5.38 162.29 25.74 5.668 0.90
Idle (FAST) 65.5 Veh. Hours
541 33.91 4.90 162.29 23.45 5.668 0.82
174

Vehicle Idling Emissions Study at Calexico East and Calexico West Ports-of-Entry October 2015, page 158
Table 90. Calexico East POE Northbound Commercial Vehicle Summer 2014 Vehicle Activity & Emissions with Calexico West Phase 1 & Calexico East Section 559 Proposal (2 of 2)
Process Activity Quantity Units Volume
ROG Rate
(g/mile) or (g/hour)
ROG Emissions (Lbs./Day)
NOx Rate
(g/mile) or
(g/hour)
NOx Emissions (Lbs./Day)
PM2.5 Rate
(g/mile) or (g/hour)
PM2.5 Emissions (Lbs./Day)
U.S. CBP Exit Stop-and-Go Queue (Standard, Laden)
7.4 VMT 389 13.56 0.22 64.90 1.05 2.267 0.04
Stop-and-Go Queue (Standard, Unladen)
6.3 VMT 332 13.56 019 64.90 0.90 2.267 0.03
Stop-and-Go Queue (FAST, Laden)
8.4 VMT 442 13.56 0.25 64.90 1.20 2.267 0.04
Stop-and-Go Queue (FAST, Unladen)
3.3 VMT 172 13.56 0.10 64.90 0.47 2.267 0.02
Idle (Standard) 5.4 Veh. Hours 721 33.91 0.40 162.29 1.93 5.668 0.07
Idle (FAST) 4.6 Veh. Hours 614 33.91 0.34 162.29 1.65 5.668 0.06
California CHP Stop-and-Go Queue (Standard, Laden)
7.4 VMT 389 13.56 0.22 64.90 1.05 2.267 0.04
Stop-and-Go Queue (Standard, Unladen)
6.3 VMT 332 13.56 0.19 64.90 0.90 2.267 0.03
Stop-and-Go Queue (FAST, Laden)
8.4 VMT 442 13.56 0.25 64.90 1.20 2.267 0.04
Stop-and-Go Queue (FAST, Unladen)
3.3 VMT 172 13.56 0.10 64.90 0.47 2.267 0.02
Idle (Standard) 7.2 Veh. Hours 721 33.91 0.54 162.29 2.58 5.668 0.09
Idle (FAST) 6.1 Veh. Hours 614 33.91 0.46 162.29 2.20 5.668 0.08
Other Uncongested Movement (Standard)
2,042.7 VMT 721 0.76 3.44 12.36 55.67 0.276 1.24
Uncongested Movement (FAST)
1,778.8 VMT 614 0.76 2.99 12.36 48.48 0.276 1.08
Subtotal, Calexico East Commercial, Northbound 31.42 223.75 6.50
175

Vehicle Idling Emissions Study at Calexico East and Calexico West Ports-of-Entry October 2015, page 159
Table 91. Calexico West POE Northbound Private Vehicle Winter 2014 Vehicle Activity & Emissions with Calexico West Phase 1 & Calexico East Section 559 Proposal
Process Activity Quantity Units Volume
ROG Rate
(g/mile) or (g/hour)
ROG Emissions (Lbs./Day)
NOx Rate
(g/mile) or
(g/hour)
NOx Emissions (Lbs./Day)
PM2.5 Rate
(g/mile) or (g/hour)
PM2.5 Emissions (Lbs./Day)
U.S. Primary, Standard Lane
Uncongested 7,536.8 VMT 3,804 0.44 7.36 0.73 12.10 0.021 0.35
Creeping Queue - VMT 3,804 3.07 0.00 1.37 0.00 0.040 0.00
Stop-and-Go Queue 72.1 VMT 3,804 6.15 0.98 2.74 0.43 0.080 0.01
Idle 102.5 Veh. Hours 3,804 15.37 3.47 6.84 1.55 0.201 0.05
U.S. Primary, Ready Lane
Uncongested 5,888.3 VMT 2,972 0.44 5.72 0.71 9.21 0.021 0.27
Creeping Queue - VMT 2,972 3.06 0.00 1.33 0.00 0.040 0.00
Stop-and-Go Queue 56.3 VMT 2,972 6.12 0.76 2.67 0.33 0.079 0.01
Idle 31.4 Veh. Hours 2,972 15.30 1.06 6.66 0.46 0.198 0.01
U.S. Primary, SENTRI Lane
Uncongested 6,060.6 VMT 3,059 0.44 5.89 0.71 9.47 0.021 0.28
Creeping Queue - VMT 3,059 3.06 0.00 1.33 0.00 0.040 0.00
Stop-and-Go Queue 57.9 VMT 3,059 6.12 0.78 2.67 0.34 0.079 0.01
Idle 24.6 Veh. Hours 3,059 15.30 0.83 6.66 0.36 0.198 0.01
U.S. Secondary Creeping Queue (Standard Lane)
3.6 VMT 3,804 3.07 0.02 1.37 0.01 0.040 0.00
Creeping Queue (Ready Lane)
3.6 VMT 2,972 3.06 0.02 1.33 0.01 0.040 0.00
Creeping Queue (SENTRI Lane)
2.9 VMT 3,059 3.06 0.02 1.33 0.01 0.040 0.00
30 Min. Soak and Restart (Standard Lane)
190.2 Vehicles 3,804 1.17 0.49 0.90 0.38 0.002 0.00
30 Min. Soak and Restart (Ready Lane)
148.6 Vehicles 2,972 1.16 0.38 0.87 0.29 0.002 0.00
30 Min. Soak and Restart (SENTRI Lane)
153.0 Vehicles 3,059 1.16 0.39 0.87 0.29 0.002 0.00
Subtotal, Calexico East POE, Northbound 28.19 35.24 1.01
176

Vehicle Idling Emissions Study at Calexico East and Calexico West Ports-of-Entry October 2015, page 160
Table 92. Calexico East POE Northbound Private Vehicle Winter 2014 Vehicle Activity & Emissions with Calexico West Phase 1 & Calexico East Section 559 Proposal
Process Activity Quantity Units Volume
ROG Rate
(g/mile) or (g/hour)
ROG Emissions (Lbs./Day)
NOx Rate
(g/mile) or
(g/hour)
NOx Emissions (Lbs./Day)
PM2.5 Rate
(g/mile) or (g/hour)
PM2.5 Emissions (Lbs./Day)
U.S. Primary, Standard Lane
Uncongested 9,915.0 VMT 5,005 0.44 9.68 0.73 15.92 0.021 0.46
Creeping Queue - VMT 5,005 3.07 0.00 1.37 0.00 0.040 0.00
Stop-and-Go Queue 94.8 VMT 5,005 6.15 1.29 2.74 0.57 0.080 0.02
Idle 134.9 Veh. Hours 5,005 15.37 4.57 6.84 2.03 0.201 0.06
U.S. Primary, Ready Lane
Uncongested 9,402.8 VMT 4,746 0.44 9.14 0.71 14.70 0.021 0.44
Creeping Queue - VMT 4,746 3.06 0.00 1.33 0.00 0.040 0.00
Stop-and-Go Queue 89.9 VMT 4,746 6.12 1.21 2.67 0.53 0.079 0.02
Idle 50.1 Veh. Hours 4,746 15.30 1.69 6.66 0.74 0.198 0.02
U.S. Primary, SENTRI Lane
Uncongested 8,340.3 VMT 4,210 0.44 8.11 0.71 13.04 0.021 0.39
Creeping Queue - VMT 4,210 3.06 0.00 1.33 0.00 0.040 0.00
Stop-and-Go Queue 79.7 VMT 4,210 6.12 1.08 2.67 0.47 0.079 0.01
Idle 33.9 Veh. Hours 4,210 15.30 1.14 6.66 0.50 0.198 0.01
U.S. Secondary Creeping Queue (Standard Lane)
4.7 VMT 5,005 3.07 0.03 1.37 0.01 0.040 0.00
Creeping Queue (Ready Lane)
4.5 VMT 4,746 3.06 0.03 1.33 0.01 0.040 0.00
Creeping Queue (SENTRI Lane)
4.0 VMT 4,210 3.06 0.03 1.33 0.01 0.040 0.00
30 Min. Soak and Restart (Standard Lane)
250.3 Vehicles 5,005 1.17 0.65 0.90 0.50 0.002 0.00
30 Min. Soak and Restart (Ready Lane)
237.3 Vehicles 4,746 1.16 0.61 0.87 0.46 0.002 0.00
30 Min. Soak and Restart (SENTRI Lane)
210.5 Vehicles 5,005 1.16 0.54 0.87 0.41 0.002 0.00
Subtotal, Calexico East POE, Northbound 39.79 49.89 1.43
177

Vehicle Idling Emissions Study at Calexico East and Calexico West Ports-of-Entry October 2015, page 161
Table 93. Calexico East POE Northbound Commercial Vehicle Winter 2014 Vehicle Activity & Emissions with Calexico West Phase 1 & Calexico East Section 559 Proposal (1 of 2)
Process Activity Quantity Units Volume
ROG Rate
(g/mile) or (g/hour)
ROG Emissions (Lbs./Day)
NOx Rate
(g/mile) or
(g/hour)
NOx Emissions (Lbs./Day)
PM2.5 Rate
(g/mile) or (g/hour)
PM2.5 Emissions (Lbs./Day)
MX Aduanas Entrance
Stop-and-Go Queue (Standard, Laden)
7.5 VMT 397 13.44 0.23 64.94 1.08 2.267 0.04
Stop-and-Go Queue (Standard, Unladen)
6.4 VMT 339 13.44 0.19 64.94 0.92 2.267 0.03
Stop-and-Go Queue (FAST, Laden)
11.1 VMT 451 13.44 0.47 64.94 1.59 2.267 0.06
Stop-and-Go Queue (FAST, Unladen)
3.3 VMT 176 13.44 0.10 64.94 0.48 2.267 0.02
Idle (Standard) 17.4 Veh. Hours 736 33.62 1.32 162.37 6.22 5.668 0.22
Idle (FAST) 14.8 Veh. Hours 627 33.62 1.12 162.37 5.30 5.668 0.18
MX Aduanas Cargo Inspection
Idle (Standard) 33.0 Veh. Hours 736 33.62 2.50 162.37 11.81 5.668 0.41
Idle (FAST) 32.4 Veh. Hours 627 33.62 2.46 162.37 11.62 5.668 0.41
U.S. CBP Primary
Stop-and-Go Queue (Standard, Laden)
7.5 VMT 397 13.44 0.22 64.94 1.08 2.267 0.04
Stop-and-Go Queue (Standard, Unladen)
6.4 VMT 339 13.44 0.19 64.94 0.92 2.267 0.03
Stop-and-Go Queue (FAST, Laden)
8.6 VMT 451 13.44 0.25 64.94 1.22 2.267 0.04
Stop-and-Go Queue (FAST, Unladen)
3.3 VMT 176 13.44 0.10 64.94 0.48 2.267 0.02
Idle (Standard) 12.3 Veh. Hours 736 33.62 0.93 162.37 4.39 5.668 0.15
Idle (FAST) 10.4 Veh. Hours 627 33.62 0.79 162.37 3.74 5.668 0.13
U.S. CBP Cargo Inspection
Stop-and-Go Queue (Standard, Laden)
13.7 VMT 397 13.44 0.67 64.94 1.97 2.267 0.07
Stop-and-Go Queue (Standard, Unladen)
11.7 VMT 339 13.44 0.57 64.94 1.68 2.267 0.06
Stop-and-Go Queue (FAST, Laden)
15.6 VMT 397 13.44 0.76 64.94 2.23 2.267 0.08
Stop-and-Go Queue (FAST, Unladen)
6.1 VMT 155 13.44 0.30 64.94 0.87 2.267 0.03
Idle (Standard) 73.5 Veh. Hours 736 33.62 5.56 162.37 26.30 5.668 0.92
Idle (FAST) 66.9 Veh. Hours 552 33.62 5.07 162.37 23.96 5.668 0.84
178

Vehicle Idling Emissions Study at Calexico East and Calexico West Ports-of-Entry October 2015, page 162
Table 93. Calexico East POE Northbound Commercial Vehicle Winter 2014 Vehicle Activity & Emissions with Calexico West Phase 1 & Calexico East Section 559 Proposal (2 of 2)
Process Activity Quantity Units Volume
ROG Rate
(g/mile) or (g/hour)
ROG Emissions (Lbs./Day)
NOx Rate
(g/mile) or
(g/hour)
NOx Emissions (Lbs./Day)
PM2.5 Rate
(g/mile) or (g/hour)
PM2.5 Emissions (Lbs./Day)
U.S. CBP Exit Stop-and-Go Queue (Standard, Laden)
9.0 VMT 397 13.44 0.27 64.94 1.28 2.267 0.04
Stop-and-Go Queue (Standard, Unladen)
7.6 VMT 339 13.44 0.23 64.94 1.09 2.267 0.04
Stop-and-Go Queue (FAST, Laden)
10.2 VMT 451 13.44 0.30 64.94 1.46 2.267 0.05
Stop-and-Go Queue (FAST, Unladen)
4.0 VMT 176 13.44 0.12 64.94 0.57 2.267 0.02
Idle (Standard) 5.5 Veh. Hours 736 33.62 0.41 162.37 1.98 5.668 0.07
Idle (FAST) 4.7 Veh. Hours 627 33.62 0.35 162.37 1.68 5.668 0.06
California CHP Stop-and-Go Queue (Standard, Laden)
7.5 VMT 397 13.44 0.22 64.94 1.08 2.267 0.04
Stop-and-Go Queue (Standard, Unladen)
6.4 VMT 339 13.44 0.19 64.94 0.92 2.267 0.03
Stop-and-Go Queue (FAST, Laden)
8.5 VMT 451 13.44 0.25 64.94 1.22 2.267 0.04
Stop-and-Go Queue (FAST, Unladen)
3.3 VMT 176 13.44 0.10 64.94 0.48 2.267 0.02
Idle (Standard) 7.4 Veh. Hours 736 33.62 0.55 162.37 2.63 5.668 0.09
Idle (FAST) 6.3 Veh. Hours 627 33.62 0.46 162.37 2.24 5.668 0.08
Other Uncongested Movement (Standard)
2,053.7 VMT 736 0.75 3.41 12.37 56.01 0.276 1.25
Uncongested Movement (FAST)
1,808.3 VMT 627 0.75 3.00 12.37 49.31 0.276 1.10
Subtotal, Calexico East Commercial, Northbound 32.18 229.79 6.70
179

Vehicle Idling Emissions Study at Calexico East and Calexico West Ports-of-Entry October 2015, page 163
Findings and Recommendations Emission Reduction Strategy Benefits The planned improvements at Calexico West are anticipated to reduce emissions impacts, however the benefits are not distributed evenly between the Calexico West and Calexico East ports-of-entry:
• Shifting traffic away from Calexico East reduces the delay and reduces emissions at Calexico East;
• Under the Phase 1 improvements at Calexico West, the increased traffic flow is anticipated to overwhelm the emission reduction benefits from the reduction in delay. A net increase in emissions at the Calexico West port-of-entry is anticipated, which is offset by a larger drop in emissions at the Calexico East port-of-entry; and
• Once the Phase 2 improvements are constructed, the additional reduction in delay eliminates those localized increases in ROG emissions at the Calexico West port-of-entry.
Adding additional CBP primary inspection booths for privately owned vehicles at the Calexico East POE through the Section 559 Proposal improvements, draws traffic away from the Calexico West POE and dramatically reduces emissions in downtown.
• Adding additional CBP primary inspection booths for commercial vehicles at the Calexico East POE through the Section 559 Proposal has only a marginal effect on emissions and border wait-times because the cargo inspection bottleneck still limits peak flow through the commercial port-of-entry.
• Because of the higher levels of aromatic compounds and higher vapor pressure found in the fuels sold in Mexicali, importing California fuel into Mexicali is anticipated to dramatically reduce emissions from privately owned vehicles.
• Strategies that focus on reducing the number of empty trucks, and moving more freight by FAST certified trucks, are only anticipated to provide an approximate 1% reduction in NOx and PM2.5. Streamlining the commercial crossing process was estimated to reduce NOx and PM2.5 by approximately 7%.
Recommendations The Calexico West improvements dramatically reduce emissions and wait-times for the Calexico/Mexicali region. Only Phase 1 of the Calexico West reconstruction project is funded. With implementation of only Phase 1, the emission reductions per vehicle at the Calexico West POE are anticipated to be more than offset by the potential redistribution of traffic from the Calexico East to the Calexico West port-of-entry. Stakeholders should work together to see the Phase 2 improvements funded, or implementation of the Section 559 Proposal’s expansion of the Calexico East privately owned vehicle port-of-entry.
Consideration should be given to adding additional cargo inspection capacity to the Section 559 Proposal’s expansion of the Calexico East commercial vehicle port-of-entry.
180

Vehicle Idling Emissions Study at Calexico East and Calexico West Ports-of-Entry October 2015, page 164
Discussion This study focused on season variations in northbound traffic, fleet characteristics and emissions, and collected extensive vehicle fleet data to aid in the development of emission factors. Analysis of that data led to important findings that can be extrapolated to other locations, and lead to recommendations for further work:
• There is not a statistically significant relationship between season (spring, summer, winter) and vehicle age distribution, or vehicle class distribution, when lane type and the country where vehicles are registered are accounted for. This finding reduces the need for intercept surveys in future studies.
• The sample size for commercial vehicles was relatively small. Additional work to verify that commercial vehicle ages and classes do not vary by lane-type would be helpful.
• Only northbound traffic was studied. The effects of southbound delay on emissions should be considered. That additional work would facilitate the use of air quality dispersion models and estimation of ambient pollutant concentrations associated with the ports-of-entry. Estimates of ambient concentrations should focus on the Calexico West port-of-entry because of its proximity to the business districts in Calexico and Mexicali.
Another noteworthy observation is that the fraction of commercial trucks experiencing long delays is difficult to determine. A notable number of trucks crossing the border in the morning were observed to have six to eight hour crossing times, suggesting they may have been subject to a lengthy cargo inspection. Commercial vehicles arriving later in the day and experiencing lengthy delays would exit the CBP facility after dark when they could not be observed by survey staff. Future studies might consider automated techniques to observe the dwell time for commercial vehicles in the port-of-entry, to understand their impact on emissions.
181

Vehicle Idling Emissions Study at Calexico East and Calexico West Ports of Entry September 2015, Page A-1
Appendix A: Documentation of Data Collection • Spring 2014 Data Collection Plan (Page A-2). • Summer 2014 Data Collection Plan (Page A-29). • Winter 2014 Data Collection Plan (Page A-56). • Spring Sampling Results Technical Memo (Page A-83). • Summer Sampling Results Technical Memo (Page A-116). • Winter Sampling Results Technical Memo (Page A-141).
182

The U.S.-Mexico Border Industry Mapping Initiative is a joint project of the North American
Research Partnership (NARP) and the Mexico Institute at the Woodrow Wilson International Center
for Scholars.
This project is designed to support the economic development work of both local communities and
the federal governments in the U.S.-Mexico border region. We have designed a methodology to
identify key industries in each sub-region that meet three criteria: highly concentrated, binational and
dynamic.
In recognition of the unique binational nature of the border- region economies, we have adapted our
process to use comparable data available on both sides of the border, and we employ a consistent
approach to the length on the U.S.-Mexico border, allowing a comparative view of the unique
strengths of each sub-region.
For analysis and details regarding our methodology, please see our report:
http://naresearchpartnership.org/wp-content/uploads/2015/05/Competitive-Border-
Communities_-Final-Report-HR.pdf
Other Projects Underway:
NARP is currently writing its second State of the Border Report. The first report had chapters on
Quality of Life, Sustainability, Economic Development, and Security.
https://www.wilsoncenter.org/sites/default/files/mexico_state_of_border_0.pdf
NARP has recently begun a project to evaluate making the ports of entry into more of a destination.
http://borderfusion.global/
Contact: D. Rick Van Schoik, North American Research Partnership
http://naresearchpartnership.org
760 942-8317
Agenda Item No. 7 Borders Committee
January 22, 2016

1
Minute 320 ‐ An Overview
SANDAGJanuary 22, 2016
Steve Smullen, Area Operations Manager, San Diego Field Office
International Boundary and Water Commission,United States and Mexico

2
IBWC HISTORY AND MISSION
Origins of agency lie in Treaty of Guadalupe Hidalgo (1848) and delineation of US/Mexico boundary.
A binational agency was formally established as International Boundary Commission (IBC) under Convention of 1889
Responsibilities were expanded under Water Treaty of 1944, name changed to International Boundary and Water Commission (IBWC).
Agency mission is to apply rights and obligations which governments of Mexico and US assume under numerous boundary and water treaties.
3
USIBWC MISSION STATEMENT
Provide binational solutions to issues that arise during the application of United States‐Mexico treaties regarding boundary demarcation, national ownership of waters, sanitation, water quality, and flood control in the border region.
4

3
STRUCTURE PER 1944 TREATY
MEXICAN
SECTION•Mexican Commissioner
•Secretary
•Two Principal
Engineers
•Legal Adviser
US
SECTION• US Commissioner
• Secretary
• Two Principal
Engineers
• Legal Adviser
5
INTERNATIONAL BOUNDARY AND WATER COMMISSION
(IBWC)
IBWC MINUTES
• Decisions of the Commission are recorded in the form of Minutes
• Minutes are binding agreements of the IBWC intended to implement treaty.
• They take effect once approved by the U.S. Department of State and Mexico’s Foreign Affairs Ministry
• Over 300 minutes approved
• A Minute is usually developed in response to a joint problem affecting the border and historically it has provided an engineering solution.
• This Minute, and recent Minutes concerning Colorado River water issues, are framework Minutes in which problems are identified and solutions are sought in a collaborative manner with stakeholders.
6

4
• 1944 Water Treaty
• Article 16 – addresses water uses in Tijuana Basin
• Article 3 – preferential treatment for water qualityissues
• Article 24 - implementation and execution of projects
• Inclusive Process
• Binational Core Group (BCG) coordinated by IBWC with representatives from both countries:
• Federal Government• State Government• NGOs• Local Government
Federal • Binational Work Groups
Elements of Minute 320
Legal Context
Organizationand Operation
1
2
7
ELEMENTS OF MINUTE 320
Set of conditions
• Transboundary Issues: Flood control,
Surface wáter -capture and utilization,
Sediment and solid waste,
Water quality,
Wastewater discharges,
Protection and environmentalrestoration,
Integrated and sustainablemanagement,
Climate change,
Public participation
• Priority Topics: Sediment
Solid Waste
Water Quality
3
8

5
1. Cooperative measures.
2. Participants and responsible institutions.
3. Studies, investigations, inventories, maps, models.
4. Short and long term priorities.
5. Operations and maintenance.
6. Implementation process.
7. Costs, funding sources and cost distribution
8. Community information.
9. Monitoring programs.
Activities of theBCG
ELEMENTS OF MINUTE 320. BINATIONAL CORE GROUP(BCG)
4
9
Binational CORE Group
10

6
Binational Core GroupMembers
11
Alfonso Alvarez, CESPTAlfonso Blancafort, SEMARNAT
Dave Gibson, RWQCBManuel Guevara, SIDUE
Dr. Tonatiuh Guillen, COLEFChris Helmer, City of Imperial Beach
John Holder, WildcoastEduardo Ledesma, CONAGUA
Doug Liden, EPAJose Lopez, City of TecateAlfredo Ocon, CONAGUA
Chris Peregrin, California State ParksRoberto Sanchez, City of Tijuana
Christine Sloan, County of San DiegoDavid Wells, City of San Diego
Margarita Diaz, PFEA
Binational Work Groups
12

7
Three Binational Working Groups
1) Sediment Control2) Solid Waste3) Water Quality
13
1. Members of the Binational Working Groupsshall be nominated by members of the BCGor the Commission and approved by the Commission.
2. BWG members can be from the BCG or from other agencies.
3. Meetings will be held monthly (or as determined by the respective BWG groups), alternately in the US and Mexico.
4. The first BWG meeting was held on January 20 for Water Quality (US side). BWG meetings will be chaired by the local IBWC area managers, Roberto Espinosa in Tijuana and Steve Smullen in San Diego.
Members and Meetings
14

8
Binational Work Groups (U.S. Side)
15
Water QualityDoug Liden ‐EPAJohn Holder‐WildcoastAndy Hall – City of Imperial BeachChris Helmer – City of Imperial BeachSarah Giddings – ScrippsRoger Kube ‐ SurfriderHiram Sarabia – San Diego Regional Water Quality Control BoardWayne Belzer ‐ USIBWC
SedimentChris Peregrin – CA State ParksVicente Rodriguez – San Diego Regional Water Quality Control BoardDavid Wells – City of San Diego Tracy Cline – County of San DiegoBob Scott‐ Haley and AldrichPadinare Unnikrishna ‐ USIBWC
Solid WasteMelissa Valdovinos ‐ San Diego Regional Water Quality Control BoardJohn Holder – WildcoastWayne Belzer – USIBWCCheryl Tieken ‐ SurfriderBob Scott‐ Haley and AldrichAna Equiarte ‐ TRNERR
Binational Work GroupsWorking Document
16
TOPIC MX VIEW US VIEW TERMPOTA as jointly agreed by MNG
Construction of New Sediment Basins in U.S.
Little benefit to Mexico, agree in principle that will reduce environmental impacts of excess sediment transport
Needed in short term to reduce sedimentation rates in Tijuana River Valley in U.S.
Mexico-U.S.-10 years

9
Thanks for your attention!ibwc.gov
17

1
Vehicle Idling Emissions Study at Calexico West and Calexico East
Land Ports‐of‐Entry
SANDAG Borders Committee
San Diego, CA, January 22, 2016
Originally presented
September 10, 2015: Imperial – Mexicali Air Quality Task Force
Image: Puen
tesLazaro Carden
as, Source: Public Trust for Tourism
Promotion M
exicali
Project Briefing
• Study: April 2014 – October 2015
• Border Environment Cooperation Commission/Comisión de Cooperación Ecológica Fronteriza (BECC/COCEF) grant, in coordination with the U.S. Environmental Protection Agency (US EPA).
• Consultant team:‐ T. Kear Transportation Planning and Management, Inc. ‐ Crossborder Group, Inc.
• Project estimated reactive organic gas (ROG), fine particulate matter (PM2.5), and oxides of nitrogen (NOx) emissions from northbound traffic, and screened strategies to reduce emissions.
2

2
Study Partners
• Imperial – Mexicali Air Quality Task Force.
• Imperial County Air Pollution Control District (ICAPCD).
• Imperial County Transportation Commission (ICTC).
• Additional agencies through Technical Advisory Committee (i.e., BECC/CECEF, USEPA, Secretariat of Environment and Natural Resources, City of Calexico, Ciudad de Mexicali, U.S. Customs and Border Protection, Air Resources Board, and Calif. Highway Patrol).
3
Objectives
• Promote environmental health and support BECC/COCEF and USEPA in achieving the goals and objectives of the U.S.‐Mexico Border 2020 Program in the California‐Baja California region.
• Support coordinated air quality planning activities on both sides of the U.S.‐Mexico border.
• Characterize key vehicle fleet characteristics at Calexico East and Calexico West based on intercept surveys.
4

3
Objectives (continued)
• Collect detailed estimates of concurrent delay, processing times, and queuing at the Calexico East and Calexico West ports‐of‐entry.
• Improve the understanding of the relationship between wait‐times and emissions at the Calexico East and Calexico West ports‐of‐entry.
• Inform agencies along the border about the effect of management decisions and infrastructure investments designed to mitigate wait‐time and emissions at the border.
5
Approach
• Analysis based on U.S.‐Mexico Joint Working Committee on Transportation Planning (JWC) template.
• Consideration of vehicle fleet characteristics, wait‐time, traffic volume, number of booths open, and inspection times.
• Data Collection:‐ Survey of commercial vehicle fleet characteristics at Calexico East;
‐ Survey of passenger vehicle fleet characteristics at Calexico West;
‐ Traffic counts, processing times, and queuing.
6

4
Data Collected
Target Number ofSurveys
SpringSurveys
SummerSurveys
WinterSurveys
Total
General‐Purpose POV
400 428 108 119 655
SENTRI 100 148 97 111 356
Commercial 250 156 n/a 38 194
April 3, 2014 7
Note: green indicates where sample targets were met, and red denoteswhere the sample size targets were missed.
Existing Condition & Emission Reduction Strategy Scenarios
• Existing condition with and without POE scenario.
• Phase 1 of the Calexico West POE reconstruction project (10 lanes).
• Phase 2 of the Calexico West POE reconstruction project (16 lanes).
• Use of California fuel in Mexicali (Reduces ROG by factor of 3.7 during the summer and 2.4 during the winter).
• A reduction in empty general‐purpose truck trips(empty truck rate reduced from 46% to 28% by eliminating trips).
• Replacing 10% of general‐purpose truck trips to FAST truck trips.
• Streamlining commercial crossing (combining the Aduanas and CBP primary inspections).
• Sec. 559 Proposal to expand the Calexico East POE (6 additional POV lanes and 3 additional commercial lanes).
8

5
Phase 1 of Calexico West Reconstruction (10 Lanes)
9
Source: Calexico West LPOE FEIS (http://www.gsa.gov/portal/category/106439)
Phase 2 of Calexico West Reconstruction (16 Lanes)
10
Source: Calexico West LPOE FEIS (http://www.gsa.gov/portal/category/106439)
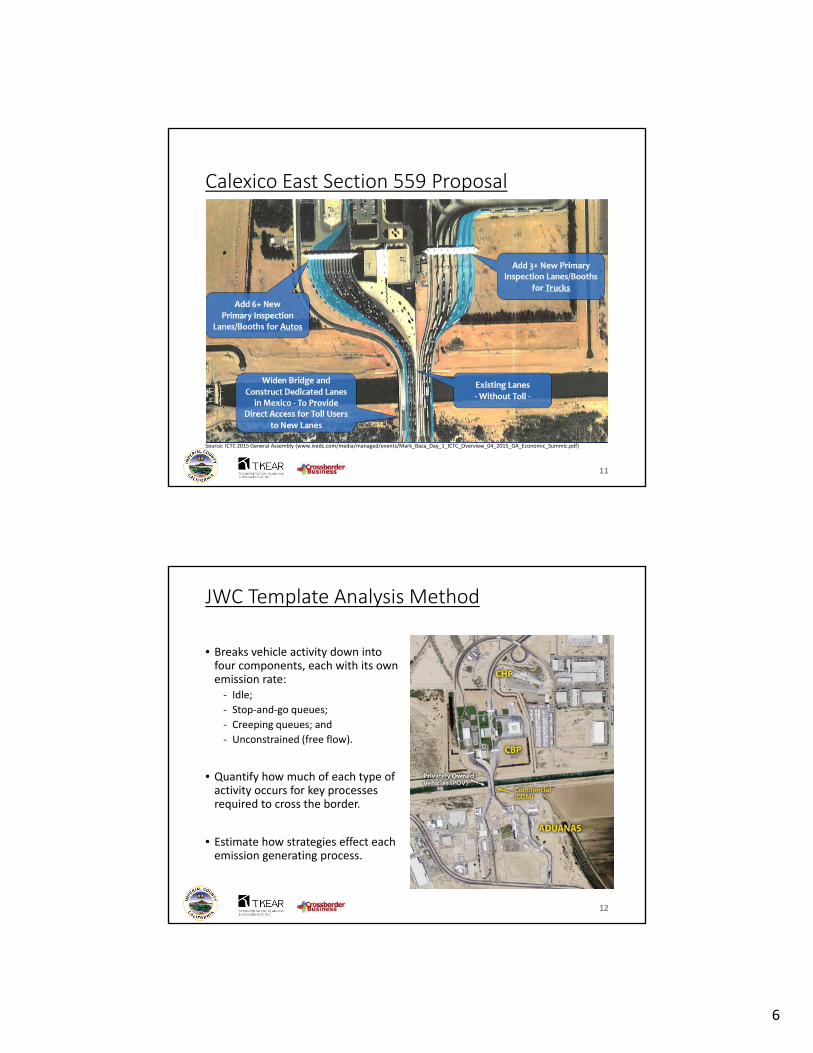
6
Calexico East Section 559 Proposal
11
Source: ICTC 2015 General Assembly (www.ivedc.com/media/managed/events/Mark_Baza_Day_1_ICTC_Overview_04_2015_GA_Economic_Summic.pdf)
JWC Template Analysis Method
• Breaks vehicle activity down into four components, each with its own emission rate:‐ Idle;
‐ Stop‐and‐go queues;
‐ Creeping queues; and
‐ Unconstrained (free flow).
• Quantify how much of each type of activity occurs for key processes required to cross the border.
• Estimate how strategies effect each emission generating process.
12

7
13
‐634
‐469
‐315
‐98 ‐80 ‐3
3
0
‐469
‐366
‐229
‐68
‐68 ‐2
6
0
‐1371
‐90
‐1310
‐681
‐19 ‐6
‐1638
C A L E X I CO EA S T S E C . 559 PROPOSA L , WITH
CA L E X I CO WEST PHAS E 1 POE
PRO J E C TCOMB INE ADUANAS AND CBP PR IMARY
CA L E X I CO WEST PHAS E 1 & 2 POE
PRO J E C T
CA L E X I CO WEST PHAS E 1 POE
PRO J E C T
SH I F T 10% OF COMMERC I A L
GENERA L ‐ PURPOSE TO FA S T
REDUCT ION I N EMPTY COMMERC I A L
GENERA L ‐ PURPOSE VOLUME CA L I FORN I A FUE L
Strategy Benefits: How Many Imperial County POVs Would Need to be Removed From The 2014 Fleet to Achieve Similar Reductions
NOx PM2.5 ROG
Results Summary (lb/day)
ROG
• Reductions up to about 90 lbs/day .
• ~ 2% of Imperial County 2012 on‐road ROG emissions.
NOx
• Reductions up to 52 lbs/day.
• ~ 0.7% of Imperial County 2012 on‐road NOx emissions.
PM2.5
• Reductions up to about 2 lbs/day.
• ~ .6% of Imperial County 2012 on‐road PM2.5 emissions.
.
(Actual results vary by season and strategy)
14

8
Findings & Recommendations
• Capacity projects that reduce per‐vehicle wait‐times will reduce emissions.
• Capacity changes could shift traffic from one POE to the other POE, overwhelming the per‐vehicle emission reductions from reduced wait‐times, and potentially creating locally higher emissions.
• Use of gasoline purchased in Mexico has a substantial impact on POV emissions.
• Commercial vehicles are orders of magnitude more important to border air quality than passenger vehicles when it comes to Nox and PM2.5.
• The Section 559 Proposal’s expansion of Calexico East POV lanes substantially benefits the Calexico West POE.
15

1
D
Does the Border Matter?D. Rick Van Schoik
North American Research Partnership
2

2
Competitive Border Communities: Mapping and Developing U.S.-Mexico Transborder
IndustriesFollow the conversation live on Twitter:
@MexicoInstitute @NARPartnership #UsMxMapping
3
OUTLINE
North American Research Partnership
Perspective
General Demographics and Economics 101
Past Work
Current Work
Cluster Development Recommendations
Border Fusion
4

3
About the PartnershipThe North American Research Partnership is an independent, non-profit think tank and network of analysts throughout North America that conduct strategic applied research and outreach on how the United States, Mexico and Canada can better position themselves for success in the 21st century.
Issue areas
Trade │ Energy │ Sustainability │ Security │ Education
Why a new organization?
• The U.S., Mexico and Canada are each at a crossroads in the process of globalization.
• Citizens, the news media and policymakers need—and often ask for—a comprehensive yet accessible understanding of complex international issues.
• Our approach: non-partisan public policy and international relations research.
• Quality partnerships = greater impact.
5
Key PartnersBoard of Advisors 2013-2014Ambassador Hattie Babbitt, Attorney at Law; Chair, U.S. Water Partnership; former Ambassador to the Organization of American StatesAndy Carey, Executive Director, Border Philanthropy Partnership*Denise Ducheny, Former State Senator, California AssemblyPedro LaFarga, Senior Vice President, Mobile Entertainment, Sony ElectronicsIsidro Morales, Director, Tec de Monterrey School for Public Policy and Foreign Policy magazine, Mexico editionAmbassador John Maisto, Former U.S. Ambassador to the Organization of American States, Nicaragua and VenezuelaSilvia Núñez Garcia, Director, Center for the Research on North America, National Autonomous University of MexicoColin Robertson, Vice President, Canadian Defence and Foreign Affairs InstituteAndrew Selee, Vice President for Programs, Woodrow Wilson International Center for ScholarsDiputado Federal Javier Treviño Cantú, Chamber of Deputies, MexicoLisa Urias, President and CEO, Urias Communications
Partner Organizations
• Bilateral Council
• Border Legislative Conference
• Border Philanthropy Partnership
• Center for Research on North America, UNAM
• Council of State Governments-WEST
• Crossborder Group
• Mexico Institute, Woodrow Wilson Center for International Scholars
• New Policy Institute
6

4
7
The U.S.-Mexico Border Economy
In Transition
• 27 recommendations drawn from stakeholder input as well as ongoing research and outreach.
• 2014 U.S.-Mexico Regional Economic Competitiveness Forums in San Diego, Rio Rico, Laredo and El Paso
1. Institutions – Erik Lee
2. Economic Development – Erik Lee
3. Border Crossings – Christopher Wilson
4. Energy – Rick Van Schoik
5. Human Capital – Ruth Soberanes
8

5
Total U.S.-Mexico Trade, 1993-2013
Source: U.S. Census Bureau and U.S. Bureau of Economic Analysis. 2013 services numbers are preliminary. http://www.census.gov/foreign-trade/statistics/country/ and http://www.bea.gov/iTable/index_ita.cfm
(in millions of U.S. dollars, includes goods and services)
The Big Picture (and the Big Secret)
Source: Wilson, Christopher E. Working Together: Economic Ties Between the United States and Mexico. Washington, DC: Woodrow Wilson International Center for Scholars, 2011. Page 17. http://www.wilsoncenter.org/sites/default/files/Working%20Together%20Full%20Document.pdf
U.S.-Mexico Trade is Different
9
Background
• Bilateral trade is growing.• Uneven growth in U.S.-Mexico border communities.• Border communities thought of as pass-through/transit
point communities.• The U.S.-Mexico High-Level Economic Dialogue• Mexico-U.S. Entrepreneurship and Innovation Council
(MUSEIC) + iCluster Subcommittee• National cluster mapping initiatives in U.S. and Mexico• Local cluster mapping initiatives in CaliBaja MegaRegion,
Saltillo-Monterrey-San Antonio corridor
10

6
BOTTOM LINE
Over 40% of all Mexican exports content originates in the US: We have created jobs and wealth and QoL here.
Mexico is poised to be the largest exporter of cars to US (surpassing Canada and EIU and Asia): We have built them together
How invest in each other?
…by design
11
BIG QUESTION
How do we capture and create more value at the border?
One answer: Cross-border, cluster-based economic development
12

7
13
What do the HLED and the U.S.-Mexico border region mean for each other?
14

8
The Big Picture: Why is the HLED important?
1. Great Recession National Exports Initiative
2. Export-led economic recovery (esp. local and state).
3. Focus on jobs.
4. A major shift in the bilateral conversation from security to commerce.
5. Elections matter (2012)May 2013 HLED launch
6. Very little trilateral traction dual bilaterals.
7. China, Pivot to Asia, TPP.
15
Border-Wide Findings
• Highly specialized manufacturing industries on the Mexican side of the border.
• Strong logistics industries on the U.S. side
• Fewer signs of deep supply chain connections or non-logistics serviceprovision by U.S. firms along the border to Mexican border industries than wehad expected.
• Highly uneven nature of cluster organization and crossborder economicdevelopment efforts throughout the border region.
• The predominance of border security over trade has affected the overallbusiness environment at the border.
• Highly uneven distribution of manufacturing operations poses a challenge forthe cultivation of binational clusters.
• Crossborder mobility and human capital development continues to be achallenge in the region. 16

9
Recommendations
1. The United States and Mexican federal governments must play an especially important role in cross-border economic development efforts.
2. Border communities should actively utilize cluster-based economic development, with its focus on collaboration among government, industry and educational institutions, as an opportunity to engage federal officials managing the border as partners in a joint effort. 17
Recommendations (cont.)
3. Link up economic development organizations along the border through a variety of formal and informal mechanisms.
4. Minimize crossborder travel restrictions for university faculty, staff and students.
5. The two federal governments need to further harmonize (and localize) data collection across the border.
18

10
Recommendations (cont.)
6. Update and streamline specialist, worker and student internship NAFTA visas to foster mobility.
7. Create binational cluster councils with public, private and education sectors all at the table.
8. Mega regions should monitor the growth of emerging binational industries that could be good candidates for cluster-based economic development.
19
• naresearchpartnership.org/projects/binationalindustries/map
• wilsoncenter.org/specialinitiatives/binationalindustries
20

11
EXAMPLE
Renewable energy clusters are growing fastest
Kyocera (Joint manufacturing)
Address intermittency
More than manufacturing
21
BORDER FUSION
How do we make the border a destination?
How can we determine the strategic, national significance of ports of entry?
How do we accommodate both flow across and communities at the border?
How do we make borders matter less and borderlands matter more?
22

12
COLLECTIVE IMPACT
Five Elements ofCollective Impact
Collective Impact Requires a Systemic Approach
Border region is program rich, but system poor.
IsolatedImpact
CollectiveImpact
North American
Global Trade
Competitiveness
23
TijuanaCross Border
OTAY II
I‐5
Plaza Int’l
New City
LAS AMERICAS
High Rise
Border Outlets
XpressInt’l Airport
SANDAG ITC
Tijuana ITC
PORT OF ENTRY GATEWAYS
PORT OF ENTRY
TijuanaInnovadora
SAN DIEGO – TIJUANA
COMMUNITIES
FOCUS AREA
BM Parking
I‐805
SAN YSIDRO
SIMNSAHealth Care
Border Outlets
Plaza
DFALPOE
1.75 milesFrom Border
OTAY MESALPOE
1.0 mileFrom Border
3.0 miles +From Border
SR 11
SR 905
Metropolitan AirparkBrown Field Airport
TijuanaManufacturing Hub
Bicentenario
24

13
OTHER ISSUES
Border Fee
Congestion-related, health-impacting emissions
Cabotage
25
LET’S KEEP TALKING
Rick van Schoik
Portfolio Director
North American Research Partnership
760 942-8317
NAResearchPartnership.org
26