Improving accuracy in astrocytomas grading by integrating a robust least squares mapping driven...
11
computer methods and programs in biomedicine 90 ( 2 0 0 8 ) 251–261 journal homepage: www.intl.elsevierhealth.com/journals/cmpb Improving accuracy in astrocytomas grading by integrating a robust least squares mapping driven support vector machine classifier into a two level grade classification scheme Dimitris Glotsos a,∗ , Ioannis Kalatzis a , Panagiota Spyridonos b , Spiros Kostopoulos b , Antonis Daskalakis b , Emmanouil Athanasiadis b , Panagiota Ravazoula c , George Nikiforidis b , Dionisis Cavouras a a Department of Medical Instruments Technology, Technological Educational Institution of Athens, Ag. Spyridonos Street, Aigaleo, Athens 122 10, Greece b Medical Image Processing and Analysis Laboratory, Medical Physics, School of Medicine, University of Patras, Rio, Patras 265 00, Greece c Department of Pathology, University Hospital, Rio, Patras 265 00, Greece article info Article history: Received 11 July 2007 Received in revised form 16 January 2008 Accepted 16 January 2008 Keywords: Astrocytomas Support vector machines Least squares mapping Computer-assisted microscopy abstract Grading of astrocytomas is an important task for treatment planning; however, it suf- fers from significantly great inter-observer variability. Computer-assisted diagnosis systems have been propose to assist towards minimizing subjectivity, however, these systems present either moderate accuracy or utilize specialized staining protocols and grading sys- tems that are difficult to apply in daily clinical practice. The present study proposes a robust mathematical formulation by integrating state-of-art technologies (support vector machines and least squares mapping) in a cascade classification scheme for separating low from high and grade III from grade IV astrocytic tumours. Results have indicated that low from high- grade tumours can be correctly separated with a certainty as high as 97.3%, whereas grade III from grade IV tumours with 97.8%. The overall performance was 95.2%. These high rates have been a result of applying the least squares mapping technique to features prior to classification. A significant byproduct of least squares mapping is that the number of sup- port vectors of the SVM classifiers dropped dramatically from about 80% when no mapping was used to less than 5% when mapping was used. The latter is a clear indication that the SVM classifier has a greater potential to generalize well to new data. In this way, digital image analysis systems for automated grading of astrocytomas are brought closer to clinical practice. © 2008 Elsevier Ireland Ltd. All rights reserved. ∗ Corresponding author at: Medical Image & Signal Processing Lab (MEDISP), Department of Medical Instruments Technology, Technological Educational Institute of Athens, Ag. Spyridonos Street, Aigaleo, Athens 122 10, Greece. Tel.: +30 210 5385375. E-mail address: [email protected] (D. Glotsos). 0169-2607/$ – see front matter © 2008 Elsevier Ireland Ltd. All rights reserved. doi:10.1016/j.cmpb.2008.01.006
Transcript of Improving accuracy in astrocytomas grading by integrating a robust least squares mapping driven...
Iams
DAGa
Ab
Rc
a
A
R
R
1
A
K
A
S
L
C
E
0d
c o m p u t e r m e t h o d s a n d p r o g r a m s i n b i o m e d i c i n e 9 0 ( 2 0 0 8 ) 251–261
journa l homepage: www. int l .e lsev ierhea l th .com/ journa ls /cmpb
mproving accuracy in astrocytomas grading by integratingrobust least squares mapping driven support vectorachine classifier into a two level grade classification
cheme
imitris Glotsosa,∗, Ioannis Kalatzisa, Panagiota Spyridonosb, Spiros Kostopoulosb,ntonis Daskalakisb, Emmanouil Athanasiadisb, Panagiota Ravazoulac,eorge Nikiforidisb, Dionisis Cavourasa
Department of Medical Instruments Technology, Technological Educational Institution of Athens, Ag. Spyridonos Street,igaleo, Athens 122 10, GreeceMedical Image Processing and Analysis Laboratory, Medical Physics, School of Medicine, University of Patras,io, Patras 265 00, GreeceDepartment of Pathology, University Hospital, Rio, Patras 265 00, Greece
r t i c l e i n f o
rticle history:
eceived 11 July 2007
eceived in revised form
6 January 2008
ccepted 16 January 2008
eywords:
strocytomas
upport vector machines
east squares mapping
omputer-assisted microscopy
a b s t r a c t
Grading of astrocytomas is an important task for treatment planning; however, it suf-
fers from significantly great inter-observer variability. Computer-assisted diagnosis systems
have been propose to assist towards minimizing subjectivity, however, these systems
present either moderate accuracy or utilize specialized staining protocols and grading sys-
tems that are difficult to apply in daily clinical practice. The present study proposes a robust
mathematical formulation by integrating state-of-art technologies (support vector machines
and least squares mapping) in a cascade classification scheme for separating low from high
and grade III from grade IV astrocytic tumours. Results have indicated that low from high-
grade tumours can be correctly separated with a certainty as high as 97.3%, whereas grade
III from grade IV tumours with 97.8%. The overall performance was 95.2%. These high rates
have been a result of applying the least squares mapping technique to features prior to
classification. A significant byproduct of least squares mapping is that the number of sup-
port vectors of the SVM classifiers dropped dramatically from about 80% when no mapping
was used to less than 5% when mapping was used. The latter is a clear indication that
the SVM classifier has a greater potential to generalize well to new data. In this way, digital
image analysis systems for automated grading of astrocytomas are brought closer to clinical
practice.
∗ Corresponding author at: Medical Image & Signal Processing Lab (MEDISducational Institute of Athens, Ag. Spyridonos Street, Aigaleo, Athens
E-mail address: [email protected] (D. Glotsos).169-2607/$ – see front matter © 2008 Elsevier Ireland Ltd. All rights resoi:10.1016/j.cmpb.2008.01.006
© 2008 Elsevier Ireland Ltd. All rights reserved.
P), Department of Medical Instruments Technology, Technological122 10, Greece. Tel.: +30 210 5385375.
erved.

s i n
252 c o m p u t e r m e t h o d s a n d p r o g r a m1. Introduction
Malignancy grading of astrocytomas is fundamentally impor-tant since it affects accurate treatment planning and patientmanagement [1]. Pathologists decide on the aggressiveness ofastrocytic tumours by visually examining tissue section slides(biopsies) with the microscope [2]. According to guidelinespublished by the World Health Organization (WHO) [3], threegrades are established on the basis of histological criteria:grade II and grade III and grade IV. Grade II (low-grade) astro-cytomas are the least malignant tumours and have generallygood prognosis with survival up to 5 years. Astrocytomas ofgrade III and IV (high grade) are the most aggressive tumours,characterized by a rapid growth pattern and a tendency toinvade nearby healthy tissue; survival time for high-gradetumours ranges on average from 6 months to 1 year [2].
However, grade differentiation, has been shown suscepti-ble to great inter-observer variability [4]. Even though the WHOgrading scheme retains its popularity among existing gradingschemes (such as Daumas-Dupport [5], the Kernohan [6], theSt. Anne/Mayo [7], and the HOM [8]), it has been questionedby many experts regarding the accuracy of its descriptionsused to define each grade has been questioned by manyexperts [4,9]. The latter has generated a lack of consensusamong experts regarding to the selection of a single best grad-ing scheme. As a consequence the exchange of histologicaldata among different laboratories, which could improve stan-dardization and reproducibility, remains the most problematicissue in grading of astrocytomas.
Another source of complication is the utilization of dif-ferent staining protocols from different laboratories. Againthere is a lack of consensus regarding the selection of asingle, or even a combination of staining protocols able tounravel and highlight the histological evidence on tumourslides, which would clarify the grade of a tumour [10–13]. Theroutine (fast, cost-effective, simple) staining protocol is theHaematoxylin–Eosin (H&E) [1]. However, H&E stained imagespresent the highest degree of complexity regarding image-processing tasks due to the diversity of the structures stainedand the severe variations in staining intensity as compared toFeulgen [14] and to the ki-67 [15] stained images. Finally, lab-oratories use different kinds of measuring equipment, fromsimple oculars to expensive microscopy imaging systems,which, on one hand are fundamentally important in addingvalue to ongoing research, however, on the other hand arerarely used in clinical practice.
In this study we continue our investigation and we proposea mathematical formulation able, on one hand, to signifi-cantly boost up the accuracy in the crucial separation of bothlow from high grade and grade III from grade IV tumours,while ensuring on the other hand good generalization tonew data. The proposed method differs from others in twokey issues. (a) Accuracy; we will show that the combinationof support vector machines [16] and least squares mappingtechniques, which has been evaluated by our group in the
field of ultrasonic image analysis [17], results in the high-est classification rates presented in literature in astrocytomasgrading based on analysis of H&E-stained images. The latteris essential since although H&E staining produces complex tob i o m e d i c i n e 9 0 ( 2 0 0 8 ) 251–261
process images, H&E remains the standard choice in daily clin-ical practice. Thus, automated grading based on such imagesbrings digital image analysis systems closer to real clini-cal practice. (b) Robustness; we will prove that the proposedmethod ensures good generalization to unseen data. The sup-port vector machine is among the few algorithms that allow amathematical assessment of its ability to generalize to unseendata, an issue that has not been comprehensively investigatedin the field of astrocytomas grading by previous studies.
2. Methods
2.1. Material
The clinical material comprised 150 biopsies of astrocytomascollected from the Department of Pathology of the Univer-sity Hospital of Patras, Greece. Five H&E stained sections weregenerated from the same block (patient). Of the 150 astrocy-tomas, 61 were classified as low grade (grade II) and 89 as highgrade (40 grade III and 49 grade IV) according the WHO gradingsystem. Table 1 illustrates the variants of different astrocytictumours utilized in this study. For each slide, a histopathol-ogist (P.R.) marked the most representative region. From thisregion, images (Fig. 1) were digitized (768 × 576 × 8 bit) usinga light Zeiss Axiostar plus microscope (Zeiss; Germany) con-nected to an Leica DC 300 F (Leica; Germany) color videocamera.
2.2. Segmentation of H&E-stained images ofastrocytomas
Subsequently, images were segmented using a pixel-basedpattern recognition methodology designed to identify texturaldifferences among regions of nuclei and surrounding tissue.Segmentation is an essential process for this application, sincefrom segmented nuclei, which are the most important struc-tures in our images, features were subsequently extracted toencode distinct tumour grade characteristics. The algorithmfor nuclei segmentation has been presented by our group else-where [18].
To facilitate evaluation of the segmentation procedure, foreach patient the original and the segmented images were dis-played on the screen. Segmented nuclei were automaticallylabeled on the original and segmented images by process-ing the binary-segmented image using connecting componentanalysis as described in [19]. Following, the labeled binaryimage was superimposed to the original image (see Fig. 1a–d).The histopathologist (P.R.) verified the correctness of thelabeled segmented nuclei against those of the original imageand also observed the non-labeled nuclei. The number ofwrongly identified and/or missed nuclei was noted againstthe number of correctly identified ones. Wrongly identifiednuclei were considered by the pathologist cases of overlapped,‘missed’ and corrupted nuclei. The number of wrongly identi-
fied over correctly identified was calculated. The accuracy ofthe segmentation algorithm for each patient’s set of imageswas calculated as the ratio of the number of correctly over thenumber of all identified nuclei.
c o m p u t e r m e t h o d s a n d p r o g r a m s i n b i o m e d i c i n e 9 0 ( 2 0 0 8 ) 251–261 253
Table 1 – Variants of different astrocytic tumours utilized in this study
Variants Number of cases Total number of cases
Astrocytoma (WHO grade II) Gemistocytic 8 61Fibrillary 19Mixed 34
Astrocytoma (WHO grade III) Anaplastic 40 40
Glioblastoma multiforme (WHO grade IV) Giant cell 13 49Gliosarcoma 1Pleomorphic 35
2
2Gchstsetfc
Fpn
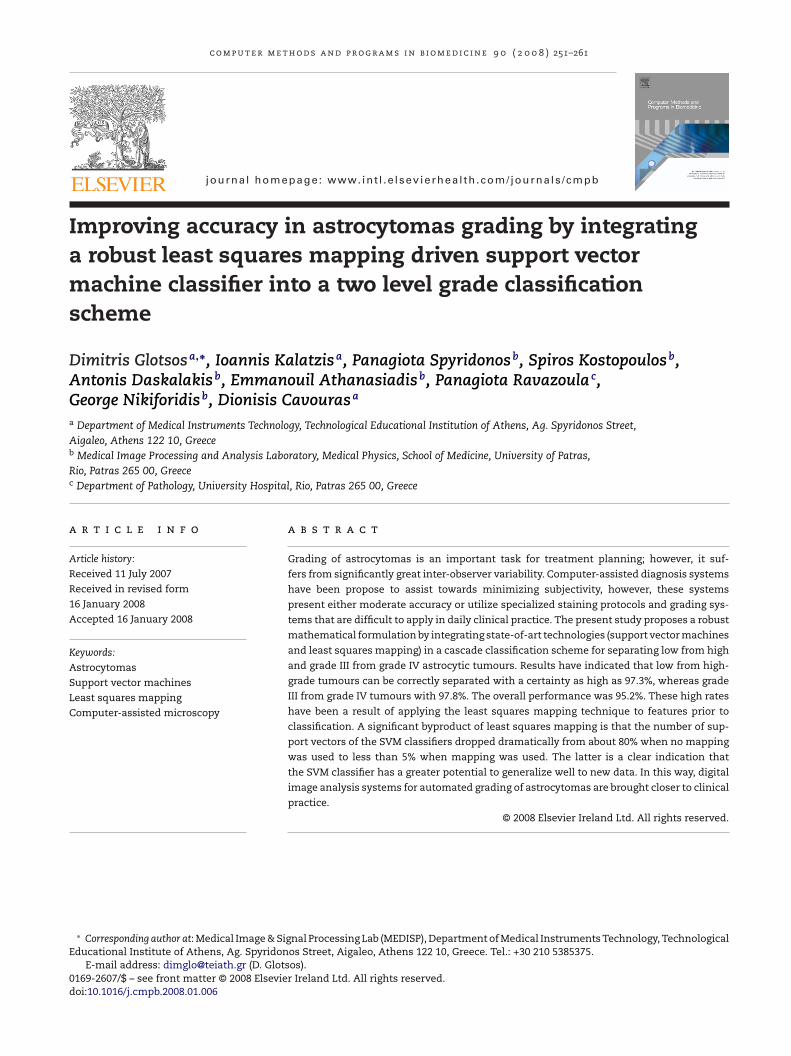
.3. Automatic grade classification
.3.1. Design of the classification schemerade classification scheme was built as a two-level hierarchi-al cascade scheme (Fig. 2). In the first level low (grade II) fromigh-grade (grade III–IV) tumours were discriminated. In theecond level, correctly classified high-grade cases were fur-her categorized as grade III or IV tumours. At each level, aet of morphological and textural features were extracted to
ncode tumour malignancy. Features we transformed usinghe least squares mapping [20] technique. Based on the trans-ormed features, classification was performed using an SVMlassifier.ig. 1 – (a) H&E stained image of astrocytomas (magnification: 40ixel-based classification algorithm. (c) Small and noisy regionsuclei were eliminated. (d) Final segmented nuclei image.
150
2.3.2. Feature extractionAfter segmentation, a set of 40 morphological and textu-ral features was extracted from correctly segmented nucleidescribing each individual case (patient). Morphological fea-tures describe the shape and size of nuclei (18 features)and comprised area, roundness and concavity. For eachone of these features the mean value, standard deviation,range, skewness, kurtosis, and maximum value was cal-culated [10,21]. Textural features (first-order, co-occurrence,
run-length based) were used to encode chromatin distribu-tion and nuclear DNA content (22 features). These featureshave been proven to encode significant information concern-ing malignancy status [10,21].0×). (b) Resulted binary image after applying theelimination by size and morphological filtering. Overlapped

254 c o m p u t e r m e t h o d s a n d p r o g r a m s i n
Fig. 2 – SVM-based cascade classification tree methodology.
2.3.3. Feature selection and classificationFeature dimensionality was initially reduced to 14 featuresusing a ranking feature selection method based on a Wilcoxonclass separability criterion [22]. Subsequently, the 14 pre-selected features were split into 13 subsets (first subsetcomprised the two most important features as described bythe ranking method, second subset the three most importantfeatures, . . ., last subset all 14 features). Each subset was trans-formed according to the least squares mapping techniquedescribed in the following Section 2.3.4 using three differentmapping degrees, first, second and third degree.
Each feature subset, thus formed, was next used in thedesign of each classifier with purpose of determining thefeature subset that provided highest classification accuracyfollowing a k-fold cross validation procedure [22]. Accordingly,data were randomly split into k = 10 subsets of approximatelysame size. One of the k subsets was held out for testing (testdata), whereas the remaining k − 1 subsets were used to trainthe SVM classifier (training data). This process was repeatedk times, such as each subset was treated only once as testdata. At each repetition, we made sure that the training datacomprised at the first level 43 low-grade and 52 high-gradecases and at the second level 26 grade III and 32 grade IV cases.Additionally, we made sure that the left-out dataset (test data)comprised at the first level 18 low-grade and 37 high-gradecases and at the second level 14 grade III and 17 grade IV cases.
Finally, the probabilistic neural network (PNN) [23], andthe k-nearest neighbor classifiers [24] were implemented asalternatives to the SVM classifier, and the sequential floatingforward selection (SFFS) [25] as alternative to the Wilcoxon-based ranking feature selection method for comparativepurposes.
2.3.4. Least squares mapping technique
The least squares mapping technique targets to increase classseparability and it consist of the transformation of patternvectors around arbitrary pre-selected points in the RC space(where C is the number of classes) called the decision space,b i o m e d i c i n e 9 0 ( 2 0 0 8 ) 251–261
in such a way that the least squares transformation error isminimized [20].
Prior to the transformation, pattern vectors are expandedso they contain all polynomial terms of 2nd, 3rd, . . ., kth-degreecombinations of their feature elements. As an example, incase of k = 3, the pattern vector x = [x1 x2] will expand to x̂ =[x1 x2 x2
1 x22 x1x2 x3
1 x32 x2
1x2 x1x22]. Given that the dimensional-
ity of a pattern vector is d, then the expanded pattern vectordimensionality is equal to [24]:
d̂ = (d + k)!k!d!
− 1 (1)
In the present study, the polynomial expansion has limited tosecond and third degree terms, due to the increased compu-tational demands that higher dimensionality pattern vectorscreate [16,24], especially when employing classifiers with poly-nomial kernels; moreover, higher dimensionality decisionboundaries often lead to over-fitting results.
After the polynomial expansion, the least squares trans-formation of the expanded feature vectors follows. Let x̂k
an expanded pattern vector of class k in Rd̂ space (wherek = 1,2, . . ., C and C the number of classes) and pk = [p1k
p2k . . . pCk] an arbitrary selected vector point in the RC space.Let the transformation:
x̂k ∈Rd̂ �→ zk = T · x̂k ∈RC (2)
where T the transformation matrix, which is define by meansof minimizing the least squares error (eLS) between vectors zk
and pk for all k:
eLS =C∑
k=1
(1C
Nk∑i=1
(Tx̂ki − pk)T(Tx̂ki − pk)
)(3)
where Nk is the number of patterns of class k.The eLS minimization is performed by solving the following
equation over T:
∇TeLS = 0 (4)
which, in conjunction to Eq. (3), leads to:
T =[
C∑k=1
(1
Nk
NK∑i=1
pkx̂Tki
)][C∑
k=1
(1
Nk
NK∑i=1
x̂kix̂Tki
)]−1
(5)
2.3.5. SVM classifier configurationThe basic idea behind the SVM approach for binary classifi-cation problems is to (a) map the input space into a higherdimensional feature space through a linear or non-lineartransformation function (kernel) and (b) in that feature space,compute a separating hyper plane that effectively splits data
into the two classes of interest. This hyper plane is optimal inthe sense that it has maximum distance from the closest-tothe hyper plane-training data (the so-called support vectors).The discriminant function of the SVM classifier has the fol-
i n b i o m e d i c i n e 9 0 ( 2 0 0 8 ) 251–261 255
l
g
wd˛
Kswoe�
mw
K
K
3
3
A2oeonblemt(
3
Tfidpsssaofiierl
haa
irst
leve
lof
the
casc
ade
clas
sifi
cati
ona
sch
eme:
aver
age
clas
sifi
cati
onra
tes
ofS
VM
,PN
N,a
nd
k-n
ncl
assi
fier
sov
er10
ran
dom
spli
tsof
avai
labl
ed
ata
into
at
(95
case
sco
nsi
stin
gof
43lo
w-g
rad
ean
d52
hig
h-g
rad
eca
ses)
and
ate
stse
t(5
5ca
ses,
com
pri
sin
g18
low
-gra
de
and
37h
igh
-gra
de
case
s)
No
map
pin
gM
app
ing
LS1
Map
pin
gLS
2M
app
ing
LS3
Feat
ure
sLo
wH
igh
Ove
rall
Feat
ure
sLo
wH
igh
Ove
rall
Feat
ure
sLo
wH
igh
Ove
rall
Feat
ure
sLo
wH
igh
Ove
rall
1391
.898
.996
.012
63.9
87.6
78.0
1393
.496
.695
.312
90.2
100.
096
.012
60.7
86.5
76.0
1463
.986
.577
.313
95.1
95.5
95.3
896
.796
.696
.712
75.4
91.0
84.7
1262
.387
.677
.313
95.1
95.5
95.3
798
.496
.697
.312
75.4
91.0
84.7
1421
.310
0.0
68.0
1495
.195
.595
.38
96.7
96.6
96.7
1365
.687
.678
.74
73.8
91.0
84.0
1396
.795
.596
.08
97.5
95.9
96.6
gh-g
rad
etu
mou
rs.
c o m p u t e r m e t h o d s a n d p r o g r a m s
owing form [16,26,27]:
(x) =(
N∑i=1
˛iyiK(x, xi) + b
)(6)
here xi represent each of the i = 1, . . ., N = 40 three-imensional training input feature vectors, yi ∈ {+1,−1},
i are the Langrage multiplies, b is a weighting coefficient, andis the kernel function. To find the optimum performance
tructure, the SVM classifier was alternatively constructedith the radial basis function (RBF) and polynomial kernelsf degree d = 1 and 2 (see Eqs. (7) and (8)). Parameter � wasxperimentally determined after examining values from= 0.1 to 4. The optimization problem of finding the Langrageultiplies was solved by using the routine quadprog providedith the MATLAB optimization toolbox [28].
RBF(x, xi) = exp(
−‖x−xi‖2
2�2
)(7)
polynomial(x, xi) = ((xTxi) + 1)d
(8)
. Results
.1. H&E image segmentation
ccording to the evaluation procedure described in Section.2, the algorithm correctly recognized and segmented 88%f all nuclei. About 12% of nuclei were erroneously or inad-quately circumscribed. Fig. 1a illustrates an H&E imagef astrocytomas. The binary image in Fig. 1b consists ofuclei (white) and surrounding tissue (black) as recognizedy the pixel-based segmentation algorithm. ‘Damaged’ nucleiocated at the image boundaries, small (less than 150 pix-ls) and noisy regions were omitted by size filtering andorphological operations (Fig. 1c). In Fig. 1d the final segmen-
ation result is illustrated by superimposing the original imageFig. 1a) with the final corrected binary image (Fig. 1c).
.2. Grade classification
ables 2 and 3 demonstrate the error estimates for all classi-ers at both levels of the cascade classification scheme usingifferent degrees of least squares mapping. The SVM witholynomial kernel of degree 2 using seven features and leastquares mapping of third degree was selected as the best clas-ifier configuration for the first level of the cascade scheme,ince it gave the highest classification accuracy (97.3% overallccuracy), and the minimum number of support vectors (≈2%f all training data). The best feature combination comprisedve textural features (from the co-occurrence matrix with
nter-pixel distance d = 1 and d = 3 homogeneityd=1, correlationd=1,nergyd=1, homogeneityd=3, correlationd=3, energyd=3 and from theun length matrix gray level non-uniformity) and one morpho-ogical (maximum of roundness).
Considering the second level of the cascade scheme, theighest classification accuracy (97.8% overall accuracy) waschieved using an SVM classifier with RBF kernel, 10 featuresnd least squares mapping of third degree. Best features com-
Tabl
e2
–F
trai
nin
gse
Cla
ssifi
er
SVM
RB
FSV
Md
=1
SVM
d=
2PN
NK
NN
aLo
wvs
.hi

256 c o m p u t e r m e t h o d s a n d p r o g r a m s i n b i o m e d i c i n e 9 0 ( 2 0 0 8 ) 251–261
Tabl
e3
–S
econ
dle
velo
fth
eca
scad
ecl
assi
fica
tion
asc
hem
e:av
erag
eer
ror
rate
sof
SV
M,P
NN
,an
dk-
nn
clas
sifi
ers
over
10ra
nd
omsp
lits
ofav
aila
ble
dat
ain
toa
trai
nin
gse
t(5
8ca
ses
con
sist
ing
of26
grad
eII
Ian
d32
grad
eIV
case
s)an
da
test
set
(48
case
s,co
mp
risi
ng
14gr
ade
III
and
17gr
ade
IVca
ses)
Cla
ssifi
erN
om
app
ing
Map
pin
gLS
1M
app
ing
LS2
Map
pin
gLS
3
Feat
ure
sG
III
GIV
Ove
rall
Feat
ure
sG
III
GIV
Ove
rall
Feat
ure
sG
III
GIV
Ove
rall
Feat
ure
sG
III
GIV
Ove
rall
SVM
RB
F12
90.0
100.
095
.59
7575
.575
.39
92.5
100
96.6
1095
.010
0.0
97.8
SVM
d=
19
80.0
71.4
75.3
990
63.3
75.3
1495
.098
.096
.68
97.5
95.9
96.6
SVM
d=
212
92.5
93.9
93.3
1070
77.6
74.2
1397
.598
.097
.88
92.5
100.
096
.6PN
N12
97.5
79.6
87.6
957
.589
.875
.314
95.0
98.0
96.6
897
.595
.996
.6K
NN
1085
.077
.580
.98
82.5
81.6
82.0
1495
.098
.096
.68
97.5
95.9
96.6
aG
rad
eII
Ivs
.Gra
de
IVtu
mou
rs.
Fig. 3 – (a) Results for the best classifier (SVM polynomial ofsecond degree) when no mapping and least squaresmapping of different degrees were used for the first level ofthe cascade scheme. (b) Results for the best classifier (SVMRBF) when no mapping and least squares mapping ofdifferent degrees were used for the second level of the
cascade scheme.prised the same seven features resulted in the first level plusrange of roundness, maximum of roundness and maximum of area.The number of support vectors for this configuration was aslow as 5% of training data used to build the classifier for eachrun of the cross validation procedure. Table 4 presents classi-fication results for the variants of different astrocytic tumoursutilized in this study.
The overall performance of system was computed as theproduct of best overall performances at each node of thecascade classification tree (95.2%) [29]. Fig. 3 indicates the per-
formance of best classifiers for the first and second level of thecascade scheme when designed without mapping, mappingof first, second and third degree. Fig. 4 illustrates the numberof support vectors needed to construct the SVM classifier for
c o m p u t e r m e t h o d s a n d p r o g r a m s i n b i o m e d i c i n e 9 0 ( 2 0 0 8 ) 251–261 257
Fig. 4 – (a) Number of support vectors of SVM classifierswhen no mapping and least squares mapping of differentdegrees were used for the first level of the cascade scheme.(b) Number of support vectors of SVM classifiers when nomw
dofc
4
Gmisimaisaiaw
Fig. 5 – ROC curves and corresponding area under the ROC
apping and least squares mapping of different degreesere used for the second level of the cascade scheme.
ifferent degrees of least squares mapping and for both levelf the cascade scheme. Fig. 5 demonstrates the system’s per-ormance in terms of receiver operating characteristic (ROC)urves. ROC curves were designed as described in [30].
. Discussion
rading of astrocytomas is an important task for treat-ent planning, however, it suffers from significantly great
nter-observer variability [4,9]. Computer-assisted diagnosisystems [13,31-36] have been proposed to assist towards min-mizing subjectivity, however, these systems present either
oderate accuracy or utilize specialized staining protocolsnd grading systems that are difficult to apply in daily clin-cal practice. Schad et al. [13] have used Feulgen-staining,emi quantitative nuclear features and quadratic discriminant
nalysis to establish a system able to classify tumours accord-ng to kernohan grades with 94% accuracy. Decaestecker etl. [32] proposed a nearest neighbor classification techniqueith 55% success rate based on the WHO guidelines, Feulgencurve (AUC) values for the first and second level of thecascade classification scheme.
staining and quantitative nuclear features. Belacel and Boulas-sel [31] presented a fuzzy-logic system analysing nuclearfeatures extracted from H&E stained images with 66% dis-crimination accuracy concerning the WHO grades. Kolles etal. [33] suggested that digital image analysis systems perfor-mance improves when using the HOM (>90% accuracy) systemrather than when using the WHO system (about 60% accuracy)analysing nuclear features derived from quantitative mea-surement from both Feulgen and ki-67 stained biopsies. Nafeand Schlote [34] used cross-validated discriminant analysis,ki-67 and the WHO system for discriminating only low (gradeII) from high-grade (grade III) tumours with 88% accuracy. In amost recent study by the same author, classification accuracywas boosted up to 97.4% [37]. Although this study gives signif-icantly high accuracy rates, it examines only discriminationof low from high-grade tumours; it does not examine the sep-aration of high-grade tumours into subgroups of grade III andgrade IV tumours. The latter has become an important taskfollowing the results from investigations proving that gradeIII tumours are more chemosensitive than grade IV tumoursin respect to certain agents. Thus, their accurate separationwould contribute to more effective treatment planning. In ourprevious studies, we have also proposed digital image anal-ysis systems to accurate grading of astrocytomas using, incontrast to previous studies, the routine combination of clini-cal protocols adopted by most laboratories: simple measuringequipment, the WHO grading, H&E staining, and quantitativenuclear features formulated to reflect visual observations ofexperts when examining astrocytic tumour slides. Addition-ally we have examined not only the separation of low fromhigh-grade tumours (with 89.7% accuracy) but also the critical
discrimination of grade III from grade IV tumours (with 83.8%accuracy) [8].What is missing here is a comprehensive investigation ofways not only to improve the accuracy of digital image analy-

258 c o m p u t e r m e t h o d s a n d p r o g r a m s i n
Table 4 – Classification results for the best classifiers’configuration regarding tumours variants
Variants Number ofcases
Correct classificationrate (%)a
Gemistocytic 8 ≈83Fibrillary 19 ≈95Mixed 34 ≈98Anaplastic 40 ≈95Giant cell 13 ≈97Gliosarcoma 1 ≈0Pleomorphic 35 ≈95
a The classification rates are presented as average accuracies, sincethese are derived from the cross-validation process.
sis systems, but also to bring them closer to clinical practice by(a) building such systems using routine clinical protocols and(b) proving that such systems generalize well to data that havenot been used for its construction. The latter is most signifi-cant and has not been investigated by previous studies to thebest of our knowledge. The present study aims to comprehen-sively investigate these issues and proposes a mathematicalformulation towards this direction by integrating state-of-arttechnologies (support vector machines and least squares map-ping) in a cascade classification scheme for separating lowfrom high and grade III from grade IV tumours.
The cascade classification scheme was preferred to usinga 3-class classifier because it resembles the diagnostic proce-dure followed by histopathologists in clinical practice. Initially,tumours were separated into subgroups of low and high gradeand subsequently high-grade cases were further categorizedinto grade III and grade IV. This scheme led to significantly highclassification rates (see Tables 2 and 3), which are on one handcomparable to those presented in literature [13,31–36], on theother hand outperform similar studies that have utilized theWHO grading and H&E staining [10,31].
Additionally, it has to be stressed that in this study wehave used routinely H&E stained biopsies. H&E produceshigh quality images for routine histopathological evaluation.For nuclear staining, hematoxilin is more reliable whenchromatin is markedly condensed in the nuclei. Currentapplications of the Feulgen reaction [14] are mainly con-cerned with DNA quantification. Specific demonstration ofDNA in cell structures at the light microscopic level is verylittle used nowadays. The Ki-67 antigen [15] is expressedduring all phases of the cell cycle, consisting in a non-histonenuclear protein of unknown function. It was pointed to be thebest marker of cellular proliferation, and its expression maypredict the grade of astrocytic tumours. However, H&E stainedimages present the highest degree of complexity regardingimage-processing tasks due to the diversity of the structuresstained and the severe variations in staining intensity ascompared to Feulgen and to the ki-67 stained images. It hasto be mentioned that in this study high classification rateswere accomplished using routinely H&E stained biopsies.This adds an additional value to the results.
More specifically, best classifier rates were as high as 97.3%for the first level and 97.8% for the second level (Table 3). Themapping process proved essential in boosting up all classifiers’performance at both levels. The effect of mapping was more
b i o m e d i c i n e 9 0 ( 2 0 0 8 ) 251–261
pronounced for the PNN and k-nn classifiers (>10% improve-ment) boosting up their performance higher than 95% for bothlevels. The improvement for the SVM classifiers in terms ofperformance was in a lesser extent compared to the PNN andk-nn, however, in terms of support vectors the enhancementwas drastic. For the best classifier for the first level accuracywas increased for 84.7% with no mapping to 97.3% with thirddegree mapping and the number of support vectors reducedfrom 52.9% of all training data to 1.5%. The latter is most essen-tial since the number of support vectors is an indication ofthe generalization capability of SVM to unseen data [16,38].The lesser the number of support vectors the better the gen-eralization expected. The high performance of SVM classifierswhen no mapping is applied (especially for the SVM RBF: firstlevel, no mapping 96%, mapping3 96%; second level, no map-ping 95.5%, mapping3 97.8%) is misleading, since high rates areresults of over fitting/overtraining of the classifier. This can beeasily observed by noting the number of support vectors. Forthe first level, for the SVM classifier to achieve 96% accuracy,about 93% of all data operated as support vectors, whereasfor the second level about 90% of all data were needed. Thus,results are factitious, since the classifier gives high rates dueto over fitting, meaning that its generalization capability isquestionable. On the other hand, mapping not only retainsthe performance of the SVM RBF classifier to same high levels(96% for the first level and 97.8% for the second level), but mostimportantly reduces the number of support vectors from 93%to 3% for the first level and from 90% to 5% for the second level.The latter proves that the classifier becomes robust, cancelingin this way over fitting. Thus, mapping is an important processand should be a part of digital image analysis systems, even incases where the performance improvement is not vociferoussince it affects generalization.
Additionally, we have tried the SFFS feature selectionmethod and we got similar results in terms of features (forthe first level seven features as compared to eight featuresusing the Wilcoxon criterion, whereas for the second level10 features as compared to 10 features using the Wilcoxoncriterion) and slightly inferior results in terms of accuracies(for the first level 96.1% accuracy as compared to 97.3% usingthe Wilcoxon criterion, whereas for the second level 94.6%accuracy as compared to 97.8% using the Wilcoxon crite-rion). The 7 features derived using the SFFS process were thesame as those derived with the Wilcoxon criterion for the firstlevel of the cascade scheme, whereas for the second level wehad slightly different results, over the 10 features 7 were thesame.
Regarding segmentation, results were promising consider-ing that the H&E staining protocol is not as accurate in stainingnuclei as other specialized protocols used in previous studies[13,31–36]. It has to be stressed that the aim of the segmen-tation procedure was to extract a representative number ofaccurately segmented nuclei from every set of images describ-ing each case (patient), in order to compute nuclear features.Under this perspective and considering that segmented nucleifor each case ranged from 275 to 415, the misclassification
error of 12% may be regarded as of limited significance. Thelatter can be furthermore supported by the fact that it has beenshown that even 200 correctly segmented nuclei per case areadequate for extracting nuclear features [35].
i n b
vdo(mfdalcoeatawvdtrIA
immeipecaiaaffnpctidtbf(agribhsttt
d
r
c o m p u t e r m e t h o d s a n d p r o g r a m s
An important comment that can be made is that rele-ant features appeared at both levels of the cascade scheme,uring the feature selection process. These were descriptorsf nuclear shape (roundness) and chromatin cluster patterns
homogeneity, energy and correlation from the co-occurrenceatrix). The latter enforces the belief that certain nuclear
eatures carry significant diagnostic information. Roundnessescribes the circularity of nuclei. Irregular shaped nuclei aren indication of higher malignancy tumours [1,5], whereas inower grade tumours nuclei shape is more circular with almostonstant size. As far as the textural differences, the existencef coarser nuclei (which are described by the correlation andnergy) is an important clue revealing abnormal DNA dissoci-tion within nuclei, and is frequently found into higher-gradeumours. Additionally, an elucidating symptom of tumours’ggressiveness is the presence of chromatic clumps in nuclei,hich are encoded by the homogeneity [1,5]. It would be a
ery interesting extension for the studies investigating theifferences in chemosensitivity in different grade astrocyticumours [39,40], to correlate chemosensitivity with the textu-al differences that seem to prevail between grade III and gradeV tumours. These features are mathematically described inppendix A.
This study investigates features encoding the follow-ng WHO nuclear criteria: presence of giant cells; nuclear
orphology, nuclear chromatin texture, pleomorphism, andultinucleated cells. Non-nuclear criteria such as necrosis,
ndothelial hyperplasia and mitotic activity are of crucialmportance for grading of astrocytomas and are not dis-ensable criteria. The proposed system’s effectiveness can bexplained by the following: (a) nuclear features are automati-ally computed within a region of interest, carefully selectednd designated on the histological image by the physiciannteractively. Thus, the physician decides which region fromll available slides is the most representative regarding nucleippearance with respect to grade differentiation. (b) Apartrom calculating features that cover the definitions of WHOor nuclei appearance, we calculate nuclear features that can-ot by resolved by the human eye [19]. (c) In most cases, experthysicians recognize nuclei attributes of different grade astro-ytic tumours almost instantly and unconsciously. However,hey do not know how precisely these features have to be takennto account in the decision process since exact definitionso not exist within the WHO guidelines. The proposed sys-em can be used to automatically summarize this knowledgey quantifying nuclear features, and identify which of theseeatures can be used for more effective grade differentiation.d) The presence of necrosis has been defined by the WHOs an excellent criterion for discriminating anaplastic fromlioblastoma multiforme [3]. However, even this critical crite-ion is not always visible on histological sections especiallyn cases where tumour’s liquid is sucked up using cavitronsy neurosurgeons [41]. If necrosis is not visible, the physicianas to perform diagnosis based on the remaining criteria. Ourtudy, in accordance to other similar studies [31–34], indicateshe potential of nuclear features to effectively discriminate
umours even when necrosis is not visible on histological sec-ions.The proposed methodology gives a new insight to buildingigital image analysis in grading of astrocytomas by combin-
i o m e d i c i n e 9 0 ( 2 0 0 8 ) 251–261 259
ing state-of-art technologies (SVM and least squares mapping)with clinical routine protocols (WHO scheme, H&E staining).This study presented a method that leads to high classifica-tion rates for the crucial separation of low from high grade andgrade III from grade IV astrocytic tumours while ensuring thathigh rates are most likely to generalize to unseen data, sincethe number of support vectors that the SVM classifier needsfor its construction is significantly low. The latter is importantsince it brings digital image analysis systems closer to clinicalpractice.
Conflicts of interest
None.
Appendix A
Roundness characterizes the circularity of nuclei and takes lowvalues for circular nuclei and high for irregular boundaries.Roundness is calculated according to Eq. (9):
Roundness = perimeter2
4� × area(9)
Homogeneity describes image smoothness and takes mini-mum values for smooth textures nuclei. Energy increases forhigh contrast nuclei, i.e. malignant nuclei within which chro-matin clumps are prominent. Finally, correlation encodes thegray-tone dependencies revealing irregular textural patterns.Features homogeneity, energy and correlation are calculated fromthe co-occurrence matrix as follows:
Homogeneity (HOM) =Ng−1∑i=0
Ng−1∑j=0
(p(i, j))2
(10)
Energy (EN) =Ng−1∑n=0
n2
⎧⎨⎩
Ng−1∑i=0
Ng−1∑j=0
(p(i, j))2
⎫⎬⎭ ,
∣∣i − j∣∣ = n (11)
Correlation (COR) =∑Ng−1
i=0
∑Ng−1j=0 (ij)p(i, j) − mxmy
�x�y(12)
where Ng is the number of gray levels in the image,i,j = 1, . . ., Ng, p(i,j) is the co-occurrence matrix, and mx, my, �x
and �y are the respective mean values and standard deviationsof px and py, which are described in Eqs. (13) and (14).
px(i) =Nrows∑
j=1
p(i, j) (13)
py(j) =Ncolumns∑
j=1
p(i, j) (14)
e f e r e n c e s
[1] L. DeAngelis, Medical progress: brain tumors, New Engl. J.Med. 344 (2001) 114–123.

s i n
260 c o m p u t e r m e t h o d s a n d p r o g r a m[2] A. Hutter, K.E. Schwetye, A.J. Bierhals, R.C. McKinstry, Brainneoplasms: epidemiology, diagnosis, and prospects forcost-effective imaging, Neuroimag. Clin. North Am. 13 (2003)237–250, x–xi.
[3] P. Kleihues, PC. Burger, B.W. Scheithauer, The new WHOclassification of brain tumours, Brain Pathol. 3 (1993)255–268.
[4] W. Coons, P. Jhonson, B. Sceithauer, A. Yates, D. Pearl,Improving diagnostic accuracy and interobserverconcordance in the classification and grading of primarygliomas, Cancer 79 (1997) 1381–1393.
[5] C. Daumas-Duport, B. Scheitauer, J. O’Fallon, P. Kelly,Grading of astrocytomas. A simple and reproduciblemethod, Cancer 62 (1988) 2152–2165.
[6] W. Kernohan, R.F. Mabon, H.J. Svien, A simplifiedclassification of gliomas, Mayo Clin. Proc. (1949).
[7] H. Kolles, I. Niedermayer, W. Feiden, Grading of astrocytomasand oligodendrogliomas, Pathologe 19 (1998) 259–268.
[8] H. Kolles, H. Ludt, G.H. Vince, W. Feiden, Application ofminimal spanning trees in glioma grading—a CLIPPERprogram for the calculation and construction of minimalspanning trees, Comput. Meth. Prog. Biomed. 42 (1994)201–206.
[9] R. Prayson, D. Agamanolis, M. Cohen, M. Estes, B.Kleinschmidt-DeMasters, F. Abdul-Karim, S. McClure, B.Sebek, R. Vinay, Interobserver reproducibility amongneuropathologists and surgical pathologists in fibrillaryastrocytoma grading, J. Neurol. Sci. 175 (2000) 33–39.
[10] D. Glotsos, P. Spyridonos, P. Petalas, D. Cavouras, P.Ravazoula, P.A. Dadioti, I. Lekka, G. Nikiforidis,Computer-based malignancy grading of astrocytomasemploying a support vector machine classifier, the WHOgrading system and the regular hematoxylin-eosindiagnostic staining procedure, Anal. Quant. Cytol. Histol. 26(2004) 77–83.
[11] C. Decaestecker, M. Petein, R. van Velthoven, T. Janssen, G.Raviv, J.L. Pasteels, C. Schulman, P. Van Ham, R. Kiss, Thecomputer-assisted microscope analysis of Feulgen-stainednuclei linked to a supervised learning algorithm as an aid toprognosis assessment in invasive transitional bladder cellcarcinomas, Anal. Cell Pathol. 10 (1996) 263–280.
[12] M. Scarpelli, P. Bartels, R. Montironi, C. Galluzzi, D.Thompson, Morphometrically assisted grading ofastrocytomas, Anal. Quant. Cytol. Histol. 16 (1994) 351–356.
[13] L.R. Schad, H.P. Schmitt, C. Oberwittler, W.J. Lorenz,Numerical grading of astrocytomas, Med. Inform. 12 (1987)11–22.
[14] A.M. Gurley, D.F. Hidvegi, J.W. Bacus, S.S. Bacus, Comparisonof the Papanicolaou and Feulgen staining methods for DNAquantification by image analysis, Cytometry 11 (1990)468–474.
[15] R. Hofmann-Wellenhof, J. Smolle, H. Kerl, The influence ofstaining procedures on the assessment of cell proliferationas defined by the monoclonal antibody Ki-67, Am. J.Dermatopathol. 12 (1990) 458–461.
[16] V. Kechman, Support Vector Machines, in Learning and SoftComputing, MIT, 2001, pp. 121–184.
[17] N. Piliouras, I. Kalatzis, N. Dimitropoulos, D. Cavouras,Development of the cubic least squares mappinglinear-kernel support vector machine classifier forimproving the characterization of breast lesions onultrasound, Comp. Med. Imag. Graph. 28 (2004)247–255.
[18] D. Glotsos, P. Spyridonos, D. Cavouras, P. Ravazoula, P.A.
Dadioti, G. Nikiforidis, Automated segmentation of routinelyhematoxylin-eosin-stained microscopic images bycombining support vector machine clustering and activecontour models, Anal. Quant. Cytol. Histol. 26 (2004) 331–340.b i o m e d i c i n e 9 0 ( 2 0 0 8 ) 251–261
[19] R. Haralick, L. Shapiro, Computer and Robot Vision,Addison-Wesley, 1992.
[20] N. Ahmed, R. Rao, Orthogonal Transforms for Digital SignalProcessing, Springer-Verlag, Berlin, 1975.
[21] N. Street, Cancer diagnosis and prognosis via linearprogramming based machine learning, PhD Thesis,University of Wisconsin, Madison, 1994.
[22] J. Fellow, R. Duin, J. Mao, Statistical pattern recognition: areview, IEEE Trans. Pattern Anal. Machine Intel. 22 (2000)4–37.
[23] D. Specht, Probabilistic neural networks, Neural Netw. 3(1990) 109–118.
[24] S. Theodoridis, K. Koutroubas, Pattern Recognition,Academic Press, 1999.
[25] J.N.P. Pudil, J. Kittler, Floating search methods in featureselection, Pattern Recogn. Lett. 15 (1994) 1119–1125.
[26] I. Kalatzis, D. Pappas, N. Piliouras, D. Cavouras, Supportvector machines based analysis of brain SPECT images fordetermining cerebral abnormalities in asymptomaticdiabetic patients, Med. Inform. Internet Med. 28 (2003)221–230.
[27] I. Kalatzis, N. Piliouras, E. Ventouras, C.C. Papageorgiou, A.D.Rabavilas, D. Cavouras, Design and implementation of anSVM-based computer classification system fordiscriminating depressive patients from healthy controlsusing the P600 component of ERP signals, Comput. Meth.Prog. Biomed. 75 (2004) 11–22.
[28] MATLAB Software, The MathWorks Inc., OptimizationToolbox, 2005.
[29] S. Theodoridis, K. Koutroubas, Pattern Recognition,Academic Press, 1999, pp. 144.
[30] A.P. Bradley, The use of the area under the ROC curve in theevaluation of machine learning algorithms, Pattern Recogn.30 (1997) 1145–1159.
[31] N. Belacel, M. Boulassel, Multicriteria fuzzy assignmentmethod: a useful tool to assist medical diagnosis, Artif. Intel.Med. 21 (2001) 201–207.
[32] C. Decaestecker, I. Salmon, O. Dewitte, I. Camby, P. Van Ham,J.L. Pasteels, J. Brotchi, R. Kiss, Nearest-neighborclassification for identification of aggressive versusnonaggressive low-grade astrocytic tumors by means ofimage cytometry-generated variables, J. Neurosurg. 86 (1997)532–537.
[33] H. Kolles, A. von Wangenheim, J. Rahmel, I. Niedermayer, W.Feiden, Data-driven approaches to decision making inautomated tumor grading. An example of astrocytomagrading, Anal. Quant. Cytol. Histol. 18 (1996) 298–304.
[34] R. Nafe, W. Schlote, Topometric analysis of diffuseastrocytomas, Anal. Quant. Cytol. Histol. 25 (2003) 12–18.
[35] P.K. Sallinen, S.L. Sallinen, P.T. Helen, I.S. Rantala, E.Rautiainen, H.J. Helin, H. Kalimo, H.K. Haapasalo, Grading ofdiffusely infiltrating astrocytomas by quantitativehistopathology, cell proliferation and image cytometric DNAanalysis. Comparison of 133 tumours in the context of theWHO 1979 and WHO 1993 grading schemes, Neuropathol.Appl. Neurobiol. 26 (2000) 319–331.
[36] M. Scarpelli, R. Montironi, D. Thompson, P. Bartels,Computer-assisted discrimination of glioblastomas, Anal.Quant. Cytol. Histopathol. 19 (1997) 369–375.
[37] R. Nafe, W. Schlote, B. Schneider, Histomorphometry oftumour cell nuclei in astrocytomas using shape analysis,densitometry and topometric analysis, Neuropathol. Appl.Neurobiol. 31 (2005) 34–44.
[38] C. Burges, A tutorial on support vector machines for pattern
recognition, Data Mining Knowl. Discov. 2 (1998)121–167.[39] Y. Iwadate, S. Fujimoto, A. Yamaura, Differentialchemosensitivity in human intracerebral gliomas measured

i n b
[41] C. Decaestecker, I. Camby, N. Nagy, J. Brotchi, R. Kiss, I.Salmon, Improving morphology-based malignancy grading
c o m p u t e r m e t h o d s a n d p r o g r a m s
by flow cytometric DNA analysis, Int. J. Mol. Med. 10 (2002)187–192.
[40] M.H. Cohen, J.R. Johnson, R. Pazdur, Food and drugadministration drug approval summary: temozolomide plusradiation therapy for the treatment of newly diagnosedglioblastoma multiforme, Clin. Cancer Res. 11 (2005)6767–6771.
i o m e d i c i n e 9 0 ( 2 0 0 8 ) 251–261 261
schemes in astrocytic tumors by means ofcomputer-assisted techniques, Brain Pathol. 8 (1998)29–38.