Improved Visualization of Glaucomatous Retinal Damage Using High-speed Ultrahigh-Resolution Optical...
15
Improved Visualization of Glaucomatous Retinal Damage Using High-speed Ultrahigh-Resolution Optical Coherence Tomography Tarkan Mumcuoglu, MD 1 , Gadi Wollstein, MD 1 , Maciej Wojtkowski, PhD 2,3 , Larry Kagemann, MSc 1,4 , Hiroshi Ishikawa, MD 1,4 , Michelle L. Gabriele, BSc 1 , Vivek Srinivasan, MSc 2 , James G. Fujimoto, PhD 2 , Jay S. Duker, MD 5 , and Joel S. Schuman, MD 1,4 1 University of Pittsburgh Medical Center Eye Center, Ophthalmology and Visual Science Research Center, Eye and Ear Institute, Department of Ophthalmology, University of Pittsburgh School of Medicine, Pittsburgh, Pennsylvania. 2 Department of Electrical Engineering and Computer Science and Research Laboratory of Electronics, Massachusetts Institute of Technology, Cambridge, Massachusetts. 3 Institute of Physics, Nicolaus Copernicus University, Torun, Poland. 4 Department of Bioengineering, University of Pittsburgh School of Engineering, Pittsburgh, Pennsylvania. 5 New England Eye Center, Tufts—New England Medical Center, Tufts University School of Medicine, Boston, Massachusetts. Abstract Purpose—To test if improving optical coherence tomography (OCT) resolution and scanning speed improves the visualization of glaucomatous structural changes as compared with conventional OCT. Design—Prospective observational case series. Participants—Healthy and glaucomatous subjects in various stages of disease. Methods—Subjects were scanned at a single visit with commercially available OCT (StratusOCT) and high-speed ultrahigh-resolution (hsUHR) OCT. The prototype hsUHR OCT had an axial resolution of 3.4 μm (3 times higher than StratusOCT), with an A-scan rate of 24 000 hertz (60 times faster than StratusOCT). The fast scanning rate allowed the acquisition of novel scanning patterns such as raster scanning, which provided dense coverage of the retina and optic nerve head. Main Outcome Measures—Discrimination of retinal tissue layers and detailed visualization of retinal structures. Results—High-speed UHR OCT provided a marked improvement in tissue visualization as compared with StratusOCT. This allowed the identification of numerous retinal layers, including the ganglion cell layer, which is specifically prone to glaucomatous damage. Fast scanning and the enhanced A-scan registration properties of hsUHR OCT provided maps of the macula and optic nerve head with unprecedented detail, including en face OCT fundus images and retinal nerve fiber layer thickness maps. © 2008 by the American Academy of Ophthalmology. Correspondence to Joel S. Schuman, MD, UPMC Eye Center, Department of Ophthalmology, University of Pittsburgh School of Medicine, 203 Lothrop Street, Eye and Ear Institute, Suite 816, Pittsburgh, PA 15213. [email protected].. The first 2 authors contributed equally to the preparation of the manuscript. Presented in part at: American Glaucoma Society Annual Meeting, March 2006, Charleston, South Carolina, and International Society for Imaging of the Eye Annual Meeting, May 2006, Ft. Lauderdale, Florida. Drs Schuman and Fujimoto receive royalties for intellectual property licensed by Massachusetts Institute of Technology to Carl Zeiss Meditec. NIH Public Access Author Manuscript Ophthalmology. Author manuscript; available in PMC 2010 March 26. Published in final edited form as: Ophthalmology. 2008 May ; 115(5): 782–789.e2. doi:10.1016/j.ophtha.2007.06.038. NIH-PA Author Manuscript NIH-PA Author Manuscript NIH-PA Author Manuscript
-
Upload
independent -
Category
Documents
-
view
0 -
download
0
Transcript of Improved Visualization of Glaucomatous Retinal Damage Using High-speed Ultrahigh-Resolution Optical...

Improved Visualization of Glaucomatous Retinal Damage UsingHigh-speed Ultrahigh-Resolution Optical Coherence Tomography
Tarkan Mumcuoglu, MD1, Gadi Wollstein, MD1, Maciej Wojtkowski, PhD2,3, Larry Kagemann,MSc1,4, Hiroshi Ishikawa, MD1,4, Michelle L. Gabriele, BSc1, Vivek Srinivasan, MSc2, JamesG. Fujimoto, PhD2, Jay S. Duker, MD5, and Joel S. Schuman, MD1,4
1University of Pittsburgh Medical Center Eye Center, Ophthalmology and Visual Science ResearchCenter, Eye and Ear Institute, Department of Ophthalmology, University of Pittsburgh School ofMedicine, Pittsburgh, Pennsylvania. 2Department of Electrical Engineering and Computer Scienceand Research Laboratory of Electronics, Massachusetts Institute of Technology, Cambridge,Massachusetts. 3Institute of Physics, Nicolaus Copernicus University, Torun, Poland. 4Departmentof Bioengineering, University of Pittsburgh School of Engineering, Pittsburgh, Pennsylvania. 5NewEngland Eye Center, Tufts—New England Medical Center, Tufts University School of Medicine,Boston, Massachusetts.
AbstractPurpose—To test if improving optical coherence tomography (OCT) resolution and scanning speedimproves the visualization of glaucomatous structural changes as compared with conventional OCT.
Design—Prospective observational case series.
Participants—Healthy and glaucomatous subjects in various stages of disease.
Methods—Subjects were scanned at a single visit with commercially available OCT (StratusOCT)and high-speed ultrahigh-resolution (hsUHR) OCT. The prototype hsUHR OCT had an axialresolution of 3.4 μm (3 times higher than StratusOCT), with an A-scan rate of 24 000 hertz (60 timesfaster than StratusOCT). The fast scanning rate allowed the acquisition of novel scanning patternssuch as raster scanning, which provided dense coverage of the retina and optic nerve head.
Main Outcome Measures—Discrimination of retinal tissue layers and detailed visualization ofretinal structures.
Results—High-speed UHR OCT provided a marked improvement in tissue visualization ascompared with StratusOCT. This allowed the identification of numerous retinal layers, including theganglion cell layer, which is specifically prone to glaucomatous damage. Fast scanning and theenhanced A-scan registration properties of hsUHR OCT provided maps of the macula and optic nervehead with unprecedented detail, including en face OCT fundus images and retinal nerve fiber layerthickness maps.
© 2008 by the American Academy of Ophthalmology.Correspondence to Joel S. Schuman, MD, UPMC Eye Center, Department of Ophthalmology, University of Pittsburgh School ofMedicine, 203 Lothrop Street, Eye and Ear Institute, Suite 816, Pittsburgh, PA 15213. [email protected] first 2 authors contributed equally to the preparation of the manuscript.Presented in part at: American Glaucoma Society Annual Meeting, March 2006, Charleston, South Carolina, and International Societyfor Imaging of the Eye Annual Meeting, May 2006, Ft. Lauderdale, Florida.Drs Schuman and Fujimoto receive royalties for intellectual property licensed by Massachusetts Institute of Technology to Carl ZeissMeditec.
NIH Public AccessAuthor ManuscriptOphthalmology. Author manuscript; available in PMC 2010 March 26.
Published in final edited form as:Ophthalmology. 2008 May ; 115(5): 782–789.e2. doi:10.1016/j.ophtha.2007.06.038.
NIH
-PA Author Manuscript
NIH
-PA Author Manuscript
NIH
-PA Author Manuscript
Conclusion—High-speed UHR OCT improves visualization of the tissues relevant to the detectionand management of glaucoma.
Glaucoma damage primarily affects the optic nerve, retinal ganglion cell layer, and retinalnerve fiber layer (RNFL).1 Therefore, detection of early glaucomatous changes in these tissuesis important for the management of glaucoma patients. A variety of imaging technologies arecurrently used for this purpose. Optical coherence tomography (OCT) is a noninvasive imagingtechnology using low-coherence interferometry to generate in vivo high-resolution cross-sectional images of retinal and optic nerve head (ONH) structure by measuring the echo timedelay and magnitude of backscattered light.2-4 Images generated by OCT are useful for theidentification, monitoring, and quantitative assessment of glaucoma and other ocular diseases.
Commercially available standard time domain OCT (StratusOCT, Carl Zeiss Meditec, Dublin,CA) quantifies reflectance within the tissue with an axial resolution of 8 to 10 μm.5 Previousstudies have demonstrated the ability of OCT to detect and quantify glaucomatous retinaldamage6-8; however, technological constraints limit the scanning speed of the standard OCTto 400 A-scans per second. Because of the relatively slow scanning speed, Stratus scans aresusceptible to motion artifacts, limited by the need to interpolate RNFL thickness in areasbetween scans, and further limited by challenges in the registration of sequential A-scans.
Recent improvements in OCT technology provide higher acquisition speeds and higherresolution than StratusOCT. Our prototype high-speed ultrahigh-resolution (hsUHR) OCT,constructed at Massachusetts Institute of Technology and the University of Pittsburgh, usesspectral/Fourier domain detection to acquire A-scans at ultrahigh resolution and high speed,and promises to improve the accuracy and details of OCT images.9-13 The fast scanning rateof hsUHR OCT allows the acquisition of novel scanning patterns that are not available byStratusOCT, which may further improve the ability to detect glaucomatous structural changes.
The purpose of this pilot study was to compare StratusOCT and hsUHR OCT images in thedetection of RNFL and ONH changes in glaucoma patients.
Materials and MethodsHealthy subjects and glaucoma patients from the University of Pittsburgh Medical Center EyeCenter received a comprehensive ocular examination, visual field (VF) test, ONH photographs,and StratusOCT and hsUHR OCT scanning at the same visit. All scans were performed throughundilated pupils. Representative samples of a healthy eye and patients at various stages ofglaucomatous damage were chosen retrospectively for this study. Institutional review boardand ethics committee approval was obtained for the study, and informed consent was obtainedfrom all subjects. This study followed the tenets of the Declaration of Helsinki and wasconducted in compliance with the Health Insurance Portability and Accountability Act.
InstrumentationVisual Field—All the participants had reliable Swedish interactive thresholding algorithm24-2 standard perimetry. Visual field examinations were considered nonreliable if they had30% or more fixation losses or false-positive or false-negative responses. Healthy subjects hadnormal VF, and the glaucoma patients had a reproducible typical glaucomatous VF defect with≥3 adjacent non-edge points in typically glaucomatous locations, all of which were depressedon the pattern deviation plot at a P<0.05 level and one of which was depressed at a P<0.01level.
StratusOCT—The commercially available StratusOCT uses a superluminescent diode lightsource that generates an 850-nm beam with a 25-nm bandwidth. The light is split into 2 beams
Mumcuoglu et al. Page 2
Ophthalmology. Author manuscript; available in PMC 2010 March 26.
NIH
-PA Author Manuscript
NIH
-PA Author Manuscript
NIH
-PA Author Manuscript
using a fiber optic coupler. One beam is projected onto the eye (measurement arm), whereasthe second beam is projected onto an oscillating mirror (reference arm). An interference signalis created when path lengths of the reference and measurement arms are matched within thecoherence length of the light. StratusOCT has an axial resolution in the eye of approximately8 to 10 μm, with a transverse resolution of 20 μm on the retina. The scanning rate of theStratusOCT is 400 A-scans per second.
High-speed Ultrahigh-Resolution Optical Coherence Tomography—Our hsUHROCT uses spectral/Fourier domain detection and has been described in detail in previouspublications.9,13 Briefly, it uses a multiplexed low-coherence superluminescent diode lightsource at 840 nm with a broad 100-nm bandwidth (Broadlighter 840T, Superlum, Moscow,Russia). The light is split into 2 beams using a fiber optic coupler. One beam is projected ontothe eye, whereas the other is projected onto a stationary reference mirror. Backscattered lightfrom each arm is combined using a coupler, creating an optical interference signal. Theinterference spectrum is measured by a spectrometer and Fourier transformed to generate A-scan information. This spectral/Fourier domain detection acquires an entire A-scansimultaneously rather than detecting echoes sequentially as in standard OCT with time domaindetection. Echo time delay is frequency encoded in the interference pattern. The intensity ofthe interference pattern at each frequency represents tissue reflectance at the location associatedwith that frequency. High-speed UHR OCT has an axial resolution of 3.4 μm in the eye and ascanning speed of 24 000 A-scans per second.
The hsUHR OCT scanning patterns used in this study included high-definition scans,consisting of 8000 A-scans evenly spaced along a 6-mm line of retina tissue; circumpapillaryscans, consisting of three 3.4-mm-diameter circular scans centered on the ONH; and rasterscans, consisting of 180 adjacent line scans, each with 501 pixels (a total of 90 000 transversepoints) covering a 6×6-mm area of retina. The circumpapillary scans were similar to thoseacquired by the fast scanning mode of the StratusOCT, in which the 3 scans are aligned andacquired automatically after the initial positioning by the operator. High-definition scans andcircumpapillary scans were acquired in 1.2 seconds, and raster scans were acquired in ~4seconds.
An en face fundus image was created from the raster scans by summing all pixel intensityvalues along individual A-scans. The resultant sum along each A-scan was the intensity valueused for the pixel corresponding to that A-scan’s location within the 2-dimensional en facehsUHR OCT fundus image. Retinal nerve fiber layer thickness maps were automaticallycreated by segmenting the retina based on detection of the internal limiting membrane andouter RNFL border in each A-scan of each OCT frame.13 The measurements were color coded.Red and yellow denoted a thicker RNFL, and blue indicated a thinner one.
ResultsA healthy subject and 3 glaucoma patients were retrospectively chosen with a range of VFabnormalities representing various stages of glaucomatous damage.
Case 1: Healthy SubjectA healthy 35-year-old Caucasian woman with normal left eye examination results and a normalVF was scanned with StratusOCT and hsUHR OCT. Circumpapillary and cross-sectionalimages of the ONH (Figs 1, 2 [available at http://aaojournal.org]) and macula (Fig 3 [availableat http://aaojournal.org]) were obtained. The typical double-hump configuration can beobserved in the circumpapillary scans with thickening of the RNFL at the superior and inferiorregions. The black vertical lines are shadows of blood vessels. High-speed UHR OCT provided
Mumcuoglu et al. Page 3
Ophthalmology. Author manuscript; available in PMC 2010 March 26.
NIH
-PA Author Manuscript
NIH
-PA Author Manuscript
NIH
-PA Author Manuscript

a finer and more detailed cross-sectional image of the retina than the StratusOCT scan. Aportion of the choroidal vasculature can be observed near the bottom of the hsUHR OCT scan.
The current StratusOCT ONH algorithms use the termination of retinal pigment epithelium(RPE) or Bruch’s membrane to determine the border of the disc for quantitative measurements(Fig 2). The RNFL and RPE/Bruch’s membrane tips can easily be distinguished in the hsUHROCT cross-sectional scan of the ONH. Due to the high resolution and high scanning speedachieved by hsUHR OCT, the lumens of vascular structures within the cup and posteriorhyaloid membrane are visible in the hsUHR OCT but not the standard OCT scan (Fig 2).
Numerous layers can be discerned with the hsUHR OCT macular scan that could not bediscriminated using StratusOCT. Boundaries of the ganglion cell layer and RNFL are clearlyvisible throughout the hsUHR OCT scan.
The novel raster scan pattern enabled the creation of an en face OCT fundus image thatresembled the clinical appearance of the fundus (Fig 4). A color-coded RNFL thickness mapwas created from the same raster scan (Fig 4). A thicker RNFL was observed in the superiorand inferior regions, with a thinner RNFL temporal to the ONH. The red line on the en faceand thickness map images corresponds to the location of the individual cross section (Fig 4)that was obtained during the raster acquisition. Thicker RNFL can be clearly observed on theleft side of the cross section image, along with thinner RNFL on the right side correspondingto the thinner temporal RNFL seen on the thickness map.
Case 2: Preperimetric GlaucomaA 68-year-old Caucasian woman was referred as an untreated glaucoma suspect. Onexamination, her visual acuity in the right eye was 20/20, and the intraocular pressure (IOP)was 24 mmHg. Pachymetry of the cornea was 578 μm, and the anterior chamber (AC)appearance was normal, with an open angle. There was minimal lenticular nuclear sclerosisand moderate ONH cupping with a thin inferotemporal neuroretinal rim (Fig 5A). The patienthad a normal-appearing VF with a normal glaucoma hemifield test result, but there was VFdeterioration in the superior arcuate region by the VF glaucoma progression analysis (Fig 5B).The StratusOCT circumpapillary scan showed a thin RNFL inferiorly (Fig 5C), which wasmore evident with the comparison to the OCT normative database in the thickness profile graphand quadrant analysis (Fig 5D). The clock-hour normative dataset comparison showed anabnormally thin RNFL at the 6-o’clock position and borderline thin RNFL (yellow) at the 7-o’clock position (Fig 5D). The thickness profile showed a second area of focally thin RNFL(Fig 5D) that was not shown in the quadrant or clock-hour analysis. Careful examination ofthe cross-sectional image revealed this focally thin region (Fig 5C). The circumpapillary scanobtained by hsUHR OCT clearly showed 2 locations with a focally thin RNFL (Fig 5E). Thethin area in the inferior sector (right side of the scan) can be appreciated when compared withthe RNFL thickness in the superior region (left side of the scan). A localized wedge defect inthe temporal inferior sector was observed in the raster scan color-coded thickness map (Fig5F) corresponding to the neuroretinal rim notch and the finding in the circumpapillary scan. Across-sectional image (Fig 5F) along the red line that appears in the lower part of the color-coded RNFL thickness map clearly demonstrates the focally thin RNFL.
Case 3: Moderate GlaucomaA 68-year-old Caucasian woman had primary open-angle glaucoma (POAG) that was treatedwith trabeculectomy in each eye and currently required no further medical treatment. Visualacuity was 20/20 in the left eye, with 7-mmHg IOP and corneal thickness of 546 μm. Clinicalexamination revealed a superior thin-walled elevated filtration bleb, open AC angle (ACA),and pseudophakia. Marked excavation was noted on fundus examination with a vertical cup-
Mumcuoglu et al. Page 4
Ophthalmology. Author manuscript; available in PMC 2010 March 26.
NIH
-PA Author Manuscript
NIH
-PA Author Manuscript
NIH
-PA Author Manuscript

to-disc ratio of 0.9 (Fig 6A). The VF showed inferior arcuate and paracentral scotomas andsuspected superior and inferior temporal wedges (Fig 6B). StratusOCT showed an overallattenuation of the RNFL with 2 punched-out defects at the temporal inferior and temporalsuperior regions (Fig 6C, D). An hsUHR OCT circular scan showed 2 locations withsubstantially thin RNFL (Fig 6E) corresponding to the defects highlighted by StratusOCT.Careful examination of another area that seemed to contain thin RNFL (center of the scan)disclosed a posterior bowing of the tissue but with intact RNFL. The retinal blood vessel lumenand choroidal details can be clearly seen. The RNFL thickness map showed 2 wedge defects,with a more pronounced and larger defect in the superior temporal region corresponding to theinferior VF defect (Fig 6F). A functional abnormality corresponding to the inferior structuraldefect was not detected on the VF. The cross section through the area denoted by the red lineon the retinal map showed the thin RNFL, with the arrows marking the edges of the defect (Fig6F).
Case 4: Moderate GlaucomaAn 89-year-old Caucasian woman with POAG in both eyes was treated medically withdorzolamide, timolol, and bimatoprost. Visual acuity was 20/40 (right eye), with an IOP of 10mmHg. On examination of the anterior segment, corneal thickness was 589 μm, with an openACA. The patient was aphakic and had a peripheral iridectomy. The posterior segment revealednear total rim attenuation in the temporal half of the ONH and was most remarkably thin inthe temporal superior area (Fig 7A). A small disc hemorrhage was noted at 11-o’clock, andthere was circular peripapillary atrophy. In the VF, an inferior nasal defect was noted, as wasa superior rim defect (Fig 7B). The StratusOCT circumpapillary RNFL scan showed markedattenuation of RNFL thickness superiorly (Fig 7C, D). Similarly, the hsUHR OCTcircumpapillary scan showed a clear delineation of the RNFL defect superiorly, presenting asa thin and weak RNFL signal (Fig 7E). The strong signal throughout the RPE layer was anindication that the scan was good, and the thin RNFL was not an artifact. The hsUHR OCTcolor-coded retinal thickness map showed substantial attenuation throughout the upper sectorthat indicated more advanced structural damage than suggested by the VF (Fig 7F).
DiscussionThe increased axial resolution and A-scan density of hsUHR OCT allowed the identificationof intraretinal structures that were unseen with StratusOCT. These structures include theganglion cell layer, external limiting membrane, and inner/outer segment junction of thephotoreceptors. Previously, UHR OCT imaging using time domain detection, with an axialresolution of 3 μm, also visualized these intraretinal layers.14-18 However, this device had aslow acquisition rate and, thus, was prone to marked eye motion artifacts. In addition toachieving UHR, the hsUHR OCT using Fourier domain detection (the device used in thepresent study) acquires A-scans approximately 60 times faster than the standard-resolutionStratusOCT and 100 times faster than UHR OCT using time domain detection. The StratusOCTimage consisting of 512 axial scans is acquired in 1.3 seconds, whereas a time domain UHROCT image consisting of 600 axial scans takes 4 seconds to acquire. In the present study,hsUHR OCT was able to acquire 2048 A-scans in only ~0.085 seconds. This improvement inscan rate allows the acquisition of high-definition images with high transverse pixel densities.Therefore, the quality of hsUHR OCT images using Fourier domain detection is superior tothat of those acquired with either standard resolution or UHR time domain OCT.
The ganglion cell layer is specifically prone to glaucomatous damage. The only in vivo methodthat is currently available to estimate the structural damage to the ganglion cells is assessmentof RNFL thickness or ONH topography. It has been suggested that RNFL thinning may precedeVF loss and changes in the ONH by as much as 6 years.19 The accurate measurement of the
Mumcuoglu et al. Page 5
Ophthalmology. Author manuscript; available in PMC 2010 March 26.
NIH
-PA Author Manuscript
NIH
-PA Author Manuscript
NIH
-PA Author Manuscript

RNFL with hsUHR OCT may provide earlier detection and treatment of glaucoma. Moreover,the unique ability of hsUHR OCT to delineate the ganglion cell layer might enable thequantification of this layer, leading to further improvements in glaucoma detection.
The images presented in this study demonstrate the ability of hsUHR OCT to provide detailedin vivo retinal information at a level that is similar to histology (Figs 1-3 [available athttp://aaojournal.org]). There is a clear delineation of the retinal layers that may be of benefitfor detection of a variety of retinal abnormalities. In Figure 4, we present an example of a noveluse of the improved performance of the device. The combination of the thickness map andcross-sectional scans was beneficial in visualizing and identifying defects, as presented inFigures 5 to 7. Figure 5 shows an example of a preperimetric defect in which the VF wasnormal, but the glaucoma progression analysis indicated progressive damage. Despite the lackof a normative database, at this stage in hsUHR OCT technology development, the cross-sectional image clearly showed a localized focal RNFL defect in the OCT fundus image andRNFL thickness map. In addition to RNFL thinning corresponding to the VF progression,hsUHR OCT may have indicated more advanced structural damage than observed in thefunctional test, as evident by the superior defect without a corresponding VF abnormality. Thisis also evident in Figure 7 with a thin superior RNFL with limited corresponding VFabnormality. Figures 6 and 7 show the ability of the hsUHR OCT image to clearly define theextent of the RNFL defect in both cross-sectional OCT images and the en face OCT fundusimage view. Some of the features that were detected by hsUHR OCT could be retrospectivelydetected in StratusOCT scans, but due to the lower resolution and eye motion artifacts theywere difficult to discern independently.
The high speed of hsUHR OCT minimizes image distortion caused by involuntary eyemovements. This in turn allows the use of novel scanning patterns not possible with standardOCT due to eye movement artifacts; however, motion artifacts are still present betweensubsequent lines within raster scans. This scan pattern is especially valuable for the assessmentof focal retinal abnormalities that might be missed by a single poorly positioned OCT line scan.The raster scan also allows a postprocessing cross-sectional sampling in any desiredorientation, including a circumpapillary sampling, thus minimizing interscan variability dueto image registration problems, as observed with StratusOCT. Sampling errors and thepossibility of missing focal pathologies could also be reduced with raster scanning, as thenumber and density of axial scans on the retina are dramatically increased compared withstandard OCT. Recently, a number of manufacturers have introduced OCT instruments usingspectral/Fourier domain detection. These instruments achieve speeds of ~24 000 A-scans persecond or faster but have axial resolutions of 5 to 6 μm. Although the axial resolution of thecommercial devices does not achieve the 3.4-μm axial resolution of the prototype instrumentused in this study, we expect that these new instruments would yield similar advantages invisualization compared with standard OCT, albeit with less axial image resolution.
In summary, the improved visualization of retinal layers obtained with hsUHR OCT mayimprove the clinical utility of this technology in the management of glaucoma.
AcknowledgmentsSupported in part by the National Institutes of Health, Bethesda, Maryland (grant nos. R01-EY013178-7, RO1-EY11289-21, P30-EY008098); National Science Foundation, Arlington, Virginia (grant no. BES-0522845); Air ForceOffice of Scientific Research and Medical Free Electron Laser Program, Arlington, Virginia (contract no.FA9550-040-1-0046); and unrestricted grants from Research to Prevent Blindness, Inc., New York, New York, andthe Eye and Ear Foundation, Pittsburgh, Pennsylvania.
Mumcuoglu et al. Page 6
Ophthalmology. Author manuscript; available in PMC 2010 March 26.
NIH
-PA Author Manuscript
NIH
-PA Author Manuscript
NIH
-PA Author Manuscript

References1. Harwerth RS, Carter-Dawson L, Shen F, et al. Ganglion cell losses underlying visual field defects from
experimental glaucoma. Invest Ophthalmol Vis Sci 1999;40:2242–50. [PubMed: 10476789]2. Hee MR, Izatt JA, Swanson EA, et al. Optical coherence tomography of the human retina. Arch
Ophthalmol 1995;113:325–32. [PubMed: 7887846]3. Puliafito CA, Hee MR, Lin CP, et al. Imaging of macular diseases with optical coherence tomography.
Ophthalmology 1995;102:217–29. [PubMed: 7862410]4. Huang D, Swanson EA, Lin CP, et al. Optical coherence tomography. Science 1991;254:1178–81.
[PubMed: 1957169]5. Fujimoto, JG.; Hee, MR.; Huang, D., et al. Principals of optical coherence tomography. In: Schuman,
JS.; Puliafito, CA.; Fujimoto, JG., editors. Optical Coherence Tomography of Ocular Diseases. 2nded. SLACK Inc.; Thorofare, NJ: 2004. p. 3-8.
6. Schuman JS, Hee MR, Puliafito CA, et al. Quantification of nerve fiber layer thickness in normal andglaucomatous eyes using optical coherence tomography. Arch Ophthalmol 1995;113:586–96.[PubMed: 7748128]
7. Wollstein G, Ishikawa H, Wang J, et al. Comparison of three optical coherence tomography scanningareas for detection of glaucomatous damage. Am J Ophthalmol 2005;139:39–43. [PubMed: 15652826]
8. Bowd C, Weinreb RN, Williams JM, Zangwill LM. The retinal nerve fiber layer thickness in ocularhypertensive, normal, and glaucomatous eyes with optical coherence tomography. Arch Ophthalmol2000;118:22–6. [PubMed: 10636409]
9. Srinivasan VJ, Wojtkowski M, Witkin AJ, et al. High-definition and 3-dimensional imaging of macularpathologies with high-speed ultrahigh-resolution optical coherence tomography. Ophthalmology2006;113:2054–65. [PubMed: 17074565]
10. Wojtkowski M, Leitgeb R, Kowalczyk A, et al. In vivo human retinal imaging by Fourier domainoptical coherence tomography. J Biomed Opt 2002;7:457–63. [PubMed: 12175297]
11. Fercher AF, Hitzenberger CK, Kamp G, El-Zaiat SY. Measurement of intraocular distances bybackscattering spectral interferometry. Opt Commun 1995;117:43–8.
12. Nassif N, Cense B, Park BH, et al. In vivo human retinal imaging by ultrahigh-speed spectral domainoptical coherence tomography. Opt Lett 2004;29:480–2. [PubMed: 15005199]
13. Wojtkowski M, Srinivasan V, Fujimoto JG, et al. Three-dimensional retinal imaging with high-speedultrahigh-resolution optical coherence tomography. Ophthalmology 2005;112:1734–46. [PubMed:16140383]
14. Drexler W, Sattmann H, Hermann B, et al. Enhanced visualization of macular pathology with the useof ultrahigh-resolution optical coherence tomography. Arch Ophthalmol 2003;121:695–706.[PubMed: 12742848]
15. Wollstein G, Paunescu LA, Ko TH, et al. Ultrahigh-resolution optical coherence tomography inglaucoma. Ophthalmology 2005;112:229–37. [PubMed: 15691556]
16. Drexler W, Morgner U, Ghanta RK, et al. Ultrahigh-resolution ophthalmic optical coherencetomography. Nat Med 2001;7:502–7. [PubMed: 11283681]
17. Wollstein G, Schuman JS, Price LL, et al. Optical coherence tomography (OCT) macular andperipapillary retinal nerve fiber layer measurements and automated visual fields. Am J Ophthalmol2004;138:218–25. [PubMed: 15289130]
18. Ko TH, Fujimoto JG, Schuman JS, et al. Comparison of ultrahigh- and standard-resolution opticalcoherence tomography for imaging macular pathology. Ophthalmology 2005;112:1922–35.[PubMed: 16183127]
19. Sommer A, Katz J, Quigley HA, et al. Clinically detectable nerve fiber atrophy precedes the onset ofglaucomatous field loss. Arch Ophthalmol 1991;109:77–83. [PubMed: 1987954]
Mumcuoglu et al. Page 7
Ophthalmology. Author manuscript; available in PMC 2010 March 26.
NIH
-PA Author Manuscript
NIH
-PA Author Manuscript
NIH
-PA Author Manuscript

Figure 1.A circumpapillary StratusOCT scan of a healthy subject (top) and high-speed ultrahigh-resolution optical coherence tomography (bottom). The white lines delineate the nerve fiberlayer, and the black vertical lines are shadows cast by the blood vessels.
Mumcuoglu et al. Page 8
Ophthalmology. Author manuscript; available in PMC 2010 March 26.
NIH
-PA Author Manuscript
NIH
-PA Author Manuscript
NIH
-PA Author Manuscript

Figure 2.A StratusOCT scan of the optic nerve head of a healthy subject scan (top) and high-speedultrahigh-resolution optical coherence tomography (hsUHR OCT) (bottom). The terminationof the retinal pigment epithelium layer (lower red horizontal band) is clearly visible in thehsUHR OCT scan. The arrows point to blood vessels, in which their patent lumen can beobserved.
Mumcuoglu et al. Page 9
Ophthalmology. Author manuscript; available in PMC 2010 March 26.
NIH
-PA Author Manuscript
NIH
-PA Author Manuscript
NIH
-PA Author Manuscript
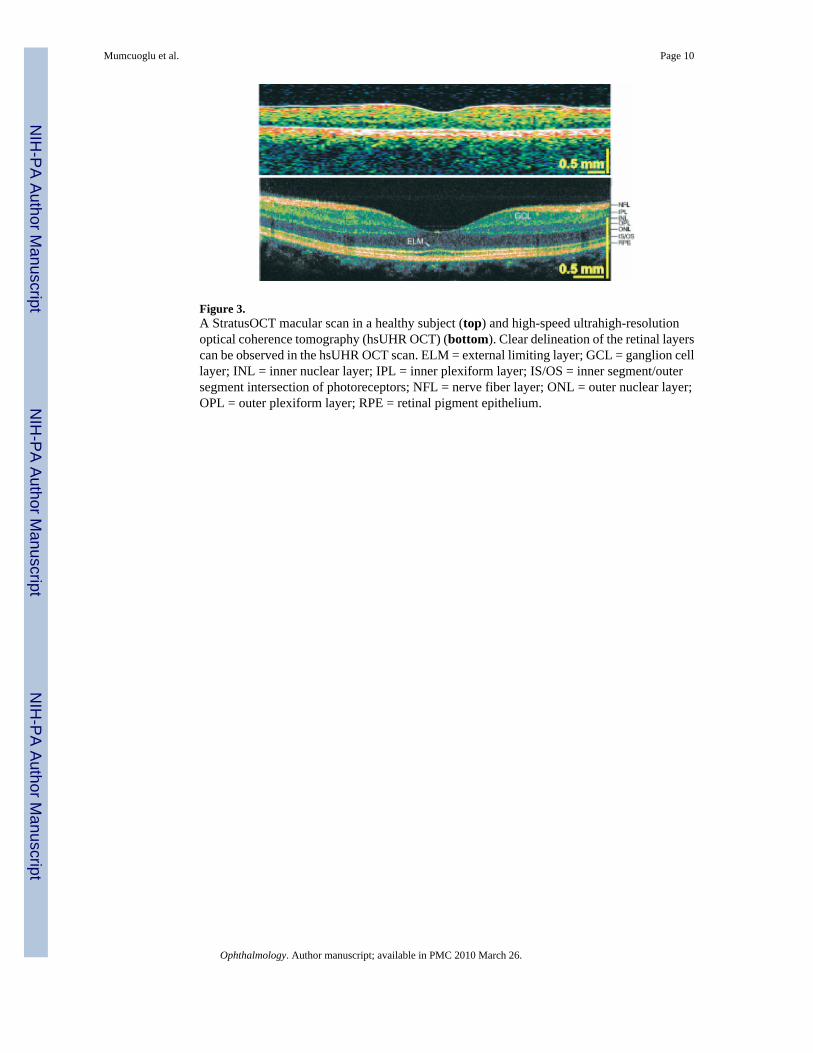
Figure 3.A StratusOCT macular scan in a healthy subject (top) and high-speed ultrahigh-resolutionoptical coherence tomography (hsUHR OCT) (bottom). Clear delineation of the retinal layerscan be observed in the hsUHR OCT scan. ELM = external limiting layer; GCL = ganglion celllayer; INL = inner nuclear layer; IPL = inner plexiform layer; IS/OS = inner segment/outersegment intersection of photoreceptors; NFL = nerve fiber layer; ONL = outer nuclear layer;OPL = outer plexiform layer; RPE = retinal pigment epithelium.
Mumcuoglu et al. Page 10
Ophthalmology. Author manuscript; available in PMC 2010 March 26.
NIH
-PA Author Manuscript
NIH
-PA Author Manuscript
NIH
-PA Author Manuscript

Figure 4.A raster optic nerve head—centered scan in a healthy subject, with an en face image (left) andcolor-coded retinal nerve fiber layer (RNFL) thickness map (center), with red and yellowdenoting a thicker layer and blue a thinner one. Right, One of the cross sections that contributedto the construction of the raster scan. The plane of the cross section is marked by the red linein the en face and thickness map.
Mumcuoglu et al. Page 11
Ophthalmology. Author manuscript; available in PMC 2010 March 26.
NIH
-PA Author Manuscript
NIH
-PA Author Manuscript
NIH
-PA Author Manuscript

Figure 5.A preperimetric glaucoma subject. A, Optic nerve head photograph. B, Visual field patterndeviation map (left) and glaucoma progression analysis (right). C, StratusOCT circumpapillaryscan. D, StratusOCT retinal nerve fiber layer (RNFL) thickness profile (left) and thecomparison with normative data, which are marked for quadrants and clock hours (right). Thegreen area denotes RNFL thickness within normal limits; yellow, borderline RNFL thickness;and red, outside normal limits. Inf = inferior; nas = nasal; OD = right eye; sup = superior; temp= temporal. E, High-speed ultrahigh-resolution optical coherence tomography (hsUHR OCT)circumpapillary scan. Arrows, location of RNFL thinning in the StratusOCT and hsUHR OCT
Mumcuoglu et al. Page 12
Ophthalmology. Author manuscript; available in PMC 2010 March 26.
NIH
-PA Author Manuscript
NIH
-PA Author Manuscript
NIH
-PA Author Manuscript

images. F, Retinal nerve fiber layer thickness is color coded on a map (left), with a wedgedefect (arrow) clearly visible in the cross section (right).
Mumcuoglu et al. Page 13
Ophthalmology. Author manuscript; available in PMC 2010 March 26.
NIH
-PA Author Manuscript
NIH
-PA Author Manuscript
NIH
-PA Author Manuscript

Figure 6.Moderate glaucoma. A, Optic nerve head photograph. B, Visual field pattern deviation map.C, Circumpapillary StratusOCT scan. D, StratusOCT retinal nerve fiber layer (RNFL)thickness profile (left) and the comparison with normative data are marked for quadrants andclock hours (right). Inf = inferior; nas = nasal; OS = left eye; sup = superior; temp = temporal.E, High-speed ultrahigh-resolution optical coherence tomography (hsUHR OCT)circumpapillary scan. Arrows, location of RNFL thinning in the StratusOCT and hsUHR OCTimages. F, Retinal nerve fiber layer thickness color-coded map (left) with 2 wedge defects.Arrows, edges of the upper defect in the map and cross section (right).
Mumcuoglu et al. Page 14
Ophthalmology. Author manuscript; available in PMC 2010 March 26.
NIH
-PA Author Manuscript
NIH
-PA Author Manuscript
NIH
-PA Author Manuscript

Figure 7.Moderate glaucoma. A, Optic nerve head photograph. B, Visual field pattern deviation map.C, Circumpapillary StratusOCT scan. D, StratusOCT retinal nerve fiber layer (RNFL)thickness profile (left) and the comparison with normative data are marked for quadrants andclock hours (right). Arrows, location of RNFL thinning in StratusOCT. Inf = inferior; nas =nasal; OD = right eye; sup = superior; temp = temporal. E, High-speed ultrahigh-resolutionoptical coherence tomography (hsUHR OCT) circumpapillary scan. Arrows, edges of theRNFL defect. F, Retinal nerve fiber layer thickness color-coded map (left), with generalthinning of the RNFL superior to the optic nerve head (left, right).
Mumcuoglu et al. Page 15
Ophthalmology. Author manuscript; available in PMC 2010 March 26.
NIH
-PA Author Manuscript
NIH
-PA Author Manuscript
NIH
-PA Author Manuscript