Improved breast cancer histological grading using deep learning
10
ORIGINAL ARTICLE Improved breast cancer histological grading using deep learning Y. Wang 1 , B. Acs 2,3 , S. Robertson 2,3 , B. Liu 1 , L. Solorzano 4 , C. Wählby 4 , J. Hartman 2,3,5y & M. Rantalainen 1,5*y Departments of 1 Medical Epidemiology and Biostatistics; 2 Oncology-Pathology, Karolinska Institutet, Stockholm; 3 Department of Clinical Pathology and Cancer Diagnostics, Karolinska University Hospital, Stockholm; 4 Department of Information Technology and SciLifeLab, Uppsala University, Uppsala; 5 MedTechLabs, BioClinicum, Karolinska University Hospital, Solna, Sweden Available online 29 September 2021 Background: The Nottingham histological grade (NHG) is a well-established prognostic factor for breast cancer that is broadly used in clinical decision making. However, w50% of patients are classified as grade 2, an intermediate risk group with low clinical value. To improve risk stratification of NHG 2 breast cancer patients, we developed and validated a novel histological grade model (DeepGrade) based on digital whole-slide histopathology images (WSIs) and deep learning. Patients and methods: In this observational retrospective study, routine WSIs stained with haematoxylin and eosin from 1567 patients were utilised for model optimisation and validation. Model generalisability was further evaluated in an external test set with 1262 patients. NHG 2 cases were stratified into two groups, DG2-high and DG2-low, and the prognostic value was assessed. The main outcome was recurrence-free survival. Results: DeepGrade provides independent prognostic information for stratification of NHG 2 cases in the internal test set, where DG2-high showed an increased risk for recurrence (hazard ratio [HR] 2.94, 95% confidence interval [CI] 1.24- 6.97, P ¼ 0.015) compared with the DG2-low group after adjusting for established risk factors (independent test data). DG2-low also shared phenotypic similarities with NHG 1, and DG2-high with NHG 3, suggesting that the model identifies morphological patterns in NHG 2 that are associated with more aggressive tumours. The prognostic value of DeepGrade was further assessed in the external test set, confirming an increased risk for recurrence in DG2-high (HR 1.91, 95% CI 1.11-3.29, P ¼ 0.019). Conclusions: The proposed model-based stratification of patients with NHG 2 tumours is prognostic and adds clinically relevant information over routine histological grading. The methodology offers a cost-effective alternative to molecular profiling to extract information relevant for clinical decisions. Key words: breast cancer, digital pathology, deep learning, artificial intelligence, histological grade INTRODUCTION Breast cancer histological grade is a well-established clinical variable in breast cancer that comprises information from three aspects, namely, the degree of tubule formation, nuclear pleomorphism and mitotic counts. Compared with other widely used prognostic factors that only consider a single aspect such as age, tumour size or lymph node status, histological grading takes both morphology and prolifera- tion into consideration, and therefore contributes with unique prognostic significance and is broadly utilised in clinical decision making. 1,2 The most broadly adopted grading classification system is the Nottingham grading system, modified by Elston and Ellis from the Bloome Richardson grading system, and its prognostic value has been validated in studies with varied populations. A higher Nottingham histological grade (NHG) is associ- ated with poor prognosis, and it is an indication for more aggressive treatment, while lower grade indicates lower risk of recurrence and allows for more conservative treat- ment. 3,4 However, grading is conducted manually by pa- thologists and is associated with a substantial uncertainty indicated by large interassessor variability. 5-8 Previous studies have found higher concordance in identifying the most aggressive tumours (NHG 3), and lower concordance in distinguishing between NHG 1 and 2 tumours. 9,10 The intermediate group (NHG 2) accounts for approxi- mately half of the patient population, 11,12 but exhibits larger variation with regard to morphological patterns and survival outcomes 13 in comparison with NHG 1 and 3. As histological grade remains central in determining thera- peutic regimens, 14 the heterogeneity in the NHG 2 group *Correspondence to: Dr Mattias Rantalainen, Department of Medical Epide- miology and Biostatistics, Karolinska Institutet, PO Box 281, SE-171 77 Stockholm, Sweden. Tel: þ46(08)-52482465 (direct line), þ46 8524-80000 (switch) E-mail: [email protected] (M. Rantalainen). y Equal contribution. 0923-7534/© 2021 The Authors. Published by Elsevier Ltd on behalf of Eu- ropean Society for Medical Oncology. This is an open access article under the CC BY license (http://creativecommons.org/licenses/by/4.0/). Volume 33 - Issue 1 - 2022 https://doi.org/10.1016/j.annonc.2021.09.007 89
-
Upload
khangminh22 -
Category
Documents
-
view
0 -
download
0
Transcript of Improved breast cancer histological grading using deep learning

ORIGINAL ARTICLE
Improved breast cancer histological grading using deep learning
Y. Wang1, B. Acs2,3, S. Robertson2,3, B. Liu1, L. Solorzano4, C. Wählby4, J. Hartman2,3,5y & M. Rantalainen1,5*y
Departments of 1Medical Epidemiology and Biostatistics; 2Oncology-Pathology, Karolinska Institutet, Stockholm; 3Department of Clinical Pathology and CancerDiagnostics, Karolinska University Hospital, Stockholm; 4Department of Information Technology and SciLifeLab, Uppsala University, Uppsala; 5MedTechLabs,BioClinicum, Karolinska University Hospital, Solna, Sweden
*Correspmiology aStockholm(switch)E-mail: m
yEqual c0923-75
ropean SocBY license
Volume 3
Available online 29 September 2021
Background: The Nottingham histological grade (NHG) is a well-established prognostic factor for breast cancer that isbroadly used in clinical decision making. However, w50% of patients are classified as grade 2, an intermediate riskgroup with low clinical value. To improve risk stratification of NHG 2 breast cancer patients, we developed andvalidated a novel histological grade model (DeepGrade) based on digital whole-slide histopathology images (WSIs)and deep learning.Patients and methods: In this observational retrospective study, routine WSIs stained with haematoxylin and eosinfrom 1567 patients were utilised for model optimisation and validation. Model generalisability was furtherevaluated in an external test set with 1262 patients. NHG 2 cases were stratified into two groups, DG2-high andDG2-low, and the prognostic value was assessed. The main outcome was recurrence-free survival.Results: DeepGrade provides independent prognostic information for stratification of NHG 2 cases in the internal testset, where DG2-high showed an increased risk for recurrence (hazard ratio [HR] 2.94, 95% confidence interval [CI] 1.24-6.97, P ¼ 0.015) compared with the DG2-low group after adjusting for established risk factors (independent test data).DG2-low also shared phenotypic similarities with NHG 1, and DG2-high with NHG 3, suggesting that the model identifiesmorphological patterns in NHG 2 that are associated with more aggressive tumours. The prognostic value of DeepGradewas further assessed in the external test set, confirming an increased risk for recurrence in DG2-high (HR 1.91, 95% CI1.11-3.29, P ¼ 0.019).Conclusions: The proposed model-based stratification of patients with NHG 2 tumours is prognostic and adds clinicallyrelevant information over routine histological grading. The methodology offers a cost-effective alternative to molecularprofiling to extract information relevant for clinical decisions.Key words: breast cancer, digital pathology, deep learning, artificial intelligence, histological grade
INTRODUCTION
Breast cancer histological grade is a well-established clinicalvariable in breast cancer that comprises information fromthree aspects, namely, the degree of tubule formation,nuclear pleomorphism and mitotic counts. Compared withother widely used prognostic factors that only consider asingle aspect such as age, tumour size or lymph node status,histological grading takes both morphology and prolifera-tion into consideration, and therefore contributes withunique prognostic significance and is broadly utilised inclinical decision making.1,2 The most broadly adopted
ondence to: Dr Mattias Rantalainen, Department of Medical Epide-nd Biostatistics, Karolinska Institutet, PO Box 281, SE-171 77, Sweden. Tel: þ46(08)-52482465 (direct line), þ46 8524-80000
[email protected] (M. Rantalainen).
ontribution.34/© 2021 The Authors. Published by Elsevier Ltd on behalf of Eu-iety for Medical Oncology. This is an open access article under the CC(http://creativecommons.org/licenses/by/4.0/).
3 - Issue 1 - 2022
grading classification system is the Nottingham gradingsystem, modified by Elston and Ellis from the BloomeRichardson grading system, and its prognostic value hasbeen validated in studies with varied populations.
A higher Nottingham histological grade (NHG) is associ-ated with poor prognosis, and it is an indication for moreaggressive treatment, while lower grade indicates lower riskof recurrence and allows for more conservative treat-ment.3,4 However, grading is conducted manually by pa-thologists and is associated with a substantial uncertaintyindicated by large interassessor variability.5-8 Previousstudies have found higher concordance in identifying themost aggressive tumours (NHG 3), and lower concordancein distinguishing between NHG 1 and 2 tumours.9,10
The intermediate group (NHG 2) accounts for approxi-mately half of the patient population,11,12 but exhibitslarger variation with regard to morphological patterns andsurvival outcomes13 in comparison with NHG 1 and 3. Ashistological grade remains central in determining thera-peutic regimens,14 the heterogeneity in the NHG 2 group
https://doi.org/10.1016/j.annonc.2021.09.007 89

Annals of Oncology Y. Wang et al.
poses challenges for deciding optimal treatment for indi-vidual patients. Therefore multiple approaches to addressthese uncertainties, and to reduce both overtreatment andundertreatment, have been proposed. Gene expressionprofiling has been applied to dichotomise patients withNHG 2 tumours into groups with different outcomes.13,15 Ithas also been suggested that NHG 2 could be eliminatedaltogether.16 Gene expression assays, including OncotypeDx and Prosigna, can predict risk of recurrence and death inpatients with intermediate risk tumours.17-19 However,molecular diagnostics remain expensive and time-consuming compared with histopathology-based di-agnostics for routine clinical applications.
The emergence of digital pathology20 and routineacquisition of high-resolution whole-slide histopathologyimages (WSIs) now enables application of advanced imageanalysis in the standard clinical setting. Advances in artificialintelligence have also opened up new opportunities forhistopathology image analysis using deep learning.21,22
Deep convolutional neural networks (CNNs) have recentlybeen applied successfully for detection and pathologicalclassification across multiple cancer types23-26 includingbreast cancer.27,28 Deep CNNs offer cost-effective solutionsfor improved cancer diagnostics based on routine histopa-thology slide images.
In this study, we propose a novel deep learning-basedapproach, DeepGrade, for histological grading of breastcancers based on digitised haematoxylin and eosin (HE)-stained WSIs, with a particular focus on improving prog-nostic stratification of NHG 2 tumours. The model wasdeveloped for classification of NHG 1 and NHG 3 morpho-logical patterns, followed with restratification of NHG 2tumours using the learned patterns. The proposed modelwas validated in independent internal and external test datawith respect to patient outcomes.
METHODS
Patients
The study comprises female patients with primary invasivebreast cancer as primary diagnosis from four differentstudies and sites: ClinSeq breast cancer study (ClinSeq-BC)15,29 (N ¼ 256), TCGA breast cancer study30 (TCGA-BC)(N ¼ 559), SöS-BC-1 breast cancer cohort phase I (SöS-BC-1)(N ¼ 752) and a subset of the SCAN-B study,31 consisting ofpatients diagnosed in Lund (Sweden) (N ¼ 1262, externaltest set) (Supplementary Table S1, available at https://doi.org/10.1016/j.annonc.2021.09.007). ClinSeq-BC includespatients diagnosed in Stockholm South General Hospital in2012 or had surgery between 2001 and 2008 at the Kar-olinska University Hospital (Stockholm, Sweden); SöS-BC-1is a retrospective cohort of patients diagnosed at theStockholm South General Hospital (Stockholm, Sweden)between April 2012 and October 2014 and betweenOctober 2015 and May 2018. SCAN-B enrolled patientsdiagnosed as having primary invasive disease from 2010 to2019; here we only include patients diagnosed in Lund(Sweden). Clinical and imaging data from the Cancer
90 https://doi.org/10.1016/j.annonc.2021.09.007
Genome Atlas (TCGA) (http://cancergenome.nih.gov/) wereretrieved from the TCGA database and from pathology re-ports with approval by the TCGA data access committee(dbGAP projectID:5621). Clinical data for ClinSeq-BC, SöS-BC-1 and SCAN-B cohorts were retrieved from the SwedishNational Breast Cancer Registry. HE-stained formalin-fixedparaffin-embedded (FFPE) histopathology slides fromresected tumours were digitised in-house for ClinSeq-BC,SöS-BC-1 and SCAN-B. Available WSIs from TCGA-BC weredownloaded from https://portal.gdc.cancer.gov/ in year2019. Only WSIs that contained invasive cancer wereincluded. WSIs from patients treated with neoadjuvantchemotherapy and WSIs scanned at 20� were excluded.Please see consort diagram for further details(Supplementary Figures S1 and S2, available at https://doi.org/10.1016/j.annonc.2021.09.007). Only one WSI image isincluded for each patient.
WSI preprocessing: overview
WSIs were tiled into tiles of 598 � 598 pixels with a down-sampled resolution equivalent to 20 � (271 � 271 mm). Alltiles were automatically quality controlled with respect tosharpness. Colour normalisation was applied to adjust forstain and scanner colour variability (Supplementary Figure S3,available at https://doi.org/10.1016/j.annonc.2021.09.007).Areas in slides containing invasive cancer, annotated by pa-thologists or predicted by model, were included in analyses(Supplementary Figure S4, available at https://doi.org/10.1016/j.annonc.2021.09.007, Supplementary Table S2, avail-able at https://doi.org/10.1016/j.annonc.2021.09.007).
Optimisation of the DeepGrade CNN model for histologicalgrade
Tumours of NHG 1 and NHG 3 from ClinSeq-BC, TCGA andSöS-BC-1 were randomly split into training set (N ¼ 844,70.6%), test set 1 (N ¼ 136, 11.4%) and test set 2 (N ¼ 215,18.0%) on a patient level (Supplementary Table S3 and S4,available at https://doi.org/10.1016/j.annonc.2021.09.007).The training set was further split into training (N ¼ 674,56.4%) and tuning set (N ¼ 170, 14.2%). For ClinSeq-BC, weused the ground truth annotated by pathologists to extracttiles within tumour regions; for TCGA-BC and SöS-BC-1, weapplied the trained invasive cancer detection model togenerate tumour regions and extract tiles from such regions(Supplementary Figure S5, available at https://doi.org/10.1016/j.annonc.2021.09.007). Several CNN architectureswere evaluated in the tuning set (Supplementary Table S5,available at https://doi.org/10.1016/j.annonc.2021.09.007).The Inception V3 model32 demonstrated the best predictionperformance. As it is also widely adopted with overallsatisfactory performance for various prediction tasks inprevious studies,24,23 it was used in all of the base models inthe ensemble. Tiles in the training and tuning sets wereused to optimise the DeepGrade model, an ensembleincluding 20 deep CNN base models (InceptionV3 model32
with weights initialised from a model pretrained byImageNet33) for classification of NHG 1 and 3. By averaging
Volume 33 - Issue 1 - 2022

Y. Wang et al. Annals of Oncology
over a number of models in the ensemble, improvements inprediction performance can be achieved by reduction ofvariance. AUCs for each deep CNN model were summarisedin Supplementary Table S6, available at https://doi.org/10.1016/j.annonc.2021.09.007. Deep learning was performedusing the Keras (2.2.4) framework with TensorFlow (1.12)backend.
Histological grade prediction by CNN models
Tile-level predicted class probabilities from the ensemblewere averaged. Slide-level predictions were based on theupper quartile of the tile-level distribution for each slide.Classification performance was assessed by slide-levelreceiver operating characteristic (ROC) curves and thearea under the curve (AUC) (‘pROC’ package in R). Boot-strapping (2000 samples) was performed to estimate the95% confidence interval (CI) of AUC.34 Optimal threshold forbinary class label (NHG 1 and 3) assignment was deter-mined by Youden’s method.35 Re-stratification of NHG 2tumours from ClinSeq-BC and TCGA-BC was achieved bydichotomisation [DeepGrade 2 (DG2)-high or DG2-low] us-ing the estimated classification threshold.
Survival analysis and statistical tests
We analysed and compared recurrence-free survival (RFS)rates among patients in clinically assigned histologicalgrades (NHG), as well as between NHG 2 tumours thatwere predicted as high grade (DG2-high) and low grade(DG2-low) by DeepGrade. Clinical outcome data wereavailable in ClinSeq-BC and TCGA-BC; survival analysis wasperformed on these two data sources together. A recur-rence event was defined as having locoregional or distantrelapses, contralateral tumours or death. A death withoutany detected metastasis was assumed to have experienceda tumour metastasis before death.15,36 The time-to-eventperiod was defined as the number of days between theinitial diagnosis date and the date of one of the followingevents: local or regional relapse, distant metastasis, deathor last follow-up. KaplaneMeier curves were generated tovisualise survival outcomes between groups (R-packages‘survminer’ and ‘survival’). Multivariate Cox proportionalhazards regression models were used to estimate adjustedhazard ratios (HRs) and 95% CI (R function ‘coxph’ and R-package ‘forestmodel’). Other risk factors included in themodel were age, tumour size, lymph node status, humanepidermal growth factor receptor 2 (HER2) status and es-trogen receptor (ER) status. Tumour size was dichotomisedinto categories with tumour diameter �20 mm or <20mm; lymph node status was dichotomised as having or nothaving lymph node metastases; HER2 status was deter-mined using immunohistochemical staining in conjunctionwith FISH test (decided in clinical routine); ER status wasdetermined based on a 10% cut-off for positively stainedcells by immunohistochemical staining. Patients withmissing data in any of the risk factors were excluded in themultivariate Cox regression analysis. Patient characteristicsafter removing missing data are summarised in
Volume 33 - Issue 1 - 2022
Supplementary Table S7, available at https://doi.org/10.1016/j.annonc.2021.09.007.
To compare differences in distribution for categoricalvariables, Fisher’s exact test or chi-square test wasemployed depending on whether the minimum value in asubgroup is smaller than 5. To test for difference in meanage, the t-test was applied. To test for differences in Ki67score, the ManneWhitney U test was used. The two-sidedP value was reported and a P value <0.05 was consideredas statistically significant. Analyses were performed using R(3.6.3).
Further methodological details can be found in theSupplementary Methods, available at https://doi.org/10.1016/j.annonc.2021.09.007.
RESULTS
A deep CNN ensemble model for discrimination betweenNHG 1 and 3 tumours
An ensemble consisting of 20 deep CNN models for binaryclassification of NHG 1 and NHG 3 based on routine HE WSIswas optimised (DeepGrade). The DeepGrade model wasapplied for re-stratification of NHG 2 tumours into two groups:DG2-high, sharing similarity with NHG 3, and DG2-low, sharingsimilarity with NHG 1. The prognostic performance of Deep-Grade for NHG 2 stratificationwas evaluated based on time-to-event analysis (RFS) in independent test data (Figure 1). Thenumber of available training tiles in ClinSeq-BC, TCGA-BC andSöS-BC-1 datasets were 1.56 million (M), 4.39 M and 3.25 M,respectively. The ROC-AUC ranged from 0.919 (95% CI 0.884-0.955) to 0.937 (95% CI 0.887-0.987) (independent test data,Supplementary Figure S6, available at https://doi.org/10.1016/j.annonc.2021.09.007, Supplementary Table S8, availableat https://doi.org/10.1016/j.annonc.2021.09.007), indicatinggood performance in classification of NHG 1 and 3.
HE-stained routine WSIs can be applied to re-stratifypatients with NHG 2 tumours into two groups withsignificant difference in outcomes
DeepGrade was then applied to re-stratify NHG 2 cases intotwo groups based on the assumption that the model hascapacity to capture morphological patterns related to NHG1 and 3 also present in NHG 2. Out of 372 NHG 2 cases(independent test data), 242 (65.0%) were classified asDG2-low and 130 (35.0%) were classified as DG2-high. Theprognostic performance (RFS) of DeepGrade was visualisedby KaplaneMeier curves, and independent prognostic valuewas evaluated by multivariable Cox proportional hazardsmodels, adjusting for established risk factors, including age,tumour size, HER2 status, ER status and lymph node status(Figure 2). The Nottingham histological grade was prog-nostic in stratification of NHG 3 and NHG 1, with an esti-mated HR of 3.74 (95% CI 1.12-12.55, P ¼ 0.033, N ¼ 670,Figures 2A and 3A). The DeepGrade model (DG2-low, DG2-high) was found to be an independent prognostic factor forstratification of NHG 2 with an HR of 2.94 (95% CI 1.24-6.97,P ¼ 0.015, N ¼ 305; Figures 2B and 3B). We also evaluated
https://doi.org/10.1016/j.annonc.2021.09.007 91

NHG 3
NHG 1
NHG 2
Modelensemble
CNN 1
CNN 2
CNN 20
WSI
Imagepreprocessing
Image tiles
Dee
pGra
deop
timis
atio
n
DeepGradeoptimisation
Dee
pGra
deap
plic
atio
nDeepGrade
re-stratification
Classification performanceevaluation
(NHG 1 and 3)
Tru
e-po
sitiv
e ra
te
False-positive rate
0.0 0.2 0.4 0.6 0.8 1.00.0
0.2
0.4
0.6
0.8
1.0
Survival analysisDG2-low
DG2-high
+++++
+++++
+++++
++++++++ ++++++++++++++++++++++++++++++++++++++++++++++++++++++++++++++++++++++++++++++++++++++++++++++++++++++++++++++++++++++++++++++++++++++++++++++++++++++++++++++++++++++++++++++++++++++++++++++++++++++++++++++++++++++++++++++++++++++++++++++++++++++++++++++++++++++++++++++++++++++++++++++++++++++++++++++++++++++++++++++++++++++++++++++++++++
++
+++
++ + ++++++++++++++++++++++++++++++++++++++++++++++++++++++++++++++++++++++++ +
Strata + +DG2-low DG2-high
Time
Sur
viva
l pro
babi
lity
Figure 1. Schematic overview of the optimisation, application and evaluation of the DeepGrade model.Stained histopathology slides from breast cancer surgical specimens were scanned, tumour regions were segmented and image tiles were extracted. Patients withtumours graded as Nottingham histological grade (NHG) 1 and 3 were used to optimise the DeepGrade model, a convolutional neural network (CNN) ensembleincluding 20 base models. The DeepGrade model was subsequently applied to re-stratify NHG 2 cases. Finally, time-to-event analysis was applied to evaluate theprognostic performance. DG, DeepGrade; WSI, whole-slide histopathology image.
Annals of Oncology Y. Wang et al.
prognostic performance in the NHG 2 ER-positive (ERþ)subgroup (HR 3.21, 95% CI 1.32e7.79, P ¼ 0.010, N ¼ 287;Figures 2C and 3C), and in the smaller NHG 2 ER-positiveand node-negative (ERþNodee) subgroup (HR 3.03, 95%CI 0.91-10.10, P ¼ 0.071, N ¼ 183; Figures 2D and 3D).Same analyses were repeated in the HER2-negative (HER2e)patients in ERþHER2e and ERþHER2eNodee subgroups,with an HR of 3.68 (95% CI 1.49-9.07, P ¼ 0.005, N ¼ 262,Supplementary Figure S7A and C, available at https://doi.org/10.1016/j.annonc.2021.09.007) and 3.14 (95% CI 0.95-10.41, P ¼ 0.061, N ¼ 166; Supplementary Figure S7B and D,available at https://doi.org/10.1016/j.annonc.2021.09.007),respectively. These results suggest that the DeepGrade modeloffers independent prognostic stratification of the NHG 2group, with an HR comparable to that observed betweenNHG 1 and 3.
Characterisation of DG2-low and DG2-high groups
The DG2-low and DG2-high cases were characterised toascertain potential differences in clinical variables andintrinsic molecular subtypes.17 We observed no significantdifferences in Ki67 scores (Figure 4A, SupplementaryTable S9, available at https://doi.org/10.1016/j.annonc.2021.09.007) between DG2-low and DG2-high (P ¼ 0.625,ManneWhitney U test). The Ki67 score was significantlyhigher in DG2-low compared with NHG 1 (P ¼ 2.80 � 10�3),while the Ki67 score in DG2-high was significantly lowerthan in NHG 3 (P ¼ 2.94 � 10�4, ManneWhitney U test).The distribution of intrinsic molecular subtypes in DG2-low
92 https://doi.org/10.1016/j.annonc.2021.09.007
and NHG 1 was not significantly different, with luminal Abeing the dominating intrinsic subtype (Figure 4B, P ¼0.618; Fisher’s exact test). By contrast, we observed a dif-ference in subtype distribution between DG2-high and NHG3 (P ¼ 2.20 � 10�16, Fisher’s exact test), where DG2-highhad a higher proportion of luminal A and lower propor-tion of basal-like subtypes compared with NHG 3. Luminal Bwas present in a higher proportion in DG2-high comparedwith DG2-low. These results indicate that DG2-low sharesstrong similarities with NHG 1 and DG2-high with NHG 3.The findings also suggest that DeepGrade identifiesmorphological patterns in NHG 2 associated with moreaggressive tumours.
Furthermore, we assessed if the NHG subcomponentscores (mitotic count, nuclear pleomorphism and tubularformation) in the NHG 2 group were associated with DG2-low and DG2-high. Only the score for the mitotic countsubcomponent (P ¼ 6.54 � 10�3, Fisher’s exact test) wasstatistically different in DG2-high compared with DG2-low(Figure 4C, Supplementary Table S10, available at https://doi.org/10.1016/j.annonc.2021.09.007). Finally, we investi-gated if the sum of NHG subcomponent scores(Supplementary Methods, available at https://doi.org/10.1016/j.annonc.2021.09.007) provided prognostic stratifica-tion of NHG 2, as a potential alternative to DeepGrade. NHG2 tumours were dichotomised into ScoreSum-low (�6) andScoreSum-high (�7). No significant difference in RFS couldbe detected between these two groups (multivariableCox proportional hazard model; HR 1.19, 95% CI 0.46-3.10,P ¼ 0.715; Supplementary Figure S8A-C, available at
Volume 33 - Issue 1 - 2022

A
+++++++++++++++++++++++++++++++ ++++++ +++++++++++++++++++++++++++++++++++ ++ +++ +
+++++++++++++++++++++++++++++++++++++++++++++++++++++++++++++++++++++++++++++++++++++++++++++++++++++++++++++++++++++++++++++++++++++++++++++++++++++++++++++++++++++++++++++++++++++++++++++++++++++++++++++++++++++++++++++++++++++++++++++++++++++++++++++++++++ ++
++++++++++++++++++++++++++++++++++++++++++++++++++++++++++++++++++++++++++++++++++++++++++++++++++++++++++++++++++++++++++++++++++++++++++++++++++++++++++++++++++++++++++++++++++++++++++++++++++++++++++++++++++++++++++++++++++++++++++ ++
0.00
0.25
0.50
0.75
1.00
0 1 2 3 4 5 6 7 8 9 10
Year
Strata + + +NHG 1 NHG 2 NHG 3
63 53 45 37 27 14 8 5 3 3
214 181 149 129 86 55 32 15 10 8
86
316
306 233 194 170 137 85 62 39 24 17 13
+++++++++++++++++++++++++++++++++++++++++++++++++++++++++++++++++++++++++++++++++++++++++++++++++++++++++++++++++++++++++++++++++++++++++++++++++++++++++++++++++++++++++++++ ++
+++++++++++++++++++++++++++++++++++++++++++++++++++++++++++++++++++++++++++++ ++++++++++++++
+ +
0.00
0.25
0.50
0.75
1.00
0 1 2 3 4 5 6 7 8 9 10
Year
Strata + +DG2-low DG2-high
203143 122 111 100 66 43 23 11 7 6
113 71 59 38 29 20 12 9 4 3 2
Number at risk
+++++++++++++++++++++++++++++++++++++++++++++++++++++++++++++++++++++++++++++++++++++++++++++++++++++++++++++++++++++++++++++++++++++++++++++++++++++++++++++++++++++++++ ++
+++++++++++++++++++++++++++++++++++++++++++++++++++++++++++++++++++++++++ ++++++++++
+ +
0.00
0.25
0.50
0.75
1.00
0 1 2 3 4 5 6 7 8 9 10Year
Strata + +DG2-low DG2-high
197 140 119 108 98 65 42 22 10 6 5
100 63 54 33 24 16 11 8 4 3 2
++++++++++++++++++++++++++++++++++++++++++++++++++++++++++++++++++++++++++++++++++++++++++++++++++++++++++++++++++ ++
++++++++++++++++ +++++++++++++ ++++++++ ++++++ ++
+ +
0.00
0.25
0.50
0.75
1.00
0 1 2 3 4 5 6 7 8 9 10
Year
Strata + +DG2-low DG2-high
130 99 89 83 76 52 33 15 6 3 2
53 37 33 21 18 11 6 5 3 2 1
Number at risk
Number at risk
Number at risk
B
C D
log-rank P = 0.022 log-rank P = 0.0016
log-rank P = 0.0027 log-rank P = 0.067
Su
rviv
al p
rob
abili
tyS
urv
ival
pro
bab
ility
Su
rviv
al p
rob
abili
tyS
urv
ival
pro
bab
ility
Figure 2. Recurrence-free survival outcomes for breast cancer patients by Nottingham histological grade, and by DeepGrade-re-stratified Nottingham histologicalgrade (NHG) 2 patients.(A) KaplaneMeier curves for patients stratified by NHG 1-3. NHG 2 had an intermediate survival rate, whereas the NHG 3 had the worst prognosis. (B) KaplaneMeiercurves for DeepGrade-re-stratified NHG 2 cases. Worse prognosis was observed in the DG2-high group. (C) KaplaneMeier curves for the DeepGrade-re-stratified NHG 2ER-positive subgroup. (D) KaplaneMeier curves for the DeepGrade-re-stratified NHG 2 ER-positive and node-negative subgroup. DG, DeepGrade; ER, estrogen receptor.
Y. Wang et al. Annals of Oncology
https://doi.org/10.1016/j.annonc.2021.09.007), indicatingthat prognostic stratification of NHG 2 cannot be achievedbased on the NHG score sum. This suggests that DeepGradecaptures independent prognostic information for stratifica-tion of NHG 2 cases, and more importantly, these featuresare not substitutable by factors included in routine patho-logical assessment.
Validation of DeepGrade in an external cohort
To evaluate the generalisability of the DeepGrade model, weanalysed WSIs from 1262 patients in the SCAN-B Lundcohort, representing a completely independent externalstudy material. The cohort is population representative andthe digitised WSIs were only used for the purpose of testingthe model performance.
We first applied the DeepGrade model to classify NHG1 and NHG 3 patients, and the resulting AUC was 0.907(95% CI 0.885-0.930; Supplementary Figure S9A, available
Volume 33 - Issue 1 - 2022
at https://doi.org/10.1016/j.annonc.2021.09.007), whichdemonstrated that the model was able to provide clas-sification performance comparable with the internal testdata. In addition, the RFS between DeepGrade-classifiedNHG 1 and 3 patients was similar to that with clinicallyassigned NHG 1 and 3 (Supplementary Figure S9B-E,available at https://doi.org/10.1016/j.annonc.2021.09.007).
The DeepGrade model was applied to re-stratify the NHG2 group (N ¼ 608) and to evaluate prognostic performance(Figures 5 and 6). A total of 376 (61.8%) patients wereclassified as DG2-low, and 232 (38.2%) patients as DG2-high.
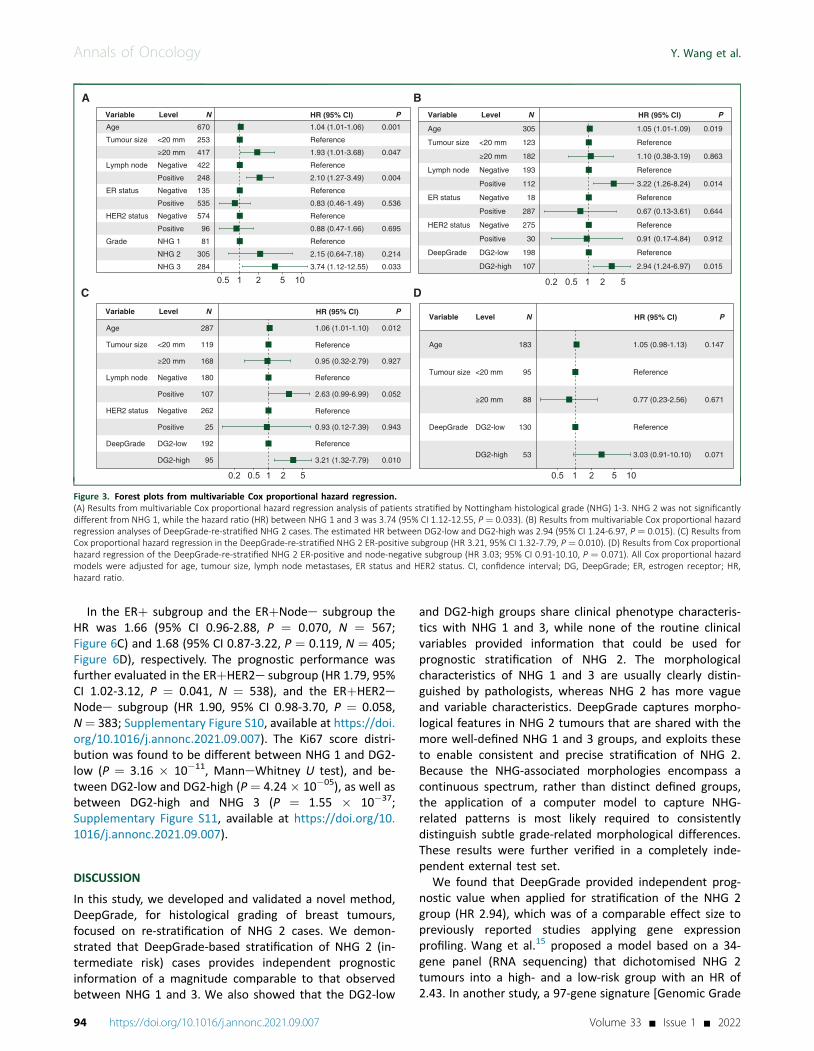
The DeepGrade model (DG2-low, DG2-high) providedsignificant prognostic value for stratification of NHG 2 (P ¼0.0045, log-rank test; Figure 5B) with an HR of 1.91 (95% CI1.11-3.29, P ¼ 0.019, N ¼ 583; Figure 6B). In comparison,the prognostic value comparing NHG 3 and NHG 1 wasfound to have an HR of 1.59 (95% CI 0.78-3.24, P ¼ 0.201,N ¼ 1191; Figure 6A).
https://doi.org/10.1016/j.annonc.2021.09.007 93
Age
Tumour size
Lymph node
ER status
HER2 status
Grade
<20 mm
≥20 mm
Negative
Positive
Negative
Positive
Negative
Positive
NHG 1
NHG 2
NHG 3
670
253
417
422
248
135
535
574
96
81
305
284
1.04 (1.01-1.06)
Reference
1.93 (1.01-3.68)
Reference
2.10 (1.27-3.49)
0.83 (0.46-1.49)
0.88 (0.47-1.66)
2.15 (0.64-7.18)
3.74 (1.12-12.55)
0.001
0.047
0.004
0.536
0.695
0.214
0.033
0.5 1 2 5
Age
Tumour size
Lymph node
ER status
HER2 status
DeepGrade
<20 mm
≥20 mm
Negative
Positive
Negative
Positive
Negative
Positive
DG2-low
DG2-high
305
123
182
193
112
18
287
275
30
198
107
1.05 (1.01-1.09)
1.10 (0.38-3.19)
3.22 (1.26-8.24)
0.67 (0.13-3.61)
0.91 (0.17-4.84)
2.94 (1.24-6.97)
0.019
0.863
0.014
0.644
0.912
0.015
10 0.2 0.5 1 2 5
Age
Tumour size
Lymph node
HER2 status
DeepGrade
<20 mm
≥20 mm
Negative
Positive
Negative
Positive
DG2-low
DG2-high
287
119
168
180
107
262
25
192
95
1.06 (1.01-1.10)
0.95 (0.32-2.79)
2.63 (0.99-6.99)
0.93 (0.12-7.39)
3.21 (1.32-7.79)
0.012
0.927
0.052
0.943
0.010
0.2 0.5 1 2 5
Age
Tumour size
DeepGrade
<20 mm
≥20 mm
DG2-low
DG2-high
183
95
88
130
53
1.05 (0.98-1.13)
0.77 (0.23-2.56)
3.03 (0.91-10.10)
0.147
0.671
0.071
0.5 1 2 5 10
D
BA
C
PNLevelVariable HR (95% Cl)
PNLevelVariable HR (95% Cl)PNLevelVariable HR (95% Cl)
PNLevelVariable HR (95% Cl)
Reference
Reference
Reference
Reference
Reference
Reference
Reference
Reference
Reference
Reference
Reference
Reference
Reference
Reference
Figure 3. Forest plots from multivariable Cox proportional hazard regression.(A) Results from multivariable Cox proportional hazard regression analysis of patients stratified by Nottingham histological grade (NHG) 1-3. NHG 2 was not significantlydifferent from NHG 1, while the hazard ratio (HR) between NHG 1 and 3 was 3.74 (95% CI 1.12-12.55, P ¼ 0.033). (B) Results from multivariable Cox proportional hazardregression analyses of DeepGrade-re-stratified NHG 2 cases. The estimated HR between DG2-low and DG2-high was 2.94 (95% CI 1.24-6.97, P ¼ 0.015). (C) Results fromCox proportional hazard regression in the DeepGrade-re-stratified NHG 2 ER-positive subgroup (HR 3.21, 95% CI 1.32-7.79, P ¼ 0.010). (D) Results from Cox proportionalhazard regression of the DeepGrade-re-stratified NHG 2 ER-positive and node-negative subgroup (HR 3.03; 95% CI 0.91-10.10, P ¼ 0.071). All Cox proportional hazardmodels were adjusted for age, tumour size, lymph node metastases, ER status and HER2 status. CI, confidence interval; DG, DeepGrade; ER, estrogen receptor; HR,hazard ratio.
Annals of Oncology Y. Wang et al.
In the ERþ subgroup and the ERþNodee subgroup theHR was 1.66 (95% CI 0.96-2.88, P ¼ 0.070, N ¼ 567;Figure 6C) and 1.68 (95% CI 0.87-3.22, P ¼ 0.119, N ¼ 405;Figure 6D), respectively. The prognostic performance wasfurther evaluated in the ERþHER2e subgroup (HR 1.79, 95%CI 1.02-3.12, P ¼ 0.041, N ¼ 538), and the ERþHER2eNodee subgroup (HR 1.90, 95% CI 0.98-3.70, P ¼ 0.058,N¼ 383; Supplementary Figure S10, available at https://doi.org/10.1016/j.annonc.2021.09.007). The Ki67 score distri-bution was found to be different between NHG 1 and DG2-low (P ¼ 3.16 � 10�11, ManneWhitney U test), and be-tween DG2-low and DG2-high (P ¼ 4.24 � 10�05), as well asbetween DG2-high and NHG 3 (P ¼ 1.55 � 10�37;Supplementary Figure S11, available at https://doi.org/10.1016/j.annonc.2021.09.007).
DISCUSSION
In this study, we developed and validated a novel method,DeepGrade, for histological grading of breast tumours,focused on re-stratification of NHG 2 cases. We demon-strated that DeepGrade-based stratification of NHG 2 (in-termediate risk) cases provides independent prognosticinformation of a magnitude comparable to that observedbetween NHG 1 and 3. We also showed that the DG2-low
94 https://doi.org/10.1016/j.annonc.2021.09.007
and DG2-high groups share clinical phenotype characteris-tics with NHG 1 and 3, while none of the routine clinicalvariables provided information that could be used forprognostic stratification of NHG 2. The morphologicalcharacteristics of NHG 1 and 3 are usually clearly distin-guished by pathologists, whereas NHG 2 has more vagueand variable characteristics. DeepGrade captures morpho-logical features in NHG 2 tumours that are shared with themore well-defined NHG 1 and 3 groups, and exploits theseto enable consistent and precise stratification of NHG 2.Because the NHG-associated morphologies encompass acontinuous spectrum, rather than distinct defined groups,the application of a computer model to capture NHG-related patterns is most likely required to consistentlydistinguish subtle grade-related morphological differences.These results were further verified in a completely inde-pendent external test set.
We found that DeepGrade provided independent prog-nostic value when applied for stratification of the NHG 2group (HR 2.94), which was of a comparable effect size topreviously reported studies applying gene expressionprofiling. Wang et al.15 proposed a model based on a 34-gene panel (RNA sequencing) that dichotomised NHG 2tumours into a high- and a low-risk group with an HR of2.43. In another study, a 97-gene signature [Genomic Grade
Volume 33 - Issue 1 - 2022

0
20
40
Sco
re
60
80
100
0NHG 1 DG2-low DG2-high NHG 3
Score1
2
3
NHG 1
DG2-low
DG2-hig
h
NHG 3
NHG 1
DG2-low
DG2-hig
h
NHG 3
NHG 1
DG2-low
DG2-hig
h
NHG 3
NHG 1 DG2-low DG2-high NHG 3
LumALumBHER2Basal
20
40
%
60
80
100Ki67 Intrinsic subtype
Mitotic count Nuclear pleomorphism Tubular formation
A B
0
20
40%
60
80
100C
0
20
40%
60
80
100
0
20
40%
60
80
100
Figure 4. Ki67 score, intrinsic subtype distribution and NHG subcomponent score distribution across NHG 1, DG2-low and DG2-high, and NHG 3 patient groups.(A) Violin plot showing distribution of Ki67 (data only available in ClinSeq-BC). The distribution was different between NHG 1 and DG2-low (P ¼ 2.80 � 10�3, ManneWhitney U test), and different between DG2-high and NHG 3 (P ¼ 2.94 � 10�4, ManneWhitney U test). No significant difference between DG2-low and DG2-high wasobserved (P ¼ 0.625, ManneWhitney U test). (B) Distribution of intrinsic subtypes. DG2-low was similar to NHG 1 with the majority being luminal A (P ¼ 0.618, Fisher’sexact test). DG2-high has a larger proportion of HER2 and basal type compared with DG2-low. The subtype distribution for NHG 3 is significantly different with DG2-high(P ¼ 2.20 � 10�16, Fisher’s exact test). (C) Distribution of three NHG subcomponent scores with respect to mitotic count, nuclear polymorphism and tubular formation.Only the score for mitotic count was found to be significantly different between DG2-low and DG2-high (P ¼ 6.54 � 10�3, Fisher’s exact test). Basal, basal-like; DG,DeepGrade; Her2, Her2-enriched; LumA, luminal A; LumB, luminal B; NHG, Nottingham histological grade.
Y. Wang et al. Annals of Oncology
Index (GGI)] dichotomised NHG 2 cases into two groupswith an estimated HR of 3.61.13 Another RNA-seq basedmethod (EndoPredict) for ER-positive, HER2-negativetamoxifen-treated patients has a reported HR of 5.07 forNHG 2 cases.37 These studies have consistently reportedthat NHG 2 tumours can be further stratified with inde-pendent prognostic value. In contrast to molecular-basedassays, DeepGrade only requires HE-stained FFPE sections,which are part of the routine diagnostic work-up, thusproviding a rapid and cost-effective alternative that couldincrease access to improved diagnostics.
Furthermore, we found that the subcomponent scores ofnuclear pleomorphism and tubule formation were notsignificantly different between DG2-low and DG2-high, andthat stratification of NHG 2 could not be achieved bydichotomisation based on NHG score sum 6 and 7. Theresults suggest that the stratification provided by theDeepGrade model is not solely based on the NHG sub-components, rather, the representations of morphologicalpatterns that the model captures is, at least to some extent,independent of the established NHG criteria. Other riskfactors including tumour size and lymph node stage werealso similar between DG2-low and DG2-high, indicating thatDeepGrade could discern more subtle features, and provideimproved capability for tumour grading.
Volume 33 - Issue 1 - 2022
Despite the similarity in morphologies, we identifiednotable differences in the distribution of intrinsic subtypes.DG2-low shared a similar molecular subtype distributionwith NHG 1. The DG2-high group shared a similar distri-bution of HER2-enriched and luminal B subtypes as theNHG 3 group, whereas the frequency of the basal-likesubtype was lower in the DG2-high group compared withthe NHG 3 group. Basal-like tumours are typically associ-ated with a high Ki67 score,38,39 and we also observed asignificant difference in Ki67 score between DG2-high andNHG 3. It should be noted that basal-like tumours havedistinct morphological features including severe nuclearatypia and expression of basal cytokeratins.40 The luminal Bsubtype, by contrast, is defined by more subtle morpho-logical features, and cannot always be easily distinguishedfrom the luminal A subtype by microscopic assessment. Asluminal A tumours are associated with lower grades andgood prognosis whereas HER2-enriched and basal-like tu-mours typically have higher grade and poorer prognosis,41
these results further support that DeepGrade identifiesaggressive morphological patterns. High-grade morpholog-ical features are considered as indications for adjuvantsystemic chemotherapy,14,42 suggesting a potential forDeepGrade to strengthen information relevant for thera-peutic selection.
https://doi.org/10.1016/j.annonc.2021.09.007 95

++++++++++++++++++++++++++++++++++++++++++++++++++++++++++++++++++++++++++++++++++++++++++++++++++++++++++++++++++++++++++++++++++++++++++++++++++++++++++ +++++++++++++++++++++++++++++++++++++++++++++++++++++++++++++++++++++++++++++++++++ +++++++++++++++++++++++++++++++++++++++++++++++++++++++++++++++++++++++++++++++++++++++++++++++++++++++++++++++++++++++++++++++++++++++++++++++++++++++++++++++++++++++++++++++++++++++++++++++++++++++++++++++++++++++++++++++++++++++++++++++++++++++++++++++++++++++++++++++++++++++++++++++++++++++++++++++++++++++++++++++++++++++++++++++++++++++++++++++++++++++++++++++++++++++++++++++++++++++
++++++++++++++++++++++++++++++++++++++++++++++++++++++ +
+++++++++ +++++++++++ ++++++++++++++++++++++++++++++++++++++++++++++++++++++++++++++++++++++++++++++++++++++++++++++++++++++++++++++++++++++++++++++++++++++++++++++++++++++++++++++++++++++++++++++++++++++++++++++++++++++++++++++++++++++++++++++++++++++++++++++++++++++++++++++++++
log-rank P = 2e−04
0.00
0.25
0.50
0.75
1.00
Year
Su
rviv
al p
rob
abili
ty
0.00
0.25
0.50
0.75
1.00
Su
rviv
al p
rob
abili
ty
0.00
0.25
0.50
0.75
1.00
Su
rviv
al p
rob
abili
ty
0.00
0.25
0.50
0.75
1.00
Su
rviv
al p
rob
abili
ty
Strata + + +
Number at riskNumber at risk
Number at risk Number at risk
+ +++++++++++++++++++++++++++++++++++++++++++++++++++++++++++++++++++++++++++++++++++++++++++++++++++++++++++++++++++++++++++++++++++++++++++++++++++++++++++++++++++++++++++++++++++++++++++++++++++++++++++++++++++++++++++++++++++++++++++++++++++++++++++++++++++++++++++++++++++++++++++++++++++++++++++++++++++
++++++++++++++++++++++++++++++++++++++++++++++++++++++++++++++++++++++++++++++++++++++++++++++++++++++++++++ ++ +++++++++++++++++++++++++++++++++++++++++++++++++
+++++++++++++++++++++++
log-rank P = 0.0045
Strata + +
+ ++++++++++++++++++++++++++++++++++++++++++++++++++++++++++++++++++++++++++++++++++++++++++++++++++++++++++++++++++++++++++++++++++++++++++++++++++++++++++++++++++++++++++++++++++++++++++++++++++++++++++++++++++++++++++++++++++++++++++++++++++++++++++++++++++++++++++++++++++++++++++++++++++++++++++++
+++++++++++++++++++++++++++++++++++++++++++++++++++++++++++++++++++++++++++++++++++++++++++++++++++++++ ++ ++
++++++++++++++++++++++++++++++++++++++++++++++
++++++++++++++++++++++
log-rank P = 0.045
DG2−low DG2−high
+ +++++++++++++++++++++++++++++++++++++++++++++++++++++++++++++++++++++++++++++++++++++++++++++++++++++++++++++++++++++++++++++++++++++++++++++++++++++++++++++++++++++++++++++++++++++++++++++++++
++++++++++++++++++++++
++++++++++++++++++++++++++++ +++++++++++++++++++++++++++++++++++++++++++
+++++++++++++
++++++++++++++++ +++++
+++++++++ +++++++++++
log-rank P = 0.048
BA
DC
0 1 2 3 4 5 6 7 8 9 10
Year
0 1 2 3 4 5 6 7 8 9 10
Year
0 1 2 3 4 5 6 7 8 9 10
156 156 124 105 85 67 46 36 21 11 0252 250 223 201 167 123 89 58 37 9 0
Year
0 1 2 3 4 5 6 7 8 9 10
NHG 1 NHG 2 NHG 3
Strata + +DG2−low DG2−high Strata + +DG2−low DG2−high
232 232 197 172 143 116 84 64 32 17 0
376 373 338 306 259 196 143 96 59 18 1280
608
374
280
605
369
253
535
347
214
478
326
179
402
288
145
312
232
113
227
173
88
160
120
45
91
68
20
35
31
0
1
0
218 218 184 160 135 110 81 62 31 16 0366 363 330 298 251 191 139 93 56 16 1
Figure 5. Recurrence-free survival outcomes for breast cancer patients from the external test set by Nottingham histological grade, and by DeepGrade re-stratifiedNHG 2 patients.(A) KaplaneMeier curves for patients stratified by NHG 1-3. NHG 2 had an intermediate survival rate, whereas the NHG 3 had the worst prognosis. (B) KaplaneMeiercurves for DeepGrade-re-stratified NHG 2 cases. DG2-high displayed significantly worse prognosis compared with the DG2-low group. (C) KaplaneMeier curves for theDeepGrade-re-stratified NHG 2 ER-positive subgroup from the external test set. (D) KaplaneMeier curves for the DeepGrade re-stratified NHG 2 ER-positive and node-negative subgroup from the external test set. DG, DeepGrade; ER, estrogen receptor; NHG, Nottingham histological grade.
Annals of Oncology Y. Wang et al.
The prognostic performance of DeepGrade was furthervalidated in an external cohort, which confirmed indepen-dent prognostic value between re-stratified NHG 2 (DG2-low and DG2-high) patients (HR 1.91).
A central objective in modern breast oncology is to de-escalate adjuvant therapy for patients with ER-positive/HER2-negative tumours with few or no lymph node metas-tases. This comprises the absolutely largest group of breastcancer patients. In a population-based register study ofpathology data with over 45 000 patients in Sweden,11
>60% of the ERþ HER2e patients were reported asNHG2. This clearly shows that methods to identify high- andlow-risk patients in this patient group could contribute toclinical decision making of adjuvant chemotherapy. Over thepast decade, gene expression profiling assays have becomeavailable in clinical practice for stratification of the samepatient group into a low- and high-risk group, to supplementtherapeutic decision making.43 The majority of tumours
96 https://doi.org/10.1016/j.annonc.2021.09.007
considered for gene expression profiling in routine health-care are NHG 2. Gene-expression profiling takes 1-2 weeks inthe clinical setting and is associated with significant costs.
The DeepGrade model provides prognostic stratificationfor NHG 2 patients, and related subgroups, in a relativelyshort time.
Timewise, the proposed workflow required, on average,1.24 and 16.4 min to predict tumour and carry out risk strat-ification on one GPU card, respectively. Significant gain inspeed can be achieved by parallelising the computation withmultiple GPUs. The direct compute costs are estimated to be<V1 in a public cloud infrastructure. Hence, it offers apotentially cost-effective alternative to gene expressionprofiling. Although the process can be considered time-consuming compared with pathologists, we believe that theadditional stratification provides pathological information thatis needed for clinical decision making in general, and for de-escalation of chemotherapy in particular.
Volume 33 - Issue 1 - 2022

Age
Tumour size
Lymph node
ER status
HER2 status
Grade
<20 mm
Negative
Positive
Negative
Positive
Negative
Positive
NHG 1
NHG 2
NHG 3
1191
835
356
858
333
122
1069
1094
97
265
583
343
1.05 (1.03-1.07)
1.83 (1.24-2.71)
Reference
1.08 (0.73-1.60)
Reference
0.36 (0.22-0.58)
Reference
0.95 (0.50-1.81)
Reference
1.63 (0.84-3.15)
1.59 (0.78-3.24)
<0.001
0.002
0.695
<0.001
0.866
0.149
0.201
PNLevel
Age
Tumour size
Lymph node
HER2 status
ER status
DeepGrade
<20 mm
Negative
Positive
Negative
Positive
Negative
Positive
DG2-low
DG2-high
583
397
186
416
167
555
28
21
562
362
221
1.05 (1.02-1.08)
Reference
1.15 (0.65-2.06)
Reference
0.77 (0.41-1.44)
Reference
0.73 (0.18-3.05)
Reference
0.39 (0.15-0.99)
Reference
1.91 (1.11-3.29)
<0.001
0.633
0.415
0.669
0.048
0.019
Age
Tumour size
Lymph node
DeepGrade
<20 mm
Negative
Positive
DG2-low
DG2-high
567
388
179
405
162
357
210
1.05 (1.02-1.08)
Reference
1.20 (0.66-2.19)
Reference
0.85 (0.46-1.60)
Reference
1.66 (0.96-2.88)
<0.001
0.542
0.624
0.070
Age
Tumour size
DeepGrade
<20 mm
DG2-low
DG2-high
405
303
102
251
154
1.05 (1.01-1.09)
Reference
0.88 (0.40-1.94)
Reference
1.68 (0.87-3.22)
0.006
0.751
0.119
Variable HR (95% Cl)
PNLevelVariable HR (95% Cl)
PNLevelVariable HR (95% Cl)
PNLevelVariable HR (95% Cl)
Reference
0.2 0.5 1 2
0.5 1.51 2 3
0.5 1 2
0.5 1.51 2 2.5
D
BA
C
Figure 6. Forest plots from multivariable Cox proportional hazard regression analysis in the external test set.(A) Stratification of all patients by routine NHG 1-3. (B) Stratification of NHG 2 cases by DeepGrade. (C) Stratification of patients in the NHG 2 and ER-positive subgroupsby DeepGrade. (D) Stratification of patients in the NHG 2, ER-positive and node-negative subgroups by DeepGrade. DG, DeepGrade; ER, estrogen receptor; NHG,Nottingham histological grade.
Y. Wang et al. Annals of Oncology
This study has limitations. The study is based on retro-spective materials because prospective studies are chal-lenging due to the need for long follow-up times. Ductalcarcinoma in situ annotations in slide images were notavailable, which could cause a conservative underestima-tion of the prognostic performance of DeepGrade. OnlyClinSeq-BC has pathologist annotation of invasive cancerareas, which were used to exclude benign regions in sub-sequent analysis. An invasive detection model was opti-mised based on the annotated ClinSeq-BC study andapplied to WSIs in all other studies to outline tumourregions. Hence, it is not impossible that the DeepGrademodel could achieve better performance if we wouldperform manual annotations of cancer regions on all WSIs,as these are expected to be more precise. The DeepGrademodel performance has not been possible to test sys-tematically across different types of slide scanners,although images from multiple scanners were included inthe study.
In conclusion, improved stratification of intermediate riskbreast cancer patients has the potential to reduce over-treatment and undertreatment by adjuvant chemotherapy.The DeepGrade model provides independent prognosticstratification for NHG 2, and offers a potential cost-effectivealternative to gene expression profiling, which could in-crease access to pathological information needed for clinicaldecision making in general, and for de-escalation ofchemotherapy in particular.
Volume 33 - Issue 1 - 2022
ACKNOWLEDGEMENTS
The authors acknowledge patients, clinicians, and hospitalstaff participating in the SCAN-B study, the staff at the cen-tral SCAN-B laboratory at Division of Oncology, Lund Uni-versity, the Swedish National Breast Cancer Quality Registry(NKBC), Regional Cancer Center South and the SouthSwedish Breast Cancer Group (SSBCG).We also acknowledgehelp and support from Dr Johan Vallon-Christersson atLund University (Sweden) with preparation of clinicopatho-logical information for the SCAN-B study. We thank theHungarian Society of Senology, for supporting Balazs Acs.
FUNDING
This work was supported by funding from the SwedishResearch Council (no grant number), Swedish Cancer Soci-ety (no grant number), Karolinska Institutet (no grantnumber), ERA PerMed (ERAPERMED2019-224-ABCAP), ERC(ERC2015CoG 682 810), MedTechLabs (no grant number),Swedish e-science Research Centre (SeRC) - eCPC, Stock-holm Region (no grant number), Stockholm Cancer Society(no grant number) and Swedish Breast Cancer Association(no grant number).
DISCLOSURE
JH has obtained speaker’s honoraria or advisory board re-munerations from Roche, Novartis, AstraZeneca, Eli Lilly andMSD and has received institutional research grants from
https://doi.org/10.1016/j.annonc.2021.09.007 97

Annals of Oncology Y. Wang et al.
Cepheid and Novartis. MR and JH are shareholders ofStratipath AB. YW has received personal fees from Strat-ipath AB outside the submitted work. All other authors havedeclared no conflicts of interest.
REFERENCES
1. Galea MH, Blamey RW, Elston CE, Ellis IO. The Nottingham PrognosticIndex in primary breast cancer. Breast Cancer Res Treat. 1992;22(3):207-219.
2. Haybittle JL, Blamey RW, Elston CW, et al. A prognostic index in primarybreast cancer. Br J Cancer. 1982;45(3):361-366.
3. Sundquist M, Thorstenson S, Brudin L, Nordenskjöld B. Applying theNottingham Prognostic Index to a Swedish breast cancer population.South East Swedish Breast Cancer Study Group. Breast Cancer ResTreat. 1999;53(1):1-8.
4. Early Breast Cancer Trialists’ Collaborative Group. Favourable andunfavourable effects on long-term survival of radiotherapy for earlybreast cancer: an overview of the randomised trials. Lancet.2000;355(9217):1757-1770.
5. Ellis IO, Coleman D,Wells C, et al. Impact of a national external qualityassessment scheme for breast pathology in the UK. J Clin Pathol.2006;59(2):138-145.
6. Dalton LW, Pinder SE, Elston CE, et al. Histologic grading of breastcancer: linkage of patient outcome with level of pathologist agree-ment. Mod Pathol. 2000;13(7):730-735.
7. Zhang R, Chen H-J, Wei B, et al. Reproducibility of the Nottinghammodification of the Scarff-Bloom-Richardson histological grading sys-tem and the complementary value of Ki-67 to this system. Chin Med J.2010;123(15):1976-1982.
8. Page DL. Interobserver agreement and reproducibility in classificationof invasive breast carcinoma: an NCI breast cancer family registrystudy. Mod Pathol. 2007;18(1):67.
9. van Dooijeweert C, van Diest PJ, Willems SM, et al. Significant inter-and intra-laboratory variation in grading of invasive breast cancer: anationwide study of 33,043 patients in the Netherlands. Int J Cancer.2020;146(3):769-780.
10. Meyer JS, Alvarez C, Milikowski C, et al. Breast carcinoma malignancygrading by BloomeRichardson system vs proliferation index: repro-ducibility of grade and advantages of proliferation index. Mod Pathol.2005;18(8):1067-1078.
11. Acs B, Fredriksson I, Rönnlund C, et al. Variability in breast cancerbiomarker assessment and the effect on oncological treatment decisions:a nationwide 5-year population-based study. Cancers. 2021;13:1166.
12. Balslev I, Axelsson CK, Zedeler K, et al. The Nottingham PrognosticIndex applied to 9,149 patients from the studies of the Danish BreastCancer Cooperative Group (DBCG). Breast Cancer Res Treat.1994;32(3):281-290.
13. Sotiriou C, Wirapati P, Loi S, et al. Gene expression profiling in breastcancer: understanding the molecular basis of histologic grade toimprove prognosis. J Natl Cancer Inst. 2006;98(4):262-272.
14. Curigliano G, Burstein HJ, Winer EP, et al. De-escalating and escalatingtreatments for early-stage breast cancer: the St. Gallen InternationalExpert Consensus Conference on the Primary Therapy of Early BreastCancer 2017. Ann Oncol. 2019;30(7):1181.
15. Wang M, Klevebring D, Lindberg J, et al. Determining breast cancerhistological grade from RNA-sequencing data. Breast Cancer Res.2016;18(1):48.
16. Ivshina AV, George J, Senko O, et al. Genetic reclassification of histo-logic grade delineates new clinical subtypes of breast cancer. CancerRes. 2006;66(21):10292-10301.
17. Parker JS, Mullins M, Cheang MCU, et al. Supervised risk predictor ofbreast cancer based on intrinsic subtypes. J Clin Oncol. 2009;27(8):1160-1167.
18. Nielsen TO, Parker JS, Leung S, et al. A comparison of PAM50 intrinsicsubtyping with immunohistochemistry and clinical prognostic factorsin tamoxifen-treated estrogen receptor-positive breast cancer. ClinCancer Res. 2010;16(21):5222-5232.
98 https://doi.org/10.1016/j.annonc.2021.09.007
19. Paik S, Shak S, Tang G, et al. A multigene assay to predict recurrence oftamoxifen-treated, node-negative breast cancer. N Engl J Med.2004;351(27):2817-2826.
20. Griffin J, Treanor D. Digital pathology in clinical use: where are we nowand what is holding us back? Histopathology. 2017;70(1):134-145.
21. Acs B, Rantalainen M, Hartman J. Artificial intelligence as the next steptowards precision pathology. J Intern Med. 2020;288:62-81.
22. Bera K, Schalper KA, Rimm DL, et al. Artificial intelligence in digitalpathologydnew tools for diagnosis and precision oncology. Nat RevClin Oncol. 2019;16(11):703-715.
23. Coudray N, Ocampo PS, Sakellaropoulos T, et al. Classification andmutation prediction from non-small cell lung cancer histopathologyimages using deep learning. Nat Med. 2018;24(10):1559-1567.
24. Ström P, Kartasalo K, Olsson H, et al. Artificial intelligence for diagnosisand grading of prostate cancer in biopsies: a population-based, diag-nostic study. Lancet Oncol. 2020;21:222-232.
25. Bulten W, Pinckaers H, van Boven H, et al. Automated deep-learningsystem for Gleason grading of prostate cancer using biopsies: a diag-nostic study. Lancet Oncol. 2020;21:233-241.
26. Campanella G, Hanna MG, Geneslaw L, et al. Clinical-grade computa-tional pathology using weakly supervised deep learning on whole slideimages. Nat Med. 2019;25(8):1301-1309.
27. Ehteshami Bejnordi B, Veta M, Johannes van Diest P, et al. Diagnosticassessment of deep learning algorithms for detection of lymph nodemetastases in women with breast cancer. JAMA. 2017;318(22):2199-2210.
28. Couture HD, Williams LA, Geradts J, et al. Image analysis with deeplearning to predict breast cancer grade, ER status, histologic subtype,and intrinsic subtype. NPJ Breast Cancer. 2018;4:30.
29. Rantalainen M, Klevebring D, Lindberg J, et al. Sequencing-basedbreast cancer diagnostics as an alternative to routine biomarkers. SciRep. 2016;6:38037.
30. Cancer Genome Atlas Network. Comprehensive molecular portraits ofhuman breast tumours. Nature. 2012;490(7418):61-70.
31. Vallon-Christersson J, Häkkinen J, Hegardt C, et al. Cross comparisonand prognostic assessment of breast cancer multigene signatures in alarge population-based contemporary clinical series. Sci Rep. 2019;9:12184.
32. Szegedy C, Vanhoucke V, Ioffe S, et al. Rethinking the inception ar-chitecture for computer vision. arXiv 1512.00567v3;2015.
33. Russakovsky O, Deng J, Su H, et al. ImageNet large scale visualrecognition challenge. Int J Comput Vis. 2015;115(3):211-252.
34. Robin X, Turck N, Hainard A, et al. pROC: an open-source package for Rand S to analyze and compare ROC curves. BMC Bioinformatics.2011;12:77.
35. Youden WJ. Index for rating diagnostic tests. Cancer. 1950;3(1):32-35.36. Early Breast Cancer Trialists’ Collaborative Group. Effect of radiotherapy
after breast-conserving surgery on 10-year recurrence and 15-yearbreast cancer death: meta-analysis of individual patient data for 10,801 women in 17 randomised trials. Lancet. 2011;378(9804):1707-1716.
37. Dubsky P, Filipits M, Jakesz R, et al. EndoPredict improves the prognosticclassification derived from common clinical guidelines in ER-positive,HER2-negative early breast cancer. Ann Oncol. 2013;24(3):640-647.
38. Healey MA, Hirko KA, Beck AH, et al. Assessment of Ki67 expression forbreast cancer subtype classification and prognosis in the Nurses’Health Study. Breast Cancer Res Treat. 2017;166(2):613-622.
39. Rhee J, Han S-W, Oh D-Y, et al. The clinicopathologic characteristics andprognostic significance of triple-negativity in node-negative breastcancer. BMC Cancer. 2008;8:307.
40. Rakha EA, Reis-Filho JS, Ellis IO. Basal-like breast cancer: a critical re-view. J Clin Oncol. 2008;26(15):2568-2581.
41. Eroles P, Bosch A, Pérez-Fidalgo JA, Lluch A. Molecular biology in breastcancer: intrinsic subtypes and signaling pathways. Cancer Treat Rev.2012;38(6):698-707.
42. Aebi S, Davidson T, Gruber G, Castiglione M. Primary breast cancer:ESMO Clinical Practice Guidelines for diagnosis, treatment and follow-up. Ann Oncol. 2010;21:v9-v14.
43. Kwa M, Makris A, Esteva FJ. Clinical utility of gene-expression signaturesin early stage breast cancer. Nat Rev Clin Oncol. 2017;14(10):595-610.
Volume 33 - Issue 1 - 2022