A filtering approach for estimating lake water quality from remote sensing data

RESEARCH ARTICLE
Impacts of population growth and economic developmenton water quality of a lake: case studyof Lake Victoria Kenya water
Dauglas Wafula Juma & Hongtao Wang & Fengting Li
Received: 11 October 2013 /Accepted: 6 January 2014# Springer-Verlag Berlin Heidelberg 2014
Abstract Anthropogenic-induced water quality pollution is amajor environmental problem in freshwater ecosystems today.As a result of this, eutrophication of lakes occurs. Populationand economic development are key drivers of water resourcepollution. To evaluate how growth in the riparian populationand in the gross domestic product (GDP) with unplanneddevelopment affects the water quality of the lake, this paperevaluates Lake Victoria Kenyan waters basin. Waters qualitydata between 1990 and 2012 were analyzed along with re-views of published literature, papers, and reports. The nitrate-nitrogen (NO3-N), soluble phosphorus (PO4-P), chlorophyll a,and Secchi transparencies were evaluated as they are keywater quality indicators. The NO3-N increased from10 μg l−1 in 1990 to 98 μg 1−1 in 2008, while PO4-P increasedfrom 4 μg l−1 in 1990 to 57μg l−1 in 2008. The population andeconomic growth of Kenya are increasing with both havingminimums in 1990 of 24.143 million people and 12.18 billionUS dollars, to maximums in 2010 of 39.742 million peopleand 32.163 billion US dollars, respectively. A Secchi trans-parency is reducing with time, indicating an increasing pollu-tion. This was confirmed by an increase in aquatic vegetationusing an analysis of moderate resolution imagingspectroradiometer (MODIS) images of 2000 and 2012 ofKenyan waters. This study found that increasing populationand GDP increases pollution discharge thus polluting lakes.One of major factors causing lake water pollution is theunplanned or poor waste management policy and service.
Keywords Water quality . MODIS . Eutrophication . LakeVictoria . Kenya .Water pollution
Introduction
Lake Victoria is the second largest fresh water lake in theworld and the largest tropical lake with a surface area of68,000 km2 (average depth of 40 m and maximum depth of79 m). The Lake is shared between Kenya, Uganda, andTanzania, which controls 6, 45, and 49 %, respectively(Wang et al. 2012b). It is located between 3°S–0°30′N latitudeand 31°40′E–34°50′E longitudes at an altitude of 1,134 mabove sea level. The Lake has a catchment basin area of195,000 km2 which includes Rwanda and Burundi. The catch-ment has a high human population density whose activitiesinfluence the lake intensively (Lung’ayia et al. 2001).
Lake Victoria is of great socioeconomic significance to theriparian states as it is the major source of water for domestic,agricultural, and industrial purposes. The lake also provides alarge quantity of fish for East African countries as well as forexport markets in USA, Australia, European Union countries,and Israel (Muli 1996). Due to its strategic location of beingshared by three nations, it acts as an avenue for transport. It isincreasingly becoming a tourist destination for sport fishing,scenic beauty, and wildlife of the area. The lake has also ahydroelectric power plant that supplies electricity to Kenyaand Uganda at source of the White Nile.
With the economic relevance attached to the lake by ripar-ian communities, the Lake Victoria basin is one of the denselypopulated regions and has a rapidly growing population(Cohen et al. 1996). As the population and economy grows,the need of more natural resources leads to more resourcesbeing used than the ecosystem can sustain, thus impacting onthe ecosystem negatively. A high population and economicdevelopments have led to change in land use in the basin. The
Responsible editor: Philippe Garrigues
D. W. Juma :H. Wang (*) : F. LiKey Laboratory of Yangtze River Water Environment,Ministry of Education, State Key Laboratory of Pollution Controland Resource Reuse, College of Environmental Scienceand Engineering, Tongji University, Shanghai 200092, Chinae-mail: [email protected]
Environ Sci Pollut ResDOI 10.1007/s11356-014-2524-5
land use activities which are mainly agricultural, urbanization,and industrialization have greatly contributed to the degrada-tion of the waters of the lake (Wang et al. 2012a).
Indeed, there have been notable changes in the physical,chemical, and biological regime of the lake when comparedwith conditions before and during 1960s. Physically, there hasbeen increase in turbidity of the waters as indicated by reduc-tion in Secchi transparencies with time (Mavuti and Litterick1991; Calamari et al. 1995; Worthington 1930). The lakewaters have also indicated nutrients enrichment, accordingto Hecky (1993). It reported an increase in the concentrationof nitrogen in the lake and more prominent in the inshorewaters than offshore waters of the lake indicating the occur-rence of chemical changes.
Biologically, the phytoplankton community that used toshow clear seasonal successions of diatom, blue-green algae(Cyanobacteria), and green algae and several other taxa(Talling and Talling 1965; Talling 1987) is now persistentlypredominated by cyanobacteria, thus showing changes in thelake (Hecky op. cit. Lung’ayia et al. 2000). Overall, algalbiomass has increased and blooms dominated bycyanobacteria are common (Ochumba and Kibaara 1989).Eutrophication in the lake has worsened the water quality bypromoting the excessive growth of weeds and increasedsuspended organic material. These are impacting negativelyon the ecological, esthetic, and the economical functions likefishing, transport, and tourism that are usually provided by thelake ecosystem (Hecky and Bugenyi 1992; Cohen et al. 1996).
In response to the degradation, the riparian countries Kenya,Uganda, and Tanzania established the Lake Victoria Environ-mental Management project (LVEMP) in 1997. It is an inte-grated program with an aim of rehabilitating the degraded lakeecosystem for it to support the multiple human activities inLake Catchment in a sustainable manner. The LVEMP hasenhanced the capacity of the government in water qualitymonitoring by establishingmonitoring network and operationalgauging stations, rehabilitation of water quality laboratories inthe lake zones, and training of manpower (Machiwa 2003).
Despite this intervention, there is still continuing degrada-tion thus the need for more interventions. This study aims toshow how an increase in the riparian population and increasein the gross domestic product (GDP) with unplanned devel-opment of the catchment area of Lake Victoria Kenyan watersaffects water quality of theWinam gulf and the generally LakeVictoria waters.
Materials and methods
Study area
The Kenyan waters of Lake Victoria comprise of the openmain lake and theWinamGulf of Lake Victoria which lies just
south of the equator between 0°6′S–0°32′S and 34°13′E–34°52′E as shown in Fig. 1. The two together covers an areaof 4,200 km2 (approximately 6 % of whole Lake Victoria).The Winam gulf is connected to the open main lake via theRusinga channel (Ochumba 1990; Mavuti and Litterick1991). The catchment is drained by five major rivers asfollows: Nzoia, Kuja, Nyando, Yala, and Sondu; throughwhich the catchment contributes approximately 30 % of totalriverine inflow into the entire Lake Victoria (Crul 1995). Therivers drain one of the densely populated area, with richintensive agricultural areas that use agrochemicals extensive-ly, municipalities, and industrial establishments, all of whichcontribute heavy loads of suspended sediments and nutrientsinto the gulf and to the open lake thereafter (Gikuma-Njuruet al. 2010; Opande et al. 2004; GIWA 2006).
The Lake Victoria region has an equatorial climate withsmall seasonal variations in solar radiations (Walter et al.1960). The area has two rainfall seasons, heavy and lightrainfall periods. Yearly rainfall averages 1,000 mm. Heavyrainfall period is between March and May while light rainfallperiod is between September and November. This is followedby a relatively dry season from January to late February. Thehottest month ranging between 29.3 and 31.6 °C (Fusilli et al.2013; Lung’ayia et al. 2001; Kite 1981).
Kisumu city, which is the main city located on the shores ofthe lake of Kenyan waters, is the third largest city in Kenya. Itis the principal city in Western Kenya and the second mostimportant city in Lake Basin after Kampala city, Uganda. Thecity has seen tremendous growth in population with a currentpopulation of 968,909 according to census 2009 (CRA 2011).The city is located on the shores of the Lake Victoria at thecusp of Winam Gulf as shown in Fig. 1. It has been a majortrading Center and water transport hub for East African coun-tries that share the lake. Just like the whole country’s econo-my, Kisumu’s economy has been increasing with time and thishas seen a lot of industries coming up and other agriculturalactivities becoming more in recent times (COWI 2002).
Methods
The data from laboratory analysis of Winam gulf and Kenyanopen waters of Lake Victoria was acquired from LVEMPoffices, Kisumu Kenya. The acquired data was analyzed andcomputed. Other methods that were used in the study werereviews of published literature, papers, and reports for projectsimplemented on the study area and Lake Victoria Basin ingeneral. Among the parameters considered were the nitrogenin form of nitrate-nitrogen (NO3-N), phosphorus as solublephosphorus (PO4-P), chlorophyll a, and Secchi transparencies,mainly because of their relevance as water quality indicators,and their contribution to the eutrophication of the lake. Thedata on population and on GDP of Kenya from 1990 to 2010was acquired from the International monetary Fund (IMF)
Environ Sci Pollut Res

database (2012). On addition, estimation data from the sameIMF database on the population and GDP from 2011 to 2016were acquired and included in the analysis. The data wasanalyzed and compared with the water quality change overthe same period.
The moderate resolution imaging spectroradiometer(MODIS) data with a spatial resolution of 250 m, which werethe images taken in the year 2000 and in 2012, were analyzedto evaluate whether there is an element of eutrophicationtaking place in the lake. Chlorophyll a pigment has a mini-mum absorption in the green region (495–570 nm) leading tosignificant increase of reflectance as a function of pigmentconcentration (Martinez et al. 2011). Chlorophyll a has alsohigh absorbance spectra in the blue (450–495 nm) and redregions (620–750 nm) that peak at around 430 and 662 nm(Gross 1991).
The Normalized Difference Vegetation Index (NDVI)values were computed from the MODIS data using spectralreflectance values in the red (R) channel (620–670 nm) andthe near-infrared (NIR) channel (841–876 nm) using theequation NDVI=(NIR−R)/(NIR+R) in ENVI 4.7 software.To determine the spatial distribution of the chlorophyll a fromthe MODIS datasets, the NIR, Red and Blue bands wereclassified under the supervised maximum likelihood functionand overlaid with NDVI to assess and attain suitable samplepoints for bare land, terrestrial vegetation, aquatic vegetation
(including algal blooms), and algal bloom-free water. Thistechnique is based on the relationships between reflectance,total absorption, and backscattering coefficients (Gordon et al.1988). The NDVI value of 0.1 was considered the thresholdfor vegetation in order to minimize bidirectional reflectanceeffects arising from turbid waters.
Results and discussion
In the past five decades, researches and studies on the waterquality of Lake Victoria have indicated a change in the waterquality. It is reported that there has been an increase in nutrientlevels in the lake that has led to eutrophication of the lake asevidenced by immense growth of water hyacinth in Winamgulf bay of Lake Victoria. Analysis of various publishedarticles on the Kenyan waters and more so in the Winam gulfwas tabulated as shown in Table 1 (Gophen et al. 1995;Lung’ayia et al. 2001; Gikuma-Njuru and Hecky 2005;LVEMP 2002; Sitoki et al. 2010).
Generally, there is increasing nutrients enrichment trend inthe lake. The nitrate-nitrogen components in the lake havebeen increasing in the lake with the minimum being 10 μg 1−1
in 1990 to a maximum recorded of 98 μg 1−1 in 2008. Thephosphorous has also been on increase, from the minimum of4μg 1−1 in 1990 to a maximum recorded of 57μg 1−1 in 2008.
Fig. 1 Location of Kisumu cityand Winam gulf (above); a colorcomposite of Winam gulf createdfrom the MODIS (below)
Environ Sci Pollut Res

The increase in the nutrients into the lake is due to increasedrunoff from land-based sources like agricultural land, whichhas led to an increase in biomass in the lake as witnessed byimmense growth of water hyacinth in the Winam gulf.
On the other hand, there has been a general decreasingtrend of the nitrogen to phosphorus ratio (TN:TP) in the lakewith the largest being less than the Redifield ratio of 16:1,which gives an indication that phytoplankton growth in theLake is nitrogen deficient (Guildford and Hecky 2000). Ac-cording to Guildford and Hecky (2000), TN:TP <20 (molar)can result in N-deficient algal growth and selects for N fixingcyanobacterial species. Thus, this has promoted the domi-nance of nitrogen fixing cyanobacteria in line with high nitro-gen fixation in the lake (Mugidde et al. 2003).
This has increased the eutrophication in the lake that hasresulted in harmful algal blooms that lead to the formation ofhypoxic or “dead” zones which could destroy the ecosystem.Low TN:TP ratio is associated with the increased phosphorusloading into the Lake and selective loss of nitrogen throughdenitrification and enhanced recycling of phosphorus which isassociated with increased anoxic conditions in the deep pe-lagic waters (Hecky 1993; Hecky et al. 1996; LVEMP 2002).
Another parameter of interest is the Secchi transparencieswhich show clearness of the lake, where the higher the valueof Secchi the better the lake because it would have lowturbidity. Researches carried out on the Kenyan waters haveresults as shown in Table 2.
There is a decreasing trend of the Secchi transparencieswith time, with a highest value between 1990 and 2012 period
being in 1990 of 1.8 m and minimum being 0.4 m in 1994 inthe open lake waters of Lake Victoria. There is clear differenceof the Secchi values in the open lake of Kenya waters and theWinam gulf, for example Lung’ayia et al. (2001) reported thatan open lake has values of 0.9–2.4 m while 0.5–1 m forWinam gulf. This also confirms the difference as seen inWorthington (1930) that noted that in 1930 the Secchi trans-parencies’ in open lake was 7.3–7.9 m and that in Winam gulfwas 1.3–1.47 m. This difference is due to the shallow depthsinWinam gulf that makes it easy for daily mixing of the watercolumn leading to the recycling and resuspension of nutrientsand mineral matter from the bottom which is not the case ofthe open lake. The difference is also because the gulf being arecipient of pollution emanating from industrial and municipalsources and from agricultural runoff (Calamari et al. 1995).The Secchi transparencies are inversely proportional to thechlorophyll a in the lake waters. In the presence of readilymeasured PO4-P and NO3-N concentrations in the gulf waters,this acts as an accelerator for the eutrophication in the lake andthus increases the chlorophyll a in the water. This in turnreduces the transparencies as it limits light which lowers theSecchi transparencies values (Lung’ayia et al. 2001). TheSecchi transparencies vary inversely with turbidity of thewaters of the lake. All these pollutions into the lake are linkedwith human activities in the riparian zones of the lake.
Anthropogenic-induced water pollution is a major environ-mental problem in freshwater ecosystems today. According toWRI (2009), the study identified population growth and eco-nomic development as the major indirect drivers for eutrophi-cation. Kenya like any other developing nations has experi-enced rapid population growth for the past 20 years, from apopulation of 24.143 million in 1990 to a population of39.742 million people in 2010. With a population growth rateof about 2.69 %, the country’s population is still increasingeach and every day. It is estimated that by the year 2016, thepopulation will be 47.147 million as shown in Fig. 2 (IMFdatabase 2012).
Just as the population of the country is growing, the pop-ulation of the cities and urban area are also growing rapidly.Kenya has three major cities as follows: Nairobi, Mombasa,and Kisumu city which are all densely populated. The countryhas 29.9 % of the population living in cities and urban centersamounting to 11.88 million people as of 2010 (CRA 2011).
Table 1 The concentrations ofnitrate-nitrogen and soluble reac-tive phosphorus (PO4-P) in LakeVictoria Winam gulf, Kenyanwaters
Year NO3-N(μg l−1) PO4-P(μg l−1) Source TN:TP
1990 10–30 4–73 Gophen et al. 1995 2.5:1
1998 66.6±44 59.7±38.5 Lung’ayia et al. 2001 1:1
2000–02 48.2±21.4 29.7±19.1 Gikuma-Njuru and Hecky 2005 1.6:1
2004 81.2±12.3 24.9±8.3 Sitoki et al. 2010 3:1
2005 78 to 140 LVEMP 2002
2008 98.7±36.44 57±7 Sitoki et al. 2010 1.9:1
Table 2 Secchi transparencies in Lake Victoria Winam Gulf, Kenyanwaters
Year Secchi transparencies (m) Source
Open lake(Kenya waters)
Winam gulf
1930 7.3–7.9 1.3–1.47 Worthington 1930
1990 1.8 – Gophen et al. 1993
1991 – 0.35–1.55 Hughes and Hughes 1992
1994 0.4–1.35 – Lung’ayia et al. 2000
1998 0.9–2.4 0.5–1 Lung’ayia et al. 2001
Environ Sci Pollut Res

Kisumu is a lake side city that is located in a densely populatedlake basin of Lake Victoria. It has a population of 968,909people as of 2009, with a high population density of 465people per square kilometer compared to Kenya’s density of66 people (CRA 2011) per square kilometer. As the popula-tion is increasing with time consequently, the populationdensity is also increasing rapidly within the lake basin. Thishigh-density population could be a result of rural–urban mi-gration which is primarily triggered by the perception thatthere are better job opportunities within urban areas anddeclining livelihood opportunities within the rural areas.
The increase in population density means management ofmore people per unit of a natural resource. This puts pressureon the natural resources like water and land resources, as theneed continues to grow for domestic use, agriculture, industry,energy, and disposal of effluents. Despite the expansion ofurban centers, towns, and cities, there has not been a corre-sponding investment in the necessary infrastructure to supportthe increasing population (Wang et al. 2012a). This has led tothe development of informal settlements, “slums” in the urbancenters as it is the case of Kisumu. The wastemanagement andsewerage disposal facilities have remained inadequate. Thishas resulted in accumulation of solid and liquid waste towhich the lake has become the sink of direct domestic andindustrial waste. This situation has been made worse by theusually unplanned expansion of urban areas. The overallimpact of these trends on the lake has been increasing levelsof eutrophication in the lake (LVBC 2007).
The increase in human population has led to increased landuse activities most of which are poorly managed which hashad a negative impact on the water quality of the lake. As thepopulation increases, the need for land use intensifies, whichhas led to wetlands and forests being converted into settle-ments, industries, and into agricultural farmlands. This in turnimpacts negatively on the water quality of the lake as theecosystem services carried out by a wetland no longer exist,thus exposing the lake to direct pollution from farmland runoff
(Sharma 2003; Kishe 2004). For example, the Yala, Nyando,and Sondu swamps have been drained for agriculture pur-poses (LVBC 2007).
It is reported that the highest rates of deforestation occur inareas with large growing populations such as the lake basinarea and the surrounding highlands where farming, grazing,and settlements have expanded at the expense of native veg-etation (Allen and Barnes 1985; FAO 2001; Tomberline andBuongiorno 2001; Achard et al. 2002). Increase in populationpressure have led to increase in cultivation and grazing inten-sity. This has resulted in massive deforestation and conversionof natural habitats to farmlands and settlements which haveled to loss of biodiversity and land degradation (Olson et al.2004; Maitima et al. 2004). About 7,084 ha of Mau forest,which is considered as the major water tower of Lake Victoria,were destroyed between 2000 and 2003. In Mt. Elgon (anoth-er water tower for Lake Victoria basin) area around TransNzoia District, there was a loss of 1,029 ha of indigenousforest, which just shows how the natural resources are beingdestroyed because of increased population (LVBC 2007).With a bare surface created as a result of deforestation, therehas been a lot of runoff that ends up in the lake (Ntiba et al.2001).
As land scarcity increases in the lake region due topopulation increase, mechanization of agricultural landhas intensified and increased usage of agrochemicals inthe farms so as to achieve more yields per acreage. Thisintensification of agriculture in the lake basin has led toland being converted to medium-scale and larger-scalesugarcane growing from 84 km2 in 1986 through102.28 km2 in 1995 to 262.75 km2 in 2005, most of whichis in reclaimed wetland areas (Twesigye et al. 2011).Small-scale mixed farming increased from 36.29 km2 in1986 to 244.036 km2 in 2005 in the Lake Victoria Kenyanbasin (Twesigye et al. 2011). All these factors increase thenutrients loading in the lake, hence polluting the waterqualities of the lake. This has drastically changed thebiomass in the lake as witnessed by increasing growth ofwater hyacinth in the Kenyan waters of Lake Victoria.
On the other hand, the rate of nutrients loading into the lakehas been to a large extent influenced by the economic growthof surrounding cities and areas of Lake Victoria. Kenyaneconomy have witnessed growth in GDP from 12.18 billionUS dollars in 1990 to 32.163 billion US dollars in 2010, and itwas estimated by IMF that the GDP would reach 64.231billion US dollars by the year 2016 as shown in Fig. 3 (IMFdatabase 2012).
The growth of GDP has brought about an increase inurbanization and industrialization of the nation which in returnhas its effects on the environment in general because ofunsustainable use of natural resources. Kenya is becomingincreasingly urbanized. In 1950, less than 6 % of the popula-tion lived in urban areas according to United Nations. Since
Fig. 2 Growth of water hyacinth on Lake Victoria
Environ Sci Pollut Res

then, urbanization has increased fourfold to 24 % in 1990. Asof 2010, 29.9 % of Kenyan population was living in urbanarea representing 11.88 million people, which is larger than itsentire 1950 population. It is projected that by 2020 about 27million people would be living in urban areas (CRA 2011).
Over the last two decades, the lake basin has experiencedincreasing urbanization with major towns and cities acting ashubs of urbanization, with cities such as Jinja, Entebbe, Kisu-mu, Homa Bay, Musoma, Bukoba, and Mwanza as examples(LVBC 2007). An increase in the economy has led to im-provement in consumption rate, which translates to moreenergy use, which in turn leads to increase in pollution ofthe atmosphere with NOx, COx, and SOx gases. During therainfall, these gases cause acidic rainfall which pollutes thewater sources.
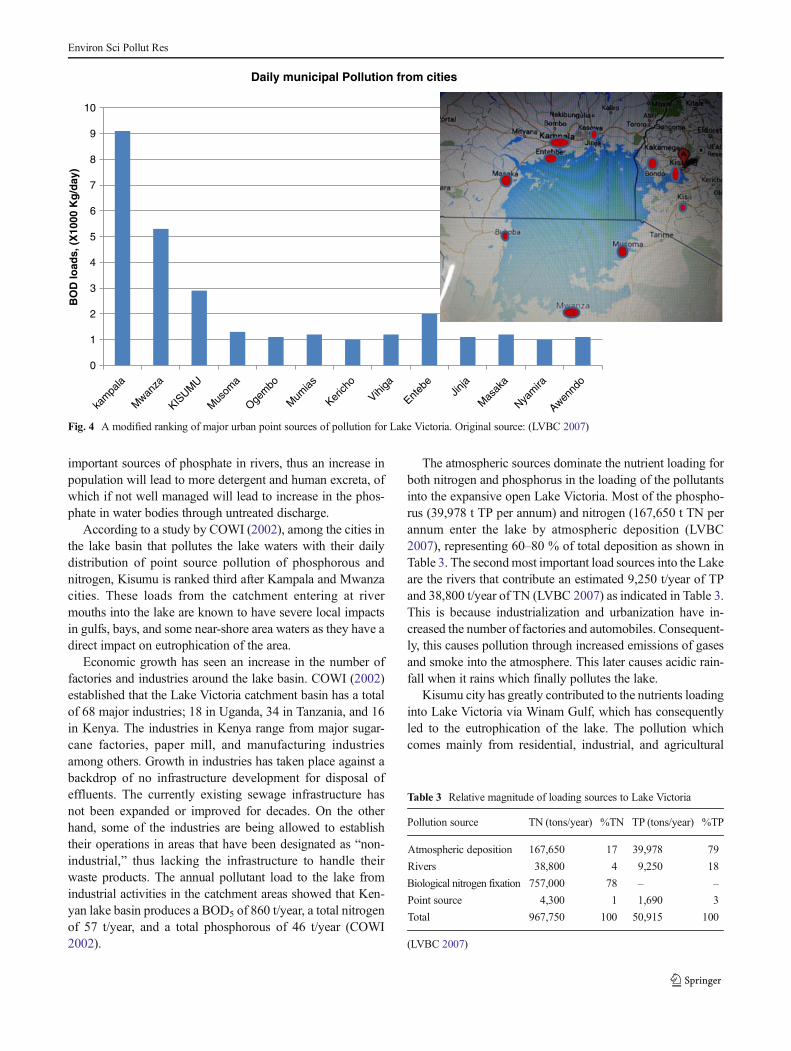
Development and expansion of urban centers and industrialestablishments have outstretched existing sewage treatmentplants. The pollution of major rivers flowing into Lake Vic-toria has increased mainly due to the discharge of raw orincompletely treated effluents particularly from urban settle-ments like Kisumu city. As Kisumu city expands in size andpopulation, there has been no corresponding investment in thenecessary infrastructure to support the increasing population(Wang et al. 2013). Thus, waste management and seweragedisposal facilities have remained inadequate in Kisumu cityand incidences of direct domestic sewage disposal into thelake are becoming common (Omosa et al. 2012). This has ledto Winam Gulf being subjected to heavy pollution by domes-tic and industrial wastes from Kisumu city more than theecosystem can handle through self-purification process(Gikuma-Njuru and Hecky 2005). A study conducted byLVBC (2007) revealed that among the cities in the lake basin,Kisumu city is the third most polluter of the lake water with
biological oxygen demand (BOD5) loads per day, as shown inthe Fig. 4.
Urbanization affects “patterns of ecologic structure andfunction” (Walsh 2006) by altering the physical landscape,increasing imperviousness, and changing channel morpholo-gy. This leads to pollution of rivers, streams, and other watersources (Paul and Meyer 2001; Sponseller et al. 2001; Walshet al. 2001; Kearns et al. 2005; Chadwick et al. 2006). Thepollution of major rivers flowing into Lake Victoria has in-creased mainly due to discharge of raw or incompletelytreated effluents particularly from urban settlements,sugar industries, pulp and paper mills, and other facto-ries in the basin. A study by Okungu and Opango(2004) on the nutrient loading from rivers into the LakeVictoria Kenyan waters revealed high concentration ofboth total nitrogen concentration and total phosphorousfrom the rivers that discharge into the lake.
On other hand, the comparison of the total annual loadingof the nutrients into the lake from Kenyan rivers revealedNzoia River to be leading in pollution loading in both the totalphosphorous and total nitrogen transportation in year averag-ing about 4,900 t per year and 1,375 t per year, respectively(Okungu and Opango 2004). This is because Nzoia River hashigh volume of water flow and its expansive catchment inwhich it passes through. The rich agricultural base and efflu-ents from various sugar factories and pan paper mill industrywhich the river passes have all contributed to the total loading.Despite increased numbers of industries, only a few of themare connected to an urban sewage system thus increasingdirect injection into the river or even directly into the lakecausing a lot of pollution (Scheren et al. 2000).
Golterman (1993) reported that next to the natural origin ofphosphate, human excreta and detergents are the second most
0
10
20
30
40
50
60
70
GD
P (
Bill
ion
s U
SD
) an
d p
op
ula
tio
n (
Mill
ion
s)
The growth in GDP and population of Kenya
Gross domestic product(Billions of USD)
Population (Million)
1990
1991
1992
1993
1994
1995
1996
1997
1998
1999
2000
2001
2002
2003
2004
2005
2006
2007
2008
2009
2010
2011
2012
2013
2014
2015
2016
Fig. 3 The GDP and populationgrowth in Kenya. (IMF Database2012)
Environ Sci Pollut Res
important sources of phosphate in rivers, thus an increase inpopulation will lead to more detergent and human excreta, ofwhich if not well managed will lead to increase in the phos-phate in water bodies through untreated discharge.
According to a study by COWI (2002), among the cities inthe lake basin that pollutes the lake waters with their dailydistribution of point source pollution of phosphorous andnitrogen, Kisumu is ranked third after Kampala and Mwanzacities. These loads from the catchment entering at rivermouths into the lake are known to have severe local impactsin gulfs, bays, and some near-shore area waters as they have adirect impact on eutrophication of the area.
Economic growth has seen an increase in the number offactories and industries around the lake basin. COWI (2002)established that the Lake Victoria catchment basin has a totalof 68 major industries; 18 in Uganda, 34 in Tanzania, and 16in Kenya. The industries in Kenya range from major sugar-cane factories, paper mill, and manufacturing industriesamong others. Growth in industries has taken place against abackdrop of no infrastructure development for disposal ofeffluents. The currently existing sewage infrastructure hasnot been expanded or improved for decades. On the otherhand, some of the industries are being allowed to establishtheir operations in areas that have been designated as “non-industrial,” thus lacking the infrastructure to handle theirwaste products. The annual pollutant load to the lake fromindustrial activities in the catchment areas showed that Ken-yan lake basin produces a BOD5 of 860 t/year, a total nitrogenof 57 t/year, and a total phosphorous of 46 t/year (COWI2002).
The atmospheric sources dominate the nutrient loading forboth nitrogen and phosphorus in the loading of the pollutantsinto the expansive open Lake Victoria. Most of the phospho-rus (39,978 t TP per annum) and nitrogen (167,650 t TN perannum enter the lake by atmospheric deposition (LVBC2007), representing 60–80 % of total deposition as shown inTable 3. The secondmost important load sources into the Lakeare the rivers that contribute an estimated 9,250 t/year of TPand 38,800 t/year of TN (LVBC 2007) as indicated in Table 3.This is because industrialization and urbanization have in-creased the number of factories and automobiles. Consequent-ly, this causes pollution through increased emissions of gasesand smoke into the atmosphere. This later causes acidic rain-fall when it rains which finally pollutes the lake.
Kisumu city has greatly contributed to the nutrients loadinginto Lake Victoria via Winam Gulf, which has consequentlyled to the eutrophication of the lake. The pollution whichcomes mainly from residential, industrial, and agricultural
0
1
2
3
4
5
6
7
8
9
10
BO
D lo
ads,
(X
1000
Kg
/day
)Daily municipal Pollution from cities
kam
pala
Mwan
za
KISUM
U
Mus
oma
Ogem
bo
Mum
ias
Kerich
o
Vihiga
Enteb
eJin
ja
Mas
aka
Nyam
ira
Awennd
o
Fig. 4 A modified ranking of major urban point sources of pollution for Lake Victoria. Original source: (LVBC 2007)
Table 3 Relative magnitude of loading sources to Lake Victoria
Pollution source TN (tons/year) %TN TP (tons/year) %TP
Atmospheric deposition 167,650 17 39,978 79
Rivers 38,800 4 9,250 18
Biological nitrogen fixation 757,000 78 – –
Point source 4,300 1 1,690 3
Total 967,750 100 50,915 100
(LVBC 2007)
Environ Sci Pollut Res

areas is released directly into the lake or through river channeland increasing the nutrient loading into the lake.
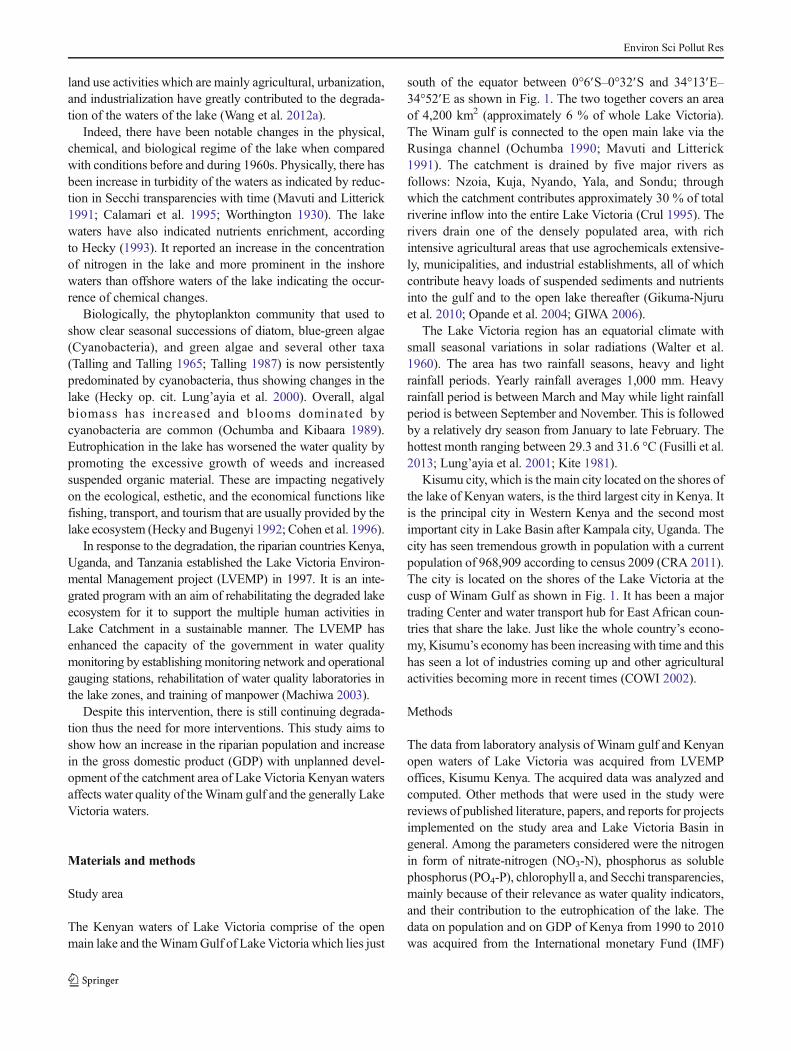
Analysis of MODIS images of 2000 and 2012 of theWinam Gulf part of Lake Victoria revealed changes in theaquatic vegetation in the waters as shown in Fig. 5. Theimages showed an increase of the chlorophyll a levels in thelake which is an indication of increased aquatic vegetation.The aquatic vegetation area increased from 64,564 ha in 2000to an area of 438,891.1 ha in 2010 as it was deduced from theanalysis of the images.
This confirms that there is eutrophication going on in theWinam gulf part of the lake over that period, as witnessed bythe increase in the aquatic vegetation cover in the lake, whichis attributed to excessive growth of water hyacinth. This isattributed to increase in nutrients loading into the lake thatpromotes vegetation growth in the lake.
Conclusion
A comprehensive analysis was carried out to investigate theeffect of population growth, economic development, and un-planned catchment management on water quality of the LakeVictoria. The study discovered that in general, rapid popula-tion growth, growing commercial activities, and industrializa-tion in Kisumu and in Lake Victoria Basin coupled withinadequate provision of waste management services have ledto the increase in volume of urban waste being discharged intothe lake and environment. This, together with poor urbanplanning, the use of old dilapidated and inappropriate tech-nologies, poor maintenance of treatment plants, lack of wastetreatment, and disposal mechanisms, has resulted in the dete-rioration of water quality of the Lake.
To reduce the high levels of nutrients loading into the lake,policies need to be put in place, which encourages inclusion ofthe environmental sustainability component on economic
development projects to avert externalities. There is need forproper management of solid waste and waste water from bothindustrial and municipal sources to improve the quality ofnatural water resources like rivers and lakes. However, thereis still a need to strengthen, monitor, and control anthropo-genic activities in the basin that are the root cause ecosystemsdegradation. There is a need to encourage proper managementof land use through public awareness programs geared to-wards sensitizing the public on the ongoing environmentaldestruction and how it can be minimized or stopped.
There is also a need to encourage regional interventions andincorporation of harmonized principles, policies, strategies,laws, and other agreements into national legislation to enhanceenforcement. Further studies should be conducted in the wholeLake Victoria catchment basin using MODIS technology toassess the effects of population growth and economic develop-ment on the water quality of the lake as a whole.
Acknowledgments This study is part of the Africa–China CooperationProgram on Environment which is supported by the Ministry of Scienceand Technology of China (MOST) and coordinated by the United NationsEnvironment Program (UNEP) (nos. 2010DFA92820 and2010DFA92800). It was supported in part by the Fundamental ResearchFunds for the Central Universities (no. 0400219184).
References
Achard F, Eva H, Stibig H-J, Mayaux P, Gallego J, Richards T, Malingreau J-P (2002) Determination of deforestation rates of the world’shumid tropical forests. Report
Allen J, Barnes D (1985) The causes of deforestation in developingcountries. Ann Assoc Am Geogr 75(2):163–184
Calamari D, Akech MO, Ochumba PBO (1995) Pollution of WinamGulf, Lake Victoria, Kenya: a case study for preliminary assessment.Lakes Reserv Res Manag 1:89–106
Chadwick MA, Dobberfuhl DR, Benke AC, Huryn AD, Suberkropp K,Thiele JE (2006) Urbanization affects stream ecosystem function by
Fig. 5 The changes in aquatic vegetation in the Winam Gulf area
Environ Sci Pollut Res

altering hydrology, chemistry, and biotic richness. Ecol Appl 16(5):1796–1807
Cohen AS, Kaufman L, Ogutu-Ohwayo R (1996) Anthropogenic threats,impacts, and conservation strategies in the African Great, Lakes: areview. In: Johnson TC, Odada E (eds) The limnology, climatologyand paleoclimatology of the East African lakes. Gordon and Breach,Toronto, pp 575–624
COWI Consulting Engineers (2002) Integrated water quality/limnologystudy for Lake Victoria. Lake Victoria Environmental ManagementProject, Part II Technical Report
CRA (2011) Commission of Revenue Allocation: Kenya County FactSheets, Kenya Bureau of Statistic. https://opendata.go.ke/Counties/Kenya-County-Fact-Sheets-Dec-2011/zn6m-25cf
Crul RCM (1995) Limnology and hydrology of Lake Victoria.UNESCO/IHP Project M-5.1, UNESCO Publishing, Paris
FAO (2001) Global forest resources assessment (2000) FAO forestrypaper 140. FAO, Rome
Fusilli LA, CollinsbMO, Lanevea G, Palomboc A, Pignattic S, Santinic F(2013) Assessment of the abnormal growth of floating-macrophytesin Winam Gulf (Kenya) by using MODIS imagery time series. Int JAppl Earth Obs Geoinformation. SciVerse ScienceDirect
Gikuma-Njuru P, Hecky RE (2005) Nutrient concentrations in NyanzaGulf, Lake Victoria, Kenya: light limits algal demand and abun-dance. Hydrobiologia 534:31–140
Gikuma-Njuru P, Hecky RE, Guildford SJ (2010) Surficial sedimentphosphorus fractions along a biogeochemical gradient in Nyanza(Winam) Gulf, Northeastern Lake Victoria and their possible role inphosphorus recycling and internal loading. Biogeochemistry
GIWA (2006) Challenges to InternationalWaters; regional assessments ina global perspective. United Nations Environment Program (UNEP)
Golterman HL (1993) Aquatic ecosystems, physiological limnology.IHE, Delft
GophenM, Ochumba PBO, Pollingher U, Kaufman LS (1993) Nile perch(Lates niloticus) invasion in Lake Victoria (East Africa). VerhInternat Verein Limnol 25:856–859
Gophen M, Ochumba PBO, Kaufman LS (1995) Some aspects of per-turbation in the structure and biodiversity of the ecosystem of LakeVictoria, East Africa. Aquat Living Resour 8:27–41
Gordon HR, Brown OB, Evans RH, Brown JW, Smith RC, Baker KS,Clark DK (1988) A semi-analytic radiance model of ocean color. JGeophys Res 93:10909–10924
Gross MR (1991) Salmon breeding-behavior and life-history evolution inchanging environments. Ecology 72:1180–1186
Guildford SJ, Hecky RE (2000) Total nitrogen, total phosphorus, andnutrient limitation in lakes and oceans. Limnol Oceanogr 6:1213–1223
Hecky RE (1993) The eutrophication of Lake Victoria. Verh Int VerLimnol Stuttg 25:39–48
Hecky RE, Bugenyi FWB (1992) Hydrology and chemistry of theAfrican great lakes andwater-quality issues: problems and solutions.Mitt Int Ver Theor Angew Limnol 23:45–54
Hecky RE, Bootsma HA, Mugidde R, Bugenyi FWB (1996)Phosphorus pumps, nitrogen sinks, and silicon drains: plumb-ing nutrients in the African Great Lakes. In: Johnson JC,Odada EO (eds) The limnology, climatology and paleoclima-tology of the East African Lakes. Gordon and BreachPublishers, Amsterdam, pp 205–223
Hughes RH, Hughes JR (1992) Lake Victoria: lake description. Directoryof African Wildlife [18/12/2001] http://www.wcmc.org.uk/dynamic/lcdb/lakesheets/victoria.desc.html
IMF Database (2012) World economic outlook database (2013/03/15).(http://www.imf.org/external/pubs/ft/weo/2012/02/weodata/index.aspx)
Kearns FR, Kelly NM, Carter JL, Resh VH (2005) A method for the useof landscape metrics in freshwater research and management.Landsc Ecol 20:113–125
KisheM (2004) Physical and chemical characteristics of water in selectedlocations in Lake Victoria, Tanzania. Tanz J Sci 30(2):1–2
Kite GW (1981) Recent changes in level of Lake Victoria. Hydrol SciBull Oxford 26:233–243
Lung’ayia HBO, M’Harzi A, Tackx M, Gichuki J, Symoens J (2000)Phytoplankton community structure and environment in the Kenyanwaters of Lake Victoria. Freshw Biol 43. Blackwell Science Ltd:529–543
Lung’ayia H, Sitoki L, Kenyanya M (2001) The nutrient enrichment ofLake Victoria (Kenyan waters)—Hydrobiologi
LVBC (2007) Regional trans-boundary diagnostic analysis of the LakeVictoria basin. Lake Victoria Basin Commission (LVBC), Kisumu
LVEMP (2002) Lake Victoria environmental management project phase,water quality and ecosystem management component, preliminaryfindings of studies conducted on Lake Victoria
Machiwa PK (2003) Water quality management and sustainability: theexperience of Lake Victoria Environmental Management Project(LVEMP)—Tanzania. Phys Chem Earth 28:111I–1115
Maitima J, Reid S, Gachimbi L, Majule A, Lyaruu H, Pomeroy D,Mugatha S, Mathai S, Mugisha S (2004) The Linkages betweenland use change, land degradation and biodiversity across EastAfrica
Martinez JM, Ventura D, Vieira MR, Attayde JL, Bubel AP, CoimbraMR, de Oliveira E (2011) Satellite-based monitoring of reservoireutrophication in the Brazil Semi-arid region. (Proceedings XVBrazilian Symposium of Remote Sensing—SBSR, Curitiba, PR,Brazil, April 30 to May 05, 2011, INPE p. 5247)
Mavuti KM, Litterick MR (1991) Composition, distribution, and ecolog-ical role of zooplankton community in Lake Victoria, Kenyan wa-ters. Verh Int Ver Limnol 24:1117–1122
Mugidde R, Hecky RE, Hendzel LL, Taylor WD (2003) Pelagic nitrogenfixation in Lake Victoria (East Africa). J Great Lakes Res 29(sup-plement 2):76–83
Muli JR (1996) Environmental problems of Lake Victoria (East Africa):what the international community can do. Lakes Reserv Res Manag2:47–53
Ntiba MJ, Kudoja WM, Mukasa CT (2001) Management issues in theLake Victoria watershed. Lakes Reserv Res Manag 6:211–216
Ochumba PBO (1990) Massive fish kills within Nyanza Gulf of LakeVictoria, Kenya. Hydrobiologia 208:93–99
Ochumba PBO, Kibaara DI (1989) Observations on blue green algalblooms in the open waters of Lake Victoria, Kenya. Afr J Ecol 27:23–34
Okungu J, Opango P (2004) Pollution loading into Lake Victoria from theKenya catchment. Available from URL:http://www.lvemp.org/L_Publications/kenya/Okunguj.pdf. Accessed 15 August 2004
Olson J, Misana S, Campbell D, Mbonile M, Mugisha S (2004) Thespatial patterns and root causes of land use change in East Africa
Omosa IB, Wang HT, Cheng S, Li F (2012) Sustainable tertiary waste-water treatment is required for water resources pollution control inAfrica. Environ Sci Technol 46(13):7065–7066
Opande GO, Onyango JC, Wagai SO (2004) Lake Victoria: the waterhyacinth (Eichhornia Crassipes [Mart.] Solms), its socioeconomiceffects, control measures, and resurgence in the Winam Gulf.Limnologica 34:5
Paul MJ, Meyer JL (2001) Streams in the urban landscape. Annu RevEcol Syst 32:333–365
Scheren PA, Zanting HA, Lemmens AMC (2000) Estimation of waterpollution sources in Lake Victoria, East Africa: application andelaboration of the rapid assessment methodology. J EnvironManag 58:235–248
Sharma UC (2003) Impact of population growth and Climate Change onthe quantity and quality of water resources in the North East of India.Water Resources Systems—Hydrological Risk, management, anddevelopment (Proceedings of symposium HS02b held duringIUGG2003 al Sapporo. July 2003 J. IAHS Publ. no. 281. 2003)
Environ Sci Pollut Res

Sitoki L, Gichuki J, Ezekiel C, Wanda F, Mkumbo OC, MarshallBE (2010) The environment of Lake Victoria (East Africa):current status and historical changes. Int Rev Hydrobiol 95:209–223
Sponseller RA, Benfield EF, Valett HM (2001) Relationships betweenland use, spatial scale and stream macroinvertebrate communities.Freshw Biol 46:1409–1424
Talling JF (1987) The phytoplankton of Lake Victoria (East Africa). ArchHydrobiol Beih Ergebn Limnol 25:229–256
Talling JF, Talling IB (1965) The chemical composition of African lakewaters. Int Rev Ges Hydrobiol 50:421–463
Tomberline D, Buongiorno J (2001) Timber plantations, timber supply,and forest conservation. In: PaloM, Usivuori J, Mery G (eds) Worldforests, markets and policies. Kluwer Academic Publishers,Dordrecht, p 504
Twesigye CK, Onywere SM, Getenga ZM, Mwakalila SS, Nakiranda JK(2011) The Impact Of Land Use Activities On Vegetation CoverAnd Water Quality In The Lake Victoria Watershed. Open EnvironEng J 4:66–77
Walsh CJ (2006) Biological indicators of stream health using macroinvertebrate assemblage composition: a comparison of sensitivityto an urban gradient. Mar Freshw Res 57:37–47
Walsh CJ, Sharpe AK, Breen PF, Sonneman JA (2001) Effects of urban-ization on streams of the Melbourne Region, Victoria, Australia:Benthic macroinvertebrate communities. Freshw Biol 46:535–551
Walter H, Lieth H, Rehder H, Karte (1960) Afrika Südlich Des Äquators.In Walter H. & H. Lieth (Eds), Klimadiagramm-Weltatlas. Veg.Fischer Verlag. Jena p. 6
Wang HT, Wang T, Brahima T, Li FT (2012a) Protect Lake Victoriathrough green economy, public participation and good governance.Environ Sci Technol 46(19):10483–10484
Wang HT, Omosa IB, Keller AA, Li FT (2012b) Ecosystem protection,integrated management, and infrastructure are vital for improvingwater quality in Africa. Environ Sci Technol 46(9):4699–4700
Wang HT,Wang T, Zhang BR, Li FT, Brahima T, Omosa IB, Chiramba T,Abdel-Monem M, Pradhan M (2013) Water and wastewater treat-ment in Africa: current practices and challenges. Clean Soil AirWater. doi:10.1002/clen.201300208, accepted
Worthington EB (1930) Observations on the temperature, hydrogen-ionconcentration, and other physical conditions f the Victoria andAlbert Nyanzas. Int Rev Ges Hydrobiol Hydrogr 328–357
WRI (2009) Eutrophication: sources and drivers of nutrient pollution.WorldResources Institute Policy Note: Water Quality: Eutrophication AndHypoxia (Pdf.Wri.Org/Eutrophication_Sources_And_Drivers.Pdf)
Environ Sci Pollut Res
Copyright © 2022 FDOKUMEN