
The atmospheric deposition of phosphorus in Lake Victoria (East Africa
20
The atmospheric deposition of phosphorus in Lake Victoria (East Africa) RASHID A. TAMATAMAH 1, *, ROBERT E. HECKY 2 and HAMISH C. DUTHIE 2 1 Department of Fisheries Science and Aquaculture, University of Dar es Salaam, P.O. Box 35064, Dar es Salaam, Tanzania; 2 Department of Biology, University of Waterloo, Waterloo, Ont., Canada N2L 3G1; *Author for correspondence (e-mail: [email protected]; Phone: + 1-255-22-2410- 462; fax: +1-255-22-2410-038) Received 6 November 2002; accepted in revised form 27 April 2004 Key words: Atmospheric deposition, Dry deposition, Lake Victoria, Phosphorus, Watershed, Wet deposition Abstract. Wet and dry atmospheric fluxes of total phosphorus (TP) and soluble reactive phos- phorus (SRP) measured at four sites over a 12-month period were used to estimate lake-wide atmospheric phosphorus (P) deposition to Lake Victoria, East Africa. Atmospheric samples were collected in plastic buckets with top diameter of 25.5 cm by 30 cm deep. The highest P loading rates of 2.7 (TP) and 0.8 (SRP) kg ha 2 year 1 were measured at Mwanza compared to less than 1.9 (TP) and 0.65 (SRP) kg ha 2 year 1 measured in other three sites. By applying these loading rates to the lake surface, it was estimated that 13.5 ktons (13.5 · 10 3 kg) of TP were deposited annually into the lake from the atmosphere. Thirty-two percent of the total was found to be in the SRP form. Dryfall, a component ignored in previous studies exceeded wet deposition by contributing 75% of the total P input. However, materials deposited by dryfall made a lesser contribution to soluble form of phosphorus, as SRP concentrations in the wet samples were 2–3 times higher than SRP concentrations in dry samples. The annual fluxes of phosphorus measured on the south and western shores of Lake Victoria (1.8–2.7 kg ha 2 year 1 ) are near the upper range of similar fluxes mea- sured in the tropics. In comparison with the existing estimates of municipal and runoff P inputs from other studies, it is estimated that atmospheric deposition represent 55% of the total phos- phorus input to the Lake Victoria. The four sampling sites were fairly clustered and wet and dry P deposition data were collected from shore/land stations and applied to open lake areas to estimate lake-wide P deposition. In this regard, the estimates determined here should be viewed as a first order approximation of actual P load deposited into the lake. Introduction The importance of atmospheric deposition as a nutrient source to aquatic ecosystems has been well documented (Schindler et al. 1976; Lewis 1981; Cole et al. 1990; Jassby et al. 1994). This is partly because important intersystem exchange of various nutrients such as N and S occurs via the atmosphere and partly because human activities release pollutants to the atmosphere in amounts that are comparable to, or even exceed, the natural (preindustrial) rates of mobilization (Likens and Butler 1981; Crutzen and Andreae 1990). For example, while the effects of human activities such as vegetation burning on C, N, and S cycles are most obvious (Crutzen and Andreae 1990), several Biogeochemistry (2005) 73: 325–344 Ó Springer 2005 DOI 10.1007/s10533-004-0196-9
-
Upload
independent -
Category
Documents
-
view
5 -
download
0
Transcript of The atmospheric deposition of phosphorus in Lake Victoria (East Africa
The atmospheric deposition of phosphorus in Lake
Victoria (East Africa)
RASHID A. TAMATAMAH1,*, ROBERT E. HECKY2 and HAMISHC. DUTHIE2
1Department of Fisheries Science and Aquaculture, University of Dar es Salaam, P.O. Box 35064,
Dar es Salaam, Tanzania; 2Department of Biology, University of Waterloo, Waterloo, Ont., Canada
N2L 3G1; *Author for correspondence (e-mail: [email protected]; Phone: + 1-255-22-2410-
462; fax: +1-255-22-2410-038)
Received 6 November 2002; accepted in revised form 27 April 2004
Key words: Atmospheric deposition, Dry deposition, Lake Victoria, Phosphorus, Watershed, Wet
deposition
Abstract. Wet and dry atmospheric fluxes of total phosphorus (TP) and soluble reactive phos-
phorus (SRP) measured at four sites over a 12-month period were used to estimate lake-wide
atmospheric phosphorus (P) deposition to Lake Victoria, East Africa. Atmospheric samples were
collected in plastic buckets with top diameter of 25.5 cm by 30 cm deep. The highest P loading rates
of 2.7 (TP) and 0.8 (SRP) kg ha�2 year�1 were measured at Mwanza compared to less than 1.9
(TP) and 0.65 (SRP) kg ha�2 year�1 measured in other three sites. By applying these loading rates
to the lake surface, it was estimated that 13.5 ktons (13.5 · 103 kg) of TP were deposited annually
into the lake from the atmosphere. Thirty-two percent of the total was found to be in the SRP form.
Dryfall, a component ignored in previous studies exceeded wet deposition by contributing 75% of
the total P input. However, materials deposited by dryfall made a lesser contribution to soluble
form of phosphorus, as SRP concentrations in the wet samples were 2–3 times higher than SRP
concentrations in dry samples. The annual fluxes of phosphorus measured on the south and western
shores of Lake Victoria (1.8–2.7 kg ha�2 year�1) are near the upper range of similar fluxes mea-
sured in the tropics. In comparison with the existing estimates of municipal and runoff P inputs
from other studies, it is estimated that atmospheric deposition represent 55% of the total phos-
phorus input to the Lake Victoria. The four sampling sites were fairly clustered and wet and dry P
deposition data were collected from shore/land stations and applied to open lake areas to estimate
lake-wide P deposition. In this regard, the estimates determined here should be viewed as a first
order approximation of actual P load deposited into the lake.
Introduction
The importance of atmospheric deposition as a nutrient source to aquaticecosystems has been well documented (Schindler et al. 1976; Lewis 1981; Coleet al. 1990; Jassby et al. 1994). This is partly because important intersystemexchange of various nutrients such as N and S occurs via the atmosphere andpartly because human activities release pollutants to the atmosphere inamounts that are comparable to, or even exceed, the natural (preindustrial)rates of mobilization (Likens and Butler 1981; Crutzen and Andreae 1990).
For example, while the effects of human activities such as vegetation burningon C, N, and S cycles are most obvious (Crutzen and Andreae 1990), several
Biogeochemistry (2005) 73: 325–344 � Springer 2005
DOI 10.1007/s10533-004-0196-9
studies have reported savannah fires associated with shifting agriculture to be amajor source of P to the atmosphere. Artaxo et al. (2000) found that 56% ofthe aerosol mass (including that of P) measured in the Amazon tropical forestwas associated with biomass burning.
More recently, there has been keen interest in the deposition and composition ofP in rainfall and air around Lake Victoria. This is largely due to concern about thelarge scale deforestation and biomass burning occurring in the region (Delmas etal. 1991; Hao and Liu 1994) which could influence P deposition. In the lake wherewater input by rainfall exceeds river inflow by a greater ratio (6:1), direct atmo-spheric deposition of P on the lake may be significant. Furthermore, the post-1960s increase in P concentrations in the sediment microfossil and water (Hecky1993) has been associated with dramatic shifts in the algal community (Kling et al.2001) and anoxic conditions in the hypolimnetic waters of Lake Victoria (Hecky etal. 1994). Concentrations of TP in the lake now are 2.5 lmol l�1, on average(Guildford andHecky 2000), more than double the TP concentrations reported byTalling (1966) in the early 1960s. Nitrogen-fixing cyanobacteria (Anabaena andCylindrospermopsis) now dominate the phytoplanktonic biomass along with thenon-fixing Microcystis and Planktolyngbya. These species which currently have acompetitive advantage at the low TN:TP ratios of the lake were either not presentor only minor elements of the phytoplankton in the 1960s.
There is a substantial seasonality of rainfall and large spatial differences in theaverage rainfall around Lake Victoria, with more rain recorded on the north-west coast and decreasing towards the south (Yin and Nicholson 1998). Suchtemporal and spatial climatic differences are likely to influence both wet and dryP deposition in the lake. Previous studies of P precipitation in Lake Victoriawere limited in sampling spatially with only one lakeshore location in the north(i.e. Jinja) being analyzed, and only the wet component of the atmosphericdeposition being measured (R. Mugidde, Fisheries Research Institute ofUganda, unpublished data). Dryfall remained unmeasured in Lake Victoriauntil the present study. Also, in a different study employing a Rapid Assessmentmethod, Scheren et al. (2000) used areal P loading rates from wet depositiononly measured for Lake Malawi (0.53 kg ha�2 year�1) and applied them to thesurface area of Lake Victoria to calculate lake-wide atmospheric P loading.
The present work attempts to utilize data of both wet and dry atmospheric Pcollected at four land stations to estimate lake-wide atmospheric P input inLake Victoria. These are the first estimates to include the contribution ofdryfall to the P precipitation in this large tropical lake.
Materials and methods
Site description
Victoria is the second largest lake by area in the world, with surface area of68,800 km2. The lake receives inflows from 17 tributaries, which contribute less
326
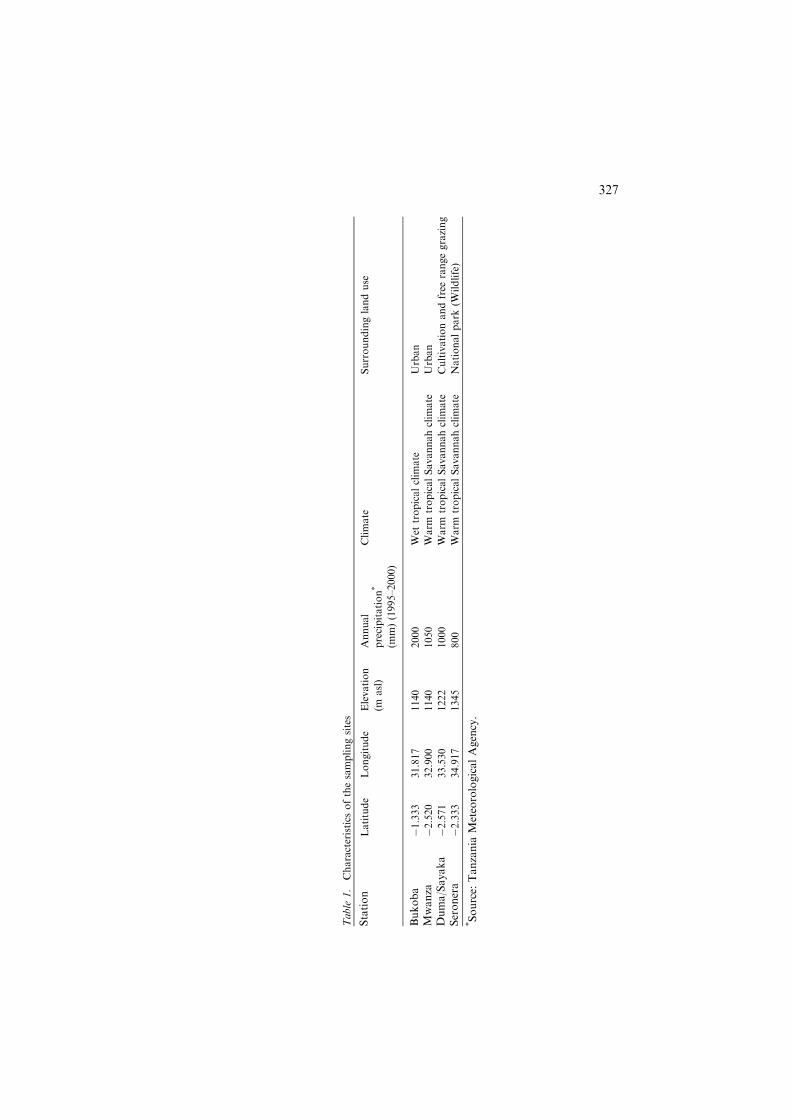
Table
1.
Characteristics
ofthesamplingsites
Station
Latitude
Longitude
Elevation
(masl)
Annual
precipitation*
(mm)(1995–2000)
Climate
Surroundinglanduse
Bukoba
�1.333
31.817
1140
2000
Wet
tropicalclim
ate
Urban
Mwanza
�2.520
32.900
1140
1050
Warm
tropicalSavannahclim
ate
Urban
Duma/Sayaka
�2.571
33.530
1222
1000
Warm
tropicalSavannahclim
ate
Cultivationandfree
rangegrazing
Seronera
�2.333
34.917
1345
800
Warm
tropicalSavannahclim
ate
Nationalpark
(Wildlife)
*Source:
Tanzania
MeteorologicalAgency.
327
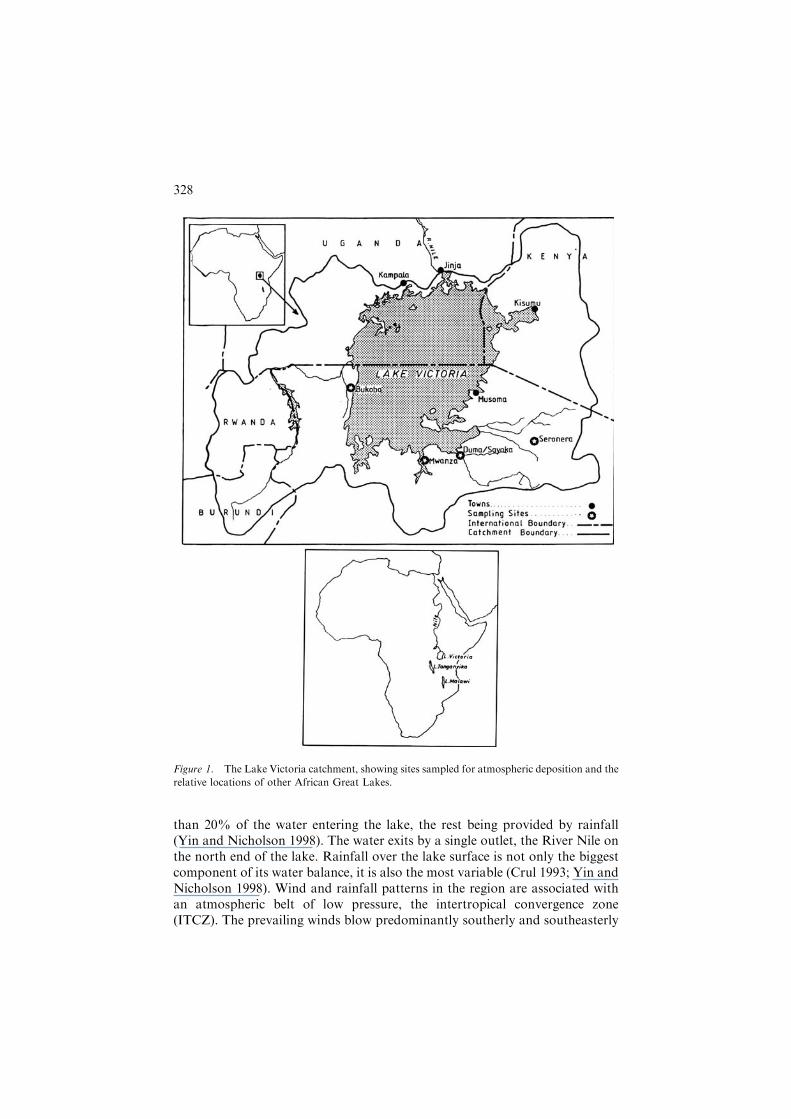
than 20% of the water entering the lake, the rest being provided by rainfall(Yin and Nicholson 1998). The water exits by a single outlet, the River Nile onthe north end of the lake. Rainfall over the lake surface is not only the biggestcomponent of its water balance, it is also the most variable (Crul 1993; Yin andNicholson 1998). Wind and rainfall patterns in the region are associated withan atmospheric belt of low pressure, the intertropical convergence zone(ITCZ). The prevailing winds blow predominantly southerly and southeasterly
Figure 1. The Lake Victoria catchment, showing sites sampled for atmospheric deposition and the
relative locations of other African Great Lakes.
328
with heavy rains falling in the period March–May and short ‘‘vuli’’ rains inNovember–December (EAMD 1975) when the ITCZ migrates back south.
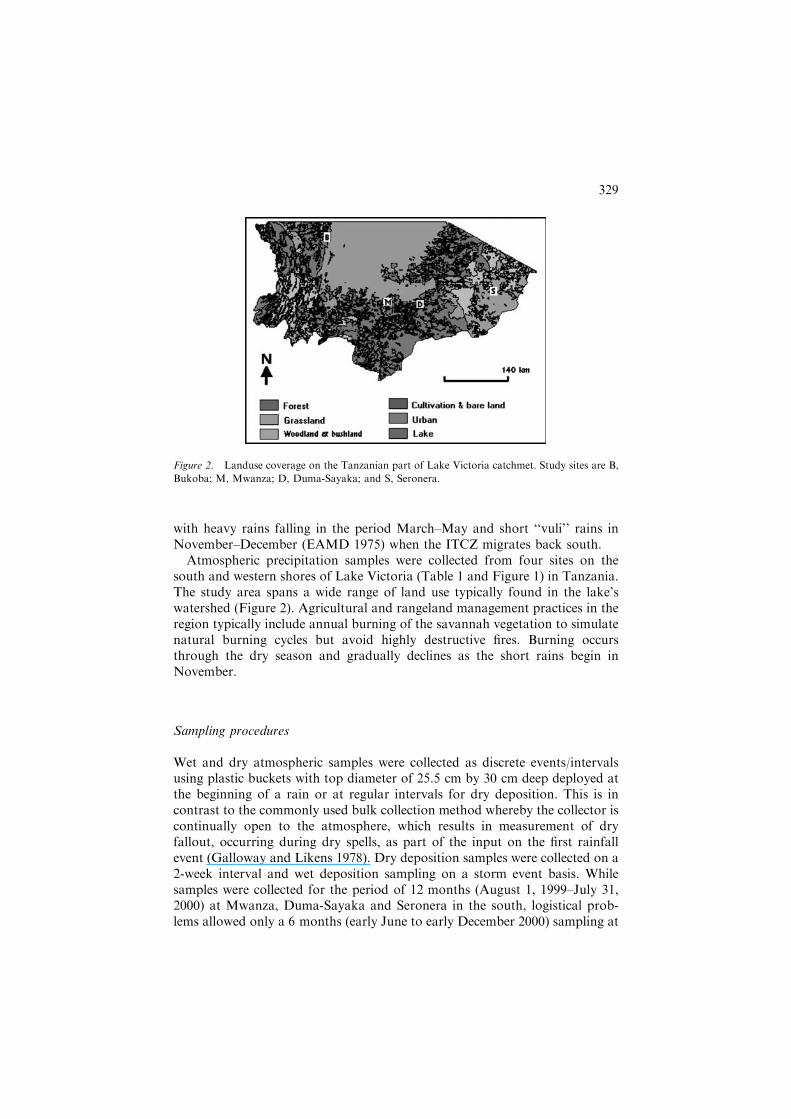
Atmospheric precipitation samples were collected from four sites on thesouth and western shores of Lake Victoria (Table 1 and Figure 1) in Tanzania.The study area spans a wide range of land use typically found in the lake’swatershed (Figure 2). Agricultural and rangeland management practices in theregion typically include annual burning of the savannah vegetation to simulatenatural burning cycles but avoid highly destructive fires. Burning occursthrough the dry season and gradually declines as the short rains begin inNovember.
Sampling procedures
Wet and dry atmospheric samples were collected as discrete events/intervalsusing plastic buckets with top diameter of 25.5 cm by 30 cm deep deployed atthe beginning of a rain or at regular intervals for dry deposition. This is incontrast to the commonly used bulk collection method whereby the collector iscontinually open to the atmosphere, which results in measurement of dryfallout, occurring during dry spells, as part of the input on the first rainfallevent (Galloway and Likens 1978). Dry deposition samples were collected on a2-week interval and wet deposition sampling on a storm event basis. Whilesamples were collected for the period of 12 months (August 1, 1999–July 31,2000) at Mwanza, Duma-Sayaka and Seronera in the south, logistical prob-lems allowed only a 6 months (early June to early December 2000) sampling at
Figure 2. Landuse coverage on the Tanzanian part of Lake Victoria catchmet. Study sites are B,
Bukoba; M, Mwanza; D, Duma-Sayaka; and S, Seronera.
329
Bukoba. Due to lack of functional meteorological instruments at Duma-Sayaka, wet precipitation samples were not collected at this station.
At the beginning of a rainfall event, the collectors were placed on a stand2 m above the ground and removed as soon as possible after the storm (usuallywithin an hour, but occasionally as long as 12 h when rain fell at night). Thewater volumes in the buckets were measured after each storm.
On a dry sampling day three buckets were set out in an attempt to insure atleast one collection without visible contamination by insects or bird droppings.Samples with obvious particulate contamination were always discarded. Aftereach sampling event the buckets were thoroughly cleaned with phosphorus-freedetergent (CONTRAD), copiously rinsed with distilled water, and kept cov-ered until the next sampling. Occasionally, distilled water used in the rinsingprocedures was treated as a sample to verify that the collector buckets wereclean, and not sources of contamination. The collectors were filled with 1 l ofdistilled water to simulate the collecting properties of a wet lake surface (Jassbyet al. 1994). The collectors were then left on top of a 2 m stand for the period of24 h, after which the final water volumes were measured. Dry precipitationsamples were discarded when rain fell during the 24-h exposure of samplecollection buckets.
Sample treatment and chemical analyses
Total phosphorus (TP) and soluble reactive phosphorus (SRP) are the twoforms of P that were measured in this study. TP, which incorporates the totalof all filterable and particulate P forms was analyzed because of its closeassociation with a wide variety of limnological variables (Peters 1986), and thelink between TP loading estimates and P content found in many lake studies.SRP consist largely of the inorganic orthophosphate (PO4) form of P andconstitutes an index of the amount of phosphorus immediately available foralgal growth (Nurnberg and Peters 1984).
Immediately following collection an aliquot of precipitation samples wasfiltered through pre-combusted Whatman GF/C filters (�1 lm nominal poresize) for SRP analyses. TP was analyzed from unfiltered samples. Samplescollected at Mwanza were immediately analyzed for SRP and TP at thewater quality laboratory in Mwanza. For the remaining stations samples werestored in 10% hydrochloric acid-washed polypropylene bottles, frozen anddelivered to the Mwanza water quality laboratory for analysis in a periodranging from 1 day to 2 weeks. TP was analyzed after digestion of unfilteredwater samples for 30 min with potassium persulfate under pressure(15 lbs in�2). This was followed by a colorimetric determination of P at885 nm by the ascorbic acid method (Parsons et al. 1984) using benchtopNovaspec II spectrophotometer. SRP was analyzed from filtered and undi-gested samples by the same method.
330
Calculations and statistical analyses
P was quantified in terms of concentration (lmol l�1 per event or day) of themass sampled and later converted to deposition rate (lmol m�2 day�1
or lmol m�2 event�1) by dividing by the surface area of the opening of thebucket (0.05 m2). For dry precipitation, on average, between 5% and 15% ofdistilled water in the buckets was lost by evaporation during the 24-h exposure.A correction factor, which takes into account the final and initial sample/watervolumes, was used to compensate for the concentrating effect of evaporation asfollows:
C2 ¼ aC1 a ¼ Vf=V0 ð1Þ
where C2 is the final P concentration corrected for evaporation (lmol l�1); a,the correction factor; C1, the measured P concentration (lmol l�1); Vf, the finalsample volume; V0, the initial sample volume.
To normalize the averages between light rains, which have relatively highconcentrations and heavy rains, in which the samples may be more dilute, wetP deposition concentrations were expressed as volume-weighted mean (VWM)concentrations (i.e. weighted by the amount of precipitation collected). VWMconcentration was calculated as follows:
WM ¼
Pn
i¼1ViPi
Pn
i¼1Vi
ð2Þ
where WM is the volume weighted mean concentration (lmol l�1); V, therainfall volume (ml); P, the phosphorus concentration (lmol l�1); n, thenumber of measured rainfall events.
050
100150200250300350400
Aug Sep Oct Nov Dec Jan Feb Mar Apr May Jun Jul1999 2000
Rai
nfal
l (m
m)
MwanzaSeroneraBukobaCatchment
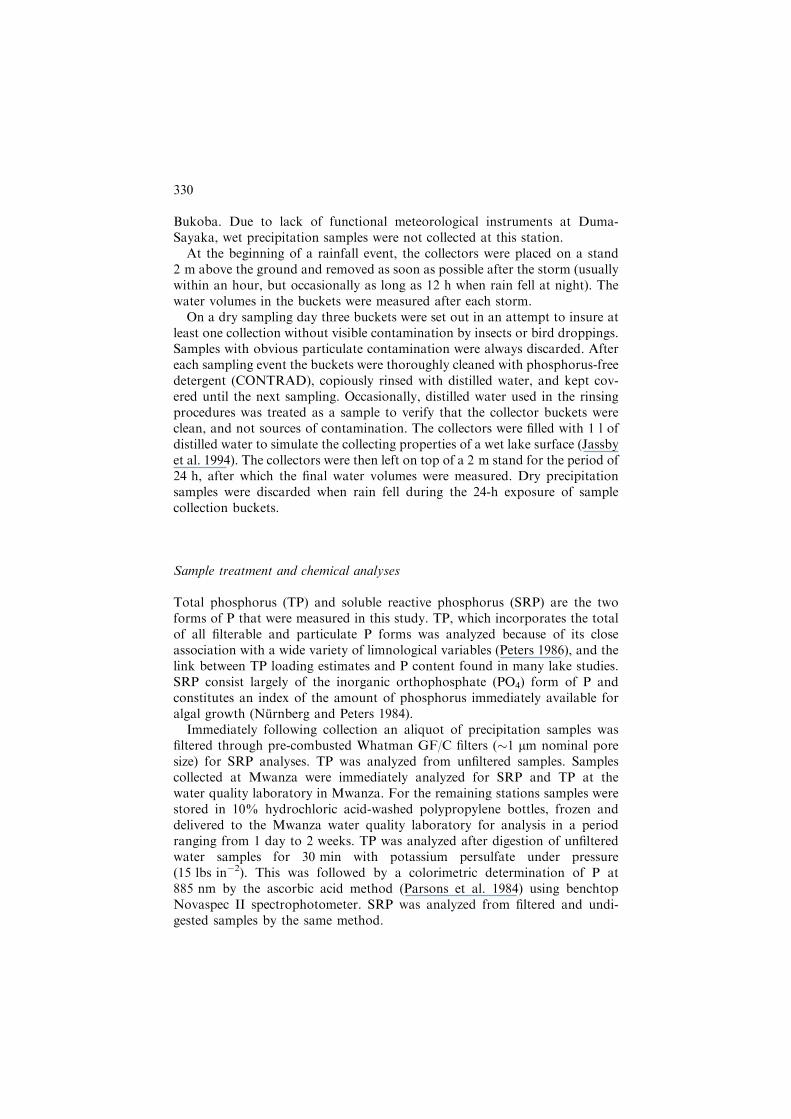
Figure 3. Comparison of mean monthly rainfall (mm) at sampling sites (1999–2000) and entire
Lake Victoria catchment (1956–1978).
331
Also, measured event concentrations were assigned to individual stormcategories (5 mm interval) in order to assess the relative contribution of dif-ferent sized storms to P deposition around the lake.
P deposition to the lake was computed using the following formula:
Pdep ¼ 31 �Dmean � d � A ð3Þ
where Pdep is the phosphorus deposition (tons year�1); 31, the molecularweight of P (to convert lmol l�1 to lg l�1); Dmean, the mean deposition(lmol m�2 day�1 or lmol m�2 event�1); d, the number of dry/wet days in ayear; A, the surface area of the lake under consideration.
For comparison, two types of procedures were used to estimate P depositionto Lake Victoria by using Equation (3) above. First, dry and wet atmospheric Pdeposition rates measured at each of the four sites were applied across the laketo calculate several possible annual lake wide P depositions. The final estimate(ktons P year�1) was computed by averaging P depositions recorded at Buk-oba, Duma-Sayaka and Seronera. Atmospheric deposition rates measured at
53
17
107 5
20
6
40
56
50 50
60
36
0
10
20
30
40
50
60
70
5 10 15 20 25 30 >30
Perc
enta
ge
Total storms=88Sampled
58
880 1 30
6067
50
0
100
22
38
0
20
40
60
80
100
120
5 10 15 20 25 30 >30Size of storm (5mm interval)
Perc
enta
ge
Total storms=72Sampled
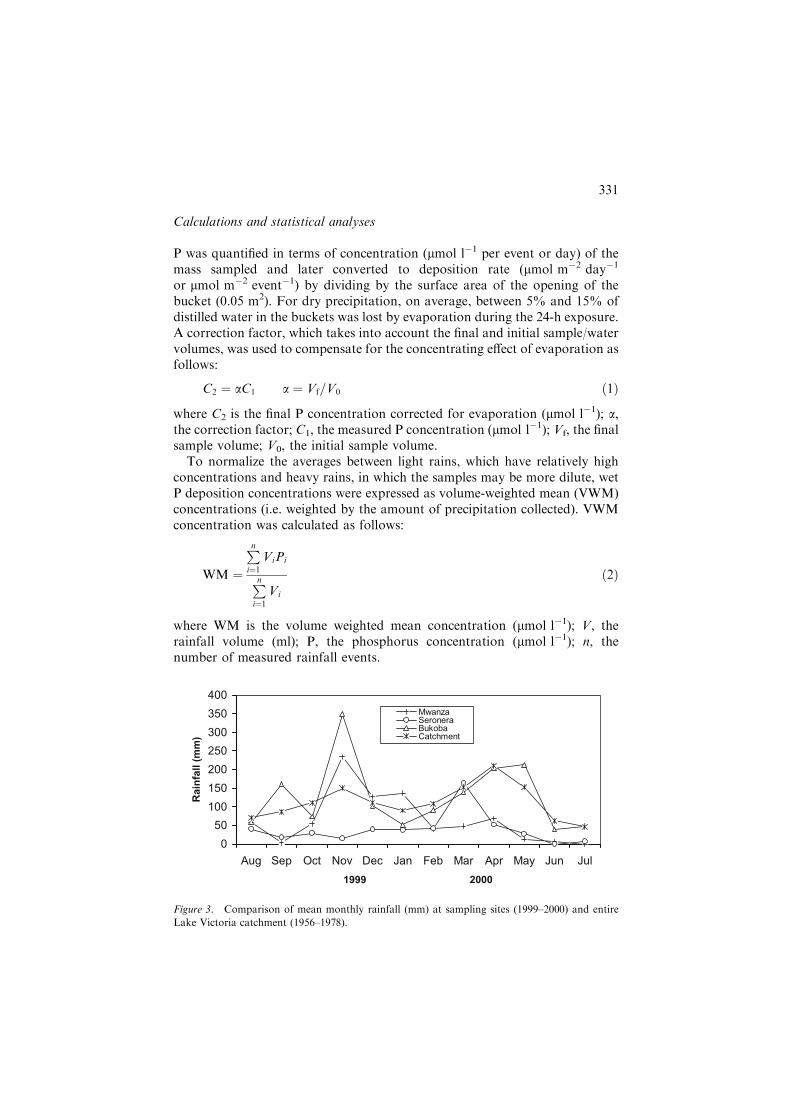
Figure 4. Distribution of the storms as a function of their size and frequency of sampling at
Mwanza (top) and Seronera (below).
332
Mwanza were excluded from the final estimate because of more frequentcontamination of samples with dust from unpaved city roads near the collec-tion site. During the study year there were 150, 88, and 72 rain events (ofgreater than 0.5 mm) at Bukoba, Mwanza and Seronera, respectively. For drydeposition, there were 215 dry days at Bukoba, 277 days at Mwanza andDuma Sayaka, and 293 days at Seronera.
The second procedure involved dividing the lake into five sections based onobserved rainfall regimes, and area weighted deposition rates from samplingsites closest to the particular lake section to estimate areal P depositions. Wetdeposition rates measured at Jinja (reported by Lindenschmidt et al. 1998) werealso included in this procedure. The number of dry/wet days used for each ofthe five lake sections were found by averaging 5-year (1996–2000) rainfall data,and their annual mean differ slightly from that used in the first procedure.
Analyses of variance (ANOVAs) were performed using the SYSTAT sta-tistical package to assess if site and seasonal variations in the quantities of TPand SRP carried by rainfall and dryfall were significantly different. WhereANOVA gave significantly different results, a post-hoc test was conducted via
18
5 10 15 20 25 30 > 30
18 1720
16
6 7
16
63
64 4
25
16
0
10
20
30
40
50
60
70
5 10 15 20 25 30 > 30
Perc
enta
ge
Rain volumeTP deposition
2016
6 7
16
58
1817
1
72.5
67.5
0
10
20
30
40
50
60
70
Perc
enta
ge
Rain volumeSRP deposition
26 27
12.5 11
0 2
23.5
67
165
19
0
10
20
30
40
50
60
70
5 10 15 20 25 >25 5 10 15 20 25 >25Size of storm (5mm interval)
Perc
enta
ge
Rain volumeTP deposition
26 27
12.5 11
0
62
3
23.5
1
85
21
0
10
20
30
40
50
60
70
Size of storm (5mm interval)
Perc
enta
ge
Rain volumeSRP deposition
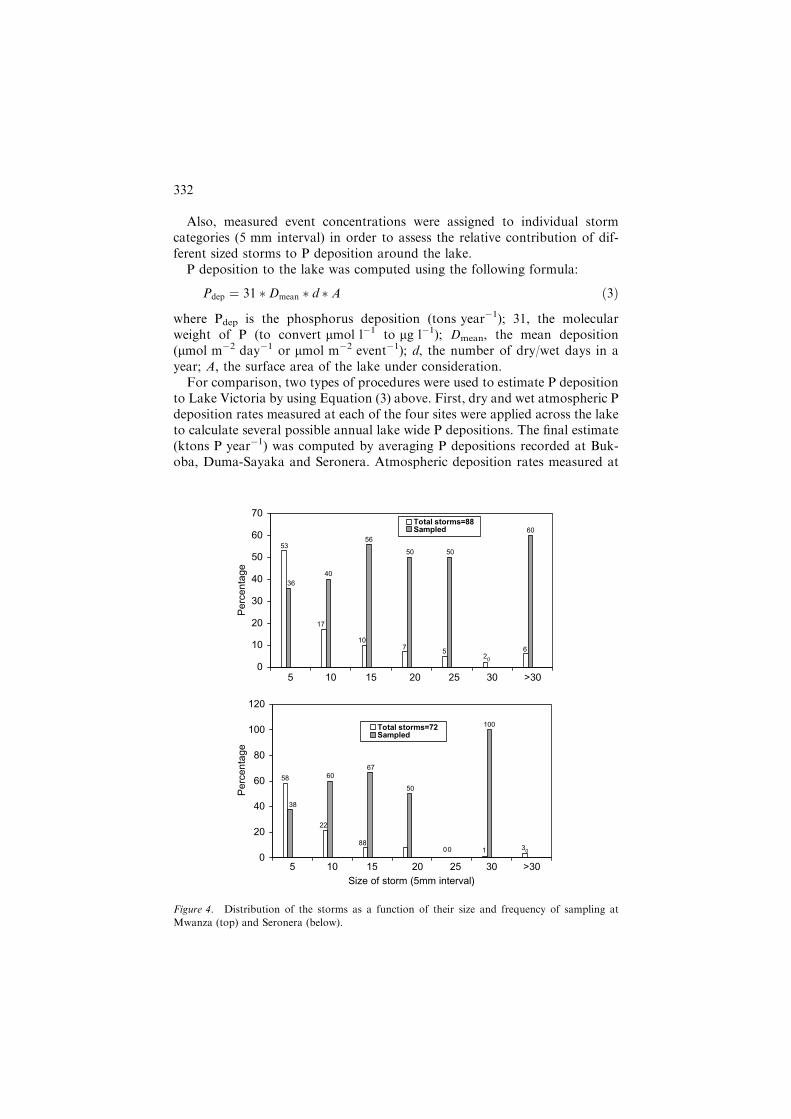
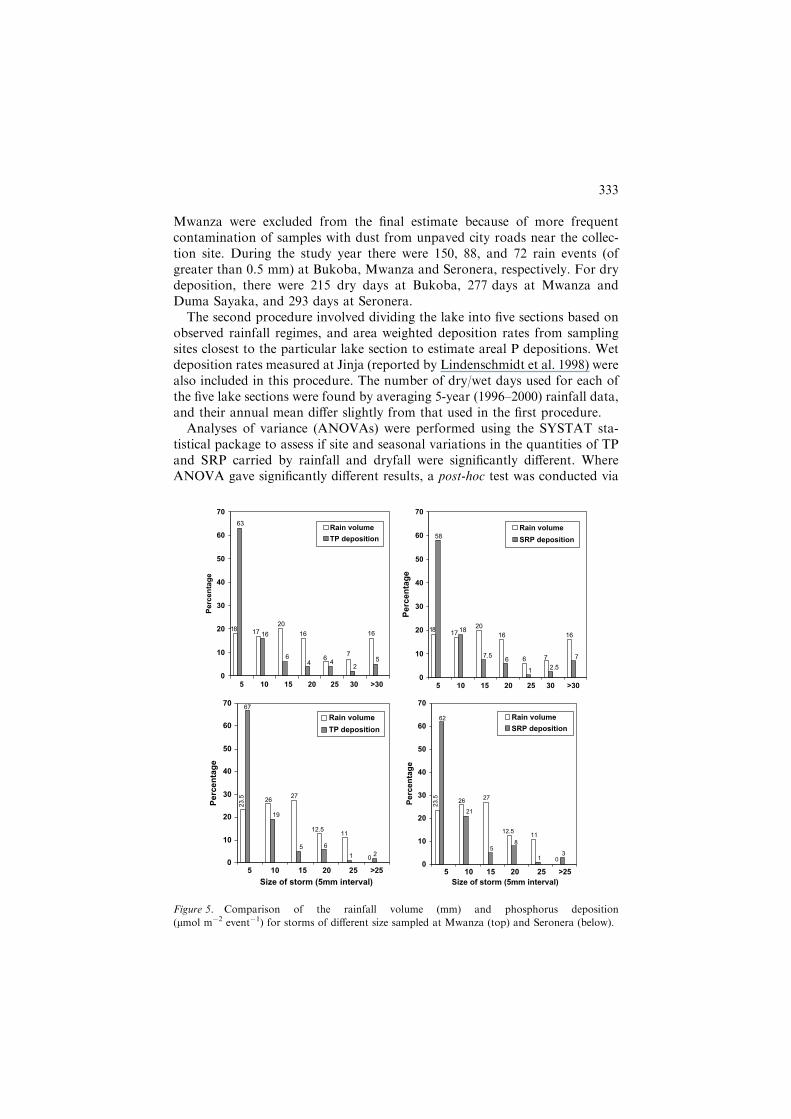
Figure 5. Comparison of the rainfall volume (mm) and phosphorus deposition
(lmol m�2 event�1) for storms of different size sampled at Mwanza (top) and Seronera (below).
333
the least significant difference (LSD) procedures to identify the sites or periodsthat were significantly different in terms of TP and SRP depositions.
Results
Rainfall
During the study period (August 1999–July 2000) 793 mm of rainfall wererecorded at Mwanza, 478 mm at Seronera, and 1531 mm Bukoba. Rainfall
Table 2. (a) Measured mean dry phosphorus deposition at four sites around Lake Victoria (this
study) and that of Lake Malawi/Nyassa (Bootsma et al. 1999). Mean values sharing a superscript
are not significantly different (Anova test; p > 0.05). (b) Measured mean wet phosphorus depo-
sition at three sites around Lake Victoria (this study) and that of Lake Malawi/Nyassa (Bootsma et
al. 1999). Mean values sharing a superscript are not significantly different (Anova test; p > 0.05)
Site TP (lmol m�2 day�1 ± s.e.) SRP (lmol m�2 day�1 ± s.e.) n
Panel ABukoba 20.4 ± 2.18a 5.2 ± 0.73a 12Mwanza 26.2 ± 2.25ab 8.2 ± 0.75b 24Seronera 17.4 ± 1.76ac 3.8 ± 0.58a 21Duma-Sayaka 21.6 ± 2.12a 5.4 ± 0.43a 23Lake Malawi/Nyassa 24.7
Panel BBukoba 13.2 ± 1.12a 8.0 ± 0.60a 35Mwanza 16.2 ± 1.31ab 7.6 ± 0.35b 60Seronera 12.4 ± 0.88ac 7.0 ± 0.38a 48Lake Malawi/Nyassa 14.2 4.53
Panel A: n = dry days sampled.Panel B: n = wet days sampled.
0
50
100
150
200
250
Aug Sep Oct Nov Dec Jan Feb Mar Apr May Jun Jul1999 2000
Rai
nfal
l (m
m)
0
5
10
15
20
25
30
35
Dep
. (um
ol m
-2ev
ent-1
)
RainfallTPSRP
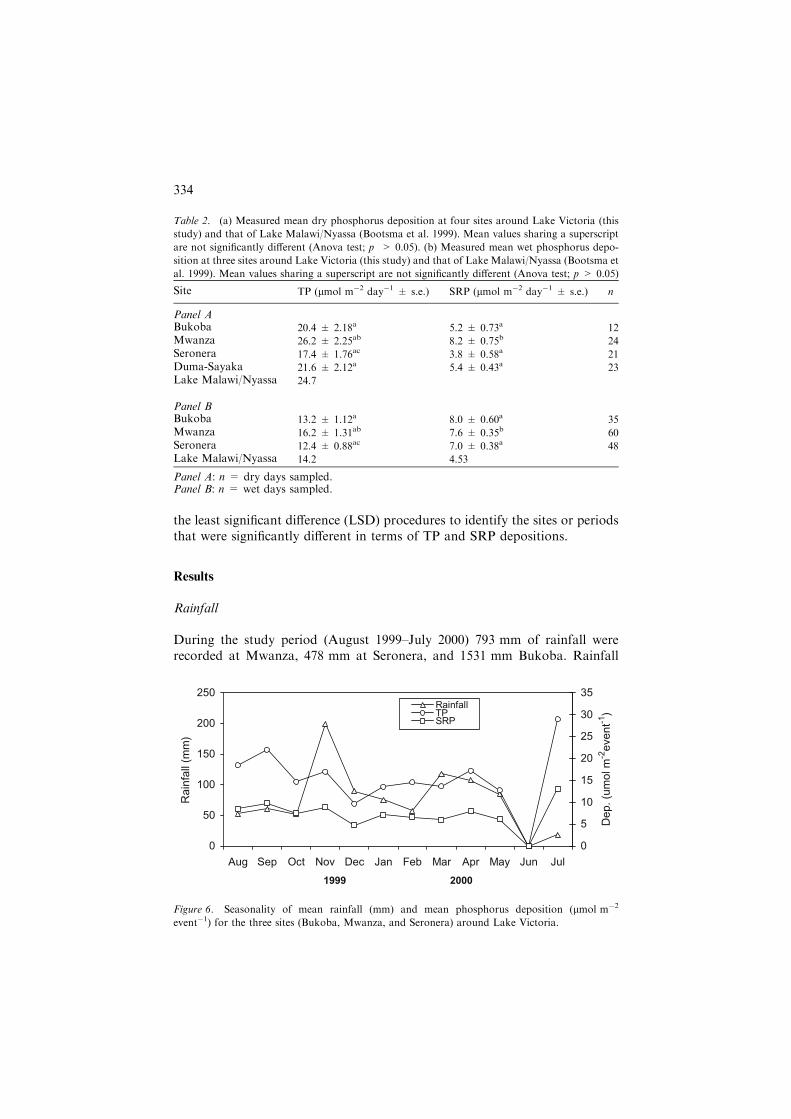
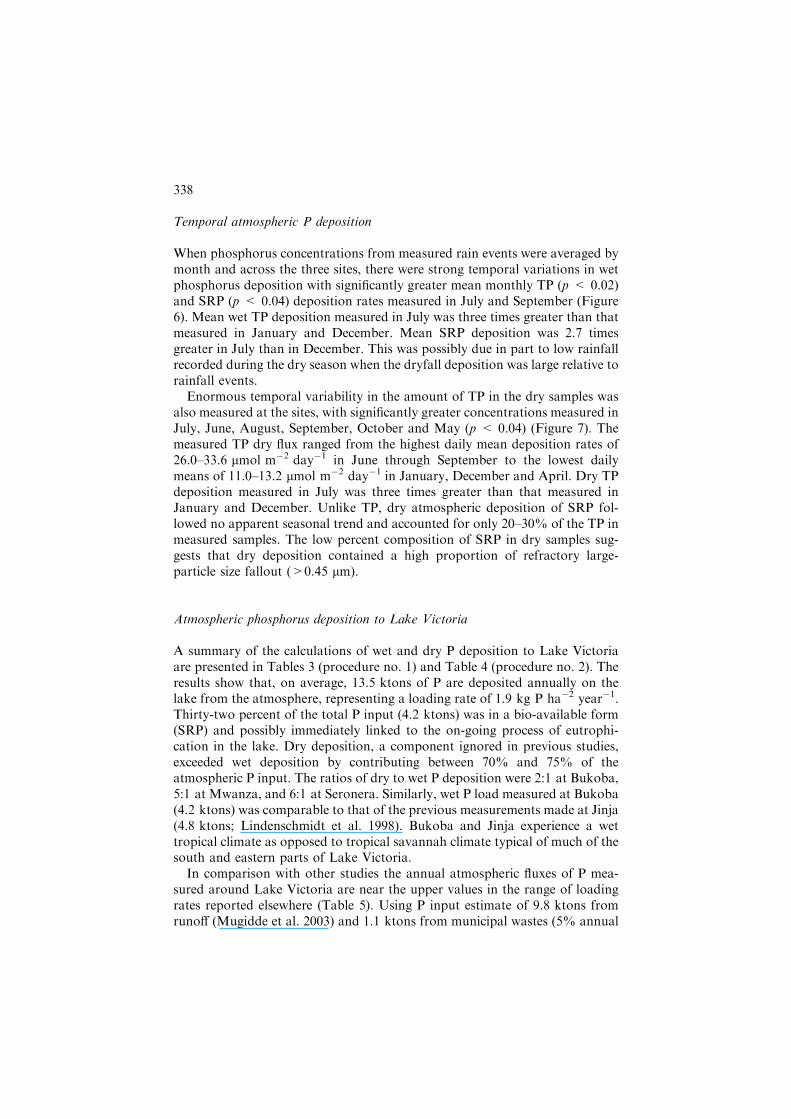
Figure 6. Seasonality of mean rainfall (mm) and mean phosphorus deposition (lmol m�2
event�1) for the three sites (Bukoba, Mwanza, and Seronera) around Lake Victoria.
334

amounts recorded at each of the three stations are lower than the estimate ofrain falling directly on the lake made by Yin and Nicholson (1998), whoestimated average annual rainfall to be 1791 mm. Figure 3 illustrates theseasonality of rainfall around Lake Victoria and compares the mean rainfallover the entire lake catchment (Yin and Nicholson 1998) with that of the threesampling sites during the study period.
During the study period 88 storms of more than 0.5 mm of rain occurred atMwanza, 72 storms at Seronera, and 150 storms at Bukoba. Figure 4 shows thefrequency distribution of storms ranging in size from 1 to 52 mm for Mwanzaand Seronera. The category of high-frequency storms of low magnitude(<5 mm) was somewhat inadequately sampled relative to larger storms. De-spite their possible under-representation in the sampling, these frequentlyoccurring small volume storms, which accounted for only 20% of the rainvolume at Mwanza and Seronera, deposited approximately two-thirds of theTP and SRP observed at the two sites (Figure 5).
Spatial atmospheric P deposition
Mean wet and dry phosphorus deposition measured at four sites around LakeVictoria are given in Table 2(a and b). For wet samples, mean SRP depositionrates were relatively similar at the three sites with no statistically significantspatial differences (p < 0.39). A weak but significant spatial heterogeneityexisted in wet TP deposition, with Mwanza having significantly greater TPdeposition than Seronera (p < 0.02). Wet TP deposition rates measured at thethree sites (12.4–16.2 lmol m�2 event�1) are relatively similar to the depositionrate of 14.2 lmol m�2 event�1 reported by Bootsma et al. (1999) for Lake
0
5
10
15
20
25
30
35
40
Aug Sep Oct Nov Dec Jan Feb Mar Apr May Jun Jul
1999 2000
Mea
n D
epos
ition
(u
mol
m-2
day
-1)
TP SRP
Figure 7. Seasonality of mean dry phosphorus deposition for four sites around Lake Victoria.
Error bars indicate ±standard error (SE) of the mean.
335
Table
3.
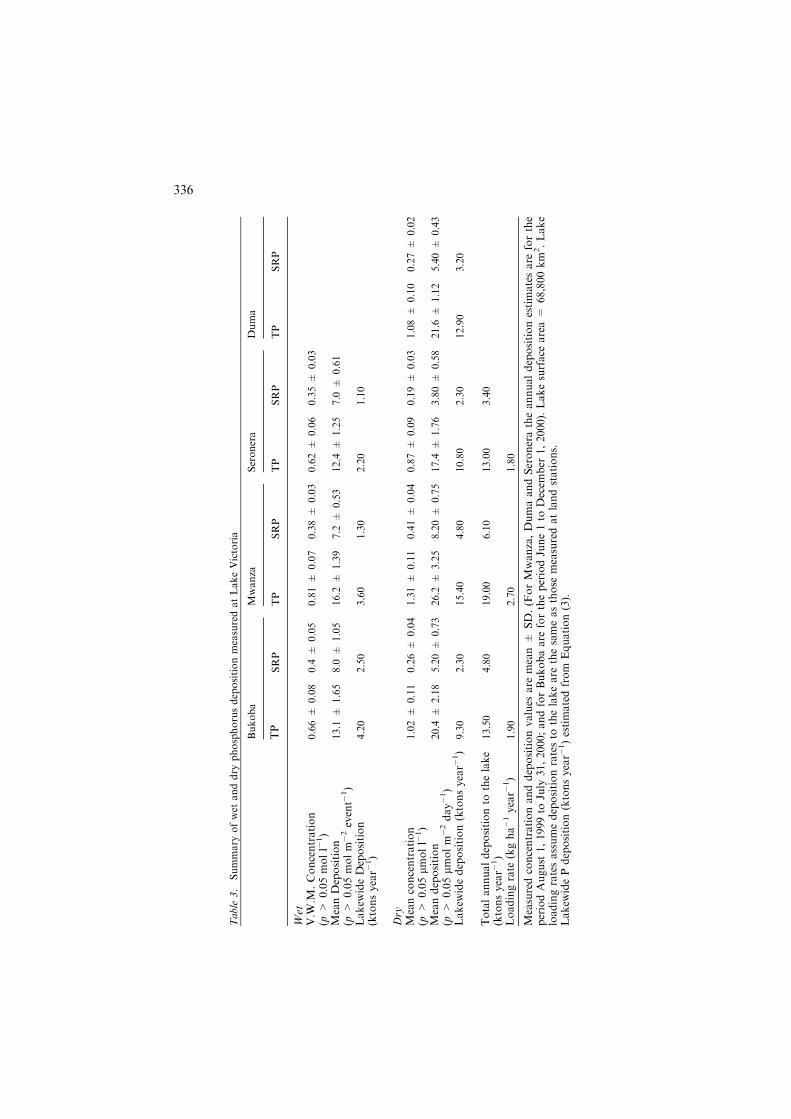
Summary
ofwet
anddry
phosphorusdepositionmeasuredatLakeVictoria
Bukoba
Mwanza
Seronera
Duma
TP
SRP
TP
SRP
TP
SRP
TP
SRP
Wet
V.W
.M.Concentration
(p>
0.05moll�
1)
0.66±
0.08
0.4
±0.05
0.81±
0.07
0.38±
0.03
0.62±
0.06
0.35±
0.03
MeanDeposition
(p>
0.05molm�2event�
1)
13.1
±1.65
8.0
±1.05
16.2
±1.39
7.2
±0.53
12.4
±1.25
7.0
±0.61
Lakew
ideDeposition
(ktonsyear�
1)
4.20
2.50
3.60
1.30
2.20
1.10
Dry
Meanconcentration
(p>
0.05
lmoll�
1)
1.02±
0.11
0.26±
0.04
1.31±
0.11
0.41±
0.04
0.87±
0.09
0.19±
0.03
1.08±
0.10
0.27±
0.02
Meandeposition
(p>
0.05
lmolm�2day�1)
20.4
±2.18
5.20±
0.73
26.2
±3.25
8.20±
0.75
17.4
±1.76
3.80±
0.58
21.6
±1.12
5.40±
0.43
Lakew
idedeposition(ktonsyear�
1)
9.30
2.30
15.40
4.80
10.80
2.30
12.90
3.20
Totalannualdepositionto
thelake
(ktonsyear�
1)
13.50
4.80
19.00
6.10
13.00
3.40
Loadingrate
(kgha�1year�
1)
1.90
2.70
1.80
Measuredconcentrationanddepositionvalues
are
mean±
SD.(ForMwanza,DumaandSeroneratheannualdepositionestimatesare
forthe
periodAugust
1,1999to
July
31,2000;andforBukobaare
fortheperiodJune1to
Decem
ber
1,2000).Lakesurface
area=
68,800km
2.Lake
loadingratesassumedepositionratesto
thelakeare
thesameasthose
measuredatlandstations.
Lakew
idePdeposition(ktonsyear�
1)estimatedfrom
Equation(3).
336

Malawi. In this study SRP constituted one half (47–60%) of the TP in wetsamples that were analyzed. This was considerably higher than for rain samplesmeasured at Lake Malawi whereby SRP comprised 30% of the wet TPdeposition (Bootsma et al. 1999).
For dry precipitation, measured TP deposition rates were significantlygreater at Mwanza than Seronera (p < 0.03). The SRP deposition rate was1.5–2.2 times greater at Mwanza than Duma-Sayaka, Bukoba and Seronera(p < 0.00). As with wet phosphorus deposition, mean dry deposition ratesmeasured in this study (17.4–26.2 lmol m�2 day�1) compare favourably withthe dry deposition rates measured at Lake Malawi (24.7 lmol m�2 day�1,Bootsma et al. 1999).
Table 4. Estimates of wet and dry phosphorus deposition to Lake Victoria by dividing the lake
into five sections of relatively similar rainfall regimes and area weighting P deposition values
measured from nearest sampling sites (Lakewide P load estimated from Equation (3))
Lake section 1 2 3 4 5 Total
Surface area (km2) 6880 17,200 18,576 13,074 13,070 68,800Mean annual rainfall (mm) 1800 2400 1200 2600 1000Mean depositionlmol m�2 day�1 20.4 20.4 17.4 20.4 21.6lmol m�2 event�1 13.8* 13.1 12.4 13.8* 16.2Mean dry days per annum 200 205 240 190 250Mean wet days per annum 165 160 125 175 115Annual deposition (tons year�1)Dry deposition 870.2 2229.8 2404.7 1570.9 2187.9 9263.5 (69%)Wet deposition 485.6 1117.6 892.6 978.8 754.8 4229.4 (31%)
Total deposition[Dry + Wet (tons year�1)]
1355.8 3347.4 3297.3 2549.7 2942.7 13,492.9
*Wet deposition rates measured at Jinja (reported in Lindenschmidt et al. (1998)).
Table 5. Summary of selected tropical and temperate TP loading rates (kg ha�1 year�1)
Wet Dry Wet + Dry Source
TropicalMwanza, L. Victoria 0.5 2.2 2.7 This study*Bukoba, L. Victoria 0.6 1.3 1.9 This study*Seronera, L. Victoria 0.3 1.5 1.8 This study*Duma, L.Victoria – 1.8 – This studyJinja, L. Victoria 0.7 – – Lindenschmidt et al. (1998)West Coast of Africa 1.2 – – Thornton (1965)Lake-Valencia, Venezuela – – 1.68 Lewis (1981)Lake Malawi, Africa 0.3 2.1 2.5 Bootsma et al. (1999)*
TemperateOntario Shield, ELA – – 0.32 Schindler et al. (1976)Colorado Mountains (USA) – – 0.20 Grant and Lewis (1982)
*Wet and dry samples collected separately, and wet samples measured on event basis.
337
Temporal atmospheric P deposition
When phosphorus concentrations from measured rain events were averaged bymonth and across the three sites, there were strong temporal variations in wetphosphorus deposition with significantly greater mean monthly TP (p < 0.02)and SRP (p < 0.04) deposition rates measured in July and September (Figure6). Mean wet TP deposition measured in July was three times greater than thatmeasured in January and December. Mean SRP deposition was 2.7 timesgreater in July than in December. This was possibly due in part to low rainfallrecorded during the dry season when the dryfall deposition was large relative torainfall events.
Enormous temporal variability in the amount of TP in the dry samples wasalso measured at the sites, with significantly greater concentrations measured inJuly, June, August, September, October and May (p < 0.04) (Figure 7). Themeasured TP dry flux ranged from the highest daily mean deposition rates of26.0–33.6 lmol m�2 day�1 in June through September to the lowest dailymeans of 11.0–13.2 lmol m�2 day�1 in January, December and April. Dry TPdeposition measured in July was three times greater than that measured inJanuary and December. Unlike TP, dry atmospheric deposition of SRP fol-lowed no apparent seasonal trend and accounted for only 20–30% of the TP inmeasured samples. The low percent composition of SRP in dry samples sug-gests that dry deposition contained a high proportion of refractory large-particle size fallout (>0.45 lm).
Atmospheric phosphorus deposition to Lake Victoria
A summary of the calculations of wet and dry P deposition to Lake Victoriaare presented in Tables 3 (procedure no. 1) and Table 4 (procedure no. 2). Theresults show that, on average, 13.5 ktons of P are deposited annually on thelake from the atmosphere, representing a loading rate of 1.9 kg P ha�2 year�1.Thirty-two percent of the total P input (4.2 ktons) was in a bio-available form(SRP) and possibly immediately linked to the on-going process of eutrophi-cation in the lake. Dry deposition, a component ignored in previous studies,exceeded wet deposition by contributing between 70% and 75% of theatmospheric P input. The ratios of dry to wet P deposition were 2:1 at Bukoba,5:1 at Mwanza, and 6:1 at Seronera. Similarly, wet P load measured at Bukoba(4.2 ktons) was comparable to that of the previous measurements made at Jinja(4.8 ktons; Lindenschmidt et al. 1998). Bukoba and Jinja experience a wettropical climate as opposed to tropical savannah climate typical of much of thesouth and eastern parts of Lake Victoria.
In comparison with other studies the annual atmospheric fluxes of P mea-sured around Lake Victoria are near the upper values in the range of loadingrates reported elsewhere (Table 5). Using P input estimate of 9.8 ktons fromrunoff (Mugidde et al. 2003) and 1.1 ktons from municipal wastes (5% annual
338
increase from 0.92 ktons in 1997) (Scheren et al. 2000), the present estimates ofatmospheric deposition would represent 55% of the total phosphorus input tothe lake.
Discussion
The atmospheric phosphorus fluxes measured around Lake Victoria arecomparable to those reported for the nearby Lake Malawi, but the values arehigh compared to measurements made in other deposition studies conducted inSouth and North America. Because phosphorus is generally a non-volatileelement, its deposition has been attributed to gravitational settling of atmo-spheric particulate phosphorus from localized sources (Hendry et al. 1984).Thus, while the cause of high phosphorus deposition rates in the Lake Victoriacatchment remains uncertain, soil particulates, dust, and fires are likely sourcesof elevated fluxes due to the intensity of deforestation and biomass burning.
The seasonal pattern that emerged from the data was both predictable andenlightening. Greater P deposition rates were measured during the dry season.This may be due to the tendency of atmospheric aerosol and dust plumes to besuppressed during periods of frequent rain. Also both average and maximumconcentrations in each event peaked in July through September. Higher valuesduring these months were not surprising because at this time of the year, themajority of the annual seasonal burning of vegetation occurs between July andSeptember. In addition, the dry season coincided with the period of maximumexposure of soil following harvest of most crops. Elevated concentrations of Pobserved during this period are likely attributable to a combination of theseactivities and the infrequent occurrence of rainfall.
The significantly lower dry P deposition measured at Seronera relative toother sites possibly reflects less input from local soil particles because thesurrounding park area is vegetated for most of the year by native plant com-munities. In contrast, Mwanza and Bukoba are urbanized and deforestationcaused by shifting cultivation is significant around Duma-Sayaka. Severalsuggestions for high P deposition include soil exposure from deforestation andopen field agriculture (Bootsma and Hecky 1993), and ash released fromvegetation burning (Lewis 1981; Artaxo et al. 2000).
It remains unclear as to why there was no statistically significant spatialdifference in wet SRP deposition in the current study. SRP in rain samplesmeasured at the three sites may have been transported from distant areas, thusrepresenting a regional phenomenon. While this is an oversimplication, it mayhave some validity. The depositional velocity of terrestrial particles injectedinto the atmosphere is related to mass, which is, in turn, related to particle size.According to Murphy (1974), large atmospheric particles that have a shortresidence time are a major contributor to dry fallout and are chiefly of localorigin. However, small particles with relatively long atmospheric residencetimes are removed chiefly by precipitation scavenging and can be of local or
339
very distant origin. If this was the case during the study period, dominantairflow over the region would normally place the sampling sites beneath theplume of dust constantly generated in a more semi-arid region south of theLake Victoria catchment. Thus, in addition to locally generated anthropogenicinputs the regional weather pattern may have had a modifying influence on thefinal concentration of solutes measured at the sampling sites and that SRPbeing scavenged by precipitation at these sites may very likely be of distantorigin.
The influence of meteorological factors on the measured atmospheric fluxeswas also demonstrated by low annual dry TP load (tons year�1) deposited atBukoba despite high P concentrations measured at this site compared to Ser-onera. The low annual dry TP load for Bukoba was the result of the largeamount of rainfall and large number of rain days per annum compared toSeronera.
A combination of long atmospheric residence time of small, potentially morereactive, particles and the importance of moisture for effective stripping ofmajor soluble substances from the atmosphere is the most likely explanationfor elevated levels of SRP in wet precipitation compared to dry precipitation.In this study SRP was analyzed from filtered (0.45 lm) samples. Similar greaterconcentrations of SRP were reported in precipitation samples measured inLake Tahoe, Nevada (Jassby et al. 1994) and Central Alberta, Canada (Cai-azza et al. 1977). Lewis et al. (1985) suspected long-distance transport ofphosphorus containing particles in filtered atmospheric water samples collectedin the montane region of Colorado, USA.
For dry precipitation the theory of depositional velocities would imply thatdry fallout should be dominated by local inputs of large particles, which areprobably the most representative of depositional trends in the immediate area.Greater TP:SRP ratios measured in dry samples especially for drier samplingsites in the south, and statistically significant site differences in both TP andSRP deposition in the dry samples, illustrate a possible linkage between dryprecipitation and locally generated inputs. Around Lake Victoria, there is ahigher contribution of dryfall to the total atmospheric deposition of P and agreater TP:SRP ratio in dry deposition samples measured in this studycompared with the results obtained by Bootsma et al. (1999) in one of the fewavailable studies of atmospheric P deposition in the Great Lakes region ofAfrica. Esser and Kohlmaier (1991) have also shown that a lack of gaseous Pphase should imply that very little (10–25%) of the total atmospheric P emittedfrom anthropogenic sources will reach land and freshwater systems as wetdeposition, since essentially all the P is in particulate form, to be deliveredpredominantly as dry deposition.
There remain some inherent difficulties in the efforts to extrapolate how farparticulate plumes from land stations would travel to the central area of thelake. However, the fact that the dominant south east trade winds system in theregion place the four sampling sites upwind relative to the lake, would makeestimates derived from these stations more reasonable to Lake Victoria than
340

estimates derived from Jinja, which is downwind relative to the lake. Similarly,while it may be true that the average transport distances of particulate mate-rials in dry deposition are shorter than those associated with wet deposition,Prospero (1979) demonstrated long distance movement of large amounts ofdust from North Africa to the Caribbean.
The present estimates of atmospheric P deposition differ from those reportedin earlier studies by rapid assessment method (Scheren et al. 2000) wherepercent contributions of 55, 36 and 9 were assigned for runoff, atmosphere, andmunicipal wastes, respectively. Different sampling and analysis protocols usedto estimates atmospheric P inputs explain the observed differences between thisstudy and data reported in the literature. In their rapid assessment study,Scheren et al. (2000) used areal P loading rates from wet deposition onlymeasured for Lake Malawi (0.53 kg ha�2 year�1 as reported by Bootsma et al.1996) and applied them to the surface area of Lake Victoria to calculateatmospheric P loading. Inclusion of dry deposition in our estimates greatlyincreases the relative importance of atmospheric P loading.
The Victoria ecosystem has been affected by an increase in P concentrationsand P loading. Concentrations of TP in the lake now are 2.5 lmol l�1, onaverage (Guildford and Hecky 2000), more than double the TP concentrationsreported in the early 1960s. Hecky (1993) reported that P concentrations inthe sediment record (assumed proportional to total P loading) began tonotably rise by 1960 and was accompanied by dramatic shifts in the algalmicrofossils. Kling et al. (2001) compared the algal community in Victoria inthe 1990s with earlier records and found a profound change. Nitrogen-fixingcyanobacteria (Anabaena and Cylindrospermopsis) now dominate the phyto-planktonic biomass and nitrogen fixation accounts for over 70% of the totalnitrogen loading to the lake (Mugidde et al. 2003). The nitrogen-fixing specieshave a competitive advantage at the low TN:TP ratios of the lake that areamong the lowest reported in the literature at an average of 13.6 molar andare observed as low as 7.5, well below Redfield proportions (Guildford andHecky 2000).
Study limitations
The major limitation of this study is that rain and dry deposition data werecollected from land stations and then applied to open lake areas to estimatelake-wide phosphorus deposition. Unlike on a wet lake surface, it is possiblefor major solutes deposited on land by dryfall to be recycled from land toatmosphere and back to land, thus falsely inflating net input of land stations.Therefore, it is difficult to know how well measurements made on land wouldadequately represent phosphorus deposition over the open lake areas.
Also, there is a possible error caused by the small sample size of rains used inwet deposition measurements. Given the frequency and variability of storms inthe study sites a relatively large sample size would be needed to reduce the
341
expected error associated with event-based estimates of the true VWM con-centration of solute measured in wet precipitation. For example, 6 months dataat Bukoba may not be representative of the annual population of storms.
Conclusions
Atmospheric precipitation fluxes measured in this study provide insights intoidentifying trends and assessing variability of P precipitation in the regionwhere there are few data on atmospheric deposition. The data allows, for thefirst time, inclusion of the contribution of dry atmospheric precipitation in thephosphorus budget of Lake Victoria. Dry precipitation, a component ignoredin previous studies, provides particularly important amounts of phosphorus indrier areas around the lake.
Circumstantial evidence gathered from flux rates measured at the four sitesallows for the general conclusion that land use was the primary factor influ-encing the observed spatial differences in atmospheric P deposition aroundLake Victoria. As land use became more intensive (e.g. for human settlement,agriculture, animal husbandry, etc.), measured P deposition rates also in-creased, possibly as a result of increased atmospheric input of terrestriallyderived material such as blown soil, dust and ash. Meteorological factors suchas amount of precipitation and wind patterns were found to have a modifyinginfluence on the spatio-temporal deposition of atmospheric phosphorus.
The concurrence of rates of wet deposition among studies on the GreatAfrican lakes and dry deposition among locations in this study and Malawiindicate that atmospheric P deposition is an important source of P loading thatmust be considered in future management of the nutrient inputs to these lakes.The measurement of very similar rates of wet and dry P deposition at suchwidely separated locations as Tanzania and Malawi suggests that our resultsare likely representative of high deposition rates throughout the tropics as aconsequence of human activities.
Acknowledgements
The work upon which this paper is based was supported by the Lake VictoriaEnvironment Management Project (LVEMP) through its Support to RiparianUniversities component in Tanzania. The field research was also supported, inpart, by the Rockefeller African Dissertation Internship Award (ADIA) RF97034 # 796. It is a pleasure to acknowledge the assistance of the Ministry ofWater and Livestock in Tanzania for permission to use Mwanza and Bukobalabs and facilitating sampling access, Mr. G.T. Mgwatu for assisting in samplecollection and analyses, and four anonymous reviewers for helpful commentson the manuscript.
342
References
Artaxo P., de Campos R.C., Fernandes E.T., Martins J.V., Xiao Z., Lindqvist O., Fernandes-
Jimenez M.T. and Maenhaut W. 2000. Large scale mercury and trace element measurements in
the Amazon basin. Atmos. Environ. 34: 4085–4096.
Bootsma H.A. and Hecky R.E. 1993. Conservation of the African Great Lakes: a limnological
perspective. Conserv. Biol. 7: 644–656.
Bootsma H.A., Bootsma M.A. and Hecky R.E. 1996. The chemical composition of precipitation
and its significance to the nutrient budget of Lake Malawi. In: Johnson T.C. and Odada E. (eds)
The Limnology Climatology and Paleoclimatology of the East African Lakes. Gordon and
Breach Publishers, pp. 251–265.
Bootsma H.A., Mwita J., Mwichande B., Hecky R.E., Kihedu J. and Mwambungu J. 1999. The
atmospheric deposition of nutrients on Lake Malawi/Nyasa. In: Bootsma H.A. and Hecky R.E.
(eds) Water Quality Report. Lake Malawi/Nyasa Biodiversity Conservation Project, pp. 85–111.
Caiazza R., Hage K.D. and Gallup D. 1977. Wet and dry deposition of nutrients in Central
Alberta. Water Air Soil Pollut. 9: 309–314.
Cole J.J., Caraco N.F. and Likens G.E. 1990. Short-range atmospheric transport: a significant
source of phosphorus to an oligotrophic lake. Limnol. Oceanogr. 35(6): 1230–1237.
Crul R.C.M. 1993. Limnology and hydrology of Lake Victoria. Comprehensive and comparative
study of Great Lakes. Unesco/IHP-IV Project M-5.1.
Crutzen P.J. and Andreae M.O. 1990. Biomass burning in the tropics: impact on atmospheric
chemistry and biogeochemical cycles. Science 250: 1669–1678.
Delmas R.A., Loudjani P., Podaire A. and Menaut J. 1991. Biomass burning in Africa. In: Levine
J.S. (ed.) Global Biomass Burning. Atmospheric, Climatic and Biospheric Implications. The
MIT Press, Cambridge, pp. 126–132.
EAMD. 1975. East African meteorological department climatological statistics for East Africa.
Part III. Tanzania, Nairobi, E.A. Meteorological Department, 92 p.
Esser G. and Kohlmaier G.H. 1991. Modelling terrestrial sources of nitrogen, phosphorus, sulphur
and organic carbon to rivers. In: Degens E. et al. (eds) Biogeochemistry of Major World Rivers
SCOPE 42. John Wiley and Sons, pp. 297–322.
Galloway J.N. and Likens G.E. 1978. The collection of precipitation for chemical analysis. Tellus
30: 71–82.
Grant M.C. and Lewis W.M. 1982. Chemical loading rates from precipitation in the Colorado
Rockies. Tellus 34: 74–88.
Guildford S.J. and Hecky R.E. 2000. Total nitrogen, total phosphorus and nutrient limitation in
lakes and oceans: is there a common relationship? Limnol. Oceanogr. 45: 1213–1223.
Hao W.M. and Liu M.H. 1994. Spatial and temporal distribution of tropical biomass burning.
Global Biogeochem. Cycles 8: 495–503.
Hecky R.E. 1993. The eutrophication of Lake Victoria. Verh. Internat. Verein. Limnol. 25: 39–48.
Hecky R.E., Bugenyi F.W.B., Ochumba P., Talling J.F., Mugidde R., Gophen M. and Kaufman L.
1994. Deoxygenation of the deep water of Lake Victoria. Limnol. Oceanogr. 39: 1476–1480.
Hendry C.D., Berish C.W. and Edgerton E.S. 1984. Precipitation chemistry at Turrialba, Costa
Rica. Water Resour. Res. 20: 1677–1684.
Kling H.J., Mugidde R. and Hecky R.E. 2001. Recent changes in the phytoplankton community of
Lake Victoria in response to eutrophication. In: Munawar M. and Hecky R.E. (eds) Great Lakes
of the World: Food Webs, Health and Integrity. Backhuys, Leiden, pp. 47–66.
Jassby A.D., Reuter J.E., Axler R.P., Goldman C.R. and Hackley S.H. 1994. Atmospheric
deposition of Nitrogen and Phosphorus in the annual load of Lake Tahoe (California–Nevada).
Water Resour. Res. 30(7): 2207–2216.
Lewis W.M. Jr. 1981. Precipitation chemistry and nutrient loading by precipitation in a tropical
watershed. Water Resour. Res. 17(1): 169–181.
Lewis W.M. Jr., Grant M.C. and Hamilton S.K. 1985. Evidence that filterable phosphorus is a
significant atmospheric link in the phosphorus cycle. Oikos 45: 428–432.
343
Likens G.E. and Butler T.J. 1981. Recent acidification of precipitation in North America. Bio-
geochem. Forested Ecosyst. 15: 1103.
Lindenschmidt K.E., Suhr M., MagumbaM.K., Hecky R.E. and Bugenyi F.W.B. 1998. Loading of
solutes and suspended solids from rural catchment areas flowing into Lake Victoria in Uganda.
Water Res. 32: 2776–2786.
Mugidde R., Hecky R.E., Hendzel L. and Taylor W.D. 2003. Pelagic nitrogen fixation in Lake
Victoria, Uganda. J. Great Lakes Research 29(2): 76–88.
Murphy T.J. 1974. Sources of phosphorus inputs from the atmosphere and their significance to
oligotrophic lakes. University of Illinois Water Resources Centre (UILU-WRC-74-0092). Re-
search Report No. 92. 45 p.
Nurnberg G. and Peters P.H. 1984. Biological availability of soluble reactive phosphorus in anoxic
and oxic freshwaters. Can. J. Fish. Aquat. Sci. 41: 757–765.
Parsons T.R., Maita Y. and Lalli C.M. 1984. A Manual of Chemical and Biological Methods of
Seawater Analysis. Pergamon, Oxford, England.
Peters R.H. 1986. The role of prediction in limnology. Limnol. Oceanogr. 31: 1143–1159.
Prospero J.M. 1979. Mineral and seal salt aerosol concentrations in various ocean regions. J.
Geophys. Res. 84: 725–731.
Scheren P.A., Zanting H.A. and Lemmens A.M. 2000. Estimation of water pollution sources in
Lake Victoria, East Africa: application and elaboration of the rapid assessment methodology. J.
Environ. Manage. 58: 235–248.
Schindler D.W., Newbury R.W., Beaty K.G. and Campbell P. 1976. Natural water and chemical
budgets for a small Precambrian lake basin in Central Canada. J. Fisheries Res. Board Canada
33: 2526–2543.
Thornton I. 1965. Nutrient content of rainwater on the Gambia. Nature 205: 1025.
Yin X. and Nicholson S.E. 1998. The water balance of Lake Victoria. Hydr. Sci. J. 43(5): 789–811.
344