Impacts of operating conditions and solution chemistry on osmotic membrane structure and performance
10
Impacts of operating conditions and solution chemistry on osmotic membrane structure and performance Mavis C.Y. Wong, Kristina Martinez, Guy Z. Ramon 1 , Eric M.V. Hoek ⁎ Department of Civil and Environmental Engineering and California NanoSystems Institute, University of California, Los Angeles, CA, USA abstract article info Article history: Received 20 June 2011 Received in revised form 11 October 2011 Accepted 13 October 2011 Available online 17 November 2011 Keywords: Forward osmosis Membrane structural parameter Concentration polarization Cellulose triacetate Herein, we report on changes in the performance of a commercial cellulose triacetate (CTA) membrane, imparted by varied operating conditions and solution chemistries. Changes to feed and draw solution flow rate did not significantly alter the CTA membrane's water permeability, salt permeability, or membrane structural parameter when operated with the membrane skin layer facing the draw solution (PRO-mode). However, water and salt permeability increased with increasing feed or draw solution temperature, while the membrane structural parameter decreased with increasing draw solution, possibly due to changes in polymer intermolecular interactions. High ionic strength draw solutions may de-swell the CTA membrane via charge neutralization, which resulted in lower water permeability, higher salt permeability, and lower structural parameter. This observed trend was further exacerbated by the presence of divalent cations which tends to swell the polymer to a greater extent. Finally, the calculated CTA membrane's structural pa- rameter was lower and less sensitive to external factors when operated in PRO-mode, but highly sensitive to the same factors when the skin layer faced the feed solution (FO-mode), presumably due to swelling/ de-swelling of the saturated porous substructure by the draw solution. This is a first attempt aimed at sys- tematically evaluating the changes in performance of the CTA membrane due to operating conditions and so- lution chemistry, shedding new insight into the possible advantages and disadvantages of this material in certain applications. © 2011 Elsevier B.V. All rights reserved. 1. Introduction The amount of accessible fresh water in the world is estimated to be less than 1% of the Earth's entire water supply, whereas nearly 70% of the planet is covered with ocean water [1,2]. With a rapidly expanding global population, fresh water is becoming a scarce re- source and hence, there is growing interest in the use of desalination technology to produce fresh water from ocean water as well as other non-traditional water sources such as brackish and waste-water. The most popular commercial technologies for desalination include ther- mal processes (multi-stage flash distillation, multi-effect distillation, mechanical vapor compression, etc.) and membrane processes (reverse osmosis, nanofiltration, and electro-dialysis) [3]; the relative merits and limitations of these are well studied [4]. While not a new idea, forward osmosis (FO) is emerging as a possible future alterna- tive to these conventional desalting technologies, and FO is considered one of “three technologies [that] promise to reduce the energy requirements of desalination by up to 30 percent” [5]. Forward osmosis is the transport of water through a semi- permeable membrane from a relatively low concentration solution (feed) to a relatively high concentration solution (draw), that is, from a high to low water chemical potential. Recently, engineered-osmosis membrane processes have been receiving increased attention due to their significantly lower operating pressures and lower fouling propen- sity. Therefore, FO may be developed into a relatively low energy and low cost desalination process [6,7]. Engineered-osmosis membrane processes are also being developed for wastewater reclamation [8,9], food and pharmaceutical concentration [10,11], as well as renewable energy production from salinity gradients [12–15]. During the osmotic transport, water permeation across the mem- brane from the feed solution dilutes the draw solution concentration at the membrane surface, while a small amount of salt diffuses through the membrane from the draw to concentrate the feed as membranes are not completely impermeable to salt. This reduction in the effective trans-membrane salinity difference, or the osmotic pressure difference, is referred to as external concentration polariza- tion (ECP). The effect of ECP can generally be minimized by increasing the mass transfer rates in the feed and draw flow channels [9]. Commercially available semi-permeable osmotic membranes have an asymmetric structure comprised of a thin, dense skin layer where Desalination 287 (2012) 340–349 ⁎ Corresponding author at: University of California, Los Angeles, 5732-G Boelter Hall, P.O. Box 951593, Los Angeles, CA, 90095-1593, USA. Tel.: +1 310 206 3735; fax: +1 310 206 2222. E-mail address: [email protected] (E.M.V. Hoek). 1 Present address: Department of Mechanical and Aerospace Engineering, Princeton University, Princeton, NJ 08544, USA. 0011-9164/$ – see front matter © 2011 Elsevier B.V. All rights reserved. doi:10.1016/j.desal.2011.10.013 Contents lists available at SciVerse ScienceDirect Desalination journal homepage: www.elsevier.com/locate/desal
Transcript of Impacts of operating conditions and solution chemistry on osmotic membrane structure and performance

Desalination 287 (2012) 340–349
Contents lists available at SciVerse ScienceDirect
Desalination
j ourna l homepage: www.e lsev ie r .com/ locate /desa l
Impacts of operating conditions and solution chemistry on osmotic membranestructure and performance
Mavis C.Y. Wong, Kristina Martinez, Guy Z. Ramon 1, Eric M.V. Hoek ⁎Department of Civil and Environmental Engineering and California NanoSystems Institute, University of California, Los Angeles, CA, USA
⁎ Corresponding author at: University of California, LoP.O. Box 951593, Los Angeles, CA, 90095-1593, USA. Te310 206 2222.
E-mail address: [email protected] (E.M.V. Hoek).1 Present address: Department of Mechanical and Aer
University, Princeton, NJ 08544, USA.
0011-9164/$ – see front matter © 2011 Elsevier B.V. Alldoi:10.1016/j.desal.2011.10.013
a b s t r a c t
a r t i c l e i n f oArticle history:Received 20 June 2011Received in revised form 11 October 2011Accepted 13 October 2011Available online 17 November 2011
Keywords:Forward osmosisMembrane structural parameterConcentration polarizationCellulose triacetate
Herein, we report on changes in the performance of a commercial cellulose triacetate (CTA) membrane,imparted by varied operating conditions and solution chemistries. Changes to feed and draw solution flowrate did not significantly alter the CTA membrane's water permeability, salt permeability, or membranestructural parameter when operated with the membrane skin layer facing the draw solution (PRO-mode).However, water and salt permeability increased with increasing feed or draw solution temperature, whilethe membrane structural parameter decreased with increasing draw solution, possibly due to changes inpolymer intermolecular interactions. High ionic strength draw solutions may de-swell the CTA membranevia charge neutralization, which resulted in lower water permeability, higher salt permeability, and lowerstructural parameter. This observed trend was further exacerbated by the presence of divalent cationswhich tends to swell the polymer to a greater extent. Finally, the calculated CTA membrane's structural pa-rameter was lower and less sensitive to external factors when operated in PRO-mode, but highly sensitiveto the same factors when the skin layer faced the feed solution (FO-mode), presumably due to swelling/de-swelling of the saturated porous substructure by the draw solution. This is a first attempt aimed at sys-tematically evaluating the changes in performance of the CTA membrane due to operating conditions and so-lution chemistry, shedding new insight into the possible advantages and disadvantages of this material incertain applications.
© 2011 Elsevier B.V. All rights reserved.
1. Introduction
The amount of accessible fresh water in the world is estimated tobe less than 1% of the Earth's entire water supply, whereas nearly 70%of the planet is covered with ocean water [1,2]. With a rapidlyexpanding global population, fresh water is becoming a scarce re-source and hence, there is growing interest in the use of desalinationtechnology to produce fresh water from ocean water as well as othernon-traditional water sources such as brackish and waste-water. Themost popular commercial technologies for desalination include ther-mal processes (multi-stage flash distillation, multi-effect distillation,mechanical vapor compression, etc.) and membrane processes(reverse osmosis, nanofiltration, and electro-dialysis) [3]; the relativemerits and limitations of these are well studied [4]. While not a newidea, forward osmosis (FO) is emerging as a possible future alterna-tive to these conventional desalting technologies, and FO is
s Angeles, 5732-G Boelter Hall,l.: +1 310 206 3735; fax: +1
ospace Engineering, Princeton
rights reserved.
considered one of “three technologies [that] promise to reduce theenergy requirements of desalination by up to 30 percent” [5].
Forward osmosis is the transport of water through a semi-permeable membrane from a relatively low concentration solution(feed) to a relatively high concentration solution (draw), that is, froma high to low water chemical potential. Recently, engineered-osmosismembrane processes have been receiving increased attention due totheir significantly lower operating pressures and lower fouling propen-sity. Therefore, FO may be developed into a relatively low energy andlow cost desalination process [6,7]. Engineered-osmosis membraneprocesses are also being developed for wastewater reclamation [8,9],food and pharmaceutical concentration [10,11], as well as renewableenergy production from salinity gradients [12–15].
During the osmotic transport, water permeation across the mem-brane from the feed solution dilutes the draw solution concentrationat the membrane surface, while a small amount of salt diffusesthrough the membrane from the draw to concentrate the feed asmembranes are not completely impermeable to salt. This reductionin the effective trans-membrane salinity difference, or the osmoticpressure difference, is referred to as external concentration polariza-tion (ECP). The effect of ECP can generally be minimized by increasingthe mass transfer rates in the feed and draw flow channels [9].
Commercially available semi-permeable osmotic membranes havean asymmetric structure comprised of a thin, dense skin layer where

341M.C.Y. Wong et al. / Desalination 287 (2012) 340–349
salt rejection occurs formed over a porous substructure, which providesmechanical support. In what follows, experiments performed with themembrane skin layer facing the draw solution will be referred to asPRO-mode while those performed with the membrane skin layer facingthe feed solution will be referred to as FO-mode. The twomodes of oper-ation are used in the FO experiments investigated herein.When operatedin PRO-mode, solute permeating through the skin layer concentrates thefeed solution, and the porous support creates a stagnant zone where sol-ute is transported solely by hindereddiffusion, exacerbating the reductionin the effective osmotic pressure difference, resulting in concentrative in-ternal concentration polarization (ICP) (Fig. 1a). Dilutive ICP occurs whenoperating in FO-mode when water permeating through the membranedilutes the draw solution within the porous support where, again, solutemass transfer is slow. Both cases of ICP result in a substantial reduction ofthe effective osmotic pressure difference across the active layer of themembrane (Fig. 1b), which in turn lowers thewaterflux across themem-brane. Furthermore, since the polarization occurs within the porousmembrane support, it cannot be reduced by hydrodynamic means, e.g.through an increased cross-flow velocity [9,16,17].
Consequently, a great deal of effort has been extended towardsunderstanding and quantifying ICP. These studies have mostly beenaimed at estimating the resistance to mass transfer within the poroussupport. The structural parameter has been used to reflect the com-bined effects of porous substructure porosity, tortuosity and thick-ness, with the foregone conclusion that a porous, thin support withstraight pores is essential for minimizing ICP. An implicit assumptionhas been that the structure of the membrane support is constant andis not affected by operating conditions. This is indeed plausible if theporous material is completely inert; in practice, however, the poly-meric material may interact, to various extents, with the solution aschanges in temperature and chemical composition are made. For ex-ample, hydrogel polymers have been reported to absorb water andswell [18,19], increasing its volume and mass significantly. Cellulosicpolymers have also been found to swell in the presence of variousmixtures [20–23]. Furthermore, cellulosic polymers contain hydroxylgroups [24,25] that could interact electrostatically with polar solventsand ionic solutions. Thus, there may be inherent changes to mem-brane structure and performance as a result of the interaction be-tween polymeric membranes and the solution it is in contact with.
Fig. 1. Concentration polarization in osmotic membrane processes. The reduced concentratiooccurs when the skin layer faces the draw, and salt builds up in the porous support (PRO-mwater flux dilutes the draw concentration (FO-mode).
Little effort has thus far been extended towards understanding thepossible effect of solution–membrane interactions on the structuralmass transfer resistance of the porous support. The increased waterflux with increasing temperature observed in RO has long beenknown (e.g. [26]), but this has not, to the best of our knowledge,been investigated for FO where two streams contact the membraneon either side. Recently, Achilli et al. [6] reported that different saltsproducing the same osmotic pressure did not have a significant effecton the calculated structural parameter for the CTA membrane in FO-mode. Indeed, the variation over the entire data range amounted toless than 20%. However, at closer scrutiny it does seem that largervariations may exist within the separate data for the varying saltsused. Furthermore, it is interesting to note that the average valuereported for the CTA membrane, 470 μm, is much lower than~670 μm, reported in another study with the membrane in PRO-mode [17] and in yet another study, the structural parameter wasreported to vary between 500 and 700 μm [18]. Certainly, thisreported variability warrants further scrutiny to determine whetherdifferent testing conditions could induce such differences in thestructural parameter of the CTA membrane.
The purpose of this study was to determine how and to what ex-tent FO process conditions affect the water flux across the membrane.Specifically, what changes are observed for the water permeabilityand calculated structural parameter with variations in solution flowrate, temperature, composition, and membrane orientation (seeTable 1 for the matrix of experimental conditions investigated here-in). In order to systematically understand the effect of process condi-tions, a commercial FO membrane was first characterized through ROexperiments, followed by FO experiments through which possiblechanges to the membrane structure were investigated.
2. Materials and methods
2.1. Membrane
The FO membrane used is a commercially available cellulose triac-etate (CTA) membrane (Hydration Technologies Innovations, Albany,OR), which is an asymmetric and a moderately hydrophilic mem-brane [25]. By appearance, the skin layer side of the membrane is
n at the external membrane surfaces is due to external CP. Concentrative internal CP (a)ode), whereas dilutive internal CP (b) occurs when the skin layer faces the feed, and
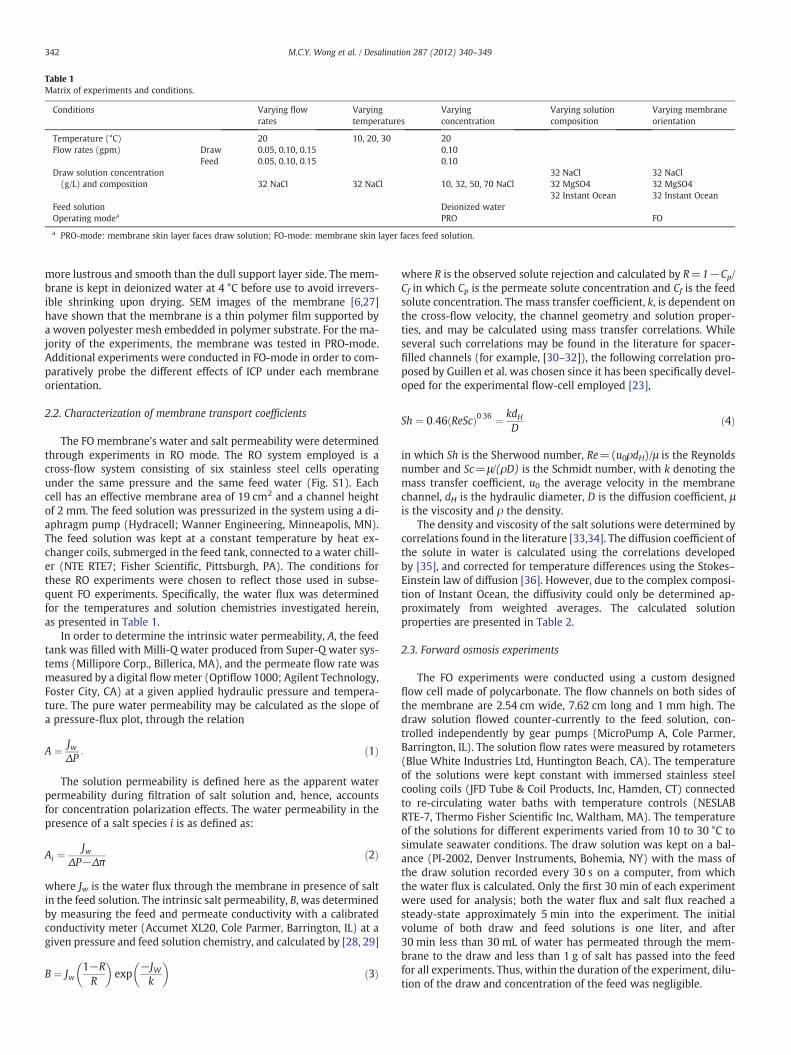
Table 1Matrix of experiments and conditions.
Conditions Varying flowrates
Varyingtemperatures
Varyingconcentration
Varying solutioncomposition
Varying membraneorientation
Temperature (°C) 20 10, 20, 30 20Flow rates (gpm) Draw 0.05, 0.10, 0.15 0.10
Feed 0.05, 0.10, 0.15 0.10Draw solution concentration(g/L) and composition
32 NaCl 32 NaCl32 NaCl 32 NaCl 10, 32, 50, 70 NaCl 32 MgSO4 32 MgSO4
32 Instant Ocean 32 Instant OceanFeed solution Deionized waterOperating modea PRO FO
a PRO-mode: membrane skin layer faces draw solution; FO-mode: membrane skin layer faces feed solution.
342 M.C.Y. Wong et al. / Desalination 287 (2012) 340–349
more lustrous and smooth than the dull support layer side. The mem-brane is kept in deionized water at 4 °C before use to avoid irrevers-ible shrinking upon drying. SEM images of the membrane [6,27]have shown that the membrane is a thin polymer film supported bya woven polyester mesh embedded in polymer substrate. For the ma-jority of the experiments, the membrane was tested in PRO-mode.Additional experiments were conducted in FO-mode in order to com-paratively probe the different effects of ICP under each membraneorientation.
2.2. Characterization of membrane transport coefficients
The FO membrane's water and salt permeability were determinedthrough experiments in RO mode. The RO system employed is across-flow system consisting of six stainless steel cells operatingunder the same pressure and the same feed water (Fig. S1). Eachcell has an effective membrane area of 19 cm2 and a channel heightof 2 mm. The feed solution was pressurized in the system using a di-aphragm pump (Hydracell; Wanner Engineering, Minneapolis, MN).The feed solution was kept at a constant temperature by heat ex-changer coils, submerged in the feed tank, connected to a water chill-er (NTE RTE7; Fisher Scientific, Pittsburgh, PA). The conditions forthese RO experiments were chosen to reflect those used in subse-quent FO experiments. Specifically, the water flux was determinedfor the temperatures and solution chemistries investigated herein,as presented in Table 1.
In order to determine the intrinsic water permeability, A, the feedtank was filled with Milli-Q water produced from Super-Q water sys-tems (Millipore Corp., Billerica, MA), and the permeate flow rate wasmeasured by a digital flowmeter (Optiflow 1000; Agilent Technology,Foster City, CA) at a given applied hydraulic pressure and tempera-ture. The pure water permeability may be calculated as the slope ofa pressure-flux plot, through the relation
A ¼ JwΔP
: ð1Þ
The solution permeability is defined here as the apparent waterpermeability during filtration of salt solution and, hence, accountsfor concentration polarization effects. The water permeability in thepresence of a salt species i is as defined as:
Ai ¼Jw
ΔP−Δπð2Þ
where Jw is the water flux through the membrane in presence of saltin the feed solution. The intrinsic salt permeability, B, was determinedby measuring the feed and permeate conductivity with a calibratedconductivity meter (Accumet XL20, Cole Parmer, Barrington, IL) at agiven pressure and feed solution chemistry, and calculated by [28, 29]
B ¼ Jw1−RR
� �exp
−JWk
� �ð3Þ
where R is the observed solute rejection and calculated by R=1−Cp/Cf in which Cp is the permeate solute concentration and Cf is the feedsolute concentration. The mass transfer coefficient, k, is dependent onthe cross-flow velocity, the channel geometry and solution proper-ties, and may be calculated using mass transfer correlations. Whileseveral such correlations may be found in the literature for spacer-filled channels (for example, [30–32]), the following correlation pro-posed by Guillen et al. was chosen since it has been specifically devel-oped for the experimental flow-cell employed [23],
Sh ¼ 0:46 ReScð Þ0:36 ¼ kdHD
ð4Þ
in which Sh is the Sherwood number, Re=(u0ρdH)/μ is the Reynoldsnumber and Sc=μ/(ρD) is the Schmidt number, with k denoting themass transfer coefficient, u0 the average velocity in the membranechannel, dH is the hydraulic diameter, D is the diffusion coefficient, μis the viscosity and ρ the density.
The density and viscosity of the salt solutions were determined bycorrelations found in the literature [33,34]. The diffusion coefficient ofthe solute in water is calculated using the correlations developedby [35], and corrected for temperature differences using the Stokes–Einstein law of diffusion [36]. However, due to the complex composi-tion of Instant Ocean, the diffusivity could only be determined ap-proximately from weighted averages. The calculated solutionproperties are presented in Table 2.
2.3. Forward osmosis experiments
The FO experiments were conducted using a custom designedflow cell made of polycarbonate. The flow channels on both sides ofthe membrane are 2.54 cm wide, 7.62 cm long and 1 mm high. Thedraw solution flowed counter-currently to the feed solution, con-trolled independently by gear pumps (MicroPump A, Cole Parmer,Barrington, IL). The solution flow rates were measured by rotameters(Blue White Industries Ltd, Huntington Beach, CA). The temperatureof the solutions were kept constant with immersed stainless steelcooling coils (JFD Tube & Coil Products, Inc, Hamden, CT) connectedto re-circulating water baths with temperature controls (NESLABRTE-7, Thermo Fisher Scientific Inc, Waltham, MA). The temperatureof the solutions for different experiments varied from 10 to 30 °C tosimulate seawater conditions. The draw solution was kept on a bal-ance (PI-2002, Denver Instruments, Bohemia, NY) with the mass ofthe draw solution recorded every 30 s on a computer, from whichthe water flux is calculated. Only the first 30 min of each experimentwere used for analysis; both the water flux and salt flux reached asteady-state approximately 5 min into the experiment. The initialvolume of both draw and feed solutions is one liter, and after30 min less than 30 mL of water has permeated through the mem-brane to the draw and less than 1 g of salt has passed into the feedfor all experiments. Thus, within the duration of the experiment, dilu-tion of the draw and concentration of the feed was negligible.

Table 2Properties of draw solutions under experimental conditions.
Parameter Symbol (Units) NaCl MgSO4 Instant Ocean
Concentration C (g/L) 32 10 50 70 32 32Bulk osmotic pressure πbulk (106 Pa) 2.74 8.41 4.36 6.20 0.65 2.55Ionic strength I (mol/L) 0.547 0.171 0.855 1.197 0.519 0.645Temperature T (°C) 20 10 30 20Flow rate Q (gpm) 0.05 0.10 0.15 0.10Water viscosity μ (10−3 Pa-s) 1.03 1.03 1.03 1.31 0.789 1.01 1.06 1.09 1.15 1.08Water density ρ (kg/m3) 1021 1021 1021 1023 1018 1007 1032 1045 1017 1024Salt diffusivity D (10−9 m2/s) 1.35 1.35 1.35 0.68 2.03 1.36 1.37 1.41 0.39 1.27Reynolds no. – 236 471 707 374 616 476 466 458 421 457Schmidt no. – 750 750 750 1889 382 737 748 739 969 781Sherwood no. – 36 46 53 59 40 46 45 45 48 46Mass transfer coefficient k (10−5 m/s) 2.5 3.2 3.7 2.1 4.7 3.2 3.2 3.3 2.9 3.2
343M.C.Y. Wong et al. / Desalination 287 (2012) 340–349
The resistance to solute diffusion by the porous substructure, K,depends on whether the skin layer faces the feed or the draw solu-tion. For the skin layer facing the draw and the feed solution asMilli-Q water (πFECP=0) [12,37],
K ¼ 1JW
� �ln
Bþ AπDECP−JWB
� �: ð5Þ
And, when the skin layer faces the feed,
K ¼ 1JW
� �ln
Bþ AπDECP
Bþ Jw
� �ð6Þ
where A, B, πDECP and Jw is the water permeability, salt permeability,osmotic pressure of the draw solution accounting for ECP and thewater flux through the membrane, respectively. The reduction in os-motic pressure of the draw due to external concentration polarizationdepends on the mass transfer coefficient, k, and is calculated by,
πDECP ¼ πD exp−JWk
� �ð7Þ
where the osmotic pressure is calculated by the Gibbs equation [38].To determine how the membrane structure changes with differentconditions, it is necessary to uncouple the solute resistance from thedraw solution chemistry by defining a membrane structural parame-ter, S, as
S ¼ KD ¼ t supτε
; ð8Þ
where tsup,τ and ε are the support membrane thickness, tortuosityand porosity, respectively [39].
Table 3Water and salt permeabilities obtained from RO experiments.
Parameter Symbol (unit)
Pure water permeability A (μm/s-MPa)Water permeability in presence of NaCl ANaCl-10 (μm/s-MPa)
ANaCl-32 (μm/s-MPa)ANaCl-50 (μm/s-MPa)ANaCl-70 (μm/s-MPa)
Intrinsic NaCl salt permeability BNaCl-10 (10−7 m/s)BNaCl-32 (10−7 m/s)BNaCl-50 (10−7 m/s)BNaCl-70 (10−7 m/s)
Water permeability in presence of MgSO4 AMgSO4 (μm/s-MPa)Intrinsic MgSO4 salt permeability BMgSO4 (10−7 m/s)Water permeability in presence of Instant Ocean AIO (μm/s-MPa)Intrinsic Instant Ocean salt permeability BIO (10−7 m/s)
2.4. Feed and draw solutions
For all experiments conducted, the feed solution was Milli-Qwater, while the draw solutions were prepared by addition of saltsto Milli-Q water. The NaCl and MgSO4·(H2O)7 used to make thedraw solutions were ACS reagent-grade (Fisher Scientific, Pittsburgh,PA) and were used as received. To simulate seawater, commercial seasalt was also used to make the draw solution, which is comprisedmostly of Na+, Cl−, Mg2+, SO4
2−, K+, Ca2+ and HCO3− (Instant
Ocean®, Spectrum Brands Inc., Atlanta, GA).
2.4.1. Variation of solution flow rateIn order to investigate the effect of solution flow rate on water flux
through the membrane, the flow rates of the draw and feed solutionswere varied independently in each experiment from 0.19 L/min to0.38 L/min to 0.57 L/min (0.05, 0.10, 0.15 gpm, respectively). The ex-periments were conducted in PRO-mode, with a constant draw solu-tion concentration of 32 g/L NaCl, while both draw and feed solutiontemperatures are kept constant at 20±1 °C.
2.4.2. Variation of solution temperatureIn these experiments, aimed at examining the effect of solution
temperature, the CTA membrane was operated in PRO-mode, com-prised of 32 g/L NaCl. Both the draw and the feed solutions werekept at a flow rate of 0.38 L/min (0.10 gpm), while the temperatureof each solution is changed independently to 10, 20 and 30 °C foreach experiment. In order to determine the effect of temperature onwater flux across the membrane, experiments were also run in thepresence of a temperature gradient but with deionized water onboth sides of the membrane.
For these experiments, when the solution temperatures are differ-ent on either side of the membrane, there exists a temperature
Feedconcentration(g/L)
Temperature
10 20 30
0 1.95±0.03 2.61±0.10 3.14±0.2110 2.56±0.1332 2.66±0.11 2.96±0.03 3.94±0.7650 3.67±0.2970 4.91±0.3110 3.38±0.5732 3.24±0.56 3.67±0.80 4.66±2.0650 5.23±1.0170 6.12±0.4832 2.75±0.0132 0.91±0.1132 3.10±0.1632 3.25±0.31
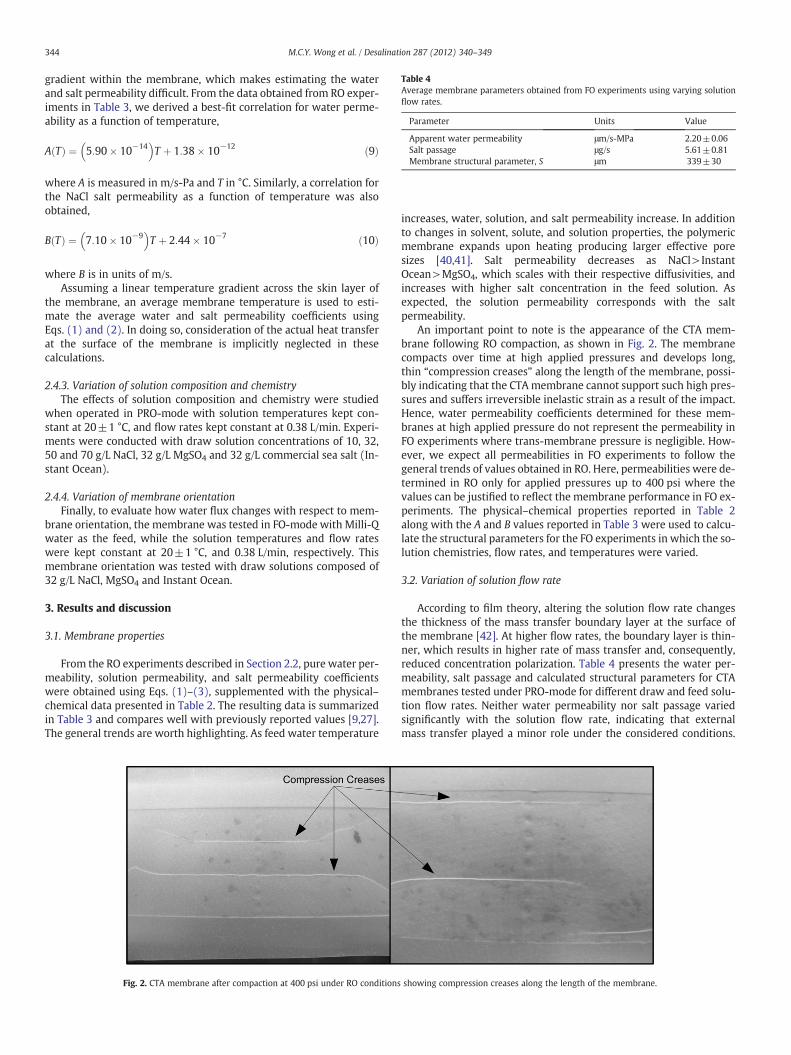
Table 4Average membrane parameters obtained from FO experiments using varying solutionflow rates.
Parameter Units Value
Apparent water permeability μm/s-MPa 2.20±0.06Salt passage μg/s 5.61±0.81Membrane structural parameter, S μm 339±30
344 M.C.Y. Wong et al. / Desalination 287 (2012) 340–349
gradient within the membrane, which makes estimating the waterand salt permeability difficult. From the data obtained from RO exper-iments in Table 3, we derived a best-fit correlation for water perme-ability as a function of temperature,
A Tð Þ ¼ 5:90� 10−14� �
T þ 1:38� 10−12 ð9Þ
where A is measured in m/s-Pa and T in °C. Similarly, a correlation forthe NaCl salt permeability as a function of temperature was alsoobtained,
B Tð Þ ¼ 7:10� 10−9� �
T þ 2:44� 10−7 ð10Þ
where B is in units of m/s.Assuming a linear temperature gradient across the skin layer of
the membrane, an average membrane temperature is used to esti-mate the average water and salt permeability coefficients usingEqs. (1) and (2). In doing so, consideration of the actual heat transferat the surface of the membrane is implicitly neglected in thesecalculations.
2.4.3. Variation of solution composition and chemistryThe effects of solution composition and chemistry were studied
when operated in PRO-mode with solution temperatures kept con-stant at 20±1 °C, and flow rates kept constant at 0.38 L/min. Experi-ments were conducted with draw solution concentrations of 10, 32,50 and 70 g/L NaCl, 32 g/L MgSO4 and 32 g/L commercial sea salt (In-stant Ocean).
2.4.4. Variation of membrane orientationFinally, to evaluate how water flux changes with respect to mem-
brane orientation, the membrane was tested in FO-mode with Milli-Qwater as the feed, while the solution temperatures and flow rateswere kept constant at 20±1 °C, and 0.38 L/min, respectively. Thismembrane orientation was tested with draw solutions composed of32 g/L NaCl, MgSO4 and Instant Ocean.
3. Results and discussion
3.1. Membrane properties
From the RO experiments described in Section 2.2, pure water per-meability, solution permeability, and salt permeability coefficientswere obtained using Eqs. (1)–(3), supplemented with the physical–chemical data presented in Table 2. The resulting data is summarizedin Table 3 and compares well with previously reported values [9,27].The general trends are worth highlighting. As feed water temperature
Fig. 2. CTA membrane after compaction at 400 psi under RO conditions
increases, water, solution, and salt permeability increase. In additionto changes in solvent, solute, and solution properties, the polymericmembrane expands upon heating producing larger effective poresizes [40,41]. Salt permeability decreases as NaCl>InstantOcean>MgSO4, which scales with their respective diffusivities, andincreases with higher salt concentration in the feed solution. Asexpected, the solution permeability corresponds with the saltpermeability.
An important point to note is the appearance of the CTA mem-brane following RO compaction, as shown in Fig. 2. The membranecompacts over time at high applied pressures and develops long,thin “compression creases” along the length of the membrane, possi-bly indicating that the CTAmembrane cannot support such high pres-sures and suffers irreversible inelastic strain as a result of the impact.Hence, water permeability coefficients determined for these mem-branes at high applied pressure do not represent the permeability inFO experiments where trans-membrane pressure is negligible. How-ever, we expect all permeabilities in FO experiments to follow thegeneral trends of values obtained in RO. Here, permeabilities were de-termined in RO only for applied pressures up to 400 psi where thevalues can be justified to reflect the membrane performance in FO ex-periments. The physical–chemical properties reported in Table 2along with the A and B values reported in Table 3 were used to calcu-late the structural parameters for the FO experiments in which the so-lution chemistries, flow rates, and temperatures were varied.
3.2. Variation of solution flow rate
According to film theory, altering the solution flow rate changesthe thickness of the mass transfer boundary layer at the surface ofthe membrane [42]. At higher flow rates, the boundary layer is thin-ner, which results in higher rate of mass transfer and, consequently,reduced concentration polarization. Table 4 presents the water per-meability, salt passage and calculated structural parameters for CTAmembranes tested under PRO-mode for different draw and feed solu-tion flow rates. Neither water permeability nor salt passage variedsignificantly with the solution flow rate, indicating that externalmass transfer played a minor role under the considered conditions.
showing compression creases along the length of the membrane.

345M.C.Y. Wong et al. / Desalination 287 (2012) 340–349
As expected, the variations in the calculated structural parameterwith the changes in flow rate are insignificant.
3.3. Variation of solution temperature
Thermo-osmosis, the transport of water through a semi-permeable membrane driven by a temperature gradient, has beenconsidered previously for cellulose acetate membranes [43]. Experi-ments to test the influence of thermo-osmosis show that temperaturegradients cause water fluxes an order of magnitude lower than thatcaused by a concentration gradient. These results are incorporatedinto the data obtained in the presence of a concentration gradientand are shown in Fig. 3, which shows that for a fixed draw solutiontemperature, increasing the feed solution temperature results inhigher water permeability (Fig. 3A). Concurrently, the structural pa-rameter decreases with the increase in draw solution temperature(Fig. 3B). These variations may be due to some thermally-inducedchanges of the membrane structure such as strain variations causedby different temperatures on each side of the membrane or weaken-ing of intermolecular bonds within the cellulosic material. However,
Fig. 3. Observed water and salt passage (A) and structural paramete
it may also be attributed to errors generated from the use of aconstant-property theory; any errors inherent to simplificationsmade for the calculation are absorbed into the structural parameter.Certainly, a structural parameter of ~150 μm is not physical, butmore likely a reflection of flaws in the theory used to interpret the ex-perimental data. Specifically, changes in the water and salt perme-ability, which are mainly a function of the membrane skin layer willaffect the structural parameter, which is intended to be characteristicof the porous substructure of the membrane as shown in Eqs. (1)–(4).Nevertheless, while such errors warrant caution in using the calculat-ed parameters as strictly representative of their intended physical in-terpretation, the observed trends are most certainly indicative ofsome underlying processes which facilitate better mass transfer dueto temperature gradients.
This sensitivity of the CTA membrane performance to solutiontemperature has important implications for its application. For exam-ple, where waste heat is available or where FO/PRO feed or drawstreams are inherently at elevated temperatures, osmotic fluxesmay be significantly enhanced; however, a trade-off may exist be-tween high water flux and high salt rejection.
r (B) as a function of solution temperature in FO experiments.
346 M.C.Y. Wong et al. / Desalination 287 (2012) 340–349
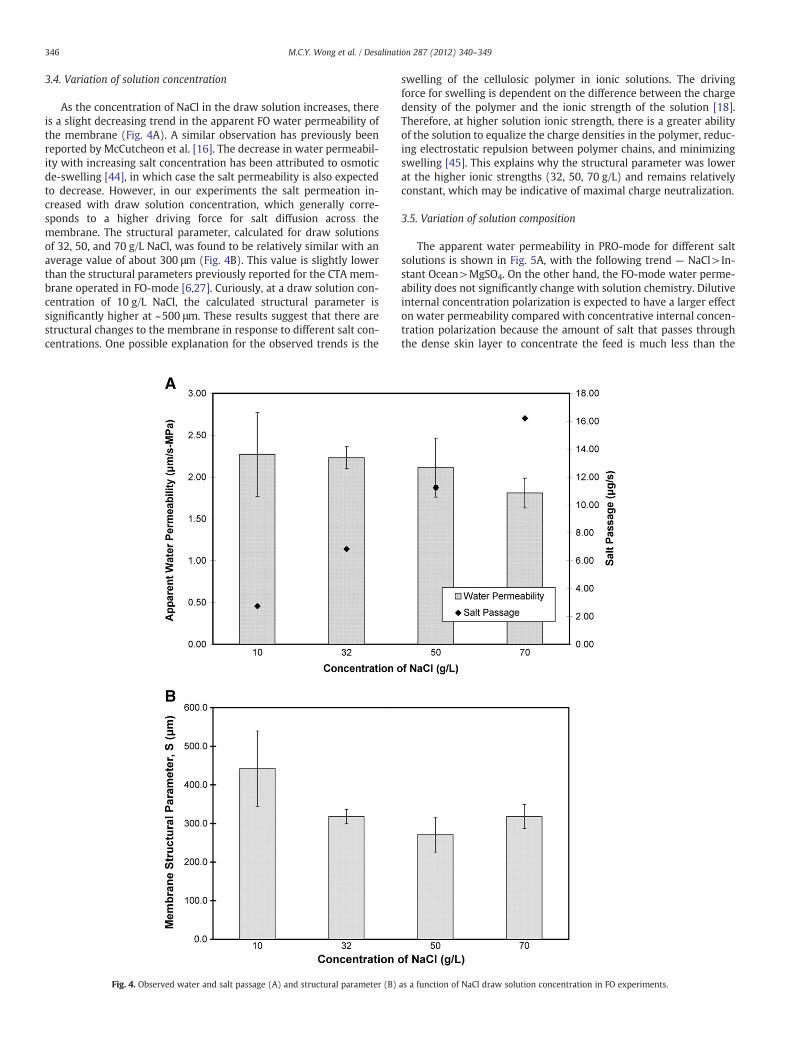
3.4. Variation of solution concentration
As the concentration of NaCl in the draw solution increases, thereis a slight decreasing trend in the apparent FO water permeability ofthe membrane (Fig. 4A). A similar observation has previously beenreported by McCutcheon et al. [16]. The decrease in water permeabil-ity with increasing salt concentration has been attributed to osmoticde-swelling [44], in which case the salt permeability is also expectedto decrease. However, in our experiments the salt permeation in-creased with draw solution concentration, which generally corre-sponds to a higher driving force for salt diffusion across themembrane. The structural parameter, calculated for draw solutionsof 32, 50, and 70 g/L NaCl, was found to be relatively similar with anaverage value of about 300 μm (Fig. 4B). This value is slightly lowerthan the structural parameters previously reported for the CTA mem-brane operated in FO-mode [6,27]. Curiously, at a draw solution con-centration of 10 g/L NaCl, the calculated structural parameter issignificantly higher at ~500 μm. These results suggest that there arestructural changes to the membrane in response to different salt con-centrations. One possible explanation for the observed trends is the
Fig. 4. Observed water and salt passage (A) and structural parameter (B)
swelling of the cellulosic polymer in ionic solutions. The drivingforce for swelling is dependent on the difference between the chargedensity of the polymer and the ionic strength of the solution [18].Therefore, at higher solution ionic strength, there is a greater abilityof the solution to equalize the charge densities in the polymer, reduc-ing electrostatic repulsion between polymer chains, and minimizingswelling [45]. This explains why the structural parameter was lowerat the higher ionic strengths (32, 50, 70 g/L) and remains relativelyconstant, which may be indicative of maximal charge neutralization.
3.5. Variation of solution composition
The apparent water permeability in PRO-mode for different saltsolutions is shown in Fig. 5A, with the following trend — NaCl>In-stant Ocean>MgSO4. On the other hand, the FO-mode water perme-ability does not significantly change with solution chemistry. Dilutiveinternal concentration polarization is expected to have a larger effecton water permeability compared with concentrative internal concen-tration polarization because the amount of salt that passes throughthe dense skin layer to concentrate the feed is much less than the
as a function of NaCl draw solution concentration in FO experiments.

Fig. 5. Observed water and salt passage (A) and structural parameter (B) as a function of draw solution composition and membrane orientation in FO experiments.
347M.C.Y. Wong et al. / Desalination 287 (2012) 340–349
amount of water that permeates through the porous support to dilutethe draw as described in Section 2.3 [9]. Despite the greater loss ofdriving force, there are certainly important practical advantages tooperate in FO-mode such as lower fouling propensity when the feedfaces the smoother skin layer, and greater ease of cleaning the skinlayer. PRO-mode is most suited for PRO processes to prevent delami-nation of the skin layer under pressurized draw solutions.
In PRO-mode, the calculated membrane structural parameter de-creases as MgSO4>Instant Ocean>NaCl (Fig. 5B); meanwhile, inFO-mode the structural parameter does not significantly changewith solution chemistry (consistent with the measured water perme-ability). The different salts may alter the membrane micro-void and,possibly, macro-void structure, to a varying extent. The concept ofpolymer swelling in response to contact with an ionic solution stillapplies in this case with regards to the salt permeability. In aqueousmedia, cations are highly hydrated, which, when incorporated intopolymeric structures, will cause the polymer to swell [23]. Further-more, salts interact electrostatically with the polymer matrix by neu-tralizing charge densities. Thus, divalent salts like MgSO4 will possessa larger hydrated cation with an increased attraction to the partial
negative charges on the acetate groups of the polymer. InstantOcean has significant but less divalent cation content and NaCl is a1:1 electrolyte. This means that the skin layer will swell to a greaterextent in the presence of MgSO4, causing it to be more swollen andless permeable, while the NaCl will cause the skin layer to be lessswollen and more permeable.
Water permeability is predominantly a function of the skin layerstructure, which in turn depends on the nature of the solution it isinteracting with. However, the permeability of the skin layer is incor-porated into the calculations of the membrane structural parameter(Eq. 4–6), which indicates that a more permeable membrane will in-herently have a lower membrane structural parameter regardless ofactual changes in the porous substructure. In FO-mode, the draw so-lution saturates the porous substructure, neutralizing the polymercharge densities, and causing swelling regardless of the salt solutionused. This causes the structural parameter to be relatively similarfor all the salts in FO-mode, as already reported in the literature [6].As a final note, it should be re-iterated that while the observed exper-imental trends are certainly indicative of the effects imparted by saltcomposition, concentration and temperature, a full explanation

348 M.C.Y. Wong et al. / Desalination 287 (2012) 340–349
remains elusive; in particular, interpretation in terms of the structuralparameter should be considered with caution, as the physically sim-plified model may not account for other mechanisms in effect.
4. Conclusions
In this study, experiments were carried out with the intent to probethe effects of flow rate, temperature and draw solution properties suchas salinity and ionic composition on the performance of a commerciallyavailable CTA FO membrane. Particular attention was given to waterpermeability, salt passage and the calculated membrane structural pa-rameter. Feed and draw solution flow rates did not significantly impactthe measured water flux across the membrane, indicating that externalmass transfer was not a limiting factor for the FO process. With in-creased temperature of either feed or draw solution, both thewater per-meability and salt passage increased, while the calculated structuralparameter decreased; these effects may be explained byweakenedmo-lecular interactions in the polymeric membrane. As the draw solutionionic strength increased frombrackish to seawater levels, the calculatedstructural parameter increased, presumably due to de-swelling of thepolymer matrix; however, the small variability observed for higher sa-linities possibly indicates that the charge densitywas already complete-ly neutralized. Solution chemistry (ionic composition) was observed tosignificantly impact the CTAmembrane's permeability and the structur-al parameter, which again can be explained by swelling of the polymermatrix. The large changes in the structural parameter due to solutiontemperature, salinity, and composition explain at least some of theinter-laboratory variations in membrane properties reported in the lit-erature to date. Finally, this study provides new insight into the possiblemechanisms by which solution chemistry and process conditions con-spire to govern the properties of osmotic membranes and theirperformance.
Supplementary materials related to this article can be found on-line at doi:10.1016/j.desal.2011.10.013.
NomenclatureA pure water permeability coefficient (m/s-Pa)A′(x) water permeability in the presence of x salt, where x is NaCl,
MgSO4 or IO (Instant Ocean) (m/s-Pa)Bx intrinsic salt permeability coefficient for x salt (m/s)ΔC concentration difference across the skin layer of the mem-
brane (g/L)CDb bulk draw solution concentration (g/L)CDECP reduced draw concentration at membrane surface due to
external concentration polarization (g/L)CICP concentration at internal surface of skin layer due to inter-
nal concentration polarization (g/L)CFECP reduced feed concentration at membrane surface due to ex-
ternal concentration polarization (g/L)CFb bulk feed solution concentration (g/L)D diffusion coefficient of solute in water (m2/s)dH hydraulic diameter (m)Jw water flux across the membrane (m/s)K resistance to solute diffusion in the porous support of the
membrane (m/s)k mass transfer coefficient (m/s)ΔP applied hydraulic pressure (Pa)Δπeff effective osmotic pressure difference (Pa)Δπbulk bulk osmotic pressure difference (Pa)Q volumetric flow rate (m3/s or gpm)R solute rejectionRe Reynolds number=(u0ρdH)/μS membrane structural parameter (m)Sc Schmidt number=μ/(ρD)Sh Sherwood number=kdH/Du0 crossflow velocity (m/s)
Td temperature of the draw solution (°C)Tf temperature of the feed solution (°C)tsup thickness of porous support layer (m)
Greek lettersε porosity of porous supportτ tortuosity of porous support
Acknowledgments
The work presented in this publication was supported by AwardNo. KUS-C1-018-02, made by King Abdullah University of Scienceand Technology (KAUST). GZR was supported by a Vaadia-BARD Post-doctoral Fellowship Award No. FI-435-2010 from BARD, The UnitedStates–Israel Binational Agricultural Research and Development Fund.
References
[1] B. Kingsolver, B. Larmer, T. Pankratz, Water: our thirsty world, National Geo-graphic, A Special Issue, National Geographic Society, New York, NY, 2010.
[2] M. Elimelech, The global challenge for adequate and safe water, Journal of WaterSupply Research and Technology-AQUA 55 (2006) 3–10.
[3] G.M. Geise, H.-S. Lee, D.J. Miller, B.D. Freeman, J.E. McGrath, D.R. Paul, Waterpurification by membranes: the role of polymer science, J. Polym. Sci., Part B:Polym. Phys. 48 (2010) 1685–1718.
[4] M. Elimelech, W.A. Phillip, The future of seawater desalination: energy, technology,and the environment, Science 333 (2011) 712–717.
[5] T. Pankratz, The big idea, National Geographic, National Geographic Society, NewYork, NY, 2010 32-36.
[6] A. Achilli, T.Y. Cath, A.E. Childress, Selection of inorganic-based draw solutions forforward osmosis applications, J. Membr. Sci. 364 (2010) 233–241.
[7] A. Tiraferri, N.Y. Yip, W.A. Phillip, J.D. Schiffman, M. Elimelech, Relating perfor-mance of thin-film composite forward osmosis membranes to support layerformation and structure, J. Membr. Sci. 367 (2011) 340–352.
[8] J.E. Miller, L.R. Evans, Forward Osmosis: A New Approach to Water Purificationand Desalination, Sandia National Laboratories, Albuquerque, NM, 2006.
[9] T.Y. Cath, A.E. Childress, M. Elimelech, Forward osmosis: principles, applicationsand recent developments, J. Membr. Sci. 281 (2006) 70–87.
[10] Q. Yang, K.Y. Wang, T.-S. Chung, A novel dual-layer forward osmosis membranefor protein enrichment and concentration, Sep. Purif. Technol. 69 (2009)269–274.
[11] E.M. Garcia-Castello, J.R. McCutcheon, M. Elimelech, Performance evaluation ofsucrose concentration using forward osmosis, J. Membr. Sci. 338 (2009) 61–66.
[12] K.L. Lee, R.W. Baker, H.K. Lonsdale, Membranes for power generation by pressure-retarded osmosis, J. Membr. Sci. 8 (1981) 141–171.
[13] S. Loeb, Production of energy from concentrated brines by pressure-retardedosmosis: 1. Preliminary technical and economic considerations, Journal of Mem-brane Science 1 (1976) 49–63.
[14] S. Loeb, Large-scale power production by pressure-retarded osmosis, using riverwater and sea water passing through spiral modules, Desalination 143 (2002)115–122.
[15] T. Thorsen, T. Holt, The potential for power production from salinity gradients bypressure retarded osmosis, J. Membr. Sci. 335 (2009) 103–110.
[16] J.R. McCutcheon, R.L. McGinnis, M. Elimelech, Desalination by ammonia–carbondioxide forward osmosis: influence of draw and feed solution concentrations onprocess performance, J. Membr. Sci. 278 (2006) 114–123.
[17] G.T. Gray, J.R. McCutcheon, M. Elimelech, Internal concentration polarization inforward osmosis: role of membrane orientation, Desalination 197 (2006) 1–8.
[18] M.F.McCurley,W.R. Seitz, Fiber-optic sensor for salt concentrationbased on polymerswelling coupled to optical displacement, Anal. Chim. Acta 249 (1991) 373–380.
[19] H. Muta, M. Miwa, M. Satoh, Ion-specific swelling of hydrophilic polymer gels,Polymer 42 (2001) 6313–6316.
[20] D.J. Buckley, M. Berger, The swelling of polymer systems in solvents. II. Mathe-matics of diffusion, Journal of Polymer Science 56 (1962) 175–188.
[21] W.R. Moore, J. Russell, Swelling and absorption by cellulose acetate in binarysolvent–hexane mixtures, Journal of Polymer Science 18 (1955) 63–89.
[22] A.E. Alexander, B. Rabinovitch, The Swelling and Solubility of Cellulose Acetate inBenzene/Xylenol Mixtures, The Royal Society, London, 1950, pp. 154–162.
[23] R.E. Kesting, Semipermeable membranes of cellulose acetate for desalination inthe process of reverse osmosis. I. Lyotropic swelling of secondary celluloseacetate, J. Appl. Polym. Sci. 9 (1965) 663–668.
[24] J. McMurry, Biomolecules: Carbohydrates, Organic Chemistry, Thomson Learning,Belmont, CA, 2004.
[25] J.R. McCutcheon, M. Elimelech, Influence of membrane support layer hydropho-bicity on water flux in osmotically driven membrane processes, J. Membr. Sci.318 (2008) 458–466.
[26] H.K. Lonsdale, U. Merten, R.L. Riley, Transport properties of cellulose acetate os-motic membranes, J. Appl. Polym. Sci. 9 (1965) 1341–1362.

349M.C.Y. Wong et al. / Desalination 287 (2012) 340–349
[27] N.Y. Yip, A. Tiraferri, W.A. Phillip, J.D. Schiffman, M. Elimelech, High performancethin-film composite forward osmosis membrane, Environ. Sci. Technol. 44 (2010)3812–3818.
[28] M.L. Lind, B.H. Jeong, A. Subramani, X.F. Huang, E.M.V. Hoek, Effect of mobilecation on zeolite–polyamide thin film nanocomposite membranes, Journal ofMaterials Research 24 (2009) 1624–1631.
[29] A.K. Ghosh, E.M.V. Hoek, Impacts of support membrane structure and chemistryon polyamide–polysulfone interfacial composite membranes, J. Membr. Sci. 336(2009) 140–148.
[30] C.P. Koutsou, S.G. Yiantsios, A.J. Karabelas, A numerical and experimental study ofmass transfer in spacer-filled channels: effects of spacer geometrical characteristicsand Schmidt number, J. Membr. Sci. 326 (2009) 234–251.
[31] G. Guillen, E.M.V. Hoek, Modeling the impacts of feed spacer geometry on reverseosmosis and nanofiltration processes, Chem. Eng. J. 149 (2009) 221–231.
[32] G. Shock, A. Miguel, Mass transfer and pressure loss in spiral wound modules,Desalination 64 (1987) 339–352.
[33] F.J. Millero, A. Poison, International one-atmosphere equation of state of seawater,Deep Sea Research 28A (1981) 625–629.
[34] Concentrative properties of aqueous solutions: density, refractive index, freezingpoint depression, and viscosity, in: D.R. Lide (Ed.), Handbook of Chemistry andPhysics, 2011.
[35] V.M. Lobo, Mutual diffusion coefficients in aqueous electrolyte solutions, PureAppl. Chem. 65 (1993) 2613–2640.
[36] J.T. Edward, Molecular volumes and the Stokes–Einstein equation, J. Chem. Educ.47 (1970) 261–270.
[37] S. Loeb, T. Leonid, E. Korngold, J. Freiman, Effect of porous support fabric onosmosis through a Loeb–Sourirajan type asymmetric membrane, J. Membr. Sci.129 (1997) 243–249.
[38] J.C. Crittenden, R.R. Trussell, D.W. Hand, K.J. Howe, G. Tchobanoglous, Reverseosmosis, Water Treatment: Principles and Design, John Wiley & Sons, Hoboken,New Jersey, 2005, pp. 1429–1506.
[39] N.Y. Yip, A. Tiraferri, W.A. Phillip, J.D. Schiffman, L.A. Hoover, Y.C. Kim, M. Elimelech,Thin-film composite pressure retarded osmosis membranes for sustainable powergeneration from salinity gradients, Environ. Sci. Technol. 45 (2011) 4360–4369.
[40] A. Jawor, E.M.V. Hoek, Effects of feed water temperature on inorganic fouling ofbrackish water RO membranes, Desalination 235 (2009) 44–57.
[41] X. Jin, X.F. Huang, E.M.V. Hoek, Role of specific ion interactions in seawater ROmembrane fouling by alginic acid, Environ. Sci. Technol. 43 (2009) 3580–3587.
[42] C.J. Geankoplis, Principles of Mass Transfer, Transport Processes and SeparationProcess Principles, Prentice Hall, Upper Saddle River, NJ, 2003, pp. 410–456.
[43] M.S. Dariel, O. Kedem, Thermoosmosis in semipermeable membranes, J. Phys.Chem. 79 (1975) 336–342.
[44] G.D. Mehta, S. Loeb, Performance of permasep B-9 and B-10 membranes invarious osmotic regions and at high osmotic pressures, J. Membr. Sci. 4 (1978)335–349.
[45] P.J. Flory, Principles of Polymer Chemistry, Cornell University Press, Ithaca, NY, 1953.