Osmotic stress response in the industrially important ...
178
Osmotic stress response in the industrially important bacterium Gluconobacter oxydans Dissertation to obtain the degree of Doctorate (Dr. rer. nat.) from the Faculty of Mathematics and Natural Sciences of the Rheinische Friedrich-Wilhelms University of Bonn, Germany submitted by Nageena Zahid from Lahore, Pakistan Bonn, November 2016
-
Upload
khangminh22 -
Category
Documents
-
view
0 -
download
0
Transcript of Osmotic stress response in the industrially important ...

Osmotic stress response in the
industrially important bacterium
Gluconobacter oxydans
Dissertation
to obtain the degree of
Doctorate (Dr. rer. nat.)
from the
Faculty of Mathematics and Natural Sciences
of the
Rheinische Friedrich-Wilhelms University of Bonn, Germany
submitted by
Nageena Zahid
from
Lahore, Pakistan
Bonn, November 2016

Finalized with the permission from the Faculty of Mathematics and Natural Sciences of the
Rheinische Friedrich-Wilhelms University of Bonn, Germany
First Referee: Prof. Dr. Uwe Deppenmeier
Second Referee: Prof. Dr. Erwin A. Galinski
Day of Promotion: 07.02.2017
Year of Publication: 2017

List of parts of this thesis that have already been published.
Zahid N., Schweiger P., Galinski E., Deppenmeier U. (2015). Identification of mannitol as
compatible solute in Gluconobacter oxydans. Appl Microbiol Biotechnol 99, 5511-
5521.
Zahid N. and Deppenmeier U. (2016). Role of mannitol dehydrogenases in osmoprotection
of Gluconobacter oxydans. Appl Microbiol Biotechnol 100, 9967-9978.

For my Son
v
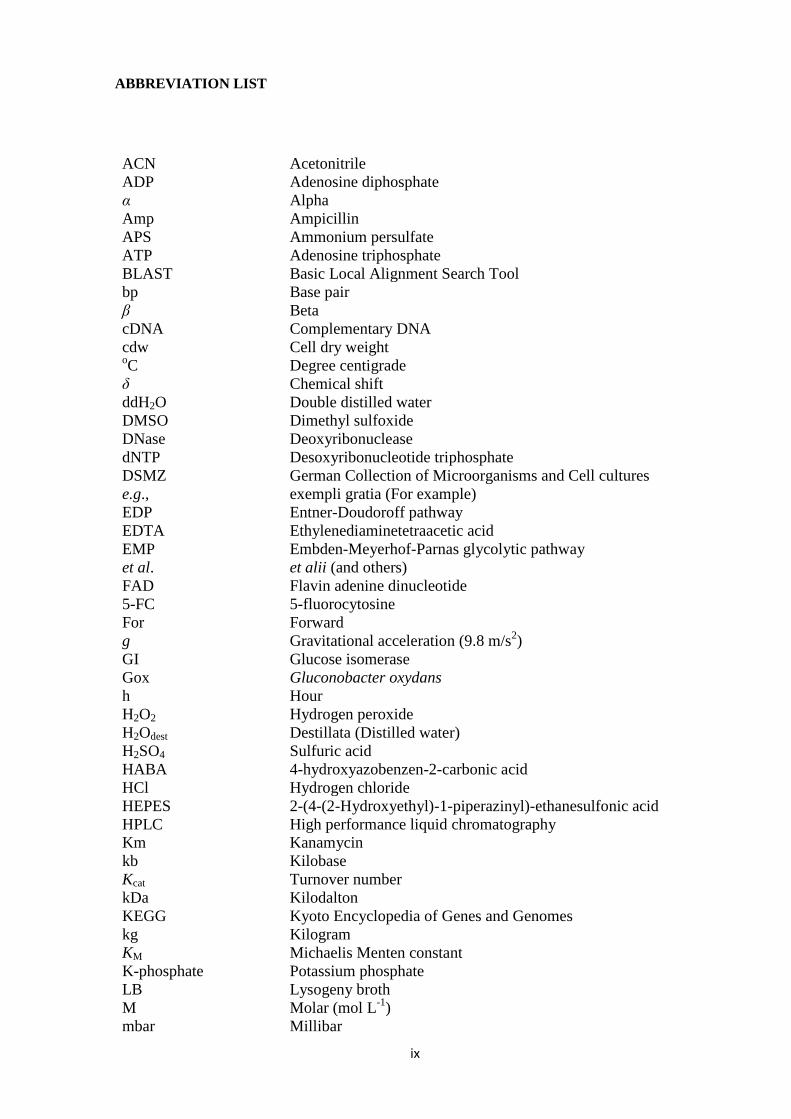
TABLE OF CONTENTS
1. INTRODUCTION 1
1.1. Acetic acid bacteria 1
1.2. The genus Gluconobacter 2
1.2.1. Respiratory chain of G. oxydans 3
1.2.2. Intracellular carbohydrate metabolism in G. oxydans 6
1.2.3. Types and function of sugars and polyols metabolizing enzymes in
Gluconobacter 7
1.2.4. Biotechnological applications of G. oxydans and its limitations 8
1.3. Aims of the work 10
2. MATERIALS AND METHODS 12
2.1. Chemicals and Enzymes 12
2.2. Bacterial strains, plasmids, primers 12
2.2.1. Bacterial strains 12
2.2.2. Oligonucleotides and Plasmids 13
2.3. Antibiotic stock solutions 18
2.4. Microbiology methods 18
2.4.1. Media and culture conditions 18
2.4.2. Measurement of osmolalities of growth media 22
2.4.3. Measurement of growth parameters 22
2.4.4. Preparation of stock cultures 23
2.5. Molecular biology methods 23
2.5.1. Isolation and purification of DNA 23
2.5.2. Isolation and purification of plasmid DNA 23
2.5.3. Isolation and purification of RNA 24
2.5.3.1. RNA extraction using the Trizol reagent method 24
2.5.3.2. RNA extraction with the Ribopure-Bacterial Kit 24
2.5.4. Spectrophotometric quantifications of DNA and RNA samples 25
2.5.5. Restriction digestion of DNA 25
2.5.6. Ligation 26

vi
2.5.7. Polymerase chain reaction (PCR) 26
2.5.8. Reverse transcription quantitative PCR (RT-qPCR) 27
2.5.9. Agarose gel electrophoresis 28
2.5.10. Denaturing agarose gel electrophoresis 29
2.5.11. Staining of agarose gels 29
2.5.12. Evaluation of RNA integrity with Bioanalyzer 29
2.5.13. DNA sequencing 30
2.5.14. Illumina Next Generation Sequencing (NGS) and data analysis 30
2.5.15. Transformation of E. coli and G. oxydans 32
2.5.16. Generation of G. oxydans strains carrying in-frame deletions 33
2.5.17. Plasmid-based expression of genes 35
2.6. Biochemical methods 35
2.6.1. Protein overproduction and purification 35
2.6.1.1. Heterologous overproduction of proteins in E. coli 35
2.6.1.2. Heterologous overproduction of proteins in G. oxydans 36
2.6.1.3. Cell disruption and extraction of crude cell extract 36
2.6.1.4. Protein purification by Strep-Tactin Affinity chromatography 36
2.6.2. Extraction of cell cytoplasm 37
2.6.3. Quantification of protein concentration 37
2.6.4. PolyAcrylamide Gel Electrophoresis (PAGE) 38
2.6.4.1. Sodium Dodecyl Sulphate PolyAcrylamide Gel Electrophoresis 38
2.6.4.2. Native PAGE 38
2.6.5. Silver staining 39
2.6.6. Immunoblot 39
2.6.7. Activity staining 40
2.6.8. Determination of enzymatic activities 41
2.6.8.1. Measurement of activities of NAD(P)H dependent
oxidoreductases 41
2.6.8.2. Glucose isomerase: enzyme assay with auxillary enzymes 43
2.7. Analytical methods 44
2.7.1. Sample preparation for the determination of intracellular solutes 44
2.7.2. High Performance Liquid Chromatography 45
2.7.3. Photometric determination of glucose and fructose concentration 46
2.7.4. 13
C-Nuclear magnetic resonance spectroscopy 46

vii
2.7.5. Microscopy 47
2.8. Internet tools used for bioinformatic analysis 47
3. RESULTS 49
3.1 Osmotic stress responses in G. oxydans 50
3.1.1. Choice of substrate and osmolyte 50
3.1.2. Expression studies of osmotically regulated genes in G. oxydans 52
3.1.3. Analysis of osmotic stress responses in G. oxydans through
genome-wide transcriptome analysis 54
3.1.3.1. Quality testing of RNA samples 55
3.1.3.2. Differential gene expression under osmotic stress analyzed by
transcriptome sequencing 57
3.1.3.3. Validation of the transcriptome data and selection of candidate
genes 63
3.1.3.4. Generation of G. oxydans strains carrying in-frame deletions for
gox1118 and gox1119 64
3.1.3.5. Characterization of Gox1849: an uncharacterized
oxidoreductase 68
3.2. Mannitol as a major intracellular metabolite and osmolyte in G. oxydans 70
3.2.1. 13
C-NMR spectroscopy of total cellular metabolites from G. oxydans 70
3.2.2. Effect of mannitol on cellular catalytic activity 72
3.2.3. De novo synthesis of mannitol in G. oxydans under reduced water activity 74
3.2.4. Effect of carbon sources and osmolytes on mannitol accumulation 79
3.2.5. Effect of exogenous mannitol on growth and morphology of osmotically
stressed cells 80
3.2.6. Effect of polyols on growth and substrate oxidation rates of G. oxydans 83
3.3. Enzymatic routes for the biosynthesis of mannitol in G. oxydans 84
3.3.1. Identification and bioinformatic analysis of the mannitol dehydrogenases
from G. oxydans 85
3.3.2. Characterization of the mannitol dehydrogenases from G. oxydans 87
3.3.3. Transcript abundance of genes coding for D-fructose reductases
in G. oxydans 91
3.3.4. Characterization of fructose reductase deletion mutants 92
3.3.4.1. Effect of the deletion of fructose reductases on growth
of G. oxydans 92
3.3.4.2. Intracellular mannitol formation and activity of cytoplasmic
fructose reductases 97

viii
3.3.4.3. Effect of the deletion of fructose reductases on cellular catalytic
efficiency 101
3.4. Metabolic engineering of G. oxydans for enhanced osmotolerance 102
3.4.1. Overproduction of D-fructose reductase (Gox1432) in G. oxydans 103
3.4.2. Heterologous overproduction of glucose isomerases in G. oxydans 104
4. DISCUSSION 108
4.1. Osmotic stress responses in G. oxydans 111
4.1.2. Response of G. oxydans to osmotic stress at transcriptional level 113
4.1.3. Genome-wide transcriptome analysis of osmotically stressed cells
of G. oxydans 113
4.2. Mannitol as a major intracellular metabolite and osmolyte in G. oxydans 116
4.2.1. De novo synthesis of mannitol in G. oxydans under reduced water activity 118
4.2.2. Osmodependent accumulation of mannitol in G. oxydans 119
4.2.3. Effect of carbon sources and osmolytes on mannitol accumulation in
G.oxydans 120
4.2.4. Protective effect of mannitol on cell physiology 121
4.2.5. Effect of polyols on growth and substrate oxidation rates of G. oxydans 125
4.3. Biosynthesis of mannitol in G. oxydans 126
4.4. Characterization of the relative contribution of Gox1432 and Gox0849
in cellular osmoprotection 131
4.5. Characterization of fructose reductase deletion mutants 133
4.6. Metabolic engineering of G. oxydans for enhanced osmotolerance 134
4.6.1. Overproduction of D-fructose reductase (Gox1432) 135
4.6.2. Heterologous overproduction of glucose isomerases in G. oxydans 136
4.7. Gox1432: key player for osmotolerance of G. oxydans 138
5. SUMMARY 140
6. REFERENCES 142
7. CURRICULUM VITAE 165
8. ACKNOWLEDGEMENTS 167
ix
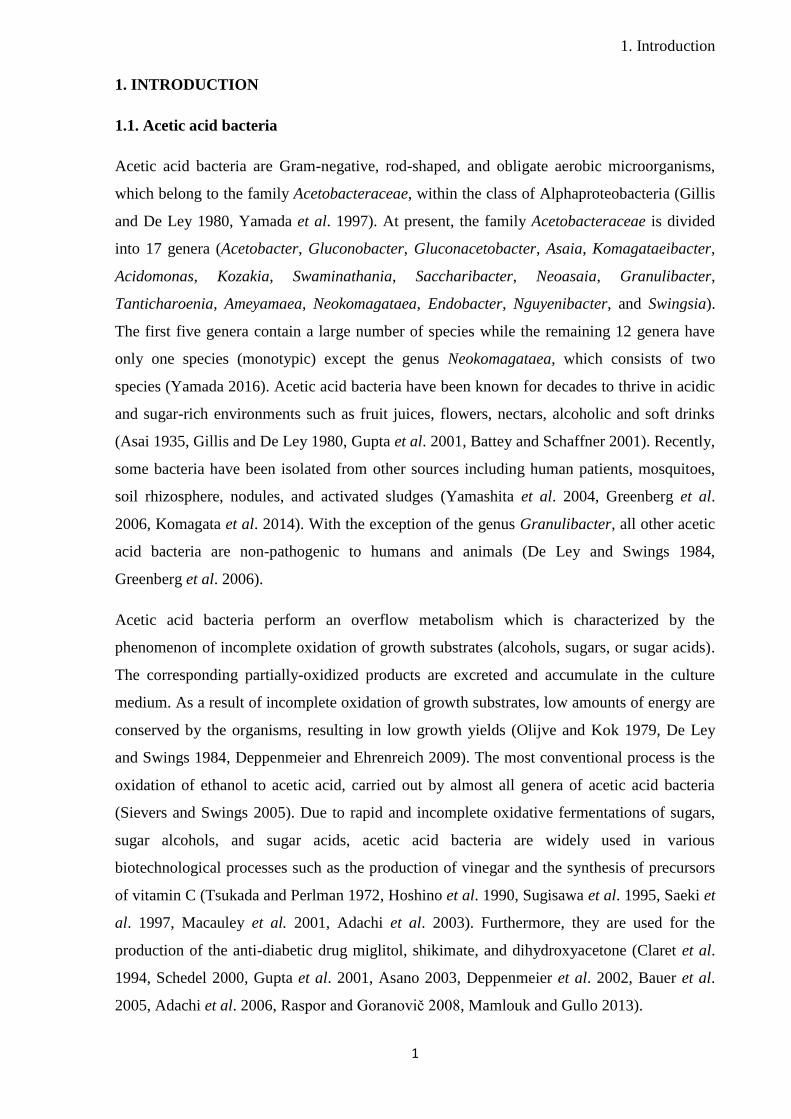
ABBREVIATION LIST
ACN Acetonitrile
ADP Adenosine diphosphate
α Alpha
Amp Ampicillin
APS Ammonium persulfate
ATP Adenosine triphosphate
BLAST Basic Local Alignment Search Tool
bp Base pair
β Beta
cDNA Complementary DNA
cdw Cell dry weight oC Degree centigrade
δ Chemical shift
ddH2O Double distilled water
DMSO Dimethyl sulfoxide
DNase Deoxyribonuclease
dNTP Desoxyribonucleotide triphosphate
DSMZ German Collection of Microorganisms and Cell cultures
e.g., exempli gratia (For example)
EDP Entner-Doudoroff pathway
EDTA Ethylenediaminetetraacetic acid
EMP Embden-Meyerhof-Parnas glycolytic pathway
et al. et alii (and others)
FAD Flavin adenine dinucleotide
5-FC 5-fluorocytosine
For Forward
g Gravitational acceleration (9.8 m/s2)
GI Glucose isomerase
Gox Gluconobacter oxydans
h Hour
H2O2 Hydrogen peroxide
H2Odest Destillata (Distilled water)
H2SO4 Sulfuric acid
HABA 4-hydroxyazobenzen-2-carbonic acid
HCl Hydrogen chloride
HEPES 2-(4-(2-Hydroxyethyl)-1-piperazinyl)-ethanesulfonic acid
HPLC High performance liquid chromatography
Km Kanamycin
kb Kilobase
Kcat Turnover number
kDa Kilodalton
KEGG Kyoto Encyclopedia of Genes and Genomes
kg Kilogram
KM Michaelis Menten constant
K-phosphate Potassium phosphate
LB Lysogeny broth
M Molar (mol L-1
)
mbar Millibar

x
Mbp Megabase pair
MDH Mannitol dehydrogenase
MgCl2 Magnesium chloride
MgSO4 Magnesium sulphate
µ Micro
min Minute
MOPS 3-(N-morpholino)-propansulfonic acid
mRNA Messenger RNA
ms Millisecond
NaCl Sodium chloride
NAD+ Nicotinamide adenine dinucleotide
NADP+ Nicotinamide adenine dinucleotide phosphate
NCBI National Center for Biotechnology information
ng Nanogram
NGS Next generation sequencing
NMR Nuclear magnetic resonance
OD Optical density
Osm Number of osmoles
ox. PPP Oxidative pentose phosphate pathway
P Phosphate
PAGE Polyacrylamide gel electrophoresis
PCR Polymerase chain reaction
PEG Polyethylene glycol
% Percent (grams per 100 mL or mL per 100 mL)
pg Picogram
Pi Inorganic phosphate
PPP Pentose phosphate pathway
PQQ Pyrroloquinoline quinone
R2 The Pearson correlation coefficient of determination
rev Reverse
rpm Revolutions per minute
RNA-Seq RNA sequencing
RPKM Reads Per Kilobase of transcript per Million mapped reads
rRNA Ribosomal RNA
RT-qPCR Real Time quantitative reverse transcription PCR
SDS Sodium dodecyl sulphate
SOC Super optimal broth with catabolite repression
sp. Species
TCA Tricarboxylic acid cycle
TEMED N,N,N′,N′-Tetramethylethane-1,2-diamine
TMSP Trimethylsilylpropanoic acid
TRI-reagent Trizol reagent
Tris Tris(hydroxymethyl)-aminomethane
U Unit
UV Ultraviolet
V Volt
v/v Voume per volume
Vmax Maximal reaction rate
w/v Weight per volume
XI Xylose isomerase
1. Introduction
1
1. INTRODUCTION
1.1. Acetic acid bacteria
Acetic acid bacteria are Gram-negative, rod-shaped, and obligate aerobic microorganisms,
which belong to the family Acetobacteraceae, within the class of Alphaproteobacteria (Gillis
and De Ley 1980, Yamada et al. 1997). At present, the family Acetobacteraceae is divided
into 17 genera (Acetobacter, Gluconobacter, Gluconacetobacter, Asaia, Komagataeibacter,
Acidomonas, Kozakia, Swaminathania, Saccharibacter, Neoasaia, Granulibacter,
Tanticharoenia, Ameyamaea, Neokomagataea, Endobacter, Nguyenibacter, and Swingsia).
The first five genera contain a large number of species while the remaining 12 genera have
only one species (monotypic) except the genus Neokomagataea, which consists of two
species (Yamada 2016). Acetic acid bacteria have been known for decades to thrive in acidic
and sugar-rich environments such as fruit juices, flowers, nectars, alcoholic and soft drinks
(Asai 1935, Gillis and De Ley 1980, Gupta et al. 2001, Battey and Schaffner 2001). Recently,
some bacteria have been isolated from other sources including human patients, mosquitoes,
soil rhizosphere, nodules, and activated sludges (Yamashita et al. 2004, Greenberg et al.
2006, Komagata et al. 2014). With the exception of the genus Granulibacter, all other acetic
acid bacteria are non-pathogenic to humans and animals (De Ley and Swings 1984,
Greenberg et al. 2006).
Acetic acid bacteria perform an overflow metabolism which is characterized by the
phenomenon of incomplete oxidation of growth substrates (alcohols, sugars, or sugar acids).
The corresponding partially-oxidized products are excreted and accumulate in the culture
medium. As a result of incomplete oxidation of growth substrates, low amounts of energy are
conserved by the organisms, resulting in low growth yields (Olijve and Kok 1979, De Ley
and Swings 1984, Deppenmeier and Ehrenreich 2009). The most conventional process is the
oxidation of ethanol to acetic acid, carried out by almost all genera of acetic acid bacteria
(Sievers and Swings 2005). Due to rapid and incomplete oxidative fermentations of sugars,
sugar alcohols, and sugar acids, acetic acid bacteria are widely used in various
biotechnological processes such as the production of vinegar and the synthesis of precursors
of vitamin C (Tsukada and Perlman 1972, Hoshino et al. 1990, Sugisawa et al. 1995, Saeki et
al. 1997, Macauley et al. 2001, Adachi et al. 2003). Furthermore, they are used for the
production of the anti-diabetic drug miglitol, shikimate, and dihydroxyacetone (Claret et al.
1994, Schedel 2000, Gupta et al. 2001, Asano 2003, Deppenmeier et al. 2002, Bauer et al.
2005, Adachi et al. 2006, Raspor and Goranovič 2008, Mamlouk and Gullo 2013).

1. Introduction
2
On the basis of acetate utilization, acetic acid bacteria are broadly classified into two groups
referred to as acetate oxidizers and non-acetate oxidizers. Acetate oxidizers assimilate acetic
acid by oxidation to CO2 through the TCA and the glyoxylate cycles. These include members
of the genera Acetobacter, Gluconacetobacter, Kozakia, Acidomonas, and Asaia. Non-acetate
oxidizers include the genus Gluconobacter. These organisms are unable to oxidize acetate to
CO2 due to the lack of the glyoxylate cycle and presence of an incomplete TCA cycle
(Greenfield and Claus 1972, Chinnawirotpisan et al. 2003, Prust et al. 2005, Yamada and
Yukphan 2008). An acetate oxidation test is routinely used as a conventional phenotypic test
for the identification of closely related genera Acetobacter and Gluconobacter (Yamada and
Yukphan 2008). At the genetic level, the differentiation between the genera is possible
through 16S rRNA gene sequence analysis (Sievers et al. 1995, Komagata et al. 2014).
1.2. The genus Gluconobacter
The generic name Gluconobacter was introduced in the family Acetobacteraceae by Asai
(1935) for the strains of acetic acid bacteria that are capable of producing large amounts of
gluconates from glucose. These strains proliferate in sugar-rich niches such as flowers, honey
bees, and fruits and oxidize glucose more efficiently than ethanol. According to the NCBI
Taxonomy Browser (https://www.ncbi.nlm.nih.gov/Taxonomy/Browser), the genus
Gluconobacter splits into 15 species (G. albidus, G. cerevisiae, G. kondonii, G. morbifer, G.
sphaericus, G. kanchanaburiensis, G. roseus, G. uchimurae, G. cerinus, G. nephelii, G.
wancherniae, G. thailandicus, G. frateurii, G. japonicus, and the type species G. oxydans).
G. oxydans is a Gram-negative, strict aerobic, and rod-shaped bacterium, which can be
present as single cells, in pairs, or in short chains (Fig. 1). Under oxygen limitations, the
bacterium is motile with the formation of 3-8 polar flagella (Gupta et al. 2001, De Muynck et
al. 2007, Deppenmeier and Ehrenreich 2009). The organism grows optimally in highly
concentrated sugar environments at 25-30oC. The optimum pH for growth is in range of 5.5-
6.0 (Olijve and Kok 1979). However, most of the strains can grow even at acidic pH (≤ 4.0).
During cultivation on complex medium with glucose as substrate, G. oxydans cells can grow
with reasonable growth rates at a constant pH of 2.5 (Olijve and Kok 1979). In addition, the
organism can grow to higher cell densities in complex media containing yeast extract and
high amounts of sugars or polyols in comparison to chemically defined media (Olijve and
Kok 1979, Raspor and Goranovič 2008).

1. Introduction
3
Figure 1: Scanning electron microscope image of G. oxydans
(The micrograph was kindly provided by K. Kosciow from the Institute for Microbiology and Biotechnology of
University Bonn, and was developed by H. J. Ensikat at the Nees-Institute for biodiversity of plants of
University Bonn, Germany).
The complete genome of G. oxydans 621H was sequenced in 2005 by Prust et al. The
genomic data provide extensive insights into the overall metabolic pathways of the organism
and is helpful to understand its physiology during growth under extreme conditions. The
genome consists of a circular chromosome (2.7 Mbp) and 5 plasmids (0.22 Mbp) with 2735
open reading frames (Prust et al. 2005). Genome analysis revealed the presence of many
genes encoding membrane-bound dehydrogenases, which are involved in rapid and
incomplete oxidation of a multitude of sugars and sugar alcohols such as glucose, sorbose,
ethanol, mannitol, sorbitol, and glycerol (De Ley et al. 1984, Prust et al. 2005, De Muynck et
al. 2007). The active centers of the enzymes are oriented towards the periplasm, facilitating
the rapid oxidation of substrates at the cell membrane level. During the oxidation process,
electrons are released that are transferred into the membrane-integral respiratory chain (Fig.
2). Here, electron carriers (ubiquinone-10) receive these electrons and transfer them via
quinol oxidases to oxygen (a terminal electron acceptor). During this transfer process, protons
are pumped across the cell-membrane, resulting in the generation of the electrochemical
proton gradient that is a driving force for ATP production in a cell (Kulhanek 1989,
Ameyama et al. 1987).
1.2.1. Respiratory chain of G. oxydans
The respiratory chain of the organism is branched at the ubiquinone level with a KCN-
sensitive and an insensitive terminal oxidases of the bo3- and the bd-type, respectively (Fig.
2). Both terminal oxidases transfer electrons from ubiquinol to molecular oxygen as terminal
acceptor (Ameyama et al. 1987, Matsushita et al. 1989, Matsushita et al. 1994). Accordingly,

1. Introduction
4
in the genome of G. oxydans, genes encoding the cytochrome bd (cydAB) and the cytochrome
bo3 (cyoBCAD) type quinol oxidase were identified (Prust et al. 2005). Among these two
oxidases, the ubiquinol bo3-type was found to be important for growth of the organism. It has
higher affinity for oxygen in comparison to the bd-type oxidase. Deletion of the bo3-type
quinol oxidase resulted in severe growth retardation of G. oxydans, while the deletion of the
bd-type oxidase had no impact on cell growth (Richhardt et al. 2013a). Moreover, the
genome sequence revealed the presence of genes coding for a cytochrome bc1 complex
(qcrABC) and for a soluble cytochrome c (cycA). However, an exact function of these
proteins could not be attributed because the genes encoding a cytochrome c oxidase
(complex-IV) were not found. In addition, genes coding for the proton-translocating NADH:
ubiquinone oxidoreductase (complex-I) were also missing. Rather than complex-I, G.
oxydans possesses a gene encoding the type II NADH dehydrogenase, which does not
translocate protons (Prust et al. 2005).
Due to the absence of complex-I and complex-IV, the ability of the respiratory chain to
translocate protons across the membrane is limited. Only the cytochrome bo3-type quinol
oxidase is able to pump protons during the transfer of electrons from ubiquinol to terminal
oxygen molecule (Matsushita et al. 1987). The quinol oxidase of bd-type does not pump
protons, but participates in the generation of proton motive force (Miller and Gennis 1985)
through the oxidation of quinol near the periplasmic surface and the uptake of protons from
the cytoplasm to form water (Miller and Gennis 1985, Dueweke and Gennis 1991, Borisov et
al. 2011). Proton translocation might also be carried out by another route involving a
membrane-bound nicotinamide dinucleotide transhydrogenase. The genome data revealed the
presence of three genes coding for such a transhydrogenase. In other organisms, these
enzymes perform a reversible hydride transfer between NADPH + H+ and NAD
+, along with
the transfer of protons across the membrane (Cotton et al. 2001, Bizouarn et al. 2002). In G.
oxydans, this membrane-bound transhydrogenase may contribute to the generation of an
electrochemical proton gradient, which is required for ATP synthesis by the F1Fo-type ATP
synthase (Prust et al. 2005).
In comparison to its enormous potential for rapid oxidation of substrates, the ability of G.
oxydans for energy transduction is limited. This is probably due to the inadequate coupling of
the electron transport with proton translocation that results in low H+/e
- ratios of 0.5-1.0.
Therefore, only a small amount of energy is conserved by the organism, which limits its
growth rates and cell yields, while most part of the energy is lost in the form of heat
(Matsushita et al. 1989).

1. Introduction
5
Figure 2: Schematic representation of the respiratory chain of G. oxydans. (1) PQQ-
dependent polyol dehydrogenase, (2) FAD-dependent sorbitol dehydrogenase, (3) NADH-
dehydrogenase (Type-II), (4) quinol oxidase (bo3-type), (5) quinol oxidase (bd-type), (6)
F1Fo-ATP-synthase. Q: Ubiquinone (electron acceptor), QH2: Ubiquinol (electron carrier).
(Modified from Deppenemeier and Ehrenreich 2009).
In several aerobic bacteria, the production of cell biomass correlates with the respiration-
driven proton extrusion ratio (H+/O). For example, Acetobacter pasteurianus has a cell yield
of 13.1 gcdw per mole ethanol with a H+/O ratio of 1.9 ± 0.1 (Luttik et al. 1997). Likewise,
cultivation of G. oxydans under pH and aeration control conditions leads to a cell biomass of
16.2 gcdw per mole glucose with a H+/O ratio of 1.8 ± 0.3 (Olijve and Kok 1979, Matsushita
et al. 1989, Krajewski et al. 2010, Richhardt et al. 2012, Richhardt et al. 2013a). The H+/O
ratio of G. oxydans is almost 50 % lower than that that of E. coli (H+/O ratios 3.0 - 4.9).
Moreover, the E. coli culture also attains higher cell yields of 68-90 gcdw per mole glucose
than that of G. oxydans (Harrison and Loveless 1971, Lawford and Haddock 1973, Minohara
et al. 2002, Soini et al. 2008, Richhardt et al. 2013a). These observations suggest that the
poor growth yield of G. oxydans is linked to the low H+/e
- and H
+/O ratios. The presence of
such an intriguing and inefficient energy transduction mechanism might have an ecological
relevance for the organism. In natural sugar-rich environments, G. oxydans co-exists with
other microorganisms and competes for available growth substrates. The presence of
membrane-bound dehydrogenases provide benefit to the organism for rapid oxidation and
utilization of the substrates at the periplasmic or the cell membrane level, without any delay
for intracellular transport. This may limit the availability of the substrates to other
Periplasm
Cytoplasm
3
Cyt bo3 Cyt bdQ QH2
Q QH2
QH2
H+2 H+
2e-
1PQQ
2FAD
4 5 6
Sorbitol
Glycerol
Gluconate
Sorbose
Dihydroxyacetone
5-ketogluconate Sorbitol Sorbose
Q QH2
NADH NAD+ ½ O2 + 2 H+ H2O ½ O2 + 2 H+ H2O
ADP + Pi ATP
2e-
QH2

1. Introduction
6
microorganisms. Meanwhile, G. oxydans excrete the oxidized products to the environment,
which might be difficult to assimilate by the others. Thus, G. oxydans probably outcompetes
the nutritional competitors in ecological niches. Moreover, in the context of less efficient
proton translocation, the rapid oxidation of substrates is also mandatory for the organism to
generate the sufficient electrochemical proton gradient across the membrane for energy
conservation and cellular maintenance. Thus, the simple respiratory chain facilitates such
uninterrupted and accelerated incomplete oxidation of carbon substrates via membrane
associated dehydrogenases (McNeil and Harvey 2005, Komagate et al. 2014).
1.2.2. Intracellular carbohydrate metabolism in G. oxydans
Gluconobacter strains transport only very small amount of substrates or oxidized products
into the cell cytoplasm for assimilation. The intracellular metabolism of the oxidized products
is carried out either by soluble NAD(P)+-dependent oxidoreductases, by the enzymes of the
oxidative pentose phosphate pathway (PPP), or the Entner-Doudoroff pathway (EDP) (Olijve
and Kok 1979, Shinjoh et al. 1990, Matsushita et al. 1994, Sievers and Swings 2005, Rauch
et al. 2010). The genome data of G. oxydans 621H depict the presence of a complete set of
genes for the PPP and the EDP (Prust et al. 2005). In contrast, the Embden-Meyerhof-Parnas
pathway (EMP) and the TCA cycle are incomplete due to the absence of genes encoding a 6-
phosphofructokinase and a succinate dehydrogenase, respectively. In addition, other
pathways for carbohydrate metabolism such as the glyoxylate cycle and the gluconeogenesis
are also absent as none of the key genes of these pathways are encoded on the genome of G.
oxydans (Prust et al. 2005, De Ley and Swings 1984, Greenfield and Claus 1972,
Deppenmeier and Ehrenreich 2009).
Between the two functional pathways for intracellular sugar catabolism, the PPP is of major
importance for G. oxydans rather than the EDP. Mutant studies revealed that the deletion of
the PPP gene gox1705 (6-phosphogluconate dehydrogenase) resulted in reduced growth of
the organism with mannitol and glucose as carbon sources. Moreover, the deletion of the
gene induced a strong selection pressure for a second mutation of gene (gox0145) encoding a
glucose-6-phosphate dehydrogenase. The resulting double mutant was inefficient to grow on
fructose as well as on gluconates. In contrast, the deletion of the EDP genes gox0430 (6-
phosphogluconate dehydratase) and gox0431 (2-keto-3-deoxy-6-phosphogluconate aldolase)
had a relatively beneficial effect on growth and substrate utilization efficiency of the mutant
strain in comparison to the reference strain with mannitol as substrate. While on glucose, the
growth characteristics of the mutant strain were unaltered and comparable to the wild type.

1. Introduction
7
These observations highlight the importance of the PPP for G. oxydans to assimilate sugar,
sugar alcohols, and their oxidized products inside the cell. In such context, the EDP pathway
is of minor importance or is dispensable for the organism (Richhardt et al. 2012, Richhardt et
al. 2013b).
1.2.3. Types and function of sugars and polyols metabolizing enzymes in Gluconobacter
Gluconobacter strains have two different enzyme systems for the oxidation and utilization of
various substrate molecules. These enzyme systems vary from one another with respect to
their sub-cellular location, cofactor specificity, and function within the cell (Fig. 2 and Fig.
3). One set, comprising membrane-bound enzymes, utilizes PQQ, FAD, or heme c as
prosthetic groups (Adachi et al. 1978, Ameyama et al. 1981, Shinagawa et al. 1984, Choi et
al. 1995, Hölscher and Görisch 2006). These dehydrogenases perform the oxidation of
substrates in a regio- and stereoselective manner at a pH range of 3.0-6.0 (Adachi et al.
2001b). Furthermore, the enzymes catalyze the oxidation of a broad range of substrates and
some of them even share overlapping substrate spectra (De Muynck et al. 2007, Peters et al.
2013a). Some examples of such enzymes are the glucose dehydrogenase (Gox0265), the
alcohol dehydrogenase (Gox0756, Gox1067 and Gox1068), the aldehyde dehydrogenase
(Gox0585 and Gox0587), the gluconate dehydrogenase (Gox1230 and Gox1232), and the
polyol dehydrogenase (Gox0854 and Gox0855) (Adachi et al. 1978, Adachi et al. 1980,
Ameyama et al. 1981, Shinagawa et al. 1984, Adachi et al. 2001b, Matsushita et al. 2003,
Prust et al. 2005). These enzymes enable the organism to catalyze the incomplete oxidation
of substrates in a single step. The oxidized products are released into the culture medium in
almost equal amounts. Due to the catalytic robustness and nearly quantitative excretion of
products, whole cells of Gluconobacter sp. are commercially used in several
biotransformation process (Shinjoh and Toyama 2016).
The second set of enzymes is confined to the cytoplasm of cells and referred to as
cytoplasmic or soluble oxidoreductases (Fig. 3). These enzymes can catalyze both oxidation
as well as reduction reactions and require NAD(P)+ or NAD(P)H as cofactors. They are
involved in intracellular assimilation of oxidized products, biosynthesis of precursor
molecules, and in maintenance of cellular functions (Adachi et al. 1991a, Adachi et al.
1991b, Adachi et al. 2001a, Parmentier et al. 2005). Examples of such alcohol-sugar
oxidoreductases are the NADPH dependent L-sorbose reductase (Gox0849), the NAD+-
specific xylitol dehydrogenase (Gox0865), the NADP+-dependent
glucose-6-phosphate

1. Introduction
8
dehydrogenase (Gox0145), and the NAD+-specific 6-phosphogluconate dehydrogenase
(Gox1705) (Shinjoh et al. 2002, Sugiyama et al. 2003, Rauch et al. 2010).
Both enzyme systems operate side by side at their respective cellular levels and enable
Gluconobacter sp. for efficient conversion and utilization of growth substrates. As an
example, the metabolic pathways involved in the oxidation and intracellular assimilation of
D-sorbitol are indicated in Figure 3. D-sorbitol is oxidized by the membrane bound D-
sorbitol dehydrogenase to L-sorbose, which is further oxidized to L-sorbosone by the
membrane-bound L-sorbose dehydrogenase. A major portion of both L-sorbose and L-
sorbosone is excreted by into the culture medium. Only a small fraction of the substrates is
transported into the cell, where L-sorbosone is reduced to L-sorbose by the catalytic activity
of cytosolic L-sorbosone reductase. L-sorbose is further reduced to D-sorbitol by the soluble
L-sorbose reductase. Then, D-sorbitol is oxidized to D-fructose by the catalytic activity of
cytoplasmic D-sorbitol dehydrogenase. D-fructose is then channeled after phosphorylation
into the PPP or the EDP by a cascade of enzymatic reactions (Reactions 6-11, Fig. 3)
(Shinagawa et al. 1982, Sugisawa et al. 1991, Adachi et al. 1999a, Adachi et al.1999b,
Shibata et al. 2000, Shinjoh et al. 2002, Toyama et al. 2005, Soemphol et al. 2007). In the
similar way, metabolism of other sugars or polyols is carried out by the organisms using both
type of enzyme systems. However, a major part of the substrates is oxidized at the
periplasmic level by the membrane-integral enzymes, while a minor portion is taken up by
the cells and catalyzed by the soluble oxidoreductases (Hanke et al. 2013).
1.2.4. Biotechnological applications of G. oxydans and its limitations
G. oxydans has tremendous potential for oxidative fermentation of sugars, sugar acids, and
polyols. The special feature is attributed to the organism due to the presence of membrane-
bound enzymes that oxidize the substrates in an enantio- and regioselective manner.
Moreover, the organism utilizes a small amount of the substrate for biomass production and
excrete almost 90% of the oxidized products into the culture media (Hanke et al. 2013).
These properties make G. oxydans an ideal organism for various bio-based applications on
industrial-scale (Macauley et al. 2001). For example, intact cells of the organism are
commercially used as biosensors for detection of different alcohols, sugars, and sugar
derivatives (Reshetilov et al. 1997, Reshetilov et al. 1998, Lusta and Reshetilov 1998, Svitel
et al. 1998). Moreover, the intact cells or the purified proteins are also used in several
biotechnological process for production of valuable compounds. Examples for economically-
important chemicals produced by G. oxydans are intermediates for the synthesis of vitamin C

1. Introduction
9
and the antidiabetic drug miglitol (Saito et al. 1997, Saito et al. 1998, Schedel 2000).
Furthermore, the cells are used for the production of gluconates (sequestering agents in food
and pharmaceutical industry), ketogluconates (precursors of isoascorbic acid and tartaric
acid), and the tanning agent dihydroxyacetone (Prescott and Dunn 1959, Meiberg and Spa
1983, Weenk et al. 1984, Klasen et al. 1995, Svitel and Sturdik 1994, Gupta et al. 2001, Tkac
et al. 2001, Deppenmeier et al. 2002, Bauer et al. 2005, Elfari et al. 2005, Merfort et al.
2006).
Figure 3: Schematic representation of metabolic pathways for the oxidation and the
intracellular assimilation of D-sorbitol and its derivatives in Gluconobacter sp. (1)
membrane-bound D-sorbitol dehydrogenases, (2) membrane-bound L-sorbose
dehydrogenase, (3) NAD(P)H-dependent L-sorbose reductase, (4) NAD(P)H-dependent L-
sorbosone reductase, (5) NAD(P) +
-dependent D-sorbitol dehydrogenase, (6) fructose kinase,
(7) glucose-6-phosphate isomerase, (8) glucose-6-phosphate dehydrogenase, (9) 6-phospho-
gluconolactonase, (10) 6-phosphogluconate dehydrogenase, (11) phosphogluconate
dehydratase. (Modified from Shinjoh et al. 2002, Deppenmeier et al. 2002).
Despite its great biotechnological importance, the use of G. oxydans in whole-cell
biotransformation processes is often limited due to low biomass production. In industrial-
scale fermentations, high-cell densities of bacterial cultures are required for volumetric
production of valuable compounds in a cost effective manner. Many studies have been
carried out to enhance the cell density of Gluconobacter species by cultivation under aeration
D-Sorbitol L-Sorbose L-Sorbosone
L-Sorbose L-Sorbosone
D-Sorbitol
D-Fructose
Fructose-6-p
Pentose phosphate pathway
Glucose-6-p 6-P-Gluconate
Ribulose-5-P 2-keto-3-deoxy-6-P-Gluconate
Entner-Doudoroffpathway
Periplasm
Cytoplasm
Outer membrane1 2
3
5
6
7 8 9
10 11
4D-Sorbitol
5
Inner membrane

1. Introduction
10
and pH control conditions (Mori et al. 1981, Rosenberg et al. 1993). In fed-batch cultures,
continuous supply of nutrients plus oxygen result in high biomass production. For example,
the maximum L-sorbose concentration of 628 g L-1
and the biomass concentration of 6 g L-1
were achieved during fed-batch cultivation of G. oxydans with D-sorbitol. In contrast, the
productivity in batch-cultures was relatively low with 190 g L-1
of sorbose and 2 g L-1
of
biomass (Yamada et al. 1979, Mori et al. 1981).
However, growth of cultures in fed-batch settings is often subjected to the inhibitory osmotic
stress, imposed by high concentrations of substrates and products that accumulate in the
media. The accumulation of L-sorbose up to a concentration of 510 g L-1
inhibits growth of
G. oxydans and decreases the sorbitol oxidation rate (Mori et al. 1981). Likewise, another
important parameter, having an impact on growth and productivity of G. oxydans, is the pH
value of fermentation medium which is often controlled either by the addition of highly
concentrated buffers (for shake flask cultures) or by titration (Olijve and Kok 1979,
Silberbach et al. 2003). However, the addition of highly concentrated soluble buffers or salts
to the growth medium increases its osmotic pressure that limits culture proliferation and may
inhibit product formation (Kumar et al. 2004, Jeude et al. 2006). It has been studied that the
growth of G. oxydans is reduced at an osmolality value of > 0.5 Osm kg-1
, raised by the
addition of soluble buffers or salts, in the culture medium (Luchterhand et al. 2015).
1.3. Aims of the work
Due to its industrial relevance, G. oxydans has been extensively studied for many decades,
particularly after the publication of the complete genome sequence (Prust et al. 2005). Most
of the studies deal with the identification and characterization of its potential dehydrogenases
and oxidoreductases (Adachi et al. 1999a, Adachi et al. 1999b, Hoshino et al. 2003,
Schweiger et al. 2007, Schweiger et al. 2010, Meyer et al. 2015). Some studies focus on the
investigation of the intracellular metabolic routes of the organism (Rauch et al. 2010,
Richhardt et al. 2012, Richhardt et al. 2013b). Recently, some other aspects such as
expansion of the substrate spectrum of G. oxydans (Kosciow et al. 2014, Kosciow et al.
2016), and the construction of molecular tools for its metabolic engineering have gained
considerable interests (Kallnik et al. 2010, Kostner et al. 2013).
So far, very little attention has been paid to understand the survival mechanisms of the
organism under osmotic stress conditions. G. oxydans frequently encounters the osmotic
stress during growth in natural habitats or under controlled conditions in fermenters. In the
1. Introduction
11
natural environment, the variable precipitation rates, desiccation periods, and the seasonal
effects exert osmotic pressure on the living organisms. Analogously, the use of high-sugar
concentrations in industrial-scale fermentation decreases the water activity of the growth
media and imposes osmotic stress to the cultures. Therefore, there is a need to investigate the
osmoprotective mechanisms present in G. oxydans to elucidate its physiology and response
under osmotic stress.
The aim of the present work is the investigation of the effects of external osmotic pressure on
growth and cellular functions of G. oxydans. To achieve these targets, two initial strategies
are designed. In the first instance, the difference in global gene expression pattern of the
organism under osmotic stress conditions in comparison to non-stress conditions is planned to
be examined by Next-Generation Sequencing (NGS). The second strategy focuses on the
identification of potential compatible solutes, accumulate in the cells under osmotic stress.
Therefore, experiments are designed targeting the analysis of total cellular extracts by 13
C-
NMR spectroscopy and HPLC.
Further objectives include the identification and characterization of genetic elements
responsible for the synthesis of compatible solutes in G. oxydans. To achieve these tasks,
experiments are planned to generate in-frame deletion mutants lacking the osmoprotectant
synthesizing genes, and to analyze the effect of deletions on the osmotic tolerance of the
mutants. It is expected that the data will provide a plethora of information regarding the
osmoprotection of G. oxydans, and will be useful for the rational engineering of osmotolerant
strains for future biotechnological applications.

2. Materials and Methods
12
2. MATERIALS AND METHODS
2.1. Chemicals and Enzymes
All media components, chemicals, and antibiotics were purchased from Sigma-Aldrich
(München, Germany), Merck KGaA (Darmstadt, Germany), Carl Roth GmbH (Karlsruhe,
Germany), or Fluka (Sigma-Aldrich München, Germany). Enzymes, PCR reagents, and other
biochemicals were obtained from Thermo Fisher Scientific Biosciencies GmbH (Schwerte,
Germany). Phusion DNA polymerase was purchased from Biozym Scientific GmbH
(Oldendorf, Germany). NAD+, NADPH, and NADH were obtained from Carl Roth GmbH
(Karlsruhe, Germany), while NADP+ was ordered from Merck KGaA (Darmstadt, Germany).
2.2. Bacterial strains, plasmids, primers
2.2.1. Bacterial strains
Organisms used in the present work were Escherichia (E.) coli (strains K12, NEB 5-α, BL21,
and ECG18), Gluconobacter (G.) oxydans 621H (ΔhsdR), and Streptomyces (S.) griseus. The
genotype of the organisms is listed in Table 1.
Table 1: Bacterial strains used in the present study and their genotypes
Strain Genotype Reference
E. coli (NEB 5-α) Derivative of DHα fhuA2, Δ(argF-lacZ)U169,
phoA, glnV44, ϕ80Δ(lacZ)M15, gyrA96,
recA1, relA1, endA1, thi-1, hsdR17
New England
Biolabs, Frankfurt
am Main, Germany
E. coli BL21
(DE3)
F–, ompT, gal, dcm, hsdSB (rB
- mB
-) Invitrogen, Carlsbad,
USA
G. oxydans 621H
ΔhsdR
Δgox2567 derivative of G. oxydans 621H
(DSM 2343), CefR, referred to as wild type
throughout the work
S. Bringer-Meyer,
research center
Juelich GmbH,
Germany
E. coli K12 Wild type (DSM 498)
E. coli ECG18
(pRK 2013)
HB 101, lamB
pRK2013 (KmR, oriColE1, Mob, RK2, Tra
+)
(DSM 5599)
S. griseus Type strain (DSM 40236)

2. Materials and Methods
13
2.2.2. Oligonucleotides and Plasmids
Primers used in the present study were generated with an online program Primer3
(http://bioinfo.ut.ee/primer3-0.4.0/primer3/), the software Primer D’Signer (IBA GmbH,
Göttingen, Germany), or designed manually. Synthesis of the oligonucleotides was done by
Eurofins MWG Operon (Ebersberg, Germany). The nucleotide sequences of these primers
are given in Table 2 with sites of restriction enzymes (underlined) and homologous sequences
for fusion PCR (in bold).
Table 2: List of primers used in the study.
Primer Sequence (5' 3') Restriction
enzyme
Primers used for RT-qPCR
Gox0352_fw CATCATTGCCGGTGTTTTCG
Gox0352_rev GCGACACCTGCGAGAATG
Gox0378_fw AATACCGTCATGAACGCACA
Gox0378_rev TGGTTACGCTCGGAAAGAAG
Gox0540_fw GTCAACAACATCCTGGACCG
Gox0540_rev CAGAAATCCACCCGCAGC
Gox0676_fw GGAAGCCTATATCACCCGCA
Gox0676_rev AGATATCTTCCTGGGACGGC
Gox0707_fw TCCAGCATCGATGGCTTCTC
Gox0707_rev CGCTGTTCTTGGCAACATCC
Gox0717_fw AAGACGCTGAAAACCGGTTC
Gox0717_rev CGTCATGCCCAATTCGACAT
Gox0820_fw TCGAGGCTCTTGAAGCACAG
Gox0820_rev CACGGGCGAATTTCTGGATG
Gox0849_fw GACCGAACATCCTGCCATTG
Gox0849_rev ATTGACCTCGATCCACTCCG
Gox0857_fw GTTCCTGGCTGACGAGTTCA
Gox0857_rev GGAGGACAGCTCGATCTTGG
2. Materials and Methods
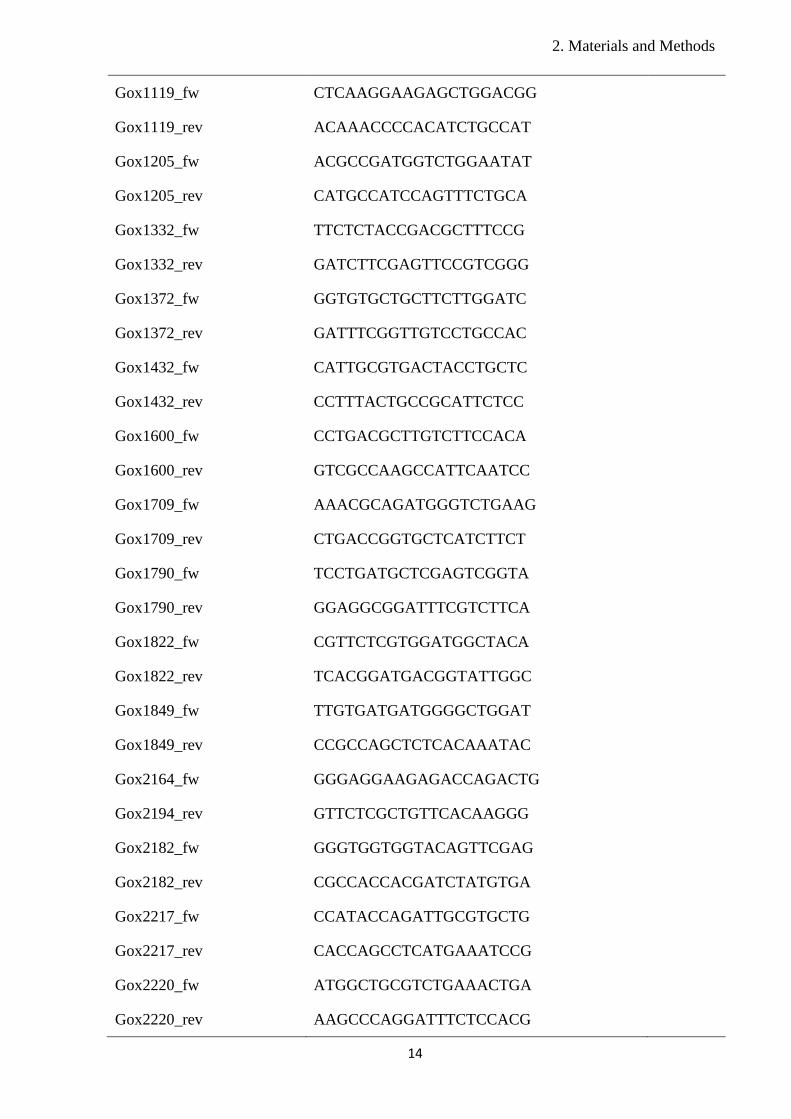
14
Gox1119_fw CTCAAGGAAGAGCTGGACGG
Gox1119_rev ACAAACCCCACATCTGCCAT
Gox1205_fw ACGCCGATGGTCTGGAATAT
Gox1205_rev CATGCCATCCAGTTTCTGCA
Gox1332_fw TTCTCTACCGACGCTTTCCG
Gox1332_rev GATCTTCGAGTTCCGTCGGG
Gox1372_fw GGTGTGCTGCTTCTTGGATC
Gox1372_rev GATTTCGGTTGTCCTGCCAC
Gox1432_fw CATTGCGTGACTACCTGCTC
Gox1432_rev CCTTTACTGCCGCATTCTCC
Gox1600_fw CCTGACGCTTGTCTTCCACA
Gox1600_rev GTCGCCAAGCCATTCAATCC
Gox1709_fw AAACGCAGATGGGTCTGAAG
Gox1709_rev CTGACCGGTGCTCATCTTCT
Gox1790_fw TCCTGATGCTCGAGTCGGTA
Gox1790_rev GGAGGCGGATTTCGTCTTCA
Gox1822_fw CGTTCTCGTGGATGGCTACA
Gox1822_rev TCACGGATGACGGTATTGGC
Gox1849_fw TTGTGATGATGGGGCTGGAT
Gox1849_rev CCGCCAGCTCTCACAAATAC
Gox2164_fw GGGAGGAAGAGACCAGACTG
Gox2194_rev GTTCTCGCTGTTCACAAGGG
Gox2182_fw GGGTGGTGGTACAGTTCGAG
Gox2182_rev CGCCACCACGATCTATGTGA
Gox2217_fw CCATACCAGATTGCGTGCTG
Gox2217_rev CACCAGCCTCATGAAATCCG
Gox2220_fw ATGGCTGCGTCTGAAACTGA
Gox2220_rev AAGCCCAGGATTTCTCCACG

2. Materials and Methods
15
Gox2667_fw AAATGGATGGATGCGAACCG
Gox2667_rev GCCACTTGATAAACCGTCCC
Primers used for generation of deletion mutants
Up_gox0849_fw ATAGGTACCGGCCCGGATGTTCGAGCTGTC KpnI
Up_gox0849_rev CCAAAAACTTGGACAGGATCTTTCAGGC
GAAAGGACCGGC
Do_gox0849_fw GATCCTGTCCAAGTTTTTGGTGAAGCTTT
TTCCAAAAAGC
Do_gox0849_rev GCGTCTAGAAGGGGCTTGAGACGCTGGGC
GC
XbaI
Up_gox1118_fw ATAGGTACCGTCTGGCAGATGAGCCCTGA KpnI
Up_gox1118_rev GCCACGAGGTGAAGCTGTCATTTCTTCCT
GTTTCTGGGTC
Do_gox1119_fw TGACAGCTTCACCTCGTGGCCAAGGAGT
TCATCGCGGCGC
Do_gox1119_rev GCGTCTAGAGCTACTGACAAAGGAGACAG XbaI
Up_gox1432_fw ATAGGTACCTGACGACGGCGCGGGACCAG KpnI
Up_gox1432_rev GAAGAAGAGGAGGAATTCTCCGTGGTTT
CGGGCCGGTCG
Do_gox1432_fw GGAGAATTCCTCCTCTTCTTCAGGGCAC
AAAAAACCGCGC
Do_gox1432_rev GCGTCTAGATGGAGCGAGCGTTTTCCCGCG XbaI
Primers used for sequencing
pASK_fw GAGTTATTTTACCACTCCT
pASK_rev CGCAGTAGCGGTAAACG
pBBR.p264_fw GTGCAGAGTCTCTGCAGGAT
CodA_fw TGTGGAGGCTAACAGTGTCG
CodA_rev GATAATCAGGTTGGCGCTGT
Up_gox0849_int_fw AATCATGTCCGTCTCGGTCT
Do_gox0849_int_rev CGAGACGATCTTCGAGAACC
Up_gox1117_fw GGTGTTGAAGCCTGTGTCAG

2. Materials and Methods
16
Do_gox1120_rev GATCGTGACAATCCCAAGCC
Up_gox1432_int_fw AGATGCGCTTTGTGATGTCC
Do_gox1432_int_rev ACCGGCAGCTTTGATCTTTC
Primers used for cloning of genes into expression vectors
pASK5_gox0849_fw ATGGTAGGTCTCAGCGCCATGATCCTGACT
TCCCAGACCC
Eco31I
pASK5_gox0849_rev ATGGTAGGTCTCATATCATACGTTTGTGAC
CAGATCCTTCAG
Eco31I
pASK3_gox1432_fw ATGGTAGGTCTCAAATGATTACGCGCGAA
ACCCTCAAGTC
Eco31I
pASK3_gox1432_rev ATGGTAGGTCTCAGCGCTGGCCGGAATAG
CGGCCTTCAC
Eco31I
pASK3_gox1849_fw ATGGTAGGTCTCAAATGCGTACAAATTTTT
CCGTAGAGGGC
Eco31I
pASK3_gox1849_rev ATGGTAGGTCTCAGCGCTTTTACGGAACCG
CCGCCAGCT
Eco31I
pBBR.p264_gox1432_fw GCGGATATCGGCCCGAAACCACGGAGAAT
TCCATG
EcoRV
pBBR.p264_gox1432_rev ATAGGCGCGCCGGCCGGAATAGCGGCCTT
C
AscI
pBBR.p264_E. coli.GI_fw
(for E.coli gene b3565)
GCAGGAATTCTGGAGTTCAATATGCAAGC
C
EcoRI
pBBR.p264_E. coli.GI_rev
(for E.coli gene b3565)
TCCAGGGCGCGCCTTTGTCGAACAGATAAT
G
AscI
pBBR.p264_S. gr.GI_fw
(for S. griseus gene SGR_RS05195)
TTATGGAATTCAAGGCGGTCGGACGACGA
TGACGGA
EcoRI
pBBR.p264_S. gr.GI_rev
(for S. griseus gene SGR_RS05195)
TATAAGGCGCGCCGCGCACGGCGAGCAGG
TGG
AscI
Up: upstream, Do: downstream

2. Materials and Methods
17
A list of plasmids used in the work is provided in Table 3.
Table 3: List of plasmids used in the present work
Plasmid Description Source
pASK-IBA.3 C-terminal Strep-tag II sequence, tetA
promoter/repressor system, AmpR
IBA GmbH
pASK-IBA.5 N-termial Strep-tag II, tetA
promoter/repressor system, AmpR
IBA GmbH
pBBR.p264.ST Derivate of pBBR1MCS-2 with the
promoter of gene gox0265 and a C-
terminal Strep-tag II from pASK-IBA.3
vector
Kallnik et al.
(2010), Meyer
et al. (2015)
pKos6b Derivative from pAJ63a, Δupp, codBA
integrated, KmR, FC
S
Kostner et al.
(2013)
pASK5-gox0849 AmpR, Derivate of pASK-IBA.5, contains
a 1476 bp long PCR fragment of gox0849
This work
pASK3-gox1432 AmpR, Derivate of pASK-IBA.3, contains
a 1458 bp long PCR fragment of gox1432
This work
pASK3-gox1849 AmpR, Derivate of pASK-IBA.3, contains
a 1023 bp long PCR fragment of gox1849
This work
pBBR.p264.gox1432.ST KmR, Derivate of pBBR.p264.ST,
contains a 1476 bp long PCR fragment of
gox1432
This work
pBBR.p264_E. coli.GI_ST KmR, Derivate of pBBR.p264.ST,
contains a 1323 bp long PCR fragment of
b3565 from E. coli
This work
pBBR.p264_S. gr.GI_ST KmR, Derivate of pBBR.p264.ST,
contains a 1167 bp long PCR fragment of
SGR_RS05195 from S. griseus
This work
pKos6bΔgox1118Δgox1119 KmR, Deletion vector based on pKos6b,
for deletion of gox1118 and gox1119
This work
pKos6bΔgox1432 KmR, Deletion vector based on pKos6b,
for deletion of gox1432
This work
pKos6bΔgox0849 KmR, Deletion vector based on pKos6b,
for deletion of gox0849
This work

2. Materials and Methods
18
2.3. Antibiotic stock solutions
Ampicillin: Ampicillin stock solution (100 mg mL-1
) was prepared in 50 % (v/v) ethanol and
stored at -20oC after filter sterilization.
Kanamycin: Kanamycin stock solution (50 mg mL-1
) was prepared in autoclaved distilled
water and stored at -20oC after filter sterilization for further use.
Cefoxitin: Cefoxitin stock solution (50 mg mL-1
) was prepared in autoclaved distilled water
and stored at -20oC after filter sterilization for further use.
2.4. Microbiology methods
2.4.1. Media and culture conditions
Unless mentioned specifically, all growth media were sterilized at 121oC for 20 min and used
for culture inoculation. Reducing sugars (glucose, fructose) were separately autoclaved and
then added to the media. Sucrose and PEG-6000 solutions were used after filter sterilization
through 0.22 µm pore size filters (Carl Roth GmbH, Karlsruhe, Germany).
E. coli cells were cultured in lysogeny broth (LB) at 37oC and 120-150 rpm. 1 % (v/v)
overnight grown cultures were used for inoculation of main cultures in 50-200 mL LB
medium.
LB medium (Miller 1972)
Yeast extract 5 g
Peptone 10 g
NaCl 10 g
H2Odest ad 1000 mL
For agar-plates, 15 g Bacto-agar was added in 1000 mL LB medium.
For protein overproduction, E. coli transformants were cultivated in 100-200 mL sterile
maximal induction (MI) medium. The medium was supplemented with M9 salts, which were
separately autoclaved and added before inoculation. In addition, some other salts such as
CaCl2, MgSO4, and FeNH2 citrate were also added in trace amounts after filter sterilization to
the sterile medium. For induction, anhydrotetracyclin was added at a concentration of 200 ng
mL-1
.

2. Materials and Methods
19
MI medium (Mott et al. 1985)
Yeast extract 20 g
Trypton 32 g
20 x M9 salts 50 mL
CaCl2 1 mM
MgSO4 1 mM
FeNH2 citrate 1 µM
H2Odest ad 1000 mL
20 x M9 salts
NH4Cl 20 g
Na2HPO4 × 2 H2O 120 g
KH2PO4 60 g
NaCl 10 g
H2Odest ad 1000 mL
To avoid contamination and for the cultivation of transformants, antibiotics such as
ampicillin or kanamycin were added in sterile media to final concentrations of 100 µg mL-1
or 50 µg mL-1
, respectively. For the regeneration of E. coli cells after transformation, SOC
medium was used, which was provided by New England Biolabs (Frankfurt am Main,
Germany).
Streptomyces griseus was cultured in 10 mL Tryptic Soya Broth (TSB) and incubated at 28oC
and 180 rpm.
TSB medium (Shepherd et al. 2010)
Tryptone 10 g
Soytone 3.0 g
Glucose 2.5 g
NaCl 5.0 g
K2HPO4 2.5 g
H2Odest ad 1000 mL
2. Materials and Methods
20
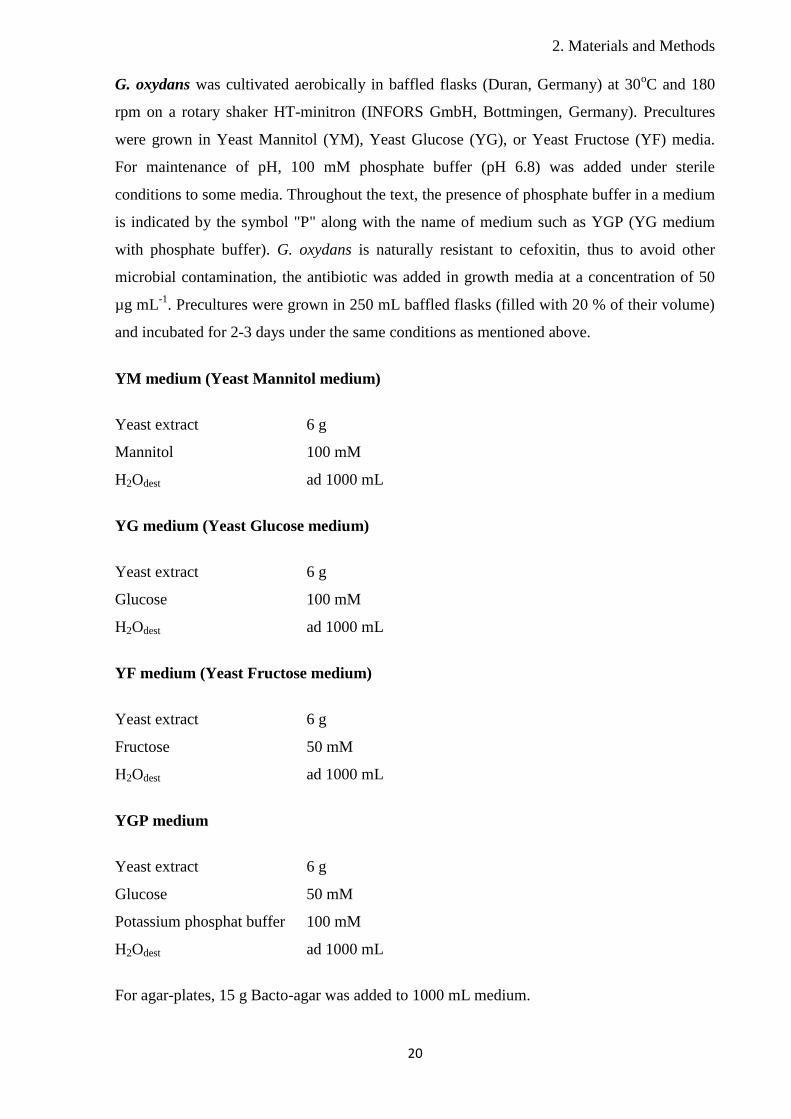
G. oxydans was cultivated aerobically in baffled flasks (Duran, Germany) at 30oC and 180
rpm on a rotary shaker HT-minitron (INFORS GmbH, Bottmingen, Germany). Precultures
were grown in Yeast Mannitol (YM), Yeast Glucose (YG), or Yeast Fructose (YF) media.
For maintenance of pH, 100 mM phosphate buffer (pH 6.8) was added under sterile
conditions to some media. Throughout the text, the presence of phosphate buffer in a medium
is indicated by the symbol "P" along with the name of medium such as YGP (YG medium
with phosphate buffer). G. oxydans is naturally resistant to cefoxitin, thus to avoid other
microbial contamination, the antibiotic was added in growth media at a concentration of 50
µg mL-1
. Precultures were grown in 250 mL baffled flasks (filled with 20 % of their volume)
and incubated for 2-3 days under the same conditions as mentioned above.
YM medium (Yeast Mannitol medium)
Yeast extract 6 g
Mannitol 100 mM
H2Odest ad 1000 mL
YG medium (Yeast Glucose medium)
Yeast extract 6 g
Glucose 100 mM
H2Odest ad 1000 mL
YF medium (Yeast Fructose medium)
Yeast extract 6 g
Fructose 50 mM
H2Odest ad 1000 mL
YGP medium
Yeast extract 6 g
Glucose 50 mM
Potassium phosphat buffer 100 mM
H2Odest ad 1000 mL
For agar-plates, 15 g Bacto-agar was added to 1000 mL medium.

2. Materials and Methods
21
To induce osmotic stress, the osmolality of growth media was raised with different
metabolizable osmolytes such as polyols (mannitol, glycerol), sugars (glucose, fructose), or
with metabolically inert organic compounds such as PEG-6000 or sucrose. The osmolytes
were added in variable amounts or concentrations to media (Table 4). All cultures were
grown in 500-2000 mL baffled flasks (filled with 20-25 % of their volume) and incubated at
30oC and 180 rpm on a rotary shaker. 3-5 % (v/v) of precultures, grown in YGP medium,
were added to the main cultures as primary inocula.
Table 4: List of media used to study the response of G. oxydans to osmotic stress
Medium Description
YMhigh YM medium containing 1000 mM mannitol
YGhigh YG medium containing 1000 mM glucose
YGPhigh YGP medium supplemented with 450 mM to 1000 mM glucose
YFhigh YF medium containing 500 mM fructose
YGP + sucrose YGP medium supplemented with 150 mM to 600 mM sucrose
YGP + PEG YGP medium supplemented with 10 % (v/v) PEG-6000
YFP + PEG YF medium with 100 mM phosphate buffer and 10 % (v/v) PEG-6000
YM + PEG YM medium supplemented with 2.5 % to 10 % (v/v) PEG-6000
YGly medium containing yeast extract (6 g L-1
) and glycerol (500 mM)
To examine the protective effect of mannitol against osmotic stress, G. oxydans was cultured
in YGP medium with 300 mM or 600 mM sucrose in the presence of 2.5 mM to 10 mM
mannitol. Moreover, the stimulatory effects of exogenous polyols on growth, rate of glucose
consumption, and gluconate formation were analyzed by the addition of 5 mM sorbitol,
mannitol, or arabitol to YGPhigh medium containing 1000 mM glucose. All the cultures were
grown in 500 mL baffled flasks (filled with 20 % of their volume) and incubated at 30oC and
180 rpm. 3-5 % (v/v) of precultures, grown in YGP medium, were used as primary inocula.
For transformation of G. oxydans, following media were used
Mating Medium (MM)
Yeast extract 6 g
Mannitol 100 mM
NaCl 10 mM
H2Odest ad 1000 mL

2. Materials and Methods
22
Electroporation medium (EP medium)
Mannitol 80 g
Yeast extract 15 g
Glycerol 0.5 g
MgSO4 x 7H2O 2.5 g
CaCl2 1.5 g
H2Odest ad 1000 mL
The pH was adjusted to 6.0 with HCl. Salt solutions such as MgSO4 and CaCl2 were prepared
separately and added to the sterile medium after filter sterilization.
For the cultivation of transformants, G. oxydans cultures were supplemented additionally
with 50 µg mL-1
kanamycin.
2.4.2. Measurement of osmolalities of growth media
The osmolality of a growth medium was measured with a Freezing-point osmometer
(Osmomat 030, Gonotec GmbH, Berlin, Germany) at the Institute of Cellular and Molecular
Botany (IZMB) of University Bonn. Prior to sample analysis, the osmometer was calibrated
using NaCl solution of 300 mOsm kg-1
(150 mM). 15 µL sample volume was used for single
measurement. Each media sample was measured at least twice, using two different biological
replicates. A mean of all the values was taken to determine the osmolality of a medium.
2.4.3. Measurement of growth parameters
Growth of bacteria in liquid cultures was determined by measuring the optical density at 600
nm (OD600) with a Helios Epsilon Photometer (Thermo Scientific, Schwäbisch-Gmünd,
Germany). OD600 values of a culture were recorded at regular intervals against the respective
blank solution (medium without inoculation). At higher cell densities (OD600 value above
0.3), appropriate dilutions of cell cultures were made with corresponding blank solutions and
used for measurement. Growth parameters of a culture such as doubling time (td) and growth
rate (µ) were determined by plotting the OD600 values on a logrithmic scale against time. In a
linear region of exponential growth phase, slope of the graph was calculated which indicated
the growth rate (µ) of the culture. With the help of the growth rate, the doubling time of the
culture was calculated as ln(2)/µ.

2. Materials and Methods
23
G. oxydans cultures were also analyzed for other parameters such as change in pH, substrate,
and product concentrations. Briefly, 1 mL sample volume was obtained from a growing
culture at regular intervals and centrifuged in 1.5 mL eppendorf cups at 10,000 x g for 5 min.
The upper supernatant was transferred to a new 1 mL cup and used for further analysis. The
pH was measured with a pH 210 Microprocessor (Hanna Instruments GmbH, Vöhringen,
Germany). Different metabolites concentrations were quantified by High Performance Liquid
Chromatography (HPLC). All growth experiments were performed in triplicates with at least
two biological replicates. Representative growth curves are shown in the present work.
2.4.4. Preparation of stock cultures
To prepare stock culture, 900 µL of an exponentially grown bacterial culture were mixed
with 100 µL of sterile DMSO (10 % (v/v)) in a sterile cryogenic vial (Carl Roth GmbH,
Karlsruhe, Germany) and stored at -70oC.
2.5. Molecular biology methods
2.5.1. Isolation and purification of DNA
For the isolation of chromosomal DNA from E. coli, G. oxydans, or S. griseus, 1 mL of the
exponentially grown cultures was centrifuged at 10,000 x g for 5 min at room temperature.
The supernatant was discarded and the cell pellet was processed according to the protocol of
the GenJETTM
Genomic DNA Purification Kit (Thermo Scientific, Schwerte, Germany). The
purified DNA samples were dissolved in sterile water and stored at 4oC.
The Purification of DNA fragments from PCR amplifications was performed using the
GenJETTM
PCR Purification Kit (Thermo Scientific, Schwerte, Germany) according to the
manufacturer's instructions. Likewise, the purification of DNA fragments from agarose gels
was done using the GenJETTM
Gel Extraction Kit (Thermo Scientific, Schwerte, Germany).
2.5.2. Isolation and purification of plasmid DNA
The isolation of plasmid DNA from E. coli cultures was done by using the GenJETTM
Plasmid Miniprep Kit (Thermo Scientific, Schwerte, Germany). Cell pellets were obtained by
centrifugation of 2 mL exponentially grown cultures at 10,000 x g for 5 min at room
temperature. The pellets were processed for DNA extraction following the manufacturer's
instructions. The isolated plasmids were eluted in sterile water and stored at 4oC.

2. Materials and Methods
24
2.5.3. Isolation and purification of RNA
Total cellular RNA was isolated from 50-100 mL culture volume of G. oxydans, grown to the
mid log-phase (OD600 0.4-0.6). The cells were harvested by centrifugation at 8,000 x g, 4oC
for 15 min. All the plastic-wares, used for RNA isolation, were autoclaved twice. The total
RNA from the cell pellets was extracted following two different methods:
2.5.3.1. RNA extraction using the Trizol reagent method (Chomczynski 1993)
The cell pellets were dissolved in 5 mL of TRI-reagent (Sigma-Aldrich, Munich, Germany)
and kept at room temperature for 15 min. Samples were distributed as 1 mL aliquots in sterile
2 mL eppendorf cups and processed for phase separation. Phase separation was carried out by
the addition of 100 µL of 1-bromo-3-chloropropane per mL of TRI-reagent (used). The
samples were vigorously stirred and kept at room temperature for 15 min. The mixtures were
centrifuged at 12,000 x g, 4oC for 10 min and the upper colorless aqueous phases (containing
RNA) were transferred to new, sterile eppendorf cups (1.5 mL). Following phase separation,
500 µL of 2-propanol was added per mL of TRI-reagent. The mixtures were gently stirred for
5-10 sec and kept at -20oC for 10-15 min. Then, the samples were centrifuged at 12,000 x g,
4oC for 10 min to pellet down the RNA. The supernatants were discarded and the RNA
pellets were washed with 1 mL of 75 % ethanol per mL of TRI-reagent. Following washing,
the RNA pellets were air-dried and dissolved in 90 µL of sterile double distilled water.
2.5.3.2. RNA extraction with the Ribopure-Bacterial Kit (AmbionTM
, Life technologies)
The cell pellets were processed according to the manufacturer's instructions for RNA
extraction. The extracted RNA was dissolved in 90 µL of sterile double distilled water.
RNA samples, prepared by both methods, were treated with DNase I (Thermo Scientific,
Schwerte, Germany) for DNA digestion. The reaction mixture, containing 90 µL RNA, 10
µL DNase I buffer, and 2 µL DNase I, was incubated at 37oC for 2-3 h. The RNA was
purified and concentrated using the Hi-Yield RNA pure Kit (Süd-Laborbedarf GmbH,
Gauting, Germany). The purified RNA samples were dissolved in sterile double distilled
water and stored at -80oC. Purity of the RNA samples was determined by denaturing agarose
gel electrophoresis and by PCR. The quality of the samples was evaluated by Bioanalyzer
(Chapter 2.5.12).

2. Materials and Methods
25
2.5.4. Spectrophotometric quantifications of DNA and RNA samples
The quantity of DNA and RNA samples was determined with a NanoDrop device (Eppendorf
AG, Hamburg, Germany) following the instructions provided by the company. Briefly, DNA
or RNA samples were diluted in double distilled water (1:100). 4 µL of the diluted samples
was used for spectrophotometric quantification at 260 nm against pure water (blank).
Concentration of DNA or RNA was calculated using the following equations (1 and 2):
DNA (µg mL-1
) = A260 x Dilution factor x 50 (Equation 1)
RNA (µg mL-1
) = A260 x Dilution factor x 40 (Equation 2)
The purity of a sample was determined by recording the absorption at 280 nm (for proteins)
and 320 nm (for salts and organic solvents) and by calculating the A260/A280 and A260/A280
ratios. Pure DNA or RNA samples usually have A260/A280 and A260/A280 ratios of 1.8-2.0
(Gallagher and Desjardins 2007).
2.5.5. Restriction digestion of DNA
The DNA samples were digested using restriction endonucleases that cut the samples at
specific positions (restriction sites). Digestion of DNA results in the generation of fragments
with either sticky- or blunt-ends. Cloning of a DNA fragment into a vector (plasmid) is
facilitated due to the formation of such complementary ends on both DNA molecules. For
single digestion, 5-10 µg DNA was used in 20 µL total reaction volume, with 1 µL of a
restriction enzyme, and 2 µL of 10 x buffer (recommend by manufacturer). For double
digestion, 1 µL each of two different restriction enzymes was used in the same reaction
volume with a suitable buffer (compatible for both enzymes). The reaction mixtures were
incubated at 37oC for 3-16 h. At the end of digestion, the plasmid DNA samples were further
treated with fast alkaline phosphatase (Thermo Scientific, Schwerte, Germany) to remove
phosphate moieties in order to prevent self ligation. Therefore, 0.5 U of the enzyme was
added in the digestion mixture, which was incubated for another 30 min at 37oC. At the end
of the reaction, the enzymes were denatured by heating the samples to 65 - 70oC for 10 min,
and the digested DNA fragments were purified as described in chapter 2.5.1.

2. Materials and Methods
26
2.5.6. Ligation
The restricted DNA fragments and the dephosphorylated plasmid molecules were joined
using the T4 DNA Ligase (Thermo Scientific, Schwerte, Germany). The reaction mixture (20
µL) was composed of 10-15 µL insert DNA, 2 µL plasmid DNA, 1 µL T4 Ligase, and 2 µL
of 10 x ligase buffer. The ligation mixture was incubated at room temperature for 1-2 h. A
final incubation was provided at 65oC for 10 min to denature the Ligase.
2.5.7. Polymerase chain reaction (PCR)
PCR is a routine-based method, performed in molecular biology labs for the amplification of
DNA fragments (Mullis and Faloona 1987). The amplified fragments can be used to construct
expression vectors or to generate deletion mutants (Rabinow 1996). Genomic or plasmid
DNA was used as template for DNA polymerase mediated amplification. The specific
oligonucleotides (primers) were used for the amplification of a target DNA (Table 2). During
PCR, the annealing temperature was adjusted to 5oC lower than the melting temperature of
the primers. Two types of DNA polymerases were used, depending on the future use of the
amplified DNA product. For non-preparative applications such as colony PCR, the Dream
Taq polymerase (Thermo Scientific, Schwerte, Germany) was used (reaction mixture as in
Table 5). The enzyme extends 1 kb DNA fragment in 1 min (per cycle). For preparative
applications such as cloning, DNA amplification was performed with the Phusion polymerase
(Biozym Scientific GmbH, Oldendorf, Germany). The enzyme has high replication fidelity
and elongates 1 kb DNA in 30 sec (reaction mixture as in Table 6). The elongation of DNA
fragments was carried out at 72oC with 30 cycles for amplification (denaturation (94-98
oC),
annealing (55-60oC), and extension (72
oC)).
Table 5: Composition of PCR reaction mixture with the Taq-polymerase
Component µL / reaction Final concentration
10 x Dream Taq Buffer 2.0 1 x
Forward primer (10 µM) 0.5 0.25 µM
Reverse primer (10 µM) 0.5 0.25 µM
dNTPs (25 mM) 0.1 125 µM
DMSO (100 %) 1.0 5 %
Taq-polymerase 0.25 1.25 U
DNA material 5.0
ddH2O ad 20 µL

2. Materials and Methods
27
Colony PCR was performed to quickly screen mutants (clones) for the presence of absence of
desired DNA fragments. A whole colony was picked with the help of a sterile tooth-pick and
resuspended in 10 µL sterile water. 3-5 µL of the mixture was used in a PCR reaction as a
source of template DNA for the amplification of a specific DNA fragment. Positive clones
were recovered and cultured by adding 100 µL of culture medium in the remaining
corresponding colony mixtures. PCR amplifications were performed with the MyCycler (Bio-
Rad, München, Germany) or the C1000 Thermal cycler (Bio-Rad, München, Germany).
Table 6: Composition of PCR reaction mixture with the Phusion polymerase
Component µL / reaction Final concentration
5 x HF Buffer 4.0 1 x
Forward primer (10 µM) 1.0 0.5 µM
Reverse primer (10 µM) 1.0 0.5 µM
dNTPs (25 mM) 0.2 250 µM
DMSO (100 %) 1.0 5 %
Phusion polymerase 0.25 0.5 U
DNA material 0.5
ddH2O ad 20 µL
2.5.8. Reverse transcription quantitative PCR (RT-qPCR)
RT-qPCR was performed to quantify the relative transcript abundance for a gene of interest
in relation to a constitutively expressed (reference) gene. Gene specific primers were used
(Table 2) to amplify a short stretch of nucleotides (maximum 200 bp). The efficiency of
primers was analyzed by quantitative PCR (qPCR) using serial dilutions of template DNA
(Stahlberg et al. 2003). For RT-qPCR, a single step SYBR Green RT-PCR Kit (Qiagen,
Hilden, Germany) was used according to the manufacturer's instructions. Each reaction
mixture contained 200-300 ng RNA, 1 pmol µL-1
of each primer, QuantiTect SYBR Green
RT-PCR Master Mix, and QuantiTect RT Mix. Control reactions were also performed
without adding reverse transcriptase to check DNA contamination in each RNA sample. As
reference, the transcript abundance of two genes, gox0378 and gox1709, was used to quantify
the relative amount of transcripts of genes of interest. The transcript abundance was
quantified with the master cycler gradient (Eppendorf, Hamburg, Germany) or the iCycler
(Bio-Rad, Munich, Germany) using SYBR Green as the fluorescent dye. The program set up
for the machines is depicted in Table 7. The data was analyzed using the software of the

2. Materials and Methods
28
cyclers as per manufacturer's recommendations. A Ct (cycle threshold) value was calculated
for each gene. To analyze the expression of a target gene in relation to the reference gene, the
Ct value of the target gene was subtracted from the reference gene to get a ΔCt value. The
ΔCt value represents the relative cDNA concentration of the target gene in relation to the
reference gene in a reaction mixture. From these values, the fold change of a given target
gene was calculated and expressed as 2ΔCt
. Moreover, for evaluation of the effect of osmotic
stress on the expression of a target gene (A), the ΔΔCt value of the gene was calculated
(Equation 3) and utilized to express the fold change as 2(ΔΔCt)
.
ΔΔCt (gene A) = ΔCt1(gene A) - ΔCt2(gene A) (Equation 3)
ΔCt1 = ΔCt of gene A under osmotic stress
ΔCt2 = ΔCt of gene A under non-osmotic stress
Table 7: RT-qPCR program set up
Step Time (min) Temperature (oC) Repeats
Reverse transcription 30 50 1
Activation of DNA polymerase 15 95
Denaturation 00:15 95 40
Annealing 00:30 55 40
Elongation 00:30 72 40
Melt curves 00:10 35 + 1 every cycle 60
2.5.9. Agarose gel electrophoresis
The separation of DNA fragments of variable sizes was done with agarose gel
electrophoresis. 1-2 % (w/v) agarose gels were prepared in 1 x TAE buffer (40mM Tris-HCl,
10 mM EDTA, pH 8.0, 20 mM glacial acetic acid). DNA samples were mixed with 6 x
sample loading dye (Carl Roth GmbH, Karlsruhe, Germany) in 6:1 ratio and loaded onto the
gels. Appropriate DNA standards (Thermo Scientific, Schwerte, Germany) were also loaded
to estimate the size of the sample DNA fragments. Electrophoresis was performed in 1 x TAE
buffer (electrophoresis buffer) at 80-100 V for 40 min.

2. Materials and Methods
29
2.5.10. Denaturing agarose gel electrophoresis
The quality of RNA samples was determined with formaldehyde containing (denaturing)
agarose gels (Sambrook and Russell 2001). Formaldehyde prevents the intramolecular base
pairing and the secondary structure formation in RNA. The linear RNA molecules can be
separated according to their sizes during electrophoresis. The quality of any RNA preparation
can be estimated on the basis of separation of two most prominent bands corresponding to the
23S and 16S rRNA and their intensity ratio. 1 % agarose gels were prepared by dissolving 1 g
agarose in 72 mL ddH2O water with 10 mL of 10 x MOPS buffer (0.4 M MOPS, pH 7.0, 0.1
M sodium acetate, 10 mM EDTA) and 18 mL of 37 % formaldehyde solution. 1-2 µg of
RNA were mixed with 2 x RNA loading dye (95 % (v/v) formamide, 0.025 % SDS, 18mM
EDTA, 0.02 % bromophenol blue, 0.02 % xylene cyanol), incubated at 65oC for 10 min, and
loaded immediately onto the gels. The electrophoresis was carried out with 1 x MOPS buffer
(running buffer) at 80 V for 30 min. For calibration and size estimation, Riboruler high range
RNA ladder (Thermo Scientific, Schwerte, Germany) was also loaded onto the gels.
2.5.11. Staining of agarose gels
After electrophoresis, agarose gels were incubated in a GelRed-solution (Biotium, Hayward,
USA) for 5-10 min at room temperature. The stained DNA or RNA fragments were
visualized under UV-light with the INTAS Gel Imager (INTAS GmbH Digital Imaging and
Microscopy, Göttingen, Germany).
2.5.12. Evaluation of RNA integrity with Bioanalyzer
The quality and integrity of the RNA preparation was determined more precisely with a
highly sophisticated electrophoretic system known as Bioanalyzer (Agilent 2100) using a
RNA600 LabChip Kit (Agilent Technologies, Waldbronn, Germany). Like traditional gel
electrophoresis, separation with the Bioanalyzer is based on the principle of capillary
electrophoresis to resolve the molecules according to their size. However, the chip format of
Bioanalyzer requires less sample volume and saves plenty of time. The Labchips were run
according to the manufacturer's instructions. Briefly, the RNA samples were applied to a
small 16 wells containing glass chip (Fig. 4A). The chip is an integrated electrical circut,
where each well (micro channel) contains a sieving polymer matrix and a fluorescent dye.
The fluorescent dye intercalates the RNA molecules and the mobility pattern of these
complexes is detected by a laser-induced fluorescence during electrophoresis. The current
was provided to each well using the 16 pin electrode cartridge. At the end of electrophoresis,

2. Materials and Methods
30
the data of each RNA sample was automatically displayed as electropherogram (Fig. 4B) and
as a gel like picture (Fig. 4C). As an internal reference, the RNA ladder was also employed
along with the samples. The migration time of each fragment of the RNA ladder was plotted
against its size to get a standard curve. On the basis of standard curve, the sizes of 23S and
16S rRNA fragments in the sample preparations were calculated. According to the 23S/16S
rRNA ratio, the integrity of each RNA sample was determined. The Agilent Expert 2100
software was used to assign the RNA integrity number (RIN) to each sample (Schroeder et al.
2006). The software calculates the RIN value on the basis of the electrophoretic traces of
degraded and intact molecules, present in each RNA preparation. The value varies between 1
(highly degraded RNA) to 10 (intact RNA), depending upon the quality of each RNA sample.
Figure 4: Evaluation of RNA quality with Bioanaylzer. (A) Nano LabChip to analyze RNA
samples. (B) Electropherogram of total RNA showing the peaks of the 23S and 16S rRNAs.
(C) Densitomertry plot showing both rRNA bands. (Modified from Kuschel 2000).
2.5.13. DNA sequencing
DNA samples were sent to StarSeq GmbH (Mainz, Germany) for sequencing. Samples were
prepared according to the standard guidelines of the company. Briefly, each reaction mixture
contained 1 µL of DNA, 1 µL primer (10 pmol µL-1
), and 5 µL ddH2O. The sequencing data
was analyzed using the Technelysium DNA sequencing software Chromas 2.6.1 (South
Brisbane, Australia).
2.5.14. Illumina Next Generation Sequencing (NGS) and data analysis
Illumina NGS was performed to analyze the effect of osmotic stress on the transcription
profile of G. oxydans. High quality RNA samples were prepared from osmotically stressed
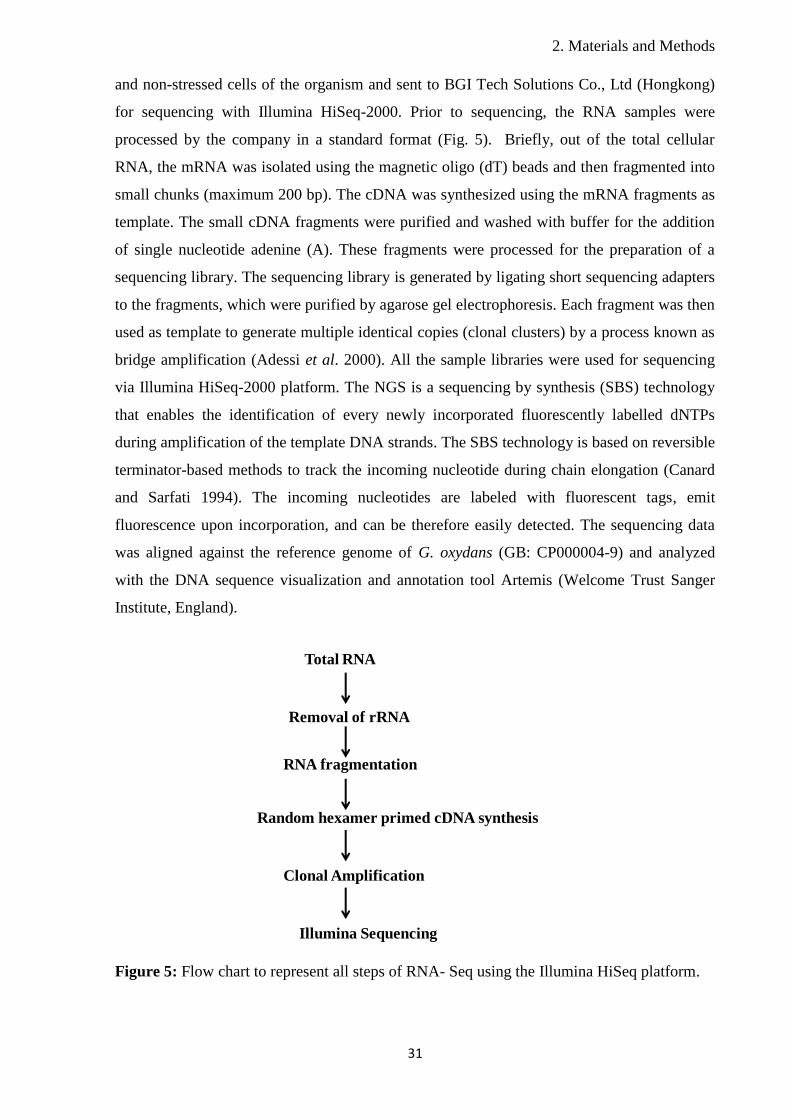
2. Materials and Methods
31
and non-stressed cells of the organism and sent to BGI Tech Solutions Co., Ltd (Hongkong)
for sequencing with Illumina HiSeq-2000. Prior to sequencing, the RNA samples were
processed by the company in a standard format (Fig. 5). Briefly, out of the total cellular
RNA, the mRNA was isolated using the magnetic oligo (dT) beads and then fragmented into
small chunks (maximum 200 bp). The cDNA was synthesized using the mRNA fragments as
template. The small cDNA fragments were purified and washed with buffer for the addition
of single nucleotide adenine (A). These fragments were processed for the preparation of a
sequencing library. The sequencing library is generated by ligating short sequencing adapters
to the fragments, which were purified by agarose gel electrophoresis. Each fragment was then
used as template to generate multiple identical copies (clonal clusters) by a process known as
bridge amplification (Adessi et al. 2000). All the sample libraries were used for sequencing
via Illumina HiSeq-2000 platform. The NGS is a sequencing by synthesis (SBS) technology
that enables the identification of every newly incorporated fluorescently labelled dNTPs
during amplification of the template DNA strands. The SBS technology is based on reversible
terminator-based methods to track the incoming nucleotide during chain elongation (Canard
and Sarfati 1994). The incoming nucleotides are labeled with fluorescent tags, emit
fluorescence upon incorporation, and can be therefore easily detected. The sequencing data
was aligned against the reference genome of G. oxydans (GB: CP000004-9) and analyzed
with the DNA sequence visualization and annotation tool Artemis (Welcome Trust Sanger
Institute, England).
Figure 5: Flow chart to represent all steps of RNA- Seq using the Illumina HiSeq platform.
Total RNA
Removal of rRNA
RNA fragmentation
Random hexamer primed cDNA synthesis
Clonal Amplification
Illumina Sequencing

2. Materials and Methods
32
From the sequencing data, the expression level of each gene was calculated using the RPKM
method (Mortazavi et al. 2008). RPKM (Reads Per Kilobase per Million mapped reads) is a
method for the quantification of gene expression from RNA-Seq data. The expression of each
gene was normalized for the total number of sequencing reads and the total length of the gene
(Equation 4). Data normalization eliminates the influence of difference in gene length and
sequencing discrepancy on the quantification of gene expression. Thus, the obtained values
were directly used to examine the difference in gene expression among control and osmotic
stress samples of G. oxydans.
RPKM (gene A) = 106 x C / N x L x 10
3 (Equation 4)
C = number of reads that are uniquely aligned to gene A
N = total number of reads that are uniquely aligned to all genes
L = number of bases of gene A
The differentially expressed gene were further categorized with respect to their biological
functions (pathway enrichment) using the KEGG database (Kanehisa et al. 2008). The
analysis enables the identification of the significantly enriched or important metabolic
pathways, induced upon osmotic stress, in the context of the whole genome of G. oxydans.
2.5.15. Transformation of E. coli and G. oxydans
Super-competent E. coli cells (New England Biolabs, Frankfurt am Main, Germany) were
transformed by the heat shock method (Hanahan 1983). 25 µL cells were mixed with 5 µL
ligation mixture and incubated on ice for 30 min. The mixture was heated to 42oC for 1 min
and immediately transferred to ice for a short incubation of 2 more min. Then, 1 mL SOC
medium was added and the cells were incubated at 37oC for 1-2 h. Transformants were
selected by spreading the cells on LB agar plates containing appropriate antibiotics for
selection. The plates were incubated at 37oC for 18-24 h, and the transformants were screened
by colony PCR.
The cells of G. oxydans were transformed via electroporation or triparental mating (Condon
et al. 1991, Kallnik et al. 2010, Choi et al. 2006). For electroporation, competent cells of G.
oxydans were generated by a modified method of Mostafa et al. (2002). Cells were grown to
an OD600 of 0.8-1.2 in 40 mL EP medium. The culture was centrifuged at 8,000 x g, 4oC for
10 min. The cell pellets were washed at least twice with 1 mM HEPES-buffer (pH 7.0) and
resuspended in 800 µL of 1 mM HEPES- buffer. 40 µL competent cells were mixed with 10

2. Materials and Methods
33
µL sterile gylcerol (75 %) and 1 µL of a purified plasmid. The electroporation of the cells
was performed with a MicroPulser (Bio-Rad, München, Germany) using pre-cooled cuvettes
with 1 mm electrode distance (Bio-Budget Technologies GmbH, Krefeld, Germany). A pulse
of 2.2 kV was provided for 4-5 ms, and the cells were transferred to 15 mL sterile falcon tube
with 1 mL fresh EP medium. After regeneration at 30oC and 120 rpm for 16 h, the cells were
plated on selective agar plates and incubated at 30oC for 2-3 days.
For the transformation of G. oxydans by triparental mating, E. coli (ECG18) was used as a
helper strain. The strain contains the plasmid pRK2013 which carries transfer genes (tra) to
assist the transfer of a mobilizable plasmid from another E. coli strain (donor) to G. oxydans
(acceptor). Therefore, both E. coli strains (helper and donor) were cultured in LB medium to
OD600 of 0.6, and G. oxydans was grown in YM medium to an OD600 of 0.8-1.2. Cell pellets
were obtained by centrifugation of 2 mL of each cell culture at 10,000 x g for 5 min. The
pellets were washed at least twice with mating medium (MM) and mixed in 1:1:1 ratios. 200-
300 µL cell suspensions were pipetted on sterile filter paper discs, which were placed on non-
selective MM agar plates. After incubation at 30oC for 16 h, the cells were scraped and
resuspended in sterile YM medium. Appropriate dilutions of the suspensions were plated on
YM agar plates containing cefoxitin and kanamycin as selection markers. Plates were
incubated at 30oC for 2-3 days. Only transformants of G. oxydans (containing the mobilizable
plasmid) could grow on these selective plates.
2.5.16. Generation of G. oxydans strains carrying in-frame deletions
G. oxydans strains having in-frame deletions in their chromosomes for target genes were
generated using the codAB marker-less deletion system (Kostner et al. 2013). The system is
based on the counter-selection of deletion mutants, lacking the codAB genes, during growth
on a medium with 5-fluorocytosine (5-FC). 5-FC is a non-toxic pyrimidine analogue that is
converted by the cytosine deaminase (encoded by codA gene) to a toxic compound 5-
fluorouracil (5-FU) (Neuhard 1983, Martinussen and Hammer 1994). Cells lacking the codA
gene can grow on the marker 5-FC containing plates. G. oxydans does not possess the
cytosine deaminase encoding gene. Therefore, a deletion system was designed by Kostner et
al. (2013) to transfer the E. coli codA and codB genes into G. oxydans using a suicidal
plasmid pKos6b. The plasmid can autonomously replicate in E. coli. Replication in G.
oxydans is only carried out after integration of the plasmid into the chromosome via
homologous recombination. The resulting transformants of G. oxydans cannot grow in a
medium containing 5-FC (> 60 µg mL-1
). The sensitivity of the transformants to 5-FC is ~ 8-

2. Materials and Methods
34
fold increased in the presence of codB gene, cloned along with codA in the vector. The gene
codB encodes for a cytosine permease that enhances the penetration of 5-FC inside the cell.
Culturing of transformants under a non-selective environment facilitates the events of second
homologous recombination to excise the integrated plasmid. The plasmid excision will result
in the generation of 5-FC resistant strains of G. oxydans that can easily be selected on a
growth medium containing 5-FC (as counter selection marker).
To generate in-frame deletion mutants of G. oxydans for the target genes (gox0849, gox1118-
gox1119, or gox1432), flanking regions (1 kb up- and downstream) of the genes were
amplified and cloned into the pKos6b vector. The recombinant plasmids can integrate at the
homologous positions on chromosome. For cloning, the flanking regions of a target gene
were amplified using special sets of primers with complementary overhangs (Table 2) via the
phusion-polymerase mediated PCR (Chapter 2.5.7). For example, for the generation of
Δgox0849, 1 kb of the up- and downstream regions of gox0849 were amplified using primers
Up_gox0849_fw/Up_gox0849_rev and Do_gox0849_fw/Do_gox0849_rev (Table 2). Then, a
crossover PCR was performed to ligate both fragments into a single 2 kb fragment using
primers Up_gox0849_fw and Do_gox0849_rev (Peters et al. 2013b, Wach 1996). The
amplified fused fragment was digested with Kpn1 and Xba1 and cloned into the MCS region
of pKos6b vector, yielding pKos6bΔgox0849 vector that was transformed into G. oxydans via
triparental mating (Chapter 2.5.15). Analogously, the other recombinant plasmids
pKos6bΔgox1432 and pKos6bΔgox1118Δgox1119 were generated for the deletion of gene
gox1432 or an operon gox1119-gox1118, respectively. The transformation of the plasmids
resulted in the generation of kanamycin-resistant and 5-FC-sensitive mutants, which were
screened by colony PCR. For plasmid excision, the positive transformants were selected and
cultured on non-selective, liquid YM medium for 1-2 days at 30oC. The excision of the
plasmids would lead to the generation of kanamycin-sensitive and 5-FC-resistant mutants that
were further selected on selective YM agar plates with 5-FC (60 µg mL-1
). Appropriate
dilutions of the cultures were plated on the marker plates that were incubated at 30oC for 2-3
days. Plasmid excision will generate two types of mutants having either the wild type copy of
chromosome or carrying in-frame deletion for the target genes. The distribution of both types
of mutants is a random process and requires additional testes for confirmation. The deletion
of desired genes was verified by amplification of the flanking regions of the genes with
subsequent sequencing.

2. Materials and Methods
35
2.5.17. Plasmid-based expression of genes
Three genes of G. oxydans (gox0849, gox1432 or gox1849) were cloned into pASK-IBA
vectors for overexpression in E. coli (host). For cloning, the genes were amplified with gene
specific primers (Table 2) and cloned into the respective vectors after restriction digestion
and ligation (Chapter 2.5.5 and 2.5.6). The resulting plasmids pASK5_gox0849,
pASK3_gox1432, and pASK3_gox1849 (Table 3) were transformed into E. coli via the heat-
shock method (Chapter 2.5.15).
Likewise, for the expression of genes in G. oxydans, the pBBR.p264.ST vector system was
used. The expression vector contained a strong, constitutively expressed promoter p264 from
G. oxydans and a C-terminal Strep-tag sequence of the IBA vector pASK3 (Kallnik et al.
2010, Meyer et al. 2015). For protein production, a desired gene was cloned in-frame to the
C-terminal Strep-tag sequence. The strong promoter allows a constitutive expression of the
cloned gene, while the C-terminal Strep-tag facilitates the purification of the target protein. In
the present study, the expression of three genes was analyzed in G. oxydans. These included
the gene gox1432 (from G. oxydans) and the xylA genes b3565 (from E. coli) and
SGR_RS05195 (from S. griseus). All the genes were amplified with their native ribosomal
binding sites and cloned into the pBBR.p264.ST vector by restriction digestion and ligation
of the DNA fragments (Chapter 2.5.5 and 2.5.6). The resulting plasmids
pBBR.p264.gox1432.ST, pBBR.p264_E. coli.GI_ST, and pBBR.p264_S. gr.GI_ST were
transformed into G. oxydans by electroporation or triparental mating (Chapter 2.5.15).
2.6. Biochemical methods
2.6.1. Protein overproduction and purification
2.6.1.1. Heterologous overproduction of proteins in E. coli
Gox0849, Gox1432, and Gox1849 were overproduced in E. coli cells using pASK-IBA
vectors (Table 3). E. coli precultures were grown in 50 mL LB medium with ampicillin (100
µg mL-1
) at 37oC. For the overproduction of the proteins, 1 % (v/v) of the exponentially
grown precultures was inoculated in 100 mL MI medium containing ampicillin (100 µg mL-1
)
and incubated at 37oC under shaking at 180 rpm. At OD600 of 0.4-0.5, the expression of the
genes was induced with the addition of anhydrotetracycin (200 ng mL-1
). The cultures were
further incubated overnight at 16oC. The cells were harvested by centrifugation at 6,000 x g
2. Materials and Methods
36
for 10 min at 4oC and resuspended in 15-20 mL buffer W (100 mM Tris-Cl, 100 mM NaCl,
pH 8.0).
2.6.1.2. Heterologous overproduction of proteins in G. oxydans
Xylose/Glucose isomerase of E. coli and S. griesus were overproduced in G. oxydans using
pBBR.p264.ST vector (Table 3). Precultures of G. oxydans were grown in 50 mL YM
medium with cefoxitin (50 µg mL-1
) and kanamycin (50 µg mL-1
) at 30oC and 180 rpm. For
the overproduction of the proteins, 500 mL YGP medium containing MgSO4 (20 mM),
cefoxitin (50 µg mL-1
), and kanamycin (50 µg mL-1
) was inoculated with 3 % (v/v) of the
exponentially grown preculture and incubated at 30oC and 180 rpm. At an OD600 of 0.8-1.2,
the cells were harvested by centrifugation at 10,000 x g for 10 min at 4oC. The pellets were
resuspended in 20 mL Buffer W and processed for the extraction and purification of proteins
using Strep-Tactin affinity chromatography.
2.6.1.3. Cell disruption and extraction of crude cell extract
E. coli and G. oxydans cells were disrupted by sonication. Prior to lysis, the cell suspensions
were treated with the addition of 5 µL protease inhibitor cocktail (Sigma-Aldrich, Munich,
Germany), a pinch of lysozyme (Serva, Heidelberg, Germany), and of DNase I (Thermo
Scientific, Schwerte, Germany), and incubated on ice for 15 min. The cell lysis was
performed by sonication (Branson Sonifier Cell Disruptor with Branson Ultrasonics
converter, Danbury USA) at 50 % amplitude with cooling (Colora Messtechnik GmbH,
Lorch/Württ, Germany) for 1.5 min mL-1
. To obtain crude cell extracts, the lysed samples
were centrifuged at 12,000 x g, for 10 min at 4oC to remove cell debris and unlysed cells.
2.6.1.4. Protein purification by Strep-Tactin Affinity chromatography
Recombinant protein, containing a Strep-tag, was purified by Strep-Tactin Superflow®
affinity chromatography as described by the manufacturer (IBA GmbH, Göttingen,
Germany). Briefly, the cell lysate was applied to a Strep-Tactin containing column that was
pre-equilibrated with buffer W. After filtration of the lysate, the column was washed with 6 x
1 column volume (CV) buffer W. Then, the protein was eluted with 6 x 0.5 mL buffer E
(buffer W and 2.5 mM desthiobiotin). The used column was regenerated with 2 x 5 mL buffer
R (buffer W and 1 mM HABA) and stored at 4oC in buffer W. The extracted protein was
quantified by the Bradford method (Bradford 1976).

2. Materials and Methods
37
2.6.2. Extraction of cell cytoplasm
To determine the activities of soluble fructose reductases, the cytoplasmic fractions were
extracted from stressed and non-stressed cultures of wild type and mutant strains (devoid of
fructose reductases) of G. oxydans. Therefore, the cultures were grown to the mid log-phase
in 100 mL YGP medium (control cultures) and 250 mL YGP medium with 450 mM sucrose
(stressed cultures). The cells were harvested by centrifugation of the samples at 10,000 x g
for 15 min at 4oC and resuspended in 10 mL cell suspension buffer (100 mM potassium
phosphate buffer, pH 7.0, 5 mM MgSO4·7H2O, 0.75 mM dithiothreitol). Lysis was performed
by sonication of the cell suspensions (Chapter 2.6.1.3), and the lysed samples were
centrifuged at 15,000 x g for 15 min at 4oC to removes unlysed cells and debris. For the
extraction of cytoplasm, the crude cell extracts were centrifuged twice at 45,000 x g for 1 h at
4oC to remove cellular membranes. The clear supernatants (cytoplasmic fractions) were used
to determine the activities of NADPH and NADH-dependent fructose reductases. The
concentration of protein in each fraction was determined by the Bradford test (1976).
2.6.3. Quantification of protein concentration
The protein concentration of a sample was quantified by the Bradford test (1976). Therefore,
a calibration curve was prepared using the known concentrations of BSA protein solutions (0-
1 mg mL-1
) for each fresh bottle of Bradford reagent (Sigma-Aldrich, Munich, Germany). For
that, 20 µL of the each protein solution was mixed with 980 µL of Bradford reagent and
incubated under dark for 10 min at room temperature. Then, the absorption of each sample
was recorded at 595 nm against blank solution (Bradford reagent with buffer) to draw a
standard curve. From a straight region of the curve, the best fit of the data was obtained to get
an equation with R2
value near to 1. Analogously, the absorption of an unknown protein
sample was recorded and used for the calculation of an exact protein concentration in the
sample (Equation 5):
y = mx (Equation 5)
y = absorption of a sample at 595 nm
m = slope of standard curve
x = concentration of an unknown protein sample
For an exact quantification, the concentration of each sample was determined at least twice.

2. Materials and Methods
38
2.6.4. PolyAcrylamide Gel Electrophoresis (PAGE)
2.6.4.1. Sodium Dodecyl Sulphate PolyAcrylamide Gel Electrophoresis (SDS-PAGE)
SDS-PAGE was used to separate proteins according to their molecular mass by
electrophoresis in polyacrylamide gel matrix with SDS as denaturant (Laemmli 1970). The
gel matrix was composed of 5 % (v/v) collecting gel and 12.5 % (v/v) resolving gel (Table 8),
and the electrophoresis was carried out in vertical chambers (Bio-Rad, Münich, Germany).
The protein samples were mixed (1:1) with 2 x sample loading buffer (2 % (w/v) SDS, 0.001
% (w/v) bromophenol blue, 5 % (v/v) β-mercaptoethanol, 50 % (v/v) glycerol, 20 % (v/v)
collecting buffer (600 mM Tris, pH 6.8)), cooked at 95oC for 10 min, and loaded onto the gel.
PageRuler prestained protein ladder (Thermo Scientific, Schwerte, Germany) was used as an
internal calibrator for the estimation of the molecular mass of protein samples. Gels were run
with 1 x electrode buffer ( 20 mM Tris, 190 mM Glycin, 0.1 % (w/v) SDS, pH 8.3) at 20 mA
for 30 min and then at 30 mA for 1-2 h. After electrophoresis, proteins were visualized by
silver staining.
Table 8: Composition of collecting and resolving gels used for SDS-PAGE
Component Collecting gel (5 %) Resolving gel (12.5 %)
40 % acrylamide solution
(Rotiphorese Gel 40)
250 µL 2.0 mL
Collecting Buffer
(600 mM Tris, pH 6.8)
400 µL
Separating Buffer
(1.8 M Tris, pH 8.8) 1.2 mL
0.5 % (w/v) SDS 400 µL 1.2 mL
10 % (w/v) APS 30 µL 30 µL
TEMED 5 µL 5 µL
ddH2O 950 µL 1.6 mL
2.6.4.2. Native PAGE
Native or non-denaturing PAGE was performed to separate proteins according to their charge
and oligomeric state. For native PAGE, 4–20 % gradient gels (Mini-Protean Precast Gels
TGX) were purchased from Bio-Rad (Münich, Germany). Gels were run in 1 x electrode
buffer (0.12 % (w/v) Tris base, 0.576 % (w/v) glycine). Prior to loading, the protein samples

2. Materials and Methods
39
were mixed in 1:1 ratio with the native sample loading buffer (0.001 % (w/v) bromophenol
blue, 40 % (w/v) sucrose, 20 % (v/v) electrode buffer, pH 8.3). Standard proteins of known
molecular masses (669 kDa thyroglobulin, 440 kDa ferritin, 232 kDa catalase, 140 kDa
lactate dehydrogenase, 66 kDa bovine serum albumin) were used for size estimation of
sample proteins. These standard proteins (high-molecular-weight calibration kit for native
electrophoresis) were obtained from GE, Health care (Buckinghamshire, UK). Before
loading, the standard protein mixture was also diluted in 1:50 with the electrode buffer.
Electrophoresis was carried out at 20 mA for 2-3 h under cold conditions.
2.6.5. Silver staining
After electrophoresis, proteins were visualized by silver staining (Blum et al. 1987). The
method is quite sensitive and can detect up to 1 ng protein. All chemicals used for silver
staining were freshly prepared before use. Proteins were fixed by the incubation of the gels in
a fixer solution (50 % (v/v) methanol, 12 % (v/v) glacial acetic acid, and 0.05 % (v/v)
formaldehyde) for 20 min. Then, the gels were washed with 50 % (v/v) methanol for 10 min,
followed by additional 10 min washing with ddH2O. To increase the sensitivity for color
development, the gels were treated for 1 min with 0.02 % (w/v) thiosulphate solution, which
was removed by subsequent washing with ddH2O (2 x 1 min). After that, the gels were
exposed to 0.1 % (w/v) silver nitrate solution for 20 min in the dark at 4oC. During this step,
silver ions bind to the negatively charged side chains of amino acids. Later on, the silver ions
were reduced to metallic silver by formaldehyde during incubation of the gels with the
developer solution (3 % (w/v) Na2CO3, 0.1 % (v/v) formaldehyde) which resulted in the
staining of protein bands. The reaction was stopped by successive washing of the gels with
ddH2O.
2.6.6. Immunoblot
Immunoblot (western blot) was used to detect specific tagged proteins from the crude cellular
extracts. The sensitivity of the method is quite high, with a detection limit of 500 pg for
proteins. During the process, the proteins, resolved by PAGE, were transferred to a
membrane by a modified method of Towbin et al. (1979). In the present study, the
recombinant Strep-tag proteins were transferred to a nitrocellulose membrane (4.5 µM, Bio-
Rad, München, Germany) by electroblotting with a Semi-Dry Electroblotter (Biozym
Scientific GmbH, Oldendorf, Germany). All the components for the western blot (whatman
filter-paper and nitrocellulose membrane) were dipped in Towbin buffer (0.34 % (w/v) Tris

2. Materials and Methods
40
base, 1.44 % (w/v) glycine, 20 % (v/v) methonal) before use. The blotting was done at 15 V
for 30-40 min.
After electroblotting, the Strep-tag proteins were chromogenically detected with horseradish
peroxidase (HRP) conjugate (IBA GmbH, Göttingen, Germany) according to the
manufacturer's instructions. The membrane was blocked overnight at room temperature with
PBS-blocking buffer (0.5 % (v/v) Tween-20, 5 % (w/v) milk powder, PBS buffer (0.8 %
NaCl, 0.02 % KCl, 0.025 % Na2HPO4, 0.02 % KH2PO4, pH 7.4)). After blocking, the
membrane was washed (3 x) with PBS-tween buffer (0.1 % Tween-20 in PBS buffer) at room
temperature. Then, the membrane was incubated with 20 mL PBS-tween buffer with 5 µL of
horseradish peroxidase (HRP) conjugate for 1-16 h at room temperature under gentle
shaking. To remove unbound, excessive conjugate, the membrane was washed with 20 mL
PBS-tween buffer (2 x) and with 20 mL PBS buffer (2 x). To detect proteins, the membrane
was treated with 20 mL PBS buffer with 200 µL chloronaphthol solution (3 % (v/v) in
methanol) and 20 µL H2O2 solution (30 %). During incubation under dark conditions, the
HRP catalyzes the oxidation of the chromogenic substrate 4-chloro-1-naphthol, in the
presence of peroxide, to an insoluble purple color product 4-chloro-1-naphthon, which
precipitates in a region of protein bands (Hawkes et al. 1982).
2.6.7. Activity staining
The activity of xylose/glucose isomerases were detected in native gels by a modified method
of Yamanka (1975) following electrophoresis. Activity staining is based on the principle of
the oxidation of a colorless compound triphenyltetrazolium chloride by xylulose to a colored
compound formazan in an alkaline environment (Sapunova et al. 2004). Xylulose was
obtained by the isomerization of xylose, catalyzed by the xylose isomerase enzymes (loaded
on the gels). Thus, the gels were soaked in 50 mL 0.1 M Tricine-NaOH buffer containing 100
mM D-xylose and 30 mM MgCl2, and incubated at 37oC for 30 min. During this step, the
xylose could be converted to xylulose by the active xylose isomerases. After washing with
dH2O, the gels were incubated in dark with 50 mL 1 M NaOH solution containing
triphenyltetrazolium chloride (1 mg mL-1
). The isomerized xylulose would oxidize the
compound to a pink color formazan that stains the protein bands in the gels.

2. Materials and Methods
41
2.6.8. Determination of enzymatic activities
In the present study, activities of different purified and cytoplasmic enzymes were
determined with the Jasco V-600 Spectophotometer (Jasco, Gross-Umstadt, Germany). For
the control of temperature, the Jasco ETC-717 Peltier-Thermostats was used. All the enzymes
were assayed for catalyzing substrate dependent changes in the absorption of cofactors
(NAD(P)H /NAD(P+)). The rate of a reaction was determined spectrophotometerically at 340
nm in 1 mL cuvette at 30oC. The reactions were started by the addition of substrates, and the
change in extinction of cofactors was recorded for 1-2 min using the Spectra Manager III
software. Following formulae were used to calculate volume activities and specific enzyme
activities:
Volume activity (U mL-1
) = ΔE min-1
x V / d x ε x v (Equation 6)
Specific activity (U mg-1
) = Volume activity / c (Equation 7)
ΔE min-1
= change in extinction min-1
V = total volume of assay (mL)
d = thickness of the cuvette (cm)
ε = molar extinction coefficient (mM-1
cm-1
)
v = volume of the sample or probe (mL)
c = protein concentration (mg mL-1
)
One unit (U) of enzyme activity corresponded to the amount of enzyme catalyzing the
conversion of 1 µmol of pyridine dinucleotide (NAD(P)/H) per minute. For the accurate
measurements, the enzymatic activities were determined from at least two biological
replicates of a sample using different dilutions.
2.6.8.1. Measurement of activities of NAD(P)H dependent oxidoreductases
The activities of purified enzymes Gox0849 and Gox1432 were determined in the presence of
NAD(P)/H (ε = 6.22 mM-1
cm-1
) at 340 nm as described by Adachi et al. (1999a). Both
enzymes primarily catalyzed the reversible reduction of fructose to mannitol (Reaction 1).
Other substrates were also tested to determine the substrate spectrum of both proteins.
Fructose Mannitol (Reaction 1)
NAD(P)H + H+ NAD(P)
+

2. Materials and Methods
42
The reduction of substrates was analyzed at acidic to neutral pH values (5.0-7.0), while the
oxidation reactions were monitored at pH 9.0-10.0. The optimum buffers for catalysis were
selected by quantifying the reaction rates at different pH values. Following buffers were used
for enzymatic reactions: potassium phosphate buffer (pH 6.0-7.0), sodium acetate buffer (pH
5.0-5.5), Tris-Cl buffer (pH 7.0-9.0), and sodium carbonate buffer (pH 10.0-10.5). The
reaction mixture contained 125 µM NAD(P)/NAD(P)H, 100 mM substrate, enzyme solution,
and 50 mM appropriate buffer in a final volume of 1 mL. The reduction of different
substrates (D-fructose, L-sorbose, or 5-keto D-gluconate) was monitored in the presence of
50 mM potassium phosphate buffer, pH 7.0, while the oxidation of substrates (D-mannitol,
D-sorbitol, D-arabitol or gluconate) was recorded with 50 mM Tris-Cl, pH 9.0 (for Gox0849)
and 50 mM sodium carbonate buffer, pH 10 (for Gox1432).
To determine enzyme kinetics, assays were performed at optimum pH conditions with
variable substrate concentrations (5 - 1000 mM) or co-factor concentrations (2.5 - 250 µM).
Kinetic parameters such as Michaelis Menten constant (KM) and maximum reaction velocity
(Vmax) were determined by applying nonlinear regression to the Michaelis-Menten data with
GraphPad Prism program 6.0 (San Diego, California, USA). Moreover, a linear regression
was also calculated from the data using LineWeaver Burk Plot. The KM value refers to the
substrate concentration at which an enzyme attained a half-maximal reaction velocity (1/2
Vmax). Vmax denotes to the maximal velocity of an enzymatic reaction irrespective of the
substrate concentration. Other kinetic parameters such as turn over number (Kcat) for an
enzyme was calculated according to Equation 8. From the turn over numbers, the catalytic
efficiency Kcat/KM (s-1
M-1
) of enzymes was calculated to compare the relative rates of
different enyzmes acting on same substrate, or of a single enzyme acting on different
competing substrates.
Besides measurements with the purified enzymes, the activities of NAD(P)/H
oxidoreductases were also determined in the cell cytoplasm of different strains of G. oxydans
(lacking one or both of the fructose reductases). Therefore, the cell cytoplasm was extracted
from the strains, grown under control and osmotic stress conditions (Chapter 2.6.2) and
assayed directly for the reduction of fructose as well as for the oxidation of mannitol at
physiological pH value (7.0). As a reference, cytoplasmic fractions of the wild type strain of
G. oxydans were also extracted and tested under the same conditions.
Kcat (s-1
) = Vmax / µmol mg-1
enzyme x 1/60 (Equation 8)

2. Materials and Methods
43
In addition, the activity of a purified putative NADH oxidoreductase (Gox1849) was also
tested in the similar way with different substrates including: ketones (acetoin, 2-hexanone, 2-
butanone, pentandion, heptandion, 3-hexanone); aldehydes (glycolaldehyde, butyraldehyde,
acetaldehyde, glyoxal,formaldehyde, p-tolualdehyde, 3-methyl-benzaldehyde,
methylvaleraldehyde, benzaldehyde); amino acids (glycin, L-serin, L-valin, lysin, valin,
alanine, tyrosin); sugars and polyols (glycerol, xylose, D-galactose, arabitol, sorbitol,
erythritol, butandiol, pentanol, 2-hexanol, cis/trans-1,2 cyclopentanediol, 2-
phenylethylamine, methanol, ethanol, ethyleneglycol, propanol, 1,4 cyclopentandiol), and
mixed substrates (2-ketogluconate, ethylpyruvate).
2.6.8.2. Glucose isomerase: enzyme assay with auxillary enzymes (Gao et al. 2002)
The glucose isomerase overproducing strains of G. oxydans were grown on YGPhigh medium
containing 450 mM glucose with 20 mM MgSO4 till the mid log-phase. The cell cytoplasm
was extracted from the cultures (Chapter 2.6.2) and used for assaying the glucose
isomerization activity. The assay mixture containing 50 mM phosphate buffer (pH 7.0), 100
µl cytoplasm, 10 mM MgCl2 and 250 mM D-glucose was incubated at 30oC for 2-18 h.
Glucose isomerase isomerizes glucose to fructose that can be quantified using Gox1432 as an
auxiliary enzyme (Reaction 2). Thus, the assay mixture was supplemented with 125 µM
NADPH and the reaction was started with the addition of purified Gox1432 (5-10 U). The
rate of the reduction of fructose to mannitol was calculated by recording the decrease in
absorption of NADPH at 340 nm and 30oC.
In addition, the isomerase activity of the purified xylose/glucose isomeases was also
determined with glucose or xylose as substrates using Gox1432 (fructose reducatse) or
Gox2181 (xylulose reductase) as auxiliary enzymes, respectively. The reaction mixtures
contained 50 mM phosphate buffer (pH 7.0), 10 mM MgCl2, 100-250 mM substrates, and 1-5
µg purified isomerase. The isomerases were activated by heating the assay mixture at 70oC
for 15 min. The concentration of the isomerized products (fructose or xylulose) was
determined using the corresponding auxiliary enzymes (in excess) with 125 µM NAD(P)H
(Reaction 2 and 3). Prior to the addition, the reaction mixtures were cooled on ice for 2 min.

2. Materials and Methods
44
2.7. Analytical methods
2.7.1. Sample preparation for the determination of intracellular solutes
For the determination of intracellular osmolytes, control and stressed cells were harvested at
the late log-phase from 200-2000 mL cultures by centrifugation at 11,300 x g for 15 min. The
cell pellets were freezed at -20oC for 2-3 h. After that, the frozen pellets were freeze-dried in
a lyophilizer (Heraeus Christ, Alpha 1-6) with a vacuum of 0.05 mbar at 20-30oC for 24-48 h.
The pellets were weighed for the cell dry mass measurement and then processed for the
extraction of intracellular osmolytes by a modified Bligh and Dyer method (1959).
The Bligh and Dyer extraction procedure is routinely employed for the separation of cellular
components using a mixture of water, methanol, and chloroform. During extraction, the
cellular components are separated into two layers, the chloroform layer containing cellular
lipids, and the upper methanol layer with all soluble, non-lipid components. Meanwhile,
cellular proteins and cell wall fragments are precipitated at an interface of both layers.
Briefly, 30-60 mg of freeze-dried cell material was transferred into a 1.5 mL eppendorf cup.
500 µL of Bligh and Dyer solution (methanol:chlorofron:water 10:5:4) was added in the tube,
and the mixture was vortexed for 5-10 min at room temperature. Then, the mixture was
extracted with the addition of 260 µL of chloroform and water mixture (1:1) and vortexed for
5 min at room temperature. Following vortexing, the mixture was processed for the phase
separation by centrifugation at 9,300 x g for 5 min. The upper polar layer of water and
methanol was transferred into a new 1.5 mL tube and analyzed by HPLC. The remaining
mixture was dried under the fume-hood to evaporate chloroform, and the left over organic
phase was hydrated with 10 mM NaOH solution and used for the quantification of protein
content by the Bradford method (Chapter 2.6.3). Different dilutions of the mixture were used
for the accurate quantification of the protein content.
Glucose Fructose Mannitol (Reaction 2)
Xylose Xylulose Arabitol (Reaction 3)
GI
GI
Gox1432
Gox2181
NADH + H+ NAD
+
NADPH + H+
NADP+

2. Materials and Methods
45
2.7.2. High Performance Liquid Chromatography (HPLC)
HPLC is an analytical method to separate the compounds, present in a sample mixture or
analyte, via column chromatography. Different types of columns (stationary phase) and
solvents (mobile phase) are employed for the separation. Different compounds in a mixture
interact differentially with both phases and have unique migration rates (retention times) on
the columns. The substances can be identified by comparing the retention times to
commercial standards. Moreover, the amount of a substance can be quantified by applying
different known concentrations of the compound to the column. The area of the signal-peaks
was measured for each concentration and used to draw a calibration curve. From a straight
region of the curve, the best fit of the data was obtained in the form of an equation with R2
value near to 1. Likewise, the concentration of a substance of interest in a sample mixture can
be quantified by measuring the area of its signal-peak and comparing the value to calibration
curve.
In the present study, the solute spectra in the Bligh and Dyer mixtures were analyzed by
isocratic HPLC system. The samples were diluted with 80 % (v/v) acetonitrile and separated
on a LiChrospher 100 NH2 column (125 × 4 mm, 5 μm) (Merck, Darmstadt, Germany) using
80 % (v/v) acetonitrile as solvent. Substances were eluted at a flow rate of 1 mL min-1
. The
elution pattern of the substances was dependent on their selective interactions with the
terminal NH2 groups of the silica matrix of the column. With 80 % acetonitrile, the resin acts
as weak anion exchanger, thus the elution of the hydrophilic compounds is decelerated in
comparison to the hydrophobic substances. The separation of sugars (e.g., glucose, fructose,
sucrose) and polyols (e.g., mannitol, arabitol) were monitored by a refractive index detector.
The concentration of sugars and polyols were quantified by their calibration curves. The
HPLC data were analyzed using the ChromQuest 4.2.34 software (Thermo Fisher Scientific
Inc, USA).
The concentration of glucose and gluconate in a glucose grown culture medium of G.
oxydans were detected by HPLC. Therefore, the samples were prepared as described in
chapter 2.4.3. The supernatants were diluted with 5 mM H2SO4 and analyzed by HPLC with
Aminex-HPX87H column (Bio-Rad, Munich, Germany, 300 mm × 7.8 mm) using 5 mM
H2SO4 as eluent. Substances were eluted at 65°C with a flow rate of 0.3 mL min−1
.
Gluconate, 2-ketogluconate, and 5-ketogluconate were detected at 210 nm by a UV-vis
detection system, while the separation of glucose was monitored by a refractive index
detection. The concentration of the substances were quantified using the respective
2. Materials and Methods
46
calibration curves. The HPLC data were analyzed using the ChromGate Client 3.1.7 software
(Knauer Wissenschaftliche Geräte GmbH, Berlin, Germany).
2.7.3. Photometric determination of glucose and fructose concentration
The cytoplasmic fractions of the glucose isomerase overproducing strains of G. oxydans were
tested for the isomerization of glucose to fructose (Chapter 2.6.8.2). The assay mixture
contained 50 mM phosphate buffer (pH 7.0), 100 µl cytoplasm, 10 mM MgCl2, and 250 mM
D-glucose. After incubation at 30oC for 18 h, the mixture was filtered with a 0.22 µM filter
paper. Glucose and fructose concentrations in the filtrate were determined using the D-
Glucose/D-Fructose UV-Kit (R-Boehringer AG Darmstadt, Germany) according to the
manufacturer's instructions. The assay was performed in 1.5 mL plastic-cuvette with 760 µL
total reaction volume. The detection limit of the kit is of approximately 4-8 mg L-1
for
glucose and fructose, respectively. As positive control, 1.4 mM glucose and 2.8 mM fructose
solutions were used along with test samples.
2.7.4. 13
C-Nuclear magnetic resonance spectroscopy (13
C-NMR)
13C-NMR is an analytical technique used to identify carbon atoms present in an organic
compound and to elucidate the chemical structure of the compound. It detects only the
magnetically active 13
C isotope of carbon, present in a substance. These isotopes resonate at a
unique frequency in a magnetic field and appear at a specific chemical shifts (δ) in NMR
spectrum. Upon comparing the NMR spectra of unknown samples with standard NMR
spectra or spectral libraries, chemical structure of all compound present in the samples could
be solved. The technique was used to identify compatible solutes in G. oxydans. Therefore,
the total cellular metabolites were extracted from 300 mg dried cell material of control, 10 %
PEG-6000 stressed, and 300 mM sucrose stressed cultures by a modified Bligh and Dyer
method (Chapter 2.7.1). The upper polar, water and methanol containing layers were dried
and dissolved separately in 500 µL of D2O. Each mixture was supplemented with 5 mg
trimethysilyl propionate sodium salt (TMSP) and 10 µL acetonitrile (ACN), added as internal
standards. The NMR spectra were recorded on a Bruker Avance 300DPX operating at 75
MHz at the Institute of Pharmaceutical Biology of University Bonn. The spectra were
processed using the Bruker TonSpin 1.3 software and calibrated to the residual solvent peaks
of TMSP (δc=0 ppm) and ACN (δc = 3.61 and 121.8 ppm) (Lewis et al. 2009). The 13
C-NMR
standard shifts of other pure compounds are mentioned below:

2. Materials and Methods
47
Mannitol-δ: 73.61, 72.04, and 66.05 ppm
Fructose-δ: 104.33, 100.90, 83.50, 78.17, 77.26, 72.51, 72.03, 70.36, 66.70, 66.19, 65.45,
and 65.22 ppm
Gluconate-δ: 181.46, 76.92, 75.41, 74.02, 73.80, and 65.46 ppm
Sucrose-δ: 106.30, 99.77, 84.00, 79.02, 76.58, 75.18, 75.01,73.68, 71.83, 64.96, 63.97,
and 62.73 ppm
Glucose-δ: 97.95, 94.18,78.01, 77.74, 76.23, 74.76, 73.61, 73.43, 71.74, 62.87, and 62.75
ppm
2.7.5. Microscopy
The morphological examinations of G. oxydans cultures were done using a Zeiss Axio
inverted microscope combined with a high-resolution fluorescence image system. Phase
contrast imaging was performed to compare the morphological variations of cells in control
and osmotically stressed cultures. Therefore, 1 µL of the cultures was placed on thin agarose
layers mounted on microscopic glass slides. Thin agarose layers were prepared by dissolving
1 % (w/v) agarose in phosphate-buffer saline. Microscopic examinations were performed with
a Zeiss Axio Observer Z1 microscope using a 100x objective (1.46 oil, phase contrast 3).
Moreover, the effect of osmotic stress was also observed on viability of the culture by
staining the cells with SYTOX green dye (Molecular Probes, Life Technologies, Eugene,
Oregon). Therefore, 20 µL of the cultures was mixed with 1 µL of 5 mM SYTOX green dye.
1 µL of the mixture was imaged within 100 ms exposure time using an Axiocam MRM
camera. A 38HE filter set was used at 470 nm and 524 nm excitation and emission maxima,
respectively. The captured images were analyzed using the ZEN 2012 software.
2.8. Internet tools used for bioinformatic analysis
In the present study, a couple of online tools were employed for the ease of data analysis. For
example, the NCBI BLAST programs (http://blast.ncbi.nlm.nih.gov/Blast.cgi) were used for
the comparison of gene and protein sequences among all orthologous sequences, available in
the databank (Altschul et al. 1997). Likewise, the KEGG database was used to access gene
and protein sequences of G. oxydans (http://www.genome.jp/kegg/). The molecular mass of
proteins was computed using the ExPASY tools (http://web.expasy.org/compute_pi/).
Likewise, the identification of extracellular or periplasmic proteins was carried out by
analyzing the amino acids sequences using Phobius (http://phobius.sbc.su.se). The prediction
of protein secondary structure was done using Psipred (http://bioinf.cs.ucl.ac.uk/psipred) and

2. Materials and Methods
48
I-TASSER (http://zhanglab.ccmb.med.umich.edu/I-TASSER/). Protein motifs and conserved
domains were identified by analyzing the amino acid sequences with the online EMBL-EBI
tools such as Interpro (https://www.ebi.ac.uk/interpro/) and pfam (http://pfam.xfam.org/). For
the comparison of gene or protein sequences, an EMBL-EBI tool Clustal Omega
(https://www.ebi.ac.uk/Tools/msa/clustalo/) was used. The complete gene sequence of G.
oxydans was obtained using the NCBI Genome database
(https://www.ncbi.nlm.nih.gov/genome).

3. Results
49
3. RESULTS
Members of the genus Gluconobacter are well known for their potential to survive in
environments containing high amounts of sugars and polyols. One interesting and still
unknown feature is the survival of these organisms in their natural osmotically enriched
habitats. It has been reported that G. oxydans can grow in media containing as high as 30 %
glucose (1.7 M) (Sievers and Swings 2005). Therefore, there was a need to analyze the
behaviour of this organism under osmotic stress conditions to understand its physiology and
to improve its catalytic efficiency.
In the present study, the physiological behavior of G. oxydans was explored in response to
various osmotic stress conditions. In the first part, genome-wide-transcriptome analysis was
performed to understand the global transcriptional response of G. oxydans induced by
hyperosmotic stress. The transcriptome data were analyzed on the basis of previously
described gene annotations, and two candidate genes were selected for further analysis
including gene deletion and expression studies.
The second part comprises the results obtained from the analysis of intracellular metabolites
of G. oxydans under osmotic stress by 13
C-NMR spectroscopy and HPLC. These experiments
were performed to identify a potential compatible solute helping the cells to survive in such
adverse growth conditions. These experiments led to the identification of mannitol as an
osmoprotectant in G. oxydans.
The third part focuses on the role of enzymes involved in the biosynthesis of mannitol and the
osmotolerance of G. oxydans. These enzymes (fructose reductases) were characterized for
their kinetic parameters. Furthermore, a closer look was taken to understand their importance
for the survival of the cells under osmotic stress.
The final part of the results deals with some engineering strategies to further enhance the
osmotolerance of G. oxydans. These experiments include the overexpression of gene gox1432
(encoding a fructose reductase) and the xylA genes from E. coli and S. griesus (encoding
glucose isomerases) in G. oxydans. The effect of overexpression of these genes on growth of
the organism under osmotic stress was also investigated.

3. Results
50
3.1 Osmotic stress responses in G. oxydans
3.1.1. Choice of substrate and osmolyte
In this study, the major aim was to examine the physiological and transcriptional responses
induced by osmotic stress in G. oxydans. Initially, the composition of growth media was
optimized to select suitable osmotic stress conditions. Therefore, two different media
containing glucose (YG) or mannitol (YM) as carbon sources as well as osmolytes were
compared for cultivation of G. oxydans. Control experiments were performed using 100 mM
glucose or mannitol as carbon sources, resulting in a osmolality of about 170 mOsm kg-1
. The
concentrations of both substrates were raised to 1000 mM (1100 mOsm kg-1
) to induce
osmotic shock to the cultures. These osmotically enriched media were referred to as YGhigh
(containing 1 M Glucose) and YMhigh (containing 1 M mannitol), respectively (Table 4). To
measure the effect of osmotic stress on G. oxydans, growth parameters including growth rate
(µ), doubling time (td), and final optical density of the cultures were evaluated. Moreover, the
pH of the cultures was recorded at the end of the cultivation. It was observed that under non-
stress conditions, both cultures had no apparent lag phase, divided exponentially with
doubling times of 1.5 ± 0.1 h, and reached final optical densities of 1.4 with glucose and of
2.0 with mannitol as substrates (Fig. 6A and 6B).
The pH of the culture grown in YG medium dropped to 3.0 due to the formation of gluconic
acid (Pronk et al. 1989). The cells grown in YM medium formed small amounts of acetate,
resulting in a pH of 4.5 (Richhardt et al. 2012). In contrast to the control cultures, remarkable
differences in growth parameters were observed between the cultures grown in YGhigh and
YMhigh media. It was found that growth of G. oxydans in YGhigh medium was highly impaired
as compared to YMhigh medium. In YGhigh medium, the culture had an increased lag phase of
10 h, followed by slow growth with a doubling time of 4.2 h, and reached a final optical
density of only 0.1 (Fig. 6A). In contrast, growth parameters in YMhigh medium were only
slightly affected with respect to the control. It was found that the doubling time of the
stressed culture increased from 1.5 h to 2 h and the final OD600 declined to 1.5 (Fig. 6B).
Moreover, consistent with the control cultures, the final pH of the stressed cultures grown on
YGhigh and YMhigh media was below 3.0 and 4.8, respectively. It has been reported that the
metabolic activities of G. oxydans cease below the optimum pH value of 5.0 and results in
poor growth yields (Olijve and Kok 1979). Therefore, it was concluded that the G. oxydans
cultures were subjected not only to osmotic, but also to pH shock in YGhigh medium. Hence,
in the absence of a suitable buffering system, it was not possible to study exclusively

3. Results
51
osmoinduced transcriptional response of G. oxydans grown on YGhigh medium. Thus, glucose
was not selected as growth substrate and osmolyte for further studies.
Mannitol was a suitable carbon source that supported growth of G. oxydans and did not cause
pH stress in un-buffered cultures. However, it was observed that in the presence of mannitol,
the growth difference of the stressed culture was less pronounced in comparison to the
control culture. This could be due to the fact that mannitol provided nutritional benefits to the
culture, a process that is described in chapter 4. The alternative choice was a non-permeating
osmolyte, such as polyethylene glycol (PEG) that decreases the water potential of growth
Figure 6: Effect of osmotic stress on the growth of G. oxydans. (A) Cultivation in YG ()
medium and YGhigh () medium. (B) Growth in YM () medium and YMhigh () medium.

3. Results
52
media similar to other osmolytes (Busse and Bottomley 1989, Kets et al. 1996a). It has been
reported that the extent of decrease in water activity depends on the concentration of PEG
applied to the medium (Michel 1983). Therefore, growth experiments were performed in the
presence of PEG-6000 which was added in different amounts to YM medium. The
concentration of PEG-6000 was varied from 25 g L-1
(2.5 %) to 100 g L-1
(10 %). It was
observed that PEG-6000 in high concentrations had a negative effect on the growth
parameters of the cultures. The growth rate and the final optical density decreased with
increasing osmolality of the medium (Table 9). Noticeably, the decrease of the growth rate
was most pronounced with 7.5 % and 10 % PEG-6000, which led to 65 % and 45 %
reduction in the cell biomass and an increase of the doubling time from 1.6 h to 2.0 h,
respectively. Thus, it was found that PEG-6000 reduced the water potential of the medium
and negatively affected the growth of G. oxydans.
Table 9: Growth parameters of G. oxydans during cultivation under non-osmotic and osmotic
stress conditions.
Media type Growth rate (h-1
) Doubling time (h) End optical density
YM (control) 0.43 1.6 2.0
YM + 2.5 % PEG-6000 0.41 1.7 1.5
YM + 5 % PEG-6000 0.39 1.8 1.4
YM + 7.5 % PEG-6000 0.37 1.9 1.3
YM + 10 % PEG-6000 0.35 2.0 0.9
3.1.2. Expression studies of osmotically regulated genes in G. oxydans
The osmotic stress responses of G. oxydans induced by mannitol or PEG-6000 were further
compared at the transcriptional scale to select a suitable osmolyte for genome-wide
transcriptome studies. Therefore, total RNA was extracted from exponentially grown cultures
cultivated in three different media: 1) YM medium (170 mOsm kg-1
), 2) YMhigh medium
(1100 mOsm kg-1
), and 3) YM medium containing 5 % PEG-6000 (240 mOsm kg-1
). The
extracted RNA preparations were checked for the contamination of DNA by conventional
PCR. Only the pure samples, free of DNA contamination, were used for RT-qPCR analysis.
To confirm the transcriptional regulation under osmotic stress, 10 different genes of G.
oxydans were selected (Table 10) on the basis of their homology to osmoinduced genes found
in E. coli and P. aeruginosa strains (Gunasekera et al. 2008, Andrés-Barrao et al. 2012). In
these organisms, the osmoinduced genes were categorised into various groups on the basis of
their functions such as involvement in the synthesis of compatible solutes, influx and efflux
of solute molecules, regulation of transcription, and signal transduction. The putative

3. Results
53
homologues of some of these genes in G. oxydans were identified using the NCBI non-
redundant protein blast database (Table 10). The corresponding nucleotide sequences were
used to generate gene specific primers (Table 2). After performing RT-qPCR, the transcript
abundance of these genes was calculated in reference to the house keeping gene gox0378
encoding the ribosomal protein L23. Genes with a fold change of above 2 were considered as
up-regulated and less than 0.5 as down-regulated in the present study.
Table 10: List of selected genes of G. oxydans for RT-qPCR analysis
Gene ID Annoatation Function
gox0707 DNA starvation/stationary phase protection
protein Cellular process (adaptation
and protection) gox1119 alpha,alpha-trehalose-phosphate synthase
gox1332 Alkyl hydroperoxide reductase
gox1822 UDP-N-acetylglucosamine acyltransferase
gox0820 Molecular chaperone GrpE Chaperon
gox0857 Molecular chaperone DnaK
gox1600 Two component response regulator Cell signalling and response
gox1790 Integrase/recombinase XerD DNA replication, repair,
recombination
gox2182 Mannitol/sorbitol ABC transporter permease ABC transporters
gox2220 Ribose ABC transporter ATP-binding protein
RT-qPCR analysis revealed that the expression of genes encoding a trehalose 6-phosphate
synthase (Gox1119) and a two component response regulator (Gox1600) was up-regulated,
whereas the gene encoding a DNA integrase/recombinase (Gox1790) was down-regulated in
both osmotically stressed cultures (Fig. 7). However, a gene gox1332 coding for an
antioxidant like AhpC protein (alkyl hydroxyperoxide reductase) did not show any
differential expression under both stress conditions. Expression of the other six genes was
uniquely induced depending upon the type of osmolyte. For example, the genes encoding
chaperonin proteins (Gox0820, Gox0857) and Dps proteins (Gox0707) were up-regulated (>
3 fold) in the culture containing PEG-6000, whereas the expression of these genes was either
down-regulated or remained unchange in YMhigh culture. Molecular chaperonins are known
to protect cells during hyperosmotic stress and heat shock by preventing the aggregation of
denatured proteins (Wu et al. 1996). Similarly, Dps proteins protect cellular DNA from
various stress situations like stationary and starvation phase, oxidative, desiccation, and acid
base conditions (Almirón et al. 1992). Likewise, two other genes (gox2182 and gox2220)
encoding ABC transporter proteins were also down-regulated in YMhigh culture. However,
gene gox2182 exhibited strong induction (4-fold), while the gene gox2220 did not show any
regulation in PEG-6000 containing culture. In addition, only one gene gox1822 was up-

3. Results
54
regulated in the culture grown in YMhigh medium. The protein Gox1822 has been annotated
as UDP-N-acetylglucosamine acyltransferase and is likely to be involved in
lipopolysaccharide biosynthesis (Prust et al. 2005).
Hence, it was concluded from RT-qPCR results that the osmotic stress exerted by PEG-6000
induced significant transcriptional regulation in G. oxydans compared to that induced by
mannitol. Therefore, pure RNA samples were extracted from the cultures stressed with PEG-
6000 and utilized for Next Generation Sequencing (NGS).
Figure 7: Differential gene expression in G. oxydans under osmotic stress. Gray and black
bars represent the change of target genes expression under stress induced by 1 M mannitol
and 5 % PEG-6000, respectively. The fold change was calculated as described in chapter
2.5.8.
3.1.3. Analysis of osmotic stress responses in G. oxydans through genome-wide
transcriptome analysis
To have an insight into the global pattern of osmotic stress induced responses in G. oxydans,
genome-wide transcriptome analysis was performed. Thus, high quality RNA samples were
prepared from non-stressed and 5 % PEG-6000 stressed cultures and sent to BGI Tech
Solutions Co., Ltd (Hongkong) for Illumina sequencing.
0
1
2
3
4
fold
ch
an
ge

3. Results
55
3.1.3.1. Quality testing of RNA samples
For Illumina sequencing, highly pure and intact RNA samples (free of DNA and protein
contaminations) are recommended. Therefore, total cellular RNA was isolated from stressed
and control cultures using the Trizol reagent method (Chapter 2.5.3.1) or the RibopureTM
-
Bacterial Kit (Ambion, Life Technologies; Chapter 2.5.3.2). The extracted RNA samples
were treated twice with DNase I and subsequently purified using the Hi-Yield RNA pure Kit
(Süd-Laborbedarf GmbH, Gauting, Germany; Chapter 2.5.3). The quality of the RNA
samples was examined by performing denaturing agarose gel electrophoresis (Fig. 8).
Therefore, 2-3 µg of each RNA sample was loaded onto the gel after spectroscopic
quantification by a NanoDrop device (Chapter 2.5.4). The quality of the samples was
analyzed by the estimation of the band intensities of the 23S and 16S rRNAs at 3 kb and 1.5
kb, respectively. The ratio of these bands for high quality RNA should be in the range of 1.5-
2.5 (Ishikawa 1977). However, in the RNA samples of G. oxydans, two distinct bands with
sizes of 1.6 kb and 1.4 kb were observed. Only a very faint band of the 23S rRNA was
detected. Therefore, it was assumed that the 23S rRNA probably denatured during the
extraction or purification procedure. However, no apparent degradation products were
observed in the gel and all RNA samples, extracted by two different methods, revealed the
similar results.
Figure 8: RNA samples separated by denaturing agarose gel electrophoresis. Lane 1 and 2:
RNA samples were extracted from the non-stressed and stressed cultures, respectively, using
the Trizol reagent method. Lane 4 and 5: RNA samples were prepared using the RibopureTM
-
Bacterial Kit from the non-stressed and stressed cultures, respectively. Lane 3: Riboruler high
range RNA ladder (Thermo Scientific).

3. Results
56
To further confirm the integrity of RNA, the samples were run on an automated
electrophoretic system known as Bioanalyzer (Agilent technologies, Waldbronn, Germany).
The intactness of RNA samples was calculated in a numerical form, referred to as RNA
integrity number (RIN) (Chapter 2.5.12). Bioanalyzer results showed that all RNA samples
were of high quality with a RIN value of above 7.0 (Fig. 9). Moreover, it was observed that
the RNA samples extracted by the Trizol reagent method were more intact and pure in
comparison to the samples extracted using the RibopureTM
-Bacterial Kit. The RNA samples
prepared by the Trizol reagent method showed high RIN values as well as high 260/230 nm
and 260/280 nm absorbance ratios (Table 11). On the basis of these results, the total RNA
extracted by the Trizol reagent method from non-stressed and 5 % PEG-6000 stressed culture
were selected for sequencing.
Figure 9: Agilent bioanalyzer based electropherograms and densitometry plots of the total
RNA samples extracted from G. oxydans. (A) and (B) total-RNA extracted from non-stressed
and stressed cultures, respectively, using the Trizol reagent method. (C) and (D) total-RNA
isolated by using the RiboPure-Bacterial Kit from non-stressed and stressed cultures,
respectively. [s] represents migration time of RNA fragments in seconds.
[s]
Ladder
Sam
ple
A
[s] Ladder
Sam
ple
B
[s] Ladder
Sam
ple
C
[s] Ladder
Sam
ple
D
RIN = 9 RIN = 8.9
RIN = 7.2 RIN = 7.4

3. Results
57
Table 11: Quality testing data of RNA samples analyzed by Bioanalyzer and NanoDrop
Name of
RNA
sample
Sample type Extraction
method 260/280
(a) 260/230
(a)
Concentration
(ng/µl)(b)
RIN
(b)
A Non-stressed Trizol based
2.12 2.13 2001 9.0
B Stressed 2.12 2.16 1836 8.0
C Non-stressed RiboPure-
Bacterial Kit
2.15 1.69 1071 7.2
D Stressed 2.17 2.03 708 7.4
(a) Absorptions at 260 nm, 280 nm, and 230 nm were measured by NanoDrop
(b) Concentration and RIN values were determined by Agilent 2100 Expert software
3.1.3.2. Differential gene expression under osmotic stress analyzed by transcriptome
sequencing
The osmoinduced differential gene expression in G. oxydans was analyzed at the
transcriptional level by sequencing the RNA samples using Illumina sequencing technology.
For NGS, a cDNA library of each RNA sample was prepared by BGI Tech Solutions Co., Ltd
(Hongkong) as described in chapter (2.5.14). The library was then processed for cluster
generation through bridge amplification, followed by Illumina HiSeq-2000 sequencing step
(Meyer and Kircher 2010). The obtained sequencing data were aligned against the reference
genome of G. oxydans 621H (GB: CP000004-9) and analyzed with the help of the DNA
sequence viewer tool “Artemis" (Rutherford et al. 2000). From the raw sequencing data, the
RPKM (Reads Per Kilobase of transcript per Million mapped reads) value of each gene was
calculated (Equation 4), which indicated the transcript abundance of the corresponding gene.
To compare the effect of osmotic stress, a ratio of the RPKM values of each gene from the
stressed and control sample's RNA-Seq data was calculated and transformed into the
logarithm base 2 (log2) ratio. The threshold value of these log2 ratios was arbitrarily set to +
1.0 and – 1.0 to select up- and down-regulated transcripts, respectively. It was found that 105
genes, out of the 2735 open reading frames (ORFs), showed differential expression (DE)
under osmotic stress condition in comparison to non-stress condition. Amongst them, 103
genes were up-regulated and only two were down-regulated (Table 12). These differentially
expressed genes were further categorized into 19 groups (Fig. 10, Table 13) according to their
putative functions (annotations) as described by Prust et al. (2005). The selected categories
are explained in the following paragraphs (i-vii).
(i). Genes involved in transport: A total of 14 genes encoding proteins involved in the
transport of molecules across the cell were differentially expressed during osmotic up-shock.
The phenomenon of water efflux across the cell membrane upon hyperosmotic shock deals

3. Results
58
with the activity of transporter proteins like aquaporins, mechanosensitive channels, and
other transporters for osmolyte uptake, etc. (Mager et al. 2000). In G. oxydans, most of the
up-regulated genes encode transporter proteins that are members of the family of TonB-
dependent receptor proteins. In addition, genes coding for ABC transporter proteins were also
up-regulated, indicating the significance of active transport of solutes in osmotically stressed
cells of G. oxydans.
(ii). Genes involved in signal transduction and regulation: Among other DE genes, an
increased expression of four genes coding for transcription regulators was observed. Three of
these proteins (Gox0676, Gox0717, Gox2164) belong to the family of single component
transcription regulators, while one protein Gox1946 is a member of two component response
regulator system.
Table 12: Number of up- and down-regulated genes of G. oxydans after osmotic up-shock.
Functional group of genes Number of osmotic stress regulated genes
Up Down
Metabolism 7 0
Respiration and energy metabolism 1 0
Carbohydrate metabolism 1 0
Glycolysis and gluconeogenesis 1 0
Pentose phosphate pathway 1 0
Amino acid metabolism 1 0
DNA modification 2 0
Lipid metabolism 1 0
Biosynthesis of lipopolysaccharide 1 0
Biosynthesis of cofactor 1 0
Regulation and signal transduction 4 0
Translation machinery 1 0
Transport 13 1
Motility 3 0
Stress link protein 1 0
Detoxification 2 0
Transposon function 11 0
Prophage function 10 0
Hypothetical proteins 41 1

3. Results
59
(iii). Genes involved in metabolism: A total of 14 genes, up-regulated under osmotic stress,
encode proteins that are probably involved in diverse cellular metabolic processes such as
metabolism of sugars, amino acids, lipids, biosynthesis of lipopolysaccharides and cofactors,
modification and repair of nucleic acid molecules, as well as biosynthesis of the secondary
metabolite (trehalose). Trehalose is known for its function as an osmoprotectant in certain
organisms e.g., bacteria, yeast, and plants (Crowe et al. 1992, Garg et al. 2002).
(iv). Genes involved in motility: Flagella and pili are the extracellular appendages that
protrude from cell surface of bacteria and participate in locomotion of cells. In G. oxydans,
there are 29 genes that encode potential proteins involved in flagella biosynthesis and
assembly. However, the transcriptomic data indicated that expression of only one of these
genes (gox0420) was up-regulated, when the cells were grown in YM medium supplemented
with 5% PEG-6000. Likewise, only two genes encoding type IV pilus proteins (PilL and
PilN) showed enhanced expression under osmotic stress.
Figure 10: Pie charts showing the classification of osmotic stress regulated genes (fold
change > 2) of G. oxydans (Prust et al. 2005).
Regulation and signal transduction
4%
Translation machinery 1%
Hypothetical proteins 40%
Transposon function
10% Prophage function
10%
Transport function
13%
Motility 3%
Stress linked proteins
1%
Detoxification 2%
Metabolism 8%
Glycolysis and Gluconeogenesis
1%
Pentose phosphate pathway
1%
Lipopolysaccharide biosynthesis
1% Biosynthesis of cofactor
1%
Lipid metabolism 1%
DNA modification
2%
Amino acid metabolism
1%
Respiration and energy metabolism
1%
Other 16%

3. Results
60
(v). Genes involved in detoxification and stress responses: In the transcriptomic data, three
genes, gox0573, gox2163, and gox2559, revealed higher expression under osmotic stress.
Two of them, gox0573 and gox2559, encode a metallo-beta-lactamase and a RND-type
multidrug efflux pump, respectively. Both proteins are involved in resistance against
antibiotics (Nikaido 1998). Whereas gene gox2163 is involved in cold shock response. As the
culture of G. oxydans was not subjected to cold and drug shock during cultivation, the
elevated expression of these genes under osmotic stress might be a result of cross regulation
among general stress response pathways (Gunasekera et al. 2008).
(vi). Genes with predicted functions: In this category, three genes (gox1849, gox2594, and
gox0201) encoding putative oxidoreductase were up-regulated under osmotic stress
condition. The oxidoreductases contain the NAD(P)+ binding domains and may be involved
in cellular metabolic pathways, respiration, or biogenesis.
(vii). Genes with unknown functions: A high proportion of differentially expressed genes in
the present data encode proteins with unknown functions. Among the 42 such DE genes, only
one gene (gox1696) was down-regulated while all others were up-regulated.
Table 13: Differentially expressed genes of G. oxydans (fold change > 2) during cultivation
on YM + 5 % PEG-6000 medium (osmotic stress culture) in comparison to YM medium
(non-stress culture)
Locus Tag Annotation log2 ratio p-value Function
GOX0543 Xaa-Pro dipeptidase 1.24 1.15E-05
Metabolism
GOX0994 Acid phosphatase 1.06 0.00
GOX1372 Glutathione S-transferase 1.44 6.11E-13
GOX1628 Protease 1.02 0.00
GOX1849 Putative oxidoreductase 1.65 5.43E-10
GOX2594 Putative oxidoreductase 1.14 7.66E-13
GOX2711 Conjugal transfer protein,
TraD
1.08 3.28E-13
GOX0201 NAD(P)H-flavin
oxidoreductase
1.05 1.76E-12
Respiration and energy
metabolism
GOX1118 Trehalose-phosphatase 1.07 0.00 Carbohydrate metabolism
GOX2217 Triosephosphate isomerase 1.5 2.07E-13
Glycolysis/Gluconeogenesis
GOX2218 Ribose-5-phosphate
isomerase B
1.08 1.10E-13
Pentose phosphate pathway
GOX0859 Shikimate 5-dehydrogenase 1.12 0.00 Amino acid metabolism
GOX2274 CDP-diacylglycerol-
glycerol-3-phosphate 3-
phosphatidyltransferase /
cardiolipin synthase
1.30 0.00 Lipid metabolism
GOX1908 Uracil-DNA glycosylase 1.05 1.02E-13
DNA modification
GOX2523 DNA helicase II UvrD 1.21 6.34E-12
GOX1205 Folylpolyglutamate
synthase / dihydrofolate
synthase
1.74 2.28E-10
Biosynthesis of cofactor

3. Results
61
GOX1610 Putative D-glycero-D-
manno-heptose 1,7-
bisphosphate phosphatase
1.12 1.12E-10
Biosynthesis of
lipopolysaccharide
GOX0676 Iron-regulated sigma factor 1.08 5.34E-05
Regulation and signal
transduction GOX0717 Transcriptional regluator
LysR family
1.93 5.04E-12
GOX1946 Two component response
regulator
1.30 0.00
GOX2164 Transcriptional regulator 1.51 0.00
GOX1175 Translation initiation
inhibitor
1.07 3.16E-06
Translation machinery
GOX0541 TonB-dependent outer
membrane receptor
1.21 3.37E-13
Transport
GOX0542 Hypothetical metabolite
transport protein
1.50 6.09E-05
GOX0972 Cation efflux system
protein CzcB
1.30 0.00
GOX1075 TonB-dependent outer
membrane receptor
1.25 0.00
GOX1173 TonB-dependent outer
membrane receptor
1.00 0.00
GOX1184 ABC transporter sugar-
binding protein
1.15 1.99 E-04
GOX1188 Outer membrane receptor
protein
1.56 1.42E-14
GOX1277 Na+/H
+ antiporter 1.05 1.26E
-12
GOX1341 TonB-dependent outer
membrane receptor
1.20 8.17E-14
GOX1886 Putative translocase
transmembrane protein
1.20 5.92E-13
GOX1924 Putative permease -1.02 5.34E-22
GOX2219 Ribose ABC transporter,
periplasmic binding protein
1.32 0.00
GOX2220 Ribose ABC transporter,
ATP-binding protein
1.30 0.00
GOX2654 Integral membrane protein 1.10 7.21E-05
GOX0420 Flagellar biosynthesis
protein A
1.05 4.88E-12
Motility
GOX2624 PilL 1.10 2.50E-05
GOX2625 PilN 1.20 0.00
GOX2163 Cold shock protein 1.84 7.86E-12
Stress link protein
GOX0573 Metallo-beta-lactamase
superfamily protein
1.06 0.00 Detoxification
GOX2559 RND-type multidrug efflux
pump
1.10 0.00
GOX0419 Transposase (class II) 1.14 1.65E-13
Transposon function
GOX0463 Transposase 1.82 3.57E-07
GOX1325 Transposase (Class III) 2.18 1.04E-08
GOX1472 Transposase 1.20 2.84E-13
GOX1566 Transposase (class IV) 1.33 1.90E-12
GOX2201 Transposase (class II) 1.01 1.53E-13
GOX2593 Transposase (class V) 1.81 1.84E-05
GOX2659 Transposase 1.40 0.00
GOX2677 Transposase (class I) 1.20 1.67E-13
GOX2719 Transposase 1.53 4.41E-12
GOX2728 Truncated transposon
gamma-delta resolvase
1.03 2.84E-13

3. Results
62
GOX1213 Phage minor structural
protein GP20
1.60 1.34E-07
Prophage function
GOX1218 Phage tail sheath protein 1.33 9.36E-08
GOX1221 Phage-recombinase-like
protein
1.03 1.76 E-04
GOX2346 Putative phage protein 1.20 3.41E-06
GOX2352 Bacteriophage tail protein 1.01 1.50E-10
GOX2356 Bacteriophage tail protein 1.26 4.10E-13
GOX2357 Bacteriophage tail fiber
protein
1.08 1.03E-08
GOX2447 Hypothetical protein 1.02 2.17E-13
GOX2465 Putative phage-related
protein
1.07 1.54E-13
GOX2479 Phage-related protein 1.37 2.42E-13
GOX0247 Hypothetical protein 1.27 0.00 Hypothetical proteins
GOX0266 Hypothetical protein 1.03 1.48E-10
GOX0326 Hypothetical protein 1.31 0.00
GOX0347 Hypothetical protein 1.20 0.00
GOX0352 Hypothetical protein 2.21 0.00
GOX0353 Hypothetical protein 1.40 2.75E-13
GOX0540 Hypothetical protein 1.90 2.54E-06
GOX0650 Hypothetical protein 1.35 8.17E-14
GOX0904 Hypothetical protein 1.08 9.89E-07
GOX1209 Hypothetical protein 1.30 3.54E-07
GOX1210 Hypothetical protein 2.40 1.50E-05
GOX1217 Hypothetical protein 2.40 4.03E-06
GOX1222 Hypothetical protein 2.25 1.18 E-04
GOX1309 Hypothetical protein 1.40 0.00
GOX1391 Hypothetical protein 1.25 0.00
GOX1401 Hypothetical protein 1.40 2.69E-13
GOX1509 Hypothetical protein 1.14 3.90E-06
GOX1696 Hypothetical protein -1.26 3.13E-16
GOX1850 Hypothetical protein 2.10 4.50E-13
GOX1890 Hypothetical protein 1.08 3.18E-12
GOX2060 Hypothetical protein 1.22 2.01E-11
GOX2212 Hypothetical protein 1.11 0.00
GOX2424 Hypothetical protein 1.04 1.72E-05
GOX2461 Hypothetical protein 1.15 0.00
GOX2463 Hypothetical protein 1.24 0.00
GOX2482 Hypothetical protein 1.20 1.06E-13
GOX2506 Hypothetical protein 1.30 0.00
GOX2533 Hypothetical protein 1.34 2.07 E-04
GOX2536 Hypothetical protein 1.25 4.57E-14
GOX2571 Hypothetical protein 1.25 4.52E-13
GOX2573 Hypothetical protein 1.70 0.00
GOX2600 Hypothetical protein 1.20 2.10E-09
GOX2614 Hypothetical protein 1.23 4.30E-04
GOX2666 Hypothetical protein 1.03 8.75E-13
GOX2667 Hypothetical protein 1.70 6.11E-13
GOX2672 Hypothetical protein 1.40 1.40E-07
GOX2688 Hypothetical protein 1.10 0.00
GOX2695 Hypothetical protein 1.60 8.67E-09
GOX2698 Hypothetical protein 1.00 4.35E-14
GOX2712 Hypothetical protein 2.23 0.00
GOX2720 Hypothetical protein 1.21 1.61E-12
GOX2723 Hypothetical protein 1.04 0.00

3. Results
63
3.1.3.3. Validation of the transcriptome data and selection of candidate genes
For the validation of the transcriptomic data, 12 out of 105 DE genes were randomly selected
and their expression profile was analyzed by RT-qPCR. Therefore, fresh RNA samples were
prepared from non-stressed and 5 % PEG-6000 induced stressed cultures. The RT-qPCR
results revealed that the expression of nine genes (gox0352, gox0676, gox1119, gox1205,
gox1849, gox2164, gox2217, gox2220, gox2667) was significantly up-regulated (fold change
> 1.5) under hyperosmolal conditions. These results were consistent with the data obtained by
RNA-Seq (NGS) technique (Table 14). However, in contrast to the NGS results, the
expression of the other three genes (gox0540, gox0717, gox1372) was found to be unchanged
by RT-qPCR. These observations indicate that most of the results obtained by RNA-Seq were
consistent with the RT-qPCR values. However, as indicated above, some slight discrepancies
existed. This result can be due to many reasons. One possible reason could be that the data
obtained by NGS were affected by certain nuisance factors, referred to as technical effects or
technology specific effects in the RNA-Seq literature (Fang and Cui 2011). However, the
results obtained by RT-qPCR were validated by both biological and technical replicates,
which confirmed the reliability of the data.
Table 14: Comparison of differential expression of selected genes under osmotic stress,
examined by RNA-Seq and RT-qPCR.
Locus tag Gene Annotation Fold change
by RNA-Seq
Fold change
by RT-qPCR
GOX0352 Hypothetical Protein 4.6 2.3 ± 0.23
GOX0540 Hypothetical protein 3.7 1.1 ± 0.16
GOX0676 Iron-regulated sigma factor / transcriptional
regulator
2.1 1.6 ± 0.23
GOX0717 LysR family transcriptional regulator 3.8 1.2 ± 1.1
GOX1119 Trehalose-phosphate synthase 1.3 2.2 ± 0.27
GOX1205 Folylpolyglutamate synthase/dihydrofolate
synthase
3.4 1.5 ± 0.51
GOX1372 Glutathione S-transferase 2.7 0.7 ± 0.1
GOX1849 NADH oxidoreductase 3.2 3.3 ± 1.35
GOX2164 Transcriptional regulator 2.8 1.8 ± 0.25
GOX2217 Triosephosphate isomerase 2.8 1.5 ± 0.15
GOX2220 Ribose ABC transporter ATP-binding
protein
2.5 1.4 ± 0.06
GOX2667 Hypothetical protein 3.3 3.2 ± 0.08

3. Results
64
For further studies, two genes (gox1119, gox1849), which showed enhanced expression
following osmotic shock, were selected and their role in osmoadaptation of G. oxydans was
investigated. The gene gox1119 encodes a trehalose-6-phosphate synthase, and forms an
operon with gene gox1118 that codes for a trehalose-6-phosphatase. Both proteins participate
in the biosynthesis of trehalose, which is reported as compatible solute in different
prokaryotic and eukaryotic organisms (Welsh and Herbert 1999). It was assumed that G.
oxydans might synthesize and accumulate this osmoprotectant to combat osmotic stress.
Therefore, deletion mutants lacking both gox1118 and gox1119 were generated and analyzed
for their growth behavior under osmotic up-shock conditions in comparison to the wild type.
The second gene gox1849, which was significantly up-regulated (> 3-fold) under osmotic
stress, encodes a putative oxidoreductase. To examine the function of Gox1849, the protein
was heterologously produced in E. coli for in vitro analysis.
3.1.3.4. Generation of G. oxydans strains carrying in-frame deletions for gox1118 and
gox1119
To generate deletion mutants of G. oxydans for the putative trehalose biosynthesis genes
(gox1118, gox1119), 1 kb DNA fragments from the up- and downstream region of gox1118-
1119 were amplified and cloned into the multiple cloning site (MCS) of pKos6b vector,
yielding pKos6bΔgox1118Δgox1119 (Fig. 11). The construct was checked by double
digestion and by sequencing of the isolated plasmid. As shown in Figure 12, double digestion
of the plasmid resulted in DNA fragments with sizes of 6 kb for the plasmid backbone and 2
kb for the fused up- and down-fragment. After electroporation, the vector was integrated into
the genome of G. oxydans by homologous recombination which resulted in kanamycin
resistant mutants. Mutants carrying in-frame deletion of gox1118 and gox1119 were
generated by plating G. oxydans transformants on 5-fluorocytosine containing agar plates
(Chapter 2.5.16). The mutants were screened for deletion of the genes by colony PCR using a
primer pair (Up_gox1117_fw/ Do_gox1120_rev), which binds in the up- and downstream
region of the deleted fragments. PCR fragments of 964 bp corresponded to the deletion
mutant, whereas 2733 bp fragments represented the wild type (Fig. 13).

3. Results
65
Figure 11: Vector map for the generation of knock out mutants of G. oxydans for genes
gox1118 and gox1119.
Figure 12: Restriction digestion of plasmid pKos6bΔgox1118Δgox1119. Lane 1: GeneRuler
1 kb DNA ladder (Thermo Scientific). Lane 2: Double digestion of the plasmid with Xba1
and Kpn1.
8680 bps
KpnI
XbaI
KanR
ptac
codB
codA
oriT-mob
Gox1118_up
Gox1119_do
pKos6bΔgox1118Δgox1119

3. Results
66
Figure 13: Colony PCR of G. oxydans to screen for mutants carrying deletion of gox1118-
gox1119. Lane 1: 1 kb DNA ladder. Lane 2: PCR product of the wild type. Lanes 3-4: PCR
products of the Δgox1118Δgox1119 mutants.
To investigate whether the deletion of genes gox1118-gox1119 had an impact on osmotic
tolerance of the cells, growth of the mutant strain (G. oxydans Δgox1118 Δgox1119) was
compared with the wild type strain during cultivation on YM medium and YM medium with
10 % PEG-6000. The growth experiments clearly indicated that the deletion of gox1118-1119
had no impact on growth of G. oxydans. Growth parameters of the mutant strain were
comparable to the wild type under both conditions (Fig. 14 A and B). In YM medium, both
cultures grew with the doubling time of 1.6 h and reached a final optical density of 2. In
comparison, the doubling time of both cultures was slightly increased to 1.85 h and the final
optical density was reduced to 0.9 in YM medium with 10 % PEG-6000. These results
depicted that the genes gox1118 and gox1119 were apparently not involved in
osmoregulation of G. oxydans.

3. Results
67
Figure 14: Effect of deletion of gox1118-gox1119 on growth of G. oxydans. (A) Growth of
the wild type culture on YM () medium and YM with 10 % PEG-6000 () medium. (B)
Growth profile of G. oxydans Δgox1118Δgox1119 on YM (Δ) medium and YM with 10 %
PEG-6000 (▲) medium.

3. Results
68
3.1.3.5. Characterization of Gox1849: an uncharacterized oxidoreductase
Protein Gox1849 was annotated as putative oxidoreductase, consisting of 340 amino acids.
The amino acid sequence of the polypeptide chain was analyzed by the Pfam protein
database, indicating the presence of a Rossmann fold NAD(P)+ binding motif (G-X1-2-G-X-
V-G) (Rossmann et al. 1974, Brakoulias and Jackson 2004).
For the characterization of the enzyme, gene gox1849 was cloned into an expression vector
with a tetracycline inducible promoter (tet promoter), yielding pASK3_gox1849 (Fig. 15).
After transformation into E. coli (BL21), the recombinant protein was overproduced using
anhydrotetracyclin as an inducer for the tet promoter. The expressed protein was purified by
Strep-Tactin affinity chromatography and analyzed by SDS-PAGE. In total 4 mg protein was
obtained from 1L E. coli culture. SDS-PAGE and western blot analysis revealed a molecular
mass of 37.4 kDa for Gox1849, which is in accordance with the expected mass of 37.2 kDa
for the recombinant tagged protein (Fig 16A and B).
Figure 15: Vector map for the heterologous overproduction of protein Gox1849 in E. coli.
pASK3_gox1849
4168 bps
Van91IMscI
HincIIXbaI
Bme1580IBssHIIBtgI
NaeINgoMIV++
AlwNI++
BssSI ++AlwNI++BglI++
AccIIIBsu36I++
BsiHKAI
BsiEIBpuEIPspXI++BpmI
BsgI
BpmI
Eco47IIIBstBIHindIII
NaeINgoMIV
PsiI
EarIBme1580IBsiHKAIBssSI
MspA1IBpuEI
XmnIBsiHKAIBsiEI
ScaIBtsI
BtsIBsiEIPvuI
FspIMunI
NmeAIIIBglI
BpmIBmrI
AhdI
NspIBpu10IEcoNISnaBI
NruI
BsmINsiI
BtsI
AleIBsgINdeI
SpeI
BpuEI
MspA1I
AlwNIBpuEIMspA1I
BsiEIBme1580I
BsiHKAIBseYI
BssSIBpuEI
Tet-Promoter
gox1849
Strep-Tag
F1 ori
Amp
Tet-Repressor

3. Results
69
Figure 16: SDS-PAGE and western blot of protein Gox1849. (A) SDS-PAGE visualized by
silver staining. (B) Immuno Blot. Lane M (A/B): PAGE ruler prestained protein ladder. Lane
1 (A/B): Gox1849.
The activity of the purified protein was tested with different substrates (polyols, aldehydes,
ketones, amino acids, sugars and derivatives) in the presence of NAD(P)H or NAD(P)+ as
electron donor or acceptor. However, the protein did not react with any of these substrates.
Nevertheless, on close inspection of the genome of G. oxydans, it was found that gene
gox1849 clustered with the genes coding for a glutamate synthase (gox1851 and gox1852)
and the hypothetical gene gox1850 (Fig. 17). It was assumed that all these four genes may
constitute a functional operon for the biosynthesis of glutamate inside the cell. In bacteria, the
glutamate synthase is a heterodimeric protein, constitutes of two subunits (αβ). The alpha-
subunit contains a FMN binding domain and an amidotransferase domain to catalyze the
conversion of 2-oxoglutarate and L-glutamine to L-glutamate (Reaction 4). The beta-subunit
is a NADPH dependent oxidoreductase, containing FAD as a cofactor. This small subunit
transfers reducing equivalents from NADPH to the FMN center of the alpha-subunit (Van
den Heuvel et al. 2004).
L-glutamine + 2-oxoglutarate
2 L-glutamine (Reaction 4)
NADPH + H+ NADP
+

3. Results
70
Motif scan analysis using the interPro protein database revealed that protein Gox1852
contains the glutamate synthase amidotransferase domain, while protein Gox1851 has a
glutamate synthase FAD/NAD(P)+ binding domain. Due to the presence of a NADPH
binding domain, it is tempting to speculate that Gox1849 could be a part of the electron
transfer chain involving the β-subunit (Gox1851) for the reduction of 2-ketoglutarate as
catalyzed by the α-subunit of the glutamate reductase. In such context, enhanced expression
of gene gox1849 provided an indication of a potential role of glutamate as an osmoprotectant
in osmotically stressed cells of G. oxydans. Therefore, the presence and the osmodependent
accumulation of glutamate in G. oxydans was needed to be examined. This issue will be
addressed in chapter 3.2.
Figure 17: Genomic organization of a putative glutamine synthase encoding genes in G.
oxydans 621H.
3.2. Mannitol as a major intracellular metabolite and osmolyte in G. oxydans
3.2.1. 13
C-NMR spectroscopy of total cellular metabolites from G. oxydans
To address the question of glutamate and trehalose production in G. oxydans under osmotic
stress, total cellular metabolites were extracted by a modified method of Bligh and Dyer
(1959) from cultures grown on YM medium with 10 % PEG-6000 and analyzed by 13
C-
NMR. It was found that neither trehalose nor glutamate were accumulated in G. oxydans
under osmotic stress. Therefore, no further studies were performed to investigate the
involvement of the above mentioned genes (Chapter 3.1.3.5.) in the osmoregulation of G.
oxydans. However, to our surprise, in the 13
C-NMR spectrum, the most prominent signals
were detected at chemical shifts of 73.6, 72.02, and 66.02 ppm that were identified as
mannitol by comparison to its commercial standard. Similarly, the second highest resonances
at 104.29, 100.87, 83.46, 78.22, 77.21, 72.46, 72.22, 70.33, 66.66, 66.15, 65.21, and 64.00
ppm were identified as D-fructose (Fig. 18). Intracellular accumulation of these two
compounds provided evidence that G. oxydans might accumulate D-mannitol from the
medium as a compatible solute to compensate the externally applied osmotic stress. D-
gox1849
gox1850 gox1851 gox1852

3. Results
71
fructose is a potential precursor molecule for intracellular mannitol biosynthesis (discussed in
detail in chapter 4 of the present study). Mannitol, which was provided as a carbon source,
was oxidized to fructose by the cells via the membrane-bound polyol dehydrogenase
(Gox0854 and Gox0855). Therefore, mannitol and fructose were present in excess in the
medium, which probably remained in part in the external water space of the cell pellet after
centrifugation of the culture for NMR analysis. Moreover, mannitol and fructose can also be
taken up by the cells for intracellular assimilation as mentioned by Richhardt et al. (2012).
Therefore, the signals observed in the 13
C-NMR spectrum derived obviously from both the
extracellular medium and the intracellular space of the cells. In agreement to this finding,
polyols such as D-mannitol have been reported as an osmoprotectant in some other organisms
such as Pseudomonas (P.) putida, Acinetobacter (A.) baylyi, and Zymomonas (Z.) mobilis
(Empadinhas and da Costa 2008, Sand et al. 2013). Regardless of being a major intracellular
metabolite, the osmoprotective role of mannitol in G. oxydans was needed to be investigated
for confirmation.

3. Results
72
Figure 18: 13
C-NMR spectrum of total cellular metabolites from G. oxydans, cultivated in
YM medium with 10 % PEG-6000. The spectrum was calibrated to the residual solvent peak
of TMSP. Signals observed were from fructose (F), mannitol (M), internal standard
acetonitrile (ACN), and from unknown compounds (?).
3.2.2. Effect of mannitol on cellular catalytic activity
The question arose, whether mannitol was able to protect G. oxydans from deleterious
osmotic effects. To shed light on this question, the substrate consumption rate of the control
culture was compared to the 10 % PEG-6000 stressed culture. In G. oxydans, most of the
substrates are oxidized in the periplasm and their products are released into medium via outer

3. Results
73
membrane porin proteins (Deppenmeier and Ehrenreich 2009). Thus, offline media samples
were collected at different points during cultivation of both cultures and analyzed for
metabolite concentrations by HPLC. In this experiment, the substrate mannitol was added at
concentration of 20 g L-1
in the control and stressed cultures. Oxidation of mannitol to
fructose is catalyzed by the membrane-bound polyol dehydrogenase (SldAB), which requires
PQQ as a prosthetic group for catalysis and oxidizes a broad range of substrates such as
mannitol, glycerol, sorbitol, arabitol, and gluconate (Matsushita et al. 2003). HPLC analysis
revealed that the mannitol oxidation rates of the control and stressed cultures were identical
during cultivation. It was observed that both cultures completely oxidized mannitol to
fructose (15-19 g L-1
) in the first 10-14 h of cultivation. Accordingly, the cells grew
exponentially in the first 10 h with the growth rates of 0.4 h-1
(control culture) and 0.32 h-1
(stressed culture). At the end of cultivation, the final optical density of the control and
stressed culture was 1.8 and 1.0, respectively. However, both cultures accumulated almost
equal amount of fructose (16 g L-1
) in the media (Fig. 19). Hence these results indicated that
growth of G. oxydans was only slightly affected under osmotic up-shock. Moreover, the
cultures could oxidize mannitol with comparable efficiencies.
In summary, these observations further supported the assumption that mannitol had an
osmoprotective role in G. oxydans to counteract osmotic stress imposed by PEG-6000. This
phenomenon could also explain the weak transcriptional response of the organism towards
the applied osmotic stress (Chapter 3.1.3.2). Because of the protective effect of mannitol,
osmotic stress imposed by PEG-6000 could have been overcome by the cells, resulting in
minor modifications of gene expression. Evidence in favor of this hypothesis came from the
NGS data that manifested a relative low change in expression level of transcripts in response
to PEG-6000 induced osmotic stress (Chapter 3.1.3.2). Moreover, the degree of protection of
cellular functions by an osmoprotectant strongly depends upon the magnitude of external
osmotic stress (Amezaga et al. 1995, Kets et al. 1996b). It was examined that 5 % PEG-6000
raised the osmolality of YM medium only from 170 to 240 mOsm kg-1
. Furthermore, the
presence of mannitol as putative compatible solute might have led to experimental conditions
which were insufficient to trigger a stringent osmotic stress response in G. oxydans.

3. Results
74
Figure 19: Effect of osmotic stress on growth and fructose production of G. oxydans. Cells
were cultivated in YM medium (open symbols) or YM medium with 10 % PEG-6000 (filled
symbols). Correlation between growth (,) and D-fructose formation (,) of the
cultures.
3.2.3. De novo synthesis of mannitol in G. oxydans under reduced water activity
In the previous experiments it was shown that G. oxydans proliferates in media with low
water activity by accumulation of exogenously supplied D-mannitol. However, there was still
the question whether G. oxydans can synthesize this osmoprotectant de novo. To address this
question, the microorganism was cultivated in YGP medium (310 mOsm kg-1
) containing
yeast extract (0.6 g L-1
), glucose (50 mM) as a carbon source, and 100 mM phosphate buffer
(pH 7.0) for pH control. To increase the osmolality, the medium was supplemented with 300
mM sucrose which resulted in a total osmolality of 680 mOsm kg-1
. Sucrose is a natural
osmolyte, present in the ecological niches of G. oxydans. It constitutes almost 40-60 % of the
total sugar content of nectar (Johnson and Nicolson 2008). Moreover, G. oxydans cannot
metabolize this sugar due to a lack of hydrolysing enzymes (Prust et al. 2005, Peters et al.
2013a). In the presence of this non-metabolizable osmolyte, cells were grown till the early
stationary phase and processed for the examination of intracellular osmolytes by 13
C-NMR
spectroscopy. In the 13
C-NMR spectra, three distinct resonances at 73.42, 71.85, and 65.87
ppm were identified as mannitol. These signals were much more pronounced in the spectrum

3. Results
75
of stressed cultures in comparison to the non-stressed cultures (Fig. 20 A and B), indicating
the osmotic relevance of the de novo-synthesized D-mannitol. Moreover, in the metabolite
pool of stressed cultures, additional resonances at 104.12, 100.70, 83.27, 78.04, 77.05, 72.28,
71.93, 70.15, 66.49, 65.98, 65.44, 65.23 ppm and 106.30, 99.77, 84.00, 79.02, 76.58, 75.18,
75.01, 73.68, 71.83, 64.96, 63.97, 62.73 ppm were identified as fructose and sucrose,
respectively. Whereas, other signals corresponded to glucose (98.5, 94.7, 78.54, 78.36, 76.75,
75.37, 74.09, 74.06, 72.29, 63.74, 63.37 ppm) and gluconate (181.24, 76.75, 75.37, 74.05,
73.74, 65.44 ppm). All these compounds were identified by comparison of their resonances
with the 13
C-NMR spectra of pure standards. Glucose and sucrose were present in the
medium while gluconate derived from the oxidation of glucose in the periplasm. Fructose
could be an intermediary compound for mannitol production. These results depicted that G.
oxydans could synthesize mannitol de novo with glucose as a substrate for biosynthesis.

3. Results
76
Figure 20: 13
C-NMR spectra of the total cellular metabolites of G. oxydans. Results are
shown for extracts of cells cultivated in YGP medium (A) and YGP medium supplemented
with 300 mM sucrose (B). The spectra were calibrated to the residual solvent peak of TMSP.
Signals were from fructose (F), glucose (g), gluconate (G), sucrose (S), mannitol (1,2,3),
internal standard acetonitrile (ACN), and from unknown compounds (?). Inset: chemical
structure of mannitol and assignment of the carbon atoms. (Modified from Zahid et al. 2015).
A
B

3. Results
77
For further analysis and quantification of the mannitol accumulation pattern under osmotic
stress, G. oxydans was grown in YGP medium with 0-600 mM sucrose (310 mOsm kg-1
to
1160 mOsm kg-1
) as osmolyte. It was found that under non-osmotic stress conditions, G.
oxydans grew with the doubling time of 1.5 h and reached a final optical density of 1.8 after
24 h of cultivation. Under stress conditions, the doubling time of the culture gradually
increased from 1.5 to 3.6 h, while the optical densities decreased from 1.8 to 0.5 with
increasing sucrose concentrations from 0-600 mM (Fig. 21). The effect of osmotic stress was
more pronounced at sucrose concentrations of 450 mM and 600 mM (900-1160 mOsm kg-1
)
that led to a sharp increase of the doubling times of the cultures up to 2.5 and 3.6 h,
respectively. Likewise, the final optical densities of the cultures were severely reduced to 0.7
and 0.5, respectively.
Figure 21: Effect of increasing sucrose concentrations on growth of G. oxydans. Cells were
cultivated in YGP medium (), supplemented with 150 mM sucrose (), 300 mM sucrose
(▲), 450 mM sucrose (), and 600 mM sucrose (). The YGP medium contained yeast
extract (0.6 g L-1
), glucose (50 mM ), and 100 mM phosphate buffer (pH 6.8). Control
cultures were cultivated in yeast extract-sucrose (300 mM) without glucose (). The inset
represents the effect of the sucrose concentration on the doubling time (td). (Modified from
Zahid et al. 2015).
-4
-3
-2
-1
0
1
2
0 5 10 15 20 25 30 35
ln O
D (
600n
m)
Time (h)
1
2
3
4
0 200 400 600
t d(h
)
Sucrose (mM)

3. Results
78
To correlate the effect of osmotic stress with the intracellular mannitol accumulation pattern,
total cellular metabolites from control and stress cultures were extracted and analyzed by
HPLC. Concordant with the 13
C-NMR results, HPLC analysis revealed the accumulation of
both mannitol and fructose in osmotically stressed cells of G. oxydans that were grown on
YGP medium in the presence of different amounts of sucrose (Fig. 22). The levels of the
internal mannitol and fructose content increased linearly with the increase of the external
sucrose concentration and reached saturation limits of up to 2.7 and 1.4 µmol mg-1
cell
protein at 450 mM sucrose (906 mOsm kg-1
), respectively. Further increment in the sucrose
concentration (600 mM) only led to a slight increase in the mannitol content up to 2.8 µmol
mg-1
protein without affecting the fructose concentrations. Moreover, the amount of
intracellular glucose remained constant, with a maximum of up to 0.4 µmol mg-1
protein at
300 mM to 600 mM external sucrose. These results corresponded to the growth profile of G.
oxydans and indicated that higher sucrose concentrations in the media (450-600 mM)
impaired cell division, biomass formation, and mannitol accumulation. In comparison to
stressed cells, mannitol was detected in very low concentrations (0.08 µmol mg-1
protein) in
non-stressed cells. These observations indicated that the intracellular accumulation of
mannitol and fructose is influenced by the extracellular osmolality of the medium. In
addition, it seems that mannitol, being a primary osmolyte, plays an important role in G.
oxydans under osmotic stress conditions.

3. Results
79
Figure 22: Effect of extracellular sucrose on intracellular mannitol and fructose
accumulation of G. oxydans. Cells were cultured in YGP medium with the addition of
sucrose (0-600 mM). Mannitol () and fructose concentration () were determined by
HPLC. The figure represents the mean of three independent experiments. Error bars indicate
standard deviation. (Modified from Zahid et al. 2015).
3.2.4. Effect of carbon sources and osmolytes on mannitol accumulation
In microorganisms, the synthesis and the accumulation of osmoprotectants are influenced by
the carbon sources and osmolytes present in the medium. For example, in P. putida
intracellular levels of compatible solutes (glycine betaine, mannitol, glutamate, and NAGGN)
were sensitive to the change in water activity of minimal medium (Kets et al. 1996a, Kets et
al. 1996b). To examine such effects on the levels of intracellular mannitol accumulation, G.
oxydans was cultivated in media containing permeating and non-permeating osmolytes such
as glucose, fructose, glycerol, and PEG-6000. It was observed that permeating and
metabolizable osmolytes such as 0.5 M (610 mOsm kg-1
) fructose or 1 M (1580 mOsm kg-1
)
glucose induced the osmodependent accumulation of mannitol up to 0.82 ± 0.01 and 2.0 ± 0.4
µmol mg-1
protein, respectively. The intracellular levels of mannitol were slightly lower but
comparable to those obtained with the non-metabolized osmolyte sucrose (Table 15). On
contrary, mannitol accumulation was not observed when 0.5 M (682 mOsm kg-1
) glycerol
0
0.5
1
1.5
2
2.5
3
3.5
0 100 200 300 400 500 600 700
Sucrose (mM)
Ma
nn
ito
l/F
ruc
tos
e (
µm
ol
mg
-1p
rote
in)

3. Results
80
was used as carbon source and osmolyte in the medium. Rather mannitol, the cells
accumulated glycerol in high amounts (5 µmol mg-1
protein) to combat external osmotic
stress. A clear fluctuation in the intracellular mannitol content was observed when the
osmolality of the growth media was raised with the non-permeating osmolyte PEG-6000.
Addition of 10 % PEG-6000 in media containing 50 mM glucose or fructose (YGP or YFP)
as carbon sources resulted in the accumulation of mannitol up to only 0.3 and 0.9 µmol mg-1
protein, respectively. These results indicated that osmodependent accumulation of mannitol
in G. oxydans was substantially affected by the change of the carbon sources and osmolytes
present in the growth media.
Table 15: Effect of carbon sources and osmolytes on the intracellular levels of mannitol in
osmotically stressed cells of G. oxydans. (Modified from Zahid and Deppenmeier 2016).
Medium Osmolality
(mOsm kg-1
)
Intracellular mannitol
(µmol mg-1
protein)
YGP 310 0.08 ± 0.03
YFhigh (0.5 M fructose) 610 0.82 ± 0.01
YFP + 10 % PEG-6000 665 0.9
YGP + 10 % PEG-6000 665 0.3
YGP + 600 mM sucrose 1160 2.80 ± 0.2
YGPhigh (1 M glucose) 1580 2.00 ± 0.4
3.2.5. Effect of exogenous mannitol on growth and morphology of osmotically stressed
cells
As mentioned above (Chapter 3.2.1 and 3.2.3), G. oxydans could synthesize mannitol during
cultivation under osmotic stress conditions. It was assumed that the bacterium might use this
compound as an osmoprotectant to survive under reduced water activity situations. To
investigate such osmoprotective role, growth of the organism was examined during
cultivation in osmotically enriched media in the presence of extracellular mannitol.
Therefore, G. oxydans was cultivated in YGP medium supplemented with either 300 mM or
600 mM sucrose (680 or 1160 mOsm kg-1
, respectively) and 10 mM mannitol. As expected,
significant improvement in growth of the stressed cultures was observed with exogenous
mannitol. Addition of 10 mM mannitol restored the normal growth pattern of the culture
exposed to 300 mM sucrose stress. The doubling time of the culture decreased from 2 h to 1.4
h and the final optical density increased from 1.5 to 1.7. In addition, 10 mM exogenous
mannitol could partially alleviate the inhibitory osmotic effect of 600 mM sucrose. However,
the growth pattern of the culture was comparable to that of G. oxydans cells exposed to 300

3. Results
81
mM sucrose stress in the absence of extracellular mannitol. The doubling time of culture in
the presence of mannitol reduced from 3.5 h to 2 h and the final optical density increased
from 0.5 to 1.5 (Fig. 23A). Next, the osmoprotective effect of mannitol was more exclusively
examined when applied in low concentrations (2.5 mM and 5 mM) to G. oxydans cells
exposed to 300 mM sucrose stress. Like the addition of 10 mM mannitol, both 2.5 and 5 mM
mannitol concentrations were equally efficient to restore normal growth behavior of the cells.
Doubling times of the cultures reduced to 1.86 h and 1.85 h and the final ODs reached 109%
and 112% of the non-stressed control cultures (Fig. 23B). In accordance with osmodependent
biosynthesis and accumulation of mannitol, these results clearly depicted the osmoprotective
role of this polyol in G. oxydans. Moreover, these data indicate that very low amounts of
exogenously supplied mannitol are sufficient for osmoprotection against 300 mM sucrose
(680 mOsm kg-1
).
Figure 23: Effect of extracellular mannitol on growth of G. oxydans. (A) Growth curves in
YGP medium supplemented with 0 mM sucrose (), 300 mM sucrose (▲), 300 mM sucrose
+ 10 mM mannitol (Δ), 600 mM sucrose () and 600 mM + 10 mM mannitol (). (B)
Growth curves in YGP media with 0 mM sucrose (), 300 mM sucrose (▲), 300 mM
sucrose + 2.5 mM mannitol (), and 300 mM sucrose + 5 mM mannitol (). Control
cultures were cultivated in yeast extract (0.6 g L-1
) with 2.5 mM mannitol () or 5 mM
mannitol ( ). (Zahid et al. 2015).
It was reported that like other acetic acid bacteria, Gluconobacter sp. form involutions during
unfavorable growth conditions (Asai 1971, De Muynck et al. 2007). These irregular cell
shapes can be of various forms such as cylindrical or filamentous cells, enlarged swollen
-4
-3
-2
-1
0
1
0 10 20 30
lnO
D (6
00
nm
)
Time (h)
-4
-3
-2
-1
0
1
0 10 20 30
lnO
D (6
00
nm
)
Time (h)
A B

3. Results
82
cells, or other aberrant forms. The presence of such involution forms was examined in G.
oxydans cultures subjected to 600 mM sucrose stress. G. oxydans cells, cultivated under
control (non-stressed) conditions were of rod- or oval-shapes (Fig. 24A). Upon addition of
600 mM sucrose, various unusual cells with swollen ends or cylindrical cell filaments along
with some normal cells were observed (Fig. 24B). The deformity of the cells was
considerably reduced upon addition of 10 mM mannitol to cells exposed to 600 mM sucrose
(Fig. 24C).
To determine the viability of such aberrant cell forms, SYTOX green dye was used. The dye
stains DNA of cells having compromised/porous cell membranes, and is used to distinguish
dead cells from live cells in a culture. Upon staining, all irregular or involuted cell forms
were found to be senescent, and comprised almost 20 % of the total cells in the culture with
600 mM sucrose (Fig. 24D). Addition of 10 mM mannitol to the stress culture resulted in an
increased viability of the cells regardless of their morphology (Fig. 24E). The stimulatory
effects of exogenously supplied mannitol on growth, viability, and morphology of the
osmotically stressed cells clearly underlines the function of mannitol as an osmoprotectant in
G. oxydans.
Figure 24: Microscopic examination of G. oxydans cells. Phase contrast microscopy of G.
oxydans cells grown in the YGP medium (A), YGP medium with 600 mM sucrose (B), YGP
medium with 600 mM sucrose + 10 mM mannitol (C). Fluorescent microscopy of SYTOX
green-stained cells with 600 mM sucrose (D) and with 600 mM sucrose + 10 mM mannitol
(E). Scale bar = 5 µm. (Modified from Zahid et al. 2015).
Dead cells Living cells
Swollen cells Filamentous cellsRod shaped cellsA
ED
CB

3. Results
83
3.2.6. Effect of polyols on growth and substrate oxidation rates of G. oxydans
The osmoprotective effects of mannitol on cellular morphology and growth behavior of G.
oxydans raised an interesting question whether other polyols could equally protect the strain
from deleterious osmotic effects. To address this question, G. oxydans was cultivated in
YGPhigh media containing 1 M glucose (1580 mOsm kg-1
) supplemented with either 5 mM
mannitol, sorbitol, or arabitol. It was observed that growth of G. oxydans was highly impaired
in YGPhigh medium with a doubling time of 6 h and a final optical density of only 0.7. In
comparison to the same medium supplemented with 5 mM mannitol, sorbitol, or arabitol, the
growth retardation of osmotically stressed cultures was restored, indicated by doubling times
of 2 h and final optical densities of 2.0 (Fig. 25A). In addition, the effect of these polyols on
glucose oxidation rates of the cultures was investigated. Glucose was oxidized to δ-
gluconolactone in the periplasm by the membrane-bound glucose dehydrogenase (mGDH),
and the hydrolyzed product (gluconate) was excreted, leading to a drop of the pH value of the
medium. During growth, samples were collected and analyzed for pH and metabolite
concentrations. Analysis of the samples revealed that the pH of polyol supplemented cultures
decreased very sharply from 7.0 to 3.5 within 12 h of cultivation, whereas in the media
without polyol addition, the same drop was observed within 25 h. Furthermore, the gluconate
content of these cultures was determined by HPLC. As expected, the rates of glucose
oxidation and gluconate formation were higher in the cultures containing 5 mM polyols in
comparison to the culture devoid of polyols. At the end of the exponential phase (t = 25 h),
the osmotically stressed culture (on YGPhigh medium) produced 305 mM gluconate, while the
cultures with 5 mM polyols supplementation produced about 560-580 mM gluconate (Fig.
25B). These results were concordant with the total amount of gluconate measured at the end
of cultivation (48 h) which showed that about 700 mM gluconate accumulated in the polyol
containing cultures and 380 mM in the polyol-free stress cultures. Overall the cultures with
polyols consumed 800 mM glucose whereas the polyol-free cultures utilized only 480 mM of
the substrate. From these results, it can be concluded that polyols (in general) play an
important osmoprotective role in G. oxydans as growth and catalytic efficiency of the cultures
significantly improved in their presence.

3. Results
84
Figure 25: Effect of polyols on growth and gluconate production of 1 M glucose stressed
cultures. (A) Correlation between optical densities of the cultures grown in YGPhigh medium
() and YGPhigh medium supplemented with 5 mM mannitol (), sorbitol (), or arabitol
(Δ). (B) Correlation between glucose consumption (symbols with solid lines) and gluconate
formation (symbols with dashed lines) rates of the cultures on YGPhigh medium (), and
YGPhigh medium with 5 mM mannitol (), 5 mM sorbitol (), or 5 mM arabitol (Δ).
3.3. Enzymatic routes for the biosynthesis of mannitol in G. oxydans
As shown above, polyols including mannitol behave as osmoprotective compounds in G.
oxydans. The accumulation of mannitol as compatible solute has been examined during
growth of the organism in media containing high concentrations of sucrose, fructose or
glucose (Zahid and Deppenmeier 2016). However, until now the enzymes and pathways
involved in mannitol biosynthesis in G. oxydans were not studied. In general, three possible
routes for the biosynthesis of mannitol are known in different microorganisms. One is the
conversion of fructose-6-phosphate to mannitol by the mannitol-1-phosphate dehydrogenase
and the mannitol-1-phosphate phosphatase. This two-step conversion pathway is present in
homofermantative lactic acid bacteria (Wisselink et al. 2002). However, in Acinetobacter
baylyi a single polypeptide chain catalyzes both the dehydrogenase as well as the phosphatase
reaction. This enzyme is a unique bifunctional mannitol dehydrogenase containing an N-
terminal phosphatase domain and a C-terminal mannitol-1-phosphate dehydrogenase domain
(Sand et al. 2015). The second route is the direct reduction of fructose to mannitol via a
mannitol-2-dehydrogenase, and is frequently present in heterofermentative lactic acid
bacteria (Saha 2004, Wisselink et al. 2002). The third pathway is based on the conversion of
mannose-6-phosphate to mannitol that is catalyzed by a mannose-6-phosphate reductase and
0
200
400
600
800
1000
0 10 20 30 40 50
Glu
co
se
/Glu
co
nate
(mM
)
Time (h)
B
-3
-2
-1
0
1
0 10 20 30 40 50
ln O
D (6
00
nm
)
Time (h)
A

3. Results
85
a phosphatase. Such type of mannitol biosynthetic route is most prevalent in certain species
of yeasts and plants (Loescher et al. 1992, Onishi and Suzuki 1968).
3.3.1. Identification and bioinformatic analysis of the mannitol dehydrogenases from G.
oxydans
In G. suboxydans IFO 12528, two types of mannitol dehydrogenases have been reported that
differ in their co-factor specificity (Adachi et al. 1999a). They are known as NADP+-
dependent mannitol dehydrogenase (EC 1.1.1.138) and NAD+-dependent mannitol
dehydrogenase (EC 1.1.1.67); however, due to the unavailability of the amino acid sequences
of theses polypeptide chains, the respective genes could not be identified. Inspection of the
genome of G. oxydans 621H using the NCBI non-redundant BLAST database revealed the
presence of two putative homologues (Gox1432 and Gox0849) of potential mannitol-2-
dehydrogenases. Gox1432 and Gox0849 were annotated as NADP+-D-sorbitol
dehydrogenase and NADPH-dependent L-sorbose reductase, respectively (Prust et al. 2005).
The amino acid sequences of these proteins were highly identical to other putative
oxidoreductases from acetic acid bacteria. Homologues of Gox1432 were polyol: NADP+
oxidoreductases from Gluconobacter oxydans (A0A149UG77, 99.4 % identity, 100 % query
coverage), Gluconobacter frateurii NBRC 103465 (A0A0S6TGQ1, 86.2 % identity, 100 %
query coverage), and from Gluconobacter japonicus (A0A149S712, 85.8 % identity, 100 %
query coverage) as well as sorbitol dehydrogenases from Gluconobacter oxydans (Q9KWR5,
95.5 % identity, 100 % query coverage) and from Gluconobacter morbifer G707 (G6XMR1,
86 % identity, 100 % query coverage). Likewise, Gox0849 was homologous to NADH
oxidoreductases from Gluconobacter oxydans (A0A149U9H1, 99 % identity, 100 %
coverage) and Gluconobacter roseus (A0A149T6L7, 94 % identity, 100 % query coverage),
as well as to NADPH dependent L-sobose reductases from G. morbifer G707 (G6XJZ3,
identity 74.8 %, query coverage 100 %), G. oxydans H24 (K7SVB4, 75.1 % identity, 100 %
identity), G. thailandicus NBRC 3255 (M9MJR6, 75.1 % identity, 100 % query coverage),
and to the mannitol dehydrogenase from Gluconobacter oxydans DSM 3504 (A0A067Z2Z1,
99 % identity, 100 % query coverage). Alignment of the amino acid sequences of Gox1432
and Gox0849 with the respective homologous enzymes is shown in Figure 26. As all these
homologues, mentioned above, were not characterized with respect to their catalytic
efficiency and substrate spectrum; therefore, it was necessary to check the prediction function
of both Gox1432 and Gox0849. An additional BLAST search using the SwissPort database
indicated a low homology of both Gox1432 and Gox0849 to other biochemically
characterized proteins. These included mannitol-2-dehydrogenase from Pseudomonas

3. Results
86
fluorescens (IM2W_B, 41-42 % identity and 86-98% query coverage; Brünker et al. 1997,
Kavanagh et al. 2002) and from Rhodobacter sphaeroides (P33216, 38-44 % identity and 89-
98 % query coverage; Schneider et al. 1993), as well as a D-arabinitol-4 dehydrogenase from
Klebsiella pneumoniae (O52720, 32-34 % identity and 83% coverage; Heuel et al. 1998).
However, since the homology between these enzymes and Gox1432/Gox0849 was low, it
was not possible to predict the function of the G. oxydans enzymes based on a blastp search.
The genes gox1432 and gox0849 are 1458 and 1476 bp long and code for polypeptide chains
of 485 and 491 amino acids, respectively. The calculated molecular masses of Gox1432 and
Gox0849 proteins were 53.6 kDa and 54.1 kDa, respectively. The secondary structure of both
proteins was predicted by PSIPRED (Buchan et al. 2013, Jones 1999) that indicated that
Gox1432 contains 19 alpha-helices with eight-parallel beta sheets, while Gox0849 has 20
alpha-helices and eight parallel beta-sheets. An additional analysis with the InterPro database
(http://www.ebi.ac.uk/interpro) revealed that Gox1432 and Gox0849 contain N-terminal
NAD+/NAD(P)
+ binding Rossmann fold domains (Rossmann et al. 1974) and C-terminal
mannitol dehydrogenase signature sequence motifs (Fig. 26). The amino acid sequences of
both proteins share 61 % similarity and 46 % identity to each other with a query coverage of
99 %.

3. Results
87
Figure 26: Multiple sequence alignment of important regions of Gox1432 and Gox0849 from
G. oxydans 621H with homologous proteins from other Gluconobacter species. The amino
acids marked in red indicate the NAD+/NADP
+ binding motifs (IPR016040) and in yellow
the mannitol dehydrogenase catalytic domains.
3.3.2. Characterization of the mannitol dehydrogenases from G. oxydans
For characterization, both putative mannitol dehydrogenases were heterologously produced in
E. coli. Therefore, the corresponding genes were amplified by PCR and cloned into pASK-
IBA vectors. Both constructs were sequenced and transformed into E. coli for overproduction
of the proteins. The resulting recombinant proteins were purified from crude cellular extract
using Strep-Tactin affinity chromatography, yielding 1-2 mg of the target proteins from 1 L
E. coli cultures. The purity of both proteins was determined by SDS-PAGE and western blot
analysis, which revealed that the proteins were apparently homogenous and formed single

3. Results
88
bands of 54.9 kDa and 55.7 kDa (Fig. 27), which were in good agreement with the deduced
masses of 54.6 kDa and 55.0 kDa for the recombinant tagged proteins Gox1432 and
Gox0849, respectively. Native PAGE revealed that Gox1432 and Gox0849 exhibited
apparent molecular mass of 56.3 kDa and 134.4 kDa, respectively, indicating that Gox1432
was a monomeric protein, while Gox0849 possessed a homodimeric structure (Fig. 27).
However, small amounts of dimers at 100 kDa for Gox1432 and trimers at 160 kDa for
Gox0849 were also observed. Similarly, Adachi et al. (1999a) has reported that among two
types of mannitol dehydrogenases, purified from G. suboxydans IFO 12528, the NADP+-
dependent enzyme (EC 1.1.1.138) was a 50 kDa monomeric protein, whereas the NAD+-
dependent enzyme (EC 1.1.1.67) was a dimeric protein with native molecular mass of 130
kDa. According to similarity of molecular masses, the proteins Gox1432 and Gox0849 from
G. oxydans 621H can be considered as the homologues of NADP+- and NAD
+-dependent
mannitol dehydrogenases from G. suboxydans IFO 12528, respectively.
Figure 27: SDS- and native PAGE of purified mannitol dehydrogenases (Gox1432,
Gox0849) from G. oxydans. Lane 1,3,5,7: SDS-PAGE of Pageruler prestained protein ladder
(Thermofisher Scientific). Lane 2: SDS-PAGE of purified Gox1432 (silver staining). Lane 4:
Western blot of purified Gox1432. Lane 6: SDS-PAGE of purified Gox0849 (silver staining).
Lane 8: Western blot of purified Gox0849. Lane 9: Native PAGE of high molecular weight
standard (HMW Native marker kit, GE, Healthcare). Lane 10: Native PAGE of purified
Gox1432. Lane 11: Native PAGE of purified Gox0849. (Modified from Zahid and
Deppenmeier 2016).
To confirm that Gox1432 and Gox0849 are indeed mannitol dehydrogenases, their catalytic
activities were determined by detecting the rate of change in absorbance of NAD(P)+ or
NAD(P)H at 340 nm in the presence of various sugars and polyols (Fig. 28, Table 16).

3. Results
89
Gox1432 catalyzed the NADP+ -dependent oxidation of various polyols such as D-mannitol,
D-sorbitol, D-arabitol, and D-glycerol. The highest activity was measured with D-mannitol as
substrate with a Kcat/KM of 7.8 x 10³
± 1.5 s-1
M-1
and KM of 11.7 ± 2.5 mM. The protein did
not show any activity with NAD+
as electron acceptor. Moreover, the enzyme was able to
catalyze the NADPH-dependent reduction of various sugars (e.g., D-fructose, L-sorbose, and
5-keto D-gluconate). The highest reduction rate was obtained for D-fructose with a KM of
55.7 ± 8.3 mM and a Kcat/KM of 2.8 x 10³
± 0.35 5 s-1
M-1
. NADH did not serve as electron
donor. In comparison, Gox0849 had a limited substrate spectrum and catalyzed only the
NADH-dependent reduction of D-fructose to D-mannitol with a Kcat/KM of 2.9 x 10³
± 0.027
s-1
M-1
and a KM of 38 ± 0.4 mM. A reduction of other sugars was not observed. It was
noticed that Gox0849 had clear preference for NADH as electron donor and showed 90 %
decrease in activity with NADPH as cofactor. In addition, Gox0849 oxidized only D-
mannitol in the presence of NAD+ as electron acceptor with an apparent Kcat/KM of 6.4 x 10
3
± 1.05 s-1
M-1
and a KM value of 8.6 ± 1.9 mM.
The activity of both purified enzymes was tested over a wide pH range of 5-10.5. It was
found that the optimum pH for the reduction of D-fructose was 7.0 for both proteins, whereas
the optimum pH for the oxidation of D-mannitol was 10.0 and 9.0 for Gox1432 and
Gox0849, respectively. A substantial decrease in the activities of both proteins was observed
when the oxidation of D-mannitol was tested at the cellular pH-value. It was noted that at
physiological pH of 7.0, the rate of mannitol oxidation was 4-fold reduced for Gox1432 and
3-fold reduced for Gox0849. Taken together, the kinetic data suggested that the proteins were
able to oxidize mannitol at alkaline pH, but their major in vivo function was the reduction of
D-fructose to D-mannitol. Therefore, the proteins Gox1432 and Gox0849 can be classified as
D-fructose reductases rather than D-mannitol dehydrogenases. From here on this
nomenclature will be used in this study.

3. Results
90
Figure 28: Kinetic parameters of Gox1432 () and Gox0849 (). (A, C) Michaelis-Menten
curves. (B, D) Lineweaver Burk curves. (A and B) Kinetic parameters for the reduction of D-
fructose at pH 7.0. (C and D) Kinetic parameters for the oxidation of D-mannitol at pH 9.0
(for Gox0849) and 10.0 (for Gox1432). The graphs were prepared using GraphPad Prism 6.

3. Results
91
Table 16: Apparent kinetic parameters of Gox1432 and Gox0849
Enzyme Substrates pH KM (mM) * Vmax *
(U/mg)
Kcat (s-1
) Kcat/KM (s-1
M-1
)
Gox1432 D-Fructose 7 55.7 ± 8.3 167.8 ± 4.0 153.8 ± 3.0 2.8 x 10³ ± 0.35
L-Sorbose 7 507.0 ± 5.4 209.3 ± 3.0 192.0 ± 3.0 3.8 x 10² ± 0.02
D-Mannitol 10 12.0 ± 2.5 98.0 ± 2.0 90.0 ± 2.0 7.8 x 10³ ± 1.5
D-Sorbitol 10 195.0 ± 28 185.5 ± 22 170.0 ± 20 8.9 x 10² ± 0.2
D-Mannitol 7 19.0 ± 1.5 13.2 ± 4.0 12.1 ± 3.0 6.6 x 10² ± 2.4
Gox0849 D-Fructose 7 38.0 ± 0.4 120.0 ± 2.4 110.0 ± 2.2 2.9 x 10³ ± 0.027
D-Mannitol 9 9.0 ± 2.0 59.0 ± 3.1 54.0 ± 3.0 6.4 x 10³ ± 1.05
D-Mannitol 7 15.0 ± 3.2 17.0 ± 3.0 16.2 ± 3.0 1.1 x 10³ ± 0.064
* KM and Vmax were determined using nonlinear regression of the Michaelis–Menten data (GraphPad Prism 6).
3.3.3. Transcript abundance of genes coding for D-fructose reductases in G. oxydans
The proteins Gox1432 and Gox0849 could reduce D-fructose to mannitol with comparable
catalytic efficiencies. To analyze their importance for the metabolism of G. oxydans, the
transcript abundance of the corresponding genes (gox1432 and gox0849) was compared by
RT-qPCR analysis. Moreover, the effect of externally applied osmotic stress on the
expression rates of the genes was monitored. Therefore, total RNA was extracted from G.
oxydans cells cultivated under non-stress (YGP medium) and osmotically stress conditions
(YGP medium + 450 mM sucrose). The expression levels of gox1432 and gox0849 were
compared in relation to the constitutively expressed gene gox1709 encoding the
gluconokinase (Rauch et al. 2010). RT-qPCR analysis revealed that the transcription of both
genes was not regulated because significant differences in their quantification cycle (Ct)
values were not observed under control and osmotic stress conditions (Fig. 29). However, it
was found that gox1432 was expressed at a higher level than gox0849. Transcript abundance
of gox1432 gene was 3.5 fold higher than the reference gene, highlighting its importance for
the cellular metabolism. In contrast, the transcripts from gox0849 were eight fold less
abundant than the reference gene. In summary, these results indicated that the expression
levels of these genes in G. oxydans were not affected by a change in osmolality of the growth
medium, and an evidence was provided that the major fructose reductase in G. oxydans was
Gox1432.

3. Results
92
Figure 29: Transcript abundance of genes gox1432 and gox0849 encoding fructose
reductases in comparison to the house-keeping gene gox1709. Dark and light gray bars
represent the transcript abundance of the genes under non-stress and osmotic stress
conditions, respectively. ΔCt values were obtained by subtracting average Ct values of the
genes of interest from the reference gene gox1709. (Modified from Zahid and Deppenmeier
2016).
3.3.4. Characterization of fructose reductase deletion mutants
3.3.4.1. Effect of the deletion of fructose reductases on growth of G. oxydans
To investigate the physiological role of the two fructose reductases in G. oxydans, the single
deletion mutants gox1432 and gox0849 as well as the corresponding double mutant
(gox1432gox0849) were generated as described by Kostner et al. 2013 (Chapter 2.5.16).
The deletion mutants were screened by colony PCR, and gene deletion was confirmed by
sequencing of the PCR fragments. As shown in Figure 30A, a PCR fragment of 559 bp was
generated with the primer pair Up_gox1432_int_fw/Do_gox1432_int_rev and corresponded
to the gox1432 deletion mutant, while the DNA fragment had a size of 2017 bp in the wild
type. Likewise, DNA amplification using the primer pair Up_gox0849_int_fw/
delt
aC
t
gox1432 gox0849
3
2
1
0
-1
-2
-3
-4
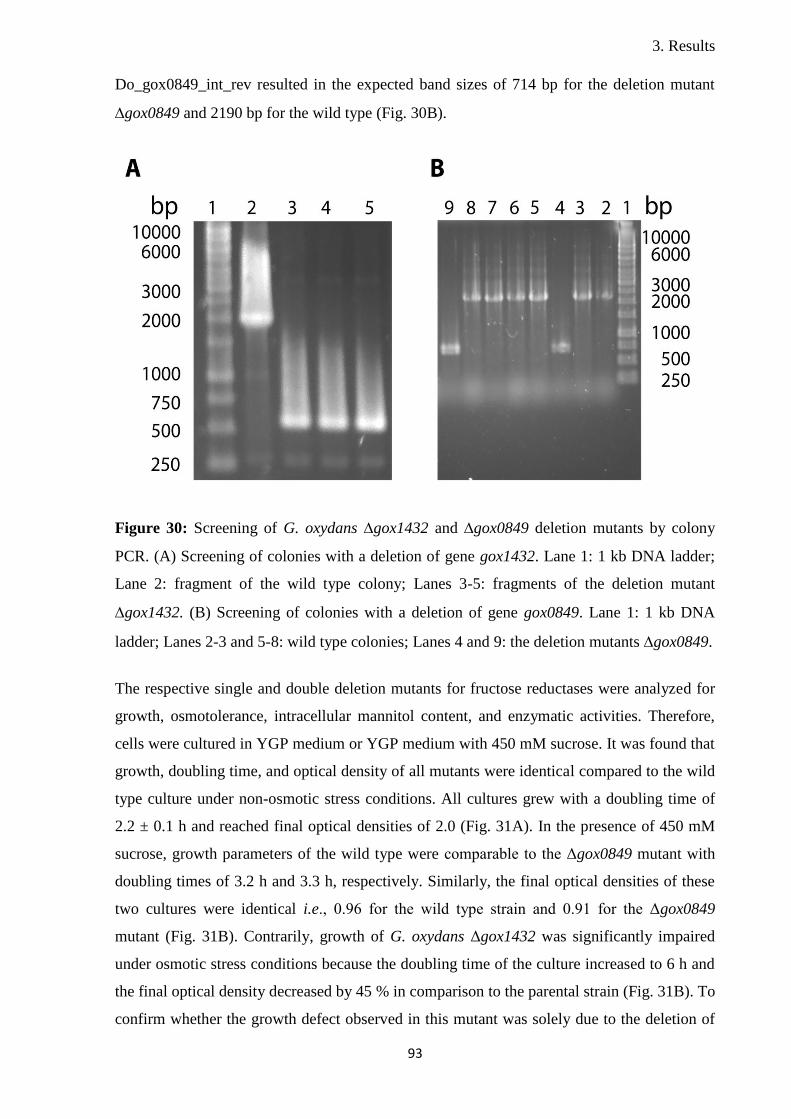
3. Results
93
Do_gox0849_int_rev resulted in the expected band sizes of 714 bp for the deletion mutant
gox0849 and 2190 bp for the wild type (Fig. 30B).
Figure 30: Screening of G. oxydans gox1432 and gox0849 deletion mutants by colony
PCR. (A) Screening of colonies with a deletion of gene gox1432. Lane 1: 1 kb DNA ladder;
Lane 2: fragment of the wild type colony; Lanes 3-5: fragments of the deletion mutant
gox1432. (B) Screening of colonies with a deletion of gene gox0849. Lane 1: 1 kb DNA
ladder; Lanes 2-3 and 5-8: wild type colonies; Lanes 4 and 9: the deletion mutants gox0849.
The respective single and double deletion mutants for fructose reductases were analyzed for
growth, osmotolerance, intracellular mannitol content, and enzymatic activities. Therefore,
cells were cultured in YGP medium or YGP medium with 450 mM sucrose. It was found that
growth, doubling time, and optical density of all mutants were identical compared to the wild
type culture under non-osmotic stress conditions. All cultures grew with a doubling time of
2.2 ± 0.1 h and reached final optical densities of 2.0 (Fig. 31A). In the presence of 450 mM
sucrose, growth parameters of the wild type were comparable to the Δgox0849 mutant with
doubling times of 3.2 h and 3.3 h, respectively. Similarly, the final optical densities of these
two cultures were identical i.e., 0.96 for the wild type strain and 0.91 for the Δgox0849
mutant (Fig. 31B). Contrarily, growth of G. oxydans Δgox1432 was significantly impaired
under osmotic stress conditions because the doubling time of the culture increased to 6 h and
the final optical density decreased by 45 % in comparison to the parental strain (Fig. 31B). To
confirm whether the growth defect observed in this mutant was solely due to the deletion of

3. Results
94
gene gox1432, a plasmid borne allele of the gene was introduced into the deletion mutant via
the broad host range vector pBBR1-MCS containing the constitutively expressed promoter
p264 from G. oxydans. Therefore, gene gox1432 was amplified from genomic DNA of G.
oxydans using the primer pair pBBR.p264.gox1432_fw/pBBR.p264.gox1432_rev and was
cloned into the EcoRV and AscI sites of the pBBR. p264. ST vector. The recombinant
plasmid (pBBR.p264.gox1432.ST) was transformed into the gox1432 mutant by triparental
mating. Colony PCR was performed to screen for positive transformants using the primer pair
pBBR.p264_gox1432_fw/pASK_rev. A PCR fragment of 1.5 kb was obtained from the
complemented strains which confirmed the presence of the full length gene gox1432 (Fig.
32). The transformants were selected and monitored for their growth behavior under osmotic
stress conditions. It was found that the complementation of gox1432 led to improve growth of
the culture in comparison to the mutant culture. As shown in Figure 31C, the complemented
strain grew with a doubling time of 3.1 h and reached a final optical density of 1.4, which
was slightly higher than the wild type (td = 3.2 h, final OD600 = 0.96). These finding
confirmed that gene gox1432 is important for proper growth and survival of G. oxydans
under osmotic stress.
Furthermore, severe growth defects, caused by osmotic stress, were observed for the double
mutant (G. oxydans Δgox1432 Δgox0849), lacking both of the fructose reductase encoding
genes. In YGP medium with 450 mM sucrose, the double deletion mutant had an extended
lag phase of 8-10 h, followed by slow growth with a doubling time of 6 h, and reached a final
optical density of only 0.4 within 32 h (Fig. 31B). It was assumed that the double mutant
could not synthesize sufficient mannitol due to the deletion of both fructose reductases that
led to impaired growth of the culture under osmotic stress. To confirm this hypothesis,
growth parameters of the double deletion mutant were monitored in YGP + 450 mM sucrose
medium supplemented with 5 mM exogenous mannitol. As expected, growth of the culture
was significantly improved and was comparable to the wild type non-stressed culture with the
doubling time of 2.1 h and a final optical density of 2.0 (Fig. 31C). These observations
further strengthen our previous findings that mannitol functions as an osmoprotectant in G.
oxydans, and low mannitol concentrations in a medium are sufficient for the cells to cope
with osmotic challenges (Zahid et al. 2015).
In summary, these results indicated that both fructose reductases were not essential for
growth under non-osmotic stress environment. In contrast, G. oxydans required gene
gox1432, encoding the NADPH-dependent fructose reductase, for efficient proliferation in
media with low water activities. Gene gox0849, encoding the NADH-dependent fructose

3. Results
95
reductase, was important for efficient proliferation of the cells under osmotic stress when
gox1432 was deleted. Moreover, the growth defect observed for the gox1432 mutant and the
double mutant under osmotic stress was due to a defect in intracellular mannitol biosynthesis.
However, it is not clear yet whether G. oxydans produces only two fructose reductases for
mannitol synthesis and osmoprotection. In this context, it is to note that in the absence of
exogenous mannitol, the double deletion mutant grew slowly with an extended lag phase in
the medium containing 450 mM sucrose. This result points towards the presence of a yet
unknown enzyme that is able to produce low amounts of intracellular mannitol under osmotic
stress conditions (Discussed in chapter 4).

3. Results
96
Figure 31: Growth of the wild type and the mutant strains of G. oxydans on YPG medium
(A) and on YGP medium supplemented with 450 mM sucrose (B and C). Wild type non-
stressed strain (), wild type stressed strain (), mutant strain Δgox0849 (Δ), mutant strain
Δgox1432 (□), double mutant Δgox1432 Δgox0849 (▲), Δgox1432 complemented strain (
), double mutant Δgox1432 Δgox0849 with 5 mM mannitol (▼). (Modified from Zahid and
Deppenmeier 2106).
-4
-3
-2
-1
0
1
0 5 10 15 20 25 30 35
ln O
D 6
00 n
m
Time (h)
A
-4
-3
-2
-1
0
0 5 10 15 20 25 30 35
Time (h)
lnO
D (
600 n
m)
1B
-4
-3
-2
-1
0
1
0 5 10 15 20 25 30 35
Time (h)
lnO
D (
600 n
m)
C
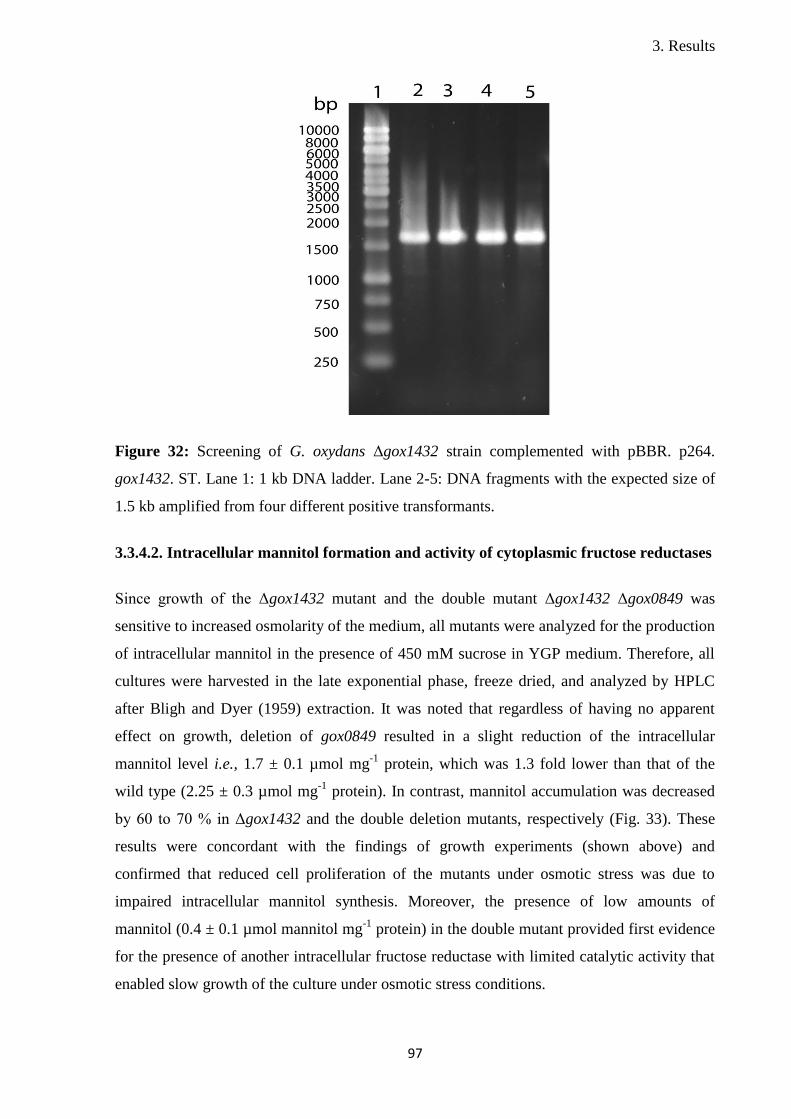
3. Results
97
Figure 32: Screening of G. oxydans Δgox1432 strain complemented with pBBR. p264.
gox1432. ST. Lane 1: 1 kb DNA ladder. Lane 2-5: DNA fragments with the expected size of
1.5 kb amplified from four different positive transformants.
3.3.4.2. Intracellular mannitol formation and activity of cytoplasmic fructose reductases
Since growth of the Δgox1432 mutant and the double mutant Δgox1432 Δgox0849 was
sensitive to increased osmolarity of the medium, all mutants were analyzed for the production
of intracellular mannitol in the presence of 450 mM sucrose in YGP medium. Therefore, all
cultures were harvested in the late exponential phase, freeze dried, and analyzed by HPLC
after Bligh and Dyer (1959) extraction. It was noted that regardless of having no apparent
effect on growth, deletion of gox0849 resulted in a slight reduction of the intracellular
mannitol level i.e., 1.7 ± 0.1 µmol mg-1
protein, which was 1.3 fold lower than that of the
wild type (2.25 ± 0.3 µmol mg-1
protein). In contrast, mannitol accumulation was decreased
by 60 to 70 % in Δgox1432 and the double deletion mutants, respectively (Fig. 33). These
results were concordant with the findings of growth experiments (shown above) and
confirmed that reduced cell proliferation of the mutants under osmotic stress was due to
impaired intracellular mannitol synthesis. Moreover, the presence of low amounts of
mannitol (0.4 ± 0.1 µmol mannitol mg-1
protein) in the double mutant provided first evidence
for the presence of another intracellular fructose reductase with limited catalytic activity that
enabled slow growth of the culture under osmotic stress conditions.

3. Results
98
Figure 33: Effect of the deletion of fructose reductases on intracellular mannitol content in
the wild type and the mutant strains of G. oxydans. Cells were cultivated in YGP medium
containing 450 mM sucrose. Compatible solutes were extracted and analyzed by HPLC. Y-
axis represents the intracellular mannitol concentrations (µmol mg-1
protein) in all strains of
G. oxydans. (Modified from Zahid and Deppenmeier 2016).
For the confirmation of these results, cytoplasmic fractions from the wild type, both single
mutants, and the double mutant were extracted and assayed for fructose reduction and
mannitol oxidation activities at the physiological pH 7.0 (Adachi et al. 1999a). At this pH,
both purified proteins had maximum catalytic activity for the reduction of D-fructose rather
than the oxidation of D-mannitol (Table 16). Hence, it became evident that both enzymes
function as fructose reductases in vivo. For activity analysis, cytoplasmic fractions were
prepared from cultures grown on YGP medium (control) and on YGP medium supplemented
with 450 mM sucrose (osmotic stress).
As shown in Figure 34A, the highest fructose reduction rates were 3.0 ± 0.4 µmol min-1
mg
of cytoplasmic protein-1
, obtained with NADPH as a cofactor. These rates were determined
with cytoplasmic fractions of the osmotically stressed wild type and Δgox0849 mutant cells,
and represented the activity of the NADPH-dependent fructose reductase Gox1432. The
activity of this enzyme was 2.4 fold lower in the cytoplasms of cells grown in the absence of
sucrose. Under non-stress conditions, the maximum reduction rate of fructose was 1.25 ± 0.2
µmol min-1
mg cytoplasmic protein-1
. In contrast, the cytoplasmic fractions of the Δgox1432
mutant and the double mutant did not reduce D-fructose in the presence of NADPH. These
0
0.5
1.0
1.5
2.0
Wild type gox1432 gox0849 double mutant
2.5
Ma
nn
ito
l (µ
mo
l m
g-1
pro
tein
)

3. Results
99
results indicated that Gox1432 is the sole NADPH-dependent D-fructose reductase present in
the cytoplasm of G. oxydans.
Besides NADPH-dependent reduction of D-fructose, the same cytoplasmic fractions were
also tested for NADH-specific reduction activities (Fig. 34A). Remarkably, the reduction
rates of fructose in the cytoplasm of the wild type with NADH were 10-folds lower (0.3 ±
0.03 µmol min-1
mg cytoplasmic protein-1
) compared to the rates with NADPH as electron
donor. Moreover, it was observed that osmotic stress had no influence on NADH-dependent
fructose reduction because comparable rates were detected in the cytoplasm of the wild type,
extracted under stress and non-stress conditions. Likewise, similar rates of NADH-specific
D-fructose reduction were found in the cytoplasm of the Δgox1432 mutant i.e., 0.3 ± 0.04
µmol min-1
mg of cytoplasmic protein-1
. In contrast, the NADH-dependent reduction of
fructose was two-fold reduced in the cytoplasm of Δgox0849 and the double mutant. These
results confirmed the presence of a third unknown intracellular NADH-dependent D-fructose
reductase in G. oxydans. The cytoplasmic fractions were also tested for the oxidation of D-
mannitol at pH 7.0. It was noticed that the rates of NADP+- and NAD
+-dependent D-mannitol
oxidation were 10-fold lower in the stressed and non-stressed cultures in comparison to the
rates of D-fructose reduction (Fig. 34B). These observations confirmed that both types of
oxidoreductases primarily work as fructose reductases in the cytoplasm of G. oxydans at
physiological conditions.
In summary, there are three types of soluble D-fructose reductases present in G. oxydans.
One is the NADPH-dependent enzyme Gox1432 whose activity is up-regulated by an
increase in osmolality of the growth medium. The other two are NADH-specific D-fructose
reductases, and their catalytic efficiencies are unaltered under stress and non-stress
conditions. The activities of these two enzymes for fructose reduction constituted only 24 %
(0.3 µmol min-1
mg of cytoplasmic protein-1
) of the activity of the NADPH-dependent
enzyme (1.25 µmol min-1
mg of cytoplasmic protein-1
). One of these two NADH-specific D-
fructose reductases is Gox0849, constituting almost 60 % of the total NADH-dependent D-
fructose reduction rate in the cytoplasm of wild type G. oxydans. However, the second
enzyme, catalyzes the remaining 40 % of the reduction of fructose, is yet unknown.

3. Results
100
Figure 34: Comparison of the activities of fructose reductases in the cytoplasmic fractions of
the wild type and the mutant strains of G. oxydans grown on YGP medium (non-stressed) or
YGP medium + 450 mM sucrose (stressed) at pH 7.0. Activities were determined with D-
fructose (A) and D-mannitol (B) in the presence of NADP(H) (black bars) and NAD(H) (gray
bars). (Modified from Zahid and Deppenmeier 2016).
0
1
2
3
4
stressed non-stressed
stressed non-stressed
stressed non-stressed
stressed non-stressed
wild type Δgox0849 Δgox1432 double mutant
Ac
tivit
y (
U m
g-1
cyto
pla
sm
icp
rote
in)
A
0
0.1
0.2
0.3
0.4
0.5
stressed non-stressed
stressed non-stressed
stressed non-stressed
stressed non-stressed
wild type Δgox0849 Δgox1432 double mutant
Ac
tivit
y (
U m
g-1
cyto
pla
sm
ic p
rote
in)
B

3. Results
101
3.3.4.3. Effect of the deletion of fructose reductases on cellular catalytic efficiency
As mentioned above, two fructose reductases Gox1432 and Gox0849 participate in vivo to
reduce D-fructose to D-mannitol that acts as an osmoprotectant in G. oxydans. The
corresponding deletion mutant could not efficiently grow under osmotic stress conditions due
to the decrease of the intracellular mannitol concentration. Here, the glucose oxidation
efficiencies of the wild type and the double deletion mutant were compared during cultivation
in YGPhigh medium containing 1 M glucose. As expected, a severe effect of glucose-induced
osmotic stress was observed on growth, gluconate formation, and pH value of the double
mutant in comparison to the wild type. The double mutant had an increased lag phase of
about 5 h, followed by slow growth with doubling time of 10 h, and reached a final optical
density of 0.2. In comparison, the wild type divided with a doubling time of 6 h and reached a
final optical density of 0.7 (Fig. 35A). Likewise, the glucose oxidation rates of both cultures
were different during cultivation. It was examined that the double mutant produced only 83
mM gluconate till the end of exponential phase (24 h), whereas the wild type produced 334
mM within the same time period. Similarly, the total amount of gluconate accumulated at the
end of the cultivation (30 h) was 3.5-fold lower (100 mM) in the double mutant in
comparison to the wild type that formed 350 mM gluconate.
Moreover, the pH of both cultures dropped accordingly due to the production of variable
amounts of gluconate under osmotic stress. The pH of the double mutant culture decreased
from 6.5 to 3.5 within 30 h, while the same drop in pH was observed in only 14 h in the wild
type (Fig. 35B). For further investigation, the intracellular mannitol contents of both cultures
were determined under the same growth conditions. Once again, it was observed that the
deletion mutant could accumulate mannitol only up to a concentration of 0.4 ± 0.2 µmol mg-1
protein in comparison to 2.0 ± 0.4 µmol mg-1
protein in the wild type. These results clearly
highlight the direct influence of the deletion of fructose reductase encoding genes on cellular
growth and catalytic efficiencies of G. oxydans. Thus, it can be concluded that G. oxydans
requires these fructose reductases for survival in medium with reduced water activity, and for
efficient product formation.

3. Results
102
Figure 35: Effect of the deletion of fructose reductases encoding genes on growth and
gluconate formation of G. oxydans strains. The cells were cultured on YGPhigh medium
containing yeast extract (0.6 g L-1
), glucose (1000 mM) and 100 mM K-phosphate buffer (pH
6.8). (A) Correlation between the growth profile of the wild type () and the Δgox1432
Δgox0849 double mutant (). (B) Comparison between gluconate formation (, ) and
decrease in pH (▲, Δ) of the wild type (filled symbols) and the Δgox1432 Δgox0849 double
mutant (open symbols). (Modified from Zahid and Deppenmeier 2016).
3.4. Metabolic engineering of G. oxydans for enhanced osmotolerance
The last part of this thesis deals with various approaches to increase the osmotolerance of G.
oxydans, a bacterium that has vast applications in pharmaceutical and food industries. It has
been shown that mannitol and other polyols have an osmoprotective effect on growth, cell
morphology, and catalytic potential of G. oxydans when the cells are grown in high osmotic
media (Chapter 3.2). Therefore, it was postulated that the biotechnological potential of this
organism can be enhanced by increasing intracellular mannitol synthesis. To achieve this goal
two different strategies were followed (Fig. 36). The first strategy was the homologous
overexpression of gene gox1432 encoding the NADPH-dependent D-fructose reductase in G.
oxydans to enhance intracellular mannitol production (Fig. 36, Reaction 4). The second
approach was the heterologous overproduction of glucose isomerases in G. oxydans to
increase the carbon flux from glucose towards fructose, a precursor of the compatible solute
mannitol (Fig. 36, Reaction 5).
-4
-3
-2
-1
0
1
0 10 20 30
ln O
D (
60
0 n
m)
Time (h)
0
50
100
150
200
250
300
350
400
0 5 10 15 20 25 30
Time (h)
Glu
co
na
te (
mM
)
0
1
2
3
4
5
6
7
pH
A B

3. Results
103
Figure 36: Scheme for metabolic engineering in G. oxydans for enhanced intracellular
mannitol biosynthesis from glucose. Steps 1-4 represent the potential reactions involved in
carbon efflux towards mannitol production. Reaction step 5 indicates a bypass reaction to
increase the intracellular fructose content by isomerization of glucose using recombinant
isomerases. The question mark indicates an unknown phosphatase. GLK - glucokinase
(Gox2419, Gox1182), GPI - glucose-6-phosphate isomerase (Gox1704), FR - fructose
reductase (Gox1432), GI - glucose isomerase.
3.4.1. Overproduction of D-fructose reductase (Gox1432) in G. oxydans
The first approach to increase the osmotic tolerance was the homologous overproduction of
the D-fructose reductase (Gox1432) in G. oxydans. As mentioned above, deletion of gox1432
resulted in a severe growth defect that was recovered upon complementation of the
corresponding gene in G. oxydans. The idea was that the reduction of fructose to mannitol
could be a rate-limiting step, and the overproduction of protein Gox1432 might be an
appropriate approach to increase the intracellular D-mannitol content. To confirm this
hypothesis, a plasmid construct (pBBR.p264.gox1432.ST) carrying gox1432 was transformed
and overexpressed in the wild type G. oxydans. The effect of overproduction of the protein on
cellular growth was examined during cultivation in YGPhigh medium containing 500 mM
glucose as carbon source and osmoticum (790 mOsm kg-1
). As shown in Figure 37A,
overexpression of gene gox1432 did not result in an improvement in the growth parameters of
G. oxydans when cultivated in YGPhigh medium. Both, the wild type and the gox1432
overexpression mutant revealed a doubling time of 2.8 h and reached a final optical density of
1.5. However, when the strains were grown in YFhigh medium containing 500 mM fructose
(610 mOsm kg-1
), growth of the gox1432 overexpression strain improved in comparison to
Fructose-6-P Fructose Mannitol
Glucose-6-P
Glucose
GLK(Gox1182, Gox2419)
GPI(Gox1704)
? FR (Gox1432)
1
2
3 4

3. Results
104
the wild type (Fig. 37B). The doubling time of G. oxydans harboring the plasmid-borne gene
gox1432 was 3.6 h in contrast to 5.3 h for the wild type. Likewise, the optical density of the
gox1432 overexpression mutant was 1.6 at the end of cultivation (t = 48 h), a value that was
1.35 times higher than that of the wild type. In accordance, the intracellular mannitol content
of the Gox1432 overproducing strain was 1.3 fold higher (1.05 µmol mg-1
protein) in
comparison to the wild type. These results indicate that the overexpression of gene gox1432
had a positive influence on growth and intracellular mannitol content of G. oxydans,
cultivated in the presence of fructose. However, this growth stimulatory effect was missing
during cultivation on YGP medium. It is tempting to speculate that limited amounts of free
fructose inside the glucose-grown cells hampered efficient mannitol production in the
Gox1432 overproducing strain. Hence, it can be concluded that both, the production of
Gox1432 (D-fructose reductase) and the availability of free fructose, are rate-limiting steps
for in vivo mannitol production in G. oxydans.
Figure 37: Effect of overexpression of gox1432 on growth of G. oxydans. Growth profiles of
the wild type G. oxydans () and the Gox1432 overproducing strain () grown on YGPhigh
medium containing 500 mM glucose (A) or YFhigh medium with 500 mM fructose (B).
3.4.2. Heterologous overproduction of glucose isomerases in G. oxydans
An alternative strategy for the production of sufficient intracellular fructose in G. oxydans
was the direct conversion of glucose to fructose by the catalytic activity of heterologously
expressed glucose isomerases (GI). For this purpose, the xylA genes encoding xylose/glucose
isomerases (XI/GI) (EC 5.3.1.5) from E. coli K12 (b3565) and Streptomyces griseus
-4
-3
-2
-1
0
1
0 10 20 30
lnO
D (6
00
nm
)
Time (h)
-4
-3
-2
-1
0
1
0 10 20 30 40 50
lnO
D (6
00
nm
)
Time (h)
A B
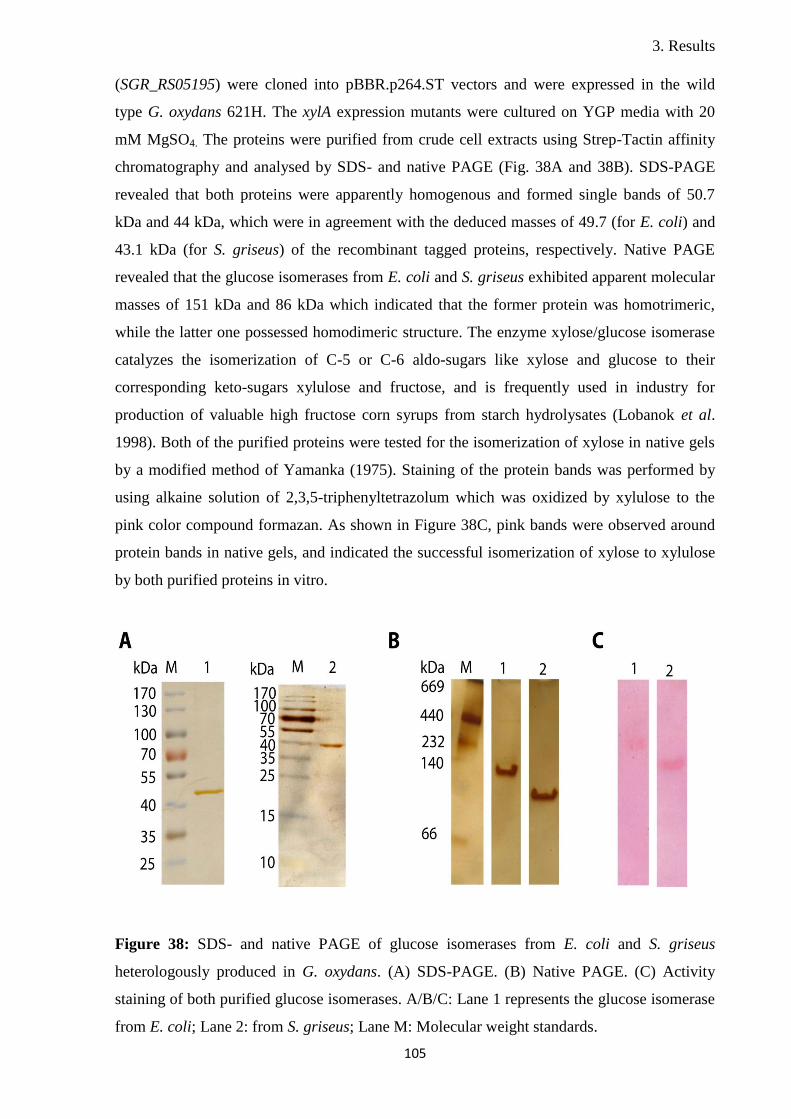
3. Results
105
(SGR_RS05195) were cloned into pBBR.p264.ST vectors and were expressed in the wild
type G. oxydans 621H. The xylA expression mutants were cultured on YGP media with 20
mM MgSO4. The proteins were purified from crude cell extracts using Strep-Tactin affinity
chromatography and analysed by SDS- and native PAGE (Fig. 38A and 38B). SDS-PAGE
revealed that both proteins were apparently homogenous and formed single bands of 50.7
kDa and 44 kDa, which were in agreement with the deduced masses of 49.7 (for E. coli) and
43.1 kDa (for S. griseus) of the recombinant tagged proteins, respectively. Native PAGE
revealed that the glucose isomerases from E. coli and S. griseus exhibited apparent molecular
masses of 151 kDa and 86 kDa which indicated that the former protein was homotrimeric,
while the latter one possessed homodimeric structure. The enzyme xylose/glucose isomerase
catalyzes the isomerization of C-5 or C-6 aldo-sugars like xylose and glucose to their
corresponding keto-sugars xylulose and fructose, and is frequently used in industry for
production of valuable high fructose corn syrups from starch hydrolysates (Lobanok et al.
1998). Both of the purified proteins were tested for the isomerization of xylose in native gels
by a modified method of Yamanka (1975). Staining of the protein bands was performed by
using alkaine solution of 2,3,5-triphenyltetrazolum which was oxidized by xylulose to the
pink color compound formazan. As shown in Figure 38C, pink bands were observed around
protein bands in native gels, and indicated the successful isomerization of xylose to xylulose
by both purified proteins in vitro.
Figure 38: SDS- and native PAGE of glucose isomerases from E. coli and S. griseus
heterologously produced in G. oxydans. (A) SDS-PAGE. (B) Native PAGE. (C) Activity
staining of both purified glucose isomerases. A/B/C: Lane 1 represents the glucose isomerase
from E. coli; Lane 2: from S. griseus; Lane M: Molecular weight standards.

3. Results
106
On the basis of activity staining, it was evident that both glucose isomerases could catalyze
the conversion of glucose to fructose in vivo. The glucose isomerase producing strains of G.
oxydans were compared for their osmotolerance during cultivation in YGPhigh medium
containing 450 mM glucose as a substrate and osmoticum. G. oxydans wild type was used as
a control strain. Unexpectedly, no significant difference in the growth parameters of the
glucose isomerase overexpressing mutants and the wild type cultures were observed (Fig.
39). All the cultures grew with the doubling time of 3.2 h and reached a final optical density
of 1.2 after 30 h of cultivation. Similarly, the drop in pH was identical, which decreased from
6.8 to 3.2 within 30 h.
To examine the activities of heterologously produced glucose isomerases, cytoplasmic
fractions were prepared from all G. oxydans cultures, grown to the mid-log phase, and were
tested for the isomerization of glucose into fructose. The assay mixture contained 50 mM
phosphate buffer (pH 7.0), 100 µl cytoplasm, 10 mM MgCl2, and 250 mM D-glucose. The
concentrations of glucose and fructose in the filtered assay mixtures were determined by a
photometric test using a D-Glucose/D-Fructose UV-Kit (Chapter 2.7.3). It was found that
glucose was not isomerized to fructose with any of the cytoplasmic fractions. In all assay
mixtures, only glucose was detected which was provided as a substrate. The results indicated
the catalytic inactivity of glucose isomerases in the cytoplasm of the cells expressing xylA
genes from E. coli or S. griseus. Marshall et al. (1957) had reported that isomerization of
glucose to fructose using cellular extracts of Pseudomonas hydrophila was dependent on the
incubation time and initial glucose concentrations. To test the effect of incubation time, the
assay mixtures were kept at 30oC for 18 h and tested for the presence of fructose. It was
found that the increase in incubation time had no positive effect on the isomerization process.
Furthermore, similar results were obtained when the same assay mixtures were tested for D-
fructose production by an alternate method using fructose reductase (Gox1432) as described
by Gao et al. (2002). The purified isomerases were also tested for isomerization of D-glucose
to D-fructose or D-xylose to xylulose using the fructose reductase Gox1432 and the xylulose
reductase Gox2181 as auxillary enzyme (Chapter 2.6.8.2). The isomerase activity of both
proteins was detected only at high temperatures. It was observed that at 70oC, the glucose
isomerases from E. coli and from S. griesus isomerized glucose to fructose with specific
activities of 0.22 U mg-1
and 0.34 U mg-1
protein, respectively. Likewise, xylose
isomerization was also catalyzed by both proteins at high temperatures with specific activities
of 0.5 U mg-1
(for E. coli isomerase) and 0.7 U mg-1
(for S. griseus isomerase). Wovcha et al.
(1983) had reported that the glucose isomerase from E. coli isomerized glucose optimally at

3. Results
107
60oC. Similarly, the optimum temperature for the catalytic activity of glucose isomerases
from Streptomyces sp. has been reported as 70oC (Chen et al. 1979). However, the optimum
temperature for growth of G. oxydans is in range of 25-30oC which is much lower than that of
the isomerases. This might also be a reason why the cell cytoplasm of glucose isomerase
producing strains of G. oxydans were devoid of the required isomerase activity. Therefore,
the proposed stimulatory effect of these isomerases on growth of G. oxydans under osmotic
stress could not be observed.
Figure 39: Effect of overexpression of glucose isomerases on growth of G. oxydans. Growth
profiles of the wild type G. oxydans (), the mutant strains overexpressing glucose
isomerases from E. coli (▲) and from S. griseus (), grown on YGPhigh media with 450 mM
glucose and 20 mM MgSO4.
-3
-2
-1
0
1
0 5 10 15 20 25 30 35
lnO
D (
60
0 n
m)
Time (h)

4. Discussion
108
4. DISCUSSION
Among different abiotic factors, water is the most important component that affects growth of
organisms in their natural habitats. Despite an abundance of water in different geographical
areas such as oceans, its availability for living organisms is limited in many environments.
The amount of dissolved solutes in water is the driving force that affects its colligative
properties such as osmotic pressure, freezing, and boiling points. For example oceanic water
contains a high percentage of salt (NaCl) that makes it unsuitable for consumption. Due to
variable rates of rainfall and evaporation, the concentration of dissolved solutes in water,
referred to as osmolality, is continuously fluctuating in ecosystems that imparts osmotic
stress on the local biota. Living organisms undergo physiological changes to overcome the
detrimental effects of limited water availability. The organisms maintain a positive
intracellular tugor pressure that guarantees cell expansion and division (Wood 2015). Gram-
positive bacteria are known to have a very high turgor pressure of approximately 20 bar while
Gram-negative bacteria have only 3-10 bars (Whatmore and Reed 1990, Ingraham and Marr
1996, Csonka and Epstein 1996).
Hence, the questions arise as how microorganisms maintain such a high tugor inside the cell.
Furthermore, it is of interest to know how the organisms sense and respond to changes in
their environment. Many studies have been published concerning osmoadaptation
mechanisms in organisms living in halophilic, osmophilic, and xerophilic conditions. So far,
it has been reported that only two types of strategies prevail among organisms to cope with
the osmotic pressure exerted by their environment. One is the salt-in strategy, and the other is
the synthesis or uptake and accumulation of organic molecules (Galinsi and Trüper 1994, da
Costa et al 1998, Kempf and Bremer, 1998). The salt-in strategy, where salts especially
inorganic ions (K+, Cl
-) are transported and accumulated inside the cell to balance the
osmolality across the cytoplasmic membrane, is commonly present in halophilic archaea and
halophilic bacteria (Galinski 1995, Oren 2008). These cations stabilize DNA molecules by
interacting with the negatively charged phosphate backbone that results in an increase in its
melting temperature (Kurz 2008). The second strategy, the accumulation of compatible
solutes, is widely distributed in all three lineages of life, including Archaea, Bacteria, and
Eukarya (Pflüger et al. 2003, da Costa et al. 1998, Loos et al. 1994, Grant 2004). In general,
compatible solutes protect the cells by osmobalancing, stabilizing cellular proteins and their
expression, as well as protecting them from denaturation in case of osmotic up-shifts,
repeated freeze-thaw cycles, desiccation, or high temperatures (Welsh 2000, Carpenter 1993).
The spectrum of these protective small organic molecules is quite broad, comprising sugar

4. Discussion
109
molecules, polyols, amines, or their derivatives (Le Rudulier et al. 1984). Interestingly, it is
known that these compounds can be accumulated within the cell in molar concentrations
without affecting the cellular metabolism (Brown 1976).
As these compounds are compatible with cell physiology, compatible solutes have been
intensively used in vitro to stabilize proteins and to increase their efficiencies such as in PCR
mixtures. Compatible solutes are also used to stabilize nucleic acids, nucleoprotein
complexes, to purify nucleic acids, and to improve cell free transcription processes (Kurz
2008). Mostly these solutes are non-polar (glycerol, mannitol, trehalose) or present as zwitter
ions (proline, ectoine, glycine betaine), and do not interfere with the charge balance of cell
cytoplasm. However, exceptions do exist in the domain of Archaea where the compatible
solutes are anionic derivatives of carbohydrate molecules, such as mannosylglycerate, 2-
sulfotrehalose, and galactopyranosyl-hydroxylysine (Desmarais et al. 1997, Lamosa et al.
1998, Martins et al. 1999). The negative charge of these molecules is conferred due to the
presence of carboxylate, phosphate, or sulphate moieties (Martins et al. 1999). The plausible
reason for the use of these anionic molecules as compatible solutes is to balance cationic
charge (K+), present in abundance in the cell cytoplasm of archaeal organisms (Roeβler and
Müller 2001). Both of these osmoadaptive strategies are not confined to a discrete group of
microorganisms as some bacteria share both of these osmoadaptive responses during osmotic
up-shock. For example, Gram-positive lactic acid bacteria initially respond to a decreases in
water activity of the growth medium by the uptake of K+ ions (transient response), followed
by the accumulation of compatible solutes (secondary response) (Le Marrec 2011). Such
temporal sequence of events for the regulation of cellular functions upon osmotic shock have
also been extensively studied in E. coli, C. glutamicum, and M. thermolithotrophicus
(Roeßler and Müller 2001, Galinski 1995).
The present study deals with the investigation of such response mechanisms in the
industrially important bacterium Gluconobacter oxydans. This organism has the ability to
incompletely oxidize various substrates (sugars and polyols) to biotechnologically important
compounds. Therefore, G. oxydans is extensively used in several biotransformation processes
to obtain valuable sugar derivatives that are used as flavoring agents (aliphatic and aromatic
carboxylic acids), pharmaceutical products (miglitol: an antidiabetic drug, L-ribose), food
additives (gluconate, vinegar), and tanning agents (dihydrocyacetone) (Rabenhorst et al.
2001, Schedel 2000, Adachi et al. 2003). The economical importance of these compounds
can be estimated by their annual production rate. As an example, gluconate is produced at the
rate of almost 10,000 tons per annum, and is one of the top-ten organic chemicals derived

4. Discussion
110
from sugar sources (Lichtenthaler 2006). Gluconate chelates metal ions and is used in various
cleaning products to prevent mineral deposition. In the form of salts, gluconate is used as an
oral or injectable metal ion supplement for humans and animals. Sodium gluconate is utilized
in the cement industry to impede the process of cement polymerization under reduced
moisture conditions (Pollard et al. 1991).
The aerobic microorganism G. oxydans oxidizes most of the substrates at the cytoplasmic
membrane or in the periplasm by the catalytic activity of a number of dehydrogenases. In the
course of the oxidation of substrates, electrons are channeled into the respiratory chain for
energy conservation. Most of the oxidized products are excreted into the media via outer
membrane porin proteins. Only a very small amount of substrate is taken up by the cells and
metabolized for biomass production (Siever and Swings 2005, Richhardt et al. 2013a). Due to
economic aspects, this bacterium has been under extensive research for many decades
regarding the identification and characterization of novel enzymes and their metabolic
relevance. However, very little attention has been paid to understand the physiological
response of this organism towards reduced water activity. In industrial-scale fermentations,
many bacteria encounter osmotic stress provided by high concentrations of substrates,
products, or salts (e.g., buffers for pH control) resulting in reduced bacterial activities
(Riesenberg et al. 1991). Recently, a study was carried out to target the effects of
concentrated soluble buffers, added to the media for pH control, on growth and product
formation rates of G. oxydans. It was found that osmolality values of more than 0.5 Osm kg-1
inhibited growth and catalytic efficiency of the organism. Similar results were obtained when
osmolalities of the growth media were raised with salts rather than buffers (Luchterhand et al.
2015). However, limited information is available with respect to the osmotic sensitivity of the
organism towards organic substrates (sugars, polyols, and their derivatives), present in
abundance in its natural habitats. G. oxydans thrives naturally in sugar-rich niches such as
fruits, honey-bees, cider, wines (Gupta et al. 2001) and can survive in highly concentrated
sugar solutions containing as high as 20-30 % glucose, sorbose, or sorbitol (Sievers and
Swings 2005, Mori et al. 1981, Rosenberg et al. 1993). Nevertheless, information regarding
protective mechanisms, which prevail in the organisms to counteract osmotic stress, is
missing. Therefore, it is necessary to investigate these osmoprotective mechanisms to
understand the physiology of G. oxydans in a better way. In the present study, experimental
evidences were provided for the role of polyols especially mannitol as an osmoprotectant in
G. oxydans. Moreover, the molecular mechanisms for mannitol biosynthesis were explored in
detail to get an overview of the osmoadaptive strategies prevailing in this organism.

4. Discussion
111
4.1. Osmotic stress responses in G. oxydans
Due to the lack of a suitable mineral medium, G. oxydans is routinely cultured on complex
media containing yeast extract using monosaccharides (glucose, mannitol, glycerol, fructose)
as carbon and energy sources. In order to select suitable conditions for osmotic stress studies,
G. oxydans was initially cultivated in complex media containing glucose (YG) or mannitol
(YM) as a growth substrate. For control experiments, both sugars were provided in
concentration of 100 mM (170 mOsm kg-1
) and analyzed for their effect on growth of G.
oxydans. No significant effect of these sugars was observed on growth of the cultures
(Chapter 3.1.1). Both cultures grew exponentially with a doubling time of 1.5 ± 0.1 h.
However, the final optical density of the culture grown with glucose was slightly lower in
comparison to the culture with mannitol as a substrate. Growth of G. oxydans with glucose
resulted in the production of gluconates (Olijve and Kok 1979), which dropped the pH of the
growth medium below 3.0 and ultimately reduced the cell proliferation. Whereas growth in
the presence of mannitol led to production of fructose and trace amounts of acetate
(Richhardt et al. 2012), thus the pH of the culture remained in a normal range to support cell
growth. The same sort of growth behavior was observed by Peters et al. (2013a) during
cultivation of G. oxydans on complex media in the presence of 50 mM glucose or mannitol.
The culture had a doubling time of 1.77 h on mannitol and of 1.82 h on glucose. In addition,
the mannitol-grown culture attained a higher final optical density of 1.94 in comparison to
1.42 of the glucose-grown culture. Thus, it can be concluded that G. oxydans can efficiently
utilize both sugars for energy conservation and biomass formation. However, in un-buffered
growth media, mannitol is a better substrate for growth rather than glucose.
For osmotic studies, different permeating and non-permeating osmolytes were used in this
study to increase the osmolality of the growth media. These included glucose and mannitol as
permeating and metabolizable osmotica that were applied to yeast extract containing media in
concentrations of 1000 mM (1100 mOsm kg-1
). G. oxydans cultures, cultivated on these sugar
rich media with comparable osmolalities, showed remarkable differences in their
osmotolerance levels. It was found that growth in 1 M glucose medium (YGhigh) was highly
impaired in comparison to the 1 M mannitol containing medium (YMhigh). With glucose, the
culture had a prolonged lag phase of 10 h, followed by slow growth with a doubling time of
4.2 h, and reached a final optical density of only 0.1 (Chapter 3.1.1). This effect was probably
due to the pH of the medium which dropped to below 3.0 and inhibited metabolic activities
especially the pentose phosphate pathway, leading to a poor growth of the culture (Olijve and
Kok 1979). In contrast, growth of the culture stressed with isosmotic concentrations of

4. Discussion
112
mannitol was significantly better and nearly resembled the control culture (Chapter 3.1.1). In
addition, pH values of the mannitol-grown culture remained in a range of 4.5-5.0 which was
close to the optimal range (5.0) for growth of this organism (Matsushita et al. 1994, Gupta et
al. 2001). These results were concordant with the findings of Luchterhand et al. (2015) that in
an un-buffered medium, a low pH-value of the culture rather than osmolality was the
responsible factor for poor growth of G. oxydans. Therefore, further experiments were
performed in the presence of mannitol as a carbon source that has been reported as preferred
substrate for growth of this organism (Prust et al. 2005, Richhardt et al. 2012).
The sensitivity of G. oxydans, with respect to increased osmolalities of growth media, was
further investigated in the presence of an inert organic polymer PEG-6000, which is a non-
permeating osmolyte in Gram-negative bacteria (Nikaido and Vaara 1985). Growth
experiments showed that the growth rates and final optical densities of the cultures decreased
with an increase in the concentrations of PEG-6000 in the growth medium (Chapter 3.1.1).
This effect was due to the fact that PEG-6000 in increasing concentrations (25 - 100 g L-1
)
raised the osmolality of the growth medium (170 to 385 mOsm kg-1
), which imparted osmotic
stress to the cultures and negatively affected their growth parameters (Mille et al. 2005,
Luchterhand et al. 2015). In comparison, it was observed that growth of the G. oxydans
culture subjected to osmotic stress with the permeating osmolyte mannitol was better than
with the non-permeating PEG-6000; although, the osmolality of the medium were higher in
the presence of the former osmolyte. A possible reason for this difference could be the
interaction between the osmolyte PEG-6000 and the carbon source mannitol. Such
cooperative interaction among solutes significantly lowers the water potential of a solution
(Michel 1983) and might be inhibitory for growth of cells. These results suggest that the
growth behavior of osmotically stressed cultures of G. oxydans depends on the nature of
osmolytes added to the media. Similar types of growth profiles have been observed in certain
other microorganisms. For example, cultivation of Pseudomonas putida S12 under
hyperosmolal conditions showed that at identical water activity (aw), hyperosmotic stress
imposed by the addition of PEG or sucrose in the growth medium resulted in a strong
decrease of the growth rate rather than by the glycerol or sodium chloride (Kets et al. 1996a).
Likewise, different strains of lactic acid bacteria have been reported for manifestation of
variable osmosensitivity levels induced by isosmotic concentrations of salts or organic
osmolytes (Glaasker et al. 1996, Prasad et al. 2003).

4. Discussion
113
4.1.2. Response of G. oxydans to osmotic stress at transcriptional level
Apart from growth studies, a closer look was taken at the transcriptional level to understand
the differential response of G. oxydans towards mannitol and PEG-induced osmotic stress.
The availability of the complete genome sequence of G. oxydans provided benefit for the
identification of potential genetic elements regulated by osmotic stress. Thus, a comparative
analysis of the differential expression of these potentially osmoinduced genes was performed
using cultures grown in YMhigh medium and YM medium supplemented with 5 % PEG-6000
(Chapter 3.1.2). The data from RT-qPCR analysis, which were in accordance with the results
of the growth experiments, showed that the expression of potentially osmoinduced genes was
significantly enhanced in the presence of PEG-6000 rather than with 1 M mannitol as
osmoticum in the growth medium. The genes, induced by osmotic stress with PEG-6000,
were most likely involved in the protection of cellular homeostasis from non-favorable
growth conditions. These include genes encoding a DNA starvation and stationary phase
protection protein (Gox0707), a trehalose phosphate synthase (Gox1119), molecular
chaperons (Gox0820, Gox0857), and ABC transporter proteins (Gox2182, Gox2220). Thus,
the results of both, RT-qPCR analysis and growth experiments, collectively supported the
hypothesis that G. oxydans undergoes different physiological and genetic changes in response
to osmotic shock elicited by PEG-6000 rather than mannitol. Therefore, genome-wide
transcriptome analysis of the PEG-induced osmotically stressed culture was performed to get
a comprehensive picture of osmotic stress responses in this organism.
4.1.3. Genome-wide transcriptome analysis of osmotically stressed cells of G. oxydans
Next-generation sequencing (NGS) analysis indicated that from the 2735 ORFs of G.
oxydans, 105 genes were differentially expressed (more than two-fold) in response to osmotic
up-shift (Chapter 3.1.3.2). Analysis of the transcriptome data revealed that various cellular
processes linked to metabolism, cell signaling, transport, and transposition were affected in
osmotically stressed G. oxydans cultures. These differentially expressed genes were
categorized into 18 groups according to their role in cellular functions (Chapter 3.1.3.2). A
major percentage (40 %) of these differentially expressed genes encode hypothetical proteins
and are classified as hypothetical genes with unknown cellular functions. It was noted that the
expression of only a few genes encoding proteins involved in cellular metabolism, transport,
transcription regulation, motility, and detoxification were induced under hyperosmotic
conditions. Moreover, the NGS data revealed that in G. oxydans, genes encoding putative
transposases and phage proteins were significantly up-regulated in response to osmotic shock.

4. Discussion
114
These included the genes gox1325, gox0463, gox2593, and gox1213, whose expression was
more than three-fold increased under osmotic stress. These findings can be explained by the
fact that bacteria are prompted to undergo genetic variability during unfavorable growth
conditions (Foster 2007). Thus, the activation of transposition could be part of various stress
responses to generate genetic diversity or to transfer genetic information from one cell into
another cell. This genetic diversity may assist the bacterial population to withstand harsh
environmental conditions (Kleckner 1990, Capy et al. 1997, Capy et al. 2000).
Furthermore, the genome-wide transcriptome analysis revealed an increased expression of
genes encoding transporter proteins in osmotically stressed cells of G. oxydans. Most of these
genes belong to the TonB type outer membrane receptor proteins and the ABC type sugar
transporter proteins. A number of studies showed that microorganisms undergo a rapid efflux
of water and plasmolysis on exposure to hypertonic conditions. To prevent the excessive
dehydration, cells tend to maintain their turgor by increasing cytoplasmic concentrations of
osmotically active solutes. These solutes can be transported from the environment by means
of various transporter proteins. For example, E. coli cells actively transport compatible solute
(proline, glycine betaine, choline) under osmotic up-shift, and the transporters responsible for
acquisition of these osmoprotectants (e.g., ProP and ProU) belong to the major facilitator
superfamily and the ABC transporter superfamily (Paulsen et al. 1996, Gouesbet et al. 1994).
Additionally, TonB proteins are known for the active transport of solutes (vitaminB12, iron,
siderophores) into the periplasm, via interaction with outer membrane receptor proteins
(Kadner 1990). Also, an increased expression of the transcriptional regulator Gox0676,
belonging to the group of iron-regulated sigma factors, was examined. Such types of
regulators control the expression of genes involved in iron transport and homeostasis. The
increased expression of these transport protein encoding genes in G. oxydans highlights the
significance of the active transport of solutes and essential ions under osmotic stress
conditions.
In addition, expression of certain genes involved in the metabolism of sugars, amino acids,
and lipids was also induced. This group includes genes encoding a glycolytic enzyme, the
triose phosphate isomerase (Gox2217) and a PPP enzyme, the ribose-5-phosphate isomerase
(Gox2218). Both pathways are involved in the assimilation of sugars for biomass generation
and synthesis of precursor molecules for anabolic processes. For example, the ribose-5-
phospahte isomerase is involved in the isomerization of ribulose-5-phosphate to ribose-5-
phosphate, which is required for the synthesis of nucleic acid molecules. Likewise, the
expression of the gene encoding a dihydrofolate synthase (Gox1205) was up-regulated. This
4. Discussion
115
enzyme participates in the de novo-synthesis of tetrahydrofolic acid, which is involved in the
synthesis of purines and in the interconversion of glycine and serine molecules (Shane 1989,
Ravanel et al. 2001). Probably, nucleic acid biosynthesis could be impaired in G. oxydans
under osmotic stress conditions. Thus, acceleration of the pathways involved in the synthesis
of such precursor molecules could be the plausible solution. Supporting evidences came from
an increased expression of the genes encoding enzymes for DNA repair such as the uracil-
DNA glycosylase (Gox1908) and the DNA helicase II UvrD (Gox2523). These types of
cellular stress responses are very common and prevalent among prokaryotes and eukaryotes
(Kültz 2003). For example, an overexpression of the pea DNA helicase 45 gene in tobacco
plants or bacteria resulted in an enhanced tolerance of the mutant strains towards salinity
stress situations (Sanan-Mishra et al. 2005, Tajrishi et al. 2001). Among other differentially
expressed genes in G. oxydans, expression of three putative oxidoreductase (Gox0201,
Gox1849, Gox2594) encoding genes was two-fold increased under osmotic stress conditions.
As the specific functions of these putative enzymes are not known, their link to osmotic stress
could not be established.
As stated above, the change of intracellular osmolytes concentrations is one of the well-
investigated physiological responses in osmotically stressed organisms. A closer inspection
of the transcriptome data revealed that the transcription of a genes encoding the putative
trehalose-6-phosphate phosphatase (Gox1118) was two-fold increased in G. oxydans
following osmotic up-shock. Likewise, RT-qPCR analysis showed that the expression of a
gene coding for a trehalose-6-phospthate synthase (Gox1119) was significantly induced
under osmotic shock (Chapter 3.1.3.3). Both genes gox1118 and gox1119 are organized in an
operon in the genome of G. oxydans. Moreover, blast analysis using the NCBI non-redundant
protein database indicated that the amino acid sequence of Gox1118 shared weak homology
(34 % identity, 78 % query coverage) to the trehalose phosphatase (OtsB: NP_416411) of E.
coli. While Gox1119 was homologous to the E. coli protein trehalose-6-phosphate synthase
(OtsA: NP_416410) with 41% identity (68 % query coverage). Both OtsA and OtsB are
osmoregulatory proteins and involved in the synthesis of the compatible solute trehalose in E.
coli (Giaever et al. 1988, Klein et al. 1991). In addition, a number of other studies showed
that the production of trehalose as well as the production of the corresponding enzymes for
trehalose synthesis was increased following desiccation or limited water activity situations in
different microorganisms (Cytryn et al. 2007, Tsuzuki et al. 2011). These observations led to
the assumption that both genes gox1118 and gox1119 could possess a similar function and
could participate in the biosynthesis of trehalose in osmotically stressed G. oxydans cells.

4. Discussion
116
Giaever et al. (1988) reported that mutants of E. coli, unable for trehalose biosynthesis,
showed compromised growth on osmotically enriched mineral medium. Similarly, deletion
mutants of Rhizobium leguminosarum for trehalose biosynthesis genes displayed an
osmosensitive phenotype under drying conditions (McIntyre et al. 2007). Thus, the role of
gox1118 and gox1119 in G. oxydans was studied by generating deletion mutants of these
genes and by analyzing their growth profile in YM medium with 10% PEG-6000 as
osmoticum. Intriguingly, growth of the mutant strain was not affected and was comparable to
the wild type (Chapter 3.1.3.4). These observations indicated that the genes gox1118 and
gox1119 were not essential for growth of G. oxydans under osmotic stress conditions.
Moreover, 13
C-NMR analysis of the intracellular metabolites of osmotically stressed cells of
G. oxydans indicated that trehalose is not produced as a potential compatible solute in this
organism (Chapter 3.2.1). Thus, it is tempting to speculate that the genes gox1118 and
gox1119 do not synthesize trehalose under given conditions. However, an enhanced
expression under osmotic stress suggests the participation of these genes in some other
unknown osmoregulatory mechanism in G. oxydans.
4.2. Mannitol as a major intracellular metabolite and osmolyte in G. oxydans
To identify compatible solutes accumulated in G. oxydans for the compensation of externally
applied osmotic pressure, 13
C-NMR studies were performed. Therefore, total cellular
metabolites of PEG-6000 osmotically stressed cells were extracted and analyzed by NMR
spectroscopy. 13
C-NMR analysis revealed the accumulation of mannitol as a major osmolyte
in osmotically stressed cells of G. oxydans (Chapter 3.2.1). This observation led to the
assumption that under osmotic stress, cells take up mannitol from the media to maintain their
osmotic homeostasis with the external environment. It has been reported that various polyols
like mannitol have an osmoprotectant role in different organisms under osmotic stress
conditions such as bacteria, yeasts, fungi, and plants (Grant 2004, Wisselink et al. 2002, Sand
et al. 2013, Zahid et al. 2015). Thus, the accumulation of polyols in these organisms might
reflect an evolutionary convergent osmoadaptive mechanism. Moreover, microbes mostly
rely on the uptake of compatible solutes (if available), from their environment because the de
novo synthesis of these compounds is energetically expensive (Oren 1999). In such
paradigms, it is tempting to speculate that in the presence of mannitol, G. oxydans takes up
this compound and does not reveal any other physiological response to the osmotic stress,
exerted by PEG-6000. However, the growth rate and the final optical density of G. oxydans
was affected by the addition of PEG-6000 to the growth medium. This could be caused by the
high molecular mass of PEG that slowly crosses the outer membrane of Gram-negative

4. Discussion
117
bacteria and imposes a gradient across the cytoplasmic membrane which may result in the
release of free cytoplasmic water and in the decrease of the growth rate (Nikaido and Vaar
1985, Record et al. 1998). A similar phenomenon was observed in Pseudomonas putida,
where the addition of PEG-4000 to the medium could not trigger any physiological response
in the osmotically stressed cells. Although PEG decreased the aw and reduced the growth rate
of the culture, the accumulation of K+ ions and glycine betaine was not observed.
Accumulation of potassium ions and glycine betaine was examined when the water activity
of the growth medium was decreased to comparable levels with other osmolytes such as
sucrose and sodium chloride (Kets et al. 1996a). Therefore, it was suggested that the
composition of growth medium has a great influence on osmotolerance of each organism
(Galinski 1995).
In E. coli, an increase in osmolarity of the growth medium leads to the release of free
cytoplasmic water and a change of the cell turgor pressure. This change of the cell turgor
triggers the activation and an increase of the production of various transport proteins for the
uptake of osmoprotectants like proline, trehalose, and glycine betaine (Record et al. 1998,
Lucht and Bremer 1994). In the present study, the transcriptome data and RT-qPCR results
revealed an increased expression of genes coding for transport proteins, indicating an
enhanced active transport of various solutes and sugar molecules. An increased expression of
ABC transporters and TonB proteins in connection with the accumulation of mannitol
highlights the active transport of sugar molecules and other solutes as an osmoinduced
response in stressed cells of G. oxydans. Interestingly, RT-qPCR analysis revealed a four-fold
enhanced expression of gene gox2182 which encodes a mannitol/sorbitol ABC transporter
permease (Chapter 3.1.2). For further investigations on the role of this transport system for
the uptake of mannitol, multiple attempts were performed to generate deletion mutants for the
putative mannitol/sorbitol transport proteins (Gox2183-2185). However, it was not possible
to create such deletion mutants indicating that the transporter proteins are essential for the
survival of G. oxydans (data not shown).
Compatible solutes have intrinsic properties to protect the cellular proteins and other
macromolecular structures against denaturing stress conditions (Santoro et al. 1992, Knapp et
al. 1999, Crowe et al.1984, Zahid et al. 2015). For example, trehalose and hydroxyectoine
confer protection to E. coli K12 against freeze drying processes (Manzanera et al. 2004).
Similarly, glycine betaine and proline provide protection to lactic acid bacteria against
salinity and thermal denaturation (Caldas et al. 1999). For the investigation of such an
osmoprotective effect of mannitol in G. oxydans, cellular catalytic activities of both the

4. Discussion
118
control and 10 % PEG-6000 applied stressed cultures were compared (Chapter 3.2.2).
Despite a decrease in the optical density of the stressed culture, the rates of the oxidation of
mannitol (substrate) to fructose (product) were identical under both growth conditions. These
observations were concordant with the fact that compatible solutes protect cellular functions
and especially stabilize the structure and activity of enzymes under adverse conditions
(Jennings 1984, Kets 1997). It has been reported that the activity of the purified α-amylase of
Bacillus sp. was significantly recovered in the presence of sorbitol as an osmoprotectant
during temperature and chemical induced denaturation (Chi et al. 2012). Likewise, the
addition of low levels of glycine betaine to a osmotically rich medium of Lactobacillus casei
increased lactic acid production by stabilization of cellular proteins including the lactate
dehydrogenase (Zou et al. 2013).
4.2.1. De novo synthesis of mannitol in G. oxydans under reduced water activity
Mannitol production and accumulation in G. oxydans, subjected to osmotic stress, was further
investigated in the absence of the exogenous supply of this osmoprotectant. Therefore, G.
oxydans was cultivated in YGP medium containing 50 mM glucose as growth substrate. To
control the pH of the culture, 100 mM soluble phosphate buffer was added to the medium.
The osmolality of this basal (control) medium was ~ 300 mOsm kg-1
. Osmotic stress was
applied by adding 300 mM sucrose to the medium that resulted in the total osmolality of 680
mOsm kg-1
. G. oxydans cannot metabolize the disaccharide sucrose due to the lack of
hydrolyzing enzymes (Prust et al. 2005, Peters et al. 2013a); therefore, it is considered an
inert osmolyte. Moreover, it is present in the natural habitats of G. oxydans such as nectar
where sucrose constitutes 40-60% of the total sugar content (Johnson and Nicolson 2008).
13C-NMR analysis revealed the presence of mannitol in great abundance in the intracellular
metabolite pool of osmotically stressed G. oxydans cultures in comparison to the non-stressed
cultures (Chapter 3.2.3). Additional compounds such as fructose, glucose, gluconates, and
sucrose were also detected at low levels in the 13
C-NMR spectrum. These findings clearly
demonstrated that mannitol is synthesized and accumulated as a compatible solute in G.
oxydans under osmotic stress. Fructose could be a precursor molecule for mannitol
biosynthesis and gluconate is produced by the oxidation of glucose (carbon source). Glucose
and sucrose were medium components which remained in part in the periplasmic and external
water space of the cells during sample preparation for spectroscopic analysis.
So far, few microorganisms are reported for the accumulation of polyols as osmoprotectant
under osmotic stress. These include Z. mobilis, P. putida, A. baylyi, and heterofermentative
4. Discussion
119
lactic acid bacteria (Barrow et al. 1984, Kets et al. 1996b, Sand et al. 2013, Wisselink et al.
2002). In these microorganisms, the synthesis and accumulation pattern of such
osmoprotectants are dependent on the concentrations of osmolytes applied in the media. In
the present study, it was found that the growth behavior and the mannitol accumulation
pattern of osmotically stressed G. oxydans cells were influenced by the change in osmolality
of the growth media (Zahid et al. 2015, Zahid and Deppenmeier 2016). An increase in the
concentration of sucrose in the YGP medium negatively affected the growth of the organism
(Chapter 3.2.3). The growth rate of the culture gradually decreased from 0.4 to 0.19 h-1
with
the increase in external osmolality from 310 to 1160 mOsm kg-1
(0-600 mM external
sucrose), respectively. The effect of osmotic stress on the growth was pronounced at very
high osmolalities (exceeding 680 mOsm kg-1
) of the growth medium. Sucrose concentrations
of 450 mM and 600 mM provided severe osmotic shock to the cells, resulting in considerably
reduced growth rates and low final optical densities of the cultures. From these data, it was
concluded that G. oxydans can optimally grow till an external osmolality of 680 mOsm kg-1
(Zahid et al. 2015). These optimum osmolality values were slightly higher in comparison to
those reported by Luchterhand et al. (2015) who determined the optimum osmolality value of
400 mOsm kg-1
for G. oxydans. This difference in the osmolality threshold could be due to
the different type of osmolytes included in the media for osmotic studies. Growth of G.
oxydans was inhibited at osmolality value of more than 500 mOsm kg-1
, raised with salts or
buffer compounds. Whereas, the herein determined optimum osmolality limit of 680 mOsm
kg-1
was detected in the presence of organic osmolytes in the growth medium. Comparably,
the optimum osmolality for growth of E. coli is 280 mOsm kg-1
(Record et al. 1998), which is
significantly lower than that for G. oxydans. E. coli grew efficiently in complex medium with
an external osmolality of ~ 0.3 Osm kg-1
. The growth rate decreased linearly and reached 0 h-
1 at an external osmolality of 2.7 to 3.0 Osm kg
-1 with NaCl (Record et al. 1998, Mclaggan et
al. 1990). Like G. oxydans, the growth rate of the closely related bacterium Z. mobilis
decreased from 0.54 to 0.12 h-1
when the external sucrose concentration increased from 200
to 300 g L-1
(Sootsuwan et al. 2013).
4.2.2. Osmodependent accumulation of mannitol in G. oxydans
The modulation of the intracellular osmolyte pool of microorganisms is actively controlled by
external osmotic fluctuations. In this study, a linear increase in the intracellular mannitol and
fructose concentration was observed with increasing external sucrose concentrations (Zahid
et al. 2015). The maximum intracellular concentrations of 2.7 µmol mg-1
and 1.4 µmol mg-1
were obtained for mannitol and fructose in the presence of 450 mM external sucrose,
4. Discussion
120
respectively (Chapter 3.2.3). A further increase of the sucrose concentration had no
significant effect on the intracellular osmolyte concentration. The reason for this could be the
saturation limit of the cells for the accumulation of these solutes and the reduced growth rate
of the cultures under conditions of high osmotic stress. Analogously, Amezaga et al. (1995)
observed an inverse correlation between growth rate and intracellular levels of compatible
solutes during growth of the Gram-positive microorganism Listeria monocytogenes under
osmotic stress conditions.
The osmodependent increase of the concentration of cytoplasmic solutes has been well-
investigated in different microorganisms. For example, in Z. mobilis, sorbitol is produced and
accumulated intracellularly during growth on either sucrose or a mixture of glucose and
fructose. It was observed that the accumulation pattern of sorbitol depends on changes of the
concentration of these sugars in the growth media. Sorbitol was accumulated intracellularly
up to concentrations of 700 mM with 1 M sucrose in the medium. Moreover, the bacterium
can accumulate exogenously supplied sorbitol in response to an osmotic up-shock by external
glucose concentrations exceeding 0.83 M. At higher glucose concentrations (> 1.3 M), the
added sorbitol was accumulated inside the cells up to a concentration of 1 M (Loos et al.
1994). Likewise, in P. putida and A. baylyi, mannitol was produced and accumulated during
growth on mineral media containing glucose and succinate as carbon substrates, respectively.
Intracellular mannitol concentrations in both organisms were also dependent on the external
osmolyte concentrations. It was observed that the concentration of mannitol increased from 0
to 170 µmol g-1
cell dry weight in P. putida S12 due to an increase of the NaCl concentration
from 0 to 0.5 M (Kets et al. 1996b). Likewise, in A. baylyi, the cellular mannitol
concentration increased five-fold from 0.3 µmol mg-1
protein at 300 mM NaCl to 1.6 µmol
mg-1
at 900 mM (Sand et al. 2013).
4.2.3. Effect of carbon sources and osmolytes on mannitol accumulation in G. oxydans
The concentration of intracellular osmolytes in osmotically stressed organisms is dependent
on the carbon source as well as on the osmolytes included in the growth medium. In this
study, G. oxydans was subjected to osmotic stress exerted by different permeating and non-
permeating osmolytes such as glucose, fructose, glycerol, and PEG-6000. Mannitol was
accumulated with all these osmotica with the exception of glycerol (Zahid and Deppenmeier
2016). However, the intracellular concentration of mannitol varied with these osmolytes
regardless of the osmolality of the media (Chapter 3.2.4). Maximum levels of mannitol
accumulation were observed with glucose as carbon source along with sucrose or glucose (in

4. Discussion
121
higher concentrations) as osmolytes. While under osmotic stress elicited by PEG-6000,
higher levels of mannitol were accumulated with fructose as growth substrate in comparison
to glucose. In the presence of glycerol as a sole carbon and osmotic source, cells accumulated
only glycerol in high amounts. This finding could be explained by the fact that glycerol is a
permeating polyol which can cross the cytoplasmic membrane simply by diffusion as shown
by Alemohammed and Knowles (1974). Thus, osmotically stressed G. oxydans cells can
accumulate this small polyol to counteract externally applied osmotic stress. As stated by
Oren (1999) and Galinski (1995), in the presence of small organic osmolytes in the
surrounding medium, their up-take and accumulation is preferred by organisms over in vivo
synthesis to acquire osmotolerance. These results indicate that not only the osmolality of
medium, but also the nature of osmolyte has great influence on cytoplasmic solutes of
osmotically stressed organisms. Analogous results were obtained in P. putida, where a
comparable decrease in water activity of a minimal medium with different osmolytes (NaCl,
KCl, Na2SO4, K2SO4 and sucrose) resulted in variable intracellular accumulation pattern of
compatible solutes (Kets et al. 1996b). For example at a medium aw value of 0.983, mannitol
accumulation was 1.25- and 1.52-fold higher with Na2SO4 and K2SO4 in comparison to NaCl,
respectively. Likewise, P. putida cells accumulated variable levels of intracellular mannitol in
the presence of different carbon sources in a mineral medium containing 0.5 M NaCl as
osmolyte. With glucose, the mannitol accumulation was 4.74-fold higher in the cells in
comparison to equimolar amounts of fructose (Kets et al. 1996b).
4.2.4. Protective effect of mannitol on cell physiology
Protective effects of osmolytes can be multifaceted. Three different modes of protective
mechanism have been suggested:
1) Maintenance of the cell turgor under reduced water activity conditions. Microbes respond
to external osmotic stress by the release of free cytoplasmic water which results in an
increase of the concentrations of cytoplasmic solutes. Moreover, microorganisms actively
maintain their cellular hydration level by the uptake of water molecules due to the
accumulation of intracellular osmolytes (Jennings 1984, Kets et al. 1997)
2) Stabilization of membrane lipids and proteins (Crowe et al. 1992, Leslie et al. 1995)
3) Protection of cellular systems from oxidative damage which is in some organisms
activated in response to osmotic stress (Smirnoff 1993). Mannitol is known as a scavenger of
hydroxyl radicals and is an effective antioxidant (Chaturvedi et al. 1997, Gilmour et al. 1995,

4. Discussion
122
Shen et al. 1997). Mannitol has also therapeutic effects (Li et al. 1996), especially protects
the human retinal pigment epithelial cells against H2O2-induced oxidative stress (Liu et al.
2010).
The present study revealed the osmoprotective effects of mannitol on cell growth,
physiology, and morphology in G. oxydans. It was noticed that very low concentrations of
mannitol (2.5-10 mM) in the growth medium could completely alleviate osmotic stress
induced by 300 mM sucrose as the doubling times of stressed cultures were similar to those
of unstressed cultures (Chapter 3.2.5, Zahid et al. 2015).
The osmoprotective effect of mannitol on growth was also observed in 600 mM sucrose
stressed cultures, but to a lesser extent (Zahid et al. 2015). It was found that the addition of
10 mM mannitol to the medium promoted growth of the culture as the doubling time of the
cells was decreased from 3.5 to 2 h but the final optical density was lower than in cultures
grown in the presence of 300 mM sucrose (Chapter 3.2.5). This effect might be due to the
higher concentration of sucrose (600 mM) that results in a high osmolality shift of the growth
medium and limits the activity of mannitol transporter proteins. In other bacteria (such as E.
coli, C. glutamicum), the activity of compatible solute transporters (ProP, ProU, BetP) is
sensitive to changes in the osmolality of the surrounding medium (Culham et al. 1993, Lucht
and Bremer 1994). The transporter proteins require a certain threshold of external osmolality
for optimal activity that could be decreased or inhibited at very high external osmolalities
(Poolman and Glaasker 1998, Rübenhagen et al. 2000).
Similar effects were observed during growth of Z. mobilis under osmotic stress in the
presence of exogenous compatible solutes. The addition of 50 mM sorbitol to a medium
containing 1.39 M glucose resulted in a better growth of the cultures in comparison to a
medium with 1.66 M glucose. With 1.39 M glucose, the cells divided without any apparent
lag phase and reached a final optical density of 6. Whereas the culture without sorbitol
supplementation had a lag phase of more than 72 h and a final optical density of only 2.
However, at increased concentration of glucose (up to 1.66 M), no growth was observed
without the addition of sorbitol. With 50 mM sorbitol, the culture grew after a lag period of
90 h and reached a final optical density of 4 (Loos et al. 1994). Such stimulatory effects of
exogenous compatible solutes (osmoprotectants) on growth were also examined in other
organisms subjected to varying osmotic stress conditions. For example, in L. plantarum, the
addition of 0.6 M NaCl to a chemically defined medium reduced the growth rate from 0.25 h-
1 to 0.17 h
-1 and decreased the final optical density from 1.4 to 0.2. The effect of 0.6 M NaCl

4. Discussion
123
was mitigated by the addition of 2 mM betaine as the growth rate and the final optical density
restored to 0.22 h-1
and 1.0, respectively (Kets and de Bont 1994).
Osmoprotectants are known for their potential to increase the survival of cells that depends
on the integrity of the macromolecular structures of the organism under denaturing stress
conditions. It has been postulated that osmoprotectants stabilize cellular membranes and
proteins either by water replacement or by the preferential exclusion phenomenon. In the
water replacement mechanism, sugar and polyols replace or substitute water molecules
between the lipid headgroups of membranes and maintain the liquid-crystalline (LC) state of
biological membranes (Crowe and Crowe 1992). In the preferential exclusion process,
stabilizing solutes do not bind to macromolecules; indeed, they are excluded from the water-
protein interface which results in more compact folding and maintenance of the native state
of proteins (Arakawa and Timasheff 1985, Timasheff 1992). This phenomenon was recently
termed, the osmophobic effect (Bolen and Baskakov 2001). The present study revealed the
protective effect of mannitol on the survival rate of osmotically stressed cells of G. oxydans
(Chapter 3.2.5). Microscopic examination and SYTOX green staining indicated that mannitol
enhanced the viability of the cultures (Zahid et al. 2015). SYTOX green is a nucleic acid
binding, membrane-impermeable fluorescent dye that stains the dsDNA of nonviable cells
due to their disintegrated membranes (Lebaron et al. 1998). In the absence of mannitol, the
morphology and viability of cells stressed with 600 mM sucrose was severely compromised.
Upon staining, it was found that almost 20 % of the total cells in the medium containing 600
mM sucrose were involuted and stained with the dye. However, in the presence of mannitol,
the degree of deformity of the cells was greatly reduced which led to almost 98 % viability of
the total cells. Although some aberrant shaped cells were still observed but they were not
stained with SYTOX green indicating the intactness of the cell membranes and viability of
the culture with mannitol supplementation (Chapter 3.2.5). Analogously, in lactic acid
bacteria, subjected to drying conditions, the addition of mannitol enhanced the viability of
dried cells (Efiuvwevwere et al. 1999). Sorbitol is also reported as a stabilizer of freeze-dried
lactic acid bacteria during long-term storage (Carvalho et al. 2003). Moreover, sorbitol also
acts as an osmoprotectant in eukaryotic organisms such as mammalian kidney medullary cells
cultured in a hyperosmotic medium (Yancey et al. 1990).
As stated above, the stimulatory effect of extracellular mannitol on the growth of osmotically
stressed cells of G. oxydans highlights the significance of an efficient transport system which
helps the cells to up-take mannitol and to maintain cellular homeostasis. Richhardt et al.
(2012) shed light on the mannitol metabolism in G. oxydans. Mannitol is oxidized to fructose

4. Discussion
124
at the cytoplasmic membrane by the catalytic activity of the PQQ-dependent polyol
dehydrogenase (Gox0854-Gox0855). Fructose is transported into the cell and is further
metabolized by the pentose phosphate pathway and the Entner Doudoroff pathway. Under
osmotic stress situations, fructose is probably taken up and part of this compounds is reduced
to mannitol to protect cellular functions from deleterious external osmotic pressure. The
PQQ-dependent polyol dehydrogenase (EC 1.1.99.22) is a versatile enzyme, which oxidizes a
broad range of polyols such as arabitol, glycerol, mannitol, sorbitol, meso-erythritol etc.
Analysis of the catalytic and kinetic properties have revealed that the purified enzyme
catalyzed the oxidation of various polyols with comparable activities (28-50 U mg-1
) but with
different KM values (KM mannitol = 113 mM, KM arabitol = 20 mM, KM sorbitol = 40 mM,
KM glycerol = 50 mM) (Adachi et al. 2001b). In the present study, mannitol was provided in
concentrations of 2.5 - 10 mM which were much lower than the KM value of the enzyme.
Thus, it is tempting to speculate that mannitol was directly transported into the cell via the
putative mannitol/sorbitol ABC transport system (Gox2182-Gox2185) without prior
oxidation to fructose (Richhardt et al. 2012, Prust et al. 2005).
In natural ecosystems, the availability of compatible solutes is generally low; transporters are
usually efficient and have a high affinity for their substrates with very low KM values, usually
in the micromolar range (Kempf and Bremer 1998). Moreover, the transport of compatible
solutes is an energy-driven process, and is carried out by different sets of transport systems in
microorganisms. For example, it has been shown that the transport of mannitol in P.
fluorescens and Phaeobacter inhibens DSM17395 is accomplished by specific ABC
transporters (Wiegmann et al. 2014). Whereas, in Z. mobilis, sorbitol is transported through
an energy-dependent carrier system that follows Michaelis-Menten kinetics and uses the
electrochemical ion gradient as a driving force for the transport rather than ATP. In certain
other organisms, such as E. coli, Bacillus subtilis, and Lactococcous lactis, mannitol up-take
is mediated by a mannitol-specific phosphotransferase system (PTS) (Groisillier et al. 2015).
However, in the genome of G. oxydans, homologues of ECIICD transport proteins were not
present (Prust et al. 2005); therefore, it is very unlikely that a PTS system participates in the
transport of mannitol in this bacterium. In G. oxydans, a couple of putative sugar/polyol-
dependent ABC transporters (Gox1179-1184, Gox2182-2185, Gox2219-2221) and
sugar/polyol-proton symporters (e.g., Gox0649, Gox0925, Gox1047, Gox1971) have been
identified that might be involved in the up-take of mannitol (Prust et al. 2005).

4. Discussion
125
4.2.5. Effect of polyols on growth and substrate oxidation rates of G. oxydans
Compatible solutes are of different types and widespread in all kingdoms of life. For
example, glycine betaine is found in every lineage of life, whereas polyols are mostly present
in terrestrial organisms that undergo desiccations or freezing conditions. Similarly, taurine is
widespread in marine organisms (Yancey 2005). Due to the limited availability of these
osmoprotectants in natural ecosystems, most organisms can use more than one compound as
compatible solutes for the protection of cellular functions against osmotic stress. For
example, growth of the Gram-positive bacterium Lactobacillus plantarum under osmotic
stress was efficiently restored with different structurally-related quaternary compounds such
as carnitine and betaine (Kets et al. 1994). Likewise, a variety of osmolytes can recover
growth of E. coli under salinity stress (Nagata et al. 2002, Nagata et al. 2005). Similarly,
osmoprotective effects of different polyols on the growth of G. oxydans were observed during
cultivation under high glucose concentrations (Chapter 3.2.6). It was found that both C-6 and
C-5 polyols (sorbitol, mannitol, and arabitol) equally restored normal growth rates and yields
of glucose stressed cultures. From these results, it can be concluded that some osmolytes,
which belong to the same chemical category, are functionally interchangeable. This could be
a plausible strategy, adopted by microbes, to survive in ecological niches where the
availability of a particular type of compound could be limiting under different environmental
conditions.
The use of osmoprotectants in biotechnology, agriculture, molecular biology, and medicine is
gaining great attention to increase product yield, treat diseases, increase efficiency of
enzymatic reactions (PCR), and to engineer drought tolerant plants and microbes. Industrially
important microorganisms are usually cultured under osmotically stressful conditions,
imposed by high substrate concentrations, to achieve high cell densities parallel to maximum
product yields (Shiloach and Fass 2005, Brown 1990, Mille et al. 2005). However, such
stress factors significantly decrease growth yields, biocatalytic rates, and often result in
mutations in the cells (Winkler et al. 2014, Dragosits and Mattanovich 2013, Riesenberg et
al. 1991). Therefore, the use of osmoprotectants to confer resistance to microorganisms and
for catalytic robustness is essential for industrial-scale fermentations. G. oxydans is an
industrially important organism for the production of valuable products such as gluconates,
ketogluconates, vitamin C, dihydroxyacetone, 6-amino-L-sorbose, etc. (Claret et al. 1994,
Hommel and Ahnert et al. 2000, Macauley et al. 2001, De Muynck et al. 2007). The increase
in osmolality of fermentation media impose osmotic stress to the cultures and result in
reduced growth and product formation (Gao et al. 2014, Mori et al. 1981, Luchterhand et al.

4. Discussion
126
2015, Zahid et al. 2015). Hence, an increase in osmotic tolerance and the maintenance of
high-cell densities are prerequisites for the synthesis of bio-based products in high amounts.
In the present study, it was observed that growth and gluconate production decreased during
growth of G. oxydans in a medium containing up to 1 M glucose (Zahid et al. 2015).
However, the addition of trace amounts of polyols (mannitol, sorbitol, or arabitol) increased
the growth rates and doubled the gluconate yield (Chapter 3.2.6). Similarly, the addition of
sorbitol to the growth medium of Z. mobilis increased the growth rates and enhanced the
fermentation capabilities of the cultures under osmotic, heat, and ethanol stress (Sootsuwan et
al. 2013). Likewise, other short-chain polyols such as arabitol, glycerol, and sorbitol serve as
compatible solutes in different microorganisms under osmotic as well as cold and oxidative
stress conditions (de Barros and Celligoi 2006, Efiuvwevwere et al. 1999, Hocking 1988).
These findings suggest that polyols, in general, protect the cellular functions and enhance the
cellular catalytic efficiencies under different stress situations. Therefore, the addition of
polyols to growth media during fermentation processes could be a suitable option to increase
the cell densities and the yield of bio-based products. Such an increase in the biocatalytic
potential of osmotically stressed cultures will definitely reduce the cost of fermentation
processes for efficient production of valuable substances. For example, gluconate, produced
at a rate of 10,000 tons per annum, has wide applications in many industries such as food and
pharmaceutical industries (Lichtenthaler 2006, Prescott et al. 1953). As shown in this thesis,
the production rate of gluconate can be increased by the supplementation of polyols in small
amounts in the fermentation media. Thus, the information regarding the role of polyols (e.g.,
mannitol) as osmoprotectant solutes in G. oxydans could be important to understand the
physiology of the organism and to improve its catalytic robustness during fermentation
processes.
4.3. Biosynthesis of mannitol in G. oxydans
G. oxydans is a strict aerobic microorganism and performs oxidative fermentation. During
this process, a great variety of substrates (sugars, alcohols, and polyols) are incompletely
oxidized by membrane-bound dehydrogenases (Deppenmeier et al. 2002). The oxidized
products are released into the periplasmic space and are further excreted into the medium.
Only very low amounts of the substrates are transported into the cells and are utilized for
biomass production. Thus mannitol is not produced from primary metabolism and it is not an
end product of fermentative processes. Moreover, mannitol is not a product of glucose
consumption in the periplasm or an intermediate of the general catabolism in the cytoplasm

4. Discussion
127
(Richhardt et al. 2013b, Hanke et al. 2013). Thus, it is obvious that mannitol is produced as a
secondary metabolite in the cytoplasm.
In other organisms, mannitol is produced either by the reduction of fructose-6-phosphate to
mannitol-1-phosphate by a mannitol-1-phosphate dehydrogenase or by direct reduction of
fructose to mannitol via a mannitol-2-deydrogenase (Wisselink et al. 2002, Saha 2004, Saha
and Racine 2008, Saha and Racine 2011, Sand et al. 2015). Hence, fructose or fructose-6-
phosphate is probably the direct precursor for mannitol biosynthesis in G. oxydans under
osmotic stress. Intracellularly, fructose-6-phosphate could be formed from glucose by two
different routes (Fig. 40). In the first pathway, glucose is converted to fructose-6-phosphate in
two steps (Reaction 1 and 10, Fig. 40) by the catalytic activities of glucokinases (Gox1182,
Gox2419) and the glucose-6-phosphate isomerase (Gox1704). Moreover, the production of
fructose-6-phosphate is possible through the oxidative pentose phosphate pathway (Reactions
2-9, Fig. 40) (Richhardt et al. 2013b, Rauch et al. 2010). In this metabolic pathway,
intracellular glucose is firstly oxidized to gluconate by a glucose dehydrogenase (Gox2015),
and then phosphorylated to 6-phosphogluconate by the catalytic activity of a gluconokinase
(Gox1709). In addition, the production of 6-phosphogluconate is also possible through the
direct oxidation of glucose-6-phosphate, carried out by a glucose-6-phosphate dehydrogenase
(Gox0145), which is then channeled into the oxidative pentose phosphate pathway.
In the PPP, 6-phosphogluconate is decarboxylated by a 6-phosphogluconate dehydrogenase
(Gox1705) to yield ribulose-5-phosphate. This conversion is followed by an interwoven
cascade of enzymatic reactions (epimerization, isomerization, transketolation, and
transaldolation) which result in the production of fructose-6-phosphate from the precursor
molecule ribulose-5-phosphate (Reactions 6-9, Fig. 40). In such ways, a sufficient amount of
fructose-6-phosphate is generated inside the cell. Under osmotic stress conditions, fructose-6-
phosphate might undergo a dephosphorylation process to form free fructose (Reaction 11,
Fig. 40). This reaction is probably carried out by a still unknown phosphatase. Possible
candidates are Gox1036, Gox1190 or Gox2002. As shown in this thesis, free fructose is then
reduced to mannitol via the fructose reductases Gox0849 or Gox1432 (Reaction 12, Fig. 40).
Another pathway for the production of fructose is the direct conversion of intracellular
glucose by the catalytic activity of glucose isomerases (EC 5.3.1.5) as present in some fungi
(Sayyed et al. 2010). However, the genes encoding such isomerases are not present in the
genome of G. oxydans (Prust et al. 2005).

4. Discussion
128
Figure 40: Intracellular routes for the synthesis of mannitol from glucose in G. oxydans. P =
phosphate, GAP = glyceraldehyde phosphate. (1) glucokinase (Gox2419, Gox1182), (2)
glucose dehydrogenase (Gox2015), (3) gluconokinase (Gox1709), (4) glucose-6-phosphate
dehydrogenase (Gox0145), (5) 6-phosphogluconate dehydrogenase (Gox1705), (6) ribulose-
phosphate-3-epimerase (Gox1352) and ribose-5-phosphate isomerase (Gox1708), (7)
transketolase (Gox1703), (8) transaldolase (Gox1704), (9) transketolase (Gox1703), (10)
glucose-6-phosphate isomerase (Gox1704), (11) unknown phosphatase, (12) fructose
reductase (Gox0849 or Gox1432). (Modified from Deppenmeier and Ehrenreich 2009).
In Gluconobacter species, four different types of polyol dehydrogenases were identified that
utilize either mannitol or fructose as substrates. These enzymes can be differentiated from
each other with respect to their molecular masses, cofactor specificity, and cellular
localization (Zahid and Deppenmeier 2016). Type 1 are the membrane-bound polyol
dehydrogenases that require PQQ as cofactor for catalysis. These enzymes have different
Glucose
Glucose-6P
6-phosphoglucoante
Ribulose-5P
Xylulose-5P + Ribose-5P
Sedoheptulose-7P + GAP
Erythrose 4P + Fructose-6P
GAP + Fructose-6P
Fructose
Gluconate
Mannitol
Xylulose-5P
1
4
5
6
7
8
9
3
10
11
12
ATPADP
NADP+
NADPH
NAD+
NADH
Pi
NAD(P)HNAD(P)+
CO2
ATP ADP

4. Discussion
129
molecular masses in different Gluconobacter strains and perform incomplete oxidations of a
variety of sugars and alcohols (Sugisawa and Hoshino 2002). For example, the enzyme
(Gox0854-0855) from G. oxydans 621H has two subunits of 80 and 14 kDa and catalyzes the
oxidation of polyols and aldoses (mannitol, glycerol, sorbitol, arabitol, ribitol, erythrose,
threose, ribose, lyxose, glyceraldehyde) as well as secondary alcohols (isopropanol, 2-
hexanol) and diols (1,2-pentanediol) (Peters et al. 2013a). This enzyme is also responsible for
the production of L-sorbose (an intermediate in vitamin C production) by the oxidation of D-
sorbitol (Matsushita et al. 2003, Hoshino et al. 2003). The following equations represent
some reactions catalyzed by such type of enzymes:
Type 2 enzymes comprise NADP+-dependent mannitol dehydrogenases (EC 1.1.1.138) that
consist of a single subunit of 50 kDa and catalyze the reversible oxidation of only mannitol to
fructose (Reaction 7, Adachi et al. 1999a).
Type 3 proteins are NADP+-dependent mannitol dehydrogenases with molecular masses of
50 kDa per single subunit and catalyze the reversible oxidation of different polyols such as
mannitol, arabitol, and sorbitol (Sugisawa et al. 1991, Klasen 1994, Shibata et al. 2000,
Shinjoh et al. 2002). These proteins are named D-sorbitol dehydrogenase in G. oxydans
G624, L-sorbose reductase in G. melanogenus N44-1 and G. suboxydans IFO 3291, and
polyol: NADP+-5-oxidoreductase in G. oxydans DSM3503. According to the molecular mass,
the number of subunits, and the homology of the amino acid sequence, it was found that
Gox1432 of G. oxydans 621H belongs to this group of mannitol dehydrogenase. Two
examples of reactions catalyzed by this group of mannitol dehydrogenase are shown below:
Type 4 represent NAD+-dependent mannitol dehydrogenases (EC 1.1.1.67) that were found
in the cell extracts of G. oxydans LMG 1489 (Parmentier et al. 2005) and G. suboxydans IFO
12528 (Adachi et al. 1999a). These mannitol dehydrogenases have a molecular mass of 130
kDa as reported by Adachi et al. (1999a). In the present study, the first enzyme belonging to
type 4 was purified which is encoded by gene gox0849. This enzyme catalyzes the following
reaction:
type 2). Mannitol + NADP+
Fructose + NADPH + H+ (Reaction 7)
type 3). Mannitol + NADP+
Fructose + NADPH + H+ (Reaction 8)
type 3). Arabitol + NADP+
Fructose + NADPH + H+
(Reaction 9)
type 1). Mannitol + CoQ10 Fructose + CoQ10H2 (Reaction 5)
type 1). Glycerol + CoQ10 Dihydroxyacetone + CoQ10H2 (Reaction 6)
type 4). Mannitol + NAD+
Fructose + NADH+ H+
(Reaction 10)

4. Discussion
130
The present study depicted that both purified enzymes (Gox1432 and Gox0849) from G.
oxydans 621H catalyze the reversible reduction of fructose to mannitol with comparable
catalytic efficiencies at pH 7.0 (Chapter 3.3.2). Gox1432 requires NADPH as cofactor for
catalysis while Gox0849 prefers NADH. Besides the reduction of D-fructose, both purified
enzymes were also capable of efficient oxidation of mannitol but at non-physiological
alkaline conditions. The pH of the cell cytoplasm is usually around 7.0, which in case of G.
oxydans is optimal for the reduction of fructose rather than the oxidation of mannitol. It was
found that at cellular pH (7), the oxidative activities of both purified enzymes decreased more
than three-fold indicating that the proteins work intracellularly as reductases and can be
classified as fructose reductases instead of mannitol dehydrogenases (Zahid and Deppenmeier
2016).
For the elucidation of the intracellular routes used by G. oxydans for mannitol synthesis, the
activity of both purified proteins was also tested with fructose-6-phosphate. However, it was
found that none of the proteins could reduce fructose-6-phosphate to mannitol-1-phosphate.
Therefore, in the context of mannitol biosynthesis, it is proposed that fructose is the precursor
for mannitol synthesis, produced by dephosphorylation of fructose-6-phosphate (Fig. 40).
The enzyme responsible for such a dephosphorylation is yet unknown. Sand et al. (2015) had
identified a unique bifunctional enzyme mannitol-1-phosphate dehydrogenase/phosphatase
that is responsible for production of mannitol in A. baylyi under osmotic stress conditions.
This unique enzyme has a N-terminal haloacid dehalogenase (HAD) superfamily like domain
that catalyzes the dephosphorylation of mannitol-1-phosphate to mannitol. The C-terminal
domain is responsible for fructose reduction. A close inspection of the genome of G. oxydans
revealed that the amino acid sequence of protein Gox1036 shares 23-25 % homology with the
HAD-like domain of mannitol-1-phosphate dehydrogenases from A. baylyi (ACIAD1672)
and P. putida (PP_2052) (Fig. 41). Moreover, sequence alignment indicates that despite
having a high sequence divergence, the members of the HAD superfamily share four
conserved sequence motifs that constitute a main catalytic scaffold for the transfer of the
phosphoryl group. These include the motifs: DXD (motif 1), T/S (motif 2), K/R (motif 3),
and E/DD (motif 4) (Caparros-Martin et al. 2013). On the basis of the presence of the
conserved motifs, it is tempting to speculate that Gox1036 might serve as a potential
phosphatase during mannitol biosynthesis in G. oxydans 621H. However, further studies are
required to confirm the phosphatase activity of this enzyme.

4. Discussion
131
Figure 41: Conserved sequence motifs of HAD-like domains from different organisms.
Multiple sequence alignment of the putative phosphatase (Gox1036) from G. oxydans
621H, the N-terminal domains of mannitol-1-phosphate dehydrogenases/phosphatases from
A. baylyi (ACIAD1672) and P. putida (PP_2052). Identical or similar amino acid residues
are indicated with asterics and dots, respectively. The conserved motifs of HAD domains
are marked in yellow.
4.4. Characterization of the relative contribution of Gox1432 and Gox0849 in cellular
osmoprotection
For the resolution of the relative contribution of the two fructose reductases for mannitol
biosynthesis and cellular osmoprotection, expression levels of the corresponding genes
(gox1432 and gox0849) were compared (Chapter 3.3.3). It was found that both genes were
constitutively transcribed as their expression levels were not affected by changes in
osmolality of the growth media. However, the transcript abundance of gene gox1432 was
much higher in comparison to gene gox0849 (Zahid and Deppenmeier 2016). These results
depicted that Gox1432 is of major importance for the production of mannitol and the
protection of the cell against osmotic stress. Evidences in favor of this hypothesis came from
the test of activities of the NADPH-dependent fructose reductase (Gox1432) in the cell
cytoplasm, which were four-fold higher than the activity of the NADH-dependent enzyme
(Gox0849) (Chapter 3.3.4.2). Moreover, the activity of the NADPH-dependent fructose
reductase within the cells was almost 2.5-fold higher in vivo under osmotic stress whereas the

4. Discussion
132
activity of the NADH-specific enzyme remained unchanged (Zahid and Deppenmeier 2016).
This effect could be due to the KM value (56 mM) of Gox1432 for fructose which is higher
than that of other orthologous enzymes such as 0.24 mM in P. fluorescens and 16.3 mM in R.
sphaeroides (Klimacek and Nidetzky 2010, Schneider and Giffhorn 1989). In the current
study, it was shown that besides mannitol, fructose concentrations progressively increased in
the cellular extracts with the increase in external sucrose concentrations (Chapter 3.2.3).
Therefore, such an increase in free fructose concentration under osmotic stress might regulate
the activity of Gox1432. Similarly, the osmodependent synthesis of sorbitol in stressed cells
of Z. mobilis is carried out by an enzyme referred to as glucose-fructose oxidoreductase
(GFOR, EC 1.1.99.-). This enzyme requires the presence of both glucose and fructose for
sorbitol formation (Barrow et al. 1984). During catalysis, the reduction of fructose to sorbitol
is accompanied by the oxidation of glucose to gluconate (Leigh et al. 1984). The enzyme
GFOR catalyzes the following reaction:
The affinity of GFOR for fructose is very low with a KM of 400 mM to 1 M (Hardman and
Scopes 1988, Zachariou and Scopes 1986). Hence, the formation of sorbitol is accomplished
at considerable rates only during cultivation of the organism with high concentrations of
sugars (Loos et al. 1994, Nidetzky et al. 1997). Normally, the intracellular availability of free
fructose is limited because of fructokinases that have a very high affinity for free fructose
(KM in micromolar ranges) and channel the substrate into the main cellular metabolic
pathways after phosphorylation. For example, in Z. mobilis, the KM value of the fructokinase
(EC 2.7.1.4-) for fructose is 70 µM, which is very low in comparison to the KM value of the
GFOR for fructose (Doelle 1982). Therefore, under normal growth conditions, the synthesis
of sorbitol cannot be accomplished. However, under osmotic stress conditions, fructose was
accumulated by growing cells due to the inhibition of the fructokinase. Hence, fructose could
be reduced to sorbitol by the GFOR oxidoreductase (Barrow et al. 1984). Moreover, in the
polyol producer yeast Candida zeylanoides, a change of the activity of transketolase, an
enzyme of the pentose phosphate pathway, resulted in an alteration from erythritol to
mannitol fermentation due to variations in the levels of erythose-4-phosphate and fructose-6-
phosphate (Hattori and Suzuki 1975). Similarly, homofermentative lactic acid bacteria
produce small amounts of mannitol during growth on glucose. Mannitol is formed by
reduction of the glycolytic intermediate fructose-6-phosphate to mannitol-1-phosphate and
Fructose Sorbitol (Reaction 11)
Glucose Gluconate

4. Discussion
133
finally to mannitol by the catalytic activities of the mannitol-1-phosphate dehydrogenase
(MPDH) and phosphatase (MPase), respectively (Loesche and Kornman 1976, Bhatt et al.
2013). It has been shown that an alteration of the pattern of glycolytic end products, by the
disruption of lactate dehydrogenase (LDH) encoding genes, resulted in an increased
expression of MPDH and MPase. Thus the LDH-deficient strains accumulate mannitol as an
end product of glucose metabolism (Ferain et al. 1996, Neves et al. 2000, Gaspar et al. 2004).
The PPP is the main route for growth of G. oxydans (Olijve and Kok 1979, Richhardt et al.
2013b) which is negatively affected by the increase in osmolality of the growth medium. It is
tempting to speculate that in G. oxydans, osmotic stress might affect the activity of the PPP
which results in a reduced proliferation of the cells and an accumulation of fructose that is
further reduced to mannitol (osmoprotectant) by fructose reductases (Zahid and Deppenmeier
2016). These results might also explain the survival of the organism in sugar rich habitats
such as honey, fruit saps, nectars. In these sugary niches, surplus amount of free fructose
might be available to the cells to form mannitol in order to counteract the high-sugar stress.
4.5. Characterization of fructose reductase deletion mutants
The importance of the fructose reductases (Gox1432 and Gox0849) for G. oxydans became
even more evident by analyzing the growth pattern and the compatible solute accumulation of
the corresponding deletion mutants. Under osmotic stress conditions, the deletion of gox1432
resulted in a 37 and 45 % reduction of the growth rate and the final optical density of the
mutant culture in comparison to the wild type strain, respectively. In addition, NADPH-
dependent fructose reduction was completely abolished in the cytoplasm of the Δgox1432
strain. However, the NADH-dependent reduction of fructose was unaltered. These results
clearly indicated that Gox1432 is the sole enzyme, catalyzing the intracellular NADPH-
specific reduction of D-fructose. Likewise, the intracellular mannitol concentration was
decreased by 60 % in osmotically stressed Δgox1432 cells, depicting the significance of
Gox1432 for the osmoadaptation of G. oxydans. Concordant effects were observed in Z.
mobilis when the GFOR encoding gene (gfo) was disrupted, which catalyzes the synthesis of
the osmoprotectant sorbitol under osmotic stress conditions. The cells became osmosensitive
and had decreased growth rates from 0.18 (without stress) to 0.08 h-1
in high-sugar media
containing 300 g L-1
sucrose. The defect in growth of the Z. mobilis Δgfo strain was
completely rescued by complementation of the gfo gene or by the addition of the osmolyte to
the sugar-rich media (Sootsuwan et al. 2013). In a similar manner, supplementation of low
amounts of mannitol to high-sugar media or complementation with the full length gene

4. Discussion
134
gox1432 led to complete recovery of the G. oxydans Δgox1432 strain from osmoinduced
growth defects (Chapter 3.3.4.1).
In contrast to the Δgox1432 strain, deletion of the gene gox0849 had no impact on the growth
of G. oxydans as the doubling time and the final optical density of the mutant culture were
comparable to the wild type culture under osmotic stress conditions (Chapter 3.3.4.1). Only
the intracellular mannitol content was slightly reduced (1.3-fold) in comparison to the wild
type cells (Chapter 3.3.4.2), which indicated a minor participation of the gene gox0849 in the
osmoprotection of G. oxydans (Zahid and Deppenmeier 2016). Moreover, the deletion of the
gene gox0849 did not result in a complete loss of the NADH-dependent D-fructose reduction
activity in cellular extracts of the stressed and non-stressed cultures. The results clearly depict
the presence of another, yet unknown, soluble fructose reductase with low catalytic activity.
These results were further supported by the analysis of the double deletion mutant strain (G.
oxydans Δgox1432 Δgox0849) which revealed the same residual potential for NADH-
mediated reduction of D-fructose (Chapter 3.3.4.2) under stress and non-stress conditions.
However, the third unknown fructose reductase could not enable the double deletion mutant
to completely restore its cellular turgor and to proliferate under osmotic stress. The culture
had a long lag phase and reached an optical density of only 0.4, which was 50 % of the
parental strain. Moreover, the intracellular mannitol content was also reduced by 70 % in the
double deletion strain. The defect in the growth pattern as well as the reduction of the internal
mannitol content in the double deletion strain strengthen the notion that fructose reductase
Gox1432 is a key player in the osmoprotection of G. oxydans (Zahid and Deppenmeier
2016). As stated above, G. oxydans contains an unknown enzyme of limited catalytic activity
for the reduction of fructose to mannitol. Sugiyama et al. (2003) had reported that the NAD+-
specific xylitol dehydrogenase (Gox0865) from G. oxydans ATCC 621 can oxidize mannitol,
but the oxidative activity is less than 1 % compared to the rate of xylitol oxidation (113 U
mg-1
). Unfortunately, information is not available regarding the reductive activity of the
enzyme with fructose as substrate. However, it is tempting to speculate that this xylitol
dehydrogenase may reduce fructose to mannitol with the same weak catalytic efficiency and
might serve as a third fructose reductase in G. oxydans.
4.6. Metabolic engineering of G. oxydans for enhanced osmotolerance
G. oxydans is often subjected to osmotic stress conditions during industrial fermentation
processes. For example, the organism is routinely cultivated in fed-batch cultures for the
volumetric production of industrially important compounds. However, during such

4. Discussion
135
cultivations, cells are often exposed to osmotic stress conditions due to the presence of high
amounts of substrates or products that result in substantial reduction in growth and product
yield (Mori et al. 1981, Gao et al. 2014, Zahid et al. 2015). The present study depicted that
mannitol is an effective protectant during cultivation of the organism under these hostile
conditions. Hence, it was proposed that the osmotolerance of the organism may be enhanced
by increasing intracellular mannitol biosynthesis. The strain G. oxydans 621H was amenable
to genetic alterations due to the availability of the complete genome sequence and the
availability of genetic tools for protein expression and the generation of deletion mutants.
Therefore, this strain was considered as suitable model organism for metabolic engineering
approaches. To achieve an increased mannitol synthesis in the organism, two different
strategies were attempted as described in chapter 3.4.
4.6.1. Overproduction of D-fructose reductase (Gox1432)
Among two different fructose reductases, it was found that Gox1432 plays a central role for
the intracellular mannitol formation and osmotolerance of G. oxydans (Zahid and
Deppenmeier 2016). Therefore, the production of the enzyme was increased inside the cell by
homologous overexpression of the gene gox1432. It was assumed that the overproduction of
Gox1432 might result in an increase in the carbon flow from glucose to mannitol formation.
Growth studies indicated that the overproduction of Gox1432 was not sufficient to direct the
hexose flux to mannitol synthesis as the growth parameters of the overexpression strain were
comparable to the wild type during cultivation on YGPhigh medium with 500 mM glucose as
carbon source and osmoticum (Chapter 3.4.1). However, substantial improvement of the
growth parameters was observed when glucose was replaced with fructose in the growth
medium (Chapter 3.4.1). These results indicated that during glucose metabolism, the
intracellular level of fructose-6-phosphate might be very low and hamper efficient mannitol
biosynthesis. The major part of fructose-6-phosphate was probably directed towards the
oxidative pentose phosphate pathway leading to a reduced supply for mannitol biosynthesis.
However, in the presence of fructose in the medium, cells might have a sufficient supply of
intracellular fructose that could be directly reduced to mannitol by the enzyme Gox1432.
Hence, it became evident that an alternative strategy to increase mannitol production during
glucose metabolism is the increase of the intracellular fructose concentration. This could be
achieved by the overproduction of either a putative phosphatase for dephosphorylation of
fructose-6-phosphate to free fructose or of a glucose isomerase for the direct conversion of
glucose to fructose. From a thermodynamic point of view, the isomerization of glucose to
fructose was a suitable option to increase the carbon flux from glucose to mannitol

4. Discussion
136
production. The bypass reaction could contribute to save cellular energy expenditure, spent
on the activation of glucose for intracellular assimilation. Phosphorylation of glucose is an
endergonic process with ∆Go' of 13.8 kJ mol
-1 (Equation 13, Cornish-Bowden 1981).
Intracellular phosphorylation of glucose is coupled with the hydrolysis of one
phosphoanhydride bond of ATP. Under standard conditions, hydrolysis of ATP to ADP and
inorganic phosphate results in the release of -31.8 kJ mol-1
energy (Equation 12, Thauer et al.
1977, Mayer and Müller 2014). This free energy change of the hydrolysis of ATP is higher
than that required for the phosphorylation of glucose, and results in the net change in free
energy of -18.0 KJ mol-1
(Equation 14).
Glucose-6-phosphate is further isomerized to fructose-6-phosphate, which in G. oxydans,
should partly undergo dephosphorylation to yield a sufficient amount of free fructose for
mannitol biosynthesis under osmotic stress (Fig. 40). Overall, one ATP equivalent is
probably consumed during conversion of one mole glucose to one mole of fructose. The net
loss of one ATP equivalent could be saved by direct conversion of glucose to fructose. In
such context, the overproduction of glucose isomerases in G. oxydans should be a rational
strategy.
4.6.2. Heterologous overproduction of glucose isomerases in G. oxydans
Xylose isomerases catalyze the reversible isomerization of C-5 or C-6 aldo-sugars like xylose
and glucose to their corresponding keto-sugars xylulose and fructose (Fig. 42). These
enzymes have a much higher affinity for xylose than for glucose (Bhosale et al. 1996, Batt et
al. 1990). Despite having a low affinity for glucose, glucose isomerases are used in industry
for the production of high fructose corn syrups from corn starch hydrolysates. They are
commercially available under various trade names such as Sweetzyme (from B. coagulans) of
Novo Nordisc industries, Maxazyme and Ketozyme (from Actinoplanes missouriensis) of
Gist Brocades N V and Universal Oil Products, respectively (Verhoff et al. 1985).
In the present study, two different glucose isomerase encoding genes xylA from E. coli
(b3565) and S. griseus (SGR_RS05195) were cloned into the broad host range vector
pBBR.p264.ST and were heterologously overexpressed in G. oxydans. Both proteins were
successfully produced and purified to apparent homogeneity from cellular extracts of G.
ATP + H2O ADP + Pi ∆Go' = -31.8 kJ mol
-1 (Equation 12)
glucose + ATP glucose-6-phosphate + ADP ∆Go' = +13.8 kJ mol
-1 (Equation 13)
(Net) glucose + ATP glucose-6-phosphate + ADP ∆G
o' = -18.0 kJ mol
-1 (Equation 14)

4. Discussion
137
oxydans strains expressing the xylA genes (Chapter 3.4.2). Activity staining indicated that the
recombinant proteins could catalyze the isomerization of xylose to xylulose (Chapter 3.4.2).
However, the overexpression of both glucose isomerases in G. oxydans did not result in an
improvement of growth parameters of the organism during cultivation under osmotic stress
conditions (Chapter 3.4.2). This might be due to the fact that the enzymes are highly active
only at high temperatures (optimum temperatures above 50oC) and have high KM values for
free glucose with poor catalytic efficiency. For example, the glucose isomerases from E. coli
K12, Streptomyces viridobrunneus and Streptomyces sp. 32 had KM values of 500 mM, 178
mM, and 288 mM, for glucose respectively (Rozanov et al. 2009, Sapunova et al. 1999).
However, glucose is usually not present in such a high concentration inside the cell. Mostly
glucose is phosphorylated and feeded into the intracellular metabolic pathways such as
glycolysis. Phosphorylation is carried out by the phosphotransferase system as well as by the
cytoplasmic glucokinases (Postma and Lengeler 1985, Bramley and Kornberg 1987, Meyer et
al. 1997). The enzymes catalyzing such phosphorylations require very low glucose
concentrations (KM in micromolar range) for activation. For example, the glucokinases from
E. coli has a KM of 150-780 µM for free glucose (Arora and Pedersen 1995, Meyer et al.
1997). On the basis of these facts, it is evident that the glucose isomerases, produced in G.
oxydans, might be inactive in the absence of sufficient amount of substrates. Furthermore, it
was found that the cytoplasm of the glucose isomerase producing strains of G. oxydans were
devoid of glucose isomerase activity when tested in vitro. Due to the lack of stimulatory
effects of the heterologously produced glucose isomerases on the osmotolerance of G.
oxydans, further studies were not carried out with these mutant strains.
Fig. 42: Isomerization of xylose and glucose to xylulose and fructose by glucose (xylose)
isomerase, respectively. (Modified from Cho et al. 2013).
D-Xylose D-Xylulose
Glucose (xylose)
isomerase
Glucose (xylose)
isomerase
D-Glucose D-Fructose

4. Discussion
138
4.7. Gox1432: key player for osmotolerance of G. oxydans
It was found in the course of this work that the NADPH-dependent fructose reductase
Gox1432 is pivotal for an efficient proliferation of G. oxydans under osmotic stress.
However, studies on the orthologous enzymes in different Gluconobacter strains revealed
that Gox1432 is essential for the utilization of partially oxidized sugar derivatives such as L-
sorbose and 5-ketogluconate (Sugisawa et al. 1990, Sugisawa et al. 1991, Shinjoh et al. 2002,
Soemphol et al. 2007). The disruption of the orthologous gene of gox1432 in G. suboxydans
IFO 3291 and G. frateurii THD 32 resulted in a growth defect of the cultures in media
containing 500 mM L-sorbose (Shinjoh et al. 2002). In G. oxydans DSM 3503, the enzyme
catalyzes the reduction of 5-ketogluconate to gluconate (Klasen 1994) which can be used as
carbon- and energy source. Analogously, it was found that the G. oxydans Δgox1432 strain
was not able to grow in the presence of L-sorbose or 5-ketogluconate (data not shown). These
observations led to the speculation that Gox1432 participates in intracellular reduction of
partially oxidized products that are formed by the membrane-bound polyol dehydrogenase
(Gox0854-0855) (Fig. 43). When the major substrates (sorbitol or gluconate) are consumed,
the corresponding oxidized products are taken up by the cells and are reduced by the catalytic
activity of Gox1432. These reduced compounds are channeled into the central metabolic
pathways (the PPP or the EDP). L-sorbose is reduced to D-sorbitol that is converted to
fructose and finally phosphorylated to fructose-6-phosphate by the putative sugar kinase
(Gox0284) (Fig. 3, Shinjoh et al. 2002, Richhardt et al. 2012). Likewise, 5-ketogluconate is
reduced to gluconate and phosphorylated to 6-phosphogluconate by a gluconokinase
(Gox1709) (Rauch et al. 2010, Richhardt et al. 2013b). Both, fructose-6-phosphate and 6-
phosphogluconate, are then catabolized in the pentose phosphate pathway. Thus, the present
study revealed that Gox1432 has a dual physiological role in G. oxydans. On one side, it
protects the cell from osmotic up-shock by participating in the synthesis of the
osmoprotectant mannitol; whereas, on other side, it enables the cell to assimilate various
oxidized substrates. Hence, it is suggested that Gox1432 is the key player for the survival of
the organism in sugar-rich habitats and in mixed microbial populations. This information is
especially useful for designing strategies to engineer G. oxydans strains with enhanced
osmotolerance for bio-based industrial applications.

4. Discussion
139
Figure 43: Function of Gox1432 and putative pathways of mannitol production. Question
mark indicates an unknown phosphatase. ox PP pathway: oxidative pentose phosphate
pathway. (Zahid and Deppenmeier 2016).
NADPH
Gox1432
NADP+
Fructose-6P Fructose Mannitol
Glucose-6P
Gluconate
6-Phospho-gluconate
ox. PP pathway
GlucoseL-Sorbose D-Sorbitol
5-Ketogluconate Gluconate
Gox1709
Gox1182, Gox2419
Gox1704
?Osmoprotection
Substrateutilization

5. Summary
140
5. SUMMARY
G. oxydans is commercially used for the oxidative fermentation of various sugars, sugar
acids, and alcohols. The oxidation of substrates, catalyzed by the organism, is generally
incomplete, stereo- and regiospecific. Moreover, the resulting biotechnologically valuable
products are almost completely excreted into the surrounding medium. Due to these unique
metabolic features, the bacterium has been exploited in industry for decades, and has been
under extensive research for many years. However, the question regarding the response of the
organism to osmotic stress has not yet been investigated. Therefore, the current study was
conducted to explore the mechanisms of osmoprotection in G. oxydans.
One common strategy to cope with osmotic stress is the intracellular accumulation of
compatible solutes. For the identification of the presence of compatible solute in G. oxydans,
total cellular metabolites were extracted from control and osmotic stress cultures and
analyzed by 13
C NMR spectroscopy and HPLC. The analysis of the total intracellular
metabolites revealed that G. oxydans accumulated mannitol as compatible solute in response
to osmotic stress to a maximum concentration of 2.7 µmol mg-1
total cell protein. The
intracellular mannitol concentration varied and depended on the type of osmoticum and the
carbon source in the growth medium. The osmoprotective role of mannitol was further
investigated by the addition of this polyol in small amounts to osmotically stressed cultures.
It was found that in the presence of external mannitol, the growth rates of the stressed
cultures were comparable to the control culture. In addition, the viability of stressed culture
was increased in the presence of external mannitol. Thus, it was concluded that mannitol
assisted the cells to alleviate osmotic stress and to maintain their proliferation rates. Another
line of evidence came from analyzing the stimulatory effects of polyols on the cellular
catalytic efficiencies. Addition of small amounts of polyols (sorbitol, arabitol, or mannitol) to
YGPhigh media (containing 1 M glucose) not only improved the cellular growth, but also
doubled the rate of glucose consumption and gluconate formation. Gluconate, for example is
a biotechnologically desirable product which is synthesized at the rate of 10,000 ton per
annum. Thus, the increment of the product formation rate of G. oxydans upon addition of
minute amounts of polyols to high-sugar containing fermentation media is important for
biotechnological applications. Hence, the finding of the present study that polyols especially
mannitol function as compatible solute in G. oxydans could have great economic impacts.
In addition to the analysis of polyols as compatible solute, the role of two cytoplasmic
fructose reductases was elucidated with respect to intracellular mannitol formation and

5. Summary
141
osmotolerance of G. oxydans. It was found that the organism possesses two genes (gox0849
and gox1432) that encode potential fructose reductases. Enzyme assays revealed that both
purified proteins (Gox0849 and Gox1432) catalyzed the reversible reduction of fructose to
mannitol. Gox1432 (EC 1.1.1.138) catalyzed a NADPH-specific fructose reduction, while
Gox0849 (EC 1.1.1.67) preferred NADH as cofactor. Both proteins could oxidize mannitol to
fructose; however, at physiological pH 7.0, the rate of fructose reduction was 3-4 fold higher
than the rate of mannitol oxidation. Thus, it was inferred that both proteins in vivo function as
D-fructose reductases.
The role of Gox0849 and Gox1432 in osmotolerance of G. oxydans was elucidated by the
deletion of the corresponding genes and the analysis of the deletion mutants under non-stress
and osmotic-stress growth conditions. During cultivation in high-sugar media, the deletion
mutant lacking gox1432 showed retarded growth, while the growth of strain Δgox0849 was
unaffected. The sensitivity of the cells towards osmotic stress was increased when both
fructose reductases were simultaneously deleted. Likewise, the intracellular mannitol content
was reduced in the mutants lacking gox1432 during growth under osmotic stress. These
results indicated the importance of Gox1432 in intracellular mannitol formation and
osmotolerance of G. oxydans. Other evidence came from the plasmid-based overexpression
of gox1432 in the Δgox1432 deletion mutant that enabled the cells to recover from osmotic
stress.
The importance of gox1432 was also evident from the transcript abundance of the gene which
was 30-fold higher than that of gox0849. Analogously, the activity of the NADPH-dependent
enzyme Gox1432 was 10-fold higher in comparison to the NADH-dependent enzyme
Gox0849 in the cytoplasmic fractions of osmotically stressed cells. These findings provided
detailed insights into the molecular mechanisms of mannitol-mediated osmoprotection in G.
oxydans. Based on these results a pathway was proposed to indicate putative routes involved
in intracellular mannitol production from potential precursor molecules. Additionally,
strategies were designed targeting the possible bottlenecks of the pathway to increase the
intracellular mannitol production and osmotolerance of G. oxydans.

6. References
142
6. REFERENCES
Adachi O., Ano Y., Toyama H., Matsushita K. (2006). High shikimate production from
quinate with two enzymatic systems of acetic acid bacteria. Biosci Biotechnol Biochem
70, 2579-2582.
Adachi O., Fujii Y., Ano Y., Moonmangmee D., Toyama H., Shinagawa E., Theeragool G.,
Lotong N., Matsushita K. (2001a). Membrane-bound sugar alcohol dehydrogenase in
acetic acid bacteria catalyzes L-ribulose formation and NAD-dependent ribitol
dehydrogenase is independent of the oxidative fermentation. Biosci Biotechnol Biochem
65, 115-125.
Adachi O., Fujii Y., Ghaly M. F., Toyama H., Shinagawa E., Matsushita K. (2001b).
Membrane-bound quinoprotein D-arabitol dehydrogenase of Gluconobacter suboxydans
IFO 3257: a versatile enzyme for the oxidative fermentation of various ketoses. Biosci
Biotechnol Biochem 65, 2755-2762.
Adachi O., Moonmangmee D., Toyama H., Shinagawa E., Matsushita K. (2003). New
developments in oxidative fermentation. Appl Microbiol Biotechnol 60, 643-653.
Adachi O., Tayama K., Shinagawa E., Matsushita K., Ameyama M. (1978). Purification and
characterization of particulate alcohol dehydrogenase from Gluconobacter suboxydans.
Agric Biol Chem 42, 2045-2056.
Adachi O., Tayama K., Shinagawa E., Matsushita K., Ameyama M. (1980). Purification and
characterization of membrane-bound aldehyde dehydrogenase from Gluconobacter
suboxydans. Agric Biol Chem 44, 503-515.
Adachi O., Toyama H., Matsushita K. (1999a). Crystalline NADP-dependent D-mannitol
dehydrogenase from Gluconobacter suboxydans. Biosci Biotechnol Biochem 63, 402-
407.
Adachi O., Toyama H., Theeragool G., Lotong N., Matsushita K. (1999b). Crystallization and
properties of NAD-dependent D-sorbitol dehydrogenase from Gluconobacter
suboxydans IFO 3257. Biosci Biotechnol Biochem 63, 1589-1595.
Adessi C., Matton G., Ayala G., Turcatti G., Mermod J. J., Mayer P., Kawashima E. (2000).
Solid phase DNA amplification: characterization of primer attachment and amplification
mechanisms. Nucleic Acids Res 28, E87.
Alemohammed M. M. and Knowles C. J. (1974). Osmotically induced volume and turbidity
changes of Escherichia coli due to salts, sucrose and glycerol, with particular reference
to rapid permeation of glycerol into the cell. J Gen Microbial 82, 125-142.
Almirón M., Link A. J., Furlong D., Kolter R. (1992). A novel DNA-binding protein with
regulatory and protective roles in starved Escherichia coli. Genes Dev 6, 2646-2654.
Altschul S. F., Madden T. L., Schäffer A. A., Zhang J., Zhang Z., Miller W., Lipman D. J.
(1997). Gapped BLAST and PSI-BLAST: a new generation of protein database search
programs. Nucleic Acids Res 25, 3389-3402.

6. References
143
Ameyama M., Matsushita K., Shinagawa E., Adachi O. (1987). Sugar-oxidizing respiratory
chain of Gluconobacter suboxydans. Evidence for a branched respiratory chain and
characterization of respiratory chain-linked cytochromes. Agric Biol Chem 51, 2943-
2950.
Ameyama M., Shinagawa E., Matsushita K., Adachi O. (1981). D-Glucose dehydrogenase of
Gluconobacter suboxydans: solubilization, purification and characterization. Agric Biol
Chem 45, 851-861.
Amezaga M.-R., Davidson I., Mclaggan D., Verheul A., Abee T., Booth I. R. (1995). The
role of peptide metabolism in the growth of Listeria monocytogenes ATCC 23074 at
high osmolarity. Microbiology 141, 41-49.
Andrés-Barrao C., Saad M. M., Chappuis M. L., Boffa M., Perret X., Pérez R. O., Barja F.
(2012). Proteome analysis of Acetobacter pasteurianus during acetic acid fermentation. J
Proteomics 75, 1701-1717.
Arakawa T. and Timasheff S. N. (1985). The stabilization of proteins by osmolytes. Biophys
J 47, 411-414.
Arora K. K. and Pedersen P. L. (1995). Glucokinase of Escherichia coli: induction in
response to the stress of overexpressing foreign proteins. Arch Biochem Biophys 319,
574-578.
Asai T. (1935). Taxonomic studies on acetic acid bacteria and allied oxidative bacteria
isolated from fruits. A new classification of the oxidative bacteria. Nippon Nogeikagaku
Kaishi 11, 674-708.
Asai T. (1971). The classification and biochemistry of acetic acid bacteria. In: K. Sakaguchi.,
T. Vemuna. and S. Kinoshito (Eds.), Biochemical and industrial aspects of fermentation.
Tokyo, Japan: Kadansha Ltd. pp. 201-232.
Asano N. (2003). Glycosidase inhibitors: update and perspectives on practical use.
Glycobiology 13, 93R-104R.
Barrow K. D., Collins J. G., Leigh D. A., Rogers P. L., Warr R. G. (1984). Sorbitol
production by Zymomonas mobilis. Appl Microbiol Biotechnol 20, 225-233.
Batt C. A., Jamieson A. C., Vandeyar M. A. (1990). Identification of essential histidine
residues in the active site of Escherichia coli xylose (glucose) isomerase. Proc Natl Acad
Sci U S A 87, 618-622.
Battey A. S. and Schaffner D. W. (2001). Modelling bacterial spoilage in cold-filled ready to
drink beverages by Acinetobacter calcoaceticus and Gluconobacter oxydans. J Appl
Microbiol 91, 237-247.
Bauer R., Katsikis N., Varga S., Hekmat D. (2005). Study of the inhibitory effect of the
product dihydroxyacetone on Gluconobacter oxydans in a semi-continuous two-stage
repeated-fed-batch process. Bioprocess Biosyst Eng 5, 37-43.
Bhatt S. M., Mohan A., Srivastava S. K. (2013). Challenges in enzymatic route of mannitol
production. ISRN Biotechnol Article ID 91418. DOI: 10.5402/2013/914187

6. References
144
Bhosale S. H., Rao M. B., Deshpande V. V. (1996). Molecular and industrial aspects of
glucose isomerase. Microbiol Rev 60, 280-300.
Bizouarn T., Althage M., Pedersen A., Tigerstrom A., Karlsson J., Johansson C., Rydstrom J.
(2002). The organization of the membrane domain and its interaction with the
NADP(H)-binding site in proton-translocating transhydrogenase from E. coli. Biochim
Biophys Acta 1555, 122-127.
Bligh E. G. and Dyer W. J. (1959). A rapid method of lipid extraction and purification. Can J
Biochem Physiol 37, 911-917.
Blum H., Beier H., Gross H. J. (1987). Improved silver staining of plant proteins, RNA and
DNA in polyacrylamide gels. Electrophoresis 8, 93-99.
Bolen D. W. and Baskakov I. V. (2001). The osmophobic effect: natural selection of a
thermodynamic force in protein folding. J Mol Biol 310, 955-963.
Borisov V. B., Murali R., Verkhovskaya M. L., Bloch D. A., Gennis R. B., Verkhovsky M.
(2011). Aerobic respiratory chain of Escherichia coli is not allowed to work in fully
uncoupled mode. Proc Natl Acad Sci U S A 108, 17320-17324.
Bradford M. M. (1976). A rapid and sensitive method for the quantitation of microgram
quantities of protein utilizing the principle of protein-dye binding. Anal Biochem 72,
248-254.
Brakoulias A. and Jackson R. M. (2004). Towards a structural classification of phosphate
binding sites in protein-nucleotide complexes: An automated all-against-all structural
comparison using geometric matching. Proteins 56, 250-260.
Bramley H. F. and Kornberg H. L. (1987). Sequence homologies between proteins of
bacterial phosphoenolpyruvate-dependent sugar phosphotransferase systems:
Identification of possible phosphate-carrying histidine residues. Proc Natl Acad Sci U S
A 84, 4777-4780.
Brown A. D. (1976). Microbial water stress. Bacteriol Rev 40, 803-846.
Brown A. D. (1990). Microbial water stress physiology. Principles and perspectives. New
York: John Wiley and Sons Inc.
Brünker P., Altenbuchner J., Kulbe K. D., Mattes R. (1997). Cloning, nucleotide sequence
and expression of a mannitol dehydrogenase gene from Pseudomonas fluorescens DSM
50106 in Escherichia coli. Biochim Biophys Acta 1351, 157-167.
Buchan D. W., Minneci F., Nugent T. C., Bryson K., Jones D. T. (2013). Scalable web
services for the PSIPRED Protein Analysis Workbench. Nucleic Acids Res 41 (Web
Server Issue): W349-W357.
Busse M. D. and Bottomley P. J. (1989). Growth and nodulation responses of Rhizobium
meliloti to water stress induced by permeating and nonpermeating solutes. Appl Environ
Microbiol 55, 2431-2436.

6. References
145
Canard B. and Sarfati R. S. (1994). DNA polymerase fluorescent substrates with reversible
3'-tags. Gene 148, 1-6.
Caparros-Martin J. A., McCarthy-Suarez I., Culianez-Macia F. A. (2013). HAD hydrolase
function unveiled by substrate screening: enzymatic characterization of Arabidopsis
thaliana subclass I phosphosugar phosphatase AtSgpp. Planta 237, 943-954.
Capy P., Bazin C., Higuet D., Langin T. (1997). Dynamic and evolution of transposable
elements. Austin, Texas, USA: R.G. Landes.
Capy P., Gasperi G., Biemont C., Bazin C. (2000). Stress and transposable elements: co-
evolution or useful parasites? Heredity 85, 101-106.
Carpenter J. F. (1993). Stabilization of proteins during freezing and dehydration: application
of lessons from nature. Cryobiology 30, 220-221.
Carvalho A. S., Silva J., Ho P., Teixeira P., Malcata F. X., Gibbs P. (2003). Protective effect
of sorbitol and monosodium glutamate during storage of freeze-dried lactic acid bacteria.
Le Lait 83, 203-210.
Chaturvedi V., Bartiss A., Wong B. (1997). Expression of bacterial mtlD in Saccharomyces
cerevisiae results in mannitol synthesis and protects a glycerol-defective mutant from
high-salt and oxidative stress. J Bacteriol 179, 157-162.
Chen W.P., Anderson A.W., Han Y.W. (1979). Production of glucose isomerase by
Streptomyces flavogriseus. Appl Environ Microbiol 37, 324-331.
Chi M.-C., Wu T.-J., Chen H.-L., Lo H.-F., Lin L.-L. (2012). Sorbitol counteracts
temperature- and chemical-induced denaturation of a recombinant α-amylase from
alkaliphilic Bacillus sp. TS-23. J ind Microbiol Biotechnol 39, 1779-1788.
Chinnawirotpisan P., Matsushita K., Toyama H., Adachi O., Limtong S., Theeragool G.
(2003). Quinoprotein alcohol dehydrogenase is involved in catabolic acetate production,
while NAD-dependent alcohol dehydrogenase in ethanol assimilation in Acetobacter
pasteurianus SKU1108. J Biosci Bioeng 96, 564-571.
Cho J.-W., Han B.-G., Park S. Y., Kim S. J., Kim M.-D., and Lee B. I. (2013).
Overexpression, crystallization preliminary X-ray crystallographic analysis of a putative
xylose isomerase from Bacteroides thetaiotaomicron. Acta Crystallogr Sect F Struct
Biol Cryst Commun 69, 1127-1130.
Choi E.-S., Lee E.-H., Rhee S.-K. (1995). Purification of a membrane-bound sorbitol
dehydrogenase from Gluconobacter suboxydans. FEMS Microbiol Lett 125, 45-50.
Choi K. H., Kumar A., Schweizer H. P. (2006). A 10 min method for preparation of highly
electrocompetent Pseudomonas aeruginosa cells: Application for DNA fragment
transfer between chromosomes and plasmid transformation. J Microbiol Methods 64,
391-397.
Chomczynski P. (1993). A reagent for the single-step simultaneous isolation of RNA, DNA
and proteins from cell and tissue samples. Biotechniques 15, 532-537

6. References
146
Cladas T., Demont-Caulet N., Ghazi A., Richarme G. (1999). Thermoprotection by glycine
betaine and choline. Microbiology 145, 2543-2548.
Claret C., Salmon J. M., Romieu C., Bories A. (1994). Physiology of Gluconobacter oxydans
during dihydroxyacetone production from glycerol. Appl Microbiol Biotechnol 41, 359-
365.
Condon C., FitzGerald R. J., O’Gara F. (1991). Conjugation and heterologous gene
expression in Gluconobacter oxydans ssp. suboxydans. FEMS Microbiol Lett 80, 173-
177.
Cornish-Bowden A. (1981). Thermodynamic aspects of glycolysis. Biochem Educ 9, 133-
137.
Cotton N. P. J., White S. A., Peake S. J., McSweeney S., Jackson J. B. (2001). The crystal
structure of an asymmetric complex of the two nucleotide binding components of
proton-translocating transhydrogenase. Structure 9, 165-176.
Crowe J. H. and Crowe L. M. (1992). Membrane integrity in anhydrobiotic organisms:
toward a mechanism for stabilizing dry cells. In: G. N. Somero., C. B. Osmond., C. L.
Bolis (Eds.), Water and life: comparative analysis of water relationships at the
organismic, cellular and molecular levels. New York: Springer . pp. 87-103.
Crowe J. H., Crowe L. M., Chapman D. (1984). Preservations of membranes in anhydrobiotic
organisms: the role of trehalose. Science 223, 701-703.
Crowe J. H., Hoekstra F. A., Crowe L. M. (1992). Anhydrobiosis. Annu Rev Physiol 54, 579-
599.
Csonka L. N. and Epstein W. (1996). Osmoregulation. In: F. C. Neidhardt (Ed.), Escherichia
coli and Salmonella. Cellular and molecular biology. 2nd ed. Washington, DC: ASM
Press. pp.1210-1223.
Culham D. E., Lasby B., Marangoni A. G., Milner J. L., Steer B. A., van Nues R. W., Wood
J. M. (1993). Isolation and sequencing of Escherichia coli gene proP reveals unusual
structural features of the osmoregulatory proline/betaine transporter, ProP. J Mol Biol
229, 268-276.
Cytryn E. J., Sangurdekar D. P., Streeter J. G., Franck W. L., Chang W. S., Stacey G.,
Emerich D. W., Joshi T., Xu D., Sadowsky M. J. (2007). Transcriptional and
physiological responses of Bradyrhizobium japonicum to desiccation-induced stress. J
Bacteriol 189, 6751-6762.
da Costa M. S., Santos H., Galinski E. A. (1998). An overview of the role and diversity of
compatible solutes in Bacteria and Archaea. Adv Biochem Eng Biotechnol 61, 117-153.
de Barros M. and Celligoi M. A. P. C. (2006). Synthesis of sorbitol by Zymomonas mobilis
under high osmotic pressure. Braz J Microbiol 37, 324-328.
De Ley J. and Swings J. (1984). Genus Gluconobacter. In: N. R. Krieg. and J. G. Holt (Eds.),
Bergey’s Manual of Systematic Bacteriology. vol 1. London: Williams and Wilkins.pp.
267-278.

6. References
147
De Muynck C., Pereira C. S. S., Naessens M., Parmentier S., Soetaert W., Vandamme E. J.
(2007). The genus Gluconobacter oxydans: comprehensive overview of biochemistry
and biotechnological applications. Crit Rev Biotechnol 27, 147-171.
Deppenmeier U. and Ehrenreich, A. (2009). Physiology of acetic acid bacteria in light of the
genome sequence of Gluconobacter oxydans. J Mol Microbiol Biotechnol 16, 69-80.
Deppenmeier U., Hoffmeister M., Prust C. (2002). Biochemistry and biotechnological
applications of Gluconobacter strains. Appl Microbiol Biotechnol 60, 233-242.
Desmarais D., Jablonski P. G., Fedarko N. S., Roberts M. I. (1997). 2-Sulfotrehalose, a novel
osmolyte in haloalkaliphilic archaea. J Bacteriol 179, 3146-3153.
Doelle H. W. (1982). Kinetic characteristics and regulatory mechanisms of glucokinase and
fructokinase from Zymomonas mobilis. Eur J Appl Microbiol Biotechnol 14, 241-246.
Dragosits M. and Mattanovich D. (2013). Adaptive laboratory evolution-principles and
applications for biotechnology. Microb Cell Fact 12, 64. DOI: 10.1186/1475-2859-12-
64.
Dueweke T. J. and Gennis R. B. (1991). Proteolysis of the cytochrome d complex with
trypsin and chymotrypsin localizes a quinol oxidase domain. Biochemistry 30, 3401-
3406.
Efiuvwevwere B. J. O., Gorris L. G. M., Smid E. J., Kets E. P. W. (1999). Mannitol enhanced
survival of Lactococcus lactis subjected to drying. Appl Microbiol Biotechnol 51, 100-
104.
Elfari M., Ha S. W., Bremus C., Merfort M., Khodaverdi V., Herrmann. U., Sahm H.,
Görisch H. (2005). A Gluconobacter oxydans mutant converting glucose almost
quantitatively to 5-keto-D-gluconic acid. Appl Microbiol Biotechnol 66, 668-674.
Empadinhas N. and da Costa M. S. (2008). Osmoadaptation mechanisms in prokaryotes:
distribution of compatible solutes. Int Microbiol 11, 151-161.
Fang Z. and Cui X. (2011). Design and validation issues in RNA-Seq experiments. Brief
Bioinform 12, 280-287.
Ferain T., Schanck A. N., Delcour J. (1996). 13
C nuclear magnetic resonance analysis of
glucose and citrate end products in an ldhL-ldhD double-knockout strain of
Lactobacillus plantarum. J Bacteriol 178, 7311-7315.
Foster P. L. (2007). Stress-induced mutagenesis in bacteria. Crit Rev Biochem Mol Biol 42,
373-397.
Galinski E. A. (1995). Osmoadaptation in bacteria. Adv Microb Physiol 37, 272-328.
Galinski E. A. and Trüper H. G. (1994). Microbial behaviour in salt stressed ecosystems.
FEMS Microbiol Rev 15, 95-108.

6. References
148
Gallagher P. R. and Desjardins P. R. (2007). Quantitation of DNA and RNA with absorption
and fluorescence spectroscopy. Curr Protoc Hum Genet Appendix 3D. DOI:
10.1002/0471142727.mba03ds76.
Gao L., Hu Y., Liu J., Du G., Zhou J., Chen J. (2014). Stepwise metabolic engineering of
Gluconobacter oxydans WSH-003 for the direct production of 2-keto-L-gulonic acid
from D-sorbitol. Metab Eng 24, 30-37.
Gao Q., Zhang M., McMillan J. D., Kompala D. S. (2002). Characterization of heterologous
and native enzyme activity profiles in metabolically engineered Zymomonas mobilis
strains during batch fermentation of glucose and xylose mixtures. Appl Biochem
Biotechnol 98-100, 341-355.
Garg A. K., Kim J.-K., Owens T. G., Ranwala A. P., Choi Y. D., Kochian L. V., Wu R. J.
(2002). Trehalose accumulation in rice plants confers high tolerance levels to different
abiotic stresses. Proc Natl Acad Sci U S A 99, 15898-15903.
Gaspar P., Neves A. R., Ramos A., Gasson M. J., Shearman C. A., Santos H. (2004).
Engineering Lactococcus lactis for production of mannitol: high yields from food-grade
strains deficient in lactate dehydrogenase and the mannitol transport system. Appl
Environ Microbiol 70, 1466-1474.
Giaever H. M., Styrvold O. B., Kaasen I., Strom A. R. (1988). Biochemical and genetic
characterization of osmoregulatory trehalose synthesis in Escherichia coli. J
Bacteriol 170, 2841-2849.
Gillis M. and De Ley J. (1980). Intra- and intergeneric similarities of the ribosomal
ribonucleic acid cistrons of Acetobacter and Gluconobacter. Int J Syst Bacteriol 30, 7-
27.
Gilmour P., Beswick H. P., Donaldson K. (1995). Surface free radical activity of a range of
respirable industrial fibres assessed using φx 174 RF1 plasmid DNA. Carcinogenesis 16,
2973-2979.
Glaasker E., Konings W. N., Poolman B. (1996). Glycine betaine fluxes in Lactobacillus
plantarum during osmostasis and hyper and hypo-osmotic shock. J Biol Chem 271,
10060-10065.
Gouesbet G., Jebbar M., Talibart R., Bernard T., Blanco C. (1994). Pipecolic acid is an
osmoprotectant for Escherichia coli taken up by the general osmoporters ProU and ProP.
Microbiology 140, 2415-2422.
Grant W. D. (2004). Life at low water activity. Philos Trans R Soc Lond B Biol Sci 359,
1249-1266.
Greenberg D. E., Porcella S. F., Stock F., Wong A., Conville P. S., Murray P. R., Holland S.
M., Zelazny A. M. (2006). Granulibacter bethesdensis gen. nov., sp. nov., a distinctive
pathogenic acetic acid bacterium in the family Acetobacteraceae. Int J Syst Evol
Microbiol 56, 2609-2616.

6. References
149
Greenfield S. and Claus G. W. (1972). Non-functional tricarboxylic acid cycle and the
mechanism of glutamate biosynthesis in Acetobacter suboxydans. J Bacteriol 112, 1295-
1301.
Groisillier A., Labourel A., Michel G., Tonon T. (2015). The mannitol utilization system of
the marine bacterium Zobellia galactanivorans. Appl Environ Microbiol 81, 1799-812.
Gunasekera T. S., Csonka L. N., Paliy O. (2008). Genome-wide transcriptional responses of
Escherichia coli K-12 to continuous osmotic and heat stresses. J Bacteriol 190, 3712-
3720.
Gupta A., Singh V. K., Qazi G. N., Kumar A. (2001). Gluconobacter oxydans: Its
biotechnological applications. J Mol Microbiol Biotechnol 3, 445-456.
Hanahan D. (1983). Studies on transformation of E. coli with plasmids. J Mol Biol 166, 557-
580.
Hanke T., Nöh K., Noack S., Polen T., Bringer S., Sahm H., Wiechert W., Bott M. (2013).
Combined fluxomics and transcriptomics analysis of glucose catabolism via a partially
cyclic pentose phosphate pathway in Gluconobacter oxydans 621H. Appl Environ
Microbiol 79, 2336-2248.
Hardman M. J. and Scopes R. K. (1988). The kinetics of glucosefructose oxidoreductase from
Zymomonas mobilis. Eur J Biochem 173, 203-209.
Harrison D. E. F. and Loveless J. E. (1971). The effect of growth conditions on respiratory
activity and growth efficiency in facultative anaerobes grown in chemostat culture. J
Gen Microbiol 68, 35-43.
Hattori K. and Suzuki T. (1975). Enzymatic studies on the conversion of erythritol
fermentation to D-mannitol fermentation in n-alkane-grown yeast Candida zeylanoides.
Agric Biol Chem 39, 57-61.
Hawkes R., Niday E., Gordon J. (1982): A dot-immunobinding assay for monoclonal and
other antibodies. Anal Biochem 119, 142-147.
Heuel H., Garakani A. S., Turgut S., Lengeler J. W. (1998). Genes for D-arabinitol and ribitol
catabolism from Klebsiella pneumoniae. Microbiology 144, 1631-1639.
Hocking A. D. (1988). Strategies for microbial growth at reduced water activities. Microbiol
Sci 5, 280-284.
Hölscher T. and Görisch H. (2006). Knockout and overexpression of pyrroloquinoline
quinone biosynthetic genes in Gluconobacter oxydans 621H. J Bacteriol 188, 7668-
7676.
Hommel R. and Ahnert P. (2000). Gluconobacter. In: R. K. Robinson., C. A. Batt., P. Patel
(Eds.), Encyclopedia of Food Microbiology. London: Academic Press. pp. 955-961.
Hoshino T., Sugisawa T., Shinjoh M., Tomiyama N., and Miyazaki T. (2003). Membrane-
bound D-sorbitol dehydrogenase of Gluconobacter suboxydans IFO 3255 enzymatic and
genetic characterization. Biochim Biophys Acta Prot Proteomics 1647, 278-288.
6. References
150
Hoshino T., Sugisawa T., Tazoe M., Shinjoh M., and Fujiwara A. (1990). Metabolic pathway
for 2-keto-Lgulonic acid formation in Gluconobacter melanogenus IFO 3293. Agric Biol
Chem 54, 1211-1218.
Ingraham J. L. and Marr A. G. (1996). Effect of temperature, pressure, pH and osmotic stress
on growth. In: F. C. Neidhardt (Ed.), Escherichia coli and Salmonella typhimurium:
cellular and molecular biology. 2nd ed. Washington, DC: ASM Press. pp.1570-1578.
Ishikawa H. (1997). Evolution of ribosonal RNA. Comp Biochem Physiol 58, 1-7.
Jennings D. H. (1984). Polyolmetabolism in fungi. Adv Microb Physiol 25, 149-193.
Jeude M., Dittrich B., Niederschulte H., Anderlei T., Knocke C., Klee D., Büchs J. (2006).
Fed-batch mode in shake flasks by slow-release technique. Biotechnol Bioeng 95, 433-
445.
Johnson S. D. and Nicolson S.W. (2008). Evolutionary associations between nectar properties
and specificity in bird pollination systems. Biol Lett 4, 49-52.
Jones D. T. (1999). Protein Secondary Structure Prediction Based on Position-specific
Scoring Matrices. J Mol Biol 292, 195-202.
Kadner R. J. (1990). Vitamin B12 transport in Escherichia coli: energy coupling between
membranes. Mol Microbiol 4, 2027-33.
Kallnik V., Meyer M., Deppenmeier U., Schweiger P. (2010). Construction of expression
vectors for protein production in Gluconobacter oxydans. J Biotechnol 150, 460-465.
Kanehisa M., Araki M., Goto S., Hattori M., Hirakawa M., Itoh M., Katayama T.,
Kawashima S., Okuda S., Tokimatsu T., Yamanishi Y. (2008). KEGG for linking
genomes to life and the environment. Nucleic Acids Res 36, D480-484.
Kavanagh K. L., Klimacek M., Nidetzky B., Wilson D. K. (2002). Crystal structure of
Pseudomonas fluorescens mannitol 2-dehydrogenase binary and ternary complexes:
specificity and catalytic mechanism. J Biol Chem 277, 43433-43442.
Kempf B. and Bremer E. (1998). Uptake and synthesis of compatible solutes as microbial
stress responses to high-osmolality environments. Arch Microbiol 170, 319-330.
Kets E. P. W. (1997). Compatible solutes in lactic acid bacteria subjected to water stress.
Ph.D. Thesis, Wageningen Agricultural University, Wageningen, The Netherlands.
Kets E. P. W. and de Bont J. A. M. (1994). Protective effect of betaine on survival of
Lactobacillus plantarum subjected to drying. FEMS Microbiol Lett 116, 251-256.
Kets E. P. W., de Bont J. A. M., Heipieper H. J. (1996a). Physiological response of
Pseudomonas putida S12 subjected to reduced water activity. FEMS Microbiol Lett 139,
133-137.
Kets E. P. W., Galinski E. A., de Witt M., de Bont J. A. M., Heipieper H. J. (1996b).
Mannitol, a novel compatible solute in Pseudomonas putida S12. J Bacteriol 178, 6665-
6670.

6. References
151
Klasen R. (1994). Molecularbiologische Untersuchungen zur 5-Ketoglukonatbildung bei
Gluconobacter oxydans. Thesis, Heinrich-Heine University of Duesseldorf, Germany.
Klasen R., Bringer S., Sahm H. (1995). Biochemical characterization and sequence analysis
of the gluconate-NADP-5-oxidoreductase gene fromGluconobacter oxydans. J Bacteriol
177, 2637-2643.
Kleckner N. (1990). Regulation of transposition in bacteria. Annu. Rev. Cell Biol 6, 297-327.
Klein W., Ehmann U., Boos W. (1991). The repression of trehalso transport and metabolism
in Escherichia coli by high osmolarity is mediated by trehalose-6-phosphate
phosphatase. Res Microbiol 142, 359-371.
Klimacek M. and Nidetzky B. (2010). The oxyanion hole of Pseudomonas fluorescens
mannitol 2-dehydrogenase: a novel structural motif for electrostatic stabilization in
alcohol dehydrogenase active sites. Biochem J 425, 455-63.
Knapp S., Ladenstein R., Galinski E. A. (1999). Extrinsic protein stabilization by the
naturally occurring osmolytes β-hydroxyectoine and betaine. Extremophiles 3, 191-198.
Komagata K., Lino T., Yamada Y. (2014). The Family Acetobacteraceae. In: E. F. DeLong.,
S. Lory., E. Stackebrandt., F. Thompson (Eds.), The Prokaryotes. Alphaproteobacteria
and Betaproteobacteria. Berlin Heidelberg: Springer. pp. 3-78.
Kosciow K., Domin C., Schweiger P., Deppenmeier U. (2016). Extracellular targeting of an
active endoxylanase by a TolB negative mutant of Gluconobacter oxydans. J Ind
Microbiol Biotechnol 43, 989-999.
Kosciow K., Zahid N., Schweiger P., Deppenmeier U. (2014). Production of periplasmic
trehalase in Gluconobacter oxydans and growth on trehalose. J Biotechnol 189, 27-35.
Kostner D., Peters B., Mientus M., Liebl W., Ehrenreich A. (2013). Importance of codB for
new codA-based markerless gene deletion in Gluconobacter strains. Appl Microbiol
Biotechnol 97, 8341-8349.
Krajewski V., Simic´ P., Mouncey N. J., Bringer S., Sahm H., Bott M. (2010). Metabolic
engineering of Gluconobacter oxydans for improved growth rate and growth yield on
glucose by elimination of gluconate formation. Appl Environ Microbiol 76, 4369-4376.
Kulhanek M. (1989). Microbial dehydrogenations of monosaccharides. Adv Appl Microbiol
34, 141-181.
Kültz D. (2003). Evolution of the cellular stress proteome: from monophyletic origin to
ubiquitous function. J Exp Biol 206, 3119-3124.
Kumar S., Wittmann C., and Heinzle E. (2004). Review: minibioreactors. Biotechnol Lett 26,
1-10.
Kurz M. (2008). Compatible solute influence on nucleic acids: Many questions but few
answers. Saline Systems 4, 6.

6. References
152
Kuschel M. (2000). Analysis of total RNA using the Agilent 2100 Bioanalyzer and the
RNA 6000 LabChip® kit. ( http://www.genomics.liv.ac.uk/tryps/papers/AGILENTR.PDF).
Laemmli U. K. (1970). Cleavage of structural proteins during the assembly of the head of
bacteriophage T4. Nature 227, 680-685.
Lamosa P., Martins L. O., da Costa M. S., Santos H. (1998). Effects of temperature, salinity
and medium composition on compatible solute accumulation by Thermococcus spp.
Appl Environ Microbiol 64, 3591-3598.
Lawford H. G. and Haddock B. A. (1973). Respiration-driven proton translocation in
Escherichia coli. Biochem J 136, 217-220.
Le Marrec C. (2011). Responses of lactic acid bacteria to osmotic stress. In: E. Tsakalidou.
and K. Papadimitriou (Eds.), Stress responses of lactic acid bacteria. Heidelberg
London: Springer US. pp. 67-90.
Le Rudulier D., Strøm A. R., Dandekar A. M., Smith L. T., Valentine R. C. (1984).
Molecular biology of osmoregulation. Science 224, 1064-1068.
Lebaron P., Catala P., Parthuisot N. (1998). Effectiveness of SYTOX green stain for bacterial
viability assessment. Appl Environ Microbiol 64, 2697-2700.
Leigh D., Scopes R. K., Rogers P. L. (1984). A proposed pathway for sorbitol production in
Zymomonas mobilis. Appl Microbiol Biotechnol 20, 413-415.
Leslie S. B., Israeli E., Lighthart B., Crowe J. H., Crowe L. M. (1995). Trehalose and sucrose
protect both membranes and proteins in intact bacteria during drying. Appl Environ
Microbiol 61, 3592-3597.
Lewis I. A., Schommer S. C., Markley J. L. (2009). rNMR: open source software for
identifying and quantifying metabolites in NMR spectra. Magn Reson Chem 47, 123-
126.
Li X. Y., Gilmour P. S., Donaldson K., Macnee W. (1996). Free radical activity and
proinflammatory effects of air pollution (PM-10) in vivo and in vitro. Thorax 51, 1216-
1222.
Lichtenthaler F. W. (2006). The key sugar of biomass: Availability, present non-food
applications and potential industrial development lines. In: B. Kamm., M. Kamm., P.
Gruber (Eds.), Biorefineries-biobased industrial processes and products. Weinheim:
Wiley-VHC. pp. 3-59.
Liu J. H., Chen M. M., Huang J. W., Wann H., Ho L. K., Pan W. H., Chen Y. C., Liu C. M.,
Yeh M. Y., Tsai S. K., Young M. S., Ho L. T., Kuo C. D., Chuang H. Y., Chao F. P.,
Chao H. M. (2010). Therapeutic effects and mechanisms of action of mannitol during
H2O2-induced oxidative stress in human retinal pigment epithelium cells. J Ocul
Pharmacol Ther 26, 249-257.
Lobanok A.G., Sapunova L. I., Dikhtievski Y. O., Kazakevich I. O. (1998). Screening of
glucose isomerase-producing microorganisms. World J Microbiol Biotechnol 14, 259-
262.

6. References
153
Loesche W. J. and Kornman K. S. (1976). Production of mannitol by Streptococcus mutans.
Arch Oral Biol 21, 551-553.
Loescher W. H., Tyson R. H., Everard J. D., Redgwell R. J., Bieleski R. L. (1992). Mannitol
synthesis in higher plants: evidence for the role and characterization of a NADPH-
dependent mannose 6-phosphate reductase. Plant Physiol 98, 1396-1402.
Loos H., Kramer R., Sahm H., Sprenger G. A. (1994). Sorbitol promotes growth of
Zymomonas mobilis in environments with high concentrations of sugar: evidence for a
physiological function of glucose-fructose oxidoreductase in osmoprotection. J Bacteriol
176, 7688-7693.
Lucht J. and Bremer E. (1994). Adaptation of Escherichia coli to high osmolarity
environments: osmoregulation of the high-affinity glycine betaine transport system.
FEMS Microbiol Rev 14, 3-20.
Luchterhand B., Fischöder T., Grimm A. R., Wewetzer S., Wunderlich M., Schlepütz T.,
Büchs J. (2015). Quantifying the sensitivity of G. oxydans ATCC 621H and DSM 3504
to osmotic stress triggered by soluble buffers. J Ind Microbiol Biotechnol 42,585-600.
Lusta K. A. and Reshetilov A. N. (1998). Physiological and biochemical features of
Gluconobacter oxydans and prospects of their use in biotechnology and biosensor
systems (review). Appl Biochem Microbiol 34, 307-320.
Luttik M., Van Spanning R., Schipper D., Van Dijken J. P., Pronk J. T. (1997). The low
biomass yields of the acetic acid bacterium Acetobacter pasteurianus are due to a low
stoichiometry of respiration-coupled proton translocation. Appl Environ Microbiol 63,
3345-3351.
Macauley S., McNeil B., Harvey L. M. (2001). The genus Gluconobacter and its applications
in biotechnology. Crit Rev Biotechnol 21, 1-25.
Mager W. H., de Boer A. H., Siderius M. H., Voss H.-P. (2000). Cellular responses to
oxidative and osmotic stress. Cell Stress Chaperones 5, 73-75.
Mamlouk D. and Gullo M. (2013). Acetic acid bacteria: physiology and carbon sources
oxidation. Indian J Microbiol 53, 377-384.
Manzanera M., Vilchez S., Tunnacliffe A. (2004). High survival and stability rates of E. coli
dried in hydroxyectoine. FEMS Microbiol Lett 233, 347-352.
Marshall R. O., Kooi E. R., Moffett G. M. (1957). Enzymatic conversion of D-glucose to D-
fructose. Science 125, 648-649.
Martins L. O., Empadinhas N., Marugg J. D., Miguel C., Ferreira C., da Costa M. S., Santos
H. (1999). Biosynthesis of mannosylglycerate in the thermophilic bacterium
Rhodothermus marinus. J Biol Chem 274, 35407-35414.
Martinussen J. and Hammer K. (1994). Cloning and characterization of upp, a gene encoding
uracil phosphoribosyltransferase from Lactococcus lactis. J Bacteriol 76, 6457-6463.

6. References
154
Matsushita K., Fujii Y., Ano Y., Toyama H., Shinjoh M., Tomiyama N., Miyazaki T.,
Sugisawa T., Hoshino T., Adachi O. (2003). 5-Keto-D-gluconate production is catalyzed
by a quinoprotein glycerol dehydrogenase, major polyol dehydrogenase, in
Gluconobacter species. Appl Environ Microbiol 69, 1959-1966.
Matsushita K., Nagatani Y., Shinagawa E., Adachi O., Ameyama M. (1989). Effect of
extracellular pH on the respiratory chain and energetics of Gluconobacter suboxydans.
Agric Biol Chem 53, 2895-2902.
Matsushita K., Shinagawa E., Adachi O., Ameyama M. (1987). Purification, characterization
and reconstitution of cytochrome o-type oxidase from Gluconobacter suboxydans.
Biochim Biophys Acta 894, 304-312.
Matsushita K., Toyama H., Adachi O. (1994). Respiratory chains and bioenergetics of acetic
acid bacteria. Adv Microb Physiol 36, 247-301.
Mayer F. and Müller V. (2014). Adaptation of anaerobic archaea to life under extreme energy
limitation. FEMS Microbiol Rev 38, 449-472.
McIntyre H. J., Davies H., Hore T. A., Miller S. H., Dufour J. P., Ronson C. W. (2007).
Trehalose biosynthesis in Rhizobium leguminosarum bv. trifolii and its role in
desiccation tolerance. Appl Environ Microbiol 73, 3984-3992.
McLaggan D., Logan T. M., Lynn D. G., Epstein W. (1990). Involvement of gamma-
glutamyl peptides in osmoadaptation of Escherichia coli. J Bacteriol 172, 3631-3636.
McNeil B. and Harvey L. (2005). Energy well spent on a prokaryotic genome. Nat Biotechnol
23, 186-187.
Meiberg J. B. M. and Spa H. A. (1983). Microbial production of gluconic acids and
gluconates. J Microbiol 49, 89-90.
Merfort M., Herrmann U., Bringer S., Sahm H. (2006). High yield 5-keto-D-gluconic acid
formation is mediated by soluble and membrane-bound gluconate-5-dehydrogenases of
Gluconobacter oxydans. Appl Microbiol Biotechnol 73, 443-451.
Meyer D., Schneider-Fresenius C., Horlacher C., Peist R. Boos W. (1997). Molecular
characterization of glucokinase from Escherichia coli K-12. J Bacteriol 179, 1298-306.
Meyer M. and Kircher M. (2010). Illumina sequencing library preparation for highly
multiplexed target capture and sequencing. Cold Spring Harb Protoc DOI:
10.1101/pdb.prot5448 pmid:20516186.
Meyer M., Schweiger P., Deppenmeier U. (2015). Succinic semialdehyde reductase Gox1801
from Gluconobacter oxydans in comparison to other succinic semialdehyde-reducing
enzymes. Appl Microbiol Biotechnol 99, 3929-3939.
Michel B. E. (1983). Evaluation of the water potentials of solutions of polyethylene glycol
8000 both in the absence and presence of other solutes. Plant Physiol 72, 66-70.
Mille Y., Beney L., Gervais P. (2005). Compared tolerance to osmotic stress in various
microorganisms: towards a survival prediction test. Biotechnol Bioeng 92, 479-484.

6. References
155
Miller J. H. (1972). Experiments in molecular genetics. Cold Spring Harbor Laboratory, Cold
Spring Harbor.
Miller M. J. and Gennis R. B. (1985). The cytochrome d complex is a coupling site in the
aerobic respiratory chain of Escherichia coli. J Bacteriol Chem 260, 14003-14008.
Minohara S., Sakamoto J., Sone N. (2002). Improved H+/O ratio and cell yield of Escherichia
coli with genetically altered terminal quinol oxidases. J Biosci Bioeng 93, 464-469.
Mori H., Kobayashi T., Shimizu S. (1981). High density production of sorbose from sorbitol
by fed-batch culture with DO-stat. J Chem Eng Jpn 14, 65-70.
Mortazavi A., William B. A., McCue K., Schaeffer L., Wold B. (2008). Mapping and
quantifying mammalian transcriptome by RNA-Seq. Nat Method 5, 621-628.
Mostafa H. E., Heller K. J., Geis A. (2002). Cloning of Escherichia coli lacZ and lacY genes
and their expression in Gluconobacter oxydans and Acetobacter liquefaciens. Appl
Environ Microbiol 68, 2619-2623.
Mott J. F., Grant R. A., Ho Y. S., Platt T. (1985). Maximizing gene expression from plasmid
vectors containing the λ PL promotor: strategies of overproducing termination factor ρ.
Proc Natl Acad Sci U S A 82, 88-92.
Mullis K. B. and Faloona F. A. (1987). Specific synthesis of DNA in vitro via a polymerase
catalyzed chain reaction. Methods Enzymol 155, 335-350.
Nagata S., Maekawa Y., Ikeuchi T., Wang Y. B., Ishida A. (2002). Effect of compatible
solutes on the respiratory activity and growth of E. coli K-12 under NaCl stress. J Biosci
Bioeng 94, 384-389.
Nagata S., Sasaki H., Oshima A., Takeda S., Hashimoto Y., Ishida A. (2005). Effect of
proline and K+ on the stimulation of cellular activities in Escherichia coli K12 under
high salinity. Biosci Biotechnol Biochem 69, 740-746.
Neuhard J. (1983). Utilization of preformed pyrimidine bases and nucleosides. In: A. Munch-
Peterson (Ed.), Metabolism of nucleotides nucleosides and nucleobases in
microorganisms. London: Academic Press. pp. 95-148.
Neves A. R., Ramos A., Shearman C., Gasson M. J., Almeida J. S., Santos H. (2000).
Metabolic characterization of Lactococcus lactis deficient in lactate dehydrogenase using
in vivo 13
C-NMR. Eur J Biochem 267, 3859-3868.
Nidetzky B., Fürlinger M., Gollhofer D., Haug I., Haltrich D., Kulbe K. D. (1997).
Simultaneous enzymatic synthesis of gluconic acid and sorbitol: production, purification,
and application of glucose-fructose oxidoreductase and gluconolactonase. Appl Biochem
Biotechnol 63-65, 173-188.
Nikaido H. and Vaara M. (1985). Molecular basis of bacterial outer membrane permeability.
Microbiol Rev 49, 1-32.

6. References
156
Nikaido H., Basina M., Nguyen V., Rosenberg E. Y. (1998). Multidrug efflux pump AcrAB
of Salmonella typhimurium excretes only those beta-lactam antibiotics containing
lipophilic side chains. J Bacteriol 180, 4686-4692.
Olijve W. and Kok J. J. (1979). Analysis of growth of Gluconobacter oxydans in glucose
containing media. Arch Microbiol 121, 283-290.
Onishi H. and Suzuki T. (1968). Production of D-mannitol and glycerol by yeast. Appl
Microbiol 16, 1847-1852.
Oren A. (1999). Bioenergetic aspects of halophilism. Microbiol Mol Biol Rev 63, 334-348.
Oren A. (2008). Microbial life at high salt concentrations: phylogenetic and metabolic
diversity. Saline Systems 4, 2.
Parmentier S., Beauprez J., Arnaut F., Soetaert W., Vandamme E. (2005). Gluconobacter
oxydans NAD-dependent, D-fructose reducing, polyol dehydrogenases activity:
screening, medium optimisation and application for enzymatic polyol production.
Biotechnol Lett 27, 305-311.
Paulsen I. T., Brown M. H., Skurray R. A. (1996). Proton-dependent multidrug efflux
systems. Microbiol Rev 60, 575-608.
Peters B., Mientus M., Kostner D., Junker A., Liebl W., Ehrenreich A. (2013a).
Characterization of membrane-bound dehydrogenases from Gluconobacter oxydans
621H via whole-cell activity assays using multideletion strains. Appl Microbiol
Biotechnol 97, 6397-6412.
Peters B., Junker A., Brauer K., Mühlthaler B., Kostner D., Mientus M., Liebl W., Ehrenreich
A. (2013b). Deletion of pyruvate decarboxylase by a new method for efficient
markerless gene deletions in Gluconobacter oxydans. Appl Microbiol Biotechnol 97,
2521–2530
Pflüger K., Baumann S., Gottschalk G., Lin W., Santos H., Müller V. (2003). Lysine-2,3-
aminomutase and β-lysine acetyltransferase genes of methanogenic archaea are salt
induced and are essential for the biosynthesis of Nε-acetyl-β-lysine and growth at high
salinity. Appl Environ Microbiol 69, 6047-6055.
Pollard S. J. T., Montgomery D. M., Sollars C. J., Perry R. (1991). Organic compounds in the
cement-based stabilisation/solidification of hazardous mixed wastes-mechanistic and
process considerations. J Hazard Mater 28, 313-327.
Poolman B. and Glaasker E. (1998). Regulation of compatible solute accumulation in
bacteria. Mol Microbiol 29, 397-407.
Postma P. W. and Lengeler J. W. (1985). Phosphoenolpyruvate: carbohydrate
phosphotransferase system of bacteria. Microbiol Rev 49: 232-269.
Prasad J., McJarrow P., Gopal P. (2003). Heat and osmotic stress responses of probiotic
Lactobacillus rhamnosus HN001 (DR20) in relation to viability after drying. Appl
Environ Microbiol 69, 917-925.

6. References
157
Prescott F. J., Shaw J. K., Bilello P., Cragwall G. O. (1953). Gluconic acid and its
derivatives. Ind Eng Chem 45, 338-342.
Prescott S. C. and Dunn C. G. (1959). Industrial Microbiology. New York, NY: McGraw-
Hill.
Pronk J. T., Levering P. R., Olijve W., Van Dijken J. P. (1989). Role of NADP-dependent
and quinoprotein glucose dehydrogenase in gluconic acid production by Gluconobacter
oxydans. Enzyme Microb Technol 11, 160-164.
Prust C., Hoffmeister M., Liesegang H., Wiezer A., Fricke W. F., Ehrenreich A., Gottschalk
G., Deppenmeier U. (2005). Complete genome sequence of the acetic acid bacterium
Gluconobacter oxydans. Nat Biotechnol 23, 195-200.
Rabenhorst J., Gatfield I., Hilmer J. M. (2001). Natural, aliphatic and thiocarboxylic acids
obtainable by fermentation and a microorganism therefore. EP Patent 1,078,990.
Rabinow P. (1996). Making PCR: A story of biotechnology. University of Chicago Press.
Raspor P. and Goranovič D. (2008). Biotechnological Applications of Acetic Acid Bacteria.
Crit Rev Biotechnol 28, 101-124.
Rauch B., Pahlke J., Schweiger P., Deppenmeier U. (2010). Characterization of enzymes
involved in the central metabolism of Gluconobacter oxydans. Appl Microbiol
Biotechnol 8, 711-718
Ravanel S., Cherest H., Jabrin S., Grunwald D., Surdin-Kerjan Y., Douce R., Rébeillé F.
(2001). Tetrahydrofolate biosynthesis in plants: molecular and functional
characterization of dihydrofolate synthetase and three isoforms of folylpolyglutamate
synthetase in Arabidopsis thaliana. Proc Natl Acad Sci U S A 98,15360-15365.
Record M. T., Courtenay E. S., Cayley D. S., Guttman H. J. (1998). Responses of E. coli to
osmotic stress: large changes in amounts of cytoplasmic solutes and water. Trends
Biochem Sci 23, 143-148.
Reshetilov A. N., Donova M. V., Dovbnya D. V., Il’yasov P. V., Boronin A. M., Leasers T.,
Green R. (1998). Membrane-bound dehydrogenases of Gluconobacter oxydans: sensors
for measuring sugars, alcohols, and polyoles. Bull Exp Biol Med 126, 702-704.
Reshetilov A. N., Iliasov P. V., Donova M. V., Dovbnya D. V., Boronin A. M., Leathers T.
D., Greene R. V. (1997). Evaluation of a Gluconobacter oxydans whole cell biosensor
for amperometric detection of xylose. Biosens Bioelectron 12, 241-247.
Richhardt J., Bringer S., Bott M. (2012). Mutational analysis of the pentose phosphate and
Entner–Doudoroff pathways in Gluconobacter oxydans reveals improved growth of a
Δedd Δeda mutant on mannitol. Appl Environ Microbiol 78, 6975-6986.
Richhardt J., Luchterhand B., Bringer S., Büchs J., Bott M. (2013a). Evidence for a key role
of cytochrome bo3 oxidase in respiratory energy metabolism of Gluconobacter oxydans.
J Bacteriol 195, 4210-4220.
6. References
158
Richhardt J., Bringer S., Bott M. (2013b). Role of the pentose phosphate pathway and the
Entner-Doudoroff pathway in glucose metabolism of Gluconobacter oxydans 621H.
Appl Microbiol Biotechnol 97, 4315-4323.
Riesenberg D., Schulz V., Knorre W. A., Pohl H. D., Korz D., Sanders E. A., Ross A.,
Deckwer W. D. (1991). High cell density cultivation of E. coli at controlled specific
growth rate. J Biotechnol 20, 17-28.
Roeßler M. and Müller V. (2001). Osmoadaptation in bacteria and archaea: common
principles and differences. Environ Microbiol 3, 743-754.
Rosenberg M., Svitel J., Rosenbergova I., Sturdik E. (1993). Optimization of sorbose
production from sorbitol by Gluconobacter oxydans. Acta Biotechnol 35, 269-274.
Rossmann M. G., Moras D., Olsen K. W. (1974). Chemical and biological evolution of a
nucleotide-binding protein. Nature 250, 194-199.
Rozanov A. S., Zagrebelny S. N., Beklemishev A. B. (2009). Cloning of Escherichia coli
K12 xylose isomerase (glucose isomerase) gene and studying the enzymatic properties
of its expression product. Appl Biochem Microbiol 45, 31-37.
Rübenhagen R., Rönsch H., Jung H., Krämer R., Morbach S. (2000). Osmosensor and
osmoregulator properties of the betaine carrier BetP from Corynebacterium glutamicum
in proteoliposomes. J Biol Chem 275, 735-741.
Rutherford K., Parkhill J., Crook J., Horsnell T., Rice P., Rajandream M. A., Barrell B.
(2000). Artemis: sequence visualization. Bioinformatics 16, 944-5.
Saeki A., Theeragool G., Matsushita K., Toyama H., Adachi O. (1997). Development of
thermotolerant acetic acid bacteria useful for vinegar fermentation at higher
temperatures. Biosci Biotechnol Biochem 61, 138-145.
Saha B. C. (2004). Purification and characterization of a novel mannitol dehydrogenase from
Lactobacillus intermedius. Biotechnol Prog 20, 537-542.
Saha B. C. and Racine F. M. (2008). Production of mannitol by lactic acid bacteria: a review.
In: C. T. Hou. and J. F. Shaw (Eds.), Biocatalysis and bioenergy. Hoboken: Wiley. pp.
391-404.
Saha B. C. and Racine F. M. (2011). Biotechnological production of mannitol and its
applications. Appl Microbiol Biotechnol 89, 879-891.
Saito Y., Ishii Y., Hayashi H., Imao Y., Akashi T., Yoshikawa K., Noguchi Y., Soeda S.,
Yoshida M., Niwa M., Hosoda J., Shimomura K. (1997). Cloning of genes coding for L-
sorbose and L-sorbosone dehydrogenases from Gluconobacter oxydans and microbial
production of 2-keto-L-gulonate, a precursor of L-ascorbic acid, in a recombinant G.
oxydans strain. Appl Environ Environ Microbiol 63, 454-460.
Saito Y., Ishii Y., Hayashi H., Yoshikawa K., Noguchi Y., Yoshida S., Soeda S., Yoshida M.
(1998). Direct fermentation of 2-keto-L-gulonic acid in recombinant Gluconobacter
oxydans. Biotechnol Bioeng 58, 309-315.

6. References
159
Sambrook J. and Russell D. W. (2001). Molecular Cloning: A Laboratory Manual. 3rd
ed.
Cold Spring Harbor New York: Cold Spring Harbor Laboratory Press.
Sanan-Mishra N., Pham X. H., Sopory S. K., Tuteja N. (2005). Pea DNA helicase 45
overexpression in tobacco confers high salinity tolerance without affecting yield. Proc
Natl Acad Sci U S A 102, 509-514.
Sand M., Mingote A. I., Santos H., Müller V., Averhoff B. (2013). Mannitol, a compatible
solute synthesized by Acinetobacter baylyi in a two-step mechanism including a salt-
induced and salt-dependent mannitol-1-phosphate dehydrogenase. Environ Microbiol 15,
2187-2197.
Sand M., Rodrigues M., González J. M., de Crécy-Lagard V., Santos H., Müller V., Averhoff
B. (2015). Mannitol-1-phosphate dehydrogenases/phosphatases: a family of novel
bifunctional enzymes for bacterial adaptation to osmotic stress. Environ Microbiol 17,
711-719.
Santoro M. M., Liu Y., Khan S. M. A., Hou L., Bolen D. W. (1992). Increased thermal
stability of proteins in the presence of naturally occurring osmolytes. Biochem 31, 5278-
5283.
Sapunova L. I., Lobanok A. G., Kazakevich I. O., Evtushenkov A. N. (2004). A plate method
to screen for microorganisms producing xylose isomerase. Microbiology 73, 107-112.
Sapunova L. I., Parakhnya E. V., Kazakevivh I. O., Lobanok A. G. (1999). Biosynthesis and
some properties of the xylose (glucose) isomerases of Streptomyces viridobrunneus GI-
97 and Streptomyces sp. 1 and 32. Microbiology 68, 270-275.
Sayyed R. Z., Shimpi G. B., Chincholkar S. B. (2010). Constitutive production of
extracellular glucose isomerase by an osmophillic Aspergillus sp. under submerged
conditions. J Food Sci Technol 47, 496-500.
Schedel M. (2000). Regioselective oxidation of aminosorbitol with Gluconobacter oxydans,
key reaction in the industrial synthesis of 1-deoxynojirimycin. In: D. R. Kelly (Ed.),
Biotechnology: Biotransformations II. vol 8b. 2nd ed. Weinheim: Wiley-VCH. pp. 296-
308.
Schneider K. H. and Giffhorn F. (1989). Purification and properties of a polyol
dehydrogenase from the phototrophic bacterium Rhodobacter sphaeroides. Eur J
Biochem 184, 15-19.
Schneider K. H., Giffhorn F., Kaplan S. (1993). Cloning, nucleotide sequence and
characterization of the mannitol dehydrogenase gene from Rhodobacter sphaeroides. J
Gen Microbiol 139, 2475-2484.
Schroeder A., Mueller O., Stocker S., Salowsky R., Leiber M., Gassmann M., Lightfoot S.,
Menzel W., Granzow M., Ragg T. (2006). The RIN: an RNA integrity number for
assigning integrity values to RNA measurements. BMC Mol Biol 7, 3.
Schweiger P., Gross H., Deppenmeier U. (2010). Characterization of two aldo-keto
reductases from Gluconobacter oxydans 621H capable of regio- and stereoselective α-
ketocarbonyl reduction. Appl Microbiol Biotechnol 87, 1415-1426.

6. References
160
Schweiger P., Volland S., Deppenmeier U. (2007). Overproduction and characterization of
two distinct aldehyde-oxidizing enzymes from Gluconobacter oxydans 621H. J Mol
Microbiol Biotechnol 13, 147-155.
Shane B. (1989). Folylpolyglutamate synthesis and role in the regulation of one-carbon
metabolism. Vitam Horm 45, 263-335.
Shen B., Jensen R. G., Bohnert H. J. (1997). Mannitol protects against oxidation by hydroxyl
radicals. Plant Physiol 115, 527-532.
Shepherd M. D., Kharel M. K., Bosserman M. A., Rohr J. (2010). Laboratory maintenance of
Streptomyces species. Curr Protoc Microbiol 10, DOI:
10.1002/9780471729259.mc10e01s18.
Shibata T., Ichikawa C., Matsuura M., Takata Y., Noguchi Y., Saito Y., Yamashita M.
(2000). Cloning of a gene for D-sorbitol dehydrogenase from Gluconobacter oxydans
G624 and expression of the gene in Pseudomonas putida IFO3738. J Biosci Bioeng 89,
463-468.
Shiloach J. and Fass R. (2005). Growing E. coli to high cell density: a historical perspective
on method development. Biotechnol Adv 23, 345-357.
Shinagawa E., Matsushita K., Adachi O., Ameyama M. (1982). Purification and
characterization of D-sorbitol dehydrogenase from membrane of Gluconobacter
suboxydans var. α. Agric Biol Chem 46, 135–141.
Shinagawa E., Matsushita K., Adachi O., Ameyama M. (1984). D-gluconate dehydrogenase,
2-keto-D-gluconate yielding, from Gluconobacter dioxyacetonicus: purification and
characterization. Agric Biol Chem 48, 1517-1522.
Shinjoh M. and Toyama H. (2016). Industrial application of acetic acid bacteria (vitamin C
and others). In: K. Matsushita., H. Toyama., N. Tonouchi., A. Okamoto-Kinuma (Eds.),
Acetic Acid Bacteria: Ecology and Physiology. Japan: Springer. pp. 321-338.
Shinjoh M., Setoguchi Y., Hoshino T. (1990). Sorbose dissimilation in 2-keto-L-gulonic acid
producing mutant UV10 derived from Gluconobacter melanogenus IFO 3293. Agric
Biol Chem 54, 2257-2263.
Shinjoh M., Tazoe M., Hoshino T. (2002). NADPH-dependent L-sorbose reductase is
responsible for L-sorbose assimilation in Gluconobacter suboxydans IFO 3291. J
Bacteriol 184, 861-863.
Sievers M. and Swings J. (2005). Family II. Acetobacteraceae Gillis and De Ley 1980. In: G.
Garrity (Ed.), Bergey’s Manual of Systematic Bacteriology. 2nd ed. New York: Springer.
pp. 41-95.
Sievers M., Gaberthüel C., Boesch C., Ludwig W., Teuber M. (1995). Phylogenetic position
of Gluconobacter species as a coherent cluster separated from all Acetobacter species on
the basis of 16S ribosomal RNA sequences. FEMS Microbiol Lett 126, 123-126.

6. References
161
Silberbach M., Maier B., Zimmermann M., Buchs J. (2003). Glucose oxidation by
Gluconobacter oxydans: characterization in shaking flasks, scale-up and optimization of
the pH profile. Appl Microbiol Biotechnol 62, 92-98.
Smirnoff N. (1993). The role of active oxygen in the response of plants to water deficit and
desiccation. New Phytol 125, 27-58.
Soemphol W., Toyama H., Moonmangmee D., Adachi O., Matsushita K. (2007). L-sorbose
reductase and its transcriptional regulator involved in L-sorbose utilization
of Gluconobacter frateurii. J Bacteriol 189, 4800-4808.
Soini J., Ukkonen K., Neubauer P. (2008). High cell density media for Escherichia coli are
generally designed for aerobic cultivations-consequences for large-scale bioprocesses
and shake flask cultures. Microb Cell Fact 7, 26. DOI: 10.1186/1475-2859-7-26.
Sootsuwan K., Thanonkeo P., Keeratirakha N., Thanonkeo S., Jaisil P., Yamada M. (2013).
Sorbitol required for cell growth and ethanol production by Zymomonas mobilis under
heat, ethanol, and osmotic stresses. Biotechnol Biofuels 6, 180-193
Stahlberg A., Aman P., Ridell B., Mostad P., Kubista M. (2003). Quantitative real-time PCR
method for detection of B-lymphocyte monoclonality by comparison of κ and λ
immunoglobulin light chain expression. Clin Chem 49, 51-59.
Sugisawa T. and Hoshino T. (2002). Purification and properties of membrane-bound D-
sorbitol dehydrogenase from Gluconobacter suboxydans IFO 3255. Biosci Biotechnol
Biochem 66, 57-64.
Sugisawa T., Hoshino T., Fujiwara A. (1991). Purification and properties of NADPH-linked
L-sorbose reductase from Gluconobacter melanogenus N44-1. Agric Biol Chem 55,
2043-2049.
Sugisawa T., Hoshino T., Masuda S., Nomura S., Setoguchi Y., Tazoe M., Shinjoh M.,
Someha S., Fujiwara A. (1990). Microbial production of 2-keto-L-gulonic acid from L-
sorbose and D-sorbitol by Gluconobacter melanogenus. Agric Biol Chem 54, 1201-1209.
Sugisawa T., Ojima S., Matzinger P., Hoshino T. (1995). Isolation and characterization of a
new vitamin C producing enzyme (L-gulono-γ-lactone dehydrogenase) of bacterial
origin. Biosci Biotechnol Biochem 59, 190-196.
Sugiyama M., Suzuki S.-i., Tonouchi N., Yokozeki K. (2003). Cloning of the xylitol
dehydrogenase gene from Gluconobacter oxydans and improved production of xylitol
from D-arabitol. Biosci Biotechnol Biochem 67, 584-591.
Svitel J. and Sturdik E. (1994). Product yield and by-product formation in glycerol
conversion to dihydroxyacetone by Gluconobacter oxydans. J Ferment Technol 78, 351-
355.
Svitel J., Curilla O., Tkac J. (1998). Microbial cell-based biosensor for sensing glucose,
sucrose or lactose. Biotechnol Appl Biochem 27, 153-158.
Tajrishi M. M., Vaid N., Tuteja R., Tuteja N. (2011).Overexpression of a pea DNA helicase
45 in bacteria confers salinity stress tolerance. Plant Signal Behav 6, 1271-1275.

6. References
162
Thauer R. K., Jungermann K., Decker K. (1977). Energy conservation in chemotrophic
anaerobic bacteria. Bacteriol Rev 41, 100-180.
Timasheff S. N. (1992). A physicochemical basis for the selection of osmolytes by nature. In:
G. N. Somero., C. B. Osmond., C. L. Bolis (Eds.), Water and life: a comparative
analysis of water relationships at the organismic, cellular, and molecular levels.
Berlin: Springer. pp. 70-84.
Tkac J., Navratil M., Sturdik E., Gemeiner P. (2001). Monitoring of dihydroxyacetone
production during oxidation of glycerol by immobilized Gluconobacter oxydans cells
with an enzyme biosensor. Enzyme Microb Technol 28, 383-388.
Towbin H., Staehelin T., Gordon J. (1979). Electrophoretic transfer of proteins from
polyacrylamide gels to nitrocellulose sheets: procedure and some applications. Proc Natl
Acad Sci U S A 76, 4350-4354.
Toyama H., Soemphol W., Moonmangmee D., Adachi O., Matsushita K. (2005). Molecular
properties of membrane-bound FAD-containing D-sorbitol dehydrogenase from
thermotolerant Gluconobacter frateurii isolated from Thailand. Biosci Biotechnol
Biochem 69, 1120-1129.
Tsukada Y. and Perlman D. (1972). The fermentation of L-sorbose by Gluconobacter
melanogenus. III. Investigation of the metabolic pathway from sorbose to 2-keto-L-
gulonic acid. Biotechnol Bioeng 14, 1035-1038.
Tsuzuki M., Moskvin O. V., Kuribayashi M., Sato K., Retamal S., Abo M., Zeilstra-Ryalls
J., Gomelsky M. (2011). Salt stress-induced changes in the transcriptome, compatible
solutes, and membrane lipids in the facultatively phototrophic bacterium Rhodobacter
sphaeroides. Appl Environ Microbiol 77, 7551-7559.
van den Heuvel R. H., Curti B., Vanoni M. A., Mattevi A. (2004). Glutamate synthase: a
fascinating pathway from L-glutamine to L-glutamate. CMLS Cell Mol Life Sci 61, 669-
681.
Verhoff F. H., Boguslawski G., Lantero O. J., Schlager S. T., Jao Y. C. (1985). Glucose
isomerase. In: M. Moo-Young., C. L. Cooney., A. E. Humphrey (Eds.), Comprehensive
Biotechnology. vol 3. New York: Pergamon Press. pp. 837-859.
Wach A. (1996). PCR-synthesis of marker cassettes with long flanking homology regions for
gene disruptions in S. cerevisiae. Yeast 12, 259-265.
Weenk G., Olijve W., Harder W. (1984). Ketogluconate formation by Gluconobacter species.
Appl Microbiol Biotechnol 20, 400-405.
Welsh D. T. (2000). Ecological significance of compatible solute accumulation by micro-
organisms: from single cells to global climate. FEMS Microbiol Rev 24, 263-290.
Welsh D. T. and Herbert R.A. (1999). Osmotically induced intracellular trehalose, but not
glycine betaine accumulation promotes desiccation tolerance in Escherichia coli. FEMS
Microbiol Lett 174, 57-63.

6. References
163
Whatmore A. M. and Reed R. H. (1990). Determination of turgor pressure in Bacillus
subtilis: a possible role of K+ in turgor regulation. J Gen Microbiol 136: 2521-2526.
Wiegmann K., Hensler M., Wöhlbrand L., Ulbrich M., Schomburg D., Rabus R. (2014).
Carbohydrate catabolism in Phaeobacter inhibens DSM 17395, a member of the marine
Roseobacter clade. Appl Environ Microbiol 80, 4725-4737.
Winkler J. D., Garcia C., Olson M., Callaway E., Kao K. C. (2014). Evolved
osmotolerant Escherichia coli mutants frequently exhibit defective N-acetylglucosamine
catabolism and point mutations in cell shape-regulating protein MreB. Appl Environ
Microbiol 80, 3729-3740.
Wisselink H. W., Weusthuis R. A., Eggink G., Hugenholtz J., Grobben G. J. (2002).
Mannitol production by lactic acid bacteria: a review. Int Dairy J 12, 151–161.
Wood J. M. (2015). Bacterial responses to osmotic challenges. J Gen Physiol 145, 381-388.
Wovcha M. G., Steuerwald D. L., Brooks K. E. (1983). Amplification of D-xylose and D-
glucose isomerase activities in Escherichia coli by gene cloning. Appl Environ Microbiol
45, 1402-1404.
Wu B., Wawrzynow A., Zylicz M., Georgopoulos C. (1996). Structure-function analysis of
the Escherichia coli GrpE heat shock protein. EMBO J 15, 4806-4816.
Yamada Y., Hoshino K., Ishikawa T. (1997). The phylogeny of acetic acid bacteria based on
the partial sequences of 16S ribosomal RNA: the elevation of the subgenus
Gluconoacetobacter to the generic level. Biosci Biotechnol Biochem 61, 1244-1251.
Yamada Y., Wada M., Chibata I. (1979). Oxygen transfer as a parameter of automatic control
of the continuous cultivation for the conversion of sorbitol to sorbose by Acetobacter
suboxydans. J Ferment Technol 57, 210-214.
Yamada Y. (2016). Systematics of Acetic Acid Bacteria. In: K. Matsushita., H. Toyama., N.
Tonouchi., and A. Okamoto-Kinuma (Eds.), Acetic Acid Bacteria: Ecology and
Physiology. Japan: Springer. pp. 1-50.
Yamada Y. and Yukphan P. (2008). Genera and species in acetic acid bacteria. Int J Food
Microbiol 125, 15-24.
Yamanka K. (1975). D-xylose isomerase from Lactobacillus brevis. Methods Enzymol 41,
466-471.
Yamashita S., Uchimura T., Komagata K. (2004). Emendation of the genus Acidomonas
Urakami, Tamaoka, Suzuki and Komagata 1989. Int J Syst Evol Microbiol 54, 865-870.
Yancey P. H. (2005). Organic osmolytes as compatible, metabolic and counteracting
cytoprotectants in high osmolarity and other stresses. J Exp Biol 208, 2819-2830.
Yancey P. H., Haner R. G., Freudenberger T. (1990). Effects of an aldose reductase inhibitor
on osmotic effectors in rat renal medulla. Am J Physiol 259, 733-738.
6. References
164
Zachariou M. and Scopes R. K. (1986). Glucose-fructose oxidoreductase, a new enzyme
isolated from Zymomonas mobilis that is responsible for sorbitol production. J Bacteriol
167, 863-869.
Zahid N. and Deppenmeier U. (2016). Role of mannitol dehydrogenase in osmoprotection of
Gluconobacter oxydans. Appl Microbiol Biotechnol 100, 9967-9978.
Zahid N., Schweiger P., Galinski E., Deppenmeier U. (2015). Identification of mannitol as
compatible solute in Gluconobacter oxydans. Appl Microbiol Biotechnol 99, 5511-5521.
Zou H., Wu Z., Xian M., Liu H., Cheng T., Cao Y. (2013). Not only osmoprotectant: betaine
increased lactate dehydrogenase activity and L-lactate production in lactobacilli.
Bioresour Technol 148, 591-595.

7. Curriculum Vitae
166
Publications Zahid N. and Deppenmeier U. (2016). Role of mannitol
dehydrogenases in osmoprotection of Gluconobacter
oxydans. Appl Microbiol Biotechnol 99, 5511-5521.
Zahid N., Schweiger P., Galinski E., Deppenmeier U.
(2015). Identification of mannitol as compatible solute in
Gluconobacter oxydans. Appl Microbiol Biotechnol 99,
5511-21.
Kosciow K., Zahid N., Schweiger P., Deppenmeier U.
(2014). Production of a periplasmic trehalase in
Gluconobacter oxydans and growth on trehalose. J
Biotechnol 189, 27-35.
Bukhari D. A., Zahid N., Shakoori A. R. (2013). Molecular
characterization of cry4B gene from local isolates of Bacillus
thuringiensis encoding 70 kDa crystal protein. Pak J Zool
45, 779-791.
Zahid N., Zulfiqar S., Shakoori A. R. (2012). Functional
analysis of cus operon promoter of Klebsiella pneumoniae
using E. coli lacZ assay. Gene 495, 81-88.
Conferences / Workshops
/ Symposia (Presented
and Attended)
Annual Conference of the Association for General and
Applied Microbiology March 2016, Jena, Germany. (Poster
presentation).
Annual Conference of the Association for General and
Applied Microbiology 2015 Marburg, Germany. (Poster
presentation).
Annual Conference of the Association for General and
Applied Microbiology 2014 Dresden, Germany. (Poster
presentation).
International Pakistan Congress of Zoology 2011
Muzaffarabad, Pakistan. (Oral presentation).
International Pakistan Congress of Zoology 2010 Faisalabad,
Pakistan. (Oral Presentation).
International Pakistan Congress of Zoology 2009 Jamshoroo,
Pakistan. (Oral Presentation).

8. Acknowledgements
167
8. ACKNOWLEDGEMENTS
I am highly thankful to Prof. Dr. Uwe Deppenmeier for allowing me to come from
Pakistan to work in his lab. Being a supervisor, he guided me with his valuable suggestions
and ideas throughout my work period. It was due to his moral support and encouragement
that I could complete my tasks successfully.
My special thanks to Prof. Dr. Erwin A Galinski to be a second referee of my work.
Moreover, I am deeply indebted to him for providing me time to time guidance, spending
his worthy time to discuss experimental problems, and to share his experience to resolve
NMR spectra and physiology of G. oxydans.
I am thankful to Prof. Dr. Lukas Schreiber and Prof. Dr. Sigurd Höger for showing
interest in my work and for being a part of my Ph.D defense committee. I am also obliged to
Prof. Dr. Florian MW Grundler for granting me permission to use Bioanalyzer in his lab.
I am grateful to Higher Education Commission of Pakistan and their German
collaborators DAAD for providing me a continuous financial support (scholarship) to stay in
Germany and to complete my present work in a peaceful way.
I am gratified to all the members of the Institute for Microbiology and Molecular Biology,
University Bonn. There is an endless list of persons whom I want to acknowledge. At first I
am grateful to Dr. Elisabeth Witt and Dr. Kati Wassman for their help especially in
dealing with HPLC instruments, Dr. Fabian Grein for assisting me in microscopic
examinations of cell cultures, Dr. Stefanie Berger and Dr. Maria Meyer for providing
moral and personal support. I am thankful to all my group members especially to Dipl. Biol.
Sarah Refai for being so friendly and for explaining all the rules and regulations regarding
lab work and thesis write up. My special thanks to two friends and colleagues M.Sc. Lena
Kröninger and M. Sc. Anna Siemen for helping me time to time and for proofreading
some parts of my write up. I am also grateful to M.Sc. Konrad Kosciow for providing me
an electron micrograph of G. oxydans and for investing efforts to keep a harmony among lab
fellows. In addition, I am thankful to M.Sc. Thomas Franke for being so understanding and
sharing his new ideas regarding science and technology.
I want to pay special thanks to Dipl. Biol. Elisabeth Schwab, a person whom I cannot
forget. You helped me not only in lab to deal with all the technical stuff regarding

8. Acknowledgements
168
instrumentation, but also invested energy and time to solve all my personal issues including
translation of letters, filling formulae, finding kindergarten, and house etc. For all these, I
am deeply indebted. You will always be in my memories. I also want to pay my deep
regards to Ms. Brigit Amendt and Mrs. Marlene Hecker for providing techical assistance.
Last but not the least, I am thankful to my husband Mr. Muhammad Shahzad Anjam and
my son Hassan Shahzad to be a backbone of my life. Without you two, it was nearly
impossible for me to do my work. You people strengthened me to pass through all the ups
and downs of life in a graceful way. May you live long and prosperous life ever. Of course,
I cannot forget my parents, brothers, family, and my teachers from Pakistan who spent
efforts to bring me to this point. I am always be indebted to you. Thank you.