IMPORTANT NOTICE IMPORTANT: You must read the following ...
667
IMPORTANT NOTICE IMPORTANT: You must read the following disclaimer before continuing. The following disclaimer applies to the attached offering memorandum (the “Offering Memorandum”) received by e-mail or otherwise received as a result of electronic communication, and you are therefore advised to read this disclaimer page carefully before reading, accessing or making any other use of the attached Offering Memorandum. In accessing the Offering Memorandum, you agree to be bound by the following terms and conditions, including any modifications to them from time to time, each time you receive any information from us as a result of such access. Confirmation of Your Representation: By accepting the email and accessing the attached Offering Memorandum you will be deemed to have represented to each of Australia and New Zealand Banking Group Limited, Barclays Bank PLC, Singapore Branch, BNP Paribas, Citigroup Global Markets Singapore Pte. Ltd., Crédit Agricole Corporate and Investment Bank, Singapore Branch, DBS Bank Ltd., Deutsche Bank AG, Singapore Branch, First Abu Dhabi Bank PJSC, ING Bank N.V., Singapore Branch, J.P. Morgan Securities plc, Merrill Lynch (Singapore) Pte. Ltd., Morgan Stanley & Co. International plc, SMBC Nikko Capital Markets Limited, Société Générale, Standard Chartered Bank and The Hongkong and Shanghai Banking Corporation Limited, Singapore Branch (collectively, the “Joint Lead Managers”), that (i) you are outside the United States and, to the extent you purchase the securities described in the attached Offering Memorandum, you will be doing so pursuant to Regulation S under the U.S. Securities Act of 1933, as amended (the “Securities Act”) and (ii) that you consent to delivery of the attached Offering Memorandum and any amendments or supplements thereto by electronic transmission. This Offering Memorandum has been sent to you in electronic form. You are reminded that documents transmitted via this medium may be altered or changed during the process of transmission and consequently none of the Issuer, the Joint Lead Managers, the Trustee (as defined in this Offering Memorandum), the Agents (as defined in this Offering Memorandum) or any person who controls, or is a director, officer, employee, agent, representative or affiliate of, any such person accepts any liability or responsibility whatsoever in respect of any difference between the Offering Memorandum distributed to you in electronic form and the hard copy version available to you on request from the Joint Lead Managers. Restrictions : The attached Offering Memorandum is being furnished in connection with an offering exempt from registration under the Securities Act solely for the purpose of enabling a prospective investor to consider the purchase of the securities described in the Offering Memorandum. You are reminded that the information in the attached document is not complete and may be changed. Any investment decision should be made on the basis of a complete final Offering Memorandum. Nothing in this electronic transmission constitutes an offer of securities for sale in any jurisdiction where it is unlawful to do so. THE SECURITIES HAVE NOT BEEN, AND WILL NOT BE, REGISTERED UNDER THE SECURITIES ACT, OR THE SECURITIES LAWS OF ANY STATE OF THE U.S. OR OTHER JURISDICTION AND MAY NOT BE OFFERED OR SOLD WITHIN THE U.S., EXCEPT PURSUANT TO AN EXEMPTION FROM, OR IN A TRANSACTION NOT SUBJECT TO, THE REGISTRATION REQUIREMENTS OF THE SECURITIES ACT AND ANY APPLICABLE STATE OR LOCAL SECURITIES LAWS. You are reminded that you have accessed the attached Offering Memorandum on the basis that you are a person into whose possession this Offering Memorandum may be lawfully delivered in accordance with the laws of the jurisdiction in which you are located and you may not nor are you authorized to deliver or forward this document, electronically or otherwise, to any other person. If you have gained access to this transmission contrary to the foregoing restrictions, you will be unable to purchase any of the securities described therein. Actions that You May Not Take : You should not reply by e-mail to this electronic transmission, and you may not purchase any securities by doing so. Any reply e-mail communications, including those you generate by using the “Reply” function on your e-mail software, will be ignored or rejected. THE ATTACHED OFFERING MEMORANDUM MAY NOT BE FORWARDED OR DISTRIBUTED TO ANY OTHER PERSON AND MAY NOT BE REPRODUCED IN ANY MANNER WHATSOEVER. ANY FORWARDING, DISTRIBUTION OR REPRODUCTION OF THIS DOCUMENT IN WHOLE OR IN PART IS UNAUTHORIZED. You are responsible for protecting against viruses and other destructive items. Your use of this e-mail is at your own risk and it is your responsibility to take precautions to ensure that it is free from viruses and other items of a destructive nature.
-
Upload
khangminh22 -
Category
Documents
-
view
1 -
download
0
Transcript of IMPORTANT NOTICE IMPORTANT: You must read the following ...

IMPORTANT NOTICE
IMPORTANT: You must read the following disclaimer before continuing. The following disclaimer appliesto the attached offering memorandum (the “Offering Memorandum”) received by e-mail or otherwisereceived as a result of electronic communication, and you are therefore advised to read this disclaimer pagecarefully before reading, accessing or making any other use of the attached Offering Memorandum. Inaccessing the Offering Memorandum, you agree to be bound by the following terms and conditions,including any modifications to them from time to time, each time you receive any information from us asa result of such access.
Confirmation of Your Representation: By accepting the email and accessing the attached OfferingMemorandum you will be deemed to have represented to each of Australia and New Zealand Banking GroupLimited, Barclays Bank PLC, Singapore Branch, BNP Paribas, Citigroup Global Markets Singapore Pte.Ltd., Crédit Agricole Corporate and Investment Bank, Singapore Branch, DBS Bank Ltd., Deutsche BankAG, Singapore Branch, First Abu Dhabi Bank PJSC, ING Bank N.V., Singapore Branch, J.P. MorganSecurities plc, Merrill Lynch (Singapore) Pte. Ltd., Morgan Stanley & Co. International plc, SMBC NikkoCapital Markets Limited, Société Générale, Standard Chartered Bank and The Hongkong and ShanghaiBanking Corporation Limited, Singapore Branch (collectively, the “Joint Lead Managers”), that (i) you areoutside the United States and, to the extent you purchase the securities described in the attached OfferingMemorandum, you will be doing so pursuant to Regulation S under the U.S. Securities Act of 1933, asamended (the “Securities Act”) and (ii) that you consent to delivery of the attached Offering Memorandumand any amendments or supplements thereto by electronic transmission.
This Offering Memorandum has been sent to you in electronic form. You are reminded that documentstransmitted via this medium may be altered or changed during the process of transmission and consequentlynone of the Issuer, the Joint Lead Managers, the Trustee (as defined in this Offering Memorandum), theAgents (as defined in this Offering Memorandum) or any person who controls, or is a director, officer,employee, agent, representative or affiliate of, any such person accepts any liability or responsibilitywhatsoever in respect of any difference between the Offering Memorandum distributed to you in electronicform and the hard copy version available to you on request from the Joint Lead Managers.
Restrictions: The attached Offering Memorandum is being furnished in connection with an offering exemptfrom registration under the Securities Act solely for the purpose of enabling a prospective investor toconsider the purchase of the securities described in the Offering Memorandum. You are reminded that theinformation in the attached document is not complete and may be changed. Any investment decision shouldbe made on the basis of a complete final Offering Memorandum.
Nothing in this electronic transmission constitutes an offer of securities for sale in any jurisdiction whereit is unlawful to do so.
THE SECURITIES HAVE NOT BEEN, AND WILL NOT BE, REGISTERED UNDER THESECURITIES ACT, OR THE SECURITIES LAWS OF ANY STATE OF THE U.S. OR OTHERJURISDICTION AND MAY NOT BE OFFERED OR SOLD WITHIN THE U.S., EXCEPT PURSUANTTO AN EXEMPTION FROM, OR IN A TRANSACTION NOT SUBJECT TO, THE REGISTRATIONREQUIREMENTS OF THE SECURITIES ACT AND ANY APPLICABLE STATE OR LOCALSECURITIES LAWS.
You are reminded that you have accessed the attached Offering Memorandum on the basis that you are aperson into whose possession this Offering Memorandum may be lawfully delivered in accordance with thelaws of the jurisdiction in which you are located and you may not nor are you authorized to deliver orforward this document, electronically or otherwise, to any other person. If you have gained access to thistransmission contrary to the foregoing restrictions, you will be unable to purchase any of the securitiesdescribed therein.
Actions that You May Not Take: You should not reply by e-mail to this electronic transmission, and youmay not purchase any securities by doing so. Any reply e-mail communications, including those yougenerate by using the “Reply” function on your e-mail software, will be ignored or rejected.
THE ATTACHED OFFERING MEMORANDUM MAY NOT BE FORWARDED OR DISTRIBUTEDTO ANY OTHER PERSON AND MAY NOT BE REPRODUCED IN ANY MANNER WHATSOEVER.ANY FORWARDING, DISTRIBUTION OR REPRODUCTION OF THIS DOCUMENT IN WHOLEOR IN PART IS UNAUTHORIZED.
You are responsible for protecting against viruses and other destructive items. Your use of this e-mail is atyour own risk and it is your responsibility to take precautions to ensure that it is free from viruses and otheritems of a destructive nature.

Thi
sP
reli
min
ary
Off
erin
gM
emor
andu
mis
subj
ect
toco
mpl
etio
nan
dam
endm
ent.
The
Not
esm
ayno
tbe
sold
nor
may
offe
rsto
buy
beac
cept
edpr
ior
toth
eti
me
afi
nal
Off
erin
gM
emor
andu
mis
com
plet
ed.
Thi
sP
reli
min
ary
Off
erin
gM
emor
andu
msh
all
not
cons
titu
tean
offe
rto
sell
orth
eso
lici
tati
onof
anof
fer
tobu
y,no
rsh
all
ther
ebe
any
sale
ofth
eN
otes
,in
any
juri
sdic
tion
inw
hich
such
offe
r,so
lici
tati
onor
sale
wou
ldbe
unla
wfu
lpr
ior
tore
gist
rati
on,
qual
ific
atio
nor
exem
ptio
nun
der
the
secu
riti
esla
ws
ofan
ysu
chju
risd
icti
on.
SUBJECT TO COMPLETIONPRELIMINARY OFFERING MEMORANDUM DATED JANUARY 14, 2018 CONFIDENTIAL
ABJA Investment Co. Pte. Ltd.(Incorporated in Singapore)
(Registration Number: 201309883M)US$ [●] [●]% Notes Due [●]US$ [●] [●]% Notes Due [●]
Each of the US$[●] [●]% Notes due [●] (the “[●] Notes”) and the US$[●] [●]% Notes due [●] (the “[●] Notes” and, togetherwith the [●] Notes, the “Notes”) will be the unsecured senior obligations of ABJA Investment Co. Pte. Ltd. (the “Issuer”), andwill rank pari passu with all of its other existing and future unsubordinated obligations and will be effectively subordinatedto its secured obligations and the obligations of its subsidiaries. Tata Steel has provided a non-binding letter of comfort to theTrustee on behalf of the noteholders in connection with the issuance of the Notes.
The [●] Notes will bear interest at a rate of [●]% per year. Interest will be paid on the [●] Notes semi-annually in arrear on[●] and [●] of each year, beginning on [●], 2018. Unless previously repurchased, cancelled, exchanged or redeemed, the [●]Notes will mature on [●]. The [●] Notes will bear interest at a rate of [●]% per year. Interest will be paid on the [●] Notessemi-annually in arrear on [●] and [●] of each year, beginning on [●], 2018. Unless previously repurchased, cancelled,exchanged or redeemed, the [●] Notes will mature on [●]. If a Change of Control (as defined herein) occurs, each Noteholder(as defined herein) shall have the right to require the Issuer to redeem all of such Noteholders’ Notes at 101% of their principalamount plus accrued and unpaid interest. Subject to the terms and conditions of the Notes (the “Conditions”), the Issuer mayalso redeem all of the Notes at 100% of their principal amount plus accrued and unpaid interest if at any time the Issuer becomesobligated to pay withholding taxes as a result of certain changes in tax law. Subject to the above and unless previouslyredeemed, purchased, exchanged or cancelled, the [●] Notes will mature and the Issuer will redeem the [●] Notes at theirprincipal amount on [●] and the [●] Notes will mature and the Issuer will redeem the [●] Notes at their principal amount on[●]. The Notes will not be guaranteed by Tata Steel or any other member of the Group.
For a more detailed description of the Notes, see “Terms and Conditions of the [●] Notes” and “Terms and Conditions of the[●] Notes” beginning on pages 175 and 199, respectively.
Issue Price for the [●] Notes: [●]%Issue Price for the [●] Notes: [●]%
Investing in the Notes involves certain risks. You should read “Risk Factors” beginning on page 39 before investing inthe Notes.
MiFID II product governance/Professional investors and ECPs only target market — For the purposes of Directive 2014/65/EU(as amended, “MiFID II”), any person offering, selling or recommending the Notes (a “distributor”) should take intoconsideration the target market in respect of the Notes which is eligible counterparties and professional clients only, each asdefined in MiFID II; however, a distributor subject to MiFID II is responsible for undertaking its own target market assessmentin respect of the Notes (by either adopting or refining the target market) and determining appropriate distribution channels.
Approval in principle has been granted for the listing and quotation of the Notes on the Singapore Exchange Securities TradingLimited (the “SGX-ST”). The SGX-ST takes no responsibility for the accuracy of any of the statements made or opinions orreports contained in this Offering Memorandum. Approval in-principle received for the listing and quotation of the Notes onthe SGX-ST is not to be taken as an indication of the merits of either us, this offering or the Notes. The Notes will be tradedon the SGX-ST in a minimum board lot size of US$200,000 for so long as any of the Notes are listed and quoted on the SGX-STand the rules of the SGX-ST so require.
The Notes have not been, and will not be, registered under the U.S. Securities Act of 1933, as amended (the “SecuritiesAct”), or any U.S. state securities laws. Accordingly, the Notes are being offered and sold only to persons outside theUnited States in compliance with Regulation S under the Securities Act (“Regulation S”). For a description of certainrestrictions on resales and transfers, see “Subscription and Sale”.
Each of the Notes will be represented by a global certificate (the “Global Certificate”) in registered form which will beregistered in the name of a nominee for a common depositary for Clearstream Banking, S.A. (“Clearstream, Luxembourg”) andEuroclear Bank S.A./N.V. (“Euroclear”) on or about [●]. Individual certificates evidencing holdings of the Notes will only beissued in certain limited circumstances described under “The Global Certificate”. The Notes are expected to be rated BB- byS&P.
Joint Lead Managers
ANZ Barclays BNP PARIBASBofA Merrill Lynch Citi DBS Bank Ltd.Crédit Agricole CIB Deutsche Bank First Abu Dhabi Bank
HSBC ING J.P. Morgan Securities plcMorgan Stanley SMBC Nikko Société Générale
Corporate & Investment BankingStandard Chartered Bank
The date of this Offering Memorandum is [●], 2018.
NOTICE TO INVESTORS
The Issuer, as well as the Joint Lead Managers, reserve the right to withdraw the offering of the Notesat any time or to reject any offer to purchase, in whole or in part, for any reason, or to sell less thanall of the Notes offered hereby.
This Offering Memorandum is personal to the prospective investor to whom it has been delivered bythe Joint Lead Managers and does not constitute an offer to any other person or to the public in generalto subscribe for or otherwise acquire the Notes. Distribution of this Offering Memorandum to anyperson other than the prospective investor and those persons, if any, retained to advise that prospectiveinvestor with respect thereto is unauthorized, and any disclosure of its contents without the Issuer’sprior written consent is prohibited. The prospective investor, by accepting delivery of this OfferingMemorandum, agrees to the foregoing and agrees not to make any photocopies of this OfferingMemorandum.
This Offering Memorandum is intended solely for the purpose of soliciting indications of interest inthe Notes from prospective investors and does not purport to summarize all of the terms, conditions,covenants and other provisions contained in any transaction documents described herein. Theinformation provided is not all-inclusive. The market information in this Offering Memorandum hasbeen obtained by the Issuer from publicly available sources deemed by it to be reliable.Notwithstanding any investigation that the Joint Lead Managers may have conducted with respect tothe information contained herein, the Joint Lead Managers do not accept any liability in relation tothe information contained in this Offering Memorandum or its distribution or with regard to any otherinformation supplied by or on the Issuer’s behalf.
The Issuer and the Group accept responsibility for the information contained in this OfferingMemorandum. To the best of the knowledge of the Issuer and the Group (having taken all reasonablecare to ensure that such is the case) the information contained in this Offering Memorandum is inaccordance with the facts and does not omit anything likely to affect the import of such information.
Prospective investors in the Notes should rely only on the information contained in this OfferingMemorandum. None of the Group, the Issuer, the Joint Lead Managers, the Trustee or the Agents hasauthorized the provision of information different from that contained in this Offering Memorandum.The information contained in this Offering Memorandum is accurate in all material respects only asof the date of this Offering Memorandum, regardless of the time of delivery of this OfferingMemorandum or of any sale of the Notes. Neither the delivery of this Offering Memorandum nor anysale made hereunder shall under any circumstances imply that there has been no change in the Issuer’saffairs and those of its subsidiaries or that the information set forth herein is correct in all materialrespects as of any date subsequent to the date hereof.
Prospective investors hereby acknowledge that (i) they have not relied on the Joint Lead Managers orany person affiliated with the Joint Lead Managers in connection with any investigation of theaccuracy of such information or their investment decision, and (ii) no person has been authorized togive any information or to make any representation concerning the Issuer or the Notes (other than ascontained herein and information given by the Issuer’s duly authorized officers and employees, asapplicable, in connection with investors’ examination of the Issuer and the terms of this offering) and,if given or made, any such other information or representation should not be relied upon as havingbeen authorized by the Group, the Issuer, the Joint Lead Managers, the Trustee or the Agents.
None of the Joint Lead Managers, the Group, the Issuer, the Trustee, the Paying Agent, theTransfer Agent and the Registrar or their respective affiliates or representatives is making anyrepresentation to any offeree or purchaser of the Notes offered hereby regarding the legality ofany investment by such offeree or purchaser under applicable legal investment or similar laws.None of the Joint Lead Managers, the Trustee, the Paying Agent, the Transfer Agent, the
i
Registrar or their respective affiliates or representatives makes any representation, warranty orundertaking, express or implied, or accepts any responsibility, with respect to the accuracy orcompleteness of any of the information in this Offering Memorandum. To the fullest extentpermitted by law, none of the Joint Lead Managers, the Trustee or the Agents accepts anyresponsibility for the contents of this Offering Memorandum or for any other statement made orpurported to be made by the Joint Lead Managers, the Trustee or the Agents or on their behalfin connection with the Issuer or the issue and offering of the Notes. Each of the Joint LeadManagers, the Trustee or the Agents accordingly disclaims all and any liability whether arisingin tort or contract or otherwise which it might otherwise have in respect of this OfferingMemorandum or any such statement.
Each prospective investor contemplating purchasing any Notes should make its own independentinvestigation of the financial condition and affairs, and its own appraisal of the creditworthinessof the Issuer and the terms of the Notes being offered, including the merits and risks involvedand its purchase of the Notes should be based upon such investigations with its own tax, legal andbusiness advisers as it deems necessary. See “Risk Factors” for a discussion of certain factors tobe considered. Any prospective investor in the Notes should be able to bear the economic risk ofan investment in the Notes for an indefinite period of time.
This Offering Memorandum does not constitute an offer to sell, or a solicitation of an offer to buy,
any Notes offered hereby by any person in any jurisdiction in which it is unlawful for such person to
make an offer or solicitation in such jurisdiction.
The distribution of this Offering Memorandum and the offer and sale of the Notes may, in certain
jurisdictions, be restricted by law. None of the Issuer, the Joint Lead Managers, the Trustee or the
Agents represents that this Offering Memorandum may be lawfully distributed, or that any Notes may
be lawfully offered, in compliance with any applicable registration or other requirements in any such
jurisdiction, or pursuant to an exemption available thereunder, or assume any responsibility for
facilitating any such distribution or offering. In particular, no action has been taken by any of the
Issuer or the Joint Lead Managers which would permit a public offering of any Notes or distribution
of this Offering Memorandum in any jurisdiction where action for that purpose is required.
Accordingly, no Notes may be offered or sold, directly or indirectly, and neither this Offering
Memorandum nor any advertisement or other offering material may be distributed or published in any
jurisdiction, except under circumstances that will result in compliance with any applicable laws and
regulations.
Each purchaser of the Notes (each, a “Noteholder”) must comply with all applicable laws and
regulations in force in each jurisdiction in which it purchases, offers or sells the Notes or possesses
or distributes this Offering Memorandum, and must obtain any consent, approval or permission
required for the purchase, offer or sale by it of the Notes under the laws and regulations in force in
any jurisdiction to which it is subject or in which it makes purchases, offers or sales. Persons into
whose possession this Offering Memorandum or any Notes may come must inform themselves about,
and observe, any such restrictions on the distribution of Offering Memorandum and the offering and
sale of the Notes. In particular, there are restrictions on the offer and sale of the Notes, and the
circulation of documents relating thereto, in certain jurisdictions including the United States and the
European Economic Area and to persons connected therewith. See “Subscription and Sale”.
This Offering Memorandum has been prepared on the basis that all offers of the Notes will be made
pursuant to an exemption under Article 3 of the Prospectus Directive, as implemented in member
states of the European Economic Area, from the requirement to produce a prospectus for offers of the
Notes.
ii

This Offering Memorandum has not been and will not be registered as a prospectus with the MonetaryAuthority of Singapore. Accordingly, this Offering Memorandum and any other document or materialin connection with the offer or sale, or invitation for subscription or purchase, of the Notes may notbe circulated or distributed, nor may the Notes be offered or sold, or be made the subject of aninvitation for subscription or purchase, whether directly or indirectly, to persons in Singapore otherthan (i) to an institutional investor under Section 274 of the Securities and Futures Act, Chapter 289of Singapore (the “SFA”), (ii) to a relevant person pursuant to Section 275(1), or any person pursuantto Section 275(1A), and in accordance with the conditions specified in Section 275, of the SFA, or (iii)otherwise pursuant to, and in accordance with the conditions of, any other applicable provision of theSFA.
Where the Notes are subscribed or purchased under Section 275 of the SFA by a relevant person whichis:
(a) a corporation (which is not an accredited investor (as defined in Section 4A of the SFA)) the solebusiness of which is to hold investments and the entire share capital of which is owned by oneor more individuals, each of whom is an accredited investor; or
(b) a trust (where the trustee is not an accredited investor) whose sole purpose is to hold investmentsand each beneficiary of the trust is an individual who is an accredited investor,
securities (as defined in Section 239(1) of the SFA) of that corporation or the beneficiaries’ rights andinterest (howsoever described) in that trust shall not be transferred within six months after thatcorporation or that trust has acquired the Notes pursuant to an offer made under Section 275 of theSFA except:
(i) to an institutional investor or to a relevant person defined in Section 275(2) of the SFA, orto any person arising from an offer referred to in Section 275(1A) or Section 276(4)(i)(B)of the SFA;
(ii) where no consideration is or will be given for the transfer;
(iii) where the transfer is by operation of law;
(iv) as specified in Section 276(7) of the SFA; or
(v) as specified in Regulation 32 of the Securities and Futures (Offers of Investments) (Sharesand Debentures) Regulations 2005 of Singapore.
For a description of these and certain further restrictions on offers and sales of the Notes and thedistribution of this Offering Memorandum, see “Subscription and Sale”.
In connection with the issue of the Notes, Australia and New Zealand Banking Group Limited (the“Stabilizing Manager”) or any person acting on behalf of the Stabilizing Manager may, to the extentpermitted by applicable laws and directives, over-allot the Notes or effect transactions with a view tosupporting the price of the Notes at a level higher than that which might otherwise prevail, but in sodoing, the Stabilizing Manager or any person acting on behalf of the Stabilizing Manager shall act asprincipal and not as agent of the Issuer. However, there is no assurance that the Stabilizing Manageror any person acting on behalf of the Stabilizing Manager will undertake stabilization action. Any lossor profit sustained as a consequence of any such overallotment or stabilization shall be for the accountof the Joint Lead Managers.
MiFID II product governance/Professional investors and ECPs only target market
Solely for the purposes of each manufacturer’s product approval process, the target market assessmentin respect of the Notes has led to the conclusion that: (i) the target market for the Notes is eligible
iii

counterparties and professional clients only, each as defined in Directive 2014/65/EU (as amended,
“MiFID II”); and (ii) all channels for distribution of the Notes to eligible counterparties and
professional clients are appropriate. Any person subsequently offering, selling or recommending the
Notes (a “distributor”) should take into consideration the manufacturer’s target market assessment;
however, a distributor subject to MiFID II is responsible for undertaking its own target market
assessment in respect of the Notes (by either adopting or refining the manufacturer’s target market
assessment) and determining appropriate distribution channels.
iv

PRESENTATION OF FINANCIAL INFORMATION
Financial Data
The Issuer’s and the Group’s fiscal year ends on March 31. Accordingly, references in this OfferingMemorandum to a particular fiscal year are to the year ended March 31 of that year. References to ayear other than a “fiscal year” are to the calendar year ended December 31 of that year.
The Group is required to prepare its financial statements in accordance with Ind-AS with effect fromApril 1, 2016. Accordingly, the financial statements as at and for the year ended March 31, 2017,together with the comparative period data as at and for the year ended March 31, 2016, have beenprepared in in accordance with Ind-AS. The Issuer is required to prepare its financial statements inaccordance with Singapore Financial Reporting Standards (“SFRS”). Accordingly, all of the Issuer’sfinancial statements presented in this Offering Memorandum have been prepared in accordance withSFRS.
All historical consolidated financial information in this Offering Memorandum is that of the Group,its consolidated subsidiaries and joint ventures and associates. In this Offering Memorandum, unlessotherwise specified, all financial information is of the Group on a consolidated basis. All historicalnon-consolidated financial information in this Offering Memorandum is that of Tata Steel or theIssuer, as specified.
The annual financial statements of the Group, on a consolidated basis, and of Tata Steel, on astandalone basis, as at and for the years ended March 31, 2015, 2016 and 2017 (collectively, the“Annual Financial Statements”), and financial results for the six month periods ended September 30,2016 and 2017, have each been prepared in accordance with the following:
(i) with respect to the six months ended September 30, 2016 and 2017, prepared and presented inaccordance with Ind-AS;
(ii) with respect to the years ended March 31, 2016 and 2017, prepared and presented in accordancewith Ind-AS; and
(iii) with respect to the comparative period data for the years ended March 31, 2015 and 2016,prepared and presented in accordance with Indian GAAP.
Ind-AS differs in certain respects from generally accepted accounting principles in the InternationalFinancial Reporting Standards (“IFRS”). For a discussion of certain significant differences betweenInd-AS and IFRS, see “Description of Certain Differences between Ind-AS and IFRS”. In making aninvestment decision, investors must rely on their own examination of the Group, the terms of theoffering and the financial information contained in this Offering Memorandum. Potential investorsshould consult their own professional advisers for an understanding of the differences between IndianGAAP and US GAAP or IFRS, and how these differences might affect their understanding of thefinancial information contained herein.
The Annual Financial Statements for the Group have been audited by Deloitte Haskins and Sells LLP,Chartered Accountants (“Deloitte”), as set forth in their audit reports included herein. For the financialyear beginning from April 1, 2017 onwards, Price Waterhouse and Co. Chartered Accountants LLP(“Price Waterhouse and Co.”) became the statutory auditor for the Group, andPricewaterhouseCoopers LLP became the auditors for the Issuer.
On January 10, 2018, SEBI imposed a two year ban on Price Waterhouse and Co network of firms inIndia (which includes Price Waterhouse & Co.) from auditing any publicly listed companies in Indiaas a result of their involvement as auditors in Satyam Computer Services Limited. The ban does notimpact Price Waterhouse & Co.’s ability to continue as statutory auditors of Tata Steel and the Groupfor financial year ending March 31, 2018. Price Waterhouse and Co network of firms in India have
v

proposed to appeal the SEBI ban, and should Price Waterhouse & Co. become legally incapable tocontinue the office of Tata Steel and the Group’s statutory auditors post March 31, 2018 Tata Steelwould evaluate to fill the vacancy in such eventuality, keeping in line with the requirements of theapplicable statutes in India.
The Annual Financial Statements for the Issuer have been audited by Deloitte, as set forth in theiraudit reports included herein. The unaudited interim financial statements of the Issuer for the sixmonths ended September 30, 2017, have been subject to limited review by PricewaterhouseCoopersLLP as set forth in their report dated January 12, 2018.
The standalone financial results of Tata Steel for the quarter and six months ended September 30, 2017have been audited by Price Waterhouse and Co. and the consolidated financial results of the Group forthe quarter ended September 30, 2017 have been subjected to a limited review by Price Waterhouseand Co. as set forth in their respective review reports included herein.
The unaudited interim financial statements of the Issuer for the six months ended September 30, 2017,have been subjected to a limited review by PricewaterhouseCoopers LLP as set forth in their reviewreport dated January 12, 2018.
Reporting Segments
The Group is engaged in the business of manufacturing steel products across the globe. The operatingsegments have been identified based on the different geographical areas where major entities withinthe Group operate, and the Chief Operating Decision Maker reviews and assesses the Group’sperformance based on the same.
The Group’s reportable segments and segment information is presented below:
• Tata Steel India
• Other Indian operations
• Tata Steel Europe
• Other trade related operations
• South East Asian operations
• Rest of the world
Non-GAAP Financial Measures
As used in this Offering Memorandum, a non-GAAP financial measure is one that purports to measurehistorical financial performance, financial position or cash flows, but excludes or includes amountsthat would not be so adjusted in the most comparable IFRS, Ind-AS and SFRS measures. From timeto time, reference is made in this Offering Memorandum to such “non-GAAP financial measures”,including EBITDA, or (unless otherwise specified) earnings before finance income and costs,taxation, depreciation, amortization and impairment and share of results of associates, and net debt,or (unless otherwise specified) non-current borrowings plus current borrowings minus cash and cashequivalents, current and non-current restricted cash, and short-term investments. The Group’smanagement believes that EBITDA, net debt, operating free cash flow, return on average net worth,return on average capital employed and other non-GAAP financial measures provide investors withadditional information about the Group’s performance, as well as ability to incur and service debt andfund capital expenditure, and are measures commonly used by investors. For more detailed
vi

information concerning EBITDA, see “Summary Financial and Operating Data”. The non-GAAP
financial measures described herein are not a substitute for IFRS, Ind-AS and SFRS measures of
earnings and may not be comparable to similarly titled measures reported by other companies due to
differences in the way these measures are calculated.
Rounding
Certain amounts and percentages included in this Offering Memorandum have been rounded.
Accordingly, in certain instances, the sum of the numbers in a column may not equal the total figure
for that column. Numbers have been rounded off to one decimal where the numbers on rounding off
amounted to zero.
vii

CERTAIN DEFINITIONS
In this Offering Memorandum, unless otherwise specified or the context otherwise requires, “the
Group” refers to Tata Steel Limited and its consolidated subsidiaries and joint ventures and associates.
References to the “Issuer” mean ABJA Investment Co. Pte. Ltd.
In this Offering Memorandum, unless otherwise specified, all financial statements and financial data
are of the Group on a consolidated basis. In this Offering Memorandum, unless otherwise specified
or the context otherwise requires, references to “$”, “US$” or “U.S. Dollars” are to United States
dollars, references to “Rs.”, “rupee”, “rupees” or “Indian rupees” are to the legal currency of India,
references to “GBP”, “pounds” or “£” are to the official currency of the United Kingdom, references
to “CAD” or “C$” are to the official currency of the Canada, references to “SGD” or “S$” are to
Singapore dollars, references to “THB” are to Thai baht and references to Euro, “Euros” or “ C= ” are
to the common currency of the Eurozone countries. References to a particular “Financial Year” are to
the financial year ended March 31 of such year. In this Offering Memorandum, references to “U.S.”
or “United States” are to the United States of America, its territories and its possessions. References
to “India” are to the Republic of India.
viii

EXCHANGE RATE INFORMATION
The following table sets forth, for the periods indicated, certain information concerning the exchange
rates between Indian rupees and U.S. Dollars. The exchange rates reflect the rates as reported by the
FEDAI.
Period Period end Average High Low
2012(1) . . . . . . . . . . . . . . . . . . . . . . . . . . . 51.16 47.95 54.24 43.95
2013(1) . . . . . . . . . . . . . . . . . . . . . . . . . . . 54.28 54.43 57.33 50.52
2014(1) . . . . . . . . . . . . . . . . . . . . . . . . . . . 59.89 60.47 68.85 53.67
2015(1) . . . . . . . . . . . . . . . . . . . . . . . . . . . 61.16 61.16 63.67 58.47
2016(1) . . . . . . . . . . . . . . . . . . . . . . . . . . . 65.45 65.45 68.72 62.19
2017(1) . . . . . . . . . . . . . . . . . . . . . . . . . . . 67.08 67.08 68.77 64.85
July 2017 . . . . . . . . . . . . . . . . . . . . . . 64.19 64.46 64.88 64.11
August 2017 . . . . . . . . . . . . . . . . . . . . 63.91 63.96 64.16 63.59
September 2017 . . . . . . . . . . . . . . . . . . 65.29 64.46 65.72 63.79
October 2017 . . . . . . . . . . . . . . . . . . . . 64.75 65.06 65.50 64.75
November 2017 . . . . . . . . . . . . . . . . . . 64.47 64.86 65.43 64.32
December 2017. . . . . . . . . . . . . . . . . . . 63.88 64.24 64.58 63.88
January 2018 (through to January 8,2018) . . . . . . . . . . . . . . . . . . . . . . . . 63.51 63.50 63.68 63.37
(1) Represents the financial year ended March 31 of the year indicated.
The exchange rate on January 8, 2018 as reported by the FEDAI was Rs.63.51 per US$1.00.
Although certain rupee amounts in this Offering Memorandum have been translated into U.S. Dollars
for convenience, this does not mean that the rupee amounts referred to could have been, or could be,
converted into U.S. Dollars at any particular rate, the rates stated below, or at all. Except as otherwise
stated, Indian Rupee amounts as at and for the financial year ended March 31, 2017, and as at and for
the six months ended September 30, 2017, were converted to U.S. Dollars at the exchange rate of
US$1.00 = Rs.64.85 and US$1.00 = Rs.65.28, respectively.
ix

FORWARD-LOOKING STATEMENTS AND ASSOCIATED RISKS
Certain statements in this Offering Memorandum are not historical facts and are forward-lookingstatements. This Offering Memorandum may contain words such as “believe”, “could”, “may”, “will”,“target”, “estimate”, “project”, “predict”, “forecast”, “guideline”, “should”, “plan”, “expect” and“anticipate” and similar expressions that are intended to identify forward-looking statements, but arenot the exclusive means of identifying these statements. All statements regarding the Group’s expectedfinancial condition and results of operations and business plans and prospects are forward-lookingstatements. In particular, “Summary”, “Management’s Discussion and Analysis of Financial Conditionand Results of Operations of the Group”, “Management’s Discussion and Analysis of FinancialCondition and Results of Operations of the Group” and “Business” contain forward-lookingstatements, including relating to market trends, capital expenditure and other factors affecting theGroup that are not historical facts.
Forward-looking statements are subject to certain risks and uncertainties, including, but not limitedto:
• changes in global economic, political and social conditions;
• changes in economic and political conditions and increases in regulatory burdens in India andother countries in which the Group operates, transacts business or has interests;
• the Group’s substantial indebtedness and ability to meet its debt service obligations;
• the risk of a potential fall in steel prices or of price volatility;
• accidents and natural disasters in India or in other countries in which the Group operates orglobally, including specifically India’s neighboring countries;
• the Group’s business and operating strategies and its ability to implement such strategies;
• the Group’s ability to successfully implement its growth and expansion plans, technologicalchanges, exposure to market risks and foreign exchange risks that have an impact on its businessactivities;
• the Group’s ability to ensure continuity of senior management and ability to attract and retainkey personnel;
• the implementation of new projects, including future acquisitions and financings;
• the availability and terms of external financing;
• the Group’s ability to meet its capital expenditure requirements or increases in capitalexpenditure requirements;
• the Group’s inability to successfully compete with other steel manufacturers;
• cost overruns or delays in commencement of production from the Group’s new projects;
• changes in the Group’s relationship with the Government and the governments of the countriesin which the Group operates;
• changes in exchange controls, import controls or import duties, levies or taxes, either ininternational markets or in India;
• changes in laws, regulations, taxation or accounting standards or practices that affect the Group;
x

• changes in prices or demand for the products produced by the Group both in India and in
international markets;
• changes in the value of the rupee against major global currencies and other currency changes;
• the ability of third parties to perform in accordance with contractual terms and specifications;
• any adverse outcome in legal proceedings in which the Group is or may become involved
including, with respect to product liability claims;
• acquisitions and divestitures which the Group may undertake;
• changes in interest rates;
• significant fluctuations of the prices of raw materials;
• the estimated reserves of the Group’s iron ore mines; and
• other factors, including those discussed in “Risk Factors”.
Forward-looking statements involve inherent risks and uncertainties. If one or more of these or other
uncertainties or risks materialize, actual results may vary materially from those estimated, anticipated
or projected. Specifically, but without limitation, capital costs could increase, projects could be
delayed, and anticipated improvements in capacity, performance or profit levels might not be fully
realized. Although the Group believes that the expectations of its management as reflected by such
forward-looking statements are reasonable based on information currently available to it, no
assurances can be given that such expectations will prove to have been correct. Accordingly, you are
cautioned not to place undue reliance on the forward-looking statements, which speak only as of the
date they are made. Neither the Issuer nor the Group undertakes any obligation to update or revise any
of them, whether as a result of new information, future developments or otherwise.
xi

TABLE OF CONTENTS
Page
DEFINITIONS AND GLOSSARY . . . . . . . . . . . . . . . . . . . . . . . . . . . . . . . . . . . . . . . . . . . . 1
SUMMARY . . . . . . . . . . . . . . . . . . . . . . . . . . . . . . . . . . . . . . . . . . . . . . . . . . . . . . . . . . . . 3
SUMMARY FINANCIAL AND OPERATING DATA . . . . . . . . . . . . . . . . . . . . . . . . . . . . . . 12
THE OFFERING . . . . . . . . . . . . . . . . . . . . . . . . . . . . . . . . . . . . . . . . . . . . . . . . . . . . . . . . . 33
RISK FACTORS . . . . . . . . . . . . . . . . . . . . . . . . . . . . . . . . . . . . . . . . . . . . . . . . . . . . . . . . . 39
USE OF PROCEEDS . . . . . . . . . . . . . . . . . . . . . . . . . . . . . . . . . . . . . . . . . . . . . . . . . . . . . 68
CAPITALIZATION . . . . . . . . . . . . . . . . . . . . . . . . . . . . . . . . . . . . . . . . . . . . . . . . . . . . . . . 69
SELECTED CONSOLIDATED FINANCIAL DATA AND OTHER INFORMATION . . . . . . . 70
MANAGEMENT’S DISCUSSION AND ANALYSIS OF FINANCIAL CONDITION
AND RESULTS OF OPERATIONS OF THE GROUP . . . . . . . . . . . . . . . . . . . . . . . . . . . 91
MANAGEMENT’S DISCUSSION AND ANALYSIS OF FINANCIAL CONDITION
AND RESULTS OF OPERATIONS OF TATA STEEL . . . . . . . . . . . . . . . . . . . . . . . . . . . 116
INDUSTRY OVERVIEW . . . . . . . . . . . . . . . . . . . . . . . . . . . . . . . . . . . . . . . . . . . . . . . . . . 126
DESCRIPTION OF THE ISSUER . . . . . . . . . . . . . . . . . . . . . . . . . . . . . . . . . . . . . . . . . . . . 133
BUSINESS . . . . . . . . . . . . . . . . . . . . . . . . . . . . . . . . . . . . . . . . . . . . . . . . . . . . . . . . . . . . . 135
MANAGEMENT . . . . . . . . . . . . . . . . . . . . . . . . . . . . . . . . . . . . . . . . . . . . . . . . . . . . . . . . . 159
SHARE OWNERSHIP OF THE GROUP . . . . . . . . . . . . . . . . . . . . . . . . . . . . . . . . . . . . . . . 163
RELATED PARTY TRANSACTIONS . . . . . . . . . . . . . . . . . . . . . . . . . . . . . . . . . . . . . . . . . 164
REGULATION . . . . . . . . . . . . . . . . . . . . . . . . . . . . . . . . . . . . . . . . . . . . . . . . . . . . . . . . . . 166
DESCRIPTION OF MATERIAL INDEBTEDNESS . . . . . . . . . . . . . . . . . . . . . . . . . . . . . . . 169
TERMS AND CONDITIONS OF THE [●] NOTES . . . . . . . . . . . . . . . . . . . . . . . . . . . . . . . 175
TERMS AND CONDITIONS OF THE [●] NOTES . . . . . . . . . . . . . . . . . . . . . . . . . . . . . . . 199
THE GLOBAL CERTIFICATE . . . . . . . . . . . . . . . . . . . . . . . . . . . . . . . . . . . . . . . . . . . . . . 223
TAXATION . . . . . . . . . . . . . . . . . . . . . . . . . . . . . . . . . . . . . . . . . . . . . . . . . . . . . . . . . . . . 224
CLEARANCE AND SETTLEMENT . . . . . . . . . . . . . . . . . . . . . . . . . . . . . . . . . . . . . . . . . . 229
SUBSCRIPTION AND SALE . . . . . . . . . . . . . . . . . . . . . . . . . . . . . . . . . . . . . . . . . . . . . . . 230
TRANSFER RESTRICTIONS . . . . . . . . . . . . . . . . . . . . . . . . . . . . . . . . . . . . . . . . . . . . . . . 235
INDEPENDENT AUDITORS . . . . . . . . . . . . . . . . . . . . . . . . . . . . . . . . . . . . . . . . . . . . . . . 236
GENERAL INFORMATION . . . . . . . . . . . . . . . . . . . . . . . . . . . . . . . . . . . . . . . . . . . . . . . . 237
DESCRIPTION OF CERTAIN DIFFERENCES BETWEEN IND-AS AND IFRS . . . . . . . . . 238
INDEX TO FINANCIAL STATEMENTS AND AUDITORS’ REPORTS . . . . . . . . . . . . . . . . F-1
xii

DEFINITIONS AND GLOSSARY
In addition to the terms that are otherwise defined in this Offering Memorandum, the following setsout the definitions of certain terms used in this Offering Memorandum.
Act or Companies Act or IndianCompanies Act . . . . . . . . . . . . .
Companies Act, 2013, together with rules and regulationsthereunder or, where applicable, the Companies Act, 1956,together with the rules and regulations thereunder, each asamended, supplemented or reenacted from time to time
Board or Board of Directors . . . . Board of Directors of Tata Steel, unless otherwise specified
brownfield . . . . . . . . . . . . . . . . . . Land occupied by defunct or under-utilized commercial orindustrial facilities
CAGR . . . . . . . . . . . . . . . . . . . . . Compounded Annual Growth Rate
crude steel . . . . . . . . . . . . . . . . . . Cast, solidified steel before further treatment
Directors . . . . . . . . . . . . . . . . . . . Directors of Tata Steel
downstream . . . . . . . . . . . . . . . . . Further processing of crude steel to produce finished steelproducts
EBITDA . . . . . . . . . . . . . . . . . . . Earnings before finance income and costs, taxation,depreciation, amortization and impairment and share ofresults of associates (unless otherwise specified). It is not aIFRS (GAAP) measure
Eurozone . . . . . . . . . . . . . . . . . . . The members of the European Union that have adopted theEuro as their common currency
FEDAI . . . . . . . . . . . . . . . . . . . . . Foreign Exchange Dealer’s Association of India
finished product . . . . . . . . . . . . . . Steel ready for construction or manufacturing use
GDP. . . . . . . . . . . . . . . . . . . . . . . gross domestic product
GoI or Government or CentralGovernment . . . . . . . . . . . . . . .
Government of India
greenfield project . . . . . . . . . . . . . a project that lacks any constraints by prior work
Group . . . . . . . . . . . . . . . . . . . . . Tata Steel Limited, its subsidiaries and joint ventures andassociates
Hazardous Wastes Rules. . . . . . . . The Hazardous and Other Wastes (Management andTransboundary Movement) Rules, 2016
IFRS . . . . . . . . . . . . . . . . . . . . . . International Financial Reporting Standards
I D Act . . . . . . . . . . . . . . . . . . . . Industrial Disputes Act, 1947, as amended
Indian GAAP . . . . . . . . . . . . . . . . Generally Accepted Accounting Practices in India
Ind-AS . . . . . . . . . . . . . . . . . . . . . Indian Accounting Standards
km . . . . . . . . . . . . . . . . . . . . . . . . Kilometers
1
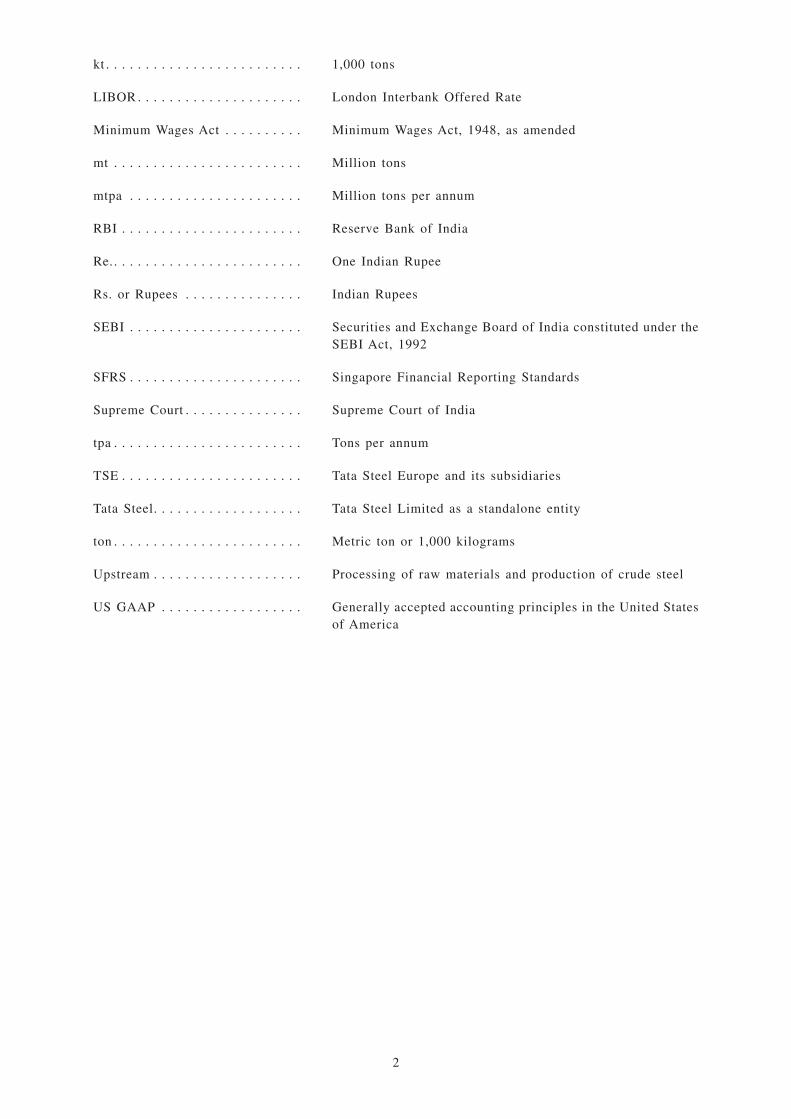
kt . . . . . . . . . . . . . . . . . . . . . . . . . 1,000 tons
LIBOR . . . . . . . . . . . . . . . . . . . . . London Interbank Offered Rate
Minimum Wages Act . . . . . . . . . . Minimum Wages Act, 1948, as amended
mt . . . . . . . . . . . . . . . . . . . . . . . . Million tons
mtpa . . . . . . . . . . . . . . . . . . . . . . Million tons per annum
RBI . . . . . . . . . . . . . . . . . . . . . . . Reserve Bank of India
Re.. . . . . . . . . . . . . . . . . . . . . . . . One Indian Rupee
Rs. or Rupees . . . . . . . . . . . . . . . Indian Rupees
SEBI . . . . . . . . . . . . . . . . . . . . . . Securities and Exchange Board of India constituted under theSEBI Act, 1992
SFRS . . . . . . . . . . . . . . . . . . . . . . Singapore Financial Reporting Standards
Supreme Court . . . . . . . . . . . . . . . Supreme Court of India
tpa . . . . . . . . . . . . . . . . . . . . . . . . Tons per annum
TSE . . . . . . . . . . . . . . . . . . . . . . . Tata Steel Europe and its subsidiaries
Tata Steel. . . . . . . . . . . . . . . . . . . Tata Steel Limited as a standalone entity
ton . . . . . . . . . . . . . . . . . . . . . . . . Metric ton or 1,000 kilograms
Upstream . . . . . . . . . . . . . . . . . . . Processing of raw materials and production of crude steel
US GAAP . . . . . . . . . . . . . . . . . . Generally accepted accounting principles in the United Statesof America
2

SUMMARY
This overview highlights certain information contained in this Offering Memorandum. This overview
does not contain all the information you should consider before investing in the Notes. You should read
this entire Offering Memorandum carefully, including the sections entitled “Forward-Looking
Statements and Associated Risks”, “Risk Factors”, “Management’s Discussion and Analysis of
Financial Condition and Results of Operations of the Group” and “Business” included elsewhere in
this Offering Memorandum and the financial information and the notes thereto set forth herein. To
understand the terms of the Notes, you should carefully read the sections of this Offering Memorandum
entitled “Terms and Conditions of the Notes”.
Overview
The Group is one of the world’s largest steel companies with a steel production capacity of
approximately 27.5 mtpa. According to the World Steel Association (“WSA”), the Group was the
world’s 10th largest steel maker by crude steel production volume in 2016. The Group is also one of
the most geographically diversified steel producers, with operations in 26 countries and a commercial
presence in more than 50 countries. As of March 31, 2017, the Group had over 70,000 employees.
Tata Steel was established as India’s first integrated steel company in 1907 by Jamsetji N. Tata and
is one of the flagship companies of the Group. The Group has a presence across the entire value chain
of steel manufacturing, including producing and distributing finished products as well as mining and
processing iron ore and coal for its steel production. The Group’s operations are primarily focused in
India, Europe, and South East Asia. For the year ended March 31, 2017, the Group’s operations in
India and Europe represented approximately 43% and 39%, respectively, of the revenue of the Group,
and for the six months ended September 30, 2017, represented approximately 45% and 46%,
respectively, of the revenue of the Group.
The steel production capacity of the Group has increased from approximately 5.0 mtpa in the year
ended March 31, 2006 to approximately 27.5 mtpa as of March 31, 2017. In India, as of September
30, 2017, the Group has steel production facilities located in Jamshedpur and Kalinganagar, with a
total steel production capacity of 12.7 mtpa. The Group’s operations in India also include captive iron
ore and coal mines. Additionally, the Group has significant operations in the United Kingdom and the
Netherlands, where the Group has a total steel production capacity of 12.4 mtpa. The remaining steel
production capacity of the Group is located in South East Asia.
For the year ended March 31, 2017, the Group’s business in India recorded sales of 10.97 mt,
recording a growth of 15.0% over the year ended March 31, 2016 and a growth of 22.0% for the six
months ended September 30, 2017, compared to the six months ended September 30, 2016. This
increase was largely due to the ramping up of operations at the Kalinganagar plant in Odisha, which
is now operating at full capacity.
The Group offers a broad range of steel products including a portfolio of high value-added
downstream products such as hot rolled, cold rolled and coated steel, sections, plates, rebars, wire
rods, tubes, rails and wires. The Group is also a large producer of ferro-chrome in India.
The Group’s main markets for its products are India and Europe, which together accounted for
approximately 82% and 83% of the Group’s revenue for the year ended March 31, 2016 and 2017,
respectively, with the remaining sales primarily taking place in other markets in Asia. The Group’s
customers are primarily in the construction, infrastructure, automotive, consumer goods, material
handling, aerospace and general engineering industries.
3

For the years ended March 31, 2016 and 2017, the Group recorded revenues of Rs.1,063,399 millionand Rs.1,174,199 million, respectively. The Group recorded a loss of Rs.4,971 million for the yearended March 31, 2016, a loss of Rs.41,686 million for the year ended March 31, 2017, a profit ofRs.19,389 million for the six months ended September 30, 2017 against a loss of Rs.32,325 millionfor the six months ended September 30, 2016. The Group had total assets of Rs.1,733,332 million asof March 31, 2017 and Rs.1,742,203 million as of September 30, 2017.
For the years ended March 31, 2016 and 2017, the Group had total steel production of 22.9 mt and24.2 mt, respectively. Similarly, the Group had steel production of 11.5 mt and 12.5 mt for the sixmonth periods ended on September 30, 2016 and September 30 2017, respectively.
Key Strengths
Sustainable and highly cost efficient operations in India
The Group is one of the lowest cost steel producers in India and it has successfully maintained its costleadership over several years. The cost of production of the Group’s Indian operations ranks amongthe lowest for hot rolled coils globally. The Group derives its competitive advantage through accessto raw materials from their captive mines and a highly skilled workforce with a relatively low cost oflabor at its operations in India. This advantage is especially valuable given the difficulty of achievingraw materials cost pass-through in the steel industry. In India, the Group has significant captive ironore, coking coal, chrome ore and manganese ore mines that accommodate a majority of its currentrequirements.
These factors have enabled the Group’s Indian operations to maintain robust operating margins inIndia. For the year ended March 31, 2017, with respect to its Indian operations, the Group obtained100% of its iron ore requirements and approximately 36% of its coking coal requirement from captivemines leased by the Group.
As a result, the Group expects that its exposure to volatility in prices of commodities such as iron oreand coking coal, for the Group’s Indian operations will be limited.
To expedite projects related to operational excellence across the value chain, in 2014, the Grouplaunched the SHIKHAR 25 program. The focus of SHIKHAR 25 is to improve process efficiency,speed and throughput, reliability, energy efficiency, value-in-use, supply chain and logistics and otherprocesses. Performance benchmarking at each of these processes allows the Group to readily identifyareas in need of improvement. The ultimate goal of SHIKHAR 25 is to improve overall processefficiency that would translate into EBITDA improvement. These initiatives resulted in approximatelyRs.34,000 million of cost savings in the year ended March 31, 2017.
Leading position across operations
The Group has significant market positions in its principal markets, India and Europe, across mainareas of operations in upstream and downstream steel products.
In India, the Group produces flat products used in the automotive and engineering industries and longproducts used in the construction industry, including in the industrial, commercial, infrastructure andhousing sectors. According to the Joint Plant Committee (a committee formed by the Indian Ministryof Steel to collect data on the industry), the Group’s Indian operations produced approximately 12%of sales of all the finished steel in India and was the third largest producer of crude steel for year endedMarch 31, 2017. According to the Joint Plant Committee, the Group had a market share of 15.7% ofsales in flat products for carbon steel for the year ended March 31, 2017.
In addition, the Group also benefits from being identified with the Tata brand, which is a widelyrecognized brand in India.
4

India is principally the largest market for the Group’s operations, representing approximately 43% of
its total revenue for the year ended March 31, 2017. The Group believes that its diversified customer
sector portfolio and strategic focus on creating customer relationships will continue to generate
customer loyalty and enable it to maintain its market share position in the construction, packaging, rail
and automotive sectors.
Global scale
The Group is one of the world’s largest steel companies and operates a global suite of integrated steel
making facilities, mining complexes and distribution companies. It has a commercial presence in over
50 countries, including both developed and emerging markets, and principal markets in Europe, India
and South East Asia. The Group believes that its global scale and reach enhances its ability to service,
retain and attract multi-national customers and, in particular, customers from the automotive,
packaging and construction industries. As major customers continue to globalize their operations and
are increasingly relying on a select few global suppliers for their products (such as in the automotive
sector), the Group believes it can attract new customers and better retain its existing customers
through its diversified downstream operations, product range and strong product branding, as well as
its extensive distribution and production capabilities.
The Group also benefits from its global scale operations, procurement, production plants and
distribution network, which allow the Group to achieve greater economies of scale and improve its
cost efficiencies across the supply chain, from raw material sourcing to product deliveries and support
functions.
Diversified product base targeting multiple end user segments
The Group has a wide range of product offerings that cater to diversified end-markets across
geographies. Over the years, the Group has significantly expanded its product portfolio through a mix
of acquisitions, downstream capacity expansions and joint ventures with other leading steel
companies.
The Group has significantly enhanced its portfolio of downstream steel products to differentiate itself
from competitors, including through its acquisition of Corus and downstream capacity expansions in
India. With its capacity expansions in India, the Group has further strengthened its ability to provide
a greater variety of value-added products.
Furthermore, the Group has entered into joint ventures with downstream foreign steel specialist
producers, including BlueScope Steel Limited and Nippon Steel and Sumitomo Metal Corporation, for
finishing plants that produce color coated steel and automotive cold rolled flat products, respectively.
In addition, the Group continues to invest in research and development and explore opportunities to
further improve their product offerings to customers.
Efficient project implementation
The Group has a proven track record of implementing significant projects, including cost reduction
plans and expansion plans for its major production facilities. The Group expanded its existing
brownfield crude steel capacity at Jamshedpur from 6.8 mtpa to 9.7 mtpa in December 2012 and
established a greenfield project of 3.0 mtpa in Kalinganagar, Odisha which increased crude steel
capacity in India from 9.7 mtpa to 12.7 mtpa. In addition, the Group has rebuilt one of the blast
furnaces at the Group’s facility in Port Talbot.
5

Uniquely positioned to undertake acquisitions opportunistically
The Group is uniquely positioned to undertake acquisitions opportunistically, in particular
opportunities with respect to companies in India undergoing the corporate insolvency resolution
process under the IBC.
The Group evaluates acquisition opportunities based on possibilities for synergies, broadening its
customer base, access to raw materials, manufacturing facilities, infrastructure, new geographic
locations and advanced technology, widening its product offerings and growth opportunities that such
acquisition may offer. The Group’s extensive operations in different parts of India and across various
verticals in the steel industry enhance possibilities for synergies from such acquisition opportunities.
The combination of the Group’s domain expertise of the Indian steel industry, coupled with its
knowledge of the global steel industry and its experience with acquisitions, enables it to better
evaluate strategic acquisition opportunities. Further, due to its track record of successful acquisitions,
the Group’s internal teams have experience and expertise in complex domestic and international
competitive acquisitions which can be leveraged in evaluating acquisition opportunities and executing
them in an efficient and timely manner. Additionally, the Group’s extensive experience in various
industries and acquisitions will help it evaluate acquisition opportunities.
If the Group pursues any acquisition opportunities, its robust balance sheet can potentially enable it
to avail internal and external funding options, which will enhance its ability to submit competitive
bids. Further, the brand name of the Group, and the reputation of the “Tata Group”, also provide it with
competitive advantages in acquisition processes.
The above factors differentiate the Group from its competitors and contribute to its unique position
to capitalize on acquisition opportunities in India, especially with respect to opportunities arising from
the corporate insolvency resolution process under the IBC.
Skilled workforce led by experienced management team
The Group’s senior management team is comprised of members with professional qualifications and
extensive experience in the steel industry. The senior management team’s rich experience and
understanding of the Group has been essential in building a sustainable global operation which
employs over 70,000 individuals, while the Group’s employee policies and welfare programs have
been instrumental in recruiting and retaining the high caliber workforce.
The Group seeks to nurture internal talent for senior management positions by hiring recent graduates
from top universities as entry-level employees, and then identifying and promoting the most promising
candidates through the management ranks. The employee welfare program is developed from the
Group’s philosophy that people are its greatest asset. The program affirms the rights to trade union
representation and collective consultation, ensures an ethical, just and fair workplace, encourages
work-life balance and provides managerial and functional training opportunities for all employees.
The Group’s commitment to building an ethical organisation through a committed workforce was
reaffirmed as it received the “World’s Most Ethical Company Award” in 2017 from Ethisphere USA
for the fifth time.
6

Strategy
Capacity Expansion in Growing Indian Steel Markets
In recent years, the Group has successfully implemented significant projects focused on expanding thecapacity of its Indian operations through brownfield and greenfield projects, such as expanding itsfacility at Jamshedpur and establishing the Kalinganagar facility. The Group intends to continue toincrease the size of its operations in India in view of the growing steel market, and its competitiveadvantage as a low-cost producer, through its brownfield and greenfield expansion projects.
Restructuring of European portfolio
As part of the process of the Group’s restructuring of its European operations, on September 20, 2017,Tata Steel and Thyssenkrupp AG signed a memorandum of understanding to create a new 50:50 jointventure company called Thyssenkrupp Tata Steel. This joint venture is expected to be the next stagein the transformation of the Group’s European business. The joint venture is intended to create a largerworld-class and globally competitive strip steel business, which, if successful, will be the secondlargest steel company in Europe.
This joint venture follows other restructuring initiatives, including the following:
• On May 31, 2016, Longs Steel UK Limited and other subsidiaries of TSE, which were involvedwith the long steel business, were sold to Greybull Capital LLP;
• On May 1, 2017, TSE completed the sale of the Specialty Steels business to Liberty SpecialtySteels Ltd.;
• On July 31, 2017, TSE completed the sale of its 42 and 84 inch pipe mills in Hartlepool toLiberty Specialty Steels Ltd. Pursuant to these portfolio changes, activities of TSE will befocused on the manufacture and sale of strip products; and
• The British Steel Pension Scheme (“BSPS”) is the principal defined benefit pension scheme ofthe Group in the United Kingdom. On March 31, 2017 the BSPS was closed to future accrual andreplaced by a defined contribution scheme. On September 11, 2017 the BSPS separated from TataSteel UK (“TSUK”) and a number of affiliated companies on completion of a RegulatedApportionment Arrangement (“RAA”). TSUK has also agreed to sponsor a proposed new pensionscheme (“BSPS2”), subject to certain qualifying conditions being met. Since the RAA hascompleted, all members of the BSPS will be invited to transfer to the new scheme. If thequalifying conditions are met, members may choose to be transferred to BSPS2. The BSPS2scheme would have lower future annual increases for pensioners and deferred members comparedto the BSPS, giving it an improved funding position which is expected to improve the risk profilefor TSUK.
Increase Sales of High Value-Added Products and Branded Sales
The Group plans to increase sales of its specialized solutions, high value products and brandedproducts to improve its product mix and generate higher and sustainable margins. In India, the Groupplans to continue increasing its production and sales of high value-added steel products such as coldrolled coil, automotive-grade sheets, coated products such as tinplate, color-coated steel andgalvanized steel.
To consolidate gains from retail growth, the Group is also offering services and solutions whichprovide spin-off benefits that could potentially open new revenue streams in the future and keep retailsales from hitting a plateau. Simultaneously, the Group has increased its production and sales throughthe commencement of new manufacturing capacities at the Kalinganagar plant, which commencedoperations in June 2016 and has recently ramped up to full capacity. The Group’s steel-based solutions
7

include Pravesh (wood-finished steel doors), Nest-In (modular housing), toilets and water ATMs andRoof Junction (a complete roofing solution). The Group is also exploring the possibility of offeringservices or solutions for the furniture space which has wood-like finishes on blended steel structures.
To further enhance the high value-added product portfolio, the Group intends to increase productionthrough its various joint ventures, including the following:
• Tata BlueScope Steel Limited manufactures coated steel coils, steel building solutions andrelated building products;
• The Group’s joint venture with Nippon Steel and Sumitomo Metal Corporation;
• Jamshedpur Continuous Annealing & Processing Company Private Limited has a continuousannealing and processing line to produce automotive cold rolled flat products; and
• The Group’s joint venture with Nichia Steel Works, Japan through its subsidiary Siam IndustrialWire Co., Thailand to set up a high-end galvanized wires facility which including galvanizedwires for cable stay strands and zinc-aluminum coated wires.
Enhance Competitiveness through Continuous Improvement
The Group continues to improve its competitiveness through a number of initiatives and programsaimed at enhancing operational efficiencies and optimizing asset and material flows. The Group seeksto benefit from sharing experiences and best operational practices across its business units in India,Europe and South East Asia.
Operational Stability
Significant capital expenditure has been committed to support the strategic growth of differentiated,high value products in the automotive, lifting and excavating, and oil and gas market sectors. TheGroup is leveraging its market position in downstream products to aid margin improvement. TheGroup is also focused on streamlining its logistical operations in Europe through a supply chaintransformation improvement initiative which commenced in September 2016.
Further, to improve its operations in Europe, TSE approved the Strategic Asset Roadmap program in2015, to increase the sales of differentiated, high value products in several market segments includingautomotive, lifting and excavating and energy and power. This has required revamping and upgradingthe facilities to produce high quality products.
Raw Materials Security
The Group seeks access to raw materials for its operations in India and internationally in order toachieve economic returns and to optimize its costs by securing off-take rights. The Group believes thatbecoming increasingly self-sufficient in raw materials procurement will enable it to better respond tocyclical fluctuations in the demand for products and reduce volatility in production costs. For the yearended March 31, 2017, with respect to its Indian operations, the Group obtained 100% of its iron orerequirements and approximately 36% of its coking coal requirement from captive mines.
The Group’s various coking coal and iron ore assets across geographies include a 64% stake in SouthAfrica’s Sedibeng Iron Ore Company and a joint venture in Canada in relation to a project spread overvarious iron ore deposits in the provinces of Quebec and Newfoundland and Labrador.
The Group intends to continue to work with its partners to pursue its current initiatives and, ifopportunities arise, to pursue new initiatives, subject to market conditions, in effort to becomeincreasingly self-sufficient in its raw material procurement.
8

Strategic Control Over Logistics and Supply Chain
The Group continues to differentiate itself from competitors in India with various initiatives inlogistics and supply chain management. With a particular focus on the automotive, construction andsmall and medium enterprise customer segments, the Group has enhanced its distribution channels.The principal goal of these initiatives was to be able to provide supplies on an “on time in full” basis.
In India, the Group has developed a nationwide network of exclusive distributors and dealers. Toincrease efficiencies, the Group redesigned its supply network using the hub-and-spoke mode ofoperations and information technology enabled color-based dispatch priority systems. As a result, theGroup has been able to increase sales in the retail segment.
Other principal supply chain improvement initiatives include:
• Supply chain enhancements such as deploying theory of constraints, improving deliverycompliance via steel service center management and the availability of ready to use materialfrom certified service centers;
• Standardization and availability of information; and
• Convenience through the development of information technology systems across the distributionchannels, channel authentication through an authorized dealer network, conducive shoppingexperience through exclusive retail outlets and improved reach to largest consumption centers.
To further enhance its supply chain and enhance control over logistics, the Group entered into a jointventure with NYK Lines, a Japanese shipping company, to provide logistics solutions such as portoperations, ship agency, custom clearance, in-land logistics, warehousing, shipping and freightforwarding for dry bulk, containerized, break-bulk and project cargo.
Strategic Alliances with Joint Venture Partners
The Group’s expansion plans have benefitted from strategic alliances with joint venture partnersthroughout its chain of operations, including for raw material procurement (primarily for mining),steel production, product diversification and shipping. For example, through the Group’s strategicpartners it has developed:
• Mining operations in Canada;
• Downstream value-added steel production pursuant to joint ventures with BlueScope SteelLimited;
• Product diversification pursuant to a joint venture with Nippon Steel and Sumitomo MetalCorporation; and
• Shipping operations with NYK Line and Martrade.
The Group continues to expand its capacity and operations through joint ventures including throughits memorandum of understanding on September 20, 2017, with Thyssenkrupp AG to create a new jointventure company, namely, Thyssenkrupp Tata Steel.
Continue to pursue inorganic growth opportunities, including with respect to distressed assets
The Group intends to continue to pursue inorganic growth opportunities, with a particular focus onacquisitions that generate greater synergies and production capacity, manufacturing facilities,infrastructure and advanced technology, and which allow it to diversify its product and customer base.
9

In addition, the Group is pursuing and may continue to pursue opportunities for acquisition of
financially stressed assets, including with respect to companies that are undergoing a corporate
insolvency resolution process under the IBC. In considering such acquisition opportunities, the Group
has and may continue to rely on its deep experience and knowledge generally for evaluating
acquisitions, including the cost benefit and financing of such acquisitions.
The IBC Process is a statutory process for insolvency resolution of corporate entities in a time-bound
manner to maximize the value of assets of such entities. Currently, certain Indian steel manufacturing
companies such as Bhushan Steel Limited, Electrosteel Steels Limited, Essar Steel India Limited,
Bhushan Power and Steel Limited and Monnet Ispat and Energy Limited are undergoing the corporate
insolvency resolution process under IBC. The Group believes that this is a strategic opportunity for
it to explore the acquisition of such companies.
Evaluating an acquisition under the IBC Process involves, among others, identification of the assets
that will generate synergies and fits into the overall strategic framework for the Group and provide
growth opportunities and estimating the optimum value for the assets proposed to be acquired. The
Group may work with external advisors to analyse and evaluate the assets to be acquired and estimate
the optimum value for such assets based on, among others, publicly available information, information
provided to the Group confidentially as part of the IBC Process and its deep domain knowledge of the
steel industry. If the Group is successful in the IBC Process, it may finance the acquisitions by internal
accruals, or additional capital raised as debt or equity or any other form in the company, or additional
capital in a subsidiary or associate of the company.
The Group will continue to evaluate acquisition opportunities that may arise in Indian or other markets
and upon completion of any such acquisitions, aim to integrate new acquisitions with its existing
operations to generate synergies and growth opportunities. For further details, see “Risk Factors”.
Tata Steel — Corporate Structure Chart
The primary subsidiaries of the Group are as follows:
Tata Steel Limited (TSL)
T Steel Holdings Pte. Ltd.
T S Global Holdings Pte. Ltd.
JVs (TBSL, CAPL, Tata NYK and Others
Natsteel Asia Pte Ltd
Tata Steel Europe
Tulip UK Holdings No.2
Tata Steel Netherlands Holdings (B.V.)
Corus Group Ltd.
TS Global Minerals Holdings, Singapore
NatSteel Holdings Pte. Ltd., Singapore
Tata Steel (Thailand) Public Co. Ltd.
TS Global Procurement Co. Pte. Ltd.
ProCo Issuer Pte. Ltd.
Black Ginger 461 (Proprietary) Ltd
New Millennium Iron Corp (Iron Ore)
Tata Steel Minerals UK Ltd
Tata Steel Minerals Canada Ltd.
Minas De Benga , LDA, Mozambique
Listed Entity Tata Steel Europe Resources Companies Others
100%
100%
100% 100% 100% 67.9% 100%
100%
100% 26.18% 100 %
100%
100%
100%
64% 4.32% 77.68%
T S Canada Capital Ltd.
100 %
100%
Tata Steel International (Singapore)
Holdings Pte. Ltd.
9336 -0634 Quebec Inc
33.33%
Tulip UK Holdings No.3
Tata Steel UK Ltd. Tata Steel
IJmuiden B.V.
Tata Steel UK Holdings
100%
100% 100% 100%
100%
100%
100%
British Steel Netherlands International
Orchid Netherlands (No. 1) B.V.
Abja Investment Co Pte Ltd
100% 100%
Tata Steel Nederland B.V.
Tata SSteelll NNNNedededeeeerrrrlalalannnnddd BBBB...VVVV...
10

Recent Developments
Proposed Equity Issuance by Tata Steel
Pursuant to a meeting of the Board of Directors of Tata Steel held on December 18 and 19, 2017, the
Board approved the issuance of equity and equity linked instruments, including ordinary shares, by
way of a rights issue to the existing shareholders of Tata Steel for an amount not exceeding Rs.128,000
million in accordance with relevant Indian regulations. The timing of the issuance is subject to certain
conditions, including receipt of regulatory approvals under Indian law.
Offshore Refinancing
The Group has received commitment letters from a number of banks with respect to proposed loan
facilities, the proceeds from which are expected to be used, along with the net proceeds of the Notes,
to refinance existing indebtedness of the Group outside of India. It is expected that the loans will be
utilized in the current financial quarter.
Corporate Information
The Issuer was incorporated in Singapore on April 12, 2013 as “ABJA Investments Co. Pte. Ltd.”,
registration number 201309883M, and has its registered office at 22 Tanjong Kling Road, Singapore
628048.
Tata Steel was incorporated with limited liability in the Republic of India on August 26, 1907 under
the Indian Companies Act, 1882 as “The Tata Iron and Steel Company Limited”. Tata Steel’s name was
changed to “Tata Steel Limited” with effect from August 12, 2005. Tata Steel’s registered office is
located at Bombay House, 24, Homi Mody Street, Fort, Mumbai 400 001, India. Tata Steel’s website
is http://www.tatasteel.com. Information contained on the Group’s website does not constitute part of
this Offering Memorandum.
11

SUMMARY FINANCIAL AND OPERATING DATA
You should read the summary financial and other data below, together with the financial statements
and related notes thereto appearing elsewhere in this Offering Memorandum, as well as
“Management’s Discussion and Analysis of Financial Condition and Results of Operations” and other
financial information included elsewhere in this Offering Memorandum. The Group’s fiscal year ends
on March 31. Accordingly, references in this Offering Memorandum to a particular fiscal year are to
the year ended March 31 of that year. References to a year other than a “fiscal year” are to the
calendar year ended December 31 of that year.
The Group is required to prepare its financial statements in accordance with Ind-AS with effect from
April 1, 2016. Accordingly, the financial statements as at and for the year ended March 31, 2017,
together with the comparative period data as at and for the year ended March 31, 2016, have been
prepared in in accordance with Ind-AS. The Issuer is required to prepare its financial statements in
accordance with the Singapore Financial Reporting Standards (“SFRS”). Accordingly, all of the
Issuer’s financial statements presented in this Offering Memorandum have been prepared in
accordance with SFRS.
All historical consolidated financial information in this Offering Memorandum is that of the Group,
its consolidated subsidiaries and proportionately consolidated joint ventures. In this Offering
Memorandum, unless otherwise specified, all financial information is of the Group on a consolidated
basis. All historical non-consolidated financial information in this Offering Memorandum is that of
Tata Steel or the Issuer, as specified.
The annual financial statements of the Group, on a consolidated basis, and of Tata Steel, on a
standalone basis, as at and for the years ended March 31, 2015, 2016 and 2017, and for the six month
periods ended September 30, 2016 and 2017, (collectively, the “Annual Financial Statements”), have
each been prepared in accordance with the following:
(i) with respect to the six months ended September 30, 2016 and 2017, prepared and presented in
accordance with Ind-AS;
(ii) with respect to the years ended March 31, 2016 and 2017, prepared and presented in accordance
with Ind-AS; and
(iii) with respect to the comparative period data for the years ended March 31, 2015 and 2016,
prepared and presented in accordance with Indian GAAP.
Ind-AS differs in certain respects from generally accepted accounting principles in the International
Financial Reporting Standards (“IFRS”). For a discussion of certain significant differences between
Ind-AS and IFRS, see “Description of Certain Differences between Ind-AS and IFRS”. In making an
investment decision, investors must rely on their own examination of the Group, the terms of the
offering and the financial information contained in this Offering Memorandum. Potential investors
should consult their own professional advisers for an understanding of the differences between
Ind-AS, Indian GAAP, US GAAP, SFRS or IFRS, and how these differences might affect their
understanding of the financial information contained herein.
The Annual Financial Statements for the Group have been audited by Deloitte Haskins and Sells LLP,
Chartered Accountants (“Deloitte”), as set forth in their audit reports included herein. For the financial
year beginning from April 1, 2017 onwards, Price Waterhouse and Co. Chartered Accountants LLP
(“Price Waterhouse and Co.”) became the statutory auditor for the Group.
12

The Annual Financial Statements for the Issuer have been audited by Deloitte, as set forth in theiraudit reports included herein. The unaudited interim financial statements of the Issuer for the sixmonths ended September 30, 2017, have been subject to limited review by PricewaterhouseCoopersLLP as set forth in their report dated January 12, 2018.
The standalone financial results of Tata Steel for the quarter and six months ended September 30, 2017have been audited by Price Waterhouse and Co. and the consolidated financial results of the Group forthe quarter ended September 30, 2017 have been subjected to a limited review by Price Waterhouseand Co. as set forth in their respective review reports included herein.
The unaudited interim financial statements of the Issuer for the six months ended September 30, 2017,have been subjected to a limited review by PricewaterhouseCoopers LLP as set forth in their reviewreport dated January 12, 2018.
Consolidated Statement of Profit and Loss of the Group
Consolidated Statement ofProfit and Loss Data
Six months endedSeptember 30,
Quarter endedSeptember 30,
Quarter endedJune 30,
Six monthsended
September 30,
(Ind-AS) 2017 2016
(US$millions)
(Unaudited)
(Rs. in millions)
I. Revenue from operations . . . . . . . 9,718 634,375 324,641 309,733 530,904II. Other income . . . . . . . . . . . . . . 63 4,087 2,532 1,555 2,452
III. Total Income . . . . . . . . . . . . . . 9,781 638,462 327,174 311,288 533,356
IV. Expenses(a) Raw materials consumed. . . . 3,161 206,340 103,546 102,794 144,492
(b) Purchases of finished,semi-finished and otherproducts . . . . . . . . . . . . . 825 53,843 26,266 27,577 57,071
(c) Changes in stock of finishedgoods, work-in-progress andstock-in-trade . . . . . . . . . . (101) (6,589) 13,084 (19,673) (26,769)
(d) Employee benefit expenses . . 1,317 85,980 42,941 43,039 88,561
(e) Finance costs . . . . . . . . . . 413 26,936 13,499 13,437 24,217
(f) Depreciation and amortisationexpense . . . . . . . . . . . . . 456 29,744 14,733 15,011 27,047
(g) Other expenses . . . . . . . . . 3,098 202,247 94,111 108,136 209,067
Subtotal expenses . . . . . . . . . . . 9,169 598,502 308,181 290,321 523,685
(h) Less: Expenditure (other thaninterest) transferred to capitaland other accounts . . . . . . . 67 4,393 2,514 1,880 4,983
Total Expenses . . . . . . . . . . . . . 9,102 594,108 305,667 288,442 518,703
V. Share of profit/(loss) of jointventures and associates . . . . . . . . 4 257 198 59 51
VI. Profit before exceptional itemsand tax (III-IV+V) . . . . . . . . . . 683 44,610 21,705 22,905 14,705
VII. Exceptional Items(a) Provision for diminution in
value of investments/doubtfuladvances . . . . . . . . . . . . . (4) (267) (267) — (1,169)
(b) Provision for demands andclaims . . . . . . . . . . . . . . . (94) (6,144) — (6,144) —
(c) Employee separationcompensation . . . . . . . . . . (3) (204) (180) (24) (1,102)
Total exceptional items . . . . . . . (101) (6,614) (447) (6,168) (2,271)
VIII. Profit/(loss) before tax (VI+VII) . . 582 37,996 21,258 16,738 12,434
13
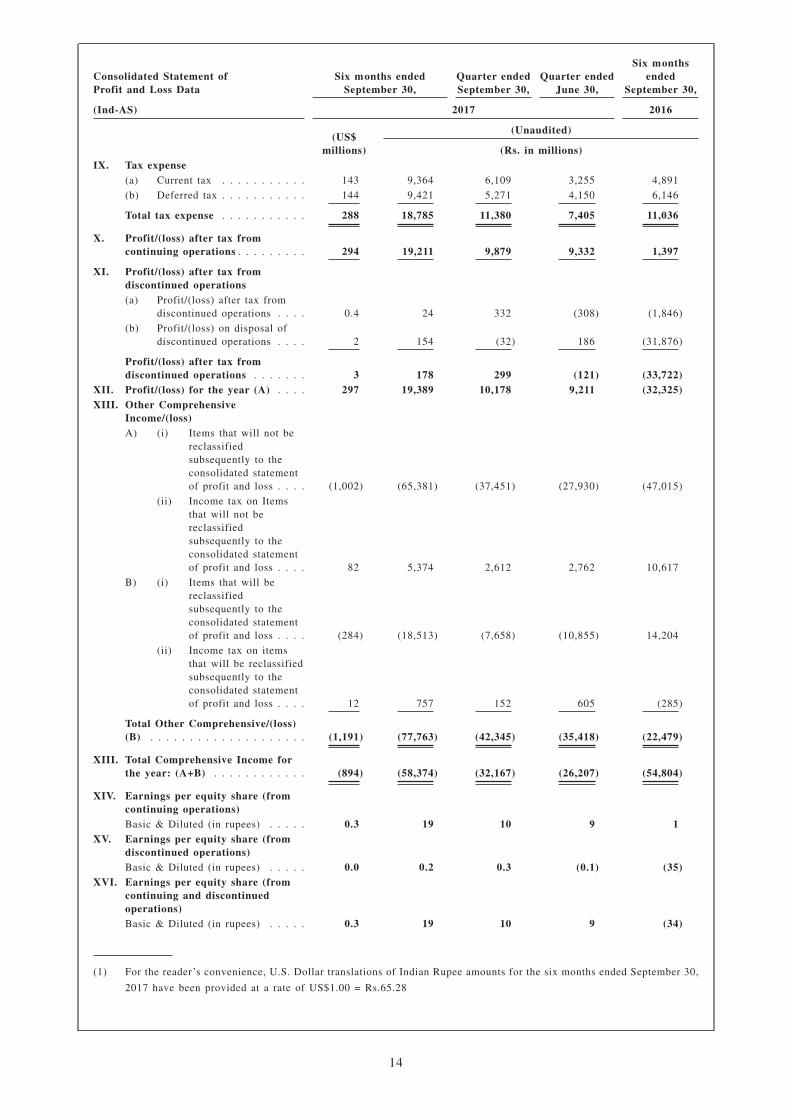
Consolidated Statement ofProfit and Loss Data
Six months endedSeptember 30,
Quarter endedSeptember 30,
Quarter endedJune 30,
Six monthsended
September 30,
(Ind-AS) 2017 2016
(US$millions)
(Unaudited)
(Rs. in millions)IX. Tax expense
(a) Current tax . . . . . . . . . . . 143 9,364 6,109 3,255 4,891
(b) Deferred tax . . . . . . . . . . . 144 9,421 5,271 4,150 6,146
Total tax expense . . . . . . . . . . . 288 18,785 11,380 7,405 11,036
X. Profit/(loss) after tax fromcontinuing operations . . . . . . . . . 294 19,211 9,879 9,332 1,397
XI. Profit/(loss) after tax fromdiscontinued operations(a) Profit/(loss) after tax from
discontinued operations . . . . 0.4 24 332 (308) (1,846)
(b) Profit/(loss) on disposal ofdiscontinued operations . . . . 2 154 (32) 186 (31,876)
Profit/(loss) after tax fromdiscontinued operations . . . . . . . 3 178 299 (121) (33,722)
XII. Profit/(loss) for the year (A) . . . . 297 19,389 10,178 9,211 (32,325)XIII. Other Comprehensive
Income/(loss)A) (i) Items that will not be
reclassifiedsubsequently to theconsolidated statementof profit and loss . . . . (1,002) (65,381) (37,451) (27,930) (47,015)
(ii) Income tax on Itemsthat will not bereclassifiedsubsequently to theconsolidated statementof profit and loss . . . . 82 5,374 2,612 2,762 10,617
B) (i) Items that will bereclassifiedsubsequently to theconsolidated statementof profit and loss . . . . (284) (18,513) (7,658) (10,855) 14,204
(ii) Income tax on itemsthat will be reclassifiedsubsequently to theconsolidated statementof profit and loss . . . . 12 757 152 605 (285)
Total Other Comprehensive/(loss)(B) . . . . . . . . . . . . . . . . . . . . (1,191) (77,763) (42,345) (35,418) (22,479)
XIII. Total Comprehensive Income forthe year: (A+B) . . . . . . . . . . . . (894) (58,374) (32,167) (26,207) (54,804)
XIV. Earnings per equity share (fromcontinuing operations)Basic & Diluted (in rupees) . . . . . 0.3 19 10 9 1
XV. Earnings per equity share (fromdiscontinued operations)Basic & Diluted (in rupees) . . . . . 0.0 0.2 0.3 (0.1) (35)
XVI. Earnings per equity share (fromcontinuing and discontinuedoperations)Basic & Diluted (in rupees) . . . . . 0.3 19 10 9 (34)
(1) For the reader’s convenience, U.S. Dollar translations of Indian Rupee amounts for the six months ended September 30,
2017 have been provided at a rate of US$1.00 = Rs.65.28
14

Consolidated Statement of Profit and Loss of the Group
Consolidated Statement of Profit and Loss Data Year ended March 31,
(Ind-AS) 2017 2016
(US$millions)
(audited)
(Rs. in millions)
I. Revenue from operations . . . . . . . . . . . . . . . . . . . . . 18,108 1,174,199 1,063,399
II. Other income . . . . . . . . . . . . . . . . . . . . . . . . . . . . 81 5,275 4,122
III. Total Income . . . . . . . . . . . . . . . . . . . . . . . . . . . . 18,189 1,179,474 1,067,521
IV. Expenses
(a) Raw materials consumed. . . . . . . . . . . . . . . . . . 4,999 324,181 281,149
(b) Purchases of finished, semi-finished and otherproducts . . . . . . . . . . . . . . . . . . . . . . . . . . . 1,762 114,249 105,814
(c) Changes in stock of finished goods,work-in-progress and stock-in-trade . . . . . . . . . . . (700) (45,381) 19,252
(d) Employee benefit expenses . . . . . . . . . . . . . . . . 2,661 172,522 175,876
(e) Finance costs . . . . . . . . . . . . . . . . . . . . . . . . 782 50,722 42,214
(f) Depreciation and amortisation expense . . . . . . . . . 875 56,729 53,064
(g) Other expenses . . . . . . . . . . . . . . . . . . . . . . . 6,881 446,197 412,555
Subtotal expenses . . . . . . . . . . . . . . . . . . . . . . . . . 17,260 1,119,219 1,089,923
(h) Less: Expenditure (other than interest) transferred tocapital and other accounts . . . . . . . . . . . . . . . . . 118 7,647 10,930
Total Expenses . . . . . . . . . . . . . . . . . . . . . . . . . . . 17,142 1,111,572 1,078,994
V. Share of profit/(loss) of joint ventures and associates . . . 1 77 (1,104)
VI. Profit before exceptional items and tax (III-IV+V) . . . . 1,048 67,979 (12,576)
VII. Exceptional Items
(a) Profit on sale of non-current investments . . . . . . . . 4 227 472
(b) Profit on sale of non-current asset . . . . . . . . . . . . 13 859 —
(c) Provision for diminution in value ofinvestments/doubtful advances . . . . . . . . . . . . . . (19) (1,255) (730)
(d) Provision for impairment of non-current assets . . . . (41) (2,679) (15,302)
(e) Provision for demands and claims . . . . . . . . . . . . (34) (2,183) (8,801)
(f) Employee separation compensation . . . . . . . . . . . (32) (2,074) (5,563)
(g) Restructuring and other provisions . . . . . . . . . . . . (557) (36,138) 69,827
Total exceptional items . . . . . . . . . . . . . . . . . . . . . (667) (43,242) 39,904
VIII. Profit/(loss) before tax (VI+VII) . . . . . . . . . . . . . . . . 381 24,736 27,327
(1) For the reader’s convenience, U.S. Dollar translations of Indian Rupee amounts for the year ended March 31, 2017 have
been provided at a rate of US$1.00 = Rs.64.85.
15

Consolidated Statement of Profit and Loss of the Group
Consolidated Statement of Profit and Loss Data Year ended March 31,
(Ind-AS) 2017 2016
(US$millions)
(audited)
(Rs. in millions)
IX. Tax expense
(a) Current tax . . . . . . . . . . . . . . . . . . . . . . . . . 269 17,417 13,210
(b) Deferred tax . . . . . . . . . . . . . . . . . . . . . . . . . 160 10,363 (6,311)
Total tax expense . . . . . . . . . . . . . . . . . . . . . . . . . 428 27,780 6,900
X. Profit/(loss) after tax from continuing operations . . . . . (47) (3,044) 20,428
XI. Profit/(loss) after tax from discontinued operations
(a) Profit/(loss) after tax from discontinued operations . (120) (7,789) (25,399)
(b) Profit/(loss) on disposal of discontinued operations . (476) (30,853) —
Profit/(loss) after tax from discontinued operations . . . . (596) (38,642) (25,399)
XII. Profit/(loss) for the year (A) . . . . . . . . . . . . . . . . . . (643) (41,686) (4,971)
XIII. Other Comprehensive Income/(loss)
A) (i) Items that will not be reclassifiedsubsequently to the consolidated statement ofprofit and loss . . . . . . . . . . . . . . . . . . . (539) (34,943) (11,882)
(ii) Income tax on Items that will not bereclassified subsequently to the consolidatedstatement of profit and loss . . . . . . . . . . . 121 7,823 (5,760)
B) (i) Items that will be reclassified subsequently tothe consolidated statement of profit and loss . 337 21,883 (1,190)
(ii) Income tax on items that will be reclassifiedsubsequently to the consolidated statement ofprofit and loss . . . . . . . . . . . . . . . . . . . (6) (395) (149)
Total Other Comprehensive/(loss) (B) . . . . . . . . . . . . (87) (5,631) (18,982)
XIII. Total Comprehensive Income for the year: (A+B) . . . . . (730) (47,316) (23,953)
XIV. Earnings per equity share (from continuing operations)
Basic & Diluted (in rupees) . . . . . . . . . . . . . . . . . . . (0.1) (5) 19
XV. Earnings per equity share (from discontinuedoperations)
Basic & Diluted (in rupees) . . . . . . . . . . . . . . . . . . . (1) (40) (26)
XVI. Earnings per equity share (from continuing anddiscontinued operations)
Basic & Diluted (in rupees) . . . . . . . . . . . . . . . . . . . (1) (45) (7)
(1) For the reader’s convenience, U.S. Dollar translations of Indian Rupee amounts for the year ended March 31, 2017 have
been provided at a rate of US$1.00 = Rs.64.85.
16

Consolidated Statement of Profit and Loss of the Group (Indian GAAP)
Statement of Profit and Loss Data Year ended March 31,
(Indian GAAP) 2016 2015
(audited)
(Rs. in millions)
(1) Revenue
(a) Revenue from operations . . . . . . . . . . . . . . . . . . . . . . . . . . . . . . 1,216,184 1,442,984
Less: Excise Duty . . . . . . . . . . . . . . . . . . . . . . . . . . . . . . . . . . . . . . . 44,668 47,946
1,171,516 1,395,037
(b) Other income . . . . . . . . . . . . . . . . . . . . . . . . . . . . . . . . . . . . . 39,257 7,962
Total Revenue . . . . . . . . . . . . . . . . . . . . . . . . . . . . . . . . . . . . . . . . . 1,210,773 1,402,999
(2) Expenses
(a) Raw materials consumed . . . . . . . . . . . . . . . . . . . . . . . . . . . . . . . 321,883 407,410
(b) Purchase of finished, semi-finished and other products . . . . . . . . . . . . 101,740 138,042
(c) Changes in inventories of finished goods, work-in-progress andstock-in-trade . . . . . . . . . . . . . . . . . . . . . . . . . . . . . . . . . . . . . 24,538 11,222
(d) Employee benefits expense . . . . . . . . . . . . . . . . . . . . . . . . . . . . . 199,668 214,076
(e) Depreciation and amortisation expense . . . . . . . . . . . . . . . . . . . . . . 50,818 59,436
(f) Finance costs . . . . . . . . . . . . . . . . . . . . . . . . . . . . . . . . . . . . . 41,286 48,478
(g) Other expenses . . . . . . . . . . . . . . . . . . . . . . . . . . . . . . . . . . . . 459,053 510,611
(h) Less: Expenditure (other than interest) transferred to capital and otheraccounts . . . . . . . . . . . . . . . . . . . . . . . . . . . . . . . . . . . . . . . . 11,223 11,682
Total Expenses . . . . . . . . . . . . . . . . . . . . . . . . . . . . . . . . . . . . . . . . 1,187,764 1,377,593
(3) Profit before Exceptional Items and Tax . . . . . . . . . . . . . . . . . . . . . . . . 23,008 25,406
(4) Exceptional Items
(a) Profit on sale of non-current investments . . . . . . . . . . . . . . . . . . . . . 1,800 13,153
(b) Profit on sale of non-current assets . . . . . . . . . . . . . . . . . . . . . . . . 11,469
(c) Provision for diminution in the value of investments/doubtful advances . . (1,291) (3,383)
(d) Provision for impairment of non-current assets . . . . . . . . . . . . . . . . . (97,206) (60,526)
(e) Provision for demands and claims . . . . . . . . . . . . . . . . . . . . . . . . . (8,801) —
(f) Employee separation compensation . . . . . . . . . . . . . . . . . . . . . . . . (5,563) —
(g) Restructuring and other provisions . . . . . . . . . . . . . . . . . . . . . . . . . 71,312 —
Total exceptional items . . . . . . . . . . . . . . . . . . . . . . . . . . . . . . . . . . . (39,749) (39,287)
(5) Profit/(Loss) before tax . . . . . . . . . . . . . . . . . . . . . . . . . . . . . . . . . . . (16,740) (13,881)
(6) Tax Expense
(a) Current tax . . . . . . . . . . . . . . . . . . . . . . . . . . . . . . . . . . . . . . . 16,311 22,147
(b) MAT credit . . . . . . . . . . . . . . . . . . . . . . . . . . . . . . . . . . . . . . . (1,526) (1,173)
(c) Deferred tax . . . . . . . . . . . . . . . . . . . . . . . . . . . . . . . . . . . . . . 264 4,700
Total tax expense . . . . . . . . . . . . . . . . . . . . . . . . . . . . . . . . . . . . . . . 15,050 25,674
(7) Profit/(Loss) after tax . . . . . . . . . . . . . . . . . . . . . . . . . . . . . . . . . . . . (31,790) (39,555)
(8) Minority Interest . . . . . . . . . . . . . . . . . . . . . . . . . . . . . . . . . . . . . . . 1,089 133
(9) Share of Profit of Associates . . . . . . . . . . . . . . . . . . . . . . . . . . . . . . . 207 167
(10) Profit/(Loss) after Tax, Minority Interest and Share of Profit of Associates . . (30,493) (39,255)
(11) Nominal Value per Share (in rupees) . . . . . . . . . . . . . . . . . . . . . . . . . . 10 10
(12) Basic Earnings per Share (in rupees) . . . . . . . . . . . . . . . . . . . . . . . . . . (33) (42)
(13) Diluted Earnings per Share (in rupees) . . . . . . . . . . . . . . . . . . . . . . . . . (33) (42)
17

Consolidated Balance Sheets of the Group
Balance Sheet Data As at September 30, As at March 31,As at
March 31,
(Ind-AS) 2017 2017 2016
(US$ inmillions)
(unaudited)
(US$ inmillions)
(audited)
(Rs. inmillions) (Rs. in millions)
ASSETS
I. Non-current assets
(a) Property, plant and equipment . . . 13,592 887,191 13,398 868,806 665,692
(b) Capital work-in-progress . . . . . . 2,371 154,788 2,393 155,144 357,933
(c) Goodwill on consolidation . . . . . 575 37,553 539 34,947 40,676
(d) Other Intangible assets . . . . . . . 241 15,728 252 16,312 15,630
(e) Intangible assets underdevelopment . . . . . . . . . . . . . 57 3,723 42 2,698 2,028
(f) Equity accounted investments . . . 251 16,370 246 15,937 16,204
(g) Financial assets:
(i) Investments . . . . . . . . . . 167 10,869 800 51,903 44,298
(ii) Loans . . . . . . . . . . . . . 102 6,643 58 3,731 4,122
(iii) Derivative assets . . . . . . . 3 215 13 832 328
(iv) Other financial assets . . . . 4 243 13 856 410
(h) Retirement benefit assets . . . . . . 1 34 270 17,526 114,774
(i) Income tax assets . . . . . . . . . . 154 10,048 151 9,812 10,403
(j) Deferred tax assets . . . . . . . . . 151 9,864 137 8,859 6,275
(k) Other assets . . . . . . . . . . . . . . 429 28,007 567 36,750 38,422
Total non-current assets . . . . . . . . . 18,097 1,181,273 18,878 1,224,112 1,317,195
II. Current assets
(a) Inventories . . . . . . . . . . . . . . 4,067 265,488 3,825 248,038 200,133
(b) Financial assets:
(i) Investments . . . . . . . . . . 1,401 91,427 875 56,731 46,636
(ii) Trade receivables . . . . . . 1,867 121,868 1,787 115,868 120,662
(iii) Cash and cash equivalents . 407 26,568 745 48,323 61,091
(iv) Other balances with bank . 21 1,378 14 888 773
(v) Loans . . . . . . . . . . . . . 48 3,138 35 2,245 2,074
(vi) Derivative assets . . . . . . . 76 4,966 16 1,040 3,096
(vii) Other financial assets . . . . 95 6,183 60 3,878 2,413
(c) Retirement benefit assets . . . . . . 0.1 4 — — —
(d) Income tax assets . . . . . . . . . . 4 291 5 351 502
(e) Other assets . . . . . . . . . . . . . . 591 38,597 338 21,944 20,279
Total current assets . . . . . . . . . . . . 8,578 559,910 7,700 499,306 457,659
III. Assets held for sale . . . . . . . . . . . . 16 1,020 153 9,914 261
TOTAL ASSETS . . . . . . . . . . . . . . . . . . 26,690 1,742,203 26,730 1,733,332 1,775,114
(1) For the reader’s convenience, U.S. Dollar translations of Indian Rupee amounts for the year ended March 31, 2017, and
for the six months ended September 30, 2017, have been provided at a rate of US$1.00 = Rs.64.85 and US$1.00 =
Rs.65.28, respectively.
18

Consolidated Balance Sheets of the Group
Balance Sheet Data As at September 30, As at March 31,As at
March 31,
(Ind-AS) 2017 2017 2016
(US$ inmillions)
(unaudited)
(US$ inmillions)
(audited)
(Rs. inmillions) (Rs. in millions)
EQUITY AND LIABILITIES
IV. Equity
(a) Equity share capital . . . . . . . . . 149 9,702 150 9,702 9,702
(b) Hybrid Perpetual Securities . . . . 349 22,750 351 22,750 22,750
(c) Other equity . . . . . . . . . . . . . 5,181 338,204 5,332 345,741 404,873
Equity attributable to shareholders ofthe Company . . . . . . . . . . . . . . . . 5,678 370,657 5,832 378,193 437,326
Non-controlling interest . . . . . . . . . . (772) (50,371) 247 16,017 7,809
Total equity . . . . . . . . . . . . . . . . . 4,907 320,285 6,079 394,210 445,135
V. Non-current liabilities
(a) Financial liabilities:
(i) Borrowings . . . . . . . . . . 10,453 682,310 9,873 640,223 648,728
(ii) Derivative liabilities . . . . 19 1,209 28 1,800 1,655
(iii) Other financial liabilities . . 17 1,098 17 1,088 4,544
(b) Provisions . . . . . . . . . . . . . . . 496 32,401 660 42,797 44,405
(c) Retirement benefit obligations . . . 427 27,878 411 26,663 29,295
(d) Deferred income . . . . . . . . . . . 289 18,889 317 20,576 24,314
(e) Deferred tax liabilities . . . . . . . 1,484 96,837 1,547 100,301 94,209
(f) Other liabilities . . . . . . . . . . . 24 1,593 35 2,265 3,291
Total non-current liabilities . . . . . . . 13,209 862,214 12,888 835,712 850,440
VI. Current liabilities
(a) Financial liabilities:
(i) Borrowings . . . . . . . . . . 3,264 213,045 2,826 183,281 157,221
(ii) Trade payables . . . . . . . . 2,794 182,372 2,864 185,745 185,567
(iii) Derivative liabilities . . . . 147 9,581 104 6,737 4,983
(iv) Other financial liabilities . . 985 64,287 974 63,155 69,011
(b) Provisions . . . . . . . . . . . . . . . 323 21,106 152 9,874 15,219
(c) Retirement benefit obligations . . . 12 770 15 952 1,111
(d) Deferred income . . . . . . . . . . . 1 53 3 225 37
(e) Income tax liabilities . . . . . . . . 204 13,323 114 7,392 10,011
(f) Other liabilities . . . . . . . . . . . 845 55,166 665 43,153 36,380
Total current liabilities . . . . . . . . . . 8,575 559,704 7,719 500,513 479,540
VII. Liabilities held for sale . . . . . . . . . . — — 45 2,898 —
TOTAL EQUITY AND LIABILITIES . . . . . 26,690 1,742,203 26,730 1,733,332 1,775,114
(1) For the reader’s convenience, U.S. Dollar translations of Indian Rupee amounts for the year ended March 31, 2017, and
for the six months ended September 30, 2017, have been provided at a rate of US$1.00 = Rs.64.85 and US$1.00 =
Rs.65.28, respectively.
19

Consolidated Balance Sheets of the Group (Indian GAAP)
Balance Sheet Data As at March 31,
(Indian GAAP) 2016 2015
(audited)
(Rs. in millions)
Equity and Liabilities
(1) Shareholders’ funds
(a) Equity share capital . . . . . . . . . . . . . . . . . . . . . . . . . . . . . . . . . . . . 9,702 9,714
(b) Reserves and surplus . . . . . . . . . . . . . . . . . . . . . . . . . . . . . . . . . . . 275,086 303,780
284,789 313,494
(2) Preference share capital issued by subsidiary . . . . . . . . . . . . . . . . . . . . . . . 200 200
(3) Hybrid Perpetual Securities . . . . . . . . . . . . . . . . . . . . . . . . . . . . . . . . . . 22,750 22,750
(4) Minority interest . . . . . . . . . . . . . . . . . . . . . . . . . . . . . . . . . . . . . . . . . 16,542 17,039
(5) Non-current liabilities
(a) Long-term borrowings . . . . . . . . . . . . . . . . . . . . . . . . . . . . . . . . . . 683,541 656,752
(b) Deferred tax liability (net) . . . . . . . . . . . . . . . . . . . . . . . . . . . . . . . . 29,049 28,845
(c) Other long-term liabilities . . . . . . . . . . . . . . . . . . . . . . . . . . . . . . . . 13,837 17,488
(d) Long-term provisions . . . . . . . . . . . . . . . . . . . . . . . . . . . . . . . . . . . 76,227 75,038
802,654 778,123
(6) Current liabilities
(a) Short-term borrowings . . . . . . . . . . . . . . . . . . . . . . . . . . . . . . . . . . 154,499 95,986
(b) Trade Payables:
(i) Total outstanding dues of micro enterprises and small enterprises . . . . 207 229
(ii) Total outstanding dues of creditors of other than micro enterprises andsmall enterprises . . . . . . . . . . . . . . . . . . . . . . . . . . . . . . . . . . 203,676 191,670
203,883 191,899
(c) Other current liabilities . . . . . . . . . . . . . . . . . . . . . . . . . . . . . . . . . . 112,090 144,796
(d) Short-term provisions . . . . . . . . . . . . . . . . . . . . . . . . . . . . . . . . . . . 35,094 27,035
505,566 459,715
TOTAL . . . . . . . . . . . . . . . . . . . . . . . . . . . . . . . . . . . . . . . . . . . . . . . . . . . 1,632,500 1,591,321
Assets
(7) Non-current Assets
(a) Fixed Assets
(i) Tangible assets . . . . . . . . . . . . . . . . . . . . . . . . . . . . . . . . . . . 450,807 512,479
(ii) Intangible assets . . . . . . . . . . . . . . . . . . . . . . . . . . . . . . . . . . 18,488 34,449
(iii) Capital work-in-progress . . . . . . . . . . . . . . . . . . . . . . . . . . . . . 349,940 278,371
(iv) Intangible assets under development . . . . . . . . . . . . . . . . . . . . . . 4,939 8,410
(b) Goodwill on consolidation . . . . . . . . . . . . . . . . . . . . . . . . . . . . . . . . 137,194 134,075
(c) Non-current investments . . . . . . . . . . . . . . . . . . . . . . . . . . . . . . . . . 20,845 20,804
(d) Deferred tax assets (net) . . . . . . . . . . . . . . . . . . . . . . . . . . . . . . . . . 219 228
(e) Long-term loans and advances . . . . . . . . . . . . . . . . . . . . . . . . . . . . . 161,109 51,066
(f) Other non-current assets . . . . . . . . . . . . . . . . . . . . . . . . . . . . . . . . . 14,059 14,037
1,157,599 1,053,919
(8) Current Assets
(a) Current investments . . . . . . . . . . . . . . . . . . . . . . . . . . . . . . . . . . . . 47,161 13,746
(b) Inventories . . . . . . . . . . . . . . . . . . . . . . . . . . . . . . . . . . . . . . . . . 203,560 251,499
(c) Trade receivables . . . . . . . . . . . . . . . . . . . . . . . . . . . . . . . . . . . . . 117,012 133,099
(d) Cash and bank balances . . . . . . . . . . . . . . . . . . . . . . . . . . . . . . . . . 67,156 87,499
(e) Short-term loans and advances . . . . . . . . . . . . . . . . . . . . . . . . . . . . . 35,778 47,483
(f) Other current assets . . . . . . . . . . . . . . . . . . . . . . . . . . . . . . . . . . . . 4,235 4,075
474,901 537,401
TOTAL . . . . . . . . . . . . . . . . . . . . . . . . . . . . . . . . . . . . . . . . . . . . . . . . . . . 1,632,500 1,591,321
20

Summary Consolidated Cash Flow Statement of the Group
Cash flow statement of the Group Year ended March 31,
(Ind-AS) 2017 2016
(US$ inmillions)
(audited)
(Rs. in millions)
Net cash flow from/(used in) operating activities . . . . . . . . . . . . . . . 1,673 108,481 114,554
Net cash from/(used in) investing activities . . . . . . . . . . . . . . . . . . . (1,401) (90,862) (92,538)
Net cash flow from/(used in) financing activities . . . . . . . . . . . . . . . (400) (25,924) (47,291)
Net increase/(decrease) in cash and cash equivalents . . . . . . . . . . . . . (128) (8,306) (25,276)
Opening cash and cash equivalents . . . . . . . . . . . . . . . . . . . . . . . . 937 60,769 81,771
Effect of exchange rate on translation of foreign currency cash and cashequivalents . . . . . . . . . . . . . . . . . . . . . . . . . . . . . . . . . . . . . . (64) (4,141) 4,595
Closing cash and cash equivalents . . . . . . . . . . . . . . . . . . . . . . . . 745 48,323 61,091
(1) For the reader’s convenience, U.S. Dollar translations of Indian Rupee amounts for the year ended March 31, 2017 have
been provided at a rate of US$1.00 = Rs.64.85.
Summary Consolidated Cash Flow Statement of the Group (Indian GAAP)
Cash flow statement of the Group Year ended March 31,
(Indian GAAP) 2016 2015
(audited)
(Rs. in millions)
Net cash flow from/(used in) operating activities . . . . . . . . . . . . . . . . . . . . . . . . . 119,632 118,798
Net cash from/(used in) investing activities . . . . . . . . . . . . . . . . . . . . . . . . . . . . (104,242) (84,221)
Net cash flow from/(used in) financing activities . . . . . . . . . . . . . . . . . . . . . . . . . (39,284) (26,172)
Net increase/(decrease) in cash and cash equivalents . . . . . . . . . . . . . . . . . . . . . . (23,894) 8,404
Opening cash and cash equivalents . . . . . . . . . . . . . . . . . . . . . . . . . . . . . . . . . 85,257 84,063
Effect of exchange rate on translation of foreign currency cash and cash equivalents . . . . 4,727 (5,990)
Closing cash and cash equivalents . . . . . . . . . . . . . . . . . . . . . . . . . . . . . . . . . . 66,090 86,478
21

Standalone Statement of Profit and Loss of Tata Steel
Statement of Profit and Loss DataSix months ended
September 30,Quarter endedSeptember 30
Quarter endedJune 30
Six monthsended
September 30,
(Ind-AS) 2017 2016
(US$millions)
(audited)
(Rs. in millions)
I. Revenue from operations . . . . . . 4,388 286,427 142,209 144,217 220,418
II. Other income . . . . . . . . . . . . . 55 3,616 2,495 1,121 2,702
III. Total Income . . . . . . . . . . . . . . 4,443 290,042 144,704 145,338 223,119
IV. Expenses
(a) Raw materials consumed . . . 1,328 86,686 44,490 42,196 49,518
(b) Purchases of finished,semi-finished and otherproducts . . . . . . . . . . . . . 53 3,438 813 2,626 4,776
(c) Changes in stock of finishedgoods, work-in-progress andstock-in-trade . . . . . . . . . . 2 143 9,189 (9,046) (9,376)
(d) Employee benefit expenses . . 348 22,728 11,151 11,577 23,412
(e) Finance costs . . . . . . . . . . 216 14,093 7,092 7,001 12,659
(f) Depreciation and amortisationexpense . . . . . . . . . . . . . 288 18,788 9,124 9,664 16,146
(g) Other expenses . . . . . . . . . 1,707 111,394 43,736 67,659 112,280
Subtotal expenses . . . . . . . . . . . 3,941 257,271 125,594 131,677 209,416
(h) Less: Expenditure (other thaninterest) transferred to capitaland other accounts . . . . . . . 21 1,378 921 457 1,554
Total Expenses . . . . . . . . . . . . 3,920 255,893 124,673 131,220 207,862
V. Profit before exceptional itemsand tax (III-IV) . . . . . . . . . . . . 523 34,150 20,032 14,119 15,258
VI. Exceptional Items . . . . . . . . . .
(a) Provision for diminution invalue of investments/doubtfuladvances . . . . . . . . . . . . . (4) (267) (267) — (1,382)
(b) Provision for demands andclaims . . . . . . . . . . . . . . (94) (6,144) — (6,144) —
(c) Employee separationcompensation . . . . . . . . . . (0.4) (24) — (24) (815)
Total exceptional items . . . . . . . (99) (6,434) (267) (6,168) (2,198)
VII. Profit/(loss) before tax (V+VI) . . 425 27,716 19,765 7,951 13,060
(1) For the reader’s convenience, U.S. Dollar translations of Indian Rupee amounts for the six months ended September 30,
2017 have been provided at a rate of US$1.00 = Rs.65.28
22

Standalone Statement of Profit and Loss of Tata Steel
Statement of Profit and Loss Data Six months ended September 30,
(Ind-AS) 2017 2016
(US$millions)
(audited)
(Rs. in millions)
VIII. Tax expense
(a) Current tax . . . . . . . . . . . . . . 109 7,089 4,894 2,195 4,495
(b) Deferred tax . . . . . . . . . . . . . 40 2,622 1,931 691 315
Total tax expense . . . . . . . . . . . . . . 149 9,711 6,824 2,886 4,810
IX. Profit/(loss) for the year (A) . . . . . . . 276 18,005 12,941 5,064 8,250
X. Other Comprehensive Income/(loss)
A) (i) Items that will not bereclassified subsequently tothe statement of profit andloss . . . . . . . . . . . . . . . (29) (1,904) (756) (1,148) 11,482
(ii) Income tax on Items thatwill not be reclassifiedsubsequently to thestatement of profit and loss (3) (180) (64) (116) 620
B) (i) Items that will bereclassified subsequently tothe statement of profit andloss . . . . . . . . . . . . . . . (0) (26) 16 (43) 3
(ii) Income tax on items thatwill be reclassifiedsubsequently to thestatement of profit and loss 0 9 (6) 15 (1)
Total Other Comprehensive/(loss) (B) . (32) (2,101) (809) (1,292) 12,104
XI. Total Comprehensive Income forthe year: (A+B) . . . . . . . . . . . . . . . 244 15,904 12,131 3,773 20,354
XII. Earnings per equity share
Basic & Diluted (in rupees) . . . . . . . . 0.3 18 13 5 8
(1) For the reader’s convenience, U.S. Dollar translations of Indian Rupee amounts for the six months ended September 30,
2017 have been provided at a rate of US$1.00 = Rs.65.28
23

Standalone Statement of Profit and Loss of Tata Steel
Statement of Profit and Loss Data Year ended March 31,
(Ind-AS) 2017 2016
(US$millions)
(audited)
(Rs. in millions)
I. Revenue from operations . . . . . . . . . . . . . . . . . . . . . . . 8,214 532,610 426,974
II. Other income . . . . . . . . . . . . . . . . . . . . . . . . . . . . . . 64 4,145 3,912
III. Total Income . . . . . . . . . . . . . . . . . . . . . . . . . . . . . . 8,277 536,754 430,886
IV. Expenses
(a) Raw materials consumed . . . . . . . . . . . . . . . . . . . . 1,927 124,968 97,000
(b) Purchases of finished, semi-finished and other products . 136 8,812 9,915
(c) Changes in stock of finished goods, work-in-progressand stock-in-trade . . . . . . . . . . . . . . . . . . . . . . . . (205) (13,297) 708
(d) Employee benefit expenses . . . . . . . . . . . . . . . . . . 710 46,051 43,199
(e) Finance costs . . . . . . . . . . . . . . . . . . . . . . . . . . 415 26,886 18,481
(f) Depreciation and amortisation expense . . . . . . . . . . . 546 35,416 29,623
(g) Other expenses . . . . . . . . . . . . . . . . . . . . . . . . . 3,847 249,491 206,024
Subtotal expenses . . . . . . . . . . . . . . . . . . . . . . . . . . . . 7,376 478,326 404,949
(h) Less: Expenditure (other than interest) transferred tocapital and other accounts . . . . . . . . . . . . . . . . . . . 34 2,175 5,989
Total Expenses . . . . . . . . . . . . . . . . . . . . . . . . . . . . . 7,343 476,151 398,960
V. Profit before exceptional items and tax (III-IV) . . . . . . . . 935 60,603 31,926
VI. Exceptional Items
(a) Profit on sale of non-current investments . . . . . . . . . . — — (9)
(b) Provision for diminution in value of investments/doubtful advances . . . . . . . . . . . . . . . . . . . . . . . . (26) (1,709) (1,606)
(c) Provision for impairment of non-current assets . . . . . . — — (515)
(d) Provision for demands and claims . . . . . . . . . . . . . . (34) (2,183) (8,801)
(e) Employee separation compensation . . . . . . . . . . . . . (28) (1,787) (5,563)
(f) Restructuring and other provisions . . . . . . . . . . . . . . (21) (1,356) —
Total exceptional items . . . . . . . . . . . . . . . . . . . . . . . . (108) (7,034) (16,493)
VII. Profit/(loss) before tax (V+VI) . . . . . . . . . . . . . . . . . . . 826 53,569 15,433
(1) For the reader’s convenience, U.S. Dollar translations of Indian Rupee amounts for the year ended March 31, 2017 have
been provided at a rate of US$1.00 = Rs.64.85.
24

Standalone Statement of Profit and Loss of Tata Steel
Statement of Profit and Loss Data Year ended March 31,
(Ind-AS) 2017 2016
(US$millions)
(audited)
(Rs. in millions)
VIII. Tax expense
(a) Current tax . . . . . . . . . . . . . . . . . . . . . . . . . . . . 216 14,005 11,933
(b) Deferred tax . . . . . . . . . . . . . . . . . . . . . . . . . . . 79 5,118 (6,056)
Total tax expense . . . . . . . . . . . . . . . . . . . . . . . . . . . . 295 19,124 5,877
IX. Profit/(loss) for the year (A) . . . . . . . . . . . . . . . . . . . . 531 34,446 9,556
X. Other Comprehensive Income/(loss)
A) (i) Items that will not be reclassified subsequently tothe statement of profit and loss . . . . . . . . . . . 93 6,012 (31,685)
(ii) Income tax on Items that will not be reclassifiedsubsequently to the statement of profit and loss . . 12 754 (2,398)
B) (i) Items that will be reclassified subsequently to thestatement of profit and loss . . . . . . . . . . . . . . (0.2) (12) 18
(ii) Income tax on items that will be reclassifiedsubsequently to the statement of profit and loss . . 0.1 4 (6)
Total Other Comprehensive/(loss) (B) . . . . . . . . . . . . . . . 104 6,758 (34,071)
XI. Total Comprehensive Income for the year: (A+B) . . . . . . . 635 41,203 (24,515)
XII. Earnings per equity share
Basic & Diluted (in rupees) . . . . . . . . . . . . . . . . . . . . . . 1 34 8
(1) For the reader’s convenience, U.S. Dollar translations of Indian Rupee amounts for the year ended March 31, 2017 have
been provided at a rate of US$1.00 = Rs.64.85.
25

Standalone Statement of Profit and Loss of Tata Steel (Indian GAAP)
Statement of Profit and Loss Data Year ended March 31,
(Indian GAAP) 2016 2015
(audited)
(Rs. in millions)
(1) Revenue
(a) Revenue from operations . . . . . . . . . . . . . . . . . . . . . . . . . . 426,863 465,773
Less: Excise Duty . . . . . . . . . . . . . . . . . . . . . . . . . . . . . . . . . . . 44,760 47,923
382,103 417,850
(b) Other income . . . . . . . . . . . . . . . . . . . . . . . . . . . . . . . . . 38,907 5,828
Total Revenue . . . . . . . . . . . . . . . . . . . . . . . . . . . . . . . . . . . . . 421,010 423,678
(2) Expenses
(a) Raw materials consumed . . . . . . . . . . . . . . . . . . . . . . . . . . . 97,000 116,786
(b) Purchase of finished, semi-finished and other products . . . . . . . . 9,915 6,883
(c) Changes in inventories of finished goods, work-in-progress andstock-in-trade . . . . . . . . . . . . . . . . . . . . . . . . . . . . . . . . . 1,430 (7,159)
(d) Employee benefits expense . . . . . . . . . . . . . . . . . . . . . . . . . 43,249 46,019
(e) Depreciation and amortisation expense . . . . . . . . . . . . . . . . . . 19,331 19,976
(f) Finance costs . . . . . . . . . . . . . . . . . . . . . . . . . . . . . . . . . 14,603 19,760
(g) Other expenses . . . . . . . . . . . . . . . . . . . . . . . . . . . . . . . . 164,381 161,100
(h) Less: Expenditure (other than interest) transferred to capital andother accounts . . . . . . . . . . . . . . . . . . . . . . . . . . . . . . . . . 5,989 5,867
Total Expenses . . . . . . . . . . . . . . . . . . . . . . . . . . . . . . . . . . . . 343,920 357,497
(3) Profit before Exceptional Items and Tax . . . . . . . . . . . . . . . . . . . . 77,091 66,180
(4) Exceptional Items
(a) Profit on sale of non-current investments . . . . . . . . . . . . . . . . . 1,043 8,061
(b) Profit on sale of non-current assets . . . . . . . . . . . . . . . . . . . . — 11,469
(c) Provision for diminution in the value of investments/doubtfuladvances . . . . . . . . . . . . . . . . . . . . . . . . . . . . . . . . . . . . (1,990) (1,984)
(d) Provision for impairment of non-current assets . . . . . . . . . . . . . (515) 1,363
(e) Provision for demands and claims . . . . . . . . . . . . . . . . . . . . . (8,801) —
(f) Employee separation compensation . . . . . . . . . . . . . . . . . . . . (5,563) —
Total exceptional items . . . . . . . . . . . . . . . . . . . . . . . . . . . . . . . . . . . (15,826) 18,909
(5) Profit/(Loss) before tax . . . . . . . . . . . . . . . . . . . . . . . . . . . . . . . 61,265 85,089
(6) Tax Expense
(a) Current tax . . . . . . . . . . . . . . . . . . . . . . . . . . . . . . . . . . . 14,331 19,086
(b) MAT credit . . . . . . . . . . . . . . . . . . . . . . . . . . . . . . . . . . . (1,522) (1,172)
(c) Deferred tax . . . . . . . . . . . . . . . . . . . . . . . . . . . . . . . . . . (553) 2,784
Total tax expense . . . . . . . . . . . . . . . . . . . . . . . . . . . . . . . . . . . 12,256 20,698
(7) Profit/(Loss) after tax . . . . . . . . . . . . . . . . . . . . . . . . . . . . . . . . 49,010 64,391
(8) Nominal Value per Share (in rupees) . . . . . . . . . . . . . . . . . . . . . . 10 10
(9) Basic Earnings per Share (in rupees) . . . . . . . . . . . . . . . . . . . . . . 49 64
(10) Diluted Earnings per Share (in rupees) . . . . . . . . . . . . . . . . . . . . . 49 64
26

Standalone Balance Sheets of Tata Steel
Balance Sheet Data As at September 30, As at March 31,As at
March 31,
(Ind-AS) 2017 2017 2016
(US$ inmillions)
(unaudited)
(US$ inmillions)
(unaudited)
(Rs. inmillions) (Rs. in millions)
ASSETS
I. Non-current assets
(a) Property, plant and equipment . . . 10,955 715,065 11,069 717,790 495,611
(b) Capital work-in-progress . . . . . . 855 55,819 945 61,254 281,740
(c) Intangible assets . . . . . . . . . . . 119 7,747 122 7,882 5,273
(d) Intangible assets underdevelopment . . . . . . . . . . . . . 8 493 6 386 319
(e) Investments in subsidiaries,associates and joint ventures . . . . 528 34,466 524 33,976 33,410
(f) Financial assets:
(i) Investments . . . . . . . . . . 886 57,815 765 49,583 41,195
(ii) Loans . . . . . . . . . . . . . 32 2,112 33 2,120 2,060
(iii) Derivative assets . . . . . . . 0 18 0 1 8
(iv) Other financial assets . . . . 3 181 12 795 369
(g) Income tax assets (net) . . . . . . . 135 8,841 134 8,678 8,377
(h) Other assets . . . . . . . . . . . . . . 331 21,632 481 31,216 33,252
Total non-current assets . . . . . . . . . 13,852 904,189 14,090 913,680 901,612
II. Current assets
(a) Inventories . . . . . . . . . . . . . . 1,572 102,586 1,579 102,369 71,374
(b) Financial assets:
(i) Investments . . . . . . . . . . 1,345 87,813 819 53,098 43,250
(ii) Trade receivables . . . . . . 268 17,497 309 20,065 11,332
(iii) Cash and cash equivalents . 48 3,125 140 9,052 9,747
(iv) Other balances with bank . 15 1,000 10 651 615
(v) Loans . . . . . . . . . . . . . 17 1,087 4 271 188
(vi) Derivative assets . . . . . . . 5 345 1 63 62
(vii) Other financial assets . . . . 70 4,553 49 3,151 2,078
(c) Other assets . . . . . . . . . . . . . . 396 25,818 189 12,255 10,889
Total current assets . . . . . . . . . . . . 3,735 243,823 3,099 200,974 149,533
TOTAL ASSETS . . . . . . . . . . . . . . . . . . 17,587 1,148,012 17,190 1,114,654 1,051,145
(1) For the reader’s convenience, U.S. Dollar translations of Indian Rupee amounts for the year ended March 31, 2017, and
for the six months ended September 30, 2017, have been provided at a rate of US$1.00 = Rs.64.85 and US$1.00 =
Rs.65.28, respectively.
27

Standalone Balance Sheets of Tata Steel
Balance Sheet Data As at September 30, As at March 31,As at
March 31,
(Ind-AS) 2017 2017 2016
(US$ inmillions)
(unaudited)
(US$ inmillions)
(audited)
(Rs. inmillions) (Rs. in millions)
EQUITY AND LIABILITIES
III. Equity
(a) Equity share capital . . . . . . . . . 149 9,714 150 9,714 9,714
(b) Hybrid Perpetual Securities . . . . 349 22,750 351 22,750 22,750
(c) Other equity . . . . . . . . . . . . . 7,511 490,312 7,508 486,876 456,660
Total equity . . . . . . . . . . . . . . . . . 8,009 522,776 8,009 519,340 489,124
IV. Non-current liabilities
(a) Financial liabilities:
(i) Borrowings . . . . . . . . . . 4,136 269,976 3,808 246,944 239,268
(ii) Derivative liabilities . . . . 17 1,137 28 1,793 1,160
(iii) Other financial liabilities . . 3 196 3 182 3,965
(b) Provisions . . . . . . . . . . . . . . . 157 10,233 312 20,247 18,621
(c) Retirement benefit obligations . . . 232 15,165 229 14,842 12,525
(d) Deferred income . . . . . . . . . . . 265 17,266 291 18,852 22,285
(e) Deferred tax liabilities . . . . . . . 864 56,386 942 61,113 56,107
(f) Other liabilities . . . . . . . . . . . 12 763 12 777 768
Total non-current liabilities . . . . . . . 5,685 371,120 5,625 364,751 354,698
V. Current liabilities
(a) Financial liabilities:
(i) Borrowings . . . . . . . . . . 578 37,732 500 32,397 58,880
(ii) Trade payables . . . . . . . . 1,565 102,148 1,653 107,174 61,969
(iii) Derivative liabilities . . . . 5 297 42 2,702 782
(iv) Other financial liabilities . . 611 39,871 626 40,624 46,334
(b) Provisions . . . . . . . . . . . . . . . 253 16,500 108 7,006 2,806
(c) Retirement benefit obligations . . . 8 539 9 566 567
(d) Income tax liabilities (net) . . . . . 158 10,304 72 4,657 7,326
(e) Other liabilities . . . . . . . . . . . 716 46,725 547 35,438 28,660
Total current liabilities . . . . . . . . . . 3,893 254,116 3,556 230,563 207,323
TOTAL EQUITY AND LIABILITIES . . . . . 17,587 1,148,012 17,190 1,114,654 1,051,145
(1) For the reader’s convenience, U.S. Dollar translations of Indian Rupee amounts for the year ended March 31, 2017, and
for the six months ended September 30, 2017, have been provided at a rate of US$1.00 = Rs.64.85 and US$1.00 =
Rs.65.28, respectively.
28
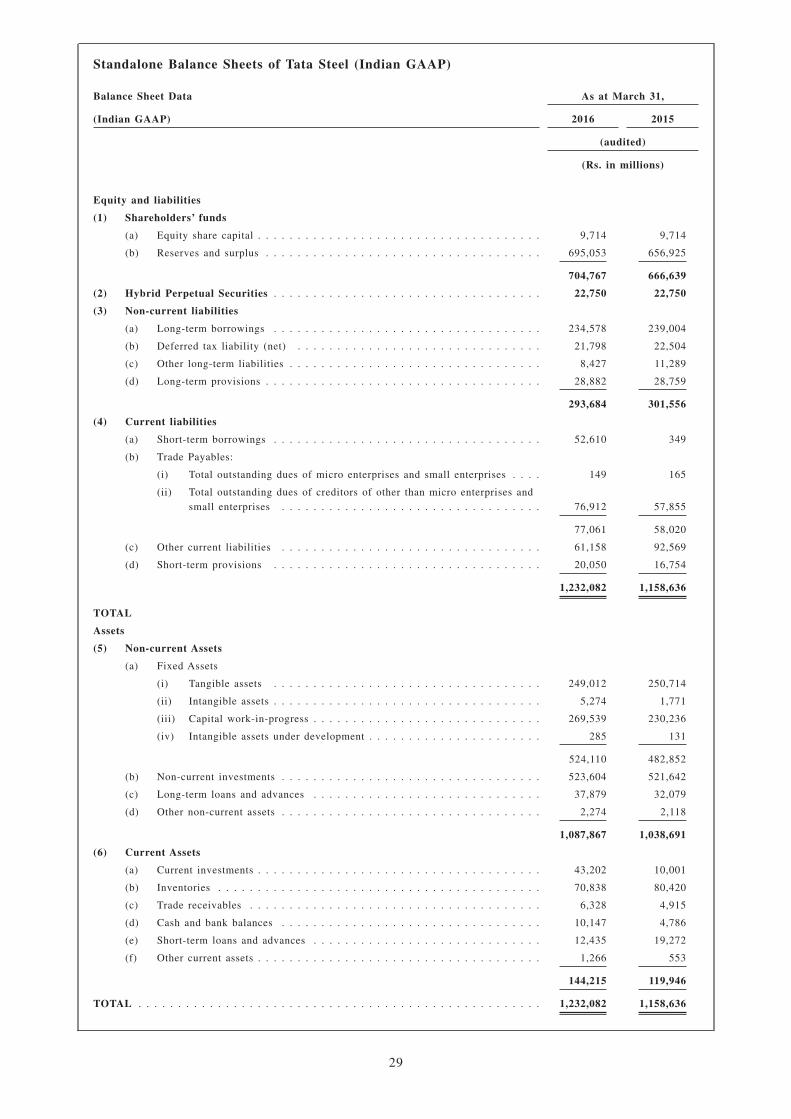
Standalone Balance Sheets of Tata Steel (Indian GAAP)
Balance Sheet Data As at March 31,
(Indian GAAP) 2016 2015
(audited)
(Rs. in millions)
Equity and liabilities
(1) Shareholders’ funds
(a) Equity share capital . . . . . . . . . . . . . . . . . . . . . . . . . . . . . . . . . . . . 9,714 9,714
(b) Reserves and surplus . . . . . . . . . . . . . . . . . . . . . . . . . . . . . . . . . . . 695,053 656,925
704,767 666,639
(2) Hybrid Perpetual Securities . . . . . . . . . . . . . . . . . . . . . . . . . . . . . . . . . . 22,750 22,750
(3) Non-current liabilities
(a) Long-term borrowings . . . . . . . . . . . . . . . . . . . . . . . . . . . . . . . . . . 234,578 239,004
(b) Deferred tax liability (net) . . . . . . . . . . . . . . . . . . . . . . . . . . . . . . . 21,798 22,504
(c) Other long-term liabilities . . . . . . . . . . . . . . . . . . . . . . . . . . . . . . . . 8,427 11,289
(d) Long-term provisions . . . . . . . . . . . . . . . . . . . . . . . . . . . . . . . . . . . 28,882 28,759
293,684 301,556
(4) Current liabilities
(a) Short-term borrowings . . . . . . . . . . . . . . . . . . . . . . . . . . . . . . . . . . 52,610 349
(b) Trade Payables:
(i) Total outstanding dues of micro enterprises and small enterprises . . . . 149 165
(ii) Total outstanding dues of creditors of other than micro enterprises andsmall enterprises . . . . . . . . . . . . . . . . . . . . . . . . . . . . . . . . . 76,912 57,855
77,061 58,020
(c) Other current liabilities . . . . . . . . . . . . . . . . . . . . . . . . . . . . . . . . . 61,158 92,569
(d) Short-term provisions . . . . . . . . . . . . . . . . . . . . . . . . . . . . . . . . . . 20,050 16,754
1,232,082 1,158,636
TOTAL
Assets
(5) Non-current Assets
(a) Fixed Assets
(i) Tangible assets . . . . . . . . . . . . . . . . . . . . . . . . . . . . . . . . . . 249,012 250,714
(ii) Intangible assets . . . . . . . . . . . . . . . . . . . . . . . . . . . . . . . . . . 5,274 1,771
(iii) Capital work-in-progress . . . . . . . . . . . . . . . . . . . . . . . . . . . . . 269,539 230,236
(iv) Intangible assets under development . . . . . . . . . . . . . . . . . . . . . . 285 131
524,110 482,852
(b) Non-current investments . . . . . . . . . . . . . . . . . . . . . . . . . . . . . . . . . 523,604 521,642
(c) Long-term loans and advances . . . . . . . . . . . . . . . . . . . . . . . . . . . . . 37,879 32,079
(d) Other non-current assets . . . . . . . . . . . . . . . . . . . . . . . . . . . . . . . . . 2,274 2,118
1,087,867 1,038,691
(6) Current Assets
(a) Current investments . . . . . . . . . . . . . . . . . . . . . . . . . . . . . . . . . . . . 43,202 10,001
(b) Inventories . . . . . . . . . . . . . . . . . . . . . . . . . . . . . . . . . . . . . . . . . 70,838 80,420
(c) Trade receivables . . . . . . . . . . . . . . . . . . . . . . . . . . . . . . . . . . . . . 6,328 4,915
(d) Cash and bank balances . . . . . . . . . . . . . . . . . . . . . . . . . . . . . . . . . 10,147 4,786
(e) Short-term loans and advances . . . . . . . . . . . . . . . . . . . . . . . . . . . . . 12,435 19,272
(f) Other current assets . . . . . . . . . . . . . . . . . . . . . . . . . . . . . . . . . . . . 1,266 553
144,215 119,946
TOTAL . . . . . . . . . . . . . . . . . . . . . . . . . . . . . . . . . . . . . . . . . . . . . . . . . . . 1,232,082 1,158,636
29

Standalone Cash Flow Statement of Tata Steel (Ind -AS)
Cash flow statement Year ended March 31,
(Ind-AS) 2017 2016
(US$ inmillions)
(audited)
(Rs. in millions)
Net cash flow from/(used in) operating activities . . . . . . . . . . . 1,717 111,313 73,718
Net cash from/(used in) investing activities . . . . . . . . . . . . . . . (605) (39,210) (43,517)
Net cash flow from/(used in) financing activities . . . . . . . . . . . . (1,123) (72,797) (25,404)
Net increase/(decrease) in cash and cash equivalents . . . . . . . . . (11) (695) 4,796
Opening cash and cash equivalents . . . . . . . . . . . . . . . . . . . . 150 9,747 4,952
Effect of exchange rate on translation of foreign currency cash andcash equivalents . . . . . . . . . . . . . . . . . . . . . . . . . . . . . . . — — (1)
Closing cash and cash equivalents . . . . . . . . . . . . . . . . . . . . . 140 9,052 9,747
(1) For the reader’s convenience, U.S. Dollar translations of Indian Rupee amounts for the year ended March 31, 2017 have
been provided at a rate of US$1.00 = Rs.64.85.
Standalone Cash Flow Statement of Tata Steel (Indian GAAP)
Cash flow statement Year ended March 31,
(Indian GAAP) 2016 2015
(audited)
(Rs. in millions)
Net cash flow from/(used in) operating activities . . . . . . . . . . . . . . . . . . . . . . 75,677 48,519
Net cash from/(used in) investing activities . . . . . . . . . . . . . . . . . . . . . . . . . . (54,052) (23,821)
Net cash flow from/(used in) financing activities . . . . . . . . . . . . . . . . . . . . . . . (16,310) (29,572)
Net increase/(decrease) in cash and cash equivalents . . . . . . . . . . . . . . . . . . . . 5,314 (4,874)
Opening cash and cash equivalents . . . . . . . . . . . . . . . . . . . . . . . . . . . . . . . 4,219 9,093
Effect of exchange rate on translation of foreign currency cash and cash equivalents . . (1) 0
Closing cash and cash equivalents . . . . . . . . . . . . . . . . . . . . . . . . . . . . . . . . 9,532 4,219
30

Statement of Financial Position of ABJA Investment Co. Pte. Ltd.
As atSeptember 30, As at March 31,
2017 2017 2016 2015
(unaudited) (audited)
(US$ inthousand) (US$ in thousand)
ASSETS
Current assets
Cash and cash equivalents . . . . . . . . . . . . . . . . . . . 2,497 16,233 11,770 7,360
Other receivables . . . . . . . . . . . . . . . . . . . . . . . . 26,159 24,848 21,699 17,235
Derivative financial instruments . . . . . . . . . . . . . . . 0 309 150 265
Total current assets . . . . . . . . . . . . . . . . . . . . . . 28,656 41,390 33,619 24,860
Non-current asset
Loan receivables due from related companies . . . . . . . 1,695,195 1,679,085 1,690,932 1,670,502
Derivative financial instruments . . . . . . . . . . . . . . . 2,816 12,808 4,793 7,563
Total non-current asset . . . . . . . . . . . . . . . . . . . . 1,698,011 1,691,893 1,695,725 1,678,065
TOTAL ASSETS . . . . . . . . . . . . . . . . . . . . . . . . 1,726,667 1,733,283 1,729,344 1,702,925
LIABILITIES AND NET CAPITAL DEFICIENCY
Current liabilities
Other payables . . . . . . . . . . . . . . . . . . . . . . . . . . 24,742 27,879 32,254 24,564
Loan payable . . . . . . . . . . . . . . . . . . . . . . . . . . . 0 0 37,800 37,800
Derivative financial instrument . . . . . . . . . . . . . . . . 53 — — —
Tax payable. . . . . . . . . . . . . . . . . . . . . . . . . . . . 1,800 1,707 450 310
Total current liabilities . . . . . . . . . . . . . . . . . . . 26,595 29,586 70,504 62,674
Non-current liabilities
Guaranteed notes . . . . . . . . . . . . . . . . . . . . . . . . 1,709,138 1,703,077 1,708,921 1,702,524
Loans payable due to related company . . . . . . . . . . . 21,800 37,800 0 0
Deferred tax liability . . . . . . . . . . . . . . . . . . . . . . 1,817 1,797 1,796 93
Other Payable . . . . . . . . . . . . . . . . . . . . . . . . . . 2,406 1,907 0 0
Derivative financial instruments . . . . . . . . . . . . . . . 1,102 68 688 469
Total non-current liabilities . . . . . . . . . . . . . . . . . 1,736,263 1,744,649 1,711,405 1,703,086
Capital, accumulated losses and reserve
Share capital . . . . . . . . . . . . . . . . . . . . . . . . . . . 200 200 200 200
Accumulated losses . . . . . . . . . . . . . . . . . . . . . . . (36,381) (41,142) (52,755) (63,025)
Translation reserve . . . . . . . . . . . . . . . . . . . . . . . (10) (10) (10) (10)
Net capital deficiency . . . . . . . . . . . . . . . . . . . . . (36,191) (40,952) (52,565) (62,835)
Total liabilities and net of capital deficiency . . . . . . 1,726,667 1,733,283 1,729,344 1,702,925
Note: The audited statement of financial position of the Issuer as at March 31, 2015, 2016 and 2017 have been prepared in
accordance with SFRS. The unaudited statement of financial position of the Issuer as at September 30, 2017 has been
extracted from the Issuer’s unaudited interim financial statements for the six months ended September 30, 2017, which
were prepared in accordance with SFRS 34, Interim Financial Reporting.
31

Statement of Profit or Loss of ABJA Investment Co. Pte. Ltd.
Statement of Profit or Loss and OtherComprehensive Income
Six months endedSeptember 30, Year ended March 31,
2017 2016 2017 2016 2015
(Unaudited) (audited)
(US$ in thousand) (US$ in thousand)
Interest Income . . . . . . . . . . . . . . . . . . . . 59,286 58,130 117,014 119,591 32,875
Finance costs . . . . . . . . . . . . . . . . . . . . . (51,293) (51,231) (102,337) (102,142) (69,027)
Foreign currency exchange gain, net . . . . . . . 12,667 298 (2,975) 6,532 (29,245)
Fair value losses on derivative financialinstruments, net . . . . . . . . . . . . . . . . . . (11,389) 501 8,794 (3,104) 14,052
Other operating expenses . . . . . . . . . . . . . . (3,554) (3,568) (7,116) (8,482) (3,739)
Profit/(loss) before tax . . . . . . . . . . . . . . 5,717 4,040 13,380 12,395 (55,084)
Note: The audited statement of profit and loss of the Issuer for the years ended March 31, 2015, 2016 and 2017 has been
prepared in accordance with SFRS. The unaudited statement of profit and loss of the Issuer for the six months ended
September 30, 2016 and 2017 have been extracted from the Issuer’s unaudited interim financial statements for the six
months ended September 30, 2017, which were prepared in accordance with SFRS 34, Interim Financial Reporting.
Statement of Cash Flows of ABJA Investment Co. Pte. Ltd.
Summary Cash Flow Statement Year ended March 31,
2017 2016 2015
(audited)
(US$ in thousand)
Net cash flow from/(used in) operating activities . . . . . . . . . . . . . . . . 4,462 4,134 1,173
Net cash from/(used in) investing activities . . . . . . . . . . . . . . . . . . . . — — —
Net cash flow from/(used in) financing activities . . . . . . . . . . . . . . . . . — — —
Net increase/(decrease) in cash and cash equivalents . . . . . . . . . . . . . . 4,462 4,134 1,173
Opening cash and cash equivalents . . . . . . . . . . . . . . . . . . . . . . . . . 11,770 7,360 7,536
Effect of exchange rate on translation of foreign currency cash andcash equivalents . . . . . . . . . . . . . . . . . . . . . . . . . . . . . . . . . . . . 1 276 (1,349)
Closing cash and cash equivalents . . . . . . . . . . . . . . . . . . . . . . . . . . 16,233 11,770 7,360
Note: The audited statement of cash flows of the Issuer for the years ended as at March 31, 2015, 2016 and 2017 have been
prepared in accordance with SFRS.
32

THE OFFERING
The following is a brief summary of the terms of this offering and is qualified in its entirety by theremainder of this Offering Memorandum. This summary is derived from, and should be read inconjunction with, the full text of the “Terms and Conditions of the Notes” and other informationincluded in this Offering Memorandum.
Issuer . . . . . . . . . . . . . . . . . . . . . . ABJA Investment Co. Pte. Ltd.
Parent . . . . . . . . . . . . . . . . . . . . . Tata Steel. The Notes are not being guaranteed by Tata Steel
Notes Offered . . . . . . . . . . . . . . . US$[●] [●]% Notes due [●] (the “[●] Notes”) and US$[●][●]% Notes due [●] (the “[●] Notes”, and together with the [●]Notes, the “Notes”)
Joint Lead Managers . . . . . . . . . . Australia and New Zealand Banking Group LimitedSingapore Branch, Barclays Bank PLC, Singapore Branch,BNP Paribas Singapore Branch, Citigroup Global MarketsSingapore Pte. Ltd., Crédit Agricole Corporate andInvestment Bank, Singapore Branch, DBS Bank Ltd.,Deutsche Bank AG, Singapore Branch, First Abu Dhabi BankPJSC, ING Bank N.V., Singapore Branch, J.P. MorganSecurities plc, Merrill Lynch (Singapore) Pte. Ltd., MorganStanley & Co. International plc, SMBC Nikko CapitalMarkets Limited, Société Générale, Standard Chartered BankSingapore Branch and The Hongkong and Shanghai BankingCorporation Limited, Singapore Branch
Issue Price . . . . . . . . . . . . . . . . . . [●] Notes: [●]%
[●] Notes: [●]%
Maturity Date . . . . . . . . . . . . . . . [●] Notes: [●]
[●] Notes: [●]
Interest . . . . . . . . . . . . . . . . . . . . The [●] Notes will bear interest from and including [●], 2018(the “Closing Date”) at the rate of [●]% per annum from, andincluding, the Closing Date to, but excluding [●] payablesemi-annually in arrear on [●] and [●], of each year. The firstpayment (for the period from, and including [●] to, butexcluding [●]) will be made on [●].
The [●] Notes will bear interest from and including theClosing Date at the rate of [●]% per annum from, andincluding, the Closing Date to, but excluding [●], payablesemi-annually in arrear on [●] and [●] of each year. The firstpayment (for the period from, and including [●] to, butexcluding [●]) will be made on [●].
Registrar . . . . . . . . . . . . . . . . . . . Citibank, N.A., London Branch
Trustee. . . . . . . . . . . . . . . . . . . . . Citicorp International Limited
Principal Paying Agent andTransfer Agent . . . . . . . . . . . . .
Citibank, N.A., London Branch
33

Status of the Notes . . . . . . . . . . . The Notes constitute (subject to Condition 7 (Covenants))unsecured and unsubordinated obligations of the Issuer andwill rank at all times pari passu without any preferenceamong themselves and at least equally with all other presentand future outstanding unsecured and unsubordinatedobligations of the Issuer but, in the event of insolvency, onlyto the extent permitted by applicable laws relating tocreditors’ rights.
Form and Denomination of theNotes . . . . . . . . . . . . . . . . . . . .
The Notes will be issued in fully registered form and in thedenomination of US$200,000 each and integral multiples ofU.S.$1,000 in excess thereof.
The Notes shall initially be represented by Global Certificatesin the aggregate principal amount of the Notes registered inthe name of a common nominee for, and held by or to theorder of a depositary (the “Common Depositary”) common to,Euroclear Bank S.A./N.V. and Clearstream Banking, societeanonyme.
Negative Pledge . . . . . . . . . . . . . . The terms of the Notes contain a negative pledge provision, asfurther described in “Terms and Conditions of the [●] Notes —Negative Pledge” and “Terms and Conditions of the [●] Notes— Negative Pledge”.
Redemption for Tax Reasons . . . . The Notes may be redeemed at the option of the Issuer inwhole, but not in part, at any time or on any Interest PaymentDate, on giving not less than 30 nor more than 60 days’ noticeto the Noteholders, at their principal amount (together withunpaid accrued interest thereon (if any)), if (i) the Issuersatisfies the Trustee immediately prior to the giving of suchnotice that it has or will become obliged to pay additionalamounts as provided or referred to in Condition 11 (Taxation)or as a result of any change in, or amendment to, the laws orregulations of a Relevant Jurisdiction, or any change in theapplication or official interpretation of such laws orregulations, which change or amendment becomes effectiveon or after the Closing Date, and (ii) such obligation cannotbe avoided by the Issuer taking reasonable measures availableto it, provided that no such notice of redemption shall begiven earlier than 90 days prior to the earliest date on whichthe Issuer (or the Parent, as the case may be) would be obligedto pay such additional amounts where a payment in respect ofthe Notes is then due. See “Terms and Conditions of the [●]Notes — Redemption and Purchase — Redemption forTaxation Reasons” and “Terms and Conditions of the [●]Notes — Redemption and Purchase — Redemption forTaxation Reasons”.
34

Redemption for Change ofControl . . . . . . . . . . . . . . . . . . .
Following the occurrence of any Change in Control, theholder of each Note will have the right at such holder’soption, to require the Issuer to redeem in whole but not in partsuch holder’s Notes on the Change of Control RedemptionDate at 101% of their principal amount together with unpaidaccrued interest in accordance with the Conditions. See“Terms and Conditions of the [●] Notes — Redemption andPurchase — Redemption for Change of Control TriggeringEvent” and “Terms and Conditions of the [●] Notes —Redemption and Purchase — Redemption for Change ofControl Triggering Event”.
Events of Default . . . . . . . . . . . . . For a description of events that would permit acceleration ofrepayment of principal and interest of the Notes See “Termsand Conditions of the [●] Notes — Events of Default” and“Terms and Conditions of the [●] Notes — Events of Default”.
Limitations on Asset Sales . . . . . So long as any of the [●] Notes or, as the case may be, the [●]Notes remain outstanding, the Parent shall apply any NetCash Proceeds from an Asset Sale to:
(a) permanently repay unsubordinated FinancialIndebtedness; or
(b) acquire properties and assets (other than current assets)that will be directly owned and used by the Parent inPermitted Businesses; or
(c) invest in subsidiaries involved in Permitted Businesses;provided that the amount of such investment,individually or when aggregated with all otherinvestments in subsidiaries in respect of the Net CashProceeds from any Asset Sales in the twelve monthperiod prior to such investment, does not exceed 3% ofthe Fixed Assets of the Parent on the immediatelypreceding balance sheet date (as stated in the Parent’smost recent semi annual or annual financial statements);or
(d) pay a dividend, provided that, the Parent shall not payany such dividend in respect of or otherwise distributesuch Net Cash Proceeds to its shareholders if suchdividend or distribution, individually or whenaggregated with all other dividends or distributions inrespect of the Net Cash Proceeds from any Asset Sales inthe twelve month period prior to the date of thedeclaration of such dividend or distribution, exceedsUS$200,000,000 or its equivalent in other currencies.
The Parent will not, directly or indirectly, consummate anAsset Sale unless the Parent receives consideration at the timeof the Asset Sale at least equal to the Fair Market Value of theFixed Assets sold or otherwise disposed of.
For details see “Terms and Conditions of the [●] Notes —Covenants — Limitations on Asset Sales” and “Terms andConditions of the [●] Notes — Covenants — Limitations onAsset Sales”.
35

Limitation on FinancialIndebtedness . . . . . . . . . . . . . . .
So long as any of the [●] Notes or, as the case may be, the [●]Notes remain outstanding, the Parent and the Issuer shall notIncur, directly or indirectly, any Financial Indebtedness,unless, after giving effect to the application of the proceedsthereof (i) no Event of Default or Potential Event of Defaultwould occur and (ii) the Total Net Long Term Debt to TotalNet Worth ratio for the Parent’s most recently endedsemi-annual or annual period for which unconsolidatedfinancial statements are available immediately preceding thedate on which such Financial Indebtedness is incurred shallnot be greater than 3.0:1.0. For details see “Terms andConditions of the [●] Notes — Covenants — Limitations onFinancial Indebtedness” and “Terms and Conditions of the[●] Notes — Covenants — Limitations on FinancialIndebtedness”.]
Suspension of Covenants . . . . . . . Following the first day (the “Suspension Date”) that (i) theNotes have Notes Investment Grade Status and (ii) no Eventof Default has occurred and is continuing, Condition 6.2(Limitation on Asset Sales) and Condition 6.3 (Limitation onFinancial Indebtedness) of the Conditions shall no longer betested in relation to the Parent for purposes of the Conditionsand the Trust Deeds (the “Suspended Covenants”). In theevent that the Suspended Covenants are no longer tested inrelation to the Parent for any period of time as a result of thepreceding sentence and, on any subsequent date (the“Reversion Date”), either (A) a Rating Agency has assignedratings to the Notes below the required Notes InvestmentGrade Status or (B) an Event of Default occurs and iscontinuing, then the Suspended Covenants will thereafteragain be tested in relation to the Parent for purposes of theConditions and the Trust Deeds. The period of time betweenthe Suspension Date and the Reversion Date is referred to inthe covenant described hereunder as the “Suspension Period”.
For details see “Terms and Conditions of the [●] Notes —Covenants — Suspension of Covenants” and “Terms andConditions of the [●] Notes — Covenants — Suspension ofCovenants”.
Mandatory exchange at the optionof the Issuer . . . . . . . . . . . . . . .
Subject to all applicable regulations, the Notes may beexchanged for New Notes issued directly by the Parent at theoption of the Issuer in whole, but not in part, at any time oron any Interest Payment Date, on giving notice to theNoteholders, the Trustee and the Principal Paying Agent(which notice shall be irrevocable). The terms and conditionsof the New Notes will be set out in Schedule [7] to the TrustDeeds and will contain the same terms as the [●] Notes, or asthe case may be, the [●] Notes, except for the issue date.
36

The exchange of the [●] Notes, or as the case may be, the [●]Notes, for the New Notes (the “Exchange”) will be done insuch a manner that each Noteholder will receive an amount ofNew Notes equal in principal amount to the principal amountof the [●] Notes, or as the case may be, the [●] Notes, thenheld by such Noteholder. For details see “Terms andConditions of the [●] Notes — Redemption and Purchase —Mandatory exchange at the option of the Issuer” and “Termsand Conditions of the [●] Notes — Redemption and Purchase— Mandatory exchange at the option of the Issuer”.
Meetings of Noteholders . . . . . . . The Terms and Conditions of the [●] Notes and the Terms andConditions of the [●] Notes contain provisions for callingmeetings of Noteholders to consider matters affecting theirinterests generally. These provisions permit definedmajorities to bind all Noteholders including Noteholders whodid not attend and vote at the relevant meeting andNoteholders who voted in a manner contrary to the majority.
Withholding Tax and AdditionalAmounts . . . . . . . . . . . . . . . . .
The Issuer will, pay such additional amounts as may benecessary in order that the net payment received by eachNoteholder in respect of the Notes, after withholding for anytaxes imposed by tax authorities in an Relevant Jurisdictionupon payments made by or on behalf of the Issuer in respectof the Notes, will equal the amount which would have beenreceived in the absence of any such withholding taxes, subjectto the customary exceptions, as described in “Terms andConditions of the Notes — Taxation”.
Selling Restrictions . . . . . . . . . . . There are restrictions on the offer, sale and transfer of theNotes in, among others, Singapore, India, the United States,the European Economic Area, the United Kingdom, HongKong and Japan. For a description of the selling restrictionson offers, sales and deliveries on the Notes, see “Subscriptionand Sale”.
Governing Law . . . . . . . . . . . . . . The Notes and any non-contractual obligations arising out ofor in connection with them will be governed by, and shall beconstrued in accordance, with English law.
Risk Factors. . . . . . . . . . . . . . . . . For a discussion of certain factors that should be consideredin evaluating an investment in the Notes, see “Risk Factors”.
Listing . . . . . . . . . . . . . . . . . . . . . Approval in principle has been granted for the listing andquotation of the Notes on the SGX-ST.
Clearing System . . . . . . . . . . . . . The Notes will be represented by beneficial interests in theGlobal Certificate, which will be registered in the name of anominee of a common depositary for Clearstream,Luxembourg and Euroclear, and deposited on or about theClosing Date. Beneficial interests in the Global Certificatewill be shown on and transfers thereof will be effected onlythrough records maintained by of Euroclear or of Clearstream,Luxembourg.
37

Use of Proceeds . . . . . . . . . . . . . . The Issuer estimates that the net proceeds from the sale ofNotes will be approximately US$[●] million after deductingfees, commissions and estimated expenses.
Of the net proceeds from the offering, the Issuer intends touse a majority to fund the pre-payment, repayment orrefinancing of the Group’s offshore debt obligations, and therest to fund general corporate purposes of the Group outsideIndia. Certain of the Joint Lead Managers participating in thisoffering are lenders under the offshore debt obligations thatwill be refinanced with the net proceeds of this offering.
Pending application of the net proceeds of this offering, theIssuer may apply such proceeds to initially repay certain of itsoffshore working capital facilities or invest in cash and cashequivalents outside India.
Letter of Comfort from the Parent The Parent has provided a letter of comfort for the benefit ofpotential investors in the Notes. The letter states that theNotes will have the benefit of the letter provided by theParent, whereby the Parent endeavours that noteholders willnot incur any loss with respect to the Notes. This letter doesnot represent a guarantee or a legally binding obligation ofthe Parent.
38

RISK FACTORS
This Offering Memorandum contains forward-looking statements that involve risks and uncertainties.Prospective investors should carefully consider the risks and uncertainties described below and theinformation contained elsewhere in this Offering Memorandum before making an investment in theNotes. In making an investment decision, each investor must rely on its own examination of the Groupand the terms of the offering of the Notes. The risks described below are not the only ones faced bythe Group or investments in India in general. The Group’s business, prospects, financial condition,cash flows and results of operations could be materially adversely affected by any of these risks. Thereare a number of factors, including those described below, that may adversely affect the Issuer’s abilityto make payment on the Notes. The risks described below are not the only ones that may affect theNotes. Additional risks not currently known to the Group or that the Group currently deems immaterialmay also impair the business, prospects, financial condition, cash flows and results of operations ofthe Issuer or the Group.
Risks Related to the Structure
The Notes are not guaranteed by, and do not have the benefit of any credit support from, Tata Steelor any other member of the Group. The Issuer’s ability to pay principal and interest on or refinancethe Notes is dependent upon payments from other members of the Group to fund payments to youon the Notes, and such other members might not be able to make such payments in somecircumstances. The Letter of Comfort is not a binding instrument and does not create anyobligations on, or rights against, Tata Steel.
The Notes are not guaranteed by Tata Steel or any other member of the Group. Tata Steel is theguarantor of the Issuer’s S$300,000,000 Guaranteed Notes due 2023, the Issuer’s US$500,000,000Guaranteed Notes due 2020 and the Issuer’s US$1,000,000,000 Guaranteed Notes due 2024 but willnot guarantee the Notes. While the terms and conditions of the Notes reference Tata Steel, and certaincovenants relate to Tata Steel, Tata Steel will not be a party to the Trust Deed and noteholders willhave no rights against, or contractual privity with, Tata Steel.
The Issuer does not itself conduct any business operations and does not have any assets or sources ofincome of its own, other than intercompany loans to one or more members of the Group. In addition,the Issuer, as at September 30, 2017, had a net capital deficiency of US$36.2 million. As a result, theIssuer’s ability to make payments on the Notes or refinance its debt is dependent directly uponpayments it receives on these intercompany loans. There can be no assurance that those assets orsources of income will be sufficient to enable the Issuer to pay interest or principal amount on theNotes. In making decisions relating to the repayment of the intercompany loan(s), the borrower(s) maytake actions that conflict with the interests of the Issuer or the holders of the Notes.
You will not have any direct claim on the cash flows or assets of any entity other than the Issuer andno member of the Group (other than the Issuer) has any obligation, contingent or otherwise, to makepayments with respect to the Notes or to make funds available to the Issuer. The Letter of Comfortprovided by Tata Steel to the trustee on behalf of noteholders is not a binding instrument and does notcreate any obligations on, or rights against, Tata Steel.
Risks Related to the Group
The steel industry is affected by global economic conditions. Slower than expected or uneven growthof the global economy or a renewed global recession could have a material adverse effect on thesteel industry and the Group.
The Group’s business and results of operations have been and continue to be affected by international,national and regional economic conditions. Following the global financial crisis in 2007 to 2009, theEurozone crisis in 2009 to 2013 and the decline in commodity prices that began in 2014, there hasbeen significant volatility in an number of indicators, making it more difficult to forecast short and
39

medium term growth. Rates of economic growth have significant impacts on substantial consumers ofsteel products, such as the automotive and construction industries and declines in steel consumptioncaused by poor or unfavorable economic conditions in one or more of the Group’s major markets orby the deterioration of the financial condition of its key customers would have a material adverseeffect on demand for its products and hence on its business and results of operations. Unfavorableeconomic conditions in any of the Group’s key markets could have a material adverse effect on theGroup’s business, results of operations, financial condition and prospects.
Europe is a significant market for the Group, and its current business and future growth could bematerially and adversely affected by poor economic conditions in Europe.
Europe is a significant market for the Group, accounting for 39% and 41% of the Group’s revenue forthe years ended March 31, 2017 and 2016, respectively. Sales of the Group’s products in Europe areaffected by the condition of major steel consuming industries, such as the automobile, infrastructureand construction sectors, and the European economy in general. In addition, a significant majority ofthe Group’s operations and assets are located in Europe.
The Eurozone sovereign debt crisis, resulting austerity measures and other factors, led to recession orstagnation in many of the national economies in the Eurozone. While conditions have since improved,there can be no certainty that such improvement will continue. The United Kingdom’s decision toleave the European Union has increased economic uncertainty and is expected to impact the level ofinvestment activity and the pace of recovery for both the United Kingdom and the Eurozone economy.Any future deterioration of the European and global economy could adversely affect the Group’sbusiness, financial condition, results of operations and prospects.
On June 23, 2016, the United Kingdom held a referendum on its membership of the European Unionand voted to leave (“Brexit”). There is significant uncertainty at this stage as to the impact of Brexiton the general economic conditions in the United Kingdom and the European Union and anyconsequential impact on global financial markets. For example, Brexit could give rise to increasedvolatility in foreign exchange rate movements and the value of equity and debt investments. A lackof clarity over the process for managing the exit and uncertainties surrounding the economic impactcould lead to a further slowdown and instability in financial markets. These and other related eventshave had a significant impact on the global credit and financial markets as a whole, including reducedliquidity, greater volatility, widening of credit spreads and a lack of price transparency in the UnitedStates, Europe and global credit and financial markets. In response to such developments, legislatorsand financial regulators in the United States, Europe and other jurisdictions, including India, haveimplemented several policy measures designed to add stability to the financial markets. In addition,any announcement by the United State Federal Reserve to increase interest rates may lead to anincrease in the borrowing costs in the United States and may impact borrowing globally as well.Further, in several parts of the world, there are signs of increasing retreat from globalisation of goods,services and people, as pressures for protectionism are building up and such developments could havethe potential to affect exports from India.
The United Kingdom’s decision to leave the European Union has increased economic uncertainty andis expected to impact the level of investment activity and the pace of recovery for both the UnitedKingdom and the Eurozone economy. Any future deterioration of the European and global economycould adversely affect the Group’s business, financial condition, results of operations and prospects.
The steel industry is highly cyclical and a decrease in steel prices may have a material adverse effecton the Group’s results of operations, prospects and financial condition.
Steel prices are volatile, reflecting the highly cyclical nature of the global steel industry. Steel pricesfluctuate based on a number of factors, such as the availability and cost of raw material inputs,fluctuations in domestic and international demand and supply of steel and steel products, worldwideproduction and capacity, fluctuation in the volume of steel imports, transportation costs, protectivetrade measures and various social and political factors, in the economies in which the steel producers
40

sell their products and are sensitive to the trends of particular industries, such as the automotive,construction, packaging, appliance, machinery, equipment and transportation industries, which areamong the biggest consumers of steel products. When downturns occur in these economies or sectors,the Group may experience decreased demand for its products, which may lead to a decrease in steelprices, which may, in turn, have a material adverse effect on the Group’s business, results ofoperations, financial condition and prospects.
Global steel prices fell sharply in 2008 as the global credit crisis led to a collapse in global demand.If there is a weakness in sectors of the economy that are substantial consumers of steel products, suchas the construction and automobile industries, steel producers would be also be hurt. While steel priceshave increased in recent years, they have been subject to fluctuation. Low steel prices adversely affectthe businesses and results of operations of steel producers generally, including the Group, resultingin lower revenue and margins and write downs of finished steel products and raw material inventories.In addition, the volatility, length and nature of business cycles affecting the steel industry havebecome increasingly unpredictable, and the recurrence of another major downturn in the industry mayhave a material adverse impact on the Group’s business, results of operations, financial condition andprospects.
In addition, substantial decreases in steel prices during periods of economic weakness have not alwaysbeen balanced by commensurate price increases during periods of economic strength. Any sustainedprice recovery will most likely require a broad economic recovery, in order to underpin an increasein real demand for steel products by end users.
Overcapacity and oversupply in the global steel industry may adversely affect the Group’sprofitability.
China is the largest steel producing country in the world by a significant margin, with the balancebetween its domestic production and demand being an important factor in the determination of globalsteel prices. In addition, Chinese steel exports may have a significant impact on steel prices in marketsoutside of China, including in the markets where the Group operates. Any production overcapacity andoversupply in the steel industry would likely cause increased competition in steel markets around theworld which would likely lead to reduced profit margins for steel producers, and would also likelyhave a negative effect on the Group’s ability to increase steel production in general. No assurance canbe given that the Group will be able to continue to compete in such an economic environment or thata prolonged stagnation of the global economy or production overcapacity will not have a materialadverse effect on the Group’s business, results of operations, financial condition or prospects.
Developments in the competitive environment in the steel industry, such as consolidation among theGroup’s competitors, could have a material adverse effect on the Group’s competitive position andhence its business, financial condition, results of operations or prospects.
The Group believes that the key competitive factors affecting its business include product quality,changes in manufacturing technology, workforce skill and productivity, cash operating costs, pricingpower with large buyers, access to funding, the degree of regulation and access to low-cost rawmaterials. Although the Group believes that it is a competitive steel producer, it cannot assureprospective investors that it will be able to compete effectively against its current or emergingcompetitors with respect to each of these key competitive factors.
In the past, there have been instances of consolidation among the Group’s competitors. For example,the merger of Mittal and Arcelor in 2006 created a company that continues to be the largest steelproducer in the world. In 2012, Nippon Steel merged with Sumitomo Metal Corporation, creating thesecond largest steel producer in the world. Competition from global steel producers with expandedproduction capacities and new market entrants, especially from China and India, could result insignificant price competition, declining margins and a reduction in revenue. For example, thesecompanies may be able to negotiate preferential prices for certain products or receive discountedprices for bulk purchases of certain raw materials that may not be available to the Group.
41

Recent changes in India’s debt restructuring and insolvency laws, including the introduction of theInsolvency and Bankruptcy Code, 2016 (the “IBC”), could also lead to consolidation among theGroup’s competitors.
In addition, the Group’s competitors may have lower leverage and stronger balance sheets. Largercompetitors may also use their resources, which may be greater than the Group’s, against the Groupin a variety of ways, including by making additional acquisitions, investing more aggressively inproduct development and capacity and displacing demand for the Group’s export products. The marketis still highly fragmented, and if the trend towards consolidation continues, the Group could be placedin a disadvantageous competitive position relative to other steel producers and its business, results ofoperations, financial condition and prospects could be materially and adversely affected. In addition,a variety of known and unknown events could have a material adverse impact on the Group’s abilityto compete. For example, changes in the level of marketing undertaken by competitors, governmentalsubsidies provided to foreign competitors, dramatic reductions in pricing policies, exporters sellingexcess capacity from markets such as China, Ukraine and Russia, irrational market behavior bycompetitors, increases in tariffs or the imposition of trade barriers could all affect the ability of theGroup to compete effectively. Any of these events could have a material adverse impact on the Group’sbusiness, results of operations, financial condition and prospects.
The steel industry is characterized by a high proportion of fixed costs and volatility in the pricesof raw materials and energy, including mismatches between trends in prices for raw materials andsteel, as well as limitations on or disruptions in the supply of raw materials, which could adverselyaffect the Group’s profitability.
Steel production requires substantial amounts of raw materials and energy, including iron ore, cokingcoal and coke, scrap and power, which are subject to significant price volatility. The production ofsteel is capital intensive, with a high proportion of fixed costs to total costs. Consequently, steelproducers generally seek to maintain high capacity utilization. If capacity exceeds demand, there isa tendency for prices to fall sharply if supply is largely maintained. Conversely, expansion of capacityrequires long lead times so that, if demand grows strongly, prices increase rapidly, as unutilizedcapacity cannot be brought on line as quickly. The result can be substantial price volatility. While theGroup has taken steps to reduce operating costs, such as entering into strategic joint ventures in Indiaand overseas to secure supplies of raw materials and energy, the Group may be negatively affected bysignificant price volatility, particularly in the event of excess production capacity in the global steelmarket, and incur operating losses as a result.
Volatility in the prices of raw materials and energy, including mismatches between trends in prices forraw materials and steel, and limitations on (or disruptions in) supply of raw materials could adverselyaffect the Group’s profitability. The availability and prices of raw materials may be negatively affectedby, among other factors: new laws or regulations; suppliers’ allocations to other purchasers; businesscontinuity of suppliers; interruptions in production by suppliers; accidents or other similar events atsuppliers’ premises or along the supply chain; wars, natural disasters and other similar events;fluctuations in exchange rates; consolidation in steel-related industries; the bargaining power of rawmaterial suppliers and the availability and cost of transportation. Although the Group’s Indianoperations source a portion of their iron ore and coal requirements from their captive mines and alsohave new mines under development, the Group currently obtains a significant majority of its rawmaterials requirements, including all raw materials for its operations in Europe, under supplycontracts or from the spot market. The raw materials industry is highly concentrated and suppliers inrecent years have had significant pricing power. Further consolidation among suppliers wouldexacerbate this trend. Since 2010, raw materials suppliers began to move towards sales based onquarterly prices rather than annually priced contracts under which steel producers, such as the Group,face increased exposure to production cost and price volatility. This change may in turn reduce thesteel producers’ access to reliable supplies of raw materials. Further, operations at some of the Group’smines in India were disrupted in 2015 due to various reasons, including judicial orders and regulatorydisputes. Such disruptions forced us to purchase iron ore and coal on a spot basis or rely on imports,resulting in increased raw material costs.
42

In recent years, many steel companies have been focused on acquiring raw materials around the worldin an effort to limit their exposure to the volatility and instability of the markets for raw materials.To the extent such companies use these raw materials in their own steel production, these acquisitionswill further limit the supply of these raw materials available for purchase in the global markets. Anyprolonged interruption in the supply of raw materials or energy, or failure to obtain adequate suppliesof raw materials or energy at reasonable prices or at all, or increases in costs which the Group cannotpass on to its customers, could have a material adverse effect on its business, financial condition,results of operations or prospects.
Despite the high correlation between steel and raw material prices, with both having experiencedsignificant declines during the global economic crisis, there can be no assurance that this correlationwill continue. If raw materials and energy prices rise significantly (either as a result of supplyconstraints or other reasons) but prices for steel do not increase commensurately, it would have amaterial adverse effect on the Group’s business, financial condition, results of operations andprospects.
In addition, energy costs, including the cost of electricity and natural gas, represent a substantialportion of the cost of goods sold by steel producers generally, including the Group. Historically,energy prices have varied significantly, and this trend may continue due to market conditions and otherfactors beyond the control of steel producers. Because the production of direct reduced iron and there-heating of steel involve the use of significant amounts of energy, steel producers are sensitive toenergy prices and are dependent on having access to reliable supplies. For example, the Groupmothballed its steel processing plant at Llanwern, United Kingdom in 2015 due to high energy prices.Accordingly, even moderate increases in energy prices can have a significant effect on the Group’sbusiness, financial condition, results of operations and prospects.
The Group faces risks relating to its proposed joint venture with Thyssenkrupp AG.
The Group has signed a memorandum of understanding with respect to the creation of a 50-50 jointventure with Thyssenkrupp AG, as announced on September 20, 2017. The proposed joint venturerelates to the parties’ flat steel activities based in Europe and Thyssenkrupp AG’s steel mill services.It would significantly change the Group’s European operations. The commitments regarding thecreation of this joint venture in the memorandum of understanding are not binding on either party andthe successful creation of the joint venture is subject to a number of conditions, including negotiationof definitive documentation, regulatory approvals and informing and, where necessary, consultingwith various stakeholders, including employee representative bodies, and other matters outside theGroup’s control. The debt finance for the European business will also need to be refinanced prior tothe creation of the joint venture. Therefore, there can be no certainty that this joint venture will becreated, nor that if it is created it will succeed or that we will be able to realize the expected benefits.In addition, if the joint venture is created, the Group’s European operations will be subject to the risksinherent with joint ventures including (since it is a 50-50 joint venture) the loss of Group control overthe business. The Group will also of course be subject to business risks inherent in the ThyssenkruppAG business, in relation to which due diligence is ongoing.
The Group’s UK business has separated from the BSPS, and BSPS members are currentlyundergoing a consensual transfer exercise to a new scheme sponsored by the UK business.
On March 31, 2017, the BSPS was closed to future accrual and replaced by a defined contributionscheme. On September 11, 2017, the BSPS separated from TSUK and a number of affiliated companiesby way of a Regulated Apportionment Arrangement (“RAA”). TSUK has also agreed to sponsor aproposed new pension scheme (“BSPS2”), to which BSPS members may choose to transfer subject tocertain qualifying conditions in relation to BSPS2. Since the RAA has completed, all members of theBSPS have been invited to transfer to BSPS2. If the qualifying conditions are met, those members whochoose to do so will transfer to the BSPS2 at the end of March 2018. There is uncertainty with respectto the creation and composition of the BSPS2, the composition of which in terms of number ofmembers, the funding position and its risk profile will not be known until March 2018.
43

The Group has a substantial amount of indebtedness, which may adversely affect its cash flow andits ability to operate its business.
The Group’s outstanding indebtedness was Rs.830,145 million as of March 31, 2017. Any downturnin the steel industry increases the possibility that the Group may be unable to generate cash sufficientto pay, when due, the principal of, interest on or other amounts due in respect of its indebtedness. Inaddition, as this debt matures, the Group may need to refinance or secure new debt which may not beavailable on favorable terms or at all. Approximately 22.9% of this outstanding indebtedness is duewithin one year and, a portion of which will be refinanced by the Group through loans with longertenors. Approximately 68.2% of this outstanding indebtedness matures within the next five years(including indebtedness maturing within one year).
The Group’s high indebtedness levels, and other financial obligations and contractual commitments,may have other significant consequences for its business and results of operations, including:
• increased vulnerability to adverse changes in economic conditions, government regulation or thecompetitive environment;
• diversion of its cash flow from operations to payments on its indebtedness and other obligationsand commitments, thereby reducing the availability of its cash flows to fund working capital,capital expenditure, acquisitions and other general corporate purposes;
• limiting additional borrowings for working capital, capital expenditure, acquisitions, debtrefinancing service requirements, execution of its business strategy or other purposes;
• impairing its ability to pay dividends in the future; and
• exacerbating the impact of foreign currency movements on the profitability and cash flows of theGroup.
A significant portion of the Group’s indebtedness has been incurred by the Group’s subsidiaries,including TSE. The Group may be required, under the Group’s various financing arrangements, toprovide financial resources to support such subsidiaries under their existing and future indebtedness.The Group has provided financial support to TSE and other subsidiaries in the past and there can beno assurance that the Group will not be required to contribute additional funds to reduce theoutstanding debt or otherwise provide substantial support to its subsidiaries in the future. While theGroup expects to transfer a portion of the Group’s external debt in TSE to the proposed joint venturein Europe with Thyssenkrupp AG, the establishment of the joint venture is not certain and the Group,as a 50% shareholder in the joint venture, may be required to provide additional support to thebusiness if the joint venture is created.
In addition, the Group’s high indebtedness levels, and other financial obligations and contractualcommitments could lead to a downgrade of its credit rating by international and domestic ratingagencies, thereby adversely impacting the Group’s ability to raise additional financing and the interestrates and commercial terms on which such additional financing is available.
The Group may incur additional borrowings in the future, including by way of issuing bonds. TheGroup’s inability to meet its debt service obligations and repay its outstanding indebtedness dependsprimarily on the revenue generated by its business. The Group cannot assure you that it will generatesufficient revenues to service existing or proposed borrowings or fund other liquidity needs.
Mining operations are subject to substantial risk, including those related to operational hazards andenvironmental issues.
The Group currently operates several iron ore and coal mines in India and has an interest in mines inMozambique, Canada and South Africa. The Group may substantially increase the scope of its mining
44

activities in the future. These operations are subject to hazards and risks normally associated with theexploration, development and production of natural resources including industrial accidents, such asexplosions, fires, transportation interruptions and inclement weather. The occurrence of any of theseevents, or similar events, could delay production, increase production costs and result in death orinjury to persons, damage to property and liability for the Group, some or all of which may not becovered by insurance, as well as substantially harm the Group’s reputation.
These operations are also subject to hazards and risks relating to negative environmental consequencessuch as those resulting from tailings and sludge disposal, effluent management and disposal ofmineralized waste water and rehabilitation of land disturbed during mining processes. In addition,environmental awareness throughout the world, including in India and other emerging markets, hasgrown significantly in recent years, and opposition to mining operations have also increased due tothe perceived negative impact they have on the environment. Public protests over the Group’s miningoperations could cause operations to slow down, damage the Group’s reputation and goodwill with thegovernments or public in the countries and communities in which the Group operates, or cause damageto its facilities. Public protest could also affect the ability of the Group to obtain necessary licensesto expand existing facilities or establish new operations. Consequently, negative environmentalconsequences as well as public opposition to the Group’s current or planned mining operations couldhave a material adverse effect on the Group’s results of operations and financial condition.
The Group’s estimates of its Indian mineral reserves and the mineral reserves of its other mininginvestments are subject to assumptions, and if the actual amounts of such reserves are less thanestimated, or if the Group is unable to gain access to sufficient mineral reserves, the Group’s resultsof operations and financial condition may be adversely affected.
The Group’s estimates of its iron ore and coal resources, including in India, Australia, Mozambique,Canada and South Africa, are subject to probabilistic assumptions based on interpretations ofgeological data obtained from sampling techniques and projected rates of production in the future. Inaddition, no independent third-party reports have been generated to ascertain the level of mineralreserves located at certain of the Group’s existing and potential mining sites. Actual reserves andproduction levels may differ significantly from reserve estimates. Furthermore, it may take many yearsfrom the initial phase of exploration before production is possible during which time the economicfeasibility of exploiting such reserves may change. There can be no assurance that commercial levelsof raw materials will be discovered or that the mines will produce raw materials at the estimatedamounts or at all.
If mineral reserves or the quality of such reserves are overestimated, the level of viable reserves wouldbe lower than expected, and the Group may be forced to purchase such minerals in the open market.Prices of minerals in the open market may significantly exceed the cost at which the Group mightotherwise be able to extract these minerals, which would cause costs to increase and consequentlyadversely affect the Group’s businesses, results of operations, financial condition and prospects.
The Group’s leased mines are valuable to its operations and consequently if it is unable to renewany lease or obtain new lease rights it may be required to purchase such minerals for higher pricesin the open market or pay escalated royalties for the existing leases which may negatively impactits results of operations and financial condition.
The Group extracts minerals in India pursuant to mining leases from state governments in the areasin which such mines are located including leases for iron ore mines in the Noamundi, Joda andKhondbond regions and coal mines in the West Bokaro, Odisha and Jamadoba, Jharkhand. These leasesare granted under the Indian Mines and Minerals (Development and Regulations) Act, 1957 (the“MMDR Act”). In addition, the Group has plans to increase the scope of its mining activities pursuantto new leases with the state governments in Odisha and Jharkhand. The Group’s current leases have
45

been extended (disputes in respect of renewal of the lease for the mines at Noamundi are beingcontested by the Group based on the interpretation of the MMDR Act, 2015) and the extension issubject to the lessee not being in breach of any applicable laws, including environmental laws andcomplying with such other conditions as the relevant governmental authorities may impose.
While granting approval for the extension of the mining lease for the Noamundi iron ore mines, theState Government of Jharkhand imposed certain additional conditions, including a demand ofRs.35,683 million towards penalty for alleged illegal mining by the Group. For further details, pleasesee “Business — Litigation”.
If the Group’s mining leases in India are not renewed, or renegotiated on terms that are lessadvantageous, no new leases are made available, or royalties charged against the Group’s leases areincreased, the Group may be forced to purchase such minerals in the open market or pay increasedroyalties. If prices in the open market exceed the cost at which the Group might otherwise be able toextract these minerals or there is an increase in royalties payable, the Group’s costs would increaseand the Group’s business, results of operations, financial condition and prospects would be materiallyand adversely affected.
Inability to obtain, renew or maintain the statutory and regulatory permits, licenses and approvalsrequired to operate the Group’s business could have a material adverse effect on its business.
The Group requires certain statutory and regulatory permits, licenses and approvals for its businessin each of the jurisdictions in which it operates. There can be no assurance that the relevant authoritieswill issue such permits or approvals in the time frame anticipated by the Group or at all.
In relation to compliance with approvals, the Group, for instance, has received demand notices in theaggregate amount of Rs.1,329 million from the Office of the Deputy Director Mines, Joda in Odishawhere it has been alleged that production of iron ore and manganese ore from the Group’s minesduring the periods between 2000-01 and 2010-11 was in excess of the quantity approved by the IndianBureau of Mines and the limits approved under the provisions of, amongst others, the Environment(Protection Act), 1986 and the Air (Prevention and Control of Pollution) Act, 1981. The Group hasresponded to these notices. The Group has also received a demand notice from the Government ofJharkhand in the aggregate amount of Rs.21,400 million in relation to four of the Group’s coal minesin Jharkhand. See “Business — Litigation”. If the Group is unable to obtain and maintain the requisitelicenses in a timely manner or at all, or to renew or maintain existing permits or approvals, or complywith the terms and conditions prescribed in such permits or approvals, it may result in the interruptionof the Group’s operations (including suspension or termination of its mining leases) and may have amaterial adverse effect on the Group’s business, financial condition and results of operations.
Changes in assumptions underlying the carrying value of certain assets, including as a result ofadverse market conditions, could result in impairment of such assets, including intangible assetssuch as goodwill.
The Group reviews the carrying amounts of its tangible and intangible assets (including investments)to determine whether there is any indication that the carrying amount of those assets may not berecoverable through continuing use.
Fixed assets are reviewed for impairment whenever events or changes in circumstances indicate thattheir carrying amount may not be recoverable. The Group makes a number of significant assumptionsand estimates when applying its impairment test, including in estimation of the net present value offuture cash flows attributable to assets or cash generating units. The actual results or performance ofthese assets or cash generating units could differ from estimates used to evaluate the impairment ofassets. In the event that the recoverable amount of any cash-generating unit is less than the carrying
46

amount of the unit, the impairment loss will first be allocated to reduce the carrying amount of anygoodwill allocated to the unit and then to the other assets of the unit in proportion to the carryingamount of each asset in the unit. However, the decrease in recoverable amount of assets is notconclusively indicative of a long-term diminution in value of the assets.
While impairment does not affect reported cash flows, the decrease in estimated recoverable amount,as well as, the related non-cash charge in the consolidated statement of profit and loss could have amaterial adverse effect on the Group’s financial results or on key financial ratios. Since the 2008financial crisis, the Group’s businesses, including its European operations, have been under severepressure, and the Group has recognized non-cash write downs of goodwill and assets in connectionwith these operations. Many of the Group’s peers in the steel industry have taken substantialimpairment charges in their accounts for their most recent financial year.
Impairment loss recognised in respect of property, plant and equipment (including capitalwork-in-progress) and intangible assets for the year ended March 31, 2017 was Rs.2,679 million. Forthe year ended March 31, 2017, provision for advances given for repurchase of equity shares in TataTeleservices Limited from NTT Docomo Inc. was Rs.1, 255 million.
In accordance with the Group’s policy, impairment review is conducted only at the end of the lastquarter of the financial year. There can be no assurance that the Group will not be required to takeimpairment charges for the year ended March 31, 2018, in relation to its operations or elsewhere, orthereafter and, if taken, such charges may be significant. Any future impairment charges mayadversely impact the Group’s financial covenants, liquidity position and results of operations.
The production of steel is capital intensive, with long gestation periods.
The production of steel is capital intensive, with a high proportion of investment in fixed assets suchas land, plant and machinery. Further, setting up of new capacities or expansion of existing capacitiesrequire long lead times. If total capacity in the industry exceeds demand, there is a tendency for pricesto fall sharply if supply is largely maintained. Conversely, if demand grows strongly, prices increaserapidly, as unutilized capacity cannot be brought on line as quickly. The result can be substantial pricevolatility. While the Group has taken steps to reduce operating costs, it may be negatively affected bysignificant price volatility, particularly in the event of excess production capacity in the global steelmarket, and incur operating losses as a result.
If the Group is unable to successfully implement its growth strategies, its results of operations andfinancial condition could be adversely affected.
As part of its future growth strategy, the Group plans to expand its steelmaking capacity through acombination of brownfield growth, new greenfield projects and acquisition opportunities and to focusthis additional capacity on the increased production of high value products. For further details see“Business — Expansion and Development Projects”. These projects, and a number of other expansionprojects, to the extent that they proceed, would involve risks, including risks associated with thetimely completion of these projects, and failure by the Group to adequately manage these risksnotwithstanding its upgraded operational and financial systems, procedures and controls could havea material adverse effect on the Group’s business, financial condition, results of operations andprospects. Factors that could affect the Group’s ability to complete these projects include receivingfinancing on reasonable terms, obtaining or renewing required regulatory approvals and licenses,delays in land acquisitions, a decline in demand for the Group’s products and general economicconditions. For example, the Group’s Odisha project experienced delays primarily associated withland acquisition, licenses and construction delays due to extreme weather conditions. Delaysassociated with land acquisitions and obtaining various licenses and approvals require thecoordination and cooperation of various governmental agencies and third parties that are outside thecontrol of the Group. In many cases, even though the Group paid for or applied for acquisitions,services or licenses, delays associated with the responsiveness of counterparties were one of the keyreasons for construction delays. To accommodate this growth, the Group has needed to implement a
47

variety of new and upgraded operational and financial systems, procedures and controls, including theimprovement of its accounting and other internal management systems, all of which require substantialmanagement time and effort. In addition, the feasibility of the Group’s growth strategies are alsodependent upon the ability of the Group to negotiate extensions of memorandums of understandingwith the relevant state governments, obtain new iron ore mining leases from the relevant stategovernments and on certain political factors including the resettlement and rehabilitation of peopleliving on the land to be used in a project. Any of these factors may cause the Group to delay, modifyor forego some or all aspects of its expansion plans. Further, there can be no assurance that the Groupwill be able to execute its strategies on time and within the estimated budget.
In addition, certain brownfield expansions, at the particular facility being upgraded, would haverequire the temporary shut-down of operations. During these periods, the Group could experiencereduced production volumes which could translate into reduced sales volume. This could have a directnegative impact on revenue and operating results for such period. Consequently, the Group cannotassure prospective investors that it will be able to execute these projects and, to the extent that theyproceed, that it will be able to complete them on schedule or within budget. In addition, there can beno assurance that the Group will be able to achieve its goal of increasing the production of high valueproducts or that it will otherwise be able to achieve an adequate return on its investment. Failure todo so could have a material adverse effect on the Group’s business, financial condition, results ofoperations and prospects.
Further, as part of the Group’s growth strategy and to improve liquidity, the Group endeavors toundertake portfolio rationalization through divestment of assets and businesses from time to time.These include some of the Group’s operating steel assets, logistics and downstream assets. Divestmentof these assets and businesses could be significant. The Group cannot assure you that any thedivestments will be completed in a timely manner on commercially acceptable terms, or at all, or thatthe divestments undertaken in the past could not have been completed on more favorable terms.
If industry-wide steel inventory levels are high, customers may draw from inventory rather thanpurchase new products, which would reduce the Group’s sales and earnings.
Above-normal industry inventory levels can cause a decrease in demand for the Group’s products andthereby adversely impact its earnings. High industry-wide inventory levels of steel reduce the demandfor production of steel because customers can draw from inventory rather than purchase new products.This reduction in demand could result in a corresponding reduction in prices and sales, both of whichcould contribute to a decrease in earnings. Industry-wide inventory levels of steel products canfluctuate significantly from period to period.
The Group is subject to certain restrictive covenants in its financing arrangements which may limitoperational and financial flexibility, and failure to comply with these covenants may have a materialadverse effect on the Group’s future results of operations and financial condition.
Certain of the Group’s financing arrangements include covenants to maintain certain debt to equityratios, debt coverage ratios and certain other liquidity and profitability ratios. There can be noassurance that such covenants will not hinder business development and growth.
In the event that the Group breaches any covenants under its financing arrangements or requisiteconsents/waivers cannot be obtained, the outstanding amounts due under such financing agreementscould become due and payable immediately. A default under one of these financing agreements mayalso result in cross-defaults under other financing agreements and result in the outstanding amountsunder such financing agreements becoming due and payable immediately. Defaults under one or moreof the Group’s financing agreements could have a material adverse effect on the Group’s business,results of operations, financial condition and prospects.
Some of the Group’s financing agreements and debt arrangements set limits on or require it to obtainlender consents before, among other things, undertaking certain projects, issuing new securities,
48

changing the business of the Group, merging, consolidating, selling significant assets or makingcertain acquisitions or investments. In the past, the Group has been able to obtain required lenderconsents for such activities. However, there can be no assurance that the Group will be able to obtainsuch consents in the future. If the Group’s financial or growth plans require such consents, and suchconsents are not obtained, or other condition or covenant under the Group’s financing agreements isnot waived by the lender, the Group may be forced to forgo or alter its plans, which could adverselyaffect its results of operations, financial condition and prospects.
In addition, certain covenants may limit the Group’s ability to raise incremental debt or to providecollateral.
The Group’s contingent liabilities could adversely affect its financial condition.
The Group has created provisions for certain contingent liabilities in its financial statements. Therecan be no assurance that the Group will not incur similar or increased levels of contingent liabilitiesin the current fiscal year or in the future and that the Group’s existing contingent liabilities will nothave material adverse effect on its business, financial condition and results of operations.
The Group relies on licensing arrangements with Tata Sons Limited to use the “Tata” brand. Anyimproper use of the associated trademarks by the licensor or any other third parties could materiallyand adversely affect the Group’s business, financial condition and results of operations.
Rights to trade names and trademarks are a crucial factor in marketing the Group’s products.Establishment of the “Tata” word mark and logo mark in and outside India is material to the Group’soperations. The Group has licensed the use of the “Tata” brand from Tata Sons. If Tata Sons, or anyof their subsidiaries or affiliated entities, or any third party uses the trade name “Tata” in ways thatadversely affect such trade name or trademark, the Group’s reputation could suffer damage, which inturn could have a material adverse effect on its business, financial condition and results of operations.
The Group may not be able to obtain adequate funding required to carry out its future plans forgrowth.
Disruptions in global credit and financial markets and the resulting governmental actions around theworld could have a material adverse impact on the Group’s ability to meet its funding needs. TheGroup requires continuous access to large quantities of capital in order to carry out its day-to-dayoperations. The Group has historically required, and in the future expects to require, outside financingto fund capital expenditure needed to support the growth of its business (including the additionaloperational and control requirements of this growth) as well as to refinance its existing debtobligations and meet its liquidity requirements.
In the event of adverse market conditions, or if actual expenditure exceeds planned expenditure, theGroup’s external financing activities and internal sources of liquidity may not be sufficient to supportcurrent and future operational plans, and the Group may be forced to, or may choose to, delay orterminate the expansion of the capacity of certain of its facilities or the construction of new facilities.The Group’s ability to arrange external financing and the cost of such financing, as well as the Group’sability to raise additional funds through the issuance of equity, equity-related or debt instruments inthe future, is dependent on numerous factors. These factors include general economic and capitalmarket conditions, interest rates, credit availability from banks or other lenders, investor confidencein the Group, the success of the Group, provisions of tax and securities laws that may be applicableto the Group’s efforts to raise capital, the political and economic conditions in the geographiclocations in which the Group operates, the amount of capital that other entities may seek to raise inthe capital markets, the liquidity of the capital markets and the Group’s financial condition and resultsof operations.
There can be no assurance that the Group will be able to obtain bank loans or renew existing creditfacilities granted by financial institutions in the future on reasonable terms or at all or that any
49

fluctuation in interest rates will not adversely affect its ability to fund required capital expenditure.The Group may be unable to raise additional equity on terms or with a structure that is favorable, ifat all. If the Group is unable to arrange adequate external financing on reasonable terms, the Group’sbusiness, operations, financial condition and prospects may be adversely and materially affected.
The Group operates a global business and its financial condition and results of operations areaffected by the local conditions in or affecting countries where it operates.
The Group operates a global business and has facilities in the United Kingdom, the Netherlands, India,Germany, Thailand, Singapore, China, Vietnam, Mozambique and Australia. As a result, the Group’sfinancial condition and results of operations are affected by political and economic conditions in oraffecting countries where it operates.
The Group faces a number of risks associated with its operations, including: challenges caused bydistance, local business customs, languages and cultural differences, adverse changes in laws andpolicies, including those affecting taxes and royalties on energy resources. In September 2014, royaltyrates on iron ores in India were increased, which had a temporary adverse impact on the Group’sprofitability, as there was a lag in passing this cost through to customers. Other risks may be relatingto labor, local competition law regimes, environmental compliance and investments, difficulty inobtaining licenses, permits or other regulatory approvals from local authorities; adverse effects fromfluctuations in exchange rates; multiple and possibly overlapping and conflicting standards andpractices of the regulatory, tax, judicial and administrative bodies of the relevant foreign jurisdiction;political strife, social turmoil or deteriorating economic conditions; military hostilities or acts ofterrorism; and natural disasters, including earthquakes in India and flooding and tsunamis in SoutheastAsia, and epidemics or outbreaks such as avian flu, swine flu or severe acute respiratory syndrome.In addition, the infrastructure of certain countries where the Group operates its business, in particularIndia but also Thailand and Vietnam is less developed than that of many developed nations andproblems with its port, rail and road networks, electricity grid, communication systems or any otherpublic facility could disrupt the Group’s normal business activities.
Investments in certain countries could also result in adverse consequences to the Group under existingor future trade or investment sanctions. The effect of any such sanctions could vary, but if sanctionswere imposed on the Group or one of its subsidiaries, there could be a material adverse impact on themarket for the Group’s securities or it could significantly impair the Group’s ability to access the U.S.or international capital markets.
Any failure on the Group’s part to recognize and respond to these risks may materially and adverselyaffect the success of its operations, which in turn could materially and adversely affect the Group’sbusiness, results of operations, financial condition and prospects.
A substantial and increasing portion of the Group’s revenues is derived from India andconsequentially it is exposed to risks associated with economic conditions in India.
India is principally the largest market for the Group’s operations and contributed to approximately43% of its revenue on a consolidated basis for the year ended March 31, 2017. A significant andever-increasing portion of the Group’s revenue is generated in India. Existing and potentialcompetitors may increase their focus on India, which could reduce the Group’s market share. Forexample, the Group’s competitors may intensify their efforts to capture a larger market share byundertaking aggressive pricing strategies and increasing their focus on product development.
Investors in emerging markets such as India should be aware that these markets are subject to variousrisks, including in some cases significant legal, economic and political risks. In addition, adversepolitical or economic developments in other Asian countries could have a significant negative impacton, among other things, India’s GDP, foreign trade and economy in general. Investors should note that
50
emerging markets, including India, are subject to rapid change and information contained in thisdocument may quickly become outdated. Investors should exercise particular care in evaluating risksinvolved and must decide for themselves whether, in light of those risks, an investment in the Notesis appropriate.
The unexpected loss, shutdown or slowdown of operations at any of the Group’s facilities could havea material adverse effect on the Group’s results of operations and financial condition.
The Group’s facilities are subject to operating risks, such as the breakdown or failure of equipment,power supply interruptions, facility obsolescence or disrepair, labor disputes, natural disasters andindustrial accidents. The occurrence of any of these risks could affect the Group’s operations bycausing production at one or more facilities to shutdown or slowdown. No assurance can be given thatone or more of the factors mentioned above will not occur, which could have a material adverse effecton the Group’s results of operations and financial condition.
In addition, the Group’s manufacturing processes depend on critical pieces of steelmaking equipment.Such equipment may, on occasion, be out of service as a result of unanticipated failures, which couldrequire the Group to close part or all of the relevant production facility or cause production reductionson one or more of its production facilities. The Group’s facility and equipment would be difficult andexpensive to replace on a timely basis. Any interruption in production may require significant andunanticipated capital expenditure to affect repairs, which could have a negative effect on profitabilityand cash flows. Although the Group maintains business interruption insurance, the recoveries underits insurance coverage may be delayed or may not be sufficient to offset the lost revenues or increasedcosts resulting from a disruption of its operations. A sustained disruption to the Group’s business couldalso result in a loss of customers. Any or all of these occurrences could result in the temporary orlong-term closure of the Group’s facilities, severely disrupt its business operations and materiallyadversely affect the Group’s business, results of operations, financial condition and prospects.
Costs related to the Group’s obligations to pension and other retirement funds could escalate,thereby adversely affecting the Group’s results of operations and financial conditions.
The Group has significant pension and other retirement obligations to its employees. For details inrelation the pension schemes and other retirement benefits made available to employees, please see thesection entitled “Business — Employees”. The relevant European entities of the Group, mostmaterially in the UK and the Netherlands, provide retirement benefits for substantially all of theirrespective employees under several defined benefit and defined contribution plans. UK defined benefitpensions contributions are calculated by independent actuaries using various assumptions about futureevents. The actuarial assumptions used may differ from actual future results due to changing marketand economic conditions, higher or lower withdrawal rates, longer or shorter life spans of participantsor other unforeseen factors. These differences may impact the actual net pension expense and liability,as well as future funding requirements. However, one of the qualifying conditions to BSPS memberstransferring to BSPS2 will be that BSPS2 members, after the transfer, will enjoy a material surplusof scheme assets relative to calculated scheme liabilities which, in the UK, materially mitigates, butdoes not eliminate, the principal financial pension risks.
The Group faces numerous protective trade restrictions, including anti-dumping laws,countervailing duties and tariffs, which could adversely affect its results of operations and financialcondition.
Protectionist measures, including anti-dumping laws, countervailing duties and tariffs and governmentsubsidization adopted or currently contemplated by governments in some of the Group’s exportmarkets could adversely affect the Group’s sales. Anti-dumping duty proceedings or any resultingpenalties or any other form of import restrictions may limit the Group’s access to export markets forits products, and in the future additional markets could be closed to the Group as a result of similarproceedings, thereby adversely impacting its sales or limiting its opportunities for growth.
51

Tariffs are often driven by local political pressure in a particular country and therefore there can beno assurance that quotas or tariffs will not be imposed on the Group in the future. In the event thatsuch protective trade restrictions are imposed on the Group or any of the Group companies, its exportscould decline. Additionally, there can be no assurance that the Group will benefit from traderestrictions that protect the markets in which it produces the majority of its products, being India andEurope. Foreign steel manufacturers may, as a result of trade restrictions in other regions or otherfactors, attempt to increase their sales in these markets thereby causing increased competition in Indiaand Europe. A decrease in exports from India and Europe or an increase in steel imports to India andEurope as a result of protective trade restrictions could have a negative impact on the Group’sbusiness, financial condition, results of operations and prospects.
The Group does avail itself to certain conditional concessionary arrangements with respect to tradethat may impose conditions on the Group which could lead to penalties if such conditions are not met.
Any change in existing government policies providing support to steel manufacturers, or newpolicies withdrawing support presently available could adversely affect the Group’s business andresults of operations.
Any change in existing government policies providing support to steel manufactures, or new policieswithdrawing support presently available, in the jurisdictions in which the Group has operations couldadversely affect the supply and demand balance and the competitive environment. For example, inFebruary 2016, the Government of India announced a minimum import price on 173 steel products toprevent dumping of steel products. Subsequently, the minimum import price was discontinued and theGovernment of India imposed anti-dumping duties on steel products with effect from August 2016 fora period of five years. Similarly, in February 2016, the European Union announced provisionalanti-dumping duties on cold-rolled flat steel from China and Russia. If any such measures arewithdrawn or not renewed upon expiry, it may adversely affect the competitive environment and theGroup cannot assure you that it would be able to pass on any resultant increase in costs to the Group’scustomers, which could adversely affect its business and results of operations.
Environmental matters, including compliance with laws and regulations and remediation ofcontamination, could result in substantially increased capital requirements and operating costs.
The Group’s businesses are subject to numerous laws, regulations and contractual commitmentsrelating to the environment in the countries in which it operates and the Group’s operations generatelarge amounts of pollutants and waste, some of which are hazardous. These laws, regulations andcontractual commitments concern air emissions, wastewater discharges, solid and hazardous wastematerial handling and disposal, and the investigation and remediation of contamination or otherenvironmental restoration. The risk of substantial costs and liabilities related to compliance with theselaws and regulations is an inherent part of the Group’s business. Facilities currently or formerly ownedor operated by the Group, or where wastes have been disposed or materials extracted, are all subjectto risk of environmental cost and liabilities, which includes the costs or liabilities relating to theinvestigation and remediation of past or present contamination or other environmental restoration. Inaddition, future conditions and contamination may develop, arise or be discovered that createsubstantial environmental compliance, remediation or restoration liabilities and costs despite theGroup’s efforts to comply with environmental laws and regulations, violations of such laws orregulations can result in civil and/or criminal penalties being imposed, the suspension of permits,requirements to curtail or suspend operations, lawsuits by third parties and negative reputationaleffects. There can be no assurance that substantial costs and liabilities will not be incurred in thefuture. For example, the Deputy Director Mines, Joda Circle, District Keonjhar has issued demandnotices to the Group in relation to seven of its iron ore and manganese ore mines located in Odisha,aggregating to Rs.38,185 million for allegedly carrying out mining in excess of the permitted limits.In addition, the same authority has issued a demand notice to the Group demanding an amount ofRs.4,111 million in relation to royalty at sized ore rates on despatches of ore fines.
52

An increase in the requirements of environmental laws and regulations, increasingly strictenforcement thereof by governmental authorities, or claims for damages to property or injury topersons resulting from the environmental impacts of the Group’s operations or past contamination,could prevent or restrict some of the Group’s operations, require the expenditure of significant fundsto bring the Group into compliance, involve the imposition of cleanup requirements and reportingobligations, and give rise to civil and/or criminal liability.
There can be no assurance that any such legislation, regulation, enforcement or private claim will nothave a material adverse effect on the Group’s business, financial condition or results of operations.In the event that production at one of the Group’s facilities is partially or wholly disrupted due to thistype of sanction, the Group’s business could suffer significantly and its results of operations andfinancial condition could be materially and adversely affected.
In addition, the Group’s current and future operations may be located in areas where communities mayregard its activities as having a detrimental effect on their natural environment and conditions of life.Any actions taken by such communities in response to such concerns could compromise the Group’sprofitability or, in extreme cases, the viability of an operation or the development of new activitiesin the relevant region or country.
The Group’s steel manufacturing operations are hazardous processes that can cause personal injuryand loss of life, severe damage to property and equipment as well as environmental damage, whichcould cause the Group to incur significant costs and liabilities and may damage the Group’sreputation.
The Group is subject to a broad range of health and safety laws and regulations in each of thejurisdictions in which it operates. These laws and regulations, as interpreted by the relevant agenciesand the courts, impose increasingly stringent health and safety protection standards. The costs ofcomplying with, and the imposition of liabilities pursuant to, health and safety laws and regulationscould be significant, and failure to comply could result in the assessment of civil and/or criminalpenalties, the suspension of permits or operations and lawsuits by third parties.
Despite the Group’s efforts to monitor and reduce accidents at its facilities, there remains a risk thathealth and safety incidents may occur. Such incidents could include explosions or gas leaks, fires orcollapses in underground mining operations, vehicular accidents, other incidents involving mobileequipment or exposure to potentially hazardous materials. Due to the nature of the Group’s business,certain incidents can and do result in employee fatalities. Some of the Group’s industrial activitiesinvolve the use, storage and transportation of dangerous chemicals and toxic substances, and theGroup is therefore subject to the risk of industrial accidents which could have significant adverseconsequences for the Group’s workers and facilities, as well as the environment. Such incidents couldlead to production stoppages, the loss of key assets, or put employees (and those of sub-contractorsand suppliers) or persons living near affected sites at risk. In addition, such incidents could damagethe Group’s reputation, leading to the rejection of products by customers, devaluation of the Tatabrands and diversion of management time into rebuilding and restoring its reputation.
The Group’s operating results are affected by movements in exchange rates and interest rates.
There has been considerable volatility in foreign exchange rates in recent years, including ratesbetween the Euro, Indian Rupee, U.S. Dollar, Japanese Yen and other major foreign currencies. To theextent that the Group incurs costs in one currency and generates sales in another, the profit marginsmay be impacted by changes in the exchange rates between the two currencies. The sales from theGroup’s European operations are denominated mainly in Euro, and sales from its Indian operations aredenominated primarily in Rupees. However, exports from India have increased significantly in recentyears, which are mainly denominated in U.S. Dollars. The raw material purchases for the Group’sEuropean operations are denominated mainly in U.S. Dollars while employee related expenses andother costs are primarily denominated in GBP and Euros. The costs of the Group’s Indian operationsare denominated primarily in Indian Rupees, although its revenue and capital goods imports are
53

denominated mostly in U.S. Dollars, and in a lesser way, in Euros, Japanese Yen and other currencies.The Group’s Indian operations have debt denominated in foreign currency, and imports of the Group’sIndian operations that are denominated in U.S. Dollars currently exceed its exports denominated inU.S. Dollars on an annual basis. In addition, because of ongoing growth projects in India for whichthe Group expects to incur significant capital expenditure, including the purchase of steel productionequipment, the Group is expected to have imports in Euros, U.S. Dollars, GBP and Japanese Yen. TheGroup has hedging policies that help minimize the volatility in cash flows, however, fluctuations inexchange rates, may impact the Group’s profit margins and revenue from its operations.
The Group books forward contracts on a rolling basis to hedge currency mismatches in its Europeanbusiness. For other exposures, it maintains a policy of booking forward contracts to hedge exposuresonce they are crystallized. The Group has hedging policies that permit the use of different hedginginstruments including forward contracts, option contracts and other derivatives to hedge foreignexchange and interest rate risks. Changes in exchange rates may nevertheless have a material andadverse effect its business results, financial condition and prospects.
As at March 31, 2017, the Group’s indebtedness included outstanding floating-rate debt in theprincipal amount of Rs.499,500 million. If interest rates rise, interest payable on this debt will alsorise, thereby increasing the Group’s interest expense and cost of new financing. Such rise in interestrates may therefore materially and adversely affect the Group’s cash flow and results of operations.
Competition from other materials, or changes in the products or manufacturing processes ofcustomers that use the Group’s steel products, could reduce market prices and demand for steelproducts and thereby reduce the Group’s cash flow and profitability.
In many applications, steel competes with other materials that may be used as substitutes, such asaluminum (particularly in the automobile industry), cement, composites, glass, plastic and wood.Government regulatory initiatives mandating or creating incentives for the use of such materials inlieu of steel, whether for environmental or other reasons, as well as the development of other newsubstitutes for steel products, could significantly reduce market prices and demand for steel productsand thereby reduce the Group’s cash flow and profitability.
In addition, the steel market is characterized by evolving technology standards that require improvedquality, changing customer specifications and wide fluctuations in product supply and demand. Theproducts or manufacturing processes of the customers that use the Group’s steel products may changefrom time to time due to improved technologies or product enhancements. These changes may requirethe Group to develop new products and enhancements for its existing products to keep pace withevolving industry standards and changing customer requirements. If the Group cannot keep pace withmarket changes and produce steel products that meet its customers’ specifications and qualitystandards in a timely and cost-effective manner, its business, results of operations, financial conditionand prospects could be materially adversely affected.
The Group has undertaken, and may undertake in the future, strategic acquisitions, which may bedifficult to integrate, and may end up being unsuccessful.
The Group has in the past pursued, and may from time to time pursue in the future, acquisitions. From2005 to 2007, the Group acquired operations in Europe through the acquisition of Corus Group plc.(“Corus”) as well as operations in Thailand, Singapore, China, Vietnam and Australia through theacquisitions of Tata Steel Thailand and NatSteel. These acquisitions posed significant logistical andintegration issues for the Group, as it had no previous experience in managing substantial foreigncompanies or large-scale international operations.
The Group’s ability to achieve the benefits it anticipates from future acquisitions will depend in largepart upon whether it is able to integrate the acquired businesses into the rest of the Group in anefficient and effective manner. The integration of acquired businesses and the achievement ofsynergies require, among other things, coordination of business development and procurement efforts,
54

manufacturing improvements and employee retention, hiring and training policies, as well as thealignment of products, sales and marketing operations, compliance and control procedures, researchand development activities and information and software systems. Any difficulties encountered incombining operations could result in higher integration costs and lower savings than expected.Integration of certain operations also requires the dedication of significant management resources, andtime and costs devoted to the integration process may divert management’s attention from day to daybusiness.
In addition, the Group is considering additional acquisitions, including acquisition of brownfield steelmanufacturing operations in India, and may make further acquisitions which may require the Groupto incur or assume substantial new debt, expose it to future funding obligations and expose it tointegration risks, and the Group cannot assure prospective investors that such acquisitions willcontribute to its profitability. The failure to successfully integrate an acquired business or the inabilityto realize the anticipated benefits of such acquisitions could materially and adversely affect theGroup’s business, results of operations, financial condition and prospects.
The Group faces risks relating to its joint ventures.
The Group has also entered into, and may from time to time in the future enter into, joint ventureagreements, including for raw material projects. The Group may have limited control of these projectsand therefore may be unable to require that its joint ventures sell assets or return invested capital,make additional capital contributions or take any other action. If there is a disagreement between theGroup and its partners in a joint venture regarding the business and operations of the project, therecan be no assurance that it will be able to resolve such disagreement in a manner that will be in theGroup’s best interests or at all. Certain major decisions, such as selling a stake in the joint project,may require the consent of all other partners. These limitations may adversely affect the Group’sability to obtain the economic and other benefits it seeks from participating in these projects. Inaddition, the Group’s joint venture partners may have economic or business interests or goals that areinconsistent with the Group; take actions contrary to the Group’s instructions, requests, policies orobjectives; be unable or unwilling to fulfill their obligations; withdraw technology licenses providedto the Group; have financial difficulties; or have disputes as to their rights, responsibilities andobligations. Joint venture partners of the Group may also enter into business partnerships withcompetitors of the Group after the expiry of applicable non-compete periods, if any. Any of these andother factors may have a material adverse effect on the Group’s joint venture projects, which may inturn materially and adversely affect the Group’s business, results of operations, financial conditionand prospects.
The Group faces risks relating to the restructuring of the Group’s European operations.
The Group is currently in the process of restructuring the Group’s European operations in order toincrease efficiency in servicing the European markets, which may include the sale of some of itsEuropean operations and facilities. Such restructuring may include, inter alia, entering into jointventure agreements, undertaking mergers or debt restructurings of the Group’s European operations.This may result in a reduction of the Group’s overall production capacity in Europe. There can be noassurances that such restructuring exercises would result in an increase in efficiency as envisaged bythe Group. There may be external factors such as a delay in obtaining regulatory approvals, dead-locksin negotiations and labor disputes which may hinder the Group’s restructuring exercise. This mayadversely affect the Group’s business, results of operations, financial condition and prospects.
Labor problems could adversely affect the Group’s results of operations and financial condition.
Most of the Group’s employees in India, and a substantial portion of the Group’s employees in Europe,other than management, are members of labor unions and are covered by collective-bargainingagreements with those labor unions, which have different terms at different locations and are subjectto periodic renegotiation. Although the Group works to maintain good relations with its unions, there
55

can be no assurance that there will be no labor unrest in the future, which may delay or disrupt itsoperations. If strikes, work stoppages, work slow-downs or lockouts at its facilities occur or continuefor a prolonged period of time, the Group’s business, results of operations, financial condition andprospects could be adversely affected.
The Group’s insurance policies provide limited coverage, potentially leaving it uninsured or underinsured against some business risks.
As part of risk management, the Group maintains insurance policies that may provide some insurancecover for labor unrest, mechanical failures, power interruptions, natural calamities or other problemsat any of its steelmaking and mining facilities. While the Group believes that it maintains insurancecoverage in amounts consistent with industry norms, the Group’s insurance policies do not cover allrisks and are subject to exclusions and deductibles.
If the Group’s production facility is damaged in whole or in part and its operations are interrupted fora sustained period due to fire and similar perils, there can be no assurance that its insurance policieswill be adequate to cover the losses that may be incurred as a result of such interruption or the costsof repairing or replacing the damaged facilities.
Notwithstanding the insurance coverage that it carries, the occurrence of any event that causes lossesin excess of limits specified under the policy, or losses arising from events not covered by insurancepolicies, could have a material adverse effect on the Group’s business, financial condition andoperating results.
The Group is involved in certain outstanding litigation, investigations and other proceedings andcannot assure Noteholders that it will prevail in these actions.
There are several outstanding litigations against the Group and its Directors. There are also variouscriminal cases against the Group, its Directors and its subsidiaries. The Group is a defendant in legalproceedings incidental to its business and operations. These legal proceedings are pending at differentlevels of adjudication before various courts and tribunals in different jurisdictions. Should theproceedings be decided adversely against the Group, or any new developments arise, such as a changein Indian law or rulings against the Group by appellate courts or tribunals, the Group may incursignificant expenses and management time in such legal proceedings and may need to make provisionsin its financial statements, which could have a material adverse effect on the Group’s business, resultsof operations, financial condition and prospects. See “Business — Litigation”.
The Group’s business is dependent on its continuing relationships with its customers and supplierswho can suspend or cancel delivery of products.
Events of force majeure such as disruptions of transportation services because of weather-relatedproblems, strikes, lock-outs, inadequacies in the road infrastructure and port facilities, governmentactions or other events that are beyond the control of the parties and allow the Group’s suppliers tosuspend or cancel deliveries of raw materials could impair its ability to source raw materials andcomponents and its ability to supply its products to customers. Similarly, the Group’s customers maysuspend or cancel delivery of its products during a period of force majeure and any suspensions orcancellations that are not replaced by deliveries under new contracts or sales to third parties on thespot market would reduce cash flows and could adversely affect the Group’s financial condition andresults of operations. There can be no assurance that such disruptions will not occur.
The Group’s success depends on the continued services of its senior management team.
The Group’s success and growth depend on the continued services of its directors and other membersof its senior management team. Their extensive experience in the steel industry and in-depthknowledge of various aspects of the Group’s business operations. There can be no assurance that anyexecutive director or member of senior management will continue in his or her present position, or that
56

the Group will be able to find and hire a suitable replacement if any of them retires or joins acompeting company. Moreover, along with the Group’s steady growth and business expansion, theGroup needs to employ, train and retain additional suitable skilled and qualified management andemployees from a wider geographical area. If the Group cannot attract and retain suitable personnel,its business and future growth may be materially and adversely affected.
Product liability claims could adversely affect the Group’s operations.
The Group sells products to major manufacturers who are engaged to sell a wide range of endproducts. Furthermore, the Group’s products are also sold to, and used in, certain safety-criticalapplications. If the Group were to sell steel that does not meet specifications or the requirements ofthe application, significant disruptions to the customer’s production lines could result. There couldalso be significant consequential damages resulting from the use of such products. The Group has alimited amount of product liability insurance coverage, and a major claim for damages related toproducts sold could leave the Group uninsured against a portion or all of the award and, as a result,materially harm its financial condition and future operating results.
Investors should not rely on any speculative information released in the press or other mediaregarding the Group, its business or the offering of Notes.
The Group is one of the leading steel producers in the world. As a result of this position, there maybe information about the Group, its business, its employees or the offering of Notes carried by thepress and other media which may be speculative and unconfirmed by the Group. Prospective investorsare cautioned that the Group does not accept any responsibility for the accuracy or completeness ofany such information in the press or other media regarding the Group, its business, its employees orthe offering of Notes. Prospective investors should rely only on information included in this OfferingMemorandum in making an investment decision with respect to this offering of Notes.
Furthermore, speculative information about the Group, its directors, officers and key employees couldadversely affect the Group’s reputation. Such speculation could potentially disrupt the Group’s abilityto do business with counterparties who give weight to media comment, thereby distracting the Group’smanagement from their responsibilities and adversely affecting the trading price of the Notes.
The Group may not be successful in acquiring assets under the IBC.
The Group is in the process of submitting resolution plans in respect of certain companies and maysubmit resolution plans in respect of other companies undergoing the corporate insolvency resolutionprocess under the IBC.
The IBC is a recent legislation which, among others, consolidates the law relating to reorganizationand insolvency resolution of corporate entities. Under the IBC, a confidential informationmemorandum is provided to prospective applicants who satisfy the eligibility criteria with informationabout the corporate debtor including the liquidation value, the latest annual financial statements andthe assets and liabilities. The applicant is required to submit a resolution plan within the prescribedperiod providing for, among others, payment of insolvency resolution process costs (including amountof any interim finance provided for the corporate debtor), repayment of the creditors as prescribed inthe IBC and the details of management and control of the corporate debtor during the term of theresolution plan. The resolution plan is required to be approved by 75% of the committee of creditorsand thereafter by the National Company Law Tribunal (“NCLT”). The corporate insolvency resolutionprocess under the IBC (the “IBC Process”) is new and relatively untested.
The Group may not be able to submit its resolution plan in a timely manner or at all, or the resolutionplan it submits may not be approved by the committee of creditors or the NCLT. Further, while theIBC has prescribed a maximum period for the IBC Process, as it is relatively untested, the Groupcannot assure you that it will be completed in a timely manner or at all.
57

The IBC Process may be challenged in court and the Group may be made a party to such litigation asa bidder or otherwise. Any such litigation could be time-consuming and expensive.
The Group cannot assure you that it will successfully acquire any entity in respect of which it has orchoose to submit a resolution plan. Participation in the IBC Process may distract managementattention from business operations and lead the Group to incur significant costs, which may have amaterial adverse effect on the Group’s business, reputation and results of operation.
The Group may be unable to realize the anticipated benefits of any acquisition it makes under theIBC Process, which could have a materially adverse impact on its business, financial condition,reputation and results of operation.
Certain Indian steel manufacturing companies such as Bhushan Steel Limited, Electrosteel SteelsLimited, Essar Steel India Limited, Bhushan Power and Steel Limited and Monnet Ispat and EnergyLimited are currently undergoing the corporate insolvency resolution process under the IBC. TheGroup is in the process of submitting resolution plans in respect of certain companies and may submitresolution plans in respect of other companies undergoing the corporate insolvency resolution processunder the IBC. The Group may also evaluate other strategic acquisition opportunities in financiallystressed companies, including with respect to the above companies, which may include submittingbids, discussions with lenders and participating in auctions.
The valuation of the company depends on and is influenced by the cyclical nature of the global steelindustry and may lead the Group to overvalue the assets it acquires or may be unable to effectivelyutilize or turnaround the acquired assets. The Group cannot assure you that any of these acquisitionswill actually yield the benefits that may have been envisaged by the Group at the time of undertakingthe same.
If the resolution plan submitted by the Group is approved by the committee of creditors and the NCLT,the Group will be required to implement the terms of the resolution plan. Acquisition of assets throughthe IBC Process requires repayment of the creditors of the corporate debtor and may require additionalinvestment to revive the stressed assets. The Group may finance such an acquisition, wholly or in part,by incurring additional debt. As of September 30, 2017, the Group had gross outstanding indebtednessof Rs.902,594 million on a consolidated basis. The Group may not be able to secure additional debtin terms favorable to it or at all. Further, additional debt incurred for such an acquisition may increasethe Group’s level of indebtedness substantially and it may be unable to generate sufficient cash to paythe principal of, or interest on, or other amounts due in respect of such indebtedness when they aredue.
The Group’s resolution plans are based on certain assumptions and expectation that the acquisitionwould generate synergies and growth opportunities. However, the Group’s assumptions may beincorrect and the acquisition may fail to generate synergies or expected benefits for various reasons.For example, the Group’s evaluation of information available as part of the IBC Process may be faultyand as a result, the acquisition may not yield the anticipated benefits. The Group’s analysis ofpotential benefits of acquisitions may be inaccurate as the assets are situated in a geographic regionwhere it does not operate or are manufacturing products in which it does not have sufficientexperience.
The Group’s ability to achieve the benefits it anticipates from its acquisition may depend significantlyon whether the Group is able to integrate its business with that of the acquired entity in an efficientand effective manner. Such integration may involve, among other things, coordination of businessdevelopment, employee retention, alignment of products, sales and marketing operations. The Groupmay also have to rely on the management team of the acquired entity and there can be no assurancethat such team will be integrated with its management or remain with the acquired entity.
58

The Group’s acquisition may also be adversely affected if there are unfavorable changes ingovernment policy or market conditions. Any change in government policy which affects the steelindustry directly or indirectly (including due to impact on supply of raw materials or reduction ofdemand), or significant change in market conditions which affects steel prices in India or globally,may result in the Group’s acquisition not achieving the anticipated benefits.
As the IBC Process is relatively untested, the Group may face unanticipated delays in completion ofthe acquisition. Further, even after approval of the resolution plan in terms of the IBC, the acquisitionmay be challenged in court and the Group may have to be involved in a protracted litigation process,the outcome of which would be uncertain. Further, the Group may require regulatory approvalsincluding from the Competition Commission of India before effecting the acquisition. Such approvalsmay not be received in time, in terms favorable to the Group or at all.
Any of the above factors could have a material adverse impact on the Group’s business, financialcondition, reputation and results of operation.
External Risks
The Group’s business is substantially affected by prevailing economic, political and other prevailingconditions in India, Europe and the other markets it currently services.
The Group is incorporated in India, and the majority of its assets and employees are located in Indiaand Europe. As a result, it is highly dependent on prevailing economic conditions in India and Europeand its results of operations are significantly affected by factors influencing the Indian and Eurozoneeconomy. Factors that may adversely affect the Indian and Eurozone economy, and therefore theGroup’s results of operations, may include:
• any increase in interest rates or inflation;
• any exchange rate fluctuation;
• any scarcity of credit or other financing in India, resulting in an adverse impact on the economicconditions in India and scarcity of financing of its developments and expansions;
• debt crisis in certain European countries;
• political instability, a change in government or a change in the economic and deregulationpolicies;
• domestic consumption and savings;
• balance of trade movements, namely export demand and movements in key imports (oil and oilproducts);
• annual rainfall in India which affects agricultural production;
• any exchange rate fluctuations;
• any scarcity of credit or other financing, resulting in scarcity of financing for its expansions;
• prevailing economic and income conditions among Indian and European consumers andcorporations;
• volatility in, and actual or perceived trends in trading activity on, India’s principal stockexchanges;
• changes in tax, trade, fiscal or monetary policies, including application of GST;
59

• political instability, terrorism or military conflicts in India or in countries in the region orglobally;
• occurrence of natural or man-made disasters;
• infectious disease outbreaks or other serious public health concerns;
• prevailing regional or global economic conditions, including in India’s principal export markets;
• other significant regulatory or economic developments in or affecting India or its financialservices and pharmaceutical sectors;
• increase in India’s trade deficits or such trade deficits becoming unmanageable; and
• decline or future material decline in India’s foreign exchange reserves.
Any slowdown or perceived slowdown in the Indian economy, or in specific sectors of the Indianeconomy, could adversely impact the Group’s business, results of operations and financial condition.The Group’s performance and the growth of its business depend on the performance of the Indianeconomy and the economies of the regional markets it currently serves. These economies could beadversely affected by various factors, such as political and regulatory changes including adversechanges in liberalization policies, social disturbances, religious or communal tensions, terroristattacks and other acts of violence or war, natural calamities, interest rates, commodity and energyprices and various other factors. Any slowdown in these economies could adversely affect the abilityof the Group’s customers to afford its services, which in turn would adversely impact the Group’sbusiness and financial performance.
High rates of inflation in India could increase the Group’s costs without proportionately increasing itsrevenues, and as such decrease its operating margins. Any slowdown or perceived slowdown in theIndian and Eurozone economy, or in specific sectors thereof, could adversely impact the Group’sbusiness, results of operations and financial condition.
India’s trade relationships with other countries can influence Indian economic conditions. For the yearended March 31, 2017, the trade deficit was approximately US$105.73 billion. This large trade deficitneutralizes the surpluses in India’s invisibles in the current account, resulting in a current accountdeficit. If India’s trade deficits increase or become unmanageable, the Indian economy, and thereforethe Group’s business, future financial performance, and cash flows could be adversely affected.
A decline or future material decline in India’s foreign exchange reserves could impact the valuationof the Rupee and could result in reduced liquidity and higher interest rates which could adverselyaffect the Group’s financial condition and future financial performance.
Changing laws, rules and regulations and legal uncertainties including adverse application of taxlaws and regulations such as application of Goods and Services Tax, may adversely affect theGroup’s business results of operations, cash flows and financial performance.
The Group’s business and financial performance could be adversely affected by changes in law orinterpretations of existing, or the promulgation of new, laws, rules and regulations in India applicableto the Group and its. There can be no assurance that the central or the state governments may notimplement new regulations and policies which will require the Group to obtain approvals and licensesfrom the governments and other regulatory bodies or impose onerous requirements and conditions onits operations. For example, the majority of the Group’s pharmaceuticals business and healthcareinsights and analytics business is based outside India and outward investments in India is governedby RBI regulations. Any change in such RBI regulation may have a severe impact on the Group’sbusinesses outside India or any expansion plans that involve support from its local operations. Anynew regulations and policies and the related uncertainties with respect to the implementation of the
60

new regulations may have a material adverse effect on the Group’s business, financial condition andresults of operations. In addition, the Group may have to incur capital expenditures to comply withthe requirements of any new regulations, which may also materially harm the Group’s results ofoperations. The Government of India has recently enacted the Central Goods and Services Tax Act,2017 which lays down a comprehensive national GST regime which has combined taxes and leviescollected by the central and state governments into a unified rate structure. This legislation wasnotified and made effective from July 1, 2017.
Based on such available information and to the best of the Group’s understanding it is of the view thatthere will be an increase in overall taxes on procurement which will lead to an additional workingcapital requirement. While there will be an increase in overall taxes on procurement, the procurementcost is likely to reduce due to the free flow of credits under GST regime. The ability of the Group totake the benefit of reduction in procurement cost shall be dependent on its ability to increase ormaintain the sale price of its products and negotiation of the purchase price with its vendors. Furtherin the transition period, the Group expects some disruptions in the procurement and sale of goods,which could affect the immediate financial performance, however this is expected to a temporary andshort term event.
The Government has also proposed major reforms in Indian tax laws with respect to the provisionsrelating to the general anti-avoidance rule (“GAAR”). The provisions have been introduced in theFinance Act, 2012 and have come into effect from April 1, 2017. The GAAR provisions intend to catcharrangements declared as “impermissible avoidance arrangements”, which is any arrangement, themain purpose or one of the main purposes of which is to obtain a tax benefit and which satisfy at leastone of the following tests (i) creates rights, or obligations, which are not ordinarily created betweenpersons dealing at arm’s length; (ii) results, directly or indirectly, in misuse, or abuse, of theprovisions of the Income Tax Act; (iii) lacks commercial substance or is deemed to lack commercialsubstance, in whole or in part; or (iv) is entered into, or carried out, by means, or in a manner, whichare not ordinarily employed for bona fide purposes. If GAAR provisions are invoked, then the Indiantax authorities have wide powers, including denial of tax benefit or a benefit under a tax treaty. Asthe taxation system is intended to undergo significant overhaul, its consequent effects on the Groupcannot be determined at present and there can be no assurance that such effects would not adverselyaffect the Group’s business and future financial performance.
Financial instability in other countries, particularly countries with emerging markets, could disruptIndian markets and the Group’s business.
The Indian financial markets and the Indian economy are influenced by the economic and marketconditions in other countries. Although economic conditions are different in each country, investors’reactions to developments in one country can have adverse effects on the securities of companies inother countries, including India. A loss of investor confidence in other financial systems may causevolatility in Indian financial markets, including with respect to the movement of exchange rates andinterest rates in India, and, indirectly, in the Indian economy in general. Any such continuing or othersignificant financial disruption could have an adverse effect on the Group’s business, financial resultsand the trading price of the Notes.
Changes in the policies of, or changes in, the Indian Government, could adversely affect economicconditions in India, and thereby adversely impact the Group’s results of operations and financialcondition.
India remains the Group’s largest market, representing 43% of the Group’s revenue for the year endedMarch 31, 2017. In addition, a significant portion of the Group’s facilities are located in India.Consequently, the Group may be affected by changes to Central Government policies, changes in theCentral Government itself, or any other political instability in India. For example, the imposition offoreign exchange controls, rising interest rates, increases in taxation or the creation of new regulationscould have a detrimental effect on the Indian economy generally and the Group in particular.
61

The Central Government has sought to implement a number of economic reforms in recent years,
including a review of the national steel policy and the preparation of a five-year strategy paper for the
promotion of the steel sector in India, and has also continued the economic liberalization policies
pursued by previous Central Governments. However, the roles of the Central Government and the state
governments in the Indian economy as producers, consumers and regulators have remained significant.
Any significant change in such liberalization and deregulation policies could adversely affect business
and economic conditions in India generally which may have an adverse effect on the Group’s results
of operations and financial condition.
The business and activities of the Group, as applicable, may be regulated by the Competition Act,2002.
The Competition Act seeks to prevent business practices that have a material adverse effect on
competition in India. Under the Indian Competition Act, any arrangement, understanding or action in
concert between enterprises, whether formal or informal, which causes or is likely to cause a material
adverse effect on competition in India is void and attracts substantial monetary penalties. Any
agreement that directly or indirectly determines purchase or sale prices, limits or controls production,
shares the market by way of geographical area, market, or number of customers in the market is
presumed to have a material adverse effect on competition. Provisions of the Competition Act relating
to the regulation of certain acquisitions, mergers or amalgamations which have a material adverse
effect on competition and regulations with respect to notification requirements for such combinationscame into force on June 1, 2011. The effect of the Competition Act on the business environment inIndia is unclear and it is difficult to predict its impact on the growth and expansion strategies of theGroup. If the Group, as applicable, is affected, directly or indirectly, by the application orinterpretation of any provision of the Indian Competition Act, or any enforcement proceedingsinitiated by the Competition Commission of India, or any adverse publicity that may be generated dueto scrutiny or prosecution by the Competition Commission of India, it may have a material adverseeffect on its business, prospects, results of operations, cash flows and financial condition.
If regional hostilities, terrorist attacks or social unrest in India increase, the Group’s businessescould be adversely affected.
India has from time to time experienced instances of civil unrest, terrorist attacks and hostilities withneighboring countries. These hostilities and tensions could lead to political or economic instability inIndia and have a possible adverse effect on the Indian economy, the Group’s businesses, prospects,results of operations, cash flows and financial condition and future financial performance.
India has also experienced localized social unrest and communal disturbances in some parts of thecountry. If such tensions become more widespread, leading to overall political and economicinstability, it could have an adverse effect on the Group’s business, future financial performance andcash flows.
In addition, certain of the Group’s current and planned facilities, including its captive mines, arelocated in geographically remote areas that may be at risk of terror attacks. For example, attacks byNaxalite rebels in 2009 targeted transportation infrastructure of mining operations in Chhattisgarh.While the Group was not directly affected by these attacks, there can be no assurance that it will notbe the target of such attacks in the future. Such attacks may be directed at Group property orpersonnel, at property belonging to the Group’s customers or at the state-owned infrastructure used bythe Group to transport goods to customers. Such attacks, or the threat of such attacks, whether or notsuccessful, may disrupt the Group’s operations and/or delivery of goods, result in increased costs forsecurity and insurance and may adversely impact the Group’s business, results of operations, financialcondition and prospects, as well as place the Group’s assets and personnel at risk.
62

If natural disasters occur in India, the Group’s results of operations and financial condition couldbe adversely affected.
India has experienced floods, earthquakes, tsunamis, cyclones and droughts in recent years. Suchnatural catastrophes could disrupt the Group’s operations, production capabilities or distributionchains or damage its facilities located in India, including its production facilities and mines. While theGroup’s facilities were not damaged in the past, a significant portion of its facilities and employeesare located in India where they are exposed to such natural disasters.
Additionally, in the event of a drought, the state governments in which the Group’s facilities arelocated could cut or limit the supply of water to the Group’s facilities, thus adversely affecting theGroup’s production capabilities by reducing the volume of products the Group can manufacture andconsequently reducing its revenues. In the event of any of the foregoing natural disasters, the abilityof the Group to produce and distribute steel may be adversely affected. There can be no assurance thatsuch events will not occur again in the future, or that its business, results of operations, financialcondition and prospects will not be adversely affected.
Health epidemics and natural calamities in Asia or elsewhere could adversely affect the Indianeconomy or the Group’s business and the price of the Notes.
Since 2003, outbreaks of Severe Acute Respiratory Syndrome in Asia, avian influenza across Asia andEurope, Ebola virus in western Africa, Zika virus in South America and Influenza A across the worldhave adversely affected a number of countries and companies. Any future outbreak of infectiousdiseases or other serious public health epidemics may have a negative impact on the economies,financial markets and level of business activity in affected areas, which may adversely affect theGroup’s business.
India has also experienced natural calamities such as earthquakes, floods, drought and a tsunami inthe recent past. The length and severity of these natural disasters determine the extent of their impacton the Indian economy. Prolonged spells of abnormal rainfall and other natural calamities could havean adverse impact on the Indian economy. Any future outbreak of infectious disease among humansand/or animals or any other serious public health concerns or the occurrence of any natural calamitiescould materially and adversely affect the Group’s business, prospects, financial condition, cash flowsand results of operations, and the price of the Notes.
The Group’s ability to raise foreign capital may be constrained by Indian law.
As an Indian company, the Group is subject to exchange controls that regulate borrowing in foreigncurrencies. Such regulatory restrictions limit the Group’s financing sources and hence could constrainits ability to obtain financing on competitive terms and refinance existing indebtedness. In addition,there can be no assurance that the required approvals will be granted to the Group without onerousconditions, on favorable terms or at all.
Limitations on raising foreign debt may have an adverse effect on the Group’s business growth,financial condition and results of operations.
Any downgrade of India’s sovereign debt rating by an international rating agency could have anegative impact on the Group’s results of operations and financial condition.
Any downgrade by international rating agencies of the credit rating for Indian domestic andinternational debt may adversely impact the Group’s ability to raise additional financing and theinterest rates and commercial terms on which such additional financing is available. This could havean adverse effect on the Group’s ability to obtain financing to fund its growth on favorable terms orat all and, as a result, could have a material adverse effect on its business, results of operations,financial condition and prospects.
63

Public companies in India, including the Group, are required to compute income tax under theICDS. The transition to ICDS in India is recent and the Group may be negatively affected by thistransition.
The Ministry of Finance had issued a notification dated March 31, 2015 presenting the ICDS whichcreates a new framework for the computation of taxable income. The ICDS was to take effect fromApril 1, 2015. However, in view of the representations from stakeholders, the Central Board of DirectTaxes, Ministry of Finance, according to its press release dated July 6, 2016, has deferred theapplicability of the ICDS to fiscal year 2017, thus fiscal year 2017 was the first year for applicabilityfor ICDS. The prescribed ICDS are prescribed in addition to the provisions of the Income Tax Act,1961 (the “IT Act”). However in the event that there is a conflict between the provisions of the ICDSand the IT Act, the provisions of the IT Act would prevail. It is understood that ICDS are based onthe Accounting Standards. However the ICDS deviate in several respects from concepts that arefollowed under general accounting standards, including Ind AS. ICDS are likely to increase the overalltax liability of the Group. There can be no assurance that the adoption of the ICDS will not adverselyaffect the Group’s business, results of operation and financial condition.
Differences exist between Ind-AS and other accounting principles, such as IFRS and Indian GAAP,which may be material to investors’ assessments of the Group’s financial condition.
The Group is required to prepare annual financial statements under Ind-AS for the year ended March31, 2017 as required under Section 133 of the Companies Act, 2013. The Group has adopted Ind-ASwith effect from April 1, 2016. In doing so, it is required to present comparative numbers for theprevious year, March 31, 2016, prepared in compliance with Ind-AS. As such, the date of transitionto Ind-AS for the Group is April 1, 2015, being the opening balance sheet of the comparative previousfinancial year. Given that Ind-AS differs in many respects from Indian GAAP, the Group’s historicalfinancial statements relating to any period prior to the year ended March 31, 2016 may not becomparable to the audited consolidated and standalone financial statements prepared under Ind-AS.
Ind-AS and other accounting standards like IFRS differ in certain respects including first timeadoption choices available. The Group has not attempted to quantify the impact of IFRS on thefinancial data included in this document, nor does it provide a reconciliation of its financial statementsto those of Ind-AS with IFRS.
Accordingly, the degree to which the financial statements prepared under earlier Indian GAAP, Ind-ASand other accounting principles, such as IFRS, will provide meaningful information is entirelydependent on the reader’s level of familiarity with these standards. Any reliance by persons notfamiliar with Indian accounting practices on the financial disclosures presented in this documentshould accordingly be limited.
A decline in India’s foreign exchange reserves may affect liquidity and interest rates in the Indianeconomy, which could adversely affect the Group’s financial conditions.
According to a ‘Weekly Statistical Supplement’ released by RBI on November 24, 2017, India’sforeign exchange reserves totaled approximately US$375.1 billion as of November 17, 2017. India’sforeign exchange reserves have declined recently and may have negatively affected the valuation ofthe Rupee. Further declines in foreign exchange reserves could adversely affect the valuation of theRupee and could result in reduced liquidity and higher interest rates that could adversely affect theGroup’s future financial condition and the market price of the Notes.
The Government of India had implemented certain currency demonetization measures, which mayaffect the Indian economy and the Group’s business, prospects, financial condition and results ofoperations.
On November 8, 2016, the RBI and the Ministry of Finance of the Government of India withdrew thelegal tender status of Rs.500 and Rs.1,000 currency notes pursuant to a notification dated November
64

8, 2016. The short-term impact of these developments has been, among other things, a decrease in theliquidity of cash in India. There is uncertainty with regard to the medium- and long-term impacts ofthis action. The medium and long-term effects of demonetization on the Indian economy and theGroup’s business are uncertain and it cannot accurately predict their effect on its business, prospects,financial condition and results of operations.
Risks Related to the Notes
The Issuer is a special purpose vehicle with no revenue generating operations of its own.
The Issuer is a special purpose vehicle that has no revenue-generating operations of its own. TheIssuer conducts no business or operations and has no significant assets. The Issuer’s ability to serviceits indebtedness, including the Notes, is entirely dependent upon the receipt of funds from Tata Steeland Tata Steel’s subsidiaries to whom the Issuer has onlent funds.
The payment of dividends and the making of loans and advances to Tata Steel and its subsidiaries aresubject to various restrictions. Existing and future debt and related agreements to which the Issuer isor may become subject may prohibit the payment of dividends or the making of loans or advances toTata Steel and its subsidiaries. In addition, the ability of Tata Steel Limited’s subsidiaries to makepayments, loans or advances or pay dividends may be limited by the relevant jurisdictions in whichsuch subsidiaries are located.
The Issuer may be able to redeem the Notes in whole at a redemption price equal to 100% of theprincipal amount plus accrued and unpaid interest in the event the Issuer is required to payadditional amounts.
As described in “Terms and Conditions of the [●] Notes — Redemption and Purchase — Redemptionfor Taxation Reasons” and “Terms and Conditions of the [●] Notes — Redemption and Purchase —Redemption for Taxation Reasons”, in the event the Issuer or Tata Steel are required to pay additionalamounts as a result of certain changes in tax law, including changes in existing official position or thestating of an official position, the Issuer may redeem the Notes in whole at a redemption price equalto 100% of the principal amount plus accrued and unpaid interest.
The Notes are intended to be “qualifying debt securities” for the purposes of the Income Tax Act,Chapter 134 of Singapore.
The Notes are intended to be “qualifying debt securities” for the purposes of the Income Tax Act,Chapter 134 of Singapore (“ITA”) subject to the fulfillment of certain conditions more particularlydescribed in the section “Taxation — Singapore Taxation”. However, there is no assurance that suchNotes will continue to enjoy the tax concessions in connection therewith should the relevant tax lawsbe amended or revoked at any time. For more information on the Singapore income tax consequences,please refer to “Taxation — Singapore Taxation”. In addition, in the event that the Issuer exercises itsexchange rights under Condition 9.4 of the Terms and Conditions of the Notes, the New Notes (asdefined therein) may not qualify as “qualifying debt securities”.
An active trading market may not develop for the Notes, in which case your ability to transfer theNotes will be more limited.
The Notes are new securities for which there is currently no existing trading market. Prior to thisoffering there has been no trading market in the Notes. The liquidity of any market for the Notes willdepend on a number of factors, including general economic conditions and the Issuer’s and TataSteel’s own financial condition, performance and prospects, as well as recommendations of securitiesanalysts. The Issuer has been informed by the Joint Lead Managers that they may make a market inthe Notes after the Issuer has completed this offering. However, they are not obligated to do so andmay discontinue such market-making activity at any time without notice. In addition, market-making
65

activity by the Joint Lead Managers’ affiliates may be subject to limits imposed by applicable law. As
a result, neither the Issuer nor Tata Steel can assure you that any market in the Notes will develop or,
if it does develop, it will be maintained. If an active market in the Notes fails to develop or be
sustained, you may not be able to sell the Notes or may have to sell them at a lower price.
Developments in other markets may adversely affect the market price of the Notes.
The market price of the Notes may be adversely affected by declines in the international financial
markets and world economic conditions. The market for Indian securities is, to varying degrees,
influenced by economic and market conditions in other markets, especially those in Asia. Although
economic conditions are different in each country, investors’ reactions to developments in one country
can affect the securities markets and the securities of issuers in other countries, including India. Since
the sub-prime mortgage crisis in 2008, the international financial markets have experienced
significant volatility. If similar developments occur in the international financial markets in the future,
the market price of the Notes could be adversely affected.
The Notes are subject to restrictions on resales and transfers.
The Notes have not been registered under the Securities Act or any U.S. state securities laws or under
the securities laws of any other jurisdiction and are being issued and sold in reliance upon exemptions
from registration provided by such laws. No Notes may be sold or transferred unless such sale or
transfer is exempt from the registration requirements of the Securities Act (for example, in reliance
on the exemption provided by Regulation S under the Securities Act) and applicable state securities
laws. For certain restrictions on resales and transfers, see “Transfer Restrictions”.
The Issuer may not be able to redeem the Notes upon the occurrence of a Change of Control.
The Issuer must offer to purchase the Notes upon the occurrence of a Change of Control, at a purchase
price equal to 101% of the principal amount plus accrued and unpaid interest. See “Terms and
Conditions of the [●] Notes” and “Terms and Conditions of the [●] Notes”.
The source of funds for any such purchase would be available cash or third-party financing. However,
the Issuer may not have or be able to obtain sufficient available funds at the time of the occurrence
of any Change of Control Triggering Event to make purchases of outstanding Notes. The Issuer’s
failure to make the offer to purchase or to purchase the outstanding Notes would constitute an Event
of Default under the Notes. The Event of Default may, in turn, constitute an event of default under
other indebtedness, any of which could cause the related debt to be accelerated after any applicable
notice or grace periods. If the Issuer’s other debt were to be accelerated, it may not have sufficient
funds to purchase the Notes and repay the debt.
In addition, the definition of Change of Control does not necessarily afford protection for the
Noteholders in the event of some highly leveraged transactions, including certain acquisitions,
mergers, refinancing, restructurings or other recapitalizations. These types of transactions could,
however, increase indebtedness or otherwise affect capital structure or credit ratings. The definition
of Change of Control for purposes of the Conditions also includes a phrase relating to the sale of “all
or substantially all” of Tata Steel’s assets. Although there is a limited body of case law interpreting
the phrase “substantially all”, there is no precise established definition under applicable law.
Accordingly, the Issuer’s obligation to make an offer to purchase the Notes and the ability of a
Noteholder to require it to purchase its Notes pursuant to the Offer as a result of a highly-leveraged
transaction or a sale of less than all of the Issuer’s assets may be uncertain.
66

Notes may not be a suitable investment for all investors.
Each prospective investor in the Notes must determine the suitability of that investment in light of itsown circumstances. In particular, each potential investor should:
• have sufficient knowledge and experience to make a meaningful evaluation of the relevant Notes,the merits and risks of investing in the relevant Notes and the information contained orincorporated by reference in this Offering Memorandum or any applicable supplement;
• have access to, and knowledge of, appropriate analytical tools to evaluate, in the context of itsparticular financial situation, an investment in the relevant Notes and the impact such investmentwill have on its overall investment portfolio;
• have sufficient financial resources and liquidity to bear all of the risks of an investment in therelevant Notes, including where principal or interest is payable in one or more currencies, orwhere the currency for principal or interest payments is different from the potential investor’scurrency;
• understand thoroughly the terms of the relevant Notes and be familiar with the behavior of anyrelevant indices and financial markets; and
• be able to evaluate (either alone or with the help of a financial adviser) possible scenarios foreconomic, interest rate and other factors that may affect its investment and its ability to bear theapplicable risks.
The Issuer may not be the sole bond financing issuer in the Group and the Group may establish inthe future additional bond issuing companies.
The Issuer is a special purpose vehicle with no revenue generating operations of its own. In the futurethe Group may establish additional bond issuing companies. As a result, the Issuer may not be the solebond financing issuer in the Group. Any such indebtedness incurred by additional bond issuingcompanies may adversely impact the value of the Notes.
MiFID II Product Governance
Solely for the purposes of each manufacturer’s product approval process, the target market assessmentin respect of the Notes has led to the conclusion that: (i) the target market for the Notes is eligiblecounterparties and professional clients only, each as defined in Directive 2014/65/EU (as amended,“MiFID II”); and (ii) all channels for distribution of the Notes to eligible counterparties andprofessional clients are appropriate. Any person subsequently offering, selling or recommending theNotes (a “distributor”) should take into consideration the manufacturers’ target market assessment;however, a distributor subject to MiFID II is responsible for undertaking its own target marketassessment in respect of the Notes (by either adopting or refining the manufacturers’ target marketassessment) and determining appropriate distribution channels.
67
USE OF PROCEEDS
The Issuer estimates that the net proceeds from the sale of Notes pursuant to this Offering
Memorandum will be approximately US$[●] million after deducting fees, commissions and estimated
expenses. The Issuer intends to use a majority of the net proceeds to fund the pre-payment, repayment
or refinancing of the Group’s offshore debt obligations, and the rest to fund general corporate purposes
of the Group outside of India. Certain of the Joint Lead Managers participating in this offering are
lenders under the offshore debt obligations that will be refinanced with the net proceeds of the
offering. See “Description of Material Indebtedness” and “Subscription and Sale”.
Pending application of the net proceeds of this offering, the Issuer may apply such proceeds to initially
repay certain of its offshore working capital facilities or invest in cash and cash equivalents outside
India.
68

CAPITALIZATION
The following table sets forth the Group’s short-term and long-term debt and shareholders’ equity at
September 30, 2017 on a consolidated basis and as adjusted to give effect to the issuance of the Notes
offered, as if such issuance had occurred as of such date. No adjustments have been made in the
following table to reflect the intended use of proceeds from the issuance of the Notes. See “Use of
Proceeds”.
You should read the following table together with “Summary Financial and Operation Data”,
“Management’s Discussion and Analysis of Financial Condition and Results of Operations of the
Group”, “Management’s Discussion and Analysis of Financial Condition and Results of Operations of
the Group”, “Terms and Conditions of the Notes” and the Annual Financial Statements set forth in this
Offering Memorandum.
As at September 30, 2017
Actual Actual As Adjusted As Adjusted
Rs. million US$ million(1) Rs. Million US$ million(1)
Indebtedness:
Short-term debt . . . . . . . . . . . . . . . . . . . . . . . 213,045 3,264 [●] [●]
Long-term debt(2) . . . . . . . . . . . . . . . . . . . . . 689,559 10,564 [●] [●]
Total Indebtedness . . . . . . . . . . . . . . . . . . . . 902,604 13,828 [●] [●]
Hybrid Perpetual Securities . . . . . . . . . . . . 22,750 349 [●] [●]
Shareholders’ funds:
Share capital . . . . . . . . . . . . . . . . . . . . . . . . . 9,702 149 [●] [●]
Other Equity . . . . . . . . . . . . . . . . . . . . . . . . . 338,204 5,181 [●] [●]
Non-controlling interest. . . . . . . . . . . . . . . . . (50,371) (772) [●] [●]
Total Equity . . . . . . . . . . . . . . . . . . . . . . . . . 297,535 4,558 [●] [●]
Total indebtedness, hybrid perpetualsecurities and equity . . . . . . . . . . . . . . . . 1,222,889 18,735 [●] [●]
(1) For the reader’s convenience, U.S. Dollar translations of Indian Rupee amounts as at September 30, 2017 have been
provided at a rate of US$1.00 = Rs.65.28.
(2) Long-term borrowing includes (i) Current maturities of long-term debt and (ii) Current maturities of finance lease
obligations.
Except as otherwise disclosed in this Offering Memorandum there have been no material changes in
the Group’s capitalization since September 30, 2017.
69
SELECTED CONSOLIDATED FINANCIAL DATA AND OTHER INFORMATION
You should read the summary financial and other data below, together with the financial statements
and related notes thereto appearing elsewhere in this Offering Memorandum, as well as
“Management’s Discussion and Analysis of Financial Condition and Results of Operations” and otherfinancial information included elsewhere in this Offering Memorandum. The Group’s fiscal year endson March 31. Accordingly, references in this Offering Memorandum to a particular fiscal year are tothe year ended March 31 of that year. References to a year other than a “fiscal year” are to thecalendar year ended December 31 of that year.
The Group is required to prepare its financial statements in accordance with Ind-AS with effect fromApril 1, 2016. Accordingly, the financial statements as at and for the year ended March 31, 2017,together with the comparative period data as at and for the year ended March 31, 2016, have beenprepared in in accordance with Ind-AS. The Issuer is required to prepare its financial statements inaccordance with the Singapore Financial Reporting Standards (“SFRS”). Accordingly, all of theIssuer’s financial statements presented in this Offering Memorandum have been prepared inaccordance with SFRS.
All historical consolidated financial information in this Offering Memorandum is that of the Group,its consolidated subsidiaries and proportionately consolidated joint ventures. In this OfferingMemorandum, unless otherwise specified, all financial information is of the Group on a consolidatedbasis. All historical non-consolidated financial information in this Offering Memorandum is that ofTata Steel or the Issuer, as specified.
The annual financial statements of the Group, on a consolidated basis, and of Tata Steel, on astandalone basis, as at and for the years ended March 31, 2015, 2016 and 2017, and for the six monthperiods ended September 30, 2016 and 2017, (collectively, the “Annual Financial Statements”), haveeach been prepared in accordance with the following:
(i) with respect to the six months ended September 30, 2016 and 2017, prepared and presented inaccordance with Ind-AS;
(ii) with respect to the years ended March 31, 2016 and 2017, prepared and presented in accordancewith Ind-AS; and
(iii) with respect to the comparative period data for the years ended March 31, 2015 and 2016,prepared and presented in accordance with Indian GAAP.
Ind-AS differs in certain respects from generally accepted accounting principles in the InternationalFinancial Reporting Standards (“IFRS”). For a discussion of certain significant differences betweenInd-AS and IFRS, see “Description of Certain Differences between Ind-AS and IFRS”. In making aninvestment decision, investors must rely on their own examination of the Group, the terms of theoffering and the financial information contained in this Offering Memorandum. Potential investorsshould consult their own professional advisers for an understanding of the differences betweenInd-AS, Indian GAAP, US GAAP, SFRS or IFRS, and how these differences might affect theirunderstanding of the financial information contained herein.
The Annual Financial Statements for the Group have been audited by Deloitte Haskins and Sells LLP,Chartered Accountants (“Deloitte”), as set forth in their audit reports included herein. For the financialyear beginning from April 1, 2017 onwards, Price Waterhouse and Co. Chartered Accountants LLP(“Price Waterhouse and Co.”) became the statutory auditor for the Group, andPricewaterhouseCoopers LLP became the auditors for the Issuer.
70

The Annual Financial Statements for the Issuer have been audited by Deloitte, as set forth in theiraudit reports included herein. The unaudited interim financial statements of the Issuer for the sixmonths ended September 30, 2017, have been subject to limited review by PricewaterhouseCoopersLLP as set forth in their report dated January 12, 2018.
The standalone financial results of Tata Steel for the quarter and six months ended September 30, 2017have been audited by Price Waterhouse and Co. and the consolidated financial results of the Group forthe quarter ended September 30, 2017 have been subjected to a limited review by Price Waterhouseand Co. as set forth in their respective review reports included herein.
The unaudited interim financial statements of the Issuer for the six months ended September 30, 2017,have been subjected to a limited review by PricewaterhouseCoopers LLP as set forth in their reviewreport dated January 12, 2018.
Consolidated Statement of Profit and Loss of the Group
Consolidated Statement ofProfit and Loss Data
Six months endedSeptember 30,
Quarter endedSeptember 30,
Quarter endedJune 30,
Six monthsended
September 30,
(Ind-AS) 2017 2016
(US$millions)
(Unaudited)
(Rs. in millions)
I. Revenue from operations . . . . . . . 9,718 634,375 324,641 309,733 530,904II. Other income . . . . . . . . . . . . . . 63 4,087 2,532 1,555 2,452
III. Total Income . . . . . . . . . . . . . . 9,781 638,462 327,174 311,288 533,356
IV. Expenses(a) Raw materials consumed . . . . 3,161 206,340 103,546 102,794 144,492(b) Purchases of finished,
semi-finished and otherproducts . . . . . . . . . . . . . . 825 53,843 26,266 27,577 57,071
(c) Changes in stock of finishedgoods, work-in-progress andstock-in-trade . . . . . . . . . . . (101) (6,589) 13,084 (19,673) (26,769)
(d) Employee benefit expenses . . 1,317 85,980 42,941 43,039 88,561(e) Finance costs . . . . . . . . . . 413 26,936 13,499 13,437 24,217(f) Depreciation and amortisation
expense . . . . . . . . . . . . . . 456 29,744 14,733 15,011 27,047(g) Other expenses . . . . . . . . . 3,098 202,247 94,111 108,136 209,067
Subtotal expenses . . . . . . . . . . . . 9,169 598,502 308,181 290,321 523,685(h) Less: Expenditure (other than
interest) transferred to capitaland other accounts . . . . . . . . 67 4,393 2,514 1,880 4,983
Total Expenses . . . . . . . . . . . . . . 9,102 594,108 305,667 288,442 518,703
V. Share of profit/(loss) of jointventures and associates . . . . . . . . 4 257 198 59 51
VI. Profit before exceptional items andtax (III-IV+V) . . . . . . . . . . . . . 683 44,610 21,705 22,905 14,705
VII. Exceptional Items(a) Provision for diminution in
value of investments/doubtfuladvances . . . . . . . . . . . . . . (4) (267) (267) — (1,169)
(b) Provision for demands andclaims . . . . . . . . . . . . . . . (94) (6,144) — (6,144) —
(c) Employee separationcompensation . . . . . . . . . . (3) (204) (180) (24) (1,102)
Total exceptional items . . . . . . . . (101) (6,614) (447) (6,168) (2,271)
VIII. Profit/(loss) before tax (VI+VII) . . 582 37,996 21,258 16,738 12,434
(1) For the reader’s convenience, U.S. Dollar translations of Indian Rupee amounts for the six months ended September 30,
2017 have been provided at a rate of US$1.00 = Rs.65.28
71

Consolidated Statement of Profit and Loss of the Group
Consolidated Statement ofProfit and Loss Data
Six months endedSeptember 30,
Quarter endedSeptember 30,
Quarter endedJune 30,
Six monthsended
September 30,
(Ind-AS) 2017 2016
(US$millions)
(Unaudited)
(Rs. in millions)
IX. Tax expense(a) Current tax . . . . . . . . . . . . 143 9,364 6,109 3,255 4,891(b) Deferred tax. . . . . . . . . . . . 144 9,421 5,271 4,150 6,146
Total tax expense . . . . . . . . . . . . 288 18,785 11,380 7,405 11,036
X. Profit/(loss) after tax fromcontinuing operations . . . . . . . . . 294 19,211 9,879 9,332 1,397
XI. Profit/(loss) after tax fromdiscontinued operations(a) Profit/(loss) after tax from
discontinued operations . . . . 0.4 24 332 (308) (1,846)(b) Profit/(loss) on disposal of
discontinued operations . . . . 2 154 (32) 186 (31,876)
Profit/(loss) after tax fromdiscontinued operations . . . . . . 3 178 299 (121) (33,722)
XII. Profit/(loss) for the year (A) . . . . 297 19,389 10,178 9,211 (32,325)XIII. Other Comprehensive Income/(loss)
A) (i) Items that will not bereclassifiedsubsequently to theconsolidated statementof profit and loss . . . . (1,002) (65,381) (37,451) (27,930) (47,015)
(ii) Income tax on Itemsthat will not bereclassifiedsubsequently to theconsolidated statementof profit and loss . . . . 82 5,374 2,612 2,762 10,617
B) (i) Items that will bereclassifiedsubsequently to theconsolidated statementof profit and loss . . . . (284) (18,513) (7,658) (10,855) 14,204
(ii) Income tax on itemsthat will be reclassifiedsubsequently to theconsolidated statementof profit and loss . . . . 12 757 152 605 (285)
Total Other Comprehensive/(loss)(B) . . . . . . . . . . . . . . . . . . . (1,191) (77,763) (42,345) (35,418) (22,479)
XIII. Total Comprehensive Income forthe year: (A+B) . . . . . . . . . . . . . (894) (58,374) (32,167) (26,207) (54,804)
XIV. Earnings per equity share (fromcontinuing operations)Basic & Diluted (in rupees) . . . . . . 0.3 19 10 9 1
XV. Earnings per equity share (fromdiscontinued operations)Basic & Diluted (in rupees) . . . . . . 0.0 0.2 0.3 (0.1) (35)
XVI. Earnings per equity share (fromcontinuing and discontinuedoperations)Basic & Diluted (in rupees) . . . . . . 0.3 19 10 9 (34)
(1) For the reader’s convenience, U.S. Dollar translations of Indian Rupee amounts for the six months ended September 30,2017 have been provided at a rate of US$1.00 = Rs.65.28
72

Consolidated Statement of Profit and Loss of the Group
Consolidated Statement of Profit and Loss Data Year ended March 31,
(Ind-AS) 2017 2016
(US$millions)
(audited)
(Rs. in millions)
I. Revenue from operations . . . . . . . . . . . . . . . . . . . . . . . 18,108 1,174,199 1,063,399
II. Other income . . . . . . . . . . . . . . . . . . . . . . . . . . . . . . 81 5,275 4,122
III. Total Income . . . . . . . . . . . . . . . . . . . . . . . . . . . . . . 18,189 1,179,474 1,067,521
IV. Expenses
(a) Raw materials consumed . . . . . . . . . . . . . . . . . . . . 4,999 324,181 281,149
(b) Purchases of finished, semi-finished and other products . 1,762 114,249 105,814
(c) Changes in stock of finished goods, work-in-progressand stock-in-trade . . . . . . . . . . . . . . . . . . . . . . . . (700) (45,381) 19,252
(d) Employee benefit expenses . . . . . . . . . . . . . . . . . . 2,661 172,522 175,876
(e) Finance costs . . . . . . . . . . . . . . . . . . . . . . . . . . 782 50,722 42,214
(f) Depreciation and amortisation expense . . . . . . . . . . . 875 56,729 53,064
(g) Other expenses . . . . . . . . . . . . . . . . . . . . . . . . . 6,881 446,197 412,555
Subtotal expenses . . . . . . . . . . . . . . . . . . . . . . . . . . . . 17,260 1,119,219 1,089,923
(h) Less: Expenditure (other than interest) transferred tocapital and other accounts . . . . . . . . . . . . . . . . . . . 118 7,647 10,930
Total Expenses . . . . . . . . . . . . . . . . . . . . . . . . . . . . . . 17,142 1,111,572 1,078,994
V. Share of profit/(loss) of joint ventures and associates . . . . . 1 77 (1,104)
VI. Profit before exceptional items and tax (III-IV+V) . . . . . . 1,048 67,979 (12,576)
VII. Exceptional Items
(a) Profit on sale of non-current investments . . . . . . . . . . 4 227 472
(b) Profit on sale of non-current asset . . . . . . . . . . . . . . 13 859 —
(c) Provision for diminution in value of investments/doubtful advances . . . . . . . . . . . . . . . . . . . . . . . . (19) (1,255) (730)
(d) Provision for impairment of non-current assets . . . . . . . (41) (2,679) (15,302)
(e) Provision for demands and claims . . . . . . . . . . . . . . (34) (2,183) (8,801)
(f) Employee separation compensation . . . . . . . . . . . . . (32) (2,074) (5,563)
(g) Restructuring and other provisions . . . . . . . . . . . . . . (557) (36,138) 69,827
Total exceptional items . . . . . . . . . . . . . . . . . . . . . . . . (667) (43,242) 39,904
VIII. Profit/(loss) before tax (VI+VII) . . . . . . . . . . . . . . . . . . 381 24,736 27,327
(1) For the reader’s convenience, U.S. Dollar translations of Indian Rupee amounts for the year ended March 31, 2017 have
been provided at a rate of US$1.00 = Rs.64.85
73

Consolidated Statement of Profit and Loss of the Group
Consolidated Statement of Profit and Loss Data Year ended March 31,
(Ind-AS) 2017 2016
(US$millions)
(audited)
(Rs. in millions)
IX. Tax expense
(a) Current tax . . . . . . . . . . . . . . . . . . . . . . . . . . . . 269 17,417 13,210
(b) Deferred tax. . . . . . . . . . . . . . . . . . . . . . . . . . . . 160 10,363 (6,311)
Total tax expense . . . . . . . . . . . . . . . . . . . . . . . . . . . . 428 27,780 6,900
X. Profit/(loss) after tax from continuing operations . . . . . . . . (47) (3,044) 20,428
XI. Profit/(loss) after tax from discontinued operations . . . . . .
(a) Profit/(loss) after tax from discontinued operations . . . . (120) (7,789) (25,399)
(b) Profit/(loss) on disposal of discontinued operations . . . (476) (30,853) —
Profit/(loss) after tax from discontinued operations . . . . . . (596) (38,642) (25,399)
XII. Profit/(loss) for the year (A) . . . . . . . . . . . . . . . . . . . . (643) (41,686) (4,971)
XIII. Other Comprehensive Income/(loss)
A) (i) Items that will not be reclassified subsequently tothe consolidated statement of profit and loss . . . (539) (34,943) (11,882)
(ii) Income tax on Items that will not be reclassifiedsubsequently to the consolidated statement ofprofit and loss . . . . . . . . . . . . . . . . . . . . . . 121 7,823 (5,760)
B) (i) Items that will be reclassified subsequently to theconsolidated statement of profit and loss . . . . . . 337 21,883 (1,190)
(ii) Income tax on items that will be reclassifiedsubsequently to the consolidated statement ofprofit and loss . . . . . . . . . . . . . . . . . . . . . . (6) (395) (149)
Total Other Comprehensive/(loss) (B) . . . . . . . . . . . . . . . (87) (5,631) (18,982)
XIII. Total Comprehensive Income for the year: (A+B) . . . . . . . (730) (47,316) (23,953)
XIV. Earnings per equity share (from continuing operations)
Basic & Diluted (in rupees) . . . . . . . . . . . . . . . . . . . . . . (0.1) (5) 19
XV. Earnings per equity share (from discontinued operations)
Basic & Diluted (in rupees) . . . . . . . . . . . . . . . . . . . . . . (1) (40) (26)
XVI. Earnings per equity share (from continuing anddiscontinued operations)
Basic & Diluted (in rupees) . . . . . . . . . . . . . . . . . . . . . . (1) (45) (7)
(1) For the reader’s convenience, U.S. Dollar translations of Indian Rupee amounts for the year ended March 31, 2017 have
been provided at a rate of US$1.00 = Rs.64.85
74

Consolidated Statement of Profit and Loss of the Group (Indian GAAP)
Statement of Profit and Loss Data Year ended March 31,
(Indian GAAP) 2016 2015
(audited)
(Rs. in millions)
(1) Revenue
(a) Revenue from operations . . . . . . . . . . . . . . . . . . . . . . . . . . . . . . 1,216,184 1,442,984
Less: Excise Duty . . . . . . . . . . . . . . . . . . . . . . . . . . . . . . . . . . . . . . . 44,668 47,946
1,171,516 1,395,037
(b) Other income . . . . . . . . . . . . . . . . . . . . . . . . . . . . . . . . . . . . . 39,257 7,962
Total Revenue . . . . . . . . . . . . . . . . . . . . . . . . . . . . . . . . . . . . . . . . . 1,210,773 1,402,999
(2) Expenses
(a) Raw materials consumed . . . . . . . . . . . . . . . . . . . . . . . . . . . . . . . 321,883 407,410
(b) Purchase of finished, semi-finished and other products . . . . . . . . . . . . 101,740 138,042
(c) Changes in inventories of finished goods, work-in-progress andstock-in-trade . . . . . . . . . . . . . . . . . . . . . . . . . . . . . . . . . . . . . 24,538 11,222
(d) Employee benefits expense . . . . . . . . . . . . . . . . . . . . . . . . . . . . . 199,668 214,076
(e) Depreciation and amortisation expense . . . . . . . . . . . . . . . . . . . . . . 50,818 59,436
(f) Finance costs . . . . . . . . . . . . . . . . . . . . . . . . . . . . . . . . . . . . . 41,286 48,478
(g) Other expenses . . . . . . . . . . . . . . . . . . . . . . . . . . . . . . . . . . . . 459,053 510,611
(h) Less: Expenditure (other than interest) transferred to capital and otheraccounts . . . . . . . . . . . . . . . . . . . . . . . . . . . . . . . . . . . . . . . . 11,223 11,682
Total Expenses . . . . . . . . . . . . . . . . . . . . . . . . . . . . . . . . . . . . . . . . 1,187,764 1,377,593
(3) Profit before Exceptional Items and Tax . . . . . . . . . . . . . . . . . . . . . . . . 23,008 25,406
(4) Exceptional Items
(a) Profit on sale of non-current investments . . . . . . . . . . . . . . . . . . . . . 1,800 13,153
(b) Profit on sale of non-current assets . . . . . . . . . . . . . . . . . . . . . . . . 11,469
(c) Provision for diminution in the value of investments/doubtful advances . . (1,291) (3,383)
(d) Provision for impairment of non-current assets . . . . . . . . . . . . . . . . . (97,206) (60,526)
(e) Provision for demands and claims . . . . . . . . . . . . . . . . . . . . . . . . . (8,801) —
(f) Employee separation compensation . . . . . . . . . . . . . . . . . . . . . . . . (5,563) —
(g) Restructuring and other provisions . . . . . . . . . . . . . . . . . . . . . . . . . 71,312 —
Total exceptional items . . . . . . . . . . . . . . . . . . . . . . . . . . . . . . . . . . . (39,749) (39,287)
(5) Profit/(Loss) before tax . . . . . . . . . . . . . . . . . . . . . . . . . . . . . . . . . . . (16,740) (13,881)
(6) Tax Expense
(a) Current tax . . . . . . . . . . . . . . . . . . . . . . . . . . . . . . . . . . . . . . . 16,311 22,147
(b) MAT credit . . . . . . . . . . . . . . . . . . . . . . . . . . . . . . . . . . . . . . . (1,526) (1,173)
(c) Deferred tax . . . . . . . . . . . . . . . . . . . . . . . . . . . . . . . . . . . . . . 264 4,700
Total tax expense . . . . . . . . . . . . . . . . . . . . . . . . . . . . . . . . . . . . . . . 15,050 25,674
(7) Profit/(Loss) after tax . . . . . . . . . . . . . . . . . . . . . . . . . . . . . . . . . . . . (31,790) (39,555)
(8) Minority Interest . . . . . . . . . . . . . . . . . . . . . . . . . . . . . . . . . . . . . . . 1,089 133
(9) Share of Profit of Associates . . . . . . . . . . . . . . . . . . . . . . . . . . . . . . . 207 167
(10) Profit/(Loss) after Tax, Minority Interest and Share of Profit of Associates . . (30,493) (39,255)
(11) Nominal Value per Share (in rupees) . . . . . . . . . . . . . . . . . . . . . . . . . . 10 10
(12) Basic Earnings per Share (in rupees) . . . . . . . . . . . . . . . . . . . . . . . . . . (33) (42)
(13) Diluted Earnings per Share (in rupees) . . . . . . . . . . . . . . . . . . . . . . . . . (33) (42)
75

Consolidated Balance Sheets of the Group
Balance Sheet Data As at September 30, As at March 31,As at
March 31,
(Ind-AS) 2017 2017 2016
(US$ inmillions)
(unaudited)
(US$ inmillions)
(audited)
(Rs. inmillions) (Rs. in millions)
ASSETS
I. Non-current assets
(a) Property, plant and equipment . . . 13,592 887,191 13,398 868,806 665,692
(b) Capital work-in-progress . . . . . . 2,371 154,788 2,393 155,144 357,933
(c) Goodwill on consolidation . . . . . 575 37,553 539 34,947 40,676
(d) Other Intangible assets . . . . . . . 241 15,728 252 16,312 15,630
(e) Intangible assets underdevelopment . . . . . . . . . . . . . 57 3,723 42 2,698 2,028
(f) Equity accounted investments . . . 251 16,370 246 15,937 16,204
(g) Financial assets:
(i) Investments . . . . . . . . . . 167 10,869 800 51,903 44,298
(ii) Loans . . . . . . . . . . . . . 102 6,643 58 3,731 4,122
(iii) Derivative assets . . . . . . . 3 215 13 832 328
(iv) Other financial assets . . . . 4 243 13 856 410
(h) Retirement benefit assets . . . . . . 1 34 270 17,526 114,774
(i) Income tax assets . . . . . . . . . . 154 10,048 151 9,812 10,403
(j) Deferred tax assets . . . . . . . . . 151 9,864 137 8,859 6,275
(k) Other assets . . . . . . . . . . . . . . 429 28,007 567 36,750 38,422
Total non-current assets . . . . . . . . . 18,097 1,181,273 18,878 1,224,112 1,317,195
II. Current assets
(a) Inventories . . . . . . . . . . . . . . 4,067 265,488 3,825 248,038 200,133
(b) Financial assets:
(i) Investments . . . . . . . . . . 1,401 91,427 875 56,731 46,636
(ii) Trade receivables . . . . . . 1,867 121,868 1,787 115,868 120,662
(iii) Cash and cash equivalents . 407 26,568 745 48,323 61,091
(iv) Other balances with bank . 21 1,378 14 888 773
(v) Loans . . . . . . . . . . . . . 48 3,138 35 2,245 2,074
(vi) Derivative assets . . . . . . . 76 4,966 16 1,040 3,096
(vii) Other financial assets . . . . 95 6,183 60 3,878 2,413
(c) Retirement benefit assets . . . . . . 0.1 4 — — —
(d) Income tax assets . . . . . . . . . . 4 291 5 351 502
(e) Other assets . . . . . . . . . . . . . . 591 38,597 338 21,944 20,279
Total current assets . . . . . . . . . . . . 8,578 559,910 7,700 499,306 457,659
III. Assets held for sale . . . . . . . . . . . . 16 1,020 153 9,914 261
TOTAL ASSETS . . . . . . . . . . . . . . . . . . 26,690 1,742,203 26,730 1,733,332 1,775,114
(1) For the reader’s convenience, U.S. Dollar translations of Indian Rupee amounts for the year ended March 31, 2017, and
for the six months ended September 30, 2017, have been provided at a rate of US$1.00 = Rs.64.85 and US$1.00 =
Rs.65.28, respectively.
76

Consolidated Balance Sheets of the Group
Balance Sheet Data As at September 30, As at March 31,As at
March 31,
(Ind-AS) 2017 2017 2016
(US$ inmillions)
(unaudited)
(US$ inmillions)
(audited)
(Rs. inmillions) (Rs. in millions)
EQUITY AND LIABILITIES
IV. Equity
(a) Equity share capital . . . . . . . . . 149 9,702 150 9,702 9,702
(b) Hybrid Perpetual Securities . . . . 349 22,750 351 22,750 22,750
(c) Other equity . . . . . . . . . . . . . 5,181 338,204 5,332 345,741 404,873
Equity attributable to shareholders ofthe Company . . . . . . . . . . . . . . . . 5,678 370,657 5,832 378,193 437,326
Non-controlling interest . . . . . . . . . . (772) (50,371) 247 16,017 7,809
Total equity . . . . . . . . . . . . . . . . . 4,907 320,285 6,079 394,210 445,135
V. Non-current liabilities
(a) Financial liabilities:
(i) Borrowings . . . . . . . . . . 10,453 682,310 9,873 640,223 648,728
(ii) Derivative liabilities . . . . 19 1,209 28 1,800 1,655
(iii) Other financial liabilities . . 17 1,098 17 1,088 4,544
(b) Provisions . . . . . . . . . . . . . . . 496 32,401 660 42,797 44,405
(c) Retirement benefit obligations . . . 427 27,878 411 26,663 29,295
(d) Deferred income . . . . . . . . . . . 289 18,889 317 20,576 24,314
(e) Deferred tax liabilities . . . . . . . 1,484 96,837 1,547 100,301 94,209
(f) Other liabilities . . . . . . . . . . . 24 1,593 35 2,265 3,291
Total non-current liabilities . . . . . . . 13,209 862,214 12,888 835,712 850,440
VI. Current liabilities
(a) Financial liabilities:
(i) Borrowings . . . . . . . . . . 3,264 213,045 2,826 183,281 157,221
(ii) Trade payables . . . . . . . . 2,794 182,372 2,864 185,745 185,567
(iii) Derivative liabilities . . . . 147 9,581 104 6,737 4,983
(iv) Other financial liabilities . . 985 64,287 974 63,155 69,011
(b) Provisions . . . . . . . . . . . . . . . 323 21,106 152 9,874 15,219
(c) Retirement benefit obligations . . . 12 770 15 952 1,111
(d) Deferred income . . . . . . . . . . . 1 53 3 225 37
(e) Income tax liabilities . . . . . . . . 204 13,323 114 7,392 10,011
(f) Other liabilities . . . . . . . . . . . 845 55,166 665 43,153 36,380
Total current liabilities . . . . . . . . . . 8,575 559,704 7,719 500,513 479,540
VII. Liabilities held for sale . . . . . . . . . . — — 45 2,898 —
TOTAL EQUITY AND LIABILITIES . . . . . 26,690 1,742,203 26,730 1,733,332 1,775,114
(1) For the reader’s convenience, U.S. Dollar translations of Indian Rupee amounts for the year ended March 31, 2017, and
for the six months ended September 30, 2017, have been provided at a rate of US$1.00 = Rs.64.85 and US$1.00 =
Rs.65.28, respectively.
77

Consolidated Balance Sheets of the Group (Indian GAAP)
Balance Sheet Data As at March 31,
(Indian GAAP) 2016 2015
(audited)
(Rs. in millions)
Equity and Liabilities
(1) Shareholders’ funds
(a) Equity share capital . . . . . . . . . . . . . . . . . . . . . . . . . . . . . . . . . . 9,702 9,714
(b) Reserves and surplus . . . . . . . . . . . . . . . . . . . . . . . . . . . . . . . . . 275,086 303,780
284,789 313,494
(2) Preference share capital issued by subsidiary . . . . . . . . . . . . . . . . . . . . . 200 200
(3) Hybrid Perpetual Securities . . . . . . . . . . . . . . . . . . . . . . . . . . . . . . . . 22,750 22,750
(4) Minority interest . . . . . . . . . . . . . . . . . . . . . . . . . . . . . . . . . . . . . . . 16,542 17,039
(5) Non-current liabilities
(a) Long-term borrowings . . . . . . . . . . . . . . . . . . . . . . . . . . . . . . . . 683,541 656,752
(b) Deferred tax liability (net) . . . . . . . . . . . . . . . . . . . . . . . . . . . . . 29,049 28,845
(c) Other long-term liabilities . . . . . . . . . . . . . . . . . . . . . . . . . . . . . . 13,837 17,488
(d) Long-term provisions . . . . . . . . . . . . . . . . . . . . . . . . . . . . . . . . . 76,227 75,038
802,654 778,123
(6) Current liabilities
(a) Short-term borrowings . . . . . . . . . . . . . . . . . . . . . . . . . . . . . . . . 154,499 95,986
(b) Trade Payables:
(i) Total outstanding dues of micro enterprises and small enterprises . . 207 229
(ii) Total outstanding dues of creditors of other than micro enterprisesand small enterprises . . . . . . . . . . . . . . . . . . . . . . . . . . . . . 203,676 191,670
203,883 191,899
(c) Other current liabilities . . . . . . . . . . . . . . . . . . . . . . . . . . . . . . . 112,090 144,796
(d) Short-term provisions . . . . . . . . . . . . . . . . . . . . . . . . . . . . . . . . 35,094 27,035
505,566 459,715
TOTAL . . . . . . . . . . . . . . . . . . . . . . . . . . . . . . . . . . . . . . . . . . . . . . . . . 1,632,500 1,591,321
Assets
(7) Non-current Assets
(a) Fixed Assets
(i) Tangible assets . . . . . . . . . . . . . . . . . . . . . . . . . . . . . . . . 450,807 512,479
(ii) Intangible assets . . . . . . . . . . . . . . . . . . . . . . . . . . . . . . . . 18,488 34,449
(iii) Capital work-in-progress . . . . . . . . . . . . . . . . . . . . . . . . . . . 349,940 278,371
(iv) Intangible assets under development . . . . . . . . . . . . . . . . . . . . 4,939 8,410
(b) Goodwill on consolidation . . . . . . . . . . . . . . . . . . . . . . . . . . . . . . 137,194 134,075
(c) Non-current investments . . . . . . . . . . . . . . . . . . . . . . . . . . . . . . . 20,845 20,804
(d) Deferred tax assets (net) . . . . . . . . . . . . . . . . . . . . . . . . . . . . . . . 219 228
(e) Long-term loans and advances . . . . . . . . . . . . . . . . . . . . . . . . . . . 161,109 51,066
(f) Other non-current assets . . . . . . . . . . . . . . . . . . . . . . . . . . . . . . . 14,059 14,037
1,157,599 1,053,919
(8) Current Assets
(a) Current investments . . . . . . . . . . . . . . . . . . . . . . . . . . . . . . . . . . 47,161 13,746
(b) Inventories . . . . . . . . . . . . . . . . . . . . . . . . . . . . . . . . . . . . . . . 203,560 251,499
(c) Trade receivables . . . . . . . . . . . . . . . . . . . . . . . . . . . . . . . . . . . 117,012 133,099
(d) Cash and bank balances . . . . . . . . . . . . . . . . . . . . . . . . . . . . . . . 67,156 87,499
(e) Short-term loans and advances . . . . . . . . . . . . . . . . . . . . . . . . . . . 35,778 47,483
(f) Other current assets . . . . . . . . . . . . . . . . . . . . . . . . . . . . . . . . . . 4,235 4,075
474,901 537,401
TOTAL . . . . . . . . . . . . . . . . . . . . . . . . . . . . . . . . . . . . . . . . . . . . . . . . . 1,632,500 1,591,321
78

Summary Consolidated Cash Flow Statement of the Group
Cash flow statement of the Group Year ended March 31,
(Ind-AS) 2017 2016
(US$ inmillions)
(audited)
(Rs. in millions)
Net cash flow from/(used in) operating activities . . . . . . . . . . . 1,673 108,481 114,554
Net cash from/(used in) investing activities . . . . . . . . . . . . . . . (1,401) (90,862) (92,538)
Net cash flow from/(used in) financing activities . . . . . . . . . . . . (400) (25,924) (47,291)
Net increase/(decrease) in cash and cash equivalents . . . . . . . . . (128) (8,306) (25,276)
Opening cash and cash equivalents . . . . . . . . . . . . . . . . . . . . 937 60,769 81,771
Effect of exchange rate on translation of foreign currency cash andcash equivalents . . . . . . . . . . . . . . . . . . . . . . . . . . . . . . . (64) (4,141) 4,595
Closing cash and cash equivalents . . . . . . . . . . . . . . . . . . . . . 745 48,323 61,091
(1) For the reader’s convenience, U.S. Dollar translations of Indian Rupee amounts for the year ended March 31, 2017 have
been provided at a rate of US$1.00 = Rs.64.85
Summary Consolidated Cash Flow Statement of the Group (Indian GAAP)
Cash flow statement of the Group Year ended March 31,
(Indian GAAP) 2016 2015
(audited)
(Rs. in millions)
Net cash flow from/(used in) operating activities . . . . . . . . . . . . . . . . . . . . . . 119,632 118,798
Net cash from/(used in) investing activities . . . . . . . . . . . . . . . . . . . . . . . . . . (104,242) (84,221)
Net cash flow from/(used in) financing activities . . . . . . . . . . . . . . . . . . . . . . . (39,284) (26,172)
Net increase/(decrease) in cash and cash equivalents . . . . . . . . . . . . . . . . . . . . (23,894) 8,404
Opening cash and cash equivalents . . . . . . . . . . . . . . . . . . . . . . . . . . . . . . . 85,257 84,063
Effect of exchange rate on translation of foreign currency cash and cash equivalents . . 4,727 (5,990)
Closing cash and cash equivalents . . . . . . . . . . . . . . . . . . . . . . . . . . . . . . . . 66,090 86,478
79

Standalone Statement of Profit and Loss of Tata Steel
Statement of Profit and Loss DataSix months ended
September 30,Quarter endedSeptember 30,
Quarter endedJune 30,
Six monthsended
September 30,
(Ind-AS) 2017 2016
US$millions)
(audited)
(Rs. in millions)
I. Revenue from operations . . . . . 4,388 286,427 142,209 144,217 220,418
II. Other income . . . . . . . . . . . . 55 3,616 2,495 1,121 2,702
III. Total Income . . . . . . . . . . . . 4,443 290,042 144,704 145,338 223,119
IV. Expenses
(a) Raw materials consumed . . 1,328 86,686 44,490 42,196 49,518
(b) Purchases of finished,semi-finished and otherproducts . . . . . . . . . . . . 53 3,438 813 2,626 4,776
(c) Changes in stock offinished goods,work-in-progress andstock-in-trade . . . . . . . . 2 143 9,189 (9,046) (9,376)
(d) Employee benefit expenses 348 22,728 11,151 11,577 23,412
(e) Finance costs . . . . . . . . 216 14,093 7,092 7,001 12,659
(f) Depreciation andamortisation expense . . . . 288 18,788 9,124 9,664 16,146
(g) Other expenses . . . . . . . 1,707 111,394 43,736 67,659 112,280
Subtotal expenses . . . . . . . . . . 3,941 257,271 125,594 131,677 209,416
(h) Less: Expenditure (otherthan interest) transferred tocapital and other accounts . 21 1,378 921 457 1,554
Total Expenses . . . . . . . . . . . 3,920 255,893 124,673 131,220 207,862
V. Profit before exceptional itemsand tax (III-IV) . . . . . . . . . . 523 34,150 20,032 14,119 15,258
VI. Exceptional Items
(a) Provision for diminution invalue of investments/doubtful advances . . . . . . (4) (267) (267) — (1,382)
(b) Provision for demands andclaims . . . . . . . . . . . . . (94) (6,144) — (6,144) —
(c) Employee separationcompensation . . . . . . . . (0.4) (24) — (24) (815)
Total exceptional items . . . . . . (99) (6,434) (267) (6,168) (2,198)
VII. Profit/(loss) before tax (V+VI) . 425 27,716 19,765 7,951 13,060
(1) For the reader’s convenience, U.S. Dollar translations of Indian Rupee amounts for the six months ended September 30,
2017 have been provided at a rate of US$1.00 = Rs.65.28
80

Standalone Statement of Profit and Loss of Tata Steel
Statement of Profit and Loss Data Six months ended September 30,
(Ind-AS) 2017 2016
(US$millions)
(audited)
(Rs. in millions)
VIII. Tax expense
(a) Current tax . . . . . . . . . . . . . . . . 109 7,089 4,894 2,195 4,495
(b) Deferred tax . . . . . . . . . . . . . . . 40 2,622 1,931 691 315
Total tax expense . . . . . . . . . . . . . . . . 149 9,711 6,824 2,886 4,810
IX. Profit/(loss) for the year (A) . . . . . . . . 276 18,005 12,941 5,064 8,250
X. Other Comprehensive Income/(loss)
A) (i) Items that will not bereclassified subsequently tothe statement of profit andloss . . . . . . . . . . . . . . . . (29) (1,904) (756) (1,148) 11,482
(ii) Income tax on Items that willnot be reclassifiedsubsequently to the statementof profit and loss . . . . . . . . (3) (180) (64) (116) 620
B) (i) Items that will be reclassifiedsubsequently to the statementof profit and loss . . . . . . . . (0) (26) 16 (43) 3
(ii) Income tax on items that willbe reclassified subsequently tothe statement of profit andloss . . . . . . . . . . . . . . . . 0 9 (6) 15 (1)
Total Other Comprehensive/(loss) (B) . . . (32) (2,101) (809) (1,292) 12,104
XI. Total Comprehensive Income for theyear: (A+B) . . . . . . . . . . . . . . . . . . . 244 15,904 12,131 3,773 20,354
XII. Earnings per equity share
Basic & Diluted (in rupees) . . . . . . . . . 0.3 18 13 5 8
(1) For the reader’s convenience, U.S. Dollar translations of Indian Rupee amounts for the six months ended September 30,
2017 have been provided at a rate of US$1.00 = Rs.65.28
81

Standalone Statement of Profit and Loss of Tata Steel
Statement of Profit and Loss Data Year ended March 31,
(Ind-AS) 2017 2016
(US$millions)
(audited)
(Rs. in millions)
I. Revenue from operations . . . . . . . . . . . . . . . . . . . . . . . 8,214 532,610 426,974
II. Other income . . . . . . . . . . . . . . . . . . . . . . . . . . . . . . 64 4,145 3,912
III. Total Income . . . . . . . . . . . . . . . . . . . . . . . . . . . . . . 8,277 536,754 430,886
IV. Expenses
(a) Raw materials consumed . . . . . . . . . . . . . . . . . . . . 1,927 124,968 97,000
(b) Purchases of finished, semi-finished and other products . 136 8,812 9,915
(c) Changes in stock of finished goods, work-in-progressand stock-in-trade . . . . . . . . . . . . . . . . . . . . . . . . (205) (13,297) 708
(d) Employee benefit expenses . . . . . . . . . . . . . . . . . . 710 46,051 43,199
(e) Finance costs . . . . . . . . . . . . . . . . . . . . . . . . . . 415 26,886 18,481
(f) Depreciation and amortisation expense . . . . . . . . . . . 546 35,416 29,623
(g) Other expenses . . . . . . . . . . . . . . . . . . . . . . . . . 3,847 249,491 206,024
Subtotal expenses . . . . . . . . . . . . . . . . . . . . . . . . . . . . 7,376 478,326 404,949
(h) Less: Expenditure (other than interest) transferred tocapital and other accounts . . . . . . . . . . . . . . . . . . . 34 2,175 5,989
Total Expenses . . . . . . . . . . . . . . . . . . . . . . . . . . . . . 7,343 476,151 398,960
V. Profit before exceptional items and tax (III-IV) . . . . . . . . 935 60,603 31,926
VI. Exceptional Items
(a) Profit on sale of non-current investments . . . . . . . . . . — — (9)
(b) Provision for diminution in value of investments/doubtful advances . . . . . . . . . . . . . . . . . . . . . . . . (26) (1,709) (1,606)
(c) Provision for impairment of non-current assets . . . . . . — — (515)
(d) Provision for demands and claims . . . . . . . . . . . . . . (34) (2,183) (8,801)
(e) Employee separation compensation . . . . . . . . . . . . . (28) (1,787) (5,563)
(f) Restructuring and other provisions . . . . . . . . . . . . . . (21) (1,356) —
Total exceptional items . . . . . . . . . . . . . . . . . . . . . . . . (108) (7,034) (16,493)
VII. Profit/(loss) before tax (V+VI) . . . . . . . . . . . . . . . . . . . 826 53,569 15,433
(1) For the reader’s convenience, U.S. Dollar translations of Indian Rupee amounts for the year ended March 31, 2017 have
been provided at a rate of US$1.00 = Rs.64.85
82

Standalone Statement of Profit and Loss of Tata Steel
Statement of Profit and Loss Data Year ended March 31,
(Ind-AS) 2017 2016
(US$millions)
(audited)
(Rs. in millions)
VIII. Tax expense
(a) Current tax . . . . . . . . . . . . . . . . . . . . . . . . . . . . 216 14,005 11,933
(b) Deferred tax . . . . . . . . . . . . . . . . . . . . . . . . . . . 79 5,118 (6,056)
Total tax expense . . . . . . . . . . . . . . . . . . . . . . . . . . . . 295 19,124 5,877
IX. Profit/(loss) for the year (A) . . . . . . . . . . . . . . . . . . . . 531 34,446 9,556
X. Other Comprehensive Income/(loss)
A) (i) Items that will not be reclassified subsequently tothe statement of profit and loss . . . . . . . . . . . 93 6,012 (31,685)
(ii) Income tax on Items that will not be reclassifiedsubsequently to the statement of profit and loss . . 12 754 (2,398)
B) (i) Items that will be reclassified subsequently to thestatement of profit and loss . . . . . . . . . . . . . . (0.2) (12) 18
(ii) Income tax on items that will be reclassifiedsubsequently to the statement of profit and loss . . 0.1 4 (6)
Total Other Comprehensive/(loss) (B) . . . . . . . . . . . . . . . 104 6,758 (34,071)
XI. Total Comprehensive Income for the year: (A+B) . . . . . . . 635 41,203 (24,515)
XII. Earnings per equity share
Basic & Diluted (in rupees) . . . . . . . . . . . . . . . . . . . . . . 1 34 8
(1) For the reader’s convenience, U.S. Dollar translations of Indian Rupee amounts for the year ended March 31, 2017 have
been provided at a rate of US$1.00 = Rs.64.85
83

Standalone Statement of Profit and Loss of Tata Steel (Indian GAAP)
Statement of Profit and Loss Data Year ended March 31,
(Indian GAAP) 2016 2015
(audited)
(Rs. in millions)
(1) Revenue
(a) Revenue from operations . . . . . . . . . . . . . . . . . . . . . . . . . . . . . . 426,863 465,773
Less: Excise Duty . . . . . . . . . . . . . . . . . . . . . . . . . . . . . . . . . . . . . . . 44,760 47,923
382,103 417,850
(b) Other income . . . . . . . . . . . . . . . . . . . . . . . . . . . . . . . . . . . . . 38,907 5,828
Total Revenue . . . . . . . . . . . . . . . . . . . . . . . . . . . . . . . . . . . . . . . . . 421,010 423,678
(2) Expenses
(a) Raw materials consumed . . . . . . . . . . . . . . . . . . . . . . . . . . . . . . . 97,000 116,786
(b) Purchase of finished, semi-finished and other products . . . . . . . . . . . . 9,915 6,883
(c) Changes in inventories of finished goods, work-in-progress andstock-in-trade . . . . . . . . . . . . . . . . . . . . . . . . . . . . . . . . . . . . . 1,430 (7,159)
(d) Employee benefits expense . . . . . . . . . . . . . . . . . . . . . . . . . . . . . 43,249 46,019
(e) Depreciation and amortisation expense . . . . . . . . . . . . . . . . . . . . . . 19,331 19,976
(f) Finance costs . . . . . . . . . . . . . . . . . . . . . . . . . . . . . . . . . . . . . 14,603 19,760
(g) Other expenses . . . . . . . . . . . . . . . . . . . . . . . . . . . . . . . . . . . . 164,381 161,100
(h) Less: Expenditure (other than interest) transferred to capital and otheraccounts . . . . . . . . . . . . . . . . . . . . . . . . . . . . . . . . . . . . . . . . 5,989 5,867
Total Expenses . . . . . . . . . . . . . . . . . . . . . . . . . . . . . . . . . . . . . . . . 343,920 357,497
(3) Profit before Exceptional Items and Tax . . . . . . . . . . . . . . . . . . . . . . . . 77,091 66,180
(4) Exceptional Items
(a) Profit on sale of non-current investments . . . . . . . . . . . . . . . . . . . . . 1,043 8,061
(b) Profit on sale of non-current assets . . . . . . . . . . . . . . . . . . . . . . . . — 11,469
(c) Provision for diminution in the value of investments/doubtful advances . . (1,990) (1,984)
(d) Provision for impairment of non-current assets . . . . . . . . . . . . . . . . . (515) 1,363
(e) Provision for demands and claims . . . . . . . . . . . . . . . . . . . . . . . . . (8,801) —
(f) Employee separation compensation . . . . . . . . . . . . . . . . . . . . . . . . (5,563) —
Total exceptional items . . . . . . . . . . . . . . . . . . . . . . . . . . . . . . . . . . . (15,826) 18,909
(5) Profit/(Loss) before tax . . . . . . . . . . . . . . . . . . . . . . . . . . . . . . . . . . . 61,265 85,089
(6) Tax Expense
(a) Current tax . . . . . . . . . . . . . . . . . . . . . . . . . . . . . . . . . . . . . . . 14,331 19,086
(b) MAT credit . . . . . . . . . . . . . . . . . . . . . . . . . . . . . . . . . . . . . . . (1,522) (1,172)
(c) Deferred tax . . . . . . . . . . . . . . . . . . . . . . . . . . . . . . . . . . . . . . (553) 2,784
Total tax expense . . . . . . . . . . . . . . . . . . . . . . . . . . . . . . . . . . . . . . . 12,256 20,698
(7) Profit/(Loss) after tax . . . . . . . . . . . . . . . . . . . . . . . . . . . . . . . . . . . . 49,010 64,391
(8) Nominal Value per Share (in rupees) . . . . . . . . . . . . . . . . . . . . . . . . . . 10 10
(9) Basic Earnings per Share (in rupees) . . . . . . . . . . . . . . . . . . . . . . . . . . 49 64
(10) Diluted Earnings per Share (in rupees) . . . . . . . . . . . . . . . . . . . . . . . . . 49 64
84

Standalone Balance Sheets of Tata Steel
Balance Sheet Data As at September 30, As at March 31,As at
March 31,
(Ind-AS) 2017 2017 2016
(US$ inmillions)
(unaudited)
(US$ inmillions)
(audited)
(Rs. inmillions) (Rs. in millions)
ASSETS
I. Non-current assets
(a) Property, plant and equipment . . . . 10,955 715,065 11,069 717,790 495,611
(b) Capital work-in-progress . . . . . . . . 855 55,819 945 61,254 281,740
(c) Intangible assets . . . . . . . . . . . . . 119 7,747 122 7,882 5,273
(d) Intangible assets under development . 8 493 6 386 319
(e) Investments in subsidiaries,associates and joint ventures . . . . . . 528 34,466 524 33,976 33,410
(f) Financial assets:
(i) Investments . . . . . . . . . . . 886 57,815 765 49,583 41,195
(ii) Loans . . . . . . . . . . . . . . . 32 2,112 33 2,120 2,060
(iii) Derivative assets . . . . . . . . 0 18 0 1 8
(iv) Other financial assets . . . . . 3 181 12 795 369
(g) Income tax assets (net) . . . . . . . . . 135 8,841 134 8,678 8,377
(h) Other assets . . . . . . . . . . . . . . . . 331 21,632 481 31,216 33,252
Total non-current assets . . . . . . . . . . . 13,852 904,189 14,090 913,680 901,612
II. Current assets
(a) Inventories . . . . . . . . . . . . . . . . 1,572 102,586 1,579 102,369 71,374
(b) Financial assets:
(i) Investments . . . . . . . . . . . 1,345 87,813 819 53,098 43,250
(ii) Trade receivables . . . . . . . . 268 17,497 309 20,065 11,332
(iii) Cash and cash equivalents . . . 48 3,125 140 9,052 9,747
(iv) Other balances with bank . . . 15 1,000 10 651 615
(v) Loans . . . . . . . . . . . . . . . 17 1,087 4 271 188
(vi) Derivative assets . . . . . . . . 5 345 1 63 62
(vii) Other financial assets . . . . . 70 4,553 49 3,151 2,078
(c) Other assets . . . . . . . . . . . . . . . 396 25,818 189 12,255 10,889
Total current assets . . . . . . . . . . . . . . 3,735 243,823 3,099 200,974 149,533
TOTAL ASSETS . . . . . . . . . . . . . . . . . . . . 17,587 1,148,012 17,190 1,114,654 1,051,145
(1) For the reader’s convenience, U.S. Dollar translations of Indian Rupee amounts for the year ended March 31, 2017, and
for the six months ended September 30, 2017, have been provided at a rate of US$1.00 = Rs.64.85 and US$1.00 =
Rs.65.28, respectively.
85

Standalone Balance Sheets of Tata Steel
Balance Sheet Data As at September 30, As at March 31,As at
March 31,
(Ind-AS) 2017 2017 2016
(US$ inmillions)
(unaudited)
(US$ inmillions)
(audited)
(Rs. inmillions) (Rs. in millions)
EQUITY AND LIABILITIES
III. Equity
(a) Equity share capital . . . . . . . . . . . 149 9,714 150 9,714 9,714
(b) Hybrid Perpetual Securities . . . . . . 349 22,750 351 22,750 22,750
(c) Other equity . . . . . . . . . . . . . . . 7,511 490,312 7,508 486,876 456,660
Total equity . . . . . . . . . . . . . . . . . . . 8,009 522,776 8,009 519,340 489,124
IV. Non-current liabilities
(a) Financial liabilities:
(i) Borrowings . . . . . . . . . . . . 4,136 269,976 3,808 246,944 239,268
(ii) Derivative liabilities . . . . . . 17 1,137 28 1,793 1,160
(iii) Other financial liabilities . . . 3 196 3 182 3,965
(b) Provisions . . . . . . . . . . . . . . . . 157 10,233 312 20,247 18,621
(c) Retirement benefit obligations . . . . 232 15,165 229 14,842 12,525
(d) Deferred income . . . . . . . . . . . . . 265 17,266 291 18,852 22,285
(e) Deferred tax liabilities . . . . . . . . . 864 56,386 942 61,113 56,107
(f) Other liabilities . . . . . . . . . . . . . 12 763 12 777 768
Total non-current liabilities . . . . . . . . . 5,685 371,120 5,625 364,751 354,698
V. Current liabilities
(a) Financial liabilities:
(i) Borrowings . . . . . . . . . . . . 578 37,732 500 32,397 58,880
(ii) Trade payables . . . . . . . . . . 1,565 102,148 1,653 107,174 61,969
(iii) Derivative liabilities . . . . . . 5 297 42 2,702 782
(iv) Other financial liabilities . . . 611 39,871 626 40,624 46,334
(b) Provisions . . . . . . . . . . . . . . . . 253 16,500 108 7,006 2,806
(c) Retirement benefit obligations . . . . 8 539 9 566 567
(d) Income tax liabilities (net) . . . . . . . 158 10,304 72 4,657 7,326
(e) Other liabilities . . . . . . . . . . . . . 716 46,725 547 35,438 28,660
Total current liabilities . . . . . . . . . . . . 3,893 254,116 3,556 230,563 207,323
TOTAL EQUITY AND LIABILITIES . . . . . . . 17,587 1,148,012 17,190 1,114,654 1,051,145
(1) For the reader’s convenience, U.S. Dollar translations of Indian Rupee amounts for the year ended March 31, 2017, and
for the six months ended September 30, 2017, have been provided at a rate of US$1.00 = Rs.64.85 and US$1.00 =
Rs.65.28, respectively.
86

Standalone Balance Sheets of Tata Steel (Indian GAAP)
Balance Sheet Data As at March 31,
(Indian GAAP) 2016 2015
(audited)
(Rs. in millions)
Equity and liabilities
(1) Shareholders’ funds
(a) Equity share capital . . . . . . . . . . . . . . . . . . . . . . . . . . . . . . . . . . 9,714 9,714
(b) Reserves and surplus . . . . . . . . . . . . . . . . . . . . . . . . . . . . . . . . . 695,053 656,925
704,767 666,639
(2) Hybrid Perpetual Securities . . . . . . . . . . . . . . . . . . . . . . . . . . . . . . . . 22,750 22,750
(3) Non-current liabilities
(a) Long-term borrowings . . . . . . . . . . . . . . . . . . . . . . . . . . . . . . . . 234,578 239,004
(b) Deferred tax liability (net) . . . . . . . . . . . . . . . . . . . . . . . . . . . . . 21,798 22,504
(c) Other long-term liabilities . . . . . . . . . . . . . . . . . . . . . . . . . . . . . . 8,427 11,289
(d) Long-term provisions . . . . . . . . . . . . . . . . . . . . . . . . . . . . . . . . . 28,882 28,759
293,684 301,556
(4) Current liabilities
(a) Short-term borrowings . . . . . . . . . . . . . . . . . . . . . . . . . . . . . . . . 52,610 349
(b) Trade Payables:
(i) Total outstanding dues of micro enterprises and small enterprises . . 149 165
(ii) Total outstanding dues of creditors of other than micro enterprisesand small enterprises . . . . . . . . . . . . . . . . . . . . . . . . . . . . . 76,912 57,855
77,061 58,020
(c) Other current liabilities . . . . . . . . . . . . . . . . . . . . . . . . . . . . . . . 61,158 92,569
(d) Short-term provisions . . . . . . . . . . . . . . . . . . . . . . . . . . . . . . . . 20,050 16,754
1,232,082 1,158,636
TOTAL
Assets
(5) Non-current Assets
(a) Fixed Assets
(i) Tangible assets . . . . . . . . . . . . . . . . . . . . . . . . . . . . . . . . 249,012 250,714
(ii) Intangible assets . . . . . . . . . . . . . . . . . . . . . . . . . . . . . . . . 5,274 1,771
(iii) Capital work-in-progress . . . . . . . . . . . . . . . . . . . . . . . . . . . 269,539 230,236
(iv) Intangible assets under development . . . . . . . . . . . . . . . . . . . . 285 131
524,110 482,852
(b) Non-current investments . . . . . . . . . . . . . . . . . . . . . . . . . . . . . . . 523,604 521,642
(c) Long-term loans and advances . . . . . . . . . . . . . . . . . . . . . . . . . . . 37,879 32,079
(d) Other non-current assets . . . . . . . . . . . . . . . . . . . . . . . . . . . . . . . 2,274 2,118
1,087,867 1,038,691
(6) Current Assets
(a) Current investments . . . . . . . . . . . . . . . . . . . . . . . . . . . . . . . . . . 43,202 10,001
(b) Inventories . . . . . . . . . . . . . . . . . . . . . . . . . . . . . . . . . . . . . . . 70,838 80,420
(c) Trade receivables . . . . . . . . . . . . . . . . . . . . . . . . . . . . . . . . . . . 6,328 4,915
(d) Cash and bank balances . . . . . . . . . . . . . . . . . . . . . . . . . . . . . . . 10,147 4,786
(e) Short-term loans and advances . . . . . . . . . . . . . . . . . . . . . . . . . . . 12,435 19,272
(f) Other current assets . . . . . . . . . . . . . . . . . . . . . . . . . . . . . . . . . . 1,266 553
144,215 119,946
TOTAL . . . . . . . . . . . . . . . . . . . . . . . . . . . . . . . . . . . . . . . . . . . . . . . . . 1,232,082 1,158,636
87

Standalone Cash Flow Statement of Tata Steel (Ind -AS)
Cash flow statement Year ended March 31,
(Ind-AS) 2017 2016
(US$ inmillions)
(audited)
(Rs. in millions)
Net cash flow from/(used in) operating activities . . . . . . . . . . . 1,717 111,313 73,718
Net cash from/(used in) investing activities . . . . . . . . . . . . . . . (605) (39,210) (43,517)
Net cash flow from/(used in) financing activities . . . . . . . . . . . . (1,123) (72,797) (25,404)
Net increase/(decrease) in cash and cash equivalents . . . . . . . . . (11) (695) 4,796
Opening cash and cash equivalents . . . . . . . . . . . . . . . . . . . . 150 9,747 4,952
Effect of exchange rate on translation of foreign currency cashand cash equivalents . . . . . . . . . . . . . . . . . . . . . . . . . . . . — — (1)
Closing cash and cash equivalents . . . . . . . . . . . . . . . . . . . . . 140 9,052 9,747
(1) For the reader’s convenience, U.S. Dollar translations of Indian Rupee amounts for the year ended March 31, 2017 have
been provided at a rate of US$1.00 = Rs.64.85.
Standalone Cash Flow Statement of Tata Steel (Indian GAAP)
Cash flow statement Year ended March 31,
(Indian GAAP) 2016 2015
(audited)
(Rs. in millions)
Net cash flow from/(used in) operating activities . . . . . . . . . . . . . . . . . . . . . . 75,677 48,519
Net cash from/(used in) investing activities . . . . . . . . . . . . . . . . . . . . . . . . . . (54,052) (23,821)
Net cash flow from/(used in) financing activities . . . . . . . . . . . . . . . . . . . . . . . (16,310) (29,572)
Net increase/(decrease) in cash and cash equivalents . . . . . . . . . . . . . . . . . . . . 5,314 (4,874)
Opening cash and cash equivalents . . . . . . . . . . . . . . . . . . . . . . . . . . . . . . . 4,219 9,093
Effect of exchange rate on translation of foreign currency cash and cash equivalents . . (1) 0
Closing cash and cash equivalents . . . . . . . . . . . . . . . . . . . . . . . . . . . . . . . . 9,532 4,219
88

Statement of Financial Position of ABJA Investment Co. Pte. Ltd.
As atSeptember 30, As at March 31,
2017 2017 2016 2015
(unaudited) (audited)
(US$ inthousand) (US$ in thousand)
ASSETS
Current assets
Cash and cash equivalents . . . . . . . . . . . . . . . . . . . . . . 2,497 16,233 11,770 7,360
Other receivables. . . . . . . . . . . . . . . . . . . . . . . . . . . . 26,159 24,848 21,699 17,235
Derivative financial instruments . . . . . . . . . . . . . . . . . . . 0 309 150 265
Total current assets . . . . . . . . . . . . . . . . . . . . . . . . . 28,656 41,390 33,619 24,860
Non-current asset
Loan receivables due from related companies . . . . . . . . . . 1,695,195 1,679,085 1,690,932 1,670,502
Derivative financial instruments . . . . . . . . . . . . . . . . . . . 2,816 12,808 4,793 7,563
Total non-current asset . . . . . . . . . . . . . . . . . . . . . . . 1,698,011 1,691,893 1,695,725 1,678,065
TOTAL ASSETS . . . . . . . . . . . . . . . . . . . . . . . . . . . 1,726,667 1,733,283 1,729,344 1,702,925
LIABILITIES AND NET CAPITAL DEFICIENCY
Current liabilities
Other payables . . . . . . . . . . . . . . . . . . . . . . . . . . . . . 24,742 27,879 32,254 24,564
Loan payable . . . . . . . . . . . . . . . . . . . . . . . . . . . . . . 0 0 37,800 37,800
Derivative financial instrument . . . . . . . . . . . . . . . . . . . 53 — — —
Tax payable . . . . . . . . . . . . . . . . . . . . . . . . . . . . . . . 1,800 1,707 450 310
Total current liabilities . . . . . . . . . . . . . . . . . . . . . . . 26,595 29,586 70,504 62,674
Non-current liabilities
Guaranteed notes . . . . . . . . . . . . . . . . . . . . . . . . . . . . 1,709,138 1,703,077 1,708,921 1,702,524
Loans payable due to related company . . . . . . . . . . . . . . . 21,800 37,800 0 0
Deferred tax liability . . . . . . . . . . . . . . . . . . . . . . . . . 1,817 1,797 1,796 93
Other Payable . . . . . . . . . . . . . . . . . . . . . . . . . . . . . . 2,406 1,907 0 0
Derivative financial instruments . . . . . . . . . . . . . . . . . . . 1,102 68 688 469
Total non-current liabilities . . . . . . . . . . . . . . . . . . . . 1,736,263 1,744,649 1,711,405 1,703,086
Capital, accumulated losses and reserve
Share capital . . . . . . . . . . . . . . . . . . . . . . . . . . . . . . 200 200 200 200
Accumulated losses . . . . . . . . . . . . . . . . . . . . . . . . . . (36,381) (41,142) (52,755) (63,025)
Translation reserve . . . . . . . . . . . . . . . . . . . . . . . . . . . (10) (10) (10) (10)
Net capital deficiency . . . . . . . . . . . . . . . . . . . . . . . . (36,191) (40,952) (52,565) (62,835)
Total liabilities and net of capital deficiency . . . . . . . . . . 1,726,667 1,733,283 1,729,344 1,702,925
Note: The audited statement of financial position of the Issuer as at March 31, 2015, 2016 and 2017 have been prepared in
accordance with SFRS. The unaudited statement of financial position of the Issuer as at September 30, 2017 has been
extracted from the Issuer’s unaudited interim financial statements for the six months ended September 30, 2017, which
were prepared in accordance with SFRS 34, Interim Financial Reporting.
89

Statement of Profit or Loss of ABJA Investment Co. Pte. Ltd.
Statement of Profit or Loss andOther Comprehensive Income
Six months endedSeptember 30, Year ended March 31,
2017 2016 2017 2016 2015
(Unaudited) (audited)
(US$ in thousand) (US$ in thousand)
Interest Income . . . . . . . . . . . . . . . . . . . . . . 59,286 58,130 117,014 119,591 32,875
Finance costs . . . . . . . . . . . . . . . . . . . . . . . (51,293) (51,231) (102,337) (102,142) (69,027)
Foreign currency exchange gain, net . . . . . . . . . 12,667 298 (2,975) 6,532 (29,245)
Fair value losses on derivative financialinstruments, net . . . . . . . . . . . . . . . . . . . . (11,389) 501 8,794 (3,104) 14,052
Other operating expenses . . . . . . . . . . . . . . . . (3,554) (3,568) (7,116) (8,482) (3,739)
Profit/(loss) before tax . . . . . . . . . . . . . . . . 5,717 4,040 13,380 12,395 (55,084)
Note: The audited statement of profit and loss of the Issuer for the years ended March 31, 2015, 2016 and 2017 has been
prepared in accordance with SFRS. The unaudited statement of profit and loss of the Issuer for the six months ended
September 30, 2016 and 2017 have been extracted from the Issuer’s unaudited interim financial statements for the six
months ended September 30, 2017, which were prepared in accordance with SFRS 34, Interim Financial Reporting.
Statement of Cash Flows of ABJA Investment Co. Pte. Ltd.
Summary Cash Flow Statement Year ended March 31,
2017 2016 2015
(audited)
(US$ in thousand)
Net cash flow from/(used in) operating activities . . . . . . . . . . . . . . . . . 4,462 4,134 1,173
Net cash from/(used in) investing activities . . . . . . . . . . . . . . . . . . . . . — — —
Net cash flow from/(used in) financing activities . . . . . . . . . . . . . . . . . . — — —
Net increase/(decrease) in cash and cash equivalents . . . . . . . . . . . . . . . 4,462 4,134 1,173
Opening cash and cash equivalents . . . . . . . . . . . . . . . . . . . . . . . . . . 11,770 7,360 7,536
Effect of exchange rate on translation of foreign currency cash andcash equivalents . . . . . . . . . . . . . . . . . . . . . . . . . . . . . . . . . . . . . 1 276 (1,349)
Closing cash and cash equivalents . . . . . . . . . . . . . . . . . . . . . . . . . . . 16,233 11,770 7,360
Note: The audited statement of cash flows of the Issuer for the years ended as at March 31, 2015, 2016 and 2017 have been
prepared in accordance with SFRS.
90

MANAGEMENT’S DISCUSSION AND ANALYSIS OF FINANCIAL CONDITION ANDRESULTS OF OPERATIONS OF THE GROUP
The following discussion is intended to convey management’s perspective on the financial conditionand results of operations of the Group as at the end of and for the years ended March 31, 2015, 2016and 2017, and the six month periods ended September 30, 2016 and 2017. The following discussionof the Group’s financial condition and results of operations should be read in conjunction with theGroup’s financial statements, the schedules and notes thereto and the other information includedelsewhere in this Offering Memorandum. The Group’s financial statements are prepared in accordancewith Ind-AS and Indian GAAP, as explained below. For a discussion of certain significant differencesbetween Ind-AS and IFRS, see “Summary of Certain Differences between Ind-AS and IFRS”.
The Group is required to prepare its consolidated financial statements in accordance with Ind-AS witheffect from April 1, 2016. Accordingly, the Group has prepared its consolidated financial statementsas at and for the year ended March 31, 2017, together with the comparative period data as at and forthe year ended March 31, 2016, in accordance with Ind-AS. For periods up to and including the yearended March 31, 2016, the Group had prepared its consolidated financial statements in accordancewith the Indian GAAP. As a result of the change in accounting standards applicable to the Group fromIndian GAAP to Ind-AS with effect from April 1, 2016 its consolidated financial statements as at andfor the years ended March 31, 2015 and 2016 prepared in accordance with Indian GAAP are notcomparable with its consolidated financial statements as at and for the year ended March 31, 2017prepared in accordance with Ind-AS. See “Presentation of Financial Information”.
In this section, the financial information presented has been (i) with respect to the six months endedSeptember 30, 2016 and 2017, prepared and presented in accordance with Ind-AS on a consolidatedbasis; (ii) with respect to the years ended March 31, 2016 and 2017, prepared and presented inaccordance with Ind-AS on a consolidated basis; (iii) with respect to the years ended March 31, 2015and 2016, prepared and presented in accordance with Indian GAAP on a consolidated basis. See“Presentation of Financial Information” and “Summary of Certain Differences between Ind-AS andIFRS” for further details.
This section contains forward-looking statements that involve risks and uncertainties. The Group’sactual results may differ materially from those discussed in such forward-looking statements as aresult of various factors, including those described under the sections “Forward-Looking Statementsand Associated Risks” and “Risk Factors” beginning on pages x and 39 of this Offering Memorandum,respectively.
Overview
The Group is one of the world’s largest steel companies with a steel production capacity ofapproximately 27.5 mtpa. According to the World Steel Association (“WSA”), the Group was theworld’s 10th largest steel maker by crude steel production volume in 2016. The Group is also one ofthe most geographically diversified steel producers, with operations in 26 countries and a commercialpresence in more than 50 countries. As of March 31, 2017, the Group had over 70,000 employees.
Tata Steel was established as India’s first integrated steel company in 1907 by Jamsetji N. Tata andis one of the flagship companies of the Group. The Group has a presence across the entire value chainof steel manufacturing, including producing and distributing finished products as well as mining andprocessing iron ore and coal for its steel production. The Group’s operations are primarily focused inIndia, Europe, and South East Asia. For the year ended March 31, 2017, the Group’s operations inIndia and Europe represented approximately 43% and 39%, respectively, of the revenue of the Group,and for the six months ended September 30, 2017, represented approximately 45% and 46%,respectively, of the revenue of the Group.
The steel production capacity of the Group has increased from approximately 5.0 mtpa in the yearended March 31, 2006 to approximately 27.5 mtpa as of March 31, 2017. In India, as of September
91

30, 2017, the Group has steel production facilities located in Jamshedpur and Kalinganagar, with atotal steel production capacity of 12.7 mtpa. The Group’s operations in India also include captive ironore and coal mines. Additionally, the Group has significant operations in the United Kingdom and theNetherlands, where the Group has a total steel production capacity of 12.4 mtpa. The remaining steelproduction capacity of the Group is located in South East Asia.
For the year ended March 31, 2017, the Group’s business in India recorded sales of 10.97 mt,recording a growth of 15.0% over the year ended March 31, 2016 and a growth of 22.0% for the sixmonths ended September 30, 2017, compared to the six months ended September 30, 2016. Thisincrease was largely due to the ramping up of operations at the Kalinganagar plant in Odisha, whichis now operating at full capacity.
The Group offers a broad range of steel products including a portfolio of high value-addeddownstream products such as hot rolled, cold rolled and coated steel, sections, plates, rebars, wirerods, tubes, rails and wires. The Group is also a large producer of ferro-chrome in India.
The Group’s main markets for its products are India and Europe, which together accounted forapproximately 82% and 83% of the Group’s revenue for the year ended March 31, 2016 and 2017,respectively, with the remaining sales primarily taking place in other markets in Asia. The Group’scustomers are primarily in the construction, infrastructure, automotive, consumer goods, materialhandling, aerospace and general engineering industries.
For the years ended March 31, 2016 and 2017, the Group recorded revenues of Rs.1,063,399 millionand Rs.1,174,199 million, respectively. The Group recorded a loss of Rs.4,971 million for the yearended March 31, 2016, a loss of Rs.41,686 million for the year ended March 31, 2017, a profit ofRs.19,389 million for the six months ended September 30, 2017 against a loss of Rs.32,325 millionfor the six months ended September 30, 2016. The Group had total assets of Rs.1,733,332 million asof March 31, 2017 and Rs.1,742,203 million as of September 30, 2017.
For the years ended March 31, 2016 and 2017, the Group had total steel production of 22.9 mt and24.2 mt, respectively. Similarly, the Group had steel production of 11.5 mt and 12.5 mt for the sixmonth periods ended on September 30, 2016 and September 30 2017, respectively.
Key Factors Affecting the Results of Operations
The primary factors affecting the Group’s results of operations are:
• sales volume and steel prices;
• production costs;
• product mix; and
• capacity utilization and expansion.
See “— Results of Operations” for a discussion of the extent to which these factors have affected theGroup’s results of operations in the periods stated.
Sales Volume and Prices
The primary factors affecting the Group’s results of operations are its sales volume and the price ofsteel. The Group derives its revenue primarily from the sale of finished steel products. The market forsteel is substantially driven by changes in supply and demand in the global steel market, which aresignificantly affected by the state of the global economy and competition and consolidation within thesteel industry. The Group’s sales revenue also depends on the price of steel in the internationalmarkets. The global price of steel, in turn, depends upon a combination of factors, including the
92

availability and cost of raw material inputs, steel demand, worldwide production and capacity,fluctuations in the volume of steel imports, transportation costs, protective trade measures and varioussocial and political factors. China has become the largest steel producing country in the world by asignificant margin, with the balance between its domestic production and demand being an importantfactor in the determination of global steel prices. According to the WSA, China’s crude steelproduction of approximately 808 mt in 2016, which represents a 1.2% increase in production over2015. The positive momentum has continued in 2017 with crude steel production for China for themonth of September 2017 at 71.8 mt, a growth of 5.3% over September 2016. See “Industry Overview— The Global Steel Industry.”
While China’s production growth has slowed since the global financial crisis in 2009, barring thedecline seen in 2015, it is still growing. In addition, China has been affected by reduced levels ofgrowth in GDP, index of industrial production, services and other factors which have all resulted inlower growth in China’s apparent steel usage in recent years, barring the year-on-year declines seenin 2014 and 2015, though it experienced an estimated growth of 1.3% in 2013 and is expected to befollowed by growth of 3% in 2017. Nonetheless, Chinese steel production and exports have had, andcan be expected to continue to have a significant impact on steel prices in Europe, India and othermarkets outside of China, even more so if the growth of China’s steel production accelerates and/orChina’s apparent steel usage falls. See “Industry Overview — Global Steel Outlook”.
Over the last 18 months, demand for steel and prices in the European markets have generally improveddue to a combination of factors including shut down of certain producing facilities in China on accountof pollution, GDP growth in the European Union region as well as protection measures undertaken bythe region. As per European Steel Association report in October 2017, “Economic and Steel MarketOutlook for 2017-18”, the macroeconomic factors for the European Union continue to strengthen.GDP growth in the second quarter of 2017 accelerated to 0.6% and 2.3% on a quarter-on-quarter andyear-on-year basis, respectively, for the Euro area. The monthly business and consumer surveyconducted by the European Commission indicates that in September 2017 economic sentiment reachedlevels last seen in the summer of 2007. This improvement has been driven by strengthening confidencein industry, the retail sector and construction. Investment cycle is also gaining momentum. Gross fixedcapital formation grew by 1.1% quarter-on-quarter in the second quarter of 2017, which resulted in a3% year-on-year rise of investment over the first half of 2017. Business conditions in steel-usingsectors in the European Union remained supportive to growth in the second quarter of 2017;production activity grew by 3.1% year-on-year and is expected to have grown 4.2% in 2017. Themomentum is expected to continue into 2018 though at a lower level of 1.9% as per the report.
The Group relies heavily on key consumers of steel products in the construction, automotive,packaging, appliance, engineering and transportation industries. These industries are in turn affectedby the state of the markets in which they operate. While the global economy showed signs of recoveryin 2010, subsequent years have been volatile primarily due to the sovereign debt crisis in certainEuropean countries, such as Greece, Portugal and Cyprus. Presently, the macroeconomic environmenthas shown signs of improvement.
According to the Asian Development Bank, India’s economy has grown significantly in recent years,with an average annual growth of 8.2% from 2005 to 2009; a GDP growth rate of 7.1% in 2017 andan estimated GDP growth rate of 7.0% in 2018. Steel consumption in India grew 4.1% in 2016, ascompared to growth of 5.7% over the previous year. According to WSA, India’s per capita steelconsumption of finished steel is relatively low at 63.0 kg in 2016, as compared to China at 492.7 kg,Japan at 492.6 kg, the United States at 282.7 kg, South Korea at 1,130.2 kg, Taiwan at 782.1 kg, theUnited Kingdom at 163.9 kg and a world average at 207.9 kg in 2016.
Europe has been on the path to recovery in recent quarters. The European construction industry whichhad been particularly affected, is showing strong signs of a rebound. As per European SteelAssociation, the growth over the first half of 2017 in the construction sector in the European Unionarea was the strongest over a period of many years and clearly reflects improving fundamentals in theEuropean Union construction industry. In the automotive segment, European Union passenger car and
93

commercial vehicle demand continued to increase during the first half of 2017, with automotive output
up 3% on a year-on-year basis in the first half of 2017. Although the Group operates a globally
diversified steel business, it derives a substantial majority of its revenue from Europe and India from
a geographic perspective. For the year ended March 31, 2017, the Group’s European operations
accounted for 39% of the Group’s total revenue from operations, compared to 41% in the previous
year. For the year ended March 31, 2017, the Group’s Indian operations accounted for 43% of the
Group’s total revenue from operations, compared to 41% in the previous year.
For the year ended March 31, 2017, India, principally the largest market for the Group’s operations,
accounted for approximately 43% of the Group’s total revenue from operations.
The European economy and the European steel industry and market have been witnessing strong
recovery from the sovereign debt crisis and the effect of cheap imports from markets such as China.
There is also increasing steel trade linkage between India and the European Union. India, on the basis
of volume, is the largest exporter to the European Union, also showing the strongest growth as per the
European Steel Association. Finished product exports from India grew by 159% year-on-year over the
first nine months of 2017, followed by Turkey with an increase of 78%. This bodes well for both of
Tata Steel’s key markets. There is no assurance that the economic conditions in Europe will continue
improving or that they will not deteriorate in the near future. See “Risk Factors — Risks Related to
the Group — Europe is the Group’s largest market outside of India, and its current business and future
growth could be materially and adversely affected by economic conditions in Europe”.
Production Costs
After revenue, production costs are the most significant factor affecting the Group’s results of
operations. The Group’s principal production costs are raw material costs (primarily coal and iron ore
and their related transportation costs), purchases of semi-finished steel, labor related expenses
(primarily salaries), and other production-related costs such as repairs to machinery, energy costs, and
freight relating to sales. The Group, except for its Indian operations, primarily purchases raw
materials, such as iron ore, coal and scrap, on the international open market from third parties.
Therefore, the Group is subject to fluctuations in prices of raw materials. In particular:
• The Group’s European operations purchase all of their iron ore and coal from international
markets.
• The Group’s Indian operations are generally self-sufficient in iron ore, but approximately 64%
of their coal requirements were purchased from international markets for the year ended March
31, 2017.
• The Group’s operations in Singapore and Thailand purchase a majority of their scrap
requirements from third parties.
For the years ended March 31, 2016 and March 31, 2017, total raw materials consumed by the Group’s
European operations was Rs.170,132 million and Rs.168,827 million, respectively, and for the six
months ended September 30, 2017, total raw materials consumed by the Group’s European operations
was Rs.111,162 million.
Total production from the Group’s Indian operations were 9.70 mt and 11.35 mt for the years ended
March 31, 2016 and March 31, 2017, respectively, and for the six months ended September 30, 2017,
production was 5.98 mt.
94

For the years ended March 31, 2016 and March 31, 2017, total raw materials consumed by the Group
was Rs.281,149 million and Rs.324,181 million, respectively, and for the six months ended September
30, 2017, total raw materials consumed by the Group was Rs.206,340 million. Iron ore and coal are
the primary sources of the Group’s total cost of raw materials. Raw material consumption amounts
reflect only the consumption of raw materials that were purchased from third parties. The costs of
mining of iron ore and coal from the Group’s captive mines in India are reflected in the respective
expenses line items based on their nature and not included as part of raw material costs.
The price of iron ore has been subject to significant fluctuation from a low of approximately US$60
per ton in April 2009 to a high of approximately US$190 per ton in March 2011. Iron ore prices
thereafter witnessed a steep drop to approximately US$100 per ton in September 2012 and continued
to drop further to approximately US$40 per ton in December 2015. Prices have subsequently recovered
and are trading in the range of US$70-77 per ton over the last 30 days.
The price of hard coking coal has steadily decreased by more than 50% during the period between May
2011 and January 2016, from approximately US$127 per ton to approximately US$50 per ton. Since
then, the prices of coking coal have nearly doubled to approximately US$102 per ton in December
2017.
The availability and prices of raw materials may be negatively affected by, among other factors: new
laws or regulations; suppliers’ allocations to other purchasers; business continuity of suppliers;
interruptions in production by suppliers; accidents or other similar events at suppliers’ premises or
along the supply chain; wars, natural disasters and other similar events; fluctuations in exchange rates;
consolidation in steel-related industries; the bargaining power of raw material suppliers; and the
availability and cost of transportation. The raw materials industry is highly concentrated and suppliers
in recent years have had significant pricing power. Starting in 2010, certain suppliers of iron ore and
coking coal moved to quarterly fixed-price schemes from annual fixed prices, increasing the Group’s
exposure to production cost and price volatility. In addition, curtailment of iron ore production due
to reduced exports, increase in price of ore due to the increased use of electronic auctions
(“e-auctions”), and reduced coking coal availability coupled with increased power and freight costs
has led to declining profitability of Indian steel makers. Increases in production costs which the Group
cannot pass on to its customers will adversely impact the Group’s results of operations. The Group has
allocated capital to its overseas raw material projects to develop material recycling technologies in an
effort to reduce its exposure to volatility in raw material prices. See “Business — Raw Materials and
Other Key Inputs”.
The following table sets forth the Group’s cost of materials for the periods indicated:
Year ended March 31,
Six months ended
September 30,
2016 2017 2017
(Rs. in millions)
Raw materials consumed . . . . . . . . . . . . . . . . . . 281,149 324,181 206,340
Purchase of finished, semi-finished steel andother products. . . . . . . . . . . . . . . . . . . . . . . . . 105,814 114,249 53,843
Total cost of materials . . . . . . . . . . . . . . . . . . . . 386,963 438,430 260,183
95

Year ended March 31,
2015 2016
(Rs. in millions)
Raw materials consumed . . . . . . . . . . . . . . . . . . . . . . . . . . . . . . . 407,410 321,883
Purchase of finished, semi-finished steel and other products . . . . 138,042 101,740
Total cost of materials . . . . . . . . . . . . . . . . . . . . . . . . . . . . . . . . . 545,452 426,623
Labor related expenses and other production-related costs (i.e., consumption of stores and spares and
repairs to machinery) and freight and handling charges relating to sales also constitute a large portion
of the Group’s total expenditure. Although these costs are not subject to the same level of volatility
as raw material costs, which fluctuate significantly depending on market conditions, the relatively
fixed nature of such costs can have a material adverse impact on profitability during times of low
production, as such costs cannot be reduced in accordance with the Group’s lower production volume.
In particular, a substantial majority of the Group’s total labor related expenses arise from its European
operations, where the Group has the majority of its steel production and where wages are higher
compared to the other regions in which it operates. Despite the Group’s European operations selling
a significantly higher proportion of high value-added products relative to its operations elsewhere, the
Group’s European operations have not performed as well due to the relatively high labor-related
expenses in Europe and the higher cost of raw materials consumed, which results from the European
operations’ purchase of all of their iron ore and coal in international markets from third parties.
Product Mix
The Group’s product mix also affects its revenue and profitability. In general, selling a greater
proportion of high value-added products should increase revenue and profitability. For example,
within the flat product category, cold rolled, galvanized and tinplate products command higher prices
and margins, while in the long products category, wires are considered to be high value-added
products. The Group’s European operations produce a greater percentage of high value-added products
relative to its operations elsewhere. The Group has been working to increase the proportion of high
value-added products of its portfolio in India, as the Group believes that India will likely continue to
be a net importer of high value-added products, meaning that there should be a strong market for the
Group’s products in this category. Therefore, the Group intends to continue to focus on downstream
value addition through new investments and product development.
Capacity Expansion
The Group is focused on expanding the capacity of its Indian operations through brownfield and
greenfield projects such as expanding its facilities at Jamshedpur and Kalinganagar. It intends to
continue to increase the size of its operations in India, and its competitive advantage as a low-cost
producer, through its brownfield and greenfield expansion projects. The Group also continues to
pursue inorganic growth opportunities, with a particular focus on acquisitions that generate greater
synergies and production capacity, manufacturing facilities, infrastructure and advanced technology,
and which allow it to diversify its product and customer base. The Group is pursuing and may continue
to pursue opportunities for acquisition of financially stressed assets, including with respect to
companies that are undergoing a corporate insolvency resolution process under the IBC. If successful
in the IBC Process, the Group may finance the acquisitions by internal accruals, or additional capital
raised as debt or equity or any other form in the company, or additional capital in a subsidiary or
associate of the company.
96

Expansion initiatives affect the comparability of the results of operations for different periods. The
Group’s current growth strategy is focused on expanding its Indian operations in order to take
advantage of the lower production costs at its Indian facilities. In recent years, the Group has
increased its Indian operations mainly through the expansion of its production facilities in Jamshedpur
and Kalinganagar. The Group expanded its existing brownfield crude steel capacity at Jamshedpur
from 6.8 mtpa to 9.7 mtpa in December 2012, and established a greenfield project with a capacity of
3.0 mtpa in Kalinganagar, Odisha, which commenced operations in June 2016 and recently ramped up
to full capacity, and increased crude steel capacity in India from 9.7 mtpa to 12.7 mtpa.
Critical Accounting Policies
Please see note 2 of our Annual Financial Statements as of and for the year ended March 31, 2017.
Description of Income Statement Items
“Revenue from Operations” includes revenue from the sale of products, income from town, medical
and other services, sale of power and water and other operating income.
“Raw Materials Consumed” comprises the expenses associated with the raw materials used, primarily
including iron ore, coal, coke, limestone and other major inputs.
“Purchase of Finished, Semi-finished and Other Products” comprises the expenditure for buying goods
intended for trading as well as own consumption.
“Changes in stock of finished goods, work-in-progress and stock-in-trade” reflects the net change in
these balance sheet items during the period.
“Employee Benefits Expense” comprises salaries and wages (including bonuses), contributions to
provident and other funds and staff welfare expenses.
“Depreciation and Amortization Expense” comprises depreciation of fixed assets and amortization of
intangible assets.
“Finance Costs” comprises interest on loans, bonds, debentures and other forms of indebtedness,
finance charges on finance leases and other borrowing costs less capitalized interest.
“Other Expenses” comprises expenses associated with stores and spare parts, conversion charges,
foreign exchange losses and royalties.
“Exceptional Items” comprises profit on sale of non-current investments, provision for diminution in
value of investments and provision for impairment of non-current assets.
“Tax Expense” comprises current tax and deferred tax.
97

Results of Operations
Results of Operations for the six months ended September 30, 2016 and September 30, 2017
The following table sets forth the Group’s statement of profit and loss data for the six months ended
September 30, 2016 and 2017 which have been extracted without material adjustment from the Annual
Financial Statements presented elsewhere in this Offering Memorandum and also includes the
percentage change between the Financial Years presented:
Consolidated Statement of Profit and Loss Data Six months ended September 30,
(Ind-AS) 2016 2017 % Change
(Rs. in millions)(unaudited)
Revenue
Revenue from operations . . . . . . . . . . . . . . . . . . . . . . . . . . . 530,904 634,375 19.5
Other income . . . . . . . . . . . . . . . . . . . . . . . . . . . . . . . . . . 2,452 4,087 66.7
I. Total Income . . . . . . . . . . . . . . . . . . . . . . . . . . . . . . 533,356 638,462 19.7
(a) Raw materials consumed . . . . . . . . . . . . . . . . . . . . 144,492 206,340 42.8
(b) Purchases of finished, semi-finished and other products . 57,071 53,843 (5.7)
(c) Changes in stock of finished goods, work-in-progressand stock-in-trade . . . . . . . . . . . . . . . . . . . . . . . . (26,769) (6,589) 75.4
(d) Employee benefit expenses . . . . . . . . . . . . . . . . . . 88,561 85,980 (2.9)
(e) Finance costs . . . . . . . . . . . . . . . . . . . . . . . . . . 24,217 26,936 11.2
(f) Depreciation and amortisation expense . . . . . . . . . . . 27,047 29,744 10.0
(g) Other expenses . . . . . . . . . . . . . . . . . . . . . . . . . 204,085 197,854 (3.1)
II. Total Expenses . . . . . . . . . . . . . . . . . . . . . . . . . . . . . 518,703 594,108 14.5
III. Share of profit/(loss) of joint ventures and associates . . . . . 51 257 403.9
IV. Profit before exceptional items and tax (I-II+III) . . . . . . . 14,705 44,610 203.4
V. Exceptional items . . . . . . . . . . . . . . . . . . . . . . . . . . . (2,271) (6,614) (191.2)
VI. Profit/(loss) before tax (IV+V) . . . . . . . . . . . . . . . . . . . 12,434 37,996 205.6
(a) Current tax . . . . . . . . . . . . . . . . . . . . . . . . . . . . 4,891 9,364 91.5
(b) Deferred tax . . . . . . . . . . . . . . . . . . . . . . . . . . . 6,146 9,421 53.3
VII. Total tax expense . . . . . . . . . . . . . . . . . . . . . . . . . . . . 11,036 18,785 70.2
VIII. Profit/(loss) after tax from continuing operations (VI -VII) . 1,397 19,211 1,275.2
The Group’s consolidated financial statements presented in this Offering Memorandum as at and for
the six months ended September 30, 2017, together with the comparative period data as at and for the
six months ended September 30, 2016, have been prepared in accordance with Ind-AS.
Revenue from operations
The Group’s revenue from operations for the six months ended September 30, 2017 increased by
19.5% to Rs.634,375 million from Rs.530,904 million for the six months ended September 30, 2016.
98

The following table presents the Group’s revenue from operations by business segment for the periods
indicated:
Six months ended September 30,
2016 2017
(Rs. in millions)
(unaudited)
Tata Steel India . . . . . . . . . . . . . . . . . . . . . . . . . . . . . . . . . . . . . . 220,418 286,427
Other Indian Operations . . . . . . . . . . . . . . . . . . . . . . . . . . . . . . . . 29,885 39,305
TSE . . . . . . . . . . . . . . . . . . . . . . . . . . . . . . . . . . . . . . . . . . . . . . . 246,713 290,849
Other Trade Related Operations . . . . . . . . . . . . . . . . . . . . . . . . . . 92,636 135,419
South East Asian Operations . . . . . . . . . . . . . . . . . . . . . . . . . . . . 39,584 44,854
Rest of the World. . . . . . . . . . . . . . . . . . . . . . . . . . . . . . . . . . . . . 2,833 3,798
Total . . . . . . . . . . . . . . . . . . . . . . . . . . . . . . . . . . . . . . . . . . . . . . 632,068 800,650
Less: Inter segment revenue . . . . . . . . . . . . . . . . . . . . . . . . . . . . . 101,165 166,275
Revenue from operations . . . . . . . . . . . . . . . . . . . . . . . . . . . . . . 530,904 634,375
Revenue from Tata Steel India increased by 29.9% to Rs.286,427 million for the six months ended
September 30, 2017 from Rs.220,418 million for the six months ended September 30, 2016, primarily
as a result of an increase in sales volume, as well as an increase in average selling prices and better
operating performance by the ferro alloys and minerals division. Sales volume from India increased
by 22.1% to 5.83 mt for the six months ended September 30, 2017, from 4.77 mt for the six months
ended September 30, 2016, primarily due to the additional production resulting from the
commissioning of the Kalinganagar plant in June 2016. Average selling prices increased primarily as
a result of improved market conditions and enhanced product mix.
Revenue from Other Indian Operations increased by 31.5% to Rs.39,305 million for the six months
ended September 30, 2017 from Rs.29,885 million for the six months ended September 30, 2016. This
increase was primarily at the operating Indian subsidiaries of the Group.
Revenue from TSE increased by 17.9% to Rs.290,849 million for the six months ended September 30,
2017 from Rs.246,713 million for the six months ended September 30, 2016, primarily as a result of
improvement in average selling prices and increase in sales volume. TSE’s 23% increase in average
revenue per tonne and 5% increase in sales volume was primarily a result of improved market
conditions, partly offset by exchange impact on translation as a result of the appreciation of the Rupee
against the GBP during this period.
Revenue from Other Trade Related Operations increased by 46.2% to Rs.135,419 million for the six
months ended September 30, 2017 from Rs.92,636 million for the six months ended September 30,
2016. This increase was primarily at Tata Steel Global Procurement, due to its increase in business
with Tata Steel India and TSE driven by increased activity at these businesses.
Revenue from South East Asian Operations increased by 13.3% to Rs.44,854 million for the six
months ended September 30, 2017 from Rs.39,584 million for the six months ended September 30,
2016. This increase was primarily due to higher revenues at NatSteel Singapore and Tata Steel
Thailand driven by higher realizations in line with an increase in input metallic price.
99

Revenue from Rest of the World increased by 34.1% to Rs.3,798 million for the six months ended
September 30, 2017 from Rs.2,833 million for the six months ended September 30, 2016 due to higher
product volumes at Tata Steel Global Minerals Holdings.
Raw Materials Consumed
Raw materials consumed increased by 42.8% to Rs.206,340 million for the six months ended
September 30, 2017 from Rs.144,492 million for the six months ended September 30, 2016. The
increase at Tata Steel India was primarily due to the higher cost and higher consumption of imported
coal. The increase at TSE was primarily due to an increase in the cost of coal and iron ore, and a 2%
increase in production, partly offset by exchange impact on translation as a result of the appreciation
of the Rupee against the GBP during this period.
Purchase of Finished, Semi-finished Steel and Other Products
The purchase of finished steel, semi-finished steel and other products decreased by 5.7% to Rs.53,843
million for the six months ended September 30, 2017 from Rs.57,071 million for the six months ended
September 30, 2016. This decrease was mainly the result of a decrease at the Group’s operations in
Europe, primarily due to exchange impact on translation as a result of the appreciation of the Rupee
against the GBP along with lower purchases by the Group’s operations in India on account of lower
requirements. Higher purchases at NatSteel Holdings Pte. Ltd. (“NatSteel Holdings”) in Singapore and
Tata Steel Thailand were primarily due to higher production.
Employee Benefits Expense
Employee benefits expense decreased by 2.9% to Rs.85,980 million for the six months ended
September 30, 2017 from Rs.88,561 million for the six months ended September 30, 2016. This
decrease in Rupee terms at TSE was due to exchange impact on translation, however, there was an
increase in GBP terms as a result of an increase in pension costs. The decrease at Tata Steel India was
primarily due to a change in actuarial estimates, mainly reflecting a change in the discount rate on
leave salary, partly offset by normal salary increase and its impact on provisions.
Depreciation and Amortization Expenses
Depreciation and amortization expenses increased by 10.0% to Rs.29,744 million for the six months
ended September 30, 2017 from Rs.27,047 million for the six months ended September 30, 2016. This
increase was primarily at Tata Steel India, and mainly due to the commencement of operations at the
Kalinganagar plant in June 2016.
Finance Costs
Finance costs increased by 11.2% to Rs.26,936 million for the six months ended September 30, 2017
from Rs.24,217 million for the six months ended September 30, 2016. This increase was primarily due
to a decrease in interest capitalization. Finance costs at TSE were higher primarily due to higher
borrowings, partly offset by exchange impact on translation.
100

Other Expenses
Other expenses decreased by 3.1% to Rs.197,854 million for the six months ended September 30, 2017
from Rs.204,085 million for the six months ended September 30, 2016. This increase was primarily
due to favorable exchange rate movement at Tata Steel Global Holdings Pte. Ltd. (“TSGH”),
Singapore, partly offset by an increase in expenses at the Group’s operations in Europe due to higher
stores and spares, an increase in levels of maintenance and freight and handling expenses.
Exceptional Items
Exceptional items consisted of provision for diminution in value of doubtful advances, provision for
demands and claims and employee separation compensation.
For the six months ended September 30, 2017, provision for doubtful advances given for repurchase
of equity shares in Tata Teleservices Limited from NTT Docomo Inc. was Rs.267 million, compared
to Rs.1,169 million for the six months ended September 30, 2016.
For the six months ended September 30, 2017, provision for demands and claims in relation to the
Indian operations was Rs.6,144 million, with respect to certain statutory demands and claims.
For the six months ended September 30, 2017, provision for employee separation compensation in
relation to the Indian operations was Rs.204 million, compared to Rs.1,102 million for the six months
ended September 30, 2016.
Tax Expense
Tax expenses increased by 70.2% to Rs.18,785 million for the six months ended September 30, 2017
from Rs.11,036 million for the six months ended September 30, 2016.
Profit/(Loss) after Tax from Continuing Operations
As a result of the foregoing, the Group recorded a profit after taxes from continuing operations of
Rs.19,211 million for the six months ended September 30, 2017 compared to Rs.1,397 million for the
six months ended September 30, 2016.
101

Results of Operations
Results of Operations for the Year Ended March 31, 2016 and the Year Ended March 31, 2017
The following table sets forth the Group’s statement of profit and loss data for the years ended March
31, 2016 and 2017 which have been extracted without material adjustment from the Annual Financial
Statements presented elsewhere in this Offering Memorandum and also includes the percentage change
between the Financial Years presented.
Consolidated Statement of Profit and Loss Data Year ended March 31,
(Ind-AS) 2016 2017 %Change
(Rs. in millions)(audited)
Revenue
Revenue from operations . . . . . . . . . . . . . . . . . . . . . . . . . . . 1,063,399 1,174,199 10.4
Other income . . . . . . . . . . . . . . . . . . . . . . . . . . . . . . . . . . 4,122 5,275 28.0
I. Total Income . . . . . . . . . . . . . . . . . . . . . . . . . . . . . . 1,067,521 1,179,474 10.5
(a) Raw materials consumed . . . . . . . . . . . . . . . . . . . . 281,149 324,181 15.3
(b) Purchases of finished, semi-finished and other products . 105,814 114,249 8.0
(c) Changes in stock of finished goods, work-in-progressand stock-in-trade . . . . . . . . . . . . . . . . . . . . . . . . 19,252 (45,381) (335.7)
(d) Employee benefit expenses . . . . . . . . . . . . . . . . . . 175,876 172,522 (1.9)
(e) Finance costs . . . . . . . . . . . . . . . . . . . . . . . . . . 42,214 50,722 20.2
(f) Depreciation and amortisation expense . . . . . . . . . . . 53,064 56,729 6.9
(g) Other expenses . . . . . . . . . . . . . . . . . . . . . . . . . 401,625 438,550 9.2
II. Total Expenses . . . . . . . . . . . . . . . . . . . . . . . . . . . . . 1,078,994 1,111,572 3.0
III. Share of profit/(loss) of joint ventures and associates . . . . . (1,104) 77 107.0
IV. Profit before exceptional items and tax (I-II+III) . . . . . . . (12,576) 67,979 640.5
V. Exceptional items . . . . . . . . . . . . . . . . . . . . . . . . . . . 39,904 (43,242) (208.4)
VI. Profit/(loss) before tax (IV+V) . . . . . . . . . . . . . . . . . . . 27,327 24,736 (9.5)
(a) Current tax . . . . . . . . . . . . . . . . . . . . . . . . . . . . 13,210 17,417 31.9
(b) Deferred tax . . . . . . . . . . . . . . . . . . . . . . . . . . . (6,311) 10,363 264.2
VII. Total tax expense . . . . . . . . . . . . . . . . . . . . . . . . . . . . 6,900 27,780 302.6
VIII. Profit/(loss) after tax from continuing operations (VI -VII) . 20,428 (3,044) (114.9)
The Group’s consolidated financial statements presented in this Offering Memorandum as at and for
the year ended March 31, 2017, together with the comparative period data as at and for the year ended
March 31, 2016, have been prepared in accordance with Ind-AS.
102

Revenue from operations
The Group’s revenue from operations for the year ended March 31, 2017 increased by 10.4% toRs.1,174,199 million from Rs.1,063,399 million for the year ended March 31, 2016. The followingtable presents the Group’s revenue from operations for the periods indicated:
Year ended March 31,
2016 2017
(Rs. in millions)
(audited)
Tata Steel India . . . . . . . . . . . . . . . . . . . . . . . . . . . . . . . . . . . . . . 426,974 532,610
Other Indian Operations . . . . . . . . . . . . . . . . . . . . . . . . . . . . . . . . 62,266 66,998
TSE . . . . . . . . . . . . . . . . . . . . . . . . . . . . . . . . . . . . . . . . . . . . . . . 535,554 520,850
Other Trade Related Operations . . . . . . . . . . . . . . . . . . . . . . . . . . 150,373 237,514
South East Asian Operations . . . . . . . . . . . . . . . . . . . . . . . . . . . . 80,670 81,359
Rest of the World. . . . . . . . . . . . . . . . . . . . . . . . . . . . . . . . . . . . . 5,411 6,300
Total . . . . . . . . . . . . . . . . . . . . . . . . . . . . . . . . . . . . . . . . . . . . . . 1,261,247 1,445,630
Less: Inter segment revenue . . . . . . . . . . . . . . . . . . . . . . . . . . . . . 197,848 271,430
Revenue from operations . . . . . . . . . . . . . . . . . . . . . . . . . . . . . . 1,063,399 1,174,199
Revenue from operations
Revenue from Tata Steel India increased by 24.7% to Rs.532,610 million for the year ended March 31,2017 from Rs.426,974 million for the year ended March 31, 2016. This increase was primarily due tothe commencement of operations at the Kalinganagar plant in June 2016 and improved marketconditions and higher revenue from the ferro alloys and minerals division.
Revenue from Other Indian Operations increased by 7.6% to Rs.66,998 million for the year endedMarch 31, 2017 from Rs.62,266 million for the year ended March 31, 2016. This increase wasprimarily at the operating Indian subsidiaries of the Group.
Revenue from TSE decreased by 2.7% to Rs.520,850 million for the year ended March 31, 2017 fromRs.535,554 million for the year ended March 31, 2016. This decrease was primarily due to exchangeimpact on translation as a result of the appreciation of the Rupee against the GBP during the period.However, in GBP terms, there was an increase of 9% which reflects an increase in realizations due toan increase in price per tonne of sales.
Revenue from Other Trade Related Operations increased by 58.0% to Rs.237,514 million for the yearended March 31, 2017 from Rs.150,373 million for the year ended March 31, 2016. This increase wasprimarily at Tata Steel Global Procurement, due to its increase in business with Tata Steel India andTSE driven by increased activity at these businesses.
Revenue from South East Asian Operations increased by 0.9% to Rs.81,359 million for the year endedMarch 31, 2017 from Rs.80,670 million for the year ended March 31, 2016. This increase wasprimarily at Tata Steel Thailand and driven by higher realizations. The increase was nearly offset bylower revenues at NatSteel Holdings in Singapore due to lower volumes.
Revenue from Rest of the World increased by 16.4% to Rs.6,300 million for the year ended March 31,2017 from Rs.5,411 million for the year ended March 31, 2016. This increase was primarily due tohigher volumes at Tata Steel Global Minerals Holdings.
103

Raw Materials Consumed
Raw materials consumed increased by 15.3% to Rs.324,181 million for the year ended March 31, 2017
from Rs.281,149 million for the year ended March 31, 2016. This increase was primarily at Tata Steel
India and driven by higher consumption due to the commencement of operations at the Kalinganagar
plant in June 2016 and the cost of imported coal.
Expense at TSE was lower mainly on account of exchange impact on translation as a result of the
appreciation of the Rupee against the GBP, partly offset by an increase in the prices of coal and iron
ore.
Purchase of Finished, Semi-finished Steel and Other Products
The purchase of finished steel, semi-finished steel and other products increased by 8.0% to Rs.114,249
million for the year ended March 31, 2017 from Rs.105,814 million for the year ended March 31,
2016. This increase was primarily due to a higher cost of purchase at Tata Steel Thailand and at
NatSteel in Singapore, attributable to an increase in production along with an increase in input
metallic price. The decrease at TSE was primarily due to exchange impact on translation, partly offset
by lower expense at Tata Steel, resulting from a lower requirement at the steel division.
Employee Benefits Expense
Employee benefits expense decreased by 1.9% to Rs.172,522 million for the year ended March 31,
2017 from Rs.175,876 million for the year ended March 31, 2016. This decrease in Rupee terms at TSE
was due to exchange impact on translation, however there was an increase in GBP terms. Expense at
Tata Steel India was higher primarily due to an increase in salary revisions and its consequential
impact on the retirement provisions.
The total strength of permanent employees in the Indian operations decreased to 34,989 as on March
31, 2017 from 35,439 as on March 31, 2016.
Depreciation and Amortization Expenses
Depreciation and amortization expenses increased by 6.9% to Rs.56,729 million for the year ended
March 31, 2017 from Rs.53,064 million for the year ended March 31, 2016. This increase was
primarily at Tata Steel India due to the commencement of the Kalinganagar plant in June 2016, partly
offset by impact of re-assessment of useful life of assets. Expense was lower at TSE mainly on account
of exchange impact on translation as a result of appreciation of the Rupee against the GBP during the
period.
Finance Costs
Finance costs increased by 20.2% to Rs.50,722 million for the year ended March 31, 2017 from
Rs.42,214 million for the year ended March 31, 2016. This increase was primarily at Tata Steel prior
to the commencement of operations at the Kalinganagar plant.
Finance costs at TSE were lower mainly on account of exchange impact on translation and decrease
in bank and other borrowings.
104

Other Expenses
Other expenses increased by 9.2% to Rs.438,550 million for the year ended March 31, 2017 fromRs.401625 million for the year ended March 31, 2016. This increase was primarily at Tata Steel Indiaand primarily due to the commencement of operations at the Kalinganagar plant in June 2016 andincreased charges under the District Mineral Foundation. The Group’s operations in Europe reporteda decrease, primarily due to lower operational cost resulting from reduced production. These changeswere partly offset by higher expense at TSGH due to adverse exchange rate movement.
Exceptional Items
Exceptional items consisted of profit on sale of non-current investments, profit on sale of non-currentassets, provision for diminution in value of doubtful advances, provision for impairment ofnon-current assets, provision for demands and claims, employee separation compensation andrestructuring and other provisions.
For the year ended March 31, 2017, profit on sale investments in subsidiaries, associates and jointventures was Rs.227 million, compared to Rs.472 million for the year ended March 31, 2016.
For the year ended March 31, 2017, profit on sale of non-current asset was Rs.859 million, relatingto sale of assets of a subsidiary in South East Asia on liquidation.
For the year ended March 31, 2017, provision for advances given for repurchase of equity shares inTata Teleservices Limited from NTT Docomo Inc. was Rs.1,255 million, compared to Rs.730 millionfor the year ended March 31, 2016, relating to advances paid for a project which the Group has decidedto discontinue.
For the year ended March 31, 2017, impairment loss recognised in respect of property, plant andequipment (including capital work-in-progress) and intangible assets was Rs.2,679 million, comparedto Rs.15,302 million for the year ended March 31, 2016.
For the year ended March 31, 2017, provision for demands and claims in relation to the Indianoperations was Rs.2,183, compared to Rs.8,801 million for year ended March 31, 2016.
For the year ended March 31, 2017, provision for employee separation compensation in relation to theIndian operations was Rs.2,074 million, compared to Rs.5,563 million for year ended March 31, 2016.
For the year ended March 31, 2017, restructuring and other provisions was Rs.36,138 million,primarily due to the curtailment charge relating to closure of TSE’s BSPS to future accrual, comparedto Rs.69,827 million for year ended March 31, 2016, primarily due to changes to the BSPS, theStichting Pensioenfonds Hoogovens scheme and other restructuring exercise relating to the Europeanoperations.
Tax Expense
Tax expenses increased/decreased by 302.6% to Rs.27,780 million for the year ended March 31, 2017from Rs.6,900 million for the year ended March 31, 2016.
Profit/(Loss) after Tax from Continuing Operations
As a result of the foregoing, the Group recorded a loss after taxes from continuing operations ofRs.3,044 million for the year ended March 31, 2017, compared to profit after tax of Rs.20,248 millionfor the year ended March 31, 2016.
105

Results of Operations
Results of Operations for the Year Ended March 31, 2016 and the Year Ended March 31, 2015
The following table sets forth the Group’s statement of profit and loss data for the years ended March
31, 2015 and 2016 which have been extracted without material adjustment from the Annual Financial
Statements presented elsewhere in this Offering Memorandum and also includes the percentage change
between the Financial Years presented:
Consolidated Statement of Profit and Loss Data Year ended March 31,
(Indian GAAP) 2015 2016 %Change
(Rs. in millions)(audited)
Revenue
Revenue from operations . . . . . . . . . . . . . . . . . . . . . . . . . . . 1,395,037 1,171,516 (16.0)
Other income . . . . . . . . . . . . . . . . . . . . . . . . . . . . . . . . . . 7,962 39,257 393.1
I. Total Income . . . . . . . . . . . . . . . . . . . . . . . . . . . . . . 1,402,999 1,210,773 (13.7)
(a) Raw materials consumed . . . . . . . . . . . . . . . . . . . . 407,410 321,883 (21.0)
(b) Purchases of finished, semi-finished and other products . 138,042 101,740 (26.3)
(c) Changes in stock of finished goods, work-in-progressand stock-in-trade . . . . . . . . . . . . . . . . . . . . . . . . 11,222 24,538 118.7
(d) Employee benefit expenses . . . . . . . . . . . . . . . . . . 214,076 199,668 (6.7)
(e) Finance costs . . . . . . . . . . . . . . . . . . . . . . . . . . 48,478 41,286 (14.8)
(f) Depreciation and amortisation expense . . . . . . . . . . . 59,436 50,818 (14.5)
(g) Other expenses . . . . . . . . . . . . . . . . . . . . . . . . . 498,929 447,830 (10.2)
II. Total Expenses . . . . . . . . . . . . . . . . . . . . . . . . . . . . . 1,377,593 1,187,764 (13.8)
III. Profit before exceptional items and tax (I-II) . . . . . . . . . . 25,406 23,008 (9.4)
IV. Exceptional items . . . . . . . . . . . . . . . . . . . . . . . . . . . (39,287) (39,749) (1.2)
V. Profit/(loss) before tax (III+IV) . . . . . . . . . . . . . . . . . . (13,881) (16,740) (20.6)
(a) Current tax . . . . . . . . . . . . . . . . . . . . . . . . . . . . 22,147 16,311 (26.4)
(b) MAT credit . . . . . . . . . . . . . . . . . . . . . . . . . . . . (1,173) (1,526) (30.1)
(c) Deferred tax . . . . . . . . . . . . . . . . . . . . . . . . . . . 4,700 264 (94.4)
VI. Total tax expense . . . . . . . . . . . . . . . . . . . . . . . . . . . . 25,674 15,050 (41.4)
VII. Profit/(Loss) after tax (V-VI). . . . . . . . . . . . . . . . . . . . . (39,555) (31,790) 19.6
The Group’s consolidated financial statements presented in this offering memorandum as at and for
the year ended March 31, 2016, together with the comparative period data as at and for the year ended
March 31, 2015, have been prepared in accordance with Indian GAAP.
106

Revenue from Operations
The Group’s revenue from operations for the year ended March 31, 2016 decreased by 16.0% toRs.1,171,516 million from Rs.1,395,037 million for the year ended March 31, 2015. The followingtable presents the Group’s revenue from operations (including inter segment sales which are notincluded in revenue from operations) by business segment for the periods indicated:
Year ended March 31,
2015 2016
(Rs. million)
(audited)
Steel business . . . . . . . . . . . . . . . . . . . . . . . . . . . . . . . . . . . . . . . 1,344,071 1,125,159
Other operations . . . . . . . . . . . . . . . . . . . . . . . . . . . . . . . . . . . . . 124,199 108,041
Unallocated . . . . . . . . . . . . . . . . . . . . . . . . . . . . . . . . . . . . . . . . . 14,481 7,746
Less: Inter segment revenue . . . . . . . . . . . . . . . . . . . . . . . . . . . . . 87,714 69,430
Revenue from operations . . . . . . . . . . . . . . . . . . . . . . . . . . . . . . 1,395,037 1,171,516
Revenue from the steel business decreased by 16.3% to Rs.1,125,159 million for the year ended March31, 2016 from Rs.1,344,071 million for the year ended March 31, 2015. This decrease was primarilydue to lower realizations across all geographies and attributable to adverse market conditions.
Revenue from other operations decreased by 13% to Rs.108,041 million for the year ended March 31,2016 from Rs.124,199 million for the year ended March 31, 2015. This decrease in revenue wasprimarily at Tata Steel India and TSE, and partly offset by an increase in revenue in the ferro alloysand minerals division in India.
Revenue from unallocated segment decreased by 47.0% to Rs.7,746 million for the year ended March31, 2016 from Rs.14,481 million for the year ended March 31, 2015. This decrease was primarily atTSE due to restructuring of the operations.
Raw Materials Consumed
Raw materials consumed decreased by 21.0% to Rs.321,883 million for the year ended March 31, 2016from Rs.407,410 million for the year ended March 31, 2015. This decrease was primarily at Tata SteelIndia due to lower consumption of purchased iron ore and pellet compared to the previous year, whichwas impacted due to a temporary closure of mines along with lower consumption of imported coal andcoke. Expense at TSE decreased primarily due to a decrease in prices of iron ore and coking coal.
Purchase of Finished, Semi-finished Steel and Other Products
The purchase of finished steel, semi-finished steel and other products decreased by 26.3% toRs.101,740 million for the year ended March 31, 2016 from Rs.138,042 million for the year endedMarch 31, 2015. This decrease was primarily at Natsteel Holdings and Tata Steel Thailand, and in linewith lower sales volume. Expense at TSE was due to the external steel purchases required foroperation.
Employee Benefits Expense
Employee benefits expense decreased by 6.7% to Rs.199,668 million for the year ended March 31,2016 from Rs.214,076 million for the year ended March 31, 2015. This decrease was primarily at TSEand due to a reduction in head count of approximately 2,000 people, resulting in a decrease inretirement provisions. Employee cost at Tata Steel India decreased primarily due to an additionalcharge in the previous year of a change in actuarial estimates, primarily reflecting discount rates,partly offset by increase in normal salary revisions and its consequential impact on retiral provisions.
107

The total strength of permanent employees in the Indian operations decreased to 35,439 as on March31, 2016 from 36,957 as on March 31, 2015.
Depreciation and Amortization Expenses
Depreciation and amortization expenses decreased by 14.5% to Rs.50,818 million for the year endedMarch 31, 2016 from Rs.59,436 million for the year ended March 31, 2015. This decrease wasprimarily at TSE due to a write down of assets.
Finance Costs
Finance costs decreased by 14.8% to Rs.41,286 million for the year ended March 31, 2016 fromRs.48,477 million for the year ended March 31, 2015. This decrease was primarily at Tata Steel Indiadue to higher interest capitalization, due to the commencement of the Kalinganagar plant in June 2016.Expense at TSE decreased due to a decrease in bank and other borrowings, partly offset by the additionof a subordinate loan over the year ended March 31, 2015.
Other Expenses
Other expenses decreased by 10.2% to Rs.447,830 million for the year ended March 31, 2016 fromRs.498,929 million for the year ended March 31, 2015. This decrease was primarily at TSE, due tolower production, and at Tata Steel Global Holdings, Singapore, due to favorable exchange ratemovement.
Decrease at NatSteel was primarily as previous year included a provision towards doubtful advances,not present during the current year.
Exceptional Items
Exceptional items consisted of profit on sale of non-current investments, profit on sale of non-currentassets, provision for diminution in value of doubtful advances, provision for impairment ofnon-current assets, provision for demands and claims, provision for employee separationcompensation and restructuring and other provisions.
For the year ended March 31, 2016, profit on sale investments in subsidiaries, associates and jointventures was Rs.1,800 million, compared to Rs.13,513 million for the year ended March 31, 2015.
For the year ended March 31, 2016, profit on sale of non-current asset was Rs.11,469 million relatingto profit on sale of land at Borivali, Mumbai.
For the year ended March 31, 2016, provision for diminution in value of doubtful advances was Rs.730million, due to exposure in the Chhattisgarh project and Rs.177 million in advances to Tata Steel KZNPty. Ltd., compared to Rs.3,383 million for the year ended March 31, 2015, due to exposure in NewMillennium Iron Corp.
For the year ended March 31, 2016, impairment loss recognised in respect of goodwill, tangible andintangible assets (including capital work-in-progress) for the year ended March 31, 2016 wasRs.97,206 million, compared toRs.60,526 million for the year ended March 31, 2015.
For the year ended March 31, 2016, provision for demands and claims in relation to the Indianoperations was Rs.8,801 million.
For the year ended March 31, 2016, provision for employee separation scheme in relation to the Indianoperations was Rs.5,563 million.
For the year ended March 31, 2016, restructuring and other provisions was Rs.71,312 million, whichwere primarily in relation to European operation.
108

Tax Expense
Tax expenses decreased by 41.4% to Rs.15,050 million for the year ended March 31, 2016 fromRs.25,674 million for the year ended March 31, 2015.
Profit/(Loss) after Tax
As a result of the foregoing, the Group recorded a loss after taxes of Rs.31,790 million for the yearended March 31, 2016, compared to a loss after taxes of Rs.39,555 million for the year ended March31, 2015.
Liquidity and Capital Resources
Capital Requirements
The Group’s principal capital requirements are for capital expenditure, payment of principal andinterest on its borrowings and, in some years, acquisitions of subsidiaries and joint ventures.Geographically, the capital requirements of the Group’s European operations have been the greatestdue to the relatively weaker operating performance of TSE. This has therefore resulted in substantialfunding of those operations from parts of the Group with stronger operating performance, in particularIndia. The Group will continue to pursue inorganic growth opportunities, with a particular focus onacquisitions that generate greater synergies and production capacity, manufacturing facilities,infrastructure and advanced technology, and which allow the Group to diversify its product andcustomer bases. The Group is pursuing and may continue to pursue opportunities for acquisition ofassets from financially stressed companies, including with respect to companies that are undergoingcorporate insolvency resolution processes under the IBC. If successful in the IBC Process, the Groupmay finance acquisitions by internal accruals, additional capital raised as debt or equity or any otherform in the Group, or through the use of additional capital in a subsidiary or associate of the Group.The principal source of funding of the Group has been, and is expected to continue to be, cashgenerated from its operations, supplemented by funding from bank borrowings and the capitalmarkets. For the three years ended March 31, 2017 the Group had met its funding requirements,including capital expenditure, satisfaction of debt obligations, investments, taxes, other workingcapital requirements, dividends and other cash outlays, principally with funds generated fromoperations and equity issuances with the balance principally met using external borrowings.
Cash Management Policy
The Group has a separate treasury function for its operations in Europe, India, Singapore andThailand. Each location manages its liquidity and cash needs separate and distinct from each other.Cash, except as set forth below, from one of the Group’s principal areas of operations has not beenused to support the operations one another.
The Group has cash pooling structures in South-East Asia and Europe to manage its liquidity andreduce overall bank borrowing and transaction costs. In each of these structures, the entity designatedas the cash pool collect all surplus cash and provides short-term liquidity to the participating entities.
In addition, T S Global Procurement Company Pte. Limited (“TSGP”) acts as a centralizedprocurement center for the Group including the provisions of trade financing structures on an arm’slength basis. Pursuant to these arrangements, TSGP provides working capital support primarily for theprocurement of materials and services in the case of TSE, and materials for India. Proco Issuer Pte.Ltd., a subsidiary of TSGP also provides working capital support by purchase of receivables fromTSE’s subsidiaries.
109

Cash Flow Data
The Group seeks, in normal circumstances, to maintain a substantial cash and cash equivalents
balances to provide it with financial liquidity and operational flexibility. The Group’s cash is placed
in bank fixed deposits, certificates of deposit with banks and mutual funds. As at March 31, 2017, the
Group had cash and cash equivalents Rs.48,323 million.
The following table sets forth selected items from the Group’s consolidated cash flow statement for
the periods indicated:
Cash flow statement of the Group Year ended March 31,
(Ind-AS) 2016 2017
(Rs. in millions)
(audited)
Net cash flow from/(used in) operating activities . . . . . . . . . . . . 114,554 108,481
Net cash from/(used in) investing activities . . . . . . . . . . . . . . . . (92,538) (90,862)
Net cash flow from/(used in) financing activities . . . . . . . . . . . . (47,291) (25,924)
Net increase/(decrease) in cash and cash equivalents . . . . . . . . . (25,276) (8,306)
Closing cash and cash equivalents . . . . . . . . . . . . . . . . . . . . . . 61,091 48,323
Cash Flows Generated from Operating Activities
The Group generated Rs.108,481 million from operations during the year ended March 31, 2017,
compared to Rs.114,554 million during the year ended March 31, 2016. The cash operating profit
before working capital changes and direct taxes during year was Rs.175,814 million, compared to
Rs.68,240 million during previous year due to higher profitability. Cash from operations was lower
than the previous year due to an increase in the working capital during the current period by Rs.48,907
million, compared to a decrease of Rs.61,656 million in the previous year, partly offset by higher
profitability. The payments of income taxes during the year was Rs.18,427 million, compared to
Rs.15,343 million during the previous year.
Cash Flows Generated From/(Used in) Investing Activities
Cash used in investing activities was Rs.90,862 million for the year ended March 31, 2017, compared
to Rs.92,538 million during the year ended March 31, 2016. The outflow during the year broadly
represented capital expenditure, which totaled Rs.77,156 million and purchase (net of sale) of current
investments amounting to Rs.6,926 million.
Cash Flows Generated From/(Used in) Financing Activities
Cash used in financing activities (which consists of loan receipts net of loan repayments interest
payments and dividend payments) for the year ended March 31, 2017 was Rs.25,924 million,
compared to Rs.47,291 million during the year ended March 31, 2016.
The net decrease in cash and cash equivalents was Rs.8,306 million, excluding the effect of exchange
fluctuation of Rs.4,141 million for the year ended March 31, 2017, with a balance of Rs.48,323 million
as on March 31, 2017 against a balance of Rs.61,091 million as on March 31, 2016.
110

The following table sets forth selected items from the Group’s consolidated cash flow statement forthe periods indicated:
Cash flow statement of the Group Year ended March 31,
(Indian GAAP) 2015 2016
(Rs. in millions)
(audited)
Net cash flow from/(used in) operating activities . . . . . . . . . . . . 118,798 119,632
Net cash from/(used in) investing activities . . . . . . . . . . . . . . . . (84,221) (104,242)
Net cash flow from/(used in) financing activities . . . . . . . . . . . . (26,172) (39,284)
Net increase/(decrease) in cash and cash equivalents . . . . . . . . . 8,404 (23,894)
Closing cash and cash equivalents . . . . . . . . . . . . . . . . . . . . . . 86,478 66,090
Cash Flows Generated from Operating Activities
The Group generated Rs.119,632 million from operations during the year ended March 31, 2016 ascompared to Rs.118,798 million during the year ended March 31, 2015. The cash operating profitbefore working capital changes and direct taxes during year was Rs.81,750 million as compared toRs.139,554 million during previous year due to decline in profitability. Cash from operations waslower than the previous year due to an increase in working capital during the current period byRs.54,332 million, compared to an increase of Rs.3,514 million in working capital, and lowerprofitability, in the previous years. The payments of income taxes during the year was Rs.16,450million as compared to Rs.24,270 million during the previous year.
Cash Flows Generated From/(Used in) Investing Activities
Cash used in investing activities was Rs.104,242 million for the year ended March 31, 2016, comparedto Rs.84,221 million for the year ended March 31, 2015. The outflow during the year broadlyrepresented capital expenditure, which totaled Rs.114,859 million and purchase (net of sale) of currentinvestments. These increases were partly offset by sales of non-current investments.
Cash Flows Generated From/(Used in) Financing Activities
Cash used in financing activities (which consists of loan receipts net of loan repayments, interestpayments and dividend payments) for the year ended March 31, 2016 was Rs.39,284 million, ascompared to Rs.26,172 million during the year ended March 31, 2015.
The net decrease in cash and cash equivalents was Rs.23,894 million, excluding the effect of exchangefluctuation of Rs.4,727 million for the year ended March 31, 2016, with a balance of Rs.66,090 millionas on March 31, 2016 against a balance of Rs.86,478 million as on March 31, 2015.
Indebtedness
The Group’s principal sources of external financing include both short-term and long-term facilities(in both Rupees and other currencies). The Group is required to secure certain of its borrowings, inline with established market practices. As at March 31, 2017, the Group had total outstandingindebtedness of Rs.830,145 million. 68% of the total outstanding indebtedness as at March 31, 2017was denominated in foreign currency, principally in U.S. Dollar, with the remainder denominated inRupees.
111

The following table sets forth the Group’s consolidated debt position and a summary of the maturityprofile for its debt obligations as at March 31, 2017:
Short
term
Less than
or equal
to one
year
One to
two years
Two to
five years
More
than
5 years
Unearned
interest on
Fin. lease
obligation
and
Unamortized
transaction
cost Total
(Rs. in millions)
Bonds/Debentures . . . . . . . . . — — 5,000 59,065 156,796 8,468 212,393
Term Loans . . . . . . . . . . . . . 102,679 4,454 13,311 304,870 86,017 3,071 508,262
Repayable on Demand . . . . . 2,447 12 — — — — 2,459
Finance Lease Obligations . . — 5,708 5,848 14,569 47,399 43,069 30,455
Other Borrowings . . . . . . . . . 78,623 — — — 101 2,147 76,577
Total loans . . . . . . . . . . . . . . 183,749 10,174 24,159 378,504 290,313 56,754 830,145
Some of the Group’s financing agreements and debt arrangements contain financial covenants thatrequire the satisfaction and/or maintenance financial tests and ratios, including requirements tomaintain debt to equity ratios, debt coverage ratios and certain other liquidity ratios. In addition, suchagreements and arrangements also require the Group to obtain prior lender consents for certainspecified actions, including issuing new securities, changing business of the Group, merging,consolidating, selling significant assets or making certain acquisitions or investments. See “RiskFactors — Risks Related to the Notes — The Group is subject to certain restrictive covenants in itsfinancing arrangements which may limit operational and financial flexibility, and failure to complywith these covenants may have a material adverse effect on the Group’s future results of operationsand financial condition” and “Description of Material Indebtedness”.
Operating leases
The Group’s operating leases consist of leases associated with its plant and machinery. Operating leasecharges were Rs.12,023 million, Rs.9,647 million, Rs.9,496 million for the year ended March 31,2015, 2016, and 2017 respectively.
The following table sets forth the total minimum lease payments for Group’s operating leases in eachperiod:
Year ended March 31,
2015 2016 2017
(Rs. in millions)
Period
Not later than one year . . . . . . . . . . . . . . . . . . . . . . . . . 11,600 9,204 6,735
Later than one year but not later than five years . . . . . . 37,451 29,805 14,798
Later than five years . . . . . . . . . . . . . . . . . . . . . . . . . . . 38,195 24,249 25,898
Total . . . . . . . . . . . . . . . . . . . . . . . . . . . . . . . . . . . . . . 87,246 63,258 47,431
112

Capital expenditure
The Group’s expansion plans, including acquisitions of other businesses, require significant capitalexpenditure. The Group’s capital expenditure totaled Rs.134,924 million, Rs.101,634 million andRs.77,156 million for the years ended March 31, 2015, 2016, and 2017, respectively. Theseexpenditures related primarily to the expansion projects at the Jamshedpur facility, the developmentof a new greenfield steel plant in Odisha and the development of iron ore and coal mines as well asexpenditures for the maintenance and improvements of various existing facilities.
The Group’s current capital investments in India are focused on the expansion of production capacityand increasing production of high value-added products. The Group’s capital investments in itsEuropean facilities are focused on maintenance and renovation of its existing capacity. The Group isalso seeking to improve the efficiency of its facilities in order to reduce production costs.
A significant portion of the Group’s total capital expenditures in India is expected to be appliedtowards the completion of Phase II of the Odisha project. Phase II is the expansion of capacity atKalinganagar by 5.0 mtpa (from 3.0 mtpa to 8.0 mtpa) with a total estimated capital investment ofapproximately Rs.235,000 million through a mixture of debt and equity. Phase II will be implementedover a 48 month period from the date of commencement of construction. The commissioning of PhaseII is planned to realize synergies with Phase I operations through improvement in productivity ofequipment and manpower, improvement in key performance indicators in operations, and theoptimization of administration costs. See “Business — Expansion and Development Projects” and“Risk Factors — Risks Related to the Group”.
The Group’s planned and budgeted capital investments in its European facilities are focused onmaintenance and renovation of its existing capacity. The Group is also seeking to improve theefficiency of its facilities in order to reduce production costs.
The Group’s expansion plans, including acquisitions of other businesses and joint ventures, requiresignificant capital expenditure. There are a number of factors that could affect the feasibility of theGroup’s expansion plans and its ability to timely complete them, including receiving financing onreasonable terms or at all, obtaining required regulatory permits and licenses, the expiration of anyagreements with local governments related to such projects, demand for the Group’s products andgeneral economic conditions. See “Risk Factors — Risks Related to the Group — If the Group isunable to successfully implement its growth strategies, its results of operations and financial conditioncould be adversely affected” and “Risk Factors — Risks Related to the Group — The Group may notbe able to obtain adequate funding required to carry out its future plans for growth.”
Capital Resources
The following tables respectively set forth (i) the Group’s proceeds from its principal financingactivities for the periods indicated and (ii) the Group’s consolidated borrowings as at the datesindicated:
Year ended March 31,
2015 2016 2017
(Rs. in millions)
Issue of share capital . . . . . . . . . . . . . . . . . . . . . . . . . . . — — 0.1
Issue of Preference Shares . . . . . . . . . . . . . . . . . . . . . . . — — —
Proceeds from issue of Hybrid Perpetual Securities . . . . — — —
Proceeds from borrowings . . . . . . . . . . . . . . . . . . . . . . . 455,186 140,477 194,846
113

For a discussion of the Group’s material indebtedness, please see “Description of MaterialIndebtedness”.
Off-Balance Sheet Arrangements
As at September 30, 2017, the Group did not have any material off-balance sheet arrangements.
Quantitative and Qualitative Disclosures about Market Risk
The Group is exposed in the ordinary course of its business to risks related to changes in exchangerates, interest rates, commodity prices and energy and transportation tariffs.
Exchange Rate Risk
The Group’s reporting currency is Rupee. The Group has significant operations in the UnitedKingdom, the Netherlands and Asia (mainly Singapore, China, Vietnam, Australia and Thailand).Respective units face fluctuations in cash flows to the extent their operating cash flows are transactedin foreign currencies. Volatility in exchange rates affects the Group’s results from operations in anumber of ways. It impacts the Group’s revenue from export markets and the costs of imports,primarily in relation to raw materials.
The Group is exposed to exchange rate risk under its trade and debt portfolio. In order to hedgeexchange rate risk under its trade portfolio and capital account transactions, the Group has a policyto hedge cash flows up to a specific tenure using forward cover contracts and options. On its debtportfolio, the Group uses forward contracts, options and principal only swaps to hedge exchange raterisk. Adverse movements in the exchange rate between the Rupee and any relevant foreign currencyresult’s in increase in the Group’s overall debt position in Rupee terms without the Group havingincurred additional debt. As at March 31, 2017, 32.1% of the Group’s total outstanding indebtedness,which totaled Rs.266,826 million, was denominated in Rupees, and the remaining 67.9% wasdenominated in various foreign currencies, including U.S. dollars, GBP, Euro, Japanese Yen andSingapore dollars. As a result, the Group’s results of operations may be materially affected by thesignificant fluctuations in the exchange rates of relevant foreign currencies. See “Risk Factors —Risks Related to the Group — The Group’s operating results are affected by movements in exchangerates and interest rates”.
Hedging Activities
The Group uses forward covers, options and principal only swaps to hedge the foreign currency riskarising on account of its revenue and debt portfolio. All hedging activities are carried out inaccordance with the Group’s internal risk management policies, as approved by the Board ofDirectors, and in accordance with the applicable regulations where the Group operates. The Group’srisk management policies attempt to protect business planning from adverse currency and interest ratemovements. The Group does not use derivative contracts for speculative purposes. As at March 31,2017, approximately half of the Group’s loans were subject to hedging arrangements.
The accounting policies of the Group require that the liabilities and hedges thereon be revalued at eachbalance sheet date. Hedges taken against contracted and forecasts exposures are marked to marketgains and losses are taken to the statement of profit and loss and gains if any are ignored. Hedges takenagainst balance sheet items are revalued along with underlying exposures.
Hedging activities in India are governed by the RBI, whose policies must be complied with at alltimes. The policies under which the RBI regulates hedging activities can change from time to time,and these policies may affect the effectiveness with which the Group manages its exchange rate risk.The Group generally keeps a hedge of three to six months on its revenue account, keeps a high hedgeratio on capital expenditure based on respective tenures and keep its debt portfolio proactively hedged.Interest rate risk is hedged on case by case basis depending on evolving economic scenario.
114

Interest Rate Risk
The Group is exposed to the interest rate risk on short-term and long-term floating rate instruments
and also on the refinancing of fixed rate debt. The Group’s policy is to maintain a balance of fixed
and floating interest rate borrowings. As at March 31, 2017, 60.2% of the Group’s total outstanding
indebtedness, which totaled Rs.499,500 million, was subject to floating rates.
The Group’s floating rate debt is mostly linked to the Euro London Interbank Offering Rate
(“LIBOR”). The costs of floating rate borrowings may be affected by the fluctuations in the interest
rates. The Group has selectively used interest rate swaps and interest rate options to manage its
exposure to interest rate movements. These exposures are reviewed by appropriate levels of
management on a regular basis. The Group does not enter into hedging instruments for speculative
purposes.
Borrowing and interest rate hedging activities in India are governed by the RBI and the Group has to
comply with its regulations. The policies under which the RBI regulates these borrowing and interest
rate hedging activities can change from time to time and can impact the effectiveness with which the
Group manages its interest rate risk. Any increase in interest rates could therefore materially and
adversely affect the Group’s cash flow, business, results of operations and financial condition. See
“Risk Factors — Risks Related to the Group — The Group’s operating results are affected by
movements in exchange rates and interest rates”.
Commodity Price Risk
The Group’s revenue is exposed to the market risk of price fluctuations related to the sale of its steel
products. Market forces generally determine prices for the steel products that the Group sells. These
prices may be influenced by factors such as supply and demand, production costs (including the costs
of raw material inputs) and global and regional economic conditions and growth. Adverse changes in
any of these factors may reduce the revenue that the Group earns from the sale of its steel products.
The Group primarily purchases its raw materials on the open market from third parties. The Group is
therefore subject to fluctuations in prices for the purchase of coal, ferro alloys, zinc, scrap and other
raw material inputs. For example, TSE purchased all of its raw material requirements from third
parties on the open market for the year ended September 30, 2017. For the year ended March 31, 2017,
approximately 64% of the coal requirements for the Group’s Indian operations were sourced from third
parties. The Group’s exposure to price fluctuations in raw materials is mitigated in part by the fact that
its Indian operations are currently self-sufficient in terms of its iron ore needs, as they are able to
extract sufficient iron ore from their captive mines to satisfy their needs.
115

MANAGEMENT’S DISCUSSION AND ANALYSIS OF FINANCIAL CONDITION ANDRESULTS OF OPERATIONS OF TATA STEEL
The following discussion is intended to convey management’s perspective on the financial condition
and results of operations of Tata Steel as at the end of and for the years ended March 31, 2015, 2016
and 2017, and the six-month periods ended September 30, 2016 and 2017. The following discussion
of the Tata Steel financial condition and results of operations should be read in conjunction with the
financial statements, the schedules and notes thereto and the other information included elsewhere in
this Offering Memorandum. The financial statements are prepared in accordance with Ind-AS and
Indian GAAP. For a discussion of certain significant differences between Ind-AS and IFRS, see
“Summary of Certain Differences between Ind-AS and IFRS”.
This section contains forward-looking statements that involve risks and uncertainties. Actual results
may differ materially from those discussed in such forward-looking statements as a result of various
factors, including those described under the sections “Forward-Looking Statements and Associated
Risks” and “Risk Factors” beginning on pages x and 39 of this Offering Memorandum, respectively.
Tata Steel standalone financial information has been presented in this Offering Memorandum together
with the Group’s financial information in order to provide potential investors with additional
information relating to the financial results of the Group as a whole.
Results of Operations
Results of Operations for the six months ended September 30, 2016 and September 30, 2017
The following table sets forth Tata Steel’s statement of profit and loss data for the six months ended
September 30, 2016 and 2017 which have been extracted without material adjustment from the Annual
Financial Statements presented elsewhere in this Offering Memorandum and also includes the
percentage change between the Financial Years presented:
Standalone Statement of Profit and Loss of Tata Steel Six months ended September 30,
(Ind-AS) 2016 2017 %Change
(Rs. in millions)(audited)
Revenue
Revenue from operations . . . . . . . . . . . . . . . . . . . . . . . . . . . 220,418 286,427 29.9
Other income . . . . . . . . . . . . . . . . . . . . . . . . . . . . . . . . . . 2,702 3,616 33.8
I. Total Income . . . . . . . . . . . . . . . . . . . . . . . . . . . . . . 223,119 290,043 30.0
(a) Raw materials consumed . . . . . . . . . . . . . . . . . . . . 49,518 86,686 75.1
(b) Purchases of finished, semi-finished and other products . 4,776 3,438 (28.0)
(c) Changes in stock of finished goods, work-in-progressand stock-in-trade . . . . . . . . . . . . . . . . . . . . . . . . (9,376) 143 101.5
(d) Employee benefit expenses . . . . . . . . . . . . . . . . . . 23,412 22,728 (2.9)
(e) Finance costs . . . . . . . . . . . . . . . . . . . . . . . . . . 12,659 14,093 11.3
(f) Depreciation and amortisation expense . . . . . . . . . . . 16,146 18,788 16.4
(g) Other expenses . . . . . . . . . . . . . . . . . . . . . . . . . 110,726 110,016 (0.6)
II. Total Expenses . . . . . . . . . . . . . . . . . . . . . . . . . . . . . 207,862 255,893 23.1
III. Profit before exceptional items and tax (I-II) . . . . . . . . . . 15,258 34,150 123.8
116

Standalone Statement of Profit and Loss of Tata Steel Six months ended September 30,
(Ind-AS) 2016 2017 %Change
(Rs. in millions)(audited)
IV. Exceptional items . . . . . . . . . . . . . . . . . . . . . . . . . . . (2,198) (6,434) (192.8)
V. Profit/(loss) before tax (III+IV) . . . . . . . . . . . . . . . . . . 13,060 27,716 112.2
(a) Current tax . . . . . . . . . . . . . . . . . . . . . . . . . . . . 4,495 7,089 57.7
(b) Deferred tax . . . . . . . . . . . . . . . . . . . . . . . . . . . 315 2,622 732.3
VI. Total tax expense . . . . . . . . . . . . . . . . . . . . . . . . . . . . 4,810 9,711 101.9
VII. Profit/(loss) after tax from continuing operations (V-VI) . . . 8,250 18,005 118.2
The Group’s consolidated financial statements presented in this Offering Memorandum as at and for
the six months ended September 30, 2017, together with the comparative period data as at and for the
six months ended September 30, 2016, have been prepared in accordance with Ind-AS.
Revenue from operations
Revenue increased by 29.9% to Rs.286,427 million for the six months ended September 30, 2017 from
Rs.220,418 million for the six months ended September 30, 2016, primarily due to an increase in sales
volume, as well as an increase in average selling prices and higher operating performance from the
ferro alloys and minerals division.
Sales volume from India increased by 22.1% to 5.83 mt for the six months ended September 30, 2017
from 4.77 mt for the six months ended September 30, 2016, primarily due to the additional production
from the Kalinganagar plant which commenced operations in June 2016. Average selling prices
increased primarily as a result of improved market conditions and enhanced product mix.
Raw Materials Consumed
Raw materials consumed increased by 75.1% to Rs.86,686 million for the six months ended September
30, 2017 from Rs.49,518 million for the six months ended September 30, 2016. The increase in
expense reflects higher costs and consumption of imported coal along with higher expenses at the ferro
alloys and minerals division resulting from increased production.
Purchase of Finished, Semi-finished Steel and Other Products
The purchase of finished steel, semi-finished steel and other products decreased by 28% to Rs.3,438
million for the six months ended September 30, 2017 from Rs.4,776 million for the six months ended
September 30, 2016. This decrease was primarily due to lower purchases of imported rebars and wire
rods.
Employee Benefits Expense
Employee benefits expense decreased by 2.9% to Rs.22,728 million for the six months ended
September 30, 2017 from Rs.23,412 million for the six months ended September 30, 2016. This
decrease was primarily due to the change in actuarial estimates mainly reflecting a change in discount
rate, partly offset by normal salary increase and its impact on provisions.
117

Depreciation and Amortization Expenses
Depreciation and amortization expenses increased by 16.4% to Rs.18,788 million for the six months
ended September 30, 2017 from Rs.16,146 million for the six months ended September 30, 2016. This
increase was primarily due to the commencement of operations at the Kalinganagar plant in June 2016.
Finance Costs
Finance costs increased by 11.3% to Rs.14,093 million for the six months ended September 30, 2017
from Rs.12,659 million for the six months ended September 30, 2016, primarily due to a decrease in
interest capitalization related to Kalinganagar operations.
Other Expenses
Other expenses decreased by 0.6% to Rs.110,016 million for the six months ended September 30, 2017
from Rs.110,726 million for the six months ended September 30, 2016.
Exceptional Items
Exceptional items consisted of provision for diminution in value of doubtful advances and
investments, provision for demands and claims and employee separation compensation.
For the six months ended September 30, 2017, provision for advances given for repurchase of equity
shares in Tata Teleservices Limited from NTT Docomo Inc. was Rs.267 million compared to Rs.1,169
million during six months ended September 30, 2016, and provision for diminution in value of
investments held in subsidiaries for Rs.213 million during six months ended September 30, 2016.
For the six months ended September 30, 2017, provision for demands and claims was Rs.6,144
million.
For the six months ended September 30, 2017, the provision for the employee compensation scheme
was Rs.24 million compared to Rs.815 million during six months ended September 30, 2016.
Tax Expense
Tax expenses increased by 101.9% to Rs.9,711 million for the six months ended September 30, 2017
from Rs.4,810 million for the six months ended September 30, 2016.
Profit/(Loss) after Tax from Continuing Operations
As a result of the foregoing, profit after taxes from continuing operations was Rs.18,005 million for
the six months ended September 30, 2017 compared to Rs.8,250 million for the six months ended
September 30, 2016.
118

Results of Operations
Results of Operations for the Year Ended March 31, 2016 and the Year Ended March 31, 2017
The following table sets forth Tata Steel’s statement of profit and loss data for the years ended March31, 2016 and 2017 which have been extracted without material adjustment from the Annual FinancialStatements presented elsewhere in this Offering Memorandum and also includes the percentage changebetween the Financial Years presented:
Standalone Statement of Profit and Loss of Tata Steel Year ended March 31,
(Ind-AS) 2016 2017 %Change
(Rs. in millions)(audited)
Revenue
Revenue from operations . . . . . . . . . . . . . . . . . . . . . . . . . . . 426,974 532,610 24.7
Other income . . . . . . . . . . . . . . . . . . . . . . . . . . . . . . . . . . 3,912 4,145 6.0
I. Total Income . . . . . . . . . . . . . . . . . . . . . . . . . . . . . . 430,886 536,754 24.6
(a) Raw materials consumed . . . . . . . . . . . . . . . . . . . . 97,000 124,968 28.8
(b) Purchases of finished, semi-finished and other products . 9,915 8,812 (11.1)
(c) Changes in stock of finished goods, work-in-progressand stock-in-trade . . . . . . . . . . . . . . . . . . . . . . . . 708 (13,297) (1,978.1)
(d) Employee benefit expenses . . . . . . . . . . . . . . . . . . 43,199 46,051 6.6
(e) Finance costs . . . . . . . . . . . . . . . . . . . . . . . . . . 18,481 26,886 45.5
(f) Depreciation and amortisation expense . . . . . . . . . . . 29,623 35,416 19.6
(g) Other expenses . . . . . . . . . . . . . . . . . . . . . . . . . 200,035 247,316 23.6
II. Total Expenses . . . . . . . . . . . . . . . . . . . . . . . . . . . . . 398,960 476,151 19.3
III. Profit before exceptional items and tax (I-II) . . . . . . . . . . 31,926 60,603 89.8
IV. Exceptional items . . . . . . . . . . . . . . . . . . . . . . . . . . . (16,493) (7,034) 57.4
V. Profit/(loss) before tax (III+IV) . . . . . . . . . . . . . . . . . . 15,433 53,569 247.1
(a) Current tax . . . . . . . . . . . . . . . . . . . . . . . . . . . . 11,933 14,005 17.4
(b) Deferred tax . . . . . . . . . . . . . . . . . . . . . . . . . . . (6,056) 5,118 184.5
VI. Total tax expense . . . . . . . . . . . . . . . . . . . . . . . . . . . . 5,877 19,124 225.4
VII. Profit/(loss) after tax from continuing operations (V -VI) . . 9,556 34,445 260.5
The Group’s consolidated financial statements presented in this Offering Memorandum as at and forthe year ended March 31, 2017, together with the comparative period data as at and for the year endedMarch 31, 2016, have been prepared in accordance with Ind-AS.
Revenue from operations
Revenue increased by 24.7% to Rs.532,610 million for the year ended March 31, 2017 fromRs.426,974 million for the year ended March 31, 2016. This increase was primarily due to thecommencement of operations at the Kalinganagar plant in June 2016, improved market conditions andhigher revenue from the ferro alloys and minerals division.
Raw Materials Consumed
Raw materials consumed increased by 28.8% to Rs.124,968 million for the year ended March 31, 2017from Rs.97,000 million for the year ended March 31, 2016. This increase was primarily at Tata SteelIndia and driven by higher consumption due to the commencement of operations at the Kalinganagarplant in June 2016 and the cost of imported coal.
119

Purchase of Finished, Semi-finished Steel and Other Products
The purchase of finished steel, semi-finished steel and other products decreased by 11.1% to Rs.8,812million for the year ended March 31, 2017 from Rs.9,915 million for the year ended March 31, 2016,primarily due to lower purchases of wire rods and imported rebars.
Employee Benefits Expense
Employee benefits expense increased by 6.6% to Rs.46,051 million for the year ended March 31, 2017from Rs.43,199 million for the year ended March 31, 2016, primarily due to an increase in salaryrevisions and its consequential impact on the retirement provisions.
The total strength of permanent employees in the Indian operations decreased to 34,989 for the yearended March 31, 2017 from 35,439 for the year ended March 31, 2016.
Depreciation and Amortization Expenses
Depreciation and amortization expenses increased by 19.6% to Rs.35,416 million for the year endedMarch 31, 2017 from Rs.29,623 million for the year ended March 31, 2016. This increase wasprimarily Tata Steel India due to the commencement of Kalinganagar operations in June 2016, partlyoffset by impact of re-assessment of useful life of assets effective April 1, 2016.
Finance Costs
Finance costs increased by 45.5% to Rs.26,886 million for the year ended March 31, 2017 fromRs.18,481 million for the year ended March 31, 2016 primarily as previous year included higherinterest capitalization of Kalinganagar operations.
Other Expenses
For the year ended March 31, 2017, other expenses increased by 23.6% to Rs.247,316 million fromRs.200,035 million for the year ended March 31, 2016. This increase was primarily due to thecommencement of operations at Kalinganagar in June 2016 and increased charges under the DistrictMineral Foundation. In previous year post-notification in September 2015 stipulating the rate to 30%of the royalty, the Group has reversed the excess provision (January 2015 to August 2015) which wasearlier provided at 100% of the royalty.
Exceptional Items
Exceptional items consisted of profit on sale of non-current investments, provision for diminution invalue of doubtful advances, provision for impairment of non-current assets, provision for demands andclaims, employee separation compensation and restructuring and other provisions.
For the year ended March 31, 2016, loss on sale investments in subsidiaries and an associates was Rs.9million.
For the year ended March 31, 2017, provision for advances given for repurchase of equity shares inTata Teleservices Limited from NTT Docomo Inc. was Rs.1,255 million and provision for diminutionin value of investments held in subsidiaries was Rs.454 million, compared to Rs.730 million duringyear ended March 31, 2016 relating to advances paid for a project which the Group has decided todiscontinue and provision for diminution in value of investments held in subsidiaries was Rs.876million for the year ended March 31, 2016.
120

For the year ended March 31, 2016, impairment loss recognised in respect of property, plant andequipment (including capital work-in-progress) and intangible assets was Rs.515 million.
For the year ended March 31, 2017, provision for demands and claims was of Rs.2,183 millioncompared to Rs.8,801 million for year ended March 31, 2016.
For the year ended March 31, 2017, provision for the employee compensation scheme was Rs.1,787million compared to Rs.5,563 million during year ended March 31, 2016.
For the year ended March 31, 2017, restructuring and other provisions was Rs.1,356 million, primarilydue to legal and constructive commitments provided by the Group with respect to a loss makingsubsidiary.
Tax Expense
Tax expenses increased/decreased by 225.4% to Rs.19,124 million for the year ended March 31, 2017from Rs.5,877 million for the year ended March 31, 2016.
Profit/(Loss) after Tax from Continuing Operations
As a result of the foregoing, the Group recorded profit after tax from continuing operations ofRs.34,445 million for the year ended March 31, 2017 as compared to profit after tax of Rs.9,556million for the year ended March 31, 2016.
Results of Operations
Results of Operations for the Year Ended March 31, 2016 and the Year Ended March 31, 2015
The following table sets forth Tata Steel’s statement of profit and loss data for the years ended March31, 2015 and 2016 which have been extracted without material adjustment from the Annual FinancialStatements presented elsewhere in this Offering Memorandum and also includes the percentage changebetween the Financial Years presented:
Standalone Statement of Profit and Loss of Tata Steel Year ended March 31,
(Indian GAAP) 2015 2016 %Change
(Rs. in millions)(audited)
Revenue
Revenue from operations . . . . . . . . . . . . . . . . . . . . . . . . . . . 417,850 382,103 (8.6)
Other income . . . . . . . . . . . . . . . . . . . . . . . . . . . . . . . . . . 5,828 38,907 567.6
I. Total Income . . . . . . . . . . . . . . . . . . . . . . . . . . . . . . 423,678 421,010 (0.6)
(a) Raw materials consumed . . . . . . . . . . . . . . . . . . . . 116,786 97,000 (16.9)
(b) Purchases of finished, semi-finished and other products . 6,883 9,915 44.1
(c) Changes in stock of finished goods, work-in-progressand stock-in-trade . . . . . . . . . . . . . . . . . . . . . . . . (7,159) 1,430 120.0
(d) Employee benefit expenses . . . . . . . . . . . . . . . . . . 46,019 43,249 (6.0)
(e) Finance costs . . . . . . . . . . . . . . . . . . . . . . . . . . 19,760 14,603 (26.1)
(f) Depreciation and amortisation expense . . . . . . . . . . . 19,976 19,331 (3.2)
(g) Other expenses . . . . . . . . . . . . . . . . . . . . . . . . . 155,233 158,392 2.0
II. Total Expenses . . . . . . . . . . . . . . . . . . . . . . . . . . . . . 357,497 343,920 (3.8)
III. Profit before exceptional items and tax (I-II) . . . . . . . . . . 66,180 77,091 16.5
121

Standalone Statement of Profit and Loss of Tata Steel Year ended March 31,
(Indian GAAP) 2015 2016 %Change
(Rs. in millions)(audited)
IV. Exceptional items . . . . . . . . . . . . . . . . . . . . . . . . . . . 18,909 (15,826) (183.7)
V. Profit/(loss) before tax (III+IV) . . . . . . . . . . . . . . . . . . 85,089 61,265 (28.0)
(a) Current tax . . . . . . . . . . . . . . . . . . . . . . . . . . . . 19,086 14,331 (24.9)
(b) MAT credit . . . . . . . . . . . . . . . . . . . . . . . . . . . . (1,172) (1,522) (29.9)
(c) Deferred tax . . . . . . . . . . . . . . . . . . . . . . . . . . . 2,784 (553) (119.9)
VI. Total tax expense . . . . . . . . . . . . . . . . . . . . . . . . . . . . 20,698 12,256 (40.8)
VII. Profit/(Loss) after tax (V-VI). . . . . . . . . . . . . . . . . . . . . 64,391 49,010 (23.9)
The Group’s consolidated financial statements presented in this Offering Memorandum as at and for
the year ended March 31, 2016, together with the comparative period data as at and for the year ended
March 31, 2015, have been prepared in accordance with Indian GAAP.
Revenue from operations
Revenue decreased by 8.6% to Rs.382,103 million for the year ended March 31, 2017 from Rs.417,850
million for the year ended March 31, 2016. This decrease was primarily due to lower domestic
realization attributable to adverse market conditions and cheap Chinese imports, partly offset by
higher sales at the ferro alloys and mineral division as the previous year was impacted by closure of
mines and change in mines lease policy by the Government of Odisha.
Raw Materials Consumed
Raw materials consumed decreased by 16.9% to Rs.97,000 million for the year ended March 31, 2016
from Rs.116,786 million for the year ended March 31, 2015. This decrease was primarily due to lower
consumption of purchased iron ore and pellet as previous year was impacted on account of temporary
closure of mines along with lower consumption of imported coal and coke.
Purchase of Finished, Semi-finished Steel and Other Products
The purchase of finished steel, semi-finished steel and other products increased by 44.1% to Rs.9,915
million for the year ended March 31, 2016 from Rs.6,883 million for the year ended March 31, 2015.
This increase was primarily due to higher purchases of wire rods and imported rebars.
Employee Benefits Expense
Employee benefits expense decreased by 6.0% to Rs.43,249 million for the year ended March 31, 2016
from Rs.46,019 million for the year ended March 31, 2015. This decrease was primarily due to a
change in actuarial estimates for the year ended March 31, 2015, resulting in an additional charge
reflecting discount rates for the year ended March 31, 2015, partly offset by an increase in normal
salary revisions and its consequential impact on retiral provisions.
The total strength of permanent employees in the Indian operations decreased to 35,439 as on March
31, 2016 from 36,957 as on March 31, 2015.
122

Depreciation and Amortization Expenses
Depreciation and amortization expenses decreased by 3.2% to Rs.19,331 million for the year ended
March 31, 2016 from Rs.19,976 million for the year ended March 31, 2015. This decrease was
primarily due to the inclusion of stamp duty and registration charges payable on grant and renewal of
mining leases for the year ended March 31, 2015.
Finance Costs
Finance costs decreased by 26.1% to Rs.14,603 million for the year ended March 31, 2016 from
Rs.19,760 million for the year ended March 31, 2015. This decrease was primarily at Tata Steel India
due to higher interest capitalization related to Kalinganagar operations.
Other Expenses
Other expenses increased by 2.0% to Rs.158,392 million for the year ended March 31, 2016 from
Rs.155,233 million for the year ended March 31, 2015. This increase was mainly due to an increase
in purchase of power, an increase in freight and handling charges and an increase in conversion
charges. The increase in purchase of power was primarily due to the increase in cost of consumption
at Jamshedpur and at the ferro alloys and minerals division, attributable to higher production. The
increase in freight and handling charges was primarily due to higher sales volume.
Exceptional Items
Exceptional items consisted of profit on sale of non-current investments, profit on sale of non-current
asset, provision for diminution in value of doubtful advances and investments, provision for
impairment of non-current assets, provision for demands and claims and employee separation
compensation.
For the year ended March 31, 2016, profit on sale investments in subsidiaries, associates and others
was Rs.1,043 million compared to Rs.8,061 million for the year ended March 31, 2015, primarily
relating to profit on divestment in The Dhamra Port Company Limited and Lanka Special Steels Ltd.
For the year ended March 31, 2015, profit on sale of non-current assets was Rs.11,469 million,
primarily relating to profit on sale of land at Borivali, Mumbai.
For the year ended March 31, 2016, provision for diminution was Rs.1,260 million was primarily due
to investment exposure in Tayo Rolls Limited (a subsidiary), Adityapur Toll Bridge Company Limited
(a subsidiary), Tata Korf Engineering Services Ltd (a subsidiary) and Strategic Energy Technology
Systems Private Limited (an associate) compared to Rs.1,984 million for the year ended March 31,
2015, primarily due to investment exposure in subsidiaries Tayo Rolls Limited and Adityapur Toll
Bridge Company Limited. A provision of Rs.730 million was taken for the year ended March 31, 2016
due to investment exposure in Chhattisgarh Project.
For the year ended March 31, 2016, impairment loss recognised was Rs.515 million with respect to
fixed assets and inventory in certain non-performing business units compared to the reversal of
impairment loss of Rs.1,363 million for the year ended March 31, 2015 with respect to land acquired
in Gopalpur.
For the year ended March 31, 2016, provision for demands and claims was Rs.8,801 million, primarily
relating to the Indian operations for year ended March 31, 2016.
123

For the year ended March 31, 2016, provision for the employee separation scheme was Rs.5,563million.
Tax Expense
Tax expenses decreased by 40.8% to Rs.12,256 million for the year ended March 31, 2016 fromRs.20,698 million for the year ended March 31, 2015.
Profit/(Loss) after Tax
As a result of the foregoing, the Group recorded a profit after tax of Rs.49,010 million for the yearended March 31, 2016 compared to a profit after tax of Rs.64,391 million for the year ended March31, 2015.
Liquidity and Capital Resources
Cash Flow Data
The Group seeks, in normal circumstances, to maintain a substantial cash and cash equivalents balanceto provide it with financial liquidity and operational flexibility. Cash is placed in bank fixed deposits,certificates of deposit with banks and mutual funds. As at March 31, 2017, Group had cash and cashequivalents of Rs.9,052 million.
The following table sets forth selected items from cash flow statement for the periods indicated:
Standalone Cash Flow Statement of Tata Steel Year ended March 31,
(Ind-AS) 2016 2017
(Rs. in millions)
(audited)
Net cash flow from/(used in) operating activities . . . . . . . . . . . . 73,718 111,313
Net cash from/(used in) investing activities . . . . . . . . . . . . . . . . (43,517) (39,210)
Net cash flow from/(used in) financing activities . . . . . . . . . . . . (25,404) (72,797)
Net increase/(decrease) in cash and cash equivalents . . . . . . . . . 4,796 (695)
Closing cash and cash equivalents . . . . . . . . . . . . . . . . . . . . . . 9,747 9,052
Cash Flows Generated from Operating Activities
The Group generated Rs.111,313 million from operations for the year ended March 31, 2017 comparedto Rs.73,718 million for the year ended March 31, 2016. The cash operating profit before workingcapital changes and direct taxes during year was Rs.115,607 million for the year ended March 31, 2017compared to Rs.76,219 million for the year ended March 31, 2016 primarily due to higher profitability.Cash from operations for the year ended March 31, 2017 was Rs.126,721 million compared toRs.86,159 for the year ended March 31, 2016, which is in line with higher profitability, along with adecrease of Rs.11,115 million in working capital for the year ended March 31, 2017, compared to adecrease of Rs.9,940 million in working capital for the year ended March 31, 2016. The payment ofincome taxes for the year ended March 31, 2017 was Rs.15,409 million compared to Rs.12,441 millionfor the year ended March 31, 2016.
Cash Flows Generated From/(Used in) Investing Activities
Cash used in investing activities was Rs.39,210 million for the year ended March 31, 2017 comparedto Rs.43,517 million for the year ended March 31, 2016. The outflow during the year broadlyrepresents capital expenditure, which totaled Rs.31,728 million and purchase (net of sale) of currentinvestments which totaled Rs.6,682 million.
124

Cash Flows Generated From/(Used in) Financing Activities
Cash used in financing activities (which consists of loan receipts net of loan repayments interest
payments and dividend payments) for the year ended March 31, 2017 was Rs.72,797 million compared
to Rs.25,404 million for the year ended March 31, 2016.
The net decrease in cash and cash equivalents was Rs.695 million for the year ended March 31, 2017,
with a balance of Rs.9,052 million as on March 31, 2017 against a balance of Rs.9,747 million as on
March 31, 2016.
Standalone Cash Flow Statement of Tata Steel Year ended March 31,
(Indian GAAP) 2015 2016
(audited)
(Rs. in millions)
Net cash flow from/(used in) operating activities . . . . . . . . . . . . 48,519 75,677
Net cash from/(used in) investing activities . . . . . . . . . . . . . . . . (23,821) (54,052)
Net cash flow from/(used in) financing activities . . . . . . . . . . . . (29,572) (16,310)
Net increase/(decrease) in cash and cash equivalents . . . . . . . . . (4,874) 5,314
Closing cash and cash equivalents . . . . . . . . . . . . . . . . . . . . . . 4,219 9,532
Cash Flows Generated from Operating Activities
The Group generated Rs.75,677 million from operations for the year ended March 31, 2016 compared
to Rs.48,519 million for the year ended March 31, 2015. The cash operating profit before working
capital changes and direct taxes for the year ended March 31, 2016 was Rs.72,303 million compared
to Rs.106,579 million for the year ended March 31, 2015, primarily due to a decline in profitability.
Cash from operations for the year ended March 31, 2016 was Rs.88,118 compared to Rs.69,052 million
for the year ended March 31, 2015, primarily due to a decrease of Rs.15,815 million in working capital
for the year ended March 31, 2016, compared to an increase of Rs.37,528 million in the previous year,
and partly offset by lower profitability. The payment of income taxes for the year ended March 31,
2016 was Rs.12,441 million compared to Rs.20,533 million for the year ended March 31, 2015.
Cash Flows Generated From/(Used in) Investing Activities
Cash used in investing activities was Rs.54,052 million for the year ended March 31, 2016 compared
to Rs.23,821 million for the year ended March 31, 2015. The outflow during the year broadly
represents capital expenditure, which totaled Rs.58,281 million and purchase (net of sale) of current
investments. These increases were partly offset by sales of non-current investments.
Cash Flows Generated From/(Used in) Financing Activities
Cash used in financing activities (which consists of loan receipts net of loan repayments interest
payments and dividend payments) for the year ended March 31, 2016 was Rs.16,310 million compared
to Rs.29,572 million for the year ended March 31, 2015.
The net increase in cash and cash equivalents was Rs.5,314 million for the year ended March 31, 2016,
with a balance of Rs.9,532 million as on March 31, 2016 against a balance of Rs.4,219 million as on
March 31, 2015.
125

INDUSTRY OVERVIEW
Market data and certain industry forecasts used in “Industry Overview” were obtained from internal
surveys, market research, publicly available information and industry publications published by the
World Steel Association, India’s Ministry of Steel, the International Monetary Fund and the OECD.
Such information has been accurately reproduced herein and, as far as the Group is aware and is able
to ascertain from information published by such third parties, no facts have been omitted which would
render the reproduced information inaccurate or misleading. Industry publications generally state
that the information that they contain has been obtained from sources believed to be reliable but that
the accuracy and completeness of that information is not guaranteed. Similarly, internal surveys,
industry forecasts and market research, while believed to be reliable, have not been independently
verified, and neither the Group nor any of the Joint Lead Managers makes any representation as to
the accuracy or completeness of this information.
Overview
Steel is a metal alloy consisting of iron as the key component. Steel also consists of carbon and other
alloys, which vary according to the grade of steel, and is generally considered to be a cornerstone of
industrial development. Steel is highly versatile, as it is hot and cold formable, weldable, hard,
lustrous, a good conductor of heat and electricity, malleable, ductile, recyclable and resistant to
corrosion, water and heat. The industries in which steel is used include construction, automotive and
transportation and engineering. Steel is also used in the production of power lines, pipelines, electrical
and electronic appliances and containers.
According to India’s Ministry of Steel, India is currently the third largest producer of crude steel in
the world as well as the largest producer of sponge iron globally between 2003 and 2015. From
2016-17, as per provisional data from the Ministry of Steel, the total production for sale of finished
steel was 100.74 mt, a growth of 10.7% over 2015-16. Production for sale of pig iron in 2016-17
(prov.) was 9.39 mt, a growth of 1.8% over 2015-16.
Price regulation of iron and steel was abolished in January 1992. Domestic steel prices are influenced
by trends in raw material prices, demand — supply conditions in the market and international price
trends among others.
An Inter-Ministerial Group within the Ministry of Steel works under the Chairmanship of the
Secretary (Steel) to monitor and coordinate major steel investments in the country. As a facilitator, the
Government monitors steel market conditions and adopts fiscal and other policy measures based on
its assessment. Currently, Goods and Services Tax of 18% is applicable on steel, and there is no export
duty on steel items. The government has also imposed an export duty of 30% on all forms of iron ore
except low grade (below Fe 58%) iron ore lump and fines and iron ore pellets both of which have zero
export duty.
The government has also released a National Steel Policy which aims to increase steel production and
gives preference to domestically manufactured steel. Its objective is to make India self-sufficient in
steel production and projects crude steel capacity of 300 mt and per capita consumption of 160 kg of
finished steel by 2030-31.
126

Production Process
The conventional production of steel from iron ore (which consists primarily of iron and oxygen)
begins with the reduction of iron ore in a blast furnace (the “BF”) using metallurgical coke as a
reducing agent. The metal produced in the BF is then processed in a basic oxygen furnace (the “BOF”),where oxygen is blown into molten iron in order to reduce its carbon content. In 2013, the BF-BOFprocess was used in the production of approximately 71.2% of the steel produced globally, accordingto the WSA. The metallurgical coke used in the BF-BOF process is produced out of low ash-contentcoking coal.
Due to inadequate supplies of coking coal in some parts of the world, a second steel-producingprocess, the electric arc furnace (“EAF”) method, was developed. In the EAF process, steel scrap ordirectly reduced iron (“DRI”) is charged in an EAF and is melted using graphite electrodes.
An alternative way of producing steel is by using a medium or high frequency electrical inductionfurnace (“IF”). In the IF, metal is melted through electro-magnetic induction in an electricallyconductive metal coil. Mild steel, stainless steel and low and high alloy steel can be made by usinginduction furnaces. Alloying elements are added to the molten metal, as needed based on themetallurgical grade to be produced.
The major raw materials used in steel production depend on the production technology. The BF-BOFprocess mainly requires iron ore and coke that, in turn, requires coking coal, the DRI-EAF processrequires scrap or sponge iron and non-coking coal and the induction furnace requires scrap and DRI.The availability of the relevant raw materials at commercial prices is essential to sustain profits forsteel producers.
Products
Steel produced by these processes is either cast into long products such as bars, rods, rails andstructural shapes or into flat products such as hot rolled (“HR”) coils and sheets.
Long products are so called because they come out of the mill as long bars of steel. However, theyare produced in a wide range of shapes and sizes and can have cross-sections shaped like an H or I(called joists, beams and columns), a U (channels) or a T (sections). Long products are principallyused in the construction industry and also used in the production of capital goods and railways.
Flat products, mainly in the form of HR coils and sheets, are used in structural materials, welded pipesand tubes and in the automobile and white goods (home appliances) industries. The major end-usesectors for pipes and tubes are water supply and distribution, other industrial applications, housingapplications and transport of petroleum products. Welded steel pipes are manufactured from HR coilsby electrical resistance welding and are used in many piping applications. Submerged arc-weldedpipes are manufactured from HR coils and are mainly used in the supply and distribution of water andgases. Seamless steel pipes and tubes manufactured from HR coils are used in the oil and gas sectors.
HR coils can also be further processed in cold rolling mills to produce cold rolled products by passingthe HR coils or strips through rollers at room temperature to reduce their thickness. “Rolling” is themain method used to shape steel into different products. Rolling the steel by passing it between a setof rolls revolving at the same speed but in opposite directions makes the otherwise coarse grainstructure of cast steel re-crystallize into a much finer grain structure, giving greater toughness, shockresistance and tensile strength. In addition to hot rolling, in which the steel is rolled at a hightemperature, steel may also be rolled at ambient temperatures, resulting in a different set of physicaland metallurgical properties.
127

The Global Steel Industry
The global steel industry is cyclical and the growth or decline of the steel industry is linked to the
economic cycle of a country and in particular, to industrial production and infrastructure development.
Global production capacity, trade policies of countries and the regional demand-supply scenario also
strongly influence the industry. Steel producers may attempt to reduce the impact of cyclicality
through various measures like diversification of manufacturing operations to various geographies
(preferably emerging markets with low-cost operations), diversification of customer base and focus on
value-added products.
The global economic recovery is now more broad. Global growth, which in 2016 was the weakest since
the global financial crisis at 3.2 percent, is projected to rise to 3.6% in 2017 and to 3.7% in 2018.
Broad-based upward revisions in the euro area, Japan, emerging Asia, emerging Europe, and Russia
where growth outcomes in the first half of 2017 were better than expected and offset downward
revisions for the United States and the United Kingdom.
(Source: IMF World Economic Outlook — Oct 2017)
The following table shows GDP growth estimates across various geographical distributions:
GDP Growth estimates (%)
CY14/
FY15
CY15/
FY16
CY16/
FY17
CY17/
FY18
CY18/
FY19
CY19/
FY20
CY20/
FY21
CY21/
FY22
CY22/
FY23
World. . . . . . . . . 3.6% 3.4% 3.2% 3.6% 3.7% 3.7% 3.7% 3.8% 3.8%
Euro Area . . . . . 1.3% 2.0% 1.8% 2.1% 1.9% 1.7% 1.6% 1.5% 1.5%
UK. . . . . . . . . . . 3.1% 2.2% 1.8% 1.7% 1.5% 1.6% 1.7% 1.7% 1.7%
Germany . . . . . . 1.9% 1.5% 1.9% 2.1% 1.8% 1.5% 1.4% 1.3% 1.2%
France . . . . . . . . 0.9% 1.1% 1.2% 1.6% 1.8% 1.9% 1.9% 1.9% 1.8%
Spain . . . . . . . . . 1.4% 3.2% 3.2% 3.1% 2.5% 2.0% 1.9% 1.7% 1.7%
India . . . . . . . . . 6.4% 7.5% 8.0% 6.8% 7.4% 7.5% 7.5% 7.5% 7.5%
Thailand . . . . . . 0.9% 2.9% 3.2% 3.7% 3.5% 3.4% 3.1% 3.0% 3.0%
China . . . . . . . . . 7.3% 6.9% 6.7% 6.6% 6.5% 6.3% 6.2% 6.0% 5.8%
(Source: IMF World Economic Outlook Database - Oct 2017)
Global Steel Production
World crude steelmaking capacity increased by 13% in 2016, to a level of 2,380.7 mtpa from 2,350.8
mtpa in 2015. Nearly 40 mtpa of gross capacity additions are currently underway and could come on
stream during the three-year period of 2017 to 2019, while an additional 54.5 mtpa of capacity
additions are currently in the planning stages for possible start-up during the same time period.
128

The following table shows global steel production capacity:
Year Capacity
(million tons)
2010 . . . . . . . . . . . . . . . . . . . . . . . . . . . . . . . . . . . . . . . . . . . . . . . . . . . . . . . . . . . 1,893
2011 . . . . . . . . . . . . . . . . . . . . . . . . . . . . . . . . . . . . . . . . . . . . . . . . . . . . . . . . . . . 1,988
2012 . . . . . . . . . . . . . . . . . . . . . . . . . . . . . . . . . . . . . . . . . . . . . . . . . . . . . . . . . . . 2,102
2013 . . . . . . . . . . . . . . . . . . . . . . . . . . . . . . . . . . . . . . . . . . . . . . . . . . . . . . . . . . . 2,274
2014 . . . . . . . . . . . . . . . . . . . . . . . . . . . . . . . . . . . . . . . . . . . . . . . . . . . . . . . . . . . 2,317
2015 . . . . . . . . . . . . . . . . . . . . . . . . . . . . . . . . . . . . . . . . . . . . . . . . . . . . . . . . . . . 2,351
2016 . . . . . . . . . . . . . . . . . . . . . . . . . . . . . . . . . . . . . . . . . . . . . . . . . . . . . . . . . . . 2,356
2017 (Est.) . . . . . . . . . . . . . . . . . . . . . . . . . . . . . . . . . . . . . . . . . . . . . . . . . . . . . . . 2,370
(Source: (OECD) Organization for Economic Co-operation and Development)
The following table shows global crude steel production for the periods presented.
Global crude steel production (million tons)
2010 2011 2012 2013 2014 2015 2016
World. . . . . . . . . 1,433.4 1,538.0 1,560.1 1,650.4 1,669.9 1,620.0 1,608.5
Euro Area . . . . . 172.9 177.8 168.6 166.4 169.3 166.1 162.1
UK. . . . . . . . . . . 9.7 9.5 9.6 11.9 12.1 10.9 7.8
Germany . . . . . . 43.8 44.3 42.7 42.6 42.9 42.7 42.1
France . . . . . . . . 15.4 15.8 15.6 15.7 16.1 15.0 14.4
Spain . . . . . . . . . 16.3 15.5 13.6 14.3 14.2 14.8 13.6
India . . . . . . . . . 69.0 73.5 77.3 81.3 87.3 89.0 95.5
China . . . . . . . . . 638.7 702.0 731.0 822.0 822.8 803.8 807.7
(Source: World Steel Association)
The following table shows crude steel production share by geography for the periods presented.
Crude steel production:
Geographical Distribution
2015 2016
China . . . . . . . . . . . . . . . . . . . . . . . . . . . . . . . . . . . . . . . . . . . . . . 49.62% 50.2%
South Korea . . . . . . . . . . . . . . . . . . . . . . . . . . . . . . . . . . . . . . . . . 4.30% 4.3%
EU-28 . . . . . . . . . . . . . . . . . . . . . . . . . . . . . . . . . . . . . . . . . . . . . 10.25% 10.1%
India . . . . . . . . . . . . . . . . . . . . . . . . . . . . . . . . . . . . . . . . . . . . . . 5.50% 5.9%
Japan . . . . . . . . . . . . . . . . . . . . . . . . . . . . . . . . . . . . . . . . . . . . . . 6.49% 6.5%
USA. . . . . . . . . . . . . . . . . . . . . . . . . . . . . . . . . . . . . . . . . . . . . . . 4.87% 4.9%
Russia . . . . . . . . . . . . . . . . . . . . . . . . . . . . . . . . . . . . . . . . . . . . . 4.38% 4.4%
Rest of World . . . . . . . . . . . . . . . . . . . . . . . . . . . . . . . . . . . . . . . 14.60% 13.7%
(Source: World Steel Association)
129

The following table shows the top 15 steel makers in the world in 2016:
RANK COMPANY TONNAGE 2016
1 ArcelorMittal ............................................................................................... 95.45
2 China Baowu Group..................................................................................... 63.81
3 HBIS Group ................................................................................................. 46.18
4 NSSMC Group ............................................................................................. 46.16
5 POSCO ........................................................................................................ 41.56
6 Shagang Group ............................................................................................ 33.25
7 Ansteel Group.............................................................................................. 33.19
8 JFE Steel Corporation .................................................................................. 30.29
9 Shougang Group .......................................................................................... 26.80
10 Tata Steel Group .......................................................................................... 24.49
11 Shandong Steel Group.................................................................................. 23.02
12 Nucor Corporation ....................................................................................... 21.95
13 Hyundai Steel Company ............................................................................... 20.09
14 Maanshan Steel ............................................................................................ 18.63
15 Thyssenkrupp AG......................................................................................... 17.24
(Source: World Steel Association)
Global Steel Consumption
Global steel demand is expected to reach 1,622.1 mt in 2017. In 2018, it is forecast that global steeldemand will reach 1,648.1 mt. Global steel demand, excluding China, will reach 856.4 mt, an increaseof 2.6% in 2017 and 882.4 mt, an increase of 3.0% in 2018.
India witnessed slowdown in economic activity in 2017, but accelerating government reforms areexpected to bring about a better investment environment leading to growth in the coming years.Investment activities are still driven by government initiatives and private sector investment is stillrestrained due to leveraged corporate balance sheets.
The apparent steel usage (ASU), defined as production plus net imports minus net exports, is providedbelow:
Apparent Steel Use (million tons)
2010 2011 2012 2013 2014 2015 2016 2017 2018
World. . . . . . . . . 1,310.8 1,415.1 1,443.2 1,535.2 1,545.8 1,500.7 1,515.9 1,622.1 1,648.1
Euro Area . . . . . 147.9 158.2 141.4 142.4 149.0 153.9 158.2 162.1 164.3
UK. . . . . . . . . . . 9.9 10.2 9.6 9.6 10.7 10.5 10.7 11.2 11.2
Germany . . . . . . 36.2 40.7 37.5 38.0 39.6 39.3 40.5 41.4 41.6
France . . . . . . . . 14.4 15.2 13.2 12.6 12.5 12.7 13.2 13.4 13.6
Spain . . . . . . . . . 13.1 13.1 10.4 10.9 11.6 12.6 12.6 13.2 13.7
India . . . . . . . . . 64.9 69.8 72.4 73.7 75.9 80.2 83.5 87.1 92.1
China . . . . . . . . . 587.6 641.2 660.1 735.1 710.8 672.3 681.0 765.7 765.7
(Source: World Steel Association)
130

Global Steel Prices
Steel prices are volatile and fluctuate in response to changes in global supply and demand, raw
material costs and general economic conditions. After a downturn in demand beginning in 1998, global
steel prices hit a historic low in the third quarter of 2001. Since then, global steel prices have generally
increased, reflecting stronger global demand, led primarily by China. In the third quarter of 2008,
global steel prices declined sharply due to weak global economic conditions which led to a fall in
global demand. The steel industry also fluctuates in response to a combination of factors, including
the availability and cost of raw materials, global production capacity, the existence of, and changes
in, steel imports, exchange rates, transportation and labor costs and protective trade measures.
Key Growth Drivers for Indian Steel Industry
There are several protectionist measures, including safeguards, anti-dumping measures and quality
control orders applicable for the Indian steel industry. For example, for hot roll in coil products, a duty
rate of 20% was imposed in March 2016, and for products without hot roll in coil, a duty rate of 10%
was imposed in November 2016. Additionally, for cold roll products, a five year anti-dumping measure
was enacted in August 2016. For wire rod and coated sheets, strips and coils, a quality control order
was released in October 2017 to ensure that qualifying products met minimum quality thresholds.
Anti-dumping duty
In view of rising imports, the government raised the import duty on most steel items twice, each time
by 2.5% and has also imposed a gamut of measures including anti-dumping and safeguard duties on
a host of applicable iron and steel items. In a further move to curb steel imports, the Indian
government banned the production and sale of steel products that does not meet Bureau of Indian
Standard approval. In February 2016, the Indian government imposed a Minimum Import Price
(“MIP”) condition on 173 steel products. The MIP was extended three times since and ceased to be
in effect in February 2017. Currently, a mix of anti-dumping, safeguard and other measures are in
place on a range of steel items to control the inflow of cheap steel. Furthermore, a Steel Price
Monitoring Committee has been formed by the government with the aim to monitor price
rationalization, analyse price fluctuations and advise all concerned regarding any irrational price
behavior of steel commodity.
Global Market Outlook
The World Steel Association in its October 2017 Short Range Outlook report forecasted that global
steel demand will reach 1,622.1 mt in 2017 and 1,648.1 mt in 2018. The report also forecasted that
global steel demand excluding China will reach 856.4 mt, an increase of 2.6% in 2017 and 882.4 mt,
an increase of 3.0% in 2018.
131

The geographical forecasted growth is as per below:
China closed most of its outdated induction furnaces in 2017, a category which was generally notcaptured in official statistics as per Worldsteel. With the closure of induction furnaces, demand fromthis sector of the market is now satisfied by mainstream steel makers and therefore captured in theofficial statistics in 2017. Consequently, the nominal growth rate for steel demand in China increasedto 12.4%, or 765.7 mt. Disregarding this statistical base effect Worldsteel expects that the underlyinggrowth rate of China’s steel demand for 2017 will be 3%, which will make the corresponding globalgrowth rate 2.8%.
As per Worldsteel, developing countries have benefitted from the strengthening of the global economy.The reform agendas in many developing countries such as Egypt, Brazil, Argentina, Mexico and Indiaare expected to enhance their growth potential over time.
While India had a slowdown in economic activity in 2017, accelerating government reforms areexpected to bring about a better investment environment leading to growth in the coming years.Investment activities are still driven by government initiatives and private sector investment is stillrestrained due to leveraged corporate balance sheets.
ASEAN remains a high growth region, especially Vietnam and the Philippines, while more matureeconomies such as Thailand and Malaysia are showing slower growth.
Outlook
With several budgetary allocations boosting infrastructure, the demand of steel and steel products isexpected to rise. Another major policy reform favoring the Indian companies is the recent ruling thatdomestic steel will be given preference in government projects as part of the Make in Indiaprogramme.
132

DESCRIPTION OF THE ISSUER
The Issuer was incorporated in Singapore on April 12, 2013 as “ABJA Investments Co. Pte. Ltd.”,
registration number 201309883M, and has its registered office at 22 Tanjong Kling Road, Singapore
628048.
Business
The principal activities of the Issuer are the provision of treasury services for and on behalf of the
Group. Since its incorporation, the Issuer has not engaged in any material activities other than the
proposed issue of the Notes and the authorization of documents and agreements referred to in this
Offering Memorandum to which it is or will be a party, as well as the issuance of the 2020 Notes, 2023
Notes and 2024 Notes (as defined below) and activities relating to the use of proceeds therefrom.
The issuance of the Notes was approved by the Board of Directors on behalf of the Issuer on January
11, 2018.
The directors of the Issuer at the date of this Offering Memorandum are Sandip Biswas, appointed
April 12, 2013, Sanjib Nanda, appointed on May 31, 2017, and Samita Shah, appointed on September
1, 2014.
The registered office of the Issuer is at 22 Tanjong Kling Road, Singapore 628048.
Debt
The Issuer issued S$300,000,000 4.95% Guaranteed Notes due 2023 (the “2023 Notes”) on May 3,
2013. The principal amount outstanding is not amortizing and is due in full on May 3, 2023. Interest
is payable semi-annually in arrears on each of May 3 and November 3. The Issuer issued
US$500,000,000 4.85% Guaranteed Notes due 2020 (the “2020 Notes”) on July 31, 2014. The
principal amount outstanding is not amortizing and is due in full on January 31, 2020. Interest is
payable semi-annually in arrears on each of January 31 and July 31. The Issuer issued
US$1,000,000,000 5.95% Guaranteed Notes due 2024 (the “2024 Notes”) on July 31, 2014. The
principal amount outstanding is not amortizing and is due in full on July 31, 2024. Interest is payable
semi-annually in arrears on each of January 31 and July 31. Other than the 2023 Notes, the 2020 Notes
and the 2024 Notes, as of the date of this Offering Memorandum, the Issuer has no borrowings or
indebtedness in the nature of borrowings (including loan capital issued, or created but unused), term
loans, liabilities under acceptances or acceptance credits, mortgages, charges or guarantees or other
contingent liabilities, except an outstanding loan in the amount of US$21.8 million taken from the
Group.
The table below reflects the statement of financial position of the Issuer as at September 30, 2017.
133

Statement of Financial Position of ABJA Investment Co. Pte. Ltd.
As at
September 30, As at March 31,
SFRS 2017 2017 2016 2015
(unaudited) (audited)
(US$ in
thousand) (US$ in thousand)
ASSETS
Current assets
Cash and cash equivalents . . . . . . . . . . . . 2,497 16,233 11,770 7,360
Other receivables . . . . . . . . . . . . . . . . . . . 26,159 24,848 21,699 17,235
Derivative financial instruments . . . . . . . . 0 309 150 265
Total current assets . . . . . . . . . . . . . . . . 28,656 41,390 33,619 24,860
Non-current asset
Loan receivables due from relatedcompanies. . . . . . . . . . . . . . . . . . . . . . . 1,695,195 1,679,085 1,690,932 1,670,502
Derivative financial instruments . . . . . . . . 2,816 12,808 4,793 7,563
Total non-current asset . . . . . . . . . . . . . 1,698,011 1,691,893 1,695,725 1,678,065
TOTAL ASSETS . . . . . . . . . . . . . . . . . . 1,726,667 1,733,283 1,729,344 1,702,925
LIABILITIES AND NET CAPITALDEFICIENCY
Current liabilities
Other payables . . . . . . . . . . . . . . . . . . . . . 24,742 27,879 32,254 24,564
Loan payable . . . . . . . . . . . . . . . . . . . . . . 0 0 37,800 37,800
Derivative financial instrument . . . . . . . . 53 — — —
Tax payable . . . . . . . . . . . . . . . . . . . . . . . 1,800 1,707 450 310
Total current liabilities . . . . . . . . . . . . . 26,595 29,586 70,504 62,674
Non-current liabilities
Guaranteed notes . . . . . . . . . . . . . . . . . . . 1,709,138 1,703,077 1,708,921 1,702,524
Loans payable due to related company . . . 21,800 37,800 0 0
Deferred tax liability . . . . . . . . . . . . . . . . 1,817 1,797 1,796 93
Other Payable . . . . . . . . . . . . . . . . . . . . . 2,406 1,907 0 0
Derivative financial instruments . . . . . . . . 1,102 68 688 469
Total non-current liabilities . . . . . . . . . . 1,736,263 1,744,649 1,711,405 1,703,086
Capital, accumulated losses and reserve
Share capital . . . . . . . . . . . . . . . . . . . . . . 200 200 200 200
Accumulated losses . . . . . . . . . . . . . . . . . (36,381) (41,142) (52,755) (63,025)
Translation reserve . . . . . . . . . . . . . . . . . . (10) (10) (10) (10)
Net capital deficiency . . . . . . . . . . . . . . . (36,191) (40,952) (52,565) (62,835)
Total liabilities and net of capitaldeficiency . . . . . . . . . . . . . . . . . . . . . . 1,726,667 1,733,283 1,729,344 1,702,925
134

BUSINESS
Unless otherwise stated, the financial information used in this section is derived from the Group’sconsolidated financial statements as of and for the six month period ended September 30, 2017, ofwhich the quarter ended September 30, 2017 has been subjected to limited review, and its auditedconsolidated financial statements as of and for the years ended March 31, 2017 and March 31, 2016.
Overview
The Group is one of the world’s largest steel companies with a steel production capacity ofapproximately 27.5 mtpa. According to the World Steel Association (“WSA”), the Group was theworld’s 10th largest steel maker by crude steel production volume in 2016. The Group is also one ofthe most geographically diversified steel producers, with operations in 26 countries and a commercialpresence in more than 50 countries. As of March 31, 2017, the Group had over 70,000 employees.
Tata Steel was established as India’s first integrated steel company in 1907 by Jamsetji N. Tata andis one of the flagship companies of the Group. The Group has a presence across the entire value chainof steel manufacturing, including producing and distributing finished products as well as mining andprocessing iron ore and coal for its steel production. The Group’s operations are primarily focused inIndia, Europe, and South East Asia. For the year ended March 31, 2017, the Group’s operations inIndia and Europe represented approximately 43% and 39%, respectively, of the revenue of the Group,and for the six months ended September 30, 2017, represented approximately 45% and 46%,respectively, of the revenue of the Group.
The steel production capacity of the Group has increased from approximately 5.0 mtpa in the yearended March 31, 2006 to approximately 27.5 mtpa as of March 31, 2017. In India, as of September30, 2017, the Group has steel production facilities located in Jamshedpur and Kalinganagar, with atotal steel production capacity of 12.7 mtpa. The Group’s operations in India also include captive ironore and coal mines. Additionally, the Group has significant operations in the United Kingdom and theNetherlands, where the Group has a total steel production capacity of 12.4 mtpa. The remaining steelproduction capacity of the Group is located in South East Asia.
For the year ended March 31, 2017, the Group’s business in India recorded sales of 10.97 mt,recording a growth of 15.0% over the year ended March 31, 2016 and a growth of 22.0% for the sixmonths ended September 30, 2017, compared to the six months ended September 30, 2016. Thisincrease was largely due to the ramping up of operations at the Kalinganagar plant in Odisha, whichis now operating at full capacity.
The Group offers a broad range of steel products including a portfolio of high value-addeddownstream products such as hot rolled, cold rolled and coated steel, sections, plates, rebars, wirerods, tubes, rails and wires. The Group is also a large producer of ferro-chrome in India.
The Group’s main markets for its products are India and Europe, which together accounted forapproximately 82% and 83% of the Group’s revenue for the year ended March 31, 2016 and 2017,respectively, with the remaining sales primarily taking place in other markets in Asia. The Group’scustomers are primarily in the construction, infrastructure, automotive, consumer goods, materialhandling, aerospace and general engineering industries.
For the years ended March 31, 2016 and 2017, the Group recorded revenues of Rs.1,063,399 millionand Rs.1,174,199 million, respectively. The Group recorded a loss of Rs.4,971 million for the yearended March 31, 2016, a loss of Rs.41,686 million for the year ended March 31, 2017, a profit ofRs.19,389 million for the six months ended September 30, 2017 against a loss of Rs.32,325 millionfor the six months ended September 30, 2016. The Group had total assets of Rs.1,733,332 million asof March 31, 2017 and Rs.1,742,203 million as of September 30, 2017.
135

For the years ended March 31, 2016 and 2017, the Group had total steel production of 22.9 mt and24.2 mt, respectively. Similarly, the Group had steel production of 11.5 mt and 12.5 mt for the sixmonth periods ended on September 30, 2016 and September 30 2017, respectively.
Key Strengths
Sustainable and highly cost efficient operations in India
The Group is one of the lowest cost steel producers in India and it has successfully maintained its costleadership over several years. The cost of production of the Group’s Indian operations ranks amongthe lowest for hot rolled coils globally. The Group derives its competitive advantage through accessto raw materials from their captive mines and a highly skilled workforce with a relatively low cost oflabor at its operations in India. This advantage is especially valuable given the difficulty of achievingraw materials cost pass-through in the steel industry. In India, the Group has significant captive ironore, coking coal, chrome ore and manganese ore mines that accommodate a majority of its currentrequirements.
These factors have enabled the Group’s Indian operations to maintain robust operating margins inIndia. For the year ended March 31, 2017, with respect to its Indian operations, the Group obtained100% of its iron ore requirements and approximately 36% of its coking coal requirement from captivemines leased by the Group.
As a result, the Group expects that its exposure to volatility in prices of commodities such as iron oreand coking coal, for the Group’s Indian operations will be limited.
To expedite projects related to operational excellence across the value chain, in 2014, the Grouplaunched the SHIKHAR 25 program. The focus of SHIKHAR 25 is to improve process efficiency,speed and throughput, reliability, energy efficiency, value-in-use, supply chain and logistics and otherprocesses. Performance benchmarking at each of these processes allows the Group to readily identifyareas in need of improvement. The ultimate goal of SHIKHAR 25 is to improve overall processefficiency that would translate into EBITDA improvement. These initiatives resulted in approximatelyRs.34,000 million of cost savings in the year ended March 31, 2017.
Leading position across operations
The Group has significant market positions in its principal markets, India and Europe, across mainareas of operations in upstream and downstream steel products.
In India, the Group produces flat products used in the automotive and engineering industries and longproducts used in the construction industry, including in the industrial, commercial, infrastructure andhousing sectors. According to the Joint Plant Committee, the Group’s Indian operations producedapproximately 12% of sales of all the finished steel in India and was the third largest producer of crudesteel for year ended March 31, 2017. According to the Joint Plant Committee, the Group had a marketshare of 15.7% of sales in flat products for carbon steel for the year ended March 31, 2017.
In addition, the Group also benefits from being identified with the Tata brand, which is a widelyrecognized brand in India.
India is principally the largest market for the Group’s operations, representing approximately 43% ofits total revenue for the year ended March 31, 2017. The Group believes that its diversified customersector portfolio and strategic focus on creating customer relationships will continue to generatecustomer loyalty and enable it to maintain its market share position in the construction, packaging, railand automotive sectors.
136

Global scale
The Group is one of the world’s largest steel companies and operates a global suite of integrated steelmaking facilities, mining complexes and distribution companies. It has a commercial presence in over50 countries, including both developed and emerging markets, and principal markets in Europe, Indiaand South East Asia. The Group believes that its global scale and reach enhances its ability to service,retain and attract multi-national customers and, in particular, customers from the automotive,packaging and construction industries. As major customers continue to globalize their operations andare increasingly relying on a select few global suppliers for their products (such as in the automotivesector), the Group believes it can attract new customers and better retain its existing customersthrough its diversified downstream operations, product range and strong product branding, as well asits extensive distribution and production capabilities.
The Group also benefits from its global scale operations, procurement, production plants anddistribution network, which allow the Group to achieve greater economies of scale and improve itscost efficiencies across the supply chain, from raw material sourcing to product deliveries and supportfunctions.
Diversified product base targeting multiple end user segments
The Group has a wide range of product offerings that cater to diversified end-markets acrossgeographies. Over the years, the Group has significantly expanded its product portfolio through a mixof acquisitions, downstream capacity expansions and joint ventures with other leading steelcompanies.
The Group has significantly enhanced its portfolio of downstream steel products to differentiate itselffrom competitors, including through its acquisition of Corus and downstream capacity expansions inIndia. With its capacity expansions in India, the Group has further strengthened its ability to providea greater variety of value-added products.
Furthermore, the Group has entered into joint ventures with downstream foreign steel specialistproducers, including BlueScope Steel Limited and Nippon Steel and Sumitomo Metal Corporation, forfinishing plants that produce color coated steel and automotive cold rolled flat products, respectively.In addition, the Group continues to invest in research and development and explore opportunities tofurther improve their product offerings to customers.
Efficient project implementation
The Group has a proven track record of implementing significant projects, including cost reductionplans and expansion plans for its major production facilities. The Group expanded its existingbrownfield crude steel capacity at Jamshedpur from 6.8 mtpa to 9.7 mtpa in December 2012 andestablished a greenfield project of 3.0 mtpa in Kalinganagar, Odisha which increased crude steelcapacity in India from 9.7 mtpa to 12.7 mtpa. In addition, the Group has rebuilt one of the blastfurnaces at the Group’s facility in Port Talbot.
Uniquely positioned to undertake acquisitions opportunistically
The Group is uniquely positioned to undertake acquisitions opportunistically, in particularopportunities with respect to companies in India undergoing the corporate insolvency resolutionprocess under the IBC.
The Group evaluates acquisition opportunities based on possibilities for synergies, broadening itscustomer base, access to raw materials, manufacturing facilities, infrastructure, new geographiclocations and advanced technology, widening its product offerings and growth opportunities that suchacquisition may offer. The Group’s extensive operations in different parts of India and across variousverticals in the steel industry enhance possibilities for synergies from such acquisition opportunities.
137

The combination of the Group’s domain expertise of the Indian steel industry, coupled with itsknowledge of the global steel industry and its experience with acquisitions, enables it to betterevaluate strategic acquisition opportunities. Further, due to its track record of successful acquisitions,the Group’s internal teams have experience and expertise in complex domestic and internationalcompetitive acquisitions which can be leveraged in evaluating acquisition opportunities and executingthem in an efficient and timely manner. Additionally, the Group’s extensive experience in variousindustries and acquisitions will help it evaluate acquisition opportunities.
If the Group pursues any acquisition opportunities, its robust balance sheet can potentially enable itto avail internal and external funding options, which will enhance its ability to submit competitivebids. Further, the brand name of the Group, and the reputation of the “Tata Group”, also provide it withcompetitive advantages in acquisition processes.
The above factors differentiate the Group from its competitors and contribute to its unique positionto capitalize on acquisition opportunities in India, especially with respect to opportunities arising fromthe corporate insolvency resolution process under the IBC.
Skilled workforce led by experienced management team
The Group’s senior management team is comprised of members with professional qualifications andextensive experience in the steel industry. The senior management team’s rich experience andunderstanding of the Group has been essential in building a sustainable global operation whichemploys over 70,000 individuals, while the Group’s employee policies and welfare programs havebeen instrumental in recruiting and retaining the high caliber workforce.
The Group seeks to nurture internal talent for senior management positions by hiring recent graduatesfrom top universities as entry-level employees, and then identifying and promoting the most promisingcandidates through the management ranks. The employee welfare program is developed from theGroup’s philosophy that people are its greatest asset. The program affirms the rights to trade unionrepresentation and collective consultation, ensures an ethical, just and fair workplace, encourageswork-life balance and provides managerial and functional training opportunities for all employees.
The Group’s commitment to building an ethical organisation through a committed workforce wasreaffirmed as it received the “World’s Most Ethical Company Award” in 2017 from Ethisphere USAfor the fifth time.
Strategy
Capacity Expansion in Growing Indian Steel Markets
In recent years, the Group has successfully implemented significant projects focused on expanding thecapacity of its Indian operations through brownfield and greenfield projects, such as expanding itsfacility at Jamshedpur and establishing the Kalinganagar facility. The Group intends to continue toincrease the size of its operations in India in view of the growing steel market, and its competitiveadvantage as a low-cost producer, through its brownfield and greenfield expansion projects.
Restructuring of European portfolio
As part of the process of the Group’s restructuring of its European operations, on September 20, 2017,Tata Steel and Thyssenkrupp AG signed a memorandum of understanding to create a new 50:50 jointventure company called Thyssenkrupp Tata Steel. This joint venture is expected to be the next stagein the transformation of the Group’s European business. The joint venture is intended to create a largerworld-class and globally competitive strip steel business, which, if successful, will be the secondlargest steel company in Europe.
138

This joint venture follows other restructuring initiatives, including the following:
• On May 31, 2016, Longs Steel UK Limited and other subsidiaries of TSE, which were involvedwith the long steel business, were sold to Greybull Capital LLP;
• On May 1, 2017, TSE completed the sale of the Specialty Steels business to Liberty SpecialtySteels Ltd.;
• On July 31, 2017, TSE completed the sale of its 42 and 84 inch pipe mills in Hartlepool toLiberty Specialty Steels Ltd. Pursuant to these portfolio changes, activities of TSE will befocused on the manufacture and sale of strip products; and
• The BSPS is the principal defined benefit pension scheme of the Group in the United Kingdom.On March 31, 2017 the BSPS was closed to future accrual and replaced by a defined contributionscheme. On September 11, 2017 the BSPS separated from TSUK and a number of affiliatedcompanies on completion of a Regulated Apportionment Arrangement (“RAA”). TSUK has alsoagreed to sponsor a proposed new pension scheme (“BSPS2”), subject to certain qualifyingconditions being met. Since the RAA has completed, all members of the BSPS will be invited totransfer to the new scheme. If the qualifying conditions are met, members may choose to betransferred to BSPS2. The BSPS2 scheme would have lower future annual increases forpensioners and deferred members compared to the BSPS, giving it an improved funding positionwhich is expected to improve the risk profile for TSUK.
Increase Sales of High Value-Added Products and Branded Sales
The Group plans to increase sales of its specialized solutions, high value products and brandedproducts to improve its product mix and generate higher and sustainable margins. In India, the Groupplans to continue increasing its production and sales of high value-added steel products such as coldrolled coil, automotive-grade sheets, coated products such as tinplate, color-coated steel andgalvanized steel.
To consolidate gains from retail growth, the Group is also offering services and solutions whichprovide spin-off benefits that could potentially open new revenue streams in the future and keep retailsales from hitting a plateau. Simultaneously, the Group has increased its production and sales throughthe commencement of new manufacturing capacities at the Kalinganagar plant, which commencedoperations in June 2016 and has recently ramped up to full capacity. The Group’s steel-based solutionsinclude Pravesh (wood-finished steel doors), Nest-In (modular housing), toilets and water ATMs andRoof Junction (a complete roofing solution). The Group is also exploring the possibility of offeringservices or solutions for the furniture space which has wood-like finishes on blended steel structures.
To further enhance the high value-added product portfolio, the Group intends to increase productionthrough its various joint ventures, including the following:
• Tata BlueScope Steel Limited manufactures coated steel coils, steel building solutions andrelated building products;
• The Group’s joint venture with Nippon Steel and Sumitomo Metal Corporation;
• Jamshedpur Continuous Annealing & Processing Company Private Limited has a continuousannealing and processing line to produce automotive cold rolled flat products; and
• The Group’s joint venture with Nichia Steel Works, Japan through its subsidiary Siam IndustrialWire Co., Thailand to set up a high-end galvanized wires facility which including galvanizedwires for cable stay strands and zinc-aluminum coated wires.
139

Enhance Competitiveness through Continuous Improvement
The Group continues to improve its competitiveness through a number of initiatives and programsaimed at enhancing operational efficiencies and optimizing asset and material flows. The Group seeksto benefit from sharing experiences and best operational practices across its business units in India,Europe and South East Asia.
Operational Stability
Significant capital expenditure has been committed to support the strategic growth of differentiated,high value products in the automotive, lifting and excavating, and oil and gas market sectors. TheGroup is leveraging its market position in downstream products to aid margin improvement. TheGroup is also focused on streamlining its logistical operations in Europe through a supply chaintransformation improvement initiative which commenced in September 2016.
Further, to improve its operations in Europe, TSE approved the Strategic Asset Roadmap program in2015, to increase the sales of differentiated, high value products in several market segments includingautomotive, lifting and excavating and energy and power. This has required revamping and upgradingthe facilities to produce high quality products.
Raw Materials Security
The Group seeks access to raw materials for its operations in India and internationally in order toachieve economic returns and to optimize its costs by securing off-take rights. The Group believes thatbecoming increasingly self-sufficient in raw materials procurement will enable it to better respond tocyclical fluctuations in the demand for products and reduce volatility in production costs. For the yearended March 31, 2017, with respect to its Indian operations, the Group obtained 100% of its iron orerequirements and approximately 36% of its coking coal requirement from captive mines.
The Group’s various coking coal and iron ore assets across geographies include a 64% stake in SouthAfrica’s Sedibeng Iron Ore Company and a joint venture in Canada in relation to a project spread overvarious iron ore deposits in the provinces of Quebec and Newfoundland and Labrador.
The Group intends to continue to work with its partners to pursue its current initiatives and, ifopportunities arise, to pursue new initiatives, subject to market conditions, in effort to becomeincreasingly self-sufficient in its raw material procurement.
Strategic Control Over Logistics and Supply Chain
The Group continues to differentiate itself from competitors in India with various initiatives inlogistics and supply chain management. With a particular focus on the automotive, construction andsmall and medium enterprise customer segments, the Group has enhanced its distribution channels.The principal goal of these initiatives was to be able to provide supplies on an “on time in full” basis.
In India, the Group has developed a nationwide network of exclusive distributors and dealers. Toincrease efficiencies, the Group redesigned its supply network using the hub-and-spoke mode ofoperations and information technology enabled color-based dispatch priority systems. As a result, theGroup has been able to increase sales in the retail segment.
Other principal supply chain improvement initiatives include:
• Supply chain enhancements such as deploying theory of constraints, improving deliverycompliance via steel service center management and the availability of ready to use materialfrom certified service centers;
• Standardization and availability of information; and
140

• Convenience through the development of information technology systems across the distributionchannels, channel authentication through an authorized dealer network, conducive shoppingexperience through exclusive retail outlets and improved reach to largest consumption centers.
To further enhance its supply chain and enhance control over logistics, the Group entered into a jointventure with NYK Lines, a Japanese shipping company, to provide logistics solutions such as portoperations, ship agency, custom clearance, in-land logistics, warehousing, shipping and freightforwarding for dry bulk, containerized, break-bulk and project cargo.
Strategic Alliances with Joint Venture Partners
The Group’s expansion plans have benefitted from strategic alliances with joint venture partnersthroughout its chain of operations, including for raw material procurement (primarily for mining),steel production, product diversification and shipping. For example, through the Group’s strategicpartners it has developed:
• Mining operations in Canada;
• Downstream value-added steel production pursuant to joint ventures with BlueScope SteelLimited;
• Product diversification pursuant to a joint venture with Nippon Steel and Sumitomo MetalCorporation; and
• Shipping operations with NYK Line and Martrade.
The Group continues to expand its capacity and operations through joint ventures including throughits memorandum of understanding on September 20, 2017, with Thyssenkrupp AG to create a new jointventure company, namely, Thyssenkrupp Tata Steel.
Continue to pursue inorganic growth opportunities, including with respect to distressed assets
The Group intends to continue to pursue inorganic growth opportunities, with a particular focus onacquisitions that generate greater synergies and production capacity, manufacturing facilities,infrastructure and advanced technology, and which allow it to diversify its product and customer base.
In addition, the Group is pursuing and may continue to pursue opportunities for acquisition offinancially stressed assets, including with respect to companies that are undergoing a corporateinsolvency resolution process under the IBC. In considering such acquisition opportunities, the Grouphas and may continue to rely on its deep experience and knowledge generally for evaluatingacquisitions, including the cost benefit and financing of such acquisitions.
The IBC Process is a statutory process for insolvency resolution of corporate entities in a time-boundmanner to maximize the value of assets of such entities. Currently, certain Indian steel manufacturingcompanies such as Bhushan Steel Limited, Electrosteel Steels Limited, Essar Steel India Limited,Bhushan Power and Steel Limited and Monnet Ispat and Energy Limited are undergoing the corporateinsolvency resolution process under IBC. The Group believes that this is a strategic opportunity forit to explore the acquisition of such companies.
Evaluating an acquisition under the IBC Process involves, among others, identification of the assetsthat will generate synergies and fits into the overall strategic framework for the Group and providegrowth opportunities and estimating the optimum value for the assets proposed to be acquired. TheGroup may work with external advisors to analyse and evaluate the assets to be acquired and estimatethe optimum value for such assets based on, among others, publicly available information, information
141

provided to the Group confidentially as part of the IBC Process and its deep domain knowledge of thesteel industry. If the Group is successful in the IBC Process, it may finance the acquisitions by internalaccruals, or additional capital raised as debt or equity or any other form in the company, or additionalcapital in a subsidiary or associate of the company.
The Group will continue to evaluate acquisition opportunities that may arise in Indian or other marketsand upon completion of any such acquisitions, aim to integrate new acquisitions with its existingoperations to generate synergies and growth opportunities. For further details, see “Risk Factors”.
Facilities
The Group has significant operations in Jamshedpur, India, where the Group operates a 9.7 mtpa steelproduction plant and a variety of finishing plants. The Group has added a new 3.0 mtpa facility inKalinganagar, Odisha which commenced operations in June 2016, and increased the crude steelproduction capacity in India to 12.7 mtpa. The Group’s steel production facilities primarily consist ofcoke ovens, sinter and pellet plants, furnaces, converters, casters, rolling facilities and downstreamfacilities and also include support facilities such as captive power plants, power stations, boilerhouses, repair and maintenance workshops, research, development and testing laboratories andharbors.
The Group conducts its European operations, with a steel production capacity of 12.4 mtpa, throughits wholly owned subsidiary TSE, while its operations in India are primarily conducted directly byTata Steel. The Group’s remaining steel production capacity of 2.2 mtpa is located in South East Asia,with finishing capacity spread across South East Asia.
Indian Facilities
The Group has its main facilities in Jamshedpur and Kalinganagar.
Jamshedpur Facility
The Group’s main facility in India is a vertically integrated 9.7 mtpa steel production facility atJamshedpur, in the State of Jharkhand in East India.
The Jamshedpur facility is the Group’s largest facility in terms of steel production capacity and hascontributed to approximately 35% of its total production capacity, globally, for the year ended March31, 2017. The Group completed the brownfield expansions of its Jamshedpur facility in May 2008 andDecember 2012, which increased its Indian steel production capacity to 9.7 mtpa, with 6.6 mtpa forflat products and 3.1 mtpa for long products. The wide variety of steel products produced at theGroup’s Jamshedpur facility are primarily sold in the domestic market.
The following table sets forth the production details of the facility:
Steel production capacity* Actual Production (in mt)
Six months ended
September 30,
2017
For the year
ended March 31,
2017
For the year
ended March 31,
2016
For the year
ended March 31,
2015
9.7 (in mtpa) . . . . . . . . . . . . . . 4.70 10.00 9.96 9.33
* Production capacity is based on the maximum possible steel production in the year ended September 30, 2017, taking intoaccount upstream and downstream bottlenecks, assuming full manning of facilities and including any plant mothballed. Inpractice, facilities may be manned only to the level required to provide semi-finished materials for downstream finishingprocesses and for sale.
142

Kalinganagar Facility
The Group’s greenfield steel production facility at Kalinganagar, which has a capacity of 3.0 mtpa,commenced operations in June 2016 and recently ramped up to full capacity. The plant producesworld-class flat, lighter, high-tensile strength steel. It has enabled the Group to expand its portfolioto high-grade flat products to cater to a range of sectors including defense, lifting, oil and gas andexcavation. Eight new product licenses and nine upgrades of existing product licenses have beengranted by the Bureau of Indian Standard for products manufactured at the Kalinganagar plant.
The following table sets forth the production details of the facility:
Steel Production capacity Actual Production (in mt)
Six months ended
September 30, 2017
For the year ended
March 31, 2017
3.0 (in mtpa) . . . . . . . . . . . . . . . . . . . . . . . . . . . . . . . . . . . . 1.29 1.68
European Facilities
As of March 31, 2017, the Group had two principal steel making sites in Europe, one in Ijmuiden inthe Netherlands and one in Port Talbot in the United Kingdom. The European operations representapproximately 45% of the Group’s global total steel production capacity. The Group sold theRotherham site in May 2017, and accordingly, its capacity is not included in these figures.
The following table sets forth the Group’s principal operating facilities in Europe as of March 31,2017:
Actual Production (in mt)
Steel production
capacity*
Six months ended
September 30,
2017
Year ended March
30, 2017
IJmuiden steelworks, Netherlands. . . . . . . . . . . . 7.3 3.5 7.0
Port Talbot steelworks, Wales . . . . . . . . . . . . . . 5.1 1.9 3.6
Total . . . . . . . . . . . . . . . . . . . . . . . . . . . . . . . . . 12.4 5.4 10.6
* Production capacity is based on the maximum possible steel production in the year ended Mar 31, 2017 taking into accountupstream and downstream bottlenecks, assuming full manning of facilities and including any plant mothballed. In practice,facilities may be manned only to the level required to provide semi-finished materials for downstream finishing processesand for sale.
IJmuiden Steelworks Facility
The IJmuiden facility is the Group’s second largest facility in terms of steel production. It contributedto approximately 66% of total steel production for the Group’s European operations for the year endedMarch 31, 2017. The facility produces a wide variety of steel products which fall into five broadcategories: hot rolled strip, cold rolled strip, hot dipped metallic coated, pre-painted, and tinplate. Thisfacility makes direct mill sales mainly into the automotive, packaging and industry strip sectors, bothin the United Kingdom and in export markets to Germany, France, Turkey, USA and Spain. Sales arealso made through other downstream tube-making facilities and coating lines into the construction,energy and building envelope sectors.
143

Port Talbot Steelworks Facility
The Port Talbot facility, including its satellite site in Llanwern, Wales, is the Group’s third largestfacility in terms of steel production capacity and contributed to approximately 34% of total steelproduction for the Group’s European operations for the year ended March 31, 2017.
The facilities produce a wide variety of steel products, which fall into three broad categories: hotrolled strip, cold rolled strip and hot dipped galvanized. The facilities make direct mill sales mainlyinto the automotive, packaging and industry strip sectors, both domestically and in export markets tothe Netherlands, Spain, Germany, Belgium and France. Sales are also made through other downstreamtube-making facilities and coating lines into the construction, energy and building envelope sectors.
Other facilities
The Group’s other facilities and the products produced are set out below:
Facilities Details
Other Indian Steel Units . . . . . . . . . . • Tube production facility at Jamshedpur
• Wire production at steelworks facility in Tarapur
• Wire division facility at Indore
Non-Steel Indian Facilities . . . . . . . . . • Ferro alloy production facilities at plants in Odisha atBamnipal, Cuttack and Joda
• Chrome concentrate production facility in the chromeore beneficiation plant at Sukinda
• Chrome ore processing facility at the ferro alloy plantat Bamnipal, Cuttack and other ferro processingcenters to produce high carbon ferro-chrome
• Ferro alloy plant near Cuttack
Other Facilities — South East Asia . . NatSteel Holdings
• Electric arc furnace based steel production plant inSingapore with a crude steel capacity ofapproximately 0.75 mtpa as of March 31, 2017
• Finishing plants in Singapore, Vietnam, Thailand,Malaysia and Hong Kong with a combined rolling millcapacity of approximately 2.2 mtpa and downstreamcapacity of 1.4 mtpa as of March 31, 2017
Tata Steel Thailand
• Three steel plants at Saraburi, Rayong and Chonburiin Thailand with a total steel production capacity of1.4 mtpa and a finishing capacity of 1.7 mtpa as ofMarch 31, 2017.
Expansion and Development Projects
Brownfield Projects
Kalingangar
The Group has developed greenfield steel production facility at Kalinganagar. Phase I of thisdevelopment, which as a capacity of 3.0 mtpa, commenced operations in June 2016 and recentlyramped up to full capacity. The total capital expenditure for Phase I is approximately Rs.234,700million.
144

Following the successful development and implementation of Phase I, the Board approved Phase II,an expansion plan at Kalinganagar expected to increase its capacity by 5.0 mtpa (from the existing 3.0mtpa to 8.0 mtpa upon completion). In addition to increasing capacity, Phase II can potentially realizesynergies with Phase I operations through improvement in productivity of equipment and manpower,improvement in key performance indicators in operations, and optimization of administration costs.This project is expected to cost approximately Rs.235,000 million, will be financed by a mixture ofdebt and equity and will be implemented over a 48 month period.
The costs for development at Kalinganagar include investments in raw material capacity expansion,upstream and midstream facilities, which includes a coke plant of 2.2 mtpa, a sinter plant of 0.8 mtpa,a blast furnace of 4.8 mtpa and a hot strip mill of 3.2 mtpa, infrastructure and downstream facilitieswith a cold rolling mill complex of 2.2 mtpa, including a continuous annealing line of 0.9 mtpa anda galvanizing line of 1.0 mtpa.
The plant capacity is planned to be expanded in order to meet market demand for value-addedproducts, and to make the Group more profitable and sustainable.
The expansion will enable TSL to expand its portfolio and customer base of high-grade flat productswhich are thicker, wider and high tensile strength with a unique grades and tighter dimensionaltolerances to cater to a range of sectors including defense, lifting, oil and gas and excavation.
Jamshedpur
The Ministry of Environment, Forest and Climate Change, Government of India has grantedenvironmental clearance dated, March 1, 2016, for the expansion of the Group’s integrated steel plantat Jamshedpur, which will increase its crude steel production from 9.7 mtpa to 11.0 mtpa.
Products
Key Products from Operations
The key products from the Group’s Indian operations include the following:
Products Types
Flat Products . . . . . . . . . . . . . . . . . . . • Hot rolled coils and sheet
• Cold rolled coils and sheets
• Coated coils and sheets (Tinplate/Color-coated steeland galvanized steel)
Long Products . . . . . . . . . . . . . . . . . . • Rebar
• Wire rods
Wires . . . . . . . . . . . . . . . . . . . . . . . . . • Coated and uncoated wires
Tubes . . . . . . . . . . . . . . . . . . . . . . . . . • Conveyance Tubes
• Structural tubes
• Precision tubes
Intermediate products . . . . . . . . . . . . . • Semi-finished steel (billets, slabs that can be madeinto flat or long products)
Others . . . . . . . . . . . . . . . . . . . . . . . . • High carbon ferro-chrome
• High carbon silico manganese
• Ferro manganese
• Chrome concentrate
• Fluxes such as dolomite and pyroxenite
145

Key Products from European and Asian Operations
The key products from the Group’s Indian operations include the following:
Products Types
Uncoated strip products . . . . . . . . . . . • Hot rolled coil
• Cold reduced coil
Coated strip products . . . . . . . . . . . . . • Hot dipped metallic coated products
• Pre-painted and plastic coated products
• Tinplate
Electrical steels . . . . . . . . . . . . . . . . . • Non-oriented and grain oriented electrical steel
Plated and precision strip products. . . • Range of nickel, zinc and other specialist platedproducts
Welded steel tubes . . . . . . . . . . . . . . . • Hot finished and cold formed steel tubular products
Semi-finished steel. . . . . . . . . . . . . . . • Slabs
Others . . . . . . . . . . . . . . . . . . . . . . . . • Tubes and bearings
• Ball bearings
• Taper roller bearings
• Refractories products
• Steel mill rolls
Sales
The Group sells a majority of its products to customers in the Indian and European markets. Indiaremains the Group’s largest market, representing approximately 43% and 41% of the Group’s revenuein the years ended March 31, 2017 and March 31, 2016, respectively. Operations in Europe represented39% and 41% of the Group’s revenue in the years ended March 31, 2017 and March 31, 2016,respectively.
The following table sets forth the Group’s revenue by destination for the periods indicated:
Year ended March 31,
2016 2017
(Rs. in millions)
India . . . . . . . . . . . . . . . . . . . . . . . . . . . . . . . . . . . . . . . . . . . . . . 436,040 509,830
Europe . . . . . . . . . . . . . . . . . . . . . . . . . . . . . . . . . . . . . . . . . . . . . 441,050 459,890
Asia (excluding India) . . . . . . . . . . . . . . . . . . . . . . . . . . . . . . . . 94,660 125,740
Other . . . . . . . . . . . . . . . . . . . . . . . . . . . . . . . . . . . . . . . . . . . . . 91,650 78,740
Total . . . . . . . . . . . . . . . . . . . . . . . . . . . . . . . . . . . . . . . . . . . . . 1,063,400 1,174,200
Distribution and Marketing
The Group has retailer reach throughout India and a network of service partners in key consumptioncentres which provide a competitive advantage in servicing the Indian market. The Group delivers itswide range of products, services and solutions through the hub-and-spoke model. The Group sellsfinished carbon steel products from its European facilities directly to end-users and throughstockholding and service centers. Stockholders purchase steel from high-volume producers forsubsequent resale, and service centers purchase steel stocks for further processing prior to selling to
146

customers. The Group’s European service center network includes centers in the United Kingdom,Ireland, Finland, France, Germany, the Netherlands, Norway, Spain and Sweden. Typically, largevolume customers purchase directly from the Group’s main hubs, while low volume customerspurchase from stockholders and service centers, including those owned by the Group.
The Group markets its products by closely monitoring its sales activities and catering to the needs ofcustomers. As a global steel producer, the Group gathers marketing intelligence and experience fromits sales offices in the respective regions where it conducts business.
Raw Materials and Other Key Inputs
Steel production requires a substantial amount of raw materials and energy, including iron ore, coaland coke, scrap and energy. Raw materials comprise the single most significant percentage of theGroup’s manufacturing costs and in the years ended March 31, 2016 and 2017, accounted for 26.1%and 29.2%, respectively, of the Group’s total expenditure.
Energy costs in the years ended March 31, 2016 and 2017, accounted for approximately 15.1% and13.9%, respectively, of the Group’s raw material and energy costs.
Raw Material Details
Iron Ore and Coal - IndianOperations . . . . . . . . . . . . . . . . . . .
• Iron ore is mainly obtained from the Noamundi andJoda iron mines
• Raw coal is obtained from the coal mines at WestBokaro and Jharia and clean coal is imported
Iron Ore and Coal - EuropeanOperations . . . . . . . . . . . . . . . . . . .
• Purchases all of its iron ore and coal requirements forits European operations from third parties
• Iron ore was purchased principally from SouthAmerica, Scandinavia and North America and coalprincipally from Australia, North America, Russia andthe United Kingdom
Energy . . . . . . . . . . . . . . . . . . . . . . . . • India - Power requirements are met by a combinationof own generation capacity and purchase from thirdparties
• Europe - Primarily purchased from respective nationalelectricity grids and generated through power stationsat the facilities
Scrap . . . . . . . . . . . . . . . . . . . . . . . . . • India and Europe - Consume scrap metal mainlygenerated as a byproduct from its own operations andsourced externally from companies that collect scrapmetal.
Raw Material Projects
The Group is focused on seeking proprietary access to raw materials in order to optimize its costs andto achieve a higher level of self-sufficiency in raw materials, which would enable it to better respondto cyclical fluctuations in demand and reduce volatility in production costs. The Group has pursued,and plans to continue to pursue, a number of initiatives to gain access to coal and iron ore depositsaround the world.
Iron Projects
Tata Steel Minerals Canada
Tata Steel Minerals Canada Ltd. (“TSMC”) is engaged in development of iron ore deposits in Quebecand Newfoundland and Labrador in Canada. The investment is deployed towards setting up miningoperations and multiple processing facilities including the state-of-the-art beneficiation plant.
147

In October 2016, TSMC signed definitive agreements with the Government of Quebec’s investmententities, Resource Quebec and Investment Quebec respectively, for providing C$175 million financialassistance in the form of equity and debt. With this investment, the Government of Quebec holds an18% stake in TSMC and the balance is held between the Group (77.66%) and New Millennium IronCorporation (4.32%), a publicly owned Canadian mining company.
On March 24, 2017, TSMC signed a multi-user-concept based non-binding MOU between thepublic-private partnership partners, Society of Plan Nord and other mining players, which willfacilitate the connectivity of the existing material handling facilities at Point Noire to the new MultiUser Deep Sea Terminal, and further enable detailed assessment of improvements to the infrastructure,cost-efficient port operations, scalability in volume and asset allocation among others.
The resource base has been enhanced three-fold since the commencement of the investment toapproximately 147 mt. TSMC achieved total sales of 1.6 mt in the year ended March 31, 2017.
Sedibeng Iron Ore Pty Ltd, South Africa
The Group, through its 100% owned SPV Black Ginger 461 Proprietary Limited, owns a 64% stakein Sedibeng Mine, South Africa, the balance is held by Cape Gannet (26%) and IndustrialDevelopment Corporation of South Africa (“IDC”) (10%). Both BEE partner and IDC jointly arecontributing their share of acquisition cost.
The Sedibeng iron ore mining is located 25 km north of Postmasburg, in the province of NorthernCape, in South Africa. Production is expected to ramped up to 2.0 mtpa, subject to availability oflogistics. The Group’s share of iron ore off-take in the project is 74%, which includes 10% of IDC’sshare. The Group had sales of approximately 1.3 mt for the year ended March 31, 2017.
Employees
As of March 31, 2017, the Group had more than 70,000 employees worldwide, includingapproximately 35,000 employees in India, approximately 22,500 employees in Europe and theremainder in South East Asia.
The Group has won a number of awards for its Indian operations, including the All India Organizationof Employers Award for Outstanding Employee Relations, and was named as the best place to workin the core sector (steel, oil, power and minerals) by Business Today in February 2017.
Competition
The market for steel is very competitive with high levels of international trade. According to the WSA,the top five steel producers represented 18% of global steel production in 2016. As a global producer,the Group faces significant competition from other steel producers worldwide. The Group’scompetitors in the global steel market include ArcelorMittal, Baosteel Co. Ltd., Nippon Steel, JFESteel Corporation, POSCO and Shagang Group among others.
In India, the Group operates in the flat product and the long product markets and faces competitionfrom integrated and partially integrated steel producers such as SAIL, JSW Steel Limited, Essar SteelIndia Limited, Jindal Steel and Power Limited, Vishakhapatnam Steel Plant (Rashtriya Ispat NigamLimited), as well as rerollers, secondary manufacturers and imports from China, Japan, and SouthKorea among others.
Research and Development and Intellectual Property
Several new infrastructure facilities relating to research and development have been installed andothers are in the process of commissioning. This will enable the Group to address the needs of itscustomers. In addition to these facilities, the Group also embarks on strategic value engineering and
148

early vendor involvement with auto original equipment manufacturers so as to integrate the new steelgrades into future vehicle platforms. The research and development operations also collaborate withleading research institutions in the world to tap into promising research work that can shape the futuretechnology of the steel business. The Group conducts its business using the “Tata” brand and licensesthe use of the “Tata” brand trademark from Tata Sons Limited, its principal shareholder, under theterms of a licensing agreement.
Quality
The Group continuously adopts modern management tools, techniques and standards. In the last threeand a half decades, the Group has adopted the ISO system, Quality Circles, Value Engineering, TotalOperative Performance, Total Productive Maintenance, Knowledge Management, Six Sigma, Theoryof Constraints and Critical Chain Project Management. Recently, the Group has introduced Kar VijayHar Shikhar, Corporate Quality Assurance, Innovent and SHIKHAR 25 to ensure quality.
While it has adopted several methodologies and techniques for improvement, it has also continuouslyassessed itself to determine the effect that each implemented measure has had on organizationalperformance. To bring about greater rigor in the assessment of excellence, the Group successfullychallenged the Deming Application Prize in 2008 and the Deming Grand Prize in 2012 (a Japaneseaward for quality). The Group became world’s first integrated steel plant outside of Japan to receivethese awards. In the evaluation of integrated steel plants in India by the Ministry of Steel, the Grouphas been recognized ten times as the Best Integrated Steel Plant and received recognition in the formof the Prime Minister’s Trophy.
Insurance
The Group’s operating assets (other than those owned by TSE) including its plants and facilities areinsured against a range of perils including fire, explosion, and acts of nature such as storms,earthquake and floods. Business interruption loss following damage to property is also covered in theinsurance policy. Terrorism risk is covered by a separate insurance policy.
TSE maintains insurance cover through a combination of policies purchased largely from externalinsurers and self-funding. TSE, including its plants and facilities, is insured against a range of risks,including property damage and business interruption, public and products liability.
The Group maintains a general liability insurance against legal liability arising from third partyproperty damage, death or bodily injury due to its business operations, or arising out of the usage ofthe products manufactured and sold.
The Group also maintains liability insurance covering the liability of its directors and officers.
The Group has taken crime insurance policy that covers financial loss due to fraudulent act(s) by anemployee or by any other persons, and cyber liability insurance policy that covers financial losssuffered by the Group and for third party liability due to data and/or network security breachesfollowing qualifying breaches of data security on the computer systems of the Group or that ofoutsourced partners’ computer systems.
Environmental Standards
The Group is committed to minimizing the environmental impact of its operations through theadoption of sustainable practices. The Group has also adopted relevant ISO, APHA, BIS or localstandards for environmental monitoring and analysis. Environmental performance is audited internallyand assured or verified externally using appropriate standards. Environmental compliance ismonitored at the boar level through the Safety, Health and Environment Committee. The Group has
149

won a number of awards for its environmental compliance activities, including a platinum rating bythe CII Green Building Council for environmental performance at the Jamshedpur steelworks,including India’s first steel company to receive a “Greenco Platinum Rating” by CII Green BuildingCouncil.
Health and Safety
Health and safety is the priority at all of the Group’s facilities and, as such, it is reviewed regularlyby the Group’s Board of Directors. The Group has established a Board Health, Safety and EnvironmentCommittee to carry out more detailed reviews of its strategy and monitor the overall performance ofthe Group in this regard. As part of its commitment to create a safer work place, the Group hasimplemented a number of structured programs and initiatives to improve hazard awareness and riskcontrol. As a result of these safety initiatives, the Group’s combined lost time injury frequency rate(“LTIFR”) for employees and contractors remained relatively low.
In India, the Group has adopted a safety management system focusing on inculcating leadershipcommitment, safe behavior among employees and achieving world-class safety and healthperformance. Regular line walks are conducted by the Group’s senior leadership team members tomonitor deployment of health and safety standards. The Group has developed and is deploying a planof six long term safety strategies at all locations to advance the organizational culture where allemployees are “Committed to Zero” LTIFR.
As a result of several safety initiatives, LTIFR has remained relatively low at 0.37 for the year endedMarch 31, 2017.
The Group has received several awards in regard to health and safety, including the “Ispat SurakshaPuraskar — 2017” award from the Joint Committee on Safety, Health and Environment in SteelIndustry for no fatal accidents at Jamshedpur in 2016.
Corporate and Social Responsibility
The Group’s CSR efforts are conducted in segments such as education, health care, ethnicity, youthand women empowerment, and rural infrastructure.
Education: In the education segment, the Group aims to develop equitable and quality educationprograms at all levels of schooling — including higher education — and has taken a stand againstincidences of child labor. The Group also brings children from tribes into the fold of education throughProject Aakanksha.
Health and Sanitation: In the health and sanitation segment, the Group has focused its efforts onproviding preventive and curative facilities to communities in Jharkhand and Odisha. In a partnershipwith the government health system and not-for-profit organizations, the Group has been working onthe Maternal and Newborn Survival Initiative. In addition, focuses on adolescent health in villagesacross Jharkhand and Odisha.
Livelihood: The Group engages in activities to develop valuable skills for youth to assist them withobtaining gainful employment in areas such as nursing, hospitality, textiles and construction.
Ethnicity: The Group aspires to nurture tribal communities through multiple interventions that caterto their social and cultural development. In November 2017, the Group organized the fourth editionof Samvaad, which drew delegates representing indigenous communities from a number of countries.The Group holds a number of events each year, including focused interventions to promote age-oldtribal sports and music.
150

Sports and Youth Empowerment: In effort to develop leadership skills and instill positive valuesamong youth, the Group facilitates outdoor leadership camps and moral re-armament camps throughthe Tata Steel Adventure Foundation and in partnership with Initiatives of Change.
Litigation
Except as described below, Tata Steel is not involved in any legal proceedings or disputes, and noproceedings are threatened, which may have, or have had, a material adverse effect on the business,financial condition or operations of Tata Steel. Tata Steel believes that the number of proceedings anddisputes in which it is involved in is not unusual for a company of its size in the context of doingbusiness in India and in the international market. The materiality threshold considered for thisdisclosure in this section is Rs.3,900 million.
Litigation filed against Tata Steel
Regulatory proceedings
1. In the matter of Common Cause v. Union of India & Ors,. the Supreme Court has by its orderdated August 2, 2017 (the “Common Cause Order”) directed payment under Section 21(5) of theMMDR Act for alleged illegal mining of iron ore and manganese ore from mines in Odisha dueto breach of limits prescribed in the environmental clearance (granted under the Environment(Protection) Act, 1986 (“EP Act”)). Pursuant to the purported application of the Common CauseOrder, Tata Steel has received the following:
(a) Additional demand notices by the Office of the Deputy Director Mines, Joda Circle, DistrictKeonjhar (the “Mines Director”) in relation to seven of Tata Steel’s iron ore and manganeseore mines located in Odisha, aggregating to Rs.1,340 million (the “Demand”) in respect ofexcess production beyond the thresholds prescribed in, among others, the environmentalclearance (granted under the EP Act), the ‘consent to operate’ (granted under the Air(Prevention and Control Of Pollution) Act, 1981 and the Water (Prevention and Control OfPollution) Act, 1974) and the mining plan (as approved under the MMDR Act).Subsequently, an interim application was filed before the Supreme Court by, among others,Tata Steel, seeking clarifications regarding the Common Cause Order. The Supreme Courtalso granted Tata Steel leave, to pursue alternative legal remedies. Tata Steel has filed anapplication before the Revisionary Authority, Ministry of Mines, Government of India andobtained a stay against the due date and continue its operations until January 22, 2018,being the next date of hearing.
(b) Demand notices in relation to four of Tata Steel’s coal mines located in Jharkhand,aggregating to Rs. 21,400 million (the “Jharkhand Demand”) and if such amounts are notpaid, its operations at the mines would be suspended. Recently, in similar circumstances,the High Court of Jharkhand has granted interim relief to another company, which hadreceived similar demand notices. Tata Steel will seek appropriate legal remedies as may bewarranted. The matter is currently pending.
(c) Tata Steel has also made a payment of Rs.570 million under protest, in respect of the ironore and manganese mines and is seeking suitable legal remedies.
A show-cause notice by the Office of the Deputy Director Mines, Joda Circle, District Keonjhar(the “Mines Director”) in relation to Tata Steel’s chromite mine at Sukinda, Orissa, involving anamount aggregating to Rs.6,940 million (the “SCN”). Tata Steel has responded to the SCN. Thematter is currently pending.
2. Tata Steel and others (the “Petitioners”) filed a writ petition challenging the constitutionalvalidity of the Orissa Rural Infrastructure and Socio-Economic Development Act, 2004 (the“ORISED Act”) before the High Court of Orissa. Under the ORISED Act, tax is required to be
151

paid on the annual value of mineral-bearing land and the annual value of such land, in relationto a financial year, is determined on the basis of average value of minerals produced frommineral bearing land in the immediately preceding two financial years. The High Court of Orissaheld that the ORISED Act was unconstitutional as the state legislature was incompetent to levyany taxes or duties on the extraction of minerals and set aside the demand notices issued to thePetitioners for an amount aggregating to Rs.62,010 million. The State Government of Odisha hasappealed the aforesaid judgment before the Supreme Court by way of a special leave petition.The matter is currently pending before the Supreme Court.
3. Tata Steel has filed petitions (the “Petitions”) in the High Court of Jharkhand (the “High Court”)against the Union of India challenging, among others, the constitutional validity of Rules 64Band 64C of Mineral Concession Rules, 1960 (the “MC Rules” and the challenged provisions, the“Impugned Rules”) in relation to differential royalty liable to be paid by Tata Steel on the coalmined from it’s West Bokaro and Jharia mines. The dispute pertains to the method of computationof, and the levy of final royalty on, coal in terms of the MC Rules and the MMDR Act. In anearlier proceeding involving Tata Steel (“Supreme Court Proceedings”), the Supreme Court,through its order dated March 17, 2015, held that (i) the removal or extraction of a mineral interms of the MMDR Act meant removal of the mineral from the mine or the pit-head and not theremoval or extraction of the mineral from the boundaries of the leased area; (ii) pursuant to theintroduction of the Impugned Rules, the levy of royalty on coal was post-poned from the pit-headto the stage of removal of the coal; (iii) Tata Steel was liable to pay royalty under the ImpugnedRules from the date of their notification i.e. from the year 2000; and (iv) Tata Steel was entitledto refund of royalty paid between August 10, 1998 and September 25, 2000. However, theconstitutionality of the Impugned Provisions was not adjudicated upon by the Supreme Court.
During the pendency of the Supreme Court Proceedings, Tata Steel received demand noticesaggregating to Rs.3,474 million received from the District Mining Officer, Ramgarh, towardsalleged short levy of royalty on washed coal of “Steel Grade-I” and short levy of royalty on“tailing coal” (the “Demand Notices”). Subsequently, the Supreme Court of India, through itsorder dated May 8, 2015, granted leave to Tata Steel to challenge the constitutional validity ofthe Impugned Provisions afresh. Pursuant to the said order, Tata Steel filed fresh writ petitionsbefore the High Court challenging the constitutional validity of the Impugned Provisions. TheHigh Court, through its order dated June 26, 2015 refused to grant a stay on the Demand Noticesand directed that as in the past, Tata Steel would have to pay the amount under the DemandNotices under protest. Subsequently, the High Court has dismissed the Petitions by way of anorder dated January 10, 2018. Tata Steel will seek appropriate legal remedies as may bewarranted.
Tata Steel has also filed revision applications against the Demand Notices before the RevisionaryAuthority, Ministry of Mines, Government of India (the “Mines Tribunal”). The total amountinvolved in the matter is Rs.14,160 million. As on date, Tata Steel has paid a total amount ofRs.5,100 million under protest. The revision applications are currently pending before the MinesTribunal.
4. Tata Steel filed a writ petition before the High Court of Orissa (the “High Court”) on July 5,2013, challenging the constitutional validity of the Indian Stamp (Odisha Amendment) Act, 2013(the “Amendment Act”) and Rule 11C of the Odisha Stamp Rules, 1952, inserted through IndianStamp (Odisha Amendment) Rules, 2013 (the “Amendment Rules”) in relation to new provisionsintroduced with respect to introduction of stamp duty chargeable on grant and renewal of miningleases and more particularly, requiring stamp duty to be paid with respect to mining leasesawaiting renewal. The High Court, through its order dated July 9, 2013 has granted an interimstay on the implementation of the provisions of the Amendment Act. Tata Steel has madeapplications for renewal of mining leases as per the provisions of the MMDR Act. As on date,Tata Steel has received demand notices, issued by the relevant authority, for various mines inOdisha aggregating to Rs.55,790 million. The matter is currently pending before the High Court.
152

5. Tata Steel is a mining lessee for iron ore in Noamundi, Jharkhand. The mining lease in respectof the said mine (the “Noamundi Mines” and the mining lease, the “Mining Lease”) was initiallygranted in 1922 and has been subsequently renewed for a period up to December 31, 2011. Priorto the expiry of the Mining Lease, Tata Steel applied for its renewal on December 17, 2009 (the“Application”). Pending the decision on the Application, Tata Steel continued mining operationsat the Noamundi Mines in accordance with the applicable licenses and the extant provisions ofthe MC Rules. Subsequently, Tata Steel filed a writ petition before the High Court of Jharkhandat Ranchi (the “High Court”) praying for directions to the State Government of Jharkhand (the“State Government”) for issuance of formal orders for renewal of the Mining Lease under theprovisions of MMDR Act. The High Court allowed the writ petition and directed the StateGovernment issue orders. Whilst the State Government through its order granted its approval forthe extension of the Mining Lease, the same was subject to compliance with certain additionalterms and conditions (the “Additional Conditions”), including a demand of Rs.35,683 milliontowards penalty for alleged illegal mining by Tata Steel (the “Demand”). Pursuant to an interimorder passed by the High Court and in order to resume mining operations at the Noamundi Mines,Tata Steel paid a total amount of Rs.5,738 million of the Demand under protest. Subsequently,the Mines and Minerals (Development and Regulations) Amendment Act, 2015 (the “AmendmentAct”) was passed and Tata Steel has amended its writ petitions before the High Court for,amongst other issues, challenging the Additional Conditions and Demand imposed on Tata Steelto further plead that these were not tenable under the provisions of extension of lease under theAmendment Act as well. The matter is currently pending.
6. Tata Steel has filed a writ petition before the High Court of Jharkhand (the “High Court”) inrelation to the water rates to be paid by it for drawing water for industrial purposes. InSeptember, 1993, the State of Jharkhand (erstwhile State of Bihar) had issued a bill for waterusage by Tata Steel for an amount of Rs.31 million at the rate of Rs.3.00 per thousand gallons.Tata Steel had filed a writ petition before the High Court challenging the aforesaid bill. The HighCourt held that the rate of Rs.3.00 per thousand gallons for usage of water for industrial purposesproposed by the State of Jharkhand was justified but that the State of Jharkhand must verify thequantum of water used and the amounts involved. Tata Steel and the State of Jharkhand both (the“Parties”) filed appeals against the order of the High Court before the Supreme Court. TheSupreme Court disposed of the appeals, on the grounds that the High Court had not consideredall issues involved, and remanded the matter back to the High Court to hear the arguments of theParties afresh. The matter is currently pending. The aggregate amount involved is Rs.4,199million.
7. The Deputy Director of Mines, Joda, Keonjhar, Odisha (the “Odisha State Government”) issuedthree demand notices to Tata Steel for an amount of Rs.8,702 million on the grounds that adifferential royalty was payable on iron ore lump removed or in the processed form, whicheveris higher (the “Demand”) in respect of Tata Steel’s mining lease for Joda East Iron Mines in thedistrict of Keonjhar. Subsequently, Tata Steel filed three revision applications against theDemand before the Revisionary Authority, Ministry of Mines, Government of India (the “MinesTribunal”) challenging the legality and validity of the Demand. The Mines Tribunal has granteda stay in respect of the Demand. Tata Steel has made a payment of an amount of Rs.1,370 million,under protest towards the Demand. The matter is currently pending.
In a separate matter, filed by, among others, Mideast Integrated Steel Limited (“MISL”), beforethe High Court of Odisha, MISL challenged circulars dated September 7, 2010 and April 9, 2012issued by the Odisha State Government prescribing that payment of royalty shall be on iron orelump or calibrated lump ore, whichever was higher, removed from the mines. The High Court ofOdisha passed an order in the matter of MISL (“MISL Order”), wherein the High Court of Odishaheld that hundred per cent of the differential royalty payable on iron ore lump removed wouldbe due to the Odisha State Government. Tata Steel has filed a special leave petition before theSupreme Court challenging the MISL Order, on the grounds that, among others, Tata Steel, whowas an aggrieved party and directly and adversely affected by the MISL Order, was not affordedan opportunity to be heard in the matter. The matter is currently pending.
153

Arbitration Proceedings
1. Vakksh Capital Company Limited (the “Claimant”) has initiated arbitration proceedings againstTata Steel. Tata Steel entered into an agreement with the Claimant in July, 2006, to provideadvisory services to Tata Steel (the “Agreement”). In January, 2008, the Claimant and Tata Steelexecuted a term-sheet which stipulated that the parties shall execute a separate agreement inrespect of fees to be paid to the Claimant in the event that certain conditions were met (the“Proposed Agreement”). The Proposed Agreement was not executed. Subsequently, Tata Steelterminated the Agreement, pursuant to which the Claimant initiated the arbitration proceedings,claiming amongst others, fees allegedly due under the Agreement and under the term-sheet (the“Claim”). Tata Steel has, among others, disputed the amount claimed and the scope of thearbitration proceedings. The matter is currently pending.
Tax Proceedings
Direct Tax
1. The income tax department has initiated reassessment proceedings (the “ReassessmentProceedings”) against Tata Steel in relation to the assessment years 2006 — 07; 2007 — 08; and2008 — 09 (the “Relevant AYs”) and issued reassessment orders along with demand notices inrespect of the Relevant AYs (the “Reassessment Orders”). The Reassessment Proceedings wereinitiated on the basis of show cause notices issued by the mining authorities of the StateGovernment of Odisha, alleging mining in excess of the permitted limits by Tata Steel (the“Excess Mining Activities”) and on the premise that Tata Steel had allegedly not disclosed theincome and profits arising out of such activities at the time of initial assessment. The demandin respect of the Excess Mining Activities aggregated to Rs.6,963 million. Tata Steel preferredappeals against the Reassessment Orders before the Commissioner of Income Tax, (Appeals)(“CIT(A)”), Mumbai, wherein the CIT(A) allowed Tata Steel’s appeals, in respect of the demandsmade in respect of the Excess Mining Activities (“Appellate Orders”).
In relation to AYs 2009 — 10 and 2010 — 11, the assessing officer alleged that Tata Steel hadnot disclosed the profits arising to it from the Excess Mining Activities and sought to makeadditions to Tata Steel’s taxable income for an amount of Rs.14,836 million and Rs.4,651 million(the “Additions to Income”) respectively, to the taxable income of Tata Steel. Tata Steel objectedto the Additions to Income before the Dispute Resolution Panel — II, Mumbai (the “DRP”). TheDRP, through its directions dated December 27, 2013 and December 23, 2014, respectively,directed the assessing officer to delete the Additions to Income for the purposes of computingthe taxable income of Tata Steel.
In relation to the Appellate Orders and the directions of the DRP for AYs 2009-10 and 2010-11,the income tax department has preferred appeals before the Income Tax Appellate Tribunal.These matters are currently pending.
2. Tata Steel has filed five appeals, in respect of AYs 2008-09, 2009-10, 2010-11, 2011-12 and2012-13 (“Appeals”) before the Income Tax Appellate Tribunal, Mumbai (the “ITAT”) againstthe directions issued by the Dispute Resolution Panel (the “DRP”) in relation to the disallowanceof interest expenses pertaining to the investment of Tata Steel in Corus, a foreign subsidiary ofTata Steel for AYs 2008-09, 2009-10, 2010-11, 2011-12 and 2012-13. Tata Steel had taken loansto invest in Corus and claimed the interest expense of the borrowings as business expenditure inthe return of income filed by Tata Steel, for the said assessment years. The assessing officer hasalleged that since the investment in Corus was made not for the advancement of Tata Steel’sbusiness, but for acquiring a controlling interest in Corus, the interest expense on borrowingsmade for making the investment in Corus could not be allowed as a business expenditure and wasdisallowed in the assessments. Consequently, the assessing officer issued an assessment order inrelation to AYs 2008-09 demanding an amount of Rs.2,255 million and draft assessment ordersfor AYs 2009-10, 2010-11, 2011-12, 2012-13 and 2013-14 proposing to demand, in respect of the
154

interest expenditure pertaining to the investments in Corus by Tata Steel, an amount of Rs.4,133million, Rs.4,518 million, Rs.2,382 million and Rs.2,006 million and Rs.1,339 millionrespectively. The proposed demand in respect of AY 2013-14 was made by way of effectivedisallowance of the Minimum Alternate Tax credit. Subsequently, Tata Steel preferred an appealbefore the Commissioner of Income Tax (Appeals) against the assessment order issued in relationto assessment year 2008-09, which was dismissed. Further, in relation to the draft assessmentorders passed with respect to AYs 2009-10 to 2013-14, Tata Steel had preferred objections to theDRP praying for directions to the assessing officer to delete the additions proposed to the taxableincome. The DRP rejected the objections and upheld the disallowance made by the assessingofficers. Therefore, Tata Steel has preferred the Appeals before the ITAT. The aggregate demandsinvolved in the matter are Rs.15,294 million. The assessing officer also initiated penaltyproceedings against Tata Steel under Section 271(1)(c) of the Income Tax Act. The matters arecurrently pending.
Indirect Tax
1. Tata Steel and others (the “Petitioners”) filed writ petitions before the High Court of Jharkhand(the “High Court”) to challenge the constitutional validity of Section 3 of the Jharkhand EntryTax on Consumption or Use of Goods Act, 2011 and Section 11 of the Jharkhand Value AddedTax Act, 2005 (the “Impugned Provisions”), respectively. In terms of the Impugned Provisions,the Government of Jharkhand is seeking to levy and collect entry tax on the scheduled goods,making entry exceeding Rs. 10,000 into local area from any place outside the state of Jharkhandfor consumption or use therein (the “Entry Tax”). The Petitioners are engaged in the activity oftrade and manufacture and during the course of their business, import scheduled goods under theAct from outside the state of Jharkhand. The High Court, declared the Impugned Provisions tobe unconstitutional. The Government of Jharkhand preferred an appeal against the order of theHigh Court before the Supreme Court (the “Appeal”). The Supreme Court allowed the Appealson the ground that the High Court had declared the levy of entry tax unconstitutional on thelimited ground that the said levy was not compensatory in nature and in view of the judgmentof Nine Judges Bench, compensatory character of tax is no longer a valid criteria for decidingthe constitutional validity of entry tax. However, the Supreme Court granted liberty to Tata Steelto file writ petitions before High Court in respect of the other issues involved, not dealt with bythe High Court. Pursuant to the order of the Supreme Court, Tata Steel has filed two writpetitions before the High Court challenging the Impugned provisions as being discriminatory.The matter is currently pending.
Litigation filed by Tata Steel
1. Tata Steel has filed a writ petition in the High Court of Calcutta against the Union of India, theJoint Plant Committee and others (“Respondents”). Tata Steel has claimed a return and refund ofbalance of the contribution of approximately Rs.17,006 million along with interest as on March31, 2008, contributed by it to the Steel Development Fund (“SDF”). The High Court of Calcuttahas passed an interim order dated February 13, 2006 restraining the Respondents from utilisingany amounts from the contributions made by Tata Steel to the SDF, except for the use towardsits members. The total amount involved in the matter is Rs.24,200 million as of March 31, 2017,including applicable interest. The matter is currently pending before the High Court of Calcutta.
Other matters
1. As a listed company in India and having operations in different parts of the world, Tata Steelreceives, from time to time, various communications, including information requests, fromvarious regulators, such as the SEBI. Tata Steel also paid penalties as part of regulatoryproceedings, which are below the materiality threshold under the SEBI Regulations.
155

Litigation involving Tata Steel’s Directors
Criminal Proceedings
1. There have been thirty four criminal cases filed against certain current and former directors andofficials of Tata Steel, in relation to alleged violations arising in the course of Tata Steel’sbusiness operations under, among other laws, the Indian Penal Code, 1860, the Prevention ofCruelty to Animals Act, 1960, the Industrial Disputes Act, 1947, the Factories Act, 1948, theMinimum Wages Act, 1948, the Environment (Protection) Act, 1986 and the rules madethereunder. These matters are currently pending at various stages of adjudication.
Litigation involving Subsidiaries
Haldia Water Management Limited
Arbitration Proceedings
1. Haldia Water Management Limited (“HWML”) has entered into a concession agreement withHaldia Development (the “Authority” and the agreement, the “Agreement”). In terms of theAgreement, HWML was required to construct a 113.5 million litres per day water treatment planton a build, operate and transfer basis. In terms of the Agreement, HWML has initiated arbitrationproceedings against the Authority for breach of the terms of the Agreement and has claimedRs.1,916 million from the Authority. HWML has submitted that the Authority indulged inpremature collection of license fees and subsequently stopped sharing revenues with HWML.Such breaches and other circumstances such as rise in the cost components and inadequate waterdemand adversely affected HWML’s ability to comply with its obligations under the Agreement.The Authority has counter-claimed an amount of Rs.7,760 million, plus applicable interest, foralleged breach of the terms of the Agreement by HWML. The matter is currently pending beforethe arbitral tribunal.
Jamshedpur Utilities and Services Company Limited (“JUSCO”)
Criminal Proceedings
1. The Superintendent of Police, Anti-corruption Branch, Central Bureau of Investigation (“CBI”),Ranchi has filed a criminal complaint against, among others, JUSCO and Sanjiv Paul, the formermanaging director of JUSCO, (the “Accused”) before the Anti-corruption Bureau, CBI, Ranchiunder Sections 120(B) and 420 of the Indian Penal Code, 1860, and Section 13(2) read withSection 13(1)(d) of the Prevention of Corruption Act, 1988 (the “Complaint”). The Complainantshave alleged that the Accused conspired to have a civil and electrical works contract unfairlyawarded in the favor of JUSCO by National Institute of Technology (“NIT”), Jamshedpur, as aresult of which NIT, Jamshedpur, suffered a loss of Rs.162.67 lakhs. The Accused have filed anapplication before the Special Judge, CBI, Ranchi for discharge of the Accused. The matter iscurrently pending.
2. Chuna Ram Baskey (the “Complainant”) has filed a complaint against, among others, AshishMathur, managing director of JUSCO and Sunil Bhaskaran, a vice president of Tata Steel, (the“Defendants”) before the Chief Judicial Magistrate, Jamshedpur (the “CJM”) under Sections3(y), 3(z) and 3(za) of the Scheduled Castes and Scheduled Tribes (Prevention of Atrocities) Act,1989 (the “Complaint”). The Complainant has alleged that the Complainant was forcefullyousted from a certain locality by the Defendants. On the basis of the Complaint, the CJM directedthe Sonari police station to register a first information report (the “FIR”). The Defendants havefiled a writ petition before the High Court of Jharkhand (the “High Court”) for quashing of theFIR. The High Court has vide order dated February 6, 2015 referred the matter to a divisionbench of the High Court and directed the local police to not take coercive steps during theinterim. The matter is currently pending.
156

3. Deepak Mukhi (the “Complainant”) has filed a criminal complaint against, among others, AshishMathur, managing director of JUSCO and Captain Dhananjay Mishra, a senior general managerof JUSCO (the “Defendants”) before the Birsanagar police station, Jamshedpur under Sections147, 148, 323, 325, 207 and 504 of the Indian Penal Code, 1860, and Sections 3 and 4 of theScheduled Castes and Scheduled Tribes (Prevention of Atrocities) Act, 1989 (the “Complaint”).The Sub-divisional magistrate had the directed the demolition of certain dilapidated quartersunder the supervision of a deputed Magistrate (the “Magistrate”). The said demolition wasresisted by the local people including the Complainant. The Complainant alleged that theDefendants along with the Magistrate committed cruelty and humiliated the Complainant. Thematter is currently pending.
TSUK
Criminal Proceedings
1. TSUK has entered guilty pleas in respect of breaches of Section 2(1) and Section 3(1) of the UKHealth and Safety at Work etc Act, 1974 following a fatal accident at its Scunthorpe works onApril 23, 2010. The sentencing hearing took place on December 18, 2017. The matter is reservedfor judgment to the earliest of the end of January, 2018.
2. TSUK is being prosecuted for a breach of Regulation 22(1) of the Construction (Design andManagement) Regulations, 2007 following an incident on January 18, 2014 when a scaffoldingcontractor’s employee fell from height. TSUK has indicated its intention to plead not guilty witha trial to be scheduled for some time during 2018.
Other Proceedings
1. TSUK is defending occupational disease claims being brought under a group litigation ordergranted in 2016 allegedly arising from exposure to dust and fumes whilst working at various cokeovens across England, Wales and Scotland mainly between 1950 and 1980. The cut-off date forclaimants to bring claims under the group litigation order is in September, 2018. The claims areunknown on date.
Litigation by the Tata Steel’s Subsidiaries
Tayo Rolls Limited (“Tayo Rolls”)
1. Tayo Rolls (the “Petitioner”) has filed a writ petition against the State of Jharkhand (the“Respondent”) before the High Court of Jharkhand challenging the rejection of an application forclosure of its operations, by the Respondent, under the Industrial Disputes Act, 1947 (the“Petition”). The board of directors of the Petitioner resolved to suspend the operations of thecompany in a phased manner, including, by way of a voluntary separation scheme for itsemployees. Pursuant to the above, it filed an application under Section 25-O of the IndustrialDisputes Act, 1947, seeking permission for the closure of the company. The Respondent rejectedthe said application, pursuant to which the Petitioner filed the Petition. The matter is currentlypending.
2. Tayo Rolls (the “Applicant”) has filed an application before the Kolkata Bench of the NationalCompany Law Tribunal (the “NCLT”), under the IBC. Due to the Applicant’s net worth becomingnegative, it had made an application to the Board for Industrial and Financial Reconstructionunder the Sick Industrial Companies (Special Provisions) Act, 1985 (the “SICA”), pursuant tothe resolutions passed by the board of directors of Tayo Rolls on February 12, 2016. Howeverthe SICA was repealed in terms of the provisions of the IBC. Accordingly, the Applicant has fileda fresh application initiating corporate insolvency resolution process under IBC. The NCLTrejected the application filed by Tayo Rolls by its order dated December 22, 2017. Tayo Rollswill seek appropriate legal remedies as may be warranted. The matter is currently pending.
157

Litigation involving the directors of Tata Steel’s Subsidiaries
Criminal Proceedings
1. Twelve criminal cases have been filed against the current and former directors and officials of
Tata Steel’s subsidiaries, in relation to alleged violations, arising in the course of its business
operations, under the Indian Penal Code, 1860 and the Factories Act, 1948 and the rules made
thereunder. These matters are currently pending at various stages of adjudication.
158
MANAGEMENT
Board of Directors
The Articles of Association provide that the minimum number of Directors shall be six and the
maximum number of Directors shall be fifteen unless otherwise determined by Tata Steel in a general
meeting, excluding the nominees of financial institutions on the Board. As of the date of this Offering
Memorandum, Tata Steel has 10 Directors, of which two Directors are Executive Directors and eight
Directors are Non-Executive Directors, including five Independent Directors.
Pursuant to the provisions of the Companies Act, 2013, at least two-thirds of the total number of
Directors, excluding the Independent Directors, are liable to retire by rotation, with one-third of such
number retiring at each annual general meeting. A retiring Director is eligible for re-election. Further,
the Independent Directors may be appointed for a maximum of two terms of up to five consecutive
years each. Any re-appointment of Independent Directors shall, inter alia, be on the basis of the
performance evaluation report and approved by the shareholders by way of a special resolution. The
quorum for meetings of the Board is one-third of the total number of Directors, excluding Directors,
if any, whose places may be vacant at the time, or two Directors, whichever is higher, provided that
where at any time the number of interested Directors exceeds or is equal to two-thirds of the total
strength, the number of remaining Directors present at the meeting, being not less than two, shall be
the quorum.
Ratan N. Tata was appointed as Chairman Emeritus with effect form December 28, 2012.
The following table sets forth details regarding Tata Steel’s Board as of the date of this Offering
Memorandum:
Name, Designation, Term, DIN, Occupation and Address Other Directorships
N. Chandrasekaran (54)Chairman and Non-Executive DirectorTerm: Liable to retire by rotationDIN: 00121863Occupation: Company DirectorAddress: 201/202 Sagar Darshan, 8 WorliSeaface, Mumbai 400 030 . . . . . . . . . . . . . . . . . .
1. Tata Sons Limited2. Tata Consultancy Services Limited3. Tata Motors Limited4. The Indian Hotels Company Limited5. The Tata Power Company Limited6. Tata Global Beverages Limited7. Jaguar Land Rover Automotive PLC8. TCS Foundation
Mallika Srinivasan (58)Independent DirectorTerm: August 14, 2014 to August 13, 2019DIN: 00037022Occupation: ProfessionalAddress: Westside House, 3 Adyar Club GateRoad, Mandaveli, Chennai 600 028 . . . . . . . . . . .
1. TAFE Motors and Tractors Limited2. Tractors and Farm Equipment Limited3. TAFE Access Limited4. TAFE Reach Limited5. TAFE Properties Limited6. The United Nilgiri Tea Estates Company
Limited7. Tata Global Beverages Limited8. Trust Properties Development Company
Private Limited9. AGCO Corporation, USA10. Chennai Willingdon Corporate Foundation11. Indian School of Business
159

Name, Designation, Term, DIN, Occupation and Address Other Directorships
O. P. Bhatt (66)Independent DirectorTerm: August 14, 2014 to August 13, 2019DIN: 00548091Occupation: ProfessionalAddress: 3, Seagull, Carmichael Road, Mumbai400026 . . . . . . . . . . . . . . . . . . . . . . . . . . . . . . . .
1. Tata Consultancy Services Limited2. Tata Motors Limited3. Hindustan Unilever Limited4. Greenco Energy Holdings Limited5. Standard Chartered PLC
Dr. Petrus Blauwhoff (64)Independent DirectorTerm: February 7, 2017 to February 6, 2022DIN: 07728872Occupation: ProfessionalAddress: Linnaeuslaan 12, 2012 PP Haarlem,The Netherlands . . . . . . . . . . . . . . . . . . . . . . . . .
1. Tata Steel Europe Limited2. Tata Steel Nederland BV3. Stichting (Foundation) Nederlands
Normalisatie Institut (NEN)4. Royal Haskoning DHV5. Blauwhoff International Consulting6. Blue Court Holdings BV7. Stichting (Foundation) de PAN8. Kongstein AS
Aman Mehta (71)Independent DirectorTerm: March 29, 2017 to August 31, 2021DIN: 00009364Occupation: ProfessionalAddress: 115A, 2nd Floor, Jor Bagh, LodhiRoad, New Delhi 110 003 . . . . . . . . . . . . . . . . . .
1. Tata Consultancy Services Limited2. Wockhardt Limited3. Godrej Consumer Products Limited4. Max Financial Services Limited5. Vedanta Limited6. PCCW Limited7. HKT Limited, Hong Kong
Deepak Kapoor (58)Independent DirectorTerm: April 1, 2017 to March 31, 2022DIN: 00162957Occupation: ProfessionalAddress: House No. K42, NDSE Part-II, NewDelhi 110 049 . . . . . . . . . . . . . . . . . . . . . . . . . . .
1. HCL Technologies Limited2. Essar Oil Limited3. Delhivery Private Limited
D. K. Mehrotra (64)Non-Executive DirectorTerm: Liable to retire by rotationDIN: 00142711Occupation: ProfessionalAddress: 6A, Harmony, Dr. E. Moses Road,Worli Naka, Worli, Mumbai 400 018. . . . . . . . . .
1. Tata AIA Life Insurance Company Limited2. Metropolitan Stock Exchange of India
Limited3. CAMS Insurance Repository Services
Limited4. Indian Energy Exchange Limited5. VLS Finance Limited6. UTI Asset Management Company Limited7. West End Housing Finance Limited8. Computer Age Management Services
Private Limited
160
Name, Designation, Term, DIN, Occupation and Address Other Directorships
Saurabh Agrawal (48)Non-Executive DirectorTerm: Liable to retire by rotationDIN: 02144558Occupation: ProfessionalAddress: Flat No. 2803, Imperial Towers, BBNakashe Marg, Tardeo, Mumbai 400 034 . . . . . .
1. Tata Sons Limited2. Tata Capital Limited3. Tata AIA Life Insurance Company Limited4. Tata AIG General Insurance Company
Limited5. Tata Teleservices Limited6. The Tata Power Company Limited7. Candid Fruits Private Limited8. Chambal Natural Fruits Private Limited9. Gradis Trading Private Limited10. Natural Fruits Private Limited11. Natural Whole Fruits Private Limited
T. V. Narendran (52)Chief Executive Officer and Managing DirectorTerm: September 19, 2013 to September 18,2018DIN: 03083605Occupation: ServiceAddress: Bungalow No. 5, C Road, NorthernTown, Jamshedpur 831 001 . . . . . . . . . . . . . . . . .
1. Tata Steel Special Economic Zone Limited2. Jamshedpur Football and Sporting Private
Limited3. Tata Steel Europe Limited4. Tata Steel Foundation
Koushik Chatterjee (49)Executive Director and Chief Financial OfficerTerm: November 9, 2017 to November 8, 2022DIN: 00004989Occupation: ServiceAddress: NCPA Residential Apartments, A Wing,22nd Floor, Flat No. 221, Nariman Point,Mumbai 400 021 . . . . . . . . . . . . . . . . . . . . . . . . .
1. Tata Metaliks Limited2. Tata Steel Special Economic Zone Limited3. The Tinplate Company of India Limited4. T S Global Holdings Pte. Ltd.5. T S Global Minerals Holdings Pte. Ltd.,
Singapore6. T S Global Procurement Co. Pte. Ltd.,
Singapore7. Tata Steel Europe Limited8. Tata Steel Foundation
None of the Directors are related to each other. A short biography for each Director is provided below:
N. Chandrasekaran is the Chairman and Non-executive Director of Tata Steel. He was the ChiefExecutive Officer and Managing Director of Tata Consultancy Services, a leading global IT solutionsand consulting firm, from 2009 till February 2017. He holds a bachelor’s degree in applied science anda master’s degree in computer application from Trichy. He is a Non-executive Director of Tata SteelLimited since January 13, 2017 and was appointed as the Chairman of the Tata Steel’s Board witheffect from February 7, 2017.
Mallika Srinivasan is an Independent Director of the Tata Steel. She is the Chairman and chiefexecutive officer of Tractors and Farm Equipment Limited and TAFE Motors and Tractors Limited.She holds a masters degree in Business Management from the Wharton School of Business, Universityof Pennsylvania, USA and a Master of Arts in Econometrics from the University of Madras, Chennai.She has been a member of the Board of the Tata Steel since May 21, 2012 and was appointed as anIndependent Director on the Tata Steel’s Board on August 14, 2014.
O. P. Bhatt is an Independent Director of the Tata Steel. He was the Chairman of State Bank Group.He completed his graduation in Science and post-graduation in English Literature from MeerutUniversity. He was appointed as a member of the Tata Steel’s Board with effect from June 10, 2013and was appointed as an Independent Director with effect from August 14, 2014.
161

Dr. Petrus Blauwhoff is an Independent Director of the Tata Steel. He has served as a Chairman of
the German National Oil Industry Association, as the chief executive officer of Deutsche Shell
Holding GmbH and as a vice-chairman of the German Forum for Future Energies, among others. He
holds a doctorate in Technical Sciences and has completed his graduation in chemical engineering with
honours (cum laude) from the University of Twente, The Netherlands. He was appointed as an
Independent Director on the Tata Steel’s Board on February 7, 2017.
Aman Mehta is an Independent Director of the Tata Steel. He has over 39 years of experience in the
field of banking and finance and was the Chief Executive Officer of the HSBC Group (Asia Pacific).
He completed his graduation in Economics from Delhi University. He was appointed as an
Independent Director on the Tata Steel’s Board on March 29, 2017.
Deepak Kapoor is an Independent Director of the Tata Steel. He was the Chairman of Price
Waterhouse Coopers India. He completed his graduation in Commerce from Delhi University. He is
a fellow member of the Institute of Chartered Accountants of India, fellow member of the Institute of
Company Secretaries of India and a member of the Institute of Certified Fraud Examiners, USA. He
was appointed as an Independent Director on the Tata Steel’s Board on April 1, 2017.
D. K. Mehrotra is a Non-Executive Director of the Tata Steel. He is the former chairman of Life
Insurance Corporation of India. He completed his graduation with honours degree in Science from the
University of Patna. He was appointed as an Non-Executive Director on the Tata Steel’s Board as a
Director on October 22, 2012.
Saurabh Agrawal is a Non-Executive Director of the Tata Steel. He has been the group Chief
Financial Officer of Tata Sons Limited since June, 2017 and was appointed as the Executive Director
of Tata Sons Limited in November, 2017. Prior to joining the Tata Group, he was the head of strategy
at the Aditya Birla Group. He completed his graduation in chemical engineering from Indian Institute
of Technology, Roorkee and his post graduate diploma in management from Indian Institute of
Management, Calcutta. He was appointed as a Non-Executive Director on the Tata Steel’s Board on
August 10, 2017.
T. V. Narendran is the Chief Executive Officer and Managing Director of the Tata Steel, having been
appointed on November 30, 2017. He joined Tata Steel in 1988 and was appointed as the Managing
Director for the India and South East Asia of Tata Steel in 2013, where he successfully executed and
commissioned one of the largest greenfield projects in India, the Kalinganagar Steel plant in Odisha,
which ramped up operations to its rated capacity within a very short span of time. He completed his
graduation in Mechanical Engineering from Regional Engineering College (National Institute of
Technology), Trichy and a post graduate diploma in management from Indian Institute of
Management, Calcutta. He is a Chevening Scholar and has also attended the Advanced Management
Programme in CEDEP-INSEAD, Fontainebleau, France. He was appointed as the Chief Executive
Officer and Managing Director of the Tata Steel on November 30, 2017.
Koushik Chatterjee is the Executive Director and Chief Financial Officer of the Tata Steel. He joined
Tata Steel in 1995 and was appointed as the Group Executive Director (Finance and Corporate) with
effect from November 9, 2012. During his tenure, he led the first overseas acquisition of a steel
manufacturer by Tata Steel, NatSteel Asia and subsequently led the acquisition of Millenium Steel
(now Tata Steel Thailand) in Thailand. He also played a critical role in the acquisition of Corus Group
Plc. He completed his graduation with honours degree in Commerce from Calcutta University and is
a Fellow Member of the Institute of Chartered Accountants of India. He was appointed as the
Executive Director and Chief Financial Officer of the Tata Steel with effect from November 9, 2017.
162

SHARE OWNERSHIP OF TATA STEEL
As at September 30, 2017, Tata Steel’s promoter, Tata Sons, together with Tata Motors and other TataGroup companies and related trusts (the “Promoter Group”) held approximately 31.4% of Tata Steel’sissued equity shares. A company’s “promoters” under the SEBI regulations includes the person orpersons who are in control of the company, the person or persons nominated as promoters in any offerdocument filed with the Indian stock exchanges and persons who are instrumental in the formulationof a plan or program pursuant to which securities are offered to public.
The directors of Tata Steel held 3,073 equity shares of Tata Steel as at September 30, 2017.
As at September 30, 2017, Tata Sons owns directly and indirectly 31.3% of Tata Steel’s issued equityshares, while the Life Insurance Corporation of India, the largest public shareholder, owned, directlyand indirectly, 10.6% of the Tata Steel’s issued equity shares.
Tata Sons
Tata Sons was set up in 1868 by Mr. Jamsetji Tata. It was incorporated as a private company underthe Indian Companies Act, 1913 on November 8, 1917. Its registered office is located at BombayHouse, 24 Homi Mody Street, Fort, Mumbai 400 001. Tata Sons became a deemed public companywith effect from May 1, 1975. Tata Sons is the principal investment and holding company of variousTata companies and has a significant shareholding in the share capital of major operating companieswhich it has promoted, including Tata Consultancy Services, a provider of information technology andinformation technology-enabled services; Tata Motors, a leading automobile manufacturer in Indiawhich also owns Jaguar and Land Rover; and Tata Power, which is engaged in the generation,transmission and distribution of electrical energy.
In addition to its significant holdings in major operating companies, Tata Sons is the owner of the Tatabrand name and the Tata trademarks, which are registered in India and several other countries and areused by most of the Tata companies in relation to their corporate names, products and services.
Tata Group
Founded by Jamsetji Tata in 1868, the Tata Group is a global enterprise headquartered in India, andcomprises over 100 operating companies in seven business sectors: communications and informationtechnology, engineering, materials, services, energy, consumer products and chemicals.
The revenue of Tata companies, taken together, was approximately Rs.6,733,470 million for the yearended March 31, 2017, with total assets of Rs.8,452,120 million as at March 31, 2017. The combinedmarket capitalization of the 32 publicly listed Tata enterprises was approximately US$151.63 billionas at January 4, 2018.
Tata Steel is the flagship company for the Tata group with significant contribution in terms of revenueand assets of the Tata group.
Brand Finance valued the Tata brand at US$13.11 billion and ranked it as the most valuable globalbrand in their Global 500 2017 Report.
Since April 1, 2007, the Tata group has invested approximately US$1.08 billion into Tata Steel througha combination of rights issues, cumulative preference shares, preferential allotment of shares andwarrants. Tata Steel also benefits from access to the Tata brand, group companies as stable customersas well as a shared pool of talented resources provided by Tata Administrative Services.
163

RELATED PARTY TRANSACTIONS
The Group, in the ordinary course of business, enters into various sales, asset purchases, rent and
service transactions with its subsidiaries, joint ventures and associates and others in which the Group
has a material interest. These transactions are pursuant to terms that are no less favorable than those
arranged with third parties.
The following table summarizes related party transactions and balances included in the financial
statements for the year ended and as at March 31, 2017. See Note 44 to the Group’s Annual Financial
Statements for further information on related party transactions determined in accordance with
Ind-AS.
Associates
Joint
Arrangements
Tata Sons and its
subsidiaries and
joint ventures Total
Purchase of goods . . . . . . . . . . 5,920 2,617 10,550 19,087
5,377 4,118 5,809 15,305
Sale of goods . . . . . . . . . . . . . 8,141 19,426 1,902 29,468
6,574 19,232 635 26,441
Services received . . . . . . . . . . 139 18,948 1,114 20,201
299 12,124 1,190 13,613
Services rendered . . . . . . . . . . 146 1,022 9 1,176
92 1,105 2 1,200
Interest income recognized. . . � 4 � 4
� 18 � 18
Interest expenses recognized . � � 162 162
9 4 8 21
Dividend paid . . . . . . . . . . . . . � � 2,365 2,365
� � 2,366 2,366
Dividend received . . . . . . . . . . 238 484 5 727
95 433 409 938
Provision for receivablesrecognized during the year . � � � �
0 � � 0
Management contracts . . . . . . 9 19 1,312 1,340
7 9 1,454 1,470
Purchase of Investments. . . . . � � � �
82 � � 82
Sale of Investments . . . . . . . . � � � �
� � 26,036 26,036
Finance provided during theyear . . . . . . . . . . . . . . . . . . . � 70 � 70
9 606 77 692
� 2,075 � 2,075
164

Associates
Joint
Arrangements
Tata Sons and its
subsidiaries and
joint ventures Total
Outstanding loans andreceivables . . . . . . . . . . . . . . 952 10,564 820 12,337
803 12,698 386 13,887
874 13,200 370 14,444
Previous for outstandingloans and receivables . . . . . 30 9,447 � 9,477
35 9,904 � 9,939
34 8,990 � 9,024
Outstanding Payables . . . . . . . 565 4,359 2,882 7,806
759 3,392 2,290 6,441
916 3,162 2,338 6,415
Guarantees providedoutstanding . . . . . . . . . . . . . � 2,226 � 2,226
� 2,422 � 2,422
� 2,561 � 2,561
165

REGULATION
The following description is a summary of certain laws, regulations and policies in India, which areapplicable to the Group. The information provided below has been obtained from sources available inthe public domain. The summary of the regulations set out below is not exhaustive, and is onlyintended to provide general information to potential investors and is neither designed nor intended tobe a substitute for professional legal advice.
Mines and Minerals (Development and Regulations) Act, 1957 (the “MMDR Act”)
The MMDR Act provides for the development and regulation of mines and minerals under the controlof the Union of India and it lays down the substantive law pertaining to the grant, renewal andtermination of reconnaissance permits, mining leases and prospecting licenses. The MMDR Act alsogoverns the transportation and storing of any mineral. In 2010, the MMDR Act was amended toempower the Central Government of India to undertake selection of the company for the purpose ofgranting reconnaissance permit, prospecting licenses or mining lease in respect of an area containingcoal or lignite through the process of auction by competitive bidding. On February 2, 2012, the CentralGovernment of India notified the Auction by Competitive Bidding of Coal Mines Rules, 2012 whichlays down the procedure for allocation of area containing coal through auction by competitive bidding.
Under the MMDR Act, the lessee is liable to pay royalties on minerals extracted or a dead rentcomponent to the relevant state government. The royalty is payable in respect of any mineral removedor consumed by him or his agent, manager, employee, contractor or sub-lessee and is computed inaccordance with a stipulated formula. The Central Government has broad powers to change the royaltyscheme, but cannot increase the rate of royalty more than once in every three years.
Reforms in the mining sector were brought about by amending the MMDR Act in 2015 (the MMDRAmendment Act 2015). As per the MMDR Amendment Act 2015, a new category of mining licensenamely “prospecting license-cum-mining lease”, has been created. The MMDR Amendment Act 2015allows the grant of mineral concessions for major minerals through auction by competitive bidding orotherwise. It stipulates the central government to prescribe the terms and conditions and procedure forthe auction while the state governments is required to select, through auction by competitive bidding,an applicant who fulfills the eligible conditions,. For the grant of a reconnaissance permit, prospectinglicense and mining lease in respect of coal or lignite, the central government (through the Ministry ofCoal) may select, through auction by competitive bidding or otherwise, on such terms and conditionsas may be prescribed, to a government company or corporation or a joint venture company, that carryon coal mining operation in India in any form either for their own consumption, sale or for any purposeand the relevant state government shall grant a permit, license or lease to such company.
The MMDR Act, was further amended in 2016 by the MMDR Amendment Act, 2016. The amendmentsmade in the MMDR Act, now allow for the transfer of mining leases which have been granted throughprocedures other than auction, and where the minerals are used for captive purpose Such leasetransfers will be subject to terms and conditions, and transfer charges as prescribed by the centralgovernment. These transfers will be in addition to the existing transfers that are allowed.
In 2016, the Government of India introduced, the National Mineral Exploration Policy, 2016, whichinter-alia, provides for the sharing of baseline geo-scientific data free of cost in public domain and theaero-geophysical survey of the country initially in the obvious geological potential area. A miningsurveillance system, has been launched to potentially curb illegal mining activities in the country.
Mineral Concession Rules, 1960, (the “MC Rules”) and the Mineral Conservation and DevelopmentRules, 1988 (the “MCD Rules”)
The MC Rules outline the procedures for obtaining reconnaissance permit, prospecting license andmining lease, the terms and conditions in relation to the same, and the model form in which they areto be issued. In addition, the lessee will be liable to pay the occupier of the surface of the land overwhich it holds the mining lease an annual compensation determined by the relevant state government,which varies depending on whether the land is agricultural or non-agricultural.
166

The Central Government has also framed the MCD Rules which lays down guidelines in order toensure that mining is carried out in a safe, scientific and environmentally friendly manner.
Coal Mines (Nationalization) Act, 1973 (the “CMN Act”)
The mining of coal is governed by the CMN Act, which provides that for a private entity, no personother than a company engaged in (i) the production of iron and steel, (ii) generation of power, (iii)washing of coal obtained from a mine, or (iv) such other end uses as the Central Government, mayby notification specify, can be granted a lease for mining of coal.
Other mining laws and regulations that may be applicable to the Group, inter alia, include thefollowing:
(i) Mining Lease (Modification of Terms) Rules, 1956;
(ii) The Mines Act, 1952 and Mines Rules, 1955;
(iii) The Payment of Wages (Mines) Rules, 1956; and
(iv) The Metalliferous Mine Regulations, 1961.
The Ministry of Coal has also issued various guidelines including Guidelines for Preparation ofMining Plan for the Coal and Lignite Blocks issued on April 4, 2011 and modified Guidelines forPreparation of Mine Closure Plan issued on January 7, 2013.
The Central Government in pursuance of directives given by the Supreme Court of India, introducedand implemented the Coal Mines (Special Provisions) Act 2015 (the “CM Act”), which waspromulgated on 30 March 2015, with retrospective date of implementation as April 21, 2014. The CMAct, provides for the allocation of coal mines and the land and mine infrastructure together with themining leases to successful bidders and allottees to ensure continuity in coal mining operations andproduction of coal.
National Mineral Policy, 2008
The Central Government approved the National Mineral Policy, 2008, (the “NMP”) for non-coal andnon-fuel minerals on March 13, 2008, revisiting the previous National Mineral Policy, 1993, and hasgiven its approval for setting up of the Mining Administrative Appellate Tribunal as an independentdispute resolution authority. The NMP seeks to streamline and simplify the procedures for grant ofmineral concessions and develop a sustainable framework for optimum utilization of the country’snatural mineral recourses. It also aims to provide a framework of sustainable development designedto take care of bio diversity issues, restoration of ecological balance, protection of environment andproper relief and rehabilitation of people displaced and affected by the mining process. The NMPproposes to facilitate financing and funding of mining activities and development of mininginfrastructure based on the principle of user charges and public private partnerships.
In a decision dated August 2, 2017, on the matter of illegal mining in the state of Odisha, the SupremeCourt, besides other issues, had directed that the Central Government to revise the National MineralPolicy of 2008. Following the directions of the SC, the Union Ministry of Mines has now set up acommittee to review the NMP.
Compliance with Other Applicable Laws
Environmental Laws
The Group is also required to obtain clearances under the EPA, the Forest (Conservation) Act, 1980,if any forest land is involved, and other environmental laws such as the Water (Prevention and Controlof Pollution) Act, 1974, the Water (Prevention and Control of Pollution) Cess Act, 1977 and the Air(Prevention and Control of Pollution) Act, 1981, before commencing mining operations. The Groupmust also comply, at all times, with the provisions of the Hazardous Wastes Rules.
167

Other Laws
Additionally, the Group is also required to comply with inter alia the following laws:
(i) Central Excise Act, 1944;
(ii) Contract Labor (Regulation and Abolition) Act, 1970;
(iii) Customs Act, 1962;
(iv) Employees’ Provident Funds and Miscellaneous Provisions Act, 1952;
(v) Employees’ State Insurance Act, 1948;
(vi) Factories Act, 1948;
(vii) Foreign Trade (Development and Regulation) Act, 1992;
(viii) I D Act and Industrial Disputes (Central) Rules, 1957;
(ix) Industries (Development and Regulation) Act, 1951;
(x) Minimum Wages Act;
(xi) Payment of Bonus Act, 1965;
(xii) Payment of Gratuity Act, 1972;
(xiii) Payment of Wages Act, 1936; and
(xiv) Shops and Commercial Establishments Act applicable to relevant states.
168

DESCRIPTION OF MATERIAL INDEBTEDNESS
The following summary of certain provisions of the Group’s loan facilities, bonds and other
indebtedness does not purport to be complete and is subject to, and qualified in its entirety by
reference to, the underlying credit agreements, bonds and other documentation. Furthermore, this
summary relates only to the Group’s principal long-term indebtedness. The Group utilizes a variety
of short-term debt instruments.
The Group’s principal sources of external financing include both secured and unsecured short-term as
well as long-term facilities (in both rupees and other currencies). As of March 31, 2017, the Group
had total borrowings of Rs.830,145 million (US$12,802 million). As of March 31, 2017, substantially
all of the Group’s borrowings by its non-Indian subsidiaries were denominated in foreign currency,
principally in USD and Euro, while approximately 32% of the Group’s borrowings, on a consolidated
basis, were denominated in rupees.
The Group’s long-term funding strategy is to continue to pay down debt from operating free cash flows
and diversify sources of financing. In the near term, the Group’s strategy is to reduce the total
indebtedness in its European operations.
Rupee Loans
The Group is party to facility agreements under which borrowings are denominated in Rupees (“Rupee
Term Loans”) with various banks and financial institutions, including the State Bank of India, HDFC
Bank Limited, ICICI Bank Limited, Axis Bank Limited and Punjab National Bank. As of March 31,
2017, the aggregate outstanding amount under these loans totaled approximately Rs.79,098.9 million.
While interest under some of the Rupee Bank Loans accrue at a fixed interest rate throughout the term
of the loans, some other Rupee Bank Loans bear interest at floating rates calculated with reference to
the Marginal Cost of Funds based Lending Rate (“MCLR”) of the relevant lenders. Interest payments
are generally payable monthly and must be made on each payment date as provided in the particular
facility agreement.
Some of the Rupee Bank Loans contains customary negative covenants, including restrictions, subject
to certain exceptions, on the Group’s ability to incur secured indebtedness, sell or otherwise dispose
of certain assets, effect a consolidation or merger or create liens on assets.
The Rupee Bank Loans contain certain customary events of default, such as failure to pay the amount
payable on the due date, material breach of the terms of the loan agreement and acceleration of
repayment obligations under other loan or financing documents, with certain exceptions. The lenders
are entitled to terminate their respective agreements and/or demand immediate repayment of the loans
and any accrued interest and/or foreclose on secured assets under the respective agreements upon the
occurrence of an event of default and after the end of its cure periods, as applicable.
The Group is party to a receivables purchase agreement with HDFC Bank Limited under which a
Rs.17,500 million receivables financing program is documented. Under this agreement approved
receivables are sold to HDFC Bank Limited on a non-recourse basis. In addition, Tata Steel also has
a First Loss Deficiency Guarantee receivable financing program of Rs.7,500 million documented with
HDFC Bank Limited.
169

The Group is also party to a secured loan denominated in Rupees from the Joint Plant Committee —Steel Development Fund, which is an Indian government body. As of March 31, 2017 the amountoutstanding under this loan was Rs.24,207 million. This loan contains certain customary events ofdefault, such as failure to pay the amount payable on the due date and material breach of the termsof any loan agreement. The lender is also entitled to demand immediate repayment of the loan and anyaccrued interest and/or enforce the security under the respective agreements upon the occurrence ofan event of default.
In connection with the Odisha project, the Group entered into long-term unsecured Rupee loan in theamount of Rs.228,000 million in July 2014 and subsequently the scope of the project was restrictedonly to Phase I and the same was amended vide amendment agreement dated March 10, 2017. Therevised Rupee loan amount was restricted to Rs.108,750 million. The loan also provides for theissuance of letters of credit up to certain limits. The loan contains customary covenants, includingcertain restrictive covenants and financial covenants. The final settlement for the Rupee loan is duein March 2025.
The Group has also raised Rupee loans from time to time including a Rs.20,000 million loan from SBIin December 2015, a Rs.15,000 million loan from HDFC Bank in two tranches.
Non-Rupee Loans
In March 2006, the Group entered into a facility agreement with Deutsche Bank Aktiengesellschaft,for EUR 49.9 million in relation to a financing amount due under specified commercial contractsrelated to the Group’s growth plan program at Jamshedpur for the blast furnace financing. This is anamortizing term loan facility, with repayment in twenty (20) equal, consecutive, semi-annualinstallments starting from July 1, 2009.
In May 2009, the Group entered into a EUR 264 million facility agreement with a consortium oflenders led by AKA Ausfuhrkredit-Gesellschaft mbH, Frankfurt (M) to finance certain contracts andassociated costs. The facility agreement comprises of two facilities: (i) a EUR 218 million commercialinterest reference rate facility and (ii) a EUR 46 million floating rate facility, under which exportcredit cover was provided by Euler Hermes Kreditversicherungs-Aktiengesellschaft, Hamburg andPricewaterhouseCoopers Aktiengesellschaft Wirtschaftsprüfungsgesellschaft, acting jointly for and onbehalf of the Federal Republic of Germany.
In April 2010, the Group entered into an unsecured EUR 72.9 million facility agreement with CreditAgricole Corporate and Investment Bank and BNP Paribas in relation to financing amounts due underspecified commercial contracts to which it is a party with Paul Wurth Italia S.p.A and Paul Wurth IndiaPvt Ltd.
In October 2014, the 2010 facility of TSE, which was the refinanced facility of the 2007 facility ofTSE, was refinanced again in full with the proceeds of a new credit facility (the “2014 Senior FacilityAgreement”) among subsidiaries of TSE (including Tata Steel UK Holdings Limited (“TSUKH”) andTata Steel Netherlands Holdings (B.V.)) and a syndicate of 23 banks, including The Royal Bank ofScotland plc as the Agent and Citibank as the Security Trustee. The terms of the 2014 Senior FacilityAgreement include a five-year term loan of EUR 370 million and seven-year term loans of EUR 1,500million and US$379.50 million. The revolving credit facilities for working capital purposes wereincreased to GBP 700 million and have a tenor of six years. Obligations under the 2014 Senior FacilityAgreement are guaranteed by certain of the Group’s European subsidiaries. The 2014 Senior FacilityAgreement is secured by a pledge of the shares of TSUKH, its material subsidiaries and theirrespective fixed assets, with limited exceptions. The five-year term loan is repayable in full at the endof five years from the first drawdown date of October 28, 2014 and the seven year term loans arerepayable in eight quarterly installments starting from January 28, 2020. Under the 2014 SeniorFacility Agreement, the obligors are required to maintain certain financial ratios linked to total netleverage and total net debt service for the quarters ended March 31, 2021 and June 30, 2021. Inaddition, obligors are subject to limitations on the amount of total capital expenditure within each
170
financial year and there is a restriction on the payment of dividends, interest and repayments of anyparent company subordinated loans by TSE while the 2014 Senior Facility Agreement is outstanding.This facility is supported by a Deed of Undertaking as well as a Letter of Comfort issued to The StateBank of India. Currently, the full amounts of the five year term loan and the seven year term loansare outstanding.
In December 2015, TSGH entered into an unsecured syndicated debt of US$1,500.0 million with 16lenders. The loan has an end-to-end tenor of six years and is covered by a Letter of Comfort from TataSteel.
In January 2016, the Group refinanced its earlier unsecured facility of US$200 million with SumitomoMitsui Banking Corporation, Singapore Branch and Export Development Canada, which wasoriginally raised in March 2013 to finance the Group’s capital expenditure. In February 2016, theGroup also refinanced its earlier unsecured facility of JPY 878,303,201 with Standard Chartered Bankfor US$7.86 million, which was originally raised in September 2012 from JBIC and BTMU for thefinancing of a portion of the cost of Japanese goods payable pursuant to specified approved contractsrequired for the upgrade of the Jamshedpur Plant.
In June 2016, Natsteel Asia, Pte. Ltd. entered into a syndicated unsecured facility of US$410.0 millionwhich was subsequently upsized to US$460.0 million in August 2016, the proceeds of which were torefinance the project debt in T S Canada Capital for the direct shipping ore project.
In 2012, TSGP entered into an unsecured syndicated facility agreement with The Hongkong andShanghai Banking Corporation Limited which was amended in March 2015. As of March 31, 2017, thebankers to the facilities are Citibank N.A., Singapore Branch, Australia and New Zealand BankingGroup Limited, Singapore Branch, Credit Agricole Corporate and Investment Bank, BNP Paribas,Barclays Bank, Axis Bank Limited, DIFC Branch and Kotak Mahindra Limited, IBU GIFT CityBranch. The facility is covered by a Letter of Comfort from Tata Steel and proceeds from the facilityare used to finance the working capital requirements of the Group. The facility is comprised of tworevolving credit facilities: (i) Facility A, a multicurrency revolving credit facility of US$250.0 millionand including a letter of credit facility; and (ii) Facility B, a S$25 million revolving credit facility.
On March 16, 2017, TSGP entered into a US$80.0 million revolving credit facility agreement withSumitomo Mitsui Banking Corporation, Singapore Branch, the proceeds of which were used to financethe working capital requirements of the Group. The facility was amended in September 2017 toincrease the facility amount to US$105.0 million. The facility is covered by a Letter of Comfort fromTata Steel.
On June 2, 2016, TSGP entered into a US$75.0 million revolving credit facility agreement with TheBank of Tokyo-Mitsubishi UFJ, Singapore Branch, the proceeds of which were used to finance theworking capital requirements of the Group. The facility is covered by a Letter of Comfort from TataSteel.
On June 20, 2012, TSGP entered into a master sale agreement with Standard Chartered Trade ServicesCorporation. As of March 31, 2017, under the eighth amendment of the master sale agreement,Standard Chartered Trade Services Corporation has agreed to provide a US$390.0 million traderevolving facility to TSGP to finance the purchase of raw materials in the ordinary course of business.
Most of the Group’s non-Rupee loans bear interest at a floating rate linked to EURIBOR, LIBOR orlocal official rates (depending on the currency) plus a margin. Interest payments on these loans aregenerally payable monthly or quarterly and must be made on each payment date as provided in theparticular facility agreement. As of March 31, 2017, the aggregate outstanding amount under theseloans totaled approximately Rs.563,319 million.
The Group’s financing agreements and debt arrangements normally contain customary negativecovenants that limit or require the Group to obtain lender consents before, among other things,
171

changing the Group’s business, conducting mergers and consolidations, selling significant assetsbeyond a certain limit, creating liens on assets or making certain acquisitions or investments. Thefinancing agreements and debt arrangements also contain customary provisions in respect of events ofdefault, including provisions whereby a default under one financing agreement may also result incross-defaults under the other financing agreements and result in the outstanding amounts under eachsuch financing agreement becoming immediately due and payable.
Some of the financing agreements and debt arrangements contain financial covenants that require thesatisfaction and/or maintenance of financial tests and ratios.
Deed of Undertaking
The Company has agreed, if requested by TSUKH, to procure an injection of funds to reduce theoutstanding net debt in TSUKH and its subsidiaries to a mutually accepted level.
Hybrid Perpetual Securities
On March 18, 2011, the Group raised Rs.15,000 million through the issuance of hybrid perpetualsecurities to fund its expansion plans. In May 2011, the Group raised an additional Rs.7,750 millionthrough the issuance of additional hybrid perpetual securities. These securities are perpetual in nature,with no maturity or redemption, and are callable only at the option of the Group. For the years endedMarch 31, 2017, 2016 and 2015, the Group made distributions of Rs.2,661.0 million, Rs.2,661.7million and Rs.2,661.1 million on these securities.
Debentures
10.40% Non-Convertible Debentures
During the first quarter of the year ended March 31, 2010, the Group raised Rs.6,509 million throughthe issuance of 10-year NCDs at a fixed rate of 10.40% per annum. The NCDs will be redeemed asa bullet payment at the end of the 10th year in May 2019.
11.00% Non-Convertible Debentures
During the first quarter of the year ended March 31, 2010, the Group raised Rs.15,000 million throughthe issuance of 10-year NCDs at a fixed rate of 11.00% per annum. The NCDs will be redeemed asa bullet payment at the end of the 10th year in May 2019.
10.25% Non-Convertible Debentures
During the first quarter of the year ended March 31, 2011, the Group contracted to raise Rs.30,000million through the issuance of 20-year NCDs. In December 2010, the Group issued the first Rs.5,000million of the NCDs at a fixed rate of 10.25% per annum. The NCDs will be redeemed in equalinstallments at the end of years 28, 29 and 30, and will have no coupon payable for the first three yearsafter issuance. Interest for the first three years is accumulated into the principal of the NCDs and theremaining coupon payments are calculated based on the accumulated principal amount beginning afterthe completion of the fourth year. The Group has the option to redeem the NCDs at the accumulatedprincipal amount, either in part or full, at the end of tenth and fifteenth years, in each case, from thedate of issuance. In January 2011, the Group issued the remaining Rs.25,000 million of the NCDs onthe same terms as those issued in December 2010. The NCDs will be redeemed in equal installmentsat the end of years 29, 30 and 31, and will have no coupon payable for the first three years afterissuance.
172

2.0% Non-Convertible Debentures
During the first quarter of the year ended March 31, 2013, the Group raised Rs.15,000 million through
the issuance of 10-year NCDs at a fixed rate of 2.0% per annum. The NCDs were issued at a discount
of 15% to the face value of Rs.1,000,000 per debenture and will be redeemed at a premium of 85.03%
of the face value in year 22. The yield to maturity of the NCDs is 9.80% per annum.
9.15% Non-Convertible Debentures
During the last quarter of the year ended March 31, 2013, the Group raised Rs.5,000 million through
the issuance of NCDs at a fixed rate of 9.15% per annum. The NCDs will be redeemed at par in 2019.
9.15% Non-Convertible Debentures
During the last quarter of the year ended March 31, 2013, the Group raised Rs.5,000 million through
the issuance of NCDs at a fixed rate of 9.15% per annum. The NCDs will be redeemed at par in 2021.
8.15% Non-Convertible Debentures
During the third quarter of the year ended March 31, 2017, the Group raised Rs.10,000 million through
the issuance of NCDs at a fixed rate of 8.15% per annum. The NCDs will be redeemed at par in 2026.
4.95% Guaranteed Notes due 2023
Tata Steel has guaranteed the S$300,000,000 4.95% Guaranteed Notes due 2023 (the “2023 Notes”)
on May 3, 2013, which were issued by the Issuer. The principal amount outstanding is not amortizing
and is due in full on May 3, 2023. Interest is payable semi-annually in arrears on each of May 3 and
November 3.
4.85% Guaranteed Notes due 2020
Tata Steel has guaranteed the US$500,000,000 4.85% Guaranteed Notes due 2020 (the “2020 Notes”)
on July 31, 2014, which were issued by the Issuer. The principal amount outstanding is not amortizing
and is due in full on January 31, 2020. Interest is payable semi-annually in arrears on each of January
31 and July 31.
5.95% Guaranteed Notes due 2024
Tata Steel has guaranteed the US$1,000,000,000 5.95% Guaranteed Notes due 2024 (the “2024
Notes”) on July 31, 2014, which were issued by the Issuer. The principal amount outstanding is not
amortizing and is due in full on July 31, 2024. Interest is payable semi-annually in arrears on each of
January 31 and July 31.
Debt and Debt Funding
The Group has stable relationships with a large variety of debt providers, principally commercial
banks. As at March 31, 2017, approximately 39.8% of the Group’s total debt carried a fixed interest
rate. As at March 31, 2017, the proportion of the Group’s short-term to total debt was 22.9%.
173

Maturity of Borrowings
The table below summarizes the maturity profile of the Group’s borrowings based on contractual
undiscounted payments. The details given below are gross of debt origination cost.
Expected maturity as
at March 31, 2017
(Rs. million)
Within one year . . . . . . . . . . . . . . . . . . . . . . . . . . . . . . . . . . . . . . . . . . . . . . . . . 193,923
Between one and two years . . . . . . . . . . . . . . . . . . . . . . . . . . . . . . . . . . . . . . . . 24,159
Between two and five years . . . . . . . . . . . . . . . . . . . . . . . . . . . . . . . . . . . . . . . . 378,504
Over five years . . . . . . . . . . . . . . . . . . . . . . . . . . . . . . . . . . . . . . . . . . . . . . . . . 290,313
886,899
Less: Future finance charges on financial leases . . . . . . . . . . . . . . . . . . . . . . . . 43,069
Less: Capitalization of transaction costs. . . . . . . . . . . . . . . . . . . . . . . . . . . . . . . 13,685
Total . . . . . . . . . . . . . . . . . . . . . . . . . . . . . . . . . . . . . . . . . . . . . . . . . . . . . . . . . 830,145
Existing Foreign Currency Indebtedness
The following table sets forth information with regard to the Group’s total debt by currency (gross of
debt obligation costs), in terms of fixed or floating rate as at March 31, 2017:
Currency of borrowings as at March 31, 2017
Total
borrowings
Floating rate
borrowings
Fixed rate
borrowings
(Rs. million)
Rupee . . . . . . . . . . . . . . . . . . . . . . . . . . . . . . . . 266,826 108,198 158,628
GBP. . . . . . . . . . . . . . . . . . . . . . . . . . . . . . . . . . 48,158 46,431 1,727
Euro. . . . . . . . . . . . . . . . . . . . . . . . . . . . . . . . . . 152,273 142,701 9,571
U.S. Dollar . . . . . . . . . . . . . . . . . . . . . . . . . . . . 334,386 190,897 143,489
Others . . . . . . . . . . . . . . . . . . . . . . . . . . . . . . . . 28,503 11,274 17,230
Total . . . . . . . . . . . . . . . . . . . . . . . . . . . . . . . . . 830,145 499,500 330,645
174

TERMS AND CONDITIONS OF THE [●] NOTES
The following is the text of the Conditions of the Notes which (subject to completion and amendmentand as supplemented or varied and except for the paragraphs in italics) will be applicable to the Notesin definitive form (if any) issued in exchange for the Global Certificate representing the Notes. Theseterms and conditions as so amended, supplemented or varied shall be endorsed on the Certificatesissued in respect of the Notes. All capitalised terms that are not defined in these Conditions will havethe meanings given to them in the Trust Deed.
1. DEFINITIONS
The following definitions are used in these Terms and Conditions:
Issuer . . . . . . . . . . . . . . . . . . . . . . ABJA Investment Co. Pte. Ltd., a company incorporatedunder the laws of Singapore with Unique Entity Number201309883M with offices at 22 Tanjong Kling Road,Singapore 628048
Parent . . . . . . . . . . . . . . . . . . . . . Tata Steel Limited, a company incorporated under thelaws of the Republic of India with registered numberL27100MH1907PLC000260 with its registered addressat Bombay House, 24, Homi Mody Street, Fort, Mumbai400 001, India
Trustee. . . . . . . . . . . . . . . . . . . . . Citicorp International Limited39th Floor,Champion Tower3 Garden Road, CentralHong KongFax: +852 2323 0279Attn: Agency and Trust
Principal Paying Agent. . . . . . . . . Citibank, N.A., London Branchc/o Citibank, N.A., Dublin BranchGround Floor1 North Wall QuayDublin 1IrelandFax: +353 I 662 2212/2210Attn: Agency and Trust
Paying Agents . . . . . . . . . . . . . . . The Principal Paying Agent and any other paying agentappointed by the Issuer
Registrar . . . . . . . . . . . . . . . . . . . Citibank, N.A., London Branchc/o Citibank, N.A., Dublin BranchGround Floor1 North Wall QuayDublin 1IrelandFax: +353 I 662 2212/2210Attn: Agency and Trust
Notes . . . . . . . . . . . . . . . . . . . . . . U.S.$[●] [●]% Notes due [●] (which term shall include,unless the context requires otherwise, any further Notesissued in accordance with Condition 19 and consolidatedand forming a single series therewith)
175

[●] Notes . . . . . . . . . . . . . . . . . . . U.S.$[●] [●]% Notes due [●]
Closing Date . . . . . . . . . . . . . . . . [●]
Maturity Date . . . . . . . . . . . . . . . [●]
Noteholders . . . . . . . . . . . . . . . . . The holders of the Notes (each a Noteholder)
2. RELATED AGREEMENTS
2.1 The Notes are constituted by a trust deed dated as of the Closing Date (the Trust Deed) madebetween the Issuer and the Trustee.
2.2 These Conditions include summaries of, and are subject to, the detailed provisions of the TrustDeed (as amended and supplemented from time to time) which includes the form of the Notes.Copies of the Trust Deed and the agency agreement dated as of the Closing Date (the AgencyAgreement) made between the Issuer, the Principal Paying Agent, the Registrar and the Trusteeare available for inspection by the Noteholders, during normal business hours at the specifiedoffice for the time being of the Trustee and at the specified office of each of the Paying Agents(and, together with the Principal Paying Agent and the Registrar, the Agents). The Noteholdersare entitled to the benefit of, are bound by, and are deemed to have notice of, all the provisionsof the Trust Deed and the Agency Agreement. References in these Conditions to the Trustee, theRegistrar or any Paying Agent include any successor appointed under the Trust Deed or AgencyAgreement, respectively.
3. FORM, DENOMINATION AND TITLE
3.1 Form and denomination
The Notes are issued in registered form in the denomination of U.S.$200,000 each and integralmultiples of U.S.$1,000 in excess thereof (referred to as the principal amount of each Note).A note certificate (each a Certificate) will be issued to each Noteholder in respect of itsregistered holding of Notes. Each Certificate will be numbered serially with an identifyingnumber which will be recorded on the relevant Certificate and in the register of Noteholderswhich the Issuer will procure to be kept by the Registrar.
3.2 Title
Title to the Notes passes only by registration in the register of Noteholders. The holder of anyNote will (except as otherwise required by law) be treated as its absolute owner for all purposes(whether or not it is overdue and regardless of any notice of ownership, trust or any interest init, any writing on it, or the theft or loss of the Certificate issued in respect of it) (other than aduly executed transfer thereof in the form endorsed thereon), and no person will be liable for sotreating the holder.
4. TRANSFER OF NOTES AND ISSUE OF CERTIFICATES
4.1 Register
The Issuer will cause to be kept at the specified office of the Registrar and in accordance withthe terms of the Agency Agreement a register on which shall be entered the names and addressesof the holders of the Notes and the particulars of the Notes held by them and of all transfers ofthe Notes (the Register).
Each Noteholder shall be entitled to receive only one Certificate in respect of its entire holdingof Notes.
176
4.2 Transfers
Subject to Conditions 4.5 and 4.6 and the terms of the Agency Agreement, a Note may betransferred by depositing the Certificate issued in respect of that Note, with the form of transferon the back duly completed and signed, at the specified office of the Registrar or the TransferAgent. No transfer of a Note will be valid unless and until entered into the Register.
4.3 Delivery of new Certificates
Each new Certificate to be issued upon a transfer of Notes will, within five business days ofreceipt by the Registrar or the relevant Agent of the duly completed form of transfer endorsedon the relevant Certificate, be mailed by uninsured mail (at the cost of the Issuer and at the riskof the holder entitled to the Note) to the address specified in the form of transfer. For thepurposes of this Condition, “business day” shall mean a day on which banks are open forbusiness in the city in which the specified office of the Agent with whom a Certificate isdeposited in connection with a transfer is located.
Where some but not all of the Notes in respect of which a Certificate is issued are to betransferred, a new Certificate in respect of the Notes not so transferred will, within five businessdays of receipt by the Registrar or the relevant Agent of the original Certificate, be mailed byuninsured mail (at the cost of the Issuer and at the risk of the holder of the Notes not sotransferred) to the address of such holder appearing on the register of Noteholders or as specifiedin the form of transfer.
4.4 Formalities free of charge
Registration of a transfer of Notes will be effected without charge by or on behalf of the Issueror any Agent but upon payment (or the giving of such indemnity as the Issuer or any Agent mayreasonably require) in respect of any tax or other governmental charges which may be imposedin relation to such transfer.
4.5 Closed Periods
No Noteholder may require the transfer of a Note to be registered (a) during the period of 15 daysending on the due date for any payment of principal, premium or interest on that Note; or (b)during a period of seven days ending on the date on which the Notes are exchanged for the NewNotes (as defined herein) pursuant to Condition 9.4.
The Issuer shall not be required in the event of a partial redemption of Notes under Condition9 (Redemption and Purchase):
(a) to register the transfer of Notes (or parts of Notes) during the period beginning on the 65thday before the date of the partial redemption and ending on the day on which notice is givenspecifying the serial numbers of Notes called (in whole or in part) for redemption (bothinclusive); or
(b) to register the transfer of any Note, or part of a Note, called for redemption.
4.6 Regulations
All transfers of Notes and entries on the register of Noteholders will be made subject to thedetailed regulations concerning a transfer of Notes scheduled to the Agency Agreement. Theregulations may be changed by the Issuer with the prior written approval of the Registrar and theTrustee. A copy of the current regulations will be mailed (at the cost of the Issuer and free ofcharge to the Noteholder) by the Registrar to any Noteholder who requests one.
177

5. STATUS OF THE NOTES
The Notes constitute (subject to Condition 6.1 (Negative Pledge)) unsecured and unsubordinatedobligations of the Issuer and will rank at all times pari passu without any preference amongthemselves and at least pari passu with all other present and future outstanding unsecured andunsubordinated obligations of the Issuer but, in the event of insolvency, only to the extentpermitted by applicable laws relating to creditors’ rights.
6. COVENANTS
6.1 Negative Pledge
So long as any of the Notes remain outstanding:
(a) the Issuer will not create or permit to subsist any Security (as defined below) upon the whole orany part of its property or assets, present or future, to secure any External Obligations (as definedbelow), unless the Issuer, in the case of the creation of the Security, at the same time or priorthereto, takes any and all action necessary to ensure that:
(i) all amounts payable by it under the Notes and the Trust Deed are secured by the Securityequally and rateably with the External Obligations to the satisfaction of the Trustee; or
(ii) such other Security or other arrangement (whether or not it includes the giving of Security)is provided as is approved by an Extraordinary Resolution of the Noteholders;
(b) the Parent will not create or permit to subsist any Security upon the whole or any part of itsproperty or assets, present or future, to secure any External Obligations, unless the Parent, in thecase of the creation of Security, at the same time or prior thereto, takes any and all actionnecessary to ensure that:
(i) all amounts payable by the Issuer under the Notes and the Trust Deed are secured by theSecurity equally and rateably with the External Obligations to the satisfaction of theTrustee; or
(ii) such other Security or other arrangement (whether or not it includes the giving of Security)is provided as is approved by an Extraordinary Resolution of the Noteholders; and
(c) the Parent will not guarantee any additional External Obligations of the Issuer unless the termsof such External Obligations include a provision substantially similar to the following:
“It shall be an Event of Default if:
(i) any of the U.S.$[●] [●]% Notes Due [●] (the “ABJA [●] Notes”) or the U.S.$[●] [●]% NotesDue [●] (the “ABJA [●] Notes”, and together with the ABJA [●] Notes, the “ABJA Notes”)of ABJA Investment Co. Pte. Ltd. (“ABJA”) become due and repayable prior to their statedmaturity by reason of an event of default or potential event of default (however described);
(ii) ABJA (or any successor entity) fails to make any payment in respect of any of the ABJANotes on the due date for payment as extended by any originally applicable grace period;
(iii) any security given by ABJA (or any successor entity) or Tata Steel Limited for the ABJANotes becomes enforceable; or
(iv) default is made by ABJA (or any successor entity) in making any payment due under anyguarantee and/or indemnity given by it in relation to any Indebtedness for Borrowed Moneyof any other person;
178

provided that no event described in this Condition shall constitute an Event of Default unless the
Indebtedness for Borrowed Money (including the ABJA Notes) or other relative liability due and
unpaid, either alone or when aggregated (without duplication) with other amounts of
Indebtedness for Borrowed Money (including the ABJA Notes) and/or other liabilities due and
unpaid relative to all (if any) other events specified in (i) to (iv) above which have occurred and
are continuing, amounts to at least U.S.$75,000,000 (or its equivalent in any other currency).
Indebtedness for Borrowed Money means any indebtedness (whether being principal, premium
(if any), interest or other amounts) for or in respect of any notes, bonds, debentures, debenture
stock, loan stock or other securities or any borrowed money or any liability under or in respect
of any acceptance under any credit facility.”
For the purposes of this Condition 6.1(c), whether a provision is considered substantially similar
to the above quoted provision in this Condition 6.1(c) shall be exclusively determined by the
Board of Directors of the Issuer or any person(s) authorised by the Board of Directors of the
Issuer, in either case acting in good faith.
6.2 Limitations on Asset Sales
(a) So long as any of the Notes remain outstanding, the Parent shall apply any Net Cash Proceeds
from an Asset Sale to:
(i) permanently repay unsubordinated Financial Indebtedness; or
(ii) acquire properties and assets (other than current assets) that will be directly owned and
used by the Parent in Permitted Businesses; or
(iii) invest in subsidiaries involved in Permitted Businesses; provided that the amount of such
investment, individually or when aggregated with all other investments in subsidiaries in
respect of the Net Cash Proceeds from any Asset Sales in the 12 month period prior to such
investment, does not exceed 3% of the Fixed Assets of the Parent on the immediately
preceding balance sheet date (as stated in the Parent’s most recent semi-annual or annual
financial statements); or
(iv) pay a dividend, provided that, the Parent shall not pay any such dividend in respect of or
otherwise distribute such Net Cash Proceeds to its shareholders if such dividend or
distribution, individually or when aggregated with all other dividends or distributions in
respect of the Net Cash Proceeds from any Asset Sales in the 12 month period prior to the
date of the declaration of such dividend or distribution, exceeds U.S.$200,000,000 or its
equivalent in other currencies.
(b) The Parent will not, directly or indirectly, consummate an Asset Sale unless the Parent receives
consideration at the time of the Asset Sale at least equal to the Fair Market Value (measured as
of the date of the definitive agreement with respect to the Asset Sale (including as to the value
of all non-cash consideration, such non-cash consideration shall, for the avoidance of doubt, not
be subject to the restrictions under Condition 6.2(a)) of the Fixed Assets sold or otherwise
disposed of.
(c) Pending application of Net Cash Proceeds as set out above, such Net Cash Proceeds may be
placed in cash deposits or invested in short term money market instruments.
179

6.3 Limitation on Financial Indebtedness
(a) So long as any of the Notes remain outstanding, the Parent and the Issuer shall not Incur, directlyor indirectly, any Financial Indebtedness, unless after giving effect to the application of theproceeds thereof:
(i) no Event of Default or Potential Event of Default would occur as a consequence of suchIncurrence or be continuing following such Incurrence; and
(ii) the Total Net Long Term Debt to Total Net Worth ratio for the Parent’s most recently endedsemi-annual or annual period for which unconsolidated financial statements are availableimmediately preceding the date on which such Financial Indebtedness is Incurred shall notbe greater than 3.0:1.0.
Provided that this Condition 6.3 shall not apply to:
A. Financial Indebtedness of the Issuer evidenced by the Notes or the [●] Notes (and any notesexchanged for the Notes or the [●] Notes);
B. Financial Indebtedness existing as at [●] 2018, and any refinancings thereof; and
C. Financial Indebtedness used to refinance Financial Indebtedness properly Incurred underthis Condition 6.3.
(b) The Total Net Long Term Debt to Total Net Worth ratio shall be calculated and interpreted onan unconsolidated basis.
6.4 Suspension of Covenants
(a) Following the first day (the Suspension Date) that (i) the Notes have Notes Investment GradeStatus and (ii) no Event of Default has occurred and is continuing, Condition 6.2 (Limitations onAsset Sales) and Condition 6.3 (Limitation on Financial Indebtedness) shall no longer be testedin relation to the Parent for purposes of these Conditions and the Trust Deed (the SuspendedCovenants). In the event that the Suspended Covenants are no longer tested in relation to theParent for any period of time as a result of the preceding sentence and, on any subsequent date(the Reversion Date), either (A) a Rating Agency has assigned ratings to the Notes below therequired Notes Investment Grade Status or (B) an Event of Default occurs and is continuing, thenthe Suspended Covenants will thereafter again be tested in relation to the Parent for purposes ofthese Conditions and the Trust Deed. The period of time between the Suspension Date and theReversion Date is referred to in the covenant described hereunder as the Suspension Period.
(b) Notwithstanding that the Suspended Covenants may be reinstated, no Event of Default will bedeemed to have occurred as a result of a failure to comply with the Suspended Covenants duringthe Suspension Period. On the Reversion Date, all Financial Indebtedness Incurred during aSuspension Period will be classified to have been Incurred pursuant to paragraph B of the provisoto Condition 6.3(a) and will be deemed to have been in existence on [●] 2018 and thereforepermitted. On the Reversion Date, for purposes of determining compliance with Condition 6.2,the amount of Net Cash Proceeds applied in the 12 month period prior to the Reversion Dateunder Condition 6.2(a)(iii) and 6.2(a)(iv) shall be deemed to be zero.
6.5 Interpretation
In these Conditions:
(a) 2024 Notes means the U.S.$1,000,000,000 5.95% Guaranteed Notes Due 2024 issued by theIssuer.
180

(b) Asset Sale means the sale, lease, conveyance or other disposition of any Fixed Assets by theParent. Notwithstanding the preceding, none of the following items will be deemed to be an AssetSale:
(i) any single transaction or series of related transactions that involves Fixed Assets having aFair Market Value of less than U.S.$100,000,000;
(ii) the sale, lease or other transfer of accounts receivable, inventory, trading stock and otherassets in the ordinary course of business (including the abandonment, sale or otherdisposition of damaged, worn out or obsolete assets or assets or intellectual property thatare, in the reasonable judgment of the Parent, no longer economically practicable tomaintain or useful in the conduct of business of the Parent);
(iii) licences, sub-licences, subleases, assignments or other disposition by the Parent of softwareor intellectual property in the ordinary course of business;
(iv) any surrender or waiver of contract rights or settlement, release, recovery on or surrenderof contract, tort or other claims in the ordinary course of business;
(v) the sale or other disposition of cash or cash equivalents;
(vi) the disposition of receivables in connection with the compromise, settlement or collectionthereof in the ordinary course of business or in bankruptcy or similar proceedings andexclusive of factoring or similar arrangements;
(vii) the foreclosure, condemnation or any similar action with respect to any property or otherassets or a surrender or waiver of contract rights or the settlement, release or surrender ofcontract, tort or other claims of any kind;
(viii) any unwinding or termination of hedging obligations not for speculative purposes;
(ix) the disposition of assets of the Parent which are seized, expropriated or compulsorypurchased by or by the order of any central or local government authority;
(x) the disposition of assets to another person whereby the Parent leases such assets back fromsuch person; and
(xi) operating leases of Fixed Assets.
(c) Cash means, at any time, the amount of cash and bank balances as stated in the latest standalonebalance sheet of the Parent.
(d) Cash Equivalents means investments that are short term investments (excluding equityinvestments) which are readily convertible into cash without incurring any significant premiumor penalty.
(e) Default means any event which is, or after notice or passage of time or both would be, an Eventof Default.
(f) External Obligations means bonds, debentures, notes or other similar securities of the Issuer orthe Parent which both:
(i) are by their terms payable, or confer a right to receive payment, in, or by reference to, anycurrency other than Rupees, or which are denominated in Rupees and more than 50% of theaggregate principal amount thereof is initially distributed outside of India by or with theauthorisation of the Issuer or the Parent; and
181

(ii) are for the time being or are capable of being quoted, listed, ordinarily dealt in or tradedon any stock exchange or over-the-counter or other similar securities market outside ofIndia.
(g) Extraordinary Resolution means:
(i) a resolution passed at a meeting duly convened and held in accordance with the Trust Deedby a majority consisting of not less than two-thirds of the Eligible Persons (as defined inthe Trust Deed) voting thereat upon a show of hands or, if a poll is duly demanded, by amajority consisting of not less than two-thirds of the votes cast on such poll; or
(ii) a resolution in writing signed by or on behalf of holders of not less than two-thirds inprincipal amount of the Notes for the time being outstanding which resolution may becontained in one document or in several documents in like form each signed by or on behalfof one or more of the holders; and
(iii) consent given by way of electronic consents through the relevant Clearing System(s) (asdefined in the Trust Deed) (in a form satisfactory to the Trustee) by or on behalf of theholders of not less than two-thirds in principal amount of the Notes for the time beingoutstanding.
(h) Fair Market Value means, with respect to any asset or property, the price which could benegotiated in an arm’s length, for cash, between a willing seller and a willing and able buyer,neither of whom is under undue pressure or compulsion to complete the transaction. Fair MarketValue will be determined in good faith by the Board of Directors of the Parent or any person(s)authorised by the Board of Directors of the Parent, whose determination will be conclusive andevidenced by a certificate from the same.
(i) Financial Indebtedness means any indebtedness Incurred by the Parent or the Issuer for or inrespect of:
(i) moneys borrowed;
(ii) any amount raised by acceptance under any acceptance credit facility or dematerialisedequivalent;
(iii) any amount raised pursuant to any note purchase facility or the issue of bonds, notes,debentures, loan stock or any similar instrument;
(iv) the amount of any liability in respect of any lease or hire purchase contract which would,in accordance with Ind-AS (in relation to the Parent) or SFRS (in relation to the Issuer), betreated as a finance or capital lease;
(v) receivables sold or discounted (other than any receivables to the extent they are sold on anon-recourse basis);
(vi) any amount raised under any other transaction having the commercial effect of a borrowingand required by Ind-AS (in relation to the Parent) or SFRS (in relation to the Issuer), to beshown as a borrowing in the balance sheet of the Parent or the Issuer, as applicable;
(vii) any derivative transaction entered into in connection with protection against or benefit fromfluctuation in any rate or price (and, when calculating the value of any derivativetransaction, only the marked to market value shall be taken into account);
(viii) shares which are expressed to be redeemable on or before [●];
182

(ix) any counter-indemnity obligation in respect of a guarantee, indemnity, bond, standby ordocumentary letter of credit or any other instrument issued by a bank or financialinstitution; and
(x) the amount of any liability in respect of any guarantee or indemnity for any of the itemsreferred to in paragraphs (i) to (ix) above.
(j) Fixed Assets refers to assets classified as such in the Parent’s unconsolidated financialstatements prepared in accordance with Ind-AS.
(k) Ind-AS means the Indian Accounting Standards.
(l) Incur means, with respect to any Financial Indebtedness, to incur, create, issue, assume,guarantee or otherwise become liable for or with respect to, or become responsible for, thepayment of, contingently or otherwise, such Financial Indebtedness. The terms “Incurrence,”“Incurred” and “Incurring” have meanings correlative with the foregoing.
(m) Net Cash Proceeds with respect to any sale of any Fixed Assets of the Parent means the cashproceeds of such sale net of payments to repay Financial Indebtedness or any other obligationoutstanding at the time that either (1) is secured by a lien on such Fixed Assets or (2) is requiredto be paid as a result of such sale, legal fees, accountants’ fees, agents’ fees, discounts orcommissions and brokerage, consultant fees and other fees actually incurred in connection withsuch sale and net of taxes paid or payable as a result thereof.
(n) Notes Investment Grade Status exists as of any time if at such time the Notes have beenassigned (x) “BBB-“ or higher by Fitch; (y) “BBB-“ or higher by S&P; or (z) “Baa3” or higherby Moody’s.
(o) Officer means any director of the Issuer.
(p) Officers’ Certificate means a certificate signed by two Officers.
(q) Permitted Business means (i) any business, services or activities engaged in by the Parent andits Subsidiaries on the Closing Date and (ii) any business, services or activities engaged in bythe Parent or any of its Subsidiaries that are related, complementary, incidental, ancillary orsimilar to any of the foregoing, or are extensions or developments of any thereof.
(r) Rating Agency shall have the meaning given to such term in Condition 9.3(e)(viii).
(s) Rupees means the lawful currency of the Republic of India.
(t) Security means a mortgage, charge, pledge, lien, encumbrance or other security interest securingany obligation of any person or any other agreement or arrangement having a similar effect,including any mortgage, pledge, retention of title arrangement, right of retention, and, in general,any right in rem, created for the purpose of granting security.
(u) SFRS means Singapore Financial Reporting Standards.
(v) Total Net Long Term Debt means at any time the aggregate of:
(i) long term borrowings of the Parent; plus
(ii) the portion of other current liabilities which comprise current maturities of long termborrowings of the Parent; plus
(iii) any guarantee or indemnity given by the Parent in respect of any indebtedness with amaturity of more than 1 year of any person; minus
183

(iv) the aggregate amount of Cash and Cash Equivalents,
each as stated, or derived from the latest standalone financial statements of the Parent.
(w) Total Net Worth means at any time the aggregate of the amounts paid up or credited as paid upon the share capital of the Parent, on a standalone basis, and the amount standing to the creditof the reserves and surplus of the Parent, on a standalone basis, but deducting (to the extentincluded) any amounts arising from an upward revaluation of assets made at any time after 30September 2017.
7. INTEREST
7.1 Interest Rate and Interest Payment Dates
The Notes bear interest on their outstanding principal amount from and including the ClosingDate at the rate of [●]% per annum, payable semi-annually in arrear on [●] and [●] of each year(each, an Interest Payment Date). The first payment (for the period from and including [●] 2018to but excluding [●] 2018) will be made on [●] 2018.
If any Interest Payment Date falls on a day which is not a Business Day, it shall be postponedto the next day which is a Business Day unless it would then fall into the next calendar month,in which event the Interest Payment Date shall be brought forward to the immediately precedingBusiness Day.
In this Condition Business Day means in relation to any place a day (other than a Saturday orSunday) on which commercial banks are open for business in London, Singapore, New York,Mumbai and, in the case of presentation of a Note Certificate, in the place in which the NoteCertificate is presented.
7.2 Interest Accrual
Each Note will cease to bear interest from and including the Maturity Date or the date on whichall amounts due in respect of such Note have been paid unless, upon due presentation, paymentof principal in respect of the Note is improperly withheld or refused or unless default isotherwise made in respect of payment. In such event, interest will continue to accrue untilwhichever is the earlier of:
(a) the date on which all amounts due in respect of such Note have been paid; and
(b) seven days after the date on which the full amount of the moneys payable in respect of suchNotes has been received by the Principal Paying Agent or the Registrar, as the case may be,and notice to that effect has been given to the Noteholders in accordance with Condition15 (Notices).
7.3 Calculation of Broken Interest
When interest is to be calculated in respect of a period of less than six months, the day-countfraction used will be the number of days in the relevant period, from (and including) the datefrom which interest begins to accrue to (but excluding) the date on which it falls due, dividedby 360.
8. PAYMENTS
8.1 Method of Payments
(a) Payment of principal, premium (if any) and interest will be made by transfer to the registeredaccount of the Noteholder in accordance with the provisions of the Agency Agreement. Payments
184

of principal and premium (if any) and payments of interest due otherwise than on an InterestPayment Date will only be made against surrender of the relevant Certificate at the specifiedoffice of any of the Agents. Interest on Notes due on an Interest Payment Date will be paid tothe holder shown on the register of Noteholders at the close of business on the date (the recorddate) being the 15th day before the relevant Interest Payment Date.
(b) For the purposes of this Condition, a Noteholder’s registered account means the US dollaraccount maintained by or on behalf of it with a bank in New York City, details of which appearon the register of Noteholders at the close of business, in the case of principal and premium (ifany) and interest due otherwise than on an Interest Payment Date, on the Business Day (asdefined below) before the due date for payment and, in the case of interest due on an InterestPayment Date, on the relevant record date.
8.2 Partial Payments
If the amount of principal, premium (if any) or interest which is due on the Notes is not paid infull, the Principal Paying Agent or the Registrar, as the case may be, will annotate the registerof Noteholders with a record of the amount of principal, premium (if any) or interest in fact paid.
8.3 Payments subject to Applicable Laws
All payments are subject in all cases to any fiscal or other laws and regulations applicable in theplace of payment, but without prejudice to the provisions of Condition 10 (Taxation). Nocommissions or expenses shall be charged to the Noteholders in respect of any such payments.
8.4 Payment on Business Days
(a) Payment instructions (for value on the due date or, if that is not a Business Day (as definedbelow), for value on the first following day which is a Business Day) will be initiated on the duedate for payment (or, if it is not a Business Day, the immediately following Business Day) or,in the case of payment of principal, if later, on the Business Day on which the relevant Certificateis surrendered at the specified office of the Agent.
(b) Noteholders will not be entitled to interest or other payment for any delay after the due date inreceiving the amount due if (i) the due date is not a Business Day or (ii) the Noteholder is latein surrendering its Certificate (if required to do so).
In this Condition Business Day means in relation to any place a day (other than a Saturday orSunday) on which commercial banks are open for business in London, Singapore, New York,Mumbai and, in the case of presentation of a Note Certificate, in the place in which the NoteCertificate is presented.
8.5 Default Interest
(a) If on or after the due date for payment of any sum in respect of the Notes, payment of all or anypart of such sum shall not be made against due presentation of the Certificates, the Issuer shallpay interest on the amount so unpaid from such due date up to the day of actual receipt by therelevant Noteholders (before and after judgment) at a rate per annum equal to [●]% per annum.The Issuer shall pay any unpaid interest accrued on the amount so unpaid on the last BusinessDay of the calendar month in which such interest accrued and any interest payable under thisCondition which is not paid on the last Business Day of the calendar month in which it accruedshall be added to the overdue sum and itself bear interest accordingly.
185

(b) The Trustee and Agents shall not be liable for (i) any such payments of default interest pursuantto Condition 8.5(a) above which shall be made directly by the Issuer to the relevant Noteholders;(ii) any failure of the Issuer to make payments of any such default interest to the Noteholders;or (iii) any calculations in respect of such default interest which are carried out by any otherparty.
8.6 Agents
The name of the initial Paying Agents and their initial specified offices are set out at the frontof these Conditions. The Issuer reserves the right, subject to the prior written approval of theTrustee, to vary or terminate the appointment of any Paying Agent at any time and to appointadditional or other Paying Agents provided that:
(a) there is always a Principal Paying Agent;
(b) there is always a Registrar; and
(c) such other agents as may be required by any stock exchange on which the Notes may belisted. Notice of any termination or appointment and of any changes in specified officesshall be given to the Noteholders promptly by the Issuer in accordance with Condition 15(Notices).
9. REDEMPTION AND PURCHASE
9.1 Redemption at Maturity
Unless previously redeemed or purchased and cancelled as provided below, the Issuer willredeem the Notes at their principal amount (together with unpaid accrued interest thereon (ifany)) on the Maturity Date.
9.2 Redemption for Taxation Reasons
(a) The Notes may be redeemed at the option of the Issuer in whole, but not in part, at any time oron any Interest Payment Date, on giving not less than 30 nor more than 60 days’ notice to theNoteholders in accordance with Condition 15 (Notices) (which notice shall be irrevocable), attheir principal amount (together with unpaid accrued interest thereon (if any)), if (i) the Issuersatisfies the Trustee immediately prior to the giving of such notice that it has or will becomeobliged to pay additional amounts as provided or referred to in Condition 10 (Taxation) as aresult of any change in, or amendment to, the laws or regulations of a Relevant Jurisdiction (asdefined in Condition 10.2(b)), or any change in the application or official interpretation of suchlaws or regulations, which change or amendment becomes effective on or after the Closing Date,and (ii) such obligation cannot be avoided by the Issuer taking reasonable measures available toit, provided that no such notice of redemption shall be given earlier than 90 days prior to theearliest date on which the Issuer would be obliged to pay such additional amounts where apayment in respect of the Notes is then due.
(b) Prior to the publication of any notice of redemption pursuant to Condition 9.2(a), the Issuer shalldeliver to the Trustee a certificate signed by two directors of the Issuer stating that the obligationreferred to in Condition 9.2(a)(ii) above cannot be avoided by the Issuer taking reasonablemeasures available to it and the Issuer is entitled to effect such redemption and setting forth astatement of facts showing that the conditions precedent to the right of the Issuer so to redeemhave occurred, and an opinion of independent legal advisers of recognised standing to the effectthat the Issuer has or will become obliged to pay such additional amounts as a result of suchchange or amendment. The Trustee shall be entitled to accept such certificate as sufficientevidence of the satisfaction of the condition precedent set out in Condition 9.2(a)(ii) above inwhich event it shall be conclusive and binding on the Noteholders and the Trustee shall not beliable to any person for doing so.
186

9.3 Redemption for Change of Control Triggering Event
(a) If a Change of Control Triggering Event (as defined below) occurs with respect to the Parent,
each Noteholder shall have the right (the Change of Control Redemption Right), at such
Noteholder’s option, to require the Issuer to redeem all of such Noteholder’s Note(s) in whole,
but not in part on the Change of Control Redemption Date (as defined below), at a price equal
to the Change of Control Redemption Amount (as defined below). The Agents shall not be
required to take any steps to ascertain whether a Change of Control Triggering Event or any event
which could lead to the occurrence of a Change of Control Triggering Event has occurred and
shall not be liable to any person for any failure to do so.
(b) To exercise the Change of Control Redemption Right attaching to a Note on the occurrence of
a Change of Control Triggering Event, the holder thereof must complete, sign and deposit at its
own expense at any time from 9.30 a.m to 5.30 p.m (local time in the place of deposit) on any
Business Day at the specified office of any Paying Agent a notice (a Change of ControlRedemption Notice) in the form (for the time being current) obtainable from the specified office
of any Paying Agent together with the relevant Certificate evidencing the Notes to be redeemed.
Such Change of Control Redemption Notice may be given on the earlier of the date on which the
relevant Noteholder becomes aware of the occurrence of the Change of Control Triggering Event
and the date on which the Change of Control Notice (as detailed below) delivered by the Issuer
under Condition 9.3(d) is received by such Noteholder. No Change of Control Redemption
Notice rnay be given after 90 days from the date of the Change of Control Notice.
(c) A Change of Control Redemption Notice, once delivered, shall be irrevocable except where, prior
to the due date of redemption, an Event of Default has occurred and is continuing in which event
such holder, at its option, may elect by notice to the Issuer to withdraw the Change of Control
Redemption Notice and instead to give notice that the Note is immediately due and repayable
under Condition 11.1 (Events of Default). The Issuer shall redeem the Notes (in whole but not
in part) which form the subject of any Change of Control Redemption Notice which is not
withdrawn on the Change of Control Redemption Date.
(d) Not later than seven days after becoming aware of a Change of Control Triggering Event, the
Issuer shall procure that notice (a Change of Control Notice) regarding the Change of Control
Triggering Event be delivered to the Trustee, the Agents and the Noteholders (in accordance with
Condition 15 (Notices) stating:
(i) that Noteholders may require the Issuer to redeem their Notes under Condition 9.3
(Redemption for Change of Control Triggering Event);
(ii) the date of such Change of Control Triggering Event and, briefly, the events causing such
Change of Control Triggering Event;
(iii) the names and addresses of all relevant Paying Agents;
(iv) such other information relating to the Change of Control Triggering Event as any
Noteholder may require; and
(v) that the Change of Control Redemption Notice pursuant to Condition 9.3(b) once validly
given, may not be withdrawn and the last day on which a Change of Control Redemption
Notice may be given.
187

(e) In this Condition:
(i) Change of Control means the occurrence of any of the following:
(A) a person or persons, acting together, other than the Tata Group, acquire Control,
directly or indirectly, of the Parent;
(B) the Parent consolidates with or merges into or sells or transfers all or substantially all
of its assets to any other person or persons, acting together;
(C) the adoption of a plan relating to the liquidation or dissolution of the Parent; or
(D) the Parent ceases directly to own 100% of the share capital of the Issuer or adopts a
plan relating to the liquidation or dissolution of the Issuer.
(ii) Change of Control Redemption Amount means an amount equal to 101% of the principal
amount of the Notes redeemed plus unpaid accrued interest, if any, to and including the
Change of Control Redemption Date.
(iii) Change of Control Redemption Date means the date specified in the Change of Control
Redemption Notice, such date being not less than 30 nor more than 60 days after the date
of the Change of Control Redemption Notice.
(iv) Change of Control Triggering Event means the occurrence of a Change of Control;
provided, however, that if the Change of Control is an event described in clauses (A) and
(B) of the definition thereof, it shall not constitute a Change of Control Triggering Event
unless and until a Rating Decline also shall have occurred.
(v) Control means (A) the acquisition or control of more than 50% of the Voting Rights of the
issued share capital of the Parent or (B) the right to appoint and/or remove all or the
majority of the members of the Parent’s Board of Directors or other governing body,
whether obtained directly or indirectly, and whether obtained by ownership of share capital,
the possession of Voting Rights, contract or otherwise, and “controlled” shall be construed
accordingly.
(vi) Investment Grade Status exists as of any time if at such time the Parent’s corporate credit
rating has been assigned at least two of the three following ratings: (x) “BBB-” or higher
by Fitch; (y) “BBB-” or higher by S&P; or (z) “Baa3” or higher by Moody’s.
(vii) for the purposes of the Change of Control Redemption Right, a “person” includes any
person, firm, company, corporation, government, state or agency of a state or any
association, trust or partnership (whether or not having separate legal personality) or two
or more of the foregoing.
(viii) Rating Agency means any of Standard & Poor’s Ratings Service, a division of the McGraw
Hill Companies Inc. (S&P) Moody’s Investors Service, Inc. (Moody’s) or Fitch Inc., a
subsidiary of Fimalac, S.A. (Fitch), and any of their successors, as applicable.
(ix) Rating Category means (i) with respect to S&P, any of the following categories: “BB”,“B”, “CCC”, “CC”, “C”, and “D” (or equivalent successor categories); (ii) with respect toMoody’s, any of the following categories: “Ba”, “B”, “Caa”, “Ca”, “C”, and “D” (or
188

equivalent successor categories); (iii) with respect to Fitch, any of the following categories:“BB”, “B”, “CCC”, “CC”, “C”, and “D” (or equivalent successor categories) and (iv) theequivalent of any such category of S&P, Moody’s and Fitch used by another Rating Agency.In determining whether the rating of the Parent has decreased by one or more gradations,gradations within Rating Categories (“+” and “-” for S&P and Fitch; “l”, “2” and “3” forMoody’s; or the equivalent gradations for another Rating Agency) shall be taken intoaccount (eg, with respect to S&P and Fitch, a decline in a rating from “BB+” to “BB”, aswell as from “BB-” to “B+” will constitute a decrease of one gradation).
(x) Rating Date means in connection with a Change of Control Triggering Event, that datewhich is 90 days prior to the earlier of (A) a Change of Control, (B) the initial public noticeof the occurrence of a Change of Control or of the intention by the Parent or any otherPerson or Persons to effect a Change of Control and (C) the date that the acquirer orprospective acquirer (1) has entered into one or more binding agreements with the Parentand/or shareholders of the Parent that would give rise to a Change of Control or (2) hascommenced an offer to acquire outstanding capital stock of the Parent.
(xi) Rating Decline means in connection with a Change of Control Triggering Event, theoccurrence on, or within six months after, the date, or public notice of the occurrence of,a Change of Control or the intention by the Parent or any other person or persons to effecta Change of Control (which period shall be extended so long as the corporate credit ratingof the Parent or the Parent and its subsidiaries, is under publicly announced considerationfor possible downgrade by any of the Rating Agencies) of any of the events listed below:
(A) in the event the Parent is rated by one or more Rating Agencies on the Rating Dateas having Investment Grade Status, the rating of the Parent by any such Rating Agencyshall be downgraded to below Investment Grade Status; or
(B) in the event the Parent is rated below Investment Grade Status by one or more RatingAgencies on the Rating Date, the rating of the Parent by any such Rating Agency shallbe withdrawn or decreased by one or more gradations (including gradations withinRating Categories as well as between Rating Categories).
(xii) Tata Group means Tata Sons Limited, Tata Power Company Limited, Tata Steel Limited,Tata Industries Limited, Tata Motors Limited, Tata Chemicals Limited, Tata Tea Limited,The Indian Hotels Company Limited, Tata International Limited, Tata Consultancy ServicesLimited, Trent Limited, Tata Investment Corporation Limited and Panatone Finvest Limited(each of which is a company incorporated under the laws of India), their respectivesubsidiaries and holding companies and any other company which includes the word ‘Tata’in its name pursuant to a brand equity promotion agreement with a member of the TataGroup.
(xiii) Voting Rights means the right generally to vote at a general meeting of shareholders of theParent (irrespective of whether or not, at the time, stock of any other class or classes shallhave, or might have, voting power by reason of the happening of any contingency).
9.4 Mandatory exchange at the option of the Issuer
(a) The Notes may be exchanged for new notes issued directly by the Parent (the New Notes), at theoption of the Issuer in whole, but not in part, at any time or on any Interest Payment Date, ongiving not less than 15 nor more than 30 days’ notice to the Noteholders, the Trustee and thePrincipal Paying Agent in accordance with Condition 15 (Notices) (which notice shall beirrevocable) (the Exchange Notice). The terms and conditions of the New Notes will be as setout in Schedule 7 to the Trust Deed and will contain the same terms as the Notes (including, butnot limited to, principal, premium and interest payable, covenants, cross-acceleration, interest
189

payment dates and the maturity date), except for the issue date. The exchange of the Notes forthe New Notes (the Exchange) will be done in such a manner that each Noteholder will receivean amount of New Notes equal in principal amount to the principal amount of the Notes then heldby such Noteholder.
(b) The Trustee shall not be liable for acting or refraining from acting in reliance on any purportedExchange Notice and shall not be responsible for checking that such Exchange Notice has beenduly completed or properly delivered and any purported Exchange Notice which the Trusteeaccepts shall be conclusive and binding on the Issuer, the Trustee, the Agents and theNoteholders.
(c) The Issuer shall be responsible for the payment of, and shall, in the relevant Exchange Notice,indemnify the Noteholders, the Trustee and the Principal Paying Agent in respect of, all stamp,stamp duty reserve, registration, documentary, transfer and other similar taxes or duties(including penalties) arising on the delivery of the New Notes to the relevant Noteholder.
9.5 Provisions relating to Partial Redemption
If fewer than all of the Notes are to be redeemed at any time, the selection of such Notes forredemption will be made by the Trustee in compliance with the rules, if any, of any stockexchange on which the Notes are listed or, if such Notes are not then listed or there are no suchapplicable rules, on a pro rata basis and in such manner as the Trustee may deem appropriate andfair, provided that no Notes shall be redeemed in part more than 30 days before the date fixedfor redemption. Notice of any such selection will be given not less than 15 days before the datefixed for redemption. Each notice will specify the date fixed for redemption and the aggregateprincipal amount of the Notes to be redeemed, the serial numbers of the Notes called forredemption, the serial numbers of Notes previously called for redemption and not presented forpayment and the aggregate principal amount of the Notes which will be outstanding after thepartial redemption. Where some but not all of the Notes in respect of which a Certificate is issuedare to be redeemed, the notice of redemption that relates to such Certificates shall state theportion of the principal amount of the Notes to be redeemed and, where applicable, a newCertificate in a principal amount equal to the unredeemed Notes will be issued in the name ofthe Noteholder thereof upon cancellation of the original Certificate. Any such new Certificatewill be delivered to the specified office of a Paying Agent or (at the risk and, if mailed at therequest of the Noteholder otherwise than by ordinary uninsured mail, at the expense of theNoteholder) sent by mail to the Noteholder.
9.6 Purchases
The Issuer and the Parent (and any other subsidiary of the Parent) may at any time purchaseNotes in any manner and at any price. The Notes so acquired, while held on behalf of the Issueror the Parent (or such other subsidiary of the Parent), shall not entitle the holders thereof to voteat any meetings of the Noteholders and shall not be deemed to be outstanding for the purposesof calculating quorums at meetings of the Noteholders for the purposes of Condition 11 (Eventsof Default), Condition 13 (Enforcement) and Condition 16 (Meetings of Noteholders,Modification, Waiver and Authorisation). If purchases are made by tender, tenders must beavailable to all Noteholders alike except where it is not possible to do so in order to qualify forexemptions from any offering restrictions imposed by any jurisdiction.
9.7 Cancellations
All Notes which are (a) redeemed or exchanged or (b) purchased by or on behalf of the Issuer,the Parent or any of the Parent’s other subsidiaries, will forthwith be cancelled, and accordinglymay not be reissued or resold.
190

9.8 Notices Final
Upon the expiry of any notice as is referred to in Conditions 9.2 or 9.3 above the Issuer shallbe bound to redeem the Notes to which the notice refers in accordance with the terms of suchCondition.
10. TAXATION
10.1 Payment without Withholding
All payments in respect of the Notes by or on behalf of the Issuer shall be made withoutwithholding or deduction for, or on account of, any present or future taxes, duties, assessmentsor governmental charges of whatever nature (Taxes) imposed or levied by or on behalf of anyof the Relevant Jurisdictions, unless the withholding or deduction of the Taxes is required by law.In that event, the Issuer will pay such additional amounts as may be necessary in order that thenet amounts received by the Noteholders after the withholding or deduction shall equal theamounts which would have been received by them had no such withholding or deduction beenrequired; except that no additional amounts shall be payable on any Note in relation to anypayment in respect of:
(a) any Taxes that would not have been withheld, deducted or imposed but for (i) the holderof the Notes, (ii) the beneficial owner of the Notes or (iii) a fiduciary, settlor, beneficiary,member or shareholder of, or possessor of power over, the relevant holder, if the relevantholder is an estate, trust, partnership or corporation, being a citizen or resident or nationalof, incorporated in or carrying on a trade or business in or having a permanentestablishment in the Relevant Jurisdiction in which such Taxes are imposed or having anyother present or former connection with the Relevant Jurisdiction other than the mereacquisition, holding, enforcement or receipt of payment in respect of the Notes;
(b) any Taxes that are withheld, deducted or imposed as a result of the failure of the holder orbeneficial owner of the Notes to comply, to the extent legally able, with any reasonablerequest, made to that holder or beneficial owner at least 60 days before any suchwithholding or deduction would be payable, by the Issuer to provide timely and accurateinformation concerning the nationality, residence or identity of such holder or beneficialowner or to make any valid and timely declaration or similar claim or satisfy anycertification, information or other reporting requirement, which is required or imposed bya statute, treaty, regulation or administrative practice of the Relevant Jurisdiction as aprecondition to any exemption from or reduction in all or part of such Taxes to which suchholder is entitled;
(c) any Taxes that would not have been withheld, deducted or imposed but for the presentationof a Note for payment more than 30 days after the relevant payment is first made availablefor payment to the holder (except to the extent that the holder would have been entitled toadditional amounts had the Note been presented on the last day of such 30 day period);
(d) any Taxes that are withheld, deducted or imposed on or with respect to any payment ofprincipal or interest on such Note made to any holder who is a fiduciary or partnership orany person other than the sole beneficial owner of such payment, to the extent that abeneficiary or settlor with respect to such fiduciary, a member of such a partnership or thebeneficial owner of such payment would not have been entitled to the additional amountshad such beneficiary, settlor, member or beneficial owner been the actual holder of suchNote;
(e) any estate, inheritance, gift, sales, excise, transfer, personal property or similar Taxes;
191

(f) where such withholding or deduction is required pursuant to an agreement described inSection 1471(b) of the U.S. Internal Revenue Code of 1986 (the Code) or otherwiseimposed pursuant to Sections 1471 through 1474 of the Code, any regulations thereunder,official interpretations thereof, or law implementing an intergovernmental approachthereto.
(g) any Taxes withheld, deducted or imposed on or with respect to any Note presented forpayment by or on behalf of a holder of Notes who would have been able to avoid suchwithholding or deduction by presenting the relevant Note to another Paying Agent;
(h) any Taxes payable other than by deduction or withholding from payments under, or withrespect to, the Notes; or
(i) any combination of items 11.1(a) through 11.1(h) above.
10.2 Interpretation
In these Conditions:
(a) Relevant Date means the date on which the payment first becomes due but, if the fullamount of the money payable has not been received by a Paying Agent or the Trustee onor before the due date, it means the date on which, the full amount of the money havingbeen so received, notice to that effect has been duly given to the Noteholders by the Issuerin accordance with Condition 15 (Notices); and
(b) Relevant Jurisdiction means Singapore or any political subdivision or any authoritythereof or therein having power to tax or any other jurisdiction or any political subdivisionor any authority thereof or therein having power to tax to which the Issuer becomes subjectin respect of payments made by it of principal and interest on the Notes.
10.3 Additional Amounts
Any reference in these Conditions to any amounts in respect of the Notes shall be deemed alsoto refer to any additional amounts which may be payable under this Condition or under anyundertakings given in addition to, or in substitution for, this Condition pursuant to the TrustDeed.
11. EVENTS OF DEFAULT
11.1 Events of Default
The Trustee at its discretion may, and if so requested in writing by the holders of at least 25%in principal amount of the Notes then outstanding or if so directed by an ExtraordinaryResolution of the Noteholders, shall (subject in each case to being indemnified and/or securedand/or prefunded to its satisfaction), give notice to the Issuer that the Notes are, and shallimmediately become, due and repayable at their principal amount, together with unpaid accruedinterest as provided in the Trust Deed, if any of the following events occurs and is continuing(Events of Default):
(a) Non-payment
If the Issuer fails to pay any principal, redemption amount or interest on any of the Noteswhen due and the default continues for a period of seven business days in the case ofprincipal or 30 days in the case of interest; or
192

(b) Breach of other obligations
If the Issuer or the Parent fail to perform or comply with any of their other obligations orthe other requirements under these Conditions or the Trust Deed and (except where theTrustee considers the failure to be incapable of remedy, when no continuation nor noticementioned below will be required) the failure continues for the period of 30 days followingthe service by the Trustee on the Issuer of notice requiring the default to be remedied; or
(c) Cross acceleration
If (i) any Indebtedness for Borrowed Money (as defined below) of the Issuer or the Parentbecomes due and repayable prior to its stated maturity by reason of an event of default orpotential event of default (however described); (ii) the Issuer or the Parent fails to make anypayment in respect of any Indebtedness for Borrowed Money on the due date for paymentas extended by any originally applicable grace period; (iii) any security given by the Issueror the Parent for any Indebtedness for Borrowed Money becomes enforceable; or (iv)default is made by the Issuer or the Parent in making any payment due under any guaranteeand/or indemnity given by it in relation to any Indebtedness for Borrowed Money of anyother person; provided that no event described in this Condition shall constitute an Eventof Default unless the Indebtedness for Borrowed Money or other relative liability due andunpaid, either alone or when aggregated (without duplication) with other amounts ofIndebtedness for Borrowed Money and/or other liabilities due and unpaid relative to all (ifany) other events specified in (i) to (iv) above which have occurred and are continuing,amounts to at least U.S.$75,000,000 (or its equivalent in any other currency); or
(d) Winding-up
If any order is made by any competent court or resolution is passed for the winding up ordissolution of the Issuer or the Parent, save for the purposes of reorganisation on termsapproved by an Extraordinary Resolution of the Noteholders; or
(e) Cessation of business
If the Issuer or the Parent ceases or threatens to cease to carry on the whole or a substantialpart of its business, save for the purposes of any reorganisation on terms approved by anExtraordinary Resolution of the Noteholders; or
(f) Insolvency
The Issuer or the Parent stops or threatens to stop payment of, or is unable to, or admitsinability to, pay, its debts (or any class of its debts) as they fall due or is deemed unableto pay its debts pursuant to or for the purposes of any applicable law, or is adjudicated orfound bankrupt or insolvent; or
(g) Liquidation and insolvency proceedings
If (i) proceedings are initiated against the Issuer or the Parent under any applicableliquidation, insolvency, composition, reorganisation or other similar laws or an applicationis made (or documents filed with a court) for the appointment of an administrative or otherreceiver, manager, administrator or other similar official, or an administrative or otherreceiver, manager, administrator or other similar official is appointed, in relation to theIssuer or the Parent or, as the case may be, in relation to the whole or a substantial part ofthe undertaking or assets of any of them or an encumbrancer takes possession of the wholeor a substantial part of the undertaking or assets of any of them, or a distress, execution,
193

attachment, sequestration or other process is levied, enforced upon, sued out or put in forceagainst the whole or a substantial part of the undertaking or assets of any of them, and (ii)in any such case (other than the appointment of an administrator) unless initiated by therelevant company is not discharged or stayed within 60 days; or
(h) Creditors arrangement
If the Issuer or the Parent (or their respective directors or shareholders) initiates or consentsto judicial proceedings relating to itself under any applicable liquidation, insolvency,composition, reorganisation or other similar laws (including the obtaining of a moratorium)or makes a conveyance or assignment for the benefit of, or enters into any composition orother arrangement with, its creditors generally (or any class of its creditors) or any meetingis convened to consider a proposal for an arrangement or composition with its creditorsgenerally (or any class of its creditors); or
(i) Nationalisation
Any step is taken by any person with a view to the seizure, compulsory acquisition,expropriation or nationalisation of all or a material part of the assets of the Issuer or theParent; or
(j) Validity
If the validity of the Notes is contested by the Issuer, or the Issuer denies any of itsobligations under the Notes or it is or will become unlawful for the Issuer to perform orcomply with any of its obligations under or in respect of the Notes or any of suchobligations are or become unenforceable or invalid; or
(k) Guarantee of the 2024 Notes by the Parent
If the guarantee by the Parent of the 2024 Notes ceases to be, or is claimed by the Parentnot to be, in full force and effect at any time while any of the 2024 Notes remainoutstanding; or
(l) Termination or Withdrawal of Letter of Comfort
If the Letter of Comfort is terminated or withdrawn; or
(m) Analogous event
If any event occurs which, under the laws of any Relevant Jurisdiction, has or may have,in the Trustee’s opinion, an analogous effect to any of the events referred to in Conditions11.1(d) to 11.1(i) above.
The Issuer shall deliver to the Trustee, as soon as possible and in any event within 21calendar days after the Issuer or the Parent becomes aware of the occurrence of a Default,an Officers’ Certificate setting forth the details of such Default, and the action which theIssuer and the Parent propose to take with respect thereto.
11.2 Interpretation
For the purposes of this Condition:
Indebtedness for Borrowed Money means any indebtedness (whether being principal, premium(if any), interest or other amounts) for or in respect of any notes, bonds, debentures, debenturestock, loan stock or other securities or any borrowed money or any liability under or in respectof any acceptance under any credit facility.
194

12. PRESCRIPTION
Claims in respect of principal and interest will become void unless presentation for payment ismade as required by Condition 8 (Payments) within ten years (in the case of principal) and fiveyears (in the case of interest) from the appropriate relevant due date.
13. ENFORCEMENT
13.1 The Trustee may at any time, at its discretion and without notice, take any proceedings or anyother steps or actions (including lodging an appeal) against, in relation to, or in connection with,the Issuer as it thinks fit to enforce the provisions of the Trust Deed and the Notes or otherwise,but it is not bound to take any such proceedings or steps or other action in relation to the TrustDeed or the Notes unless (a) it has been directed to do so by an Extraordinary Resolution of theNoteholders or requested to do so in writing by the holders of at least 25% in principal amountof the Notes then outstanding, and (b) it has been indemnified and/or secured and/or prefundedto its satisfaction.
13.2 No Noteholder will be entitled to take any steps, action or proceedings against the Issuer to (i)enforce any of the provisions of the Trust Deed or the Notes or (ii) take any proceedings(including the lodging of an appeal in respect of or concerning the Issuer) unless the Trustee,having become bound to do so itself, fails to do so within a reasonable period and the failure iscontinuing.
14. REPLACEMENT OF CERTIFICATES
If any Certificate is lost, stolen, mutilated, defaced or destroyed it may be replaced at thespecified office of the Principal Paying Agent upon payment by the claimant of the expensesincurred in connection with the replacement and on such terms as to evidence and indemnity asthe Issuer may reasonably require. Mutilated or defaced Certificates must be surrendered beforereplacements will be issued.
15. NOTICES
15.1 Notices to the Noteholders
(a) Notices to Noteholders will be valid if published in a leading newspaper having generalcirculation in (i) Asia (which is expected to be the Asian Wall Street Journal) and (ii) Europe(which is expected to be the Financial Times) If at any time publication in such newspapers isnot practicable, notices will be valid if published in such other manner as the Issuer shalldetermine. Notices will, if published more than once or on different dates, be deemed to havebeen given on the first date on which publication is made.
(b) Notwithstanding the other provisions of this Condition, in any case where the identity andaddresses of all the Noteholders are known to the Issuer, notices to such holders may be givenindividually by recorded delivery mail to such addresses and will be deemed to have been givenwhen received at such addresses.
15.2 Notices from the Noteholders
Notices to be given by any Noteholder shall be in writing and given by lodging the same,together with the relative Certificate, with the Registrar, or, if the Certificates are held in aclearing system, may be given through the clearing system in accordance with its standard rulesand procedure.
195

16. MEETINGS OF NOTEHOLDERS, MODIFICATION, WAIVER AND AUTHORISATION
16.1 Meetings of Noteholders
The Trust Deed contains provisions for convening meetings of the Noteholders to consider anymatter affecting their interests, including the modification or abrogation by ExtraordinaryResolution of any of these Conditions or any of the provisions of the Trust Deed. The quorumat any meeting for passing an Extraordinary Resolution will be one or more persons presentholding or representing more than 50% in principal amount of the Notes for the time beingoutstanding, or at any adjourned meeting one or more persons present whatever the principalamount of the Notes held or represented by him or them, except that, at any meeting the businessof which includes the modification or abrogation of certain of the provisions of these Conditionsand certain of the provisions of the Trust Deed, the necessary quorum for passing anExtraordinary Resolution will be one or more persons present holding or representing not lessthan two-thirds, or at any adjourned meeting not less than one-third, of the principal amount ofthe Notes for the time being outstanding. An Extraordinary Resolution passed at any meeting ofthe Noteholders will be binding on all Noteholders, whether or not they are present at themeeting.
16.2 Modification, Waiver, Authorisation and Determination
The Trustee may agree, without the consent of the Noteholders, to any modification of (exceptas mentioned in Condition 16.1 above), or to the waiver or authorisation of any breach orproposed breach of, any of these Conditions or any of the provisions of the Trust Deed or theAgency Agreement, or determine, without any such consent as aforesaid, that any Event ofDefault or Potential Event of Default (as defined in the Trust Deed) shall not be treated as such(provided that, in any such case, it is not, in the opinion of the Trustee, materially prejudicialto the interests of the Noteholders) or may agree, without any such consent as aforesaid, to anymodification which, in its opinion, is of a formal, minor or technical nature or to correct amanifest error or an error which is, in the opinion of the Trustee, proven. Any such modification,authorisation or waiver shall be binding on the Noteholders and, unless Trustee otherwise agrees,such modification authorisation or waiver shall be notified to the Noteholders as soon aspracticable in accordance with Condition 15.
16.3 Trustee to have Regard to Interests of Noteholders as a Class
In connection with the exercise by it of any of its functions (including, without limitation, anymodification, waiver, authorisation, or determination), the Trustee shall have regard to thegeneral interests of the Noteholders as a class but shall not have regard to any interests arisingfrom circumstances particular to individual Noteholders (whatever their number) and, inparticular, shall not have regard to the consequences of any such exercise for individualNoteholders (whatever their number) resulting from their being domiciled or resident in, orotherwise connected with, or subject to the jurisdiction of, any particular territory or anypolitical sub-division thereof and the Trustee shall not be entitled to require, nor shall anyNoteholder be entitled to claim, from the Issuer, the Parent, the Trustee or any other person anyindemnification or payment in respect of any tax consequence of any such exercise uponindividual Noteholders.
16.4 Notification to the Noteholders
Any modification, waiver, authorisation, or determination shall be binding on the Noteholdersand, unless the Trustee agrees otherwise, any modification shall be notified by the Issuer to theNoteholders as soon as practicable thereafter in accordance with Condition 15 (Notices).
196

17. SUBSTITUTION
The Trust Deed contains provisions permitting the Trustee to agree, subject to such amendmentof the Trust Deed and such other conditions as the Trustee may require, but without the consentof the Noteholders, to the substitution of certain other entities in place of the Issuer or of anyprevious substituted company, as principal debtor under the Trust Deed and the Notes. In the caseof such a substitution the Trustee may agree, without the consent of the Noteholders, to a changeof the law governing the Notes and/or the Trust Deed provided that such change would not in theopinion of the Trustee be materially prejudicial to the interests of the Noteholders.
18. INDEMNIFICATION OF THE TRUSTEE AND ITS CONTRACTING WITH THE ISSUER
18.1 Indemnification and protection of the Trustee
The Trust Deed contains provisions for the indemnification of the Trustee and for its relief fromresponsibility and liability towards the Issuer and the Noteholders including provisions relievingit from taking action unless indemnified and/or secured and/or prefunded to its satisfaction.
18.2 Trustee Contracting with the Issuer and the Parent
The Trust Deed also contains provisions pursuant to which the Trustee is entitled, inter alia, (i)to enter into business transactions with the Issuer and/or the Parent and/or any of the Parent’sother subsidiaries and to act as trustee for the holders of any other securities issued or guaranteedby, or relating to, the Issuer and/or the Parent and/or any of the Parent’s other subsidiaries, (ii)to exercise and enforce its rights, comply with its obligations and perform its duties under or inrelation to any such transactions or, as the case may be, any such trusteeship without regard tothe interests of, or consequences for, the Noteholders, and (iii) to retain and not be liable toaccount for any profit made or any other amount or benefit received thereby or in connectiontherewith.
18.3 Reliance
The Trustee may rely, without any liability to the Noteholders, on any certificate or report of, orconfirmation, advice or information provided by the Issuer or the Parent or the Parent’s auditorsas sufficient and conclusive evidence of the facts stated therein, regardless of whether suchcertificate, report, or confirmation, advise or information is addressed to the Trustee, was madepursuant to any document, engagement letter or agreement to which the Trustee is a party, orregardless of any monetary or other limitation or exclusion of liability of any such person inrespect thereof. The Trustee may accept and shall be entitled to rely on any such report,certificate confirmation, advice or information and such report, certificate or information shallbe binding on the Issuer, the Parent and the Noteholders.
19. FURTHER ISSUES
The Issuer is at liberty from time to time without the consent of the Noteholders to create andissue further Notes ranking pari passu in all respects (or in all respects save for the first paymentof interest thereon) and so that the same shall be consolidated and form a single series with theoutstanding Notes constituted by the Trust Deed or any supplemental deed, subject to the receiptby the Trustee of a certificate signed by two authorised signatories or directors of the Issuer anda legal opinion from an internationally recognised law firm, in each case in form and substancesatisfactory to the Trustee.
The Issuer will also be permitted to issue and incur indebtedness through the issuance of furthernotes or bonds.
197

20. GOVERNING LAW AND SUBMISSION TO JURISDICTION
20.1 Governing Law
The Trust Deed, the Agency Agreement and the Notes and any non-contractual obligations
arising out of or in connection with them are governed by, and will be construed in accordance
with, English law.
20.2 Jurisdiction of English Courts
The Issuer has, in the Trust Deed, irrevocably agreed for the benefit of the Trustee and the
Noteholders that the courts of England are to have exclusive jurisdiction to settle any disputes
which may arise out of or in connection with the Trust Deed or the Notes (including any dispute
relating to any non-contractual obligations arising out of or in connection with the Trust Deed
or the Notes) and accordingly has submitted to the exclusive jurisdiction of the English courts.
The Issuer has, in the Trust Deed, waived any objection to the courts of England on the grounds
that they are an inconvenient or inappropriate forum. The Trustee and the Noteholders may take
any suit, action or proceeding arising out of or in connection with the Trust Deed or the Notes
respectively (including any suit, action or proceedings relating to any non-contractual
obligations arising out of or in connection with the Trust Deed or the Notes) (together referred
to as Proceedings) against the Issuer in any other court of competent jurisdiction and concurrent
Proceedings in any number of jurisdictions.
20.3 Appointment of Process Agent
The Issuer has, in the Trust Deed, irrevocably and unconditionally appointed Tata Limited, 18,
Grosvenor Place, London SW1X 7HS (Attention: J.D. Contractor) as its agent for service of
process in England in respect of any Proceedings and has undertaken that in the event of such
agent ceasing so to act it will appoint such other person as the Trustee may approve as its agent
for that purpose.
20.4 Sovereign Immunity
The Issuer has, in the Trust Deed, irrevocably and unconditionally waived and agreed not to raise
with respect to the Notes any right to claim sovereign or other immunity from jurisdiction or
execution or any similar defence, and has irrevocably and unconditionally consented to the
giving of any relief or the issue of any process, including, without limitation, the making,
enforcement or execution against any property whatsoever (irrespective of its use or intended
use) of any order or judgment made or given in connection with any Proceedings.
21. RIGHTS OF THIRD PARTIES
No person shall have any right to enforce any term of this Note under the Contracts (Rights of
Third Parties) Act 1999, but this does not affect any right or remedy of any person which exists
or is available apart from that Act.
198

TERMS AND CONDITIONS OF THE [●] NOTES
The following is the text of the Conditions of the Notes which (subject to completion and amendmentand as supplemented or varied and except for the paragraphs in italics) will be applicable to the Notesin definitive form (if any) issued in exchange for the Global Certificate representing the Notes. Theseterms and conditions as so amended, supplemented or varied shall be endorsed on the Certificatesissued in respect of the Notes. All capitalised terms that are not defined in these Conditions will havethe meanings given to them in the Trust Deed.
1. DEFINITIONS
The following definitions are used in these Terms and Conditions:
Issuer . . . . . . . . . . . . . . . . . . . . . . ABJA Investment Co. Pte. Ltd., a company incorporatedunder the laws of Singapore with Unique Entity Number201309883M with offices at 22 Tanjong Kling Road,Singapore 628048
Parent . . . . . . . . . . . . . . . . . . . . . Tata Steel Limited, a company incorporated under thelaws of the Republic of India with registered numberL27100MH1907PLC000260 with its registered addressat Bombay House, 24, Homi Mody Street, Fort, Mumbai400 001, India
Trustee. . . . . . . . . . . . . . . . . . . . . Citicorp International Limited39th Floor,Champion Tower3 Garden Road, CentralHong KongFax: +852 2323 0279Attn: Agency and Trust
Principal Paying Agent. . . . . . . . . Citibank, N.A., London Branchc/o Citibank, N.A., Dublin BranchGround Floor1 North Wall QuayDublin 1IrelandFax: +353 I 662 2212/2210Attn: Agency and Trust
Paying Agents . . . . . . . . . . . . . . . The Principal Paying Agent and any other paying agentappointed by the Issuer
Registrar . . . . . . . . . . . . . . . . . . . Citibank, N.A., London Branchc/o Citibank, N.A., Dublin BranchGround Floor1 North Wall QuayDublin 1IrelandFax: +353 I 662 2212/2210Attn: Agency and Trust
Notes . . . . . . . . . . . . . . . . . . . . . . U.S.$[●] [●]% Notes due [●] (which term shall include,unless the context requires otherwise, any further Notesissued in accordance with Condition 19 and consolidatedand forming a single series therewith)
199

[●] Notes . . . . . . . . . . . . . . . . . . . U.S.$[●] [●]% Notes due [●]
Closing Date . . . . . . . . . . . . . . . . [●]
Maturity Date . . . . . . . . . . . . . . . [●]
Noteholders . . . . . . . . . . . . . . . . . The holders of the Notes (each a Noteholder)
2. RELATED AGREEMENTS
2.1 The Notes are constituted by a trust deed dated as of the Closing Date (the Trust Deed) madebetween the Issuer and the Trustee.
2.2 These Conditions include summaries of, and are subject to, the detailed provisions of the TrustDeed (as amended and supplemented from time to time) which includes the form of the Notes.Copies of the Trust Deed and the agency agreement dated as of the Closing Date (the AgencyAgreement) made between the Issuer, the Principal Paying Agent, the Registrar and the Trusteeare available for inspection by the Noteholders, during normal business hours at the specifiedoffice for the time being of the Trustee and at the specified office of each of the Paying Agents(and, together with the Principal Paying Agent and the Registrar, the Agents). The Noteholdersare entitled to the benefit of, are bound by, and are deemed to have notice of, all the provisionsof the Trust Deed and the Agency Agreement. References in these Conditions to the Trustee, theRegistrar or any Paying Agent include any successor appointed under the Trust Deed or AgencyAgreement, respectively.
3. FORM, DENOMINATION AND TITLE
3.1 Form and denomination
The Notes are issued in registered form in the denomination of U.S.$200,000 each and integralmultiples of U.S.$1,000 in excess thereof (referred to as the principal amount of each Note).A note certificate (each a Certificate) will be issued to each Noteholder in respect of itsregistered holding of Notes. Each Certificate will be numbered serially with an identifyingnumber which will be recorded on the relevant Certificate and in the register of Noteholderswhich the Issuer will procure to be kept by the Registrar.
3.2 Title
Title to the Notes passes only by registration in the register of Noteholders. The holder of anyNote will (except as otherwise required by law) be treated as its absolute owner for all purposes(whether or not it is overdue and regardless of any notice of ownership, trust or any interest init, any writing on it, or the theft or loss of the Certificate issued in respect of it) (other than aduly executed transfer thereof in the form endorsed thereon), and no person will be liable for sotreating the holder.
4. TRANSFER OF NOTES AND ISSUE OF CERTIFICATES
4.1 Register
The Issuer will cause to be kept at the specified office of the Registrar and in accordance withthe terms of the Agency Agreement a register on which shall be entered the names and addressesof the holders of the Notes and the particulars of the Notes held by them and of all transfers ofthe Notes (the Register).
Each Noteholder shall be entitled to receive only one Certificate in respect of its entire holdingof Notes.
200

4.2 Transfers
Subject to Conditions 4.5 and 4.6 and the terms of the Agency Agreement, a Note may betransferred by depositing the Certificate issued in respect of that Note, with the form of transferon the back duly completed and signed, at the specified office of the Registrar or the TransferAgent. No transfer of a Note will be valid unless and until entered into the Register.
4.3 Delivery of new Certificates
Each new Certificate to be issued upon a transfer of Notes will, within five business days ofreceipt by the Registrar or the relevant Agent of the duly completed form of transfer endorsedon the relevant Certificate, be mailed by uninsured mail (at the cost of the Issuer and at the riskof the holder entitled to the Note) to the address specified in the form of transfer. For thepurposes of this Condition, “business day” shall mean a day on which banks are open forbusiness in the city in which the specified office of the Agent with whom a Certificate isdeposited in connection with a transfer is located.
Where some but not all of the Notes in respect of which a Certificate is issued are to betransferred, a new Certificate in respect of the Notes not so transferred will, within five businessdays of receipt by the Registrar or the relevant Agent of the original Certificate, be mailed byuninsured mail (at the cost of the Issuer and at the risk of the holder of the Notes not sotransferred) to the address of such holder appearing on the register of Noteholders or as specifiedin the form of transfer.
4.4 Formalities free of charge
Registration of a transfer of Notes will be effected without charge by or on behalf of the Issueror any Agent but upon payment (or the giving of such indemnity as the Issuer or any Agent mayreasonably require) in respect of any tax or other governmental charges which may be imposedin relation to such transfer.
4.5 Closed Periods
No Noteholder may require the transfer of a Note to be registered (a) during the period of 15 daysending on the due date for any payment of principal, premium or interest on that Note; or (b)during a period of seven days ending on the date on which the Notes are exchanged for the NewNotes (as defined herein) pursuant to Condition 9.4.
The Issuer shall not be required in the event of a partial redemption of Notes under Condition9 (Redemption and Purchase):
(a) to register the transfer of Notes (or parts of Notes) during the period beginning on the 65thday before the date of the partial redemption and ending on the day on which notice is givenspecifying the serial numbers of Notes called (in whole or in part) for redemption (bothinclusive); or
(b) to register the transfer of any Note, or part of a Note, called for redemption.
4.6 Regulations
All transfers of Notes and entries on the register of Noteholders will be made subject to thedetailed regulations concerning a transfer of Notes scheduled to the Agency Agreement. Theregulations may be changed by the Issuer with the prior written approval of the Registrar and theTrustee. A copy of the current regulations will be mailed (at the cost of the Issuer and free ofcharge to the Noteholder) by the Registrar to any Noteholder who requests one.
201

5. STATUS OF THE NOTES
The Notes constitute (subject to Condition 6.1 (Negative Pledge)) unsecured and unsubordinatedobligations of the Issuer and will rank at all times pari passu without any preference amongthemselves and at least pari passu with all other present and future outstanding unsecured andunsubordinated obligations of the Issuer but, in the event of insolvency, only to the extentpermitted by applicable laws relating to creditors’ rights.
6. COVENANTS
6.1 Negative Pledge
So long as any of the Notes remain outstanding:
(a) the Issuer will not create or permit to subsist any Security (as defined below) upon the whole orany part of its property or assets, present or future, to secure any External Obligations (as definedbelow), unless the Issuer, in the case of the creation of the Security, at the same time or priorthereto, takes any and all action necessary to ensure that:
(i) all amounts payable by it under the Notes and the Trust Deed are secured by the Securityequally and rateably with the External Obligations to the satisfaction of the Trustee; or
(ii) such other Security or other arrangement (whether or not it includes the giving of Security)is provided as is approved by an Extraordinary Resolution of the Noteholders;
(b) the Parent will not create or permit to subsist any Security upon the whole or any part of itsproperty or assets, present or future, to secure any External Obligations, unless the Parent, in thecase of the creation of Security, at the same time or prior thereto, takes any and all actionnecessary to ensure that:
(i) all amounts payable by the Issuer under the Notes and the Trust Deed are secured by theSecurity equally and rateably with the External Obligations to the satisfaction of theTrustee; or
(ii) such other Security or other arrangement (whether or not it includes the giving of Security)is provided as is approved by an Extraordinary Resolution of the Noteholders; and
(c) the Parent will not guarantee any additional External Obligations of the Issuer unless the termsof such External Obligations include a provision substantially similar to the following:
“It shall be an Event of Default if:
(i) any of the U.S.$[●] [●]% Notes Due [●] (the “ABJA [●] Notes”) or the U.S.$[●] [●]% NotesDue [●] (the “ABJA [●] Notes”, and together with the ABJA [●] Notes, the “ABJA Notes”)of ABJA Investment Co. Pte. Ltd. (“ABJA”) become due and repayable prior to their statedmaturity by reason of an event of default or potential event of default (however described);
(ii) ABJA (or any successor entity) fails to make any payment in respect of any of the ABJANotes on the due date for payment as extended by any originally applicable grace period;
(iii) any security given by ABJA (or any successor entity) or Tata Steel Limited for the ABJANotes becomes enforceable; or
(iv) default is made by ABJA (or any successor entity) in making any payment due under anyguarantee and/or indemnity given by it in relation to any Indebtedness for Borrowed Moneyof any other person;
202

provided that no event described in this Condition shall constitute an Event of Default unless the
Indebtedness for Borrowed Money (including the ABJA Notes) or other relative liability due and
unpaid, either alone or when aggregated (without duplication) with other amounts of
Indebtedness for Borrowed Money (including the ABJA Notes) and/or other liabilities due and
unpaid relative to all (if any) other events specified in (i) to (iv) above which have occurred and
are continuing, amounts to at least U.S.$75,000,000 (or its equivalent in any other currency).
Indebtedness for Borrowed Money means any indebtedness (whether being principal, premium
(if any), interest or other amounts) for or in respect of any notes, bonds, debentures, debenture
stock, loan stock or other securities or any borrowed money or any liability under or in respect
of any acceptance under any credit facility.”
For the purposes of this Condition 6.1(c), whether a provision is considered substantially similar
to the above quoted provision in this Condition 6.1(c) shall be exclusively determined by the
Board of Directors of the Issuer or any person(s) authorised by the Board of Directors of the
Issuer, in either case acting in good faith.
6.2 Limitations on Asset Sales
(a) So long as any of the Notes remain outstanding, the Parent shall apply any Net Cash Proceeds
from an Asset Sale to:
(i) permanently repay unsubordinated Financial Indebtedness; or
(ii) acquire properties and assets (other than current assets) that will be directly owned and
used by the Parent in Permitted Businesses; or
(iii) invest in subsidiaries involved in Permitted Businesses; provided that the amount of such
investment, individually or when aggregated with all other investments in subsidiaries in
respect of the Net Cash Proceeds from any Asset Sales in the 12 month period prior to such
investment, does not exceed 3% of the Fixed Assets of the Parent on the immediately
preceding balance sheet date (as stated in the Parent’s most recent semi-annual or annual
financial statements); or
(iv) pay a dividend, provided that, the Parent shall not pay any such dividend in respect of or
otherwise distribute such Net Cash Proceeds to its shareholders if such dividend or
distribution, individually or when aggregated with all other dividends or distributions in
respect of the Net Cash Proceeds from any Asset Sales in the 12 month period prior to the
date of the declaration of such dividend or distribution, exceeds U.S.$200,000,000 or its
equivalent in other currencies.
(b) The Parent will not, directly or indirectly, consummate an Asset Sale unless the Parent receives
consideration at the time of the Asset Sale at least equal to the Fair Market Value (measured as
of the date of the definitive agreement with respect to the Asset Sale (including as to the value
of all non-cash consideration, such non-cash consideration shall, for the avoidance of doubt, not
be subject to the restrictions under Condition 6.2(a)) of the Fixed Assets sold or otherwise
disposed of.
(c) Pending application of Net Cash Proceeds as set out above, such Net Cash Proceeds may be
placed in cash deposits or invested in short term money market instruments.
203

6.3 Limitation on Financial Indebtedness
(a) So long as any of the Notes remain outstanding, the Parent and the Issuer shall not Incur, directlyor indirectly, any Financial Indebtedness, unless after giving effect to the application of theproceeds thereof:
(i) no Event of Default or Potential Event of Default would occur as a consequence of suchIncurrence or be continuing following such Incurrence; and
(ii) the Total Net Long Term Debt to Total Net Worth ratio for the Parent’s most recently endedsemi-annual or annual period for which unconsolidated financial statements are availableimmediately preceding the date on which such Financial Indebtedness is Incurred shall notbe greater than 3.0:1.0.
Provided that this Condition 6.3 shall not apply to:
A. Financial Indebtedness of the Issuer evidenced by the Notes or the [●] Notes (and any notesexchanged for the Notes or the [●] Notes);
B. Financial Indebtedness existing as at [●] 2018, and any refinancings thereof; and
C. Financial Indebtedness used to refinance Financial Indebtedness properly Incurred underthis Condition 6.3.
(b) The Total Net Long Term Debt to Total Net Worth ratio shall be calculated and interpreted onan unconsolidated basis.
6.4 Suspension of Covenants
(a) Following the first day (the Suspension Date) that (i) the Notes have Notes Investment GradeStatus and (ii) no Event of Default has occurred and is continuing, Condition 6.2 (Limitations onAsset Sales) and Condition 6.3 (Limitation on Financial Indebtedness) shall no longer be testedin relation to the Parent for purposes of these Conditions and the Trust Deed (the SuspendedCovenants). In the event that the Suspended Covenants are no longer tested in relation to theParent for any period of time as a result of the preceding sentence and, on any subsequent date(the Reversion Date), either (A) a Rating Agency has assigned ratings to the Notes below therequired Notes Investment Grade Status or (B) an Event of Default occurs and is continuing, thenthe Suspended Covenants will thereafter again be tested in relation to the Parent for purposes ofthese Conditions and the Trust Deed. The period of time between the Suspension Date and theReversion Date is referred to in the covenant described hereunder as the Suspension Period.
(b) Notwithstanding that the Suspended Covenants may be reinstated, no Event of Default will bedeemed to have occurred as a result of a failure to comply with the Suspended Covenants duringthe Suspension Period. On the Reversion Date, all Financial Indebtedness Incurred during aSuspension Period will be classified to have been Incurred pursuant to paragraph B of the provisoto Condition 6.3(a) and will be deemed to have been in existence on [●] 2018 and thereforepermitted. On the Reversion Date, for purposes of determining compliance with Condition 6.2,the amount of Net Cash Proceeds applied in the 12 month period prior to the Reversion Dateunder Condition 6.2(a)(iii) and 6.2(a)(iv) shall be deemed to be zero.
6.5 Interpretation
In these Conditions:
(a) 2024 Notes means the U.S.$1,000,000,000 5.95% Guaranteed Notes Due 2024 issued by theIssuer.
204

(b) Asset Sale means the sale, lease, conveyance or other disposition of any Fixed Assets by theParent. Notwithstanding the preceding, none of the following items will be deemed to be an AssetSale:
(i) any single transaction or series of related transactions that involves Fixed Assets having aFair Market Value of less than U.S.$100,000,000;
(ii) the sale, lease or other transfer of accounts receivable, inventory, trading stock and otherassets in the ordinary course of business (including the abandonment, sale or otherdisposition of damaged, worn out or obsolete assets or assets or intellectual property thatare, in the reasonable judgment of the Parent, no longer economically practicable tomaintain or useful in the conduct of business of the Parent);
(iii) licences, sub-licences, subleases, assignments or other disposition by the Parent of softwareor intellectual property in the ordinary course of business;
(iv) any surrender or waiver of contract rights or settlement, release, recovery on or surrenderof contract, tort or other claims in the ordinary course of business;
(v) the sale or other disposition of cash or cash equivalents;
(vi) the disposition of receivables in connection with the compromise, settlement or collectionthereof in the ordinary course of business or in bankruptcy or similar proceedings andexclusive of factoring or similar arrangements;
(vii) the foreclosure, condemnation or any similar action with respect to any property or otherassets or a surrender or waiver of contract rights or the settlement, release or surrender ofcontract, tort or other claims of any kind;
(viii) any unwinding or termination of hedging obligations not for speculative purposes;
(ix) the disposition of assets of the Parent which are seized, expropriated or compulsorypurchased by or by the order of any central or local government authority;
(x) the disposition of assets to another person whereby the Parent leases such assets back fromsuch person; and
(xi) operating leases of Fixed Assets.
(c) Cash means, at any time, the amount of cash and bank balances as stated in the latest standalonebalance sheet of the Parent.
(d) Cash Equivalents means investments that are short term investments (excluding equityinvestments) which are readily convertible into cash without incurring any significant premiumor penalty.
(e) Default means any event which is, or after notice or passage of time or both would be, an Eventof Default.
(f) External Obligations means bonds, debentures, notes or other similar securities of the Issuer orthe Parent which both:
(i) are by their terms payable, or confer a right to receive payment, in, or by reference to, anycurrency other than Rupees, or which are denominated in Rupees and more than 50% of theaggregate principal amount thereof is initially distributed outside of India by or with theauthorisation of the Issuer or the Parent; and
205

(ii) are for the time being or are capable of being quoted, listed, ordinarily dealt in or tradedon any stock exchange or over-the-counter or other similar securities market outside ofIndia.
(g) Extraordinary Resolution means:
(i) a resolution passed at a meeting duly convened and held in accordance with the Trust Deedby a majority consisting of not less than two-thirds of the Eligible Persons (as defined inthe Trust Deed) voting thereat upon a show of hands or, if a poll is duly demanded, by amajority consisting of not less than two-thirds of the votes cast on such poll; or
(ii) a resolution in writing signed by or on behalf of holders of not less than two-thirds inprincipal amount of the Notes for the time being outstanding which resolution may becontained in one document or in several documents in like form each signed by or on behalfof one or more of the holders; and
(iii) consent given by way of electronic consents through the relevant Clearing System(s) (asdefined in the Trust Deed) (in a form satisfactory to the Trustee) by or on behalf of theholders of not less than two-thirds in principal amount of the Notes for the time beingoutstanding.
(h) Fair Market Value means, with respect to any asset or property, the price which could benegotiated in an arm’s length, for cash, between a willing seller and a willing and able buyer,neither of whom is under undue pressure or compulsion to complete the transaction. Fair MarketValue will be determined in good faith by the Board of Directors of the Parent or any person(s)authorised by the Board of Directors of the Parent, whose determination will be conclusive andevidenced by a certificate from the same.
(i) Financial Indebtedness means any indebtedness Incurred by the Parent or the Issuer for or inrespect of:
(i) moneys borrowed;
(ii) any amount raised by acceptance under any acceptance credit facility or dematerialisedequivalent;
(iii) any amount raised pursuant to any note purchase facility or the issue of bonds, notes,debentures, loan stock or any similar instrument;
(iv) the amount of any liability in respect of any lease or hire purchase contract which would,in accordance with Ind-AS (in relation to the Parent) or SFRS (in relation to the Issuer), betreated as a finance or capital lease;
(v) receivables sold or discounted (other than any receivables to the extent they are sold on anon-recourse basis);
(vi) any amount raised under any other transaction having the commercial effect of a borrowingand required by Ind-AS (in relation to the Parent) or SFRS (in relation to the Issuer), to beshown as a borrowing in the balance sheet of the Parent or the Issuer, as applicable;
(vii) any derivative transaction entered into in connection with protection against or benefit fromfluctuation in any rate or price (and, when calculating the value of any derivativetransaction, only the marked to market value shall be taken into account);
(viii) shares which are expressed to be redeemable on or before [●];
206

(ix) any counter-indemnity obligation in respect of a guarantee, indemnity, bond, standby ordocumentary letter of credit or any other instrument issued by a bank or financialinstitution; and
(x) the amount of any liability in respect of any guarantee or indemnity for any of the itemsreferred to in paragraphs (i) to (ix) above.
(j) Fixed Assets refers to assets classified as such in the Parent’s unconsolidated financialstatements prepared in accordance with Ind-AS.
(k) Ind-AS means the Indian Accounting Standards.
(l) Incur means, with respect to any Financial Indebtedness, to incur, create, issue, assume,guarantee or otherwise become liable for or with respect to, or become responsible for, thepayment of, contingently or otherwise, such Financial Indebtedness. The terms “Incurrence,”“Incurred” and “Incurring” have meanings correlative with the foregoing.
(m) Net Cash Proceeds with respect to any sale of any Fixed Assets of the Parent means the cashproceeds of such sale net of payments to repay Financial Indebtedness or any other obligationoutstanding at the time that either (1) is secured by a lien on such Fixed Assets or (2) is requiredto be paid as a result of such sale, legal fees, accountants’ fees, agents’ fees, discounts orcommissions and brokerage, consultant fees and other fees actually incurred in connection withsuch sale and net of taxes paid or payable as a result thereof.
(n) Notes Investment Grade Status exists as of any time if at such time the Notes have beenassigned (x) “BBB-“ or higher by Fitch; (y) “BBB-“ or higher by S&P; or (z) “Baa3” or higherby Moody’s.
(o) Officer means any director of the Issuer.
(p) Officers’ Certificate means a certificate signed by two Officers.
(q) Permitted Business means (i) any business, services or activities engaged in by the Parent andits Subsidiaries on the Closing Date and (ii) any business, services or activities engaged in bythe Parent or any of its Subsidiaries that are related, complementary, incidental, ancillary orsimilar to any of the foregoing, or are extensions or developments of any thereof.
(r) Rating Agency shall have the meaning given to such term in Condition 9.3(e)(viii).
(s) Rupees means the lawful currency of the Republic of India.
(t) Security means a mortgage, charge, pledge, lien, encumbrance or other security interest securingany obligation of any person or any other agreement or arrangement having a similar effect,including any mortgage, pledge, retention of title arrangement, right of retention, and, in general,any right in rem, created for the purpose of granting security.
(u) SFRS means Singapore Financial Reporting Standards.
(v) Total Net Long Term Debt means at any time the aggregate of:
(i) long term borrowings of the Parent; plus
(ii) the portion of other current liabilities which comprise current maturities of long termborrowings of the Parent; plus
(iii) any guarantee or indemnity given by the Parent in respect of any indebtedness with amaturity of more than 1 year of any person; minus
207

(iv) the aggregate amount of Cash and Cash Equivalents,
each as stated, or derived from the latest standalone financial statements of the Parent.
(w) Total Net Worth means at any time the aggregate of the amounts paid up or credited as paid upon the share capital of the Parent, on a standalone basis, and the amount standing to the creditof the reserves and surplus of the Parent, on a standalone basis, but deducting (to the extentincluded) any amounts arising from an upward revaluation of assets made at any time after 30September 2017.
7. INTEREST
7.1 Interest Rate and Interest Payment Dates
The Notes bear interest on their outstanding principal amount from and including the ClosingDate at the rate of [●]% per annum, payable semi-annually in arrear on [●] and [●] of each year(each, an Interest Payment Date). The first payment (for the period from and including [●] 2018to but excluding [●] 2018) will be made on [●] 2018.
If any Interest Payment Date falls on a day which is not a Business Day, it shall be postponedto the next day which is a Business Day unless it would then fall into the next calendar month,in which event the Interest Payment Date shall be brought forward to the immediately precedingBusiness Day.
In this Condition Business Day means in relation to any place a day (other than a Saturday orSunday) on which commercial banks are open for business in London, Singapore, New York,Mumbai and, in the case of presentation of a Note Certificate, in the place in which the NoteCertificate is presented.
7.2 Interest Accrual
Each Note will cease to bear interest from and including the Maturity Date or the date on whichall amounts due in respect of such Note have been paid unless, upon due presentation, paymentof principal in respect of the Note is improperly withheld or refused or unless default isotherwise made in respect of payment. In such event, interest will continue to accrue untilwhichever is the earlier of:
(a) the date on which all amounts due in respect of such Note have been paid; and
(b) seven days after the date on which the full amount of the moneys payable in respect of suchNotes has been received by the Principal Paying Agent or the Registrar, as the case may be,and notice to that effect has been given to the Noteholders in accordance with Condition15 (Notices).
7.3 Calculation of Broken Interest
When interest is to be calculated in respect of a period of less than six months, the day-countfraction used will be the number of days in the relevant period, from (and including) the datefrom which interest begins to accrue to (but excluding) the date on which it falls due, dividedby 360.
8. PAYMENTS
8.1 Method of Payments
(a) Payment of principal, premium (if any) and interest will be made by transfer to the registeredaccount of the Noteholder or, in the case of payments of interest due on an Interest Payment Date,
208

in accordance with the provisions of the Agency Agreement. Payments of principal and premium(if any) and payments of interest due otherwise than on an Interest Payment Date will only bemade against surrender of the relevant Certificate at the specified office of any of the Agents.Interest on Notes due on an Interest Payment Date will be paid to the holder shown on theregister of Noteholders at the close of business on the date (the record date) being the 15th daybefore the relevant Interest Payment Date.
(b) For the purposes of this Condition, a Noteholder’s registered account means the US dollaraccount maintained by or on behalf of it with a bank in New York City, details of which appearon the register of Noteholders at the close of business, in the case of principal and premium (ifany) and interest due otherwise than on an Interest Payment Date, on the Business Day (asdefined below) before the due date for payment and, in the case of interest due on an InterestPayment Date, on the relevant record date.
8.2 Partial Payments
If the amount of principal, premium (if any) or interest which is due on the Notes is not paid infull, the Principal Paying Agent or the Registrar, as the case may be, will annotate the registerof Noteholders with a record of the amount of principal, premium (if any) or interest in fact paid.
8.3 Payments subject to Applicable Laws
All payments are subject in all cases to any fiscal or other laws and regulations applicable in theplace of payment, but without prejudice to the provisions of Condition 10 (Taxation). Nocommissions or expenses shall be charged to the Noteholders in respect of any such payments.
8.4 Payment on Business Days
(a) Payment instructions (for value on the due date or, if that is not a Business Day (as definedbelow), for value on the first following day which is a Business Day) will be initiated on the duedate for payment (or, if it is not a Business Day, the immediately following Business Day) or,in the case of payment of principal, if later, on the Business Day on which the relevant Certificateis surrendered at the specified office of the Agent.
(b) Noteholders will not be entitled to interest or other payment for any delay after the due date inreceiving the amount due if (i) the due date is not a Business Day or (ii) the Noteholder is latein surrendering its Certificate (if required to do so).
In this Condition Business Day means in relation to any place a day (other than a Saturday orSunday) on which commercial banks are open for business in London, Singapore, New York,Mumbai and, in the case of presentation of a Note Certificate, in the place in which the NoteCertificate is presented.
8.5 Default Interest
(a) If on or after the due date for payment of any sum in respect of the Notes, payment of all or anypart of such sum shall not be made against due presentation of the Certificates, the Issuer shallpay interest on the amount so unpaid from such due date up to the day of actual receipt by therelevant Noteholders (before and after judgment) at a rate per annum equal to [●]% per annum.The Issuer shall pay any unpaid interest accrued on the amount so unpaid on the last BusinessDay of the calendar month in which such interest accrued and any interest payable under thisCondition which is not paid on the last Business Day of the calendar month in which it accruedshall be added to the overdue sum and itself bear interest accordingly.
209

(b) The Trustee and Agents shall not be liable for (i) any such payments of default interest pursuantto Condition 8.5(a) above which shall be made directly by the Issuer to the relevant Noteholders;(ii) any failure of the Issuer to make payments of any such default interest to the Noteholders;or (iii) any calculations in respect of such default interest which are carried out by any otherparty.
8.6 Agents
The name of the initial Paying Agents and their initial specified offices are set out at the frontof these Conditions. The Issuer reserves the right, subject to the prior written approval of theTrustee, to vary or terminate the appointment of any Paying Agent at any time and to appointadditional or other Paying Agents provided that:
(a) there is always a Principal Paying Agent;
(b) there is always a Registrar; and
(c) such other agents as may be required by any stock exchange on which the Notes may belisted. Notice of any termination or appointment and of any changes in specified officesshall be given to the Noteholders promptly by the Issuer in accordance with Condition 15(Notices).
9. REDEMPTION AND PURCHASE
9.1 Redemption at Maturity
Unless previously redeemed or purchased and cancelled as provided below, the Issuer willredeem the Notes at their principal amount (together with unpaid accrued interest thereon (ifany)) on the Maturity Date.
9.2 Redemption for Taxation Reasons
(a) The Notes may be redeemed at the option of the Issuer in whole, but not in part, at any time oron any Interest Payment Date, on giving not less than 30 nor more than 60 days’ notice to theNoteholders in accordance with Condition 15 (Notices) (which notice shall be irrevocable), attheir principal amount (together with unpaid accrued interest thereon (if any)), if (i) the Issuersatisfies the Trustee immediately prior to the giving of such notice that it has or will becomeobliged to pay additional amounts as provided or referred to in Condition 10 (Taxation) as aresult of any change in, or amendment to, the laws or regulations of a Relevant Jurisdiction (asdefined in Condition 10.2(b)), or any change in the application or official interpretation of suchlaws or regulations, which change or amendment becomes effective on or after the Closing Date,and (ii) such obligation cannot be avoided by the Issuer taking reasonable measures available toit, provided that no such notice of redemption shall be given earlier than 90 days prior to theearliest date on which the Issuer would be obliged to pay such additional amounts where apayment in respect of the Notes is then due.
(b) Prior to the publication of any notice of redemption pursuant to Condition 9.2(a), the Issuer shalldeliver to the Trustee a certificate signed by two directors of the Issuer stating that the obligationreferred to in Condition 9.2(a)(ii) above cannot be avoided by the Issuer taking reasonablemeasures available to it and the Issuer is entitled to effect such redemption and setting forth astatement of facts showing that the conditions precedent to the right of the Issuer so to redeemhave occurred, and an opinion of independent legal advisers of recognised standing to the effectthat the Issuer has or will become obliged to pay such additional amounts as a result of suchchange or amendment. The Trustee shall be entitled to accept such certificate as sufficientevidence of the satisfaction of the condition precedent set out in Condition 9.2(a)(ii) above inwhich event it shall be conclusive and binding on the Noteholders and the Trustee shall not beliable to any person for doing so.
210

9.3 Redemption for Change of Control Triggering Event
(a) If a Change of Control Triggering Event (as defined below) occurs with respect to the Parent,
each Noteholder shall have the right (the Change of Control Redemption Right), at such
Noteholder’s option, to require the Issuer to redeem all of such Noteholder’s Note(s) in whole,
but not in part on the Change of Control Redemption Date (as defined below), at a price equal
to the Change of Control Redemption Amount (as defined below). The Agents shall not be
required to take any steps to ascertain whether a Change of Control Triggering Event or any event
which could lead to the occurrence of a Change of Control Triggering Event has occurred and
shall not be liable to any person for any failure to do so.
(b) To exercise the Change of Control Redemption Right attaching to a Note on the occurrence of
a Change of Control Triggering Event, the holder thereof must complete, sign and deposit at its
own expense at any time from 9.30 a.m to 5.30 p.m (local time in the place of deposit) on any
Business Day at the specified office of any Paying Agent a notice (a Change of ControlRedemption Notice) in the form (for the time being current) obtainable from the specified office
of any Paying Agent together with the relevant Certificate evidencing the Notes to be redeemed.
Such Change of Control Redemption Notice may be given on the earlier of the date on which the
relevant Noteholder becomes aware of the occurrence of the Change of Control Triggering Event
and the date on which the Change of Control Notice (as detailed below) delivered by the Issuer
under Condition 9.3(d) is received by such Noteholder. No Change of Control Redemption
Notice rnay be given after 90 days from the date of the Change of Control Notice.
(c) A Change of Control Redemption Notice, once delivered, shall be irrevocable except where, prior
to the due date of redemption, an Event of Default has occurred and is continuing in which event
such holder, at its option, may elect by notice to the Issuer to withdraw the Change of Control
Redemption Notice and instead to give notice that the Note is immediately due and repayable
under Condition 11.1 (Events of Default). The Issuer shall redeem the Notes (in whole but not
in part) which form the subject of any Change of Control Redemption Notice which is not
withdrawn on the Change of Control Redemption Date.
(d) Not later than seven days after becoming aware of a Change of Control Triggering Event, the
Issuer shall procure that notice (a Change of Control Notice) regarding the Change of Control
Triggering Event be delivered to the Trustee, the Agents and the Noteholders (in accordance with
Condition 15 (Notices) stating:
(i) that Noteholders may require the Issuer to redeem their Notes under Condition 9.3
(Redemption for Change of Control Triggering Event);
(ii) the date of such Change of Control Triggering Event and, briefly, the events causing such
Change of Control Triggering Event;
(iii) the names and addresses of all relevant Paying Agents;
(iv) such other information relating to the Change of Control Triggering Event as any
Noteholder may require; and
(v) that the Change of Control Redemption Notice pursuant to Condition 9.3(b) once validly
given, may not be withdrawn and the last day on which a Change of Control Redemption
Notice may be given.
211

(e) In this Condition:
(i) Change of Control means the occurrence of any of the following:
(A) a person or persons, acting together, other than the Tata Group, acquire Control,
directly or indirectly, of the Parent;
(B) the Parent consolidates with or merges into or sells or transfers all or substantially all
of its assets to any other person or persons, acting together;
(C) the adoption of a plan relating to the liquidation or dissolution of the Parent; or
(D) the Parent ceases directly to own 100% of the share capital of the Issuer or adopts a
plan relating to the liquidation or dissolution of the Issuer.
(ii) Change of Control Redemption Amount means an amount equal to 101% of the principal
amount of the Notes redeemed plus unpaid accrued interest, if any, to and including the
Change of Control Redemption Date.
(iii) Change of Control Redemption Date means the date specified in the Change of Control
Redemption Notice, such date being not less than 30 nor more than 60 days after the date
of the Change of Control Redemption Notice.
(iv) Change of Control Triggering Event means the occurrence of a Change of Control;
provided, however, that if the Change of Control is an event described in clauses (A) and
(B) of the definition thereof, it shall not constitute a Change of Control Triggering Event
unless and until a Rating Decline also shall have occurred.
(v) Control means (A) the acquisition or control of more than 50% of the Voting Rights of the
issued share capital of the Parent or (B) the right to appoint and/or remove all or the
majority of the members of the Parent’s Board of Directors or other governing body,
whether obtained directly or indirectly, and whether obtained by ownership of share capital,
the possession of Voting Rights, contract or otherwise, and “controlled” shall be construed
accordingly.
(vi) Investment Grade Status exists as of any time if at such time the Parent’s corporate credit
rating has been assigned at least two of the three following ratings: (x) “BBB-” or higher
by Fitch; (y) “BBB-” or higher by S&P; or (z) “Baa3” or higher by Moody’s.
(vii) for the purposes of the Change of Control Redemption Right, a “person” includes any
person, firm, company, corporation, government, state or agency of a state or any
association, trust or partnership (whether or not having separate legal personality) or two
or more of the foregoing.
(viii) Rating Agency means any of Standard & Poor’s Ratings Service, a division of the McGraw
Hill Companies Inc. (S&P) Moody’s Investors Service, Inc. (Moody’s) or Fitch Inc., a
subsidiary of Fimalac, S.A. (Fitch), and any of their successors, as applicable.
(ix) Rating Category means (i) with respect to S&P, any of the following categories: “BB”,“B”, “CCC”, “CC”, “C”, and “D” (or equivalent successor categories); (ii) with respect toMoody’s, any of the following categories: “Ba”, “B”, “Caa”, “Ca”, “C”, and “D” (or
212

equivalent successor categories); (iii) with respect to Fitch, any of the following categories:“BB”, “B”, “CCC”, “CC”, “C”, and “D” (or equivalent successor categories) and (iv) theequivalent of any such category of S&P, Moody’s and Fitch used by another Rating Agency.In determining whether the rating of the Parent has decreased by one or more gradations,gradations within Rating Categories (“+” and “-” for S&P and Fitch; “l”, “2” and “3” forMoody’s; or the equivalent gradations for another Rating Agency) shall be taken intoaccount (eg, with respect to S&P and Fitch, a decline in a rating from “BB+” to “BB”, aswell as from “BB-” to “B+” will constitute a decrease of one gradation).
(x) Rating Date means in connection with a Change of Control Triggering Event, that datewhich is 90 days prior to the earlier of (A) a Change of Control, (B) the initial public noticeof the occurrence of a Change of Control or of the intention by the Parent or any otherPerson or Persons to effect a Change of Control and (C) the date that the acquirer orprospective acquirer (1) has entered into one or more binding agreements with the Parentand/or shareholders of the Parent that would give rise to a Change of Control or (2) hascommenced an offer to acquire outstanding capital stock of the Parent.
(xi) Rating Decline means in connection with a Change of Control Triggering Event, theoccurrence on, or within six months after, the date, or public notice of the occurrence of,a Change of Control or the intention by the Parent or any other person or persons to effecta Change of Control (which period shall be extended so long as the corporate credit ratingof the Parent or the Parent and its subsidiaries, is under publicly announced considerationfor possible downgrade by any of the Rating Agencies) of any of the events listed below:
(A) in the event the Parent is rated by one or more Rating Agencies on the Rating Dateas having Investment Grade Status, the rating of the Parent by any such Rating Agencyshall be downgraded to below Investment Grade Status; or
(B) in the event the Parent is rated below Investment Grade Status by one or more RatingAgencies on the Rating Date, the rating of the Parent by any such Rating Agency shallbe withdrawn or decreased by one or more gradations (including gradations withinRating Categories as well as between Rating Categories).
(xii) Tata Group means Tata Sons Limited, Tata Power Company Limited, Tata Steel Limited,Tata Industries Limited, Tata Motors Limited, Tata Chemicals Limited, Tata Tea Limited,The Indian Hotels Company Limited, Tata International Limited, Tata Consultancy ServicesLimited, Trent Limited, Tata Investment Corporation Limited and Panatone Finvest Limited(each of which is a company incorporated under the laws of India), their respectivesubsidiaries and holding companies and any other company which includes the word ‘Tata’in its name pursuant to a brand equity promotion agreement with a member of the TataGroup.
(xiii) Voting Rights means the right generally to vote at a general meeting of shareholders of theParent (irrespective of whether or not, at the time, stock of any other class or classes shallhave, or might have, voting power by reason of the happening of any contingency).
9.4 Mandatory exchange at the option of the Issuer
(a) The Notes may be exchanged for new notes issued directly by the Parent (the New Notes), at theoption of the Issuer in whole, but not in part, at any time or on any Interest Payment Date, ongiving not less than 15 nor more than 30 days’ notice to the Noteholders, the Trustee and thePrincipal Paying Agent in accordance with Condition 15 (Notices) (which notice shall beirrevocable) (the Exchange Notice). The terms and conditions of the New Notes will be as setout in Schedule 7 to the Trust Deed and will contain the same terms as the Notes (including, butnot limited to, principal, premium and interest payable, covenants, cross-acceleration, interest
213

payment dates and the maturity date), except for the issue date. The exchange of the Notes forthe New Notes (the Exchange) will be done in such a manner that each Noteholder will receivean amount of New Notes equal in principal amount to the principal amount of the Notes then heldby such Noteholder.
(b) The Trustee shall not be liable for acting or refraining from acting in reliance on any purportedExchange Notice and shall not be responsible for checking that such Exchange Notice has beenduly completed or properly delivered and any purported Exchange Notice which the Trusteeaccepts shall be conclusive and binding on the Issuer, the Trustee, the Agents and theNoteholders.
(c) The Issuer shall be responsible for the payment of, and shall, in the relevant Exchange Notice,indemnify the Noteholders, the Trustee and the Principal Paying Agent in respect of, all stamp,stamp duty reserve, registration, documentary, transfer and other similar taxes or duties(including penalties) arising on the delivery of the New Notes to the relevant Noteholder.
9.5 Provisions relating to Partial Redemption
If fewer than all of the Notes are to be redeemed at any time, the selection of such Notes forredemption will be made by the Trustee in compliance with the rules, if any, of any stockexchange on which the Notes are listed or, if such Notes are not then listed or there are no suchapplicable rules, on a pro rata basis and in such manner as the Trustee may deem appropriate andfair, provided that no Notes shall be redeemed in part more than 30 days before the date fixedfor redemption. Notice of any such selection will be given not less than 15 days before the datefixed for redemption. Each notice will specify the date fixed for redemption and the aggregateprincipal amount of the Notes to be redeemed, the serial numbers of the Notes called forredemption, the serial numbers of Notes previously called for redemption and not presented forpayment and the aggregate principal amount of the Notes which will be outstanding after thepartial redemption. Where some but not all of the Notes in respect of which a Certificate is issuedare to be redeemed, the notice of redemption that relates to such Certificates shall state theportion of the principal amount of the Notes to be redeemed and, where applicable, a newCertificate in a principal amount equal to the unredeemed Notes will be issued in the name ofthe Noteholder thereof upon cancellation of the original Certificate. Any such new Certificatewill be delivered to the specified office of a Paying Agent or (at the risk and, if mailed at therequest of the Noteholder otherwise than by ordinary uninsured mail, at the expense of theNoteholder) sent by mail to the Noteholder.
9.6 Purchases
The Issuer and the Parent (and any other subsidiary of the Parent) may at any time purchaseNotes in any manner and at any price. The Notes so acquired, while held on behalf of the Issueror the Parent (or such other subsidiary of the Parent), shall not entitle the holders thereof to voteat any meetings of the Noteholders and shall not be deemed to be outstanding for the purposesof calculating quorums at meetings of the Noteholders for the purposes of Condition 11 (Eventsof Default), Condition 13 (Enforcement) and Condition 16 (Meetings of Noteholders,Modification, Waiver and Authorisation). If purchases are made by tender, tenders must beavailable to all Noteholders alike except where it is not possible to do so in order to qualify forexemptions from any offering restrictions imposed by any jurisdiction.
9.7 Cancellations
All Notes which are (a) redeemed or exchanged or (b) purchased by or on behalf of the Issuer,the Parent or any of the Parent’s other subsidiaries, will forthwith be cancelled, and accordinglymay not be reissued or resold.
214

9.8 Notices Final
Upon the expiry of any notice as is referred to in Conditions 9.2 or 9.3 above the Issuer shallbe bound to redeem the Notes to which the notice refers in accordance with the terms of suchCondition.
10. TAXATION
10.1 Payment without Withholding
All payments in respect of the Notes by or on behalf of the Issuer shall be made withoutwithholding or deduction for, or on account of, any present or future taxes, duties, assessmentsor governmental charges of whatever nature (Taxes) imposed or levied by or on behalf of anyof the Relevant Jurisdictions, unless the withholding or deduction of the Taxes is required by law.In that event, the Issuer will pay such additional amounts as may be necessary in order that thenet amounts received by the Noteholders after the withholding or deduction shall equal theamounts which would have been received by them had no such withholding or deduction beenrequired; except that no additional amounts shall be payable on any Note in relation to anypayment in respect of:
(a) any Taxes that would not have been withheld, deducted or imposed but for (i) the holderof the Notes, (ii) the beneficial owner of the Notes or (iii) a fiduciary, settlor, beneficiary,member or shareholder of, or possessor of power over, the relevant holder, if the relevantholder is an estate, trust, partnership or corporation, being a citizen or resident or nationalof, incorporated in or carrying on a trade or business in or having a permanentestablishment in the Relevant Jurisdiction in which such Taxes are imposed or having anyother present or former connection with the Relevant Jurisdiction other than the mereacquisition, holding, enforcement or receipt of payment in respect of the Notes;
(b) any Taxes that are withheld, deducted or imposed as a result of the failure of the holder orbeneficial owner of the Notes to comply, to the extent legally able, with any reasonablerequest, made to that holder or beneficial owner at least 60 days before any suchwithholding or deduction would be payable, by the Issuer to provide timely and accurateinformation concerning the nationality, residence or identity of such holder or beneficialowner or to make any valid and timely declaration or similar claim or satisfy anycertification, information or other reporting requirement, which is required or imposed bya statute, treaty, regulation or administrative practice of the Relevant Jurisdiction as aprecondition to any exemption from or reduction in all or part of such Taxes to which suchholder is entitled;
(c) any Taxes that would not have been withheld, deducted or imposed but for the presentationof a Note for payment more than 30 days after the relevant payment is first made availablefor payment to the holder (except to the extent that the holder would have been entitled toadditional amounts had the Note been presented on the last day of such 30 day period);
(d) any Taxes that are withheld, deducted or imposed on or with respect to any payment ofprincipal or interest on such Note made to any holder who is a fiduciary or partnership orany person other than the sole beneficial owner of such payment, to the extent that abeneficiary or settlor with respect to such fiduciary, a member of such a partnership or thebeneficial owner of such payment would not have been entitled to the additional amountshad such beneficiary, settlor, member or beneficial owner been the actual holder of suchNote;
(e) any estate, inheritance, gift, sales, excise, transfer, personal property or similar Taxes;
215

(f) where such withholding or deduction is required pursuant to an agreement described inSection 1471(b) of the U.S. Internal Revenue Code of 1986 (the Code) or otherwiseimposed pursuant to Sections 1471 through 1474 of the Code, any regulations thereunder,official interpretations thereof, or law implementing an intergovernmental approachthereto.
(g) any Taxes withheld, deducted or imposed on or with respect to any Note presented forpayment by or on behalf of a holder of Notes who would have been able to avoid suchwithholding or deduction by presenting the relevant Note to another Paying Agent;
(h) any Taxes payable other than by deduction or withholding from payments under, or withrespect to, the Notes; or
(i) any combination of items 11.1(a) through 11.1(h) above.
10.2 Interpretation
In these Conditions:
(a) Relevant Date means the date on which the payment first becomes due but, if the fullamount of the money payable has not been received by a Paying Agent or the Trustee onor before the due date, it means the date on which, the full amount of the money havingbeen so received, notice to that effect has been duly given to the Noteholders by the Issuerin accordance with Condition 15 (Notices); and
(b) Relevant Jurisdiction means Singapore or any political subdivision or any authoritythereof or therein having power to tax or any other jurisdiction or any political subdivisionor any authority thereof or therein having power to tax to which the Issuer becomes subjectin respect of payments made by it of principal and interest on the Notes.
10.3 Additional Amounts
Any reference in these Conditions to any amounts in respect of the Notes shall be deemed alsoto refer to any additional amounts which may be payable under this Condition or under anyundertakings given in addition to, or in substitution for, this Condition pursuant to the TrustDeed.
11. EVENTS OF DEFAULT
11.1 Events of Default
The Trustee at its discretion may, and if so requested in writing by the holders of at least 25%in principal amount of the Notes then outstanding or if so directed by an ExtraordinaryResolution of the Noteholders, shall (subject in each case to being indemnified and/or securedand/or prefunded to its satisfaction), give notice to the Issuer that the Notes are, and shallimmediately become, due and repayable at their principal amount, together with unpaid accruedinterest as provided in the Trust Deed, if any of the following events occurs and is continuing(Events of Default):
(a) Non-payment
If the Issuer fails to pay any principal, redemption amount or interest on any of the Noteswhen due and the default continues for a period of seven business days in the case ofprincipal or 30 days in the case of interest; or
216

(b) Breach of other obligations
If the Issuer or the Parent fail to perform or comply with any of their other obligations orthe other requirements under these Conditions or the Trust Deed and (except where theTrustee considers the failure to be incapable of remedy, when no continuation nor noticementioned below will be required) the failure continues for the period of 30 days followingthe service by the Trustee on the Issuer of notice requiring the default to be remedied; or
(c) Cross acceleration
If (i) any Indebtedness for Borrowed Money (as defined below) of the Issuer or the Parentbecomes due and repayable prior to its stated maturity by reason of an event of default orpotential event of default (however described); (ii) the Issuer or the Parent fails to make anypayment in respect of any Indebtedness for Borrowed Money on the due date for paymentas extended by any originally applicable grace period; (iii) any security given by the Issueror the Parent for any Indebtedness for Borrowed Money becomes enforceable; or (iv)default is made by the Issuer or the Parent in making any payment due under any guaranteeand/or indemnity given by it in relation to any Indebtedness for Borrowed Money of anyother person; provided that no event described in this Condition shall constitute an Eventof Default unless the Indebtedness for Borrowed Money or other relative liability due andunpaid, either alone or when aggregated (without duplication) with other amounts ofIndebtedness for Borrowed Money and/or other liabilities due and unpaid relative to all (ifany) other events specified in (i) to (iv) above which have occurred and are continuing,amounts to at least U.S.$75,000,000 (or its equivalent in any other currency); or
(d) Winding-up
If any order is made by any competent court or resolution is passed for the winding up ordissolution of the Issuer or the Parent, save for the purposes of reorganisation on termsapproved by an Extraordinary Resolution of the Noteholders; or
(e) Cessation of business
If the Issuer or the Parent ceases or threatens to cease to carry on the whole or a substantialpart of its business, save for the purposes of any reorganisation on terms approved by anExtraordinary Resolution of the Noteholders; or
(f) Insolvency
The Issuer or the Parent stops or threatens to stop payment of, or is unable to, or admitsinability to, pay, its debts (or any class of its debts) as they fall due or is deemed unableto pay its debts pursuant to or for the purposes of any applicable law, or is adjudicated orfound bankrupt or insolvent; or
(g) Liquidation and insolvency proceedings
If (i) proceedings are initiated against the Issuer or the Parent under any applicableliquidation, insolvency, composition, reorganisation or other similar laws or an applicationis made (or documents filed with a court) for the appointment of an administrative or otherreceiver, manager, administrator or other similar official, or an administrative or otherreceiver, manager, administrator or other similar official is appointed, in relation to theIssuer or the Parent or, as the case may be, in relation to the whole or a substantial part ofthe undertaking or assets of any of them or an encumbrancer takes possession of the wholeor a substantial part of the undertaking or assets of any of them, or a distress, execution,
217

attachment, sequestration or other process is levied, enforced upon, sued out or put in forceagainst the whole or a substantial part of the undertaking or assets of any of them, and (ii)in any such case (other than the appointment of an administrator) unless initiated by therelevant company is not discharged or stayed within 60 days; or
(h) Creditors arrangement
If the Issuer or the Parent (or their respective directors or shareholders) initiates or consentsto judicial proceedings relating to itself under any applicable liquidation, insolvency,composition, reorganisation or other similar laws (including the obtaining of a moratorium)or makes a conveyance or assignment for the benefit of, or enters into any composition orother arrangement with, its creditors generally (or any class of its creditors) or any meetingis convened to consider a proposal for an arrangement or composition with its creditorsgenerally (or any class of its creditors); or
(i) Nationalisation
Any step is taken by any person with a view to the seizure, compulsory acquisition,expropriation or nationalisation of all or a material part of the assets of the Issuer or theParent; or
(j) Validity
If the validity of the Notes is contested by the Issuer, or the Issuer denies any of itsobligations under the Notes or it is or will become unlawful for the Issuer to perform orcomply with any of its obligations under or in respect of the Notes or any of suchobligations are or become unenforceable or invalid; or
(k) Guarantee of the 2024 Notes by the Parent
If the guarantee by the Parent of the 2024 Notes ceases to be, or is claimed by the Parentnot to be, in full force and effect at any time while any of the 2024 Notes remainoutstanding; or
(l) Termination or Withdrawal of Letter of Comfort
If the Letter of Comfort is terminated or withdrawn; or
(m) Analogous event
If any event occurs which, under the laws of any Relevant Jurisdiction, has or may have,in the Trustee’s opinion, an analogous effect to any of the events referred to in Conditions11.1(d) to 11.1(i) above.
The Issuer shall deliver to the Trustee, as soon as possible and in any event within 21calendar days after the Issuer or the Parent becomes aware of the occurrence of a Default,an Officers’ Certificate setting forth the details of such Default, and the action which theIssuer and the Parent propose to take with respect thereto.
11.2 Interpretation
For the purposes of this Condition:
Indebtedness for Borrowed Money means any indebtedness (whether being principal, premium(if any), interest or other amounts) for or in respect of any notes, bonds, debentures, debenturestock, loan stock or other securities or any borrowed money or any liability under or in respectof any acceptance under any credit facility.
218

12. PRESCRIPTION
Claims in respect of principal and interest will become void unless presentation for payment ismade as required by Condition 8 (Payments) within ten years (in the case of principal) and fiveyears (in the case of interest) from the appropriate relevant due date.
13. ENFORCEMENT
13.1 The Trustee may at any time, at its discretion and without notice, take any proceedings or anyother steps or actions (including lodging an appeal) against, in relation to, or in connection with,the Issuer as it thinks fit to enforce the provisions of the Trust Deed and the Notes or otherwise,but it is not bound to take any such proceedings or steps or other action in relation to the TrustDeed or the Notes unless (a) it has been directed to do so by an Extraordinary Resolution of theNoteholders or requested to do so in writing by the holders of at least 25% in principal amountof the Notes then outstanding, and (b) it has been indemnified and/or secured and/or prefundedto its satisfaction.
13.2 No Noteholder will be entitled to take any steps, action or proceedings against the Issuer to (i)enforce any of the provisions of the Trust Deed or the Notes or (ii) take any proceedings(including the lodging of an appeal in respect of or concerning the Issuer) unless the Trustee,having become bound to do so itself, fails to do so within a reasonable period and the failure iscontinuing.
14. REPLACEMENT OF CERTIFICATES
If any Certificate is lost, stolen, mutilated, defaced or destroyed it may be replaced at thespecified office of the Principal Paying Agent upon payment by the claimant of the expensesincurred in connection with the replacement and on such terms as to evidence and indemnity asthe Issuer may reasonably require. Mutilated or defaced Certificates must be surrendered beforereplacements will be issued.
15. NOTICES
15.1 Notices to the Noteholders
(a) Notices to Noteholders will be valid if published in a leading newspaper having generalcirculation in (i) Asia (which is expected to be the Asian Wall Street Journal) and (ii) Europe(which is expected to be the Financial Times) If at any time publication in such newspapers isnot practicable, notices will be valid if published in such other manner as the Issuer shalldetermine. Notices will, if published more than once or on different dates, be deemed to havebeen given on the first date on which publication is made.
(b) Notwithstanding the other provisions of this Condition, in any case where the identity andaddresses of all the Noteholders are known to the Issuer, notices to such holders may be givenindividually by recorded delivery mail to such addresses and will be deemed to have been givenwhen received at such addresses.
15.2 Notices from the Noteholders
Notices to be given by any Noteholder shall be in writing and given by lodging the same,together with the relative Certificate, with the Registrar, or, if the Certificates are held in aclearing system, may be given through the clearing system in accordance with its standard rulesand procedure.
219

16. MEETINGS OF NOTEHOLDERS, MODIFICATION, WAIVER AND AUTHORISATION
16.1 Meetings of Noteholders
The Trust Deed contains provisions for convening meetings of the Noteholders to consider anymatter affecting their interests, including the modification or abrogation by ExtraordinaryResolution of any of these Conditions or any of the provisions of the Trust Deed. The quorumat any meeting for passing an Extraordinary Resolution will be one or more persons presentholding or representing more than 50% in principal amount of the Notes for the time beingoutstanding, or at any adjourned meeting one or more persons present whatever the principalamount of the Notes held or represented by him or them, except that, at any meeting the businessof which includes the modification or abrogation of certain of the provisions of these Conditionsand certain of the provisions of the Trust Deed, the necessary quorum for passing anExtraordinary Resolution will be one or more persons present holding or representing not lessthan two-thirds, or at any adjourned meeting not less than one-third, of the principal amount ofthe Notes for the time being outstanding. An Extraordinary Resolution passed at any meeting ofthe Noteholders will be binding on all Noteholders, whether or not they are present at themeeting.
16.2 Modification, Waiver, Authorisation and Determination
The Trustee may agree, without the consent of the Noteholders, to any modification of (exceptas mentioned in Condition 16.1 above), or to the waiver or authorisation of any breach orproposed breach of, any of these Conditions or any of the provisions of the Trust Deed or theAgency Agreement, or determine, without any such consent as aforesaid, that any Event ofDefault or Potential Event of Default (as defined in the Trust Deed) shall not be treated as such(provided that, in any such case, it is not, in the opinion of the Trustee, materially prejudicialto the interests of the Noteholders) or may agree, without any such consent as aforesaid, to anymodification which, in its opinion, is of a formal, minor or technical nature or to correct amanifest error or an error which is, in the opinion of the Trustee, proven. Any such modification,authorisation or waiver shall be binding on the Noteholders and, unless Trustee otherwise agrees,such modification authorisation or waiver shall be notified to the Noteholders as soon aspracticable in accordance with Condition 15.
16.3 Trustee to have Regard to Interests of Noteholders as a Class
In connection with the exercise by it of any of its functions (including, without limitation, anymodification, waiver, authorisation, or determination), the Trustee shall have regard to thegeneral interests of the Noteholders as a class but shall not have regard to any interests arisingfrom circumstances particular to individual Noteholders (whatever their number) and, inparticular, shall not have regard to the consequences of any such exercise for individualNoteholders (whatever their number) resulting from their being domiciled or resident in, orotherwise connected with, or subject to the jurisdiction of, any particular territory or anypolitical sub-division thereof and the Trustee shall not be entitled to require, nor shall anyNoteholder be entitled to claim, from the Issuer, the Parent, the Trustee or any other person anyindemnification or payment in respect of any tax consequence of any such exercise uponindividual Noteholders.
16.4 Notification to the Noteholders
Any modification, waiver, authorisation, or determination shall be binding on the Noteholdersand, unless the Trustee agrees otherwise, any modification shall be notified by the Issuer to theNoteholders as soon as practicable thereafter in accordance with Condition 15 (Notices).
220

17. SUBSTITUTION
The Trust Deed contains provisions permitting the Trustee to agree, subject to such amendmentof the Trust Deed and such other conditions as the Trustee may require, but without the consentof the Noteholders, to the substitution of certain other entities in place of the Issuer or of anyprevious substituted company, as principal debtor under the Trust Deed and the Notes. In the caseof such a substitution the Trustee may agree, without the consent of the Noteholders, to a changeof the law governing the Notes and/or the Trust Deed provided that such change would not in theopinion of the Trustee be materially prejudicial to the interests of the Noteholders.
18. INDEMNIFICATION OF THE TRUSTEE AND ITS CONTRACTING WITH THE ISSUER
18.1 Indemnification and protection of the Trustee
The Trust Deed contains provisions for the indemnification of the Trustee and for its relief fromresponsibility and liability towards the Issuer and the Noteholders including provisions relievingit from taking action unless indemnified and/or secured and/or prefunded to its satisfaction.
18.2 Trustee Contracting with the Issuer and the Parent
The Trust Deed also contains provisions pursuant to which the Trustee is entitled, inter alia, (i)to enter into business transactions with the Issuer and/or the Parent and/or any of the Parent’sother subsidiaries and to act as trustee for the holders of any other securities issued or guaranteedby, or relating to, the Issuer and/or the Parent and/or any of the Parent’s other subsidiaries, (ii)to exercise and enforce its rights, comply with its obligations and perform its duties under or inrelation to any such transactions or, as the case may be, any such trusteeship without regard tothe interests of, or consequences for, the Noteholders, and (iii) to retain and not be liable toaccount for any profit made or any other amount or benefit received thereby or in connectiontherewith.
18.3 Reliance
The Trustee may rely, without any liability to the Noteholders, on any certificate or report of, orconfirmation, advice or information provided by the Issuer or the Parent or the Parent’s auditorsas sufficient and conclusive evidence of the facts stated therein, regardless of whether suchcertificate, report, or confirmation, advise or information is addressed to the Trustee, was madepursuant to any document, engagement letter or agreement to which the Trustee is a party, orregardless of any monetary or other limitation or exclusion of liability of any such person inrespect thereof. The Trustee may accept and shall be entitled to rely on any such report,certificate confirmation, advice or information and such report, certificate or information shallbe binding on the Issuer, the Parent and the Noteholders.
19. FURTHER ISSUES
The Issuer is at liberty from time to time without the consent of the Noteholders to create andissue further Notes ranking pari passu in all respects (or in all respects save for the first paymentof interest thereon) and so that the same shall be consolidated and form a single series with theoutstanding Notes constituted by the Trust Deed or any supplemental deed, subject to the receiptby the Trustee of a certificate signed by two authorised signatories or directors of the Issuer anda legal opinion from an internationally recognised law firm, in each case in form and substancesatisfactory to the Trustee.
The Issuer will also be permitted to issue and incur indebtedness through the issuance of furthernotes or bonds.
221

20. GOVERNING LAW AND SUBMISSION TO JURISDICTION
20.1 Governing Law
The Trust Deed, the Agency Agreement and the Notes and any non-contractual obligationsarising out of or in connection with them are governed by, and will be construed in accordancewith, English law.
20.2 Jurisdiction of English Courts
The Issuer has, in the Trust Deed, irrevocably agreed for the benefit of the Trustee and theNoteholders that the courts of England are to have exclusive jurisdiction to settle any disputeswhich may arise out of or in connection with the Trust Deed or the Notes (including any disputerelating to any non-contractual obligations arising out of or in connection with the Trust Deedor the Notes) and accordingly has submitted to the exclusive jurisdiction of the English courts.
The Issuer has, in the Trust Deed, waived any objection to the courts of England on the groundsthat they are an inconvenient or inappropriate forum. The Trustee and the Noteholders may takeany suit, action or proceeding arising out of or in connection with the Trust Deed or the Notesrespectively (including any suit, action or proceedings relating to any non-contractualobligations arising out of or in connection with the Trust Deed or the Notes) (together referredto as Proceedings) against the Issuer in any other court of competent jurisdiction and concurrentProceedings in any number of jurisdictions.
20.3 Appointment of Process Agent
The Issuer has, in the Trust Deed, irrevocably and unconditionally appointed Tata Limited, 18,Grosvenor Place, London SW1X 7HS (Attention: J.D. Contractor) as its agent for service ofprocess in England in respect of any Proceedings and has undertaken that in the event of suchagent ceasing so to act it will appoint such other person as the Trustee may approve as its agentfor that purpose.
20.4 Sovereign Immunity
The Issuer has, in the Trust Deed, irrevocably and unconditionally waived and agreed not to raisewith respect to the Notes any right to claim sovereign or other immunity from jurisdiction orexecution or any similar defence, and has irrevocably and unconditionally consented to thegiving of any relief or the issue of any process, including, without limitation, the making,enforcement or execution against any property whatsoever (irrespective of its use or intendeduse) of any order or judgment made or given in connection with any Proceedings.
21. RIGHTS OF THIRD PARTIES
No person shall have any right to enforce any term of this Note under the Contracts (Rights ofThird Parties) Act 1999, but this does not affect any right or remedy of any person which existsor is available apart from that Act.
222

THE GLOBAL CERTIFICATE
The Global Certificate
The Global Certificate contains provisions which apply to the Notes in respect of which the GlobalCertificate is issued, some of which modify the effect of the terms and conditions of the Notes set outin this Offering Memorandum. The following is a summary of certain of those provisions:
Exchange for definitive Notes and purchases
The Global Certificate will be exchangeable in whole but not in part (free of charge to the holder) fordefinitive Notes only upon happening of any of the events defined in the Trust Deed as Events ofDefault, if Euroclear or Clearstream, Luxembourg is closed for business for a continuous period of 14days (other than by reason of holiday, statutory or otherwise) or if Euroclear or Clearstream announcesan intention permanently to cease business or does in fact do so and no alternative clearing system isavailable.
Cancellation
Cancellation of any Notes following its redemption, exchange or purchase by the Issuer or the Groupwill be effected by reduction in the aggregate principal amount of the Notes in the register ofNoteholders and by the annotation of the appropriate schedule to the relevant Global Certificate.
Trustee’s Powers
In considering the interests of holders while the Global Certificate is registered in the name of anominee for a clearing system, the Trustee may, without being obliged to do so, have regard to anyinformation provided to it by such clearing system or its operator as to the identity (either individuallyor by category) of its accountholders with entitlements to Notes and may consider such interests asif such accountholders were the holders of the Notes in respect of which the Global Certificate isissued.
Payments
Payments of principal, premium (if any) and interest in respect of Notes represented by a GlobalCertificate will be made against presentation for endorsement and, if no further payment falls to bemade in respect of the Notes, surrender of the Global Certificate to the order of the Principal PayingAgent or such other Paying Agent as shall have been notified to the holders for such purposes. A recordof each payment made will be endorsed on the appropriate schedule to the relevant Global Certificateby or on behalf of the Registrar and shall be prima facie evidence that payment has been made.
Notices
So long as the Notes are represented by a Global Certificate and such Global Certificate is held onbehalf of Euroclear or Clearstream, Luxembourg, notices to holders may be given by delivery of therelevant notice to Euroclear or Clearstream, Luxembourg rather than by publication as required byCondition 16.
Prescription
Claims in respect of principal and interest will become void unless presentation for payment is madeas required by Condition 8 (Payments) within 10 years (in the case of principal) and five years (in thecase of interest) from the appropriate relevant due date.
223

TAXATION
The information provided below does not purport to be a comprehensive description of all taxconsiderations that may be relevant to a decision to purchase Notes. In particular, the informationdoes not consider any specific facts or circumstances that may apply to a particular purchaser. Neitherthese statements nor any other statements in this Offering Memorandum are to be regarded as adviceon the tax position of any holder of Notes or of any person acquiring, selling or otherwise dealing insecurities or on any tax implications arising from the acquisition, sale of or other dealings in Notes.The statements do not purport to be a comprehensive description of all the tax considerations that maybe relevant to a decision to purchase, own or dispose of Notes and do not purport to deal with the taxconsequences applicable to all categories of investors, some of which (such as dealers in Notes) maybe subject to special rules.
Prospective purchasers of Notes are advised to consult their own tax advisors as to the taxconsequences of the purchase, ownership and disposition of Notes, including the effect of anyapplicable local taxes as well as the tax laws of India or any political sub division thereof.Additionally, in view of the number of different jurisdictions where local laws may apply, thisOffering Memorandum does not discuss the local tax consequences to a potential holder arisingfrom the acquisition, holding or disposition of the Notes. Prospective investors must, therefore,inform themselves as to any tax laws and regulations in force relating to the purchase, holdingor disposition of the Notes in their country of residence and in the countries of which they arecitizens or in which they purchase, hold or dispose of Notes.
Indian Taxation
The following summary describes certain Indian tax consequences applicable to the ownership anddisposal of Notes by persons who are not resident for tax purposes in India and who do not hold Notesin connection with an Indian trade, business or permanent establishment.
It is not intended to constitute a complete analysis of all the Indian tax consequences that may berelevant to a holder of the Notes. It does not cover all tax matters that may be of importance to aparticular purchaser. Prospective investors should consult their own tax advisors about the taxconsequences of purchasing, holding and disposing of an investment in the Notes. This summary isbased on Indian tax law and practice as at the date of this Offering Memorandum.
Income and withholding taxes
Holders of the Notes should not be subject to income or withholding taxes in India in connection withpayments of interest made by the Issuer on the Notes in the manner set out in “Terms and Conditionsof the Notes”, provided, as the Issuer intends, all the proceeds of issue of the Notes are used by theIssuer for the purposes of its business carried on outside India. Payments of principal made by theIssuer on the Notes should also not be subject to Indian income or withholding taxes.
Although the position is not free from doubt because the Group includes Indian companies, paymentsby any such Indian company in respect of interest and principal on the Notes should also not be subjectto withholding tax in India. If prospective investors are held to be liable to tax on interest in India,then payments in respect of interest will be subject to withholding tax at the rate of 20% (plusapplicable surcharge and education cess and secondary and higher education cess). However, it ispossible that withholding tax at a higher rate of 40% (plus applicable surcharge and education cess andsecondary and higher education cess) could apply if the holder is a foreign company and in other casesat the rate of 30% (plus applicable surcharge and education cess and secondary and higher educationcess). If the prospective investor creates a Permanent Establishment (“PE”) or business connection inIndia and the said interest is effectively connected to the PE or the business connection then the rateof 40% or 30% (plus applicable surcharge and education cess and secondary and higher education
224

cess), as the case may be, could apply. The rate of tax will be reduced if the beneficial recipient isa resident of a country with which the Central Government has entered into a Double TaxationAvoidance Agreement (“DTAA”) and the provisions of such DTAA provide for taxation of suchincome at a reduced rate, subject to the requisite documentation being fulfilled.
Taxation of gains arising on disposal of the Notes (including redemption)
Subject to any relief available under a DTAA, gains arising on disposals of capital assets situated inIndia are subject to income tax in India. Since the Notes would be issued by the Issuer and the Issueris an overseas entity, the capital assets would be regarded as situated outside of India andconsequently, the capital gains should not be taxable in India provided the Notes continue to bemaintained at all times in registered form on a register outside India.
Singapore Taxation
The statements below are general in nature and are based on certain aspects of current tax laws inSingapore, administrative guidelines and circulars issued by the Monetary Authority of Singapore(“MAS”) in force as of the date of this Offering Memorandum and are subject to any changes in suchlaws, administrative guidelines or circulars, or the interpretation of those laws, guidelines orcirculars, occurring after such date, which changes could be made on a retroactive basis. These laws,guidelines and circulars are also subject to various interpretations and the relevant tax authorities orthe courts could later disagree with the explanations or conclusions set out below. Neither thesestatements nor any other statements in this Offering Memorandum are intended or are to be regardedas advice on the tax position of any holder of the Notes or of any person acquiring, selling orotherwise dealing with the Notes or on any tax implications arising from the acquisition, sale or otherdealings in respect of the Notes. The statements made herein do not purport to be a comprehensive orexhaustive description of all the tax considerations that may be relevant to a decision to subscribe for,purchase, own or dispose of the Notes and do not purport to deal with the tax consequences applicableto all categories of investors, some of which (such as dealers in securities or financial institutions inSingapore which have been granted the relevant Financial Sector Incentive(s)) may be subject tospecial rules or tax rates. Prospective holders of the Notes are advised to consult their own taxadvisers as to the Singapore or other tax consequences of the acquisition, ownership of or disposalof the Notes, including, in particular, the effect of any foreign, state or local tax laws to which theyare subject. It is emphasized that none of the Issuer, the Joint Lead Managers and any other personsinvolved in the issuance of the Notes accepts responsibility for any tax effects or liabilities resultingfrom the subscription for, purchase, holding or disposal of the Notes.
Interest and Other Payments
Subject to the following paragraphs, under Section 12(6) of the Income Tax Act, Chapter 134 ofSingapore (“ITA”), the following payments are deemed to be derived from Singapore:
(a) any interest, commission, fee or any other payment in connection with any loan or indebtednessor with any arrangement, management, guarantee, or service relating to any loan or indebtednesswhich is (i) borne, directly or indirectly, by a person resident in Singapore or a permanentestablishment in Singapore (except in respect of any business carried on outside Singaporethrough a permanent establishment outside Singapore or any immovable property situatedoutside Singapore) or (ii) deductible against any income accruing in or derived from Singapore;or
(b) any income derived from loans where the funds provided by such loans are brought into or usedin Singapore.
Such payments, where made to a person not known to the paying party to be a resident in Singaporefor tax purposes, are generally subject to withholding tax in Singapore. The rate at which tax is to bewithheld for such payments (other than those subject to the 15% final withholding tax described
225

below) to non-resident persons (other than non-resident individuals) is currently 17%. The applicablewithholding tax rate for non-resident individuals is currently 22%. However, if the payment is derivedby a person not resident in Singapore otherwise than from any trade, business, profession or vocationcarried on or exercised by such person in Singapore and is not effectively connected with anypermanent establishment in Singapore of that person, the payment is subject to a final withholding taxof 15%. The 15% withholding tax rate may be reduced by applicable tax treaties.
Certain Singapore-sourced investment income derived by individuals from financial instruments isexempt from tax, including:
(a) interest from debt securities derived on or after January 1, 2004;
(b) discount income (not including discount income arising from secondary trading) from debtsecurities derived on or after February 17, 2006; and
(c) prepayment fee, redemption premium and break cost from debt securities derived on or afterFebruary 15, 2007,
except where such income is derived through a partnership in Singapore or is derived from thecarrying on of a trade, business or profession in Singapore.
As the issue of each of the [●] Notes and the [●] Notes is jointly lead-managed by Australia and NewZealand Banking Group Limited Singapore Branch, Barclays Bank PLC, Singapore Branch, BNPParibas Singapore Branch, Citigroup Global Markets Singapore Pte. Ltd., Crédit Agricole Corporateand Investment Bank, Singapore Branch, DBS Bank Ltd., Deutsche Bank AG, Singapore Branch, FirstAbu Dhabi Bank PJSC, ING Bank N.V., Singapore Branch, J.P. Morgan Securities plc, Merrill Lynch(Singapore) Pte. Ltd., Morgan Stanley & Co. International plc, SMBC Nikko Capital Markets Limited,Société Générale, Standard Chartered Bank Singapore Branch and The Hongkong and ShanghaiBanking Corporation Limited, Singapore Branch, and more than half of them are Financial SectorIncentive (Bond Market) (“FSI-BM”), Financial Sector Incentive (Standard Tier) (“FSI-ST”) orFinancial Sector Incentive (Capital Market) (“FSI-CM”) Companies (as defined in the ITA), and morethan half of each of the [●] Notes and the [●] Notes issued are distributed by FSI-BM, FSI-ST and/orFSI-CM Companies, and the Notes are issued as debt securities before December 31, 2018, each ofthe [●] Notes and the [●] Notes would be QDS for the purposes of the ITA, to which the followingtreatment shall apply:
(i) subject to certain prescribed conditions having been fulfilled (including the furnishing by theIssuer, or such other person as the MAS may direct), to the MAS of a return on debt securitiesfor each of the [●] Notes and the [●] Notes in the prescribed format within such period as theMAS may specify and such other particulars in connection with such Notes as the MAS mayrequire and the inclusion by the Issuer in all offering documents relating to the Notes of astatement to the effect that where interest, discount income, prepayment fee, redemptionpremium or break cost from the Notes is derived by a person who is not resident in Singaporeand who carries on any operation in Singapore through a permanent establishment in Singapore,the tax exemption for QDS shall not apply if the non-resident person acquires the Notes usingthe funds and profits of such person’s operations through the permanent establishment), interest,discount income (not including discount income arising from secondary trading), prepaymentfee, redemption premium and break cost (collectively, the “Qualifying Income”) from the Notesderived by a holder who is not resident in Singapore and who (aa) does not have any permanentestablishment in Singapore or (bb) carries on any operation in Singapore through a permanentestablishment in Singapore but the funds used by that person to acquire the Notes are notobtained from such person’s operation through a permanent establishment in Singapore, areexempt from Singapore tax;
(ii) subject to certain prescribed conditions having been fulfilled (including the furnishing by theIssuer, or such other person as the MAS may direct, to the MAS of a return on debt securities
226

for each of the [●] Notes and the [●] Notes in the prescribed format within such period as theMAS may specify and such other particulars in connection with the Notes as the MAS mayrequire), Qualifying Income from the Notes derived by any company or a body of persons (asdefined in the ITA) in Singapore is subject to tax at a concessionary rate of 10% (except forholders of the relevant Financial Sector Incentive(s) who may be taxed at different rates); and
(iii) subject to:
(aa) the Issuer including in all offering documents relating to the Notes a statement to the effectthat any person whose interest, discount income, prepayment fee, redemption premium orbreak cost derived from the Notes is not exempt from tax shall include such income in areturn of income made under the ITA; and
(bb) the furnishing by the Issuer, or such other person as the MAS may direct, to the MAS ofa return on debt securities for each of the [●] Notes and the [●] Notes in the prescribedformat within such period as the MAS may specify and such other particulars in connectionwith the Notes as the MAS may require,
payments of Qualifying Income derived from the Notes are not subject to withholding of tax bythe Issuer.
Notwithstanding the foregoing:
(A) if during the primary launch of each of the [●] Notes and the [●] Notes, the [●] Notes or the [●]Notes are issued to fewer than four persons and 50% or more of the issue of the [●] Notes or the[●] Notes (as the case may be) are beneficially held or funded, directly or indirectly, by relatedparties of the Issuer, such Notes would not qualify as QDS; and
(B) even though the [●] Notes and the [●] Notes are QDS, if, at any time during the tenure of the[●] Notes or the [●] Notes, 50% or more of the [●] Notes and the [●] Notes (as the case may be)which are outstanding at any time during the life of their issue is beneficially held or funded,directly or indirectly, by any related party(ies) of the Issuer, Qualifying Income derived fromsuch Notes held by:
(i) any related party of the Issuer; or
(ii) any other person where the funds used by such person to acquire such Notes are obtained,directly or indirectly, from any related party of the Issuer,
shall not be eligible for the tax exemption or concessionary rate of tax as described above.
The term “related party”, in relation to a person, means any other person who, directly or indirectly,controls that person, or is controlled, directly or indirectly, by that person, or where a person and thatother person, directly or indirectly, are under the control of a common person.
The terms “break cost”, “prepayment fee” and “redemption premium” are defined in the ITA asfollows:
• “break cost”, in relation to debt securities and QDS, means any fee payable by the issuer of thesecurities on the early redemption of the securities, the amount of which is determined by anyloss or liability incurred by the holder of the securities in connection with such redemption;
• “prepayment fee”, in relation to debt securities and qualifying debt securities, means any feepayable by the issuer of the securities on the early redemption of the securities, the amount ofwhich is determined by the terms of the issuance of the securities; and
227

• “redemption premium”, in relation to debt securities and QDS, means any premium payable bythe issuer of the securities on the redemption of the securities upon their maturity.
References to “break cost”, “prepayment fee” and “redemption premium” in this Singapore taxdisclosure have the same meaning as defined in the ITA.
Where interest, discount income, prepayment fee, redemption premium or break cost (i.e. theQualifying Income) is derived from each of the [●] Notes and the [●] Notes by any person who is notresident in Singapore and who carries on any operations in Singapore through a permanentestablishment in Singapore, the tax exemption available for QDS under the ITA (as mentioned above)shall not apply if such person acquires such Notes using the funds and profits of such person’soperations through a permanent establishment in Singapore. Any person whose interest, discountincome, prepayment fee, redemption premium or break cost (i.e. the Qualifying Income) derived fromthe [●] Notes or the [●] Notes is not exempt from tax is required to include such income in a returnof income made under the ITA.
Capital Gains
Any gains considered to be in the nature of capital made from the sale of the Notes will not be taxablein Singapore. However, any gains derived by any person from the sale of the Notes which are gainsfrom any trade, business, profession or vocation carried on by that person, if accruing in or derivedfrom Singapore, may be taxable as such gains are considered revenue in nature.
Holders of the Notes who are adopting Singapore Financial Reporting Standard 39 (“FRS 39”) orSingapore Financial Reporting Standard 109 (“FRS 109”), may for Singapore income tax purposes, berequired to recognize gains or losses (not being gains or losses in the nature of capital) on the Notes,irrespective of disposal, in accordance with FRS 39 or FRS 109. Please see the section below on“Adoption of FRS 39 and FRS 109 for Singapore Income Tax Purposes”.
Adoption of FRS 39 and FRS 109 for Singapore Income Tax Purposes
Section 34A of the ITA provides for the tax treatment for financial instruments in accordance with FRS39 (subject to certain exceptions and “opt-out” provisions) to taxpayers who are required to complywith FRS 39 for financial reporting purposes. The Inland Revenue Authority of Singapore has alsoissued a circular entitled “Income Tax Implications Arising from the Adoption of FRS 39 — FinancialInstruments: Recognition and Measurement”.
FRS 109 is mandatorily effective for annual periods beginning on or after January 1, 2018, replacingFRS 39. Section 34AA of the ITA requires taxpayers who comply or who are required to comply withFRS 109 for financial reporting purposes to calculate their profit, loss or expense for Singaporeincome tax purposes in respect of financial instruments in accordance with FRS 109, subject to certainexceptions. The Inland Revenue Authority of Singapore has also issued a circular entitled “IncomeTax: Income Tax Treatment Arising from Adoption of FRS 109 — Financial Instruments”.
Holders of the Notes who may be subject to the tax treatment under Sections 34A or 34AA of the ITAshould consult their own accounting and tax advisers regarding the Singapore income taxconsequences of their acquisition, holding or disposal of the Notes.
Estate Duty
Singapore estate duty has been abolished with respect to all deaths occurring on or after February 15,2008.
228

CLEARANCE AND SETTLEMENT
See “Definitions” in “Terms and Conditions of the Notes” for the definitions of certain capitalizedterms used in this section.
Investors in the Notes may hold Notes through Euroclear or Clearstream, Luxembourg. Initialsettlement and all secondary trades will settle as described below. Although the Issuer understands thatEuroclear and Clearstream, Luxembourg will comply with the procedures provided below in order tofacilitate transfers of Notes among participants of Euroclear and Clearstream, Luxembourg, they areunder no obligation to perform or continue to perform such procedures, and such procedures may bemodified or discontinued at any time. None of the Issuer, the Group, the Trustee, the Registrar, theTransfer Agents, the Paying Agents or any other agent of any of them will have any responsibility forthe performance by Euroclear or Clearstream, Luxembourg or their respective participants or indirectparticipants of their respective obligations under the rules and procedures governing their operations.With respect to clearance and settlement through Euroclear and Clearstream, Luxembourg, the Issuerunderstands as follows:
THE CLEARING SYSTEMS
Euroclear and Clearstream, Luxembourg
Euroclear and Clearstream, Luxembourg hold securities for participating organizations and facilitatethe clearance and settlement of securities transactions between their respective participants throughelectronic book-entry changes in accounts of such participants. Euroclear and Clearstream,Luxembourg provide to their participants, among other things, services for safekeeping,administration, clearance and settlement of internationally traded securities and securities lending andborrowing. Euroclear and Clearstream, Luxembourg interface with domestic securities markets.
Euroclear and Clearstream, Luxembourg participants are financial institutions such as underwriters,securities brokers and dealers, banks, trust companies and certain other organizations. Indirect accessto Euroclear or Clearstream, Luxembourg is also available to others such as banks, brokers, dealersand trust companies that clear through or maintain a custodial relationship with a Euroclear orClearstream, Luxembourg participant, either directly or indirectly.
Initial Settlement
The Notes will be issued initially in the form of a Global Certificate in book-entry form and will bedeposited with a common depository for Euroclear and Clearstream, Luxembourg. Investors’ interestsin Notes held in book-entry form by Euroclear or Clearstream, Luxembourg, as the case may be, willbe represented through financial institutions acting on their behalf as direct and indirect participantsin Euroclear or Clearstream, Luxembourg, as the case may be. In addition, Euroclear and Clearstream,Luxembourg may hold positions in the Notes on behalf of their participants through their respectivedepositories.
Investors electing to hold their Notes through Euroclear or Clearstream, Luxembourg accounts willfollow the settlement procedures applicable to conventional notes. Notes will be credited to theaccounts of depositories and will be processed by Euroclear or Clearstream, Luxembourg inaccordance with usual new issue procedures.
Because the purchaser determines the place of delivery, it is important to establish at the time oftrading of any Notes where both the purchaser’s and seller’s accounts are located to ensure thatsettlement can be made on the desired value date.
Trading between Euroclear and/or Clearstream, Luxembourg participants
Secondary market trading between Euroclear participants and/or Clearstream, Luxembourgparticipants will be settled using the procedures applicable to conventional notes in same-day funds.
229
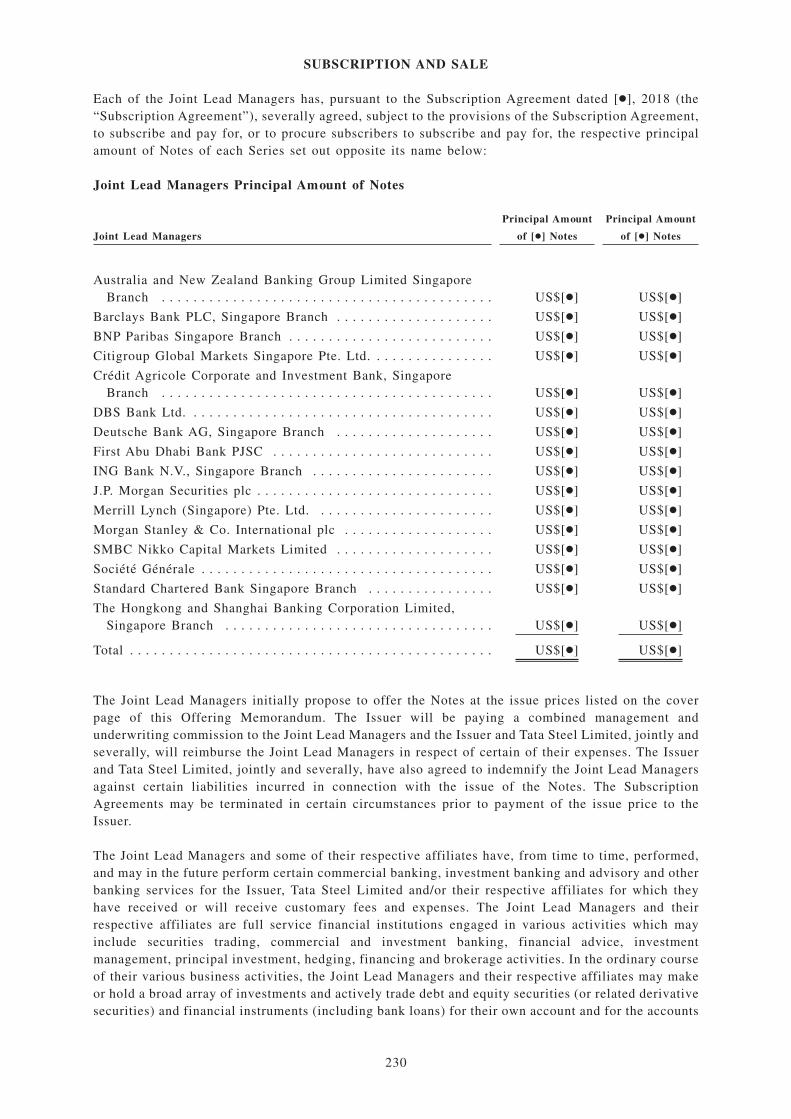
SUBSCRIPTION AND SALE
Each of the Joint Lead Managers has, pursuant to the Subscription Agreement dated [●], 2018 (the“Subscription Agreement”), severally agreed, subject to the provisions of the Subscription Agreement,to subscribe and pay for, or to procure subscribers to subscribe and pay for, the respective principalamount of Notes of each Series set out opposite its name below:
Joint Lead Managers Principal Amount of Notes
Joint Lead Managers
Principal Amount
of [●] Notes
Principal Amount
of [●] Notes
Australia and New Zealand Banking Group Limited SingaporeBranch . . . . . . . . . . . . . . . . . . . . . . . . . . . . . . . . . . . . . . . . . . US$[●] US$[●]
Barclays Bank PLC, Singapore Branch . . . . . . . . . . . . . . . . . . . . US$[●] US$[●]
BNP Paribas Singapore Branch . . . . . . . . . . . . . . . . . . . . . . . . . . US$[●] US$[●]
Citigroup Global Markets Singapore Pte. Ltd. . . . . . . . . . . . . . . . US$[●] US$[●]
Crédit Agricole Corporate and Investment Bank, SingaporeBranch . . . . . . . . . . . . . . . . . . . . . . . . . . . . . . . . . . . . . . . . . . US$[●] US$[●]
DBS Bank Ltd. . . . . . . . . . . . . . . . . . . . . . . . . . . . . . . . . . . . . . . US$[●] US$[●]
Deutsche Bank AG, Singapore Branch . . . . . . . . . . . . . . . . . . . . US$[●] US$[●]
First Abu Dhabi Bank PJSC . . . . . . . . . . . . . . . . . . . . . . . . . . . . US$[●] US$[●]
ING Bank N.V., Singapore Branch . . . . . . . . . . . . . . . . . . . . . . . US$[●] US$[●]
J.P. Morgan Securities plc . . . . . . . . . . . . . . . . . . . . . . . . . . . . . . US$[●] US$[●]
Merrill Lynch (Singapore) Pte. Ltd. . . . . . . . . . . . . . . . . . . . . . . US$[●] US$[●]
Morgan Stanley & Co. International plc . . . . . . . . . . . . . . . . . . . US$[●] US$[●]
SMBC Nikko Capital Markets Limited . . . . . . . . . . . . . . . . . . . . US$[●] US$[●]
Société Générale . . . . . . . . . . . . . . . . . . . . . . . . . . . . . . . . . . . . . US$[●] US$[●]
Standard Chartered Bank Singapore Branch . . . . . . . . . . . . . . . . US$[●] US$[●]
The Hongkong and Shanghai Banking Corporation Limited,Singapore Branch . . . . . . . . . . . . . . . . . . . . . . . . . . . . . . . . . . US$[●] US$[●]
Total . . . . . . . . . . . . . . . . . . . . . . . . . . . . . . . . . . . . . . . . . . . . . . US$[●] US$[●]
The Joint Lead Managers initially propose to offer the Notes at the issue prices listed on the coverpage of this Offering Memorandum. The Issuer will be paying a combined management andunderwriting commission to the Joint Lead Managers and the Issuer and Tata Steel Limited, jointly andseverally, will reimburse the Joint Lead Managers in respect of certain of their expenses. The Issuerand Tata Steel Limited, jointly and severally, have also agreed to indemnify the Joint Lead Managersagainst certain liabilities incurred in connection with the issue of the Notes. The SubscriptionAgreements may be terminated in certain circumstances prior to payment of the issue price to theIssuer.
The Joint Lead Managers and some of their respective affiliates have, from time to time, performed,and may in the future perform certain commercial banking, investment banking and advisory and otherbanking services for the Issuer, Tata Steel Limited and/or their respective affiliates for which theyhave received or will receive customary fees and expenses. The Joint Lead Managers and theirrespective affiliates are full service financial institutions engaged in various activities which mayinclude securities trading, commercial and investment banking, financial advice, investmentmanagement, principal investment, hedging, financing and brokerage activities. In the ordinary courseof their various business activities, the Joint Lead Managers and their respective affiliates may makeor hold a broad array of investments and actively trade debt and equity securities (or related derivativesecurities) and financial instruments (including bank loans) for their own account and for the accounts
230

of their customers and may at any time hold long and short positions in such securities andinstruments. Such investments and securities activities may involve securities and instruments of theIssuer and Tata Steel Limited, including the Notes. Certain of the Joint Lead Managers or theiraffiliates that have a lending relationship with the Issuer and/or Tata Steel Limited routinely hedgetheir credit exposure to the Issuer and/or Tata Steel Limited consistent with their customary riskmanagement policies. Typically, such Joint Lead Managers and their affiliates would hedge suchexposure by entering into transactions which consist of either the purchase of credit default swaps orthe creation of short positions in the Issuer’s and/or Tata Steel Limited’s securities, includingpotentially the Notes offered hereby. Any such short positions could adversely affect future tradingprices of the Notes offered hereby. The Joint Lead Managers and their affiliates may make investmentrecommendations and/or publish or express independent research views (positive or negative) inrespect of the Notes or other financial instruments of the Issuer or Tata Steel Limited, and mayrecommend to their clients that they acquire long and/or short positions in the Notes or other financialinstruments.
The Issuer may use some or all of the net proceeds from the sale of the Notes pursuant to this OfferingMemorandum for the full or partial repayment, or refinancing, of loans to its lenders, some of whominclude Australia and New Zealand Banking Group Limited Singapore Branch, Barclays Bank PLC,Singapore Branch, BNP Paribas Singapore Branch, Citigroup Global Markets Singapore Pte. Ltd.,Crédit Agricole Corporate and Investment Bank, Singapore Branch, DBS Bank Ltd., Deutsche BankAG, Singapore Branch, First Abu Dhabi Bank PJSC, ING Bank N.V., Singapore Branch, J.P. MorganSecurities plc, Merrill Lynch (Singapore) Pte. Ltd., Morgan Stanley & Co. International plc, SMBCNikko Capital Markets Limited, Société Générale, Standard Chartered Bank Singapore Branch andThe Hongkong and Shanghai Banking Corporation Limited, Singapore Branch, who are also JointLead Managers, or their affiliates.
The Joint Lead Managers and/or their respective affiliates may purchase the Notes for their ownaccount and enter into transactions, including credit derivatives, such as asset swaps, repackaging andcredit default swaps relating to the Notes and/or other securities of the Issuer, Tata Steel Limited ortheir respective subsidiaries or associates at the same time as the offer and sale of the Notes or insecondary market transactions. Such transactions would be carried out as bilateral trades with selectedcounterparties and separately from any existing sale or resale of the Notes to which this OfferingMemorandum relates (notwithstanding that such selected counterparties may also be purchasers of theNotes).
Each Joint Lead Manager or its affiliates may also purchase Notes for asset management and/orproprietary purposes but not with a view to distribution or may hold Notes on behalf of clients or inthe capacity of investment advisors. While each Joint Lead Manager and its affiliates have policies andprocedures to deal with conflicts of interests, any such transactions may cause a Joint Lead Manageror its affiliates or its clients or counterparties to have economic interests and incentives which mayconflict with those of an investor in the Notes. Each Joint Lead Manager may receive returns on suchtransactions and has no obligation to take, refrain from taking or cease taking any action with respectto any such transactions based on the potential effect on a prospective investor in the Notes.
If a jurisdiction requires that the offering be made by a licensed broker or dealer and the Joint LeadManagers or any affiliate of the Joint Lead Managers is a licensed broker or dealer in that jurisdiction,the offering shall be deemed to be made by the Joint Lead Managers or such affiliate on behalf of theIssuer in such jurisdiction.
Selling Restrictions
Dubai International Financial Centre
Each Joint Lead Manager has represented and agreed that it has not offered and will not offer the Notesto any person in the Dubai International Financial Centre unless such offer is: (a) an “Exempt Offer”in accordance with the Markets Rules (MKT module) of the Dubai Financial Services Authority (the“DFSA”); and (b) made only to persons who meet the Professional Client criteria set out in Rule 2.3.2of the DFSA Conduct of Business Module.
231

Hong Kong
The Notes may not be offered or sold in Hong Kong by means of any document other than to (a) to“professional Investors” as defined in the SFO and any rules made under the Securities and FuturesOrdinance (Cap. 571) of Hong Kong) (the “SFO”); or (b) in other circumstances which do not resultin the document being a “prospectus” as defined in the Companies (Winding Up and MiscellaneousProvisions) Ordinance (Cap. 32) of Hong Kong (the “C(WUMP)O”) or which do not constitute anoffer to the public within the meaning of the C(WUMP)O; and (2) it has not issued or had in itspossession for the purposes of issue, and will not issue or have in its possession for the purposes ofissue, whether in Hong Kong or elsewhere, any advertisement, invitation or document relating to theNotes, which is directed at, or the contents of which are likely to be accessed or read by, the publicof Hong Kong (except if permitted to do so under the securities laws of Hong Kong) other than withrespect to Notes which are or are intended to be disposed of only to persons outside Hong Kong oronly to “professional investors” as defined in the SFO and any rules made under the SFO.
India
Each Joint Lead Manager has represented and agreed that: (a) this Offering Memorandum has notbeen, nor will it be, registered, produced or published as an offer document (whether a prospectus inrespect of a public offer or information memorandum or other offering material in respect of anyprivate placement under the Companies Act or any other applicable Indian laws) with any Registrarof Companies, the Securities and Exchange Board of India or any other statutory or regulatory bodyof like nature in India, (b) the Notes will not be offered or sold, and have not been offered or sold,in India by means of any document, other than to persons permitted to acquire Notes under Indian law,whether as a principal or agent and (c) this Offering Memorandum or any other offering document ormaterial relating to the Notes will not be circulated or distributed and have not been circulated ordistributed, directly or indirectly, to any person or the public or any member of the public in India orotherwise generally distributed or circulated in India such that it would constitute an advertisement,invitation offer, sale, or solicitation of, or offer to subscribe for, or purchase, any securities inviolation of Indian laws. The Notes have not been offered or sold, and will not be offered or sold, inIndia in circumstances which would constitute an offer of securities (whether to the public or by wayof private placement) within the meaning of the Companies Act or any other applicable Indian lawsfor the time being in force.
Japan
The Notes have not been and will not be registered under the Financial Instruments and Exchange Lawof Japan, and may not be offered or sold in Japan or to, or for the account or benefit of, any residentof Japan (which term as used herein means any person resident in Japan, including any corporationor other entity organized under the laws of Japan) or to, or for the account or benefit of, any personfor reoffering or resale, directly or indirectly, in Japan or to, or for the account or benefit of, anyresident of Japan, except pursuant to an exemption from the registration requirements of, or otherwisein compliance with, the Financial Instruments and Exchange Law of Japan, and in compliance with theother relevant laws and regulations of Japan.
Kingdom of Bahrain
Each Joint Lead Manager has represented and agreed that it has not offered or sold, and will not offeror sell, any Notes except on a private placement basis to persons in the Kingdom of Bahrain who are“accredited investors.” For this purpose, an “accredited investor” means: (a) an individual holdingfinancial assets (either singly or jointly with a spouse) of US$1,000,000 or more; (b) a company,partnership, trust or other commercial undertaking which has financial assets available for investmentof not less than US$1,000,000; or (c) a government, supranational organization, central bank or othernational monetary authority or a state organization whose main activity is to invest in financialinstruments (such as a state pension fund).
232

Singapore
This Offering Memorandum has not been and will not be registered as a prospectus with the MonetaryAuthority of Singapore. Accordingly, each Joint Lead Manager has represented, warranted andundertaken that it has not offered or sold any Notes or caused the Notes to be made the subject of aninvitation for subscription or purchase and will not offer or sell any Notes or cause the Notes to bemade the subject of an invitation for subscription or purchase, and has not circulated or distributed,nor will it circulate or distribute, this Offering Circular or any other document or material inconnection with the offer or sale, or invitation for subscription or purchase, of the Notes, whetherdirectly or indirectly, to any person in Singapore other than (i) to an institutional investor pursuantto Section 274 of the SFA, (ii) to a relevant person pursuant to Section 275(1) of the SFA, or anyperson pursuant to Section 275(1A) of the SFA, and in accordance with the conditions specified inSection 275 of the SFA, or (iii) otherwise pursuant to, and in accordance with the conditions of, anyother applicable provision of the SFA. Where the Notes are subscribed or purchased under Section 275of the SFA by a relevant person which is:
(a) a corporation (which is not an accredited investor (as defined in Section 4A of the SFA)) the solebusiness of which is to hold investments and the entire share capital of which is owned by oneor more individuals, each of whom is an accredited investor; or
(b) a trust (where the trustee is not an accredited investor) whose sole purpose is to hold investmentsand each beneficiary of the trust is an individual who is an accredited investor,
securities (as defined in Section 239(1) of the SFA) of that corporation or the beneficiaries’ rights andinterest (howsoever described) in that trust shall not be transferred within six months after thatcorporation or that trust has acquired the Notes pursuant to an offer made under Section 275 of theSFA except:
(1) to an institutional investor or to a relevant person defined in Section 275(2) of the SFA, orto any person arising from an offer referred to in Section 275(1A) or Section 276(4)(i) (B)of the SFA;
(2) where no consideration is or will be given for the transfer;
(3) where the transfer is by operation of law;
(4) as specified in Section 276(7) of the SFA; or
(5) as specified in Regulation 32 of the Securities and Futures (Offers of Investments) (Sharesand Debentures) Regulations 2005 of Singapore.
State of Qatar
All applications for an investment in the Notes should be received, and any allotments made from,outside Qatar. The Notes have not been offered, sold or delivered, and will not be offered, sold ordelivered at any time, directly or indirectly, in Qatar in a manner that would constitute a publicoffering. Therefore, this Offering Memorandum is strictly private and confidential and is being issuedto a limited number of institutional and high net worth sophisticated investors in Qatar and may notbe reproduced or used for any other purpose nor provided to any other person other than the recipientthereof. By receiving this Offering Memorandum, the person or entity to whom it has been providedto understands, acknowledges and agrees that: (i) neither this Prospectus nor the Notes have beenregistered, considered, authorised or approved by the Qatar Central Bank, the Qatar Financial MarketsAuthority, the Qatar Financial Centre Regulatory Authority or any other authority or agency in theState of Qatar; (ii) no person has been authorised or licensed by the Qatar Central Bank, the QatarFinancial Markets Authority, the Qatar Financial Centre Regulatory Authority or any other regulatory
233

authority or agency in the State of Qatar to market or sell the Notes within the State of Qatar; (iii)
this Offering Memorandum may not be provided to any person other than the original recipient and
is not for general circulation in the State of Qatar; and (iv) no agreement relating to the sale of the
Notes shall be consummated within the State of Qatar.
United Arab Emirates (excluding the Dubai International Financial Centre)
Each Joint Lead Manager has represented and agreed that the Notes have not been and will not be
offered, sold or publicly promoted or advertised by it in the United Arab Emirates other than in
compliance with any laws applicable in the United Arab Emirates governing the issue, offering and
sale of securities.
United Kingdom
The Joint Lead Managers have represented and agreed that (i) they have only communicated or caused
to be communicated and will only communicate or cause to be communicated an invitation or
inducement to engage in investment activity (within the meaning of Section 21 of the Financial
Services and Market Act 2000 (the “FSMA”)) to persons who have professional experience in matters
relating to investments falling within Article 19(5) of the Financial Services and Markets Act of 2000
(Financial Promotion) Order 2005 or in circumstances in which Section 21(1) of the FSMA does not
apply to the Issuer or Tata Steel Limited; and (ii) they have complied and will comply with all
applicable provisions of the FSMA with respect to anything done by them in relation to the Notes in,
from or otherwise involving the United Kingdom.
Prohibition of Sales to EEA Retail Investors
Each Joint Lead Manager has represented and agreed that it has not offered, sold or otherwise made
available and will not offer, sell or otherwise make available any Notes to any retail investor in the
European Economic Area. For the purposes of this provision:
a. the expression “retail investor” means a person who is one (or more) of the following:
(i) a retail client as defined in point (11) of Article 4(1) of Directive 2014/65/EU (as
amended, “MiFID II”); or
(ii) a customer within the meaning of Directive 2002/92/EC (as amended, the “Insurance
Mediation Directive”), where that customer would not qualify as a professional client
as defined in point (10) of Article 4(1) of MiFID II; or
(iii) not a qualified investor as defined in Directive 2003/71/EC (as amended, the
“Prospectus Directive”); and
b. the expression “offer” includes the communication in any form and by any means of
sufficient information on the terms of the offer and the Notes to be offered so as to enable
an investor to decide to purchase or subscribe the Notes.
234

TRANSFER RESTRICTIONS
Because of the following restrictions, purchasers are advised to consult legal counsel prior to making
any offer, sale, resale, pledge or other transfer of the Notes.
Each purchaser of the Notes, by accepting the delivery of this Offering Memorandum, will be deemed
to have represented and agreed as follows (terms used in this paragraph that are defined in Regulation
S are used herein as defined therein):
1. it is purchasing the Notes for its own account or an account with respect to which it exercises
sole investment discretion, and it and any such account is outside the United States (as defined
in Regulation S);
2. it understands and acknowledges that the Notes have not been and will not be registered under
the Securities Act or with any securities regulatory authority of any jurisdiction and may not be
offered or sold within the United States except as set forth below;
3. agree that the Notes are being offered and sold only outside the United States in an offshore
transaction in compliance with Rule 903 under the Securities Act;
4. agree that it will inform each person to whom it transfers the Notes of any restrictions on transfer
of such Notes; and
5. acknowledge that each of Notes will be represented by a Global Certificate and that transfers
thereto are restricted as described under “Terms and Conditions of the Notes — Transfer of Notes
and Issue of Certificates”.
235

INDEPENDENT AUDITORS
The Annual Financial Statements for the Group have been audited by Deloitte, as set forth in their
audit reports included herein. For the financial year beginning from April 1, 2017 onwards, Price
Waterhouse and Co. became the statutory auditor for the Group.
The Annual Financial Statements for the Issuer have been audited by Deloitte, as set forth in their
audit reports included herein. The unaudited interim financial statements of the Issuer for the six
months ended September 30, 2017, have been subject to a limited review by PricewaterhouseCoopers
LLP as set forth in their report dated January 12, 2018.
The standalone financial results of Tata Steel for the quarter and six months ended September 30, 2017
have been audited by Price Waterhouse and Co. and the consolidated financial results of the Group for
the quarter ended September 30, 2017 have been subjected to a limited review by Price Waterhouse
and Co. as set forth in their respective review reports included herein.
The unaudited interim financial statements of the Issuer for the six months ended September 30, 2017,
have been subjected to a limited review by PricewaterhouseCoopers LLP as set forth in their review
report dated January 12, 2018.
With respect to the unaudited consolidated interim financial results of the Group for the quarter ended
September 30, 2017 included in this Offering Memorandum, Price Waterhouse and Co. have reported
that they have applied limited procedures in accordance with professional standards for a review of
such unaudited consolidated interim financial results. However, their separate report dated October
30, 2017 appearing herein states that they did not audit and they do not express an audit opinion on
the unaudited consolidated interim financial results of the Group for the quarter ended September 30,
2017 included in this Offering Memorandum. Accordingly, the degree of reliance on their report on
such information should be restricted in light of the limited nature of the review procedures applied.
With respect to the unaudited interim financial statements of the Issuer for the six months ended
September 30, 2017, prepared under SFRS 34, Interim Financial Reporting, included in this Offering
Memorandum, PricewaterhouseCoopers have reported that they have applied limited procedures in
accordance with professional standards for a review of such unaudited interim financial statements.
However, their separate report dated January 12, 2018, states that they did not audit and they do not
express an audit opinion on the unaudited interim financial statements of the Issuer for the six months
ended September 30, 2017 included in this Offering Memorandum. Accordingly, the degree of reliance
on their report on such information should be restricted in light of the limited nature of the review
procedures applied.
On January 10, 2018, SEBI imposed a two year ban on Price Waterhouse and Co network of firms in
India (which includes Price Waterhouse & Co.) from auditing any publicly listed companies in India
as a result of their involvement as auditors in Satyam Computer Services Limited. The ban does not
impact Price Waterhouse & Co.’s ability to continue as statutory auditors of Tata Steel and the Group
for financial year ending March 31, 2018. Price Waterhouse and Co network of firms in India have
proposed to appeal the SEBI ban, and should Price Waterhouse & Co. become legally incapable to
continue the office of Tata Steel and the Group’s statutory auditors post March 31, 2018 Tata Steel
would evaluate to fill the vacancy in such eventuality, keeping in line with the requirements of the
applicable statutes in India.
236

GENERAL INFORMATION
1. The creation and issue of the Notes has been authorized by resolutions of the Issuer’s Board of
Directors dated January 11, 2018.
2. Copies of the following documents, all of which are published in English, may be inspected
during normal business hours at the offices of the Paying Agent after the date of this Offering
Memorandum for so long as any of the Notes remains outstanding:
(a) the Issuer’s Constitution;
(b) the Trust Deeds; and
(c) the Agency Agreements.
3. The International Securities Identification Number (ISIN) in respect of the [●] Notes is
XS1753594198.
4. The International Securities Identification Number (ISIN) in respect of the [●] Notes is
X1753595328.
5. Approval in principle has been granted for the listing and quotation of the Notes on the SGX-ST.
The SGX-ST takes no responsibility for the accuracy of any of the statements made or opinions
or reports contained in this Offering Memorandum. Approval in-principle received for the listing
and quotation of the Notes on the SGX-ST is not to be taken as an indication of the merits of
either us, this offering or the Notes. The Notes will be traded on the SGX-ST in a minimum board
lot size of US$200,000 for so long as any of the Notes are listed and quoted on the SGX-ST and
the rules of the SGX-ST so require.
237

DESCRIPTION OF CERTAIN DIFFERENCES BETWEEN IND-AS AND IFRS
The Annual and Interim Financial Statements are prepared in conformity with Ind-AS, which differ in
certain significant respects from IFRS. Such differences involve methods for measuring amounts in
the Annual and Interim Financial Statements, as well as additional disclosures required by IFRS.
The following summarizes certain general differences between Ind-AS and IFRS that could have a
significant impact on the financial position and operations of the Group if its financial statements were
prepared under IFRS. The summary below should not be considered exhaustive, as no attempt has been
made by the Group to quantify the effects of those differences, nor has a reconciliation of Ind-AS to
IFRS been undertaken by the Group. Had any such quantification or reconciliation been undertaken,
other potential significant accounting and disclosure differences may have come to its attention, which
are not identified below.
Prospective investors should consult their own professional advisors for an understanding of the
principal differences between Ind-AS and IFRS and how these differences might affect the Annual and
Interim Financial Statements beginning on page F-1 of this Offering Memorandum.
Summary of Certain Differences
No. Particulars of the Standard Treatment under IFRS Treatment under Ind-AS
Presentation of Financial Statement
1 Primary requirement IAS 1 sets out therequirements for presentationof financial statements and theguidelines for their structureand content.
The requirements for thepresentation of financialstatements are set out inInd-AS 1 and Schedule III tothe Companies Act, 2013.
2 Statements ofcomprehensive income/Statement of profit andloss
With regard to preparation ofstatement of profit and loss,IFRS provides an option eitherto follow the single statementapproach or to follow the twostatement approach. An entitymay present a single statementof profit or loss and othercomprehensive income; or
It may present the profit orloss section in a separate‘statement of profit or loss’which shall immediatelyprecede the ‘statement ofcomprehensive income’.
Ind-AS 1 allows only thesingle statement approach anddoes not permit the twostatements approach.
238
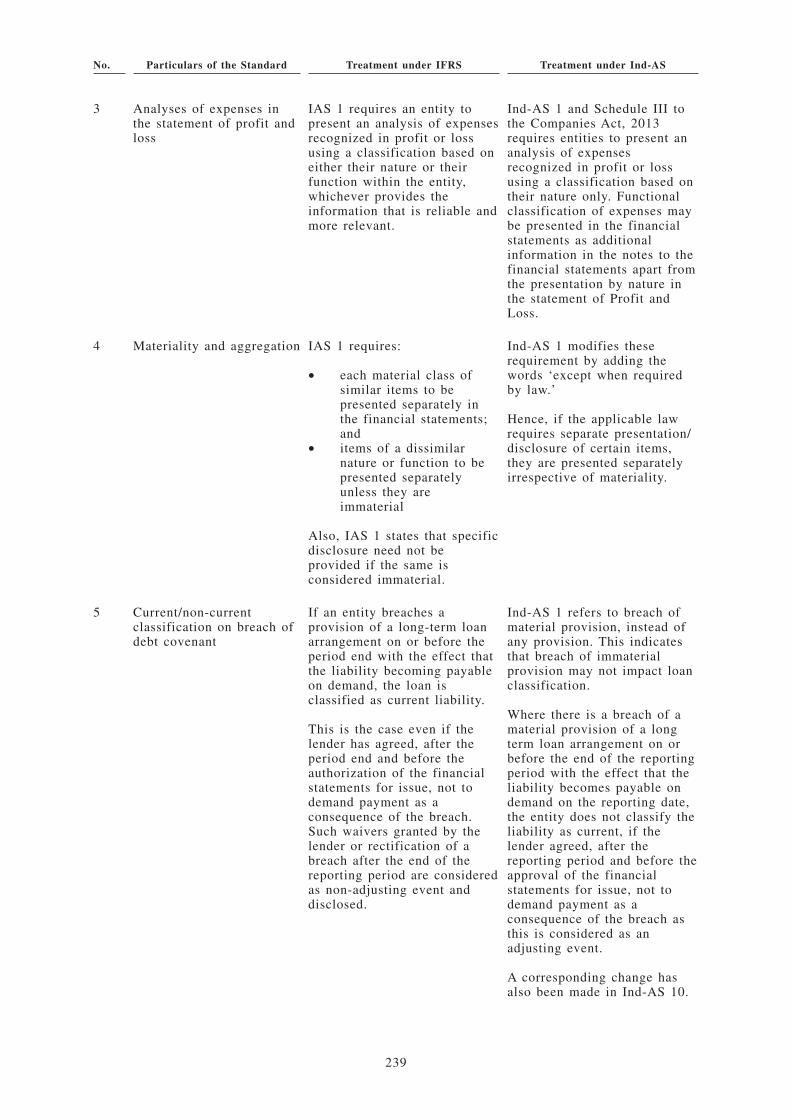
No. Particulars of the Standard Treatment under IFRS Treatment under Ind-AS
3 Analyses of expenses inthe statement of profit andloss
IAS 1 requires an entity topresent an analysis of expensesrecognized in profit or lossusing a classification based oneither their nature or theirfunction within the entity,whichever provides theinformation that is reliable andmore relevant.
Ind-AS 1 and Schedule III tothe Companies Act, 2013requires entities to present ananalysis of expensesrecognized in profit or lossusing a classification based ontheir nature only. Functionalclassification of expenses maybe presented in the financialstatements as additionalinformation in the notes to thefinancial statements apart fromthe presentation by nature inthe statement of Profit andLoss.
4 Materiality and aggregation IAS 1 requires:
• each material class ofsimilar items to bepresented separately inthe financial statements;and
• items of a dissimilarnature or function to bepresented separatelyunless they areimmaterial
Also, IAS 1 states that specificdisclosure need not beprovided if the same isconsidered immaterial.
Ind-AS 1 modifies theserequirement by adding thewords ‘except when requiredby law.’
Hence, if the applicable lawrequires separate presentation/disclosure of certain items,they are presented separatelyirrespective of materiality.
5 Current/non-currentclassification on breach ofdebt covenant
If an entity breaches aprovision of a long-term loanarrangement on or before theperiod end with the effect thatthe liability becoming payableon demand, the loan isclassified as current liability.
This is the case even if thelender has agreed, after theperiod end and before theauthorization of the financialstatements for issue, not todemand payment as aconsequence of the breach.Such waivers granted by thelender or rectification of abreach after the end of thereporting period are consideredas non-adjusting event anddisclosed.
Ind-AS 1 refers to breach ofmaterial provision, instead ofany provision. This indicatesthat breach of immaterialprovision may not impact loanclassification.
Where there is a breach of amaterial provision of a longterm loan arrangement on orbefore the end of the reportingperiod with the effect that theliability becomes payable ondemand on the reporting date,the entity does not classify theliability as current, if thelender agreed, after thereporting period and before theapproval of the financialstatements for issue, not todemand payment as aconsequence of the breach asthis is considered as anadjusting event.
A corresponding change hasalso been made in Ind-AS 10.
239

No. Particulars of the Standard Treatment under IFRS Treatment under Ind-AS
First-time Adoption
6 Deemed cost exemption forproperty, plant andequipment
IFRS 1 permits a first-timeadopter to measure its items ofproperty, plant and equipment(PPE) at deemed cost at thetransition date. The deemedcost can be:
• The fair value of the itemat the date of transition
• A previous GAAPrevaluation at or beforetransition date, ifrevaluation met certaincriteria
Similar exemption is alsoavailable for intangible assets(if active market exists) andinvestment property measuredat cost.
Ind-AS 101 also providessimilar deemed costexemption.
In addition, if there is nochange in the functionalcurrency at the transition date,Ind-AS 101 allows a first-timeadopter to continue with theIndian GAAP (“previousGAAP”) carrying value for allof its property, plant andequipment as recognized in theprevious GAAP financialstatements at the transitiondate. The same is used asdeemed cost at that date, aftermaking adjustment relating todecommissioning liabilities.
In consolidated Ind-ASfinancial statements, theprevious GAAP amount of thesubsidiary is the amount usedin the consolidated financialstatements.
If an entity avails this option,no further adjustments to thedeemed cost so determined ismade.Similar exemption is alsoavailable for intangible assetsand investment property.However, for investmentproperty, fair valuation underdeemed cost is not applicable.
240

No. Particulars of the Standard Treatment under IFRS Treatment under Ind-AS
7 Additional exemptionsrelating to compositeleases and land lease
Under IFRS 1, an entityclassifies a lease based on thelease terms that are in force atits date of transition based onthe circumstances that existedat the inception of the lease.
No exemption is available forclassification of compositeleases.
Ind-AS 101 provides thefollowing additionalexemptions:
• When a lease includesboth land and buildingelements, a first timeadopter may assess theclassification of eachelement as finance oroperating lease at thedate of transition toInd-AS based on the factsand circumstancesexisting as at that date.
• If there is any land leaseclassified as finance leaseat the transition date,which was classifieddifferently under previousGAAP, then the first timeadopter may recognizeasset and liability at fairvalues on that date. Anydifference between thosefair values is recognizedin retained earnings.
241
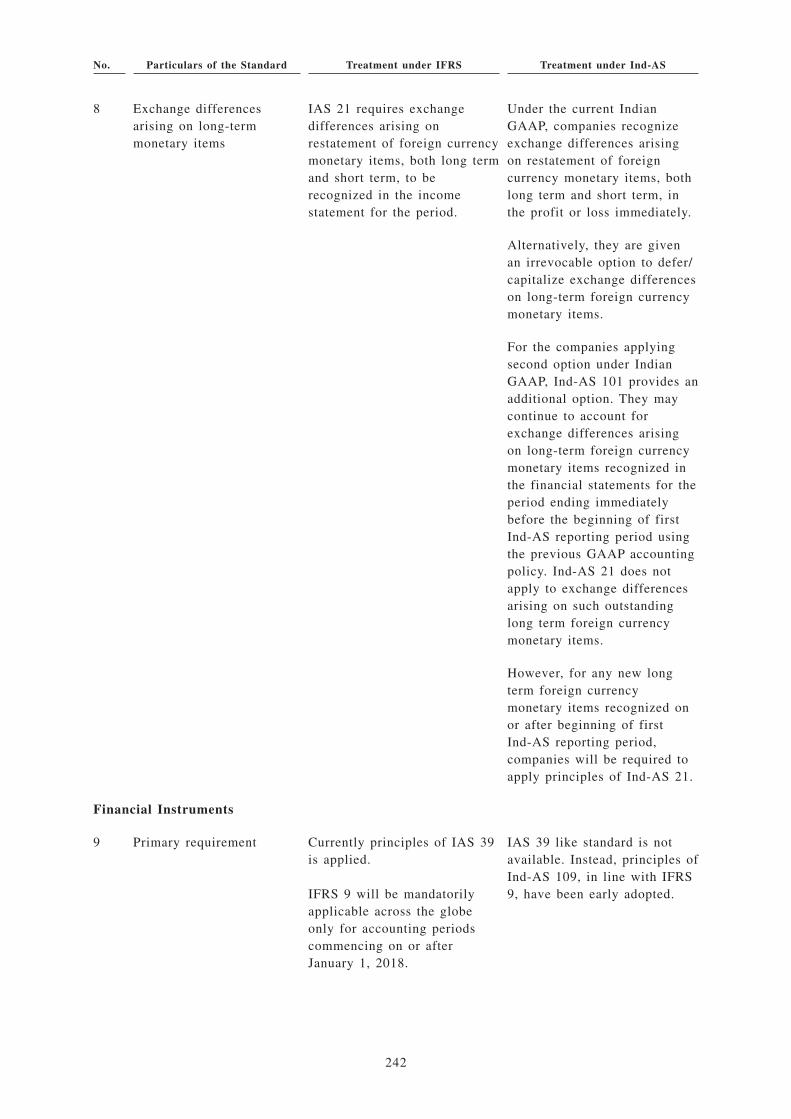
No. Particulars of the Standard Treatment under IFRS Treatment under Ind-AS
8 Exchange differencesarising on long-termmonetary items
IAS 21 requires exchangedifferences arising onrestatement of foreign currencymonetary items, both long termand short term, to berecognized in the incomestatement for the period.
Under the current IndianGAAP, companies recognizeexchange differences arisingon restatement of foreigncurrency monetary items, bothlong term and short term, inthe profit or loss immediately.
Alternatively, they are givenan irrevocable option to defer/capitalize exchange differenceson long-term foreign currencymonetary items.
For the companies applyingsecond option under IndianGAAP, Ind-AS 101 provides anadditional option. They maycontinue to account forexchange differences arisingon long-term foreign currencymonetary items recognized inthe financial statements for theperiod ending immediatelybefore the beginning of firstInd-AS reporting period usingthe previous GAAP accountingpolicy. Ind-AS 21 does notapply to exchange differencesarising on such outstandinglong term foreign currencymonetary items.
However, for any new longterm foreign currencymonetary items recognized onor after beginning of firstInd-AS reporting period,companies will be required toapply principles of Ind-AS 21.
Financial Instruments
9 Primary requirement Currently principles of IAS 39is applied.
IFRS 9 will be mandatorilyapplicable across the globeonly for accounting periodscommencing on or afterJanuary 1, 2018.
IAS 39 like standard is notavailable. Instead, principles ofInd-AS 109, in line with IFRS9, have been early adopted.
242

No. Particulars of the Standard Treatment under IFRS Treatment under Ind-AS
Leases
10 Straight-line of leaserentals in operating leases
Rental payments/income underan operating lease arerecognized on a straight-linebasis over the lease termunless another systematic basisis more representative of thetime pattern of the user’sbenefit.
Lease payments/income underan operating lease arerecognized as an expense/income on a straight-line basisover the lease term unlesseither:
(a) Another systematic basisis more representative ofthe time pattern of theuser’s benefit, or
(b) Payments to the lessorare structured to increasein line with expectedgeneral inflation tocompensate for thelessor’s expectedinflationary costincreases. If payments/income to the lessor varybecause of factors otherthan general inflation,then this condition is notmet.
Business Combinations
11 Common control businesscombinations
IFRS 3 excludes from its scopebusiness combinations ofentities under common control.
In practice, companies developand consistently apply anaccounting policy; managementcan elect to apply theacquisition method or poolingof interest method to abusiness combination involvingentities under common control.
Ind-AS 103 requires businesscombinations of entities orbusinesses under commoncontrol to be mandatorilyaccounted using the pooling ofmethod. The application of thismethod requires the following:
(i) The assets and liabilitiesof the combining entitiesare reflected at theircarrying amounts.
(ii) No adjustments are madeto reflect fair values, orrecognize any new assetsor liabilities. The onlyadjustments that are madeare to harmonize theaccounting policies.
243

No. Particulars of the Standard Treatment under IFRS Treatment under Ind-AS
(iii) The financial informationin respect of prior periodshave to be restated as ifthe business combinationhad occurred from thebeginning of the earliestperiod presented,irrespective of the actualdate of the combination.
(iv) The balance of theretained earningsappearing in the financialstatements of thetransferor is aggregatedwith the correspondingbalance appearing in thefinancial statements ofthe transferee;alternatively, it istransferred to generalreserves, if any.
(v) The identity of thereserves is preserved andappear in the financialstatements of thetransferee in the sameform in which theyappeared in the financialstatements of thetransferor.
(vi) The difference betweenthe amount recorded asshare capital issued plusany additionalconsideration in cash orother assets and theamount of share capitalof the transferor istransferred to capitalreserve and presentedseparately from othercapital reserves.
244
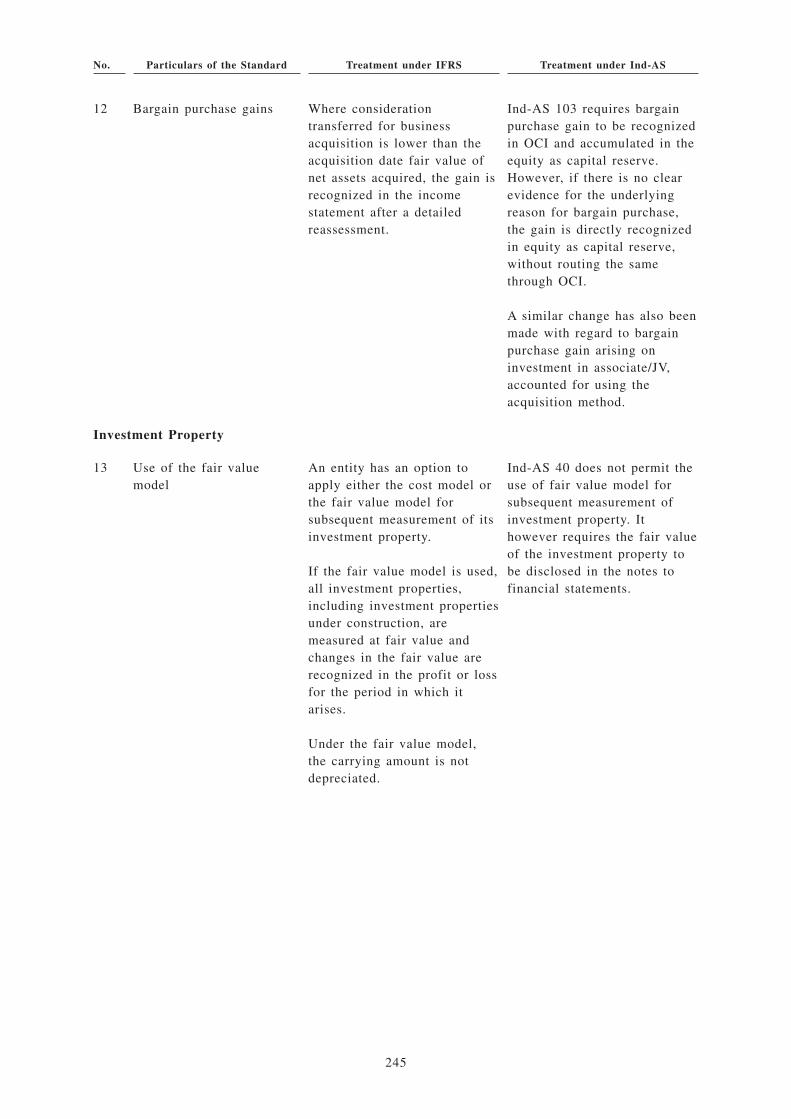
No. Particulars of the Standard Treatment under IFRS Treatment under Ind-AS
12 Bargain purchase gains Where considerationtransferred for businessacquisition is lower than theacquisition date fair value ofnet assets acquired, the gain isrecognized in the incomestatement after a detailedreassessment.
Ind-AS 103 requires bargainpurchase gain to be recognizedin OCI and accumulated in theequity as capital reserve.However, if there is no clearevidence for the underlyingreason for bargain purchase,the gain is directly recognizedin equity as capital reserve,without routing the samethrough OCI.
A similar change has also beenmade with regard to bargainpurchase gain arising oninvestment in associate/JV,accounted for using theacquisition method.
Investment Property
13 Use of the fair valuemodel
An entity has an option toapply either the cost model orthe fair value model forsubsequent measurement of itsinvestment property.
If the fair value model is used,all investment properties,including investment propertiesunder construction, aremeasured at fair value andchanges in the fair value arerecognized in the profit or lossfor the period in which itarises.
Under the fair value model,the carrying amount is notdepreciated.
Ind-AS 40 does not permit theuse of fair value model forsubsequent measurement ofinvestment property. Ithowever requires the fair valueof the investment property tobe disclosed in the notes tofinancial statements.
245

No. Particulars of the Standard Treatment under IFRS Treatment under Ind-AS
Government Grants and Disclosure of Government Assistance
14 Grants in the form ofnon-monetary assets
IAS 20 provides an option toentities to recognizegovernment grants in the formof non-monetary assets, givenat a concessional rate, either attheir fair value or at thenominal value.
Ind-AS 20 requiresmeasurement of such grantsonly at their fair value.
Government Grants andDisclosure of GovernmentAssistance and Grantsrelated to assets
IAS 20 gives an option topresent the grants related toassets, including non-monetarygrants at fair value, in thebalance sheet either by settingup the grant as deferredincome or by deducting thegrant in arriving at thecarrying amount of the asset.
Ind-AS 20 requirespresentation of such grants inthe balance sheet only bysetting up the grant as deferredincome. Thus, the option topresent such grants bydeduction of the grant inarriving at the carrying amountof the asset is not available.
Borrowing Cost
15 Exchange differencesregarded as adjustment tointerest costs
In accordance with IAS 23,borrowing cost includesexchange difference arisingfrom foreign currencyborrowings to the extent thatthey are regarded as anadjustment to interest costs.However, it does not provideany specific guidance onmeasurement of such amounts.
Ind-AS 23 is similar to IAS23. However, Ind-AS 23provides following additionalguidance on manner of arrivingat this adjustment:
The adjustment should be ofan amount equivalent to theextent to which the exchangeloss does not exceed thedifference between the costs ofborrowing in functionalcurrency when compared to thecosts of borrowing in a foreigncurrency.
If there is an unrealizedexchange loss which is treatedas an adjustment to interestand subsequently there is arealized or unrealized gain inrespect of the settlement ortranslation of the sameborrowing, the gain to theextent of the loss previouslyrecognized as an adjustmentshould also be recognized asan adjustment to interest.
246

No. Particulars of the Standard Treatment under IFRS Treatment under Ind-AS
Related Party Disclosures
16 Aggregation of transactionsfor disclosure
IFRS does not provide anyguidance on the aggregation oftransaction for disclosure.
Ind-AS 24 provides anadditional guidance wherebyitems of similar nature may bedisclosed in aggregate by typeof related party. However, thisis not done in such a way as toobscure the importance ofsignificant transactions. Hence,purchases or sales of goods arenot aggregated with purchasesor sales of fixed assets. Nor amaterial related partytransaction with an individualparty is clubbed in anaggregated disclosure.
Cash Flow Statement
17 Classification of interestpaid and interest anddividend received
For non-financial entities,interest paid and interest anddividends received may beclassified as ‘operatingactivities’. Alternatively,interest paid and interest anddividends received may beclassified as ‘financingactivities’ and ‘investingactivities’ respectively.
Ind-AS 7 does not give anoption It requires non-financialentities to classify interest paidas part of ‘financing activities’and interest and dividendreceived as ‘investingactivities’.
Separate Financial Statements
18 Use of equity method toaccount for investments insubsidiaries, joint venturesand associates in SFS
IAS 27 allows an entity to usethe equity method to accountfor its investments insubsidiaries, joint ventures andassociates in its SFS.Consequently, an entity ispermitted to account for theseinvestments either
• At cost
• In accordance with AS 39
• Using the equity method
This is an accounting policychoice for each category ofinvestment.
Ind-AS 27 does not allow theuse of equity method toaccount for investments insubsidiaries, joint ventures andassociates in SFS. The reasonfor the same that Ind-ASconsiders equity method to bea manner of consolidationrather than a measurementbasis.
247
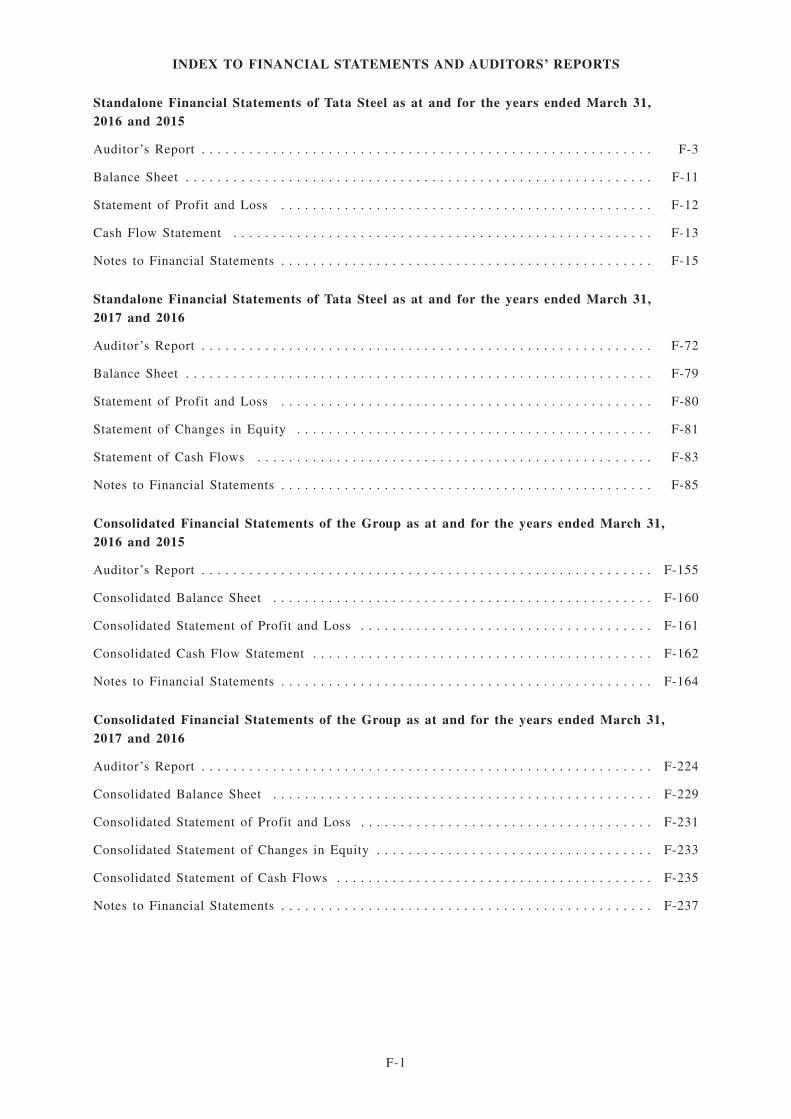
INDEX TO FINANCIAL STATEMENTS AND AUDITORS’ REPORTS
Standalone Financial Statements of Tata Steel as at and for the years ended March 31,2016 and 2015
Auditor’s Report . . . . . . . . . . . . . . . . . . . . . . . . . . . . . . . . . . . . . . . . . . . . . . . . . . . . . . . . . F-3
Balance Sheet . . . . . . . . . . . . . . . . . . . . . . . . . . . . . . . . . . . . . . . . . . . . . . . . . . . . . . . . . . . F-11
Statement of Profit and Loss . . . . . . . . . . . . . . . . . . . . . . . . . . . . . . . . . . . . . . . . . . . . . . . F-12
Cash Flow Statement . . . . . . . . . . . . . . . . . . . . . . . . . . . . . . . . . . . . . . . . . . . . . . . . . . . . . F-13
Notes to Financial Statements . . . . . . . . . . . . . . . . . . . . . . . . . . . . . . . . . . . . . . . . . . . . . . . F-15
Standalone Financial Statements of Tata Steel as at and for the years ended March 31,2017 and 2016
Auditor’s Report . . . . . . . . . . . . . . . . . . . . . . . . . . . . . . . . . . . . . . . . . . . . . . . . . . . . . . . . . F-72
Balance Sheet . . . . . . . . . . . . . . . . . . . . . . . . . . . . . . . . . . . . . . . . . . . . . . . . . . . . . . . . . . . F-79
Statement of Profit and Loss . . . . . . . . . . . . . . . . . . . . . . . . . . . . . . . . . . . . . . . . . . . . . . . F-80
Statement of Changes in Equity . . . . . . . . . . . . . . . . . . . . . . . . . . . . . . . . . . . . . . . . . . . . . F-81
Statement of Cash Flows . . . . . . . . . . . . . . . . . . . . . . . . . . . . . . . . . . . . . . . . . . . . . . . . . . F-83
Notes to Financial Statements . . . . . . . . . . . . . . . . . . . . . . . . . . . . . . . . . . . . . . . . . . . . . . . F-85
Consolidated Financial Statements of the Group as at and for the years ended March 31,2016 and 2015
Auditor’s Report . . . . . . . . . . . . . . . . . . . . . . . . . . . . . . . . . . . . . . . . . . . . . . . . . . . . . . . . . F-155
Consolidated Balance Sheet . . . . . . . . . . . . . . . . . . . . . . . . . . . . . . . . . . . . . . . . . . . . . . . . F-160
Consolidated Statement of Profit and Loss . . . . . . . . . . . . . . . . . . . . . . . . . . . . . . . . . . . . . F-161
Consolidated Cash Flow Statement . . . . . . . . . . . . . . . . . . . . . . . . . . . . . . . . . . . . . . . . . . . F-162
Notes to Financial Statements . . . . . . . . . . . . . . . . . . . . . . . . . . . . . . . . . . . . . . . . . . . . . . . F-164
Consolidated Financial Statements of the Group as at and for the years ended March 31,2017 and 2016
Auditor’s Report . . . . . . . . . . . . . . . . . . . . . . . . . . . . . . . . . . . . . . . . . . . . . . . . . . . . . . . . . F-224
Consolidated Balance Sheet . . . . . . . . . . . . . . . . . . . . . . . . . . . . . . . . . . . . . . . . . . . . . . . . F-229
Consolidated Statement of Profit and Loss . . . . . . . . . . . . . . . . . . . . . . . . . . . . . . . . . . . . . F-231
Consolidated Statement of Changes in Equity . . . . . . . . . . . . . . . . . . . . . . . . . . . . . . . . . . . F-233
Consolidated Statement of Cash Flows . . . . . . . . . . . . . . . . . . . . . . . . . . . . . . . . . . . . . . . . F-235
Notes to Financial Statements . . . . . . . . . . . . . . . . . . . . . . . . . . . . . . . . . . . . . . . . . . . . . . . F-237
F-1

Consolidated and Standalone Interim Financial Statements for the quarters endedJune 30, 2017 and September 30, 2017
Auditors’ Report of Tata Steel for the quarter ended June 30, 2017 . . . . . . . . . . . . . . . . . . F-331
Standalone Financial Results for the quarter ended June 30, 2017 . . . . . . . . . . . . . . . . . . . F-332
Auditors Review Report of the Group for the quarter ended June 30, 2017 . . . . . . . . . . . . . F-333
Consolidated Financial Results for the quarter ended June 30, 2017 . . . . . . . . . . . . . . . . . . F-339
Auditors Report of Tata Steel for the quarter ended September 30, 2017 . . . . . . . . . . . . . . F-342
Standalone Financial Results for the quarter ended September 30, 2017 . . . . . . . . . . . . . . . F-343
Standalone Balance Sheet for the quarter ended September 30, 2017 . . . . . . . . . . . . . . . . . F-345
Auditors Review Report of the Group for the quarter ended September 30, 2017 . . . . . . . . F-346
Consolidated Financial Results for the quarter ended September 30, 2017 . . . . . . . . . . . . . F-348
Consolidated Balance Sheet as at September 30, 2017 . . . . . . . . . . . . . . . . . . . . . . . . . . . . F-351
Standalone Financial Statements of the Issuer as at and for the years ended March 31,2016 and 2015
Auditors’ Report . . . . . . . . . . . . . . . . . . . . . . . . . . . . . . . . . . . . . . . . . . . . . . . . . . . . . . . . . F-353
Statement of Financial Position . . . . . . . . . . . . . . . . . . . . . . . . . . . . . . . . . . . . . . . . . . . . . F-354
Statement of Profit or Loss . . . . . . . . . . . . . . . . . . . . . . . . . . . . . . . . . . . . . . . . . . . . . . . . . F-354
Statement of Changes in Equity . . . . . . . . . . . . . . . . . . . . . . . . . . . . . . . . . . . . . . . . . . . . . F-355
Cash Flow Statement . . . . . . . . . . . . . . . . . . . . . . . . . . . . . . . . . . . . . . . . . . . . . . . . . . . . . F-355
Notes to Financial Statements . . . . . . . . . . . . . . . . . . . . . . . . . . . . . . . . . . . . . . . . . . . . . . . F-356
Standalone Financial Statements of the Issuer as at and for the years ended March 31,2017 and 2016
Auditors’ Report . . . . . . . . . . . . . . . . . . . . . . . . . . . . . . . . . . . . . . . . . . . . . . . . . . . . . . . . . F-374
Statement of Financial Position . . . . . . . . . . . . . . . . . . . . . . . . . . . . . . . . . . . . . . . . . . . . . F-376
Statement of Profit or Loss . . . . . . . . . . . . . . . . . . . . . . . . . . . . . . . . . . . . . . . . . . . . . . . . . F-376
Statement of Changes in Equity . . . . . . . . . . . . . . . . . . . . . . . . . . . . . . . . . . . . . . . . . . . . . F-377
Cash Flow Statement . . . . . . . . . . . . . . . . . . . . . . . . . . . . . . . . . . . . . . . . . . . . . . . . . . . . . F-377
Notes to Financial Statements . . . . . . . . . . . . . . . . . . . . . . . . . . . . . . . . . . . . . . . . . . . . . . . F-378
Standalone Financial Statements of the Issuer as at and for the six months endedSeptember 30, 2017
Auditors’ Report . . . . . . . . . . . . . . . . . . . . . . . . . . . . . . . . . . . . . . . . . . . . . . . . . . . . . . . . . F-395
Statement of Financial Position . . . . . . . . . . . . . . . . . . . . . . . . . . . . . . . . . . . . . . . . . . . . . F-396
Statement of Profit or Loss . . . . . . . . . . . . . . . . . . . . . . . . . . . . . . . . . . . . . . . . . . . . . . . . . F-396
Statement of Cash Flows . . . . . . . . . . . . . . . . . . . . . . . . . . . . . . . . . . . . . . . . . . . . . . . . . . F-397
Statement of Changes in Equity . . . . . . . . . . . . . . . . . . . . . . . . . . . . . . . . . . . . . . . . . . . . . F-397
Notes to Consolidated Summary Financial Statements . . . . . . . . . . . . . . . . . . . . . . . . . . . . . F-398
F-2

INDEPENDENT AUDITORS’ REPORT
TO THE MEMBERS OF TATA STEEL LIMITED
REPORT ON THE STANDALONE FINANCIAL STATEMENTS
We have audited the accompanying standalone financial statements of TATA STEEL LIMITED (“the Company”), which comprise the Balance Sheet as at 31st March, 2016, the Statement of Profit and Loss and the Cash Flow Statement for the year then ended, and a summary of the significant accounting policies and other explanatory information.
MANAGEMENT’S RESPONSIBILITY FOR THE STANDALONE
FINANCIAL STATEMENTS
The Company’s Board of Directors is responsible for the matters stated in Section 134(5) of the Companies Act, 2013 (“the Act”) with respect to the preparation of these standalone financial statements that give a true and fair view of the financial position, financial performance and cash flows of the Company in accordance with the accounting principles generally accepted in India, including the Accounting Standards prescribed under section 133 of the Act, as applicable.
This responsibility also includes maintenance of adequate accounting records in accordance with the provisions of the Act for safeguarding the assets of the Company and for preventing and detecting frauds and other irregularities; selection and application of appropriate accounting policies; making judgments and estimates that are reasonable and prudent; and design, implementation and maintenance of adequate internal financial controls, that were operating effectively for ensuring the accuracy and completeness of the accounting records, relevant to the preparation and presentation of the financial statements that give a true and fair view and are free from material misstatement, whether due to fraud or error.
AUDITORS' RESPONSIBILITY
Our responsibility is to express an opinion on these standalone financial statements based on our audit.
We have taken into account the provisions of the Act, the accounting and auditing standards and matters which are required to be included in the audit report under the provisions of the Act and the Rules made thereunder and the Order under section 143 (11) of the Act.
We conducted our audit of the standalone financial statements in accordance with the Standards on Auditing specified under Section 143(10) of the Act. Those Standards require that we comply with ethical requirements and plan and perform the audit to obtain reasonable assurance about whether the financial statements are free from material misstatement.
An audit involves performing procedures to obtain audit evidence about the amounts and the disclosures in the financial statements. The procedures selected depend on the auditors' judgment, including the assessment of the risks of material misstatement of the financial statements, whether due to fraud or error. In making those risk assessments, the auditor considers internal financial control relevant to the Company’s preparation of the financial statements that give a true and fair view in order to design audit procedures that are appropriate in the circumstances. An audit also includes evaluating the appropriateness of the accounting policies used and the reasonableness of the accounting estimates made by the Company’s Directors, as well as evaluating the overall presentation of the financial statements.
We believe that the audit evidence we have obtained is sufficient and appropriate to provide a basis for our audit opinion on the standalone financial statements.
OPINION
In our opinion and to the best of our information and according to the explanations given to us, the aforesaid standalone financial statements give the information required by the Act in the manner so required and give a true and fair view in conformity with the accounting principles generally accepted in India, of the state of affairs of the Company as at 31st March, 2016, and its profit and its cash flows for the year ended on that date.
REPORT ON OTHER LEGAL AND REGULATORY
REQUIREMENTS
1. As required by Section 143 (3) of the Act, we report that:a) We have sought and obtained all the information and
explanations which to the best of our knowledge and beliefwere necessary for the purposes of our audit.
b) In our opinion, proper books of account as required by lawhave been kept by the Company so far as it appears from our examination of those books.
c) The Balance Sheet, the Statement of Profit and Loss, andthe Cash Flow Statement dealt with by this Report are inagreement with the books of account.
d) In our opinion, the aforesaid standalone financial statements comply with the Accounting Standards prescribed undersection 133 of the Act, as applicable.
e) On the basis of the written representations received from thedirectors taken on record by the Board of Directors, none of
F-3

the directors is disqualified as on 31st March, 2016 from being appointed as a director in terms of Section 164 (2) of the Act.
f ) With respect to the adequacy of the internal financial controls over financial reporting of the Company and the operating effectiveness of such controls, refer to our separate report in “Annexure A”. Our report expresses an unmodified opinion on the adequacy and operating effectiveness of the Company’s internal financial controls over financial reporting.
g) With respect to the other matters to be included in the Auditors' Report in accordance with Rule 11 of the Companies (Audit and Auditors) Rules, 2014, in our opinion and to the best of our information and according to the explanations given to us:
i. The Company has disclosed the impact of pending litigations on its financial position in its financial statements;
ii. The Company has made provision, as required under the applicable law or accounting standards, for material foreseeable losses, on long-term contracts including derivative contracts;
iii. There has been no delay in transferring amounts, required to be transferred, to the Investor Education and Protection Fund by the Company
2. As required by the Companies (Auditor’s Report) Order, 2016 (“the Order”) issued by the Central Government in terms of Section 143(11) of the Act, we give in “Annexure B” a statement on the matters specified in paragraphs 3 and 4 of the Order.
For DELOITTE HASKINS & SELLS LLP
Chartered Accountants (Firm’s Registration No.117366W/W-100018)
N. VENKATRAM
Partner (Membership No. 71387)
Mumbai, 25th May, 2016
F-4

ANNEXURE “A” TO THE INDEPENDENT AUDITORS' REPORT
(Referred to in paragraph 1(f) under ‘Report on Other Legal and
Regulatory Requirements’ of our report of even date)
Report on the Internal Financial Controls Over Financial
Reporting under Clause (i) of Sub-section 3 of Section 143 of the
Companies Act, 2013 (“the Act”)
We have audited the internal financial controls over financial reporting of Tata Steel Limited (“the Company”) as of 31st March, 2016 in conjunction with our audit of the standalone financial statements of the Company for the year ended on that date.
MANAGEMENT’S RESPONSIBILITY FOR INTERNAL
FINANCIAL CONTROLS
The Company’s management is responsible for establishing and maintaining internal financial controls based on the internal control over financial reporting criteria established by the Company considering the essential components of internal control stated in the Guidance Note on Audit of Internal Financial Controls Over Financial Reporting issued by the Institute of Chartered Accountants of India. These responsibilities include the design, implementation and maintenance of adequate internal financial controls that were operating effectively for ensuring the orderly and efficient conduct of its business, including adherence to company’s policies, the safeguarding of its assets, the prevention and detection of frauds and errors, the accuracy and completeness of the accounting records, and the timely preparation of reliable financial information, as required under the Companies Act, 2013.
AUDITORS' RESPONSIBILITY
Our responsibility is to express an opinion on the Company's internal financial controls over financial reporting based on our audit. We conducted our audit in accordance with the Guidance Note on Audit of Internal Financial Controls Over Financial Reporting (the “Guidance Note”) issued by the Institute of Chartered Accountants of India and the Standards on Auditing prescribed under Section 143(10) of the Companies Act, 2013, to the extent applicable to an audit of internal financial controls. Those Standards and the Guidance Note require that we comply with ethical requirements and plan and perform the audit to obtain reasonable assurance about whether adequate internal financial controls over financial reporting was established and maintained and if such controls operated effectively in all material respects.
Our audit involves performing procedures to obtain audit evidence about the adequacy of the internal financial controls system over financial reporting and their operating effectiveness. Our audit of internal financial controls over financial reporting included obtaining an understanding of internal financial controls over financial reporting, assessing the risk that a material weakness exists, and testing and evaluating the design and operating effectiveness of internal control based on the assessed risk. The procedures selected depend on the auditors' judgement, including the assessment of the risks of material misstatement of the financial statements, whether due to fraud or error.
We believe that the audit evidence we have obtained is sufficient and appropriate to provide a basis for our audit opinion on the Company’s internal financial controls system over financial reporting.
MEANING OF INTERNAL FINANCIAL CONTROLS OVER
FINANCIAL REPORTING
A company's internal financial control over financial reporting is a process designed to provide reasonable assurance regarding the reliability of financial reporting and the preparation of financial statements for external purposes in accordance with generally accepted accounting principles. A company's internal financial control over financial reporting includes those policies and procedures that (1) pertain to the maintenance of records that, in reasonable detail, accurately and fairly reflect the transactions and dispositions of the assets of the company; (2) provide reasonable assurance that transactions are recorded as necessary to permit preparation of financial statements in accordance with generally accepted accounting principles, and that receipts and expenditures of the company are being made only in accordance with authorisations of management and directors of the company; and (3) provide reasonable assurance regarding prevention or timely detection of unauthorised acquisition, use, or disposition of the company's assets that could have a material effect on the financial statements.
INHERENT LIMITATIONS OF INTERNAL FINANCIAL
CONTROLS OVER FINANCIAL REPORTING
Because of the inherent limitations of internal financial controls over financial reporting, including the possibility of collusion or improper management override of controls, material misstatements due to error or fraud may occur and not be detected.
F-5

Also, projections of any evaluation of the internal financial controls over financial reporting to future periods are subject to the risk that the internal financial control over financial reporting may become inadequate because of changes in conditions, or that the degree of compliance with the policies or procedures may deteriorate.
OPINION
In our opinion, to the best of our information and according to the explanations given to us, the Company has, in all material respects, an adequate internal financial controls system over financial reporting and such internal financial controls over financial reporting were operating effectively as at 31st March, 2016, based on the internal control over financial reporting criteria established by the Company considering the essential components of internal
control stated in the Guidance Note on Audit of Internal Financial Controls Over Financial Reporting issued by the Institute of Chartered Accountants of India.
For DELOITTE HASKINS & SELLS LLP
Chartered Accountants (Firm’s Registration No.117366W/W-100018)
N. VENKATRAM
Partner (Membership No. 71387)
Mumbai, 25th May, 2016
F-6

ANNEXURE “B” TO THE INDEPENDENT AUDITORS' REPORT
(Referred to in paragraph 2 under ‘Report on Other Legal and
Regulatory Requirements’ section of our report of even date
(i) (a) The Company has maintained proper records showing full particulars, including quantitative details and situation of fixed assets.
(b) The Company has a program of verification of fixed assets to cover all the items in a phased manner over a period of three years which, in our opinion, is reasonable having regard to the size of the Company and the nature of its assets. Pursuant to the program, certain fixed assets were physically verified by the Management during the year. According to the information and explanations given to us no material discrepancies were noticed on such verification.
(c) According to the information and explanations given to us and the records examined by us and based on the examination of the registered sale deeds, transfer deeds, mutation of title papers, property tax papers and conveyance deeds provided to us, we report that, the title deeds, comprising all the immovable properties of land and buildings which are freehold, are held in the name of the Company as at the balance sheet date, except the following:
i. in respect to freehold land amounting to`3.4 million the title deeds of which are held in the name of erstwhile companies which have subsequently been amalgamated with the Company;
ii. title deeds to freehold land amounting to `22,579 were not in the name of the Company;
iii. title deeds to freehold land amounting to`0.3 million which have not been executed.
iv. title deeds to freehold land with carrying amount of `67.4 million were not readily available; and
v. title deeds to buildings with gross carrying amount
and net carrying amount of `48.1 million and`25.6 million respectively were not readily available.
In respect of immovable properties of land and buildings that have been taken on lease and disclosed as fixed assets in the financial statements, the lease agreements are in the name of the Company, where the Company is the lessee in the agreement, except the following:
i. in respect of certain leasehold lands with gross and net carrying amount of `551.1 million and `492.5 millionrespectively, in which the lease agreement are in the name of the erstwhile Company which have been subsequently amalgamated with the Company.
ii. lease agreements for leasehold land with gross carrying amount and net carrying amount of `1.9 million and`1.3 million were not readily available.
(ii) As explained to us, inventories of finished and semi-finished goods and raw materials at Works, Mines and Collieries were physically verified during the year by the Management. In respect of inventories of stores and spare parts and stocks at stockyards and with consignment/ conversion agents, the Company has a programme of verification of stocks over a three year period. In case of materials lying with third parties, certificates for stocks held have been received. In our opinion and according to the information and explanations given to us, the inventories have been verified by the management at reasonable intervals in relation to size of the Company and nature of business and no material discrepancies were noticed on physical verification.
(iii) According to the information and explanations given to us, the Company has granted loans, secured or unsecured, to companies, firms, Limited Liability Partnerships or other parties covered in the register maintained under section 189 of the Companies Act, 2013, in respect of which:
(a) The terms and conditions of the grant of such loans are, in our opinion, prima facie, not prejudicial to the Company’s
F-7

interest except an intercorporate deposit of `221.3 million placed with a subsidiary company which is not a going concern.
(b) The schedule of repayment of principal and payment of interest has been stipulated and the repayments of principal amounts and interest have been regular as per stipulations except for loans and interest amounting to `5,555.1 million and interest amounting to `1,709.5 million representing due from two subsidiary companies.
(c) Amounts referred to (b) above have been overdue for more than 90 days and, as explained to us, the Management has taken reasonable steps for recovery of the principal amounts and interest thereon.
(iv) In our opinion and according to the information and explanations given to us, the Company has complied with the provisions of Sections 185 and 186 of the Companies Act, 2013 in respect of grant of loans, making investments and providing guarantees and securities, as applicable.
(v) According to the information and explanations given to us, the Company has not accepted any deposit during the year. In respect of unclaimed deposits, the Company has complied with the provisions of Sections 73 to 76 or any other relevant provisions of the Companies Act, 2013.
(vi) The maintenance of cost records has been specified by the Central Government under section 148(1) of the Companies Act, 2013. We have broadly reviewed the cost records maintained by the Company pursuant to the Companies (Cost Records and Audit) Rules, 2014, as amended and The Cost Accounting Records (Electricity Industry) Rules, 2011 prescribed by the Central Government under sub – section (1) of Section 148 of the Companies Act, 2013, and are of the opinion that, prima facie, the prescribed cost records have been made and maintained. We have, however, not made a detailed examination of the cost records with a view to determine whether they are accurate or complete.
(vii) According to the information and explanations given to us, in respect of statutory dues :
(a) The Company has generally been regular in depositing undisputed statutory dues, including Provident Fund, Employees’ State Insurance, Income-tax, Sales Tax, Service Tax, Customs Duty, Excise Duty, Value Added Tax, Cess and other material statutory dues applicable to it with the appropriate authorities. We are informed that the Company intends to obtain exemption from operations of Employees’ State Insurance Act at some locations and necessary steps have been taken by the Company. We are also informed that actions taken by the authorities at some locations to bring the employees of the Company under the Employees’ State Insurance Scheme has been contested by the Company and full payment has not been made of the contributions demanded.
(b) There were no undisputed amounts payable in respect of Provident Fund, Employees’ State Insurance, Income-tax, Sales Tax, Service Tax, Customs Duty, Excise Duty, Value Added Tax, Cess and other material statutory dues in arrears as at 31st March, 2016 for a period of more than six months from the date they became payable, except for collection of sales tax which we are informed are refundable to customers because they have been collected in excess or which have been collected pending receipt of necessary certificates from the customers and Jharkhand value added tax liability of `179.7 millionon account of provision for input tax credit surrender pursuant to notification issued by the state.
F-8

(c) Details of dues of Income-tax, Sales Tax, Service Tax, Customs Duty, Excise Duty, Value Added Tax which have not been deposited as on 31st March, 2016 on account of disputes are given below:
Name of the
Statute
(Nature of Dues)
Forum where Dispute
is pendingPeriod to which the amount relates
Amount (net
of payments)
(` million)
Amounts paid
under Protest
(` million)
Income TaxCIT(A)/ITAT 2004-05, 2006-07 to 2009-2010 6,689.0 6,417.6
Income Tax Officer 2010-11 6.7 -
Customs Act
Supreme Court 1990-91 & 1993-94 97.1 -
High Court 2002-03 0.2 0.7
Commissioner 1993-94 & 2014-15 835.9 500.0
Central Excise Act
Supreme Court 2004-05 2,354.8 -
High Court 1988-90, 1995-96, 2000-01 & 2003-06 1,019.7 19.7
Tribunal 1990-91, 1992-94, 1996-97 & 1998-99 to 2015-16 10,602.1 425.0
Commissioner 1988-90, 1994-95 to 2003-04 & 2005-06 to 2015-16 452.9 13.7
Deputy Commissioner 1985-87 & 1998-99 1.8 -
Assistant Commissioner 1983-2006 8.5 -
Sales Tax
Supreme Court 1969-73, 2000-04 & 2006-16 59.1 1,122.0
High Court 1971-75, 1977-79, 1983-84, 1991-97,1999-2004, 2007-10 & 2012-16 2,806.4 2,71.3
Tribunal 1980-81, 1983-85, 1989-99, 2001-12 739.6 181.9
Commissioner 1988-90, 1991- 92, 1993-95, 2000-01 to 2014-15 5,311.0 88.0
Deputy Commissioner 1975-76, 1977-82, 1983-88 & 1993-94 to 2015-16 727.5 129.3
Assistant Commissioner1973-74, 1980-81, 1983-84 to 1996-97,
2000-01 to 2005-06 & 2008-09 to 2009-10
93.7 34.8
F-9

(viii) In our opinion and according to the information and explanations given to us, the Company has not defaulted in the repayment of loans or borrowings to financial institutions, banks and government and dues to debenture holders.
(ix) In our opinion and according to the information and explanations given to us, term loans taken have been applied by the Company during the year for the purposes for which they were raised, other than temporary deployment pending application of proceeds.
(x) To the best of our knowledge and according to the information and explanations given to us, no fraud by the Company and no material fraud on the Company by its officers or employees has been noticed or reported during the year.
(xi) In our opinion and according to the information and explanations given to us, the Company has paid / provided managerial remuneration in accordance with the requisite approvals mandated by the provisions of section 197 read with Schedule V to the Companies Act, 2013.
(xii) The Company is not a Nidhi Company and hence reporting under clause (xii) of the CARO 2016 Order is not applicable.
(xiii) In our opinion and according to the information and explanations given to us the Company is in compliance with Section 177 and 188 of the Companies Act, 2013, where applicable, for all transactions with the related parties and the details of related party transactions have been disclosed
in the financial statements as required by the applicable accounting standards.
(xiv) During the year the Company has not made any preferential allotment or private placement of shares or fully or partly convertible debentures and hence reporting under clause (xiv) of CARO 2016 is not applicable to the Company.
(xv) In our opinion and according to the information and explanations given to us, during the year the Company has not entered into any non-cash transactions with its directors or directors of its holding, subsidiary or associate Company or persons connected with them and hence provisions of section 192 of the Companies Act, 2013 are not applicable.
(xvi) The Company is not required to be registered under section 45-IA of the Reserve Bank of India Act, 1934.
For DELOITTE HASKINS & SELLS LLP
Chartered Accountants (Firm’s Registration No.117366W/W-100018)
N. VENKATRAM
Partner (Membership No. 71387)
Mumbai, 25th May, 2016
F-10

BALANCE SHEET AS AT 31ST MARCH, 2016
(` in million)
Note As at
31st March, 2016
As at
31st March, 2015
Equity and Liabilities(1) SHAREHOLDERS’ FUNDS (a) Share capital 2 9,714.1 9,714.1 (b) Reserves and surplus 3 6,95,053.1 6,56,924.8
7,04,767.2 6,66,638.9(2) HYBRID PERPETUAL SECURITIES 4 22,750.0 22,750.0(3) NON-CURRENT LIABILITIES
(a) Long-term borrowings 5 2,34,577.7 2,39,003.7 (b) Deferred tax liabilities (net) 6 21,798.3 22,504.1 (c) Other long-term liabilities 7 8,426.6 11,288.7 (d) Long-term provisions 8 28,881.8 28,759.2
2,93,684.4 3,01,555.7(4) CURRENT LIABILITIES (a) Short-term borrowings 5 52,610.2 348.8 (b) Trade payables 9 (i) Total outstanding dues of micro enterprises and
small enterprises; and149.0 165.1
(ii) Total outstanding dues of creditors other than micro enterprises and small enterprises
76,912.3 57,854.7
77,061.3 58,019.8 (c) Other current liabilities 10 61,158.1 92,569.1 (d) Short-term provisions 8 20,050.3 16,754.1
2,10,879.9 1,67,691.812,32,081.5 11,58,636.4
Assets(5) NON-CURRENT ASSETS (a) Fixed assets (i) Tangible assets 11 2,49,012.4 2,50,713.8 (ii) Intangible assets 12 5,273.5 1,771.4 (iii) Capital work-in-progress 2,69,539.0 2,30,236.1 (iv) Intangibles assets under development 284.7 130.6
5,24,109.6 4,82,851.9 (b) Non-current investments 13 5,23,604.2 5,21,642.4 (c) Long-term loans and advances 14 37,878.8 32,079.0 (d) Other non-current assets 15 2,274.0 2,117.5
10,87,866.6 10,38,690.8(6) CURRENT ASSETS (a) Current investments 16 43,201.7 10,000.8 (b) Inventories 17 70,838.1 80,420.0 (c) Trade receivables 18 6,328.0 4,914.6 (d) Cash and bank balances 19 10,146.7 4,785.9 (e) Short-term loans and advances 14 12,434.8 19,271.6 (f) Other current assets 20 1,265.6 552.7
1,44,214.9 1,19,945.612,32,081.5 11,58,636.4
Notes to Balance Sheet and Statement of Profit and Loss 1-46
F-11

STATEMENT OF PROFIT AND LOSS FOR THE YEAR ENDED 31ST MARCH, 2016
(` in million)
NoteYear ended
31st March, 2016
Year ended
31st March, 2015
(1) Revenue
(a) Revenue from operations 21 4,26,862.9 4,65,772.6Less: Excise duty 44,759.5 47,922.6
3,82,103.4 4,17,850.0(b) Other income 22 38,907.0 5,827.8
Total Revenue 4,21,010.4 4,23,677.8
(2) Expenses
(a) Raw materials consumed 23 97,000.1 1,16,786.0(b) Purchase of finished, semi-finished and other products 24 9,915.4 6,883.2(c) Changes in inventories of finished goods, work-in-progress and
stock-in-trade25 1,429.7 (7,159.4)
(d) Employee benefits expense 26 43,249.0 46,019.2(e) Depreciation and amortisation expense 27 19,331.1 19,975.9(f ) Finance costs 28 14,602.7 19,759.5(g) Other expenses 29 1,64,380.6 1,61,099.9
3,49,908.6 3,63,364.3(h) Less: Expenditure (other than interest) transferred to capital and
other accounts5,988.9 5,866.9
Total Expenses 3,43,919.7 3,57,497.4
(3) Profit before Exceptional Items and Tax 77,090.7 66,180.4
(4) Exceptional Items 30(a) Profit on sale of non-current investments 1,042.9 8,061.0(b) Profit on sale of non-current assets – 11,468.6(c) Provision for diminution in the value of investments/ doubtful
advances(1,990.3) (1,984.0)
(d) Provision / Reversal for impairment of non-current assets (515.1) 1,362.9(e) Provision for demands and claims (8,800.5) –(f ) Employee Seperation Compensation (5,562.5) –
(15,825.5) 18,908.5
(5) Profit before Tax 61,265.2 85,088.9
(6) Tax Expense
(a) Current tax 14,330.6 19,086.0(b) MAT credit (1,521.7) (1,172.1)(c) Deferred tax (553.2) 2,783.8
12,255.7 20,697.7
(7) Profit after Tax 49,009.5 64,391.2
(8) Nominal Value per Share (`) 10.00 10.00
(9) Basic Earnings per Share (`) 31 48.67 64.49
(10) Diluted Earnings per Share (`) 31 48.67 64.49
Notes to Balance Sheet and Statement of Profit and Loss 1-46
F-12

CASH FLOW STATEMENT FOR THE YEAR ENDED 31ST MARCH, 2016
(` in million)Year ended
31st March, 2016
Year ended
31st March, 2015
A. Cash Flow from Operating Activities:
Profit before tax 61,265.2 85,088.9
Adjustments for: Depreciation and amortisation expense 19,331.1 19,975.9 Impairment of fixed assets – 515.0 Income from other non-current investments (1,070.8) (1,196.0) (Profit)/Loss on assets sold/discarded/written off 21.1 (9.7) Provision for diminution in value of investments – 0.1 Profit on sale of non-current investments (35,075.2) (17.0) Exceptional (Income) / Expenses 15,825.5 (18,908.5) (Gain)/Loss on cancellation of forwards, swaps and options 12.1 774.1 Interest and other income from current investments and guarantees (2,665.1) (4,891.3) Finance costs 14,602.7 19,759.5 Provision for wealth tax – 20.0 Exchange (gain) / loss on revaluation of foreign currency loans and
swaps55.9 5,468.3
11,037.3 21,490.4
Operating Profit before Working Capital Changes 72,302.5 1,06,579.3
Adjustments for: Trade and other receivables 379.7 (12,505.0) Inventories 9,597.0 (19,942.8) Trade payables and other liabilities 5,838.6 (5,079.8)
15,815.3 (37,527.6)
Cash Generated from Operations 88,117.8 69,051.7
Direct tax paid (12,441.0) (20,532.8)
Net Cash Flow from/(used in) Operating Activities 75,676.8 48,518.9
B. Cash Flow from Investing Activities:
Purchase of fixed assets(1) (58,280.5) (69,225.8) Sale of fixed assets 302.0 10,501.2 Advance received against sale of asset 19.3 3.5 Purchase of other non-current investments (4,233.8) (2,248.1) Purchase of investments in subsidiaries (1,712.8) (805.3) Sale of Investments in Subsidiaries 0.6 666.3 Sale of other non-current investments 39,803.5 12,357.6 (Purchase) / Sale of current investments (net) (31,396.9) 17,499.7 Inter-corporate deposits given (446.9) (20.0) Repayment of inter-corporate deposits 629.2 4,769.1 Fixed/Restricted deposits with banks (placed)/realised (19.8) (106.5) Interest received 213.1 1,557.4 Dividend received 1,070.8 1,229.9Net Cash Flow from/(used in) Investing Activities (54,052.2) (23,821.0)
F-13

(` in million)Year ended
31st March, 2016
Year ended
31st March, 2015
C. Cash Flow from Financing Activities:
Capital contributions received 79.0 101.9 Proceeds from borrowings 88,933.5 71,210.4 Repayment of borrowings (77,545.5) (67,242.6) Amount received/(paid) on cancellation of forwards and swaps (29.6) (790.8) Expenses (incurred) /reimbursed on issue of equity instruments 33.6 38.9 Distribution on Hybrid Perpetual Securities (2,664.9) (2,661.3) Interest paid (1) (15,853.8) (18,917.5) Dividend paid (7,769.7) (9,712.1) Tax on dividend paid (1,493.0) (1,599.0)Net Cash Flow from/(used in) Financing Activities (16,310.4) (29,572.1)
Net increase/(decrease) in Cash and Cash Equivalents 5,314.2 (4,874.2)
Opening Cash and Cash Equivalents 4,219.3 9,093.3
Effect of exchange rate on translation of foreign currency
cash and cash equivalents
(1.2) 0.2
Closing Cash and Cash Equivalents 9,532.3 4,219.3
Additional information:
(1) Interest paid is exclusive of and purchase of fixed assets is inclusive of interest capitalised `10,325.6 million (2014-15: `6,472.5 million)
(2) Previous year figures have been recast / restated where necessary.
F-14

NOTES FORMING PART OF THE FINANCIAL STATEMENTS
1. Accounting Policies
(A) BASIS FOR ACCOUNTING
The financial statements are prepared under the historical cost convention on an accrual basis of accounting in accordance with the Generally Accepted Accounting Principles, Accounting Standards notified under Section 133 of the Companies Act, 2013 and the relevant provisions thereof.
(B) USE OF ESTIMATES AND JUDGEMENTS
In preparation of the financial statements, the Company makes judgements, estimates and assumptions about the carrying amounts of assets and liabilities that are not readily apparent from other sources. The estimates and the associated assumptions are based on historical experience and other factors that are considered to be relevant. Actual results may differ from these estimates.
The estimates and the underlying assumptions are reviewed on an ongoing basis. Revisions to accounting estimates are recognised in the period in which the estimate is revised and future periods affected. Significant judgements and estimates relating to the carrying amounts of assets and liabilities include useful lives of tangible and intangible assets, impairment of tangible assets, intangible assets, employee benefits and other provisions and recoverability of deferred tax assets. Long term investments are tested for decline in value which is other than temporary when there are any indicators of impairment. Any change in the underlying assumptions used such as discount rate or growth rate may have an impact on the carrying value of such long term investments.
(C) REVENUE RECOGNITION
(i) Revenue from sale of goods is recognised net of rebates and discounts on transfer of significant risks and rewards of ownership to the buyer. Sale of goods is recognised gross of excise duty but net of sales tax and value added tax.
(ii) Export incentive under various schemes notified by the Government has been recognised on the basis of amount received.
(iii) Dividend is recorded when the right to receive payment is established. Interest income is
recognised on time proportion basis taking into account the amount outstanding and the rate applicable.
(D) EMPLOYEE BENEFITS
(i) Short-term employee benefits are recognised as an expense at the undiscounted amount in the Statement of Profit and Loss of the year in which the employee has rendered services.
(ii) For defined-benefit plans, the amount recognised in the Balance Sheet is the present value of the defined-benefit obligation less the fair value of any plan assets and any past service costs not yet recognised. The present value of the defined-benefit obligation is the present value of expected future payments required to settle the obligation resulting from employee service in the current and prior periods. The discount rate used is the market yields on government bonds at the Balance Sheet date with remaining terms to maturity approximating those of the Company’s obligations.
(iii) Other long-term employee benefits are recognised as an expense in the Statement of Profit and Loss of the year in which the employee has rendered services. Estimated liability on account of long-term benefits is discounted to the present value, using the market yield on Government Bonds, as on the date of Balance Sheet.
(iv) Actuarial gains and losses in respect of post employment and other long-term benefits are charged to the Statement of Profit and Loss.
(v) In respect of the Employee Separation Scheme, the increase in the net present value of the future liability for pension payable to employees, who have opted for retirement under the Employee Separation Scheme of the Company, is charged to the Statement of Profit and Loss.
1. Accounting Policies (contd.)
(E) TANGIBLE ASSETS
Tangible assets are stated at cost less accumulated depreciation and net of impairment, if any. Trial run expenses
F-15

NOTES FORMING PART OF THE FINANCIAL STATEMENTS
(net of revenue) are capitalised. Borrowing costs during the period of construction is added to the cost of eligible tangible assets.
Major expenses on relining of furnace are capitalised. The written down value of the asset consisting of lining/relining expenditure embedded in the cost of the furnace is written off in the year of fresh relining.
(F) INTANGIBLE ASSETS
Intangible assets are stated at cost less accumulated amortisation and net of impairments, if any. An intangible asset is recognised if it is probable that the expected future economic benefits that are attributable to the asset will flow to the Company and its cost can be measured reliably. Intangible assets having finite useful lives are amortised on a straight-line basis over their estimated useful lives.
(G) DEPRECIATION AND AMORTISATION
Depreciation is provided on a straight line basis over the useful lives of assets, which is as stated in Schedule II of Companies Act 2013 or based on technical estimate made by the Company. However, assets value upto `25,000 are fully depreciated in the year of acquisition. The details of estimated life for each category of asset are as under:
(i) Buildings – 30 to 60 years (ii) Roads – 5 years (iii) Plant and Machinery used in manufacturing of Steel – 20
years* (iv) Other Plant and Machinery – 6 to 40 years* (v) Railway Sidings – 20 years* (vi) Vehicles and Aircraft – 5 to 20 years (vii) Furniture, Fixtures and Office Equipments – 4 to 6 years (viii) Computer Software – 5 years (ix) Assets covered under Electricity Act (life as prescribed
under the Electricity Act) – 3 to 34 years (x) Development of property for development of mines
and collieries are amortised over the useful life of the mine or lease period whichever is lower.
(xi) Major furnace relining expenses are depreciated over a period of 10 years (average expected life).
(xii) Freehold land is not depreciated. (xiii) Leasehold land and other leasehold assets are amortised
over the life of the lease.
*For these class of assets, based on internal assessment and independent technical evaluation carried out by external valuers the Company believes that the useful lives as given above best represent the period over which Company expects to use these assets. Hence the useful lives for these assets are different from the useful lives as prescribed under Part C of Schedule II of the Companies Act 2013.
(H) IMPAIRMENT
Fixed assets are reviewed for impairment whenever events or changes in circumstances indicate that their carrying amount may not be recoverable.
An impairment loss is recognised in the Statement of Profit and Loss if the carrying amount of an asset exceeds its recoverable amount. Recoverable amount is the higher of an asset’s net selling price and value in use.
An impairment loss recognised on asset is reversed when the conditions warranting impairment provision no longer exists.
(I) LEASES
A lease is classified at the inception date as finance lease or an operating lease. A lease that transfers substantially all the risks and rewards incidental to ownership to the Company is classified as a finance lease.
The Company as a lessee (i) Operating lease - Rentals payable under operating
leases are charged to the statement of profit and loss on a straight line basis over the term of the relevant lease.
(ii) Finance lease - Finance leases are capitalised at the commencement of lease, at the lower of the fair value of the property or the present value of the minimum lease payments. The corresponding liability to the lessor is included in the balance sheet as a finance lease obligation. Lease payments are apportioned between finance charges and reduction of the lease obligation so as to achieve a constant rate of interest on the remaining balance of the liability. Finance charges are charged directly against income over the period of the lease.
The Company as a lessor (i) Operating lease - Rental income from operating leases
is recognised in the statement of profit and loss on a straight line basis over the term of the relevant lease.
(ii) Finance lease – Amounts due from lessees under finance leases are recorded as receivables at the Company’s net investment in the leases. Finance lease income is allocated to accounting periods so as to reflect a constant periodic rate of return on the net investment outstanding in respect of the lease.
F-16

NOTES FORMING PART OF THE FINANCIAL STATEMENTS
(J) FOREIGN CURRENCY TRANSACTIONS
Transactions in foreign currency are recorded at the rate of exchange prevailing on the date of transaction. Year-end balance of foreign currency monetary item is translated at the year-end rates. Exchange differences arising on settlement of monetary items or on reporting of monetary items at rates different from those at which they were initially recorded during the period or reported in previous financial statements are recognised as income or expense in the period in which they arise.
The Company has elected to account for exchange differences arising on reporting of long-term foreign currency monetary items in accordance with Companies (Accounting Standards) Amendment Rules, 2009 pertaining to Accounting Standard 11 (AS-11) notified by Government of India on 31st March, 2009 (as amended on 29th December, 2011). Accordingly, the effect of exchange differences on foreign currency loans of the Company is accounted by addition or deduction to the cost of the assets so far it relates to depreciable capital assets and in other cases by transfer to “Foreign Currency Monetary Item Translation Difference Account” to be amortised over the balance period of the long-term monetary items.
Exchange differences relating to monetary items that are in substance forming part of the Company’s net investment in non-integral foreign operations are accumulated in Foreign Exchange Fluctuation Reserve Account.
Foreign currency monetary items that are used as hedge instruments or hedged items are accounted as per accounting policy on derivative financial instruments.
(K) DERIVATIVE FINANCIAL INSTRUMENTS
(i) The Company uses derivative financial instruments such as forwards, swaps and options, to hedge its risks associated with foreign exchange fluctuations. Such derivative financial instruments are used as risk management tools and not for speculative purposes.
(ii) Derivative financial instruments entered into for hedging foreign exchange risks of recognised foreign currency monetary items are accounted for as per the principles laid down in Accounting Standard - 11 “The effects of changes in Foreign Rates”.
(iii) For derivative financial instruments and foreign currency monetary items designated as Cash Flow hedges, the effective portion of the fair value of the derivative
financial instruments are recognised in Cash Flow Hedge Reserve and reclassified in the period in which the Statement of Profit and Loss is impacted by the hedged items. In cases where the exposure gives rise to a non-financial asset, the effective portion is reclassified from Hedging Reserve to the initial carrying amount of the non-financial asset as a ‘basis adjustment’ and recycled to the Statement of Profit and Loss when the respective non-financial asset affects the Statement of Profit and Loss in future periods. The ineffective portion of the change in fair value of such instruments is recognised in the Statement of Profit and Loss in the period in which they arise. Hedge accounting is discontinued when the hedging instrument expires or is sold, terminated, or exercised, or no longer qualifies for hedge accounting. For forecasted transactions, any cumulative gain or loss on the hedging instrument recognised in Cash Flow Hedge Reserve is retained there until the forecasted transaction occurs.
If the forecasted transaction is no longer expected to occur, the net cumulative gain or loss recognised in Cash Flow Hedge Reserve is immediately transferred to the Statement of Profit and Loss.
(iv) If no hedging relationship is designated, the fair value of the derivative financial instruments is marked to market through the Statement of Profit and Loss.
(L) INVESTMENTS
Long-term investments are carried at cost less provision for diminution other than temporary, if any, in value of such investments. Current investments are carried at lower of cost and fair value.
(M) INVENTORIES
Finished and semi-finished products produced and purchased by the Company are carried at lower of cost and net realisable value.
Work-in-progress is carried at lower of cost and net realisable value.
Coal, iron ore and other raw materials produced and purchased by the Company are carried at lower of cost and net realisable value.
1. Accounting Policies (contd.)
F-17

NOTES FORMING PART OF THE FINANCIAL STATEMENTS
Stores and spare parts are carried at cost. Necessary provision is made and expensed in case of identified obsolete and non-moving items.
Cost of inventories is generally ascertained on the ‘weighted average’ basis. Work-in-progress and finished and semi-finished products are valued on full absorption cost basis.
(N) RELINING EXPENSES
Relining expenses other than major expenses on furnace relining are charged as an expense in the Statement of Profit and Loss in the year in which they are incurred.
(O) RESEARCH AND DEVELOPMENT
Research and Development costs (other than cost of fixed assets acquired) are charged as an expense in the Statement of Profit and Loss in the year in which they are incurred.
(P) DEFERRED TAX
Deferred Tax is accounted for by computing the tax effect of timing differences, subject to the consideration of prudence in respect of deferred tax assets, which arise during the year and reverse in subsequent periods. Deferred tax is measured at substantively enacted tax rates by the Balance Sheet date.
2. Share Capital
(` in million) As at
31st March, 2016
As at
31st March, 2015
AUTHORISED:
1,75,00,00,000 Ordinary Shares of `10 each (31.03.2015: 1,75,00,00,000 Ordinary Shares of `10 each)
17,500.0 17,500.0
35,00,00,000 “A” Ordinary Shares of `10 each (31.03.2015: 35,00,00,000 “A” Ordinary Shares of `10 each)
3,500.0 3,500.0
2,50,00,000 Cumulative Redeemable Preference Shares of `100 each (31.03.2015: 2,50,00,000 Shares of `100 each)
2,500.0 2,500.0
60,00,00,000 Cumulative Convertible Preference Shares of `100 each (31.03.2015: 60,00,00,000 Shares of `100 each)
60,000.0 60,000.0
83,500.0 83,500.0
ISSUED:
97,21,26,020 Ordinary Shares of `10 each (31.03.2015: 97,21,26,020 Ordinary Shares of `10 each)
9,721.3 9,721.3
Subscribed and Paid up:
97,12,15,439 Ordinary Shares of `10 each fully paid up (31.03.2015: 97,12,15,439 Ordinary Shares of `10 each)
9,712.1 9,712.1
Amount paid up on 3,89,516 Ordinary Shares forfeited (31.03.2015: 3,89,516 Shares of `10 each)
2.0 2.0
9,714.1 9,714.1
1. Accounting Policies (contd.)
F-18

NOTES FORMING PART OF THE FINANCIAL STATEMENTS
Additional information:(1) The movement in subscribed and paid up share capital is set out below:
As at
31st March, 2016
As at
31st March, 2015
No. of shares (` in million) No. of shares (` in million)
Ordinary Shares of `10 each
At beginning of the year 97,12,15,439 9,712.1 97,12,15,405 9,712.1Shares allotted during the year – – 34 (a) –
97,12,15,439 9,712.1 97,12,15,439 9,712.1 (a) (i) 20 Ordinary Shares of face value of `10 per share allotted on 1st December, 2014 at a premium of `290 per share to
shareholders whose shares were kept in abeyance in the Rights issue made in 2007. (ii) 14 Ordinary Shares of face value of `10 per share allotted on 1st December, 2014 at a premium of `590 per share to
holders of Cumulative Convertible Preference Shares in the ratio of 6:1 on conversion whose shares were kept in abeyance in the Rights issue made in 2007.
(b) The balance Ordinary Shares kept in abeyance are 3,01,183 (31.03.2015: 3,01,183) in respect of Rights issue of 2007.
(2) Shareholders holding more than 5 percent shares in the Company:
As at
31st March, 2016
As at
31st March, 2015
No. of Ordinary
Shares
% No. of Ordinary
Shares
%
Name of shareholders
(a) Tata Sons Limited 28,88,98,245 29.75% 28,88,98,245 29.75%(b) Life Insurance Corporation of India 14,17,39,415 14.59% 14,17,39,185 14.59%
(3) 2,25,14,584 shares (31.03.2015: 1,79,07,847 shares) of face value of `10 per share represent the shares underlying GDRs which were issued during 1994 and 2009. Each GDR represents one underlying Ordinary Share.
(4) The rights, powers and preferences relating to each class of share capital and the qualifications, limitations and restrictions thereof are contained in the Memorandum and Articles of Association of the Company. The principal rights are as follows:
A. ORDINARY SHARES OF `10 EACH
(a) In respect of every Ordinary Share (whether fully paid or partly paid), voting right shall be in the same
proportion as the capital paid up on such Ordinary Share bears to the total paid up Ordinary Capital of the Company.
(b) The dividend proposed by the Board of Directors is subject to the approval of the shareholders in the ensuing Annual General Meeting, except in case of interim dividend.
(c) In the event of liquidation, the shareholders
of Ordinary Shares are eligible to receive the remaining assets of the Company after distribution of all preferential amounts, in proportion to their shareholding.
2. Share Capital (Contd.)
F-19

NOTES FORMING PART OF THE FINANCIAL STATEMENTS
B. ‘A’ ORDINARY SHARES OF `10 EACH
(a) (i) The holders of ‘A’ Ordinary Shares shall be entitled to such rights of voting and/or dividend and such other rights as per the terms of the issue of such shares, provided always that :
− in the case where a resolution is put to vote on a poll, such differential voting entitlement (excluding fractions, if any) will be applicable to holders of ‘A’ Ordinary Shares.
− in the case where a resolution is put to vote in the meeting and is to be decided on a show of hands, the holders of ‘A’ Ordinary Shares shall be entitled to the same number of votes as available to holders of Ordinary Shares
(ii) The holders of Ordinary Shares and the holders of ‘A’ Ordinary Shares shall vote as a single class with respect to all matters submitted for voting by shareholders of the Company and shall exercise such votes in proportion to the voting rights attached to such shares including in relation to any scheme under Sections 391 to 394 of the Companies Act, 1956.
(b) The holders of ‘A’ Ordinary Shares shall be entitled to dividend on each ‘A’ Ordinary Share which may be equal to or higher than the amount per Ordinary Share declared by the Board for each Ordinary Share, and as may be specified at the time of the issue. Different series of ‘A’ Ordinary Shares may carry different entitlements to dividend to the extent permitted under applicable law and as prescribed under the terms applicable to such issue.
C. PREFERENCE SHARES
The Company has two classes of preference shares i.e. Cumulative Redeemable Preference Shares (CRPS) of `100 per share and Cumulative Convertible Preference Shares (CCPS) of `100 per share.
(a) Such shares shall confer on the holders thereof, the right to a fixed preferential dividend from the date of allotment, at a rate as may be determined by the Board at the time of the issue, on the capital for the time being paid up or credited as paid up thereon.
(b) Such shares shall rank for capital and dividend (including all dividend undeclared upto the commencement of winding up) and for repayment of capital in a winding up, pari passu inter se and in priority to the Ordinary Shares of the Company, but shall not confer any further or other right to participate either in profits or assets. However, in case of CCPS, such preferential rights shall automatically cease on conversion of these shares into Ordinary Shares.
(c) The holders of such shares shall have the right to receive all notices of general meetings of the Company but shall not confer on the holders thereof the right to vote at any meetings of the Company save to the extent and in the manner provided in the Companies Act, 1956, or any re-enactment thereof.
(d) CCPS shall be converted into Ordinary Shares as per the terms, determined by the Board at the time of issue; as and when converted, such Ordinary Shares shall rank pari passu with the then existing Ordinary Shares of the Company in all respects.
2. Share Capital (Contd.)
F-20

NOTES FORMING PART OF THE FINANCIAL STATEMENTS
3. Reserves and Surplus
(` in million) As at
31st March, 2016
As at
31st March, 2015
(A) CAPITAL RESERVE
Balance as per last account 14.9 14.9
(B) CAPITAL REDEMPTION RESERVE
Balance as per last account 207.8 207.8
(C) SECURITIES PREMIUM RESERVE
Balance as per last account 1,78,528.0 1,78,423.7 Expenses/reimbursement related to GDR – 38.9 Effect of tax rate changes on items adjusted against reserves – 65.4 1,78,528.0 1,78,528.0
(D) DEBENTURE REDEMPTION RESERVE
Balance as per last account 20,460.0 20,460.0
(E) AMALGAMATION RESERVE
Balance as per last account 2.6 2.6
(F) EXPORT PROFITS RESERVE
Balance as per last account 12.5 12.5
(G) FOREIGN EXCHANGE FLUCTUATION RESERVE
Balance as per last account 140.0 140.0
(H) CONTRIBUTIONS FOR CAPITAL EXPENDITURE
Balance as per last account 687.8 599.5 Received/Capitalised during the year 111.4 88.3
799.2 687.8
(I) CONTINGENCY RESERVE
Balance as per last account 1,000.0 1,000.0
(J) DEBENTURE FORFEITURE RESERVE
Balance as per last account 0.4 0.4
(K) CASH FLOW HEDGE RESERVE(1)
Balance as per last account (17.4) (158.4) Changes recognised (net of tax) 11.9 141.0
(5.5) (17.4)
(L) GENERAL RESERVE
Balance as per last account 1,15,963.6 1,09,524.5 Transfer from Surplus in Statement of Profit and Loss – 6,439.1
1,15,963.6 1,15,963.6
(M) FOREIGN CURRENCY MONETARY ITEM TRANSLATION DIFFERENCE
ACCOUNT(2)
Balance as per last account 1.2 (2,767.5) Exchange gain/(loss) during the year – (856.5) Amortisation during the year (1.2) 3,625.2
– 1.2
F-21

NOTES FORMING PART OF THE FINANCIAL STATEMENTS
3. Reserves and Surplus (Contd.)
Additional information:
(` in million) As at
31st March, 2016
As at
31st March, 2015
(1) (a) Opening Balance of Cash Flow Hedge Reserve (17.4) (158.4)Add: Effective portion of changes in fair value of cash flow hedges (48.6) (185.9)Less: Amount subsequently adjusted against cost of inventory 66.7 317.7Gross Balance of Cash Flow Hedge Reserve 0.7 (26.6)Add: Deferred tax on above (6.2) 9.2Net Balance of Cash Flow Hedge Reserve (5.5) (17.4)
(b) The amount recognised in Cash Flow Hedge Reserve is expected to impact Statement of Profit and Loss within the next one year.
(c) Ineffective portion taken to Statement of Profit and Loss during the year `0.5 million (31.03.2015: `4.4 million).
(2) The Company has elected to account for exchange differences arising on reporting of long-term foreign currency monetary item in accordance with Companies (Accounting Standards) Amendment Rules 2009 pertaining to Accounting Standard 11 (AS-11) notified by Government of India on 31st March, 2009 (as amended on 29th December, 2011) which allows foreign exchange differences on long-term monetary items arising on or after 1st April, 2011 to be capitalised to the extent they relate to acquisition of depreciable assets and in other cases to amortise over the balance period of the respective monetary items. As on 31st March, 2016, Nil (31.03.2015: `1.2 million) remains to be amortised in the “Foreign Currency Monetary Item Translation Difference Account”.
(3) During the year ended 31st March, 2015, the Company had revised depreciation rate on certain fixed assets as per the useful life specified in the Companies Act, 2013 or re-assessed by the Company based on technical evaluation. Accordingly, depreciation of ̀ 1,278.0 million (net of deferred tax of ̀ 667.4 million) on account of assets with no remaining useful life as on 1st April, 2014 had been adjusted to retained earnings.
Had there been no change in useful life of assets, depreciation for the year ended 31st March, 2015 would have been higher by `348.7 million.
(` in million) As at
31st March, 2016
As at
31st March, 2015
(N) SURPLUS IN THE STATEMENT OF PROFIT AND LOSS
Balance as per last account 3,39,923.4 2,94,305.8 Profit for the year 49,009.5 64,391.2 Adjustment on account of Schedule II of the Companies Act, 2013
(Net of Tax)(3)
– (1,278.0)
Distribution on Hybrid Perpetual Securities [net of tax of `921.1 million (2014-15: `904.5 million)]
(1,740.6) (1,756.6)
Proposed dividend on Ordinary Shares (7,769.7) (7,769.7) Tax on dividend (1,493.0) (1,530.2) Transfer to General Reserve – (6,439.1)
3,77,929.6 3,39,923.4
6,95,053.1 6,56,924.8
F-22

NOTES FORMING PART OF THE FINANCIAL STATEMENTS
4. Hybrid Perpetual Securities (` in million)
As at
31st March, 2016
As at
31st March, 2015
Hybrid Perpetual Securities 22,750.0 22,750.022,750.0 22,750.0
Additional information:(1) The Company had issued Hybrid Perpetual Securities of ̀ 7,750.0 million and ̀ 15,000.0 million in May 2011 and March 2011 respectively.
These securities are perpetual in nature with no maturity or redemption and are callable only at the option of the Company. The distribution on these securities are 11.50% p.a. and 11.80% p.a. respectively, with a step up provision if the securities are not called after 10 years. The distribution on the securities may be deferred at the option of the Company if in the six months preceding the relevant distribution payment date, the Company has not made payment on, or repurchased or redeemed, any securities ranking pari passu with, or junior to the instrument. As these securities are perpetual in nature and the Company does not have any redemption obligation, these are not classified as ‘debt’.
5. Borrowings
(` in million) As at
31st March, 2016
As at
31st March, 2015
Long-Term Short-Term Total Long-Term Short-Term Total
A. SECURED BORROWINGS
(a) Term loan(i) Joint Plant Committee – Steel
Development Fund1(a)
23,389.1 – 23,389.1 22,323.6 – 22,323.6
(b) Repayable on demand(i) From banks – – – – 2.8 2.8
23,389.1 – 23,389.1 22,323.6 2.8 22,326.4
B. UNSECURED BORROWINGS
(a) Bonds/Debentures2(a)
(i) Non-convertible debentures 99,466.4 – 99,466.4 1,03,633.0 – 1,03,633.0(b) Term loans
(i) From banks2(b) 1,11,722.2 20,000.0 1,31,722.2 1,04,557.1 – 1,04,557.1(ii) From financial institutions and others – – – 8,490.0 – 8,490.0
(c) Commercial Paper – 32,348.5 32,348.5 – – –(d) Other loans – 261.7 261.7 – 346.0 346.0
2,11,188.6 52,610.2 2,63,798.8 2,16,680.1 346.0 2,17,026.1
2,34,577.7 52,610.2 2,87,187.9 2,39,003.7 348.8 2,39,352.5
Additional information:(1) Details of outstanding secured borrowings are as follows: (a) Loan from Joint Plant Committee – Steel Development Fund which includes funded interest `6,995.8 million (31.03.2015:
`5,930.3 million). It is repayable in 16 equal semi-annual installments after completion of 4 years from the date of receipt of the last tranche.
F-23

NOTES FORMING PART OF THE FINANCIAL STATEMENTS
5. Borrowings (contd.)
It is secured by mortgages on, all present and future immovable properties wherever situated and hypothecation of movable assets, excluding land and building mortgaged in favour of Government of India under the deed of mortgage dated 13th April, 1967 and in favour of Government of Bihar under two deeds of mortgage dated 11th May, 1963, immovable properties and movable assets of the Tube Division, Bearing Division, Ferro Alloys Division and Cold Rolling Complex (West) at Tarapur and all investments and book debts of the Company subject to the prior charges created and/or to be created in favour of the bankers for securing borrowing for the working capital requirement and charges created and/or to be created on specific items of machinery and equipment procured/to be procured under Deferred Payment schemes/Bill Re-discounting schemes/Asset Credit schemes.
The Company has filed a writ petition before the High Court at Kolkata in February 2006 claiming waiver of the outstanding loan and interest and refund of the balance lying with Steel Development Fund and the matter is sub-judice. Loan from the Joint Plant Committee-Steel Development Fund includes `16,393.3 million (31.03.2015: `16,393.3 million) representing repayments and interest on earlier loans for which applications of funding are awaiting sanction is not secured by charge on movable assets of the Company.
(2) Terms of repayment of outstanding unsecured borrowings are as follows:
(a) Bonds/Debentures (i) 10.25% p.a. interest bearing 25,000 debentures of
face value `10,00,000 each are redeemable at par in 3 equal annual instalments commencing from 6th January, 2029.
(ii) 10.25% p.a. interest bearing 5,000 debentures of face value `10,00,000 each are redeemable at par in 3 equal annual instalments commencing from 22nd December, 2028.
(iii) 2.00% p.a. interest bearing 15,000 debentures of face value `10,00,000 each are redeemable at a premium of 85.03% of the face value on 23rd April, 2022.
(iv) 9.15% p.a. interest bearing 5,000 debentures of face value `10,00,000 each are redeemable at par on 24th January, 2021.
(v) 11.00% p.a. interest bearing 15,000 debentures of face value `10,00,000 each are redeemable at par on 19th May, 2019.
(vi) 10.40% p.a. interest bearing 6,509 debentures of face value `10,00,000 each are redeemable at par on 15th May, 2019.
(vii) 9.15% p.a. interest bearing 5,000 debentures of face value `10,00,000 each are redeemable at par on 24th January, 2019.
(viii) 12.50% p.a. interest bearing 12,500 debentures of face value `10,00,000 each, amounting to `4,166.7 million are redeemable at par on 19th November, 2016.
(b) Term loans from banks (i) USD 7.86 million equivalent to `520.8 million
(31.03.2015: Nil) is repayable on 1st March, 2021.
(ii) USD 200.00 million equivalent to `13,250.5
million (31.03.2015: USD 200.00 million equivalent to `1,2500.0 million) loan is repayable in 3 equal annual instalments commencing from 18th February, 2020.
(iii) Indian rupee loan amounting `20,000.0 million (31.03.2015: Nil) is repayable in 10 semi-annual instalments commencing from 30th April, 2019.
(iv) Indian rupee loan amounting `70,000.0 million (31.03.2015: `70,000.0 million) is repayable in 34 quarterly instalments commencing from 31st December, 2016.
F-24

NOTES FORMING PART OF THE FINANCIAL STATEMENTS
(v) Euro 32.42 million equivalent to `2,446.9 million (31.03.2015: Euro 37.83 million equivalent to `2,541.7 million) loan is repayable in 12 equal semi-annual instalments; the next instalment is due on 6th July, 2016.
(vi) Euro 14.08 million equivalent to `1,062.5 million (31.03.2015: Euro 18.77 million equivalent to `1,261.3 million) loan is repayable in 6 equal semi-annual instalments; the next instalment is due on 1st July, 2016.
6. Deferred Tax Liabilities (Net) (` in million)
Deferred tax
(asset)/ liability
as at 01.04.2015
Adjustment
through reserves
Current year
charge/ (credit)
Deferred tax
(asset)/ liability
as at 31.03.2016
DEFERRED TAX LIABILITIES
(a) Differences in depreciation and amortisation for accounting and income tax purposes
38,569.6 (158.9) 2,711.2 41,121.9
(b) Prepaid expenses 681.2 – (3.9) 677.339,250.8 (158.9) 2,707.3 41,799.2
DEFERRED TAX ASSETS
(a) Employee separation compensation (3,159.1) – (1,419.1) (4,578.2)(b) Provision for doubtful debts and advances (804.6) – (128.8) (933.4)(c) Disallowance under Section 43B of Income Tax
Act, 1961(3,655.9) – (1,864.6) (5,520.5)
(d) Provision for employee benefits (5,442.1) – (289.1) (5,731.2)(e) Redemption Premium on issue of non-
convertible debenture(3,116.5) – 441.4 (2,675.1)
(f ) Discount on issue of non-convertible debenture
(549.7) – 77.8 (471.9)
(g) Fair value changes of cash flow hedges (9.2) 6.3 – (2.9)(h) Others (9.6) – (78.1) (87.7)
(16,746.7) 6.3 (3,260.5) (20,000.9)
Net amount charged to Statement of Profit and Loss
(553.2)
Deferred tax liabilities (net) 22,504.1 21,798.3
(vii) Euro 1.94 million equivalent to `146.4 million (31.03.2015: Euro 2.91 million equivalent to `195.5 million) loan is repayable in 4 equal semi-annual instalments; the next instalment is due on 2nd May, 2016.
(viii) Euro 124.19 million equivalent to ̀ 9,372.2 million (31.03.2015: Euro 143.29 million equivalent to `9,628.4 million) loan is repayable in 13 equal semi-annual instalments; the next instalment is due on 30th April, 2016.
5. Borrowings (contd.)
F-25

NOTES FORMING PART OF THE FINANCIAL STATEMENTS
7. Other Long-term Liabilities
(` in million) As at
31st March, 2016
As at
31st March, 2015
(a) Creditors for capital supplies/services 6,111.6 9,101.9(b) Others 2,315.0 2,186.8
8,426.6 11,288.7
8. Provisions
(` in million) As at
31st March, 2016
As at
31st March, 2015
Long-Term Short-Term Total Long-Term Short-Term Total
(a) Provision for employee benefits(1) 21,169.5 1,179.6 22,349.1 24,340.4 1,027.6 25,368.0(b) Provision for employee separation
compensation(2)
7,712.3 2,193.5 9,905.8 4,418.8 1,317.6 5,736.4
(c) Provision for taxation(3) – 8,860.2 8,860.2 – 6,591.9 6,591.9(d) Provision for fringe benefit tax – 47.3 47.3 – 47.3 47.3(e) Proposed dividend – 7,769.7 7,769.7 – 7,769.7 7,769.7
28,881.8 20,050.3 48,932.1 28,759.2 16,754.1 45,513.3
Additional information:(1) Includes provision for leave salaries `9,188.1 million (31.03.2015: `8,543.7 million).(2) Provision for employee separation compensation has been calculated on the basis of net present value of the future monthly
payments of pension and lump sum benefits under the scheme including `5,198.5 million (2014-15: `335.2 million) in respect of schemes introduced during the year.
(3) Provision for taxation is after year wise set off against advance payment against taxes.
9. Trade Payables
(` in million) As at
31st March, 2016
As at
31st March, 2015
(a) Creditors for supplies/services(1) 66,348.7 48,846.5(b) Creditors for accrued wages and salaries 10,712.6 9,173.3
77,061.3 58,019.8
F-26

NOTES FORMING PART OF THE FINANCIAL STATEMENTS
Additional information:(1) The amount due to Micro and Small Enterprises as defined in the “The Micro, Small and Medium Enterprises Development Act, 2006”
has been determined to the extent such parties have been identified on the basis of information available with the Company. The disclosures relating to Micro and Small Enterprises as at 31st March, 2016 are as under:
(` in million)Year ended
31st March, 2016
Year ended
31st March, 2015
Description
(i) The principal amount remaining unpaid to supplier as at the end of the year 149.0 165.1(ii) The interest due thereon remaining unpaid to supplier as at the end of the year 7.2 5.6(iii) The amount of interest due and payable for the period of delay in making payment
(which have been paid but beyond the appointed day during the year) but without adding the interest specified under this Act
43.6 43.3
(iv) The amount of interest accrued during the year and remaining unpaid at the end of the year
50.8 48.9
10. Other Current Liabilities
(` in million) As at
31st March, 2016
As at
31st March, 2015
(a) Current maturities of long-term borrowings 9,243.7 42,631.9(b) Interest accrued but not due on borrowings 4,593.2 5,878.6(c) Unpaid dividend 516.4 514.9(d) Application money received due for refund and interest accrued thereon 0.2 1.6(e) Unpaid matured deposits and interest accrued thereon 0.7 1.2(f ) Advances received from customers 2,650.2 2,291.0(g) Creditors for capital supplies/services 22,650.7 19,210.5(h) Creditors for other liabilities(1)(2) 21,503.0 22,039.4
61,158.1 92,569.1
Additional information: (1) Includes liability for employee family benefit scheme `1,083.9 million (31.03.2015: `957.2 million)
(2) Includes liability for VAT, Sales tax, Excise duty etc.
9. Trade Payables (contd.)
F-27

NOTES FORMING PART OF THE FINANCIAL STATEMENTS
11. Tangible Assets (` in million)
Tangible Assets Freehold
Land and
Roads
Leasehold
Land
Buildings(3) Leasehold
Buildings
Plant and
Machinery
Furniture and
Fixtures
Office
Equipments
Vehicles Railway
Sidings
Total
Gross block as at 01.04.2015 4,411.7 7,262.0 30,866.0 5.9 3,63,737.6 525.6 1,633.5 2,840.1 4,861.4 4,16,143.8
5,599.8 1,947.7 28,471.5 9.0 3,43,357.6 491.8 1,496.3 2,282.3 4,528.0 3,88,184.0Additions during the year(1) 1,636.1 1,506.8 3,423.6 – 8,792.5 70.0 155.3 303.1 13.4 15,900.8
176.7 3,951.4 2,592.0 – 20,850.6 43.2 193.4 702.8 310.6 28,820.7Deductions during the year(2) (49.4) – (36.8) – (316.0) (0.5) (1.0) (76.0) – (479.7)
(1.9) – (118.7) (3.1) (841.7) (9.5) (56.2) (145.0) (0.8) (1,176.9)Transfer and other movements – – – – – – – – – –
(1,362.9) 1,362.9 (78.8) – 55.1 0.1 – – 23.6 –Exchange fluctuations capitalised during the year
– – – – 1,078.4 – – – – 1,078.4
– – – – 316.0 – – – – 316.0Gross block as at 31.03.2016 5,998.4 8,768.8 34,252.8 5.9 3,73,292.5 595.1 1,787.8 3,067.2 4,874.8 4,32,643.3
4,411.7 7,262.0 30,866.0 5.9 3,63,737.6 525.6 1,633.5 2,840.1 4,861.4 4,16,143.8 Impairment as at 01.04.2015 – – 12.5 – – – – – – 12.5
1,362.9 – 12.5 – – – – – – 1,375.4Impairment during the year 1.2 – 1.1 – 0.9 – – – – 3.2
– – – – – – – – – – Reversal during the year – – – – – – – – – –
(1,362.9) – – – – – – – – (1,362.9)Transfer and other movements – – (0.4) – – – – – – (0.4)
– – – – – – – – – –Impairment as at 31.03.2016 1.2 – 13.2 – 0.9 – – – – 15.3
– – 12.5 – – – – – – 12.5Accumulated depreciation as at 01.04.2015 2,342.7 442.6 6,496.6 5.9 1,51,631.8 489.3 1,279.6 1,165.5 1,563.5 1,65,417.5
411.6 176.4 5,669.5 7.6 1,35,900.1 454.3 1,161.2 1,077.8 1,305.8 1,46,164.3Impact of adoption of Schedule II – – – – – – – – – –
1,125.9 – 0.8 – 803.1 0.2 0.3 2.6 7.0 1,939.9Depreciation during the year 511.9 111.3 1,107.8 – 16,105.3 40.6 180.8 257.4 229.3 18,544.4
805.6 266.2 879.8 0.2 15,676.1 44.1 174.1 217.7 251.2 18,315.0Depreciation on assets written off during the year(1)
– – (12.2) – (271.3) (0.2) (0.8) (62.3) – (346.8)
(0.4) – (53.5) (1.9) (747.5) (9.3) (56.0) (132.6) (0.5) (1,001.7)Transfer and other movements – – 0.4 – 0.1 – – – – 0.5
– – – – – – – – – –Accumulated depreciation as at 31.03.2016 2,854.6 553.9 7,592.6 5.9 1,67,465.9 529.7 1,459.6 1,360.6 1,792.8 1,83,615.6
2,342.7 442.6 6,496.6 5.9 1,51,631.8 489.3 1,279.6 1,165.5 1,563.5 1,65,417.5Total accumulated depreciation and impairment as at 31.03.2016
2,855.8 553.9 7,605.8 5.9 1,67,466.8 529.7 1,459.6 1,360.6 1,792.8 1,83,630.9
2,342.7 442.6 6,509.1 5.9 1,51,631.8 489.3 1,279.6 1,165.5 1,563.5 1,65,430.0Net block as at 31.03.2016 3,142.6 8,214.9 26,647.0 – 2,05,825.7 65.4 328.2 1,706.6 3,082.0 2,49,012.4
2,069.0 6,819.4 24,356.9 – 2,12,105.8 36.3 353.9 1,674.6 3,297.9 2,50,713.8
Additional information:
(1) Additions and depreciation on assets written off during the year include adjustments for inter se transfers.
(2) Deductions include cost of assets scrapped/surrendered during the year.
(3) Buildings include `23.2 million (31.03.2015: `23.2 million) being cost of shares in Co-operative Housing Societies and Limited Companies.(4) Rupee liability has increased by `1,078.4 million (net) (2014-15: `316.0 million) arising out of realignment of the value of long-term foreign currency loans and
vendor retention liability for procurement of fixed assets. This increase has been adjusted in the carrying cost of respective fixed assets and has been depreciated over their remaining depreciable life. The depreciation for the current year has increased by `64.8 million (2014-15: `17.5 million) arising on account of this adjustment.
F-28

NOTES FORMING PART OF THE FINANCIAL STATEMENTS
(5) Tangible assets schedule includes the capital cost of in-house research recognised facility as under:
(` in million)
Tangible Assets Freehold Land and
Roads
Leasehold Land
Buildings Leasehold Buildings
Plant and Machinery
Furniture and
fixtures
Office Equipments
Vehicles Railway Sidings
Total
Gross block as at 01.04.2015 – – 0.2 – 734.7 20.9 25.3 0.9 – 782.0
– – 0.2 – 542.6 20.4 21.7 0.9 – 585.8Additions during the year – – 1.8 – 187.9 0.4 3.4 – – 193.5
– – – – 192.3 0.5 5.7 – – 198.5Deductions during the year – – – – – – – – – –
– – – – (0.2) – (2.1) – – (2.3)Gross block as at 31.03.2016 – – 2.0 – 922.6 21.3 28.7 0.9 – 975.5
– – 0.2 – 734.7 20.9 25.3 0.9 – 782.0Capital work-in-progress 58.9
121.9
12. Intangible Assets
(` in million)Intangible Assets Software
Costs
Development
of property(3)
Total
Gross block as at 01.04.2015 1,424.0 8,266.0 9,690.01,420.6 6,835.9 8,256.5
Additions during the year(1) 53.6 4,623.6 4,677.23.4 1,430.1 1,433.5
Deductions during the year(2) – (54.7) (54.7)– – –
Gross block as at 31.03.2016 1,477.6 12,834.9 14,312.51,424.0 8,266.0 9,690.0
Impairment at beginning of period – – –– – –
Charge for the period – 359.2 359.2– – –
Impairment at end of period – 359.2 359.2– – –
Accumulated amortisation as at 01.04.2015 1,080.0 6,838.6 7,918.6921.3 5,322.0 6,243.3
Impact of adoption of Schedule II – – –14.4 – 14.4
Amortisation during the year 147.2 639.5 786.7144.3 1,516.6 1,660.9
Amortisation on assets written off during the year – (25.5) (25.5)– – -
Accumulated amortisation as at 31.03.2016 1,227.2 7,452.6 8,679.81,080.0 6,838.6 7,918.6
Net block as at 31.03.2016 250.4 5,023.1 5,273.5344.0 1,427.4 1,771.4
(1) Additions and amortisation on assets written off during the year include adjustments for inter se transfers.(2) Deductions include cost of assets scrapped/surrendered during the year.(3) Development of property represents expenditure incurred on development of mines/collieries.(4) The above intangible assets do not include any internally generated assets.
11. Tangible Assets (contd.)
F-29

NOTES FORMING PART OF THE FINANCIAL STATEMENTS
13. Non-current Investments
(` in million)No. of equity shares of face value of `10
each fully paid-up unless otherwise
specified
As at 31st March, 2016
As at 31st March, 2015
A. TRADE INVESTMENTS
(I) Investments in Equity Instruments
(a) Investments in Subsidiary Companies(i) Quoted
(1) Tata Metaliks Ltd. 1,26,67,590 263.0 263.0(2) Tayo Rolls Limited 55,87,372 485.7 485.7(3) Tata Sponge Iron Limited 83,93,554 865.4 865.4(4) The Tinplate Company of India Ltd. 7,84,57,640 3,950.2 3,950.2
5,564.3 5,564.3(ii) Unquoted
(1) ABJA Investment Co. Pte Ltd. (Face value of USD 1 each)
2,00,000 10.8 10.8
(2) Adityapur Toll Bridge Company Limited 1,50,00,000 144.4 144.4(3) Bangla Steel & Mining Co. Ltd.* 9,998 – –(4) Indian Steel & Wire Products Ltd. 56,92,651 30.9 30.9(5) Jamshedpur Continuous Annealing &
Processing Company Private Limited (2,95,80,000 shares acquired during the year)
47,53,20,000 4,753.2 4,457.4
(6) Jamshedpur Utilities & Services Company Limited
2,03,50,000 203.5 203.5
(7) Mohar Exports Services Pvt. Limited 3,352 – –(8) NatSteel Asia Pte. Ltd.
(Face value of SGD 1 each)28,14,37,128 7,738.6 7,738.6
(9) Rujuvalika Investments Limited (10,08,333 shares acquired during the year)
13,28,800 604.0 –
(10) Tata Steel Special Economic Zone Limited (5,96,70,000 shares acquired during the year)
9,20,92,631 920.9 324.2
(11) T M International Logistics Limited 91,80,000 91.8 91.8(12) T M Mining Company Limited 1,62,800 1.6 1.6(13) Tata Incorporated
(Face value of USD 1,000 each) (1,500 shares disposed during the year)
– – 16.4
(14) Tata Korf Engineering Services Ltd.* 3,99,986 – –(15) Tata Steel (KZN) (Pty) Ltd.
(Face value of ZAR 1 each)12,96,00,000 847.0 847.0
(16) T Steel Holdings Pte Ltd. (Face value of GBP 1 each)
5,93,17,67,688 4,78,753.3 4,78,753.3
(17) Tata Steel Processing and Distribution Limited
6,82,50,000 2,744.5 2,744.5
(18) Tata Steel Odisha Limited 25,50,000 25.5 25.5(19) Tata Pigments Limited
(Face value of `100 each)75,000 7.0 7.0
(20) TS Alloys Limited (62,33,067 shares acquired during the year)
6,57,07,544 786.4 724.1
4,97,663.4 4,96,121.05,03,227.7 5,01,685.3
F-30

NOTES FORMING PART OF THE FINANCIAL STATEMENTS
13. Non-current Investments (contd.)
(` in million)No. of equity shares of face value of `10
each fully paid-up unless otherwise
specified
As at 31st March, 2016
As at 31st March, 2015
(b) Investments in Joint Ventures
(i) Unquoted(1) Bhubaneshwar Power Private Limited
(75,32,306 shares acquired during the year)3,27,57,836 327.6 252.2
(2) Himalaya Steel Mill Services Private Limited 36,19,945 36.1 36.1(3) mjunction services limited 40,00,000 40.0 40.0(4) S & T Mining Company Private Limited 1,29,41,400 129.4 129.4(5) Tata BlueScope Steel Limited 43,30,00,000 4,330.0 4,330.0(6) Tata NYK Shipping Pte Ltd.
(Face value of USD 1 each) (34,20,000 shares acquired during the year)
6,51,67,500 3,501.4 3,288.6
8,364.5 8,076.3
8,364.5 8,076.3
(c) Investments in Associate Companies
(i) Quoted(1) Kumardhubi Fireclay and Silica Works Ltd.* 1,50,001 – –(2) TRF Limited
(19,739 shares disposed during the year)37,53,275 57.9 58.2
57.9 58.2
(ii) Unquoted(1) Industrial Energy Limited
(96,72,000 shares acquired during the year)17,31,60,000 1,731.6 1,634.9
(2) Jamipol Limited 36,75,000 83.9 83.9(3) Kalinga Aquatics Ltd.* 10,49,920 – –(4) Kumardhubi Metal Casting and
Engineering Limited*10,70,000 – –
(5) Nicco Jubilee Park Limited * 3,40,000 – –(6) Rujuvalika Investments Limited – – 6.0(7) Strategic Energy Technology Systems
Private Limited (9,05,000 shares acquired during the year)
2,56,14,500 256.2 247.1
(8) Tata Construction & Projects Ltd.* 11,97,699 – –(9) TRL Krosaki Refractories Limited 55,63,864 423.8 423.8(10) Others `33,520 (31.03.2015: `67,040)(3) – 0.1
2,495.5 2,395.8
2,553.4 2,454.0
F-31

NOTES FORMING PART OF THE FINANCIAL STATEMENTS
13. Non-current investments (contd.)
(` in million)No. of equity shares of face value of `10
each fully paid-up unless otherwise
specified
As at 31st March, 2016
As at 31st March, 2015
(d) Investments in Others
(i) Quoted(1) Steel Strips Wheels Limited
(1,00,000 shares disposed during the year)11,55,856 196.5 213.5
(2) Tata Investment Corporation Limited 2,46,018 65.1 65.1(3) Tata Motors Ltd.
(Face value of `2 each) (83,49,770 shares acquired during the year and 7,63,99,588 shares disposed during the year)
8,36,37,697 3,507.4 2,953.5
(4) The Tata Power Company Ltd. (Face value of `1 each)
3,91,22,725 2,250.9 2,250.9
(5) Titan Company Limited (Face value of `1 each) (3,87,75,840 shares disposed during the year)
– – 133.6
(6) Others `7,574 (31.03.2015: `7,574)(4) – –6,019.9 5616.6
(ii) Unquoted(1) Medica TS Hospital Pvt. Ltd. 2,60,000 2.6 2.6(2) Panatone Finvest Ltd. 45,000 0.5 0.5(3) Steelscape Consultancy Pvt. Ltd. 50,000 0.3 0.3(4) Taj Air Limited 42,00,000 42.0 42.0(5) Tarapur Environment Protection Society
(52,352 shares acquired during the year)82,776 8.9 3.1
(6) Tata Industries Ltd. (Face value of `100 each)
99,80,436 2,021.9 2,021.9
(7) Tata International Ltd. (Face value of `1,000 each)
28,616 311.9 311.9
(8) Tata Projects Ltd. (Face value of `100 each) (2,18,250 shares disposed during the year)
– – 323.6
(9) Tata Services Ltd. (Face value of `1,000 each)
1,621 1.6 1.6
(10) Tata Sons Limited (Face value of `1,000 each)
12,375 687.5 687.5
(11) Tata Teleservices Ltd. 6,46,92,310 1,386.8 1,386.8(12) Others `72,737 (31.03.2015: `72,737)(5) 0.1 0.1
4,464.1 4,781.9
10,484.0 10,398.5
5,24,629.6 5,22,614.1
F-32

NOTES FORMING PART OF THE FINANCIAL STATEMENTS
13. Non-current investments (contd.)
(` in million)No. of equity shares of face value of `10
each fully paid-up unless otherwise
specified
As at 31st March, 2016
As at 31st March, 2015
(II) Investments in Preference Shares(a) Investments in Subsidiary Companies
(i) Unquoted(1) Tata Metaliks Ltd. 8.50% non-cumulative
redeemable preference shares (Face value of `100 each)
1,00,00,000 1,000.0 1,000.0
(2) Tayo Rolls Limited 8.50% non-cumulative redeemable preference shares (Face value of `100 each) (16,00,000 shares acquired during the year)
2,31,00,000 2,310.0 2,150.0
3,310.0 3,150.0
3,310.0 3,150.0
(III) Investments in Debentures/Bonds
(a) Investments in Associate Companies
(i) Unquoted(1) Tata Construction & Projects Ltd.*
10% Convertible debentures of `100 each97,000 – –
– –
(b) Investments in Others
(i) Unquoted(1) Medica TS Hospital Pvt. Ltd.
Secured optionally convertible redeemable debentures of `1,000 each (3,39,500 debentures acquired during the year)
3,39,500 339.5 –
339.5 –
339.5 –
Provision for diminution in the value of
investments
(i) Investment in Equity Instruments (2,367.0) (1,973.8)(ii) Investment in Preference Shares (2,310.0) (2,150.0)
(4,677.0) (4,123.8)
Total trade investments 5,23,602.1 5,21,640.3
B. OTHER INVESTMENTS
(I) Investments in Equity Instruments(a) Investments in others
(i) Quoted(1) Credit Analysis & Research Limited 3,54,000 1.0 1.0(2) Housing Development Finance
Corporation Ltd. (Face value of `2 each)7,900 0.1 0.1
1.1 1.1(ii) Unquoted
(1) IFCI Venture Capital Funds Ltd. 1,00,000 1.0 1.0(2) Others `47,488 (31.03.2015: `47,488)(6) – –
1.0 1.0Total other investments 2.1 2.1Total non-current investments 5,23,604.2 5,21,642.4
* These investments are carried at a book value of `1.00
F-33
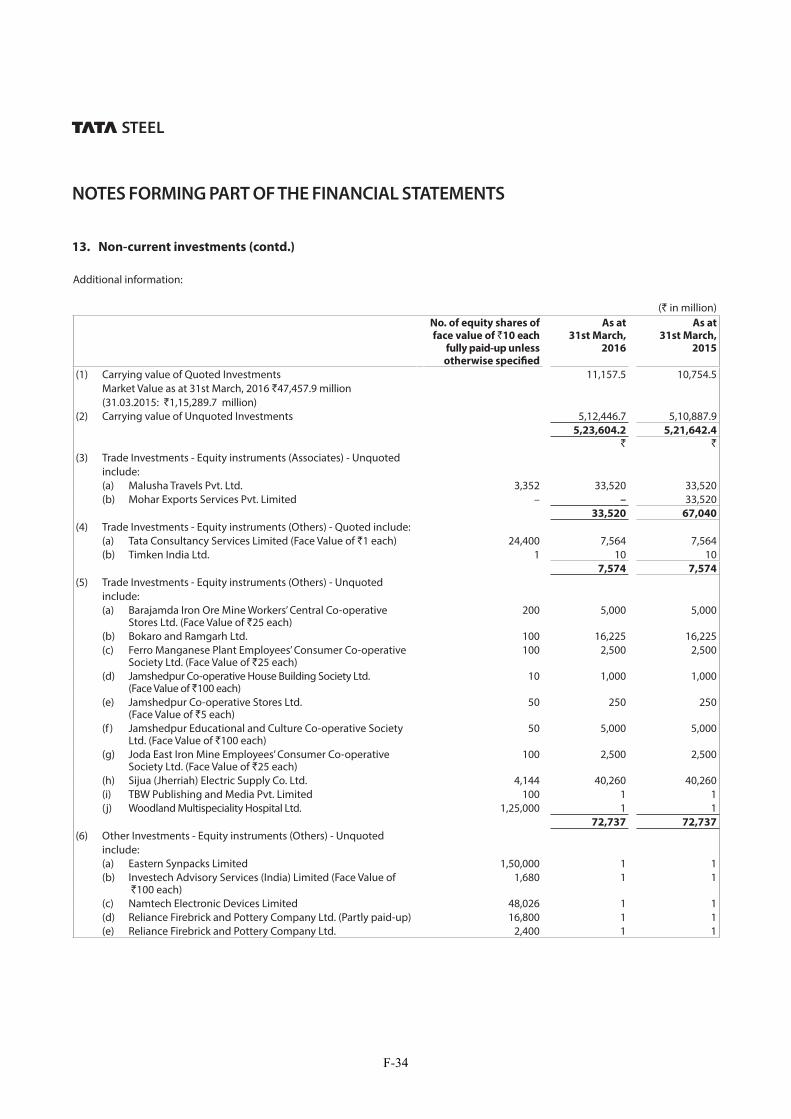
NOTES FORMING PART OF THE FINANCIAL STATEMENTS
13. Non-current investments (contd.)
Additional information:
(` in million)No. of equity shares of face value of `10 each
fully paid-up unless otherwise specified
As at 31st March,
2016
As at 31st March,
2015
(1) Carrying value of Quoted Investments Market Value as at 31st March, 2016 `47,457.9 million (31.03.2015: `1,15,289.7 million)
11,157.5 10,754.5
(2) Carrying value of Unquoted Investments 5,12,446.7 5,10,887.9 5,23,604.2 5,21,642.4
` `(3) Trade Investments - Equity instruments (Associates) - Unquoted
include:(a) Malusha Travels Pvt. Ltd. 3,352 33,520 33,520 (b) Mohar Exports Services Pvt. Limited – – 33,520
33,520 67,040
(4) Trade Investments - Equity instruments (Others) - Quoted include:(a) Tata Consultancy Services Limited (Face Value of `1 each) 24,400 7,564 7,564(b) Timken India Ltd. 1 10 10 7,574 7,574
(5) Trade Investments - Equity instruments (Others) - Unquoted include:(a) Barajamda Iron Ore Mine Workers’ Central Co-operative
Stores Ltd. (Face Value of `25 each)200 5,000 5,000
(b) Bokaro and Ramgarh Ltd. 100 16,225 16,225 (c) Ferro Manganese Plant Employees’ Consumer Co-operative
Society Ltd. (Face Value of `25 each)100 2,500 2,500
(d) Jamshedpur Co-operative House Building Society Ltd. (Face Value of `100 each)
10 1,000 1,000
(e) Jamshedpur Co-operative Stores Ltd. (Face Value of `5 each)
50 250 250
(f ) Jamshedpur Educational and Culture Co-operative Society Ltd. (Face Value of `100 each)
50 5,000 5,000
(g) Joda East Iron Mine Employees’ Consumer Co-operative Society Ltd. (Face Value of `25 each)
100 2,500 2,500
(h) Sijua (Jherriah) Electric Supply Co. Ltd. 4,144 40,260 40,260 (i) TBW Publishing and Media Pvt. Limited 100 1 1(j) Woodland Multispeciality Hospital Ltd. 1,25,000 1 1 72,737 72,737
(6) Other Investments - Equity instruments (Others) - Unquoted include:(a) Eastern Synpacks Limited 1,50,000 1 1(b) Investech Advisory Services (India) Limited (Face Value of
`100 each)1,680 1 1
(c) Namtech Electronic Devices Limited 48,026 1 1(d) Reliance Firebrick and Pottery Company Ltd. (Partly paid-up) 16,800 1 1 (e) Reliance Firebrick and Pottery Company Ltd. 2,400 1 1
F-34

NOTES FORMING PART OF THE FINANCIAL STATEMENTS
(` in million)No. of equity shares of face value of `10 each
fully paid-up unless otherwise specified
As at 31st March,
2016
As at 31st March,
2015
(f ) Sanderson Industries Ltd. 3,33,876 2 2 (g) Standard Chrome Ltd. 11,16,000 2 2 (h) Wellman Incandescent India Ltd. 15,21,234 2 2 (i) Unit Trust of India – Mastershares 2,229 47,477 47,477
47,488 47,488
* These investments are carried at a book value of `1.00
13. Non-current investments (contd.)
14. Loans and Advances
(` in million) As at 31st March, 2016 As at 31st March, 2015
Long-Term Short-Term Total Long-Term Short-Term Total
(A) CAPITAL ADVANCES(1)
Unsecured and considered good 5,981.8 – 5,981.8 7,812.9 – 7,812.9Unsecured and considered doubtful 734.3 – 734.3 – – –Less: Provision for bad & doubtful loans and advances
734.3 – 734.3 – – –
5,981.8 – 5,981.8 7,812.9 – 7,812.9
(B) SECURITY DEPOSITS
Unsecured and considered good 1,659.2 – 1,659.2 988.5 – 988.5Unsecured and considered doubtful 14.0 – 14.0 17.2 – 17.2Less: Provision for bad & doubtful loans and advances
14.0 – 14.0 17.2 – 17.2
1,659.2 – 1,659.2 988.5 – 988.5
(C) ADVANCE WITH PUBLIC BODIES
Unsecured and considered good 18,409.0 9,280.6 27,689.6 13,320.5 8,075.6 21,396.1Unsecured and considered doubtful 127.3 26.9 154.2 133.0 18.5 151.5Less: Provision for bad & doubtful loans and advances
127.3 26.9 154.2 133.0 18.5 151.5
18,409.0 9,280.6 27,689.6 13,320.5 8,075.6 21,396.1
(D) LOANS AND ADVANCES TO RELATED
PARTIES(2)
Unsecured and considered good 504.5 509.2 1,013.7 840.5 1,399.3 2,239.8Unsecured and considered doubtful 5,405.1 2,560.7 7,965.8 5,305.7 1,772.6 7,078.3Less: Provision for bad & doubtful loans and advances
5,405.1 2,560.7 7,965.8 5,305.7 1,772.6 7,078.3
504.5 509.2 1,013.7 840.5 1,399.3 2,239.8
F-35
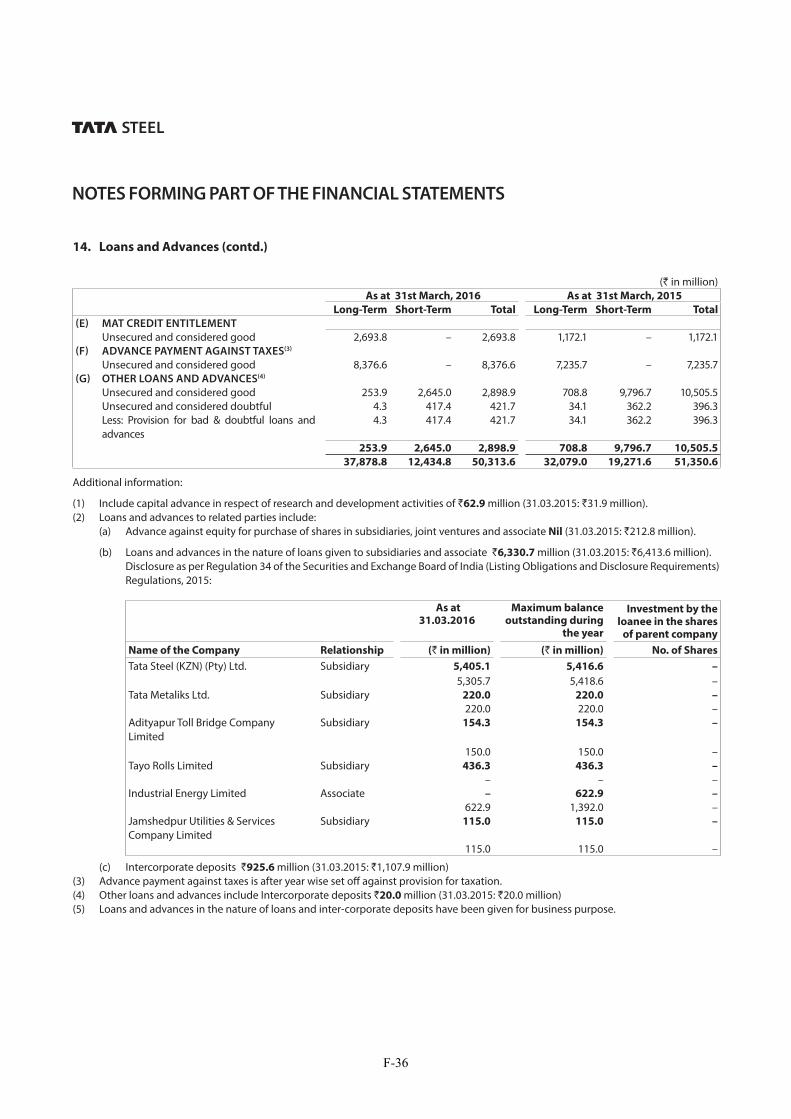
NOTES FORMING PART OF THE FINANCIAL STATEMENTS
14. Loans and Advances (contd.)
(` in million) As at 31st March, 2016 As at 31st March, 2015
Long-Term Short-Term Total Long-Term Short-Term Total
(E) MAT CREDIT ENTITLEMENT
Unsecured and considered good 2,693.8 – 2,693.8 1,172.1 – 1,172.1(F) ADVANCE PAYMENT AGAINST TAXES(3)
Unsecured and considered good 8,376.6 – 8,376.6 7,235.7 – 7,235.7(G) OTHER LOANS AND ADVANCES(4)
Unsecured and considered good 253.9 2,645.0 2,898.9 708.8 9,796.7 10,505.5Unsecured and considered doubtful 4.3 417.4 421.7 34.1 362.2 396.3Less: Provision for bad & doubtful loans and advances
4.3 417.4 421.7 34.1 362.2 396.3
253.9 2,645.0 2,898.9 708.8 9,796.7 10,505.5
37,878.8 12,434.8 50,313.6 32,079.0 19,271.6 51,350.6
Additional information:
(1) Include capital advance in respect of research and development activities of `62.9 million (31.03.2015: `31.9 million).(2) Loans and advances to related parties include: (a) Advance against equity for purchase of shares in subsidiaries, joint ventures and associate Nil (31.03.2015: `212.8 million).
(b) Loans and advances in the nature of loans given to subsidiaries and associate `6,330.7 million (31.03.2015: `6,413.6 million). Disclosure as per Regulation 34 of the Securities and Exchange Board of India (Listing Obligations and Disclosure Requirements)
Regulations, 2015:
As at 31.03.2016
Maximum balance outstanding during
the year
Investment by the loanee in the shares
of parent company
Name of the Company Relationship (` in million) (` in million) No. of Shares
Tata Steel (KZN) (Pty) Ltd. Subsidiary 5,405.1 5,416.6 –
5,305.7 5,418.6 –Tata Metaliks Ltd. Subsidiary 220.0 220.0 –
220.0 220.0 –Adityapur Toll Bridge Company Limited
Subsidiary 154.3 154.3 –
150.0 150.0 –Tayo Rolls Limited Subsidiary 436.3 436.3 –
– – –Industrial Energy Limited Associate – 622.9 –
622.9 1,392.0 –Jamshedpur Utilities & Services Company Limited
Subsidiary 115.0 115.0 –
115.0 115.0 –
(c) Intercorporate deposits `925.6 million (31.03.2015: `1,107.9 million)(3) Advance payment against taxes is after year wise set off against provision for taxation.(4) Other loans and advances include Intercorporate deposits `20.0 million (31.03.2015: `20.0 million)(5) Loans and advances in the nature of loans and inter-corporate deposits have been given for business purpose.
F-36

NOTES FORMING PART OF THE FINANCIAL STATEMENTS
15. Other Non-current Assets
(` in million) As at
31st March, 2016
As at
31st March, 2015
(a) Balances with banks(1)(2) 350.0 378.1(b) Unamortised loan issue expenses 1,720.1 1,723.2(c) Others 203.9 16.2
2,274.0 2,117.5
Additional information:(1) Represents bank deposits not due for realisation within 12 months of the balance sheet date.(2) Includes balances with banks held as security against guarantees `346.4 million (31.03.2015: `295.7 million).
16. Current Investments
(` in million) As at
31st March, 2016
As at
31st March, 2015
INVESTMENTS IN MUTUAL FUNDS – UNQUOTED
Axis Liquid Fund - Growth 3,800.0 –Goldman Sachs Mutual Fund - Liquid Bees 0.8 0.8 HDFC Liquid Fund - Growth 5,000.0 –ICICI Prudential Liquid - Reg - Growth – 1,000.0 ICICI Prudential Money Market Fund - Reg - Growth 7,000.0 –Kotak Liquid Scheme - Plan A - Growth 3,000.0 –Reliance Liquidity Fund - Growth 6,300.0 1,000.0 Religare Invesco Liquid Fund - Growth 1,000.0 –SBI Premier Liquid Fund - Reg - Growth 3,500.0 500.0 Tata Money Market Fund - Plan A - Growth – 7,500.0 Tata Money Market Fund - Growth 9,000.0 –UTI Liquid Fund - Cash Plan - IP - Growth 4,600.9 –
43,201.7 10,000.8
17. Inventories (At lower of cost and net realisable value)
(` in million) As at
31st March, 2016
As at
31st March, 2015
(a) Raw materials 23,686.1 32,651.9(b) Work-in-progress 183.0 443.2(c) Finished and semi-finished goods 27,391.2 28,884.7(d) Stock-in-trade of goods acquired for trading 697.5 373.5(e) Stores and spares 18,880.3 18,066.7
70,838.1 80,420.0
INCLUDED ABOVE, GOODS-IN-TRANSIT:
(i) Raw materials 3,824.2 5,986.3(ii) Finished and semi-finished goods 0.4 196.2(iii) Stock-in-trade of goods acquired for trading 653.1 238.5(iv) Stores and spares 1,607.0 1,607.7
6,084.7 8,028.7
F-37

NOTES FORMING PART OF THE FINANCIAL STATEMENTS
18. Trade Receivables (` in million)
As at
31st March, 2016
As at
31st March, 2015
(a) More than six months 244.4 242.8(b) Others 6,223.2 4,838.5
6,467.6 5,081.3
Less: Provision for doubtful trade receivables (a) More than six months 119.6 166.7(b) Others 20.0 –
6,328.0 4,914.6
Unsecured and considered good 6,328.0 4,914.6Doubtful 139.6 166.7
6,467.6 5,081.3
19. Cash and Bank Balances
(` in million) As at
31st March, 2016
As at
31st March, 2015
(a) Cash in hand 4.1 4.6(b) Cheques, drafts on hand 245.3 422.1(c) Remittances in-transit 2.7 1.3(d) Balances with banks 9,280.2 3,791.3Total cash and cash equivalents 9,532.3 4,219.3(e) Earmarked balances with banks (1) 614.4 566.6
10,146.7 4,785.9
Additional information:(1) Includes balances with banks held as security against guarantees `93.2 million (31.03.2015: `45.4 million).
F-38

NOTES FORMING PART OF THE FINANCIAL STATEMENTS
20. Other Current Assets
(` in million) As at
31st March, 2016
As at
31st March, 2015
(a) Interest accrued on deposits, loans and advances 118.4 66.3(b) Others(1) 1,147.2 486.4
1,265.6 552.7
Additional information:(1) Includes `237.0 million (31.03.2015: `255.6 million) on account of loan issue expenses.
21. Revenue from Operations
(` in million) Year ended
31st March, 2016
Year ended
31st March, 2015
(a) Sale of products(1) 4,06,892.2 4,50,076.3(b) Sale of power and water 14,683.7 11,189.1(c) Income from town, medical and other services 1,330.5 995.4(d) Other operating income(2) 3,956.5 3,511.8
4,26,862.9 4,65,772.6
Additional information:(1) Details of products sold:
(` in million) Year ended
31st March, 2016
Year ended
31st March, 2015
Class of Products
(i) Saleable Steel (Finished) 3,35,623.6 3,76,396.2(ii) Agrico Products 1,493.6 1,569.5(iii) Semi-finished Steel and Scrap 9,896.3 13,982.5(iv) Welded Steel Tubes 20,891.5 23,472.9(v) By-Products, etc. 3,365.9 4,457.8(vi) Raw Materials:
– Ferro Manganese 1,700.3 1,998.6– Charge Chrome/Ferro Chrome 10,905.4 5,297.7– Other Raw Materials 15,536.6 18,102.5
(vii) Bearings 1,831.4 1,741.9(viii) Metallurgical Machinery 245.4 137.7(ix) Sale of Purchased Materials:
– Saleable Steel (Finished/Converted) 5,368.4 2,889.7– Raw Materials/Scrap/Other Materials 33.8 29.3
4,06,892.2 4,50,076.3
(2) Includes lease rentals of `2.0 million (2014-15: `2.0 million) on wagons leased to railways under Own Your Wagon Scheme.
F-39

NOTES FORMING PART OF THE FINANCIAL STATEMENTS
22. Other Income
(` in million) Year ended
31st March, 2016
Year ended
31st March, 2015
(a) Dividend income(i) Investment in subsidiaries 435.6 350.4(ii) Investment in joint ventures and associates 205.8 262.3(iii) Other non-current investments 429.4 583.3(iv) From current investments – 5.1
(b) Interest income 427.6 1,075.1(c) Net gain/(loss) on sale of investments
(i) On sale of other non-current investments 35,075.2 17.2(ii) On sale of current investments 1,804.1 4,068.1
(d) Profit on sale of capital assets (net of loss on assets sold/written off) (21.1) 9.7(e) Gain/(Loss) on cancellation of forwards, swaps and options (net) (12.1) (774.1)(f ) Other miscellaneous income 562.5 230.7
38,907.0 5,827.8
23. Raw Materials Consumed (` in million)
Year ended
31st March, 2016
Year ended
31st March, 2015
(a) Iron Ore 31,199.7 36,668.4(b) Coal [excluding `48,929.3 million (2014-15: `54,113.0 million) used for
manufacturing coke]14,061.7 12,474.7
(c) Coke 47,274.8 55,809.4(d) Limestone and Dolomite 8,124.5 7,865.8(e) Ferro Manganese 1,616.4 1,693.8(f ) Zinc and Zinc Alloys 2,732.9 2,962.3(g) Sulphur and Other Materials 21,710.5 20,922.6
1,26,720.5 1,38,397.0
Additional information:(1) The consumption figures shown above are after adjusting excess and shortages ascertained on physical count, unserviceable
items, etc.(2) Raw materials consumed includes `29,720.4 million (2014-15: `21,611.0 million) charged to wages and salaries and other revenue
accounts.
F-40

NOTES FORMING PART OF THE FINANCIAL STATEMENTS
24. Purchase of Finished, Semi-finished and Other Products
(` in million) Year ended
31st March, 2016
Year ended
31st March, 2015
(a) For Resale:(i) Finished/Semi-finished steel materials 5,886.4 4,426.3(ii) Finished/Semi-finished steel materials - Agrico and Tubes 251.6 349.8
(b) For Own Consumption:(i) Finished/Semi-finished steel materials(1) 3,619.0 1,552.2(ii) Sponge/Pig iron 58.8 458.6(iii) Others 99.6 96.3
9,915.4 6,883.2
Additional information:(1) Includes components for manufacture of metallurgical machinery `226.4 million (2014-15: `259.6 million).
25. Changes in Inventories of Finished Goods, Work-in-Progress and Stock-in-Trade
(` in million) Year ended
31st March, 2016
Year ended
31st March, 2015
INVENTORIES AT THE END OF THE YEAR
(a) Work-in-progress 183.0 443.2(b) Finished and semi-finished goods 27,391.2 28,884.7(c) Stock-in-trade of goods acquired for trading 697.5 373.5
28,271.7 29,701.4
INVENTORIES AT THE BEGINNING OF THE YEAR
(a) Work-in-progress 443.2 359.9(b) Finished and semi-finished goods 28,884.7 22,161.4(c) Stock-in-trade of goods acquired for trading 373.5 20.7
29,701.4 22,542.0
(1,429.7) 7,159.4
Additional information:(1) Details of finished and semi-finished goods, stock-in-trade of goods acquired for trading:
F-41

NOTES FORMING PART OF THE FINANCIAL STATEMENTS
(` in million)
Class of Products As at
31st March, 2016
As at
31st March, 2015
Closing Stock Opening Stock Closing Stock Opening Stock
(a) Saleable Steel (Finished) 15,109.7 19,250.5 19,250.5 11,956.5(b) Agrico Products 118.5 143.5 143.5 110.8(c) Semi-finished Steel and Scrap 9,310.4 6,623.7 6,623.7 7,616.6(d) Welded Steel Tubes 843.8 859.3 859.3 935.4(e) By-Products, etc. 518.9 189.8 189.8 157.9(f ) Other Products 1,214.7 1,348.3 1,348.3 1,159.7(g) Bearings 252.2 264.5 264.5 219.7(h) Sale of Purchased Materials –
Saleable Steel (Finished/Converted) 708.1 559.6 559.6 4.8Raw Materials/Scrap/Other Materials 12.4 19.0 19.0 20.7
28,088.7 29,258.2 29,258.2 22,182.1
26. Employee Benefits Expense
(` in million) Year ended
31st March, 2016
Year ended
31st March, 2015
(a) Salaries and wages, including bonus 36,077.9 35,688.6(b) Contribution to provident and other funds 4,646.4 6,001.4(c) Staff welfare expenses 2,524.7 4,329.2
43,249.0 46,019.2
27. Depreciation and Amortisation Expense
(` in million) Year ended
31st March, 2016
Year ended
31st March, 2015
(a) Depreciation on tangible assets 18,544.4 18,315.0(c) Amortisation of intangible assets 786.7 1,660.9
19,331.1 19,975.9
25. Changes in Inventories of Finished Goods, Work-in-Progress and Stock-in-Trade (contd.)
F-42

NOTES FORMING PART OF THE FINANCIAL STATEMENTS
28. Finance Costs
(` in million) Year ended
31st March, 2016
Year ended
31st March, 2015
(a) Interest expense(i) Debentures/bonds and fixed loans 20,849.8 23,255.8(ii) Others(1) 1,052.6 1,997.7
(b) Other borrowing costs 3,025.9 978.524,928.3 26,232.0
Less: Interest capitalised 10,325.6 6,472.514,602.7 19,759.5
Additional information:(1) Includes interest on service tax Nil (2015-14: `22.1 million) and income tax Nil (2014-15: `804.0 million).
29. Other Expenses
(` in million) Year ended
31st March, 2016
Year ended
31st March, 2015
(a) Consumption of stores and spares 24,251.1 23,054.7(b) Repairs to buildings 574.1 765.1(c) Repairs to machinery 20,253.0 18,644.4(d) Relining expenses 431.0 455.8(e) Fuel oil consumed 1,380.7 1,342.6(f ) Purchase of power 27,431.0 25,701.6(g) Conversion charges 22,044.3 18,859.8(h) Freight and handling charges 29,948.8 28,833.2(i) Rent 735.3 753.4(j) Royalty 9,386.2 8,072.2(k) Rates and taxes 7,528.3 6,848.5(l) Insurance 568.2 571.8(m) Commission, discounts and rebates 1,827.8 1,643.5(n) Provision for wealth tax – 20.0(o) Provision for doubtful debts and advances 224.9 260.5(p) Excise duty (471.8) 1,069.3(q) Others(1)(2) 18,267.7 24,203.5
1,64,380.6 1,61,099.9
F-43
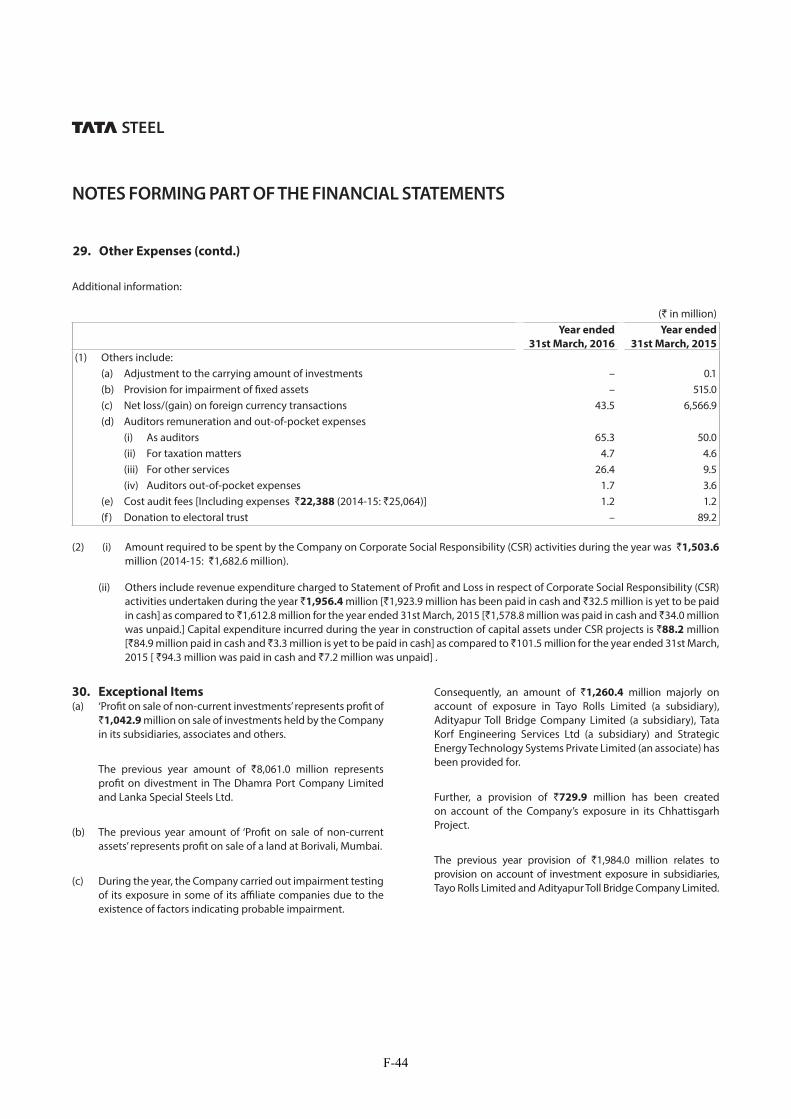
NOTES FORMING PART OF THE FINANCIAL STATEMENTS
Additional information:
(` in million) Year ended
31st March, 2016
Year ended
31st March, 2015
(1) Others include:(a) Adjustment to the carrying amount of investments – 0.1(b) Provision for impairment of fixed assets – 515.0(c) Net loss/(gain) on foreign currency transactions 43.5 6,566.9(d) Auditors remuneration and out-of-pocket expenses
(i) As auditors 65.3 50.0(ii) For taxation matters 4.7 4.6(iii) For other services 26.4 9.5(iv) Auditors out-of-pocket expenses 1.7 3.6
(e) Cost audit fees [Including expenses `22,388 (2014-15: `25,064)] 1.2 1.2(f ) Donation to electoral trust – 89.2
(2) (i) Amount required to be spent by the Company on Corporate Social Responsibility (CSR) activities during the year was `1,503.6
million (2014-15: `1,682.6 million).
(ii) Others include revenue expenditure charged to Statement of Profit and Loss in respect of Corporate Social Responsibility (CSR) activities undertaken during the year `1,956.4 million [`1,923.9 million has been paid in cash and `32.5 million is yet to be paid in cash] as compared to `1,612.8 million for the year ended 31st March, 2015 [`1,578.8 million was paid in cash and `34.0 million was unpaid.] Capital expenditure incurred during the year in construction of capital assets under CSR projects is `88.2 million [`84.9 million paid in cash and `3.3 million is yet to be paid in cash] as compared to ̀ 101.5 million for the year ended 31st March, 2015 [ `94.3 million was paid in cash and `7.2 million was unpaid] .
30. Exceptional Items (a) ‘Profit on sale of non-current investments’ represents profit of
`1,042.9 million on sale of investments held by the Company in its subsidiaries, associates and others.
The previous year amount of `8,061.0 million represents profit on divestment in The Dhamra Port Company Limited and Lanka Special Steels Ltd.
(b) The previous year amount of ‘Profit on sale of non-current assets’ represents profit on sale of a land at Borivali, Mumbai.
(c) During the year, the Company carried out impairment testing of its exposure in some of its affiliate companies due to the existence of factors indicating probable impairment.
Consequently, an amount of `1,260.4 million majorly on account of exposure in Tayo Rolls Limited (a subsidiary), Adityapur Toll Bridge Company Limited (a subsidiary), Tata Korf Engineering Services Ltd (a subsidiary) and Strategic Energy Technology Systems Private Limited (an associate) has been provided for.
Further, a provision of `729.9 million has been created on account of the Company’s exposure in its Chhattisgarh Project.
The previous year provision of `1,984.0 million relates to provision on account of investment exposure in subsidiaries, Tayo Rolls Limited and Adityapur Toll Bridge Company Limited.
29. Other Expenses (contd.)
F-44

NOTES FORMING PART OF THE FINANCIAL STATEMENTS
31. Earnings Per Share (EPS) (` in million)
As at
31st March, 2016
As at
31st March, 2015
(a) Profit after tax 49,009.5 64,391.2Less: Distribution on Hybrid Perpetual Securities (net of tax) 1,740.6 1,756.6Profit attributable to Ordinary Shareholders – for Basic EPS 47,268.9 62,634.6Profit attributable to Ordinary Shareholders – for Diluted EPS 47,268.9 62,634.6
Nos. Nos.(b) Weighted average no. of Ordinary Shares for Basic EPS 97,12,15,439 97,12,15,416
Weighted average no. of Ordinary Shares for Diluted EPS 97,12,15,439 97,12,15,416(c) Nominal value per Ordinary Share `10.00 `10.00(d) Basic Earnings per Ordinary Share `48.67 `64.49(e) Diluted Earnings per Ordinary Share `48.67 `64.49(1)
Additional information:(1) 4.5% Foreign Currency Convertible Bonds are anti-dilutive.
32. Contingent Liabilities and Commitments
A. CONTINGENT LIABILITIES
(a) Claims not acknowledged by the Company
(` in million) As at
31st March, 2016
As at
31st March, 2015
(i) Excise and Service Tax 4,701.4 4,513.2(ii) Customs 137.2 137.2(iii) Sales Tax and VAT 5,678.8 4,323.3(iv) State Levies 3,914.0 2,649.7(v) Suppliers and Service Contract 868.3 820.7(vi) Labour Related 543.0 517.1(vii) Income Tax 3,545.7 3,011.1(viii) Royalty 140.1 14 0.1
(d) ‘Provision for impairment on non-current assets’ of `515.1 million represents non-cash write down of fixed assets and inventory in certain non-performing business units.
The previous year reversal of impairment loss of `1362.9 million was in respect of land acquired in Gopalpur.
(e) ‘Provisions for demands and claims’ of `8,800.5 million represents provisions created during the year for certain demands and claims.
(f ) ‘Employee Separation Compensation’ represents the charge of `5,562.5 million taken on Employee Separation Scheme.
30. Exceptional Items (contd.)
F-45

NOTES FORMING PART OF THE FINANCIAL STATEMENTS
(b) Claim by a party arising out of conversion arrangement- `1,958.2 million (31.03.2015: `1,958.2 million). The Company has not acknowledged this claim and has instead filed a claim of `1,396.5 million (31.03.2015: `1,396.5 million) on the party. The matter is pending before the Calcutta High Court.
(c) The State Government of Odisha introduced "Orissa Rural Infrastructure and Socio Economic Development Act, 2004" with effect from February 2005 levying tax on mineral bearing land computed on the basis of value of minerals produced from the mineral bearing land. The Company had filed a Writ Petition in the High Court of Orissa challenging the validity of the Act. Orissa High Court held in November 2005 that State does not have authority to levy tax on minerals. The State Government of Odisha moved to the Supreme Court against the order of Orissa High Court and the case is pending with Supreme Court. The potential liability, as of 31st March, 2016 would be approximately `55,019.8 million (31.03.2015: `48,051.8 million).
(d) Interest expenditure on loans taken for acquisition of a subsidiary has been disallowed in assessments with tax demand raised for `9,580.6 million (31.03.2015: `7,150.1 million). Company has deposited `4,150.0
million (31.03.2015: `3,400.0 million) as part payment as a precondition to obtain stay of demand. The Company expects to sustain its position on ultimate resolution of the appeals.
(e) For the purpose of payment of royalty, there are two salient provisions viz: Section 9 in Mines and Minerals (Development and Regulation) Act (MMDR) 1957 related to the incidence of royalty and Rules 64B and 64C of Mineral Concession Rules (MC Rules), 1960. The Company has been paying royalty on coal extracted from its quarries pursuant to the judgment and order dated 23rd July, 2002 passed by the Jharkhand High Court. However, the State Government demanded royalty at rates applicable to processed coal. Though the Company contested the above demand, it started paying, under protest, royalty on processed coal from November 2008. The demand of the state mining authority was confirmed by the High Court vide its Judgment dated 12th March, 2014. The Court concluded that the State cannot claim interest till the Hon’ble Supreme Court decides the
pending Special Leave Petitions (SLP) filed by State and Company in the year 2004.
In the appeals filed by Tata Steel in respect of the issues related to Coal royalty, the Hon’ble Supreme Court has pronounced the judgment on 17th March, 2015 in which it has interpreted Section 9 and approved the law that removal of coal from the seam in the mine and extracting it through the pithead to the surface satisfies the requirement of Section 9 (charging section) of the MMDR Act in order to give rise to a liability for royalty. In regard to the interpretation of Rules 64B and 64C of MC Rules, the Supreme Court has clarified that the constitutional validity or the vires of the Rules has not been adjudicated upon. Therefore it is open to Tata Steel either to revive the appeals limited to this question or to separately challenge the constitutionality and vires of these Rules. Accordingly, Tata Steel has filed writ petitions challenging the constitutionality and vires of Rules 64B and 64C of MC Rules on 19th May, 2015 at Hon’ble High Court of Jharkhand. Vide it’s judgment dated 26.06.2015, High Court has held that , the writ petitions are maintainable. It is also pertinent to mention that the Union of India in its counter-affidavit has stated that the provisions of Rules 64B and 64C may not be applicable to the mineral coal.
All demands are solely based on application of Rules 64B and 64C. In view of (i) the clear interpretation of charging Section 9 by Supreme Court by three judges Bench following two earlier three Judge Bench orders (ii) the affidavit of Union of India and (iii) the liberty given by Supreme Court, the Company is of the opinion that any related present/probable demands are not payable. Out of the principal demand of ̀ 1,902.5 million, an amount of `1,638.0 million has been paid till FY 15 and balance has been provided for. Interest amount of `3,240.6 million (31.03.2015: `3,184.5 million) has been considered as contingent liability.
(f) The Company pays royalty on ore on the basis of quantity removed from the leased area at the rates based on notification by the Ministry of Mines, Government of India and the price published by India Bureau of Mines (IBM) on a monthly basis.
A demand of `4,110.8 million has been raised by Deputy Director of Mines, Joda, claiming royalty at
32. Contingent Liabilities and Commitments (contd.)
A. CONTINGENT LIABILITIES
F-46

NOTES FORMING PART OF THE FINANCIAL STATEMENTS
sized ore rates on despatches of ore fines. The Company has filed a revision petition on 14th November, 2013 before the Mines Tribunal, Government of India, Ministry of Mines, New Delhi, challenging the legality and validity of the demand raised and also to grant refund of royalty excess paid by the Company. Mines tribunal vide its order dated 13th November, 2014 has stayed the demand of royalty on iron ore for Joda east of `3,142.8 million upto the period ending 31st March, 2014. For the demand of `968.0 million for April, 2014 to September, 2014, a separate revision application was filed before Mines Tribunal. The matter was heard by Mines Tribunal on 14th July, 2015 and stay was granted on the total demand with directive to Government of Odisha not to take any coercive action for realization of this demanded amount Accordingly, the demand of `4,110.8 million (31.03.2015: `4,110.8 million) has been considered as a contingent liability.
(g) In 2008-09, NTT DoCoMo Inc (Docomo) entered into an Agreement with Tata Teleservices Ltd (TTSL) and Tata Sons Limited to acquire 20% of the equity share capital under the primary issue and 6% under the secondary sale from Tata Sons Limited. In terms of the Agreements with Docomo, Tata Sons Limited, inter alia, agreed to provide various indemnities and a Sale Option entitling Docomo to sell its entire shareholding in 2014 at a minimum pre-determined price of `58.045 per share if certain performance parameters were not met by TTSL. The minimum pre-determined price represented 50% of the acquisition price of 2008-09. The Agreements are governed by Indian Law.
The Company in 2008-09 had accepted an offer made voluntarily by Tata Sons Limited to all shareholders of TTSL to participate pro-rata in the secondary sale to Docomo together with bearing liabilities, if any, including the Sale Option in proportion of the number of shares sold by the Company to the aggregate Secondary Sale to Docomo. Accordingly, an Inter se Agreement was executed by the Company with Tata Sons and other Selling Shareholders. The Company sold 52,46,590 shares of TTSL to Docomo at `116.09 per share, resulting in a profit of `497.7 million. The Company is obliged to acquire 2,58,83,846 shares of TTSL in the above proportion in the event the Sale Option is exercised by Docomo.
Docomo has exercised the Sale Option in July 2014 and has called upon Tata Sons Limited to acquire its entire shareholding in TTSL at the pre-determined price of `58.045 per share. Tata Sons Limited has in turn informed the Company that they may be called upon to acquire 2,58,83,846 shares, in terms of its original offer to the Company and the inter-se agreement to participate in the Secondary Sale.
Tata Sons have also informed the Company that the Reserve Bank of India have not permitted acquisition of the shares at the pre-determined price and have advised that the acquisition can only be made at Fair Market Value (FMV) prevailing at the time of the acquisition. Docomo reiterated its position that the shares be acquired at minimum pre-determined price of 50% of the acquisition price in 2008-09.
Docomo had initiated Arbitration in the matter before the LCIA, London. The evidentiary hearing was completed on 6th May 2016. The arbitral award is awaited.
The liability, if any, to the extent of the difference between the amount sought by Docomo and the Fair Market Value is dependent upon the outcome of the Arbitration and prevailing FEMA Regulations.
(h) Bills discounted `3,602.8 million (31.03.2015: `2,608.3 million).
B. COMMITMENTS
(` in million) As at
31st
March,
2016
As at
31st
March,
2015
(a) Capital Commitments
Estimated amount of contracts remaining to be executed on Capital account and not provided for
54,161.6 64,666.3
32. Contingent Liabilities and Commitments (contd.)
A. CONTINGENT LIABILITIES
F-47

NOTES FORMING PART OF THE FINANCIAL STATEMENTS
(b) Other Commitments
(i) Export obligation against import of capital goods under EPCG Scheme
2,37,510.0 2,35,570.0
(ii) Uncalled liability on partly paid shares and debentures
0.1 0.1
33. The Company has given undertakings to: (a)IDBI not to dispose of its investment in Wellman Incandescent India Ltd., (b) IDBI and ICICI Bank Limited (formerly ICICI) not to dispose of its investment in Standard Chrome Ltd.,(c) Mizuho Corporate Bank Limited and Japan Bank for International Co-operation, not to dispose of its investments in Tata NYK Shipping Pte Limited (to retain minimal stake required to be able to provide a corporate guarantee towards long-term debt), (d) ICICI Bank Limited to directly or indirectly continue to hold at least 51 % shareholding in Jamshedpur Continuous Annealing & Processing Company Private Limited, (e) Sumitomo Mitsui Banking Corporation not to dispose of the management control in Tata Metaliks DI Pipes Limited (Formerly known as Tata Metaliks Kubota Pipes Limited) held through Tata Metaliks Ltd. so long as the dues to Sumitomo Mitsui Banking Corporation is subsisting.
The Company has furnished a security bond in respect of its immovable property to the extent of `200 million in favour of the Registrar of the Delhi High Court and has given an undertaking not to sell or otherwise dispose of the said property.
The Promoters of Tata BlueScope Steel Limited (TBSL) (i.e. Bluescope Steel Asia Holdings Pty Limited, Australia and Tata Steel Limited) have given an undertaking to IDBI Trusteeship Services Ltd., Debenture Trustees, and State Bank of India not to reduce collective shareholding in TBSL, below 51 % without prior consent of the Lender. Further, the Company has given an undertaking to State Bank of India to intimate them before diluting its shareholding in TBSL below 50%.
The Company, as a promoter, has pledged 4,41,55,800 equity shares of Industrial Energy Limited with Infrastructure Development Finance Corporation Limited.
The Company has agreed, if requested by Tata Steel UK Holdings Limited (TSUKH) (an indirect wholly owned subsidiary), to procure an injection of funds to reduce the outstanding net debt in TSUKH and its subsidiaries, to a mutually accepted level.
The Company along with TS Alloys Limited (Promoters) has given an undertaking to Power Finance Corporation Limited (PFC) and Rural Electrification Corporation Limited (REC) (Lenders) not to dispose off /transfer their equity holding of 26% of total equity in Bhubaneshwar Power Private Limited (BPPL) without prior written approval of lenders. Such shareholding of promoters may be transferred to the Company or its affiliates subject to compliance of applicable laws. The Company along with TS Alloys Limited has pledged 60% of their equity contribution in BPPL to PFC and REC.
The Company has given guarantees aggregating `1,17,417.1 million (31.03.2015: `1,37,614.5 million).
(a) In favour of Timken India Limited for `800.0 million (31.03.2015: `800.0 million) against renewal of lease of land pending with State Government and further `10.7 million (31.03.2015: `10.7 million) on behalf of Timken India Limited to Commissioner of Customs in respect of goods imported.
(b) In favour of Mizuho Corporate Bank Ltd., Japan for `650.4 million (31.03.2015: `788.9 million) against the loan granted to Tata NYK Shipping Pte. Ltd.
(c) In favour of The President of India for `1,771.8 million (31.03.2015: `1,771.8 million) against performance of export obligation under the various bonds executed by Jamshedpur Continuous Annealing & Processing Company Private Limited.
(d) In favour of the Note holders against due and punctual repayment of the 100% amounts outstanding as on 31st March, 2016 towards issued Guaranteed Notes by ABJA Investment Co. Pte. Ltd for ̀ 99,378.8 million (31.03.2015: `1,17,187.5 million) and `14,803.9 million (31.3.2015: `17,054.1 million). The guarantee is capped at an amount equal to 125% of the outstanding principal amount of the Notes as detailed in "Terms and Conditions" of the Offering Memorandum.
(e) In favour of President of India for ̀ 1.5 million (31.03.2015: `1.5 million) as bank guarantee against advance license.
34. Odisha legislative assembly issued an amendment to Indian Stamp Act on 9th May, 2013 and inserted a new provision (Section 3a) in respect of stamp duty payable on grant/renewal of mining leases. As per the amended provision, stamp duty is levied equal to 15% of the average royalty that would accrue out of the highest annual extraction of
32. Contingent Liabilities and Commitments (contd.)
F-48

NOTES FORMING PART OF THE FINANCIAL STATEMENTS
minerals under the approved mining plan multiplied by the period of such mining lease. The Company had filed a writ petition challenging the constitutionality of the Act on 5th July, 2013. The Hon’ble High Court, Cuttack passed an order on 9th July, 2013 granting interim stay on the operation of the Amendment Act, 2013. As a result of the stay, as on date, the Act is not enforceable and any demand received by the Company is not liable to be proceeded with. Meanwhile, the Company received demand notices for the various mines at Odisha totalling to `55,790 million. On the basis of external legal opinion, the Company has concluded that it is remote that the claim will sustain on ultimate resolution of the legal case by the courts.
In April, 2015 the Company has received an intimation from Government of Odisha, granting extension of validity period for leases under the MMDR Amendment Act, 2015 up to 31st March, 2030 in respect of eight mines and up to 31st March, 2020 for two mines subject to execution of supplementary lease deed within 3 months from the date of the intimation. Liability has been provided in the books of accounts as on 31st March, 2016 as per the existing provisions of the Stamp Act 1899 and the Company has since paid the stamp duty and registration charges totalling `3,530.8 million for supplementary deed execution in respect of eight mines out of the above mines.
35. Demand notices have been raised by Deputy Director of Mines, Odisha amounting to `38,280 million for the excess production over the quantity permitted under the mining plan scheme, environment clearance or consent to operate, during the period 2000-01 to 2009-10. The demand notices have been raised under Section 21(5) of the Mines & Minerals (Development and Regulations) Act (MMDR). However, the Act specifies that demand can be raised only when the land is occupied without lawful authority. The Company is of the view that Section 21(5) of the MMDR Act is not applicable as the mining is done within the sanctioned mining lease area and accordingly the Company has filed revision petitions before the Mines Tribunal against all such demand notices. Consequent to it stay has been granted by the Mines Tribunal against the entire demand of `38,280 million and directed the State that no coercive action should be taken for recovery of demand.
Based on the judgment of Hon’ble High court of Jharkhand on 11th December, 2014 in the matter of our writ petition for renewal of lease and continuation of operation at Noamundi iron mine, the Government of Jharkhand approved the renewal of lease of Noamundi Mines by an express order on 31st December, 2014. Express Order also held that the mining operation carried out between 1st January, 2012 to 31st August, 2014 to be unlawful and computed an amount of `35,680 million on account of such alleged unlawful mining. The Mines and Minerals Development and Regulation (MMDR) Amendment Ordinance 2015 promulgated on 12th January, 2015 provides for renewal of the above mines.
Based on the new Ordinance, Jharkhand Government revised the Express Order on 12th February, 2015 for lease renewal up to 31st March, 2030 with following terms and conditions:
• Value of Iron Ore produced by alleged unlawful mining during the period 1.1.12 to 20.04.2014 for `29,944.9 million to be decided on the basis of disposal of our writ petition before Hon’ble High Court of Jharkhand.
• Value of Iron Ore produced from 21.4.2014 to 17.7.2014 amounting to `4,218.3 million to be paid in maximum 3 installments.
• Value of Iron Ore produced from 18.7.2014 to 31.08.2014 i.e. `1,520 million to be paid immediately.
The Company paid `1,520 million under protest. District Mining Officer Chaibasa on 16th March, 2015 has issued demand note for payment of `4,218.3 million, payable in three monthly installments. The Company replied on 20th March, 2015, since the lease has been extended till 31st March, 2030, the above demand is not tenable. The Company paid `500 million under protest on 27th July, 2015.
A writ petition was filed before Hon'ble High Court of Jharkhand and heard on 9th September, 2015. An interim order has been given by Hon’ble High Court of Jharkhand on 18th September, 2015 wherein court has directed the company to pay outstanding amount of ` 3,718.3 million in 3 equal installments, first installment by 15th October, 2015, second installment by 15th November, 2015 and third installment by 15th December, 2015.
F-49
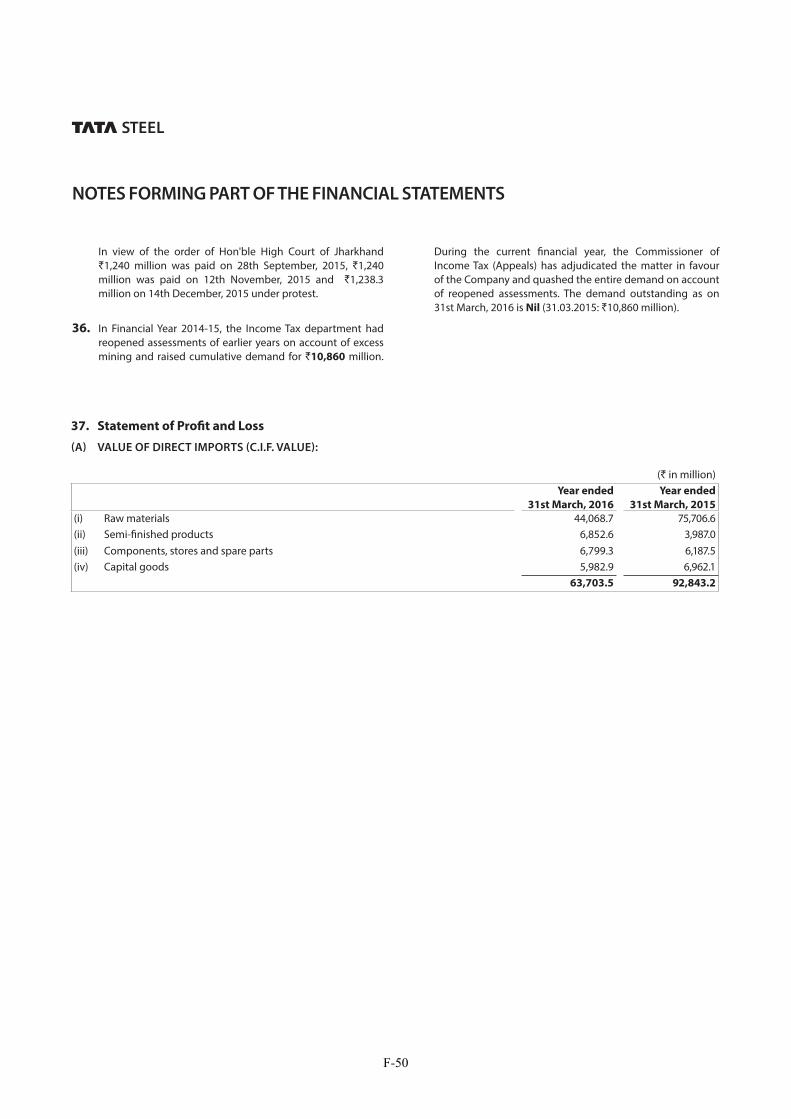
NOTES FORMING PART OF THE FINANCIAL STATEMENTS
In view of the order of Hon'ble High Court of Jharkhand `1,240 million was paid on 28th September, 2015, `1,240 million was paid on 12th November, 2015 and `1,238.3 million on 14th December, 2015 under protest.
36. In Financial Year 2014-15, the Income Tax department had reopened assessments of earlier years on account of excess mining and raised cumulative demand for `10,860 million.
During the current financial year, the Commissioner of Income Tax (Appeals) has adjudicated the matter in favour of the Company and quashed the entire demand on account of reopened assessments. The demand outstanding as on 31st March, 2016 is Nil (31.03.2015: `10,860 million).
37. Statement of Profit and Loss
(A) VALUE OF DIRECT IMPORTS (C.I.F. VALUE):
(` in million)Year ended
31st March, 2016
Year ended
31st March, 2015
(i) Raw materials 44,068.7 75,706.6(ii) Semi-finished products 6,852.6 3,987.0(iii) Components, stores and spare parts 6,799.3 6,187.5(iv) Capital goods 5,982.9 6,962.1
63,703.5 92,843.2
F-50
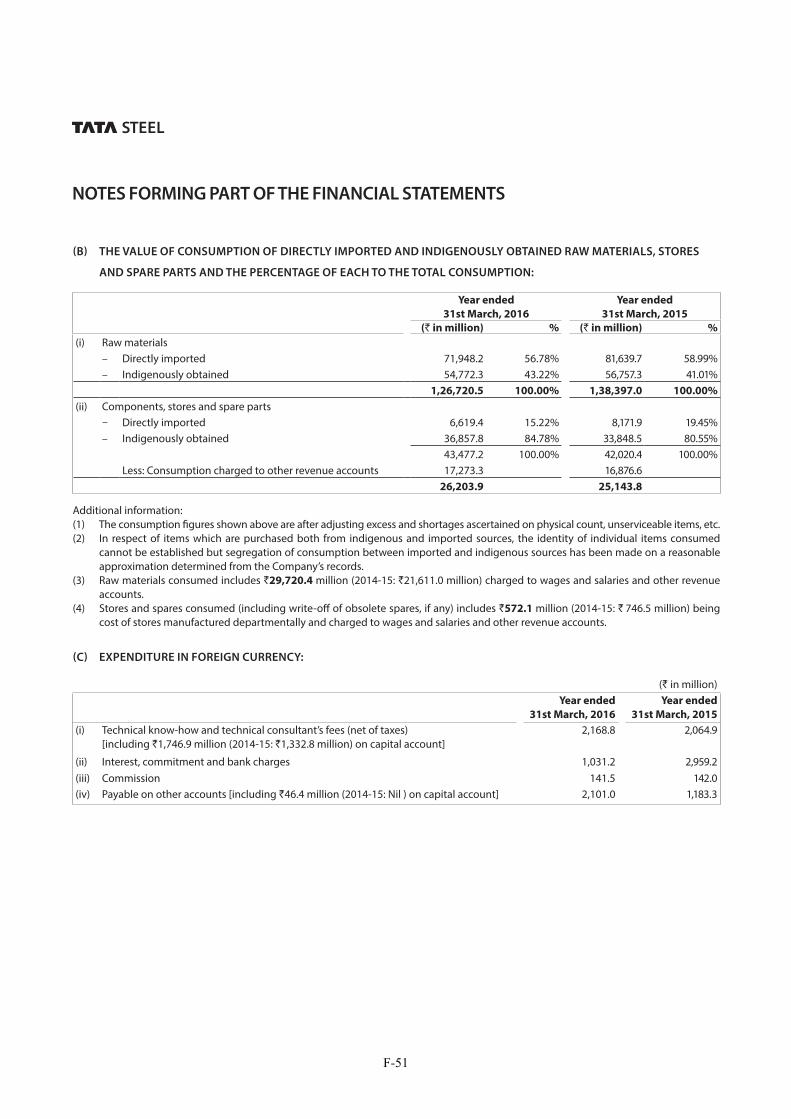
NOTES FORMING PART OF THE FINANCIAL STATEMENTS
(B) THE VALUE OF CONSUMPTION OF DIRECTLY IMPORTED AND INDIGENOUSLY OBTAINED RAW MATERIALS, STORES
AND SPARE PARTS AND THE PERCENTAGE OF EACH TO THE TOTAL CONSUMPTION:
Year ended
31st March, 2016
Year ended
31st March, 2015
(` in million) % (` in million) %
(i) Raw materials– Directly imported 71,948.2 56.78% 81,639.7 58.99%– Indigenously obtained 54,772.3 43.22% 56,757.3 41.01%
1,26,720.5 100.00% 1,38,397.0 100.00%
(ii) Components, stores and spare parts– Directly imported 6,619.4 15.22% 8,171.9 19.45%– Indigenously obtained 36,857.8 84.78% 33,848.5 80.55%
43,477.2 100.00% 42,020.4 100.00%Less: Consumption charged to other revenue accounts 17,273.3 16,876.6
26,203.9 25,143.8
Additional information:(1) The consumption figures shown above are after adjusting excess and shortages ascertained on physical count, unserviceable items, etc.(2) In respect of items which are purchased both from indigenous and imported sources, the identity of individual items consumed
cannot be established but segregation of consumption between imported and indigenous sources has been made on a reasonable approximation determined from the Company’s records.
(3) Raw materials consumed includes `29,720.4 million (2014-15: `21,611.0 million) charged to wages and salaries and other revenue accounts.
(4) Stores and spares consumed (including write-off of obsolete spares, if any) includes `572.1 million (2014-15: ` 746.5 million) being cost of stores manufactured departmentally and charged to wages and salaries and other revenue accounts.
(C) EXPENDITURE IN FOREIGN CURRENCY:
(` in million)Year ended
31st March, 2016
Year ended
31st March, 2015
(i) Technical know-how and technical consultant’s fees (net of taxes) [including `1,746.9 million (2014-15: `1,332.8 million) on capital account]
2,168.8 2,064.9
(ii) Interest, commitment and bank charges 1,031.2 2,959.2(iii) Commission 141.5 142.0(iv) Payable on other accounts [including `46.4 million (2014-15: Nil ) on capital account] 2,101.0 1,183.3
F-51

NOTES FORMING PART OF THE FINANCIAL STATEMENTS
(D) REMITTANCE IN FOREIGN CURRENCIES FOR DIVIDEND:
The Company has not remitted any amount in foreign currencies on account of dividend during the year and does not have information as to the extent to which remittances, if any, in foreign currencies on account of dividend have been made by/on behalf of non-resident shareholders. The particulars of dividend payable to non-resident shareholders (including non-resident Indian shareholders) which were declared during the year are as under:
Year ended
31st March, 2016
Year ended
31st March, 2015
(i) Number of non-resident shareholders 13,129 11,943(ii) Number of Ordinary Shares held by them 16,09,92,882 20,77,84,354(iii) Gross amount of dividend `1287.9 million `2,077.8 million
Gross amount of dividend declared in current and previous year pertain to FY 2014-15 and FY 2013-14 respectively.
(E) EARNINGS IN FOREIGN EXCHANGE:
(` in million)Year ended
31st March, 2016
Year ended
31st March, 2015
(i) Export of steel and other materials (F.O.B.) (including value of exports through export houses)
10,013.7 8,837.9
(ii) Interest received 225.8 303.6(iii) Others 656.5 258.2
(F) Revenue expenditure charged to Statement of Profit and Loss in respect of research and development activities undertaken during the year is `1,162.5 million (2014-15: `1,078.7 million) including depreciation of `67.5 million (2014-15: `48.0 million). Capital expenditure in respect of research and development activities undertaken during the year is ̀ 130.6 million (2014-15: `259.3 million).
38. The Committee of Directors (Committee) in April 2013 had approved the scheme of amalgamation of Tata Metaliks Ltd. and Tata Metaliks Kubota Pipes Limited (Scheme) with the Company, subject to the approval of the High Courts of Judicature at Bombay and Calcutta. The Bombay High Court vide its Order dated August 21, 2015 (Order) had approved the Scheme subject to similar approval being obtained from the Calcutta High Court. However, on May 17, 2016 the Committee, after careful consideration of various factors, approved the proposal of the Company to file appropriate application before the Hon'ble High Court of Bombay seeking recall of the said Order.
39. The Company has entered into operating lease arrangements for certain facilities. The leases are non-cancellable and for a period of 20 years and may be renewed for a further period of 5 years based on mutual agreement of the parties. Lease payments recognised in the Statement of Profit and Loss Account for the year is `23.2 million (2014-15 : Nil). Future minimum lease payments are as follows:
(` in million)As at
31st March, 2016
As at
31st March, 2015
Period Minimum Lease Payments
Minimum Lease Payments
Not later than one year 277.8 –Later than one year but not later five years 1,111.2 –Later than five years 6,345.9 –
7,734.9 –
F-52

NOTES FORMING PART OF THE FINANCIAL STATEMENTS
40. Employee Benefits(A) The Company has recognised, in the Statement of Profit and Loss for the year ended 31st March, 2016, an amount of
`3,036.5 million (2014-15: `2,833.4 million) as expenses under the following defined contribution plans.
(` in million)Year ended
31st March, 2016
Year ended
31st March, 2015
Benefit (Contribution to)
Provident Fund 2,108.6 2,015.8Superannuation Fund 250.7 260.2Employees Pension Scheme/Coal Mines Pension Scheme/ National Pension Scheme 454.4 366.2 TISCO Employees Pension Scheme 222.8 191.2
3,036.5 2,833.4
The Company’s Provident Fund is exempted under Section 17 of The Employees’ Provident Funds and Miscellaneous Provisions Act, 1952
(B) THE COMPANY OPERATES POST RETIREMENT DEFINED BENEFIT PLANS AS FOLLOWS:
(i) Funded - Post Retirement Gratuity (ii) Unfunded - Post Retirement Medical Benefits - Pensions to Directors - Farewell Gifts - Packing and Transportation Costs on Retirement
(C) DETAILS OF THE POST RETIREMENT GRATUITY PLAN ARE AS FOLLOWS:
(` in million)Year ended
31st March, 2016
Year ended
31st March, 2015
Description
(i) Reconciliation of opening and closing balances of obligation
Obligation as at beginning of the year 25,729.1 20,031.6Current service cost 1,167.1 876.8Interest cost 1,876.5 1,753.0Actuarial (gain)/loss 662.1 5,228.7Benefits paid (3,032.6) (2,161.0)Obligation as at end of the year 26,402.2 25,729.1
(ii) Reconciliation of opening and closing balances of plan assets
Fair value of plan assets as at beginning of the year 20,115.3 18,889.6Expected return on plan assets 1,712.6 1,470.4Actuarial gain/(loss) 383.6 774.3Contributions 5,616.4 1,142.0Benefits paid (3,032.6) (2,161.0)Fair value of plan assets as at end of the year 24,795.3 20,115.3
F-53

NOTES FORMING PART OF THE FINANCIAL STATEMENTS
(` in million)Year ended
31st March, 2016
Year ended
31st March, 2015
(iii) Reconciliation of fair value of assets and obligations
Fair value of plan assets as at end of the year 24,795.3 20,115.3Present value of obligation as at end of the year 26,402.2 25,729.1Net obligation/(asset) recognised in the balance sheet (included in the line item - Provision for employee benefits)
1,606.9 5,613.8
(iv) Expenses recognised during the year
Current service cost 1,167.1 876.8Interest cost 1,876.5 1,753.0Expected return on plan assets (1,712.6) (1,470.4)Actuarial (gain)/loss 278.5 4,454.4Expense recognised during the year (included in the line item - Employee benefits expense)*
1,609.5 5,613.8
(v) Investment details % %GOI securities 8.76 10.51Public sector unit bonds 5.23 7.92Central/State Government guaranteed securities 7.21 8.62Private sector unit bonds 6.88 9.30Deposit with LIC 64.14 55.94Others (including bank balances) 7.78 7.71 100.00 100.00
(vi) Assumptions
Discount rate (per annum) 7.75% 7.75%Expected return on plan assets (per annum) 8.00% 8.00%Rate of escalation in salary (per annum) 7.50 to 10.00% 7.50% to 10.00%
* Includes impact of Nil (2014-15: `2,445.7 million) on account of arrear wage settlement, provision for which was included under salaries and wages including bonus
The long-term estimate of the expected rate of return on the plan assets have been arrived at based on the asset allocation and prevailing yield rates on such assets. The major portions of the assets are invested in GOI Securities, PSU bonds and LIC. Assumed rate of return on assets is expected to vary from year to year reflecting the returns on matching Government Bonds.
40. Employee Benefits (contd.)
(C) DETAILS OF THE POST RETIREMENT GRATUITY PLAN ARE AS FOLLOWS:
F-54

NOTES FORMING PART OF THE FINANCIAL STATEMENTS
The estimate of future salary increases take into account inflation, seniority, promotion and other relevant factors.
(D) DETAILS OF THE UNFUNDED POST RETIREMENT DEFINED BENEFIT OBLIGATION ARE AS FOLLOWS:
(` in million)Year ended
31st March, 2016
Year ended
31st March, 2015
Description Medical Others Medical Others
(i) Reconciliation of opening and closing balances of obligation
Obligation as at beginning of the year 10,341.8 791.9 7,756.7 636.2Current service cost 172.7 54.4 106.7 35.8Interest cost 782.4 59.4 697.0 56.5Plan amendment cost/(credit) – – – 25.6Actuarial (gain)/loss (165.1) (9.8) 2,224.2 88.8Benefits paid (492.5) (52.1) (442.8) (51.0)
Obligation as at end of the year 10,639.3 843.8 10,341.8 791.9
(ii) Expenses recognised during the year
Current service cost 172.7 54.4 106.7 35.8Interest cost 782.4 59.4 697.0 56.5Plan amendment cost/(credit) – – – 25.6Actuarial (gain)/loss (165.1) (9.8) 2,224.2 88.8Expense recognised during the year (included in the line item - Employee benefits expense)
790.0 104.0 3,027.9 206.7
(iii) Assumptions
Discount rate (per annum) as at the beginning of the year 7.75% 7.75% 9.25% 9.25%Discount rate (per annum) as at the end of the year 7.75% 7.75% 7.75% 7.75%Medical costs inflation rate 8.00% – 8.00% –Effect of a 1% change in health care cost on Increase 9% p.a 9% p.a – aggregate current service and interest cost (154.0) 130.4 – closing balance of obligation 1,642.9 1,637.4 Decrease 7% p.a 7% p.a – aggregate current service and interest cost (358.3) (100.4) – closing balance of obligation (1,372.8) (1,313.3)
40. Employee Benefits (contd.)
F-55

NOTES FORMING PART OF THE FINANCIAL STATEMENTS
(E) OTHER DISCLOSURES:
(` in million)Benefits 2015-16 2014-15 2013-14 2012-13 2011-12
Retiring Gratuity
Present value of defined benefit obligation 26,402.2 25,729.1 20,031.6 18,882.2 16,355.7Fair value of plan assets 24,795.3 20,115.3 18,889.6 17,004.4 15,546.1Surplus/(Deficit) in plan assets (1,606.9) (5,613.8) (1,142.0) (1,877.8) (809.6)Experience adjustment on obligation - (gain)/loss 662.2 2,721.7 2,088.7 923.3 780.4Experience adjustment on plan assets - gain/(loss) 383.6 774.3 72.4 595.7 206.5Expected contribution (best estimate) to funded plans in subsequent financial year
1,606.9 5,613.8 1,142.0 1,877.8 809.6
MedicalPresent value of defined benefit obligation 10,639.3 10,341.8 7,756.7 8,322.5 6,958.0Experience adjustment on obligation - (gain)/loss (165.1) 369.5 448.9 485.3 1,043.9
OthersPresent value of defined benefit obligation 843.8 791.9 636.2 625.4 541.3Experience adjustment on obligation - (gain)/loss (9.8) (12.5) 37.9 19.2 53.2
40. Employee Benefits (contd.)
F-56

NOTES FORMING PART OF THE FINANCIAL STATEMENTS
41. Segment Reporting
PRIMARY SEGMENT INFORMATION (BUSINESS SEGMENT)
(` in million)Particulars Steel Ferro
Alloys and
Minerals
Others Unallocable Eliminations Total
Segment revenueExternal revenue 3,48,081.1 13,336.3 20,686.0 – – 38,21,034.0
3,85,865.9 8,752.9 23,231.2 – – 4,17,850.0Inter segment revenue 14,858.9 3,180.3 510.2 – (18,549.4) –
17,572.6 2,796.0 552.7 – (20,921.3) –Total revenue 3,62,940.0 16,516.6 21,196.2 – (18,549.4) 3,82,103.4
4,03,438.5 11,548.9 23,783.9 – (20,921.3) 4,17,850.0Segment results before finance costs, exceptional items and tax
55,036.8 1,358.0 967.2 34,331.4 – 91,693.4
87,494.7 1,087.9 486.4 (3,129.1) – 85,939.9Less: Finance costs 14,602.7
19,759.5Profit before exceptional items and tax 77,090.7
66,180.4Exceptional items(a) Profit on sale of non-current
investments1,042.9
8,061.0(b) Provision for diminution in the value
of investment/doubtful advances(1,990.3)
(1,984.0)(c) (Provision)/reversal for impairment on
non-current assets(515.1)
1,362.9(d) Profit on sale of non-current assets –
11,468.6(e) Provision for demands and claims (8,800.5)
–(f ) Employee separation compensation (5,562.5)
–Profit before tax 61,265.2
85,088.9Tax expense 12,255.7
20,697.7Profit after tax 49,009.5
64,391.2Segment assets 6,29,051.6 7,196.7 3,348.3 25,679.0 – 6,65,275.6
5,92,393.7 6,379.1 3,561.9 24,445.7 – 6,26,780.4
Segment liabilities 1,38,856.2 5,182.9 3,214.2 29,175.3 – 1,76,428.6
1,19,823.0 3,715.9 2,486.8 32,996.9 – 1,59,022.6
F-57

NOTES FORMING PART OF THE FINANCIAL STATEMENTS
41. Segment Reporting (contd.)
SECONDARY SEGMENT INFORMATION (GEOGRAPHICAL SEGMENT)
(` in million)Particulars Steel Ferro
Alloys and
Minerals
Others Unallocable Eliminations Total
Capital expenditure 60,340.0 1,024.3 10.6 – – 61,374.9
75,817.2 703.0 36.4 – – 76,556.6Segment depreciation 18,965.4 293.3 72.4 – – 19,331.1
19,438.0 467.3 70.6 – – 19,975.9
Non-cash expenditure other than depreciation
332.8 – 13.9 – – 346.7
922.3 4.0 4.3 – – 930.6
SECONDARY SEGMENT INFORMATION (GEOGRAPHICAL SEGMENT)
(` in million)Year ended
31st March, 2016
Year ended
31st March, 2015
Segment Revenue– Within India 3,71,531.6 4,08,690.9– Outside India 10,571.8 9,159.1
3,82,103.4 4,17,850.0
Capital Expenditure– Within India 61,374.9 76,556.6– Outside India – –
61,374.9 76,556.6
As at 31st March, 2016
As at 31st March, 2015
Segment Assets– Within India 6,65,275.6 6,26,534.8 – Outside India – 245.6
6,65,275.6 6,26,780.4
F-58

NOTES FORMING PART OF THE FINANCIAL STATEMENTS
Additional information: (1) The Company has disclosed Business Segment as the primary segment. Segments have been identified taking into account the
nature of the products, the differing risks and returns, the organisational structure and internal reporting system. The Company’s operations predominantly relate to manufacture of Steel and Ferro Alloys and Minerals business. Other business segments comprise Tubes and Bearings.
(2) Segment Revenue, Segment Results, Segment Assets and Segment Liabilities include the respective amounts identifiable to each of the segments as also amounts allocated on a reasonable basis. The expenses, which are not directly relatable to the business segment, are shown as unallocated corporate cost. Assets and liabilities that cannot be allocated between the segments are shown as unallocated corporate assets and liabilities respectively.
(3) Unallocable Assets and Liabilities exclude:
(` in million) As at
31st March, 2016
As at
31st March, 2015
Assets
Non-current investments 5,23,604.2 5,21,642.4Current investments 43,201.7 10,000.8Advance against equity – 212.8
5,66,805.9 5,31,856.0
Liabilities
Long-term borrowings 2,34,577.7 2,39,003.7Short-term borrowings 52,610.2 348.8Current maturities of long-term borrowings 9,243.7 42,631.9Hybrid perpetual securities 22,750.0 22,750.0Provision for employee separation compensation 9,905.8 5,736.4Deferred tax liabilities (net) 21,798.3 22,504.1
3,50,885.7 3,32,974.9
(4) Transactions between segments are primarily for materials which are transferred at market determined prices and common costs are apportioned on a reasonable basis.
41. Segment Reporting (contd.)
SECONDARY SEGMENT INFORMATION (GEOGRAPHICAL SEGMENT)
F-59

NOTES FORMING PART OF THE FINANCIAL STATEMENTS
Name of the Party Country
A. Subsidiaries:
i) ABJA Investment Co. Pte. Ltd. Singapore
ii) Adityapur Toll Bridge Company Limited India
iii) Bangla Steel & Mining Co. Ltd. Bangladesh
iv) Tata Steel Special Economic Zone Limited India
v) Indian Steel & Wire Products Ltd. India
vi) Jamshedpur Continuous Annealing &
Processing Company Private Limited
India
vii) Jamshedpur Utilities & Services Company Limited India
1. Haldia Water Management Limited India
2. Naba Diganta Water Management Limited India
3. SEZ Adityapur Limited India
viii) Mohar Export Services Pvt. Ltd.^ India
ix) NatSteel Asia Pte. Ltd. Singapore
1. TS Asia (Hong Kong) Ltd. Hong Kong SAR
2. Tata Steel Resources Australia Pty. Ltd.* Australia
x) Rujuvalika Investments Limited^ India
xi) T M Mining Company Limited India
xii) T S Alloys Limited India
xiii) Tata Incorporated* USA
xiv) Tata Korf Engineering Services Ltd. India
xv) Tata Metaliks Ltd. India
1. Tata Metaliks Di Pipes Limited India
xvi) Tata Sponge Iron Limited India
1. TSIL Energy Limited India
xvii) Tata Steel (KZN) (Pty) Ltd. South Africa
xviii) T Steel Holdings Pte. Ltd. Singapore
1. T S Global Holdings Pte Ltd. Singapore
I. Orchid Netherlands (No.1) B.V. Netherlands
II. NatSteel Holdings Pte. Ltd. Singapore
1. Burwill Trading Pte. Ltd.* Singapore
2. Easteel Services (M) Sdn. Bhd. Malaysia
3. Eastern Steel Fabricators Phillipines, Inc.
Phillipines
4. Eastern Steel Services Pte. Ltd.* Singapore
5. Eastern Wire Pte. Ltd.* Singapore
6. NatSteel (Xiamen) Ltd. China
7. NatSteel Asia (S) Pte. Ltd.* Singapore
8. NatSteel Equity IV Pte. Ltd.* Singapore
Name of the Party Country
9. NatSteel Recycling Pte Ltd. Singapore
10. NatSteel Trade International (Shanghai) Company Ltd.
China
11. NatSteel Trade International Pte. Ltd.
Singapore
12. NatSteel Vina Co. Ltd. Vietnam
13. The Siam Industrial Wire Company Ltd.
Thailand
14. TSN Wires Co., Ltd. Thailand
III. Tata Steel Europe Limited UK
1. Almana Steel Dubai (Jersey) Limited
Jersey
2. Apollo Metals Limited USA
3. Ashorne Hill Management College*
UK
4. Augusta Grundstucks GmbH Germany
5. Automotive Laser Technologies Limited
UK
6. B S Pension Fund Trustee Limited UK
7. Beheermaatschappij Industriele Produkten B.V.
Netherlands
8. Belfin Beheermaatschappij B.V.* Netherlands
9. Bell & Harwood Limited UK
10. Blastmega Limited UK
11. Blume Stahlservice GmbH Germany
12. Blume Stahlservice Polska Sp.Z.O.O
Poland
13. Bore Samson Group Limited UK
14. Bore Steel Limited UK
15. British Guide Rails Limited UK
16. British Steel Corporation Limited UK
17. British Steel De Mexico S.A. de C.V.* Mexico
18. British Steel Directors (Nominees) Limited
UK
19. British Steel Engineering Steels (Exports) Limited
UK
20. British Steel Nederland International B.V.
Netherlands
21. British Steel Samson Limited UK
22. British Steel Service Centres Limited
UK
23. British Tubes Stockholding Limited
UK
42. Related Party Transactions
(A) LIST OF RELATED PARTIES AND RELATIONSHIPS
F-60

NOTES FORMING PART OF THE FINANCIAL STATEMENTS
42. Related Party Transactions (contd.)
(A) LIST OF RELATED PARTIES AND RELATIONSHIPS
Name of the Party Country
24. C V Benine Netherlands
25. C Walker & Sons Limited UK
26. Catnic GmbH Germany
27. Catnic Limited UK
28. CBS Investissements SAS France
29. Cladding & Decking (UK) Limited UK
30. Cogent Power Inc. Canada
31. Cogent Power SA DE CV Mexico
32. Cogent Power Inc. USA
33. Cogent Power Limited UK
34. Color Steels Limited UK
35. Corbeil Les Rives SCI France
36. Corby (Northants) & District Water Co.
UK
37. Cordor (C& B) Limited UK
38. Corus Aluminium Verwaltungsgesellschaft Mbh
Germany
39. Corus Beteiligungs GmbH Germany
40. Corus Building Systems Bulgaria AD
Bulgaria
41. Corus Building Systems SAS France
42. Corus CNBV Investments UK
43 Corus Cold drawn Tubes Limited UK
44. Corus Engineering Steels (UK) Limited
UK
45. Corus Engineering Steels Holdings Limited
UK
46. Corus Engineering Steels Limited UK
47. Corus Engineering Steels Overseas Holdings Limited
UK
48. Corus Engineering Steels Pension Scheme Trustee Limited
UK
49. Corus Group Limited UK
50. Corus Holdings Limited UK
51. Corus International (Overseas Holdings) Limited
UK
52. Corus International Limited UK
53. Corus International Romania SRL. Romania
54. Corus Investments Limited UK
55. Corus Ireland Limited Ireland
56. Corus Large Diameter Pipes Limited
UK
Name of the Party Country
57. Corus Liaison Services (India) Limited
UK
58. Corus Management Limited UK
59. Corus Primary Aluminium B.V. Netherlands
60. Corus Properties (Germany) Limited
UK
61. Corus Property UK
62. Corus Republic Of Ireland Subsidiaries Pension Scheme Trustee Limited
Ireland
63. Corus Service Centre Limited N Ireland
64. Corus Steel Service STP LLC Russia
65. Corus Tubes Poland Spolka Z.O.O Poland
66. Corus UK Healthcare Trustee Limited
UK
67. Corus Ukraine LLC Ukraine
68. CPN (85) Limited UK
69. Crucible Insurance Company Limited
I of Man
70. Degels GmbH Germany
71. Demka B.V. Netherlands
72. DSRM Group Plc. UK
73. Eric Olsson & Soner Forvaltnings AB
Sweden
74. Esmil B.V. Netherlands
75. Europressings Limited UK
76. Firsteel Group Limited UK
77. Firsteel Holdings Limited UK
78. Firsteel Strip Mill Products Limited
UK
79. Fischer Profil GmbH Germany
80. Gamble Simms Metals Limited Ireland
81. Grant Lyon Eagre Limited UK
82. H E Samson Limited UK
83. Hadfields Holdings Limited UK
84. Halmstad Steel Service Centre AB Sweden
85. Hammermega Limited UK
86. Harrowmills Properties Limited UK
87. Hille & Muller GmbH Germany
88. Hille & Muller USA Inc. USA
89. Hoogovens (UK) Limited UK
F-61

NOTES FORMING PART OF THE FINANCIAL STATEMENTS
42. Related Party Transactions (contd.)
(A) LIST OF RELATED PARTIES AND RELATIONSHIPS
Name of the Party Country
90. Hoogovens Aluminium UK Limited
UK
91. Hoogovens Finance B.V. Netherlands
92. Hoogovens USA Inc. USA
93. Huizenbezit “Breesaap” B.V. Netherlands
94. Ickles Cottage Trust Limited UK
95. Inter Metal Distribution SAS France
96. Kalzip Asia Pte Limited Singapore
97. Kalzip FZE UAE
98. Kalzip GmbH Germany
99. Kalzip GmbH Austria
100. Kalzip Guangzhou Limited China
101. Kalzip Inc USA
102. Kalzip India Private Limited India
103. Kalzip Italy SRL Italy
104. Kalzip Limited UK
105. Kalzip Spain S.L.U. Spain
106. Layde Steel S.L. Spain
107. Lister Tubes Limited Ireland
108. London Works Steel Company Limited
UK
109. Longs Steel UK Limited UK
110. Midland Steel Supplies Limited UK
111. Mistbury Investments Limited UK
112. Montana Bausysteme AG Switzerland
113. Myriad Nederland B.V.* Netherlands
114. Naantali Steel Service Centre OY Finland
115. Namascor B.V.* Netherlands
116. Nationwide Steelstock Limited UK
117. Norsk Stal Tynnplater AS Norway
118. Orb Electrical Steels Limited UK
119. Ore Carriers Limited UK
120. Oremco Inc. USA
121. Plated Strip (International) Limited
UK
122. Precoat International Limited UK
123. Precoat Limited UK
124. Rafferty-Brown Steel Co Inc Of Conn.
USA
125. Round Oak Steelworks Limited UK
Name of the Party Country
126. Runblast Limited UK
127. Runmega Limited UK
128. S A B Profiel B.V. Netherlands
129. S A B Profil GmbH Germany
130. Seamless Tubes Limited UK
131. Service Center Gelsenkirchen GmbH
Germany
132. Service Centre Maastricht B.V. Netherlands
133. Skruv Erik AB Sweden
134. Societe Europeenne De Galvanisation (Segal) Sa
Belgium
135. Staalverwerking en Handel B.V. Netherlands
136. Stainless Velsen-Noord BV Netherlands
137. Steel StockHoldings Limited UK
138 Steelstock Limited UK
139. Stewarts & Lloyds Of Ireland Limited
Ireland
140. Stewarts And Lloyds (Overseas) Limited
UK
141. Stocksbridge Works Cottage Trust Limited
UK
142. Surahammar Bruks AB Sweden
143. Swinden Housing Association Limited
UK
144. Tata Steel Belgium Packaging Steels N.V.
Belgium
145. Tata Steel Belgium Services N.V. Belgium
146. Tata Steel Denmark Byggsystemer A/S
Denmark
147. Tata Steel Europe Distribution BV Netherlands
148. Tata Steel Europe Metals Trading BV
Netherlands
149. Tata Steel France Batiment et Systemes SAS
France
150. Tata Steel France Holdings SAS France
151. Tata Steel France Rail SAS France
152. Tata Steel Germany GmbH Germany
153. Tata Steel IJmuiden BV Netherlands
154. Tata Steel International (Americas) Holdings Inc
USA
155. Tata Steel International (Americas) Inc
USA
F-62

NOTES FORMING PART OF THE FINANCIAL STATEMENTS
Name of the Party Country
156. Tata Steel International (Benelux) BV
Netherlands
157. Tata Steel International (Canada) Holdings Inc
Canada
158. Tata Steel International (Czech Republic) S.R.O
Czech Republic
159. Tata Steel International (Denmark) A/S
Denmark
160. Tata Steel International (Finland) OY
Finland
161. Tata Steel International (France) SAS
France
162. Tata Steel International (Germany) GmbH
Germany
163. Tata Steel International (South America) Representações LTDA
Brazil
164. Tata Steel International Hellas SA Greece
165. Tata Steel International (Italia) SRL
Italy
166. Tata Steel International (Middle East) FZE
UAE
167. Tata Steel International (Nigeria) Ltd.
Nigeria
168. Tata Steel International (Poland) sp Zoo
Poland
169. Tata Steel International (Schweiz) AG
Switzerland
170. Tata Steel International (Sweden) AB
Sweden
171. Tata Steel International (India) Limited
India
172. Tata Steel International Iberica SA
Spain
173. Tata Steel Istanbul Metal Sanayi ve Ticaret AS
Turkey
174. Tata Steel Latvia Building Systems SIA
Latvia
175. Tata Steel Logistics and Shipping BV*
Netherlands
176. Tata Steel Maubeuge SAS France
177. Tata Steel Nederland BV Netherlands
178. Tata Steel Nederland Consulting & Technical Services BV
Netherlands
179. Tata Steel Nederland Services BV Netherlands
180. Tata Steel Nederland Star-Frame BV
Netherlands
42. Related Party Transactions (contd.)
(A) LIST OF RELATED PARTIES AND RELATIONSHIPS
Name of the Party Country
181. Tata Steel Nederland Technology BV
Netherlands
182. Tata Steel Nederland Tubes BV Netherlands
183. Tata Steel Netherlands Holdings B.V.
Netherlands
184. Tata Steel Norway Byggsystemer A/S
Norway
185. Tata Steel Speciality Service Centre Suzhou Co. Limited
China
186. Tata Steel Sweden Byggsystem AB
Sweden
187. Tata Steel Speciality Service Centre Xian Co. Limited
China
188. Tata Steel UK Consulting Limited UK
189. Tata Steel UK Holdings Limited UK
190. Tata Steel UK Limited UK
191. Tata Steel UK Rail Consultancy Limited
UK
192. Tata Steel USA Inc. USA
193. The Newport And South Wales Tube Company Limited
UK
194. The Stanton Housing Company Limited
UK
195. The Steel Company of Ireland Limited
Ireland
196. The Templeborough Rolling Mills Limited
UK
197. Thomas Processing Company USA
198. Thomas Steel Strip Corp. USA
199. Toronto Industrial Fabrications Limited
UK
200. Trierer Walzwerk GmbH Germany
201. TS South Africa Sales Office Proprietary Limited*^
South Africa
202. Tulip UK Holdings (No.2) Limited UK
203. Tulip UK Holdings (No.3) Limited UK
204. Tuscaloosa Steel Corporation USA
205. U.E.S. Bright Bar Limited UK
206. UK Steel Enterprise Limited UK
207. Ukse Fund Managers (General Partner) Limited*
UK
208. UKSE Fund Managers Limited UK
209. Unitol SAS France
210. Walker Manufacturing And Investments Limited
UK
F-63

NOTES FORMING PART OF THE FINANCIAL STATEMENTS
42. Related Party Transactions (contd.)
(A) LIST OF RELATED PARTIES AND RELATIONSHIPS
Name of the Party Country
211. Walkersteelstock Ireland Limited Ireland
212. Walkersteelstock Limited UK
213. Westwood Steel Services Limited UK
214. Whitehead (Narrow Strip) Limited
UK
IV. T S Global Minerals Holdings Pte Ltd. Singapore
1. Al Rimal Mining LLC Oman
2. Black Ginger 461 (Proprietary) Ltd. South Africa
3. Howse Minerals Ltd. Canada
4. Kalimati Coal Company Pty. Ltd. Australia
5. Sedibeng Iron Ore Pty. Ltd. South Africa
6. Tata Steel Cote D’ Ivoire S.A Ivory Coast
7. Tata Steel Minerals UK Limited UK
8. Tata Steel Minerals Canada Limited
Canada
9. T S Canada Capital Ltd. Canada
V. Tata Steel International (Singapore)
Holdings Pte. Ltd.
Singapore
1. TSIA Holdings (Thailand) Limited Thailand
2. Tata Steel International (Shanghai) Ltd.
China
3. Tata Steel International (Thailand) Limited
Thailand
4. Tata Steel International (Singapore) Pte. Ltd.
Singapore
5. Tata Steel International (Asia) Limited
Hong Kong S.A.R
VI. Tata Steel (Thailand) Public Company
Ltd.
Thailand
1. N.T.S Steel Group Plc. Thailand
2. The Siam Construction Steel Co. Ltd.
Thailand
3. The Siam Iron And Steel (2001) Co. Ltd.
Thailand
VII. T S Global Procurement Company
Pte. Ltd.
Singapore
1. ProCo Issuer Pte. Ltd. Singapore
xix) Tata Steel Odisha Limited India
xx) Tata Steel Processing and Distribution
Limited
India
xxi) Tayo Rolls Limited India
xxii) TM International Logistics Limited India
Name of the Party Country
1. International Shipping and Logistics FZE UAE
2. TKM Global China Ltd. China
3. TKM Global GmbH Germany
4. TKM Global Logistics Limited India
5. TM Harbour Services Private Limited India
xxiii) Tata Pigments Limited India
xxiv) The Tinplate Company of India Ltd. India
B. Joint Ventures of:
i) Tata Steel Ltd.
1. Bhubaneshwar Power Private Limited India
2. Himalaya Steel Mill Services Private Limited India
3. mjunction services limited India
4. S & T Mining Company Private Limited India
5. Tata BlueScope Steel Limited India
6. Tata NYK Shipping Pte Ltd. Singapore
ii) T Steel Holdings Pte. Ltd.
a) T S Global Holdings Pte Ltd.
I. NatSteel Holdings Pte. Ltd.
1. TVSC Construction Steel Solutions Limited
Hong Kong S.A.R
II. Tata Steel Europe Limited
1. Afon Tinplate Company Limited UK
2. Air Products Llanwern Limited UK
3. BSR Pipeline Services Limited UK
4. Caparo Merchant Bar Plc UK
5. Corus Kalpinis Simos Cladding Industry SA
Greece
6. Danieli Corus Technical Services B.V.*
Netherlands
7. Fabsec Limited UK
8. Industrial Rail Services IJmond B.V.
Netherlands
9. Laura Metaal Holding B.V. Netherlands
10. Norsk Stal AS* Norway
11. Ravenscraig Limited UK
12. Redcar Bulk Terminal Limited UK
13. Tata Elastron Steel Service Center SA
Greece
14. Tata Steel Ticaret AS Turkey
15. Texturing Technology Limited UK
III. T S Global Minerals Holdings Pte. Ltd.
1. Minas De Benga (Mauritius) Limited
Mauritius
F-64

NOTES FORMING PART OF THE FINANCIAL STATEMENTS
* Part of the year ^ Became subsidiary during the year
Incorporated during the year
Name of the Party Country
C. Associate of:
i) Tata Steel Limited
1. Industrial Energy Limited India
2. Jamipol Limited India
3. Kalinga Aquatics Ltd. India
4. Kumardhubi Fireclay & Silica Works Ltd. India
5. Kumardhubi Metal Casting and Engineering Limited
India
6. Nicco Jubilee Park Limited India
7. Rujuvalika Investments Limited*^ India
8. Strategic Energy Technology Systems Private Limited
India
9. Tata Construction & Projects Ltd. India
10. TRL Krosaki Refractories Limited India
11. TRF Limited India
12. Malusha Travels Pvt Ltd. India
13. Mohar Export Services Pvt. Ltd*^ India
ii) T Steel Holdings Pte. Ltd.
a) T S Global Holdings Pte Ltd.
I. Tata Steel International (Singapore)
Holdings Pte. Ltd.
1. European Profiles (M) Sdn. Bhd. Malaysia
II. Tata Steel Europe Limited
1. Albi Profils SRL France
Name of the Party Country
2. Appleby Frodingham Cottage Trust Limited
UK
3. GietWalsOnderhoudCombinatie B.V.
Netherlands
4. Hoogovens Court Roll Service Technologies VOF
Netherlands
5. Hoogovens Gan Multimedia S.A. De C.V.
Mexico
6. ISSB Limited UK
7. Wupperman Staal Nederland B.V. Netherlands
III. T S Global Minerals Holdings Pte Ltd.
1. New Millennium Iron Corp. Canada
iii) Indian Steel & Wire Products Ltd.
1. Metal Corporation of India Limited India
D. Promoters holding together with its subsidiary is more than 20%
Tata Sons Limited
E. Key Managerial Personnel
Mr. Koushik Chatterjee – Group Executive Director (Finance & Corporate)
Mr. T. V. Narendran – Managing Director (India & South East Asia)
42. Related Party Transactions (contd.)
(A) LIST OF RELATED PARTIES AND RELATIONSHIPS
F-65
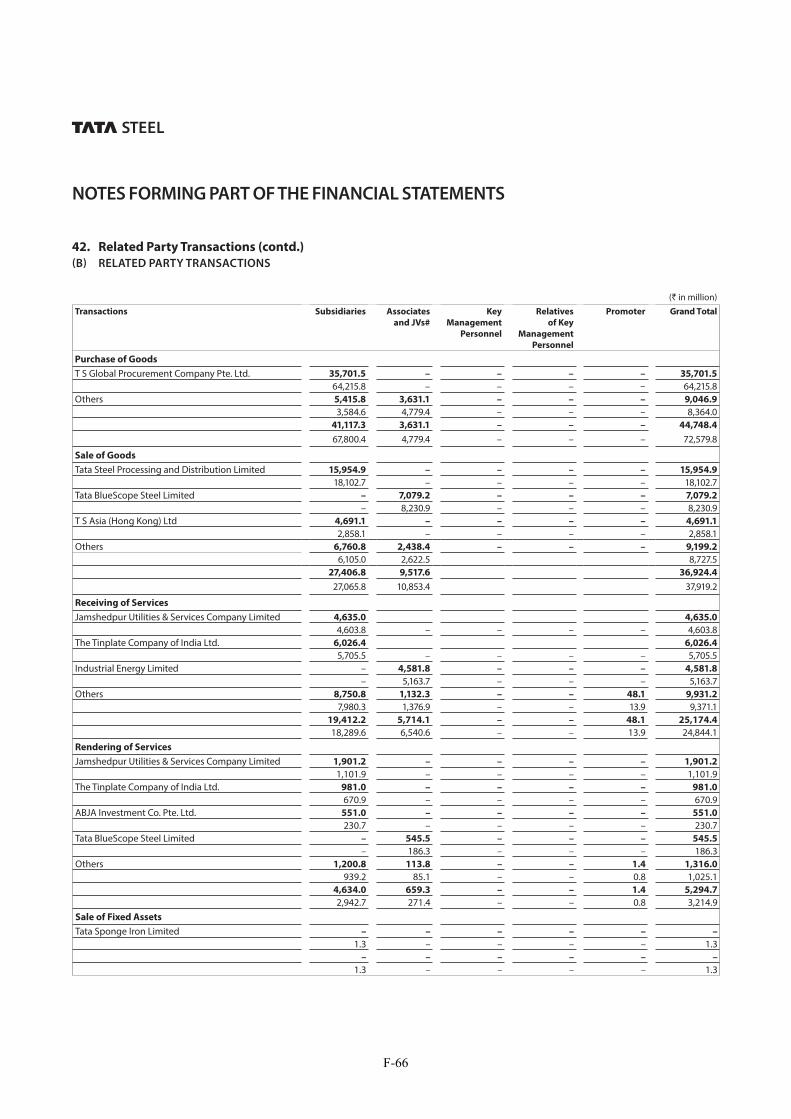
NOTES FORMING PART OF THE FINANCIAL STATEMENTS
(` in million)
Transactions Subsidiaries Associates
and JVs#
Key
Management
Personnel
Relatives
of Key
Management
Personnel
Promoter Grand Total
Purchase of Goods
T S Global Procurement Company Pte. Ltd. 35,701.5 – – – – 35,701.5
64,215.8 – – – – 64,215.8 Others 5,415.8 3,631.1 – – – 9,046.9
3,584.6 4,779.4 – – – 8,364.0 41,117.3 3,631.1 – – – 44,748.4
67,800.4 4,779.4 – – – 72,579.8
Sale of Goods
Tata Steel Processing and Distribution Limited 15,954.9 – – – – 15,954.9
18,102.7 – – – – 18,102.7 Tata BlueScope Steel Limited – 7,079.2 – – – 7,079.2
– 8,230.9 – – – 8,230.9 T S Asia (Hong Kong) Ltd 4,691.1 – – – – 4,691.1
2,858.1 – – – – 2,858.1Others 6,760.8 2,438.4 – – – 9,199.2
6,105.0 2,622.5 8,727.527,406.8 9,517.6 36,924.4
27,065.8 10,853.4 37,919.2
Receiving of Services
Jamshedpur Utilities & Services Company Limited 4,635.0 4,635.0
4,603.8 – – – – 4,603.8 The Tinplate Company of India Ltd. 6,026.4 6,026.4
5,705.5 – – – – 5,705.5 Industrial Energy Limited – 4,581.8 – – – 4,581.8
– 5,163.7 – – – 5,163.7 Others 8,750.8 1,132.3 – – 48.1 9,931.2
7,980.3 1,376.9 – – 13.9 9,371.119,412.2 5,714.1 – – 48.1 25,174.4
18,289.6 6,540.6 – – 13.9 24,844.1Rendering of Services
Jamshedpur Utilities & Services Company Limited 1,901.2 – – – – 1,901.2
1,101.9 – – – – 1,101.9 The Tinplate Company of India Ltd. 981.0 – – – – 981.0
670.9 – – – – 670.9 ABJA Investment Co. Pte. Ltd. 551.0 – – – – 551.0
230.7 – – – – 230.7Tata BlueScope Steel Limited – 545.5 – – – 545.5
– 186.3 – – – 186.3Others 1,200.8 113.8 – – 1.4 1,316.0
939.2 85.1 – – 0.8 1,025.14,634.0 659.3 – – 1.4 5,294.7
2,942.7 271.4 – – 0.8 3,214.9 Sale of Fixed Assets
Tata Sponge Iron Limited – – – – – –
1.3 – – – – 1.3 – – – – – –
1.3 – – – – 1.3
42. Related Party Transactions (contd.)
(B) RELATED PARTY TRANSACTIONS
F-66

NOTES FORMING PART OF THE FINANCIAL STATEMENTS
(` in million)
Transactions Subsidiaries Associates
and JVs#
Key
Management
Personnel
Relatives
of Key
Management
Personnel
Promoter Grand Total
Dividend Paid
Tata Sons Limited – – – – 2,311.2 2,311.2
– – – – 2,889.0 2,889.0 Others 9.3 – * *** – 9.3
– 11.7 ** **** – 11.7 9.3 – * *** 2,311.2 2,320.5
– 11.7 ** **** 2,889.0 2,900.7 Dividend Income
Industrial Energy Limited – 163.5 – – – 163.5
– 173.2 – – – 173.2 Tata Sons Limited – – – – 297.0 297.0
– – – – 99.0 99.0 The Tinplate Company of India Ltd. 164.9 – – – – 164.9
206.0 – – – – 206.0 Others 270.7 42.3 – – – 313.0
144.3 89.1 – – – 233.4435.6 205.8 297.0 938.4
350.3 262.3 – – 99.0 711.6 Interest Income
Tata Steel (KZN) (Pty) ltd. 134.7 – – – – 134.7
256.9 – – – – 256.9Others 46.9 17.9 – – – 64.8
27.0 192.4 – – – 219.4 181.6 17.9 – – – 199.5
283.9 192.4 – – – 476.3 Management contracts
Tata Sons Limited – – – – 750.0 750.0
– – – – 750.0 750.0 – – – – 750.0 750.0
– – – – 750.0 750.0 Finance Provided
Tayo Rolls Limited 596.3 – – – – 596.3
630.0 – – – – 630.0 Tata Steel Special Economic Zone Limited 596.7 – – – – 596.7
84.4 – – – – 84.4Jamshedpur Continuous Annealing & Processing Company Private Limited
295.8 – – – – 295.8
– – – – – –Others 72.9 181.1 – – – 254.0
119.9 1,906.9 – – – 2,026.8 1,561.7 181.1 – – – 1,742.8
834.3 1,906.9 – – – 2,741.2
42. Related Party Transactions (contd.)
(B) RELATED PARTY TRANSACTIONS
F-67

NOTES FORMING PART OF THE FINANCIAL STATEMENTS
(` in million)
Transactions Subsidiaries Associates
and JVs#
Key
Management
Personnel
Relatives
of Key
Management
Personnel
Promoter Grand Total
Purchase of Investment
TRF Limited – 81.5 – – – 81.5
– – – – – – The Tinplate Company of India Ltd. 81.5 – – – – 81.5
– – – – – –81.5 81.5 – – – 163.0
– – – – – –
Remuneration
Mr. Koushik Chatterjee – – 89.4 – – 89.4
– – 56.2 – – 56.2Mr. T.V. Narendran – – 83.0 – – 83.0
– – 64.7 – – 64.7– – 172.4 – – 172.4
– – 120.9 – – 120.9Provision for receivables made during the year
Tayo Rolls Limited 690.5 – – – – 690.5
– – – – – –Tata Steel (KZN) (Pty) Ltd. 172.2 – – – – 172.2
225.8 – – – – 225.8Others 25.2 0.3 – – – 25.5
179.3 – – – – 179.3
887.9 0.3 888.2
405.1 – – – – 405.1Guarantees and collaterals given
ABJA Investment Co. Pte. Ltd. – – – – – –
1,15,800.0 – – – – 1,15,800.0 – – – – – –
1,15,800.0 – – – – 1,15,800.0
Guarantees outstanding
ABJA Investment Co. Pte. Ltd. 1,14,182.7 – – – – 1,14,182.7
1,34,241.6 – – – – 1,34,241.6 Others 1,771.8 650.4 – – – 2,422.2
1,771.8 788.9 – – – 2,560.7 1,15,954.5 650.4 – – – 1,16,604.9
1,36,013.4 788.9 – – – 1,36,802.3 Outstanding Receivables
Tata Steel (KZN) (Pty) Ltd. 7,071.2 – – – – 7,071.2
6,899.0 – – – – 6,899.0 Others 3,394.4 232.7 12.5 3,639.6
2,524.3 1,064.9 – – 12.5 3,601.710,465.6 232.7 – – 12.5 10,710.8
9,423.3 1,064.9 – – 12.5 10,500.7
42. Related Party Transactions (contd.)
(B) RELATED PARTY TRANSACTIONS
F-68

NOTES FORMING PART OF THE FINANCIAL STATEMENTS
(` in million)
Transactions Subsidiaries Associates
and JVs#
Key
Management
Personnel
Relatives
of Key
Management
Personnel
Promoter Grand Total
Provision for outstanding receivables
Tata Steel (KZN) (Pty) Ltd. 7,071.2 – – – – 7,071.2
6,899.0 – – – – 6,899.0 Others 895.0 0.3 – – – 895.3
179.3 – – – – 179.3 7,966.2 0.3 – – – 7,966.5
7,078.3 – – – – 7,078.3 Outstanding Payables
T S Global Procurement Company Pte. Ltd. 15,174.0 – – – – 15,174.0
14,103.8 – – – – 14,103.8 Others 4,471.6 1,360.7 – – 735.1 6,567.4
2,785.1 1,384.6 – – 734.3 4,904.0 19,645.6 1,360.7 – – 735.1 21,741.4
16,888.9 1,384.6 – – 734.3 19,007.8 Safe of Investment
Tata Sons Ltd. – – – – 25,920.1 25,920.1
– – – – – –– – – – 25,920.1 25,920.1
– – – – – –
# Transaction with Joint Ventures have been disclosed at full value.
* `21,936.00 ** `27,420.00 *** `2,648.00 **** `3,310.00
43. The Company has the following Joint Ventures as on 31st March, 2016 and its proportionate share in the Assets, Liabilities, Income and Expenditure of the Joint Ventures is given below:
As at 31st March, 2016 2015-16
Name of the Joint Ventures Country of
Incorporation
Percentage
of Holding
Assets Liabilities Contingent
Liabilities
Capital
Commitment
Income Expenditure
mjunction services limited India 50% 1,553.5 613.3 20.8 11.3 913.1 600.5
1,379.2 580.6 – 14.9 695.5 484.2Tata BlueScope Steel Limited India 50% 7,774.2 6,174.6 287.9 0.7 7,872.3 7,671.3
7,918.6 6,510.6 343.5 0.2 7,742.2 7,981.0Tata NYK Shipping Pte Ltd. Singapore 50% 7,705.2 7,396.5 – – 7,040.6 7,366.6
8,153.8 7,690.0 – – 7,120.2 7,499.9Bhubaneshwar Power Private Limited
India 14.23% 1,439.2 1,118.2 30.9 – 3.0 6.0
1,134.0 889.2 3.9 87.7 18.5 21.1S & T Mining Company Private Limited
India 50% 38.6 18.4 – – 1.9 22.6
49.1 8.1 – 0.7 1.6 22.9Himalaya Steel Mill Services Private Limited
India 26% 54.2 32.8 – – 39.4 43.3
63.2 39.2 – – 40.4 46.4
42. Related Party Transactions (contd.)
(B) RELATED PARTY TRANSACTIONS
F-69

NOTES FORMING PART OF THE FINANCIAL STATEMENTS
44. Derivative instruments (a) The Company has entered into the following derivative instruments. All the swaps and forward contracts are accounted for as
per Accounting Policies stated in Note 1 annexed to Balance Sheet and Statement of Profit and Loss.
(i) The Company uses foreign currency forward contracts to hedge its risks associated with foreign currency fluctuations. The use of foreign currency forward contracts is governed by the Company’s strategy approved by the Board of Directors, which provides principles on the use of such forward contracts consistent with the Company’s Risk Management Policy. The Company does not use forward contracts for speculative purposes.
Outstanding short-term forward exchange contracts and option contracts entered into by the Company on account of payables including forecast payables:
As at
31st March, 2016
As at
31st March, 2015
No. of contracts 226 125US Dollar equivalent (million) 442.32 547.00INR equivalent (million) 29,304.6 34,187.5
Outstanding short-term forward exchange contracts and option contracts entered into by the Company on account of receivables including forecast receivables:
As at
31st March, 2016
As at
31st March, 2015
No. of contracts 12 12US Dollar equivalent (million) 10.50 12.00INR equivalent (million) 695.5 749.9
Outstanding long-term forward exchange contracts entered into by the Company:
As at
31st March, 2016
As at
31st March, 2015
No. of contracts 11 1014* 16*
US Dollar equivalent (million) 104.00 385.00INR equivalent (million) 6,890.3 24,062.5
* Represents outstanding long-term forward exchange contracts used to hedge currency risk of Euro and GBP against USD. The corresponding USD exposure has been disclosed under unhedged loans payable. (Long-term forward exchange contracts outstanding as on 31st March, 2016 have been used to hedge the foreign currency risk on repayment of External Commercial Borrowings of the Company).
(ii) The Company also uses derivative contracts other than forward contracts to hedge the interest rate and currency risk on its capital account. Such transactions are governed by the strategy approved by the Board of Directors which provides principles on the use of these instruments, consistent with the Company’s Risk Management Policy. The Company does not use these contracts for speculative purposes.
F-70

NOTES FORMING PART OF THE FINANCIAL STATEMENTS
Outstanding Interest Rate Swaps to hedge against fluctuations in interest rate changes:
As at
31st March, 2016
As at
31st March, 2015
No. of contracts 8 8*US Dollar equivalent (million) 301.9 335.0INR equivalent (million) 20,000.0 20,937.5
* The above interest rate swap is part of full currency swap and the number of contract is also reflected in the outstanding long-term forward exchange contract as part of hedging the exchange risk.
(b) The year end foreign currency exposures that have not been hedged by a derivative instrument or otherwise are given below:
As at
31st March, 2016
As at
31st March, 2015
US Dollar
equivalent
(million)
INR
equivalent
(` million)
US Dollar
equivalent
(million)
INR
equivalent
(` million)
Amounts receivable in foreign currency on account of the following:(i) Loans receivable 81.6 5,405.1 84.9 5,305.7(ii) Interest receivable 25.2 1,666.0 25.5 1,593.3(iii) Debtors outstanding 13.0 861.3 7.8 488.2Amounts payable in foreign currency on account of the following:(i) Import of goods and services 128.1 8,484.0 157.2 9,822.1(ii) Capital imports 72.3 4,789.3 82.9 5,183.0(iii) Interest and commitment charges payable 3.7 246.6 7.9 494.6(iv) Loans payable 325.4 21,554.9 562.6 35,162.8
45. The Board recommended dividend of `8.00 per Ordinary Share (2014-15: `8.00 per Ordinary Share) of `10 each for the year ended 31st March, 2016. The dividend is subject to the approvals of the shareholders at the Annual General Meeting. The total dividend payout (including tax on dividend) works out to `9,262.7 million (2014-15: `9,299.9 million) for the Company.
46. Previous year’s figures have been recast/restated where necessary.
44. Derivative instruments (contd.)
F-71

INDEPENDENTAUDITOR’S REPORT
TO THE MEMBERS OF TATA STEEL LIMITED
Report on the Standalone Ind AS Financial Statements
We have audited the accompanying standalone Ind AS financial statements of TATA STEEL LIMITED (“the Company”), which comprise the Balance Sheet as at March 31, 2017, and the Statement of Profit and Loss (including Other Comprehensive Income), the Cash Flow Statement and the Statement of Changes in Equity for the year then ended, and a summary of the significant accounting policies and other explanatory information.
Management’s Responsibility for the Standalone Ind AS
Financial Statements
The Company’s Board of Directors is responsible for the matters stated in Section 134(5) of the Companies Act, 2013 (“the Act”) with respect to the preparation of these standalone Ind AS financial statements that give a true and fair view of the financial position, financial performance including other comprehensive income, cash flows and changes in equity of the Company in accordance with the accounting principles generally accepted in India, including the Indian Accounting Standards (Ind AS) prescribed under section 133 of the Act.
This responsibility also includes maintenance of adequate accounting records in accordance with the provisions of the Act for safeguarding the assets of the Company and for preventing and detecting frauds and other irregularities; selection and application of appropriate accounting policies; making judgments and estimates that are reasonable and prudent; and design, implementation and maintenance of adequate internal financial controls, that were operating effectively for ensuring the accuracy and completeness of the accounting records, relevant to the preparation and presentation of the standalone Ind AS financial statements that give a true and fair view and are free from material misstatement, whether due to fraud or error.
Auditor’s Responsibility
Our responsibility is to express an opinion on these standalone Ind AS financial statements based on our audit.
In conducting our audit, we have taken into account the provisions of the Act, the accounting and auditing standards and matters which are required to be included in the audit report under the provisions of the Act and the Rules made thereunder.
We conducted our audit of the standalone Ind AS financial statements in accordance with the Standards on Auditing specified under Section 143(10) of the Act. Those Standards require that we comply with ethical requirements and plan and perform the audit to obtain reasonable assurance about whether the standalone Ind AS financial statements are free from material misstatement.
An audit involves performing procedures to obtain audit evidence about the amounts and the disclosures in the standalone Ind AS financial statements. The procedures selected depend on the auditor’s judgment, including the assessment of the risks of material misstatement of the standalone Ind AS financial statements, whether due to fraud or error. In making those risk assessments, the auditor considers internal financial control relevant to the Company’s preparation of the standalone Ind AS financial statements that give a true and fair view in order to design audit procedures that are appropriate in the circumstances. An audit also includes evaluating the appropriateness of the accounting policies used and the reasonableness of the accounting estimates made by the Company’s Directors, as well as evaluating the overall presentation of the standalone Ind AS financial statements.
We believe that the audit evidence obtained by us, is sufficient and appropriate to provide a basis for our audit opinion on the standalone Ind AS financial statements.
Opinion
In our opinion and to the best of our information and according to the explanations given to us, the aforesaid standalone Ind AS financial statements give the information required by the Act in the manner so required and give a true and fair view in conformity with the accounting principles generally accepted in India, of the state of affairs of the Company as at March 31, 2017, and its profit, total comprehensive income, its cash flows and the changes in equity for the year ended on that date.
Report on Other Legal and Regulatory Requirements
1. As required by Section 143(3) of the Act we report, to the extent applicable that:
a) We have sought and obtained all the information and explanations which to the best of our knowledge and belief were necessary for the purposes of our audit.
b) In our opinion, proper books of account as required by law have been kept by the Company so far as it appears from our examination of those books.
c) The Balance Sheet, the Statement of Profit and Loss including Other Comprehensive Income, the Cash Flow Statement and Statement of Changes in Equity dealt with by this Report are in agreement with the relevant books of account.
d) In our opinion, the aforesaid standalone Ind AS financial statements comply with the Indian Accounting Standards prescribed under section 133 of the Act.
F-72

e) On the basis of the written representations received from the directors as on March 31, 2017 taken on record by the Board of Directors, none of the directors is disqualified as on March 31, 2017 from being appointed as a director in terms of Section 164(2) of the Act.
f ) With respect to the adequacy of the internal financial controls over financial reporting of the Company and the operating effectiveness of such controls, refer to our separate Report in “Annexure A”. Our report expresses an unmodified opinion on the adequacy and operating effectiveness of the Company’s internal financial controls over financial reporting.
g) With respect to the other matters to be included in the Auditor’s Report in accordance with Rule 11 of the Companies (Audit and Auditors) Rules, 2014, as amended, in our opinion and to the best of our information and according to the explanations given to us:
i. The Company has disclosed the impact of pending litigations on its financial position in its standalone Ind AS financial statements;
ii. The Company has made provision, as required under the applicable law or accounting standards, for material foreseeable losses, if any, on long-term contracts including derivative contracts;
iii. There has been no delay in transferring amounts, required to be transferred, to the Investor Education and Protection Fund by the Company
iv. The Company has provided requisite disclosures in the standalone Ind AS financial statements as regards its holding and dealings in Specified Bank Notes as defined in the Notification S.O. 3407(E) dated November 8, 2016 of the Ministry of Finance, during the period from November 8, 2016 to December 30, 2016. Based on audit procedures performed and the representations provided to us by the management we report that the disclosures are in accordance with the books of account maintained by the Company.
2. As required by the Companies (Auditor’s Report) Order, 2016 (“the Order”) issued by the Central Government in terms of Section 143(11) of the Act, we give in “Annexure B” a statement on the matters specified in paragraphs 3 and 4 of the Order.
For DELOITTE HASKINS & SELLS LLP Chartered Accountants
(Firm’s Registration No. 117366W/W-100018)
N. Venkatram
(Partner)
(Membership No. 71387)
Mumbai, May 16, 2017
F-73

ANNEXURE “A” TO THE INDEPENDENT AUDITOR’S REPORT
(Referred to in paragraph 1(f) under ‘Report on Other Legal
and Regulatory Requirements’ section of our report of even
date)
Report on the Internal Financial Controls Over Financial
Reporting under Clause (i) of Sub-section 3 of Section 143
of the Companies Act, 2013 (“the Act”)
We have audited the internal financial controls over financial reporting of Tata Steel Limited (“the Company”) as of March 31, 2017 in conjunction with our audit of the standalone Ind AS financial statements of the Company for the year ended on that date.
Management’s Responsibility for Internal Financial
Controls
The Company’s management is responsible for establishing and maintaining internal financial controls based on the internal control over financial reporting criteria established by the Company considering the essential components of internal control stated in the Guidance Note on Audit of Internal Financial Controls Over Financial Reporting issued by the Institute of Chartered Accountants of India. These responsibilities include the design, implementation and maintenance of adequate internal financial controls that were operating effectively for ensuring the orderly and efficient conduct of its business, including adherence to respective company’s policies, the safeguarding of its assets, the prevention and detection of frauds and errors, the accuracy and completeness of the accounting records, and the timely preparation of reliable financial information, as required under the Companies Act, 2013.
Auditor’s Responsibility
Our responsibility is to express an opinion on the Company’s internal financial controls over financial reporting based on our audit. We conducted our audit in accordance with the Guidance Note on Audit of Internal Financial Controls Over Financial Reporting (the “Guidance Note”) issued by the Institute of Chartered Accountants of India and the Standards on Auditing prescribed under Section 143(10) of the Companies Act, 2013, to the extent applicable to an audit of internal financial controls. Those Standards and the Guidance Note require that we comply with ethical requirements
and plan and perform the audit to obtain reasonable assurance about whether adequate internal financial controls over financial reporting was established and maintained and if such controls operated effectively in all material respects.
Our audit involves performing procedures to obtain audit evidence about the adequacy of the internal financial controls system over financial reporting and their operating effectiveness. Our audit of internal financial controls over financial reporting included obtaining an understanding of internal financial controls over financial reporting, assessing the risk that a material weakness exists, and testing and evaluating the design and operating effectiveness of internal control based on the assessed risk. The procedures selected depend on the auditor’s judgement, including the assessment of the risks of material misstatement of the financial statements, whether due to fraud or error.
We believe that the audit evidence we have obtained is sufficient and appropriate to provide a basis for our audit opinion on the Company’s internal financial controls system over financial reporting.
Meaning of Internal Financial Controls Over Financial
Reporting
A company’s internal financial control over financial reporting is a process designed to provide reasonable assurance regarding the reliability of financial reporting and the preparation of financial statements for external purposes in accordance with generally accepted accounting principles. A company’s internal financial control over financial reporting includes those policies and procedures that (1) pertain to the maintenance of records that, in reasonable detail, accurately and fairly reflect the transactions and dispositions of the assets of the company; (2) provide reasonable assurance that transactions are recorded as necessary to permit preparation of financial statements in accordance with generally accepted accounting principles, and that receipts and expenditures of the company are being made only in accordance with authorisations of management and directors of the company; and (3) provide reasonable assurance regarding prevention or timely detection of unauthorised acquisition, use, or disposition of the company’s assets that could have a material effect on the financial statements.
F-74

Inherent Limitations of Internal Financial Controls Over
Financial Reporting
Because of the inherent limitations of internal financial controls over financial reporting, including the possibility of collusion or improper management override of controls, material misstatements due to error or fraud may occur and not be detected. Also, projections of any evaluation of the internal financial controls over financial reporting to future periods are subject to the risk that the internal financial control over financial reporting may become inadequate because of changes in conditions, or that the degree of compliance with the policies or procedures may deteriorate.
Opinion
In our opinion and to the best of our information and according to the explanations given to us, the Company has, in all material respects, an adequate internal financial controls system over financial reporting and such internal financial controls over financial reporting were operating effectively as at March 31, 2017, based on the internal control over financial reporting criteria
established by the Company considering the essential components of internal control stated in the Guidance Note on Audit of Internal Financial Controls Over Financial Reporting issued by the Institute of Chartered Accountants of India.
For DELOITTE HASKINS & SELLS LLP Chartered Accountants
(Firm’s Registration No. 117366W/W-100018)
N. Venkatram
(Partner)
(Membership No. 71387)
Mumbai, May 16, 2017
F-75

ANNEXURE “B” TO THE INDEPENDENT AUDITOR’S REPORT
(Referred to in paragraph 2 under ‘Report on Other Legal and
Regulatory Requirements’ section of our report of even date)
(i) (a) The Company has maintained proper records showing full particulars, including quantitative details and situation of fixed assets.
(b) The Company has a program of verification of fixed assets to cover all the items in a phased manner over a period of three years which, in our opinion, is reasonable having regard to the size of the Company and the nature of its assets. Pursuant to the program, certain fixed assets were physically verified by the Management during the year. According to the information and explanations given to us no material discrepancies were noticed on such verification.
(c) According to the information and explanations given to us and the records examined by us and based on the examination of the registered sale deeds, transfer deeds, mutation of title papers, property tax papers and conveyance deeds provided to us, we report that the title deeds, comprising all the immovable properties in respect of land and buildings which are freehold, are held in the name of the Company as at the balance sheet date, except the following:
i. in respect to freehold land fair value at deemed cost amounting to `601.6 million (purchase cost `3.4 million) the title deeds of which are held in the name of erstwhile companies which have subsequently been amalgamated with the Company;
ii. title deeds to freehold land fair value at deemed cost amounting to `18.7 million (purchase price `0.3 million) which has not been executed.
iii. title deeds to freehold land fair value at deemed cost amounting to `1,176.8 million (purchase cost `67.4 million) were not readily available.
iv. title deeds to buildings with gross carrying amount and net carrying amount of `6.1 million and `5.7 million respectively were not readily available.
(ii) As explained to us, inventories of finished and semi-finished goods and raw materials at Works, Mines and Collieries were physically verified during the year by the Management. In respect of inventories of stores and spare parts and stocks at stockyards and with consignment/conversion agents, the Company has a programme of verification of stocks over a three year period. In case of materials lying with third parties, certificates for stocks held have been received. In our opinion
and according to the information and explanations given to us, the inventories have been verified by the management at reasonable intervals in relation to size of the Company and nature of business and no material discrepancies were noticed on physical verification.
(iii) According to the information and explanations given to us, the Company has granted loans, secured or unsecured, to companies, firms, Limited Liability Partnerships or other parties covered in the register maintained under section 189 of the Companies Act, 2013, in respect of which:
(a) The terms and conditions of the grant of such loans are, in our opinion, prima facie, not prejudicial to the Company’s interest except an intercorporate deposit of `213.7 million placed with a subsidiary company which is not a going concern.
(b) The schedule of repayment of principal and payment of interest has been stipulated and the repayments of principal amounts and interest have been regular as per stipulations except for loans and interest amounting to `5,397.3 million representing due from a subsidiary company and interest amounting to `131.1 million representing due from three subsidiary companies.
(c) Amounts referred to (b) above have been overdue for more than 90 days and, as explained to us, the Management has taken reasonable steps for recovery of the principal amounts and interest thereon.
(iv) In our opinion and according to the information and explanations given to us, the Company has complied with the provisions of Sections 185 and 186 of the Companies Act, 2013 in respect of grant of loans, making investments and providing guarantees and securities, as applicable.
(v) According to the information and explanations given to us, the Company has not accepted any deposit during the year. In respect of unclaimed deposits, the Company has complied with the provisions of Sections 73 to 76 or any other relevant provisions of the Companies Act, 2013.
(vi) The maintenance of cost records has been specified by the Central Government under section 148(1) of the Companies Act, 2013. We have broadly reviewed the cost records maintained by the Company pursuant to the Companies (Cost Records and Audit) Rules, 2014, as amended and The Cost Accounting Records (Electricity Industry) Rules, 2011 prescribed by the Central Government under sub-section (1) of Section 148 of the Companies Act, 2013, and are of the opinion that, prima facie, the prescribed cost records have been made and maintained. We have, however, not made a detailed examination of the cost records with a view to determine whether they are accurate or complete.
F-76
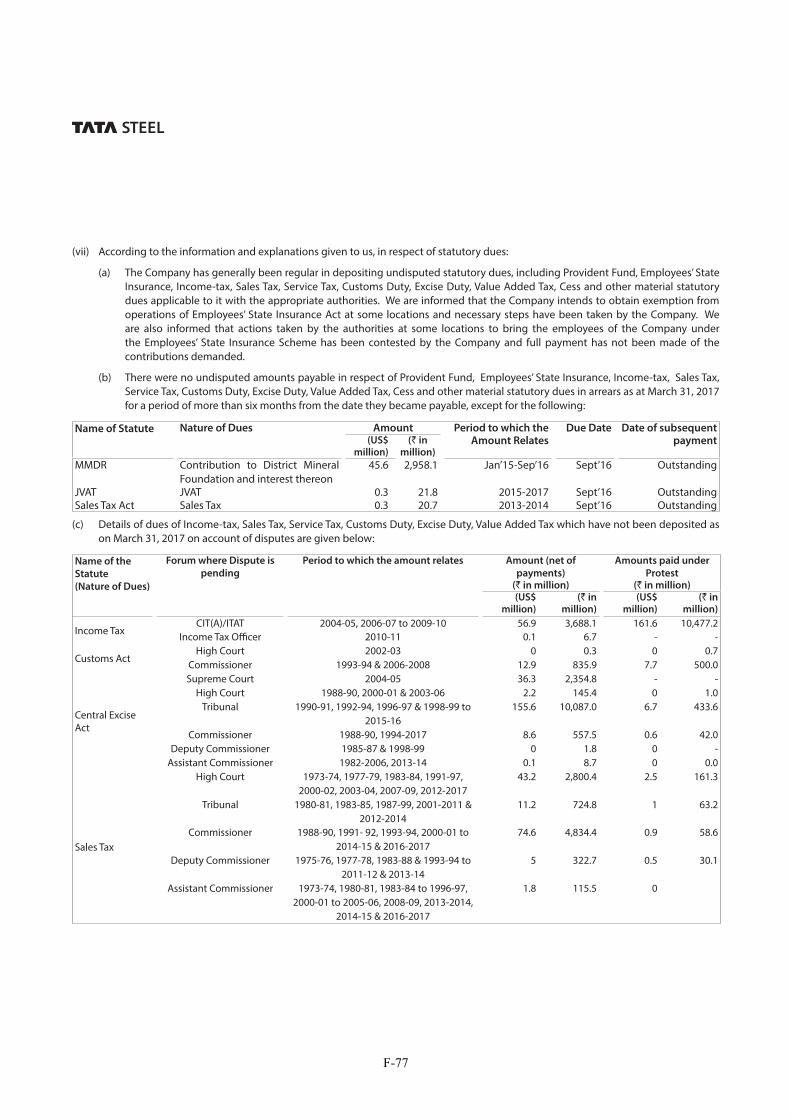
(vii) According to the information and explanations given to us, in respect of statutory dues:
(a) The Company has generally been regular in depositing undisputed statutory dues, including Provident Fund, Employees’ State Insurance, Income-tax, Sales Tax, Service Tax, Customs Duty, Excise Duty, Value Added Tax, Cess and other material statutory dues applicable to it with the appropriate authorities. We are informed that the Company intends to obtain exemption from operations of Employees’ State Insurance Act at some locations and necessary steps have been taken by the Company. We are also informed that actions taken by the authorities at some locations to bring the employees of the Company under the Employees’ State Insurance Scheme has been contested by the Company and full payment has not been made of the contributions demanded.
(b) There were no undisputed amounts payable in respect of Provident Fund, Employees’ State Insurance, Income-tax, Sales Tax, Service Tax, Customs Duty, Excise Duty, Value Added Tax, Cess and other material statutory dues in arrears as at March 31, 2017 for a period of more than six months from the date they became payable, except for the following:
Name of Statute Nature of Dues Amount Period to which the Amount Relates
Due Date Date of subsequent payment(US$
million)(` in
million)
MMDR Contribution to District Mineral Foundation and interest thereon
45.6 2,958.1 Jan’15-Sep’16 Sept’16 Outstanding
JVAT JVAT 0.3 21.8 2015-2017 Sept’16 OutstandingSales Tax Act Sales Tax 0.3 20.7 2013-2014 Sept’16 Outstanding
(c) Details of dues of Income-tax, Sales Tax, Service Tax, Customs Duty, Excise Duty, Value Added Tax which have not been deposited as on March 31, 2017 on account of disputes are given below:
Name of the
Statute
(Nature of Dues)
Forum where Dispute is
pending
Period to which the amount relates Amount (net of
payments) (` in million)
Amounts paid under
Protest (` in million)
(US$ million)
(` in million)
(US$ million)
(` in million)
Income TaxCIT(A)/ITAT 2004-05, 2006-07 to 2009-10 56.9 3,688.1 161.6 10,477.2
Income Tax Officer 2010-11 0.1 6.7 - -
Customs ActHigh Court 2002-03 0 0.3 0 0.7
Commissioner 1993-94 & 2006-2008 12.9 835.9 7.7 500.0
Central Excise Act
Supreme Court 2004-05 36.3 2,354.8 - -High Court 1988-90, 2000-01 & 2003-06 2.2 145.4 0 1.0
Tribunal 1990-91, 1992-94, 1996-97 & 1998-99 to 2015-16
155.6 10,087.0 6.7 433.6
Commissioner 1988-90, 1994-2017 8.6 557.5 0.6 42.0Deputy Commissioner 1985-87 & 1998-99 0 1.8 0 -
Assistant Commissioner 1982-2006, 2013-14 0.1 8.7 0 0.0
Sales Tax
High Court 1973-74, 1977-79, 1983-84, 1991-97, 2000-02, 2003-04, 2007-09, 2012-2017
43.2 2,800.4 2.5 161.3
Tribunal 1980-81, 1983-85, 1987-99, 2001-2011 & 2012-2014
11.2 724.8 1 63.2
Commissioner 1988-90, 1991- 92, 1993-94, 2000-01 to 2014-15 & 2016-2017
74.6 4,834.4 0.9 58.6
Deputy Commissioner 1975-76, 1977-78, 1983-88 & 1993-94 to 2011-12 & 2013-14
5 322.7 0.5 30.1
Assistant Commissioner 1973-74, 1980-81, 1983-84 to 1996-97, 2000-01 to 2005-06, 2008-09, 2013-2014,
2014-15 & 2016-2017
1.8 115.5 0
F-77

(viii) In our opinion and according to the information and explanations given to us, the Company has not defaulted in the repayment of loans or borrowings to financial institutions, banks and government and dues to debenture holders.
(ix) In our opinion and according to the information and explanations given to us, term loans taken have been applied by the Company during the year for the purposes for which they were raised, other than temporary deployment pending application of proceeds.
(x) To the best of our knowledge and according to the information and explanations given to us, no fraud by the Company and no material fraud on the Company has been noticed or reported during the year.
(xi) In our opinion and according to the information and explanations given to us, the Company has paid / provided managerial remuneration in accordance with the requisite approvals mandated by the provisions of section 197 read with Schedule V to the Companies Act, 2013.
(xii) The Company is not a Nidhi Company and hence reporting under clause (xii) of the CARO 2016 Order is not applicable.
(xiii) In our opinion and according to the information and explanations given to us the Company is in compliance with Section 177 and 188 of the Companies Act, 2013, where applicable, for all transactions with the related parties and the details of related party transactions have been disclosed in the financial statements as required by the applicable accounting standards.
(xiv) During the year the Company has not made any preferential allotment or private placement of shares or fully or partly convertible debentures and hence reporting under clause (xiv) of CARO 2016 is not applicable to the Company.
(xv) In our opinion and according to the information and explanations given to us, during the year the Company has not entered into any non-cash transactions with its directors or directors of its holding, subsidiary or associate Company or persons connected with them and hence provisions of section 192 of the Companies Act, 2013 are not applicable.
(xvi) The Company is not required to be registered under section 45-IA of the Reserve Bank of India Act, 1934.
.
For DELOITTE HASKINS & SELLS LLP Chartered Accountants
(Firm’s Registration No. 117366W/W-100018)
N. Venkatram
(Partner)
(Membership No. 71387)
Mumbai, May 16, 2017
F-78

BALANCE SHEET AS AT MARCH 31, 2017, 2016 AND APRIL 1, 2015
As at
March 31, 2017
As at
March 31, 2016
As at
April 1, 2015
Note(US$
million)(` in million) (` in million) (` in million)
ASSETSI Non-current assets (a) Property, plant and equipment 03 11,069.3 7,17,789.7 4,95,610.5 5,08,824.8 (b) Capital work-in-progress 944.6 61,253.5 2,81,740.1 2,41,537.8 (c) Intangible assets 05 121.5 7,881.8 5,273.4 1,771.4 (d) Intangible assets under development 6.0 386.1 318.7 164.6 (e) Investments in subsidiaries, associates and joint ventures 06 524 33,975.7 33,409.7 31,488.9 (f ) Financial assets (i) Investments 07 764.6 49,583.3 41,194.5 1,08,531.3 (ii) Loans 08 32.7 2,119.7 2,059.6 1,418.3 (iii) Derivative assets 0 1.2 8.0 409.1 (iv) Other financial assets 09 12.3 794.9 369.2 607.0 (g) Income tax assets (net) 133.8 8,677.5 8,376.6 7,235.7 (h) Other assets 11 481.4 31,216.4 33,251.8 28,458.7 Total non-current assets 14,090.2 9,13,679.8 9,01,612.1 9,30,447.6 II Current assets (a) Inventories 12 1578.7 1,02,368.5 71,373.8 80,233.5 (b) Financial assets (i) Investments 07 818.9 53,098.1 43,250.0 10,011.5 (ii) Trade receivables 13 309.4 20,065.2 11,331.7 10,570.2 (iii) Cash and cash equivalents 14 139.6 9,052.1 9,746.8 4,951.6 (iv) Other balances with bank 15 10 651.0 614.5 566.6 (v) Loans 08 4.2 271.4 187.5 820.4 (vi) Derivative assets 1.0 62.6 62.0 6,141.0 (vii) Other financial assets 09 48.5 3,150.6 2,077.5 2,340.1 (c) Other assets 11 189.0 12,254.8 10,888.7 10,250.9 Total current assets 3,099.3 2,00,974.3 1,49,532.5 1,25,885.8 TOTAL ASSETS 17,189.5 11,14,654.1 10,51,144.6 10,56,333.4 EQUITY AND LIABILITIESIII Equity (a) Equity Share Capital 16 149.8 9,714.1 9,714.1 9,714.1 (b) Hybrid Perpetual Securities 17 350.8 22,750.0 22,750.0 22,750.0 (c) Other equity 18 7,508.3 4,86,876.0 4,56,659.7 4,92,179.0 Total equity 8,008.9 5,19,340.1 4,89,123.8 5,24,643.1IV Non-current liabilities (a) Financial liabilities (i) Borrowings 19 3,808.2 2,46,943.7 2,39,267.6 2,43,161.0 (ii) Derivative liabilities 27.7 1,793.3 1,160.1 1,719.7 (iii) Other financial liabilities 20 2.8 182.2 3,965.1 8,418.9 (b) Provisions 21 312.2 20,247.4 18,620.5 13,209.9 (c) Retirement benefit obligations 22 228.9 14,842.1 12,524.5 16,232.3 (d) Deferred income 23 290.7 18,851.9 22,284.8 21,305.8 (e) Deferred tax liabilities (net) 10 942.4 61,112.7 56,107.0 62,315.5 (f ) Other liabilities 24 12.0 777.4 767.9 196.7
Total non-current liabilities 5,624.9 3,64,750.7 3,54,697.5 3,66,559.8 V Current liabilities (a) Financial liabilities (i) Borrowings 19 499.5 32,396.7 58,880.0 8,197.4 (ii) Trade payables 25 1,652.8 1,07,174.4 61,968.8 49,359.6 (iii) Derivative liabilities 41.7 2,701.7 782.3 1,291.7 (iv) Other financial liabilities 20 626.6 40,623.5 46,333.5 77,389.0 (b) Provisions 21 108.1 7,006.0 2,806.4 1,829.9 (c) Retirement benefit obligations 22 8.7 565.8 566.7 515.3 (d) Income tax liabilities (net) 71.8 4,657.2 7,325.8 5,057.5 (e) Other liabilities 24 546.5 35,438.0 28,659.8 21,490.1
Total current liabilities 3,555.7 2,30,563.3 2,07,323.3 1,65,130.5 TOTAL EQUITY AND LIABILITIES 17,189.5 11,14,654.1 10,51,144.6 10,56,333.4 NOTES FORMING PART OF THE FINANCIAL STATEMENTS 1-43
F-79

As at
March 31, 2017
As at
March 31, 2016
Note(US$
million)(` in million) (` in million)
I Revenue from operations 26 8,213.5 5,32,609.6 4,26,974.4II Other income 27 63.8 4,144.6 3,911.6III Total income 8,277.3 5,36,754.2 4,30,886.0
IV Expenses:
(a) Raw materials consumed 1,927.2 1,24,967.8 97,000.1 (b) Purchases of finished, semi-finished and other products 135.9 8,811.8 9,915.4 (c) Changes in stock of finished goods, work-in-progress and stock-in-trade 28 (205.0) (13,296.5) 707.5 (d) Employee benefits expenses 29 710.2 46,051.3 43,198.9 (e) Finance costs 30 414.6 26,885.5 18,480.5 (f ) Depreciation and amortisation expense 31 546.1 35,415.5 29,622.8 (g) Other expenses 32 3,847.4 2,49,490.9 2,06,023.5
7,376.4 4,78,326.3 4,04,948.7
Less: Expenditure (other than interest) transferred to capital and other accounts 33.5 2,175.2 5,988.9 Total expenses 7,342.9 4,76,151.1 3,98,959.8
V Profit before exceptional items and tax (III-IV) 934.4 60,603.1 31,926.2
VI Exceptional items: 33 (a) Profit/(Loss) on sale of non-current investments - - (8.5) (b) Profit on sale of non current assets - - (b) Provision for impairment of investments/doubtful advances (26.4) (1,708.7) (1,606.2) (c) Provision for impairment of non-current assets - - (515.1) (d) Provision for demands and claims (33.7) (2,182.5) (8,800.5) (e) Employee separation compensation (27.6) (1,786.8) (5,562.5) (f ) Restructuring and other provisions (20.9) (1,355.8) -
Total exceptional items (108.6) (7,033.8) (16,492.8)
VII Profit before tax (V+VI) 825.8 53,569.3 15,433.4
VIII Tax expense:
(a) Current Tax 216.0 14,005.4 11,932.8 (b) Deferred Tax 78.9 5,118.4 (6,055.9)
Total tax expense 294.9 19,123.8 5,876.9
IX Profit for the year (VII-VIII) 530.9 34,445.5 9,556.5
X Other comprehensive income/(loss)
A (i) Items that will not be reclassified subsequently to the statement of profit
and loss
(a) Remeasurement gains/(losses) on post employment defined benefit plans
(33.6) (21,77.9) (50.1)
(b) Fair value changes of investments in equity shares 126.3 8,190.1 (31,635.2) (ii) Income tax on items that will not be reclassified subsequently to the statement
of profit and loss
11.6 753.7 (2,397.8)
B (i) Items that will be reclassified subsequently to the statement of profit and
loss
(a) Fair value changes of cash flow hedges (0.2) (12.2) 18.0
(ii) Income tax on items that will be reclassified subsequently to the statement of
profit and loss
0.1 4.2 (6.2)
Total other comprehensive income/(loss) 104.2 6,757.9 (34,071.3)
XI Total comprehensive income/(loss) for the year (IX+X) 635.1 41,203.4 (24,514.8)
XII Earnings per share 34Basic and Diluted (`) 0.52 33.67 8.05
XIII Notes forming part of the financial statements 1-43
STATEMENT OF PROFIT AND LOSS FOR THE YEARS ENDED MARCH 31, 2017 AND 2016
F-80
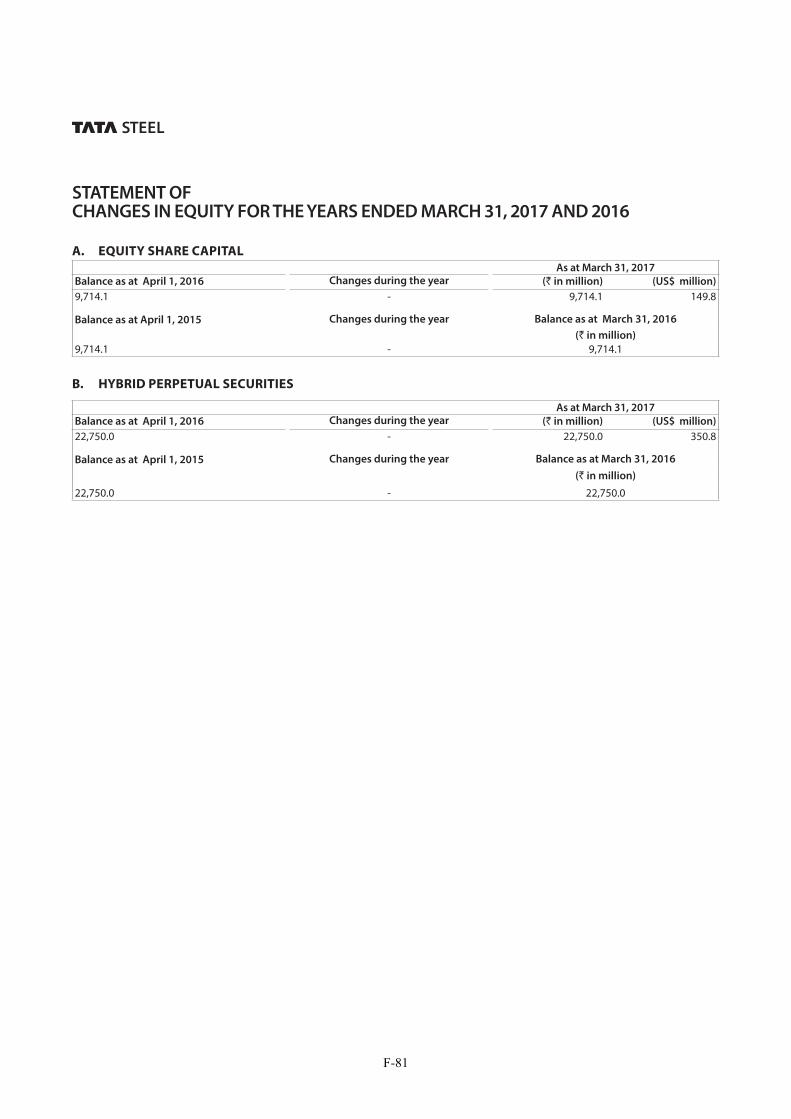
STATEMENT OF CHANGES IN EQUITY FOR THE YEARS ENDED MARCH 31, 2017 AND 2016
A. EQUITY SHARE CAPITAL As at March 31, 2017
Balance as at April 1, 2016 Changes during the year (` in million) (US$ million)
9,714.1 - 9,714.1 149.8
Balance as at April 1, 2015 Changes during the year Balance as at March 31, 2016
(` in million)
9,714.1 - 9,714.1
B. HYBRID PERPETUAL SECURITIES
As at March 31, 2017
Balance as at April 1, 2016 Changes during the year (` in million) (US$ million)
22,750.0 - 22,750.0 350.8
Balance as at April 1, 2015 Changes during the year Balance as at March 31, 2016
(` in million)
22,750.0 - 22,750.0
F-81

C. OTHER EQUITY
Retained Earnings
Other Comprehensive
Income reserves
Other reserves
Share application
money pending
allotment
Total Equity
(` in million)
(US$ million)
Balance as at April 1, 2016 1,00,757.5 29,363.7 3,26,538.5 - 4,56,659.7 7,042.3
Profit for the year 34,445.5 - - - 34,445.5 531.2 Other comprehensive income (1,424.2) 8,182.1 - - 6,757.9 104.2 Total comprehensive income 33,021.3 8,182.1 - - 41,203.4 635.4
Dividend (7,769.7) - - - (7,769.7) (119.8) Tax on dividend (1,477.4) (1,477.4) (22.8) Distribution on Hybrid Perpetual Securities (2,661.0) - - - (2,661.0) (41.0) Tax on distribution on Hybrid Perpetual Securities 920.9 - - - 9,20.9 14.2
Transfers within equity 17.5 (17.5) - - - - Application money received - - - 0.1 0.1 - Balance as at March 31, 2017 1,22,809.1 37,528.3 3,26,538.5 0.1 4,86,876.0 7,508.3
(` in million)Retained Earnings
Other Comprehensive
Income reserves
Other reserves
Share application
money pending
allotment
Total Equity
Balance as at April 1, 2015 68,525.6 97,113.7 3,26,539.7 - 4,92,179.0
Profit for the year 9,556.5 - - - 9,556.5Other comprehensive income (32.8) (34,038.5) - - (34,071.3)Total comprehensive income 9,523.7 (34,038.5) - - (24,514.8)
Dividend (7,769.7) - - - (7,769.7)Tax on dividend (1,493.0) (1,493.0)Distribution on Hybrid Perpetual Securities (2,661.7) - - - (2,661.7)Tax on distribution on Hybrid Perpetual Securities 921.1 - - - 921.1
Transfers within equity 33,711.5 (33,711.5) - - -Transfer to statement of profit and loss - - (1.2) - (1.2)Balance as at March 31, 2016 1,00,757.5 29,363.7 3,26,538.5 - 4,56,659.7
STATEMENT OF CHANGES IN EQUITY (CONTD.) FOR THE YEARS ENDED MARCH 31, 2017 AND 2016
F-82

Year ended March 31, 2017
Year ended March 31, 2016
(US$ million)
(` in million) (` in million)
(A) CASH FLOWS FROM OPERATING ACTIVITIES:
Profit before taxes 826.1 53,569.3 15,433.4
Adjustments for:Depreciation and amortisation expense 546.2 35,415.5 29,622.8(Profit)/loss on sale of non-current investments (0.1) (9.7) -Income from non-current investments (14.8) (960.1) (1,070.8)(Profit)/loss on assets sold/discarded/written off 1.1 69.1 (21.2)Exceptional (income)/expenses 108.5 7,033.8 16,492.8(Gain)/loss on cancellation of forwards, swaps and options 10.3 669.5 12.1Interest and income from current investments and guarantees (60.0) (3,893.6) (2,702.6)Finance costs 414.6 26,885.5 18,480.5Exchange (gain)/loss on revaluation of foreign currency loans and swaps
2.4 154.7 (28.2)
Other non cash items (51.3) (3,327.2) (0.1)956.9 62,037.5 60,785.3
Operating profit before working capital changes 1,783.0 1,15,606.8 76,218.7
Adjustments for:Non-Current/Current financial and other assets (1,65.3) (10,719.2) (6,786.9)Inventories (477.0) (30,930.5) 8,874.8Non-Current/Current financial and other liabilities/provisions 8,13.7 52,764.2 7,852.4
171.4 11,114.5 9,940.3Cash generated from operations 1,954.2 1,26,721.3 86,159.0
Direct taxes paid (237.6) (15,408.7) (12,441.0)Net cash from/(used in) operating activities 1,716.6 1,11,312.6 73,718.0
(B) CASH FLOWS FROM INVESTING ACTIVITIES:
Purchase of fixed assets (489.3) (31,728.7) (47,779.1)Sale of fixed assets 1.0 68.0 321.3Purchase of investments in subsidiaries (15.4) (1,001.2) (1,712.8)Sale of investments in subsidiaries - - 0.6Purchase of other non-current investments (27.4) (1,777.3) (4,233.8)Sale of other non-current investments 0.6 39.0 39,803.5(Purchase)/sale of current investments (net) (103.0) (6,681.9) (31,396.9)Loans given (4.8) (313.7) (446.9)Repayment of loans given 3.2 204.3 629.2Fixed deposits with banks (placed)/realised (1.0) (67.2) (19.8)Interest and guarantee commission received 18.1 1,173.4 246.7Dividend received from subsidiaries 5.9 381.4 412.7Dividend received from associates and joint ventures 6.3 408.9 228.7Dividend received from others 1.3 84.8 429.4
Net cash from/(used in) investing activities (604.5) (39,210.2) (43,517.2)
STATEMENT OF CASH FLOWS FOR THE YEARS ENDED MARCH 31, 2017 AND 2016
F-83

Year ended March 31, 2017
Year ended March 31, 2016
(US$ million)
(` in million) (` in million)
(C) CASH FLOWS FROM FINANCING ACTIVITIES:
Proceeds from issue of equity shares - 0.1 -Proceeds from borrowings 448.2 29,061.8 88,933.5Repayment of borrowings (950.3) (61,620.7) (79,124.4)Repayment of finance lease obligations (17.2) (1,116.3) (828.2)Amount received/(paid) on utilisation/cancellation of derivatives (15.0) (972.2) 6,252.9Distribution on Hybrid Perpetual Securities (41.0) (2,657.6) (2,664.9)Interest paid (404.7) (26,245.1) (28,710.6)Dividend paid (119.8) (7,769.7) (7,769.7)Tax on dividend paid (22.8) (1,477.4) (1,493.0)Net cash from/(used in) financing activities (1122.6) (72,797.1) (25,404.4)
Net increase/(decrease) in cash and cash equivalents (10.5) (694.7) 4,796.4
Opening cash and cash equivalents 150.3 9,746.8 4,951.6
Effect of exchange rate on translation of foreign currency cash and cash equivalents
- - (1.2)
Closing cash and cash equivalents 139.8 9,052.1 9,746.8
(i) The Company has acquired property, plant and equipment of ₹ 7,300.0 million (US$ 112.6 million) (2015-16: Nil) on finance lease.
STATEMENT OF CASH FLOWS (CONTD.) FOR THE YEARS ENDED MARCH 31, 2017 AND 2016
F-84

NOTES FORMING PART OF THE FINANCIAL STATEMENTS
1. COMPANY INFORMATION
Tata Steel Limited (“the Company”) is a public limited Company incorporated in India with its registered office in Mumbai, Maharashtra, India. The Company is listed on the Bombay Stock Exchange (BSE) and the National Stock Exchange (NSE).
The Company has presence across the entire value chain of steel manufacturing, from mining and processing iron ore and coal to producing and distributing finished products. The Company offers a broad range of steel products including a portfolio of high value-added downstream products such as hot rolled, cold rolled and coated steel, rebars, wire rods, tubes and wires.
The financial statements as at March 31, 2017 present the financial position of the Company.
The functional and presentation currency of the Company is Indian Rupee (“`”) which is the currency of the primary economic environment in which the Company operates.
As on March 31, 2017, Tata Sons Limited (or Tata Sons) owns 29.75% of the Ordinary shares of the Company, and has the ability to influence the Company’s operations
The financial statements for the year ended March 31, 2017 were approved by the Board of Directors and authorised for issue on May 16, 2017.
2. SIGNIFICANT ACCOUNTING POLICIES
The significant accounting policies applied by the Company in the preparation of its financial statements are listed below. Such accounting policies have been applied consistently to all the periods presented in these financial statements and in preparing the opening Ind AS Balance Sheet as at April 1, 2015 for the purpose of transition to Ind AS, unless otherwise indicated.
(a) Statement of compliance
In accordance with the notification issued by the Ministry of Corporate Affairs, the Company has adopted Ind AS notified under the Companies (Indian Accounting Standards) Rules, 2015 with effect from April 1, 2016.
The transition from Previous GAAP to Ind AS has been accounted for in accordance with Ind AS 101 “First Time Adoption of Indian Accounting Standards”, with April 1, 2015 being the transition date.
In accordance with Ind As 101 “First time adoption of Indian Accounting Standard”, the Company has presented a reconciliation from the presentation of financial statements
under accounting standards notified under the Companies (Accounting Standards) Rules, 2006 (“Previous GAAP”) to Ind AS of total equity as at April 1, 2015 and March 31, 2016, total comprehensive income and cash flow for the year ended March 31, 2016.
(b) Basis of preparation
The financial statements have been prepared under the historical cost convention with the exception of certain assets and liabilities that are required to be carried at fair values by Ind AS.
Fair value is the price that would be received to sell an asset or paid to transfer a liability in an orderly transaction between market participants at the measurement date.
(c) Use of estimates and critical accounting judgements
In preparation of the financial statements, the Company makes judgements, estimates and assumptions about the carrying values of assets and liabilities that are not readily apparent from other sources. The estimates and the associated assumptions are based on historical experience and other factors that are considered to be relevant. Actual results may differ from these estimates.
The estimates and the underlying assumptions are reviewed on an ongoing basis. Revisions to accounting estimates are recognised in the period in which the estimate is revised and future periods affected.
Significant judgements and estimates relating to the carrying values of assets and liabilities include useful lives of property, plant and equipment and intangible assets, impairment of property, plant and equipment, intangible assets and investments, provision for employee benefits and other provisions, recoverability of deferred tax assets, commitments and contingencies.
(d) Property, plant and equipment
An item of property, plant and equipment is recognised as an asset if it is probable that the future economic benefits associated with the item will flow to the Company and its cost can be measured reliably. This recognition principle is applied to the costs incurred initially to acquire an item of property, plant and equipment and also to costs incurred subsequently to add to, replace part of, or service it. All other repair and maintenance costs, including regular servicing, are recognised in the statement of profit and loss as incurred. When a replacement occurs, the carrying value of the replaced part is de-recognised. Where an item of property, plant and equipment comprises major components having different useful lives, these components are accounted for as separate items.
F-85

NOTES FORMING PART OF THE FINANCIAL STATEMENTS
Property, plant and equipment are stated at cost, less accumulated depreciation and impairment. Cost includes all direct costs and expenditures incurred to bring the asset to its working condition and location for its intended use. Trial run expenses (net of revenue) are capitalised. Borrowing costs incurred during the period of construction is capitalised as part of cost of the qualifying assets.
The gain or loss arising on disposal of an asset is determined as the difference between the sale proceeds and the carrying value of the asset, and is recognised in the statement of profit and loss.
(e) Exploration for and evaluation of mineral resources
Expenditures associated with search for specific mineral resources are recognised as exploration and evaluation assets. The following expenditure comprises cost of exploration and evaluation assets:
obtaining of the rights to explore and evaluate mineral reserves and resources including costs directly related to this acquisition
researching and analysing existing exploration data conducting geological studies, exploratory drilling and
sampling examining and testing extraction and treatment
methods compiling pre-feasibility and feasibility studies activities in relation to evaluating the technical
feasibility and commercial viability of extracting a mineral resource.
Administration and other overhead costs are charged to the cost of exploration and evaluation assets only if directly related to an exploration and evaluation project.
If a project does not prove viable, all irrecoverable exploration and evaluation expenditure associated with the project net of any related impairment allowances is written off to the statement of profit and loss.
The Company measures its exploration and evaluation assets at cost and classifies as property, plant and equipment or intangible assets according to the nature of the assets acquired and applies the classification consistently. To the extent that tangible asset is consumed in developing an intangible asset, the amount reflecting that consumption is capitalised as a part of the cost of the intangible asset.
As the asset is not available for use, it is not depreciated. All exploration and evaluation assets are monitored for indications of impairment. An exploration and evaluation
asset is no longer classified as such when the technical feasibility and commercial viability of extracting a mineral resource are demonstrable and the development of the deposit is sanctioned by the management. The carrying value of such exploration and evaluation asset is reclassified to mining assets.
(f) Development expenditure for mineral reserves
Development is the establishment of access to mineral reserves and other preparations for commercial production. Development activities often continue during production and include:
sinking shafts and underground drifts (often called mine development)
making permanent excavations developing passageways and rooms or galleries building roads and tunnels and advance removal of overburden and waste rock.
Development (or construction) also includes the installation of infrastructure (e.g., roads, utilities and housing), machinery, equipment and facilities.
Development expenditure is capitalised and presented as part of mining assets. No depreciation is charged on the development expenditure before the start of commercial production.
(g) Provision for restoration and environmental costs
The Company has liabilities related to restoration of soil and other related works, which are due upon the closure of certain of its production sites.
Such liabilities are estimated case-by-case based on available information, taking into account applicable local legal requirements. The estimation is made using existing technology, at current prices, and discounted using a discount rate where the effect of time value of money is material. Future restoration and environmental costs, discounted to net present value, are capitalised and the corresponding restoration liability is raised as soon as the obligation to incur such costs arises. Future restoration and environmental costs are capitalised in property, plant and equipment or mining assets as appropriate and are depreciated over the life of the related asset. The effect of the time value of money on the restoration and environmental costs liability is recognised in the statement of profit and loss.
(h) Intangible assets (excluding goodwill)
Patents, trademarks and software costs are included in the balance sheet as intangible assets where they are clearly
2. SIGNIFICANT ACCOUNTING POLICIES (CONTD.)
F-86

NOTES FORMING PART OF THE FINANCIAL STATEMENTS
linked to long term economic benefits for the Company. In this case they are measured initially at purchase cost and then amortised on a straight line basis over their estimated useful lives. All other costs on patents, trademarks and software are expensed in the statement of profit and loss as and when incurred.
Expenditure on research activities is recognised as an expense in the period in which it is incurred. Costs incurred on individual development projects are recognised as intangible assets from the date when all of the following conditions are met:
(i) completion of the development is technically feasible. (ii) it is the intention to complete the intangible asset and
use or sell it. (iii) it is clear that the intangible asset will generate probable
future economic benefits. (iv) adequate technical, financial and other resources
to complete the development and to use or sell the intangible asset are available and;
(v) it is possible to reliably measure the expenditure attributable to the intangible asset during its development.
Recognition of costs as an asset is ceased when the project is complete and available for its intended use, or if these criteria no longer applicable.
Where development activities do not meet the conditions for recognition as an asset, any associated expenditure is treated as an expense in the period in which it is incurred.
Subsequent to initial recognition, intangible assets with definite useful lives are reported at cost less accumulated amortisation and accumulated impairment losses.
(i) Depreciation and amortisation of property, plant and
equipment and intangible assets
Depreciation or amortisation is provided so as to write off, on a straight line basis, the cost of property, plant and equipment and other intangible assets, including those held under finance leases to their residual value. These charges are commenced from the dates the assets are available for their intended use and are spread over their estimated useful economic lives or, in the case of leased assets, over the lease period, if shorter. The estimated useful lives of assets and residual values are reviewed regularly and, when necessary, revised. No further charge is provided in respect of assets that are fully written down but are still in use.
Depreciation on assets under construction commences only when the assets are ready for their intended use.
The estimated useful lives for the main categories of property, plant and equipment and other intangible assets are:
Estimated useful life (years)
Buildings upto 60 years*Roads 5 yearsPlant and Machinery upto 40 years*Railway Sidings upto 35 years*Vehicles and Aircraft 5 to 20 yearsFurniture, Fixtures and Office Equipments
4 to 6 years
Computer Software 5 yearsAssets covered under Electricity Act (life as prescribed under the Electricity Act)
3 to 34 years
Mining assets are amortised over the useful life of the mine or lease period whichever is lower.
Major furnace relining expenses are depreciated over a period of 10 years (average expected life).
Freehold land is not depreciated.
Assets value upto `25,000 are fully depreciated in the year of acquisition.
*For these class of assets, based on internal assessment and independent technical evaluation carried out by chartered engineers, the Company believes that the useful lives as given above best represent the period over which Company expects to use these assets. Hence the useful lives for these assets are different from the useful lives as prescribed under Part C of Schedule II of the Companies Act, 2013.
(j) Impairment
At each balance sheet date, the Company reviews the carrying values of its property, plant and equipment and intangible assets to determine whether there is any indication that the carrying value of those assets may not be recoverable through continuing use. If any such indication exists, the recoverable amount of the asset is reviewed in order to determine the extent of impairment loss (if any). Where the asset does not generate cash flows that are independent from other assets, the Company estimates the recoverable amount of the cash generating unit to which the asset belongs.
Recoverable amount is the higher of fair value less costs to sell and value in use. In assessing value in use, the estimated future cash flows are discounted to their present value using a pre-tax discount rate that reflects current market assessments of the time value of money and the risks specific to the asset for which the estimates of future cash flows have not been adjusted. An impairment loss is recognised in the statement
2. SIGNIFICANT ACCOUNTING POLICIES (CONTD.)
F-87

NOTES FORMING PART OF THE FINANCIAL STATEMENTS
of profit and loss as and when the carrying value of an asset exceeds its recoverable amount.
Where an impairment loss subsequently reverses, the carrying value of the asset (or cash generating unit) is increased to the revised estimate of its recoverable amount so that the increased carrying value does not exceed the carrying value that would have been determined had no impairment loss been recognised for the asset (or cash generating unit) in prior years. A reversal of an impairment loss is recognised in the statement of profit and loss immediately.
(k) Leases
The Company determines whether an arrangement contains a lease by assessing whether the fulfillment of a transaction is dependent on the use of a specific asset and whether the transaction conveys the right to use that asset to the Company in return for payment. Where this occurs, the arrangement is deemed to include a lease and is accounted for either as finance or operating lease.
Leases are classified as finance leases where the terms of the lease transfers substantially all the risks and rewards of ownership to the lessee. All other leases are classified as operating leases.
The Company as lessee
(i) Operating lease – Rentals payable under operating leases are charged to the statement of profit and loss on a straight line basis over the term of the relevant lease unless another systematic basis is more representative of the time pattern in which economic benefits from the leased asset are consumed. Contingent rentals arising under operating leases are recognised as an expense in the period in which they are incurred.
In the event that lease incentives are received to enter into operating leases, such incentives are recognised as a liability. The aggregate benefit of incentives is recognised as a reduction of rental expense on a straight line basis, except where another systematic basis is more representative of the time pattern in which economic benefits from the leased asset are consumed.
(ii) Finance lease – Finance leases are capitalised at the commencement of lease, at the lower of the fair value of the property or the present value of the minimum lease payments. The corresponding liability to the lessor is included in the balance sheet as a finance lease obligation. Lease payments are apportioned between finance charges and reduction of the lease obligation so as to achieve a constant rate of interest
on the remaining balance of the liability. Finance charges are recognised in the statement of profit and loss over the period of the lease.
The Company as lessor
(i) Operating lease – Rental income from operating leases is recognised in the statement of profit and loss on a straight line basis over the term of the relevant lease unless another systematic basis is more representative of the time pattern in which economic benefits from the leased asset is diminished. Initial direct costs incurred in negotiating and arranging an operating lease are added to the carrying value of the leased asset and recognised on a straight line basis over the lease term.
(ii) Finance lease – When assets are leased out under a finance lease, the present value of the minimum lease payments is recognised as a receivable. The difference between the gross receivable and the present value of the receivable is recognised as unearned finance income. Lease income is recognised over the term of the lease using the net investment method before tax, which reflects a constant periodic rate of return.
(l) Stripping costs
The Company separates two different types of stripping costs that are incurred in surface mining activity:
developmental stripping costs and production stripping costs
Developmental stripping costs which are incurred in order to obtain access to quantities of mineral reserves that will be mined in future periods are capitalised as part of mining assets. Capitalisation of developmental stripping costs ends when the commercial production of the mineral reserves begins.
A mine can operate several open pits that are regarded as separate operations for the purpose of mine planning and production. In this case, stripping costs are accounted for separately, by reference to the ore extracted from each separate pit. If, however, the pits are highly integrated for the purpose of mine planning and production, stripping costs are aggregated too.
The determination of whether multiple pit mines are considered separate or integrated operations depends on each mine’s specific circumstances. The following factors normally point towards the stripping costs for the individual pits being accounted for separately:
mining of the second and subsequent pits is conducted consecutively with that of the first pit, rather than concurrently
2. SIGNIFICANT ACCOUNTING POLICIES (CONTD.)
F-88

NOTES FORMING PART OF THE FINANCIAL STATEMENTS
separate investment decisions are made to develop each pit, rather than a single investment decision being made at the outset
the pits are operated as separate units in terms of mine planning and the sequencing of overburden and ore mining, rather than as an integrated unit
expenditures for additional infrastructure to support the second and subsequent pits are relatively large
the pits extract ore from separate and distinct ore bodies, rather than from a single ore body.
The relative importance of each factor is considered by the management to determine whether, on balance, the stripping costs should be attributed to the individual pit or to the combined output from the several pits.
Production stripping costs are incurred to extract the ore in the form of inventories and/or to improve access to an additional component of an ore body or deeper levels of material. Production stripping costs are accounted for as inventories to the extent the benefit from production stripping activity is realised in the form of inventories.
The Company recognises a stripping activity asset in the production phase if, and only if, all of the following are met:
it is probable that the future economic benefit (improved access to the ore body) associated with the stripping activity will flow to the Company
the entity can identify the component of the ore body for which access has been improved and
the costs relating to the improved access to that component can be measured reliably.
Such costs are presented within mining assets. After initial recognition, stripping activity assets are carried at cost less accumulated amortisation and impairment. The expected useful life of the identified component of the ore body is used to depreciate or amortise the stripping asset.
(m) Financial Instruments
Financial assets and financial liabilities are recognised when the Company becomes a party to the contractual provisions of the instrument. Financial assets and liabilities are initially measured at fair value. Transaction costs that are directly attributable to the acquisition or issue of financial assets and financial liabilities (other than financial assets and financial liabilities at fair value through profit and loss) are added to or deducted from the fair value measured on initial recognition of financial asset or financial liability. The transaction costs directly attributable to the acquisition of financial assets and
financial liabilities at fair value through profit and loss are immediately recognised in the statement of profit and loss.
Effective interest method
The effective interest method is a method of calculating the amortised cost of a financial instrument and of allocating interest income or expense over the relevant period. The effective interest rate is the rate that exactly discounts future cash receipts or payments through the expected life of the financial instrument, or where appropriate, a shorter period.
(a) Financial assets
Cash and bank balances
Cash and bank balances consist of:
(i) Cash and cash equivalents - which includes cash in hand, deposits held at call with banks and other short term deposits which are readily convertible into known amounts of cash, are subject to an insignificant risk of change in value and have maturities of less than one year from the date of such deposits. These balances with banks are unrestricted for withdrawal and usage.
(ii) Other bank balances - which includes balances and deposits with banks that are restricted for withdrawal and usage.
Financial assets at amortised cost
Financial assets are subsequently measured at amortised cost if these financial assets are held within a business model whose objective is to hold these assets in order to collect contractual cash flows and the contractual terms of the financial asset give rise on specified dates to cash flows that are solely payments of principal and interest on the principal amount outstanding.
Financial assets measured at fair value
Financial assets are measured at fair value through other comprehensive income if these financial assets are held within a business model whose objective is to hold these assets in order to collect contractual cash flows or to sell these financial assets and the contractual terms of the financial asset give rise on specified dates to cash flows that are solely payments of principal and interest on the principal amount outstanding.
The Company in respect of equity investments (other than in subsidiaries, associates and joint ventures) which are not held for trading has made an irrevocable election to present in other comprehensive income subsequent changes in the fair value of such equity instruments. Such an election is made by the Company on an instrument by instrument basis at the time of initial recognition of such equity investments.
2. SIGNIFICANT ACCOUNTING POLICIES (CONTD.)
F-89

NOTES FORMING PART OF THE FINANCIAL STATEMENTS
Financial asset not measured at amortised cost or at fair value through other comprehensive income is carried at fair value through the statement of profit and loss.
Impairment of financial assets
Loss allowance for expected credit losses is recognised for financial assets measured at amortised cost and fair value through other comprehensive income.
The Company recognises life time expected credit losses for all trade receivables that do not constitute a financing transaction.
For financial assets whose credit risk has not significantly increased since initial recognition, loss allowance equal to twelve months expected credit losses is recognised. Loss allowance equal to the lifetime expected credit losses is recognised if the credit risk on the financial instruments has significantly increased since initial recognition.
De-recognition of financial assets
The Company de-recognises a financial asset only when the contractual rights to the cash flows from the asset expire, or it transfers the financial asset and substantially all risks and rewards of ownership of the asset to another entity.
If the Company neither transfers nor retains substantially all the risks and rewards of ownership and continues to control the transferred asset, the Company recognises its retained interest in the assets and an associated liability for amounts it may have to pay.
If the Company retains substantially all the risks and rewards of ownership of a transferred financial asset, the Company continues to recognise the financial asset and also recognises a collateralised borrowing for the proceeds received.
(b) Financial liabilities and equity instruments
Classification as debt or equity
Financial liabilities and equity instruments issued by the Company are classified according to the substance of the contractual arrangements entered into and the definitions of a financial liability and an equity instrument.
Equity instruments
An equity instrument is any contract that evidences a residual interest in the assets of the Company after deducting all of its liabilities. Equity instruments are recorded at the proceeds received, net of direct issue costs.
Financial Liabilities
Trade and other payables are initially measured at fair value, net of transaction costs, and are subsequently measured at amortised cost, using the effective interest rate method where the time value of money is significant.
Interest bearing bank loans, overdrafts and issued debt are initially measured at fair value and are subsequently measured at amortised cost using the effective interest rate method. Any difference between the proceeds (net of transaction costs) and the settlement or redemption of borrowings is recognised over the term of the borrowings in the statement of profit and loss.
De-recognition of financial liabilities
The Company de-recognises financial liabilities when, and only when, the Company’s obligations are discharged, cancelled or they expire.
Derivative financial instruments and hedge accounting
In the ordinary course of business, the Company uses certain derivative financial instruments to reduce business risks which arise from its exposure to foreign exchange and interest rate fluctuations. The instruments are confined principally to forward foreign exchange contracts, cross currency swaps, interest rate swaps and collars. The instruments are employed as hedges of transactions included in the financial statements or for highly probable forecast transactions/firm contractual commitments. These derivatives contracts do not generally extend beyond six months, except for certain currency swaps and interest rate derivatives.
Derivatives are initially accounted for and measured at fair value from the date the derivative contract is entered into and are subsequently re-measured to their fair value at the end of each reporting period.
The Company adopts hedge accounting for forward and interest rate contracts wherever possible. At the inception of each hedge, there is a formal, documented designation of the hedging relationship. This documentation includes, inter alia, items such as identification of the hedged item or transaction and the nature of the risk being hedged. At inception each hedge is expected to be highly effective in achieving an offset of changes in fair value or cash flows attributable to the hedged risk. The effectiveness of hedge instruments to reduce the risk associated with the exposure being hedged is assessed and measured at the inception and on an ongoing basis. The ineffective portion of designated hedges is recognised immediately in the statement of profit and loss.
2. SIGNIFICANT ACCOUNTING POLICIES (CONTD.)
F-90

NOTES FORMING PART OF THE FINANCIAL STATEMENTS
When hedge accounting is applied:
for fair value hedges of recognised assets and liabilities, changes in fair value of the hedged assets and liabilities attributable to the risk being hedged, are recognised in the statement of profit and loss and compensate for the effective portion of symmetrical changes in the fair value of the derivatives
for cash flow hedges, the effective portion of the change in the fair value of the derivative is recognised directly in equity and the ineffective portion is taken to the statement of profit and loss. If the cash flow hedge of a firm commitment or forecasted transaction results in the recognition of a non-financial asset or liability, then, at the time the asset or liability is recognised, the associated gains or losses on the derivative that had previously been recognised in equity are included in the initial measurement of the asset or liability. For hedges that do not result in the recognition of a non-financial asset or a liability, amounts deferred in equity are recognised in the statement of profit and loss in the same period in which the hedged item affects the statement of profit and loss.
In cases where hedge accounting is not applied, changes in the fair value of derivatives are recognised in the statement of profit and loss as and when they arise.
Hedge accounting is discontinued when the hedging instrument expires or is sold, terminated, or exercised, or no longer qualifies for hedge accounting. At that time, any cumulative gain or loss on the hedging instrument recognised in equity is retained in equity until the forecasted transaction occurs. If a hedged transaction is no longer expected to occur, the net cumulative gain or loss recognised in equity is transferred to the statement of profit and loss for the period.
(n) Employee benefits
Defined contribution plans
Payments to defined contribution plans are charged as an expense as they fall due. Payments made to state managed retirement benefit schemes are dealt with as payments to defined contribution schemes where the Company’s obligations under the schemes are equivalent to those arising in a defined contribution retirement benefit scheme.
Defined benefit plans
For defined benefit retirement schemes the cost of providing benefits is determined using the Projected Unit Credit Method, with actuarial valuation being carried out at each balance sheet date. Re-measurement gains and losses
of the net defined benefit liability/(asset) are recognised immediately in other comprehensive income. The service cost and net interest on the net defined benefit liability/(asset) is treated as a net expense within employment costs.
Past service cost is recognised as an expense when the plan amendment or curtailment occurs or when any related restructuring costs or termination benefits are recognised, whichever is earlier.
The retirement benefit obligation recognised in the balance sheet represents the present value of the defined-benefit obligation as reduced by the fair value plan assets.
Compensated absences
Compensated absences which are not expected to occur within twelve months after the end of the period in which the employee renders the related service are recognised based on actuarial valuation at the present value of the obligation as on the reporting date.
(o) Inventories
Inventories are stated at the lower of cost and net realisable value. Costs comprise direct materials and, where applicable, direct labour costs and those overheads that have been incurred in bringing the inventories to their present location and condition. Net realisable value is the price at which the inventories can be realised in the normal course of business after allowing for the cost of conversion from their existing state to a finished condition and for the cost of marketing, selling and distribution.
Stores and spare parts are carried at lower of cost and net realisable value.
Provisions are made to cover slow moving and obsolete items based on historical experience of utilisation on a product category basis, which involves individual businesses considering their product lines and market conditions.
(p) Provisions
Provisions are recognised in the balance sheet when the Company has a present obligation (legal or constructive) as a result of a past event, which is expected to result in an outflow of resources embodying economic benefits which can be reliably estimated. Each provision is based on the best estimate of the expenditure required to settle the present obligation at the balance sheet date. Where the time value of money is material, provisions are measured on a discounted basis.
Constructive obligation is an obligation that derives from an entity’s actions where:
2. SIGNIFICANT ACCOUNTING POLICIES (CONTD.)
F-91

NOTES FORMING PART OF THE FINANCIAL STATEMENTS
(a) by an established pattern of past practice, published policies or a sufficiently specific current statement, the entity has indicated to other parties that it will accept certain responsibilities and;
(b) as a result, the entity has created a valid expectation on the part of those other parties that it will discharge those responsibilities.
(q) Onerous contracts
A provision for onerous contracts is recognised when the expected benefits to be derived by the Company from a contract are lower than the unavoidable cost of meeting its obligations under the contract. The provision is measured at the present value of the lower of the expected cost of terminating the contract and the expected net cost of continuing with the contract. Before a provision is established, the Company recognises any impairment loss on the assets associated with that contract.
(r) Government grants
Government grants related to expenditure on property, plant and equipment are credited to the statement of profit and loss over the useful lives of qualifying assets or other systematic basis representative of the pattern of fulfilment of obligations associated with the grant received. Total grants received less the amounts credited to the statement of profit and loss at the balance sheet date are included in the balance sheet as deferred income.
(s) Non-current assets held for sale and discontinued
operations
Non-current assets and disposal groups classified as held for sale are measured at the lower of their carrying value and fair value less costs to sell.
Assets and disposal groups are classified as held for sale if their carrying value will be recovered through a sale transaction rather than through continuing use. This condition is only met when the sale is highly probable and the asset, or disposal group, is available for immediate sale in its present condition and is marketed for sale at a price that is reasonable in relation to its current fair value. The Company must also be committed to the sale, which should be expected to qualify for recognition as a completed sale within one year from the date of classification.
Where a disposal group represents a separate major line of business or geographical area of operations, or is part of a
single coordinated plan to dispose of a separate major line of business or geographical area of operations, then it is treated as a discontinued operation. The post-tax profit or loss of the discontinued operation together with the gain or loss recognised on its disposal are disclosed as a single amount in the statement of profit and loss, with all prior periods being presented on this basis.
(t) Income taxes
Tax expense for the year comprises current and deferred tax. The tax currently payable is based on taxable profit for the year. Taxable profit differs from net profit as reported in the statement of profit and loss because it excludes items of income or expense that are taxable or deductible in other years and it further excludes items that are never taxable or deductible. The Company’s liability for current tax is calculated using tax rates and tax laws that have been enacted or substantively enacted by the end of the reporting period.
Deferred tax is the tax expected to be payable or recoverable on differences between the carrying values of assets and liabilities in the financial statements and the corresponding tax bases used in the computation of taxable profit and is accounted for using the balance sheet liability method. Deferred tax liabilities are generally recognised for all taxable temporary differences. In contrast, deferred tax assets are only recognised to the extent that it is probable that future taxable profits will be available against which the temporary differences can be utilised.
The carrying value of deferred tax assets is reviewed at the end of each reporting period and reduced to the extent that it is no longer probable that sufficient taxable profits will be available to allow all or part of the asset to be recovered.
Deferred tax is calculated at the tax rates that are expected to apply in the period when the liability is settled or the asset is realised based on the tax rates and tax laws that have been enacted or substantially enacted by the end of the reporting period. The measurement of deferred tax liabilities and assets reflects the tax consequences that would follow from the manner in which the Company expects, at the end of the reporting period, to cover or settle the carrying value of its assets and liabilities.
Deferred tax assets and liabilities are offset to the extent that they relate to taxes levied by the same tax authority and there are legally enforceable rights to set off current tax assets and current tax liabilities within that jurisdiction.
Current and deferred tax are recognised as an expense or income in the statement of profit and loss, except when they relate to items credited or debited either in other
2. SIGNIFICANT ACCOUNTING POLICIES (CONTD.)
F-92

NOTES FORMING PART OF THE FINANCIAL STATEMENTS
comprehensive income or directly in equity, in which case the tax is also recognised in other comprehensive income or directly in equity.
Deferred tax assets include Minimum Alternate Tax (MAT) paid in accordance with the tax laws in India, which is likely to give future economic benefits in the form of availability of set off against future income tax liability. MAT is recognised as deferred tax assets in the Balance Sheet when the asset can be measured reliably and it is probable that the future economic benefit associated with the asset will be realised.
(u) Revenue
Revenue is recognised to the extent that it is probable that the economic benefits will flow to the Company and the revenue can be reliably measured, regardless of when the payment is being made. Revenue is measured at the fair value of the consideration received or receivable net of discounts, taking into account contractually defined terms and excluding taxes or duties collected on behalf of the government.
Sale of goods
Revenue from the sale of goods is recognised when the significant risks and rewards of ownership have been transferred to the buyer. No revenue is recognised if there are significant uncertainties regarding recovery of the amount due, associated costs or the possible return of goods.
Interest income
Interest income is accrued on a time proportion basis, by reference to the principal outstanding and the effective interest rate applicable.
Dividend income
Dividend income from investments is recognised when the shareholder’s rights to receive payment have been established.
Rental income
Rental income from investment properties and subletting of properties is recognised on a straight line basis over the term of the relevant leases.
Commission income
Commission income is recognised when the services are rendered.
(v) Foreign currency transactions and translations
The financial statements of the Company are presented in Indian rupees (`), which is the functional currency of the Company and the presentation currency for the financial statements.
In preparing the financial statements, transactions in currencies other than the Company’s functional currency are recorded at the rates of exchange prevailing on the date of the transaction. At the end of each reporting period, monetary items denominated in foreign currencies are re-translated at the rates prevailing at the end of the reporting period. Non-monetary items carried at fair value that are denominated in foreign currencies are retranslated at the rates prevailing on the date when the fair value was determined. Non-monetary items that are measured in terms of historical cost in a foreign currency are not translated.
Exchange differences arising on translation of long term foreign currency monetary items recognised in the financial statements before the beginning of the first Ind AS financial reporting period in respect of which the Company has elected to recognise such exchange differences in equity or as part of cost of assets as allowed under Ind AS 101-“First time adoption of Indian Accounting Standard” are recognised directly in equity or added/deducted to/ from the cost of assets as the case may be. Such exchange differences recognised in equity or as part of cost of assets is recognised in the statement of profit and loss on a systematic basis.
Exchange differences arising on the retranslation or settlement of other monetary items are included in the statement of profit and loss for the period.
(w) Borrowing costs
Borrowings costs directly attributable to the acquisition, construction or production of qualifying assets, which are assets that necessarily take a substantial period of time to get ready for their intended use or sale, are added to the cost of those assets, until such time as the assets are substantially ready for the intended use or sale.
Investment income earned on the temporary investment of specific borrowings pending their expenditure on qualifying assets is recognised in the statement of profit and loss.
Discounts or premiums and expenses on the issue of debt securities are amortised over the term of the related securities and included within borrowing costs. Premiums payable on early redemptions of debt securities, in lieu of future finance costs, are written off as borrowing costs when paid.
2. SIGNIFICANT ACCOUNTING POLICIES (CONTD.)
F-93

NOTES FORMING PART OF THE FINANCIAL STATEMENTS
3. PROPERTY, PLANT AND EQUIPMENT
Land
including
roads
Buildings Plant and
Machinery
Furniture,
fixtures
and office
equipments
Vehicles Railway
Sidings
Total
(` in million)
(US$ million)
Cost/Deemed cost as at April 1, 2016 1,37,771.7 49,209.1 3,47,170.9 2,382.9 3,090.0 4,147.2 5,43,771.8 8,385.7Additions 2,815.7 8,019.1 2,37,448.6 1,140.0 221.2 6,092.8 2,55,737.4 3,943.8Disposals - (0.5) (36.9) (1.1) (69.7) - (108.2) (1.7)Cost /Deemed cost as at March 31, 2017 1,40,587.4 57,227.7 5,84,582.6 3,521.8 3,241.5 10,240.0 7,99,401.0 12,327.8
Impairment as at April 1, 2016 1.3 13.2 0.9 - - - 15.4 0.2Other re-classifications 0.2 - - - - - 0.2 - Accumulated impairment as at March 31, 2017 1.5 13.2 0.9 - - - 15.6 0.2
Accumulated depreciation as at April 1, 2016 2,852.8 2,397.5 39,256.7 1,989.3 1,366.2 283.4 48,145.9 742.5Charge for the period 1,051.4 2,216.8 29,197.1 476.2 281.0 292.4 33,514.9 516.8Disposals - - (8.2) (0.9) (55.8) - (64.9) (1.0) Other re-classifications (0.2) - - - - - (0.2) - Accumulated depreciation as at March 31, 2017 3,904.0 4,614.3 68,445.6 2,464.6 1,591.4 575.8 81,595.7 1,258.3
Total accumulated depreciation and impairment
as at March 31, 20173,905.5 4,627.5 68,446.5 2,464.6 1,591.4 575.8 81,611.3 1,258.5
Net carrying value as at April 1, 2016 1,34,917.6 46,798.4 3,07,913.3 393.6 1,723.8 3,863.8 4,95,610.5 7,643.0Net carrying value as at March 31, 2017 1,36,681.9 52,600.2 5,16,136.1 1,057.2 1,650.1 9,664.2 7,17,789.7 11,069.3
(` in million)Land
including
roads
Buildings Plant and
Machinery
Furniture,
fixtures
and office
equipments
Vehicles Railway
Sidings
Total
Cost/Deemed cost as at April 1, 2015 1,36,140.2 45,826.9 3,37,106.6 2,159.1 2,849.3 4,133.8 5,28,215.9Additions 1,636.0 3,423.7 10,100.6 225.3 316.7 13.4 15,715.7Disposals (4.5) (41.5) (36.3) (1.5) (76.0) - (159.8)Cost /Deemed cost as at March 31, 2016 1,37,771.7 49,209.1 3,47,170.9 2,382.9 3,090.0 4,147.2 5,43,771.8
Accumulated impairment as at April 1, 2015 - 12.5 - - - - 12.5 Charge for the period 1.3 1.1 0.9 - - - 3.3 Other re-classifications - (0.4) - - - - (0.4)Accumulated impairment as at March 31, 2016 1.3 13.2 0.9 - - - 15.4
Accumulated depreciation as at April 1, 2015 2,340.8 5.9 14,094.2 1,769.0 1,168.7 - 19,378.6 Charge for the period 512.0 2,393.7 25,165.8 221.4 259.8 283.4 28,836.1 Disposals - (2.5) (3.3) (1.1) (62.3) - (69.2)Other re-classifications - 0.4 - - - - 0.4 Accumulated depreciation as at March 31, 2016 2,852.8 2,397.5 39,256.7 1,989.3 1,366.2 283.4 48,145.9
Total accumulated depreciation and
impairment as at March 31, 20162,854.1 2,410.7 39,257.6 1,989.3 1,366.2 283.4 48,161.3
Net carrying value as at April 1, 2015 1,33,799.4 45,808.5 3,23,012.4 390.1 1,680.6 4,133.8 5,08,824.8Net carrying value as at March 31, 2016 1,34,917.6 46,798.4 3,07,913.3 393.6 1,723.8 3,863.8 4,95,610.5
(i) Buildings include `23.2 million (US$0.4 million) (March 31, 2016: `23.2 million; April 1, 2015: `23.2 million) being cost of shares in co-operative housing societies and limited companies.
F-94

NOTES FORMING PART OF THE FINANCIAL STATEMENTS
(ii) The net carrying value of plant and machinery comprises of: As at
March 31, 2017As at
March 31, 2016As at
April 1, 2015
(US$ million) (` in million) (` in million) (` in million)
Assets held under finance leases
Cost/ Deemed cost 543.2 35,220.9 27,920.9 27,920.9 Accumulated depreciation and impairment losses 229.3 14,866.9 13,937.4 13,251.3
313.9 20,354.0 13,983.5 14,669.6
Owned assets 7,645.6 4,95,782.1 2,93,929.8 3,08,342.8
7,959.5 5,16,136.1 3,07,913.3 3,23,012.4
(iii) The net carrying value of furniture, fixtures and office equipments comprises of:
As at March 31, 2017
As at March 31, 2016
As at April 1, 2015
(US$ million) (` in million) (` in million) (` in million)
Furniture and fixtures: Cost/Deemed cost 13.0 840.2 595.1 525.6Accumulated depreciation and impairment losses 11.0 714.7 529.7 489.4
2.0 125.5 65.4 36.2
Office equipments:
Cost/Deemed cost 41.4 2,681.6 1,787.8 1,633.5Accumulated depreciation and impairment losses 27.0 1,749.9 1,459.6 1,279.6
14.4 931.7 328.2 353.9
16.4 1,057.2 393.6 390.1
(iv) ₹2,212.5 million (US$34.1 million) (2015-16: ₹10,695.8 million) of borrowing costs has been capitalised during the year on qualifying assets using a capitalisation rate of 9.50% (2015-16: 9.50%).
(v) Rupee liability has increased by `1,371.1 million (US$21.1 million) (2015-16: `1,078.4 million) arising out of realignment of the value of long-term foreign currency loans and liabilities for procurement of property, plant and equipment. This increase has been adjusted against the carrying cost of assets and has been depreciated over their remaining useful life. The depreciation for the current year is higher by `31.6 million (US$0.5 million) (2015-16: `64.8 million) on account of this adjustment.
(vi) With effect from April 1, 2016, the Company has revised the useful life of certain items of property, plant and equipment based on technical evaluation on assessment of the physical condition of the underlying assets and benchmarking with peers across the industry. Had there been no change in the useful life of assets, depreciation for the year would have been higher by `6,534.4 million (US$100.8 million).
(vii) Property, plant and equipment (including capital work-in-progress) were tested for impairment during the year where indicators of impairment existed. Based on an assessment of external market conditions relating to input costs and final product realisation and evaluation of physical working conditions for items of property, plant and equipment, no indicators of impairment were identified during the current year.
During the year ended March 31, 2016, the Company recognised an impairment charge of ₹104.3 million which primarily relates to expenses incurred on a project which the Company has decided to discontinue.
(viii) Property, plant and equipment includes capital cost of in-house research facilities as below:
3. PROPERTY, PLANT AND EQUIPMENT (CONTD.)
F-95

NOTES FORMING PART OF THE FINANCIAL STATEMENTS
Buildings Plant and
Machinery
Furniture,
fixtures & office
equipments
Vehicles Total
(` in million)
(US$ million)
Cost/ Deemed cost as at April 1, 2016 2.6 600.0 50.1 0.9 653.6 10.1
0.8 412.1 46.2 0.9 460.0Additions 57.8 65.6 10.7 - 134.1 2.1
1.8 187.9 3.8 - 193.5 Cost as at March 31, 2017 60.4 665.6 60.8 0.9 787.7 12.1
2.6 600.0 50.0 0.9 653.5Capital work-in-progress 47.4 0.7
58.9
Figures in italics represents comparative figures of previous years.
(ix) The details of property, plant and equipment pledged against borrowings are presented in Note 19.
4. LEASES
The Company has taken land, buildings and plant and machinery under operating and finance leases. The following is the summary of future minimum lease rental payments under non-cancellable operating leases and finance leases entered into by the Company:
A. Operating leases:
Significant leasing arrangements include lease of land for periods ranging between 12 to 99 years with renewal option, lease of office spaces and assets dedicated for use under long term arrangements. Payments under long term arrangements involving use of dedicated assets are allocated between those relating to the right to use of assets, executory services and for output based on the underlying contractual terms and conditions. Any change in the allocation assumptions may have an impact on the lease assessment and/or lease classification. Payments linked to changes in inflation index under the lease arrangements have been considered as contingent rent and recognised in the statement of profit and loss as and when incurred.
Future minimum lease payments under non-cancellable operating leases are as below: As at
March 31, 2017
As at March 31, 2016
As at April 1, 2015
(US$ million) (` in million) (` in million) (` in million)
Not later than one year 21.6 1,399.8 1,660.3 1,356.1Later than one year but not later than five years 58.0 3,757.9 4,117.4 3,412.9Later than five years 196.4 12,738.5 9,523.8 2,244.6
276.0 17,896.2 15,301.5 7,013.6
During the year ended March 31, 2017, total operating lease rental recognised in the statement of profit and loss was `2,552.7 million (US$39.4 million), (2015-16: `2,313.0 million) including contingent rent of `370.7 million (US$5.7 million) (2015-16: `372.4 million).
3. PROPERTY, PLANT AND EQUIPMENT (CONTD.)
F-96

NOTES FORMING PART OF THE FINANCIAL STATEMENTS
B. Finance leases:
Significant leasing arrangements include assets dedicated for use under long term arrangements. The arrangements covers a substantial part of the economic life of the underlying asset and contain a renewal option on expiry. Payments under long term arrangements involving use of dedicated assets are allocated between those relating to the right to use of assets, executory services and for output based on the underlying contractual terms and conditions. Any change in the allocation assumptions may have an impact on lease assessment and/or lease classification.
The minimum lease payments and the present value of minimum lease payments in respect of arrangements classified as finance leases are as below:
(` in million)
As at March 31, 2017 As at March 31, 2016 As at April 1, 2015
Minimum Lease
payments
Present value of
minimum lease payments
Minimum
Lease
payments
Present value
of minimum
lease
payments
Minimum
Lease
payments
Present value
of minimum
lease
payments(US$
million)(` in
million)(US$
million)(` in
million)
Not later than one year 67.5 4,375.5 17.4 1,126.9 3,520.8 999.8 3,589.2 942.5Later than one year but not later than five years 235.2 15,252.5 63.2 4,098.1 10,911.5 2,593.9 11,474.2 2,786.5
Later than five years 654.9 42,469.2 266.6 17,287.2 32,831.7 12,734.8 35,476.3 13,427.7Total future minimum lease
commitments957.6 62,097.2 347.2 22,512.2 47,264.0 16,328.5 50,539.7 17,156.7
Less: future finance charges 610.4 39,585.0 30,935.5 33,383.0Present value of minimum
lease payments347.2 22,512.2 16,328.5 17,156.7
Disclosed as:
Non-current borrowings329.8 21,385.3 15,328.7 16,214.2
Other financial liabilities - Current 17.4 1,126.9 999.8 942.5
347.2 22,512.2 16,328.5 17,156.7
4. LEASES (CONTD.)
F-97

NOTES FORMING PART OF THE FINANCIAL STATEMENTS
5. INTANGIBLE ASSETS
Softwarecosts
Mining assets
Total
(` in million)
(US$ million)
Cost/Deemed cost as at April 1, 2016 1,477.6 12,834.9 14,312.5 220.7Additions 509.6 4,010.7 4,520.3 69.7Cost/Deemed cost as at March 31, 2017 1,987.2 16,845.6 18,832.8 290.4
Accumulated impairment as at April 1, 2016 - 359.2 359.2 5.5Charge for the period - 11.3 11.3 0.2Accumulated impairment as at March 31, 2017 - 370.5 370.5 5.7
Accumulated amortisation as at April 1, 2016 1,227.2 7,452.7 8,679.9 133.9Charge for the period 236.3 1,664.3 1,900.6 29.3Accumulated amortisation as at March 31, 2017 1,463.5 9,117.0 10,580.5 163.2
Total accumulated amortisation and impairment as at March 31, 2017 1,463.5 9,487.5 10,951.0 168.9
Net carrying value as at April 1, 2016 250.4 5,023.0 5,273.4 81.3
Net carrying value as at March 31, 2017 523.7 7,358.1 7,881.8 121.5
(` in million)
Softwarecosts
Mining assets
Total
Cost/Deemed cost as at April 1, 2015 1,424.0 8,266.0 9,690.0 Additions 53.6 4,623.6 4,677.2 Disposals - (54.7) (54.7)Cost/Deemed cost as at March 31, 2016 1,477.6 12,834.9 14,312.5
Accumulated impairment as at April 1, 2015 - - -Charge for the period - 359.2 359.2 Accumulated impairment as at March 31, 2016 - 359.2 359.2
Accumulated amortisation as at April 1, 2015 1,080.1 6,838.5 7,918.6Charge for the period 147.1 639.6 786.7Disposals - (25.4) (25.4)Accumulated amortisation as at March 31, 2016 1,227.2 7,452.7 8,679.9
Total accumulated amortisation and impairment as at March 31, 2016 1,227.2 7,811.9 9,039.1
Net carrying value as at April 1, 2015 343.9 1,427.5 1,771.4
Net carrying value as at March 31, 2016 250.4 5,023.0 5,273.4
(i) Mining assets represent expenditure incurred in relation to acquisition of mines, mine development expenditure post establishment of technical and commercial feasibility and restoration obligations as per applicable regulations.
(ii) During the year, the Company recognised an impairment charge of ₹11.3 million (US$0.2 million) (2015-16: ₹359.2 million) which represents expenditure incurred in connection with mines which are not currently being operated by the Company.
(iii) Software costs include software related to in-house research and development ₹2.7 million (US$0 million) (March 31, 2016: ₹2.7 million; April 1, 2015: ₹2.7 million).
F-98

NOTES FORMING PART OF THE FINANCIAL STATEMENTS
6. INVESTMENT IN SUBSIDIARIES, ASSOCIATES AND JOINT VENTURES
No. of shares of face value of `10 each
fully paid-up unless otherwise specified
As at
March 31,
2017
As at
March 31,
2016
As at
April 1,
2015
(US$ million)
(` in million)
(` in million)
(` in million)
A. Investments carried at cost
(a) Equity Investments in Subsidiary Companies
(i) Quoted
(1) Tata Metaliks Ltd. 1,26,67,590 4.1 263.0 263 .0 263.0 (2) Tayo Rolls Limited 55,87,372 0 - - -(3) Tata Sponge Iron Limited 83,93,554 13.3 865.4 865.4 865.4 (4) The Tinplate Company of India Ltd. 7,84,57,640 61.0 3,950.2 3,950.2 3,950.2
78.4 5,078.6 5,078.6 5,078.6
(ii) Unquoted
(1) ABJA Investment Co. Pte. Ltd. (Face value of USD 1 each)
2,00,000 0.2 10.8 10.8 10.8
(2) Adityapur Toll Bridge Company Limited 4,14,00,000 4.1 264.0 - -(2,64,00,000 shares acquired during the current year)
(3) Bangla Steel & Mining Co. Ltd. - - - - -(liquidated during the current year)
(4) Indian Steel & Wire Products Ltd. 56,92,651 0.5 30.8 30.8 30.8 (5) Jamshedpur Utilities & Services Company Limited 2,03,50,000 3.1 203.5 203.5 203.5 (6) Mohar Exports Services Pvt. Ltd. 3,352 0 - - - (7) NatSteel Asia Pte. Ltd.
(Face value of SGD 1 each) 28,14,37,128 119.3 7,738.6 7,738.6 7,738.6
(8) Rujuvalika Investments Limited 13,28,800 9.3 604.0 604.0 - (9) Tata Steel Special Economic Zone Limited 12,57,42,631 15.5 1,008.2 671.7 75.0
(3,36,50,000 shares acquired during the current year)(10) Tata Incorporated - - - - 16.4(11) Tata Korf Engineering Services Ltd.* 3,99,986 - - - -(12) Tata Steel (KZN) (Pty) Ltd.
(Face value of ZAR 1 each) 12,96,00,000 - - - -
(13) Tata Steel Holdings Pte Ltd. (Face value of GBP 1 each)
5,93,17,67,688 - - - -
(14) Tata Steel Processing and Distribution Limited 6,82,50,000 42.3 2,744.5 2,744.5 2,744.5 (15) Tata Steel Odisha Limited 25,67,000 0.4 25.7 25.5 25.5
(17,000 shares acquired during the current year)(16) Tata Pigments Limited
(Face value of `100 each) 75,000 0.1 7.0 7.0 7.0
(17) TS Alloys Limited 6,57,07,544 12.1 786.4 786.4 724.1 (18) Tata Steel Foundation 10,00,000 0.2 10.0 - -
(wholly owned subsidiary incorporated during the current year)
207.1 13,433.5 12,822.8 11,576.2
Aggregate provision for impairment in value of investments
(2.3) (154.3) - -
204.8 13,279.2 12,822.8 11,576.2
283.2 18,357.8 17,901.4 16,654.8
F-99

NOTES FORMING PART OF THE FINANCIAL STATEMENTS
6. INVESTMENT IN SUBSIDIARIES, ASSOCIATES AND JOINT VENTURES (CONTD.)
No. of shares of face value of `10 each
fully paid-up unless otherwise specified
As at
March 31,
2017
As at
March 31,
2016
As at
April 1,
2015
(US$ million)
(` in million)
(` in million)
(` in million)
(b) Investments in Associate Companies
(i) Quoted
(1) TRF Limited 37,53,275 0.9 57.9 57.9 58.2 0.9 57.9 57.9 58.2
(ii) Unquoted
(1) Kalinga Aquatics Limited* 10,49,920 - - -(2) Kumardhubi Metal Casting and Engineering Ltd.* 10,70,000 - - -(3) Nicco Jubilee Park Limited* 3,40,000 - - -(4) Kumardhubi Fireclay and Silica Works Ltd.* 1,50,001 - - - (5) Rujuvalika Investments Limited - - - 6.0 (6) Strategic Energy Technology Systems Private Limited 2,56,14,500 0.1 9.1 9.1 -(7) Tata Construction and Projects Ltd.* 11,97,699 - - - - (8) TRL Krosaki Refractories Limited 55,63,864 6.5 423.8 423.8 423.8 (9) Others `33,520 (March 31, 2016 : `33,520;
April 1, 2015 : `67,040 ) - - 0.1
6.6 432.9 432.9 429.9
Aggregate provision for impairment in value of investments
0.1 9.1 9.1 -
6.5 423.8 423.8 429.9
7.4 481.7 481.7 488.1
(c) Investments in Joint Ventures
(i) Unquoted
(1) Bhubaneshwar Power Private Limited 4,36,00,825 6.7 437.2 327.6 252.3 (1,08,42,989 shares acquired during the current year)
(2) Himalaya Steel Mills Services Private Limited 36,19,945 0.6 36.1 36.1 36.1 (3) mjunction services limited 40,00,000 0.6 40.0 40.0 40.0 (4) S & T Mining Company Private Limited 1,29,41,400 2 129.4 129.4 129.4 (5) Tata BlueScope Steel Limited 43,30,00,000 66.8 4,330.0 4,330.0 4,330.0 (6) Tata NYK Shipping Pte Ltd.
(Face value of USD 1 each) 6,51,67,500 54 3,501.4 3,501.4 3,288.6
(7) T M Mining Company Limited 1,62,800 0 1.6 1.6 1.6 (8) T M International Logistics Limited 91,80,000 1.4 91.8 91.8 91.8 (9) Jamshedpur Continuous Annealing and Processing
Company Private Limited 47,53,20,000 73.3 4,753.2 4,753.2 4,457.4
(10) Industrial Energy Limited 17,31,60,000 26.7 1,731.6 1,731.6 1,634.9 (11) Jamipol Limited 36,75,000 1.3 83.9 83.9 83.9
233.4 15,136.2 15,026.6 14,346.0
Total investment in subsidiaries, associates and joint ventures 524.0 33,975.7 33,409.7 31,488.9
* These investments are carried at a book value of `1.00
F-100

NOTES FORMING PART OF THE FINANCIAL STATEMENTS
6. INVESTMENT IN SUBSIDIARIES, ASSOCIATES AND JOINT VENTURES (CONTD.)
(i) The Company holds 51% of total equity share capital and voting rights in T M International Logistics Limited, Jamshedpur Continuous
Annealing and Processing Company Private Limited and T M Mining Company Limited. However, decisions in respect of certain activities which significantly affect the risks and rewards of the respective businesses require unanimous consent of all the shareholders. These entities have therefore been considered as joint ventures.
(ii) The carrying value and market value of quoted and unquoted investments are as below:As at
March 31, 2017As at
March 31, 2016As at
April 1, 2015
(US$ million) (` in million) (` in million) (` in million)
(a) Subsidiaries:
Aggregate carrying value of quoted investments 78.3 5,078.6 5,078.6 5,078.6 Aggregate market value of quoted investments 303.4 19,677.0 10,574.9 12,194.8 Aggregate carrying value of unquoted investments 204.8 13,279.2 12,822.8 11,576.2(b) Associates: 0
Aggregate carrying value of quoted investments 0.9 57.9 57.9 58.2Aggregate market value of quoted investments 13.2 853.5 1,108.7 1,232.6Aggregate carrying value of unquoted investments 6.5 423.8 423.8 429.9
(c) Joint ventures: 0
Aggregate carrying value of unquoted investments 233.4 15,136.2 15,026.6 14,346.0
(iii) Other unquoted investments in associate companies include:
No. of shares of face value of ` 10 each
fully paid-up unless otherwise specified
As at March 31, 2017
As at March 31, 2016
As at April 1, 2015
(US$ million) (` in million) (` in million) (` in million)
(a) Malusha Travels Pvt. Ltd. 3,352 5,169.2 3,35,200.0 3,35,200.0 3,35,200.0(b) Mohar Exports Services Pvt. Limited - 0 - - 3,35,200.0
5,169.2 3,35,200.0 3,35,200.0 6,70,400.0
F-101

NOTES FORMING PART OF THE FINANCIAL STATEMENTS
7. INVESTMENTS
A. NON-CURRENT
No. of shares of face value of `10 each
fully paid-up unless otherwise specified
As at
March 31, 2017
As at
March 31, 2016
As at
April 1, 2015
(US$ million)
(` in million) (` in million) (` in million)
(I) Investments carried at amortised cost:
Investments in Bonds and Debentures
(a) Associate Companies
(i) Unquoted(1) Tata Construction & Projects Ltd.
10% Convertible debentures of `100 each (97,000 debentures redeemed at face value on liquidation during the current year)
- - - -
(b) Other Companies
(i) Unquoted(1) Medica TS Hospital Pvt. Ltd. 4,97,400 7.7 497.4 339.5 -
Secured optionally convertible redeemable debentures (Face value of `1,000 each) (1,57,900 debentures acquired during the current year)
7.7 497.4 339.5 -
(II) Investments carried at fair value through other
comprehensive income:
Investments in Equity shares
(i) Quoted(1) Credit Analysis & Research Limited 3,54,000 9.2 599.2 331.6 523.8 (2) Housing Development Finance
Corporation Ltd. 7,900 0.2 11.9 8.7 10.4
(Face value of `2 each) - (3) Tata Consultancy Services Limited
(Face Value of `1 each) 24,400 1.0 59.3 61.5 62.3
(4) Tata Motors Ltd. (Face value of `2 each)
8,36,37,697 600.9 38,962.6 32,334.3 83,458.5
(5) The Tata Power Company Ltd. (Face value of `1 each)
3,91,22,725 54.5 3,534.8 2,529.3 3,016.4
(6) Tata Investment Corporation Limited 2,46,018 2.4 156.4 116.2 140.9 (7) Titan Company Limited
(Face value of `1 each) - - - - 15,184.6
(8) Steel Strips Wheels Limited (68,884 shares disposed during the current year)
10,86,972 13.8 897.5 392.7 351.8
(9) Timken India Ltd. - `645.05 (March 31, 2016: `436.95; April 1, 2015: `611.10)
1 - - - -
682.0 44,221.7 35,774.3 1,02,748.7
(ii) Unquoted
F-102
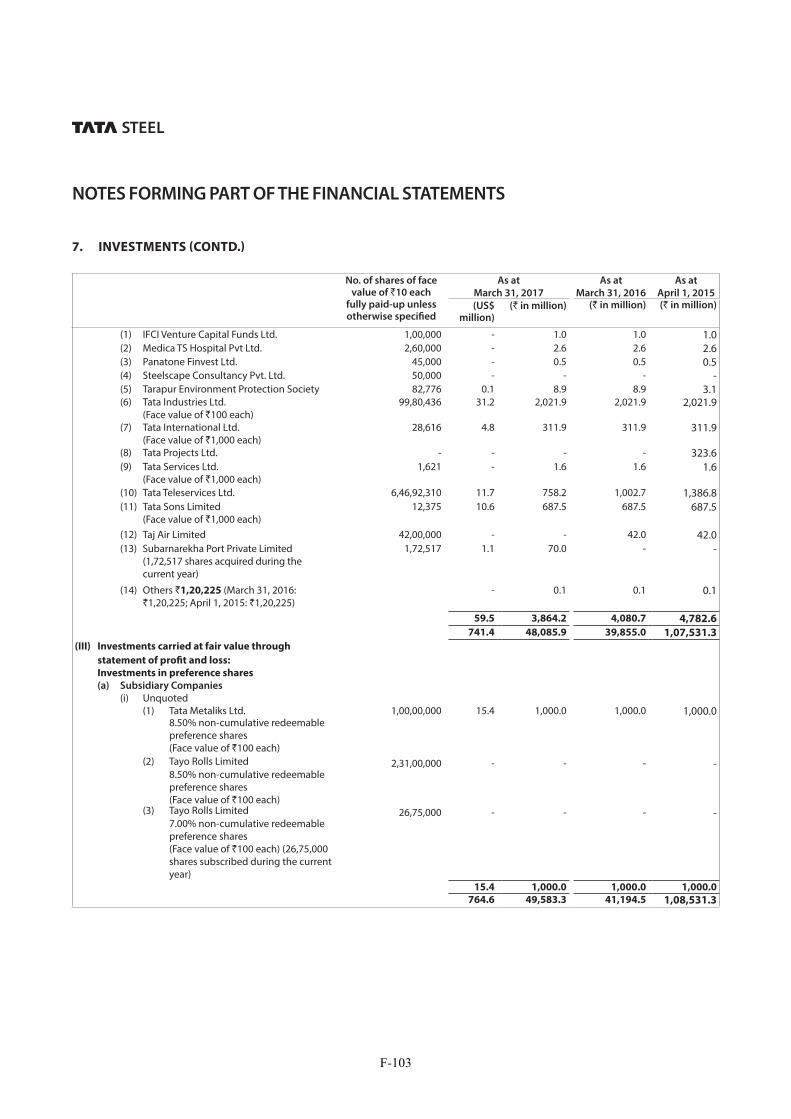
NOTES FORMING PART OF THE FINANCIAL STATEMENTS
No. of shares of face value of `10 each
fully paid-up unless otherwise specified
As at
March 31, 2017
As at
March 31, 2016
As at
April 1, 2015
(US$ million)
(` in million) (` in million) (` in million)
(1) IFCI Venture Capital Funds Ltd. 1,00,000 - 1.0 1.0 1.0 (2) Medica TS Hospital Pvt Ltd. 2,60,000 - 2.6 2.6 2.6 (3) Panatone Finvest Ltd. 45,000 - 0.5 0.5 0.5 (4) Steelscape Consultancy Pvt. Ltd. 50,000 - - - -(5) Tarapur Environment Protection Society 82,776 0.1 8.9 8.9 3.1 (6) Tata Industries Ltd.
(Face value of `100 each) 99,80,436 31.2 2,021.9 2,021.9 2,021.9
(7) Tata International Ltd. (Face value of `1,000 each)
28,616 4.8 311.9 311.9 311.9
(8) Tata Projects Ltd. - - - - 323.6 (9) Tata Services Ltd.
(Face value of `1,000 each) 1,621 - 1.6 1.6 1.6
(10) Tata Teleservices Ltd. 6,46,92,310 11.7 758.2 1,002.7 1,386.8 (11) Tata Sons Limited
(Face value of `1,000 each) 12,375 10.6 687.5 687.5 687.5
(12) Taj Air Limited 42,00,000 - - 42.0 42.0 (13) Subarnarekha Port Private Limited
(1,72,517 shares acquired during the current year)
1,72,517 1.1 70.0 - -
(14) Others `1,20,225 (March 31, 2016: `1,20,225; April 1, 2015: `1,20,225)
- 0.1 0.1 0.1
59.5 3,864.2 4,080.7 4,782.6
741.4 48,085.9 39,855.0 1,07,531.3
(III) Investments carried at fair value through
statement of profit and loss:
Investments in preference shares
(a) Subsidiary Companies
(i) Unquoted(1) Tata Metaliks Ltd. 1,00,00,000 15.4 1,000.0 1,000.0 1,000.0
8.50% non-cumulative redeemable preference shares (Face value of `100 each)
(2) Tayo Rolls Limited 2,31,00,000 - - - -8.50% non-cumulative redeemable preference shares (Face value of `100 each)
(3) Tayo Rolls Limited 26,75,000 - - - -7.00% non-cumulative redeemable preference shares (Face value of `100 each) (26,75,000 shares subscribed during the current year)
15.4 1,000.0 1,000.0 1,000.0
764.6 49,583.3 41,194.5 1,08,531.3
7. INVESTMENTS (CONTD.)
F-103

NOTES FORMING PART OF THE FINANCIAL STATEMENTS
B. CURRENT
As at March 31, 2017
As at March 31, 2016
As at April 1, 2015
(US$ million) (` in million) (` in million) (` in million)
Investments carried at fair value through the statement of
profit and loss:
Investments in Mutual funds – Unquoted
(a) Axis Liquid Fund - Growth 88.1 5,711.1 3,803.0 - (b) DSP BlackRock Liquidity Fund - IP - Growth 19.3 1,250.3 - - (c) Goldman Sachs Mutual Fund - Liquid Bees - 0.8 0.8 0.7 (d) HDFC Liquid Fund - Growth 77.2 5,003.3 5,007.0 - (e) ICICI Prudential Money Market Fund - Reg - Growth 93.2 6,040.5 7,007.6 - (f ) ICICI Prudential Liquid - Reg - Growth - - - 1,000.5(g) IDFC Cash Fund - Reg - Growth 35.7 2,313.4 - - (h) Invesco India Liquid Fund - Growth 54.5 3,536.0 - -(i) JM High Liquidity - Growth 3.9 250.8 - - (j) Kotak Liquid Scheme - Plan A - Growth - - 3,003.2 - (k) Kotak Liquid Scheme - Reg - Growth 52.4 3,396.1 - -(l) Reliance Liquidity Fund - Growth 155.2 10,067.4 6,306.7 1,000.6 (m) Religare Invesco Liquid Fund - Growth - - 1,000.7 - (n) SBI Premier Liquid Fund - Reg - Growth 46.3 3,002.5 3,504.6 500.7 (o) Tata Money Market Fund - Plan A - Growth - - - 7,509.0(p) Tata Money Market Fund - Reg - Growth 101.7 6,595.9 9,010.1 - (q) UTI Liquid Fund - Cash Plan - IP - Growth 91.4 5,930.0 4,606.3 -
818.9 53,098.1 43,250.0 10,011.5
(i) The carrying value and market value of quoted and unquoted investments are as below:
As at March 31, 2017
As at March 31, 2016
As at
April 1, 2015
(US$ million) (` in million) (` in million) (` in million)
(a) Quoted
Carrying value 682.0 44,221.7 35,774.3 1,02,748.7 Market value 682.0 44,221.7 35,774.3 1,02,748.7
(b) Unquoted#
Carrying value 901.5 58,459.7 48,670.2 15,794.1
# Costs of unquoted equity instruments has been considered as an appropriate estimate of fair value because of a wide range of possible fair value measurements and cost represents the best estimate of fair value within that range.
7. INVESTMENTS (CONTD.)
F-104

NOTES FORMING PART OF THE FINANCIAL STATEMENTS
(ii) Details of other unquoted investments carried at fair value through other comprehensive income are as below:
No. of shares of face value of `10 each
fully paid-up unless otherwise specified
As at March 31, 2017
As at March 31, 2016
As at April 1, 2015
(US$ million) (`) (`) (`)
(a) Barajamda Iron Ore Mine Workers’ Central Co-operative Stores Ltd.
200 77.1 5,000.00 5,000.00 5,000.00
(Face value of `25 each)(b) Bokaro and Ramgarh Ltd. 100 2,50.2 16,225.00 16,225.00 16,225.00 (c) Eastern Synpacks Limited
(Face value of `25 each)1,50,000 0 1.00 1.00 1.00
(d) Ferro Manganese Plant Employees’ Consumer Co-operative Society Ltd.
100 38.6 2,500.00 2,500.00 2,500.00
(Face value of `25 each)(e) Investech Advisory Services (India)
Limited (Face value of `100 each)
1,680 0 1.00 1.00 1.00
(f ) Jamshedpur Co-operative House Building Society Ltd.
10 15.4 1,000.00 1,000.00 1,000.00
(Face value of `100 each)(g) Jamshedpur Co-operative Stores Ltd.
(Face value of `5 each)50 3.9 250.00 250.00 250.00
(h) Jamshedpur Educational and Culture Co-operative Society Ltd.
50 77.1 5,000.00 5,000.00 5,000.00
(Face value of `100 each)(i) Joda East Iron Mine Employees’
Consumer Co-operative Society Ltd.100 38.6 2,500.00 2,500.00 2,500.00
(Face value of `25 each)(j) Namtech Electronic Devices Limited 48,026 0 1.00 1.00 1.00 (k) Reliance Firebrick and Pottery
Company Ltd. (Partly paid-up)
16,800 0 1.00 1.00 1.00
(l) Reliance Firebrick and Pottery Company Ltd.
2,400 0 1.00 1.00 1.00
(m) Sanderson Industries Ltd. 3,33,876 0 2.00 2.00 2.00 (n) Standard Chrome Ltd. 11,16,000 0 2.00 2.00 2.00 (o) Sijua (Jherriah) Electric Supply Co. Ltd. 4,144 620.9 40,260.00 40,260.00 40,260.00 (p) TBW Publishing and Media Pvt.
Limited 100 0 1.00 1.00 1.00
(q) Wellman Incandescent India Ltd. 15,21,234 0 2.00 2.00 2.00 (r) Woodland Multispeciality Hospital Ltd. 1,25,000 0 1.00 1.00 1.00 (s) Unit Trust of India - Mastershares 2,229 732.2 47,477.00 47,477.00 47,477.00
1,854.0 1,20,225.00 1,20,225.00 1,20,225.00
7. INVESTMENTS (CONTD.)
F-105

NOTES FORMING PART OF THE FINANCIAL STATEMENTS
8. LOANS
A. NON-CURRENT
As at March 31, 2017
As at March 31, 2016
As at April 1, 2015
(US$ million) (` in million) (` in million) (` in million)
(a) Security deposits
Unsecured, considered good 29.3 1,900.4 1,811.7 1,141.0 Unsecured, considered doubtful 0.2 12.6 14.0 17.2 Less: Allowance for credit losses 0.2 12.6 14.0 17.2
29.3 1,900.4 1,811.7 1,141.0
(b) Loans to related parties
Unsecured, considered doubtful 83.2 5,397.3 5,405.1 5,305.7 Less: Allowance for credit losses 83.2 5,397.3 540.51 5,305.7
- - - -
(c) Other loans
Unsecured, considered good 3.4 219.3 247.9 277.3 Unsecured, considered doubtful 0.1 6.2 4.2 4.3 Less: Allowance for credit losses 0.1 6.2 4.2 4.3
3.4 219.3 247.9 277.3
32.7 2,119.7 2,059.6 1,418.3
B. CURRENT
As at March 31, 2017
As at March 31, 2016
As at April 1, 2015
(US$ million) (` in million) (` in million) (` in million)
(a) Loans to related parties
Unsecured, considered good 3.3 215.1 115.0 737.9 Unsecured, considered doubtful 9.3 606.3 596.9 150.0 Less: Allowance for credit losses 9.3 606.3 596.9 150.0
3.3 215.1 115.0 737.9
(b) Other loans
Unsecured, considered good 0.9 56.3 72.5 82.5 Unsecured, considered doubtful 0.3 20.0 20.0 20.0 Less: Allowance for credit losses 0.3 20.0 20.0 20.0
0.9 56.3 72.5 82.5
4.2 271.4 187.5 820.4
(i) Security deposits include deposit with a subsidiary `140.0 million (US$2.2 million) (March 31, 2016: `140.0 million; April 1, 2015: `140.0 million) and Tata Sons `12.5 million (US$0.2 million) (March 31, 2016: `12.5 million; April 1, 2015: `12.5 million).
(ii) Non-current loans to related parties represent loans given to subsidiaries `5,397.3 million (US$83.2 million) (March 31, 2016: `5,405.1 million; April 1, 2015: `5,305.7million).
(iii) Current loans to related parties represent inter-corporate deposits given to subsidiaries `821.4 million (US$12.7 million) (March 31, 2016: `711.9 million; April 1, 2015: `265.0 million) and joint venture Nil (March 31, 2016: Nil; April 1, 2015: `622.9 million).
(iv) Current other loans include inter-corporate deposits `20.0 (US$0.3 million) million (March 31, 2016: `20.0 million; April 1, 2015: `20.0 million) and loans given to employees.
(v) Disclosure as per Regulation 34 of the Securities and Exchange Board of India (Listing Obligations and Disclosure Requirements) Regulations, 2015:
F-106

NOTES FORMING PART OF THE FINANCIAL STATEMENTS
Name of the Company Relationship
As at March 31, 2017
Maximum balance outstanding during
the year
Investment by the loanee in shares of
parent Company
(US$ million) (` in million) (` in million) No. of Shares
Tata Steel Special Economic Zone Limited
Subsidiary 1.5 100.0 100.0 -
- - - -- - - -
Tayo Rolls Limited Subsidiary 9.3 600.0 650.0 -
436.3 436.3 - - - - -
Industrial Energy Limited Joint venture - - - - - - 622.9 - 622.9 1,392.0 -
Tata Steel (KZN) (Pty) Ltd. Subsidiary 83.2 5,397.3 5,617.7 -
5,405.1 5,416.6 - 5,305.7 5,418.6 -
Jamshedpur Utilities & Services Company Limited
Subsidiary 1.8 115.0 115.0 -
115.0 115.0 - 115.0 115.0 -
Adityapur Toll Bridge Company Limited
Subsidiary - - 154.3 -
154.3 154.3 - 150.0 150.0 -
Figures in italics represents comparative figures of previous years.
The above loans and inter-corporate deposits have been given for business purpose.
(vi) There are no outstanding debts due from directors or other officers of the Company.
9. OTHER FINANCIAL ASSETS
A. NON-CURRENT
As at March 31, 2017
As at March 31, 2016
As at April 1, 2015
(US$ million) (` in million) (` in million)
(a) Interest accrued on deposits and loans
Unsecured, considered good 0.4 22.7 19.1 16.2
(b) Earmarked bank balances 5.8 377.4 350.1 378.1
(c) Other financial assets
Unsecured, considered good 6.1 394.8 - 212.7 Unsecured, considered doubtful 18.5 1,197.2 - - Less: Allowance for credit losses 18.5 1,197.2 - -
6.1 394.8 - 212.7
12.3 794.9 369.2 607.0
8. LOANS (CONTD.)
F-107

NOTES FORMING PART OF THE FINANCIAL STATEMENTS
B. CURRENT
As at March 31, 2017
As at March 31, 2016
As at
April 1, 2015
(US$ million) (` in million) (` in million) (` in million)
(a) Interest accrued on deposits and loans
Unsecured, considered good 1.5 99.8 118.4 66.3 Unsecured, considered doubtful 1.2 78.1 1,724.3 1,622.6 Less: Allowance for credit losses 1.2 78.1 1,724.3 1,622.6
1.5 99.8 118.4 66.3
(b) Other financial assets 47.0 3,050.8 1,959.1 2,273.8
48.5 3,150.6 2,077.5 2,340.1
(i) Earmarked bank balances represent deposits not due for realisation within 12 months from the balance sheet date. These are primarily placed as security with government bodies and margin money against issue of bank guarantees.
(ii) Non-current other financial assets include:
(a) advance against equity for purchase of shares in subsidiaries and joint ventures `123.0 million (US$1.9 million) (March 31, 2016: Nil; April 1, 2015: `212.7 million)
(b) advance for repurchase of equity shares in Tata Teleservices Limited (TTSL) from NTT Docomo Inc, ̀ 1,440.7 million (US$22.2 million) (March 31, 2016: Nil; April 1, 2015: Nil).
(iii) Current other financial assets include amount receivable from post-employment benefit fund `2,470.4 million (US$38.1million) (March 31, 2016: `976.1 million; April 1, 2015: `1,543.4 million) on account of retirement benefit obligations paid by the Company directly.
10. INCOME TAX
A. INCOME TAX EXPENSES/(BENEFITS)
The Company is subject to income tax in India on the basis of standalone financial statements. As per the Income Tax Act, the Company is liable to pay income tax which is the higher of regular income tax payable or the amount payable based on the provisions applicable for Minimum Alternate Tax (MAT).
MAT paid in excess of regular income tax during a year can be carried forward for a period of 15 years and can be offset against future tax liabilities.
Companies can claim for tax exemptions/deductions under specific section subject to fulfilment of prescribed conditions as may be applicable. The effective tax rate of the Company was lower as a result of tax deduction claimed by the Company on account of investment allowance on capital expenditure, expenditure on research and development etc.
Business loss can be carried forward for a maximum period of eight assessment years immediately succeeding the assessment year to which the loss pertains. Unabsorbed depreciation can be carried forward for an indefinite period.
9. OTHER FINANCIAL ASSETS (CONTD.)
F-108

NOTES FORMING PART OF THE FINANCIAL STATEMENTS
The reconciliation of estimated income tax to income tax expense is as below: Year ended
March 31, 2017Year ended
March 31, 2016
(US$ million) (` in million) (` in million)
Profit/(loss)before tax 826.1 53,569.3 15,433.4
Expected income tax expense at statutory income tax rate 285.9 18,539.3 5,341.2 (i) Income exempt from tax/Items not deductible 29.0 1,880.6 1,338.6(ii) Tax on income at different rates - - (135.4) (iii) Additional tax benefit for capital investment including research and
development expenditures(20.0) (1,296.1) (667.5)
Tax expense as reported 294.9 19,123.8 5,876.9
B. DEFERRED TAX ASSETS/(LIABILITIES)
(i) Components of deferred tax assets and liabilities as at March 31, 2017 is as below: Balance as at April 1, 2016
Recognised/(reversed) in statement of
profit and loss
Recognised in other
comprehensive income
Recognised in equity
Balance as at March 31, 2017
(` in million) (US$ million)
Deferred tax assets: Tax-loss carry forwards - 1,074.3 - - 1,074.3 16.6Investments 30,115.6 - - - 30,115.6 464.4Retirement benefit assets 1,842.1 - - - 1,842.1 28.4Provisions 15,008.9 3,205.7 - - 18,214.6 280.9MAT credit entitlement 2,693.8 12,439.2 - - 15,133.0 233.4Others 1,923.2 (1,162.2) 4.2 - 765.2 11.8
51,583.6 15,557.0 4.2 - 67,144.8 1,035.5
Deferred tax liabilities: Property, plant and equipment and intangible assets
1,06,956.6 20,967.7 - (108.5) 1,27,815.8 1,971.1
Others 734.0 (292.3) - - 441.7 6.81,07,690.6 20,675.4 - (108.5) 1,28,257.5 1,977.9
Net deferred tax assets/(liabilities) (56,107.0) (5,118.4) 4.2 108.5 (61,112.7) (942.4)
Disclosed as:
Deferred tax assets - - -
Deferred tax liabilities (56,107.0) (61,112.7) (942.4)
(56,107.0) (61,112.7) (942.4)
10. INCOME TAX (CONTD.)
F-109

NOTES FORMING PART OF THE FINANCIAL STATEMENTS
Components of deferred tax assets and liabilities as at March 31, 2016 is as below: (` in million)
Balance as at April 1, 2015
Recognised/(reversed) in
statement of profit and loss
Recognised in other
comprehensive income
Recognised in equity
Balance as at March 31, 2016
Deferred tax assets: Investments 30,115.6 - - - 30,115.6Retirement benefit assets 1,842.1 - - - 1,842.1 Provisions 11,229.3 3,779.6 - - 15,008.9MAT credit entitlement 1,172.1 1,521.7 - - 2,693.8Others 2,063.2 (133.8) (6.2) - 1,923.2
46,422.3 5,167.5 (6.2) - 51,583.6
Deferred tax liabilities: Property, plant and equipment and intangible assets
1,07,919.0 (803.6 ) - (158.8) 1,06,956.6
Others 818.8 (84.8) - - 734.01,08,737.8 (888.4) - (158.8) 1,07,690.6
Net deferred tax assets/(liabilities) (62,315.5) 6055.9 (6.2) 158.8 (56,107.0)
Disclosed as:
Deferred tax assets - -
Deferred tax liabilities (62,315.5) (56,107.0)
(62,315.5) (56,107.0)
(ii) The Company has not recognised deferred tax assets amounting to ̀ 80,342.3 million (US$1,239 million) as on March 31, 2017 (March 31, 2016: `80,342.3 million; April 1, 2015: `80,342.3 million) on fair value adjustment recognised in respect of investments held in a subsidiary on transition to Ind AS due to uncertainty surrounding availability of future taxable income against which such losses can be offset.
11. OTHER ASSETS
A. NON-CURRENT
As at March 31, 2017
As at March 31, 2016
As at April 1, 2015
(US$ million) (` in million) (` in million) (` in million)
(a) Capital advances
Unsecured, considered good 55.5 3,596.2 5,981.7 7,812.9Unsecured, considered doubtful 13.3 861.5 734.3 -Less: Provision for doubtful advances 13.3 861.5 734.3 -
55.5 3,596.2 5,981.7 7,812.9
(b) Advance with public bodies
Unsecured, considered good 272.3 17,658.5 18,518.3 13,320.5Unsecured, considered doubtful 2.0 127.6 127.3 133.0Less: Provision for doubtful advances 2.0 127.6 127.3 133.0
272.3 17,658.5 18,518.3 13,320.5
10. INCOME TAX (CONTD.)
F-110

NOTES FORMING PART OF THE FINANCIAL STATEMENTS
As at March 31, 2017
As at March 31, 2016
As at April 1, 2015
(US$ million) (` in million) (` in million) (` in million)
(c) Prepaid lease payments 137.3 8,901.5 8,215.0 6,819.5
(d) Capital advances to related parties 14.7 954.6 352.0 475.3
(e) Other assets
Unsecured, considered good 1.6 105.6 184.8 30.5Unsecured, considered doubtful - - - 29.9Less: Provision for doubtful advances - - - 29.9
1.6 105.6 184.8 30.5
481.4 31,216.4 33,251.8 28,458.7
B. CURRENT
As at March 31, 2017
As at March 31, 2016
As at April 1, 2015
(US$ million) (` in million) (` in million) (` in million)
(a) Advance with public bodies
Unsecured, considered good 157.9 10,239.7 9,171.3 8,075.6Unsecured, considered doubtful 0.4 24.3 26.9 18.5Less: Provision for doubtful advances 0.4 24.3 26.9 18.5
157.9 10,239.7 9,171.3 8,075.6
(b) Advances to related parties
Unsecured, considered good 4.3 280.2 394.1 661.4Unsecured, considered doubtful 0 - 239.7 -Less: Provision for doubtful advances 0 - 239.7 -
4.3 280.2 394.1 661.4
(c) Other assets
Unsecured, considered good 26.8 1,734.9 1,323.3 1,513.9Unsecured, considered doubtful 9.3 604.6 397.4 342.2Less: Provision for doubtful advances 9.3 604.6 397.4 342.2
26.8 1,734.9 1,323.3 1,513.9
189.0 12,254.8 10,888.7 10,250.9
(i) Advance with public bodies primarily relate to duty credit entitlements and amounts paid under protest in respect of demands from regulatory authorities.
(ii) Prepaid lease payment relate to land leases classified as operating in nature as the title is not expected to transfer at the end of the lease term and considering that land has an indefinite economic life.
(iii) Other assets include advances against supply of goods and services and advances paid to employees.
11. OTHER ASSETS (CONTD.)
F-111

NOTES FORMING PART OF THE FINANCIAL STATEMENTS
12. INVENTORIES
As at
March 31, 2017
As at March 31, 2016
As at April 1, 2015
(US$ million) (` in million) (` in million) (` in million)
(a) Raw materials 601.3 38,989.9 23,686.1 32,651.9 (b) Work-in-progress 1.0 58.8 183.0 443.2 (c) Finished and semi-finished goods 631.7 40,965.6 27,926.9 28,698.2 (d) Stock-in-trade 16.6 1,079.5 697.5 373.5 (e) Stores and spares 328.1 21,274.7 18,880.3 18,066.7
1,578.7 1,02,368.5 71,373.8 80,233.5
Included above, goods-in-transit:
(i) Raw materials 99.4 6,443.8 3,824.2 5,986.3 (ii) Finished and semi-finished goods - - 0.4 196.2(iii) Stock-in-trade 15.0 970.9 653.1 238.5 (iv) Stores and spares 21.0 1,363.0 1,607.0 1,607.7
135.4 8,777.7 6,084.7 8,028.7
(i) The value of inventories above is stated after impairment of `608.1 million (US$9.4 million) (March 31, 2016: `689.9 million; April 1, 2015: `480.8 million) for write-downs to net realisable value and provision for slow moving and obsolete item.
(ii) Cost of inventory recognised as expense during the year amounted to ₹3,87,047.8 million (US$5,968.8 million) (2015-16: ₹ 3,27,965.5 million).
13. TRADE RECEIVABLES
As at March 31, 2017
As at March 31, 2016
As at April 1, 2015
(US$ million) (` in million) (` in million) (` in million)
(a) Unsecured, considered good 309.4 20,065.2 11,331.7 10,570.2 (b) Unsecured, considered doubtful 2.8 181.0 139.6 166.7
312.2 20,246.2 11,471.3 10,736.9
Less: Allowance for credit losses 2.8 181.0 139.6 166.7309.4 20,065.2 11,331.7 10,570.2
In determining the allowances for credit losses of trade receivables, the Company has used a practical expedient by computing the expected credit loss allowance for trade receivables based on a provision matrix. The provision matrix takes into account historical credit loss experience and is adjusted for forward looking information. The expected credit loss allowance is based on the ageing of the receivables that are due and rates used in the provision matrix.
(i) Movements in allowance for credit losses of receivables is as below:As at
March 31, 2017
As at March 31, 2016
(US$ million) (` in million) (` in million)
Balance at the beginning of the year 2.2 139.6 166.7Charge in statement of profit and loss 1.2 76.4 52.9 Release to statement of profit and loss (0.3) (20.3) (39.7) Utilised during the year (0.2) (14.7) (40.3) Balance at the end of the year 2.9 181.0 139.6
F-112

NOTES FORMING PART OF THE FINANCIAL STATEMENTS
(ii) Ageing of trade receivables and credit risk arising there from is as below:As at March 31, 2017 Net credit risk
Gross credit risk Allowance for credit losses
(` in million) (US$ million)
Amounts not yet due 18,689.3 5.0 18,684.3 288.1One month overdue 486.7 3.1 483.6 7.5Two months overdue 129.5 3.3 126.2 1.9Three months overdue 92.5 3.0 89.5 1.4Between three to six months overdue 186.3 10.9 175.4 2.7Greater than six months overdue 661.9 155.7 506.2 7.8
20,246.2 181.0 20,065.2 309.4
(` in million)As at March 31, 2016
Gross credit risk Allowance for credit losses
Net credit risk
Amounts not yet due 9,991.6 15.5 9,976.1One month overdue 449.5 02.7 446.8Two months overdue 183.0 0.6 182.4Three months overdue 86.9 0.6 86.3Between three to six months overdue 515.9 0.6 515.3Greater than six months overdue 244.4 119.6 124.8
11,471.3 139.6 11,331.7
(` in million)As at April 1, 2015
Gross credit risk Allowance for credit losses
Net credit risk
Amounts not yet due 9,741.6 0.2 9,741.4One month overdue 523.9 0.5 523.4Two months overdue 98.1 0.9 97.2Three months overdue 56.9 - 56.9Between three to six months overdue 73.6 4.4 69.2Greater than six months overdue 242.8 160.7 82.1
10,736.9 166.7 10,570.2
(iii) The Company considers its maximum exposure to credit risk with respect to customers as at March 31, 2017 to be `20,065.2 million (US$309.4 million) (March 31, 2016: ̀ 11,331.7 million; April 1, 2015: ̀ 10,570.2 million), which is the fair value of trade receivables (after allowance for credit losses).
The Company’s exposure to customers is diversified and no single customer contributes more than 10% of the outstanding receivables as at March 31, 2017, March 31, 2016 and April 1, 2015.
(iv) There are no outstanding debts due from directors or other officers of the Company.
13. TRADE RECEIVABLES (CONTD.)
F-113

NOTES FORMING PART OF THE FINANCIAL STATEMENTS
14. CASH AND CASH EQUIVALENTS
As at March 31, 2017
As at March 31, 2016
As at April 1, 2015
(US$ million) (` in million) (` in million) (` in million)
(a) Cash in hand 0.1 4.4 4.1 4.6 (b) Cheques, drafts on hand 2.9 191.9 245.3 422.1 (c) Remittances-in-transit 8.1 525.5 2.7 1.3 (d) Unrestricted balances with banks 128.5 8,330.3 9,494.7 4,523.6
139.6 9,052.1 9,746.8 4,951.6
(i) The cash and bank balances are denominated and held in Indian rupees.
15. OTHER BALANCES WITH BANK
As at March 31, 2017
As at March 31, 2016
As at April 1, 2015
(US$ million) (` in million) (` in million) (` in million)
(a) Earmarked balances with banks 10 651.0 614.5 566.6
(i) Earmarked balances with bank represents balances held for unpaid dividends and margin money against issue of bank guarantees.
(ii) In accordance with the MCA notification G.S.R. 308(E) dated March 30, 2017, details of Specified Bank Notes (SBN) and Other Denomination Notes (ODN) held and transacted during the period from November 8, 2016 to December 30, 2016, is as below:
SBNs ODNs Total
Closing cash in hand as on November 8, 2016 35,40,500 6,72,235 42,12,735Add: Unpermitted receipts 1,15,20,000 - 1,15,20,000Add: Permitted receipts - 6,16,97,156 6,16,97,156Less: Unpermitted payments 70,000 - 70,000Less: Permitted payments - 67,28,665 67,28,665Less: Amounts deposited in Banks 1,49,90,500 5,26,06,715 6,75,97,215Closing cash in hand as on December 30, 2016 - 30,34,011 30,34,011
(a) Unpermitted receipts include: 1. Company hospital receipts `1,06,21,500 which includes receipts at Tata Main Hospital, Jamshedpur of `1,04,34,000. Since Tata
Main Hospital is the only hospital equipped with modern facilities and super-speciality services in the region, on advice from the district administration, specified notes were accepted.
2. Refund of advances by employees & internal departments `74,500. 3. Canteen receipts of `5,90,500 are primarily received from Contractor’s employees. 4. Refund of advance by Steel Welfare Workers Society `2,33,500.
(b) Unpermitted payments represents amount collected by Company’s employees and exchanged for new notes against their individual Permanent Account Number.
(iii) The earmarked bank balances are denominated and held in Indian rupees.
F-114

NOTES FORMING PART OF THE FINANCIAL STATEMENTS
16. EQUITY SHARE CAPITAL
As at
March 31, 2017
As at
March 31, 2016
As at
April 1, 2015
(US$ million) (` in million) (` in million) (` in million)
Authorised:
1,75,00,00,000 Ordinary Shares of `10 each 269.9 17,500.0 17,500.0 17,500.0 (March 31, 2016: 1,75,00,00,000 Ordinary Shares of `10 each)(April 1, 2015: 1,75,00,00,000 Ordinary Shares of `10 each)
35,00,00,000 "A" Ordinary Shares of `10 each 54 3,500.0 3,500.0 3,500.0 (March 31, 2016: 35,00,00,000 "A" Ordinary Shares of `10 each)
(April 1, 2015: 35,00,00,000 “A” Ordinary Shares of `10 each)
2,50,00,000 Cumulative Redeemable Preference Shares of `100 each
38.6 2,500.0 2,500.0 2,500.0
(March 31, 2016: 2,50,00,000 Shares of `100 each)(April 1, 2015: 2,50,00,000 Shares of `100 each)
60,00,00,000 Cumulative Convertible Preference Shares of `100 each
925.3 60,000.0 60,000.0 60,000.0
(March 31, 2016: 60,00,00,000 Shares of `100 each)
(April 1, 2015: 60,00,00,000 Shares of `100 each)
1,287.8 83,500.0 83,500.0 83,500.0
Issued:
97,21,26,020 Ordinary Shares of `10 each 149.9 9,721.3 9,721.3 9,721.3
(March 31, 2016: 97,21,26,020 Ordinary Shares of `10 each)(April 1, 2015: 97,21,26,020 Ordinary Shares of `10 each)
Subscribed and Paid up:
97,12,15,439 Ordinary Shares of `10 each fully paid up 149.8 9,712.1 9,712.1 9,712.1 (March 31, 2016: 97,12,15,439 Ordinary Shares of `10 each)(April 1, 2015: 97,12,15,439 Ordinary Shares of `10 each)Amount paid up on 3,89,516 Ordinary Shares forfeited
0 2.0 2.0 2.0
(March 31, 2016: 3,89,516 Shares of `10 each)(April 1, 2015: 3,89,516 Shares of `10 each)
149.8 9,714.1 9,714.1 9,714.1
(i) Subscribed and paid up capital excludes 11,68,393 Ordinary shares (March 31, 2016: 11,68,393 shares and April 1, 2015: Nil) were held by a wholly owned subsidiary.
F-115

NOTES FORMING PART OF THE FINANCIAL STATEMENTS
16. EQUITY SHARE CAPITAL (CONTD.)
(ii) The movement in subscribed and paid up share capital is as below:
As at March 31, 2017
As at March 31, 2016
No. of shares (US$ million) (` in million) No. of shares (` in million)
Ordinary shares of `10 each
Balance at the beginning of the year 97,12,15,439 149.8 9,712.1 97,12,15,439 9,712.1Balance at the end of the year 97,12,15,439 149.8 9,712.1 97,12,15,439 9,712.1
(iii) As at March 31, 2017: 3,01,183 Ordinary Shares (March 31, 2016: 3,01,183 Ordinary Shares; April 1, 2015: 3,01,183 Ordinary Shares) are kept in abeyance in respect of rights issue of 2007.
(iv) Details of shareholders holding more than 5 percent shares in the Company is as below:
As at March 31, 2017
As at March 31, 2016
As at April 1, 2015
No. of ordinary shares
% No. of ordinary shares
% No. of ordinary shares
%
Name of shareholders (a) Tata Sons Limited 28,88,98,245 29.75 28,88,98,245 29.75 28,88,98,245 29.75(b) Life Insurance Corporation of India 12,20,50,996 12.57 14,17,39,415 14.59 14,17,39,185 14.59
F-116

NOTES FORMING PART OF THE FINANCIAL STATEMENTS
(v) 1,55,10,420 shares (March 31, 2016: 2,25,14,584 shares; April 1, 2015: 1,79,07,847 shares) of face value of `10 per share represent the shares underlying GDRs which were issued during 1994 and 2009. Each GDR represents one underlying Ordinary share.
(vi) The rights, powers and preferences relating to each class of share capital and the qualifications, limitations and restrictions thereof are contained in the Memorandum and Articles of Association of the Company. The principal rights are as below:
A. Ordinary Shares of `10 each
(a) In respect of every Ordinary Share (whether fully paid or partly paid), voting right shall be in the same proportion as the capital paid up on such Ordinary Share bears to the total paid up Ordinary Capital of the Company.
(b) The dividend proposed by the Board of Directors is subject to the approval of the shareholders in the ensuing Annual General Meeting, except in case of interim dividend.
(c) In the event of liquidation, the shareholders of Ordinary Shares are eligible to receive the remaining assets of the Company after distribution of all preferential amounts, in proportion to their shareholding.
B. ‘A’ Ordinary Shares of `10 each
(a) (i) The holders of ‘A’ Ordinary Shares shall be entitled to such rights of voting and/or dividend and such other rights as per the terms of the issue of such shares, provided always that:
− in the case where a resolution is put to vote on a poll, such differential voting entitlement (excluding fractions, if any) will be applicable to holders of ‘A’ Ordinary Shares.
− in the case where a resolution is put to vote in the meeting and is to be decided on a show of hands, the holders of ‘A’ Ordinary Shares shall be entitled to the same number of votes as available to holders of Ordinary Shares.
(ii) The holders of Ordinary Shares and the holders of ‘A’ Ordinary Shares shall vote as a single class with respect to all matters submitted for voting by shareholders of the Company and shall exercise such votes in proportion to the voting rights attached to such shares including in relation to any scheme under Sections 391 to 394 of the Companies Act, 1956.
(b) The holders of ‘A’ Ordinary Shares shall be entitled to dividend on each ‘A’ Ordinary Share which may be equal to or higher than the amount per Ordinary Share declared by the Board for each Ordinary Share, and as may be specified at the time of the issue. Different series of ‘A’ Ordinary Shares may carry different entitlements to dividend to the extent permitted under applicable law and as prescribed under the terms applicable to such issue.
C. Preference Shares
The Company has two classes of preference shares i.e. Cumulative Redeemable Preference Shares (CRPS) of `100 per share and Cumulative Convertible Preference Shares (CCPS) of `100 per share.
(a) Such shares shall confer on the holders thereof, the right to a fixed preferential dividend from the date of allotment, at a rate as may be determined by the Board at the time of the issue, on the capital for the time being paid up or credited as paid up thereon.
(b) Such shares shall rank for capital and dividend (including all dividend undeclared upto the commencement of winding
F-117

NOTES FORMING PART OF THE FINANCIAL STATEMENTS
16. EQUITY SHARE CAPITAL (CONTD.)
up) and for repayment of capital in a winding up, pari passu inter se and in priority to the Ordinary Shares of the Company, but shall not confer any further or other right to participate either in profits or assets. However, in case of CCPS, such preferential rights shall automatically cease on conversion of these shares into Ordinary Shares.
(c) The holders of such shares shall have the right to receive all notices of general meetings of the Company but shall
not confer on the holders thereof the right to vote at any meetings of the Company save to the extent and in the manner provided in the Companies Act, 1956, or any re-enactment thereof.
(d) CCPS shall be converted into Ordinary Shares as per the terms, determined by the Board at the time of issue; as and when converted, such Ordinary Shares shall rank pari passu with the then existing Ordinary Shares of the Company in all respects.
17. HYBRID PERPETUAL SECURITIES
The detail of movement in Hybrid Perpetual Securities is as below:
As at March 31, 2017
As at March 31, 2016
As at April 1, 2015
(US$ million) (` in million) (` in million) (` in million)
Balance at the beginning of the year 350.8 22,750.0 22,750.0 22,750.0Balance at the end of the year 350.8 22,750.0 22,750.0 22,750.0
The Company had issued Hybrid Perpetual Securities of `7,750.0 million and `15,000.0 million in May 2011 and March 2011 respectively. These securities are perpetual in nature with no maturity or redemption and are callable only at the option of the Company. The distribution on these securities are 11.50% p.a. and 11.80% p.a. respectively, with a step up provision if the securities are not called after 10 years. The distribution on the securities may be deferred at the option of the Company if in the six months preceding the relevant distribution payment date, the Company has not made payment on, or repurchased or redeemed, any securities ranking pari passu with, or junior to the instrument. As these securities are perpetual in nature and the Company does not have any redemption obligation, these have been classified as equity.
18. OTHER EQUITY
A. OTHER COMPREHENSIVE INCOME RESERVES
(a) Cash flow hedge reserve
The cumulative effective portion of gain or losses arising on changes in the fair value of hedging instruments designated as cash flow hedges are recognised in cash flow hedge reserve. Such changes recognised are reclassified to the consolidated statement of profit and loss when the hedged item affects the profit or loss or are included as an adjustment to the cost of the related non-financial hedged item.
The Company has designated certain foreign currency contracts and interest rate collars as cash flow hedges in respect of foreign exchange and interest rate risks.
The detail of movement in Cash flow hedge reserve are as below:As at
March 31, 2017
As at March 31, 2016
(US$ million) (` in million) (` in million)
Balance at the beginning of the year (0.1) (5.5) (17.3)Other comprehensive income recognised during the year (0.1) (8.0) 11.8Transfers within equity - - -Balance at the end of the year (0.2) (13.5) (5.5)
F-118
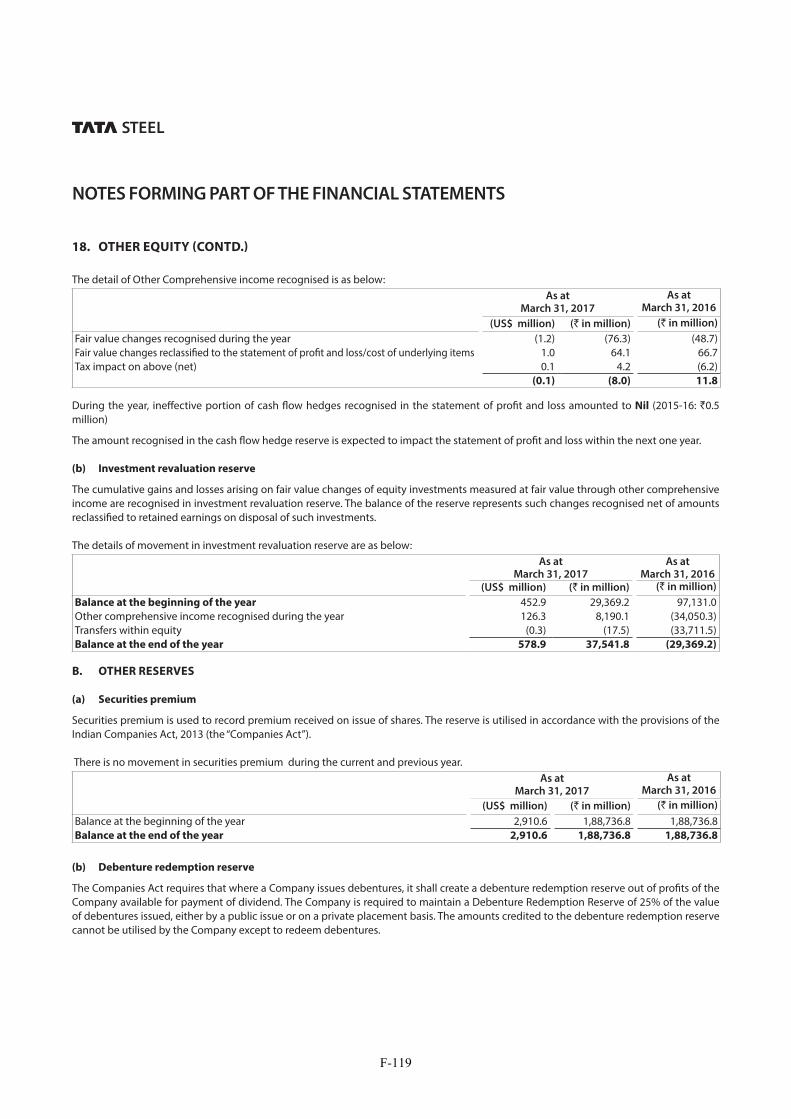
NOTES FORMING PART OF THE FINANCIAL STATEMENTS
18. OTHER EQUITY (CONTD.)
The detail of Other Comprehensive income recognised is as below:As at
March 31, 2017
As at March 31, 2016
(US$ million) (` in million) (` in million)
Fair value changes recognised during the year (1.2) (76.3) (48.7)Fair value changes reclassified to the statement of profit and loss/cost of underlying items 1.0 64.1 66.7Tax impact on above (net) 0.1 4.2 (6.2)
(0.1) (8.0) 11.8
During the year, ineffective portion of cash flow hedges recognised in the statement of profit and loss amounted to Nil (2015-16: `0.5 million)
The amount recognised in the cash flow hedge reserve is expected to impact the statement of profit and loss within the next one year.
(b) Investment revaluation reserve
The cumulative gains and losses arising on fair value changes of equity investments measured at fair value through other comprehensive income are recognised in investment revaluation reserve. The balance of the reserve represents such changes recognised net of amounts reclassified to retained earnings on disposal of such investments.
The details of movement in investment revaluation reserve are as below:As at
March 31, 2017As at
March 31, 2016
(US$ million) (` in million) (` in million)
Balance at the beginning of the year 452.9 29,369.2 97,131.0Other comprehensive income recognised during the year 126.3 8,190.1 (34,050.3)Transfers within equity (0.3) (17.5) (33,711.5)Balance at the end of the year 578.9 37,541.8 (29,369.2)
B. OTHER RESERVES
(a) Securities premium
Securities premium is used to record premium received on issue of shares. The reserve is utilised in accordance with the provisions of the Indian Companies Act, 2013 (the “Companies Act”).
There is no movement in securities premium during the current and previous year.As at
March 31, 2017
As at March 31, 2016
(US$ million) (` in million) (` in million)
Balance at the beginning of the year 2,910.6 1,88,736.8 1,88,736.8Balance at the end of the year 2,910.6 1,88,736.8 1,88,736.8
(b) Debenture redemption reserve
The Companies Act requires that where a Company issues debentures, it shall create a debenture redemption reserve out of profits of the Company available for payment of dividend. The Company is required to maintain a Debenture Redemption Reserve of 25% of the value of debentures issued, either by a public issue or on a private placement basis. The amounts credited to the debenture redemption reserve cannot be utilised by the Company except to redeem debentures.
F-119

NOTES FORMING PART OF THE FINANCIAL STATEMENTS
There is no movement in debenture redemption reserve during the current and previous year.As at
March 31, 2017
As at March 31, 2016
(US$ million) (` in million) (` in million)
Balance at the beginning of the year 315.5 20,460.0 20,460.0Balance at the end of the year 315.5 20,460.0 20,460.0
(c) General reserve
Under the erstwhile Companies Act 1956, a general reserve was created through an annual transfer of net profit at a specified percentage in accordance with applicable regulations. Consequent to the introduction of the Companies Act, the requirement to mandatory transfer a specified percentage of net profit to general reserve has been withdrawn.
There is no movement in general reserve during the current and previous year.
As at March 31, 2017
As at March 31, 2016
(US$ million) (` in million) (` in million)
Balance at the beginning of the year 1,788.3 1,15,963.5 1,15,963.5Balance at the end of the year 1,788.3 1,15,963.5 1,15,963.5
(d) Capital redemption reserve
The Companies Act requires that where a Company purchases its own shares out of free reserves or securities premium account, a sum equal to the nominal value of the shares so purchased shall be transferred to a capital redemption reserve account and details of such transfer shall be disclosed in the balance sheet. The capital redemption reserve account may be applied by the Company, in paying up unissued shares of the Company to be issued to shareholders of the Company as fully paid bonus shares. The Company established this reserve pursuant to the redemption of preference shares issued in earlier years.
There is no movement in capital redemption reserve during the current and previous year.As at
March 31, 2017As at
March 31,2016
(US$ million) (` in million) (` in million)
Balance at the beginning of the year 3.2 207.8 207.8Balance at the end of the year 3.2 207.8 207.8
(e) Others
Others primarily include:
(i) the balance of foreign currency monetary item translation difference account (“FCMITDA”) created for recognising exchange differences on revaluation of long term foreign currency monetary items as per the Previous GAAP. Such exchange differences recognised are transferred to the statement of profit and loss on a systematic basis.
(ii) amounts appropriated out of profit or loss for unforeseen contingencies. Such appropriations are free in nature.
The details of movement in others are as below:As at
March 31, 2017
As at March 31, 2016
(US$ million) (` in million) (` in million)
Balance at the beginning of the year 18.0 1,170.4 1,171.6Release to the statement of profit and loss - - (1.2)Balance at the end of the year 18.0 1,170.4 1,170.4
18. OTHER EQUITY (CONTD.)
F-120

NOTES FORMING PART OF THE FINANCIAL STATEMENTS
19. BORROWINGS
A. NON-CURRENT
As at March 31, 2017
As at March 31, 2016
As at April 1, 2015
(US$ million) (` in million) (` in million) (` in million)
(a) Secured
(i) Loans from Joint Plant Committee - Steel Development Fund
373.3 24,206.5 23,389.1 22,323.6
(b) Unsecured
(i) Non-convertible debentures 1,569.2 1,01,757.0 90,230.3 92,980.9 (ii) Term loans from banks and financial institutions 1,535.9 99,594.9 1,10,319.5 1,11,642.3(iii) Finance lease obligations 329.8 21,385.3 15,328.7 16,214.2
3,808.2 2,46,943.7 2,39,267.6 2,43,161.0
B. CURRENT
As at March 31, 2017
As at March 31, 2016
As at April 1, 2015
(US$ million) (` in million) (` in million) (` in million)
(a) Secured
(i) Repayable on demand from banks and financial institutions
20.2 1,311.2 214.6 735.1
(b) Unsecured
(i) Loans from banks and financial institutions 128.6 8,341.9 26,316.9 7,462.3(ii) Commercial papers 350.7 22,743.6 32,348.5 -
499.5 32,396.7 58,880.0 8,197.4
(i) As at March 31, 2017, `25,517.7 million (US$393.5 million) (March 31, 2016: `23,603.7 million, April 1, 2015: `23,058.7 million) of the total outstanding borrowings were secured by a charge on property, plant and equipment, inventories and receivables. The security details of major borrowings of the Company are as below:
(a) Loan from Joint Plant Committee-Steel Development
Fund
It is secured by mortgages on, all present and future immovable properties wherever situated and hypothecation of movable assets, excluding land and building mortgaged in favour of Government of India under the deed of mortgage dated April 13, 1967 and in favour of Government of Bihar under two deeds of mortgage dated May 11, 1963, immovable properties and movable assets of the Tube Division, Bearing Division, Ferro Alloys Division and Cold Rolling Complex (West) at Tarapur and all investments and book debts of the Company subject to the prior charges created and/or to be created in favour of the bankers for securing borrowing for the working capital requirement and charges created and/or to be created on specific items of machinery and equipment procured/to be procured under deferred payment schemes/bill re-discounting schemes/asset credit schemes.
The loan is repayable in 16 equal semi-annual installments after completion of four years from the date of the tranche.
The Company has filed a writ petition before the High Court at Kolkata in February 2006 claiming waiver of the outstanding loan and interest and refund of the balance lying with Steel Development Fund and the matter is subjudice.
The loan includes funded interest ̀ 7,813.2 million (US$120.5
million) (March 31, 2016: `6,995.8 million and April 1, 2015: `5,930.3 million).
It includes `16,393.3 million (US$252.8 million) (March 31, 2016: `16,393.3 million; April 1, 2015: `16,393.3 million) representing repayments and interest on earlier loans for which applications of funding are awaiting sanction is not secured by charge on movable assets of the Company.
(ii) The details of major unsecured borrowings taken by the Company are given below:
(a) Non-Convertible Debentures
(i) 10.25% p.a. interest bearing 25,000 debentures of face value `10,00,000 each are redeemable at par in 3 equal annual installments commencing from January 6, 2029.
F-121

NOTES FORMING PART OF THE FINANCIAL STATEMENTS
19. BORROWINGS (CONTD.)
(ii) 10.25% p.a. interest bearing 5,000 debentures of
face value `10,00,000 each are redeemable at par in 3 equal annual installments commencing from December 22, 2028.
(iii) 8.15% p.a. interest bearing 10,000 debentures of face value `10,00,000 each are redeemable at par on October 1, 2026.
(iv) 2.00% p.a. interest bearing 15,000 debentures of face value `10,00,000 each are redeemable at a premium of 85.03% of the face value on April 23, 2022.
(v) 9.15% p.a. interest bearing 5,000 debentures of face value `10,00,000 each are redeemable at par on January 24, 2021.
(vi) 11.00% p.a. interest bearing 15,000 debentures of face value `10,00,000 each are redeemable at par on May 19, 2019.
(vii) 10.40% p.a. interest bearing 6,509 debentures of face value `10,00,000 each are redeemable at par on May 15, 2019.
(viii) 9.15% p.a. interest bearing 5,000 debentures of face value `10,00,000 each are redeemable at par on January 24, 2019.
(b) Term loans from banks and financial institutions
(i) Indian rupee loan amounting `44,500.0 million (US$686.3 million) (March 31, 2016: `70,000.0 million; April 1, 2015: `70,000.0 million) is repayable in 17 quarterly installments. The next instalment is due on March 31, 2021.
(ii) USD 7.86 million equivalent to `509.8 million (March 31, 2016: 7.86 million equivalent to ̀ 520.8 million) (April 1, 2015: Nil) is repayable on March1, 2021.
(iii) USD 200.00 million equivalent to `12,971.0 million (March 31, 2016: USD 200.00 million equivalent to `13,250.5 million; April 1, 2015: USD 200.00 million equivalent to `12,500.0 million) loan is repayable in 3 equal annual installments commencing from February 18, 2020.
(iv) Indian rupee loan amounting `20,000.0 million (US$308.4 million) (March 31, 2016: `20,000.0 million; April 1, 2015: Nil) is repayable in 10 semi-annual installments commencing from 30th April, 2019.
(v) Indian rupee loan amounting `6,500.0 million (US$100.2 million) (March 31, 2016: Nil; April 1, 2015: Nil) is repayable in 20 semi-annual installments commencing from August 15, 2017.
(vi) Euro 27.02 million equivalent to `1,871.8 million (March 31, 2016: Euro 32.42 million equivalent to `2,446.9 million; April 1, 2015: Euro 37.83 million equivalent to `2,541.7 million) loan is repayable in 10 equal semi-annual installments; the next instalment is due on July 6, 2017.
(vii) Euro 9.39 million equivalent to `650.2 million (March 31, 2016: Euro 14.08 million equivalent to ̀ 1,062.5 million; April 1, 2015: Euro 18.77 million equivalent to `1,261.3 million) loan is repayable in 4 equal semi-annual installments; the next instalment is due on July 3, 2017.
(viii) Indian rupee loan amounting `8,500.0 million (US$131.1 million) (March 31, 2016: Nil; April 1, 2015: Nil) is repayable in 16 semi-annual installments commencing from June 15, 2017.
(ix) Euro 0.97 million equivalent to `67.2 million (March 31, 2016: Euro 1.94 million equivalent to `146.4 million; April 1, 2015: Euro 2.91 million equivalent to `195.5 million) loan is repayable in 2 equal semi-annual installments; the next instalment is due on May 2, 2017.
(x) Euro 105.08 million equivalent to `7,279.8 million (March 31, 2016: Euro 124.19 million equivalent to `9,372.2 million; April 1, 2015: Euro 143.29 million equivalent to `9,628.4 million) loan is repayable in 11 equal semi-annual installments; the next instalment is due on April 28, 2017.
(c) Commercial papers
Commercial papers raised by the Company are short-term in nature ranging between one to three months.
F-122

NOTES FORMING PART OF THE FINANCIAL STATEMENTS
(iii) The currency and interest exposure of borrowings at the end of the reporting period are as below:
(` in million)As at March 31, 2017 As at March 31, 2016 As at April 1, 2015
Fixed rate Floating rate Total (US$ million)
Fixed rate Floating rate Total Fixed rate Floating rate Total
INR 1,55,354.8 1,03,449.2 2,58,804.0 3,991.1 1,49,391.9 1,32,947.1 2,82,339.0 1,27,965.1 1,10,731.3 2,38,696.4EURO 5,889.9 3,754.0 9,643.9 148.7 7,528.4 5,119.7 12,648.1 7,710.1 5,470.5 13,180.6USD - 14,398.4 14,398.4 222.0 - 13,448.0 13,448.0 - 33,235.8 33,235.8Others - - - - - - - 509.2 9,240.5 9,749.7Total 1,61,244.7 1,21,601.6 2,82,846.3 4,361.8 1,56,920.3 1,51,514.8 3,08,435.1 1,36,184.4 1,58,678.1 2,94,862.5
INR-Indian rupees, USD-United states dollars.
Others primarily include borrowings in GBP-Great Britain Pound
(iv) The majority of floating rate borrowings are bank borrowings bearing interest rates based on LIBOR, EURIBOR or local official rates. Of the total floating rate borrowings as at March 31, 2017: `9,728.3 million (US$150 million) (March 31, 2016: `20,000.0 million; April 1, 2015: `20,937.5 million) has been hedged using interest rate swaps and collars, with contracts covering a period of more than one year.
(v) The maturity profile of Company’s borrowings is as below:
As at March 31, 2017
As at March 31, 2016
As at April 1, 2015
(US$ million) (` in million) (` in million) (` in million)
Not later than one year or on demand 603.9 39,162.4 71,644.5 54,418.5Later than one year but not two years 176.1 11,421.2 8,623.1 20,915.2Later than two years but not three years 554.6 35,962.9 13,450.9 15,930.6Later than three years but not four years 326.8 21,192.0 41,449.4 17,433.1Later than four years but not five years 375.3 24,333.5 27,531.9 43,553.6More than five years 3068 1,98,944.8 1,87,265.6 1,88,121.7
5104.7 3,31,016.8 3,49,965.4 3,40,372.7
Less: Future finance charges on finance leases 610.5 39,585.0 30,935.5 33,383.0Less: Capitalisation of transaction costs 132.4 8,585.5 10,594.8 12,127.2
4,361.8 2,82,846.3 3,08,435.1 2,94,862.5
(vi) Some of the Company’s major financing arrangements include financial covenants, which require compliance to certain debt-equity ratios and debt coverage ratios. Additionally, certain negative covenants may limit the Company’s ability to borrow additional funds or to incur additional liens, and/or provide for increased costs in case of breach.
19. BORROWINGS (CONTD.)
F-123

NOTES FORMING PART OF THE FINANCIAL STATEMENTS
20. OTHER FINANCIAL LIABILITIES
A. NON-CURRENT
As at March 31, 2017
As at March 31, 2016
As at April 1, 2015
(US$ million) (` in million) (` in million) (` in million)
(a) Creditors for other liabilities 2.8 182.2 3,965.1 8,418.9
B. CURRENT
As at March 31, 2017
As at March 31, 2016
As at April 1, 2015
(US$ million) (` in million) (` in million) (` in million)
(a) Current maturities of long-term borrowings 36.7 2,379.0 9,287.7 4,2561.6 (b) Current maturities of finance lease obligations 17.4 1,126.9 999.8 942.5(c) Interest accrued but not due 84.1 5,450.5 4,593.2 5,878.6(d) Unclaimed dividends 8.0 517.6 516.4 514.9 (e) Creditors for other liabilities 480.4 31,149.5 30,936.4 27,491.4
626.6 40,623.5 46,333.5 77,389.0
(i) Non-current and current creditors for other liabilities includes: (a) Creditors for capital supplies and services amounting to ̀ 20,568.0 million (US$317.2 million) (March 31, 2016: ̀ 25,923.2 million;
April 1, 2015: `27,129.4 million). (b) Liability for employee family benefit scheme `1,156.0 million (US$17.8 million) (March 31, 2016: `1,083.9 million; April 1, 2015:
`957.2 million).
21. PROVISIONS
A. NON-CURRENT
As at March 31, 2017
As at March 31, 2016
As at April 1, 2015
(US$ million) (` in million) (` in million) (` in million)
(a) Employee benefits 269.8 17,494.4 16,357.4 12,526.9 (b) Others 42.4 2,753.0 2,263.1 683.0
312.2 20,247.4 18,620.5 13,209.9
B. CURRENT
As at March 31, 2017
As at March 31, 2016
As at April 1, 2015
(US$ million) (` in million) (` in million) (` in million)
(a) Employee benefits 48.0 3,111.9 2,806.4 1,829.9 (b) Others 60.1 3,894.1 - -
108.1 7,006.0 2,806.4 1,829.9
(i) Non-current and current provision for employee benefits include leave salaries `10,169.5 million (US$156.8 million) (March 31, 2016: `9,188.1 million; April 1, 2015: `8,543.7 million) and provision for early separation scheme `10,368.9 million (US$159.9 million) (March 31, 2016 `9,905.9 million; April 1, 2015: `5,736.4 million).
F-124

NOTES FORMING PART OF THE FINANCIAL STATEMENTS
(ii) Others include:
(a) provision for compensatory afforestation, mine closure and rehabilitation obligations ̀ 5,291.3 million (US$81.6 million) (March 31, 2016: `2,263.1 million; April 1, 2015: `683.0 million). These amounts become payable upon closure of the mines and are expected to be incurred over a period of 1 to 35 years.
(b) provision for legal and constructive commitments provided by the Company in respect of a loss making subsidiary `1,355.8
(US$20.9 million) million (March 31, 2016: Nil; April 1, 2015: Nil). The same is expected to be settled in the next financial year.
(iii) The details of movement in other provisions is as below: As at
March 31, 2017
As at March 31, 2016
(US$ million) (` in million) (` in million)
Balance at the beginning of the year 34.9 2,263.1 683.0Charged to the statement of profit and loss 20.9 1,355.8 - Additions during the year 46.7 3,028.2 1,580.1Balance at the end of the year 102.5 6,647.1 2,263.1
22. RETIREMENT BENEFIT OBLIGATIONS
A. NON-CURRENT
As at March 31, 2017
As at March 31, 2016
As at April 1, 2015
(US$ million) (` in million) (` in million) (` in million)
(a) Retiring gratuities 33.5 2,170.3 1,608.1 5,613.8 (b) Post retirement medical benefits 180.5 11,705.1 10,126.9 9,881.1 (c) Other defined benefit obligations 14.9 966.7 789.5 737.4
228.9 14,842.1 12,524.5 16,232.3
B. CURRENT
As at March 31, 2017
As at March 31, 2016
As at April 1, 2015
(US$ million) (` in million) (` in million) (` in million)
(a) Post retirement medical benefits 7.8 506.7 512.4 460.7 (b) Other defined benefit obligations 0.9 59.1 54.3 54.6
8.7 565.8 566.7 515.3
(i) Detailed disclosure in respect post retirement defined benefit schemes is provided in Note 35.
21. PROVISIONS (CONTD.)
F-125

NOTES FORMING PART OF THE FINANCIAL STATEMENTS
23. DEFERRED INCOME
As at March 31, 2017
As at March 31, 2016
As at April 1, 2015
(US$ million) (` in million) (` in million) (` in million)
(a) Grants relating to property, plant and equipment 290.7 18,851.9 22,284.8 2,1305.8
(i) Grants relating to property, plant and equipment relate to duty saved on import of capital goods and spares under the EPCG scheme. Under such scheme, the Company is committed to export prescribed times of the duty saved on import of capital goods over a specified period of time. In case such commitments are not met, the Company would be required to pay the duty saved along with interest to the regulatory authorities. Such grants recognised are released to the statement of profit and loss based on fulfilment of related export obligations.
(ii) During the year an amount of `3,429.0 million (US$52.9 million) (2015-2016: `Nil) was released to statement of profit and loss on fulfillment of export obligations.
24. OTHER LIABILITIES
A. NON-CURRENT
As at March 31, 2017
As at March 31, 2016
As at April 1, 2015
(US$ million) (` in million) (` in million) (` in million)
(a) Statutory dues 8.5 553.1 640.6 -(b) Other credit balances 3.5 224.3 127.3 196.7
12.0 777.4 767.9 196.7
B. CURRENT
As at March 31, 2017
As at March 31, 2016
As at April 1, 2015
(US$ million) (` in million) (` in million) (` in million)
(a) Advances received from customers 58.6 3,800.1 2,650.1 2,291.0 (b) Employee recoveries and employer contributions 6.1 393.9 417.3 403.1 (c) Statutory dues 481.8 31,244.0 25,592.4 18,796.0
546.5 35,438.0 28,659.8 21,490.1
(i) Statutory dues primarily include payables in respect of excise duties, service tax, sales tax, VAT, tax deducted at source and royalties.
25. TRADE PAYABLES
As at March 31, 2017
As at March 31, 2016
As at April 1, 2015
(US$ million) (` in million) (` in million) (` in million)
(a) Creditors for supplies and services 1440.8 93,428.3 51,256.1 40,186.3 (b) Creditors for accrued wages and salaries 212.0 13,746.1 10,712.7 9,173.3
1,652.8 1,07,174.4 61,968.8 49,359.6
F-126

NOTES FORMING PART OF THE FINANCIAL STATEMENTS
(i) The amount due to Micro and Small Enterprises as defined in the “The Micro, Small and Medium Enterprises Development Act, 2006” has been determined to the extent such parties have been identified on the basis of information available with the Company. The disclosures relating to Micro and Small Enterprises are as below:
Year ended March 31, 2017
Year ended March 31, 2016
Year ended April 1, 2015
(US$ million) (` in million) (` in million) (` in million)
(i) The principal amount remaining unpaid to supplier as at the end of the year
2.2 142.8 149.0 165.1
(ii) The interest due thereon remaining unpaid to supplier as at the end of the year
0.1 9.5 7.2 5.6
(iii) The amount of interest due and payable for the period of delay in making payment (which have been paid but beyond the appointed day during the year) but without adding the interest specified under this Act
0.8 48.8 43.6 43.3
(iv) The amount of interest accrued during the year and remaining unpaid at the end of the year
0.9 58.4 50.8 48.9
26. REVENUE FROM OPERATIONS
As at March 31, 2017
As at March 31, 2016
(US$ million) (` in million) (` in million)
(a) Sale of products 7,866.5 5,10,105.3 4,06,892.2 (b) Sale of power and water 218.7 14,184.3 14,683.7 (c) Income from town, medical and other services 21.0 1,359.7 1,330.5 (d) Other operating income 107.3 6,960.3 4,068.0
8,213.5 5,32,609.6 4,26,974.4
27. OTHER INCOME
Year ended
March 31, 2017
Year ended March 31, 2016
(US$ million) (` in million) (` in million)
(a) Dividend income 13.5 875.1 1,070.8(b) Finance income 5.5 358.9 427.6(c) Net gain/(loss) on sale of non-current investments 0.1 9.7 -(d) Net gain/(loss) on investments carried at fair value through statement of
profit and loss48.8 3,166.3 1,841.6
(e) Gain/(loss) on sale of capital assets (net of loss on assets sold/scrapped/written off)
(1.1) (69.1) 21.2
(f ) Gain/(loss) on cancellation of forwards, swaps and options (10.3) (669.5) (12.1)(g) Other miscellaneous income 7.3 473.2 562.5
63.8 4,144.6 3,911.6
(i) Finance income includes:
(a) income on financial assets carried at amortised cost `273.9 million (US$4.2 million) (2015-2016: `427.6 million).
(b) income on financial assets carried at fair value through profit and loss `85.0 million (US$1.3 million) (2015-2016: Nil).
25. TRADE PAYABLES (CONTD.)
F-127

NOTES FORMING PART OF THE FINANCIAL STATEMENTS
28. CHANGES IN STOCK OF FINISHED GOODS, WORK-IN-PROGRESS AND STOCK-IN-TRADE
Year ended
March 31, 2017
Year ended March 31, 2016
(US$ million) (` in million) (` in million)
Inventories at the end of the year
(a) Work-in-progress 1.0 58.8 183.0 (b) Finished and semi-finished goods 631.7 40,965.6 27,926.9 (c) Stock-in-trade 16.6 1,079.5 697.5
649.3 42,103.9 28,807.4
Inventories at the beginning of the year
(a) Work-in-progress 2.8 183.0 443.2 (b) Finished and semi-finished goods 430.7 27,926.9 28,698.2 (c) Stock-in-trade 10.8 697.5 373.5
444.3 28,807.4 29,514.9
205.0 13,296.5 (707.5)
29. EMPLOYEE BENEFIT EXPENSES
Year ended March 31, 2017
Year ended March 31, 2016
(US$ million) (` in million) (` in million)
(a) Salaries and wages 606.8 39,345.8 36,082.8 (b) Contribution to provident and other funds 67.0 4,343.0 4,421.3 (c) Staff welfare expenses 36.4 2,362.5 2,694.8
710.2 46,051.3 43,198.9
During the year, the Company recognised an amount of `181.3 million (US$2.8 million) (2015-16: `179.4 million ) as remuneration to key managerial personnel. The details of such remuneration is as below:
Year ended March 31, 2017
Year ended March 31, 2016
(US$ million) (` in million) (` in million)
(a) Short term employee benefits 2.6 171.3 172.4(b) Post employment benefits 0.1 7.1 4.2 (c) Other long term employee benefits 0 2.9 2.8
2.7 181.3 179.4
30. FINANCE COSTS
Year ended
March 31, 2017Year ended
March 31, 2016
(US$ million) (` in million) (` in million)
Interest expense on: (a) Bonds, debentures, bank borrowings and others 400.5 25,970.4 26,654.5 (b) Finance leases 48.2 3,127.6 2,521.8
448.7 29,098.0 29,176.3
Less: Interest capitalised 34.1 2,212.5 10,695.8 414.6 26,885.5 18,480.5
(i) Other interest expense include interest on income tax `162.2 million (US$2.5 million) (2015-16: Nil).
F-128

NOTES FORMING PART OF THE FINANCIAL STATEMENTS
31. DEPRECIATION AND AMORTISATION EXPENSE
Year ended
March 31, 2017Year ended
March 31, 2016
(US$ million) (` in million) (` in million)
(a) Depreciation on tangible assets 516.8 33,514.9 28,836.1 (b) Amortisation of intangible assets 29.3 1,900.6 786.7
546.1 35,415.5 29,622.8
32. OTHER EXPENSES
Year ended
March 31, 2017Year ended
March 31, 2016
(US$ million) (` in million) (` in million)
(a) Consumption of stores and spares 424.4 27,518.1 24,457.7 (b) Repairs to buildings 10.9 708.0 574.1 (c) Repairs to machinery 351.9 22,818.2 20,253.0 (d) Relining expenses 8.5 554.4 431.0 (e) Fuel oil consumed 17.1 1,111.7 1,380.7 (f ) Purchase of power 427.1 27,697.5 24,077.5 (g) Conversion charges 416.5 27,010.3 22,044.3 (h) Freight and handling charges 583.5 37,835.6 29,948.8 (i) Rent 11.7 756.0 735.3 (j) Royalty 176.7 11,455.1 9,386.2 (k) Rates and taxes 200.2 12,984.1 7,528.3 (l) Insurance charges 12.3 796.1 568.2 (m) Commission, discounts and rebates 31.9 2071.4 1,827.8 (n) Allowance for credit losses/provision for advances 2.5 160.9 224.9 (o) Excise duty (including recovered on sales) 812.4 52,679.4 44,287.7(p) Others 359.8 23,334.1 18,298.0
3,847.4 2,49,490.9 2,06,023.5
(i) Others include foreign exchange (gain)/loss of `21.6 million (US$0.3 million) (2015-16: `597.3 million)
(ii) Details of auditors’ remuneration and out-of-pocket expenses are as below:Year ended
March 31, 2017
Year ended March 31, 2016
(US$ million) (` in million) (` in million)
(a) Auditors remuneration and out-of-pocket expenses(i) As auditors 1 63.0 65.3 (ii) For taxation matters 0.1 4.6 4.7(iii) For other services 0.1 3.3 26.4(iv) Out-of-pocket expenses 0 1.8 1.7
(b) Cost audit fees [Including expenses `25,084 (2015-16: `22,388), (2014-15: `25,064)]
0 1.2 1.2
(iii) (a) Amount required to be spent by the Company on Corporate Social Responsibility (CSR) activities during the year was `1,158.0 million (US$17.9 million) (2015-16 : `1,503.6 million).
(b) Revenue expenditure charged to statement of profit and loss in respect of Corporate Social Responsibility (CSR) activities undertaken during the year is `1,912.1 million (US$29.5 million) [`1,902.9 million has been paid in cash and `9.3 million is yet to be paid] as compared to `1,956.4 million for the year ended March 31, 2016 [`1,923.9 million was paid in cash and `32.5 million was unpaid].
F-129

NOTES FORMING PART OF THE FINANCIAL STATEMENTS
Capital expenditure incurred during the year in construction of capital assets under CSR projects is `24.0 million (US$0.40 million) [`16.6 million paid in cash and `7.4 million is yet to be paid] as compared to `88.2 million for the year ended March 31, 2016 [`84.9 million was paid in cash and `3.3 million was unpaid].
(iv) Revenue expenditure charged to Statement of Profit and Loss in respect of research and development activities undertaken during the year is `1,322.6 million (US$20.4 million) (2015-16: `1,162.5 million) including depreciation of `78.7 million (US$1.2 million) (2015-16: `67.5 million). Capital expenditure in respect of research and development activities undertaken during the year is `123.2 million (2015-16: `130.6 million).
33. EXCEPTIONAL ITEMS
(a) Loss (net) on sale of investment in a subsidiary and an associate Nil (2015-16: ₹8.5 million).
(b) Provision for dimunition in value of investments held in subsidiaries ₹454.2 million (US$7.0 million) (2015-16: ₹876.3 million), in respect of advances paid for repurchase of equity shares in Tata Teleservices Limited from NTT Docomo Inc ₹1,254.5 million (US$19.4 million) (2015-16: Nil). During 2015-16, the Company has recognised provision of `729.9 million relating to advances paid for a project which the Company has decided to discontinue.
(c) Impairment loss recognised in respect of property, plant and equipment (including capital work in progress) and intangible assets of Nil (2015-16: ₹515.1 million).
(d) Provision of ₹2,182.5 million (US$33.7 million) (2015-16: `8,800.5 million) in respect of certain statutory demands and claims.
(e) Provision of ₹1,786.8 million (US$27.6 million) (2015-16: ₹5,562.5 million) on account of employee seperation scheme.
(f ) Provision towards legal and constructive commitments provided by the Company in respect of a loss making subsidiary ₹1,355.8 million (US$20.9 million) (2015-16: Nil).
34. EARNINGS PER SHARE
The following table reflects the profit and shares data used in the computation of basic and diluted earnings per share. Year ended
March 31, 2017Year ended
March 31, 2016
(US$ million) (` in million) (` in million)
(a) Profit after tax 531.2 34,445.5 9,556.5Less: Distribution on Hybrid Perpetual Securities (net of tax) 26.8 1,740.1 1,740.6Profit attributable to ordinary shareholders - for Basic and Diluted EPS 504.4 32,705.4 7,815.9
Nos. Nos. Nos.(b) Weighted average number of Ordinary Shares for Basic EPS 97,12,15,439 97,12,15,439 97,12,15,439
Weighted average number of Ordinary Shares for Diluted - EPS 97,12,15,493 97,12,15,493 97,12,15,439(c) Nominal value of Ordinary Shares (`) 0.2 10.00 10.00(d) Basic and Diluted Earnings per Ordinary Share (`) 0.5 33.67 8.05
32. OTHER EXPENSES (CONTD.)
F-130

NOTES FORMING PART OF THE FINANCIAL STATEMENTS
35. EMPLOYEE BENEFITS
A. Defined contribution plans
The Company participates in a number of defined contribution plans on behalf of relevant personnel. Any expense recognised in relation to these schemes represents the value of contributions payable during the period by the Company at rates specified by the rules of those plans. The only amounts included in the balance sheet are those relating to the prior months contributions that were not due to be paid until after the end of the reporting period.
The major defined contribution plans operated by the Company are as below:
(a) Provident fund and pension
In accordance with the Employee’s Provident Fund and Miscellaneous Provisions Act, 1952 and The Coal Mines Provident Fund and Miscellaneous Provisions Act, 1948, eligible employees of the Company are entitled to receive benefits in respect of provident fund, a defined contribution plan, in which both employees and the Company make monthly contributions at a specified percentage of the covered employees’ salary.
The contributions, as specified under the law, are made to the provident fund set up as an irrevocable trust by the Company, post contribution of amount specified under the law to Employee Provident Fund Organisation on account of employee pension scheme.
(b) Superannuation fund
The Company has a superannuation plan for the benefit of its employees. Employees who are members of the defined benefit superannuation plan are entitled to benefits depending on the years of service and salary drawn.
Separate irrevocable trusts are maintained for employees covered and entitled to benefits. The Company contributes up to 15% of the eligible employees’ salary or `1,00,000, whichever is lower, to the trust every year. Such contributions are recognised as an expense as and when incurred. The Company does not have any further obligation beyond this contribution.
The total expenses recognised in the statement of profit and loss during the year on account of defined contribution plans amounted to `3,100.9 million (US$47.8 million) (2016: `3,036.5 million).
B. Defined benefit plans
The defined benefit plans operated by the Company are as below:
(a) Retiring gratuity
The Company has an obligation towards gratuity, a defined benefit retirement plan covering eligible employees. The plan provides for a lump-sum payment to vested employees at retirement, death while in employment or on termination of employment of an amount equivalent to 15 to 30 days salary payable for each completed year of service. Vesting occurs upon completion of five years of service. The Company makes annual contributions to gratuity funds established as trusts or insurance companies. The Company accounts for the liability for gratuity benefits payable in the future based on an actuarial valuation.
(b) Post retirement medical benefits
Under this unfunded scheme, employees of the Company receive medical benefits subject to certain limits on amounts of benefits, periods after retirement and types of benefits, depending on their grade and location at the time of retirement. Employees separated from the Company under an early separation scheme, on medical grounds or due to permanent disablement are also covered under the scheme. The Company accounts for the liability for post-retirement medical scheme based on an actuarial valuation.
(c) Other defined benefits
Other benefits provided under unfunded schemes include pension payable to directors of the Company on their retirement, farewell gifts and reimbursement of packing and transportation charges to the employees based on their last drawn salary.
The defined benefit plans expose the Company to a number of actuarial risks as below:
(a) Investment risk: The present value of the defined benefit plan liability is calculated using a discount rate determined by reference to government/high quality bond yields; if the return on plan asset is below this rate, it will create a plan deficit.
(b) Interest risk: A decrease in the bond interest rate will increase the plan liability; however, this will be partially offset by an increase in the return on the plan’s debt investments.
F-131

NOTES FORMING PART OF THE FINANCIAL STATEMENTS
C. Details of defined benefit obligation and plan assets:
(a) Retiring gratuity:
(i) The following table sets out the amounts recognised in the financial statements in respect of retiring gratuity plan:
Year ended March 31, 2017
Year ended March 31, 2016
(US$ million) (` in million) (` in million)
Change in defined benefit obligations:
Obligation at the beginning of the year 407.2 26,402.2 25,729.1Current service costs 18.2 1,180.0 1,167.1Interest costs 29.7 1,924.4 1,876.5Remeasurement (gains)/losses 22.1 1,434.4 662.1Benefits paid (48.4) (3,141.5) (3,032.6)Obligation at the end of the year 428.8 27,799.5 26,402.2
Year ended March 31, 2017
Year ended March 31, 2016
(US$ million) (` in million) (` in million)
Change in plan assets:
Fair value of plan assets at the beginning of the year 382.4 24,795.3 20,115.3Interest income 28.7 1,862.3 1,659.1Remeasurement gains/(losses) 7.8 503.1 437.1Employers' contributions 24.8 1,610.0 5,616.4Benefits paid (48.4) (3,141.5) (3,032.6)Fair value of plan assets at the end of the year 395.3 25,629.2 24,795.3
Amounts recognised in the balance sheet consists of:
As at March 31, 2017
As at March 31, 2016
As at April 1, 2015
(US$ million) (` in million) (` in million) (` in million)
Fair value of plan assets at beginning/end of the year 395.2 25,629.2 24,795.3 20,115.3Present value of obligation at the beginning/end of the year (428.7) (27,799.5) (26,402.2) (25,729.1)
(33.5) (2,170.3) (1,606.9) (5,613.8)
Recognised as:Retirement benefit liability - Non-current (33.5) (2,170.3) (1,606.9) (5,613.8)
35. EMPLOYEE BENEFITS (CONTD.)
(c) Salary risk: The present value of the defined benefit plan liability is calculated by reference to the future salaries of plan participants. As such, an increase in the salary of the plan participants will increase the plan’s liability.
(d) Longevity risk: The present value of the defined benefit plan liability is calculated by reference to the best estimate of the mortality of plan participants both during and after their employment. An increase in the life expectancy of the plan participants will increase the plan’s liability.
F-132

NOTES FORMING PART OF THE FINANCIAL STATEMENTS
35. EMPLOYEE BENEFITS (CONTD.)
Expenses recognised in the statement of profit and loss consists of:
Year ended March 31, 2017
Year ended March 31, 2016
(US$ million) (` in million) (` in million)
Employee benefits expenses:
Current service costs 18.2 1,180.0 1,167.1Net interest expenses 1.0 62.1 217.4
19.2 1,242.1 1,384.5
Other comprehensive income:
(Gain)/loss on plan assets (7.8) (503.1) (437.1)Actuarial (gain)/loss arising from changes in financial assumption 23.0 1,492.6 -Actuarial (gain)/loss arising from changes in experience adjustments (0.9) (58.2) 662.1
14.3 931.3 225.0
Expenses recognised in the statement of profit and loss 33.5 2,173.4 1,609.5
(ii) The fair value of plan assets as at March 31, 2017, March 31, 2016 and April 1, 2015 by category are as below:
(%)As at
March 31, 2017
As at March 31, 2016
As at April 1, 2015
(US$ million) (` in million) (` in million) (` in million)
Assets category (%)
Equity instruments (quoted) 0 2.1 - -Debt instruments (quoted) 4.5 289.1 307.3 391.0Insurance products (unquoted) 10.9 708.8 692.7 609.0
15.4 1,000.0 1,000.0 1,000.0
The Company’s policy is driven by considerations of maximising returns while ensuring credit quality of debt instruments. The asset allocation for plan assets is determined based on investment criteria prescribed under the Indian Income Tax Act, 1961, and is also subject to other exposure limitations. The Company evaluates the risks, transaction costs and liquidity for potential investments. To measure plan asset performance, the Company compares actual returns for each asset category with published benchmarks.
(iii) The key assumptions used in accounting for retiring gratuity is as below:(%)
As at March 31, 2017
As at March 31, 2016
As at April 1, 2015
Discount rate 7.00 7.75 7.75Rate of escalation in salary 7.50 to 10.00 7.50 to 10.00 7.50 to 10.00
(iv) The weighted average duration of the obligations as at March 31, 2017 is 9 years (March 31, 2016: 10 Years; April 1, 2015: 10 Years).
(v) The Company expects to contribute `2,170.3 million (US$33.5 million) to the plan during financial year 2017-18.
F-133

NOTES FORMING PART OF THE FINANCIAL STATEMENTS
(vi) The table below outlines the effect on obligation in the event of a decrease/increase of 1% in the assumptions used.
As at March 31, 2017
Assumption Change in assumption Impact on scheme liabilities
Discount rate Increase by 1%, decrease by 1% Decrease by `1,955.5 million, increase by `2,265.8 millionSalary rate Increase by 1%, decrease by 1% Increase by `2,215.1 million, decrease by `1,951.4 million
As at March 31, 2016
Assumption Change in assumption Impact on scheme liabilities
Discount rate Increase by 1%, decrease by 1% Decrease by `1,797.3 million, increase by `1,929.1millionSalary rate Increase by 1%, decrease by 1% Increase by `1,972.7 million, decrease by `1,745.8 million
As at April 1, 2015
Assumption Change in assumption Impact on scheme liabilities
Discount rate Increase by 1%, decrease by 1% Decrease by `1,726.8 million, increase by `1,985.4 millionSalary rate Increase by 1%, decrease by 1% Increase by `1,957.6 million, decrease by `1,735.9 million
The above sensitivities may not be representative of the actual change as it is unlikely that the change in assumptions would occur in isolation of one another as some of the assumptions may be correlated.
(b) Post retirement medical benefits and other defined benefits:
(i) The following table sets out the amounts recognised in the financial statements in respect of post retirement medical benefits and other defined benefit plans.
April- March 2017 April- March 2016
Medical Others Medical Others
(US$ million) (` in million) (US$ million) (` in million) (` in million)
Change in defined benefit obligation:
Obligation as at the beginning of the year 164.1 10,639.3 13.0 843.8 10,341.8 792.0Current service cost 2.9 190.4 0.9 57.7 172.7 54.4Interest cost 12.4 803.4 1.0 63.0 782.4 59.3Remeasurement (gains)/losses(i) Actuarial gains and losses arising from
changes in financial assumptions19.5 1,261.7 1.2 78.4 - -
(ii) Actuarial gains and losses arising from changes in experience adjustments
(2.1) (136.9) 0.7 43.4 (165.1) (9.8)
Benefits paid (8.4) (546.1) (0.9) (60.5) (492.5) (52.1)Obligation as at the end of the year 188.4 12,211.8 15.9 1,025.8 10,639.3 843.8
Amount recognised in balance sheet consists of:
As at March 31, 2017 As at March 31, 2016 As at April 1, 2015
Medical Others Medical Others Medical Others
(US$
million)
(` in
million)
(US$
million)
(` in
million)
(` in million) (` in million)
Present value of obligation as at the beginning/end of the year
(188.3) (12,211.8) (15.8) (1,025.8) (10,639.3) (843.8) (10,341.8) (792.0)
Recognised as:Retirement benefit liability - Current (7.8) (506.7) (0.9) (59.1) (512.4) (54.3) (460.7) (54.6)Retirement benefit liability - Non-current (180.5) (11,705.1) (14.9) (966.7) (10,126.9) (789.5) (9,881.1) (737.4)
35. EMPLOYEE BENEFITS (CONTD.)
F-134

NOTES FORMING PART OF THE FINANCIAL STATEMENTS
Expenses recognised in the statement of profit and loss consists of:
April- March 2017 April- March 2016
Medical Others Medical Others
(US$ million) (` in million) (US$ million) (` in million) (` in million)
Employee benefits expenses:
Current service costs 2.9 190.4 0.9 57.7 172.7 54.4Net interest expenses 12.4 803.4 1.0 63.0 782.4 59.4
15.3 993.8 1.9 120.7 955.1 113.8
Other comprehensive income:
Actuarial (gain)/loss arising from changes in financial assumption
19.5 1,261.7 1.2 78.4 - -
Actuarial (gain)/loss arising from changes in experience adjustments
(2.1) (136.9) 0.7 43.4 (165.1) (09.8)
17.4 1,124.8 1.9 121.8 (165.1) (09.8)
32.7 2,118.6 3.7 242.5 790.0 104.0
(ii) The key assumptions used in accounting for the post-retirement medical benefits and other employee benefit plans are as below:
As at March 31, 2017 As at March 31, 2016 As at April 1, 2015
Medical Others Medical Others Medical Others
Discount rate (per annum) 7.00% 7.00% 7.75% 7.75% 7.75% 7.75%Rate of escalation in salary (per annum) N.A. 10.00% -
15.00%N.A. 10.00% -
15.00%N.A. 10.00% -
15.00%Inflation rate (per annum) 8.00% 4.00% 8.00% 4.00% 8.00% 4.00%
(iii) The weighted average duration of post-retirement medical benefit obligations as at March 31, 2017 is 9 years (March 31, 2016: 10 Years; April 1, 2015: 10 Years)
The weighted average duration of other defined benefit obligations as at March 31, 2017 ranges from 9 to 12 years (March 31, 2016: 10 Years; April 1, 2015: 10 Years)
(iv) The table below outlines the effect on post retirement medical benefit obligation in the event of a decrease/increase of 1 % in the assumptions used:
As at March 31, 2017
Assumption Change in assumption Impact on scheme liabilities
Discount rate Increase by 1%, decrease by 1% Decrease by `1,634.2 million, increase by `2,099.4 millionMedical cost inflation rate Increase by 1%, decrease by 1% Increase by `2,003.7 million, decrease by `1,595.6 million
As at March 31, 2016
Assumption Change in assumption Impact on scheme liabilities
Discount rate Increase by 1%, decrease by 1% Decrease by `1,364.5 million, increase by `1,664.9 millionMedical cost inflation rate Increase by 1%, decrease by 1% Increase by `1,642.9 million, decrease by `1,372.8 million
As at April 1, 2015
Assumption Change in assumption Impact on scheme liabilities
Discount rate Increase by 1%, decrease by 1% Decrease by `1,326.3 million, increase by `1,618.4 millionMedical cost inflation rate Increase by 1%, decrease by 1% Increase by `1,597.0 million, decrease by `1,334.4 million
35. EMPLOYEE BENEFITS (CONTD.)
F-135

NOTES FORMING PART OF THE FINANCIAL STATEMENTS
The table below outlines the effect on other defined benefit obligations in the event of a decrease/increase of 1 % in the assumptions used.
As at March 31, 2017
Assumption Change in assumption Impact on scheme liabilities
Discount rate Increase by 1%, decrease by 1% Decrease by `102.3 million, increase by `123.2 millionRate of escalation in salary Increase by 1%, decrease by 1% Increase by `65.0 million, decrease by `56.6 millionInflation rate Increase by 1%, decrease by 1% Increase by `50.0 million, decrease by `44.2 million
As at March 31, 2016
Assumption Change in assumption Impact on scheme liabilities
Discount rate Increase by 1%, decrease by 1% Decrease by `79.3 million, increase by `91.4 millionRate of escalation in salary Increase by 1%, decrease by 1% Increase by `47.5 million, decrease by `41.4 millionInflation rate Increase by 1%, decrease by 1% Increase by `40.0 million, decrease by `35.5 million
As at April 1, 2015
Assumption Change in assumption Impact on scheme liabilities
Discount rate Increase by 1%, decrease by 1% Decrease by `71.3 million, increase by `81.6 millionRate of escalation in salary Increase by 1%, decrease by 1% Increase by `47.1 million, decrease by `41.2 millionInflation rate Increase by 1%, decrease by 1% Increase by `48.0 million, decrease by `41.0 million
The above sensitivities may not be representative of the actual change as it is unlikely that the change in assumptions would occur in isolation of one another as some of the assumptions may be correlated.
35. EMPLOYEE BENEFITS (CONTD.)
36. CONTINGENCIES AND COMMITMENTS
A. CONTINGENCIES
In the ordinary course of business, the Company faces claims and assertions by various parties. The Company assesses such claims and assertions and monitors the legal environment on an on-going basis with the assistance of external legal counsel, wherever necessary. The Company records a liability for any claims where a potential loss is probable and capable of being estimated and discloses such matters in its financial statements, if material. For potential losses that are considered possible, but not probable, the Company provides disclosure in the financial statements but does not record a liability in its accounts unless the loss becomes probable.
The following is a description of claims and assertions where a potential loss is possible, but not probable. The Company believes that none of the contingencies described below would have a material adverse effect on the Company’s financial condition, results of operations or cash flows.
Litigations
The Company is involved in legal proceedings, both as plaintiff and as defendant. There are claims which the Company does not believe to be of material nature, other than those described below.
Income Tax
The Company has ongoing disputes with income tax authorities relating to tax treatment of certain items. These mainly include disallowance of expenses, tax treatment of certain expenses claimed by the Company as deductions and the computation of, or eligibility of the Company’s use of certain tax incentives or allowances.
Most of these disputes and/or dis-allowances, being repetitive in nature, have been raised by the income tax authorities consistently in most of the years.
As at March 31, 2017, there are matters and/or disputes pending in appeal amounting to `14,175.4 million (US$218.6 million) (March 31, 2016: `13,126.3 million; April 1, 2015: `10,161.2 million).
The details of demands for more than `1,000 million is as below:
Interest expenditure on loans taken by the Company for acquisition of a subsidiary has been disallowed in assessments with tax demand raised for `12,177.9 million (US$187.8 million) (inclusive of interest) (March 31, 2016: `11,244.8 million; April 1, 2015: `8,703.6 million). The Company has deposited `5,150.0 million (US$79.4 million) (March 31, 2016: `4,150.0 million; April 1, 2015: `3,400.0 million) as part payment as a precondition to obtain stay of demand. The Company expects to sustain its position on ultimate resolution of the appeals.
F-136

NOTES FORMING PART OF THE FINANCIAL STATEMENTS
36. CONTINGENCIES AND COMMITMENTS (CONTD.)
Customs, Excise Duty and Service Tax
As at March 31, 2017, there were pending litigations for various matters relating to customs, excise duty and service taxes involving demands of `4,827.2 million (US$74.4 million) (March 31, 2016: `4,838.6 million; April 1, 2015: `4,650.4 million).
Sales Tax /VAT
The total sales tax demands that are being contested by the Company amounted to `3,495.8 million (US$53.9 million) (March 31, 2016: `5,678.8 million; April 1, 2015: `4,323.3 million).
Other Taxes, Dues and Claims
Other amounts for which the Company may contingently be liable aggregate to `85,710.0 million (US$1,321.8 million) (March 31, 2016: `69,794.8 million; April 1, 2015: `61,433.1 million).
The details of demands for more than `1000 million are as below:
(a) Claim by a party arising out of conversion arrangement- `1,958.2 million (US$30.2 million) (March 31, 2016: `1,958.2 million; April 1, 2015: `1,958.2 million). The Company has not acknowledged this claim and has instead filed a claim of `1,396.5 million (US$21.5 million) (March 31, 2016: `1,396.5 million; April 1, 2015: `1,396.5 million) on the party. The matter is pending before the Calcutta High Court.
(b) The State Government of Odisha introduced “Orissa Rural Infrastructure and Socio Economic Development Act, 2004” with effect from February 2005 levying tax on mineral bearing land computed on the basis of value of minerals produced from the mineral bearing land. The Company had filed a Writ Petition in the High Court of Orissa challenging the validity of the Act. Orissa High Court held in November 2005 that State does not have authority to levy tax on minerals. The State Government of Odisha moved to the Supreme Court against the order of Orissa High Court and the case is pending with Supreme Court. The potential liability, as at March 31, 2017 would be approximately `58,808.3 million (US$906.9 million) (March 31, 2016: `55,019.8 million; April 1, 2015: `48,051.8 million).
(c) For the purpose of payment of royalty, there are two salient provisions viz; Section 9 in Mines and Minerals (Development and Regulation) Act (MMDR) 1957, related to the incidence of royalty and Rules 64B and 64C of Mineral Concession Rules (MC Rules), 1960. The Company has been paying royalty on coal extracted from its coal mines pursuant to the judgement and order dated July 23, 2002 passed by the Jharkhand High Court. However, the State Government demanded royalty at rates applicable to processed coal. Though the Company
contested the above demand, it started paying, under protest, royalty on processed coal from November 2008. The demand of the state mining authority was confirmed by the High Court vide its judgement dated March 12, 2014. The Court concluded that the State cannot claim interest till the Hon’ble Supreme Court decides the pending Special Leave Petitions (SLP) filed by State and Company in the year 2004.
In the appeals filed by the Company in respect of the issues related to coal royalty, the Hon’ble Supreme Court has pronounced the judgement on March 17, 2015 in which it has interpreted Section 9 and approved the law that removal of coal from the seam in the mine and extracting it through the pithead to the surface satisfies the requirement of Section 9 (charging section) of the MMDR Act in order to give rise to a liability for royalty. In regard to the interpretation of Rules 64B and 64C of MC Rules, the Supreme Court has clarified that the constitutional validity or the vires of the Rules has not been adjudicated upon. Therefore it is open to the Company either to revive the appeals limited to this question or to separately challenge the constitutionality and vires of these Rules. Accordingly, the Company has filed writ petitions challenging the constitutionality and vires of Rules 64B and 64C of MC Rules on May 19, 2015 at Hon’ble High Court of Jharkhand. Vide it’s judgement dated June 26, 2015, High Court has held that, the writ petitions are maintainable. It is also pertinent to mention that the Union of India in its counter affidavit has stated that the provisions of Rules 64B and 64C may not be applicable to the mineral coal.
All demands are solely based on application of Rules 64B and 64C. In view of (i) the clear interpretation of charging Section 9 by Supreme Court by three judges Bench following two earlier three Judge Bench orders (ii) the affidavit of Union of India and (iii) the liberty given by Supreme Court, the Company is of the opinion that any related present/probable demands are not payable. Out of the principal demand of `1,902.5 million, an amount of `1,638.0 million has been paid till FY’ 2015 and balance has been provided for. As the Hon’ble High Court of Jharkhand refused to grant stay on demand raised in case of West Bokaro division, the Company started providing for differential royalty in the books. Interest amount of `10,437.9 million (US$161 million) (March 31, 2016: `3,240.6 million; April 1, 2015: `3,184.5 million) being interest raised on all the demands, which are disputed in several cases has been considered as a contingent liability. The interest demand has been raised after several years for the entire past period and is being contested. `129.2 million, being interest on District Mineral Fund (DMF) and National Mineral Foundation Trust contribution on differential royalty is also considered as a contingent liability.
F-137

NOTES FORMING PART OF THE FINANCIAL STATEMENTS
36. CONTINGENCIES AND COMMITMENTS (CONTD.)
(d) The Company pays royalty on ore on the basis of quantity removed from the leased area at the rates based on notification by the Ministry of Mines, Government of India and the price published by India Bureau of Mines (IBM) on a monthly basis.
A demand of `4,110.8 million has been raised by Deputy Director of Mines, Joda, claiming royalty at sized ore rates on despatches of ore fines. The Company has filed a revision petition on November 14, 2013 before the Mines Tribunal, Government of India, Ministry of Mines, New Delhi, challenging the legality and validity of the demand raised and also to grant refund of royalty excess paid by the Company. Mines tribunal vide its order dated November 13, 2014 has stayed the demand of royalty on iron ore for Joda east of `3,142.8 million upto the period ending March 31, 2014. For the demand of `968.0 million for April, 2014 to September, 2014, a separate revision application was filed before Mines Tribunal. The matter was heard by Mines Tribunal on July 14, 2015 and stay was granted on the total demand with directive to Government of Odisha not to take any coercive action for realisation of this demanded amount. Likely demand of royalty on fines at sized ore rates as on March 31, 2017: `8,479.6 million (US$130.8 million) (March 31, 2016: `4,110.8 million: April 1, 2015: `4,110.8 million.
B. COMMITMENTS
(a) The Company has entered into various contracts with suppliers and contractors for the acquisition of plant and machinery, equipment and various civil contracts of a capital nature amounting to `38,258.5 million (US$590 million), (2016: `54,161.6 million, 2015: `64,666.3 million).
Other commitments as at March 31, 2017 amounts to `0.1
million (US$0 million) (March 31, 2016: ̀ 0.1 million, March 15: `0.1 million).
(b) The Company has given undertakings to: (a) IDBI not to dispose of its investment in Wellman Incandescent India Ltd., (b) IDBI and ICICI Bank Ltd. (formerly ICICI) not to dispose of its investment in Standard Chrome Ltd., (c) Mizuho Corporate Bank Limited and Japan Bank for International Co-operation, not to dispose of its investments in Tata NYK Shipping Pte Limited, (to retain minimal stake required to be able to provide a corporate guarantee towards long-term debt), (d) ICICI Bank Limited to directly or indirectly continue to hold atleast 51 % shareholding in Jamshedpur Continuous Annealing & Processing Company Private Limited.
(c) The Company has furnished a security bond in respect of its immovable property to the extent of `200 million in favour of the Registrar of the Delhi High Court and has given an
undertaking not to sell or otherwise dispose of the said property.
(d) The Promoters of Tata BlueScope Steel Limited (TBSL) (i.e. BlueScope Steel Asia Holdings Pty Limited, Australia and Tata Steel Limited) have given an undertaking to IDBI Trusteeship Services Ltd., Debenture Trustees, and State Bank of India not to reduce collective shareholding in TBSL, below 51% without prior consent of the Lender. Further, The Company has given an undertaking to State Bank of India to intimate them before diluting its shareholding in TBSL below 50%.
(e) The Company, as a promoter, has pledged 4,41,55,800 equity shares of Industrial Energy Limited with Infrastructure Development Finance Corporation Limited.
(f) The Company along with TS Alloys Limited (Promoters) has given an undertaking to Power Finance Corporation Limited (PFC) and Rural Electrification Corporation Limited (REC) (Lenders) not to dispose off/transfer their equity holding of 26% of total equity in Bhubaneshwar Power Private Limited (BPPL) till the repayment of entire loan by BPPL to the lenders without prior written approval of lenders. Such shareholding of promoters may be transferred to the Company or its affiliates subject to compliance of applicable laws. The Company along with TS Alloys Limited has pledged 60% of their equity contribution in BPPL to PFC, PFC being the security agent.
(g) The Company has agreed, if requested by Tata Steel UK Holdings Limited (TSUKH) (an indirect wholly owned subsidiary), to procure an injection of funds to reduce the outstanding net debt in TSUKH and its subsidiaries, to a mutually accepted level.
(h) The Company has given guarantees aggregating `1,13,444.7 million (US$1,749.5 million) (2016: `1,17,417.1 million, 2015: `1,37,614.5 million) details of which are as below:
(i) in favour of Timken India Limited for Nil, (March 31, 2016: `800.0 million; April 1, 2015: `800.0 million) against renewal of lease of land pending with State Government and `10.7 million (US$0.2 million) (March 31, 2016: `10.7 million; April 1, 2015: `10.7 million) on behalf of Timken India Limited to Commissioner of Customs in respect of goods imported.
(ii) in favour of Mizuho Corporate Bank Ltd., Japan for `453.8 million (US$7 million) (March 31, 2016: `650.4
million; April 1, 2015: `788.9 million) against the loan granted to a joint venture Tata NYK Shipping Pte. Limited.
F-138

NOTES FORMING PART OF THE FINANCIAL STATEMENTS
(iii) in favour of The President of India for `1,771.8 million (US$27.3 million) (March 31, 2016: `1,771.8 million; April 1, 2015: `1,771.8 million) against performance of export obligation under the various bonds executed by a joint venture Jamshedpur Continuous Annealing & Processing Company Private Limited.
(iv) in favour of the note holders against due and punctual repayment of the 100% amounts outstanding as on March 31, 2017 towards issued Guaranteed Notes by a subsidiary, ABJA Investment Co. Pte. Limited for `97,282.5 million (US$1,500.2 million) (March 31, 2016: `99,378.8 million; April 1, 2015: `1,17,187.5 million) and `13,924.4 million (US$214.7 million) (March 31, 2016: `14,803.9 million; April 1, 2015: `17,054.1 million). The guarantee is capped at an amount equal to 125% of the outstanding principal amount of the Notes as detailed in “Terms and Conditions” of the Offering Memorandum.
(v) in favour of President of India for (`1.5 million (US$0 million) March 31, 2016: `1.5 million; April 1, 2015: `1.5 million) against advance license.
37. OTHER SIGNIFICANT LITIGATIONS
(a) Odisha legislative assembly issued an amendment to Indian Stamp Act on May 9, 2013 and inserted a new provision (Section 3a) in respect of stamp duty payable on grant/renewal of mining leases. As per the amended provision, stamp duty is levied equal to 15% of the average royalty that would accrue out of the highest annual extraction of minerals under the approved mining plan multiplied by the period of such mining lease. The Company had filed a writ petition challenging the constitutionality of the Act on July 5, 2013. The Hon’ble High Court, Cuttack passed an order on July 9, 2013 granting interim stay on the operation of the Amendment Act, 2013. As a result of the stay, as on date, the Act is not enforceable and any demand received by the Company is not liable to be proceeded with. Meanwhile, the Company received demand notices for the various mines at Odisha totalling to `55,790 million (US$860.4 million). On the basis of external legal opinion, the Company has concluded that it is remote that the claim will sustain on ultimate resolution of the legal case by the courts.
In April, 2015 the Company has received an intimation from Government of Odisha, granting extension of validity period for leases under the MMDR Amendment Act, 2015 up to March 31, 2030 in respect of eight mines and up to March 31,
2020 for two mines subject to execution of supplementary lease deed within 3 months from the date of the intimation. Liability has been provided in the books of accounts as on March 31, 2017 as per the existing provisions of the Stamp Act 1899 and the Company has since paid the stamp duty and registration charges totalling `4,137.2 million for supplementary deed execution in respect of eight mines out of the above mines.
(b) Demand notices have been raised by Deputy Director of Mines, Odisha amounting to `38,280 million (US$590.3 million) for the excess production over the quantity permitted under the mining plan scheme, environment clearance or consent to operate, during the period 2000-01 to 2009-10. The demand notices have been raised under Section 21(5) of the Mines & Minerals (Development and Regulations) Act (MMDR). However, the Act specifies that demand can be raised only when the land is occupied without lawful authority. The Company is of the view that Section 21(5) of the MMDR Act is not applicable as the mining is done within the sanctioned mining lease area and accordingly the Company has filed revision petitions before the Mines Tribunal against all such demand notices. Consequent to it stay has been granted by the Mines Tribunal against the entire demand of `38,280 million and directed the State that no coercive action should be taken for recovery of demand.
Based on the judgement of Hon’ble High court of Jharkhand on December 11, 2014 in the matter of the writ petition filed by the Company for renewal of lease and continuation of operation at Noamundi iron mine, the Government of Jharkhand approved the renewal of lease of Noamundi Mines by an express order on December 31, 2014. Express Order also held mining operation carried out between January 1, 2012 to August 31, 2014 to be unlawful and computed an amount of `35,680 million on account of such alleged unlawful mining.
The Mines and Minerals Development and Regulation (MMDR) Amendment Ordinance 2015 promulgated on January 12, 2015 provides for renewal of the above mines. Based on the new Ordinance, Jharkhand Government revised the Express Order on February 12, 2015 for lease renewal up to March 31, 2030 with following terms and conditions:
value of iron ore produced by alleged unlawful mining during the period January 1, 2012 to April 20, 2014 for `29,944.9 million to be decided on the basis of disposal of writ petition filed before Hon’ble High Court of Jharkhand.
36. CONTINGENCIES AND COMMITMENTS (CONTD.)
F-139

NOTES FORMING PART OF THE FINANCIAL STATEMENTS
value of iron ore produced from April 21, 2014 to July 17, 2014 amounting to `4,218.3 million to be paid in maximum 3 installments.
value of iron ore produced from July 18, 2014 to August 31, 2014 i.e. `1,520 million to be paid immediately.
The Company paid `1,520 million under protest. District Mining Officer Chaibasa on March 16, 2015 has issued demand notice for payment of `4,218.3 million, payable in three monthly installments. The Company replied on March 20, 2015, since the lease has been extended till March 31, 2030, the above demand is not tenable. The Company paid `500 million under protest on July 27, 2015.
A writ petition was filed before Hon’ble High Court of Jharkhand and heard on September 9, 2015. An interim order has been given by Hon’ble High Court of Jharkhand on September 18, 2015 wherein court has directed the Company to pay outstanding amount of `3,718.3 million in 3 equal installments, first instalment by October 15, 2015, second instalment by November 15, 2015 and third instalment by December 15, 2015.
In view of the order of Hon’ble High Court of Jharkhand `1,240 million was paid on September 28, 2015, `1,240 million was paid on November 12, 2015 and `1,238.3 million on December 14, 2015 under protest.
(c) During Financial Year 2014-15, the Income Tax department had reopened assessments of earlier years on account of excess mining and raised cumulative demand for `10,860 million. During 2015-16, the Commissioner of Income Tax (Appeals) has adjudicated the matter in favour of the Company and quashed the entire demand on account of reopened assessments. The demand outstanding as on March 31, 2017 is Nil (March 31, 2016: Nil; April 1, 2015: `10,860 million).
(d) During the current year, NTT Docomo Inc. had filed a petition with the Delhi High Court for implementation of the arbitration award (damages along with cost and interest) by the London Court of International Arbitration. The Delhi High Court directed Tata Sons to deposit the damages including costs and interest in an escrow account. During the year, the Company has accordingly remitted its share of ₹ 1,520 million to Tata Sons and recognised a provision of ₹1,254.4 million being the difference between the fair value of equity shares to be repurchased and the consideration payable to NTT Docomo Inc.
37. OTHER SIGNIFICANT LITIGATIONS (CONTD.)
F-140

NOTES FORMING PART OF THE FINANCIAL STATEMENTS
38. CAPITAL MANAGEMENT
The Company’s capital management is intended to create value for shareholders by facilitating the meeting of long term and short term goals of the Company.
The Company determines the amount of capital required on the basis of annual business plan coupled with long term and short term strategic investment and expansion plans. The funding needs are met through equity, cash generated from operations, long term and short term bank borrowings and issue of non-convertible debt securities.
The Company monitors the capital structure on the basis of net debt to equity ratio and maturity profile of the overall debt portfolio of the Company.
Net debt includes interest bearing borrowings less cash and cash equivalents, other bank balances (including non-current earmarked balances) and current investments.
The table below summarises the capital, net debt and net debt to equity ratio of the Company.
As at March 31, 2017
As at March 31, 2016
As at April 1, 2015
(US$ million) (` in million) (` in million) (` in million)
Equity share capital 149.8 9,714.1 9,714.1 9,714.1Hybrid Perpetual Securities 350.8 22,750.0 22,750.0 22,750.0Other equity 7,508.3 4,86,876.0 4,56,659.7 4,92,179.0Total Equity (A) 8,008.9 5,19,340.1 4,89,123.8 5,24,643.1
Non-current borrowings 3,808.2 2,46,943.7 2,39,267.6 2,43,161.0Short term borrowings 499.6 32,396.7 58,880.0 8,197.4Current maturities of long term borrowings and finance lease obligations
54.1 3,505.9 10,287.5 43,504.1
Gross Debt (B) 4,361.9 2,82,846.3 3,08,435.1 2,94,862.5
Total Capital (A+B) 12,370.8 8,02,186.4 7,97,558.9 8,19,505.6
Gross Debt as above 4,361.9 2,82,846.3 3,08,435.1 2,94,862.5Less: Current investments (818.8) (53,098.1) (43,250.0) (10,011.5)Less: Cash and cash equivalents (139.6) (9,052.1) (9,746.8) (4,951.6)Less: Other balances with bank (including non-current earmarked balances)
(15.9) (1,028.4) (964.6) (944.7)
Net Debt (C) 3,387.6 2,19,667.7 2,54,473.7 2,78,954.7
Net debt to equity 0.44 0.44 0.50 0.53
Net debt to equity as at March 31, 2017 and March 31, 2016 has been computed based on average equity and as on April 1, 2015, it is based on closing equity.
F-141

NOTES FORMING PART OF THE FINANCIAL STATEMENTS
39. DISCLOSURES ON FINANCIAL INSTRUMENTS
This section gives an overview of the significance of financial instruments for the Company and provides additional information on balance sheet items that contain financial instruments.
The details of significant accounting policies, including the criteria for recognition, the basis of measurement and the basis on which income and expenses are recognised in respect of each class of financial asset, financial liability and equity instrument are disclosed in Note 2(m), to the financial statements.
(a) Financial assets and liabilities
The following tables presents the carrying value and fair value of each category of financial assets and liabilities as at March 31, 2017, March 31, 2016 and April 1, 2015.
As at March 31, 2017 Amortised
cost
Fair Value
through other
comprehensive
income
Derivative
instruments
in hedging
relationship
Derivative
instruments
not in hedging
relationship
Fair Value
through
statement of
profit and loss
Total
carrying
value
Total fair value
(` in
million)
(US$
million)
Financial assets:
Cash and bank balances 10,080.5 - - - - 10,080.5 10,080.5 155.5Trade receivables 20,065.2 - - - - 20,065.2 20,065.2 309.4Investments 497.4 48,085.9 - - 54,098.1 1,02,681.4 1,02,681.4 1,583.5Derivatives - - 01.6 62.2 - 63.8 63.8 1Loans 2,391.1 - - - - 2,391.1 2,391.1 36.9Other financial assets 3,568.1 - - - - 3,568.1 3,568.1 55
36,602.3 48,085.9 01.6 62.2 54,098.1 1,38,850.1 1,38,850.1 2,141.3
Financial liabilities:
Trade and other payables 1,07,174.4 - - - - 1,07,174.4 1,07,174.4 1,652.8Borrowings 2,82,846.3 - - - - 2,82,846.3 2,95,388.9 4,555.3Derivatives - - 25.7 4,469.3 - 4,495.0 4,495.0 69.3Other financial liabilities 37,299.8 - - - - 37,299.8 37,299.8 575.2
4,27,320.5 - 25.7 4,469.3 - 4,31,815.5 4,44,358.1 6,852.6
As at March 31, 2016(` in million)
Amortised cost
Fair Value through other
comprehensive income
Derivative instruments
in hedging relationship
Derivative instruments
not in hedging relationship
Fair Value through
statement of profit and loss
Total carrying
value
Total fair value
Financial assets:
Cash and bank balances 10,711.4 - - - - 10,711.4 10,711.4 Trade receivables 11,331.7 - - - - 11,331.7 11,331.7 Investments 339.5 39,855.0 - - 44,250.0 84,444.5 84,444.5 Derivatives - - - 70.0 - 70.0 70.0 Loans 2,247.1 - - - - 2,247.1 2,247.1Other financial assets 2,096.6 - - - - 2,096.6 2,096.6
26,726.3 39,855.0 - 70.0 44,250.0 1,10,901.3 1,10,901.3
F-142

NOTES FORMING PART OF THE FINANCIAL STATEMENTS
As at March 31, 2016(` in million)
Amortised cost
Fair Value through other
comprehensive income
Derivative instruments
in hedging relationship
Derivative instruments
not in hedging relationship
Fair Value through
statement of profit and loss
Total carrying
value
Total fair value
Financial liabilities:
Trade and other payables 61,968.8 - - - - 61,968.8 61,968.8 Borrowings 3,08,435.1 - - - - 3,08,435.1 3,16,406.4 Derivatives - - 08.5 1,933.9 - 1,942.4 1,942.4 Other financial liabilities 40,011.1 - - - - 40,011.1 40,011.1
4,10,415.0 - 08.5 1,933.9 - 4,12,357.4 4,20,328.7
As at April 1, 2015(` in million)
Amortised cost
Fair Value through other
comprehensive income
Derivative instruments
in hedging relationship
Derivative instruments
not in hedging relationship
Fair Value through
statement of profit and loss
Total carrying
value
Total fair value
Financial assets:
Cash and bank balances 5,896.3 - - - - 5,896.3 5,896.3 Trade receivables 10,570.2 - - - - 10,570.2 10,570.2 Investments - 1,07,531.3 - - 11,011.5 1,18,542.8 1,18,542.8 Derivatives - - 2.0 6,548.1 - 6,550.1 6,550.1 Loans 2,238.7 - - - - 2,238.7 2,238.7Other financial assets 2,569.0 - - - - 2,569.0 2,569.0
21,274.2 1,07,531.3 2.0 6,548.1 11,011.5 1,46,367.1 1,46,367.1
Financial liabilities:
Trade and other payables 49,359.6 - - - - 49,359.6 49,359.6 Borrowings 2,94,862.5 - - - - 2,94,862.5 3,02,217.1 Derivatives - - 29.9 2,981.5 - 3,011.4 3,011.4 Other financial liabilities 42,303.8 - - - - 42,303.8 42,303.8
3,86,525.9 - 29.9 2,981.5 - 3,89,537.3 3,96,891.9
(i) Investments in mutual funds and derivative instruments are mandatorily classified as fair value through statement of profit and loss.
(b) Fair value hierarchy
The following table provides an analysis of financial instruments that are measured subsequent to initial recognition at fair value, grouped into Level 1 to Level 3, as described below:
Quoted prices in an active market (Level 1): This level of hierarchy includes financial assets that are measured by reference to quoted prices (unadjusted) in active markets for identical assets or liabilities. This category consists of investment in quoted equity shares, and mutual fund investments.
Valuation techniques with observable inputs (Level 2): This level of hierarchy includes financial assets and liabilities, measured using inputs other than quoted prices included within Level 1 that are observable for the asset or liability, either directly (i.e., as prices) or indirectly (i.e., derived from prices). This level of hierarchy includes Company’s over-the-counter (OTC) derivative contracts.
39. DISCLOSURES ON FINANCIAL INSTRUMENTS (CONTD.)
F-143

NOTES FORMING PART OF THE FINANCIAL STATEMENTS
Valuation techniques with significant unobservable inputs (Level 3): This level of hierarchy includes financial assets and liabilities measured using inputs that are not based on observable market data (unobservable inputs). Fair values are determined in whole or in part, using a valuation model based on assumptions that are neither supported by prices from observable current market transactions in the same instrument nor are they based on available market data.
As at March 31, 2017
Level 1 Level 2 Level 3 Total
(` in million) (US$ million)
Financial assets: Investment in mutual funds 53,098.1 - - 53,098.1 818.8Investment in equity shares 44,221.7 - 3,864.2 48,085.9 741.6Investment in preference shares - 1,000.0 - 1,000.0 15.4Derivative financial assets - 63.8 - 63.8 1
97,319.8 1,063.8 3,864.2 1,02,247.8 1576.8
Financial liabilities:
Derivative financial liabilities - 4,495.0 - 4,495.0 69.3- 4,495.0 - 4,495.0 69.3
(` in million)
As at March 31, 2016
Level 1 Level 2 Level 3 Total
Financial assets: Investment in mutual funds 43,250.0 - - 43,250.0Investment in equity shares 35,774.3 - 4,080.7 39,855.0Investment in preference shares - 1,000.0 - 1,000.0Derivative financial assets - 70.0 - 70.0
79,024.3 1,070.0 4,080.7 84,175.0
Financial liabilities:
Derivative financial liabilities - 1,942.4 - 1,942.4 - 1,942.4 - 1,942.4
(` in million)As at April 1, 2015
Level 1 Level 2 Level 3 Total
Financial assets: Investment in mutual funds 10,011.5 - - 10,011.5Investment in equity shares 1,02,748.7 - 4,782.6 1,07,531.3Investment in preference shares - 1,000.0 - 1,000.0Derivative financial assets - 6,550.1 - 6,550.1
1,12,760.2 7,550.1 4,782.6 1,25,092.9
Financial liabilities:
Derivative financial liabilities - 3,011.4 - 3,011.4 - 3,011.4 - 3,011.4
(i) Short-term financial assets and liabilities are stated at carrying value which is approximately equal to their fair value.
(ii) Derivatives are fair valued using market observable rates and published prices together with forecasted cash flow information where applicable.
39. DISCLOSURES ON FINANCIAL INSTRUMENTS (CONTD.)
F-144

NOTES FORMING PART OF THE FINANCIAL STATEMENTS
(iii) Investments carried at fair value are generally based on market price quotations. Costs of unquoted equity instruments has been considered as an appropriate estimate of fair value because of a wide range of possible fair value measurements and cost represents the best estimate of fair value within that range.
(iv) Fair value of borrowings which have a quoted market price in an active market is based on its market price which is categorised as level 1. Fair value of borrowings which do not have an active market or are unquoted is estimated by discounting expected future cash flows using a discount rate equivalent to the risk-free rate of return adjusted for credit spread considered by lenders for instruments of similar maturities which is categorised as level 2 in the fair value hierarchy.
(v) Management uses its best judgement in estimating the fair value of its financial instruments. However, there are inherent limitations in any estimation technique. Therefore, for substantially all financial instruments, the fair value estimates presented above are not necessarily indicative of the amounts that the Company could have realised or paid in sale transactions as of respective dates. As such, fair value of financial instruments subsequent to the reporting dates may be different from the amounts reported at each reporting date.
(vi) There have been no transfers between Level 1 and Level 2 for the years ended March 31, 2017, March 31, 2016 and April 1, 2015.
(c) Derivative financial instruments
Derivative instruments used by the Company include forward exchange contracts, interest rate swaps, currency swaps, options and interest rate caps and collars. These financial instruments are utilised to hedge future transactions and cash flows and are subject to hedge accounting under Ind AS 109 “ Financial Instruments” to the extent possible. The Company does not hold or issue derivative financial instruments for trading purpose. All transactions in derivative financial instruments are undertaken to manage risks arising from underlying business activities.
The following table sets out the fair value of derivatives held by the Company as at the end of each reporting period.As at March 31, 2017 As at March 31, 2016 As at April 1, 2015
Assets Liabilities Assets Liabilities Assets Liabilities
(US$ million)
(` in million)
(US$ million)
(` in million)
(` in million)
(` in million)
(i) Foreign currency forwards, swaps and options
1.0 62.3 68.9 4,469.3 69.5 1,941.5 6,550.1 3,011.4
(ii) Interest rate swaps and collars 0 1.5 0.4 25.7 0.5 0.9 - -1.0 63.8 69.3 4,495.0 70.0 1,942.4 6,550.1 3,011.4
Classified as:
Non-current 0 1.2 27.7 1,793.3 8.0 1,160.1 409.1 1,719.7Current 1.0 62.6 41.6 2,701.7 62.0 782.3 6,141.0 1,291.7
At the end of the reporting period the total notional amount of outstanding foreign currency contracts and interest rate swaps and collars that the Company has committed to are as below:
As at March 31, 2017
As at March 31, 2016
As at April 1, 2015
(US$ million) (` in million) (` in million) (` in million)
(i) Foreign currency forwards, swaps and options 206.3 13,376.9 7,354.6 12,787.4(ii) Interest rate swaps and collars 23.1 1,500.0 3,018.7 3,350.0
229.4 14,876.9 10,373.3 16,137.4
39. DISCLOSURES ON FINANCIAL INSTRUMENTS (CONTD.)
F-145
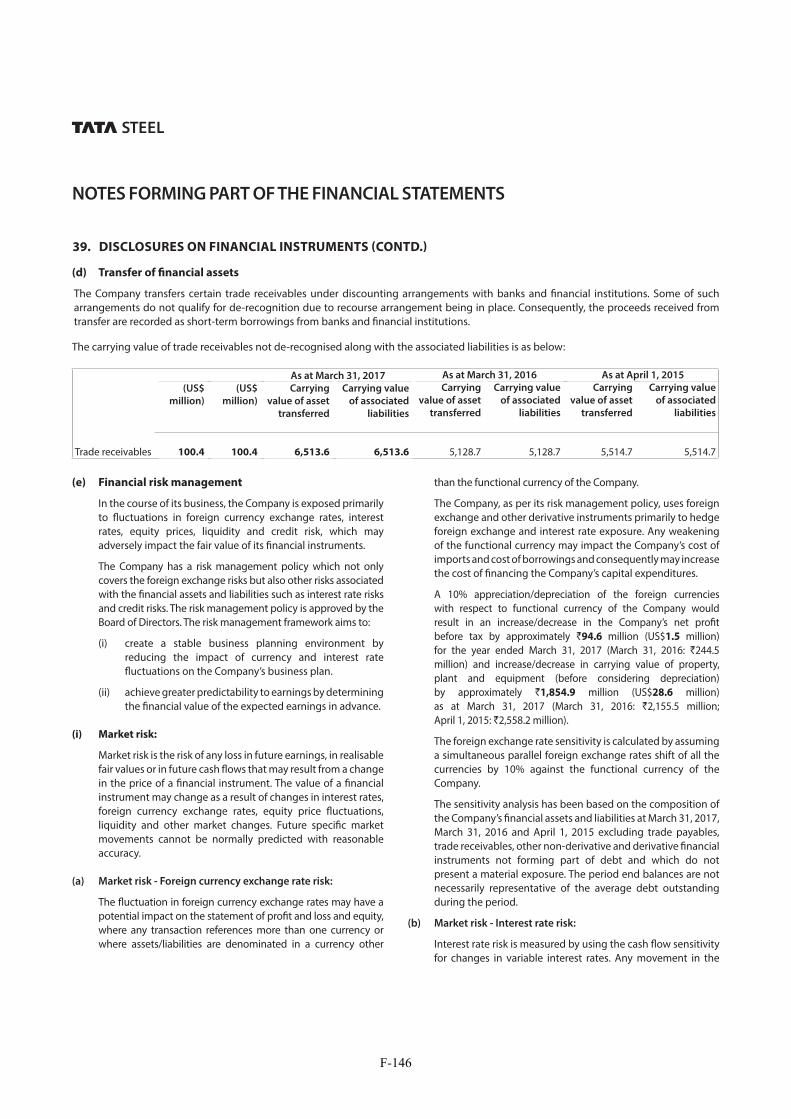
NOTES FORMING PART OF THE FINANCIAL STATEMENTS
(d) Transfer of financial assets
The Company transfers certain trade receivables under discounting arrangements with banks and financial institutions. Some of such arrangements do not qualify for de-recognition due to recourse arrangement being in place. Consequently, the proceeds received from transfer are recorded as short-term borrowings from banks and financial institutions.
The carrying value of trade receivables not de-recognised along with the associated liabilities is as below:
As at March 31, 2017 As at March 31, 2016 As at April 1, 2015
(US$
million)
(US$
million)
Carrying
value of asset
transferred
Carrying value
of associated
liabilities
Carrying
value of asset
transferred
Carrying value
of associated
liabilities
Carrying
value of asset
transferred
Carrying value
of associated
liabilities
Trade receivables 100.4 100.4 6,513.6 6,513.6 5,128.7 5,128.7 5,514.7 5,514.7
39. DISCLOSURES ON FINANCIAL INSTRUMENTS (CONTD.)
(e) Financial risk management
In the course of its business, the Company is exposed primarily to fluctuations in foreign currency exchange rates, interest rates, equity prices, liquidity and credit risk, which may adversely impact the fair value of its financial instruments.
The Company has a risk management policy which not only covers the foreign exchange risks but also other risks associated with the financial assets and liabilities such as interest rate risks and credit risks. The risk management policy is approved by the Board of Directors. The risk management framework aims to:
(i) create a stable business planning environment by reducing the impact of currency and interest rate fluctuations on the Company’s business plan.
(ii) achieve greater predictability to earnings by determining the financial value of the expected earnings in advance.
(i) Market risk:
Market risk is the risk of any loss in future earnings, in realisable fair values or in future cash flows that may result from a change in the price of a financial instrument. The value of a financial instrument may change as a result of changes in interest rates, foreign currency exchange rates, equity price fluctuations, liquidity and other market changes. Future specific market movements cannot be normally predicted with reasonable accuracy.
(a) Market risk - Foreign currency exchange rate risk:
The fluctuation in foreign currency exchange rates may have a potential impact on the statement of profit and loss and equity, where any transaction references more than one currency or where assets/liabilities are denominated in a currency other
than the functional currency of the Company.
The Company, as per its risk management policy, uses foreign exchange and other derivative instruments primarily to hedge foreign exchange and interest rate exposure. Any weakening of the functional currency may impact the Company’s cost of imports and cost of borrowings and consequently may increase the cost of financing the Company’s capital expenditures.
A 10% appreciation/depreciation of the foreign currencies with respect to functional currency of the Company would result in an increase/decrease in the Company’s net profit before tax by approximately `94.6 million (US$1.5 million) for the year ended March 31, 2017 (March 31, 2016: `244.5 million) and increase/decrease in carrying value of property, plant and equipment (before considering depreciation) by approximately `1,854.9 million (US$28.6 million) as at March 31, 2017 (March 31, 2016: `2,155.5 million; April 1, 2015: `2,558.2 million).
The foreign exchange rate sensitivity is calculated by assuming a simultaneous parallel foreign exchange rates shift of all the currencies by 10% against the functional currency of the Company.
The sensitivity analysis has been based on the composition of the Company’s financial assets and liabilities at March 31, 2017, March 31, 2016 and April 1, 2015 excluding trade payables, trade receivables, other non-derivative and derivative financial instruments not forming part of debt and which do not present a material exposure. The period end balances are not necessarily representative of the average debt outstanding during the period.
(b) Market risk - Interest rate risk:
Interest rate risk is measured by using the cash flow sensitivity for changes in variable interest rates. Any movement in the
F-146

NOTES FORMING PART OF THE FINANCIAL STATEMENTS
reference rates could have an impact on the Company’s cash flows as well as costs.
The Company is subject to variable interest rates on some of its interest bearing liabilities. The Company’s interest rate exposure is mainly related to debt obligations.
Based on the composition of debt as at March 31, 2017 and March 31, 2016 a 100 basis points increase in interest rates would increase the Company’s finance costs (before interest capitalised) and thereby consequently reduce net profit before tax by approximately `1,223.4 million (US$18.9 million) for the year ended March 31, 2017 (2015-16: `1,526.4 million).
The risk estimates provided assume a parallel shift of 100 basis points interest rate across all yield curves. This calculation also assumes that the change occurs at the balance sheet date and has been calculated based on risk exposures outstanding as at that date. The period end balances are not necessarily representative of the average debt outstanding during the period.
(c) Market risk - Equity price risk:
Equity price risk is related to change in market reference price of investments in equity securities held by the Company.
The fair value of quoted investments held by the Company exposes the Company to equity price risks. In general, these investments are not held for trading purposes.
The fair value of quoted investments in equity, classified as fair value through other comprehensive income as at March 31, 2017, March 31, 2016 and April 1, 2015, was `44,221.7 million (US$682.0 million) and `35,774.3 million and `1,02,748.7 million respectively.
A 10% change in equity prices of such securities held as at March 31, 2017, March 31, 2016 and April 1, 2015, would result in an impact of `4,422.2 million (US$68.2 million), `3,577.4 million and `10,274.9 million respectively on equity before considering tax impact.
(ii) Credit risk:
Credit risk is the risk of financial loss arising from counter-party failure to repay or service debt according to the contractual terms or obligations. Credit risk encompasses both the direct risk of default and the risk of deterioration of creditworthiness as well as concentration risks.
The Company has a policy of dealing only with credit worthy counter parties and obtaining sufficient collateral, where appropriate as a means of mitigating the risk of financial loss from defaults.
Financial instruments that are subject to credit risk and concentration thereof principally consist of trade receivables, loans receivables, investments, cash and cash equivalents, derivatives and financial guarantees provided by the Company. None of the financial instruments of the Company result in material concentration of credit risk.
The carrying value of financial assets represents the maximum credit risk. The maximum exposure to credit risk was ₹89,139.4
million (US$1,374.7 million), ₹69,702.7 million, ₹37,618.5 million, as at March 31, 2017, March 31, 2016 and April 1, 2015 respectively, being the total carrying value of trade receivables, balances with bank, bank deposits, investments in debt securities and other financial assets.
The risk relating to trade receivables is presented in Note 13.
The Company’s exposure to customers is diversified and no single customer contributes to more than 10 % of outstanding trade receivables as at March 31, 2017, March 31, 2016 and April 1, 2015.
In respect of financial guarantees provided by the Company to banks and financial institutions, the maximum exposure which the Company is exposed to is the maximum amount which the Company would have to pay if the guarantee is called upon. Based on the expectation at the end of the reporting period, the Company considers that it is more likely than not that such an amount will not be payable under the guarantees provided.
(iii) Liquidity risk:
Liquidity risk refers to the risk that the Company cannot meet its financial obligations. The objective of liquidity risk management is to maintain sufficient liquidity and ensure that funds are available for use as per requirements.
The Company has obtained fund and non-fund based working capital lines from various banks. Furthermore, the Company has access to funds from debt markets through commercial paper programs, non-convertible debentures and other debt instruments. The Company invests its surplus funds in bank fixed deposit and in mutual funds, which carry no or low market risk.
39. DISCLOSURES ON FINANCIAL INSTRUMENTS (CONTD.)
F-147

NOTES FORMING PART OF THE FINANCIAL STATEMENTS
The following table shows a maturity analysis of the anticipated cash flows including interest obligations for the Company’s derivative and non-derivative financial liabilities on an undiscounted basis, which therefore differ from both carrying value and fair value. Floating rate interest is estimated using the prevailing interest rate at the end of the reporting period. Cash flows in foreign currencies are translated using the period end spot rates.
(` in million) As at March 31, 2017
Carrying value
Contractual cash flows
less than one year
between one to five years
More than five years
Non-derivative financial liabilities:
Borrowings including interest obligations 2,82,846.3 4,43,331.5 48,169.8 1,59,216.4 2,35,945.3Trade payables 1,07,174.4 1,07,174.4 1,07,174.4 - -Other financial liabilities 37,299.8 37,299.8 37,117.6 52.6 129.6
4,27,320.5 5,87,805.7 1,92,461.8 1,59,269.0 2,36,074.9
(US$ million) 6,589.9 9,064.8 2,968.0 2,456.1 3,640.6
Derivative financial liabilities 4,495.0 4,495.0 2,701.7 9,61.1 832.2
(US$ million) 69.3 69.3 41.7 14.8 12.8
(` in million) As at March 31, 2016
Carrying value
Contractual cash flows
less than one year
between one to five years
More than five years
Non-derivative financial liabilities:
Borrowings including interest obligations 3,08,435.1 4,72,252.9 82,653.9 1,61,984.6 2,27,614.4Trade payables 61,968.8 61,968.8 61,968.8 - -Other financial liabilities 40,011.1 40,011.1 36,046.0 3,890.9 74.2
4,10,415.0 5,74,232.8 1,80,668.7 1,65,875.5 2,27,688.6
Derivative financial liabilities 1,942.4 1,942.4 782.3 872.8 287.3
(` in million) As at April 1, 2015
Carrying value
Contractual cash flows
less than one year
between one to five years
More than five years
Non-derivative financial liabilities:
Borrowings including interest obligations 2,94,862.5 4,81,918.1 67,322.8 1,76,593.8 2,38,001.5Trade payables 49,359.6 49,359.6 49,359.6 - -Other financial liabilities 42,303.8 42,303.8 33,884.9 8,418.9 -
3,86,525.9 5,73,581.5 1,50,567.3 1,85,012.7 2,38,001.5
Derivative financial liabilities 3,011.4 3,011.4 1,291.7 1,148.9 570.8
40. SEGMENT REPORTING
The Company is engaged in the business of manufacturing steel products and is primarily operated out of India. In accordance with Ind AS 108 “Operating Segments”, the Company has presented segment information on the basis of consolidated financial statements which form part of this report.
39. DISCLOSURES ON FINANCIAL INSTRUMENTS (CONTD.)
F-148

NOTES FORMING PART OF THE FINANCIAL STATEMENTS
41. RELATED PARTY TRANSACTIONS
The Company’s related parties principally consist of its subsidiaries, associates and joint ventures, Tata Sons Limited including its subsidiaries and joint ventures. The Company routinely enters into transactions with these related parties in the ordinary course of business at market rates and terms.
The following table summarises related party transactions and balances included in the financial statements of the Company for the year ended as at March 31, 2017, March 31, 2016 and April 1, 2015:
Subsidiaries Associates Joint
Ventures
Tata Sons and its
subsidiaries and joint ventures
Total
(` in million)
(US$ million)
Purchase of goods 83,828.1 2,545.6 1,412.2 1,709.1 89,495.0 1,380.1
41,112.8 2,462.9 1,172.7 1,311.5 46,059.9
Sale of goods 42,338.4 272.3 15,224.9 1,148.9 58,984.5 909.6
26,274.0 267.0 10,383.4 113.8 37,038.2
Services received 16,013.0 77.3 13,055.9 888.8 30,035.0 463.2
16,291.7 242.5 8,592.1 1,131.3 26,257.6
Services rendered 3,355.3 49.4 963.9 8.5 4,377.1 67.5
4,138.3 74.2 1,080.7 2.3 5,295.6
Interest income recognised 97.0 - - - 97.0 1.5
181.6 - 17.9 - 199.5
Interest expenses recognised - - - 161.6 161.6 2.5
- - - 192.3 192.3
Dividend paid 9.3 - - 2,364.8 2,374.1 36.6
9.3 - - 2,366.1 2,375.4
Dividend received 466.4 11.1 397.8 5.4 880.7 13.6
412.7 5.6 223.2 409.4 1,050.8
Provision for receivables recognised during the
year
49.8 - - - 49.8 0.8
907.7 0.3 - - 908.0
Management contracts - - - 1,000.0 1,000.0 15.4
- - - 750.0 750.0
Purchase of investments 109.6 - - - 109.6 1.7
81.5 81.5 - - 163.0
Sale of investments - - - - -
- - - 25,920.1 25,920.1 -
Finance provided during the year 4,707.8 - - - 4,707.8 72.6
1,265.9 9.1 467.8 - 1,742.8
F-149

NOTES FORMING PART OF THE FINANCIAL STATEMENTS
42. ADOPTION OF INDIAN ACCOUNTING STANDARDS (IND AS)
A. Mandatory exceptions to retrospective application
The Company has applied the following exceptions to the retrospective application of Ind AS as mandatorily required under Ind AS 101 “First Time Adoption of Indian Accounting Standards”.
(i) Estimates
On assessment of estimates made under the Previous GAAP financial statements, the Company has concluded that there is no necessity to revise such estimates under Ind AS, as there is no objective evidence of an error in those estimates.
(ii) Classification and measurement of financial assets
The classification of financial assets to be measured at amortised cost or fair value through other comprehensive income is made on the basis of facts and circumstances that existed on the date of transition to Ind AS.
B. Optional exemptions from retrospective application
Ind AS 101 “First time Adoption of Indian Accounting Standards” permits Companies adopting Ind AS for the first time to take certain exemptions from the full retrospective application of Ind AS during the transition. The Company has accordingly on transition to Ind AS availed the following key exemptions:
Subsidiaries Associates Joint
Ventures
Tata Sons and its
subsidiaries and joint ventures
Total
(` in million)
(US$ million)
Outstanding loans and receivables 11,383.0 266.8 463.8 803.8 12,917.4 199.2
10,376.9 94.6 226.8 360.3 11,058.6 9,337.5 205.1 945.6 326.5 10,814.7
Provision for outstanding loans and receivables 6,369.8 0.3 - - 6,370.1 98.2
7,966.2 0.3 - - 7,966.5 7,078.3 - - - 7,078.3
Outstanding payables 55,206.6 284.4 3,883.9 1,628.8 61,003.7 940.8
18,973.6 374.1 1,658.6 1,340.8 22,347.1 16,371.1 483.2 1,419.2 1,302.9 19,576.4
Guarantees provided outstanding 1,11,206.9 - 2,225.6 - 1,13,432.5 1749.3
1,14,182.7 - 2,422.2 - 1,16,604.9 1,34,241.6 - 2,560.7 - 1,36,802.3
Figures in italics represents comparative figures of previous years.
(i) The details of remuneration paid to key managerial personnel is provided in Note 29.
In addition, during the year the Company has paid dividend of `21,936.00 (US$338.3 million) (2015-16: `21,936.0) to key managerial personnel and `2,648.00 (US$40.8 million) (2015-16: `2,648.0) to relatives of key managerial personnel.
(ii) During the year, the Company has contributed `4,710.9 million (US$72.6 million) (2015-16: `8,653.0 million) to post employment benefit plans.
(iii) Transaction with joint ventures have been disclosed at full value and not at their proportionate share.
41. RELATED PARTY TRANSACTIONS (CONTD.)
F-150

NOTES FORMING PART OF THE FINANCIAL STATEMENTS
i. Fair value as deemed cost for items of property, plant
and equipment
The Company has elected to treat fair value as deemed cost for certain items of its property, plant and equipment.
The aggregate fair value of property, plant and equipment where the exemption was availed amounted to ₹ 4,75,807.8 million with an aggregate adjustment of ₹2,43,452.4 million being recognised to the carrying value reported under the Previous GAAP.
ii. Fair value as deemed cost for investments in
subsidiaries, associates and joint ventures
On transition, Ind AS 101 allows an entity to treat fair value as deemed cost for investments held in subsidiaries, associates and joint ventures.
Accordingly, the Company has elected to treat fair value as deemed cost for its investments held in a subsidiary. The fair value of such investments was considered as Nil with an adjustment of ₹4,78,753.3 million being recognised to the carrying value reported under the Previous GAAP.
iii. Designation of previously recognised financial
instruments
Under Ind AS 109 “Financial Instruments”, at initial recognition of a financial asset, an entity may make an irrevocable election to present subsequent changes in fair value of an investment in equity instrument in other comprehensive income.
Ind AS 101 “First time Adoption of Indian Accounting Standards” allows such designation of previously recognised financial assets as “fair value through other comprehensive income” on the basis of facts and circumstances that existed at the date of transition to Ind AS.
Accordingly, the Company has designated its investments in equity instruments at fair value through other comprehensive income on the basis of facts and circumstances that existed at the date of transition to Ind AS.
iv. Effect of changes in exchange rate
In respect of long term foreign currency monetary items recognised in the financial statements for the period ending immediately before the beginning of the first Ind AS financial reporting period, the Company has elected to recognise exchange differences on translation of such long term foreign currency monetary items in line with its Previous GAAP accounting policy.
In respect of long term foreign currency monetary items recognised in the financial statements beginning with the first Ind AS financial reporting period, exchange differences are recognised in the statement of profit and loss.
C. Transition to Ind AS - Reconciliations
The following reconciliations provide the explanation and qualification of the differences arising from the transition from Previous GAAP to Ind AS in accordance with Ind AS 101 “First Time Adoption of Indian Accounting Standards”.
(i) Reconciliation of total equity as at April 1, 2015 and March 31, 2016.
(ii) Reconciliation of total comprehensive income for the year ended March 31, 2016.
(iii) Reconciliation of statement of cash flows for the year ended March 31, 2016.
Previous GAAP figures have been reclassified/regrouped wherever necessary to confirm with the financial statements prepared under Ind AS.
42. ADOPTION OF INDIAN ACCOUNTING STANDARDS (IND AS) (CONTD.)
F-151

NOTES FORMING PART OF THE FINANCIAL STATEMENTS
42. ADOPTION OF INDIAN ACCOUNTING STANDARDS (IND AS) (CONTD.)
(1) Reconciliation of total equity (` in million)
NoteAs at
March 31, 2016As at
April 1, 2015
Equity as per Previous GAAP 7,04,767.2 6,66,638.9
Re-measurements on transition to Ind AS
(1) Property, plant and equipment (ii) 2,32,931.7 2,42,606.3 (2) Financial Instruments (i) 39,296.2 1,07,911.4 (3) Re-classification of Hybrid Perpetual Securities (v) 22,750.0 22,750.0(4) Reversal of proposed dividend and tax thereon (vii) 9,351.5 9,351.5(5) Leases (iii) (2,230.7) (2,376.2)(6) Government grants (vi) (2,315.4) (2,315.4)(7) Fair valuation as deemed cost for investments in subsidiaries (iv) (4,78,753.3) (4,78,753.3)(8) Others (x) 329.1 (186.6)(9) Tax impact on above adjustments (ix) (37,002.5) (40,983.5)Equity as per Ind AS 4,89,123.8 5,24,643.1
(2) Reconciliation of total comprehensive income
(` in million) Note Year Ended
March 31, 2016
Net Profit as per Previous GAAP 49,009.5
Re-measurements on transition to Ind AS
(1) Leases (iii) 145.5 (2) Employee benefits (viii) 50.1 (3) Property, plant and equipment (ii) (9,674.6)(4) Financial instruments (i) (36,980.0)(5) Others (x) 627.2 (6) Tax impact on above adjustments (ix) 6,378.8 Net Profit as per Ind AS 9,556.5
Other comprehensive income/(loss) (xi) (34,071.3)Total comprehensive income/(loss) as per Ind AS (24,514.8)
(3) Reconciliation of statement of cash flows (` in million)
NoteAmount as per Previous GAAP
Effect of transition to Ind AS
Amount as per Ind AS
Net cash generated from/(used in) operating activities (xii), (xiii) 69,394.3 4,323.7 73,718.0Net cash generated from/(used in) investing activities (43,693.0) 175.8 (43,517.2)Net cash generated from/(used in) financing activities (xii), (xiii) (20,387.1) (5,017.3) (25,404.4)Net increase/(decrease) in cash and cash equivalents 5,314.2 (517.8) 4,796.4
Cash and cash equivalents as at April 1, 2015 4,219.3 732.3 4,951.6Effect of exchange rate on translation of foreign currency cash and cash equivalents
(1.2) - (1.2)
Cash and cash equivalents as at March 31, 2016 9,532.3 214.5 9,746.8
F-152

NOTES FORMING PART OF THE FINANCIAL STATEMENTS
Notes to reconciliation of total equity and total comprehensive
income
(i) Financial Instruments
(a) In accordance with Ind AS 109 “Financial Instruments”, investments in quoted equity instruments (other than in subsidiaries, associates and joint ventures) have been recognised at fair value at each reporting date through other comprehensive income.
Consequently, on eventual sale of such investments, profit or loss recognised in the statement of profit and loss under the Previous GAAP have been reversed as the fair value changes are recognised through other comprehensive income.
(b) In accordance with Ind AS 109 “Financial Instruments”, premium payable on redemption, discount on issue, transaction costs on issue of bonds and debentures are required to be considered as effective finance costs and recognised in the statement of profit and loss using the effective interest rate.
Consequently, premium on redemption/discounts on issue and transaction costs recognised directly in equity or amortised using a different approach under the Previous GAAP has been reversed and are now recognised through the statement of profit and loss using the effective interest rate.
(c) In accordance with Ind AS 109 “Financial Instruments”, investments in mutual funds are recognised at fair value through the statement of profit and loss at each reporting period.
(d) In accordance with Ind AS 109 “Financial Instruments”, all derivative financial instruments are recognised at fair value as at each reporting date through the statement of profit and loss except where designated in a hedging relationship.
(ii) Property, plant and equipment
On transition to Ind AS, the Company has treated fair value as deemed cost for certain items of property, plant and equipment resulting in an uplift in carrying value as compared to the Previous GAAP.
The consequential impact of additional depreciation on fair value uplift is recognised in the statement of profit and loss.
(iii) Leases
As per Ind AS 17, “Leases”, the Company has assessed certain long term arrangements, fulfilment of which is dependant on use of specified assets and where the Company has the right
42. ADOPTION OF INDIAN ACCOUNTING STANDARDS (IND AS) (CONTD.)
to control the use of such assets for being in the nature of a lease.
This resulted in certain arrangements being treated as a lease and classified as finance lease. The impact on total equity and profit and loss is on account of timing difference in recognition of expenses under the lease accounting model as compared to those recognised under the Previous GAAP.
(iv) Fair value as deemed cost for investments in subsidiaries
The Company has treated fair value as deemed cost for its investment held in a subsidiary. The difference between fair value and carrying value as per Previous GAAP has accordingly been adjusted against reserves on transition to Ind AS.
(v) Re-classification of Hybrid perpetual securities
In accordance with Ind AS 109 “Financial Instruments”, Hybrid Perpetual Securities have been re-classified as equity based on its substance and the fact that the Company has an unconditional right to avoid making payments on the instrument as per the contractual terms.
(vi) Governments Grants
In accordance with Ind AS 20 “Government Grants”, duty saved on import of capital goods and spares under the EPCG scheme has been treated as a Government grant.
The benefit has been grossed up with the cost of the related asset and has been recognised as a deferred income. Such deferred income is released to the statement of profit and loss based on fulfilment of related export obligations. The duty benefit grossed up to the cost of the asset is depreciated based on its useful economic life or as and when the spares are consumed.
(vii) Reversal of proposed dividend
In accordance with Ind AS 8 “Accounting Policies, Changes in Accounting Estimates and Errors”, dividend recommended by the Board of Directors is recognised only once approved by the shareholders as compared to the Previous GAAP where it was considered as an adjusting event.
(viii) Employee benefits
(a) In accordance with Ind AS 19, “Employee Benefits” re-measurement gains and losses on post employment defined benefit plans are recognised in other comprehensive income as compared to the statement of profit and loss under the Previous GAAP.
F-153

NOTES FORMING PART OF THE FINANCIAL STATEMENTS
(b) Interest expense/income on the net defined benefit liability/asset is recognised in the statement of profit and loss using the discount rate used for defined benefit obligation as compared to the expected rate used for recognising income from plan assets under the Previous GAAP.
(ix) Deferred Taxes
In accordance with Ind AS 12, “Income Taxes”, the Company on transition to Ind AS has recognised deferred tax on temporary differences, i.e. based on balance sheet approach as compared to the earlier approach of recognising deferred taxes on timing differences , i.e. profit and loss approach.
The tax impacts as above primarily represent deferred tax consequences arising out of Ind AS re-measurement changes.
(x) Other adjustments
Other adjustments primarily relate to consequential impact on inventory valuation due to Ind AS transition.
(xi) Other comprehensive Income
Under Ind AS, all items of income and expense recognised during the year are included in the profit or loss for the year, unless Ind AS requires or permits otherwise. Items that are not recognised in profit or loss but are shown in the statement of profit and loss and other comprehensive income include re-measurement gains or losses on defined benefit plans, effective portion of gains or losses on cash flow hedges and fair value changes of equity investments.
The concept of other comprehensive Income did not exist under the Previous GAAP.
Notes to reconciliation of statement of cash flows
(xii) The Company transfers trade receivables under discounting arrangements with banks and financial institutions. Some of the arrangements do not meet the de-recognition criteria due to re-course arrangements being in place. Consequently, proceeds received from such transactions are recorded as short term borrowings and trade receivables continue to be recognised in the financial statements. Under the Previous GAAP, such transactions were de-recognised and recorded as a sale.
As a result, cash flow from operating activities under Ind AS is lower and cash flow from financing activities is higher.
(xiii) On transition to Ind AS, long term arrangements have been assessed as being in the nature of a lease and classified as finance leases, where applicable. Under the Previous GAAP, such long term contracts were treated as a normal contract for purchase of output. Payments made under such contracts have therefore been re-classified as part of financing activities under Ind AS as compared to operating activities under the Previous GAAP.
As a result, cash flow from operating activities under Ind AS is higher and cash flow from financing activities is lower.
43. DIVIDENDS
The dividends declared by the Company are based on the profits available for distribution as reported in the financial statements of the Company. On May 16, 2017, the Board of Directors of the Company have proposed a dividend of ₹10 per share in respect of the year ended March 31, 2017 subject to the approval of shareholders at the Annual General Meeting. If approved, the dividend would result in a cash outflow of ₹ 11,689.3 million inclusive of a dividend distribution tax of ₹1,977.2 million.
42. ADOPTION OF INDIAN ACCOUNTING STANDARDS (IND AS) (CONTD.)
F-154

INDEPENDENT AUDITORS’ REPORT ON CONSOLIDATED FINANCIAL STATEMENTS
TO THE MEMBERS OF TATA STEEL LIMITED
REPORT ON THE CONSOLIDATED FINANCIAL STATEMENTS
We have audited the accompanying consolidated financial statements of TATA STEEL LIMITED (hereinafter referred to as “the Holding Company”) and its subsidiaries (the Holding Company and its subsidiaries together referred to as “the Group”) its associates and jointly controlled entities, comprising of the Consolidated Balance Sheet as at 31st March, 2016, the Consolidated Statement of Profit and Loss, the Consolidated Cash Flow Statement for the year then ended, and a summary of the significant accounting policies and other explanatory information (hereinafter referred to as “the consolidated financial statements”).
MANAGEMENT’S RESPONSIBILITY FOR THE
CONSOLIDATED FINANCIAL STATEMENTS
The Holding Company’s Board of Directors is responsible for the preparation of these consolidated financial statements in terms of the requirements of the Companies Act, 2013 (hereinafter referred to as “the Act”) that give a true and fair view of the consolidated financial position, consolidated financial performance and consolidated cash flows of the Group including its Associates and Jointly controlled entities in accordance with the accounting principles generally accepted in India, including the Accounting Standards prescribed under Section 133 of the Act, as applicable. The respective Board of Directors of the companies included in the Group and of its associates and jointly controlled entities are responsible for maintenance of adequate accounting records in accordance with the provisions of the Act for safeguarding the assets of the Group and for preventing and detecting frauds and other irregularities; the selection and application of appropriate accounting policies; making judgments and estimates that are reasonable and prudent; and the design, implementation and maintenance of adequate internal financial controls, that were operating effectively for ensuring the accuracy and completeness of the accounting records, relevant to the preparation and presentation of the financial statements that give a true and fair view and are free from material misstatement, whether due to fraud or error, which have been used for the purpose of preparation of the consolidated financial statements by the Directors of the Holding Company, as aforesaid.
AUDITORS’ RESPONSIBILITY
Our responsibility is to express an opinion on these consolidated financial statements based on our audit. While conducting the audit, we have taken into account the provisions of the Act, the accounting and auditing standards and matters which are required to be included in the audit report under the provisions of the Act and the Rules made thereunder.
We conducted our audit in accordance with the Standards on Auditing specified under Section 143(10) of the Act. Those Standards require that we comply with ethical requirements and plan and perform the audit to obtain reasonable assurance about whether the consolidated financial statements are free from material misstatement.
An audit involves performing procedures to obtain audit evidence about the amounts and the disclosures in the consolidated financial statements. The procedures selected depend on the auditor’s judgment, including the assessment of the risks of material misstatement of the consolidated financial statements, whether due to fraud or error. In making those risk assessments, the auditor considers internal financial control relevant to the Holding Company’s preparation of the consolidated financial statements that give a true and fair view in order to design audit procedures that are appropriate in the circumstances. An audit also includes evaluating the appropriateness of the accounting policies used and the reasonableness of the accounting estimates made by the Holding Company’s Board of Directors, as well as evaluating the overall presentation of the consolidated financial statements.
We believe that the audit evidence obtained by us and the audit evidence obtained by the other auditors in terms of their reports referred to in sub-paragraph (a) of the Other Matters paragraph below, is sufficient and appropriate to provide a basis for our audit opinion on the consolidated financial statements.
OPINION
In our opinion and to the best of our information and according to the explanations given to us, the aforesaid consolidated financial statements give the information required by the Act in the manner so required and give a true and fair view in conformity with the accounting principles generally accepted in India, of the consolidated state of affairs of the Group, its associates and jointly controlled entities as at 31st March, 2016, and their consolidated loss and their consolidated cash flows for the year ended on that date.
EMPHASIS OF MATTER
We draw attention to Note 41 to the consolidated financial statements regarding accounting policy for recognition of actuarial valuation changes of `12,312.3 million in the pension and other post retirement benefit plans of Tata Steel Europe Limited, a subsidiary for the reasons specified therein. Had the Company recognized actuarial valuation changes in the Consolidated Statement of Profit and Loss, the loss after taxes, minority interest and share of profits of associates would have been lower by `12,312.3 million.
Our opinion is not modified in respect of this matter.
F-155

OTHER MATTERS
a) We did not audit the financial statements of fourteen subsidiaries, and two jointly controlled entities, whose financial statements reflect total assets of `7,76,921.4 million as at 31st March, 2016, total revenues of `7,64,888.5 million and net cash flows amounting to `8,431.4 million for the year ended on that date, as considered in the consolidated financial statements. The consolidated financial statements also include the Group’s share of net profit of `45.0 million for the year ended 31st March, 2016, as considered in the consolidated financial statements, in respect of an associate, whose financial statements have not been audited by us. These financial statements have been audited by other auditors whose reports have been furnished to us by the Management and our opinion on the consolidated financial statements, in so far as it relates to the amounts and disclosures included in respect of these subsidiaries, jointly controlled entities and associate, is based solely on the reports of the other auditors.
b) We did not audit the financial statements of eight subsidiaries, whose financial statements reflect total assets of `875.6 million as at 31st March, 2016, total revenues of `817.6 million and net cash flows amounting to `124.7 million for the year ended on that date, as considered in the consolidated financial statements. These financial statements are unaudited and have been furnished to us by the Management and our opinion on the consolidated financial statements, in so far as it relates to the amounts and disclosures included in respect of these subsidiaries, is based solely on such unaudited financial statements. In our opinion and according to the information and explanations given to us by the Management, these financial statements are not material to the Group.
c) In case of a subsidiary and a jointly controlled entity, the financial statements as at 31st March, 2016 are not available. The consolidated financial statement reflect total assets of `3,051.8 million as at 31st March, 2016, total revenues of `1,577.7 million and net cash flows amounting to `169.2 million for the year ended on that date, as considered in the consolidated financial statements, is based on the unaudited financial statements of such subsidiary and jointly controlled entity as at 30 September, 2015 and 31st December, 2015, respectively. The consolidated financial statements also include the Group’s share of net loss of `136.4 million for the year ended 31st March, 2016, as considered in the consolidated financial statements, in respect of two associates, is based
on the unaudited financial statements as at 31st December, 2015. These financial statements are unaudited and have been furnished to us by the Management and our opinion on the consolidated financial statements, in so far as it relates to the amounts and disclosures included in respect of the subsidiary, jointly controlled entity and associates, is based solely on such unaudited financial statements.
d) In the case of a subsidiary and eight associates the financial statements as at 31st March, 2016 are not available. The investments in these companies are carried at `1 each as at 31st March, 2016. In the absence of their financial statements as at 31st March, 2016, the total assets, total revenue and net cash flows of the subsidiary and the Group’s share of profit/(loss) of these associates have not been included in the Consolidated Financial Results.
Our opinion on the consolidated financial statements, and our report on Other Legal and Regulatory Requirements below is not modified in respect of the above matters with respect to our reliance on the work done and the reports of the other auditors and the financial statements certified by the Management.
REPORT ON OTHER LEGAL AND REGULATORY
REQUIREMENTS
1. As required by Section 143(3) of the Act, we report, to the extent applicable, that:
a) We have sought and obtained all the information and explanations which to the best of our knowledge and belief were necessary for the purposes of our audit of the aforesaid consolidated financial statements.
b) In our opinion, proper books of account as required by law relating to preparation of the aforesaid consolidated financial statements have been kept so far as it appears from our examination of those books and the reports of the other auditors.
c) The Consolidated Balance Sheet, the Consolidated Statement of Profit and Loss, and the Consolidated Cash Flow Statement dealt with by this Report are in agreement with the relevant books of account maintained for the purpose of preparation of the consolidated financial statements.
F-156

d) In our opinion, the aforesaid consolidated financial statements comply with the Accounting Standards prescribed under Section 133 of the Act, as applicable.
e) On the basis of the written representations received from the directors of the Holding Company as on 31st March, 2016 taken on record by the Board of Directors of the Holding Company and the reports of the statutory auditors of its subsidiary companies, associate companies and jointly controlled companies incorporated in India, none of the directors of the Group companies, its associate companies and jointly controlled companies incorporated in India is disqualified as on 31st March, 2016 from being appointed as a director in terms of Section 164 (2) of the Act.
f ) With respect to the adequacy of the internal financial controls over financial reporting and the operating effectiveness of such controls, refer to our Report in “Annexure A”, which is based on the auditors’ reports of the Holding company, subsidiary companies, associate companies and jointly controlled companies incorporated in India. Our report expresses an unmodified opinion on the adequacy and operating effectiveness of the Holding company’s/ subsidiary company’s / associate company’s / jointly controlled company’s incorporated in India internal financial controls over financial reporting.
g) With respect to the other matters to be included in the Auditors’ Report in accordance with Rule 11 of the Companies (Audit and Auditors) Rules, 2014, in our opinion and to the best of our information and according to the explanations given to us:
i. The consolidated financial statements disclose the impact of pending litigations on the consolidated financial position of the Group, its associates and jointly controlled entities.
ii. Provision has been made in the consolidated financial statements, as required under the applicable law or accounting standards, for material foreseeable losses, if any, on long-term contracts including derivative contracts.
iii. There has been no delay in transferring amounts, required to be transferred, to the Investor Education and Protection Fund by the Holding Company and its subsidiary companies, associate companies and jointly controlled companies incorporated in India.
For DELOITTE HASKINS & SELLS LLP
Chartered Accountants (Firm’s Registration No.117366W/W-100018)
N. VENKATRAM
Partner (Membership No. 71387)
Mumbai, 25th May, 2016
F-157

(Referred to in paragraph 1 (f) under ‘Report on Other Legal and
Regulatory Requirements’ of our report of even date)
Report on the Internal Financial Controls Over Financial
Reporting under Clause (i) of Sub-section 3 of Section 143 of the
Companies Act, 2013 (“the Act”)
In conjunction with our audit of the consolidated financial statements of the Company as of and for the year ended 31st March, 2016, we have audited the internal financial controls over financial reporting of TATA STEEL LIMITED (hereinafter referred to as “the Holding Company”) and its subsidiary companies, its associate companies and jointly controlled companies, which are companies incorporated in India, as of that date.
MANAGEMENT’S RESPONSIBILITY FOR INTERNAL
FINANCIAL CONTROLS
The respective Board of Directors of the Holding company, its subsidiary companies, its associate companies and jointly controlled companies, which are companies incorporated in India, are responsible for establishing and maintaining internal financial controls based on the internal control over financial reporting criteria established by the Company considering the essential components of internal control stated in the Guidance Note on Audit of Internal Financial Controls Over Financial Reporting issued by the Institute of Chartered Accountants of India (ICAI). These responsibilities include the design, implementation and maintenance of adequate internal financial controls that were operating effectively for ensuring the orderly and efficient conduct of its business, including adherence to the respective company’s policies, the safeguarding of its assets, the prevention and detection of frauds and errors, the accuracy and completeness of the accounting records, and the timely preparation of reliable financial information, as required under the Companies Act, 2013.
AUDITORS’ RESPONSIBILITY
Our responsibility is to express an opinion on the Company’s internal financial controls over financial reporting based on our audit. We conducted our audit in accordance with the Guidance Note on Audit of Internal Financial Controls Over Financial Reporting (the “Guidance Note”) issued by the Institute of Chartered Accountants of India and the Standards on Auditing, prescribed under Section 143(10) of the Companies Act, 2013, to the extent applicable to an audit of internal financial controls. Those Standards and the Guidance Note require that we comply with ethical requirements and plan and perform the audit to obtain reasonable assurance about whether adequate internal financial controls over financial reporting was established and maintained and if such controls operated effectively in all material respects.
Our audit involves performing procedures to obtain audit evidence about the adequacy of the internal financial controls system over financial reporting and their operating effectiveness. Our audit of internal financial controls over financial reporting included obtaining an understanding of internal financial controls over financial reporting, assessing the risk that a material weakness exists, and testing and evaluating the design and operating effectiveness of internal control based on the assessed risk. The procedures selected depend on the auditors’ judgement, including the assessment of the risks of material misstatement of the financial statements, whether due to fraud or error.
We believe that the audit evidence we have obtained and the audit evidence obtained by the other auditors of the subsidiary companies, associate companies and joint controlled companies, which are companies incorporated in India, in terms of their reports referred to in the Other Matters paragraph below, is sufficient and appropriate to provide a basis for our audit opinion on the Company’s internal financial controls system over financial reporting.
MEANING OF INTERNAL FINANCIAL CONTROLS OVER
FINANCIAL REPORTING
A company’s internal financial control over financial reporting is a process designed to provide reasonable assurance regarding the reliability of financial reporting and the preparation of financial statements for external purposes in accordance with generally accepted accounting principles. A company’s internal financial control over financial reporting includes those policies and procedures that (1) pertain to the maintenance of records that, in reasonable detail, accurately and fairly reflect the transactions and dispositions of the assets of the company; (2) provide reasonable assurance that transactions are recorded as necessary to permit preparation of financial statements in accordance with generally accepted accounting principles, and that receipts and expenditures of the company are being made only in accordance with authorisations of management and directors of the company; and (3) provide reasonable assurance regarding prevention or timely detection of unauthorised acquisition, use, or disposition of the company’s assets that could have a material effect on the financial statements.
INHERENT LIMITATIONS OF INTERNAL FINANCIAL
CONTROLS OVER FINANCIAL REPORTING
Because of the inherent limitations of internal financial controls over financial reporting, including the possibility of collusion or improper management override of controls, material misstatements due to error or fraud may occur and not be detected. Also, projections of any evaluation of the internal financial controls over financial reporting to future periods are subject to the risk that
ANNEXURE “A” TO THE INDEPENDENT AUDITORS’ REPORT
F-158

the internal financial control over financial reporting may become inadequate because of changes in conditions, or that the degree of compliance with the policies or procedures may deteriorate.
OPINION
In our opinion to the best of our information and according to the explanations given to us, the Holding Company, its subsidiary companies, its associate companies and jointly controlled companies, which are companies incorporated in India, have, in all material respects, an adequate internal financial controls system over financial reporting and such internal financial controls over financial reporting were operating effectively as at March 31, 2016, based on the internal control over financial reporting criteria established by the Company considering the essential components of internal control stated in the Guidance Note on Audit of Internal Financial Controls Over Financial Reporting issued by the Institute of Chartered Accountants of India”.
OTHER MATTERS
Our aforesaid report under Section 143(3)(i) of the Act on the adequacy and operating effectiveness of the internal financial controls over financial reporting insofar as it relates to 17 subsidiary companies, 2 associate companies and 5 jointly controlled companies, which are companies incorporated in India, is based on the corresponding reports of the auditors of such companies incorporated in India.
For DELOITTE HASKINS & SELLS LLP
Chartered Accountants (Firm’s Registration No.117366W/W-100018)
N. VENKATRAM
Partner (Membership No. 71387)
Mumbai, 25th May, 2016
F-159

CONSOLIDATED BALANCE SHEET AS AT 31ST MARCH, 2016
(` in million)
Note As at
31st March, 2016
As at
31st March, 2015
Equity and Liabilities
(1) SHAREHOLDERS’ FUNDS(a) Share capital 3 9,702.4 9,714.1(b) Reserves and surplus 4 2,75,086.1 3,03,780.0
2,84,788.5 3,13,494.1(2) PREFERENCE SHARES ISSUED BY SUBSIDIARY COMPANIES 5 200.0 200.0(3) HYBRID PERPETUAL SECURITIES 6 22,750.0 22,750.0(4) MINORITY INTEREST 16,542.4 17,038.5(5) NON-CURRENT LIABILITIES
(a) Long-term borrowings 7 6,83,540.9 6,56,752.0(b) Deferred tax liabilities 8 29,048.8 28,845.1(c) Other long-term liabilities 9 13,836.9 17,488.0(d) Long-term provisions 10 76,227.0 75,037.6
8,02,653.6 7,78,122.7(6) CURRENT LIABILITIES
(a) Short-term borrowings 7 1,54,498.8 95,985.5(b) Trade payables 11
(i) Total outstanding dues of micro enterprises and small enterprises; and
206.8 228.7
(ii) Total outstanding dues of creditors other than micro enterprises and small enterprises
2,03,675.7 1,91,669.9
2,03,882.5 1,91,898.6(c) Other current liabilities 12 1,12,090.1 1,44,795.9(d) Short-term provisions 10 35,094.2 27,035.2
505,565.6 4,59,715.216,32,500.1 15,91,320.5
Assets(7) NON-CURRENT ASSETS
(a) Fixed assets(i) Tangible assets 13 4,50,807.2 5,12,479.2(ii) Intangible assets 14 18,488.4 34,449.0(iii) Capital work-in-progress 3,49,939.6 2,78,371.1(iv) Intangible assets under development 4,939.1 8,410.1
8,24,174.3 8,33,709.4(b) Goodwill on consolidation 1,37,193.8 1,34,075.1(c) Non-current investments 15 20,845.2 20,804.3(d) Deferred tax assets 8 218.5 227.5(e) Long-term loans and advances 16 1,61,108.6 51,065.7(f ) Other non-current assets 17 14,058.9 14,037.1
11,57,599.3 10,53,919.1(8) CURRENT ASSETS
(a) Current investments 15 47,161.0 13,746.2(b) Inventories 18 2,03,559.8 2,51,499.1(c) Trade receivables 19 1,17,011.8 1,33,098.7(d) Cash and bank balances 20 67,155.8 87,499.4(e) Short-term loans and advances 16 35,777.9 47,483.4(f ) Other current assets 21 4,234.5 4,074.6
4,74,900.8 5,37,401.416,32,500.1 15,91,320.5
Notes to Consolidated Balance Sheet and Statement of Profit and Loss 1-47
F-160

CONSOLIDATED STATEMENT OF PROFIT AND LOSS FOR THE YEAR ENDED 31ST MARCH, 2016
(` in million)
NoteYear ended
31st March, 2016
Year ended
31st March, 2015
(1) Revenue
(a) Revenue from operations 22 12,16,184.2 14,42,983.6Less: Excise Duty 44,668.3 47,946.3
11,71,515.9 13,95,037.3(b) Other income 23 39,256.6 7,961.8
Total Revenue 12,10,772.5 14,02,999.1
(2) Expenses
(a) Raw materials consumed 3,21,883.0 4,07,410.4(b) Purchase of finished, semi-finished and
other products1,01,740.1 1,38,042.2
(c) Changes in inventories of finished goods, work-in-progress and stock-in-trade
24,538.2 11,221.8
(d) Employee benefits expense 24 1,99,668.0 2,14,076.4(e) Depreciation and amortisation expense 25 50,818.4 59,436.0(f ) Finance costs 26 41,286.4 48,477.5(g) Other expenses 27 4,59,053.2 5,10,610.9
11,98,987.3 13,89,275.2
(h) Less: Expenditure (other than interest) transferred to capital and other accounts 11,223.1 11,681.9
Total Expenses 11,87,764.2 13,77,593.3
(3) Profit before Exceptional Items and Tax 23,008.3 25,405.8
(4) Exceptional Items 28(a) Profit on sale of non-current investments 1,799.5 13,153.4(b) Profit on sale of non-current assets – 11,468.6(c) Provision for diminution in the value of investments/
doubtful advances(1,291.0) (3,383.0)
(d) Provision for impairment of non-current assets (97,205.9) (60,525.7)(e) Provision for demands and claims (8,800.5) –(f ) Employee seperation compensation (5,562.5) –(g) Restructuring and other provisions 71,311.7 –
(39,748.7) (39,286.7)
(5) Profit/(Loss) before tax (16,740.4) (13,880.9)
(6) Tax Expense
(a) Current tax 16,311.4 22,147.1(b) MAT credit (1,525.6) (1,173.2)(c) Deferred tax 263.8 4,700.2
15,049.6 25,674.1
(7) Profit/(Loss) after tax (31,790.0) (39,555.0)
(8) Minority Interest 1,089.4 132.9
(9) Share of Profit of Associates 207.4 166.9
(10) Profit/(Loss) after Tax, Minority Interest and Share of Profit
of Associates
(30,493.2) (39,255.2)
(11) Nominal Value per Share (`) 10.0 10.0
(12) Basic Earnings per Share (`) 29 (33.23) (42.24)
(13) Diluted Earnings per Share (`) 29 (33.23) (42.24)
Notes to Consolidated Balance Sheet and Statement of Profit and Loss 1-47
F-161

CONSOLIDATED CASH FLOW STATEMENT FOR THE YEAR ENDED 31ST MARCH, 2016
(` in million)Year ended
31st March, 2016
Year ended
31st March, 2015
A. Cash Flow from Operating Activities:
Profit/(Loss) before tax (16,740.4) (13,880.9)
Adjustments for: Depreciation and amortisation expense 50,818.4 59,436.0 Income from non-current investments (499.5) (687.9) (Profit)/Loss on sale of non-current investments (35,075.2) (17.3) (Profit)/Loss on assets sold/discarded/written off (402.4) (2,001.9) Interest and Income from current Investments (3,400.2) (6,169.7) Finance costs 41,286.4 48,477.5 (Gain) / Loss on cancellation of forwards and swaps 153.7 915.0 Exchange (gain)/loss on revaluation of foreign currency loans and
swaps3,678.6 9,327.7
Provision for Wealth Tax – 21.2 Exceptional (income)/expenditure 39,748.7 39,286.7 Other non-cash expenditure 2,182.3 4,847.9
98,490.8 1,53,435.2
Operating Profit before Working Capital Changes 81,750.4 1,39,554.3
Adjustments for: Trade and other receivables 32,436.8 14,416.2 Inventories 57,041.8 (4,853.6) Trade payables and other liabilities (35,147.0) (6,049.1)
54,331.6 3,513.5
Cash Generated from Operations 1,36,082.0 1,43,067.8
Direct tax paid (16,450.1) (24,270.1)
Net Cash Flow from/(used in) Operating Activities 1,19,631.9 1,18,797.7
B. Cash Flow from Investing Activities:
Purchase of fixed assets(1) (1,14,858.9) (1,34,923.7) Sale of fixed assets 2,057.5 14,435.7 Purchase of non-current investments (4,979.4) (1,725.3) Acquisition of subsidiaries/joint ventures/associates (766.7) (1,080.5) Disposal of subsidiaries/joint ventures/undertakings 1,899.8 13,009.9 Sale of other non-current investments 40,820.3 2,618.3 (Purchase)/sale of current investments (net) (31,218.6) 17,039.6 Inter-corporate deposits (net) 622.9 2,769.1 Fixed/Restricted deposits with banks (placed)/realised (256.2) 256.8 Interest and Income from current investments received 1,434.3 2,110.9 Dividend received 1,003.0 1,267.8
Net Cash Flow from/(used in) Investing Activities (1,04,242.0) (84,221.4)
F-162

(` million)Year ended
31st March, 2016
Year ended
31st March, 2015
C. Cash Flow from Financing Activities:
Capital contributions received 179.0 127.5 Contribution received from minority 337.0 00.2 Proceeds from borrowings 1,45,780.6 4,55,186.0 Repayment of borrowings (1,30,280.3) (4,12,135.5) Amount received/(paid) on cancellation of forwards and swaps (171.1) (931.7) Distribution on Hybrid Perpetual Securities (2,664.9) (2,661.3) Expenses (incurred)/reimbursed on issue of equity instruments 33.6 38.9 Interest paid (1) (43,003.7) (54,276.2) Dividend paid (7,903.8) (9,833.9) Tax on dividend paid (1,590.3) (1,685.9)
Net Cash Flow from/(used in) Financing Activities (39,283.9) (26,171.9)
Net increase/(decrease) in Cash and Cash Equivalents (23,894.0) 8,404.4
Opening Cash & Cash equivalents (2) 85,256.6 84,063.3
Effect of exchange rate on translation of foreign currency cash and
cash equivalents
4,727.3 (5,989.9)
Closing Cash & Cash equivalents 66,089.9 86,477.8
Additional information:(1) Interest paid is exclusive of and purchase of fixed assets is inclusive of interest capitalised ̀ 12,317.4 million (Apr-Mar 15: ̀ 8,974.1 million)(2) Excludes `1,221.9 million (Apr-Mar 15: `449.7 million) in respect of subsidiaries and joint ventures disposed off during the year and
includes `0.7 million in respect of a subsidiary acquired during the year.(3) Previous years figures have been recast/restated where necessary.
CONSOLIDATED CASH FLOW STATEMENT FOR THE YEAR ENDED 31ST MARCH, 2016 (CONTD.)
F-163

NOTES FORMING PART OF THE FINANCIAL STATEMENTS
1. Principles of Consolidation: The Consolidated Financial Statements consist of Tata Steel
Limited (“the Company”) and its subsidiary companies (collectively referred to as “the Group”). The Consolidated Financial Statements have been prepared on the following basis:
• The financial statements of the Company and its subsidiary companies have been combined on a line-by-line basis by adding together the book values of like items of assets, liabilities, income and expenses, after fully eliminating intra-group balances and intra-group transactions resulting in unrealised profits or losses as per Accounting Standard 21 – “Consolidated Financial Statements” notified by Companies (Accounting Standards) Rules, 2006.
• In case of foreign subsidiaries, being non-integral operations, revenue items are consolidated at the average rate prevailing during the year. All assets and liabilities are converted at the rates prevailing at the end of the year. Any exchange difference arising on consolidation is recognised in the “Foreign Currency Translation Reserve”.
• The difference between the cost of investment in the subsidiaries and joint ventures, and the Group’s share of net assets at the time of acquisition of shares in the subsidiaries and joint ventures is recognised in the financial statements as Goodwill or Capital Reserve as the case may be.
• Minority Interest in the net assets of consolidated subsidiaries is identified and presented in the Consolidated Balance Sheet separately from liabilities and equity of the Company’s shareholders.
Minority interest in the net assets of consolidated subsidiaries consists of:
a) The amount of equity attributable to minority at the date on which investment in a subsidiary is made; and
b) The minority share of movements in equity since the date the parent subsidiary relationship came into existence.
• Minority’s share of net profit for the year of consolidated subsidiaries is identified and adjusted against the Profit After Tax of the Group.
• Investment in associates where the Company directly or indirectly through subsidiaries holds more than 20% of equity, are accounted for using equity method as per Accounting Standard 23 – Accounting for Investments in Associates in Consolidated Financial Statements notified by Companies (Accounting Standards) Rules, 2006.
• The Group accounts for its share of post acquisition changes in net assets of associates, after eliminating unrealised profits and losses resulting from transactions between the Company and its associates to the extent of its share, through its Consolidated Statement of Profit and Loss, to the extent such change is attributable to the associates’ Statement of Profit and Loss and through its reserves for the balance based on available information.
• The difference between the cost of investment in the associates and the Group’s share of net assets at the time of acquisition of share in the associates is identified in the financial statements as Goodwill or Capital Reserve as the case may be.
• Interests in Joint Ventures have been accounted by using the proportionate consolidation method as per Accounting Standard 27 – “Financial Reporting of Interests in Joint Ventures” notified by Companies (Accounting Standards) Rules, 2006.
• The financial statements of the subsidiaries, associates and joint ventures used in the consolidation are drawn up to the same reporting date as that of the Company i.e. 31st March, 2016, except for certain subsidiary, joint venture and associates (indicated as $ below) for which financial statements as on reporting date are not available. These have been consolidated based on latest available financial statements.
• In the absence of financial statements as on the reporting date for certain subsidiary and associates (indicated as # below), no adjustment has been made in the consolidated financial statements. These investments are carried at `1 in the financial statements.
• Unaudited financial statement of Orchid Netherlands (No. 1) B.V., Tata Korf Engineering Services Ltd., Bangla Steel and Mining Co. Ltd., Tayo Rolls Limited, Tata Steel (KZN) (Pty) Ltd. being subsidiaries and Industrial Energy Limited. an associate have been considered for consolidation.
The list of subsidiary companies, joint ventures and associates which are included in the consolidation and the Group’s holdings therein are as under:
F-164

NOTES FORMING PART OF THE FINANCIAL STATEMENTS
Ownership in % either
directly or through
Subsidiaries@
Name of the Company 2015-16 2014-15 Country of
Incorporation
A. SUBSIDIARIES:
i) ABJA Investment Co. Pte. Ltd. 100.00 100.00 Singaporeii) Adityapur Toll Bridge Company Limited 73.63 73.63 Indiaiii) Bangla Steel & Mining Co. Ltd. 100.00 100.00 Bangladeshiv) Tata Steel Special Economic Zone Limited 100.00 100.00 Indiav) Indian Steel & Wire Products Ltd. 95.01 95.01 Indiavi) Jamshedpur Continuous Annealing & Processing Company Private
Limited
51.00 51.00 India
vii) Jamshedpur Utilities & Services Company Limited 100.00 100.00 India1. Haldia Water Management Limited 60.00 60.00 India2. Naba Diganta Water Management Limited 74.00 74.00 India3. SEZ Adityapur Limited 51.00 51.00 India
viii) Mohar Export Services Pvt. Ltd.^# 66.46 – Indiaix) NatSteel Asia Pte. Ltd. 100.00 100.00 Singapore
1. TS Asia (Hong Kong) Ltd. 100.00 100.00 Hong Kong SAR2. Tata Steel Resources Australia Pty. Ltd.* – 100.00 Australia
x) Rujuvalika Investments Limited^ 100.00 – Indiaxi) T M Mining Company Limited 74.00 74.00 Indiaxii) T S Alloys Limited 100.00 100.00 Indiaxiii) Tata Incorporated* – 100.00 USAxiv) Tata Korf Engineering Services Ltd. 100.00 100.00 Indiaxv) Tata Metaliks Ltd. 50.09 50.09 India
1. Tata Metaliks DI Pipes Limited 100.00 100.00 Indiaxvi) Tata Sponge Iron Limited 54.50 54.50 India
1. TSIL Energy Limited 100.00 100.00 Indiaxvii) Tata Steel (KZN) (Pty) Ltd.$ 90.00 90.00 South Africaxviii) T Steel Holdings Pte. Ltd. 100.00 100.00 Singapore
1. T S Global Holdings Pte Ltd. 100.00 100.00 SingaporeI. Orchid Netherlands (No.1) B.V. 100.00 100.00 NetherlandsII. NatSteel Holdings Pte. Ltd. 100.00 100.00 Singapore
1. Burwill Trading Pte. Ltd.* – 100.00 Singapore2. Easteel Services (M) Sdn. Bhd. 100.00 100.00 Malaysia3. Eastern Steel Fabricators Phillipines, Inc. 67.00 67.00 Phillipines4. Eastern Steel Services Pte. Ltd.* – 100.00 Singapore5. Eastern Wire Pte. Ltd.* – 100.00 Singapore6. NatSteel (Xiamen) Ltd. 100.00 100.00 China7. NatSteel Asia (S) Pte. Ltd.* – 100.00 Singapore8. NatSteel Equity IV Pte. Ltd.* - 100.00 Singapore
1. Principles of Consolidation: (contd.)
F-165

NOTES FORMING PART OF THE FINANCIAL STATEMENTS
Ownership in % either
directly or through
Subsidiaries@
Name of the Company 2015-16 2014-15 Country of
Incorporation
9. NatSteel Recycling Pte Ltd. 100.00 100.00 Singapore10. NatSteel Trade International (Shanghai) Company Ltd. 100.00 100.00 China11. NatSteel Trade International Pte. Ltd. 100.00 100.00 Singapore12. NatSteel Vina Co. Ltd. 56.50 56.50 Vietnam13. The Siam Industrial Wire Company Ltd. 100.00 100.00 Thailand14. TSN Wires Co., Ltd. 60.00 60.00 Thailand
III. Tata Steel Europe Limited 100.00 100.00 UK1. Almana Steel Dubai (Jersey) Limited 100.00 100.00 Jersey2. Apollo Metals Limited 100.00 100.00 USA3. Ashorne Hill Management College* – 100.00 UK4. Augusta Grundstucks GmbH 100.00 100.00 Germany5. Automotive Laser Technologies Limited 100.00 100.00 UK6. B S Pension Fund Trustee Limited 100.00 100.00 UK7. Beheermaatschappij Industriele Produkten B.V. 100.00 100.00 Netherlands8. Belfin Beheermaatschappij B.V.* – 100.00 Netherlands9. Bell & Harwood Limited 100.00 100.00 UK10. Blastmega Limited 100.00 100.00 UK11. Blume Stahlservice GmbH 100.00 100.00 Germany12. Blume Stahlservice Polska Sp.Z.O.O 100.00 100.00 Poland13. Bore Samson Group Limited 100.00 100.00 UK14. Bore Steel Limited 100.00 100.00 UK15. British Guide Rails Limited 100.00 100.00 UK16. British Steel Corporation Limited 100.00 100.00 UK17. British Steel De Mexico S.A. de C.V.* – 100.00 Mexico18. British Steel Directors (Nominees) Limited 100.00 100.00 UK19. British Steel Engineering Steels (Exports) Limited 100.00 100.00 UK20. British Steel Nederland International B.V. 100.00 100.00 Netherlands21. British Steel Samson Limited 100.00 100.00 UK22. British Steel Service Centres Limited 100.00 100.00 UK23. British Tubes Stockholding Limited 100.00 100.00 UK24. C V Benine 76.92 76.92 Netherlands25. C Walker & Sons Limited 100.00 100.00 UK26. Catnic GmbH 100.00 100.00 Germany27. Catnic Limited 100.00 100.00 UK28. CBS Investissements SAS 100.00 100.00 France29. Cladding & Decking (UK) Limited 100.00 100.00 UK30. Cogent Power Inc. 100.00 100.00 Canada31. Cogent Power SA DE CV 100.00 100.00 Mexico32. Cogent Power Inc. 100.00 100.00 USA33. Cogent Power Limited 100.00 100.00 UK
1. Principles of Consolidation: (contd.)
F-166

NOTES FORMING PART OF THE FINANCIAL STATEMENTS
Ownership in % either
directly or through
Subsidiaries@
Name of the Company 2015-16 2014-15 Country of
Incorporation
34. Color Steels Limited 100.00 100.00 UK35. Corbeil Les Rives SCI 67.30 67.30 France36. Corby (Northants) & District Water Co. 100.00 100.00 UK37. Cordor (C& B) Limited 100.00 100.00 UK38. Corus Aluminium Verwaltungsgesellschaft Mbh 100.00 100.00 Germany39. Corus Beteiligungs GmbH 100.00 100.00 Germany40. Corus Building Systems Bulgaria AD 65.00 65.00 Bulgaria41. Corus Building Systems SAS 100.00 100.00 France42. Corus CNBV Investments 100.00 100.00 UK43 Corus Cold drawn Tubes Limited 100.00 100.00 UK44. Corus Engineering Steels (UK) Limited 100.00 100.00 UK45. Corus Engineering Steels Holdings Limited 100.00 100.00 UK46. Corus Engineering Steels Limited 100.00 100.00 UK47. Corus Engineering Steels Overseas Holdings Limited 100.00 100.00 UK48. Corus Engineering Steels Pension Scheme Trustee
Limited 100.00 100.00 UK
49. Corus Group Limited 100.00 100.00 UK50. Corus Holdings Limited 100.00 100.00 UK51. Corus International (Overseas Holdings) Limited 100.00 100.00 UK52. Corus International Limited 100.00 100.00 UK53. Corus International Romania SRL. 100.00 100.00 Romania54. Corus Investments Limited 100.00 100.00 UK55. Corus Ireland Limited 100.00 100.00 Ireland56. Corus Large Diameter Pipes Limited 100.00 100.00 UK57. Corus Liaison Services (India) Limited 100.00 100.00 UK58. Corus Management Limited 100.00 100.00 UK59. Corus Primary Aluminium B.V. 100.00 100.00 Netherlands60. Corus Properties (Germany) Limited 100.00 100.00 UK61. Corus Property 100.00 100.00 UK62. Corus Republic Of Ireland Subsidiaries Pension Scheme
Trustee Limited 100.00 100.00 Ireland
63. Corus Service Centre Limited 100.00 100.00 N Ireland64. Corus Steel Service STP LLC 100.00 100.00 Russia65. Corus Tubes Poland Spolka Z.O.O 100.00 100.00 Poland66. Corus UK Healthcare Trustee Limited 100.00 100.00 UK67. Corus Ukraine LLC 100.00 100.00 Ukraine68. CPN (85) Limited 100.00 100.00 UK69. Crucible Insurance Company Limited 100.00 100.00 I of Man70. Degels GmbH 100.00 100.00 Germany71. Demka B.V. 100.00 100.00 Netherlands72. DSRM Group Plc. 100.00 100.00 UK
1. Principles of Consolidation: (contd.)
F-167

NOTES FORMING PART OF THE FINANCIAL STATEMENTS
Ownership in % either
directly or through
Subsidiaries@
Name of the Company 2015-16 2014-15 Country of
Incorporation
73. Eric Olsson & Soner Forvaltnings AB 100.00 100.00 Sweden74. Esmil B.V. 100.00 100.00 Netherlands75. Europressings Limited 100.00 100.00 UK76. Firsteel Group Limited 100.00 100.00 UK77. Firsteel Holdings Limited 100.00 100.00 UK78. Firsteel Strip Mill Products Limited 100.00 100.00 UK79. Fischer Profil GmbH 100.00 100.00 Germany80. Gamble Simms Metals Limited 100.00 100.00 Ireland81. Grant Lyon Eagre Limited 100.00 100.00 UK82. H E Samson Limited 100.00 100.00 UK83. Hadfields Holdings Limited 62.50 62.50 UK84. Halmstad Steel Service Centre AB 100.00 100.00 Sweden85. Hammermega Limited 100.00 100.00 UK86. Harrowmills Properties Limited 100.00 100.00 UK87. Hille & Muller GmbH 100.00 100.00 Germany88. Hille & Muller USA Inc. 100.00 100.00 USA89. Hoogovens (UK) Limited 100.00 100.00 UK90. Hoogovens Aluminium UK Limited 100.00 100.00 UK91. Hoogovens Finance B.V. 100.00 100.00 Netherlands92. Hoogovens USA Inc. 100.00 100.00 USA93. Huizenbezit “Breesaap” B.V. 100.00 100.00 Netherlands94. Ickles Cottage Trust Limited 100.00 100.00 UK95. Inter Metal Distribution SAS 100.00 100.00 France96. Kalzip Asia Pte Limited 100.00 100.00 Singapore97. Kalzip FZE 100.00 100.00 UAE98. Kalzip GmbH 100.00 100.00 Germany99. Kalzip GmbH 100.00 100.00 Austria100. Kalzip Guangzhou Limited 100.00 100.00 China101. Kalzip Inc 100.00 100.00 USA102. Kalzip India Private Limited 100.00 100.00 India103. Kalzip Italy SRL 100.00 100.00 Italy104. Kalzip Limited 100.00 100.00 UK105. Kalzip Spain S.L.U. 100.00 100.00 Spain106. Layde Steel S.L. 100.00 100.00 Spain107. Lister Tubes Limited 100.00 100.00 Ireland108. London Works Steel Company Limited 100.00 100.00 UK109. Longs Steel UK Limited 100.00 100.00 UK110. Midland Steel Supplies Limited 100.00 100.00 UK111. Mistbury Investments Limited 100.00 100.00 UK112. Montana Bausysteme AG 100.00 100.00 Switzerland113. Myriad Nederland B.V.* - 100.00 Netherlands
1. Principles of Consolidation: (contd.)
F-168

NOTES FORMING PART OF THE FINANCIAL STATEMENTS
Ownership in % either
directly or through
Subsidiaries@
Name of the Company 2015-16 2014-15 Country of
Incorporation
114. Naantali Steel Service Centre OY 100.00 100.00 Finland115. Namascor B.V.* – 100.00 Netherlands116. Nationwide Steelstock Limited 100.00 100.00 UK117. Norsk Stal Tynnplater AS 100.00 100.00 Norway118. Orb Electrical Steels Limited 100.00 100.00 UK119. Ore Carriers Limited 100.00 100.00 UK120. Oremco Inc. 100.00 100.00 USA121. Plated Strip (International) Limited 100.00 100.00 UK122. Precoat International Limited 100.00 100.00 UK123. Precoat Limited 100.00 100.00 UK124. Rafferty-Brown Steel Co Inc Of Conn. 100.00 100.00 USA125. Round Oak Steelworks Limited 100.00 100.00 UK126. Runblast Limited 100.00 100.00 UK127. Runmega Limited 100.00 100.00 UK128. S A B Profiel B.V. 100.00 100.00 Netherlands129. S A B Profil GmbH 100.00 100.00 Germany130. Seamless Tubes Limited 100.00 100.00 UK131. Service Center Gelsenkirchen GmbH 100.00 100.00 Germany132. Service Centre Maastricht B.V. 100.00 100.00 Netherlands133. Skruv Erik AB 100.00 100.00 Sweden134. Societe Europeenne De Galvanisation (Segal) Sa 100.00 100.00 Belgium135. Staalverwerking en Handel B.V. 100.00 100.00 Netherlands136. Stainless Velsen-Noord BV 100.00 100.00 Netherlands137. Steel StockHoldings Limited 100.00 100.00 UK138. Steelstock Limited 100.00 100.00 UK139. Stewarts & Lloyds Of Ireland Limited 100.00 100.00 Ireland140. Stewarts And Lloyds (Overseas) Limited 100.00 100.00 UK141. Stocksbridge Works Cottage Trust Limited 100.00 100.00 UK142. Surahammar Bruks AB 100.00 100.00 Sweden143. Swinden Housing Association Limited 100.00 100.00 UK144. Tata Steel Belgium Packaging Steels N.V. 100.00 100.00 Belgium145. Tata Steel Belgium Services N.V. 100.00 100.00 Belgium146. Tata Steel Denmark Byggsystemer A/S 100.00 100.00 Denmark147. Tata Steel Europe Distribution BV 100.00 100.00 Netherlands148. Tata Steel Europe Metals Trading BV 100.00 100.00 Netherlands149. Tata Steel France Batiment et Systemes SAS 100.00 100.00 France150. Tata Steel France Holdings SAS 100.00 100.00 France151. Tata Steel France Rail SAS 100.00 100.00 France152. Tata Steel Germany GmbH 100.00 100.00 Germany153. Tata Steel IJmuiden BV 100.00 100.00 Netherlands154. Tata Steel International (Americas) Holdings Inc 100.00 100.00 USA
1. Principles of Consolidation: (contd.)
F-169

NOTES FORMING PART OF THE FINANCIAL STATEMENTS
Ownership in % either
directly or through
Subsidiaries@
Name of the Company 2015-16 2014-15 Country of
Incorporation
155. Tata Steel International (Americas) Inc 100.00 100.00 USA156. Tata Steel International (Benelux) BV 100.00 100.00 Netherlands157. Tata Steel International (Canada) Holdings Inc 100.00 100.00 Canada158. Tata Steel International (Czech Republic) S.R.O 100.00 100.00 Czech Republic159. Tata Steel International (Denmark) A/S 100.00 100.00 Denmark160. Tata Steel International (Finland) OY 100.00 100.00 Finland161. Tata Steel International (France) SAS 100.00 100.00 France162. Tata Steel International (Germany) GmbH 100.00 100.00 Germany163. Tata Steel International (South America) Representações
LTDA 100.00 100.00 Brazil
164. Tata Steel International Hellas SA 100.00 100.00 Greece165. Tata Steel International (Italia) SRL 100.00 100.00 Italy166. Tata Steel International (Middle East) FZE 100.00 100.00 UAE167. Tata Steel International (Nigeria) Ltd. 100.00 100.00 Nigeria168. Tata Steel International (Poland) sp Zoo 100.00 100.00 Poland169. Tata Steel International (Schweiz) AG 100.00 100.00 Switzerland170. Tata Steel International (Sweden) AB 100.00 100.00 Sweden171. Tata Steel International (India) Limited 100.00 100.00 India172. Tata Steel International Iberica SA 100.00 100.00 Spain173. Tata Steel Istanbul Metal Sanayi ve Ticaret AS 100.00 100.00 Turkey174. Tata Steel Latvia Building Systems SIA 100.00 100.00 Latvia175. Tata Steel Logistics and Shipping BV* – 100.00 Netherlands176. Tata Steel Maubeuge SAS 100.00 100.00 France177. Tata Steel Nederland BV 100.00 100.00 Netherlands178. Tata Steel Nederland Consulting & Technical Services BV 100.00 100.00 Netherlands179. Tata Steel Nederland Services BV 100.00 100.00 Netherlands180. Tata Steel Nederland Star-Frame BV 100.00 100.00 Netherlands181. Tata Steel Nederland Technology BV 100.00 100.00 Netherlands182. Tata Steel Nederland Tubes BV 100.00 100.00 Netherlands183. Tata Steel Netherlands Holdings B.V. 100.00 100.00 Netherlands184. Tata Steel Norway Byggsystemer A/S 100.00 100.00 Norway185. Tata Steel Speciality Service Centre Suzhou Co. Limited 100.00 100.00 China186. Tata Steel Sweden Byggsystem AB 100.00 100.00 Sweden187. Tata Steel Speciality Service Centre Xian Co. Limited 100.00 100.00 China188. Tata Steel UK Consulting Limited 100.00 100.00 UK189. Tata Steel UK Holdings Limited 100.00 100.00 UK190. Tata Steel UK Limited 100.00 100.00 UK191. Tata Steel UK Rail Consultancy Limited 100.00 100.00 UK192. Tata Steel USA Inc. 100.00 100.00 USA193. The Newport And South Wales Tube Company Limited 100.00 100.00 UK194. The Stanton Housing Company Limited 100.00 100.00 UK
1. Principles of Consolidation: (contd.)
F-170
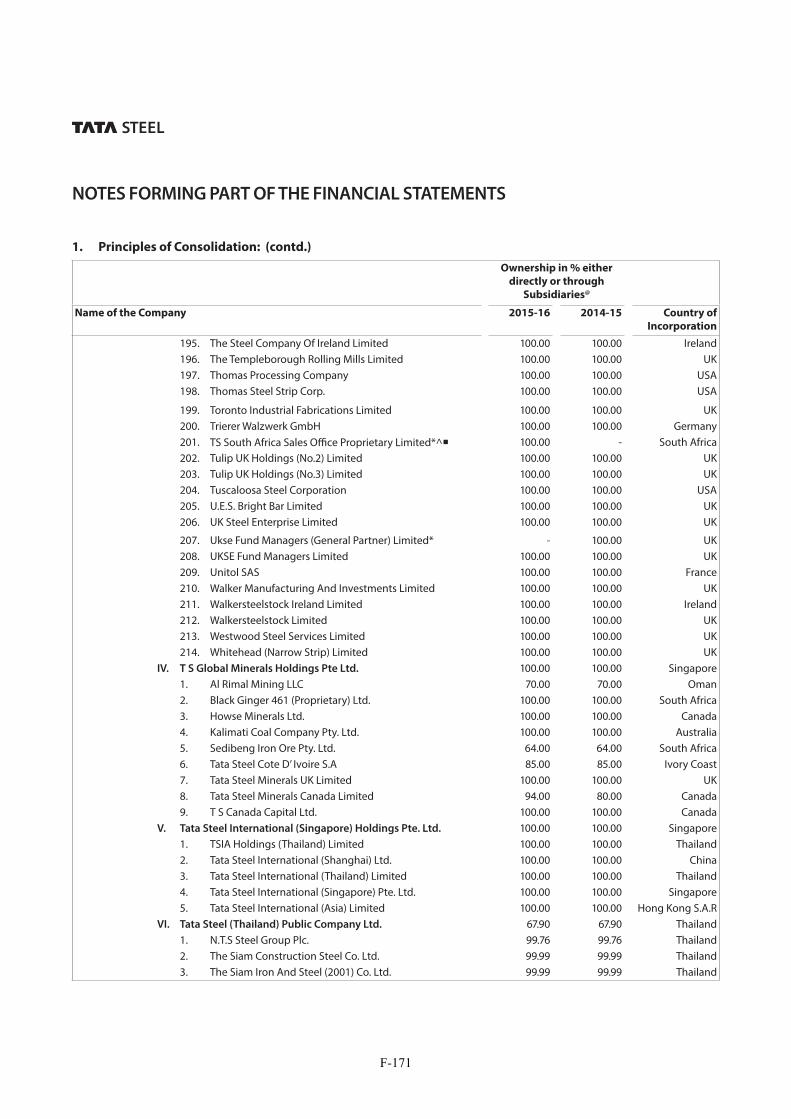
NOTES FORMING PART OF THE FINANCIAL STATEMENTS
Ownership in % either
directly or through
Subsidiaries@
Name of the Company 2015-16 2014-15 Country of
Incorporation
195. The Steel Company Of Ireland Limited 100.00 100.00 Ireland196. The Templeborough Rolling Mills Limited 100.00 100.00 UK197. Thomas Processing Company 100.00 100.00 USA198. Thomas Steel Strip Corp. 100.00 100.00 USA
199. Toronto Industrial Fabrications Limited 100.00 100.00 UK200. Trierer Walzwerk GmbH 100.00 100.00 Germany201. TS South Africa Sales Office Proprietary Limited*^ 100.00 - South Africa202. Tulip UK Holdings (No.2) Limited 100.00 100.00 UK203. Tulip UK Holdings (No.3) Limited 100.00 100.00 UK204. Tuscaloosa Steel Corporation 100.00 100.00 USA205. U.E.S. Bright Bar Limited 100.00 100.00 UK206. UK Steel Enterprise Limited 100.00 100.00 UK
207. Ukse Fund Managers (General Partner) Limited* - 100.00 UK208. UKSE Fund Managers Limited 100.00 100.00 UK209. Unitol SAS 100.00 100.00 France210. Walker Manufacturing And Investments Limited 100.00 100.00 UK211. Walkersteelstock Ireland Limited 100.00 100.00 Ireland212. Walkersteelstock Limited 100.00 100.00 UK213. Westwood Steel Services Limited 100.00 100.00 UK214. Whitehead (Narrow Strip) Limited 100.00 100.00 UK
IV. T S Global Minerals Holdings Pte Ltd. 100.00 100.00 Singapore1. Al Rimal Mining LLC 70.00 70.00 Oman2. Black Ginger 461 (Proprietary) Ltd. 100.00 100.00 South Africa3. Howse Minerals Ltd. 100.00 100.00 Canada4. Kalimati Coal Company Pty. Ltd. 100.00 100.00 Australia5. Sedibeng Iron Ore Pty. Ltd. 64.00 64.00 South Africa6. Tata Steel Cote D’ Ivoire S.A 85.00 85.00 Ivory Coast7. Tata Steel Minerals UK Limited 100.00 100.00 UK8. Tata Steel Minerals Canada Limited 94.00 80.00 Canada9. T S Canada Capital Ltd. 100.00 100.00 Canada
V. Tata Steel International (Singapore) Holdings Pte. Ltd. 100.00 100.00 Singapore1. TSIA Holdings (Thailand) Limited 100.00 100.00 Thailand2. Tata Steel International (Shanghai) Ltd. 100.00 100.00 China3. Tata Steel International (Thailand) Limited 100.00 100.00 Thailand4. Tata Steel International (Singapore) Pte. Ltd. 100.00 100.00 Singapore5. Tata Steel International (Asia) Limited 100.00 100.00 Hong Kong S.A.R
VI. Tata Steel (Thailand) Public Company Ltd. 67.90 67.90 Thailand1. N.T.S Steel Group Plc. 99.76 99.76 Thailand2. The Siam Construction Steel Co. Ltd. 99.99 99.99 Thailand3. The Siam Iron And Steel (2001) Co. Ltd. 99.99 99.99 Thailand
1. Principles of Consolidation: (contd.)
F-171

NOTES FORMING PART OF THE FINANCIAL STATEMENTS
Ownership in % either
directly or through
Subsidiaries@
Name of the Company 2015-16 2014-15 Country of
Incorporation
VII. T S Global Procurement Company Pte. Ltd. 100.00 100.00 Singapore1. ProCo Issuer Pte. Ltd. 100.00 100.00 Singapore
xix) Tata Steel Odisha Limited 100.00 100.00 Indiaxx) Tata Steel Processing and Distribution Limited 100.00 100.00 Indiaxxi) Tayo Rolls Limited 54.91 54.45 Indiaxxii) TM International Logistics Limited 51.00 51.00 India
1. International Shipping and Logistics FZE 100.00 100.00 UAE2. TKM Global China Ltd. 100.00 100.00 China3. TKM Global GmbH 100.00 100.00 Germany4. TKM Global Logistics Limited 100.00 100.00 India5. TM Harbour Services Private Limited 100.00 100.00 India
xxiii) Tata Pigments Limited 100.00 100.00 Indiaxxiv) The Tinplate Company of India Ltd. 74.96 74.96 India
B. JOINT VENTURES OF:
i) Tata Steel Limited
1. Bhubaneshwar Power Private Limited 26.00 26.00 India2. Himalaya Steel Mill Services Private Limited 26.00 26.00 India3. mjunction services limited 50.00 50.00 India4. S & T Mining Company Private Limited 50.00 50.00 India5. Tata BlueScope Steel Limited 50.00 50.00 India6. Tata NYK Shipping Pte Ltd. 50.00 50.00 Singapore
ii) T Steel Holdings Pte. Ltd.
a) T S Global Holdings Pte Ltd.
I. NatSteel Holdings Pte. Ltd.
1. TVSC Construction Steel Solutions Limited 50.00 50.00 Hong Kong S.A.RII. Tata Steel Europe Limited
1. Afon Tinplate Company Limited 64.00 64.00 UK2. Air Products Llanwern Limited 50.00 50.00 UK3. BSR Pipeline Services Limited 50.00 50.00 UK4. Caparo Merchant Bar Plc 25.00 25.00 UK5. Corus Kalpinis Simos Cladding Industry SA 50.00 50.00 Greece6. Danieli Corus Technical Services B.V.* - 50.00 Netherlands7. Fabsec Limited 25.00 25.00 UK8. Industrial Rail Services IJmond B.V. 50.00 50.00 Netherlands9. Laura Metaal Holding B.V. 49.00 49.00 Netherlands10. Norsk Stal AS* – 50.00 Norway11. Ravenscraig Limited 33.33 33.33 UK12. Redcar Bulk Terminal Limited 50.00 50.00 UK13. Tata Elastron Steel Service Center SA 50.00 50.00 Greece
1. Principles of Consolidation: (contd.)
F-172

NOTES FORMING PART OF THE FINANCIAL STATEMENTS
Ownership in % either
directly or through
Subsidiaries@
Name of the Company 2015-16 2014-15 Country of
Incorporation
14. Tata Steel Ticaret AS 50.00 50.00 Turkey15. Texturing Technology Limited 50.00 50.00 UK
III. T S Global Minerals Holdings Pte. Ltd.
1. Minas De Benga (Mauritius) Limited$ 35.00 35.00 MauritiusC. ASSOCIATE OF:
i) Tata Steel Limited
1. Industrial Energy Limited$ 26.00 26.00 India2. Jamipol Limited 39.78 39.78 India3. Kalinga Aquatics Ltd.# 30.00 30.00 India4. Kumardhubi Fireclay & Silica Works Ltd.# 27.78 27.78 India5. Kumardhubi Metal Casting and Engineering Limited# 49.31 49.31 India6. Nicco Jubilee Park Limited # 25.31 25.31 India7. Rujuvalika Investments Limited*^ – 34.46 India8. Strategic Energy Technology Systems Private Limited# 25.00 25.00 India9. Tata Construction & Projects Ltd.# 27.19 27.19 India10. TRL Krosaki Refractories Limited 26.62 26.62 India11. TRF Limited+$ 34.11 34.29 India12. Malusha Travels Pvt Ltd.+ 33.23 33.23 India13. Mohar Export Services Pvt. Ltd.*^ - 33.23 India
ii) T Steel Holdings Pte. Ltd.
a) T S Global Holdings Pte Ltd.
I. Tata Steel International (Singapore) Holdings Pte. Ltd.
1. European Profiles (M) Sdn. Bhd. 20.00 20.00 MalaysiaII. Tata Steel Europe Limited
1. Albi Profils SRL + 30.00 30.00 France2. Appleby Frodingham Cottage Trust Limited + 33.30 33.30 UK3. GietWalsOnderhoudCombinatie B.V. 50.00 50.00 Netherlands4. Hoogovens Court Roll Service Technologies VOF 50.00 50.00 Netherlands5. Hoogovens Gan Multimedia S.A. De C.V. + 50.00 50.00 Mexico6. ISSB Limited + 50.00 50.00 UK7. Wupperman Staal Nederland B.V. 30.00 30.00 Netherlands
III. T S Global Minerals Holdings Pte Ltd.
1. New Millennium Iron Corp.$# 26.18 26.18 Canadaiii) Indian Steel & Wire Products Ltd.
1. Metal Corporation of India Limited # 42.05 42.05 India
* Part of the year
^ Became subsidiary during the year
Incorporated during the year
+ Investments in these associates are reported at nil value in the consolidated financial statements.
@ Represents the holding percentage of the respective companies and does not indicate the effective percentage holding of the group.
1. Principles of Consolidation: (contd.)
F-173

NOTES FORMING PART OF THE FINANCIAL STATEMENTS
2. Accounting Policies
(A) BASIS FOR ACCOUNTING
The financial statements are prepared under the historical cost convention on an accrual basis of accounting in accordance with the Generally Accepted Accounting Principles, Accounting Standards notified under Section 133 of the Companies Act, 2013 and the relevant provisions thereof.
(B) USE OF ESTIMATES AND JUDGEMENTS
In preparation of the financial statements, the Company makes judgements, estimates and assumptions about the carrying amounts of assets and liabilities that are not readily apparent from other sources. The estimates and the associated assumptions are based on historical experience and other factors that are considered to be relevant. Actual results may differ from these estimates.
The estimates and the underlying assumptions are reviewed on an ongoing basis. Revisions to accounting estimates are recognised in the period in which the estimate is revised and future periods affected. Significant judgements and estimates relating to the carrying amounts of assets and liabilities include useful lives of tangible and intangible assets, impairment of tangible assets, intangible assets including goodwill, employee benefits and other provisions and recoverability of deferred tax assets. Long term investments are tested for decline in value which is other than temporary when there are any indicators of impairment. Any change in the underlying assumptions used such as discount rate, or growth rate may have an impact on the carrying value of such long term investments.
(C) REVENUE RECOGNITION
(i) Revenue from sale of goods is recognised net of rebates and discounts on transfer of significant risks and rewards of ownership to the buyer. Sale of goods is recognised gross of excise duty but net of sales tax and value added tax.
(ii) Revenue from services rendered is recognised on pro-rata basis in proportion to the stage of completion of the related transaction.
(iii) Export incentive under various schemes notified by the Government has been recognised on the basis of amount received.
(iv) Dividend is recorded when the right to receive payment is established. Interest income is recognised on time proportion basis taking into account the amount outstanding and the rate applicable.
(D) EMPLOYEE BENEFITS
(i) Short-term employee benefits are recognised as an expense at the undiscounted amount in the Consolidated Statement of Profit and Loss of the year in which the employee has rendered services.
(ii) For defined-benefit plans, the amount recognised in the Balance Sheet is the present value of the defined-benefit obligation less the fair value of any plan assets and any past service costs not yet recognised. The present value of the defined-benefit obligation is the present value of expected future payments required to settle the obligation resulting from employee service in the current and prior periods. The discount rate used is the market yields on Government Bonds at the Balance Sheet date with remaining terms to maturity approximating those of the Group’s obligations. In some of the foreign subsidiaries, the present value is determined using the AA rated corporate bonds.
(iii) Other long-term employee benefits are recognised as an expense in the Consolidated Statement of Profit and Loss of the year in which the employee has rendered services. Estimated liability on account of long-term benefits is discounted to the present value, using the market yield on Government Bonds, as on the date of Balance Sheet, as the discounting rate. In some of the foreign subsidiaries, the present value is determined using the AA rated corporate bonds.
(iv) Actuarial gains and losses in respect of post employment and other long-term benefits are charged in the Consolidated Statement of Profit and Loss. However, in one of the subsidiaries (Tata Steel Europe Limited) because of volatility caused by periodic changes in the assumptions underlying the computation of the pension and other post retirement benefit liabilities, it is not considered practicable to adopt a common accounting policy for accounting for these liabilities of the Company and Tata Steel Europe Limited. The actuarial gains and losses for these liabilities of Tata Steel Europe Limited have been accounted in Reserves and Surplus.
F-174

NOTES FORMING PART OF THE FINANCIAL STATEMENTS
(v) In respect of the Employee Separation Scheme, the increase in the net present value of the future liability for pension payable to employees, who have opted for retirement under the Employee Separation Scheme of the Company, is charged to the Consolidated Statement of Profit and Loss.
(E) EXPLORATION FOR AND EVALUATION OF MINERAL
RESOURCES
Expenditures associated with search for specific mineral resources are recognised as an asset within fixed assets. The following expenditure generally comprises cost of exploration and evaluation:
• obtaining of the rights to explore and evaluate mineral reserves and resources including costs directly related to this acquisition
• researching and analysing existing exploration data • conducting geological studies, exploratory drilling and
sampling • examining and testing extraction and treatment methods • compiling pre-feasibility and feasibility studies • activities in relation to evaluating the technical
feasibility and commercial viability of extracting a mineral resource.
Administration and other overhead costs are charged to the cost of exploration and evaluation only if directly related to an exploration and evaluation project.
If a project does not prove viable, all irrecoverable exploration and evaluation expenditure associated with the project net of any related impairment allowances is written off to the Consolidated Statement of Profit and Loss.
The Group measures such assets at cost and classifies as tangible or intangible according to the nature of the assets acquired and applies the classification consistently. Exploration and evaluation expenditure considered to be tangible are recorded as a component of fixed assets at cost less impairment charges, otherwise, they are recorded as intangible assets. To the extent that tangible asset is consumed in developing an intangible asset, the amount reflecting that consumption is capitalised as a part of the cost of the intangible asset.
As the asset is not available for use, it is not depreciated. All exploration and evaluation expenditures are monitored for indications of impairment.
(F) TANGIBLE ASSETS
Tangible assets are stated at cost less accumulated depreciation and net of impairments, if any. Trial run expenses (net of revenue) are capitalised. Borrowing costs during the period of construction is added to the cost of eligible assets.
Major expenses on relining of furnace are capitalised. The written down value of the asset consisting of lining/relining expenditure embedded in the cost of the furnace is written off in the year of fresh relining.
(G) INTANGIBLE ASSETS
Intangible assets are stated at cost less accumulated amortisation and net of impairments, if any. An intangible asset is recognised if it is probable that the expected future economic benefits that are attributable to the asset will flow to the Group and its cost can be measured reliably. Intangible assets having finite useful lives are amortised on a straight-line basis over their estimated useful lives.
(H) DEPRECIATION AND AMORTISATION
(i) Capital assets whose ownership does not vest with the Group are depreciated over their estimated useful life or five years, whichever is less.
(ii) Depreciation is provided on a straight line basis over the useful lives of assets, which is as stated in Schedule II of Companies Act 2013 or based on technical estimate made by the Company. However, assets value upto `25,000 are fully depreciated in the year of acquisition. The details of estimated life for each category of asset are as under:
(a) Buildings and Roads – 30 to 60 years (b) Roads – 5 years (c) Plant and Machinery – 3 to 40 years (d) Railway Sidings/Lines – 20 years (e) Vehicles and Aircraft – 5 to 20 years (f ) Furniture, Fixtures and Office Equipments – 4 to
6 years (g) Intangibles (Computer Software) – 5 to 10 years (h) Development of property for development of
mines and collieries are amortised over the useful life of the mine or lease period whichever is less, subject to maximum of 10 years.
(i) Major furnace relining expenses are depreciated over a period of 5 to 10 years (average expected life).
(j) Freehold land is not depreciated. (k) Leasehold land and other leasehold assets are
amortised over the life of the lease.
2. Accounting Policies (contd.)
F-175
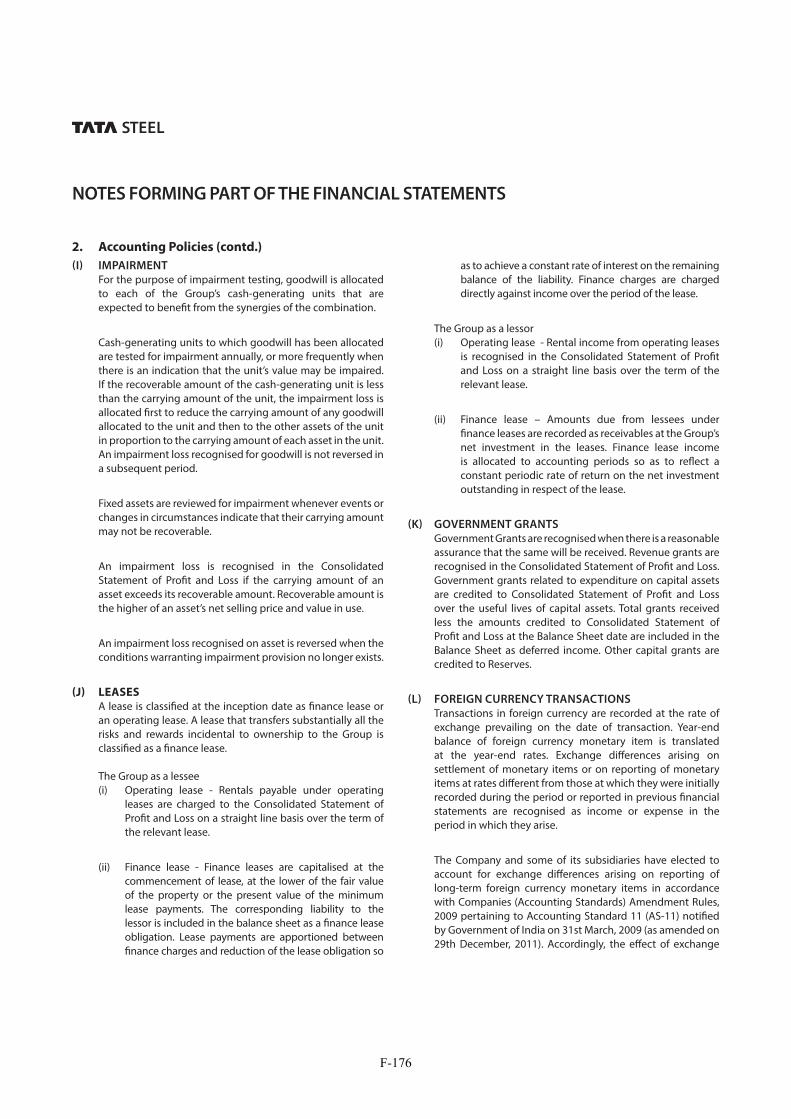
NOTES FORMING PART OF THE FINANCIAL STATEMENTS
(I) IMPAIRMENT
For the purpose of impairment testing, goodwill is allocated to each of the Group’s cash-generating units that are expected to benefit from the synergies of the combination.
Cash-generating units to which goodwill has been allocated are tested for impairment annually, or more frequently when there is an indication that the unit’s value may be impaired. If the recoverable amount of the cash-generating unit is less than the carrying amount of the unit, the impairment loss is allocated first to reduce the carrying amount of any goodwill allocated to the unit and then to the other assets of the unit in proportion to the carrying amount of each asset in the unit. An impairment loss recognised for goodwill is not reversed in a subsequent period.
Fixed assets are reviewed for impairment whenever events or changes in circumstances indicate that their carrying amount may not be recoverable.
An impairment loss is recognised in the Consolidated Statement of Profit and Loss if the carrying amount of an asset exceeds its recoverable amount. Recoverable amount is the higher of an asset’s net selling price and value in use.
An impairment loss recognised on asset is reversed when the conditions warranting impairment provision no longer exists.
(J) LEASES
A lease is classified at the inception date as finance lease or an operating lease. A lease that transfers substantially all the risks and rewards incidental to ownership to the Group is classified as a finance lease.
The Group as a lessee (i) Operating lease - Rentals payable under operating
leases are charged to the Consolidated Statement of Profit and Loss on a straight line basis over the term of the relevant lease.
(ii) Finance lease - Finance leases are capitalised at the commencement of lease, at the lower of the fair value of the property or the present value of the minimum lease payments. The corresponding liability to the lessor is included in the balance sheet as a finance lease obligation. Lease payments are apportioned between finance charges and reduction of the lease obligation so
as to achieve a constant rate of interest on the remaining balance of the liability. Finance charges are charged directly against income over the period of the lease.
The Group as a lessor (i) Operating lease - Rental income from operating leases
is recognised in the Consolidated Statement of Profit and Loss on a straight line basis over the term of the relevant lease.
(ii) Finance lease – Amounts due from lessees under finance leases are recorded as receivables at the Group’s net investment in the leases. Finance lease income is allocated to accounting periods so as to reflect a constant periodic rate of return on the net investment outstanding in respect of the lease.
(K) GOVERNMENT GRANTS
Government Grants are recognised when there is a reasonable assurance that the same will be received. Revenue grants are recognised in the Consolidated Statement of Profit and Loss. Government grants related to expenditure on capital assets are credited to Consolidated Statement of Profit and Loss over the useful lives of capital assets. Total grants received less the amounts credited to Consolidated Statement of Profit and Loss at the Balance Sheet date are included in the Balance Sheet as deferred income. Other capital grants are credited to Reserves.
(L) FOREIGN CURRENCY TRANSACTIONS
Transactions in foreign currency are recorded at the rate of exchange prevailing on the date of transaction. Year-end balance of foreign currency monetary item is translated at the year-end rates. Exchange differences arising on settlement of monetary items or on reporting of monetary items at rates different from those at which they were initially recorded during the period or reported in previous financial statements are recognised as income or expense in the period in which they arise.
The Company and some of its subsidiaries have elected to account for exchange differences arising on reporting of long-term foreign currency monetary items in accordance with Companies (Accounting Standards) Amendment Rules, 2009 pertaining to Accounting Standard 11 (AS-11) notified by Government of India on 31st March, 2009 (as amended on 29th December, 2011). Accordingly, the effect of exchange
2. Accounting Policies (contd.)
F-176

NOTES FORMING PART OF THE FINANCIAL STATEMENTS
differences on foreign currency loans of the Group is accounted by addition or deduction to the cost of the assets so far it relates to depreciable capital assets and in other cases by transfer to “Foreign Currency Monetary Item Translation Difference Account” to be amortised over the balance period of the long-term monetary items.
Exchange differences relating to monetary items that are in substance forming part of the Company’s net investment in non-integral foreign operations are accumulated in Foreign Exchange Fluctuation Reserve Account.
Foreign currency monetary items that are used as hedge instruments or hedged items are accounted as per accounting policy on derivative financial instruments.
(M) DERIVATIVE FINANCIAL INSTRUMENTS
i) The Group uses derivative financial instruments such as Forwards, Swaps and Options to hedge its risks associated with foreign exchange fluctuations. Such derivative financial instruments are used as risk management tools and not for speculative purposes.
ii) Derivative financial instruments entered into for hedging foreign exchange risks of recognised foreign currency monetary items are accounted for as per the principles laid down in Accounting Standard 11 “The effects of changes in Foreign Exchange Rates”.
iii) For derivative financial instruments and foreign currency monetary items designated as Cash Flow hedges, the effective portion of the fair value changes of the derivative financial instruments are recognised in Cash Flow Hedge Reserve and reclassified in the period in which the Consolidated Statement of Profit and Loss is impacted by the hedged items. In cases where the exposure gives rise to a non-financial asset, the effective portion is reclassified from Hedging Reserve to the initial carrying amount of the non-financial asset as a ‘basis adjustment’ and recycled to the Consolidated Statement of Profit and Loss when the respective non-financial asset affects the Consolidated Statement of Profit and Loss in future periods. The ineffective portion of the change in fair value of such instruments is recognised in the Consolidated Statement of Profit and Loss in the period in which they arise. Hedge accounting is discontinued when the hedging instrument expires
or is sold, terminated, or exercised, or no longer qualifies for hedge accounting. For forecasted transactions, any cumulative gain or loss on the hedging instrument recognised in Cash Flow Hedge Reserve is retained there until the forecasted transaction occurs.
If the forecasted transaction is no longer expected to occur, the net cumulative gain or loss recognised in Cash Flow Hedge Reserve is immediately transferred to the Consolidated Statement of Profit and Loss.
iv) If no hedging relationship is designated, the fair value of the derivative financial instruments is marked to market through the Consolidated Statement of Profit and Loss.
(N) INVESTMENTS
Long-term investments are carried at cost less provision for diminution other than temporary, if any, in value of such investments. Current investments are carried at lower of cost and fair value.
(O) INVENTORIES
Finished and semi-finished products produced and purchased by the Group are carried at lower of cost and net realisable value.
Work-in-progress is carried at lower of cost and net realisable value.
Coal, iron ore and other raw materials produced and purchased by the Group are carried at lower of cost and net realisable value.
Stores and spare parts are carried at cost. Necessary provision is made and expensed in case of identified obsolete and non-moving items.
Cost of inventories is generally ascertained on the ‘weighted average’ basis. Work-in-progress and finished and semi-finished products are valued on full absorption cost basis.
(P) RELINING EXPENSES
Relining expenses other than major expenses on furnace relining are charged as an expense in the Consolidated Statement of Profit and Loss in the year in which they are incurred.
2. Accounting Policies (contd.)
F-177

NOTES FORMING PART OF THE FINANCIAL STATEMENTS
(Q) RESEARCH AND DEVELOPMENT
Research and development costs (other than cost of fixed assets acquired) are charged as an expense in the Consolidated Statement of Profit and Loss in the year in which they are incurred.
(R) DEFERRED TAX
Deferred Tax is accounted for by computing the tax effect of timing differences, subject to the consideration of prudence in respect of deferred tax assets, which arise during the year and reverse in subsequent periods. Deferred tax is measured at substantively enacted tax rates by the Balance Sheet date.
3. Share Capital
(` in million)
As at
31st March, 2016
As at
31st March, 2015
AUTHORISED
1,75,00,00,000 Ordinary Shares of `10 each (31.03.2015: 1,75,00,00,000 Ordinary Shares of `10 each)
17,500.0 17,500.0
35,00,00,000 “A” Ordinary Shares of `10 each (31.03.2015: 35,00,00,000 “A” Ordinary Shares of `10 each)
3,500.0 3,500.0
2,50,00,000 Cumulative Redeemable Preference Shares of `100 each (31.03.2015: 2,50,00,000 Shares of `100 each)
2,500.0 2,500.0
60,00,00,000 Cumulative Convertible Preference Shares of `100 each (31.03.2015: 60,00,00,000 Shares of `100 each)
60,000.0 60,000.0
83,500.0 83,500.0
ISSUED
97,21,26,020 Ordinary Shares of `10 each (31.03.2015: 97,21,26,020 Ordinary Shares of `10 each)
9,721.3 9,721.3
Subscribed and Paid up:
97,00,47,046@ Ordinary Shares of `10 each fully paid up (31.03.2015: 97,12,15,439 Ordinary Shares of `10 each)
9,700.5 9,712.1
Add: Amount paid-up on 3,89,516 Ordinary Shares forfeited (31.03.2015: 3,89,516 Ordinary Shares of `10 each)
1.9 2.0
9,702.4 9,714.1
@ Excludes 11,68,393 Ordinary Shares (31.03.2015 : Nil) held by a subsidiary.
2. Accounting Policies (contd.)
(S) TAX ON INCOME
Tax on income is determined on the basis of taxable income and tax credits computed in accordance with the provisions of applicable tax laws of the respective countries.
Foreign companies recognise tax liabilities and assets in accordance with the applicable local laws.
F-178

NOTES FORMING PART OF THE FINANCIAL STATEMENTS
4. Reserves and Surplus
(` in million)
As at
31st March, 2016
As at
31st March, 2015
(A) CAPITAL RESERVE
Balance as per last account 572.1 547.0Equity accounting of associates – 25.1
572.1 572.1
(B) CAPITAL REDEMPTION RESERVE
Balance as per last account 1,331.1 868.1Transfer from Surplus in Consolidated Statement of Profit and Loss – 463.0
1,331.1 1331.1
(C) SECURITIES PREMIUM RESERVE
Balance as per last account 1,78,507.8 1,78,403.5Premium on issue of Ordinary Shares – –Expenses/reimbursement related to CARS/NCD/GDR/Hybrid Securities/preferential and public issue of equity share
– 38.9
Effect of tax rate changes on items adjusted against reserves – 65.4 1,78,507.8 1,78,507.8
(D) DEBENTURE REDEMPTION RESERVE
Balance as per last account 20,460.0 20,460.0Transfer to General Reserve – –
20,460.0 20,460.0
(E) AMALGAMATION RESERVE
Balance as per last account 2.6 2.6
(F) EXPORT PROFITS RESERVE
Balance as per last account 12.5 12.5
(G) FOREIGN EXCHANGE FLUCTUATION RESERVE
Balance as per last account 140.0 140.0
(H) CONTRIBUTIONS FOR CAPITAL EXPENDITURE
Balance as per last account 1,332.9 1,268.3Received/capitalised during the year 211.2 100.7Released to Consolidated Statement of Profit and Loss (37.9) (36.1)
1,506.2 1,332.9
(I) CONTINGENCY RESERVE
Balance as per last account 1,000.0 1,000.0
(J) DEBENTURE FORFEITURE RESERVE
Balance as per last account 0.4 0.4
(K) CAPITAL RESERVE ON CONSOLIDATION
Balance as per last account 734.4 178.8Additions on account of acquisitions 2.8 555.6Less: Recycled to Consolidated Statement of Profit and Loss on disposal of Tata Incorporated
(80.6) –
656.6 734.4
(L) INVESTMENT ALLOWANCE/(UTILISED) RESERVE
Balance as per last account 2.3 2.3
(M) FOREIGN CURRENCY TRANSLATION RESERVE
Balance as per last account 67,547.2 59,507.6Translation of Non Integral Foreign Operations 1,919.7 8,039.6
69,466.9 67,547.2
F-179

NOTES FORMING PART OF THE FINANCIAL STATEMENTS
(` in million)
As at
31st March, 2016
As at
31st March, 2015
(N) SPECIAL RESERVE
Balance as per last account 57.6 45.6Transfer from Surplus in Consolidated Statement of Profit and Loss 31.2 12.0Transfer to General Reserve – –
88.8 57.6
(O) STATUTORY RESERVE Balance as per last account 2,544.4 1,878.1Transfer from Surplus in Consolidated Statement of Profit and Loss – 666.3Transfer to Consolidated Statement of Profit and Loss (2,196.6) –Exchange gain/(loss) during the period 406.4 –
754.2 2544.4
(P) ACTUARIAL GAIN/(LOSS) RESERVE
Balance as per last account (1,21,095.0) (68,515.3)Actuarial gain/(loss) (net of tax) during the year 12,312.3 (52,579.7)
(1,08,782.7) (1,21,095.0)
(Q) CASH FLOW HEDGE RESERVE (1)
Balance as per last account 2,016.3 (34.1)Changes recognised (net of tax) (1,814.3) 2,050.4
202.0 2,016.3
(R) GENERAL RESERVE
Balance as per last account 1,21,974.9 1,14,677.2Add: Adjustment on acquisition of Rujuvalika Investments Limited as on 30th April, 2015
(359.6) –
Transfer from Surplus in Consolidated Statement of Profit and Loss 317.7 7,297.71,21,933.0 1,21,974.9
(S) FOREIGN CURRENCY MONETARY ITEM TRANSLATION DIFFERENCE ACCOUNT (2)
Balance as per last account (1,619.0) (3,319.4)Exchange gain/(loss) during the year 28.0 (2,069.6)Amortisation during the year 351.7 3,770.0
(1,239.3) (1,619.0)
(T) SURPLUS IN THE CONSOLIDATED STATEMENT OF PROFIT AND LOSS
Balance as per last account 28,257.5 88,482.3Profit/(Loss) for the year (30,493.2) (39,255.2)Adjustment on account of Schedule II of the Companies Act, 2013(Net of Tax) (3)
– (1,362.3)
Distribution on Hybrid Perpetual Securities [net of tax of `921.2 million (2014-15: `904.5 million)]
(1,740.6) (1,756.6)
Proposed dividend on Ordinary Shares (7,760.4) (7,769.7)Tax on dividend (1,639.4) (1,642.0)Transfers to Reserves: General Reserve (317.7) (7,297.7) Special Reserve (31.2) (12.0) Capital Redemption Reserve – (463.0) Statutory Reserve 2,196.6 (666.3)
(11,528.4) 28,257.5
2,75,086.1 3,03,780.0
4. Reserves and Surplus (contd.)
F-180

NOTES FORMING PART OF THE FINANCIAL STATEMENTS
Additional information:
(` in million)
As at
31st March, 2016
As at
31st March, 2015
(1) (a) Opening Balance of Cash Flow Hedge Reserve 2,016.3 (34.1)Add: Effective portion of changes in fair value of cash flow hedges 1,053.1 2,943.3Less: Recycled to Consolidated Statement of Profit and Loss (2,927.9) (1,219.8)Less: Basis Adjustment 66.7 317.7Gross Balance of Cash Flow Hedge Reserve 208.2 2,007.1
Add: Deferred tax on above (6.2) 9.2Net balance of Cash Flow Hedge Reserve 202.0 2,016.3
(b) A credit of `232.6 million (31.03.2015: Credit of `2,059.5 million) is expected to impact the Consolidated Statement of Profit and Loss within one year, a debit of `26.8 million (31.03.2015: Debit of `43.2 million) between one to five years and a debit of `3.8 million (31.03.2015: Nil) in more than five years.
(c) Ineffective portion taken to Consolidated Statement of Profit and Loss during the year `0.5 million (31.03.2015: `4.4 million).
(2) The Company and some of its subsidiaries have elected to account for exchange differences arising on reporting of long-term foreign currency monetary items in accordance with Companies (Accounting Standards) Amendment Rules 2009 pertaining to Accounting Standard 11 (AS-11) notified by Government of India on 31st March, 2009 (as amended on 29th December, 2011) which allows foreign exchange differences on long-term monetary items arising on or after 1st April, 2011 to be capitalised to the extent they relate to acquisition of depreciable assets and in other cases to amortise over the balance period to maturity of the respective monetary items.
As on 31st March, 2016, ̀ 1,239.3 million (31.03.2015: ̀ 1,619.0 million) remains to be amortised in the “Foreign Currency Monetary Item Translation Difference Account”.
(3) During the year ended 31st March, 2015, the Company and some of its group companies has revised depreciation rate on certain fixed assets as per the useful life specified in the Companies Act, 2013 or re-assessed by the Company based on technical evaluation. Accordingly, depreciation of `1,362.4 million (net of deferred tax of `712.5 million) on account of assets whose useful life is already exhausted as on 1st April, 2014 has been adjusted to retained earnings.
Had there been no change in useful life of assets, depreciation for the year ended 31st March, 2015 would have been higher by `343.1 million.
4. Reserves and Surplus (contd.)
F-181

NOTES FORMING PART OF THE FINANCIAL STATEMENTS
5. Preference Shares Issued by Subsidiary Companies
(` in million)
As at
31st March, 2016
As at
31st March, 2015
Preference Shares issued by a subsidiary company 200.0 200.0200.0 200.0
Additional information:
(1) 8.50% – 20,00,000 non-cumulative Redeemable Preference Shares (RPS) of ̀ 100 each were issued by Tayo Rolls Limited, a subsidiary of the Company in March 2012. These RPS are redeemable in 3 equal annual installments with all arrears of dividend, if any, commencing from 1st April, 2020. The subsidiary may exercise its call option by giving 30 days clear notice at the expiry of 36 months from the date of allotment thereof.
6. Hybrid Perpetual Securities
(` in million)
As at
31st March, 2016
As at
31st March, 2015
Hybrid Perpetual Securities 22,750.0 22,750.022,750.0 22,750.0
Additional information:(1) The Company issued Hybrid Perpetual Securities of `7,750.0 million and `15,000.0 million in May 2011 and March 2011 respectively.
These securities are perpetual in nature with no maturity or redemption and are callable only at the option of the Company. The distribution on these securities are 11.50% p.a. and 11.80% p.a. respectively, with a step up provision if the securities are not called after 10 years. The distribution on the securities may be deferred at the option of the Company, if in the six months preceding the relevant distribution payment date, the Company has not made payment on, or repurchased or redeemed, any securities ranking pari passu with, or junior to the instrument. As these securities are perpetual in nature and the Company does not have any redemption obligation, these are not classified as ‘debt’.
F-182

NOTES FORMING PART OF THE FINANCIAL STATEMENTS
7. Borrowings
(` in million)
As at
31st March, 2016
As at
31st March, 2015
Long-Term Short-Term Total Long-Term Short-Term Total
A. SECURED BORROWINGS
(a) Bonds/Debentures(i) Non-convertible bonds/debentures 1,250.0 – 1,250.0 1,250.0 – 1,250.0
(b) Term loans(i) From banks (1) 2,07,436.8 67,031.5 2,74,468.3 2,00,014.7 60,056.4 2,60,071.1(ii) From financial institutions and others(2) 35,650.7 – 35,650.7 23,716.2 – 23,716.2
(c) Repayable on demand(i) From banks – 1,586.1 1,586.1 – 3,192.4 3,192.4
(d) Finance lease obligations 6,102.6 – 6,102.6 4,997.0 – 4,997.0(e) Other loans – – – – 20.8 20.8
2,50,440.1 68,617.6 3,19,057.7 2,29,977.9 63,269.6 2,93,247.5
B. UNSECURED BORROWINGS
(a) Bonds/Debentures(i) Non-convertible bonds/debentures 2,13,589.2 – 2,13,589.2 2,11,040.2 – 2,11,040.2
(b) Term loans(i) From banks 2,13,089.4 52,957.5 2,66,046.9 2,00,534.3 29,605.1 2,30,139.4(ii) From financial institutions and others – – – 8,490.0 – 8,490.0
(c) Deferred payment liabilities 55.8 – 55.8 25.3 – 25.3(d) Commercial paper – 32,348.5 32,348.5 – – –(e) Finance lease obligations 4,396.7 – 4,396.7 3,921.1 – 3,921.1(f ) Other loans 1,969.7 575.2 2,544.9 2,763.2 3,110.8 5,874.0
4,33,100.8 85,881.2 5,18,982.0 4,26,774.1 32,715.9 4,59,490.0
6,83,540.9 1,54,498.8 8,38,039.7 6,56,752.0 95,985.5 7,52,737.5Additional information:(1) Major portion of bank borrowings relate to finance raised by Tata Steel UK Holdings Limited, a wholly owned indirect subsidiary of
Tata Steel Limited. These borrowings are secured by guarantees granted by material subsidiaries of Tata Steel Europe Limited (other than Tata Steel Nederland B.V. and its subsidiaries) and by a share pledge over the shares of Tata Steel Nederland B.V.
Apart from the above, bank borrowings raised by other Companies within the Group are secured by a charge on their immovable properties and hypothecation of movable properties.
(2) Includes loan from Joint Plant Committee – Steel Development Fund of `23,389.1 million (31.03.2015: `22,323.6 million) which also includes funded interest `6,995.8 million (31.03.2015: `5,930.3 million). The security details of the same are provided on.
(3) The maturity profile of borrowings (including current maturities of long-term borrowings) is as follows:
(` in million)
As at
31st March, 2016
As at
31st March, 2015
In one year or less or on demand 1,79,371.8 1,50,840.1Between one-two years 17,943.5 29,831.4Between two-three years 25,654.9 22,158.8Between three-four years 1,26,906.5 24,361.5Between four-five years 1,01,966.9 91,358.5More than five years 4,15,129.5 4,92,490.2
8,66,973.1 8,11,040.5
Less: Unearned interest on Finance lease obligation (4,935.3) (4,027.6)8,62,037.8 8,07,012.9
F-183

NOTES FORMING PART OF THE FINANCIAL STATEMENTS
(4) The interest rate exposure of the above borrowings at the end of the year is as follows:
(` in million)
As at
31st March, 2016
As at
31st March, 2015
Fixed Rate Borrowings 2,97,844.2 2,51,538.4 Floating Rate Borrowings 5,64,193.6 5,55,474.5
8,62,037.8 8,07,012.9
The majority of floating rate borrowings bear interest rates based on LIBOR, EURIBOR or other official rates.
8. Deferred Tax Liabilities/(Assets)
(` in million)
As at
31st March, 2016
As at
31st March, 2015
DEFERRED TAX LIABILITIES
(a) Differences in depreciation and amortisation for 40,592.9 44,434.9accounting and income tax purposes
(b) Prepaid expenses 677.3 683.6(c) Actuarial gain/(loss) 26,845.7 8,391.4(d) Others 6,747.4 6,792.8
74,863.3 60,302.7
DEFERRED TAX ASSETS
(a) Unabsorbed losses (23,820.9) (12,774.0)(b) Employee separation compensation (4,618.2) (3,192.9)(c) Provision for doubtful debts and advances (1,097.7) (958.4)(d) Disallowance under Section 43B of Income Tax Act, 1961 (5,705.6) (3,801.1)(e) Provision for employee benefits (5,206.4) (4,985.7)(f ) Redemption premium on issue of non-convertible debenture (2,675.1) (3,116.5)(g) Discount on issue of non-convertible debenture (471.9) (549.7)(h) Others (2,437.2) (2,306.7)
(46,033.0) (31,685.1)
Deferred tax liabilities/(assets) 28,830.3 28,617.6
Amount recognised in Balance Sheet
Deferred tax liabilities [Item No. 5(b)] 29,048.8 28,845.1Deferred tax assets [Item No. 7(d)] (218.5) (227.5)
28,830.3 28,617.6
7. Borrowings (contd.)
F-184

NOTES FORMING PART OF THE FINANCIAL STATEMENTS
9. Other Long-term Liabilities
(` in million)
As at
31st March, 2016
As at
31st March, 2015
(a) Creditors for capital supplies/services 6,296.1 9,407.6(b) Deferred income 1,582.8 1,650.0(c) Creditors for other liabilities 5,958.0 6,430.4
13,836.9 17,488.0
10. Provisions
(` in million)
As at
31st March, 2016
As at
31st March, 2015
Long-Term Short-Term Total Long-Term Short-Term Total
(a) Provision for employee benefits 49,489.4 2,060.5 51,549.9 56,655.0 1,925.4 58,580.4(b) Provision for employee separation
compensation(1)7,776.2 2,218.1 9,994.3 4,456.1 1,330.2 5,786.3
(c) Provision for taxation 0.2 11,579.1 11,579.3 – 9,955.5 9,955.5(d) Provision for fringe benefits tax – 49.8 49.8 – 50.1 50.1(e) Proposed dividend – 7,760.4 7,760.4 – 7,769.7 7,769.7(f ) Other provisions(2) 18,961.2 11,426.3 30,387.5 13,926.5 6,004.3 19,930.8
76,227.0 35,094.2 1,11,321.2 75,037.6 27,035.2 1,02,072.8
Additional information:(1) Provision for employee separation compensation has been calculated on the basis of net present value of the future monthly
payments of pension and lump sum benefits under the scheme including `5,202.1 million (2014-15: `339.5 million) in respect of schemes introduced during the year.
(2) Includes provision for rationalisation and redundancy.
11. Trade Payables
(` in million)
As at
31st March, 2016
As at
31st March, 2015
(a) Creditors for supplies/services(1) 1,67,209.2 1,56,721.1(b) Creditors for accrued wages and salaries 36,673.3 35,177.5
2,03,882.5 1,91,898.6
Additional information:(1) The amount due to Micro and Small Enterprises as defined in the “The Micro, Small and Medium Enterprises Development Act,
2006” has been determined to the extent such parties have been identified on the basis of information available with the Group. The disclosures relating to Micro and Small Enterprises as at 31st March, 2016 are as under:
F-185

NOTES FORMING PART OF THE FINANCIAL STATEMENTS
(` in million)
Year ended
31st March, 2016
Year ended
31st March, 2015
Description
(i) The principal amount remaining unpaid to supplier as at the end of the year 206.8 228.7(ii) The interest due thereon remaining unpaid to supplier as at the end of the year 8.1 6.4(iii) The amount of interest paid in terms of section 16 along with the amount of payment
made to supplier beyond the appointment day during the year 2010-11124.6 146.0
(iv) The amount of interest due and payable for the period of delay in making payment (which have been paid but beyond the appointed day during the year) but without adding the interest specified under this Act
48.1 45.0
(v) The amount of interest accrued during the year and remaining unpaid at the end of the year
55.6 51.0
12. Other Current Liabilities
(` in million)
As at
31st March, 2016
As at
31st March, 2015
(a) Current maturities of long-term borrowings 22,655.9 53,199.3(b) Current maturities of finance lease obligations 1,342.2 1,076.1(c) Interest accrued but not due on borrowings 7,468.6 9,324.5(d) Unpaid dividend 636.2 633.9(e) Advances received from customers 4,780.9 3,672.7(f ) Creditors for capital supplies/services 32,730.7 31,850.4(g) Creditors for other liabilities(1) 42,475.6 45,039.0
1,12,090.1 1,44,795.9
Additional information:(1) Includes liability for VAT, Sales tax, Excise duty etc.
11. Trade Payables (contd.)
F-186

NOTES FORMING PART OF THE FINANCIAL STATEMENTS
13. Tangible Assets
(` in million)
Tangible Assets Freehold
Land and
Roads
Leasehold
Land
Buildings(3) Leasehold
Buildings
Plant and
Machinery
Leased
Plant and
Machinery
Furniture
and Fixtures
(FF)
Office
Equipments
(OE)
Vehicles Leased
FFOE and
Vehicles
Railway
Sidings/
Lines
Total
Gross block as at 01.04.2016 15,528.7 8,800.1 1,34,200.5 7,659.0 12,24,814.6 17,675.6 9,164.7 4,033.5 3,663.9 95.4 12,388.9 14,38,024.9
18,259.7 9,322.2 1,43,853.4 7,557.0 12,64,840.2 19,404.1 10,640.1 3,846.7 3,401.2 94.4 14,163.2 14,95,382.2 Assets of new companies – – – – – – – – – – – –
16.4 10.8 138.4 611.1 548.2 – – – – – – 1,324.9Additions during the year(1) 1,640.5 2,118.7 4,448.6 316.6 33,820.5 1,928.2 173.6 327.8 334.8 1.6 391.3 45,502.2
647.7 3,963.0 7,463.8 165.2 75,602.6 221.2 333.3 585.2 614.9 1.1 2,515.1 92,113.1Deductions during the year(2) (69.1) (0.1) (769.0) (2.3) (8,220.8) (399.6) (242.7) (57.5) (138.4) – – (9,899.5)
(237.4) (37.6) (2,775.8) (3.4) (18,179.7) (34.3) (247.8) (117.2) (280.7) – (6.6) (21,920.5)Disposal of group undertakings (29.6) – (394.0) – (628.6) – – – – – – (1,052.2)
(29.2) (5,735.1) (3,763.6) (147.8) (8,633.8) (105.2) (30.4) (206.0) (14.4) – (3,206.7) (21,872.2)Transfers and other movements(1) 3.8 – (293.2) 47.1 1,241.3 – 22.3 93.9 31.6 – – 1,146.8
(2,022.2) 1,362.9 415.6 – (436.6) 296.3 (56.0) 9.9 – – (12.7) (442.8)Exchange fluctuations capitalised during the year
– – 11.2 – 1,105.4 – – – – – – 1,116.6
– – 10.8 – 427.5 – – – – – – 438.3Exchange difference on consolidation 584.7 66.6 5371.1 415.3 42,251.0 1,063.4 817.4 86.0 43.7 – 599.0 51,298.2
(1,106.3) (86.1) (11,142.1) (523.1) (89,353.8) (2,106.5) (1,474.5) (85.1) (57.1) (0.1) (1,063.4) (1,06,998.1)Gross block as at 31.03.2016 17,659.0 10,985.3 1,42,575.2 8,435.7 12,94,383.4 20,267.6 9,935.3 4,483.7 3,935.6 97.0 13,379.2 15,26,137.0
15,528.7 8,800.1 1,34,200.5 7,659.0 12,24,814.6 17,675.6 9,164.7 4,033.5 3,663.9 95.4 12,388.9 14,38,024.9Impairment as at 01.04.2015 1,220.7 7.2 8,613.6 465.2 88,894.9 3,115.4 49.2 67.3 43.5 – 319.6 1,02,796.6
2,516.5 7.2 7,815.2 391.0 71,939.5 1,063.3 12.7 0.2 0.5 – – 83,746.1Impairment during the year 5,46.5 – 66.9 8.8 72,035.4 1,398.3 31.1 7.4 12.6 – 199.7 74,306.7
280.4 0.5 1,717.9 109.9 24,769.9 2,271.9 38.7 65.7 42.2 – 312.7 29,609.8Reversal during the year – – (104.4) – (91.5) – – (0.6) (0.7) – – (197.2)
(1,362.9) – – – (225.6) – – – – – – (1,588.5)Deduction on disposals(1) – – (282.7) – (19.2) – (2.6) (0.6) (10.2) – – (315.3)
– – (253.4) – (260.8) – (0.1) – – – – (514.3)Disposal of group undertaking – – – – (215.7) – – – – – – (215.7)
– – – – (925.5) – – – – – – (925.5)Transfers and other movements(1) – – 61.7 – 2,580.7 – – – – – – 2,642.4
– – – – 191.2 – – – – – – 191.2Exchange difference on consolidation 112.0 0.2 331.8 14.5 387.3 50.5 4.0 3.8 2.7 – 13.2 920.0
(213.3) (0.5) (666.1) (35.7) (6,593.8) (219.8) (2.1) 1.4 0.8 – 6.9 (7,722.2)Impairment as at 31.03.2016 1,879.2 7.4 8,686.9 488.5 1,63,571.9 4,564.2 81.7 77.3 47.9 – 532.5 1,79,937.5
1,220.7 7.2 8,613.6 465.2 88,894.9 3,115.4 49.2 67.3 43.5 – 319.6 1,02,796.6Accumulated depreciation as at 01.04.2015
4,288.1 1,221.0 73,979.3 3,953.7 7,07,361.3 12,702.5 8,407.0 2,819.0 1,700.0 33.4 6,283.8 8,22,749.1
2,384.6 1,516.2 80,413.7 3,977.3 7,35,975.7 13,492.8 9,877.2 2,664.0 1,686.9 28.4 7,125.6 8,59,142.4Impact of adoption of Schedule II – – – – – – – – – – – –
1,125.9 – 26.5 – 883.2 – 1.7 21.4 3.5 – 7.2 2,069.4Depreciation of new companies – – – – – – – – – – – –
– – 24.4 – 164.8 – – – – – – 189.2Depreciation during the year 681.9 142.8 5,871.0 372.4 38,604.1 657.6 263.6 483.7 320.3 6.1 471.2 47,874.7
896.9 344.9 3,549.7 341.4 47,903.5 909.8 261.6 470.9 298.8 5.0 512.9 55,495.4Depreciation on assets written off during the year (1)
– – (390.1) (2.3) (7,130.1) (398.7) (218.9) (51.6) (104.2) – – (8,295.9)
(9.6) (0.3) (2,268.6) (2.1) (16,187.3) (35.7) (253.0) (108.9) (236.5) – (6.3) (19,108.3)Disposal of group undertakings (3.5) – (137.6) – (447.6) – – – – – – (588.7)
– (603.7) (458.9) (75.9) (2,772.4) (63.0) (17.4) (176.6) (5.1) _ (495.6) (4,668.6)Transfers and other movements(1) (4.8) – (18.9) 34.8 (14.4) – 9.0 6.7 3.6 – (1.2) 14.8
(28.1) – 240.7 (30.2) (164.0) (2.8) (39.7) 9.8 – – (36.5) (50.8)Exchange difference on consolidation 46.8 32.4 3,610.7 211.6 27,669.2 776.2 784.7 50.3 33.6 (0.1) 422.9 33,638.3
(81.6) (36.1) (7,548.2) (256.8) (58,442.2) (1,598.6) (1,423.4) (61.6) (47.6) – (823.5) (70,319.6)Accumulated depreciation as at 31.03.2016
5,008.5 1,396.2 82,914.4 4,570.2 7,66,042.5 13,737.6 9,245.4 3,308.1 1,953.3 39.4 7,176.7 8,95,392.3
4,288.1 1,221.0 73,979.3 3,953.7 7,07,361.3 12,702.5 8,407.0 2,819.0 1,700.0 33.4 6,283.8 8,22,749.1Total accumulated depreciation and impairment as at 31.03.2016
6,887.7 1,403.6 91,601.3 5,058.7 9,29,614.4 18,301.8 9,327.1 3,385.4 2,001.2 39.4 7,709.2 10,75,329.8
5,508.8 1,228.2 82,592.9 4,418.9 7,96,256.2 15,817.9 8,456.2 2,886.3 1,743.5 33.4 6,603.4 9,25,545.7Net book value as at 31.03.2016 10,771.3 9,581.7 50,973.9 3,377.0 3,64,769.0 1,965.8 608.2 1,098.3 1,934.4 57.6 5,670.0 4,50,807.2
10,019.9 7,571.9 51,607.6 3,240.1 4,28,558.4 1,857.7 708.5 1,147.2 1,920.4 62.0 5,785.5 5,12,479.2
Additional information:(1) Includes adjustments for inter se transfers and reclassification between tangible assets and intangible assets.(2) Deductions include cost of assets scrapped/surrendered during the year.(3) Buildings include `23.2 million (31.03.2015: `23.2 million) being cost of shares in Co-operative Housing Societies and Limited Companies.(4) Rupee liability has increased by a net amount of `1,116.6 million (2014-15: `438.3 million) arising out of realignment of the value of long-term foreign currency
loans for procurement of tangible assets. This increase has been adjusted in the carrying cost of respective tangible assets and has been depreciated over their remaining depreciable life. The depreciation for the current year has increased by `69.1 million (2014-15 `18.5 million) arising on account of this adjustment.
F-187

NOTES FORMING PART OF THE FINANCIAL STATEMENTS
14. Intangible Assets
(` in million)
Intangible Assets Patents Development
Costs
Software
Costs
Mining
Rights
Development
of Property(3)
Other
Intangible
Assets
Total
Gross block as at 01.04.2016 928.1 4,180.2 19,136.4 6,158.3 41,588.9 2,087.8 74,079.7
1,089.6 4,491.0 20,680.5 6,712.3 32,130.0 940.1 66,043.5Assets of new companies – – – – – – –
– – 6.4 – – – 6.4Additions during the year(1) 0.6 426.0 685.0 – 14,683.6 4.6 15,799.8
3.4 579.8 903.4 268.1 9,182.5 452.1 11,389.3Deductions during the year(2) (1.9) – (87.6) – (70.8) – (160.3)
– – (910.3) – (24.3) – (934.6)Disposal of group undertakings – – (75.0) – – – (75.0)
– – (46.5) (546.3) (789.5) – (1,382.3)Transfers and other movements(1) – – (162.9) – (28,018.6) – (28,181.5)
– – 186.3 196.6 – 695.6 1,078.5 Exchange differences capitalised – – – – – – –
– – – 90.5 2,639.8 – 2,730.3Exchange difference on consolidation 82.4 504.0 709.7 (64.1) 1,715.8 – 2,947.8
(164.9) (890.6) (1683.4) (562.9) (1,549.6) – (4,851.4)Gross block as at 31.03.2016 1,009.2 5,110.2 20,205.6 6,094.2 29,898.9 2,092.4 64,410.5
928.1 4,180.2 19,136.4 6,158.3 41,588.9 2,087.8 74,079.7Impairment as at 01.04.2015 – – 295.3 200.9 12,427.4 324.5 13,248.1
– – 320.8 453.1 801.6 – 1,575.5Impairment during the year 46.5 – 1136.1 – 374.9 – 1,557.5
– – 6.2 196.6 12,159.5 324.5 12,686.8Deduction on disposals – – (0.1) – – (17.9) (18.0)
– – (8.5) – (24.3) – (32.8)Disposal of group undertakings – – – – – – –
– – – (435.0) (746.7) – (1,181.7)Transfers and other movements(1) – – – – – – –
– – – – – – – Exchange difference on consolidation (1.4) – (24.9) (15.9) 745.5 – 703.3
– – (23.4) (13.8) 237.3 – 200.1Impairment as at 31.03.2016 45.1 – 1,406.4 185.0 13,547.8 306.6 15,490.9
– – 295.1 200.9 12,427.4 324.5 13,247.9Accumulated amortisation as at 01.04.2015 805.1 3,280.6 13,806.4 113.5 7,932.5 444.5 26,382.6
936.0 3,511.8 14,102.4 166.0 6,350.9 313.3 25,380.4Impact of adoption of Schedule II – – – – – – –
– – 14.4 – – – 14.4Amortisation during the year 10.6 453.7 1,739.8 115.2 679.9 129.9 3,129.1
18.6 466.1 1,861.9 73.3 1,669.3 66.8 4,156.0 Amortisation on assets written off during the year (1) – – (87.0) – (25.5) – (112.5)
– – (898.4) – – – (898.4)Disposal of group undertakings – – – – – – –
– – (30.5) (111.3) (42.7) – (184.5)Transfers and other movements(1) – – 5.1 – – – 5.1
– – (2.3) – – 64.4 62.1Exchange difference on consolidation 75.7 400.5 516.6 (21.8) 55.9 – 1,026.9
(149.5) (697.3) (1,240.9) (14.5) (45.0) – (2,147.2)Accumulated amortisation as at 31.03.2016 891.4 4,134.8 15,980.9 206.9 8,642.8 574.4 30,431.2
805.1 3,280.6 13,806.6 113.5 7,932.5 444.5 26,382.8Total accumulated amortisation and impairment as at 31.03.2016 936.5 4,134.8 17,387.3 391.9 22,190.6 881.0 45,922.1
805.1 3,280.6 14,101.7 314.4 20,359.9 769.0 39,630.7Net book value as at 31.03.2016 72.7 975.4 2,818.3 5,702.3 7,708.3 1,211.4 18,488.4
123.0 899.6 5,034.7 5,843.9 21,229.0 1,318.8 34,449.0
Additional information:(1) Includes adjustments for inter se transfers and reclassification between intangible assets and tangible assets.(2) Deductions include cost of assets scrapped/surrendered during the year.(3) Development of property represents expenditure incurred on development of mines/collieries.(4) Rupee liability has increased by a net amount of Nil (2014-15: ` 2,730.3 million) arising out of realignment of the value of long-term foreign currency loans taken
for development of mining assets and has been adjusted against the carrying cost of assets.
F-188

NOTES FORMING PART OF THE FINANCIAL STATEMENTS
15. Investments
(` in million)
As at 31st March, 2016 As at 31st March, 2015
Non-current Current Total Non-current Current Total
(a) Investments in equity instruments 15,151.8 – 15,151.8 15,232.0 – 15,232.0(b) Investments in government or trust securities 0.2 – 0.2 0.2 – 0.2(c) Investments in debentures and bonds 4,006.7 – 4,006.7 3,933.1 – 3,933.1(d) Investments in partnership firms 227.1 – 227.1 204.4 – 204.4(e) Investment properties 1,446.5 – 1,446.5 1,392.1 – 1,392.1(f ) Investments in mutual funds 12.9 47,161.0 47,173.9 42.5 13,746.2 13,788.7
20,845.2 47,161.0 68,006.2 20,804.3 13,746.2 34,450.5
Additional information:
(` in million)
As at 31st March, 2016 As at 31st March, 2015
Non-current Current Total Non-current Current Total
(1) Aggregate amount of quoted investments 9,785.9 – 9,785.9 9,859.8 15.0 9,874.8(2) Aggregate amount of unquoted investments
(excluding investment properties)9,612.8 47,161.0 56,773.8 9,552.4 13,731.2 23,283.6
19,398.7 47,161.0 66,559.7 19,412.2 13,746.2 33,158.4
(3) Equity accounted associates(i) Cost of investment
[including `1,429.9 million (31.03.2015: `1,347.5 million) of goodwill (net of capital reserve) arising on consolidation]
8,191.9 7,845.2
(ii) Share of post acquisition profit (net of losses)
(3,286.3) (2,975.6)
4,905.6 4,869.6
(4) Details of equity accounted associates are as follows:
(` in million)
Name of the Company Original cost of
investment (a)
Goodwill/ (Capital
Reserve) (a)
Accumulated
profit/(loss) as at
31.03.2016
Carrying amount
of investments as
at 31.03.2016 (a) (b)
European Profiles (M) Sdn. Bhd. 82.4 – 10.8 93.2
80.1 – 20.9 101.0 GietWalsOnderhoudCombinatie B.V. 107.8 – 86.5 194.3
104.7 – 62.5 167.2 Hoogovens Court Roll Service Technologies Vof 110.0 – 117.7 227.7
106.9 – 83.0 189.9 Industrial Energy Limited 1,731.6 – 277.3 2,008.9
1,634.9 – 351.4 1,986.3 Jamipol Limited 104.0 3.2 360.8 464.8
104.0 3.2 330.3 434.3 Nicco Jubliee Park Limited (`1/-) 3.8 – (3.8) –
3.8 – (3.8) –
F-189
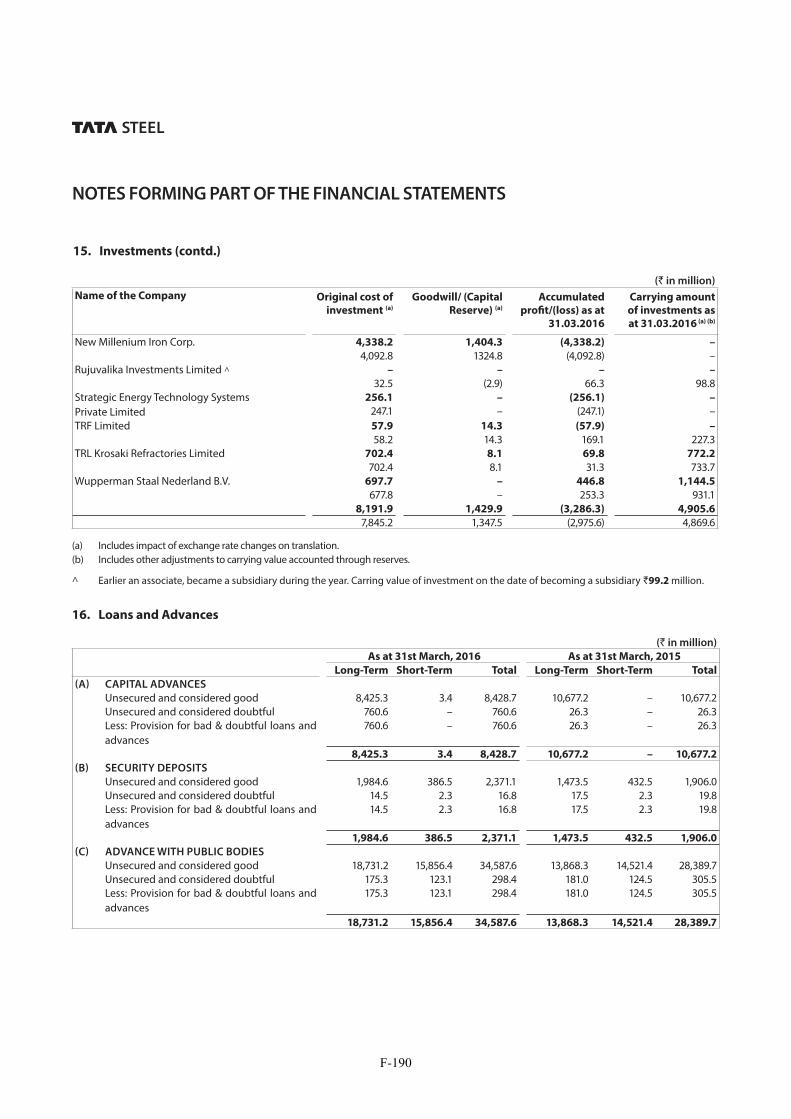
NOTES FORMING PART OF THE FINANCIAL STATEMENTS
(` in million)
Name of the Company Original cost of
investment (a)
Goodwill/ (Capital
Reserve) (a)
Accumulated
profit/(loss) as at
31.03.2016
Carrying amount
of investments as
at 31.03.2016 (a) (b)
New Millenium Iron Corp. 4,338.2 1,404.3 (4,338.2) –
4,092.8 1324.8 (4,092.8) – Rujuvalika Investments Limited ^ – – – –
32.5 (2.9) 66.3 98.8 Strategic Energy Technology Systems Private Limited
256.1 – (256.1) –
247.1 – (247.1) – TRF Limited 57.9 14.3 (57.9) –
58.2 14.3 169.1 227.3 TRL Krosaki Refractories Limited 702.4 8.1 69.8 772.2
702.4 8.1 31.3 733.7 Wupperman Staal Nederland B.V. 697.7 – 446.8 1,144.5
677.8 – 253.3 931.1 8,191.9 1,429.9 (3,286.3) 4,905.6
7,845.2 1,347.5 (2,975.6) 4,869.6
(a) Includes impact of exchange rate changes on translation.(b) Includes other adjustments to carrying value accounted through reserves.
^ Earlier an associate, became a subsidiary during the year. Carring value of investment on the date of becoming a subsidiary `99.2 million.
16. Loans and Advances
(` in million)
As at 31st March, 2016 As at 31st March, 2015
Long-Term Short-Term Total Long-Term Short-Term Total
(A) CAPITAL ADVANCES
Unsecured and considered good 8,425.3 3.4 8,428.7 10,677.2 – 10,677.2Unsecured and considered doubtful 760.6 – 760.6 26.3 – 26.3Less: Provision for bad & doubtful loans and advances
760.6 – 760.6 26.3 – 26.3
8,425.3 3.4 8,428.7 10,677.2 – 10,677.2
(B) SECURITY DEPOSITS
Unsecured and considered good 1,984.6 386.5 2,371.1 1,473.5 432.5 1,906.0Unsecured and considered doubtful 14.5 2.3 16.8 17.5 2.3 19.8Less: Provision for bad & doubtful loans and advances
14.5 2.3 16.8 17.5 2.3 19.8
1,984.6 386.5 2,371.1 1,473.5 432.5 1,906.0
(C) ADVANCE WITH PUBLIC BODIES
Unsecured and considered good 18,731.2 15,856.4 34,587.6 13,868.3 14,521.4 28,389.7Unsecured and considered doubtful 175.3 123.1 298.4 181.0 124.5 305.5Less: Provision for bad & doubtful loans and advances
175.3 123.1 298.4 181.0 124.5 305.5
18,731.2 15,856.4 34,587.6 13,868.3 14,521.4 28,389.7
15. Investments (contd.)
F-190

NOTES FORMING PART OF THE FINANCIAL STATEMENTS
16. Loans and Advances (contd.)
(` in million)
As at 31st March, 2016 As at 31st March, 2015
Long-Term Short-Term Total Long-Term Short-Term Total
(D) LOANS AND ADVANCES TO RELATED
PARTIES
Unsecured and considered good 85.5 – 85.5 208.2 622.9 831.1(E) ADVANCE PAYMENT AGAINST TAXES
Unsecured and considered good 10,785.0 390.3 11,175.3 8,876.7 522.5 9,399.2(F) MAT CREDIT ENTITLEMENT
Unsecured and considered good 2,760.3 5.8 2,766.1 1,440.9 1.1 1,442.0(G) OTHER LOANS AND ADVANCES
Unsecured and considered good 1,18,336.7 19,135.5 1,37,472.2 14,520.9 31,383.0 45,903.9Unsecured and considered doubtful 2,269.1 1,713.3 3,982.4 2,197.9 2,841.9 5,039.8Less: Provision for bad & doubtful loans and advances
2,269.1 1,713.3 3,982.4 2,197.9 2,841.9 5,039.8
1,18,336.7 19,135.5 13,7472.2 14,520.9 31,383.0 45,903.9
1,61,108.6 35,777.9 19,6886.5 51,065.7 47,483.4 98,549.1
17. Other Non-current Assets
(` in million)
As at
31st March, 2016
As at
31st March, 2015
(a) Balances with banks(1)(2) 1,465.7 1,249.6(b) Unamortised loan issue expenses 12,360.2 12,661.0(c) Others 233.0 126.5
14,058.9 14,037.1
Additional information:(1) Represents bank deposits not due for realisation within 12 months of the Balance Sheet date.(2) Includes balances with banks held as security against guarantees.
18. Inventories (At lower of cost and net realisable value)
(` in million)
As at
31st March, 2016
As at
31st March, 2015
(a) Raw materials 52,010.7 79,102.6(b) Work-in-progress 43,369.8 47,642.2(c) Finished and semi-finished goods 73,960.6 87,662.2(d) Stock-in-trade of goods acquired for trading 1,314.0 3,915.1(e) Stores and spares 32,904.7 33,177.0
2,03,559.8 2,51,499.1
F-191

NOTES FORMING PART OF THE FINANCIAL STATEMENTS
18. Inventories (contd.) (At lower of cost and net realisable value)
(` in million)
As at
31st March, 2016
As at
31st March, 2015
Included above, goods-in-transit:
(i) Raw materials 11,430.7 14,186.8(ii) Finished and semi-finished goods 1,359.3 2,161.4(iii) Stock-in-trade of goods acquired for trading 653.1 240.5(iv) Stores and spares 1,648.6 1,670.5
15,091.7 18,259.2
19. Trade Receivables
(` in million)
As at
31st March, 2016
As at
31st March, 2015
(a) More than six months 7,425.2 4,426.8(b) Others 1,13,596.8 1,31,618.7
1,21,022.0 1,36,045.5
Less: Provision for bad and doubtful debts(a) More than six months 3,266.3 2,334.5(b) Others 743.9 612.3
1,17,011.8 1,33,098.7
Unsecured and considered good 1,17,011.8 1,33,098.7Doubtful 4,010.2 2,946.8
1,21,022.0 1,36,045.5
20. Cash and Bank Balances
(` in million)
As at
31st March, 2016
As at
31st March, 2015
(a) Cash in hand 8.5 10.7(b) Cheques, drafts on hand 350.1 553.5(c) Remittances in-transit 44.9 44.5(d) Balances with banks 65,686.4 85,869.1Total cash and cash equivalents 66,089.9 86,477.8
(e) Earmarked balances with banks 1,065.9 1,021.667,155.8 87,499.4
F-192

NOTES FORMING PART OF THE FINANCIAL STATEMENTS
21. Other Current Assets
(` in million)
As at
31st March, 2016
As at
31st March, 2015
(a) Interest accrued on investments 19.9 52.8(b) Interest accrued on deposits, loans and advances 265.2 361.3(c) Others(1) 3,949.4 3,660.5
4,234.5 4,074.6
Additional information:(1) Includes `2,761.8 million (31.03.2015: `2,408.4 million) on account of loan issue expenses.
22. Revenue from Operations
(` in million)
Year ended
31st March, 2016
Year ended
31st March, 2015
(a) Sale of products 11,79,774.3 14,07,082.1(b) Sale of power and water 14,047.6 10,997.5(c) Income from town, medical and other services 10,363.8 13,055.8(c) Other operating income 11,998.5 11,848.2
12,16,184.2 14,42,983.6
23. Other Income
(` in million)
Year ended
31st March, 2016
Year ended
31st March, 2015
(a) Dividend income(i) Non-current investments 499.5 687.9(ii) Current investments 200.2 212.0
(b) Interest income 1,230.9 1,855.9(c) Net gain/(loss) on sale of
(i) Other non-current investments 35,075.2 17.3(ii) Current investments 1,969.1 4,101.8
(d) Profit on sale of capital assets (net of loss on assets sold/written off) 402.4 2,001.9(e) Gain/(Loss) on cancellation of forwards, swaps and options (net) (153.7) (915.0)(f ) Other miscellaneous income 33.0 –
39,256.6 7,961.8
F-193

NOTES FORMING PART OF THE FINANCIAL STATEMENTS
24. Employee Benefits Expense
(` in million)
Year ended
31st March, 2016
Year ended
31st March, 2015
(a) Salaries and wages, including bonus 1,67,381.2 1,82,009.9(b) Contribution to provident and other funds 26,451.5 24,636.0(c) Staff welfare expenses 5,835.3 7,430.5
1,99,668.0 2,14,076.4
25. Depreciation and Amortisation Expense
(` in million)
Year ended
31st March, 2016
Year ended
31st March, 2015
(a) Depreciation on tangible assets 47,874.7 55,495.4(b) Amortisation of intangible assets 3,129.1 4,156.0
51,003.8 59,651.4
Less: Amount released from specific grants 185.4 215.450,818.4 59,436.0
26. Finance Costs
(` in million)
Year ended
31st March, 2016
Year ended
31st March, 2015
(a) Interest expense(i) Debentures/bonds and fixed loans 45,292.1 49,503.1(ii) Others 1,909.0 3,090.1
(b) Finance charges on finance leases 863.4 688.8(c) Other borrowing costs 5,539.3 4,169.6
53,603.8 57,451.6
Less: Interest capitalised 12,317.4 8,974.141,286.4 48,477.5
F-194

NOTES FORMING PART OF THE FINANCIAL STATEMENTS
27. Other Expenses
(` in million)
Year ended
31st March, 2016
Year ended
31st March, 2015
(a) Consumption of stores and spares 1,06,671.4 11,8774.7(b) Repairs to buildings 4,851.5 5,056.9(c) Repairs to machinery 59,626.9 60,252.7(d) Relining expenses 1,179.5 1,333.2(e) Fuel oil consumed 7,373.2 9,321.0(f ) Purchase of power 54,335.9 59,132.8(g) Conversion charges 18,032.0 17,151.6(h) Freight and handling charges 80,454.8 88,114.1(i) Rent 40,415.4 40,719.7(j) Royalty 10,057.9 9,434.1(k) Rates and taxes 12,596.0 12,760.0(l) Insurance 3,772.6 4,674.1(m) Commission, discounts and rebates 3,409.6 2,981.7(n) Provision for wealth tax 0.2 21.2(o) Provision for doubtful debts and advances 1,622.4 3,950.3(p) Excise duty (369.2) 1,135.7(q) Others(1)(2) 55,023.1 75,797.1
4,59,053.2 5,10,610.9
Additional information:(1) Includes reversal of provision for impairment losses on fixed assets `40.1 million (2014-15: Provision for impairment loss on fixed
assets `571.5 million). (2) Others include revenue expenditure charged to Consolidated Statement of Profit and Loss in respect of Corporate Social Responsibility
(CSR) activities undertaken during the year `2,040.5 million [`2,001.4 million has been paid in cash and `39.1 million is yet to be paid in cash] as compared to `1,676.0 million for the year ended 31st March, 2015. Capital expenditure incurred during the year in construction of capital assets under CSR projects is `88.2 million [`84.9 million paid in cash and `3.3 million is yet to be paid in cash] as compared to `101.5 million for the year ended 31st March, 2015.
28. Exceptional Items
Exceptional items as shown in the Consolidated Statement of Profit and Loss include: (a) Profit on sale of investments in subsidiaries, joint ventures, associates and other non-current investments by the Group of
`1,799.5 million (Previous year: `13,153.4 million). (b) Previous year figure of `11,468.6 million present profit on sale of a land at Borivali, Mumbai. (c) Provision of ̀ 729.9 million on account of exposure in Chhattisgarh Project and ̀ 177.0 million on account of provision of advances
in Tata Steel (KZN) (Pty) Ltd. (Previous year: `3,383.0 million) on account of investment exposure in New Millennium Iron Corp.) (d) Impairment loss recognised in respect of:
(` in million)
Year ended
31st March, 2016
Year ended
31st March, 2015
(i) Goodwill on consolidation 901.5 12,728.2(ii) Tangible and intangible assets (including assets under construction) 96,304.4 47,797.5Total disclosed as exceptional items, item no. 4(d) 97,205.9 60,525.7
F-195

NOTES FORMING PART OF THE FINANCIAL STATEMENTS
During the year the Company has recognised a non-cash write down of fixed assets and inventory of `97,205.9 million. The impairment is primarily due to the external economic environment and macro-economic conditions in each geography of operation, the underlying demand-supply imbalance facing the global steel industry, significant volatility in iron ore and coal prices in the last twelve months and the current long term view of steel and its raw material prices.
The impairment review was performed for cash generating units (CGUs) which were generally taken as legal entities or businesses within the group. The recoverable amount of CGUs and other
assets were primarily based on their value in use. The discounting rates used for the value in use calculations were based on the pre-tax weighted average cost of capital and are in the range of 7.00% - 15.50%.
The impairment loss on tangible and intangible assets relate to the following primary business reportable segments, however the same has been shown as an exceptional item and does not form part of segment result for the purpose of segment reporting:
(` in million)
Year ended
31st March, 2016
Year ended
31st March, 2015
Steel 94,879.3 47,491.0Others 1,425.1 306.5
96,304.4 47,797.5
Impairment on goodwill recognised during the previous year relates to goodwill allocated to CGUs forming part of the steel business segment.(e) Provisions of `8,800.5 million for demands and claims in relation to the Indian operations.(f ) Provisions of `5,562.5 million being the charge taken of employee seperation scheme in Tata Steel India.(g) Restructuring and other provision of `71,311.7 million primarily relating to the European operations.
29. Earnings per Share (EPS)
(` in million)
Year ended
31st March, 2016
Year ended
31st March, 2015
(a) Profit/(Loss) after tax, minority interest and share of profit of associates (30,493.2) (39,255.2)Less: Dividend on Preference Shares (including tax on dividend) – 8.0Less: Distribution on Hybrid Perpetual Securities (net of tax) 1,740.6 1,756.6Profit/(Loss) attributable to Ordinary Shareholders – for Basic EPS (32,233.8) (41,019.8)Profit/(Loss) attributable to Ordinary Shareholders – for Diluted EPS (32,233.8) (41,019.8)
Nos. Nos.(b) Weighted average no. of Ordinary Shares for Basic EPS 97,01,42,816 97,12,15,416
Weighted average no. of Ordinary Shares for Diluted EPS 97,01,42,816 97,12,15,416(c) Nominal value per Ordinary Share `10.00 `10.00(d) Basic earnings per Ordinary Share `(33.23) `(42.24)(e) Diluted earnings per Ordinary Share `(33.23) `(42.24)(1)
Additional information:(1) 4.5% Foreign Currency Convertible Bonds are anti-dilutive.
28. Exceptional Items (contd.)
F-196

NOTES FORMING PART OF THE FINANCIAL STATEMENTS
30. Contingent Liabilities and Commitments
A. CONTINGENT LIABILITIES
(a) Claims not acknowledged by the Company
(` in million)
As at
31st March, 2016
As at
31st March, 2015
(i) Excise and Service Tax 7,630.7 7,103.6(ii) Customs 166.2 165.4(iii) Sales Tax and VAT 6,188.6 4,753.4(iv) State Levies 6,806.1 5,890.6(v) Suppliers and Service Contract 868.3 820.7(vi) Labour Related 567.3 540.2(vii) Income Tax 3,780.3 3,560.3(viii) Royalty 140.1 140.1(ix) Others 7,136.9 6,209.2
(b) Claim by a party arising out of conversion arrangement- `1,958.2 million (31.03.2015: `1,958.2 million). The Company has not acknowledged this claim and has instead filed a claim of `1,396.5 million (31.03.2015: `1,396.5 million) on the party. The matter is pending before the Calcutta High Court.
(c) The State Government of Odisha introduced “Orissa Rural Infrastructure and Socio Economic Development Act, 2004” with effect from February 2005 levying tax on mineral bearing land computed on the basis of value of minerals produced from the mineral bearing land. The Company had filed a Writ Petition in the High Court of Orissa challenging the validity of the Act. Orissa High Court held in November 2005 that State does not have authority to levy tax on minerals. The State Government of Odisha moved to the Supreme Court against the order of Orissa High Court and the case is pending with Supreme Court. The potential liability, as of 31st March, 2016 would be approximately `55,019.8 million (31.03.2015: `48,051.8 million).
(d) Interest expenditure on loans taken for acquisition of a subsidiary has been disallowed in assessments with tax demand raised for `9,580.6 million (31.03.2015: `7,150.1 million). Company has deposited `4,150.0
million (31.03.2015: ̀ 3,400.0 million) as part payment as a precondition to obtain stay of demand. The Company expects to sustain its position on ultimate resolution of the appeals.
(e) For the purpose of payment of royalty, there are two salient provisions viz: Section 9 in Mines and Minerals (Development and Regulation) Act (MMDR) 1957, related to the incidence of royalty and Rules 64B and 64C of Mineral Concession Rules (MC Rules), 1960. The Company has been paying royalty on coal extracted from its quarries pursuant to the judgment and order dated 23rd July, 2002 passed by the Jharkhand High Court. However, the State Government demanded royalty at rates applicable to processed coal. Though the Company contested the above demand, it started paying, under protest, royalty on processed coal from November 2008. The demand of the state mining authority was confirmed by the High Court vide its Judgment dated 12th March, 2014. The Court concluded that the State cannot claim interest till the Hon’ble Supreme Court decides the pending Special Leave Petitions (SLP) filed by State and Company in the year 2004.
In the appeals filed by Tata Steel in respect of the issues related to Coal royalty, the Hon’ble Supreme Court has pronounced the judgment on 17th March, 2015 in which it has interpreted Section 9 and approved the law that removal of coal from the seam in the mine and extracting it through the pithead to the surface satisfies the requirement of Section 9 (charging section) of the MMDR Act in order to give rise to a liability for royalty. In regard to the interpretation of Rules 64B and 64C of MC Rules, the Supreme Court has clarified that the constitutional validity or the vires of the Rules has not been adjudicated upon. Therefore it is open to Tata Steel either to revive the appeals limited to this question or to separately challenge the constitutionality and vires of these Rules.
F-197

NOTES FORMING PART OF THE FINANCIAL STATEMENTS
Accordingly, Tata Steel has filed writ petitions challenging the constitutionality and vires of Rules 64B and 64C of MC Rules on 19th May, 2015 at Hon’ble High Court of Jharkhand. Vide it’s judgment dated 26.06.2015, High Court has held that, the writ petitions are maintainable. It is also pertinent to mention that the Union of India in its counter-affidavit has stated that the provisions of Rules 64B and 64C may not be applicable to the mineral coal.
All demands are solely based on application of Rules 64B and 64C. In view of (i) the clear interpretation of charging Section 9 by Supreme Court by three judges Bench following two earlier three Judge Bench orders (ii) the affidavit of Union of India and (iii) the liberty given by Supreme Court, the Company is of the opinion that any related present/probable demands are not payable. Out of the principal demand of ̀ 1,902.5 million, an amount of `1,638.0 million has been paid till FY 15 and balance has been provided for. Interest amount of `3,240.6 million (31.03.2015: `3,184.5 million) has been considered as contingent liability.
(f) The Company pays royalty on ore on the basis of quantity removed from the leased area at the rates based on notification by the Ministry of Mines, Government of India and the price published by India Bureau of Mines (IBM) on a monthly basis.
A demand of `4,110.8 million has been raised by Deputy Director of Mines, Joda, claiming royalty at sized ore rates on despatches of ore fines. The Company has filed a revision petition on 14th November, 2013 before the Mines Tribunal, Government of India, Ministry of Mines, New Delhi, challenging the legality and validity of the demand raised and also to grant refund of royalty excess paid by the Company. Mines tribunal vide its order dated 13th November, 2014 has stayed the demand of royalty on iron ore for Joda east of `3,142.8 million upto the period ending 31st March, 2014. For the demand of `968.0 million for April, 2014 to September, 2014, a separate revision application was filed before Mines Tribunal. The matter was heard by Mines Tribunal on 14th July, 2015 and stay was granted on the total demand with directive to Government of Odisha not to take any coercive action for realization of this demanded amount Accordingly, the demand of `4,110.8 million (31.03.2015: `4,110.8 million) has been considered as a contingent liability.
(g) In 2008-09, NTT DoCoMo Inc (Docomo) entered into an Agreement with Tata Teleservices Ltd (TTSL) and Tata Sons Limited to acquire 20% of the equity share capital under the primary issue and 6% under the secondary sale from Tata Sons Limited. In terms of the Agreements with Docomo, Tata Sons Limited, inter alia, agreed to provide various indemnities and a Sale Option entitling Docomo to sell its entire shareholding in 2014 at a minimum pre-determined price of `58.045 per share if certain performance parameters were not met by TTSL. The minimum pre-determined price represented 50% of the acquisition price of 2008-09. The Agreements are governed by Indian Law.
The Company in 2008-09 had accepted an offer made voluntarily by Tata Sons Limited to all shareholders of TTSL to participate pro-rata in the secondary sale to Docomo together with bearing liabilities, if any, including the Sale Option in proportion of the number of shares sold by the Company to the aggregate Secondary Sale to Docomo. Accordingly, an Inter se Agreement was executed by the Company with Tata Sons and other Selling Shareholders. The Company sold 52,46,590 shares of TTSL to Docomo at `116.09 per share, resulting in a profit of `497.7 million. The Company is obliged to acquire 2,58,83,846 shares of TTSL in the above proportion in the event the Sale Option is exercised by Docomo.
Docomo has exercised the Sale Option in July 2014 and has called upon Tata Sons Limited to acquire its entire shareholding in TTSL at the pre-determined price of `58.045 per share. Tata Sons Limited has in turn informed the Company that they may be called upon to acquire 2,58,83,846 shares, in terms of its original offer to the Company and the inter-se agreement to participate in the Secondary Sale.
Tata Sons have also informed the Company that the Reserve Bank of India have not permitted acquisition of the shares at the pre-determined price and have advised that the acquisition can only be made at Fair Market Value (FMV) prevailing at the time of the acquisition. Docomo reiterated its position that the shares be acquired at minimum pre-determined price of 50% of the acquisition price in 2008-09.
Docomo had initiated Arbitration in the matter before the LCIA, London. The evidentiary hearing was completed on 6th May 2016. The arbitral award is awaited.
30. Contingent Liabilities and Commitments (contd.)
F-198

NOTES FORMING PART OF THE FINANCIAL STATEMENTS
The liability, if any, to the extent of the difference between the amount sought by Docomo and the Fair Market Value is dependent upon the outcome of the Arbitration and prevailing FEMA Regulations.
(h) Bills discounted `4,133.5 million (31.03.2015: `4,811.7
million).
B. COMMITMENTS
(` in million)
31.03.2016 31.03.2015
(a) Capital Commitments
Estimated amount of contracts remaining to be executed on Capital account and not provided for
80,189.0 83,087.8
(b) Other Commitments
(i) Export obligation against import of capital goods under EPCG Scheme
2,53,549.6 2,51,304.2
(ii) Uncalled liability on partly paid shares and debentures
0.1 0.1
31. The Company has given undertakings to: (a)IDBI not to dispose
of its investment in Wellman Incandescent India Ltd., (b) IDBI and ICICI Bank Limited (formerly ICICI) not to dispose of its investment in Standard Chrome Ltd.,(c) Mizuho Corporate Bank Limited and Japan Bank for International Co-operation, not to dispose of its investments in Tata NYK Shipping Pte Limited (to retain minimal stake required to be able to provide a corporate guarantee towards long-term debt), (d) ICICI Bank Limited to directly or indirectly continue to hold at least 51 % shareholding in Jamshedpur Continuous Annealing & Processing Company Private Limited, (e) Sumitomo Mitsui Banking Corporation not to dispose of the management control in Tata Metaliks DI Pipes Limited (Formerly known as Tata Metaliks Kubota Pipes Limited) held through Tata Metaliks Ltd. so long as the dues to Sumitomo Mitsui Banking Corporation is subsisting.
The Company has furnished a security bond in respect of its immovable property to the extent of ̀ 200 million in favour of the Registrar of the Delhi High Court and has given an undertaking not to sell or otherwise dispose of the said property.
The Promoters of Tata BlueScope Steel Limited (TBSL) (i.e. Bluescope Steel Asia Holdings Pty Limited, Australia and Tata Steel Limited) have given an undertaking to IDBI Trusteeship Services Ltd., Debenture Trustees, and State Bank of India not to reduce collective shareholding in TBSL, below 51 % without prior consent of the Lender. Further, the Company has given an undertaking to State Bank of India to intimate them before diluting its shareholding in TBSL below 50%.
The Company, as a promoter, has pledged 4,41,55,800 equity shares of Industrial Energy Limited with Infrastructure Development Finance Corporation Limited.
The Company along with TS Alloys Limited (Promoters) has given an undertaking to Power Finance Corporation Limited (PFC) and Rural Electrification Corporation Limited (REC) (Lenders) not to dispose off /transfer their equity holding of 26% of total equity in Bhubhaneshwar Power Private Limited (BPPL) without prior written approval of lenders. Such shareholding of promoters may be transferred to the Company or its affiliates subject to compliance of applicable laws. The Company along with TS Alloys Limited has pledged 60% of their equity contribution in BPPL to PFC and REC.
T S Global Minerals Holdings Pte Ltd. (formerly known as Tata Steel Global Minerals Holdings Pte Ltd.), an indirect subsidiary and Riversdale Mining Pty Limited (formerly Riversdale Mining Limited) have executed a deed of cross charge in favour of each other to secure the performance of obligation under Joint Venture agreement and funding requirements of the Joint Venture Minas De Benga (Mauritius) Limited (formerly Rio Tinto Benga (Mauritius) Limited) upto a maximum amount of US$ 100 million on the shares of Minas De Benga (Mauritius) Limited and all of its present and future benefits and rights under the Joint Venture agreement. .
The Group has given guarantees aggregating `6,507.3 million (31.03.2015: `6,310.9 million) on behalf of others.
32. Odisha legislative assembly issued an amendment to Indian Stamp Act on 9th May, 2013 and inserted a new provision (Section 3a) in respect of stamp duty payable on grant/renewal of mining leases. As per the amended provision, stamp duty is levied equal to 15% of the average royalty that would accrue out of the highest annual extraction of minerals under the approved mining plan multiplied by the period of such mining lease. The Company had filed a writ petition challenging the constitutionality of the Act on 5th July, 2013. The Hon’ble High Court, Cuttack passed an order
30. Contingent Liabilities and Commitments (contd.)
F-199

NOTES FORMING PART OF THE FINANCIAL STATEMENTS
on 9th July, 2013 granting interim stay on the operation of the Amendment Act, 2013. As a result of the stay, as on date, the Act is not enforceable and any demand received by the Company is not liable to be proceeded with. Meanwhile, the Company received demand notices for the various mines at Odisha totalling to `55,790 million. On the basis of external legal opinion, the Company has concluded that it is remote that the claim will sustain on ultimate resolution of the legal case by the courts.
In April, 2015 the Company has received an intimation from Government of Odisha, granting extension of validity period for leases under the MMDR Amendment Act, 2015 up to 31st March, 2030 in respect of eight mines and up to 31st March, 2020 for two mines subject to execution of supplementary lease deed within 3 months from the date of the intimation. Liability has been provided in the books of accounts as on 31st March, 2016 as per the existing provisions of the Stamp Act 1899 and the Company has since paid the stamp duty and registration charges totalling `3,530.8 million for supplementary deed execution in respect of eight mines out of the above mines.
33. Demand notices have been raised by Deputy Director of Mines, Odisha amounting to `38,280 million for the excess production over the quantity permitted under the mining plan scheme, environment clearance or consent to operate, during the period 2000-01 to 2009-10. The demand notices have been raised under Section 21(5) of the Mines & Minerals (Development and Regulations) Act (MMDR). However, the Act specifies that demand can be raised only when the land is occupied without lawful authority. The Company is of the view that Section 21(5) of the MMDR Act is not applicable as the mining is done within the sanctioned mining lease area and accordingly the Company has filed revision petitions before the Mines Tribunal against all such demand notices. Consequent to it stay has been granted by the Mines Tribunal against the entire demand of `38,280 million and directed the State that no coercive action should be taken for recovery of demand.
Based on the judgment of Hon’ble High court of Jharkhand on 11th December, 2014 in the matter of our writ petition for renewal of lease and continuation of operation at Noamundi iron mine, the Government of Jharkhand approved the renewal of lease of Noamundi Mines by an express order on 31st December, 2014. Express Order also held that the mining operation carried out between 1st January, 2012 to 31st August, 2014 to be unlawful and computed an amount of
`35,680 million on account of such alleged unlawful mining. The Mines and Minerals Development and Regulation (MMDR) Amendment Ordinance 2015 promulgated on 12th January, 2015 provides for renewal of the above mines.
Based on the new Ordinance, Jharkhand Government revised the Express Order on 12th February, 2015 for lease renewal up to 31st March, 2030 with following terms and conditions:
• Value of Iron Ore produced by alleged unlawful mining during the period 1.1.12 to 20.04.2014 for `29,944.9 million to be decided on the basis of disposal of our writ petition before Hon’ble High Court of Jharkhand.
• Value of Iron Ore produced from 21.4.2014 to 17.7.2014 amounting to `4,218.3 million to be paid in maximum 3 installments.
• Value of Iron Ore produced from 18.7.2014 to 31.08.2014 i.e. `1,520 million to be paid immediately.
The Company paid `1,520 million under protest. District Mining Officer Chaibasa on 16th March, 2015 has issued demand note for payment of `4,218.3 million, payable in three monthly installments. The Company replied on 20th March, 2015, since the lease has been extended till 31st March, 2030, the above demand is not tenable. The Company paid `500 million under protest on 27th July, 2015.
A writ petition was filed before Hon’ble High Court of Jharkhand and heard on 9th September, 2015. An interim order has been given by Hon’ble High Court of Jharkhand on 18th September, 2015 wherein court has directed the company to pay outstanding amount of ` 3,718.3 million in 3 equal installments, first installment by 15th October, 2015, second installment by 15th November, 2015 and third installment by 15th December, 2015.
In view of the order of Hon’ble High Court of Jharkhand `1,240 million was paid on 28th September, 2015, `1,240 million was paid on 12th November, 2015 and `1,238.3 million on 14th December, 2015 under protest.
34. In Financial Year 2014-15, the Income Tax department had reopened assessments of earlier years on account of excess mining and raised cumulative demand for `10,860 million. During the current financial year, the Commissioner of Income Tax (Appeals) has adjudicated the matter in favour of the Company and quashed the entire demand on account of reopened assessments. The demand outstanding as on 31st March, 2016 is Nil (31.03.2015: `10,860 million).
F-200

NOTES FORMING PART OF THE FINANCIAL STATEMENTS
35. The significant notes appearing in the accounts of Indian Steel & Wire Products Ltd. are given below: As per clause 6.12 (xiii) of BIFR Order dated 21st November, 2003 for all liabilities not disclosed in the audited Balance Sheet for the
year ended 31st March, 2002 including notes on accounts as then would be the personal responsibility of the erstwhile promoters to discharge. In view of the above, the following liabilities which were not disclosed in the said Balance Sheet including the notes on
accounts, have not been provided for or recognised in the accounts for Financial Years 2003-04 to 2015-16.
(` in million)
Particulars 31.03.2016 31.03.2015
Show cause notices/Demand raised by Central Excise Authorities (Under Appeal)* 3.0 3.0Employee State Insurance demand (Under Appeal) 14.9 14.9Leave liability for ex-employees 3.3 3.3Labour court cases 0.1 0.1Railway dues 0.4 0.4Power dues 62.1 62.1Liability for loan for Learjet Aircraft purchase 14.9 14.9Wealth tax 39.0 39.0
* The items of contingent liability indicated above are not exhaustive and any other liability which may come to the notice of the present management would also be the personal liability of the erstwhile promoters.
36. In one of the subsidiaries, in terms of the License Agreement dated 29th January, 2002 with Board of Trustees for the Port of Kolkata, the subsidiary is required to invest in equipment and infrastructure as follows:
Phasing of Investment (` in million)
Purpose of Investment Within 18
months
Within 24
months
Within 36
months
Total
1. For procurement of equipment for ship to shore 230.6 28.5 – 259.12. Storage of cargo – 17.4 12.0 29.43. Office building, workshop etc. – 7.5 2.5 10.04. Utility Services – 2.2 – 2.2
230.6 55.6 14.5 300.7
As at 31st March, 2016, the subsidiary’s investments in equipments and infrastructure aggregate to `258.0 million (31.03.2015: `258.0 million). The management of the subsidiary company has requested the Port Trust Authorities for suitable modification to the investment obligation in view of the changes in the business and economic scenario. The Port Trust Authorities have, subject to sanction of Government of India approved the changes proposed by the subsidiary in the specifications of the equipments and other required infrastructure.
37. The Company has entered into a Conditional Share Purchase Agreement with Greybull Partners on 11th April, 2016 for a strategic divestment of its long products business in Europe. Accordingly, Long Products has been considered as a continuing business as at 31st March, 2016.
F-201

NOTES FORMING PART OF THE FINANCIAL STATEMENTS
38. The effect of acquisition and disposal of subsidiaries on the financial position and results as included in the consolidated financial statements as at and for the year ended 31st March, 2016 are given below:
(` in million)
Disposal Acquisition
EQUITY AND LIABILITIES
Share Capital 98.1 13.3Reserves and surplus (97.4) 282.8Trade payables – 0.1
0.7 296.2
ASSETS
Non current investments – 66.9Long-term loans and advances – 1.4Current investments – 227.2Trade receivables 0.6 –Cash and cash equivalents – 0.7Other current assets 0.1 –
0.7 296.2
REVENUE
Other Income 0.1 –EXPENSES
Manufacturing and other expenses 0.1 –PROFIT/(LOSS) BEFORE TAX – –
F-202

NOTES FORMING PART OF THE FINANCIAL STATEMENTS
39. In respect of joint ventures directly owned by the Company, the contingent liabilities and capital commitments are as follows:
Name of the Joint Ventures Country of
Incorporation
Percentage of
Holding
Contingent
Liabilities
(` in million)
Capital
Commitment
(` in million)
mjunction services limited India 50% 20.8 11.3
– 14.9Tata BlueScope Steel Limited India 50% 287.9 0.7
343.5 0.2Tata NYK Shipping Pte Ltd. Singapore 50% – –
– –Bhubaneshwar Power Private Limited India 26% 56.5 –
7.3 162.8S & T Mining Company Private Limited India 50% – –
– 0.7Himalaya Steel Mill Services Private Limited India 26% – –
– –
40. Revenue expenditure charged to Consolidated Statement of Profit and Loss in respect of research and development activities
undertaken during the year is `6,287.1 million (2014-15: `5,355.1 million).
41. Leases The break-up of total minimum lease payments for operating lease due as on 31st March, 2016, entered into by the Group and its joint
ventures are as follows:
(` in million)
Period As at
31st March, 2016
As at
31st March, 2015
Not later than one year 9,636.3 11,600.3Later than one year but not later than five years 32,388.3 37,450.6Later than five years 30,340.5 38,194.9Total 72,365.1 87,245.8
The total charge to the Consolidated Statement of Profit and Loss for the year on account of operating lease is `10,741.4 million (2014-15: `12,023.5 million).
The Group and its joint ventures have taken certain plant and machinery on finance lease, having an aggregate cost of `20,267.6 million (31.03.2015: `17,675.6 million). The break-up of total minimum lease payments due as on 31st March, 2016 and their corresponding present value are as follows:
(` in million)
As at
31st March, 2016
As at
31st March, 2015
Period Minimum Lease
Payments
Present Value Minimum Lease
Payments
Present Value
Not later than one year 2,208.6 1,536.7 1,739.7 1,256.0Later than one year but not later than five years 7,987.3 5,910.3 6,157.3 4,499.2Later than five years 6,580.9 4,394.5 6,430.4 4,172.3Total 16,776.8 11,841.5 14,327.4 9,927.5
F-203

NOTES FORMING PART OF THE FINANCIAL STATEMENTS
42. Employee Benefits (a) The Group has recognised, in the Consolidated Statement of Profit and Loss for the current year, an amount of
`8,469.4 million (2014-15: `4,396.4 million) as expenses under the following defined contribution plans:
(` in million)
Benefit (Contribution to) Year ended
31st March, 2016
Year ended
31st March, 2015
Provident Fund 2,727.6 2,742.3Superannuation Fund 355.1 423.1Employees Pension Scheme/Coal Mines Pension Scheme 5,149.0 1,024.6TISCO Employees Pension Scheme 234.9 202.5Employees State Insurance 2.8 3.9
8,469.4 4,396.4
(b) The Group operates post retirement defined benefit plans as follows: Funded - Post Retirement Gratuity - Post Retirement Pension Plan Unfunded - Post Retirement Medical Benefits - Other Post Retirement Benefits (includes Pension to Directors, Farewell Gifts, Packing and Transportation Expenses etc.)
(c) Details of the post retirement gratuity plan are as follows:
(` in million)
Description Year ended
31st March, 2016
Year ended
31st March, 2015
(i) Reconciliation of opening and closing balances of obligation
Obligation as at the beginning of the year 27,526.7 21,539.9Current service cost 1,302.8 982.2Interest cost 2,010.5 1,881.8Actuarial (gain)/loss 775.2 5,465.0Exchange rate difference 0.9 0.6Obligation of companies sold – (4.2)Past service cost – (0.3)Benefits paid (3,175.8) (2,338.3)Settlement and Curtailment 6.8 –Obligation as at the end of the year 28,447.1 27,526.7
The defined benefit obligation as at 31st March, 2016 is funded except in the case of Tata BlueScope Steel Limited, S & T Mining Company Private Limited, NatSteel Holdings Pte. Ltd., Himalaya Steel Mill Services Private Limited and Tata Steel (Thailand) Public Company Ltd.
F-204

NOTES FORMING PART OF THE FINANCIAL STATEMENTS
(` in million)
Description Year ended
31st March, 2016
Year ended
31st March, 2015
(ii) Reconciliation of opening and closing balances of plan assets
Fair value of plan assets as at the beginning of the year 21,685.7 20,176.9Expected return on plan assets 1,845.6 1,586.4Actuarial gain/(loss) 406.2 808.0Employers’ Contributions 5,813.6 1,453.2Plan assets of companies sold – (2.6)Benefits paid (3,169.7) (2,336.2)Fair value of plan assets as at the end of the year 26,581.4 21,685.7
(iii) Reconciliation of fair value of assets and obligations
Fair value of plan assets as at the end of the year 26,581.4 2,1685.7Present value of obligation as at the end of the year 2,8447.1 2,7526.7Amount recognised in the Balance Sheet 1865.7 5841.0- Provisions 1872.4 5847.7- Loans and advances (6.7) (6.7)
(iv) Expenses recognised in the year
Current service cost 1302.8 982.2Interest cost 2010.5 1881.8Expected return on plan assets (1845.6) (1586.4)Actuarial (gain)/loss 369.0 4657.0Past Service Cost – (0.2)Expense recognised during the year* 1836.7 5934.4
31.03.2016 31.03.2015% %
(v) Investment details
Government securities 9.00 11.00Public Sector unit bonds 6.00 9.00Central/State Government Guaranteed securities 7.00 8.00Private sector unit bonds 7.00 9.00Others (including funds with LIC and bank balances) 71.00 63.00
100.00 100.00
(vi) Assumptions
Discount rate (per annum) 0.51-7.90% 0.51-7.90%Expected Return on Plan Assets (per annum) 3.02-9.25% 3.02-9.25%Rate of escalation in salary (per annum) 5.00-10.00% 5.00-10.00%
(vii) Other Disclosures
Experience adjustment on plan liabilities - gain/(loss) (750.4) (2,729.8)Experience adjustment on plan assets - gain/(loss) 406.4 808.0
* Includes impact of Nil (2014-15: `2,445.7 million) on account of arrear wage settlement, provision for which was included
under salaries and wages including bonus.
42. Employee Benefits (contd.)
F-205
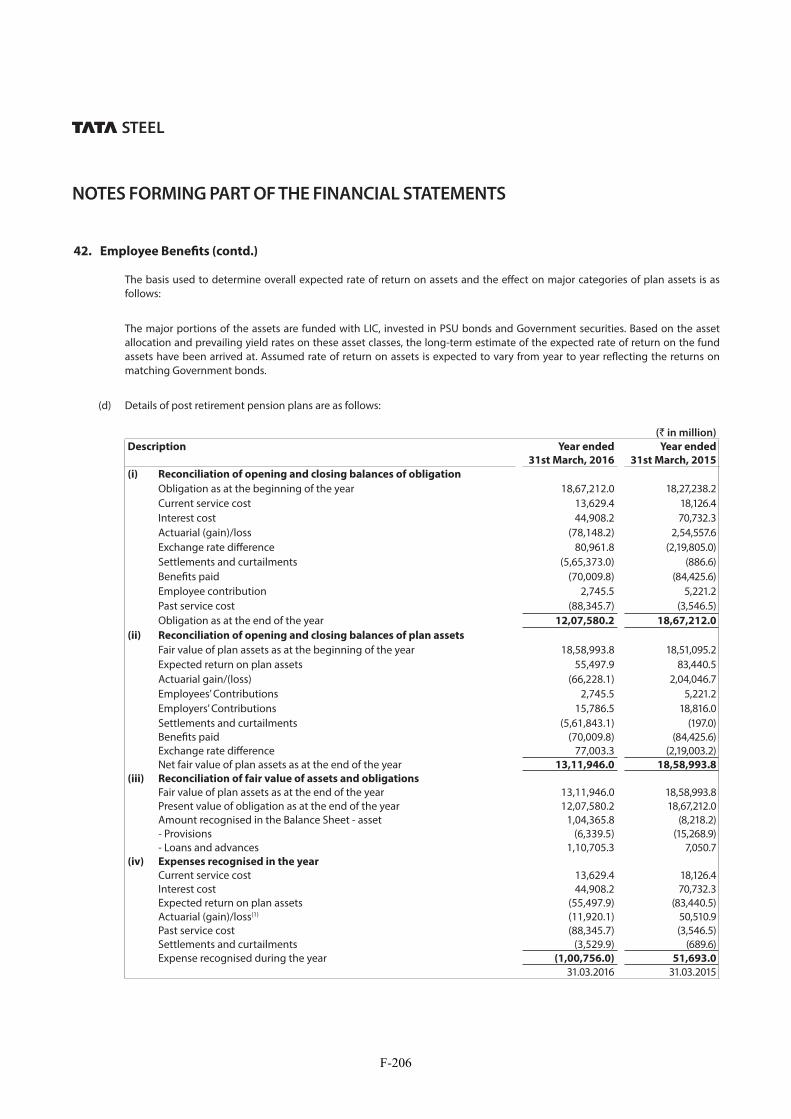
NOTES FORMING PART OF THE FINANCIAL STATEMENTS
The basis used to determine overall expected rate of return on assets and the effect on major categories of plan assets is as follows:
The major portions of the assets are funded with LIC, invested in PSU bonds and Government securities. Based on the asset allocation and prevailing yield rates on these asset classes, the long-term estimate of the expected rate of return on the fund assets have been arrived at. Assumed rate of return on assets is expected to vary from year to year reflecting the returns on matching Government bonds.
(d) Details of post retirement pension plans are as follows:
(` in million)
Description Year ended
31st March, 2016
Year ended
31st March, 2015
(i) Reconciliation of opening and closing balances of obligation
Obligation as at the beginning of the year 18,67,212.0 18,27,238.2Current service cost 13,629.4 18,126.4Interest cost 44,908.2 70,732.3Actuarial (gain)/loss (78,148.2) 2,54,557.6Exchange rate difference 80,961.8 (2,19,805.0)Settlements and curtailments (5,65,373.0) (886.6)Benefits paid (70,009.8) (84,425.6)Employee contribution 2,745.5 5,221.2Past service cost (88,345.7) (3,546.5)Obligation as at the end of the year 12,07,580.2 18,67,212.0
(ii) Reconciliation of opening and closing balances of plan assets
Fair value of plan assets as at the beginning of the year 18,58,993.8 18,51,095.2Expected return on plan assets 55,497.9 83,440.5Actuarial gain/(loss) (66,228.1) 2,04,046.7Employees’ Contributions 2,745.5 5,221.2Employers’ Contributions 15,786.5 18,816.0Settlements and curtailments (5,61,843.1) (197.0)Benefits paid (70,009.8) (84,425.6)Exchange rate difference 77,003.3 (2,19,003.2)Net fair value of plan assets as at the end of the year 13,11,946.0 18,58,993.8
(iii) Reconciliation of fair value of assets and obligations
Fair value of plan assets as at the end of the year 13,11,946.0 18,58,993.8Present value of obligation as at the end of the year 12,07,580.2 18,67,212.0Amount recognised in the Balance Sheet - asset 1,04,365.8 (8,218.2)- Provisions (6,339.5) (15,268.9)- Loans and advances 1,10,705.3 7,050.7
(iv) Expenses recognised in the year
Current service cost 13,629.4 18,126.4Interest cost 44,908.2 70,732.3Expected return on plan assets (55,497.9) (83,440.5)Actuarial (gain)/loss(1) (11,920.1) 50,510.9Past service cost (88,345.7) (3,546.5)Settlements and curtailments (3,529.9) (689.6)Expense recognised during the year (1,00,756.0) 51,693.0
31.03.2016 31.03.2015
42. Employee Benefits (contd.)
F-206

NOTES FORMING PART OF THE FINANCIAL STATEMENTS
(` in million)
Description Year ended
31st March, 2016
Year ended
31st March, 2015
% %(v) Investment details
Equities 27.00 30.00Bonds 62.00 55.00Property 10.00 8.00Others (including bank balances) 1.00 7.00
100.00 100.00
(vi) Assumptions
Discount rate (per annum) 0.40-4.10% 0.80-3.85%Expected Return on Plan Assets (per annum) 1.55-5.50% 1.40-7.40%Rate of escalation in salary (per annum) 1.00-2.00% 1.00-2.95%
(vii) Other Disclosures
Experience adjustment on plan liabilities - gain/(loss) 25,787.9 10,146.8Experience adjustment on plan assets - gain/(loss) (66,283.8) 2,04,020.4
(e) Details of the unfunded post retirement defined benefit obligation are as follows:
(` in million)
Description 2015-16 2014-15
Medical Others Medical Others
(i) Reconciliation of opening and closing balances of obligation
Obligation as at the beginning of the year 10,674.7 11,109.3 8,006.3 10,558.2Current/Employer service cost 182.2 330.2 114.9 338.4Interest cost 807.1 288.6 718.2 283.0Plan amendment cost/(credit) – – – 25.6Actuarial (gain)/loss (161.1) (356.4) 2,308.7 2,219.2Past service cost – – – (68.9)Exchange rate difference – 861.9 – (1,826.0)Benefits paid (524.1) (517.6) (473.4) (420.2)Obligation as at the end of the year 10,978.8 11,716.0 10,674.7 11,109.3
(ii) Expenses recognised in the year
Current/Employer service cost 182.2 330.2 114.9 338.4Interest cost 807.1 288.6 718.2 283.0Past service cost – – – (68.9)Actuarial (gain)/loss (161.1) (356.4) 2,308.7 2,219.2
Expense recognised during the year 82.82 26.24 314.18 277.17
42. Employee Benefits (contd.)
F-207

NOTES FORMING PART OF THE FINANCIAL STATEMENTS
(` in million)
Description 2015-16 2014-15
Medical Others Medical Others
(iii) Assumptions
Discount rate (per annum) as at the beginning of the year 7.75-7.90% 3.75-9.25% 8.10-9.25% 3.75-9.25%Discount rate (per annum) as at the end of the year 7.75-7.90% 3.75-9.25% 7.75-7.90% 3.75-9.25%Medical costs inflation rate 5.00-8.00% 5.00-8.00%Average medical cost (`/person) at the beginning of the year 8,748.00 7,927.00Average medical cost (`/person) at the end of the year 9,366.00 8,748.00Effect of a 1% change in health care cost on Increase - aggregate current service and interest cost (122.1) 153.8 - closing balance of obligation 1,926.8 1,916.0 Decrease - aggregate current service and interest cost (338.9) (87.4) - closing balance of obligation (1,148.0) (1,097.4)
(iv) Other Disclosures
Experience adjustment on plan liabilities - gain/(loss) 147.1 377.7 (414.2) (1,639.6)
(1) The Consolidated Statement of Profit and Loss includes the consolidated results of Tata Steel Europe Limited and its subsidiaries whose income contributes 56% of the consolidated total revenue. The pension and other post retirement defined benefit liability of Tata Steel Europe Limited is computed and accounted for in accordance with International Financial Reporting Standards (IFRS)/IND AS. IFRS/IND AS permits the impact of changes in the assets and liabilities, inter alia, due to assumption of variables like bond yield rates, inflation and demographic assumptions to be accounted for in “Reserves and Surplus”. This practice is consistently followed by Tata Steel Europe Limited. The Accounting Standard (AS-15) – “Employee Benefits” is different from the above and requires such changes to be accounted for in the Statement of Profit and Loss. Given the large share of Tata Steel Europe Limited in the Consolidated Statement of Profit and Loss of the Company, and the potential volatility caused by periodic changes in the assumptions underlying the computation of the liabilities, it is not considered practicable to adopt a common accounting policy for accounting of the actuarial gains/losses in respect of the pension and other post retirement defined benefit liability of the Company and Tata Steel Europe Limited. Accordingly the actuarial gain of `12,312.3 million (2014-15: actuarial loss of `52,579.7 million) recognised in Tata Steel Europe Limited has been accounted in “Reserves and Surplus” in the consolidated financial statements in accordance with IFRS principles and as permitted by Accounting Standard 21 – “Consolidated Financial Statements”. Had the Company followed the practice of recognising changes in actuarial valuations in respect of the pension and other post retirement benefit plans of Tata Steel Europe Limited, in the Consolidated Statement of Profit and Loss, the Loss after tax, minority interest and share of profit of associates would have been lower by `12,312.3 million (2014-15: the Loss after tax, minority interest and share of profit of associates would have been higher by `52,579.7 million).
42. Employee Benefits (contd.)
F-208

NOTES FORMING PART OF THE FINANCIAL STATEMENTS
43. Segment Reporting
PRIMARY SEGMENT INFORMATION (BUSINESS SEGMENT)
(` in million)
Particulars Business Segments Unallocable Eliminations Total
Steel Others
Segment revenue
External revenue 10,82,012.2 87,638.6 1,865.1 – 11,71,515.9
12,87,806.7 99,119.0 8,111.6 – 13,95,037.3Inter segment revenue 43,146.9 20,402.1 5,881.1 (69,430.1) –
56,264.0 25,079.8 6,369.8 (87,713.6) –Total revenue 11,25,159.1 1,08,040.7 7,746.2 (69,430.1) 11,71,515.9
13,44,070.7 1,24,198.8 14,481.4 (87,713.6) 13,95,037.3Segment results before finance costs, exceptional
items and tax
40,354.5 162.0 84,567.8 (60,789.6) 64,294.7
95,007.8 276.5 52,050.2 (73,451.2) 73,883.3Less: Finance costs 41,286.4
48,477.5Profit before tax and exceptional items 23,008.3
25,405.8
F-209

NOTES FORMING PART OF THE FINANCIAL STATEMENTS
(` in million)
Particulars Business Segments Unallocable Eliminations Total
Steel Others
Exceptional Items
(a) Profit/(loss) on sale of non-current investments 1,799.5
13,153.4(b) Provision for diminution in the value of investments (1,291.0)
(3,383.0)(c) Provision for impairment of non-current assets (97,205.9)
(60,525.7)(d) Profit on sale of non-current assets –
11,468.6(e) Provision for demands and claims (8,800.5)
–(f ) Employee separation compensation (5,562.5)
–(g) Restructuring and other provisions 71,311.7
–Profit before tax (16,740.4)
(13,880.9)Tax expense 15,049.6
25,674.1Profit after tax (31,790.0)
(39,555.0)Segment assets 11,55,199.4 60,093.2 2,45,193.1 (33,145.8) 14,27,339.9
12,55,406.3 63,386.4 1,42,307.7 (38,633.0) 14,22,467.4 Segment liabilities 2,34,784.3 34,348.6 1,74,443.5 (36,438.1) 4,07,138.3
2,07,864.6 35,637.9 1,90,986.4 (38,295.3) 3,96,193.6 Capital expenditure 1,41,408.7 3,313.3 – – 1,44,722.0
1,35,929.1 4,245.0 – – 1,40,174.1Segment depreciation 46,733.4 2,210.2 1,874.8 – 50,818.4
54,756.3 2,715.5 1,964.2 – 59,436.0Non-cash expenditure other than depreciation 1,978.7 238.6 – – 2,217.3
4,674.1 149.4 (9.9) – 4,813.6
F-210

NOTES FORMING PART OF THE FINANCIAL STATEMENTS
SECONDARY SEGMENT INFORMATION (GEOGRAPHICAL SEGMENT)
(` in million)
Year ended
31st March, 2016
Year ended
31st March, 2015
Segment Revenue– Within India 4,01,016.6 4,44,521.6– Outside India 7,70,499.3 9,50,515.7
11,71,515.9 13,95,037.3
Capital Expenditure– Within India 66,334.2 81,315.9– Outside India 78,387.8 58,858.2
1,44,722.0 1,40,174.1
Segment Assets– Within India 7,41,158.4 7,01,085.6 – Outside India 6,86,181.5 7,21,381.8
14,27,339.9 14,22,467.4
Additional information: (1) The Group has disclosed Business Segment as the primary segment. Segments have been identified taking into account the
nature of the products, the differing risks and returns, the organisational structure and internal reporting system. The Company’s operations predominantly relate to manufacture of Steel. Other business segments comprise of Tubes, Bearings, Refractories, Pigments, Port operations, Town services etc.
(2) Segment Revenue, Segment Results, Segment Assets and Segment Liabilities include the respective amounts identifiable to each of the segments as also amounts allocated on a reasonable basis. The expenses, which are not directly relatable to the business segment, are shown as unallocated corporate cost. Assets and liabilities that cannot be allocated between the segments are shown as unallocated corporate assets and liabilities respectively.
(3) Unallocable assets and liabilities exclude.
(` in million)
As at
31st March, 2016
As at
31st March, 2015
Assets
Non-current investments 20,836.0 20,804.3Current investments 46,911.9 13,746.2Goodwill on consolidation 1,37,193.8 1,34,075.1Deferred tax assets 218.5 227.5
2,05,160.2 1,68,853.1
Liabilities
Long-term borrowings 6,83,540.9 6,56,752.0Short-term borrowings 1,54,498.8 95,985.5Current maturities of long-term borrowings 23,998.1 54,275.4Hybrid perpetual securities 22,750.0 22,750.0Provision for employee separation compensation 9,994.3 5,786.3Deferred tax liabilities 29,048.8 28,845.1Preference shares issued by subsidiary companies 200.0 200.0Minority interest 16,542.4 17,038.5
9,40,573.3 8,81,632.8
(4) Transactions between segments are primarily for materials which are transferred at market determined prices and common costs are apportioned on a reasonable basis.
43. Segment Reporting (contd.)
PRIMARY SEGMENT INFORMATION (BUSINESS SEGMENT)
F-211

NOTES FORMING PART OF THE FINANCIAL STATEMENTS
A. Associate of:
i) Tata Steel Limited
1. Industrial Energy Limited 2. Jamipol Limited 3. Kalinga Aquatics Ltd. 4. Kumardhubi Fireclay & Silica Works Ltd. 5. Kumardhubi Metal Casting and Engineering Limited 6. Nicco Jubilee Park Limited 7. Rujuvalika Investments Limited^* 8. Strategic Energy Technology Systems Private Limited 9. Tata Construction & Projects Ltd. 10. TRL Krosaki Refractories Limited 11. TRF Limited 12. Malusha Travels Pvt Ltd. 13. Mohar Export Services Pvt. Ltd^*
ii) T Steel Holdings Pte. Ltd.
a) T S Global Holdings Pte Ltd.
I. Tata Steel International (Singapore)
Holdings Pte. Ltd.
1. European Profiles (M) Sdn. Bhd.
II. Tata Steel Europe Limited
1. Albi Profils SRL 2. Appleby Frodingham Cottage Trust
Limited 3. GietWalsOnderhoudCombinatie B.V. 4. Hoogovens Court Roll Service Technologies
VOF 5. Hoogovens Gan Multimedia S.A. De C.V. 6. ISSB Limited 7. Wupperman Staal Nederland B.V.
III. T S Global Minerals Holdings Pte Ltd.
1. New Millennium Iron Corp.
iii) Indian Steel & Wire Products Ltd.
1. Metal Corporation of India Limited
B. Joint Ventures of:
i) Tata Steel Ltd.
1. Bhubaneshwar Power Private Limited
2. Himalaya Steel Mill Services Private Limited
3. mjunction services limited
4. S & T Mining Company Private Limited
5. Tata BlueScope Steel Limited
6. Tata NYK Shipping Pte Ltd.
ii) T Steel Holdings Pte. Ltd.
a) T S Global Holdings Pte Ltd.
I. NatSteel Holdings Pte. Ltd.
1. TVSC Construction Steel Solutions Limited
II. Tata Steel Europe Limited
1. Afon Tinplate Company Limited
2. Air Products Llanwern Limited
3. BSR Pipeline Services Limited
4. Caparo Merchant Bar Plc
5. Corus Kalpinis Simos Cladding Industry SA
6. Danieli Corus Technical Services B.V.*
7. Fabsec Limited
8. Industrial Rail Services IJmond B.V.
9. Laura Metaal Holding B.V.
10. Norsk Stal AS*
11. Ravenscraig Limited
12. Redcar Bulk Terminal Limited
13. Tata Elastron Steel Service Center SA
14. Tata Steel Ticaret AS
15. Texturing Technology Limited
III. T S Global Minerals Holdings Pte Ltd.
1. Minas De Benga (Mauritius) Limited
C. Promoters holding together with its subsidiary is more than 20%
Tata Sons Limited
D. Key Managerial Personnel
44. Related Party Disclosures
LIST OF RELATED PARTIES AND RELATIONSHIPS
* Part of the year^ Became subsidiary during the year
F-212

NOTES FORMING PART OF THE FINANCIAL STATEMENTS
Dr. Karl-Ulrich Koehler – Managing Director and Chief Executive Officer, Tata Steel Europe Limited*
Mr. Koushik Chatterjee – Group Executive Director (Finance & Corporate), Tata Steel Limited
Mr. T. V. Narendran – Managing Director (India & South East Asia), Tata Steel Limited
(` in million)
Transactions Associates
and JVs#
Key
Management
Personnel
Relatives of Key
Management
Personnel
Promoter Total
Purchase of Goods
GietWalsOnderhoudCombinatie B. V. 944.8 – – – 944.8
986.6 – – – 986.6Wupperman Staal Nederland B.V. 1,693.9 – – – 1,693.9
1,450.3 – – – 1,450.3TRL Krosaki Refractories Limited 1,882.5 – – – 1,882.5
1,923.9 – – – 1,923.9Jamipol Limited 1,007.8 – – – 1,007.8
1,367.3 – – – 1,367.3Others 2,940.1 – – – 2,940.1
6,620.0 – – – 6,620.08,469.1 – – – 8,469.1
12,348.1 – – – 12,348.1Sale of Goods
Tata BlueScope Steel Limited 7,079.2 – – – 7,079.2
8,230.9 – – – 8,230.9Caparo Merchant Bar Plc 4,173.0 – – – 4,173.0
4,038.2 – – – 4,038.2Laura Metaal Holding B.V. 4,064.6 – – – 4,064.6
4,855.9 – – – 4,855.9Wupperman Staal Nederland B.V. 6,153.1 – – – 6,153.1
6,798.6 – – – 6,798.6Others 3,092.6 – – – 3,092.6
3,803.9 – – – 3,803.924,562.5 – – – 24,562.5
27,727.5 – – – 27,727.5Receiving of Services
Industrial Energy Limited 4,581.8 – – – 4,581.8
5,163.7 – – – 5,163.7Tata NYK Shipping Pte Ltd. 4,327.5 – – – 4,327.5
5,227.8 – – – 5,227.8Others 1,225.7 – – 48.1 1,273.8
1,453.3 – – 19.3 1,472.610,135.0 – – 48.1 10,183.1
11,844.8 – – 19.3 11,864.1
44. Related Party Disclosures (contd.)
RELATED PARTY TRANSACTIONS
F-213

NOTES FORMING PART OF THE FINANCIAL STATEMENTS
(` in million)
Transactions Associates
and JVs#
Key
Management
Personnel
Relatives of Key
Management
Personnel
Promoter Total
Rendering of Services
Tata BlueScope Steel Limited 587.7 – – – 587.7
223.5 – – – 223.5Others 144.5 – – 1.4 145.9
199.0 – – 0.8 199.8732.2 – – 1.4 733.6
422.5 – – 0.8 423.3Dividend Paid
Tata Sons Limited – – – 2,311.2 2,311.2
– – – 2,889.0 2,889.0Others – * *** – –
11.7 ** **** – 11.7– * *** 2,311.2 2,311.2
11.7 ** **** 2,889.0 2,900.7Dividend Income
Industrial Energy Limited 163.5 – – – 163.5
173.2 – – – 173.2Tata Sons Limited – – – 297.0 297.0
– – – 99.0 99.0Others 333.9 – – – 333.9
670.9 – – – 670.9497.4 – – 297.0 794.4
844.1 – – 99.0 943.1Interest Income
Industrial Energy Limited 17.9 – – – 17.9
97.9 – – – 97.9Others – – – – –
94.5 – – – 94.517.9 – – – 17.9
192.4 – – – 192.4Interest Expenses
New Millenium Iron Corp. 9.4 – – – 9.4
18.6 – – – 18.6Tata Elastron Steel Service Center SA 3.7 – – – 3.7
3.9 – – – 3.913.1 – – – 13.1
22.5 – – – 22.5Management Contracts
Tata Sons Limited – – – 1,454.1 1,454.1
– – – 1,706.9 1,706.9– – – 1,454.1 1,454.1
– – – 1,706.9 1,706.9Finance Provided
Industrial Energy Limited 96.7 – – – 96.7
769.1 – – – 769.1Bhubaneshwar Power Private Limited 137.7 – – – 137.7
219.5 – – – 219.5
44. Related Party Disclosures (contd.)
RELATED PARTY TRANSACTIONS
F-214

NOTES FORMING PART OF THE FINANCIAL STATEMENTS
(` in million)
Transactions Associates
and JVs#
Key
Management
Personnel
Relatives of Key
Management
Personnel
Promoter Total
Tata Elastron Steel Service Center SA 75.3 – – – 75.3
67.4 – – – 67.4Others 9.1 – – – 9.1
1,017.7 – – – 1,017.7318.8 – – – 318.8
2,073.7 – – – 2,073.7Purchase of Investment
TRF Limited 81.5 – – – 81.5
– – – – –81.5 – – – 81.5
– – – – –Sale of Investment
Tata Sons Limited – – – 25,920.1 25,920.1
– – – – –– – – 25,920.1 25,920.1
– – – – –Remuneration
Dr. Karl–Ulrich Koehler – 117.7 – – 117.7
– 147.8 – – 147.8Mr. Koushik Chatterjee – 89.4 – – 89.4
– 56.2 – – 56.2Mr. T. V. Narendran – 83.0 – – 83.0
– 64.7 – – 64.7– 290.1 – – 290.1
– 268.7 – – 268.7Guarantees outstanding
Tata NYK Shipping Pte Ltd. 650.4 – – – 650.4
788.9 – – – 788.9650.4 – – – 650.4
788.9 – – – 788.9Outstanding Receivables
Caparo Merchant Bar Plc 1,048.6 – – – 1,048.6
1135.7 – – – 1,135.7Laura Metaal Holding B.V. 508.1 – – – 508.1
295.0 – – – 295.0BSR Pipeline Services Limited 843.8 – – – 843.8
778.6 – – – 778.6Wupperman Staal Nederland B.V. 479.6 – – – 479.6
273.2 – – – 273.2Others 402.8 – – 12.7 415.5
2,326.4 – – 12.5 2,338.93,282.9 – – 12.7 3,295.6
4,808.9 – – 12.5 4,821.4
44. Related Party Disclosures (contd.)
RELATED PARTY TRANSACTIONS
F-215

NOTES FORMING PART OF THE FINANCIAL STATEMENTS
(` in million)
Transactions Associates
and JVs#
Key
Management
Personnel
Relatives of Key
Management
Personnel
Promoter Total
Provision for outstanding receivables
made during the year
Malusha Travels Pvt Ltd 0.3 – – – 0.3
– – – – –0.3 – – – 0.3
– – – – –Provision for outstanding receivables
Malusha Travels Pvt. Ltd. 0.3 – – – 0.3
– – – – –0.3 – – – 0.3
– – – – –Outstanding Payables
BSR Pipeline Services Limited 1,244.9 – – – 1,244.9
974.7 – – – 974.7Tata Sons Limited – – – 1,444.1 1,444.1
– – – 2,200.2 2,200.2Industrial Energy Limited 702.8 – – – 702.8
583.6 – – – 583.6Others 1,569.5 – – – 1,569.5
2,044.8 – – – 2,044.83,517.2 – – 1,444.1 4,961.3
3,603.1 – – 2,200.2 5,803.3
# Transaction with Joint Ventures have been disclosed at full value * `21,936.00 ** `27,420.00 *** `2,648.00 **** `3,310.00
44. Related Party Disclosures (contd.)
RELATED PARTY TRANSACTIONS
F-216

NOTES FORMING PART OF THE FINANCIAL STATEMENTS
45. Statement of Net Assets and Profit or Loss Attributable to Owners and Minority Interest
Name of the Entity Reporting
Currency
As % of
consolidated
net assets
Net Assets, i.e.
total assets minus
total liabilities
Amount
(` in million)
As % of
consolidated
profit or loss
Share in profit
or (loss)
Amount
(` in million)
A. PARENT
Tata Steel Limited INR 20.12% 72,7517.2 (42.78%) 4,9009.5 B. SUBSIDIARIES
a) Indian
1 Adityapur Toll Bridge Company Limited INR 0.00% 168.8 0.01% (11.9)2 Tata Steel Special Economic Zone Limited INR 0.02% 897.1 0.01% (12.0)3 Indian Steel & Wire Products Ltd. INR 0.02% 587.7 (0.05%) 58.2 4 Jamshedpur Continuous Annealing & Processing Company
Private Limited INR 0.19% 6,726.0 1.93% (2,211.1)
5 Jamshedpur Utilities & Services Company Limited INR 0.02% 675.9 (0.28%) 321.3 6 Haldia Water Management Limited INR (0.04%) (1,472.8) 0.11% (122.3)7 Naba Diganta Water Management Limited INR 0.01% 310.9 (0.02%) 22.3 8 SEZ Adityapur Limited INR 0.00% (0.5) 0.00% (0.1)9 Mohar Export Services Pvt. Ltd INR 0.00% (0.3) 0.00% - 10 Rujuvalika Investments Limited INR 0.01% 309.6 (0.02%) 20.0 11 T M Mining Company Limited INR 0.00% (0.2) 0.00% (0.3)12 T S Alloys Limited INR 0.03% 1,120.8 (0.01%) 12.4 13 Tata Korf Engineering Services Ltd. INR 0.00% (97.8) 0.00% (4.5)14 Tata Metaliks Ltd. INR 0.06% 2,220.8 (0.44%) 506.1 15 Tata Metaliks Di Pipes Limited INR 0.03% 1,047.6 (0.63%) 721.8 16 Tata Sponge Iron Limited INR 0.22% 8,075.1 (0.27%) 308.7 17 TSIL Energy Limited INR 0.00% 11.1 0.00% 0.5 18 Kalzip India Private Limited INR 0.00% 94.3 (0.01%) 10.1 19 Tata Steel International (India) Limited INR 0.01% 391.2 (0.02%) 23.7 20 Tata Steel Odisha Limited INR 0.00% (0.1) 0.00% (0.1)21 Tata Steel Processing and Distribution Limited INR 0.14% 4,987.0 (0.43%) 493.1 22 Tayo Rolls Limited INR (0.02%) (8,83.4) 1.36% (1,562.8)23 TM International Logistics Limited INR 0.05% 1,729.5 (0.26%) 297.5 24 TKM Global Logistics Limited INR 0.01% 246.8 (0.03%) 30.1 25 TM Harbour Services Private Limited INR 0.03% 1,143.8 (0.14%) 159.0 26 Tata Pigments Limited INR 0.01% 406.7 (0.05%) 56.4 27 The Tinplate Company of India Ltd. INR 0.17% 5,971.4 (0.64%) 733.7 b) Foreign
1 ABJA Investment Co. Pte. Ltd. USD (0.08%) (2,879.0) 0.08% (96.4)2 Bangla Steel & Mining Co. Ltd. BDT 0.00% 0.1 0.00% - 3 NatSteel Asia Pte. Ltd. SGD 0.47% 16,995.1 (0.38%) 439.2 4 TS Asia (Hong Kong) Ltd. USD 0.03% 1,024.5 0.24% (273.4)5 Tata Steel (KZN) (Pty) Ltd. ZAR (0.26%) (9,394.0) 2.44% (2,789.4)6 T Steel Holdings Pte. Ltd. GBP 13.36% 4,83,317.1 65.48% (75,011.0)7 T S Global Holdings Pte Ltd. GBP 14.59% 5,27,483.1 11.93% (13,661.7)8 Orchid Netherlands (No.1) B.V. EUR 0.00% 17.6 0.00% (0.1)9 NatSteel Holdings Pte. Ltd. SGD 0.03% 1,102.2 1.35% (1,541.8)10 Easteel Services (M) Sdn. Bhd. MYR 0.01% 338.7 0.00% 3.2 11 Eastern Steel Fabricators Phillipines, Inc. SGD (0.01%) (424.2) 0.00% - 12 NatSteel (Xiamen) Ltd. CNY (0.06%) (2,142.8) 3.61% (4,134.3)13 NatSteel Recycling Pte Ltd. SGD 0.06% 2,020.4 0.00% 0.9 14 NatSteel Trade International (Shanghai) Company Ltd. CNY 0.00% (2.2) 0.00% (0.9)15 NatSteel Trade International Pte. Ltd. USD 0.03% 942.7 (0.03%) 29.8 16 NatSteel Vina Co. Ltd. VND 0.02% 725.2 (0.18%) 201.4 17 The Siam Industrial Wire Company Ltd. THB 0.25% 9,175.8 (0.89%) 1,015.7 18 TSN Wires Co., Ltd. THB 0.00% 5.9 0.18% (201.4)19 Tata Steel Europe Limited GBP 6.63% 2,39,615.3 3.94% (4,516.0)20 Almana Steel Dubai (Jersey) Limited AED 0.02% 604.8 0.00% -
F-217

NOTES FORMING PART OF THE FINANCIAL STATEMENTS
Name of the Entity Reporting
Currency
As % of
consolidated
net assets
Net Assets, i.e.
total assets minus
total liabilities
Amount
(` in million)
As % of
consolidated
profit or loss
Share in profit
or (loss)
Amount
(` in million)
21 Apollo Metals Limited USD 0.00% 59.5 (0.17%) 200.2 22 Augusta Grundstucks GmbH EUR 0.00% (11.3) (0.02%) 19.7 23 Automotive Laser Technologies Limited GBP 0.00% - 0.00% - 24 B S Pension Fund Trustee Limited GBP 0.01% 210.7 0.00% - 25 Beheermaatschappij Industriele Produkten B.V. EUR (0.01%) (516.9) 0.00% 4.3 26 Bell & Harwood Limited GBP 0.00% (120.2) 0.00% - 27 Blastmega Limited GBP 0.24% 8,848.7 0.00% - 28 Blume Stahlservice GmbH EUR 0.01% 465.7 (0.03%) 31.3 29 Blume Stahlservice Polska Sp.Z.O.O PLN 0.00% 0.2 (0.01%) 15.8 30 Bore Samson Group Limited GBP 0.04% 1,427.8 0.00% - 31 Bore Steel Limited GBP 0.04% 1,622.0 0.00% - 32 British Guide Rails Limited GBP 0.01% 462.2 0.00% - 33 British Steel Corporation Limited GBP 0.08% 2,902.0 0.00% - 34 British Steel Directors (Nominees) Limited GBP 0.00% - 0.00% - 35 British Steel Engineering Steels (Exports) Limited GBP 0.00% - 0.00% - 36 British Steel Nederland International B.V. EUR 0.17% 6,091.1 (0.96%) 1,096.1 37 British Steel Samson Limited GBP 0.00% 95.1 0.00% - 38 British Steel Service Centres Limited GBP 0.14% 5,087.4 0.00% - 39 British Tubes Stockholding Limited GBP 0.03% 1,001.9 0.00% - 40 C V Benine EUR 0.00% 163.3 0.00% 1.7 41 C Walker & Sons Limited GBP 0.04% 1,545.8 0.00% - 42 Catnic GmbH EUR 0.01% 397.9 (0.01%) 16.3 43 Catnic Limited GBP 0.00% (5.8) 0.00% - 44 CBS Investissements SAS EUR 0.00% 16.1 0.00% 0.1 45 Cladding & Decking (UK) Limited GBP 0.00% 47.9 0.00% - 46 Cogent Power Inc. CAD 0.04% 1,468.1 0.01% (13.8)47 Cogent Power Inc. USD 0.01% 285.7 0.00% - 48 Cogent Power Limited GBP 0.11% 4,114.3 0.01% (11.4)49 Cogent Power SA DE CV USD 0.00% (71.8) 0.00% - 50 Color Steels Limited GBP 0.02% 557.8 0.00% - 51 Corbeil Les Rives SCI EUR 0.00% 92.7 0.00% - 52 Corby (Northants) & District Water Co. GBP 0.00% 54.4 0.00% - 53 Cordor (C& B) Limited GBP 0.00% 30.9 0.00% - 54 Corus Aluminium Verwaltungsgesellschaft Mbh EUR 0.00% (50.5) (0.01%) 9.5 55 Corus Beteiligungs GmbH EUR 0.01% 219.1 0.00% (1.5)56 Corus Building Systems Bulgaria AD LEV (0.01%) (235.2) (0.04%) 43.8 57 Corus Building Systems SAS EUR 0.00% 76.5 (0.01% 11.1 58 Corus CNBV Investments GBP 0.00% - 0.00% - 59 Corus Cold drawn Tubes Limited GBP (0.01%) (207.2) 0.00% - 60 Corus Engineering Steels (UK) Limited GBP 0.12% 4,358.0 0.00% - 61 Corus Engineering Steels Holdings Limited GBP 1.18% 42,634.9 0.00% - 62 Corus Engineering Steels Limited GBP 1.25% 45,227.6 0.00% - 63 Corus Engineering Steels Overseas Holdings Limited GBP 0.00% 94.6 0.00% - 64 Corus Engineering Steels Pension Scheme Trustee Limited GBP 0.00% - 0.00% - 65 Corus Group Limited GBP 1.54% 55,745.9 2.72% (3,116.0)66 Corus Holdings Limited GBP 0.00% 33.2 0.00% - 67 Corus International (Overseas Holdings) Limited GBP 1.22% 43,973.0 (0.60%) 682.9 68 Corus International Limited GBP 0.79% 28,648.1 (0.09%) 103.9 69 Corus International Romania SRL. RON 0.00% 4.3 0.00% (2.0)70 Corus Investments Limited GBP 0.06% 2,157.7 0.00% - 71 Corus Ireland Limited EUR 0.00% 46.3 0.00% (0.7)72 Corus Large Diameter Pipes Limited GBP 0.19% 6,920.5 0.00% - 73 Corus Liaison Services (India) Limited GBP 0.00% 0.3 0.00% - 74 Corus Management Limited GBP (0.12%) (4,313.8) 0.00% -
45. Statement of Net Assets and Profit or Loss Attributable to Owners and Minority Interest (contd.)
F-218

NOTES FORMING PART OF THE FINANCIAL STATEMENTS
Name of the Entity Reporting
Currency
As % of
consolidated
net assets
Net Assets, i.e.
total assets minus
total liabilities
Amount
(` in million)
As % of
consolidated
profit or loss
Share in profit
or (loss)
Amount
(` in million)
75 Corus Primary Aluminium B.V. EUR (0.04%) (1,296.4) 0.02% (23.6)76 Corus Properties (Germany) Limited GBP 0.00% (3.5) 0.00% - 77 Corus Property GBP 0.00% - 0.00% - 78 Corus Republic Of Ireland Subsidiaries Pension Scheme Trustee
Limited
EUR 0.00% - 0.00% -
79 Corus Service Centre Limited GBP 0.04% 1,518.5 0.00% - 80 Corus Steel Service STP LLC RUB 0.00% (16.0) 0.01% (7.6)81 Corus Tubes Poland Spolka Z.O.O EUR 0.00% 3.3 0.00% - 82 Corus UK Healthcare Trustee Limited GBP 0.00% - 0.00% - 83 Corus Ukraine LLC UAH 0.00% 0.2 0.00% - 84 CPN (85) Limited GBP 0.00% (8.0) 0.00% - 85 Crucible Insurance Company Limited GBP 0.07% 2,702.3 0.29% (337.2)86 Degels GmbH EUR (0.01%) (319.7) 0.26% (300.8)87 Demka B.V. EUR 0.02% 663.2 0.01% (8.2)88 DSRM Group Plc. GBP 0.05% 1,887.9 0.00% - 89 Eric Olsson & Soner Forvaltnings AB SEK 0.00% 1.4 0.03% (36.8)90 Esmil B.V. EUR 0.01% 202.1 0.00% 1.2 91 Europressings Limited GBP 0.00% 60.8 0.00% - 92 Firsteel Group Limited GBP 0.05% 1,705.7 0.00% - 93 Firsteel Holdings Limited GBP 0.02% 736.4 0.00% - 94 Firsteel Strip Mill Products Limited GBP 0.03% 972.6 0.00% - 95 Fischer Profil GmbH EUR 0.00% (155.3) 0.11% (129.2)96 Gamble Simms Metals Limited EUR 0.00% (21.2) 0.00% - 97 Grant Lyon Eagre Limited GBP 0.02% 560.4 0.00% - 98 H E Samson Limited GBP 0.01% 496.9 0.00% - 99 Hadfields Holdings Limited GBP (0.02%) (764.5) 0.00% - 100 Halmstad Steel Service Centre AB SEK 0.01% 433.3 0.14% (156.8)101 Hammermega Limited GBP 0.01% 214.1 0.00% - 102 Harrowmills Properties Limited GBP 0.05% 1,811.9 0.00% - 103 Hille & Muller GmbH EUR 0.03% 960.9 0.07% (80.8)104 Hille & Muller USA Inc. USD 0.03% 1,128.6 (0.01%) 6.0 105 Hoogovens (UK) Limited GBP 0.00% 44.3 0.00% - 106 Hoogovens Aluminium UK Limited GBP 0.00% 23.1 0.00% - 107 Hoogovens Finance B.V. EUR 0.43% 15,382.9 (0.02%) 28.3 108 Hoogovens USA Inc. USD 0.13% 4,849.2 0.00% 3.8 109 Huizenbezit “Breesaap” B.V. EUR 0.00% (82.1) 0.00% 0.6 110 Ickles Cottage Trust Limited GBP 0.00% 15.9 0.00% 2.0 111 Inter Metal Distribution SAS EUR 0.01% 346.5 (0.07%) 83.5 112 Kalzip Guangzhou Limited CNY 0.01% 533.8 (0.08%) 92.6 113 Kalzip Asia Pte Limited SGD (0.03%) (939.8) 0.11% (127.7)114 Kalzip FZE AED 0.00% 39.2 (0.01%) 8.9 115 Kalzip GmbH EUR 0.00% 10.4 0.00% 0.2 116 Kalzip GmbH EUR 0.00% (44.2) (0.02%) 27.7 117 Kalzip Inc USD (0.01%) (463.6) 0.00% (4.1)118 Kalzip Italy SRL EUR 0.00% 2.8 0.00% 0.9 119 Kalzip Limited GBP 0.00% 161.0 0.01% (12.3)120 Kalzip Spain S.L.U. EUR 0.00% 112.1 0.00% 1.2 121 Layde Steel S.L. EUR 0.02% 579.4 0.28% (321.3)122 Lister Tubes Limited EUR 0.00% 122.1 0.00% - 123 London Works Steel Company Limited GBP (0.03%) (980.5) 0.00% - 124 Longs Steel UK Limited GBP (0.32%) (11,517.0) 10.00% (11,459.5)125 Midland Steel Supplies Limited GBP 0.00% - 0.00% - 126 Mistbury Investments Limited GBP 0.00% 7.2 0.00% -
45. Statement of Net Assets and Profit or Loss Attributable to Owners and Minority Interest (contd.)
F-219

NOTES FORMING PART OF THE FINANCIAL STATEMENTS
Name of the Entity Reporting
Currency
As % of
consolidated
net assets
Net Assets, i.e.
total assets minus
total liabilities
Amount
(` in million)
As % of
consolidated
profit or loss
Share in profit
or (loss)
Amount
(` in million)
127 Montana Bausysteme AG CHF 0.02% 811.7 (0.06%) 63.6 128 Naantali Steel Service Centre OY EUR 0.01% 376.0 0.10% (118.1)129 Nationwide Steelstock Limited GBP 0.00% (107.9) 0.00% - 130 Norsk Stal Tynnplater AS NOK 0.01% 522.1 (0.08%) 93.3 131 Orb Electrical Steels Limited GBP 0.00% - 0.00% - 132 Ore Carriers Limited GBP 0.01% 271.0 0.00% - 133 Oremco Inc. USD 0.00% (88.9) 0.01% (8.9)134 Plated Strip (International) Limited GBP 0.00% 165.8 0.00% - 135 Precoat International Limited GBP 0.02% 737.5 0.00% - 136 Precoat Limited GBP (0.01%) (201.8) 0.00% - 137 Rafferty-Brown Steel Co Inc Of Conn. USD 0.01% 272.6 0.00% (0.5)138 Round Oak Steelworks Limited GBP (0.13%) (4,558.3) 0.00% - 139 Runblast Limited GBP 0.14% 4,950.7 0.00% - 140 Runmega Limited GBP 0.00% 41.4 0.00% - 141 S A B Profiel B.V. EUR 0.18% 6,380.1 (0.31%) 353.5 142 S A B Profil GmbH EUR 0.03% 1,234.0 (0.02%) 26.8 143 Seamless Tubes Limited GBP 0.05% 1,766.6 0.00% - 144 Service Center Gelsenkirchen Gmbh EUR 0.17% 6,122.5 0.06% (73.8)145 Service Centre Maastricht B.V. EUR 0.00% 35.8 0.17% (194.3)146 Skruv Erik AB SEK 0.00% 5.6 0.02% (17.5)147 Societe Europeenne De Galvanisation (Segal) Sa EUR 0.06% 2,007.6 (0.06%) 68.5 148 Staalverwerking en Handel B.V. EUR 0.25% 8,947.6 0.07% (83.3)149 Stainless Velsen-Noord BV EUR 0.00% 7.7 0.00% - 150 Steel StockHoldings Limited GBP 0.01% 435.8 0.00% - 151 Steelstock Limited GBP 0.00% 1.9 0.00% - 152 Stewarts & Lloyds Of Ireland Limited EUR 0.00% (17.5) 0.00% - 153 Stewarts And Lloyds (Overseas) Limited GBP 0.05% 1,947.1 0.00% - 154 Stocksbridge Works Cottage Trust Limited GBP 0.00% 10.9 0.00% 2.0 155 Surahammar Bruks AB SEK 0.04% 1,515.9 (1.14%) 1,300.7 156 Swinden Housing Association Limited GBP 0.00% 61.5 (0.02%) 19.4 157 Tata Steel Belgium Packaging Steels N.V. EUR 0.06% 2,012.9 (0.07%) 77.0 158 Tata Steel Belgium Services N.V. EUR 0.11% 3,836.7 (0.13%) 144.3 159 Tata Steel Denmark Byggsystemer A/S DKK 0.01% 233.2 0.02% (24.4)160 Tata Steel Europe Distribution BV EUR (0.01%) (250.9) 0.00% (0.1)161 Tata Steel Europe Metals Trading BV EUR 0.07% 2,434.0 (0.29%) 327.0 162 Tata Steel France Batiment et Systemes SAS EUR 0.01% 308.8 0.15% (172.2)163 Tata Steel France Holdings SAS EUR 0.49% 17,801.2 (0.31%) 359.1 164 Tata Steel France Rail SAS EUR 0.13% 4,773.9 (0.79%) 909.0 165 Tata Steel Germany GmbH EUR 0.11% 4,109.4 1.22% (1,401.1)166 Tata Steel Ijmuiden BV EUR 4.48% 1,61,953.9 (6.78%) 7,768.1 167 Tata Steel International (Americas) Holdings Inc USD 0.16% 5,803.3 (0.10%) 118.5 168 Tata Steel International (Americas) Inc USD 0.30% 10,738.5 (0.11%) 123.5 169 Tata Steel International (Benelux) BV EUR 0.00% 93.8 (0.02%) 25.2 170 Tata Steel International (Canada) Holdings Inc CAD 0.00% 18.3 0.00% - 171 Tata Steel International (Czech Republic) S.R.O CZK 0.00% 61.4 (0.05%) 54.2 172 Tata Steel International (Denmark) A/S DKK 0.00% 8.2 0.00% (0.2)173 Tata Steel International (Finland) OY EUR 0.00% 19.2 (0.01%) 8.1 174 Tata Steel International (France) SAS EUR 0.01% 341.2 (0.01%) 9.9 175 Tata Steel International (Germany) GmbH EUR 0.00% (21.1) (0.05%) 56.7 176 Tata Steel International (Italia) SRL EUR 0.00% 93.5 (0.05%) 62.0 177 Tata Steel International (Middle East) FZE AED 0.04% 1,457.4 (0.04%) 41.9 178 Tata Steel International (Nigeria) Ltd. NGN 0.00% - 0.00% - 179 Tata Steel International (Poland) sp Zoo PLN 0.00% 12.4 (0.03%) 34.2
45. Statement of Net Assets and Profit or Loss Attributable to Owners and Minority Interest (contd.)
F-220

NOTES FORMING PART OF THE FINANCIAL STATEMENTS
Name of the Entity Reporting
Currency
As % of
consolidated
net assets
Net Assets, i.e.
total assets minus
total liabilities
Amount
(` in million)
As % of
consolidated
profit or loss
Share in profit
or (loss)
Amount
(` in million)
180 Tata Steel International (Schweiz) AG CHF 0.00% 51.0 (0.01%) 7.6 181 Tata Steel International (South America) Representações LTDA USD 0.00% 1.4 0.00% (1.1)182 Tata Steel International (Sweden) AB SEK 0.00% 45.8 (0.04%) 42.5 183 Tata Steel International Hellas SA EUR 0.00% 11.0 0.00% - 184 Tata Steel International Iberica SA EUR 0.00% 99.0 (0.07%) 85.3 185 Tata Steel Istanbul Metal Sanayi ve Ticaret AS USD 0.01% 181.6 0.09% (107.9)186 Tata Steel Latvia Building Systems SIA EUR 0.00% 0.9 0.00% 2.0 187 Tata Steel Maubeuge SAS EUR 0.02% 738.6 0.14% (162.7)188 Tata Steel Nederland BV EUR 3.50% 1,26,642.4 (8.27%) 9,478.6 189 Tata Steel Nederland Consulting & Technical Services BV EUR 0.01% 414.2 (1.40%) 1,600.4 190 Tata Steel Nederland Services BV EUR 0.11% 3,974.6 0.20% (228.1)191 Tata Steel Nederland Star-Frame BV EUR 0.00% 1.9 (0.01%) 11.6 192 Tata Steel Nederland Technology BV EUR 0.14% 4,988.2 (0.35%) 397.1 193 Tata Steel Nederland Tubes BV EUR (0.02%) (743.7) (0.03%) 29.1 194 Tata Steel Netherlands Holdings B.V. EUR 2.82% 1,01,929.7 2.15% (2,466.1)195 Tata Steel Norway Byggsystemer A/S NOK 0.01% 404.1 (0.03%) 35.1 196 Tata Steel Speciality Service Centre Suzhou Co. Limited USD 0.00% (8.3) 0.03% (28.6)197 Tata Steel Speciality Service Centre Xian Co. Limited USD 0.00% 57.3 (0.01%) 7.2 198 Tata Steel Sweden Byggsystem AB SEK 0.00% (15.4) 0.10% (113.6)199 Tata Steel UK Consulting Limited GBP 0.00% 29.9 (0.03%) 36.2 200 Tata Steel UK Holdings Limited GBP 8.04% 2,90,854.1 (2.71%) 3106.0 201 Tata Steel UK Limited GBP (1.64%) (59,255.6) 47.17% (54,029.1)202 Tata Steel UK Rail Consultancy Limited GBP 0.06% 2,087.0 (0.65%) 742.9 203 Tata Steel USA Inc. USD 0.02% 746.9 (0.01%) 6.6 204 The Newport And South Wales Tube Company Limited GBP 0.00% 1.5 0.00% - 205 The Stanton Housing Company Limited GBP 0.00% 91.6 0.00% - 206 The Steel Company Of Ireland Limited EUR 0.01% 234.2 0.00% (0.4)207 The Templeborough Rolling Mills Limited GBP 0.04% 1,510.1 0.00% - 208 Thomas Processing Company USD 0.04% 1,403.0 0.01% (13.1)209 Thomas Steel Strip Corp. USD (0.09%) (3,167.5) (0.24%) 279.0 210 Toronto Industrial Fabrications Limited GBP 0.00% (47.2) 0.00% - 211 Trierer Walzwerk GmbH EUR 0.01% 232.2 0.00% 3.0 212 Ts South Africa Sales Office Proprietary Limited ZAR 0.00% - 0.00% - 213 Tulip UK Holdings (No.2) Limited GBP 5.42% 1,95,856.3 0.00% - 214 Tulip UK Holdings (No.3) Limited GBP 5.35% 1,93,329.5 3.17% (3,633.5)215 Tuscaloosa Steel Corporation USD 0.00% 4.4 0.00% 0.5 216 U.E.S. Bright Bar Limited GBP 0.00% 142.7 0.00% - 217 UK Steel Enterprise Limited GBP 0.04% 1,412.5 0.02% (18.4)218 UKSE Fund Managers Limited GBP 0.00% 4.3 0.00% - 219 Unitol SAS EUR 0.01% 368.6 0.22% (252.7)220 Walker Manufacturing And Investments Limited GBP 0.04% 1,469.8 0.00% - 221 Walkersteelstock Ireland Limited EUR 0.00% 36.8 0.99% (1,133.0)222 Walkersteelstock Limited GBP 0.00% 95.1 0.00% - 223 Westwood Steel Services Limited GBP 0.06% 2,235.7 0.00% - 224 Whitehead (Narrow Strip) Limited GBP 0.03% 1,091.1 0.00% - 225 T S Global Minerals Holdings Pte Ltd. USD 1.00% 36,229.8 3.64% (4,173.3)226 Al Rimal Mining LLC OMR 0.00% 63.0 0.00% - 227 Black Ginger 461 (Proprietary) Ltd ZAR 0.01% 375.4 0.03% (38.9)228 Kalimati Coal Company Pty. Ltd. AUD (0.05%) (1,956.0) 0.00% (2.8)229 Sedibeng Iron Ore Pty. Ltd. ZAR 0.01% 285.9 (0.12%) 139.2
45. Statement of Net Assets and Profit or Loss Attributable to Owners and Minority Interest (contd.)
F-221

NOTES FORMING PART OF THE FINANCIAL STATEMENTS
Name of the Entity Reporting
Currency
As % of
consolidated
net assets
Net Assets, i.e.
total assets minus
total liabilities
Amount
(` in million)
As % of
consolidated
profit or loss
Share in profit
or (loss)
Amount
(` in million)
230 Tata Steel Cote D’ Ivoire S.A FCFA 0.02% 685.1 0.06% (66.5)231 Tata Steel Minerals UK Limited USD 0.79% 28,679.7 0.00% (0.4)232 Tata Steel Minerals Canada Limited USD 0.39% 14,255.6 11.91% (13,641.0)233 T S Canada Capital Ltd USD 0.01% 331.0 (0.01%) 12.0 234 Howse Minerals Ltd. USD 0.04% 1,372.8 0.01% (8.8)235 Tata Steel International (Singapore) Holdings Pte. Ltd. HKD 0.11% 3,909.6 0.00% - 236 TSIA Holdings (Thailand) Limited THB 0.00% (1.0) 0.00% (0.2)237 Tata Steel International (Shanghai) Ltd. CNY 0.00% 77.0 0.00% (2.6)238 Tata Steel International (Thailand) Limited THB 0.00% (0.8) 0.00% (2.5)239 Tata Steel International (Singapore) Pte. Ltd. SGD 0.01% 305.3 0.07% (74.7)240 Tata Steel International (Asia) Limited HKD 0.16% 5,835.0 0.16% (177.7)241 Tata Steel (Thailand) Public Company Ltd. THB 0.66% 23,975.0 (0.09%) 102.3 242 N.T.S Steel Group Plc. THB 0.06% 2,046.9 0.02% (26.9)243 The Siam Construction Steel Co. Ltd. THB 0.11% 3,899.0 (0.44%) 508.2 244 The Siam Iron And Steel (2001) Co. Ltd. THB 0.06% 2,072.4 (0.23%) 267.1 245 T S Global Procurement Company Pte. Ltd. USD 0.62% 22,461.6 (1.09%) 1,244.4 246 ProCo Issuer Pte. Ltd. GBP 0.88% 31,665.3 (2.72%) 3,118.9 247 International Shipping and Logistics FZE USD 0.06% 2,074.5 0.10% (114.3)248 TKM Global China Ltd CNY 0.00% 36.0 0.00% (1.8)249 TKM Global GmbH EUR 0.04% 1,265.3 (0.03%) 38.8 C. JOINT VENTURES
a) Indian
1. Bhubaneshwar Power Private Limited INR 0.02% 586.6 0.00% (5.6)2. Himalaya Steel Mill Services Private Limited INR 0.00% 21.4 0.00% (2.7)3. mjunction services limited INR 0.03% 940.3 (0.19%) 213.8 4 S & T Mining Company Private Limited INR 0.00% 20.3 0.02% (20.7)5 Tata BlueScope Steel Limited INR 0.04% 1,599.6 (0.17%) 191.3 b) Foreign
1 Tata NYK Shipping Pte Ltd. USD 0.01% 308.7 0.29% (327.4)Total 100.00% 36,16,501.4 100.00% (1,14,552.9)
A. ADJUSTMENT DUE TO CONSOLIDATION (33,30,210.8) 82,762.9 B. MINORITY INTERESTS IN SUBSIDIARIES
a) Indian Subsidiary
1 The Tinplate Company of India Ltd. INR 1,547.7 166.0 2 Indian Steel & Wire Products Ltd INR 29.3 2.9 3 Jamshedpur Continuous Annealing & Processing Company
Private LimitedINR 3,295.7 (1,083.5)
4 Tata Metaliks Ltd. INR 489.5 489.5 5 TM International Logistics Limited INR 2,760.4 195.3 6 Adityapur Toll Bridge Company Limited INR 44.5 (3.1)7 Tata Sponge Iron Limited INR 3,778.0 128.8 8 Jamshedpur Utilities & Services Company Limited INR 33.8 5.8 9 T M Mining Company Limited INR - (0.1)b) Foreign Subsidiary
1 Tata Steel (Thailand) Public Company Ltd. THB 3,077.9 84.7 2 Tata Steel Europe Limited GBP 77.6 15.1 3 Natsteel Holdings Pte. Ltd. SGD 318.9 7.7 4 T S Global Minerals Holdings Pte Ltd. USD 1,089.1 (1,098.5)
16,542.4 (1,089.4)
45. Statement of Net Assets and Profit or Loss Attributable to Owners and Minority Interest (contd.)
F-222

NOTES FORMING PART OF THE FINANCIAL STATEMENTS
Name of the Entity Reporting
Currency
As % of
consolidated
net assets
Net Assets, i.e.
total assets minus
total liabilities
Amount
(` in million)
As % of
consolidated
profit or loss
Share in profit
or (loss)
Amount
(` in million)
C. ASSOCIATES
a) Indian
1. Industrial Energy Limited INR 2,008.9 89.4 2. Jamipol Limited INR 464.8 75.2 3 Rujuvalika Investments Limited* INR - 0.4 4 Strategic Energy Technology Systems Private Limited INR - (9.0)5 TRF Limited INR - (124.0)6 TRL Krosaki Refractories Limited INR 772.2 44.9 b) Foreign
1 Tata Steel Europe Limited GBP 1,566.5 213.8 2 European Profiles (M) Sdn. Bhd. MYR 93.2 18.5 3 New Millenium Iron Corp. CAD - (101.8)
4,905.6 207.4
Consolidated Net Asset / Profit after Tax 3,07,738.6 (30,493.2)
* Part of the Year
List of subsidiaries, associates and joint ventures which have not been consolidated and reasons for not consolidating
Sl. No. Name Reason
1 Fabsec Limited The operations of the companies are not significant and hence are immaterial for consolidation2 Industrial Rail Services IJmond B.V. The operations of the companies are not significant and hence are immaterial for consolidation3 European Profiles (M) Sdn. Bhd. The operations of the companies are not significant and hence are immaterial for consolidation4 Albi Profils SRL The operations of the companies are not significant and hence are immaterial for consolidation5 Appleby Frodingham Cottage Trust Limited The operations of the companies are not significant and hence are immaterial for consolidation6 Hoogovens Gan Multimedia S.A. De C.V. The operations of the companies are not significant and hence are immaterial for consolidation7 ISSB Limited The operations of the companies are not significant and hence are immaterial for consolidation8 Kalinga Aquatics Ltd. Not Consolidated as the financials were not available 9 Kumardhubi Fireclay & Silica Works Ltd. Not Consolidated as the financials were not available 10 Kumardhubi Metal Casting and Engineering Limited Not Consolidated as the financials were not available 11 Nicco Jubilee Park Limited Not Consolidated as the financials were not available 12 Tata Construction & Projects Ltd. Not Consolidated as the financials were not available 13 Malusha Travels Pvt Ltd. Not Consolidated as the financials were not available 14 Mohar Export Services Pvt. Ltd Not Consolidated as the financials were not available 15 Metal Corporation of India Limited Not Consolidated as the financials were not available 16 Medica TS Hospital Pvt. Ltd. Not Consolidated as the financials were not available
46. Figures pertaining to the subsidiaries and joint ventures have been reclassified where necessary to bring them in line with the Group’s
financial statements.
47. Previous year’s figures have been recast/restated where necessary.
45. Statement of Net Assets and Profit or Loss Attributable to Owners and Minority Interest (contd.)
F-223

TO THE MEMBERS OF TATA STEEL LIMITED
Report on the Consolidated Ind AS Financial Statements
We have audited the accompanying consolidated Ind AS financial statements of TATA STEEL LIMITED (hereinafter referred to as “the Parent”) and its subsidiaries (the Parent and its subsidiaries together referred to as “the Group”) its associates and its joint ventures, comprising the Consolidated Balance Sheet as at March 31, 2017, the Consolidated Statement of Profit and Loss including other comprehensive income, the Consolidated Cash Flow Statement, the Consolidated Statement of Changes in Equity, for the year then ended, and a summary of the significant accounting policies and other explanatory information (hereinafter referred to as “the consolidated Ind AS financial statements”).
Management’s Responsibility for the Consolidated Ind AS
Financial Statements
The Parent’s Board of Directors is responsible for the preparation of these consolidated Ind AS financial statements in terms of the requirements of the Companies Act, 2013 (hereinafter referred to as “the Act”) that give a true and fair view of the consolidated financial position, consolidated financial performance including other comprehensive income, consolidated cash flows and statement of changes in equity of the Group including its Associates and Joint ventures in accordance with the accounting principles generally accepted in India, including the Indian Accounting Standards (Ind AS) prescribed under Section 133 of the Act. The respective Board of Directors of the companies included in the Group and of its associates and joint ventures are responsible for maintenance of adequate accounting records in accordance with the provisions of the Act for safeguarding the assets of the Group and its associates and its joint ventures and for preventing and detecting frauds and other irregularities; the selection and application of appropriate accounting policies; making judgments and estimates that are reasonable and prudent; and the design, implementation and maintenance of adequate internal financial controls, that were operating effectively for ensuring the accuracy and completeness of the accounting records, relevant to the preparation and presentation of the financial statements that give a true and fair view and are free from material misstatement, whether due to fraud or error, which have been used for the purpose of preparation of the consolidated Ind AS financial statements by the Directors of the Parent, as aforesaid.
Auditor’s Responsibility
Our responsibility is to express an opinion on these consolidated Ind AS financial statements based on our audit. In conducting our audit, we have taken into account the provisions of the Act, the accounting and auditing standards and matters which are required
INDEPENDENT AUDITORS’ REPORT ON CONSOLIDATED FINANCIAL STATEMENTS
to be included in the audit report under the provisions of the Act and the Rules made thereunder.
We conducted our audit in accordance with the Standards on Auditing specified under Section 143(10) of the Act. Those Standards require that we comply with ethical requirements and plan and perform the audit to obtain reasonable assurance about whether the consolidated Ind AS financial statements are free from material misstatement.
An audit involves performing procedures to obtain audit evidence about the amounts and the disclosures in the consolidated Ind AS financial statements. The procedures selected depend on the auditor’s judgment, including the assessment of the risks of material misstatement of the consolidated Ind AS financial statements, whether due to fraud or error. In making those risk assessments, the auditor considers internal financial control relevant to the Parent’s preparation of the consolidated Ind AS financial statements that give a true and fair view in order to design audit procedures that are appropriate in the circumstances. An audit also includes evaluating the appropriateness of the accounting policies used and the reasonableness of the accounting estimates made by the Parent’s Board of Directors, as well as evaluating the overall presentation of the consolidated Ind AS financial statements.
We believe that the audit evidence obtained by us and other auditors in terms of their reports referred to in sub-paragraph (a) of the Other Matters paragraph below, is sufficient and appropriate to provide a basis for our audit opinion on the consolidated Ind AS financial statements.
Opinion
In our opinion and to the best of our information and according to the explanations given to us and based on the consideration of reports of the other auditors on separate financial statements of the subsidiaries, associates and joint ventures referred to below in the Other Matters paragraph, the aforesaid consolidated Ind AS financial statements give the information required by the Act in the manner so required and give a true and fair view in conformity with the accounting principles generally accepted in India, of the consolidated state of affairs of the Group, its associates and joint ventures as at March 31, 2017, and their consolidated loss, consolidated total comprehensive loss, their consolidated cash flows and consolidated statement of changes in equity for the year ended on that date.
Other Matters
(a) We did not audit the financial statements of eight subsidiaries, whose financial statements reflect total assets of `6,05,144.9 million as at March 31, 2017, total revenues of `6,22,376.2 million and net cash outflows amounting to ̀ 5,684.2 million for
F-224

the year ended on that date, as considered in the consolidated Ind AS financial statements. The consolidated Ind AS financial statements also include the Group’s share of net profit of ` 241.0 million for the year ended March 31, 2017, as considered in the consolidated Ind AS financial statements, in respect of an associate and two joint ventures, whose financial statements have not been audited by us. These financial statements have been audited by other auditors whose reports have been furnished to us by the Management and our opinion on the consolidated Ind AS financial statements, in so far as it relates to the amounts and disclosures included in respect of these subsidiaries, joint ventures and associate, and our report in terms of sub-section (3) of Section 143 of the Act, in so far as it relates to the aforesaid subsidiaries, joint ventures and associate is based solely on the reports of the other auditors.
(b) We did not audit the financial statements of thirteen subsidiaries, whose financial statements reflect total assets of ` 6,475.1 million as at March 31, 2017, total revenues of ` 6,502.0 million and net cash inflows amounting to ` 407.4 million for the year ended on that date, as considered in the consolidated Ind AS financial statements. The consolidated Ind AS financial statements also include the Group’s share of net loss of ` 106.4 million for the year ended March 31, 2017, as considered in the consolidated Ind AS financial statements, in respect of a joint venture, whose financial statements have not been audited by us. These financial statements are unaudited and have been furnished to us by the Management and our opinion on the consolidated Ind AS financial statements, in so far as it relates to the amounts and disclosures included in respect of these subsidiaries and joint venture, is based solely on such unaudited financial statements. In our opinion and according to the information and explanations given to us by the Management, these financial statements are not material to the Group.
(c) In the case of one subsidiary and eight associates the financial statements as at March 31, 2017 are not available. The investment in these companies are carried at Re. 1 each as at March 31, 2017, the total assets, the total revenue, and net cash flows of the subsidiary and the Group’s share of profit/(loss) of these associates have not been included in the consolidated Ind AS financial statements.
Our opinion on the consolidated Ind AS financial statements above, and our report on Other Legal and Regulatory Requirements below, is not modified in respect of the above matters with respect to our reliance on the work done and the reports of the other auditors and the financial statements certified by the Management.
Report on Other Legal and Regulatory Requirements
As required by Section 143(3) of the Act, based on our audit and the other financial information of subsidiaries, associates and joint venture companies incorporated in India, referred in the Other Matters paragraph above we report, to the extent applicable, that:
(a) We have sought and obtained all the information and explanations which to the best of our knowledge and belief were necessary for the purposes of our audit of the aforesaid consolidated Ind AS financial statements.
(b) In our opinion, proper books of account as required by law relating to preparation of the aforesaid consolidated Ind AS financial statements have been kept so far as it appears from our examination of those books, returns and the reports of the other auditors.
(c) The Consolidated Balance Sheet, the Consolidated Statement of Profit and Loss including Other Comprehensive Income, the Consolidated Cash Flow Statement and Consolidated Statement of Changes in Equity dealt with by this Report are in agreement with the relevant books of account maintained for the purpose of preparation of the consolidated Ind AS financial statements.
(d) In our opinion, the aforesaid consolidated Ind AS financial statements comply with the Indian Accounting Standards prescribed under Section 133 of the Act.
(e) On the basis of the written representations received from the directors of the Parent as on March 31, 2017 taken on record by the Board of Directors of the Parent and the reports of the statutory auditors of its subsidiary companies, associate companies and joint venture companies incorporated in India, none of the directors of the Group companies, its associate companies and joint venture companies incorporated in India is disqualified as on March 31, 2017 from being appointed as a director in terms of Section 164 (2) of the Act.
(f ) With respect to the adequacy of the internal financial controls over financial reporting and the operating effectiveness of such controls, refer to our separate Report in “Annexure A”, which is based on the auditors’ reports of the Holding company, subsidiary companies, associate companies and jointly controlled companies incorporated in India. Our report expresses an unmodified opinion on the adequacy and operating effectiveness of the Parent’s/ subsidiary company’s / associate company’s / joint venture company’s incorporated in India internal financial controls over financial reporting.
F-225

(g) With respect to the other matters to be included in the Auditor’s Report in accordance with Rule 11 of the Companies (Audit and Auditor’s) Rules, 2014, as amended, in our opinion and to the best of our information and according to the explanations given to us:
i. The consolidated Ind AS financial statements disclose the impact of pending litigations on the consolidated financial position of the Group, its associates and joint ventures.
ii. Provision has been made in the consolidated Ind AS financial statements, as required under the applicable law or accounting standards, for material foreseeable losses, if any, on long-term contracts including derivative contracts.
iii. There has been no delay in transferring amounts required to be transferred, to the Investor Education and Protection Fund by the Parent and its subsidiary companies, associate companies and joint venture companies incorporated in India.
iv. The Parent has provided requisite disclosures in the consolidated Ind AS financial statements as regards the holding and dealings in Specified Bank Notes as defined in the Notification S.O. 3407(E) dated the
November 8, 2016 of the Ministry of Finance, during the period from November 8, 2016 to December 30, 2016 of the Group entities as applicable. Based on audit procedures performed and the representations provided to us by the management we report that the disclosures are in accordance with the relevant books of accounts maintained by those entities for the purpose of preparation of the consolidated Ind AS financial statements and as produced to us (and the other auditors) by the Management of the respective Group entities.
For DELOITTE HASKINS & SELLS LLP Chartered Accountants
(Firm’s Registration No. 117366W/W-100018)
N. Venkatram
(Partner)
(Membership No. 071387)
Mumbai, May 16, 2017
F-226

ANNEXURE “A” TO THE INDEPENDENT AUDITOR’S REPORT
(Referred to in paragraph (f) under ‘Report on Other Legal and
Regulatory Requirements’ section of our report of even date)
Report on the Internal Financial Controls Over Financial
Reporting under Clause (i) of Sub-section 3 of Section 143 of the
Companies Act, 2013 (“the Act”)
In conjunction with our audit of the consolidated Ind AS financial statements of the Company as of and for the year ended March 31, 2017, we have audited the internal financial controls over financial reporting of Tata Steel Limited (hereinafter referred to as “Parent”) and its subsidiary companies, its associate companies and joint ventures, which are companies incorporated in India, as of that date.
Management’s Responsibility for Internal Financial
Controls
The respective Board of Directors of the Parent, its subsidiary companies, its associate companies and joint ventures, which are companies incorporated in India, are responsible for establishing and maintaining internal financial controls based on the internal control over financial reporting criteria established by the respective Companies considering the essential components of internal control stated in the Guidance Note on Audit of Internal Financial Controls Over Financial Reporting issued by the Institute of Chartered Accountants of India (ICAI). These responsibilities include the design, implementation and maintenance of adequate internal financial controls that were operating effectively for ensuring the orderly and efficient conduct of its business, including adherence to the respective company’s policies, the safeguarding of its assets, the prevention and detection of frauds and errors, the accuracy and completeness of the accounting records, and the timely preparation of reliable financial information, as required under the Companies Act, 2013.
Auditor’s Responsibility
Our responsibility is to express an opinion on the internal financial controls over financial reporting of the Parent, its subsidiary companies, its associate companies and its joint ventures, which are companies incorporated in India, based on our audit. We conducted our audit in accordance with the Guidance Note on Audit of Internal Financial Controls Over Financial Reporting (the “Guidance Note”) issued by the Institute of Chartered Accountants of India and the Standards on Auditing, prescribed under Section 143(10) of the Companies Act, 2013, to the extent applicable to an audit of internal financial controls. Those Standards and the Guidance Note require that we comply with ethical requirements and plan and perform the audit to obtain reasonable assurance about whether adequate internal financial controls over financial reporting was established and maintained and if such controls operated effectively in all material respects.
Our audit involves performing procedures to obtain audit evidence about the adequacy of the internal financial controls system over financial reporting and their operating effectiveness. Our audit of internal financial controls over financial reporting included obtaining an understanding of internal financial controls over financial reporting, assessing the risk that a material weakness exists, and testing and evaluating the design and operating effectiveness of internal control based on the assessed risk. The procedures selected depend on the auditor’s judgement, including the assessment of the risks of material misstatement of the financial statements, whether due to fraud or error.
We believe that the audit evidence we have obtained and the audit evidence obtained by other auditors of the subsidiary companies, associate companies and joint ventures, which are companies incorporated in India, in terms of their reports referred to in the Other Matters paragraph below, is sufficient and appropriate to provide a basis for our audit opinion on the internal financial controls system over financial reporting of the Parent, its subsidiary companies, its associate companies and its joint ventures, which are companies incorporated in India.
Meaning of Internal Financial Controls over Financial
Reporting
A company’s internal financial control over financial reporting is a process designed to provide reasonable assurance regarding the reliability of financial reporting and the preparation of financial statements for external purposes in accordance with generally accepted accounting principles. A company’s internal financial control over financial reporting includes those policies and procedures that (1) pertain to the maintenance of records that, in reasonable detail, accurately and fairly reflect the transactions and dispositions of the assets of the company; (2) provide reasonable assurance that transactions are recorded as necessary to permit preparation of financial statements in accordance with generally accepted accounting principles, and that receipts and expenditures of the company are being made only in accordance with authorisations of management and directors of the company; and (3) provide reasonable assurance regarding prevention or timely detection of unauthorised acquisition, use, or disposition of the company’s assets that could have a material effect on the financial statements.
Inherent Limitations of Internal Financial Controls over
Financial Reporting
Because of the inherent limitations of internal financial controls over financial reporting, including the possibility of collusion or improper management override of controls, material misstatements due to error or fraud may occur and not be detected. Also, projections of any evaluation of the internal financial controls
F-227
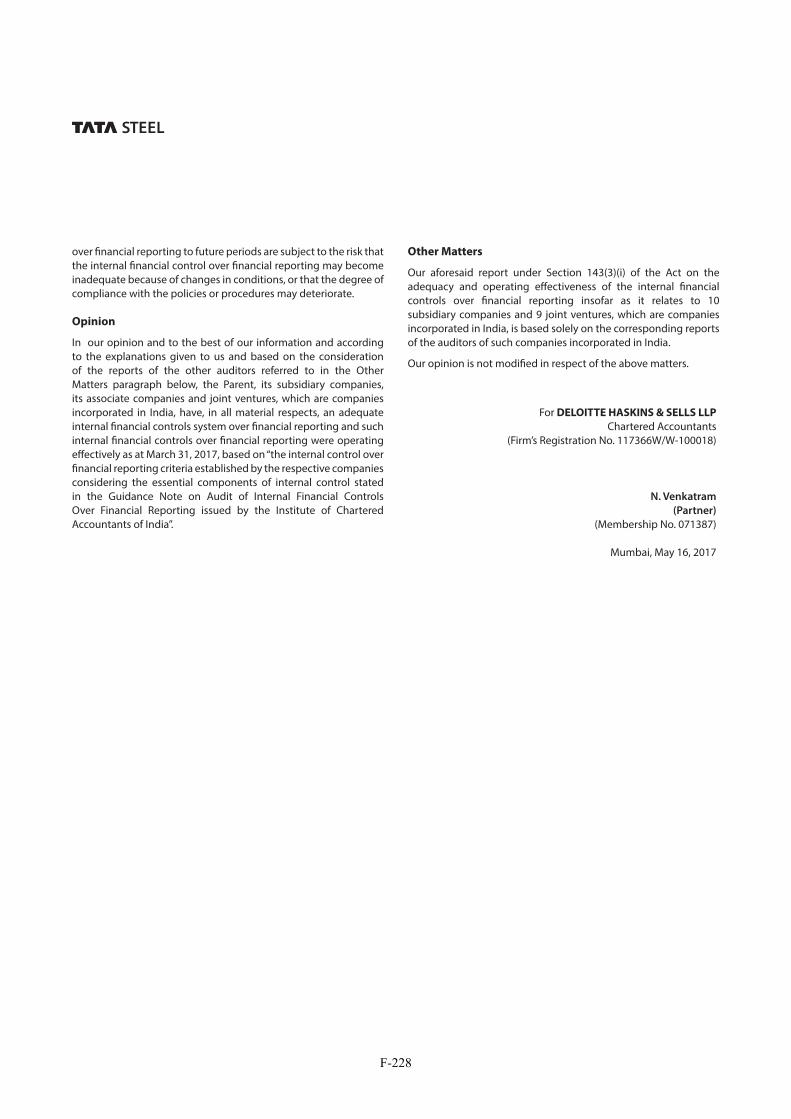
over financial reporting to future periods are subject to the risk that the internal financial control over financial reporting may become inadequate because of changes in conditions, or that the degree of compliance with the policies or procedures may deteriorate.
Opinion
In our opinion and to the best of our information and according to the explanations given to us and based on the consideration of the reports of the other auditors referred to in the Other Matters paragraph below, the Parent, its subsidiary companies, its associate companies and joint ventures, which are companies incorporated in India, have, in all material respects, an adequate internal financial controls system over financial reporting and such internal financial controls over financial reporting were operating effectively as at March 31, 2017, based on “the internal control over financial reporting criteria established by the respective companies considering the essential components of internal control stated in the Guidance Note on Audit of Internal Financial Controls Over Financial Reporting issued by the Institute of Chartered Accountants of India”.
Other Matters
Our aforesaid report under Section 143(3)(i) of the Act on the adequacy and operating effectiveness of the internal financial controls over financial reporting insofar as it relates to 10 subsidiary companies and 9 joint ventures, which are companies incorporated in India, is based solely on the corresponding reports of the auditors of such companies incorporated in India.
Our opinion is not modified in respect of the above matters.
For DELOITTE HASKINS & SELLS LLP Chartered Accountants
(Firm’s Registration No. 117366W/W-100018)
N. Venkatram
(Partner)
(Membership No. 071387)
Mumbai, May 16, 2017
F-228

CONSOLIDATED BALANCE SHEETAS AT MARCH 31, 2017, 2016 AND APRIL 1, 2015
As at
March 31, 2017
As at
March 31 2016
As at
April 1, 2015
Note (US$ million) (` in million) (` in million) (` in million)
ASSETS
I Non-current assets
(a) Property, plant and equipment 3 13,398.2 8,68,805.9 6,65,692.4 6,71,495.5 (b) Capital work-in-progress 2,392.5 1,55,143.7 3,57,933.2 2,80,994.3 (c) Goodwill on consolidation 5 538.9 34,947.3 40,675.6 39,608.5 (d) Other Intangible assets 6 251.6 16,312.3 15,629.6 29,871.6 (e) Intangible assets under development 41.6 2,697.6 2,027.7 819.8 (f ) Equity accounted investments 7 245.8 15,936.8 16,204.1 17,196.1 (g) Financial assets
(i) Investments 8 800.4 51,903.1 44,297.5 1,11,587.7(ii) Loans 9 57.5 3,730.6 4,122.3 2,900.9(iii) Derivative assets 12.8 831.7 328.2 881.7 (iv) Other financial assets 10 13.2 855.8 410.4 705.1
(h) Retirement benefit assets 11 270.3 17,526.4 1,14,774.4 13,306.3 (i) Income tax assets 151.3 9,812.3 10,402.6 8,490.2 (j) Deferred tax assets 12 136.6 8,858.7 6,274.5 8,122.0 (k) Other assets 13 566.7 36,749.6 38,422.3 33,544.3 Total non-current assets 18,877.4 12,24,111.8 13,17,194.8 12,19,524.0
II Current assets
(a) Inventories 14 3,825.1 2,48,038.2 2,00,133.3 2,45,933.6 (b) Financial assets
(i) Investments 8 874.9 56,731.3 46,635.5 12,146.0 (ii) Trade receivables 15 1,786.8 1,15,868.2 1,20,662.2 1,35,797.7 (iii) Cash and cash equivalents 16 745.2 48,322.9 61,090.5 81,771.3(iv) Other balances with bank 17 13.7 887.6 772.9 713.4(v) Loans 9 34.6 2,245.0 2,074.2 2,155.2(vi) Derivative assets 16.0 1,040.4 3,096.2 14,973.4 (vii) Other financial assets 10 59.8 3,878.2 2,413.0 3,516.7
(c) Income tax assets 5.4 350.8 502.0 446.9 (d) Other assets 13 338.4 21,943.8 20,278.7 19,580.6 Total current assets 7,699.9 4,99,306.4 4,57,658.5 5,17,034.8
III Assets held for sale 18 152.9 9,914.2 261.1 1,454.2
TOTAL ASSETS 26,730.2 17,33,332.4 17,75,114.4 17,38,013.0
F-229

CONSOLIDATED BALANCE SHEET (CONTD.) AS AT MARCH 31, 2017, 2016 AND APRIL 1, 2015
As at
March 31, 2017
As at
March 31 2016
As at
April 1, 2015
Note (US$ million) (` in million) (` in million) (` in million)
EQUITY AND LIABILITIES
IV Equity
(a) Equity share capital 19 149.6 9,702.4 9,702.4 9,714.1 (b) Hybrid Perpetual Securities 20 350.8 22,750.0 22,750.0 22,750.0 (c) Other equity 21 5,331.8 3,45,740.8 4,04,873.1 4,38,672.2Equity attributable to shareholders of the Company 5,832.2 3,78,193.2 4,37,325.5 4,71,136.3
Non controlling interest 247.0 16,017.0 7809.4 8,541.8 Total equity 6,079.2 3,94,210.2 44,5134.9 4,79,678.1
V Non-current liabilities
(a) Financial liabilities(i) Borrowings 22 9,873.1 6,40,222.7 6,48,727.8 6,22,515.6 (ii) Derivative liabilities 27.8 1,799.8 1,654.7 1,749.1 (iii) Other financial liabilities 23 16.8 1,087.8 4,544.2 9,005.5
(b) Provisions 24 660.0 42,796.9 44,404.8 29,734.9 (c) Retirement benefit obligations 11 411.2 26,662.7 29,294.8 33,533.7 (d) Deferred income 25 317.3 20,575.9 24,314.1 23,351.9 (e) Deferred tax liabilities 12 1,546.8 1,00,300.8 94,208.9 99,377.1 (f ) Other liabilities 26 34.9 2,265.1 3,290.5 3,204.9 Total non-current liabilities 12,887.9 8,35,711.7 8,50,439.8 8,22,472.7
VI Current liabilities
(a) Financial liabilities(i) Borrowings 22 2,826.4 1,83,281.0 1,57,221.2 96,932.5 (ii) Trade payables 27 2,864.4 1,85,744.6 1,85,567.0 1,80,666.6(iii) Derivative liabilities 103.9 6,736.7 4,982.8 7,366.3 (iv) Other financial liabilities 23 973.9 63,155.1 69,011.2 1,05,285.6
(b) Provisions 24 152.3 9,873.8 15,218.6 8,164.8 (c) Retirement benefit obligations 11 14.7 952.0 1,110.8 1,103.1 (d) Deferred income 25 3.4 225.2 37.0 30.8 (e) Income tax liabilities 113.9 7,391.8 10,011.0 7,944.9 (f ) Other liabilities 26 665.5 43,152.7 36,380.1 28,367.6 Total current liabilities 7,718.4 5,00,512.9 4,79,539.7 4,35,862.2
VII Liabilities held for sale 18 44.7 2,897.6 - -
TOTAL EQUITY AND LIABILITIES 26,730.2 17,33,332.4 17,75,114.4 17,38,013.0
NOTES FORMING PART OF THE FINANCIAL
STATEMENTS1-48
F-230

CONSOLIDATED STATEMENT OF PROFIT AND LOSS FOR THE YEARS ENDED MARCH 31, 2017 AND 2016
Year ended
March 31, 2017
Year ended
March 31, 2016
Note(US$
million)(` in million) (` in million)
I Revenue from Operations 28 18,107.8 11,74,199.4 10,63,399.2 II Other income 29 81.3 5,274.7 4,122.2 III Total Income 18,189.1 11,79,474.1 10,67,521.4
IV Expenses
(a) Raw materials consumed 4,999.3 3,24,180.9 2,81,149.0 (b) Purchases of finished, semi-finished and other products 1,761.9 1,14,249.4 1,05,813.7 (c) Changes in stock of finished goods, work-in-progress and
stock-in-trade (699.8) (45,381.3) 19,251.9
(d) Employee benefit expenses 30 2,660.5 172,522.2 1,75,876.3 (e) Finance costs 31 782.2 50,722.0 42,214.1 (f ) Depreciation and amortisation expense 32 874.8 56,728.8 53,063.5 (g) Other expenses 33 6,881.0 4,46,197.1 4,12,554.7
17,259.9 11,19,219.1 10,89,923.2 (h) Less: Expenditure (other than interest) transferred to capital
and other accounts 117.9 7,647.1 10,929.7
Total Expenses 17,142.0 11,11,572.0 10,78,993.5
V Share of profit/(loss) of joint ventures and associates 1.2 76.5 (1,104.2)VI Profit before exceptional items and tax (III-IV+V) 1,048.3 67,978.6 (12,576.3)
VII Exceptional Items 34(a) Profit on sale of non-current investments 3.5 227.0 471.7 (b) Profit on sale of non-current asset 13.2 858.7 -(c) Provision for diminution in value of investments/doubtful
advances (19.3) (1,254.5) (729.9)
(d) Provision for impairment of non-current assets (41.3) (2,679.3) (15,301.7)(e) Provision for demands and claims (33.7) (2,182.5) (8,800.5)(f ) Employee separation compensation (32.0) (2,073.7) (5,562.5)(g) Restructuring and other provisions (557.3) (36,138.0) 69,826.7 Total exceptional items (666.9) (43,242.3) 39,903.8
VIII Profit/(loss) before tax (VI+VII) 381.4 24,736.3 27,327.5
IX Tax expense:
(a) Current tax 268.6 17,417.0 13,210.2(b) Deferred tax 159.8 10,363.1 (6,310.6)Total tax expense 428.4 27,780.1 6,899.6
X Profit/(loss) after tax from continuing operations (47.0) (3,043.8) 20,427.9
XI Profit/(loss) after tax from discontinued operations 35(a) Profit/(loss) after tax from discontinued operations (120.1) (7,788.7) (25,398.8)(b) Profit/(loss) on disposal of discontinued operations (475.8) (30,853.2) -Profit/(loss) after tax from discontinued operations (595.9) (38,641.9) (25,398.8)
XII Profit/(loss) for the year (A) (642.9) (41,685.7) (4,970.9)
F-231

CONSOLIDATED STATEMENT OF PROFIT AND LOSS (CONTD.) FOR THE YEARS ENDED MARCH 31, 2017 AND 2016
Year ended
March 31, 2017
Year ended
March 31, 2016
Note(US$
million)(` in million) (` in million)
XIII Other Comprehensive Income/(loss)
A) (i) Items that will not be reclassified subsequently to
the consolidated statement of profit and loss a) Remeasurement gains/(losses) on post
employment defined benefit plans (668.4) (43,345.4) 19,793.0
b) Fair value changes of investments in equity shares
129.1 8,369.2 (31,672.7)
c) Share of equity accounted investees 5.0 33.7 (2.7)(ii) Income tax on Items that will not be reclassified
subsequently to the consolidated statement of
profit and loss
120.6 7,823.4 (5,760.2)
B) (i) Items that will be reclassified subsequently to the
consolidated statement of profit and loss a) Foreign currency translation differences 315.4 20,451.4 (2,635.9) b) Fair value changes of cash flow hedges 22.4 1,453.3 1,169.1 c) Share of equity accounted investees (0.3) (21.7) 276.9(ii) Income tax on items that will be reclassified
subsequently to the consolidated statement of
profit and loss
(6.1) (394.5) (149.2)
Total Other Comprehensive Income/(loss) (B) (86.8) (5,630.6) (18,981.7)
XIV Profit/(loss) from continuing operations for the year:Shareholders of the Company (58.1) (3,766.1) 21,571.0 Non controlling interests 11.1 722.3 (1,143.1)
(47.0) (3,043.8) 20,427.9 XV Profit/(loss) from discontinued operations for the year:
Shareholders of the Company 595.9 (38,641.9) (25,398.8)Non controlling interests - - -
595.9 (38,641.9) (25,398.8)XVI Total Comprehensive Income for the year: (A+B)
(i) Shareholders of the Company (740.3) (48,003.2) (22,832.1)(ii) Non controlling interests 10.6 686.9 (1,120.5)
(729.7) (47,316.3) (23,952.6)
XVII Earnings per equity share (from continuing operations)
Basic & Diluted (`) 37 (0.1) (4.93) 19.26XVIII Earnings per equity share (from discontinued operations)
Basic & Diluted (`) 37 (0.6) (39.84) (26.18)XIX Earnings per equity share (from continuing and
discontinued operations) Basic & Diluted (`) 37 (0.7) (44.77) (6.92)
XX Notes forming part of the financial statements 1-48
F-232

CONSOLIDATED STATEMENT OF CHANGES IN EQUITY FOR THE YEARS ENDED MARCH 31, 2017 AND 2016
A. EQUITY SHARE CAPITAL Balance as at April 1, 2016
Changes during the year Balance as at March 31, 2017
(` in million) (US$ million)
9,702.4 - 9,702.4 149.6
Balance as at April 1, 2015
Changes during the year Balance as at March 31, 2016
(` in million)
9,714.1 (11.7) 9,702.4
(i) Changes in equity share capital during the year 2015-16 represents adjustment on account of shares held by a subsidiary in the Company.
B. HYBRID PERPETUAL SECURITIES
Balance as at April 1, 2016
Changes during the year Balance as at March 31, 2017
(` in million) (US$ million)
22,750.0 - 22,750.0 350.8
Balance as at April 1, 2015
Changes during the year Balance as at March 31, 2016
(` in million)
22,750.0 - 22,750.0
C. OTHER EQUITY
Retained
earnings
Other
comprehensive
income reserves
Other
consolidated
reserves
Share
application
money pending
allotment
Equity
attributable to
share holders of
the Group
Non-
controlling
interest
Total Equity
(` in
million)
(US$
million)
Balance as at April 1, 2016 (24,154.9) 94,407.0 3,34,621.0 - 4,04,873.1 7,809.4 4,12,682.5 6,364.0
Profit /(loss) for the year (42,408.0) - - - (42,408.0) 722.3 (41,685.7) (642.90)
Other comprehensive income
(35,494.3) 29,899.1 - - (5,595.2) (35.4) (5,630.6) (86.80)
Total comprehensive
income (77,902.3) 29,899.1 - - (48,003.2) 686.9 (47,316.3) (729.70)
Dividend (7,769.7) - - - (7,769.7) (147.7) (7,917.4) (122.10)
Tax on dividend (1,477.4) - - - (1,477.4) - (1,477.4) (22.80)
Additions during the year - - 1,913.9 - 1,913.9 - 1,913.9 29.50
Transfer to consolidated statement of profit and loss
- - (402.2) - (402.2) - (402.2) (6.20)
Distribution on Hybrid Perpetual Securities
(2,661.0) - - - (2,661.0) - (2,661.0) (41.00)
Tax on distribution on Hybrid Perpetual Securities
920.9 - - - 920.9 - 920.9 14.20
Transfers within equity (37.6) (17.5) (75.2) - (130.3) 130.3 - 0
Adjustment for change in ownership interests/ capital contributions received
(1,330.1) - 17.5 00.1 (1,312.5) 7,831.5 6,519.0 100.50
Other movements (58.0) - (152.8) - (210.8) (293.4) (504.2) (7.8)
Balance as at March 31,
2017
(1,14,470.1) 1,24,288.6 3,35,922.2 00.1 3,45,740.8 16,017.0 3,61,757.8 5,578.8
F-233

CONSOLIDATED STATEMENT OF CHANGES IN EQUITY (CONTD.) FOR THE YEARS ENDED MARCH 31, 2017 AND 2016
(` in million) Retained
earnings
Other
comprehensive
income reserves
Other
consolidated
reserves
Share
application
money pending
allotment
Equity
attributable to
share holders of
the Group
Non-
controlling
interest
Total
Equity
Balance as at April 1, 2015 (59,257.5) 1,63,461.9 3,34,467.8 - 4,38,672.2 8,541.8 4,47,214.0
Profit /(loss) for the year (3,827.8) - - - (3,827.8) (1,143.1) (4,970.9)
Other comprehensive income 16,449.3 (35,453.7) - - (19,004.4) 22.7 (18,981.7)
Total comprehensive income 12,621.5 (35,453.7) - - (22,832.2) (1,120.4) (23,952.6)
Dividend (7,769.7) - - - (7,769.7) (111.9) (7,881.6)
Tax on dividend (1,493.0) - - - (1,493.0) - (1,493.0)
Additions during the year - - 420.4 - 420.4 - 420.4
Transfer to consolidated statement of profit and loss - - (81.8) - (81.8) - (81.8)
Distribution on Hybrid Perpetual Securities (2,661.7) - - - (2,661.7) - (2,661.7)
Tax on distribution on Hybrid Perpetual Securities 921.1 - - - 921.1 - 921.1
Transfers within equity 33,484.4 (33,711.5) 187.5 - (39.6) 39.6 -
Capital contributions received - - - - - 426.0 426.0
Adjustments for cross holdings - - (372.9) - (372.9) - (372.9)
Other movements - 110.3 - - 110.3 34.3 144.6
Balance as at March 31, 2016 (24,154.9) 94,407.0 3,34,621.0 - 4,04,873.1 7,809.4 4,12,682.5
F-234

CONSOLIDATED STATEMENT OF CASH FLOWS FOR THE YEARS ENDED MARCH 31, 2017 AND 2016
Year ended March 31, 2017
Year ended March 31, 2016
(US$
million)
(` in
million)
(` in
million)
(A) CASH FLOWS FROM OPERATING ACTIVITIES:
Profit before taxes (213.2) (13,825.5) 2,473.0
Adjustments for:Depreciation and amortisation expense 877.5 56,904.4 53,840.7(Profit)/loss on sale of non-current investments (0.1) (9.7) -Income from non-current investments (8.8) (571.7) (499.5)(Profit)/loss on assets sold/discarded/written off 0.0 (1.5) (314.2)Exceptional Income/(Expenses) 666.9 43,242.1 (30,943.9)(Gain)/loss on cancellation of forwards, swaps and options 10.5 679.5 12.3Interest and income from current investments and guarantees
(79.8) (5,176.2) (3,195.4)
Finance costs 782.2 50,722.0 4,2214.1Exchange (gain) /loss on revaluation of foreign currency loans and swaps
219.4 14,225.0 1646.1
Share of profit or loss of joint ventures and associates (1.2) (76.5) 1,104.2(Profit)/loss on disposal of discontinued operation 475.8 30,853.2 -Other non cash items (17.7) (1,150.7) 1,902.7
2,924.5 1,89,639.9 65,767.1
Operating profit before working capital changes 2,711.3 1,75,814.4 68,240.1
Adjustments for:Non-current/current financial and other assets (80.9) (5,242.9) 2,6408.8Inventories (1,271.2) (82,431.7) 5,6178.5Non-current/current financial and other liabilities/provisions 597.8 38,767.5 (2,0931.1)
(754.2) (48,907.1) 61,656.2
Cash generated from operations 1,957.1 1,26,907.3 1,29,896.3
Direct taxes paid (284.2) (18,426.6) (15,342.8)
Net cash from/(used in) operating activities 1,672.9 1,08,480.7 1,14,553.5
(B) CASH FLOWS FROM INVESTING ACTIVITIES:
Purchase of fixed assets (1,189.9) (77,156.4) (1,01,634.4)Sale of fixed assets 44.5 2,887.2 2,306.3Purchase of non-current investments (3.8) (247.4) (5,535.8)Sale of non-current investments 14.1 912.4 42,750.7(Purchase)/sale of current investments (net) (106.8) (6,926.3) (32,419.4)Loans given (net of repayments) (23.2) (1,501.4) 373.2Fixed/Restricted deposits with banks (placed)/realised (4.2) (272.2) (12.9)Interest received 21.6 1,401.2 1,330.6Dividend received from associates and joint ventures 8.2 532.9 407.1Dividend received from others 5.0 321.4 670.9Acquisition of subsidiaries/undertakings 0 - (775.1)Sale of subsidiaries/undertakings (166.8) (1,0813.6) 0.6
Net cash from/(used in) investing activities (1,401.2) (90,862.2) (92,538.2)
F-235

CONSOLIDATED STATEMENT OF CASH FLOWS (CONTD.) FOR THE YEARS ENDED MARCH 31, 2017 AND 2016
Year ended March 31, 2017
Year ended March 31, 2016
(US$
million)
(` in
million)
(` in
million)
(C) CASH FLOWS FROM FINANCING ACTIVITIES:
Capital contributions received 100.5 6,518.9 -
Proceeds from borrowings 3,004.8 194,845.5 1,40,477.0
Repayment of borrowings (2,528.2) (1,63,940.7) (1,27,093.9) Repayment of finance lease obligations (32.1) (2,082.3) (2,004.8) Amount received/(paid) on utilisation/cancellation of
derivatives(27.5) (1,781.8) 8,291.2
Distribution on Hybrid Perpetual Securities (41.0) (2,661.0) (2,664.9) Interest paid (729.8) (47,324.6) (54,833.1) Dividend paid (122.0) (7,913.2) (7,881.7) Tax on dividend paid (24.5) (1,585.2) (1,581.0)Net cash from/(used in) financing activities (399.8) (25,924.4) (47,291.2)
Net increase /(decrease) in cash or cash equivalents (128.1) (8,305.9) (25,275.9)
Opening cash and cash Equivalents (1) 937.1 60,769.4 81,771.3
Effect of exchange rate on translation of foreign currency cash and cash equivalents
(63.8) (4,140.6) 4,595.1
Closing cash and cash Equivalents 745.2 48,322.9 61,090.5
(1) Excludes `321.1 million (US$ 4.95 million) in respect of subsidiaries disposed off/ held for sale during the year (2015-16: Includes `0.7 million in respect of subsidiaries acquired off during the year)
(2) The Group has acquired property, plant and equipment of ₹ 7,902.1 million (US$ 121.9 million) (2015-16: ₹ 2,219.7 million) on finance lease.
F-236
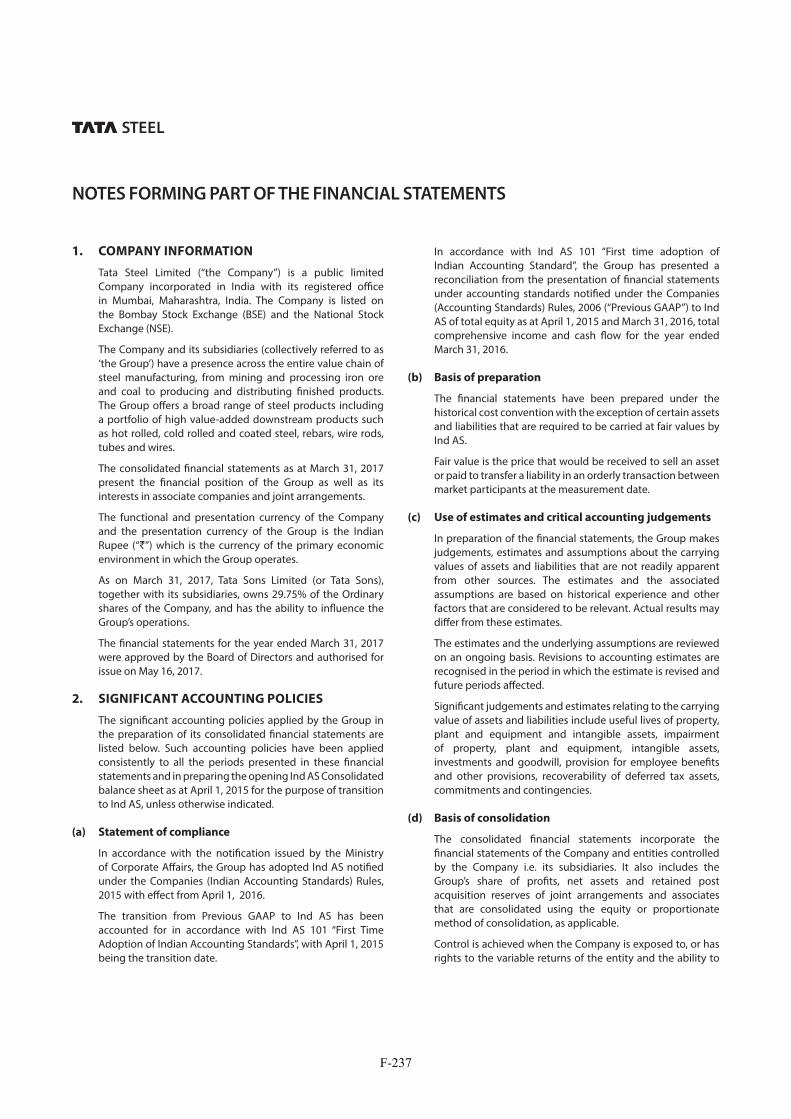
1. COMPANY INFORMATION
Tata Steel Limited (“the Company”) is a public limited Company incorporated in India with its registered office in Mumbai, Maharashtra, India. The Company is listed on the Bombay Stock Exchange (BSE) and the National Stock Exchange (NSE).
The Company and its subsidiaries (collectively referred to as ‘the Group’) have a presence across the entire value chain of steel manufacturing, from mining and processing iron ore and coal to producing and distributing finished products. The Group offers a broad range of steel products including a portfolio of high value-added downstream products such as hot rolled, cold rolled and coated steel, rebars, wire rods, tubes and wires.
The consolidated financial statements as at March 31, 2017 present the financial position of the Group as well as its interests in associate companies and joint arrangements.
The functional and presentation currency of the Company and the presentation currency of the Group is the Indian Rupee (“`”) which is the currency of the primary economic environment in which the Group operates.
As on March 31, 2017, Tata Sons Limited (or Tata Sons), together with its subsidiaries, owns 29.75% of the Ordinary shares of the Company, and has the ability to influence the Group’s operations.
The financial statements for the year ended March 31, 2017 were approved by the Board of Directors and authorised for issue on May 16, 2017.
2. SIGNIFICANT ACCOUNTING POLICIES
The significant accounting policies applied by the Group in the preparation of its consolidated financial statements are listed below. Such accounting policies have been applied consistently to all the periods presented in these financial statements and in preparing the opening Ind AS Consolidated balance sheet as at April 1, 2015 for the purpose of transition to Ind AS, unless otherwise indicated.
(a) Statement of compliance
In accordance with the notification issued by the Ministry of Corporate Affairs, the Group has adopted Ind AS notified under the Companies (Indian Accounting Standards) Rules, 2015 with effect from April 1, 2016.
The transition from Previous GAAP to Ind AS has been accounted for in accordance with Ind AS 101 “First Time Adoption of Indian Accounting Standards”, with April 1, 2015 being the transition date.
In accordance with Ind AS 101 “First time adoption of Indian Accounting Standard”, the Group has presented a reconciliation from the presentation of financial statements under accounting standards notified under the Companies (Accounting Standards) Rules, 2006 (“Previous GAAP”) to Ind AS of total equity as at April 1, 2015 and March 31, 2016, total comprehensive income and cash flow for the year ended March 31, 2016.
(b) Basis of preparation
The financial statements have been prepared under the historical cost convention with the exception of certain assets and liabilities that are required to be carried at fair values by Ind AS.
Fair value is the price that would be received to sell an asset or paid to transfer a liability in an orderly transaction between market participants at the measurement date.
(c) Use of estimates and critical accounting judgements
In preparation of the financial statements, the Group makes judgements, estimates and assumptions about the carrying values of assets and liabilities that are not readily apparent from other sources. The estimates and the associated assumptions are based on historical experience and other factors that are considered to be relevant. Actual results may differ from these estimates.
The estimates and the underlying assumptions are reviewed on an ongoing basis. Revisions to accounting estimates are recognised in the period in which the estimate is revised and future periods affected.
Significant judgements and estimates relating to the carrying value of assets and liabilities include useful lives of property, plant and equipment and intangible assets, impairment of property, plant and equipment, intangible assets, investments and goodwill, provision for employee benefits and other provisions, recoverability of deferred tax assets, commitments and contingencies.
(d) Basis of consolidation
The consolidated financial statements incorporate the financial statements of the Company and entities controlled by the Company i.e. its subsidiaries. It also includes the Group’s share of profits, net assets and retained post acquisition reserves of joint arrangements and associates that are consolidated using the equity or proportionate method of consolidation, as applicable.
Control is achieved when the Company is exposed to, or has rights to the variable returns of the entity and the ability to
NOTES FORMING PART OF THE FINANCIAL STATEMENTS
F-237

NOTES FORMING PART OF THE FINANCIAL STATEMENTS
affect those returns through its power over the entity.
The results of subsidiaries, joint arrangements and associates acquired or disposed off during the year are included in the consolidated statement of profit and loss from the effective date of acquisition or up to the effective date of disposal, as appropriate.
Wherever necessary, adjustments are made to the financial statements of subsidiaries, joint arrangements and associates to bring their accounting policies in line with those used by other members of the Group.
Intra-group transactions, balances, income and expenses are eliminated on consolidation.
Non-controlling interests in the net assets (excluding goodwill) of consolidated subsidiaries are identified separately from the Group’s equity. The interest of non-controlling shareholders may be initially measured either at fair value or at the non-controlling interests’ proportionate share of the fair value of the acquiree’s identifiable net assets. The choice of measurement basis is made on an acquisition-by-acquisition basis. Subsequent to acquisition, the carrying value of non-controlling interests is the amount of those interests at initial recognition plus the non-controlling interests’ share of subsequent changes in equity. Total comprehensive income is attributed to non-controlling interests even if it results in the non-controlling interests having a deficit balance.
(e) Business combinations
Acquisition of subsidiaries and businesses are accounted for using the purchase method. The consideration transferred in each business combination is measured at the aggregate of the acquisition date fair values of assets given, liabilities incurred by the Group to the former owners of the acquiree, and equity interests issued by the Group in exchange for control of the acquiree.
Acquisition related costs are recognised in the consolidated statement of profit and loss.
Goodwill arising on acquisition is recognised as an asset and measured at cost, being the excess of the consideration transferred in the business combination over the Group’s interest in the net fair value of the identifiable assets acquired, liabilities assumed and contingent liabilities recognised. Where the fair value of the identifiable assets and liabilities exceed the cost of acquisition, after re-assessing the fair values of the net assets and contingent liabilities, the excess is recognised as capital reserve on consolidation.
Once control has been achieved, any subsequent acquisitions where the Group does not originally hold hundred percent interest in a subsidiary are treated as an acquisition of shares from non-controlling shareholders. The identifiable net assets are not subject to further fair value adjustments and the difference between the cost of acquisition of the non-controlling interest and the net book value of the additional proportion acquired is adjusted in equity. The amount of non-controlling interests in the acquiree is measured either at the non-controlling interests proportion of the net fair value of the assets, liabilities and contingent liabilities recognised or at fair value.
Business combinations arising from transfers of interests in entities that are under the common control are accounted for using the pooling of interest method. The difference between any consideration transferred and the aggregate historical carrying values of assets and liabilities of the acquired entity are recognised in shareholder’s equity.
(f) Goodwill
Goodwill arising on the acquisition of a subsidiary represents the excess of the consideration transferred in the business combination over the Group’s interest in the net fair value of the identifiable assets acquired, liabilities assumed and contingent liabilities recognised at the date of acquisition. Goodwill is initially recognised as an asset at cost and is subsequently measured at cost less any accumulated impairment losses.
For the purpose of impairment testing, goodwill is allocated to each of the Group’s cash-generating units or groups of cash-generating units that are expected to benefit from the synergies of the combination. Cash-generating units to which goodwill has been allocated are tested for impairment annually, or more frequently when there is an indication that the unit’s value may be impaired. If the recoverable amount of the cash-generating unit is less than the carrying value of the unit, the impairment loss is allocated first to reduce the carrying value of any goodwill allocated to the unit and then to the other assets of the unit in proportion to the carrying value of each asset in the unit.
An impairment loss recognised for goodwill is not reversed in a subsequent period. On disposal of a subsidiary, the attributable amount of goodwill is included in the determination of profit or loss on disposal.
(g) Investment in associates
Associates are those enterprises in which the Group has significant influence, but does not have control.
2. SIGNIFICANT ACCOUNTING POLICIES (CONTD.)
F-238

NOTES FORMING PART OF THE FINANCIAL STATEMENTS
Investments in associates are accounted for using the equity method and are initially recognised at cost, from the date significant influence commences until the date that significant influence ceases. Subsequent changes in the carrying value reflect the post-acquisition changes in the Group’s share of net assets of the associate and impairment charges, if any.
When the Group’s share of losses exceeds the carrying value of the associate, the carrying value is reduced to nil and recognition of further losses is discontinued, except to the extent that the Group has incurred obligations in respect of the associate.
Unrealised gains on transactions between the Group and its associates are eliminated to the extent of the Group’s interest in the associates, unrealised losses are also eliminated unless the transaction provides evidence of an impairment of the asset transferred and where material, the results of associates are modified to confirm to the Group’s accounting policies.
(h) Interest in joint arrangements
A joint arrangement is a contractual arrangement whereby the Group and other parties undertake an economic activity where the strategic financial and operating policy decisions relating to the activities of the joint arrangement require the unanimous consent of the parties sharing control.
Where Group entity undertakes its activities under joint arrangements directly, the Group’s share of jointly controlled assets and any liabilities incurred jointly with other parties are recognised in its financial statements and classified according to their nature. Liabilities and expenses incurred directly in respect of interests in jointly controlled assets are accounted for on the accrual basis. Income from the sale or use of the Group’s share of the output of jointly controlled assets, and its share of joint arrangements expenses, are recognised when it is probable that the economic benefits associated with the transactions will flow to the Group and their amount can be measured reliably.
Joint arrangements that involve the establishment of a separate entity in which each venturer has an interest are referred to as joint ventures. The Group reports its interests in joint ventures using the equity method of accounting whereby an interest in joint venture is initially recorded at cost and adjusted thereafter for post-acquisition changes in the Group’s share of net assets of the joint venture. The consolidated statement of profit and loss reflects the Group’s share of the results of operations of the joint venture.
Unrealised gains on transactions between the Group and its joint ventures are eliminated to the extent of the Group’s interest in the joint venture, unrealised losses are also eliminated unless the transaction provides evidence of an impairment of the asset transferred and where material, the results of joint ventures are modified to confirm to the Group’s accounting policies.
(i) Property, plant and equipment
An item of property, plant and equipment is recognised as an asset if it is probable that future economic benefits associated with the item will flow to the Group and its cost can be measured reliably. This recognition principle is applied to the costs incurred initially to acquire an item of property, plant and equipment and also to costs incurred subsequently to add to, replace part of, or service it. All other repair and maintenance costs, including regular servicing, are recognised in the consolidated statement of profit and loss as incurred. When a replacement occurs, the carrying value of the replaced part is de-recognised. Where an item of property, plant and equipment comprises major components having different useful lives, these components are accounted for as separate items.
Property, plant and equipment are stated at cost, less accumulated depreciation and impairment. Cost includes all direct costs and expenditures incurred to bring the asset to its working condition and location for its intended use. Trial run expenses (net of revenue) are capitalised. Borrowing costs incurred during the period of construction is capitalised as part of cost of the qualifying asset.
The gain or loss arising on disposal of an asset is determined as the difference between the sale proceeds and the carrying value of the asset, and is recognised in the consolidated statement of profit and loss.
(j) Exploration for and evaluation of mineral resources
Expenditures associated with search for specific mineral resources are recognised as exploration and evaluation assets. The following expenditure comprises the cost of exploration and evaluation assets:
obtaining of the rights to explore and evaluate mineral reserves and resources including costs directly related to this acquisition
researching and analysing existing exploration data conducting geological studies, exploratory drilling and
sampling examining and testing extraction and treatment
methods compiling pre-feasibility and feasibility studies
2. SIGNIFICANT ACCOUNTING POLICIES (CONTD.)
F-239

NOTES FORMING PART OF THE FINANCIAL STATEMENTS
activities in relation to evaluating the technical feasibility and commercial viability of extracting a mineral resource.
Administration and other overhead costs are charged to the cost of exploration and evaluation assets only if directly related to an exploration and evaluation project.
If a project does not prove viable, all irrecoverable exploration and evaluation expenditure associated with the project net of any related impairment allowances is written off to the consolidated statement of profit and loss.
The Group measures its exploration and evaluation assets at cost and classifies as Property, plant and equipment or intangible assets according to the nature of the assets acquired and applies the classification consistently. To the extent that tangible asset is consumed in developing an intangible asset, the amount reflecting that consumption is capitalised as a part of the cost of the intangible asset.
As the asset is not available for use, it is not depreciated. All exploration and evaluation assets are monitored for indications of impairment. An exploration and evaluation asset is no longer classified as such when the technical feasibility and commercial viability of extracting a mineral resource are demonstrable and the development of the deposit is sanctioned by the management. The carrying value of such exploration and evaluation asset is reclassified to mining assets.
(k) Development expenditure for mineral reserves
Development is the establishment of access to mineral reserves and other preparations for commercial production. Development activities often continue during production and include:
sinking shafts and underground drifts (often called mine development)
making permanent excavations developing passageways and rooms or galleries building roads and tunnels and advance removal of overburden and waste rock.
Development (or construction) also includes the installation of infrastructure (e.g., roads, utilities and housing), machinery, equipment and facilities.
Development expenditure is capitalised and presented as part of mining assets. No depreciation is charged on the development expenditure before the start of commercial production.
(l) Provision for restoration and environmental costs
The Group has liabilities related to restoration of soil and other related works, which are due upon the closure of certain of its production sites.
Such liabilities are estimated case-by-case based on available information, taking into account applicable local legal requirements. The estimation is made using existing technology, at current prices, and discounted using a discount rate where the effect of time value of money is material. Future restoration and environmental costs, discounted to net present value, are capitalised and the corresponding restoration liability is raised as soon as the obligation to incur such costs arises. Future restoration and environmental costs are capitalised in property, plant and equipment or mining assets as appropriate and are depreciated over the life of the related asset. The effect of the time value of money on the restoration and environmental costs liability is recognised in the consolidated statement of profit and loss.
(m) Intangible assets (excluding goodwill)
Patents, trademarks and software costs are included in the consolidated balance sheet as intangible assets where they are clearly linked to long term economic benefits for the Group. In this case they are measured initially at purchase cost and then amortised on a straight-line basis over their estimated useful lives. All other costs on patents, trademarks and software are expensed in the consolidated statement of profit and loss as and when incurred.
Expenditure on research activities is recognised as an expense in the period in which it is incurred. Costs incurred on individual development projects are recognised as intangible assets from the date when all of the following conditions are met:
(i) completion of the development is technically feasible
(ii) it is the intention to complete the intangible asset and use or sell it
(iii) it is clear that the intangible asset will generate probable future economic benefits
(iv) adequate technical, financial and other resources to complete the development and to use or sell the intangible asset are available and
(v) it is possible to reliably measure the expenditure attributable to the intangible asset during its development.
Recognition of costs as an asset is ceased when the project is complete and available for its intended use, or if these criteria no longer applicable.
2. SIGNIFICANT ACCOUNTING POLICIES (CONTD.)
F-240

NOTES FORMING PART OF THE FINANCIAL STATEMENTS
Where development activities do not meet the conditions for recognition as an asset, any associated expenditure is treated as an expense in the period in which it is incurred.
Intangible assets acquired in a business combination are identified and recognised separately from goodwill where they satisfy the definition of an intangible asset and their fair values can be measured reliably. The cost of such intangible assets is their fair value at the acquisition date.
Subsequent to initial recognition, intangible assets with definite useful lives acquired in a business combination are reported at cost less accumulated amortisation and accumulated impairment losses.
(n) Depreciation and amortisation of property, plant and
equipment and intangible assets
Depreciation or amortisation is provided so as to write off, on a straight-line basis, the cost of property, plant and equipment and other intangible assets, including those held under finance leases to their residual value. These charges are commenced from the dates the assets are available for their intended use and are spread over their estimated useful economic lives or, in the case of leased assets, over the lease period, if shorter. The estimated useful lives of assets and residual values are reviewed regularly and, when necessary, revised. No further charge is provided in respect of assets that are fully written down but are still in use.
Depreciation on assets under construction commences only when the assets are ready for their intended use.
The estimated useful lives for the main categories of property, plant and equipment and other intangible assets are:
Estimated useful life (years)
Freehold and long leasehold buildings
upto 60 years*
Roads 5 yearsRailway sidings upto 35 years*Plant and machinery 3 to 40 years*Furniture, fixture and office equipment
3 to 25 years
Vehicles and aircraft 4 to 20 yearsAssets covered under the Electricity Act (life as prescribed under the Electricity Act)
3 to 34 years
Patents and trademarks 4 yearsProduct and process development costs
5 years
Computer software upto 8 yearsOther assets 1 to 15 years
Mining assets are amortised over the useful life of the mine or lease period whichever is lower.
Major furnace relining expenses are depreciated over a period of 10 years (average expected life).
Freehold land is not depreciated.
Assets value upto `25,000 are fully depreciated in the year of acquisition.
* For these class of assets, based on internal assessment and independent technical evaluation carried out by chartered engineers, the Company and some of its subsidiaries believes that the useful lives as given above best represent the period over which Group expects to use these assets. Hence the useful lives for these assets are different from the useful lives as prescribed under Part C of Schedule II of the Companies Act, 2013.
(o) Impairment
At each balance sheet date, the Group reviews the carrying values of its property, plant and equipment and intangible assets to determine whether there is any indication that the carrying value of those assets may not be recoverable through continuing use. If any such indication exists, the recoverable amount of the asset is reviewed in order to determine the extent of impairment loss (if any). Where the asset does not generate cash flows that are independent from other assets, the Group estimates the recoverable amount of the cash generating unit to which the asset belongs.
Recoverable amount is the higher of fair value less costs to sell and value in use. In assessing value in use, the estimated future cash flows are discounted to their present value using a pre-tax discount rate that reflects current market assessments of the time value of money and the risks specific to the asset for which the estimates of future cash flows have not been adjusted. An impairment loss is recognised in the consolidated statement of profit and loss as and when the carrying value of an asset exceeds its recoverable amount.
Where an impairment loss subsequently reverses, the carrying value of the asset (or cash generating unit) is increased to the revised estimate of its recoverable amount, so that the increased carrying value does not exceed the carrying value that would have been determined had no impairment loss been recognised for the asset (or cash generating unit) in prior years. A reversal of an impairment loss is recognised in the consolidated statement of profit and loss immediately.
(p) Leases
The Group determines whether an arrangement contains a lease by assessing whether the fulfilment of a transaction
2. SIGNIFICANT ACCOUNTING POLICIES (CONTD.)
F-241

NOTES FORMING PART OF THE FINANCIAL STATEMENTS
is dependent on the use of a specific asset and whether the transaction conveys the right to use that asset to the Group in return for payment. Where this occurs, the arrangement is deemed to include a lease and is accounted for either as finance or operating lease.
Leases are classified as finance leases where the terms of the lease transfer substantially all the risks and rewards of ownership to the lessee. All other leases are classified as operating leases.
The Group as lessee:
(i) Operating lease – Rentals payable under operating leases are charged to the consolidated statement of profit and loss on a straight line basis over the term of the relevant lease unless another systematic basis is more representative of the time pattern in which economic benefits from the leased asset are consumed. Contingent rentals arising under operating leases are recognised as an expense in the period in which they are incurred.
In the event that lease incentives are received to enter into operating leases, such incentives are recognised as a liability. The aggregate benefit of incentives is recognised as a reduction of rental expense on a straight line basis, except where another systematic basis is more representative of the time pattern in which economic benefits from the leased asset are consumed.
(ii) Finance lease – Finance leases are capitalised at the commencement of lease, at the lower of the fair value of the property or the present value of the minimum lease payments. The corresponding liability to the lessor is included in the consolidated balance sheet as a finance lease obligation. Lease payments are apportioned between finance charges and reduction of the lease obligation so as to achieve a constant rate of interest on the remaining balance of the liability. Finance charges are charged directly against recognised in the consolidated statement of profit and loss over the period of the lease.
The Group as lessor:
(i) Operating lease – Rental income from operating leases is recognised in the consolidated statement of profit and loss on a straight line basis over the term of the relevant lease unless another systematic basis is more representative of the time pattern in which economic benefits from the leased asset is diminished. Initial direct costs incurred in negotiating and arranging an operating lease are added to the carrying value of the leased asset and recognised on a straight line basis over the lease term.
(ii) Finance lease – When assets are leased out under a finance lease, the present value of the minimum lease payments is recognised as a receivable. The difference between the gross receivable and the present value of the receivable is recognised as unearned finance income. Lease income is recognised over the term of the lease using the net investment method before tax, which reflects a constant periodic rate of return.
(q) Stripping costs
The Group separates two different types of stripping costs that are incurred in surface mining activity:
developmental stripping costs and production stripping costs
Developmental stripping costs in order to obtain access to quantities of mineral reserves that will be mined in future periods are capitalised as part of mining assets. Capitalisation of developmental stripping costs ends when the commercial production of the mineral reserves begins.
A mine can operate several open pits that are regarded as separate operations for the purpose of mine planning and production. In this case, stripping costs are accounted for separately, by reference to the ore extracted from each separate pit. If, however, the pits are highly integrated for the purpose of mine planning and production, stripping costs are aggregated too.
The determination of whether multiple pit mines are considered separate or integrated operations depends on each mine’s specific circumstances. The following factors normally point towards the stripping costs for the individual pits being accounted for separately:
mining of the second and subsequent pits is conducted consecutively with that of the first pit, rather than concurrently
separate investment decisions are made to develop each pit, rather than a single investment decision being made at the outset
the pits are operated as separate units in terms of mine planning and the sequencing of overburden and ore mining, rather than as an integrated unit
expenditure for additional infrastructure to support the second and subsequent pits are relatively large
the pits extract ore from separate and distinct ore bodies, rather than from a single ore body.
The relative importance of each factor is considered by the management to determine whether, on balance, the stripping costs should be attributed to the individual pit or to the combined output from the several pits.
2. SIGNIFICANT ACCOUNTING POLICIES (CONTD.)
F-242
NOTES FORMING PART OF THE FINANCIAL STATEMENTS
Production stripping costs are incurred to extract the ore in the form of inventories and/or to improve access to an additional component of an ore body or deeper levels of material. Production stripping costs are accounted for as inventories to the extent the benefit from production stripping activity is realised in the form of inventories.
The Group recognises a stripping activity asset in the production phase if, and only if, all of the following are met:
it is probable that the future economic benefit (improved access to the ore body) associated with the stripping activity will flow to the Group
the Group can identify the component of the ore body for which access has been improved and
the costs relating to the improved access to that component can be measured reliably.
Such costs are presented within mining assets. After initial recognition, stripping activity assets are carried at cost less accumulated amortisation and impairment. The expected useful life of the identified component of the ore body is used to depreciate or amortise the stripping asset.
(r) Financial Instruments
Financial assets and financial liabilities are recognised when the Group becomes a party to the contractual provisions of the instrument. Financial assets and liabilities are initially measured at fair value. Transaction costs that are directly attributable to the acquisition or issue of financial assets and financial liabilities (other than financial assets and financial liabilities at fair value through profit or loss) are added to or deducted from the fair value measured on initial recognition of financial asset or financial liability. The transaction costs directly attributable to the acquisition of financial assets and financial liabilities at fair value through profit and loss are immediately recognised in the consolidated statement of profit and loss.
Effective interest method
The effective interest method is a method of calculating the amortised cost of a financial instrument and of allocating interest income or expense over the relevant period. The effective interest rate is the rate that exactly discounts future cash receipts or payments through the expected life of the financial instrument, or where appropriate, a shorter period.
(a) Financial assets
Cash and bank balances
Cash and bank balances consists of:
(i) Cash and cash equivalents - which include cash in hand, deposits held at call with banks and other short term deposits which are readily convertible into known amounts of cash, are subject to an insignificant risk of change in value and have maturities of less than one year from the date of such deposits. These balances with banks are unrestricted for withdrawal and usage.
(ii) Other bank balances - which includes balances and deposits with banks that are restricted for withdrawal and usage.
Financial assets at amortised cost
Financial assets are subsequently measured at amortised cost if these financial assets are held within a business model whose objective is to hold these assets in order to collect contractual cash flows and the contractual terms of the financial asset give rise on specified dates to cash flows that are solely payments of principal and interest on the principal amount outstanding.
Financial assets measured at fair value
Financial assets are measured at fair value through other comprehensive income if these financial assets are held within a business model whose objective is to hold these assets in order to collect contractual cash flows or to sell these financial assets and the contractual terms of the financial asset give rise on specified dates to cash flows that are solely payments of principal and interest on the principal amount outstanding.
The Group in respect of equity investments (other than associates and joint arrangements) which are not held for trading has made an irrevocable election to present in other comprehensive income subsequent changes in the fair value of such equity instruments. Such an election is made by the Group on an instrument by instrument basis at the time of initial recognition of such equity investments.
Financial asset not measured at amortised cost or at fair value through other comprehensive income is carried at fair value through the consolidated statement of profit and loss.
Impairment of financial assets
Loss allowance for expected credit losses is recognised for financial assets measured at amortised cost and fair value through other comprehensive income.
The Group recognises life time expected credit losses for all trade receivables that do not constitute a financing transaction.
2. SIGNIFICANT ACCOUNTING POLICIES (CONTD.)
F-243

NOTES FORMING PART OF THE FINANCIAL STATEMENTS
For financial assets whose credit risk has not significantly increased since initial recognition, loss allowance equal to twelve months expected credit losses is recognised. Loss allowance equal to the lifetime expected credit losses is recognised if the credit risk on the financial instruments has significantly increased since initial recognition.
De-recognition of financial assets
The Group de-recognises a financial asset only when the contractual rights to the cash flows from the asset expires, or it transfers the financial asset and substantially all risks and rewards of ownership of the asset to another entity.
If the Group neither transfers nor retains substantially all the risks and rewards of ownership and continues to control the transferred asset, the Group recognises its retained interest in the assets and an associated liability for amounts it may have to pay.
If the Group retains substantially all the risks and rewards of ownership of a transferred financial asset, the Group continues to recognise the financial asset and also recognises a collateralised borrowing for the proceeds received.
(b) Financial liabilities and equity instruments
Classification as debt or equity
Financial liabilities and equity instruments issued by the Group are classified according to the substance of the contractual arrangements entered into and the definitions of a financial liability and an equity instrument.
Equity instruments
An equity instrument is any contract that evidences a residual interest in the assets of the Group after deducting all of its liabilities. Equity instruments are recorded at the proceeds received, net of direct issue costs.
Financial Liabilities
Trade and other payables are initially measured at fair value, net of transaction costs, and are subsequently measured at amortised cost, using the effective interest rate method where the time value of money is significant.
Interest bearing bank loans, overdrafts and issued debt are initially measured at fair value and are subsequently measured at amortised cost using the effective interest rate method. Any difference between the proceeds (net of transaction costs) and the settlement or redemption of borrowings is recognised over the term of the borrowings in the consolidated statement of profit and loss.
De-recognition of financial liabilities
The Group derecognises financial liabilities when, and only when, the Group’s obligations are discharged, cancelled or they expire.
Derivative financial instruments and hedge accounting
In the ordinary course of business, the Group uses certain derivative financial instruments to reduce business risks which arise from its exposure to foreign exchange base metal prices and interest rate fluctuations. The instruments are confined principally to forward foreign exchange contracts, forward rate agreements, cross currency swaps, interest rate swaps and collar. The consolidated instruments are employed as hedges of transactions included in the financial statements or for highly probable forecast transactions/firm contractual commitments. These derivatives contracts do not generally extend beyond six months, except for certain currency swaps and interest rate derivatives.
Derivatives are initially accounted for and measured at fair value from the date the derivative contract is entered into and are subsequently re-measured to their fair value at the end of each reporting period.
The Group adopts hedge accounting for forward, interest rate and commodity contracts wherever possible. At the inception of each hedge, there is a formal, documented designation of the hedging relationship. This documentation includes, inter alia, items such as identification of the hedged item or transaction and the nature of the risk being hedged. At inception each hedge is expected to be highly effective in achieving an offset of changes in fair value or cash flows attributable to the hedged risk. The effectiveness of hedge instruments to reduce the risk associated with the exposure being hedged is assessed and measured at the inception and on an ongoing basis. The ineffective portion of designated hedges is recognised immediately in the consolidated statement of profit and loss.
When hedge accounting is applied:
for fair value hedges of recognised assets and liabilities, changes in fair value of the hedged assets and liabilities attributable to the risk being hedged, are recognised in the consolidated statement of profit and loss and compensated for the effective portion of symmetrical changes in the fair value of the derivatives
for cash flow hedges, the effective portion of the change in the fair value of the derivative is recognised directly in equity and the ineffective portion is taken to the consolidated statement of profit and loss. If the cash flow hedge of a firm commitment or forecasted transaction results in the recognition of a non-financial asset or liability, then, at the time the asset or liability is recognised, the associated gains or losses on the derivative that had previously been recognised
2. SIGNIFICANT ACCOUNTING POLICIES (CONTD.)
F-244
NOTES FORMING PART OF THE FINANCIAL STATEMENTS
in equity are included in the initial measurement of the asset or liability. For hedges that do not result in the recognition of a non-financial asset or a liability, amounts deferred in equity are recognised in the consolidated statement of profit and loss in the same period in which the hedged item affects the consolidated statement of profit and loss.
In cases where hedge accounting is not applied, changes in the fair value of derivatives are recognised in the consolidated statement of profit and loss as and when they arise.
Hedge accounting is discontinued when the hedging instrument expires or is sold, terminated, or exercised, or no longer qualifies for hedge accounting. At that time, any cumulative gain or loss on the hedging instrument recognised in equity is retained in equity until the forecasted transaction occurs. If a hedged transaction is no longer expected to occur, the net cumulative gain or loss recognised in equity is transferred to the consolidated statement of profit and loss for the period.
(s) Employee benefits
Defined contribution plans
Payments to defined contribution plans are charged as an expense as they fall due. Payments made to state managed retirement benefit schemes are dealt with as payments to defined contribution schemes where the Group’s obligations under the schemes are equivalent to those arising in a defined contribution retirement benefit scheme.
Defined benefit plans
For defined benefit retirement schemes, the cost of providing benefits is determined using the Projected Unit Credit Method, with actuarial valuation being carried out at each balance sheet date. Re-measurement gains and losses of the net defined benefit liability/(asset) are recognised immediately in other comprehensive income. The service cost and net interest on the net defined benefit liability/(asset) is treated as a net expense within employment costs.
Past service cost is recognised as an expense when the plan amendment or curtailment occurs or when any related restructuring costs or termination benefits are recognised, whichever is earlier.
The retirement benefit obligation recognised in the consolidated balance sheet represents the present value of the defined-benefit obligation as reduced by the fair value plan assets.
Compensated absences
Compensated absences which are not expected to occur within twelve months after the end of the period in which the employee renders the related service are recognised based on actuarial valuation at the present value of the obligation as on the reporting date.
(t) Inventories
Inventories are stated at the lower of cost and net realisable value. Costs comprise direct materials and, where applicable, direct labour costs and those overheads that have been incurred in bringing the inventories to their present location and condition. Net realisable value is the price at which the inventories can be realised in the normal course of business after allowing for the cost of conversion from their existing state to a finished condition and for the cost of marketing, selling and distribution.
Stores and spare parts are carried at lower of cost and net realisable value.
Provisions are made to cover slow moving and obsolete items based on historical experience of utilisation on a product category basis, which involves individual businesses considering their product lines and market conditions.
(u) Provisions
Provisions are recognised in the consolidated balance sheet when the Group has a present obligation (legal or constructive) as a result of a past event, which is expected to result in an outflow of resources embodying economic benefits which can be reliably estimated. Each provision is based on the best estimate of the expenditure required to settle the present obligation at the balance sheet date. Where the time value of money is material, provisions are measured on a discounted basis.
Constructive obligation is an obligation that derives from an entity’s actions where:
(a) by an established pattern of past practice, published policies or a sufficiently specific current statement, the entity has indicated to other parties that it will accept certain responsibilities and
(b) as a result, the entity has created a valid expectation on the part of those other parties that it will discharge those responsibilities.
(v) Onerous contracts
A provision for onerous contracts is recognised when the expected benefits to be derived by the Group from a contract
2. SIGNIFICANT ACCOUNTING POLICIES (CONTD.)
F-245

NOTES FORMING PART OF THE FINANCIAL STATEMENTS
are lower than the unavoidable cost of meeting its obligations under the contract. The provision is measured at the present value of the lower of the expected cost of terminating the contract and the expected net cost of continuing with the contract. Before a provision is established, the Group recognises any impairment loss on the assets associated with that contract.
(w) Government grants
Government grants related to expenditure on property, plant and equipment are credited to the consolidated statement of profit and loss over the useful lives of qualifying assets or other systematic basis representative of the pattern of fulfilment of obligations associated with the grant received. Total grants received less the amounts credited to the consolidated statement of profit and loss at the reporting date are included in the consolidated balance sheet as deferred income.
(x) Non-current assets held for sale and discontinued
operations
Non-current assets and disposal groups classified as held for sale are measured at the lower of their carrying value and fair value less costs to sell.
Assets and disposal groups are classified as held for sale if their carrying value will be recovered through a sale transaction rather than through continuing use. This condition is only met when the sale is highly probable and the asset, or disposal group, is available for immediate sale in its present condition and is marketed for sale at a price that is reasonable in relation to its current fair value. The Group must also be committed to the sale, which should be expected to qualify for recognition as a completed sale within one year from the date of classification.
Where a disposal group represents a separate major line of business or geographical area of operations, or is part of a single coordinated plan to dispose of a separate major line of business or geographical area of operations, then it is treated as a discontinued operation. The post-tax profit or loss of the discontinued operation together with the gain or loss recognised on its disposal are disclosed as a single amount in the consolidated statement of profit and loss, with all prior periods being presented on this basis.
(y) Income taxes
Tax expense for the year comprises of current and deferred tax. The tax currently payable is based on taxable profit for
the year. Taxable profit differs from net profit as reported in the consolidated statement of profit and loss because it excludes items of income or expense that are taxable or deductible in other years and it further excludes items that are never taxable or deductible. The Group’s liability for current tax is calculated using tax rates and tax laws that have been enacted or substantively enacted in countries where the Company and its subsidiaries operate by the end of the reporting period.
Deferred tax is the tax expected to be payable or recoverable on differences between the carrying value of assets and liabilities in the financial statements and the corresponding tax bases used in the computation of taxable profit, and is accounted for using the balance sheet liability method. Deferred tax liabilities are generally recognised for all taxable temporary differences. In contrast, deferred tax assets are only recognised to the extent that it is probable that future taxable profits will be available against which the temporary differences can be utilised.
Deferred tax liabilities are recognised on taxable temporary differences arising on investments in subsidiaries, joint ventures and associates, except where the Group is able to control the reversal of the temporary difference and it is probable that the temporary difference will not reverse in the foreseeable future.
The carrying value of deferred tax assets is reviewed at the end of each reporting period and reduced to the extent that it is no longer probable that sufficient taxable profits will be available to allow all or part of the asset to be recovered.
Deferred tax is calculated at the tax rates that are expected to apply in the period when the liability is settled or the asset is realised based on the tax rates and tax laws that have been enacted or substantially enacted by the end of the reporting period. The measurement of deferred tax liabilities and assets reflects the tax consequences that would follow from the manner in which the Group expects, at the end of the reporting period, to cover or settle the carrying value of its assets and liabilities.
Deferred tax assets and liabilities are offset to the extent that they relate to taxes levied by the same tax authority and they are in the same taxable entity, or a Group of taxable entities where the tax losses of one entity are used to offset the taxable profits of another and there are legally enforceable rights to set off current tax assets and current tax liabilities within that jurisdiction.
Current and deferred tax are recognised as an expense or income in the consolidated statement of profit and loss, except when they relate to items credited or debited either
2. SIGNIFICANT ACCOUNTING POLICIES (CONTD.)
F-246

NOTES FORMING PART OF THE FINANCIAL STATEMENTS
in other comprehensive income or directly in equity, in which case the tax is also recognised in other comprehensive income or directly in equity.
Deferred tax assets include Minimum Alternate Tax (MAT) paid in accordance with the tax laws in India, which is likely to give future economic benefits in the form of availability of set off against future income tax liability. MAT is recognised as deferred tax assets in the Consolidated balance sheet when the asset can be measured reliably and it is probable that the future economic benefit associated with the asset will be realised.
(z) Revenue
Revenue is recognised to the extent that it is probable that the economic benefits will flow to the Group and the revenue can be reliably measured, regardless of when the payment is being made. Revenue is measured either at the fair value of the consideration received or receivable net of discounts, taking into account contractually defined terms and excluding taxes or duties collected on behalf of the government.
Sale of goods
Revenue from the sale of goods is recognised when the significant risks and rewards of ownership have been transferred to the buyer. No revenue is recognised if there are significant uncertainties regarding recovery of the amount due, associated costs or the possible return of goods.
Interest income
Interest income is accrued on a time proportion basis, by reference to the principal outstanding and the effective interest rate applicable.
Dividend income
Dividend income from investments is recognised when the shareholder’s rights to receive payment have been established.
Rental income
Rental income from investment properties and subletting of properties is recognised on a straight line basis over the term of the relevant leases.
Commission income
Commission income is recognised when the services are rendered.
(aa) Foreign currency transactions and translation
The consolidated financial statements of the Group are presented in (`), which is the functional currency of the Company and the presentation currency for the consolidated financial statements.
In preparing the consolidated financial statements, transactions in currencies other than the entity’s functional currency are recorded at the rates of exchange prevailing on the date of the transaction. At the end of each reporting period, monetary items denominated in foreign currencies are re-translated at the rates prevailing at the end of the reporting period. Non-monetary items carried at fair value that are denominated in foreign currencies are re-translated at the rates prevailing on the date when the fair value was determined. Non-monetary items that are measured in terms of historical cost in a foreign currency are not translated.
Exchange differences arising on translation of long term foreign currency monetary items recognised in the consolidated financial statements before the beginning of the first Ind AS financial reporting period in respect of which the Group has elected to recognise such exchange differences in equity or as part of cost of assets as allowed under Ind As 101-“First time adoption of Indian Accounting Standard” are recognised directly in equity or added/deducted to/from the cost of assets as the case may be. Such exchange differences recognised in equity or as part of cost of assets is recognised in the consolidated statement of profit and loss on a systematic basis.
Exchange differences arising on the retranslation or settlement of other monetary items are included in the consolidated statement of profit and loss for the period.
For the purpose of presenting financial statements, the assets and liabilities of the Company’s foreign operations are expressed in ` using exchange rates prevailing at the end of the reporting period. Income and expense items are translated at the average exchange rates for the period. Exchange differences arising, if any, are recognised in other comprehensive income and accumulated in a separate component of equity. On the disposal of a foreign operation, all of the accumulated exchange differences in respect of that operation attributable to the Company are reclassified to the consolidated statement of profit and loss.
Goodwill and fair value adjustments arising on the acquisition of a foreign operation are treated as assets and liabilities of the foreign operation and translated at the closing rate
2. SIGNIFICANT ACCOUNTING POLICIES (CONTD.)
F-247
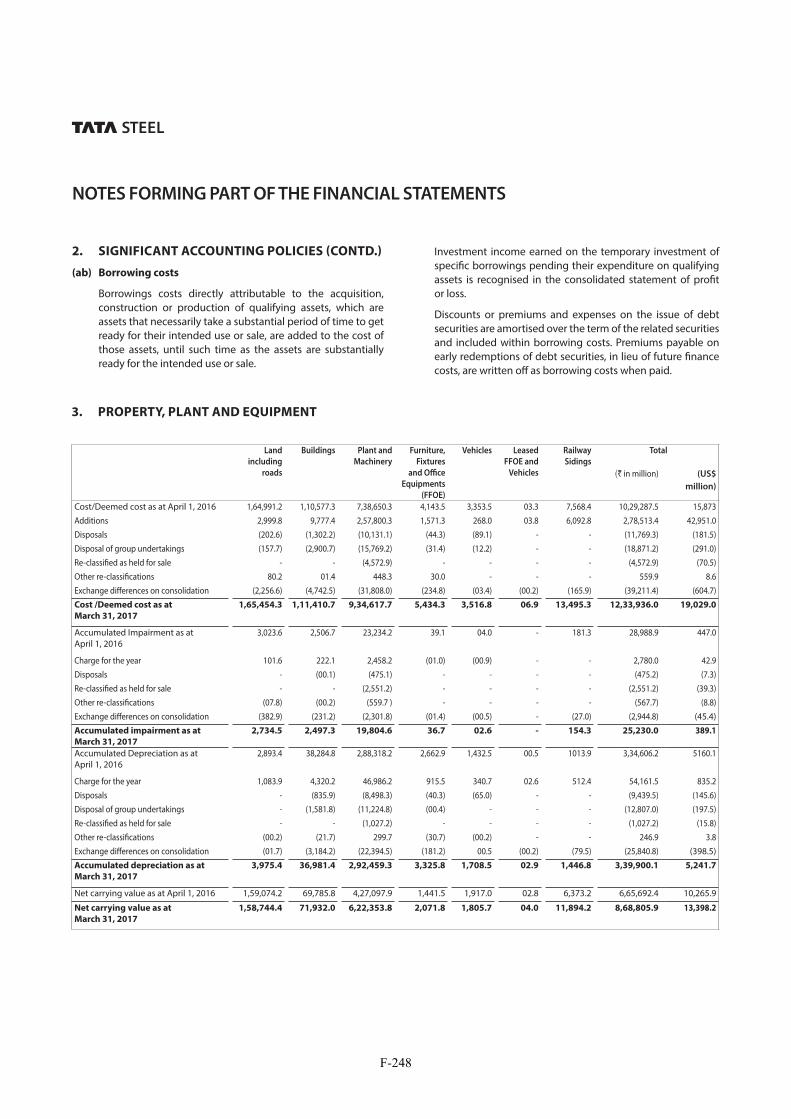
NOTES FORMING PART OF THE FINANCIAL STATEMENTS
2. SIGNIFICANT ACCOUNTING POLICIES (CONTD.)
(ab) Borrowing costs
Borrowings costs directly attributable to the acquisition, construction or production of qualifying assets, which are assets that necessarily take a substantial period of time to get ready for their intended use or sale, are added to the cost of those assets, until such time as the assets are substantially ready for the intended use or sale.
Investment income earned on the temporary investment of specific borrowings pending their expenditure on qualifying assets is recognised in the consolidated statement of profit or loss.
Discounts or premiums and expenses on the issue of debt securities are amortised over the term of the related securities and included within borrowing costs. Premiums payable on early redemptions of debt securities, in lieu of future finance costs, are written off as borrowing costs when paid.
3. PROPERTY, PLANT AND EQUIPMENT
Land
including
roads
Buildings Plant and
Machinery
Furniture,
Fixtures
and Office
Equipments
(FFOE)
Vehicles Leased
FFOE and
Vehicles
Railway
Sidings
Total
(` in million) (US$
million)
Cost/Deemed cost as at April 1, 2016 1,64,991.2 1,10,577.3 7,38,650.3 4,143.5 3,353.5 03.3 7,568.4 10,29,287.5 15,873Additions 2,999.8 9,777.4 2,57,800.3 1,571.3 268.0 03.8 6,092.8 2,78,513.4 42,951.0Disposals (202.6) (1,302.2) (10,131.1) (44.3) (89.1) - - (11,769.3) (181.5)Disposal of group undertakings (157.7) (2,900.7) (15,769.2) (31.4) (12.2) - - (18,871.2) (291.0)Re-classified as held for sale - - (4,572.9) - - - - (4,572.9) (70.5)Other re-classifications 80.2 01.4 448.3 30.0 - - - 559.9 8.6Exchange differences on consolidation (2,256.6) (4,742.5) (31,808.0) (234.8) (03.4) (00.2) (165.9) (39,211.4) (604.7)Cost /Deemed cost as at
March 31, 2017
1,65,454.3 1,11,410.7 9,34,617.7 5,434.3 3,516.8 06.9 13,495.3 12,33,936.0 19,029.0
Accumulated Impairment as at April 1, 2016
3,023.6 2,506.7 23,234.2 39.1 04.0 - 181.3 28,988.9 447.0
Charge for the year 101.6 222.1 2,458.2 (01.0) (00.9) - - 2,780.0 42.9Disposals - (00.1) (475.1) - - - - (475.2) (7.3)Re-classified as held for sale - - (2,551.2) - - - - (2,551.2) (39.3)Other re-classifications (07.8) (00.2) (559.7 ) - - - - (567.7) (8.8)Exchange differences on consolidation (382.9) (231.2) (2,301.8) (01.4) (00.5) - (27.0) (2,944.8) (45.4)Accumulated impairment as at
March 31, 2017
2,734.5 2,497.3 19,804.6 36.7 02.6 - 154.3 25,230.0 389.1
Accumulated Depreciation as at April 1, 2016
2,893.4 38,284.8 2,88,318.2 2,662.9 1,432.5 00.5 1013.9 3,34,606.2 5160.1
Charge for the year 1,083.9 4,320.2 46,986.2 915.5 340.7 02.6 512.4 54,161.5 835.2Disposals - (835.9) (8,498.3) (40.3) (65.0) - - (9,439.5) (145.6)Disposal of group undertakings - (1,581.8) (11,224.8) (00.4) - - - (12,807.0) (197.5)Re-classified as held for sale - - (1,027.2) - - - - (1,027.2) (15.8)Other re-classifications (00.2) (21.7) 299.7 (30.7) (00.2) - - 246.9 3.8Exchange differences on consolidation (01.7) (3,184.2) (22,394.5) (181.2) 00.5 (00.2) (79.5) (25,840.8) (398.5)Accumulated depreciation as at
March 31, 2017
3,975.4 36,981.4 2,92,459.3 3,325.8 1,708.5 02.9 1,446.8 3,39,900.1 5,241.7
Net carrying value as at April 1, 2016 1,59,074.2 69,785.8 4,27,097.9 1,441.5 1,917.0 02.8 6,373.2 6,65,692.4 10,265.9
Net carrying value as at
March 31, 2017
1,58,744.4 71,932.0 6,22,353.8 2,071.8 1,805.7 04.0 11,894.2 8,68,805.9 13,398.2
F-248

NOTES FORMING PART OF THE FINANCIAL STATEMENTS
3. PROPERTY, PLANT & EQUIPMENT (CONTD.)
Cost/Deemed cost as at April 1, 2015 1,61,517.3 1,02,473.0 6,85,831.5 3,873.9 3,070.2 1.7 6,996.6 9,63,764.2 Additions 1,636.1 4,515.6 30,775.0 444.5 340.4 1.5 383.5 38,096.6
Disposals (150.4) (807.5) (9,132.6) (133.8) (100.0) - - (10,324.3)Re-classified as held for sale - - 217.7 - - - - 217.7Other re-classifications (174.5) (268.7) 1,113.5 93.7 32.0 - 17.9 813.9 Exchange differences on consolidation 2,162.7 4,664.9 29,845.2 (134.8) 10.9 0.1 170.4 36,719.4Cost/Deemed cost as at March 31,
2016
1,64,991.2 1,10,577.3 7,38,650.3 4,143.5 3,353.5 3.3 7,568.4 10,29,287.5
Accumulated Impairment as at April 1, 2015
2,858.5 2,221.0 18,616.5 8.7 2.3 - 176.1 23,883.1
Charge for the year 45.0 84.4 3,140.1 36.6 11.8 - - 3,317.9 Disposals - (3.2) (9.4 ) (3.0) (10.2) - - (25.8)Other re-classifications - (.4) 1,176.7 (5.3) - - - 1,171.0 Exchange differences on consolidation 120.1 204.9 310.3 2.1 0.1 - 5.2 642.7Accumulated impairment as at
March 31, 2016
3,023.6 2,506.7 23,234.2 39.1 04.0 - 181.3 28,988.9
Accumulated Depreciation as at April 1, 2015
2,341.0 30,893.1 2,31,194.2 2,303.9 1,182.9 - 470.5 2,68,385.6
Charge for the year 551.8 4,915.7 4,5400.2 652.0 313.5 0.5 510.7 52,344.4 Disposals - (414.2) (8,091.0) (105.2) (68.8) - - (8,679.2)Re-classified as held for sale - - 7.2 - - - - 7.2Other re-classifications - 10.9 10.4 4.8 0.6 - - 26.7 Exchange differences on consolidation 0.6 2,879.3 19,797.2 (192.6) 4.3 - 32.7 22,571.5Accumulated depreciation as at
March 31, 2016
2,893.4 38,284.8 2,88,318.2 2,662.9 1,432.5 0.5 1,013.9 3,34,606.2
Net carrying value as at April 1, 2015 1,56,317.8 69,358.9 4,36,020.8 1,561.3 1,885.0 1.7 6,350.0 6,71,495.5Net carrying value as at
March 31, 2016
1,59,074.2 69,785.8 4,27,097.9 1,441.5 1,917.0 2.8 6,373.2 6,65,692.4
(i) The net carrying value of land comprises of:As at
March 31, 2017
As at March 31, 2016
As at April 1, 2015
(US$ million) (` in million) (` in million) (` in million)
Leasehold land
Cost/Deemed cost 4.1 268.4 464.9 433.0
Accumulated depreciation and impairment losses 0.2 12.2 10.2 0.73.9 256.2 454.7 432.3
Freehold land 2,444.1 1,58,488.2 1,58,619.5 1,55,885.5
2,448.0 1,58,744.4 1,59,074.2 1,56,317.8
(` in million)Land
including
roads
Buildings Plant and
Machinery
Furniture,
Fixtures
and Office
Equipments
(FFOE)
Vehicles Leased
FFOE
and
Vehicles
Railway
Sidings
Total
F-249

NOTES FORMING PART OF THE FINANCIAL STATEMENTS
(ii) The net carrying value of building comprises of:As at
March 31, 2017
As at March 31, 2016
As at April 1, 2015
(US$ million) (` in million) (` in million) (` in million)
Leasehold building
Cost/Deemed cost 55.4 3,591.1 4,456.8 3,819.0Accumulated depreciation and impairment losses 27.1 1,759.2 1,676.9 1,249.9
28.3 1,831.9 2,779.9 2,569.1
Freehold building 1081.0 70,100.1 67,005.9 66,789.8
1,109.3 71,932.0 69,785.8 69,358.9
(iii) The net carrying value of plant and machinery comprises of:
As at March 31, 2017
As at March 31, 2016
As at April 1, 2015
(US$ million) (` in million) (` in million) (` in million)
Assets held under finance leases
Cost/Deemed cost 661.0 42,860.6 36,199.8 33,991.7Accumulated depreciation and impairment losses 318.7 20,665.5 20,259.4 18,955.8
342.3 22,195.1 15,940.4 15,035.9
Owned assets 9,255.3 6,00,158.7 4,11,157.5 4,20,984.9
9,597.6 6,22,353.8 4,27,097.9 4,36,020.8
(iv) The net carrying value of furniture, fixtures and office equipments comprises of:As at
March 31, 2017
As at March 31, 2016
As at April 1, 2015
(US$ million) (` in million) (` in million) (` in million)
Furniture and fixtures Cost/Deemed cost 22.0 1,423.8 1,407.2 1,549.3Accumulated depreciation and impairment losses 15.7 1,018.8 903.9 955.6
6.2 405.0 503.3 593.7
Office equipments
Cost/Deemed cost 61.8 4,010.5 2,736.3 2,324.6Accumulated depreciation and impairment losses 36.1 2,343.7 1,798.1 1,357.0
25.7 1,666.8 938.2 967.6
32.0 2,071.8 1,441.5 1,561.3
(v) ̀ 2,842.2 million (US$ 43.8 million) (2015-16: `12,833.5 million) of borrowing costs has been capitalised during the year on qualifying assets. The capitalisation rate ranges between 0.34% to 9.50% (2015-16: 0.18% to 9.50%).
(vi) Rupee liability has increased by `1,362.2 million (US$ 21.0 million) (2015-16: `1,106.3 million) arising out of realignment of the value of long-term foreign currency loans and liabilities for procurement of property, plant and equipment. This increase has been adjusted against the carrying cost of assets and has been depreciated over their remaining useful life. The depreciation for the current year is higher by `36.0 million (2015-16: `69.0 million) on account of this adjustment.
3. PROPERTY, PLANT & EQUIPMENT (CONTD.)
F-250

NOTES FORMING PART OF THE FINANCIAL STATEMENTS
3. PROPERTY, PLANT & EQUIPMENT (CONTD.)
(vii) With effect from April 1, 2016, the Company and some of its subsidiaries have revised the useful life of certain items of property, plant
and equipment based on technical evaluation on assessment of the physical condition of the underlying assets and benchmarking with peers across the industry. Had there been no change in the useful life of assets, depreciation for the year would have been higher by `6,534.4 million (US$ 100.8 million).
(viii) During the year, the Group recognised an impairment charge of ₹5,034.6 million (US$ 77.6 million) (2015-16:19,097.4 million) against property, plant and equipment (including CWIP). The impairments were primarily contained in the European, South-east Asian and mining businesses.
Within the European business, consistent with annual test for impairment of goodwill as at March 31, 2017, property, plant and equipment (including CWIP) were also tested for impairment as at that date where indicators of impairment existed. The outcome of the test indicated that the value in use of certain CGU’s within the European business against which the property, plant and equipment (including CWIP) is included, using a discount rate of 7.80% (2015-16: 7.40%) was lower than its carrying value due to a significant detoriation of trading conditions, which are expected to remain weak over the medium term. Accordingly, an impairment charge of ₹4,108.7 million (US$ 63.4 million) (2015-16: ₹ 4,385.5 million) was recognised which was contained in the following units : Strip Products MLE ₹790.4 million (US$ 12.2 million) (2015-16: ₹ Nil million), Longs UK ₹351.3 million (US$ 5.4 million) (2015-16: ₹ 3,235.7 million), Speciality and bar business ₹1,229.5 million (US$ 19 million) (2015-16: ₹ 240.2 million), Packaging ₹ 790.4 million (US$ 12.2 million) (2015-16: ₹ 176.5 million), tubes ₹175.6 (US$ 2.7 million) (2015-16: ₹117.7 million) and other smaller UK downstream business ₹771.5 million (US$ 11.9 million) (2015-16: ₹ 615.4 million).
Out of the total impairment recognised during the year, ₹1,483.7 million (US$ 22.9 million) has been included within exceptional items with the balance being primarily included in profit and loss from discontinued operations.
Within the South East Asian business, impairment charge of ₹905.2 million (US$ 14.0 million) (2015-16: Nil) was recognised during the year which primarily relates to the Thailand operations. The impairment relates to assets, which are not under operations and where the carrying value exceeded the recoverable value based on fair of such assets. The fair value is based on interests expressed by potential unrelated buyer for such assets. The impairment recognised has been included within exceptional items in the consolidated statement of profit and loss.
During the year ended March 31, 2016, significant volatility in commodity prices triggered an impairment assessment for mining out by the Group in Canada. The recoverable value was based on value in use using cash flow projections for 16 years and a discount rate of 8.30%. The impairment recognised has been included within exceptional items in the consolidated statement of profit and loss.
The balance impairment charge for the year ended March 31, 2017 amounting to ₹20.7 million (US$ 0.3 million) (2015-16: ₹1,646.5 million) relates to other small businesses within the Group.
The Group has conducted sensitivity analysis on the impairment tests of the carrying value of the Group’s CGUs and property, plant and equipment. The directors believe that no reasonably possible change in any of the key assumptions used in the value in use calculations would cause the carrying value of property, plant and equipment in any CGU to materially exceed its value in use.
(ix) The details of property, plant and equipment pledged against borrowings are presented in Note 22.
4. LEASES
The Group has taken land, buildings, plant and machinery under operating and finance leases. The following is the summary of future minimum lease rental payments under non-cancellable operating leases and finance leases entered into by the Group:
A. Operating leases:
Significant leasing arrangements include lease of land for periods ranging between 12 to 99 years with renewal option, lease of office spaces, assets dedicated for use under long term arrangements, and time charter hire vessels with lease period varying from 2 to 7 years. Payments under long term arrangements involving use of dedicated assets are allocated between those relating to the right
F-251

NOTES FORMING PART OF THE FINANCIAL STATEMENTS
to use of assets, executory services and for output based on the underlying contractual terms and conditions. Any change in the allocation assumptions may have an impact on lease assessment and/or lease classification. Payments linked to changes in inflation index under lease arrangements have been considered as contingent rent and recognised in the consolidated statement of profit and loss as and when incurred.
Future minimum rentals payable under non-cancellable operating leases are as below:
As at March 31, 2017
As at March 31, 2016
As at April 1, 2015
(US$ million) (` in million) (` in million) (` in million)
Not later than one year 103.9 6,735.0 9,203.6 9,542.5 Later than one year but not later than five years 228.2 14,798.0 29,805.2 30,525.9 Later than five years 399.4 25,897.6 24,248.8 27,981.7
731.4 47,430.6 63,257.6 68,050.1
During the year ended March 31, 2017, total operating lease rental recognised in the consolidated statement of profit and loss was `9,496.2million (US$ 146.4 million), (2015-16: `9,646.9 million) including contingent rent of `370.7 million (US$ 5.7 million) (2015-16: `372.4 million).
B. Finance leases:
Significant leasing arrangements include assets dedicated for use under long term arrangements. The arrangements covers a substantial part of the economic life of the underlying asset and contain a renewal option on expiry. Payments under long term arrangements involving use of dedicated assets are allocated between those relating to the right to use of assets, executory services and for output based on the underlying contractual terms and conditions. Any change in the allocation assumptions may have an impact on lease assessment and/or lease classification.
The minimum lease payments and the present value of minimum lease payments in respect of arrangements classified as finance leases are as below:
(` in million)
As at March 31, 2017 As at March 31, 2016 As at April 1, 2015
Minimum Lease
payments
Present value of
minimum lease payments
Minimum
Lease
payments
Present value
of minimum
lease
payments
Minimum
Lease
payments
Present value
of minimum
lease
payments(US$
million)(` in
million)(US$
million)(` in
million)
Not later than one year 91.4 5,925.6 33.7 2,182.7 5,554.2 2,425.4 5,150.0 2,032.6Later than one year but not later than five years 311.5 20,199.3 116.9 7,583.6 17,888.6 7,547.9 17,048.3 6,606.0
Later than five years 731.0 47,398.6 319.0 20,688.3 39,453.3 17,428.7 41,484.9 17,698.6Total future minimum lease commitments
1,133.8 73,523.5 469.7 30,454.6 62,896.1 27,402.0 63,683.2 26,337.2
Less: future finance charges 664.2 43,068.9 35,494.1 37,346.0Present value of minimum lease payments
469.7 30,454.6 27,402.0 26,337.2
Disclosed as:
Non-current borrowings 435.9 28,268.3 25,136.2 24,386.2Other financial liabilities - Current 33.7 2,186.3 2,265.8 1,951.0
469.7 30,454.6 27,402.0 26,337.2
3. PROPERTY, PLANT & EQUIPMENT (CONTD.)
F-252

NOTES FORMING PART OF THE FINANCIAL STATEMENTS
5. GOODWILL ON CONSOLIDATION
As at March 31, 2017
As at March 31, 2016
(US$ million) (` in million) (` in million)
Cost as at beginning of the year 852.7 55,290.7 53,802.8 Exchange differences on consolidation (121.6) (7,887.7) 1,487.9 Cost as at end of the year 731.0 47,403.0 55,290.7
Impairment as at beginning of year 225.4 14,615.1 14,194.3 Exchange differences on consolidation (33.3) (2,159.4) 420.8 Impairment as at end of the year 192.1 12,455.7 14,615.1
Net carrying value as at beginning of the year 627.3 40,675.6 39,608.5
Net carrying value as at end of the year 538.9 34,947.3 40,675.6
The carrying value predominantly relates to the goodwill that arose on the acquisition of erstwhile Corus Group Plc. and has been tested against the recoverable amount of Strip Products Mainland Europe cash generating unit (CGU) by the Tata Steel Europe, a wholly owned subsidiary of the Tata Steel Group. This goodwill relates to expected synergies from combining Corus’ activities with those of the Group and to assets, which could not be recognised as separately identifiable intangible assets. The goodwill is tested annually for impairment more frequently if there are any indications that the goodwill may be impaired.
The recoverable amount of Strip Products Mainland Europe CGU has been determined from a value in use calculation. The calculation uses cash flow forecasts based on the most recently approved financial budgets and strategic forecasts which cover a period of three years and future projections taking the analysis out to 15 years. Key assumptions for the value in use calculation
are those regarding expected changes to selling prices and raw material costs, EU steel demand, exchange rates and a discount rate of 7.8% (March 31, 2016: 7.4%, April 1, 2015: 8.0%). Changes in selling prices, raw material costs, exchange rates and EU steel demand are based on expectations of future changes in the steel market based on external market sources. A nil growth rate is used to extrapolate the cash flow projections beyond the three-year period of the financial budgets to 15 years The pre-tax discount rate is derived from the Tata Steel Europe (TSE) weighted average cost of capital (WACC) and the WACCs of its main European steel competitors. The outcome of the Group’s goodwill impairment test as at March 31, 2017 for the Strip Products Mainland Europe CGU resulted in no impairment of goodwill (March 31, 2016: Nil).
The directors believe that no reasonably possible change in any of the key assumptions used in the value in use calculation would cause the carrying value of the CGU to materially exceed its value in use.
F-253

NOTES FORMING PART OF THE FINANCIAL STATEMENTS
6. OTHER INTANGIBLE ASSETS
(` in million)Patents
and
Trademarks
Development
costs
Software
costs
Mining
assets
Other
intangible
assets
Total
(` in million)
(US$ million)
Cost/Deemed cost as at April 1, 2016 92.7 4,880.8 3,148.5 22,042.8 26,342.3 56,507.1 871.4Additions 0.8 352.3 1,418.1 8,004.6 12.2 9,788.0 150.9Disposals - (2,571.3) (145.6) - (23,461.0) (26,177.9) (403.7)Disposal of group undertakings (4.0) (6.8) (51.2) - - (62.0) (1.0)Other re-classifications - - (17.8) (6,093.5) - (6,111.3) (94.2)Exchange differences on consolidation 12.1 (262.8) (99.1) 40.6 (1,954.1) (2,263.3) (34.9)Cost/Deemed cost as at March 31, 2017 101.6 2,392.2 4,252.9 23,994.5 939.4 31,680.6 488.6
Accumulated impairment as at April 1, 2016 - - 5.0 1,244.5 14,017.9 15,267.4 235.4Charge for the year - - 2.0 11.3 - 13.3 0.2Disposals - - - - (12,657.2) (12,657.2) (195.2)Other re-classifications - - (2.1) - - (2.1) 0Exchange differences on consolidation - - (0.7) (30.1) (1,054.2) (1,085.0) (16.7)Accumulated impairment as at March 31, 2017 - - 04.2 1,225.7 306.5 1,536.4 23.7
Accumulated amortisation as at April 1, 2016 59.7 3,907.3 2,132.4 7,585.5 11,925.2 25,610.1 394.9Charge for the year 7.1 454.3 474.0 1,883.1 45.6 2864.1 44.2Disposals - (2,571.3) (145.2) - (10,803.9) (13,520.4) (208.5)Disposal of group undertakings (4.0) (6.8) (16.6) - - (27.4) (0.4)Other re-classifications - - (14.7) - - (14.7) (0.2)Exchange differences on consolidation 14.3 (190.6) (16.3) 12.6 (899.8) (1,079.8) (16.7)Accumulated amortisation as at
March 31, 2017
77.1 1,592.9 2,413.6 9,481.2 267.1 13,831.9 213.3
Net carrying value as at April 1, 2016 33.0 973.5 1,011.1 13,212.8 399.2 15,629.6 241.0Net carrying value as at March 31, 2017 24.5 799.3 1,835.1 13,287.6 365.8 16,312.3 251.6
F-254

NOTES FORMING PART OF THE FINANCIAL STATEMENTS
6. OTHER INTANGIBLE ASSETS (CONTD.)
(` million)Patents
and Trademarks
Developmentcosts
Softwarecosts
Miningassets
Other intangible
assets
Total
Cost/Deemed cost as at April 1, 2015 49.9 3,970.3 2,757.0 34,402.8 25,588.0 66,768.0 Additions 0.6 426.0 352.7 14,823.7 0.3 15,603.3Disposals (1.9) - (87.5) (64.6) - (154.0)Other re-classifications - - 4.8 (27,790.2) 27.4 (27,758.0)Exchange differences on consolidation 44.1 484.5 121.5 671.1 726.6 2,047.8 Cost/Deemed cost as at March 31, 2016 92.7 4,880.8 3,148.5 22,042.8 26,342.3 56,507.1
Accumulated impairment as at April 1, 2015 - - 0.2 - 13,643.8 13,644.0 Charge for the year - - 5.0 1,260.7 - 1,265.7 Reversals during the year - - (0.1) - (17.9) (18.0)Exchange differences on consolidation - - (0.1) (16.2) 392.0 375.7 Accumulated impairment as at March 31, 2016 - - 5.0 1,244.5 14,017.9 15,267.4
Accumulated amortisation as at April 1, 2015 14.5 3,072.5 1,799.1 6,838.5 11,527.8 23,252.4 Additions through business combinations - - - - - -Charge for the period 4.9 453.7 340.9 783.1 62.9 1,645.5 Disposals - - (86.8) (26.8) - (113.6)Exchange differences on consolidation 40.3 381.1 79.2 (9.3) 334.5 825.8 Accumulated amortisation as at March 31, 2016
59.7 3,907.3 2,132.4 7,585.5 11,925.2 25,610.1
Net carrying value as at April 1, 2015 35.4 897.8 957.7 27,564.3 416.4 29,871.6Net carrying value as at March 31, 2016 33.0 973.5 1,011.1 13,212.8 399.2 15,629.6
(i) Mining assets represent expenditure incurred in relation to acquisition of mines, mine development expenditure post establishment of technical and commercial feasibility and restoration obligations as per applicable regulations.
(ii) During the year, the Group recognised an impairment charge of ₹ 11.3 million (US$ 0.2 million) (2015-16: ₹ 359.2 million) which was contained within India operations and related to expenditures incurred in connection with mines which are not being currently operated by the Group.
During the year ended March 31, 2016 significant volatility in commodity prices triggered an impairment assessment for mining operations carried out by the Group. This resulted in an impairment of ₹ 901.5 million (US$ 13.9 million) being recognised for mining operations carried out by the Group in Canada. The details of key assumptions used for impairment assessment are included in Note 3.
F-255

NOTES FORMING PART OF THE FINANCIAL STATEMENTS
7. EQUITY ACCOUNTED INVESTMENTS
(a) Associates:
(i) The Group has no material associates as at March 31, 2017. The aggregate summarised financial information in respect of the Group’s immaterial associates that are accounted for using the equity method is as below:
As at March 31, 2017
As at March 31, 2016
As at April 1, 2015
(US$ million) (` in million) (` in million) (` in million)
Carrying value of the Group’s interest in associates* 35.7 2,316.2 2,207.4 2,254.8
Year ended March 31, 2017
Year ended March 31, 2016
(US$ million) (` in million) (` in million)
Group’s share of profit/(loss) in associates* 6.8 440.0 114.9Group’s share of other comprehensive income in associates (0.8) (50.2) (03.0)Group’s share of total comprehensive income in associates 6.0 389.8 111.9
(ii) Fair value of investments in equity accounted associates for which published price quotation is available, which is a level 1 input, was ̀ 1,303.5 million (US$ 20.1 million) (March 31, 2016: ̀ 1,363.0 million and April 1, 2015: ̀ 1,672.3 million). The carrying value of such investments is Nil (March 31, 2016: Nil; April 1, 2015: `227.1 million) as the Group’s share in net assets of such associates exceeds the cost of investments made.
(iii) Share of unrecognised loss in respect of equity accounted associates amounted to `1,051.7 million (US$ 16.2 million) for the year ended March 31, 2017 (2015-16: `595.3 million). Cumulative shares of unrecognised losses in respect of equity accounted associates as at March 31, 2017 amounted to `2,090.8 million (US$ 32.2 million). (March 31, 2016: `1,088.4 million; April 1, 2015: `459.6 million)
(iv) The Group did not recognise any impairment in respect of its equity accounted associates during the current year as well as in previous year.
(b) Joint ventures:
(i) The Company holds 51% of the total equity share capital and voting rights in T M International Logistics Limited, Jamshedpur Continuous Annealing and Processing Company Private Limited and T M Mining Company Limited. The decisions in respect of activities which significantly affect the risks and rewards of these respective entities, however require an unanimous consent of all the shareholders. These entities have therefore been accounted for as joint ventures.
(ii) The Group has no material joint ventures as at March 31, 2017. The aggregate summarised financial information in respect of the Group’s immaterial joint ventures that are accounted for using the equity method is as below:
As at March 31, 2017
As at March 31, 2016
As at April 1, 2015
(US$ million) (` in million) (` in million) (` in million)
Carrying value of the Group’s interest in joint ventures* 210.0 1,3620.6 1,3996.7 14,941.3
Year ended March 31, 2017
Year ended March 31, 2016
(US$ million) (` in million) (` in million)
Group’s share of profit/(loss) in joint ventures* (5.6) (363.5) (1,219.1)Group’s share of other comprehensive income in joint ventures 1.0 62.2 277.1Group’s share of total comprehensive income in joint ventures (4.6) (301.3) (942.0)
F-256
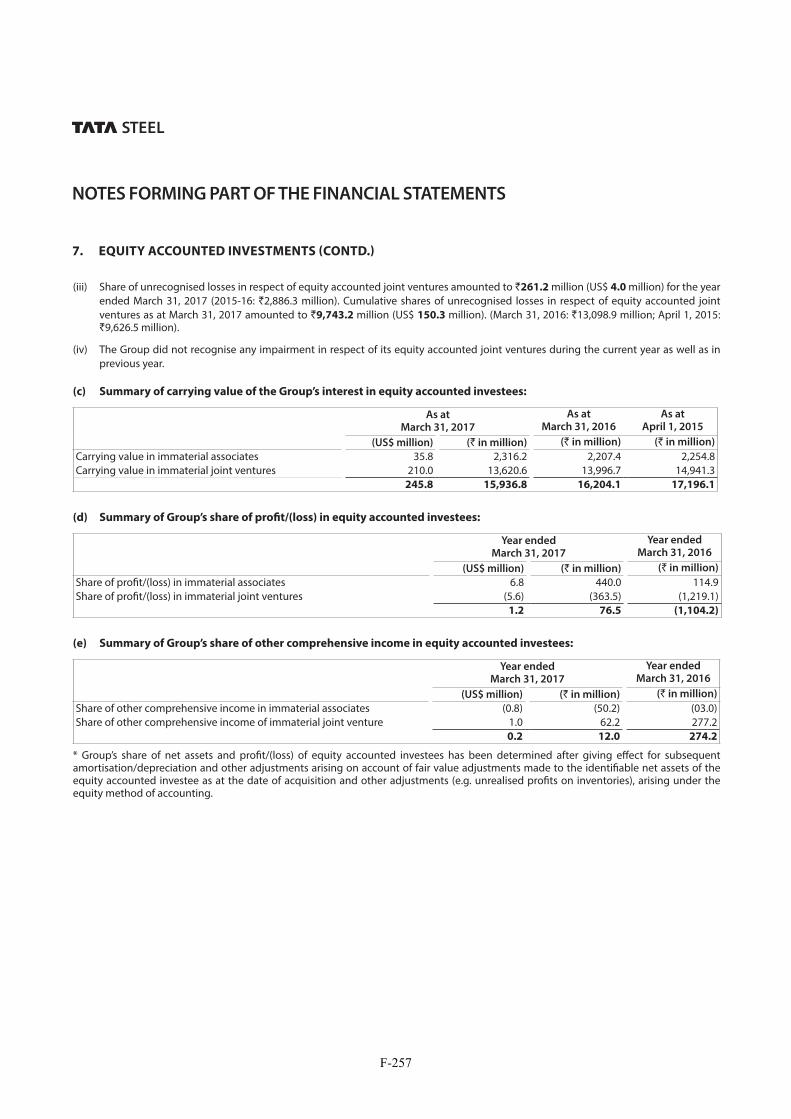
NOTES FORMING PART OF THE FINANCIAL STATEMENTS
(iii) Share of unrecognised losses in respect of equity accounted joint ventures amounted to `261.2 million (US$ 4.0 million) for the year ended March 31, 2017 (2015-16: `2,886.3 million). Cumulative shares of unrecognised losses in respect of equity accounted joint ventures as at March 31, 2017 amounted to `9,743.2 million (US$ 150.3 million). (March 31, 2016: `13,098.9 million; April 1, 2015: `9,626.5 million).
(iv) The Group did not recognise any impairment in respect of its equity accounted joint ventures during the current year as well as in previous year.
(c) Summary of carrying value of the Group’s interest in equity accounted investees:
As at March 31, 2017
As at March 31, 2016
As at April 1, 2015
(US$ million) (` in million) (` in million) (` in million)
Carrying value in immaterial associates 35.8 2,316.2 2,207.4 2,254.8Carrying value in immaterial joint ventures 210.0 13,620.6 13,996.7 14,941.3
245.8 15,936.8 16,204.1 17,196.1
(d) Summary of Group’s share of profit/(loss) in equity accounted investees:
Year ended March 31, 2017
Year ended March 31, 2016
(US$ million) (` in million) (` in million)
Share of profit/(loss) in immaterial associates 6.8 440.0 114.9Share of profit/(loss) in immaterial joint ventures (5.6) (363.5) (1,219.1)
1.2 76.5 (1,104.2)
(e) Summary of Group’s share of other comprehensive income in equity accounted investees:
Year ended March 31, 2017
Year ended March 31, 2016
(US$ million) (` in million) (` in million)
Share of other comprehensive income in immaterial associates (0.8) (50.2) (03.0)Share of other comprehensive income of immaterial joint venture 1.0 62.2 277.2
0.2 12.0 274.2
* Group’s share of net assets and profit/(loss) of equity accounted investees has been determined after giving effect for subsequent amortisation/depreciation and other adjustments arising on account of fair value adjustments made to the identifiable net assets of the equity accounted investee as at the date of acquisition and other adjustments (e.g. unrealised profits on inventories), arising under the equity method of accounting.
7. EQUITY ACCOUNTED INVESTMENTS (CONTD.)
F-257

NOTES FORMING PART OF THE FINANCIAL STATEMENTS
8. INVESTMENTS
(A) NON-CURRENT
As at March 31, 2017
As at March 31, 2016
As at April 1, 2015
(US$ million) (` in million) (` in million) (` in million)
(a) Investment carried at amortised cost:
Investments in Government or Trust securities - 00.2 00.2 0.2Investments in Bonds and Debentures 7.7 499.1 341.6 2.0
7.7 499.3 341.8 2.2
(b) Investments carried at fair value through other
comprehensive income:
Investments in Equity shares 749.3 48,588.2 40,154.5 1,07,701.4 749.3 48,588.2 40,154.5 1,07,701.4
(c) Investments carried at fair value through the
consolidated statement of profit and loss:
Investments in Bonds and Debentures 37.7 2,447.2 3,454.3 3,614.1Investments in Equity shares 5.7 368.4 346.9 270.0
43.4 2,815.6 3,801.2 3,884.1
800.4 51,903.1 44,297.5 1,11,587.7
(B) CURRENT
As at March 31, 2017
As at March 31, 2016
As at April 1, 2015
(US$ million) (` in million) (` in million) (` in million)
Investments carried at fair value through the consolidated
statement of profit and loss:
Investments in mutual funds 874.9 56,731.3 46,635.5 12,146.0 874.9 56,731.3 46,635.5 12,146.0
(i) The carrying value and market value of quoted and unquoted investments is as follows:
As at March 31, 2017
As at March 31, 2016
As at April 1, 2015
(US$ million) (` in million) (` in million) (` in million)
(a) Quoted
Carrying value 730.2 47,352.8 39,895.0 1,06,924.8 Market value 730.2 47,352.8 39,895.0 1,06,924.8
(b) Unquoted#
Carrying value Market value 945.0 61,281.6 51,038.0 16,808.9
# Costs of unquoted equity instruments has been considered as an appropriate estimate of fair value because of a wide range of possible fair value measurements and cost represents the best estimate of fair value within that range.
F-258
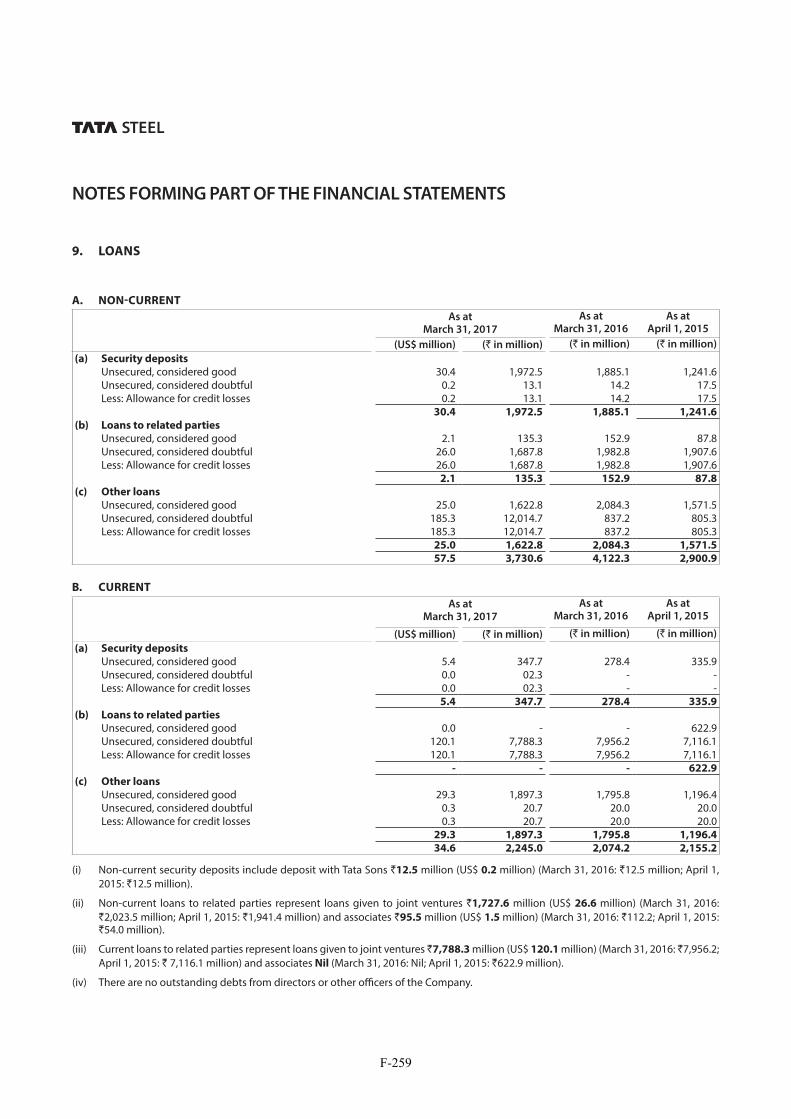
NOTES FORMING PART OF THE FINANCIAL STATEMENTS
9. LOANS
A. NON-CURRENT
As at March 31, 2017
As at March 31, 2016
As at April 1, 2015
(US$ million) (` in million) (` in million) (` in million)
(a) Security deposits
Unsecured, considered good 30.4 1,972.5 1,885.1 1,241.6 Unsecured, considered doubtful 0.2 13.1 14.2 17.5 Less: Allowance for credit losses 0.2 13.1 14.2 17.5
30.4 1,972.5 1,885.1 1,241.6
(b) Loans to related parties
Unsecured, considered good 2.1 135.3 152.9 87.8 Unsecured, considered doubtful 26.0 1,687.8 1,982.8 1,907.6 Less: Allowance for credit losses 26.0 1,687.8 1,982.8 1,907.6
2.1 135.3 152.9 87.8
(c) Other loans
Unsecured, considered good 25.0 1,622.8 2,084.3 1,571.5 Unsecured, considered doubtful 185.3 12,014.7 837.2 805.3 Less: Allowance for credit losses 185.3 12,014.7 837.2 805.3
25.0 1,622.8 2,084.3 1,571.5
57.5 3,730.6 4,122.3 2,900.9
B. CURRENT
As at March 31, 2017
As at March 31, 2016
As at April 1, 2015
(US$ million) (` in million) (` in million) (` in million)
(a) Security deposits
Unsecured, considered good 5.4 347.7 278.4 335.9 Unsecured, considered doubtful 0.0 02.3 - - Less: Allowance for credit losses 0.0 02.3 - -
5.4 347.7 278.4 335.9
(b) Loans to related parties
Unsecured, considered good 0.0 - - 622.9 Unsecured, considered doubtful 120.1 7,788.3 7,956.2 7,116.1 Less: Allowance for credit losses 120.1 7,788.3 7,956.2 7,116.1
- - - 622.9
(c) Other loans
Unsecured, considered good 29.3 1,897.3 1,795.8 1,196.4 Unsecured, considered doubtful 0.3 20.7 20.0 20.0 Less: Allowance for credit losses 0.3 20.7 20.0 20.0
29.3 1,897.3 1,795.8 1,196.4
34.6 2,245.0 2,074.2 2,155.2
(i) Non-current security deposits include deposit with Tata Sons `12.5 million (US$ 0.2 million) (March 31, 2016: `12.5 million; April 1, 2015: `12.5 million).
(ii) Non-current loans to related parties represent loans given to joint ventures `1,727.6 million (US$ 26.6 million) (March 31, 2016: `2,023.5 million; April 1, 2015: `1,941.4 million) and associates `95.5 million (US$ 1.5 million) (March 31, 2016: `112.2; April 1, 2015: `54.0 million).
(iii) Current loans to related parties represent loans given to joint ventures `7,788.3 million (US$ 120.1 million) (March 31, 2016: `7,956.2; April 1, 2015: ` 7,116.1 million) and associates Nil (March 31, 2016: Nil; April 1, 2015: `622.9 million).
(iv) There are no outstanding debts from directors or other officers of the Company.
F-259

NOTES FORMING PART OF THE FINANCIAL STATEMENTS
10. OTHER FINANCIAL ASSETS
A. NON-CURRENT
As at March 31, 2017
As at March 31, 2016
As at April 1, 2015
(US$ million) (` in million) (` in million) (` in million)
(a) Interest accrued on deposits, loans and advances
Unsecured, considered good 0.4 24.3 27.9 67.4Unsecured, considered doubtful 0.0 02.7 02.7 -Less: Allowance for credit losses 0.0 02.7 02.7 -
0.4 24.3 27.9 67.4
(b) Earmarked balances with bank 6.3 408.7 361.4 414.6
(c) Other balances with banks 2.0 126.7 21.1 10.4
(d) Other financial assets
Unsecured, considered good 4.6 296.1 - 212.7Unsecured, considered doubtful 18.1 1,174.2 - 375.0Less: Allowance for credit losses 18.1 1,174.2 - 375.0
4.6 296.1 - 212.7
13.2 855.8 410.4 705.1
B. CURRENT
As at March 31, 2017
As at March 31, 2016
As at April 1, 2015
(US$ million) (` in million) (` in million) (` in million)
(a) Interest accrued on deposits and loans
Unsecured, considered good 9.3 605.7 180.5 265.3Unsecured, considered doubtful 16.6 1,077.0 755.4 267.4Less: Allowance for credit losses 16.6 1,077.0 755.4 267.4
9.3 605.7 180.5 265.3
(b) Other financial assets
Unsecured, considered good 50.5 3,272.5 2,232.5 3,251.450.5 3,272.5 2,232.5 3,251.4
59.8 3,878.2 2,413.0 3,516.7
(i) Earmarked balances with bank represent fixed deposits placed as security with government bodies and margin money against issue of bank guarantees.
(ii) Other balances with banks, represent bank deposits not due for realisation within 12 months from the balance sheet date.
(iii) Non-current other financial assets include:
(a) advance against equity for purchase of shares in joint ventures Nil (March 31, 2016: Nil; April 1, 2015: `212.7 million).
(b) advance for repurchase of equity shares in Tata Teleservices Limited (TTSL) from NTT Docomo Inc, ̀ 1,440.7 million (US$ 22.2 million) (March 31, 2016: Nil; April 1, 2015: Nil).
(iv) Current other financial assets include amount receivable from post-employment benefit fund `2,470.4 million (US$ 38.1 million) (March 31, 2016: `976.1 million; April 1, 2015: `1,543.4 million) on account of retirement benefit obligations paid by the Group.
F-260

NOTES FORMING PART OF THE FINANCIAL STATEMENTS
11. RETIREMENT BENEFIT ASSETS AND OBLIGATIONS
(I) RETIREMENT BENEFIT ASSETS
A. NON-CURRENT
As at March 31, 2017
As at March 31, 2016
As at April 1, 2015
(US$ million) (` in million) (` in million) (` in million)
(a) Pension 270.2 17,521.4 1,14,767.7 13,305.0 (b) Retiring gratuities 0.1 5.0 6.7 1.3
270.3 17,526.4 1,14,774.4 13,306.3
(II) RETIREMENT BENEFIT OBLIGATIONS
A. NON-CURRENT
As at March 31, 2017
As at March 31, 2016
As at April 1, 2015
(US$ million) (` in million) (` in million) (` in million)
(a) Pension 155.0 10,050.3 15,002.9 15,629.1 (b) Retiring gratuities 35.9 2,330.5 1,795.0 5,758.4 (c) Post-retirement medical benefits 185.3 12,018.3 10,435.1 10,185.9 (d) Other defined benefits 34.9 2,263.6 2,061.8 1,960.3
411.2 26,662.7 29,294.8 33,533.7
B. CURRENT
As at March 31, 2017
As at March 31, 2016
As at April 1, 2015
(US$ million) (` in million) (` in million) (` in million)
(a) Pension 4.1 264.3 409.5 477.4 (b) Retiring gratuities 0.5 32.9 - - (c) Post-retirement medical benefits 8.5 548.0 539.8 485.9 (d) Other defined benefits 1.6 106.8 161.5 139.8
14.7 952.0 1,110.8 1,103.1
(i) Detailed disclosure in respect post retirement defined benefit schemes is provided in Note 38
F-261

NOTES FORMING PART OF THE FINANCIAL STATEMENTS
12. INCOME TAXES
A. INCOME TAX EXPENSES/(BENEFITS)
The Company is subject to income tax in India on the basis of standalone financial statements. As per the Income Tax Act, the Company is liable to pay income tax which is the higher of regular income tax payable or the amount payable based on the provisions applicable for Minimum Alternate Tax (MAT).
MAT paid in excess of regular income tax during a year can be carried forward for a period of 15 years and can be offset against future tax liabilities.
Companies can claim for tax exemptions/deductions under specific section subject to fulfilment of prescribed conditions as may be applicable. The effective tax rate of the Company was lower as a result of tax deduction claimed by the Company on account of investment allowance on capital expenditure, expenditure on research and development etc.
Business loss can be carried forward for a maximum period of eight assessment years immediately succeeding the assessment year to which the loss pertains. Unabsorbed depreciation can be carried forward for an indefinite period.
Apart from India, the major tax jurisdiction of the Group include Singapore, Thailand, United Kingdom and Netherlands. The number of years that are subject to tax assessments varies depending on tax jurisdiction.
The reconciliation of estimated income tax to income tax expense is as below: Year ended
March 31, 2 017
Year ended March 31, 2016
(US$ million) (` in million) (` in million)
Profit/(loss) before tax 381.5 24,736.3 27,327.5
Income tax expense at applicable tax rates applicable to individual entities
72.4 4,693.6 (15,186.0)
(a) Tax on income at different rates (4.9) (320.1) (22.9)(b) Additional tax benefit for capital investment including
research & development expenditures (20.3) (1,316.5) (667.5)
(c) Items not deductible/income exempt from tax 1.3 12,925.5 26,864.5(d) Undistributed earning of subsidiaries, joint ventures and
equity accounted investees 199.3 82.6 53.5
(e) Deferred tax assets not recognised because realisation is not probable
273.6 17,741.6 8,841.8
(f ) Adjustments to current tax in respect of prior periods (1.8) (118.6) (290.7)(g) Utilisation/credit of unrecognised tax losses unabsorbed
depreciation and other tax benefits (91.1) (5,908.0) (12,693.1)
Tax expense as reported 428.4 27,780.1 6,899.6
F-262

NOTES FORMING PART OF THE FINANCIAL STATEMENTS
12. INCOME TAXES (CONTD.)
B. DEFERRED TAX ASSETS/(LIABILITIES)
(a) Components of deferred tax assets and liabilities as at March 31, 2017 is as below: (` in million)
Balance
as at
April 1,
2016
Recognised/
(reversed in
profit or loss
Recognised
in Other
comprehensive
Income
Recognised
in equity
Disposal
of group
undertakings
Other
reclassifications
Exchange
differences on
consolidation
Balance as at
March 31, 2017
(` in
million)
(US$
million)
Deferred tax assets /
(liabilities)
Tax-loss carry forwards 24,776.3 (12,907.6) - - - 2.4 (1,779.1) 10,092.0 155.6Provisions 16,704.7 5,131.9 - - - (33.9) (284.7) 21,518.0 331.8MAT credit entitlement 2,758.1 12,439.2 - - - (64.3) - 15,133.0 233.4Others 223.7 521.5 (2.5) - - - (9.0) 733.7 11.3
44,462.8 5,185.0 (2.5) - - (95.8) (2,072.8) 47,476.7 732.10
Deferred tax liabilities
/(assets)
Property plant and equipment
1,07,716.7 23,869.8 - (108.4) - - 349.6 1,31,827.7 2,033.0
Intangible assets 281.2 290.1 - - - - 86.1 657.4 10.1Retirement benefit assets/ liabilities
18,086.1 (8,483.6) (7,038.4) - 155.1 - (1,815.2) 904.0 13.9
Trade and other receivables
5,012.9 1,650.6 4.6 - - - (831.1) 5,837.0 90.0
Others 1,300.3 (1,778.8) 138.2 - 53.1 77.7 (97.8) (307.3) (4.7) 1,32,397.2 15,548.1 (6,895.6) (108.4) 208.2 77.7 (2,308.4) 1,38,918.8 2,142.3
Net Deferred tax
assets/(liabilities)
(87,934.4) (10,363.1) 6,893.1 108.4 (208.2) (173.5) 235.6 (91,442.1) (1,410.2)
Disclosed as :
Deferred tax assets 6,274.5 8,858.7 136.6
Deferred tax liabilities 94,208.9 1,00,300.8 1,546.8
(87,934.4) (91,442.1) (1,410.2)
F-263

NOTES FORMING PART OF THE FINANCIAL STATEMENTS
12. INCOME TAXES (CONTD.)
Components of deferred tax assets and liabilities as at March 31, 2016 is as below: (` in million)
Balance as at
April 1, 2015
Recognised/(reversed
in profit or loss
Recognised in Other
comprehensive Income
Recognised in equity
Disposal of group
undertakings
Other reclassifications
Exchange differences on consolidation
Balance as at March 31, 2016
Deferred tax assets /
(liabilities)
Tax-loss carry forwards 16,189.4 7,720.1 - - - (329.4) 1,196.2 24,776.3 Retirement benefit assets/ liabilities
62.9 (15,309.0) (3,377.1) - - - 537.1 (18,086.1)
Provisions 13,172.4 4,061.7 - - - (567.8) 38.4 16,704.7 MAT credit entitlement 1,172.1 1,521.7 - - - 64.3 - 2,758.1 Others 221.0 (66.2) (03.2) - - - - 151.6
30,817.8 (2,071.7) (3,380.3) - - (832.9) 1,771.7 26,304.6
Deferred tax liabilities /
(assets)
Property plant and equipment
1,15,043.3 (7,959.2) - (158.9) - (04.7) 796.2 1,07,716.7
Intangible assets 816.7 (559.5) - - 31.3 - (07.3) 281.2 Trade and other receivables 3,640.5 1,283.4 - - - - 89.0 5,012.9 Others 2,572.4 (1,147.0) (770.1) - (31.3) 255.9 348.3 1,228.2
1,22,072.9 (8,382.3) (770.1) (158.9) - 251.2 1,226.2 1,14,239.0
Net Deferred tax assets/
(liabilities)
(91,255.1) 6,310.6 (2,610.2) 158.9 - (1,084.1) 545.5 (87,934.4)
Disclosed as :
Deferred tax assets 8,122.0 6,274.5
Deferred tax liabilities 99,377.1 94,208.9
(91,255.1) (87,934.4)
(b) Deferred tax assets have not been recognised in respect of tax losses of `4,80,419.1 million (US$ 7,408.7 million) (March 31, 2016: `5,65,419.5 million; April 1, 2015: `5,08,113.4 million) as its recovery is not considered probable in the foreseable future. These losses primarily relate to the Group’s European operations.
F-264

NOTES FORMING PART OF THE FINANCIAL STATEMENTS
12. INCOME TAXES (CONTD.)
(c) Unrecognised tax losses in respect of which deferred tax asset have not been recognised expire unutilised based on the year of origination as below:
(US$ million) (` in million)
As at March 31, 2017
As at March 31, 2017
Not later than one year 10.2 662.1Later than one year but less than five years 836.5 54,240.9Later than five years but less than ten years 437.6 28,377.8Later than ten years but less than twenty years 4.7 306.1No expiry 6,119.7 3,96,832.2
7,408.7 4,80,419.1
(d) Deferred tax assets have also not been recognised in respect of deductible temporary differences and unused tax credits of ̀ 68,675.3 million (US$ 1,059.1 million) (March 31,2016: `26,608.7 million; April 1, 2015: `25,323.8 million) which do not carry an expiry date.
(e) At the end of the reporting period, the aggregate amount of temporary differences associated with undistributed earnings of subsidiaries, joint ventures and associates for which deferred tax liabilities have not been recognised is `1,02,280.2 million (US$ 1,577.3 million) (March 31, 2016: `98,836.1million and April 1, 2015: `86,918.2 million). No liability has been recognised in respect of these differences because the Group is in a position to control the timing of the reversal of the temporary differences and it is probable that such differences will not reverse in the foreseeable future.
13. OTHER ASSETS
A. NON-CURRENT
As at March 31, 2017
As at March 31, 2016
As at April 1, 2015
(US$ million) (` in million) (` in million) (` in million)
(a) Capital advancesUnsecured, considered good 95.3 6,181.6 8,351.8 10,525.0Unsecured, considered doubtful 13.7 886.1 758.8 24.5Less: Provision for doubtful advances 13.7 886.1 758.8 24.5
95.3 6,181.6 8,351.8 10,525.0
(b) Advance with public bodiesUnsecured, considered good 278.3 18,044.4 18,808.4 1,3537.9Unsecured, considered doubtful 2.0 127.6 172.6 178.3Less: Provision for doubtful advances 2.0 127.6 172.6 178.3
278.3 18,044.4 18,808.4 13,537.9
(c) Prepaid lease payments 142.8 9,256.7 8,544.0 6,998.7
(d) Capital advances to related partiesUnsecured, considered good 5.0 325.4 73.0 195.7
(e) Other assetsUnsecured, considered good 45.4 2,941.5 2,645.1 2,287.0Unsecured, considered doubtful 3.0 193.4 119.0 130.8Less: Provision for doubtful advances 3.0 193.4 119.0 130.8
45.4 2,941.5 2,645.1 2,287.0
566.7 36,749.6 38,422.3 33,544.3
F-265

NOTES FORMING PART OF THE FINANCIAL STATEMENTS
B. CURRENT
As at March 31, 2017
As at March 31, 2016
As at April 1, 2015
(US$ million) (` in million) (` in million) (` in million)
(a) Capital advancesUnsecured, considered good 0.1 5.5 3.4 -
(b) Advance with public bodiesUnsecured, considered good 215.0 13,940.9 13,166.6 11,982.9Unsecured, considered doubtful 0.4 28.5 30.8 18.5Less: Provision for doubtful advances 0.4 28.5 30.8 18.5
215.0 13,940.9 13,166.6 11,982.9
(c) Prepaid lease payments 0.1 5.9 5.7 5.6
(d) Advances to related partiesUnsecured, considered good 0.8 51.4 53.8 10.0
(e) Other assetsUnsecured, considered good 122.4 7,940.1 7,049.2 7,582.1Unsecured, considered doubtful 21.5 1,391.3 1,517.5 2,884.0Less: Provision for doubtful advances 21.5 1,391.3 1,517.5 2,884.0
122.4 7,940.1 7,049.2 7,582.1
338.4 21,943.8 20,278.7 19,580.6
(i) Advance with public bodies primarily relate to duty credit entitlements and amounts paid under protest in respect of demands from regulatory authorities.
(ii) Prepaid lease payments relate to land leases classified as operating in nature as the title is not expected to transfer at the end of the lease term and considering that land has an indefinite economic life.
(iii) Other assets include advances against supply of goods and services and advances paid to employees.
14. INVENTORIES
As at March 31, 2017
As at March 31, 2016
As at April 1, 2015
(US$ million) (` in million) (` in million) (` in million)
(a) Raw materials 1,236.8 80,202.3 51,529.4 79,013.3 (b) Work-in-progress 675.3 43,787.5 43,010.9 46,522.4 (c) Finished and semi-finished goods 1,394.9 90,453.1 72,524.9 84,408.8 (d) Stock-in-trade 21.6 1,399.1 1,003.2 3,913.1 (e) Stores and spares 496.5 32,196.2 32,064.9 32,076.0
3,825.1 2,48,038.2 2,00,133.3 2,45,933.6
Included above, goods-in-transit:
(i) Raw materials 100.3 6,503.0 3,824.2 14,186.8 (ii) Finished and semi-finished goods 21.4 1,385.5 302.9 2,105.6 (iii) Stock-in-trade 15.0 970.9 653.1 238.5 (iv) Stores and spares 22.0 1,428.5 1,607.0 1,513.1
293.9 10,287.9 6,387.2 18,044.0
(i) The value of inventories above is stated after impairment of `5,651.1 million (US$ 87.1 million) (March 31, 2016: `11,645.6 million; April 1, 2015: `10,378.4 million) for write-down to net realisable value and provision for slow moving and obsolete item.
13. OTHER ASSETS (CONTD.)
F-266
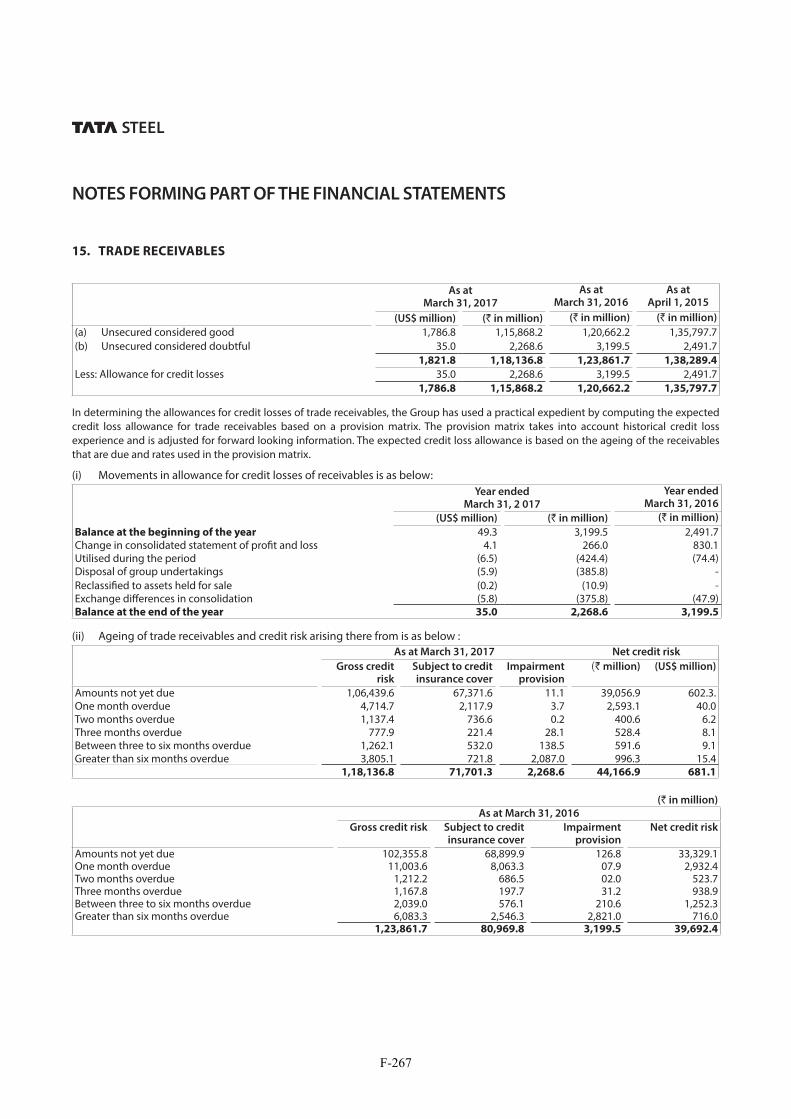
NOTES FORMING PART OF THE FINANCIAL STATEMENTS
15. TRADE RECEIVABLES
As at March 31, 2017
As at March 31, 2016
As at April 1, 2015
(US$ million) (` in million) (` in million) (` in million)
(a) Unsecured considered good 1,786.8 1,15,868.2 1,20,662.2 1,35,797.7 (b) Unsecured considered doubtful 35.0 2,268.6 3,199.5 2,491.7
1,821.8 1,18,136.8 1,23,861.7 1,38,289.4
Less: Allowance for credit losses 35.0 2,268.6 3,199.5 2,491.71,786.8 1,15,868.2 1,20,662.2 1,35,797.7
In determining the allowances for credit losses of trade receivables, the Group has used a practical expedient by computing the expected credit loss allowance for trade receivables based on a provision matrix. The provision matrix takes into account historical credit loss experience and is adjusted for forward looking information. The expected credit loss allowance is based on the ageing of the receivables that are due and rates used in the provision matrix.
(i) Movements in allowance for credit losses of receivables is as below:Year ended
March 31, 2 017
Year ended March 31, 2016
(US$ million) (` in million) (` in million)
Balance at the beginning of the year 49.3 3,199.5 2,491.7 Change in consolidated statement of profit and loss 4.1 266.0 830.1Utilised during the period (6.5) (424.4) (74.4)Disposal of group undertakings (5.9) (385.8) -Reclassified to assets held for sale (0.2) (10.9) -Exchange differences in consolidation (5.8) (375.8) (47.9)Balance at the end of the year 35.0 2,268.6 3,199.5
(ii) Ageing of trade receivables and credit risk arising there from is as below :As at March 31, 2017 Net credit risk
Gross credit risk
Subject to credit insurance cover
Impairment provision
(` million) (US$ million)
Amounts not yet due 1,06,439.6 67,371.6 11.1 39,056.9 602.3.One month overdue 4,714.7 2,117.9 3.7 2,593.1 40.0Two months overdue 1,137.4 736.6 0.2 400.6 6.2Three months overdue 777.9 221.4 28.1 528.4 8.1Between three to six months overdue 1,262.1 532.0 138.5 591.6 9.1Greater than six months overdue 3,805.1 721.8 2,087.0 996.3 15.4
1,18,136.8 71,701.3 2,268.6 44,166.9 681.1
(` in million)
As at March 31, 2016
Gross credit risk Subject to credit insurance cover
Impairment provision
Net credit risk
Amounts not yet due 102,355.8 68,899.9 126.8 33,329.1 One month overdue 11,003.6 8,063.3 07.9 2,932.4 Two months overdue 1,212.2 686.5 02.0 523.7 Three months overdue 1,167.8 197.7 31.2 938.9 Between three to six months overdue 2,039.0 576.1 210.6 1,252.3 Greater than six months overdue 6,083.3 2,546.3 2,821.0 716.0
1,23,861.7 80,969.8 3,199.5 39,692.4
F-267

NOTES FORMING PART OF THE FINANCIAL STATEMENTS
(iii) The Group considers its maximum exposure to credit risk with respect to customers as at March 31, 2017 to be `44,166.9 million (US$ 681.1 million) (March 31, 2016: `39,692.4 million; April 1, 2015: `43,333.4 million), which is the fair value of trade receivables (after allowance for credit losses). The Group’s exposure to customers is diversified and there is no concentration of credit risk with respect to any particular customer.
(iv) There are no outstanding receivable due from directors or officers of the respective entities.
16. CASH AND CASH EQUIVALENTS
As at
March 31, 2017
As at March 31, 2016
As at April 1, 2015
(US$ million) (` in million) (` in million) (` in million)
(a) Cash in hand 0.1 08.0 07.5 13.8 (b) Cheques, drafts on hand 4.5 294.4 342.9 541.0 (c) Remittance in-transits 9.1 592.7 44.9 44.5 (d) Unrestricted balances with banks 731.4 47,427.8 60,695.2 81,172.0
745.2 48,322.9 61,090.5 81,771.3
Currency profile of cash and cash equivalents is as below:As at
March 31, 2017
As at March 31, 2016
As at April 1, 2015
(US$ million) (` in million) (` in million) (` in million)
INR 222.7 14,441.6 12,847.0 7,929.5GBP 94.8 6,146.3 (1,448.5) 14,356.0EURO (10.9) (704.4) 20,029.2 13,002.9USD 314.2 20,375.0 25,462.2 42,096.7Others 124.4 8,064.4 4,200.6 4,386.2Total 745.2 48,322.9 61,090.5 81,771.3
INR-Indian rupees, GBP- Great Britain Pound, USD-United states dollars.
(i) Others primarily include SGD-Singapore dollars, CAD- Canadian dollars and THB-Thai Baht.
17. OTHER BALANCES WITH BANK
As at March 31, 2017
As at March 31, 2016
As at April 1, 2015
(US$ million) (` in million) (` in million) (` in million)
Earmarked balances with bank 13.7 887.6 772.9 713.4 13.7 887.6 772.9 713.4
15. TRADE RECEIVABLES (CONTD.)
F-268

NOTES FORMING PART OF THE FINANCIAL STATEMENTS
(a) Currency profile of Earmarked balances is as below:
As at March 31, 2017
As at March 31, 2016
As at April 1, 2015
(US$ million) (` in million) (` in million) (` in million)
INR 11.4 741.6 704.3 643.6USD 2.3 146.0 - -Others - - 68.6 69.8Total 13.7 887.6 772.9 713.4
INR-Indian rupees, GBP- Great Britain Pound, USD-United States dollars.
(i) Others primarily include SGD-Singapore dollars, CAD-Canadian dollars and THB-Thai Baht.
(b) Earmarked balances with bank represents balances held for unpaid dividends, margin money against issue of bank guarantees and deposits made against contract performance.
(c) In accordance with the MCA notification G.S.R. 308(E) dated March 30, 2017, details of Specified Bank Notes (SBN) and Other Denomination Notes (ODN) held and transacted during the period from November 8, 2016 to December 30, 2016, are given below:
(` )SBNs ODNs Total
Closing cash in hand as on November 8, 2016 54,93,500 15,07,262 70,00,762Add: Unpermitted receipts 1,15,20,000 - 1,15,20,000Add: Permitted receipts 23,36,000 7,81,04,948 8,04,40,948Less: Unpermitted payments 70,000 - 70,000Less: Permitted payments - 1,23,92,544 1,23,92,544Less: Amounts deposited in Banks 1,89,80,000 6,21,24,540 8,11,04,540Closing cash in hand as on December 30, 2016 2,99,500 50,95,126 53,94,626
(i) Unpermitted receipts include: 1. Company hospital receipts `1,06,21,500 which includes receipts at Tata Main Hospital, Jamshedpur of `1,04,34,000. Since
Tata Main Hospital is the only hospital equipped with modern facilities and super-speciality services in the region, on advice from the district administration, specified notes were accepted.
2. Refund of advances by employees & internal departments `74,500. 3. Canteen receipts of `5,90,500 are primarily received from Contractor’s employees. 4. Refund of advance by Steel Welfare Workers Society `2,33,500.
(ii) Unpermitted payments represents amount collected by Company’s employees and exchanged for new notes against their individual Permanent Account Number.
18. ASSETS AND LIABILITIES HELD FOR SALE
(a) On May 1, 2017, the Group’s wholly owned subsidiary Tata Steel UK Limited completed the sale of its speciality steels business. As at March 31, 2017, the Speciality Steels business has been classified as a disposal group held for sale. Following this classification, a write down of ₹ 1,813.2 million (US$ 28.0 million) was recognised to reduce the carrying value of the assets in the disposal group to their fair value less costs to sell. The impairment charge has been included within profit/loss of discontinued operations in the consolidated statement of profit and loss.
F-269

NOTES FORMING PART OF THE FINANCIAL STATEMENTS
The major classes of assets and liabilities held for sale as on the respective reporting dates is as below: As at
March 31, 2017
As at March 31, 2016
As at April 1, 2015
(US$ million) (` in million) (` in million) (` in million)
Assets classified as held for sale:
Property, Plant and Equipment 0 - 210.5 -Equity accounted investments 0 - 50.6 1,454.2 Inventories 120.0 7,781.2 - - Trade receivables 45.1 2,925.0 - - Cash and bank balances 0.2 10.3 - - Other financial assets 0.4 27.8 - -
165.7 10,744.3 261.1 1,454.2Less: Write down to fair value less costs to sell (28.0) (1,813.2) - -
137.7 8,931.1 261.1 1,454.2
Liabilities classified as held for sale:
Non-current financial liabilities 1.4 88.9 - - Provisions 1.5 100.3 - - Other Non-current liabilities 0.0 00.1 - - Trade payables 35.2 2,285.1 - - Other financial liabilities 0.4 24.9 - - Short term provisions 4.2 271.6 - - Current tax liabilities 0.1 04.6 - -
Other Current liabilities 1.9 122.1 - - 44.7 2,897.6 - -
(b) As at March 31, 2017, the Group has also reclassified certain assets with carrying value of ₹ 983.1 million (US$ 15.2 million) pertaining to the South East Asian operations as held for sale since it expects to recover the carrying value principally through sale and is in the process of identifying a prospective buyer. The Group expects to complete the sale within a period of one year from the reporting date. The Group has recognised an impairment loss of ₹ 904.8 million (US$ 14.0 million) on reclassification of such items as held for sale which is included within the exceptional items in the consolidated statement of profit and loss.
(c) As at March 31, 2016, assets classified as held for sale relates to certain items of plant and machinery relating to European operations.
(d) On May 6, 2015, the Group’s wholly owned subsidiary Tata Steel Nederland Consulting and Technical Services B.V. completed the sale of its 50% interest in Danieli Corus Technical Services B.V. to Industrielle Beteiligung S.A. (the other 50% shareholder) for proceeds of ₹ 1,674.7 million, of which ₹ 492.6 million is related to deferred consideration. Prior to the classification as held for sale, the Group’s interest in Danieli Corus Technical Services B.V. was accounted for as an equity investment with a carrying value of ₹ 174.97 million. On classification as held for sale at March 31, 2015, the Group has recognised an impairment charge of ₹ 295.5 million to write down the carrying value of the equity investment to the fair value less costs to sell. On completion the Group has recognised a profit on disposal of ₹ 250.1 million, including foreign exchange recycled to the consolidated statement of profit and loss. This has been included within exceptional items in the consolidated statement of profit and loss for the year ended March 31, 2016.
F-270

NOTES FORMING PART OF THE FINANCIAL STATEMENTS
19. EQUITY SHARE CAPITAL
As at
March 31, 2017
As at
March 31, 2016
As at
April 1, 2015
(US$ million) (` in million) (` in million) (` in million)
Authorised:
1,75,00,00,000 Ordinary Shares of `10 each 269.9 17,500.0 17,500.0 17,500.0 (March 31, 2016: 1,75,00,00,000 Ordinary Shares of `10 each)(April 1, 2015: 1,75,00,00,000 Ordinary Shares of `10 each)
35,00,00,000 "A" Ordinary Shares of `10 each 54.0 3,500.0 3,500.0 3,500.0 (March 31, 2016: 35,00,00,000 "A" Ordinary Shares of `10 each)(April 1, 2015: 35,00,00,000 “A” Ordinary Shares of `10 each)
2,50,00,000 Cumulative Redeemable Preference Shares of `100 each
38.6 2,500.0 2,500.0 2,500.0
(March 31, 2016: 2,50,00,000 Shares of `100 each)
(April 1, 2015: 2,50,00,000 Shares of `100 each)
60,00,00,000 Cumulative Convertible Preference Shares of `100 each
925.3 60,000.0 60,000.0 60,000.0
(March 31, 2016: 60,00,00,000 Shares of `100 each)
(April 1, 2015: 60,00,00,000 Shares of `100 each)
1,287.7 83,500.0 83,500.0 83,500.0
Issued:
97,21,26,020 Ordinary Shares of `10 each 149.9 9,721.3 9,721.3 9,721.3 (March 31, 2016: 97,21,26,020 Ordinary Shares of `10 each)(April 1, 2015: 97,21,26,020 Ordinary Shares of `10 each)
Subscribed and Paid up:
97,00,47,046 Ordinary Shares of `10 each fully paid up 149.6 9,700.4 9,700.4 9,712.1 (March 31, 2016: 97,00,47,046 Ordinary Shares of `10 each)(April 1, 2015: 97,12,15,439 Ordinary Shares of `10 each)
Amount paid up on 3,89,516 Ordinary Shares forfeited
0 02.0 02.0 2.0
(March 31, 2016: 3,89,516 Shares of `10 each)(April 1, 2015: 3,89,516 Shares of `10 each)
149.6 9,702.4 9,702.4 9,714.1
(a) Subscribed and paid up capital excludes 11,68,393 Ordinary shares (March 31, 2016: 11,68,393 ordinary shares and April 1, 2015: Nil) held by a wholly owned subsidiary.
F-271

NOTES FORMING PART OF THE FINANCIAL STATEMENTS
(b) The movement in subscribed and paid up share capital is as below:
As at March 31, 2017
As at March 31, 2016
No. of shares (US$ million) (` in million) No. of shares (` in million)
Ordinary shares of `10 each
Balance at the beginning of the year 97,00,47,046 149.6 9,702.4 97,12,15,439 9,714.1Adjustment for cross holdings - - - 11,68,393 11.7Balance at the end of the year 97,00,47,046 149.6 9,702.4 97,00,47,046 9,702.4
(c) As at March 31, 2017, 3,01,183 Ordinary Shares (March 31, 2016: 3,01,183 ordinary shares and April 1, 2015: 3,01,183 ordinary shares) are kept in abeyance in respect of right issue of 2007.
(d) Details of shareholders holding more than 5 percent shares in the Company is as below:
As at March 31, 2017
As at March 31, 2016
As at April 1, 2015
No. of ordinary shares
% No. of ordinary shares
% No. of ordinary shares
%
Name of shareholders (a) Tata Sons Limited 28,88,98,245 29.75 28,88,98,245 29.75 28,88,98,245 29.75(b) Life Insurance Corporation of India 12,20,50,996 12.57 14,17,39,415 14.59 14,17,39,185 14.59
(e) 1,55,10,420 shares (March 31, 2016: 2,25,14,584 shares; April 1, 2015: 1,79,07,847 shares) of face value of ̀ 10 per share represent the
19. EQUITY SHARE CAPITAL (CONTD.)
shares underlying Global Depositary Receipts (GDRs) which were issued during 1994 and 2009. Each GDR represents one underlying Ordinary Share.
(f ) The rights, powers and preferences relating to each class of share capital and the qualifications, limitations and restrictions thereof are contained in the Memorandum and Articles of Association of the Company. The principal rights are as below:
A. Ordinary Shares of `10 each
(a) In respect of every Ordinary Share (whether fully paid or partly paid), voting right shall be in the same proportion as the capital paid up on such Ordinary Share bears to the total paid up Ordinary Capital of the Company.
(b) The dividend proposed by the Board of Directors is subject to the approval of the shareholders in the ensuing Annual General Meeting, except in case of interim dividend.
(c) In the event of liquidation, the shareholders of Ordinary Shares are eligible to receive the remaining assets of the Company after distribution of all preferential amounts, in proportion to their shareholding.
B. ‘A’ Ordinary Shares of `10 each
(a) (i) The holders of ‘A’ Ordinary Shares shall be entitled to such rights of voting and/or dividend and such other rights as per the terms of the issue of such shares, provided always that :
− in the case where a resolution is put to vote on a poll, such differential voting entitlement (excluding fractions, if any) will be applicable to holders of ‘A’ Ordinary Shares.
− in the case where a resolution is put to vote in the meeting and is to be decided on a show of hands, the holders of ‘A’ Ordinary Shares shall be entitled to the same number of votes as available to holders of Ordinary Shares
(ii) The holders of Ordinary Shares and the holders of ‘A’ Ordinary Shares shall vote as a single class with respect to all matters submitted for voting by shareholders of the Company and shall exercise such votes in proportion to the voting rights attached to such shares including in relation to any scheme under Sections 391 to 394 of the Companies Act, 1956.
F-272

NOTES FORMING PART OF THE FINANCIAL STATEMENTS
20. HYBRID PERPETUAL SECURITIES
The detail of movement in Hybrid Perpetual Securities is as below:As at
March 31, 2017
As at March 31, 2016
As at April 1, 2015
(US$ million) (` in million) (` in million) (` in million)
Balance at the beginning of the year 350.8 22,750.0 22,750.0 22,750.0Balance at the end of the year 350.8 22,750.0 22,750.0 22,750.0
The Group had issued Hybrid Perpetual Securities of `7,750.0 million and `15,000.0 million in May 2011 and March 2011 respectively. These securities are perpetual in nature with no maturity or redemption and are callable only at the option of the Group. The distribution on these securities are 11.50% p.a. and 11.80% p.a. respectively, with a step up provision if the securities are not called after 10 years. The distribution on the securities may be deferred at the option of the Group if in the six months preceding the relevant distribution payment date, the Group has not made payment on, or repurchased or redeemed, any securities ranking pari passu with, or junior to the instrument. As these securities are perpetual in nature and the Group does not have any redemption obligation, these have been classified as equity.
(b) The holders of ‘A’ Ordinary Shares shall be entitled to dividend on each ‘A’ Ordinary Share which may be equal to or higher than the amount per Ordinary Share declared by the Board for each Ordinary Share, and as may be specified at the time of the issue. Different series of ‘A’ Ordinary Shares may carry different entitlements to dividend to the extent permitted under applicable law and as prescribed under the terms applicable to such issue.
C. Preference Shares
The Company has two classes of preference shares i.e. Cumulative Redeemable Preference Shares (CRPS) of `100 per share and Cumulative Convertible Preference Shares (CCPS) of `100 per share.
(a) Such shares shall confer on the holders thereof, the right to a fixed preferential dividend from the date of allotment, at a rate as may be determined by the Board at the time of the issue, on the capital for the time being paid up or credited as paid up thereon.
(b) Such shares shall rank for capital and dividend (including all dividend undeclared upto the commencement of winding up) and for repayment of capital in a winding up, pari passu inter se and in priority to the Ordinary Shares of the Company, but shall not confer any further or other right to participate either in profits or assets. However, in case of CCPS, such preferential rights shall automatically cease on conversion of these shares into Ordinary Shares.
(c) The holders of such shares shall have the right to receive all notices of general meetings of the Company but shall not confer on the holders thereof the right to vote at any meetings of the Company save to the extent and in the manner provided in the Companies Act, 1956, or any re-enactment thereof.
(d) CCPS shall be converted into Ordinary Shares as per the terms, determined by the Board at the time of issue; as and when converted, such Ordinary Shares shall rank pari passu with the then existing Ordinary Shares of the Company in all respects.
F-273

NOTES FORMING PART OF THE FINANCIAL STATEMENTS
21. OTHER EQUITY
A. OTHER COMPREHENSIVE INCOME RESERVES
(a) Cash flow hedge reserve
The cumulative effective portion of gain or losses arising on changes in the fair value of hedging instruments designated as cash flow hedges are recognised in cash flow hedge reserve. Such changes recognised are reclassified to the consolidated statement of profit and loss when the hedged item affects the profit or loss or are included as an adjustment to the cost of the related non-financial hedged item.
The Company has designated certain foreign currency contracts, commodity contracts and interest rate swaps as cash flow hedges in respect of foreign exchange, commodity price and interest rate risks.
The details of movement in Cash flow hedge reserve are as below:As at
March 31, 2017
As at March 31, 2016
(US$ million) (` in million) (` in million)
Balance at the beginning of the year (1.6) (103.4) (1,273.5)Other comprehensive income recognised during the year 17.9 1,163.3 1,170.1Balance at the end of the year 16.3 1,059.9 (103.4)
The details of Other Comprehensive income recognised is as below:Year ended
March 31, 2 017
Year ended March 31, 2016
(US$ million) (` in million) (` in million)
Fair value changes recognised during the year 53.2 3447.4 2041.5Fair value changes reclassified to the statement of profit and loss/cost of underlying items
(29.1) (1,889.6) (722.2)
Tax impact on above (net) (6.1) (394.5) (149.2)17.9 1,163.3 1,170.1
During the year, ineffective portion of cash flow hedges recognised in the consolidated statement of profit and loss amounted to Nil (2015-16: `0.5 million).
The amount recognised in the cash flow hedge reserve is expected to impact the consolidated statement of profit and loss within the next one year.
F-274

NOTES FORMING PART OF THE FINANCIAL STATEMENTS
21. OTHER EQUITY (CONTD.)
(b) Investment revaluation reserve
The cumulative gains and losses arising on fair value changes of equity investments measured at fair value through other comprehensive income are recognised in investment revaluation reserve. The balance of the reserve represents such changes recognised net of amounts reclassified to retained earnings on disposal of such investments.
The details of movement in investment revaluation reserve are as below:As at
March 31, 2017
As at March 31, 2016
(US$ million) (` in million) (` in million)
Balance at the beginning of the year 455.8 29,555.2 97,349.7Other comprehensive income recognised during the year 128.7 8,346.3 (34,083.0)Transfers within equity (0.3) (17.5) (33,711.5)Balance at the end of the year 584.2 37,884.0 29,555.2
(c) Foreign currency translation reserve
Exchange differences arising on translation of assets, liabilities, income and expenses of the Group’s foreign subsidiaries, associates and joint ventures are recognised in other comprehensive income and accumulated separately in foreign currency translation reserve. The amounts recognised are transferred to the consolidated statement of profit and loss on disposal of the related foreign subsidiaries, associates and joint ventures.
The details of movement in foreign currency translation reserve are as below:As at
March 31, 2017
As at March 31, 2016
(US$ million) (` in million) (` in million)
Balance at the beginning of the year 1,001.7 64,955.2 67,385.7Other comprehensive income recognised during the year 314.4 20,389.5 (2,540.8)Transfers within equity - - 110.3Balance at the end of the year 1,316.1 85,344.7 64,955.2
B. OTHER CONSOLIDATED RESERVES
(a) Securities premium
Securities premium is used to record premium received on issue of shares. The reserve is utilised in accordance with the provisions of the Indian Companies Act, 2013 (the “Companies Act”).
There is no movement in securities premium during the current and previous year.As at
March 31, 2017
As at March 31, 2016
(US$ million) (` in million) (` in million)
Balance at the beginning of the year 2,910.3 1,88,716.6 1,88,716.6Balance at the end of the year 2,910.3 1,88,716.6 1,88,716.6
F-275

NOTES FORMING PART OF THE FINANCIAL STATEMENTS
21. OTHER EQUITY (CONTD.)
(b) Debenture redemption reserve
The Companies Act requires that where a Company issues debentures, it shall create a debenture redemption reserve out of profits of the Company available for payment of dividend. The Company is required to maintain a Debenture Redemption Reserve of 25% of the value of debentures issued, either by a public issue or on a private placement basis. The amounts credited to the debenture redemption reserve cannot be utilised by the Company except to redeem debentures.
There is no movement in debenture redemption reserve during the current and previous year.As at
March 31, 2017
As at March 31, 2016
(US$ million) (` in million) (` in million)
Balance at the beginning of the year 315.5 20,460.0 20,460.0Balance at the end of the year 315.5 20,460.0 20,460.0
(c) General reserve
Under the erstwhile Companies Act 1956, a general reserve was created through an annual transfer of net profit at a specified percentage in accordance with applicable regulations. Consequent to the introduction of the Companies Act, the requirement to mandatorily transfer a specified percentage of net profit to general reserve has been withdrawn.
As at March 31, 2017
As at March 31, 2016
(US$ million) (` in million) (` in million)
Balance at the beginning of the year 1,878.6 1,21,819.7 1,21,974.8Adjustments for cross holding - - 217.8Transfers within equity - - (372.9)Balance at the end of the year 1,878.6 1,21,819.7 1,21,819.7
(d) Capital redemption reserve
The Companies Act requires that where a Company purchases its own shares out of free reserves or securities premium account, a sum equal to the nominal value of the shares so purchased shall be transferred to a capital redemption reserve account and details of such transfer shall be disclosed in the balance sheet. The capital redemption reserve account may be applied by the Company, in paying up unissued shares of the Company to be issued to shareholders of the Company as fully paid bonus shares. The Group established this reserve pursuant to the redemption of preference shares issued in earlier years.
There is no movement in capital redemption reserve during the current and previous year.As at
March 31, 2017
As at March 31, 2016
(US$ million) (` in million) (` in million)
Balance at the beginning of the year 20.5 1,331.1 1,331.1Balance at the end of the year 20.5 1,331.1 1,331.1
F-276

NOTES FORMING PART OF THE FINANCIAL STATEMENTS
(e) Special reserve
The special reserve represents the reserve created by two subsidiaries of the Company pursuant to the Reserve Bank of India Act, 1934 (the “RBI Act”) and related regulations applicable to those companies. Under the RBI Act, a non-banking finance company is required to transfer an amount not less than 20% of its net profit to a reserve fund before declaring any dividend. Appropriation from this reserve fund is permitted only for the purposes specified by the RBI.
As at March 31, 2017
As at March 31, 2016
(US$ million) (` in million) (` in million)
Balance at the beginning of the year 1.0 61.9 57.7Transfers within equity 0.1 4.7 04.2Balance at the end of the year 1.1 66.6 61.9
(f) Others
Others primarily include:
(i) the balance of foreign currency monetary item translation difference account (“FCMITDA”) created for recognising exchange differences on revaluation of long term foreign currency monetary items as per the Previous GAAP. Such exchange differences recognised are transferred to the consolidated statement of profit and loss on a systematic basis.
(ii) amounts appropriated out of profit or loss for unforeseen contingencies. Such appropriations are free in nature.
The details of movement in others are as below:As at
March 31, 2017
As at March 31, 2016
(US$ million) (` in million) (` in million)
Balance at the beginning of the year 34.4 2,231.7 1,927.6Additions during the year 29.5 1,913.9 420.4Transfer to consolidated statement of profit and loss (6.2) (402.2) (81.8)Transfers within equity (1.2) (79.9) (34.5)Changes in ownership interests 0.3 17.5 -Other movements (2.4) (152.8) -Balance at the end of the year 54.4 3,528.2 2,231.7
21. OTHER EQUITY (CONTD.)
F-277

NOTES FORMING PART OF THE FINANCIAL STATEMENTS
22. BORROWINGS
A. NON-CURRENT
As at March 31, 2017
As at March 31, 2016
As at April 1, 2015
(US$ million) (` in million) (` in million) (` in million)
(a) Secured
(i) Loans from Joint Plant Committee - Steel Development Fund
373.3 24,206.6 23,389.1 22,323.5
(ii) Term loans from banks and financial institutions 2,292.4 1,48,648.4 1,88,621.9 1,68,915.2(iii) Finance leases obligations 67.9 4,400.8 5,410.8 4,250.9
2,733.5 1,77,255.8 2,17,421.8 1,95,489.6
(b) Unsecured
(i) Bonds and debentures 3,272.3 2,12,193.0 2,03,432.5 1,99,380.2 (ii) Non-convertible preference shares 3.1 199.7 199.7 199.7 (iii) Term loans from banks and financial institutions 3,487.4 2,26,137.7 2,07,451.4 2,06,550.0(iv) Finance leases obligations 368.1 23,867.5 19,725.4 20,135.3 (v) Deferred payment liabilities 1.5 96.1 55.8 25.3(vi) Other loans 7.3 472.9 441.2 735.5
7,139.6 4,62,966.9 4,31,306.0 4,27,026.0
9,873.1 6,40,222.7 6,48,727.8 6,22,515.6
B. CURRENT
As at March 31, 2017
As at March 31, 2016
As at April 1, 2015
(US$ million) (` in million) (` in million) (` in million)
(a) Secured
(i) Loans from banks and financial institutions 747.8 48,489.6 66,917.1 60,054.9 (ii) Repayable on demand from banks and financial
institutions37.7 2,446.6 1,470.4 3,924.6
(iii) Other Loans 3 194.1 45.9 20.8 788.5 51,130.3 68,433.4 64,000.3
(b) Unsecured
(i) Loans from banks and financial institutions 1,529.5 99,180.7 49,067.0 25,099.6 (ii) Commercial papers 358.3 23,235.4 32,348.5 -(iii) Other loans 150.1 9,734.6 7,372.3 7,832.6
2,037.9 1,32,150.7 88,787.8 32,932.2
2,826.4 1,83,281.0 1,57,221.2 96,932.5
(a) As at March 31, 2017, `2,28,386.1 million (US$ 3,522 million) (March 31, 2016: `2,85,855.2 million; April 1, 2015: `2,59,490.0 million) of the total outstanding borrowings were secured by a charge on property, plant and equipment, inventories and receivables. The security details of major borrowings of the Group are as below:
(i) Loans from Joint Plant Committee - Steel Development Fund
It is secured by mortgages on, all present and future immovable properties wherever situated and hypothecation of movable assets, excluding land and building mortgaged in favour of Government of India under the deed of mortgage dated April 13, 1967 and in favour of Government of Bihar under two deeds of mortgage dated May 11, 1963, immovable properties and movable assets of the Tube Division, Bearing Division, Ferro Alloys Division and Cold Rolling Complex (West) at Tarapur and all investments and book debts of the Company subject to the prior charges created and/or to be created in favour of the bankers for securing borrowing for the working capital requirement and charges created and/or to be created on specific items of machinery and equipment procured/to be procured under deferred payment schemes/bill re-discounting schemes/asset credit schemes.
F-278

NOTES FORMING PART OF THE FINANCIAL STATEMENTS
It is repayable in 16 equal semi-annual installments after completion of four years from the date of the tranche.
The Company has filed a writ petition before the High Court at Kolkata in February 2006 claiming waiver of the outstanding loan and interest and refund of the balance lying with Steel Development Fund and the matter is subjudice.
The loan includes funded interest `7,813.2 million (US$ 120.5 million) (March 31, 2016: `6,995.8 million and April 1, 2015: `5,930.3 million).
It includes `16,393.3 million (US$ 252.8 million) (March 31, 2016: `16,393.3 million and April 1, 2015: `16,393.3 million) representing repayments and interest on earlier loans for which applications of funding are awaiting sanction is not secured by charge on movable assets of the Company.
(ii) Term loans from banks/financial institution
The majority of the secured borrowings from banks and financial institutions relates to the senior facility arrangement of Tata Steel Europe, a wholly owned subsidiary of the Company. The facilities are secured by guarantees and debentures granted by material subsidiaries of Tata Steel Europe (other than Tata Steel Nederland B.V. and its subsidiaries) and by a pledge over the shares in Tata Steel Nederland B.V.
(iii) Commercial papers
Commercial papers raised by the Company are short-term in nature ranging between one to three months.
(iv) Finance lease obligations
The Group has taken certain items of plant and machinery as lease for business purpose. In addition the Company has entered into long term arrangements whose fulfillment is dependent on the use of dedicated assets. Some of these arrangements have been assessed as being in the nature of lease and have been classified as finance leases.
Finance lease obligations represent the present value of minimum lease payments payable over the lease term. The arrangements have been classified as secured or unsecured based on the legal form.
(b) Bonds and debentures
The details of major unsecured borrowings taken by the Group are given below:
(i) The debentures issued by the Group are non convertible in nature with interest rates ranging from 2% to 11%.
ABJA Investment Company Pte Ltd. a wholly owned subsidiary of the Company has issued bonds that are listed on the Singapore Stock Exchange and Frankfurt Stock Exchange. Details of the bonds outstanding at the end of the year are as follows:
Issued on Currency Initial principal due (in million)
Outstanding principal (in million)
Interest rate Redeemable on
As at March 31, 2017
As at March 31, 2016
As at April 1, 2015
July 2014 USD 1000 1000 1000 1000 5.95% July 2024July 2014 USD 500 500 500 500 4.85% January 2020May 2013 SGD 300 300 300 300 4.95% May 2023
The above figures do not include current maturities of long term debt and finance lease obligations of `6,641.2 million (US$ 102.4 million) (March 31, 2016: `13,920.3 million; April 1, 2015: `48,484.8 million).
22. BORROWINGS (CONTD.)
F-279

NOTES FORMING PART OF THE FINANCIAL STATEMENTS
(c) The currency and interest exposure of borrowings (including current maturities of long term debt and finance lease obligations) at the end of the reporting period is as below:
As at March 31, 2017 US$ (Millions)
As at March 31, 2016 As at April 1, 2015
Fixed rate Floating rate
Total Fixed rate Floating rate Total Fixed rate Floating rate
Total
(` in
million)
(` in
million)
(` in
million)
(` in
million)
(` in
million)
(` in
million)
(` in
million)
(` in
million)
(` in
million)
INR 1,58,628.0 1,08,197.6 2,66,825.6 4,114.8 1,50,504.6 1,37,318.9 2,87,823.5 1,28,782.4 1,15,887.3 2,44,669.7GBP 1,726.9 46,430.7 48,157.6 742.7 4,799.5 56,638.9 61,438.4 5,271.4 55,548.8 60,820.2EURO 9,571.1 1,42,701.4 1,52,272.5 2,348.3 11,826.1 1,55,277.8 1,67,103.9 9,838.8 1,33,120.5 1,42,959.3USD 1,43,489.2 1,90,896.6 3,34,385.8 5,156.7 1,10,909.0 1,66,697.9 2,77,606.9 1,02,353.0 1,81,491.7 2,83,844.7Others 17,229.6 11,273.8 28,503.4 439.6 18,378.6 7,518.0 25,896.6 19,638.1 16,000.9 35,639.0Total 3,30,644.8 4,99,500.1 8,30,144.9 12,802.0 2,96,417.8 5,23,451.5 8,19,869.3 2,65,883.7 5,02,049.2 7,67,932.9
INR-Indian rupees, GBP- Great Britain Pound, USD-United states dollars.
(i) Others primarily include SGD-Singapore dollars, CAD- Canadian dollars and THB-Thai Baht.
(ii) The majority of floating rate borrowings are bank borrowings bearing interest rates based on LIBOR, EURIBOR or local official rates. Of the total floating rate borrowings as at March 31, 2017, `1,08,818.3 million (US$ 1,678.1 million) (March 31, 2016, `1,27,856.7; April 1, 2015, `1,47,823.3) has been hedged using interest rate swaps and collars, with contracts covering a period of more than one year.
(d) The maturity profile of Group’s borrowings is as below:
As at March 31, 2017
As at March 31, 2016
As at April 1, 2015
(US$ million) (` in million) (` in million) (` in million)
Not later than one year or on demand 2,990.6 1,93,923.0 1,74,682.4 1,48,988.0Later than one year but not two years 372.6 24,159.1 17,357.5 27,550.3Later than two years but not three years 2,067.7 1,34,077.3 32,542.4 46,357.9Later than three years but not four years 1,899.4 1,23,164.2 1,48,348.1 47,259.0Later than four years but not five years 1,870.0 1,21,262.9 1,34,658.1 1,44,839.8More than five years 4,477.0 2,90,312.5 3,65,531.7 4,09,161.5
13,677.2 8,86,899.0 8,73,120.2 8,24,156.5
Less: Future finance charges on financial leases 664.2 43,068.9 35,494.1 37,346.0Less: Capitalisation of transaction costs 211.0 13,685.2 17,756.8 18,877.6
12,802.0 8,30,144.9 81,986.93 7,67,932.9
(e) Some of the Group’s major financing arrangements include financial covenants, which require compliance to certain debt-equity ratios and debt coverage ratios in the various entities in the Group which have such covenants. Additionally, certain negative covenants may limit the Group’s ability to borrow additional funds or to incur additional liens, and/or provide for increased costs in case of breach.
22. BORROWINGS (CONTD.)
F-280

NOTES FORMING PART OF THE FINANCIAL STATEMENTS
23. OTHER FINANCIAL LIABILITIES
A. NON-CURRENT
As at March 31, 2017
As at March 31, 2016
As at April 1, 2015
(US$ million) (` in million) (` in million) (` in million)
(a) Interest accrued but not due 1.9 123.7 - -(b) Creditors for other liabilities 14.9 964.1 4,544.2 9,005.5
16.8 1,087.8 4,544.2 9,005.5
B. CURRENT
As at March 31, 2017
As at March 31, 2016
As at April 1, 2015
(US$ million) (` in million) (` in million) (` in million)
(a) Current maturities of long-term borrowings 68.7 4,454.9 11,654.5 46,533.8 (b) Current maturities of finance lease obligations 33.7 2,186.3 2,265.8 1,951.0 (c) Interest accrued but not due 116.0 7,520.2 6,166.0 8,142.5 (d) Unclaimed dividends 9.7 628.1 636.2 633.9 (e) Creditors for other liabilities 745.9 48,365.6 48,288.7 48,024.4
973.9 63,155.1 69,011.2 1,05,285.6
(i) Non-current and current creditors for other liabilities includes creditors for capital supplies and services of `30,769.6 million (US$ 474.5 million) (March 31, 2016: `35,501.3 million; April 1, 2015: `38,901.6 million).
24. PROVISIONS
A. NON-CURRENT
As at March 31, 2017
As at March 31, 2016
As at April 1, 2015
(US$ million) (` in million) (` in million) (` in million)
(a) Employee benefits 398.4 25,832.3 27,339.7 19,118.0 (b) Insurance provisions 136.1 8,824.6 9,575.1 2,878.8(c) Others 125.5 8,140.0 7,490.0 7,738.1
660.0 42,796.9 44,404.8 29,734.9
B. CURRENT
As at March 31, 2017
As at March 31, 2016
As at April 1, 2015
(US$ million) (` in million) (` in million) (` in million)
(a) Employee benefits 61.5 3,989.4 8,293.9 3,248.0 (b) Insurance provisions - - 30.0 14.9(c) Others 90.8 5,884.4 6,894.7 4,901.9
152.3 9,873.8 15,218.6 8,164.8
(i) Non current and current provision for employee benefits include provision for leave salaries of ̀ 10,940.3 million (US$ 168.7million) (March 31, 2016: `9,862.8 million; April 1, 2015: `9,135.5 million). It also includes provision for early separation and disability scheme amounting to `17,895.9 million (US$ 276.0 million) (March 31, 2016 : `19,689.4 million; April 1, 2015: `11,315.4 million).
F-281

NOTES FORMING PART OF THE FINANCIAL STATEMENTS
(ii) The Insurance provisions relate to Crucible Insurance Company which underwrites marine cargo, public liability and retrospective hearing impairment policies of Tata Steel Europe. These provisions represent losses incurred but not yet reported in respect of risks retained by the Group rather then passed to third party insurers and include amounts in relation to certain disease insurance claims. Such provisions are subject to regular review and are adjusted as appropriate. The value of final insurance settlements is uncertain and so is the timing of the expenditure.
(iii) Others primarily include:
a. Provision for compensatory afforestation mine closure and rehabilitation obligations of `5,293.1 million (US$ 81.6 million) (March 31, 2016: `2,261.3 million; April 1, 2015: `683.0 million). These amounts become payable upon closure of the mines and are expected to be incurred over a period of 1 to 35 years.
b. Provision in respect of onerous leases. The outstanding term of these leases ranges between 1 to 16 years.
(iv) The detail of movement in provision balances is as below:
As at March 31, 2017 Insurance
ProvisionsOthers Total
(US$ million) (` in million) (` in million) (` in million)
Balance at the beginning of the year 370 9,605.1 14,384.7 23,989.8Recognised during the year 102.3 1,262.3 5,370.3 6,632.6Disposal of group undertakings (54.2) - (3,517.3) (3,517.3)Utilised during the year (25.2) (498.7) (1,135.1) (1,633.8)Classified as held for sale (1.5) - (95.7) (95.7)Exchange differences on consolidation (39) (1,544.1) (982.5) (2,526.6)Balance at the end of the year 352.4 8,824.6 14,024.4 22,849.0
As at March 31, 2016
Insurance Provisions
Others Total
(US$ million) (` in million) (` in million) (` in million)
Balance at the beginning of the year 239.6 2,893.7 12,640.0 15,533.7Recognised during the year 156.7 7,152.3 3,009.3 10,161.6Utilised during the year (33.7) (324.5) (1,858.0) (2,182.5)Exchange differences on consolidation 7.4 (116.4) 593.4 477.0Balance at the end of the year 370.0 9,605.1 14,384.7 23,989.8
24. PROVISIONS (CONTD.)
F-282

NOTES FORMING PART OF THE FINANCIAL STATEMENTS
25. DEFERRED INCOME
A. NON-CURRENT
As at March 31, 2017
As at March 31, 2016
As at April 1, 2015
(US$ million) (` in million) (` in million) (` in million)
(a) Grants relating to property, plant and equipment 305.2 19,791.9 23,391.2 22,298.1(b) Others 12.1 784.0 922.9 1,053.8
317.3 20,575.9 24,314.1 23,351.9
B. CURRENT
As at March 31, 2017
As at March 31, 2016
As at April 1, 2015
(US$ million) (` in million) (` in million) (` in million)
(a) Grants relating to property, plant and equipment 0 2.2 2.1 0.1 (b) Others 3.4 223.0 34.9 30.7
3.40 225.2 37.0 30.8
(i) Grants relating to property, plant and equipment relates to duty saved on import of capital goods and spares under the EPCG scheme. Under such scheme the Group is committed to export prescribed times of the duty saved on import of capital goods over a specified
period of time. In case such commitments are not met, the Group would be required to pay the duty saved along with interest to the regulatory authorities. Such grants recognised are released to the consolidated statement of profit and loss based on fulfillment of export obligations.
(ii) During the year, an amount of `3,517.3 million (US$ 54.2 million) (2015-16: `52.4 million) was released to consolidated statement of profit and loss on fulfillment of export obligations.
26. OTHER LIABILITIES
A. NON-CURRENT
As at March 31, 2017
As at March 31, 2016
As at April 1, 2015
(US$ million) (` in million) (` in million) (` in million)
(a) Statutory dues 8.5 553.1 640.6 - (b) Other credit balances 26.4 1,712.0 2,649.9 3,204.9
34.9 2,265.1 3,290.5 3,204.9
B. CURRENT
As at March 31, 2017
As at March 31, 2016
As at April 1, 2015
(US$ million) (` in million) (` in million) (` in million)
(a) Advances received from customers 84.6 5,484.2 4,211.6 2,975.5 (b) Employee recoveries and employer contributions 10.2 658.9 776.2 751.7 (c) Statutory dues 568 36,834.1 31,043.3 24,423.2 (d) Other credit balances 2.7 175.5 349.0 217.2
665.5 43,152.7 36,380.1 28,367.6
(i) Statutory dues primarily include payables in respect of excise duties, service tax, sales tax, VAT, tax deducted at source and royalties.
F-283

NOTES FORMING PART OF THE FINANCIAL STATEMENTS
27. TRADE PAYABLES
As at March 31, 2017
As at March 31, 2016
As at April 1, 2015
(US$ million) (` in million) (` in million) (` in million)
(a) Creditors for supplies and services 2,242.8 1,45,432.6 1,49,185.9 1,45,818.1(b) Creditors for accrued wages and salaries 621.6 40,312.0 36,381.1 34,848.5
2,864.4 1,85,744.6 1,85,567.0 1,80,666.6
28. REVENUE FROM OPERATIONS
Year ended March 31, 2 017
Year ended March 31, 2016
(US$ million) (` in million) (` in million)
(a) Sale of products 17,743.2 11,50,559.0 10,40,628.2 (b) Sale of power and water 218.8 14,188.7 13,998.7 (c) Income from town, medical and other services 32.1 2,078.0 2,204.9 (d) Other operating income 113.7 7,373.7 6,567.4
18,107.8 11,74,199.4 10,63,399.2
29. OTHER INCOME
Year ended
March 31, 2 017
Year ended March 31, 2016
(US$ million) (` in million) (` in million)
(a) Dividend income 11.3 730.3 670.9(b) Finance income 28.5 1,847.6 1,179.8 (c) Net gain/(loss) on investments carried at fair value through consolidated
statement of profit and loss48.9 3,169.5 1,842.2
(d) Net gain/(loss) on sale of non-current investments 0.10 9.7 -(e) Profit/(loss) on sale of capital assets (net of loss on assets sold/scrapped/
written off)0 1.5 335.6
(f ) Gain/(loss) on cancellation of forwards, swaps and options (10.5) (679.5) (12.3)(g) Other miscellaneous income 3 195.6 106.0
81.3 5,274.7 4,122.2
(i) Finance income includes:
(a) Income from financial assets carried at amortised cost of `1,722.5 million (US$ 26.6 million) (2015-16: `1,097.6 million).
(b) Income from financial assets carried at fair value through consolidated profit and loss of `125.1 million (US$ 1.9 million) (2015-16: `82.2 million).
F-284

NOTES FORMING PART OF THE FINANCIAL STATEMENTS
30. EMPLOYEE BENEFIT EXPENSES
Year ended
March 31, 2 017
Year ended March 31, 2016
(US$ million) (` in million) (` in million)
(a) Salaries and wages 2,160.7 1,40,113.1 1,37,842.2 (b) Contribution to provident and other funds 421.8 27,354.4 32,265.5 (c) Staff welfare expenses 78.0 5,054.7 5,768.6
2,660.5 1,72,522.2 1,75,876.3
During the year, the Group recognised an amount of `181.3 million (US$ 2.8 million) (2015-16: `179.4 million) as remuneration to key managerial personnel. The details of such remuneration is as below:
Year ended March 31, 2 017
Year ended March 31, 2016
(US$ million) (` in million) (` in million)
(a) Short term employee benefits 2.6 171.3 172.4(b) Post employment benefits 0.1 7.1 4.2 (c) Other long term employee benefits 0 2.9 2.8
2.7 181.3 179.4
31. FINANCE COSTS
Year ended March 31, 2 017
Year ended March 31, 2016
(US$ million) (` in million) (` in million)
Interest expense on:(a) Bonds, debentures, bank borrowings and others 767.7 49,782.6 51,908.1(b) Finance leases 58.3 3,781.6 3,139.5
826.0 53,564.2 55,047.6
Less: Interest capitalised 43.8 2,842.2 12,833.5 782.2 50,722.0 42,214.1
32. DEPRECIATION AND AMORTISATION EXPENSE
Year ended
March 31, 2 017
Year ended March 31, 2016
(US$ million) (` in million) (` in million)
Depreciation of tangible and amortisation of intangible assets 876.8 56,856.7 53,197.6Less : Amount released from specific grants 2.0 127.9 134.1
874.8 56,728.8 53,063.5
F-285

NOTES FORMING PART OF THE FINANCIAL STATEMENTS
33. OTHER EXPENSES
Year ended
March 31, 2 017
Year ended March 31, 2016
(US$ million) (` in million) (` in million)
(a) Consumption of stores and spares 1,215.4 78,810.7 82,879.1 (b) Repairs to buildings 15.6 1,009.5 1,136.9 (c) Repairs to machinery 822.4 53,329.8 55,343.4 (d) Relining expenses 21.7 1,410.0 1,179.5 (e) Fuel oil consumed 72.0 4,671.2 4,862.7 (f ) Purchase of power 733.1 47,537.1 45,076.2 (g) Conversion charges 361.4 23,431.4 19,803.9 (h) Freight and handling charges 1,120.8 72,680.8 68,321.1 (i) Rent 364.6 23,641.0 27,295.5 (j) Royalty 183.3 11,884.6 9,977.2 (k) Rates and taxes 253.6 16,443.0 11,573.3 (l) Insurance charges 65.7 4,261.3 2,957.6 (m) Commission, discounts and rebates 36.2 2,350.1 2,584.0 (n) Allowance for credit loss/provision for advances 7.1 459.5 1,010.8 (o) Excise duty (including recovered on sales) 789.7 51,205.2 43,752.0(p) Others 818.4 53,071.9 34,801.5
6,881.0 4,46,197.1 4,12,554.7
(i) Other expenses include foreign exchange gain/(loss) of `5,765.7 million (US$ 88.9 million) [2015-16: `(1,106.5) million]
(ii) Revenue expenditure charged to consolidated statement of profit and loss in respect of research and development activities undertaken during the year is `6,462.4 million (US$ 99.7 million) (2015-16: `6,375.5 million)
34. EXCEPTIONAL ITEMS
(a) Profit on sale of investments in subsidiaries, associates and joint ventures of `227.0 million (US$ 3.5 million) (2015-16: `471.7 million)
(b) Profit on sale of assets amounting to `858.7 million (US$ 13.2 million) (2015-16: Nil) of a subsidiary in South East Asia on liquidation.
(c) Provision for advances paid for repurchase of equity shares in Tata Teleservices Limited from NTT Docomo Inc. of `1,254.5 million (US$ 19.3 million) (2015-16: Provision of `729.9 million relating to advances paid for a project which the Company has decided to discontinue).
(d) Impairment loss recognised in respect of property, plant and equipment (including capital work-in-progress) and intangible assets of `2,679.3 million (US$ 41.3 million) (2015-16: `15,301.7 million)
The impairment loss relates to the reportable segments as below. The same however has been shown as an exceptional item and does not form part of segment result in the segment report:
Year ended March 31, 2 017
Year ended March 31, 2016
(US$ million) (` in million) (` in million)
Tata Steel India 0 - 515.1Other Indian Operations 0.2 14.4 -Tata Steel Europe 22.9 1,483.7 819.7South East Asian Operations 18.2 1,181.2 -Rest of the World 0 - 13,966.9
41.3 2,679.3 15,301.7
(e) Provision of ̀ 2,182.5 million (US$ 33.7 million) for demands and claims in relation to the Indian operations (2015-16: ̀ 8,800.5 million)
F-286

NOTES FORMING PART OF THE FINANCIAL STATEMENTS
(f ) Provision of ̀ 2,073.7 million (US$ 32.0 million) on account of employee separation scheme in relation to the Indian operations (2015-16: `5,562.5 million)
(g) Restructuring and other provisions of `36,138.0 million (US$ 557.3 million) primarily include curtailment charge relating to closure of Tata Steel Europe’s British Steel Pension Scheme (BSPS) to future accrual (2015-16: Represents a gain of `69,826.7 million primarily on account of changes to BSPS and Stichting Pensioenfonds Hoogovens (SPH) scheme and other restructuring exercise relating to the European operations).
35. DISCONTINUED OPERATIONS
The recognition of non-current assets (or disposal group) as held for sale is dependent upon whether its carrying value will be recovered principally through a sale transaction rather than through continuing use. Significant judgement is required to assess whether the sale of the assets (or disposal group) is highly probable. A discontinued operation is a component of an entity that either has been disposed of or is classified as held for sale. Judgement is required to assess whether the component represents a separate major line of business or geographical area of operation, and is part of a single co-ordinated plan to dispose of a separate major line of business or geographical area of operation.
These businesses have been classified as discontinued operations during the current year following a coordinated plan to dispose of these businesses which do not form part of the Group’s core Strip Products. The previous year figures have also been restated accordingly.
On May 31, 2016, the Group disposed of the trade and other assets of its Long Products Europe business to Greybull Capital LLP.
On February 9, 2017, the Group announced a definitive sales agreement to dispose of the trade and other assets of its Speciality Steels business. The disposal was completed on May 1, 2017.
The results of the discontinued operations in each of the reporting periods are as below:
Year ended March 31, 2 017
Year ended March 31, 2016
(US$ million) (` in million) (` in million)
Revenue from operations 481.7 31,237.7 1,27,517.3 Other income 0 0.5 (22.7)
481.7 31,238.2 1,27,494.6
Expenses
Raw materials consumed 114.0 7,389.7 34,236.1 Purchases of finished, semi-finished and other products 39.8 2,578.1 4,181.5 Employee benefit expense 151.3 9,810.5 37,118.2 Finance costs 6.1 393.4 (183.9) Depreciation and amortisation expense 2.6 168.9 867.3 Other expenses 286.8 18,606.2 76,129.9
600.6 38,946.8 1,52,349.1
Profit/(loss) before tax from discontinued operations (118.9) (7,708.6) (24,854.5)
Tax expenses: 1.2 80.1 544.3
(a) Current tax 1.6 103.1 472.8 (b) Deferred tax (0.4) (23.0) 71.5
Profit/(loss) after tax from discontinued operations (120.1) (7,788.7) (25,398.8)
Profit/(loss) on disposal of discontinued operations (475.8) (30,853.2) - Total Profit/(loss) from discontinued operations 595.9 (38,641.9) (25,398.8)
An impairment charge of ₹ 1,966.3 million (US$ 30.3 million) was recognised during the year being the write down to fair value less costs to sell for assets classified as held for sale.
34. EXCEPTIONAL ITEMS(CONTD.)
F-287

NOTES FORMING PART OF THE FINANCIAL STATEMENTS
During the year, discontinued operations resulted in an outflow of ₹ 5,005.9 million (US$ 77.2 million) (March 31, 2016: ₹ 12,550.8 million) to the Group’s net operating cash flows, an outflow of ₹ 1,053.9 million (US$ 16.3 million) (March 31, 2016: ₹ 5,294.9 million) in respect of investing activities and an outflow of Nil (March 31, 2016: ₹ 196.1 million) in respect of financing activities.
36. DISPOSAL OF SUBSIDIARIES
On May 31,2016 the Group completed the sale of its long products Europe business to Greybull Capital LLP. On March 29, 2017, the Group also completed the sale of its subsidiary Kalzip (Guangzhou) Limited to Shangai Qinheng International Trade Co. Ltd
(a) The details of net assets disposed off and profit/(loss) on disposal is as below:
As at March 31, 2017
(US$ million) (` in million)
Property,plant and equipment 93.8 6,081.7 Other Intangible assets 0.5 35.6 Deferred tax Assets 3.2 208.2 Inventories 219.2 14,212.2 Trade receivables 291 18,871.2 Cash and bank balances 4.8 309.9 Long term borrowings (29.8) (1,930.7)Long term provisions (7.6) (494.3)Non-Current retirement benefit obligations (49.1) (3,183.8) Trade payables (304.3) (19,732.9)Short term borrowings (2.8) (180.7)Short term provisions (48.5) (3,145.2)Current tax liabilities (1.2) (78.1)Carrying value of net assets disposed off 169.2 10,973.1
As at March 31, 2017
(US$ million) (` in million)
Sale consideration (180.3) (11,691.8)Exchange differences recycled to consolidated statement of profit and loss 6.5 420.1Transaction costs 7.5 488.7 Pension curtailment (136.8) (8,870.1)Net consideration (303.1) (19,653.1)Carrying value of net assets disposed off 169.2 10,973.1 Profit/(Loss) on disposal (472.3) (30,626.2)
F-288

NOTES FORMING PART OF THE FINANCIAL STATEMENTS
(b) The net cash flow arising on disposal is as below:
As at March 31, 2017
(US$ million) (` in million)
Consideration paid in cash and cash equivalents (180.3) (11,691.8)Deferred consideration 13.5 878.2 Less: Cash and cash equivalents disposed off 4.8 309.9 Net cash flow arising on disposal (171.6) (11,123.5)
37. EARNINGS PER SHARE
The following table reflects the profit and shares data used in the computation of basic and diluted earnings per share. Year ended
March 31, 2 017
Year ended March 31, 2016
(US$ million) (` in million) (` in million)
(a) Profit after tax from continuing operations (46.9) (3,043.8) 20,427.9Less: Distribution on Hybrid Perpetual Securities (net of tax) 26.8 1,740.1 1,740.6Profit after tax from continuing operations attributable to Ordinary Shareholders - for Basic and Diluted EPS (A)
(73.8) (4,783.9) 18,687.3
Profit after tax from discontinued operations attributable to Ordinary Shareholders - for Basic and Diluted EPS (B)
(595.9) (38,641.9) (25,398.8)
Profit after tax from continuing and discontinued operations attributable to Ordinary Shareholders - for Basic and Diluted EPS (A+B)
(669.7) (43,425.8) (6,711.5)
Nos. Nos. Nos.(b) Weighted average number of Ordinary Shares for Basic EPS 97,00,47,046 97,00,47,046 97,01,42,816
Weighted average number of Ordinary Shares for Diluted EPS 97,00,47,100 97,00,47,100 97,01,42,816
(c) Nominal value of Ordinary Shares (`) - 10.00 10.00
(d) Basic and Diluted Earnings per Ordinary Share (`) - continuing operations (0.1) (4.93) 19.26
Basic and Diluted Earnings per Ordinary Share (`) - discontinued operations (0.6) (39.84) (26.18)
Basic and Diluted Earnings per Ordinary Share (`) - continuing and discontinued operations
(0.7) (44.77) (6.92)
F-289

NOTES FORMING PART OF THE FINANCIAL STATEMENTS
38. EMPLOYEE BENEFITS
A. Defined Contribution Plans
The Group participates in a number of defined contribution plans on behalf of relevant personnel. Any expense recognised in relation to these schemes represents the value of contributions payable during the period by the Group at rates specified by the rules of those plans. The only amounts included in the consolidated balance sheet are those relating to the prior months contributions that were not due to be paid until after the end of the reporting period.
The major defined contribution plans operated by the Group are as below:
(a) Provident fund and pension
In accordance with the Employee’s Provident Fund and Miscellaneous Provisions Act, 1952 and the Coal Mines Provident Fund and Miscellaneous Provisions Act, 1948, eligible employees of the Company and its Indian subsidiaries are entitled to receive benefits in respect of provident fund, a defined contribution plan, in which both employees and the Company and its Indian subsidiaries make monthly contributions at a specified percentage of the covered employees’ salary.
The contributions, as specified under the law, are made to the provident fund set up as an irrevocable trust by the Company and its Indian subsidiaries, post contribution of amount specified under the law to Employee Provident Fund Organisation on account of employee pension scheme.
(b) Superannuation fund
The Company and some of its Indian subsidiaries have a superannuation plan for the benefit of its employees. Employees who are members of the defined benefit superannuation plan are entitled to benefits depending on the years of service and salary drawn.
Separate irrevocable trusts are maintained for employees covered and entitled to benefits. The Company and its Indian subsidiaries contributes up to 15% of the eligible employees’ salary or `1,00,000, whichever is lower,to the trust every year. Such contributions are recognised as an expense as and when incurred. The Company and its Indian subsidiaries does not have any further obligations beyond this contribution.
The total expenses recognised in the consolidated statement of profit and loss during the year on account of defined contribution plans amounted to `10,145.6 million (2016: `8,411.0 million).
B. Defined Benefit Plans
The defined benefit plans operated by the Group are as below:
(a) Retiring gratuity
The Company and its Indian subsidiaries have an obligation towards gratuity, a defined benefit retirement plan covering eligible employees. The plan provides for a lump-sum payment to vested employees at retirement, death while in employment or on termination of employment of an amount equivalent to 15 to 30 days salary payable for each completed year of service. Vesting occurs upon completion of five years of service. The Group makes annual contributions to gratuity funds established as trusts or insurance companies. The Company and its Indian subsidiaries accounts for the liability for gratuity benefits payable in the future based on an actuarial valuation.
(b) Post retirement medical benefits
Under this unfunded scheme, employees of the Company and some of its subsidiaries receive medical benefits subject to certain limits on amounts of benefits, periods after retirement and types of benefits, depending on their grade and location at the time of retirement. Employees separated from the Company and its subsidiaries under an early separation scheme, on medical grounds or due to permanent disablement are also covered under the scheme. The Company and such subsidiaries accounts for the liability for post-retirement medical scheme based on an actuarial valuation.
(c) Pension Plan
Tata Steel Europe operates a number of defined benefit pension and post-retirement schemes covering the majority of employees. The benefits offered by these schemes are largely based on pensionable pay and years of service at retirement. With the exception of certain unfunded arrangements, the assets of these schemes are held in administered funds that are legally separated from Tata Steel Europe. For those pension schemes set up under a trust, the trustees are required by law to act in the best interests of the schemes beneficiaries in accordance with the scheme rules and relevant pension legislation. The trustees are generally responsible for the investment policy with regard to the assets of the fund, after consulting with the sponsoring employer.
Tata Steel Europe accounts for all pension and post-retirement defined benefit arrangements using Ind AS 19 ‘Employee Benefits’, with independent actuaries being used to calculate the costs, assets and liabilities to be recognised
F-290

NOTES FORMING PART OF THE FINANCIAL STATEMENTS
in relation to these schemes. The present value of the defined benefit obligation, the current service cost and past service costs are calculated by these actuaries using the Projected unit credit method. However, the ongoing funding arrangements of each scheme, in place to meet their long term pension liabilities, are governed by the individual scheme documentation and national legislation. The accounting and disclosure requirements of Ind AS 19 do not affect these funding arrangements.
The principal defined benefit pension scheme of the Group at March 31, 2017 was the BSPS, which is the main scheme for historic and present employees based in the UK. The main scheme for historic and present employees in the Netherlands is the SPH which, from July 7, 2015, switched from being classified as a defined benefit scheme to a defined contribution scheme.
(d) Other defined benefits
Other benefits provided under unfunded schemes include pension payable to directors on their retirement, farewell gifts and reimbursement of packing and transportation charges to the employees based on their last drawn salary.
The defined benefit plans expose the Group to a number of actuarial risks as below:
(i) Investment risk: The present value of the defined benefit plan liability is calculated using a discount rate determined by reference to government/high quality bond yields; if the return on plan asset is below this rate, it will create a plan deficit.
(ii) Interest risk: A decrease in the bond interest rate will increase the plan liability; however, this will be partially offset by an increase in the return on the plan’s debt investments.
(iii) Salary risk: The present value of the defined benefit plan liability is calculated by reference to the future salaries of plan participants. As such, an increase in the salary of the plan participants will increase the plan’s liability.
(iv) Longevity risk: The present value of the defined benefit plan liability is calculated by reference to the best estimate of the mortality of plan participants both during and after their employment. An increase in the life expectancy of the plan participants will increase the plan’s liability.
(v) Inflation risk: Some of the Group’s Pension obligations are linked to inflation, and higher inflation will lead to higher liabilities ( although), in most cases, caps on the level of inflationary increases are in place to protect the plan against extreme inflation).
38. EMPLOYEE BENEFITS (CONTD.)
C. Details of defined benefit obligation and plan assets:
(a) Retiring gratuity:
(i) The following table sets out the amounts recognised in the consolidated financial statements in respect of retiring gratuity plan:Year ended
March 31, 2 017
Year ended March 31, 2016
(US$ million) (` in million) (` in million)
Change in defined benefit obligation:
Obligation at the beginning of the year 435.6 28,247.8 27,358.4 Current service costs 20.2 1,312.4 1,281.3Interest costs 31.6 2,051.1 1,997.8 Remeasurement (gains)/losses 24.2 1,566.2 772.7 Benefits paid (51.9) (3,365.7) (3,162.4)Obligation at the end of the year 459.7 29,811.8 28,247.8
F-291

NOTES FORMING PART OF THE FINANCIAL STATEMENTS
Year ended March 31, 2 017
Year ended March 31, 2016
(US$ million) (` in million) (` in million)
Change in plan assets:
Fair value of plan assets at the beginning of the year 408.1 26,460.7 2,1601.3 Interest income 30.7 1,989.0 1,775.7Remeasurement gains/(losses) 8.8 569.3 462.2Employers' contributions 27.7 1,799.4 5,783.9 Benefits paid (51.9) (3,365.0) (3,162.4)Fair value of plan assets at the end of the year 423.4 27,453.4 26,460.7
Amounts recognised in the consolidated balance sheet consists of:
As at March 31, 2017
As at March 31, 2016
As at April 1, 2015
(US$ million) (` in million) (` in million) (` in million)
Fair value of plan assets at the beginning/end of the year 423.4 27,453.4 26,460.7 21,601.3Present value of obligation at the beginning/end of the year 459.7 29,811.8 28,247.8 27,358.4
(36.4) (2,358.4) (1,787.1) (5,757.1)
Recognised as:Retirement benefit assets - Non-current 0.1 5.0 6.7 1.3Retirement benefit liability - Current (0.5) (32.9) - -Retirement benefit liability - Non-current (35.9) (2,330.5) (1,793.8) (5,758.4)
(36.3) (2,358.4) (1,787.1) (5,757.1)
Expenses recognised in the consolidated statement of profit and loss consists of:
Year ended March 31, 2 017
Year ended March 31, 2016
(US$ million) (` in million) (` in million)
Employee benefits expenses:
Current service costs 20.2 1,312.4 1,281.3Net interest expenses/(income) 1.0 62.1 222.1
21.2 1,374.5 1,503.4
Other comprehensive income:
(Gain)/loss on plan assets (8.8) (569.3) (462.2)Actuarial (gain)/loss arising from changes in financial assumption 24.8 1,605.4 22.7
Actuarial (gain)/loss arising from changes in experience adjustments (0.6) (39.2) 750.0
15.4 996.9 310.5
Expenses recognised in the consolidated statement of profit and loss 36.6 2,371.4 1,813.9
38. EMPLOYEE BENEFITS (CONTD.)
F-292

NOTES FORMING PART OF THE FINANCIAL STATEMENTS
38. EMPLOYEE BENEFITS (CONTD.)
(ii) The fair value of plan assets as at March 31, 2017, March 31, 2016 and April 1, 2015 by category are as below:(%)
As at March 31, 2017
As at March 31, 2016
As at April 1, 2015
Assets category (%)
Quoted
Equity instruments 0.21 - -Debt instruments 29.53 31.40 39.58Other assets 0.04 - 0.05
29.78 31.40 39.63
Unquoted
Debt instruments 0.42 0.42 0.45Insurance products 69.32 67.35 59.14Other assets 0.48 0.83 0.78
70.22 68.60 60.37
100.00 100.00 100.00
The Group’s policy is driven by considerations of maximising returns while ensuring credit quality of debt instruments. The asset allocation for plan assets is determined based on investment criteria prescribed under the Indian Income Tax Act, 1961, and is also subject to other exposure limitations. The Group evaluates the risks, transaction costs and liquidity for potential investments. To measure plan assets performance, the Group compares actual returns for each asset category with published benchmarks.
(iii) The key assumptions used in accounting for retiring gratuity is as below:(%)
As at March 31, 2017
As at March 31, 2016
As at April 1, 2015
(a) Discount rate 7.00-7.50% 7.50-7.80% 7.50-7.80%(b) Rate of escalation in salary 5.00-10.00% 5.00-10.00% 6.00-10.00%
(iv) The weighted average duration of the obligation as at March 31, 2017 ranges between 6 to 22 years (March 31, 2016: 6 to 15 years and April 1, 2015: 6 to 16 years).
(v) The Group expects to contribute `2,341.7 million (US$ 36.1 million) to the plan during the financial year 2017-18.
(vi) The table below outlines the effect on obligation in the event of a decrease/ increase of 1% in the assumptions used.
As at March 31, 2017
Assumption Change in assumption Impact on scheme liabilities
Discount rate Increase by 1%, decrease by 1% Decrease by `2,101.7 million, increase by `2,453.2 millionRate of escalation in salary Increase by 1%, decrease by 1% Increase by `2,394.0 million, decrease by `2,101.6 million
As at March 31, 2016
Assumption Change in assumption Impact on scheme liabilities
Discount rate Increase by 1%, decrease by 1% Decrease by `1,933.7 million, increase by `2,085.6 millionRate of escalation in salary Increase by 1%, decrease by 1% Increase by `2,123.6 million, decrease by `1,883.9 million
As at April 1, 2015
Assumption Change in assumption Impact on scheme liabilities
Discount rate Increase by 1%, decrease by 1% Decrease by `1,849.9 million, increase by `2,122.9 millionRate of escalation in salary Increase by 1%, decrease by 1% Increase by `2,095.5 million, decrease by `1,850.3 million
The above sensitivities may not be representative of the actual change as it is unlikely that the change in assumptions would occur in isolation of one another as some of the assumptions may be correlated.
F-293

NOTES FORMING PART OF THE FINANCIAL STATEMENTS
(b) Tata Steel Europe Pension Plan
(i) The following table sets out the amounts recognised in the consolidated financial statements for Tata Steel Europe’s pension plans. Year ended
March 31, 2 017
Year ended March 31, 2016
(US$ million) (` in million) (` in million)
Change in defined benefit obligations:
Obligation at the beginning of the year 18,711.8 12,13,365.2 18,62,369.1 Current service costs 128.7 8,343.1 15,002.1 Interest costs 552.6 35,831.6 44,810.2 Past service costs 559.3 36,270.7 (76,971.5)Remeasurement (gains)/losses 2,878.1 1,86,628.1 (78,113.8)Employees' contributions 16.3 1,053.9 2,745.5 Curtailment 138.1 8,957.9 -Settlements 0 - (5,67,432.1)Benefits paid (1,053.7) (68,325.9) (70,205.9)Obligations of companies disposed off (135.4) (8,782.3) -Exchange differences on consolidation (2,989.9) (1,93,880.2) 81,161.6Obligation at the end of the year 18,805.9 12,19,462.1 12,13,365.2
Year ended March 31, 2 017
Year ended March 31, 2016
(US$ million) (` in million) (` in million)
Change in plan assets:
Fair value of plan assets at beginning of the year 20233.5 13,12,041.4 18,58,887.6 Interest income 600 38,905.4 47,261.5 Remeasurement gains/(losses) 2245.5 1,45,609.7 (58,145.4)Employers' contributions 81.3 5,269.4 15,884.6 Employees' contributions 16.3 1,053.9 2,745.5 Settlements 0 - (5,61,843.1)Benefits paid (1048.3) (67,974.6) (69,813.7)Assets of companies disposed off (86.7) (5,620.6) -Exchange differences on consolidation (3133.2) (2,03,173.2) 77,064.4Fair value of plan assets at end of the year 18,908.4 12,26,111.4 13,12,041.4
Amount recognised in the consolidated balance sheet consist of:
As at March 31, 2017
As at March 31, 2016
As at April 1, 2015
(US$ million) (` in million) (` in million) (` in million)
Fair value of plan assets at the beginning/end of the year 18,908.4 12,26,111.4 13,12,041.4 18,58,887.6Present value of obligation at the beginning/end of the year 18,805.9 12,19,462.1 12,13,365.2 18,62,369.1
102.5 6,649.3 98,676.2 (3,481.5)
Recognised as:Retirement benefit assets - Non-current 270.2 17,521.4 1,14,767.7 13,305.0Retirement benefit liability - Current (4.2) (270.7) (462.1) (528.3)Retirement benefit liability - Non-current (163.5) (10,601.4) (15,629.4) (16,258.2)
102.5 6,649.3 98,676.2 (3,481.5)
38. EMPLOYEE BENEFITS (CONTD.)
F-294

NOTES FORMING PART OF THE FINANCIAL STATEMENTS
Expenses recognised in the consolidated statement of profit and loss consist of:
Year ended March 31, 2 017
Year ended March 31, 2016
(US$ million) (` in million) (` in million)
Employee benefit expenses:
Current service costs 128.7 8,343.1 15,002.1 Past service costs 559.3 36,270.7 (76,971.5)Net interest expenses/(income) (47.4) (3,073.8) (2,451.3)Settlements 0 - (5,589.0)Curtailments 138.1 8,957.9 -
778.7 50,497.9 (70,009.7)
Other comprehensive income:
Return on plan assets (2,245.5) (1,45,609.7) 58,145.4Actuarial (gain)/loss arising from changes in demographic assumptions (108.3) (7,025.8) -
Actuarial (gain)/loss arising from changes in financial assumption 3115 2,01,991.7 (63,734.3)
Actuarial (gain)/loss arising from changes in experience adjustments (1,28.6) (8,337.8) (14,379.5)
632.6 41,018.4 (19,968.4)
Expenses recognised in the consolidated statement of profit and loss 1,411.3 91,516.3 (89,978.1)
(ii) The fair value of plan assets as at March 31, 2017, March 31, 2016 and April 1, 2015 by category is as below: (%)
As atMarch 31, 2017
As atMarch 31, 2016
As atApril 1, 2015
Assets category (%)
Quoted
(a) Equity - UK Entities 0.79 8.02 5.96(b) Equity - Non-UK Entities 8.79 19.08 22.28(c) Bonds - Fixed rate 39.71 17.69 24.84(d) Bonds - indexed linked 42.20 44.13 30.75(e) Others 0.23 0.05 0.17
91.72 88.97 84.00
Unquoted (a) Property 8.49 9.42 7.84(b) Others (0.21) 1.61 8.16
8.28 11.03 16.00
100.00 100.00 100.00
(iii) The key assumptions used in accounting for the pension plans is as below:
As at March 31, 2017
As at March 31, 2016
As atApril 1, 2015
(a) Discount rate 0.5-4.1% 0.4-4.1% 0.8-4.5%(b) Rate of escalation in salary 1.0-3.0% 1.0-2.5% 1.0-3.0%(c) Inflation rate 1.0-2.0% 1.0-3.0% 1.0-3.0%
(iv) The weighted average duration of the obligation as at March 31, 2017 is 16 years (March 31, 2016: 16 years and April 1, 2015: 16 years).
(v) The Group expects to contribute `11,943.9 million (US$ 184.2 million) to the plan during the financial year 2017-18.
(vi) The table below outlines the effect on obligation in the event of a decrease/ increase of 10 bps in the assumptions used.
38. EMPLOYEE BENEFITS (CONTD.)
F-295

NOTES FORMING PART OF THE FINANCIAL STATEMENTS
As at March 31, 2017
Assumption Change in assumption Impact on scheme liabilities
Discount rate Increase by 10 bps, decrease by 10 bps Decrease by 1.5%, increase by 1.5%Rate of escalation in salary Increase by 10 bps, decrease by 10 bps Increase by 0.3%, decrease by 0.3%Inflation rate Increase by 10 bps, decrease by 10 bps Increase by 1.2%, decrease by 1.2%
As at March 31, 2016
Assumption Change in assumption Impact on scheme liabilities
Discount rate Increase by 10 bps, decrease by 10 bps Decrease by 1.5%, increase by 1.5%Rate of escalation in salary Increase by 10 bps, decrease by 10 bps Increase by 0.3%, decrease by 0.3%Inflation rate Increase by 10 bps, decrease by 10 bps Increase by 1.2%, decrease by 1.2%
As at April 1, 2015
Assumption Change in assumption Impact on scheme liabilities
Discount rate Increase by 10 bps, decrease by 10 bps Decrease by 1.5%, increase by 1.5%Rate of escalation in salary Increase by 10 bps, decrease by 10 bps Increase by 0.3%, decrease by 0.3%Inflation rate Increase by 10 bps, decrease by 10 bps Increase by 1.4%, decrease by 1.4%
The above sensitivities may not be representative of the actual change as it is unlikely that the change in assumptions would occur in isolation of one another as some of the assumptions may be correlated.
(c) Post retirement medical and other defined benefit plans
(i) The following table sets out the amounts recognised in the consolidated financial statements for post retirement medical and other defined benefit plans.
As at March 31, 2017 As at March 31, 2016
Medical Others Medical Others
(US$
million)
(` in
million)
(US$
million)
(` in
million)
(US$
million)
(` in
million)
Change in defined benefit obligations:
Obligations at the beginning of the year 169.2 10,974.9 23.8 1,544.2 10,671.8 1,420.1 Current service cost 3.1 198.9 1.8 118.3 182.2 122.7Interest cost 12.7 824.1 1.4 90.4 806.9 86.9Remeasurement (gain)/loss:(i) Actuarial (gain)/loss arising from changes in
financial assumptions 19.8 1,283.3 1.4 89.8 2.8 32.2
(ii) Actuarial (gain)/loss arising from changes in experience adjustments (1.6) (102.3) 0.9 59.5 (165.4) (4.4)
(iii) Actuarial (gain)/loss arising from changes in demographic assumptions 0 (0.2) 0 - (0.2) -
Exchange differences on consolidation 0 - 0 (2.0) - (3.5)Benefits paid (9.5) (615.0) (2.2) (144.9) (523.2) (109.8)Past service costs 0 2.6 0.9 57.6 - -Obligations at the end of the year 193.7 12,566.3 28.0 1,812.9 10,974.9 1,544.2
38. EMPLOYEE BENEFITS (CONTD.)
F-296

NOTES FORMING PART OF THE FINANCIAL STATEMENTS
Amounts recognised in the consolidated balance sheet consist of:
As at March 31, 2017 As at March 31, 2016 As at April 1, 2015
Medical Others Medical Others Medical Others
(US$
million)
(` in
million)
(US$
million)
(` in
million)
(` in million) (` in million)
Present value of obligations at the beginning/end of the year
193.8 12,566.3 28.0 1,812.9 10,974.9 1,544.2 10,671.8 1,420.1
Recognised as:(a) Retirement benefit liability - Current 8.5 548.0 1.5 100.4 539.8 108.9 485.9 88.9(b) Retirement benefit liability - Non-
current185.3 12,018.3 26.5 1,712.5 10,435.1 1,435.3 10,185.9 1,331.2
Expenses recognised in the consolidated statement of profit and loss consist of:
(` million)As at March 31, 2017 As at March 31, 2016
Medical Others Medical Others
(US$
million)
(` in
million)
(US$
million)
(` in
million)
(` in million)
Employee benefit expenses:
Current service costs 3.1 198.9 1.8 118.3 182.2 122.7 Past service costs 0 2.6 0.9 57.6 - -Interest costs 12.7 824.1 1.4 90.4 806.9 86.9
15.8 1,025.6 4.1 266.3 989.1 209.6
Other comprehensive income consist of:
Actuarial (gain)/loss arising from changes in demographic assumption
0 (0.2) 0 - (0.2) -
Actuarial (gain)/loss arising from changes in financial assumption
19.8 1,283.3 1.4 89.8 2.8 32.2
Actuarial (gain)/loss arising from changes in experience adjustments
(1.6) (102.3) 0.9 59.5 (165.4) (4.4)
18.2 1180.8 2.3 149.3 (162.8) 27.8
Expenses recognised in the consolidated statement of profit and loss
34.0 2,206.4 6.4 415.6 826.3 237.4
(ii) The key assumptions used in accounting for the post-retirement medical benefits and other defined benefits is as below:
As at March 31, 2017 As at March 2016 As at April 1, 2015
Medical Others Medical Others Medical Others
(a) Discount rate 7.00-7.50% 0.51-7.75% 7.50-7.75% 0.51-7.75% 7.75-7.90% 3.02-7.90% (b) Rate of escalation in salary N.A. 4.95-15.00% N.A. 5.00-15.00% N.A. 4.00-15.00% (c) Inflation rate 6.00-8.00% 4.00-8.00% 6.00-8.00% 4.00-8.00% 6.00-8.00% 4.00-8.00%
(iii) The weighted average duration of the post-retirement medical benefit obligations as at March 31, 2017 ranges between 4-10 years (March 31, 2016: 6-10 years and April 1, 2015: 6-10.5 years).
The weighted average duration of the other defined benefit obligations as at March 31, 2017 ranges between 6-12 years (March 31, 2016: 6-11 years and April 1, 2015: 6-10.5 years).
38. EMPLOYEE BENEFITS (CONTD.)
F-297

NOTES FORMING PART OF THE FINANCIAL STATEMENTS
(iv) The table below outlines the effect on the post-retirement medical benefit obligations in the event of a decrease/increase of 1% in the assumptions used:
As at March 31, 2017
Assumption Change in assumption Impact on scheme liabilities
Discount rate Increase by 1%, decrease by 1% Decrease by `1,667.7 million, increase by `2,139.7 millionMedical cost inflation rate Increase by 1%, decrease by 1% Increase by `2,039.1 million, decrease by `1,629.2 million
As at March 31, 2016
Assumption Change in assumption Impact on scheme liabilities
Discount rate Increase by 1%, decrease by 1% Decrease by `1,400.3 million, increase by `1,709.6 millionMedical cost inflation rate Increase by 1%, decrease by 1% Increase by `1,684.6 million, decrease by `1,406.5 million
As at April 1, 2015
Assumption Change in assumption Impact on scheme liabilities
Discount rate Increase by 1%, decrease by 1% Decrease by `1,358.3 million, increase by `1,655.8 millionMedical cost inflation rate Increase by 1%, decrease by 1% Increase by `1,633.4 million, decrease by `1,367.7 million
(v) The table below outlines the effect on other defined benefit obligations in the event of a decrease/increase of 1% in the assumptions used:
As at March 31, 2017
Assumption Change in assumption Impact on scheme liabilities
Discount rate Increase by 1%, decrease by 1% Decrease by `132.7 million, increase by `141.8 millionRate of escalation in salary Increase by 1%, decrease by 1% Increase by `142.9 million, decrease by `124.2 millionInflation rate Increase by 1%, decrease by 1% Increase by `116.2 million, decrease by `99.6 million
As at March 31, 2016
Assumption Change in assumption Impact on scheme liabilities
Discount rate Increase by 1%, decrease by 1% Decrease by `131.3 million, increase by `151.1 millionRate of escalation in salary Increase by 1%, decrease by 1% Increase by `94.7 million, decrease by `83.1 millionInflation rate Increase by 1%, decrease by 1% Increase by `78.7 million, decrease by `69.6 million
As at April 1, 2015
Assumption Change in assumption Impact on scheme liabilities
Discount rate Increase by 1%, decrease by 1% Decrease by `99.0 million, increase by `113.6 millionRate of escalation in salary Increase by 1%, decrease by 1% Increase by `51.0 million, decrease by `44.6 millionInflation rate Increase by 1%, decrease by 1% Increase by `91.2 million, decrease by `78.2 million
The above sensitivities may not be representative of the actual change as it is unlikely that the change in assumptions would occur in isolation of one another as some of the assumptions may be correlated.
38. EMPLOYEE BENEFITS (CONTD.)
F-298

NOTES FORMING PART OF THE FINANCIAL STATEMENTS
39. CONTINGENCIES AND COMMITMENTS
A. CONTINGENCIES
In the ordinary course of business, the Group faces claims and assertions by various parties. The Group assesses such claims and assertions and monitors the legal environment on an on-going basis, with the assistance of external legal counsel, wherever necessary. The Group records a liability for any claims where a potential loss is probable and capable of being estimated and discloses such matters in its consolidated financial statements, if material. For potential losses that are considered possible, but not probable, the Group provides disclosure in the consolidated financial statements but does not record a liability in its accounts unless the loss becomes probable.
The following is a description of claims and assertions where a potential loss is possible, but not probable. The Group believes that none of the contingencies described below would have a material adverse effect on the Group’s financial condition, results of operations or cash flows.
Litigations
The Group is involved in legal proceedings, both as plaintiff and as defendant. There are claims which the Group does not believe to be of material nature, other than those described below.
Income Tax
The Group has ongoing disputes with income tax authorities relating to tax treatment of certain items. These mainly include disallowance of expenses, tax treatment of certain expenses claimed by the Group as deductions and the computation of, or eligibility of the Group’s use of certain tax incentives or allowances.
Most of these disputes and/or disallowances, being repetitive in nature, have been raised by the income tax authorities consistently in most of the years.
As at March 31, 2017, there are matters and/or disputes pending in appeal amounting to `14,429.5 million (US$222.5 million) (March 31, 2016: `13,347.3 million; April 1, 2015: `10,706.6 million) which includes `77.1 million (US$1.2 million) (March 31, 2016: `72.4 million, April 1, 2015: `55.2 million) in respect of equity accounted investees.
The details of demands for more than `1 billion is as below:
Interest expenditure on loans taken by the Company for acquisition of a subsidiary has been disallowed in assessments with tax demand raised for `12,177.9 million (US$ 187.8 million) (inclusive of interest) (March 31, 2016: `11,244.8 million, April 1, 2015: `8,703.6 million). The Company has deposited `5,150 million (US$ 79.4 million) (March 31, 2016: `4,150 million; April 1, 2015: `3,400 million) as part payment as a
precondition to obtain stay of demand. The Company expects to sustain its position on ultimate resolution of the appeals.
Customs, Excise Duty and Service Tax
As at March 31, 2017, there were pending litigation for various matters relating to customs, excise duty and service taxes involving demands of `8,048.4 million (US$124.1 million) (March 31, 2016: `7,419.6 million, April 1, 2015: `6,917.6 million), which includes `433.5 million (US$6.7 million) (March 31, 2016: `414.2 million, April 1, 2015: `421.7 million) in respect of equity accounted investees.
Sales Tax /VAT
The total sales tax demands that are being contested by the Group amounted to `4,380.6 million (US$67.6 million) (March 31, 2016: `6,227.4 million, April 1, 2015: `4,779.7 million), which includes `281.0 million (US$4.3 million) (March 31, 2016: `91.2 million, April 1, 2015: `70.4 million) in respect of equity accounted investees.
Other Taxes, Dues and Claims
Other amounts for which the Group may contingently be liable aggregate to `94,211.3 million (US$1,452.9 million) (March 31, 2016: `79,694.9 million, April 1, 2015: `71,588.5 million), which includes `685.4 million (US$10.6 million) (March 31, 2016: `674.9 million, April 1, 2015: `682.6) in respect of equity accounted investees.
The details of demands for more than `1,000 million is as below:
(a) Claim by a party arising out of conversion arrangement- `1958.2 million (US$30.2 million) (March 31, 2016: `1,958.2 million; April 1, 2015: `1,958.2 million). The Company has not acknowledged this claim and has instead filed a claim of `1,396.5 million (US$21.6 million) (March 31, 2016: `1,396.5 million; April 1, 2015: `1,396.5 million) on the party. The matter is pending before the Calcutta High Court.
(b) The State Government of Odisha introduced “Orissa Rural Infrastructure and Socio Economic Development Act, 2004” with effect from February 2005 levying tax on mineral bearing land computed on the basis of value of minerals produced from the mineral bearing land. The Company had filed a Writ Petition in the High Court of Orissa challenging the validity of the Act. Orissa High Court held in November 2005 that State does not have authority to levy tax on minerals. The State Government of Odisha moved to the Supreme Court against the order of Orissa High Court and the case is pending with Supreme Court. The potential liability, as at March 31, 2017 would be approximately `58,808.3 million (US$906.9 million) (March 31, 2016: `55,019.8 million; April 1, 2015: `48,051.8 million).
F-299

NOTES FORMING PART OF THE FINANCIAL STATEMENTS
(c) For the purpose of payment of royalty, there are two salient provisions viz. Section 9 in Mines and Minerals (Development and Regulation) Act (MMDR) 1957, related to the incidence of royalty and Rules 64B and 64C of Mineral Concession Rules (MC Rules), 1960. The Company has been paying royalty on coal extracted from its coal mines pursuant to the judgement and order dated July 23, 2002 passed by the Jharkhand High Court. However, the State Government demanded royalty at rates applicable to processed coal. Though the Company contested the above demand, it started paying, under protest, royalty on processed coal from November 2008. The demand of the state mining authority was confirmed by the High Court vide its judgement dated March 12, 2014. The Court concluded that the State cannot claim interest till the Hon’ble Supreme Court decides the pending Special Leave Petitions (SLP) filed by State and Company in the year 2004.
In the appeals filed by the Company in respect of the issues related to Coal royalty, the Hon’ble Supreme Court has pronounced the judgement on March 17, 2015 in which it has interpreted Section 9 and approved the law that removal of coal from the seam in the mine and extracting it through the pithead to the surface satisfies the requirement of Section 9 (charging section) of the MMDR Act in order to give rise to a liability for royalty. In regard to the interpretation of Rules 64B and 64C of MC Rules, the Supreme Court has clarified that the constitutional validity or the vires of the Rules has not been adjudicated upon. Therefore it is open to the Company either to revive the appeals limited to this question or to separately challenge the constitutionality and vires of these Rules. Accordingly, the Company has filed writ petitions challenging the constitutionality and vires of Rules 64B and 64C of MC Rules on May 19, 2015 at Hon’ble High Court of Jharkhand. Vide it’s judgement dated 26.06.2015, High Court has held that, the writ petitions are maintainable. It is also pertinent to mention that the Union of India in its counter affidavit has stated that the provisions of Rules 64B and 64C may not be applicable to the mineral coal.
All demands are solely based on application of Rules 64B and 64C. In view of (i) the clear interpretation of charging Section 9 by Supreme Court by three judges Bench following two earlier three Judge Bench orders (ii) the affidavit of Union of India and (iii) the liberty given by Supreme Court, the Company is of the opinion that any related present/probable demands are not payable. Out of the principal demand of `1,902.5 million an amount of `1,638 million has been paid till FY 15 and balance has been provided for. As the Hon’ble High Court of Jharkhand refused to grant stay on demand raised in case of West Bokaro division, the Company started
providing for differential royalty in the books. Interest amount of `10,437.9 million (US$161.0 million) (March 31, 2016: `3,240.6 million; April 1, 2015: `3,184.5 million) being interest raised on all the demands, which are disputed in several cases has been considered as a contingent liability. The interest demand has been raised after several years for the entire past period and is being contested. ̀ 129.2 million, being interest on District Mineral Fund (DMF) and National Mineral Foundation Trust contribution on differential royalty is also considered as a contingent liability.
(d) The Company pays royalty on ore on the basis of quantity removed from the leased area at the rates based on notification by the Ministry of Mines, Government of India and the price published by India Bureau of Mines (IBM) on a monthly basis.
A demand of `4,110.8 million has been raised by Deputy Director of Mines, Joda, claiming royalty at sized ore rates on despatches of ore fines. The Company has filed a revision petition on November 14, 2013 before the Mines Tribunal, Government of India, Ministry of Mines, New Delhi, challenging the legality and validity of the demand raised and also to grant refund of royalty excess paid by the Company. Mines tribunal vide its order dated November 13, 2014 has stayed the demand of royalty on iron ore for Joda east of `3,142.8 million upto the period ending March 31, 2014. For the demand of `968.0 million for April, 2014 to September, 2014, a separate revision application was filed before Mines Tribunal. The matter was heard by Mines Tribunal on July 14, 2015 and stay was granted on the total demand with directive to Government of Odisha not to take any coercive action for realisation of this demanded amount. Likely demand of Royalty on fines at sized ore rate as on March 31, 2017: `8,479.6 million (US$130.8 million) (March 31, 2016: `4,110.8 million: April 1, 2015: `4,110.8 million.
B. COMMITMENTS
(a) The Group has entered into various contracts with suppliers and contractors for the acquisition of plant and machinery, equipment and various civil contracts of capital nature amounting to `67,378.8 million (US$1039.1million), which includes `218.0 million (US$3.4 million) in respect of equity accounted investees as at March, 2017 (`91,737.9 million, which includes `107.7 million in respect of equity accounted investees as at March 31, 2016 and `97,396.0 million which includes `51.5 million in respect of equity accounted investees as at April 1, 2015), which are yet to be executed.
Other commitments amounts to `0.1 million (US$0 million) which includes Nil in respect of equity accounted investees as at March 31, 2017 (`0.1 million which includes Nil in
39. CONTINGENCIES AND COMMITMENTS (CONTD.)
F-300

NOTES FORMING PART OF THE FINANCIAL STATEMENTS
39. CONTINGENCIES AND COMMITMENTS (CONTD.)
respect of equity accounted investees as at March 31, 2016, `0.1 million which includes Nil in respect of equity accounted investees as at April 1, 2015.
(b) The Company has given undertakings to: (a) IDBI not to dispose of its investment in Wellman Incandescent India Ltd., (b) IDBI and ICICI Bank Ltd. (formerly ICICI) not to dispose of its investment in Standard Chrome Ltd., (c) Mizuho Corporate Bank Limited and Japan Bank for International Co-operation, not to dispose of its investments in Tata NYK Shipping Pte Limited, (minimal stake required to be able to provide a corporate guarantee towards long-term debt), (d) ICICI Bank Limited to directly or indirectly continue to hold atleast 51% shareholding in Jamshedpur Continuous Annealing and Processing Company Private Limited.
(c) The Company has furnished a security bond in respect of its immovable property to the extent of `20 million in favour of the Registrar of the Delhi High Court and has given an undertaking not to sell or otherwise dispose of the said property.
(d) The Promoters of Tata BlueScope Steel Limited (TBSL) (i.e. Bluescope Steel Asia Holdings Pty Limited, Australia and Tata Steel. Limited) have given an undertaking to IDBI Trusteeship Services Ltd., Debenture Trustees, and State Bank of India not to reduce collective shareholding in TBSL, below 51 % without prior consent of the Lender. Further, the Company has given an undertaking to State Bank of India to intimate them before diluting its shareholding in TBSL below 50%.
(e) The Company, as a promoter, has pledged 4,41,55,800 equity shares of Industrial Energy Limited with Infrastructure Development Finance Corporation Limited.
(f ) The Company along with TS Alloys Limited (Promoters) has given an undertaking to Power Finance Corporation Limited (PFC) and Rural Electrification Corporation Limited (REC) (Lenders) not to dispose off /transfer their equity holding of 26% of total equity in Bhubaneshwar Power Private Limited (BPPL) without prior written approval of lenders. Such shareholding of promoters may be transferred to the Company or its affiliates subject to compliance of applicable laws. The Company along with TS Alloys Limited has pledged 60% of their equity contribution in BPPL to PFC and REC.
(g) T S Global Minerals Holdings Pte Ltd. (formerly known as Tata Steel Global Minerals Holdings Pte Ltd.), an indirect subsidiary and Riversdale Mining Pty Limited (formerly Riversdale Mining Limited) have executed a deed of cross charge in favour of each other to secure the performance of obligation under Joint Venture agreement and funding requirements of the Joint Venture Minas De Benga (Mauritius)
Limited (formerly Rio Tinto Benga (Mauritius) Limited) upto a maximum amount of US$ 100 million on the shares of Minas De Benga (Mauritius) Limited and all of its present and future benefits and rights under the joint venture agreement.
(h) The Group has given guarantees aggregating `2,237.8
million (US$34.5 million) (March 31, 2016: `3,234.4 million, April 1, 2015: `3,372.9 million) details of which are as below:
(i) in favour of Timken India Limited for Nil, (March 31, 2016: `800.0 million; April 1, 2015: `800.0 million) against renewal of lease of land pending with State Government and `10.7 million (US$0.2
million) (March 31, 2016: `10.7 million; April 1, 2015: `10.7 million) on behalf of Timken India Limited to Commissioner of Customs in respect of goods imported.
(ii) in favour of Mizuho Corporate Bank Ltd., Japan for `453.8 million (US$7.0 million) (March 31, 2016: `650.4
million; April 1, 2015: `788.9 million) against the loan granted to a joint venture Tata NYK Shipping Pte. Limited.
(iii) in favour of The President of India for `1,771.8 million (March 31, 2016: ̀ 1,771.8 million; April 1, 2015: ̀ 1,771.8 million) against performance of export obligation under the various bonds executed by a joint venture Jamshedpur Continuous Annealing & Processing Company Private Limited.
(iv) in favour of President of India for `1.5 million (US$0 million) (March 31, 2016: `1.5 million; April 1, 2015: `1.5 million) against advance license.
40. OTHER SIGNIFICANT LITIGATIONS
(a) Odisha legislative assembly issued an amendment to Indian Stamp Act on May 9, 2013 and inserted a new provision (Section 3a) in respect of stamp duty payable on grant/renewal of mining leases. As per the amended provision, stamp duty is levied equal to 15% of the average royalty that would accrue out of the highest annual extraction of minerals under the approved mining plan multiplied by the period of such mining lease. The Company had filed a writ petition challenging the constitutionality of the Act on July 5, 2013. The Hon’ble High Court, Cuttack passed an order on July 9, 2013 granting interim stay on the operation of the Amendment Act, 2013. As a result of the stay, as on date, the Act is not enforceable and any demand received by the Company is not liable to be proceeded with. Meanwhile, the Company received demand notices for the various mines at Odisha totalling to ̀ 55,790 million (US$860.4 million). On the basis of external legal opinion, the Company has concluded that it is remote that the claim will sustain on ultimate
F-301

NOTES FORMING PART OF THE FINANCIAL STATEMENTS
resolution of the legal case by the courts. In April, 2015 the Company has received an intimation from Government of Odisha, granting extension of validity period for leases under the MMDR Amendment Act, 2015 up to March 31, 2030 in respect of eight mines and up to March 31, 2020 for two mines subject to execution of supplementary lease deed within 3 months from the date of the intimation. Liability has been provided in the books of accounts as on March 31, 2017 as per the existing provisions of the Stamp Act 1899 and the Company has since paid the stamp duty and registration charges totalling `4,137.2 million for supplementary deed execution in respect of eight mines out of the above mines.
(b) Demand notices have been raised by Deputy Director of Mines, Odisha amounting to `38,280 million for the excess production over the quantity permitted under the mining plan scheme, environment clearance or consent to operate, during the period 2000-01 to 2009-10. The demand notices have been raised under Section 21(5) of the Mines & Minerals (Development and Regulations) Act (MMDR). However, the Act specifies that demand can be raised only when the land is occupied without lawful authority. The Company is of the view that Section 21(5) of the MMDR Act is not applicable as the mining is done within the sanctioned mining lease area and accordingly the Company has filed revision petitions before the Mines Tribunal against all such demand notices. Consequent to it stay has been granted by the Mines Tribunal against the entire demand of `38,280 million and directed the State that no coercive action should be taken for recovery of demand.
Based on the judgement of Hon’ble High court of Jharkhand on December 11, 2014 in the matter of writ petition filed by the Company for renewal of lease and continuation of operation at Noamundi iron mine, the Government of Jharkhand approved the renewal of lease of Noamundi Mines by an express order on December 31, 2014. Express Order also held mining operation carried out between January 1, 2012 to August 31, 2014 to be unlawful and computed an amount of `35,680 million on account of such alleged unlawful mining.
The Mines and Minerals Development and Regulation (MMDR) Amendment Ordinance 2015 promulgated on January 12, 2015 provides for renewal of the above mines. Based on the new Ordinance, Jharkhand Government revised the Express Order on February 12, 2015 for lease renewal up to March 31, 2030 with following terms and conditions:
value of iron ore produced by alleged unlawful mining during the period January 1, 2012 to April 20, 2014 for
`29,944.9 million to be decided on the basis of disposal of writ petition filed before Hon’ble High Court of Jharkhand.
value of iron ore produced from April 21, 2014 to July 17, 2014 amounting to `4,218.3 million to be paid in maximum 3 installments.
value of iron ore produced from July 18, 2014 to August 31, 2014 i.e. `1,520 million to be paid immediately.
The Company paid `1,520 million under protest. District Mining Officer Chaibasa on March 16, 2015 has issued demand notice for payment of `4,218.3 million, payable in three monthly installments. The Company replied on March 20, 2015, since the lease has been extended till March 31, 2030, the above demand is not tenable. The Company paid `500 million under protest on July 27, 2015.
A writ petition was filed before Hon’ble High Court of Jharkhand and heard on September 9, 2015. An interim order has been given by Hon’ble High Court of Jharkhand on September 18, 2015 wherein court has directed the company to pay outstanding amount of `3,718.3 million in 3 equal installments, first installment by October 15, 2015, second installment by November 15, 2015 and third installment by December 15, 2015.
In view of the order of Hon’ble High Court of Jharkhand, `1,240 million was paid on September 28, 2015, `1,240 million was paid on November 12, 2015 and `1,238.3 million on December 14, 2015 under protest.
(c) During Financial Year 2014-15, the Income Tax department had reopened assessments of earlier years on account of excess mining and raised cumulative demand for `10,860 million. During 2015-16, the Commissioner of Income Tax (Appeals) has adjudicated the matter in favour of the Company and quashed the entire demand on account of reopened assessments. The demand outstanding as on March 31, 2017 is Nil (March 31, 2016: Nil; April 1, 2015: `10,860 million).
(d) During the current year, NTT Docomo Inc. had filed a petition with the Delhi High Court for implementation of the arbitration award (damages along with cost and interest) by the London Court of International Arbitration. The Delhi High Court directed Tata Sons to deposit the damages including costs and interest in an escrow account. During the year, the Company has accordingly remitted its share of ₹1,520 million (US$23.4 million) to Tata Sons and recognised a provision of ₹1,254.4 million (US$19.3 million) being the difference between the fair value of equity shares to be repurchased and the consideration payable to NTT Docomo Inc.
40. OTHER SIGNIFICANT LITIGATIONS (CONTD.)
F-302

NOTES FORMING PART OF THE FINANCIAL STATEMENTS
41. CAPITAL MANAGEMENT
The Group’s capital management is intended to create value for shareholders by facilitating the meeting of long term and short term goals of the Group.
The Group determines the amount of capital required on the basis of annual business plan of the entities within the Group coupled with long term and short term strategic investment and expansion plans. The funding needs are met through equity, cash generated from operations, long and short term bank borrowings and issue of non-convertible debt securities.
The Group monitors the capital structure on the basis of net debt to equity ratio and maturity profile of the overall debt portfolio of the Group.
Net debt includes interest bearing borrowings less cash and cash equivalents, other bank balances (including non-current and earmarked balances) and current investments.
The table below summarises the capital, net debt and net debt to equity ratio of the Group.
As at March 31, 2017
As at March 31, 2016
As at April 1, 2015
(US$ million) (` in million) (` in million) (` in million)
Equity share capital 149.6 9,702.4 9,702.4 9,714.1 Hybrid Perpetual Securities 350.8 22,750.0 22,750.0 22,750.0 Other equity 5,331.8 3,45,740.8 4,04,873.1 4,38,672.2Equity attributable to shareholders of the Company 5,832.2 3,78,193.2 4,37,325.5 4,71,136.3
Non controlling interests 247.0 16,017.0 7,809.4 8,541.8 Total Equity (A) 6,079.2 3,94,210.2 4,45,134.9 4,79,678.1
Non-current borrowings 9,873.1 6,40,222.7 6,48,727.8 6,22,515.6 Current borrowings 2,826.4 1,83,281.0 1,57,221.2 96,932.5 Current maturities of non-current borrowings and finance lease obligations
102.4 6,641.2 13,920.3 48,484.8
Gross Debt (B) 12,801.9 8,30,144.9 8,19,869.3 7,67,932.9
Total Capital (A+B) 18,881.2 12,24,355.1 12,65,004.2 12,47,611.0
Gross Debt as above 12,801.9 8,30,144.9 8,19,869.3 7,67,932.9Less: Current investments 874.9 56,731.3 46,635.5 12,146.0 Less: Cash and cash equivalents 745.2 48,322.9 61,090.5 81,771.3Less: Other balances with bank (including non-current and earmarked balances)
21.9 1,423.0 1,155.4 1,138.4
Net Debt (C) 11,160.0 7,23,667.7 7,10,987.9 6,72,877.2
Net debt to equity 1.72 1.54 1.4
Net debt to equity as at March 31, 2017 and March 31, 2016 has been computed based on average equity and as on April 1, 2015, it is based on closing equity.
F-303

NOTES FORMING PART OF THE FINANCIAL STATEMENTS
42. DISCLOSURES ON FINANCIAL INSTRUMENTS
This section gives an overview of the significance of financial instruments for the Group and provides additional information on balance sheet items that contain financial instruments.
The details of significant accounting policies, including the criteria for recognition, the basis of measurement and the basis on which income and expenses are recognised in respect of each class of financial asset, financial liability and equity instrument are disclosed in Note 2(r), to the consolidated financial statements.
(a) Financial assets and liabilities
The following table presents the carrying value and fair value of each category of financial assets and liabilities as at March 31, 2017, 2016 and April 1, 2015.
As at March 31, 2017 (` in million) (US$
million)Amortised
cost
Fair value
through other
comprehensive
income
Derivative
instruments
in hedging
relationship
Derivative
instruments
not in
hedging
relationship
Fair value
through
consolidated
statement
profit and loss
Total
Carrying
Value
Total Fair
Value
Financial assets
Cash and bank balances
49,210.5 - - - - 49,210.5 49,210.5 758.9
Trade receivables 1,15,868.2 - - - - 1,15,868.2 1,15,868.2 1,786.8Investments 499.3 48,588.2 - - 5,9546.9 1,08,634.4 1,08,634.4 1,675.3Derivatives - - 904.2 967.9 - 1,872.1 1,872.1 28.9Loans 3,730.6 3,730.6 3,730.6 57.5Other financial assets
6,979.0 - - - - 6,979.0 6,979.0 107.6
1,76,287.6 48,588.2 904.2 967.9 5,9546.9 2,86,294.8 2,86,294.8 4,415.0
Financial
liabilities
Trade and other payables
1,85,744.6 - - - - 1,85,744.6 1,85,744.6 2,864.4
Borrowings 8,30,144.9 - - - - 8,30,144.9 8,48,706.8 13,088.2Derivatives - - 2,214.7 6,321.8 - 8,536.5 8,536.5 131.6Other financial liabilities
57,601.7 - - - - 57,601.7 57,601.7 888.3
10,73,491.2 - 2,214.7 6,321.8 - 10,82,027.7 11,00,589.6 16,972.5
F-304

NOTES FORMING PART OF THE FINANCIAL STATEMENTS
As at March 31, 2016 (` in million)
Amortised cost
Fair value through other
comprehensive income
Derivative instruments
in hedging relationship
Derivative instruments
not in hedging relationship
Fair value through
consolidated statement
profit and loss
Total Carrying
Value
Total Fair Value
Financial assets
Cash and bank balances 61,863.4 - - - - 61,863.4 61,863.4Trade receivables 1,20,662.2 - - - - 1,20,662.2 1,20,662.2Investments 341.8 40,154.5 - - 50,436.7 90,933.0 90,933.0Derivatives - - 2,966.7 457.7 - 3,424.4 3,424.4Loans 4,122.3 4,122.3 4,122.3Other financial assets 4,897.6 - - - - 4,897.6 4,897.6
1,91,887.3 40,154.5 2,966.7 457.7 50,436.7 2,85,902.9 2,85,902.9
Financial liabilities
Trade and other payables 1,85,567.0 - - - - 1,85,567.0 1,85,567.0Borrowings 8,19,869.3 - - - - 8,19,869.3 8,23,212.0Derivatives 4,300.6 2,336.9 - 6,637.5 6,637.5Other financial liabilities 59,635.1 - - - - 59,635.1 59,635.1
10,65,071.4 - 4,300.6 2,336.9 - 10,71,708.9 10,75,051.6
As at April 1, 2015 (` in million)
Amortised
cost
Fair value
through other
comprehensive
income
Derivative
instruments
in hedging
relationship
Derivative
instruments
not in hedging
relationship
Fair value
through
consolidated
statement
profit and loss
Total
Carrying
Value
Total Fair
Value
Financial assets
Cash and bank balances 82,484.7 82,484.7 82,484.7Trade receivables 1,35,797.7 1,35,797.7 1,35,797.7Investments 2.2 1,07,701.4 16,030.1 1,23,733.7 1,23,733.7Derivatives 6,157.7 9,697.4 15,855.1 15,855.1Loans 2,900.9 2,900.9 2,900.9Other financial assets 6,377.0 6,377.0 6,377.0
2,27,562.5 1,07,701.4 6,157.7 9,697.4 16,030.1 3,67,149.1 3,67,149.1
Financial liabilities
Trade and other payables 1,80,666.6 1,80,666.6 1,80,666.6Borrowings 7,67,932.9 7,67,932.9 7,81,234.1Derivatives 6,036.3 3,079.1 9,115.4 9,115.4Other financial liabilities 65,806.3 65,806.3 65,806.4
10,14,405.8 - 6,036.3 3,079.1 - 10,23,521.2 10,36,822.3
(i) Investments in mutual funds and derivative instruments are mandatorily classified as fair value through the consolidated statement of profit and loss.
(b) Fair value hierarchy
The following table provides an analysis of financial instruments that are measured subsequent to initial recognition at fair value, grouped into Level 1 to Level 3, as described below.
Quoted prices in an active market (Level 1): This level of hierarchy includes financial assets and liabilities, that are measured by reference to quoted prices (unadjusted) in active markets for identical assets or liabilities. This category consists of quoted equity shares and mutual fund investments.
42. DISCLOSURES ON FINANCIAL INSTRUMENTS (CONTD.)
F-305

NOTES FORMING PART OF THE FINANCIAL STATEMENTS
Valuation techniques with observable inputs (Level 2): This level of hierarchy includes financial assets and liabilities, measured using inputs other than quoted prices included within Level 1 that are observable for the asset or liability, either directly (i.e., as prices) or indirectly (i.e., derived from prices). This level of hierarchy includes Group’s over-the-counter (OTC) derivative contracts.
Valuation techniques with significant unobservable inputs (Level 3): This level of hierarchy includes financial assets and liabilities measured using inputs that are not based on observable market data (unobservable inputs). Fair values are determined in whole or in part, using a valuation model based on assumptions that are neither supported by prices from observable current market transactions in the same instrument nor are they based on available market data.
As at March 31, 2017
Level 1 Level 2 Level 3 Total
(` in million) (` in million) (` in million) (` in million) (US$ million)Financial assets: Investments in mutual funds 56,731.3 - - 56,731.3 874.9Investments in equity shares 44,903.8 - 4,052.8 48,956.6 755Investments in bonds and debentures
2,447.2 - - 2,447.2 37.7
Derivative financial assets - 1,872.1 - 1,872.1 28.91,04,082.3 1,872.1 4,052.8 1,10,007.2 1,696.5
Financial liabilities:
Derivative financial liabilities - 8,536.5 - 8,536.5 131.6- 8,536.5 - 8,536.5 131.6
(` in million)
As at March 31, 2016
Level 1 Level 2 Level 3 Total
Financial assets: Investments in mutual funds 46,635.5 - - 46,635.5 Investments in equity shares 36,438.6 - 4,062.8 40,501.4Investments in bonds and debentures 3,454.3 - - 3,454.3 Derivative financial assets - 3,424.4 - 3,424.4
86,528.4 3,424.4 4,062.8 94,015.6
Financial liabilities:
Derivative financial liabilities - 6,637.5 - 6,637.5- 6,637.5 - 6,637.5
(` in million)
As at April 1, 2015
Level 1 Level 2 Level 3 TotalFinancial assets: Investments in mutual funds 12,146.0 - - 12,146.0 Investments in equity shares 1,03,308.6 - 4,662.8 1,07,971.4Investments in bonds and debentures 3,614.1 - - 3,614.1 Derivative financial assets - 15,855.1 - 15,855.1
1,19,068.7 15,855.1 4,662.8 1,39,586.6
Financial liabilities:
Derivative financial liabilities - 9,115.4 - 9,115.4- 9,115.4 - 9,115.4
42. DISCLOSURES ON FINANCIAL INSTRUMENTS (CONTD.)
F-306

NOTES FORMING PART OF THE FINANCIAL STATEMENTS
Notes:
(i) Short-term financial assets and liabilities are stated at carrying value which is approximately equal to their fair value.
(ii) Derivatives are fair valued using market observable rates and published prices together with forecasted cash flow information where applicable.
(iii) Investments carried at fair value are generally based on market price quotations. Cost of unquoted equity instruments has been considered as an appropriate estimate of fair value because of a wide range of possible fair value measurements and cost represents the best estimate of fair value within that range.
(iv) Fair value of borrowings which have a quoted market price in an active market is based on its market price which is categorised as level 1. Fair value of borrowings which do not have an active market or are unquoted is estimated by discounting expected future cash flows using a discount rate equivalent to the risk-free rate of return adjusted for credit spread considered by lenders for instruments of similar maturities which is categorised as level 2 in the fair value hierarchy.
(v) Management uses its best judgement in estimating the fair value of its financial instruments. However, there are inherent limitations in any estimation technique. Therefore, for substantially all financial instruments, the fair value estimates presented above are not necessarily indicative of the amounts that the Group could have realised or paid in sale transactions as of respective dates. As such, fair value of financial instruments subsequent to the reporting dates may be different from the amounts reported at each reporting date.
(vi) There have been no transfers between Level 1 and Level 2 for the years ended March 31, 2017, March 31, 2016 and April 1, 2015.
(c) Derivative financial instruments
Derivative instruments used by the Group include forward exchange contracts, interest rate swaps, currency swaps, options, commodity futures and interest rate caps/collars. These financial instruments are used to hedge future transactions and cash flows and are subject to hedge accounting under Ind AS 109 “Financial Instruments” to the extent possible. The Group does not hold or issue derivative financial instruments for trading purposes. All transactions in derivative financial instruments are undertaken to manage risks arising from underlying business activities.
The following table sets out the fair value of derivatives held by the Group as at the end of the reporting period.As at March 31, 2017 As at March 31, 2016 As at April 1, 2015
Assets Liabilities Assets Liabilities Assets Liabilities
(US$ million)
(` in million)
(US$ million)
(` in million)
(` in million) (` in million)
(i) Foreign currency forwards, futures and options
25.5 1,650.7 127 8,235.7 2,790.5 6,077.8 15,608.0 6,220.4
(ii) Commodity futures and options 0.1 6.6 1.8 114.6 456.5 108.2 1.1 853.3(iii) Interest rate swaps and collars 3.3 214.8 2.9 186.2 177.4 451.5 246.0 2,041.7
28.9 1,872.1 131.7 8,536.5 3,424.4 6,637.5 15,855.1 9,115.4
Classified as :
Non-current 12.9 831.7 27.8 1,799.8 328.2 1,654.7 881.7 1,749.1 Current 16.0 1,040.4 103.9 6,736.7 3,096.2 4,982.8 14,973.4 7,366.3
42. DISCLOSURES ON FINANCIAL INSTRUMENTS (CONTD.)
F-307

NOTES FORMING PART OF THE FINANCIAL STATEMENTS
42. DISCLOSURES ON FINANCIAL INSTRUMENTS (CONTD.)
At the end of the reporting period, the total notional amount of outstanding foreign currency contracts, commodity futures, options and interest rate swap/collars that the Group has committed to are as follows:
As at March 31, 2017As at
March 31, 2016As at
April1, 2015
(US$ million) (` in million) (` in million) (` in million)
(i) Foreign currency forwards, futures and options 1,123.1 7,282.80 6,186.69 59,945.5(ii) Commodity futures and options 22.0 142.37 84.74 1,138.7(iii) Interest rate swaps and collars 288.8 1,872.57 2,132.08 25,604.9
1,433.9 9,297.74 8,403.51 86,689.1
(d) Transfer of financial assets
The Group transfers certain trade receivables under discounting arrangements with banks and financial institutions. Some of such arrangements do not qualify for de-recognition due to recourse arrangement being in place. Consequently, the proceeds received from transfer are recorded as short-term borrowings from banks and financial institutions.
The carrying value of trade receivables not de-recognised along with the associated liabilities is as below:
As at March 31, 2017 As at March 31, 2016 As at April 1, 2015
(US$
million)
(US$
million)
Carrying
value of asset
transferred
Carrying value
of associated
liabilities
Carrying
value of asset
transferred
Carrying value
of associated
liabilities
Carrying
value of asset
transferred
Carrying value
of associated
liabilities
(` in million) (` in million) (` in million) (` in million) (` in million) (` in million)
Trade receivables 100.99 100.99 6,548.8 6,548.8 5,174.6 5,174.6 5,589.8 5,589.8
F-308

NOTES FORMING PART OF THE FINANCIAL STATEMENTS
42. DISCLOSURES ON FINANCIAL INSTRUMENTS (CONTD.)
(e) Financial risk management
In the course of its business, the Group is exposed primarily to fluctuations in foreign currency exchange rates, commodity prices, interest rates, equity prices, liquidity and credit risk, which may adversely impact the fair value of its financial instruments.
The Group has a risk management policy which not only covers the foreign exchange risks but also other risks associated with the financial assets and liabilities. The risk management policy is approved by the Board of Directors. The risk management framework aims to:
(i) create a stable business planning environment by reducing the impact of currency, commodity prices and interest rate fluctuations on the entity’s business plan.
(ii) achieve greater predictability to earnings by determining the financial value of the expected earnings in advance.
(i) Market risk
Market risk is the risk of any loss in future earnings, in realisable fair values or in future cash flows that may result from a change in the price of a financial instrument. The value of a financial instrument may change as a result of changes in interest rates, foreign currency exchange rates, commodity prices, equity price fluctuations, liquidity and other market changes. Future specific market movements cannot be normally predicted with reasonable accuracy.
(a) Market risk - Foreign currency exchange rate risk:
The fluctuation in foreign currency exchange rates may have potential impact on the consolidated statement of profit and loss and equity, where any transaction references more than one currency or where assets/liabilities are denominated in a currency other than the functional currency of the respective consolidated entities.
Considering the countries and economic environment in which the Group operates, its operations are subject to risks arising from fluctuations in exchange rates in those countries. The risks primarily relate to fluctuations in US Dollar, Great British Pound, Euro, Singapore dollar, and Thai Baht against the respective functional currencies of the Company and its subsidiaries.
The Group, as per its risk management policy, uses foreign exchange and other derivative instruments primarily to hedge foreign exchange rate exposure. Any weakening of the functional currency may impact the Group’s cost of imports and cost of borrowings and consequently may increase the cost of financing the Group’s capital expenditures.
A 10% appreciation/depreciation of the foreign currencies with respect to functional currency of the entities within the Group would result in a decrease/increase in the Group’s net profit before tax by approximately ̀ 8,857.4 million (US$136.6
million) for the year ended March 31, 2017, (`8,041.8 million for the year ended March 31, 2016; ̀ 9,606.4 million as on April 1, 2015) and increase/decrease in carrying value of property, plant and equipment (before considering depreciation impact) by approximately `1,854.9 million (US$28.6 million) as at March 31, 2017 (March 31, 2016: `2,155.5 million).
The foreign exchange rate sensitivity is calculated by assuming a simultaneous parallel foreign exchange rates shift of all the currencies by 10% against the functional currency of the entities within the Group .
The sensitivity analysis has been based on the composition of the Group’s financial assets and liabilities at March 31, 2017, March 31, 2016 and April 1, 2015 excluding trade payables, trade receivables, other non-derivative and derivative financial instruments not forming part of debt and which do not present a material exposure. The period end balances are not necessarily representative of the average debt outstanding during the period.
(b) Market risk - Interest rate risk:
Interest rate risk is measured by using the cash flow sensitivity for changes in variable interest rates. Any movement in the reference rates could have an impact on the Group’s cash flows as well as costs.
The Group is subject to variable interest rates on some of its interest bearing liabilities. The Group’s interest rate exposure is mainly related to debt obligations.
Based on the composition of debt as at March 31, 2017 and March 31, 2016 a 100 basis points increase in interest rates would increase the Group’s finance costs and thereby consequently reduce net profit before tax by approximately `4,217.3 million (US$65.1 million) for the year ended March 31, 2017 (2015-16: `4,247.3 million and `3,891.2 million as on April 1, 2015).
F-309
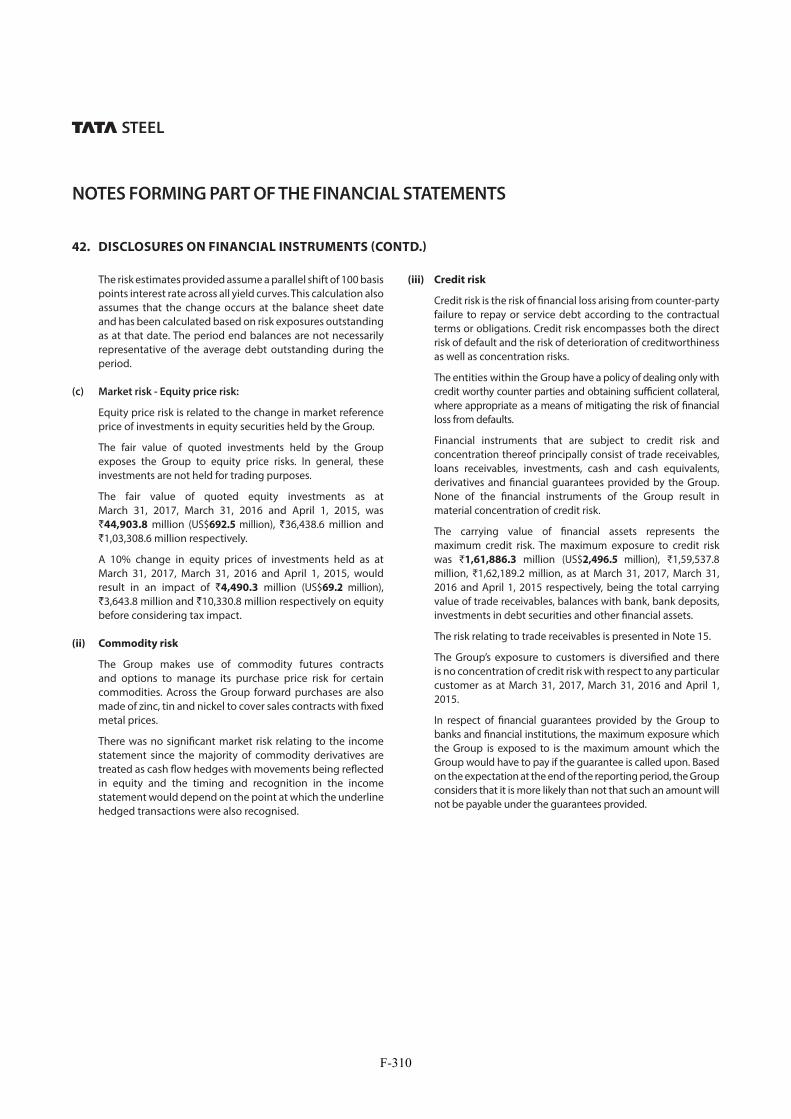
NOTES FORMING PART OF THE FINANCIAL STATEMENTS
The risk estimates provided assume a parallel shift of 100 basis points interest rate across all yield curves. This calculation also assumes that the change occurs at the balance sheet date and has been calculated based on risk exposures outstanding as at that date. The period end balances are not necessarily representative of the average debt outstanding during the period.
(c) Market risk - Equity price risk:
Equity price risk is related to the change in market reference price of investments in equity securities held by the Group.
The fair value of quoted investments held by the Group exposes the Group to equity price risks. In general, these investments are not held for trading purposes.
The fair value of quoted equity investments as at March 31, 2017, March 31, 2016 and April 1, 2015, was `44,903.8 million (US$692.5 million), `36,438.6 million and `1,03,308.6 million respectively.
A 10% change in equity prices of investments held as at March 31, 2017, March 31, 2016 and April 1, 2015, would result in an impact of `4,490.3 million (US$69.2 million), `3,643.8 million and `10,330.8 million respectively on equity before considering tax impact.
(ii) Commodity risk
The Group makes use of commodity futures contracts and options to manage its purchase price risk for certain commodities. Across the Group forward purchases are also made of zinc, tin and nickel to cover sales contracts with fixed metal prices.
There was no significant market risk relating to the income statement since the majority of commodity derivatives are treated as cash flow hedges with movements being reflected in equity and the timing and recognition in the income statement would depend on the point at which the underline hedged transactions were also recognised.
(iii) Credit risk
Credit risk is the risk of financial loss arising from counter-party failure to repay or service debt according to the contractual terms or obligations. Credit risk encompasses both the direct risk of default and the risk of deterioration of creditworthiness as well as concentration risks.
The entities within the Group have a policy of dealing only with credit worthy counter parties and obtaining sufficient collateral, where appropriate as a means of mitigating the risk of financial loss from defaults.
Financial instruments that are subject to credit risk and concentration thereof principally consist of trade receivables, loans receivables, investments, cash and cash equivalents, derivatives and financial guarantees provided by the Group. None of the financial instruments of the Group result in material concentration of credit risk.
The carrying value of financial assets represents the maximum credit risk. The maximum exposure to credit risk was ₹1,61,886.3 million (US$2,496.5 million), ₹1,59,537.8 million, ₹1,62,189.2 million, as at March 31, 2017, March 31, 2016 and April 1, 2015 respectively, being the total carrying value of trade receivables, balances with bank, bank deposits, investments in debt securities and other financial assets.
The risk relating to trade receivables is presented in Note 15.
The Group’s exposure to customers is diversified and there is no concentration of credit risk with respect to any particular customer as at March 31, 2017, March 31, 2016 and April 1, 2015.
In respect of financial guarantees provided by the Group to banks and financial institutions, the maximum exposure which the Group is exposed to is the maximum amount which the Group would have to pay if the guarantee is called upon. Based on the expectation at the end of the reporting period, the Group considers that it is more likely than not that such an amount will not be payable under the guarantees provided.
42. DISCLOSURES ON FINANCIAL INSTRUMENTS (CONTD.)
F-310

NOTES FORMING PART OF THE FINANCIAL STATEMENTS
42. DISCLOSURES ON FINANCIAL INSTRUMENTS (CONTD.)
The following table shows a maturity analysis of the anticipated cash flows including interest obligations for the Group’s derivative and non-derivative financial liabilities on an undiscounted basis, which therefore differ from both carrying value and fair value. Floating rate interest is estimated using the prevailing interest rate at the end of the reporting period. Cash flows in foreign currencies are translated using the period end spot rates.
(` in million)As at March 31, 2017
Carrying value
Contractual cash flows
less than one year
between one to five years
More than five years
Non-derivative financial liabilities:
Borrowings including interest obligations 8,30,144.9 10,54,643.2 2,11,834.9 5,05,746.0 3,37,062.3 Trade payables 1,85,744.6 1,85,744.6 1,85,744.6 - - Other financial liabilities 57,601.7 57,601.7 56,514.0 362.9 724.8
10,73,491.2 12,97,989.5 4,54,093.5 5,06,108.9 3,37,787.1
(US$ million) 16,554.7 20,016.8 7,002.8 7,804.9 5,209.1
Derivative financial liabilities 8,536.5 8,536.5 6,736.7 967.6 832.2
(US$ million) 131.6 131.6 103.9 14.9 12.8
(` in million)
As at March 31, 2016
Carrying value
Contractual cash flows
less than one year
between one to five years
More than five years
Non-derivative financial liabilities:
Borrowings including interest obligations 8,19,869.3 10,70,857.9 1,94,763.3 4,54,410.0 4,21,684.6 Trade payables 1,85,567.0 1,85,567.0 1,85,567.0 - - Other financial liabilities 59,635.1 59,635.1 55,091.1 4,058.7 485.3
10,65,071.4 13,16,060.0 4,35,421.4 4,58,468.7 4,22,169.9
Derivative financial liabilities 6,637.5 6,637.5 4,982.8 1,367.4 287.3
(` in million)As at April 1, 2015
Carrying value
Contractual cash flows
less than one year
between one to five years
More than five years
Non-derivative financial liabilities:
Borrowings including interest obligations 7,67,932.9 10,88,961.6 1,75,656.7 4,15,053.5 4,98,251.4 Trade payables 1,80,666.6 1,80,666.6 1,80,666.6 - - Other financial liabilities 65,806.3 65,806.3 56,800.7 8,483.4 522.2
10,14,405.8 13,35,434.5 4,13,124.0 4,23,536.9 4,98,773.6
Derivative financial liabilities 9,115.4 9,115.4 7,366.4 1,178.2 570.8
(iv) Liquidity risk
Liquidity risk refers to the risk that the Group cannot meet its financial obligations. The objective of liquidity risk management is to maintain sufficient liquidity and ensure that funds are available for use as per requirements.
The Group has obtained fund and non-fund based working capital lines from various banks. Furthermore, the Group has access to funds from debt markets through commercial paper programs, non-convertible debentures and other debt instruments. The Group invests its surplus funds in bank fixed deposit and mutual funds, which carry no or low mark to market risk.
F-311

NOTES FORMING PART OF THE FINANCIAL STATEMENTS
43. SEGMENT REPORTING
(I) The Group is engaged in the business of manufacturing steel products across the globe. The operating segments have been identified based on the different geographical areas where major entities within the Group operate and which is also the basis on which the Chief Operating Decision Maker (CODM) reviews and assess the Group’s performances.
The Group’s reportable segments and segment information is presented below: (` in million)
Tata Steel
India
Other
Indian
operations
Tata Steel
Europe
Other trade
related
operations
South-
East Asian
operations
Rest of the
world
Inter-segment
eliminations
Total
(` in million) (US$
million)Segment revenue
External revenue 4,87,415.1 51,420.9 5,20,174.8 32,580.7 76,532.5 6,075.4 - 11,74,199.4 18,107.8
3,97,186.5 45,955.3 5,32,258.7 8,404.4 75,589.2 4,005.1 - 10,63,399.2Intersegment revenue 45,194.5 15,577.5 674.8 2,04,933.0 4,826.5 224.1 (2,71,430.4) -
29,787.9 16,311.0 3,294.9 1,41,968.3 5,080.5 1,405.5 (1,97,848.1) -Total Revenue 5,32,609.6 66,998.4 5,20,849.6 2,37,513.7 81,359.0 6,299.5 (2,71,430.4) 11,74,199.4 18,107.8
4,26,974.4 62,266.3 535,553.6 1,50,372.7 80,669.7 5,410.6 (1,97,848.1) 10,63,399.2
Segment results before
exceptional items, interest,
tax and depreciation :
1,19,527.5
77,923.15,800.8
6,069.147,049.1
(5,132.0)2,616.2
12,781.05,312.7
1,974.1(195.6)
(1526.3)(9857.0)
(1,2581.1)1,70,253.7
79,507.92,625.5
Segment results include:
Share of profit/(loss) of joint ventures and associates
(300.1) 25.3 482.9 - (131.6) - - 76.5 1.2
(896.9) 16.5 (140.5) - (83.3) - - (1,104.2)
Reconciliation to profit/
(loss) for the year:
Finance income 5,175.7 79.8
3,193.4Finance cost 50,722.0 782.2
42,214.1Depreciation and Amortisation 56,728.8 874.8
53,063.5
Profit before exceptional
items and tax
67,978.6
(12,576.3)1,048.3
Exceptional items (43,242.3) (666.9)
39,903.8Profit before tax 24,736.3 384.5
27,327.5Tax 27,780.1 428.4
6,899.6Profit after tax from
continuing operations
(3,043.8)
20,427.9(46.9)
Profit after tax from discontinued operations
(38,641.9)
(25,398.8)(595.9)
Net profit/(loss) for the
period
(41,685.7)
(4,970.9)(624.9)
Segment assets 10,91,806.0 55,322.6 4,36,873.1 4,34,135.0 50,914.3 79,046.6 (4,14,765.2) 17,33,332.4 26,730.4
10,29,294.7 49,109.9 5,55,859.9 4,26,161.5 49,369.8 73,479.1 (4,08,160.5) 17,75,114.4Segment assets include:
Equity accounted investments 12,810.5 256.2 2,752.6 - 117.5 - - 15,936.8 245.8
12,951.4 339.3 2,756.6 - 156.8 - - 16,204.1
Segment liabilities 6,25,429.5 32,749.0 7,30,617.1 3,32,083.4 27,245.0 22,051.1 (4,31,052.9) 13,39,122.2 2,05,707.8
5,92,136.4 28,942.1 7,86,563.8 2,54,713.6 27,972.0 62,138.1 (422,486.5) 3,29,979.5Additions to non-current
assets
38,467.3
60,749.24,198.1
3,676.736,658.0
35,392.431.7
5.753.8
320.32,166.7
15,820.9-
-81,575.6
1,15,965.21,258.0
Figures in italics represents comparative figures of previous year.
F-312

NOTES FORMING PART OF THE FINANCIAL STATEMENTS
Details of revenue by nature of business is as below:
Year ended March 31, 2017
Year endedMarch 31, 2016
(US$ million) (` in million) (` in million)
Steel 16,286.8 10,56,115.2 9,63,217.4Others 1,821.0 1,18,084.2 1,00,181.8
18,107.8 11,74,199.4 10,63,399.2
Revenue from other business primarily relate to from ferro alloys, power, town and medical services.
Details of revenue based on geographical location of customers is as below:
Year ended March 31, 2017
Year endedMarch 31, 2016
(US$ million) (` in million) (` in million)
India 7,862.3 5,09,828.1 4,36,036.1Outside India 10,245.5 6,64,371.3 6,27,363.1
18,107.8 11,74,199.4 10,63,399.2
Revenue outside India primarily relates to the United Kingdom and other European countries.
Details of non-current assets (property, plant and equipment, intangibles and goodwill on consolidation) based on geographical
area is as below:
Year ended March 31, 2017
Year endedMarch 31, 2016
(US$ million) (` in million) (` in million)
India 12,506.3 8,10,972.6 8,04,557.4Outside India 4,116.5 2,66,934.2 2,77,401.1
16,622.8 10,77,906.8 10,81,958.5
Notes:
(i) Segment performance is reviewed by the CODM on the basis of profit or loss from continuing operations before finance income and finance cost, depreciation and amortisation and tax expenses. Segment results reviewed by the CODM also exclude income or expenses which are non-recurring in nature and are classified as exceptional.
Information about segment assets and liabilities provided to the CODM, however, include the related assets and liabilities arising on account of items excluded in measurement of segment results. Such amounts, therefore, form part of the reported segment assets and liabilities.
(ii) No single customer represents 10% or more of the Group’s total revenue during the year ended March 31, 2017 and March 31, 2016
(iii) The accounting policies of the reportable segments are the same as of the Group’s accounting policies.
43. SEGMENT REPORTING (CONTD.)
F-313

NOTES FORMING PART OF THE FINANCIAL STATEMENTS
44. RELATED PARTY TRANSACTIONS
The Group’s related parties primarily consists of its associates and joint ventures, Tata Sons Limited including its subsidiaries and joint ventures. The Group’s routinely enters into transactions with these related parties in the ordinary course of business at market rates and terms. Transactions and balances between the Company, its subsidiaries and fellow subsidiaries are eliminated on consolidation.
The following table summarises related-party transactions and balances included in the consolidated financial statements for the year ended/as at March 31, 2017, March 31, 2016 and April 1, 2015.
AssociatesJoint
Arrangements
Tata Sons and its subsidiaries
and joint ventures
Total
(` in million)
(US$
million)
Purchase of goods 5,919.6 2,616.8 10,550.2 19,086.6 294.3
5,377.4 4,118.3 5,809.3 15,305.0
Sale of goods 8,140.9 19,425.8 1,901.5 29,468.2 454.4
6,573.5 19,232.4 634.8 26,440.7
Services received 138.8 18,948.2 1,114.0 20,201.0 311.5
299.0 12,124.2 1,189.5 13,612.7
Services rendered 145.7 1,021.7 8.5 1,175.9 18.1
91.5 1,105.4 2.3 1,199.2
Interest income recognised - 3.9 - 3.9 0.1
- 17.9 - 17.9
Interest expenses recognised - - 161.6 161.6 2.5
9.4 3.7 08.3 21.4
Dividend paid - - 2,364.8 2,364.8 36.5
- - 2,366.1 2,366.1
Dividend received 238.3 483.6 05.4 727.3 11.2
95.0 433.2 409.4 937.6
Provision for receivables recognised during
the year
- - - -
0.3 - - 0.3
Management contracts 8.6 18.9 1,312.2 1,339.7 20.7
7.1 8.8 1454.1 1,470.0
Purchase of Investments - - - - - 81.5 - - 81.5
Sale of Investments - - - - -
- - 26,036.3 26,036.3
Finance provided during the year - 70.0 - 70.0 1.1
9.1 606.1 76.9 692.1 - 2,074.7 - 2,074.7
F-314

NOTES FORMING PART OF THE FINANCIAL STATEMENTS
AssociatesJoint
Arrangements
Tata Sons and its subsidiaries
and joint ventures
Total
(` in million)
(US$
million)
Outstanding loans and receivables 951.9 10,564.4 820.3 12,336.6 190.2
803.4 12,697.8 385.6 13,886.8873.7 13,199.7 370.4 14,443.8
Provision for outstanding loans and receivables
29.8 9,446.6 - 9,476.4 146.1
35.0 9,904.3 - 9,939.333.7 8,990.0 - 9,023.7
Outstanding Payables 565.2 4,358.9 2,882.1 7,806.2 120.4
758.7 3,392.3 2,290.1 6,441.1 915.6 3,162.0 2,337.7 6,415.3
Guarantees provided outstanding - 2,225.6 - 2,225.6 34.3
- 2,422.2 - 2,422.2 - 2,560.7 - 2,560.7
Figures in italics represents comparative figures of previous years.
(i) The details of remuneration paid to the managerial personnel is provided in Note 30
In addition, during the year the Group has paid dividend of `2,19,360.0 (US$ 3,382.8 million) (2015-16: `2,19,360.0) to key managerial personnel and `26,480.0 (US$ 408.4 million) (2015-16: `26,480.0) to relatives of key managerial personnel.
(ii) During the year, the Group has contributed `4,710.9 million (US$72.6 million) (2015-16: `8,653.0 million) to post employment benefit plans.
(iii) Transactions with joint ventures have been disclosed at full value and not at their proportionate share.
44. RELATED PARTY TRANSACTIONS (CONTD.)
F-315

NOTES FORMING PART OF THE FINANCIAL STATEMENTS
45. ADOPTION OF INDIAN ACCOUNTING STANDARDS (IND AS)
A. Mandatory exceptions to retrospective application
The Group has applied the following exceptions to the retrospective application of Ind AS as mandatorily required under Ind AS 101 “First Time Adoption of Indian Accounting Standards”.
(i) Estimates
On assessment of estimates made under the Previous GAAP financial statements, the Group has concluded that there is no necessity to revise such estimates under Ind AS, as there is no objective evidence of an error in those estimates.
(ii) Classification and measurement of financial assets
The classification of financial assets to be measured at amortised cost or fair value through other comprehensive income is made on the basis of facts and circumstances that existed on the date of transition to Ind AS.
B. Optional exemptions from retrospective application
Ind AS 101 “First time adoption of Indian Accounting Standards” permits Companies adopting Ind AS for the first time to take certain exemptions from the full retrospective application of Ind AS during transition. The Group has accordingly on transition to Ind AS availed the following key exemptions:
i. Fair value as deemed cost for items of property, plant
and equipment
The Company and some of its subsidiaries has elected to treat fair value as deemed cost for certain items of its property, plant and equipment.
The aggregate fair value of property, plant and equipment where the exemption was availed amounted to ₹4,75,807.8 million with an aggregate adjustment of ₹1,41,296.8 million being recognised to the carrying value reported under the Previous GAAP.
ii. Business combination
The Group has elected to apply the principles of Ind AS 103, ‘Business Combinations’ retrospectively to acquisitions made on or after April 2, 2007. The assets acquired and liabilities assumed in such business combinations have thus been accounted for at their respective fair values as on the acquisition date adjusted till the date of transition and for subsequent reporting periods.
iii. Designation of previously recognised financial
instruments
As per Ind AS 109, “Financial Instruments” at initial recognition of a financial asset, an entity may make an irrevocable election to present subsequent changes in fair value of an investment in equity instrument in other comprehensive income.
Ind AS 101 “First time Adoption of Indian Accounting Standards” allows such designation of previously recognised financial assets as “fair value through other comprehensive income” on the basis of facts and circumstances that existed at the date of transition to Ind AS.
Accordingly, the Group has designated its investments in equity instruments at fair value through other comprehensive income on the basis of facts and circumstances that existed at the date of transition to Ind AS.
iv. Effects of changes in exchange rates
In respect of long term foreign currency monetary items recognised in the financial statements for the period ending immediately before the beginning of the first Ind AS financial reporting period, the Company and some of its subsidiaries have elected to recognise exchange differences on translation of such long term foreign currency monetary items in line with their Previous GAAP accounting policy.
In respect of long term foreign currency monetary items recognised in the financial statements beginning with the first Ind AS financial reporting period, exchange differences are recognised in the consolidated statement of profit and loss
F-316

NOTES FORMING PART OF THE FINANCIAL STATEMENTS
46. EXPLANATION OF TRANSITION TO IND AS
C. Transition to Ind AS - Reconciliations
The following reconciliations provide the explanation and qualification of the differences arising from the transition from Previous GAAP to Ind AS in accordance with Ind AS 101 “First Time Adoption of Indian Accounting Standards”.
(a) Reconciliation of total equity as at April 1, 2015 and March 31, 2016.
(b) Reconciliation of total comprehensive income for the year ended March 31, 2016.
(c) Reconciliation of consolidated statement of cash flows for the year ended March 31, 2016.
Previous GAAP figures have been reclassified/regrouped wherever necessary to confirm with the financial statements prepared under Ind AS.
(a) Reconciliation of total equity (` in million)
Note As at March 31, 2016
As at April 1, 2015
Equity as per Previous GAAP 2,84,788.6 3,13,494.1Re-measurements on transition to Ind AS: (1) Property, plant and equipment (ii) 2,10,121.2 1,40,410.1 (2) Financial instruments (i) 39,047.8 1,04,580.8 (3) Re-classification of Hybrid Perpetual Securities (v) 22,750.0 22,750.0 (4) Reversal of proposed dividend and tax thereon (vii) 9,463.7 9,431.5 (5) Leases (iii) (1,536.9) (1,649.2) (6) Employee benefits (viii) 5,318.2 14,149.1(7) Change in method/scope of consolidation (vi) 9,026.8 6,105.2 (8) Re-classification of non-controlling interests (x) 9,358.9 10,165.8(9) Business combinations (iv) (76,770.3) (72,290.9) (10) Others (xi) (3,803.5) (3,468.4)(11) Tax impact on above adjustments (ix) (62,629.6) (64,000.0) Equity as per Ind AS 4,45,134.9 4,79,678.1
(b) Reconciliation of total comprehensive income
(` in million) Note Year ended
March 31, 2016
Profit/(loss) after tax as per Previous GAAP (30,493.2)Re-measurements on transition to Ind AS: (1) Financial instruments (i) (37,618.1) (2) Property, plant and equipment (ii) 72,074.0 (3) Employee benefits (viii) (17,071.8) (4) Others (xi) 814.0 (5) Tax impact on above adjustments (ix) 7,324.2 Profit/(loss) after tax as per Ind AS (4,970.9)
Other Comprehensive Income/(loss) (xii) (18,981.7) Total Comprehensive Income/(loss) as per Ind AS (23,952.6)
F-317

NOTES FORMING PART OF THE FINANCIAL STATEMENTS
46. EXPLANATION OF TRANSITION TO IND AS (CONTD.)
(c) Reconciliation of consolidated statement of cash flows
(` in million)
Note Amount as per Previous GAAP
Effect of transition to Ind AS
Amount as per Ind AS
Net cash generated from/(used in) operating activities (xiii-xv) 1,11,169.6 3,383.9 1,14,553.5 Net cash generated from/(used in) investing activities (xiii-xv) (91,924.6 ) (6,13.6) (92,538.2) Net cash generated from/(used in) financing activities (xiii-xv) (43,137.7) (4,153.5) (47,291.2)Net increase/(decrease) in cash and cash equivalents (23,894.0) (1,381.9) (25,275.9)
Cash and cash equivalents as at April 1, 2015 (xiii-xv) 85,256.6 (3,485.3) 81,771.3Effect of exchange rate on translation of foreign currency cash and cash equivalents
(xiii-xv) 4,727.3 (132.2) 4,595.1
Cash and cash equivalents as at March 31, 2016 (xiii-xv) 66,089.9 (4,999.4) 61,090.5
Notes to reconciliation of total equity and total comprehensive
income
(i) Financial Instruments
(a) In accordance with Ind AS 109 “Financial Instruments”, investments in quoted equity instruments (other than in subsidiaries, associates and joint ventures) have been recognised at fair value at each reporting date through other comprehensive income.
Consequently, on eventual sale of such investments, profit or loss recognised in the consolidated statement of profit and loss under the Previous GAAP has been reversed as the fair value changes are recognised through other comprehensive income.
(b) In accordance with Ind AS 109 “Financial Instruments”, premium payable on redemption, discount on issue, transaction costs on issue of bonds and debentures are required to be considered as effective finance costs and recognised in the consolidated statement of profit and loss using the effective interest rate.
Consequently, premium on redemption/discount on issue and transaction costs recognised directly in equity or amortised using a different approach under the Previous GAAP have been reversed and are now recognised through the consolidated statement of profit and loss using effective interest rate.
(c) In accordance with Ind AS 109 “Financial Instruments”, investments in mutual funds are recognised at fair value through the consolidated statement of profit and loss at each reporting period.
(d) In accordance with Ind AS 109 “Financial Instruments”, all derivative financial instruments are recognised at fair value as
at each reporting date through the consolidated statement of profit and loss except where designated in a hedging relationship.
(ii) Property, plant and equipment
On transition to Ind AS, the Company and some of its subsidiaries have treated fair value as deemed cost for certain items of property, plant and equipment resulting in an uplift in the carrying value as compared to the Previous GAAP.
The consequential impact of additional depreciation on fair value uplift is recognised in the consolidated statement of profit and loss.
(iii) Leases
As per Ind AS 17, “Leases”, the Group has assessed long term arrangements, fulfilment of which is dependant on use of specified assets and where the Group has the right to control the use of such assets for being in the nature of a lease.
This resulted in certain arrangements being treated as a lease and classified as finance lease. The impact on total equity and profit and loss is on account of timing difference in recognition of expenses under the lease accounting model as compared to those recognised under the Previous GAAP.
(iv) Business combinations
The Group has fair valued business combinations effected on or after April 2, 2007. The assets acquired and liabilities assumed in such business combinations have thus been recorded at fair values on the date of acquisition and adjusted for subsequent depreciation and amortisation till the date of transition to Ind AS and for subsequent reporting periods.
F-318

NOTES FORMING PART OF THE FINANCIAL STATEMENTS
(v) Re-classification of Hybrid Perpetual Securities
In accordance with Ind AS 109 “Financial Instruments”, Hybrid Perpetual Securities have been re-classified as equity based on its substance and the fact that the Company has an unconditional right to avoid making payments on the instrument as per the contractual terms.
(vi) Equity accounting of joint ventures and changes in scope
of consolidation
In accordance with Ind AS 28, “Investments in Associates and Joint Ventures”, the Group has accounted for its joint ventures using the equity method unlike proportionate line by line method under the previous GAAP.
In addition, certain entities consolidated as subsidiaries under the Previous GAAP have been consolidated as joint ventures and accounted for using the equity method under Ind AS.
(vii) Reversal of proposed dividend
In accordance with Ind AS 8 “Accounting Policies, Changes in Accounting Estimates and Errors”, dividend recommended by the Board of Directors is recognised only once approved by the shareholders as compared to the Previous GAAP where it was considered as an adjusting event.
(viii) Employee benefits
(a) In accordance with Ind AS 19, “Employee benefits” re-measurement gains and losses on post employment defined benefit obligations are recognised in other comprehensive income as compared to the consolidated statement of profit and loss under the Previous GAAP.
(b) Interest expense/income on the net defined benefit liability/asset is recognised in the consolidated statement of profit and loss using the discount rate used for defined benefit obligation as compared to the expected rate used for recognising income from plan assets under the Previous GAAP.
(c) Plan administration costs are recognised in the consolidated statement of profit and loss as and when incurred, as compared to the Previous GAAP where the same was included in the valuation of obligations or assets as the case may be.
(ix) Deferred Taxes
In accordance with Ind AS 12, “Income Taxes”, the Company on transition to Ind AS has recognised deferred tax on temporary differences, i.e. based on balance sheet approach as compared to the earlier approach of recognising deferred taxes on timing differences , i.e. profit and loss approach.
The tax impacts as above primarily represent deferred tax consequences arising out of Ind AS re-measurement changes.
(x) Non-controlling Interests
Under the Previous GAAP, non-controlling interest was not considered as part of total equity and was presented separately. In the consolidated statement of profit and loss, share of non-controlling interest for the year was shown as a deduction from Group’s profit or loss.
Under Ind AS, non-controlling interests are considered as a part of total equity and its share in profit or loss for the year and total comprehensive income is shown as an allocation instead of as a deduction from profit or loss for the year.
Further, under Ind AS, profit or loss and each component of other comprehensive income is attributed to the owners of the Company and to non-controlling interests even if this results in the non-controlling interests having a deficit balance. Under the Previous GAAP, the excess of such losses attributable to non-controlling interests over its interest in the equity of subsidiary was attributed to the owners of the Company.
(xi) Other Adjustments
(a) In accordance with Ind AS 20 “Government Grants”, duty saved on import of capital goods and spares under the EPCG scheme has been treated as a Government grant.
The benefit has been grossed up with the cost of the related asset and has been recognised as a deferred income. Such deferred income is released to the consolidated statement of profit and loss based on fulfilment of related export obligations. The duty benefit grossed up to the cost of the asset is depreciated based on its useful economic life or as and when the spares are consumed.
(b) Other adjustments also include consequential impact on inventory valuation due to Ind AS transition.
46. EXPLANATION OF TRANSITION TO IND AS (CONTD.)
F-319

NOTES FORMING PART OF THE FINANCIAL STATEMENTS
46. EXPLANATION OF TRANSITION TO IND AS (CONTD.)
(xii) Other comprehensive Income
Under Ind AS, all items of income and expense recognised during the year are included in the profit or loss for the year, unless Ind AS requires or permits otherwise. Items that are not recognised in profit or loss but are shown in the consolidated statement of profit and loss and other comprehensive income include re-measurements gains or losses on defined benefit plans, effective portion of gains or losses on cash flow hedges, fair value changes of equity investments and foreign currency translation differences of foreign subsidiaries.
The concept of other comprehensive income did not exist under the Previous GAAP.
Notes to reconciliation of consolidated statement of cash flows
(xiii) The Group transfers trade receivables under discounting arrangements with banks and financial institutions. Some of the arrangements do not meet the de-recognition criteria due to recourse arrangements being in place. Consequently, proceeds received from such transactions are recorded as short term borrowings and trade receivables continue to be recognised in the consolidated financial statements. Under the Previous GAAP, such transactions were de-recognised and recorded as a sale.
As a result, cash flow from operating activities under Ind AS is lower and cash flow from financing activities is higher.
(xiv) On transition to Ind AS, long term arrangements have been assessed as being in the nature of a lease and classified as finance leases, where applicable. Under the Previous GAAP, such long term contracts were treated as a normal contract for purchase of output. Payments made under such contracts have therefore been re-classified as part of financing activities under Ind AS as compared to operating activities under the Previous GAAP.
As a result, cash flow from operating activities under Ind AS is higher and cash flow from financing activities is lower.
(xv) Under the Previous GAAP, joint ventures were consolidated using line by line proportionate method whereas under Ind AS joint ventures have been accounted for using the equity method. As a result, proportionate cash flows for operating, investing and financing activities including cash and cash equivalents of joint ventures included in the consolidated cash flow under the Previous GAAP do not form part of consolidated cash flow under Ind AS.
47. DIVIDEND The dividends declared by the Company are based on the
profits available for distribution as reported in the financial statements of the Company. On May 16, 2017, the Board of Directors of the Company have proposed a dividend of ₹10 per share in respect of the year ended March 31, 2017 subject to the approval of shareholders at the Annual General Meeting. If approved, the dividend would result in a cash outflow of ₹11,677.6 million inclusive of a dividend distribution tax of ₹1,977.2 million.
F-320

NOTES FORMING PART OF THE FINANCIAL STATEMENTS
Na
me
of
the
En
tity
Re
po
rtin
g
Cu
rre
nc
y
Ne
t A
sse
ts, i
.e. t
ota
l a
sse
ts
min
us
tota
l li
ab
ilit
ies
Sh
are
in
pro
fit
or
(lo
ss)
Sh
are
in
oth
er
com
pre
he
nsi
ve
in
com
e
Sh
are
in
to
tal
com
pre
he
nsi
ve
in
com
e
As
% o
f
con
soli
da
ted
ne
t a
sse
ts
Am
ou
nt
As
% o
f
con
soli
da
ted
pro
fit
or
loss
Am
ou
nt
As
% o
f
con
soli
da
ted
oth
er
com
pre
he
nsi
ve
inco
me
Am
ou
nt
As
% o
f to
tal
com
pre
he
nsi
ve
inco
me
Am
ou
nt
A.
PA
RE
NT
Ta
ta S
tee
l L
imit
ed
INR
19
.64
% 5
,19
,34
0.1
(4
4.4
4%
) 3
4,4
45
.5
(27
.94
%)
6,7
57
.9
(40
.52
%)
41
,20
3.4
B.
SU
BS
IDIA
RIE
S
a)
Ind
ian
1Ad
ityap
ur To
ll Br
idge
Com
pany
Lim
ited
INR
0.02
% 3
97.9
0.
05%
(35.
0)0.
00%
- 0.
03%
(35.
0)
2Ta
ta S
teel
Spe
cial
Eco
nom
ic Z
one
Lim
ited
INR
0.05
% 1
,326
.2
0.02
% (1
3.1)
0.00
% (0
.0)
0.01
% (1
3.1)
3In
dian
Ste
el &
Wire
Pro
duct
s Lt
d.IN
R0.
02%
634
.1
(0.0
8%)
61.
2 0.
04%
(9.7
)(0
.05%
) 5
1.5
4Ja
msh
edpu
r Util
ities
& S
ervi
ces
Com
pany
Lim
ited
INR
0.02
% 6
38.8
(0
.67%
) 5
15.6
0.
00%
0.5
(0
.51%
) 5
16.1
5H
aldi
a W
ater
Man
agem
ent L
imite
dIN
R(0
.06%
) (1
,608
.4)
0.18
% (1
35.7
)0.
00%
- 0.
13%
(135
.7)
6Ru
juva
lika
Inve
stm
ents
Lim
ited
INR
0.03
% 8
41.4
(0
.03%
) 2
3.8
(0.8
0%)
194
.1
(0.2
1%)
217
.9
7T
S A
lloys
Lim
ited
INR
0.04
% 1
,127
.9
(0.0
1%)
8.4
0.
01%
(1.4
)(0
.01%
) 7
.0
8Ta
ta K
orf E
ngin
eerin
g Se
rvic
es L
td.
INR
0.00
% (9
8.0)
0.00
% (0
.2)
0.00
% -
0.00
% (0
.2)
9Ta
ta M
etal
iks
Ltd.
INR
0.08
% 2
,071
.8
(1.5
0%)
1,1
64.8
0.
09%
(22.
6)(1
.12%
) 1
142.
2
10Ta
ta S
pong
e Iro
n Li
mite
d IN
R0.
34%
8,6
48.5
(0
.75%
) 5
81.8
0.
06%
(13.
6)(0
.56%
) 5
68.2
11TS
IL E
nerg
y Li
mite
dIN
R0.
00%
11.
4 0.
00%
0.3
0.
00%
- 0.
00%
0.3
12Ka
lzip
Indi
a Pr
ivat
e Li
mite
dIN
R0.
00%
103
.3
(0.0
1%)
9.0
0.
00%
- (0
.01%
) 9
.0
13Ta
ta S
teel
Inte
rnat
iona
l (In
dia)
Lim
ited
INR
0.02
% 4
31.8
(0
.05%
) 4
0.6
0.00
% -
(0.0
4%)
40.
6
14Ta
ta S
teel
Odi
sha
Lim
ited
INR
0.00
% (0
.1)
0.00
% (0
.2)
0.00
% -
0.00
% (0
.2)
15Ta
ta S
teel
Pro
cess
ing
and
Dis
trib
utio
n Li
mite
dIN
R0.
20%
5,3
67.6
(0
.52%
) 4
04.1
0.
07%
(17.
6)(0
.38%
) 3
86.5
16Ta
yo R
olls
Lim
ited
INR
(0.1
5%)
(4,2
26.6
)1.
08%
(840
.0)
0.00
% 0
.2
0.83
% (8
39.8
)
17Ta
ta P
igm
ents
Lim
ited
INR
0.02
% 4
64.5
(0
.08%
) 6
4.6
0.03
% (6
.8)
(0.0
6%)
57.
8
18Th
e Ti
npla
te C
ompa
ny o
f Ind
ia L
td
INR
0.25
% 6
,222
.9
(0.3
6%)
278
.6
0.14
% (3
2.7)
(0.2
4%)
245
.9
19Ta
ta S
teel
Fou
ndat
ion
INR
0.00
% 9
.9
0.00
% (0
.1)
0.00
% -
0.00
% (0
.1)
b)
Fo
reig
n
1A
BJA
Inve
stm
ent C
o. P
te. L
td.
USD
(0.1
0%)
(2,6
54.6
)(0
.97%
) 7
55.2
0.
00%
- (0
.74%
) 7
55.2
2N
atSt
eel A
sia
Pte.
Ltd
.U
SD0.
56%
14,
930.
7 0.
94%
(729
.7)
3.87
% (9
36.2
)1.
64%
(1,6
65.9
)
3TS
Asi
a (H
ong
Kong
) Ltd
.U
SD0.
04%
1,1
53.1
(0
.19%
) 1
50.1
0.
00%
- (0
.15%
) 1
50.1
4Ta
ta S
teel
(KZN
) (Pt
y) L
td.
ZAR
(0.3
8%)
(10,
119.
1)0.
00%
- 0.
00%
- 0.
00%
-
5T
Stee
l Hol
ding
s Pt
e. L
td.
GBP
17.9
8% 4
,75,
270.
1 0.
00%
(0.7
)0.
00%
- 0.
00%
(0.7
)
6T
S G
loba
l Hol
ding
s Pt
e Lt
d.G
BP11
.88%
3,1
4,10
6.0
69.1
7% (5
3,61
1.1)
0.00
% -
52.7
2% (5
3,61
1.1)
7O
rchi
d N
ethe
rland
s (N
o.1)
B.V
.EU
R0.
00%
15.
8 0.
00%
(0.2
)0.
00%
- 0.
00%
(0.2
)
8N
atSt
eel H
oldi
ngs
Pte.
Ltd
.SG
D0.
00%
24.
9 (0
.25%
) 1
96.0
(0
.16%
) 3
9.0
(0.2
3%)
235
.0
9Ea
stee
l Ser
vice
s (M
) Sdn
. Bhd
.M
YR0.
01%
287
.8
0.00
% (3
.3)
0.00
% -
0.00
% (3
.3)
10Ea
ster
n St
eel F
abric
ator
s Ph
ilipp
ines
, Inc
.SG
D(0
.02%
) (3
99.1
)0.
00%
- 0.
00%
- 0.
00%
-
11N
atSt
eel (
Xiam
en) L
td.
CNY
(0.0
4%)
(1,0
10.9
)(1
.23%
) 9
53.9
0.
00%
- (0
.94%
) 9
53.9
12N
atSt
eel R
ecyc
ling
Pte
Ltd.
SGD
0.07
% 1
,950
.6
(0.0
5%)
42.
3 0.
00%
- (0
.04%
) 4
2.3
13N
atSt
eel T
rade
Inte
rnat
iona
l (Sh
angh
ai) C
ompa
ny L
td.
CNY
0.00
% (2
.7)
0.00
% (0
.7)
0.00
% -
0.00
% (0
.7)
14N
atSt
eel T
rade
Inte
rnat
iona
l Pte
. Ltd
.U
SD0.
01%
150
.3
(0.0
1%)
7.5
0.
00%
- (0
.01%
) 7
.5
48
. S
TA
TE
ME
NT
OF
NE
T A
SS
ET
S A
ND
PR
OF
IT O
R L
OS
S A
TT
RIB
UT
AB
LE
TO
OW
NE
RS
AN
D M
INO
RIT
Y I
NT
ER
ES
T
F-321

NOTES FORMING PART OF THE FINANCIAL STATEMENTS
Na
me
of
the
En
tity
Re
po
rtin
g
Cu
rre
nc
y
Ne
t A
sse
ts, i
.e. t
ota
l a
sse
ts
min
us
tota
l li
ab
ilit
ies
Sh
are
in
pro
fit
or
(lo
ss)
Sh
are
in
oth
er
com
pre
he
nsi
ve
in
com
e
Sh
are
in
to
tal
com
pre
he
nsi
ve
in
com
e
As
% o
f
con
soli
da
ted
ne
t a
sse
ts
Am
ou
nt
As
% o
f
con
soli
da
ted
pro
fit
or
loss
Am
ou
nt
As
% o
f
con
soli
da
ted
oth
er
com
pre
he
nsi
ve
inco
me
Am
ou
nt
As
% o
f to
tal
com
pre
he
nsi
ve
inco
me
Am
ou
nt
15N
atSt
eel V
ina
Co. L
td.
VND
0.03
% 7
55.9
(0
.09%
) 7
1.9
0.00
% -
(0.0
7%)
71.
9
16Th
e Si
am In
dust
rial W
ire C
ompa
ny L
td.
THB
0.38
% 1
0,03
6.3
(1.1
0%)
850
.1
(0.0
4%)
8.5
(0
.84%
) 8
58.6
17TS
N W
ires
Co.,
Ltd.
THB
0.02
% 5
68.5
0.
13%
(100
.5)
(0.0
1%)
1.6
0.
10%
(98.
9)
18Ta
ta S
teel
Eur
ope
Lim
ited
GBP
6.39
% 1
,68,
772.
7 12
.64%
(9,7
95.9
)0.
00%
- 9.
64%
(9,7
95.9
)
19A
pollo
Met
als
Lim
ited
USD
0.03
% 7
06.2
(0
.51%
) 3
95.7
(0
.20%
) 4
7.3
(0.4
4%)
443
.0
20Au
gust
a G
rund
stuc
ks G
mbH
EUR
0.00
% (1
8.7)
0.01
% (1
1.2)
(0.0
1%)
3.0
0.
01%
(8.2
)
21Au
tom
otiv
e La
ser T
echn
olog
ies
Lim
ited
GBP
0.00
% -
0.00
% -
0.00
% -
0.00
% -
22B
S Pe
nsio
n Fu
nd T
rust
ee L
imite
dG
BP0.
01%
179
.3
0.00
% -
0.00
% -
0.00
% -
23Be
heer
maa
tsch
appi
j Ind
ustr
iele
Pro
dukt
en B
.V.
EUR
(0.0
2%)
(478
.0)
0.00
% (3
.4)
0.00
% -
0.00
% (3
.4)
24Be
ll &
Har
woo
d Li
mite
dG
BP0.
00%
(102
.3)
0.00
% -
0.00
% -
0.00
% -
25Bl
astm
ega
Lim
ited
GBP
0.28
% 7
,532
.4
0.00
% -
0.00
% -
0.00
% -
26Bl
ume
Stah
lser
vice
Gm
bHEU
R0.
02%
530
.2
0.13
% (1
04.5
)0.
06%
(14.
4)0.
12%
(118
.9)
27Bl
ume
Stah
lser
vice
Pol
ska
Sp.Z
.O.O
PLZ
0.00
% -
0.00
% 0
.6
0.00
% -
0.00
% 0
.6
28Bo
re S
amso
n G
roup
Lim
ited
GBP
0.05
% 1
,215
.4
0.00
% -
0.00
% -
0.00
% -
29Bo
re S
teel
Lim
ited
GBP
0.05
% 1
,380
.7
0.00
% -
0.00
% -
0.00
% -
30Br
itish
Gui
de R
ails
Lim
ited
GBP
0.01
% 3
93.5
0.
00%
- 0.
00%
- 0.
00%
-
31Br
itish
Ste
el C
orpo
ratio
n Li
mite
dG
BP0.
09%
2,4
70.4
0.
00%
- 0.
00%
- 0.
00%
-
32Br
itish
Ste
el D
irect
ors
(Nom
inee
s) L
imite
dG
BP0.
00%
- 0.
00%
- 0.
00%
- 0.
00%
-
33Br
itish
Ste
el E
ngin
eerin
g St
eels
(Exp
orts
) Lim
ited
GBP
0.00
% -
0.00
% -
0.00
% -
0.00
% -
34Br
itish
Ste
el N
eder
land
Inte
rnat
iona
l B.V
.EU
R0.
16%
4,3
21.6
(0
.07%
) 5
5.6
0.00
% -
(0.0
5%)
55.
6
35Br
itish
Ste
el S
ervi
ce C
entr
es L
imite
dG
BP0.
16%
4,3
30.6
0.
00%
- 0.
00%
- 0.
00%
-
36Br
itish
Tub
es S
tock
hold
ing
Lim
ited
GBP
0.03
% 8
52.9
0.
00%
- 0.
00%
- 0.
00%
-
37C
V Be
nine
EUR
0.01
% 1
50.0
0.
00%
- 0.
00%
- 0.
00%
-
38C
Wal
ker &
Son
s Li
mite
dG
BP0.
05%
1,3
15.8
0.
00%
- 0.
00%
- 0.
00%
-
39Ca
tnic
Gm
bHEU
R0.
02%
405
.7
(0.0
5%)
40.
3 0.
00%
- (0
.04%
) 4
0.3
40Ca
tnic
Lim
ited
GBP
0.00
% (4
.9)
0.10
% (8
1.0)
0.00
% -
0.08
% (8
1.0)
41CB
S In
vest
isse
men
ts S
AS
EUR
0.00
% 1
6.4
0.00
% 1
.5
0.00
% -
0.00
% 1
.5
42Co
gent
Pow
er In
c.CA
D0.
06%
1,4
68.8
(0
.09%
) 6
8.0
0.00
% -
(0.0
7%)
68.
0
43Ta
ta S
teel
Inte
rnat
iona
l Mex
ico
SA d
e CV
USD
0.00
% (4
.5)
0.01
% (4
.6)
0.00
% -
0.00
% (4
.6)
44Co
gent
Pow
er In
c.U
SD0.
01%
197
.5
0.11
% (8
2.1)
0.00
% -
0.08
% (8
2.1)
45Co
gent
Pow
er L
imite
dG
BP0.
04%
1,0
71.6
0.
00%
(1.2
)0.
00%
- 0.
00%
(1.2
)
46Co
lor S
teel
s Li
mite
dG
BP0.
01%
367
.1
0.00
% -
0.00
% -
0.00
% -
47Co
rbei
l Les
Riv
es S
CIEU
R0.
00%
85.
1 0.
00%
- 0.
00%
- 0.
00%
-
48Co
rby
(Nor
than
ts) &
Dis
tric
t Wat
er C
ompa
ny L
imite
dG
BP0.
00%
46.
5 0.
00%
- 0.
00%
- 0.
00%
-
49Co
rdor
(C&
B) L
imite
dG
BP0.
00%
26.
3 0.
00%
- 0.
00%
- 0.
00%
-
50Co
rus
Alu
min
ium
Ver
wal
tung
sges
ells
chaf
t Mbh
EUR
0.00
% 3
6.0
(0.1
1%)
82.
3 0.
00%
- (0
.08%
) 8
2.3
51Co
rus
Bete
iligu
ngs
Gm
bHEU
R0.
00%
17.
6 0.
24%
(183
.5)
0.00
% -
0.18
% (1
83.5
)
52Co
rus
Build
ing
Syst
ems
Bulg
aria
AD
LEV
(0.0
1%)
(239
.8)
0.03
% (2
3.2)
0.00
% -
0.02
% (2
3.2)
53Co
rus
CNBV
Inve
stm
ents
GBP
0.00
% -
0.00
% -
0.00
% -
0.00
% -
54Co
rus
Cold
dra
wn
Tube
s Li
mite
dG
BP(0
.01%
) (1
39.5
)0.
00%
- 0.
00%
- 0.
00%
-
48
. S
TA
TE
ME
NT
OF
NE
T A
SS
ET
S A
ND
PR
OF
IT O
R L
OS
S A
TT
RIB
UT
AB
LE
TO
OW
NE
RS
AN
D M
INO
RIT
Y I
NT
ER
ES
T (
CO
NT
D.)
F-322
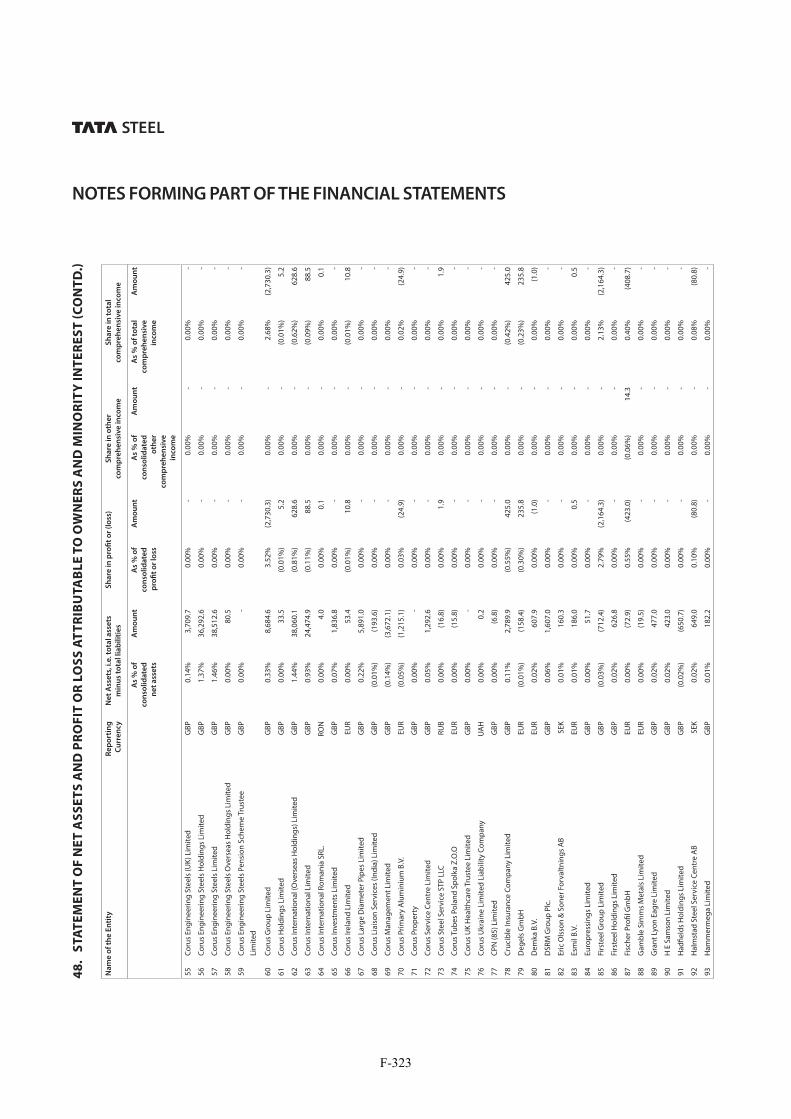
NOTES FORMING PART OF THE FINANCIAL STATEMENTS
Na
me
of
the
En
tity
Re
po
rtin
g
Cu
rre
nc
y
Ne
t A
sse
ts, i
.e. t
ota
l a
sse
ts
min
us
tota
l li
ab
ilit
ies
Sh
are
in
pro
fit
or
(lo
ss)
Sh
are
in
oth
er
com
pre
he
nsi
ve
in
com
e
Sh
are
in
to
tal
com
pre
he
nsi
ve
in
com
e
As
% o
f
con
soli
da
ted
ne
t a
sse
ts
Am
ou
nt
As
% o
f
con
soli
da
ted
pro
fit
or
loss
Am
ou
nt
As
% o
f
con
soli
da
ted
oth
er
com
pre
he
nsi
ve
inco
me
Am
ou
nt
As
% o
f to
tal
com
pre
he
nsi
ve
inco
me
Am
ou
nt
55Co
rus
Engi
neer
ing
Stee
ls (U
K) L
imite
dG
BP0.
14%
3,7
09.7
0.
00%
- 0.
00%
- 0.
00%
-
56Co
rus
Engi
neer
ing
Stee
ls H
oldi
ngs
Lim
ited
GBP
1.37
% 3
6,29
2.6
0.00
% -
0.00
% -
0.00
% -
57Co
rus
Engi
neer
ing
Stee
ls L
imite
dG
BP1.
46%
38,
512.
6 0.
00%
- 0.
00%
- 0.
00%
-
58Co
rus
Engi
neer
ing
Stee
ls O
vers
eas
Hol
ding
s Li
mite
dG
BP0.
00%
80.
5 0.
00%
- 0.
00%
- 0.
00%
-
59Co
rus
Engi
neer
ing
Stee
ls P
ensi
on S
chem
e Tr
uste
e Li
mite
dG
BP0.
00%
- 0.
00%
- 0.
00%
- 0.
00%
-
60Co
rus
Gro
up L
imite
dG
BP0.
33%
8,6
84.6
3.
52%
(2,7
30.3
)0.
00%
- 2.
68%
(2,7
30.3
)
61Co
rus
Hol
ding
s Li
mite
dG
BP0.
00%
33.
5 (0
.01%
) 5
.2
0.00
% -
(0.0
1%)
5.2
62Co
rus
Inte
rnat
iona
l (O
vers
eas
Hol
ding
s) L
imite
dG
BP1.
44%
38,
060.
1 (0
.81%
) 6
28.6
0.
00%
- (0
.62%
) 6
28.6
63Co
rus
Inte
rnat
iona
l Lim
ited
GBP
0.93
% 2
4,47
4.9
(0.1
1%)
88.
5 0.
00%
- (0
.09%
) 8
8.5
64Co
rus
Inte
rnat
iona
l Rom
ania
SRL
.RO
N0.
00%
4.0
0.
00%
0.1
0.
00%
- 0.
00%
0.1
65Co
rus
Inve
stm
ents
Lim
ited
GBP
0.07
% 1
,836
.8
0.00
% -
0.00
% -
0.00
% -
66Co
rus
Irela
nd L
imite
dEU
R0.
00%
53.
4 (0
.01%
) 1
0.8
0.00
% -
(0.0
1%)
10.
8
67Co
rus
Larg
e D
iam
eter
Pip
es L
imite
dG
BP0.
22%
5,8
91.0
0.
00%
- 0.
00%
- 0.
00%
-
68Co
rus
Liai
son
Serv
ices
(Ind
ia) L
imite
dG
BP(0
.01%
) (1
93.6
)0.
00%
- 0.
00%
- 0.
00%
-
69Co
rus
Man
agem
ent L
imite
dG
BP(0
.14%
) (3
,672
.1)
0.00
% -
0.00
% -
0.00
% -
70Co
rus
Prim
ary
Alu
min
ium
B.V
.EU
R(0
.05%
) (1
,215
.1)
0.03
% (2
4.9)
0.00
% -
0.02
% (2
4.9)
71Co
rus
Prop
erty
GBP
0.00
% -
0.00
% -
0.00
% -
0.00
% -
72Co
rus
Serv
ice
Cent
re L
imite
dG
BP0.
05%
1,2
92.6
0.
00%
- 0.
00%
- 0.
00%
-
73Co
rus
Stee
l Ser
vice
STP
LLC
RUB
0.00
% (1
6.8)
0.00
% 1
.9
0.00
% -
0.00
% 1
.9
74Co
rus T
ubes
Pol
and
Spol
ka Z
.O.O
EUR
0.00
% (1
5.8)
0.00
% -
0.00
% -
0.00
% -
75Co
rus
UK
Hea
lthca
re T
rust
ee L
imite
dG
BP0.
00%
- 0.
00%
- 0.
00%
- 0.
00%
-
76Co
rus
Ukr
aine
Lim
ited
Liab
ility
Com
pany
UA
H0.
00%
0.2
0.
00%
- 0.
00%
- 0.
00%
-
77CP
N (8
5) L
imite
dG
BP0.
00%
(6.8
)0.
00%
- 0.
00%
- 0.
00%
-
78Cr
ucib
le In
sura
nce
Com
pany
Lim
ited
GBP
0.11
% 2
,789
.9
(0.5
5%)
425
.0
0.00
% -
(0.4
2%)
425
.0
79D
egel
s G
mbH
EUR
(0.0
1%)
(158
.4)
(0.3
0%)
235
.8
0.00
% -
(0.2
3%)
235
.8
80D
emka
B.V
.EU
R0.
02%
607
.9
0.00
% (1
.0)
0.00
% -
0.00
% (1
.0)
81D
SRM
Gro
up P
lc.
GBP
0.06
% 1
,607
.0
0.00
% -
0.00
% -
0.00
% -
82Er
ic O
lsso
n &
Son
er F
orva
ltnin
gs A
BSE
K0.
01%
160
.3
0.00
% -
0.00
% -
0.00
% -
83Es
mil
B.V.
EUR
0.01
% 1
86.0
0.
00%
0.5
0.
00%
- 0.
00%
0.5
84Eu
ropr
essi
ngs
Lim
ited
GBP
0.00
% 5
1.7
0.00
% -
0.00
% -
0.00
% -
85Fi
rste
el G
roup
Lim
ited
GBP
(0.0
3%)
(712
.4)
2.79
% (2
,164
.3)
0.00
% -
2.13
% (2
,164
.3)
86Fi
rste
el H
oldi
ngs
Lim
ited
GBP
0.02
% 6
26.8
0.
00%
- 0.
00%
- 0.
00%
-
87Fi
sche
r Pro
fil G
mbH
EUR
0.00
% (7
2.9)
0.55
% (4
23.0
)(0
.06%
) 1
4.3
0.40
% (4
08.7
)
88G
ambl
e Si
mm
s M
etal
s Li
mite
dEU
R0.
00%
(19.
5)0.
00%
- 0.
00%
- 0.
00%
-
89G
rant
Lyo
n Ea
gre
Lim
ited
GBP
0.02
% 4
77.0
0.
00%
- 0.
00%
- 0.
00%
-
90H
E S
amso
n Li
mite
dG
BP0.
02%
423
.0
0.00
% -
0.00
% -
0.00
% -
91H
adfie
lds
Hol
ding
s Li
mite
dG
BP(0
.02%
) (6
50.7
)0.
00%
- 0.
00%
- 0.
00%
-
92H
alm
stad
Ste
el S
ervi
ce C
entr
e A
BSE
K0.
02%
649
.0
0.10
% (8
0.8)
0.00
% -
0.08
% (8
0.8)
93H
amm
erm
ega
Lim
ited
GBP
0.01
% 1
82.2
0.
00%
- 0.
00%
- 0.
00%
-
48
. S
TA
TE
ME
NT
OF
NE
T A
SS
ET
S A
ND
PR
OF
IT O
R L
OS
S A
TT
RIB
UT
AB
LE
TO
OW
NE
RS
AN
D M
INO
RIT
Y I
NT
ER
ES
T (
CO
NT
D.)
F-323

NOTES FORMING PART OF THE FINANCIAL STATEMENTS
Na
me
of
the
En
tity
Re
po
rtin
g
Cu
rre
nc
y
Ne
t A
sse
ts, i
.e. t
ota
l a
sse
ts
min
us
tota
l li
ab
ilit
ies
Sh
are
in
pro
fit
or
(lo
ss)
Sh
are
in
oth
er
com
pre
he
nsi
ve
in
com
e
Sh
are
in
to
tal
com
pre
he
nsi
ve
in
com
e
As
% o
f
con
soli
da
ted
ne
t a
sse
ts
Am
ou
nt
As
% o
f
con
soli
da
ted
pro
fit
or
loss
Am
ou
nt
As
% o
f
con
soli
da
ted
oth
er
com
pre
he
nsi
ve
inco
me
Am
ou
nt
As
% o
f to
tal
com
pre
he
nsi
ve
inco
me
Am
ou
nt
94H
arro
wm
ills
Prop
ertie
s Li
mite
dG
BP0.
06%
1,5
42.4
0.
00%
- 0.
00%
- 0.
00%
-
95H
ille
& M
ulle
r Gm
bHEU
R0.
04%
1,1
01.4
(0
.04%
) 3
1.5
0.03
% (0
7.4)
(0.0
2%)
24.
1
96H
ille
& M
ulle
r USA
Inc.
USD
0.04
% 1
,149
.0
(0.0
4%)
29.
3 0.
00%
- (0
.03%
) 2
9.3
97H
oogo
vens
USA
Inc.
USD
0.18
% 4
,755
.8
(0.0
1%)
8.9
0.
00%
- (0
.01%
) 8
.9
98H
uize
nbez
it “B
rees
aap”
B.V
.EU
R0.
00%
(74.
7)0.
00%
0.6
0.
00%
- 0.
00%
0.6
99Ic
kles
Cot
tage
Tru
st L
imite
dG
BP0.
00%
16.
3 0.
00%
- 0.
00%
- 0.
00%
-
100
Inte
r Met
al D
istr
ibut
ion
SAS
EUR
0.01
% 3
43.8
(0
.12%
) 9
6.3
0.01
% (1
.2)
(0.0
9%)
95.
1
101
Kalz
ip A
sia
Pte
Lim
ited
SGD
(0.0
4%)
(1,1
40.9
)0.
33%
(256
.6)
0.00
% -
0.25
% (2
56.6
)
102
Kalz
ip F
ZEA
ED0.
00%
46.
9 (0
.01%
) 8
.5
0.00
% -
(0.0
1%)
8.5
103
Kalz
ip G
mbH
EUR
0.00
% 9
.6
0.00
% -
0.00
% -
0.00
% -
104
Kalz
ip G
mbH
EUR
0.01
% 1
80.3
(0
.03%
) 2
5.7
(0.1
3%)
31.
0 (0
.06%
) 5
6.7
105
Kalz
ip In
cU
SD(0
.02%
(452
.4)
0.00
% 1
.4
0.00
% -
0.00
% 1
.4
106
Kalz
ip It
aly
SRL
EUR
0.00
% 3
.0
0.00
% 0
.4
0.00
% -
0.00
% 0
.4
107
Kalz
ip L
imite
dG
BP0.
01%
157
.6
(0.0
3%)
20.
5 0.
00%
- (0
.02%
) 2
0.5
108
Kalz
ip S
pain
S.L
.U.
EUR
0.00
% 1
04.0
0.
00%
1.1
0.
00%
- 0.
00%
1.1
109
Layd
e St
eel S
.L.
EUR
0.03
% 7
10.9
(0
.23%
) 1
79.0
0.
00%
- (0
.18%
) 1
79.0
110
List
er T
ubes
Lim
ited
EUR
0.00
% 1
12.1
0.
00%
- 0.
00%
- 0.
00%
-
111
Lond
on W
orks
Ste
el C
ompa
ny L
imite
dG
BP(0
.03%
) (8
34.6
)0.
00%
- 0.
00%
- 0.
00%
-
112
Mid
land
Ste
el S
uppl
ies
Lim
ited
GBP
0.00
% -
0.00
% -
0.00
% -
0.00
% -
113
Mon
tana
Bau
syst
eme
AGCH
F0.
04%
934
.5
(0.1
5%)
116
.2
(0.2
7%)
65.
1 (0
.18%
) 1
81.3
114
Naa
ntal
i Ste
el S
ervi
ce C
entr
e O
YEU
R0.
01%
277
.6
0.09
% (6
7.7)
0.00
% -
0.07
% (6
7.7)
115
Nat
ionw
ide
Stee
lsto
ck L
imite
dG
BP0.
00%
(91.
8)0.
00%
- 0.
00%
- 0.
00%
-
116
Nor
sk S
tal T
ynnp
late
r AS
NO
K0.
02%
475
.8
(0.1
1%)
87.
7 0.
00%
- (0
.09%
) 8
7.7
117
Nor
sk S
tal T
ynnp
late
r AB
NO
K0.
01%
156
.7
(0.0
4%)
29.
4 0.
00%
- (0
.03%
) 2
9.4
118
Orb
Ele
ctric
al S
teel
s Li
mite
dG
BP0.
00%
- 0.
00%
- 0.
00%
- 0.
00%
-
119
Ore
Car
riers
Lim
ited
GBP
0.01
% 2
30.7
0.
00%
- 0.
00%
- 0.
00%
-
120
Ore
mco
Inc.
USD
0.00
% (1
03.1
)0.
02%
(16.
1)0.
00%
- 0.
02%
(16.
1)
121
Plat
ed S
trip
Inte
rnat
iona
l Lim
ited
GBP
0.01
% 1
43.9
0.
00%
- 0.
00%
- 0.
00%
-
122
Prec
oat I
nter
natio
nal L
imite
dG
BP0.
02%
627
.8
0.00
% -
0.00
% -
0.00
% -
123
Prec
oat L
imite
dG
BP(0
.01%
) (1
71.8
)0.
00%
- 0.
00%
- 0.
00%
-
124
Raffe
rty-
Brow
n St
eel C
o In
c O
f Con
n.U
SD0.
01%
289
.5
0.00
% (2
.0)
0.00
% -
0.00
% (2
.0)
125
Roun
d O
ak S
teel
wor
ks L
imite
dG
BP(0
.15%
) (3
,880
.2)
0.00
% -
0.00
% -
0.00
% -
126
Runb
last
Lim
ited
GBP
0.16
% 4
,214
.2
0.00
% -
0.00
% -
0.00
% -
127
Runm
ega
Lim
ited
GBP
0.00
% 3
5.2
0.00
% -
0.00
% -
0.00
% -
128
S A
B P
rofie
l B.V
.EU
R0.
12%
3,2
11.0
(1
.97%
) 1
,523
.7
0.00
% -
(1.5
0%)
1,5
23.7
129
S A
B P
rofil
Gm
bHEU
R0.
05%
1,1
98.5
(0
.08%
) 6
5.6
0.00
% -
(0.0
6%)
65.
6
130
Seam
less
Tub
es L
imite
dG
BP0.
06%
1,5
03.7
0.
00%
- 0.
00%
- 0.
00%
-
131
Serv
ice
Cent
er G
else
nkirc
hen
Gm
bHEU
R0.
13%
3,4
51.9
2.
84%
(2,2
05.6
)0.
15%
(35.
6)2.
20%
(2,2
41.2
)
132
Serv
ice
Cent
re M
aast
richt
B.V
.EU
R0.
01%
289
.3
(0.3
3%)
256
.4
0.00
% -
(0.2
5%)
256
.4
133
Skru
v Er
ik A
BSE
K0.
00%
5.0
0.
00%
- 0.
00%
- 0.
00%
-
48
. S
TA
TE
ME
NT
OF
NE
T A
SS
ET
S A
ND
PR
OF
IT O
R L
OS
S A
TT
RIB
UT
AB
LE
TO
OW
NE
RS
AN
D M
INO
RIT
Y I
NT
ER
ES
T (
CO
NT
D.)
F-324

NOTES FORMING PART OF THE FINANCIAL STATEMENTS
Na
me
of
the
En
tity
Re
po
rtin
g
Cu
rre
nc
y
Ne
t A
sse
ts, i
.e. t
ota
l a
sse
ts
min
us
tota
l li
ab
ilit
ies
Sh
are
in
pro
fit
or
(lo
ss)
Sh
are
in
oth
er
com
pre
he
nsi
ve
in
com
e
Sh
are
in
to
tal
com
pre
he
nsi
ve
in
com
e
As
% o
f
con
soli
da
ted
ne
t a
sse
ts
Am
ou
nt
As
% o
f
con
soli
da
ted
pro
fit
or
loss
Am
ou
nt
As
% o
f
con
soli
da
ted
oth
er
com
pre
he
nsi
ve
inco
me
Am
ou
nt
As
% o
f to
tal
com
pre
he
nsi
ve
inco
me
Am
ou
nt
134
Soci
ete
Euro
peen
ne D
e G
alva
nisa
tion
(Seg
al) S
aEU
R0.
07%
1,8
79.0
(0
.05%
) 3
5.9
0.00
% -
(0.0
4%)
35.
9
135
Staa
lver
wer
king
en
Han
del B
.V.
EUR
0.47
% 1
2,33
8.9
(5.3
2%)
412
4.6
0.00
% -
(4.0
6%)
4,1
24.6
136
Stee
l Sto
ckH
oldi
ngs
Lim
ited
GBP
0.01
% 3
71.0
0.
00%
- 0.
00%
- 0.
00%
-
137
Stee
lsto
ck L
imite
dG
BP0.
00%
1.6
0.
00%
- 0.
00%
- 0.
00%
-
138
Stew
arts
& L
loyd
s O
f Ire
land
Lim
ited
EUR
0.00
% (1
6.1)
0.00
% -
0.00
% -
0.00
% -
139
Stew
arts
And
Llo
yds
(Ove
rsea
s) L
imite
dG
BP0.
06%
1,6
57.4
0.
00%
- 0.
00%
- 0.
00%
-
140
Stoc
ksbr
idge
Wor
ks C
otta
ge T
rust
Lim
ited
GBP
0.00
% 8
.9
0.00
% -
0.00
% -
0.00
% -
141
Sura
ham
mar
Bru
ks A
BSE
K0.
05%
1,3
07.4
0.
09%
(71.
6)(0
.14%
) 3
2.8
0.04
% (3
8.8)
142
Swin
den
Hou
sing
Ass
ocia
tion
Lim
ited
GBP
0.00
% 5
2.3
0.00
% -
0.00
% -
0.00
% -
143
Tata
Ste
el B
elgi
um P
acka
ging
Ste
els
N.V
.EU
R0.
07%
1,9
28.5
(0
.05%
) 3
7.9
0.00
% -
(0.0
4%)
37.
9
144
Tata
Ste
el B
elgi
um S
ervi
ces
N.V
.EU
R0.
14%
3,6
07.0
(0
.12%
) 9
0.9
0.00
% -
(0.0
9%)
90.
9
145
Tata
Ste
el D
enm
ark
Bygg
syst
emer
A/S
DKK
0.01
% 1
87.9
0.
03%
(27.
1)0.
00%
- 0.
03%
(27.
1)
146
Tata
Ste
el E
urop
e D
istr
ibut
ion
BVEU
R(0
.01%
) (2
10.5
)(0
.03%
) 1
9.9
0.00
% -
(0.0
2%)
19.
9
147
Tata
Ste
el E
urop
e M
etal
s Tra
ding
BV
EUR
0.10
% 2
,572
.2
0.00
% (3
.1)
0.00
% -
0.00
% (3
.1)
148
Tata
Ste
el F
ranc
e Ba
timen
t et S
yste
mes
SA
SEU
R0.
01%
136
.3
0.19
% (1
47.2
)0.
00%
- 0.
14%
(147
.2)
149
Tata
Ste
el F
ranc
e H
oldi
ngs
SAS
EUR
0.30
% 7
,813
.9
0.75
% (5
81.5
)0.
13%
(32.
3)0.
60%
(613
.8)
150
Tata
Ste
el G
erm
any
Gm
bHEU
R0.
00%
29.
6 5.
29%
(4,1
03.4
)0.
05%
(12.
1)4.
06%
(4,1
15.5
)
151
Tata
Ste
el IJ
mui
den
BVEU
R6.
30%
1,6
6,47
0.7
(21.
27%
) 1
6,48
8.3
(2.6
3%)
635
.0
(16.
84%
) 1
7,12
3.3
152
Tata
Ste
el In
tern
atio
nal (
Am
eric
as) H
oldi
ngs
Inc
USD
0.22
% 5
,892
.1
0.25
% (1
97.0
)0.
00%
- 0.
19%
(197
.0)
153
Tata
Ste
el In
tern
atio
nal (
Am
eric
as) I
ncU
SD0.
40%
10,
446.
4 (0
.40%
) 3
11.6
(0
.13%
) 3
1.1
(0.3
4%)
342
.7
154
Tata
Ste
el In
tern
atio
nal (
Bene
lux)
BV
EUR
0.00
% 8
6.7
0.00
% 0
.7
0.00
% -
0.00
% 0
.7
155
Tata
Ste
el In
tern
atio
nal (
Cana
da) H
oldi
ngs
Inc
CAD
0.00
% 1
7.4
0.00
% -
0.00
% -
0.00
% -
156
Tata
Ste
el In
tern
atio
nal (
Czec
h Re
publ
ic) S
.R.O
CZ
K0.
00%
88.
3 (0
.04%
) 3
1.7
0.00
% -
(0.0
3%)
31.
7
157
Tata
Ste
el In
tern
atio
nal (
Den
mar
k) A
/SD
KK0.
00%
4.8
0.
00%
(2.8
)0.
00%
- 0.
00%
(2.8
)
158
Tata
Ste
el In
tern
atio
nal (
Finl
and)
OY
EUR
0.00
% 8
.9
0.00
% -
0.00
% -
0.00
% -
159
Tata
Ste
el In
tern
atio
nal (
Fran
ce) S
AS
EUR
0.01
% 3
17.3
(0
.01%
) 4
.1
0.00
% -
0.00
% 4
.1
160
Tata
Ste
el In
tern
atio
nal (
Ger
man
y) G
mbH
EUR
0.00
% 7
.9
(0.0
3%)
26.
2 0.
00%
1.0
(0
.03%
) 2
7.2
161
Tata
Ste
el In
tern
atio
nal (
Sout
h A
mer
ica)
Re
pres
enta
ções
LTD
AU
SD0.
00%
5.3
0.
00%
3.4
0.
00%
- 0.
00%
3.4
162
Tata
Ste
el In
tern
atio
nal H
ella
s SA
EUR
0.00
% 1
0.2
0.00
% -
0.00
% -
0.00
% -
163
Tata
Ste
el In
tern
atio
nal (
Italia
) SRL
EUR
0.00
% 1
24.0
(0
.05%
) 3
8.1
0.00
% -
(0.0
4%)
38.
1
164
Tata
Ste
el In
tern
atio
nal (
Mid
dle
East
) FZE
AED
0.08
% 2
,097
.6
(0.1
0%)
78.
4 0.
00%
- (0
.08%
) 7
8.4
165
Tata
Ste
el In
tern
atio
nal (
Nig
eria
) Ltd
.N
GN
0.00
% -
0.00
% -
0.00
% -
0.00
% -
166
Tata
Ste
el In
tern
atio
nal (
Pola
nd) s
p Zo
oPL
Z0.
00%
30.
4 (0
.02%
) 1
9.0
0.00
% -
(0.0
2%)
19.
0
167
Tata
Ste
el In
tern
atio
nal (
Schw
eiz)
AG
CHF
0.00
% 4
5.0
0.00
% (2
.2)
0.00
% -
0.00
% (2
.2)
168
Tata
Ste
el In
tern
atio
nal (
Swed
en) A
BSE
K0.
00%
61.
3 (0
.03%
) 2
0.7
0.00
% -
(0.0
2%)
20.
7
169
Tata
Ste
el In
tern
atio
nal I
beric
a SA
EUR
0.00
% 3
8.2
(0.0
4%)
30.
4 0.
00%
- (0
.03%
) 3
0.4
170
Tata
Ste
el Is
tanb
ul M
etal
San
ayi v
e Ti
care
t AS
USD
0.01
% 1
65.8
0.
02%
(12.
0)0.
00%
- 0.
01%
(12.
0)
171
Tata
Ste
el L
atvi
a Bu
ildin
g Sy
stem
s SI
AEU
R0.
00%
0.9
0.
00%
0.1
0.
00%
- 0.
00%
0.1
172
Tata
Ste
el M
aube
uge
SAS
EUR
0.05
% 1
,369
.6
(0.9
9%)
768
.8
0.11
% (2
7.3)
(0.7
3%)
741
.5
48
. S
TA
TE
ME
NT
OF
NE
T A
SS
ET
S A
ND
PR
OF
IT O
R L
OS
S A
TT
RIB
UT
AB
LE
TO
OW
NE
RS
AN
D M
INO
RIT
Y I
NT
ER
ES
T (
CO
NT
D.)
F-325
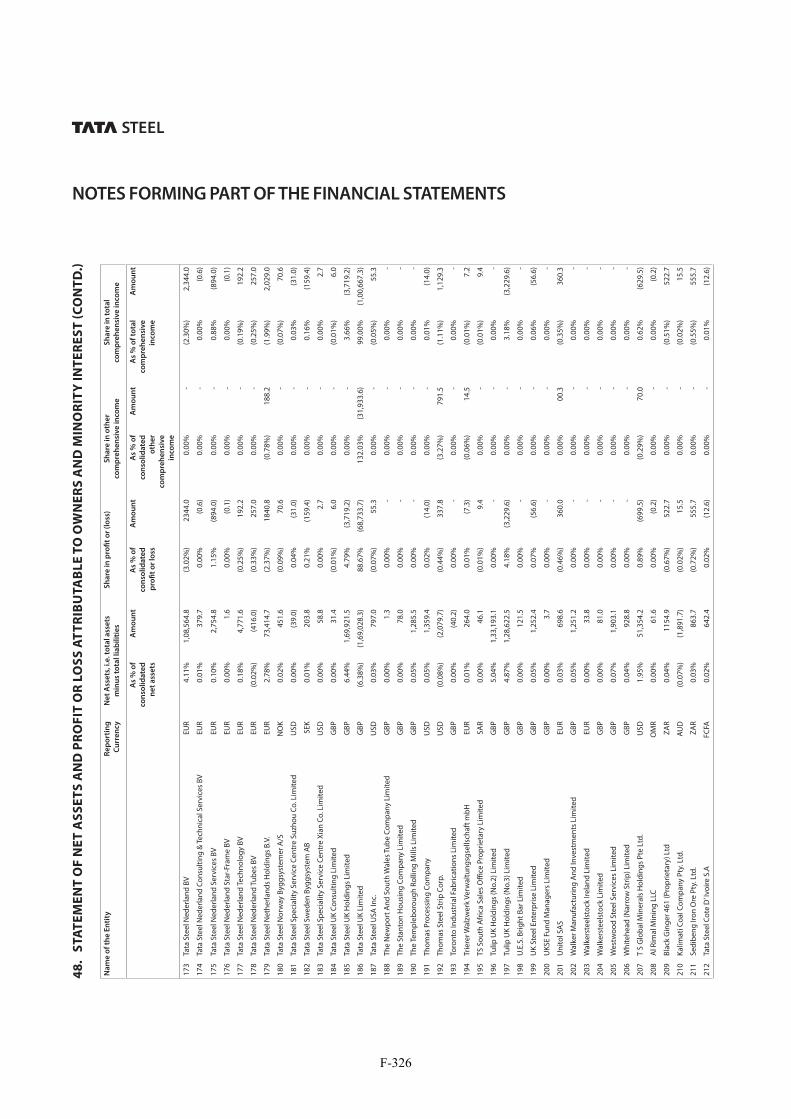
NOTES FORMING PART OF THE FINANCIAL STATEMENTS
Na
me
of
the
En
tity
Re
po
rtin
g
Cu
rre
nc
y
Ne
t A
sse
ts, i
.e. t
ota
l a
sse
ts
min
us
tota
l li
ab
ilit
ies
Sh
are
in
pro
fit
or
(lo
ss)
Sh
are
in
oth
er
com
pre
he
nsi
ve
in
com
e
Sh
are
in
to
tal
com
pre
he
nsi
ve
in
com
e
As
% o
f
con
soli
da
ted
ne
t a
sse
ts
Am
ou
nt
As
% o
f
con
soli
da
ted
pro
fit
or
loss
Am
ou
nt
As
% o
f
con
soli
da
ted
oth
er
com
pre
he
nsi
ve
inco
me
Am
ou
nt
As
% o
f to
tal
com
pre
he
nsi
ve
inco
me
Am
ou
nt
173
Tata
Ste
el N
eder
land
BV
EUR
4.11
% 1
,08,
564.
8 (3
.02%
) 2
344.
0 0.
00%
- (2
.30%
) 2
,344
.0
174
Tata
Ste
el N
eder
land
Con
sulti
ng &
Tech
nica
l Ser
vice
s BV
EUR
0.01
% 3
79.7
0.
00%
(0.6
)0.
00%
- 0.
00%
(0.6
)
175
Tata
Ste
el N
eder
land
Ser
vice
s BV
EUR
0.10
% 2
,754
.8
1.15
% (8
94.0
)0.
00%
- 0.
88%
(894
.0)
176
Tata
Ste
el N
eder
land
Sta
r-Fr
ame
BVEU
R0.
00%
1.6
0.
00%
(0.1
)0.
00%
- 0.
00%
(0.1
)
177
Tata
Ste
el N
eder
land
Tech
nolo
gy B
VEU
R0.
18%
4,7
71.6
(0
.25%
) 1
92.2
0.
00%
- (0
.19%
) 1
92.2
178
Tata
Ste
el N
eder
land
Tub
es B
VEU
R(0
.02%
) (4
16.0
)(0
.33%
) 2
57.0
0.
00%
- (0
.25%
) 2
57.0
179
Tata
Ste
el N
ethe
rland
s H
oldi
ngs
B.V.
EUR
2.78
% 7
3,41
4.7
(2.3
7%)
184
0.8
(0.7
8%)
188
.2
(1.9
9%)
2,0
29.0
180
Tata
Ste
el N
orw
ay B
yggs
yste
mer
A/S
NO
K0.
02%
451
.6
(0.0
9%)
70.
6 0.
00%
- (0
.07%
) 7
0.6
181
Tata
Ste
el S
peci
ality
Ser
vice
Cen
tre
Suzh
ou C
o. L
imite
dU
SD0.
00%
(39.
0)0.
04%
(31.
0)0.
00%
- 0.
03%
(31.
0)
182
Tata
Ste
el S
wed
en B
yggs
yste
m A
BSE
K0.
01%
203
.8
0.21
% (1
59.4
)0.
00%
- 0.
16%
(159
.4)
183
Tata
Ste
el S
peci
ality
Ser
vice
Cen
tre
Xian
Co.
Lim
ited
USD
0.00
% 5
8.8
0.00
% 2
.7
0.00
% -
0.00
% 2
.7
184
Tata
Ste
el U
K Co
nsul
ting
Lim
ited
GBP
0.00
% 3
1.4
(0.0
1%)
6.0
0.
00%
- (0
.01%
) 6
.0
185
Tata
Ste
el U
K H
oldi
ngs
Lim
ited
GBP
6.44
% 1
,69,
921.
5 4.
79%
(3,7
19.2
)0.
00%
- 3.
66%
(3,7
19.2
)
186
Tata
Ste
el U
K Li
mite
dG
BP(6
.38%
) (1
,69,
028.
3)88
.67%
(68,
733.
7)13
2.03
% (3
1,93
3.6)
99.0
0% (1
,00,
667.
3)
187
Tata
Ste
el U
SA In
c.U
SD0.
03%
797
.0
(0.0
7%)
55.
3 0.
00%
- (0
.05%
) 5
5.3
188
The
New
port
And
Sou
th W
ales
Tub
e Co
mpa
ny L
imite
dG
BP0.
00%
1.3
0.
00%
- 0.
00%
- 0.
00%
-
189
The
Stan
ton
Hou
sing
Com
pany
Lim
ited
GBP
0.00
% 7
8.0
0.00
% -
0.00
% -
0.00
% -
190
The
Tem
pleb
orou
gh R
ollin
g M
ills
Lim
ited
GBP
0.05
% 1
,285
.5
0.00
% -
0.00
% -
0.00
% -
191
Thom
as P
roce
ssin
g Co
mpa
nyU
SD0.
05%
1,3
59.4
0.
02%
(14.
0)0.
00%
- 0.
01%
(14.
0)
192
Thom
as S
teel
Str
ip C
orp.
USD
(0.0
8%)
(2,0
79.7
)(0
.44%
) 3
37.8
(3
.27%
) 7
91.5
(1
.11%
) 1
,129
.3
193
Toro
nto
Indu
stria
l Fab
ricat
ions
Lim
ited
GBP
0.00
% (4
0.2)
0.00
% -
0.00
% -
0.00
% -
194
Trie
rer W
alzw
erk
Verw
altu
ngsg
sells
chaf
t mbH
EUR
0.01
% 2
64.0
0.
01%
(7.3
)(0
.06%
) 1
4.5
(0.0
1%)
7.2
195
TS S
outh
Afr
ica
Sale
s O
ffice
Pro
prie
tary
Lim
ited
SAR
0.00
% 4
6.1
(0.0
1%)
9.4
0.
00%
- (0
.01%
) 9
.4
196
Tulip
UK
Hol
ding
s (N
o.2)
Lim
ited
GBP
5.04
% 1
,33,
193.
1 0.
00%
- 0.
00%
- 0.
00%
-
197
Tulip
UK
Hol
ding
s (N
o.3)
Lim
ited
GBP
4.87
% 1
,28,
622.
5 4.
18%
(3,2
29.6
)0.
00%
- 3.
18%
(3,2
29.6
)
198
U.E
.S. B
right
Bar
Lim
ited
GBP
0.00
% 1
21.5
0.
00%
- 0.
00%
- 0.
00%
-
199
UK
Stee
l Ent
erpr
ise
Lim
ited
GBP
0.05
% 1
,252
.4
0.07
% (5
6.6)
0.00
% -
0.06
% (5
6.6)
200
UKS
E Fu
nd M
anag
ers
Lim
ited
GBP
0.00
% 3
.7
0.00
% -
0.00
% -
0.00
% -
201
Uni
tol S
AS
EUR
0.03
% 6
98.6
(0
.46%
) 3
60.0
0.
00%
00.
3 (0
.35%
) 3
60.3
202
Wal
ker M
anuf
actu
ring
And
Inve
stm
ents
Lim
ited
GBP
0.05
% 1
,251
.2
0.00
% -
0.00
% -
0.00
% -
203
Wal
kers
teel
stoc
k Ire
land
Lim
ited
EUR
0.00
% 3
3.8
0.00
% -
0.00
% -
0.00
% -
204
Wal
kers
teel
stoc
k Li
mite
dG
BP0.
00%
81.
0 0.
00%
- 0.
00%
- 0.
00%
-
205
Wes
twoo
d St
eel S
ervi
ces
Lim
ited
GBP
0.07
% 1
,903
.1
0.00
% -
0.00
% -
0.00
% -
206
Whi
tehe
ad (N
arro
w S
trip
) Lim
ited
GBP
0.04
% 9
28.8
0.
00%
- 0.
00%
- 0.
00%
-
207
T S
Glo
bal M
iner
als
Hol
ding
s Pt
e Lt
d.U
SD1.
95%
51,
354.
2 0.
89%
(699
.5)
(0.2
9%)
70.
0 0.
62%
(629
.5)
208
Al R
imal
Min
ing
LLC
OM
R0.
00%
61.
6 0.
00%
(0.2
)0.
00%
- 0.
00%
(0.2
)
209
Blac
k G
inge
r 461
(Pro
prie
tary
) Ltd
ZAR
0.04
% 1
154.
9 (0
.67%
) 5
22.7
0.
00%
- (0
.51%
) 5
22.7
210
Kalim
ati C
oal C
ompa
ny P
ty. L
td.
AUD
(0.0
7%)
(1,8
91.7
)(0
.02%
) 1
5.5
0.00
% -
(0.0
2%)
15.
5
211
Sedi
beng
Iron
Ore
Pty
. Ltd
.ZA
R0.
03%
863
.7
(0.7
2%)
555
.7
0.00
% -
(0.5
5%)
555
.7
212
Tata
Ste
el C
ote
D’ Iv
oire
S.A
FCFA
0.02
% 6
42.4
0.
02%
(12.
6)0.
00%
- 0.
01%
(12.
6)
48
. S
TA
TE
ME
NT
OF
NE
T A
SS
ET
S A
ND
PR
OF
IT O
R L
OS
S A
TT
RIB
UT
AB
LE
TO
OW
NE
RS
AN
D M
INO
RIT
Y I
NT
ER
ES
T (
CO
NT
D.)
F-326

NOTES FORMING PART OF THE FINANCIAL STATEMENTS
Na
me
of
the
En
tity
Re
po
rtin
g
Cu
rre
nc
y
Ne
t A
sse
ts, i
.e. t
ota
l a
sse
ts
min
us
tota
l li
ab
ilit
ies
Sh
are
in
pro
fit
or
(lo
ss)
Sh
are
in
oth
er
com
pre
he
nsi
ve
in
com
e
Sh
are
in
to
tal
com
pre
he
nsi
ve
in
com
e
As
% o
f
con
soli
da
ted
ne
t a
sse
ts
Am
ou
nt
As
% o
f
con
soli
da
ted
pro
fit
or
loss
Am
ou
nt
As
% o
f
con
soli
da
ted
oth
er
com
pre
he
nsi
ve
inco
me
Am
ou
nt
As
% o
f to
tal
com
pre
he
nsi
ve
inco
me
Am
ou
nt
213
TSM
UK
Lim
ited
USD
1.79
% 4
7,44
0.6
0.00
% (0
.4)
0.00
% -
0.00
% (0
.4)
214
Tata
Ste
el M
iner
als
Cana
da L
imite
d U
SD1.
71%
45,
160.
2 2.
09%
(1,6
22.8
)0.
00%
- 1.
61%
(1,6
22.8
)
215
T S
Cana
da C
apita
l Ltd
USD
0.01
% 3
23.8
0.
00%
(0.1
)0.
00%
- 0.
00%
(0.1
)
216
Tata
Ste
el In
tern
atio
nal (
Sing
apor
e) H
oldi
ngs
Pte.
Ltd
.H
KD0.
14%
3,7
81.8
0.
00%
0.7
0.
00%
- 0.
00%
0.7
217
Tata
Ste
el In
tern
atio
nal (
Shan
ghai
) Ltd
.CN
Y0.
00%
72.
0 0.
00%
1.3
0.
00%
- 0.
00%
1.3
218
Tata
Ste
el In
tern
atio
nal (
Sing
apor
e) P
te. L
td.
SGD
0.01
% 3
25.8
(0
.05%
) 3
8.5
0.00
% -
(0.0
4%)
38.
5
219
Tata
Ste
el In
tern
atio
nal (
Asi
a) L
imite
dH
KD0.
20%
5,3
87.9
(0
.01%
) 4
.0
0.00
% -
0.00
% 4
.0
220
Tata
Ste
el (T
haila
nd) P
ublic
Com
pany
Ltd
.TH
B0.
94%
24,
977.
1 (1
.28%
) 9
95.8
(0
.07%
)17
.5(0
.97%
) 9
95.8
221
N.T
.S S
teel
Gro
up P
lc.
THB
0.06
% 1
,468
.8
0.74
% (5
73.6
)0.
00%
-0.
56%
(573
.6)
222
The
Siam
Con
stru
ctio
n St
eel C
o. L
td.
THB
0.14
% 3
,805
.2
(0.9
4%)
731
.8
0.00
%-
(0.7
2%)
731
.8
223
The
Siam
Iron
And
Ste
el (2
001)
Co.
Ltd
.TH
B0.
08%
2,1
81.1
(0
.39%
) 3
03.9
0.
00%
-(0
.30%
) 3
03.9
224
T S
Glo
bal P
rocu
rem
ent C
ompa
ny P
te. L
td.
USD
0.86
% 2
2,64
9.2
(0.8
8%)
679
.7
0.00
% -
(0.6
7%)
679
.7
225
ProC
o Is
suer
Pte
. Ltd
. G
BP1.
07%
28,
414.
9 (2
.33%
) 1
,805
.5
0.00
% -
(1.7
8%)
1,8
05.5
C.
AS
SO
CIA
TE
S
a)
Ind
ian
1In
dust
rial E
nerg
y Li
mite
dIN
R0.
08%
2,1
29.3
0.
00%
(0.0
)0.
00%
00.
8 0.
00%
0.8
2Ja
mip
ol L
imite
dIN
R0.
02%
539
.3
0.00
% 0
.0
(0.0
1%)
01.
4 0.
00%
1.4
3St
rate
gic
Ener
gy Te
chno
logy
Sys
tem
s Lt
dIN
R0.
00%
- 0.
00%
- 0.
00%
- 0.
00%
-
4TR
F Li
mite
dIN
R(0
.02%
) (4
39.4
)0.
00%
- 0.
00%
- 0.
00%
-
5TR
L Kr
osak
i Ref
ract
orie
s Li
mite
dIN
R0.
03%
887
.5
0.00
% 0
.0
(0.3
1%)
75.
2 (0
.07%
) 7
5.2
6YO
RK T
rans
port
Equ
ipm
ent I
ndia
Pvt
. Ltd
INR
0.02
% 5
21.8
0.
00%
0.0
0.
00%
- 0.
00%
0.0
b)
Fo
reig
n
1Eu
rope
an P
rofil
es (M
) Sdn
. Bhd
.M
YR0.
00%
- 0.
00%
- 0.
00%
- 0.
00%
-
2N
ew M
illen
nium
Iron
Cor
p.CA
D0.
02%
644
.3
0.87
% (6
77.4
)0.
00%
- 0.
67%
(677
.4)
3A
lbi P
rofil
s SR
LEU
R0.
00%
- 0.
00%
- 0.
00%
- 0.
00%
-
4A
pple
by F
rodi
ngha
m C
otta
ge T
rust
Lim
ited
GBP
0.00
% -
0.00
% -
0.00
% -
0.00
% -
5Fa
bsec
Lim
ited
GBP
0.00
% -
0.00
% -
0.00
% -
0.00
% -
6G
ietw
also
nder
houd
com
bina
tie B
.V.
EUR
0.01
% 1
71.6
(0
.01%
) 6
.2
0.00
% -
(0.0
1%)
06.
2
7H
oogo
vens
Cou
rt R
oll S
ervi
ce Te
chno
logi
es V
OF
EUR
0.00
% -
0.00
% -
0.00
% -
0.00
% -
8H
oogo
vens
Gan
Mul
timed
ia S
.A. D
e C.
V.M
EX P
ESO
0.00
% -
0.00
% -
0.00
% -
0.00
% -
9IS
SB L
imite
dG
BP0.
00%
- 0.
00%
- 0.
00%
- 0.
00%
-
10W
uppe
rman
Sta
al N
eder
land
B.V
.EU
RO0.
04%
1,1
69.9
(0
.27%
) 2
13.0
0.
00%
- (0
.21%
) 2
13.0
11YO
RK T
rans
port
Equ
ipm
ent (
Asi
a) P
te L
tdU
SD0.
05%
1,2
28.0
0.
05%
(40.
8)0.
00%
- 0.
04%
(40.
8)
12YO
RK T
rans
port
Equ
ipm
ent P
ty L
tdAU
D0.
00%
(71.
2)0.
00%
0.6
0.
00%
- 0.
00%
0.6
13YO
RK S
ales
(Tha
iland
) Co.
Ltd
BHT
0.01
% 1
67.2
0.
00%
3.4
0.
00%
- 0.
00%
3.4
14YT
E Tr
ansp
ort E
quip
men
t (SA
) (Pt
y) L
imite
d RA
ND
0.00
% 2
.7
(0.0
1%)
9.1
0.
00%
- (0
.01%
) 9
.1
15Re
dnet
Pte
Ltd
.U
SD0.
00%
(58.
8)0.
00%
(0.3
)0.
00%
- 0.
00%
(0.3
)
16PT
YO
RK E
ngin
eerin
gRu
piah
0.00
% (2
2.1)
0.00
% -
0.00
% -
0.00
% -
48
. S
TA
TE
ME
NT
OF
NE
T A
SS
ET
S A
ND
PR
OF
IT O
R L
OS
S A
TT
RIB
UT
AB
LE
TO
OW
NE
RS
AN
D M
INO
RIT
Y I
NT
ER
ES
T (
CO
NT
D.)
F-327

NOTES FORMING PART OF THE FINANCIAL STATEMENTS
Na
me
of
the
En
tity
Re
po
rtin
g
Cu
rre
nc
y
Ne
t A
sse
ts, i
.e. t
ota
l a
sse
ts
min
us
tota
l li
ab
ilit
ies
Sh
are
in
pro
fit
or
(lo
ss)
Sh
are
in
oth
er
com
pre
he
nsi
ve
in
com
e
Sh
are
in
to
tal
com
pre
he
nsi
ve
in
com
e
As
% o
f
con
soli
da
ted
ne
t a
sse
ts
Am
ou
nt
As
% o
f
con
soli
da
ted
pro
fit
or
loss
Am
ou
nt
As
% o
f
con
soli
da
ted
oth
er
com
pre
he
nsi
ve
inco
me
Am
ou
nt
As
% o
f to
tal
com
pre
he
nsi
ve
inco
me
Am
ou
nt
17YT
E Sp
ecia
l Pro
duct
s Pt
e Lt
dU
SD0.
00%
66.
8 0.
01%
(9.7
)0.
00%
- 0.
01%
(9.7
)
18Q
ingd
ao Y
TE S
peci
al P
rodu
cts
Co. L
tdRM
B(0
.01%
) (1
70.7
)0.
06%
(48.
5)0.
00%
- 0.
05%
(48.
5)
19YO
RK T
rans
port
Equ
ipm
ent (
Shan
ghai
) Co.
Ltd
RMB
0.01
% 1
65.2
0.
01%
(8.1
)0.
00%
- 0.
01%
(8.1
)
20D
utch
Lan
ka T
raile
r Man
ufac
turin
g Li
mite
dU
SD0.
00%
118
.1
(0.0
2%)
18.
9 0.
00%
- (0
.02%
) 1
8.9
21D
urch
Lan
ka E
ngin
eerin
g Pr
ivat
e Li
mite
dLK
R0.
00%
45.
4 (0
.03%
) 2
6.2
0.00
% -
(0.0
3%)
26.
2
22D
urch
Lan
ka T
raile
rs M
anuf
actu
ring
LLC
OM
R0.
00%
15.
1 0.
00%
(0.1
)0.
00%
- 0.
00%
(0.1
)
23H
ewit
Robi
ns In
tern
atio
nal L
imite
dG
BP0.
01%
305
.9
(0.0
5%)
36.
1 0.
00%
- (0
.04%
) 3
6.1
24H
ewit
Robi
ns In
tern
atio
nal H
oldi
ngs
Lim
ited
GBP
0.00
% 6
.0
0.00
% -
0.00
% -
0.00
% -
25TR
F Si
ngap
ore
Pte
Lim
ited
SGD
0.08
% 2
,153
.4
0.01
% (7
.8)
0.00
% -
0.01
% (7
.8)
26TR
F H
oldi
ng P
te L
imite
dU
SD(0
.01%
) (3
59.3
)0.
07%
(53.
1)0.
00%
- 0.
05%
(53.
1)
D.
JOIN
T V
EN
TU
RE
S
a)
Ind
ian
1Bh
uban
eshw
ar P
ower
Priv
ate
Lim
ited
INR
0.02
% 5
24.1
0.
08%
(62.
5)0.
00%
0.1
0.
06%
(62.
4)
2H
imal
aya
Stee
l Mill
s Se
rvic
es P
rivat
e Li
mite
dIN
R0.
00%
20.
7 0.
00%
(0.6
)0.
00%
0.0
0.
00%
(0.6
)
3m
junc
tion
serv
ices
Lim
ited
INR
0.04
% 1
,143
.4
(0.1
5%)
116
.5
0.01
% (1
.2)
(0.1
1%)
115
.3
4S
& T
Min
ing
Com
pany
Priv
ate
Lim
ited
INR
0.00
% (5
.0)
0.03
% (2
5.3)
0.00
% (0
.0)
0.02
% (2
5.3)
5Ta
ta B
lues
cope
Ste
el L
imite
dIN
R0.
07%
1,8
85.7
(0
.36%
) 2
82.0
(0
.02%
) 4
.1
(0.2
8%)
286
.1
6Ta
ta N
YK S
hipp
ing
(Indi
a) P
vt. L
td.
INR
0.00
% 2
6.1
0.00
% 0
.7
0.00
% -
0.00
% 0
.7
7N
aba
Dig
anta
Wat
er M
anag
emen
t Lim
ited
INR
0.01
% 1
64.1
(0
.03%
) 2
5.3
0.00
% -
(0.0
2%)
25.
3
8SE
Z Ad
ityap
ur L
imite
dIN
R0.
00%
(0.6
)0.
00%
- 0.
00%
- 0.
00%
-
9Ja
msh
edpu
r Con
tinuo
us A
nnea
ling
& P
roce
ssin
g Co
mpa
ny P
rivat
e Li
mite
dIN
R0.
09%
2,3
51.9
1.
35%
(1,0
48.8
)0.
00%
(1.2
)1.
03%
(1,0
50.0
)
10T
M M
inin
g Co
mpa
ny L
imite
dIN
R0.
00%
(0.2
)0.
00%
(0.1
)0.
00%
- 0.
00%
(0.1
)
11TM
Inte
rnat
iona
l Log
istic
s Li
mite
dIN
R0.
11%
2,8
94.4
(0
.27%
) 2
07.0
(0
.04%
) 9
.4
(0.2
1%)
216
.4
12TK
M G
loba
l Log
istic
s Li
mite
dIN
R0.
01%
248
.9
0.00
% 2
.8
0.00
% (0
.7)
0.00
% 2
.1
b)
Fo
reig
n
1Ta
ta N
YK S
hipp
ing
Pte
Ltd.
USD
0.02
% 6
09.3
(0
.27%
) 2
11.1
(0
.01%
) 3
.1
(0.2
1%)
214
.2
2M
inas
De
Beng
a (M
aurit
ius)
Lim
ited
USD
(0.3
3%)
(8,7
85.6
)(4
.26%
) 3
,298
.5
0.00
% -
(3.2
4%)
3,2
98.5
3M
inas
de
Beng
a Li
mite
d-M
ozam
biqu
eU
SD(0
.61%
) (1
6,23
4.6)
0.51
% (3
95.8
)0.
00%
- 0.
39%
(395
.8)
4Bl
ueSc
ope
Lysa
ght L
anka
(Pvt
) Ltd
LKR
0.01
% 1
84.0
(0
.06%
) 4
3.5
0.00
% -
(0.0
4%)
43.
5
5In
tern
atio
nal S
hipp
ing
and
Logi
stic
s FZ
EU
SD0.
08%
2,1
48.7
(0
.15%
) 1
18.5
0.
19%
(44.
9)(0
.07%
) 7
3.6
6TK
M G
loba
l Chi
na L
tdCN
Y0.
00%
31.
2 0.
00%
(1.8
)0.
01%
(2.9
)0.
00%
(4.7
)
7TK
M G
loba
l Gm
bHEU
R0.
06%
1,6
63.0
(0
.64%
) 4
99.5
0.
29%
(71.
2)(0
.42%
) 4
28.3
8A
fon
Tinp
late
Com
pany
Lim
ited
GBP
0.01
% 3
12.9
(0
.04%
) 2
7.3
0.00
% -
(0.0
3%)
27.
3
9Ca
paro
Mer
chan
t Bar
Plc
GBP
0.00
% (5
1.3)
(0.0
2%)
12.
3 0.
00%
- (0
.01%
) 1
2.3
48
. S
TA
TE
ME
NT
OF
NE
T A
SS
ET
S A
ND
PR
OF
IT O
R L
OS
S A
TT
RIB
UT
AB
LE
TO
OW
NE
RS
AN
D M
INO
RIT
Y I
NT
ER
ES
T (
CO
NT
D.)
F-328

NOTES FORMING PART OF THE FINANCIAL STATEMENTS
Na
me
of
the
En
tity
Re
po
rtin
g
Cu
rre
nc
y
Ne
t A
sse
ts, i
.e. t
ota
l a
sse
ts
min
us
tota
l li
ab
ilit
ies
Sh
are
in
pro
fit
or
(lo
ss)
Sh
are
in
oth
er
com
pre
he
nsi
ve
in
com
e
Sh
are
in
to
tal
com
pre
he
nsi
ve
in
com
e
As
% o
f
con
soli
da
ted
ne
t a
sse
ts
Am
ou
nt
As
% o
f
con
soli
da
ted
pro
fit
or
loss
Am
ou
nt
As
% o
f
con
soli
da
ted
oth
er
com
pre
he
nsi
ve
inco
me
Am
ou
nt
As
% o
f to
tal
com
pre
he
nsi
ve
inco
me
Am
ou
nt
10In
dust
rial R
ail S
ervi
ces
IJm
ond
B.V.
EUR
0.00
% -
0.00
% -
0.00
% -
0.00
% -
11La
ura
Met
aal H
oldi
ng B
.V.
EUR
0.05
% 1
,281
.1
(0.2
0%)
151
.4
0.00
% -
(0.1
5%)
151
.4
12Ra
vens
crai
g Li
mite
dG
BP(0
.01%
) (3
,77.
0)0.
10%
(81.
1)0.
00%
- 0.
08%
(81.
1)
13Ta
ta E
last
ron
Stee
l Ser
vice
Cen
ter S
AEU
R0.
00%
92.
6 0.
06%
(44.
8)0.
00%
- 0.
04%
(44.
8)
14Ta
ta S
teel
Tic
aret
AS
TRY
0.00
% 1
21.1
(0
.02%
) 1
1.7
0.00
% -
(0.0
1%)
11.
7
15A
ir Pr
oduc
ts L
lanw
ern
Lim
ited
GBP
0.00
% 6
0.8
(0.0
3%)
24.
8 0.
00%
- (0
.02%
) 2
4.8
16BS
R Pi
pelin
e Se
rvic
es L
imite
dG
BP0.
00%
77.
7 0.
00%
1.9
0.
00%
- 0.
00%
1.9
17Te
xtur
ing
Tech
nolo
gy L
imite
dG
BP0.
00%
47.
0 (0
.03%
) 2
6.1
0.00
% -
(0.0
3%)
26.
1
18TV
SC C
onst
ruct
ion
Stee
l Sol
utio
ns L
imite
dH
KD0.
00%
29.
5 0.
19%
(147
.5)
0.00
% -
0.15
% (1
47.5
)
TO
TA
L1
00
.00
% 2
6,4
3,8
32
.9
10
0.0
0%
(7
7,5
06
.2)
10
0.0
0%
(2
4,1
88
.6)
10
0.0
0%
(1
,01
,69
4.8
)
D.
Ad
just
me
nt
du
e t
o c
on
soli
da
tio
n (2
2,65
,639
.7)
35,
098.
2 1
8,59
3.4
53,6
91.6
E.
Min
ori
ty I
nte
rest
s in
su
bsi
dia
rie
s
a)
Ind
ian
Su
bsi
dia
rie
s
1Th
e Ti
npla
te C
ompa
ny o
f Ind
ia L
imite
dIN
R 1
,558
.4
59.
1 (8
.2)
50.
9
2In
dian
Ste
el &
Wire
Pro
duct
s Lt
dIN
R 3
1.6
3.1
(0
.5)
2.6
3Ta
ta M
etal
iks
Ltd.
INR
1,0
34.0
5
74.0
(9
.1)
564
.9
4Ad
ityap
ur To
ll Br
idge
Com
pany
Ltd
INR
45.
7 1
4.4
- 1
4.4
5Ta
ta S
pong
e Iro
n Lt
dIN
R 3
,975
.0
255
.0
(6.2
) 2
48.8
6Ja
msh
edpu
r Util
ities
& S
ervi
ces
Com
pany
Lim
ited
INR
(103
.2)
(54.
3) -
(54.
3)
7Ta
yo R
olls
Lim
ited
INR
(1,9
05.7
) (3
58.6
) 0
.1
(358
.5)
b)
Fo
reig
n S
ub
sid
iari
es
1Ta
ta S
teel
(Tha
iland
) Pub
lic C
ompa
ny L
td.
THB
3,2
67.2
1
30.0
5
0.2
180
.2
2TA
TA S
teel
Eur
ope
Lim
ited
GBP
(40.
4) (7
.2)
- (7
.2)
3N
atst
eel H
oldi
ngs
Pte.
Ltd
.SG
D 5
62.2
(7
.4)
17.
5 1
0.1
4T
S G
loba
l Min
eral
s H
oldi
ngs
Pte
Ltd.
USD
8,6
04.1
1
14.2
(6
.8)
107
.4
5Ta
ta S
teel
(KZN
) (Pt
y) L
td.
ZAR
(1,0
11.9
) -
(72.
5) (7
2.5)
16
,01
7.0
7
22
.3
(3
5.4
) 6
86
.9
Co
nso
lid
ate
d N
et
Ass
et
/ P
rofi
t a
fte
r T
ax
3,9
4,2
10
.2
(4
1,6
85
.7)
(5
,63
0.6
) (
47
,31
6.3
)
48
. S
TA
TE
ME
NT
OF
NE
T A
SS
ET
S A
ND
PR
OF
IT O
R L
OS
S A
TT
RIB
UT
AB
LE
TO
OW
NE
RS
AN
D M
INO
RIT
Y I
NT
ER
ES
T (
CO
NT
D.)
F-329

NOTES FORMING PART OF THE FINANCIAL STATEMENTS
48
. S
TA
TE
ME
NT
OF
NE
T A
SS
ET
S A
ND
PR
OF
IT O
R L
OS
S A
TT
RIB
UT
AB
LE
TO
OW
NE
RS
AN
D M
INO
RIT
Y I
NT
ER
ES
T (
CO
NT
D.)
Lis
t o
f su
bsi
dia
rie
s, a
sso
cia
tes
an
d j
oin
t v
en
ture
s w
hic
h h
av
e n
ot
be
en
co
nso
lid
ate
d a
nd
re
aso
ns
for
no
t co
nso
lid
ati
ng
Sl.
No
. N
am
eR
ea
son
1Fa
bsec
Lim
ited
The
ope
ratio
ns o
f the
com
pani
es a
re n
ot s
igni
fican
t and
hen
ce a
re im
mat
eria
l for
con
solid
atio
n 2
Indu
stria
l Rai
l Ser
vice
s IJ
mon
d B.
V. T
he o
pera
tions
of t
he c
ompa
nies
are
not
sig
nific
ant a
nd h
ence
are
imm
ater
ial f
or c
onso
lidat
ion
3Eu
rope
an P
rofil
es (M
) Sdn
. Bhd
. T
he o
pera
tions
of t
he c
ompa
nies
are
not
sig
nific
ant a
nd h
ence
are
imm
ater
ial f
or c
onso
lidat
ion
4N
ew M
illen
nium
Iron
Cor
p. T
he o
pera
tions
of t
he c
ompa
nies
are
not
sig
nific
ant a
nd h
ence
are
imm
ater
ial f
or c
onso
lidat
ion
5A
lbi P
rofil
s SR
L T
he o
pera
tions
of t
he c
ompa
nies
are
not
sig
nific
ant a
nd h
ence
are
imm
ater
ial f
or c
onso
lidat
ion
6H
oogo
vens
Gan
Mul
timed
ia S
.A. D
e C.
V. T
he o
pera
tions
of t
he c
ompa
nies
are
not
sig
nific
ant a
nd h
ence
are
imm
ater
ial f
or c
onso
lidat
ion
7IS
SB L
imite
d T
he o
pera
tions
of t
he c
ompa
nies
are
not
sig
nific
ant a
nd h
ence
are
imm
ater
ial f
or c
onso
lidat
ion
8Ka
linga
Aqu
atic
s Lt
d. N
ot C
onso
lidat
ed a
s th
e fin
anci
als
wer
e no
t ava
ilabl
e 9
Kum
ardh
ubi F
irecl
ay &
Sili
ca W
orks
Ltd
. N
ot C
onso
lidat
ed a
s th
e fin
anci
als
wer
e no
t ava
ilabl
e 10
Kum
ardh
ubi M
etal
Cas
ting
& E
ngin
eerin
g Lt
d. N
ot C
onso
lidat
ed a
s th
e fin
anci
als
wer
e no
t ava
ilabl
e 11
Nic
co Ju
bile
e Pa
rk L
imite
d N
ot C
onso
lidat
ed a
s th
e fin
anci
als
wer
e no
t ava
ilabl
e 12
Tata
Con
stru
ctio
n &
Pro
ject
s Lt
d. N
ot C
onso
lidat
ed a
s th
e fin
anci
als
wer
e no
t ava
ilabl
e 13
Mal
usha
Tra
vels
Pvt
Ltd
. N
ot C
onso
lidat
ed a
s th
e fin
anci
als
wer
e no
t ava
ilabl
e 14
Moh
ar E
xpor
t Ser
vice
s Pv
t. Lt
d N
ot C
onso
lidat
ed a
s th
e fin
anci
als
wer
e no
t ava
ilabl
e 15
Met
al C
orpo
ratio
n of
Indi
a N
ot C
onso
lidat
ed a
s th
e fin
anci
als
wer
e no
t ava
ilabl
e 16
Med
ica
TS H
ospi
tal P
vt. L
td.
Not
Con
solid
ated
as t
he fi
nanc
ials
wer
e no
t ava
ilabl
e
F-330

INDEPENDENT AUDITOR’S REPORT ON AUDIT OF INTERIM FINANCIAL RESULTS
TO
THE BOARD OF DIRECTORS OF
TATA STEEL LIMITED
1. We have audited the accompanying Statement of Standalone Financial Results of TATA STEEL LIMITED (“the Company”), for the quarter ended June 30, 2017 (“the Statement”), being submitted by the Company pursuant to the requirement of Regulation 33 of the SEBI (Listing Obligations and Disclosure Requirements) Regulations, 2015, as modified by Circular No. CIR/CFD/FAC/62/2016 dated July 5, 2016.
This Statement, which is the responsibility of the Company’s Management and approved by the Board of Directors, has been compiled from the related interim standalone financial statements which has been prepared in accordance with the recognition and measurement principles laid down in Indian Accounting Standard 34 “Interim Financial Reporting” (“Ind AS 34”), prescribed under Section 133 of the Companies Act, 2013 read with relevant rules issued thereunder and other accounting principles generally accepted in India. Our responsibility is to express an opinion on the Statement based on our audit of such interim standalone financial statements.
2. We conducted our audit in accordance with the Standards on Auditing issued by the Institute of Chartered Accountants of India. Those Standards require that we comply with ethical requirements and plan and perform the audit to obtain reasonable assurance about whether the Statement is free from material misstatement.
An audit involves performing procedures to obtain audit evidence about the amounts and the disclosures in the Statement. The procedures selected depend on the auditor’s judgment, including the assessment of the risks of material misstatement of the Statement, whether due to fraud or error. In making those risk assessments, the auditor considers internal control relevant to the Company’s preparation and fair presentation of the Statement in order to design audit procedures that are appropriate in the circumstances, but not for the purpose of expressing an opinion on the effectiveness
of the Company’s internal control. An audit also includes evaluating the appropriateness of the accounting policies used and the reasonableness of the accounting estimates made by the Management, as well as evaluating the overall presentation of the Statement.
We believe that the audit evidence obtained by us is sufficient and appropriate to provide a basis for our audit opinion.
3. In our opinion and to the best of our information and according to the explanations given to us, the Statement:
a. is presented in accordance with the requirements of Regulation 33 of the SEBI (Listing Obligations and Disclosure Requirements) Regulations, 2015, as modified by Circular No. CIR/CFD/FAC/62/2016 dated July 5, 2016; and
b. gives a true and fair view in conformity with the aforesaid Indian Accounting Standards (“Ind AS”) and other accounting principles generally accepted in India of the net profit and Total comprehensive income and other financial information of the Company for the quarter ended June 30, 2017.
For DELOITTE HASKINS & SELLS LLP
Chartered Accountants(Firm’s Registration No. 117366W/W-100018)
N. Venkatram
Partner
(Membership No.71387)
MUMBAI, August 7, 2017
F-331

STANDALONE FINANCIAL RESULTS FOR THE QUARTER ENDED ON JUNE 30, 2017
(` in million)Particulars Quarter
ended on 30.06.2017
Quarter ended on
31.03.2017
Quarter ended on
30.06.2016
Financial year ended on
31.03.2017USD mn
Financial year ended on
31.03.2017
Audited Audited Audited Audited Audited1 Revenue from operations a) Gross sales / income from operations 1,42,867.3 1,66,926.7 1,02,612,4 8,106.2 5,25,649.3 b) Other operating revenues 1,349.9 4,204.6 622.4 107.3 6,960.3 Total revenue from operations [ 1(a) + 1(b) ] 1,44,217.2 1,71,131.3 1,03,234.8 8,213.5 5,32,609.6 2 Other income 1,121.4 465.1 1,055.0 63.8 4,144.6 3 Total income [ 1 + 2 ] 1,45,338.6 1,71,596.4 1,04,289.8 8,277.3 5,36,754.2 4 Expenses a) Raw materials consumed 42,195.8 42,474.5 23,079.2 1,927.2 1,24,967.8 b) Purchases of finished, semi-finished & other
products 2,625.7 2,064.4 2,648.4 135.9 8,811.8
c) Changes in inventories of finished goods, work-in-progress and stock-in-trade
(9,045.7) 961.5 (10,970.5) (205.1) (13,296.5)
d) Employee benefits expense 11,576.9 10,611.2 11,603.6 710.2 46,051.3 e) Finance costs 7,001.4 6,529.2 5,291.9 414.6 26,885.5 f ) Depreciation and amortisation expense 9,664.1 10,574.9 7,029.7 546.2 35,415.5 g) Excise duty 14,511.0 14,742.1 12,030.0 812.4 52,679.4 h) Other expenses 52,690.7 56,668.0 42,630.5 3,001.6 1,94,636.3 Total expenses [ 4(a) to 4(h) ] 1,31,219.9 1,44,625.8 93,342.8 7,342.9 4,76,151.1 5 Profit / (Loss) before exceptional items & tax [ 3 - 4 ]
14,118.7 26,970.6 10,947.0 934.4 60,603.1
6 Exceptional items : a) Provision for impairment of investments / doubtful
advances - (196.5) (1,332.2) (26.4) (1,708.7)
b) Provision for demands and claims (6,144.1) (2,182.5) - (33.7) (2,182.5) c) Employee separation compensation (23.8) (685.8) (222.5) (27.6) (1,786.8) d) Restructuring and other provisions - (1,355.8) - (20.9) (1,355.8) Total exceptional items [ 6(a) to 6(d) ] (6,167.9) (4,420.6) (1,554.7) (108.6) (7,033.8)7 Profit / (Loss) before tax [ 5 + 6 ] 7,950.8 22,550.0 9,392.3 825.8 53,569.3
8 Tax Expense a) Current tax 2,195.0 4,937.5 2,682.6 216.0 14,005.4 b) Deferred tax 691.3 3,462.9 955.4 78.9 5,118.4 Total tax expense [ 8(a) + 8(b) ] 2,886.3 8,400.4 3,638.0 294.9 19,123.8 9 Net Profit / (Loss) for the period [ 7 - 8] 5,064.5 14,149.6 5,754.3 530.9 34,445.5 10 Other comprehensive income A (i) Items that will not be reclassified to profit or
loss (1,147.9) 171.5 6,266.6 92.7 6,012.2
(ii) Income tax relating to items that will not be reclassified to profit or loss
(115.7) 76.7 109.2 11.6 753.7
B (i) Items that will be reclassified to profit or loss (42.7) (18.7) 9.2 (0.2) (12.2) (ii) Income tax relating to items that will be
reclassified to profit or loss 14.8 6.5 (3.2) 0.1 4.2
Total other comprehensive income (1,291.5) 236.0 6,381.8 104.2 6,757.9 11 Total Comprehensive Income for the period [ 9 + 10 ]
3,773.0 14,385.6 12,136.1 635.1 41,203.4
12 Paid-up equity share capital [Face value ₹ 10 per share]
9,714.1 9,714.1 9,714.1 149.8 9,714.1
13 Reserves excluding revaluation reserves 4,86,875.9
14 Earnings per equity share Basic earnings per share (not annualised) - in Rupees
(after exceptional items) 4.77 14.12 5.48 0.52 33.67
Diluted earnings per share (not annualised) - in Rupees (after exceptional items)
4.77 14.12 5.48 0.52 33.67
F-332

1. We have reviewed the accompanying Statement of Consolidated Unaudited Financial Resultsof TATA STEEL LIMITED (“the Parent”) and its subsidiaries (the Parent and its subsidiaries together referred to as “the Group”),and its share of the profit/(loss) of its joint ventures and associates for the quarter ended June 30, 2017 (“the Statement”)being submitted by the Parent pursuant to the requirement of Regulation 33 of the SEBI (Listing Obligations and Disclosure Requirements) Regulations, 2015, as modified by Circular No. CIR/CFD/FAC/62/2016 dated July 5, 2016.
This Statement,which is the responsibility of the Parent’s Management and approved by the Board of Directors, has been prepared in accordance with the recognition and measurement principles laid down in Indian Accounting Standard 34 “Interim Financial Reporting” (“Ind AS 34”), prescribed under Section 133 of the Companies Act, 2013 read with relevant rules issued thereunder and other accounting principles generally accepted in India. Our responsibility is to issue a report on the Statement based on our review.
2. We conducted our review of the Statement in accordance with the Standard on Review Engagements (SRE) 2410 “Review of Interim Financial Information Performed by the Independent Auditor of the Entity”, issued by the Institute of Chartered Accountants of India. This Standard requires that we plan and perform the review to obtain moderate assurance as to whether the Statement is free of material misstatement. A review is limited primarily to inquiries of Parent’s personnel and analyticalprocedures applied to financial data and thus provides less assurance than an audit. We have not performed an audit and, accordingly, we do not express an audit opinion.
INDEPENDENT AUDITOR’S REVIEW REPORT ON REVIEW OF INTERIM FINANCIAL RESULTS
TO
THE BOARD OF DIRECTORS OF
TATA STEEL LIMITED
3. The Statement includes the results of the entities listed in Annexure A.
4. We did not review the interim financial information of threesubsidiaries included in the consolidated unaudited financial results, whose interim financial information reflect total revenues of Rs. 16,085.74 crores for the quarter ended June 30, 2017, and total loss after tax of Rs. 497.07 crores and total comprehensive loss of Rs. 4,252.89 croresfor the quarter ended June 30, 2017, as considered in the consolidated unaudited financial results. These interim financial information have been reviewed by other auditors whose reports have been furnished to us by the Management and our report on the Statement, in so far as it relates to the amounts and disclosures included in respect of these subsidiaries is based solely on the reports of the other auditors.
Our report on the Statement is not modified in respect of these matters.
5. Based on our review conducted as stated above and based on the consideration of the review reports of the other auditors referred to in paragraph 4above, nothing has come to our attention that causes us to believe that the accompanying Statement, prepared in accordance with the aforesaid Indian Accounting Standards and other accounting principles generally accepted in India, has not disclosed the information required to be disclosed in terms of Regulation 33 of the SEBI (Listing Obligations and Disclosure Requirements) Regulations, 2015, as modified by Circular No. CIR/CFD/FAC/62/2016 dated July 5, 2016, including the manner in which it is to be disclosed, or that it contains any material misstatement.
F-333

6. The consolidated unaudited financial resultsincludes the interim financial information of sixteensubsidiaries which have not been reviewed/audited by their auditors, whose interim financial information reflect total revenue of Rs. 729.52 crores for the quarter ended June 30, 2017 and total profit after tax of Rs.186.07 crores and total comprehensive income of Rs. 391.73 croresfor the quarter ended June 30, 2017, as considered in the consolidated unaudited financial results. The consolidated unaudited financial results also includes the Group’s share of profitafter tax of Rs. 2.03 crores and total comprehensive income of Rs. 5.83 croresfor the quarter ended June 30, 2017, as considered in the consolidated unaudited financial results, in respect of an associate and seven joint ventures, based on their interim financial information which have not been reviewed/audited by their auditors. According to the information and explanations given to us by the Management, these interim financial information are not material to the Group.
Our report on the Statement is not modified in respect of our reliance on the interim financial information certified by the Management.
7. In the case of one subsidiary and eight associates the financial information as at June 30, 2017 are not available. The investments in these companies are carried at Re. 1 each as at June 30, 2017. In the absence of their financial information as at June 30, 2017, the total revenue and total profit/(loss) of the subsidiary and the Group’s share of profit/(loss) of these associates have not been included in the Consolidated Financial results.
Our report is not qualified in respect of this matter.
For DELOITTE HASKINS & SELLS LLP
Chartered Accountants(Firm’s Registration No. 117366W/W-100018)
N. Venkatram
Partner
(Membership No.71387)
MUMBAI, August 7, 2017
F-334

ANNEXURE A:
List of entities consolidated
Sl. No Name of the Company
A. Subsidiaries (Direct)
1 ABJA Investment Co. Pte. Ltd.2 Adityapur Toll Bridge Company Limited3 Tata Steel Special Economic Zone Limited4 Indian Steel & Wire Products Ltd.5 Jamshedpur Utilities & Services Company Limited6 Mohar Export Services Pvt. Ltd7 NatSteel Asia Pte. Ltd.8 Rujuvalika Investments Limited9 T S Alloys Limited10 Tata Korf Engineering Services Ltd.11 Tata Metaliks Ltd.12 Tata Sponge Iron Limited 13 Tata Steel (KZN) (Pty) Ltd.14 T Steel Holdings Pte. Ltd.15 Tata Steel Odisha Limited16 Tata Steel Processing and Distribution Limited17 Tayo Rolls Limited18 Tata Pigments Limited19 The Tinplate Company of India Ltd 20 Tata Steel Foundation
B. Subsidiaries (Indirect)
1 Haldia Water Management Limited2 TS Asia (Hong Kong) Ltd.3 TSIL Energy Limited4 T S Global Holdings Pte Ltd.5 Orchid Netherlands (No.1) B.V.6 NatSteel Holdings Pte. Ltd.7 Easteel Services (M) Sdn. Bhd.8 Eastern Steel Fabricators Philippines, Inc.9 NatSteel (Xiamen) Ltd.10 NatSteel Recycling Pte Ltd.11 NatSteel Trade International (Shanghai) Company Ltd.12 NatSteel Trade International Pte. Ltd.13 NatSteel Vina Co. Ltd.14 The Siam Industrial Wire Company Ltd.15 TSN Wires Co., Ltd.16 Tata Steel Europe Limited17 Apollo Metals Limited18 Augusta Grundstucks GmbH19 Automotive Laser Technologies Limited20 B S Pension Fund Trustee Limited21 Beheermaatschappij Industriele Produkten B.V.22 Bell & Harwood Limited23 Blastmega Limited
Sl. No Name of the Company
24 Blume Stahlservice GmbH25 Blume Stahlservice Polska Sp.Z.O.O26 Bore Samson Group Limited27 Bore Steel Limited28 British Guide Rails Limited29 British Steel Corporation Limited30 British Steel Directors (Nominees) Limited31 British Steel Engineering Steels (Exports) Limited32 British Steel Nederland International B.V.33 British Steel Service Centres Limited34 British Tubes Stockholding Limited35 C V Benine36 C Walker & Sons Limited37 Catnic GmbH38 Catnic Limited39 CBS Investissements SAS40 Cogent Power Inc.41 Tata Steel International Mexico SA de CV42 Cogent Power Inc.43 Cogent Power Limited44 Color Steels Limited45 Corbeil Les Rives SCI46 Corby (Northants) & District Water Company Limited47 Cordor (C& B) Limited48 Corus Aluminium Verwaltungsgesellschaft Mbh49 Corus Beteiligungs GmbH50 Corus Building Systems Bulgaria AD51 Corus CNBV Investments52 Corus Cold drawn Tubes Limited53 Corus Engineering Steels (UK) Limited54 Corus Engineering Steels Holdings Limited55 Corus Engineering Steels Limited56 Corus Engineering Steels Overseas Holdings Limited57 Corus Engineering Steels Pension Scheme Trustee
Limited58 Corus Group Limited59 Corus Holdings Limited60 Corus International (Overseas Holdings) Limited61 Corus International Limited62 Corus International Romania SRL.63 Corus Investments Limited64 Corus Ireland Limited65 Corus Large Diameter Pipes Limited66 Corus Liaison Services (India) Limited67 Corus Management Limited68 Corus Primary Aluminium B.V.
F-335

ANNEXURE A: (CONTD.)
List of entities consolidated
Sl. No Name of the Company
69 Corus Property70 Corus Service Centre Limited71 Corus Steel Service STP LLC72 Corus Tubes Poland Spolka Z.O.O73 Corus UK Healthcare Trustee Limited74 Corus Ukraine Limited Liability Company75 CPN (85) Limited76 Crucible Insurance Company Limited77 Degels GmbH78 Demka B.V.79 DSRM Group Plc.80 Eric Olsson & Soner Forvaltnings AB81 Esmil B.V.82 Europressings Limited83 Firsteel Group Limited84 Firsteel Holdings Limited85 Fischer Profil GmbH86 Gamble Simms Metals Limited87 Grant Lyon Eagre Limited88 H E Samson Limited89 Hadfields Holdings Limited90 Halmstad Steel Service Centre AB91 Hammermega Limited92 Harrowmills Properties Limited93 Hille & Muller GmbH94 Hille & Muller USA Inc.95 Hoogovens USA Inc.96 Huizenbezit “Breesaap” B.V.97 Inter Metal Distribution SAS98 Kalzip Asia Pte Limited99 Kalzip FZE100 Kalzip GmbH101 Kalzip GmbH102 Kalzip Inc103 Kalzip India Private Limited104 Kalzip Italy SRL105 Kalzip Limited106 Kalzip Spain S.L.U.107 Layde Steel S.L.108 Lister Tubes Limited109 London Works Steel Company Limited110 Midland Steel Supplies Limited111 Montana Bausysteme AG112 Naantali Steel Service Centre OY113 Nationwide Steelstock Limited114 Norsk Stal Tynnplater AS
Sl. No Name of the Company
115 Norsk Stal Tynnplater AB116 Orb Electrical Steels Limited117 Ore Carriers Limited118 Oremco Inc.119 Plated Strip (International) Limited120 Precoat International Limited121 Precoat Limited122 Rafferty-Brown Steel Co Inc Of Conn.123 Round Oak Steelworks Limited124 Runblast Limited125 Runmega Limited126 S A B Profiel B.V.127 S A B Profil GmbH128 Seamless Tubes Limited129 Service Center Gelsenkirchen GmbH130 Service Centre Maastricht B.V.131 Skruv Erik AB132 Societe Europeenne De Galvanisation (Segal) Sa133 Speciality Steels UK Limited134 Staalverwerking en Handel B.V.135 Steel StockHoldings Limited136 Steelstock Limited137 Stewarts & Lloyds Of Ireland Limited138 Stewarts And Lloyds (Overseas) Limited139 Surahammar Bruks AB140 Tata Steel Belgium Packaging Steels N.V.141 Tata Steel Belgium Services N.V.142 Tata Steel Denmark Byggsystemer A/S143 Tata Steel Europe Distribution BV144 Tata Steel Europe Metals Trading BV145 Tata Steel France Batiment et Systemes SAS146 Tata Steel France Holdings SAS147 Tata Steel Germany GmbH148 Tata Steel IJmuiden BV149 Tata Steel International (Americas) Holdings Inc150 Tata Steel International (Americas) Inc151 Tata Steel International (Benelux) BV152 Tata Steel International (Canada) Holdings Inc153 Tata Steel International (Czech Republic) S.R.O 154 Tata Steel International (Denmark) A/S155 Tata Steel International (Finland) OY156 Tata Steel International (France) SAS157 Tata Steel International (Germany) GmbH158 Tata Steel International (South America) Representações
LTDA159 Tata Steel International Hellas SA
F-336

ANNEXURE A: (CONTD.)
List of entities consolidated
Sl. No Name of the Company
160 Tata Steel International (Italia) SRL161 Tata Steel International (Middle East) FZE162 Tata Steel International (Nigeria) Ltd.163 Tata Steel International (Poland) sp Zoo164 Tata Steel International (Schweiz) AG165 Tata Steel International (Sweden) AB166 Tata Steel International (India) Limited167 Tata Steel International Iberica SA168 Tata Steel Istanbul Metal Sanayi ve Ticaret AS169 Tata Steel Latvia Building Systems SIA170 Tata Steel Maubeuge SAS171 Tata Steel Nederland BV172 Tata Steel Nederland Consulting & Technical Services BV173 Tata Steel Nederland Services BV174 Tata Steel Nederland Star-Frame BV175 Tata Steel Nederland Technology BV176 Tata Steel Nederland Tubes BV177 Tata Steel Netherlands Holdings B.V.178 Tata Steel Norway Byggsystemer A/S179 Tata Steel Speciality Service Centre Suzhou Co. Limited180 Tata Steel Sweden Byggsystem AB181 Tata Steel Speciality Service Centre Xian Co. Limited182 Tata Steel UK Consulting Limited183 Tata Steel UK Holdings Limited184 Tata Steel UK Limited185 Tata Steel USA Inc.186 The Newport And South Wales Tube Company Limited187 The Stanton Housing Company Limited188 The Templeborough Rolling Mills Limited189 Thomas Processing Company190 Thomas Steel Strip Corp.191 Toronto Industrial Fabrications Limited192 Trier Walzwerk Verwaltungsgsellschaft mbH 193 TS South Africa Sales Office Proprietary Limited194 Tulip UK Holdings (No.2) Limited195 Tulip UK Holdings (No.3) Limited196 U.E.S. Bright Bar Limited197 UK Steel Enterprise Limited198 UKSE Fund Managers Limited199 Unitol SAS200 Walker Manufacturing And Investments Limited201 Walkersteelstock Ireland Limited202 Walkersteelstock Limited203 Westwood Steel Services Limited204 Whitehead (Narrow Strip) Limited205 T S Global Minerals Holdings Pte Ltd.206 Al Rimal Mining LLC
Sl. No Name of the Company
207 Black Ginger 461 (Proprietary) Ltd208 Kalimati Coal Company Pty. Ltd.209 Sedibeng Iron Ore Pty. Ltd.210 Tata Steel Cote D’ Ivoire S.A211 TSMUK Limited 212 Tata Steel Minerals Canada Limited 213 T S Canada Capital Ltd214 Tata Steel International (Singapore) Holdings Pte. Ltd.215 TSIA Holdings (Thailand) Limited216 Tata Steel International (Shanghai) Ltd.217 Tata Steel International (Thailand) Limited218 Tata Steel International (Singapore) Pte. Ltd.219 Tata Steel International (Asia) Limited220 Tata Steel (Thailand) Public Company Ltd.221 N.T.S Steel Group Plc.222 The Siam Construction Steel Co. Ltd.223 The Siam Iron And Steel (2001) Co. Ltd.224 T S Global Procurement Company Pte. Ltd. 225 ProCo Issuer Pte. Ltd.
C. Jointly Controlled Entities (Direct)
1 Bhubaneshwar Power Private Limited2 Himalaya Steel Mills Services Private Limited3 mjunction services limited4 S & T Mining Company Private Limited5 Tata BlueScope Steel Limited6 Tata NYK Shipping Pte Ltd.7 Jamshedpur Continuous Annealing & Processing
Company Private Limited8 T M Mining Company Limited9 TM International Logistics Limited10 Industrial Energy Limited11 Jamipol Limited
D. Jointly Controlled Entities (Indirect)
1 SEZ Adityapur Limited2 Naba Diganta Water Management Limited3 TVSC Construction Steel Solutions Limited4 Afon Tinplate Company Limited5 Caparo Merchant Bar Plc6 Fabsec Limited7 Industrial Rail Services IJmond B.V.8 Laura Metaal Holding B.V.9 Ravenscraig Limited10 Tata Elastron Steel Service Center SA11 Tata Steel Ticaret AS12 Minas De Benga (Mauritius) Limited
F-337

ANNEXURE A: (CONTD.)
List of entities consolidated
Sl. No Name of the Company
13 International Shipping and Logistics FZE14 TKM Global China Ltd15 TKM Global GmbH16 TKM Global Logistics Limited17 Tata NYK Shipping (India) Pvt. Ltd.18 BlueScope Lysaght Lanka (Pvt) Ltd
E. Joint Operation
1 Air Products Llanwern Limited2 BSR Pipeline Services Limited3 Texturing Technology Limited4 Hoogovens Court Roll Service Technologies VOF
F. Associates (Direct)
1 Kalinga Aquatics Ltd.2 Kumardhubi Fireclay & Silica Works Ltd.3 Kumardhubi Metal Casting and Engineering Limited 4 Nicco Jubilee Park Limited 5 Strategic Energy Technology Systems Private Limited6 Tata Construction & Projects Ltd.7 TRL Krosaki Refractories Limited8 TRF Limited9 Malusha Travels Pvt Ltd.G. Associates (Indirect)
Sl. No Name of the Company
1 European Profiles (M) Sdn. Bhd.2 Albi Profils SRL3 GietWalsOnderhoudCombinatie B.V.4 Hoogovens Gan Multimedia S.A. De C.V.5 ISSB Limited6 Wupperman Staal Nederland B.V.7 New Millennium Iron Corp.8 Metal Corporation of India Limited9 TRF Singapore Pte Limited10 TRF Holding Pte Limited11 York Transport Equipment (Asia) Pte Ltd12 York Transport Equipment (India) Pvt Ltd13 York Transport Equipment Pty Ltd14 York Sales (Thailand) Company Limited15 York Transport Equipment (SA) (Pty) Ltd16 Rednet Pte Ltd17 PT York Engineering18 YTE Special Products Pte. Limited19 Qingdao YTE Special Products Co. Limited20 York Transport Equipment (Shanghai) Co. Ltd21 Aditya Automotive Applications Private Limited22 Dutch Lanka Trailer Manufacturers Limited23 Dutch Lanka Engineering (Private) Limited24 Dutch Lanka Trailers Manufacturing LLC25 Hewitt Robins International Ltd26 Hewitt Robins International Holdings Ltd
F-338

(` in million)Particulars Quarter ended
on 30.06.2017
Quarter ended
on 31.03.2017
Quarter ended
on 30.06.2016
Financial year
ended on
31.03.2017
USD mn
Financial year
ended on
31.03.2017
Unaudited Unaudited Unaudited Audited Audited
1 Revenue from operations a) Gross sales / income from operations 3,08,033.2 3,48,329.8 2,58,969.4 17,994.1 11,66,825.7 b) Other operating revenues 1,700.1 4,719.1 737.7 113.7 7,373.7 Total revenue from operations [ 1(a) + 1(b) ] 3,09,733.3 3,53,048.9 2,59,707.1 18,107.8 11,74,199.4 2 Other income 1,554.7 1,521.7 1,363.8 81.3 5,274.7 3 Total income [ 1 + 2 ] 3,11,288.0 3,54,570.6 2,61,070.9 18,189.1 11,79,474.1 4 Expenses a) Raw materials consumed 1,02,794.3 99,576.4 68,151.1 4,999.3 3,24,180.9 b) Purchases of finished, semi-finished & other products 27,577.0 27,848.0 29,161.4 1,761.9 1,14,249.4 c) Changes in inventories of finished goods, work-in-progress
and stock-in-trade (19,672.8) (2,953.1) (15,936.1) (699.8) (45,381.3)
d) Employee benefits expense 43,038.6 42,169.4 45,033.3 2,660.5 1,72,522.2 e) Finance costs 13,437.1 12,631.2 10,706.8 782.2 50,722.0 f ) Depreciation and amortisation expense 15,011.3 15,892.2 12,377.7 874.8 56,728.8 g) Excise duty recovered on sales 14,165.6 14,088.9 11,763.5 789.7 51,205.2 h) Other expenses 92,090.5 1,02,067.2 88,780.2 5,973.4 3,87,344.8 Total expenses [ 4(a) to 4(h) ] 2,88,441.6 3,11,320.2 2,50,037.9 17,142.0 11,11,572.0 5 Profit / (Loss) before share of profit/(loss) of joint ventures &
associates, exceptional items & tax [ 3 - 4 ] 22,846.4 43,250.4 11,033.0 1,047.1 67,902.1
6 Share of profit / (loss) of joint ventures & associates 59.0 27.6 142.0 1.2 76.5 7 Profit / (Loss) before exceptional items & tax [ 5 + 6 ] 22,905.4 43,278.0 11,175.0 1,048.3 67,978.6
8 Exceptional items : a) Profit / (Loss) on sale of non current investments - 227.0 - 3.5 227.0 b) Profit on sale of non current assets - 858.7 - 13.2 858.7 c) Provision for diminution in value of investments / doubtful
advances - (85.9) (1,168.6) (19.3) (1,254.5)
d) Provision for impairment of non-current assets - (2,679.3) - (41.3) (2,679.3) e) Provision for demands and claims (6,144.1) (2,182.5) - (33.7) (2,182.5) f ) Employee separation compensation (23.8) (685.9) (509.4) (32.0) (2,073.7) g) Restructuring and other provisions - (36,138.0) - (557.3) (36,138.0) Total exceptional items [ 8(a) to 8(g) ] (6,167.9) (40,685.9) (1,678.0) (666.9) (43,242.3)9 Profit / (Loss) before tax [ 7 + 8 ] 16,737.5 2,592.1 9,497.0 381.5 24,736.3
10 Tax Expense a) Current tax 3,255.0 6,675.0 2,336.6 268.6 17,417.0 b) Deferred tax 4,150.3 3,084.6 5,066.1 159.8 10,363.1 Total tax expense [ 10(a) + 10(b) ] 7,405.3 9,759.6 7,402.7 428.4 27,780.1 11 Net Profit / (Loss) after tax from continuing operations [ 9 - 10 ] 9,332.2 (7,167.5) 2,094.3 (46.9) (3,043.8)12 Profit / (Loss) before tax from discontinued operations (307.7) (4,939.0) (907.8) (118.9) (7,708.6)13 Tax expense of discontinued operations - (1.1) 52.4 1.2 80.1 14 Profit / (Loss) after tax from discontinued operations [ 12 - 13 ]
(307.7) (4,937.9) (960.2) (120.1) (7,788.7)
15 Profit / (Loss) on disposal of discontinued operations 186.4 425.2 (32,964.8) (475.8) (30,853.2)16 Net Profit / (Loss) after tax from discontinued operations [14 + 15] (121.3) (4,512.7) (33,925.0) (595.9) (38,641.9)17 Net Profit / (Loss) for the period [ 11 + 16 ] 9,210.9 (11,680.2) (31,830.7) (642.9) (41,685.7)
CONSOLIDATED FINANCIAL RESULTS FOR THE QUARTER/ THREE MONTHS ENDED ON 30TH JUNE 2017
F-339

(` in million)Particulars Quarter ended
on 30.06.2017
Quarter ended
on 31.03.2017
Quarter ended
on 30.06.2016
Financial year
ended on
31.03.2017
USD mn
Financial year
ended on
31.03.2017
Unaudited Unaudited Unaudited Audited Audited
18 Profit/ (Loss) from continuing operations for the period attributable to:
Owners of the Company 9,184.0 (7,251.4) 1,858.2 (58.1) (3,766.1) Non controlling interests 148.2 83.9 236.1 11.1 722.3 19 Profit / (Loss) from discontinued operations for the period
attributable to: Owners of the Company (121.3) (4,512.7) (33,925.0) (595.9) (38,641.9) Non controlling interests - - - - - 20 Other comprehensive income A (i) Items that will not be reclassified to profit or loss (27,929.9) 18,203.0 (6,254.0) (538.9) (34,942.5) (ii) Income tax relating to items that will not be
reclassified to profit or loss 2,762.0 (3,034.2) 2,353.4 120.6 7,823.4
B (i) Items that will be reclassified to profit or loss (10,855.3) (1,524.4) 7,555.4 337.5 21,883.0 (ii) Income tax on items that will be reclassified to
profit or loss 605.2 281.8 (112.9) (6.1) (394.5)
Total other comprehensive income (35,418.0) 1,3926.2 3,541.9 (86.8) (5,630.6)21 Total Comprehensive Income for the period [ 17 + 20 ] (26,207.1) 2,246.0 (28,288.8) (729.7) (47,316.3)
22 Total comprehensive income for the period attributable to: Owners of the Company (26,367.7) 2,122.6 (28,621.3) (740.3) (48,003.2) Non controlling interests 160.6 123.4 332.5 10.6 686.9 23 Paid-up equity share capital [Face value ₹ 10 per share] 9,702.4 9,702.4 9,702.4 149.6 9,702.4 24 Reserves (excluding revaluation reserves) and Non controlling
interest 3,61,757.7
25 Earnings per equity share (for continuing operation): Basic earnings per share (not annualised) - in Rupees (after
exceptional items) 9.17 (7.83) 1.71 0.1 1.71
Diluted earnings per share (not annualised) - in Rupees (after exceptional items)
9.17 (7.83) 1.71 0.1 1.71
26 Earnings per equity share (for discontinued operation): Basic earnings per share (not annualised) - in Rupees (0.13) (4.65) (34.97) 0.6 (39.84) Diluted earnings per share (not annualised) - in Rupees (0.13) (4.65) (34.97) 0.6 (39.84)27 Earnings per equity share (for continuing and discontinued
operations): Basic earnings per share (not annualised) - in Rupees (after
exceptional items) 9.04 (12.48) (33.26) 0.7 (44.77)
Diluted earnings per share (not annualised) - in Rupees (after exceptional items)
9.04 (12.48) (33.26) 0.7 (44.77)
CONSOLIDATED FINANCIAL RESULTS FOR THE QUARTER/ THREE MONTHS ENDED ON 30TH JUNE 2017
F-340

CONSOLIDATED SEGMENT REVENUE, RESULTS, ASSETS AND LIABILITIES
(` in million)Particulars Quarter
ended on 30.06.2017
Quarter ended on
31.03.2017
Quarter ended on
30.06.2016
Financial year ended on
31.03.2017 USD mn
Financial year ended on
31.03.2017
Unaudited Unaudited Unaudited Audited AuditedSegment Revenue:Tata Steel India 1,44,217.2 1,71,131.3 1,03,234.8 8,213.6 5,32,609.6 Other Indian Operations 18,311.7 20,569.6 14,708.3 1,033.2 66,998.4 Tata Steel Europe 1,40,787.9 1,52,435.2 1,26,650.8 8,032.2 5,20,849.6 Other Trade Related Operations 72,026.7 72,022.6 44,510.4 3,662.8 2,37,513.7 South East Asian Operations 19,909.6 22,208.4 20,030.9 1,254.7 81,359.0 Rest of the World 1,187.6 2,404.8 1,472.7 97.1 6,299.5 Total 3,96,440.7 4,40,771.9 3,10,607.9 22,293.6 14,45,629.8
Less: Inter Segment Revenue 86,707.4 87,723.0 50,900.8 4,185.8 2,71,430.4 Total Segment Revenue from operations 3,09,733.3 3,53,048.9 2,59,707.1 18,107.8 11,74,199.4
Segment Results before exceptional items, interest, tax
and depreciation :
Tata Steel India 29,215.4 43,243.9 22,361.0 1,843.3 1,19,527.5 Other Indian Operations 2,048.2 2,147.5 1,238.9 89.5 5,800.8 Tata Steel Europe 12,525.2 19,721.7 8,897.3 725.6 47,049.1 Other Trade Related Operations 8,176.6 5,823.9 (237.1) 40.3 2,616.2 South East Asian Operations 257.7 1,545.6 1,850.3 81.9 5,312.7 Rest of the World (254.7) 444.8 98.4 (3.0) (195.6)Less: Inter Segment Eliminations 2,575.2 3,107.5 1,175.2 152.0 9,857.0 Total Segment Results before exceptional items, interest,
tax and depreciation
49,393.2 69,819.9 33,033.6 2,625.5 1,70,253.7
Add: Finance income 1,960.6 1,981.5 1,225.9 79.8 5,175.7 Less: Finance costs 13,437.1 12,631.2 10,706.8 782.2 50,722.0 Less: Depreciation and Amortisation 15,011.3 15,892.2 12,377.7 874.8 56,728.8 Profit / (Loss) before exceptional items & tax 22,905.4 43,278.0 11,175.0 1,048.3 67,978.6
Add: Exceptional items (6,167.9) (40,685.9) (1,678.0) (666.9) (43,242.3)Profit / (Loss) before tax 16,737.5 2,592.1 9,497.0 381.5 24,736.3
Less: Tax expense 7,405.3 9,759.6 7,402.7 428.4 27,780.1 Net Profit / (Loss) after tax from continuing operations 9,332.2 (7,167.5) 2,094.3 (46.9) (3,043.8)
Net Profit / (Loss) after tax from discontinued operations (121.3) (4,512.7) (33,925.0) (595.9) (38,641.9)Net Profit / (Loss) for the period 9,210.9 (11,680.2) (31,830.7) (642.9) (41,685.7)
Segment Assets:
Tata Steel India 11,31,735.9 10,91,806.0 10,63,287.6 16,837.2 10,91,806.0 Other Indian Operations 56,376.0 55,322.6 50,975.6 853.2 55,322.6 Tata Steel Europe 4,34,389.0 4,36,873.1 4,92,723.5 6,737.2 4,36,873.1 Other Trade Related Operations 4,67,793.9 4,34,135.0 4,81,220.1 6,695.0 4,34,135.0 South East Asian Operations 49,134.1 50,914.3 52,206.7 785.2 50,914.3 Rest of the World 78,962.4 79,046.6 74,572.3 1,219.0 79,046.6 Less: Inter Segment Eliminations 4,42,608.5 4,14,765.2 4,51,853.7 6,396.3 4,14,765.2 Total Segment Assets 17,75,782.8 17,33,332.4 17,63,132.1 26,730.4 17,33,332.4
Segment Liabilities:
Tata Steel India 6,62,135.0 6,25,429.5 6,14,336.3 9,645.0 6,25,429.5 Other Indian Operations 32,678.0 32,749.0 30,951.1 505.0 32,749.0 Tata Steel Europe 7,70,369.3 7,30,617.1 7,62,539.1 11,267.1 7,30,617.1 Other Trade Related Operations 3,54,395.8 3,32,083.4 3,14,411.8 5,121.2 3,32,083.4 South East Asian Operations 25,744.9 27,245.0 29,334.0 420.2 27,245.0 Rest of the World 22,747.7 22,051.1 62,748.5 340.1 22,051.1 Less: Inter Segment Eliminations 4,59,832.7 4,31,052.9 4,67,178.5 6,647.4 4,31,052.9 Total Segment Liabilities 14,08,238.0 13,39,122.2 13,47,142.3 20,651.1 13,39,122.2
F-341

INDEPENDENTAUDITOR’S REPORT
The Board of Directors
Tata Steel Limited
Bombay House
24, Homi Mody Street,
Fort, Mumbai 400 001
1. We have audited the financial results of Tata Steel Limited (the “Company”) for the quarter ended September 30, 2017 and the year to date results for the period April 1, 2017 to September 30, 2017 including the period from April 1, 2017 to June 30, 2017 which was audited by another firm of chartered accountants on whose report dated August 7, 2017 we have relied upon, (the “results”) which are included in the accompanying ‘Standalone Financial Results for the quarter and six months ended on 30th September, 2017’ and the Standalone Balance Sheet as on that date, being submitted by the company pursuant to the requirement of Regulation 33 of the SEBI (Listing Obligations and Disclosure Requirements) Regulations, 2015 (the “Listing Regulations, 2015”).
2. The Company’s Management is responsible for preparation of the results on the basis of its interim financial statements prepared in accordance with the recognition and measurement principles laid down in Ind AS 34 ‘Interim Financial Reporting’, prescribed under section 133 of the Companies Act, 2013 and other accounting principles generally accepted in India. Our responsibility is to express an opinion on the results based on our audit of such interim financial statements.
3. We conducted our audit in accordance with the Standards on Auditing and other applicable authoritative pronouncements issued by the Institute of Chartered Accountants of India. Those standards require that we plan and perform the audit to obtain reasonable assurance about whether the results are free of material misstatements. An audit includes examining, on a test basis, evidence supporting the amounts and disclosures in the results. An audit also includes assessing the accounting principles used and significant estimates made by Management. We believe that our audit provides a reasonable basis for our opinion. (Also refer paragraph 5 below)
4. In our opinion, and to the best of our information and according to the explanations given to us, the results :
(i) are presented in accordance with the requirements of Regulation 33 of the Listing Regulations, 2015 in this regard; and
(ii) give a true and fair view of the net profit and other financial information for the quarter ended September 30, 2017 as well as the year to date results for the period from April 1, 2017 to September 30, 2017, including the period from April 1, 2017 to June 30, 2017 audited by another firm of chartered accountants on whose report dated August 7, 2017 we have relied upon, and also the Standalone Balance Sheet as at September 30, 2017.
5. (a) The standalone financial results of the Company for the quarters ended June 30, 2017, September 30, 2016/ year to date results for the period April 1, 2016 to September 30, 2016 were audited by another firm of chartered accountants, who issued their unmodified opinions vide their reports dated August 7, 2017 and November 11, 2016 respectively.
(b) The financial statements of the Company for the year ended March 31, 2017 was audited by another firm of chartered accountants, who issued their unmodified opinion, vide their report dated May 16, 2017.
For Price Waterhouse & Co Chartered Accountants LLP Chartered Accountants
Registration Number: 304026E/E-300009
Russell I Parera
(Partner)
(Membership Number : 042190)
Mumbai, October 30, 2017
F-342

(` in million)Particulars Quarter
ended on
30.09.2017
Quarter
ended on
30.06.2017
Quarter
ended on
30.09.2016
Six months
ended on
30.09.2017
USD mn
Six months
ended on
30.09.2017
Six months
ended on
30.09.2016
Financial year
ended on
31.03.2017
USD mn
Financial year
ended on
31.03.2017
Audited Audited Audited Audited Audited Audited Audited Audited1 Revenue from operations a) Gross sales / income from
operations 1,39,103.6 1,42,867.3 1,16,392.3 4,319.7 2,81,970.9 2,19,004.7 8,106.2 5,25,649.3
b) Other operating revenues 3,105.7 1,349.9 790.8 68.3 4,455.6 1,413.2 107.3 6,960.3 Total revenue from operations [ 1(a) + 1(b) ]
1,42,209.3 1,44,217.2 1,17,183.1 4,388.0 2,86,426.5 2,20,417.9 8,213.6 5,32,609.6
2 Other income 2,494.8 1,121.4 1,646.5 55.4 3,616.2 2,701.5 63.9 4,144.6 3 Total income [ 1 + 2 ] 1,44,704.1 1,45,338.6 1,18,829.6 4,443.4 2,90,042.7 2,23,119.4 8,277.5 5,36,754.2 4 Expenses a) Raw materials consumed 44,489.8 42,195.8 26,438.5 1,328.0 86,685.6 49,517.7 1,927.2 1,24,967.8 b) Purchases of finished,
semi-finished & other products
812.6 2,625.7 2,127.7 52.7 3,438.3 4,776.1 135.9 8,811.8
c) Changes in inventories of finished goods, work-in-progress and stock-in-trade
9,188.9 (9,045.7) 1,594.7 2.2 143.2 (9,375.8) (205.1) (13,296.5)
d) Employee benefits expense
11,151.1 11,576.9 11,808.7 348.2 22,728.0 23,412.3 710.2 46,051.3
e) Finance costs 7,091.6 7,001.4 7,367.2 215.9 14,093.0 12,659.1 414.6 26,885.5 f ) Depreciation and
amortisation expense 9,124.2 9,664.1 9,116.5 287.8 18,788.3 16,146.2 546.2 35,415.5
g) Excise duty recovered on sales
- 13,585.8 11,970.9 208.1 13,585.8 22,536.4 789.1 51,171.8
h) Other expenses 42,814.4 53,615.9 44,094.9 1,477.3 96,430.3 88,189.9 3,024.8 1,96,143.9 Total expenses [ 4(a) to 4(h) ] 1,24,672.6 1,31,219.9 1,14,519.1 3,920.2 2,55,892.5 2,07,861.9 7,342.9 4,76,151.1 5 Profit / (Loss) before
exceptional items & tax [ 3 - 4 ]
20,031.5 14,118.7 4,310.5 523.2 34,150.2 15,257.5 934.6 60,603.1
6 Exceptional items : a) Provision for impairment
of investments / doubtful advances
(266.5) - (50.0) (4.1) (266.5) (1,382.2) (26.4) (1,708.7)
b) Provision for demands and claims
- (6,144.1) - (94.1) (6,144.1) - (33.7) (2,182.5)
c) Employee separation compensation
- (23.8) (592.9) (0.4) (23.8) (815.4) (27.6) (1,786.8)
d) Restructuring and other provisions
- - - 0.0 - - (20.9) (1,355.8)
Total exceptional items [ 6(a) to 6(d) ]
(266.5) (6167.9) (642.9) (98.6) (6,434.4) (2,197.6) (108.5) (7,033.8)
7 Profit / (Loss) before tax [5 + 6] 19,765.0 7,950.8 3,667.6 424.6 27,715.8 13,059.9 826.1 53,569.3
8 Tax Expense a) Current tax 4,893.6 2,195.0 1,812.1 108.6 7,088.6 4,494.7 216.0 14,005.4 b) Deferred tax 1,930.6 691.3 (640.1) 40.2 2,621.9 315.3 78.9 5,118.4 Total tax expense [ 8(a) + 8(b) ] 6,824.2 2,886.3 1,172.0 148.8 9,710.5 4,810.0 294.9 19,123.8 9 Net Profit / (Loss) for the period
[ 7 - 8]
12,940.8 5,064.5 2,495.6 275.8 18,005.3 8,249.9 531.2 34,445.5
10 Other comprehensive income A (i) Items that will not
be reclassified to profit or loss
(755.9) (1,147.9) 5,215.8 (29.2) (1,903.8) 11,482.3 92.7 6,012.2
STANDALONE FINANCIAL RESULTS FOR THE QUARTER/ SIX MONTHS ENDED ON 30TH SEPTEMBER 2017
F-343

(` in million)Particulars Quarter
ended on
30.09.2017
Quarter
ended on
30.06.2017
Quarter
ended on
30.09.2016
Six months
ended on
30.09.2017
USD mn
Six months
ended on
30.09.2017
Six months
ended on
30.09.2016
Financial year
ended on
31.03.2017
USD mn
Financial year
ended on
31.03.2017
Audited Audited Audited Audited Audited Audited Audited Audited (ii) Income tax relating
to items that will not be reclassified to profit or loss
(64.1) (115.7) 510.2 (2.8) (179.8) 619.5 11.6 753.7
B (i) Items that will be reclassified to profit or loss
16.3 (42.7) (6.3) (0.4) (26.4) 2.9 (0.2) (12.2)
(ii) Income tax relating to items that will be reclassified to profit or loss
(5.7) 14.8 7.2 0.1 9.1 (1.0) 0.1 4.2
Total other comprehensive income
(809.4) (1,291.5) 5,721.9 (32.2) (2,100.9) 12,103.7 104.2 6,757.9
11 Total Comprehensive Income
for the period [ 9 + 10 ]
12,131.4 3,773.0 8,217.5 243.7 15,904.4 20,353.6 635.4 41,203.4
12 Paid-up equity share capital [Face value ₹ 10 per share]
9,714.1 9,714.1 9,714.1 148.8 9,714.1 9,714.1 149.8 9,714.1
13 Paid-up debt capital 1,571.9 1,02,607.1 95,173.6 1,569.2 1,01,757.0 14 Reserves excluding revaluation
reserves 4,86,875.9
15 Hybrid perpetual securities
348.5 22,750.0 22,750.0 350.8 22,750.0
16 Debenture redemption reserve
313.4 20,460.0 20,460.0 315.5 20,460.0
17 Earnings per equity share Basic earnings per share (not
annualised) - in Rupees (after exceptional items)
12.87 4.77 2.12 0.27 17.64 7.6 0.52 33.67
Diluted earnings per share (not annualised) - in Rupees (after exceptional items)
12.87 4.77 2.12 0.27 17.64 7.6 0.52 33.67
18 Net Debt Equity Ratio
0.42 0.42 0.53 0.44 0.44
19 Debt Service Coverage Ratio
4.25 4.25 2.03 2.72 2.72
20 Interest Service Coverage Ratio
5.15 5.15 2.81 4.21 4.21
(a) Paid up debt capital represents debentures (b) Net Debt to Equity: Net Debt / Average Net Worth (Net debt: Long term borrowings + Current maturities of long term borrowings + Short term borrowings - Cash & bank balances - Current investments)
(Net Worth: Equity Share Capital + Other Equity + Hybrid Perpetual Securities) (c) Debt Service Coverage Ratio: EBIT / (Net Finance Charges + Scheduled Principal repayments of long term borrowings (excluding prepayments) during the
period) (EBIT : Profit before Taxes +/(-) Exceptional Items + Net Finance Charges) (Net Finance Charges: Finance costs (excluding interest on short term debts) - Interest income - Dividend income from current investments - Net Gain/(Loss) on
sale of current investments) (d) Interest Service Coverage Ratio: EBIT / Net Finance Charges
STANDALONE FINANCIAL RESULTS FOR THE QUARTER/ SIX MONTHS ENDED ON 30TH SEPTEMBER 2017
F-344
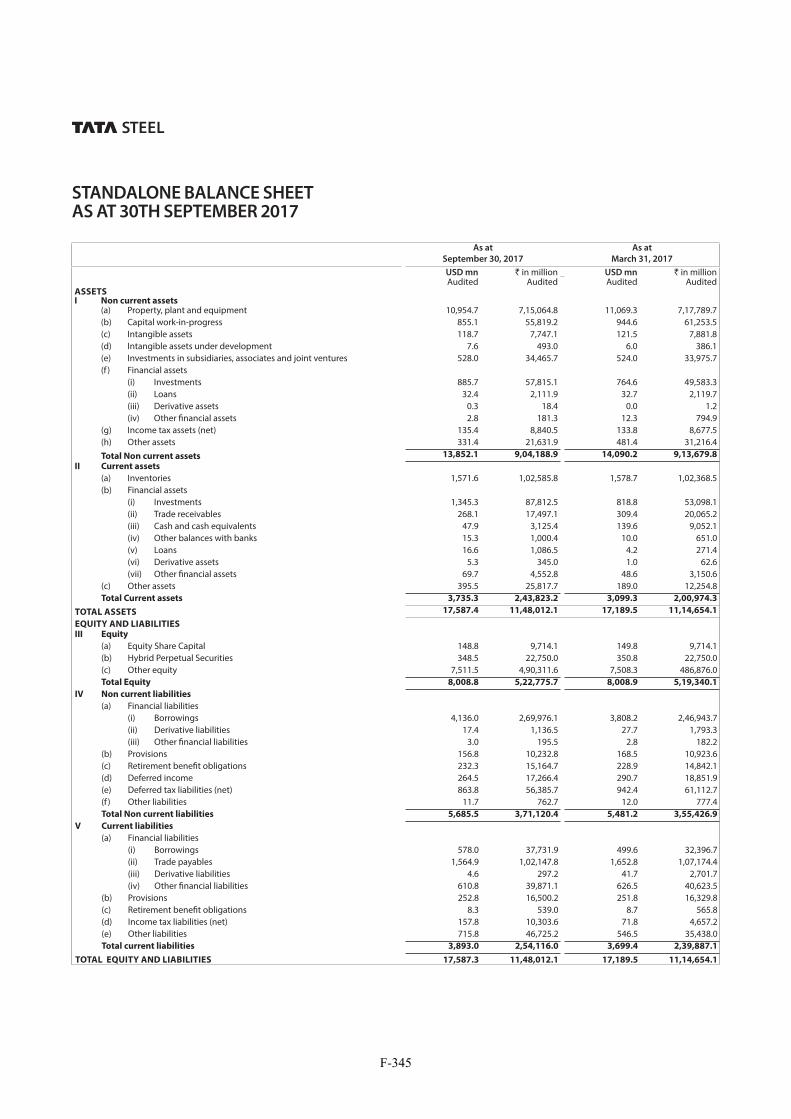
STANDALONE BALANCE SHEET AS AT 30TH SEPTEMBER 2017
As at
September 30, 2017
As at
March 31, 2017
USD mn ` in million USD mn ` in millionAudited Audited Audited Audited
ASSETSI Non current assets (a) Property, plant and equipment 10,954.7 7,15,064.8 11,069.3 7,17,789.7 (b) Capital work-in-progress 855.1 55,819.2 944.6 61,253.5 (c) Intangible assets 118.7 7,747.1 121.5 7,881.8 (d) Intangible assets under development 7.6 493.0 6.0 386.1 (e) Investments in subsidiaries, associates and joint ventures 528.0 34,465.7 524.0 33,975.7 (f ) Financial assets (i) Investments 885.7 57,815.1 764.6 49,583.3 (ii) Loans 32.4 2,111.9 32.7 2,119.7 (iii) Derivative assets 0.3 18.4 0.0 1.2 (iv) Other financial assets 2.8 181.3 12.3 794.9 (g) Income tax assets (net) 135.4 8,840.5 133.8 8,677.5 (h) Other assets 331.4 21,631.9 481.4 31,216.4 Total Non current assets 13,852.1 9,04,188.9 14,090.2 9,13,679.8
II Current assets
(a) Inventories 1,571.6 1,02,585.8 1,578.7 1,02,368.5 (b) Financial assets (i) Investments 1,345.3 87,812.5 818.8 53,098.1 (ii) Trade receivables 268.1 17,497.1 309.4 20,065.2 (iii) Cash and cash equivalents 47.9 3,125.4 139.6 9,052.1 (iv) Other balances with banks 15.3 1,000.4 10.0 651.0 (v) Loans 16.6 1,086.5 4.2 271.4 (vi) Derivative assets 5.3 345.0 1.0 62.6 (vii) Other financial assets 69.7 4,552.8 48.6 3,150.6 (c) Other assets 395.5 25,817.7 189.0 12,254.8 Total Current assets 3,735.3 2,43,823.2 3,099.3 2,00,974.3
TOTAL ASSETS 17,587.4 11,48,012.1 17,189.5 11,14,654.1
EQUITY AND LIABILITIESIII Equity
(a) Equity Share Capital 148.8 9,714.1 149.8 9,714.1 (b) Hybrid Perpetual Securities 348.5 22,750.0 350.8 22,750.0 (c) Other equity 7,511.5 4,90,311.6 7,508.3 486,876.0 Total Equity 8,008.8 5,22,775.7 8,008.9 5,19,340.1
IV Non current liabilities
(a) Financial liabilities (i) Borrowings 4,136.0 2,69,976.1 3,808.2 2,46,943.7 (ii) Derivative liabilities 17.4 1,136.5 27.7 1,793.3 (iii) Other financial liabilities 3.0 195.5 2.8 182.2 (b) Provisions 156.8 10,232.8 168.5 10,923.6 (c) Retirement benefit obligations 232.3 15,164.7 228.9 14,842.1 (d) Deferred income 264.5 17,266.4 290.7 18,851.9 (e) Deferred tax liabilities (net) 863.8 56,385.7 942.4 61,112.7 (f ) Other liabilities 11.7 762.7 12.0 777.4
Total Non current liabilities 5,685.5 3,71,120.4 5,481.2 3,55,426.9
V Current liabilities
(a) Financial liabilities (i) Borrowings 578.0 37,731.9 499.6 32,396.7 (ii) Trade payables 1,564.9 1,02,147.8 1,652.8 1,07,174.4 (iii) Derivative liabilities 4.6 297.2 41.7 2,701.7 (iv) Other financial liabilities 610.8 39,871.1 626.5 40,623.5 (b) Provisions 252.8 16,500.2 251.8 16,329.8 (c) Retirement benefit obligations 8.3 539.0 8.7 565.8 (d) Income tax liabilities (net) 157.8 10,303.6 71.8 4,657.2 (e) Other liabilities 715.8 46,725.2 546.5 35,438.0
Total current liabilities 3,893.0 2,54,116.0 3,699.4 2,39,887.1
TOTAL EQUITY AND LIABILITIES 17,587.3 11,48,012.1 17,189.5 11,14,654.1
F-345

The Board of Directors
Tata Steel Limited
Bombay House
24, Homi Mody Street Fort,
Mumbai 400 001
1. We have reviewed the unaudited consolidated financial results of Tata Steel Limited (the “Company”), its subsidiaries, jointly controlled entities and associate companies (hereinafter referred to as the “Group”) for the quarter ended September 30, 2017 which are included in the accompanying Consolidated Financial Results for the quarter/ six months ended on 30th September 2017 and the unaudited Consolidated Balance Sheet as at that date (the “Statement”). The Statement has been prepared by the Company’s Management pursuant to Regulation 33 of the Securities and Exchange Board of India (Listing Obligations and Disclosure Requirements) Regulations, 2015 (the “Listing Regulations, 2015”), which has been initialled by us for identification purposes. The Statement is the responsibility of the Company’s Management and has been approved by its Board of Directors. Our responsibility is to issue a report on the Statement based on our review.
2. We conducted our review in accordance with the Standard on Review Engagement (SRE) 2410, “Review of Interim Financial Information Performed by the Independent Auditor of the Entity” issued by the Institute of Chartered Accountants of India. This Standard requires that we plan and perform the review to obtain moderate assurance as to whether the Statement is free of material misstatement.
3. The Statement includes the results of the entities listed in Annexure A.
4. A review is limited primarily to inquiries of Group personnel and analytical procedures applied to the Group’s financial data and thus provides less assurance than an audit. We have not performed an audit and, accordingly, we do not express an audit opinion.
5. We did not review the interim financial information of four subsidiaries considered in the preparation of the Statement
INDEPENDENT AUDITORS’ REPORT ON CONSOLIDATED FINANCIAL STATEMENTS
and which constitute total assets of ` 49,783.30 crores and net assets of ` (37,142.62) crores as at September 30, 2017, total revenue of ` 17,588.63 crores and total comprehensive income (comprising of loss and other comprehensive income) of ` (5584.68) crores for the quarter ended September 30, 2017 and which also include their step down joint ventures and associates representing `16.06 crores of the Group’s share of total comprehensive income for the quarter ended September 30, 2017. These financial information have been reviewed by other auditors whose reports have been furnished to us, and our conclusion on the Statement to the extent they have been derived from such financial information is based solely on the report of such other auditors.
6. We did not review the financial information of (i) eleven subsidiaries considered in the preparation of the Statement and which constitute total assets of ` 13,511.48 crores and net assets of ` 4,088.49 crores as at September 30, 2017, total revenue of ` 783.88 crores and total comprehensive income of ` 87.96 crores for the quarter ended September 30, 2017 and (ii) six joint ventures and three associates representing ` 11.52 crores of the Group’s share of total comprehensive income for the quarter ended September 30, 2017. These financial information have been furnished to us by the Management, and our conclusion on the Statement in so far as it relates to the amounts and disclosures included in respect of these subsidiaries, joint ventures and associates is based solely on such financial information.
7. In the case of one subsidiary, one joint venture and seven associates, the financial information for the quarter ended September 30, 2017 and as at that date is not available. The investments in these companies are carried at Re. 1 each as at September 30, 2017. In absence of the aforementioned financial information (i) the total assets and net assets as at September 30, 2017 and the total revenue and total comprehensive income of this subsidiary for the quarter ended September 30, 2017 and (ii) the Group’s share of total comprehensive income of this joint venture and these associates for the quarter ended September 30, 2017, have not been included in the Consolidated Financial Information of the Group.
F-346

Our Report is not modified in respect of matters set out in Paragraphs 5, 6 and 7 above.
8. Based on our review conducted as above, nothing has come to our attention that causes us to believe that the Statement has not been prepared in all material respects in accordance with the applicable Accounting Standards prescribed under Section 133 of the Companies Act, 2013 and other recognised accounting practices and policies, and has not disclosed the information required to be disclosed in terms of Regulation 33 of the Listing Regulations, 2015 including the manner in which it is to be disclosed, or that it contains any material misstatement.
9. (a) The consolidated financial results of the Group for the quarters ended June 30, 2017, September 30, 2016/ year to date results for the period April 1, 2016 to September 30, 2016 were reviewed by another firm of chartered accountants, who issued their unmodified conclusion vide their reports dated August 7, 2017 and November 11, 2016 respectively.
(b) The financial statements of the Group for the year ended March 31, 2017 was audited by another firm of chartered accountants, who issued their unmodified opinion, vide their report dated May 16, 2017.
For Price Waterhouse & Co Chartered Accountants LLP Chartered Accountants
Registration Number: 304026E/E-300009
Russell I Parera
(Partner)
(Membership Number : 042190)
Mumbai, October 30, 2017
F-347

(` in million)Particulars Quarter
ended on
30.09.2017
Quarter
ended on
30.06.2017
Quarter
ended on
30.09.2016
Six months
ended on
30.09.2017
USD mn
Six months
ended on
30.09.2017
Six months
ended on
30.09.2016
Financial year
ended on
31.03.2017
USD mn
Financial
year
ended on
31.03.2017
Unaudited Unaudited Unaudited Unaudited Unaudited Unaudited Audited Audited1 Revenue from operations a) Gross sales / income from operations 3,21,010.3 3,08,033.2 2,70,405.5 9,636.8 6,29,043.5 5,29,374.9 17,994.1 11,66,825.7 b) Other operating revenues 3,631.1 1,700.1 791.0 81.7 5,331.2 1,528.7 113.7 7,373.7 Total revenue from operations [ 1(a) + 1(b) ] 3,24,641.4 3,09,733.3 2,71,196.5 9,718.5 6,34,374.7 5,30,903.6 18,107.8 11,74,199.4 2 Other income 2,532.1 1,554.7 1,088.5 62.6 4,086.8 2,452.3 81.3 5,274.7 3 Total income [ 1 + 2 ] 3,27,173.5 3,11,288.0 2,72,285.0 9,781.1 6,38,461.5 5,33,355.9 18,189.1 11,79,474.1 4 Expenses a) Raw materials consumed 1,03,545.9 1,02,794.3 76,340.4 3,161.1 2,06,340.2 1,44,491.5 4,999.3 3,24,180.9 b) Purchases of finished, semi-
finished & other products 26,266.1 27,577.0 27,909.1 824.9 53,843.1 57,070.5 1,761.9 1,14,249.4
c) Changes in inventories of finished goods, work-in-progress and stock-in-trade
13,084.2 (19,672.8) (10,832.5) (100.9) (6,588.6) (26,768.6) (699.8) (45,381.3)
d) Employee benefits expense 42,941.0 43,038.6 43,527.4 1,317.2 85,979.6 88,560.7 2,660.5 1,72,522.2 e) Finance costs 13,499.3 13,437.1 13,510.2 412.7 26,936.4 24,217.0 782.2 50,722.0 f ) Depreciation and amortisation
expense 14,732.8 15,011.3 14,669.1 455.7 29,744.1 27,046.8 874.8 56,728.8
g) Excise duty recovered on sales - 13,160.4 11,985.7 201.6 13,160.4 22,047.9 770.3 49,951.6 h) Other expenses 91,597.5 93,095.7 91,555.5 2,829.5 1,84,693.2 1,82,037.0 5,992.7 3,88,598.4 Total expenses [ 4(a) to 4(h) ] 3,05,666.8 2,88,441.6 2,68,664.9 9,101.6 5,94,108.4 5,18,702.8 17,142.0 11,11,572.0 5 Profit / (Loss) before share of profit/
(loss) of joint ventures & associates, exceptional items & tax [ 3 - 4 ]
21,506.7 22,846.4 3,620.1 679.5 44,353.1 14,653.1 1,047.1 67,902.1
6 Share of profit / (loss) of joint ventures & associates
198.0 59.0 (90.6) 3.9 257.0 51.4 1.2 76.5
7 Profit / (Loss) before exceptional
items & tax [5+6]
21,704.7 22,905.4 3,529.5 683.4 44,610.1 14,704.5 1,048.3 67,978.6
8 Exceptional items : a) Profit / (Loss) on sale of non
current investments - - - 0.0 - - 3.5 227.0
b) Profit on sale of non current assets
- - - 0.0 - - 13.2 858.7
c) Provision for diminution in value of investments / doubtful advances
(266.5) - - (4.1) (266.5) (1,168.6) (19.3) (1,254.5)
d) Provision for impairment of non-current assets
- - - 0.0 - - (41.3) (2679.3)
e) Provision for demands and claims - (6,144.1) - (94.1) (6,144.1) - (33.7) (2,182.5) f ) Employee separation
compensation (180.0) (23.8) (592.9) (3.1) (203.8) (1,102.3) (32.0) (2,073.7)
g) Restructuring and other provisions - - - 0.0 - - (557.3) (36138.0) Total exceptional items [ 8(a) to 8(g) ] (446.5) (6,167.9) (592.9) (101.3) (6,614.4) (2,270.9) (666.9) (4,3242.3)9 Profit / (Loss) before tax [ 7 + 8 ] 21,258.2 16,737.5 2,936.6 582.1 37,995.7 12,433.6 381.5 24,736.3
10 Tax Expense a) Current tax 6,108.6 3,255.0 2,554.2 143.4 9,363.6 4,890.8 268.6 17,417.0 b) Deferred tax 5,271.1 4,150.3 1,079.5 144.3 9,421.4 6,145.6 159.8 10,363.1 Total tax expense [ 10(a) + 10(b) ] 11,379.7 7,405.3 3,633.7 287.8 18,785.0 11,036.4 428.4 27,780.1 11 Net Profit / (Loss) after tax from
continuing operations [ 9 - 10 ] 9,878.5 9,332.2 (6,97.1) 294.3 19,210.7 1,397.2 (46.9) (3,043.8)
12 Profit / (Loss) before tax from discontinued operations
331.6 (307.7) (855.3) 0.4 23.9 (1,763.1) (118.9) (7,708.6)
13 Tax expense of discontinued operations - - 30.3 0.0 - 82.7 1.2 80.1 14 Profit / (Loss) after tax from
discontinued operations [ 12 - 13 ] 331.6 (307.7) (885.6) 0.4 23.9 (1,845.8) (120.1) (7,788.7)
15 Profit / (Loss) on disposal of discontinued operations
(32.3) 186.4 1,088.9 2.4 154.1 (31,875.9) (475.8) (30,853.2)
CONSOLIDATED FINANCIAL RESULTS FOR THE QUARTER/ SIX MONTHS ENDED ON 30TH SEPTEMBER 2017
F-348

(` in million)Particulars Quarter
ended on
30.09.2017
Quarter
ended on
30.06.2017
Quarter
ended on
30.09.2016
Six months
ended on
30.09.2017
USD mn
Six months
ended on
30.09.2017
Six months
ended on
30.09.2016
Financial year
ended on
31.03.2017
USD mn
Financial
year
ended on
31.03.2017
Unaudited Unaudited Unaudited Unaudited Unaudited Unaudited Audited Audited16 Net Profit / (Loss) after tax from
discontinued operations [ 14 + 15 ] 299.3 (121.3) 203.3 2.7 178.0 (33,721.7) (595.9) (38,641.9)
17 Net Profit / (Loss) for the period [11+16] 10,177.8 9,210.9 (493.8) 297.0 19,388.7 (32,324.5) (642.9) (41,685.7)
18 Profit/ (Loss) from continuing operations for the period attributable to:
Owners of the Company 9,758.7 9,184.0 (799.4) 290.2 18,942.7 1,058.8 (58.1) (3,766.1) Non controlling interests 119.8 148.2 102.3 4.1 268.0 338.4 11.1 722.3 19 Profit / (Loss) from discontinued
operations for the period attributable to: Owners of the Company 299.3 (121.3) 203.3 2.7 178.0 (33,721.7) (595.9) (38,641.9) Non controlling interests - - - 0.0 - - 0.0 - 20 Other comprehensive income A (i) Items that will not be
reclassified to profit or loss (37,450.9) (27,929.9) (40,760.7) (1,001.6) (65,380.8) (47,014.7) (538.9) (34,942.5)
(ii) Income tax relating to items that will not be reclassified to profit or loss
2,611.9 2,762.0 8,263.6 82.3 5,373.9 10,617.0 120.6 7,823.4
B (i) Items that will be reclassified to profit or loss
(7,657.8) (10,855.3) 6,648.4 (283.6) (18,513.1) 14,203.8 337.5 21,883.0
(ii) Income tax on items that will be reclassified to profit or loss
152.1 605.2 (172.5) 11.6 757.3 (285.4) (6.1) (394.5)
Total other comprehensive income (42,344.7) (35,418.0) (26,021.2) (1,191.3) (77,762.7) (22,479.3) (86.8) (5,630.6)21 Total Comprehensive Income for the
period [ 17 + 20 ] (32,166.9) (26,207.1) (26,515.0) (894.3) (58,374.0) (54,803.8) (729.7) (47,316.3)
22 Total comprehensive income for the period attributable to:
Owners of the Company (32,739.0) (26,367.7) (26,565.4) (905.5) (59,106.7) (55,186.7) (740.3) (48,003.2) Non controlling interests 572.1 160.6 50.4 11.2 732.7 382.9 10.6 686.9 23 Paid-up equity share capital [Face
value ₹ 10 per share] 9,702.4 9,702.4 9,702.4 148.6 9,702.4 9,702.4 149.6 9,702.4
24 Reserves (excluding revaluation reserves) and Non controlling interest
5,578.8 3,61,757.8
25 Hybrid perpetual securities 22,750.0 22,750.0 350.8 22,750.0 26 Earnings per equity share (for
continuing operation): “Basic earnings per share (not
annualised) - in Rupees (after exceptional items)”
9.73 9.17 (1.17) 0.3 18.90 0.54 (0.1) (4.93)
“Diluted earnings per share (not annualised) - in Rupees (after exceptional items)”
9.73 9.17 (1.17) 0.3 18.90 0.54 (0.1) (4.93)
27 Earnings per equity share (for discontinued operation):
Basic earnings per share (not annualised) - in Rupees
0.31 (0.13) 0.21 - 0.18 (34.76) (0.6) (39.84)
Diluted earnings per share (not annualised) - in Rupees
0.31 (0.13) 0.21 - 0.18 (34.76) (0.6) (39.84)
28 Earnings per equity share (for continuing and discontinued operations):
Basic earnings per share (not annualised) - in Rupees (after exceptional items)
10.04 9.04 (0.96) 0.3 19.08 (34.22) (0.7) (44.77)
Diluted earnings per share (not annualised) - in Rupees (after exceptional items)
10.04 9.04 (0.96) 0.3 19.08 (34.22) (0.7) (44.77)
CONSOLIDATED FINANCIAL RESULTS FOR THE QUARTER/ SIX MONTHS ENDED ON 30TH SEPTEMBER 2017
F-349

CONSOLIDATED SEGMENT REVENUE, RESULTS, ASSETS AND LIABILITIES
(` in million)Particulars Quarter
ended on
30.09.2017
Quarter
ended on
30.06.2017
Quarter
ended on
30.09.2016
Six months
ended on
30.09.2017
USD mn
Six months
ended on
30.09.2017
Six months
ended on
30.09.2016
Financial year
ended on
31.03.2017
USD mn
Financial
year
ended on
31.03.2017
Unaudited Unaudited Unaudited Unaudited Unaudited Unaudited Audited AuditedSegment Revenue:Tata Steel India 1,42,209.3 1,44,217.2 1,17,183.1 4,388.0 2,86,426.5 2,20,417.9 8,213.6 5,32,609.6 Other Indian Operations 20,992.9 18,311.7 15,176.6 602.1 39,304.6 29,884.9 1,033.2 66,998.4 Tata Steel Europe 1,50,060.8 1,40,787.9 1,20,061.7 4,455.7 2,90,848.7 2,46,712.6 8,032.2 5,20,849.6 Other Trade Related Operations 63,391.9 72,026.7 48,125.2 2,074.6 1,35,418.6 92,635.7 3,662.8 2,37,513.7 South East Asian Operations 24,944.1 19,909.6 19,553.5 687.1 44,853.7 39,584.4 1,254.7 81,359.0 Rest of the World 2,610.1 1,187.6 1,359.9 58.2 3,797.7 2,832.6 97.1 6,299.5 Total 4,04,209.1 3,96,440.7 3,21,460.0 12,265.8 8,00,649.8 6,32,068.1 22,293.6 14,45,629.8
Less: Inter Segment Revenue 79,567.7 86,707.4 50,263.5 2,547.3 1,66,275.1 1,01,164.5 4,185.8 2,71,430.4 Total Segment Revenue from
operations
3,24,641.4 3,09,733.3 2,71,196.5 9,718.5 6,34,374.7 5,30,903.6 18,107.8 11,74,199.4
Segment Results before exceptional
items, interest, tax and depreciation :
Tata Steel India 34,076.9 29,215.4 19,912.2 969.6 63,292.3 42,273.3 1,842.0 1,19,442.5 Other Indian Operations 2,012.7 2,048.2 1,152.1 62.2 4,060.9 2,391.0 89.5 5,800.8 Tata Steel Europe 7,531.3 12,525.2 11,359.1 307.3 20,056.5 20,256.4 725.6 47,049.1 Other Trade Related Operations 4,512.1 8,176.6 1,695.9 194.4 12,688.7 1,458.8 40.3 2,616.2 South East Asian Operations 1,350.3 257.7 681.6 24.6 1,608.0 2,531.9 81.9 5,312.7 Rest of the World 466.6 (254.7) (1,037.7) 3.2 211.9 (939.3) (3.0) (195.6)Less: Inter Segment Eliminations 2,689.1 2,575.2 2,830.0 80.6 5,264.3 4,005.3 150.7 9,772.0 Total Segment Results before exceptional items, interest, tax and depreciation
47,260.8 49,393.2 30,933.2 1,480.7 96,654.0 63,966.8 2,625.5 1,70,253.7
Add: Finance income 2,676.0 1,960.6 775.6 71.0 4,636.6 2,001.5 79.8 5,175.7 Less: Finance costs 13,499.3 13,437.1 13,510.2 412.7 26,936.4 24,217.0 782.2 50,722.0 Less: Depreciation and Amortisation 14,732.8 15,011.3 14,669.1 455.7 29,744.1 27,046.8 874.8 56,728.8 Profit / (Loss) before exceptional items
& tax
21,704.7 22,905.4 3,529.5 683.4 44,610.1 14,704.5 1,048.3 67,978.6
Add: Exceptional items (446.5) (6,167.9) (592.9) (101.3) (6,614.4) (2,270.9) (666.9) (43,242.3)Profit / (Loss) before tax 21,258.2 16,737.5 2,936.6 582.1 37,995.7 12,433.6 381.5 24,736.3
Less: Tax expense 11,379.7 7,405.3 3,633.7 287.8 18,785.0 11,036.4 428.4 27,780.1 Net Profit / (Loss) after tax from
continuing operations
9,878.5 9,332.2 (697.1) 294.3 19,210.7 1,397.2 (46.9) (3,043.8)
Net Profit / (Loss) after tax from discontinued operations
299.3 (121.3) 203.3 2.7 178.0 (33,721.7) (595.9) (38,641.9)
Net Profit / (Loss) for the period 10,177.8 9210.9 (493.8) 297.0 19388.7 (32324.5) (642.9) (41685.7)
Segment Assets:
Tata Steel India 10,76,189.8 11,31,735.9 10,67,259.5 16,487.0 10,76,189.8 10,67,259.5 16,837.2 10,91,806.0 Other Indian Operations 59,986.6 56,376.0 50,893.0 919.0 59,986.6 50,893.0 853.2 55,322.6 Tata Steel Europe 4,48,974.8 4,34,389.0 4,33,238.0 6,878.2 4,48,974.8 4,33,238.0 6,737.2 4,36,873.1 Other Trade Related Operations 5,28,092.7 4,67,793.9 4,26,448.5 8,090.3 5,28,092.7 4,26,448.5 6,695.0 4,34,135.0 South East Asian Operations 48,734.8 49,134.1 49,400.9 746.6 48,734.8 49,400.9 785.2 50,914.3 Rest of the World 82,474.6 78,962.4 75,982.6 1,263.5 82,474.6 75,982.6 1,219.0 79,046.6 Less: Inter Segment Eliminations 5,02,250.3 4,42,608.5 3,94,249.7 7,694.4 5,02,250.3 3,94,249.7 6,396.3 4,14,765.2 Total Segment Assets 17,42,203.0 17,75,782.8 17,08,972.8 26,690.2 17,42,203.0 17,08,972.8 26,730.4 17,33,332.4
Segment Liabilities:
Tata Steel India 6,55,351.9 6,62,135.0 6,20,307.4 10,039.9 6,55,351.9 6,20,307.4 9,645.0 6,25,429.5 Other Indian Operations 35,482.5 32,678.0 30,565.6 543.6 35,482.5 30,565.6 505.0 32,749.0 Tata Steel Europe 8,44,920.6 7,70,369.3 7,18,320.3 12,944.0 8,44,920.6 7,18,320.3 11,267.1 7,30,617.1 Other Trade Related Operations 3,56,709.8 3,54,395.8 3,17,483.9 5,464.7 3,56,709.8 3,17,483.9 5,121.2 3,32,083.4 South East Asian Operations 24,258.9 25,744.9 26,370.1 371.6 24,258.9 26,370.1 420.2 27,245.0 Rest of the World 25,227.8 22,747.7 23,762.8 386.5 25,227.8 23,762.8 340.1 22,051.1 Less: Inter Segment Eliminations 5,20,033.6 4,59,832.7 4,09,526.2 7,966.8 5,20,033.6 4,09,526.2 6,647.4 4,31,052.9 Total Segment Liabilities 14,21,917.9 14,08,238.0 13,27,283.9 21,783.5 14,21,917.9 13,27,283.9 20,651.1 13,39,122.2
F-350

CONSOLIDATED BALANCE SHEETAS AT 30TH SEPTEMBER 2017
(` in million)As at
September 30, 2017
USD mn
As at
September 30, 2017
As at
March 31, 2017
USD mn
As at
March 31, 2017
Unaudited Unaudited Audited AuditedASSETS
I Non current assets(a) Property, plant and equipment 13,591.6 8,87,190.5 13,398.2 8,68,805.9 (b) Capital work-in-progress 2,371.3 1,54,787.5 2,392.5 1,55,143.7 (c) Goodwill on consolidation 575.3 37,552.6 538.9 34,947.3 (d) Other Intangible assets 240.9 15,727.7 251.6 16,312.3 (e) Intangible assets under development 57.0 3,722.6 41.6 2,697.6 (f ) Equity accounted investments 250.8 16,369.9 245.8 15,936.8 (g) Financial assets
(i) Investments 166.5 10,868.9 800.4 51,903.1 (ii) Loans 101.8 6,642.7 57.5 3,730.6 (iii) Derivative assets 3.3 214.7 12.8 831.7 (iv) Other financial assets 3.7 242.7 13.2 855.8
(h) Retirement benefit assets 0.5 34.0 270.3 17,526.4 (i) Income tax assets 153.9 10,048.4 151.3 9,812.3 (j) Deferred tax assets 151.1 9,864.3 136.6 8,858.7 (k) Other assets 429.1 28,006.5 566.7 36,749.6 Total Non current assets 18,096.9 11,81,273.0 18,877.4 12,24,111.8
II Current assets(a) Inventories 4,067.2 2,65,488.1 3,825.1 2,48,038.2 (b) Financial assets
(i) Investments 1,400.6 91,426.9 874.9 56,731.3 (ii) Trade receivables 1,867.0 1,21,867.6 1,786.8 1,15,868.2 (iii) Cash and cash equivalents 407.0 26,568.3 745.2 48,322.9 (iv) Other balances with banks 21.1 1,378.0 13.7 887.6 (v) Loans 48.1 3,138.4 34.6 2,245.0 (vi) Derivative assets 76.1 4,966.2 16.0 1,040.4 (vii) Other financial assets 94.7 6,183.3 59.8 3,878.2
(c) Retirement benefit assets 0.1 04.4 0.0 - (d) Income tax assets 4.5 291.2 5.4 350.8 (e) Other assets 591.3 38,597.3 338.4 21,943.8 Total current assets 8,577.7 5,59,909.7 7,699.9 4,99,306.4
III Assets held for sale 15.6 1,020.3 152.9 9,914.2
TOTAL ASSETS 26,690.2 17,42,203.0 26,730.2 17,33,332.4 EQUITY AND LIABILITIES
IV Equity(a) Equity share capital 148.6 9,702.4 149.6 9,702.4 (b) Hybrid Perpetual Securities 348.5 22,750.0 350.8 22,750.0 (c) Other equity 5,181.2 3,38,204.1 5,331.8 3,45,740.8 Equity attributable to shareholders of the Company 5,678.4 3,70,656.5 5,832.2 3,78,193.2
Non controlling interest (771.7) (50,371.4) 247.0 16,017.0 Total Equity 4,906.7 3,20,285.1 6,079.2 3,94,210.2
V Non current liabilities(a) Financial liabilities
(i) Borrowings 10,452.8 6,82,309.5 9,873.1 6,40,222.7 (ii) Derivative liabilities 18.5 1,208.5 27.8 1,799.8 (iii) Other financial liabilities 16.8 1,097.5 16.8 1,087.8
(b) Provisions 496.4 32,401.1 505.6 32,785.0 (c) Retirement benefit obligations 427.1 27,878.2 411.2 26,662.7 (d) Deferred income 289.4 18,888.6 317.3 20,575.9 (e) Deferred tax liabilities 1,483.5 96,837.3 1,546.8 1,00,300.8 (f ) Other liabilities 24.4 1,593.3 34.9 2,265.1 Total Non current liabilities 13,208.9 8,62,214.0 12,733.5 8,25,699.8
VI Current liabilities(a) Financial liabilities
(i) Borrowings 3,263.8 2,13,045.4 2,826.4 1,83,281.0 (ii) Trade payables 2,793.9 1,82,371.9 2,864.4 1,85,744.6 (iii) Derivative liabilities 146.8 9,581.4 103.9 6,736.7 (iv) Other financial liabilities 984.9 64,287.2 973.9 63,155.1
(b) Provisions 323.3 21,106.3 306.7 19,885.7 (c) Retirement benefit obligations 11.8 769.5 14.7 952.0 (d) Deferred income 0.8 53.2 3.4 225.2 (e) Income tax liabilities 204.1 13,323.2 113.9 7,391.8 (f ) Other liabilities 845.1 55,165.8 665.5 43,152.7 Total Current liabilities 8,574.6 5,59,703.9 7,872.8 5,10,524.8
VII Liabilities held for sale - - 44.7 2,897.6
TOTAL EQUITY AND LIABILITIES 26,690.2 17,42,203.0 26,730.2 17,33,332.4
F-351

Notes:
1. The results have been reviewed by the Audit Committee in its meeting held on October 29, 2017 and were approved by the Board of Directors in its meeting of date.
2. Post the applicability of Goods and Service Tax (GST) with effect from July 01, 2017, revenue from operations is disclosed net of GST. Accordingly, the revenue from operations and other expenses for the quarter/ six months ended on September 30, 2017 are not comparable with the previous periods presented in the results.
3. Exceptional item 6(a) and 8(c) in the standalone and consolidated financial results respectively represents provision for advances given for repurchase of equity shares in Tata Teleservices Limited from NTT Docomo Inc.
4. On August 11, 2017, Tata Steel UK announced it had signed the documentation for a Regulated Apportionment Arrangement (RAA) with the Trustee of the British Steel Pension Scheme (BSPS). Subsequently, on September 11,
2017, Tata Steel UK received confirmation from The Pensions Regulator that it had approved the RAA, consequent to which the BSPS has now been separated from Tata Steel UK.
5. On September 19, 2017, Tata Steel Limited and thyssenkrupp AG signed a memorandum of understanding to create a new 50:50 joint venture company called thyssenkrupp Tata Steel. Due diligence has commenced and is currently expected to run for several months prior to signing definitive shareholder agreements and other binding commitments. Completion is currently expected to take place towards the end of 2018 following anti-trust approvals.
6. The consolidated financial results have been subjected to limited review and the standalone financial results have been audited by the statutory auditors.
7. Figures for the previous periods have been regrouped and reclassified to conform to the classification of the current period, where necessary.
T V Narendran Koushik Chatterjee
Managing Director Group Executive Director
Mumbai: October 30, 2017
F-352

2
REPORT ON THE FINANCIAL STATEMENTS
We have audited the accompanying financial statements of Abja Investment Co. Pte. Ltd. (the “Company”) which comprise the statement of financial position of the Company as at March 31, 2016 and the statement of profit or loss and other comprehensive income, statement of changes in equity and statement of cash flows of the Company for the year then ended, and a summary of significant accounting policies and other explanatory information, as set out on pages 5 to 40.
MANAGEMENT’S RESPONSIBILITY FOR THE FINANCIAL STATEMENTS
Management is responsible for the preparation of financial statements that give a true and fair view in accordance with the provisions of the Singapore Companies Act (the “Act”) and Singapore Financial Reporting Standards, and for devising and maintaining a system of internal accounting controls sufficient to provide a reasonable assurance that assets are safeguarded against loss from unauthorised use or disposition; and transactions are properly authorised and that they are recorded as necessary to permit the preparation of true and fair financial statements and to maintain accountability of assets.
AUDITORS’ RESPONSIBILITY
Our responsibility is to express an opinion on these financial statements based on our audit. We conducted our audit in accordance with Singapore Standards on Auditing. Those standards require that we comply with ethical requirements and plan and perform the audit to obtain reasonable assurance about whether the financial statements are free from material misstatement.
An audit involves performing procedures to obtain audit evidence about the amounts and disclosures in the financial statements. The procedures selected depend on the auditor’s judgement, including the assessment of the risks of material misstatement of
INDEPENDENT AUDITORS’ REPORT TO THE MEMBER OFABJA INVESTMENT CO. PTE. LTD.
the financial statements, whether due to fraud or error. In making those risk assessments, the auditor considers internal control relevant to the entity’s preparation of the financial statements that give a true and fair view in order to design audit procedures that are appropriate in the circumstances, but not for the purpose of expressing an opinion on the effectiveness of the entity’s internal control. An audit also includes evaluating the appropriateness of accounting policies used and the reasonableness of accounting estimates made by management, as well as evaluating the overall presentation of the financial statements.
We believe that the audit evidence we have obtained is sufficient and appropriate to provide a basis for our audit opinion.
OPINION
In our opinion, the financial statements are properly drawn up in accordance with the provisions of the Act and Singapore Financial Reporting Standards so as to give a true and fair view of the financial position of the Company as at March 31, 2016 and the financial performance, changes in equity and cash flows of the Company for the year ended on that date.
REPORT ON OTHER LEGAL AND REGULATORY REQUIREMENTS
In our opinion, the accounting and other records required by the Act to be kept by the Company have been properly kept in accordance with the provisions of the Act.
Public Accountants andChartered AccountantsSingapore
November 9, 2016
F-353

3
STATEMENT OF FINANCIAL POSITIONMARCH 31, 2016
Note2016
US$’000
2015
US$’000
ASSETS
Current assets
Cash and cash equivalents 7 11,770 7,360Other receivables 8 21,699 17,235Derivative financial instruments 10 150 265Total current assets 33,619 24,860
Non-current assets
Loan receivables due from related companies 9 16,90,932 16,70,502Derivative financial instruments 10 4,793 7,563Total non-current assets 16,95,725 16,78,065
Total assets 17,29,344 17,02,925
LIABILITIES AND NET CAPITAL DEFICIENCY
Current liabilities
Other payables 11 32,254 24,564Loan payable 12 37,800 37,800Tax payable 450 310Total current liabilities 70,504 62,674Non-current liabilities
Guaranteed notes 13 17,08,921 17,02,524Deferred tax liability 14 1,796 93Derivative financial instruments 10 688 469Total non–current liabilities 17,11,405 17,03,086Capital, accumulated losses and reserve
Share capital 15 200 200Accumulated losses (52,755) (63,025)Translation reserve (10) (10)Net capital deficiency (52,565) (62,835)Total liabilities and net of capital deficiency 17,29,344 17,02,925
STATEMENT OF PROFIT OR LOSS AND OTHER COMPREHENSIVE INCOMEYEAR ENDED MARCH 31, 2016
Note2016
US$’000
2015
US$’000
Interest income 16 1,14,957 32,875Finance costs 17 (97,508) (69,027)Foreign currency exchange gain (loss), net 6,532 (29,245)Fair value (losses) gains on derivative financial instruments, net 18 (3,104) 14,052Other operating expenses (8,482) (3,739)Profit (Loss) before tax 12,395 (55,084)
Income tax expense 19 (2,125) (386)Profit (Loss) for the year, representing to comprehensive income (loss) for the financial year
20 10,270 (55,470)
F-354

44
STATEMENT OF CHANGES IN EQUITYYEAR ENDED MARCH 31, 2016
CASH FLOW STATEMENT FOR THE YEAR ENDED MARCH 31, 2016
Share
capital
Accumulated losses
Translation
reserve (1)
Total
US$’000 US$’000 US$’000 US$’000
Balance at April 1, 2014 200 (7,555) (10) (7,365)Loss for the year, representing total comprehensive loss for the financial year - (55,470) - (55,470)Balance at March 31, 2015 200 (63,025) (10) (62,835)Profit for the year, representing total comprehensive income for the financial year
- 10,270 - 10,270
Balance at March 31, 2016 200 (52,755) (10) (52,565)
(1) This arose from change in functional currency in 2015.
2016
US$’000
2015
US$’000
Operating activities
Profit (Loss) before tax 12,395 (55,084)Adjustments for:Finance costs 97,508 69,027Interest income (1,14,957) (32,875)Fair value losses (gains) on derivative financial instruments, net instruments, net 3,104 (14,052)Unrealised foreign currency exchange (gain) loss, net (6,364) 30,319Operating cash flows before movements in working capital (8,314) (2,665)
Loans to related companies - (14,88,000)Proceeds From Issue of Guaranteed Notes - 15,00,000Loan due to a related company - 37,800Other payables 8,427 4,607Cash generated from operations 113 51,742Interest received 1,05,243 18,328Finance costs paid (99,337) (54,331)Income tax paid (267) (37)Guaranteed notes issue costs paid (1,618) (14,529)
Net cash from operating activities, representing net increase in cash and cash equivalents 4,134 1,173
Effect of exchange rate changes on the balance of cash held in foreign currencies 276 (1,349)Cash and cash equivalents at the beginning of the year 7,360 7,536Cash and cash equivalents at the end of the year 11,770 7,360
F-355

NOTES TO FINANCIAL STATEMENTS MARCH 31, 2016
5
1 GENERAL
The Company (Registration No. 201309883M) is incorporated in Singapore with its principal place of business and registered office at 22 Tanjong Kling Road, Singapore 628048. The financial statements are expressed in United States dollars (“US$”).
The principal activity of the Company consists of provision of treasury services.
The Company had in prior years, issued guaranteed notes (Note 13) with principal amount of US$1,500,000,000 and S$300,000,000 which are listed on the Freiverkehr (Open Market) of the Frankfurter Wertpapierborse (“Frankfurt Stock Exchange”) and the Official List of the Singapore Exchange Securities Trading Limited (“SGX-ST”) respectively. Further information is disclosed in Note 13.
As at March 31, 2016, the Company has a capital deficiency of US$52,565,000 (2015 : US$62,835,000), current liabilities in excess of current assets of US$36,885,000 (2015 : current liabilities in excess of current assets of US$37,814,000) and current year total comprehensive income of US$10,270,000 (2015 : total comprehensive loss of US$55,470,000).
The total comprehensive loss for 2015 arose mainly due to temporary lending of US$1,488,000,000 at lower interest rates than its finance costs for the period from July 2014 to February 2015 which resulted in net cash outflow of interest expenses and foreign exchange losses offset with fair value gains on its foreign currency swap and interest swap contracts which were non-cash in nature.
In February 2015, the loans of US$1,488,000,000 were re-assigned to a related company which bear higher interest rates and are repayable in the period from 2020 to 2024. The interest rates on these loan receivables were further revised upwards subsequent to the financial year end as part of management’s review. Management had assessed that the cash flows from interest income expected to be received from loans to related companies will be sufficient to cover the interest expenses that the Company expects to incur as the interest rate charges are higher than the interest rate payable on the debt. However, while these future cash inflows estimated will cover the future interest outflows and related expenses, management had assessed that these may not sufficiently cover the Company’s existing net capital deficiency in the future.
During the year ended March 31, 2016, the Company earned interest income of US$114,957,000 and incurred finance costs of US$97,508,000 and generated net profit of US$10,270,000 for the year. Subsequent to the year end, the interest rates for the long-term loans of US$988,000,000 and US$300,000,000
are revised from 6.45% to 6.92% and 5.35% to 5.92% per annum respectively with effect from April 1, 2016 until the end of the tenure of the loans (Note 9). Any future revision to interest rates due to market changes will be at mutual agreement of third parties.
Management had considered the above and assessed that (i) the total guaranteed notes of US$1,708,921,000 (2015 : US$1,702,524,000) (Note 13) issued by the Company, including any current and future related interest payables, are guaranteed by the ultimate holding company (Note 5); (ii) subsequent to the year end, the maturity date of the short-term loan of US$37,800,000 loan (Note 12) was extended to January 26, 2018; and (iii) the Company has obtained a letter of undertaking from a related company that it has the intention to convert the total loan and interest payable of US$38,697,000 (2015 : US$37,921,000) into additional capital contribution in the future to ensure the eventual extinguishment of liabilities. On the above, management has assessed that there are no material uncertainties on the Company’s ability to continue as going concern and these will sufficiently cover the Company’s existing net capital deficiency in the future. In addition, management has also assessed that if required, fundings from the ultimate holding company will be available.
The financial statements of the Company for the year ended March 31, 2016 were authorised for issue by the Board of Directors on November 9, 2016.
2 SUMMARY OF SIGNIFICANT ACCOUNTING POLICIES
BASIS OF ACCOUNTING – The financial statements are prepared in accordance with the historical cost basis, except as disclosed in the accounting policies below, and are drawn up in accordance with the provisions of the Singapore Companies Act and Singapore Financial Reporting Standards (“FRS”).
Historical cost is generally based on the fair value of the consideration given in exchange for goods and services.
Fair value is the price that would be received to sell an asset or paid to transfer a liability in an orderly transaction between market participants at the measurement date, regardless of whether that price is directly observable or estimated using another valuation technique. In estimating the fair value of an asset or a liability, the Company takes into account the characteristics of the asset or liability which market participants would take into account when pricing the asset or liability at the measurement date. Fair value for measurement and/or disclosure purposes in the financial statements is determined on such a basis, except for share-
F-356

NOTES TO FINANCIAL STATEMENTS MARCH 31, 2016
6
2. SIGNIFICANT ACCOUNTING POLICIES (CONTD.)
based payment transactions that are within the scope of FRS 102 Share-based Payments, leasing transactions that are within the scope of FRS 17 Leases, and the measurements that have some similarities to fair value but are not fair value, such as net realisable value in FRS 2 Inventories or value in use in FRS 36 Impairment of Assets.
In addition, for financial reporting purposes, fair value measurements are categorised into Level 1, 2 or 3 based on the degree to which the inputs to the fair value measurements are observable and the significance of the inputs to the fair value measurement in its entirety, which are described as follows:
• Level 1 inputs are quoted prices (unadjusted) in active markets for identical assets or liabilities that the entity can access at the measurement date;
• Level 2 inputs are inputs, other than quoted prices included within Level 1, that are observable for the asset or liability, either directly or indirectly; and
• Level 3 inputs are unobservable inputs for the asset or liability.
ADOPTION OF NEW AND REVISED STANDARDS – On April 1, 2015, the Company adopted all the new and revised FRSs and Interpretations of FRS (“INT FRS”) that are effective from the date and all relevant to its operations. The adoption of these new/revised FRSs and INT FRSs does not result in significant changes to the Company’s accounting policies and has no material effect on the amounts reported for the current or prior years.
At the date of authorisation of the financial statements, the following FRSs, amendments to FRSs and improvements to FRSs that are relevant to the Company were issued but not effective:
• FRS 109 Financial Instruments (4)
• FRS 115 Revenue from Contracts with Customers (4)
• FRS 116 Leases (5)
• Amendments to FRS 1 Presentation of Financial Statements: Disclosure Initiative (1)
• Amendments to FRS 7 Statement of Cash Flow: Disclosure Initiative (2)
• Amendments to FRS 12 Income Taxes: Recognition of Deferred Tax Assets for Unrealised Losses (3)
• Amendments to FRS 115 Clarification to FRS 115 Revenue from Contracts with Customers (4)
• Improvements to Financial Reporting Standards (November 2014) (1)
(1) Applies to annual periods beginning on or after January 1, 2016, with early adoption permitted.
(2) Applies prospectively to annual periods beginning on or after January 1, 2017, with early adoption permitted.
(3) Applies to annual periods beginning on or after January 1, 2017, with early adoption permitted.
(4) Applies to annual periods beginning on or after January 1, 2018, with early adoption permitted.
(5) Applies to annual periods beginning on or after January 1, 2019, with early adoption permitted for entities that apply FRS 115 at or before the date of initial application of FRS 116.
Consequential amendments were also made to various standards as a result of these new/revised standards.
The management anticipates that the adoption of the above FRSs, amendments to FRSs and improvements to FRSs in future periods will not have a material impact on the financial statements of the Company in the period of their initial adoption except for the following:
FRS 109 Financial Instruments
FRS 109 was issued in December 2014 to replace FRS 39 Financial Instruments: Recognition and Measurement and introduced new requirements for (i) the classification and measurement of financial assets and financial liabilities (ii) general hedge accounting (iii) impairment requirements for financial assets.
Key requirements of FRS 109:
• All recognised financial assets that are within the scope of FRS 39 are now required to be subsequently measured at amortised cost or fair value through profit or loss (“FVTPL”). Specifically, debt investments that are held within a business model whose objective is to collect the contractual cash flows, and that have contractual cash flows that are solely payments of principal and interest on the principal outstanding are generally measured at amortised cost at the end of subsequent accounting periods. Debt instruments that are held within a business model whose objective is achieved both by collecting contractual cash flows and selling financial assets, and that have contractual terms that give rise on specified dates to cash flows that are solely payments of principal and interest on the principal amount outstanding, are measured at fair value through other comprehensive income (“FVTOCI”). All other debt investments and equity investments are measured at FVTPL at the end of subsequent accounting periods. In addition, under FRS 109, entities
F-357

NOTES TO FINANCIAL STATEMENTS MARCH 31, 2016
7
2. SIGNIFICANT ACCOUNTING POLICIES (CONTD.)
may make an irrevocable election, at initial recognition, to measure an equity investment (that is not held for trading) at FVTOCI, with only dividend income generally recognised in profit or loss.
• With some exceptions, financial liabilities are generally subsequently measured at amortised cost. With regard to the measurement of financial liabilities designated as at FVTPL, FRS 109 requires that the amount of change in fair value of the financial liability that is attributable to changes in the credit risk of that liability is presented in other comprehensive income, unless the recognition of the effects of changes in the liability’s credit risk in other comprehensive income would create or enlarge an accounting mismatch to profit or loss. Changes in fair value attributable to a financial liability’s credit risk are not subsequently reclassified to profit or loss.
• In relation to the impairment of financial assets, FRS 109 requires an expected credit loss model, as opposed to an incurred credit loss model under FRS 39. The expected credit loss model requires an entity to account for expected credit losses and changes in those expected credit losses at each reporting date to reflect changes in credit risk since initial recognition. In other word, it is no longer necessary for a credit event to have occurred before credit losses are recognised.
• The new general hedge accounting requirements retain the three types of hedge accounting mechanisms currently available in FRS 39. Under FRS 109, greater flexibility has been introduced to the types of transactions eligible for hedge accounting, specifically broadening the types of instruments that qualify for hedging instruments and the types of risk components of non-financial items that are eligible for hedge accounting. In addition, the effectiveness test has been overhauled and replaced with the principle of an ‘economic relationship’. Retrospective assessment of hedge effectiveness is also no longer required. Enhanced disclosure requirements about an entity’s risk management activities have also been introduced.
Management is currently evaluating the potential impact of the application of FRS 109 on the financial statements of the Company in the period of initial application.
Amendments to FRS 12 Income Taxes: Recognition of
Deferred Tax Assets for Unrealised Losses
The amendments clarify that unrealised losses on debt instruments measured at fair value in the financial statements but at cost for tax purposes can give rise to deductible temporary differences.
The amendments also clarify that the carrying amount of an asset does not limit the estimation of probable future taxable profits, and that when comparing deductible temporary differences with future taxable profits, the future taxable profits excludes tax deductions resulting from the reversal of those deductible temporary differences.
Management is currently evaluating the potential impact of the application of amendments to FRS 12 on the financial statements of the company in the period of initial adoption.
Other than FRS 109 and amendments to FRS 1, FRS 7 and FRS 12, management has considered and is of the view that the adoption of the other amendments and improvements to FRSs that are issued as at date of authorisation of these financial statements but effective only in future periods will not have material impact on the financial statements in the period of their initial adoption.
FINANCIAL INSTRUMENTS - Financial assets and financial liabilities are recognised on the Company’s statement of financial position when the Company becomes a party to the contractual provisions of the instrument.
Effective interest method
The effective interest method is a method of calculating the amortised cost of a financial instrument and of allocating interest income or expense over the relevant period. The effective interest rate is the rate that exactly discounts estimated future cash receipts or payments through the expected life of the financial instrument, or where appropriate, a shorter period. Income and expense is recognised on an effective interest rate basis for debt instruments.
Financial assets
Cash and cash equivalents in the statement of cash flows
Cash and cash equivalents comprise cash at bank that are readily convertible to a known amount of cash and are subject to an insignificant risk of changes in value. Bank overdrafts that are repayable on demand and form an integral part of the Company’s cash management are included as a component of cash and cash equivalents for the purpose of statement of cash flows.
Amendments to FRS 1 Presentation of Financial Statements:
Disclosure Initiative
The amendments have been made to the following:
• Materiality and aggregation - An entity shall not obscure useful information by aggregating or disaggregating information and materiality considerations apply to the primary statements, notes and any specific disclosure requirements in FRSs.
F-358

NOTES TO FINANCIAL STATEMENTS MARCH 31, 2016
8
2. SIGNIFICANT ACCOUNTING POLICIES (CONTD.)
• Statement of financial position and statement of profit or loss and other comprehensive income - The list of line items to be presented in these statements can be aggregated or disaggregated as relevant. Guidance on subtotals in these statements has also been included.
• Presentation of items of other comprehensive income (“OCI”) arising from equity-accounted investments - An entity’s share of OCI of equity-accounted associates and joint ventures should be presented in aggregate as single items based on whether or not it will subsequently be reclassified to profit or loss.
• Notes - Entities have flexibility when designing the structure of the notes and guidance is introduced on how to determine a systematic order of the notes. In addition, unhelpful guidance and examples with regard to the identification of significant accounting policies are removed.
Management is currently evaluating the potential impact of the application of amendments to FRS 1 on the financial statements of the company in the period of initial adoption.
Amendments to FRS 7 Statement of Cash Flows: Disclosure
Initiative
The amendments required an entity to provide disclosures that enable users of financial statements to evaluate changes in liabilities arising from financing activities, including both changes arising from cash flows and non-cash changes.
Management is currently evaluating the potential impact of the application of amendments to FRS 7 on the financial statements of the company in the period of initial adoption.
Loans and receivables
Loans and other receivables are initially measured at fair value and are subsequently measured at amortised cost using the effective interest method less impairment. Interest is recognised by applying the effective interest rate method except for short-term receivables when the effect of discounting is immaterial.
Impairment of financial assets
Financial assets are assessed for indicators of impairment at the end of each reporting period. Financial assets are considered to be impaired when there is objective evidence that, as a result of one or more events that occurred after the initial recognition of the financial asset, the estimated future cash flows of the financial asset have been impacted. For financial assets carried at amortised cost, the amount of the impairment is the difference between the asset’s carrying amount and the present value of estimated future cash flows, discounted at the original effective interest rate.
The carrying amount of the financial asset is reduced by the impairment loss directly for all financial assets with the exception of receivables where the carrying amount is reduced through the use of an allowance account. When a receivable is uncollectible, it is written off against the allowance account. Subsequent recoveries of amounts previously written off are credited against the allowance account. Changes in the carrying amount of the allowance account are recognised in profit or loss.
If, in a subsequent period, the amount of the impairment loss decreases and the decrease can be related objectively to an event occurring after the impairment loss was recognised, the previously recognised impairment loss is reversed through the profit or loss to the extent the carrying amount of the financial asset at the date the impairment is reversed does not exceed what the amortised cost would have been had the impairment not been recognised.
Derecognition of financial assets
The Company derecognises a financial asset only when the contractual rights to the cash flows from the asset expire, or it transfers the financial asset and substantially all the risks and rewards of ownership of the asset to another entity. If the Company neither transfers nor retains substantially all the risks and rewards of ownership and continues to control the transferred asset, the Company recognises its retained interest in the asset and an associated liability for amounts it may have to pay. If the Company retains substantially all the risks and rewards of ownership of a transferred financial asset, the Company continues to recognise the financial asset and also recognises a collateralised borrowing for the proceeds received.
Financial liabilities and equity instruments
Classification as debt or equity
Financial liabilities and equity instruments issued by the Company are classified according to the substance of the contractual arrangements entered into and the definitions of a financial liability and an equity instrument.
Equity instruments
An equity instrument is any contract that evidences a residual interest in the assets of the Company after deducting all of its liabilities. Equity instruments are recorded at the proceeds received, net of direct issue costs.
Financial liabilities
Other payables are initially measured at fair value, net of transaction costs, and are subsequently measured at amortised cost, using the effective interest method, with interest expense recognised on an effective yield basis, except for short-term payables when the effect of discounting is immaterial.
F-359

NOTES TO FINANCIAL STATEMENTS MARCH 31, 2016
9
2. SIGNIFICANT ACCOUNTING POLICIES (CONTD.)
Interest-bearing guaranteed notes and loans are initially measured at fair value, and are subsequently measured at amortised cost, using the effective interest method. Any difference between the proceeds (net of transaction costs) and the settlement or redemption of borrowings is recognised over the term of the borrowings in accordance with the Company’s accounting policy for borrowing costs (see below).
Derecognition of financial liabilities
The Company derecognises financial liabilities when, and only when, the Company’s obligations are discharged, cancelled or they expire.
Derivative financial instruments
The Company enters into certain derivative financial instruments to manage its exposure to foreign exchange rate risk and interest rate, including forward foreign exchange contracts and interest rate swaps. Further details of derivative financial instruments are disclosed in Note 10.
Derivatives are initially recognised at fair value at the date a derivative contract is entered into and are subsequently remeasured to their fair value at the end of each reporting period. The resulting gain or loss is recognised in profit or loss immediately unless the derivative is designated and effective as a hedging instrument, in which event the timing of the recognition in profit or loss depends on the nature of the hedge relationship. A derivative is presented as a non-current asset or a non-current liability if the remaining maturity of the instrument is more than 12 months and it is not expected to be realised or settled within 12 months. Other derivatives are presented as current assets or current liabilities.
Offsetting arrangements
Financial assets and financial liabilities are offset and the net amount presented in the statement of financial position when the Company has a legally enforceable right to set off the recognised amounts; and intends either to settle on a net basis, or to realise the asset and settle the liability simultaneously. A right to set-off must be available today rather than being contingent on a future event and must be exercisable by any of the counterparties, both in the normal course of business and in the event of default, insolvency or bankruptcy.
PROVISIONS - Provisions are recognised when the Company has a present obligation (legal or constructive) as a result of a past event, it is probable that the Company will be required to settle the obligation, and a reliable estimate can be made of the amount of the obligation.
The amount recognised as a provision is the best estimate of the consideration required to settle the present obligation at the end of the reporting period, taking into account the risks and uncertainties surrounding the obligation. Where a provision is measured using the cash flows estimated to settle the present obligation, its carrying amount is the present value of those cash flows.
When some or all of the economic benefits required to settle a provision are expected to be recovered from a third party, the receivable is recognised as an asset if it is virtually certain that reimbursement will be received and the amount of the receivable can be measured reliably.
REVENUE RECOGNITION - Revenue is measured at the fair value of the consideration received or receivable.
Interest income
Interest income is accrued on a time basis, by reference to the principal outstanding and at the effective interest rate applicable.
BORROWING COSTS - Borrowing costs directly attributable to the acquisition, construction or production of qualifying assets, which are assets that necessarily take a substantial period of time to get ready for their intended use or sale, are added to the cost of those assets, until such time as the assets are substantially ready for their intended use or sale.
All other borrowing costs are recognised in profit or loss in the period in which they are incurred.
INCOME TAX - Income tax expense represents the sum of the tax currently payable and deferred tax.
The tax currently payable is based on taxable profit for the year. Taxable profit differs from profit as reported in the statement of profit or loss and other comprehensive income because it excludes items of income or expense that are taxable or deductible in other years and it further excludes items that are not taxable or tax deductible. The Company’s liability for current tax is calculated using tax rates (and tax laws) that have been enacted or substantively enacted by the end of the reporting period.
Deferred tax is recognised on differences between the carrying amounts of assets and liabilities in the financial statements and the corresponding tax bases used in the computation of taxable profit. Deferred tax liabilities are generally recognised for all taxable temporary differences and deferred tax assets are recognised to the extent that it is probable that taxable profits will be available against which deductible temporary differences can be utilised.
The carrying amount of deferred tax assets is reviewed at the end of each reporting period and reduced to the extent that it is no longer probable that sufficient taxable profits will be available to allow all or part of the asset to be recovered.
F-360

NOTES TO FINANCIAL STATEMENTS MARCH 31, 2016
10
2. SIGNIFICANT ACCOUNTING POLICIES (CONTD.)
Deferred tax is calculated at the tax rates that are expected to apply in the period when the liability is settled or the asset realised based on the tax rates (and tax laws) that have been enacted or substantively enacted by the end of the reporting period.
Deferred tax assets and liabilities are offset when there is a legally enforceable right to set off current tax assets against current tax liabilities and when they relate to income taxes levied by the same taxation authority and the Company intends to settle its current tax assets and liabilities on a net basis.
Current and deferred tax are recognised as an expense or income in profit or loss, except when they relate to items credited or debited outside profit or loss (either in other comprehensive income or directly in equity), in which case the tax is also recognised outside profit or loss (either in other comprehensive income or directly in equity, respectively).
FOREIGN CURRENCY TRANSACTIONS AND TRANSLATION - The financial statements of the Company is measured and presented in United States dollar (US$), which is the currency of the primary economic environment in which the entity operates (its functional currency).
Transactions in currencies other than the Company’s functional currency are recorded at the rates of exchange prevailing on the date of the transaction. At the end of each reporting period, monetary items denominated in foreign currencies are retranslated at the rates prevailing the end of each reporting period. Non-monetary items carried at fair value that are denominated in foreign currencies are retranslated at the rates prevailing on the date when the fair value was determined. Non-monetary items that are measured in terms of historical cost in a foreign currency are not retranslated.
Exchange differences arising on the settlement of monetary items, and on retranslation of monetary items are included in profit or loss for the period. Exchange differences arising on the retranslation of non-monetary items carried at fair value are included in profit or loss for the period except for differences arising on the retranslation of non-monetary items in respect of which gains and losses are recognised directly in equity. For such non-monetary items, any exchange component of that gain or loss is also recognised in other comprehensive income.
3 CRITICAL ACCOUNTING JUDGEMENTS AND KEY SOURCES OF ESTIMATION UNCERTAINTY
In the application of the Company’s accounting policies, which are described in Note 2, management is required to make judgements, estimates and assumptions about the carrying amounts of assets and liabilities that are not readily
apparent from other sources. The estimates and associated assumptions are based on historical experience and other factors that are considered to be relevant. Actual results may differ from these estimates.
The estimates and underlying assumptions are reviewed on an ongoing basis. Revisions to accounting estimates are recognised in the period in which the estimate is revised if the revision affects only that period, or in the period of the revision and future periods if the revision affects both current and future periods.
(i) Critical judgements in applying the Company’s
accounting policies
The following are the critical judgements, apart from those involving estimations (see below), that management has made in the process of applying the Company’s accounting policies and that have the most significant effect on the amounts recognised in the financial statements.
Functional currency
FRS 21 The Effects of Changes in Foreign Exchange Rates requires the Company determine its functional currency to prepare the financial statements. When determining its functional currency, the Company considers the primary economic environment in which it operates i.e. the one in which it primarily generates and expends cash. The Company also considers the funds generated from financing activities.
During the year ended March 31, 2015, the Company’s significant funding and transactions were denominated in United States dollars. Assessment of the primary and secondary indicators of FRS 21 Effects of Changes in Foreign Exchange Rates was made and management has exercised its judgement in concluding that the functional currency of the Company to be United States dollars with effect from April 1, 2014.
During the year ended March 31, 2016, management had reassessed and determined that the functional currency of the Company continues to be United States dollars on the basis that its majority funding and its significant transactions are denominated in United States dollars.
(ii) Key sources of estimation uncertainty
The key assumptions concerning the future, and other key sources of estimation uncertainty at the end of the reporting period, that have a significant risk of causing a material adjustment to the carrying amounts of assets and liabilities within the next financial year, are discussed below.
F-361

NOTES TO FINANCIAL STATEMENTS MARCH 31, 2016
11
4 FINANCIAL RISKS AND MANAGEMENT
(a) Categories of financial instruments
The following table sets out the financial instruments as at the end of the reporting period:
2016
US$’000
2015
US$’000
Financial assets
Loans and receivables (including cash and cash equivalents) 17,24,401 16,95,097Derivative financial instruments 4,943 7,828
17,29,344 17,02,925
Financial liabilities
Amortised cost 17,78,975 17,64,888Derivative financial instruments 688 469
17,79,663 17,65,357
(b) Financial instruments subject to offsetting, enforceable master netting arrangement and similar agreements2016
(a) (b) (c) = (a) - (b)Type of financial asset Gross
amounts ofrecognised
financialasset
Gross amountsof recognised
financial liabilityset off in thestatement of
financial position
Net amountsof financial
assetpresented in
the statementof financial
positionUS$’000 US$’000 US$’000
Other receivables (Note 8) 23,679 (1,980) 21,699
Loan receivables and interest receivables from related companies
The Company has interest receivables and loan receivables due from related companies of US$21,240,000 (2015 : US$16,710,000) (Note 8) and US$1,690,932,000 (2015 : US$1,670,502,000) (Note 9) respectively.
The policy for allowances for bad and doubtful receivables of the Company is based on the evaluation of collectability and management’s judgement. Judgement is required in
assessing the ultimate realisation of these receivables from these related companies. If the financial conditions of related companies were to deteriorate, resulting in an impairment of their ability to make payments, additional allowances may be required. Based on management’s evaluation, no impairment is assessed to be necessary for loan receivables and interest receivables from these related companies. The carrying amount of interest receivables and loan receivables are disclosed in Notes 8 and 9 respectively.
F-362

NOTES TO FINANCIAL STATEMENTS MARCH 31, 2016
12
4 FINANCIAL RISKS AND MANAGEMENT (CONTD.)
(c) Financial risk management policies and objectives
The Company’s overall risk management policy seeks to minimise potential adverse effects of financial performance of the Company.
The Company is exposed to financial risks such as foreign exchange, interest rate, credit and liquidity risks. Management regularly reviews its policy governing risk management practices. There has been no change to the Company’s exposure to these financial risks or the manner in which it manages and measures these risks during the year.
(i) Foreign exchange risk management
Certain of the Company’s financial assets and financial liabilities are denominated in currencies other than its functional currency and hence the Company is therefore exposed to foreign exchange risk. The Company uses forward foreign exchanges contracts to manage its exposure to foreign currency risk in the local reporting currency. Further details on these derivative financial instruments are disclosed in Note 10.
At the end of the reporting period, the carrying amounts of significant monetary assets and monetary liabilities denominated in currencies other than the Company’s functional currency which have the exposure to foreign currency risk are as follows:
Liabilities Assets
2016 US$’000
2015 US$’000
2016 US$’000
2015 US$’000
Euro - - 1,319 5,395Indian Rupee - 3,691 - -Singapore dollars 222,819 216,628 22,407 23,162
If the United States dollars strengthen/weaken by 10% against the relevant foreign currency, profit before tax will (decrease)/increase (2015 : loss before tax will be (increase)/decrease) by:
2016 US$’000
2015 US$’000
Euro (132) (540)Indian Rupee - 369Singapore dollars 20,041 19,347
2015
(a) (b) (c) = (a) - (b)Type of financial asset Gross
amounts ofrecognised
financialasset
Gross amountsof recognised
financial liabilityset off in thestatement of
financial position
Net amountsof financial
assetpresented in
the statementof financial
positionUS$’000 US$’000 US$’000
Other receivables (Note 8) 19,115 (1,880) 17,235
In reconciling the ‘Net amounts of financial asset and financial liability presented in the statement of financial position’ to the line item amounts presented in the statement of financial position, the above amounts represent only those which are subject to offsetting, enforceable master netting arrangements and similar agreements.
F-363

NOTES TO FINANCIAL STATEMENTS MARCH 31, 2016
13
4 FINANCIAL RISKS AND MANAGEMENT (CONTD.)
(ii) Interest rate risk management
Interest rate risk refers to the risk faced by the Company as a result of fluctuation in interest rates. The Company is exposed to interest rate risk associated with certain of its loan receivables and loan payables which have floating rates. The interest rate and terms of repayment are as disclosed in Note 9.
The Company uses interest swaps to manage its interest rate risk. Further details of the interest rate swaps are disclosed in Note 10.
Interest rate sensitivity
The sensitivity analyses below have been determined based on year-end balance which is subject to floating interest rates at the end of the reporting period.
If interest rates had been 100 basis points higher or lower and all other variables were held constant, the Company’s profit for the year ended March 31, 2016 would increase/ decrease by US$1,374,000 (2015 : loss for the year would decrease/increase by US$1,569,000).
(iii) Credit risk management
The Company’s credit risk is primarily attributable to its cash and cash equivalents, loan receivables and interest receivables due from related companies.
Cash balances are held with creditworthy financial institutions. At March 31, 2016, the Company has a concentration of credit risk from loan receivables and interest receivables due from 3 (2015 : 3) related companies which account for 99.9% (2015 : 99.9%), amounting to approximately US$1,712,172,000 (2015 : US$1,687,212,000) of total receivables. Management has evaluated the credit quality of these receivables and who the counterparties are and has assessed that the credit risk for these amounts to be manageable.
(iv) Liquidity risk management
Liquidity risk reflects the risk that the Company will have insufficient resources to meet its financial liabilities as they fall due. The Company’s strategy to manage liquidity risk is to ensure that the Company has sufficient funds to meet its potential liabilities as they fall due. As at March 31, 2016, the Company has a capital deficiency of US$52,565,000 (2015 : US$62,835,000) and current liabilities in excess of current assets of US$36,885,000 (2015 : current liabilities in excess of current assets of US$37,814,000), and management has assessed as disclosed in Note 1 that the Company will have sufficient funds to operate as a going concern. In addition, management is of the opinion that with the continued financial support from its related company and ultimate holding company, there are reasonable grounds to believe that the Company will be able to pay its debts when they fall due.
Financial liabilities
The Company’s operations are largely financed by short-term loan from a related company (Note 12) and guaranteed notes (Note 13). The Company’s financial liabilities are due on demand within 1 year, except for derivative financial instruments (Note 10) and interest bearing guaranteed notes (Note 13) which are repayable between January 2020 to July 2024.
Non-derivative financial liabilities
The following tables detail the remaining contractual maturity for non-derivative financial liabilities. The tables have been drawn up based on the undiscounted cash flows of financial liabilities based on the earliest date on which the Company can be required to pay. The table includes both interest and principal cash flows. The adjustment column represents the possible future cash flows attributable to the instrument included in the maturity analysis which is not included in the carrying amount of the financial liabilities on the statement of financial position.
F-364

NOTES TO FINANCIAL STATEMENTS MARCH 31, 2016
14
Average effective interest rate %
On demand or within
1 year US$’000
Within 2 to 5 years US$’000
After 5 years
US$’000
Adjustment US$’000
Total US$’000
2016
Non-interest bearing - 32,254 - - - 32,254Variable interest rate instrument 2.4 908 38,556 - (1,664) 37,800Fixed interest rate instrument 4.85 – 5.95 76,020 8,74,000 13,73,341 (6,14,440) 17,08,921
1,09,182 9,12,556 13,73,341 (6,16,104) 17,78,975
2015
Non-interest bearing - 24,564 - - - 24,564Variable interest rate instrument 1.86 702 38,381 - (1,283) 37,800Fixed interest rate instrument 4.85 – 5.95 95,757 8,79,161 15,14,604 (7,86,998) 17,02,524
1,21,023 9,17,542 15,14,604 (7,88,281) 17,64,888
Financial assets
The Company’s financial assets comprise cash and cash equivalents, other receivables and loan receivables due from related companies as disclosed in Notes 7, 8 and 9 respectively.
Non-derivative financial assets
The following table details the expected maturity for non-derivative financial assets. The tables below have been drawn up based on the undiscounted contractual maturities of the financial assets including interest that will be earned on those assets except where the Company anticipates that the cash flow will occur in a different period. The adjustment column represents the possible future cash flows attributable to the instrument included in the maturity analysis which are not included in the carrying amount of the financial assets on the statement of financial position.
Average effective interest rate %
On demand or within
1 year US$’000
Within 2 to 5 years US$’000
After 5 years
US$’000
Adjustment US$’000
Total US$’000
2016
Non-interest bearing - 33,469 - - - 33,469Variable interest rate instrument 7.60 8,502 51,934 1,97,907 (83,117) 1,75,226Fixed interest rate instrument 5.10 – 6.92 82,213 8,80,724 12,15,899 (663,130) 15,15,706
1,24,184 9,32,658 14,13,806 (746,247) 17,24,401
2015
Non-interest bearing - 24,595 - - - 24,595Variable interest rate instrument 7.67 12,216 54,217 2,15,923 (1,19,136) 1,63,220Fixed interest rate instrument 5.10 – 6.45 92,716 8,66,480 12,88,958 (7,40,872) 15,07,282
1,29,527 9,20,697 15,04,881 (8,60,008) 16,95,097
Derivative financial instruments
As at the end of the reporting period, the Company’s derivative financial instruments comprise of foreign exchange forward contracts with contracted net cash inflow amounting to US$1,583,000 (2015 : net cash inflow amounted to US$3,422,000) (Note 10) and interest rate swaps with contracted net cash inflow amounting to US$2,672,000 (2015 : net cash inflow amounted to US$3,937,000) (Note 10). Further information of these derivative financial instruments is disclosed in Note 10.
4 FINANCIAL RISKS AND MANAGEMENT (CONTD.)
F-365

NOTES TO FINANCIAL STATEMENTS MARCH 31, 2016
15
4 FINANCIAL RISKS AND MANAGEMENT (CONTD.)
(v) Fair value of the financial assets and financial liabilities
Some of the Company’s financial assets and financial liabilities are measured at fair value at the end of each reporting period. Management classifies fair value measurements using a fair value hierarchy that reflects the significance of the inputs used in making the measurements. The fair value hierarchy levels are as described in Note 2.
The Company’s derivative financial instruments consisting of forward foreign exchange contracts and interest rate swaps, are measured at fair value at the end of each reporting period, and are determined based on observable quoted market rates for equivalent instruments with the same quantum and maturity dates at the end of each reporting period. The fair value measurement of these derivative financial instruments as determined by management, are classified as Level 2 in the fair value hierarchy. The carrying amounts and further information of these derivative financial instruments are disclosed in Note 10.
There were no significant transfers between respective levels of the fair value hierarchy in the period.
Management considers that the carrying amounts of the financial assets and financial liabilities of the Company recorded at amortised cost in the financial statements approximate their fair values due to the relative short-term maturity of these financial instruments.
The fair values of other classes of financial assets and liabilities are disclosed in the respective notes to the financial statements.
(d) Capital risk management policies and objectives
The Company reviews its capital structure at least annually to ensure that the Company will be able to continue as a going concern. The capital structure of the Company comprises only of issued capital, accumulated losses and guaranteed notes. The Company’s overall strategy remained unchanged from the previous financial year.
5 HOLDING COMPANY AND RELATED COMPANY TRANSACTIONS
The Company is a wholly-owned subsidiary of Tata Steel Limited, incorporated in India, which is also the Company’s ultimate holding company. Related companies in these financial statements refer to members of the holding company’s group of companies.
Some of the Company’s transactions and arrangements are between members of the group and the effect of these on the basis determined between the parties is reflected in these financial statements. The intercompany balances are unsecured, interest-free and repayable on demand unless otherwise stated.
During the year, other than as disclosed elsewhere in the financial statements, the Company entered into the following significant transactions with related companies:
2016
US$’000
2015
US$’000
Guarantee commission expense on guaranteed notes charged by ultimate holding company (8,426) (3,691)Interest income from loan receivables due from related companies 113,835 31,839Interest expenses on loan payable due to a related company (776) (121)Long-term loans to a related company - (1,488,000)Loan due to a related company - 37,800
F-366

NOTES TO FINANCIAL STATEMENTS MARCH 31, 2016
16
6 OTHER RELATED PARTY TRANSACTIONS
Compensation of directors and key management personnel
There are no key managerial personnel other than the directors of the Company. No remuneration is paid by the Company to the directors. The directors are paid remuneration by related corporations in their capacity as directors and/or executives of those related corporations.
7 CASH AND CASH EQUIVALENTS
2016
US$’000
2015
US$’000
Cash at bank 11,770 7,360
8 OTHER RECEIVABLES
2016
US$’000
2015
US$’000
Accrued interest income on loan receivables due from related companies (Note 5) 21,240 16,710Interest receivables on derivative financial instruments 459 525
21,699 17,235
9 LOAN RECEIVABLES DUE FROM RELATED COMPANIES
2016
US$’000
2015
US$’000
Notes due from a related company (1) 175,226 163,220Loan receivables due from related companies (2) 1,515,706 1,507,282
1,690,932 1,670,502
Loan receivables consist of:
(1) (a) Notes of Euro75,000,000 issued on December 20, 2013 to a related company, Tata Steel Netherlands Holdings B.V (“TSNH”), which is unsecured and repayable by May 2, 2023. The note bear interest rates of 6.601% per annum for the first interest period ending May 1, 2014, interest rate of Euribor + 6.250% per annum for the subsequent interest periods ending November 1, 2016, and interest rate of 8.250% per annum for further subsequent interest periods to maturity on May 2, 2023. As at March 31, 2016, this note is measured at an amortised cost of Euro77,003,000 (equivalent to US$87,694,000) [2015 : Euro75,996,000 (equivalent to US$81,713,000)] based on the effective interest method with an effective interest rate of 7.577% (2015 : 7.646%) per annum.
(b) Notes of Euro75,000,000 issued on March 20, 2014 to TSNH, which is unsecured and repayable by May 2, 2023. The note bear interest rates of 6.634% per annum for the first interest period ending May 1, 2014, interest rate of Euribor + 6.250% per annum for the subsequent interest periods ending November 1, 2016, and interest rate of 8.250% per annum for further subsequent interest periods to maturity on May 2, 2023. As at March 31, 2016, this note is measured at an amortised cost of Euro76,861,000 (equivalent to US$87,532,000) [2015 : Euro75,827,000 (equivalent to US$81,507,000)] based on the effective interest method with an effective interest rate of 7.615% (2015 : 7.688%) per annum.
(2) (a) As at March 31, 2016, long-term loans of US$1,488,000,000 (2015 : US$1,488,000,000) to a related company, T S Global Procurement Company Pte. Ltd. consist of:
- a long-term loan of US$988,000,000 which bear interest rate at 6.450% (2015 : 6.050%) per annum and is repayable on July 30, 2024. This loan is measured at an amortised cost of US$993,274,000 (2015 : US$988,000,000) based on the effective interest method with an effective interest rate of 6.875% (2015 : 6.050%) per annum.
- a long-term loan of US$500,000,000 which bears interest rate at 5.350% (2015 : 4.950%) per annum and is repayable on January 30, 2020. This loan is measured at an amortised cost of US$502,783,000 (2015 : US$500,000,000) based on the effective interest method with an effective interest rate of 5.794% (2015 : 4.950%) per annum.
F-367

NOTES TO FINANCIAL STATEMENTS MARCH 31, 2016
17
During the year ended 2016, the interest rates for the long-term loans of US$988,000,000 and US$500,000,000 were raised from 6.050% to 6.450% and 4.950% to 5.350% per annum respectively with effect from April 1, 2015. Subsequent to the year end, the interest rates for the long-term loans of US$988,000,000 and US$500,000,000 are revised from 6.450% to 6.920% and 5.350% to 5.920% per annum respectively with effect from April 1, 2016 until the end of the tenure of the loans. Any future revision to interest rates due to market changes will be at mutual agreement of both parties.
(b) As at March 31, 2016, a long-term loan of S$26,457,000 (equivalent to US$19,649,000) [2015 : S$26,457,000 (equivalent to US$19,282,000)] to a related company, T S Global Holdings Pte. Ltd. (“TSGH”), is unsecured, bears interest rate of 5.100% (2015 : 5.100%) per annum and repayable by December 20, 2021.
During the year ended March 31, 2016, the Company had signed an initial subordinated creditor’s certificate to an agent for syndicated facilities granted to TSGH, for any amount receivable from TSGH is subordinated to the prior right of the financial institutions to prior repayment to the Company.
Management is of the opinion that fair value of these loan receivables approximates the carrying value as these are either charged at floating rates or at approximate rates which the management expects would be available to the related companies based on transfer pricing studies by qualified tax specialist.
10 DERIVATIVE FINANCIAL INSTRUMENTS
2016
US$’000
2015
US$’000
Current assets:
Forward foreign exchange contracts – unrealised fair value gains 150 265Non-current assets::
Forward foreign exchange contracts – unrealised fair value gains 2,121 3,626Interest rate swaps – unrealised fair value gains 2,672 3,937Non-current liabilities: 4,793 7,563Forward foreign exchange contracts – unrealised fair value losses 688 469
Forward foreign exchange contracts
The Company uses currency derivatives in the management of its foreign exchange exposures.
At the end of the reporting period, the total notional amount of outstanding forward foreign exchange contracts to which the Company is committed are as follows:
2016
US$’000
2015
US$’000
Forward foreign exchange contracts 199,117 186,366
Changes in the fair value of derivative financial instruments
2016
US$’000
2015
US$’000
Current assets:
Opening fair value of derivative financial instruments 3,422 (6,475)Net fair value (losses) gains of derivative financial instruments recognised in profit or loss (Note 18) during the year (1,839) 9,897
Closing fair value of derivative financial instruments representing unrealised net fair value gains 1,583 3,422
F-368

NOTES TO FINANCIAL STATEMENTS MARCH 31, 2016
18
10 DERIVATIVE FINANCIAL INSTRUMENTS (CONTD.)
The following table details information on the forward foreign currency contracts outstanding as at March 31, 2016:
Outstanding contracts Average effective
rate
Foreign currency
Contract value
Fair value gains
(losses)FC$’000 FC$’000 US$’000 US$’000
Sell Euro with maturity date less than 1 year 1.596 3,800 4,328 150Sell Euro with maturity date before 2023 1.661 17,750 20,216 347Sell Euro with maturity date on May 2, 2023 1.762 75,000 85,418 1,775Sell Euro with maturity date on May 2, 2023 1.729 75,000 85,418 (634)Buy SGD with maturity date on May 2, 2023 0.660 5,000 3,737 (55)Total 199,117 1,583
The following table details information on the forward foreign currency contracts outstanding as at March 31, 2015:
Outstanding contracts Average effective
rate
Foreign currency
Contract value
Fair value gains
(losses)FC$’000 FC$’000 US$’000 US$’000
Sell Euro with maturity date less than 1 year 1.580 3,800 4,082 265Sell Euro with maturity date before 2023 1.619 16,200 17,403 630Sell Euro with maturity date on May 2, 2023 1.756 92,150 98,996 2,996Sell Euro with maturity date on May 2, 2023 1.729 57,850 62,148 (317)Buy SGD with maturity date on May 2, 2023 0.747 5,000 3,737 (152)Total 186,366 3,422
Interest rate swaps
The Company uses interest rate swaps to manage its exposure to interest rate movements. Contracts with nominal values of S$150,000,000 (2015 : S$150,000,000) have been entered where the Company will pay fixed interest payments at an average rate of 4.479% (2015 : 4.479%) on the Euro notional principal equivalent of S$150,000,000 (2015 : S$150,000,000) and receive fixed interest receipt at 4.950% (2015 : 4.950%) on the Singapore dollar notional principal of S$150,000,000 (2015 : S$150,000,000). These contracts are for the period until May 2, 2023 (2015 : May 2, 2023).
Changes in the fair value of derivative financial instruments
2016
US$’000
2015
US$’000
Opening fair value of derivative financial instruments 3,937 (218)Net fair value (losses) gains of derivative financial instruments recognised in profit or loss (Note 18) during the year (1,265) 4,155
Closing fair value of derivative financial instruments representing unrealised net fair value gains 2,672 3,937
The following table details information on the interest rate swap contracts outstanding as at March 31, 2016:
Outstanding floating for fixed contractsNotional principal
amount
Fair value
gains
S$’000 US$’000With maturity date on May 2, 2023 1,50,000 2,672
F-369
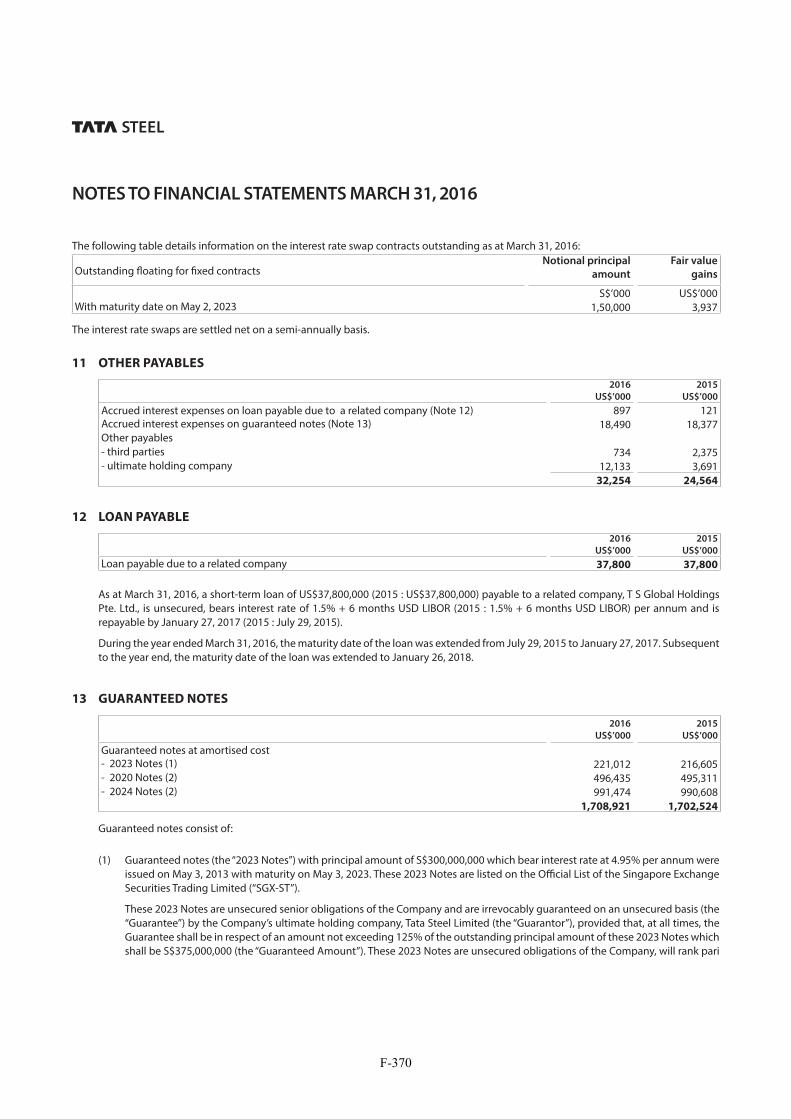
NOTES TO FINANCIAL STATEMENTS MARCH 31, 2016
19
The following table details information on the interest rate swap contracts outstanding as at March 31, 2016:
Outstanding floating for fixed contractsNotional principal
amount
Fair value
gains
S$’000 US$’000With maturity date on May 2, 2023 1,50,000 3,937
The interest rate swaps are settled net on a semi-annually basis.
11 OTHER PAYABLES
2016
US$’000
2015
US$’000
Accrued interest expenses on loan payable due to a related company (Note 12) 897 121Accrued interest expenses on guaranteed notes (Note 13) 18,490 18,377Other payables- third parties 734 2,375- ultimate holding company 12,133 3,691
32,254 24,564
12 LOAN PAYABLE
2016
US$’000
2015
US$’000
Loan payable due to a related company 37,800 37,800
As at March 31, 2016, a short-term loan of US$37,800,000 (2015 : US$37,800,000) payable to a related company, T S Global Holdings Pte. Ltd., is unsecured, bears interest rate of 1.5% + 6 months USD LIBOR (2015 : 1.5% + 6 months USD LIBOR) per annum and is repayable by January 27, 2017 (2015 : July 29, 2015).
During the year ended March 31, 2016, the maturity date of the loan was extended from July 29, 2015 to January 27, 2017. Subsequent to the year end, the maturity date of the loan was extended to January 26, 2018.
13 GUARANTEED NOTES
2016
US$’000
2015
US$’000
Guaranteed notes at amortised cost- 2023 Notes (1) 221,012 216,605- 2020 Notes (2) 496,435 495,311- 2024 Notes (2) 991,474 990,608
1,708,921 1,702,524
Guaranteed notes consist of:
(1) Guaranteed notes (the “2023 Notes”) with principal amount of S$300,000,000 which bear interest rate at 4.95% per annum were issued on May 3, 2013 with maturity on May 3, 2023. These 2023 Notes are listed on the Official List of the Singapore Exchange Securities Trading Limited (“SGX-ST”).
These 2023 Notes are unsecured senior obligations of the Company and are irrevocably guaranteed on an unsecured basis (the “Guarantee”) by the Company’s ultimate holding company, Tata Steel Limited (the “Guarantor”), provided that, at all times, the Guarantee shall be in respect of an amount not exceeding 125% of the outstanding principal amount of these 2023 Notes which shall be S$375,000,000 (the “Guaranteed Amount”). These 2023 Notes are unsecured obligations of the Company, will rank pari
F-370

NOTES TO FINANCIAL STATEMENTS MARCH 31, 2016
20
passu with all of its other existing and future unsubordinated obligations and will be effectively subordinated to its secured obligations and the obligations of the Guarantor’s subsidiaries.
These 2023 Notes bear interest at a rate of 4.95% per annum. Interest is paid on the 2023 Notes semi-annually in arrears on May 3 and November 3 of each year, beginning on November 4, 2013. Unless previously repurchased, cancelled or redeemed, these 2023 Notes will mature on May 3, 2023. Issue related costs amounted to approximately S$3,194,000 (equivalent to US$2,536,000).
As at March 31, 2016, these 2023 Notes are measured at an amortised cost of S$297,737,000 (equivalent to US$221,012,000) [2015 : S$297,418,000 (equivalent to US$216,605,000)].
(2) Guaranteed notes with principal amount of US$500,000,000 which bear interest rate at 4.85% per annum (the “2020 Notes”) and US$1,000,000,000 which bear interest rate at 5.95% per annum (the “2024 Notes”) were issued on July 31, 2014 with maturity on January 31, 2020 and July 31, 2024 respectively. These guaranteed notes are listed on the Freiverkehr (Open Market) of the Frankfurter Wertpapierborse (“Frankfurt Stock Exchange”).
The guaranteed notes are unsecured senior obligations of the Company and are irrevocably guaranteed on an unsecured basis (the “Guarantee”) by the Company’s ultimate holding company, Tata Steel Limited (the “Guarantor”), provided that, at all times, the Guarantee shall be in respect of an amount not exceeding 125% of the outstanding principal amount of the guaranteed notes which shall be US$625,000,000 and US$1,250,000,000 respectively (the “Guaranteed Amount”). These guaranteed notes are unsecured obligations of the Company, will rank pari passu with all of its other existing and future unsubordinated obligations and will be effectively subordinated to its secured obligations and the obligations of the Guarantor’s subsidiaries.
These 2020 Notes and 2024 Notes bear interest at a rate of 4.85% and 5.95% per annum respectively. Interest is paid on the 2020 Notes and 2024 Notes semi-annually in arrears on January 31 and July 31 of each year, beginning on January 31, 2015. Unless previously repurchased, cancelled or redeemed, these 2020 Notes and 2024 Notes will mature on January 31, 2020 and July 31, 2024 respectively. Issue related costs amounted to approximately US$15,370,000.
As at March 31, 2016, these 2020 Notes and 2024 Notes are measured at an amortised cost of US$496,435,000 (2015 : US$495,311,000) and US$991,474,000 (2015 : US$990,608,000) respectively.
As at March 31, 2016, the fair values of the 2023 Notes, 2020 Notes and 2024 Notes approximates S$285,720,000 (equivalent to US$212,198,000), US$498,500,000 and US$931,500,000 respectively.
As at March 31, 2015, the fair values of the 2023 Notes, 2020 Notes and 2024 Notes approximates S$287,790,000 (equivalent to US$209,593,000), US$515,500,000 and US$1,043,500,000 respectively.
The fair values are classified under Level 1 of the fair value hierarchy (Note 2).
14 DEFERRED TAX LIABILITY
2016
US$’000
2015
US$’000
Deferred tax liability 1,796 93
The deferred tax liability is recognised by the Company on account of interest income from foreign sources not remitted to Singapore. The movement during the reporting period is as follow:
2016
US$’000
2015
US$’000
Balance at beginning of year 93 17Charge to profit or loss (Note 19) 1,703 76Balance at end of year 1,796 93
F-371

NOTES TO FINANCIAL STATEMENTS MARCH 31, 2016
21
15 SHARE CAPITAL
Outstanding contracts 2016 Number of
ordinary shares
2015 Number of
ordinary shares
2016 US$’000
2015 US$’000
Issued and paid up:At beginning and end of year 200,000 200,000 200 200
Fully paid ordinary shares, which have no par value, carry one vote per share and carry a right to dividends.
16 INTEREST INCOME
2016
US$’000
2015
US$’000
Interest income on loan receivables due from related companies (Notes 5 and 9) 113,835 31,839Interest income from bank 6 217Interest income on derivative financial instruments (1) 1,116 819
114,957 32,875
(1) Amount is net of interest expenses of US$4,634,000 (2015 : US$4,763,000) on interest rate swaps contracts.
17 FINANCE COSTS
2016
US$’000
2015
US$’000
Interest expenses:- loan payable due to a related company (Notes 5 and 12) 776 121- guaranteed notes (Note 13) 94,511 67,346Amortisation of borrowing costs 2,221 1,560
97,508 69,027
18 FAIR VALUE (LOSSES) GAINS ON DERIVATIVE FINANCIAL INSTRUMENTS, NET
2016
US$’000
2015
US$’000
Fair value (losses) gains on derivative financial instruments- forward foreign exchange contracts (Note 10) (1,839) 9,897- interest rate swaps (Note 10) (1,265) 4,155
(3,104) 14,052
19 INCOME TAX EXPENSE
2016
US$’000
2015
US$’000
Current tax:- current year 513 310- overprovision in prior year (91) - Deferred tax (Note 14) 1,703 76Total income tax expenses 2,125 386
Statutory income tax is calculated at 17% (2015 : 17%) of the estimated assessable profit (loss) for the year.
F-372

NOTES TO FINANCIAL STATEMENTS MARCH 31, 2016
22
Tax for the year can be reconciled to the accounting profit (loss) as follows:2016
US$’000
2015
US$’000
Profit (Loss) before tax 12,395 (55,084)Tax expense (benefit) calculated at statutory tax rate of 17% 2,107 (9,364)Tax effect of expense that is not deductible for tax purposes 71 9,763Tax exemptions and tax rebates (33) (36)Overprovision in prior year (91) -Others 71 23Tax expense 2,125 386
20 PROFIT (LOSS) FOR THE YEAR
Profit (Loss) for the year has been arrived at after charging (crediting):2016
US$’000
2015
US$’000
Fair value losses (gains) on derivative financial instruments, net 3,104 (14,052)Foreign currency exchange (gain) loss, net (6,532) 29,245Guarantee commission expense on guaranteed notes charged by ultimate holding company (Note 5) 8,426 3,691
The Company has no employees and associated staff costs for the financial year end March 31, 2016 and March 31, 2015. Administrative support is provided by the ultimate holding company.
F-373

2323
REPORT ON THE FINANCIAL STATEMENTS
Opinion
We have audited the financial statements of Abja Investment Co. Pte. Ltd. (the “Company”), which comprise the statement of financial position as at March 31, 2017, and the statement of profit or loss and other comprehensive income, statement of changes in equity and statement of cash flows of the Company for the year then ended, and notes to the financial statements, including a summary of significant accounting policies, as set out on pages 7 to 35.
In our opinion, the accompanying financial statements are properly drawn up in accordance with the provisions of the Companies Act, Chapter 50 (the “Act”) and Financial Reporting Standards in Singapore (“FRSs”) so as to give a true and fair view of the financial position of the Company as at March 31, 2017 and of the financial performance, changes in equity and cash flows of the Company for the year ended on that date.
Basis for Opinion
We conducted our audit in accordance with Singapore Standards on Auditing (“SSAs”). Our responsibilities under those standards are further described in the Auditor’s Responsibilities for the Audit of the Financial Statements section of our report. We are independent of the Company in accordance with the Accounting and Corporate Regulatory Authority (“ACRA”) Code of Professional Conduct and Ethics for Public Accountants and Accounting Entities (“ACRA Code”) together with the ethical requirements that are relevant to our audit of the financial statements in Singapore, and we have fulfilled our other ethical responsibilities in accordance with these requirements and the ACRA Code. We believe that the audit evidence we have obtained is sufficient and appropriate to provide a basis for our opinion.
Key Audit Matters
Key audit matters are those matters that, in our professional judgement, were of most significance in our audit of the financial statements of the current period. These matters were addressed in the context of our audit of the financial statements as a whole, and in forming our opinion thereon, and we do not provide a separate opinion on these matters.
Recoverability of intercompany receivables
The Company has intercompany receivables consisting of notes and loans due from related companies and interest receivables from related companies, which account for approximately 98% of the Company’s total assets.
INDEPENDENT AUDITORS’ REPORT TO THE MEMBER OFABJA INVESTMENT CO. PTE. LTD.
Significant judgement is required by management in assessing the recoverability of these intercompany receivables including those that are past due but not provided for and the level of allowance for doubtful debts that may be required. Inappropriate judgement and estimates made in the impairment assessment would result in a significant impact on the carrying amount of the intercompany receivables.
The Company’s disclosures on intercompany receivables are set out in Notes 8 and 9 to the financial statements.
Our procedures performed and responses thereon
We performed procedures to understand management’s process over the monitoring of receivables and the assessment of allowance for doubtful debts.
We discussed with management on the reasons for any delay in payments for significant aged receivables and assessed the appropriateness of any allowance for doubtful receivables to be made, by considering amongst other factors such as, the financial position and results of the respective entities, subsequent cash receipts, payment history, settlement arrangements or the presence of any financial support that the ultimate holding company has given to any of the related company.
We have also assessed the adequacy and appropriateness of the disclosures made in the financial statements.
INFORMATION OTHER THAN THE FINANCIAL STATEMENTS AND AUDITOR’S REPORT THEREON
Management is responsible for the other information. The other information comprises information included in the Directors’ Statement set out on pages 1 to 2. Our opinion on the financial statements does not cover the other information and we do not express any form of assurance conclusion thereon.
In connection with our audit of the financial statements, our responsibility is to read the other information and, in doing so, consider whether the other information is materially inconsistent with the financial statements or our knowledge obtained in the audit or otherwise appears to be materially misstated. If, based on the work we have performed, we conclude that there is a material misstatement of this other information, we are required to report that fact. We have nothing to report in this regard.
F-374

24
Responsibilities of Management and Directors for the
Financial Statements
Management is responsible for the preparation of financial statements that give a true and fair view in accordance with the provisions of the Act and FRSs, and for devising and maintaining a system of internal accounting controls sufficient to provide a reasonable assurance that assets are safeguarded against loss from unauthorised use or disposition; and transactions are properly authorised and that they are recorded as necessary to permit the preparation of true and fair financial statements and to maintain accountability of assets.
In preparing the financial statements, management is responsible for assessing the Company’s ability to continue as a going concern, disclosing, as applicable, matters related to going concern and using the going concern basis of accounting unless management either intends to liquidate the Company or to cease operations, or has no realistic alternative but to do so.
The directors’ responsibilities include overseeing the Company’s financial reporting process.
Auditor’s Responsibilities for the Audit of the Financial
Statements
Our objectives are to obtain reasonable assurance about whether the financial statements as a whole are free from material misstatement, whether due to fraud or error, and to issue an auditor’s report that includes our opinion. Reasonable assurance is a high level of assurance, but is not a guarantee that an audit conducted in accordance with SSAs will always detect a material misstatement when it exists. Misstatements can arise from fraud or error and are considered material if, individually or in the aggregate, they could reasonably be expected to influence the economic decisions of users taken on the basis of these financial statements.
As part of an audit in accordance with SSAs, we exercise professional judgement and maintain professional skepticism throughout the audit. We also:
a) Identify and assess the risks of material misstatement of the financial statements, whether due to fraud or error, design and perform audit procedures responsive to those risks, and obtain audit evidence that is sufficient and appropriate to provide a basis for our opinion. The risk of not detecting a material misstatement resulting from fraud is higher than for one resulting from error, as fraud may involve collusion, forgery, intentional omissions, misrepresentations, or the override of internal control.
b) Obtain an understanding of internal control relevant to the audit in order to design audit procedures that are appropriate in the circumstances, but not for the purpose of expressing an opinion on the effectiveness of the Company’s internal control.
c) Evaluate the appropriateness of accounting policies used and the reasonableness of accounting estimates and related disclosures made by management.
d) Conclude on the appropriateness of management’s use of the going concern basis of accounting and, based on the audit evidence obtained, whether a material uncertainty exists related to events or conditions that may cast significant doubt on the Company’s ability to continue as a going concern. If we conclude that a material uncertainty exists, we are required to draw attention in our auditor’s report to the related disclosures in the financial statements or, if such disclosures are inadequate, to modify our opinion. Our conclusions are based on the audit evidence obtained up to the date of our auditor’s report. However, future events or conditions may cause the Company to cease to continue as a going concern.
e) Evaluate the overall presentation, structure and content of the financial statements, including the disclosures, and whether the financial statements represent the underlying transactions and events in a manner that achieves fair presentation.
We communicate with the directors regarding, among other matters, the planned scope and timing of the audit and significant audit findings, including any significant deficiencies in internal control that we identify during our audit.
We also provide the directors with a statement that we have complied with relevant ethical requirements regarding independence, and to communicate with them all relationships and other matters that may reasonably be thought to bear on our independence, and where applicable, related safeguards.
From the matters communicated with the directors, we determine those matters that were of most significance in the audit of the financial statements of the current period and are therefore the key audit matters. We describe these matters in our auditor’s report unless law or regulation precludes public disclosure about the matter or when, in extremely rare circumstances, we determine that a matter should not be communicated in our report because the adverse consequences of doing so would reasonably be expected to outweigh the public interest benefits of such communication.
Report on Other Legal and Regulatory Requirements
In our opinion, the accounting and other records required by the Act to be kept by the Company have been properly kept in accordance with the provisions of the Act.
Public Accountants andChartered AccountantsSingapore
September 27, 2017
F-375

25
STATEMENT OF FINANCIAL POSITIONMARCH 31, 2017
Note2017
US$’000
2016
US$’000
ASSETS
Current assets
Cash and cash equivalents 7 16,233 11,770 Other receivables 8 24,848 21,699 Derivative financial instruments 10 309 150 Total current assets 41,390 33,619
Non-current assets
Loan receivables due from related companies 9 1,679,085 1,690,932 Derivative financial instruments 10 12,808 4,793 Total non-current assets 1,691,893 1,695,725
Total assets 1,733,283 1,729,344
LIABILITIES AND NET CAPITAL DEFICIENCY
Current liabilities
Other payables 11 27,879 32,254 Loan payable 12 - 37,800 Tax payable 1,707 450 Total current liabilities 29,586 70,504
Non-current liabilities
Guaranteed notes 13 1,703,077 1,708,921 Loans payable 12 37,800 -Deferred tax liability 14 1,797 1,796 Other Payable 11 1,907 -Derivative financial instruments 10 68 688 Total non-current liabilities 1,744,649 1,711,405
Capital, accumulated losses and reserve
Share capital 15 200 200 Accumulated losses (41,142) (52,755)Translation reserve (10) (10)Net capital deficiency (40,952) (52,565)Total liabilities and net of capital deficiency 1,733,283 1,729,344
STATEMENT OF PROFIT OR LOSS AND OTHER COMPREHENSIVE INCOMEYEAR ENDED MARCH 31, 2017
Note2017
US$’000
2016
US$’000
Interest income 16 1,17,014 1,19,591Finance costs 17 (1,02,337) (1,02,142)Foreign currency exchange gain (loss), net (2,975) 6,532Fair value (losses) gains on derivative financial instruments, net 18 8,794 (3,104Other operating expenses (7,116) (8,482)Profit (Loss) before tax 13,380 12,395
Income tax expense 19 (1,767) (2,125)Profit (Loss) for the year, representing to comprehensive income (loss) for the financial year
20 11,613 10,270
F-376
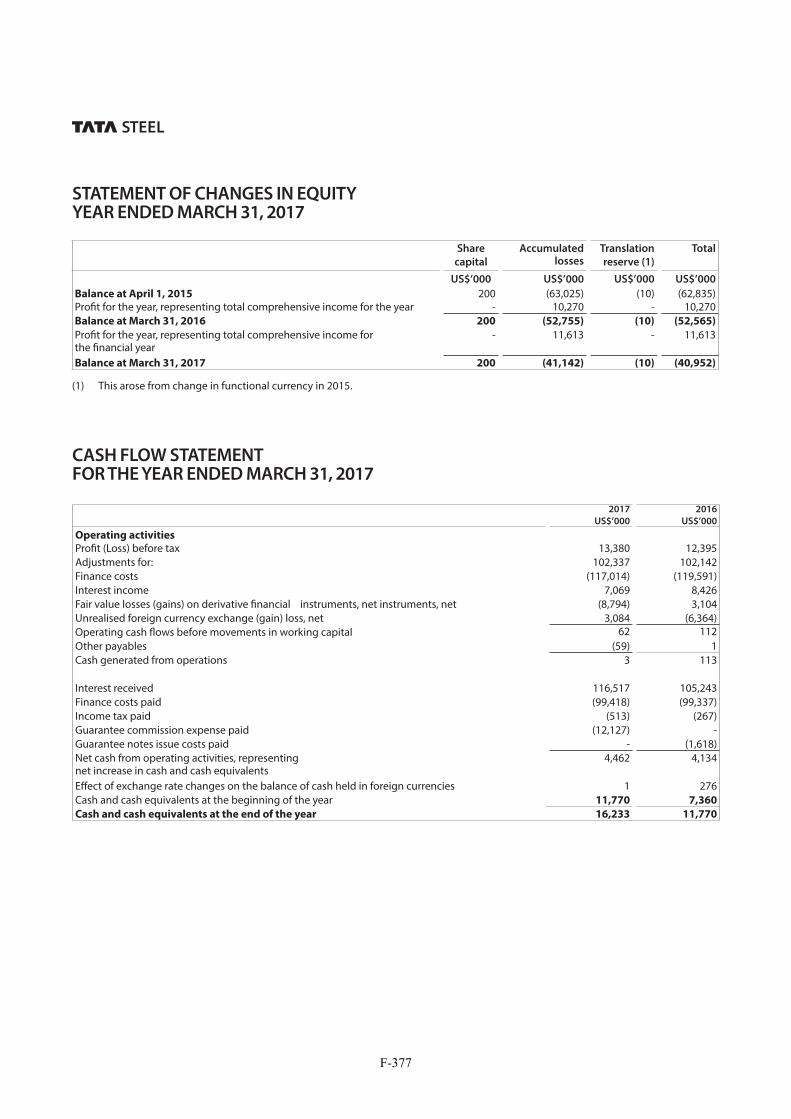
26
STATEMENT OF CHANGES IN EQUITYYEAR ENDED MARCH 31, 2017
CASH FLOW STATEMENT FOR THE YEAR ENDED MARCH 31, 2017
Share
capital
Accumulated losses
Translation
reserve (1)
Total
US$’000 US$’000 US$’000 US$’000
Balance at April 1, 2015 200 (63,025) (10) (62,835)Profit for the year, representing total comprehensive income for the year - 10,270 - 10,270Balance at March 31, 2016 200 (52,755) (10) (52,565)
Profit for the year, representing total comprehensive income for the financial year
- 11,613 - 11,613
Balance at March 31, 2017 200 (41,142) (10) (40,952)
(1) This arose from change in functional currency in 2015.
2017
US$’000
2016
US$’000
Operating activities
Profit (Loss) before tax 13,380 12,395Adjustments for: 102,337 102,142 Finance costs (117,014) (119,591)Interest income 7,069 8,426Fair value losses (gains) on derivative financial instruments, net instruments, net (8,794) 3,104Unrealised foreign currency exchange (gain) loss, net 3,084 (6,364)Operating cash flows before movements in working capital 62 112Other payables (59) 1 Cash generated from operations 3 113 Interest received 116,517 105,243 Finance costs paid (99,418) (99,337)Income tax paid (513) (267)Guarantee commission expense paid (12,127) -Guarantee notes issue costs paid - (1,618)Net cash from operating activities, representing net increase in cash and cash equivalents
4,462 4,134
Effect of exchange rate changes on the balance of cash held in foreign currencies 1 276Cash and cash equivalents at the beginning of the year 11,770 7,360
Cash and cash equivalents at the end of the year 16,233 11,770
F-377

27
1 GENERAL
The Company (Registration No. 201309883M) is incorporated in Singapore with its principal place of business and registered office at 22 Tanjong Kling Road, Singapore 628048. The financial statements are expressed in United States dollars (“US$”).
The principal activity of the Company consists of provision of treasury services.
The Company had in prior years, issued guaranteed notes (Note 13) with principal amount of US$1,500,000,000 and S$300,000,000 which are listed on the Freiverkehr (Open Market) of the Frankfurter Wertpapierborse (“Frankfurt Stock Exchange”) and the Official List of the Singapore Exchange Securities Trading Limited (“SGX-ST”) respectively. Further information is disclosed in Note 13.
As at March 31, 2017, the Company has a capital deficiency of US$40,952,000 (2016 : US$52,565,000), current assets in excess of current liabilities of US$ 11,804,000 (2016 : current liabilities in excess of current assets of US$36,885,000) and current year total comprehensive income of US$11,613,000 (2016 : US$10,270,000).
During the year ended March 31, 2017, the Company earned interest income of US$117,014,000 (2016 : US$119,591,000) and incurred finance costs of US$102,337,000 (2016 : US$102,142,000) and generated net profit of US$11,613,000 (2016 : US$10,270,000) for the year.
The interest rates for the long-term loans of US$988,000,000 and US$300,000,000 were also revised from 6.45% to 6.92% and 5.35% to 5.92% per annum respectively with effect from April 1, 2016 until the end of the tenure of the loans (Note 9). Any future revision to interest rates due to market changes will be at mutual agreement of third parties.
Management had considered the above and also assessed that (i) the total guaranteed notes of US$1,703,077,000 (2016 : US$1,708,921,000) (Note 13) issued by the Company, including any current and future related interest payables, are guaranteed by the ultimate holding company (Note 5); (ii) the cash flows from interest income expected to be received from loans to related companies will be sufficient to cover the interest expenses that the Company expects to incur as the interest rate charges are higher than the interest rate payable on the debt; and (iii) prior to the year end, the maturity date of the long-term loan of US$37,800,000 loan (Note 12) was extended to January 26, 2019. On the above, management has assessed that there are no material uncertainties on the Company’s ability to continue as going concern and these will sufficiently cover the Company’s existing net capital deficiency in the future. In addition, management has also assessed that if required, fundings from the ultimate holding company will be available.
The financial statements of the Company for the year ended March 31, 2017 were authorised for issue by the Board of Directors on September 27, 2017.
2 SUMMARY OF SIGNIFICANT ACCOUNTING POLICIES
BASIS OF ACCOUNTING – The financial statements are prepared in accordance with the historical cost basis, except as disclosed in the accounting policies below, and are drawn up in accordance with the provisions of the Singapore Companies Act and Financial Reporting Standards in Singapore (“FRSs”).
Historical cost is generally based on the fair value of the consideration given in exchange for goods and services.
Fair value is the price that would be received to sell an asset or paid to transfer a liability in an orderly transaction between market participants at the measurement date, regardless of whether that price is directly observable or estimated using another valuation technique. In estimating the fair value of an asset or a liability, the Company takes into account the characteristics of the asset or liability which market participants would take into account when pricing the asset or liability at the measurement date. Fair value for measurement and/or disclosure purposes in the financial statements is determined on such a basis, except for measurements that have some similarities to fair value but are not fair value, such as value in use in FRS 36 Impairment of Assets.
In addition, for financial reporting purposes, fair value measurements are categorised into Level 1, 2 or 3 based on the degree to which the inputs to the fair value measurements are observable and the significance of the inputs to the fair value measurement in its entirety, which are described as follows:
• Level 1 inputs are quoted prices (unadjusted) in active markets for identical assets or liabilities that the entity can access at the measurement date;
• Level 2 inputs are inputs, other than quoted prices included within Level 1, that are observable for the asset or liability, either directly or indirectly; and
• Level 3 inputs are unobservable inputs for the asset or liability.
ADOPTION OF NEW AND REVISED STANDARDS – On April 1, 2016, the Company adopted all the new and revised FRSs and Interpretations of FRS (“INT FRS”) that are effective from that date and are relevant to its operations. The adoption of these new/revised FRSs and INT FRSs does not result in significant changes to the Company’s accounting policies and has no
NOTES TO FINANCIAL STATEMENTS MARCH 31, 2017
F-378

NOTES TO FINANCIAL STATEMENTS MARCH 31, 2017
28
material effect on the amounts reported for the current or prior years.
At the date of authorisation of these financial statements, the following FRSs that are relevant to the Company were issued but not effective:
• FRS 109 Financial Instruments 1
• FRS 115 Revenue from Contracts with Customers (withclarifications issued) 1
• FRS 116 Leases 2
1 Applies to annual periods beginning on or after January 1,2018, with early application permitted.
2 Applies to annual periods beginning on or after January 1,2019, with earlier application permitted if FRS 115 is adopted
• The new general hedge accounting requirements retainthe three types of hedge accounting mechanisms currentlyavailable in FRS 39. Under FRS 109, greater flexibility has been introduced to the types of transactions eligible for hedgeaccounting, specifically broadening the types of instruments that qualify for hedging instruments and the types of riskcomponents of non-financial items that are eligible forhedge accounting. In addition, the effectiveness test hasbeen overhauled and replaced with the principle of an‘economic relationship’. Retrospective assessment of hedgeeffectiveness is also no longer required. Enhanced disclosure requirements about an entity’s risk management activitieshave also been introduced.
Management is currently assessing the potential financialimpact of FRS 109 in the period of initial adoption. It iscurrently impracticable to disclose any further informationon the known or reasonably estimable impact to the financial statements in the period of initial application as management has yet to complete its detailed assessment. Managementdoes not plan to early adopt the new FRS 109.
FINANCIAL INSTRUMENTS - Financial assets and financialliabilities are recognised on the Company’s statement offinancial position when the Company becomes a party to the contractual provisions of the instrument.
Effective interest method
The effective interest method is a method of calculating theamortised cost of a financial instrument and of allocatinginterest income or expense over the relevant period. Theeffective interest rate is the rate that exactly discountsestimated future cash receipts or payments through theexpected life of the financial instrument, or where appropriate,
a shorter period. Income and expense is recognised on an effective interest rate basis for debt instruments.
Financial assets
Cash and cash equivalents in the statement of cash flows Cash and cash equivalents comprise cash at bank that are readily convertible to a known amount of cash and are subject to an insignificant risk of changes in value.
Loans and receivables
Loans and other receivables are initially measured at fair value and are subsequently measured at amortised cost using the effective interest method less impairment. Interest is recognised by applying the effective interest rate method except for short-term receivables when the effect of discounting is immaterial.
Impairment of financial assets
Financial assets are assessed for indicators of impairment at the end of each reporting period.
Financial assets are considered to be impaired when there is objective evidence that, as a result of one or more events that occurred after the initial recognition of the financial asset, the estimated future cash flows of the financial asset have been impacted. For financial assets carried at amortised cost, the amount of the impairment is the difference between the asset’s carrying amount and the present value of estimated future cash flows, discounted at the original effective interest rate.
The carrying amount of the financial asset is reduced by the impairment loss directly for all financial assets with the exception of receivables where the carrying amount is reduced through the use of an allowance account. When a receivable is uncollectible, it is written off against the allowance account. Subsequent recoveries of amounts previously written off are credited against the allowance account. Changes in the carrying amount of the allowance account are recognised in profit or loss.
If, in a subsequent period, the amount of the impairment loss decreases and the decrease can be related objectively to an event occurring after the impairment loss was recognised, the previously recognised impairment loss is reversed through the profit or loss to the extent the carrying amount of the financial asset at the date the impairment is reversed does not exceed what the amortised cost would have been had the impairment not been recognised.
F-379

NOTES TO FINANCIAL STATEMENTS MARCH 31, 2017
29
Derecognition of financial assets
The Company derecognises a financial asset only when the contractual rights to the cash flows from the asset expire, or it transfers the financial asset and substantially all the risks and rewards of ownership of the asset to another entity. If the Company neither transfers nor retains substantially all the risks and rewards of ownership and continues to control the transferred asset, the Company recognises its retained interest in the asset and an associated liability for amounts it may have to pay. If the Company retains substantially all the risks and rewards of ownership of a transferred financial asset, the Company continues to recognise the financial asset and also recognises a collateralised borrowing for the proceeds received.
Financial liabilities and equity instruments
Classification as debt or equity
Financial liabilities and equity instruments issued by the Company are classified according to the substance of the contractual arrangements entered into and the definitions of a financial liability and an equity instrument.
Equity instruments
An equity instrument is any contract that evidences a residual interest in the assets of the Company after deducting all of its liabilities. Equity instruments are recorded at the proceeds received, net of direct issue costs.
Financial liabilities
Other payables are initially measured at fair value, net of transaction costs, and are subsequently measured at amortised cost, using the effective interest method, with interest expense recognised on an effective yield basis, except for short-term payables when the effect of discounting is immaterial.
Interest-bearing guaranteed notes and loans are initially measured at fair value, and are subsequently measured at amortised cost, using the effective interest method. Any difference between the proceeds (net of transaction costs) and the settlement or redemption of borrowings is recognised over the term of the borrowings in accordance with the Company’s accounting policy for borrowing costs (see below).
Derecognition of financial liabilities
The Company derecognises financial liabilities when, and only when, the Company’s obligations are discharged, cancelled or they expire.
Derivative financial instruments
The Company enters into certain derivative financial instruments to manage its exposure to foreign exchange rate risk and interest rate, including forward foreign exchange contracts and interest rate swaps. Further details of derivative financial instruments are disclosed in Note 10.
Derivatives are initially recognised at fair value at the date a derivative contract is entered into and are subsequently remeasured to their fair value at the end of each reporting period. The resulting gain or loss is recognised in profit or loss immediately unless the derivative is designated and effective as a hedging instrument, in which event the timing of the recognition in profit or loss depends on the nature of the hedge relationship. A derivative is presented as a non-current asset or a non-current liability if the remaining maturity of the instrument is more than 12 months and it is not expected to be realised or settled within 12 months. Other derivatives are presented as current assets or current liabilities.
Offsetting arrangements
Financial assets and financial liabilities are offset and the net amount presented in the statement of financial position when the Company has a legally enforceable right to set off the recognised amounts; and intends either to settle on a net basis, or to realise the asset and settle the liability simultaneously. A right to set-off must be available today rather than being contingent on a future event and must be exercisable by any of the counterparties, both in the normal course of business and in the event of default, insolvency or bankruptcy.
PROVISIONS - Provisions are recognised when the Company has a present obligation (legal or constructive) as a result of a past event, it is probable that the Company will be required to settle the obligation, and a reliable estimate can be made of the amount of the obligation.
The amount recognised as a provision is the best estimate of the consideration required to settle the present obligation at the end of the reporting period, taking into account the risks and uncertainties surrounding the obligation. Where a provision is measured using the cash flows estimated to settle the present obligation, its carrying amount is the present value of those cash flows.
When some or all of the economic benefits required to settle a provision are expected to be recovered from a third party, the receivable is recognised as an asset if it is virtually certain that reimbursement will be received and the amount of the receivable can be measured reliably.
F-380

NOTES TO FINANCIAL STATEMENTS MARCH 31, 2017
30
REVENUE RECOGNITION - Revenue is measured at the fair value of the consideration received or receivable.
Interest income
Interest income is accrued on a time basis, by reference to the principal outstanding and at the effective interest rate applicable
BORROWING COSTS - Borrowing costs directly attributable to the acquisition, construction or production of qualifying assets, which are assets that necessarily take a substantial period of time to get ready for their intended use or sale, are added to the cost of those assets, until such time as the assets are substantially ready for their intended use or sale.
All other borrowing costs are recognised in profit or loss in the period in which they are incurred.
INCOME TAX - Income tax expense represents the sum of the tax currently payable and deferred tax.
The tax currently payable is based on taxable profit for the year. Taxable profit differs from profit as reported in the statement of profit or loss and other comprehensive income because it excludes items of income or expense that are taxable or deductible in other years and it further excludes items that are not taxable or tax deductible. The Company’s liability for current tax is calculated using tax rates (and tax laws) that have been enacted or substantively enacted by the end of the reporting period.
Deferred tax is recognised on differences between the carrying amounts of assets and liabilities in the financial statements and the corresponding tax bases used in the computation of taxable profit. Deferred tax liabilities are generally recognised for all taxable temporary differences and deferred tax assets are recognised to the extent that it is probable that taxable profits will be available against which deductible temporary differences can be utilised.
The carrying amount of deferred tax assets is reviewed at the end of each reporting period and reduced to the extent that it is no longer probable that sufficient taxable profits will be available to allow all or part of the asset to be recovered.
Deferred tax is calculated at the tax rates that are expected to apply in the period when the liability is settled or the asset realised based on the tax rates (and tax laws) that have been enacted or substantively enacted by the end of the reporting period.
Deferred tax assets and liabilities are offset when there is a legally enforceable right to set off current tax assets against current tax liabilities and when they relate to income taxes levied by the same taxation authority and the Company
intends to settle its current tax assets and liabilities on a net basis.
Current and deferred tax are recognised as an expense or income in profit or loss, except when they relate to items credited or debited outside profit or loss (either in other comprehensive income or directly in equity), in which case the tax is also recognised outside profit or loss (either in other comprehensive income or directly in equity, respectively).
FOREIGN CURRENCY TRANSACTIONS AND TRANSLATION - The financial statements of the Company is measured and presented in United States dollar (US$), which is the currency of the primary economic environment in which the entity operates (its functional currency).
Transactions in currencies other than the Company’s functional currency are recorded at the rates of exchange prevailing on the date of the transaction. At the end of each reporting period, monetary items denominated in foreign currencies are retranslated at the rates prevailing the end of each reporting period. Non-monetary items carried at fair value that are denominated in foreign currencies are retranslated at the rates prevailing on the date when the fair value was determined. Non-monetary items that are measured in terms of historical cost in a foreign currency are not retranslated.
Exchange differences arising on the settlement of monetary items, and on retranslation of monetary items are included in profit or loss for the period. Exchange differences arising on the retranslation of non-monetary items carried at fair value are included in profit or loss for the period except for differences arising on the retranslation of non-monetary items in respect of which gains and losses are recognised directly in equity. For such non-monetary items, any exchange component of that gain or loss is also recognised in other comprehensive income.
3 CRITICAL ACCOUNTING JUDGEMENTS AND KEY SOURCES OF ESTIMATION UNCERTAINTY
In the application of the Company’s accounting policies, which are described in Note 2, management is required to make judgements, estimates and assumptions about the carrying amounts of assets and liabilities that are not readily apparent from other sources. The estimates and associated assumptions are based on historical experience and other factors that are considered to be relevant. Actual results may differ from these estimates.
The estimates and underlying assumptions are reviewed on an ongoing basis. Revisions to accounting estimates are recognised in the period in which the estimate is revised if
F-381

NOTES TO FINANCIAL STATEMENTS MARCH 31, 2017
31
the revision affects only that period, or in the period of the revision and future periods if the revision affects both current and future periods.
(i) Critical judgements in applying the Company’s accounting policies
The following are the critical judgements, apart from those involving estimations (see below), that management has made in the process of applying the Company’s accounting policies and that have the most significant effect on the amounts recognised in the financial statements.
Functional currency
FRS 21 The Effects of Changes in Foreign Exchange Rates requires the Company determine its functional currency to prepare the financial statements. When determining its functional currency, the Company considers the primary economic environment in which it operates i.e. the one in which it primarily generates and expends cash. The Company also considers the funds generated from financing activities.
For the years ended March 31, 2016 and March 31, 2017, management had reassessed and determined that the functional currency of the Company continues to be United States dollars on the basis that its majority funding and its significant transactions are denominated in United States dollars.
(ii) Key sources of estimation uncertainty
The key assumptions concerning the future, and other key sources of estimation uncertainty at the end of the reporting period, that have a significant risk of causing a material adjustment to the carrying amounts of assets and liabilities within the next financial year, are discussed below.
Loan receivables and interest receivables from related companies
The Company has interest receivables and loan receivables due from related companies of US$22,516,000 (2016 : US$21,240,000) (Note 8) and US$1,679,085,000 (2016 : US$1,690,932,000) (Note 9) respectively.
The Company’s assessment of allowances for bad and doubtful receivables is based on the evaluation of collectability and management’s judgement. Judgement is required in assessing the ultimate realisation of these receivables from these related companies. The management considers amongst other factors such as the financial position and results of the respective related companies, subsequent cash receipts, payment history, settlement arrangements or the presence of any financial support that the ultimate holding company has given. If the financial conditions of related companies were to deteriorate, resulting in an impairment of their ability to make payments, additional allowances may be required. Based on management’s evaluation, no impairment is assessed to be necessary for loan receivables and interest receivables from these related companies. The carrying amount of interest receivables and loan receivables are disclosed in Notes 8 and 9 respectively.
F-382
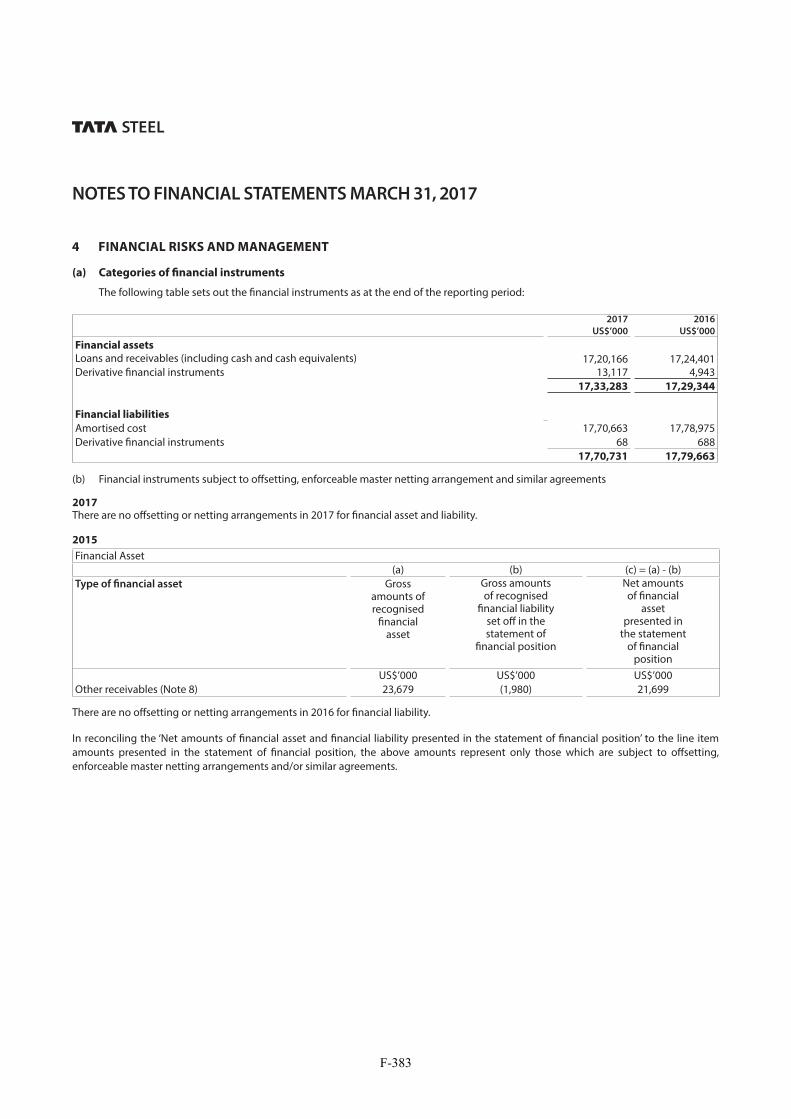
NOTES TO FINANCIAL STATEMENTS MARCH 31, 2017
32
4 FINANCIAL RISKS AND MANAGEMENT
(a) Categories of financial instruments
The following table sets out the financial instruments as at the end of the reporting period:
2017
US$’000
2016
US$’000
Financial assets
Loans and receivables (including cash and cash equivalents) 17,20,166 17,24,401Derivative financial instruments 13,117 4,943
17,33,283 17,29,344
Financial liabilities
Amortised cost 17,70,663 17,78,975Derivative financial instruments 68 688
17,70,731 17,79,663
(b) Financial instruments subject to offsetting, enforceable master netting arrangement and similar agreements
2017There are no offsetting or netting arrangements in 2017 for financial asset and liability.
2015
Financial Asset(a) (b) (c) = (a) - (b)
Type of financial asset Grossamounts ofrecognised
financialasset
Gross amountsof recognised
financial liabilityset off in thestatement of
financial position
Net amountsof financial
assetpresented in
the statementof financial
positionUS$’000 US$’000 US$’000
Other receivables (Note 8) 23,679 (1,980) 21,699
There are no offsetting or netting arrangements in 2016 for financial liability.
In reconciling the ‘Net amounts of financial asset and financial liability presented in the statement of financial position’ to the line item amounts presented in the statement of financial position, the above amounts represent only those which are subject to offsetting, enforceable master netting arrangements and/or similar agreements.
F-383

NOTES TO FINANCIAL STATEMENTS MARCH 31, 2017
33
(c) Financial risk management policies and objectives
The Company’s overall risk management policy seeks to minimise potential adverse effects of financial performance of the Company.
The Company is exposed to financial risks such as foreign exchange, interest rate, credit and liquidity risks. Management regularly reviews its policy governing risk management practices. There has been no change to the Company’s exposure to these financial risks or the manner in which it manages and measures these risks during the year.
(i) Foreign exchange risk management
Certain of the Company’s financial assets and financial liabilities are denominated in currencies other than its functional currency and hence the Company is therefore exposed to foreign exchange risk. The Company uses forward foreign exchanges contracts tomanage its exposure to foreign currency risk in the local reporting currency. Further details on these derivative financial instruments are disclosed in Note 10.
At the end of the reporting period, the carrying amounts of significant monetary assets and monetary liabilities denominated in currencies other than the Company’s functional currency which have the exposure to foreign currency risk are as follows:
Liabilities Assets
2017 US$’000
2016 US$’000
2017 US$’000
2016 US$’000
Euro 1,847 1,980 1,72,315 1,81,130 Singapore dollars 2,18,437 2,22,819 21,772 22,407
If the United States dollars strengthen/weaken by 10% against the relevant foreign currency, profit before tax will (decrease)/increase (2015 : loss before tax will be (increase)/decrease) by:
2017 US$’000
2016 US$’000
Euro (17,047) (17,915)Singapore dollars 19,667 20,041
(ii) Interest rate risk management
Interest rate risk refers to the risk faced by the Company as a result of fluctuation in interest rates. The Company is exposed to interest rate risk associated with certain of its loan receivables and loan payables which have floating rates.
The Company uses interest swaps to manage its interest rate risk. Further details of the interest rate swaps are disclosed in Note 10.
Interest rate sensitivity
The sensitivity analyses below have been determined based on year-end balances which are subject to floating interest rates at theend of the reporting period.
If interest rates had been 100 basis points higher or lower and all other variables were held constant, the Company’s profit for the year ended March 31, 2017 would increase/ decrease by US$378,000 (2016: US$ 1,374,000).
(iii) Credit risk management
The Company’s credit risk is primarily attributable to its cash and cash equivalents, loan receivables and interest receivables due from related companies.
Cash balances are held with creditworthy financial institutions. At March 31, 2017, the Company has a concentration of credit risk from loan receivables and interest receivables due from 3 (2016 : 3) related companies which account for 99.9% (2016 : 99.9%) of total receivables, amounting to approximately US$1,701,601,000 (2016 : US$1,712,172,000). Management has evaluated the credit quality of these receivables and who the counterparties are and has assessed that the credit risk for these amounts to be manageable.
4 FINANCIAL RISKS AND MANAGEMENT (CONTD.)
F-384

NOTES TO FINANCIAL STATEMENTS MARCH 31, 2017
34
(iv) Liquidity risk management
Liquidity risk reflects the risk that the Company will have insufficient resources to meet its financial liabilities as they fall due. The Company’s strategy to manage liquidity risk is to ensure that the Company has sufficient funds to meet its potential liabilities as they fall due. As at March 31, 2017, the Company has a capital deficiency of US$40,952,000 (2016 : US$52,565,000) and current assets in excess of current liability of US$11,804,000 (2016 : current liabilities in excess of current assets of US$36,885,000), and management has assessed as disclosed in Note 1 that the Company will have sufficient funds to operate as a going concern. In addition, management is of the opinion that there are reasonable grounds to believe that the Company will be able to pay its debts when they fall due.
Non-derivative financial liabilities
The following tables detail the remaining contractual maturity for non-derivative financial liabilities. The tables have been drawn up based on the undiscounted cash flows of financial liabilities based on the earliest date on which the Company can be required to pay.
The table includes both interest and principal cash flows. The adjustment column represents the possible future cash flows attributable to the instrument included in the maturity analysis which is not included in the carrying amount of the financial liabilities on the statement of financial position.
Average effective interest rate %
On demand or within
1 year US$’000
Within 2 to 5 years US$’000
After 5 years
US$’000
Adjustment US$’000
Total US$’000
2017
Non-interest bearing - 27,879 1,907 - - 29,786Variable interest rate instrument 2.86 - 39,870 - (2,070) 37,800Fixed interest rate instrument 4.85 – 5.95 76,083 829,024 1,379,463 (581,493) 1,703,077
103,962 870,801 1,379,463 (583,563) 1,770,663
2016
Non-interest bearing - 32,254 32,254Variable interest rate instrument 2.40 908 38,556 (1,664) 37,800Fixed interest rate instrument 4.85 - 5.95 76,020 8,74,000 1,373,341 (6,14,440) 1,708,921
1,09,182 9,12,556 1,373,341 (6,16,104) 17,78,975
Financial assets
The Company’s financial assets comprise cash and cash equivalents, other receivables and loan receivables due from related companies as disclosed in Notes 7, 8 and 9 respectively.
Non-derivative financial assets
The following table details the expected maturity for non-derivative financial assets. The tables below have been drawn up based on the undiscounted contractual maturities of the financial assets including interest that will be earned on those assets except where the Company anticipates that the cash flow will occur in a different period. The adjustment column represents the possible future cash flows attributable to the instrument included in the maturity analysis which are not included in the carrying amount of the financial assets on the statement of financial position.
F-385

NOTES TO FINANCIAL STATEMENTS MARCH 31, 2017
35
Average effective interest rate %
On demand or within
1 year US$’000
Within 2 to 5 years US$’000
After 5 years
US$’000
Adjustment US$’000
Total US$’000
2017
Non-interest bearing - 41,081 - - - 41,081Fixed interest rate instrument 5.10-7.61 70,605 9,02,603 13,38,848 (632,971 1,679,085
1,11,686 9,02,603 13,38,848 (632,971) 1,720,166
2016
Non-interest bearing - 33,469 - - - 33,469 Variable interest rate instrument 7.60 8,502 51,934 1,97,907 (83,117) 1,75,226Fixed interest rate instrument 5.10 - 6.92 82,213 8,80,724 12,15,899 (6,63,130) 15,15,706
1,24,184 9,32,658 14,13,806 (7,46,247) 17,24,401
Derivative financial instruments
As at the end of the reporting period, the Company’s derivative financial instruments comprise of foreign exchange forward contracts with contracted net cash inflow amounting to US$9,760,000 (2016 : net cash inflow amounted to US$1,583,000) (Note 10) and interest rate swaps with contracted net cash inflow amounting to US$3,289,000 (2016 : net cash inflow amounted to US$2,672,000) (Note 10).
Further information of these derivative financial instruments is disclosed in Note 10.
(v) Fair value of the financial assets and financial liabilities
Some of the Company’s financial assets and financial liabilities are measured at fair value at the end of each reporting period. Management classifies fair value measurements using a fair value hierarchy that reflects the significance of the inputs used in making the measurements. The fair value hierarchy levels are as described in Note 2.
The Company’s derivative financial instruments consisting of forward foreign exchange contracts and interest rate swaps, are measured at fair value at the end of each reporting period, and are determined based on observable quoted market rates for equivalent instruments with the same quantum and maturity dates at the end of each reporting period. The fair value measurement of these derivative financial instruments as determined by management, are classified as Level 2 in the fair value hierarchy.
The carrying amounts and further information of these derivative financial instruments are disclosed in Note 10.
There were no significant transfers between respective levels of the fair value hierarchy in the period.
Management considers that the carrying amounts of the financial assets and financial liabilities of the Company recorded at amortised cost in the financial statements approximate their fair values due to the relative short-term maturity of these financial instruments.
The fair values of other classes of financial assets and liabilities are disclosed in the respective notes to the financial statements.
(d) Capital risk management policies and objectives
The Company reviews its capital structure at least annually to ensure that the Company will be able to continue as a going concern. The capital structure of the Company comprises only of issued capital, accumulated losses, loan payable and guaranteed notes. The Company’s overall strategy remained unchanged from the previous financial year.
F-386

NOTES TO FINANCIAL STATEMENTS MARCH 31, 2017
36
5 HOLDING COMPANY AND RELATED COMPANY TRANSACTIONS
The Company is a wholly-owned subsidiary of Tata Steel Limited, incorporated in India, which is also the Company’s ultimate holding company. Related companies in these financial statements refer to members of the holding company’s group of companies.
Some of the Company’s transactions and arrangements are between members of the group and the effect of these on the basis determined between the parties is reflected in these financial statements. The intercompany balances are unsecured, interest-free and repayable on demand unless otherwise stated.
During the year, other than as disclosed elsewhere in the financial statements, the Company entered into the following significant transactions with related companies:
2017
US$’000
2016
US$’000
Guarantee commission expense on guaranteed notes charged by ultimate holding company (7,069) (8,426)Interest income from loan receivables due from related companies 1,11,244 1,13,835 Interest expenses on loan payable due to a related company (1,011) (776)
6 RELATED PARTY TRANSACTIONS
Compensation of directors and key management personnel
There are no key managerial personnel other than the directors of the Company. No remuneration is paid by the Company to the directors. The directors are paid remuneration by related corporations in their capacity as directors and/or executives of those related corporations.
7 CASH AND CASH EQUIVALENTS
2017
US$’000
2016
US$’000
Cash at bank 16,233 11,770
8 OTHER RECEIVABLES
2017
US$’000
2016
US$’000
Accrued interest income on loan receivables due from related companies (Note 5) 22,516 21,240 Interest receivables on derivative financial instruments 2,332 459
24,848 21,699
9 LOAN RECEIVABLES
2017
US$’000
2016
US$’000
Notes due from a related company (1) 165,686 175,226 Loan receivables due from related companies (2) 1,513,399 1,515,706
1,679,085 1,690,932
Loan receivables consist of:
(1) (a) Notes of Euro75,000,000 issued on December 20, 2013 to a related company, Tata Steel Netherlands Holdings B.V (“TSNH”), which is unsecured and repayable by May 2, 2023. The notes bear interest rates of 6.601% per annum for the first interest period ending May 1, 2014, interest rate of Euribor + 6.250% per annum for the subsequent interest periods ending November 1, 2016, and interest rate of 8.250% per annum for further subsequent interest periods to maturity on May 2, 2023. As at March 31, 2017, this note is measured at an amortised cost of Euro77,387,000 (equivalent to US$82,912,000) [2016 : Euro77,003,000 (equivalent to US$87,694,000)] based on the effective interest method with an effective interest rate of 7.579% (2016 : 7.577%) per annum.
F-387

NOTES TO FINANCIAL STATEMENTS MARCH 31, 2017
37
(b) Notes of Euro75,000,000 issued on March 20, 2014 to TSNH, which is unsecured and repayable by May 2, 2023. The note bearinterest rates of 6.634% per annum for the first interest period ending May 1, 2014, interest rate of Euribor + 6.250% per annum for the subsequent interest periods ending November 1, 2016, and interest rate of 8.250% per annum for further subsequentinterest periods to maturity on May 2, 2023. As at March 31, 2017, this note is measured at an amortised cost of Euro77,258,000 (equivalent to US$82,774,000) [2016 : Euro 76,861,000 (equivalent to US$87,532,000)] based on the effective interest methodwith an effective interest rate of 7.615% (2016 : 7.615%) per annum.
(2) (a) As at March 31, 2017, long-term loans of US$1,488,000,000 (2016 : US$1,488,000,000) due from a related company, T S Global Procurement Company Pte. Ltd. consist of:
- a long-term loan of US$988,000,000 which bear interest rate at 6.920% (2016 : 6.450%) per annum and is repayable on July 30, 2024. This loan is measured at an amortised cost of US$992,467,000 (2016 : US$993,274,000) based on the effectiveinterest method with an effective interest rate of 6.88% (2016 : 6.88%) per annum.
- a long-term loan of US$500,000,000 which bears interest rate at 5.920% (2016 : 5.350%) per annum and is repayable onJanuary 30, 2020. This loan is measured at an amortised cost of US$501,992,000 (2016 : US$502,783,000) based on theeffective interest method with an effective interest rate of 5.79% (2016 : 5.79%) per annum.
With effect from April 1, 2016 until the end of the tenure of the loans, the interest rates for the long-term loans of US$988,000,000 and US$500,000,000 are revised from 6.450% to 6.920% and 5.350% to 5.920% per annum respectively. Any future revision to interest rates due to market changes will be at mutual agreement of both parties.
(b) As at March 31, 2017, a long-term loan of S$26,457,000 (equivalent to US$18,940,000) [2016 : S$26,457,000 (equivalent toUS$19,649,000)] due from a related company, T S Global Holdings Pte. Ltd. (“TSGH”), is unsecured, bears interest rate of 5.100% (2016 : 5.100%) per annum and repayable by December 20, 2021.
During the year ended March 31, 2016, the Company had signed an initial subordinated creditor’s certificate to an agent for syndicated facilities granted to TSGH, for any amount receivable from TSGH is subordinated to the prior right of the financial institutions to prior repayment to the Company.
During the year ended March 31, 2017, other than the arrangement as disclosed above, the Company had entered into anotherarrangement with TSGH, a related company and a financial institution, whereby any amount receivable from TSGH is furthersubordinated to the debts owning by the related company to the financial institution, where TSGH is the guarantor to the creditfacilities granted by the financial institution to the related company.
Management is of the opinion that fair value of these loan receivables approximates the carrying value as these are either charged at floating rates or at approximate rates which the management expects would be available to the related companies based on transfer pricing studies by qualified tax specialist.
10 DERIVATIVE FINANCIAL INSTRUMENTS
2017
US$’000
2016
US$’000
Current assets:
Forward foreign exchange contracts – unrealised fair value gains 309 150 Non-current assets::
Forward foreign exchange contracts – unrealised fair value gains 9,519 2,121 Interest rate swaps – unrealised fair value gains 3,289 2,672
12,808 4,793 Non-current liabilities:Forward foreign exchange contracts – unrealised fair value losses 68 688
F-388

NOTES TO FINANCIAL STATEMENTS MARCH 31, 2017
38
Forward foreign exchange contracts
The Company uses currency derivatives in the management of its foreign exchange exposures.
At the end of the reporting period, the total notional amount of outstanding forward foreign exchange contracts to which the Company is committed are as follows:
2017
US$’000
2016
US$’000
Forward foreign exchange contracts 1,83,033 1,99,117
Changes in the fair value of derivative financial instruments
2016
US$’000
2015
US$’000
Current assets:
Opening fair value of derivative financial instruments 1,583 3,422 Net fair value (losses) gains of derivative financial instruments recognised in profit or loss (Note 18) during the year 8,177 (1,839)
Closing fair value of derivative financial instruments representing unrealised net fair value gains 9,760 1,583
10 DERIVATIVE FINANCIAL INSTRUMENTS (CONT’D)
The following table details information on the forward foreign currency contracts outstanding as at March 31, 2017:
Outstanding contracts Average effective
rate
Foreign currency
Contract value
Fair value gains
(losses)FC$’000 FC$’000 US$’000 US$’000
Sell Euro with maturity date less than 1 year 1.607 4,200 4,493 309Sell Euro with maturity date before 2023 1.677 13,550 14,495 948Sell Euro with maturity date on May 2, 2023 1.762 75,000 80,233 5,708Sell Euro with maturity date on May 2, 2023 1.729 75,000 80,233 2,863Buy SGD with maturity date on May 2, 2023 1.339 5,000 3,579 (68)Total 183,033 9,760
The following table details information on the forward foreign currency contracts outstanding as at March 31, 2015:
Outstanding contracts Average effective
rate
Foreign currency
Contract value
Fair value gains
(losses)FC$’000 FC$’000 US$’000 US$’000
Sell Euro with maturity date less than 1 year 1.596 3,800 4,328 150Sell Euro with maturity date before 2023 1.661 17,750 20,216 347Sell Euro with maturity date on May 2, 2023 1.762 75,000 85,418 1,775Sell Euro with maturity date on May 2, 2023 1.729 75,000 85,418 (634)Buy SGD with maturity date on May 2, 2023 0.660 5,000 3,737 (55)Total 199,117 1,583
F-389

NOTES TO FINANCIAL STATEMENTS MARCH 31, 2017
39
Interest rate swaps
The Company uses interest rate swaps to manage its exposure to interest rate movements. Contracts with nominal values of S$150,000,000 (2016 : S$150,000,000) have been entered where the Company will pay fixed interest payments at an average rate of 4.479% (2016 : 4.479%) on the Euro notional principal equivalent of S$150,000,000 (2016 : S$150,000,000) and receive fixed interest receipt at 4.950% (2016 : 4.950%) on the Singapore dollar notional principal of S$150,000,000 (2016 : S$150,000,000). These contracts are for the period until May 2, 2023 (2016 : May 2, 2023).
Changes in the fair value of derivative financial instruments
2017
US$’000
2016
US$’000
Opening fair value of derivative financial instruments 2,672 3,937Net fair value (losses) gains of derivative financial instruments recognised in profit or loss (Note 18) during the year 617 (1,265)
Closing fair value of derivative financial instruments representing unrealised net fair value gains 3,289 2,672
The following table details information on the interest rate swap contracts outstanding as at March 31, 2016:
Outstanding floating for fixed contractsNotional principal
amount
Fair value
gains
S$’000 US$’000With maturity date on May 2, 2023 1,50,000 3,289
The following table details information on the interest rate swap contracts outstanding as at March 31, 2016:
Outstanding floating for fixed contractsNotional principal
amount
Fair value
gains
S$’000 US$’000With maturity date on May 2, 2023 1,50,000 2,672
The interest rate swaps are settled net on a semi-annually basis.
11 OTHER PAYABLES
2017
US$’000
2016
US$’000
Current:Accrued interest expenses on loan payable due to a related company (Note 12) - 897 Accrued interest expenses on guaranteed notes (Note 13) 18,298 18,490 Other payables- third parties 2,522 734 - ultimate holding company 7,059 12,133
27,879 32,254
Non-current:Accrued interest expenses on loan payable due to a related company (Note 12) 1,907 -
29,786 32,254
F-390

NOTES TO FINANCIAL STATEMENTS MARCH 31, 2017
40
12 LOAN PAYABLE
2017
US$’000
2016
US$’000
Current:Loan payable due to a related company - 37,800Non-current:Loan payable due to a related company 37,800 -
37,800 37,800
During the year ended March 31, 2017, the maturity date of the loan was extended from January 27, 2017 to January 26, 2019.
As at March 31, 2017, a long-term loan of US$37,800,000 (2016 : US$37,800,000) payable to a related company, T S Global Holdings Pte. Ltd., is unsecured, bears interest rate of 1.5% + 6 months USD LIBOR (2016 : 1.5% + 6 months USD LIBOR) per annum and is repayable by January 26, 2019 (2016 : January 27, 2017). Subsequent to the year end, there is a partial repayment of loan of US$10,000,000 and US$6,000,000 on June 22, 2017 and September 21, 2017 respectively.
13 GUARANTEED NOTES
2017
US$’000
2016
US$’000
Guaranteed notes at amortised cost- 2023 Notes (1) 2,13,215 2,21,012 - 2020 Notes (2) 4,97,365 4,96,435 - 2024 Notes (2) 9,92,497 9,91,474
17,03,077 17,08,921
Guaranteed notes consist of:
(1) Guaranteed notes (the “2023 Notes”) with principal amount of S$300,000,000 which bear interest rate at 4.95% per annum were issued on May 3, 2013 with maturity on May 3, 2023. These 2023 Notes are listed on the Official List of the Singapore Exchange Securities Trading Limited (“SGX-ST”).
These 2023 Notes are unsecured senior obligations of the Company and are irrevocably guaranteed on an unsecured basis (the “Guarantee”) by the Company’s ultimate holding company, Tata Steel Limited (the “Guarantor”), provided that, at all times, the Guarantee shall be in respect of an amount not exceeding 125% of the outstanding principal amount of these 2023 Notes which shall be S$375,000,000 (the “Guaranteed Amount”). These 2023 Notes are unsecured obligations of the Company, will rank pari passu with all of its other existing and future unsubordinated obligations and will be effectively subordinated to its secured obligations and the obligations of the Guarantor’s subsidiaries.
These 2023 Notes bear interest at a rate of 4.95% per annum. Interest is paid on the 2023 Notes semi-annually in arrears on May 3 and November 3 of each year, beginning on November 4, 2013. Unless previously repurchased, cancelled or redeemed, these 2023 Notes will mature on May 3, 2023. Issue related costs amounted to approximately S$3,194,000 (equivalent to US$2,536,000).
As at March 31, 2017, these 2023 Notes are measured at an amortised cost of S$297,832,000 (equivalent to US$213,215,000) [2016 : S$297,737,000 (equivalent to US$221,012,000)].
(2) Guaranteed notes with principal amount of US$500,000,000 which bear interest rate at 4.85% per annum (the “2020 Notes”) and US$1,000,000,000 which bear interest rate at 5.95% per annum (the “2024 Notes”) were issued on July 31, 2014 with maturity on January 31, 2020 and July 31, 2024 respectively. These guaranteed notes are listed on the Freiverkehr (Open Market) of the Frankfurter Wertpapierborse (“Frankfurt Stock Exchange”).
The guaranteed notes are unsecured senior obligations of the Company and are irrevocably guaranteed on an unsecured basis (the “Guarantee”) by the Company’s ultimate holding company, Tata Steel Limited (the “Guarantor”), provided that, at all times, the Guarantee shall be in respect of an amount not exceeding 125% of the outstanding principal amount of the guaranteed
F-391

NOTES TO FINANCIAL STATEMENTS MARCH 31, 2017
41
notes which shall be US$625,000,000 and US$1,250,000,000 respectively (the “Guaranteed Amount”). These guaranteed notes are unsecured obligations of the Company, will rank pari passu with all of its other existing and future unsubordinated obligations and will be effectively subordinated to its secured obligations and the obligations of the Guarantor’s subsidiaries.
These 2020 Notes and 2024 Notes bear interest at a rate of 4.85% and 5.95% per annum respectively. Interest is paid on the 2020 Notes and 2024 Notes semi-annually in arrears on January 31 and July 31 of each year, beginning on January 31, 2015. Unless previously repurchased, cancelled or redeemed, these 2020 Notes and 2024 Notes will mature on January 31, 2020 and July 31, 2024 respectively. Issue related costs amounted to approximately US$15,370,000.
As at March 31, 2017, these 2020 Notes and 2024 Notes are measured at an amortised cost of US$497,365,000 (2016: US$496,435,000) and US$992,497,000 (2016 : US$991,474,000) respectively.
As at March 31, 2017, the fair values of the 2023 Notes, 2020 Notes and 2024 Notes approximates S$294,375,000 (equivalent to US$210,740,119), US$513,625,000 and US$1,034,400,000 respectively.
As at March 31, 2016, the fair values of the 2023 Notes, 2020 Notes and 2024 Notes approximates S$285,720,000 (equivalent to US$212,198,000), US$498,500,000 and US$931,500,000 respectively.
The fair values are classified under Level 1 of the fair value hierarchy (Note 2).
14 DEFERRED TAX LIABILITY
2017
US$’000
2016
US$’000
Deferred tax liability 1,797 1,796
The deferred tax liability is recognised by the Company on account of interest income from foreign sources not remitted to Singapore. The movement during the reporting period is as follow:
2017
US$’000
2016
US$’000
Balance at beginning of year 1,796 93 Charge to profit or loss (Note 19) 1 1,703Balance at end of year 1,797 1,796
15 SHARE CAPITAL
Outstanding contracts 2017 Number of
ordinary shares
2016 Number of
ordinary shares
2015 US$’000
2014 US$’000
Issued and paid up:At beginning and end of year 200,000 200,000 200 200
Fully paid ordinary shares, which have no par value, carry one vote per share and carry a right to dividends.
16 INTEREST INCOME
2017
US$’000
2016
US$’000
Interest income on loan receivables due from related companies (Notes 5 and 9) 1,11,244 1,13,835 Interest income from bank 24 6 Interest income on derivative financial instruments (1) 5,746 5,750
1,17,014 1,19,591
F-392

NOTES TO FINANCIAL STATEMENTS MARCH 31, 2017
42
17 FINANCE COSTS
2017
US$’000
2016
US$’000
Interest expenses: 1,011 776 - loan payable due to a related company (Notes 5 and 12) 94,503 94,511 - guaranteed notes (Note 13) 4,615 4,634Amortisation of borrowing costs 2,208 2,221
1,02,337 1,02,142
18 FAIR VALUE (LOSSES) GAINS ON DERIVATIVE FINANCIAL INSTRUMENTS, NET
2017
US$’000
2016
US$’000
Fair value (losses) gains on derivative financial instruments- forward foreign exchange contracts (Note 10) 8,177 (1,839)- interest rate swaps (Note 10) 617 (1,265)
8,794 (3,104)
19 INCOME TAX EXPENSE
2017
US$’000
2016
US$’000
Current tax:- current year 1,707 513 - underprovision (overprovision) in prior year 59 (91)Deferred tax (Note 14) 1 1,703 Total income tax expenses 1,767 2,125
Statutory income tax is calculated at 17% (2016 : 17%) of the estimated assessable profit (loss) for the year.
Tax for the year can be reconciled to the accounting profit (loss) as follows:2016
US$’000
2015
US$’000
Profit (Loss) before tax 13,380 12,395Tax expense (benefit) calculated at statutory tax rate of 17% 2,275 2,107 Tax effect of expense that is not deductible for tax purposes - 71 Tax exemptions and tax rebates (21) (33)Underprovision (Overprovision) in prior years 59 (91)Others (546) 71 Tax expense 1,767 2,125
F-393

NOTES TO FINANCIAL STATEMENTS MARCH 31, 2017
43
20 PROFIT (LOSS) FOR THE YEAR
Profit (Loss) for the year has been arrived at after charging (crediting):2017
US$’000
2016
US$’000
Fair value losses (gains) on derivative financial instruments, net (8,794) 3,104 Foreign currency exchange (gain) loss, net 2,975 (6,532) Guarantee commission expense on guaranteed notes charged by ultimate holding company (Note 5) 7,069 8,426
The Company has no employees and associated staff costs for the financial year end March 31, 2016 and March 31, 2015. Administrative support is provided by the ultimate holding company.
21 RECLASSIFICATIONS AND COMPARATIVE FIGURES
Certain reclassifications have been made to the prior year’s financial statements to enhance comparability with current year’s financial statements.
As a result, certain items have been amended on the face of the statement of profit or loss and other comprehensive income, statement of cash flows and the related notes to the financial statements. The reclassification does not affect the statement of financial position.
These items were reclassified as follows:
Outstanding contracts Previously reported
March 31, 2016
Reclassification March 31, 2016
After reclassification March 31, 2016
$’000 $’000 $’000Interest income on derivative financial instruments 1,116 4,634 5,750Interest expense on derivative financial instruments - (4,634) (4,634)
F-394

44
INTRODUCTION
We have reviewed the accompanying condensed balance sheet of ABJA Investment Co. Pte. Ltd. (“the Company”) as at 30 September 2017, the related condensed statements of comprehensive income, changes in equity and cash flows for the six-month period then ended set out on pages 2 to 16. Management is responsible for the preparation and presentation of this condensed interim financial information in accordance with Financial Reporting Standard 34 Interim Financial Reporting. Our responsibility is to express a conclusion on this interim financial information based on our review.
SCOPE OF REVIEW
We conducted our review in accordance with Singapore Standard on Review Engagements 2410, Review of Interim Financial Information Performed by the Independent Auditor of the Entity. A review of interim financial information consists of making inquiries, primarily of persons responsible for financial and accounting matters, and applying analytical and other review procedures. A review is substantially less in scope than an audit conducted in accordance with Singapore Standards on Auditing and consequently does not enable us to obtain assurance that we would become aware of all significant matters that might be identified in an audit. Accordingly, we do not express an audit opinion.
REPORT ON REVIEW OF INTERIM FINANCIAL INFORMATION TO THE SHAREHOLDERS OF ABJA INVESTMENT CO. PTE. LTD.
CONCLUSION
Based on our review, nothing has come to our attention that causes us to believe that the accompanying condensed interim financial information is not prepared, in all material respects, in accordance with Financial Reporting Standard 34 Interim Financial Reporting.
OTHER MATTERS
The corresponding figures for the condensed statements of comprehensive income, changes in equity and cash flows for the six-month period ended 30 September 2016, and the related explanatory notes are unaudited. The auditor’s report dated 27 September 2017 issued by the predecessor audit firm on the financial statements for the financial year ended 31 March 2017 is unqualified.
PricewaterhouseCoopers LLP
Singapore
January 12, 2018
F-395

45
STATEMENT OF FINANCIAL POSITION SEPTEMBER 30, 2017
Note
September 30,
2017
US$’000
March 31,
2017
US$’000
ASSETS
Current assets
Cash and cash equivalents 7 2,497 16,233Other receivables 8 26,159 24,848Derivative financial instruments 10 - 309Total current assets 28,656 41,390
Non-current assets
Loan receivables due from related companies 9 1,695,195 1,679,085Derivative financial instruments 10 2,816 12,808Total non-current assets 1,698,011 1,691,893
Total assets 1,726,667 1,733,283
LIABILITIES AND NET CAPITAL DEFICIENCY
Current liabilities
Other payables 11 24,742 27,879Derivative financial instruments 10 53 -Tax payables 1,800 1,707Total current liabilities 26,595 29,586
Non-current liabilities
Guaranteed notes 13 1,709,138 1,703,077Loan payable due to related company 12 21,800 37,800Deferred tax liability 1,817 1,797Other payables 11 2,406 1,907Derivative financial instruments 10 1,102 68Total non-current liabilities 1,736,263 1,744,649
Capital, accumulated losses and reserve
Share capital 200 200Accumulated losses (36,381) (41,142)Translation reserve (10) (10)Net capital deficiency (36,191) (40,952)
Total liabilities and net capital deficiency 1,726,667 1,733,283
The accompanying notes form an integral part of these condensed interim financial information.
STATEMENT OF PROFIT OR LOSS AND OTHER COMPREHENSIVE INCOME SEPTEMBER 30, 2017
Note
Six months
ended on
September 30,
2017
US$’000
Six months
ended on
September 30,
2016
US$’000
Interest income 14 59,286 58,130Finance costs 15 (51,293) (51,321)Foreign currency exchange gain (loss), net 12,667 298Fair value (losses) / gains on derivative financial instruments, net 16 (11,389) 501Other operating expenses (3,554) (3,568)Profit (Loss) before tax 5,717 4,040
Income tax expense (956) (734)Profit (Loss) for the period, representing to total comprehensive income for the period
4,761 3,306
The accompanying notes form an integral part of these condensed interim financial information.
F-396

46
STATEMENT OF CHANGES IN EQUITYSEPTEMBER 30, 2017
STATEMENT OF CASH FLOWS SEPTEMBER 30, 2017
Share
capital
Accumulated losses
Translation
reserve
Total
US$’000 US$’000 US$’000 US$’000
Balance at March 31, 2016 200 (52,755) (10) (52,565)Profit for the period, representing total comprehensive income for the period - 3,306 - 3,306Balance at September 30, 2016 200 (49,449) (10) (49,259)
Balance at March 31, 2017 200 (41,142) (10) (40,952)Profit for the period, representing total comprehensive income for the period - 4,761 - 4,761Balance at September 30, 2017 200 (36,381) (10) (36,191)
The accompanying notes form an integral part of these condensed interim financial information.
Note
Six months
ended on
September 30,
2017
US$’000
Six months
ended on
September 30,
2016
US$’000
Operating activities
Profit before tax 5,717 4,040Adjustments for:Finance costs 51,293 51,321Interest income (59,286) (58,130)Guarantee commission 3,536 3,543Fair value losses / (gains) on derivative financial instruments, net 11,389 (501)Unrealised foreign currency exchange gain, net (12,530) (286)Operating cash flows before movements in working capital 119 (13)Cash generated from operations 119 (13)Interest received 59,352 54,652Finance costs paid (49,427) (47,379)Income tax paid (860) (231)Guaranteed commission paid (7,063) (12,188)Repayment of loan payable to a related company (16,000) -Net cash from operating activities, representing net increase in cash and cash equivalents
(13,879) (5,159)
Effect of exchange rate changes on the balance of cash held in foreign currencies 143 31Cash and cash equivalents at the beginning of the period 16,233 11,770Cash and cash equivalents at the end of the period 7 2,497 6,642
The accompanying notes form an integral part of these condensed interim financial information.
F-397

47
NOTES TO FINANCIAL STATEMENTS SEPTEMBER 30, 2017
1 GENERAL
The Company (Registration No. 201309883M) is incorporated in Singapore with its principal place of business and registered office at 22 Tanjong Kling Road, Singapore 628048. The financial s tatements a re e xpressed i n U nited S tates dollars (“US$”).
The principal activity of the Company consists of provision of treasury services.
The Company had in prior years, issued guaranteed notes (Note 13) with principal amount of US$1,500,000,000 and S$300,000,000 which are listed on the Freiverkehr (Open Market) of the Frankfurter Wertpapierborse (“Frankfurt Stock Exchange”) and the Official List of the Singapore Exchange Securities Trading Limited (“SGX-ST”) respectively. Further information is disclosed in Note 13.
As at September 30, 2017, the Company has a capital deficiency of US$36,191,000 (March 31, 2017 : US$40,952,000), current assets in excess of current liabilities of US$ 2,061,000 (March 31, 2017 : current assets in excess of current liabilities of US$11,804,000) and current period total comprehensive income of US$4,761,000 (6 months ended September 30, 2016: total comprehensive income of US$3,306,000).
During the period ended September 30, 2017, the Company earned interest income of US$59,286,000 (6 months ended September 30, 2016: US$58,130,000) and incurred finance costs of US$ 51,293,000 (6 months ended September 30, 2016: US$51,321,000) and generated net profit o f U S$4,761,000 (6 months ended September 30, 2016: net profit o f US$3,306,000) for the year. In 2016, the interest rates for the long-term loans of US$988,000,000 and US$500,000,000 are revised from 6.45% to 6.92% and 5.35% to 5.92% per annum respectively with effect from April 1, 2016 until the end of the tenure of the loans (Note 9). Any future revision to interest rates due to market changes will be at mutual agreement of third parties.
Management had considered the above and assessed that (i) the total guaranteed notes of US$1,709,138,000 (March 31, 2017 : US$1,703,077,000) (Note 13) issued by the Company, including any current and future related interest payables, are guaranteed by the ultimate holding company(Note5); (ii) In the previous financial year, the maturity date of the long-term loan of US$21,800,000 loan (Note 12) was extended to January 26, 2019. On the above, management has assessed that there are no material uncertainties on the Company’s ability to continue as going concern and these will sufficiently cover the Company’s existing net capital deficiency i n t he future. In addition, management has also assessed that if
required, fundings from the ultimate holding company will be available.
The financial statements of the Company for the year ended March 31, 2017 were authorised for issue by the Board of Directors on September 27, 2017.
2 BASIS OF PREPARATION
The condensed interim financial information for the six month ended September 30, 2017 has been prepared in accordance with Singapore Financial Reporting Standards (“FRS”) 34, “Interim Financial Reporting”. The condensed interim financial information should be read in conjunction with the Company’s annual financial statements for the financial year ended March 31, 2017, which has been prepared in accordance with Singapore FRS.
Except for accounting policies disclosed below, the accounting policies applied are consistent with those of the annual financial statements for the financial ended March 31, 2017, as described in those annual financial statements.
Income tax
Taxes on income in the interim periods are accrued using the effective tax rate that would be applicable to expected total annual earnings.
INTERPRETATIONS AND AMENDMENTS TO PUBLISHED STANDARDS EFFECTIVE IN 2017
On April 1, 2017 the Company adopted the new or amended FRS and Interpretations to FRS (INT FRS) that are mandatory for application for the financial year. Changes to the Company’s accounting policies have been made as required,in accordance with the transitional provisions in the respective FRS and INT FRS.
The adoption of these new or amended FRS and INT FRS did not result in substantial changes to the accounting policies of the company and had no material effect on the amounts reported for the current or prior financials periods.
3 CRITICAL ACCOUNTING JUDGEMENTS AND KEY SOURCES OF ESTIMATION UNCERTAINTY
In the application of the Company’s accounting policies, management is required to make judgements, estimates and assumptions about the carrying amounts of assets and liabilities that are not readily apparent from other sources. The estimates and associated assumptions are based on historical experience and other factors that are considered to be relevant. Actual results may differ from these estimates.
F-398

48
NOTES TO FINANCIAL STATEMENTS SEPTEMBER 30, 2017
The estimates and underlying assumptions are reviewed on an ongoing basis. Revisions to accounting estimates are recognised in the period in which the estimate is revised if the revision affects only that period, or in the period of the revision and future periods if the revision affects both current and future periods.
Key sources of estimation uncertainty
The key assumptions concerning the future, and other key sources of estimation uncertainty at the end of the reporting period, that have a significant risk of causing a material adjustment to the carrying amounts of assets and liabilities within the next financial year, are discussed below.
The assessment for allowances for bad and doubtful receivables of the Company is based on the evaluation of
collectability and management’s judgement. Judgement is required in assessing the ultimate realisation of these receivables from these related companies. The management consider amongst other factors such as the financial position and result of the respective related companies, subsequent cash receipts, payment history, settlement arrangements or the presence that the ultimate holding company has given. If the financial conditions of related companies were to deteriorate, resulting in an impairment of their ability to make payments, additional allowances may be required. Based on management’s evaluation, no impairment is assessed to be necessary for loan receivables and interest receivables from these related companies.
F-399

49
NOTES TO FINANCIAL STATEMENTS SEPTEMBER 30, 2017
4 FINANCIAL INSTRUMENTS, FINANCIAL RISKS AND CAPITAL RISKS MANAGEMENT
(a) Categories of financial instruments
The following table sets out the financial instruments as at the end of the reporting period:September 30,
2017
US$’000
March 31,
2017
US$’000
Financial assets
Loans and receivables (including cash and cash equivalents) 1,723,851 1,720,166Derivative financial instruments 2,816 13,117
1,726,667 1,733,283
Financial liabilities
Amortised cost 1,758,086 1,770,663Derivative financial instruments 1,155 68
1,759,241 1,770,731
(i) Fair value of the financial assets and financial liabilities
Some of the Company’s financial assets and financial liabilities are measured at fair value at the end of each reporting period. Management classifies fair value measurements using a fair value hierarchy that reflects the significance of the inputs used in making the measurements. The fair value hierarchy levels are as follows:
• Level 1 inputs are quoted prices (unadjusted) in active markets for identical assets or liabilities that the entity can access at the measurement date;
• Level 2 inputs are inputs, other than quoted prices included within Level 1, that are observable for the asset or liability, eitherdirectly or indirectly; and
• Level 3 inputs are unobservable inputs for the asset or liability.
The Company’s derivative financial instruments consisting of forward foreign exchange contracts and interest rate swaps, are measured at fair value at the end of each reporting period, and are determined based on observable quoted market rates for equivalent instruments with the same quantum and maturity dates at the end of each reporting period. The fair value measurement of these derivative financial instruments as determined by management, are classified as Level 2 in the fair value hierarchy. The carrying amounts and further information of these derivative financial instruments are disclosed in Note 10.
There were no significant transfers between respective levels of the fair value hierarchy in the period.
Management considers that the carrying amounts of the financial assets and financial liabilities of the Company recorded at amortised cost in the financial statements approximate their fair values due to the relative short-term maturity of these financial instruments.
The fair values of other classes of financial assets and liabilities are disclosed in the respective notes to the financial statements. There are no off-setting or netting arrangements in 2017 for financial assets and liabilities.
(b) Capital risk management policies and objectives
The Company reviews its capital structure at least annually to ensure that the Company will be able to continue as a going concern. The capital structure of the Company comprises only of issued capital, accumulated losses and guaranteed notes. The Company’soverall strategy remained unchanged from the previous financial year.
5 HOLDING COMPANY AND RELATED PARTIES TRANSACTIONS
The Company is a wholly-owned subsidiary of Tata Steel Limited, incorporated in India, which is also the Company’s ultimate holding company. Related companies in these financial statements refer to members of the holding company’s group of companies.
Some of the Company’s transactions and arrangements are between members of the group and the effect of these on the basis determined between the parties is reflected in these financial statements. The intercompany balances are unsecured, interest-free and repayable on demand unless otherwise stated.
F-400
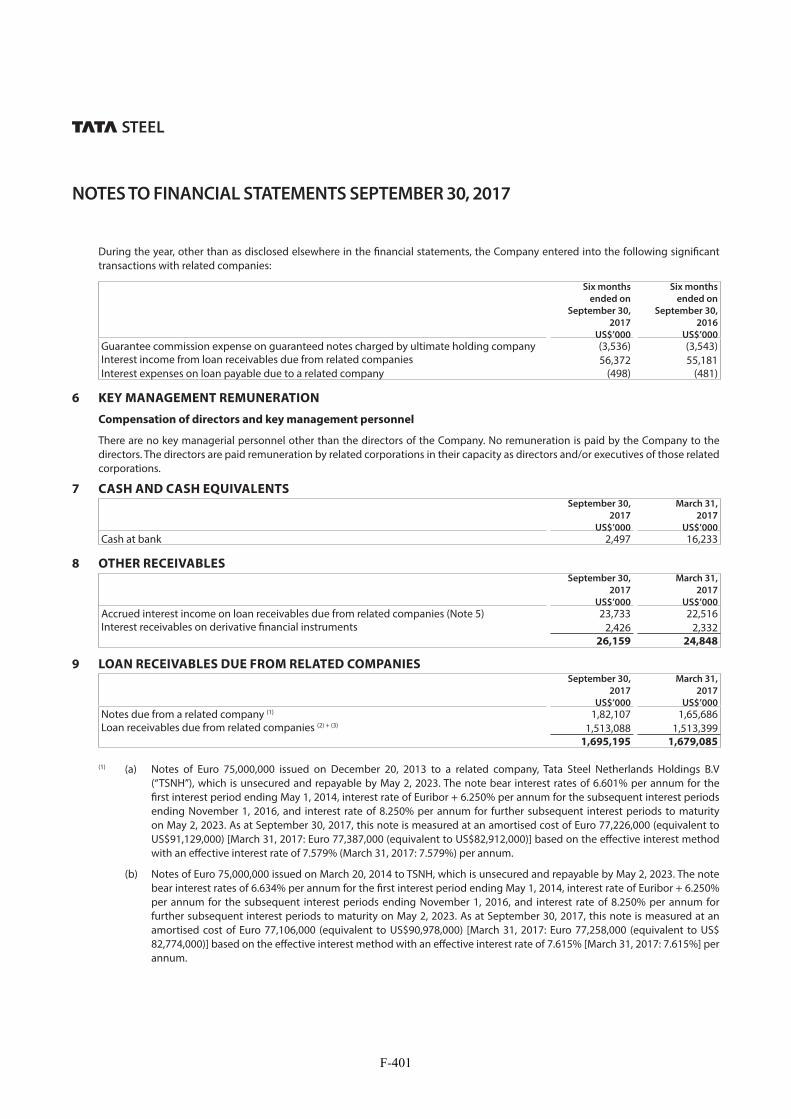
50
NOTES TO FINANCIAL STATEMENTS SEPTEMBER 30, 2017
During the year, other than as disclosed elsewhere in the financial statements, the Company entered into the following significant transactions with related companies:
Six months
ended on
September 30,
2017
US$’000
Six months
ended on
September 30,
2016
US$’000
Guarantee commission expense on guaranteed notes charged by ultimate holding company (3,536) (3,543)Interest income from loan receivables due from related companies 56,372 55,181Interest expenses on loan payable due to a related company (498) (481)
6 KEY MANAGEMENT REMUNERATION
Compensation of directors and key management personnel
There are no key managerial personnel other than the directors of the Company. No remuneration is paid by the Company to the directors. The directors are paid remuneration by related corporations in their capacity as directors and/or executives of those related corporations.
7 CASH AND CASH EQUIVALENTSSeptember 30,
2017
US$’000
March 31,
2017
US$’000
Cash at bank 2,497 16,233
8 OTHER RECEIVABLES September 30,
2017
US$’000
March 31,
2017
US$’000
Accrued interest income on loan receivables due from related companies (Note 5) 23,733 22,516Interest receivables on derivative financial instruments 2,426 2,332
26,159 24,848
9 LOAN RECEIVABLES DUE FROM RELATED COMPANIES September 30,
2017
US$’000
March 31,
2017
US$’000
Notes due from a related company (1) 1,82,107 1,65,686Loan receivables due from related companies (2) + (3) 1,513,088 1,513,399
1,695,195 1,679,085
(1) (a) Notes of Euro 75,000,000 issued on December 20, 2013 to a related company, Tata Steel Netherlands Holdings B.V(“TSNH”), which is unsecured and repayable by May 2, 2023. The note bear interest rates of 6.601% per annum for the first interest period ending May 1, 2014, interest rate of Euribor + 6.250% per annum for the subsequent interest periods ending November 1, 2016, and interest rate of 8.250% per annum for further subsequent interest periods to maturity on May 2, 2023. As at September 30, 2017, this note is measured at an amortised cost of Euro 77,226,000 (equivalent to US$91,129,000) [March 31, 2017: Euro 77,387,000 (equivalent to US$82,912,000)] based on the effective interest method with an effective interest rate of 7.579% (March 31, 2017: 7.579%) per annum.
(b) Notes of Euro 75,000,000 issued on March 20, 2014 to TSNH, which is unsecured and repayable by May 2, 2023. The notebear interest rates of 6.634% per annum for the first interest period ending May 1, 2014, interest rate of Euribor + 6.250% per annum for the subsequent interest periods ending November 1, 2016, and interest rate of 8.250% per annum forfurther subsequent interest periods to maturity on May 2, 2023. As at September 30, 2017, this note is measured at anamortised cost of Euro 77,106,000 (equivalent to US$90,978,000) [March 31, 2017: Euro 77,258,000 (equivalent to US$82,774,000)] based on the effective interest method with an effective interest rate of 7.615% [March 31, 2017: 7.615%] per annum.
F-401

51
NOTES TO FINANCIAL STATEMENTS SEPTEMBER 30, 2017
(2) (a) As at September 30, 2017, long-term loans of US$1,488,000,000 (March 31, 2017: US$1,488,000,000) to a related company, T S Global Procurement Company Pte. Ltd. consist of:
– a long-term loan of US$988,000,000 which bear interest rate at 6.920% (March 31, 2017 : 6.920%) per annum and is repayable on July 30, 2024. This loan is measured at an amortised cost of US$ 992,091,000 (March 31, 2017: US$992,467,000) based on the effective interest method with an effective interest rate of 6.88% (March 31, 2017: 6.88%) per annum.
– a long-term loan of US$500,000,000 which bears interest rate at 5.920% (2016 : 5.920%) per annum and is repayable onJanuary 30, 2020. This loan is measured at an amortised cost of US$501,619,000 (March 31, 2017: US$501,992,000) basedon the effective interest method with an effective interest rate of 5.79% (March 31, 2017: 5.79%) per annum.
With effect from April 1,2016 until the end of the tenure of the loan, the interest rates for the long-term loans ofUS$988,000,000 and US$500,000,000 are revised from 6.450% to 6.920% and 5.350% to 5.920% per annum respectivelywith effect from April 1, 2016 until the end of the tenure of the loans. Any future revision to interest rates due to marketchanges will be at mutual agreement of both parties.
(3) As at September 30, 2017, a long-term loan of S$26,457,000 (equivalent to US$19,378,000) [March 31, 2017: S$26,457,000(equivalent to US$18,940,000)] to a related company, T S Global Holdings Pte. Ltd. (“TSGH”), is unsecured, bears interest rate of 5.100% (March 31, 2017: 5.100%) per annum and repayable by December 20, 2021.
Management is of the opinion that fair value of these loan receivables approximates the carrying value as these are eithercharged at floating rates or at approximate rates which the management expects would be available to the related companies.
10 DERIVATIVE FINANCIAL INSTRUMENTS
September 30,
2017
US$’000
March 31,
2017
US$’000
Current assets:Forward foreign exchange contracts - unrealised fair value gains - 309
Non-current assets:Forward foreign exchange contracts - unrealised fair value gains 1,475 9,519Interest rate swaps - unrealised fair value gains 1,341 3,289
2,816 12,808Current liabilities:
Forward foreign exchange contracts - unrealised fair value losses 53 -Non-current liabilities:
Forward foreign exchange contracts - unrealised fair value losses 1,102 68
Forward foreign exchange contracts
At the end of the reporting period, the total notional amount of outstanding forward foreign exchange contracts to which the Company is committed are as follows
September 30,
2017
US$’000
March 31,
2017
US$’000
Forward foreign exchange contracts 199,693 183,033
Interest rate swaps
The Company uses interest rate swaps to manage its exposure to interest rate movements. Contracts with nominal values of S$150,000,000 (March 31, 2017 : S$150,000,000) have been entered where the Company will pay fixed interest payments at an average rate of 4.479% (March 31, 2017: 4.479%) on the Euro notional principal equivalent of S$150,000,000 (March 31,2017: S$150,000,000) and receive fixed interest receipt at 4.950% (March 31, 2017: 4.950%) on the Singapore dollar notional principal of S$150,000,000 (March 31, 2017: S$150,000,000). These contracts are for the period until May 2, 2023 (March 31, 2017: May 2, 2023).
F-402

52
NOTES TO FINANCIAL STATEMENTS SEPTEMBER 30, 2017
The following table details information on the interest rate swap contracts outstanding as at September 30, 2017:
Outstanding floating for fixed contractsNotional
principal amountFair value
gains
US$’000 US$’000
With maturity date on May 2, 2023 150,000 1,341
The following table details information on the interest rate swap contracts outstanding as at March 31, 2017:
Outstanding floating for fixed contractsNotional
principal amountFair value
gains
US$’000 US$’000
With maturity date on May 2, 2023 150,000 3,289
The interest rate swaps are settled net on a semi-annually basis.
11 OTHER PAYABLES
September 30,
2017
US$’000
March 31,
2017
US$’000
Current:Accrued interest expenses on guaranteed notes (Note 13) 18,458 18,298Other payables:- third parties 2,745 2,522- ultimate holding company 3,539 7,059
24,742 27,879
Non-current:Accrued interest expenses on loan payable due to a related company (Note 12) 2,406 1,907
27,148 29,786
12 LOAN PAYABLE DUE TO A RELATED COMPANY
September 30,
2017
US$’000
March 31,
2017
US$’000
Non-current:Loan payable due to a related company 21,800 37,800
As at September 30, 2017, a long-term loan of US$21,800,000 (March 31, 2017: US$37,800,000) payable to a related company, T S Global Holdings Pte. Ltd., is unsecured, bears interest rate of 1.5% + 6 months USD LIBOR (March 31, 2017: 1.5% + 6 months USD LIBOR) per annum and is repayable by January 26, 2019 (March 31, 2017: January 26, 2019). During the period ended, there is a partial repayment of loan of US$10,000,000 and US$6,000,000 on June 22, 2017 and September 21, 2017 respectively.
F-403

53
NOTES TO FINANCIAL STATEMENTS SEPTEMBER 30, 2017
13 GUARANTEED NOTES
September 30,
2017
US$’000
March 31,
2017
US$’000
Guaranteed notes at amortised cost- 2023 Notes (1) 218,299 213,215- 2020 Notes (2) 497,830 497,365- 2024 Notes (2) 993,009 992,497
1,709,138 1,703,077
Guaranteed notes consist of:
(1) Guaranteed notes (the “2023 Notes”) with principal amount of S$300,000,000 which bear interest rate at 4.95% per annum were issued on May 3, 2013 with maturity on May 3, 2023. These 2023 Notes are listed on the Official List of the Singapore Exchange Securities Trading Limited (“SGX-ST”).
These 2023 Notes are unsecured senior obligations of the Company and are irrevocably guaranteed on an unsecured basis (the“Guarantee”) by the Company’s ultimate holding company, Tata Steel Limited (the “Guarantor”), provided that, at all times, theGuarantee shall be in respect of an amount not exceeding 125% of the outstanding principal amount of these 2023 Notes which shall be S$375,000,000 (the “Guaranteed Amount”). These 2023 Notes are unsecured obligations of the Company, will rank pari passu with all of its other existing and future unsubordinated obligations and will be effectively subordinated to its secured obligations and the obligations of the Guarantor’s subsidiaries.
These 2023 Notes bear interest at a rate of 4.95% per annum. Interest is paid on the 2023 Notes semi-annually in arrears on May 3 and November 3 of each year, beginning on November 4, 2013. Unless previously repurchased, cancelled or redeemed, these 2023 Notes will mature on May 3, 2023. Issue related costs amounted to approximately S$3,194,000 (equivalent to US$2,536,000).
As at September 30, 2017, these 2023 Notes are measured at an amortised cost of S$ 298,055,000 (equivalent to US$ 218,299,000) [March 31, 2017 : S$297,832,000 (equivalent to US$213,215,000)].
(2) Guaranteed notes with principal amount of US$500,000,000 which bear interest rate at 4.85% per annum (the “2020 Notes”) andUS$1,000,000,000 which bear interest rate at 5.95% per annum (the “2024 Notes”) were issued on July 31, 2014 with maturity onJanuary 31, 2020 and July 31, 2024 respectively. These guaranteed notes are listed on the Freiverkehr (Open Market) of the Frankfurter Wertpapierborse (“Frankfurt Stock Exchange”).
The guaranteed notes are unsecured senior obligations of the Company and are irrevocably guaranteed on an unsecured basis(the “Guarantee”) by the Company’s ultimate holding company, Tata Steel Limited (the “Guarantor”), provided that, at all times, theGuarantee shall be in respect of an amount not exceeding 125% of the outstanding principal amount of the guaranteed notes which shall be US$625,000,000 and US$1,250,000,000 respectively (the “Guaranteed Amount”). These guaranteed notes are unsecuredobligations of the Company, will rank pari passu with all of its other existing and future unsubordinated obligations and will be effectively subordinated to its secured obligations and the obligations of the Guarantor’s subsidiaries.
These 2020 Notes and 2024 Notes bear interest at a rate of 4.85% and 5.95% per annum respectively. Interest is paid on the 2020 Notes and 2024 Notes semi-annually in arrears on January 31 and July 31 of each year, beginning on January 31, 2015. Unless previously repurchased, cancelled or redeemed, these 2020 Notes and 2024 Notes will mature on January 31, 2020 and July 31, 2024 respectively. Issue related costs amounted to approximately US$15,370,000.
As at September 30, 2017, these 2020 Notes and 2024 Notes are measured at an amortised cost of US$ 497,830,000 (March 31, 2017: US$497,365,000) and US$ 993,009,000 (March 31, 2017: US$992,497,000) respectively.
As at September 30, 2017, the fair values of the 2023 Notes, 2020 Notes and 2024 Notes approximates S$309,540,000 (equivalent toUS$226,710,000), US$ 516,500,000 and US$ 1,067,500,000 respectively.
As at March 31, 2017, the fair values of the 2023 Notes, 2020 Notes and 2024 Notes approximates S$294,375,000 (equivalent toUS$210,740,119), US$ 513,625,000 and US$ 1,034,400,000 respectively.
The fair values are classified under Level 1 of the fair value hierarchy (Note 4).
F-404

54
NOTES TO FINANCIAL STATEMENTS SEPTEMBER 30, 2017
14 INTEREST INCOME
Six months
ended on
September
30,2017
US$’000
Six months
ended on
September
30,2016
US$’000
Interest income on loan receivables due from related companies (Notes 5 and 9) 56,372 55,181Interest income from bank 17 12Interest income on derivative financial instruments 2,897 2,937
59,286 58,130
15 FINANCE COSTS
Six months
ended on
September
30,2017
US$’000
Six months
ended on
September
30,2016
US$’000
Interest expenses:- loan payable due to a related company (Notes 5 and 12) 498 481 - guaranteed notes (Note 13) 47,290 47,371 Interest expense on derivative financial instruments 2,401 2,365Amortisation of borrowing costs 1,104 1,104
51,293 51,321
16 FAIR VALUE (LOSSES) / GAINS ON DERIVATIVE FINANCIAL INSTRUMENTS, NET
Six months
ended on
September
30,2017
US$’000
Six months
ended on
September
30,2016
US$’000
Fair value (losses) / gains on derivative financial instruments- forward foreign exchange contracts (Note 10) (9,441) 568 - interest rate swaps (Note 10) (1,948) (67)
(11,389) 501
F-405

ISSUER
ABJA Investment Co. Pte. Ltd.22 Tanjong Kling Road
Singapore 628048
TRUSTEE
Citicorp International Limited39th Floor
Champion Tower3 Garden Road, Central
Hong Kong
REGISTRAR
Citibank, N.A., London Branchc/o Citibank, N.A., Dublin Branch
Ground Floor1 North Wall Quay
Dublin 1Ireland
PAYING AND TRANSFER AGENT
Citibank, N.A., London Branchc/o Citibank, N.A., Dublin Branch
Ground Floor1 North Wall Quay
Dublin 1Ireland
LEGAL ADVISERS TO THE ISSUER AND TO THE GROUP
as to English LawMilbank, Tweed, Hadley &
McCloy LLP12 Marina Boulevard
#36-03 MBFC Tower 3Singapore 018982
as to Indian LawCyril Amarchand MangaldasPeninsula Chambers Peninsula
Corporate ParkGanpatrao Kadam Marg
Lower Parel, Mumbai 400013, India
as to Singapore LawAllen and Gledhill LLPOne Marina Boulevard
#28-00Singapore 018989
LEGAL ADVISERS TO THE JOINT LEAD MANAGERS
as to English law
Allen & Overy
9th Floor
Three Exchange Square
Central
Hong Kong
LEGAL ADVISERS TO THE TRUSTEE
as to English law
Allen & Overy
50 Collyer Quay
#09-01
OUE Bayfront
Singapore 049321
INDEPENDENT AUDITORS OF THE GROUP
Price Waterhouse & Co. Chartered Accountants LLP
252, Veer Savarkar Marg, Shivaji Park
Dadar (West)
Mumbai — 400 028
India


![ICND10S08A [Read-Only]](https://static.fdokumen.com/doc/165x107/6316f88cf68b807f880375d2/icnd10s08a-read-only.jpg)

![sequential.ppt [Read-Only]](https://static.fdokumen.com/doc/165x107/6319ca5fc51d6b41aa04902b/sequentialppt-read-only.jpg)

![Bles.ppt [Read-Only]](https://static.fdokumen.com/doc/165x107/633bffc7197a6737f10ceddf/blesppt-read-only.jpg)