
Board of Trustees - Must Read Alaska
512
Board of Trustees Quarterly Meeting MAY 23-24, 2018
-
Upload
khangminh22 -
Category
Documents
-
view
4 -
download
0
Transcript of Board of Trustees - Must Read Alaska

Board of Trustees
Quarterly Meeting
MAY 23-24, 2018

5/14/2018
TABLE OF CONTENTS
Tab No. Title
1 Agenda
2 Approval of Minutes Memo a) February 21-22, 2018 b) March 15, 2018
3 CEO’s Reports
a) Pending Board Matters b) Trustee Education c) Disclosure Reports d) Travel e) Due Diligence Log f) Staff Education & Training
4 Communications
5 Financial Report
6 Cash Flow 7 Monthly Performance Report 8 Strategic and Tactical Moves
9 Investment Management Fee Report
10 FY18 Budget Update
a) FY2018 Budget Status b) Budget to Actual Report FY 2018
11 CIO’s Report Memo a) CIO’s Report
12 Investing with Environmental, Social & Governance Factors Memo
a) BlackRock Presentation b) Goldman Sachs Presentation c) Morgan Stanley Presentation
13 Callan APFC Performance Review Memo a) Callan APFC Performance Presentation
14 Asset Allocation and Performance Memo
a) Asset Allocation and Performance Presentation
15 Investment Risk Report Memo a) Investment Risk Report
1/511

Table of Contents, continued
5/14/2018
Tab No. Title
16 Asset Class Updates Memo: Real Assets
a) Presentation: Real Assets (Infrastructure, Special Income, Real Estate, Absolute Return)
17 Asset Allocation Strategies Memo
a) Asset Allocation Strategies Asset Class Review
18 Asset Class Updates Memo: Fixed Income a) Presentation: Fixed Income
19 Asset Class Updates Memo: Public Equities
a) Presentation: Public Equities
20 Asset Class Updates Memo: Private Equity & Special Opportunities a) Presentation: Private Equity & Special Opportunities
21 Executive Session Memo
22 Investment Policy and Procedures Memo
a) Proposed Investment Policy MAY 2018
23 Annual Investment Pacing a) Real Assets and Private Income Pacing Memo
aa) Real Assets and Private Income Pacing Presentation b) Private Equity and Special Opportunities Pacing Memo
bb) Private Equity and Special Opportunities Pacing Presentation
24 Annual Asset Allocation Review Memo a) Asset Allocation Review Presentation
25 APFC Budget Review a) FY18 Budget Projections Memo
aa) Budget Status 3.31.18 b) FY 19 Budget Approval Memo c) Budget Projections & Approval Presentation
26 Legislative Update
27 Incentive Compensation Structure Memo
a) Incentive Compensation Presentation b) McLagan Presentation c) Compensation Resolution
28 Calendar of Upcoming Board Meetings Memo
a) 2018 BOT Meetings b) 2019 BOT Meetings
2/511

Agenda
Separator Page
3/511

QUARTERLY MEETING OF THE BOARD OF TRUSTEES
May 23-24, 2018
Atwood Building – Room 104 550 West 7th Avenue, Anchorage, AK 99501
Webinar Access (Click link to join webinar) - Password: APFC Join via WebEx and enjoy the ability to listen on your computer and follow presentations:
https://alaskapfc.webex.com/alaskapfc/j.php?MTID=m381f49bfa26d6759dc120abd7fe0dd66
Teleconference Access Call-in toll-free number: 1-844-740-1264 / Access Code (Meeting Number): 801 847 101
AGENDA
WEDNESDAY, MAY 23, 2018
8:30 a.m. CALL TO ORDER
ROLL CALL (Action) APPROVAL OF AGENDA (Action)
APPROVAL OF MINUTES (Action)
February 21-22, 2018
March 15, 2018
SCHEDULED APPEARANCES AND PUBLIC PARTICIPATION 8:45 a.m. CHIEF EXECUTIVE OFFICER’S REPORTS (Information/Standard Reports)
Pending Board Matters, Trustee Education Report, Disclosures, Travel, Due Diligence Log, Staff Education & Training
Communications
Financials
Cash Flow
Monthly Performance Report
Strategic and Tactical Moves
Investment Management Fee Report
FY18 Budget Update 9:00 a.m. CHIEF INVESTMENT OFFICER REPORT (Information)
Russell Read, Chief Investment Officer
4/511

2 | P a g e 5/14/2018
9:15 a.m. INVESTING WITH ENVIRONMENTAL, SOCIAL & GOVERNANCE FACTORS (Information) Moderator: Russell Read, Chief Investment Officer Brian Deese, Blackrock, Managing Director, Global Head of Sustainable Investments
John Goldstein, Goldman Sachs, Managing Director, ESG and Impact Investment Client Strategy
Hilary Irby, Morgan Stanley, Managing Director, Co-Head of Global Sustainable Finance
11:15 a.m. BREAK 11:30 a.m. PERFORMANCE REVIEW (Information) Greg Allen, Callan, Chief Executive Officer and Chief Research Officer
Steve Center, Callan, Senior Vice President 12:30 p.m. BREAK/LUNCH 1:00 p.m. FUND PERFORMANCE OVERVIEW AND UPDATE (Information) Valeria Martinez, Director of Asset Allocation 1:20 p.m. RISK OVERVIEW (Information) Russell Read, Chief Investment Officer
ASSET CLASS UPDATES (Information)
1:50 p.m. Real Assets (Infrastructure, Special Income, Real Estate, Absolute Return)
Marcus Frampton, Director of Real Assets 2:30 p.m. Asset Allocation Strategies Valeria Martinez, Director of Asset Allocation 3:00 p.m. Fixed Income
Jim Parise, Director of Fixed Income 3:30 p.m. BREAK 3:45 p.m. Public Equities
Fawad Razzaque, Director of Pubic Equities 4:15 p.m. Private Equity & Special Opportunities
Steve Moseley, Director of Private Equity & Special Opportunities 4:45 p.m. EXECUTIVE SESSION (Information) Alaska Mental Health Trust Authority Mike Abbott, Executive Director 5:15 p.m. BOARD RECESS FOR THE DAY
5/511
3 | P a g e 5/14/2018
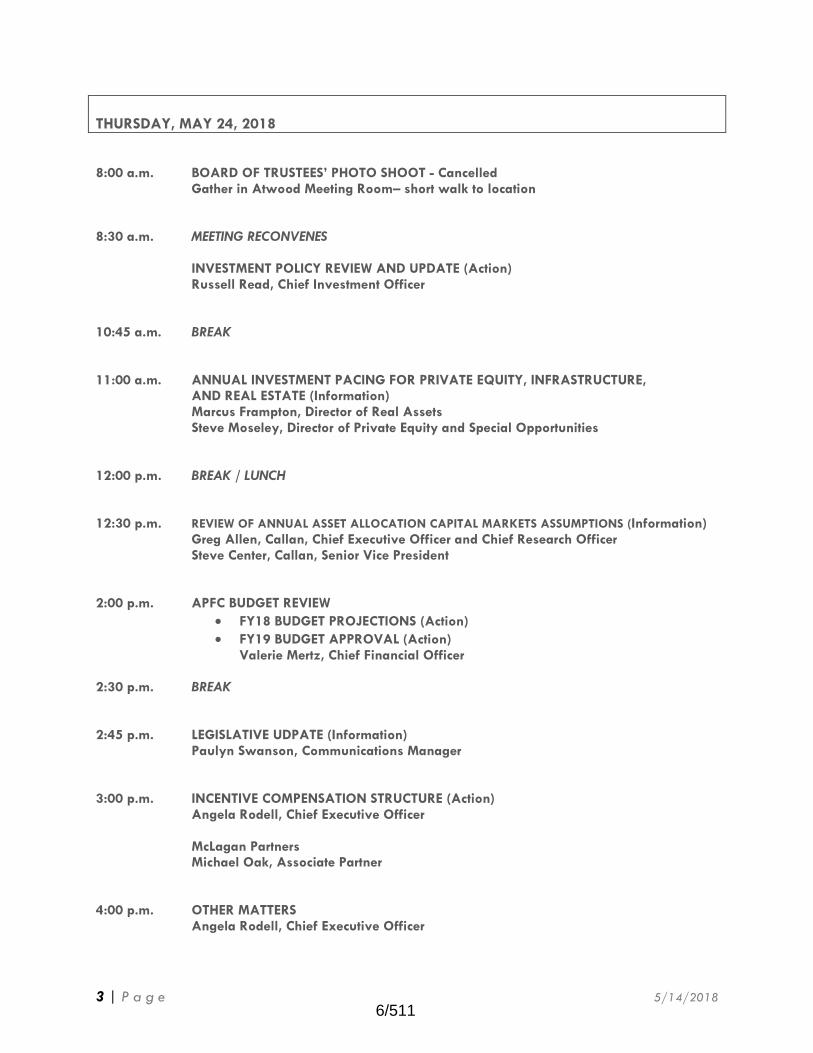
THURSDAY, MAY 24, 2018 8:00 a.m. BOARD OF TRUSTEES’ PHOTO SHOOT - Cancelled Gather in Atwood Meeting Room– short walk to location 8:30 a.m. MEETING RECONVENES
INVESTMENT POLICY REVIEW AND UPDATE (Action) Russell Read, Chief Investment Officer 10:45 a.m. BREAK 11:00 a.m. ANNUAL INVESTMENT PACING FOR PRIVATE EQUITY, INFRASTRUCTURE,
AND REAL ESTATE (Information) Marcus Frampton, Director of Real Assets Steve Moseley, Director of Private Equity and Special Opportunities 12:00 p.m. BREAK / LUNCH 12:30 p.m. REVIEW OF ANNUAL ASSET ALLOCATION CAPITAL MARKETS ASSUMPTIONS (Information) Greg Allen, Callan, Chief Executive Officer and Chief Research Officer
Steve Center, Callan, Senior Vice President 2:00 p.m. APFC BUDGET REVIEW
FY18 BUDGET PROJECTIONS (Action)
FY19 BUDGET APPROVAL (Action) Valerie Mertz, Chief Financial Officer
2:30 p.m. BREAK 2:45 p.m. LEGISLATIVE UDPATE (Information) Paulyn Swanson, Communications Manager 3:00 p.m. INCENTIVE COMPENSATION STRUCTURE (Action) Angela Rodell, Chief Executive Officer
McLagan Partners Michael Oak, Associate Partner 4:00 p.m. OTHER MATTERS Angela Rodell, Chief Executive Officer
6/511

4 | P a g e 5/14/2018
4:05 p.m. INVESTMENT ADVISOR COMMENTS (Information) Jerrold Mitchell 4:20 p.m. TRUSTEE COMMENTS FUTURE AGENDA ITEMS
4:30 p.m. ADJOURNMENT
NOTE: TIMES MAY VARY AND THE CHAIR MAY REORDER AGENDA ITEMS (Please telephone Danielle Graham at 907.796.1519 with agenda questions.)
7/511

Approval of Minutes Memo
Separator Page
8/511

SUBJECT: Approval of Minutes
ACTION: X
DATE: May 23, 2018
INFORMATION:
BACKGROUND: Staff reviewed the following Board of Trustees meeting summary minutes, draft copies are attached for your approval.
February 21-22, 2018 Quarterly Board of Trustees Meeting
March 15, 2018 Special Board of Trustees Meeting RECOMMENDATION: Approval of the summary minutes of the Board of Trustees meetings listed above.
9/511

February 21-22, 2018
Separator Page
10/511

Alaska Permanent Fund Corporation 1 Board of Trustees Meeting Minutes
February 21-22, 2018
ALASKA PERMANENT FUND CORPORATION QUARTERLY MEETING OF THE BOARD OF TRUSTEES
February 21-22, 2018
Location of Meeting:
Alaska Permanent Fund Corporation Hugh Malone Boardroom
Juneau, Alaska
SUMMARY MINUTES
Trustees Present: William G. Moran, Chair
Sheldon Fisher
Craig Richards
Marty Rutherford
Andrew Mack
Investment Advisor: Tim Walsh
Staff Present: Angela Rodell, CEO Russell Read, CIO Valerie Mertz, CFO
Chris Poag Paulyn Swanson Valeria Martinez
Marcus Frampton Ben Chang Jared Brimberry
Steve Moseley Fawad Razzaque Youlian Ninkov
Moctar Diouf Jim Parise Masha Skuratovskaya
Christopher Cummins Tom O’Day Matthew Olmsted
Jacob Vandervest Tim Andreyka Robin Mason
Rose Duran Laura Achee Charlie Vice
Andrew Clower Samantha LaPierre Chad Brown
Invited Participants and Others Present:
Vince Lishay
Tom Gammel
Elaine Schroeder, Public Comment
Gretchen Kaiser, Public Comment
Doug Woodby, Public Comment
Bob Schroeder, Public Comment
Perry Miller, Public Comment
Kate Troll, Public Comment
Rick Steiner, Public Comment (Via telephone)
Neal Olson, Public Comment (Via telephone)
Ceal Smith, Public Comment
Scott Gruhn, Public Comment
Gregory Allen, Callan Associates
Steven Center, Callan Associates
Michael Mendelson, AQR
Jilly Lee, AQR
Seth Birmbaum, Bridgewater Associates
Roy Appelman, Goldman Sachs Asset Management
11/511
Alaska Permanent Fund Corporation 2 Board of Trustees Meeting Minutes
February 21-22, 2018
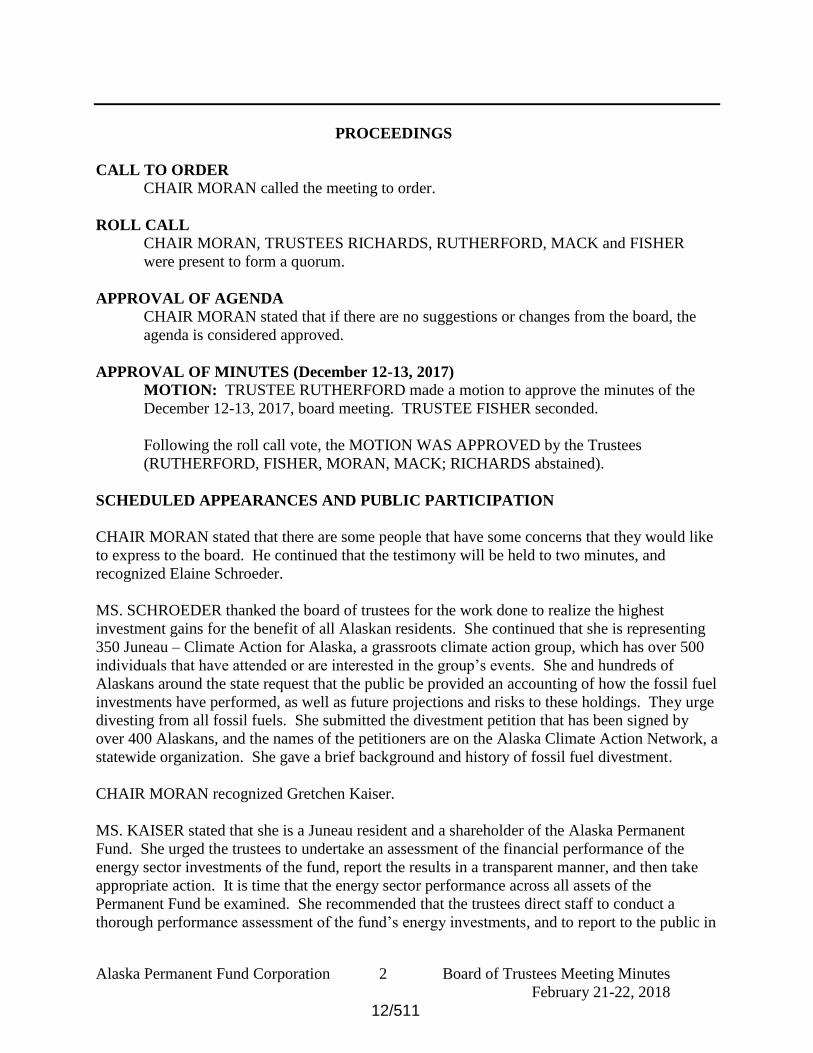
PROCEEDINGS
CALL TO ORDER
CHAIR MORAN called the meeting to order.
ROLL CALL
CHAIR MORAN, TRUSTEES RICHARDS, RUTHERFORD, MACK and FISHER
were present to form a quorum.
APPROVAL OF AGENDA
CHAIR MORAN stated that if there are no suggestions or changes from the board, the
agenda is considered approved.
APPROVAL OF MINUTES (December 12-13, 2017)
MOTION: TRUSTEE RUTHERFORD made a motion to approve the minutes of the
December 12-13, 2017, board meeting. TRUSTEE FISHER seconded.
Following the roll call vote, the MOTION WAS APPROVED by the Trustees
(RUTHERFORD, FISHER, MORAN, MACK; RICHARDS abstained).
SCHEDULED APPEARANCES AND PUBLIC PARTICIPATION
CHAIR MORAN stated that there are some people that have some concerns that they would like
to express to the board. He continued that the testimony will be held to two minutes, and
recognized Elaine Schroeder.
MS. SCHROEDER thanked the board of trustees for the work done to realize the highest
investment gains for the benefit of all Alaskan residents. She continued that she is representing
350 Juneau – Climate Action for Alaska, a grassroots climate action group, which has over 500
individuals that have attended or are interested in the group’s events. She and hundreds of
Alaskans around the state request that the public be provided an accounting of how the fossil fuel
investments have performed, as well as future projections and risks to these holdings. They urge
divesting from all fossil fuels. She submitted the divestment petition that has been signed by
over 400 Alaskans, and the names of the petitioners are on the Alaska Climate Action Network, a
statewide organization. She gave a brief background and history of fossil fuel divestment.
CHAIR MORAN recognized Gretchen Kaiser.
MS. KAISER stated that she is a Juneau resident and a shareholder of the Alaska Permanent
Fund. She urged the trustees to undertake an assessment of the financial performance of the
energy sector investments of the fund, report the results in a transparent manner, and then take
appropriate action. It is time that the energy sector performance across all assets of the
Permanent Fund be examined. She recommended that the trustees direct staff to conduct a
thorough performance assessment of the fund’s energy investments, and to report to the public in
12/511

Alaska Permanent Fund Corporation 3 Board of Trustees Meeting Minutes
February 21-22, 2018
a timely manner. She stated that this is the appropriate, prudent, and transparent action, and
thanked the board.
CHAIR MORAN recognized Doug Woodby.
MR. WOODBY stated that he is a resident of Juneau and a shareholder with questions about the
fund’s investments. He continued that in his attempts to understand how the Permanent Fund
Corporation works, he came across the prudent investor rule in Title 37, Chapter 13, Section 120,
which instructs the fund managers to preserve the purchasing power of the fund while
maximizing expected return. He added that he also has seen the highlighted slogan on the home
page of the Corporation’s website, “Investing for Alaska, Investing for the Long Run.” He asked
several questions, which he also submitted in writing. He thanked the board, and stated that he is
looking forward to a response.
CHAIR MORAN recognized Bob Schroeder.
MR. SCHROEDER thanked all for the opportunity to provide testimony. He stated that he is a
long-term Juneau resident, and his career is a research and applied anthropologist. He added that
he works on national resource issues for the State of Alaska and for the Federal Government. He
believes that the Corporation has generally served Alaskans very well and has done its best to
stay clear of politically motivated investments. He stated that his testimony highlights what he
considers to be excessive concentration of investments in the fossil fuel portion of the market
energy sector. He continued that this concentration has been harmful to the Permanent Fund
returns since fossil fuel investments have performed very poorly over the past 10 years. He
requested that the Corporation provide to its shareholders a sector of investment analysis that
shows how the Permanent Fund compares with other similar funds in its sector allocation. He
further requested that the Corporation provide a comprehensive analysis of past and expected
future performance of its energy sector holdings to the public.
CHAIR MORAN recognized Kate Troll.
MS. TROLL stated that she is a long-term Alaskan and testified in support of Ms. Rodell’s claim
made in her recent op-ed, which was that it is time for Alaskans to establish a new contract to
support the evolution and continued health of the fund. She read the first two paragraphs of a
letter delivered last year signed by Jim Ayers, Bruce Botelho, Beth Kerttula, and herself. Since
writing that letter, she explained that she learned that with all the 196 countries that have signed
on to the Paris Climate Accord, many financial institutions have been concerned about doing the
two-degree stress test. She stated that it would be very appropriate for the Permanent Fund
Board to also conduct a similar stress test. She explained the importance of this type of analysis.
She also emphasized the opportunities to invest in renewable energy and energy efficiencies and
electrification of the transport industry. She thanked all, leaving a copy of the letter.
CHAIR MORAN recognized Rick Steiner.
MR. STEINER stated that he is from Anchorage and endorsed the previous exceptional in-
person testimony that has been heard from the people in Juneau. He then congratulated the
13/511

Alaska Permanent Fund Corporation 4 Board of Trustees Meeting Minutes
February 21-22, 2018
Permanent Fund on their December agreement to hold an environmental, social, and government
work session at an upcoming board meeting.
CHAIR MORAN stated that a good part of Mr. Steiner’s testimony was broken up because of
technical difficulties. He requested that Mr. Steiner submit some written testimony to the board
for a closer look at his comments. He then recognized Neal Olson, who also had technical
difficulties, and stated that he would also submit written testimony. He asked that anyone else
on the phone that would like to testify, to please submit the testimony in writing. On behalf of
the board, he thanked people for their testimony. He added that there is a session scheduled for
the next meeting to bring the full board up to speed on the various issues associated with fossil
fuel investments. He then moved to the Chief Executive Officer’s reports.
CHIEF EXECUTIVE OFFICER’S REPORT
CEO RODELL began with the organizational changes that were made: Robin Mason is the
Chief Operating Officer for the Corporation; Scott Balovich has been promoted to Director of IT
Info Tech; Charlie Vice and Andrew Clower are two new employees. She stated that she had the
opportunity to do an investor tour through India and spoke at a conference in Abu Dhabi. It was
four cities in five days, and we met with 28 CEOs and chairmen of conglomerations, and seven
government ministers. She continued that one of the key takeaways is that these are companies
that for years have been expanding their reach outside of India, and are now turning inward and
are really invigorated in investing in India. She added that part of the world is going to provide
some interesting opportunities down the road. There is a huge demographic growth in this part
of the world. She moved on and highlighted the tactical changes that were implemented during
the fourth quarter of 2017. She stated that there was a lot of movement to rebalance some of the
public equity positions, and she went through some of the management fees. She asked for any
questions.
TRUSTEE RICHARDS stated that he noticed that the investment fees with fixed income was
$12 million and asked what that constituted.
CEO RODELL replied that a year and a half ago the fixed-income-plus asset allocation was
created. This includes REITs and listed infrastructure. Those external managers are now located
in the fixed income asset allocation, which is driving that fee change.
TRUSTEE RUTHERFORD asked how things were progressing on APFC’s budget over in the
Legislature for the coming year.
CEO RODELL replied that the House Finance Subcommittee has heard the budget and will be
having a committee meeting this evening to close out the Department of Revenue budget. She
continued that five amendments were made to move the budget out of the language section back
into the numbers section of the operating budget, and to break it into one appropriation and two
allocations. She added that the reasoning for that was to give the subcommittee oversight of our
budget. She stated that she was very discouraged by that rationale when the subcommittee is
taking the actions and does have oversight.
TRUSTEE RUTHERFORD asked if the amendment was passed.
14/511

Alaska Permanent Fund Corporation 5 Board of Trustees Meeting Minutes
February 21-22, 2018
CEO RODELL replied that it was passed, and her understanding is that when the House Finance
rolls out a committee substitute for the operating budget that it will have those amendments
incorporated.
CHAIR MORAN moved to the Chief Investment Officer report.
CHIEF INVESTMENT OFFICER’S REPORT
CIO READ stated that during the calendar year of 2017 the world’s capital markets and the
Alaska Permanent Fund enjoyed broad-based gains. He continued that publicly traded stocks
advanced more than 25 percent; private equity investments more than 20 percent; infrastructure
more than 15 percent; and private credit more than 10 percent. The remaining asset classes,
including fixed-income-plus, real estate, absolute return funds, and ECIOs all delivered in excess
of 5 percent returns. He continued that the overall one-year return of 16.1 percent would
represent the third best year for the Fund over the past two decades. In order to provide a context
for the Fund’s investment performance for the board, staff, and the public, at the end of the past
fiscal year the concept of a performance scorecard, specifically, long-term, medium-term, and
short-term objectives, in which to gauge whether the Fund is being successful was introduced.
He stated that the long-term, five-year performance measure focuses on delivering actuarial
progress, defined as a return of CPI plus 5 percent or better. He explained in greater detail and
stated that the Fund’s principal sources of diversification in order are: Income orientation,
international scope, and private initiatives. He continued that the asset class which have been
particularly value-added for the Permanent Fund have included publicly traded stocks, fixed-
income-plus, private equity, and infrastructure. He explained how the Permanent Fund is
positioned today, and the investment return prospects for the remainder of the fiscal year and
beyond. He added that each APFC investment team will discuss its investment strategy for
achieving best-in-class performance in the future, as well as the investment risks that are being
undertaken within and across asset classes.
RISK AND ASSET ALLOCATION OVERVIEW
CIO READ introduced Valeria Martinez and Samantha LaPierre.
MS. MARTINEZ began with a brief presentation of the December quarter and covering asset
allocation, risk management, liquidity and performance. She stated that the portfolio is divided
into two groups: those investments that provide income for the Fund, and those that are for
appreciation and growth. The investments that are held for income purposes represent 37
percent of the Fund which include fixed income, real estate, infrastructure, credit and cash. She
continued to value-at-risk, which is a statistical technique used to quantify the level of financial
risk of portfolios and the probability of loss in them. It is a very popular measure of risk
management because it is simple and compares the risk of different portfolios used. She asked
Ms. LaPierre to explain the analysis in a stress test, showing what could happen when the market
started to be stressed as opposed to normal conditions.
MS. LAPIERRE moved to the scenario analyses which are all listed and stress the portfolio and
the strategic benchmark to give an idea of what would happen to these portfolios in certain
15/511

Alaska Permanent Fund Corporation 6 Board of Trustees Meeting Minutes
February 21-22, 2018
specific circumstances. She went through the stress analysis that is done which shows that the
portfolio is particularly sensitive to moves and risky assets, such as equities, credit spreads, and
volatility spikes, all of which are common for a portfolio, and which equities contribute the
majority of their risk. She then showed the same factors stressed in the opposite direction.
MS. MARTINEZ reminded all that this is a stress test, and is not correlated in the portfolio. It
just shows how the factors affect the portfolios.
CHAIR MORAN asked how the graphs change with the currency overlay program.
MS. LAPIERRE replied that it primarily affects the non-U.S. developed markets because they
are only hedging those currencies. It will not affect the emerging market currency exposure but
will take from the non-dollar developed market. She moved to geographic exposure and stated
that most of the exposure is to the United States, followed by non-U.S. developed markets and
emerging market countries. There is also a slight overweight to the U.S. and to emerging
markets when compared to the benchmark and underweight to non-U.S. developed. She
compared the exposures to the currency exposures and finds that not all geographic exposure
translates to currency exposure. She moved to the emerging market countries and showed the
detailed geographic exposure to China, South Korea, India, Taiwan, Brazil, South Africa, and
Mexico. She stated that these seven countries represent $3.6 million or 5.85 percent of the total
fund. Including the other emerging market countries shows the total E.M. exposure is 7.44
percent of the total portfolio.
MS. MARTINEZ broke down the portfolio into two separate groups. The public investments or
securities that are registered and then exchanged are very liquid. That group represents 70
percent of the Fund, which is slightly more than the 67 percent benchmark. She stated that the
other group is private investments, which represents 30 percent of the Fund. These are
investments that do not trade on the exchange and are considered less liquid or illiquid. This
category includes private equity, private infrastructure, hedge funds, private credit, et cetera. She
continued that the board established ranges on how much private investment can be held. She
then gave a brief update about the asset allocation portfolio, which includes the asset allocation
strategies, like external CIOs. She stated that these are managers that manage multiple asset
portfolios with CPI-plus-5 return objectives, and are all liquid. They are not allowed to have any
private investments. There is also a liquidity portfolio that includes cash and bonds. In general,
funds that are on hand for everything that is needed: operations, management fees, funding
strategies, et cetera. She summarized that the cash used to fund new strategies and operations
was redeployed last year, so there was a lot less liquidity at the end of that year. The concerns
of a long run-up and of a correction started the rebalancing, which continued through the year.
That will be seen in the next quarter, as well. She continued that, in addition, the board approved
a liquidity overlay that started in February, which will also be seen next quarter. There will be a
full review on the multi-asset space with the eCIOs continuing to perform as expected.
CHAIR MORAN called a ten-minute break.
(Break.)
16/511

Alaska Permanent Fund Corporation 7 Board of Trustees Meeting Minutes
February 21-22, 2018
CHAIR MORAN called the meeting back to order and moved to Performance Review with
Callan Associates Inc.
PERFORMANCE REVIEW
MR. ALLEN stated that this is the first time in the history of the S&P 500, since 1926, where
there was not a single down month for equities in a calendar year. It is truly a historic period.
He added that there was not a single down month for the MSCI ACWI index either. The
emerging markets had only one down month in September, which was down .4 percent.
MR. CENTER began the presentation by talking about the capital markets as a whole, trends that
were observed in the U.S. and non-U.S. equity markets, along with fixed income and
alternatives, and a brief update about the U.S. market. He stated that the capital market
performance, year-end December 2017, was driven by strong performance in the equity markets.
TRUSTEE RICHARDS stated that there was an expectation that some of the energy stocks were
going to underperform going forward. He asked if there were any specifics that could be shared.
MR. CENTER replied that it is difficult to make a blanket statement about energy stocks as a
whole. He stated that oil-dependent stocks could have a structural headwind given the trends
towards clean energy and other areas within the energy space. The energy sector as a whole is
not strictly fossil-fuel-related and does include other areas, clean energy and such. He continued
that over the last 10 years there has been a definite downward trend in the sector that could be
cyclical. There could be a period of positive performance attributable to energy as a whole. He
stated that, overall, all sectors had positive performance for the quarter ending December 31st.
He continued that emerging markets had its fourth consecutive positive quarter, fueled primarily
by a soft U.S. dollar and rebound in oil and commodity prices. He then moved on to the
currency perspective and stated that the U.S. dollar fell and was relatively flat to begin with. He
continued that these shifts benefited U.S. investors, and were a tailwind given that investments in
U.S. dollars were increasing in value during the quarter. He looked at some of the fixed-income
market where volatility remained at historic lows during the quarter. The U.S. aggregate came in
at a 0.4 percent positive return; most spread sectors outperformed Treasuries. The one exception
was asset-backed securities that were basically flat. He stated that the tax reform is expected to
have some impact on the fixed-income market. Most issues did quite well in the global fixed
income market within emerging market debt with positive returns across the board, with the one
exception of Venezuela. He added that higher commodity prices helped within the emerging
market debt space. Local currency emerging market debt rose 0.8 percent during the quarter. He
moved to real estate, and the domestic growth has continued to stoke demand for commercial
real estate; tighter lending standards have been able to balance some of that supply, as well. It
has been in an equilibrium state. He stated that there was a continued softening in retail and
hotel; however, all returns by sectors were positive for the quarter. Commercial real estate
remains a positive contributor to performance; REITs were also positive. He continued that
hedge funds performed well for the quarter and the year. Overall, Callan’s long/short equity
database was up about 1.8 percent, while diversified hedge funds were up 1.5 percent. Equity
exposure did contribute to performance during the quarter. He continued through his
presentation, and stated that the U.S. market continues to be a strong engine driving the global
17/511

Alaska Permanent Fund Corporation 8 Board of Trustees Meeting Minutes
February 21-22, 2018
economy, and he does not see any huge areas of concern other than that specter of inflation that
was mentioned before.
MR. ALLEN added that it was also a good year for active managers generally in equity, which
has not happened for a while.
MR. CENTER touched on the current asset allocation of the Fund. Using the Fund's stated asset
allocation buckets, it currently has allocated 44 percent to public equity; 21 percent to fixed
income; and 34 percent to alternative; a moderate increase in fixed income; and a slight decrease
on the public equity side. He reminded all that the private equity and growth opportunities, real
estate and infrastructure, private credit income opportunities are all reported at a one-quarter lag.
He then moved to discussing asset class structure and performance, beginning with the equity
portfolio and an overview of the Permanent Fund’s public market equity structure. Then he
focused on U.S. equities performance, stating that this is a domestic equity performance of other
total plan sponsors. The Permanent Fund ranks favorably against this peer group over all time
periods. He added that the portfolio is not out of line with other peers, and he does not see any
areas of concern. The U.S. equity structure within the Permanent Fund is approximately 70
percent active and 30 percent passive, a slight overweight to small cap. About 20 percent of the
small-cap allocation is actively managed. He stated that, overall, a very strong performance for
the large-cap portfolio. It did benefit from that growth bias that it has relative to most peers. He
continued that the small-cap portfolio’s performance ranks near the median over all time periods.
The fourth quarter performance was strong and outperformed the index by approximately 65
basis points. He added that the Permanent Fund’s small-cap portfolio is pretty mature and tends
to have a mid-cap bias because the funds are established, which is not uncommon. He continued
going through the different portfolios and shared positive comments about each. He then moved
on to fixed-income-plus, detailing the structure of the fixed-income-plus portfolio and reminded
all that this portfolio is a combination of internally and externally managed assets. He stated that
the Permanent Fund’s fixed-income-plus portfolio performed better than its benchmarks over all
the time periods shown except for the last five years. When compared to its peers, this portfolio
maintains a solid lead.
MR. ALLAN stated that there is a lot of equity exposure in the rest of the portfolio that may not
present itself as equity. He added that the way that the internal bond portfolio is positioned is a
good thing.
MR. CENTER moved to the comparison of the performance of the global high-yield portfolio
versus peers and the benchmark. The Permanent Fund’s global high-yield portfolio currently
consists of portfolios managed by Oaktree, Capital Guardian, and an exchange-traded fund that
Jim Parise and team purchased. Performance for the quarter performed very close to the
benchmark.
CIO READ asked what is seen as the key difference between what the external managers are
doing versus what others are doing.
MR. CENTER answered that Oaktree has been a higher quality, high-yield manager and are
historically going to be underweight to anything rated triple C or lower. There is a systematic
market where lower quality high-yield has rallied well and is one of the reasons why there are
18/511
Alaska Permanent Fund Corporation 9 Board of Trustees Meeting Minutes
February 21-22, 2018
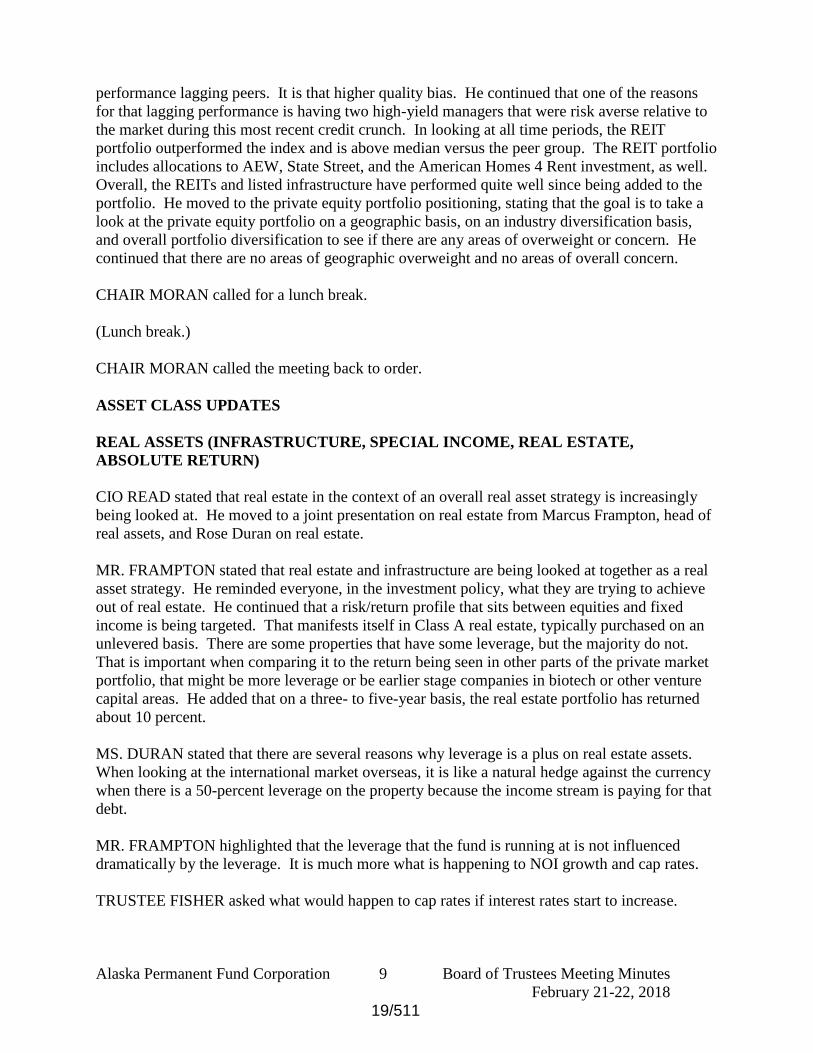
performance lagging peers. It is that higher quality bias. He continued that one of the reasons
for that lagging performance is having two high-yield managers that were risk averse relative to
the market during this most recent credit crunch. In looking at all time periods, the REIT
portfolio outperformed the index and is above median versus the peer group. The REIT portfolio
includes allocations to AEW, State Street, and the American Homes 4 Rent investment, as well.
Overall, the REITs and listed infrastructure have performed quite well since being added to the
portfolio. He moved to the private equity portfolio positioning, stating that the goal is to take a
look at the private equity portfolio on a geographic basis, on an industry diversification basis,
and overall portfolio diversification to see if there are any areas of overweight or concern. He
continued that there are no areas of geographic overweight and no areas of overall concern.
CHAIR MORAN called for a lunch break.
(Lunch break.)
CHAIR MORAN called the meeting back to order.
ASSET CLASS UPDATES
REAL ASSETS (INFRASTRUCTURE, SPECIAL INCOME, REAL ESTATE,
ABSOLUTE RETURN)
CIO READ stated that real estate in the context of an overall real asset strategy is increasingly
being looked at. He moved to a joint presentation on real estate from Marcus Frampton, head of
real assets, and Rose Duran on real estate.
MR. FRAMPTON stated that real estate and infrastructure are being looked at together as a real
asset strategy. He reminded everyone, in the investment policy, what they are trying to achieve
out of real estate. He continued that a risk/return profile that sits between equities and fixed
income is being targeted. That manifests itself in Class A real estate, typically purchased on an
unlevered basis. There are some properties that have some leverage, but the majority do not.
That is important when comparing it to the return being seen in other parts of the private market
portfolio, that might be more leverage or be earlier stage companies in biotech or other venture
capital areas. He added that on a three- to five-year basis, the real estate portfolio has returned
about 10 percent.
MS. DURAN stated that there are several reasons why leverage is a plus on real estate assets.
When looking at the international market overseas, it is like a natural hedge against the currency
when there is a 50-percent leverage on the property because the income stream is paying for that
debt.
MR. FRAMPTON highlighted that the leverage that the fund is running at is not influenced
dramatically by the leverage. It is much more what is happening to NOI growth and cap rates.
TRUSTEE FISHER asked what would happen to cap rates if interest rates start to increase.
19/511

Alaska Permanent Fund Corporation 10 Board of Trustees Meeting Minutes
February 21-22, 2018
MR. FRAMPTON replied that the spread of cap rates to Treasuries is one of the most followed
metrics in the industry. He does not think that rising interest rates would help too many asset
classes.
MS. DURAN added that when looking at rising rate environments it goes back to the NCREIF
data when it was originally collected in 1983; and in four of those six periods of rising rates, the
cap rates went down or moved up very little. She stated that there is not a direct relationship,
and it is probably because there is a lot of supply-and-demand characteristics that are at play. As
risk is repriced in the market for the interest rate adjustments across asset classes, real estate
looks to be a preferred asset class because of the inflation-proofing dynamics of real estate itself.
She moved on to the portfolio overview. She stated that the end of December, which is actually
the end of September, the portfolio invested $5.6 billion, which is 9 percent of the total portfolio.
She showed an underweight on total allocation by $2.3 billion, currently net of the Simpson sale
at about 6.5 percent, and about $3 billion below target. She continued that the real estate
performance by manager had very strong results. The benchmark was outperformed by 180
basis points for the quarter. She pointed out that there is a good, strong overweight to retail. She
moved to the current real estate cycle that shows 33 quarters of transaction volume, which is
actually December 31, 2017 information. She pointed out a pullback in transaction volume,
which is consistent with the broader market indices.
MR. FRAMPTON transitioned to Ben Chang and Jared Brimberry who will go through the rest
of the portfolio he manages. He added that Mr. Chang will focus on hedge funds on his team,
and Mr. Brimberry will focus on private credit.
MR. CHANG stated that about 18 months ago the fund-of-funds model was shifted to a direct
investments model. He continued that this shift resulted in about $15 million in fee savings for
the Fund. The mandate for hedge funds is basically noncorrelation to everything, looking to
generate a high single-digit return regardless of broader market environment. In terms of
updates, a new investment of about $50 million was made to a market-neutral, sector-specific
financials manager.
MR. BRIMBERRY moved to the private credit fund and talked about the cumulative capital
distributed, the cumulative capital called, and the current value. He stated that the net IRR has
improved by about 30 basis points since the last quarter. Since the start of the staff-direct
program, the net IRR is 10.9 percent, which is actually the return over the last year. The
uncalled commitments or the committed capital that has not been called yet stands at about $950
million for this portfolio. On the special opportunities front, the distributed renewable energy
commitment with Generate Capital has been made.
CIO READ moved to the fixed-income-plus team, and recognized Jim Parise.
FIXED INCOME
MR. PARISE introduced Masha Skuratovskaya who does global rates, rates, and TIPS; Chris
Cummins, who does all of the structured product, which is MBS, CMBS, ABS, and works on the
$3.6 billion aggregate portfolio; and Matt Olmsted, who works on the corporate portfolio, the
corporate portion of the ag portfolio and is also in charge of the high-yield effort. He began with
20/511

Alaska Permanent Fund Corporation 11 Board of Trustees Meeting Minutes
February 21-22, 2018
the internal portfolios where all of the one-year numbers are positive versus their benchmarks.
He stated that on the fixed-income desk they are singularly focused on the benchmark and
beating their benchmark. He then explained the chart of the internal aggregate portfolio, which
is the one that all work on, and is essentially a best-ideas portfolio. He stated that it is where the
duration versus the index can be changed, and we do try to outperform based on duration, which
is not done very often. He continued that most of the performance for the quarter came from
asset allocation and security selection. He added that security selection is just picking the
cheapest bond in whatever sector is being traded in and across the curve.
MS. SKURATOVSKAYA stated that the TIPS portfolio is the Treasury index portfolio and is
the only Treasury portfolio. The main strategy followed is very similar to the mean reversion
trade. Cheap bonds are looked for, mostly off the runs or particular issues that people have
decided to offload from their portfolios. They are bought, and sooner or later those returns are
realized. In the past quarter, the inflation expectations went up by about 15 basis points. Those
were not done in even fashion, so the expectations moved the most. She then stated that the next
portfolio is the global government’s portfolio. One of the things to address is the imminent rise
in interest rates that has been brought up a number of times. She continued that one of the
degrees of freedom in this portfolio is that markets that are in different points of their interest
rate cycles can be invested in. The main theme in this portfolio is placing money outside of the
markets that are for increasing rates. The largest exposures in that portfolio is Eurozone and
Japan. Markets are looked at different points in their economic cycle, so those rate increases can
be avoided or at least we can sit them out. During this quarter, the rates rallied toward the end of
the term, and there will be some negative performance in the last quarter. We diversified from
Eurozone and Japan, and exposures to several small markets were added. Access to the South
Korean bond market has been gained, which is a fairly large exposure in the portfolio, and we
are now able to directly invest in it instead of buying property from that country. She added that
access to the Indian bond market was not gained because it is an investment-grade sovereign. It
has a very tight way of controlling foreign investors and requires an extensive application
process. This process was gone through, and we have received a Category 1 status, and are now
able to purchase Indian government bonds in the portfolio. The final thing that took place at the
very end of the year was taking over the management of foreign exchange internally. We can
now respond to and forward trades internally.
MR. PARISE moved to the fixed-income-plus allocation. He explained that before this became
a benchmark, each of these portfolios was on their own. He explained that there is now an
increased focus on the managers within this fixed-income-plus. He asked Matt Olmsted to touch
on some of the things that were done and the future plans.
MR. OLMSTED stated that one of the managers has underperformed clearly and it has a
defensive bias. We talked to the analyst team on multiple occasions, and it is very consistent
within the firm that is their bias, and they have underperformed generally in a bull market.
Given where the spreads and the markets are in general, that would not be an allocation to reduce
right now. He added that they may consider increasing with a manager, just given their quality
bias.
MS. SKURATOVSKAYA stated that Capital Group is the only manager in emerging markets.
The current benchmark for emerging markets is hard currency debt only. She explained that
21/511

Alaska Permanent Fund Corporation 12 Board of Trustees Meeting Minutes
February 21-22, 2018
hard currency debt is basically dollar denominated external debt of emerging markets that has a
high correlation to the U.S. yield curve. The benchmarks and mandates that the EM portfolio is
structured against is 50 percent local debt and 50 percent external debt. Local debt has a
different profile, duration, and interest rate profile, and it has a very strong currency component.
CHAIR MORAN asked about what fees are embedded in those emerging market ETFs.
MS. SKURATOVSKAYA replied around 40 basis points.
MR. PARISE explained that they are not low and that is one of the issues with an ETF. He
added that an ETF is not a free lunch because a 40-basis-point loss is locked to the index.
MR. OLMSTED stated that with the U.S. HY, a significant percentage of that ETF is owned by
the Fund. It is brand new, and when the bond is bought the shares are created, submitted to
BlackRock, who then creates shares and issues them to the fund. He added that they are
significant, but essentially priced based upon what it costs to source the bonds in the market.
MR. ALLEN asked if they are looked at regularly to see how well it is tracking once fully
vested, and if it tracks the indexes.
MR. OLMSTED replied that, in terms of high yield, the U.S. HY, which is a large liquid high-
yield fund, has its own index. With certain liquidity limitations, there are basically about 400
issuers in it. It tracks that well, but does not track our benchmark very well.
PUBLIC EQUITIES
MR. RAZZAQUE introduced Youlian Ninkov, part of the public equities team for the last five
years. He stated that Moctar Diouf joined last year to exclusively assist him as his external
manager, and for research selection and due diligence. He continued that equity markets, again,
delivered strong returns: Global economic expansion, synchronized global growth, strong
corporate earnings growth, and a benign environment, which is very friendly for equities because
of low interest rate, low inflation, and the dollar. He added that everything is good, and nothing
is bad, which is why volatility was not seen in 2017. Now, volatility is back, earlier this month.
That has been the environment for 2017 and the same environment for Q4. Within that, public
equities and emerging markets led the gains, followed by U.S. equities. He noted that non-U.S.
developed markets underperformed quite significantly at 4.23, which is largely because of
Europe. Japan did okay, but Europe really underperformed, especially in the fourth quarter.
Another significant difference throughout 2017, and also in the fourth quarter, is how much
information technology is in the portfolio versus the benchmark. He explained that as long as
China is stable, and we are still in that global economic expansion, emerging markets should
continue to do well. He added that the fund managers have been a consistent source of the
value-add, and it is the asset allocation that is warehoused in different parts of the allocation
where it hurts. Domestic equities, positive relative performance from active managers is about
13 basis points. He continued that during the last quarter, the managers in aggregate
outperformed their respective benchmarks. He separated tactical tilt from external managers,
explaining that the external managers added value, and tactical tilt subtracted 10 basis points.
22/511

Alaska Permanent Fund Corporation 13 Board of Trustees Meeting Minutes
February 21-22, 2018
CIO READ introduced Steve Moseley, head of the private equity and special growth
opportunities portfolio.
PRIVATE EQUITY AND SPECIAL GROWTH OPPORTUNITIES
MR. MOSELEY stated that he manages private equities and special opportunities which
represents about $13 billion in commitments and about $8 billion in current market value. He
continued that they are investing through funds, venture capital, buyouts, distressed situations,
and others. He added that they are also co-investing along with managers and are investing
directly in operating companies. He noted that the official results are based on September 30th
data, which now seems stale because there has been a lot of interesting activity since that time.
He continued that the headline number is a combined portfolio one-year net IRR of 20.6 percent
at 9/30. The public benchmark was outperformed by 130 basis points, which is 1,207 basis
points of performance over three years. He moved on, explaining about the activity that
happened since September 30th, beginning with four of the five most significant changes in the
portfolio. He stated that this represented from cost to total value. Denali was one of the
significant investments because it was written up, went public, and the stock has performed
moderately well. He continued that Juno was one of the largest public company positions and
essentially liquidated size and position. Celgene announced a definitive plan to purchase Juno,
which may close in early March. They just received antitrust clearance last night, and if that
happens, that would move the portfolio. There was also a meaningful up-round in Indigo
Agriculture, which is one of the larger direct investments. He continued that HealthSun was
acquired by Anthem. That was owned for less than a year, and made three times the money. He
added that a new investment was made in a company called Foundation Health; returns so far
have been zero because that investment was just made last quarter. He stated that the net of the
portfolio value since 9/30 increased by $586 million. The cash-on-cash multiple increased 2.5
times to 2.9 times. The IRR, which was 67 percent, is now 77 percent. He added that he expects
there will be movement before reporting these numbers finally, but they are definitive events that
he knows about. He stated that there is other good news in the portfolio, but those are the big
events. Part of the reason for live reports is that all the numbers are rolled up from the bottom.
There are over 3,000 underlying portfolio companies. Those are rolled up to different mangers,
and then are rolled up to Bank of New York and Pathway and others to report on it.
CHAIR MORAN called a five-minute break.
(Break.)
LEGISLATIVE UPDATE
MS. SWANSON stated that she has the opportunity of bringing forward the legislative update
today, which happens to be the 32nd day of the second session of the 30th Alaska State
Legislature. She continued that a lot of the debate centers around the use of the Earnings
Reserve Account to fund the current fiscal debt the State has. Thus far this session, CEO Rodell
has presented to both the Senate and House Finance Committees, offering an overview of the
Fund and the stress analysis that was presented to the board during the December meeting. Chair
Moran joined her and was available for questions during the first Senate Finance Committee
hearing of the session. Since then, there have been some additional inquiries for follow-up
23/511

Alaska Permanent Fund Corporation 14 Board of Trustees Meeting Minutes
February 21-22, 2018
presentations for both the House and the Senate, and we are still looking at getting those
scheduled. She stated that a Permanent Fund 101 was held for legislators and staff at the Capitol
Building, which was jointly sponsored by the House and Senate, and was also streamed. She
continued that there is a summary of legislation in the packets, and we've highlighted a few of
those items starting with the Governor’s FY19 proposed operating budget. She added that this
budget is House Bill 286 and Senate Bill 144, and are both before their respective finance
committees at this time. She continued that the House Finance Budget Subcommittee has
amended the proposed language, and they have relocated it from the language section to the
numbers section of the budget. They also separated it into two allocations: one for APFC
operations, and the other for APFC investment management fees. She noted that there is still a
long budget process ahead.
TRUSTEE RICHARDS stated that there has been a big change in the State of Alaska in terms of
how we are operating around the governance structure for the rules of the Permanent Fund. He
continued that what is being seen is a dangerous trend in the form of inflows and outflows, and
the flows between the earnings reserve and the corpus of the fund have rules that are not
necessarily being followed. He asked whether the board should consider taking a more proactive
stance in encouraging sound leadership and custodianship in terms of governance rules, and for it
to take a position encouraging the government follow the rules that are on the books. He
encouraged the board to think about that because eventually this may be heading towards a
system of not just taking money out of the Permanent Fund to pay dividends, but ultimately
funding the State Government.
TRUSTEE RUTHERFORD asked Trustee Richards if he has any proposed language
surrounding something like this.
TRUSTEE RICHARDS replied that he has tried to draft something, and will certainly double his
efforts to see if it is something that the board will get behind.
TRUSTEE RUTHERFORD asked when the next meeting is.
CEO RODELL replied that the next meeting follows the week after the adjournment of a 120-
day session. May 23-24 is the board meeting and is in Anchorage.
TRUSTEE RICHARDS committed to getting a draft done in the next week and informing the
board through general counsel.
MS. SWANSON let the board know that the Governor has brought forth the FY18 supplemental
bill, and an appropriation for $5 million for investment management fees is included in that
supplemental bill. That bill is currently in process. She highlighted that CEO Rodell continues
to keep looking out for legislation that is going on to pursue a procurement exemption as the
board has discussed over the past few years.
CHAIR MORAN moved to real estate.
MR FRAMPTON followed up on the earlier discussion of real estate and stated that there are a
couple of action items. He added that he wanted to go through what will be done over the next
24/511

Alaska Permanent Fund Corporation 15 Board of Trustees Meeting Minutes
February 21-22, 2018
few months in advance of the May board meeting. He stated that there are two action items:
The first is that we are in the red zone on real estate following the disposition of Simpson
Housing. His understanding is that status requires board action to approve remaining in the red
zone status. In May there will be a revision to the investment policy statement which includes
the bands, and likely resolution in the near term. That status will be combined bands between
infrastructure, private credit, and real estate. He stated that relief is being looked at on that item
in the interim. Then, the strategic plan for real estate creates a manager exposure limitation of 35
percent. It is close to 50 percent with L&B after the exit of Simpson Housing. That would also
require the board’s acceptance of that until it is addressed in May.
TRUSTEE RUTHERFORD stated that she understood what the real estate fund category will be,
but did not understand what the co-investment is and how that differs from some of the
investments that are already being done.
MR. FRAMPTON explained that, to date, no real estate funds are really invested, and the
properties are held directly. He proposed to make a commitment to a private-equity-style fund
that just purchased property; and as is the case in credit, they may have transactions that are
larger than can be accommodated and can co-invest with them and reduce the fees.
CHAIR MORAN asked CEO Rodell to review the green, yellow, and red zones, and what the
board involvement is at each stage.
CEO RODELL replied that in the green zone there is full discretion and board authority is given.
There are other things controlling specific investments. When moved into the yellow zone,
Valerie, the Chief Financial Officer, lets the board know. Staff is required to notify the board
that we are operating in a yellow zone. It is a heads-up to the Board of Trustees. No action is
specified or required at the time. In a red zone area, staff is required to go before the board and
are not allowed to stay in that for more than 30 days without board action specifically directing
us to stay in that. It has to be cured on a very quick time frame. What is being asked for is the
recognition that we are well underweight of the board’s target asset allocation for real estate and
to continue to operate in this red zone knowing that these steps will be taken. Part of the cure is
going to be getting an international real estate manager onboard so some of the money can be
deployed through the Fund commitment and gain some real estate exposure through that
mechanism.
MOTION: TRUSTEE RICHARDS made a motion to approve operating in the red zone
for the real estate allocation until the May 2018 board meeting, and to approve exceeding
35 percent manager exposure guideline with L&B until the May 2018 board meeting.
TRUSTEE RUTHERFORD seconded.
Following the roll call vote, the MOTION WAS APPROVED by the Trustees
(RUTHERFORD, MORAN, MACK, RICHARDS).
CEO RODELL stated that the investment policy will be taken up and reviewed in total in May.
It made sense to wait and do it all at once rather than doing it as a separate real estate investment
policy at this meeting.
25/511

Alaska Permanent Fund Corporation 16 Board of Trustees Meeting Minutes
February 21-22, 2018
CHAIR MORAN recessed the meeting until tomorrow, 8:30.
(Alaska Permanent Fund Corporation Board of Trustees meeting adjourned at 3:51 p.m.)
FEBRUARY 22, 2018
CHAIR MORAN reconvened the meeting and recognized CIO Read.
POSITIONING A PORTFOLIO IN SUSTAINED BULL MARKETS
CIO READ stated that the morning will begin with a timely panel represented by our eCIO
managers. The discussion topic is looking at how to position portfolios, the overall Permanent
Fund, considering the run-up in stocks over the past 18 months. He continued that, from a staff
perspective, this is a particularly relevant topic. He added that it will be moderated by Valeria
Martinez, head of asset allocation and risk management.
MS. MARTINEZ stated that 2018 started with the wind in the back and as a process we have the
expectations of the global growth to continue for this year. She continued that the objective
today is to share some thinking on how to construct portfolios to achieve the investment goals in
this environment. She invited three of the Fund’s partner firms that deal with the same kinds of
challenges; Bridgewater, AQR, and Goldman Sachs. Seth Birmbaum has been with Bridgewater
for 15 years. He is a senior portfolio strategist, and is a member of the research team, as well,
with expertise in Bridgewater’s investment process, portfolio structuring in different markets,
like currency rates, commodities, and equities. He works closely with clients to develop custom
portfolios and modeling capabilities and training and development experiences. She also
introduced Michael Mendelson, who is a principal at AQR. He is a portfolio manager for AQR’s
risk parity strategies and a member of both the firm’s strategic planning and risk committees.
She continued that prior to AQR, he was a managing director of Goldman Sachs, and founded
the quality training group there. He has been a member of the Managed Funds Association
board of directors, and chairman of the trading and Markets Committee, and is currently the
chairman of the Government Affairs Committee. She also introduced Roy Appleman, who is a
senior strategist and head of a strategic asset allocation team within the global portfolio solutions
group at Goldman Sachs Asset Management. Previously, he led the corporate strategies team in
the investment banking division where he advised institutional clients in capital structure, risk
management, and hedging considerations. He joined Goldman Sachs in 2005. She asked the
panelists to give a brief introduction to the topic and a background to begin the discussion.
MR. BIRMBAUM thanked all for the opportunity to be here and to partner with Alaska for
going on eight years. He stated that, as part of the program, there is a combined mandate that
holds a diversified mix of assets and combines that with the tactical trading across the major
markets: currencies, equities, bonds. It is a combined mandate of a diversified mix that is
intended to be beneficial relative to the overall mix of Alaska. He continued that he was asked to
give some context on the macroeconomic backdrop, how conditions are seen right now, and the
implications for equities, but more the implications for managing portfolios through that. He
added that the most interesting part of the market action in February is not that it was that
volatile, but it was much more normal. It is more about how lowly volatile and complacent
market action has been over the last number of years amidst the tremendous amount of liquidity
26/511

Alaska Permanent Fund Corporation 17 Board of Trustees Meeting Minutes
February 21-22, 2018
in the system. He thinks that it is in a transition in terms of where it is cyclically which will
mean more volatility, more risk, and difficulty navigating. He moved on and talked about the
most important portfolio implications of that. The secular backdrop is a picture in the U.S. that
goes back to the post-World War I period; and remains about the same. He went through
different charts explaining how pushing money into the system supported the best backward-
looking period for a 60/40 portfolio in modern history. It allowed that backdrop of continued
easiness with monetary-policy-supported growth that has been sustained for nine years. It
gradually ate up the capacity in the economy that was created in the financial crisis. He
summarized a measure of performance by taking a ratio of return to risk. The early cycle tends
to be the best period for financial assets, the mid cycle is an okay period, and the late cycle tends
to favor inflationary assets, like real assets and commodities, until the turn when the economy
weakens and assets like bonds will be more favorable. He explained that, in modern history, this
magnitude of a fiscal push has never been seen when unemployment is this low, and we are this
far into expansion. That means that the near term will look good, but it is also speeding up the
time frame of Central Bank’s tightening and bringing in the inflection point to the next
downturn. He added, that will be a challenge for investors because Central Bank's rates are
already at zero. They are coming up a little bit, but to reverse a downturn has taken between 5
percent and 8 percent interest rate cuts. He stated that the view would be strategically having an
exposure to assets structurally that can do well when equities do not do well, that are
diversifying, is critical. He continued that finding managers that have skill in navigating and
timing markets and adding value would be particularly valuable because the yields on most
assets are quite low. Passively holding assets as the next inflection point is approached is a
question on whether that makes sufficient returns. He thanked all for their time.
MR. MENDELSON stated appreciation for the long-standing relationship with the Alaska
Permanent Fund. He continued that he is a portfolio manager and not an economist. The
difference for a portfolio manager is the need to be very practical people. He added that he did
not disagree with anything that Mr. Birmbaum stated, and talked about the need to turn that into
something that generates returns. He stated that a lot of times it is because the time scale that is
operated on as portfolio managers tends to be very different than the economic cycle. Things
must be turned over and positions changed to get the right economics, to get the math working,
and making a lot of small bets instead of one big one. He continued that economic outlooks
matter, but they do not tell how to generate returns or manage risks. He pointed out that
forecasts are not prophecies, and there are a lot of other things that can happen. The only way to
make a lot of bets is to do it fairly often, which does not quite correspond with the timescale of
which the economic forecast is made. He talked about the equity returns that returned 11.5
percent in the last five years, which is pretty good. He also talked about the longer term. He
added the need to know where they are in the business cycle and to have some idea of it. He
stated that having lots of different drivers of risk, drivers of return in the portfolio may be
consistent with anyone’s view of markets going forward. Along with that, it might be interesting
to consider that the world is often driven by benchmarking which has huge impacts of how you
are positioned. Peer benchmarking drives toward an asset allocation that cements in a large
amount of equity risk.
MR. APPELMAN talked about their perspectives on how to position and forward the late cycle.
He stated that he agrees with his colleagues on many things, both on the importance of
understanding where the economic cycle is and also the importance of making sure that the
27/511

Alaska Permanent Fund Corporation 18 Board of Trustees Meeting Minutes
February 21-22, 2018
appropriate level of confidence is taken. He continued that positioning for the late cycle starts
with portfolio construction in the strategic sense. Here, the focus is on diversification across
both traditional and alternative datas, as well as skill-based strategies. This means trying to
balance ways that systematically make money over time because of rewards with risk-taking
with the active management that is needed in order to adjust for the dynamic changes in both the
macroeconomic environment as well as markets. He added that, in the traditional beta space, his
firm believes in diversifying away from equities. He stated that one of the things that is
considered at the portfolio level is what to do when interest rates have been at zero or close to
zero for an extended period of time, and are starting to expand. He talked about what is done on
the strategic side, which is incredibly important. As the cycle progresses, it is helpful to adjust
the overall position. Currently, we are late in the expansion phase, and we do believe there is
more room to grow. He continued that one way to see that is to compare some relevant
macroeconomic indicators to where they were in historical cycles. He added that valuations are
more attractive given the upside potential for surprises on growth in those markets and do have a
modest overweight to emerging markets versus developed markets.
MS. MARTINEZ asked Mr. Appelman to expand a bit more on emerging markets in the U.S.
and in other asset classes, as well.
MR. APPELMAN replied that they have a certain set of beliefs about emerging markets. First,
that relative to a cap-weighted index, on a strategic basis, a modest overweight is wanted, but
one that is rather small. He stated the belief that the historical evidence suggests that, over time,
compensation is a bit more than what is purely implied by data for taking that risk in emerging
markets. He continued that there can be years of underperformance, which is definitely a risk;
and having that modest overweight is likely to be helpful in the long run. He added that the
emerging markets have come off a long downturn from 2012 to late 2016. That downturn was
largely related to imbalances created in the commodity markets due to a China slowdown.
Imbalances accumulated on the effects side. He stated that it is important that it is not a direct
overweight. It is offset by reducing some of the exposures in the developed markets where the
prospects for forward-looking returns is a bit more modest.
MR. BIRMBAUM added, similar to the points raised, the part of trading globally diversified
liquid markets where no one thing can bite too much. He noted, from a strategic standpoint,
China is the second or largest economy in the world at this point. He stated that, by most
measures, they are the biggest driver of swings in global growth of fixed investment, of
commodity demand. It is a very large economy, and their markets have developed over the last
few years. In the last 18 months, 58 percent of their market cap has opened up in government
bonds and in equities. Most investors in the U.S. have almost no or very little exposure to
emerging, developing markets. From an historical standpoint, it would be the equivalent of most
investors have U.S., and are diversified to Europe, Canada and few other countries. He added
that, tactically, it is a good time to be overweight emerging markets and across the 40 or so
emerging market currencies, equities, and bonds traded.
MR. MENDELSON stated that he had a small point of disagreement with emerging markets.
The trend is that people are going to own emerging markets, which has been going on a long
time. They are diversifying in that they are not perfectly correlated to developed market stocks.
28/511

Alaska Permanent Fund Corporation 19 Board of Trustees Meeting Minutes
February 21-22, 2018
They are pretty correlated, and it is still an equity bet. He added that emerging stocks and
developed stocks are first and foremost stocks and then there is some diversification.
CIO READ stated that the general question is: If you were running the Alaska Permanent Fund,
what advice would you be giving?
MR. BIRMBAUM replied that the world is changing and is very different than 15 years ago.
The role of China, India, Brazil, the size of a number of the markets has increased in a material
way. He stated that secular shift is massive where income in the world has been generated, and
the development and opening up of the capital markets that connect to that income has been
slower. He added that amid all the liquidity in the world and the desire for those countries to try
to have capital come in and also be able to leave is happening extremely rapidly in a way that has
not happened in modern history. He continued, that is the first big point: It is a much bigger
world. The second is, in the West and in general, when there is a secular decline in interest rates,
a debt boom, and the benefits of women joining the work force and a variety of factors that
supported, secularly, equities, and, to a lesser extent, disinflation that supported government
bonds, the western world has become concentrated in equities. He added that very few players in
the world actually have much in the way of real assets because financial assets have
outperformed real assets for the last 30 years. He stated that the Fund has a significant amount
of wealth that is being managed for the State. Concentration in those commodities, those
resources, helped to create that; but, also, holding the assets in a concentrated way can destroy
that.
MR. MENDELSON replied that a large part is being freed from the considerations around peer
benchmarking. In looking at all three portfolios, it is the focus on diversification away from
equities. All three have independently arrived in that direction.
MR. ALLEN asked if Mr. Mendelson will talk about how leverage is used in the portfolio.
MR. MENDELSON replied that the first premise is that when diversifying from equities, return
is lost. This is really a statement that says as risk is reduced so is return. He stated that equities
are the riskiest asset and most everything else is less risky. He continued that a risk parity
strategy is a good example of this. The belief here is that other forms of risk are diversifying and
valuable and just as good on a basis of that risk/reward tradeoff. He then moved to the role of
leverage in any of those portfolios. Generally, that is going to make things risky enough. He
continued that leverage is a tool for taking low-risk things and making them risky enough. It can
be used or abused to take risky things and make them too risky.
TRUSTEE FISHER asked, in describing risk in those two parameters, if it is thought of and
measured in the same way between equities and other alternatives.
MR. MENDELSON replied that there is a difference between the real dividing line used between
liquid stuff and illiquid stuff. He added that illiquid stuff is harder to get a grip on risk. He
continued that it is known that stocks tend to be three or four times as volatile as bonds and are
riskier than bonds. The volatility is persistent.
29/511

Alaska Permanent Fund Corporation 20 Board of Trustees Meeting Minutes
February 21-22, 2018
MR. ALLEN asked if the amount of leverage varies from month to month, quarter to quarter,
while adjusting to the relative volatility of things.
MR. MENDELSON replied that it did for them.
MR. APPELMEN replied that a lot of it depends on what horizon is being adjusted that the
volatility is based on.
MR. BIRMBAUM replied that in some a very long-term perspective is used and the volatility
metric is not risk. It is how much the thing goes up and down, and it is mostly down. He stated
that leverage is one of the most basic fundamental tools of the financial system, where it is a
house where people are levered 5 to 1, or equity companies, typically, levered 2 to 1. Generally,
the leverage is embedded in equities that people buy because they are not doing the leverage
themselves.
CHAIR MORAN asked how the regression is looked at to the mean concept that is seen where
there is a big run-up of stocks, and it is above the line or going back to the line.
MR. APPELMAN replied, to be fair, they do not subscribe fully to the concept of pure
regression to the mean. There is an element that when valuation becomes expensive, returns
later on are lower. Essentially, in making an investment, a future set of cash flows are being
bought at a given price. If those cash flows end up being higher than what was expected, even if
the valuation is expensive, money is still being made. He continued that one of the reasons they
are comfortable with continuing to have diversified portfolios that are diversified away from
equity risk is the fact that equities, over the long term right now, have essentially a lower return
prospect if reasonable assumptions on growth are factored in.
MR. MENDELSON replied that they make sure that they distinguish between recent returns and
valuations.
MR. BIRMBAUM replied that in thinking about valuation of stocks, there are the earnings, and
then there is an interest rate to discount those to a price.
MR. MENDELSON stated that each firm looks at the investing world and there are a number of
different types of risks out there. He continued that there is risk in the bond market, commodity
risk premium, credit risk premium, illiquidity premiums, premium that has to be demanded to get
paid for tying up the money for a long time, like in private equity.
CIO READ thanked the panel for the excellent insights. This was very timely given that the
annual asset allocation work is coming up in May, and this is a good perspective as we get into
the planning session.
CHAIR MORAN called a break.
(Break.)
CHAIR MORAN called the meeting back to order and recognized Valeria Martinez.
30/511

Alaska Permanent Fund Corporation 21 Board of Trustees Meeting Minutes
February 21-22, 2018
eCIO MULTIASSET STRATEGY REVIEW
CIO READ stated that this is a review of the eCIO program which has been around since 2010.
Ms. Martinez will give a summary of how the program came about and its objectives. He
continued that this is an action item, and we are going to be looking to recalibrate the program.
There is enough experience, knowledge and belief about how to position these managers, and
what the benchmarks should be. He added that the recommendations will be gone over, and we
will be looking for a motion.
CEO RODELL clarified that the motion is about the program and whether or not it should
continue in this phase. If it is decided that this program will continue, then it will need some
adjustment at the May meeting.
MS. MARTINEZ began with some historical perspectives to help understand why this program
was started. The initial premise was that there were not many multi-asset or asset allocation
strategies in the portfolio. There were the different asset classes that were equities and bonds,
and managers that just managed money for each of the asset classes. The only type of multi-
asset portfolios was the fund of funds, and that one ended up in the repair shop, after market
crash in 2008, 2009. It did not perform as expected because the decision was made to start a
program, not only in the eCIO space, but in other parts of the portfolio. There would be
managers choosing and making asset allocation decisions between multiple asset classes. The
design of the program was to hire firms that were best in class in the world with a good track
record, that they produced CPI plus 5, and have the objective to think in risk terms, and look at
the guidelines of the Permanent Fund in terms of volatility and concentration, and to be able to
learn from them. Because of the objectives and parameters, the expectation was that superior
risk-adjusted returns will be produced, and additionally we were looking for a partnership that
would allow seeing them as an extension of staff. She continued that there were 14 finalists, and
the second phase was visiting all of these firms to identify those that would most likely meet the
objectives. There were five finalists: AQR, Bridgewater, GMO, Goldman Sachs, and PIMCO.
Those were funded at the beginning of 2010 with $500 million for each firm. In 2014, the board
reviewed the program. The table presented was the market value of this program in 2013 was $3
billion. By 2014 it was less, but there were two less managers. The market values for each of
the firms grew, were returning money and were very profitable firms. The ones that were
terminated were GMO and PIMCO because they were not meeting the objective of CPI plus 5
for the 12-month, three-year, and five-year return. They were much lower. She then introduced
a portfolio evolution table because during these years the fund also evolved; the needs of the
fund evolved; and sometimes the partnership has been used to adjust some of the things that were
being done. She added that the objective always stayed the same, the CPI plus 5. In 2017, the
Sharpe ratios requirement and a report card were added to the portfolio. The Sharpe ratio is
around .5.
CHAIR MORAN stated that, by the end of the day, the Fund’s objective is to meet or beat 5
percent, which is the way it was set up.
31/511

Alaska Permanent Fund Corporation 22 Board of Trustees Meeting Minutes
February 21-22, 2018
MR. WALSH asked what the management fees were and if any types of incentives are taken.
MS. MARTINEZ replied that they have a base fee and an incentive fee, which is on the returns.
She explained that this is to maximize return for the risk that they are allowed to have. This risk
has to be maintained or they will be out of compliance in the contract. It is their mandate. She
added that the incentive kicks in when the benchmark is passed. She added that page 15 has a
summary of the profits of these managers. She stated that with the eCIO program there is full
transparency. They are completely liquid, are more flexible, and can be customized to our needs
and goals. She continued that they also give strategic advice, investment insights, not only to the
board and in terms of asset allocation and risk, but have met with several other portfolio
managers that are managing other asset classes here at the Fund -- fixed income, currency, etc.
They share knowledge, participate in forums and have information on what is going on in the
market. She added that this is a strategic partnership with these three managers. She stated that
the presence of this program to the Fund has increased returns and has lowered volatility.
Overall, there is an improvement in diversification and efficiency. She continued that this
program definitely provides diversification and liquidity to the Fund. There is no lockup, so they
can be called, and the money returned. She added that they use innovation in their portfolio
construction that is sometimes hard to implement at the Fund level. She summarized that the
eCIO has played an important part in the portfolio. These managers have demonstrated a good
track record and strong performance through different market cycles. They have been in a
historically good run that should not be extrapolated. Today, the current eCIOs have met their
objectives, met their benchmarks, and also the other objectives that were set up in their contracts.
It has grown to be a sizeable allocation from $500,000 to over $100 million, each of them.
CIO READ stated that the recommendation is that the evaluation will be based on their
objective. Their objective is CPI plus 5, and we are recommending that is the evaluative
standard. The benchmark should equal the objective. He also stated that we are interested in
them as a multi-strategy program. As a multi-strategy program, there is a different logic,
different benchmark, and a different role in the portfolio. He continued that it seems like a
subtlety, but what is being recommended is to recast the program from an eCIO program to a
multi-strategy program, and the direction is to incorporate, to revise the benchmarks accordingly.
He added that in May part of the discussion will be giving direction for that, and it can be a
subtle one, which is any allocation discussions should be revisited accordingly.
CHAIR MORAN explained that this will be tabled until May.
CIO READ added that is a fine result and an appropriate recommendation.
CHAIR MORAN moved on to Other Matters.
OTHER MATTERS
CEO RODELL stated that the May meeting will be packed because there will be environmental,
social, governance, an education panel, a review of the investment policy, asset allocation. She
added that Callan’s 2018 capital market forecast will be incorporated in that. It will also be a
week after day 121 of the 30th Legislative Session, and will set up, at that point, a final adoption
of a budget for FY19 based on the actions taken by the Legislature and what we expect them to
32/511

Alaska Permanent Fund Corporation 23 Board of Trustees Meeting Minutes
February 21-22, 2018
do. She stated that they will also be taking up pacing and incentive compensation as a discussion
item. The other piece is that the capital project is moving forward and we will be signing off on
bids in March. The hope is that construction will begin in May. That means that the September
meeting will need to be in Anchorage. She stated the need to have an Audit Committee in May
to launch the audit parameters for the audit that will begin in July. She continued that a date for
a special board meeting here in March will be worked on. She stated that this board room was
dedicated and named after Hugh Malone, and one of the questions will be whether the board
would want to rename or rededicate it. That will, most likely, be done at the December meeting.
TRUSTEE MACK stated that the board has agreed to commit to a special meeting in March,
which he supports strongly. He continued that the board should be prepared to meet on a
consistent basis in special meetings, not just May and September. There may be multiple
situations requiring a need to meet.
INVESTMENT ADVISOR COMMENTS
CHAIR MORAN recognized Timothy Walsh, the investment advisor.
MR. WALSH introduced and gave a little background about himself. He stated that he has been
in the investment world for about 14 years and was a former trustee of another plan for a few
years. He continued and congratulated the board, the staff, the consultant for staying firm on
emerging equities. His second comment was on Fawad Razzaque’s presentation yesterday. The
focus from public funds and endowments and foundations have all been alternatives, and the
public fund and public equity guys get pushed to the back. When he talked about his active
manager report and, over the last year, 68 percent of his managers beat their benchmarks. What
really jumped out was his five-year number. It was 65 percent of his active managers, and he
took into account the managers that he terminated. He added, that was very impressive. His
third comment was Mr. Moseley’s presentation yesterday on co-investment reports. It was a
67.5 percent IRR, which is venture capital-type numbers; and more impressive was his multiple
at 2.5 multiple of money. That was an extra $1.3 billion that went into the coffers of the Alaska
Permanent Fund. He added that those numbers are about as good as any seen in any fund
anywhere in the world. He then commented on the question of having an office outside of
Alaska. Alaska Permanent Fund isn’t GIC, but there are two public funds a bit bigger than the
Alaska Permanent Fund that have opened offices outside of where they domiciled. There is a lot
of concern about public backlash moving out of state.
CHAIR MORAN thanked Mr. Walsh and moved to trustee comments.
TRUSTEE COMMENTS
TRUSTEE MACK stated that he found the presentation very helpful, and it was a good
conversation. It triggered a lot of questions, which is very good. He continued that he
completely supports what Trustee Richards was talking about with respect to having a special
meeting. He also stated that the board should be prepared to think, talk, and respond to things
that are happening in realtime. He added that he is really focused on making sure that we are
doing everything to build capacity in the State of Alaska, build this organization, and make sure
33/511

Alaska Permanent Fund Corporation 24 Board of Trustees Meeting Minutes
February 21-22, 2018
to stay true to the objectives. He proposed putting on the agenda the start of a private
equity/emerging managers program that can be vetted in the policies.
CHAIR MORAN stated that may need a special meeting.
TRUSTEE RICHARDS stated that he is glad to be back on the board, working with amazing
staff, and getting to participate in some of the coolest stuff in the State of Alaska. He added that
he was very grateful for the opportunity.
CHAIR MORAN commented that for the next meeting there is a need to give some thought
about the public comment period and how we intend to deal with this over the long term. It is
probably an issue that will not go away. The Juneau paper had a long article about a Permanent
Fund meeting regarding comments that were made in the first ten minutes.
CEO RODELL replied that staff will come up with some ideas.
CHAIR MORAN also thanked staff and stated that it was a good meeting.
MOTION: TRUSTEE RUTHERFORD made a motion to adjourn.
CHAIR MORAN adjourned the meeting.
(Alaska Permanent Fund Corporation Board of Trustees meeting adjourned at 11:47 a.m.)
34/511

March 15, 2018
Separator Page
35/511

Alaska Permanent Fund Corporation 1 Special Board of Trustees Meeting Minutes
March 15, 2018
ALASKA PERMANENT FUND CORPORATION
SPECIAL MEETING OF THE BOARD OF TRUSTEES
March 15, 2018 9:00 a.m.
Teleconference
SUMMARY MINUTES
Trustees Present: William G. Moran, Chair
Carl Brady, Vice Chair
Andrew Mack
Sheldon Fisher
Craig Richards
Marty Rutherford
Staff Present: Angela Rodell, CEO
Valerie Mertz, CFO
Chris Poag
Paulyn Swanson
Jacob Vandervest
PROCEEDINGS
CALL TO ORDER
CHAIR MORAN called the meeting to order and asked for a roll call.
ROLL CALL
MR. VANDERVEST called the roll and reported that there is a quorum.
APPROVAL OF AGENDA
CHAIR MORAN moved to the limited agenda. He asked for any discussion or
amendments. There being none, the agenda is approved.
PUBLIC PARTICIPATION
CHAIR MORAN asked if there was anyone on-line that would like to address the board. There
being no response, he continued that there is only one item on the agenda and it is consideration
of a proposed resolution supporting adherence to a rules-based framework for fund transfers.
36/511

Alaska Permanent Fund Corporation 2 Special Board of Trustees Meeting Minutes
March 15, 2018
CONSIDERATION OF A PROPOSED RESOLUTION SUPPORTING ADHERENCE TO
A RULES-BASED FRAMEWORK FOR FUND TRANSFERS.
CHAIR MORAN stated that the resolution has been distributed to all and opened the discussion,
asking if anyone cared to make a motion.
TRUSTEE FISHER stated that it is appropriately the role of the board, which is consistent with
this resolution, to frame and help the State understand that the real value of the Fund is that it is
maintained, and the Fund is there for future generations. He encouraged all not to weigh into the
debate around the proper size of the dividends, but rather to focus on how money is withdrawn
from the Fund and the rules around that. He stated that his second principle is preferring to
express a view that helps decision-makers frame what should happen looking forward without
weighing in about whether a particular action in the past was or was not appropriate or justified.
MOTION: TRUSTEE RUTHERFORD moved the resolution that was provided, for the
purpose of discussion. VICE CHAIR BRADY seconded.
TRUSTEE RUTHERFORD stated that she is speaking in support of Resolution 18-01, as it
reads. She reiterated what Trustee Fisher stated and believes it is the Board of Trustees’
responsibility to share opinions and insights, that are provided by serving on the corporation
board, with the decision-makers. This is so that they can make the best and most informed
decisions possible. She continued that the Fund has been recognized internationally as a high-
quality sovereign fund, and she believes that recognition has provided investment opportunities
that would not have been available if it was not considered one of the best in the world with best
practices. She added that her third point is that a rule-based approach to fund transfers allows the
Fund to optimize investments and strategies, as well as providing greater public transparency.
That is important to the Fund’s operation and is important to Alaskans as a whole to have the
best insight into how the Fund will be operated on both an annual basis and into the future. She
stated that a dependable and identifiable system gives the Fund the greatest chance to be
sustainable and insures that our grandchildren and their children in the years to come can use it
to improve the lives of Alaskans. She continued that this sustainability is our touchstone. She
strongly encouraged this resolution as it exists because it identifies some things that have been
passed in the last several years that had a negative impact.
CHAIR MORAN asked for any other comments.
TRUSTEE RICHARDS concurred wholeheartedly with Trustee Rutherford and most of what
Trustee Fisher said. Trustee Fisher said that the purpose of this resolution is not to be critical.
He continued that he likes the way it is drafted and that it calls out that the process for changing
the rules-based system from the one that is governed for something like 30 years to something
that is different that will likely govern in the future is a time-consuming process. It is also a
difficult one that involves a lot of stakeholders. He added that it is not the board’s job to weigh
in strongly on the governance structure. That governance structure is what this resolution aims
toward. He asked the trustees to recommit themselves to the rules-based system, and moving
forward, to commit to a strong governance structure.
TRUSTEE MACK stated that he supported the concept of this resolution, but thought that it goes
too far in looking back to what has happened historically. He continued that it is his opinion to
37/511

Alaska Permanent Fund Corporation 3 Special Board of Trustees Meeting Minutes
March 15, 2018
try to encourage the decision-makers in this broad process to recognize that a structured and
rules-based process works best. He continued that he would like to see a streamlined resolution
which simply focuses on the future. He explained that recently a resolution on inflation-proofing
was passed that was a very short and succinct resolution, and that ought to be happening here as
well. He added that he would be happy to try to amend the resolution to make it more
streamlined, making it forward-looking only.
VICE CHAIR BRADY concurred with Trustee Mack. He stated that the problem he has with
the resolution, although it has been modified, was its lookback. He also concurred with a
resolution that simply says what we want as opposed to any dialogue of what happened in that
past. He stated that he will oppose this unless it is amended.
TRUSTEE FISHER stated that there is a lot of value to this resolution. He would like to see
some changes, but it is unclear how to process the changes. He continued that, from his
perspective, the changes are relatively modest. He added that he does not know how to move
forward, but would like to support adopting something.
TRUSTEE MACK stated that there are clear ideas of what we would like to see and none of us
equivocated when commenting. He clarified that he supports the concept here, but is very
sensitive about the lookback part. He continued that this meeting did not take a lot of time and
suggested taking another week to work on this to come up with something that would be
acceptable. He added that he would like to see a much shorter, consolidated resolution.
TRUSTEE RUTHERFORD shared a couple comments about some of the opposition to the
existing resolution. She stated that forward-looking will not capture the fact that for a couple
years there has not been any inflation-proofing made to the Fund by the Legislature. That is one
of the most problematic issues. She continued that sustainability of the Fund over time is one of
our largest responsibilities. If inflation-proofing is not done, then over time the process will be
eroded. She added that she is nervous about the whole concept of removing any discussion
about inflation-proofing. Just making it a rules-based approach does not accomplish protecting
the Fund.
VICE CHAIR BRADY agreed on the inflation-proofing and is not opposed to the resolution. He
explained that he likes the resolution in its entirety, with the exception of the slant that it may
appear to be too critical. He would like something to happen as a result of this resolution. He
added that he agreed with Trustee Mack about further working on this resolution.
CEO RODELL stated that this is a public meeting with the notice requirements, and suggested
taking a recess for about 30 minutes to allow Chris Poag, general counsel, to rework this
resolution. She reminded the trustees that meetings have to be noticed seven days in advance.
CHAIR MORAN replied that procedurally, there is a motion and a second. He asked if a vote
was needed and then a motion to reconsider.
MOTION: TRUSTEE RUTHERFORD made a friendly amendment recognizing there
has been some concern about the way the resolution is drafted, to allow staff and
Mr. Poag to get it back to the trustees and to reconvene in 20 minutes. VICE CHAIR
BRADY seconded.
38/511
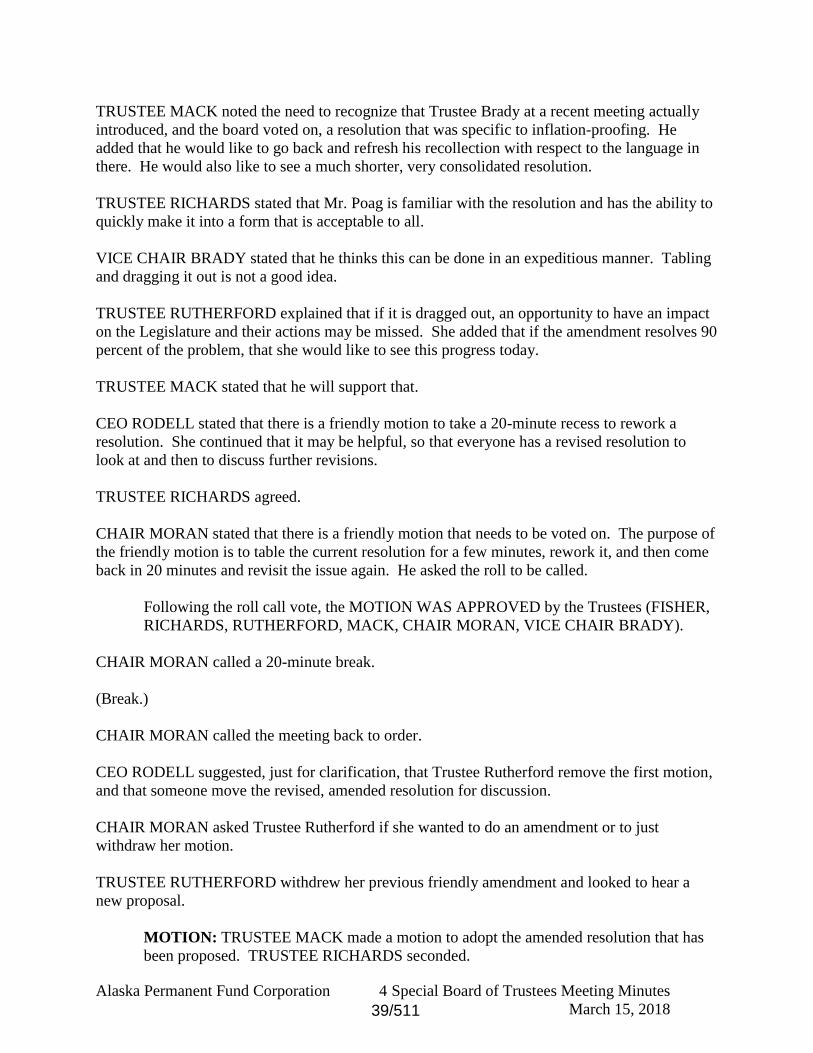
Alaska Permanent Fund Corporation 4 Special Board of Trustees Meeting Minutes
March 15, 2018
TRUSTEE MACK noted the need to recognize that Trustee Brady at a recent meeting actually
introduced, and the board voted on, a resolution that was specific to inflation-proofing. He
added that he would like to go back and refresh his recollection with respect to the language in
there. He would also like to see a much shorter, very consolidated resolution.
TRUSTEE RICHARDS stated that Mr. Poag is familiar with the resolution and has the ability to
quickly make it into a form that is acceptable to all.
VICE CHAIR BRADY stated that he thinks this can be done in an expeditious manner. Tabling
and dragging it out is not a good idea.
TRUSTEE RUTHERFORD explained that if it is dragged out, an opportunity to have an impact
on the Legislature and their actions may be missed. She added that if the amendment resolves 90
percent of the problem, that she would like to see this progress today.
TRUSTEE MACK stated that he will support that.
CEO RODELL stated that there is a friendly motion to take a 20-minute recess to rework a
resolution. She continued that it may be helpful, so that everyone has a revised resolution to
look at and then to discuss further revisions.
TRUSTEE RICHARDS agreed.
CHAIR MORAN stated that there is a friendly motion that needs to be voted on. The purpose of
the friendly motion is to table the current resolution for a few minutes, rework it, and then come
back in 20 minutes and revisit the issue again. He asked the roll to be called.
Following the roll call vote, the MOTION WAS APPROVED by the Trustees (FISHER,
RICHARDS, RUTHERFORD, MACK, CHAIR MORAN, VICE CHAIR BRADY).
CHAIR MORAN called a 20-minute break.
(Break.)
CHAIR MORAN called the meeting back to order.
CEO RODELL suggested, just for clarification, that Trustee Rutherford remove the first motion,
and that someone move the revised, amended resolution for discussion.
CHAIR MORAN asked Trustee Rutherford if she wanted to do an amendment or to just
withdraw her motion.
TRUSTEE RUTHERFORD withdrew her previous friendly amendment and looked to hear a
new proposal.
MOTION: TRUSTEE MACK made a motion to adopt the amended resolution that has
been proposed. TRUSTEE RICHARDS seconded.
39/511

Alaska Permanent Fund Corporation 5 Special Board of Trustees Meeting Minutes
March 15, 2018
CHAIR MORAN moved to call the roll to vote on the resolution.
Following the roll call vote, the MOTION WAS APPROVED by the Trustees (FISHER,
RICHARDS, RUTHERFORD, MACK, CHAIR MORAN, VICE CHAIR BRADY).
CHAIR MORAN stated that one of the members of the Audit Committee has retired from the
board, and there is a need to reappoint one more person to the Audit Committee. The two
remaining members are Trustees Fisher and Rutherford. He continued that Larry Cash was the
third member, and he rotated out. He asked Trustee Richards if he would be willing to serve.
TRUSTEE RICHARDS replied that he is willing to serve.
CHAIR MORAN appointed Trustee Richards to the Audit Committee. He asked for any further
business to come before the meeting. There being none, he adjourned the meeting.
(Special Meeting of the Board of Trustees adjourned at 10:16 a.m.)
40/511

Pending Board Matters
Separator Page
41/511

SUBJECT: Pending Board Maters
ACTION:
DATE: 5/23/2018
INFORMATION: X
BY TASK CAPTURED TARGET COMPLETED
Chair Moran
ECIO Program Recommendation – Tabled
2/18
5/18
Rodell/Read
Updates to Asset Allocation: Investment Policy
9/17
5/18
Read
ESG Education Session
12/17
5/18
42/511

b) Trustee Education
Separator Page
43/511

SUBJECT: CEO’s Reports Trustee Education
ACTION:
DATE: May 23, 2018
INFORMATION: X
BACKGROUND: APFC Board of Trustees Charters and Governance Policies The Board of Trustees of the APFC has established a Trustee Education Policy with the following objectives:
To ensure that the members of the Board have access to the knowledge and information necessary for them to fulfill their fiduciary duties as trustees of the Alaska Permanent Fund; and
To assist them in becoming well informed in all matters pertaining generally to the management of a large institutional fund, both public and private, and more specifically to the management and investments of the APFC.
In accordance with the Trustee Education Policy, the following is a list of conferences and seminars that Trustees may wish to attend.
TRUSTEE TRAINING OPPORTUNITY
TOPIC LOCATION DATES
Pacific Pension & Investments
Winter Roundtables Summer Roundtables
Los Angeles, CA
La Jolla, CA Chicago, IL
Feb 27 – March 1, 2019
July 11 – 13, 2018 July 10 – 12, 2019
ARMB Education
Conference
TBD
New York, NY
October 2018
IFSWF Annual
Meeting
TBD
Juneau, AK
September 2019
44/511

c) Disclosure Reports
Separator Page
45/511

Memo To: Carl Brady, Chair
Governance Committee
Through: Angela Rodell Executive Director
From: Chad Brown HR Manager
Date: May 23, 2017
Re: APFC Financial Disclosures
As required by AS 37.13.110(b) and Alaska Permanent Fund Corporation policy relating to personal investments conduct and reporting, trustees and staff must disclose certain financial interests. Below is a list of disclosures for transactions made by trustees and staff, covering a period of January 1 – March 31, 2018
January 2018
Name Position Title Disclosure Type Received
Matt Olmstead Senior Portfolio Manager Individual Transaction 2/12/2018
Jared Brimberry Portfolio Manager Individual Transaction 2/9/2018
Jim Parise Director of Investments Individual Transaction 1/4/2018
William Moran Trustee Individual Transaction 2/9/2018
Chris LaVallee Accountant Individual Transaction 2/15/2018
Jim Parise Director of Investments Individual Transaction 1/10/2018
February 2018
Name Position Title Disclosure Type Received
Jared Brimberry Portfolio Manager Individual Transaction 3/2/2018
Chris LaVallee Accountant Individual Transaction 3/9/2018
William Moran Trustee Individual Transaction 3/2/2018
Marcus Frampton Director of Investments Individual Transaction 3/5/2018
Steve Moseley Director of Investments Individual Transaction 3/19/2018
46/511

─
March 2018
Name Position Title Disclosure Type Received
Robin Mason COO Individual Transaction 4/6/2018
Jared Brimberry Portfolio Manager Individual Transaction 4/6/2018
Chris LaVallee Accountant Individual Transaction 4/19/2018
Marcus Frampton Director of Investments Individual Transaction 4/7/2018
Steve Moseley Director of Investments Individual Transaction 3/19/2018
William Moran Trustee Individual Transaction 4/9/2018
All disclosures have been reviewed by the Executive Director or me, in our capacity as compliance officers. All disclosures were in compliance with policy requirements. Disclosures will be filed in the appropriate personnel file and copies will be placed behind the corporate minutes of the next meeting.
If you have any questions, please call me at 796-1541.
47/511

d) Travel
Separator Page
48/511

Subject: Travel ReportDate: 23-May-18
Background: This report includes APFC Board/staff completed travel for the period February 1, 2018 through May 1, 2018. The travel report is presented to the Board of Trustees for review at each board meeting as required by APFC Resolution 04-10.
APFC Trustees and Staff Travel Purpose Location Andreyka Macerich Quarterly Meeting 02/23/18 03/11/18 Washington D.C.Andreyka Meeting with Macerich, L&B Realty Advisors 03/19/18 03/21/18 Los AngelesBrimberry Atalaya Annual Meeting, TPG Annual Meeting 04/30/18 05/09/18 New York, San FranciscoBrown C. BambooHR Conference 04/25/18 05/02/18 Salt Lake City Chang Manager meetings and Context Miami 2018 01/23/18 02/04/18 Dallas, MiamiCummins ABS Vegas - SFUG Vegas 02/24/18 03/01/18 Las VegasDuran Macerich Quarterly Meeting 03/06/18 03/09/18 Washington D.C.Duran Manager meetings 03/19/18 03/21/18 Los AngelesFisher Board of Trustees meeting 02/20/18 02/22/18 JuneauFrampton Generate board meeting 02/07/18 02/08/18 San FranciscoFrampton Attend PPI Conference 03/12/18 03/18/18 Washington D.C.Frampton Manager Meetings 04/23/18 04/26/18 New YorkKim Upfront Ventures Summit 2018, due diligence, manager meetings 01/26/18 02/04/18 Los AngelesKim Due Diligence 02/16/18 03/08/18 San Francisco, Berlin, Boston, New YorkKim Manger Meetings 04/12/18 04/22/18 New YorkKim Manager Meetings 04/13/18 05/06/18 Seattle, New York, Chicago, LAKim Manager Meetings 04/28/18 05/06/18 Los AngelesMack Board of Trustee meeting 02/20/18 02/23/18 JuneauMartinez BNY Mellon Risk Advisory Board Meeting 04/10/18 04/13/18 New YorkMartinez Pacific Northwest Institutional Forum 04/23/18 04/25/18 SeattleMertz BNYM Client Advisory Board meeting 04/17/18 04/23/18 PittsburghMoran Board of Trustees meeting 02/20/18 02/22/18 JuneauMoseley board meetings, manager and advisor meetings, due diligence 02/27/18 03/09/18 Boston, New YorkMoseley manager meetings and due diligence 03/10/18 03/15/18 San FranciscoMoseley Due Diligence, ILPA Board meeting, Catterton Board meeting 03/23/18 04/05/18 New York NY, Austin TXMoseley Premia Board Meeting, Capital Constellation Board Meeting 04/19/18 04/29/18 New YorkNinkov Sociate Generale's Quant conference, manager meetings 04/03/18 04/10/18 New YorkO'Day SFIG Vegas 02/24/18 03/01/18 Las VegasO'Day Meeting with AQR, GSAM, Rogge, and BNY 04/11/18 04/18/18 New YorkParise Visit dealer syndicate and trade desks 01/28/18 02/03/18 New YorkParise Milken Conference and Manager Visits 04/29/18 05/06/18 Los AngelesPoag Institutional Governance and Legal Symposium 04/30/18 05/07/18 London UKRazzaque Fund Manager Site Visit 02/06/18 03/04/18 San Francisco, Los AngelesRazzaque Fund Manager Visit 03/16/18 03/24/18 Washington DC, New YorkRead Manager meetings, FCLT Summit 02/27/18 03/11/18 New York, San FranciscoRead Pension Bridge, SF Managers and NYC Managers 04/07/18 04/22/18 San Francisco, New York, ChicagoRead Milken Global Conference 04/26/18 05/02/18 Los AngelesRichards Board of Trustees meeting 02/20/18 02/22/18 JuneauRodell 2018 GSAM India Investor tour, review investment opportunities 02/01/18 02/09/18 IndiaRodell Kelso Annual Meeting 04/16/18 04/18/18 Orange County, CARodell GWG Funds Roundtable, Manager Meetings, IFSWF Meeting 05/01/18 05/05/18 London UKRutherford Board of Trustees meeting 02/20/18 02/22/18 JuneauSkuratovskaya Goldman's Global Macro conference, meet with counterparts 03/04/18 03/09/18 New YorkSwanson Present to the European Marshall Memorial Fellows 03/09/18 03/09/18 Anchorage
Dates of Travel
49/511

e) Due Diligence Log
Separator Page
50/511

1
APFC Investment Due Dilligence: January 2018 - March 2018
Manager Due Diligence Log - Asset Allocation Strategies
Date of Visit APFC Staff Broker, Manager, Consultant Individuals Visiting/Visited Topic Location1/17/2018 Samantha LaPierre and Valeria Martinez BNY Mellon Anna Pencoglu Securities Lending New York, New York
1/17/2018 Samantha LaPierre and Valeria Martinez GSAM Tom Davie and Rob Patch ECIO Portfolio New York, New York
1/18/2018 Samantha LaPierre and Valeria Martinez AQR Iwan Djanali ECIO Portfolio Greenwich, CT
1/18/2018 Samantha LaPierre and Valeria Martinez Bridgewater Brian Lawlor ECIO Portfolio Westport, CT
1/24/2018 Valeria Martinez Aberdeen Standard Investments Peter Schmole Multi-Asset Portfolios Juneau
1/25/2018 Samantha LaPierre and Valeria Martinez Adrian Lee Philip Lawson FX Overlay Juneau
1/26/2018 Valeria Martinez NISA Anne-Marie Lanza Liquidity Overlay Juneau
2/14/2018 Valeria Martinez AQR Iwan Djanali ECIO Portfolio Juneau
2/28/2018 Valeria Martinez Axioma Ken Fujii Multi-Asset Portfolios Juneau
3/5/2018 Valeria Martinez BNY Mellon Dan Wilcox Asset Allocation Portfolio Juneau
3/6/2018 Valeria Martinez NISA Anne-Marie Lanza Liquidity Overlay Juneau
3/14/2018 Samantha LaPierre and Valeria Martinez GSAM John Goldstein ESG Analysis Juneau
3/19/2018 Samantha LaPierre and Valeria Martinez GSAM Tom Davie and Rob Patch ECIO Portfolio Juneau
3/21/2018 Valeria Martinez Wellington Akin Greville Multi-Asset Portfolios Juneau
Manager Due Diligence Log - Fixed Income Plus
Date of Visit APFC Staff Broker, Manager, Consultant Individuals Visiting/Visited Topic Location1/17/2018 Tom O'Day/Masha Skuratovskaya Bank of New York Chrs Foti Currency Hedging Phone
1/25/2018 Tom O'Day/Masha Skuratovskaya Allianz John Makowske, Sam Hogg, Julian Le Beron Global Rates Phone
3/22/2018 Tom O'Day/Masha Skuratovskaya DB Christopher Engl European Rates Phone
1/17/2018 Matthew Olmsted OakTree David Rosenberg High Yield Phone
2/6/2018 Matthew Olmsted/Jim Parise iShares/BlackRock Andrew Hartman HY ETF Phone
2/5/2018 Masha Skuratovskaya Capital Group Michael Bowman EM External Mandate performance Phone
3/6/2018 Masha Skuratovskaya CSFB Oscar Lopes Global Rates, EM New York
3/7/2018 Masha Skuratovskaya Deutsche Bank Christopher Engl US Rates, US Economy New York
3/7/2018 Masha Skuratovskaya BAML Kate Brethauer US Rates, TIPS, Economy New York
3/7/2018 Masha Skuratovskaya Standard Chartered Mike Burrowes EM Trading, Hedging, FX New York
3/7/2018 Masha Skuratovskaya JPM Richard Singh US Rates, FX trading, ETFs, ISDAs New York
3/8/2018 Masha Skuratovskaya Barclays Mike Pond, James Carpi US TIPS, G4 Economies New York
3/8/2018 Masha Skuratovskaya Allianz/Rogge John Makowske EM New York
3/8/2018 Masha Skuratovskaya BBVA Tim Goodell Latin America Economics/Trading New York
3/22/2018 Masha Skuratovskaya Deutsche Bank Christopher Engl European Rates Strategy Phone
2/12/2018 Chris Cummins JPM/Security Capital REIT Todd Evans REITs APFC
1/29/2018 Jim Parise JP Morgan Syndicate/Trading Desk Allocation/Execution New York
1/29/2018 Jim Parise Citigroup Syndicate/Trading Desk Allocation/Execution New York
1/30/2018 Jim Parise Goldman Sachs Syndicate/Trading Desk Allocation/Execution New York
1/30/2018 Jim Parise Morgan Stanley Syndicate/Trading Desk Allocation/Execution New York
1/31/2018 Jim Parise Barclays Syndicate/Trading Desk Allocation/Execution New York
1/31/2018 Jim Parise Bank of America Syndicate/Trading Desk Allocation/Execution New York
Manager Due Diligence Log - Public Equities
Date of Visit APFC Staff Broker, Manager, Consultant Individuals Visiting/Visited Topic Location1/9/2018 Diouf, Ninkov Alliance Bernstein Liz Smith Strategy Review Juneau, AK
1/9/2018 Ninkov Pavilion Corp Michael Avedesian Strategy Review conference call
1/10/2018 Ninkov SSGA Sonya Park, Paul Colona Strategy Review Juneau, AK
1/11/2018 Diouf, Ninkov Wells Capital Daniel E. Anderson Strategy Review Juneau, AK
1/17/2018 Ninkov DFA Joe Young Strategy Review conference call
1/17/2018 Razzaque Schroders Alan Duckett Quarterly review conference call
1/17/2018 Razzaque Pzena Investment team Quarterly review conference call
1/17/2018 Razzaque Schroders Investment team Quarterly review conference call
1/18/2018 Razzaque Acadian Investment team Quarterly review conference call
1/18/2018 Razzaque Trustbridge Investment team Quarterly review conference call
1/22/2018 Razzaque Arrowstreet Investment team Quarterly review conference call
1/23/2018 Razzaque Jennison Investment team Quarterly review conference call
1/24/2018 Razzaque Lee Munder Investment team Quarterly review conference call
1/24/2018 Razzaque Lyrical Investment team Quarterly review conference call
1/25/2018 Razzaque McKinley Capital Investment team Quarterly review conference call
1/25/2018 Razzaque CDAM Investment team Quarterly review conference call
1/26/2018 Razzaque AGI Investment team Quarterly review conference call
1/29/2018 Razzaque T.Rowe Investment team Quarterly review conference call
1/30/2018 Razzaque DSM Investment team Quarterly review conference call
1/31/2018 Razzaque SKBA Investment team Quarterly review conference call
1/31/2018 Razzaque Wells China Investment team Quarterly review conference call
2/1/2018 Razzaque JP Morgan International Investment team Quarterly review conference call
2/2/2018 Razzaque RBA Investment team Quarterly review conference call
2/5/2018 Razzaque AQR Investment team Quarterly review conference call
2/5/2018 Ninkov SSGA Michael Putica Strategy Review Juneau, AK
2/6/2018 Razzaque Johnston Investment team Quarterly review conference call
2/7/2018 Razzaque William Blair Investment team Quarterly review conference call
2/8/2018 Razzaque JP Morgan EM Investment team Quarterly review conference call
2/9/2018 Ninkov Intech Bret Young Strategy Review conference call
2/12/2018 Razzaque CastleArk Investment team Quarterly review conference call
The due diligence activities undertaken by APFC on-site and off-site are listed below. Conference calls were included if a product was substantially reviewed or previewed during the course of the call.
The due diligence activities undertaken by APFC on-site and off-site are listed below. Conference calls were included if a product was substantially reviewed or previewed during the course of the call.
The due diligence activities undertaken by APFC on-site and off-site are listed below. Conference calls were included if a product was substantially reviewed or previewed during the course of the call.
51/511
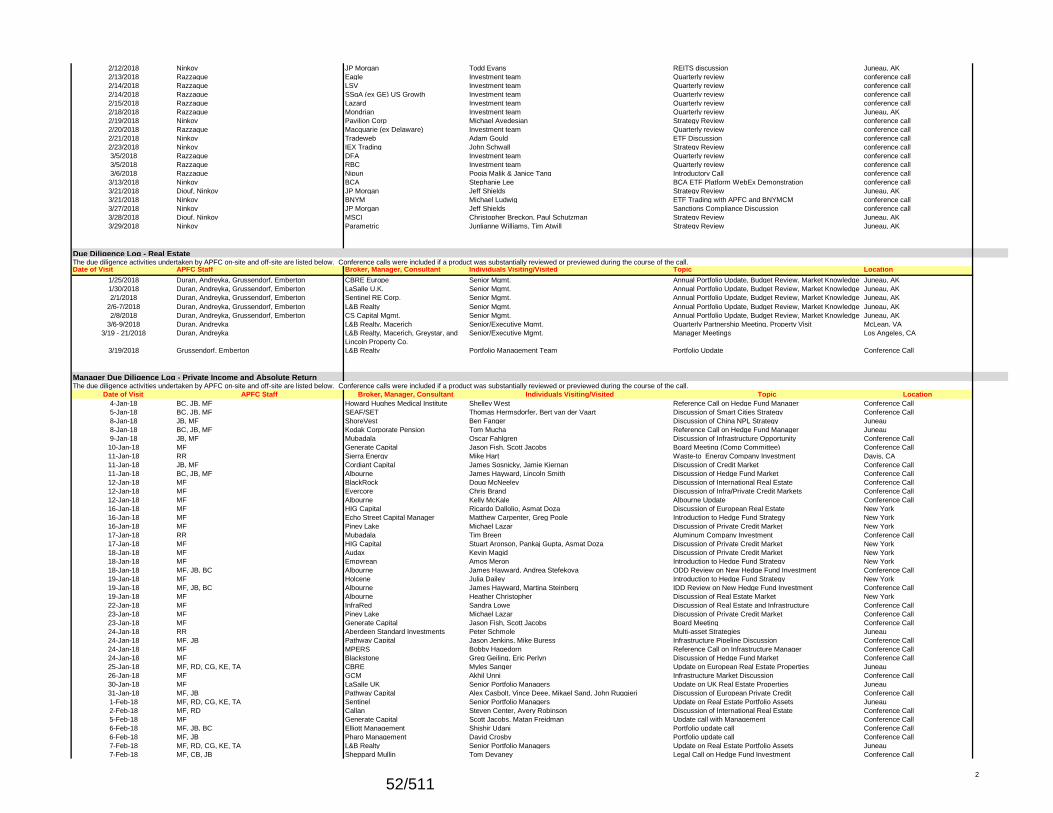
2
2/12/2018 Ninkov JP Morgan Todd Evans REITS discussion Juneau, AK
2/13/2018 Razzaque Eagle Investment team Quarterly review conference call
2/14/2018 Razzaque LSV Investment team Quarterly review conference call
2/14/2018 Razzaque SSgA (ex GE) US Growth Investment team Quarterly review conference call
2/15/2018 Razzaque Lazard Investment team Quarterly review conference call
2/18/2018 Razzaque Mondrian Investment team Quarterly review Juneau, AK
2/19/2018 Ninkov Pavilion Corp Michael Avedesian Strategy Review conference call
2/20/2018 Razzaque Macquarie (ex Delaware) Investment team Quarterly review conference call
2/21/2018 Ninkov Tradeweb Adam Gould ETF Discussion conference call
2/23/2018 Ninkov IEX Trading John Schwall Strategy Review conference call
3/5/2018 Razzaque DFA Investment team Quarterly review conference call
3/5/2018 Razzaque RBC Investment team Quarterly review conference call
3/6/2018 Razzaque Nipun Pooja Malik & Janice Tang Introductory Call conference call
3/13/2018 Ninkov BCA Stephanie Lee BCA ETF Platform WebEx Demonstration conference call
3/21/2018 Diouf, Ninkov JP Morgan Jeff Shields Strategy Review Juneau, AK
3/21/2018 Ninkov BNYM Michael Ludwig ETF Trading with APFC and BNYMCM conference call
3/27/2018 Ninkov JP Morgan Jeff Shields Sanctions Compliance Discussion conference call
3/28/2018 Diouf, Ninkov MSCI Christopher Breckon, Paul Schutzman Strategy Review Juneau, AK
3/29/2018 Ninkov Parametric Junlianne Williams, Tim Atwill Strategy Review Juneau, AK
Due Diligence Log - Real Estate
Date of Visit APFC Staff Broker, Manager, Consultant Individuals Visiting/Visited Topic Location1/25/2018 Duran, Andreyka, Grussendorf, Emberton CBRE Europe Senior Mgmt. Annual Portfolio Update, Budget Review, Market Knowledge Juneau, AK
1/30/2018 Duran, Andreyka, Grussendorf, Emberton LaSalle U.K. Senior Mgmt. Annual Portfolio Update, Budget Review, Market Knowledge Juneau, AK
2/1/2018 Duran, Andreyka, Grussendorf, Emberton Sentinel RE Corp. Senior Mgmt. Annual Portfolio Update, Budget Review, Market Knowledge Juneau, AK
2/6-7/2018 Duran, Andreyka, Grussendorf, Emberton L&B Realty Senior Mgmt. Annual Portfolio Update, Budget Review, Market Knowledge Juneau, AK
2/8/2018 Duran, Andreyka, Grussendorf, Emberton CS Capital Mgmt. Senior Mgmt. Annual Portfolio Update, Budget Review, Market Knowledge Juneau, AK
3/6-9/2018 Duran, Andreyka L&B Realty, Macerich Senior/Executive Mgmt. Quarterly Partnership Meeting, Property Visit McLean, VA
3/19 - 21/2018 Duran, Andreyka L&B Realty, Macerich, Greystar, and
Lincoln Property Co.
Senior/Executive Mgmt. Manager Meetings Los Angeles, CA
3/19/2018 Grussendorf, Emberton L&B Realty Portfolio Management Team Portfolio Update Conference Call
Manager Due Diligence Log - Private Income and Absolute Return
Date of Visit APFC Staff Broker, Manager, Consultant Individuals Visiting/Visited Topic Location4-Jan-18 BC, JB, MF Howard Hughes Medical Institute Shelley West Reference Call on Hedge Fund Manager Conference Call
5-Jan-18 BC, JB, MF SEAF/SET Thomas Hermsdorfer, Bert van der Vaart Discussion of Smart Cities Strategy Conference Call
8-Jan-18 JB, MF ShoreVest Ben Fanger Discussion of China NPL Strategy Juneau
8-Jan-18 BC, JB, MF Kodak Corporate Pension Tom Mucha Reference Call on Hedge Fund Manager Juneau
9-Jan-18 JB, MF Mubadala Oscar Fahlgren Discussion of Infrastructure Opportunity Conference Call
10-Jan-18 MF Generate Capital Jason Fish, Scott Jacobs Board Meeting (Comp Committee) Conference Call
11-Jan-18 RR Sierra Energy Mike Hart Waste-to_Energy Company Investment Davis, CA
11-Jan-18 JB, MF Cordiant Capital James Sosnicky, Jamie Kiernan Discussion of Credit Market Conference Call
11-Jan-18 BC, JB, MF Albourne James Hayward, Lincoln Smith Discussion of Hedge Fund Market Conference Call
12-Jan-18 MF BlackRock Doug McNeeley Discussion of International Real Estate Conference Call
12-Jan-18 MF Evercore Chris Brand Discussion of Infra/Private Credit Markets Conference Call
12-Jan-18 MF Albourne Kelly McKale Albourne Update Conference Call
16-Jan-18 MF HIG Capital Ricardo Dallolio, Asmat Doza Discussion of European Real Estate New York
16-Jan-18 MF Echo Street Capital Manager Matthew Carpenter, Greg Poole Introduction to Hedge Fund Strategy New York
16-Jan-18 MF Piney Lake Michael Lazar Discussion of Private Credit Market New York
17-Jan-18 RR Mubadala Tim Breen Aluminum Company Investment Conference Call
17-Jan-18 MF HIG Capital Stuart Aronson, Pankaj Gupta, Asmat Doza Discussion of Private Credit Market New York
18-Jan-18 MF Audax Kevin Magid Discussion of Private Credit Market New York
18-Jan-18 MF Empyrean Amos Meron Introduction to Hedge Fund Strategy New York
18-Jan-18 MF, JB, BC Albourne James Hayward, Andrea Stefekova ODD Review on New Hedge Fund Investment Conference Call
19-Jan-18 MF Holcene Julia Dailey Introduction to Hedge Fund Strategy New York
19-Jan-18 MF, JB, BC Albourne James Hayward, Martina Steinberg IDD Review on New Hedge Fund Investment Conference Call
19-Jan-18 MF Albourne Heather Christopher Discussion of Real Estate Market New York
22-Jan-18 MF InfraRed Sandra Lowe Discussion of Real Estate and Infrastructure Conference Call
23-Jan-18 MF Piney Lake Michael Lazar Discussion of Private Credit Market Conference Call
23-Jan-18 MF Generate Capital Jason Fish, Scott Jacobs Board Meeting Conference Call
24-Jan-18 RR Aberdeen Standard Investments Peter Schmole Multi-asset Strategies Juneau
24-Jan-18 MF, JB Pathway Capital Jason Jenkins, Mike Buress Infrastructure Pipeline Discussion Conference Call
24-Jan-18 MF MPERS Bobby Hagedorn Reference Call on Infrastructure Manager Conference Call
24-Jan-18 MF Blackstone Greg Geiling, Eric Perlyn Discussion of Hedge Fund Market Conference Call
25-Jan-18 MF, RD, CG, KE, TA CBRE Myles Sanger Update on European Real Estate Properties Juneau
26-Jan-18 MF GCM Akhil Unni Infrastructure Market Discussion Conference Call
30-Jan-18 MF LaSalle UK Senior Portfolio Managers Update on UK Real Estate Properties Juneau
31-Jan-18 MF, JB Pathway Capital Alex Casbolt, Vince Deee, Mikael Sand, John Ruggieri Discussion of European Private Credit Conference Call
1-Feb-18 MF, RD, CG, KE, TA Sentinel Senior Portfolio Managers Update on Real Estate Portfolio Assets Juneau
2-Feb-18 MF, RD Callan Steven Center, Avery Robinson Discussion of International Real Estate Conference Call
5-Feb-18 MF Generate Capital Scott Jacobs, Matan Freidman Update call with Management Conference Call
6-Feb-18 MF, JB, BC Elliott Management Shishir Udani Portfolio update call Conference Call
6-Feb-18 MF, JB Pharo Management David Crosby Portfolio update call Conference Call
7-Feb-18 MF, RD, CG, KE, TA L&B Realty Senior Portfolio Managers Update on Real Estate Portfolio Assets Juneau
7-Feb-18 MF, CB, JB Sheppard Mullin Tom Devaney Legal Call on Hedge Fund Investment Conference Call
The due diligence activities undertaken by APFC on-site and off-site are listed below. Conference calls were included if a product was substantially reviewed or previewed during the course of the call.
The due diligence activities undertaken by APFC on-site and off-site are listed below. Conference calls were included if a product was substantially reviewed or previewed during the course of the call.
52/511

3
7-Feb-18 JB TPG Credit Brian D'Arcy Market and portfolio update Conference Call
8-Feb-18 RD, CG, KE, TA CS Capital Mike McHargue, Joe Spicer Update on Real Estate Portfolio Assets Juneau
8-Feb-18 MF Generate Capital Jason Fish, Scott Jacobs Quarterly Board Meeting San Francisco
9-Feb-18 RR Crestline Zach Smith Aluminum Company Investment Conference Call
12-Feb-18 JB HIG Capital Duncan Priston, Asmat Doza, John Bolduc Discussion of Distressed Debt Opportunity Juneau
13-Feb-18 MF KKR Dan McLaughin Discussion of KKR Infrastructure Fund Conference Call
13-Feb-18 MF Corsair Capital Kelly Ramirez LPAC Call on Infrastructure Fund Conference Call
13-Feb-18 MF BNP Joe Salvatore Discussion of Power Direct Investment Opportunity Conference Call
14-Feb-18 MF CBRE Myles Sanger Discussion of European Real Estate Opportunities Conference Call
14-Feb-18 MF CS Capital Joe Spicer Discussion of Real Assets opportunity Conference Call
14-Feb-18 MF, JB, CP Sheppard Mullin Tom Devaney Legal Call on Private Credit Investment Conference Call
20-Feb-18 MF Asana Partners Brian Purcell Discussion of Real Estate Fund Conference Call
20-Feb-18 MF Lansdowne Partners Julian Colville Update on portfolio and market Conference Call
20-Feb-18 MF CBRE Myles Sanger Discussion of International Real Estate Conference Call
20-Feb-18 MF Pathway Capital Vince Dee, John Ruggieri Private Credit Pipeline Discussion Conference Call
20-Feb-18 MF, TA Brookfield Brian Kingston, Chris Harris Discussion of Global Real Estate Conference Call
21-Feb-18 RR McKinley, Al-Maskari Rob Gillam, Nabyl Al-Maskari, Peter Lejre MEASA Stock Fund Initiative Conference Call
21-Feb-18 MF Stepstone Todd Lapenna Infrastructure discussion Conference Call
22-Feb-18 MF Generate Capital Judy Bornstein, Jeff Colin, Matan Friedman Board Audit Committee Call Conference Call
23-Feb-18 MF Generate Capital Jason Fish, Scott Jacobs and Others Board Finance Committee Call Conference Call
23-Feb-18 MF, JB Goldman Sachs Jessica Yueh, Garrett White Review Model on Infrastructure Project Conference Call
23-Feb-18 MF, JB Crestline Keith Williams, James Delaune Private Credit Discussion Conference Call
23-Feb-18 MF, JB, BC Albourne James Hayward, Julie Lauer Wurster IDD Review on New Hedge Fund Investment Conference Call
26-Feb-18 MF KSL Capital Kenn Lee Review Real Assets Strategy Conference Call
26-Feb-18 MF Blackstone Alexandra Hill Discussion of International Real Estate Conference Call
26-Feb-18 MF, JB, BC Albourne Andrew Mcaloney ODD Review on New Hedge Fund Investment Conference Call
26-Feb-18 MF Goldman Sachs Rob Patch, Thomas Davie Market update call Conference Call
26-Feb-18 MF Generate Capital Scott Jacobs, Matan Freidman Update call with Management Conference Call
27-Feb-18 MF CFM Gaurang Shah Review of Hedge Fund Strategy Conference Call
27-Feb-18 MF Green Tech Capital Steve Megyery Review Direct Investment Opportunity Conference Call
27-Feb-18 MF, JB Empyrean Kate Baumann Review of Hedge Fund Strategy Conference Call
27-Feb-18 MF Ares Julie Solomon Discussion of International Real Estate Conference Call
27-Feb-18 MF Crestline Caroline Cooley Update on Summit hedge fund strategy Conference Call
27-Feb-18 MF Red Reef Farmland Suzanne Petrela Discussion of Agricultural Land strategy Conference Call
27-Feb-18 MF CLSA Chi Wing Leung Discussion of International Real Estate Conference Call
28-Feb-18 RR Blackrock FCLT (Focusing on the Long-Term Conference) Long-Term Investing New York
28-Feb-18 MF CBRE Caledon Igor Nirenshtein Discussion of Infrastructure Opportunity Conference Call
28-Feb-18 MF, JB American Homes 4 Rent David Goldberg Portfolio update call Conference Call
28-Feb-18 MF Morgan Stanley Markus Hottenrott Discuss Infrastructure Investment Opportunity Conference Call
28-Feb-18 MF, JB Albourne James Hayward, Jonathan Choslovsky Discuss Hedge Fund Manager Conference Call
28-Feb-18 MF Activate Capital Raj Atlaru Introductory call on infrastructure strategy Conference Call
1-Mar-18 RR Morgan Stanley Global Asset Allocation Conference Asset Allocation Strategies New York
1-Mar-18 MF Warburg Pincus Jim Wilson Discussion of Private Equity Market Conference Call
1-Mar-18 MF Cityview George Ochs Discussion of Real Estate Opportunity Conference Call
1-Mar-18 MF, CP, JB Sheppard Mullin Tom Devaney Discussion of two in process investments Conference Call
1-Mar-18 MF Ardian Erin Odisio Discussion of International Real Estate Conference Call
2-Mar-18 MF Tishman Speyer Jackie Fuld Discussion of International Real Estate Conference Call
2-Mar-18 MF Heitman John Mancuso Discussion of International Real Estate Conference Call
5-Mar-18 RR Access Alts Association Access Alts Industry Association Asian Hedge Fund Managers New York
5-Mar-18 MF Macquarie Sean Fitzgerald Discussion of Private Markets Investment Opportunity Conference Call
5-Mar-18 MF JLC Infra Rob Keough Discussion of Infrastructure Opportunity Conference Call
5-Mar-18 MF, RD HIG Capital Asmat Doza, Riccardo Dallolio Discussion of European Real Estate Market Juneau
5-Mar-18 JB TPG Credit Jaime Gates, Brian D'arcy Discussion credit investment opportunity Conference Call
5-Mar-18 MF, JB Pathway Capital Jason Jenkins, Mike Buress Discussion of in-process infrastructure investment Conference Call
5-Mar-18 MF, CP Cox Castle Amy Wells Discussion of Market Real Estate Fund Terms Conference Call
5-Mar-18 MF SC Capital Ho Liwen Discussion of International Real Estate Conference Call
6-Mar-18 MF JPMorgan Jeffrey Shields; Peter Reilly; Janet Field; Todd Evans Discussion of European Real Estate Conference Call
6-Mar-18 MF, JB GIP Michael McGhee Portfolio Company Update - Terminal Investments Ltd. Conference Call
6-Mar-18 MF, RD Henderson Park Nick Weber Discussion of European Real Estate Conference Call
6-Mar-18 MF, RD Meyer Bergman Markus Meijer, Sanjiv Raykundalia, Tami Chuang Discussion of European Real Estate Conference Call
6-Mar-18 MF, RD Harbert Scott O'Donnell, Rich Brereton Discussion of European Real Estate Conference Call
6-Mar-18 MF CBRE Caledon Aaron Vale Discussion of Confidential Infrastructure Transaction Conference Call
6-Mar-18 MF, JB, CP Sheppard Mullin Tom Devaney Discussion of In-process private credit investment Conference Call
6-Mar-18 MF Activate Capital Raj Atlaru, Anup Jacob Discussion of Infrastructure Opportunity Conference Call
6-Mar-18 MF, JB Morgan Stanley Raja Parthasarathy, Greg Best Disussion of India Infrastructure Conference Call
7-Mar-18 MF Oaktree Talbot Carlton Private Markets Discussion Conference Call
7-Mar-18 MF Varde Partners Tim Mooney, Eric Perry Discussion of European Real Estate Conference Call
7-Mar-18 MF Bain Capital Steve Radokovich Discussion of Real Estate market Conference Call
7-Mar-18 MF Generate Capital Judy Bornstein, Scott Jacobs, Matan Friedman Review Budget and Projections Conference Call
7-Mar-18 MF TPG Real Estate Kelvin Davis Review TPG's Real Estate activities Conference Call
7-Mar-18 MF Alpha Investment Partners Marie Yan, Lok Kuan Young Discussion of Asia Real Estate Conference Call
8-Mar-18 MF Benson Elliot Laura Coleman, Trish Barrigan, Rupal Shah Discussion of European Real Estate Conference Call
8-Mar-18 MF Moorfield Group Marc Gilbard, Charlie Ferguson-Davie, Robbert Zoet Discussion of European Real Estate Conference Call
8-Mar-18 MF Guggenheim Partners Jim Pass Infrastructure discussion Juneau
8-Mar-18 MF, BC, JB HHMI Shelley West Reference Call on in-process hedge fund investment Conference Call
8-Mar-18 MF Heitman John Mancuso Discussion of Asia Real Estate Conference Call
9-Mar-18 MF Field Street Aaron Gillespie Absolute Return portfolio review Conference Call
9-Mar-18 MF, JB, BC Winton Ramyata Joshi, Nick Smith Absolute Return portfolio review Conference Call
13-Mar-18 MF Sloan Foundation Will Maslovsky Reference Call on in-process hedge fund investment Conference Call
53/511

4
14-Mar-18 MF Brookfield Barry Blattman Discussion of International Real Estate Washington DC
15-Mar-18 MF Callan Steven Center, Avery Robinson Discussion of International Real Estate Conference Call
19-Mar-18 MF AXA Real Estate Matt Holberton Discussion of European Real Estate Conference Call
19-Mar-18 MF Angelo Gordon Aliana Spungen Discussion of Asia Real Estate Conference Call
19-Mar-18 MF Phoenix Katie Chau Discussion of Asia Real Estate Conference Call
20-Mar-18 JB GoldenTree Asset Management Laurie Katz Update on Structured Products market Conference Call
20-Mar-18 MF AEW Laura Banks, Alex Griffiths, Rob Wilkinson Discussion of European Real Estate Conference Call
20-Mar-18 MF Gaw Capital Mike Hu Discussion of Asia Real Estate Conference Call
20-Mar-18 MF Barings Asia Tom Addison, Dora Chan Discussion of Asia Real Estate Conference Call
21-Mar-18 MF Hancock Natural Resources Glenn Smith Discussion of Investment Opportunity Conference Call
21-Mar-18 MF Aermont Capital Nathan Shike, Camilla Mathews Discussion of European Real Estate Conference Call
21-Mar-18 MF California Endowment David Greenberg Reference Call on in-process hedge fund investment Conference Call
21-Mar-18 MF Albourne Lincoln Smith, Tom Cawkwell, Kelly McKale Private Markets and Hedge Fund Discussion Juneau
21-Mar-18 MF Generate Capital Scott Jacobs Update call with Management Conference Call
22-Mar-18 MF Morgan Stanley Markus Hottenrott Portfolio and Market Update Conference Call
22-Mar-18 MF JPMorgan Jeffrey Shields Real Estate and Hedge Fund Discussion Juneau
26-Mar-18 MF Callan Steven Center, Avery Robinson Discussion of International Real Estate Conference Call
27-Mar-18 MF Global Infrastructure Partners Matt Harris Portfolio and Market Update Conference Call
27-Mar-18 MF CBRE Myles Sanger, Charles Baigler, Jeremy Plummer Discussion of European Real Estate Conference Call
27-Mar-18 MF Morgan Stanley Greg Best, Markus Hottenrott Infrastructure discussion Juneau
27-Mar-18 MF Park Hill Group Zachary Stassi Discussion of International Real Estate Juneau
27-Mar-18 MF Pathway Capital Jason Jenkins, Mike Buress Infrastructure Pipeline Discussion Conference Call
29-Mar-18 MF, RD, TA Callan Steven Center, Avery Robinson Due Diligence on International Real Estate Funds Conference Call
Manager Due Diligence Log - Private Equity and Special Opportunities
Date of Visit APFC Staff Broker, Manager, Consultant Individuals Visiting/Visited Topic Location2-Jan-18 SM, YK Pathway Senior management Fund due diligence Call
2-Jan-18 YK Arch Ventures Senior management Direct deal diligence Call
3-Jan-18 SM, YK Crestline Deal team Direct deal diligence Call
3-Jan-18 YK NGP Senior management Fund due diligence Call
3-Jan-18 YK Pavilion Deal team Direct deal diligence Call
5-Jan-18 YK NIO Management team Direct deal diligence SF
5-Jan-18 YK DCVC Senior management Fund due diligence SF
8-Jan-18 YK West Arrow Senior management Direct deal diligence Call
8-Jan-18 YK Allurion Management team Direct deal diligence SF
8-Jan-18 YK Guidepoint Reference Direct deal diligence SF
9-Jan-18 YK Evelo Management team Direct deal diligence SF
9-Jan-18 YK Altos Ventures Senior management Fund due diligence SF
9-Jan-18 YK Pavilion Deal team Fund due diligence SF
9-Jan-18 YK Apax Senior management Fund due diligence Call
9-Jan-18 YK Baring Asia Senior management Fund due diligence Call
10-Jan-18 YK H3 Biomedicine Management team Direct deal diligence SF
10-Jan-18 SM, YK Crestline Deal team Direct deal diligence SF
10-Jan-18 YK Grail Management team Direct deal diligence SF
10-Jan-18 YK Capricorn Senior management Fund due diligence SF
11-Jan-18 YK UBS Deal team Fund due diligence SF
11-Jan-18 YK Arch Ventures Deal team Direct deal diligence SF
11-Jan-18 YK General Atlantic Senior management Fund due diligence SF
12-Jan-18 YK Crescent Point Senior management Fund due diligence SF
12-Jan-18 YK SVB Capital Senior management Fund due diligence SF
12-Jan-18 YK Saildrone Senior management Direct deal diligence SF
12-Jan-18 YK Joby Senior management Direct deal diligence SF
15-Jan-18 YK Builders / Ascus Senior management Direct deal diligence SD
15-Jan-18 YK Braidy Senior management Direct deal diligence Call
17-Jan-18 YK Braidy Senior management Direct deal diligence Call
17-Jan-18 YK Borealis Senior management Fund due diligence Call
17-Jan-18 YK NGP Deal team Direct deal diligence Call
17-Jan-18 SM, YK Pathway Deal team Fund due diligence Call
17-Jan-18 YK Lightspeed Senior management Fund due diligence Call
17-Jan-18 YK General Catalyst Senior management Fund due diligence Call
18-Jan-18 YK Insight Senior management Fund due diligence Call
18-Jan-18 YK Joby Senior management Direct deal diligence Call
18-Jan-18 YK NGP Deal team Direct deal diligence Call
18-Jan-18 YK Fountainvest Senior management Fund due diligence Call
18-Jan-18 YK EvHive Senior management Direct deal diligence Call
19-Jan-18 YK Carbonsul Senior management Direct deal diligence Call
19-Jan-18 YK GS Coop Fund Senior management Fund due diligence Call
19-Jan-18 YK IP Group Senior management Direct deal diligence Call
22-Jan-18 YK SpaceX Deal team Direct deal diligence Call
24-Jan-18 YK Camino Senior management Direct deal diligence Call
24-Jan-18 YK Sky9 Senior management Fund due diligence Call
25-Feb-18 YK Nordic Senior management Fund due diligence Call
25-Feb-18 YK TIF Senior management Fund due diligence Call
29-Jan-18 YK Lightspeed Senior management Fund due diligence Call
6-Feb-18 SM, YK Crestline Senior management Fund due diligence Call
6-Feb-18 YK Sprout Senior management Fund due diligence SF
6-Feb-18 YK NGP Senior management Direct deal diligence Call
7-Feb-18 SM, YK Pathway Deal team Fund due diligence Call
The due diligence activities undertaken by APFC on-site and off-site are listed below. Conference calls were included if a product was substantially reviewed or previewed during the course of the call.
54/511

5
7-Feb-18 SM, YK Pathway Deal team Direct deal diligence Call
8-Feb-18 SM, YK Blackrock Senior management Fund due diligence Call
9-Feb-18 SM, YK Stepstone Senior management Fund due diligence Juneau
9-Feb-18 YK Hillhouse Senior management Fund due diligence Call
9-Feb-18 YK Canaan Senior management Direct deal diligence Call
12-Feb-18 YK Exponent Senior management Fund due diligence Call
12-Feb-18 YK Silver Point Senior management Fund due diligence Call
12-Feb-18 YK JP Morgan Deal team Direct deal diligence Call
12-Feb-18 YK HIG Senior management Fund due diligence Juneau
13-Feb-18 SM, YK EGA Senior management Direct deal diligence Call
13-Feb-18 YK Gemstone Senior management Direct deal diligence Call
14-Feb-18 YK Northgate Senior management Fund due diligence Call
14-Feb-18 YK Camino Senior management Direct deal diligence Call
14-Feb-18 YK Builders Senior management Fund due diligence Call
15-Feb-18 SM, YK L Catterton Senior management Direct deal diligence Call
15-Feb-18 SM, YK Pathway Deal team Direct deal diligence Call
16-Feb-18 YK Canaan Senior management Direct deal diligence Call
20-Feb-18 SM, YK Pathway Deal team Fund due diligence Call
20-Feb-18 SM, YK Kelso Senior management Direct deal diligence Call
20-Feb-18 YK Sprout Senior management Fund due diligence SF
20-Feb-18 YK SVB Capital Senior management Fund due diligence SF
23-Feb-18 SM, YK Kelso Deal team Direct deal diligence SF
23-Feb-18 YK Holtzbrink Senior management Fund due diligence Meeting
23-Feb-18 YK NorthCapital Senior management Direct deal diligence Meeting
25-Feb-18 YK W Capital Senior management Fund due diligence Meeting
26-Feb-18 YK Vickers Ventures Senior management Fund due diligence Meeting
26-Feb-18 YK Rocket Internet Senior management Fund due diligence Meeting
26-Feb-18 YK Monomoy Capital Senior management Fund due diligence Meeting
26-Feb-18 YK Vista Senior management Fund due diligence Meeting
26-Feb-18 YK Top Tier Senior management Fund due diligence Meeting
26-Feb-18 YK Ridgemont Senior management Fund due diligence Meeting
26-Feb-18 YK Evercore Senior management Fund due diligence Meeting
26-Feb-18 YK Sun Capital Senior management Fund due diligence Meeting
26-Feb-18 YK Disruptive Senior management Fund due diligence Meeting
27-Feb-18 YK TDR Senior management Fund due diligence Meeting
27-Feb-18 YK Vista Senior management Fund due diligence Meeting
27-Feb-18 YK CIEP Senior management Fund due diligence Meeting
27-Feb-18 YK Nordic Senior management Fund due diligence Meeting
27-Feb-18 YK Apax Senior management Fund due diligence Meeting
27-Feb-18 YK Actera Senior management Fund due diligence Meeting
27-Feb-18 YK Gridiron Senior management Fund due diligence Meeting
27-Feb-18 YK Rocket Internet Senior management Fund due diligence Meeting
27-Feb-18 YK Bain Capital Senior management Fund due diligence Meeting
27-Feb-18 YK Vista Senior management Fund due diligence Meeting
2-Mar-18 YK Holtzbrink Senior management Direct deal diligence Call
2-Mar-18 SM, YK Crestline Senior management Direct deal diligence Call
2-Mar-18 YK Performance Equity Senior management Direct deal diligence Call
5-Mar-18 YK Providence Senior management Direct deal diligence NYC
5-Mar-18 YK Two Sigma Senior management Fund due diligence NYC
6-Mar-18 YK One Equity Senior management Fund due diligence NYC
6-Mar-18 YK Warburg Pincus Senior management Fund due diligence NYC
6-Mar-18 YK GS Coop Fund Senior management Fund due diligence NYC
6-Mar-18 YK Sunfarm Senior management Direct deal diligence NYC
7-Mar-18 YK Towerbrook Senior management Fund due diligence NYC
7-Mar-18 YK Menda Senior management Fund due diligence NYC
7-Mar-18 YK Charlesbank Senior management Fund due diligence NYC
9-Mar-18 YK Primavera Senior management Fund due diligence Call
12-Mar-18 YK Lightspeed Deal team Direct deal diligence Call
12-Mar-18 YK Braidy Senior management Direct deal diligence Call
12-Mar-18 SM, YK Pathway Deal team Fund due diligence Call
13-Mar-18 YK Mubadala Deal team Direct deal diligence Call
13-Mar-18 YK Quad C Senior management Fund due diligence Call
13-Mar-18 YK Rittenhouse Senior management Fund due diligence Call
13-Mar-18 YK New Horizon Senior management Fund due diligence Call
13-Mar-18 YK Braidy Senior management Direct deal diligence Call
15-Mar-18 SM, YK Summit Deal team Direct deal diligence Call
16-Mar-18 YK Providence Senior management Direct deal diligence Call
16-Mar-18 SM, YK Summit Deal team Direct deal diligence Call
18-Mar-18 YK Sprout Senior management Fund due diligence Call
19-Mar-18 YK Braidy Senior management Direct deal diligence Call
19-Mar-18 YK Sound Mgmt Management team Direct deal diligence Call
19-Mar-18 YK Hillhouse Senior management Fund due diligence Call
19-Mar-18 SM, YK Crestline Deal team Direct deal diligence Call
20-Mar-18 SM, YK Crestline Deal team Direct deal diligence Call
20-Mar-18 SM, YK Pathway Deal team Direct deal diligence Call
20-Mar-18 YK Metacrine Management team Direct deal diligence Call
20-Mar-18 YK Lightspeed Senior management Fund due diligence Call
21-Mar-18 SM, YK Summit Senior management Direct deal diligence Call
22-Mar-18 SM, YK Indigo Senior management Direct deal update Call
55/511

6
22-Mar-18 YK Sprout Senior management Fund due diligence Call
22-Mar-18 YK Goodwater Senior management Fund due diligence Call
22-Mar-18 SM, YK Blackrock Senior management Fund due diligence Call
23-Mar-18 YK Zymergen Senior management Direct deal diligence Call
23-Mar-18 YK UBS Deal team Fund due diligence Call
56/511

f) Staff Education & Training
Separator Page
57/511
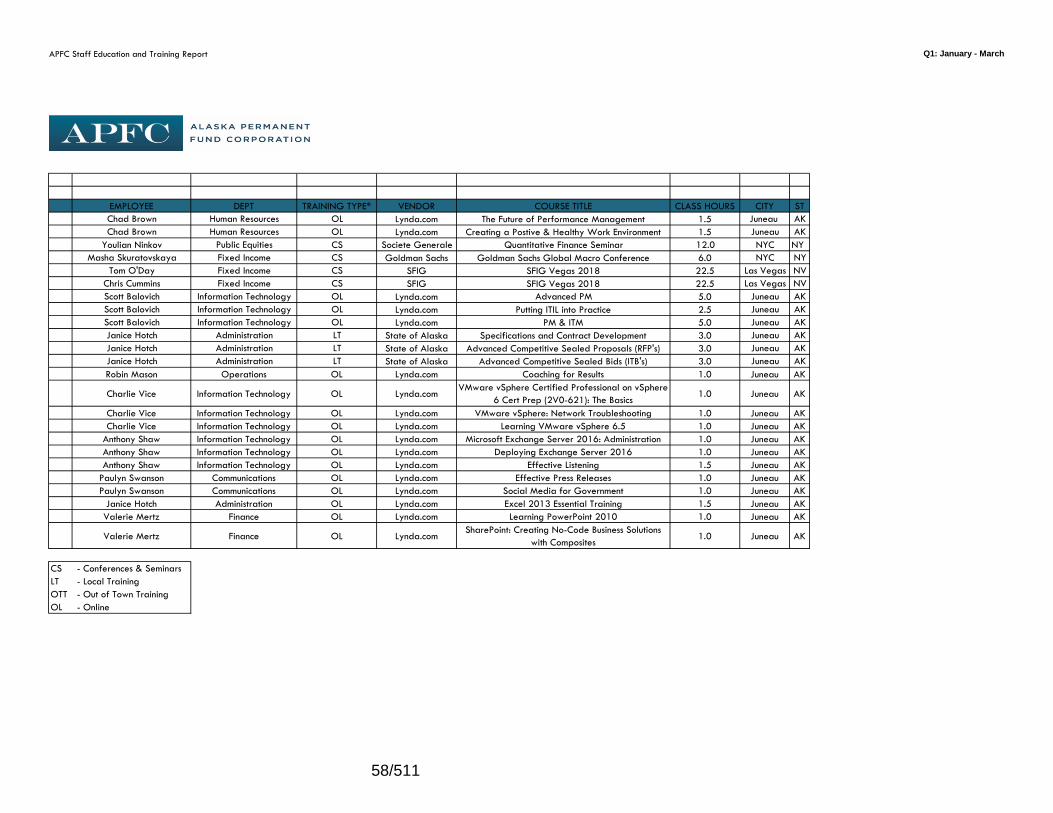
APFC Staff Education and Training Report Q1: January - March
EMPLOYEE DEPT TRAINING TYPE* VENDOR COURSE TITLE CLASS HOURS CITY ST
Chad Brown Human Resources OL Lynda.com The Future of Performance Management 1.5 Juneau AK
Chad Brown Human Resources OL Lynda.com Creating a Postive & Healthy Work Environment 1.5 Juneau AK
Youlian Ninkov Public Equities CS Societe Generale Quantitative Finance Seminar 12.0 NYC NY
Masha Skuratovskaya Fixed Income CS Goldman Sachs Goldman Sachs Global Macro Conference 6.0 NYC NY
Tom O'Day Fixed Income CS SFIG SFIG Vegas 2018 22.5 Las Vegas NV
Chris Cummins Fixed Income CS SFIG SFIG Vegas 2018 22.5 Las Vegas NV
Scott Balovich Information Technology OL Lynda.com Advanced PM 5.0 Juneau AK
Scott Balovich Information Technology OL Lynda.com Putting ITIL into Practice 2.5 Juneau AK
Scott Balovich Information Technology OL Lynda.com PM & ITM 5.0 Juneau AK
Janice Hotch Administration LT State of Alaska Specifications and Contract Development 3.0 Juneau AK
Janice Hotch Administration LT State of Alaska Advanced Competitive Sealed Proposals (RFP's) 3.0 Juneau AK
Janice Hotch Administration LT State of Alaska Advanced Competitive Sealed Bids (ITB's) 3.0 Juneau AK
Robin Mason Operations OL Lynda.com Coaching for Results 1.0 Juneau AK
Charlie Vice Information Technology OL Lynda.comVMware vSphere Certified Professional on vSphere
6 Cert Prep (2V0-621): The Basics1.0 Juneau AK
Charlie Vice Information Technology OL Lynda.com VMware vSphere: Network Troubleshooting 1.0 Juneau AK
Charlie Vice Information Technology OL Lynda.com Learning VMware vSphere 6.5 1.0 Juneau AK
Anthony Shaw Information Technology OL Lynda.com Microsoft Exchange Server 2016: Administration 1.0 Juneau AK
Anthony Shaw Information Technology OL Lynda.com Deploying Exchange Server 2016 1.0 Juneau AK
Anthony Shaw Information Technology OL Lynda.com Effective Listening 1.5 Juneau AK
Paulyn Swanson Communications OL Lynda.com Effective Press Releases 1.0 Juneau AK
Paulyn Swanson Communications OL Lynda.com Social Media for Government 1.0 Juneau AK
Janice Hotch Administration OL Lynda.com Excel 2013 Essential Training 1.5 Juneau AK
Valerie Mertz Finance OL Lynda.com Learning PowerPoint 2010 1.0 Juneau AK
Valerie Mertz Finance OL Lynda.comSharePoint: Creating No-Code Business Solutions
with Composites1.0 Juneau AK
CS - Conferences & Seminars
LT - Local Training
OTT - Out of Town Training
OL - Online
58/511

Communications
Separator Page
59/511

SUBJECT: Communications ACTION: DATE: 5/23/2018 INFORMATION: X
Communications The primary objectives of the Communication’s program this past quarter have been to message “How the Fund Works”, impart a foundational understanding of the various components of the Fund, and in accordance with the Trustees’ resolutions 17-01 and 18-01 promote the importance of inflation proofing the Principal to maintain its value over time and of a rules based structure for withdrawals from the Fund. Time has been spent talking with Alaska lawmakers, Alaskan citizens and members of the media to facilitate a better understanding of the Alaska Permanent Fund and the work that the Alaska Permanent Fund Corporation is doing to ensure prudent management of the assets that are under our stewardship. Presentations – Discussions - Interviews Angela Rodell, Chief Executive Officer, talked about the history, governance, investment structure, and performance of the Alaska Permanent Fund Corporation and the Alaska Permanent Fund during the following:
March 2018
KTOO, Solutions Desk, On-Air Interview with Anne Hillman
Alaska State Legislature, House Finance Committee – HJR 23 Questions
Meetings with Legislative Leadership to Discuss Resolutions 18-01 and 17-01
Alaska State Legislature, House State Affairs Committee – Fund Governance Presentation
Alaska State Legislature, Senate Finance Budget SubCommittee – FY19 Operating Budget
April 2018
Juneau Empire, Interview with James Brooks
Alaska State Legislature, Senate Finance Committee – HB 287 Questions
Alaska State Legislature, House State Affairs Committee – HJR 41 Questions May 2018
KTVA, On-Camera Interview with Steve Quinn – “How the Fund Works” and SB 26
60/511

Financial Report
Separator Page
61/511

Alaska Permanent Fund Corpora on 1
Fiscal Year 2018 Net Assets
Balances through March 31, 2018 (in millions)
Fiscal Year 2018 Income
For the nine months ending March 31, 2018 (in millions)
Statutory (Realized) Net Income
Interest, dividends, real estate, and other income $1,124.1
Realized gains on the sale of invested assets $3,926.5
Less opera ng expenses/legisla ve appropria ons ($113.2)
Alaska Capital Income Fund commi ed realized earnings ($33.7)
Statutory net income $4,903.7
GAAP (Accoun ng) Net Income
Statutory net income $4,903.7
Unrealized gains on invested assets $313.4
Alaska Capital Income Fund commi ed realized earnings $33.7
Accoun ng net income $5,250.8
Total assets $65,437.5
Less liabili es ($826.6)
Net assets $64,610.9
Fund Balances:
Nonspendable
Permanent Fund corpus—contribu ons and appropria ons $40,115.2
Not in spendable form—unrealized apprecia on on invested assets $6,847.8
Total nonspendable fund balance $46,963.0
Commi ed
Current FY dividend $ ‐
Current FY infla on proofing $ ‐
Current FY AK Capital Income Fund $33.7
$33.7
Assigned for future appropria ons
Realized earnings $15,040.9
Unrealized apprecia on on invested assets $2,573.3
Total assigned fund balance $17,614.2
Total fund balances $64,610.9
Commi ed fund balance
Financial Report March 31, 2018
62/511

Alaska Permanent Fund Corpora on 2
Statutory Net Income, Fiscal Years 2015 ‐ 2018
Comprised of receipts from interest on fixed income, real estate rentals, stock dividends, and all realized gains and losses on the sales of invested assets, less AK Capital Income Fund commi ed amounts and opera ng expenses.
FY15 statutory net income was $2,907.3 million. FY16 statutory net income was $2,198.2 million. FY17 statutory net income was $3,214.27 million. FY18 statutory net income through March 31st was $4,903.7 million.
GAAP Accoun ng Net Income (Loss), Fiscal Years 2015 ‐ 2018
Accoun ng net income is the same as statutory net income, except it includes unrealized gains and losses. Accoun ng net income for FY15 was $2.4 billion. Accoun ng net income for FY16 was $398.5 million. Accoun ng net income for FY17 was $6.7 billion. Accoun ng net income for FY18 through March 31st was $5,250.8 million.
(mill
ion
s)
(mill
ion
s)
63/511
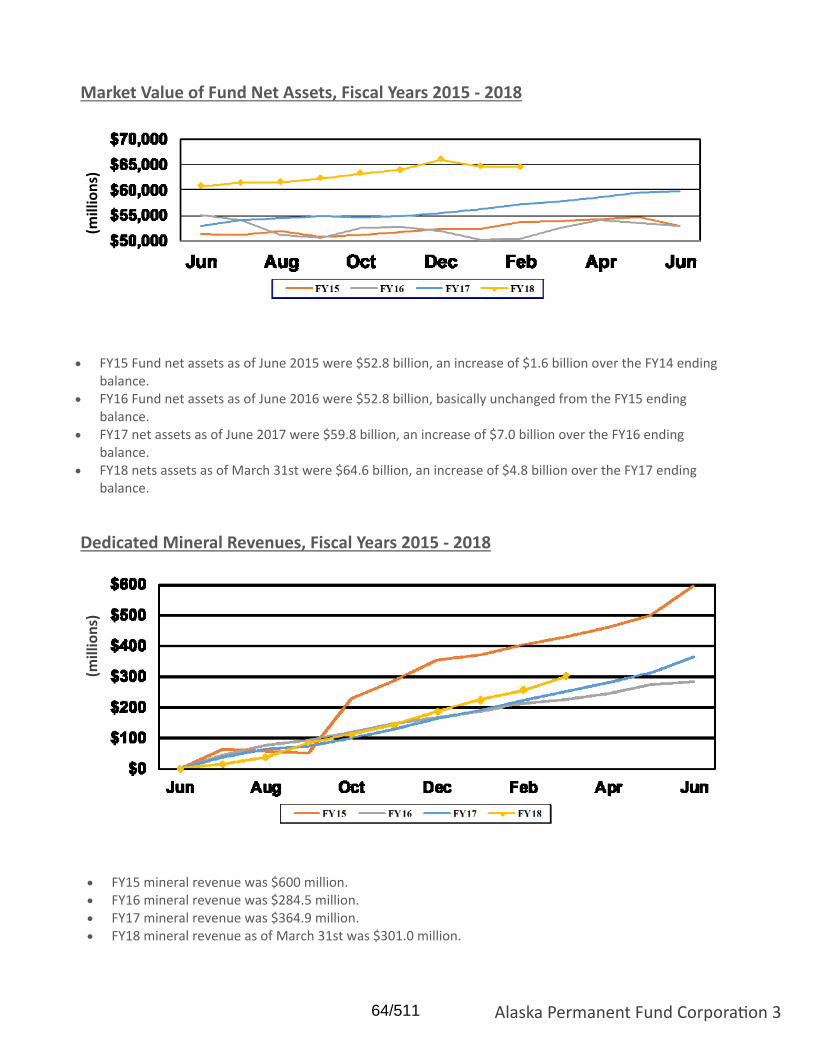
Alaska Permanent Fund Corpora on 3
Market Value of Fund Net Assets, Fiscal Years 2015 ‐ 2018
Dedicated Mineral Revenues, Fiscal Years 2015 ‐ 2018
FY15 Fund net assets as of June 2015 were $52.8 billion, an increase of $1.6 billion over the FY14 ending
balance. FY16 Fund net assets as of June 2016 were $52.8 billion, basically unchanged from the FY15 ending
balance. FY17 net assets as of June 2017 were $59.8 billion, an increase of $7.0 billion over the FY16 ending
balance. FY18 nets assets as of March 31st were $64.6 billion, an increase of $4.8 billion over the FY17 ending
balance.
FY15 mineral revenue was $600 million. FY16 mineral revenue was $284.5 million. FY17 mineral revenue was $364.9 million. FY18 mineral revenue as of March 31st was $301.0 million.
(mill
ion
s)
(mill
ion
s)
64/511

Alaska Permanent Fund Corpora on 4
Alaska Permanent Fund Historical Returns, Fiscal Year 1998‐2017 Total return minus infla on equals real return
Total return annualized over 33 years is 8.90% Real return annualized over 33 years is 6.25%
Total return annualized over 33 years is 8.90% Realized return annualized over 32 years is 7.49%
Alaska Permanent Fund Historical Returns, Fiscal Year 1998‐2017 Total return minus unrealized gains/losses equals realized return
65/511

ALASKA PERMANENT FUND
Balance Sheets
Unaudited March 31, June 30,(millions of dollars) 2018 2017
AssetsCash and temporary investments $ 4,935.0 2,653.5
Re Receivables, prepaid expenses and other assets 681.2 544.8
Investments: Marketable debt securities bs 11,624.6 10,114.6Preferred and common stock bs 26,027.9 25,354.4Real estate bs 5,486.8 6,886.8
AbsoluAbsolute return 5,093.2 4,567.0DisMePublic-private credit 1,279.4 1,111.8
PrivPrivate equity 7,437.6 6,818.1InfrInfrastructure 2,871.8 2,458.3
Total investments 59,821.3 57,311.0
TOTAL ASSETS $ 65,437.5 60,509.3
LiabilitiesAccounts payable bs $ 826.6 699.1Income distributable to the State of Alaska 0.0 25.1
TOTAL LIABILITIES 826.6 724.2
Fund Balances
Nonspendable: ConPermanent Fund corpus - contributions and appropriations 40,115.2 39,814.3Un Not in spendable form - unrealized appreciation on invested assets 6,847.8 7,155.3
ToTotal nonspendable 46,963.0 46,969.6
Committed:ReCurrent FY dividend 0.0 0.0ReCurrent FY inflation proofing 0.0 0.0ReCurrent FY AK Capital Income Fund 33.7 0.0
Total committed 33.7 0.0Assigned for future appropriations:
Realized earnings 15,040.9 10,863.2Un Unrealized appreciation on invested assets 2,573.3 1,952.3
Total assigned 17,614.2 12,815.5
TOTAL FUND BALANCES 64,610.9 59,785.1
TOTAL LIABILITIES AND FUND BALANCES $ 65,437.5 60,509.3
66/511

Statements of Revenues, Expenditures and Changesin Fund Balances
Month ended Nine months Fiscal year-endUnaudited March 31, ended March 31, audited June 30,(millions of dollars) 2018 2018 2017
Revenues
Interest is $ 39.9 332.1 310.8Dividends is 79.7 439.1 563.0Real estate and other income 62.9 352.9 380.3
Total interest, dividends, real estateand other income 182.5 1,124.1 1,254.1
Net increase (decrease) in the fair value of investments:Marketable debt securities 15.6 (166.6) (62.5)Preferred and common stock (546.5) 2,461.2 4,125.6Real estate 17.2 122.6 102.6
urn isAbAbsolute return (17.9) 228.7 351.8Dist M Public-private credit 8.8 39.1 85.3
Pr Private equity 149.0 1,314.8 1,056.6InfInfrastructure 86.9 277.3 259.2DeDerivative Instruments (31.2) (80.7) 69.1
Currency 23.1 43.5 (436.4)
Total net increase (decrease) in investments (295.0) 4,239.9 5,551.3
TOTAL REVENUES (112.5) 5,364.0 6,805.4
ExpendituresOperating expenditures (14.1) (104.6) (121.2)
LegiOther legislative appropriations 0.0 (8.6) (8.6)
TOTAL EXPENDITURES (14.1) (113.2) (129.8)
Excess (deficiency) of revenue over expenditures $ (126.6) 5,250.8 6,675.6
Other Financing Sources (Uses)Transfers in 45.7 301.0 364.9Transfers out 0.0 (726.0) (25.1)
NET CHANGE IN FUND BALANCES (80.9) 4,825.8 7,015.4
Fund BalancesBeginning of period 64,691.8 59,785.1 52,769.7
End of period $ 64,610.9 64,610.9 59,785.1
Statutory Income CalculationExcess (deficiency) of revenues over (under) expenditures (126.6) 5,250.8 6,675.6Adjustments to bring net income to statutory net income:SNUnrealized (gains) losses 1,042.5 (313.4) (3,436.3)
Alaska Capital Income Fund realized income (6.3) (33.7) (25.1)
SNI AmSTATUTORY NET INCOME $ 909.6 4,903.7 3,214.2
ALASKA PERMANENT FUND
67/511

Receivables and Payables
Unaudited March 31,(millions of dollars) 2018
Accounts Receivable
Interest Receivable $ 99.3Dividends Receivable 68.4Foreign Exchange Contracts Receivable (0.6)Pending Sales Fixed Income 274.7Pending Sales Equities 65.1
PenPending Sales Alternative Investments 120.0State Dedicated Revenues Receivable 52.8
PenPending Sales Real Estate/REITs 1.5
Prepaid and Other Receivables 0.0
RecTOTAL RECEIVABLES $ 681.2
Accounts PayableOperating Accrued PayablesFo Accrued Operating Payables $ 28.8
Pending Purchase Fixed Income 703.1PenPending Purchase Equities 78.3
Pending Purch. Alt. Investmnt 15.0Pe Pending Purchase Real Estate/REITs 1.4
AcTOTAL PAYABLES $ 826.6
ALASKA PERMANENT FUND
68/511

FY-Begin Dedicated (2) FY-End FY-End Non- Acct. Statutory FY-End Net FY-EndContrib. Appro- (1) State Inflation Balance Net FY-End spendable Net Net Inf-Proofing Gen. Fund Balance Net FY-End Assigned Assigned
FY Balance priations Revenues Proofing Contributions Change Balance Balance Income (3) Income (3) Dividends / Other (10) / Other (4) Realized Change Balance (5) Change Balance FY77-08 0 7,039 10,537 11,573 29,149 2,312 2,064 31,213 37,724 37,556 16,652 15,314 421 4,969 352 352 5,942 5,321 77-08 36,534
09 29,149 0 651 1,144 30,945 (3,513) (1,449) 29,496 (6,394) (2,509) (8) 875 1,144 0 (8) 441 (373) (21) (4,901) 420 09 29,91710 30,944 0 679 0 (9) 31,624 1,869 421 32,045 3,517 1,590 (8) 858 0 (9) 0 (8) 1,194 37 16 790 1,210 10 33,25511 31,624 0 887 533 33,044 4,367 4,788 37,832 6,812 2,143 (8) 801 533 13 (8) 2,016 276 292 1,098 2,308 11 40,14012 33,044 0 915 1,073 35,033 (1,568) 3,220 38,253 (100) 1,568 605 1,073 17 1,905 (117) 175 (227) 2,081 12 40,33313 35,033 0 840 743 36,615 964 4,184 40,800 4,314 2,928 604 743 30 3,487 392 567 1,973 4,054 13 44,85314 36,615 0 779 546 37,941 2,878 7,062 45,002 6,848 3,531 1,235 546 32 5,237 408 975 2,158 6,211 14 51,21415 37,941 0 600 624 39,165 (589) 6,473 45,638 2,384 2,907 1,373 624 24 6,147 41 1,016 951 7,162 15 52,80016 39,165 0 284 0 39,449 (1,723) 4,750 44,199 398 (6) 2,198 696 (11) 0 (12) 18 7,649 (95) 921 1,408 8,570 16 52,76917 39,449 0 365 0 39,814 2,405 7,155 46,969 6,676 3,214 0 0 (12) 25 10,864 1,031 1,952 4,246 12,816 17 59,785
Lo 18 39,814 0 310 1,403 41,527 (3,734) 3,421 44,948 (947) 3,689 726 1,403 (13) 27 12,424 (929) 1,023 631 13,447 18 58,395Mid 18 39,814 0 310 1,403 41,527 (1,078) 6,078 47,605 3,315 4,391 726 1,403 (13) 32 13,126 (31) 1,921 2,231 15,047 18 62,652Hi 18 39,814 0 310 1,403 41,527 1,323 8,478 50,005 7,504 5,242 726 1,403 (13) 38 13,977 901 2,854 4,015 16,831 18 66,836
19 41,527 0 416 944 42,887 (107) 5,971 48,858 3,963 3,954 1,705 944 28 14,431 88 2,009 1,393 16,441 19 65,29820 42,887 0 402 974 44,263 (107) 5,863 50,127 4,131 4,123 1,750 974 28 15,830 88 2,097 1,486 17,927 20 68,05421 44,263 0 405 1,005 45,673 (100) 5,763 51,437 4,306 4,299 1,877 1,005 28 17,247 79 2,176 1,497 19,423 21 70,86022 45,673 0 400 1,037 47,109 (86) 5,678 52,787 4,485 4,479 2,098 1,037 28 18,591 64 2,241 1,408 20,832 22 73,61923 47,109 0 403 1,069 48,581 (80) 5,598 54,179 4,661 4,655 2,231 1,069 28 19,946 58 2,298 1,413 22,244 23 76,42424 48,581 0 413 1,102 50,097 (83) 5,515 55,612 4,839 4,835 2,258 1,102 28 21,420 60 2,358 1,534 23,779 24 79,39025 50,097 0 433 1,137 51,667 (81) 5,435 57,101 5,029 5,025 2,351 1,137 28 22,957 57 2,415 1,594 25,372 25 82,47426 51,667 0 454 1,173 53,293 (79) 5,356 58,649 5,226 5,223 2,446 1,173 28 24,562 54 2,469 1,658 27,030 26 85,67927 53,293 0 463 1,210 54,965 (77) 5,279 60,244 5,430 5,428 2,543 1,210 28 26,237 51 2,520 1,727 28,758 27 89,00228 54,965 0 479 1,247 56,691 (76) 5,203 61,895 5,642 5,641 2,642 1,247 28 27,989 49 2,569 1,801 30,558 28 92,453
Cumulative Totals Proj. for 2018-2027 0 4,578 12,300 (1,952) 51,027 52,053 22,627 12,300 309 617 17,742
Total Return - Inflation = Total Real Return Statutory Return Notes related to financial history and projections FY1977 - FY2028:Lo FY 2018 -1.38% 2.13% -3.51% Lo 6.40% (1)
Mid FY 2018 (6) 5.73% 2.13% 3.60% Mid 7.58% (2)
Hi FY 2018 12.72% 2.13% 10.59% Hi 9.01% (3)
FY 2019-2027 (7) 6.50% 2.25% 4.25% 6.53%(4) FY05 and forward, Amerada Hess, et al. annual net positive settlement earnings are transferred to Alaska Capital Income Fund (ACIF) per AS 37.13.145(d). (5)
(6) Current year returns and inflation are based on 2017 Callan capital market assumptions.(7)
(8) During FY 2009, the ACIF realized losses of $33.3 million, which are excluded from statutory net income, and are included in the ending unreserved balance as a deficit account. During FY 2010 and FY 2011, the ACIF had realized income of $20.8 and $25.3 million, which is excluded from statutory net income, and served to reduce the FY 2009 deficit.
(9) The statutory inflation calculation for FY 2010 was -.36%; therefore, there was no inflation proofing transfer during FY 2010.(10) FY77-08 includes special appropriations to principal of $3.7 billion.
$ 1,124.1 (11) The dividend transfer reported for FY16 was paid out in dividends during FY17.3,926.5 (12) There was no appropriation for inflation proofing for FY16 and FY17.(113.2) (13) Current year inflation proofing includes unfunded amounts from prior years.(33.7)
Statutory net income (loss) $ 4,903.7 PUBLIC EQUITIES
FIXED INCOME PLUS ◊ † ‡PRIVATE EQUITY AND GROWTH OPPORTUNITIES ●
REAL ESTATE**
$ 4,903.7 INFRASTRUCTURE, PRIVATE CREDIT AND INCOME OPPORTUNITIES ● ◊ ‡313.4 ABSOLUTE RETURN33.7 ASSET ALLOCATION
$ 5,250.8 TOTAL FUND ●
Total Fund Return Objective3Total Fund Return Objective3
Income year-to-date as of March 31, 2018
Future returns are based on 2017 Callan capital market assumptions and median expected returns (the mid case). Actual results will vary.
Beginning in FY08, based on legal opinion, unrealized gains and losses were allocated between the nonspendable fund balance (principal) and the assigned fund balance (earnings reserve). Prior to FY08, all unrealized gains and losses were included with principal.
Accounting net income is based on United States Generally Accepted Accounting Principles (GAAP). Statutory net income is accounting net income, excluding any unrealized gains and losses on investments, and excluding earnings of the Alaska Capital Income Fund (AM Hess, et al principal).
FUND
FY-EndStatutory Net Income
Distributions of
Balance
Appropriations include special general fund, realized earnings, and other miscellaneous appropriation transfers into principal.
UnrealizedGain (Loss)
Dedicated State Revenues in current and future fiscal years are based on the Spring 2018 Department of Revenue forecast.
TOTAL
Assumptions:
UnrealizedGain (Loss)
ALASKA PERMANENT FUND FUND FINANCIAL HISTORY & PROJECTIONS
as of March 31, 2018Projections extend ten years, and are based on best available information ($ in millions)
Assigned Fund BalanceNonspendable Fund Balance - Principal
Interest, dividends, real estate & other income
Realized gains (losses) on the sale of invested assets
FY18 Statutory net income
Accounting (GAAP) net income (loss)
Less operating exp / Legis. Appropriations Less AK Capital Inc. Fund committed realized earnings
Statutory net income (loss) Unrealized gains (losses) on invested assets AK Capital Income Fund committed realized earnings
FY18 Accounting (GAAP) net income
69/511

Cash Flow
Separator Page
70/511
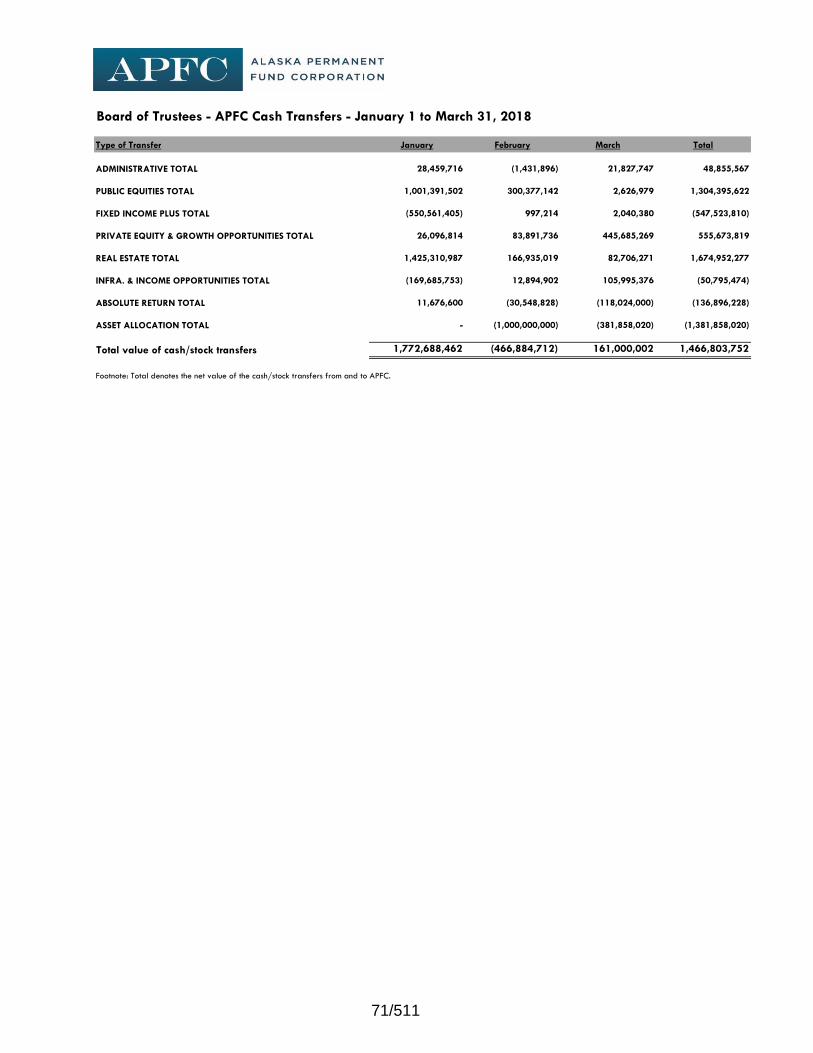
Board of Trustees - APFC Cash Transfers - January 1 to March 31, 2018
Type of Transfer January February March Total
ADMINISTRATIVE TOTAL 28,459,716 (1,431,896) 21,827,747 48,855,567
PUBLIC EQUITIES TOTAL 1,001,391,502 300,377,142 2,626,979 1,304,395,622
FIXED INCOME PLUS TOTAL (550,561,405) 997,214 2,040,380 (547,523,810)
PRIVATE EQUITY & GROWTH OPPORTUNITIES TOTAL 26,096,814 83,891,736 445,685,269 555,673,819
REAL ESTATE TOTAL 1,425,310,987 166,935,019 82,706,271 1,674,952,277
INFRA. & INCOME OPPORTUNITIES TOTAL (169,685,753) 12,894,902 105,995,376 (50,795,474)
ABSOLUTE RETURN TOTAL 11,676,600 (30,548,828) (118,024,000) (136,896,228)
ASSET ALLOCATION TOTAL - (1,000,000,000) (381,858,020) (1,381,858,020)
Total value of cash/stock transfers 1,772,688,462 (466,884,712) 161,000,002 1,466,803,752
Footnote: Total denotes the net value of the cash/stock transfers from and to APFC.
71/511

Date Type of Transfer Amount Source Destination
ADMINISTRATIVE SUBTOTAL 28,459,716
Various Transfer in - Mineral revenue 28,900,060 Department of Natural Resources APF Internal Cash Account
1/3/2018 Transfer in - AIM STIF Interest 475,740 Bank of NY Mellon APF Internal Cash Account
1/24/2018 Transfer in - Commission Recapture proceeds 45,674 Bank of NY Mellon APF Internal Cash Account
1/12/2018 Transfer in - Securities Lending Income 136,986 Bank of NY Mellon APF Internal Cash Account
Various Transfer in - Class Actions 188 Class action proceeds APF Internal Cash Account
1/8/2018 Transfer in - Alaska Mental Health Trust Increase 5,000,000 Wells Fargo Bank APF Internal Cash Account
Various Transfer out - Corporate Expenses (6,098,931) APF Internal Cash Account FNBA, Department of Revenue
PUBLIC EQUITIES SUBTOTAL 1,001,391,502
INTERNATIONAL EQUITIES
1/23/2018 William Blair Emerging Markets account decrease 100,000,000 William Blair Emerging Markets Account APF Internal Cash Account
1/23/2018 Acadian Asset Mgmt account decrease 200,000,000 Acadian Asset Mgmt Account APF Internal Cash Account
1/23/2018 Hardman Johnston Int'l Large Cap account decrease 30,000,000 Hardman Johnston Int'l Large Cap Account APF Internal Cash Account
1/23/2018 JP Morgan Int'l Large Cap account decrease 70,000,000 JP Morgan Int'l Large Cap Account APF Internal Cash Account
Various SSgA International account liquidation 9,554 SSgA International Account APF Internal Cash Account
GLOBAL EQUITIES
Various APF Tactical Tilts account decrease 300,000,000 APF Tactical Tilts Account APF Internal Cash Account
DOMESTIC EQUITIES
1/19/2018 SSgA Large Cap account decrease 100,000,000 SSgA Large Cap Account APF Internal Cash Account
1/2/2018 APF SPDR Yield account increase (4,020) APF Internal Cash Account APF SPDR Yield Account
1/22/2018 Jennison Associates LLC account decrease 40,000,000 Jennison Associates LLC Account APF Internal Cash Account
1/19/2018 RBC Asset Mgmt account decrease 40,000,000 RBC Asset Mgmt Account APF Internal Cash Account
1/22/2018 Eagle Asset Mgmt account decrease 40,000,000 Eagle Asset Mgmt Account APF Internal Cash Account
1/19/2018 T Rowe Price account decrease 40,000,000 T Rowe Price Account APF Internal Cash Account
1/22/2018 Pzena Investment Mgmt account decrease 40,000,000 Pzena Investment Mgmt Account APF Internal Cash Account
APF PUBLIC EQUITY CASH
1/12/2018 Public Equity Sec Lending account decrease 1,395,512 Public Equity Sec Lending Account APF Internal Cash Account
FIXED INCOME PLUS SUBTOTAL (550,561,405)
US FIXED INCOME AGGREGATE
Various APF Fixed Income - Aggregate account increase (155,118,943) APF Internal Cash Account APF Fixed Income - Aggregate Account
US INVESTMENT GRADE CORPORATE
1/29/2018 US Investment Grade Corporate account increase (77,000,000) APF Internal Cash Account US Investment Grade Corporate Account
NON US FIXED INCOME
1/29/2018 APF Global Government Bonds account increase (52,000,005) APF Internal Cash Account APF Global Government Bonds Account
GLOBAL HIGH YIELD
1/29/2018 APF High Yield account increase (77,000,000) APF Internal Cash Account APF High Yield Account
EMERGING MARKET DEBT
1/29/2018 APF Emerging Market Debt account increase (26,000,000) APF Internal Cash Account APF Emerging Market Debt Account
TIPS
1/29/2018 Alaska Permanent Capital Mgmt account increase (26,000,000) APF Internal Cash Account Alaska Permanent Capital Mgmt Account
REITS
1/9/2018 American Homes 4 Rent account decrease 83,595 American Homes 4 Rent Account APF Internal Cash Account
LISTED INFRASTRUCTURE
Various Wellington Listed Infrastructure account liquidation 213,524 Wellington Listed Infrastructure Account APF Internal Cash Account
FIXED INCOME PLUS CASH
1/12/2018 Fixed Income Sec Lending account decrease 473,941 Fixed Income Sec Lending Account APF Internal Cash Account
Various APF Fixed Income Plus Cash account increase (138,213,519) APF Internal Cash Account APF Fixed Income Plus Cash Account
PRIVATE EQUITY & GROWTH OPPORTUNITIES SUBTOTAL 26,096,814
PRIVATE EQUITY
Various Private Equity distributions 34,136,447 Private Equity APF Internal Cash Account
Various Private Equity capital calls (23,140,710) APF Internal Cash Account Private Equity
GROWTH OPPORTUNITIES
Various Growth Opportunities distributions 56,356,884 Growth Opportunities APF Internal Cash Account
Various Growth Opportunities capital calls (41,255,808) APF Internal Cash Account Growth Opportunities
REAL ESTATE SUBTOTAL 1,425,310,987
Various Real Estate distributions 1,427,765,518 Real Estate APF Internal Cash Account
Various Real Estate capital calls (2,454,531) APF Internal Cash Account Real Estate
INFRA. & INCOME OPPORTUNITIES SUBTOTAL (169,685,753)
INFRASTRUCTURE
Various Infrastructure capital calls (171,090,933) APF Internal Cash Account Infrastructure
PUBLIC/PRIVATE CREDIT
Various Public/Private Credit distributions 19,683,040 Public/Private Credit APF Internal Cash Account
Various Public/Private Credit capital calls (17,688,956) APF Internal Cash Account Public/Private Credit
INCOME OPPORTUNITIES
Various Income Opportunities capital calls (588,903) APF Internal Cash Account Income Opportunities
ABSOLUTE RETURN SUBTOTAL 11,676,600
Various Absolute Return distributions 11,676,600 Absolute Return APF Internal Cash Account
Various Absolute Return -
Total value of cash/stock transfers 1,772,688,462
Footnote: Total denotes the net value of the cash/stock transfers from and to APFC.
APFC Cash Transfers - January 2018
72/511

Date Type of Transfer Amount Source Destination
ADMINISTRATIVE SUBTOTAL (1,431,896)
Various Transfer in - Mineral revenue 50,389,778 Department of Natural Resources APF Internal Cash Account
Various Transfer in - AIM STIF Interest 1,348,536 Bank of NY Mellon APF Internal Cash Account
2/20/2018 Transfer in - Commission Recapture proceeds 63,649 Bank of NY Mellon APF Internal Cash Account
2/14/2018 Transfer in - Securities Lending Income 103,950 Bank of NY Mellon APF Internal Cash Account
Various Transfer in - Class Actions 3,327 Class action proceeds APF Internal Cash Account
2/12/2018 Transfer out - Alaska Mental Health Trust Withdrawal (21,111,000) APF Internal Cash Account Wells Fargo Bank
Various Transfer out - Corporate Expenses (32,230,135) APF Internal Cash Account FNBA, Department of Revenue
PUBLIC EQUITIES SUBTOTAL 300,377,142
INTERNATIONAL EQUITIES
Various SSgA International account liquidation 92,781 SSgA International Account APF Internal Cash Account
GLOBAL EQUITIES
2/5/2018 APF Tactical Tilts account decrease 299,000,000 APF Tactical Tilts Account APF Internal Cash Account
APF PUBLIC EQUITY CASH
2/14/2018 Public Equity Sec Lending account decrease 1,377,142 Public Equity Sec Lending Account APF Internal Cash Account
FIXED INCOME PLUS SUBTOTAL 997,214
US FIXED INCOME AGGREGATE
Various APF Fixed Income - Aggregate account decrease 486,798 APF Fixed Income - Aggregate Account APF Internal Cash Account
FIXED INCOME PLUS CASH
2/14/2018 Fixed Income Sec Lending account decrease 510,399 Fixed Income Sec Lending Account APF Internal Cash Account
PRIVATE EQUITY & GROWTH OPPORTUNITIES SUBTOTAL 83,891,736
PRIVATE EQUITY
Various Private Equity distributions 25,286,427 Private Equity APF Internal Cash Account
Various Private Equity capital calls (42,150,661) APF Internal Cash Account Private Equity
GROWTH OPPORTUNITIES
Various Growth Opportunities distributions 103,555,331 Growth Opportunities APF Internal Cash Account
Various Growth Opportunities capital calls (2,799,361) APF Internal Cash Account Growth Opportunities
REAL ESTATE SUBTOTAL 166,935,019
Various Real Estate distributions 174,887,807 Real Estate APF Internal Cash Account
Various Real Estate capital calls (7,952,788) APF Internal Cash Account Real Estate
INFRA. & INCOME OPPORTUNITIES SUBTOTAL 12,894,902
INFRASTRUCTURE
Various Infrastructure distributions 301,547 Infrastructure APF Internal Cash Account
Various Infrastructure capital calls (22,137,816) APF Internal Cash Account Infrastructure
PUBLIC/PRIVATE CREDIT
Various Public/Private Credit distributions 49,824,723 Public/Private Credit APF Internal Cash Account
Various Public/Private Credit capital calls (11,278,021) APF Internal Cash Account Public/Private Credit
INCOME OPPORTUNITIES
Various Income Opportunities distributions 720,000 Income Opportunities APF Internal Cash Account
Various Income Opportunities capital calls (4,535,531) APF Internal Cash Account Income Opportunities
ABSOLUTE RETURN SUBTOTAL (30,548,828)
Various Absolute Return distributions 5,600,000 Absolute Return APF Internal Cash Account
Various Absolute Return capital calls (36,148,828) APF Internal Cash Account Absolute Return
ASSET ALLOCATION SUBTOTAL (1,000,000,000)
NISA CASH OVERLAY COMPOSITE
Various NISA Cash Overlay Composite increase (1,000,000,000) APF Internal Cash Account NISA Cash Overlay Composite
Total value of cash/stock transfers (466,884,712)
Footnote: Total denotes the net value of the cash/stock transfers from and to APFC.
APFC Cash Transfers - February 2018
73/511

Date Type of Transfer Amount Source Destination
ADMINISTRATIVE SUBTOTAL 21,827,747
Various Transfer in - Mineral revenue 29,665,571 Department of Natural Resources APF Internal Cash Account
3/2/2018 Transfer in - AIM STIF Interest 1,357,893 Bank of NY Mellon APF Internal Cash Account
3/21/2018 Transfer in - Commission Recapture proceeds 19,283 Bank of NY Mellon APF Internal Cash Account
3/14/2018 Transfer in - Securities Lending Income 90,157 Bank of NY Mellon APF Internal Cash Account
Various Transfer in - Class Actions 7,638 Class action proceeds APF Internal Cash Account
Various Transfer out - Corporate Expenses (9,312,795) APF Internal Cash Account FNBA, Department of Revenue
PUBLIC EQUITIES SUBTOTAL 2,626,979
INTERNATIONAL EQUITIES
Various SSgA International account liquidation (10,000) APF Internal Cash Account SSgA International Account
GLOBAL EQUITIES
3/16/2018 Lazard Asset Management account decrease 597,837,170 Lazard Asset Management Account APF Internal Cash Account
Various Longview Global Equity account increase (384,799,097) APF Internal Cash Account Longview Global Equity Account
3/28/2018 Arrowstreet Global Equity account increase (190,499,474) APF Internal Cash Account Arrowstreet Global Equity Account
APF PUBLIC EQUITY CASH
3/14/2018 Public Equity Sec Lending account decrease 1,241,711 Public Equity Sec Lending Account APF Internal Cash Account
FIXED INCOME PLUS SUBTOTAL 2,040,380
US FIXED INCOME AGGREGATE
Various APF Fixed Income - Aggregate account decrease 1,279,571 APF Fixed Income - Aggregate Account APF Internal Cash Account
US INVESTMENT GRADE CORPORATE
Various APF Corporate Bonds account decrease 36,440 APF Corporate Bonds Account APF Internal Cash Account
FIXED INCOME PLUS CASH
3/14/2018 Fixed Income Sec Lending account decrease 724,369 Fixed Income Sec Lending Account APF Internal Cash Account
PRIVATE EQUITY & GROWTH OPPORTUNITIES SUBTOTAL 445,685,269
PRIVATE EQUITY
Various Private Equity distributions 35,923,712 Private Equity APF Internal Cash Account
Various Private Equity capital calls (28,055,104) APF Internal Cash Account Private Equity
GROWTH OPPORTUNITIES
Various Growth Opportunities distributions 475,573,218 Growth Opportunities APF Internal Cash Account
Various Growth Opportunities capital calls (37,756,557) APF Internal Cash Account Growth Opportunities
REAL ESTATE SUBTOTAL 82,706,271
Various Real Estate distributions 85,561,508 Real Estate APF Internal Cash Account
Various Real Estate capital calls (2,855,237) APF Internal Cash Account Real Estate
INFRA. & INCOME OPPORTUNITIES SUBTOTAL 105,995,376
INFRASTRUCTURE
Various Infrastructure distributions 176,978,641 Infrastructure APF Internal Cash Account
Various Infrastructure capital calls (23,078,113) APF Internal Cash Account Infrastructure
PUBLIC/PRIVATE CREDIT
Various Public/Private Credit distributions 4,246,138 Public/Private Credit APF Internal Cash Account
Various Public/Private Credit capital calls (38,023,282) APF Internal Cash Account Public/Private Credit
INCOME OPPORTUNITIES
Various Income Opportunities distributions 2,410,087 Income Opportunities APF Internal Cash Account
Various Income Opportunities capital calls (16,538,094) APF Internal Cash Account Income Opportunities
ABSOLUTE RETURN SUBTOTAL (118,024,000)
Various Absolute Return distributions 11,976,000 Absolute Return APF Internal Cash Account
Various Absolute Return capital calls (130,000,000) APF Internal Cash Account Absolute Return
ASSET ALLOCATION SUBTOTAL (381,858,020)
APF FI LIQUIDITY
3/17/2018 APF FI Liquidity account decrease 4,999,995 APF FI Liquidity APF Internal Cash Account
NISA CASH OVERLAY COMPOSITE
Various NISA Cash Overlay Composite increase (386,858,015) APF Internal Cash Account NISA Cash Overlay Composite
Total value of cash/stock transfers 161,000,002
Footnote: Total denotes the net value of the cash/stock transfers from and to APFC.
APFC Cash Transfers - March 2018
74/511

Monthly Performance Report
Separator Page
75/511
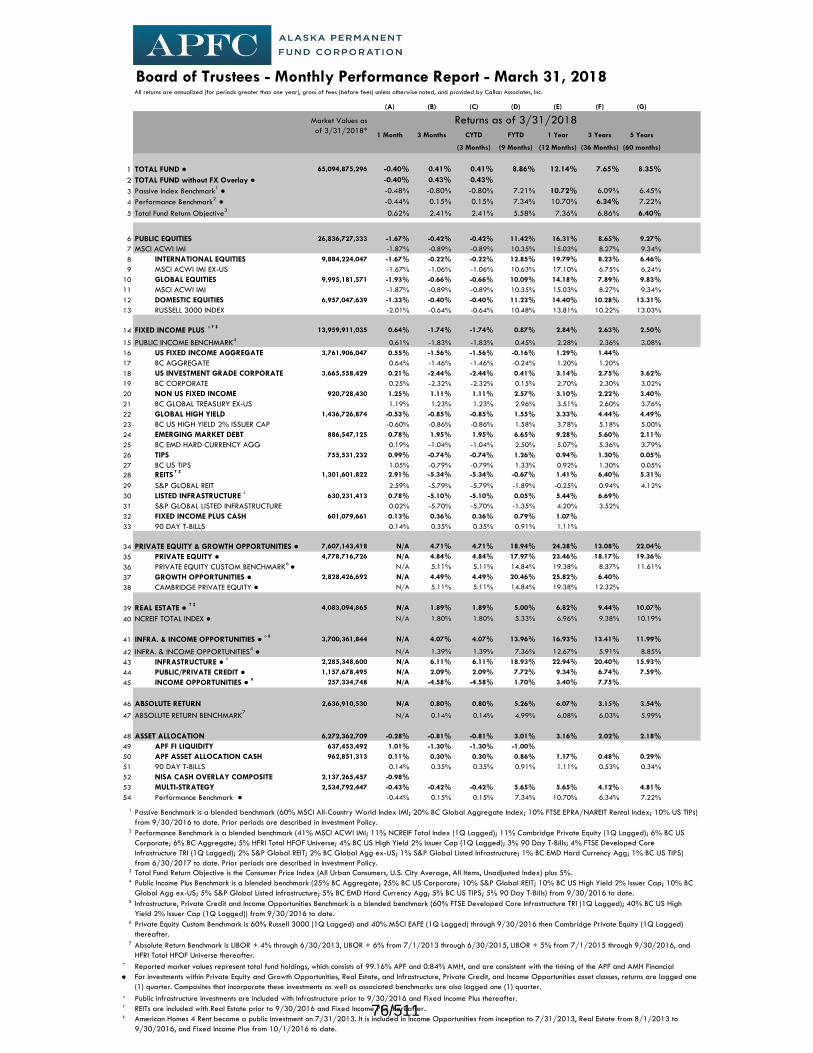
Board of Trustees - Monthly Performance Report - March 31, 2018All returns are annualized (for periods greater than one year), gross of fees (before fees) unless otherwise noted, and provided by Callan Associates, Inc.
(A) (B) (C) (D) (E) (F) (G)
1 Month 3 Months CYTD FYTD 1 Year 3 Years 5 Years
Make lookup! Only show quarter-end report. (3 Months) (9 Months) (12 Months) (36 Months) (60 months)
1 TOTAL FUND ● 65,094,875,296 -0.40% 0.41% 0.41% 8.86% 12.14% 7.65% 8.35%
2 TOTAL FUND without FX Overlay ● -0.40% 0.43% 0.43%
3 Passive Index Benchmark1 ● -0.48% -0.80% -0.80% 7.21% 10.72% 6.09% 6.45%
4 Performance Benchmark2 ● -0.44% 0.15% 0.15% 7.34% 10.70% 6.34% 7.22%
5 Total Fund Return Objective3
0.62% 2.41% 2.41% 5.58% 7.36% 6.86% 6.40%
6 PUBLIC EQUITIES 26,836,727,333 -1.67% -0.42% -0.42% 11.42% 16.31% 8.65% 9.27%
7 MSCI ACWI IMI -1.87% -0.89% -0.89% 10.35% 15.03% 8.27% 9.34%
8 INTERNATIONAL EQUITIES 9,884,224,047 -1.67% -0.22% -0.22% 12.85% 19.79% 8.23% 6.46%
9 MSCI ACWI IMI EX-US -1.67% -1.06% -1.06% 10.63% 17.10% 6.75% 6.24%
10 GLOBAL EQUITIES 9,995,181,571 -1.93% -0.66% -0.66% 10.09% 14.18% 7.89% 9.83%
11 MSCI ACWI IMI -1.87% -0.89% -0.89% 10.35% 15.03% 8.27% 9.34%
12 DOMESTIC EQUITIES 6,957,047,639 -1.33% -0.40% -0.40% 11.23% 14.40% 10.28% 13.31%
13 RUSSELL 3000 INDEX -2.01% -0.64% -0.64% 10.48% 13.81% 10.22% 13.03%
14 FIXED INCOME PLUS ◊ † ‡
13,959,911,035 0.64% -1.74% -1.74% 0.87% 2.84% 2.63% 2.50%
15 PUBLIC INCOME BENCHMARK4
0.61% -1.83% -1.83% 0.45% 2.28% 2.36% 3.08%
16 US FIXED INCOME AGGREGATE 3,761,906,047 0.55% -1.56% -1.56% -0.16% 1.29% 1.44%
17 BC AGGREGATE 0.64% -1.46% -1.46% -0.24% 1.20% 1.20%
18 US INVESTMENT GRADE CORPORATE 3,665,558,429 0.21% -2.44% -2.44% 0.41% 3.14% 2.75% 3.62%
19 BC CORPORATE 0.25% -2.32% -2.32% 0.15% 2.70% 2.30% 3.02%
20 NON US FIXED INCOME 920,728,430 1.25% 1.11% 1.11% 2.57% 3.10% 2.22% 3.40%
21 BC GLOBAL TREASURY EX-US 1.19% 1.23% 1.23% 2.96% 3.51% 2.60% 3.76%
22 GLOBAL HIGH YIELD 1,436,726,874 -0.53% -0.85% -0.85% 1.55% 3.33% 4.44% 4.49%
23 BC US HIGH YIELD 2% ISSUER CAP -0.60% -0.86% -0.86% 1.58% 3.78% 5.18% 5.00%
24 EMERGING MARKET DEBT 886,547,125 0.78% 1.95% 1.95% 6.65% 9.28% 5.60% 2.11%
25 BC EMD HARD CURRENCY AGG 0.19% -1.04% -1.04% 2.50% 5.07% 5.36% 3.79%
26 TIPS 755,531,232 0.99% -0.74% -0.74% 1.26% 0.94% 1.30% 0.05%
27 BC US TIPS 1.05% -0.79% -0.79% 1.33% 0.92% 1.30% 0.05%
28 REITS † ‡
1,301,601,822 2.91% -5.34% -5.34% -0.67% 1.41% 6.40% 5.31%
29 S&P GLOBAL REIT 2.59% -5.79% -5.79% -1.89% -0.25% 0.94% 4.12%
30 LISTED INFRASTRUCTURE ◊
630,231,413 0.78% -5.10% -5.10% 0.05% 5.44% 6.69%
31 S&P GLOBAL LISTED INFRASTRUCTURE 0.02% -5.70% -5.70% -1.35% 4.20% 3.52%
32 FIXED INCOME PLUS CASH 601,079,661 0.13% 0.36% 0.36% 0.79% 1.07%
33 90 DAY T-BILLS 0.14% 0.35% 0.35% 0.91% 1.11%
34 PRIVATE EQUITY & GROWTH OPPORTUNITIES ● 7,607,143,418 N/A 4.71% 4.71% 18.94% 24.38% 13.08% 22.04%
35 PRIVATE EQUITY ● 4,778,716,726 N/A 4.84% 4.84% 17.97% 23.46% 18.17% 19.36%
36 PRIVATE EQUITY CUSTOM BENCHMARK6 ● N/A 5.11% 5.11% 14.84% 19.38% 8.37% 11.61%
37 GROWTH OPPORTUNITIES ● 2,828,426,692 N/A 4.49% 4.49% 20.46% 25.82% 6.40%
38 CAMBRIDGE PRIVATE EQUITY ● N/A 5.11% 5.11% 14.84% 19.38% 12.32%
39 REAL ESTATE ● † ‡
4,083,094,865 N/A 1.89% 1.89% 5.00% 6.82% 9.44% 10.07%
40 NCREIF TOTAL INDEX ● N/A 1.80% 1.80% 5.33% 6.96% 9.38% 10.19%
41 INFRA. & INCOME OPPORTUNITIES ● ◊ ‡
3,700,361,844 N/A 4.07% 4.07% 13.96% 16.93% 13.41% 11.99%
42 INFRA. & INCOME OPPORTUNITIES4 ● N/A 1.39% 1.39% 7.36% 12.67% 5.91% 8.85%
43 INFRASTRUCTURE ● ◊ 2,285,348,600 N/A 6.11% 6.11% 18.93% 22.94% 20.40% 15.93%
44 PUBLIC/PRIVATE CREDIT ● 1,157,678,495 N/A 2.09% 2.09% 7.72% 9.34% 6.74% 7.59%
45 INCOME OPPORTUNITIES ● ‡ 257,334,748 N/A -4.58% -4.58% 1.70% 3.40% 7.75%
46 ABSOLUTE RETURN 2,636,910,530 N/A 0.80% 0.80% 5.26% 6.07% 3.15% 3.54%
47 ABSOLUTE RETURN BENCHMARK7
N/A 0.14% 0.14% 4.99% 6.08% 6.03% 5.99%
48 ASSET ALLOCATION 6,272,362,709 -0.28% -0.81% -0.81% 3.01% 3.16% 2.02% 2.18%
49 APF FI LIQUIDITY 637,453,492 1.01% -1.30% -1.30% -1.00%
50 APF ASSET ALLOCATION CASH 962,851,313 0.11% 0.30% 0.30% 0.86% 1.17% 0.48% 0.29%
51 90 DAY T-BILLS 0.14% 0.35% 0.35% 0.91% 1.11% 0.53% 0.34%
52 NISA CASH OVERLAY COMPOSITE 2,137,265,457 -0.98%
53 MULTI-STRATEGY 2,534,792,447 -0.43% -0.42% -0.42% 5.65% 5.65% 4.12% 4.81%
54 Performance Benchmark ● -0.44% 0.15% 0.15% 7.34% 10.70% 6.34% 7.22%
† REITs are included with Real Estate prior to 9/30/2016 and Fixed Income Plus thereafter.‡
* Reported market values represent total fund holdings, which consists of 99.16% APF and 0.84% AMH, and are consistent with the timing of the APF and AMH Financial
For investments within Private Equity and Growth Opportunities, Real Estate, and Infrastructure, Private Credit, and Income Opportunities asset classes, returns are lagged one
(1) quarter. Composites that incorporate these investments as well as associated benchmarks are also lagged one (1) quarter.
American Homes 4 Rent became a public investment on 7/31/2013. It is included in Income Opportunities from inception to 7/31/2013, Real Estate from 8/1/2013 to
9/30/2016, and Fixed Income Plus from 10/1/2016 to date.
◊ Public infrastructure investments are included with Infrastructure prior to 9/30/2016 and Fixed Income Plus thereafter.
●
Private Equity Custom Benchmark is 60% Russell 3000 (1Q Lagged) and 40% MSCI EAFE (1Q Lagged) through 9/30/2016 then Cambridge Private Equity (1Q Lagged)
thereafter.
Total Fund Return Objective is the Consumer Price Index (All Urban Consumers, U.S. City Average, All Items, Unadjusted Index) plus 5%.
Returns as of 3/31/2018
Absolute Return Benchmark is LIBOR + 4% through 6/30/2013, LIBOR + 6% from 7/1/2013 through 6/30/2015, LIBOR + 5% from 7/1/2015 through 9/30/2016, and
HFRI Total HFOF Universe thereafter.
6
7
3
4 Public Income Plus Benchmark is a blended benchmark (25% BC Aggregate; 25% BC US Corporate; 10% S&P Global REIT; 10% BC US High Yield 2% Issuer Cap; 10% BC
Global Agg ex-US; 5% S&P Global Listed Infrastructure; 5% BC EMD Hard Currency Agg; 5% BC US TIPS; 5% 90 Day T-Bills) from 9/30/2016 to date.5 Infrastructure, Private Credit and Income Opportunities Benchmark is a blended benchmark (60% FTSE Developed Core Infrastructure TRI (1Q Lagged); 40% BC US High
Yield 2% Issuer Cap (1Q Lagged)) from 9/30/2016 to date.
1 Passive Benchmark is a blended benchmark (60% MSCI All-Country World Index IMI; 20% BC Global Aggregate Index; 10% FTSE EPRA/NAREIT Rental Index; 10% US TIPs)
from 9/30/2016 to date. Prior periods are described in Investment Policy. 2 Performance Benchmark is a blended benchmark (41% MSCI ACWI IMI; 11% NCREIF Total Index (1Q Lagged); 11% Cambridge Private Equity (1Q Lagged); 6% BC US
Corporate; 6% BC Aggregate; 5% HFRI Total HFOF Universe; 4% BC US High Yield 2% Issuer Cap (1Q Lagged); 3% 90 Day T-Bills; 4% FTSE Developed Core
Infrastructure TRI (1Q Lagged); 2% S&P Global REIT; 2% BC Global Agg ex-US; 1% S&P Global Listed Infrastructure; 1% BC EMD Hard Currency Agg; 1% BC US TIPS)
from 6/30/2017 to date. Prior periods are described in Investment Policy.
Market Values as
of 3/31/2018*
76/511

(A) (B) (C) (D) (E) (F) (G)
1 Month 3 Months CYTD FYTD 1 Year 3 Years 5 Years
55 PUBLIC EQUITIES 26,836,727,333 -1.67% -0.42% -0.42% 11.42% 16.31% 8.65% 9.27%
56 MSCI ACWI IMI -1.87% -0.89% -0.89% 10.35% 15.03% 8.27% 9.34%
57 INTERNATIONAL EQUITIES 9,884,224,047 -1.67% -0.22% -0.22% 12.85% 19.79% 8.23% 6.46%
58 MSCI ACWI IMI EX-US -1.67% -1.06% -1.06% 10.63% 17.10% 6.75% 6.24%
59 Macquarie Emerging Markets 252,330,683 -2.10% 1.69% 1.69% 18.46% 27.21% 12.41%
60 JP Morgan Emerging Markets 566,673,380 -2.69% 0.91% 0.91% 17.85% 25.72% 11.40%
61 Lee Munder Emerging Markets 102,323,172 -1.33% 2.23% 2.23% 16.62% 25.66% 7.75%
62 Mondrian Investment Partners 624,475,506 -1.50% 0.14% 0.14% 10.30% 14.92% 6.16% 1.66%
63 SSgA MSCI Emerging Markets 277,902,378 -1.79% 1.51% 1.51% 16.87% 24.14% 8.76% 5.05%
64 William Blair Emerging Markets 579,123,970 -1.41% 0.96% 0.96% 19.84% 29.58% 8.44%
65 MSCI Emerging Markets Index -1.86% 1.42% 1.42% 17.56% 24.93% 8.81% 4.99%
66 DFA Emerging Markets Value 607,345,542 -2.34% 2.06% 2.06% 16.64% 19.73%
67 MSCI Emerging Markets Value Index -1.96% 1.62% 1.62% 14.51% 18.14%
68 DFA Emerging Markets Small Cap 214,031,657 -1.51% 0.57% 0.57% 16.68% 19.30%
69 MSCI Emerging Markets Small Cap Index -1.27% 0.17% 0.17% 15.58% 18.62%
70 Trustbridge Emerging Markets 179,024,644 -0.49% 5.47% 5.47% 39.63% 54.78%
71 MSCI All China Net Total Return Index -2.61% -0.18% -0.18% 15.39% 23.66%
72 Wells Capital 75,832,270 -2.16% 3.33% 3.33% 26.46% 41.02%
73 MSCI All China Net Total Return Index -2.61% -0.18% -0.18% 15.39% 23.66%
74 Mellon MSCI World ex-USA 1,447,251,163 -1.67% -1.94% -1.94% 7.95% 14.26% 5.60% 6.34%
75 DFA International Large Cap 947,547,363 -1.78% -1.65% -1.65% 10.20% 16.70% 6.64% 6.89%
76 Int'l Passive/Quasi-Passive Custom Benchmark1
-1.73% -2.04% -2.04% 7.85% 13.92% 5.30% 6.04%
77 DFA International Small Cap Value 431,668,577 -2.08% -2.36% -2.36% 9.66% 16.62% 11.17% 10.94%
78 MSCI World ex-USA Small Cap Value Index -1.31% -1.77% -1.77% 10.53% 17.66% 9.72% 8.78%
79 DFA International Small Company 434,161,231 -1.22% -0.66% -0.66% 11.88% 20.46% 12.38% 10.67%
80 SSgA International Developed Small Cap 424,497,788 -1.05% -0.44% -0.44% 12.93% 21.44% 11.55% 10.05%
81 MSCI World ex-USA Small Cap Index -1.09% -0.50% -0.50% 12.93% 21.16% 11.30% 9.71%
82 Acadian Asset Mgmt 536,436,439 -1.63% 1.15% 1.15% 14.32% 20.38% 11.01% 7.68%
83 MSCI Custom Benchmark2
-2.24% -2.52% -2.52% 7.00% 11.66% 5.56% 6.20%
84 LSV International Large Cap 580,220,020 -2.08% -0.81% -0.81% 11.03% 17.34% 7.49%
85 Schroders International Large Cap 623,186,967 -1.66% -0.42% -0.42% 9.12% 14.43% 8.52%
86 MSCI All Country World ex-USA Value Index -2.17% -1.50% -1.50% 8.82% 13.26% 5.04%
87 Johnston International Large Cap 400,807,493 -0.18% 1.46% 1.46% 15.67% 25.76% 11.34%
88 JP Morgan International Large Cap 579,342,770 -1.50% -1.16% -1.16% 9.98% 19.00% 8.27%
89 MSCI World ex-USA Growth Index -1.23% -1.56% -1.56% 8.69% 16.28% 6.06%
90 GLOBAL EQUITIES 9,995,181,571 -1.93% -0.66% -0.66% 10.09% 14.18% 7.89% 9.83%
91 MSCI ACWI IMI -1.87% -0.89% -0.89% 10.35% 15.03% 8.27% 9.34%
92 AQR Global Equity 1,549,337,975 -2.01% -0.53% -0.53% 12.28% 17.18% 9.71% 11.50%
93 SSgA MSCI World 178,874,863 -2.12% -1.17% -1.17% 9.50% 14.15% 8.47%
94 CDAM Global Equity 146,884,755 -3.31% -5.31% -5.31%
95 MSCI World Index -2.18% -1.28% -1.28% 9.19% 13.59% 7.97% 9.70%
96 SSgA Russell Fundamental Developed Lrg Co 1,594,513,929 -1.81% -2.16% -2.16% 9.46% 12.61% 7.92% 9.97%
97 Russell Fundamental Dvlpd Lrg Co Index -1.80% -2.25% -2.25% 9.48% 12.55% 8.05% 10.11%
98 Lazard Asset Management4
1,351,136,002 -0.41% 0.25% 0.25% 10.52% 14.67% 7.83% 9.86%
99 McKinley Capital Management 739,005,893 -2.47% 1.33% 1.33% 13.59% 18.97% 8.48% 10.85%
100 RBA Global Equity 207,161,980 -1.66% 1.32% 1.32%
101 WCM Global Equity 205,591,077 -1.45% 0.75% 0.75%
102 MSCI All-Country World Index -2.14% -0.96% -0.96% 10.14% 14.85% 8.12% 9.20%
103 APF Tactical Tilts 2,768,293,047 -2.08% -0.43% -0.43% 9.03% 12.96% 4.04%
104 SSgA MSCI ACWI IMI 165,588,139 -1.81% -0.85% -0.85% 10.43% 15.33%
105 APF Global Equities 101,928,843 -1.45% -0.51% -0.51%
106 Arrowstreet Global Equity 600,959,706 -2.14% 0.35% 0.35%
107 Longview Global Equity 385,218,544
108 MSCI All-Country World IMI -1.87% -0.89% -0.89% 10.35% 15.03% 8.27%
109 DOMESTIC EQUITIES 6,957,047,639 -1.33% -0.40% -0.40% 11.23% 14.40% 10.28% 13.31%
110 RUSSELL 3000 INDEX -2.01% -0.64% -0.64% 10.48% 13.81% 10.22% 13.03%
111 Mellon S&P 500 285,999,916 -2.54% -0.75% -0.75% 10.64% 14.07% 10.71% 13.27%
112 S&P 500 Index -2.54% -0.75% -0.75% 10.58% 14.00% 10.78% 13.31%
113 Mellon FTSE RAFI US Large Cap 429,582,863 -1.86% -2.43% -2.43% 8.50% 9.98% 9.09% 12.03%
114 FTSE RAFI US 1000 Index -1.87% -2.43% -2.43% 8.46% 9.95% 9.20% 12.09%
115 AGI - Large Cap 879,046,242 -2.63% 1.67% 1.67% 15.75% 21.18% 12.31% 15.87%
116 SSgA Large Cap 221,482,878 -2.41% 1.31% 1.31% 12.21% 17.55% 11.30% 15.09%
117 DSM - Large Cap 489,895,661 -2.78% 2.24% 2.24% 16.46% 28.58% 13.38%
118 CastleArk - Large Cap 324,202,172 -1.55% 4.53% 4.53% 21.57% 26.98% 14.66%
119 APF SPDR Yield 382,899,568 -1.22% -2.73% -2.73% 6.98% 7.38%
120 APF SPDR Momentum 408,226,820 -0.27% 0.04% 0.04% 12.69% 14.44%
121 APF SPDR Low Vol 404,041,761 0.05% -0.86% -0.86% 8.29% 10.41%
122 Russell 1000 Growth Index -2.74% 1.42% 1.42% 15.84% 21.25% 12.90% 15.53%
123 Russell 1000 Index -2.27% -0.69% -0.69% 10.59% 13.98% 10.39% 13.17%
124 Lyrical - Large Cap 678,341,721 -1.63% -3.23% -3.23% 5.66% 7.88% 7.45%
125 SKBA - Large Cap 357,328,899 -1.75% -1.19% -1.19% 14.03% 15.57% 11.19%
126 LSV - Large Cap Value 874,351,326 -2.27% -2.00% -2.00% 10.90% 11.81%
127 Russell 1000 Value Index -1.76% -2.83% -2.83% 5.53% 6.95% 7.88%
128 Mellon S&P 400 173,296,480 0.92% -0.77% -0.77% 8.83% 10.98% 8.99% 12.00%
129 S&P 400 Index 0.93% -0.77% -0.77% 8.83% 10.97% 8.96% 11.97%
130 Jennison Associates LLC 184,201,224 1.40% 1.85% 1.85% 11.70% 15.98% 8.05% 12.58%
131 Russell 2000 Index 1.29% -0.08% -0.08% 9.11% 11.79% 8.39% 11.47%
132 RBC Asset Mgmt 162,836,855 3.03% 2.42% 2.42% 9.99% 14.18% 8.77% 11.59%
133 Eagle Asset Mgmt 189,961,681 0.46% 2.88% 2.88% 14.23% 18.96% 11.72% 13.29%
134 Russell 2000 Growth Index 1.35% 2.30% 2.30% 13.64% 18.63% 8.77% 12.90%
135 Russell 2000 Index 1.29% -0.08% -0.08% 9.11% 11.79% 8.39% 11.47%
136 T Rowe Price 177,663,464 1.79% -2.08% -2.08% 8.14% 9.90% 11.46% 11.19%
137 Pzena Investment Mgmt 183,134,264 2.41% -0.83% -0.83% 6.65% 5.21% 10.45% 13.39%
138 Russell 2000 Value Index 1.24% -2.64% -2.64% 4.43% 5.13% 7.87% 9.96%
139 Russell 2000 Index 1.29% -0.08% -0.08% 9.11% 11.79% 8.39% 11.47%
140 AGI Structured Alpha 150,553,845 -2.52% -2.14% -2.14% 10.21% 14.25%
141 S&P 500 Index -2.54% -0.75% -0.75% 10.58% 14.00%
MSCI Custom Blend benchmark is MSCI EAFE TRI through 2/28/11, MSCI World ex-USA TRI through 4/30/2016, then MSCI World ex-USA Value TRI thereafter.2
Int'l Passive/Quasi-Passive Custom Benchmark is MSCI EAFE through 5/26/10 then MSCI World ex US thereafter.
Returns as of 3/31/2018
3 MSCI World ex-USA/MSCI EAFE benchmark is MSCI EAFE TRI through 2/28/11 then MSCI World ex-USA TRI thereafter.
1
Market Values as
of 3/31/2018*
4 Lazard global equity accounts' annual fees do not include fees paid on imbedded mutual fund positions.
Reported market values represent total fund holdings, which consists of 99.16% APF and 0.84% AMH, and are consistent with the timing of the APF and AMH Financial Statements.*77/511

(A) (B) (C) (D) (E) (F) (G)
1 Month 3 Months CYTD FYTD 1 Year 3 Years 5 Years
142 FIXED INCOME PLUS ◊ † ‡ 13,959,911,035 0.64% -1.74% -1.74% 0.87% 2.84% 2.63% 2.50%
143 PUBLIC INCOME BENCHMARK 0.61% -1.83% -1.83% 0.45% 2.28% 2.36% 3.08%
144 US FIXED INCOME AGGREGATE 3,761,906,047 0.55% -1.56% -1.56% -0.16% 1.29% 1.44%
145 BC AGGREGATE 0.64% -1.46% -1.46% -0.24% 1.20% 1.20%
146 APF Fixed Income - Aggregate 3,761,906,047 0.55% -1.56% -1.56% -0.16% 1.29% 1.44%
147 US INVESTMENT GRADE CORPORATE 3,665,558,429 0.21% -2.44% -2.44% 0.41% 3.14% 2.75% 3.62%
148 BC CORPORATE 0.25% -2.32% -2.32% 0.15% 2.70% 2.30% 3.02%
149 APF Corporate Bonds 3,665,558,429 0.21% -2.44% -2.44% 0.41% 3.14% 2.75% 3.62%
150 NON US FIXED INCOME 920,728,430 1.25% 1.11% 1.11% 2.57% 3.10% 2.22% 3.40%
151 BC GLOBAL TREASURY EX-US 1.19% 1.23% 1.23% 2.96% 3.51% 2.60% 3.76%
152 Rogge Global Partners 351,150,899 1.28% 1.16% 1.16% 2.97% 3.54% 2.45% 3.48%
153 APF Global Government Bonds 569,577,531 1.23% 1.06% 1.06% 2.69% 3.16% 2.11%
154 GLOBAL HIGH YIELD 1,436,726,874 -0.53% -0.85% -0.85% 1.55% 3.33% 4.44% 4.49%
155 BC US HIGH YIELD 2% ISSUER CAP -0.60% -0.86% -0.86% 1.58% 3.78% 5.18% 5.00%
156 Oaktree High Yield 577,696,975 -0.56% -1.09% -1.09% 0.91% 3.24% 3.83% 3.90%
156 Capital Guardian High Yield 399,108,702 -0.75% -0.64% -0.64% 2.73% 3.47% 6.12% 6.01%
157 APF High Yield 459,921,196 -0.31% -0.80% -0.80% 1.18% 3.40%
158 BC US High Yield 2% Issuer Cap Index -0.60% -0.86% -0.86% 1.58% 3.78% 5.18% 5.00%
159 HY Fixed Income Custom Blend1
-0.60% -0.86% -0.86% 1.58% 3.78% 5.32% 5.29%
160 FIXED INCOME PLUS CASH 601,079,661 0.13% 0.36% 0.36% 0.79% 1.07%
161 90 DAY T-BILLS 0.14% 0.35% 0.35% 0.91% 1.11%
162 APF Fixed Income Plus Cash 600,962,693 0.13% 0.36% 0.36% 0.79% 1.07%
163 EMERGING MARKET DEBT 886,547,125 0.78% 1.95% 1.95% 6.65% 9.28% 5.60% 2.11%
164 BC EMD HARD CURRENCY AGG 0.19% -1.04% -1.04% 2.50% 5.07% 5.36% 3.79%
165 Capital Guardian HY EM Gov't 679,077,156 0.74% 2.17% 2.17% 6.94% 9.58% 5.70% 2.17%
166 HY Emerging Markets Benchmark2
0.69% 1.30% 1.30% 5.03% 8.10% 5.53% 1.63%
167 APF Emerging Market Debt 207,469,969 0.89% 1.16% 1.16%
168 BC EMD Hard Currency AGG 0.19% -1.04% -1.04%
169 TIPS 755,531,232 0.99% -0.74% -0.74% 1.26% 0.94% 1.30% 0.05%
170 BC US TIPS 1.05% -0.79% -0.79% 1.33% 0.92% 1.30% 0.05%
171 APF TIPS 628,933,440 1.02% -0.81% -0.81% 1.30% 0.99% 1.35% 0.10%
172 BC U.S. TIPS 1.05% -0.79% -0.79% 1.33% 0.92% 1.30% 0.05%
173 Alaska Permanent Capital Mgmt 126,597,792 0.80% -0.33% -0.33% 0.88% 0.55% 1.24% 0.00%
174 BC U.S. TIPS 1-10 Year Index 0.82% -0.40% -0.40% 0.83% 0.43% 1.24% -0.06%
175 REITS † ‡ 1,301,601,822 2.91% -5.34% -5.34% -0.67% 1.41% 6.40% 5.31%
176 S&P GLOBAL REIT 2.59% -5.79% -5.79% -1.89% -0.25% 0.94% 4.12%
177 AEW Global RE Securities 502,210,446 3.10% -4.93% -4.93% 0.81% 3.91% 3.17% 6.28%
178 American Homes 4 Rent † 33,655,226 4.90% -7.82% -7.82% -10.39% -16.45% 5.87% 7.69% Net
179 MSCI US REIT Index 3.90% -8.09% -8.09% -5.93% -4.38% 0.87% 5.86%
180 REIT Benchmark3
3.21% -5.07% -5.07% -0.03% 2.45% 2.45% 5.60%
181 SSGA REITS 765,736,150 2.70% -5.50% -5.50% -1.17% 0.71%
182 S&P GLOBAL REIT 2.59% -5.79% -5.79% -1.89% -0.25%
183 LISTED INFRASTRUCTURE ◊ 630,231,413 0.78% -5.10% -5.10% 0.05% 5.44% 6.69%
184 S&P GLOBAL LISTED INFRASTRUCTURE 0.02% -5.70% -5.70% -1.35% 4.20% 3.52%
185 Lazard Listed Infrastructure 180,773,623 1.32% -5.75% -5.75% -0.67% 5.07% 9.70%
186 FTSE Core Developed Infrastructure (Hedged) 1.87% -4.14% -4.14% -0.58% 2.88% 4.74%
187 Cohen & Steers Listed Infrastructure 136,764,768 1.66% -3.19% -3.19% 2.93% 7.47% 4.98%
188 FTSE Core Developed Infrastructure Custom 1.52% -3.81% -3.81% 0.93% 5.13% 5.28%
189 SSGA Listed Infrastructure 312,682,994 0.10% -5.53% -5.53% -0.86% 4.88%
190 S&P Global Listed Infrastructure 0.02% -5.70% -5.70% -1.35% 4.20%
191 ABSOLUTE RETURN 2,636,910,530 N/A 0.80% 0.80% 5.26% 6.07% 3.15% 3.54% Net
192 ABSOLUTE RETURN BENCHMARK N/A 0.14% 0.14% 4.99% 6.08% 6.03% 5.99%
193 ASSET ALLOCATION 6,272,362,709 -0.28% -0.81% -0.81% 3.01% 3.16% 2.02% 2.18%
194 APF FI LIQUIDITY 637,453,492 1.01% -1.30% -1.30% -1.00%
195 APF ASSET ALLOCATION CASH 962,851,313 0.11% 0.30% 0.30% 0.86% 1.17% 0.48% 0.29%
196 90 DAY T-BILLS 0.14% 0.35% 0.35% 0.91% 1.11% 0.53% 0.34%
197 NISA CASH OVERLAY COMPOSITE 2,137,265,457 -0.98%
198 MULTI-STRATEGY 2,534,792,447 -0.43% -0.42% -0.42% 5.65% 5.65% 4.12% 4.81%
199 Performance Benchmark ● -0.44% 0.15% 0.15% 7.34% 10.70% 6.34% 7.22%
200 Bridgewater 842,907,896 -0.95% 0.05% 0.05% 6.00% 4.34% 2.64% 5.16%
201 AQR 871,012,862 -0.09% 0.06% 0.06% 6.47% 5.79% 6.64% 6.50%
202 Goldman Sachs 820,871,689 -0.23% -1.39% -1.39% 4.44% 6.88% 3.14% 4.15%
203 CPI + 5% 0.62% 2.41% 2.41% 5.58% 7.36% 6.86% 6.40%
*
Returns as of 3/31/2018
For investments within Private Equity and Growth Opportunities, Real Estate, and Infrastructure, Private Credit, and Income Opportunities asset classes, returns are lagged one (1) quarter.
Composites that incorporate these investments as well as associated benchmarks are also lagged one (1) quarter.
American Homes 4 Rent became a public investment on 7/31/2013. It is included in Income Opportunities from inception to 7/31/2013, Real Estate from 8/1/2013 to 9/30/2016, and ‡
Market Values as
of 3/31/2018*
Reported market values represent total fund holdings, which consists of 99.16% APF and 0.84% AMH, and are consistent with the timing of the APF and AMH Financial Statements.
Public infrastructure investments are included with Infrastructure prior to 9/30/2016 and Fixed Income Plus thereafter.
REITs are included with Real Estate prior to 9/30/2016 and Fixed Income Plus thereafter.
HY Fixed Income Custom Blend is BC Global High Yield Corporate Index through 7/31/2016 then BC US High Yield 2% Issuer Cap Index thereafter.1
2
3
●
HY Emerging Markets Benchmark is 50% JP Morgan Emerging Markets Bond Index Global and 50% JP Morgan Government Bond Index-Emerging Markets Global
REIT Benchmark is UBS Global Real Estate Investors Index through 12/31/2014 then FTSE EPRA/NAREIT Developed Rental Index thereafter.
†
◊
78/511
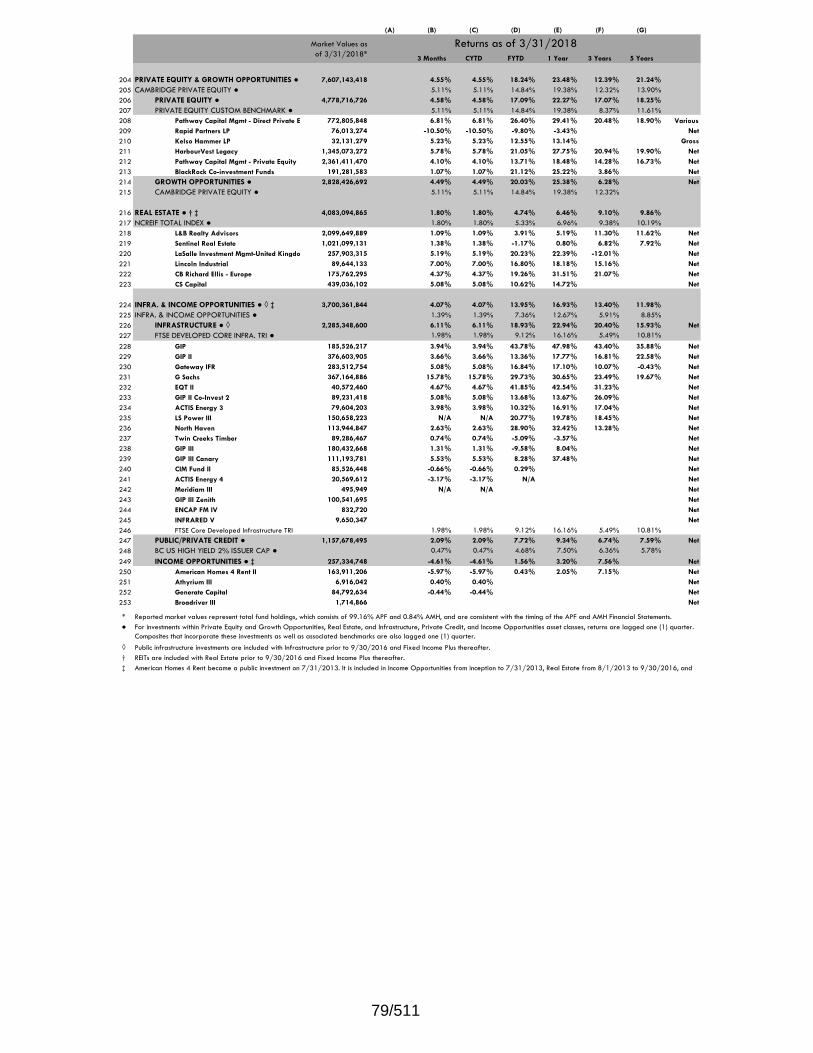
(A) (B) (C) (D) (E) (F) (G)
3 Months CYTD FYTD 1 Year 3 Years 5 Years
204 PRIVATE EQUITY & GROWTH OPPORTUNITIES ● 7,607,143,418 4.55% 4.55% 18.24% 23.48% 12.39% 21.24%
205 CAMBRIDGE PRIVATE EQUITY ● 5.11% 5.11% 14.84% 19.38% 12.32% 13.90%
206 PRIVATE EQUITY ● 4,778,716,726 4.58% 4.58% 17.09% 22.27% 17.07% 18.25%
207 PRIVATE EQUITY CUSTOM BENCHMARK ● 5.11% 5.11% 14.84% 19.38% 8.37% 11.61%
208 Pathway Capital Mgmt - Direct Private Equity 772,805,848 6.81% 6.81% 26.40% 29.41% 20.48% 18.90% Various
209 Rapid Partners LP 76,013,274 -10.50% -10.50% -9.80% -3.43% Net
210 Kelso Hammer LP 32,131,279 5.23% 5.23% 12.55% 13.14% Gross
211 HarbourVest Legacy 1,345,073,272 5.78% 5.78% 21.05% 27.75% 20.94% 19.90% Net
212 Pathway Capital Mgmt - Private Equity 2,361,411,470 4.10% 4.10% 13.71% 18.48% 14.28% 16.73% Net
213 BlackRock Co-investment Funds 191,281,583 1.07% 1.07% 21.12% 25.22% 3.86% Net
214 GROWTH OPPORTUNITIES ● 2,828,426,692 4.49% 4.49% 20.03% 25.38% 6.28% Net
215 CAMBRIDGE PRIVATE EQUITY ● 5.11% 5.11% 14.84% 19.38% 12.32%
216 REAL ESTATE ● † ‡ 4,083,094,865 1.80% 1.80% 4.74% 6.46% 9.10% 9.86%
217 NCREIF TOTAL INDEX ● 1.80% 1.80% 5.33% 6.96% 9.38% 10.19%
218 L&B Realty Advisors 2,099,649,889 1.09% 1.09% 3.91% 5.19% 11.30% 11.62% Net
219 Sentinel Real Estate 1,021,099,131 1.38% 1.38% -1.17% 0.80% 6.82% 7.92% Net
220 LaSalle Investment Mgmt-United Kingdom 257,903,315 5.19% 5.19% 20.23% 22.39% -12.01% Net
221 Lincoln Industrial 89,644,133 7.00% 7.00% 16.80% 18.18% 15.16% Net
222 CB Richard Ellis - Europe 175,762,295 4.37% 4.37% 19.26% 31.51% 21.07% Net
223 CS Capital 439,036,102 5.08% 5.08% 10.62% 14.72% Net
224 INFRA. & INCOME OPPORTUNITIES ● ◊ ‡ 3,700,361,844 4.07% 4.07% 13.95% 16.93% 13.40% 11.98%
225 INFRA. & INCOME OPPORTUNITIES ● 1.39% 1.39% 7.36% 12.67% 5.91% 8.85%
226 INFRASTRUCTURE ● ◊ 2,285,348,600 6.11% 6.11% 18.93% 22.94% 20.40% 15.93% Net
227 FTSE DEVELOPED CORE INFRA. TRI ● 1.98% 1.98% 9.12% 16.16% 5.49% 10.81%
228 GIP 185,526,217 3.94% 3.94% 43.78% 47.98% 43.40% 35.88% Net
229 GIP II 376,603,905 3.66% 3.66% 13.36% 17.77% 16.81% 22.58% Net
230 Gateway IFR 283,512,754 5.08% 5.08% 16.84% 17.10% 10.07% -0.43% Net
231 G Sachs 367,164,886 15.78% 15.78% 29.73% 30.65% 23.49% 19.67% Net
232 EQT II 40,572,460 4.67% 4.67% 41.85% 42.54% 31.23% Net
233 GIP II Co-Invest 2 89,231,418 5.08% 5.08% 13.68% 13.67% 26.09% Net
234 ACTIS Energy 3 79,604,203 3.98% 3.98% 10.32% 16.91% 17.04% Net
235 LS Power III 150,658,223 N/A N/A 20.77% 19.78% 18.45% Net
236 North Haven 113,944,847 2.63% 2.63% 28.90% 32.42% 13.28% Net
237 Twin Creeks Timber 89,286,467 0.74% 0.74% -5.09% -3.57% Net
238 GIP III 180,432,668 1.31% 1.31% -9.58% 8.04% Net
239 GIP III Canary 111,193,781 5.53% 5.53% 8.28% 37.48% Net
240 CIM Fund II 85,526,448 -0.66% -0.66% 0.29% Net
241 ACTIS Energy 4 20,569,612 -3.17% -3.17% N/A Net
242 Meridiam III 495,949 N/A N/A Net
243 GIP III Zenith 100,541,695 Net
244 ENCAP FM IV 832,720 Net
245 INFRARED V 9,650,347 Net
246 FTSE Core Developed Infrastructure TRI 1.98% 1.98% 9.12% 16.16% 5.49% 10.81%
247 PUBLIC/PRIVATE CREDIT ● 1,157,678,495 2.09% 2.09% 7.72% 9.34% 6.74% 7.59% Net
248 BC US HIGH YIELD 2% ISSUER CAP ● 0.47% 0.47% 4.68% 7.50% 6.36% 5.78%
249 INCOME OPPORTUNITIES ● ‡ 257,334,748 -4.61% -4.61% 1.56% 3.20% 7.56% Net
250 American Homes 4 Rent II 163,911,206 -5.97% -5.97% 0.43% 2.05% 7.15% Net
251 Athyrium III 6,916,042 0.40% 0.40% Net
252 Generate Capital 84,792,634 -0.44% -0.44% Net
253 Broadriver III 1,714,866 Net
†
‡
●
*
REITs are included with Real Estate prior to 9/30/2016 and Fixed Income Plus thereafter.
American Homes 4 Rent became a public investment on 7/31/2013. It is included in Income Opportunities from inception to 7/31/2013, Real Estate from 8/1/2013 to 9/30/2016, and
For investments within Private Equity and Growth Opportunities, Real Estate, and Infrastructure, Private Credit, and Income Opportunities asset classes, returns are lagged one (1) quarter.
Composites that incorporate these investments as well as associated benchmarks are also lagged one (1) quarter.
Reported market values represent total fund holdings, which consists of 99.16% APF and 0.84% AMH, and are consistent with the timing of the APF and AMH Financial Statements.
◊ Public infrastructure investments are included with Infrastructure prior to 9/30/2016 and Fixed Income Plus thereafter.
Returns as of 3/31/2018 Market Values as
of 3/31/2018*
79/511

Strategic and Tactical Moves
Separator Page
80/511

Board Report on Tactical and Strategic Manager Actions
12/31/2017 through 3/31/2018
Private Income and Absolute Return Tactical Changes Implemented: Private Income Fund Commitments closed in Q3: $100.0 million to Heitman Real Estate Debt Separate Account
$200.0 million to KKR Infrastructure III Direct Investments/Co-Investments closed in Q3: $15.9 million private credit co-investment with Clearlake Capital Real Estate Direct Investment Dispositions closed in Q3:
$1.6 billion of proceeds from the sale of three multi-family/apartment assets including Simpson Housing REOC, Bent Tree (Centreville, VA), and Churchill on the Park (Dallas, TX)
Absolute Return $10 million to Market Neutral Equity Manger
$50 million to Hedged Event Driven Manager $150 million to Systematic Macro / CTA Manager $100 million to Market Neutral Equity Manager $100 million to Fixed Income Arbitrage / Relative Value Manager $90 million to Systematic Macro Manager Strategic Changes Implemented: Private Income and Absolute Return - None
81/511
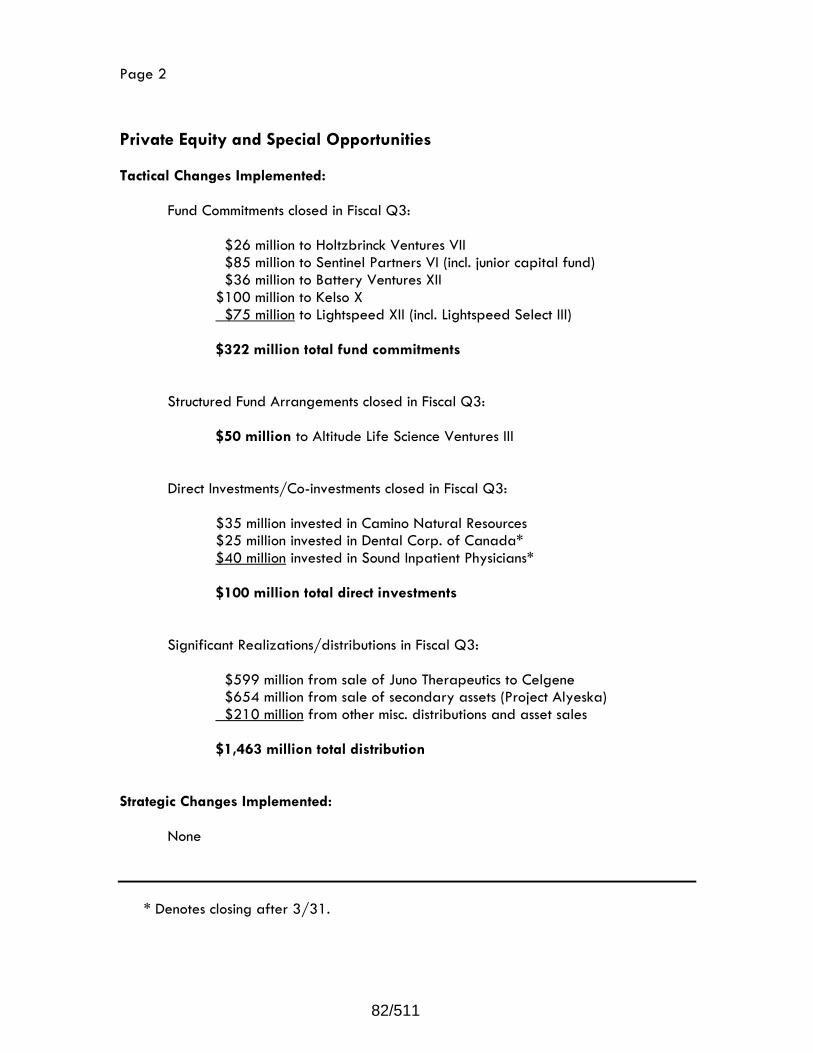
Page 2
Private Equity and Special Opportunities Tactical Changes Implemented:
Fund Commitments closed in Fiscal Q3:
$26 million to Holtzbrinck Ventures VII $85 million to Sentinel Partners VI (incl. junior capital fund) $36 million to Battery Ventures XII $100 million to Kelso X $75 million to Lightspeed XII (incl. Lightspeed Select III) $322 million total fund commitments
Structured Fund Arrangements closed in Fiscal Q3:
$50 million to Altitude Life Science Ventures III
Direct Investments/Co-investments closed in Fiscal Q3:
$35 million invested in Camino Natural Resources $25 million invested in Dental Corp. of Canada* $40 million invested in Sound Inpatient Physicians* $100 million total direct investments
Significant Realizations/distributions in Fiscal Q3:
$599 million from sale of Juno Therapeutics to Celgene $654 million from sale of secondary assets (Project Alyeska) $210 million from other misc. distributions and asset sales $1,463 million total distribution
Strategic Changes Implemented:
None
* Denotes closing after 3/31.
82/511
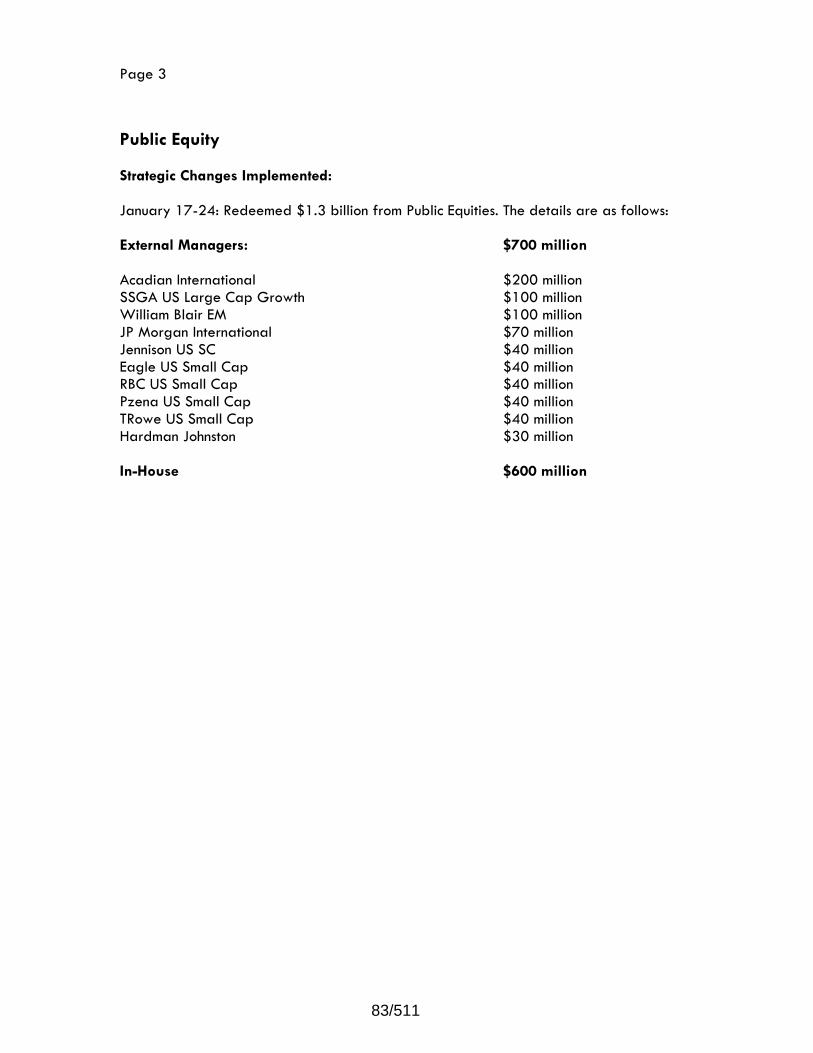
Page 3
Public Equity Strategic Changes Implemented: January 17-24: Redeemed $1.3 billion from Public Equities. The details are as follows: External Managers: $700 million Acadian International $200 million SSGA US Large Cap Growth $100 million William Blair EM $100 million JP Morgan International $70 million Jennison US SC $40 million Eagle US Small Cap $40 million RBC US Small Cap $40 million Pzena US Small Cap $40 million TRowe US Small Cap $40 million Hardman Johnston $30 million In-House $600 million
83/511

Investment Management Fee Report
Separator Page
84/511

YTD YTD3/31/2018 12/31/2017 9/30/2017 FY2018 6/30/2017 3/31/2017 12/31/2016 9/30/2016 FY2017
Transition Management (a) - 562,000 - 562,000 - - - - -
Non-Domestic Equity & FI Managers 670,000 735,000 597,000 2,002,000 546,000 564,000 540,000 744,000 2,394,000
Real Estate Advisors:Real Estate Advisors (b)(f)(h) 7,761,000 8,311,000 6,281,000 22,353,000 10,433,000 5,580,000 4,723,000 3,282,000 24,018,000
Abs. Return, Mezz. & Distressed Debt (c)(d)4,440,000 4,793,000 4,337,000 13,570,000 5,018,000 5,339,000 8,117,000 7,105,000 25,579,000
Infrastructure 6,546,000 5,851,000 4,779,000 17,176,000 6,425,000 5,610,000 7,899,000 6,506,000 26,440,000
Public Equity (g)- 793,000 493,000 1,286,000 685,000 163,000 366,000 257,000 1,471,000
Private Equity (e)(h)51,890,000 51,674,000 54,081,000 157,645,000 39,326,000 7,688,000 12,098,000 9,313,000 68,425,000
Fees Funded by Investments 71,307,000 72,719,000 70,568,000 214,594,000 62,433,000 24,944,000 33,743,000 27,207,000 148,327,000
Fees Funded by Appropriation 39,831,000 25,202,000 26,127,000 91,160,000 24,467,000 32,815,000 22,825,000 22,756,000 102,863,000
APFC Corporate Expenses 7,627,000 4,909,000 4,391,000 16,927,000 6,465,000 4,568,000 4,154,000 4,229,000 19,416,000
TOTAL Investment Management Fees 118,765,000 102,830,000 101,086,000 322,681,000 93,365,000 62,327,000 60,722,000 54,192,000 270,606,000
Assets Under Management 65,118,515,000 64,527,103,000 62,043,958,000 65,118,515,000 60,286,353,000 58,245,649,000 55,859,408,000 55,239,923,000 60,286,353,000
Notes: (a) Commissions and futures overlay fees only (if applicable, including commissions paid to third party brokers); excludes taxes and other implementation costs.(b) Includes accrued but unpaid real estate advisor incentive fees. (c) Fund-of-Fund structures include only fund manager fees, not underlying partnership fees.(d) Remaining ECIOs moved to Absolute Return beginning in FY2016.(e) Direct placement Private Equity began in FY2014.(f) FY16 Q1 negative fees result from reversal of accrued incentive fees because actual performance did not live up to expectations.(g) Public Equity with a net of fees component began in FY2016.(h) Beginning with the quarter ended 6/30/17, estimates of management fees for private equity and real estate investments accessed through external managers are included.
Quarter Ended
Quarterly Investment Management Fees
Quarter Ended
85/511

a) FY2018 Budget Status
Separator Page
86/511

Corporate Operations Budget Allocation
Board approved
authorization
Payments and
Encumbrances
Budget
Remaining
Personal Services 9,600,700$ 7,046,770$ 2,553,930$
Staff 9,572,700 7,033,430 2,539,270
Board: Honorarium 28,000 13,340 14,660
Travel 605,500 384,763 220,737
Staff 492,785 343,262 149,523
Trustees 47,300 14,832 32,468
Moving/Non‐Employee 65,415 26,669 38,746
Contractual Services 1,870,900 1,198,503 672,397
Audit, Legal, Consulting 260,500 150,636 109,864
Public Communications 146,500 93,916 52,584
Board Support and Meetings 94,500 53,001 41,499
Information Technology 617,100 298,782 318,318
HR and Recruitment 20,000 ‐ 20,000
Training/Education 56,500 22,140 34,360
Office Support 675,800 580,027 95,773
Commodities 97,300 29,117 68,183
Equipment 80,000 61,380 18,620
Total 12,254,400$ 8,720,532$ 3,533,868$
Investment Management Budget Allocation
Investment Systems 5,447,100$ 3,403,563$ 2,043,537$
Investment Due Diligence 6,095,000 1,704,355 4,390,645
Custody Fees 1,400,000 1,014,977 385,023
Investment Manager Fees 130,827,100 91,159,393 39,667,707
Public Equities 68,827,100 56,862,998 11,964,102
Fixed Income 11,250,000 8,114,101 3,135,899
Real Estate 4,500,000 537,291 3,962,709
Alternative Assets 46,250,000 25,645,003 20,604,997
Total 143,769,200$ 97,282,288$ 46,486,912$
Total appropriation 156,023,600$ 106,002,820$ 50,020,780$
FY18 BUDGET STATUSas of March 31, 2018
87/511

b) Budget to Actual Report FY 2018
Separator Page
88/511
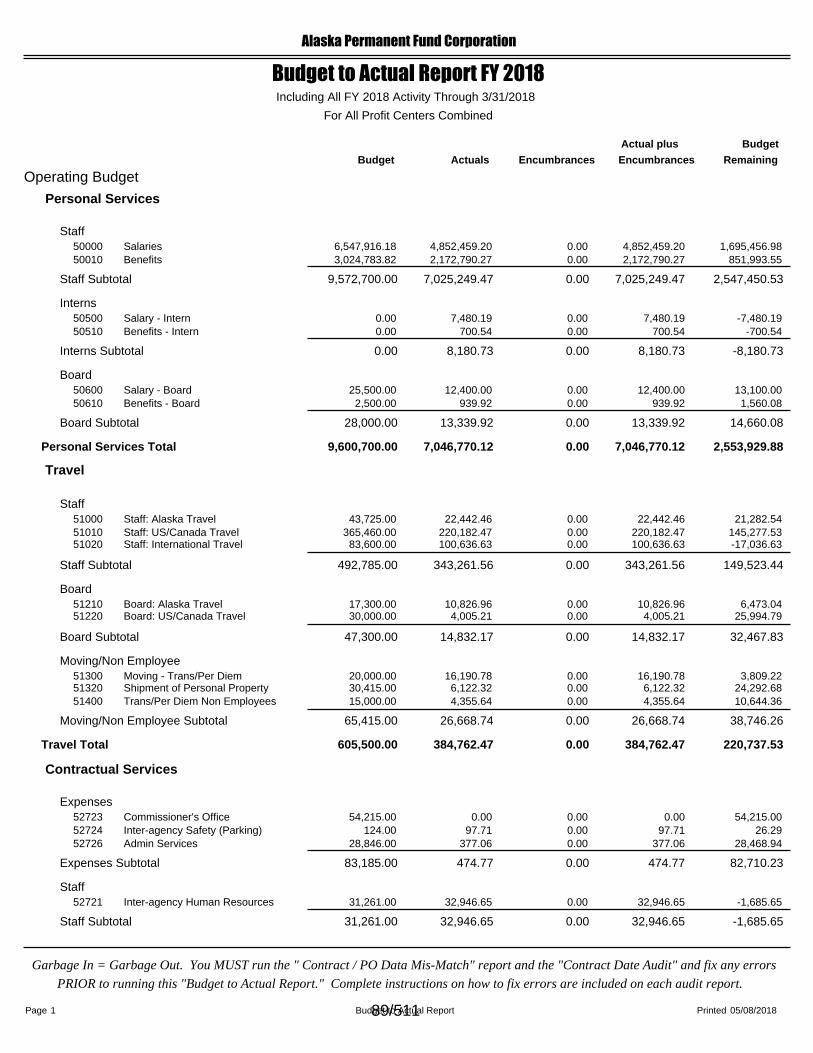
Alaska Permanent Fund Corporation
Actual plus
EncumbrancesEncumbrancesActuals
Budget
Budget
For All Profit Centers Combined
Including All FY 2018 Activity Through 3/31/2018
Budget to Actual Report FY 2018
Remaining
Operating Budget
Personal Services
Staff0.006,547,916.18 4,852,459.20 1,695,456.98Salaries 4,852,459.20500000.003,024,783.82 2,172,790.27 851,993.55Benefits 2,172,790.2750010
9,572,700.00Staff Subtotal 0.00 7,025,249.47 2,547,450.537,025,249.47
Interns0.000.00 7,480.19 -7,480.19Salary - Intern 7,480.19505000.000.00 700.54 -700.54Benefits - Intern 700.5450510
0.00Interns Subtotal 0.00 8,180.73 -8,180.738,180.73
Board0.0025,500.00 12,400.00 13,100.00Salary - Board 12,400.00506000.002,500.00 939.92 1,560.08Benefits - Board 939.9250610
28,000.00Board Subtotal 0.00 13,339.92 14,660.0813,339.92
Personal Services Total 2,553,929.887,046,770.120.009,600,700.00 7,046,770.12
Travel
Staff0.0043,725.00 22,442.46 21,282.54Staff: Alaska Travel 22,442.46510000.00365,460.00 220,182.47 145,277.53Staff: US/Canada Travel 220,182.47510100.0083,600.00 100,636.63 -17,036.63Staff: International Travel 100,636.6351020
492,785.00Staff Subtotal 0.00 343,261.56 149,523.44343,261.56
Board0.0017,300.00 10,826.96 6,473.04Board: Alaska Travel 10,826.96512100.0030,000.00 4,005.21 25,994.79Board: US/Canada Travel 4,005.2151220
47,300.00Board Subtotal 0.00 14,832.17 32,467.8314,832.17
Moving/Non Employee0.0020,000.00 16,190.78 3,809.22Moving - Trans/Per Diem 16,190.78513000.0030,415.00 6,122.32 24,292.68Shipment of Personal Property 6,122.32513200.0015,000.00 4,355.64 10,644.36Trans/Per Diem Non Employees 4,355.6451400
65,415.00Moving/Non Employee Subtotal 0.00 26,668.74 38,746.2626,668.74
Travel Total 220,737.53384,762.470.00605,500.00 384,762.47
Contractual Services
Expenses0.0054,215.00 0.00 54,215.00Commissioner's Office 0.00527230.00124.00 97.71 26.29Inter-agency Safety (Parking) 97.71527240.0028,846.00 377.06 28,468.94Admin Services 377.0652726
83,185.00Expenses Subtotal 0.00 474.77 82,710.23474.77
Staff0.0031,261.00 32,946.65 -1,685.65Inter-agency Human Resources 32,946.6552721
31,261.00Staff Subtotal 0.00 32,946.65 -1,685.6532,946.65
Garbage In = Garbage Out. You MUST run the " Contract / PO Data Mis-Match" report and the "Contract Date Audit" and fix any errors
PRIOR to running this "Budget to Actual Report." Complete instructions on how to fix errors are included on each audit report.
Budget to Actual Report1 Printed 05/08/2018Page 89/511

Alaska Permanent Fund Corporation
Actual plus
EncumbrancesEncumbrancesActuals
Budget
Budget
For All Profit Centers Combined
Including All FY 2018 Activity Through 3/31/2018
Budget to Actual Report FY 2018
Remaining
Professional Services145,500.00145,500.00 145,500.00 0.00Annual Audit 0.0052100
0.0010,000.00 0.00 10,000.00Auditor Consulting 0.00521100.0045,000.00 35,320.37 9,679.63Consulting Other 35,320.37524900.0075,000.00 468.00 74,532.00Legal Fees Corp Matters 468.00525100.0030,000.00 4,668.48 25,331.52DOL Legal 4,668.4852520
305,500.00Professional Services Subtotal 145,500.00 185,956.85 119,543.1540,456.85
Public Educ./Info. Progra3,300.75102,000.00 55,210.81 46,789.19Communications Program 51,910.0652600
102,000.00Public Educ./Info. Program Subtotal 3,300.75 55,210.81 46,789.1951,910.06
IT Services60,699.3496,500.00 74,739.34 21,760.66IT Consulting Services 14,040.0052700
4,500.00100,000.00 4,500.00 95,500.00MIS System Services 0.005270457,398.63283,200.00 151,605.82 131,594.18Netwk/Server Software Lic/Mnt. 94,207.1953810
479,700.00IT Services Subtotal 122,597.97 230,845.16 248,854.84108,247.19
Communications20,520.5640,000.00 37,135.18 2,864.82Phone/Fax Lines/Toll/Cell 16,614.6253100
0.004,000.00 4,000.00 0.00State EPR Charge 4,000.00531104,933.697,500.00 7,044.70 455.30Tele/Videoconferencing 2,111.01531209,644.1635,000.00 19,757.09 15,242.91Mobile Devices 10,112.9353140
86,500.00Communications Subtotal 35,098.41 67,936.97 18,563.0332,838.56
Investment Systems
0.00Investment Systems Subtotal 0.00 0.00 0.000.00
Postage/Transportation0.004,000.00 3,340.90 659.10Inter-agency Mail 3,340.9053300
220.462,300.00 1,128.65 1,171.35Delivery Services 908.195332059.75250.00 422.85 -172.85Postage 363.1053325
6,550.00Postage/Transportation Subtotal 280.21 4,892.40 1,657.604,612.19
Advertising/Printing/Bind0.0020,000.00 0.00 20,000.00Recruitment Notices 0.00534400.0044,500.00 38,705.52 5,794.48Communications Advert/Print 38,705.5253500
64,500.00Advertising/Printing/Binding Subtotal 0.00 38,705.52 25,794.4838,705.52
Repairs/Maintenance2,191.003,000.00 2,299.50 700.50Office Furniture/Other Repair 108.50536004,052.7611,500.00 11,500.00 0.00Copier/FAX Maintenance 7,447.2453610
0.0050,900.00 12,749.03 38,150.97IT Equipment Repair 12,749.0353650
65,400.00Repairs/Maintenance Subtotal 6,243.76 26,548.53 38,851.4720,304.77
Leases0.00510,000.00 505,399.08 4,600.92Office Rent/Lease 505,399.0853700
847.002,500.00 2,500.00 0.00Records Retention Storage 1,653.0053710595.895,000.00 2,383.56 2,616.44Copier Lease 1,787.6753720
0.001,000.00 1,020.00 -20.00Other Rent/Leases 1,020.0053790
518,500.00Leases Subtotal 1,442.89 511,302.64 7,197.36509,859.75
Training/Education0.0056,500.00 22,140.07 34,359.93Training & Conferences 22,140.0753900
Garbage In = Garbage Out. You MUST run the " Contract / PO Data Mis-Match" report and the "Contract Date Audit" and fix any errors
PRIOR to running this "Budget to Actual Report." Complete instructions on how to fix errors are included on each audit report.
Budget to Actual Report2 Printed 05/08/2018Page 90/511
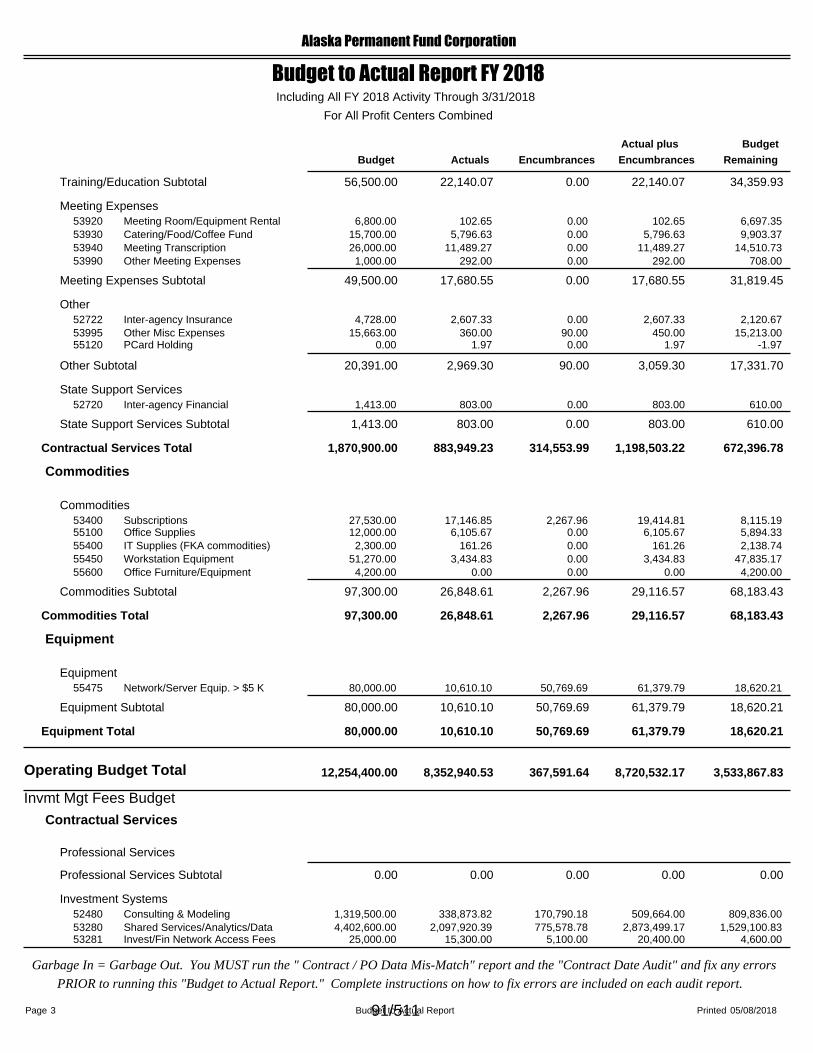
Alaska Permanent Fund Corporation
Actual plus
EncumbrancesEncumbrancesActuals
Budget
Budget
For All Profit Centers Combined
Including All FY 2018 Activity Through 3/31/2018
Budget to Actual Report FY 2018
Remaining
56,500.00Training/Education Subtotal 0.00 22,140.07 34,359.9322,140.07
Meeting Expenses0.006,800.00 102.65 6,697.35Meeting Room/Equipment Rental 102.65539200.0015,700.00 5,796.63 9,903.37Catering/Food/Coffee Fund 5,796.63539300.0026,000.00 11,489.27 14,510.73Meeting Transcription 11,489.27539400.001,000.00 292.00 708.00Other Meeting Expenses 292.0053990
49,500.00Meeting Expenses Subtotal 0.00 17,680.55 31,819.4517,680.55
Other0.004,728.00 2,607.33 2,120.67Inter-agency Insurance 2,607.3352722
90.0015,663.00 450.00 15,213.00Other Misc Expenses 360.00539950.000.00 1.97 -1.97PCard Holding 1.9755120
20,391.00Other Subtotal 90.00 3,059.30 17,331.702,969.30
State Support Services0.001,413.00 803.00 610.00Inter-agency Financial 803.0052720
1,413.00State Support Services Subtotal 0.00 803.00 610.00803.00
Contractual Services Total 672,396.781,198,503.22314,553.991,870,900.00 883,949.23
Commodities
Commodities2,267.9627,530.00 19,414.81 8,115.19Subscriptions 17,146.8553400
0.0012,000.00 6,105.67 5,894.33Office Supplies 6,105.67551000.002,300.00 161.26 2,138.74IT Supplies (FKA commodities) 161.26554000.0051,270.00 3,434.83 47,835.17Workstation Equipment 3,434.83554500.004,200.00 0.00 4,200.00Office Furniture/Equipment 0.0055600
97,300.00Commodities Subtotal 2,267.96 29,116.57 68,183.4326,848.61
Commodities Total 68,183.4329,116.572,267.9697,300.00 26,848.61
Equipment
Equipment50,769.6980,000.00 61,379.79 18,620.21Network/Server Equip. > $5 K 10,610.1055475
80,000.00Equipment Subtotal 50,769.69 61,379.79 18,620.2110,610.10
Equipment Total 18,620.2161,379.7950,769.6980,000.00 10,610.10
Operating Budget Total 12,254,400.00 8,352,940.53 367,591.64 8,720,532.17 3,533,867.83
Invmt Mgt Fees Budget
Contractual Services
Professional Services
0.00Professional Services Subtotal 0.00 0.00 0.000.00
Investment Systems170,790.181,319,500.00 509,664.00 809,836.00Consulting & Modeling 338,873.8252480775,578.784,402,600.00 2,873,499.17 1,529,100.83Shared Services/Analytics/Data 2,097,920.3953280
5,100.0025,000.00 20,400.00 4,600.00Invest/Fin Network Access Fees 15,300.0053281
Garbage In = Garbage Out. You MUST run the " Contract / PO Data Mis-Match" report and the "Contract Date Audit" and fix any errors
PRIOR to running this "Budget to Actual Report." Complete instructions on how to fix errors are included on each audit report.
Budget to Actual Report3 Printed 05/08/2018Page 91/511

Alaska Permanent Fund Corporation
Actual plus
EncumbrancesEncumbrancesActuals
Budget
Budget
For All Profit Centers Combined
Including All FY 2018 Activity Through 3/31/2018
Budget to Actual Report FY 2018
Remaining
5,747,100.00Investment Systems Subtotal 951,468.96 3,403,563.17 2,343,536.832,452,094.21
Investment Due Diligence189,666.712,000,000.00 723,125.24 1,276,874.76Fiduciary Advice 533,458.5352405
0.001,385,000.00 0.00 1,385,000.00Subject Matter Experts 0.00524150.00650,000.00 368,954.50 281,045.50Performance Measurement 368,954.5052435
353.93100,000.00 39,175.68 60,824.32Research & Memberships 38,821.75524400.00160,000.00 38,250.00 121,750.00Manager Searches 38,250.00524550.001,500,000.00 534,850.05 965,149.95Legal Fees-Investment Specific 534,850.0552502
5,795,000.00Investment Due Diligence Subtotal 190,020.64 1,704,355.47 4,090,644.531,514,334.83
Custody0.001,400,000.00 1,014,976.70 385,023.30Custody Fees 1,014,976.7052200
1,400,000.00Custody Subtotal 0.00 1,014,976.70 385,023.301,014,976.70
Investment Manager Fees0.0068,827,100.00 56,862,998.28 11,964,101.72Public Equities Manager Fees 56,862,998.28523000.0011,250,000.00 8,114,100.51 3,135,899.49Fixed Income Manager Fees 8,114,100.51523100.004,500,000.00 537,290.82 3,962,709.18Real Estate Manager Fees 537,290.82523200.0046,250,000.00 25,645,002.93 20,604,997.07Alternative Markets Mgr Fees 25,645,002.9352330
130,827,100.00Investment Manager Fees Subtotal 0.00 91,159,392.54 39,667,707.4691,159,392.54
Contractual Services Total 46,486,912.1297,282,287.881,141,489.60143,769,200.00 96,140,798.28
Invmt Mgt Fees Budget Total 143,769,200.00 96,140,798.28 1,141,489.60 97,282,287.88 46,486,912.12
50,020,779.95106,002,820.051,509,081.24104,493,738.81Total Before Legislative Appropriations 156,023,600.00
Legislative Appropriation
Legislative Appropriation
Legislative Appropriation0.002,616,500.00 2,616,500.00 0.00Law Legislative Appropriation 2,616,500.00591000.005,959,400.00 5,959,400.00 0.00DNR Legislative Appropriation 5,959,400.00592000.0094,100.00 0.00 94,100.00DOR Legislative Appropriation 0.0059300
8,670,000.00Legislative Appropriations Subtotal 0.00 8,575,900.00 94,100.008,575,900.00
Legislative Appropriations Total 94,100.008,575,900.000.008,670,000.00 8,575,900.00
Legislative Appropriations Total 8,670,000.00 8,575,900.00 0.00 8,575,900.00 94,100.00
50,114,879.95114,578,720.051,509,081.24113,069,638.81164,693,600.00Grand Total
Garbage In = Garbage Out. You MUST run the " Contract / PO Data Mis-Match" report and the "Contract Date Audit" and fix any errors
PRIOR to running this "Budget to Actual Report." Complete instructions on how to fix errors are included on each audit report.
Budget to Actual Report4 Printed 05/08/2018Page 92/511

CIO's Report Memo
Separator Page
93/511

SUBJECT: Chief Investment Officer’s Report
DATE: 5/23/2018
INFORMATION: _____X_____
APFC’s Chief Investment Officer provides a summary investment review of the Permanent Fund on a quarterly basis at each Board Meeting, which is read and also provided in hardcopy form.
94/511

a) CIO's Report
Separator Page
95/511

CIO Report for the May 23, 2018 APFC Board Meeting
Good morning, Mr. Chairman and members of the Permanent Fund Board.
In contrast to the generally strong market returns for both US and international stocks in the
year-and-a half period from mid-2016 through 2017, 2018 is proving to be a different year altogether.
Despite sometimes breathtaking day-to-day volatility in stock markets, the story for stocks cumulatively
year-to-date is largely that they are range-bound and their investment performance flat. Moreover,
with rising interest rates, fixed-income plus has retreated nearly 1 ¾ % in the first three months of 2018.
As we noted at our previous Board meeting in February, we anticipate that rising interest rates will likely
continue to mute stock returns for most of the remainder of the calendar year or longer. In essence,
despite some impressive increases in corporate earnings among companies, the rate at which the
market discounts those earnings has also increased, thereby offsetting the potential benefits of those
earnings increases.
For the first three-quarters of the current fiscal year through March 2018, the Permanent Fund
has returned 8.86%, or slightly less than ½ % better than for the 6-month period reported at our recent
February Board meeting. This strong 9-month overall return for the Fund resulted from better than a
15% return on Private Equity & Special Opportunities, better than a 10% return for infrastructure and
public equities, better than a 5% return for absolute return funds and real estate, and positive
contributions for the remainder of APFC’s investment programs. As you will see from our performance
scorecard to be presented later this morning by Valeria Martinez, our long-term (5-year) performance of
8.35% has outperformed the Fund’s CPI+5% objective by nearly 2%, our medium-term (3-year)
performance of 7.65% has out-performed the median US public fund peer by 1%, and our short-term 12-
month Fund return of 12.14% has outpaced benchmark indexes by nearly 1.5%. Consequently, the
overall size of the Permanent Fund rose to $64.6 billion, up only slightly from the end of 2017 but $4.8
billion more than where we started the fiscal year in July 2017. The Fund’s size is comprised of $47
96/511
2
billion in Principal and a record $17.6 billion in its Earnings Reserve (up by $2.3 billion compared with
December 31st).
If the US stock market continues to be range bound for the remainder of 2018 or even longer,
how could the Permanent Fund be expected to add value? The answer lies in the Permanent Fund’s
multiple sources of investment return. First, US stocks comprise only about 20% of the Permanent
Fund’s overall portfolio. Another 20% is invested in international stocks with a relative underweight to
Europe and an overweight towards the Emerging Markets. Thus APFC’s relatively modest exposure to
publicly-traded stocks (less than half our overall Fund) contrasts to most public plans in the United
States whose stock portfolio comprises a majority of plan assets. Second, APFC’s strong private equity
and private income programs (including infrastructure) have been increasing moderately in scale while
preserving their top-quartile record against peer programs. Thus, the illiquidity premium that we seek
by investing in private market assets has continued to add meaningful value. Third, our fund is typically
more diversified globally (particularly across the Emerging Markets) in every asset class than many of
our US fund peers.
This diversification advantage has also resulted in meaningful ways from investment
partnerships that the Fund has already established or continues to develop with investment managers
and large plan peers internationally in virtually every asset class. Notably thus far this calendar year,
APFC has launched (1) Capital Constellation for new Private Equity managers in conjunction with the
Kuwait Social Security System (PIFSS) and UK’s RaiPen and (2) the MEASA (Middle East, Africa, South
Asia) Stock Fund in conjunction with McKinley Capital and sovereign wealth funds from the Middle East
and Far East. We anticipate that the strength of these international investment partnerships will
effectively give the Permanent Fund a materially higher quality and quantity of investment opportunities
compared with other US and even other sovereign wealth funds.
97/511

3
As a result of APFC’s generally strong investment performance coupled with strong partnerships
and initiatives, we have secured some important recognition as of late. Specifically, APFC has been
named North American Private Equity Investment Plan of the Year for 2017 by PEI Magazine and has
also been named as one of five finalists for two-consecutive years as best Sovereign Wealth Fund
manager of hedge funds by Institutional Investor magazine.
Although APFC will undoubtedly be unable to achieve such strong performance against market
indexes, peers, and CPI+5% for all periods in the future, staff believes that strong relative and absolute
investment performance should generally continue so long as the quality of our staff, external
investment managers, and international investment partnerships remain a competitive advantage.
The Board meeting today and tomorrow will cover some special topics in addition to the usual
review of the Fund and its asset classes. Specifically, at the Board’s request from our last meeting, we
will hear from a panel of Environmental, Social, and Governance or ESG experts from our leading fund
management partners regarding prevailing industry best practices. Also, we have completed an entirely
new revision of APFC’s Investment Policies & Procedures, by my reckoning for only the third time in the
past 23 years, which we believe reflects the prevailing best practice standards among investment
plans as well as APFC’s unique investment plan history and trajectory.
Thank you in advance for your consideration, questions, and recommendations. We very much
look forward to our work with you over the coming two days. I am happy to answer any questions you
may have regarding APFC’s overall investment strategy and outlook.
98/511

Investing with Environmental, Social & Governance
Factors Memo
Separator Page
99/511

SUBJECT: ESG Panel Discussion
ACTION: ____________
DATE: 5/23/2018
INFORMATION: ______X______
BACKGROUND: At the most recent APFC Board meeting in February 2018, the Board of Trustees requested that staff prepare an ESG panel discussion so that it could evaluate potential policy alternatives. Investing by public plans, endowments, and foundations which reflects environmental, social, and governance (ESG) objectives has become of increasing interest among plan boards, legislatures, and constituencies over the past several years. Legislatures and plan boards have adopted a range of ESG policy options, including: (1)no action, (2) targeted divestments, (3) targeted engagement to transformative investment themes in the private markets, (4) shareholder activism, and (5) the use of some form of ESG factors in making future investment decisions. Importantly, these institutional investors need to reconcile the objectives of the selected option with the fiduciary requirements that guide their investment process. That said, several state legislatures and foreign governments have expressly imposed ESG requirements on government-managed investment plans based upon prevailing social objectives of those states or countries. The objective of this two-hour panel discussion is to identify the range of evolving best practices among institutional investment plans and their boards. The panel will be moderated by Russell Read (APFC’s Chief Investment Officer) with the following three panelists representing some of the most respected and experienced ESG-related investment efforts from our leading investment management partners: Brian Deese (Managing Director, Blackrock): Brian Deese, Managing Director, is Global Head of Sustainable Investing at BlackRock. The Sustainable Investing team is focused on identifying drivers of long-term return associated with environmental, social and governance issues, integrating them throughout Blackrock's investment processes, and creating solutions for our clients to achieve sustainable investment return. Previously, Brian worked in White House under President Obama where he was the President's senior advisor for climate and energy policy, helping to negotiate the Paris Climate Agreement and other national and international initiatives. Early on in the Obama Administration, Brian was one of the key architects in the resurgence of the auto industry after the financial crisis. Brian also served as deputy director of the National Economic Council and deputy director of the Office of Management and Budget. Most recently, he has been providing advice to institutions interested in sustainable investing strategies and lecturing at the Kennedy School of Government at Harvard University. Brian earned a J.D. from Yale Law School, and a B.A. from Middlebury College. He lives in Brookline Massachusetts.
100/511
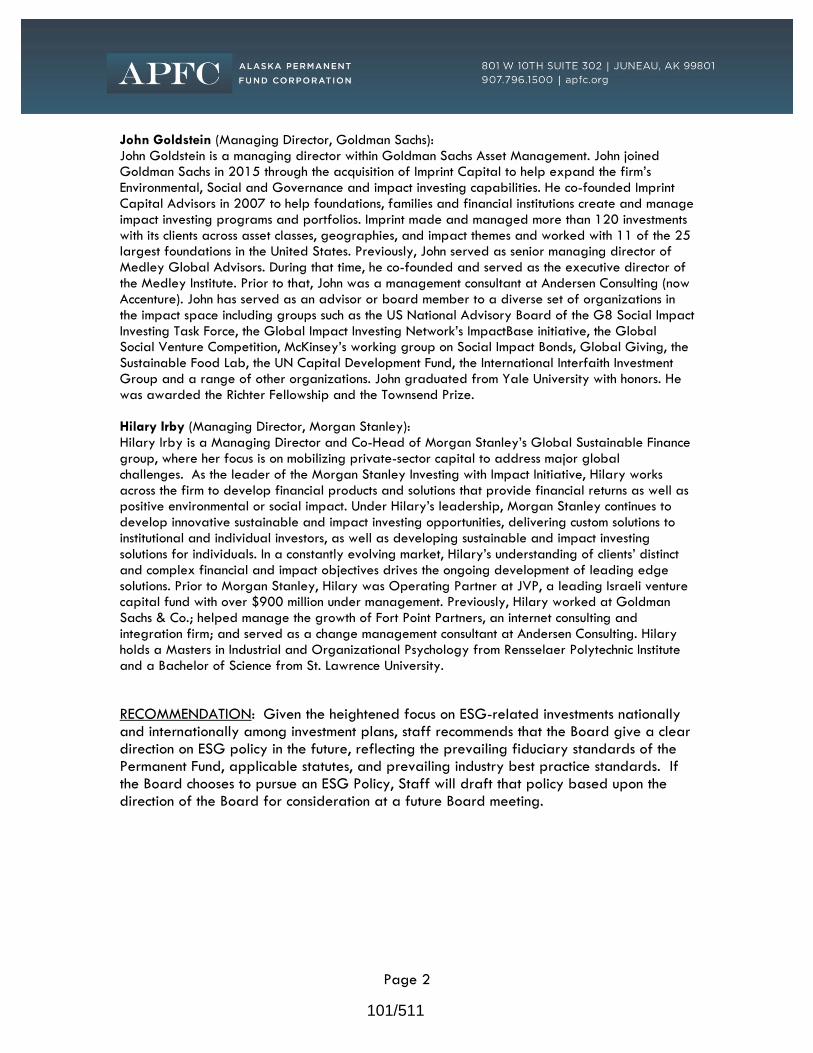
Page 2
John Goldstein (Managing Director, Goldman Sachs): John Goldstein is a managing director within Goldman Sachs Asset Management. John joined Goldman Sachs in 2015 through the acquisition of Imprint Capital to help expand the firm’s Environmental, Social and Governance and impact investing capabilities. He co-founded Imprint Capital Advisors in 2007 to help foundations, families and financial institutions create and manage impact investing programs and portfolios. Imprint made and managed more than 120 investments with its clients across asset classes, geographies, and impact themes and worked with 11 of the 25 largest foundations in the United States. Previously, John served as senior managing director of Medley Global Advisors. During that time, he co-founded and served as the executive director of the Medley Institute. Prior to that, John was a management consultant at Andersen Consulting (now Accenture). John has served as an advisor or board member to a diverse set of organizations in the impact space including groups such as the US National Advisory Board of the G8 Social Impact Investing Task Force, the Global Impact Investing Network’s ImpactBase initiative, the Global Social Venture Competition, McKinsey’s working group on Social Impact Bonds, Global Giving, the Sustainable Food Lab, the UN Capital Development Fund, the International Interfaith Investment Group and a range of other organizations. John graduated from Yale University with honors. He was awarded the Richter Fellowship and the Townsend Prize. Hilary Irby (Managing Director, Morgan Stanley): Hilary Irby is a Managing Director and Co-Head of Morgan Stanley’s Global Sustainable Finance group, where her focus is on mobilizing private-sector capital to address major global challenges. As the leader of the Morgan Stanley Investing with Impact Initiative, Hilary works across the firm to develop financial products and solutions that provide financial returns as well as positive environmental or social impact. Under Hilary’s leadership, Morgan Stanley continues to develop innovative sustainable and impact investing opportunities, delivering custom solutions to institutional and individual investors, as well as developing sustainable and impact investing solutions for individuals. In a constantly evolving market, Hilary’s understanding of clients’ distinct and complex financial and impact objectives drives the ongoing development of leading edge solutions. Prior to Morgan Stanley, Hilary was Operating Partner at JVP, a leading Israeli venture capital fund with over $900 million under management. Previously, Hilary worked at Goldman Sachs & Co.; helped manage the growth of Fort Point Partners, an internet consulting and integration firm; and served as a change management consultant at Andersen Consulting. Hilary holds a Masters in Industrial and Organizational Psychology from Rensselaer Polytechnic Institute and a Bachelor of Science from St. Lawrence University.
RECOMMENDATION: Given the heightened focus on ESG-related investments nationally and internationally among investment plans, staff recommends that the Board give a clear direction on ESG policy in the future, reflecting the prevailing fiduciary standards of the Permanent Fund, applicable statutes, and prevailing industry best practice standards. If the Board chooses to pursue an ESG Policy, Staff will draft that policy based upon the direction of the Board for consideration at a future Board meeting.
101/511

BlackRock Presentation
Separator Page
102/511

Sustainable Investing LandscapeBrian Deese, Global Head of Sustainable Investing, BlackRockMay 2018
FOR USE WITH INSTITUTIONAL INVESTORS ONLY - NOT FOR FURTHER DISTRIBUTION
MAS0518U-494964-1557513
103/511
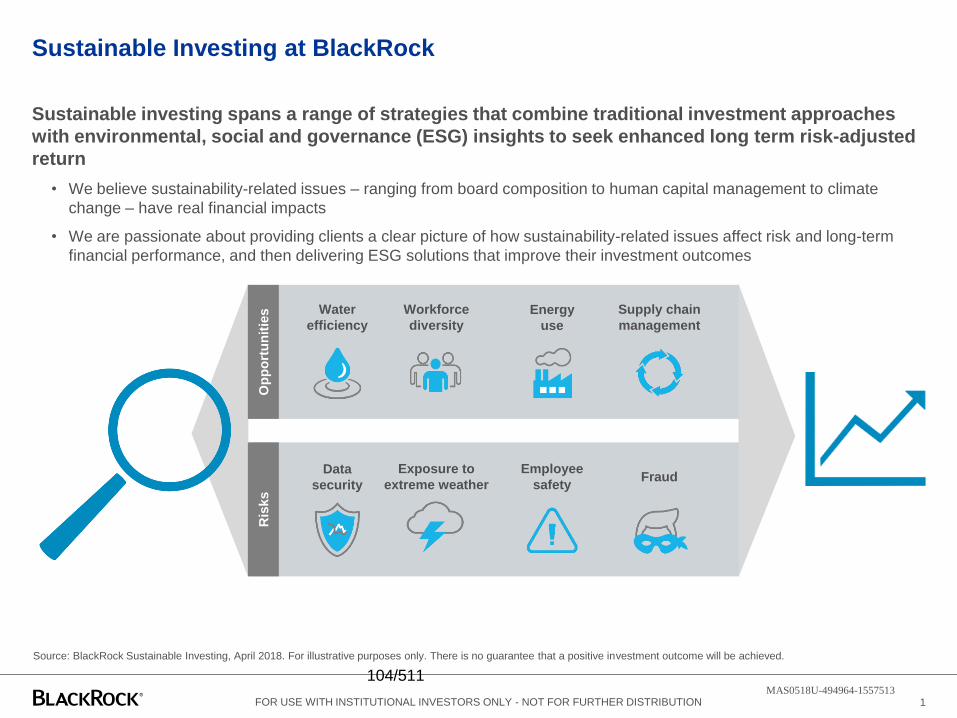
Sustainable Investing at BlackRock
FOR USE WITH INSTITUTIONAL INVESTORS ONLY - NOT FOR FURTHER DISTRIBUTION
Source: BlackRock Sustainable Investing, April 2018. For illustrative purposes only. There is no guarantee that a positive investment outcome will be achieved.
Sustainable investing spans a range of strategies that combine traditional investment approaches with environmental, social and governance (ESG) insights to seek enhanced long term risk-adjusted return
• We believe sustainability-related issues – ranging from board composition to human capital management to climate
change – have real financial impacts
• We are passionate about providing clients a clear picture of how sustainability-related issues affect risk and long-term
financial performance, and then delivering ESG solutions that improve their investment outcomes
Data security
Exposure to extreme weather
Water efficiency
Workforce diversity
Employee safety
Energy use
Opp
ortu
nitie
sR
isks
Fraud
Supply chain management
1MAS0518U-494964-1557513
104/511

We believe companies that effectively manage ESG risks and opportunities perform better over time
FOR USE WITH INSTITUTIONAL INVESTORS ONLY - NOT FOR FURTHER DISTRIBUTION
MSCI: “Foundations of ESG Investing, Part 1: How ESG affects Equity Valuation, Risk and Performance,” 2017. Giese, Guido, Lee, Melas, Nagy, Nishik
Sources: BlackRock Investment Institute, ASSET4 and MSCI, July 2016. Notes: The analysis above calculates the carbon intensity of all MSCI World companies by dividing their annual
carbon emissions by annual sales. Companies are ranked and bucketed in five quintiles based on their year-over-year change in carbon intensity. We then analyze each quintile’s stock
price performance versus the MSCI World Index. Most improved means the 20% of companies that posted the greatest annual decline in carbon intensity. Data are from March 2012
through April 2016. The example is for illustrative purposes only. Past performance is no indication of future results.
Stronger cash flows• They are more competitive than their peers
because they more efficiently use their resources,
and/or have better human capital management as
well as better manage long term business plans.
• This leads to higher profitability and higher
dividends.
Less idiosyncratic risk• They have better risk control and compliance
standards.
• Better risk control leads to fewer negative incidents and less stock-specific downside or tail risk in the
company’s stock price.
Higher valuations• They are less vulnerable to systematic market
shocks and therefore show lower systematic risk.
• Lower systematic risk means a lower beta, which
translate to lower cost of capital and a higher
valuation. Further valuation is increased through the
increased size of investor base.
MSCI found that companies with strong ESG profiles exhibit the following characteristics:
BlackRock found that companies who reduce their carbon footprint also have stronger equity performance
-7
-5
-3
-1
1
3
5
7
2012 2013 2014 2015 2016
Stoc
k Pr
ice
Perf
orm
ance
vs
. MSC
I Wor
ld In
dex
Group 1 (MOST
improved
carbon
efficiency)
Group 2
Group 4
Group 5 (LEAST
improved
carbon
efficiency)
Group 3
Efficiency Improvement: Equity Performance by Carbon Intensity 2012-2016
2MAS0518U-494964-1557513
105/511

Broad spectrum of ways to incorporate Sustainable Investing
FOR USE WITH INSTITUTIONAL INVESTORS ONLY - NOT FOR FURTHER DISTRIBUTION
Source: BlackRock Sustainable Investing, April 2018. For illustrative purposes only and should not be interpreted as investment advice or recommendation.
Clients motivations often fall into one of two categories: Avoid and Advance• Avoid is about eliminating exposures to certain sectors or activities
• Advance is about aligning capital with certain behaviors, activities or outcomes
Avoid Advance
Impact
• Removal of certain
companies based on
specific criteria such as
business involvement,
sector, or controversy
Exclusionary Screens
ESG
• Focuses on a particular E,
S, or G issue, for example
carbon emissions or the
diversity of a company’s
workforce
• Particular issues are
weighted in a thematic
sustainable investment
solution
• Scoring of ESG data at
the security or asset level
• Weights the data to
provide an investment
solution that aligns capital
with stronger ESG
performance
Thematic• Identifies a specific
sustainable outcome as a
goal of the investment
solution, alongside financial
returns
• Provides dedicated
reporting on progress
toward that outcome as a
part of the investment
solution
3
Sustainable Investing
MAS0518U-494964-1557513
106/511

Country–Imposed Regulations
Risks Posed by Global Challenges
Demographic Shifts
Organizations Facing Client Pressure
Asset Owners with Social Missions
• Fund mandates
demanding global
ESG integration
• Business models and
industries changing
in response to
climate risks
• Transfer of wealth to
millennial generation
• Stakeholder
advocacy for
social objectives
• Foundations
aligning
investments
with mission
Global sustainable assets = approx. $23tn*
53%38%
5% 2% 2%
Europe
United States
Canada
Australia/NZ
Asia
Global growth in sustainable investing driven by a range of factors
75% and 86%• 75% of the general population and 86% of millennial
investors are interested in sustainable investing1
Article 173• France passed a law introducing mandatory
climate change-related reporting for asset owners
and asset managers
500 Institutions• Institutions facing client pressure > 500 institutions,
which combined managed over $3.4T in assets
managed, have committed to divesting from fossil fuels2
Source: Global Sustainable Investment Review 2016
* Most widely used industry figure. Exclusionary screens, Environmental Social Governance (ESG), and Impact Investment Strategies
1 Morgan Stanley Sustainable Signals, 2017 https://www.morganstanley.com/pub/content/dam/msdotcom/ideas/sustainable-signals/pdf/Sustainable_Signals_Whitepaper.pdf
2 GoFossilFuelFree.org. http://gofossilfree.org/commitments/
FOR USE WITH INSTITUTIONAL INVESTORS ONLY - NOT FOR FURTHER DISTRIBUTION 4MAS0518U-494964-1557513
107/511
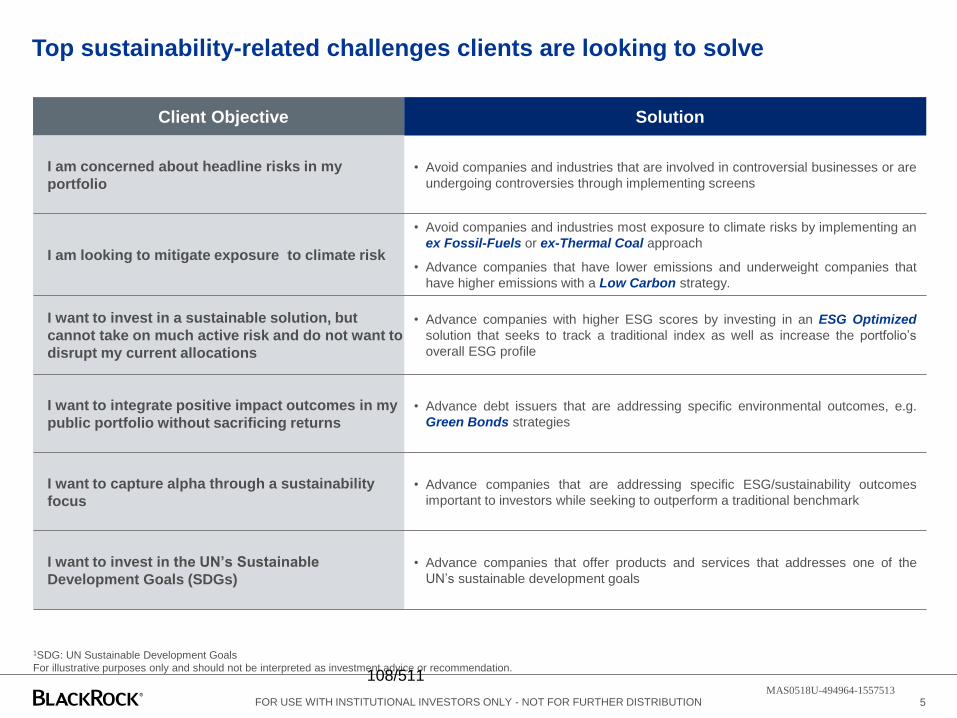
Top sustainability-related challenges clients are looking to solve
FOR USE WITH INSTITUTIONAL INVESTORS ONLY - NOT FOR FURTHER DISTRIBUTION
1SDG: UN Sustainable Development Goals
For illustrative purposes only and should not be interpreted as investment advice or recommendation.
Client Objective Solution
I am concerned about headline risks in my portfolio
• Avoid companies and industries that are involved in controversial businesses or are
undergoing controversies through implementing screens
I am looking to mitigate exposure to climate risk
• Avoid companies and industries most exposure to climate risks by implementing an
ex Fossil-Fuels or ex-Thermal Coal approach
• Advance companies that have lower emissions and underweight companies that
have higher emissions with a Low Carbon strategy.
I want to invest in a sustainable solution, but cannot take on much active risk and do not want to disrupt my current allocations
• Advance companies with higher ESG scores by investing in an ESG Optimized
solution that seeks to track a traditional index as well as increase the portfolio’s
overall ESG profile
I want to integrate positive impact outcomes in my public portfolio without sacrificing returns
• Advance debt issuers that are addressing specific environmental outcomes, e.g.
Green Bonds strategies
I want to capture alpha through a sustainability focus
• Advance companies that are addressing specific ESG/sustainability outcomes
important to investors while seeking to outperform a traditional benchmark
I want to invest in the UN’s Sustainable
Development Goals (SDGs)• Advance companies that offer products and services that addresses one of the
UN’s sustainable development goals
5MAS0518U-494964-1557513
108/511

Incorporating sustainable investment strategies
Asset allocations are shown for illustrative purposes only.
Broad allocationTake total portfolio
view on sustainability
Key considerations in building a sustainable investment portfolio:
1) Know what you own by using risk and sustainability metrics (e.g., ESG ratings, carbon emissions, sustainable sectors)
2) Set objectives e.g., reduce carbon exposure, integrate ESG, target impact
3) Take action & evaluate by implementing sustainable investments and re-assessing risk and sustainability performance
US ESG Focus
EAFE ESG FocusEM ESG
Focus
US Corporate
ESG
Barclays AGG Impact
Green Bonds
Renewable Power
ACWI ESG Focus
Active Equity
Active Fixed
Income
Barclays IG Corp
ESG
Alts
Low Carbon Equity
Passive Equity
Active Equity
Green Bonds
Active Fixed
Income
Passive Fixed
Income
Alts
Index replacementSubstitute traditional passive solutions
with sustainable investments
Carve outAllocate a portion of an asset class
to sustainable investments
Institutional clients incorporate sustainable strategies into their overall investment program in various ways:
FOR USE WITH INSTITUTIONAL INVESTORS ONLY - NOT FOR FURTHER DISTRIBUTION 6MAS0518U-494964-1557513
109/511

Case Studies
MAS0518U-494964-1557513
110/511

Putting it into practice: Defined ContributionWe partner with our clients to develop innovative investment solutions
FOR USE WITH INSTITUTIONAL INVESTORS ONLY - NOT FOR FURTHER DISTRIBUTION
Source: BSI Analysis, as of April 2018. The above represents BlackRock’s observations and analysis process in proposing solutions to introduce ESG factors in a target date strategy. It
should not be assumed that these solutions were implemented and if implemented were actually successful. Source: BlackRock, MSCI. MSCI ESG scores are on a numerical scale of 0-10,
which is mapped to a 7 –point letter rating scale of CCC (worst) to AAA (best) and are based on 37 ESG key issues as determined by MSCI. Assessments for each company’s ESG
performance is relative to the standards and performance of its industry peers. Case studies are for illustrative purposes only. They are not meant as a guarantee of any future results or
experience, and should not be interpreted as advice or recommendation.
CASE STUDY
US Corporation considering implementing ESG in a target date structure• Background: US corporation with a commitment to sustainability and a younger work force considered offering target date fund
that utilizes ESG building blocks. The investment objective is to: 1) Offer competitive risk adjusted returns relative to traditional
target date funds, and 2) Demonstrate improved ESG ratings profile relative to traditional target date funds
• Analysis: BlackRock ran an analysis of existing index target date strategy leveraging equity and fixed income building blocks
that optimize for ESG factors.
• Proposed Solution: Results indicated that plan participants could potentially realize financial results in line with the traditional
index strategy while improving the ESG score of their investments
USA Large/Mid
USA Small
Global ex US Eq
REITs
Commodities
Broad F.I.
USA ESG
USA ESG
EAFE ESG
USA ESG
EAFE ESG
EM ESG
Standard LifePath Fund USA ESG USA + EAFE ESG USA + EAFE + EM ESG
MSCI ESG Score 5.0 5.84 6.13 6.25
MSCI ESG Letter Score BBB A A A
ESG score potential % increase +16.80% +22.60% +25.0%
8MAS0518U-494964-1557513
111/511
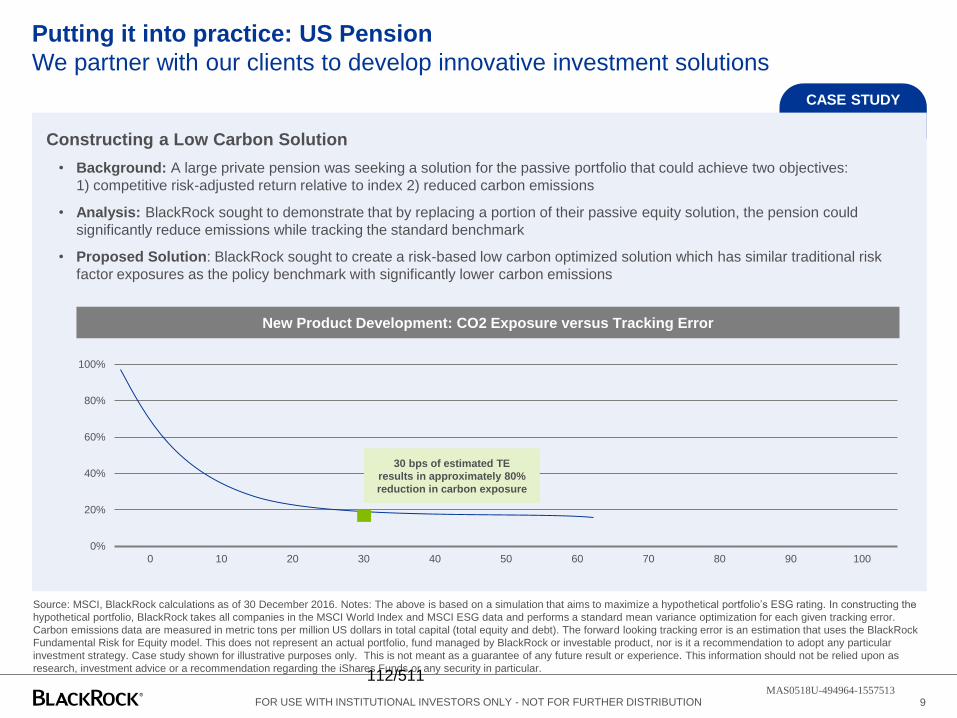
Putting it into practice: US PensionWe partner with our clients to develop innovative investment solutions
FOR USE WITH INSTITUTIONAL INVESTORS ONLY - NOT FOR FURTHER DISTRIBUTION
Source: MSCI, BlackRock calculations as of 30 December 2016. Notes: The above is based on a simulation that aims to maximize a hypothetical portfolio’s ESG rating. In constructing the
hypothetical portfolio, BlackRock takes all companies in the MSCI World Index and MSCI ESG data and performs a standard mean variance optimization for each given tracking error.
Carbon emissions data are measured in metric tons per million US dollars in total capital (total equity and debt). The forward looking tracking error is an estimation that uses the BlackRock
Fundamental Risk for Equity model. This does not represent an actual portfolio, fund managed by BlackRock or investable product, nor is it a recommendation to adopt any particular
investment strategy. Case study shown for illustrative purposes only. This is not meant as a guarantee of any future result or experience. This information should not be relied upon as
research, investment advice or a recommendation regarding the iShares Funds or any security in particular.
CASE STUDY
Constructing a Low Carbon Solution• Background: A large private pension was seeking a solution for the passive portfolio that could achieve two objectives:
1) competitive risk-adjusted return relative to index 2) reduced carbon emissions
• Analysis: BlackRock sought to demonstrate that by replacing a portion of their passive equity solution, the pension could
significantly reduce emissions while tracking the standard benchmark
• Proposed Solution: BlackRock sought to create a risk-based low carbon optimized solution which has similar traditional risk
factor exposures as the policy benchmark with significantly lower carbon emissions
New Product Development: CO2 Exposure versus Tracking Error
0%
20%
40%
60%
80%
100%
0 10 20 30 40 50 60 70 80 90 100
30 bps of estimated TE results in approximately 80% reduction in carbon exposure
9MAS0518U-494964-1557513
112/511

Putting it into practice: EMEA PensionWe partner with our clients to develop innovative investment solutions
FOR USE WITH INSTITUTIONAL INVESTORS ONLY - NOT FOR FURTHER DISTRIBUTION
* TE between Mar 2015 - Mar 2017
Source: FTSE Russell as at March 2015 to March 2017. The above represents BlackRock’s observations and analysis process in proposing solutions to introduce a single ESG tilt with
variable value tilt. It should not be assumed that these solutions were implemented and if implemented were actually successful. MSCI ESG scores are on a numerical scale of 0-10, which
are based on 37 ESG key issues as determined by MSCI. Assessments for each company’s ESG performance is relative to the standards and performance of its industry peers. Case
studies are for illustrative purposes only; they are not meant as a guarantee of any future results or experience, and should not be interpreted as advice or a recommendation.
CASE STUDY
Analysis of Single ESG Tilt with Variable Value Tilt
0
0.5
1
1.5
2
2.5
3
3.5
4
4.5
1.5 2.5 3.5 4.5 5.5 6.5 7.5
ESG
ratin
gs/ E
xpos
ure
TEESG ratings Value Exposure
Constructing an ESG + Value strategy• Background: A European pension wanted to move a $2billion allocation from a value index portfolio to a value index strategy
that incorporated Environmental, Social and Governance (ESG) consideration in a cost efficient manner. The client’s primary
objective was to maintain a high value factor loading, but also show a meaningful improvement in ESG metrics.
• Analysis: BlackRock in partnership with an index provider, delivered factor analysis and simulated multiple combinations to
understand the impact of combining ESG scores and the value factor.
• Proposed Solution: BlackRock created a solution that targeted improved levels of active value factor exposure compared to the
broad market cap weighted index, while also seeking an increase in ESG ratings.
10MAS0518U-494964-1557513
113/511
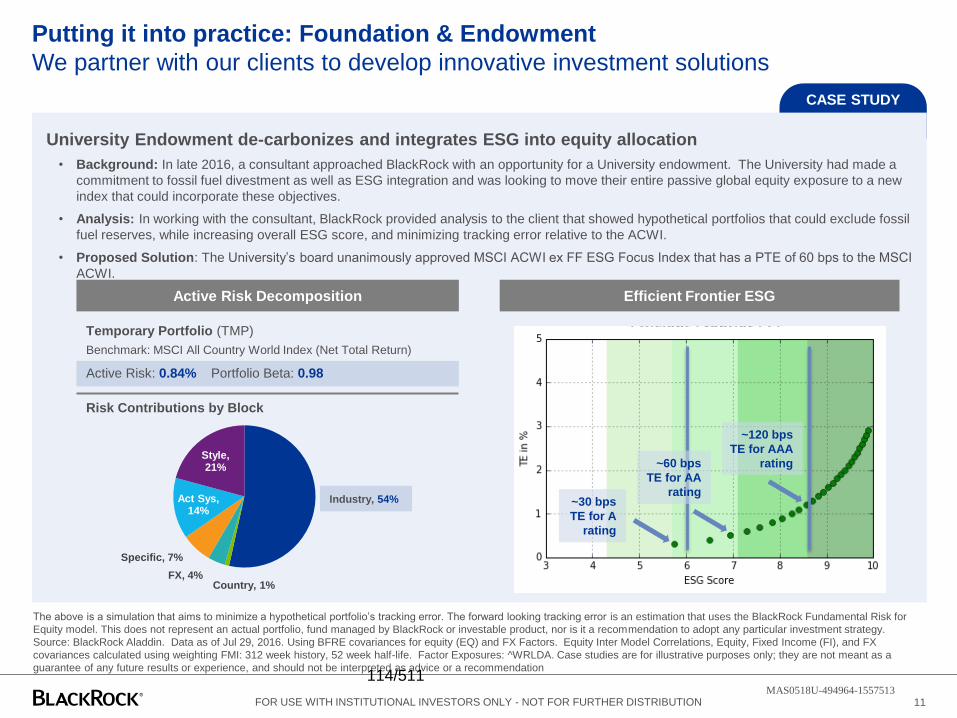
Putting it into practice: Foundation & EndowmentWe partner with our clients to develop innovative investment solutions
FOR USE WITH INSTITUTIONAL INVESTORS ONLY - NOT FOR FURTHER DISTRIBUTION
The above is a simulation that aims to minimize a hypothetical portfolio’s tracking error. The forward looking tracking error is an estimation that uses the BlackRock Fundamental Risk for
Equity model. This does not represent an actual portfolio, fund managed by BlackRock or investable product, nor is it a recommendation to adopt any particular investment strategy.
Source: BlackRock Aladdin. Data as of Jul 29, 2016. Using BFRE covariances for equity (EQ) and FX Factors. Equity Inter Model Correlations, Equity, Fixed Income (FI), and FX
covariances calculated using weighting FMI: 312 week history, 52 week half-life. Factor Exposures: ^WRLDA. Case studies are for illustrative purposes only; they are not meant as a
guarantee of any future results or experience, and should not be interpreted as advice or a recommendation
CASE STUDY
University Endowment de-carbonizes and integrates ESG into equity allocation• Background: In late 2016, a consultant approached BlackRock with an opportunity for a University endowment. The University had made a
commitment to fossil fuel divestment as well as ESG integration and was looking to move their entire passive global equity exposure to a new
index that could incorporate these objectives.
• Analysis: In working with the consultant, BlackRock provided analysis to the client that showed hypothetical portfolios that could exclude fossil
fuel reserves, while increasing overall ESG score, and minimizing tracking error relative to the ACWI.
• Proposed Solution: The University’s board unanimously approved MSCI ACWI ex FF ESG Focus Index that has a PTE of 60 bps to the MSCI
ACWI.
Active Risk Decomposition
Industry, 54%
Country, 1%FX, 4%
Specific, 7%
Act Sys, 14%
Style, 21%
Temporary Portfolio (TMP)
Benchmark: MSCI All Country World Index (Net Total Return)
Active Risk: 0.84% Portfolio Beta: 0.98
Risk Contributions by Block
Efficient Frontier ESG
~30 bps TE for A
rating
~60 bps TE for AA
rating
~120 bps TE for AAA
rating
11MAS0518U-494964-1557513
114/511

Putting it into practice: Insurance CompanyWe partner with our clients to develop innovative investment solutions
FOR USE WITH INSTITUTIONAL INVESTORS ONLY - NOT FOR FURTHER DISTRIBUTION
Source: BlackRock, World Bank, as of April 2018. The above represents BlackRock’s observations and analysis process in proposing solutions in impact measurement and reporting. It
should not be assumed that these solutions were implemented and if implemented were actually successful. Screenshots are for illustrative purposes only.
CASE STUDY
Building an Impact Reporting Framework within Green Bonds and Infrastructure• Background: Large insurance plan seeking to better to understand social and environmental impact across real assets and green
bonds portfolios
• Analysis: BlackRock reviewed available impact reporting standards, uncovered common standards across provider, and determined
feasibility to source underlying project metrics on ongoing basis
• Proposed Solution: BlackRock proposed ongoing impact evaluation report for investment exposures – focus on key social and environmental
metrics, allowing client to track progress overtime.
12MAS0518U-494964-1557513
115/511

Important Notes
FOR USE WITH INSTITUTIONAL INVESTORS ONLY - NOT FOR FURTHER DISTRIBUTION
THE INFORMATION CONTAINED HEREIN MAY BE PROPRIETARY IN NATURE AND HAS BEEN PROVIDED TO YOU ON A CONFIDENTIAL BASIS, AND MAYNOT BE REPRODUCED, COPIED OR DISTRIBUTED WITHOUT THE PRIOR CONSENT OF BLACKROCK, INC. (“BLACKROCK”). These materials are not an
advertisement and are not intended for public use or dissemination.
This communication is not an offer and should not be deemed to be a contractual commitment or undertaking between the intended recipient of this communication and
BlackRock but an indication of what services may be offered subject to a legally binding contract between the parties and therefore no reliance should be placed on this
document or its content. Opinions, estimates and recommendations offered constitute our judgment and are subject to change without notice, as are statements of
financial market trends, which are based on current market conditions. We believe the information provided here is reliable, but do not warrant its accuracy or
completeness. This communication and its content represent confidential information. This material has been prepared for informational purposes only, and is not
intended to provide, and should not be relied on for, accounting, legal or tax advice. You should consult your tax or legal adviser regarding such matters.
Any reference herein to any security and/or a particular issuer shall not constitute a recommendation to buy or sell, offer to buy, offer to sell, or a solicitation of an offer to
buy or sell any such securities issued by such issuer.
Credit QualityThe credit quality of a particular security or group of securities does not ensure the stability or safety of an overall portfolio. The Quality ratings of individual
issues/issuers are provided to indicate the credit worthiness of such issues/issuer and generally range from AAA, Aaa, or AAA (highest) to D, C, or D (lowest) for S&P,
Moody’s, and Fitch respectively.
Forward Looking InformationThis material may contain “forward-looking” information that is not purely historical in nature. Such information may include, among other things, projections, forecasts,
estimates of yields or returns, and proposed or expected portfolio composition. Moreover, where certain historical performance information of other investment vehicles
or composite accounts managed by BlackRock, Inc. and/or its subsidiaries (together, “BlackRock”) has been included in this material and such performance information
is presented by way of example only. No representation is made that the performance presented will be achieved, or that every assumption made in achieving,
calculating or presenting either the forward-looking information or the historical performance information herein has been considered or stated in preparing this material.
Any changes to assumptions that may have been made in preparing this material could have a material impact on the investment returns that are presented herein by
way of example.
This material is not intended to be relied upon as a forecast, research or investment advice, and is not a recommendation, offer or solicitation to buy or sell any securities
or to adopt any investment strategy. The opinions expressed may change as subsequent conditions vary. The information and opinions contained in this material are
derived from proprietary and nonproprietary sources deemed by BlackRock to be reliable, are not necessarily all inclusive and are not guaranteed as to accuracy. There
is no guarantee that any forecasts made will come to pass.
13MAS0518U-494964-1557513
116/511

Important Notes
FOR USE WITH INSTITUTIONAL INVESTORS ONLY - NOT FOR FURTHER DISTRIBUTION
IndexIt is not possible to directly invest in an unmanaged index.
RiskInvesting in the bond market is subject to certain risks including market, interest-rate, issuer, credit, and inflation risk. Equities may decline in value due to both real and
perceived general market, economic, and industry conditions. Mortgage and asset-backed securities may be sensitive to changes in interest rates, subject to early
repayment risk, and while generally backed by a government, government-agency or private guarantor there is no assurance that the guarantor will meet its obligations.
High-yield, lower-rated, securities involve greater risk than higher-rated securities; portfolios that invest in them may be subject to greater levels of credit and liquidity risk
than portfolios that do not. Investors will, at times, incur a tax liability. Income from municipal bonds may be subject to state and local taxes and at times the alternative
minimum tax. Derivatives may involve certain costs and risks such as liquidity, interest rate, market, credit, management and the risk that a position could not be closed
when most advantageous. Investing in derivatives could lose more than the amount invested.
BlackRock Sustainable Investing intends to invest in companies with measurable societal impact outcomes, as determined by BlackRock, and screen out particular
companies and industries. This may affect the portfolio’s exposure to certain companies or industries and the portfolio will forego certain investment opportunities. The
portfolio’s results may be lower than other portfolios that do not seek to invest in companies based on expected societal impact outcomes and/or screen out certain
companies or industries. BlackRock Sustainable Investing seeks to identify companies that it believes may have a societal impact outcome, but investors may differ in
their views of what constitutes positive or negative societal impact outcomes. As a result, the portfolio may invest in companies that do not reflect the beliefs and values
of any particular investor.
Under certain market conditions, growth investments have performed better during the later stages of economic expansion and value investments have performed better
during periods of economic recovery. Therefore, these investment styles may over time go in and out of favor. At times when the investment style used by BlackRock
Sustainable Investing is out of favor, the BlackRock Sustainable Investing may underperform other equity strategies that use different investment styles.
BlackRock makes no representations or warranties as to the accuracy or completeness of the information contained herein, and further nothing contained herein shall be
relied upon as a promise by, or representation by, BlackRock whether as to past or future performance results. Past performance is not indicative or predictive of future
performance.
These materials are being provided for informational purposes only and are not intended to constitute tax, legal or accounting advice. You should consult your own
advisers on such matters. Additional information is available on request. Information contained herein is believed to be reliable but BlackRock does not warrant its
accuracy or completeness. Information contained herein represents BlackRock’s own opinions. There can be no assurance that the investment objectives of any strategy
referred to herein will be achieved. An investment in any strategy referred to herein involves a high degree of risk, including the risk that the entire amount invested may
be lost.
THIS MATERIAL IS HIGHLY CONFIDENTIAL AND IS NOT TO BE REPRODUCED OR DISTRIBUTED TO PERSONS OTHER THAN THE RECIPIENT.
© 2018 BlackRock, Inc. All rights reserved. ALADDIN, BLACKROCK, BLACKROCK SOLUTIONS, and iSHARES are registered trademarks of BlackRock, Inc. or its
subsidiaries in the United States and elsewhere. All other trademarks are the property of their respective owners.
14MAS0518U-494964-1557513
117/511
Goldman Sachs Presentation
Separator Page
118/511

FOR APFC ONLY - NOT FOR FURTHER DISTRIBUTION
ESG & Impact Investing Overview
May 2018
This material is provided for informational purposes only and should not be construed as investment advice or an offer or solicitation to buy or sell securities.
Goldman Sachs Asset Management
119/511

FOR APFC ONLY - NOT FOR FURTHER DISTRIBUTION
Executive Summary
• ESG and impact investing is of growing importance to Goldman Sachs Asset Management
- In 2015, we acquired the assets of Imprint Capital Advisors, a leading ESG and impact investing advisor
- We have more than 30 ESG and impact investing experts and supervise more than $13.2B in ESG and
impact investments1
• Broadly, ESG and impact investing strategies are designed to enable investors to do the following:
- Alignment: Optimize units of alignment with ESG factors per incremental unit of tracking error
- ESG integration: Invest in managers who incorporate a company’s environmental, social, and governance
practices into their selection process, believing it might be material to financial returns
- Impact investing: Invest in private companies that seek social and environmental impact alongside market-
rate financial returns
• We seek high-quality ESG and impact strategies that target market rates of return
• We work with clients in an advisory capacity to design and implement the appropriate ESG and impact
investing strategy across their asset class allocation
1Assets and personnel as of February 2018.
2
120/511

FOR APFC ONLY - NOT FOR FURTHER DISTRIBUTION
We view ESG and impact investing as a spectrum of
approaches with varying financial and impact characteristics
* Historically Socially Responsible Investing “SRI”
For informational purposes only and should not be construed as research, investment advice or a recommendation. There is no guarantee that these objectives will be met. 3
Alignment Impact
Market Rate Concessionary
ESG and Impact Investing Spectrum
What
• Avoiding objectionable
exposures, optimizing for desired exposures
• Integrating ESG
factors into active investment analysis
• Investing in strategies
with social/ environmental impacts that seek market rates of return
• Accepting below
market rates of return for impact
• Donating
Why
• To better align portfolio with ESG factors with minimal financial impact
• To drive better performance by incorporating financially material ESG factors
• To have positive impact and produce sustained alpha, predominantly in private markets
• To have a positive impact
How
• Ex. Passive low carbon equity strategy
• Ex. Active ESG equity strategy
• Ex. Private markets impact investing
• While we do not focus here, we can help clients think
through how it fits in a
comprehensive program.
Concessionary
Impact Investing Philanthropy ESG Integration Alignment*
Market Rate
Impact Investing
121/511

FOR APFC ONLY - NOT FOR FURTHER DISTRIBUTION
We believe ESG factors can be financially material
Key Observations
• We believe that the business case for ESG investing is
empirically well founded
• The positive ESG impact on corporate financial performance
has remained stable over time
ESG & Financial Performance (Percentage of Studies with Positive, Neutral, or Negative Findings)
Source: Friede, Busch, Bassen (December 2015). Past performance does not guarantee future results, which may vary. Views and opinions are current as of the date of this presentation and may be
subject to change, they should not be construed as investment advice.
Negative 10%
Positive or Neutral
90%
96% 100% 100% 89%
4% 0% 0% 11%
Equities Bonds Real Estate Portfolio Studies
Positive or Neutral Negative
Sample Meta Study: Findings from more than 2,200 Unique Empirical Studies
4 122/511

FOR APFC ONLY - NOT FOR FURTHER DISTRIBUTION
5
In quantitative approaches, it’s important to identify the specific
metrics that can potentially generate alpha, given the growth of
ESG data
0
$1mm
$2mm
$3mm
$4mm
$5mm
$6mm
$7mm
2007 2008 2009 2010 2011 2012 2013 2014 2015 2016
Hig
h
6.01% 1.96%
Lo
w
-2.90% 0.60%
Low High
Stock Returns (in annualized alpha) by type of
sustainability performance
Pe
rfo
rmance
on
Ma
teri
al f
acto
rs
Performance on Immaterial factors
Cumulative ESG data points available from Bloomberg for
453 select metrics
Growth of ESG data availability1 Importance of material ESG metrics2
1 Bloomberg data cited in The GS Sustain Report, “The PM’s Guide to the ESG Revolution” (April 18, 2017) 2 “Corporate Sustainability: First Evidence of Materiality”, HBS, 2015, Mozaffar Khan,
George Serafeim & Aaron Yoon. Charted cited in The GS Sustain Report, “The PM’s Guide to the ESG Revolution” 3 GSAM Quantitative Investment Strategies as of October 2017. There can be
no assurance that the same or similar results to those presented above can or will be achieved. Past performance does not guarantee future results, which may vary.
123/511

FOR APFC ONLY - NOT FOR FURTHER DISTRIBUTION
We believe ESG integration can be a potential driver of
portfolio value
AIMS Imprint, March 2018. For discussion purposes. The portfolio risk management process includes an effort to monitor and manage risk, but does not imply low risk.
Risk Management Operational PerformanceImprovements
Potential Upside ESG-Led Value Creation
Market, regulatory
and reputational risk
Resource efficiency to
drive cost reduction
Additional growth
initiatives or an exit
premium
WE BELIEVE AN ESG INTEGRATED APPROACH TO
SOURCING, DUE DILIGENCE AND PORTFOLIO
MANAGEMENT CAN DRIVE VALUE CREATION.
6 124/511

FOR APFC ONLY - NOT FOR FURTHER DISTRIBUTION
ESG integration can also help to drive value in other asset
classes, such as real estate
Seeking to Increase Margins Improving the Brand of the Property
– Increase Rental Rates −
– Reduce Utility Expenses
– Reduce Frequency and Cost of Capital
Expenditures
Align Business Plan with Tenant (Opex, Capex,
Amenities)
– Increase Desirability of Asset from a Capital
Markets Perspective
– Implement Discrete Projects to Integrate the
Property’s Brand with the Community’s Identity
– Reduce Carbon Footprint
Go
als
P
osit
ive
Ex
tern
ali
tie
s
– Reduce Materials Waste
– Support Local Culture
– Employ Minority and Veteran
Owned Businesses − Support Local Quality of Life
– Lighting Retrofit Programs
– Higher-Quality / Higher-Efficiency Mechanicals
– Recycled Materials Use in Capital Investment
Programs
– Asset Specific Retro-Commissioning Measures
– Local Artist Engagement or Property Focal Pieces
(LED Sunroof / Live Walls)
– Effective Opex / Capex Management may Attract
Tenants and/or Buyers
– Increase Operating and Capital Expense
Transparency to Attract Tenant Imp
lem
en
tati
on
Str
ate
gy
– Job Creation for Local Artists and
Businesses
For illustrative purposes only. Any mention of an investment decision is intended only to illustrate our investment approach and/or strategy, and is not indicative of the performance of our strategy as
a whole. It should not be assumed that any investment decisions shown will prove to be profitable, or that any investment decisions made in the future will be profitable or will equal the performance
of the investments discussed herein. Please see additional disclosures. Objectives stated do not provide any assurance as to future results as there is no guarantee that the objectives will be met. 7
125/511

FOR APFC ONLY - NOT FOR FURTHER DISTRIBUTION
An integrated ESG process among teams helps to identify
potential risks and opportunities
For illustrative purposes only.
8
ESG Themes
Risks
Inclusions
Exclusions
Topical Themes
GSAM Privates Private Real Estate
Credit Alternatives
Operational Perspective
Fundamental
Equity Sector Reviews
Management Meetings
Shareholder Engagement
Quantitative
Investment
Strategies Big Data
Proprietary Alpha Factors
Rules-Based Overlays
Fixed Income Credit Risk
Financial Statement
Analysis
Management Meetings
Industry Reviews
Imprint Internal Research External Research Ongoing Partnership NGO/Sector Networks
126/511
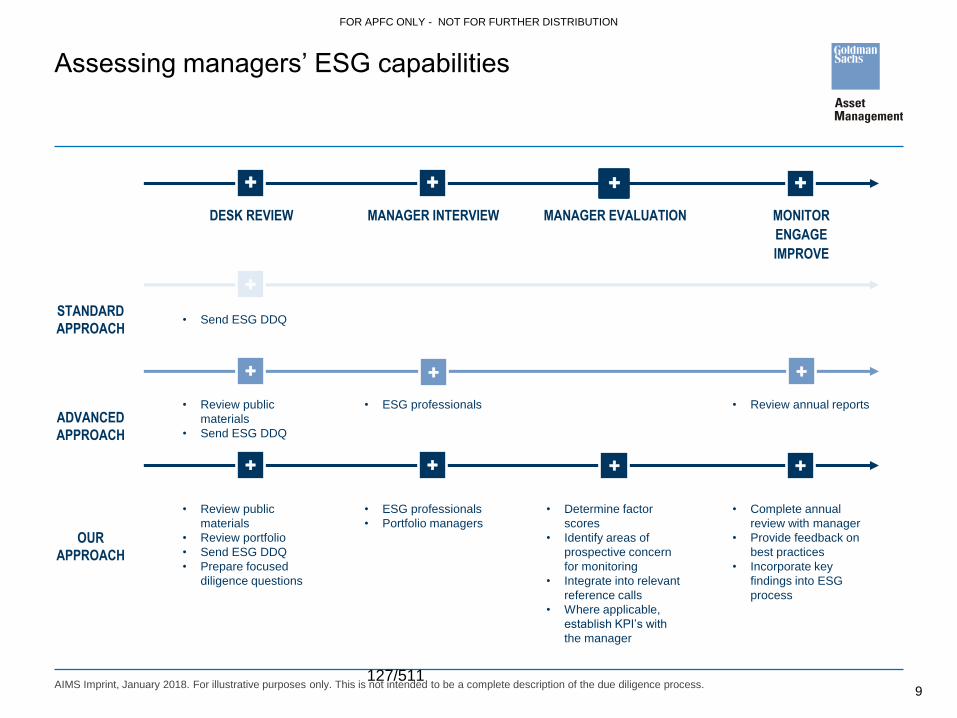
FOR APFC ONLY - NOT FOR FURTHER DISTRIBUTION
Assessing managers’ ESG capabilities
AIMS Imprint, January 2018. For illustrative purposes only. This is not intended to be a complete description of the due diligence process.
DESK REVIEW MANAGER INTERVIEW MANAGER EVALUATION MONITOR
ENGAGE
IMPROVE
STANDARD
APPROACH
ADVANCED
APPROACH
OUR
APPROACH
• Send ESG DDQ
• Review public
materials
• Send ESG DDQ
• Review public
materials
• Review portfolio
• Send ESG DDQ
• Prepare focused
diligence questions
• ESG professionals
• ESG professionals
• Portfolio managers
• Determine factor
scores
• Identify areas of
prospective concern
for monitoring
• Integrate into relevant
reference calls
• Where applicable,
establish KPI’s with
the manager
• Review annual reports
• Complete annual
review with manager
• Provide feedback on
best practices
• Incorporate key
findings into ESG
process
9 127/511

FOR APFC ONLY - NOT FOR FURTHER DISTRIBUTION
10
Impact investments are primarily in private markets and cover
a broad range of themes
For Discussion Purposes Only.
RESOURCE EFFICIENCY
FOOD, HEALTH & WELL BEING
Private Equity
SUSTAINABLE TIMBER &
ECOSYSTEMS SERVICES
SUSTAINABLE AGRICULTURE &
WATER
SUSTAINABLE REAL ESTATE
Real Assets Private Credit
EDUCATION
HEALTH IT & SERVICES
FINANCIAL SERVICES
CONSUMER LENDING
SMALL BUSINESS LENDING
ENVIRONMENTAL ASSETS
CLEAN INFRASTRUCTURE
128/511

FOR APFC ONLY - NOT FOR FURTHER DISTRIBUTION
Thesis driven investing
Source: GSAM. As of October 2017. For illustrative purposes only to demonstrate a sample report/analysis and should not be construed as investment advice or an offer to sell or the solicitation of an offer
to buy any Goldman Sachs product or service described herein. The information shown herein should not be relied upon as representative of actual or future information for any Goldman Sachs products.
Results for the products depicted herein may vary substantially from those in this report or analysis.
Process Overview
Complete comprehensive scan of market
Update view of relative
attractiveness of market
on a quarterly basis
Filter manager
database to short
list
Map short list
against
financial &
impact factors
Initiate
diligence on
top picks
Sample Scan: Renewable Energy
11 129/511

FOR APFC ONLY - NOT FOR FURTHER DISTRIBUTION
Source: AIMS, as of December 2017. Views and opinions expressed are for informational purposes only and do not constitute a recommendation by GSAM to buy, sell, or hold any security. Views and
opinions are current as of the date of this presentation and may be subject to change, they should not be construed as investment advice. 1 Weights are relative to long-term strategic allocations for each
AIMS Asset Class. Allocations as of December 2017. Manager Quality Pipeline – Red indicates fewer than 2 managers in the AIMS Imprint pipeline; orange indicates fewer than 4; yellow indicates fewer
than 6; light green indicates fewer than 8; dark green indicates over 8 managers.
Underweight1 Overweight1
12
In addition to our market scans, we complete an investment
views process on a quarterly basis
Resource Efficiency4 3 3 4
Education3 4 2 2
Healthcare2 4 3 4
Financial Services3 3 4 3
Clean Energy2 5 2 3
Sustainable Real
Estate 3 4 3 4
Sustainable Timber
& Eco Svcs 4 3 4 3
Sustainable
Agriculture & Water 3 3 2 4
Marketplace
Lending 3 2 2
Direct Lending3 3 3
Environmental
Assets 3 2 3
◄ 1 2 3 4 5 ►
Private Credit
Underweight Overweight
Yield
Environment
Credit
Environment
Private Equity
Real Assets
ValuationDeal
Environment
Market
Environment
Manager Pipeline
Quality
130/511

Appendix & Important Disclosures
131/511

0:53:95
127:154:175
115:153:198
180:204:149
0:63:45
248:156:87
70:22:107
2:108:182
162:138:181
185:204:226
128:181:218
127:159:150
217:229:202
250:228:166
255:255:153 Table Highlight
227:235:244 Object fills
245:202:77
251:205:171
Primary
Colors
Secondary
Colors
Color Palette
FOR APFC ONLY - NOT FOR FURTHER DISTRIBUTION
Appendix: Theme Definitions
Alignment: Strategies that seek to eliminate or mitigate portfolio exposure to holdings that investors may regard as objectionable such as
coal, tobacco or weapons companies. Alternatively, values-aligned strategies may also seek to provide clients with enhanced exposure to
holdings that positively reflect their social or environmental values such as companies with low carbon emissions profiles or high levels of
executive diversity.
ESG Integration: Strategies that formally incorporate environmental, social and governance-related factors into an investment process with
the objective of enhancing risk-adjusted returns.
Thematic Strategies: Strategies that seek to identify alpha associated with a secular ESG theme. An example is “resource efficiency,”
wherein investors seek to identify companies that provide solutions to challenges associated with scarce resources or resource-related
externalities.
Resource Efficiency: Companies developing technologies and/or business models that use resources in a sustainable manner while
minimizing environmental impact. Examples include alternative energy technologies such as wind and solar, energy efficiency technologies
such as LED lighting, etc.
Food, Health & Well Being: Consumer-oriented companies offering a broad range of products and services that improve health and/or
minimize environmental impact. Examples include healthy and organic foods, green packaging solutions, fitness and wellness services, and
mental health solutions.
Education: Companies whose primary purpose is to improve outcomes for all learners, regardless of age. Examples include infrastructure
software, content generation and distribution, mobile and social applications, technologies that improve teaching and learning processes and
methodologies, credentialing, curricular innovation, as well as schools, universities, and service providers.
Health IT & Services: Companies providing healthcare delivery and life science solutions that increase access, improve care, and lower
costs to underserved populations. Examples include single and multi-specialty clinics and hospitals, telemedicine and healthcare IT solutions,
medical technology devices, and diagnostic solutions.
Financial Services: Companies that provide beneficial financial services to underserved populations. Examples include technologies and
services in the areas of payments, credit, savings, and insurance.
14 132/511

0:53:95
127:154:175
115:153:198
180:204:149
0:63:45
248:156:87
70:22:107
2:108:182
162:138:181
185:204:226
128:181:218
127:159:150
217:229:202
250:228:166
255:255:153 Table Highlight
227:235:244 Object fills
245:202:77
251:205:171
Primary
Colors
Secondary
Colors
Color Palette
FOR APFC ONLY - NOT FOR FURTHER DISTRIBUTION
Appendix: Theme Definitions
Sustainable Timber & Ecosystem Services: Timberland that has been preserved from future development and/or harvested responsibly
using sustainable management practices. Ecosystem services capitalize on environmental offset markets by deriving revenue from carbon or
the restoration of wetlands, streams, or endangered species.
Sustainable Agriculture & Water: Production of food and fiber through farmland management practices and/or agricultural technologies
that have the potential to enhance yields and reduce inputs while limiting negative environmental impacts.
Sustainable Real Estate: Residential and non-residential buildings that are energy efficient and environmentally friendly and/or provide
access to low income populations or create jobs and economic activity in low wealth communities. Examples include LEED certified office
buildings that are energy efficient and affordable housing projects for low income tenants.
Clean Infrastructure: Asset-backed assets that have minimal environmental impacts related to power generation and distribution or transit.
Examples include clean and low carbon power generation from solar and wind projects as well as transit investments in electric vehicle
charging infrastructure and electrified mass transit.
Consumer Lending: Providing appropriately structured and/or lower cost credit to consumers directly or through online platforms. Examples
include micro loans to underserved consumers in emerging markets and lower cost loans to prime and sub-prime borrowers in developed
markets via online platforms.
Small Business Lending: Providing appropriately structured credit to small businesses directly or through online platforms. Examples
include working capital financing, receivables financing, factoring, supply chain financing, and credit insurance and guarantees to underserved
small businesses and/or businesses with social/environmental attributes.
Environmental Assets: Loanable assets with tangible environmental attributes. Examples include renewable energy infrastructure projects
and energy efficiency solutions in areas such as lighting, HVAC systems, and water heating that improve efficiencies while decreasing natural
resource use.
15 133/511
0:53:95
127:154:175
115:153:198
180:204:149
0:63:45
248:156:87
70:22:107
2:108:182
162:138:181
185:204:226
128:181:218
127:159:150
217:229:202
250:228:166
255:255:153 Table Highlight
227:235:244 Object fills
245:202:77
251:205:171
Primary
Colors
Secondary
Colors
Color Palette
FOR APFC ONLY - NOT FOR FURTHER DISTRIBUTION
Disclosures
THIS MATERIAL IS FOR INFORMATIONAL PURPOSES ONLY AND IS PROVIDED SOLELY ON THE BASIS THAT IT WILL NOT CONSTITUTE INVESTMENT OR OTHER ADVICE OR A
RECOMMENDATION RELATING TO ANY PERSON’S OR PLAN’S INVESTMENT OR OTHER DECISIONS, AND GOLDMAN SACHS IS NOT A FIDUCIARY OR ADVISOR WITH
RESPECT TO ANY PERSON OR PLAN BY REASON OF PROVIDING THE MATERIAL OR CONTENT HEREIN INCLUDING UNDER THE EMPLOYEE RETIREMENT INCOME SECURITY
ACT OF 1974 OR DEPARTMENT OF LABOR REGULATIONS. PLAN SPONSORS AND OTHER FIDUCIARIES SHOULD CONSIDER THEIR OWN CIRCUMSTANCES IN ASSESSING
ANY POTENTIAL COURSE OF ACTION.
Prospective investors should inform themselves as to any applicable legal requirements and taxation and exchange control regulations in the countries of their citizenship, residence or domicile
which might be relevant..
THIS MATERIAL DOES NOT CONSTITUTE AN OFFER OR SOLICITATION IN ANY JURISDICTION WHERE OR TO ANY PERSON TO WHOM IT WOULD BE UNAUTHORIZED OR
UNLAWFUL TO DO SO.
This material is provided at your request for informational purposes only. It is not an offer or solicitation to buy or sell any securities.
This material is provided for informational purposes only and should not be construed as investment advice or an offer or solicitation to buy or sell securities. This material is not intended to be
used as a general guide to investing, or as a source of any specific investment recommendations, and makes no implied or express recommendations concerning the manner in which any
client’s account should or would be handled, as appropriate investment strategies depend upon the client’s investment objectives.
Views and opinions expressed are for informational purposes only and do not constitute a recommendation by GSAM to buy, sell, or hold any security. Views and opinions are current as of the
date of this presentation and may be subject to change, they should not be construed as investment advice.
Although certain information has been obtained from sources believed to be reliable, we do not guarantee its accuracy, completeness or fairness. We have relied upon and assumed without
independent verification, the accuracy and completeness of all information available from public sources.
Hedge funds and other private investment funds (collectively, “Alternative Investments”) are subject to less regulation than other types of pooled investment vehicles such as mutual funds.
Alternative Investments may impose significant fees, including incentive fees that are based upon a percentage of the realized and unrealized gains and an individual’s net returns may differ
significantly from actual returns. Such fees may offset all or a significant portion of such Alternative Investment’s trading profits. Alternative Investments are not required to provide periodic
pricing or valuation information. Investors may have limited rights with respect to their investments, including limited voting rights and participation in the management of such Alternative
Investments.
Alternative Investments often engage in leverage and other investment practices that are extremely speculative and involve a high degree of risk. Such practices may increase the volatility of
performance and the risk of investment loss, including the loss of the entire amount that is invested. There may be conflicts of interest relating to the Alternative Investment and its service
providers, including Goldman Sachs and its affiliates. Similarly, interests in an Alternative Investment are highly illiquid and generally are not transferable without the consent of the sponsor, and
applicable securities and tax laws will limit transfers.
This information discusses general market activity, industry or sector trends, or other broad-based economic, market or political conditions and should not be construed as research or
investment advice. This material has been prepared by GSAM and is not financial research nor a product of Goldman Sachs Global Investment Research (GIR). It was not prepared in
compliance with applicable provisions of law designed to promote the independence of financial analysis and is not subject to a prohibition on trading following the distribution of financial
research. The views and opinions expressed may differ from those of Goldman Sachs Global Investment Research or other departments or divisions of Goldman Sachs and its affiliates.
Investors are urged to consult with their financial advisors before buying or selling any securities. This information may not be current and GSAM has no obligation to provide any updates or
changes.
16 134/511

0:53:95
127:154:175
115:153:198
180:204:149
0:63:45
248:156:87
70:22:107
2:108:182
162:138:181
185:204:226
128:181:218
127:159:150
217:229:202
250:228:166
255:255:153 Table Highlight
227:235:244 Object fills
245:202:77
251:205:171
Primary
Colors
Secondary
Colors
Color Palette
FOR APFC ONLY - NOT FOR FURTHER DISTRIBUTION
Disclosures
Economic and market forecasts presented herein reflect a series of assumptions and judgments as of the date of this presentation and are subject to change without notice. These forecasts do
not take into account the specific investment objectives, restrictions, tax and financial situation or other needs of any specific client. Actual data will vary and may not be reflected here. These
forecasts are subject to high levels of uncertainty that may affect actual performance. Accordingly, these forecasts should be viewed as merely representative of a broad range of possible
outcomes. These forecasts are estimated, based on assumptions, and are subject to significant revision and may change materially as economic and market conditions change. Goldman
Sachs has no obligation to provide updates or changes to these forecasts. Case studies and examples are for illustrative purposes only.
Any reference to a specific company or security does not constitute a recommendation to buy, sell, hold or directly invest in the company or its securities. It should not be assumed that
investment decisions made in the future will be profitable or will equal the performance of the securities discussed in this document.
Private equity investments are speculative, highly illiquid, involve a high degree of risk, have high fees and expenses that could reduce returns, and subject to the possibility of partial or total loss
of fund capital; they are, therefore, intended for experienced and sophisticated long-term investors who can accept such risks. There can be no assurance that any objectives or targets stated in
this material can be achieved; any targets provided are subject to change and do not provide any assurance as to future results. The ability of underlying funds to achieve their objectives or
targets depends upon a variety of factors, not the least of which are political, public market and economic conditions. Any historical performance of individual partnerships shown is for
informational purposes only and does not guarantee their future performance, which can vary considerably. The trading market for the securities of any portfolio investment of the underlying
funds may not be sufficiently liquid to enable such funds to sell such securities when it believes it is most advantageous to do so, or without adversely affecting the stock price. In addition, such
portfolio companies may be highly leveraged, which leverage could have significant adverse consequences to these companies and the funds offered by AIMS Private Equity. Furthermore,
restrictions on transferring interests in AIMS Private Equity funds may exist so prospective investors should be prepared to retain their investments in any AIMS Private Equity fund until the fund
liquidates. For a complete discussion of risks that are unique to a particular AIMS Private Equity fund, please refer to the respective fund’s offering documents, which should be carefully
reviewed prior to investing.
Tracking Error (TE) is one possible measurement of the dispersion of a portfolio’s returns from its stated benchmark. More specifically, it is the standard deviation of such excess returns. TE
figures are representations of statistical expectations falling within “normal” distributions of return patterns. Normal statistical distributions of returns suggests that approximately two thirds of the
time the annual gross returns of the accounts will lie in a range equal to the benchmark return plus or minus the TE if the market behaves in a manner suggested by historical returns. Targeted
TE therefore applies statistical probabilities (and the language of uncertainty) and so cannot be predictive of actual results. In addition, past tracking error is not indicative of future TE and there
can be no assurance that the TE actually reflected in your accounts will be at levels either specified in the investment objectives or suggested by our forecasts.
Back tested performance results do not represent the results of actual trading using client assets. They do not reflect the reinvestment of dividends, the deduction of any fees, commissions or
any other expenses a client would have to pay. If GSAM had managed your account during the period, it is highly improbable that your account would have been managed in a similar fashion
due to differences in economic and market conditions.
17 135/511

0:53:95
127:154:175
115:153:198
180:204:149
0:63:45
248:156:87
70:22:107
2:108:182
162:138:181
185:204:226
128:181:218
127:159:150
217:229:202
250:228:166
255:255:153 Table Highlight
227:235:244 Object fills
245:202:77
251:205:171
Primary
Colors
Secondary
Colors
Color Palette
FOR APFC ONLY - NOT FOR FURTHER DISTRIBUTION
Disclosures
Conflicts of Interest
There may be conflicts of interest relating to the Alternative Investment and its service providers, including Goldman Sachs and its affiliates. These activities and interests include potential
multiple advisory, transactional and other interests in securities and instruments that may be purchased or sold by the Alternative Investment. These are considerations of which investors
should be aware and additional information relating to these conflicts is set forth in the offering materials for the Alternative Investment.
Environmental, Social, and Governance (“ESG”) strategies may take risks or eliminate exposures found in other strategies or broad market benchmarks that may cause performance to diverge
from the performance of these other strategies or market benchmarks.
ESG strategies will be subject to the risks associated with their underlying investments’ asset classes. Further, the demand within certain markets or sectors that an ESG strategy targets may
not develop as forecasted or may develop more slowly than anticipated.
The business of investing in assets such as energy, real assets, infrastructure, and commodities assets is highly competitive and will be subject to risk associated with market changes in interest
rates as well as certain risks related to adverse economic or regulatory occurrences, as well as environmental liabilities, force majeure events, and high interest costs in connection with capital
construction programs, among others.
The Global Industry Classification Standard (GICS) was developed by and is the exclusive property and a service mark of Morgan Stanley Capital International Inc. (MSCI) and Standard &
Poor’s, a division of The McGraw-Hill Companies, Inc. (S&P) and is licensed for use by Goldman Sachs. Neither MSCI, S&P nor any other party involved in making or compiling the GICS or any
GICS classifications makes any express or implied warranties or representations with respect to such standard or classification (or the results to be obtained by the use thereof), and all such
parties hereby expressly disclaim all warranties of originality, accuracy, completeness, merchantability or fitness for a particular purpose with respect to any of such standard or classification.
Without limiting any of the foregoing, in no event shall MSCI, S&P, any of their affiliates or any third party involved in making or compiling the GICS or any GICS classifications have any liability
for any direct, indirect, special, punitive, consequential or any other damages (including lost profits) even if notified of the possibility of such damages.
Past performance does not guarantee future results, which may vary. The value of investments and the income derived from investments will fluctuate and can go down as well as
up. A loss of principal may occur.
Index Benchmarks
Indices are unmanaged. The figures for the index reflect the reinvestment of all income or dividends, as applicable, but do not reflect the deduction of any fees or expenses which would reduce
returns. Investors cannot invest directly in indices.
The indices referenced herein have been selected because they are well known, easily recognized by investors, and reflect those indices that the Investment Manager believes, in part based on
industry practice, provide a suitable benchmark against which to evaluate the investment or broader market described herein. The exclusion of “failed” or closed hedge funds may mean that
each index overstates the performance of hedge funds generally.
References to indices, benchmarks or other measures of relative market performance over a specified period of time are provided for your information only and do not imply that the portfolio will
achieve similar results. The index composition may not reflect the manner in which a portfolio is constructed. While an adviser seeks to design a portfolio which reflects appropriate risk and
return features, portfolio characteristics may deviate from those of the benchmark.
Confidentiality
No part of this material may, without GSAM’s prior written consent, be (i) copied, photocopied or duplicated in any form, by any means, or (ii) distributed to any person that is not an employee,
officer, director, or authorized agent of the recipient.
© 2018 Goldman Sachs. All rights reserved. Compliance Code : 130798-OTU-754444
18 136/511

Morgan Stanley Presentation
Separator Page
137/511

Sustainable Investing: Drivers and ThemesMay 2018
138/511

SUSTAINABLE INVESTING: DRIVERS AND THEMES 2MAY 2018
% Change from 1900 Baseline
Global Demands Are Growing Rapidly
1. United Nations, Department of Economic and Social Affairs, Population Division (2015). World Population Prospects: The 2015 Revision, Key Findings.2. Change in global exojoule consumption, Smil, V. 2010. Energy Transitions: History, Requirements, Prospects. Praeger, Santa Barbara, CA, ix + 178 pp. U.S. Energy Information Agency.3. Change in km3 Shiklomanov I. A., World Water Resources: Modern Assessment and Outlook for the 21st Century, 1999. (Summary of World Water Resources at the Beginning of the 21st Century,
prepared in the framework of the IHP UNESCO). Federal Service of Russia for Hydrometeorology & Environment Monitoring, State Hydrological Institute, St. Petersburg., OECD (2012), OECD Environmental Outlook to 2050, OECD Publishing.
4. Change in Million Metric Tons of Carbon, Boden, T.A., Marland, G., and Andres, R.J. (2015). National CO2 Emissions from Fossil-Fuel Burning, Cement Manufacture, and Gas Flaring: 1751 – 2011, Carbon Dioxide Information Analysis Center, Oak Ridge National Laboratory, U.S. Department of Energy, doi, OECD (2012), OECD Environmental Outlook 2050 , OECD Publishing.
0%
500%
1,000%
1,500%
2,000%
2,500%
1900 1910 1920 1930 1940 1950 1960 1970 1980 1990 2000 2010 2020 2030 2040 2050
Carbon
Water
Population
Energy
CO2
139/511

SUSTAINABLE INVESTING: DRIVERS AND THEMES 3MAY 2018
… Driven by a Range of Motivations (1)
Institutional Investors Are Taking Action
Risk Management
(78%)
Return Potential
(77%)
Mission Alignment
(77%)
Evolving Policies and Regulations
(76%)
Constituent andStakeholder
Demand(74%)
Source: Morgan Stanley Institute for Sustainable Investing as of March 31, 2018, “Sustainable Signals: Asset Owners Embrace Sustainability,” forthcoming1. Percentages reflect motivations identified as “extremely” or “somewhat” important.
84% of asset owners are either already integrating ESG criteria – or actively considering integration of ESG criteria – within their investment process84%
Among asset owners integrating ESG criteria, 60% have begun doing so within the last 4 years – with 40% doing so for the past 5 years or more60%
Among asset owners integrating or considering ESG criteria, 43% can envision a time when allocations will be limited to managers with a formal approach to sustainable investing
43%
140/511
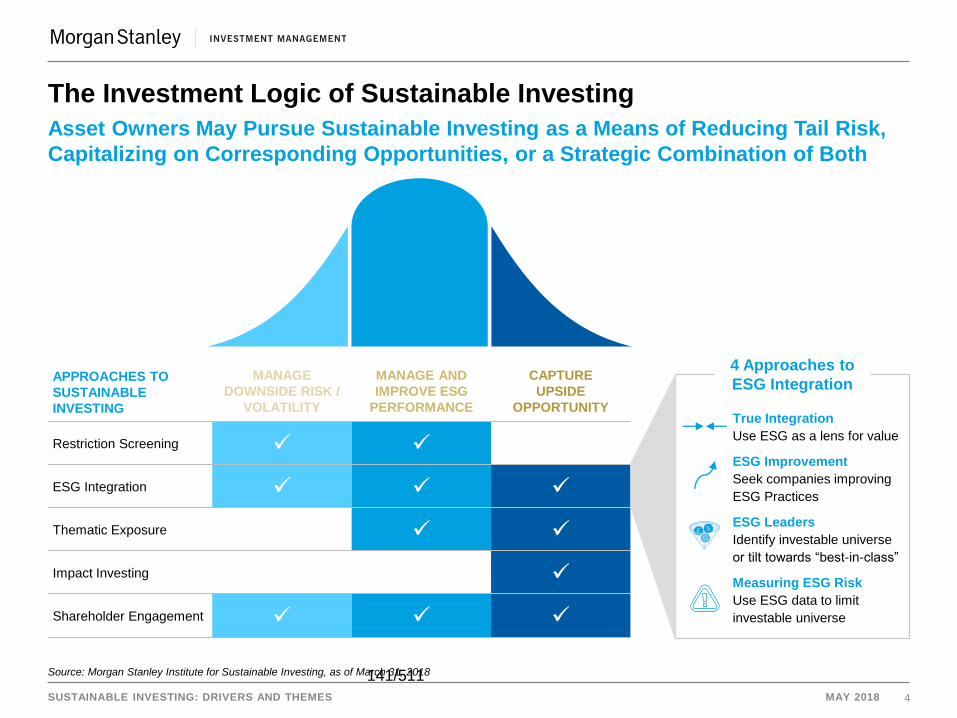
SUSTAINABLE INVESTING: DRIVERS AND THEMES 4MAY 2018
Asset Owners May Pursue Sustainable Investing as a Means of Reducing Tail Risk, Capitalizing on Corresponding Opportunities, or a Strategic Combination of Both
The Investment Logic of Sustainable Investing
APPROACHES TO SUSTAINABLE INVESTING
MANAGE DOWNSIDE RISK /
VOLATILITY
MANAGE AND IMPROVE ESG
PERFORMANCE
CAPTUREUPSIDE
OPPORTUNITY
Restriction Screening
ESG Integration
Thematic Exposure
Impact Investing
Shareholder Engagement
4 Approaches to ESG Integration
True IntegrationUse ESG as a lens for value
ESG ImprovementSeek companies improving
ESG Practices
ESG LeadersIdentify investable universe
or tilt towards “best-in-class”
Measuring ESG RiskUse ESG data to limit
investable universe
GF S
Source: Morgan Stanley Institute for Sustainable Investing, as of March 31, 2018141/511

SUSTAINABLE INVESTING: DRIVERS AND THEMES 5MAY 2018
A Spectrum of Approaches to Sustainable Investing
Climate Change Is a Leading Investment Theme
Institutional Investors Employ a Range of Approaches
52%
40%
9%
22%
8%
41%
29%
40% 39%31%
11%
20%
35%
22%
35%
0%
15%
30%
45%
60%
ESG Integration Restriction Screening Thematic Investing Shareholder Engagement Impact Investment
Required by Investment Policy Statement Wherever Possible Across Portfolio Opportunistically
31%
16%
12%
13%
18%
16%
0% 10% 20% 30% 40% 50%
Climate Change
Inclusive Growth
Gender Diversity
Seeking to Address Under Consideration
Source: Morgan Stanley Institute for Sustainable Investing, as of March 31, 2018. “Sustainable Signals: Asset Owners Embrace Sustainability,” forthcoming142/511
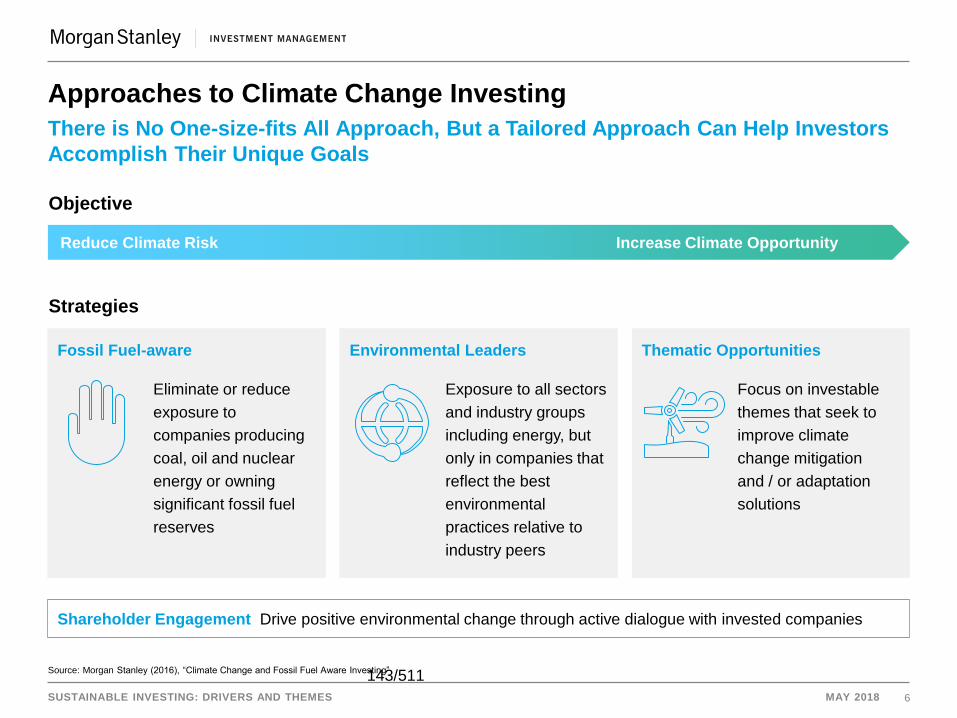
SUSTAINABLE INVESTING: DRIVERS AND THEMES 6MAY 2018
There is No One-size-fits All Approach, But a Tailored Approach Can Help Investors Accomplish Their Unique Goals
Approaches to Climate Change Investing
Objective
Strategies
Fossil Fuel-aware
Eliminate or reduce
exposure to
companies producing
coal, oil and nuclear
energy or owning
significant fossil fuel
reserves
Environmental Leaders
Exposure to all sectors
and industry groups
including energy, but
only in companies that
reflect the best
environmental
practices relative to
industry peers
Thematic Opportunities
Focus on investable
themes that seek to
improve climate
change mitigation
and / or adaptation
solutions
Shareholder Engagement Drive positive environmental change through active dialogue with invested companies
Source: Morgan Stanley (2016), “Climate Change and Fossil Fuel Aware Investing”
Reduce Climate Risk Increase Climate Opportunity
143/511

SUSTAINABLE INVESTING: DRIVERS AND THEMES 7MAY 2018
Select Investment Opportunities Can Help Address Poverty and Promote Human Rights
Approaches to Investing for Inclusive Growth
INCLUSIVE GROWTHBroad based economic growth that provides wide opportunity for participation
Productive Employment Opportunity for Entrepreneurship
FINANCIAL
INCLUSION
INCLUSIVE
HEALTHCARE
INCLUSIVE
EDUCATION
GENDER
INCLUSION
PILLARS OF INCLUSIVE GROWTH
Source: Morgan Stanley Institute for Sustainable Investing, “Inclusive Growth Opportunities Index 2017,” 2017144/511

SUSTAINABLE INVESTING: DRIVERS AND THEMES 8MAY 2018
Are Key Stakeholders Aware of Strategic Priorities, Targets and Accomplishments?Amplifying Sustainable Investing Activities
Potential Key Stakeholders
• Internal stakeholders may include:
– Board and/or Investment
Committee
– Senior management and
executives
– Employees (including investment
and public affairs teams)
– Third-party service providers
• External stakeholders may include:
– Beneficiaries
– Potential clients
– General public and community
members
– Partners and peers
Sample Channels of Communication
CHANNEL INTERNAL EXTERNAL
Vision Statement Formalizes objectives Communicates objectives
Governing Policies and Procedures
Creates clear processes Promotes accountability
Goals or Targets Guides investment decision-
making; helps track progress
Promotes accountability;
demonstrates measureable
commitment
KPI Dashboard Tracks progress of key
performance indicators
Execution Plans Guides implementation
activities
Promotes accountability and
market learnings
Sustainability Report/ Webpage
Provides transparency and
highlights progress and
achievements
Commitments and Affiliations
Promotes knowledge-sharing
and alignment with peers
Signals commitment and
raises awareness
Source: Morgan Stanley Institute for Sustainable Investing, as of March 31, 2018145/511

SUSTAINABLE INVESTING: DRIVERS AND THEMES 9MAY 2018
Delivering Sustainable Investing Ideas and Solutions to All Morgan Stanley ClientsMorgan Stanley Institute for Sustainable Investing
Morgan Stanley Institute for Sustainable Investing
Sustainable Investing• Fosters innovation by leveraging
our experience and market
perspective to advance the field of
sustainable investing
Thought Leadership• Produces informative analysis and
thought leadership from firm,
industry and issue experts to inform
and empower investors
Capacity Building• Trains and develops the next
generation of sustainable investing
leaders through strategic
partnerships and programs
WEALTH MANAGEMENT
Investing with Impact
Platform
INVESTMENT MANAGEMENT
Custom Portfolio
Solutions
Public & Private
Markets Strategies
RESEARCH
Integrating ESG into
Stock Valuation
Models
GLOBAL CAPITAL MARKETS
Green / Social
Bonds
Renewable Energy &
Clean Tech Finance
SALES & TRADING
Strategic advice and
Bespoke Structured
Finance
Source: Morgan Stanley Institute for Sustainable Investing, as of March 31, 2018146/511

SUSTAINABLE INVESTING: DRIVERS AND THEMES 10MAY 2018
This material has been prepared for informational purposes only and is not intended as an offer or solicitation with respect to the purchase or sale of any security.
It does not provide individually tailored investment advice. It has been prepared without regard to the individual financial circumstances and objectives of persons
who receive it. Morgan Stanley Smith Barney LLC & Morgan Stanley & Co LLC (collectively "Morgan Stanley") recommends that investors independently evaluate
particular investments and strategies, and encourages investors to seek the advice of a Morgan Stanley Financial Advisor or Private Wealth Advisor. The
appropriateness of a particular investment or strategy will depend on an investor's individual circumstances and objectives.
The views and opinions expressed in this material are as of the time of this writing and do not necessarily represent those of Morgan Stanley, its affiliates or its
other employees. These views may change without notice in response to changing circumstances and market conditions. Furthermore, this material contains
forward-looking statements and there can be no guarantee that they will come to pass. Past performance is not a guarantee of future results.
Although the statements of fact and data in this report have been obtained from, and are based upon, sources that Morgan Stanley believes to be reliable, we do
not guarantee their accuracy, and any such information may be incomplete or condensed.
Private Funds (which include hedge funds and private equity funds) often engage in speculative investment techniques and are only sui table for long-term,
qualified investors. Investors could lose all or a substantial amount of their investment. They are generally illiquid, not tax-efficient and have higher fees than many
traditional investments.
Investing in the market entails the risk of market volatility. The value of all types of investments may increase or decrease over varying time periods. Fixed Income
investing entails credit risks and interest rate risks. When interest rates rise, bond prices generally fall.
The returns on a portfolio consisting primarily of sustainable investments may be lower or higher than a portfolio that is more diversified or where decisions are
based solely on investment considerations. Because sustainability criteria exclude some investments, investors may not be able to take advantage of the same
opportunities or market trends as investors that do not use such criteria.
An investment in an exchange-traded fund involves risks similar to those of investing in a broadly based portfolio of equity securities traded on exchange in the
relevant securities market, such as market fluctuations caused by such factors as economic and political developments, changes in interest rates and perceived
trends in stock prices. The investment return and principal value of ETF investments will fluctuate so that an investor’s ETF shares, if or when sold, may be worth
more or less than the original cost.
Investors should carefully consider the investment objectives and risks as well as charges and expenses of a mutual fund / exchange-traded fund before investing. To obtain a prospectus, contact your Financial Advisor or visit the fund company’s website. The prospectus contains this and other information about the mutual fund / exchange-traded fund. Read the prospectus carefully before investing.
© 2018 Morgan Stanley & Co. LLC and Morgan Stanley Smith Barney LLC. Members SIPC.
Disclaimers
147/511

Callan APFC Performance Review Memo
Separator Page
148/511

SUBJECT: Callan Associates, Inc. APFC Performance Review
ACTION:
DATE: May 23, 2018
INFORMATION: X
BACKGROUND: Callan Associates, Inc. is currently under contract to perform APFC’s core general consulting services of 1) investment policies and procedures review; 2) annual preparation of an asset allocation plan; 3) performance reporting and analysis; 4) risk analysis; 5) statistical modeling, manager searches, selection, and oversight; and 6) other special consulting services as needed. STATUS: At every quarterly board meeting or as requested, Callan Associates, Inc. provides an extensive review of the Fund’s performance as well as updates on market conditions. President, Gregory Allen, and Senior Vice President, Steve Center, will be the presenters at this meeting.
149/511

Callan APFC Performance Presentation
Separator Page
150/511

Alaska Permanent Fund Corporation
1st Quarter 2018
Performance Review
May 23, 2018
Greg Allen CEO and Chief Research Officer
Steven Center, CFA Senior Vice President
151/511

2 Knowledge. Experience. Integrity. First Quarter 2018
Agenda
●Capital Markets Overview
● Total Fund Asset Allocation and Performance
● Asset Class Structure and Performance
152/511

3 First Quarter 2018 Knowledge. Experience. Integrity.
Broad Capital Market Performance Periods Ended March 31, 2018
(5.0)
0.0
5.0
10.0
15.0
20.0
Last Quarter Last Year Last 3 Years Last 5 Years Last 7 Years Last 10 Years
Ret
urns
3 Month T-Bill Barclays Aggregate S&P 500 Russell 2000 MSCI ACWI ex-US
0.41.1
0.5 0.3 0.3 0.3
(1.5)
1.2 1.21.8
2.93.6
(0.8)
14.0
10.8
13.312.7
9.5
(0.1)
11.8
8.4
11.5
10.49.8
(1.1)
17.0
6.7 6.4
4.7
3.2
153/511
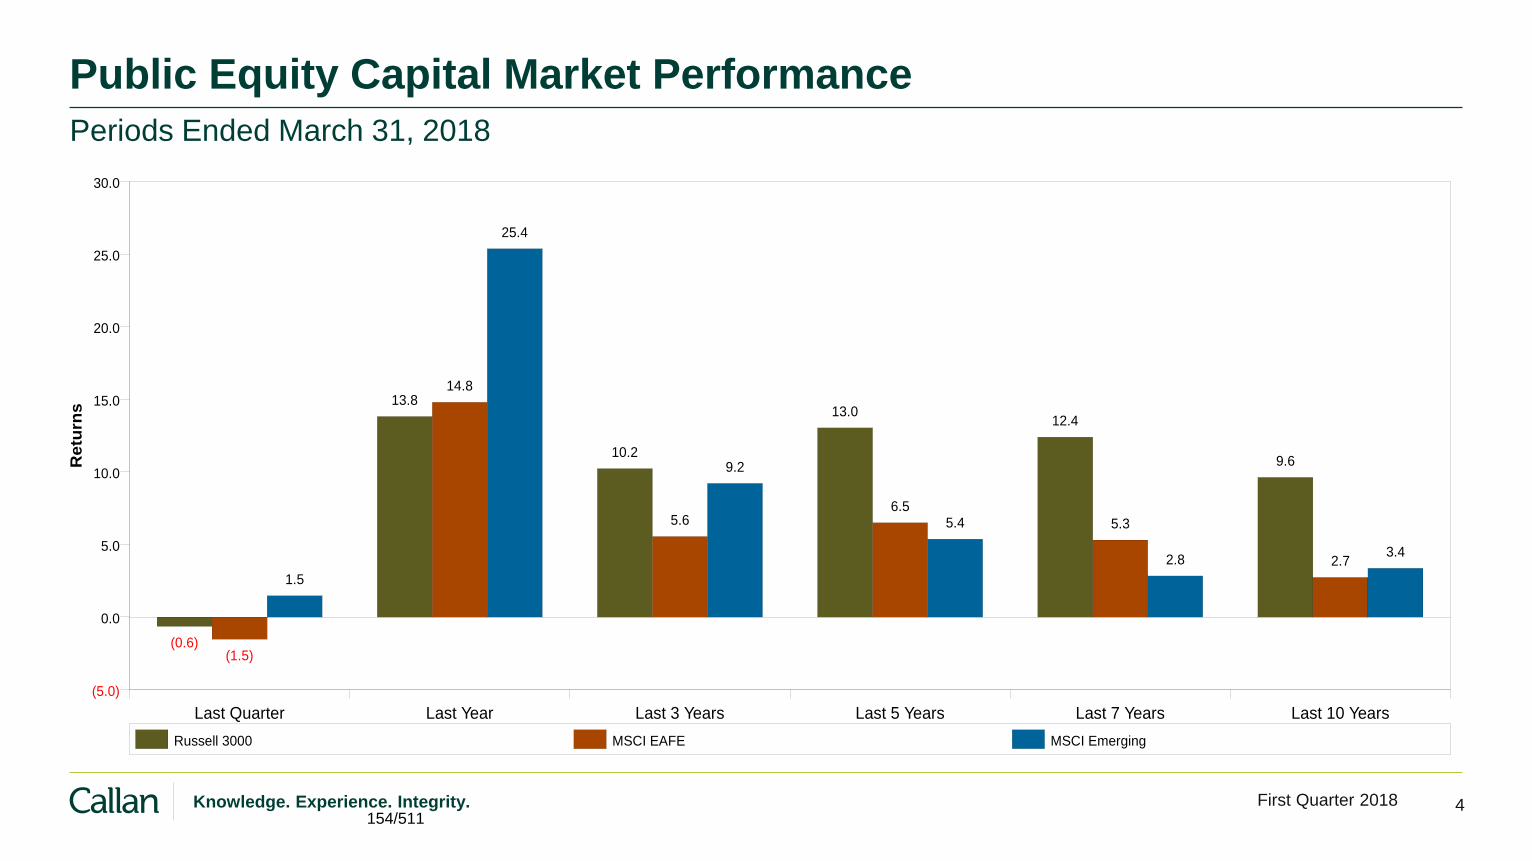
4 First Quarter 2018 Knowledge. Experience. Integrity.
Public Equity Capital Market Performance Periods Ended March 31, 2018
Last Quarter Last Year Last 3 Years Last 5 Years Last 7 Years Last 10 Years
(5.0)
0.0
5.0
10.0
15.0
20.0
25.0
30.0
Ret
urns
Russell 3000 MSCI EAFE MSCI Emerging
(0.6)
13.8
10.2
13.012.4
9.6
(1.5)
14.8
5.66.5
5.3
2.7
1.5
25.4
9.2
5.4
2.83.4
154/511

5 First Quarter 2018 Knowledge. Experience. Integrity.
Information Technology
Consumer Discretionary
Health Care
Financials
Industrials
Utilities
Materials
Energy
Real Estate
Consumer Staples
Telecommunications
4.07%
-5.24%
-0.42%
-1.89%
1.94%
-6.09%
-0.33%
-6.75%
-7.27%
-3.34%
-6.22%
Callan Style Group Quarterly Returns Economic Sector Quarterly Returns (Russell 3000)
R1000 Growth
vs.
Style
Large Cap Growth
R1000 Value
vs.
Style
Large Cap Value
R2000 Growth
vs.
Style
Small Cap Growth
R2000 Value
vs.
Style
Small Cap Value
(8%)
(4%)
0%
4%
8%
10th Percentile 5.80 -0.89 7.66 -0.27
25th Percentile 4.98 -1.58 5.82 -1.18
Median 3.00 -2.34 4.29 -2.20
75th Percentile 1.57 -3.29 2.43 -3.06
90th Percentile 0.93 -3.87 0.13 -3.84
Benchmark 1.42 -2.83 2.30 -2.64
U.S. Equity
● Volatility returned in 1Q18, with the Russell 3000 (-0.6%) losing ground — a first since 3Q15. After starting strong on the back of solid earnings and tax
reform, U.S. equities faltered in the 2nd half over concerns about a more aggressive global trade policy and uncertainty over the pace of interest rate hikes.
● Small Cap (Russell 2000: -0.1%) outperformed Large Cap (Russell 1000: -0.7%) across styles for the quarter. Possible trade war with China weighed on
large companies from their higher exposure to international markets.
● Growth, in a repeat of last quarter, outperformed Value across the market cap range (R1G: +1.4% vs R1V: -2.8%; R2G: +2.3% vs R2V: -2.6%). Value
trailed as accelerating rates brought down interest rate-sensitive sectors (Financials, Real Estate, & Utilities) and from a prospective rise in inflation.
● Within Russell 3000, Consumer Discretionary & Tech topped performance, supported by Amazon, Netflix & Microsoft. Energy took a hit as Exxon Mobil &
Chevron missed 4Q17 earnings expectations. Staples & Telecom were the two worst-performing sectors.
First Quarter 2018
Sources: Callan, Russell Investment Group
155/511

6 First Quarter 2018 Knowledge. Experience. Integrity.
U.S. Equity Economic Sector Quarterly Performance
Source: Russell Investment Group
3.5%
1.9%
-0.4% -0.9% -1.5%
-4.8% -5.4% -5.8%
-7.4%
6.0%
-0.8% -1.4%
6.5%
-2.0%
-5.1% -4.9%
-9.9%
-7.0%
-10.0%
-9.0%
-8.0%
-7.0%
-6.0%
-5.0%
-4.0%
-3.0%
-2.0%
-1.0%
0.0%
1.0%
2.0%
3.0%
4.0%
5.0%
6.0%
7.0%
Tech Cons Disc Financials Health Care Producer Durables Utilities Materials &Processing
Energy Cons Staples
Russell 1000 Russell 2000
156/511
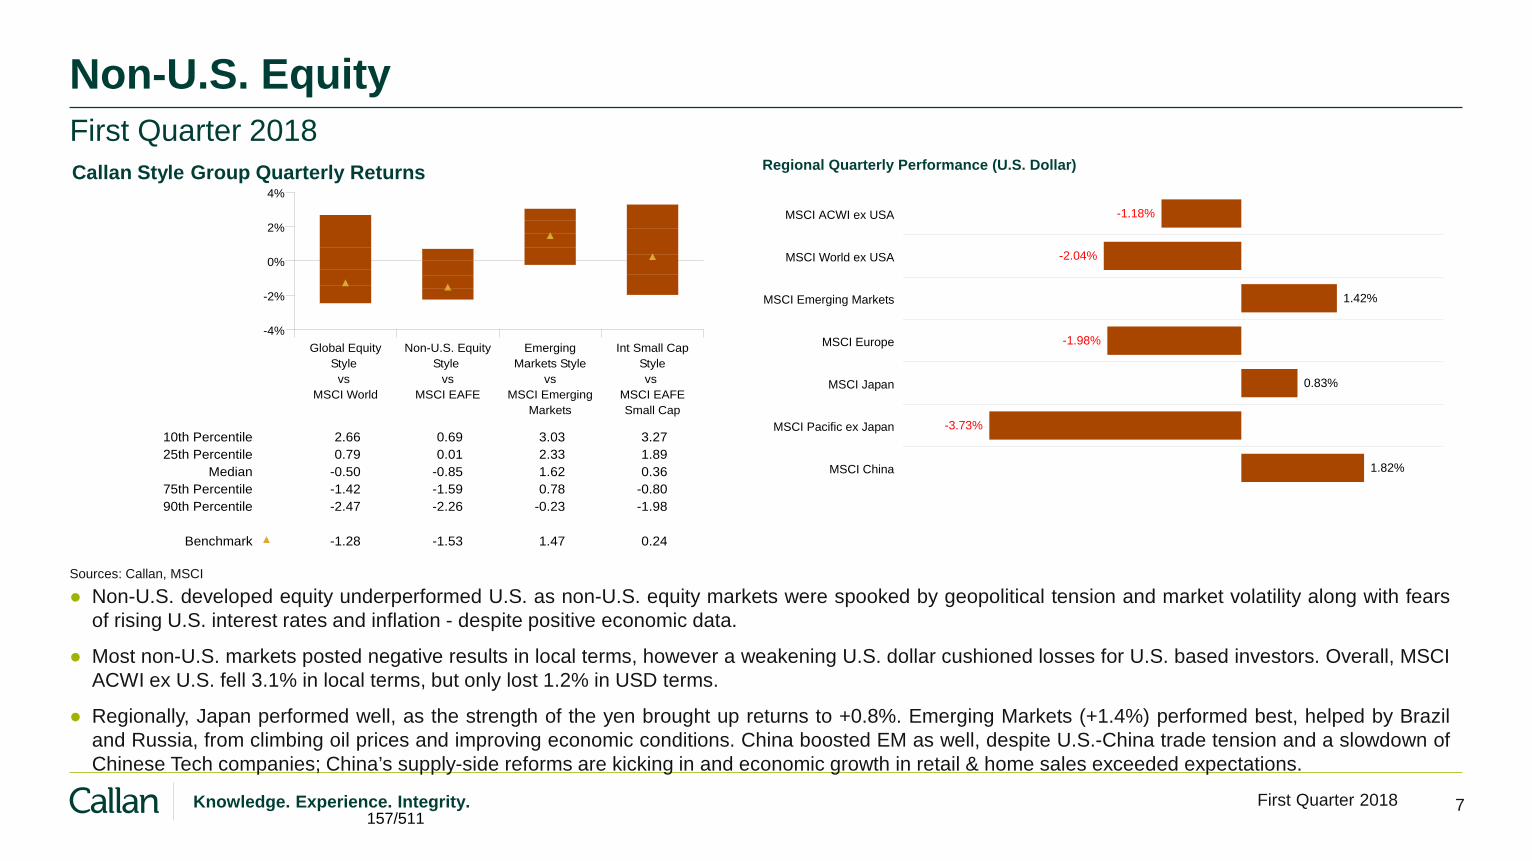
7 First Quarter 2018 Knowledge. Experience. Integrity.
MSCI World
vs
Style
Global Equity
MSCI EAFE
vs
Style
Non-U.S. Equity
Markets
MSCI Emerging
vs
Markets Style
Emerging
Small Cap
MSCI EAFE
vs
Style
Int Small Cap
-4%
-2%
0%
2%
4%
10th Percentile 2.66 0.69 3.03 3.27
25th Percentile 0.79 0.01 2.33 1.89
Median -0.50 -0.85 1.62 0.36
75th Percentile -1.42 -1.59 0.78 -0.80
90th Percentile -2.47 -2.26 -0.23 -1.98
Benchmark -1.28 -1.53 1.47 0.24
MSCI ACWI ex USA
MSCI World ex USA
MSCI Emerging Markets
MSCI Europe
MSCI Japan
MSCI Pacific ex Japan
MSCI China
Regional Quarterly Performance (U.S. Dollar)
-1.18%
-2.04%
1.42%
-1.98%
0.83%
-3.73%
1.82%
Non-U.S. Equity
● Non-U.S. developed equity underperformed U.S. as non-U.S. equity markets were spooked by geopolitical tension and market volatility along with fears
of rising U.S. interest rates and inflation - despite positive economic data.
● Most non-U.S. markets posted negative results in local terms, however a weakening U.S. dollar cushioned losses for U.S. based investors. Overall, MSCI
ACWI ex U.S. fell 3.1% in local terms, but only lost 1.2% in USD terms.
● Regionally, Japan performed well, as the strength of the yen brought up returns to +0.8%. Emerging Markets (+1.4%) performed best, helped by Brazil
and Russia, from climbing oil prices and improving economic conditions. China boosted EM as well, despite U.S.-China trade tension and a slowdown of
Chinese Tech companies; China’s supply-side reforms are kicking in and economic growth in retail & home sales exceeded expectations.
First Quarter 2018
Callan Style Group Quarterly Returns
Sources: Callan, MSCI
157/511

8 First Quarter 2018 Knowledge. Experience. Integrity.
Non-U.S. Equity
● The U.S. dollar fell against all major currencies, a trend observed over the last 12 months.
Currencies
1998 1999 2000 2001 2002 2003 2004 2005 2006 2007 2008 2009 2010 2011 2012 2013 2014 2015 2016 2017 2018
-40%
-30%
-20%
-10%
0%
10%
20%
30%
40%
50%
60%
70%
Major Currencies' Cumulative Returns (vs. U.S. Dollar)
Japanese yen U.K. sterling Euro* Swiss franc
* Euro returns from 1Q99. German mark prior to 1Q99. Source: MSCI
158/511
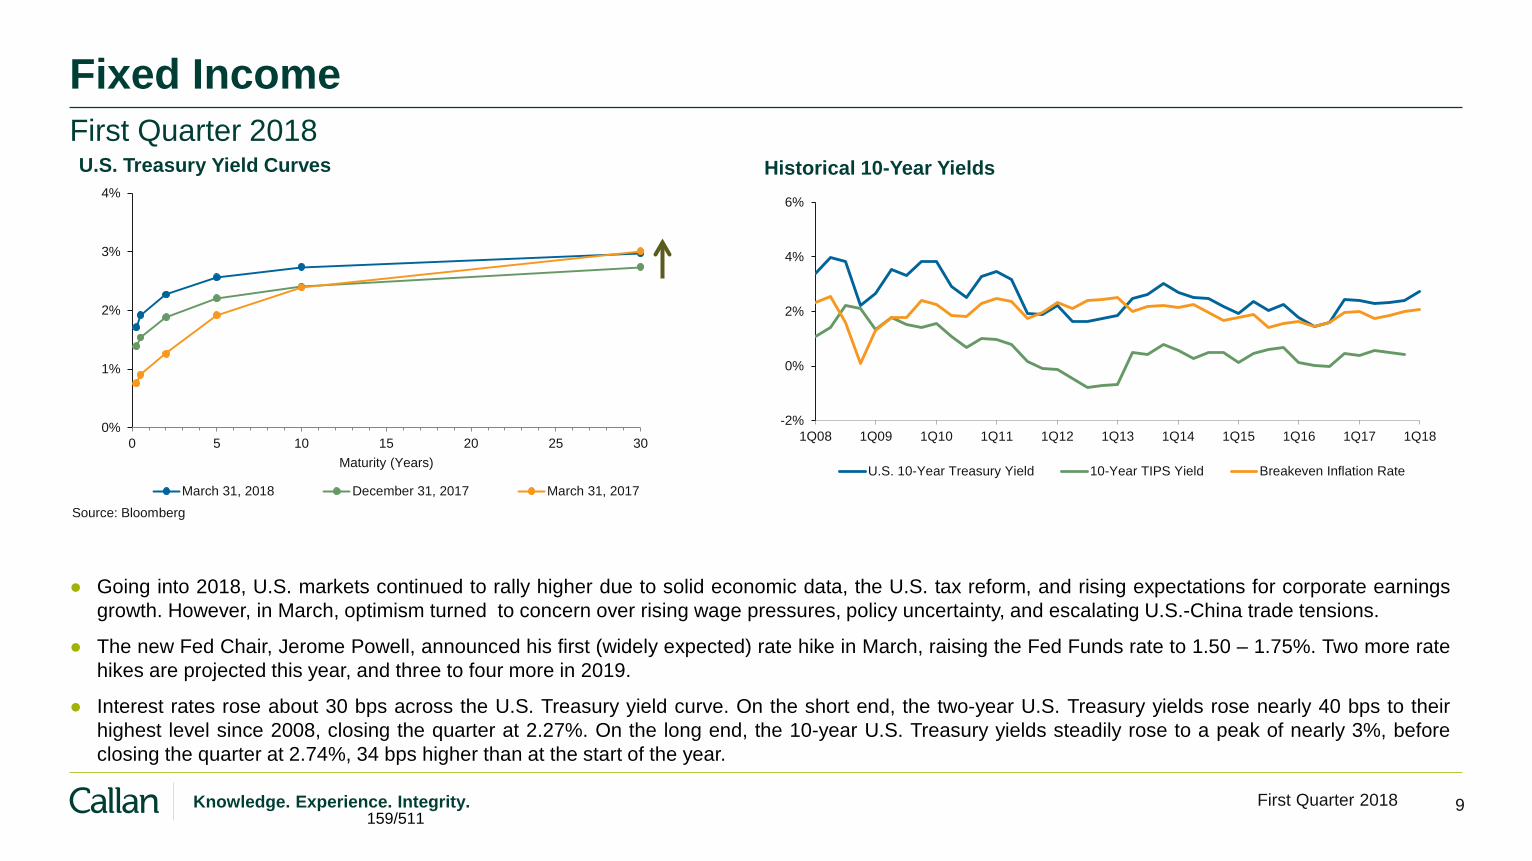
9 First Quarter 2018 Knowledge. Experience. Integrity.
0%
1%
2%
3%
4%
0 5 10 15 20 25 30
Maturity (Years)
March 31, 2018 December 31, 2017 March 31, 2017
Fixed Income
● Going into 2018, U.S. markets continued to rally higher due to solid economic data, the U.S. tax reform, and rising expectations for corporate earnings
growth. However, in March, optimism turned to concern over rising wage pressures, policy uncertainty, and escalating U.S.-China trade tensions.
● The new Fed Chair, Jerome Powell, announced his first (widely expected) rate hike in March, raising the Fed Funds rate to 1.50 – 1.75%. Two more rate
hikes are projected this year, and three to four more in 2019.
● Interest rates rose about 30 bps across the U.S. Treasury yield curve. On the short end, the two-year U.S. Treasury yields rose nearly 40 bps to their
highest level since 2008, closing the quarter at 2.27%. On the long end, the 10-year U.S. Treasury yields steadily rose to a peak of nearly 3%, before
closing the quarter at 2.74%, 34 bps higher than at the start of the year.
First Quarter 2018
Source: Bloomberg
U.S. Treasury Yield Curves Historical 10-Year Yields
-2%
0%
2%
4%
6%
1Q08 1Q09 1Q10 1Q11 1Q12 1Q13 1Q14 1Q15 1Q16 1Q17 1Q18
U.S. 10-Year Treasury Yield 10-Year TIPS Yield Breakeven Inflation Rate
159/511

10 First Quarter 2018 Knowledge. Experience. Integrity.
Barclays Aggregate
Barclays Treasury
Barclays Agency
Barclays CMBS
Barclays ABS
Barclays Mortgage
Barclays Credit
Barclays High Yield
Absolute Returns for Quarter ended March 31, 2018
-1.46%
-1.18%
-0.53%
-1.32%
-0.39%
-1.19%
-2.13%
-0.86%
Fixed Income
● Volatility picked up across risk assets as geopolitical uncertainties took center stage; market expectations reflect the possibility of four rate hikes, up from
three at the end of 2017. The U.S. bond market, represented by the Bloomberg Barclays U.S. Aggregate Bond Index returned -1.5%.
● Corporate and securitized sectors underperformed Treasuries for the first time in many quarters on the back of corporate risk premia that tightened, then
widened, for both investment grade and high yield corporates.
● Investment grade corporates returned -2.1%. Investors were fairly sanguine as they reassessed fairly healthy balance sheets juxtaposed with fair/rich
valuations. High yield corporates returned -0.9%. Corporate fundamentals remained healthy as earnings growth supported debt coverage. On a positive
note, Bank loans returned +1.4%, benefitted by healthy balance sheets, strong demand for CLO formation, and higher short-term interest rates.
First Quarter 2018
Interm Agg
Blmbg
vs
Interm Style
Blmbg Agg
vs
Core Style
Blmbg Agg
vs
Core Plus Style
Long Gov/Cr
Blmbg
vs
Style
Ext Maturity
High Yield
Blmbg
vs
High Yield Style
-5%
-4%
-3%
-2%
-1%
0%
10th Percentile -0.68 -1.10 -0.80 -3.28 -0.06
25th Percentile -0.84 -1.19 -1.05 -3.56 -0.47
Median -0.93 -1.36 -1.20 -3.70 -0.79
75th Percentile -1.01 -1.45 -1.41 -3.92 -1.11
90th Percentile -1.12 -1.55 -1.55 -4.03 -1.55
Benchmark -1.05 -1.46 -1.46 -3.58 -0.86
Callan Style Group Quarterly Returns
Sources: Bloomberg Barclays, Callan
160/511

11 First Quarter 2018 Knowledge. Experience. Integrity.
NCREIF All Equity Sector Returns By Region
East
Midwest
South
West
1.20%
1.27%
1.83%
2.16%
NCREIF All Equity Sector Returns By Property Type
Apartments
Hotels
Industrial
Office
Retail
1.50%
1.00%
3.25%
1.80%
0.72%
Callan Style Group Quarterly Returns
Real Estate
● Supply and demand fundamentals are balanced but peaking. Supply is in check and aided by strict commercial real estate lending standards. Demand continues on
the back of synchronized domestic growth.
● The NCREIF Property Index advanced 1.7% during the 1st quarter (Income: +1.1%; Appreciation: +0.6%). Global REITs outperformed U.S. REITs, but still lost 4.3%.
U.S. REITs ended the quarter with -8.2%.
● The industrial sector is performing the strongest, benefitting as structural shifts in the economy, property markets, and consumer habits continue to dampen demand
for traditional retail space. The Western region continues to lead other regions.
First Quarter 2018
NCREIF Property
vs
Real Estate Database
NAREIT Equity
vs
REIT Database
REITs
EPRA/NAREIT Developed
vs
Global REIT Database
-10%
-6%
-2%
2%
10th Percentile 2.60 -5.26 -1.99
25th Percentile 2.14 -5.75 -2.89
Median 1.61 -6.67 -3.59
75th Percentile 0.82 -7.40 -4.21
90th Percentile -0.57 -7.85 -4.59
Benchmark 1.70 -8.20 -4.30
Sources: Callan, NAREIT, NCREIF, The FTSE Group
161/511

12 First Quarter 2018 Knowledge. Experience. Integrity.
FOF Style
Absolute Return
FOF Style
Core Diversified
FOF Style
Long/Short Equity
-2%
-1%
0%
1%
2%
3%
4%
10th Percentile 1.95 2.43 3.13
25th Percentile 1.49 1.62 1.55
Median 1.23 0.87 1.16
75th Percentile 0.53 0.32 0.52
90th Percentile -0.17 -0.03 -1.34
T-Bills + 5% 1.57 1.57 1.57
Callan Style Group Quarterly Returns
Hedge Funds
● Despite the quarter’s rocky ride for stocks and bonds, hedge fund strategies were mostly
positive. As a proxy of unmanaged hedge fund interests without implementation costs, the
Credit Suisse Hedge Fund Index (CS HFI) grew 0.5%. Representing actual hedge
fund-of-fund portfolios, the median manager in the Callan Hedge Fund-of-Funds Database gained 1.2%, net of all fees and expenses.
● Within CS HFI, the best-performing strategy was Long/Short Equity (+1.0%). Despite the
quarter’s negative market beta, the strategy provided investors with some positive alpha.
Managed Futures struggled to add value.
● Market exposures marginally affected performance. The median Callan Long/Short Equity FOF matched the Callan Absolute Return FOF with 1.2% gains, while the Core Diversified FOF returned 0.9%.
First Quarter 2018
Diversified Hedge Fund Strategy Quarter
Last
Date
Year to
Last Year Years
Last 3
Years
Last 5
Years
Last 10
Years
Last 15
Hedge Fund-of-Funds Database 1.16 1.16 5.34 2.51 4.28 3.51 5.04
CS Hedge Fund 0.47 0.47 5.43 1.82 3.61 3.49 5.89
Credit Suisse Subindices
Equity Market Neutral 0.73 0.73 6.96 2.81 2.58 -3.10 0.51
Convertible Arbitrage 0.84 0.84 3.56 4.24 2.93 4.59 4.19
Fixed Income Arbitrage 1.75 1.75 5.93 4.42 3.81 4.60 4.24
Multi-Strategy 1.66 1.66 5.68 4.56 6.15 5.47 6.80
Distressed 0.36 0.36 5.31 2.66 4.21 4.16 7.15
Risk Arbitrage -0.58 -0.58 3.93 3.57 2.91 2.69 4.35
Event Driven Multi-Strategy -0.46 -0.46 2.41 -0.85 2.09 3.01 6.10
Long/Short Equity 1.01 1.01 10.73 4.00 6.26 4.54 7.07
Global Macro 0.57 0.57 2.48 0.67 2.33 3.72 7.06
Managed Futures -3.45 -3.45 0.76 -4.99 0.48 1.04 3.18
Emerging Markets 1.20 1.20 13.43 6.74 5.44 3.96 8.55
Style Median and Index Returns* for Periods ended March 31, 2018
*Returns less than one year are not annualized.
Sources: Callan, Credit Suisse Hedge Index
Sources: Callan, Merrill Lynch
162/511

13 First Quarter 2018 Knowledge. Experience. Integrity.
Private Equity First Quarter 2018
● Investors remain enthusiastic, however rising borrowing costs and the impact of tax reform may curb some of the optimism, on a near-term and long-term basis.
● Fund raising figures indicate that 2018 is off to a slower start than 2017 by about 17%. Oversubscribed funds remain common and vigilance in commitment pacing is recommended during this frothy market.
● Once published, we anticipate returns to be in line with the Russell 3000.
● Valuations remain elevated. Within Buyouts, the median purchase and leverage multiples remained elevated in 1Q18 tracking upwards of 10x and 5x respectively. In VC, the median pre-money valuation continues to increase, only Series D+ fell, showing a 20% decline.
● Exits: Buyouts first quarter M&A exits held steady with last years quarter rates with 164 sales and $28.8 billion in disclosed value. The 11 IPO backed exits raising $3.9 billion was the strongest quarterly rate since 2Q15.
● 1Q18 VC-backed exits were lower than any quarter in 2017, 188 exits and $8.1 billion of disclosed values. The exits were split between 173 M&A exits with $6.0 billion of announced value and 15 IPOs raising $2.1 billion.
Funds Closed January 1 through March 31, 2018
Strategy # of Funds $ Amt (mil) % Venture Capital 111 6,034 9%
Acquisition/Buyouts 91 52,481 79%
Private Debt 18 4,133 6%
Secondary and Other 10 2,231 3%
Fund-of-funds 12 1,593 2%
Totals 242 66,472 100% Source: Private Equity Analyst
Private Equity Performance Database – Pooled Horizon IRRs Through September 30, 2017 – Returns are net of fees Strategy 3 Mos 1 Yr 3 Yrs 5 Yrs 10 Yrs 15 yrs 20 Yrs All Venture 3.5% 8.8% 12.3% 15.5% 9.5% 9.0% 17.9%
Growth Equity 4.9% 15.8% 10.7% 13.2% 10.1% 12.6% 13.1%
All Buyouts 4.6% 19.3% 12.6% 14.4% 8.8% 14.4% 12.5%
Mezzanine 4.2% 13.1% 9.4% 10.1% 9.0% 9.5% 8.6%
Distressed 2.4% 14.9% 9.0% 11.4% 9.1% 11.3% 11.3%
All Private Equity 4.3% 16.2% 11.9% 14.1% 9.1% 12.7% 13.0% S&P 500 4.5 18.6 10.8 14.2 7.4 10.0 7.0
Source: Thomson Reuters/Cambridge
163/511

14 First Quarter 2018 Knowledge. Experience. Integrity.
Inflation Year-Over-Year Quarterly Real GDP Growth (20 Years)
Labor Force Statistics from the Current Population Survey 2018 (Seasonally Adj.) December January February March
Employment Level (thousands) 154,021 154,430 155,215 155,178
Unemployment Level (thousands) 6,576 6,684 6,706 6,585
Civilian Labor Force Level (thousands) 160,597 161,115 161,921 161,763
Unemployment Rate 4.1% 4.1% 4.1% 4.1%
Labor Force Participation Rate 62.7% 62.7% 63.0% 62.9%
U.S. Economy First Quarter 2018
Source: Bureau of Labor Statistics Source: Bureau of Economic Analysis
98 99 00 01 02 03 04 05 06 07 08 09 10 11 12 13 14 15 16 17
-15%
-10%
-5%
0%
5%
10%
15%
20%
2.1% - CPI-U
4.4% - PPI
-10%
-8%
-6%
-4%
-2%
0%
2%
4%
6%
8%
97 98 99 00 01 02 03 04 05 06 07 08 09 10 11 12 13 14 15 16 17 18
164/511

15 First Quarter 2018 Knowledge. Experience. Integrity.
Total Fund
Asset Allocation and Performance
165/511

16 First Quarter 2018 Knowledge. Experience. Integrity.
Total Fund Asset Allocation As of March 31, 2018
● APFC portfolio is well diversified across all major
asset classes employed by institutional investors.
● Using institutional standard asset class definitions, the
portfolio is currently allocated 40% to public equity,
21% to fixed income, and 39% to alternative
investments.
● Compared to allocations in the 4th quarter, this reflects
a 4% decrease in public equity and a corresponding
increase in alternative investments. Fixed income
allocation remained unchanged.
● Alternatives include private equity, growth
opportunities, real estate, private infrastructure,
private credit, income opportunities, absolute return,
and asset allocation.
● Private Equity & Growth Opportunities, Real Estate,
and Infrastructure/Private Credit/Income Opportunities
are now reported on a one-quarter lag.
40%
0%
21%
11%
9%
6% 4%
9%
(5.0%)
0.0%
5.0%
10.0%
15.0%
20.0%
25.0%
30.0%
35.0%
40.0%
45.0%
166/511

17 First Quarter 2018 Knowledge. Experience. Integrity.
10%
15% 15%
0%
12%
1%
2%
1% 1%
2%
1%
7%
5%
9%
3%
2%
0%
4% 4%
1%
3%
1%
-2.0%
0.0%
2.0%
4.0%
6.0%
8.0%
10.0%
12.0%
14.0%
16.0%
Total Fund Asset Allocation As of March 31, 2018
167/511
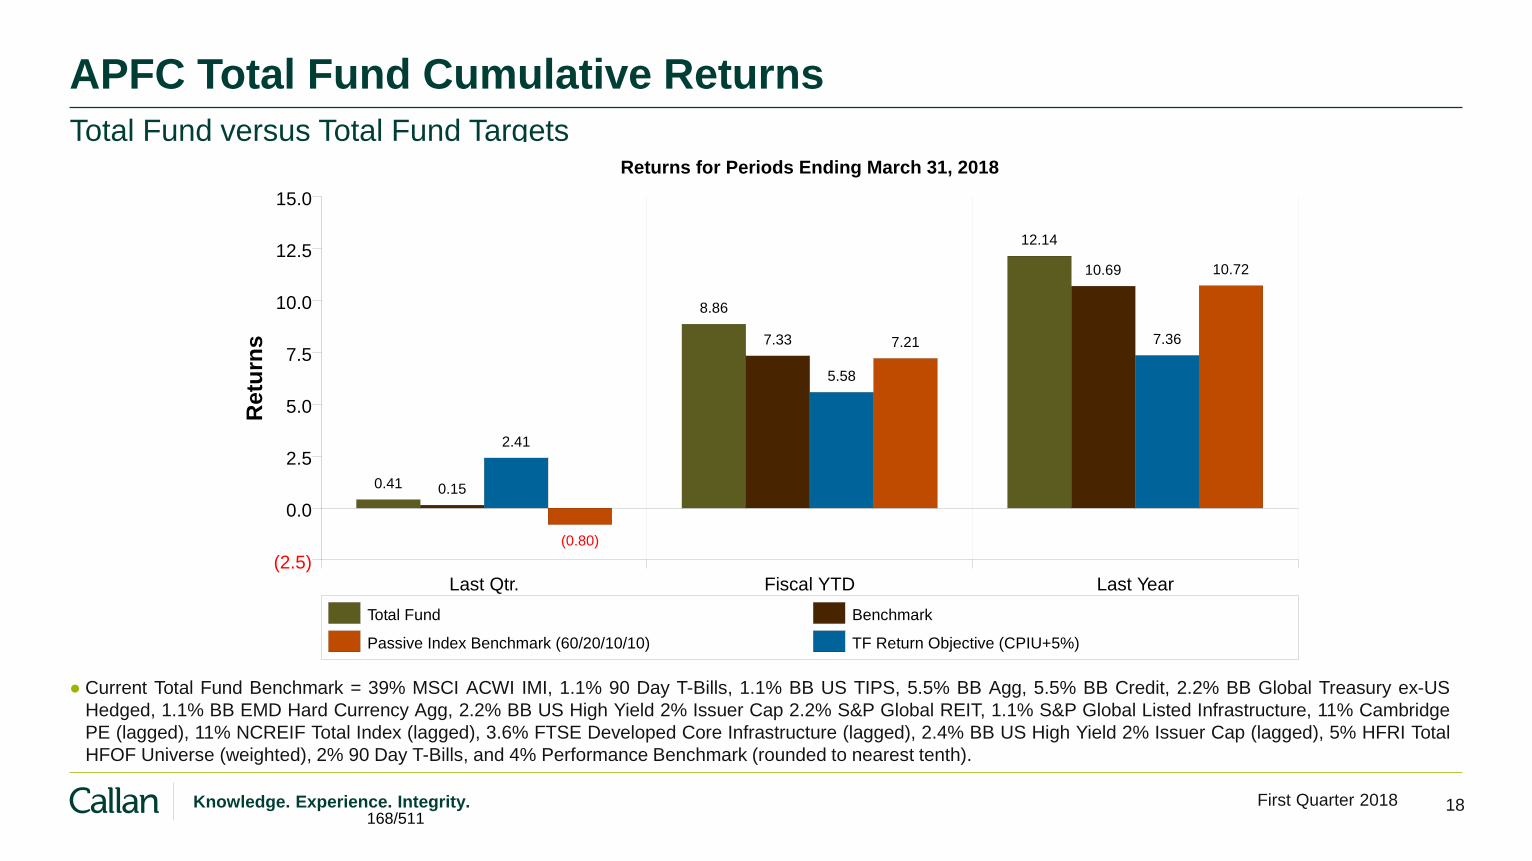
18 First Quarter 2018 Knowledge. Experience. Integrity.
APFC Total Fund Cumulative Returns Total Fund versus Total Fund Targets
Fiscal YTD
0.41
8.86
12.14
0.15
7.33
10.69
2.41
5.58
7.36
Last Qtr. Fiscal YTD Last Year
(2.5)
0.0
2.5
5.0
7.5
10.0
12.5
15.0
Returns for Periods Ending March 31, 2018
Total Fund Benchmark
Passive Index Benchmark (60/20/10/10) TF Return Objective (CPIU+5%)
Ret
urns
(0.80)
7.21
10.72
● Current Total Fund Benchmark = 39% MSCI ACWI IMI, 1.1% 90 Day T-Bills, 1.1% BB US TIPS, 5.5% BB Agg, 5.5% BB Credit, 2.2% BB Global Treasury ex-US
Hedged, 1.1% BB EMD Hard Currency Agg, 2.2% BB US High Yield 2% Issuer Cap 2.2% S&P Global REIT, 1.1% S&P Global Listed Infrastructure, 11% Cambridge
PE (lagged), 11% NCREIF Total Index (lagged), 3.6% FTSE Developed Core Infrastructure (lagged), 2.4% BB US High Yield 2% Issuer Cap (lagged), 5% HFRI Total
HFOF Universe (weighted), 2% 90 Day T-Bills, and 4% Performance Benchmark (rounded to nearest tenth).
168/511

19 First Quarter 2018 Knowledge. Experience. Integrity.
APFC Total Fund Cumulative Returns Total Fund versus Total Fund Targets
7.65
8.35
6.216.52
6.33
7.22
5.67
6.07
6.86
6.406.58
7.18
Last 3 Years Last 5 Years Last 10 Years Last 20 Years
0.0
2.5
5.0
7.5
10.0
Returns for Periods Ending March 31, 2018
Total Fund Benchmark Passive Index Benchmark (60/20/10/10)
TF Return Objective (CPIU+5%)
Ret
urns
6.096.45
5.32
● Current Total Fund Benchmark = 39% MSCI ACWI IMI, 1.1% 90 Day T-Bills, 1.1% BB US TIPS, 5.5% BB Agg, 5.5% BB Credit, 2.2% BB Global Treasury ex-US
Hedged, 1.1% BB EMD Hard Currency Agg, 2.2% BB US High Yield 2% Issuer Cap 2.2% S&P Global REIT, 1.1% S&P Global Listed Infrastructure, 11% Cambridge
PE (lagged), 11% NCREIF Total Index (lagged), 3.6% FTSE Developed Core Infrastructure (lagged), 2.4% BB US High Yield 2% Issuer Cap (lagged), 5% HFRI Total
HFOF Universe (weighted), 2% 90 Day T-Bills, and 4% Performance Benchmark (rounded to nearest tenth).
169/511

20 First Quarter 2018 Knowledge. Experience. Integrity.
Effective Effective Total Actual Target Actual Target Manager Asset Relative
Asset Class Weight Weight Return Return Effect Allocation Return Public Equities + FXO 42% 39% (0.47%) (0.89%) 0.18% 0.02% 0.20% Fixed Income Plus 21% 22% (1.74%) (1.83%) 0.02% 0.02% 0.04% Real Estate 9% 11% 1.89% 1.80% 0.01% (0.04%) (0.04%) Priv Credit/Infra/Inc Opp 5% 6% 4.07% 1.39% 0.14% (0.01%) 0.13% Absolute Return 4% 5% 0.80% 0.02% 0.03% 0.00% 0.03% Private Eq & Growth Opp 11% 11% 4.71% 5.11% (0.04%) 0.01% (0.03%) Asset Allocation 8% 6% (0.81%) 0.23% (0.08%) 0.02% (0.06%)
Total = + + 0.41% 0.15% 0.26% 0.01% 0.26%
APFC Total Fund Attribution
● The Total Fund outperformed the Performance Benchmark by 0.3% during the quarter.
●Manager performance within Public Equities and Infrastructure/ Private Credit/ Income Opportunities was
beneficial and offset manager performance within Asset Allocation, which detracted slightly.
● In aggregate, active management added 26 basis points to the relative performance, while deviations from the
Policy Target were neutral.
For One Quarter Ended March 31, 2018
170/511

21 First Quarter 2018 Knowledge. Experience. Integrity.
Effective Effective Total Actual Target Actual Target Manager Asset Relative
Asset Class Weight Weight Return Return Effect Allocation Return Public Equities + FXO 44% 39% 11.35% 10.35% 0.42% 0.24% 0.67% Fixed Income Plus 21% 22% 0.87% 0.45% 0.09% 0.10% 0.20% Real Estate 9% 11% 5.00% 5.33% (0.04%) 0.02% (0.01%) Priv Credit/Infra/Inc Opp 5% 6% 13.96% 7.36% 0.34% (0.01%) 0.33% Absolute Return 4% 5% 5.26% 4.86% 0.02% 0.04% 0.05% Private Eq & Growth Opp 11% 11% 18.94% 14.84% 0.42% 0.02% 0.44% Asset Allocation 7% 6% 3.01% 5.17% (0.16%) 0.01% (0.15%)
Total = + + 8.86% 7.33% 1.11% 0.42% 1.53%
APFC Total Fund Attribution
● The Total Fund outperformed the Performance Benchmark by 1.5% for Fiscal YTD 2018.
●Manager performance within Public Equity with FX Overlay, Private Equity & Growth Opportunities, and
Private Credit/ Infrastructure/ Income Opportunities was beneficial, and offset manager performance within
Asset Allocation, which detracted.
● In aggregate, active management added 111 basis points to the relative performance, while deviations from
the Policy Target contributed 42 basis points (primarily due to a slight underweight to Fixed Income Plus and
an overweight to Public Equities with FX Overlay).
For Fiscal YTD Ended March 31, 2018
171/511
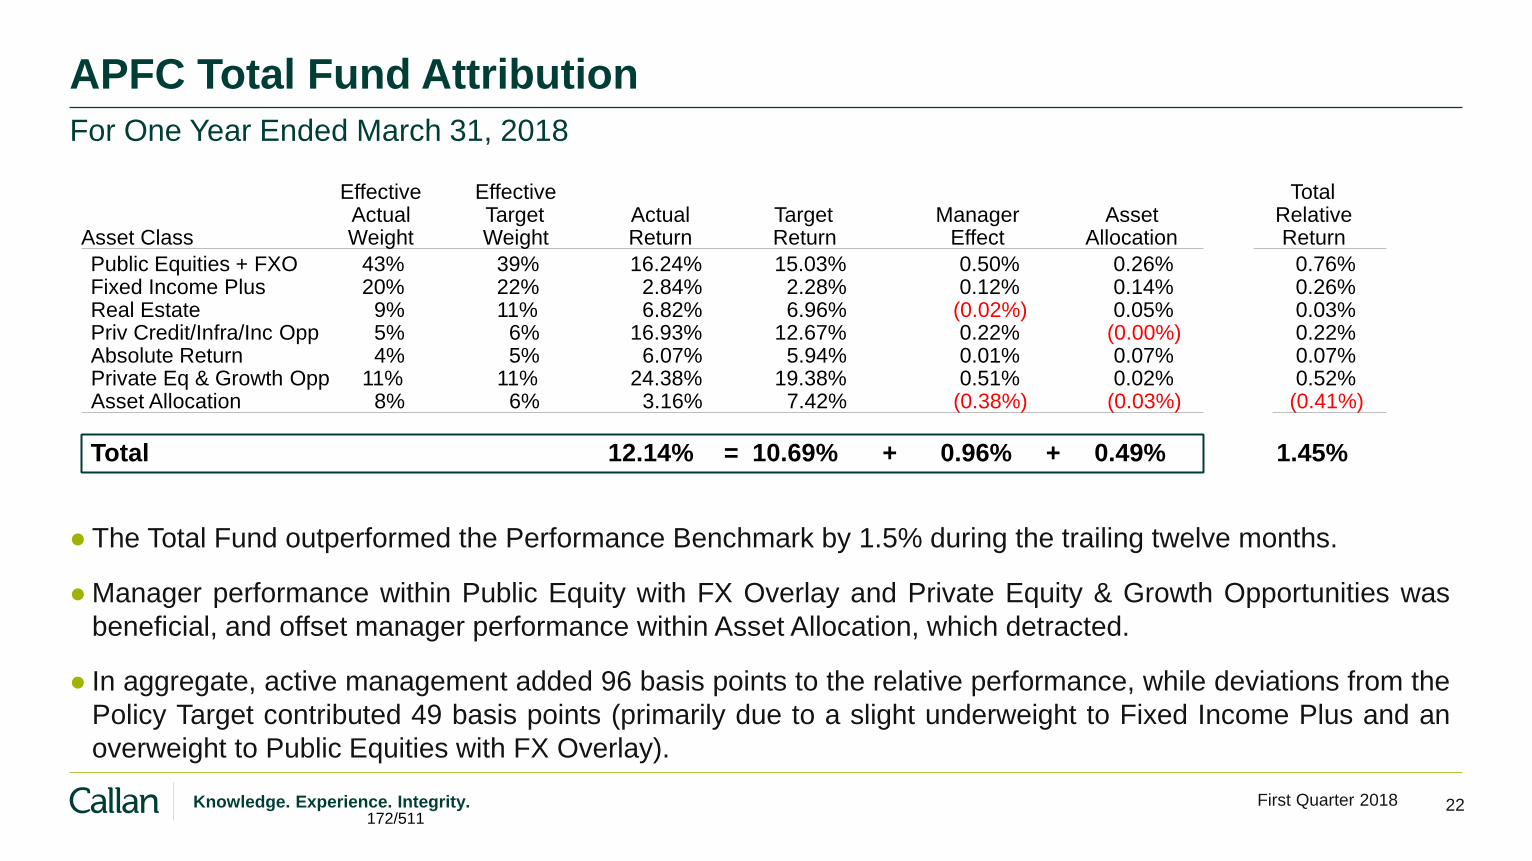
22 First Quarter 2018 Knowledge. Experience. Integrity.
APFC Total Fund Attribution
● The Total Fund outperformed the Performance Benchmark by 1.5% during the trailing twelve months.
●Manager performance within Public Equity with FX Overlay and Private Equity & Growth Opportunities was
beneficial, and offset manager performance within Asset Allocation, which detracted.
● In aggregate, active management added 96 basis points to the relative performance, while deviations from the
Policy Target contributed 49 basis points (primarily due to a slight underweight to Fixed Income Plus and an
overweight to Public Equities with FX Overlay).
For One Year Ended March 31, 2018
Effective Effective Total Actual Target Actual Target Manager Asset Relative
Asset Class Weight Weight Return Return Effect Allocation Return
Public Equities + FXO 43% 39% 16.24% 15.03% 0.50% 0.26% 0.76% Fixed Income Plus 20% 22% 2.84% 2.28% 0.12% 0.14% 0.26% Real Estate 9% 11% 6.82% 6.96% (0.02%) 0.05% 0.03% Priv Credit/Infra/Inc Opp 5% 6% 16.93% 12.67% 0.22% (0.00%) 0.22% Absolute Return 4% 5% 6.07% 5.94% 0.01% 0.07% 0.07% Private Eq & Growth Opp 11% 11% 24.38% 19.38% 0.51% 0.02% 0.52% Asset Allocation 8% 6% 3.16% 7.42% (0.38%) (0.03%) (0.41%)
Total = + + 12.14% 10.69% 0.96% 0.49% 1.45%
172/511

23 First Quarter 2018 Knowledge. Experience. Integrity.
APFC Total Fund Relative to Callan’s Large Public Fund Database
Last Quarter Fiscal YTD Last Year Last 3 Years Last 5 Years Last 10 Years Last 20 Years
(2.5)
0.0
2.5
5.0
7.5
10.0
12.5
15.0
Group: Callan Public Fund Sponsor - Large (>1B)Returns for Periods Ended March 31, 2018
10th Percentile 0.72 8.76 12.69 8.17 9.44 7.47 7.03
25th Percentile 0.12 8.14 11.85 7.50 8.75 6.95 6.77
Median (0.24) 7.55 11.14 7.08 8.31 6.48 6.47
75th Percentile (0.49) 6.77 10.16 6.59 7.36 5.96 6.18
90th Percentile (0.75) 6.00 8.50 5.29 5.68 5.33 5.81
Member Count 76 75 75 75 73 70 56
Total Fund A 0.41 8.86 12.14 7.65 8.35 6.21 6.52
A (18)
A (8)
A (17)
A (22)A (44)
A (63) A (45)
173/511

24 First Quarter 2018 Knowledge. Experience. Integrity.
APFC Total Fund Relative to Callan’s Large Endowment / Foundation Database
Last Quarter Fiscal YTD Last Year Last 3 Years Last 5 Years Last 10 Years Last 20 Years
(2.5)
0.0
2.5
5.0
7.5
10.0
12.5
15.0
Group: Callan Endow/Foundation - Large (>1B)Returns for Periods Ended March 31, 2018
10th Percentile 3.07 10.23 13.41 8.24 9.89 7.15 10.00
25th Percentile 2.00 9.19 12.55 7.57 8.77 6.66 8.78
Median 0.82 8.08 11.34 6.86 8.11 6.13 7.11
75th Percentile 0.00 6.57 9.58 6.20 7.41 5.72 6.42
90th Percentile (0.62) 5.85 8.72 5.54 6.78 4.86 5.38
Member Count 37 37 37 37 37 36 23
Total Fund A 0.41 8.86 12.14 7.65 8.35 6.21 6.52
A (64)
A (27)
A (31)
A (21)A (39)
A (45)A (67)
174/511

25 First Quarter 2018 Knowledge. Experience. Integrity.
APFC Total Fund Return versus Standard Deviation Relative to Callan’s Public Fund Database
Ten Year Annualized Risk vs Return
0% 2% 4% 6% 8% 10% 12% 14% 16%0%
1%
2%
3%
4%
5%
6%
7%
8%
9%
Total Fund
Total Fund Target
Standard Dev iation
Retu
rns
Squares represent membership of the Callan Public Fund Sponsor Database
175/511

26 First Quarter 2018 Knowledge. Experience. Integrity.
APFC Total Fund Standard Deviation Relative to Callan’s Large Public Fund Database
Last 3 Years Last 5 Years Last 7 Years Last 10 Years Last 20 Years100
90
80
70
60
50
40
30
20
10
0
Group: Callan Public Fund Sponsor - Large (>1B)Standard Deviation for Periods Ended March 31, 2018
10th Percentile 6.22 5.85 8.41 12.09 11.18
25th Percentile 5.88 5.44 7.51 11.27 10.90
Median 5.31 5.08 6.81 10.63 10.49
75th Percentile 5.03 4.74 6.08 9.69 9.68
90th Percentile 4.26 3.98 5.12 8.25 9.08
Member Count 75 73 70 70 56
Total Fund A 4.64 4.63 6.16 9.59 8.99
A (83)A (78)
A (73)A (78)
A (91)
176/511

27 First Quarter 2018 Knowledge. Experience. Integrity.
APFC Total Fund Sharpe Ratio Relative to Callan’s Large Public Fund Database
Last 3 Years Last 5 Years Last 7 Years Last 10 Years Last 20 Years100
90
80
70
60
50
40
30
20
10
0
Group: Callan Public Fund Sponsor - Large (>1B)Sharpe Ratio for Periods Ended March 31, 2018
10th Percentile 1.61 1.93 1.39 0.75 0.51
25th Percentile 1.36 1.77 1.25 0.64 0.46
Median 1.18 1.55 1.10 0.59 0.43
75th Percentile 1.07 1.33 1.01 0.54 0.41
90th Percentile 0.90 1.11 0.94 0.49 0.38
Member Count 75 73 70 70 56
Total Fund A 1.53 1.73 1.23 0.61 0.50
A (15)
A (27)A (30)
A (40)
A (11)
177/511
28 First Quarter 2018 Knowledge. Experience. Integrity.
Asset Classes
Structure and Performance
178/511

29 First Quarter 2018 Knowledge. Experience. Integrity.
APFC Public Market Equity Structure As of March 31, 2018
● APFC public equity portfolio has a
weighting of roughly 47% in US equity,
and 53% in non-US equity.
● The MSCI ACWI IMI benchmark has a
weighting of roughly 52% in US equity,
and 48% in non-US equity.
● The median allocation to US equity
across public equity portfolios in Callan’s
Large Public Fund Sponsor database is
roughly 60%.
● Note that all of the following information
does not include the Juno Therapeutics
exposure, which resides within the
Growth Opportunities allocation.
$6,956 26%
$9,884 37%
$9,995 37%
Domestic Equity
International Equity
Global Equity
179/511

30 First Quarter 2018 Knowledge. Experience. Integrity.
APFC Public Equities w/o FX Overlay vs. MSCI ACWI-IMI Periods Ended March 31, 2018
Fiscal YTD
● The Total Public Equity w/o FX
Overlay portfolio outperformed
the MSCI ACWI IMI index in
the first quarter.
● The portfolio is solidly ahead of
the benchmark for Fiscal YTD
and over the trailing 12
months.
● Much of this outperformance is
attributable to the portfolio’s
overweight exposure to non-
US equity, including emerging
markets, along with strong
relative performance from US
managers. Last Quarter Fiscal YTD Last Year
(5.0)
0.0
5.0
10.0
15.0
20.0
Current Quarter Ending March 31, 2018Returns for Various Periods
Ret
urns
Public Equity w/o FX Overlay MSCI:ACWI IMI
(0.4)
11.4
16.3
(0.9)
10.3
15.0
180/511
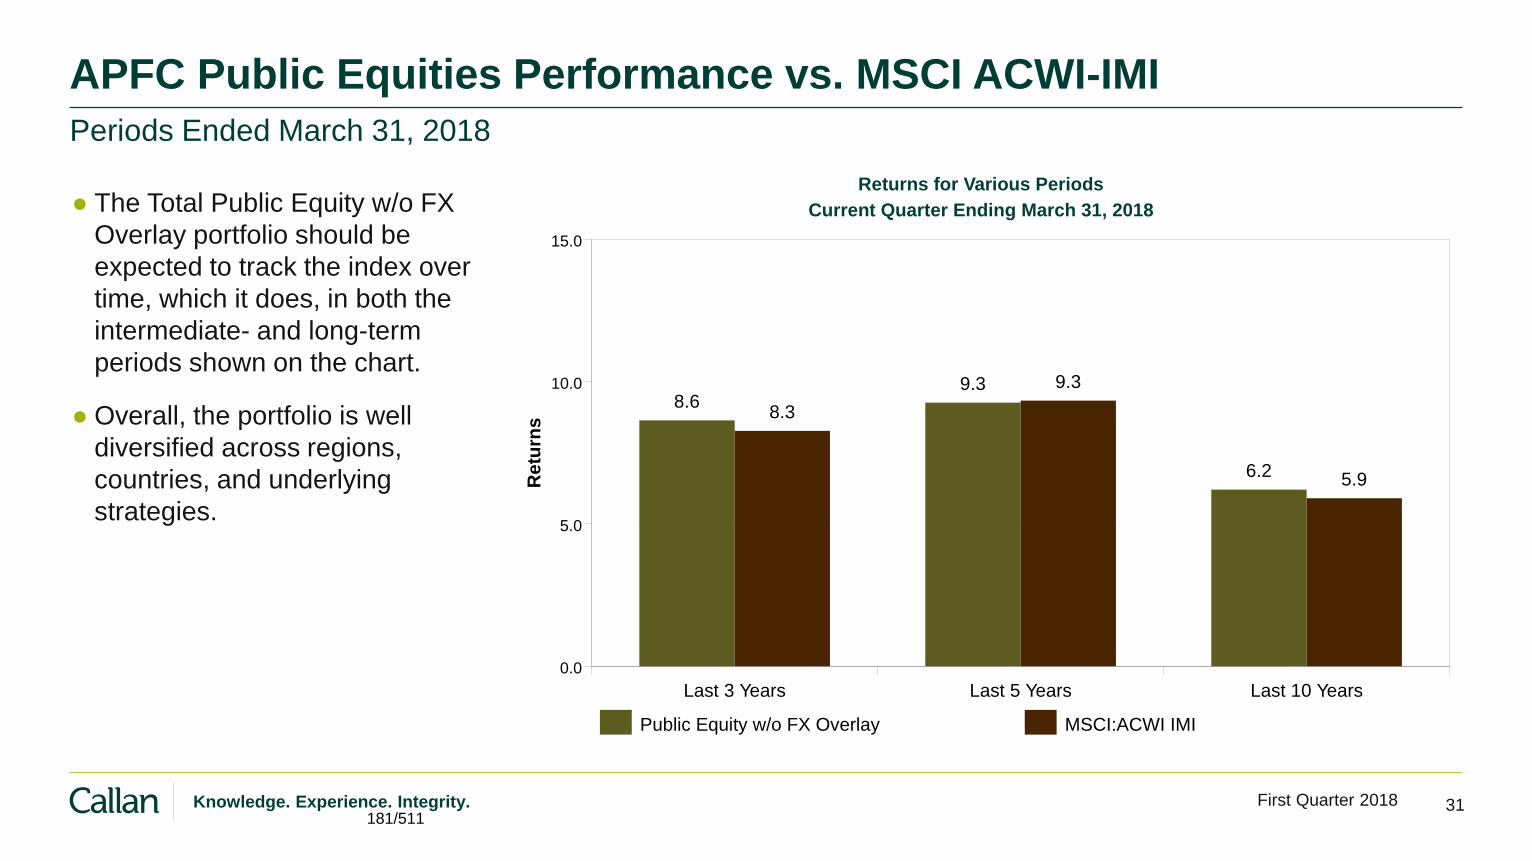
31 First Quarter 2018 Knowledge. Experience. Integrity.
APFC Public Equities Performance vs. MSCI ACWI-IMI Periods Ended March 31, 2018
● The Total Public Equity w/o FX
Overlay portfolio should be
expected to track the index over
time, which it does, in both the
intermediate- and long-term
periods shown on the chart.
● Overall, the portfolio is well
diversified across regions,
countries, and underlying
strategies.
Last 3 Years Last 5 Years Last 10 Years
0.0
5.0
10.0
15.0
Current Quarter Ending March 31, 2018Returns for Various Periods
Ret
urns
Public Equity w/o FX Overlay MSCI:ACWI IMI
8.69.3
6.2
8.3
9.3
5.9
181/511

32 First Quarter 2018 Knowledge. Experience. Integrity.
APFC US Equity Performance vs. Fund Sponsor US Equity Periods Ended March 31, 2018
● Universe is comprised of total
domestic equity portfolios of large
institutional investors in Callan’s
Fund Sponsor Database.
● APFC total US equity portfolio ranks
favorably against US equity
portfolios of other large institutional
investors over all time periods
shown.
● US equity portfolio returned -0.4% in
the 1st quarter of 2018.
● Longer-term performance exceeds
the benchmark and ranks above
median.
Performance vs Fund Spnsor - Domestic Equity (Gross)
(5%)
0%
5%
10%
15%
20%
Last Quarter Fiscal YTD Last Last 3 Years Last 5 Years Last 7 Years Last 10 YearsYear
(50)(67)
(32)(57)
(42)(58)
(35)(40)
(22)(38)(25)(30)
(19)(50)
10th Percentile 0.94 13.11 17.66 11.07 13.78 12.80 10.4725th Percentile 0.29 11.75 15.73 10.50 13.26 12.47 10.01
Median (0.40) 10.59 13.99 10.00 12.80 12.04 9.6375th Percentile (0.75) 9.95 13.06 9.32 12.24 11.37 9.0890th Percentile (1.10) 9.04 11.90 8.61 11.47 10.62 8.45
DomesticEquity (0.40) 11.23 14.40 10.28 13.31 12.46 10.11
Russell3000 Index (0.64) 10.48 13.81 10.22 13.03 12.39 9.62
182/511

33 First Quarter 2018 Knowledge. Experience. Integrity.
APFC US Equity Portfolio Risk Adjusted Return Rankings
Risk Adjusted Return Measures vs Russell 3000 Index Rankings Against Fund Sponsor Domestic Equity Database
● Universe comprised of total domestic equity
portfolios of large institutional investors in
Callan’s Fund Sponsor Domestic Equity
Database.
● For the trailing ten-year period, APFC portfolio
ranks in the top quartile for all three risk
adjusted return measures.
● Alpha measures contribution to performance –
portfolio’s return above index adjusted for risk.
● Sharpe Ratio represents return gained per
unit of risk taken (return/risk).
● Excess Return Ratio measures alpha (return
above benchmark) divided by tracking error
(risk versus benchmark).
Ten Years Ended March 31, 2018
(2.0)
(1.5)
(1.0)
(0.5)
0.0
0.5
1.0
1.5
Alpha Sharpe Excess ReturnRatio Ratio
(25)(23)
(11)
10th Percentile 0.96 0.62 0.4025th Percentile 0.36 0.58 0.18
Median (0.06) 0.55 0.0075th Percentile (0.56) 0.52 (0.25)90th Percentile (1.31) 0.47 (0.43)
Domestic Equity 0.37 0.58 0.39
183/511

34 First Quarter 2018 Knowledge. Experience. Integrity.
APFC US Equity Portfolio Characteristics Rankings
● US equity portfolio has a small capitalization bias relative to the index, which benefitted performance during the
quarter.
Portfolio Characteristics Percentile RankingsRankings Against Total Domestic Equity Databaseas of March 31, 2018
Perc
en
tile
Ran
kin
g
100%
90%
80%
70%
60%
50%
40%
30%
20%
10%
0%
Weighted Median Price/Fore- Price/Book Forecasted Div idend MSCIMarket Cap casted Earnings Earnings Growth Yield Combined Z-Score
(46)
(26)
(62)
(46)(51)
(43)(39)
(48)
(38)
(30)
(49)(50)
10th Percentile 98.89 25.09 4.87 20.03 2.49 0.8825th Percentile 64.98 20.35 3.59 17.14 1.94 0.49
Median 14.98 16.81 2.64 14.91 1.43 (0.01)75th Percentile 3.29 14.99 2.07 12.66 0.92 (0.36)90th Percentile 1.83 13.69 1.74 10.36 0.55 (0.70)
*Domestic Equity 21.61 15.93 2.62 15.62 1.69 0.00
Russell 3000 Index 64.11 17.23 2.87 14.97 1.85 (0.01)
184/511
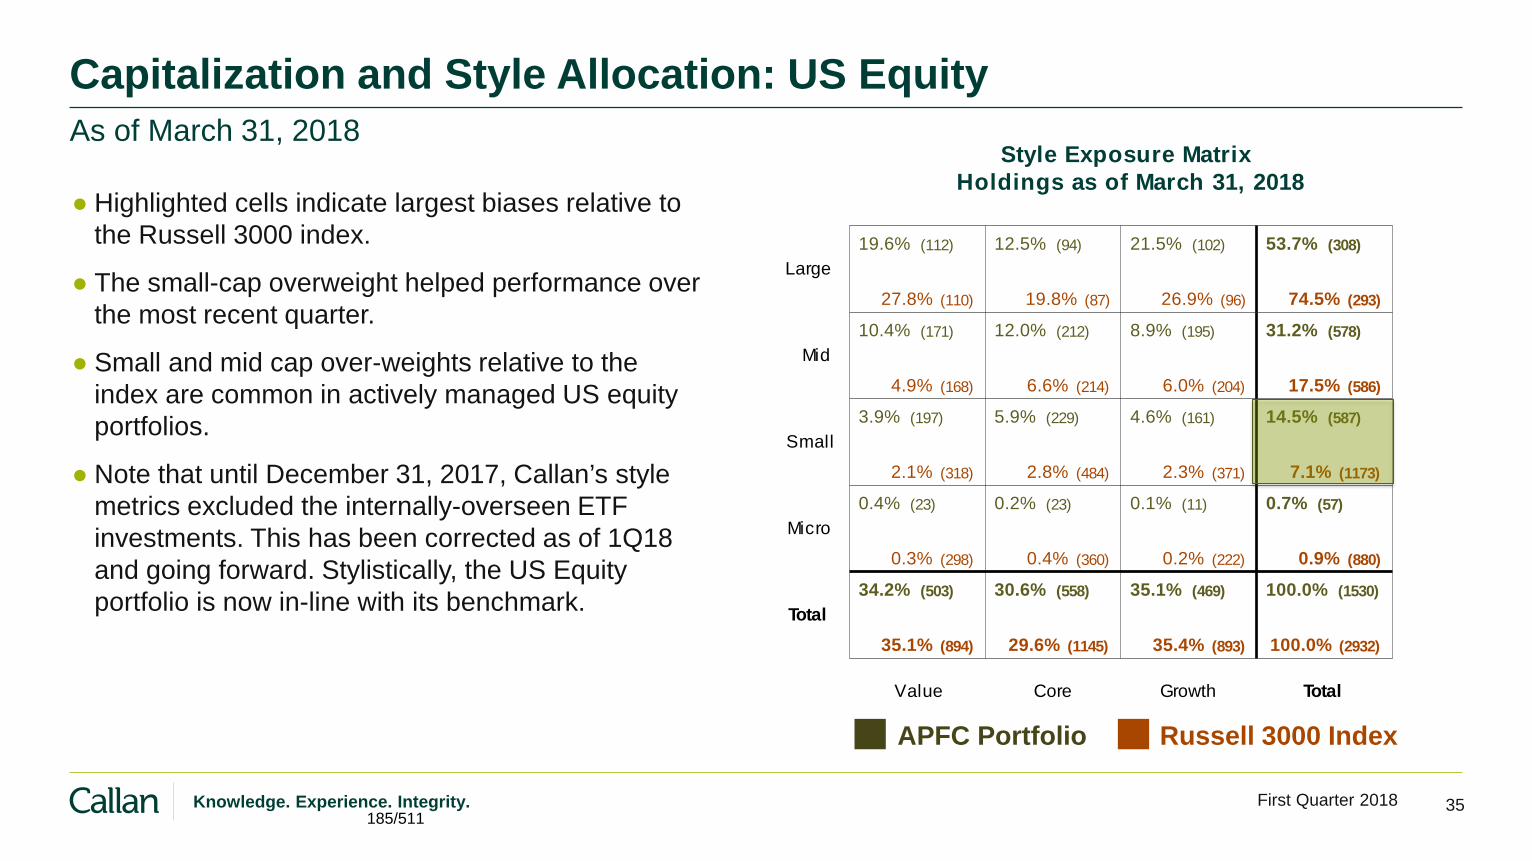
35 First Quarter 2018 Knowledge. Experience. Integrity.
Style Exposure MatrixHoldings as of March 31, 2018
Large
Mid
Small
Micro
Total
Value Core Growth Total
19.6% (112) 12.5% (94) 21.5% (102) 53.7% (308)
10.4% (171) 12.0% (212) 8.9% (195) 31.2% (578)
3.9% (197) 5.9% (229) 4.6% (161) 14.5% (587)
0.4% (23) 0.2% (23) 0.1% (11) 0.7% (57)
34.2% (503) 30.6% (558) 35.1% (469) 100.0% (1530)
27.8% (110) 19.8% (87) 26.9% (96) 74.5% (293)
4.9% (168) 6.6% (214) 6.0% (204) 17.5% (586)
2.1% (318) 2.8% (484) 2.3% (371) 7.1% (1173)
0.3% (298) 0.4% (360) 0.2% (222) 0.9% (880)
35.1% (894) 29.6% (1145) 35.4% (893) 100.0% (2932)
Capitalization and Style Allocation: US Equity As of March 31, 2018
● Highlighted cells indicate largest biases relative to
the Russell 3000 index.
● The small-cap overweight helped performance over
the most recent quarter.
● Small and mid cap over-weights relative to the
index are common in actively managed US equity
portfolios.
● Note that until December 31, 2017, Callan’s style
metrics excluded the internally-overseen ETF
investments. This has been corrected as of 1Q18
and going forward. Stylistically, the US Equity
portfolio is now in-line with its benchmark.
APFC Portfolio Russell 3000 Index
185/511

36 First Quarter 2018 Knowledge. Experience. Integrity.
APFC US Equity Structure As of March 31, 2018
● US equity portfolio is roughly 70%
actively managed and 30% passive
(or quasi-passive).
● Structure has a slight overweight to
small cap with 18% of portfolio
allocated to dedicated small cap
strategies.
● Roughly 67% of the large cap
allocation is actively managed while
83% of the small cap allocation is
actively managed.
$3,826 55%
$1,912 27%
$1,045 15%
$173 3%
Large Cap Active
Large Cap Passive
Small Cap Active
Small Cap Passive
186/511

37 First Quarter 2018 Knowledge. Experience. Integrity.
Periods Ended March 31, 2018
APFC Large Cap Equity Relative to Large Cap Universe
● APFC’s large cap portfolio ranks
around median within the large cap
universe over all time periods shown.
● Large cap portfolio is ahead of the
benchmark for all time periods
measured.
● Large cap portfolio has a small cap
size bias relative to the index.
● Large Cap Equity Composite was
ahead of the Index in the 1st quarter.
Returns were lifted by small cap
stocks as they led large cap stocks by
about 60 bps during the quarter.
Performance vs Callan Large Capitalization (Gross)
(10%)
(5%)
0%
5%
10%
15%
20%
25%
30%
Last Quarter Fiscal YTD Last Last 3 Years Last 5 Years Last 7 Years Last 10 YearsYear
A(56)B(59)(59)
A(46)B(57)(57)
A(47)B(53)(53)
B(44)A(47)(49)
A(44)B(53)(56) B(51)
A(53)(54)
A(50)B(58)(55)
10th Percentile 4.86 18.54 25.50 13.17 16.04 14.49 11.7825th Percentile 2.00 14.85 20.73 11.86 14.91 13.52 10.79
Median (0.32) 11.17 14.82 10.32 13.42 12.75 9.8075th Percentile (1.94) 8.89 11.01 8.95 12.08 11.48 8.7890th Percentile (3.10) 6.00 8.58 7.63 10.89 10.57 7.77
Large CapEquity Composite A (0.50) 11.76 15.10 10.59 13.63 12.64 9.86
Standard& Poor's 500 B (0.76) 10.58 13.99 10.78 13.31 12.71 9.50
Russell 1000 Index (0.69) 10.59 13.98 10.39 13.17 12.57 9.61
187/511

38 First Quarter 2018 Knowledge. Experience. Integrity.
Style Exposure MatrixHoldings as of March 31, 2018
Large
Mid
Small
Micro
Total
Value Core Growth Total
23.2% (112) 14.8% (94) 25.5% (102) 63.5% (308)
11.1% (170) 12.1% (210) 7.8% (171) 31.1% (551)
2.2% (149) 2.2% (104) 0.9% (44) 5.2% (297)
0.1% (10) 0.0% (6) 0.0% (1) 0.1% (17)
36.7% (441) 29.2% (414) 34.2% (318) 100.0% (1173)
29.6% (109) 21.6% (87) 29.3% (96) 80.5% (292)
5.3% (162) 6.9% (198) 5.7% (163) 17.9% (523)
0.7% (70) 0.5% (47) 0.3% (35) 1.6% (152)
0.0% (0) 0.0% (0) 0.0% (1) 0.0% (1)
35.7% (341) 28.9% (332) 35.4% (295) 100.0% (968)
Capitalization and Style Allocation: Large Cap Equity As of March 31, 2018
● Highlighted cells indicate largest biases
relative to the Russell 1000 index.
● The large cap portfolio has a small cap tilt
relative to the benchmark in the dimension
of capitalization.
● Note that until December 31, 2017,
Callan’s style metrics excluded the
internally-overseen ETF investments. This
has been corrected for 1Q18 and going
forward. Stylistically, the Large Cap Equity
portfolio is now in-line with its benchmark.
APFC Portfolio Russell 1000 Index
188/511

39 First Quarter 2018 Knowledge. Experience. Integrity.
Periods Ended March 31, 2018
APFC Small Cap Equity Relative to Small Cap Universe
● APFC small cap portfolio ranks near the
small cap universe median over all time
periods.
● 1st quarter results led the index by 61
basis points. Performance for all other
time periods shown in the chart is also
ahead of the benchmark.
● APFC small cap investments are relatively
mature and successful products. Due to
higher AUM levels, such products tend to
maintain a mid cap bias.
● Portfolio’s growth tilt contributed to
returns, as growth outperformed value by
5% during the quarter.
Performance vs Callan Small Capitalization (Gross)
(10%)
(5%)
0%
5%
10%
15%
20%
25%
30%
Last Quarter Fiscal YTD Last Last 3 Years Last 5 Years Last 7 Years Last 10 YearsYear
(45)(52)
(49)(57)
(47)(50)
(40)(62)
(54)(70) (45)
(75)(52)
(79)
10th Percentile 5.53 18.15 25.43 12.17 15.15 13.99 13.5525th Percentile 3.05 14.37 19.66 10.66 13.85 12.74 12.58
Median 0.07 9.82 11.98 9.14 12.68 11.69 11.4175th Percentile (1.70) 7.11 7.68 7.64 11.16 10.37 10.1990th Percentile (2.96) 4.52 4.88 5.91 9.88 9.36 9.21
Small CapEquity Composite 0.53 9.84 12.36 9.73 12.36 11.86 11.25
Russell2000 Index (0.08) 9.11 11.79 8.39 11.47 10.39 9.84
189/511
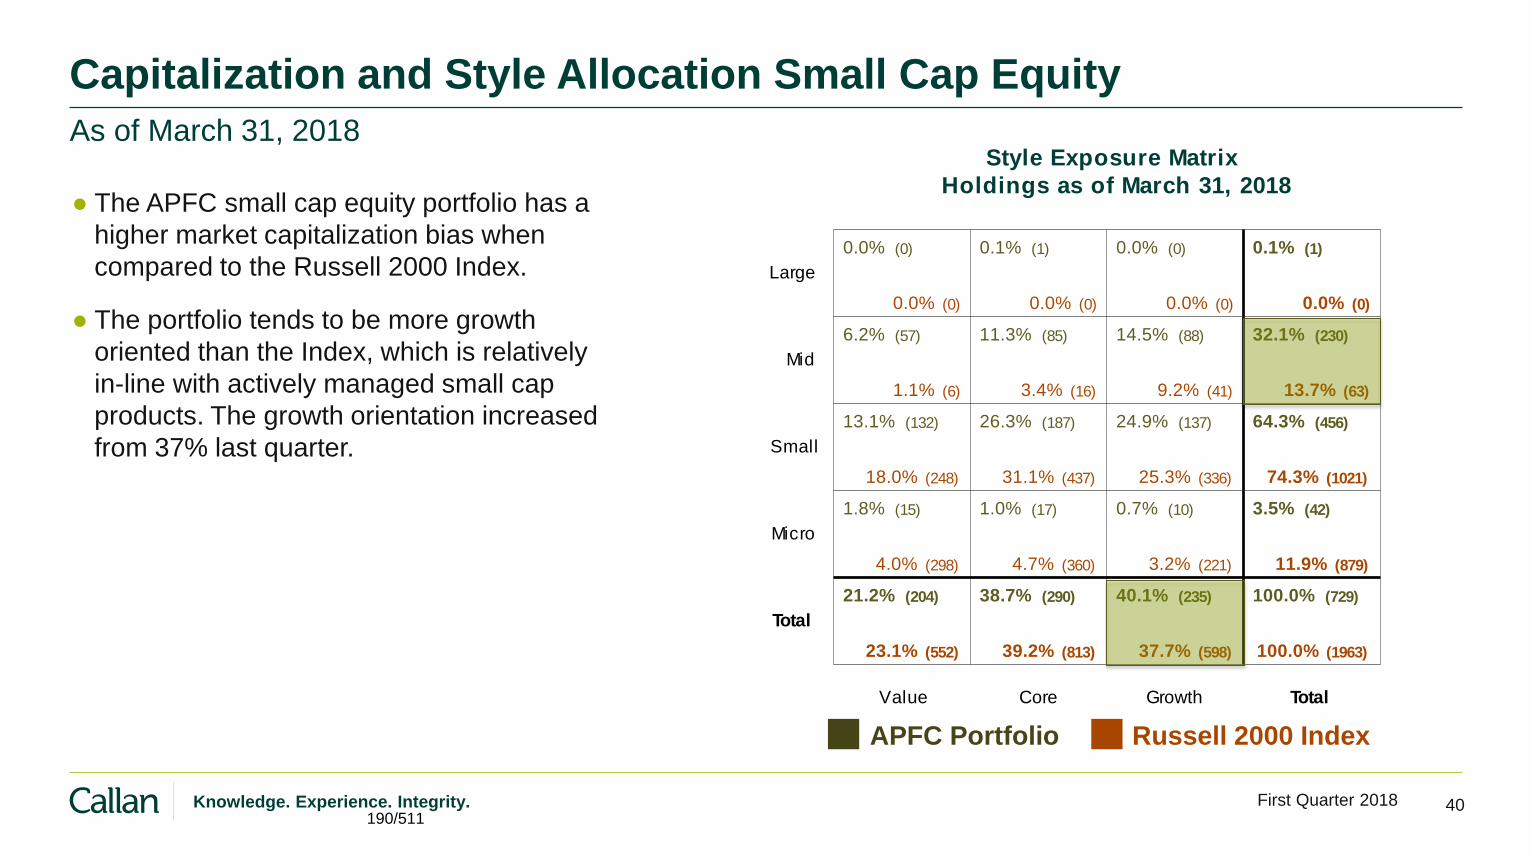
40 First Quarter 2018 Knowledge. Experience. Integrity.
Style Exposure MatrixHoldings as of March 31, 2018
Large
Mid
Small
Micro
Total
Value Core Growth Total
0.0% (0) 0.1% (1) 0.0% (0) 0.1% (1)
6.2% (57) 11.3% (85) 14.5% (88) 32.1% (230)
13.1% (132) 26.3% (187) 24.9% (137) 64.3% (456)
1.8% (15) 1.0% (17) 0.7% (10) 3.5% (42)
21.2% (204) 38.7% (290) 40.1% (235) 100.0% (729)
0.0% (0) 0.0% (0) 0.0% (0) 0.0% (0)
1.1% (6) 3.4% (16) 9.2% (41) 13.7% (63)
18.0% (248) 31.1% (437) 25.3% (336) 74.3% (1021)
4.0% (298) 4.7% (360) 3.2% (221) 11.9% (879)
23.1% (552) 39.2% (813) 37.7% (598) 100.0% (1963)
Capitalization and Style Allocation Small Cap Equity
● The APFC small cap equity portfolio has a
higher market capitalization bias when
compared to the Russell 2000 Index.
● The portfolio tends to be more growth
oriented than the Index, which is relatively
in-line with actively managed small cap
products. The growth orientation increased
from 37% last quarter.
As of March 31, 2018
APFC Portfolio Russell 2000 Index
190/511

41 First Quarter 2018 Knowledge. Experience. Integrity.
APFC Non-US Equity Structure As of March 31, 2018
● Portfolio is divided between
global, non-US, and emerging
markets mandates.
● Both global and non-US equity
managers invest in emerging
markets.
● Global managers invest in US
markets as part of their
mandate.
$6,405 32%
$3,479 18%
$9,995 50%
Developed International
Dedicated Emerging
Global Equity
191/511

42 First Quarter 2018 Knowledge. Experience. Integrity.
APFC International Equity Relative to Fund Sponsor Universe Periods Ended March 31, 2018
● During the quarter, weak US dollar and strong
Emerging Markets that continue to outpace
developed, aided performance. As a result, APFC
international equity portfolio bested its target.
● Longer-term returns are either ahead or almost
caught up with the benchmark.
● Relative to other fund sponsor international equity
portfolios, performance sits above median in the
short-term and below median over longer time
periods.
● In the longer-term developed markets have
outperformed emerging markets. However,
emerging equities have had a better run over the
last few years.
● This has had a positive impact on portfolio’s
shorter-term returns, but weighs down portfolio’s
longer-term returns.
Performance vs Fund Spnsor - International Equity (Gross)
(5%)
0%
5%
10%
15%
20%
25%
Last Quarter Fiscal YTD Last Last 3 Years Last 5 Years Last 7 Years Last 10 YearsYear
(39)(85)
(17)
(47)
(25)
(56)
(27)
(61) (72)(79)
(76)(79)
(73)(71)
10th Percentile 1.10 13.56 21.77 9.31 9.09 7.45 5.6225th Percentile 0.20 11.98 19.82 8.35 8.14 6.53 4.50
Median (0.44) 10.52 17.47 7.23 7.26 5.62 3.5975th Percentile (0.88) 9.26 16.01 6.26 6.40 4.68 2.8590th Percentile (1.30) 7.83 14.21 5.27 5.22 3.91 1.90
InternationalEquity Composite (0.22) 12.85 19.79 8.23 6.46 4.67 2.94
MSCI ACWIex US IMI (1.06) 10.63 17.10 6.75 6.24 4.52 3.06
192/511

43 First Quarter 2018 Knowledge. Experience. Integrity.
Region and Style Allocation International Equity
● The APFC portfolio has a meaningful
overweight to Emerging Markets (40% vs
26%).
● The portfolio is underweight Europe (33%
vs 43%), Pacific/Asia (23% vs 26%), and
N. America (5% vs 6%).
● During the quarter, APFC international
equity portfolio benefitted from broad-
based regional gains, particularly from the
notable overweight to Emerging Markets,
which had a strong quarter. Underweight to
Europe was also a benefit, as this region
lagged.
As of March 31, 2018
APFC Portfolio MSCI ACWI ex-US Index
Style Exposure MatrixHoldings as of March 31, 2018
10.5% (600) 10.7% (710) 11.7% (699) 32.9% (2009)
1.4% (159) 2.2% (178) 1.2% (107) 4.7% (444)
8.1% (1238) 6.3% (885) 8.2% (820) 22.7% (2943)
13.7% (1550) 12.8% (1212) 13.2% (1091) 39.7% (3853)
33.7% (3547) 32.0% (2985) 34.3% (2717) 100.0% (9249)
13.3% (427) 13.8% (530) 15.5% (534) 42.5% (1491)
1.8% (96) 2.9% (134) 1.7% (86) 6.4% (316)
9.1% (597) 7.0% (569) 9.5% (542) 25.5% (1708)
7.8% (900) 8.0% (899) 9.8% (853) 25.6% (2652)
32.0% (2020) 31.6% (2132) 36.5% (2015) 100.0% (6167)
Europe/
Mid East
N. America
Pacific
Emerging/
FM
Total
Value Core Growth Total
193/511

44 First Quarter 2018 Knowledge. Experience. Integrity.
APFC Emerging Markets Equity Relative to EM Universe Periods March 31, 2018
● APFC emerging markets equity
portfolio performed roughly in-line with
the benchmark, adding 1.3%.
● Additionally, composite’s trailing one-
year return is impressive in absolute
terms, up 24%.
● The portfolio underperforms the
median actively managed portfolio
over all time periods except for the last
3 years.
● Recent strength in the asset class has
resulted in near-term performance
improvement for APFC’s overall public
equity portfolio.
Performance vs Emerging Markets Equity DB (Gross)
(5%)
0%
5%
10%
15%
20%
25%
30%
35%
40%
Last Quarter Fiscal YTD Last Last 3 Years Last 5 Years Last 7 Years Last 10 YearsYear
(61)(59)
(48)(48)
(54)(48)
(62)(65)
(81)(74)
(86)(86) (86)(86)
10th Percentile 3.99 23.14 33.62 13.88 11.41 8.98 8.3125th Percentile 2.68 20.37 28.94 11.78 8.49 6.26 6.46
Median 1.76 17.40 24.78 10.10 6.15 4.60 4.6975th Percentile 0.61 14.14 19.85 8.22 4.94 3.34 3.6390th Percentile (0.48) 9.97 15.46 6.19 3.74 2.24 2.54
EmergingMarkets Composite 1.32 17.55 24.44 9.15 4.72 2.42 3.08
MSCI EM 1.42 17.56 24.93 8.81 4.99 2.47 3.02
194/511

45 First Quarter 2018 Knowledge. Experience. Integrity.
APFC Global Equity Relative to Global Universe Periods Ended March 31, 2018
● APFC global equity portfolio ranks
in the third quartile when
compared to other global equity
managers over all time periods.
● Portfolio’s 1st quarter performance
was 23 bps ahead of the index.
● Trailing one year performance has
fallen behind the benchmark, but
is strong in an absolute sense.
● Performance for longer time
periods shown solidly exceeds the
benchmark.
Performance vs Global Equity Database (Gross)
(10%)
(5%)
0%
5%
10%
15%
20%
25%
30%
Last Quarter Fiscal YTD Last Last 3 Years Last 5 Years Last 7 Years Last 10 YearsYear
(51)(57)
(54)(52)
(62)(55)
(64)(57)
(62)(69) (56)(75)
(68)(71)
10th Percentile 2.48 16.72 24.07 12.70 13.68 12.48 9.8725th Percentile 0.77 13.23 19.55 10.43 11.71 10.68 8.27
Median (0.62) 10.51 15.59 8.72 10.42 9.40 6.9975th Percentile (1.58) 7.83 11.99 7.19 8.86 8.00 5.7190th Percentile (2.88) 5.58 9.19 5.64 6.70 6.53 4.40
Global Equity (0.66) 10.09 14.18 7.89 9.83 9.05 6.07
MSCI ACWI IMI (0.89) 10.35 15.03 8.27 9.34 7.99 5.91
195/511

46 First Quarter 2018 Knowledge. Experience. Integrity.
APFC Global Equity Portfolio Region Exposure
● The APFC global equity portfolio has
an underweight to Emerging Markets
and the Pacific Rim relative to its
benchmark.
● The portfolio has a corresponding
relative overweight to North America
and Europe. Allocation to Japan is in-
line with the index.
● This positioning hurt the performance of
the global equity portfolio. In particular,
the benefits of the North America
overweight were offset by the
underweight exposure to Emerging
Markets and higher-than-index
allocation to Europe.
As of March 31, 2018
Region Exposure
0 10 20 30 40 50 60 70
North America
Europe
Japan
Emerging Markets
Pacific Rim
Frontier Markets
59.1%
23.0%
8.6%
6.1%
3.0%
0.2%
54.7%
20.8%
8.5%
12.1%
3.9%
0.0%
APFC Portfolio MSCI ACWI IMI Index
196/511

47 First Quarter 2018 Knowledge. Experience. Integrity.
APFC Fixed Income Plus Structure As of March 31, 2018
● 66% of the fixed income plus portfolio
is managed internally, including
allocations within Fixed Income Plus
Cash, US Fixed Income, US
Investment Grade, Non-US Fixed
Income, and TIPS.
● External mandates are focused in
specialty areas including Non-US
Fixed Income, Global High Yield,
Emerging Market Debt, REITs, and
Listed Infrastructure.
$601 4%
$3,762 27%
$3,666 26%
$921 7%
$1,437 10%
$887 6%
$756 6%
$1,302 9%
$630 5%
Fixed Income Plus Cash US Fixed Income
US Investment Grade Non-US Fixed Income
Global High Yield Emerging Market Debt
TIPS REITs
Listed Infrastructure
197/511

48 First Quarter 2018 Knowledge. Experience. Integrity.
Fixed Income Plus Relative to Public Fixed Income Funds Periods Ended March 31, 2018
● The APFC Fixed Income Plus
portfolio leads its benchmark in the
short-term time, but trails in the
longer-term time periods.
● When compared to its peers, with
the exception of the current quarter,
the portfolio maintains a solid lead
over all other time periods
measured.
● Prior to October 1, 2016, presented
history does not include REITs or
Listed Infrastructure.
● REITs and Listed Infrastructure,
both down over -5.0%, were primary
source of underperformance for the
quarter.
Performance vs Public Fund - Domestic Fixed (Gross)
(3%)
(2%)
(1%)
0%
1%
2%
3%
4%
5%
6%
7%
Last Quarter Fiscal YTD Last Last 3 Years Last 5 Years Last 7 Years Last 10 YearsYear
(97)(98)
(27)
(45)
(18)
(35)(31)
(34) (34)
(17)
(34)
(21)(36)
(29)
10th Percentile (0.48) 1.45 3.67 3.21 3.90 5.07 5.5225th Percentile (0.83) 0.99 2.64 2.73 2.91 4.13 4.93
Median (1.09) 0.34 1.89 1.95 2.27 3.52 4.3075th Percentile (1.31) (0.03) 1.21 1.33 1.66 2.81 3.3590th Percentile (1.43) (0.34) 0.65 1.00 1.26 2.21 2.60
Fixed Income Plus (1.74) 0.87 2.84 2.63 2.50 3.85 4.59
Fixed IncomePlus Benchmark (1.83) 0.45 2.28 2.36 3.08 4.36 4.77
198/511

49 First Quarter 2018 Knowledge. Experience. Integrity.
US Fixed Income Relative to Core Bond Funds Periods Ended March 31, 2018
● APFC US Fixed Income portfolio
marginally trailed the benchmark
during the recent quarter but is
ahead over all other time periods
measured.
● The portfolio lags the median
core bond manager for all time
periods shown on the chart.
● Underperformance is primarily
driven by APFC’s higher quality
bias and lower allocation to
credit relative to peers.
Performance vs Callan Core Bond Fixed Income (Gross)
(3%)
(2%)
(1%)
0%
1%
2%
3%
4%
Last Quarter Fiscal YTD Last Year Last 3 Years Last 5 Years
(91)(77)
(76)(81)
(82)(85)(72)
(94)
(71)(92)
10th Percentile (1.10) 0.58 2.16 2.09 2.7125th Percentile (1.19) 0.29 1.88 1.93 2.49
Median (1.36) 0.10 1.65 1.62 2.2075th Percentile (1.45) (0.15) 1.43 1.40 1.9690th Percentile (1.55) (0.34) 1.03 1.28 1.86
US FixedIncome Aggregate (1.56) (0.16) 1.29 1.44 2.00
Blmbg Aggregate (1.46) (0.24) 1.20 1.20 1.82
199/511

50 First Quarter 2018 Knowledge. Experience. Integrity.
US Investment Grade Relative to Investment Grade Funds Periods Ended March 31, 2018
● During the recent quarter, APFC
US Investment Grade was just
shy of its index.
● The portfolio has a comfortable
lead over the benchmark for all
other time periods shown.
● The Investment Grade composite
is slightly below median in the
short- and long-term, and above
peer median over the
intermediate-term time periods.
Performance vs Callan Investment Grade Credit Fixed Inc (Gross)
(4%)
(2%)
0%
2%
4%
6%
8%
Last Quarter Fiscal YTD Last Last 3 Years Last 5 Years Last 7 Years Last 8-1/2Year Years
(82)(71)
(65)(88)
(45)(84) (47)
(89)
(33)
(95)
(41)
(97)
(57)
(97)
10th Percentile (1.81) 1.00 3.74 3.54 4.28 6.05 6.8425th Percentile (1.96) 0.69 3.35 2.95 3.68 5.36 6.10
Median (2.18) 0.49 3.09 2.70 3.47 5.03 5.6875th Percentile (2.34) 0.28 2.87 2.52 3.30 4.89 5.4290th Percentile (2.50) 0.06 2.51 2.29 3.11 4.83 5.29
US Inv estGrade Corp Bonds (2.44) 0.41 3.14 2.75 3.62 5.07 5.61
Blmbg Corporate (2.32) 0.15 2.70 2.30 3.02 4.55 5.06
200/511

51 First Quarter 2018 Knowledge. Experience. Integrity.
Global High Yield Relative to High Yield Funds Periods Ended March 31, 2018
● The APFC Global High Yield
portfolio performed on par with its
index during the quarter and
Fiscal YTD, but trails for the
remainder of time periods shown.
● When compared to peers, the
portfolio kept up with the median
manager in the first quarter, but
falls behind during all other time
periods measured.
● This composite includes
allocations to Oaktree, Capital
Guardian, and an iShares ETF.
Performance vs Callan High Yield Fixed Income (Gross)
(4%)
(2%)
0%
2%
4%
6%
8%
10%
12%
Last Quarter Fiscal YTD Last Last 3 Years Last 5 Years Last 7 Years Last 10 YearsYear
(52)(53)
(72)(71)
(82)(68)
(78)
(43)
(80)(53)
(84)(52)
(67)
(39)
10th Percentile (0.06) 3.42 5.31 6.58 6.17 7.21 8.9025th Percentile (0.47) 2.54 4.70 5.52 5.41 6.79 8.55
Median (0.79) 1.85 4.24 5.06 5.03 6.33 8.0575th Percentile (1.11) 1.43 3.67 4.53 4.61 5.97 7.4390th Percentile (1.55) 0.81 3.01 4.05 4.24 5.56 7.07
Global High Yield (0.85) 1.55 3.33 4.44 4.49 5.84 7.61
Blmbg HY 2% Iss Cap (0.86) 1.58 3.78 5.18 5.00 6.32 8.32
201/511

52 First Quarter 2018 Knowledge. Experience. Integrity.
Emerging Market Debt Relative to EMD Funds Periods Ended March 31, 2018
● APFC emerging market debt
portfolio added 3% over its
benchmark in the 1st quarter.
● Trailing year performance is
notable in absolute and relative
sense.
● However, the EMD portfolio has
fallen behind the index for the
periods of 5-years and greater.
● The composite hovers around 40th
percentile in Callan’s EMD
database in the shorter-term, and
around 60th percentile in the
longer-term.
Performance vs Emerging Debt Database (Gross)
(4%)
(2%)
0%
2%
4%
6%
8%
10%
12%
14%
16%
Last Quarter Fiscal YTD Last Last 3 Years Last 5 Years Last 7 Years Last 7-1/2Year Years
(41)
(69)
(40)
(83)
(40)
(80)(71)(79)
(64)
(44) (61)
(46)
(63)
(50)
10th Percentile 5.08 10.18 13.93 8.31 5.37 7.25 6.9925th Percentile 4.05 8.46 12.09 7.12 4.70 6.55 6.25
Median 0.08 4.70 7.64 6.24 3.54 5.15 5.1775th Percentile (1.18) 3.09 5.25 5.47 0.79 2.02 2.4590th Percentile (1.54) 2.06 4.34 4.71 (0.41) 1.13 1.47
EmergingMarket Debt 1.95 6.65 9.28 5.60 2.11 3.77 3.92
Blmbg EMHard Curr Agg (1.04) 2.50 5.07 5.36 3.79 5.41 5.20
202/511

53 First Quarter 2018 Knowledge. Experience. Integrity.
REITs Performance Relative to Callan’s REITs database Periods Ended March 31, 2018
● APFC REITs portfolio has done well
versus its benchmark and peers
over all time periods shown.
● REITs allocation includes AEW
Global, SSGA, and American
Homes 4 Rent.
Performance vs Callan Real Estate REIT (Gross)
(10%)
(5%)
0%
5%
Last Quarter Fiscal YTD Last Year Last 1-1/2 Years
(11)(26)
(12)
(23)
(19)
(29)
(30)
(56)
10th Percentile (5.26) (0.10) 2.76 0.7425th Percentile (5.75) (2.19) 0.01 (0.33)
Median (6.67) (3.33) (1.79) (2.45)75th Percentile (7.40) (4.56) (3.37) (3.57)90th Percentile (7.85) (5.71) (3.86) (4.27)
REITs (5.34) (0.67) 1.41 (1.18)
S&P Global REIT (5.79) (1.89) (0.25) (2.67)
203/511

54 First Quarter 2018 Knowledge. Experience. Integrity.
Listed Infrastructure Relative to Listed Infrastructure Funds Periods Ended March 31, 2018
● APFC listed infrastructure
portfolio has performed well
relative to both its index and the
Publicly Listed Infrastructure
peer group over all time periods.
● Since Inception (4 ½ years), the
portfolio has outperformed its
benchmark by 4.5%.
● Listed Infrastructure composite
includes Lazard, Cohen &
Steers, and SSGA.
Performance vs Callan Publicly Listed Infrastructure (Gross)
(10%)
(5%)
0%
5%
10%
15%
Last Quarter Fiscal YTD Last Year Last 3 Years Last 4-1/2 Years
(57)(86)
(43)
(70)
(32)
(53)
(28)
(67)
(12)
(84)
10th Percentile (2.55) 4.58 9.99 8.85 10.6125th Percentile (3.97) 1.04 6.55 6.93 9.04
Median (4.80) (0.40) 4.66 4.50 7.3775th Percentile (5.49) (1.80) 1.93 2.40 6.3290th Percentile (6.72) (2.43) (0.23) 0.88 4.85
Listed Infrastructure (5.10) 0.05 5.44 6.69 10.23
S&P GlobalInfrastructure (5.70) (1.35) 4.20 3.52 5.73
204/511

55 First Quarter 2018 Knowledge. Experience. Integrity.
APFC Real Estate Structure (1Q LAG) As of March 31, 2018
● 74% of the structure is invested in
direct real estate portfolio. 10% of
this allocation is invested
internationally (CBRE Europe and
LaSalle UK).
● 26% of the structure is invested in
real estate operating companies
(Simpson and Lincoln).
$4,201 74%
$1,489 26%
Direct Real Estate
Operating Companies
205/511

56 First Quarter 2018 Knowledge. Experience. Integrity.
Real Estate Relative to Callan’s Total Real Estate Database
● Real estate portfolio performance is shown net of fees for all investments.
● APFC Real Estate was in-line with its target in the 1st quarter and trails for all other time periods measured on the chart.
● Relative to the peer group, the portfolio ranks favorably in the very long run, but falls below median in the short- and
intermediate-term.
Periods Ended March 31, 2018 Performance vs Public Fund - Real Estate (Gross)
0%
5%
10%
15%
Last Quarter Fiscal YTD Last Last 3 Years Last 5 Years Last 7 Years Last 10 YearsYear
(66)(67)
(78)(70)
(74)(67)
(58)(55)(67)(62) (70)(61)
(20)(15)
10th Percentile 3.16 7.61 10.48 11.76 12.50 13.30 6.3925th Percentile 2.53 6.72 8.67 10.70 11.74 12.71 5.50
Median 2.07 5.88 7.70 9.47 10.65 11.51 4.5775th Percentile 1.79 4.91 6.27 7.78 9.34 10.31 3.6390th Percentile 1.37 3.82 5.29 5.25 7.52 8.68 1.81
APFC Real Estate 1.80 4.74 6.46 9.10 9.86 10.46 5.77
APFC Target 1.80 5.33 6.96 9.21 10.13 10.79 6.09
206/511
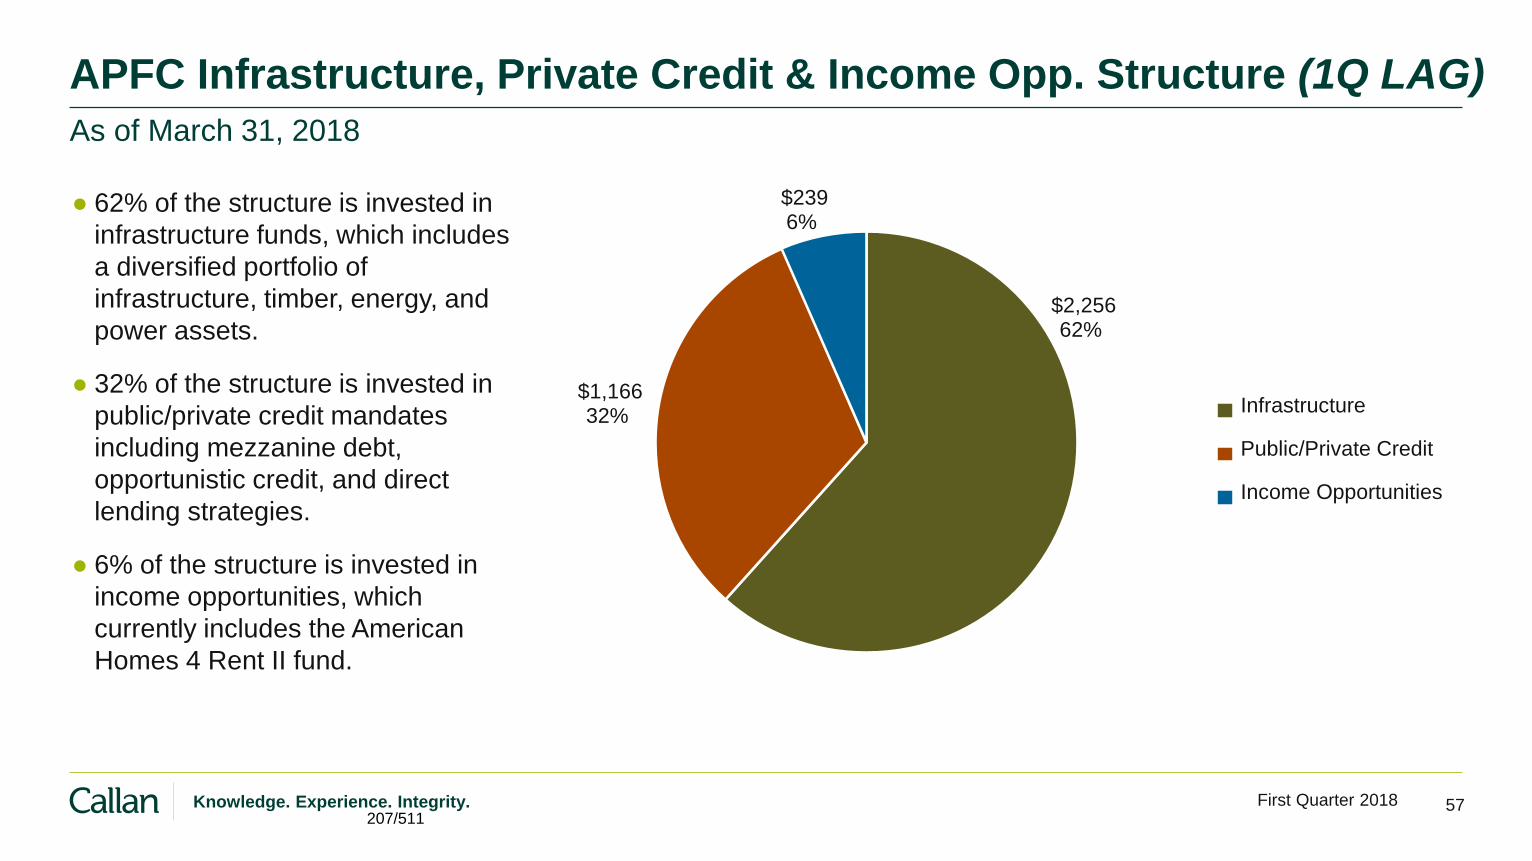
57 First Quarter 2018 Knowledge. Experience. Integrity.
APFC Infrastructure, Private Credit & Income Opp. Structure (1Q LAG)
● 62% of the structure is invested in
infrastructure funds, which includes
a diversified portfolio of
infrastructure, timber, energy, and
power assets.
● 32% of the structure is invested in
public/private credit mandates
including mezzanine debt,
opportunistic credit, and direct
lending strategies.
● 6% of the structure is invested in
income opportunities, which
currently includes the American
Homes 4 Rent II fund.
As of March 31, 2018
$2,256 62%
$1,166 32%
$239 6%
Infrastructure
Public/Private Credit
Income Opportunities
207/511

58 First Quarter 2018 Knowledge. Experience. Integrity.
Infrastructure, Private Credit & Income Opp. Performance (1Q LAG)
● APFC’s Infrastructure, Private Credit, and Income Opportunities composite is ahead of its custom benchmark (60%
FTSE Developed Core Infrastructure and 40% BC US Corp HY 2%) for all time periods shown.
● Quarterly outperformance is attributable to Infrastructure, which added 6.1% for the quarter, with notable
performance from the Goldman Sachs (+16%) portfolio.
As of March 31, 2018
Quarter
Last
FYTD Year
Last
Years
Last 3
Years
Last 5
Infrastructure, Private Credit, Income Opp 4.07 13.96 16.93 13.41 11.99
60% FTSE Dev Core Infr / 40% BC US Corp HY 2% 1.39 7.36 12.67 5.91 8.85
208/511
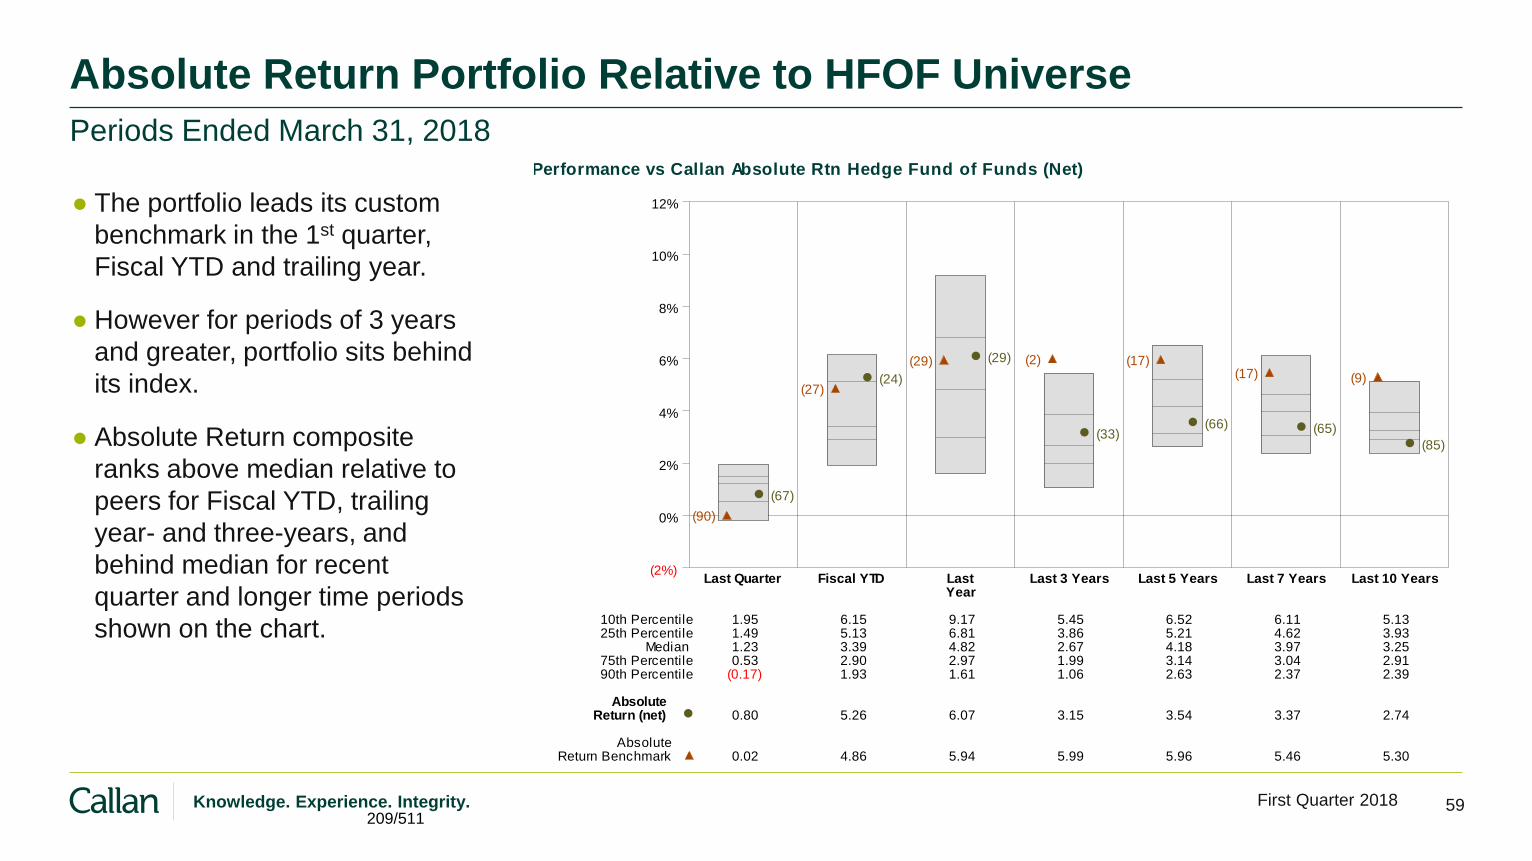
59 First Quarter 2018 Knowledge. Experience. Integrity.
Absolute Return Portfolio Relative to HFOF Universe Periods Ended March 31, 2018
● The portfolio leads its custom
benchmark in the 1st quarter,
Fiscal YTD and trailing year.
● However for periods of 3 years
and greater, portfolio sits behind
its index.
● Absolute Return composite
ranks above median relative to
peers for Fiscal YTD, trailing
year- and three-years, and
behind median for recent
quarter and longer time periods
shown on the chart.
Performance vs Callan Absolute Rtn Hedge Fund of Funds (Net)
(2%)
0%
2%
4%
6%
8%
10%
12%
Last Quarter Fiscal YTD Last Last 3 Years Last 5 Years Last 7 Years Last 10 YearsYear
(67)
(90)
(24)(27)
(29)(29)
(33)
(2)
(66)
(17)
(65)
(17)
(85)
(9)
10th Percentile 1.95 6.15 9.17 5.45 6.52 6.11 5.1325th Percentile 1.49 5.13 6.81 3.86 5.21 4.62 3.93
Median 1.23 3.39 4.82 2.67 4.18 3.97 3.2575th Percentile 0.53 2.90 2.97 1.99 3.14 3.04 2.9190th Percentile (0.17) 1.93 1.61 1.06 2.63 2.37 2.39
AbsoluteReturn (net) 0.80 5.26 6.07 3.15 3.54 3.37 2.74
AbsoluteReturn Benchmark 0.02 4.86 5.94 5.99 5.96 5.46 5.30
209/511

60 First Quarter 2018 Knowledge. Experience. Integrity.
APFC Private Equity and Growth Opportunities Structure (1Q LAG) As of March 31, 2018
● 60% of the structure is invested in private
equity.
● The legacy HarbourVest investments
have been transferred to Pathway for
oversight management.
● The Pathway portfolio also includes
direct investments overseen by Pathway.
● 40% of the structure is invested in growth
opportunities.
$4,272 56%
$286 4%
$3,026 40%
Private Equity - Pathway
Private Equity - BlackRock
Growth Opportunities
210/511

61 First Quarter 2018 Knowledge. Experience. Integrity.
Quarter
Last
FYTD Year
Last
Years
Last 3
Years
Last 5
Private Equity and Growth Opportunities 4.71 18.94 24.38 13.08 22.04
Cambridge Private Equity 5.11 14.84 19.38 12.32 13.90
APFC Private Equity and Growth Opportunities Performance (1Q LAG)
● APFC’s Private Credit and Growth Opportunities composite is ahead of the Cambridge Private Equity Index for all
time periods shown, except the recent quarter.
● Quarterly performance was roughly similar between the two portfolios, with Private Equity gaining 4.8% and
Growth Opportunities adding 4.5%.
As of March 31, 2018
211/511

62 First Quarter 2018 Knowledge. Experience. Integrity.
APFC Multi-Strategy Structure
● Roughly $2.5 billion distributed across three
mandates.
● Equal weight target.
● Multi asset class portfolios, limited use of
illiquid assets.
● Leverage is used to amplify the impact of
asset classes and/or strategies.
● Generally has maintained higher fixed
income exposure than APFC total fund.
● Medium-term improvement in performance,
particularly from AQR, has enhanced value
added since inception of the program
As of March 31, 2018
$843 33%
$871 34%
$821 33%
Bridgewater
AQR
Goldman Sachs
212/511

63 First Quarter 2018 Knowledge. Experience. Integrity.
Last Quarter FYTD Last Year Last 3 Years Last 5 Years Last 8 YearsAQR 0.06 6.47 5.79 6.64 6.50 9.06
Bridgewater 0.05 6.00 4.34 2.64 5.16 9.36
Goldman Sachs (1.39) 4.44 6.88 3.14 4.15 6.23
Multi-Strategy Portfolio (0.42) 5.65 5.65 4.12 4.81 6.65TF Ret Objective (CPIU+5%) 2.41 5.58 7.36 6.86 6.40 6.73
Benchmark 0.15 7.33 10.69 6.33 7.22 7.66
Passive Index (60/20/10/10) (0.80) 7.21 10.72 6.09 6.45 6.78
Total Fund 0.41 8.86 12.14 7.65 8.35 8.38
Multi-Strategy Performance
● The multi-strategy portfolio trails the Total Fund, the CPIU+5% objective, the Performance Benchmark, and the Passive
Benchmark over the majority of the time periods measured, including since inception.
● Recent improvement in performance has dramatically strengthened long-term returns for the program, however the multi-
strategy program still trails the total fund since inception. Since Inception, Bridgewater has contributed the most, followed
by AQR, with Goldman contributing the least. However, Goldman has performed best over the last twelve months.
● Long-term underperformance relative to the total fund is explained by a number of factors, but primarily can be attributed
to a low exposure to US Equity, an overweight to emerging markets, and levered exposure to fixed income. Additionally,
the Multi-Strategy Composite includes terminated managers PIMCO and GMO.
Periods Ended March 31, 2018
213/511

64 First Quarter 2018 Knowledge. Experience. Integrity.
Private Equity Portfolio Positioning As of September 30, 2017
● APFC’s Total Private Equity
Portfolio is well-diversified by
strategy, geography, and
industry.
● All key sectors are included:
venture capital, buyout, special
situations and distressed debt.
Buyouts remain the largest
allocation.
● The largest non-U.S. sector
exposure is developed Europe.
● The largest industry sector is
Technology.
Portfolio Diversification by NAV
Geographic Diversification by NAV Industry Diversification by NAV
Buyout51.7%
Venture/Growth Capital24.6%
Special Situations21.2%
Distressed/Restructuring2.5%
West/Pacific Northwest18.7%
Mid-West10.9%
North Atlantic11.7%
Southwest/Rockies12.7%
Southeast9.4%
Mid-Atlantic4.7%
Europe21.3%
Pacific Basin5.8%
Rest of World4.8%
Technology39.7%
Industrials14.5%
Consumer Discretionary10.6%
Health Care11.4%
Financial7.5%
Telecommunications5.8%
Energy8.1%
Other/Misc2.4%
214/511

65 First Quarter 2018 Knowledge. Experience. Integrity.
Closing Remarks ● Total Fund ended the first quarter of 2018 with $66.5 billion in assets, gaining 0.4% for the quarter. For the last 12 months, the Fund has
risen 12.1%. This trailing year performance puts the Total Fund in the top fifth relative to other large public funds, and in the top third
versus other large endowments/foundations.
● Total Fund trails the CPIU+5% objective for the quarter, but bests the other two performance targets. Additionally, Total Fund is ahead of
all three targets for Fiscal YTD and the trailing 1-, 3- and 5-year periods.
● Over longer periods (last 10- and 20-years), the total Fund trails only the CPIU+5% return objective.
● Strong recent performance has helped the Fund perform well relative to most large public funds and endowments. Longer-term
performance has not fared as well versus peers, largely due to a comparatively high allocation to non-US equity, emerging markets, and
fixed income – this effect, particularly versus endowments, has improved in the near-term.
● The Public Equity portfolio led its index during the quarter. Within Domestic Equities, the small capitalization bias benefitted performance.
International Equities performance was aided by a weak US dollar and an overweight to the strong performing emerging markets.
Intermediate- and longer-term performance of the Public Equity portfolio closely tracks the index.
● The Fixed Income Plus portfolio was roughly in-line with its respective benchmark. Non US Fixed Income and Emerging Market Debt
helped buoy returns, but were offset by absolute performance from REITs and Listed Infrastructure.
● The alternatives portfolios’ performance for the most part saw broad based gains. Private Equity & Growth Opportunities (+4.7%) added
the most value to overall performance, followed by Infrastructure, Private Credit & Income Opportunities (+4.1%), Real Estate (+1.9%
gross), and Absolute Return (+0.8%). Asset Allocation (-0.8%) was the only portfolio with returns in the red.
● The Total Fund return in the 1st quarter provided solid gains. Prudent asset allocation with appropriate levels of diversification and a long-
term perspective remain Callan’s recommended course.
215/511

Asset Allocation and Performance Memo
Separator Page
216/511
SUBJECT: Asset Allocation and Performance ACTION: DATE: May 23, 2018 INFORMATION: X
BACKGROUND: The Asset Allocation and Performance overview provides a snapshot of the asset allocation and performance of the Total Fund and its underlying asset classes through March 31, 2018. STATUS: At this meeting, the Director of Risk and Asset Allocation will provide an overview of key measures of asset allocation and performance.
217/511

Asset Allocation and Performance Presentation
Separator Page
218/511

Asset Allocation and Performance
May 2018219/511

Total Fund Allocation
220/511

ALASKA PERMANENT FUND CORPORATION 3
Asset Allocation by Objective
as of 3/31/2018
Growth, 59%
Income, 41%
Growth Income
Tradable Growth
40%
Illiquid Growth
19%
Growth
Tradable Income
27%
Illiquid Income
14%
Income
221/511

ALASKA PERMANENT FUND CORPORATION 4
Asset Allocation by Strategy
PublicEquities
Fixed IncomePlus
Private Equity& SpecialGrowth
Real EstateInfrastructure
& SpecialIncome
AbsoluteReturn
AssetAllocation
Actual 40.3% 21.0% 11.4% 8.6% 5.5% 3.8% 9.4%
Target 39.0% 22.0% 11.0% 11.0% 6.0% 5.0% 6.0%
0.0%
5.0%
10.0%
15.0%
20.0%
25.0%
30.0%
35.0%
40.0%
45.0%
WE
IGH
Tas of 03/31/2018
222/511

Performance
223/511
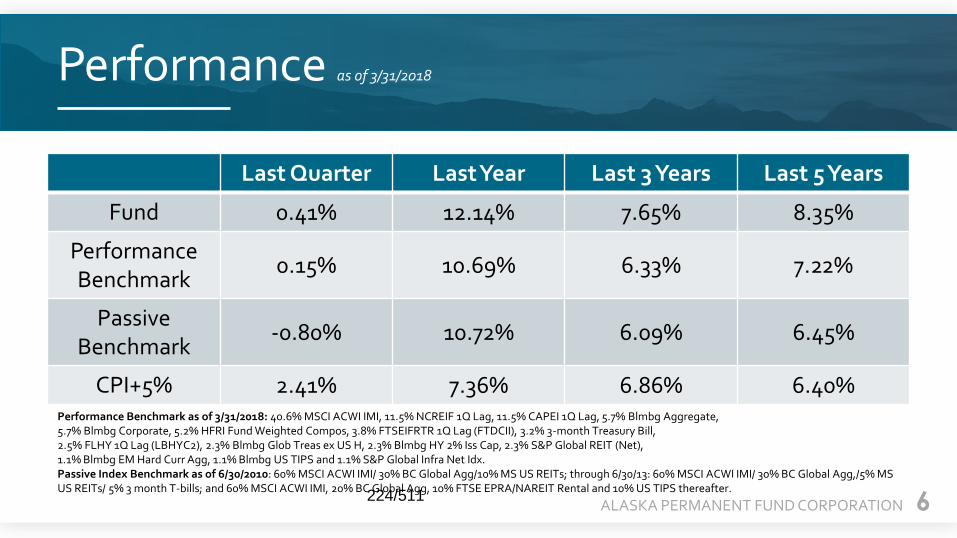
ALASKA PERMANENT FUND CORPORATION 6
Last Quarter Last Year Last 3 Years Last 5 Years
Fund 0.41% 12.14% 7.65% 8.35%
Performance Benchmark
0.15% 10.69% 6.33% 7.22%
Passive Benchmark
-0.80% 10.72% 6.09% 6.45%
CPI+5% 2.41% 7.36% 6.86% 6.40%
Performance as of 3/31/2018
Performance Benchmark as of 3/31/2018: 40.6% MSCI ACWI IMI, 11.5% NCREIF 1Q Lag, 11.5% CAPEI 1Q Lag, 5.7% Blmbg Aggregate,5.7% Blmbg Corporate, 5.2% HFRI Fund Weighted Compos, 3.8% FTSEIFRTR 1Q Lag (FTDCII), 3.2% 3-month Treasury Bill,2.5% FLHY 1Q Lag (LBHYC2), 2.3% Blmbg Glob Treas ex US H, 2.3% Blmbg HY 2% Iss Cap, 2.3% S&P Global REIT (Net),1.1% Blmbg EM Hard Curr Agg, 1.1% Blmbg US TIPS and 1.1% S&P Global Infra Net Idx.Passive Index Benchmark as of 6/30/2010: 60% MSCI ACWI IMI/ 30% BC Global Agg/10% MS US REITs; through 6/30/13: 60% MSCI ACWI IMI/ 30% BC Global Agg,/5% MS US REITs/ 5% 3 month T-bills; and 60% MSCI ACWI IMI, 20% BC Global Agg, 10% FTSE EPRA/NAREIT Rental and 10% US TIPS thereafter.224/511

ALASKA PERMANENT FUND CORPORATION 7
3 months ending 3/18
Portfolio Weight Portfolio ReturnBenchmark
WeightBenchmark
ReturnRelative
Contribution
Public Equities 40.30% -0.42% 39.00% -0.89% 0.18%
Fixed Income Plus 21.00% -1.74% 22.00% -1.83% 0.04%
Private Equity and Growth
11.40% 4.71% 11.00% 5.11% -0.03%
Real Estate 8.60% 1.89% 11.00% 1.80% -0.04%
Infrastructure, Private Credit and
Income Opportunities
5.51% 4.07% 6.00% 1.39% 0.14%
Absolute Return 3.80% 0.80% 5.00% 0.02% 0.03%
Asset Allocation 9.40% -0.81% 6.00% 0.15% -0.09%
Fund vs. Risk Benchmark as of 3/31/2018
225/511

ALASKA PERMANENT FUND CORPORATION 8
One Year Relative Attribution as of 3/31/2018
226/511

ALASKA PERMANENT FUND CORPORATION 9
Efficiency as of 3/31/2018
Performance Benchmark
Total Portfolio
227/511

ALASKA PERMANENT FUND CORPORATION 10
Time Horizon Objective APFC Benchmark Percentile
Short-Term (1 year Return)
Outperform Indexes
12.14% 10.71% 24%ile
Medium Term(3-year Return)
OutperformPeers
7.65% 6.66% 11%ile
Long-Term(5-year Return and Sharpe
Ratio)
Outperform CPI +5%
8.35% 6.40% 16%ile
Sharpe Ratio > 0.5 1.4 0.5 4%ile
Average Long-Term Percentile 10%ile
Average Percentile Ranking Among the Three Objectives: 15%ile
Average Percentile Ranking as of December 31, 2017: 19%ile
Performance Scorecard as of 3/31/2018
228/511

Investment Risk Report Memo
Separator Page
229/511
SUBJECT: Investment Risk Report ACTION: ____ DATE: May 23, 2018 INFORMATION: ___X_
BACKGROUND: The Investment Risk Report provides an overview of historical and forward-looking measures of risk for the Total Fund and its underlying asset classes. The updated Investment Risk Report considers realized volatility and Sharpe Ratios as a risk framework for evaluating forward-looking Value-at-Risk and scenario analysis. It then covers Geographic, Currency, and Liquidity risks for the Total Fund. STATUS: At this meeting, Staff will present some of the key measures of the Risk of the fund. The graphical presentation of the APFC’s key risk measures include statistics that measure realized volatility and Sharpe Ratios, asset class and factor contributions to risk, tracking error to benchmarks, risk scenarios, and Value-at-Risk.
230/511
Investment Risk Report
Separator Page
231/511

Investment Risk Report
May 23, 2018232/511

Prevailing Realized Fund Risk
As of March 30, 2018
233/511

ALASKA PERMANENT FUND CORPORATION 3
Realized Fund Volatility
4%
6%
8%
10%
12%
14%
16%
18%
Prevailing Realized Fund Volatility (1990-2018)
• Calculated as 3-Year Rolling Weighted Moving Average Volatility• M = March 234/511

ALASKA PERMANENT FUND CORPORATION 4
Realized Fund Sharpe Ratio
-1.00
-0.50
0.00
0.50
1.00
1.50
Prevailing Realized Fund Sharpe Ratio (1990-2018)
• Calculated using 3 Mo. US Govt. Bonds and 3 year Rolling Weighted Moving Average Returns and Volatility for the Total Fund
• M = March235/511

ALASKA PERMANENT FUND CORPORATION 5
Comparative Fund Volatility
20%
30%
40%
50%
60%
70%
80%
90%
100%
Ratio of Prevailing Realized Fund Volatility over Implied US Stock Volatility (1990-2018)
• Calculated using VIX and Rolling Weighted Average Volatility• M = March 236/511

Asset Class Risk
As of March 30, 2018
237/511
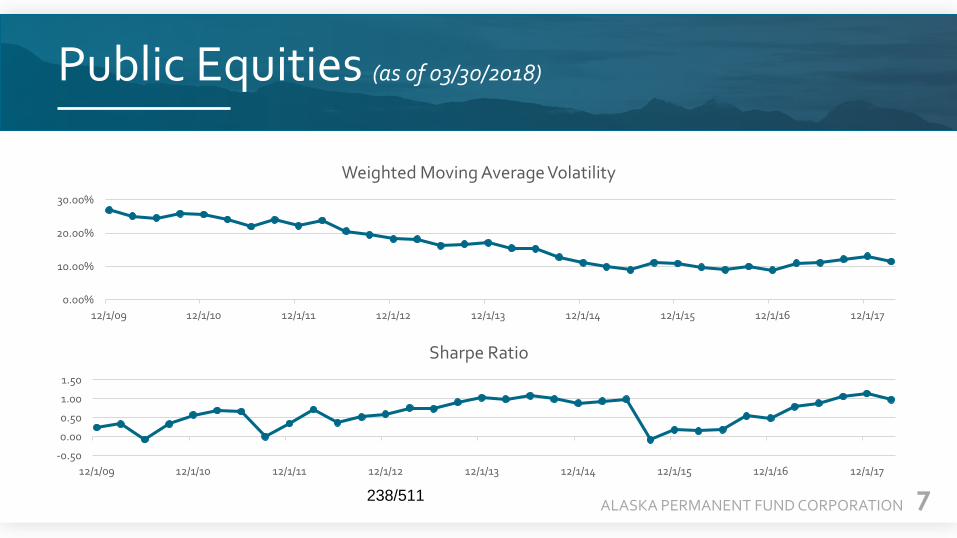
ALASKA PERMANENT FUND CORPORATION 7
Public Equities (as of 03/30/2018)
0.00%
10.00%
20.00%
30.00%
12/1/09 12/1/10 12/1/11 12/1/12 12/1/13 12/1/14 12/1/15 12/1/16 12/1/17
Weighted Moving Average Volatility
-0.50
0.00
0.50
1.00
1.50
12/1/09 12/1/10 12/1/11 12/1/12 12/1/13 12/1/14 12/1/15 12/1/16 12/1/17
Sharpe Ratio
238/511
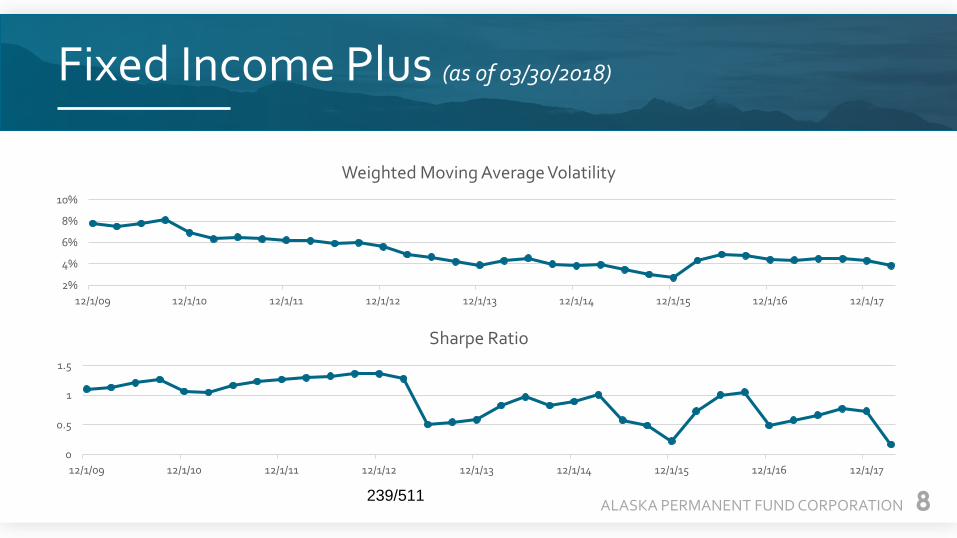
ALASKA PERMANENT FUND CORPORATION 8
Fixed Income Plus (as of 03/30/2018)
2%
4%
6%
8%
10%
12/1/09 12/1/10 12/1/11 12/1/12 12/1/13 12/1/14 12/1/15 12/1/16 12/1/17
Weighted Moving Average Volatility
0
0.5
1
1.5
12/1/09 12/1/10 12/1/11 12/1/12 12/1/13 12/1/14 12/1/15 12/1/16 12/1/17
Sharpe Ratio
239/511

ALASKA PERMANENT FUND CORPORATION 9
Real Estate (as of 03/30/2018)
-1
0
1
Sharpe Ratio
4%
9%
14%
19%
Weighted Moving Average Volatility
240/511

ALASKA PERMANENT FUND CORPORATION 10
Infrastructure, Private Credit, and Income Opportunities (as of 03/30/2018)
6%
8%
10%
12%
14%
12/1/10 12/1/11 12/1/12 12/1/13 12/1/14 12/1/15 12/1/16 12/1/17
Weighted Moving Average Volatility
0
0.5
1
1.5
12/1/10 12/1/11 12/1/12 12/1/13 12/1/14 12/1/15 12/1/16 12/1/17
Sharpe Ratio
241/511

ALASKA PERMANENT FUND CORPORATION 11
Private Equity and Special Opportunities (as of 03/30/2018)
8%
15%
22%
29%
36%
12/1/10 12/1/11 12/1/12 12/1/13 12/1/14 12/1/15 12/1/16 12/1/17
Moving Weighted Average Volatility
-0.5
0.5
1.5
12/1/10 12/1/11 12/1/12 12/1/13 12/1/14 12/1/15 12/1/16 12/1/17
Sharpe Ratio
242/511

ALASKA PERMANENT FUND CORPORATION 12
Absolute Return (as of 03/30/2018)
2.00%
4.00%
6.00%
8.00%
10.00%
12/1/09 12/1/10 12/1/11 12/1/12 12/1/13 12/1/14 12/1/15 12/1/16 12/1/17
Moving Weighted Average Volatility
-0.5
0
0.5
1
1.5
12/1/09 12/1/10 12/1/11 12/1/12 12/1/13 12/1/14 12/1/15 12/1/16 12/1/17
Sharpe Ratio
243/511

ALASKA PERMANENT FUND CORPORATION 13
Asset Allocation (as of 03/30/2018)
1%
3%
5%
7%
9%
12/1/09 12/1/10 12/1/11 12/1/12 12/1/13 12/1/14 12/1/15 12/1/16 12/1/17
Moving Weighted Average Volatility
-0.5
0
0.5
1
1.5
12/1/09 12/1/10 12/1/11 12/1/12 12/1/13 12/1/14 12/1/15 12/1/16 12/1/17
Sharpe Ratio
244/511

Value-at-Risk
As of March 30, 2018
245/511

ALASKA PERMANENT FUND CORPORATION 15
Historical Ex-Ante Value-at-Risk (VaR)
4%
6%
8%
10%
12%
14%
16%
18%
20%
7/15/2015 10/23/2015 1/31/2016 5/10/2016 8/18/2016 11/26/2016 3/6/2017 6/14/2017 9/22/2017 12/31/2017 4/10/2018
Ex-Ante VaR (2015-2018)
246/511
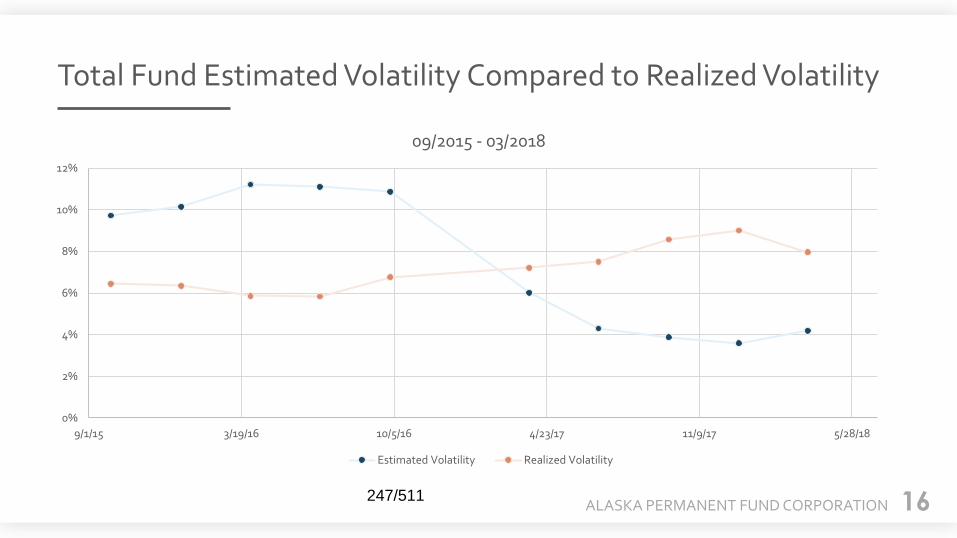
ALASKA PERMANENT FUND CORPORATION 16
Total Fund Estimated Volatility Compared to Realized Volatility
0%
2%
4%
6%
8%
10%
12%
9/1/15 3/19/16 10/5/16 4/23/17 11/9/17 5/28/18
09/2015 - 03/2018
Estimated Volatility Realized Volatility
247/511

ALASKA PERMANENT FUND CORPORATION 17
Ex-Ante VaR & Tracking Error (as of 03/30/2018)
248/511
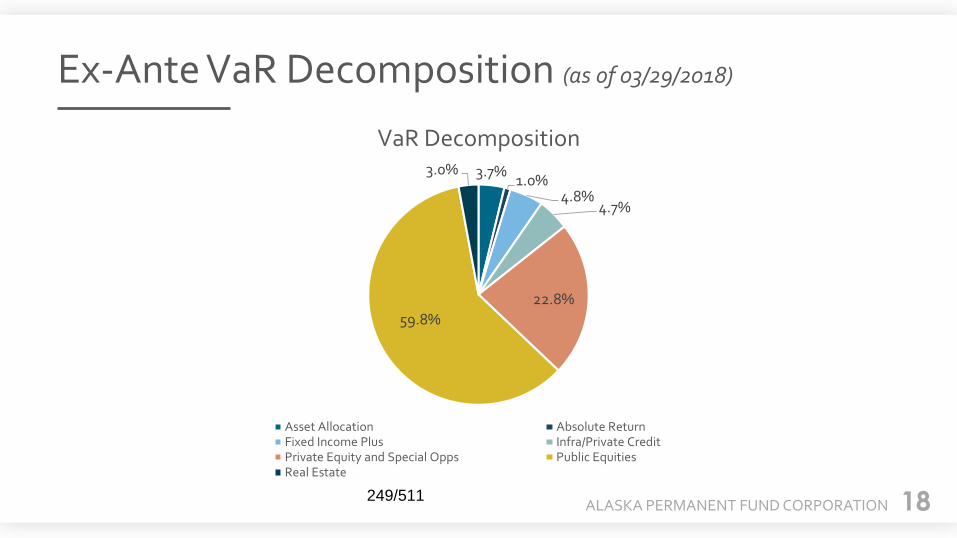
ALASKA PERMANENT FUND CORPORATION 18
Ex-Ante VaR Decomposition (as of 03/29/2018)
3.7%1.0%
4.8%4.7%
22.8%
59.8%
3.0%
VaR Decomposition
Asset Allocation Absolute ReturnFixed Income Plus Infra/Private CreditPrivate Equity and Special Opps Public EquitiesReal Estate
249/511

Scenario Analysis
As of March 30, 2018
250/511

ALASKA PERMANENT FUND CORPORATION 20
Tail Risk: Scenarios
Scenario Definition
2007 Credit CrisisCredit & liquidity crisis stemming from a severe slowdown in the
housing market causing significant widening of credit spreads and increased implied volatility.
2008 Market Crash S&P 500 down 20% (2000 bps).
US Downgrade 2011
The period starts with 50% chance US downgrade indicationfrom S&P standards and ends with Operational Twist
announcement from the Fed (stock market losses and bond market gains).
Fed Tapering Talk 2013
Equity & bond markets sold off. EM suffered badly due to hot money flight back to U.S.
Chinese Market Crash
Chinese stock market crash beginning with the popping of the stock market bubble on June 12, 2017.
Rapid DeflationOil down 60% (6000 bps); ST Inflation down 350 bps; Mortgage
spreads tighten 25 bps.
Slow DeflationLT deflation down 200 bps; LT Treasury Rates down 100 bps;
Mortgage spreads tighten 25 bps.
-25% -20% -15% -10% -5% 0%
Slow Deflation
Rapid Deflation
Chinese Market Crash
Fed Tapering Talk 2013
US Downgrade 2011
2008 Market Crash
2007 Credit Crisis
Scenarios (as of March 30, 2018)
Benchmark APFC
251/511

Other Risk Factors
As of March 30, 2018
252/511

ALASKA PERMANENT FUND CORPORATION 22
Currency Risk (as of 03/30/2018)
4%
19%
4%
18%
0 5 10 15 20 25
EM
DM (Non-US)
Portfolio Performance Benchmark
23%
77%
22%
78%
0 20 40 60 80 100
Non-Dollar
Dollar
Portfolio Performance Benchmark
253/511

ALASKA PERMANENT FUND CORPORATION 23
Country Name Exposure ($, millions)
Euro 3,364
British Pound 2,286
Japanese Yen 2,072
Hong Kong Dollar 1,292
Canadian Dollar 890
Total 9,904 (15% of NAV)
Total Non-US DM Exposure 11,430 (18% of NAV)
Non-US Developed Market Currency Exposures (as of 03/30/2018)
Top Non-US DM Currency Exposures
1.15%
1.37%0.30%
0.28%
5.18%
3.19%
1.99%
0.05%
3.52%
0.13%
0.21%0.03%
0.20%
Currency Exposures
Australian Dollar Canadian Dollar Swiss FrancDanish Krone Euro British PoundHong Kong Dollar Israeli Shekel Japanese YenNowegian Krone New Zealand Dollar Swedish KronaSingapore Dollar 254/511
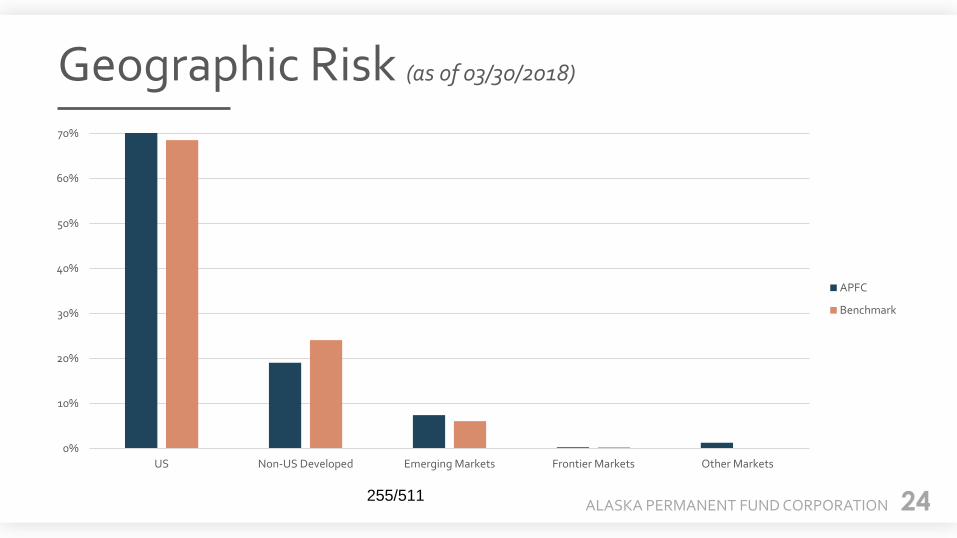
ALASKA PERMANENT FUND CORPORATION 24
Geographic Risk (as of 03/30/2018)
0%
10%
20%
30%
40%
50%
60%
70%
US Non-US Developed Emerging Markets Frontier Markets Other Markets
APFC
Benchmark
255/511

ALASKA PERMANENT FUND CORPORATION 25
Country Name Exposure ($, millions)
South Korea 455
India 383
Brazil 325
Taiwan 312
South Africa 279
Thailand 214
Total 1,968 (3.03% of NAV)
Total EM Exposure 2,520 (3.88% of NAV)
Emerging Market Exposure (as of 03/30/2018)
EM Country Exposures
South Korea India Brazil Taiwan South Africa
Thailand Indonesia Mexico Turkey China (Yuan)
Poland Russia Hungary Chile Colombia
Philippines Egypt Peru Czech Republic Pakistan
Top EM Country Exposures
256/511

ALASKA PERMANENT FUND CORPORATION 26
Liquidity Risk (as of 03/30/2018)
0% 10% 20% 30% 40% 50%
Private Investment Limits
0% 10% 20% 30%
Future Commitments Limits
$17.9 Billion Invested in Private Markets
28% 10.6%
$6.9 Billion Committed to Managers
257/511

ALASKA PERMANENT FUND CORPORATION 27
Risk Highlights
Realized Volatility
and Sharpe Ratios
Ex-Ante VaR
Other Risk
Factors
Provides useful framework for appreciating existing
and future risks
Uneven success as a prediction tool, but still important to consider
Remain in the approved ‘green zones’
258/511

Asset Class Updates Memo: Real Assets
Separator Page
259/511

SUBJECT: APFC Real Assets/Private Income & Absolute Return Asset Class Update ACTION: ___________
DATE: May 23, 2018 INFORMATION: X
BACKGROUND: The Real Assets/Private Income and Absolute Return presentation provides a portfolio update and investment performance analysis. Specific portfolios covered will include Real Estate, Infrastructure, Private Credit, Income Opportunities and Absolute Return. STATUS: At this meeting Staff will present some of the key elements of the Real Asset/Private Income and Absolute Return portfolio including, as context, overall market performance and outlook. Staff will also compare performance of, and provide updates on, portfolio components.
260/511

a) Presentation: Real Assets (Infrastructure, Special Income, Real
Estate, Absolute Return)
Separator Page
261/511

Real Assets, Private Incomeand Absolute Return
May 23, 2018262/511
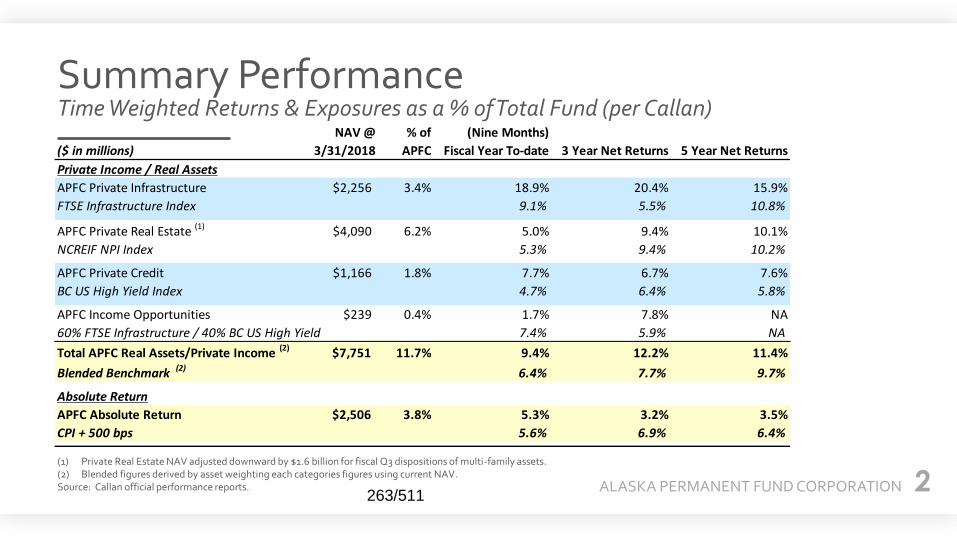
ALASKA PERMANENT FUND CORPORATION 2
Summary PerformanceTime Weighted Returns & Exposures as a % of Total Fund (per Callan)
(1) Private Real Estate NAV adjusted downward by $1.6 billion for fiscal Q3 dispositions of multi-family assets.(2) Blended figures derived by asset weighting each categories figures using current NAV.Source: Callan official performance reports.
NAV @ % of (Nine Months)
($ in millions) 3/31/2018 APFC Fiscal Year To-date 3 Year Net Returns 5 Year Net Returns
Private Income / Real Assets
APFC Private Infrastructure $2,256 3.4% 18.9% 20.4% 15.9%
FTSE Infrastructure Index 9.1% 5.5% 10.8%
APFC Private Real Estate (1) $4,090 6.2% 5.0% 9.4% 10.1%
NCREIF NPI Index 5.3% 9.4% 10.2%
APFC Private Credit $1,166 1.8% 7.7% 6.7% 7.6%
BC US High Yield Index 4.7% 6.4% 5.8%
APFC Income Opportunities $239 0.4% 1.7% 7.8% NA
60% FTSE Infrastructure / 40% BC US High Yield 7.4% 5.9% NA
Total APFC Real Assets/Private Income (2) $7,751 11.7% 9.4% 12.2% 11.4%
Blended Benchmark (2) 6.4% 7.7% 9.7%
Absolute Return
APFC Absolute Return $2,506 3.8% 5.3% 3.2% 3.5%
CPI + 500 bps 5.6% 6.9% 6.4%
263/511

ALASKA PERMANENT FUND CORPORATION 3
Private Infrastructure
Income Opportunities
Private Credit
Private Real Estate
Absolute Return
• As is the case with Absolute Return, we have (in the past several years) moved away from a Fund-of-Fund model for Private Credit; the new Staff Direct program has been performing particularly well
• Net Returns solidly beating the investable benchmark (US High Yield) for FYTD, 1-year, 3-year and 5-year periods
Portfolio HighlightsQuarter Ended March 31, 2018
• Two years into new direct strategy, results continue to be very promising with ~7-8% annualized returns over this period (vs. low single digits previously); made money in seven of the eight down months on the S&P 500 in this period
• In calendar year-to-date period, team has been active on the deployment front (~$700 million deployed to seven managers)
• Underlying portfolio performance remains solid (in spite of low leverage profile and occasional quarter-to-quarter appraisal “noise”) and generating strong cash distributions to the APFC
• Focused on International diversification (via funds/co-invest) and direct investment activity domestically led by in-house team
• Portfolio today is relatively small ($239 million of NAV) and have two investments that make up substantially all of current exposure (American Homes for Rent JV and Generate Capital direct equity investment)
• Going forward, Staff plans to grow portfolio through recent notable initiatives: (i) BroadRiver life settlements investment and (ii) Alaska Direct Alternative Credit (ADAC), a collaboration with the Fixed Income Plus team to manage a fully in-house opportunistic credit strategy comprised of high yield bonds/ETFs and co-investments with Private Credit managers
• Twelve years since the establishment of APFC’s Private Infrastructure program, the portfolio is a well diversified mix of Transportation, Energy and Other (Telecom, Waste, Timber) inflation-protected cash yielding investments with a mix of Fund investments and Direct/Co-Investments
• Portfolio has benefitted from being the first area of the APFC Private Markets portfolio where a co-investment strategy was implemented 264/511

ALASKA PERMANENT FUND CORPORATION 4
Absolute ReturnProgram Summary and Objectives
• The Absolute Return program objective is to deliver reasonably consistent and accretive returns (versus the CPI + 500 bps Total Fund objective) that are largely uncorrelated with traditional, market-driven asset classes (i.e., avoid “market beta”)
• Representative Investments: (i) Zero beta/market neutral equity managers who short as much stock as they are long, (ii) Macro hedge fund managers who specialize in trading relative value in commodity, interest rate, and currency markets, (iii) Activist investors who seek position of influence with an undermanaged public company and hedge their market risk by shorting a basket of comparable (deemed fairly valued or overvalued) comparable companies
11.5%
16.7%
1.4%
(17.4%)
12.2%
8.0%
0.4%
8.7% 7.6%
1.7%
(1.9%)
7.2% 7.0%
(20.0%)
(15.0%)
(10.0%)
(5.0%)
0.0%
5.0%
10.0%
15.0%
20.0%
2006 2007 2008 2009 2010 2011 2012 2013 2014 2015 2016 2017 2018
(Fiscal Year End June Net Return) Old Fund-of-Fund Driven “Hedge Fund” Program; moderate beta profile
New “Direct” Program; Zero tolerance for persistent beta profiles
1. FYTD net return annualized. All returns per Callan year-end monthly performance report.
(1)
265/511

ALASKA PERMANENT FUND CORPORATION 5
Absolute Return (cont’d)
Source: Bloomberg and Investment Staff calculations.
APFC Performance vs. S&P 500 Down Months
Source: APFC manager statements and investment staff calculations.Note: March NAV and performance figures may utilize preliminary estimates where finalized numbers not yet available; performance figures calculated as NAV-weighted geometric mean over applicable timeframe
Portfolio Performance
-13.55%
-3.69%
5.43%
-15.00%
-10.00%
-5.00%
0.00%
5.00%
10.00%
S&P 500 HFRI APFC Direct Portfolio
The S&P 500 experienced 8 down months since January 2016; during these months:
APFC’s direct portfolio was up in 7 out of 8 months, generating an average return of 0.66% versus a loss of -1.79% for the S&P 500
APFC’s portfolio vastly outperformed other hedge funds, as measured by the HFRI Fund Weighted Composite
($ in millions) 3/31/2018 FY 2018 Q3 2018
NAV Return Return
Fund-of-Funds
Crestline $402 8.7% 1.0%
Mariner $144 5.0% 1.6%
Total - Fund-of-Funds $549 7.2% 1.3%
Direct Program
Total - Direct Program $1,948 5.4% 1.3%
Total - Overall $2,496 5.9% 1.3%
266/511

ALASKA PERMANENT FUND CORPORATION 6
Absolute Return (Cont’d)CY2018 Q1 Update
• The S&P 500 drew down -3.69% in February and -2.54% in March
• APFC’s direct Absolute Return portfolio remained resilient during the market drawdowns, demonstrating our intended non-correlation to broader asset classes
• In spite of this, we have observed higher volatility amongst our managers monthly returns
Demonstrated non-correlated return stream
(1) APFC Direct Portfolio includes all direct investments measured from inception of APFC’s new direct mandate, less any managers from whom APFC had issued redemptions
APFC Direct Portfolio (1)
Avg Return 7.92%
Corr to S&P 0.02
Corr to HFRI -0.27
Volatility 2.60%
Sharpe 2.57
• APFC has deployed ~$700 mm across 7 managers calendar year-to-date
2018
Jan Feb Mar Feb & Mar Q1
APFC Direct HF 1.12% -0.29% 0.45% 0.16% 1.28%
S&P 500 5.73% -3.69% -2.54% -6.14% -0.76%
267/511

ALASKA PERMANENT FUND CORPORATION 7
6.8%
1.2%
(3.0%)
1.8%
10.1%9.3%
(4.0%)
(2.0%)
0.0%
2.0%
4.0%
6.0%
8.0%
10.0%
12.0%
DomesticFixed Income(Barclays Agg)
APFC RealEstate
GlobalEquities(ACWI)
DomesticFixed Income(Barclays Agg)
APFC RealEstate
GlobalEquities(ACWI)
Private Real EstateProgram Summary and Objectives
• The APFC’s Private Real Estate objective is to generate an inflation-protected private income stream to the APFC with a total return between public equities and public fixed income
• Because the vast majority of our properties are directly-held and managed internally, APFC controls or co-controls key decisions like leverage, capital budgets and leases
• Representative Investments: (i) 50% Joint Venture stakes in Class A/Trophy well-positioned assets like 299 Park and Tyson’s Corner, (ii) Directly held 100% interests in Real Estate assets in United States and Western Europe, (iii) new focus on International/Global private funds and co-investments
Real Estate’s Place in Risk/Return Landscape
5 Year Ending 6/30/12(Includes Financial Crisis)
5 Year Ending 3/31/18(Bull Market)
(Net Annual Returns)
268/511

ALASKA PERMANENT FUND CORPORATION 8
Private Real Estate (Cont’d)Portfolio Update
Portfolio Composition by Property Type
(Note: Real Estate values and returns are reported with a one quarter lag.)
Property TypeMarch 2018
Market Value ($mm)
% of Portfolio
NCREIF % of Portfolio
March 2018LTV %
GROSS RETURNS
1 Year 3 Year
APFC NCREIF APFC NCREIF
Hotel $68 1% 1% 0.0% 7.1% 4.9% 10.7% 7.5%
Industrial $271 5% 15% 25.4% 13.9% 13.1% 11.1% 13.4%
Multi-Family $1,958 34% 24% 31.1% 6.7% 6.2% 11.2% 8.5%
Office $1,484 26% 37% 26.6% 3.3% 6.0% 6.2% 8.2%
Retail $1,909 34% 23% 34.7% 9.1% 5.7% 10.3% 9.9%
Total: $5,690 100% 100% 30.8% 6.8% 7.0% 9.3% 9.4%
269/511

ALASKA PERMANENT FUND CORPORATION 9
Private InfrastructureProgram Summary and Objectives
• The APFC’s Private Infrastructure program seeks to invest in long-lived assets and companies that exhibit contractual and/or inflation-protection characteristics while protecting capital and generating income
• Representative Investments: (i) Gatwick Airport (via Fund), (ii) Equis Energy, LLC (renewable energy developer via Fund and Direct investment), (iii) Terminal Investments, Ltd. (via Fund and Direct investment), (iv) Twin Creeks Timber, LLC (joint venture formed with several other state funds to purchase and hold institutional quality timberland properties)
Since Inception Net IRR @ Calendar Year-End: 7.3%6.0%3.7%2.4% 8.8% 10.3%
($500)
$0
$500
$1,000
$1,500
Q4
'07
Q1 '0
8
Q2
'08
Q3 '0
8
Q4
'08
Q1 '0
9
Q2
'09
Q3 '0
9
Q4
'09
Q1 '10
Q2
'10
Q3 '10
Q4
'10
Q1 '11
Q2
'11
Q3 '11
Q4
'11
Q1 '12
Q2
'12
Q3 '12
Q4
'12
Q1 '13
Q2
'13
Q3 '13
Q4
'13
Q1 '14
Q2
'14
Q3 '14
Q4
'14
Q1 '15
Q2
'15
Q3 '15
Q4
'15
Q1 '16
Q2
'16
Q3 '16
Q4
'16
Q1 '17
Q2
'17
Q3 '17
Q4
'17
Q1 '18
Cu
mu
lati
ve
Gai
ns/
(Lo
sses
) ($
in m
illio
ns)
Gain: $1,252 mmIRR: 10.8%
Start of current team; establishment of direct/co-investment program
270/511

ALASKA PERMANENT FUND CORPORATION 10
Private Infrastructure (Cont’d)
Since Inception Portfolio PerformanceHorizon IRR’s @ December 31 Marks23.0%
18.4%
15.5%
10.8%
16.2%
5.4%
10.4%
5.3%5.4% 5.2% 5.2% 5.5%
1-Year 3-Year 5-Year Since Inception
APFC Infra/Real Assets
Investable Benchmark (FTSE Infra Index)
Return Objective (CPI + 400 bps)
Note: Returns are as of December 31, 2018 NAVs as calculated by APFC Staff and Pathway Capital. APFC portfolio returns are calculated on a money-weighted (IRR) basis as opposed to Callan’s returns which are reported on a time weighted basis.
Capital Capital Capital Current Net Multiple-
($ in millions) Committed Called Returned Value IRR of-Money
Pre-2012 Funds $1,700 $1,567 $1,350 $1,213 10.4% 1.64x
2012 and Newer Funds $1,956 739 152 688 10.6% 1.14x
Total Fund Investments $3,656 $2,306 $1,502 $1,901 10.4% 1.48x
Direct Investments $370 $342 $13 $387 12.3% 1.17x
Listed Infrastructure $300 $300 $397 $0 10.6% 1.32x
Total - 12/31/17 $4,326 $2,948 $1,912 $2,288 10.8% 1.42x
12-Months Ago $3,604 $2,470 $1,518 $1,787 8.8% 1.34x
Total (Excl. Citi Infra) $3,826 $2,503 $1,807 $2,004 16.1% 1.52x
271/511
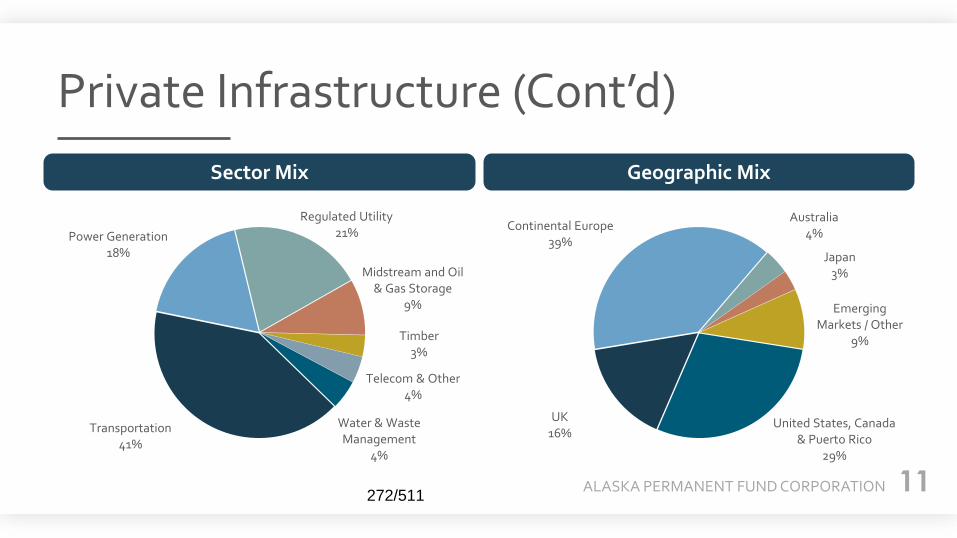
ALASKA PERMANENT FUND CORPORATION 11
Private Infrastructure (Cont’d)
Sector Mix Geographic Mix
Water & Waste Management
4%
Transportation41%
Power Generation18%
Regulated Utility21%
Midstream and Oil & Gas Storage
9%
Timber3%
Telecom & Other4%
United States, Canada & Puerto Rico
29%
UK16%
Continental Europe39%
Australia4%
Japan3%
Emerging Markets / Other
9%
272/511

ALASKA PERMANENT FUND CORPORATION 12
Private Credit and Income OpportunitiesProgram Summary and Objectives
• The Private Credit and Income Opportunities program objective is to provide an income source to the APFC in excess of what is available in public markets for similar risk investments and outperform a US High Yield and a blended Real Assets benchmark
• Generally speaking, in the Real Assets and Private Income portfolio we are defaulting to allocating capital to Private Infrastructure and Private Real Estate, so a decision to allocate capital to a Private Credit or Income Opportunities investmentis a statement that we believe the risk/return profile of that particular investment is more attractive than the default options
• Income Opportunities reflects the reality that there will from time-to-time be interesting opportunistic investments that do not fit neatly into the Real Estate, Infrastructure, or Private Credit categories – one recent example is Life Settlements
• APFC’s Private Credit program involves allocating capital to private funds which engage in direct lending to private companies and other activities such as distressed debt; we invest largely through closed-end, draw-down private funds, but also consider open-ended alternative credit funds where we can achieve immediate exposure and do not have to commit to multi-year unfunded commitments
• Representative Investments: (i) Mezzanine Debt or Senior Direct Lending Funds, (ii) Alaska Direct Alternative Credit (ADAC), (iii) Generate Capital direct investment, (iv) American Homes 4 Rent Joint Venture
273/511

ALASKA PERMANENT FUND CORPORATION 13
Private Credit
Since Inception Portfolio PerformanceHorizon IRR’s @ December 31 Marks
Note: Returns are as of December 31, 2017 NAVs as calculated by APFC Staff and Pathway Capital. APFC portfolio returns are calculated on a money-weighted (IRR) basis as opposed to Callan’s returns which are reported on a time weighted basis.
9.6%
5.8%
7.5% 7.5%7.5%6.4% 5.8%
7.6%
5.4% 5.2% 5.2% 5.6%
1-Year 3-Year 5-Year Since Inception
APFC Private Credit
Investable Benchmark (BC US High Yield 2% Issuer Cap)
Return Objective (CPI + 400 bps)
Vintage Capital Capital Current Net
($ in millions) Year Called Dist. Value IRR MOIC
Crestline AK Distressed Investments 2007 $429 $490 $0 6.5% 1.1x
Oak Tree VIII (Distressed Debt) 2009 $250 $314 $45 8.9% 1.4x
Oak Tree III (Mezzanine Debt) 2010 $229 $237 $59 9.4% 1.3x
Audax III (Mezzanine Debt) 2010 $223 $201 $89 10.2% 1.3x
AK Credit Opportunities Fund 2011 $716 $353 $700 6.7% 1.5x
Audax IV (Mezzanine Debt) 2015 $11 $1 $10 8.2% 1.0x
Crestline AK Opportunistic 2015 $142 $30 $130 12.1% 1.1x
APFC Staff Direct 2015 $141 $13 $138 11.5% 1.1x
Total Private Credit $2,140 $1,640 $1,166 7.5% 1.3x
12 months ago $1,996 $1,431 $1,129 7.1% 1.3x
274/511

ALASKA PERMANENT FUND CORPORATION 14
Income Opportunities
Since Inception Portfolio PerformanceHorizon IRR’s @ December 31 Marks
Note: Investable Benchmark is 60% FTSE Developed Core Infrastructure and 40% Barclays U.S. High Yield. Returns are as of December 31, 2017 NAVs as calculated by APFC Staff and Pathway Capital. APFC portfolio returns are calculated on a money-weighted (IRR) basis as opposed to Callan’s returns which are reported on a time weighted basis.
1.9%
8.3% 7.8%
13.9%
6.3%7.2%
5.4% 5.2% 5.0%
1-Year 3-Year Since Inception
APFC Special Income Opportunities
Investable Benchmark
Return Objective (CPI + 400 bps)
Vintage Capital Capital Current Net
($ in millions) Year Called Dist. Value IRR MOIC
American Homes for Rent II 2013 $161 $32 $165 11.2% 1.2x
Athyrium Opportunities Fund III 2016 $6 $1 $5 NM 1.0x
Generate Capital 2017 $70 $0 $70 NM 1.0x
BroadRiver III 2017 $0 $0 $0 NM NM
Total Income Opportunities $237 $32 $239 7.8% 1.1x
12 months ago $164 $29 $161 10.7% 1.2x
275/511

Asset Allocation Strategies Memo
Separator Page
276/511
SUBJECT: Asset Allocation Strategies ACTION: DATE: May 23, 2018 INFORMATION: X
BACKGROUND: The Asset Allocation Strategies presentation provides information on the Asset Allocation Asset Class through March 31, 2018. STATUS: At this meeting, the Director of Risk and Asset Allocation will present on key elements of the Asset Allocation Portfolio, which includes the Liquidity portfolio, the eCIO program, and the FX Overlay. This presentation will provide an overview of Portfolio composition and performance.
277/511

Asset Allocation Strategies Asset Class Review
Separator Page
278/511
Asset Allocation Strategies
March 23, 2018279/511

ALASKA PERMANENT FUND CORPORATION 2
AA Strategies Overview
LiquidityMulti-Asset
FX Overlay
Liquidity increased from 900mm (1.4%) to 3.7 billion
(5.7%)
A portfolio of multi-strategy managers focused
on investing within an outlined risk framework
$2 billion currency overlay program
280/511

ALASKA PERMANENT FUND CORPORATION 3
Liquidity
Source: Callan, Staff calculations.
281/511

ALASKA PERMANENT FUND CORPORATION 4
Liquidity OverlayProgram Performance
*Program inception dated 2/2/2018. Therefore, February 2018 performance is calculated from 2/2/2018 to 2/28/2018.
Fixed Income Overlay Program Benchmark is the Bloomberg Barclays US Aggregate Index Net Financing.
Equity Overlay Program Benchmark is the ACWI-IMI Index Net
Source: Manager calculations.
282/511

ALASKA PERMANENT FUND CORPORATION 5
Liquidity OverlayProgram Performance
*Program inception dated 2/2/2018. Therefore, February 2018 performance is calculated from 2/2/2018 to 2/28/2018.
Fixed Income Overlay Program Benchmark is the Bloomberg Barclays US Aggregate Index Net Financing.
Equity Overlay Program Benchmark is the ACWI-IMI Index Net
Source: Manager calculations.
283/511

ALASKA PERMANENT FUND CORPORATION 6
Liquidity OverlayPerformance Attribution –Q1 2018
Program inception dated 2/2/2018. Therefore, February 2018 performance is calculated from 2/2/2018 to 2/28/2018.Fixed Income Overlay Program Benchmark is the Bloomberg Barclays US Aggregate Index Net Financing. Equity Overlay Program Benchmark is the ACWI-IMI Index Net
Source: Manager calculations.
284/511

ALASKA PERMANENT FUND CORPORATION 7
Multi-Asset Managers (ECIOs)
Portfolio Performance
0.9
1.1
1.3
1.5
1.7
1.9
De
c-0
9
Jun
-10
De
c-10
Jun
-11
De
c-11
Jun
-12
De
c-12
Jun
-13
De
c-13
Jun
-14
De
c-14
Jun
-15
De
c-15
Jun
-16
De
c-16
Jun
-17
De
c-17
Since inception
CPI+5% ECIO
Source: Manager calculations, Albourne, Callan.
285/511

ALASKA PERMANENT FUND CORPORATION 8
By Region
Global Europe North America Asia & Oceania South America & Africa Other
Sector Mix
Energy Materials Industrials Consumer Discr Consumer Staples
Health Care Financials Info Tech Telcom Services Utilities
Real Estate Conglomerates Brd Mkt Indexes Other
ECIO Portfolio Positioning
286/511

ALASKA PERMANENT FUND CORPORATION 9
AQR
0.91
1.11.21.31.41.51.61.71.81.9
22.12.22.3
2009 2010 2011 2012 2013 2014 2015 2016 2017
Gro
wth
of
$1
Since Inception Performance
AQR CPI+5%
Source: Manager calculations, Albourne.
287/511

ALASKA PERMANENT FUND CORPORATION 10
Goldman
0.91
1.11.21.31.41.51.61.71.81.9
2
2009 2010 2011 2012 2013 2014 2015 2016 2017
Gro
wth
of
$1
Since Inception Performance
GOLDMAN SACHS CPI+5%
Source: Manager calculations, Albourne.
288/511

ALASKA PERMANENT FUND CORPORATION 11
Bridgewater
0.91
1.11.21.31.41.51.61.71.81.9
22.12.22.3
2009 2010 2011 2012 2013 2014 2015 2016 2017
Gro
wth
of
$1
Since Inception Performance
BRIDGEWATER CPI+5%
Source: Manager calculations, Albourne.
289/511

ALASKA PERMANENT FUND CORPORATION 12
Guidelines
- Actively manage foreign currency exposure of $2 billion- Mitigate adverse impact of foreign currency weakening- Add value over benchmark by 100 bps per annum over a 3-5 yr period- Annual ex-post active risk expected to be 175-200 bps on average
- Benchmark is the currency component of return on the unhedged MSCI EAFE plus Canada index
- Hedging shall be between 0%-100% per currency. - Cross hedging is allowed- Authorized instruments are foreign exchange spot and forward contracts of currencies in the MSCI EAFE plus Canada
Currency Overlay Program Performance (Adrian Lee & Partners)
290/511

ALASKA PERMANENT FUND CORPORATION 13
Currency Overlay Program Performance (Adrian Lee & Partners)
Period Passive Return (%) Overlay Return (%)Managed Currency
Return (%)Excess Currency
Return (%)
January 2018 3.65 -0.05 3.60 -0.05
February 2018 -1.55 -0.54 -2.08 -0.53
March 2018 0.35 -0.02 0.33 -0.02
Compound Returns
Last 3 Months 2.41 -0.61 1.79 -0.62
Since Inception 2.78 -0.87 1.90 -0.88
Annualized SD 6.27 1.59 6.76 1.60
Source: Manager calculations.
291/511

ALASKA PERMANENT FUND CORPORATION 14
Currency Overlay Program Performance (Adrian Lee & Partners)
CurrencyAsset (%)
(Mar. 31, 2018)Deviation (%) Currency Return (%)
Excess Currency Return (%)
US Dollars 0.00 0.07 0.00 0.00
Japanese Yen 22.41 -5.14 5.92 -0.46
Euro 30.29 -2.55 2.42 -0.01
British Pound 15.92 -1.60 3.70 -0.11
Swiss Franc 7.13 -6.96 1.76 -0.09
Canadian Dollar 8.36 4.44 -2.82 -0.10
Australian Dollar 6.05 5.08 -1.93 -0.07
Swedish Krona 2.43 -0.31 -2.24 -0.03
Norwegian Krone 0.64 5.00 4.18 0.15
New Zealand Dollar 0.15 4.30 1.43 0.06
Singapore Dollar 1.24 -0.75 1.91 -0.01
Israeli Shekel 0.41 -1.55 -1.12 0.07
Source: Manager calculations.292/511

ALASKA PERMANENT FUND CORPORATION 15
Portfolio SummaryQuarter Ended March 31, 2018
Liquidity
Multi-Asset
FX Overlay
• Since Inception last quarter, liquidity increased from 900mm (1.4%) to 3.7 billion (5.7%)
• Recent notable programs include the liquidity overlay to securitize excess cash
• Of the current liquidity, approximately 2 billion is securitized with a mix of bond and equity derivatives
• Other liquidity includes treasury holdings and cash for operational activities
• The liquidity portfolio contributes to all funding of new programs, capital calls and operational expenses of the Fund
• Program is a mix of managers that allocates to risks in a balanced way and adjusts the risk profile for the economic cycle
• Program started and has been in the same cycle from inception. Since inception return 6.81%, Sharpe ratio of 1.28
• Diversified portfolio exposed to all asset classes with 10%-12% expected volatility, beta to MSCI of 0.5
• Accessed through hedge funds and actively managed long only products
• Current themes include:– Moderating Expansion
– Monetary tightening
– Low return environment supportive of dynamic asset allocation
– Preference of emerging markets over developed markets
• Uses fundamental economic factors and research-driven valuation analysis
• $2 billion of currency exposure resulting from our international investments are actively managed
• During this quarter trade war concerns brought volatility up pushing investors temporarily to safe heaven currencies
• This quarter FX overlay detracted 2 basis points293/511

Asset Class Updates Memo: Fixed Income
Separator Page
294/511

SUBJECT: APFC Fixed Income Asset Class Update
ACTION:
DATE: May 23, 2018
INFORMATION: X
BACKGROUND: The Fixed Income presentation provides information on the Fixed Income + Portfolio STATUS: At this meeting staff will present some of the key elements of the Fixed Income Portfolio including performance and positioning. We will also cover the publicly traded mandates that are part of the Fixed Income + strategy.
295/511

Presentation: Fixed Income
Separator Page
296/511

APFC Internal Fixed Income Portfolio
May 23, 2018297/511

ALASKA PERMANENT FUND CORPORATION 2
Fixed Income Plus Performance
Barclays U.S. Aggregate Portfolio ($3,762mm)• Neutral duration• Overweight spread product and reduced TIPS exposure
Corporate Bond Portfolio ($3,666mm)• Increase in credit quality while spreads tightened• Overweight 10+ year Credit
Performance as of 3/31/2018
Fixed Income Plus ($13,960mm)• Overweight US Agg, Corporates, High Yield and Emerging Markets• Underweight REITs, Global Rates, Listed Infrastructure and Cash
Portfolio -2.44% 3.14% 2.75% 3.62%
Index -2.32% 2.70% 2.30% 3.02%
Strategy -1.74% 2.84% n/a n/a
Index -1.83% 2.28% n/a n/a
Portfolio -1.56% 1.29% 1.44% n/a
Index -1.46% 1.20% 1.20% n/a
QTD (%) 1Yr (%) 3Yr (%) 5Yr(%)
QTD (%) 1Yr (%) 3Yr (%) 5Yr(%)
QTD (%) 1Yr (%) 3Yr (%) 5Yr(%)
298/511

ALASKA PERMANENT FUND CORPORATION 3
Fixed Income Plus Performance
Performance as of 3/31/2018
Fixed Income Plus Cash($601 mm)• Source of liquidity• Seek to at least match T-Bills
Global Rates ($570mm)• Portfolio benefited from overweight to Mexico and Eastern Europe• Duration underweight to Eurozone periphery, underexposure to Japan
and newly-established position in India detracted from performance
Portfolio 1.06% 3.16% 2.11% n/a
Index 1.23% 3.51% 2.60% n/a
Portfolio -0.81% 0.99% 1.35% 0.10%
Index -0.79% 0.92% 1.30% 0.05%
TIPS ($629mm)• Neutral duration with overweight to 10yrs vs 5s and 30s
QTD (%) 1Yr (%) 3Yr (%) 5Yr(%)
QTD (%) 1Yr (%) 3Yr (%) 5Yr(%)
QTD (%) 1Yr (%) 3Yr (%) 5Yr(%)
Portfolio 0.36% 1.07% n/a n/a
Index 0.35% 1.11% n/a n/a
299/511
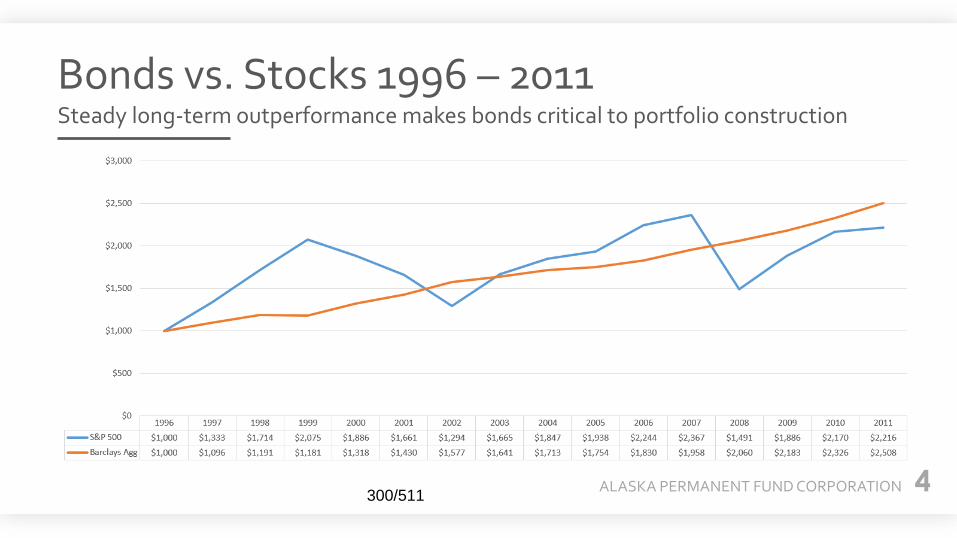
ALASKA PERMANENT FUND CORPORATION 4
Bonds vs. Stocks 1996 – 2011 Steady long-term outperformance makes bonds critical to portfolio construction
300/511

ALASKA PERMANENT FUND CORPORATION 5
Internal Aggregate Portfolio
Composition• $3.762 Billion• Investment Grade Bonds• Barclays’ US Aggregate Index• Duration based on interest rate forecast• Internal Fixed Income Team’s Best Ideas• Primary PM: Jim Parise, Chris Cummins, Masha Skuratovskaya
Performance as of 3/31/2018
Index Comparison
Portfolio Index
Duration 5.9 5.9
Yield 3.1 3.1
Spread 51 43
Rating Aa2 Aa2
Performance
Predicted Tracking Error
Quarterly Attribution
Total Tracking Error
CurveSector Spread
Inflation Other
28 bps 4% 88% 8% 0%
Duration/Curve
Asset Allocation
Security Selection
Other
Portfolio +0.01% -0.06% -0.03% -0.02%
LatestQuarter
YTD One Year Three Year
Portfolio -1.56% -1.56% 1.29% 1.44%
Index -1.46% -1.46% 1.20% 1.20%
301/511
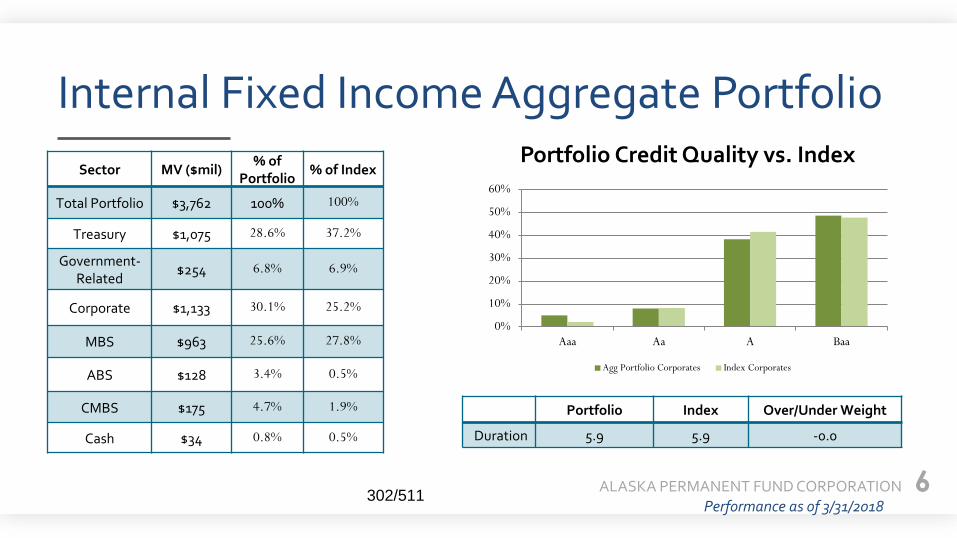
ALASKA PERMANENT FUND CORPORATION 6
Internal Fixed Income Aggregate Portfolio
Sector MV ($mil) % of
Portfolio % of Index
Total Portfolio $3,762 100% 100%
Treasury $1,075 28.6% 37.2%
Government-Related
$254 6.8% 6.9%
Corporate $1,133 30.1% 25.2%
MBS $963 25.6% 27.8%
ABS $128 3.4% 0.5%
CMBS $175 4.7% 1.9%
Cash $34 0.8% 0.5%
Portfolio Index Over/Under Weight
Duration 5.9 5.9 -0.0
Performance as of 3/31/2018
Portfolio Credit Quality vs. Index
0%
10%
20%
30%
40%
50%
60%
Aaa Aa A Baa
Agg Portfolio Corporates Index Corporates
302/511

ALASKA PERMANENT FUND CORPORATION 7
• $3.666 Billion• Investment Grade Corporate Bonds• 300+ positions with 200+ issuers• Barclays’ U.S. Corporate Bond Index• Futures used to control curve and duration exposure• Primary PM: Jim Parise
Internal Corporate Bonds
Performance
Predicted Tracking Error
Composition
Quarterly Attribution
Index Comparison
LatestQuarter
YTD One Year Three Year Five Year
Portfolio -2.44% -2.44% 3.14% 2.75% 3.62%
Index -2.32% -2.32% 2.70% 2.30% 3.02%
Duration/Curve
Asset Allocation
Security Selection
Other
Portfolio 0.01% -0.07% -0.06% 0.00%
Total Tracking Error
CurveSector Spread
Idiosyncratic Other
52 0.0% 100% 0.0% 0.0%
Portfolio Index
Duration 7.3 7.3
Yield 3.8 3.8
Spread 110 109
Rating A3 A3
Performance as of 3/31/2018303/511

ALASKA PERMANENT FUND CORPORATION 8
• $629 Million•US Treasury Inflation Protected Securities• 14+ positions• Barclays’ U.S. TIPS Index• Portfolio duration and curve position reflects views on rates and inflation valuation• Primary PM: Masha Skuratovskaya
Internal Tips Portfolio
Composition
Index Comparison
Portfolio Index
Duration 7.5 7.5
Yield 2.6 2.6
Performance as of 3/31/2018*The internal TIPS portfolio is managed to the BC U.S. TIPS index while the external TIPS portfolio is managed to the BC US TIPS 1-10 year index because the portfolios have a different duration target.
Total Tracking Error
CurveSector Spread
Inflation Other
8 bps 37% 0% 63% 0%
Predicted Tracking Error
Performance
Quarterly Attribution
LatestQuarter
YTD One Year Three Year Five Year
Portfolio -0.81% -0.81% 0.99% 1.35% 0.10%
Index -0.79% -0.79% 0.92% 1.30% 0.05%
Duration/Curve
Asset Allocation
Security Selection
Other
Portfolio -0.01% 0.00% 0.02% -0.03%
304/511

ALASKA PERMANENT FUND CORPORATION 9
• $570 Million• Investment Grade Sovereign and Agency bonds• 60+ positions with 25+ issuers• Barclays’ Global Treasury Ex-U.S. Index Hedged•Cross country allocation is driven by expectation for relative performance. Primary PM: Masha Skuratovskaya
Internal Global Government Bonds
Performance
Predicted Tracking Error
Composition Quarterly Attribution
LatestQuarter
YTD One Year Three Year
Portfolio 1.06% 1.06% 3.16% 2.11%
Index 1.23% 1.23% 3.51% 2.60%
FX Hedging
Country Allocation
Duration / Curve
Asset Allocation
Security Selection
Portfolio -0.17% 0.0% -0.07% -0.07% 0.12%
Portfolio Index
Duration 7.9 8.5
Yield 3.16 2.19
Rating A1 A1
Performance as of 3/31/2018
Total Tracking Error
CurveSector Spread
Idiosyncratic Other
31 bps 95% 0% 4% 1%
Index Comparison
305/511

ALASKA PERMANENT FUND CORPORATION 10
Fixed Income + AllocationFixed Income + Allocation (000’s) CYTD Excess Return Contribution
Benchmark Portfolio
Sector Allocation
Within Sector Allocation
Total Excess Return
US Aggregate 25.00% 3,489,977 26.95% 3,761,906 -0.01% 0.04% 0.03%
US Corporates 25.00% 3,489,977 26.26% 3,665,558 0.00% 0.07% 0.07%
High Yield 10.00% 1,395,991 10.29% 1,436,726 0.00% -0.01% -0.01%
REITs 10.00% 1,395,991 9.32% 1,301,601 0.00% 0.13% 0.12%
Non-US Rates 10.00% 1,395,991 6.60% 920,728 -0.10% -0.01% -0.12%
TIPS 5.00% 697,995 5.41% 755,531 0.01% -0.01% 0.00%
Emerging Market 5.00% 697,995 6.35% 886,547 0.02% 0.24% 0.26%
Listed Infrastructure 5.00% 697,995 4.51% 630,231 0.00% 0.04% 0.04%
Total Cash 5.00% 697,995 4.31% 601,079 -0.01% 0.04% 0.03%
Total 100.00% 100.00% -0.10% 0.52% 0.42%
306/511

ALASKA PERMANENT FUND CORPORATION 11
Fixed Income Plus Performance
Barclays U.S. Aggregate Portfolio ($3,762mm)• Neutral duration• Overweight spread product and reduced TIPS exposure
Corporate Bond Portfolio ($3,666mm)• Increase in credit quality while spreads tightened• Overweight 10+ year Credit
Global Rates ($921mm)
Performance as of 3/31/2018
Fixed Income Plus ($13,960mm)• Overweight US Agg, Corporates, High Yield and Emerging Markets• Underweight REITs, Global Rates, Listed Infrastructure and Cash
Aggregate -1.74% 2.84% 2.63% 2.50%
Index -1.83% 2.28% 2.36% 3.08%
Strategy -1.56% 1.29% 1.44% n/a
Index -1.46% 1.20% 1.20% n/a
Strategy -2.44% 3.14% 2.75% 3.62%
Index -2.32% 2.70% 2.30% 3.02%
Strategy 1.11% 3.10% 2.22% 3.40%
Index 1.23% 3.51% 2.60% 3.76%
In House 1.06% 3.16% 2.11% n/a
Index 1.23% 3.51% 2.60% n/a
Allianz 1.16% 3.54% 2.45% 3.48%
Index 1.23% 3.51% 2.60% 3.76%
Internal ($570mm)• Portfolio benefited from overweight to Mexico and Eastern Europe• Duration underweight to Eurozone periphery, underexposure to Japan
and newly-established position in India detracted from performanceAllianz ($351mm)
• Headline duration underweight and overweight to Italy and Mexico worked out
• Performance suffered from underweight to Japan and overweights to New Zealand and Canada.
QTD (%) 1Yr (%) 3Yr (%) 5Yr(%)
307/511

ALASKA PERMANENT FUND CORPORATION 12
Fixed Income Plus PerformanceGlobal High Yield ($1,437mm)
• Predominantly managed externally. ETFs used to fill allocation
Performance as of 3/31/2018*The internal TIPS portfolio is managed to the BC U.S. TIPS index while the external TIPS portfolio is managed to the BC US TIPS 1-10 year index because the portfolios have a different duration target.
Strategy -0.85% 3.33% 4.44% 4.49%
Index -0.86% 3.78% 5.18% 5.00%
ETF -0.80% 3.40% n/a n/a
Index -0.86% 3.78% n/a n/a
OakTree -1.09% 3.24% 3.83% 3.90%
Index -0.86% 3.78% 5.32% 5.29%
CapGuard -0.64% 3.47% 6.12% 6.01%
Index -0.65% 4.42% 5.46% 5.38%
TIPS ($756mm)Strategy -0.74% 0.94% 1.30% 0.05%
Index -0.79% 0.92% 1.30% 0.05%
In House -0.81% 0.99% 1.35% 0.10%
Index -0.79% 0.92% 1.30% 0.05%
APCM -0.33% 0.55% 1.24% 0.00%
Index -0.40% 0.43% 1.24% -0.06%
Capital Guardian High Yield ($399mm)• BB underweight and B overweight were accretive to relative results;
Underweight CCC detracted
Oaktree High Yield ($578mm)• Performance trailed due to higher yields (risk) benefitting from rising rates
High Yield ETF ($460mm)• Outperformed the index due to risk underweight
Internal TIPS ($629mm)• Neutral duration with overweight to 10yrs vs 5s and 30s
Alaska Permanent Capital Mgmt. ($127mm)• Maintain short duration bias and reduce underweight in 10yr sector vs 5yrs
QTD (%) 1Yr (%) 3Yr (%) 5Yr(%)
308/511

ALASKA PERMANENT FUND CORPORATION 13
Fixed Income Plus Performance
Performance as of 3/31/2018
Strategy 1.95% 9.28% 5.60% 2.11%
Index -1.04% 5.07% 5.36% 3.79%
ETF 1.16% n/a n/a n/a
Index -1.04% n/a n/a n/a
CapGuard 2.17% 9.58% 5.70% 2.17%
Index 1.30% 8.10% 5.53% 1.63%
Emerging Market Debt ($887mm)
Strategy -5.34% 1.41% 6.40% 5.31%
Index -5.79% -0.25% 0.94% 4.12%
AEW -4.93% 3.91% 3.17% 6.28%
Index -5.79% -0.25% 0.94% 4.12%
AH4R -7.82% -16.45% 5.87% 7.69%
Index -5.79% -0.25% 0.94% 4.12%
SSGA -5.50% 0.71% n/a n/a
Index -5.79% -0.25% n/a n/a
REITS ($1,302mm)• Small underweight to the overall REIT sector
AEW ($502mm)• Rising long-term rates were a headwind for U.S. REITs in Q1• Corporate tax cuts were much more beneficial to earnings growth in other
equity sectors relative to U.S. REITs• Overweight Industrial REITs and underweight Shopping Center REITs
benefited relative performance to the index
American Homes 4 Rent ($34mm)
SSGA Global REITS ($766mm)
ETF ($207mm)• Overweight Local Currency vs Hard Currency debt
Capital Group ($679mm)• Benefitted from overweight to unhedged Local Currency debt in Mexico• Suffered from exposure to Brazil and Argentina
QTD (%) 1Yr (%) 3Yr (%) 5Yr(%)
309/511

ALASKA PERMANENT FUND CORPORATION 14
Fixed Income Plus Performance
Performance as of 3/31/2018
Listed Infrastructure ($630 mm)• Small underweight to overall sector
Strategy -5.10% 5.44% 6.69% n/a
Index -5.70% 4.20% 3.52% n/a
Lazard -5.75% 5.07% 9.70% n/a
Index -4.14% 2.88% 4.74% n/a
SSGA -5.53% 4.88% n/a n/a
Index -5.70% 4.20% n/a n/a
C&S -3.19% 7.47% 4.98% n/a
Index -3.81% 5.13% 5.28% n/a
Lazard ($181 mm)• World leading satellite companies (SES and Eutelsat) and UK Infrastructure
companies (United Utilities and Pennon Group) dragged performance lower.
• As the portfolio maintains a full, passive currency hedge, it did not benefit from a weaker dollar.
SSGA ($313 mm)• Passive portfolio used to adjust weighting
Cohen & Steers ($137 mm)• Q1 Infrastructure sector underperformance to the broad equity market
reflected weakness in electric utilities drive by the spike in 10 Year Treasury rate.
Fixed Income Plus Cash($601 mm)• Neutral duration while focused on security selection
Strategy 0.36% 1.07% n/a n/a
Index 0.35% 1.11% n/a n/a
QTD (%) 1Yr (%) 3Yr (%) 5Yr(%)
310/511

Asset Class Updates Memo: Public Equities
Separator Page
311/511

SUBJECT: APFC Public Equities Asset Class Update ACTION: ____ DATE: May 23, 2018 INFORMATION: __X___
BACKGROUND: The Public Equities presentation provides information on the APFC Public Equities Portfolio. STATUS: At this meeting staff will present key elements of performance, positioning, initiatives, and expectations of APFC Public Equities Portfolio. This includes overview of the markets, manager selection, asset allocation, and internal management of equities.
312/511
a) Presentation: Public Equities
Separator Page
313/511
Public Equities Portfolio Update
Fawad Razzaque
May 23, 2018314/511

Public Equities – Performance
What Drove Equity Market Returns in the March quarter?
• Global Economic Growth with Concerns over Inflation and Global Trade– Continued positive trend in Global Corporate
Revenue and Earnings Growth– Valuation compression due to fear of tighter
(than expected) monetary policy in the US– Growth Scare related to Global Trade issues
• Relative Outperformance– Emerging Markets Equities outperformed US
and Non US Developed markets– Narrow Sector Performance– US Growth outperformed US Value– Small Caps outperformed Large caps in
Developed Markets
ALASKA PERMANENT FUND CORPORATION 2
Public Equities FY18 Q3 Ret. (%)
MSCI ACWI IMI -0.89
MSCI Emerging Markets +1.28
Russell 3000 -0.64
MSCI World ex US -2.19
-6.0 -4.0 -2.0 0.0 2.0 4.0
Telecom
Consc. Staples
Energy
Materials
Real Estate
Industrials
Utilities
MSCI ACWI IMI
Financials
Health Care
Consc. Disc
Info Tech
MSCI ACWI IMI Sector Returns
315/511

Stronger Earnings Growth Should Support Stocks Despite Slightly Tighter Monetary Policy
ALASKA PERMANENT FUND CORPORATION 3As of April 30, 2018
Sources: Wolfe Research Portfolio Strategy, Compustat, Standard &Poor’s,
Thomson Reuters, Bloomberg, and Factset
316/511

Public Equities –Valuation
ALASKA PERMANENT FUND CORPORATION 4
16.3 16.0 16.5
12.1
15.0 14.6
12.813.7
16.917.5 17.5
18.820
16.9
15.615.1
14.0
10.8
14.913.8
11.8
13.7
16.3 16.016.6 16.3 16.1
14.1
12.713.8
15.8
8.9
20.4
14.1
11.0
13.212.7
13.4 13.1 13.113.6
12.2
0.0
5.0
10.0
15.0
20.0
25.0
Dec 31,2005
Dec 31,2006
Dec 31,2007
Dec 31,2008
Dec 31,2009
Dec 31,2010
Dec 31,2011
Dec 31,2012
Dec 31,2013
Dec 31,2014
Dec 31,2015
Dec 31,2016
Dec 31,2017
March31, 2018
S&P 500 vs. EAFE Core vs. Emerging CoreP/E (FY1): 2005-2018
S&P 500 MSCI EAFE Core MSCI Emerg Core
317/511

The profits Cycle Drives Cyclical vs. Defensive PperformanceS&P 500® Sector Performance & The Profits Cycle
9/89-
6/90
3/91-
12/91
3/93-
9/93
3/95-
6/96
3/97-
12/98
3/00-
12/01
12/03-
6/05
3/06-
3/09
6/10-
3/13
12/13-
12/15
6/90-
3/91
12/91-
3/93
9/93-
3/95-
6/96-
3/97
12/98-
3/00
12/01-
12/03
6/05-
3/06
3/09-
6/10
3/13-
12/13
12/15-
12/17
HlthCare
19%
HlthCare
29%
Tel. Svcs
11%
HlthCare
54%
HlthCare
72%
Cons Stpl
32%
Energy
58%
Cons Stpl
-3%
Cons. Disc
91%
HlthCare
34%
HlthCare
24%
Financials
35%
Info Tech
42%
Financials
28%
Info Tech
177%
Materials
31%
Materials
22%
Financials
59%
Cons. Disc
28%
Info Tech
58%
Cons Stpl
16%
Cons Stpl
20%
Energy
9%
Financials
50%
Tel. Svcs
71%
HlthCare
20%
Utilities
43%
Utilities
-7%
Tel. Svcs
79%
Info Tech
27%
Cons Stpl
23%
Tel. Svcs
29%
HlthCare
39%
Info Tech
26%
Cons. Disc
56%
Financials
12%
Energy
19%
Industrials
52%
Industrials
27%
Financials
50%
Energy
11%
Utilities
19%
Utilities
9%
Cons Stpl
47%
Info Tech
66%
Financials
12%
Tel. Svcs
14%
Energy
-12%
HlthCare
74%
Cons Stpl
24%
Utilities
10%
Cons. Disc
28%
Cons Stpl
30%
Energy
20%
Tel. Svcs
51%
Energy
12%
Industrials
15%
Cons. Disc
51%
Info Tech
23%
Materials
45%
Info Tech
10%
Financials
18%
Financials
8%
Info Tech
44%
Utilities
44%
Utilities
2%
Industrials
12%
Tel. Svcs
-14%
Cons Stpl
70%
Utilities
23%
Energy
9%
Utilities
19%
Materials
27%
HlthCare
17%
S&P 500
50%
Cons Stpl
7%
Tel. Svcs
13%
Info Tech
39%
HlthCare
22%
Industrials
44%
Industrials
7%
Cons. Disc
16%
Industrials
7%
Industrials
40%
Cons. Disc
41%
Energy
1%
S&P 500
10%
HlthCare
-19%
Energy
66%
Cons. Disc
21%
S&P 500
8%
Energy
15%
Industrials
16%
Cons Stpl
15%
Industrials
42%
Cons. Disc
5%
Financials
13%
S&P 500
33%
Financials
22%
S&P 500
36%
S&P 500
5%
Materials
14%
Info Tech
4%
S&P 500
38%
S&P 500
38%
Industrials
1%
Financials
8%
Materials
-28%
Industrials
62%
S&P 500
15%
Financials
6%
Industrials
14%
S&P 500
14%
S&P 500
15%
Financials
30%
S&P 500
0%
Info Tech
12%
Materials
32%
Materials
20%
Cons. Disc
30%
Utilities
2%
S&P 500
14%
S&P 500
3%
Tel. Svcs
32%
Financials
29%
Materials
-1%
Cons Stpl
8%
Info Tech
-28%
S&P 500
61%
Financials
13%
Materials
3%
Info Tech
14%
Energy
10%
Industrials
11%
Energy
23%
Industrials
-3%
S&P 500
10%
Cons Stpl
25%
S&P 500
20%
Utilities
30%
Cons. Disc
-1%
Industrials
12%
Materials
1%
Energy
30%
Cons Stpl
20%
Cons. Disc
-15%
Cons. Disc
6%
S&P 500
-34%
Utilities
56%
Industrials
7%
Cons. Disc
2%
Materials
12%
Cons. Disc
6%
Materials
9%
Materials
13%
HlthCare
-7%
Cons Stpl
5%
HlthCare
19%
Energy
14%
Energy
26%
Tel. Svcs
-2%
Tel. Svcs
9%
Cons. Disc
0%
Utilities
29%
Industrials
19%
S&P 500
-22%
HlthCare
5%
Cons. Disc
-39%
Materials
53%
Tel. Svcs
6%
Industrials
0%
S&P 500
12%
Financials
1%
Cons. Disc
4%
HlthCare
3%
Info Tech
-8%
HlthCare
4%
Utilities
16%
Cons Stpl
10%
Tel. Svcs
22%
Materials
-6%
Energy
0%
HlthCare
-4%
Cons. Disc
26%
Energy
18%
Tel. Svcs
-46%
Materials
4%
Industrials
-44%
Info Tech
52%
Materials
-2%
Info Tech
-1%
Cons Stpl
3%
Tel. Svcs
-5%
Tel. Svcs
1%
Utilities
0%
Utilities
-12%
Cons. Disc
3%
Energy
13%
Tel. Svcs
2%
Cons Stpl
20%
Financials
-13%
Info Tech
-5%
Cons Stpl
-9%
Materials
19%
Materials
-2%
Info Tech
-61%
Info Tech
-3%
Financials
-70%
Financials
39%
Energy
-27%
Tel. Svcs
-2%
HlthCare
-27%
Utilities
-13%
Utilities
-1%
Cons Stpl
-14%
Tel. Svcs
-29%
Utilities
0%
Tel. Svcs
7%
Utilities
0%
HlthCare
19%
Decelerating Profits Growth Accelerating Profits Growth
l Cyclical
Defensive
ALASKA PERMANENT FUND CORPORATION 5318/511

Public Equities - AllocationMarch 31, 2018
APFC Public Equity Regions and Sectors
ALASKA PERMANENT FUND CORPORATION 6
-2.0 -1.0 0.0 1.0 2.0 3.0
Consc. Staples
Health Care
Real Estate
Info Tech
Utilities
Telecom
Consc. Disc
Materials
Industrials
Energy
Financials
Sector over/under weights
-10 -5 0 5 10
United States
Australia
European Union
UK
Canada
Japan
Emerging Markets
Regional (over/under) Weights
319/511

Public Equities - Performance
APFC Public Equity
FY 18 Q3 (%)
FYTD
Public Equities -0.42 11.42
MSCI ACWI IMI -0.89 10.35
Excess Returns (bps) +47 +107
Domestic Equities -0.40 11.23
Russell 3000 Index -0.64 10.48
Excess Returns (bps) +24 +75
International Equities -0.22 12.85
MSCI ACWI IMI ex-US -1.06 10.63
Excess Returns (bps) +84 +222
Global Equities -0.66 10.09
MSCI ACWI IMI -0.89 10.35
Excess Returns (bps) +23 -26
March 31, 2018
ALASKA PERMANENT FUND CORPORATION 7
What Drove Relative Returns in the December Quarter?
•Fund Managers•Emerging markets
Domestic Equities•Positive relative performance from Active Managers (+8 bps)•Over Weight to Small Caps over Large caps modestly beneficial
International Equities•Positive relative performance from Active Managers (+15 bps)•Over Weight to Emerging Markets and Info. Tech Sector was beneficial
Global Equities•Positive relative performance from Active Managers (+15 bps)•Tactical Tilts (+5 bps) added value•Overweight to Europe was a drag
320/511
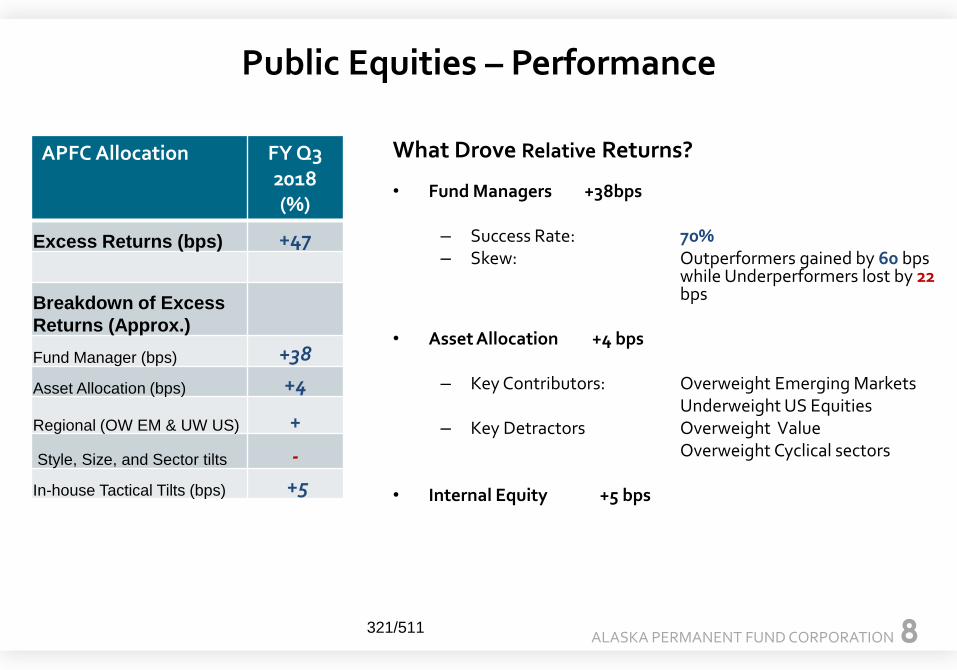
Public Equities – Performance
What Drove Relative Returns?
• Fund Managers +38bps
– Success Rate: 70%– Skew: Outperformers gained by 60 bps
while Underperformers lost by 22bps
• Asset Allocation +4 bps
– Key Contributors: Overweight Emerging Markets Underweight US Equities
– Key Detractors Overweight ValueOverweight Cyclical sectors
• Internal Equity +5 bps
ALASKA PERMANENT FUND CORPORATION 8
APFC Allocation FY Q32018 (%)
Excess Returns (bps) +47
Breakdown of Excess Returns (Approx.)Fund Manager (bps) +38
Asset Allocation (bps) +4
Regional (OW EM & UW US) +
Style, Size, and Sector tilts -
In-house Tactical Tilts (bps) +5
321/511

Fund Managers Assets AttributionMcKinley Global Growth 2.75% 0.06%
Lazard Global Core 5.03% 0.06%
Acadian Intl LCV 2.00% 0.05%
Johnston Intl LCG 1.49% 0.05%
AQR Global Core 5.77% 0.04%
CastleArk US LCG 1.21% 0.04%
ArrowStreet Global 2.24% 0.03%
LSV US LC Value 3.26% 0.03%
Schroders Intl ACV 2.32% 0.03%
Trustbridge EM 0.67% 0.02%
SKBA US LCV 1.33% 0.02%
RBA Global 0.77% 0.02%
DSM US LCG 1.83% 0.01%
LSV Intl LCV 2.16% 0.01%
DFA INTL Large Cap 3.53% 0.01%
Jennison US SCC 0.69% 0.01%
WCM Global 0.77% 0.01%
Pzena US SCV 0.68% 0.01%
In House SPDR Momentum 1.53% 0.01%
DFA EM Value 2.26% 0.01%
Wells Capital 0.28% 0.01%
JP Morgan Intl LCG 2.16% 0.01%
AGI US LCG 3.28% 0.01%
Fund Managers Assets AttributionEagle US SCG 0.71% 0.00%T Rowe US SCV 0.66% 0.00%DFA EM Small Cap 0.80% 0.00%Lee Munder EM 0.38% 0.00%Macquarie EM 0.94% 0.00%APF Global Equities 0.38% 0.00%RBC US SCG 0.61% 0.00%SSGA US LCG 0.83% 0.00%In House SPDR Low Vol 1.51% 0.00%DFA INTL Small Company 1.62% 0.00%AGI Structured Alpha 0.55% -0.01%DFA INTL SCV 1.61% -0.01%William Blair EM 2.16% -0.01%Lyrical US LCV 2.53% -0.01%JP Morgan EM 2.11% -0.01%CDAM Global 0.55% -0.02%Mellon FTSE RAFI US LC 1.60% -0.03%In House SPDR Yield 1.43% -0.03%Mondrian EM 2.33% -0.03%SSgA Russ FDMTL DVLPD LC 5.94% -0.05%
Total 0.38%
Performance – Positive Skew in Fund Manager Excess Returns (FY 18 Q3)
ALASKA PERMANENT FUND CORPORATION 9322/511

FY 18 Q3 Performance –Global Equity Managers
Global Equity Managers 1 Year (%)
3 Years (%)
5 Years (%)
Public Equities 16.31 8.65 9.27
MSCI ACWI IMI 15.03 8.27 9.34
Domestic Equities 14.40 10.28 13.31
Russell 3000 13.81 10.22 13.03
International Equities 19.79 8.23 6.46
MSCI ACWI ex-US 17.10 6.75 6.24
Global Equities 14.18 7.89 9.83
MSCI ACWI 14.85 8.12 9.20
ALASKA PERMANENT FUND CORPORATION 10323/511

Performance – External Fund Managers (1 Year)
68% Outperformed
ALASKA PERMANENT FUND CORPORATION 11
Fund Managers with 3 yrs of Fund history
Excess Returns
(%)Wells Capital 17.36%Trustbridge EM 15.87%
Johnston Intl LCG 9.48%SKBA US LCV 8.62%DSM US LCG 7.33%Acadian Intl LCV 7.12%CastleArk US LCG 5.73%LSV US LC Value 4.86%T Rowe US SCV 4.77%William Blair EM 4.65%Jennison US SCC 4.19%McKinley Global Growth 4.12%LSV Intl LCV 4.08%AQR Global Core 3.59%DFA INTL Large Cap 2.78%JP Morgan Intl LCG 2.72%Macquarie EM 2.28%DFA EM Value 1.59%Schroders Intl ACV 1.17%Lyrical US LCV 0.93%JP Morgan EM 0.79%Lee Munder EM 0.73%DFA EM Small Cap 0.68%In House SPDR Momentum 0.46%Eagle US SCG 0.33%AGI US LCG 0.25%Pzena US SCV 0.08%AGI Structured Alpha -0.07%Lazard Global Core -0.18%DFA INTL Small Company -0.70%SSgA Russ FDMTL DVLPD LC -0.98%
DFA INTL SCV -1.04%
In House SPDR Low Vol -3.57%SSGA US LCG -3.70%Mellon FTSE RAFI US LC -4.00%RBC US SCG -4.45%In House SPDR Yield -6.60%Mondrian EM -10.01%
-15%-10% -5% 0% 5% 10% 15% 20%Mondrian EM
In House SPDR YieldRBC US SCG
Mellon FTSE RAFI US LCSSGA US LCG
In House SPDR Low VolDFA INTL SCV
SSgA Russ FDMTL DVLPD LCDFA INTL Small Company
Lazard Global CoreAGI Structured Alpha
Pzena US SCVAGI US LCG
Eagle US SCGIn House SPDR Momentum
DFA EM Small CapLee Munder EMJP Morgan EM
Lyrical US LCVSchroders Intl ACV
DFA EM ValueMacquarie EM
JP Morgan Intl LCGDFA INTL Large Cap
AQR Global CoreLSV Intl LCV
McKinley Global GrowthJennison US SCC
William Blair EMT Rowe US SCV
LSV US LC ValueCastleArk US LCG
Acadian Intl LCVDSM US LCG
SKBA US LCVJohnston Intl LCG
Trustbridge EMWells Capital
Active Managers Excess Returns 1 Year ended 03/31/18
Performance (%)
324/511

Public Equities – Fund Managers (3 Years) Fund Managers with 3 yrs of Fund history
Excess Returns (%)
Acadian Intl LCV 5.97%Johnston Intl LCG 5.28%
Macquarie EM 3.60%T Rowe US SCV 3.59%Schroders Intl ACV 3.48%SKBA US LCV 3.31%Eagle US SCG 2.95%JP Morgan EM 2.59%Pzena US SCV 2.58%LSV Intl LCV 2.45%JP Morgan Intl LCG 2.21%CastleArk US LCG 1.76%AQR Global Core 1.74%DFA INTL SCV 1.45%DFA INTL Large Cap 1.34%DFA INTL Small Company 1.08%DSM US LCG 0.48%McKinley Global Growth 0.36%RBC US SCG 0.00%SSgA Russ FDMTL DVLPD LC -0.05%Lazard Global Core -0.29%Jennison US SCC -0.34%William Blair EM -0.37%Lyrical US LCV -0.43%AGI US LCG -0.59%Lee Munder EM -1.06%Mellon FTSE RAFI US LC -1.30%SSGA US LCG -1.60%Mondrian EM -2.65%Herndon *
SSGA INTL * ALASKA PERMANENT FUND CORPORATION 12APFC External Fund Managers: 61% Outperformed
-4% -2% 0% 2% 4% 6% 8%
Mondrian EMSSGA US LCG
Mellon FTSE RAFI US LCLee Munder EM
AGI US LCGLyrical US LCV
William Blair EMJennison US SCC
Lazard Global CoreSSgA Russ FDMTL DVLPD LC
RBC US SCGMcKinley Global Growth
DSM US LCGDFA INTL Small Company
DFA INTL Large CapDFA INTL SCV
AQR Global CoreCastleArk US LCG
JP Morgan Intl LCGLSV Intl LCV
Pzena US SCVJP Morgan EMEagle US SCGSKBA US LCV
Schroders Intl ACVT Rowe US SCV
Macquarie EMJohnston Intl LCG
Acadian Intl LCVFund Managers Excess Returns 3 Yrs ended 03/31/18
Performance
325/511

Fund Manager Selection – Excess Returns (5 Years)
APFC Fund Managers: 64% Outperformed•*GMO, Capital Group were terminated in 2014 and 2015, respectively•Herndon and SSGA INTL were terminated in 2017• No Survivorship bias
Fund Managers 5 Yr Fund history
Mgr Ret. (%)
Index (%)
+/-(%)
Lyrical US LCV 15.22% 10.78% 4.44%Pzena US SCV 13.39% 9.96% 3.43%
Acadian Intl LCV 7.68% 4.88% 2.80%DFA INTL SCV 10.94% 8.78% 2.16%AQR Global Core 11.50% 9.70% 1.80%McKinley Global Growth 10.85% 9.20% 1.65%T Rowe US SCV 11.19% 9.96% 1.23%SKBA US LCV 11.96% 10.78% 1.18%Jennison US SCC 12.58% 11.47% 1.11%DFA INTL Small Company 10.67% 9.71% 0.96%DFA INTL Large Cap 6.89% 6.04% 0.85%Lazard Global Core 9.86% 9.20% 0.66%DSM US LCG 16.18% 15.53% 0.65%Eagle US SCG 13.29% 12.90% 0.39%AGI US LCG 15.87% 15.53% 0.34%SSgA Russ FDMTL DVLPD LC 9.97% 9.70% 0.27%SSGA US LCG 15.09% 15.53% -0.44%CastleArk US LCG 14.55% 15.53% -0.98%Mellon FTSE RAFI US LC 12.03% 13.17% -1.14%RBC US SCG 11.59% 12.90% -1.31%Mondrian EM 1.66% 4.99% -3.33%SSGA INTL *
Herndon US LCV *
Cap Group EM *
GMO Global Core *
ALASKA PERMANENT FUND CORPORATION 13
-4% -2% 0% 2% 4% 6%
Mondrian EMRBC US SCG
Mellon FTSE RAFI US LCCastleArk US LCG
SSGA US LCGSSgA Russ FDMTL DVLPD…
AGI US LCGEagle US SCGDSM US LCG
Lazard Global CoreDFA INTL Large Cap
DFA INTL Small CompanyJennison US SCC
SKBA US LCVT Rowe US SCV
McKinley Global GrowthAQR Global Core
DFA INTL SCVAcadian Intl LCV
Pzena US SCVLyrical US LCV
Fund Managers Excess Returns 5 Yrs ended 03/31/18
Performance
326/511
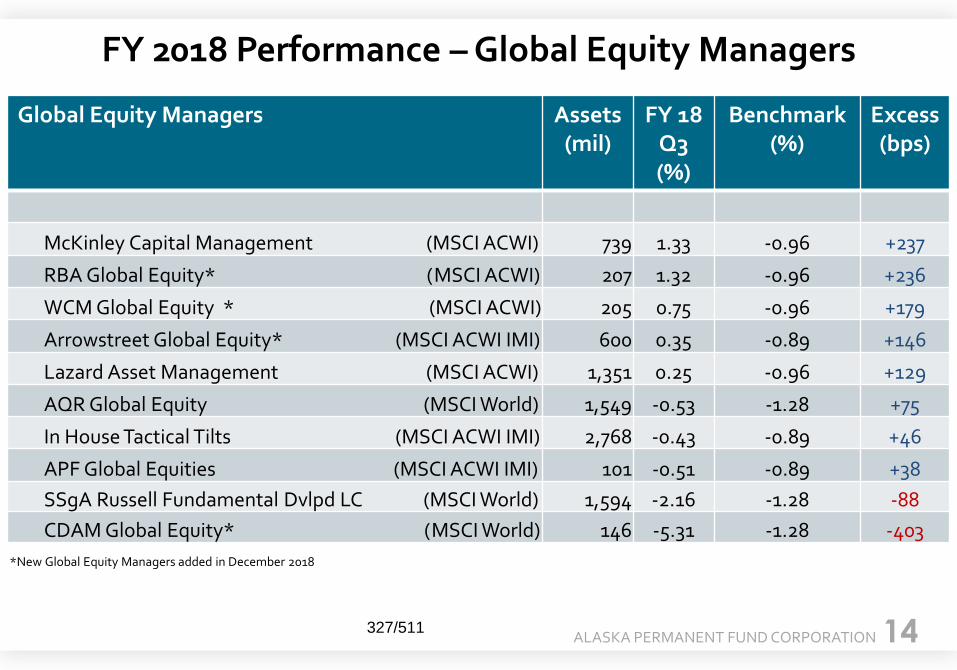
FY 2018 Performance –Global Equity Managers
Global Equity Managers Assets (mil)
FY 18 Q3 (%)
Benchmark (%)
Excess(bps)
McKinley Capital Management (MSCI ACWI) 739 1.33 -0.96 +237
RBA Global Equity* (MSCI ACWI) 207 1.32 -0.96 +236
WCM Global Equity * (MSCI ACWI) 205 0.75 -0.96 +179
Arrowstreet Global Equity* (MSCI ACWI IMI) 600 0.35 -0.89 +146
Lazard Asset Management (MSCI ACWI) 1,351 0.25 -0.96 +129
AQR Global Equity (MSCI World) 1,549 -0.53 -1.28 +75
In House Tactical Tilts (MSCI ACWI IMI) 2,768 -0.43 -0.89 +46
APF Global Equities (MSCI ACWI IMI) 101 -0.51 -0.89 +38
SSgA Russell Fundamental Dvlpd LC (MSCI World) 1,594 -2.16 -1.28 -88
CDAM Global Equity* (MSCI World) 146 -5.31 -1.28 -403
*New Global Equity Managers added in December 2018
ALASKA PERMANENT FUND CORPORATION 14327/511

In-House Tactical Tilt – Positions as of 3/31/2018
In-House Tactical Tilts (2,768 million) (%)
Vanguard S&P 500 (VOO) 30.2
Vanguard FTSE Emerging Markets (VWO) 13.7
Vanguard FTSE Developed Markets (VEA) 11.4
US Financial Select SPDR (XLF) 10.0
US Technology Select SPDR (XLK) 8.0
Ishares Russell 2000 (IWM) 5.3
Ishares MSCI Europe Financial (EUFN) 4.5
Kranesahres CSI China Internet* 3.6
Ishares MSCI China ETF* 3.5
Ishares MSCI Mexico 3.0
US Energy Sector Select SPDR (XLE) 2.9
Ishares MSCI Taiwan 1.8
Ishares MSCI South Korea 1.8
Total 100%
Allocation % +/-
US 56.4 +
Non US DM 15.9 -
EM 27.4 +
ALASKA PERMANENT FUND CORPORATION 15
Sector Emphasis: FinancialsTechnologyEnergy
Regional Emphasis:Overweight US EquitiesOverweight Emerging MarketsUnderweight non-US DM
328/511

Public Equities - PositioningMarch 31, 2018
APFC Public Equity Allocation – No Change:
• Regions: Overweight to Emerging Markets - Strategic/Tactical
• Sectors: Modest tilt towards economically sensitive sectors - Tactical
• Style: Modest tilt in favor of Value - Tactical
Risks to Current Positioning (Listed in the order of Importance)– Rise in US Dollar
– US - China Trade Relations
– Sharp rise in US Interest Rates / QT
– Inverted Yield Curve
– Decline in Corporate Earnings
– Greater than expected slowdown in China Growth
– Geopolitical Risks – North Korea/Mideast
ALASKA PERMANENT FUND CORPORATION 16329/511

Public Equities – Key Macro Factors to Watch
US DOLLAR (5 Yr period)
ALASKA PERMANENT FUND CORPORATION 17330/511

Public Equities – Key Macro Factors to WatchYield Spread between US 10 Yr and US 2 Yr (1977 – 2018) - at the lowest point over the last decade, 47 bps from the point of inversion
ALASKA PERMANENT FUND CORPORATION 18331/511

Public Equities – Key Macro Factors to Watch
Sources: Wolfe Research Portfolio Strategy, Compustat, Standard &Poor’s, Thomson Reuters, Bloomberg, and FactsetAs of April 30, 2018
ALASKA PERMANENT FUND CORPORATION 19332/511

Asset Class Updates Memo: Private Equity & Special
Opportunities
Separator Page
333/511

SUBJECT: Private Equity & Special Opportunities ACTION: ___________ Asset Class Update DATE: May 23, 2018 INFORMATION: X
BACKGROUND: The Private Equity and Special Opportunities presentation provides a portfolio update and investment performance analysis. STATUS: At this meeting staff will present some of the key elements of the Private Equity and Special Opportunities portfolio including, as context, overall market performance and outlook. Staff will compare performance of portfolio components, including performance of staff investments versus gatekeeper investments and fund investments versus co-investments. All Policy guidelines are identified in the Investment Policy Manual and Strategic Plan.
334/511

a) Presentation: Private Equity & Special Opportunities
Separator Page
335/511

Private Equity & Special OpportunitiesPortfolio Update | May 23, 2018
Steve Moseley336/511

ALASKA PERMANENT FUND CORPORATION 2
Executive Summary
Portfolio Summary
($mm, 31-Dec-17)
PortfolioMarketValue
%APF
1-Year Net IRR
3-Year Net IRR
Since Inception Returns
Net IRR Net Gain
Private Equity $4,735 7.3% 23.5% 16.5% 13.3% $3,190
Special Opportunities 3,049 4.7% 27.0% 7.0% 28.7% 1,672
Combined Portfolio $7,784 12.0%4 24.8% 12.6% 15.4% $4,862
Public Benchmark1 23.0% 10.4% 9.5% $2,368
Excess Return 1.8% 2.2% 5.9% $2,494
Tactical Summary
($mm, 31-Dec-17)
Investment Activity
Investment Activity Since Inception Net Returns
CommentsFY20182 Total Average IRR Multiple Gain
Fund Commitments $1,448 $12,251 $37 12.8% 1.4x $3,453 • Private equity program launched with gatekeepers in 2004
Direct/co-investments $58 $1,069 $49 64.0% 2.4x $1,409 • Staff-managed program launched in 2014; minimal fees
Portfolio continues to generate strong returns; cumulative net gains reached $4.9 billion at calendar year end
Program Summary
($mm, 31-Dec-17)
Program
Commitments Since InceptionNet IRR
FY 20182 Total
Pathway + HarbourVest $416 $6,556 12.9%
APFC PE 723 2,677 21.2%
APFC SpecOps 367 4,087 28.7%
Combined Portfolio $1,505 $13,320 15.4%
Source: Pathway Capital Management as of 31-Dec-2017, unless otherwise specified.Note: All dollars in millions. All returns net of management fees and carry. Returns may differ slightly from Callan due to timing and methodology.(1) Public market equivalent benchmark assumes combined portfolio cash flows are invested in, or distributed from, a public index fund (60% Russell 3000/40% MSCI EAFE).(2) Includes commitments through March 31, 2018.(3) Of the portfolio's 397 partnerships, December 31, 2017, data was pending or not yet available for 16 (5% by market value) at the time of this report. (4) Pro-forma for completed Q1 ‘18 strategic sales, Combined Portfolio % drops to 11.4%.
337/511

ALASKA PERMANENT FUND CORPORATION 3
Private Equity Market UpdatePurchase price multiples and fundraising velocity will eventually depress returns
…although exit activity decelerated in 2017.U.S. PE multiples reach new highs (again)…
Institutional investors continue to break recent PE allocation records… • …with large cap PE firms raising a disproportionate share of the capital
Source: Pitchbook as of Q4 2017.
5.8
x
5.9
x
2.9
x 4.7
x
4.9
x
4.2
x
5.7x
5.6
x
4.6
x
4.8
x 6.7
x
4.2
x
3.9
x
3.4
x 3.5x 4.3
x
4.x
3.7x
4.4
x
3.5x 4
.8x
5.9
x
10.x 9.8x
6.4x
8.2x9.1x
8.2x9.4x
10.x
8.2x
9.6x
12.6x
0x
5x
10x
15x
2007 2008 2009 2010 2011 2012 2013 2014 2015 2016 2017
Debt / EBITDA Equity / EBITDAValuation / EBITDA
$12
2
$15
8
$72
$4
7
$12
7
$12
2
$18
4
$17
3
$2
37
$30
4
$2
22
$18
5
760
926
637
425
826904
1,1241,044
1,306 1,3601,238
1,097
0
500
1,000
1,500
$0
$100
$200
$300
$400
2006 2007 2008 2009 2010 2011 2012 2013 2014 2015 2016 2017
Exit Value ($B) # of Exits
$18
5
$2
68
$18
8
$12
1
$72
$9
3
$11
4
$2
00
$2
05
$2
01
$2
15
$2
33
275
316
271
167 163198
220
297
342312
290
247
0
50
100
150
200
250
300
350
400
$0
$50
$100
$150
$200
$250
$300
2006 2007 2008 2009 2010 2011 2012 2013 2014 2015 2016 2017Capital Raised ($B) # of Funds Closed
0%
10%
20%
30%
40%
50%
60%
70%
80%
90%
100%
2010 2011 2012 2013 2014 2015 2016 2017
$5B+
$1B-$5B
$500M-$1B
$250M-$500M
$100M-$250M
Under $100M
338/511

ALASKA PERMANENT FUND CORPORATION 4
Vintage Year PerformanceAPFC has outperformed the median private equity benchmark every year since inception
Source: Pathway Capital Management and Burgiss as of 31-Dec-2017.Note: All returns net of management fees and carry. Returns may differ slightly from Callan’s time-weighted returns due to reporting lag and methodology.a) Represents weighted average benchmark, based on APFC fund commitments for each vintage year.
11%
8%
12%
14% 15% 14% 15%
22%
27%
17%
25%
29%
0%
5%
10%
15%
20%
25%
30%
35%2
00
4/2
00
5a
20
06
20
07
20
08
20
09
20
10
20
11
20
12
20
13
20
14
20
15
20
16
Median S-I IRR
339/511

ALASKA PERMANENT FUND CORPORATION 5
Portfolio PerformancePE and SpecOps portfolios continue to outperform both public market and industry benchmarks
Sources: Pathway Capital Management and Cambridge Associates as of 31-Dec-2017.
Notes: All returns net of management fees and carry. Returns may differ slightly from Callan due to timing and methodology.
Public market equivalent benchmark assumes combined portfolio cash flows are invested in, or distributed from, a public index fund (60% Russell 3000/40% MSCI EAFE).
PE Median represents the Cambridge Associates global all private equity return benchmark for 2004- through 2017-vintage funds, as of December 31, 2017, as produced using Cambridge data.
Of the portfolio's 397 investments, December 31, 2017, data was not yet available for 16 (5% by market value) at the time of this report.
23%
10%
12%
9%
19%
12%
13%
11%
25%
13%
20%
15%
1-Year 3-Year 5-Year Since Inception
Public Benchmark PE Median APFC PE + SpecOpps
340/511
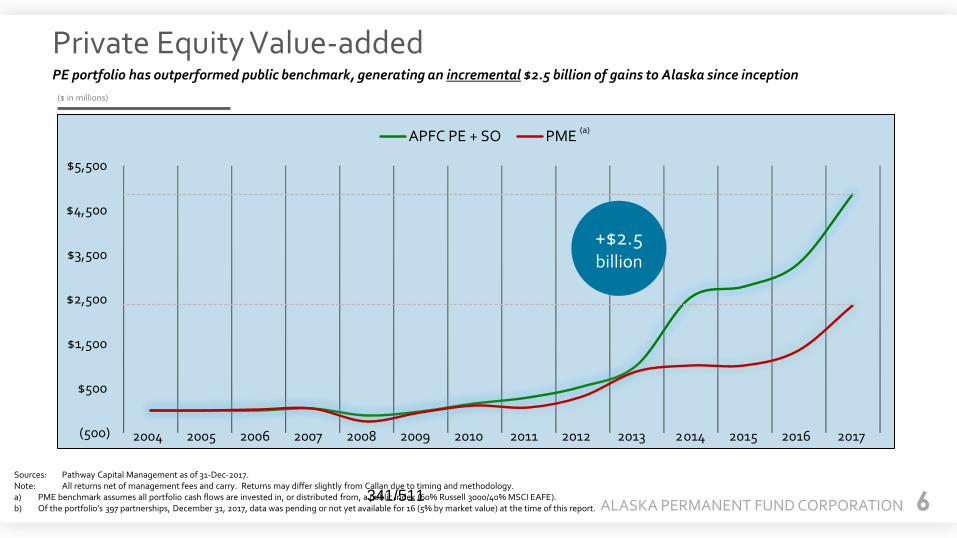
ALASKA PERMANENT FUND CORPORATION 6
Private Equity Value-addedPE portfolio has outperformed public benchmark, generating an incremental $2.5 billion of gains to Alaska since inception
Sources: Pathway Capital Management as of 31-Dec-2017.Note: All returns net of management fees and carry. Returns may differ slightly from Callan due to timing and methodology.a) PME benchmark assumes all portfolio cash flows are invested in, or distributed from, a public index (60% Russell 3000/40% MSCI EAFE).b) Of the portfolio's 397 partnerships, December 31, 2017, data was pending or not yet available for 16 (5% by market value) at the time of this report.
($ in millions)
(500)
$500
$1,500
$2,500
$3,500
$4,500
$5,500
APFC PE + SO PME
+$2.5 billion
2004 2005 2006 2007 2008 2009 2010 2011 2012 2013 2014 2015 2016 2017
(a)
341/511

ALASKA PERMANENT FUND CORPORATION 7
Market perception of APFC supports our market objectives
342/511

ALASKA PERMANENT FUND CORPORATION 8
Highlights and expectations
• Manage team and geographic constraints– Sourcing and diligence more critical than ever before
– Leverage consultants, advisors and other 3rd parties
• Internationalize for diversification and growth– Position APFC for long-term growth opportunities
• Reinforce defensive posture– Consolidate preferred GP relationships
– Favor contractual returns, asset coverage
• Maintain agility– Enhance portfolio monitoring and data analytics
– Harvest gains, de-risk portfolio, maintain steady pacing
– Seek counter-cyclical, uncorrelated strategies and assets
– Deploy with conviction when markets turn
• Risk– Reduced targeted concentrations and harvested gains
• Returns (1)
– 1-yr, 3-yr, and 5-yr net returns of 25%, 13%, and 20%, respectively
– Exceeded PE industry and public market equivalent benchmarks
– Cum. incremental gain of $2.5 billion above public benchmark
– Direct and co-investments sourced by APFC staff have generated 64% net annual returns since 2014
• Yield– Record quarterly distributions: $1.463 billion Jan. to March 2018
• Organizational management– Team size limits potential and increases cost
• Smaller team greater costs (and vice versa)
Recent activity Plans and expectations
Source: Returns as reported by Pathway Capital Management as of 31-Dec-2017, unless otherwise specified.
Note: All returns net of management fees and carry. Returns may differ slightly from Callan data due to timing and methodology.
(1) PE Median represents the Cambridge Associates global all private equity return benchmark for 2004- through 2017-vintage funds, as of December 31, 2017, as produced using Cambridge data.. Public market equivalent benchmark assumes combined portfolio cash flows are invested in, or
distributed from, a public index fund (60% Russell 3000/40% MSCI EAFE).
Portfolio continues to achieve return and diversification objectives; only early evidence of progress on key strategic and operational initiatives
343/511

Executive Session Memo
Separator Page
344/511

SUBJECT: Executive Session – AMHTA Audit ACTION: _________ DATE: May 24, 2018 INFORMATION: ______X___
BACKGROUND: The Division of Legislative Audit is in the process of finalizing a special audit of the Alaska Mental Health Trust Authority’s compliance with state and federal law in the management of its assets. At the time this memo was composed, the preliminary audit report is considered a confidential record under state law. Consequently, until this audit report has been finalized and made public, any discussion of its contents and its potential impacts on APFC must take place in executive session for the reasons identified in AS 44.62.310(c)(4). RECOMMENDATION: Convene an Executive Session for the Board of Trustees to receive a briefing on how the audit may affect APFC.
345/511

Investment Policy and Procedures Memo
Separator Page
346/511
SUBJECT: Investment Policy & Procedures
ACTION: ______X_______
DATE: 5/23/2018
INFORMATION: _____________
BACKGROUND: APFC’s Investment Policy & Procedures are intended to provide the Board with its primary mechanism for expressing its objectives, operating expectations, and preferred practices for how APFC should succeed in its management of the Permanent Fund and other state assets as prescribed by law. Previous Policy was established on May 27th, 2010 (with amendments thereafter) and an earlier version dating back to April 25th, 1995. Since this policy was last established in 2010, investment plans across the United States have sought to adapt better to the prevailing industry best practice standards, improve policy comparability with other leading plans, and to distill the language of their policies into its most accessible form possible. STATUS: Attached you will find a streamlined proposed statement of Investment Policy & Procedures, along with related appendices listing prevailing Investment Guidelines, a listing of internal APFC portfolio managers and traders, a glossary of terms, a listing of the previous Investment Policy adoption and amendments, and a chart covering Callan’s capital markets projections from 2018-2027. The objective is for the Board to consider and potentially ratify a readable, compelling document which can be used to direct staff, consultants, and advisors to work in the best possible interests of the Plan and its investments. This Policy & Procedures statement generally does not seek to make new policy at this time but rather to translate existing policies and practices into a much more accessible and compelling format. RECOMMENDATION: Staff recommends that the APFC Board approve the new Investment Policy & Procedures as of May 23, 2018 to take effect for the new fiscal year beginning on July 1, 2018.
347/511

Proposed Investment Policy MAY 2018
Separator Page
348/511

1
APFC Investment Policy & Procedures
Adopted May 23, 2018 to be effective July 1, 2018
________________________________________________________________________
TABLE OF CONTENTS
Section Page
I Objectives 2
II Total Fund & Portfolio Design Philosophy 3
III Public Markets 11
IV Alternative Investments 16
V Alaska Investment Policy 21
VI Authorized Use of Derivatives 22
VII Risk Management & Oversight 24
VIII Internal & External Portfolio Management 27
Appendix A: Investment Guidelines 30
Appendix B: Internal Investment Managers 46
Appendix C: Glossary 47
Appendix D: Previous Investment Policy Adoption and Amendments 48
Appendix E: Callan’s Capital Markets Projections (2018‐2027) 49
349/511
2
I OBJECTIVES
Mission
The Mission of the Alaska Permanent Fund Corporation (“Corporation” or “APFC”)
is to manage and invest the assets of the Alaska Permanent Fund (“Fund”) and
other funds designated by law.
Vision and Values
APFC’s vision is to deliver sustained, compelling investment returns as the United
States’ leading sovereign endowment manager, benefiting all current and future
generations of Alaskans.
To fulfill its mission and vision, the Corporation will adhere to the following values:
Integrity: We act in an honorable, respectful, professional manner that continually earns and justifies the trust and confidence of each other and those we serve.
Stewardship: We are committed to wisely investing and protecting the assets, resources, and information with which we have been entrusted.
Passion: We are driven to excellence through self‐improvement, innovative solutions, and an open, creative culture; and are energized by the challenges and rewards of serving Alaskans.
350/511

3
II TOTAL FUND & PORTFOLIO DESIGN PHILOSOPHY
A. Purpose
The purpose of this Investment Policy & Procedures Statement (“Policy &
Procedures”) is to provide a formal plan for investing and managing the assets of
the Alaska Permanent Fund and other state assets as prescribed by law to achieve
the defined investment objectives consistent with the APFC Mission adopted by
the Board. The Policy & Procedures also define the roles and responsibilities of
the various parties involved in the investment process and facilitates external
communication of investment policy. The appendices to the Policy & Procedures
are incorporated into and form part of this document. Terms that are not defined
within the body of the Policy & Procedures have meanings assigned to them in the
“Glossary,” Appendix C of this document.
This document is not intended to be a static, one‐time document and will be
considered for possible amendment on an annual basis or any time the Board of
Trustees (“Board”) modifies or adds to the Corporation’s investment‐related
policies and practices. Amendment to this document require Board action as
described in AS 37.13.080. Following any Board approved amendment to this
document, changes will be noted in Board meeting minutes and as soon as
practicable this document will be amended to reflect the approved changes and
posted on the APFC website.
The Policy & Procedures addressed herein shall be interpreted and applied in a
manner consistent with: (1) 15 AAC 137.410 – 15 AAC 137.990, and (2) AS
37.13.120(a), which provides, in relevant part:
The prudent‐investor rule as applied to investment activity of the fund
means that the corporation shall exercise the judgment and care under
the circumstances then prevailing that an institutional investor of ordinary
prudence, discretion, and intelligence exercises in the designation and
management of large investments entrusted to it, not in regard to
speculation, but in regard to permanent disposition of funds, considering
preservation of purchasing power of the fund over time while maximizing
the expected total return from both income and appreciation of capital.
B. Roles of Board, Staff, Consultants, and Advisors
The Board has the primary fiduciary responsibility for investing Fund assets in
accordance with the Alaska Constitution and applicable law. The roles of the
Board are to set investment policy and procedures, oversee investment
management through the Executive Director and Staff through regularly
351/511
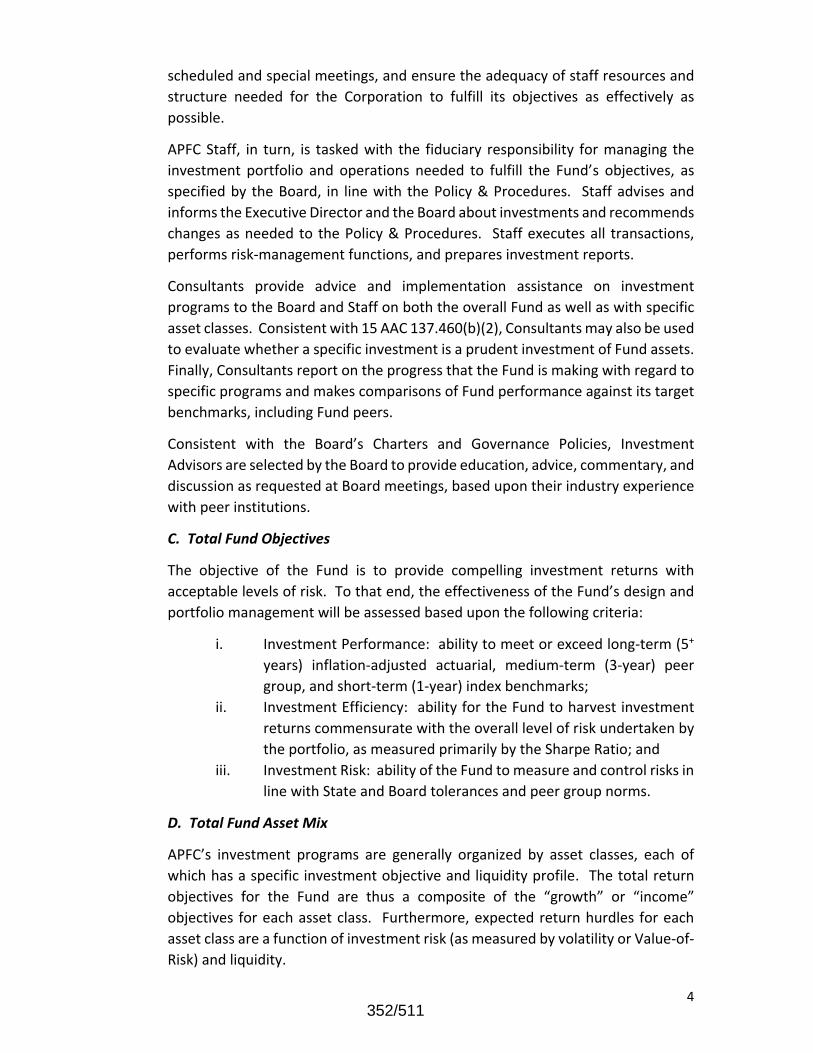
4
scheduled and special meetings, and ensure the adequacy of staff resources and
structure needed for the Corporation to fulfill its objectives as effectively as
possible.
APFC Staff, in turn, is tasked with the fiduciary responsibility for managing the
investment portfolio and operations needed to fulfill the Fund’s objectives, as
specified by the Board, in line with the Policy & Procedures. Staff advises and
informs the Executive Director and the Board about investments and recommends
changes as needed to the Policy & Procedures. Staff executes all transactions,
performs risk‐management functions, and prepares investment reports.
Consultants provide advice and implementation assistance on investment
programs to the Board and Staff on both the overall Fund as well as with specific
asset classes. Consistent with 15 AAC 137.460(b)(2), Consultants may also be used
to evaluate whether a specific investment is a prudent investment of Fund assets.
Finally, Consultants report on the progress that the Fund is making with regard to
specific programs and makes comparisons of Fund performance against its target
benchmarks, including Fund peers.
Consistent with the Board’s Charters and Governance Policies, Investment
Advisors are selected by the Board to provide education, advice, commentary, and
discussion as requested at Board meetings, based upon their industry experience
with peer institutions.
C. Total Fund Objectives
The objective of the Fund is to provide compelling investment returns with
acceptable levels of risk. To that end, the effectiveness of the Fund’s design and
portfolio management will be assessed based upon the following criteria:
i. Investment Performance: ability to meet or exceed long‐term (5+
years) inflation‐adjusted actuarial, medium‐term (3‐year) peer
group, and short‐term (1‐year) index benchmarks;
ii. Investment Efficiency: ability for the Fund to harvest investment
returns commensurate with the overall level of risk undertaken by
the portfolio, as measured primarily by the Sharpe Ratio; and
iii. Investment Risk: ability of the Fund to measure and control risks in
line with State and Board tolerances and peer group norms.
D. Total Fund Asset Mix
APFC’s investment programs are generally organized by asset classes, each of
which has a specific investment objective and liquidity profile. The total return
objectives for the Fund are thus a composite of the “growth” or “income”
objectives for each asset class. Furthermore, expected return hurdles for each
asset class are a function of investment risk (as measured by volatility or Value‐of‐
Risk) and liquidity.
352/511

5
APFC Staff will assist the Board in engaging in an asset allocation study for the
Fund at least once every five (5) years to review asset classes, return‐risk
assumptions, and correlations of investment returns with applicable benchmarks
and across asset classes. A key objective of the asset allocation study shall be the
development through statistical modelling techniques of a diversified portfolio
that specifies ranges of prudent portfolio exposures and “long‐term target”
position for each asset class. The normal portfolio mix will represent the portfolio
that is expected to meet the Board’s actuarial, peer group, and index benchmark
targets within the risk tolerances specified herein.
Each asset class allocation percentage has a “long‐term target” position within the
overall portfolio as well as maximum and minimum ranges around those targets.
Ranges are specified by a “green zone” which reflect normal expected variability
around the targets, “yellow zones” which prescribe remediation by the staff
according to prudent portfolio management over a reasonable period of time, and
“red zones” which require reporting to the Board and a remediation plan to be
presented by staff at the regularly scheduled Board Meetings. Allocation ranges
of these zones are expressed as percentages of the overall Fund.
353/511

6
Table 1
Category Target Allocation (FY2019)
Green Zone (CIO)
Yellow Zone (ED)
Red Zone (Board)
Investment Objective
Growth (Public Equities + Private Equity + Absolute Return & Asset Allocation)
60% +/‐ 10% 0‐5% beyond the green zone
>5% beyond the green zone
Income (Fixed‐Income‐Plus + Real Estate, Private Income)
40% +/‐ 10% 0‐5% beyond the green zone
>5% beyond the green zone
Investment Objective ‐ Liquidity
Tradable (Public Equities + Fixed‐Income‐Plus + Asset Allocation)
65% +/‐ 10% 0‐5% beyond the green zone
>5% beyond the green zone
Illiquid (Private Equity + Real Estate, Private Income + Absolute Return)
35% +/‐ 10% 0‐5% beyond the green zone
>5% beyond the green zone
Asset Classes
Public Equities 38% +/‐ 5% 0‐10% beyond the green zone
>10% beyond the green zone
Fixed Income Plus 22% +/‐ 5% 0‐10% beyond the green zone
>10% beyond the green zone
Private Equity & Special Opportunities
12% +/‐ 5% 0‐5% beyond the green zone
>5% beyond the green zone
Real Estate 11% +/‐ 5% 0‐5% beyond the green zone
>5% beyond the green zone
Private Income 7% +/‐ 5% 0‐5% beyond the green zone
>5% beyond the green zone
Absolute Return 5% +/‐ 3% 0‐5% beyond the green zone
>5% beyond the green zone
Asset Allocation 5% +/‐3% 0‐3% beyond the green zone
>3% beyond the green zone
354/511

7
E. Total Fund Measurement & Reporting Criteria—Performance Scorecard
The Board’s General Consultant will deliver reports to the Board at each regular
Board meeting which indicate whether the Fund is meeting its objectives as
described in the Policy & Procedures. In addition, the General Consultant will
provide a “Performance Scorecard” at each Board meeting based on the prior
quarter‐end investment performance intended to assess the overall effectiveness
of the Fund in terms of its objectives as outlined above in Section II.C. Reporting
on measures of Investment Performance and Investment Efficiency will be
distilled into the equivalent of “percentile rankings” through comparisons with
peers (i.e., institutional investment plans) and through the computation of
statistical “Z‐scores” against investment return and variability targets. The overall
percentile ranking of the Fund will be assessed and reported as the simple average
of its returns in comparison with long‐term (5+ year) inflation‐adjusted actuarial,
medium‐term (3‐year) peer group, and short‐term (1‐year) index benchmarks.
Each asset class is associated with a benchmark that describes in general terms
the opportunity set and return characteristics associated with the asset class. For
certain private or more complex asset classes, the benchmark serves as a proxy
for expected returns rather than an approximation of the actual investments that
will characterize that component of the portfolio. Those benchmarks, along with
the allocation ranges, for each asset class are also referred to as Policy
Benchmarks. Note that the investment returns and benchmarks for all private
market asset classes (i.e., Private Equity & Special Opportunities, Real Estate,
Infrastructure, Private Credit, and Income Opportunities) are lagged by 1‐quarter
for performance calculation purposes, as is common practice among large
complex investment plans in the United States and internationally.
The long‐term investment objectives for the Fund should target a return of CPI+5%
or better into the future. This CPI+5% or better target should be achieved through
a combination of (1) strategic asset allocation among the asset classes, (2) tactical
asset allocation, which overweights or underweights specific assets classes on a
shorter‐term basis due to perceived valuational or risk imbalances between the
asset classes, and (3) value‐added contributions within each asset class. The
following table reflects the long‐term return objectives for each of the asset
classes based upon the prevailing strategic asset allocation and value‐added
contributions from both tactical asset allocation and asset class portfolio
management:
355/511
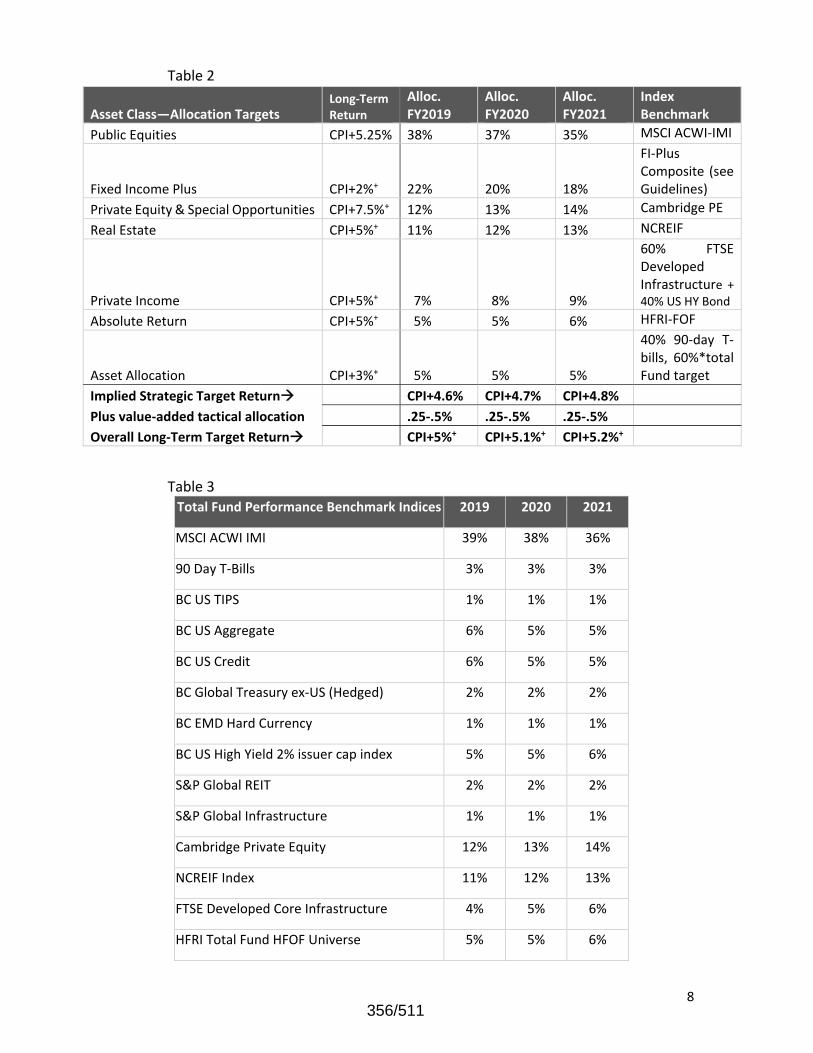
8
Table 2
Table 3 Total Fund Performance Benchmark Indices 2019 2020 2021
MSCI ACWI IMI 39% 38% 36%
90 Day T‐Bills 3% 3% 3%
BC US TIPS 1% 1% 1%
BC US Aggregate 6% 5% 5%
BC US Credit 6% 5% 5%
BC Global Treasury ex‐US (Hedged) 2% 2% 2%
BC EMD Hard Currency 1% 1% 1%
BC US High Yield 2% issuer cap index 5% 5% 6%
S&P Global REIT 2% 2% 2%
S&P Global Infrastructure 1% 1% 1%
Cambridge Private Equity 12% 13% 14%
NCREIF Index 11% 12% 13%
FTSE Developed Core Infrastructure 4% 5% 6%
HFRI Total Fund HFOF Universe 5% 5% 6%
Asset Class—Allocation Targets Long‐Term Return
Alloc. FY2019
Alloc. FY2020
Alloc. FY2021
Index Benchmark
Public Equities CPI+5.25% 38% 37% 35% MSCI ACWI‐IMI
Fixed Income Plus CPI+2%+ 22% 20% 18%
FI‐Plus Composite (see Guidelines)
Private Equity & Special Opportunities CPI+7.5%+ 12% 13% 14% Cambridge PE
Real Estate CPI+5%+ 11% 12% 13% NCREIF
Private Income CPI+5%+ 7% 8% 9%
60% FTSE Developed Infrastructure + 40% US HY Bond
Absolute Return CPI+5%+ 5% 5% 6% HFRI‐FOF
Asset Allocation CPI+3%+ 5% 5% 5%
40% 90‐day T‐bills, 60%*total Fund target
Implied Strategic Target Return CPI+4.6% CPI+4.7% CPI+4.8%
Plus value‐added tactical allocation .25‐.5% .25‐.5% .25‐.5%
Overall Long‐Term Target Return CPI+5%+ CPI+5.1%+ CPI+5.2%+
356/511

9
In addition, after the conclusion of each fiscal year, the General Consultant will
provide an asset class breakdown of the Performance Scorecard (in addition to
the total Fund Performance Scorecard which will be reported quarterly). Rather
than utilizing equal weightings among long‐term, medium‐term, and short‐term
objectives, however, the asset class Performance Scorecards will reflect the
greater relevance of short‐term (40% weight) and medium‐term peer group (40%
weighting) objectives versus the long‐term inflation‐adjusted actuarial (20%
weighting) objective for Public Equities and Fixed‐Income‐Plus asset classes. By
contrast, private markets asset classes including Private Equity, Real Estate, and
Private Income will emphasize the greater importance of medium term peer group
(40% weighting) and long‐term inflation‐adjusted actuarial (40%) objectives
versus the short‐term index benchmark (20% weighting) objective.
Peer group comparisons will generally be made on a 3‐year basis for assessing the
effectiveness of the Fund and its asset classes on a medium‐term basis. Fund
peers will include large US Public Funds as well as other plans deemed comparable
by the General Consultant, Staff, and Board. To the extent that peer comparisons
may not be directly available for specific asset class comparisons, the General
Consultant should select the closest available proxy for comparison and percentile
ranking purposes (including the use of statistical Z‐scores when appropriate).
Index comparisons are to be utilized for assessing the short‐term (1‐year)
performance of the Fund. Such comparisons should include a Passive Index
Benchmark (comprised of investable publicly traded securities, reflected as 60%
MSCI ACWI IMI, 20% Barclay’s Fixed‐Income Global Aggregate Index, 10% US TIPS,
and 10% FTSE EPRA NAREIT) and the Performance Benchmark (comprised of both
publicly traded and private indexes, see Table 3).
F. Total Fund Portfolio Implementation, Restrictions, Delegations
The structure of the Fund is organized through asset classes, each with a
distinctive investment objective (growth or income) as well as liquidity profile
(tradable or illiquid), plus an allocation to a portfolio named “Asset Allocation,”
designed to: (1) manage Fund liquidity, and (2) manage Fund risk through
rebalancing and tactical hedging. APFC Staff directs all investment activities
through a delegation from the Board to the Executive Director as described in the
Board’s Bylaws. Delegations of Authority will thus be conferred from the Board to
the Executive Director (ED) and then by extension to specific investment staff in
order to effect investment transactions. The Executive Director will also convene
a Public Markets Investment Committee and a Private Markets Investment
Committee on a regular and as needed basis in order to discuss and deliberate on
decisions requiring the authorization of ED from the Policy & Procedures or
357/511

10
Investment Guidelines. Investment decisions resulting from those meetings will
generally be affirmed by email to and from the ED.
G. Relationship of the Policy & Procedures with Regulations and Guidelines
As required by Alaska Statute 37.13.120(a), the Board has adopted regulations
specifically designating the types of investments that Fund assets can be invested
in. All investments authorized by the Policy & Procedures shall be limited to those
investments authorized and in the manner authorized by the Board’s investment
regulations, 15 AAC 137.010 – 15 AAC 137.990. Recommended changes to these
regulations must be approved by the Board and adopted in conformity with the
process provided in Alaska Statute 37.13.206.
The Investment Guidelines attached as Appendix A, reflect the day‐to‐day
operational expectations and requirements needed to ensure effective
management of Fund assets consistent with the regulations and the Policy &
Procedures. With the written approval of the Executive Director, the Investment
Guidelines may be changed and any approved changes will be described to the
Board at its next regular meeting.
358/511

11
III PUBLIC MARKETS
A. Public Equity
i. Objective
The objective of the APFC’s Public Equity portfolio is to invest in publicly traded
securities to meet or exceed the performance of a well‐diversified pool of global
equities, embodied in the MSCI ACWI IMI Index, while staying within predefined
risk constraints.
The above objective is achieved via both external and internal investment
management activities with respect to security selection and allocation size.
ii. Structure
The structure of the Public Equity portfolio may include a combination of actively
and passively managed investments within prescribed tracking error targets
relative to the ACWI IMI benchmark:
Actively managed equity strategies that strive to enhance total returns of a
portfolio relative to its assigned benchmark;
Passively managed equity strategies that strive to replicate, in a cost efficient
manner, the returns of a benchmark index;
iii. Authorized Investments
The Public Equity portfolio, whether external or internal, are authorized to invest
in the following:
All publicly traded equity securities described in 15 AAC 137.440(1), including
equity‐oriented funds, or equity related securities, and securities issued in
underwritten initial public offerings (“IPOs”);
Equity derivatives as described in 15 AAC 440(2), including forwards, futures,
options, swaps, collateralized securities, and structure notes; and
Other investment as permitted in the APFC Regulations, including
commingled investment funds as described in 15 AAC 137.470.
iv. Rebalancing and Mandate Modification
The Director of Public Equity may:
With the approval of the Chief Investment Officer and the Executive Director, add, terminate, or rebalance Public Equity portfolio mandates and allocations for external investment managers; and
Rebalance assets to, from, or between individual Public Equity portfolios at his/her own discretion within the Guidelines.
359/511
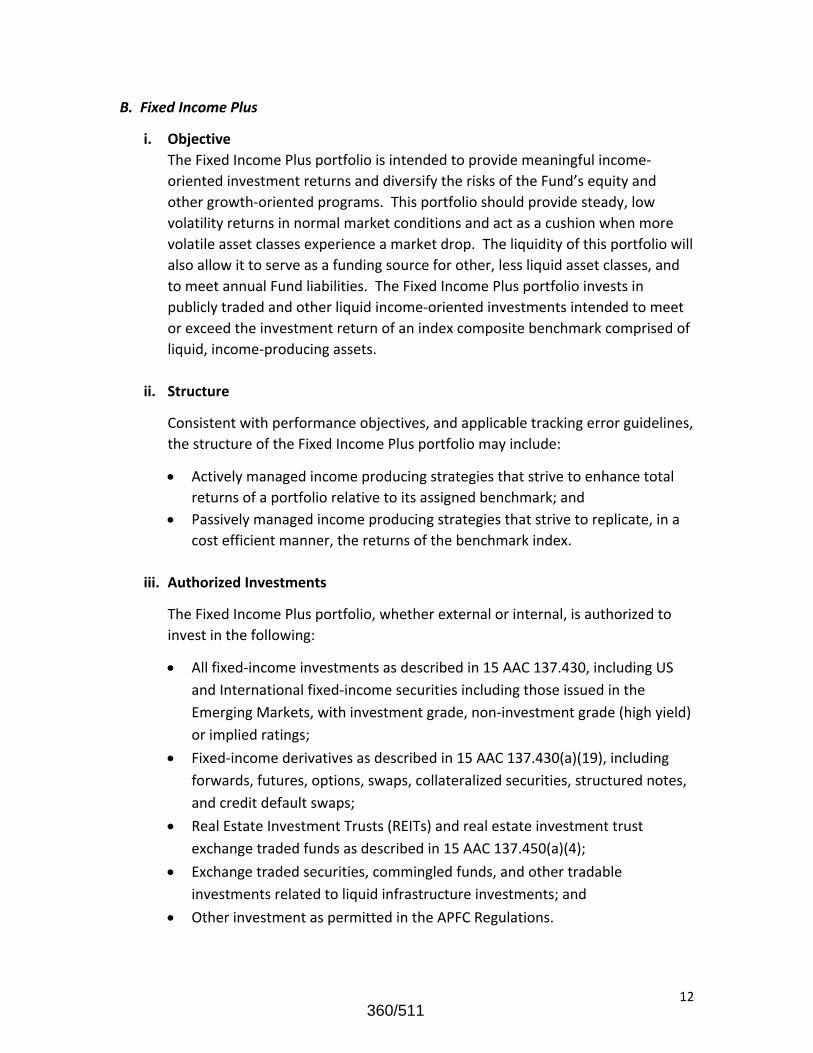
12
B. Fixed Income Plus
i. Objective
The Fixed Income Plus portfolio is intended to provide meaningful income‐
oriented investment returns and diversify the risks of the Fund’s equity and
other growth‐oriented programs. This portfolio should provide steady, low
volatility returns in normal market conditions and act as a cushion when more
volatile asset classes experience a market drop. The liquidity of this portfolio will
also allow it to serve as a funding source for other, less liquid asset classes, and
to meet annual Fund liabilities. The Fixed Income Plus portfolio invests in
publicly traded and other liquid income‐oriented investments intended to meet
or exceed the investment return of an index composite benchmark comprised of
liquid, income‐producing assets.
ii. Structure
Consistent with performance objectives, and applicable tracking error guidelines,
the structure of the Fixed Income Plus portfolio may include:
Actively managed income producing strategies that strive to enhance total
returns of a portfolio relative to its assigned benchmark; and
Passively managed income producing strategies that strive to replicate, in a
cost efficient manner, the returns of the benchmark index.
iii. Authorized Investments
The Fixed Income Plus portfolio, whether external or internal, is authorized to
invest in the following:
All fixed‐income investments as described in 15 AAC 137.430, including US
and International fixed‐income securities including those issued in the
Emerging Markets, with investment grade, non‐investment grade (high yield)
or implied ratings;
Fixed‐income derivatives as described in 15 AAC 137.430(a)(19), including
forwards, futures, options, swaps, collateralized securities, structured notes,
and credit default swaps;
Real Estate Investment Trusts (REITs) and real estate investment trust
exchange traded funds as described in 15 AAC 137.450(a)(4);
Exchange traded securities, commingled funds, and other tradable
investments related to liquid infrastructure investments; and
Other investment as permitted in the APFC Regulations.
360/511

13
iv. Rebalancing and Mandate Modification
The Director of Fixed Income Plus may:
With the approval of the Chief Investment Officer and Executive Director
hire, terminate, approve or modify any external manager mandate within
Fixed‐Income Plus; and
Rebalance assets to, from or between individual external managers at
his/her discretion within the Guidelines.
C. Asset Allocation
i. Objectives
The objectives of the Asset Allocation portfolio are to: (1) provide liquidity
management for the Fund, (2) manage foreign currency risks, (3) avoid “cash drag”
by maintaining synthetic public equity and fixed‐income exposure to surplus
portfolio cash, (4) manage allocation transfers between asset classes, and (5)
manage a liquid Risk Parity portfolio with an attractive risk/return profile. In
aggregate, the long‐term return of the Asset Allocation portfolio is intended to
produce investment returns equal to 65% MSCI ACWI IMI + 35% Barclays Fixed
Income Aggregate a benchmark of or better.
ii. Structure and Authorized Investments
The Asset Allocation portfolio refers to four distinct programs, each with specific
roles for the Fund:
Liquidity Program—Comprised of cash, cash equivalents and other liquid
investment balances, including lines of credit and letters of credit, this
program is intended to meet the Fund’s operational needs including capital
calls and appropriations from the earnings reserve account to the State’s
general fund. This program may also utilize stock and bond‐related securities
used for transitional purposes;
Cash Overlay Program—Comprised of exchange‐traded and over‐the‐counter
derivatives managed by external investment managers to provide efficient
exposure to public equity and fixed‐income markets, thereby reducing “cash
drag” that is a natural side effect of holding cash for liquidity management
purposes;
Currency Overlay Program—Comprised of currency‐related derivatives, as
described in 15 AAC 137.480, managed by external investment managers, this
program seeks to add value and manage the risks associated with the Fund’s
exposure to foreign currencies; and
Risk Parity Program—Designed to deliver long‐term returns of CPI+5% or
better through external managers which seek to generate returns that are less
361/511

14
correlated to global public markets through allocation of risk (i.e. volatility)
rather than allocation of capital. Private market investments are generally
excluded from Risk Parity funds. Because Risk Parity investments are
diversifying, they represent a small share of the Fund’s risk while generating a
proportionately larger share of the Fund’s returns. To avoid investment
manager concentration risk, allocations to Risk Parity Managers shall be
limited to no more than 1% of the Fund at the time of investment. Risk Parity
investments are generally liquid and highly scalable. Risk Parity Fund
investments will be consummated following a search process and the
recommendation of APFC’s General Consultant.
D. Securities Lending
The Executive Director may execute an agreement with the Fund’s custodian or other lending agent to lend domestic and non‐domestic public equity and debt securities from the Fund’s portfolio directly to borrowers for a fee in accordance with 15 AAC 137.510 and the following guidelines:
i. The custodian or lending agent shall extend without reservation or qualification
complete indemnification against any direct loss from a borrower default, the reinvestment of cash collateral, and failure to comply with the terms and conditions of the lending agreements;
ii. As described in 15 AAC 137.510, collateral shall be required at the following levels:
Minimum of 102% of the market value of the loaned securities which are denominated in the same currency as the collateral provided by the borrower; and
Minimum of 105% of the market value of the loaned securities which are denominated in a currency other than the collateral provided by the borrower;
iii. Collateral and loaned securities shall be marked to market daily;
iv. The investment of cash collateral posted by borrowers shall be restricted to those investment‐grade securities permissible under the provisions of AS 37.13.120, 15 AAC 137, and the Investment Guidelines; and
v. The Corporation shall periodically review investments of cash collateral for compliance with the provisions of AS 37.13.120, 15 AAC 137, and the Investment Guidelines.
At the discretion of the Executive Director, the Corporation may elect to have cash collateral released to the Corporation to meet liquidity needs rather than having it invested by the Custodian or lending agent.
362/511

15
IV ALTERNATIVE INVESTMENTS
A. Private Equity & Special Opportunities
i. Objectives
The objective of the Private Equity & Special Opportunities portfolio is to diversify and enhance the overall expected return of the Fund through the identification, purchase, and sales of illiquid growth‐oriented investments. The portfolio will seek to benefit from the:
long‐term ownership of businesses and assets;
application of specialized skills;
allocation of capital into disrupted markets; and
potential incremental return premium connected with the illiquidity of targeted investments.
Private Equity: Private equity assets are typically characterized by long investment horizons and limited liquidity but bring to the Fund increased diversification and the potential for risk‐adjusted returns that exceed those of publicly‐listed securities. In constructing a diversified private equity portfolio, Staff will consider the following characteristics: strategy, geography, industry, investment size, leverage, investment structure, competitive landscape, market position, and vintage year. Special Opportunities: Technological innovation and market volatility periodically create attractive investment opportunities that do not fit precisely into standard, predetermined categories. These opportunities may be caused by temporary market dislocations, evolving social or economic trends, or a changing regulatory environment. APFC seeks to be positioned to capture such opportunities for the benefit of the Fund. Portfolio performance will be evaluated using:
a comparison of vintage year performance against the Cambridge Private Equity Index benchmark; and
a comparison of long‐term performance over five‐ and ten‐year rolling periods to public equity benchmarks plus a premium of 200 basis points;
and CPI+7.5%. Annually, Staff will provide to the Board a pacing and investment plan that reflects
then current exposures, assumptions, and outlook.
ii. Authorized Investments
Investment strategies include venture capital, growth equity, leveraged buyouts, special situations, and distressed debt. Opportunities are accessed both through
363/511

16
long‐term commitments to funds managed by external investment managers and through targeted, co‐investments and direct investments into operating companies.
The purchase or sale of individual private equity or special opportunities
investments or fund investments with a single manager that exceed 1% of the
Fund shall be approved Board. In addition, as described in 15 AAC 137.460(b),
investments into new externally‐managed funds may be consummated following
the advice and recommendation of a qualified, independent consultant. A
commitment to successor funds to ones previously invested in by APFC shall also
be deemed consistent with regulation. Co‐investments and direct investments
shall only be consummated pursuant to the advice and recommendation of an
independent fiduciary, except a co‐investment alongside an existing manager or a
commitment to subsequent funds managed by an existing manager, however, shall
be deemed to have met the requirements of 15 AAC 137.460(b).
B. Real Estate, Infrastructure, and Private Income
i. Objective
The long‐term objective of the Real Estate, Infrastructure & Private Income
Portfolio is to generate a return between the expected return for public equity
and fixed income that is comprised of an attractive level of current income and
capital appreciation, while maintaining a prudent diversification of assets. Staff
will seek to accomplish this as follows:
Achieve investment returns in excess of the long‐term and short‐term
portfolio benchmarks listed in Section II.F.;
Generate a sustained, attractive level of current income judged relative to
comparable risk income investments available in the public markets; and
Construct a diversified portfolio as measured by the following attributes: asset
type, strategy, industry, geography, vintage year, inflation sensitivity, public
market sensitivity, and fund or asset manager.
ii. Structure
APFC shall invest in the Real Estate, Infrastructure & Private Income Portfolio
primarily through limited liability entities into (i) commingled or separately
managed fund investments with independent fiduciaries, (ii) co‐investments
with independent fiduciaries, or (iii) direct equity interests in, or debt
obligations secured by, securities or interests of real assets or companies.
Fund investments shall primarily be made through commitments to
drawdown funds with multi‐year investment periods, followed by multi‐year
harvest periods and a defined termination date. As described in 15 AAC
137.460(b), co‐investments shall primarily be made alongside current APFC
364/511

17
investment managers or upon the advice of a qualified, independent
consultant.
iii. Authorized Investments
The Real Estate, Infrastructure & Private Income Portfolio will consist of four
programs with specific goals designed to contribute to long‐term objectives of
the portfolio and the Fund. The performance of these programs will be
evaluated individually against the return mandate of the portfolio and an
asset‐specific benchmark. The purchase or sale of individual investments or
fund investments with a single manager in any of the four programs that
exceed 1% of the Fund shall be approved Board.
Private Real Estate: Private Real Estate investments shall primarily target
(i) directly‐held income producing, core real estate in the United States
and globally, (ii) directly‐held build‐to‐core or other non‐core properties,
(iii) funds that invest predominantly in real estate strategies (e.g. core,
core‐plus, value‐added, and opportunistic), and (iv) co‐investments
alongside fund managers described above.
Private Infrastructure: Private Infrastructure investments shall primarily
target long‐lived assets and companies that exhibit contractual or
inflation protection characteristics, while safeguarding principal.
Investments may include energy infrastructure, transportation, water
infrastructure, telecommunications, social infrastructure (e.g. lotteries,
student housing, prisons), other infrastructure (e.g. protected income
stream assets, other interests of infrastructure issuers, infrastructure‐
related assets), other real assets (e.g. timberlands, agricultural farmlands,
leasable hard assets), and any other tangible or intangible asset that
possesses similar characteristics as those outlined in this section.
Private Credit: Private Credit investments, in the context of a diversified
portfolio, shall exhibit a high level of income and potentially provide for
capital appreciation, while safeguarding principal. These investments
shall primarily target funds that pursue one or more of the following
strategies: direct lending, subordinated and mezzanine lending,
distressed debt, opportunistic credit‐oriented funds with flexibility to
pursue illiquid and liquid strategies, and other private credit (e.g. special
situations, asset‐based lending, structured credit, leasing, royalties
lending, ventured debt).
Income Opportunities: The dynamic nature of global markets, company
innovation, market volatility, and behavioral economics often create
attractive investment opportunities that do not fit precisely into
standard, predetermined categories. These Income Opportunities, to the
extent they are income generating in nature, shall be included in the Real
Estate, Infrastructure & Private Income portfolio.
365/511
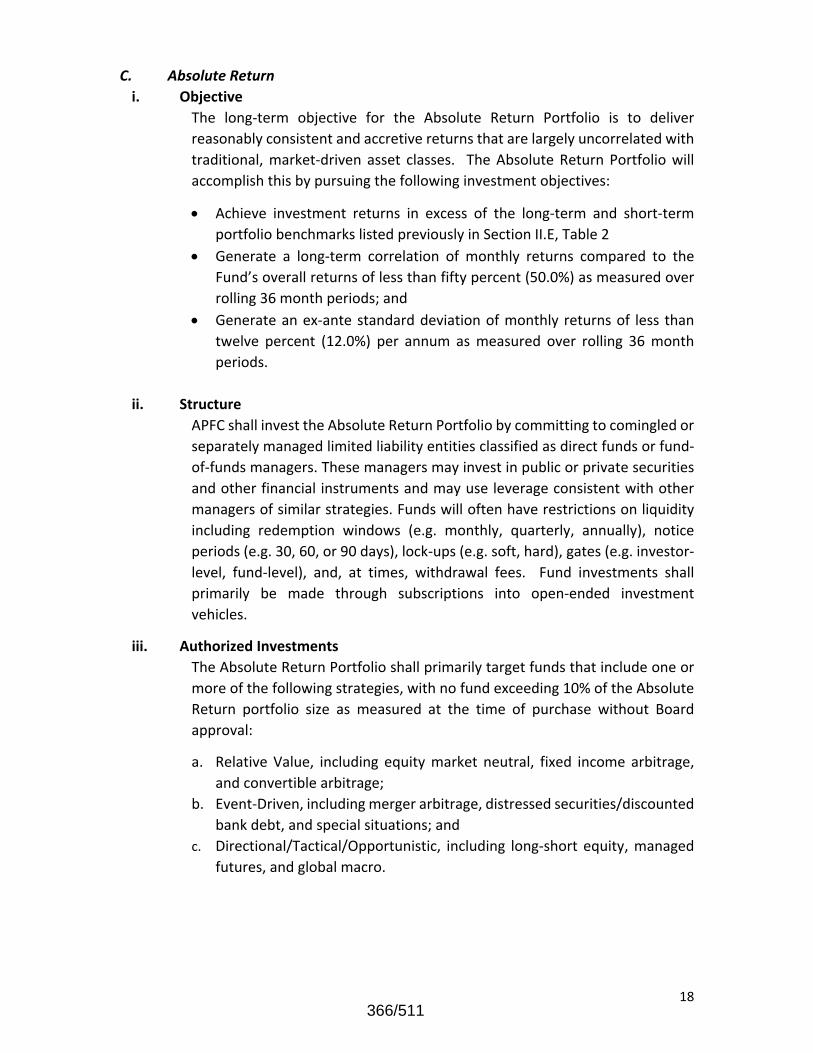
18
C. Absolute Return
i. Objective
The long‐term objective for the Absolute Return Portfolio is to deliver
reasonably consistent and accretive returns that are largely uncorrelated with
traditional, market‐driven asset classes. The Absolute Return Portfolio will
accomplish this by pursuing the following investment objectives:
Achieve investment returns in excess of the long‐term and short‐term
portfolio benchmarks listed previously in Section II.E, Table 2
Generate a long‐term correlation of monthly returns compared to the
Fund’s overall returns of less than fifty percent (50.0%) as measured over
rolling 36 month periods; and
Generate an ex‐ante standard deviation of monthly returns of less than
twelve percent (12.0%) per annum as measured over rolling 36 month
periods.
ii. Structure
APFC shall invest the Absolute Return Portfolio by committing to comingled or
separately managed limited liability entities classified as direct funds or fund‐
of‐funds managers. These managers may invest in public or private securities
and other financial instruments and may use leverage consistent with other
managers of similar strategies. Funds will often have restrictions on liquidity
including redemption windows (e.g. monthly, quarterly, annually), notice
periods (e.g. 30, 60, or 90 days), lock‐ups (e.g. soft, hard), gates (e.g. investor‐
level, fund‐level), and, at times, withdrawal fees. Fund investments shall
primarily be made through subscriptions into open‐ended investment
vehicles.
iii. Authorized Investments
The Absolute Return Portfolio shall primarily target funds that include one or
more of the following strategies, with no fund exceeding 10% of the Absolute
Return portfolio size as measured at the time of purchase without Board
approval:
a. Relative Value, including equity market neutral, fixed income arbitrage,
and convertible arbitrage;
b. Event‐Driven, including merger arbitrage, distressed securities/discounted
bank debt, and special situations; and
c. Directional/Tactical/Opportunistic, including long‐short equity, managed
futures, and global macro.
366/511

19
V ALASKA INVESTMENT POLICY
To implement the requirements of Alaska Statute 37.13.120(c), the Board believes the
Fund should have an in‐state investment policy that maintains the investment integrity of
the Fund and is both proactive and impartial. As such, any in‐state investment should be
considered by APFC under the following considerations:
Honor Alaska Statute 37.13.120(c): Prescribes that if an Alaskan investment has
equivalent risk and expected return comparable to or better than a similar non‐
Alaskan investment, the Alaskan investment should be preferred.
Require Compelling Risk‐Adjusted Returns: To honor the prudent investor rule
provided in Alaska Statute 37.13.120(a), any Alaskan investment contemplated by
APFC must be attractive on a stand‐alone basis.
Ensure Fund Diversification: In order to provide sufficient risk diversification as
required under Alaska Statute 37.13.120(c), the total of all in‐state investments
shall generally not exceed 1% of the Fund without Board approval (measured at
the time of purchase)—includes public and private market investments.
Seek Participation by Non‐Alaskan Institutional Investors: In order to ensure that
an Alaskan investment opportunity is attractive on a stand‐alone basis and
satisfies the institutional quality requirements of 15 AAC 137.420, APFC should
generally seek to invest into an Alaskan investment alongside of at least one of its
peers (i.e., a large institutional investor, which may include endowments,
foundations, sovereign wealth funds, or public or private pension funds).
367/511

20
VI AUTHORIZED USE OF DERIVATIVES
This section describes the applications and limitations for the use of derivatives as
authorized in 15 AAC 137.430, 15 AAC 137.440, and 15 AAC 137.460; and defined in 15
AAC 137.990(6) and (7).
A. Objective
The use of derivatives as described in the Policy & Procedures and as authorized in the
Board’s Investment Regulations is for the purpose of efficient portfolio management and
reduction of risk in various Fund portfolios.
The requirements of the Policy & Procedures apply to all derivatives transactions
executed by APFC Staff and all external managers operating under an Investment
Management Agreement.
B. Derivatives Definition; Authorization
As defined in 15 AAC 137.990(6), “Derivative” means “an instrument whose value,
usefulness, and marketability is dependent upon or derives from an underlying asset;
classes of derivatives include futures contracts, options, forward contracts, including
currency forward contracts, swaps, and options on futures.”
Both exchange traded and over the counter (“OTC”) derivative instruments are under the
scope of the Policy & Procedures. Exchange traded derivatives are listed and traded on a
national exchange. In the exchange, the derivative contracts are standardized, there is no
credit risk between market participants because the exchange generally guarantees the
fulfilment of the contract, and there is a very visible and transparent market price of the
instruments. Whereas, OTC derivatives are privately negotiated between a buyer and a
counterparty directly, which may result in non‐standard terms. Consequently, the value
of the derivative may be affected by the credit‐worthiness of the counter‐party, triggering
the need for this section of the Policy & Procedures.
C. Derivatives Applications Permitted
Derivative instruments maybe used by internal and external managers to achieve the
objectives described in this section. Permitted applications of derivatives include:
Implement investment strategies in a lower cost and efficient manner;
Efficiently manage portfolio exposures synthetically as opposed to trading
underlying securities;
Build portfolios with targeted risk and return characteristics that otherwise
could not be efficiently created with securities;
Hedge and control risks of portfolios and the total Fund so they better align
with benchmarks and objectives; and
Facilitate rebalancing.
368/511

21
D. Derivatives Risk Management and Compliance
APFC Staff shall have due regard for operational risk associated with various derivatives
strategies, including risk management, accounting systems, liquidity needs, adequate
staffing, and staff qualifications.
Management of counterparty risk is required to reduce the possibility of the Fund being
overly exposed to risk that a counterparty fails to fulfill its financial obligation. The risks
associated with an individual counterparty may change due to factors like financial
solvency, systemic risks, regulatory or legal claims; operational fraud, and financial stress.
Staff will monitor and report on counterparty risk each quarter as follows:
Regular monitoring and oversight of the exposures within portfolios,
including unrealized profit and losses (P&L) and potential exposures;
Ensuring external investment managers have strong counterparty risk
controls;
Ongoing due diligence of investment managers, including regular onsite
meetings with managers.
The Fund will measure counterparty risk as the P&L, netted where applicable from OTC
contracts. The P&L more accurately reflects the total amount at risk than the notional
contract amount should a counterparty fail to honor its obligation. Net is preferred as the
managers usually employ ISDAs and/or netting agreements. Staff will monitor and reports
these exposures each quarter or more frequently if required. The Fund does not set
exposure limits to individual counterparties.
Through the following strategies the risks resulting from the use of derivatives shall be
measured and mitigated:
Analyzing collateral exposure under various rate shocks;
Establishing minimum counterparty credit ratings that the Fund uses
directly;
Diversifying counterparties;
Collateral requirements or third‐party guarantees
369/511

22
VII RISK MANAGEMENT & OVERSIGHT
The objective of APFC’s risk management program is the balancing of risk in order to
generate investment returns. The assumption of risk is necessary to meet the Fund’s
objectives. As such, the Board recognizes that risk cannot be eliminated and should be
managed by understanding the risks in various strategies, ensuring the Fund is properly
compensated for these risks, and measuring and monitoring them frequently. The Board
sets the framework for risk management through the Policy & Procedures, the Fund’s
asset allocation, and benchmarks. In addition, the Board will express its risk tolerance in
the form of various metrics of risk and defined ranges for those metrics. The CIO, Director
of Risk Management and Asset Class Directors shall allocate risk exposure within and
between asset classes in order to optimize return.
A. Market Risk Management
APFC Staff will establish a framework for measuring absolute and risk of the Fund and its
asset classes as well as relative risks in comparison to established benchmarks. This
framework should generally include a quantifiable estimates of active and relative risk.
APFC Staff will monitor and produce reports as appropriate for the Board, ED, CIO, and
other staff which may incorporate the following market risks:
i. Asset allocation limits – In addition to the Total Fund level risk limits, the portfolio
will be constrained to the asset allocation percentages and ranges prescribed in
Section II.D, Table 1. Accordingly, the total exposure to each asset class must be
based on the individual exposures of each cash security and each outstanding
derivative contract. These limits are specified in the Investment Guidelines.
ii. Active risk limits – Tracking error is a measure of how closely a portfolio follows
the index to which it is benchmarked. Tracking error is used to ascertain how much
the portfolio expected return will deviate from the prescribed risk benchmark.
Tracking error is calculated for this purpose on an ex‐ante basis using a holdings‐
based risk analytical system. By convention, tracking error is reported as the
annualized one‐standard deviation of the expected difference in returns between
a portfolio and the risk benchmark. A target tracking error will be imposed on the
Total Fund and on each underlying asset class mandate. These limits are specified
in the Investment Guidelines.
iii. Relative risk limit – Relative risk measures the expected investment portfolio’s
risk and return relative to a benchmark using industry‐standard risk measures.
APFC Staff will model and monitor the Total Fund as compared to its benchmarks
to ensure that the total estimated risk for the Total Fund is within the upper and
lower bounds of this Policy and Procedure’s risk framework, following the specific
green zones illustrated in the Investment Guidelines.
iv. Downside risk – Downside risk is risk of significant loss of capital. Staff will actively
monitor the Total Fund’s downside risk relative to the risk benchmark using
370/511

23
scenario analysis and stress testing. Specific scenario analyses and stress tests are
outlined in the Investment Guidelines.
v. Scenario Analysis – Scenario analysis utilizes historical market dislocations to
evaluate mark‐to‐market impacts on the portfolio. For each historical market
dislocation, the changes in the major risk factors are applied to the existing
portfolio simultaneously. This shock may provide insight into potential future
downside risks.
vi. Stress Testing – Stress testing involves shocking a major market factor by a
predetermined magnitude to measure the Fund’s change in mark‐to‐market.
Stress testing is designed to determine which factors, given an independent move,
produce a large deviation in mark‐to‐market.
vii. Proxy securities and indices – If necessary and prudent, APFC Staff will employ
index proxies to approximate the economic characteristics of specific investments
to the extent that the terms and conditions of those investments or the underlying
holdings (in the case of funds) are not readily available or where the complexity
of the underlying investment renders direct empirical measurement impractical.
viii. Private market asset holdings – APFC Staff will actively monitor the portion of the
Total Fund invested in private market asset holdings to ensure that the percent of
the total fund invested in private markets adheres to the private investments
limits outlined in the Investment Guidelines.
ix. Future Commitments – Future commitments are a function of committed capital
to private investments where the general partner has the right to drawdown
capital from the limited partners over a specified period of time. To mitigate the
risk presented because the cash draws are in essence a cash draw liability with
unknown timing, APFC Staff will monitor and limit future commitments relative to
the Fund’s overall size. Specific limits are outlined in the Investment Guidelines.
In addition to this framework, APFC Staff will monitor regularly and report quarterly on a
multitude of risks to the extent they are material, either on an absolute or relative basis,
to the Board:
Economic Environment;
Country/Currency Risk;
Counterparty Risk;
Business Relationship Risk;
Pricing Risk;
Credit (Quality) Risk;
Leverage;
Debt Refinancing Risk;
Active Risk Contribution;
Liquidity Risk;
Geographical Risk;
Equity Style Risk;
371/511

24
Fixed Income Risk;
Ex‐ante versus Ex‐post VaR; and
Ex‐ante versus Ex‐post Tracking Error
B. Foreign Exchange Risk
Investment managers and APFC Staff, may, with prior approval of the Executive Director,
transact in any foreign exchange instrument (including currency futures and forward
contracts, options, and swap agreements), to implement their investment strategies,
contingent upon such transactions being consistent with the Policy & Procedures and the
requirements of 15 AAC 137.480.
APFC Staff analyzes foreign exchange risk regularly and presents quarterly to the Board.
This analysis includes both internal hedging and external foreign exchange overlay
manager positioning and performance.
C. Legal Risk Management
Legal documentation for all internally managed public and private investments will be
reviewed, negotiated and approved for execution by the Executive Director. APFC Staff
will seek the assistance, review, and advice of legal counsel for all internally managed
investments which are executed by the Executive Director. APFC General Counsel has
primary responsibility for the engagement of outside legal counsel for investment
matters, subject to applicable statutes and rules adopted by the Office of the Attorney
General.
D. Permitted Use of Leverage
APFC Staff and external managers, consistent with the requirements of 15 AAC 137.500
and the Policy & Procedures (including the risk parameters established by the asset
allocation ranges), is authorized to use the leverage on behalf of the overall Fund or
specific funds and investments, provided that such leverage is non‐recourse to APFC or
the Fund.
372/511

25
VIII INTERNAL AND EXTERNAL MANAGERS
A. Internal versus External Management The Board retains the authority to select internal versus external management of the
Fund’s assets. The Board will consider recommendations from the Executive Director,
CIO, Advisors and Consultants to manage portions of or entire investment programs
internally.
B. Manager Searches and Selection The Board authorizes the Executive Director to hire new investment managers and
advisors (including real estate advisors) upon conclusion of an appropriate search by
a qualified consultant and Staff. Although a specific situation may warrant modifying
the process, a typical manager or advisor search process would involve the following
steps:
i. setting of relevant search criteria by Staff of applicable manager qualifications;
ii. identification by the Consultant of a list of potential managers that the Consultant believes are qualified to provide the investment management services needed, based on the qualifications and other search criteria established by Staff;
iii. evaluation by a review committee established within the Consultant's organization of the list of potential, qualified managers identified with the goal of recommending managers for consideration to Staff;
iv. informing the CIO of selected managers recommended by the Consultant's review committee;
v. selection by Staff of between three and five of the managers as finalists from those recommended by the Consultant's review committee. This process may include, as part of due diligence, on‐site visits by Staff; presentations to Staff by the recommended managers are at the election of the CIO and Executive Director;
vi. analysis by staff which then provides a detailed recommendation to the CIO and Executive Director, taking into account not only manager‐specific characteristics but also portfolio considerations; and
vii. approval of the new manager or advisor by the CIO, with Executive Director consent, assignment of benchmarks as appropriate, and the initial amount to be placed under management with the manager.
Upon the CIO’s recommendation that (1) it is in the best interest of the Fund to move
more quickly than the foregoing procedures permit, or (2) it is otherwise prudent due to
the confidentiality or specificity of the investment strategy or structure, the Executive
Director may modify or waive portions of the foregoing steps, as long as the Board Chair
is promptly notified and the modification or waiver is reported to the Board at the next
regularly‐scheduled Board meeting.
373/511

26
C. Alternative Manager Search and Selection Process Circumstances may make a deviation from normal practice appropriate. Even if this alternative process is utilized, the CIO, with Executive Director consent, retains the final manager selection authority. Use of an alternative process may be considered when any of these conditions exist:
i. a manager under consideration for hire has already been vetted in a significant manner either through a search process with a qualified consultant or advisor, or the manager is already employed in a manager capacity by APFC;
ii. the skill for which the manager is being considered is related in a substantive manner to the role the manager already fulfills for APFC or was the subject of a manager search that first identified this manager; or
iii. the Consultant and the Staff are both recommending hiring a particular manager for the specific mandate even though the CIO and Executive Director recognize that a more complete search process might reasonably be expected to identify additional qualified candidates to compete for the business.
The CIO and Executive Director are required to report use of the alternative manager search and selection process, along with the rationale for the use, at the next regularly‐scheduled Board meeting.
D. Monitoring and Evaluation of Managers The Board looks to its General Consultant as the primary source of quantitative evaluation
of the performance of the Fund and its investment managers. As promptly as possible
after the close of each calendar quarter, the Consultant shall submit a report to the Board,
Executive Director and CIO analyzing the performance of the Fund, its asset classes and
investment programs, including both internally and externally assets. The report shall
include a comparison of total Fund performance with the Board's long‐term investment
goal, an analysis of the returns of each asset class as measured against established
benchmarks for each class; and an analysis of the returns of each manager or relevant
groupings of managers as measured against relevant benchmarks. The Consultant's
report shall also address any special concerns or observations the Consultant concludes
should be brought to the attention of the Board, Executive Director and CIO.
The Board expects Staff to also monitor the performance of the Fund's external managers,
using the quarterly quantitative performance reports prepared by the Consultant,
information obtained from the APFC's annual manager evaluation questionnaire, and
such other review and analysis of an individual manager's performance, both quantitative
and qualitative, as Staff considers appropriate, including on‐site visits to the manager's
offices, discussions with other clients of the manager, and such analytical tools as may be
available. The CIO and Executive Director shall report to the Board any special concerns
or observations they may have with respect to the performance of a manager no later
than the next regular meeting of the Board.
374/511

27
If the CIO and Executive Director terminate or give notice of unsatisfactory performance
to a particular manager, they shall inform the Board of the actions and rationale at the
next regularly‐scheduled Board meeting.
E. Manager Retention A manager shall be retained by execution of a written investment management
agreement ("IMA") with the APFC. The IMA shall address such matters of performance,
compensation, and term/termination, investment guidelines, among others, as the APFC
and the manager consider necessary and appropriate.
F. Manager Termination The Board authorizes the CIO, with Executive Director consent, to terminate an
investment manager.
G. Reporting The CIO and Executive Director are required to report all manager additions and
terminations, along with the rationale, at the next regular Board meeting.
375/511

28
AppendixA: InvestmentGuidelines
I.: Objective
The objective of the APFC Investment Guidelines is to supplement the APFC Policy & Procedures
by providing operational guidelines for APFC’s internal and external portfolio managers. The
Executive Director may update this Appendix from time‐to‐time; updates will be provided to the
Board at its next regularly scheduled meeting. Section headings generally correspond to their
counterparts in the Policy & Procedures.
II. Total Fund & Portfolio Design Philosophy
The following table outlines the components of the Fund’s Performance Scorecard (which can
then be adapted to apply to individual asset classes):
Time Horizon APFC Benchmark Spread (Standard Deviation)
Percentile‐Calculation
Short‐Term (ST)
1‐year Return
50% * Performance Benchmark (Table 10.3.1.1 50% * Passive (60% MSCI ACWI IMI 20% Barclay Global Aggregate (less management and transaction fees) 20% Real Assets (10% FTSE EPRA/NAREIT Rental Index/10% US TIPs))
1‐year standard deviation of returns among public plan peers (typically 1%‐2%, with 2% being the conservative default)
Implied Percentile {statistical Z‐score: =1‐NORMSDIST((Return‐Benchmark)/2%) }
Medium‐Term (MT)
3‐year Return
Peers Policy Asset Allocation Benchmark Large USPublic Plans
3‐year returns for Peers
Percentile among Peers
376/511

29
Time Horizon APFC Benchmark Spread (Standard Deviation)
Percentile‐Calculation
Long‐Term (LT)
5‐year Return, Sharpe Ratio
CPI + 5% & Sharpe Ratio>0.5
5‐year Peer variation (2%), Sharpe Ratio vol = 0.5
Implied Percentile (average):
=1‐Normsdist((Return‐(CPI+5%))/2%) and
=1‐Normsdist((SR‐0.5)/.5)
III.A. Public Equity
APFC’s Internal Compliance will issue an alert (i.e., a notification) to APFC’s Director of Public
Equity for potential follow‐up either internally or with external managers in the following
instances:
1. Tracking Error: Issue an alert when the tracking error of the overall Public Equity
portfolio exceeds 350 basis points (“bps”) versus the MSCI ACWI IMI.
2. Active manager concentration risk: Issue an alert when an allocation to an active
external manager reaches 5% of total Public Equity allocation; no limits are set a priori
for passively managed assets.
3. Other Guidelines:
a. Cash: Issue an alert when cash held by a manager reaches 5% of the manager’s
account’s Net Asset Value (“NAV”). Transactional cash (i.e.
payables/receivables) and cash used for collateral will be excluded from this
calculation; there is no alert on cash for performance‐fee based external
managers; there is no alert on cash for internally managed public equity
portfolios.
377/511

30
b. Percentage Ownership: Issue an alert when the Fund’s ownership of total
shares outstanding of a public company reaches 5% or more. This applies to the
total shares outstanding that is used to determine the market capitalization of a
company. The guideline above is applied once at the individual account level
(internal or external), and separately across all public equity managers
combined.
c. Short Selling: Issue an alert in instances of short selling in external and internal
accounts (only applies to cash equities and ETFs, not to derivatives);
d. Derivatives Holdings (External and Internal Accounts): Issue an alert when the
gross notional value across all derivatives holdings (exchange traded and OTC)
within a public equity account reaches 20% of the account NAV. Guideline
applies to aggregate notional value across different types of derivatives; issue an
alert when the gross notional value of all OTC derivatives holdings within an
account reaches 10% of the account NAV;
e. Rebalancing: Generally, the team leader should seek the approvals from the
CIO and ED for rebalancing programs among internal and/or external managers
aggregating to in excess of 1% of the value of the Fund.
378/511
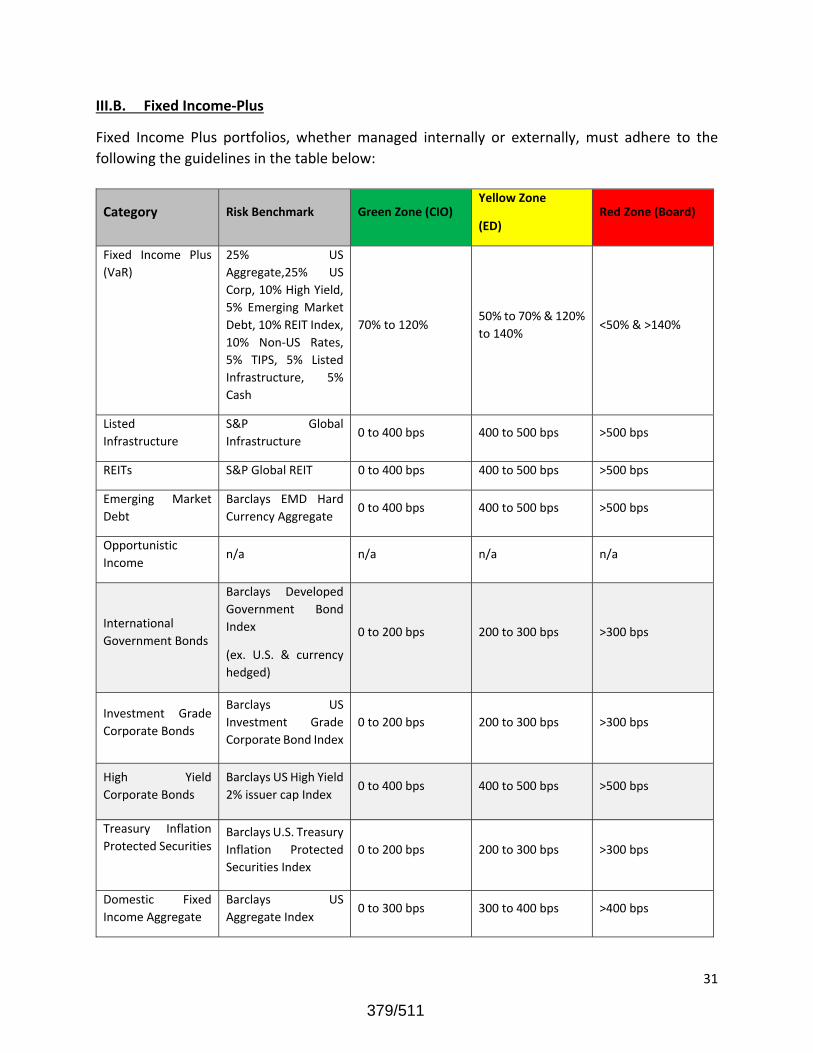
31
III.B. Fixed Income‐Plus
Fixed Income Plus portfolios, whether managed internally or externally, must adhere to the
following the guidelines in the table below:
Category Risk Benchmark Green Zone (CIO) Yellow Zone
(ED) Red Zone (Board)
Fixed Income Plus
(VaR)
25% US
Aggregate,25% US
Corp, 10% High Yield,
5% Emerging Market
Debt, 10% REIT Index,
10% Non‐US Rates,
5% TIPS, 5% Listed
Infrastructure, 5%
Cash
70% to 120% 50% to 70% & 120%
to 140% <50% & >140%
Listed
Infrastructure
S&P Global
Infrastructure 0 to 400 bps 400 to 500 bps >500 bps
REITs S&P Global REIT 0 to 400 bps 400 to 500 bps >500 bps
Emerging Market
Debt
Barclays EMD Hard
Currency Aggregate 0 to 400 bps 400 to 500 bps >500 bps
Opportunistic
Income n/a n/a n/a n/a
International
Government Bonds
Barclays Developed
Government Bond
Index
(ex. U.S. & currency
hedged)
0 to 200 bps 200 to 300 bps >300 bps
Investment Grade
Corporate Bonds
Barclays US
Investment Grade
Corporate Bond Index
0 to 200 bps 200 to 300 bps >300 bps
High Yield
Corporate Bonds
Barclays US High Yield
2% issuer cap Index 0 to 400 bps 400 to 500 bps >500 bps
Treasury Inflation
Protected Securities Barclays U.S. Treasury
Inflation Protected
Securities Index
0 to 200 bps 200 to 300 bps >300 bps
Domestic Fixed
Income Aggregate
Barclays US
Aggregate Index 0 to 300 bps 300 to 400 bps >400 bps
379/511

32
Fixed Income Plus, may, with prior written approval of the Chief Investment Officer, transact in
any derivative authorized in 15 AAC 137.430(a)(19). For purposes of rebalancing, the Director of
Fixed Income Plus shall seek the approval of the CIO and ED for re‐allocations among internal
and/or external portfolio managers in excess of 1% of the value of the total Fund.
Requirements regarding Cash Account:
fixed or floating rate securities with weighted average maturities of no greater than 24 months. These securities must be investment grade rated income producing listed securities.
approved money market funds utilized for cash sweep purposes.
Commercial paper that, at the time of purchase, is rated: (1) A‐a or A‐1 by S&P, or (2) P‐1 by Moody’s.
Requirements of Corporate Bond Portfolio:
At time of purchase, security must be investment grade; and
If a security falls below investment grade, it must be sold within seven months of downgrade.
Requirements of US Aggregate Portfolio:
At time of purchase, securities must be investment grade.
If a security falls below investment grade, it must be sold within seven months of downgrade.
Requirements of US TIPS Portfolio:
Portfolio shall be invested in investment‐grade, inflation‐linked, income producing instruments.
Requirements of Global Rates Portfolio:
Portfolio shall be invested in investment‐grade, income producing instruments issued by supranational institutions, sovereign governments and their instrumentalities.
Portfolio exposure to foreign currency cannot exceed 1% of NAV. Investment Grade Ratings
Regarding any fixed income investment that is required by the Investment Guidelines to
be “investment grade”: (1) if three ratings are given, two must be investment grade, (2)
if two ratings are given, both must be investment grade, (3) if one rating is given, it must
be investment grade; and (4) if no rating is given, it must have an implied investment
grade rating.
380/511

33
III.C. Asset Allocation
The following guidelines should be adhered to for all investments authorized by Policy & Procedures regarding the Asset Allocation portfolio:
a. The Liquidity Overlay Program should be monitored as such: a. Overlay manager will equitize cash in the account indicated by the portfolio
manager i. Overlay manager is allowed to use exchange‐traded futures, options on
exchange‐traded futures, over‐the‐counter or exchange‐traded swap, over‐the‐counter or exchange‐traded option, and forward contracts.
b. The overlay manager will target an exposure of 65% ACWI IMI and 35% Bloomberg Aggregate Bond index.
c. The notional value of the overlay exposure will be equal to 100% of the value of the underlying cash with a +/‐ 5% range to allow for normal daily variations.
d. The overlay exposure will be trued up on a daily basis by the external manager based on cash reports provided by the APFC custodian.
b. To the extent that additional liquidity is desired to manage plan assets, APFC staff will notify the Board of Trustees and Investment Committee immediately to establish a an additional liquidity plan.
c. Additional guidelines will be established for the liquidity portfolio, currency overlay, and Risk Parity programs as needed for the future management of these programs, as they are managed by a combination of internal APFC staff and external investment managers.
IV.A. Private Equity & Special Opportunities
Standard of Care
Higher expected return implies necessarily a wider range of potential outcomes for each of the underlying assets, and this uncertainty increases the importance and the benefits of informed manager selection, rigorous deal selection, and active portfolio management. Accordingly, the following investment guidelines and restrictions are intended to ensure appropriate asset diversification, analytical deliberation, and risk mitigation. Institutional Quality: All investments must be of institutional investment quality. Institutional quality is defined as an investment that would reasonably be considered acceptable by other prudent institutional investors (e.g., insurance company, commercial banks, employee benefit and retirement plans, endowments and foundations). Portfolio Diversification: The part of the Private Equity & Special Opportunities portfolio committed to private equity funds will be diversified by strategy, size, vintage, industry, manager, and geography. No more than twenty percent (20%) of the total allocation will be invested at any
381/511

34
time with or in any single general partnership, entity, or organization. No single private equity investment strategy, as described below under “Strategy Diversification,” may comprise more than 70% of the Private Equity & Special Opportunities allocation as established by the Board.
Strategy Diversification: The following private equity strategies and investment types will be considered eligible for the Fund’s portfolio. Long‐term ranges are established with percentage exposures based on market value plus undrawn committed capital.
o Venture Capital: (5% to 45%) – Venture capital commitments and investments will be allocated into two categories. Early‐Stage: Seed or start‐up equity investments in private companies. Later‐Stage: Investments in more mature companies to provide funding for
growth and expansion. o Buyouts/Acquisition: (40% to 70%) – Partnerships or direct investments which
provide funding to acquire substantial interests in a business or product. These investments will be diversified by industry and other relevant factors.
o Specialized Funds or Investments: (0% to 50%) ‐This will include, but not be limited to, distressed debt strategies, royalty strategies, other direct investments, co‐investments, and certain asset‐specific or industry‐specific strategies.
Geographical Diversification: Although the priority should be to achieve diversification by investment strategy and industry, geographical diversification is also desirable. Over the long‐term, the portfolio should seek reasonably balanced global geographic diversification.
o International private equity investments should not total more than 40% of the invested private equity portfolio and shall be diversified in the context of the total portfolio.
Industry Sector Diversification: The portfolio shall be diversified by industry sector (e.g., biotechnology, software, financial services, healthcare, medical, media/communications, basic industry, etc.) so that no single industry classification is too heavily represented in the private equity portfolio.
Time and Life Cycle Diversification: Commitments to private investments shall be staged over time, and venture capital investments shall include early, later, and multi‐stage investments.
General Partner Diversification: Fund commitments shall be diversified by investment partner and will limit discretionary control of any single general partnership or investment sponsor organization to a maximum of 20% of the total private equity portfolio (based on total commitments).
IV.B. Real Estate, Infrastructure & Private Income
i. Investment Process
Real Estate, Infrastructure & Private Income investments shall only be consummated
following (i) a search process conducted by a qualified, independent consultant or
APFC’s general consultant, (ii) through an existing manager of APFC assets, or (iii) upon
382/511

35
the written analysis of a qualified consultant retained to evaluate a specific proposed
investment.
Investments will be identified as Private Real Estate, Private Infrastructure, Private
Credit, or Income Opportunities at the time of investment and included in each
respective composite from that time forward for performance and compliance
purposes. Any movement of individual investments between composites will only
occur with written approval of the Executive Director.
ii. Diversification
APFC Staff shall construct the Real Estate, Infrastructure & Private Income portfolio
with a level of diversification consistent with other institutional investors in this asset
class, specifically:
a. Manager Diversification
No manager or fund general partner shall represent more than 35% of total Real
Estate, Infrastructure & Private Income exposures when measured both on the
basis of (i) manager advised NAV divided by total NAV for this portfolio, and (ii)
manager advised NAV plus unfunded commitments divided by total NAV for this
portfolio plus unfunded commitments.
b. Strategy Diversification
Staff shall manage the portfolio with a combination of the four primary programs
defined in the Policy & Procedures. Measured on the basis of NAV plus unfunded
commitments (i) 0‐75% of the portfolio shall be invested in the Private Real Estate
program, (ii) 0‐75% of the portfolio shall be invested in the Private Infrastructure
program, (iii) 0‐50% of the portfolio shall be invested in the Private Credit
program, and (iv) 0‐50% of the portfolio shall be invested in the Income
Opportunities program.
c. Individual Company and Asset Diversification
Individual direct investments and co‐investments (or a series of investments in
securities issued by the same underlying operating entity or company) will not
exceed an aggregate total commitment or cost basis of 1.0% of the value of the
total Fund as determined at the time of investment. This rule does not apply to
existing positions in excess of this threshold (for example, Tyson’s Corner and 299
Park).
The diversification limits outlined above may be exceeded with written approval of
the Executive Director.
iii. Direct Equity Real Estate Investments Guidelines
Authorized investments include directly‐held core and non‐core properties as noted
in the Policy & Procedures. The following guidelines apply to those strategies:
383/511

36
a. Core real estate: leverage limited to 50% of assets.
b. Non‐core real estate: leverage limited to 65% of project cost on “build‐to‐core”
assets.
c. Total directly‐held private real estate: leverage limited to 40% of assets.
d. Any additional land acquired shall be permitted so long as it is fully entitled at
point of purchase. Entitlement risk may only be assumed in limited circumstances
upon the approval of Executive Director.
iv. ADAC Investments Guidelines
In fiscal year 2018, Staff established an in‐house hybrid liquid / illiquid alternative
credit effort named Alaska Direct Alternative Credit (or “ADAC”). Investments
included in ADAC will be (i) non‐investment grade high yield ETF’s and individual
bonds and cash (“Liquid Portfolio”) and (ii) co‐investments with Private Credit
managers and working capital cash (“Private Portfolio”). The following guidelines
apply to ADAC:
a. ADAC shall be included in the Special Opportunities / Income Opportunities
category.
b. Size and Funding Schedule
‐ $500 million funded at inception, initially invested in Liquid Portfolio.
‐ Following inception, additional funds will be invested into ADAC through cash
transfers to the Liquid Portfolio and capital calls into the Private Portfolio for
co‐investments, or working capital or organizational expenses for the Private
Credit Co‐Investment Vehicle.
‐ Funding of additional cash transfers to the Liquid Portfolio will be done at no
greater than a 1:1 ratio with cumulative Private Portfolio capital calls.
‐ Total invested capital of $1,000 million targeted to be funded within twenty‐
four months of inception.
c. Portfolio Control and Decision Making
‐ Private Income team will have discretion over portfolio‐wide decisions
including: (i) percentage of portfolio invested in Liquid vs. Private Portfolio, (ii)
retaining APFC Fixed Income Plus team as manager of the Liquid Portfolio, and
(iii) individual investment decisions in the Private Portfolio
d. Liquid Portfolio and Benchmark
‐ Liquid Portfolio, initially 100% of ADAC, ultimately scaling down to less than
50%, will be managed by the APFC Fixed Income Plus team at inception.
‐ The targeted maximum allocation will be the greater of $750 million and 75%
of ADAC NAV.
‐ The targeted minimum allocation will be 25% of ADAC NAV.
‐ ETF Account within Liquid Portfolio benchmarked to Barclays US High Yield
Index (after July 1, 2018 to allow for an initial ramp‐up).
384/511

37
‐ Individual securities portfolio will favor BB‐B over CCC‐rated securities and will
be benchmarked to the Barclays BB High Yield Index (after July 1, 2018 to allow
for an initial ramp‐up). A relatively high tracking error to this index will be
tolerated with the aim of outperformance over a full market cycle.
e. Private Portfolio and Benchmark
‐ Private Portfolio, initially 0% of ADAC, ultimately scaling to greater than 50%,
will be managed by the Private Income team
‐ The targeted maximum allocation will be 75% of ADAC NAV.
‐ The targeted minimum allocation will be 25% of ADAC NAV (after initial,
twenty‐four month ramp‐up).
‐ Private Portfolio will target having a minimum of $100 million committed
within twelve months of inception and a minimum of $250 million within
twenty‐four months of inception.
‐ Co‐investment opportunities will be primarily sourced through existing
managers.
‐ Maximum commitment per co‐investment of $75 million without Executive
Director written approval.
‐ Private Portfolio will be benchmarked to CPI + 500 bps.
f. Overall ADAC Portfolio Benchmarks
‐ Barclays US High Yield Index (relatively high tracking error to this index will be
tolerated with the aim of outperformance over a full market cycle).
‐ A long‐term target of CPI + 400 bps.
g. Tenor and Termination
‐ This is an evergreen strategy with realized gains re‐invested, which means the
size of ADAC will be equal to invested capital, plus cumulative
realized/unrealized gains, minus cumulative realized/unrealized losses.
‐ The CIO, with Executive Director consent, may choose to invest additional
capital at any time.
‐ The CIO, with Executive Direct consent, may choose to terminate the strategy
at any time. Upon termination, available cash will be distributed from ADAC,
the Liquid Portfolio will be sold within 180 days, and the Private Portfolio will
cease making new commitments (with the exception of follow‐on investments
to existing portfolio holdings and investments to which a written commitment
to invest has already been executed; both to be pursued only with written
consent of the Executive Director) and will distribute proceeds upon any
partial or full realization of existing investments.
385/511

38
IV.C. Absolute Return
i. Investment Process
Absolute Return investments shall only be consummated following (i) a search
process conducted by one of APFC’s Absolute Return consultants or APFC’s general
consultant or (ii) upon the written analysis of a qualified consultant retained to
evaluate a specific proposed investment. All investments, in addition to the preceding
process, shall only be consummated following an independent review of the
manager’s operational processes (also known as “Operational Due Diligence”).
ii. Diversification
Staff shall construct the Absolute Return portfolio with a level of diversification
consistent with other institutional investors in the asset class, specifically:
a. Manager Diversification
To achieve prudent diversification, the portfolio shall (i) at any given time be
limited to investments with 10 to 25 managers, and (ii) at the time of investment
no individual fund shall represent more than 10% of the target Absolute Return
allocation.
b. Strategy Diversification
Staff shall manage the portfolio with a mix of the three primary strategies defined
in the Policy & Procedures: (i) 0‐75% of the portfolio shall be invested with Relative
Value Managers, (ii) 0‐50% of the portfolio shall be invested with Event Driven
Managers, (iii) 0‐75% of the portfolio shall be invested with
Directional/Tactical/Opportunistic Managers.
The diversification limits outlined above may be exceeded with written approval of
the Executive Director.
iii. Liquidity
Staff shall manage the liquidity terms and portfolio composition such that they can
rely on contractual terms to liquidate 50% of the NAV of the portfolio, at any given
time, within a 12‐month period. The legacy illiquid fund‐of‐fund exposures (lock‐up
funds, private credit exposures, and side‐pocket exposures) shall not be included for
purposes of applying this test.
The liquidity limits outlined above may be exceeded with written approval of the
Executive Director.
VI. Derivatives The following guidelines should be adhered for risk management purposes:
386/511

39
a. APFC risk management staff will monitor and report on the use of derivatives based on the following:
a. Monthly reconciliation of managers’ derivatives reports with custodian positions in derivatives;
b. Monthly review of Managers’ use of derivatives relative to their own policies and guidelines;
c. Monthly reports of risk model results (for fixed income only): i. Contribution to effective duration and effective convexity, by portfolio, of
all positions; and ii. Economic exposures and risk characteristics of derivatives.
d. A monthly statement that all portfolios are in compliance with the Policy & Procedures and these guidelines, and a description of any instances of non‐compliance and their disposition; and
e. An annual report that compares Fund risks with and without the derivatives. b. Permitted derivatives include those listed in Section VI.B. of the Policy & Procedures as
well as others allowed in the regulations.
The following guidelines should be adhered to for risk management purposes when investing in derivatives in the Public Equities and Fixed Income Plus Portfolios:
a. The net of long and short dollar exposures to assets or currencies, whether derived from physical or derivative securities, must be less than or equal to the dollar market value of the portfolio, except for very small, inadvertent, or temporary amounts that occur in the normal course of portfolio management or authorized by the Executive Director;
b. The gross dollar exposures of the portfolio from physical and derivative securities (futures, options, swaps) cannot exceed 300% of the market value of the aggregate underlying portfolio at all times unless authorized by the Executive Director;
c. The CIO may impose further limits on the use of derivatives so that derivative notional values are not only constrained by their contribution to portfolio risk factors (such as beta, regional or industry exposure) but also with consideration to: liquidity, counterparty credit risk, pricing transparency, and model risk. Thus derivative use may be limited even if other portfolio risk limits are not breached.
d. If derivatives are used by a manager to actively manage currency exposure, net short exposure to any single currency remains within limits established for that manager’s strategy.
VII. Risk Management and Oversight
The following tables illustrate the guidelines to be followed in terms of active risk limits:
387/511

40
Table VII.2. Relative Risk Guidelines – VaR (Value‐at‐Risk)
Category Green Zone
(CIO) Yellow Zone
(ED) Red Zone (Board)
Portfolio 85% to 110%
70% to 85% & 110% to 120% <70% & >120%
Fixed Income Plus 70% to 120%
50% to 70% & 120% to 140% <50% & >140%
Public Equities 70% to 120%
50% to 70% & 120% to 140% <50% & >140%
Table VII.3. Relative Risk Guidelines – Tracking Error
Category Green Zone
(CIO) Yellow Zone
(ED) Red Zone (Board)
Portfolio 0 to 400 bps*
400 to 600 bps >600 bps
Public Equities** 0 to 350 bps
350 to 500 bps >500 bps
Fixed Income Plus 0 to 350 bps
350 to 500 bps > 500 bps
* bps = basis points (where 100bps = 1%) ** Compared to the MSCI All Country Investable Market Equity Index
a. Scenario Analysis: APFC staff will look at a range of scenarios to evaluate mark‐to‐market impacts on the portfolio. These scenarios might include (illustrative):
a. Slow Deflation b. Rapid Deflation c. Chinese Market Crash d. Fed Tapering Talk (2013) e. US Downgrade (2011) f. 2008 Market Crash g. 2007 Credit Crisis
b. Stress Testing: APFC staff will analyze how specific market shocks might affect the Total Fund. Sample shocks to be analyzed are (illustrative):
a. Global Stock Market Crash b. U.S. Stock Market Crash c. Euro Stock Market Crash d. Japan Stock Market Crash e. U.S. Interest Rates Risk f. Euro Interest Rates Rise g. Japan Interest Rates Rise h. U.S. Inflation Rise i. Euro Inflation Rise j. U.S. Credit Spread Widening
388/511

41
k. Euro Credit Spread Widening l. U.S. Dollar Weakens m. VIX Volatility Spike n. Oil Crash
c. The following table provides the guidelines regarding private market asset holdings:
Table VII.4. Private Investments Limits
Category Green Zone
(CIO) Yellow Zone
(ED) Red Zone (Board)
Private Assets 35 to 50% 25% to 35% & 50% to 55% <25% & >55%
d. The following table provides the guidelines regarding future commitments: Table VII.5. Future Commitment Limits
Category Green Zone
(CIO) Yellow Zone
(ED) Red Zone (Board)
Future Commitments
< 20% 20% to 25% >25%
e. Counterparty Exposures: all counterparties should have at least a AAA credit rating.
APFC staff should also make sure no manager is funded over 5% of the Total Fund NAV. f. Liquidity management should be analyzed routinely by APFC Staff as such:
a. A monthly assessment of Total Fund liquidity b. A monthly review and reporting of liquidity ratios c. A quarterly review of liquidity scenario analysis to be presented to the Board of
Trustees d. An annual assessment of the conditions required to result in a liquidity breach
event g. Risk Management Compliance Cure Periods and Remedies should follow these
guidelines: The Green Zone Operating Range (“Green Zone”) concept is designed to indicate the Board‐approved operating risk limits.
1. The Green Zone is the Board‐approved Chief Investment Officer (“CIO”) operating range. a. The portfolio must be within the Green Zone at least 80% of the calendar year;
the Board must approve exceptions. 2. The Yellow Zone is the Board‐approved Executive Director (“ED”) operating range.
a. The Chief Financial Officer (“CFO”) will notify the CIO and ED promptly upon entry into a Yellow Zone.
b. The CIO will respond by requesting ED approval to operate within the Yellow Zone.
389/511

42
c. With ED approval, the CIO may operate within a Yellow Zone for up to 90 consecutive days or, if longer, until the next Board meeting following entry into a Yellow Zone.
d. The CFO will notify the Board (i) when approaching 90 days of operating within a Yellow Zone and (ii) monthly thereafter.
e. Following Board notification, a Trustee may request in writing a meeting to discuss an extension to continue operating within the Yellow Zone.
f. The Board may grant the CIO and ED an extension to continue operating within a Yellow Zone. Between Board meetings, unless a Trustee requests a meeting, the Board Chair may grant the CIO and ED an extension to continue operating within a Yellow Zone.
3. The Red Zone is the operating range that requires Board approval. a. The CFO will notify the Board upon entry into a Red Zone. b. The ED will respond to the Board with an action plan. c. Absent Board approval, operating within a Red Zone is limited to 30 consecutive
days (plus the time needed to notice a Board meeting). d. The Board has the authority to approve operating within a Red Zone, beyond 30
days. Even though the Fund is expected to operate most of the time within the Green Zone, the Fund may periodically be within a Yellow Zone, and there may be times when the Fund will be within a Red Zone. The zones are designed to increase transparency and awareness; they should not be viewed as explicit violations. A historical report showing periods of operating within the Yellow and Red Zones will be included in Board meeting packets.
390/511

43
Exhibit VII.1. Visual Display of Green Zone Concept
Exhibit VII.2. Green Zone Example for Public Equities
391/511

44
AppendixB:InternalInvestmentManagers
This Appendix identifies internal Investment Managers at APFC. The Executive Director may update this
Appendix from time‐to‐time; updates will be provided to the Board at its next regularly scheduled
meeting.
NAMEANDTITLE ASSETCLASS
JimParise,DirectorofInvestments,TradableIncome
ChrisCummins,SeniorPortfolioManager,FixedIncome
MashaSkuratovskaya,SeniorPortfolioManager,FixedIncome
MattOlmsted,SeniorPortfolioManager
TomO’Day,AnalystandTrader
FixedIncomePlus
MarcusFrampton,DirectorofInvestments,RealEstate,InfrastructureandPrivateIncome
JaredBrimberry,SeniorPortfolioManager,PrivateIncome
RoseDuran,DirectorofRealEstateInvestments
TimAndreyka,SeniorPortfolioManager,RealEstate
RealEstate,InfrastructureandPrivateIncome
AbsoluteReturn
SteveMoseley,DirectorofInvestments,PrivateEquityandSpecialOpportunities
YupKim,SeniorPortfolioManager
PrivateEquityandSpecialOpportunities
FawadRazzaque,DirectorofInvestments,PublicEquities
YoulianNinkov,AnalystandTraderPublicEquities
ValeriaMartinez,DirectorofInvestments,AssetAllocationAssetAllocationprograms
RussellRead,ChiefInvestmentOfficer OverseesallAssetsClasses
392/511

45
AppendixC:Glossary
AAC means the Alaska Administrative Code.
ADA means the Americans With Disabilities Act of 1990.
Advisors and Board Advisors mean the investment professionals who comprise the Board’s
Investment Advisory Group.
APFC and Corporation mean the Alaska Permanent Fund Corporation, established under AS
37.13.040.
AS means Alaska Statutes.
Board means the Board of Trustees of the APFC.
CMBS means commercial mortgage‐backed securities.
CFO means the APFC’s Chief Financial Officer.
CIO means the APFC’s Chief Investment Officer.
Consultant means the Board’s investment consultant(s), not including Board Advisors.
CPI means the Consumer Price Index.
Custodian means the APFC’s custodian.
Days means calendar days.
ED means the APFC’s Executive Director.
FoF means fund‐of‐funds.
Fund and Permanent Fund mean the Alaska Permanent Fund, established under Article IX,
Section 15, of the Alaska Constitution, and described in AS 37.13.010.
IMA means investment management agreement.
Investment Manager and Manager mean investment manager(s) retained by the APFC.
IRR means internal rate‐of‐return.
Long‐Term means over one or more business cycles.
MBS means mortgage‐backed securities.
RBM means Strategic Risk Benchmark, as defined in Section 9.3.1.
Staff means the APFC Investment staff and, where the context requires, also means or includes
the Executive Director and/or other APFC staff.
TE means Tracking Error, as defined in Section 9.4.1.
Trustees means the members of the APFC’s Board of Trustees.
VaR means Value at Risk, as defined in Section 9.3.2.
393/511

46
AppendixD:PreviousInvestmentPolicyAdoptionandAmendmentsThe previous APFC Investment Policy was adopted or amended effective as follows:
Adopted: May 27, 2010
Amended: September 30, 2010 (§14.9 added)
Amended: December 1, 2010 (§9.1 revised; new §11.1 added and prior §§11.1‐11.3 and
subsections thereunder renumbered; and §18.2.4 revised)
Amended: May 20, 2011 (§18A added)
Amended: September 30, 2011 (§§ 8, 8.2, 8.3, 8.5, 9.2, 9.3.1, 9.4.1, 11.3.1, 15.3, and 15.4
revised)
Amended: December 8, 2011 (§11.3.2 revised)
Amended: February 22, 2012 (§20 revised)
Amended: April 23, 2012 (§§16.3.1 and 16.3.2 revised; and Specific Policy Modifications for
Tysons Corner Phase I Project and Mariner Frontier Fund, L.P. added)
Amended: February 27, 2013 (§§ 15.2, 15.3, and 15.4 revised)
Amended: May 22, 2013 (§§9.5.4, 9.5.5,12.4, 12.6, 13.2, 13.3.1, 13.3.3, 14.9.4.10, 16.1.2,
16.1.3, 16.1.4, 16.2, 16.3, 16.3.1, 18A, 23.2, and 23.5 revised; Specific Policy
Modification for Mariner Frontier Fund, L.P. revised; Specific Policy Modification
for Crestline AK Permanent Fund, L.P. added; and Addendum re Internal
Investment Managers added)
Amended: May 23, 2013 (§§ 3.1, 3.3, 5.3, 6, 8 (including Table 8a), 8.1 revised; §8.2 deleted;
§§ 8.3‐8.5 renumbered (as §§ 8.2‐8.4) and newly‐renumbered §§ 8.2‐8.4 revised;
and §§ 9.2, 9.3.1, 9.4.1, 10, 11.3.1, and 22.2 revised)
Amended: February 26, 2014 (§§23.3.1, and 23.2 revised; and Addendum re Internal
Investment Managers revised)
Amended: May 21, 2014 (§14.9.4.10 (including Table 14.9.4.10.1) revised)
Amended: December 10, 2014 (§§ 8, 9.3.1, 11.3.2, 14.2.2, and Table 14.5.4.1revised)
Amended: May 19, 2015 (§§ 15 and 16, including conforming changes in other sections
revised)
Amended: September 27, 2016
Amended: December, 2016 (§§ 9, 10 and 12, including conforming changes in other sections revised) Amended: May 23, 2018, complete re‐write of the Policy and Guidelines. Changes to be effective on
July 1, 2018.
394/511

47
AppendixE:Callan’sCapitalMarketsProjections(2018‐2027)
Asset Class PROJECTED RETURN PROJECTED
RISK
Asset Class Performance Index Target Weight
Target Weight
1-Year Arithmetic
10-Year Geometric*
Standard Deviation
Projected Yield
Public Equities 39.0% 8.60% 7.05% 18.85% 2.60%
Global Equity MSCI ACWI - IMI 8.60% 7.05% 18.85% 2.40%
Fixed Income Plus 22.0% 4.10% 4.05% 5.00% 4.00%
Money Markets 90-Day T-Bill 5.0% 1.1% 2.25% 2.25% 0.90% 2.25%
TIPS Barclays TIPS 5.0% 1.1% 3.10% 3.00% 5.25% 3.30%
US Fixed Income Barclays Aggregate 25.0% 5.5% 3.05% 3.00% 3.75% 3.45%
US Investment Grade Credit Barclays Credit 25.0% 5.5% 3.65% 3.55% 5.05% 4.00%
Non-US Fixed Income Barclays Global AggregateXUS 10.0% 2.2% 1.80% 1.40% 9.20% 1.90%
Emerging Market Debt Barclays EMD Hard Currency 5.0% 1.1% 4.85% 4.50% 9.60% 4.90%
Global High Yield Barclays Global High Yield 10.0% 2.2% 5.20% 4.75% 10.35% 5.40%
Global REITs S&P Global REIT 10.0% 2.2% 8.25% 6.40% 20.30% 4.30%
Global Listed Infrastructure S&P Global Listed Infrastructure 5.0% 1.1% 7.65% 6.40% 17.25% 4.00%
Private Equity/Growth Opps 11.0% 10.60% 8.50% 22.00% 0.00%
Private Equity Cambridge Private Equity 11.0% 10.60% 8.50% 22.00% 0.00%
Private Real Estate 10.0% 6.90% 5.75% 16.35% 4.75%
Real Estate NCREIF Total Index 10.0% 6.90% 5.75% 16.35% 4.75%
Private Infra/Credit/Income 6.0% 6.65% 5.75% 14.50% 5.50%
Private Infrastructure FTSE Global Listed Infrastruc 60.0% 3.6% 6.45% 5.75% 13.00% 5.00%
Private Credit Barclays Global High Yield 40.0% 2.4% 6.95% 5.75% 16.50% 6.25%
Absolute Return 6.0% 5.35% 5.05% 9.15% 0.00%
Hedge Funds HFRI Total HFOF Universe 6.0% 5.35% 5.05% 9.15% 0.00%
Asset Allocation 6.0% 7.15% 6.55% 12.55% 3.00%
Cash Equivalents 90-Day T-Bill 33.3% 2.0% 2.25% 2.25% 0.90% 2.25%
Multi Asset Class/ECIO APFC Total Fund Target 66.7% 4.0% 7.15% 6.55% 12.55% 3.00%
Inflation CPI-U 2.25% 1.50%
Total Fund APFC Total Fund Target 100.0% 7.15% 6.55% 12.55% 3.00%
395/511

Real Assets and Private Income Pacing Memo
Separator Page
396/511

SUBJECT: APFC Real Assets/Private Income FYE June 2019 Private Commitment Pacing ACTION: ___________
DATE: May 24, 2018 INFORMATION: X
BACKGROUND: Each May, APFC Private Markets investment staff provides an informational update to the Board of Trustees on their current positioning vis-à-vis target allocations and projection for the subsequent fiscal year commitment activity to the Private Market asset classes. STATUS: At this meeting Staff will provide an update to the Board of Trustees that includes:
Current Real Assets / Private Income funded NAV and unfunded commitments relative to our current and FY 2021 target allocation
Summary of FYE June 2018 commitment activity
Projection model with recommended commitment pace for FYE June 2019 and beyond to achieve targeted 22% FY 2021 exposure for Real Assets & Private Income
A sensitivity analysis showing the likely range of outcomes with a variety of deployment paces and overall APFC fund growth
As an Informational matter, Staff will indicate that they plan on deploying up to $2.5 billion of private commitment activity to Real Assets & Private Income in FY 2019. This is roughly in-line with the current investment pace (in FY 2018) and is required to achieve the targeted exposure levels to this asset class. In FY 2019, Staff may make some investments into liquid structures (such as certain open-ended alternative credit funds) which is not included in these private commitment projections.
397/511

Real Assets and Private Income Pacing Presentation
Separator Page
398/511
Real Assets and Private IncomeFY19 Deployment Plan and Pacing Projection
May 24, 2018399/511

ALASKA PERMANENT FUND CORPORATION 2
• Programs and Underlying Structures (and current NAV)
– Private Real Estate ($4.1 bn): Predominantly direct investments held through LLCs; new focus on international funds and co-investments
– Private Infrastructure ($2.3 bn): Mix of private equity style fund structures (10-25 year lives) and longer-term direct investments and JVs
– Private Credit ($1.2 bn): Mostly private equity style fund structures (7-12 year lives)
– Income Opportunities ($740 mm): Will vary, including direct investments, funds, and in-house non-investment grade direct credit (ADAC)
• Current Exposure: $8.2 billion, 12.7% of overall $65 billion fund
• Target Allocation (combining Real Estate and Private Income):
– 17% for FY 2018, 18% for FY 2019, 20% for FY 2020, 22% for FY 2021
– Current exposure is $2.8 billion below FY 2018 Target Allocation
• Current Unfunded Commitments(1): ~$2.7 billion
– $1.6 billion for Private Infrastructure
– $1.0 billion for Private Credit
– $128 million for Income Opportunities
Key Statistics – Real Assets and Private Income
Note: Exposure figures outlined here are as of March 2018 adjusted for $500 million initial funding of in-house direct credit initiative (ADAC) included within Income Opportunities.(1) Excludes commitments that are in APFC’s unilateral control such as co-investment rights or funding commitments to real estate structures that APFC controls. 400/511

ALASKA PERMANENT FUND CORPORATION 3
Alchemy SOF IV: $38.5 million
Atalaya AIF IV: $50.0 million
Diligent Corp. (Direct Investment): $15.9 million
Monroe Capital Private Credit Fund III: $50.0 million
TPG TAO 4.0: $100 million
Pending Private Credit Funds: $150 million
Total Private Credit: $404 million
Encap Flatrock Midstream IV: $22.5 million
Equis Energy (Direct Investment): $100 million
InfraRed Infrastructure V: $100 million
LS Power IV: $200 million
Twin Creeks Timber, LLC (Direct Investment): $18.6 million
Pending Infrastructure Funds: $275 million
Total Private Infrastructure: $716 million
FY18 Real Assets and Private Income Commitment ActivityAPFC Staff Expects to Complete FYE June 2018 with an Estimated $2.5 billion of Commitment Activity
Private Real EstateHeitman Credit Separate Account: $100 million
Direct Real Estate (Multi-family “build-to-core”, Industrial) $100 million
Q4 Expected Indirect Commitments: $500 million
Total Private Real Estate: $700 million
Encap Flatrock Midstream IV: $22.5 million
Equis Energy (Direct Investment): $100 million
InfraRed Infrastructure V: $100 million
LS Power IV: $200 million
Twin Creeks Timber, LLC (Direct Investment): $18.6 million
Pending Infrastructure Funds: $275 million
Total Private Infrastructure: $716 million
ADAC (in-house, direct credit effort): $500 million
Broad River III: $100 million
Generate Capital (Direct Investment): $100 million
Pending Direct Investment: $15 million
Total Income Opportunities: $715 million
Total Expected Real Assets and Private Income FY18 Deployment: $2.5 billion
Private CreditPrivate Infrastructure
Income Opportunities
401/511

ALASKA PERMANENT FUND CORPORATION 4
0%
5%
10%
15%
20%
25%
30%
FY 2008 FY 2009 FY 2010 FY 2011 FY 2012 FY 2013 FY 2014 FY 2015 FY 2016 FY 2017 FY 2018
Infrastructure Private Credit Income Opportunities Real Estate
Real Assets and Private Income Exposure HistoryNAV as a % of Total APFC Fund Net Assets (FY 2008-2018)
Current Target Allocation = 17.0%
FY21 Target Allocation = 22.0%
402/511

ALASKA PERMANENT FUND CORPORATION 5
Modeling of New and Existing Exposures (numerator)• Staff models a projection for future NAV’s of existing investments based on (i) known near-term cash flows, (ii) exits and distributions based on prior
history of similar investments, (iii) review of legal terms of partnerships, and (iv) discussions with partners
• Similar approach taken on projected future capital deployments via funds taking into consideration mix implications of private credit funds (short duration, often <10 year partnerships) vs. infrastructure (12-25 year partnerships) vs. potentially multi-decade investments (such as some infrastructure and real estate direct investments and APFC’s timber joint venture)
• Staff does not make any assumption around exiting fund interests via the secondary market due to the inconsistent availability of this exit mechanism over time and the discounted pricing that Real Assets and Private Income investments tend to command in this market vis-à-vis corporate private equity and leveraged buy-out secondary markets
Modeling of APFC Total Fund Growth (denominator)• For this year’s projection model, Staff assumes: (i) June 2018 draw of $2.7 billion off of current value plus (ii) 2.0% annual Fund growth after dividend
payments and any other transfer payments
• Similar methodology to last year; previously Staff (in consultation with Callan) had generally used a long-term growth assumption of 5.0% after dividend payments for the Total APFC Fund size
Because the Real Assets and Private Income portfolio is in growth mode, Staff will have much more ability to course correct along the way if projections deviate from currently modeled assumptions (vs. a more mature situation where a private markets investor is at or above their long-term target already)
Real Assets and Private Income Exposure Projection Model
403/511

ALASKA PERMANENT FUND CORPORATION 6
Status Quo Pacing ProjectionAssumes No New Commitments / Capital Deployment
($ in billions)
Est. Fund NAV $62.3 $63.5 $64.8 $66.1 $67.4 $68.8 $70.2 $71.6 $73.0
PI / RA NAV $8.2 $9.5 $10.2 $10.9 $9.3 $8.6 $8.2 $7.9 $7.8
PI / RA % 13.2% 14.9% 15.8% 16.5% 13.8% 12.6% 11.7% 11.0% 10.8%
Target % 17.0% 18.0% 20.0% 22.0% 22.0% 22.0% 22.0% 22.0% 22.0%
0%
5%
10%
15%
20%
25%
30%
FY 2018 FY 2019 FY 2020 FY 2021 FY 2022 FY 2023 FY 2024 FY 2025 FY 2026
Infrastructure Private Credit Income Opportunities Real Estate
FY21 Target Allocation = 22.0%
404/511

ALASKA PERMANENT FUND CORPORATION 7
0%
5%
10%
15%
20%
25%
30%
FY 2018 FY 2019 FY 2020 FY 2021 FY 2022 FY 2023 FY 2024 FY 2025 FY 2026
Infrastructure Private Credit Income Opportunities Real Estate
Current Run-Rate Deployment Pacing ProjectionAssumes $2.5 billion of Annual Commitments / Capital Deployment
FY21 Target Allocation = 22.0%
Note: Annual deployment between categories will be at APFC Staff discretion based on quality of opportunities, however, for modeling purposes long-term split assumed to be 30% to Real Estate, 35% to Infrastructure, and 35% to Private Credit.
($ in billions)
Est. Fund NAV $62.3 $63.5 $64.8 $66.1 $67.4 $68.8 $70.2 $71.6 $73.0
PI / RA NAV $8.2 $10.3 $12.4 $14.8 $15.2 $16.3 $16.7 $16.9 $17.2
PI / RA % 13.2% 16.2% 19.1% 22.4% 22.5% 23.7% 23.8% 23.6% 23.6%
Target % 17.0% 18.0% 20.0% 22.0% 22.0% 22.0% 22.0% 22.0% 22.0%
405/511
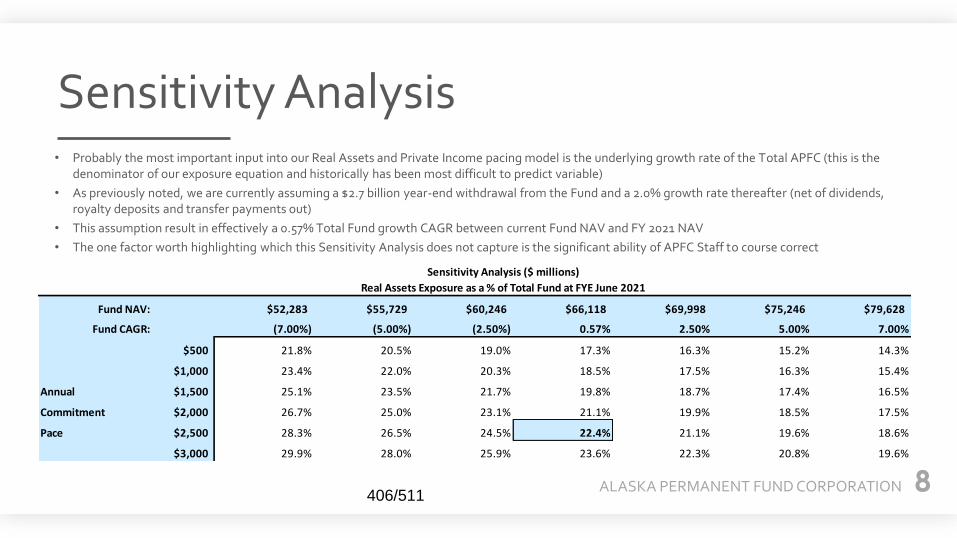
ALASKA PERMANENT FUND CORPORATION 8
Sensitivity Analysis• Probably the most important input into our Real Assets and Private Income pacing model is the underlying growth rate of the Total APFC (this is the
denominator of our exposure equation and historically has been most difficult to predict variable)
• As previously noted, we are currently assuming a $2.7 billion year-end withdrawal from the Fund and a 2.0% growth rate thereafter (net of dividends, royalty deposits and transfer payments out)
• This assumption result in effectively a 0.57% Total Fund growth CAGR between current Fund NAV and FY 2021 NAV
• The one factor worth highlighting which this Sensitivity Analysis does not capture is the significant ability of APFC Staff to course correct
Fund NAV: $52,283 $55,729 $60,246 $66,118 $69,998 $75,246 $79,628
Fund CAGR: 22.4% (7.00%) (5.00%) (2.50%) 0.57% 2.50% 5.00% 7.00%
$500 21.8% 20.5% 19.0% 17.3% 16.3% 15.2% 14.3%
$1,000 23.4% 22.0% 20.3% 18.5% 17.5% 16.3% 15.4%
Annual $1,500 25.1% 23.5% 21.7% 19.8% 18.7% 17.4% 16.5%
Commitment $2,000 26.7% 25.0% 23.1% 21.1% 19.9% 18.5% 17.5%
Pace $2,500 28.3% 26.5% 24.5% 22.4% 21.1% 19.6% 18.6%
$3,000 29.9% 28.0% 25.9% 23.6% 22.3% 20.8% 19.6%
Sensitivity Analysis ($ millions)
Real Assets Exposure as a % of Total Fund at FYE June 2021
406/511

ALASKA PERMANENT FUND CORPORATION 9
• Given the growth mode of the Real Assets and Private Income portfolio and its diversity of activities across Private Real Estate, Private Infrastructure, Private Credit, and Income Opportunities, Staff intends to pursue a plan of up to $2.5 billion of new commitment / deployment activity in FYE June 2019 (net of potential sales)
• Allocation will be split between direct investments, co-investments, and fund investments as Staff sees opportunities
• In FY19 Staff may make investments into liquid structures (such as certain open-ended alternative credit funds); commitment budgeting here refers to illiquid private commitments as opposed to vehicles with liquidity features of under twelve months
• Areas of specific focus in FY19 include:– Private credit co-investments (via ADAC)
– International Real Estate
– North American Industrial Real Estate and Multi-Family “build-to-core” investments
– North American Private Infrastructure Opportunities
– Potential Follow-on Investments into Existing Direct Real Asset Platforms
– Re-ups to top performing existing manager relationships who are back in the market
Summary (Information Item for BOT)
407/511

Private Equity and Special Opportunities Pacing Memo
Separator Page
408/511

SUBJECT: FY 2019 Private Equity and Special Opportunities Investment Pacing ACTION: ___________
DATE: May 24, 2018 INFORMATION: X
BACKGROUND: Each May, APFC Private Equity and Special Opportunities investment staff provides an informational update to the Board of Trustees on current portfolio exposure, targets, and projections for the next fiscal year’s activity in the Private Equity and Special Opportunities portfolios. STATUS: At this meeting Staff will provide an update to the Board of Trustees that includes:
Current Private Equity and Special Opportunities NAV relative to target;
snapshot of FY2018 commitment activity;
projection model with recommended pacing for FY 2019 and beyond necessary to achieve targeted exposures; and
A sensitivity analysis showing the probabilistic range of outcomes in various hypothetical market scenarios.
As an informational matter, staff will summarize a plan to invest or commit approximately $1.6 billion to a combination of funds, co-investments, and direct investments in FY 2019. As in prior years, staff seeks to maintain flexibility to increase or decrease deployment by up to $550 million based on market conditions, opportunistic deal flow, and transaction timing. The FY 2019 target represents a gradual increase (in absolute dollar terms though not as a percentage of the overall fund) from prior years.
409/511

Private Equity and Special Opportunities Pacing Presentation
Separator Page
410/511

Private Equity & Special OpportunitiesFY 2019 Pacing Plan | May 23, 2018
Steve Moseley411/511

ALASKA PERMANENT FUND CORPORATION 2
Private Equity Pacing Model
• Methodology and key assumptions:
– Base case: 2% net growth in APFC AUM (net of all inflows and outflows)
– Assumes disbursement of $2.7 billion from APF on June 30, 2018 and reflects recent exits
– Expected partnership life of 14 years
– Long term historical rates of deployment and realizations but lower net PE returns
– Sensitivity analysis to identify range and variance of potential outcomes• Slow (and fast) fund growth, economic stress, increased volatility, etc.
• Targeted commitment pace also reflects cautious market outlook
– Portfolio successfully normalized for accelerated commitments made in 2014-2015
– Seek to maintain flexibility to invest more aggressively in cheaper markets
Anticipates systematic, gradual program growth
412/511

ALASKA PERMANENT FUND CORPORATION 3
Snapshot: Private Equity & Special Opportunities portfolios
Commitments/Investments Since NAV NAV PF*
(in US$ millions) FY2018* Inception 12/31 12/31
Private Equity $1,139 $9,233 $4,735 $4,263
Special Opportunities 367 4,087 3,049 2,855
Total $1,505 $13,320 $7,784 $7,118
% of APFC AUM 12.0% 11.4%
Target allocation 11.0%
FY 2017 Actual Commitments + Investments $1,371 FY 2018 Actual Commitments + Investments $1,505
FY 2019 Planned Commitments and Investments $1,600
* pro forma for Q1 exits
413/511

ALASKA PERMANENT FUND CORPORATION 4
Proposed Portfolio Commitment PacePropose $1.6 billion in commitments for FY2019 ($1.1 billion and $500 million committed to PE and Special Opps, respectively)
APFC Private Equity and Special Opportunities Exposure 5-year Projections(in US$ millions)
APF assumed net growth rate: 2%Combined Portfolio Current FY 2019 FY 2020 FY 2021 FY 2022 FY 2023
Private Equity $900 $1,100 $1,100 $1,200 $1,200 $1,200Special Opportunities $450 $500 $500 $500 $500 $550Total FY Deployment $1,350 $1,600 $1,600 $1,700 $1,700 $1,750
Private Equity $4,735 $4,263 $4,613 $5,033 $5,527 $6,033Special Opportunities $3,049 $2,855 $3,099 $3,190 $3,221 $3,233Total Market Value $7,784 $7,118 $7,712 $8,223 $8,748 $9,266
Projected APF Market Value $65,000 $62,300 $63,546 $64,817 $66,113 $67,436
Private Equity % 6.8% 7.3% 7.8% 8.4% 8.9%Special Opportunities % 4.6% 4.9% 4.9% 4.9% 4.8%PE + Spec Opps Exposure 12.0% 11.4% 12.1% 12.7% 13.2% 13.7%
414/511
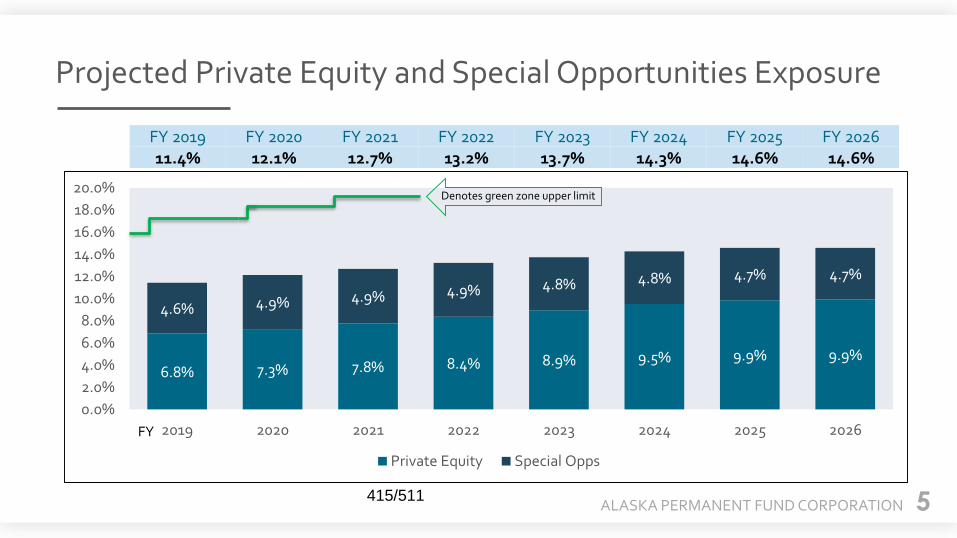
ALASKA PERMANENT FUND CORPORATION 5
Projected Private Equity and Special Opportunities Exposure
6.8% 7.3% 7.8% 8.4% 8.9% 9.5% 9.9% 9.9%
4.6% 4.9% 4.9% 4.9% 4.8% 4.8% 4.7% 4.7%
0.0%
2.0%
4.0%
6.0%
8.0%
10.0%
12.0%
14.0%
16.0%
18.0%
20.0%
2019 2020 2021 2022 2023 2024 2025 2026
Private Equity Special Opps
FY 2019 FY 2020 FY 2021 FY 2022 FY 2023 FY 2024 FY 2025 FY 202611.4% 12.1% 12.7% 13.2% 13.7% 14.3% 14.6% 14.6%
Denotes green zone upper limit
FY
415/511

ALASKA PERMANENT FUND CORPORATION 6
Sensitivity Analysis
7%
9%
11%
13%
15%
17%
19%
21%
FY 2019 FY 2020 FY 2021 FY 2022 FY 2023 FY 2024 FY 2025 FY 2026
PE
an
d S
pec
Op
ps
Exp
osu
re
Base (2%)
0% APF Growth
Market Correction*
5% APF Growth
Green zone limits
Broad range of scenarios suggest that the risk of significant overexposure or underexposure is small
*Market Correction Scenario: A value decline of 26% applied to all assets, reflecting the ~26% decline for the year ended 3/31/09 (GFC trough). Assumes zero growth for 1 year with rebound over the following 5 years, and 2% annual growth thereafter
416/511

ALASKA PERMANENT FUND CORPORATION 7
Summary FY2019 Pacing Plan
• $1.1 billion target allocation to traditional Private Equity with:– Allocation divided between co-investments (up to 30%) and fund commitments, depending on comparative value
– Consistent with prior years, flexibility to increase to $200 million if market opportunities are compelling
– Represents $200 million (22%) increase from FY2018 target deployment
• $500 million target allocation to Special Opportunities with:– Flexibility to increase or decrease as much as $350 million based on quality of opportunity set
– Represents $50 million (11%) increase from FY2018 target deployment
• Maintain and monitor diversification (vintage, strategy, manager, industry, etc.)– Continue to build non-U.S. portfolio
– Above figures refer to new commitments, net of potential sales, and may be transferable between the programs, so that aggregate new purchases are $1.6 billion with the flexibility to increase by $550 million (net of sales)
Proposed deployment targets for FY 2019
417/511

Annual Asset Allocation Review Memo
Separator Page
418/511

SUBJECT: Annual Asset Allocation Discussion ACTION: Capital Markets Assumptions DATE: 5/24/2018 INFORMATION: X
BACKGROUND: Each year, the Board of Trustees assesses APFC’s asset allocation and projected returns based on the general consultant’s market projections and correlations. In light of recent market volatility and progression of the current business cycle, the general consultant updated projected returns for FY2019 and FY 2021. STATUS: At this board meeting, the general consultant will give their market projections and correlations. Then, staff will provide an update on how these projections reflect into APFC’s current target asset allocation and projected returns. RECOMMENDATION: Staff recommends that the current asset allocation remain the asset allocation for FY19.
419/511

Asset Allocation Review Presentation
Separator Page
420/511

Asset Allocation DiscussionFY 2019 Projections
May, 2018
Capital Market Projections and
Asset Allocation Framework
Steve Center, CFASenior Vice President, Fund
Sponsor Consulting
President, Director of Research
Gregory C. Allen
421/511

2Knowledge. Experience. Integrity.
Outline
●Summary of Callan’s capital market projections, economic outlook, projection
process.
●Projected return and risk for 2019, and 2021 policy portfolios.
●Efficient Frontier Analysis.
Evaluation of APFC Strategic Policy using Callan’s Capital Market Projections
422/511

3Knowledge. Experience. Integrity.
Capital Market ProjectionsProjected Return, Standard Deviation, and Yield
● 10-year projections focus on the compound, 10-year geometric return
● Geometric return incorporates the impact of capital market volatility (standard deviation) on the return earned by an investor over time
Asset Class PROJECTED
RISK
Asset Class Performance IndexTarget Weight
Target Weight
1-Year Arithmetic
10-Year Geometric*
Standard Deviation
Projected Yield
Public Equities 38.0% 8.60% 7.05% 18.85% 2.60%Global Equity MSCI ACWI - IMI 8.60% 7.05% 18.85% 2.40%
Fixed Income Plus 22.0% 4.10% 4.05% 5.00% 4.00%Money Markets 90-Day T-Bill 5.0% 1.1% 2.25% 2.25% 0.90% 2.25%
TIPS Bloomberg TIPS 5.0% 1.1% 3.10% 3.00% 5.25% 3.30%
US Fixed Income Bloomberg Aggregate 25.0% 5.5% 3.05% 3.00% 3.75% 3.45%
US Investment Grade Credit Bloomberg Credit 25.0% 5.5% 3.65% 3.55% 5.05% 4.00%
Non-US Fixed Income Bloomberg Global Aggregate ex US 10.0% 2.2% 1.80% 1.40% 9.20% 1.90%
Emerging Market Debt Bloomberg EMD Hard Currency Agg 5.0% 1.1% 4.85% 4.50% 9.60% 4.90%
High Yield Bloomberg US High Yield 10.0% 2.2% 5.20% 4.75% 10.35% 5.40%
Global REITs S&P Global REIT 10.0% 2.2% 8.25% 6.40% 20.30% 4.30%
Global Listed Infrastructure S&P Global Listed Infrastructure 5.0% 1.1% 7.65% 6.40% 17.25% 4.00%
Private Equity/Growth Opps 12.0% 10.60% 8.50% 22.00% 0.00%Private Equity Cambridge Private Equity 11.0% 10.60% 8.50% 22.00% 0.00%
Private Real Estate 11.0% 6.90% 5.75% 16.35% 4.75%Real Estate NCREIF Total Index 10.0% 6.90% 5.75% 16.35% 4.75%
Private Infra/Credit/Income Opps 7.0% 6.65% 5.75% 14.50% 5.50%Private Infrastructure FTSE Global Listed Infrastructure 60.0% 4.2% 6.45% 5.75% 13.00% 5.00%
Private Credit Bloomberg US High Yield 40.0% 2.8% 6.95% 5.75% 16.50% 6.25%
Absolute Return 5.0% 5.35% 5.05% 9.15% 0.00%Hedge Funds HFRI Total HFOF Universe 6.0% 5.35% 5.05% 9.15% 0.00%
Asset Allocation 5.0% 5.20% 5.00% 7.50% 2.70%Cash Equivalents 90-Day T-Bill 40.0% 2.0% 2.25% 2.25% 0.90% 2.25%
Multi Asset Class/ECIO APFC Total Fund Target 60.0% 3.0% 7.15% 6.55% 12.50% 3.05%
Inflation CPI-U 2.25% 1.50%
Total Fund APFC Total Fund Target 100.0% 7.15% 6.55% 12.50% 3.05%
PROJECTED RETURN
Summary of Callan's Long-Term Capital Market Projections for APFC Asset Allocation Model (FY 2019 - 2028)
423/511

4Knowledge. Experience. Integrity.
Capital Market Assumptions
● Projected correlations between asset classes are the third dimension of capital market
expectations.
● Historical trending behavior is evaluated for each pair in the matrix.
● Correlations must be consistent (positive semi-definite) as a set in order to work properly in
optimization and simulation analysis.
Projected Correlation Matrix
GE CASH TIPS US FI CRDT NU FI EMD GHY GR GLI PE RE PI HF CPI
Global Equity 1.000 -0.072 -0.059 -0.115 0.299 -0.067 0.541
Cash Equivalents -0.040 1.000 -0.056 -0.108 0.265 -0.063 0.508
US TIPS -0.052 0.070 1.000 -0.154 0.169 -0.046 0.438
US Fixed Income -0.123 0.100 0.600 1.000 0.259 -0.042 0.365
US Investment Grade Credit 0.304 -0.081 0.404 0.688 1.000 -0.030 0.262
Non US Fixed Income 0.019 -0.090 0.340 0.510 0.447 1.000 0.540
Emerging Market Debt 0.593 -0.070 0.180 0.100 0.254 0.010 1.000Global High Yield 0.652 -0.110 0.060 0.020 0.373 0.120 0.600 1.000Global REITS 0.860 -0.072 -0.059 -0.115 0.299 -0.067 0.541 0.598 1.000Global Listed Infrastructure 0.808 -0.068 -0.056 -0.108 0.265 -0.063 0.508 0.562 0.773 1.000Private Equity 0.745 -0.023 -0.085 -0.154 0.169 -0.046 0.438 0.492 0.652 0.613 1.000Real Estate 0.602 -0.050 0.000 -0.025 0.259 -0.042 0.365 0.465 0.540 0.507 0.457 1.000Private Infrastructure 0.439 -0.036 0.000 -0.018 0.186 -0.030 0.262 0.333 0.387 0.363 0.328 0.395 1.000Hedge Funds 0.805 -0.070 0.075 0.080 0.379 -0.080 0.540 0.570 0.712 0.670 0.600 0.502 0.360 1.000Inflation -0.001 0.000 0.180 -0.280 -0.210 -0.150 0.000 0.070 0.020 0.019 0.046 0.083 0.060 0.200 1.000
424/511

5Knowledge. Experience. Integrity.
APFC 2019 Target Asset AllocationProjected Return and Standard Deviation
● Median expected 10-year geometric
return for the 2019 Total Fund target
asset allocation is roughly 6.55%.
● The projected annualized standard
deviation is roughly 12.50%.
● This means that there is a 2 out of 3
chance (67%) that in any single year
the return for this asset mix will fall
between -5.95% and 19.05%.
● The median expected real return for
this mix is 4.35% annualized.
● Based on Callan’s projections, the
probability of this mix exceeding a
5.00% annualized real return over the
next 10 years is roughly 43%.Expected 10-year Geometric Return: 6.55%
Expected Standard Deviation: 12.50%Expected Inflation: 2.25%
Public Equities, 38%
Fixed Income Plus, 22%
Private Equity, 12%
Real Estate, 11%
Private Infra/Credit, 7%
Absolute Return, 5%
Asset Allocation, 5%
2019 Total Fund Target
425/511

6Knowledge. Experience. Integrity.
APFC 2021 Target Asset AllocationProjected Return and Standard Deviation
● The median expected 10-year
geometric return for the 2021 target
increases by roughly 10 basis points
relative to the 2019 target.
● The projected annualized standard
deviation decreases by roughly 10
basis points relative to the 2019 target.
● Improvements are due primarily to
modest increases in illiquid asset
classes (private equity, infrastructure,
and absolute return).
● Median expected real return for this mix
is 4.40% annualized.
● Based on Callan’s projections, the
probability of this mix exceeding a
5.00% annualized real return over the
next 10 years is roughly 44%.
Expected 10-year Geometric Return: 6.65%Expected Standard Deviation: 12.60%
Expected Inflation: 2.25%
Public Equities, 35%
Fixed Income Plus, 18%
Private Equity, 14%
Real Estate, 13%
Private Infra/Credit, 9%
Absolute Return, 6%
Asset Allocation, 5%
2021 Total Fund Target
426/511

7Knowledge. Experience. Integrity.
Constrained Efficient Frontier Analysis 40% Private AssetsProjected Return and Standard Deviation
● This Efficient Frontier is
constrained to limit the
allocation to private assets
to a total of 40% of portfolio
(the 2021 target allocation
to illiquid asset classes).
● The 2019 target is below
the constrained efficient
frontier due to the smaller
allocation to illiquid asset
categories (37% versus
40% for the frontier).
● The increase in illiquid
asset classes from 37% in
2019 to 40% in 2021
improves the long-term
efficiency of the portfolio.
5.00 6.00 7.00 8.00 9.00 10.00 11.00 12.00 13.00 14.00 15.00 16.00 17.00
5.00
5.25
5.50
5.75
6.00
6.25
6.50
6.75
7.00
7.25
7.50
10-Year Expected Geometric Mean Return versus Projected Standard DeviationEfficient Frontier
Projected Standard Deviation
10 Y
r. G
eom
etric
Mea
n R
etur
n2021 Target
2019 Target
(40% Illiquidity)Efficient Frontier
427/511

FY18 Budget Projections Memo
Separator Page
428/511

SUBJECT: FY18 Budget Projections
ACTION: X
DATE: May 24, 2018
INFORMATION:
BACKGROUND: Per Board Resolution 98-4 – Pertaining to the Operating Budget of The Corporation:
APFC staff shall, prior to the last meeting of the Board of Trustees of each fiscal year, prepare an analysis of expenditures to date and status of programs, identify projected shortfalls and surpluses by the objects of expenditures set out herein, and recommend transfers to the Board of Trustees. The Board of Trustees may, following discussion and due consideration of staff recommendations, authorize the transfer of budgeted funds between the objects of expenditures set out herein pursuant to such recommendations as may be amended by the Board of Trustees.
STATUS: The attached report shows the projected fiscal year-end status of the Corporation’s two Fiscal Year 2018 budget components. The estimates are based on actual expenditures through March 2018 and expenditure projections for April – June, 2018. An analysis of the projected FY2018 expenditure activity for each of the objects of expenditure is provided below, along with budget detail highlights. OPERATIONS COMPONENT Total Corporate Operations
FY18 Budget
FY18 Actual (projected)
Surplus (shortfall)
FY19 Request**
$12,254,400 $11,659,235 $595,165 $168,573,300
** The investment management component was combined with the corporate operations component, resulting in a single allocation in the FY19 budget request.
The total expenditure for corporate operations is well within this year’s budget.
429/511

Page 2
Personal Services
FY18 Budget FY18 Actual (projected)
Surplus (shortfall)
FY19 Request
$9,600,700 $9,433,418 $167,282 $11,861,200
The Personal Services line is projected to have a small surplus at year-end. The corporation experienced significant restructuring during FY18, mainly in the Administration area, with the elimination of the Director of Operations position and the addition of the Chief Operating Officer. Currently, recruitment is underway to fill administrative vacancies that will provide de-centralized departmental support, as well as reception. Other departments experienced some intermittent vacancy throughout the year as positions turned over. One FTE, an investment analyst, remained vacant throughout the year. Travel
FY18 Budget FY18 Actual (projected)
Surplus (shortfall)
FY19 Request
$605,500 $560,926 $44,574 $1,203,200
Travel expenditures are projected to be slightly less than budgeted. As the Fund grows and the portfolio becomes increasingly global in nature, travel becomes more and more essential to accessing deal flow. International travel has increased as we add non-domestic investments to almost every asset class. The authorization for staff travel is projected to be fully expended. Most of the surplus on the travel line is due to lower than anticipated Trustee travel for conferences and other non-Board meeting events.
FY17 Actual FY18 Projected
Total expenditure $323,539 $560,926
Total trips 185 224
Staff travel 162 186
Trustee travel 23 19
Contractual Services
FY18 Budget FY18 Actual (projected)
Surplus (shortfall)
FY19 Request**
$1,870,900 $1,494,120 $376,780 $154,673,600
** The investment management component was combined with the corporate operations component, resulting in a single allocation in the FY19 budget request.
430/511

Page 3
The Contractual Services item of expenditure encompasses all services provided to the corporation by non-employees such as contractors, consultants, auditors, and attorneys.
FY18 Budget FY18 Actual (projected)
Surplus (shortfall)
FY19 Request
CONTRACTUAL SERVICES TOTAL
$1,870,900 $1,494,120 $376,780 $154,673,600
Professional Services 305,500 201,957 103,543 434,270
Public Ed/Info Program 102,000 92,136 9,864 146,500
IT Services 479,700 370,845 108,855 2,502,300
Repairs & Maintenance 65,400 30,049 35,351 93,500
Leases 518,500 511,303 7,197 538,300
Training & Education 56,500 28,440 28,060 186,620
Meeting Expenses 49,500 25,181 24,319 65,181
Other 293,800 234,209 59,591 208,229
Investment Management Fees
- - - 150,498,700
Professional Services – This expenditure line is expected to have a $104,000 surplus primarily as a result of lower than anticipated non-investment related legal work, both by outside counsel and on APFC’s behalf by the Department of Law. There was also an amount budgeted for consulting projects related to the audit, which is projected to go unspent. In addition to these areas, the Professional Services line funds the annual audit and the Board’s investment advisors. Public Education / Information Program – The year-end expenditure on this line is projected to have a surplus authorization of $10,000. During FY18, a complete overhaul of the corporation’s website was funded through this line in addition to the development and printing of the annual report, newspaper inserts, and election pamphlets. IT Services – The IT Services line is projected to lapse $109,000. Most of the funding in this line is discretionary in nature and project-based. The projects undertaken this fiscal year by IT did not utilize as many consultant resources as budgeted. This fiscal year’s IT projects included complete replacement of the corporation’s data center, setup of the disaster recovery equipment and protocol, continuing work on the conversion to Blackrock Aladdin, upgrade of OneSolution, and conversion of workstations to Virtual Desktop Infrastructure (VDI) to allow for secure remote access to workstation functionality for all APFC users. Repairs/Maintenance — It is projected that this line will be under-expended by $35,000 due primarily to lower than anticipated IT equipment repair needs.
431/511

Page 4
Leases — It is anticipated that this line will end the year with a slight surplus of $7,000. This line encompasses amounts expended for office space in addition to leases on copying equipment. Training and Education – This line is projected to have a $28,000 surplus. Staff did attend conferences that were deemed essential to increase efficiency, performance, or reduce operational risk. However, during this year, the demands of daily work often made it more difficult for staff to travel for training, which is viewed as more discretionary than for other purposes. Meeting Expenses – This line is projected to lapse $24,000. This is the result of hosting Board meetings in locations for which there is no charge for the venue. Commodities
FY18 Budget FY18 Actual (projected)
Surplus (shortfall)
FY19 Request
$97,300 $90,770 $6,530 $435,300
The Commodities line includes subscriptions, reference materials and office supplies, as well as furniture and IT equipment that cost less than $5,000 per item. The expenditure in this line is under-budget by $7,000. In anticipation of the newly configured office space and to fully implement VDI, much of this budget was spent on laptops, docking stations, and monitors for staff. The surplus results from lower than anticipated expenditures on subscriptions.
Equipment FY18 Budget
FY18 Actual (projected)
Surplus (shortfall)
FY19 Request
$80,000 $80,000 $- $400,000
The Equipment line includes furniture and IT equipment which cost more than $5,000 per item. It is anticipated that this line will be fully expended by the end of FY18. Funds from this line have been used to purchase equipment to support the new disaster recovery project and to build the new data center.
432/511

Page 5
INVESTMENT MANAGEMENT COMPONENT
FY18 Budget** FY18 Actual (projected)
Surplus (shortfall)
FY19 Request
INVESTMENT MANAGEMENT TOTAL
$143,769,200 $124,203,029 $19,566,171 $150,498,700
Investment Manager Fees $130,827,100 $117,120,157 $13,706,943 $136,520,085
Public Equity 68,827,100 71,733,893 (2,906,793) 82,493,617
Fixed Income Plus 11,250,000 9,824,865 1,425,135 13,116,245
Real Estate 4,500,000 709,800 3,790,200 780,000
Alternative Investments 46,250,000 34,851,600 11,398,400 40,130,223
Investment Due Diligence $5,795,000 $2,200,605 $3,594,395 $7,178,200
Investment Systems $5,747,100 $3,548,563 $2,198,537 $5,300,415
Custody Fees $1,400,000 $1,333,703 $66,297 $1,500,000
** The FY18 budget reflects the initial budget authorization in addition to the $5 million supplemental appropriation put forward by the Board and approved by the Legislature.
Note: This analysis includes a projection for investment management fees that are paid directly with corporate receipts. APFC has agreements in place in which management fees are netted directly from assets under management. This analysis and projection does not address these net fee arrangements directly. A report of fees paid to managers with net fee arrangements is included in each quarterly Board meeting packet. Total expenditures for the Investment Management budget are expected to be $124.2 million, ending the year with a surplus authorization of approximately $19.6 million. Management fees are largely dependent upon investment performance, which is difficult to predict, particularly as far in advance as the budget process requires. The budget is built based upon projected growth for each asset class combined with anticipated actual fee structures for external management. Because of the unpredictability of these inputs and the nature of the budget approval process, a conservative buffer is built in to ensure that the corporation is always in a position to honor the terms of the contracts with its investment partners. Surplus authorization does not lapse and remains invested as part of the Earnings Reserve account of the Fund. Public Equity – The shortfall of $2.9 million for fees paid for management of the public equity portfolio is due to higher than anticipated growth in this market. Fixed Income Plus – FY2018 fees paid for external management of these portfolios are projected to result in a surplus allocation of $1.4 million. Fees paid for fixed income management are directly related to the value of assets managed.
433/511

Page 6
Real Estate – Since the FY18 budget was approved, the REIT portfolios have been moved from Real Estate to Fixed Income Plus. The surplus of $3.8 million is largely related to the amounts budgeted in this line for these accounts. Alternatives – It is anticipated that there will be a large surplus authorization, $11.4 million, in this allocation. Included in this category are fees paid for the ECIO portfolios, the private equity gatekeeper, the currency overlay manager, and fees paid for oversight of AH4RII. To be conservative, the budget was prepared assuming that incentive fees would be paid to the ECIO managers; however, incentive fees were not paid this fiscal year on any of the ECIO or listed infrastructure portfolios. Investment Due Diligence – The projection indicates that expenditures in this category will be about $2.2 million, which is substantially less than the budget authorization of $5.8 million. A substantial portion of this surplus authorization, approximately $3.3 million, resides in the budget to secure third-party fiduciary advice, subject matter experts, and legal services when considering and acquiring investment opportunities. Budgetary depth will continue to be requested for this discretionary work to avoid restricting the required due diligence of investment opportunities. The remainder of the surplus authorization relates to manager searches and memberships that were not utilized this fiscal year. Investment Systems – There is a projected surplus of $2.2 million on this line for the year. Expenditures on this line include consulting related to systems that support investment activity such as Bloomberg and Aladdin, data feeds for investment systems that facilitate analytics and trading, and internet access fees. Also included in this line for FY18 are the disaster recovery expenditures related to establishing business continuity on the Aladdin trading platform. CAPITAL PROJECTS
Project Name Year Authorized
Authorization
Expended to Date
Balance
APFC Headquarters Renovation
FY2018
$4,050,000
$0
$4,050,000
Plans are complete for the office reconfiguration and the RFP has been released for bid. Prep work is scheduled to begin in early June, with demolition and rebuilding starting in early July. To date, Department of Transportation and Public Facilities has made all payments related to this project. The corporation has not yet been invoiced to reimburse DOT/PF for any of this work.
434/511

Page 7
RECOMMENDATION:
The current direction of the corporation towards VDI and remote accessibility creates the need to update user workstations. This need has become more urgent as staff is caused to relocate during the office remodel. Staff requests Board approval to transfer $95,000 from the Contractual Services item of expenditure to Commodities and Equipment to allow some of these expenditures to happen before the end of FY18. Planned usage of this additional equipment authorization is as follows: Commodities: IT Supplies $5,000 IP Telephony Phones $20,000 Workstation Equipment $50,000 Top of Rack Switches in Data Center $8,000 Equipment: POE (Power Over Ethernet) Switch $12,000 Proposed Board motion: “The Board of Trustees approves the transfer of $95,000 from the Contractual Services item of expenditure, $83,000 to Commodities and $12,000 to Equipment.”
435/511

Budget Status 3.31.18
Separator Page
436/511

FY18 Budget Status Report
Payments & Encumbrances as of 3/31/18
AuthorizationPersonal Services 9,600,700 7,046,770 9,433,418 167,282
Staff & Interns 9,572,700 7,033,430 9,418,034 154,666 Board 28,000 13,340 15,384 12,616
Travel 605,500 384,762 560,926 44,574 Staff 492,785 343,262 483,626 9,159 Trustees 47,300 14,832 20,632 26,668 Moving/Non‐Employee 65,415 26,669 56,669 8,746
Contractual Services 1,870,900 1,198,501 1,494,120 376,780 Professional Services 305,500 185,957 201,957 103,543 Public Education/Info Program 102,000 55,211 92,136 9,864 IT Services 479,700 230,845 370,845 108,855 Communications 86,500 67,937 48,180 38,320 Postage/Delivery 6,550 4,892 5,432 1,118 Advertising/Printing 64,500 38,706 55,706 8,794 Repairs/Maintenance 65,400 26,549 30,049 35,351 Leases 518,500 511,303 511,303 7,197 Training/Education 56,500 22,140 28,440 28,060 Meeting Expenses 49,500 17,681 25,181 24,319 Other 15,663 450 5,000 10,663 State Support Services 120,587 36,832 119,893 694
Commodities 97,300 29,117 90,770 6,530 Equipment 80,000 61,380 80,000 ‐
Total 12,254,400 8,720,530 11,659,235 595,165
Financial Networks 5,747,100 3,403,563 3,548,563 2,198,537 Investment Due Diligence 5,795,000 1,704,355 2,200,605 3,594,395 Custody Fees 1,400,000 1,014,977 1,333,703 66,297 Investment Manager Fees 130,827,100 91,159,393 117,120,157 13,706,943 Public Equities 68,827,100 56,862,998 71,733,893 (2,906,793) Fixed Income Plus 11,250,000 8,114,101 9,824,865 1,425,135 Real Estate 4,500,000 537,291 709,800 3,790,200 Alternative Assets 46,250,000 25,645,003 34,851,600 11,398,400
Total 143,769,200 97,282,288 124,203,029 19,566,171
Projected Year‐end
VarianceCorporate Operations Allocation
Investment Management Fees
Allocation
Payments &
Encumbrances
Year‐end
Projection
437/511

FY 19 Budget Approval Memo
Separator Page
438/511
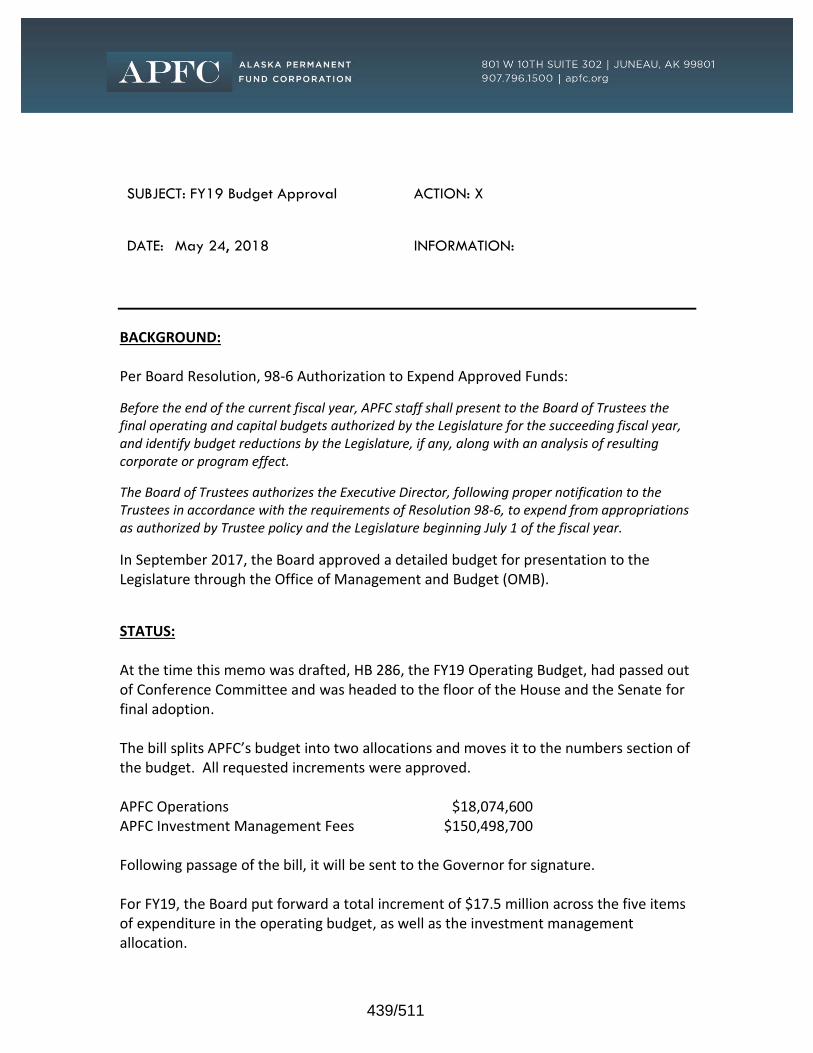
SUBJECT: FY19 Budget Approval
ACTION: X
DATE: May 24, 2018
INFORMATION:
BACKGROUND: Per Board Resolution, 98-6 Authorization to Expend Approved Funds:
Before the end of the current fiscal year, APFC staff shall present to the Board of Trustees the final operating and capital budgets authorized by the Legislature for the succeeding fiscal year, and identify budget reductions by the Legislature, if any, along with an analysis of resulting corporate or program effect.
The Board of Trustees authorizes the Executive Director, following proper notification to the Trustees in accordance with the requirements of Resolution 98-6, to expend from appropriations as authorized by Trustee policy and the Legislature beginning July 1 of the fiscal year.
In September 2017, the Board approved a detailed budget for presentation to the Legislature through the Office of Management and Budget (OMB).
STATUS: At the time this memo was drafted, HB 286, the FY19 Operating Budget, had passed out of Conference Committee and was headed to the floor of the House and the Senate for final adoption. The bill splits APFC’s budget into two allocations and moves it to the numbers section of the budget. All requested increments were approved. APFC Operations $18,074,600 APFC Investment Management Fees $150,498,700 Following passage of the bill, it will be sent to the Governor for signature. For FY19, the Board put forward a total increment of $17.5 million across the five items of expenditure in the operating budget, as well as the investment management allocation.
439/511

Page 2
The increment includes ten new positions: four new investment officers and six support staff across the organization, as well as the related equipment, travel, etc. for these additional staff. The increment also includes $362,800 for reduced vacancy factor and retention adjustments to salaries. Investment management fees and due diligence were increased by $11.7 million to reflect the growing portfolio and evolving asset allocation. RECOMMENDATION:
FY 19 Authorizations
Corporate Operations
Personal Services $11,861,200
Travel $1,203,200
Contractual Services $4,174,900
Commodities $435,300
Equipment $400,000
Total $18,074,600
Investment Management Fees
Investment Manager Fees $136,520,085
Investment Due Diligence $7,178,200
Investment Systems $5,300,415
Custody Fees $1,500,000
Total $150,498,700
Total FY19 Authorization $168,573,300
Proposed Board Motion: “The Board moves to authorize the Chief Executive Officer to expend the APFC budget authorization as approved by the Legislature and enacted by the Governor.”
440/511

Budget Projections & Approval Presentation
Separator Page
441/511

FY18 Budget Projections & FY19 Authorization
442/511

ALASKA PERMANENT FUND CORPORATION 2
Two Allocations -
• Corporate Operations
• Investment Management Fees
Capital Budget
443/511

ALASKA PERMANENT FUND CORPORATION 3
Corporate Operations
• Personal Services
• Travel
• Contractual Services
• Commodities
• Equipment
444/511

ALASKA PERMANENT FUND CORPORATION 4
Total Corporate Operations
Total Corporate Operations
FY18 Budget FY18 Actual(projected)
Surplus (shortfall)
FY19 Request
$12,254,400 $11,659,235 $595,165 $168,573,300
445/511

ALASKA PERMANENT FUND CORPORATION 5
Personal Services
Total Personal Services FY18 Budget FY18 Actual(projected)
Surplus (shortfall)
FY19 Request
$9,600,700 $9,433,418 $167,282 $11,861,200
• Salaries• Benefits• Trustee Honorarium
446/511

ALASKA PERMANENT FUND CORPORATION 6
Travel
Total Travel FY18 Budget FY18 Actual(projected)
Surplus (shortfall)
FY19 Request
$605,500 $560,926 $44,574 $1,203,200
• Staff• Trustee• Moving/Non-employee
447/511

ALASKA PERMANENT FUND CORPORATION 7
Contractual Services
FY18 BudgetFY18 Actual
(projected) Surplus (shortfall)FY19 RequestCONTRACTUAL SERVICES TOTAL
$1,870,900 $1,494,120 $376,780 $154,673,600
Professional Services 305,500 201,957 103,543 434,270Public Ed/Info Program 102,000 92,136 9,864 146,500IT Services 479,700 370,845 108,855 2,502,300
Repairs & Maintenance 65,400 30,049 35,351 93,500Leases 518,500 511,303 7,197 538,300Training & Education 56,500 28,440 28,060 186,620Meeting Expenses 49,500 25,181 24,319 65,181Other 293,800 234,209 59,591 208,229Investment Management Fees
- - - 150,498,700
448/511

ALASKA PERMANENT FUND CORPORATION 8
Commodities
Total Commodities FY18 Budget FY18 Actual(projected)
Surplus (shortfall)
FY19 Request
$97,300 $90,770 $6,530 $435,300
• Office/IT Supplies• Subscriptions• Equipment < $5,000
449/511
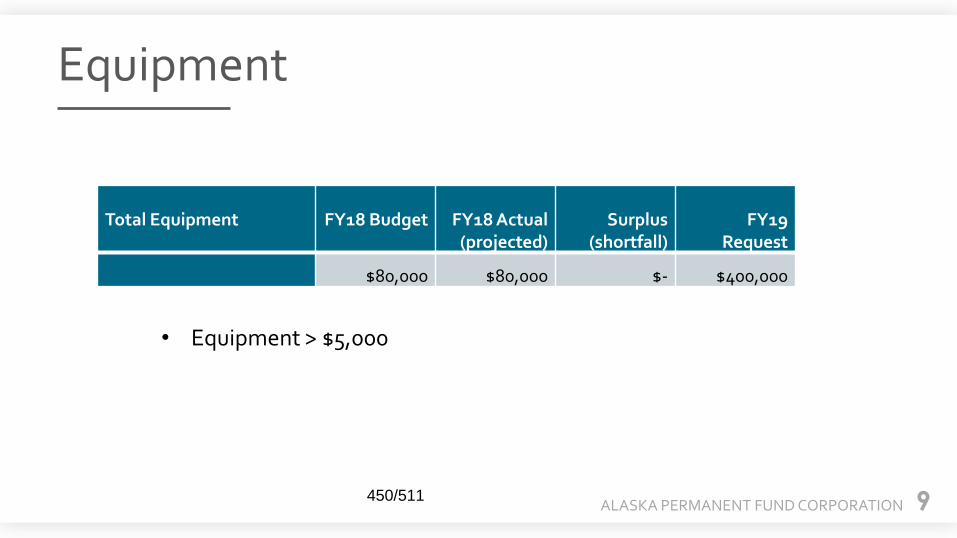
ALASKA PERMANENT FUND CORPORATION 9
Equipment
Total Equipment FY18 Budget FY18 Actual(projected)
Surplus (shortfall)
FY19 Request
$80,000 $80,000 $- $400,000
• Equipment > $5,000
450/511
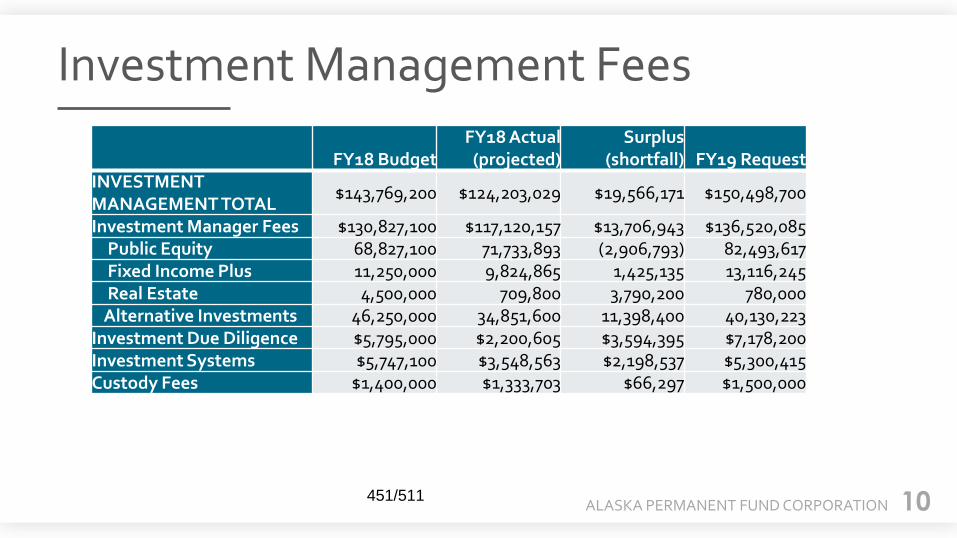
ALASKA PERMANENT FUND CORPORATION 10
Investment Management Fees
FY18 BudgetFY18 Actual
(projected)Surplus
(shortfall) FY19 RequestINVESTMENT MANAGEMENT TOTAL
$143,769,200 $124,203,029 $19,566,171 $150,498,700
Investment Manager Fees $130,827,100 $117,120,157 $13,706,943 $136,520,085Public Equity 68,827,100 71,733,893 (2,906,793) 82,493,617Fixed Income Plus 11,250,000 9,824,865 1,425,135 13,116,245Real Estate 4,500,000 709,800 3,790,200 780,000
Alternative Investments 46,250,000 34,851,600 11,398,400 40,130,223Investment Due Diligence $5,795,000 $2,200,605 $3,594,395 $7,178,200Investment Systems $5,747,100 $3,548,563 $2,198,537 $5,300,415Custody Fees $1,400,000 $1,333,703 $66,297 $1,500,000
451/511

ALASKA PERMANENT FUND CORPORATION 11
Capital Project
Year Authorized Authorization
Expended to Date Balance
APFC Headquarters Renovation FY2018 $4,050,000 $0 $4,050,000
452/511

Questions?
453/511

ALASKA PERMANENT FUND CORPORATION 13
Transfer Request
Contractual ServicesIT Services
$95,000
CommoditiesIT Supplies/Small Equipment
EquipmentNetwork/Server Equipment
454/511

FY19 Budget Approval
455/511

ALASKA PERMANENT FUND CORPORATION 15
FY19 Budget Request
• $168,537,300
• Single Allocation
• Language Section
456/511

ALASKA PERMANENT FUND CORPORATION 16
• Personal Services $3.9 million
• Travel $0.3 million
• IT Equipment/Commodities $1.6 million
• Investment Management Fees $11.7 million
Increments
457/511

ALASKA PERMANENT FUND CORPORATION 17
HB286
** includes $300,000 for IFSWF 2019 Annual Meeting in Juneau
Corporate OperationsPersonal Services $11,861,200Travel $1,203,200Contractual Services $4,174,900Commodities $435,300Equipment $400,000
Total $18,074,600
Investment Management FeesInvestment Manager Fees $136,520,085Investment Due Diligence** $7,178,200Investment Systems $5,300,415Custody Fees $1,500,000
Total $150,498,700
Total FY19 Authorization $168,573,300
458/511

Motion to Authorize Expenditure
459/511

Legislative Update
Separator Page
460/511

SUBJECT: Legislative Update
ACTION:
DATE: 5/24/2018
INFORMATION: X
As this memo is drafted, the second session of the 30th Alaska State Legislature is working towards sine die adjournment within the constitutional 120-day session limit. The use of the Alaska Permanent Fund as a source of revenue to support state government and assist in filling the current fiscal gap has been a primary focus of this Legislature. Much of the debate has centered on establishing a sustainable draw amount, the distribution of those funds for dividends and general government, and the need to inflation proof the Principal of the Fund. Both statutory and constitutional constructs for establishing a rules based framework for withdrawals from the Fund have been introduced and heard during the legislative committee process. At this time, the following bills affecting the Alaska Permanent Fund have been passed out of conference committee and it is anticipated that they will pass the legislature and be signed into law by the Governor: Appropriation Bill – FY 19 Operating Budget HB 286
Draw from the ERA
5.25% POMV draw of $2.7 billion from the ERA for FY19
Intent Language provides flexibility over FY in transfer of $s to DOR Inflation Proofing the Principal
$942.0 million for FY19 Inflation Proofing
Inflation proofing for FY16-FY18 remains unfunded. Royalty Deposits
$295.5 million of constitutionally required 25% of royalty proceeds
Neither version includes 50% for the newer leases after 1979 per AS 37.13.010 (a)(2)
Earnings Reserve Account Contingency Appropriation Language was added during conference committee that appropriates funds from the ERA to the General Fund (GF) if the required ¾ vote threshold to access the Constitutional Budget Reserve to fund FY19 appropriations is not attained. At the time this memo was written the outcome of the CBR vote was not determined.
461/511

Page 2
If a ¾ vote to access the CBR fails, then funds are appropriated from the ERA to the GF–
a) fund any GF insufficiencies based on the FY19 appropriations (Mental Health Budget, Operating Budget, K-12 Education Funding, Capital Budget)
b) fund up to $100 million to balance revenue and GF appropriations should unrestricted state revenue available for appropriation in FY19 be insufficient.
Earnings Reserve Draw Legislation – Statutory POMV SB 26 Royalty Deposits
No changes were made to existing statute. Maintains the constitutionally required 25% of royalty deposits to the Principal of the Fund, and 50% of deposits from leases issued after 1979, which are above the constitutional requirement.
o Note: The FY19 Operating Budget appropriates only 25% of royalties to the Principal.
POMV Draw from the Earnings Reserve Account (ERA)
Provides for a POMV draw of the average market value of the Fund for the first five of the preceding six fiscal years (subject to annual appropriation by the Legislature);
o 5.25% - Effective July 1, 2019 = $2.7 Billion Draw in FY19 o Steps down to 5.0% - Effective July 1, 2021
Inflation Proofing
Maintains existing inflation proofing mechanism, and places the inflation proofing transfer outside of the amount available for appropriation under the POMV draw.
Appropriation Limit from ERA
Stipulates that the Legislature may not appropriate from the ERA to the GF an amount that exceeds the POMV %.
Further stipulates that the combined total of the dividend transfer and the POMV appropriation may not exceed the POMV%.
Statutory Net Income
Bill maintains the current statutory net income calculation and the amount available for distribution, including the current dividend calculation. But limits the amount available for appropriation from the Fund to the POMV %. Thus, APFC will still be required to calculate statutory net income and the amount available for distribution, in addition to the amount available for appropriation under POMV %. The Legislature has the power of appropriation to designate the % that will go to pay dividends and the % that will go to general government.
462/511

Incentive Compensation Structure Memo
Separator Page
463/511

SUBJECT: Incentive Compensation Structure
ACTION: X
DATE: May 24, 2018
INFORMATION:
BACKGROUND: Since 2011, the Board, through the adoption of its Personnel Management Program, has had a compensation philosophy as follows: “APFC strives for a compensation program that competes well in the market and motivates all employees to bring their best efforts to the scope of their job responsibilities. The program provides a systematic means of tracking, measuring, and compensating employees and allows flexibility for APFC to act quickly.” This is a compensation philosophy that recognizes all employees are valued and that individually and collectively that value needs to be compensated for fairly. Compensation should reflect our mission, vision and values and incentivize the behaviors we want to see as an organization. APFC Mission
To manage and invest the assets of the Permanent Fund and other funds designated by law.
APFC Vision Our vision is to deliver sustained compelling investment returns as the United States’ leading sovereign endowment manager, benefitting all current and future generations of Alaskans.
Strategic Priorities – From 2017-2021 Strategic Plan
Priority #3: Develop best-in-class investment management capabilities, partnerships, and geographic reach to maximize investment returns Priority #4: Enhance talent and staff across APFC
Goals – From 2017-2021 Strategic Plan
Designed to help fulfill above Strategic Priorities Goal #5: Implement a competitive incentive compensation program by October 2019
STATUS: In March of 2017, APFC, at the request of the Board of Trustees, hired McLagan to undertake a compensation review and develop an incentive compensation plan for APFC. At the December 2017 Board meeting, the Board of Trustees adopted updated base salary pay bands for each position as a result of that review. The adjustments warranted by the new base salary bands have been made and were incorporated into the FY19 budget request for APFC.
464/511

Page 2
The purpose of this agenda item is to take the next step and present an incentive compensation plan. This is a plan designed to attract and retain talent, recognize our value of being good stewards of resources, recognize our passion for investing for Alaskans, encourage teamwork and collaboration and ultimately deliver best in class results across all operational areas of APFC. The adoption of an incentive program will inform the budget request to be assembled by the Board in September for submission to the Governor in October. It is important to note that the amounts adopted for an incentive compensation program are subject to Governor and Legislative approval. RECOMMENDATION: The Executive Director recommends adoption of the attached resolution and the creation of a limited incentive compensation program. Upon adoption, staff will develop the required changes to the Personnel Management Plan for Board approval as well as a budget request to be included in the FY20 budget submission.
465/511

Incentive Compensation Presentation
Separator Page
466/511

Incentive Compensation Structure
May 24, 2018467/511

ALASKA PERMANENT FUND CORPORATION 2
APFC’s Mission
To manage and invest the assets of the permanent fund and other funds designated by law.
468/511
ALASKA PERMANENT FUND CORPORATION 3
APFC’s Vision
“to deliver sustained, compelling investment returns as the United States’ leading sovereign endowment manager, benefitting all current and future generations of Alaskans”
• Reflects statutory language and intent, as well as Board and staff aspirations
• Emphasizes maximizing returns in a fully sustainable manner
• Underscores the intention for the Fund to be a perpetual resource for Alaska
• Embodies core values of -
Integrity, Stewardship, and Passion
469/511

Strategic Plan
470/511

ALASKA PERMANENT FUND CORPORATION 5
APFC’s Strategic 5 Year Plan
Priorities FY17-FY21
1. Gain greater control of resource allocations
2. Optimize APFC’s operational processes and use of financial networks and resources
3. Develop best-in-class investment management capabilities, partnerships, and geographic reach to maximize investment returns
4. Enhance talent and staff across APFC
471/511
ALASKA PERMANENT FUND CORPORATION 6
Strategic Plan: Goal 5
5. (P4)
Implement a competitive incentive compensation program for FY19 by Oct 2019.
472/511

Personnel Management Program
473/511

ALASKA PERMANENT FUND CORPORATION 8
Since 2011, the Board, through the adoption of its Personnel Management Program, a compensation philosophy as follows:
APFC strives for a compensation program that competes well in the market and motivates all employees to bring their best efforts to the scope of their job responsibilities. The program provides a systematic means of tracking, measuring, and compensating employees and allows flexibility for APFC to act quickly.
Compensation Philosophy
474/511
ALASKA PERMANENT FUND CORPORATION 9
Peer Group
• In developing an incentive program APFC needs to formally adopt a compensation peer group and potentially amend its compensation philosophy.
• The compensation peer group provides the data with which a compensation structure is developed.
475/511
ALASKA PERMANENT FUND CORPORATION 10
Blended Peer Group The staff recommend the board adopt a blended peer group comprised of 75% public fund and 25% private fund for the following reasons:
1. APFC views itself as a “sovereign endowment.” It recognizes that it is inherently public in nature. However, much of the investment goal is driven by “endowment-like” mandates.
2. Generally speaking, investment staff have departed APFC to work for significantly higher compensation at endowment funds.
3. It is important to continue to compensate all staff fairly and making sure staff not eligible for incentive compensation do receive merit increases to base compensation.
476/511

McLagan Analysis
477/511

Recommendation
478/511

McLagan Presentation
Separator Page
479/511

Alaska Permanent Fund CorporationCompensation Program ReviewMay 24, 2018
480/511

2
Introduction
Alaska Permanent Fund Corporation (APFC) asked McLagan to review the competitiveness of APFC’s compensation program.
Recognizing that APFC competes with a broad range of firms for investment talent, McLagan assembled pay data from three peer groups (see Appendix for additional detail on each peer group):
I. US and Canadian public funds with internal/direct asset management capability.
II. Private sector investment organizations with AUM less than $100B including advisory firms, banks, insurance companies, endowments, foundations, and corporate plan sponsors with.
III. A blended peer group: 75% public fund and 25% private sector firms.
This report contains information about:
‒ The competitive range of salary and total cash compensation (e.g., salary + cash incentives) for 44 AFPC positions. Note that long-term incentives common in the private sector have been excluded (e.g., stock options, mutual fund deferrals, restricted stock, etc.).
‒ The typical features and mechanics of incentive compensation plans within public funds.
481/511
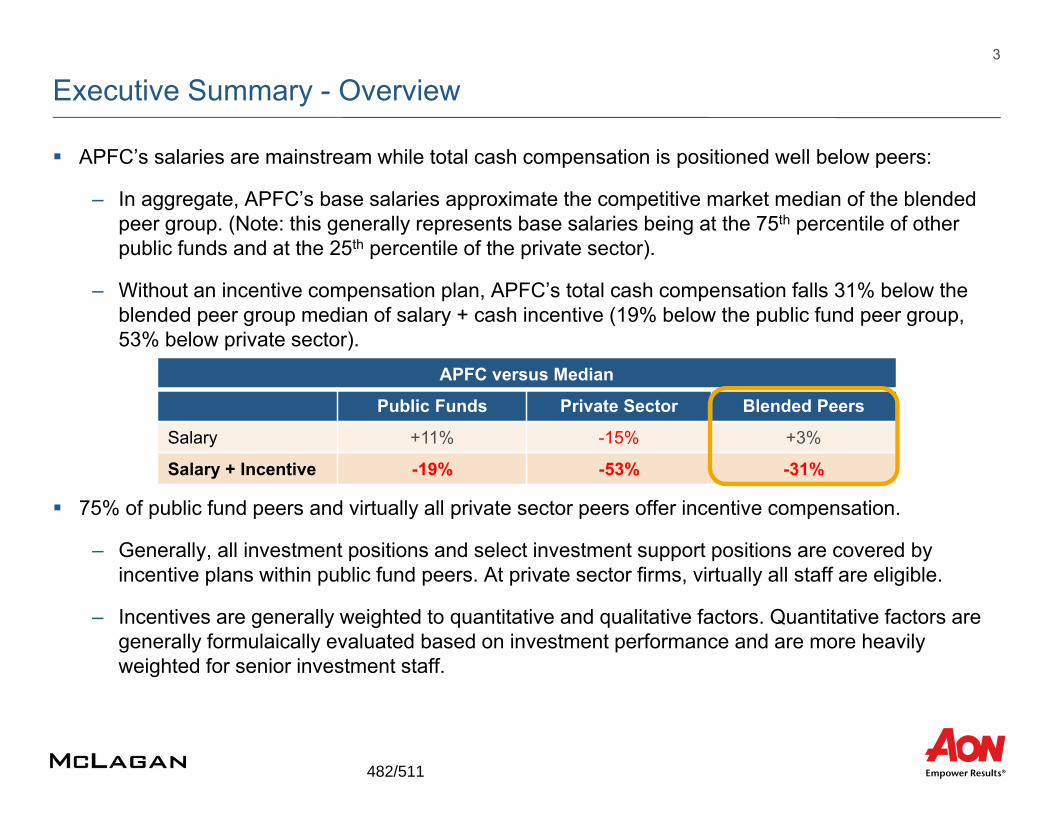
3
Executive Summary - Overview
APFC’s salaries are mainstream while total cash compensation is positioned well below peers:
‒ In aggregate, APFC’s base salaries approximate the competitive market median of the blended peer group. (Note: this generally represents base salaries being at the 75th percentile of other public funds and at the 25th percentile of the private sector).
‒ Without an incentive compensation plan, APFC’s total cash compensation falls 31% below the blended peer group median of salary + cash incentive (19% below the public fund peer group, 53% below private sector).
75% of public fund peers and virtually all private sector peers offer incentive compensation.
‒ Generally, all investment positions and select investment support positions are covered by incentive plans within public fund peers. At private sector firms, virtually all staff are eligible.
‒ Incentives are generally weighted to quantitative and qualitative factors. Quantitative factors are generally formulaically evaluated based on investment performance and are more heavily weighted for senior investment staff.
APFC versus Median
Public Funds Private Sector Blended Peers
Salary +11% -15% +3%
Salary + Incentive -19% -53% -31%
482/511

4
Executive Summary - Recommendations
APFC should consider:
I. Confirming (formally adopting) peer groups and establishing a compensation philosophy to guide further pay decision making:
• Salaries targeted at the 75th percentile of the public fund group with total cash, at maximum, targeted at the median of the blended peer group.
II. Implementing a performance-based incentive compensation plan that:
• Aligns compensation with APFC’s long-term investment success.
• Provides pay opportunities that allow APFC to attract, retain, and motivate talented investment professionals.
• Is aligned with market practice.
• Is fair to all stakeholders.
483/511

1. Pay Level Analysis
484/511

6
25th 75th Variance Quartile APFC Percentile Median Percentile to Median Positioning
Base Salary $6,514 $5,318 $6,320 $7,525 3% ❷Total Cash 6,514 6,897 9,447 13,285 ‐31% ❹
Aggregate Pay Spend ($000s)APFC's vs. Blended Peer Group (75% Public / 25% Private)
As detailed below, APFC’s salaries, in aggregate, approximate the competitive market median of the blended peer group.
Without incentive compensation, APFC’s total cash compensation falls below the 25th percentile (31% below median).
Pay Level Analysis
Salaries are Mainstream, Total Cash Well Below Market
Represents the total pay for 44 of APFC’s incumbents. Represents the total pay, at
median, for 44 matching survey positions.
❶Top quartile / Q1 pay positioning (75th to 100th percentile)
❸25th to 50th percentile / Q3 pay positioning
❷50th to 75th / Q2 percentile pay positioning
❹Bottom quartile / Q4 pay positioning (0 to 25th percentile)
485/511

7Pay Level Analysis
Some Variation in Pay Positioning by Function
Pay positioning varies somewhat by function:
‒ Investment salaries are positioned 17% above median of the blended peer group. However, total cash compensation falls 26% below median.
‒ Management is positioned closest to median on a salary only basis yet is positioned worst on a total cash basis.
Base Salary Total Cash Base Salary Total Cash
Management ‐9% ‐48% ❸ ❹Investments 17% ‐26% ❷ ❹Administrative ‐12% ‐25% ❸ ❹Total 3% ‐31% ❷ ❹
Variance to Median Quartile PositioningAggregate Pay Spend ($000s)
APFC's vs. Blended Peer Group (75% Public / 25% Private)
❶Top quartile / Q1 pay positioning (75th to 100th percentile)
❸25th to 50th percentile / Q3 pay positioning
❷50th to 75th / Q2 percentile pay positioning
❹Bottom quartile / Q4 pay positioning (0 to 25th percentile)
486/511

8
Not surprisingly, APFC’s competitive pay positioning varies depending on which peer group is focused on. While the majority of this report has been focused on the blended peer group is it important to note:
‒ Base salaries approximate the 75th percentile of public fund peers and 25th percentile of the private sector peers.
‒ Total cash compensation falls between the 25th percentile and median for public fund peers and well below the 25th percentile for private sector peers.
# of APFC % APFC % APFC % APFC QuartileEmployees APFC $ vs. Mkt $ vs. Mkt $ vs. Mkt Positioning
Base SalaryPrivate Sector Firms 44 $6,514 $6,537 0% $7,706 ‐15% $9,252 ‐30% ❹Public Funds 44 6,514 4,912 33% 5,858 11% 6,949 ‐6% ❷75%/25% Public/Private Sector 44 6,514 5,318 22% 6,320 3% 7,525 ‐13% ❷
Total Cash CompensationPrivate Sector Firms 44 $6,514 $10,280 ‐37% $13,807 ‐53% $19,734 ‐67% ❹Public Funds 44 6,514 5,769 13% 7,994 ‐19% 11,135 ‐41% ❸75%/25% Public/Private Sector 44 6,514 6,897 ‐6% 9,447 ‐31% 13,285 ‐51% ❹
APFC's Pay vs. Multiple Peer GroupsAggregate Pay Spend ($000s)
25th Percentile Median 75th Percentile
Pay Level Analysis
Different Peer Groups = Different Pay Positioning
❶Top quartile / Q1 pay positioning (75th to 100th percentile)
❸25th to 50th percentile / Q3 pay positioning
❷50th to 75th / Q2 percentile pay positioning
❹Bottom quartile / Q4 pay positioning (0 to 25th percentile)
487/511

2. Incentive Structure
488/511

10Incentive Structure
Executive Summary
~75% of public fund peers offer incentive compensation.
‒ Generally all investment and senior management positions participate in the incentive plan.
‒ Incentive awards are generally weighted to quantitative and qualitative components.
• Quantitative components generally provide formulaic linkages between pay and long-term investment returns. The most common metrics is three-year performance relative to the policy benchmark.
• Qualitative components are generally assessed on a discretionary basis and may include performance and achievements made towards individual goals, objectives, and behaviors.
The following pages describe a “typical” incentive plan within US public pension funds. APFC should consider adopting a market competitive incentive compensation plan.
489/511

11
Near the Beginning of Each Year:
1. Identify/Re-Confirm Maximum Award
Assume $80K (for illustrative purposes)
2. Weight Maximum Award to Specific Components
After the End of Each Year:
1. Determine Multipliers for each Plan Component
3. Establish Performance Criteria/Scales:
Investment performance criteria.
Individual performance criteria.
2. Determine Final Awards
3. Pay Out Award
Plan IncentiveComponent Weighting
Total Fund 20%Asset Class 60%Qualitative 20%Total 100%
$16,000
16,000$80,000
48,000
Weighted Portionof Target Incentive
60 bps or more 100% 50 bps or more 100%: : : :
30 bps 50% 25 bps 50%: : : :
0 bps or less 0% 0 bps or less 0%Intermediate points are interpolated. Intermediate points are interpolated.
Total FundPerformance-Award Scale
bps of Above-B'mark
PerformanceAward Earned
Asset Class - Internal EquityPerformance-Award Scale
Award Earned
bps of Above-B'mark
Performance
Plan Performance PerformanceComponents (illustrative) Multiplier
Total Fund 45 bps 0.75Asset Class 25 bps 0.50Qualitative "Very good year" 0.75
Plan Performance ActualComponent Multiplier Award
Total Fund x 0.75 = $12,000Asset Class x 0.50 = 24,000Qualitative x 0.75 = 12,000
= Final Award $48,000
48,000$16,000
16,000
of Target IncentiveWeighted Portion
Incentive Structure
A “Typical” Public Fund Incentive Plan
490/511

12Incentive Structure
APFC’s Incentive Recommendation
Mirroring the structure presented on the prior page, each participant would:
‒ Have an incentive maximum expressed as a percentage of base salary. The opportunity would vary by position and be calibrated to deliver competitive levels of total cash compensation.
‒ Have incentive opportunities weighted to quantitative and qualitative components. Weightings would likely vary by position with:
• Senior leadership having a higher weighting (70%-80%) towards total fund results and a modest qualitative award.
• Senior investment staff would have weightings toward total fund (30%-40%) and asset class (30%-40%) with a modest qualitative award.
• Junior and administrative staff would have a modest weighting (20%-50%) to total fund performance and the majority of their incentives determined on a discretionary basis.
Quantitative investment performance would be measured net-of-fees on a three- and/or five-year basis versus policy benchmark.
491/511

Appendix
492/511

14
12/31/16 % Internally 12/31/16 % InternallyAUM Managed AUM Managed
California Public Employees Retirement System $302.8 Virginia Retirement System $69.9Canada Pension Plan Investment Board 235.9 OMERS 63.5Caisse de Depot 201.6 State of Michigan Retirement Systems 62.2California State Teachers' Retirement System 196.4 Public School Employees' Retirement System 57.8New York State Common Retirement Fund 186.0 Healthcare of Ontario Pension Plan 52.4State Board of Administration of Florida 184.6 Tennessee Consolidated Retirement System (TCRS) 47.0Teacher Retirement System of Texas 140.4 Colorado Public Employees' Retirement Association 45.0Ontario Teachers' Pension Plan Board 130.8 Arizona State Retirement System 35.1Washington State Investment Board 112.4 Montana Board of Investments 16.9State of Wisconsin Investment Board 109.1 OPTrust 14.2PSP Investments 101.0 New Mexico Educational Retirement Board 12.1Ohio Public Employees Retirement System 89.1 South Dakota Investment Council 11.3New York State Teachers' Retirement System 83.6 Municipal Employees' Retirement System of Michigan 9.6State Teachers' Retirement System of Ohio 71.7 Missouri State Employees' Retirement System (MOSERS) 8.0Alberta Investment Management Corporation 71.3 Employees' Retirement Fund of the City of Dallas 3.2State of New Jersey Pension Fund 71.2
75th Percentile $121.6 68%Median 71.2 50%25th Percentile 40.1 35%
Alaska Permanent Fund Corporation $55.1 20%
APFC's Public Pension Fund Comparator Group
Public Fund Peers
493/511

15
Private Sector Peers
# Firms 25th Median 75th
Investment Management Firms 106 $11.0 $29.2 $53.4Banks (Investment Management Department) 23 9.3 31.0 45.3Insurance Companies (Investment Management Departments) 41 18.5 34.7 56.3Endowments, Foundations, & Corporate Plan Sponsors 89 2.3 5.2 11.9Total 259 $5.4 $18.7 $41.7
APFC's Private Sector Pay Comparators (AUM < $100B)
12/31/16 AUM ($Bs)
494/511

Confidential Appendix – Person by Person Detail
495/511

Confidential Appendix 1 of 6
25th 75th 25th 75thSurvey Match Percentile Median Percentile Percentile Median Percentile Salary T. Cash
ManagementCIO $331 $378 $441 $462 $767 $1,303 ❷ ❹ED without CIO Resp 261 361 447 392 704 1,444 ❸ ❹CLO 200 249 282 238 378 499 ❸ ❹CFO 174 240 290 222 324 614 ❸ ❹
$966 $1,228 $1,460 $1,315 $2,174 $3,860 ❸ ❹16% ‐9% ‐23% ‐15% ‐48% ‐71%
InvestmentsHd of Inv Area ‐ Fixed Income $220 $254 $290 $347 $482 $719 ❶ ❹Sr PM I ‐ Fixed Income 163 193 225 242 345 449 ❶ ❸Hd of Area/Asset Class ‐ Real Estate 198 226 272 307 362 485 ❷ ❹Sr PM I ‐ Fixed Income 163 193 225 242 345 449 ❶ ❸Hd of Area/Team Leader ‐ Priv EQ 205 243 296 254 382 503 ❷ ❹Hd of Area/Team Leader ‐ EQ 169 191 219 263 326 367 ❶ ❹Hd of Area/Team Leader ‐ Priv EQ 205 243 296 254 382 503 ❸ ❹Sr PM I ‐ Real Estate 181 205 221 255 399 505 ❸ ❹Sr Mgr / Sr PM I 152 181 211 198 237 290 ❷ ❹Sr PM II ‐ Fixed Income 116 138 166 163 238 295 ❶ ❸Sr Risk/Inv Strat 111 139 172 148 199 261 ❷ ❸Sr PM II ‐ EQ 133 156 210 194 257 369 ❸ ❹Sr PM II ‐ EQ 133 156 210 194 257 369 ❸ ❹Sr Port Analyst / Port Analyst 75 85 96 82 95 113 ❶ ❶Sr Portfolio Analyst 78 88 117 100 119 140 ❶ ❷Sr Portfolio Analyst 78 88 117 100 119 140 ❶ ❷Sr Portfolio Analyst 78 88 117 100 119 140 ❶ ❷Sr Port Analyst / Port Analyst 75 85 96 82 95 113 ❶ ❶Interm Analyst ‐ Ext Inv 72 81 95 77 92 107 ❷ ❸Interm Analyst ‐ Ext Inv 72 81 95 77 92 107 ❷ ❸
$2,677 $3,115 $3,748 $3,679 $4,945 $6,421 ❷ ❹36% 17% ‐3% ‐1% ‐26% ‐43%
Competitive Market (75% Public / 25% Private)
PositioningQuartileSalary Total Cash
496/511

Confidential Appendix 2 of 6
25th 75th 25th 75thSurvey Match Percentile Median Percentile Percentile Median Percentile Salary T. Cash
Competitive Market (75% Public / 25% Private)
PositioningQuartileSalary Total Cash
AdministrativeHd of IT $148 $183 $214 $182 $243 $367 ❹ ❹Hd of Plan Admin/Ops 103 121 145 113 141 184 ❷ ❷Dept/Func Head ‐ Fin & Acct 125 147 173 167 200 265 ❸ ❹Hd of Media/PR 117 154 205 154 188 276 ❸ ❹Team Lead/Supv ‐ Fin & Acct 86 95 103 96 115 126 ❶ ❸Hd of Infrastructure 133 146 175 150 189 324 ❹ ❹Hd of HR 130 182 225 153 212 268 ❹ ❹Sr Tech Exp ‐ IT Dev 97 103 108 100 118 130 ❹ ❹Team Lead/Supv ‐ Fin & Acct 86 95 103 96 115 126 ❸ ❹Supv, Sec Ops 68 77 105 77 88 112 ❷ ❸Hd of General Services 106 122 138 109 142 164 ❹ ❹Interm Inv Perf Analysis & Complianc 57 72 82 65 73 84 ❸ ❸Specialist, Sec Ops 58 67 75 63 71 80 ❸ ❸Interm Staff ‐ Fin & Accounting 54 60 67 57 63 71 ❷ ❸Interm Staff ‐ Fin & Accounting 54 60 67 57 63 71 ❷ ❸Sr Admin Asst 47 53 60 50 56 65 ❶ ❷Purchasing Asst 47 59 65 47 62 67 ❸ ❸Admin Asst 39 45 50 42 46 52 ❶ ❶Infra Staff ‐ Network Sys Admin Spec 53 60 68 52 59 67 ❹ ❹Exec Dir's Asst 69 78 89 73 84 105 ❹ ❹
$1,675 $1,977 $2,316 $1,903 $2,329 $3,004 ❸ ❹4% ‐12% ‐25% ‐8% ‐25% ‐42%
Total Fund $5,318 $6,320 $7,525 $6,897 $9,447 $13,285 ❷ ❹22% 3% ‐13% ‐6% ‐31% ‐51%
497/511

Confidential Appendix 3 of 6
25th 75th 25th 75thSurvey Match Percentile Median Percentile Percentile Median Percentile Salary T. Cash
ManagementCIO $323 $364 $399 $375 $671 $1,113 ❶ ❸ED without CIO Resp 215 330 378 215 473 921 ❸ ❸CLO 179 224 253 180 279 387 ❸ ❸CFO 155 221 269 173 244 518 ❸ ❸
$872 $1,139 $1,299 $943 $1,667 $2,939 ❸ ❸28% ‐2% ‐14% 19% ‐33% ‐62%
InvestmentsHd of Inv Area ‐ Fixed Income $218 $245 $270 $304 $437 $637 ❶ ❸Sr PM I ‐ Fixed Income 151 185 216 209 322 420 ❶ ❸Hd of Area/Asset Class ‐ Real Estate 189 215 267 220 266 380 ❷ ❸Sr PM I ‐ Fixed Income 151 185 216 209 322 420 ❶ ❸Hd of Area/Team Leader ‐ Priv EQ 187 215 266 179 292 410 ❷ ❸Hd of Area/Team Leader ‐ EQ 142 151 167 231 294 299 ❶ ❸Hd of Area/Team Leader ‐ Priv EQ 187 215 266 179 292 410 ❷ ❸Sr PM I ‐ Real Estate 177 207 225 230 394 514 ❸ ❹Sr Mgr / Sr PM I 147 179 209 178 215 252 ❷ ❸Sr PM II ‐ Fixed Income 108 128 155 146 228 274 ❶ ❸Sr Risk/Inv Strat 102 128 161 138 180 233 ❶ ❸Sr PM II ‐ EQ 121 140 197 183 217 292 ❷ ❹Sr PM II ‐ EQ 121 140 197 183 217 292 ❷ ❹Sr Port Analyst / Port Analyst 76 85 92 80 88 100 ❶ ❶Sr Portfolio Analyst 77 85 109 98 109 120 ❶ ❶Sr Portfolio Analyst 77 85 109 98 109 120 ❶ ❶Sr Portfolio Analyst 77 85 109 98 109 120 ❶ ❶Sr Port Analyst / Port Analyst 76 85 92 80 88 100 ❶ ❶Interm Analyst ‐ Ext Inv 75 85 100 81 97 113 ❷ ❸Interm Analyst ‐ Ext Inv 75 85 100 81 97 113 ❸ ❸
$2,533 $2,924 $3,524 $3,203 $4,371 $5,617 ❶ ❸44% 25% 4% 14% ‐16% ‐35%
Positioning
Competitive Market (Public Pension Funds)Salary Total Cash Quartile
498/511

Confidential Appendix 4 of 6
25th 75th 25th 75thSurvey Match Percentile Median Percentile Percentile Median Percentile Salary T. Cash
Positioning
Competitive Market (Public Pension Funds)Salary Total Cash Quartile
AdministrativeHd of IT $130 $160 $186 $135 $170 $289 ❸ ❸Hd of Plan Admin/Ops 86 104 129 84 115 153 ❶ ❷Dept/Func Head ‐ Fin & Acct 111 130 155 154 183 252 ❸ ❹Hd of Media/PR 93 130 191 109 134 217 ❸ ❸Team Lead/Supv ‐ Fin & Acct 82 89 95 92 111 119 ❶ ❷Hd of Infrastructure 105 118 145 105 121 253 ❸ ❸Hd of HR 104 160 208 100 142 192 ❹ ❹Sr Tech Exp ‐ IT Dev 98 103 106 101 120 133 ❹ ❹Team Lead/Supv ‐ Fin & Acct 82 89 95 92 111 119 ❶ ❸Supv, Sec Ops 66 75 107 76 85 108 ❷ ❷Hd of General Services 100 113 126 95 120 136 ❹ ❹Interm Inv Perf Analysis & Complianc 56 73 82 65 72 80 ❸ ❸Specialist, Sec Ops 55 64 70 60 66 76 ❷ ❸Interm Staff ‐ Fin & Accounting 51 57 63 55 61 66 ❷ ❷Interm Staff ‐ Fin & Accounting 51 57 63 55 61 66 ❷ ❷Sr Admin Asst 43 48 54 47 52 57 ❶ ❶Purchasing Asst 44 58 62 43 61 66 ❸ ❸Admin Asst 37 43 47 40 43 48 ❶ ❶Infra Staff ‐ Network Sys Admin Spec 49 55 62 48 53 61 ❸ ❸Exec Dir's Asst 64 71 79 66 76 87 ❹ ❹
$1,507 $1,796 $2,126 $1,623 $1,957 $2,579 ❸ ❸16% ‐3% ‐18% 8% ‐11% ‐32%
Total Fund $4,912 $5,858 $6,949 $5,769 $7,994 $11,135 ❷ ❸33% 11% ‐6% 13% ‐19% ‐41%
499/511

Confidential Appendix 5 of 6
25th 75th 25th 75thSurvey Match Percentile Median Percentile Percentile Median Percentile Salary T. Cash
ManagementCIO $356 $420 $567 $725 $1,055 $1,873 ❸ ❹ED without CIO Resp 400 455 654 922 1,399 3,014 ❹ ❹CLO 263 325 371 412 676 833 ❹ ❹CFO 230 296 353 371 565 902 ❹ ❹
$1,248 $1,496 $1,944 $2,429 $3,694 $6,622 ❹ ❹‐10% ‐25% ‐42% ‐54% ‐70% ‐83%
InvestmentsHd of Inv Area ‐ Fixed Income $225 $278 $350 $473 $619 $965 ❷ ❹Sr PM I ‐ Fixed Income 200 217 250 341 416 535 ❶ ❹Hd of Area/Asset Class ‐ Real Estate 225 260 290 566 651 800 ❸ ❹Sr PM I ‐ Fixed Income 200 217 250 341 416 535 ❷ ❹Hd of Area/Team Leader ‐ Priv EQ 260 327 386 480 652 781 ❹ ❹Hd of Area/Team Leader ‐ EQ 248 312 375 360 424 573 ❹ ❹Hd of Area/Team Leader ‐ Priv EQ 260 327 386 480 652 781 ❹ ❹Sr PM I ‐ Real Estate 193 200 211 331 415 477 ❹ ❹Sr Mgr / Sr PM I 166 188 219 258 301 405 ❸ ❹Sr PM II ‐ Fixed Income 141 169 199 216 271 358 ❷ ❹Sr Risk/Inv Strat 140 171 205 179 258 345 ❸ ❹Sr PM II ‐ EQ 170 205 250 227 379 600 ❹ ❹Sr PM II ‐ EQ 170 205 250 227 379 600 ❹ ❹Sr Port Analyst / Port Analyst 72 86 110 88 115 150 ❶ ❷Sr Portfolio Analyst 80 100 140 109 151 200 ❷ ❸Sr Portfolio Analyst 80 100 140 109 151 200 ❷ ❸Sr Portfolio Analyst 80 100 140 109 151 200 ❷ ❸Sr Port Analyst / Port Analyst 72 86 110 88 115 150 ❶ ❷Interm Analyst ‐ Ext Inv 63 70 80 63 77 88 ❶ ❷Interm Analyst ‐ Ext Inv 63 70 80 63 77 88 ❶ ❷
$3,108 $3,688 $4,420 $5,108 $6,668 $8,831 ❸ ❹17% ‐1% ‐17% ‐29% ‐45% ‐59%
Positioning
Competitive Market (Private Sector Firms)Salary Total Cash Quartile
500/511
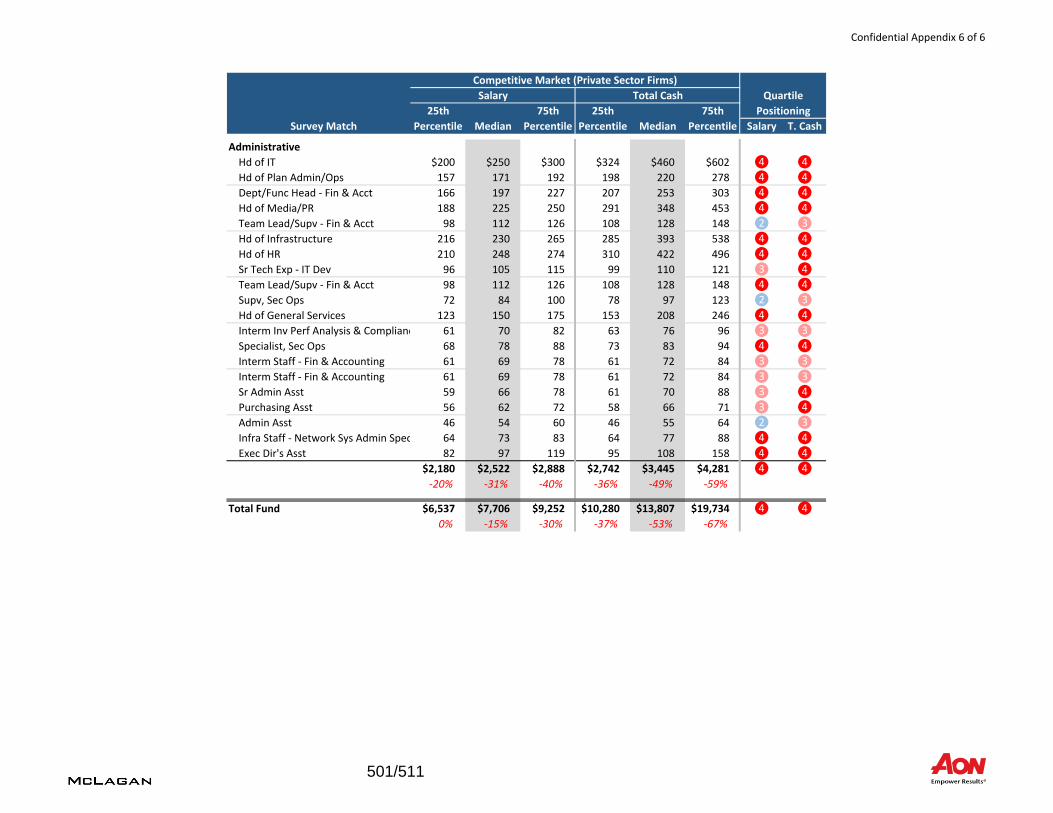
Confidential Appendix 6 of 6
25th 75th 25th 75thSurvey Match Percentile Median Percentile Percentile Median Percentile Salary T. Cash
Positioning
Competitive Market (Private Sector Firms)Salary Total Cash Quartile
AdministrativeHd of IT $200 $250 $300 $324 $460 $602 ❹ ❹Hd of Plan Admin/Ops 157 171 192 198 220 278 ❹ ❹Dept/Func Head ‐ Fin & Acct 166 197 227 207 253 303 ❹ ❹Hd of Media/PR 188 225 250 291 348 453 ❹ ❹Team Lead/Supv ‐ Fin & Acct 98 112 126 108 128 148 ❷ ❸Hd of Infrastructure 216 230 265 285 393 538 ❹ ❹Hd of HR 210 248 274 310 422 496 ❹ ❹Sr Tech Exp ‐ IT Dev 96 105 115 99 110 121 ❸ ❹Team Lead/Supv ‐ Fin & Acct 98 112 126 108 128 148 ❹ ❹Supv, Sec Ops 72 84 100 78 97 123 ❷ ❸Hd of General Services 123 150 175 153 208 246 ❹ ❹Interm Inv Perf Analysis & Complianc 61 70 82 63 76 96 ❸ ❸Specialist, Sec Ops 68 78 88 73 83 94 ❹ ❹Interm Staff ‐ Fin & Accounting 61 69 78 61 72 84 ❸ ❸Interm Staff ‐ Fin & Accounting 61 69 78 61 72 84 ❸ ❸Sr Admin Asst 59 66 78 61 70 88 ❸ ❹Purchasing Asst 56 62 72 58 66 71 ❸ ❹Admin Asst 46 54 60 46 55 64 ❷ ❸Infra Staff ‐ Network Sys Admin Spec 64 73 83 64 77 88 ❹ ❹Exec Dir's Asst 82 97 119 95 108 158 ❹ ❹
$2,180 $2,522 $2,888 $2,742 $3,445 $4,281 ❹ ❹‐20% ‐31% ‐40% ‐36% ‐49% ‐59%
Total Fund $6,537 $7,706 $9,252 $10,280 $13,807 $19,734 ❹ ❹0% ‐15% ‐30% ‐37% ‐53% ‐67%
501/511

Compensation Resolution
Separator Page
502/511

ALASKA PERMANENT FUND CORPORATION
RESOLUTION OF THE BOARD OF TRUSTEES RELATING TO APFC STAFF COMPENSATION
RESOLUTION 18-02
All employees of the Alaska Permanent Fund Corporation (“APFC”) are valued and essential to
fulfilling APFC’s mission to deliver sustained compelling investment returns as the United States’ leading
sovereign endowment manager, benefiting all current and future generations of Alaskans. In fulfillment
of this mission it is imperative that APFC is in a position to attract, incent, and retain staff at all levels
and in all positions.
The APFC Board of Trustees Charters and Governance Policies, therefore, obligate the Board to
establish human resources policies and procedures necessary for the effective management of the
Permanent Fund, including a compensation and benefits policy. Because the level and complexity of
internal investment management at APFC and the value-added and savings achieved by this internal
management has grown significantly in the last five years, the Board feels strongly that fair and
competitive compensation for APFC staff needs to evolve and grow to acknowledge and foster this
successful result.
NOW THEREFORE BE IT RESOLVED THAT:
1. Compensation for APFC staff should be commensurate with its peer equivalent, which the
Board has determined shall be comprised of a weighting that reflects 75% US and Canadian public fund
asset managers with internal/direct asset management capability and 25% of the private sector
investment organizations with assets under management of less than $100 billion, including
endowments, foundations, advisory firms, banks, insurance companies and corporate plan sponsors;
2. APFC staff responsible for the Administration and Operations, including the Director of IT,
Administrative Services Director and the Human Resources Manager should be compensated at
competitive regional salaries, eligible for annual merit increases, targeted at median total cash
compensation in comparison to the APFC peer equivalent;
3. APFC staff responsible for the Investment, including the Chief Investment Officer should be
compensated through a base salary plus annual incentive compensation targeted at median total cash
compensation in comparison to the APFC peer equivalent;
4. Annual incentive compensation will be measured net-of-fees on a three year basis versus the
relative performance benchmark and no incentive compensation will exceed 50% of an individual’s base
salary;
5. APFC Executive Management, including the Executive Director, Chief Financial Officer, Chief
Operating Officer and General Counsel may be subject to incentive compensation at the discretion of
the Board;
6. The Board of Trustees will include an incentive compensation request with each annual
budget request beginning with its Fiscal Year 2020 request, which will be based on incentive
compensation earned for Fiscal Year 2019 performance benchmarks; and
503/511

7. Upon the appropriation of funds to award annual incentive compensation and amendment to
the APFC Personnel Management Program, the Executive Director will be responsible for determining
and distributing individual incentive awards.
PASSED AND APPROVED by the Board of Trustees of the Alaska Permanent Fund Corporation
this 24th day of May, 2018.
/s/ Bill Moran Chairman, Board of Trustees
Alaska Permanent Fund Corporation
ATTEST:
/s/
Angela M. Rodell, Corporate Secretary
504/511

Calendar of Upcoming Board Meetings Memo
Separator Page
505/511

BACKGROUND:
APFC’s Board of Trustees holds quarterly meetings to review and evaluate the investment performance of the portfolio, the asset allocation and investment risk of the Fund, and the compliance program in relation to applicable laws, regulations, and governance policies. Special meetings of the Board of Trustees are scheduled as required.
The 2018 and 2019 Board of Trustees Meeting schedules have been previously approved. Please note that the September 2018 Annual Board Meeting will be held in Anchorage and the December 2018 Quarterly Board Meeting will be held in Juneau. Attached are the calendars for your information, please mark your schedules. 2018 BOARD OF TRUSTEES MEETINGS ARE CURRENTLY SCHEDULED: MAY 23-24, 2018 Regular Quarterly Meeting Wednesday & Thursday Memorial Day is Monday, May 28 Location: Anchorage SEPTEMBER 6, 2018 Audit Committee/Budget Planning Session Thursday Labor is Monday, September 3 Location: Anchorage SEPTEMBER 26-27, 2018 Annual Board Meeting Wednesday & Thursday Location: Anchorage
DECEMBER 11-12, 2018 Regular Quarterly Meeting Tuesday & Wednesday Location: Juneau
SUBJECT: Board of Trustees Meetings
ACTION: X
DATE: May 24, 2018
INFORMATION:
506/511

Page 2
2019 BOARD OF TRUSTEES MEETINGS ARE PROPOSED TO BE SCHEDULED: FEBRUARY 20-21, 2018 Regular Quarterly Meeting Wednesday & Thursday Advisor: TBD Location: Junuea MAY 22-23, 2019 Regular Quarterly Meeting/Audit Committee Wednesday & Thursday Advisor: TBD Location: Juneau Memorial Day is Monday, May 27
SEPTEMBER 5, 2019 Audit Committee/Budget Planning Session
Thursday Advisor: TBD Location: Juneau Labor Day is Monday, September 2 SEPTEMBER 25-26, 2019 Annual Board Meeting Wednesday & Thursday Advisor: TBD Location: Juneau DECEMBER 3-4, 2019 Regular Quarterly Meeting Tuesday & Wednesday Advisor: TBD Location: Juneau RECOMMENDATION:
Review of 2018 Board of Trustees Meeting Schedule
Re-approval of 2019 Board of Trustees Meeting Schedule
507/511

2018 BOT Meetings
Separator Page
508/511

2018 BOARD OF TRUSTEES MEETING SCHEDULE
DATE LOCATION TYPE OF MEETING ADVISOR
February 21-22, 2018 Juneau Regular Walsh
(Wednesday/Thursday)
March 15, 2018 Telephonic Special
(Thursday)
May 16, 2018 Anchorage Audit Committee
(Wednesday)
May 23-24, 2018 Anchorage Regular Mitchell
(Wednesday/Thursday)
September 6, 2018* Anchorage Audit Committee
(Thursday) Budget Work Session
September 26-27, 2018 Anchorage Annual Meeting Zinn
(Wednesday/Thursday)
December 11-12, 2018 Juneau Regular Mitchell
(Tuesday/Wednesday)
Committee Meetings and Special or additional APFC board meetings will be scheduled as needed.
*The Audit Committee Meeting in September must be scheduled in advance to coordinate with the
release dates for the Audited Statements and the Annual Report as required in statute.
509/511

2019 BOT Meetings
Separator Page
510/511

2019 BOARD OF TRUSTEES MEETING SCHEDULE
DATE LOCATION TYPE OF MEETING ADVISOR
February 20-21, 2019 Juneau Regular TBD (Wednesday/Thursday)
May 22-23, 2019* Juneau Regular TBD (Wednesday/Thursday) Audit Committee
September 5, 2019* Juneau Audit Committee TBD (Thursday) Budget Planning Session
September 25-26, 2019 Juneau Annual Meeting TBD (Wednesday/Thursday)
December 3-4, 2019 Juneau Regular TBD (Tuesday/Wednesday)
Committee Meetings and Special or additional APFC board meetings will be scheduled as
needed.
*The Audit Committee Meeting in September must be scheduled in advance to coordinate with the
release date for the Audited Statements and the Annual Report as required in statute.
511/511