interpretation of osmotic pressure - CORE
15
INTERPRETATION OF OSMOTIC PRESSURE IN SOLUTIONS OF ONE AND TWO NONDIFFUSIBLE COMPONENTS MARION SHAW From the University of Washington School of Medicine, Seattle, Washington 98195 ABSTRACT Osmotic pressure data from aqueous solutions of nondiffusible serum albumin (BSA), chondroitin sulfate (CHS), and dextran TI 10 (Di 10), taken singly and in binary combinations, were interpreted in terms of excluded volume. The principal solvent was phosphate-buffered saline, pH 7.2, at 23°C. Osmotic pressures were measured with a membrane osmometer fitted with Amicon PM-10 membranes. Data from each solution were fit by stepwise regression with a three- or four-term polynomial in integral powers of total nondiffusible solute concentration in accordance with the general solution theory of McMillan and Mayer (1945, J. Chem. Phys. 13:276) as extended by Yamakawa (1971, Modem Theory of Polymer Solutions, Harper & Row, New York). The data display a high internal consistency, and the results correlate well with published molecular weights and exclusion data where available. Number average molecular weights calculated from the "first virial coefficients" are: BSA, 67,000 11%; Dl 10, 76,000 i 11%, CHS, 39,000 + 6%. Excluded volumes (in cubic centimeters per molecule) calculated from the "second virial coefficients" are: BSA, 0.97 x 10⁻¹⁸; Dl 10, 3.04 x 10⁻¹⁸; CHS, 14.3 x 10⁻¹⁸; BSA-D1 10, 6.8 x 10⁻¹⁸; BSA- CHS, 7.8 x 10⁻¹⁸. Uncertainty is about 30%. An empirical model for interpretation of calculated excluded volumes is proposed. It appears that CHS has the "largest" exclusion effect of the three molecules. INTRODUCTION There is at present no well-accepted theory by which one can calculate excluded volume from osmotic pressure data or interpret such results unambiguously. Moreover, there is still no way of obtaining sufficient data about particular intermolecular interactions to evaluate any theoretical expression for excluded volume derived from basic princi- ples. A statistical mechanical theory of solutions formulated by McMillan and Mayer (1945) serves as a basis for calculating excluded volume from osmotic pressure data (Yamakawa, 1971). To go beyond the calculation of excluded volume to an explicit molecular interpretation then requires either details of intermolecular potentials, usually unobtainable, or the assumption of an empirical model. The latter approach has been followed in this paper. The application of the McMillan-Mayer (1945) theory also requires adequate Debye-Hueckel shielding of polyelectrolytes. The data in this study are demonstrated to be internally consistent without conflict with principle. BIOPHYSICAL JOURNAL VOLUME 16 1976 43
-
Upload
khangminh22 -
Category
Documents
-
view
0 -
download
0
Transcript of interpretation of osmotic pressure - CORE
INTERPRETATION OF OSMOTIC PRESSURE
IN SOLUTIONS OF ONE AND
TWO NONDIFFUSIBLE COMPONENTS
MARION SHAW
From the University of Washington School ofMedicine, Seattle, Washington 98195
ABSTRACT Osmotic pressure data from aqueous solutions of nondiffusible serumalbumin (BSA), chondroitin sulfate (CHS), and dextran TI 10 (Di 10), taken singlyand in binary combinations, were interpreted in terms of excluded volume. Theprincipal solvent was phosphate-buffered saline, pH 7.2, at 23°C. Osmotic pressureswere measured with a membrane osmometer fitted with Amicon PM-10 membranes.Data from each solution were fit by stepwise regression with a three- or four-termpolynomial in integral powers of total nondiffusible solute concentration in accordancewith the general solution theory of McMillan and Mayer (1945, J. Chem. Phys. 13:276)as extended by Yamakawa (1971, Modem Theory ofPolymer Solutions, Harper & Row,New York). The data display a high internal consistency, and the results correlatewell with published molecular weights and exclusion data where available. Numberaverage molecular weights calculated from the "first virial coefficients" are: BSA,67,000 11%; Dl 10, 76,000 i 11%, CHS, 39,000 + 6%. Excluded volumes (in cubiccentimeters per molecule) calculated from the "second virial coefficients" are: BSA,0.97 x 10-18; Dl 10, 3.04 x 10⁻¹⁸; CHS, 14.3 x 10⁻¹⁸; BSA-D1 10, 6.8 x 10⁻¹⁸; BSA-CHS, 7.8 x 10⁻¹⁸. Uncertainty is about 30%. An empirical model for interpretationof calculated excluded volumes is proposed. It appears that CHS has the "largest"exclusion effect of the three molecules.
INTRODUCTION
There is at present no well-accepted theory by which one can calculate excluded volumefrom osmotic pressure data or interpret such results unambiguously. Moreover, thereis still no way of obtaining sufficient data about particular intermolecular interactionsto evaluate any theoretical expression for excluded volume derived from basic princi-ples. A statistical mechanical theory of solutions formulated by McMillan and Mayer(1945) serves as a basis for calculating excluded volume from osmotic pressure data(Yamakawa, 1971). To go beyond the calculation of excluded volume to an explicitmolecular interpretation then requires either details of intermolecular potentials,usually unobtainable, or the assumption of an empirical model. The latter approachhas been followed in this paper. The application of the McMillan-Mayer (1945) theoryalso requires adequate Debye-Hueckel shielding of polyelectrolytes. The data in thisstudy are demonstrated to be internally consistent without conflict with principle.
BIOPHYSICAL JOURNAL VOLUME 16 1976 43

The usefulness of this modeling approach is established in part by the consistency ofnumber average molecular weights of bovine serum albumin (BSA), dextran Ti 10(DI 10), and chondroitin sulfate (CHS), calculated from the reduced data and themodel, with published information and data obtained by independent methods. Themolecular weights obtained from mixed-solute solutions are consistent with thosefrom single-solute solutions of the same nondiffusible solutes. The second virialcoefficients and corresponding excluded volumes calculated for BSA in aqueous solu-tions ofBSA and for DI 10 in aqueous solutions of Dl 10 are in the range of values tobe anticipated from published data (Scatchard et al., 1954; Landis and Pappenheimer,1963; and Granath, 1958). Although this consistency does not prove the theory orestablish the model, it is an important and necessary step.
Little data have been published concerning the osmotic properties, or directly re-lated properties, of solutions containing CHS. Results obtained by Wasteson throughgel column chromatography (1971) suggest that the CHS molecule is intermediate inconfiguration between rod and flexible chain at near-physiologic values of ionicstrength and pH. The rod-like character would lead one to predict a nonideal osmoticbehavior at relatively low concentrations of this molecule.
In this study osmotic pressure data are interpreted in terms of excluded volume.Two molecules cannot occupy the same space; the presence of molecule A excludesmolecule B from a volume of space, and this is the excluded volume of molecule Awith respect to molecule B. The exclusion effect is determined in either single- ormixed-solute aqueous solutions of BSA, CHS, and Dl 10 with the objective of develop-ing an approach for further application to solutions of biologic macromolecules,particularly the glycosaminoglycans and nonfibrous proteins of connective tissue. Theosmotic pressure method is of particular interest among the methods for observing thesecond virial coefficient' and related excluded volume, because osmotic pressure isoften employed by the physiologist to describe body fluids, the nature of the inter-stitium, and transcapillary exchange.There have been such studies on solutions containing mixtures of nondiffusible com-
ponents. Scatchard et al. (1954) examined the effects of pH and concentration on thesecond virial coefficient of the osmotic pressure expansion in solutions of human serumalbumin and y-globulins, but did not investigate excluded volume explicitly. Laurentand Ogston (1963) showed the dependence of osmotic pressure data taken from mix-tures of hyaluronate and albumin on exclusion effects, but did not extensively investi-gate the relationship. For example, they did not calculate excluded volume on eithera molecular or a molar basis or establish the parameter in different mixtures of thesubject components. All of these investigators were handicapped by the use of hetero-geneous and uncharacterized materials (i.e. the y-globulins and the hyaluronate) andosmometers with long time constants, in the order of days.
1 The second virial coefficient is defined as the coefficient ofthe second-order term of the solvent chemical po-tential expanded in powers of total nondiffusible solute concentration (Tanford, 1961).
4BIOPHYSICAL JOURNAL VOLUME 16 197644

METHODS AND MATERIALS
Dl 10, BSA, and CHS were taken from single lots and human serum albumin (HSA) was ob-tained from a pooled blood bank sample. The Dl 10 was described by number average andweight average molecular weights of approximately 76,000 and 110,000 (Pharmacia Fine Chemi-cals, Inc., Piscataway, N.J.; also note Granath, 1958). The sample of BSA was "fraction V"(Pentex Biochemical, Kankakee, Ill.). This sample produced a nearly identical chromatogramto that obtained from crystalline BSA (Armour, Chicago, Ill.) when both were eluted separatelyfrom a column of G-200. Both chromatograms indicated the presence of a minor polymerizedcomponent. The CHS (Sigma Chemical Co., St. Louis, Mo.) had a protein contamination ofless than 0.03% as determined by amino acid analysis and exhibited number average and weightaverage molecular weights of 39,000 + 10% and 50,000 -i± 10% as determined by high-speedequilibrium ultracentrifugation. Chromatography on G-200 showed approximately the sameelution volume as blue dextran, and on Sepharose 6B qualitatively the elution pattern predictedby extrapolations of earlier results obtained by Wasteson (1971) from a number of chondroitinsulfate preparations.The principal solvent used was phosphate-buffered saline (0.15 M NaCl, 0.0019M NaH2PO4,
0.0081 M Na2HPO4 in H20 at pH 7.2). Sodium azide (0.02%) was a component of all solu-tions.
Solution concentrations were routinely monitored by refractometry. The refractometer wascalibrated from standard solutions prepared according to measured solution volumes of weighedquantities of solute. The procedure appeared to result in more scatter for CHS than normal;therefore the calibration curve of refractive index vs. concentration for CHS was determinedfrom averages of many measurements.Osmotic pressure was measured with a temperature-controlled membrane osmometer (Instru-
mentation for Physiology and Medicine, Inc., San Diego, Calif.) with an average equilibrationtime of about 1 min, when fitted with Amicon PM-10 membranes (Amicon Corp., Lexington,Mass.). The reproducibility with this apparatus and membrane averaged about ±0.3 mm Hg.The reproducibility of the instrument was checked before each run with readings from solutionsof HSA at concentrations of5% and 10%, since these concentrations gave osmotic pressures ap-proximately midrange on the two scales of the instrument. The means of 26 trials involving fivedifferent membranes at 23°C were 18.8 ± 0.5 mm Hg (SD) at 5% and 60.0 ± 1.3 mm Hg (SD) at10%. When corrected to 37 C, these observations were within 6% of values predicted by the em-pirical curve obtained by Landis and Pappenheimer (1963) for HSA at 370 C and were identical(within the experimental reproducibility) to values obtained by W. H. Brown,2 using the samemodel of osmometer, for both the identical samples of HSA and others prepared at these con-centrations. Membranes were rejected which (1) gave significantly lower values of osmotic pres-sure for the HSA standards, or (2) had an equilibration time of greater than 3 min, or (3) couldnot maintain a steady pressure for at least 10 min after equilibration. Cross-checks were alsoperformed with W. H. Brown on samples of solutions containing both Dl 10 and BSA.The osmotic pressure data from a series of solutions containing a given relative macro-
molecular solute composition were fit with a polynomial expansion in integral powers of con-centration by means of a stepwise regression program (Program BMD02R, Dixon, 1970). Usu-ally a polynomial of three terms was adequate to describe the data to within the experimentalerror.The program generated the virial coefficients of this expansion together with the standard
2W. H. Brown, Department of Bioengineering, University ofCalifornia, San Diego, is the designer of the os-mometer used in this study.
M. SHAW Osmotic Pressure in Solutions ofNondiffusible Components 45
errors of the coefficients. The uncertainties estimated for the number average molecular weightsand excluded volumes calculated from these coefficients were compounded from these standarderrors (Wilson, 1952, p. 272).
THEORY
According to McMillan and Mayer (1945), osmotic pressure data can be fit with avirial expansion in integral powers of concentration:
r = AXC+ A2C2 + O(C3) +* , (1)
where r is the osmotic pressure, and C is the total nondiffusible solute concentration.They were able to show that the expansion representation is valid at low nondiffusi-
ble solute concentration provided no long-range forces act between the nondiffusiblecomponents. Both albumin and chondroitin sulfate are polyelectrolytes; however, ob-servations were taken in the present study at the relatively high ionic strength of 0.15,and it will be assumed that there was sufficient Debye-Huekel shielding to satisfy therequirement.The notation of Eq. 1 is used to describe the experimental data (see Results). Os-
motic pressure is expressed in millimeters of Hg and concentrations of total non-diffusible solute in grams per 100 ml of solution.
It was necessary to extract number average molecular weights from the data for cal-culation of excluded volumes and evaluation of the validity of the general approach.The number average molecular weight in grams per mole can be evaluated from Eq. 2expressed in the units of the data:
M, = (0.75 x 10⁻⁵)RT/A,, (2)
where R is the gas constant, and T is the absolute temperature. M., the numberaverage molecular weight of total nondiffusible solute, is given by Eq. 3 for a solutioncontaining two nondiffusible3 solute components:
Mn = x2M2 + x4M4 = (W2 + W4)/(W2/M2 + w4/M4), (3)where Mj is the number average molecular weight of component J, and w, is theweight fraction of nondiffusible solute consisting of component J, and X, is thecorresponding mole fraction.
Relative mole fractions were calculated from the number average molecular weightsand relative weight fractions by Eq. 4:
X, = (w,/M,)/(w2/M2 + w4/M4). (4)The number average molecular weight (see Eqs. 1 and 2) is the ideal, or low, con-
centration value.The excluded volume and its relation to the second virial coefficient A2 of the osmotic
3Even-numbersubscriptsaretraditionallyreservedfor the nondiffusible solutes (Casassa and Eisenberg,1964).
BIOPHYSICAL JOURNAL VOLUME 16 197646

pressure expansion (Eq. 1) can be found in the general solution theory of McMillanand Mayer (1945). This point was demonstrated by Yamakawa (1971). Using thenotation and units of Yamakawa, one can rewrite the osmotic pressure expansion inthe form
r/kT = p, + p2B2 + O(P3), (5)
where k is Boltzmann's constant, p1 is the total nondiffusible solute concentration inmolecules per milliliter of solution, and r is the osmotic pressure in dynes per squarecentimeter. The coefficient B2 is a form of second virial coefficient alternative to thatused in directly describing the experimental data (see Eq. 1) and is obtainable from thecoefficient A2 by conversion from one system of units to the other by Eq. 6:
B2 - (1.34 x 10⁷)(M,2/NRT)A2, (6)where N is Avogadro's number.For calculation of excluded volume from the coefficient B2, the expanded form
shown in Eq. 7 is necessary:
B2 - [x2b;,22 + X2x4b;,24 + X2b2,"]. (7)where b2,, is the cluster integral of the set of two molecules, one of component Jand one ofcomponent K.For a solution of known composition in components 2 and 4, the coefficient B2° is
extracted from the data for the mixed-solutes. The values of b2°,n and b2,44 aredetermined from the appropriate sets of data for single-solutes. It is then possibleto calculate the coefficient b2,24,, and from this coefficient, the excluded volume, u, byuse of Eq. 8:
b - -u/2. (8)
The relationship between the coefficient b2°,, and excluded volume can be derived usinga cluster integral, and this approach is outlined in the Discussion. In Eq. 8, the indicesJ and K always refer to nondiffusible components. In Eqs. 5-8 the superscriptindicates the constraint that the nondiffusible solute concentration be dilute.
For purposes of comparison with other types of molecular parameters, I have in-terpreted the results of the excluded volume calculations in terms of the equivalentsphere model defined by Eq. 9:
u = (4/3) r (D)3, (9)where D is the average center-to-center separation of the two interacting "spherical"molecules.
RESULTS
Curve Fit and Data ScatterFor each mixture of macromolecular solute components, the best fit to the osmoticpressure data was obtained over two overlapping ranges in total nondiffusible solute
M. SHAW Osmotic Pressure in Solutions ofNondiffusible Components 47

concentration: over the linear range at low concentration and over an expanded rangeincluding the linear portion. The'two sets of computer-generated virial coefficientsand associated standard errors obtained for each solute type are shown in Tables Iand II. The data points and the computer-generated curves are shown in Figs.I a and b.The best estimates of number average molecular weight come from the virial co-
efficient derived from the curve fit over the linear concentration range, judged byresults from solutions containing BSA and Dl 1O of known molecular weight. How-ever, the difference between the two curve fits for each nondiffusible solute type wasnot significant over the lower concentration range when the standard ertor in thecoefficients and the usual scatter in data were considered. Thus, the procedure fol-lowed in this paper was to calculate number average molecular weights from thelower concentration range linear coefficient A, and use the value of A2 obtained fromthe fit over the expanded range in calculations of the coefficient B2 (see Eq. 6).The data (Fig. 1 a) from solutions of BSA or DI 10, or BSA and DI 10 allowed
direct calculation of the number average molecular weights of both BSA and DI 10,as described in the next part of the Results. There appeared to be an optimum con-centration range of nondiffusible solution composition where smooth osmotic pressuredata could be obtained from solutions containing CHS (see Fig. 1 b). Correspond-ingly, the number average molecular weight of CHS could most reliably be obtainedfrom the data involving mixtures of CHS and BSA (of previously determined molecu-lar weight). The "linear" region in the CHS data was not utilized in calculationsbecause of the relatively wide scatter. The data for pure CHS were subsequentlyevaluated for consistency with the information from solutions of mixed BSA and CHS,as described in the next part of the Results.
Number Average Molecular WeightsSolutions of BSA, DIlO, and BSA and DIlO. From the low concentration
range of each curve, the number average molecular weight of total nondiffusiblesolute was calculated for each of the five solute compositions listed in Table I, bymeans of Eq. 2, and substituted in Eq. 3. This procedure resulted in five equationsin the unknown number average molecular weights ofBSA and Dl 10. The three equa-tions involving the mixtures were then solved simultaneously in pairs, and three valuesfor each of the two number average molecular weights were obtained. Each of thesetwo sets of three values was averaged with the value obtained from the correspondingsingle nondiffusible solute solution. See Table III for results and comparison withindependently established parameters.
Values for the relative mole fractions x2 and X4 were calculated by substitutionof the measured values of the relative weight fractions w2 and w4 and the above valuesfor number average molecular weights in Eq. 4. The results are given in Table I.
Solutions ofCHS and Mixtures ofCHS and BSA. The data from solutionscontaining CHS were not sufficiently precise to allow simultaneous calculation of num-ber average molecular weight of both BSA and CHS by the procedure employed for
BIOPHYSICAL JOURNAL VOLUME 16 197648
~.5 6 7 8 9'X
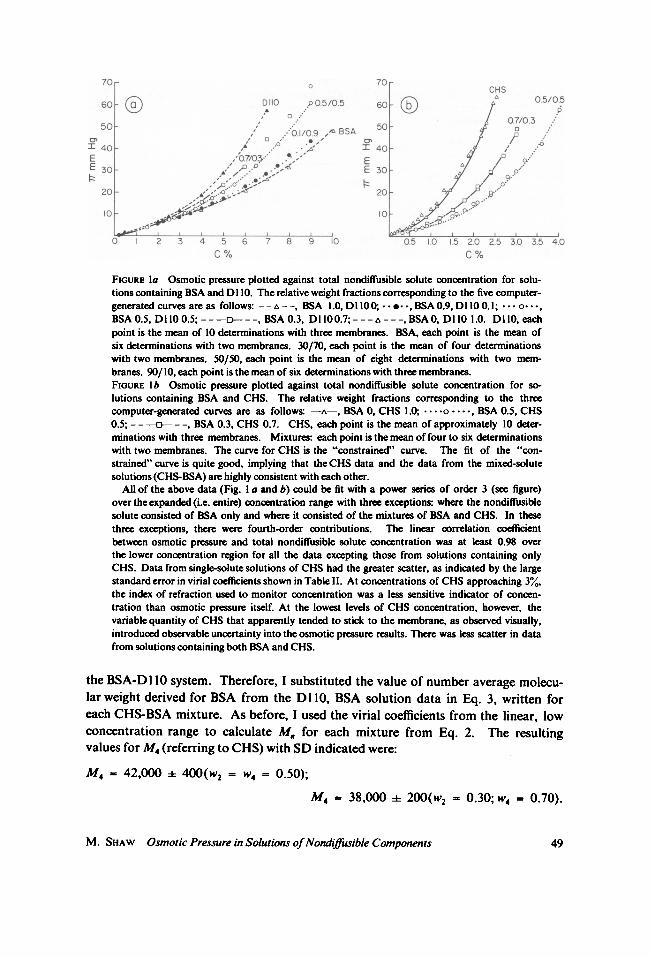
FIGURE la Osmotic pressure plotted against total nondiffusible solute concentration for solu-tions containing BSA and Dl 10. The relative weight fractions corresponding to the five computer-generated curves are as follows: - -A - -, BSA 1.0, Dl 0 0; *- - A -, BSA 0.9, D1 10 0.1; ...A.o-,BSA 0.5, Dl 10 0.5; ----- -, BSA 0.3, D 100.7;--- A -- -,BSA0, Dl 10 1.0. Dl 10, eachpoint is the mean of 10 determinations with three membranes. BSA, each point is the mean ofsix determinations with two membranes. 30/70, each point is the mean of four determinationswith two membranes. 50/50, each point is the mean of eight determinations with two mem-branes. 90/10, each point is the mean of six determinations with three membranes.FIGURE lb Osmotic pressure plotted against total nondiffusible solute concentration for so-lutions containing BSA and CHS. The relative weight fractions corresponding to the threecomputer-generated curves are as follows: -A-, BSA 0, CHS 1.0; ....*o ---, BSA 0.5, CHS0.5; - - -o- - -, BSA 0.3, CHS 0.7. CHS, each point is the mean of approximately 10 deter-minations with three membranes. Mixtures: each point is the mean of four to six determinationswith two membranes. The curve for CHS is the "constrained" curve. The fit of the "con-strained" curve is quite good, implying that theCHS data and the data from the mixed-solutesolutions (CHS-BSA) are highly consistent with each other.
All of the above data (Fig. I a and b) could be fit with a power series of order 3 (see figure)over the expanded (i.e. entire) concentration range with three exceptions: where the nondiffusiblesolute consisted of BSA only and where it consisted of the mixtures of BSA and CHS. In thesethree exceptions, there were fourth-order contributions. The linear correlation coefficientbetween osmotic pressure and total nondiffusible solute concentration was at least 0.98 overthe lower concentration region for all the data excepting those from solutions containing onlyCHS. Data from single-solute solutions of CHS had the greater scatter, as indicated by the largestandard error in virial coefficients shown in Table II. At concentrations of CHS approaching 3%,the index of refraction used to monitor concentration was a less sensitive indicator of concen-tration than osmotic pressure itself. At the lowest levels of CHS concentration, however, thevariable quantity of CHS that apparently tended to stick to the membrane, as observed visually,introduced observable uncertainty into the osmotic pressure results. There was less scatter in datafrom solutions containing both BSA and CHS.
the BSA-Dl 10 system. Therefore, I substituted the value of number average molecu-lar weight derived for BSA from the Dl O, BSA solution data in Eq. 3, written foreach CHS-BSA mixture. As before, I used the virial coefficients from the linear, lowconcentration range to calculate M. for each mixture from Eq. 2. The resultingvalues for M4 (referring to CHS) with SD indicated were:
M4 = 42,000 400(w2 = W4 = 0.50);
M4 = 38,000 4 200(w2 = 0.30; w4 = 0.70).
M. SHAW Osmotic Pressure in Solutions ofNondiffusible Components 49
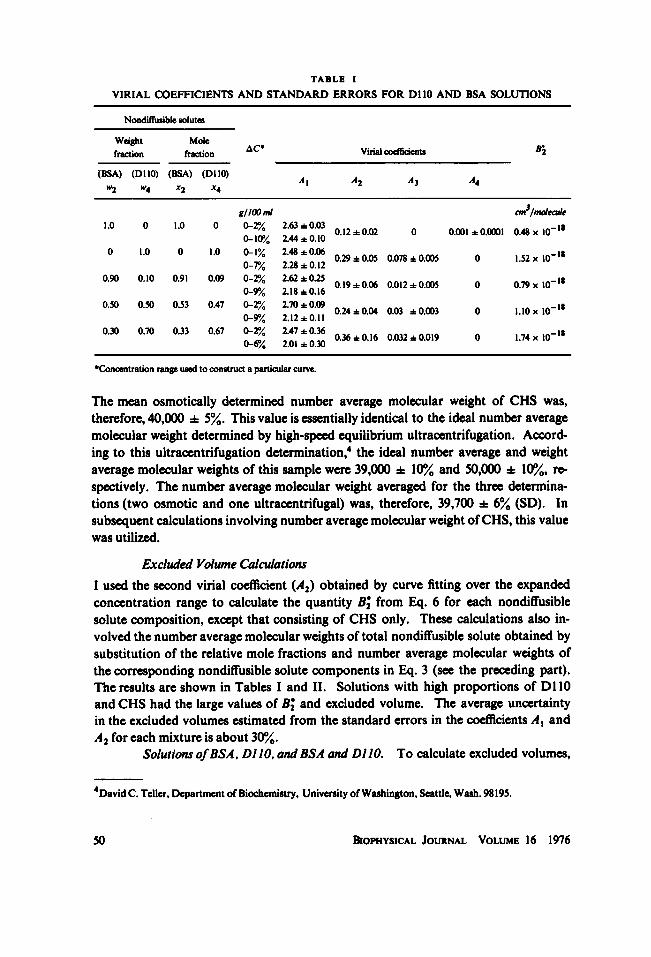
TABLE IVIRIAL COEFFICIENTS AND STANDARD ERRORS FOR Dl 10 AND BSA SOLUTIONS
Nondiffusible solutes
Weight Molefraction fraction Virial coefficients
(BSA) (DO10) (BSA) (DO10) A, A2 A3 A4w2 W4 x2 x4
g/l(KIml /cm Imoleclde1.0 0 1.0 0 0-2%o 2.63 * 0.03 0 12 0.02 0 0.001 i 0.0001 0.48 x 10⁻¹⁸
0-1(r/1. 2.44*:k0.100 1.0 0 1.0 0-7% 2.48 *0.06 0.29 *0.05 0.078 *0.005 0 1.52 x -18
0.90 0.10 0.91 0.09 0-2o 2.62 * 0.25 0.19:0.06 0.012us.@S ° 0.79x 10-180-9%/1 2.18*k0.16 01*.6002005 0 07x1
0.50 0.50 0.53 0.47 0-2%. 2.70 * 0.09 0.24*
0.04 0.03*
0.003 0 1.10 x 10 180-91% 2.12*~-0. 1
0.30 0.70 0.33 0.67 0-2%o 2.47 :0.36 036 *016 0.032 * 0.019 0 1.74 x 10-0-6%1 2.01*:k0.30
Concentration range used to construct a particular curw.
The mean osmotically determined number average molecular weight of CHS was,therefore, 40,000 fi- 5%. This value is essentially identical to the ideal number averagemolecular weight determined by high-speed equilibrium ultracentrifugation. Accord-ing to this ultracentrifugation determination,4 the ideal number average and weightaverage molecular weights of this sample were 39,000 -O/10% and 50,000 i 10%, re-spectively. The number average molecular weight averaged for the three determina-tions (two osmotic and one ultracentrifugal) was, therefore, 39,700 X 6% (SD). Insubsequent calculations involving number average molecular weight ofCHS, this valuewas utilized.
Excluded Volume CalculationsI used the second virial coefficient (A2) obtained by curve fitting over the expandedconcentration range to calculate the quantity B2° from Eq. 6 for each nondiffusiblesolute composition, except that consisting of CHS only. These calculations also in-volved the number average molecular weights of total nondiffusible solute obtained bysubstitution of the relative mole fractions and number average molecular weights ofthe corresponding nondiffusible solute components in Eq. 3 (see the preceding part).The results are shown in Tables I and II. Solutions with high proportions of DI 10and CHS had the large values of B2° and excluded volume. The average uncertaintyin the excluded volumes estimated from the standard errors in the coefficients A, andA2 for each mixture is about 30%.
Solutions ofBSA, DlO, and BSA and DlO. To calculate excluded volumes,
4David C. Teller, Department ofBiochemistry, University ofWashington, Seattle, Wash. 98195.
BIOPHYSICAL JOURNAL VOLUME 16 197650

TABLE IIVIRIAL COEFFICIENTS AND STANDARD ERRORS FOR BSA AND CHS SOLUTIONS
Nondiffusible solutes
Weight Molefraction fraction &C Virial coefficients
(BSA) (CHS) (BSA) (CHS) Al A2 A3 A4w2 W4 x2 X4
g/1Cml cm Imolecule0 1.0 0 1.0 G-2.5%/ 5.28 + 1.3 6.0 1.5 0.81 + 0.43 0 7.17 x 10⁷ St
0-2.5% 4.64t 5.02t 1.40 + 0.04t0.30 0.70 0.20 0.80 0-0.48% 4.24 i 0.28
0-3.0% 3.39 + 0.48 2.83 t 0.35 0 0.16 + 0.02 5.22 x 10-0.50 0.50 0.37 0.63 0-0.48% 3.57 + 0.17
0-4.0% 3.21 i 0.33 1.72 + 0.18 0 0.07 X 0.01 3.85 x 10- is
*Concentration range used to construct a particular curve.tlnferred from BSA/CHS mixture data.
I performed an intermediate calculation to obtain the coefficients b2,K (see Eqs. 7and 8). The coefficients b2,22 and b2," were obtained directly from the respectivecoefficients B2° derived from single-nondiffusible-solute solutions of BSA and Dl 10 ac-cording to Eq. 7. From the values of B2° for the mixtures and the coefficients bo222and b°,44, the quantities b2°,24 were obtained for the Dl 10-BSA mixtures. The re-sulting values of b2°,24 were averaged, and a value of excluded volume, u, for theDl 1-BSA pair was calculated from this average. Excluded volumes in the single-solute solutions (from b2°,22 and b2,,) and in the Dl IO-BSA solutions are given inTables III and IV. Note that the excluded volume per molecule (Dl 10 with respect toBSA or vice versa) is largest in the mixed system (BSA-Di 10).
Solutions ofCHS and Mixtures ofCHS and BSA. Eq. 7 was evaluated forthe two mixtures (w2 = w4 = 0.50) and (w2 = 0.30; w4 = 0.70). In this sectionthe subscript "2" designates BSA, as usual, and the subscript "4" designates CHS.The calculated values for the mole fractions x2 and X4 for these mixtures were sub-stituted in the equation. The actual value of b2°x for BSA was that extracted fromthe BSA-Dl 10 system. The resulting pair of simultaneous equations in two unknowns(b;,24 and b2,") was then solved, yielding:
bo,24 = -3.9 x 10⁻¹⁸ cm3/molecule; b244 = -7.2 x 10⁻¹⁸ cm3/molecule.
The value of B2° for single-nondiffusible-solute solutions of CHS, as inferred fromthe mixture results, could then be calculated from Eq. 7 and was found to be 7.2 x10-I8 cm3/molecule.The values of the coefficients AI and A2 were then calculated from Eqs. 2 and 6,
based solely on the mixture data, for single-nondiffusible-solute solutions ofCHS.Assuming the above inferred values for A, and A2, I calculated the value of A3
M. SHAW Osmotic Pressure in Solutions ofNondiffusible Components 51
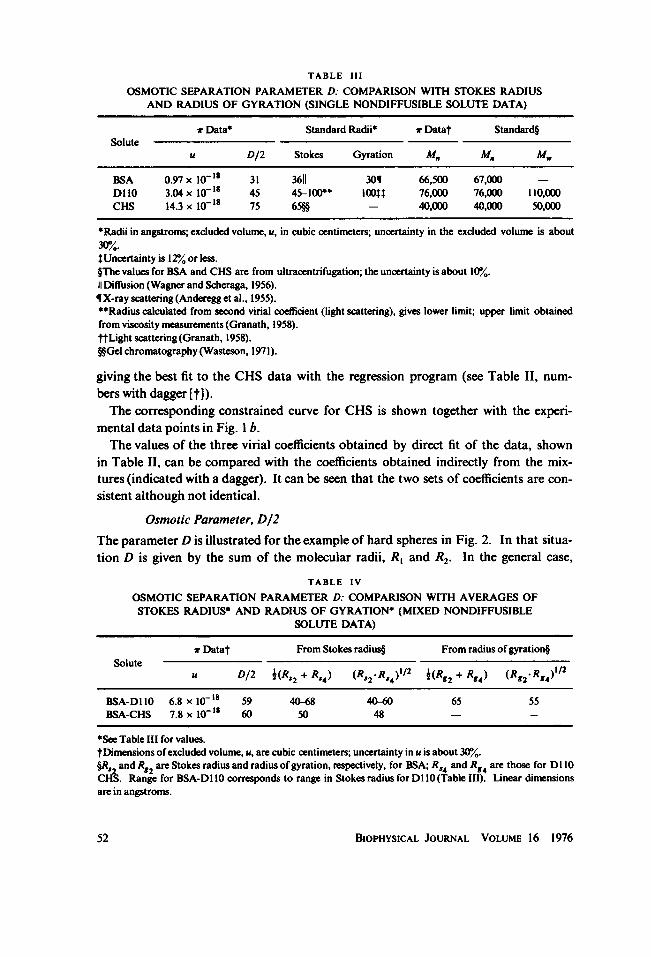
TABLE III
OSMOTIC SEPARATION PARAMETER D: COMPARISON WITH STOKES RADIUSAND RADIUS OF GYRATION (SINGLE NONDIFFUSIBLE SOLUTE DATA)
,r Data* Standard Radii* w Datat Standard§Solute
u D/2 Stokes Gyration Mn MR MW
BSA 0.97 x 10-i 31 3611 301 66,500 67,000 -DI10 3.04x 10⁻¹⁸ 45 45-100** lOOtt 76,000 76,000 110,000CHS 14.3 x 10⁻¹⁸ 75 65§§ - 40,000 40,000 50,000
*Radii in angstroms; excluded volume, u, in cubic centimeters; uncertainty in the excluded volume is about30%/.WUncertainty is 12% or less.§The values for BSA and CHS are from ultracentrifugation; the uncertainty is about 10%.11 Diffusion (Wagner and Scheraga, 1956).fl X-ray scattering (Anderegg et al., 1955).**Radius calculated from second virial coefficient (light scattering), gives lower limit; upper limit obtainedfrom viscosity measurements (Granath, 1958).ifLight scattering (Granath, 1958).§§Gel chromatography (Wasteson, 1971).
giving the best fit to the CHS data with the regression program (see Table II, num-bers with dagger [t]).The corresponding constrained curve for CHS is shown together with the experi-
mental data points in Fig. 1 b.The values of the three virial coefficients obtained by direct fit of the data, shown
in Table II, can be compared with the coefficients obtained indirectly from the mix-tures (indicated with a dagger). It can be seen that the two sets of coefficients are con-sistent although not identical.
Osmotic Parameter, D/2
The parameter D is illustrated for the example of hard spheres in Fig. 2. In that situa-tion D is given by the sum of the molecular radii, R, and R2. In the general case,
TABLE IVOSMOTIC SEPARATION PARAMETER D: COMPARISON WITH AVERAGES OFSTOKES RADIUS* AND RADIUS OF GYRATION* (MIXED NONDIFFUSIBLE
SOLUTE DATA)
-w Datat From Stokes radius§ From radius of gyration§Solute
U D/2 4(R,2 + R,4) (R *2.R,4)2 i(R2 + R,4) (R,2 * R,4)"/
BSA-D110 6.8 x lo18 59 40-68 40-60 65 55BSA-CHS 7.8 x 10⁻¹⁸ 60 50 48 - -
*See Table III for values.tDimensions ofexcluded volume, u, are cubic centimeters; uncertainty in u is about 30%.§R, and R92 are Stokes radius and radius ofgyration, respectively, for BSA; R54 and Rg4 are those for DI 10CHS. Range for BSA-DI 10 corresponds to range in Stokes radius for Dl 10 (Table III). Linear dimensionsare in angstroms.
BIoPHYSICAL JOURNAL VOLUME 16 197652

50
R RI 7r-~~R 40-mm Hg
30
20-
10
u (41t/ 3) D? 5 LO 15 2.0 2.50/03.05 40
Figure 2 Figure 3
FIGURE 2 The parameter D is illustrated for the example of a solution of two nondiffusiblesolute components which can be represented by hard spheres of radii RI and R2. In this in-stanceD- RI +R2FIGURE 3 Osmotic pressure plotted against total nondiffusible solute concentration. The nondif-fusible solute components are DI 10 and CHS present in the relative weight fractions w2 -
w4 - 0.50. Each point is the average of four determinations with a single membrane. The curveis the "constrained" curve.
I am defining D as twice an average molecular radius and will compare D/2 with ageometric mean radius (R, R2)'12-and an arithmetic mean radius (RI + R2)/2.The osmotic parameter, D/2, was calculated from excluded volumes by Eq. 9 for
the macromolecules BSA, Dl 10, and CHS in solution as the single nondiffusiblesolute and for the mixed pairs BSA-Dl 10 and BSA-CHS. The results are shown inTables III and IV. The value of D/2 is largest for CHS for the single-solute solutions.BSA and DI 10 are seen to be comparable in "size" in their single-solute solutions.BSA has about the same interaction parameter with respect to either CHS or DI 10, asshown by the results from the mixed-solute solutions.Values of Stokes radius and radius of gyration for BSA, Dl 10, and CHS were in-
cluded in Table III where available. The arithmetic and geometric means of theseradii are given in Table IV for the two classics (BSA-DI 10 and BSA-DI 10) of mixture.(The rationale for introducing these hydrodynamic radii is presented in the Discus-sion.) Since the overall standard errors in the determinations of D/2 are about 30%,D/2 in the single-solute solution is essentially undistinguishable from the correspond-ing Stokes radius for either BSA, DI 10, or CHS but smaller than the radius of gyrationfor DI 10 (Table III). The values of D/2 for the two classes of mixture are withinthe ranges defined by the standard averages of the hydrodynamic radii; however, onecannot make a more refined comparison because ofexperimental error.
Consistency Check Involving DIIO-CHSOsmotic pressure measurements of mixed-solute solutions ofDI 10 and CHS with rela-tive weight fractions 0.50 and 0.50, respectively, were conducted for evaluation of the
M. SHAW Osmotic Pressure in Solutions ofNondiffusible Components 53

method developed from data from the other combinations of nondiffusible solutesreported above (see Fig. 3).
I calculated the first virial coefficient from Eq. 2, assuming a value for the numberaverage molecular weight of the total nondiffusible solute calculated by substitutingthe above values of w2 and w4 and values for AM2 and A4 previously obtained forDl 10 and CHS in Eq. 3. The resulting value for A1 was 3.55 af 0.10.To estimate from theory a value for the second virial coefficient, A2, I first hypothe-
sized a value for the osmotic parameter, D/2. The value of D/2 assumed as geometricmean of Stokes radii for Dl O and CHS (Table IV) or as geometric mean of theindividual values of D/2 for CHS or Dl 10 was 56 5 A. The value of b;24 wasthen calculated from Eqs. 8 and 9. The value of A2 resulting from this assumption forD/2 is 1.11. This value for A2 was obtained from Eqs. 6 and 7 in which the valuespreviously obtained for b,22 representing DI10 and b244 representing CHS were sub-stituted. The substituted values of x2 and X4 were those calculated by use of previ-ously obtained values ofM2 and A4, of 76,000 and 39,600, respectively.From the data and the above values of A, and A2, the best least-squares value for
A3 was calculated. The resulting forced, or constrained, curve is shown in Fig. 3. Asshown in Fig. 3, the data for the Dl 10-CHS solutions could be fit relatively well, thusvalidating the general approach. The deviations from the curve can be easily explainedon the basis of the uncertainties in the values for A1 and A2.
DISCUSSION
Excluded Volume and D/2The intermolecular excluded volume has been shown to be equal to the followingcluster integral for a solution of a single nondiffusible solute (Yamakawa, 1971; Hill,1960):
u f I - exp[-V12(S,2)/kT]IdS12,where 512 is the vector between the centers of mass of two interacting molecules, andV,2 (S12) is the average intermolecular potential (assumed to be of relatively short-range nature).The coefficient b2,, (see Eq. 8) is also proportional to a cluster integral of the
same form (Yamakawa, 1971):
b2-jK (- 1/2) f Il - exp[- V12 (S12)/kT]JdS12,where the interacting molecules being to two different components. The coefficientb2;,, has been explicitly identified with excluded volume for the nondiffusible compo-nent in single-solute solution (Yamakawa, 1971). I believe that my paper is the firstaccount explicitly extending the identification of b,,K to excluded volume in thebinary solution (Eq. 8) and applying it to interpret osmotic pressure data. The cluster-integral approach emphasizes the concept that excluded volume is a function of allforces acting between a pair of molecules, including solvent modifications. The de-
BIoPHYSICAL JOURNAL VOLUME 16 197654

tailed nature of the potential need not necessarily be specified; e.g., excluded volume isnot defined on purely steric grounds. This formulation is advantageous in situationswhere the intermolecular potential is ill-defined. In the simplified example of a solu-tion of uncharged, hard spheres of radius R, the cluster-integral expression for ex-cluded volume reduces to the anticipated form: u - (32/3)wR3 (Hill, 1960).The definition of thermodynamic excluded volume requires that the interacting
molecular components either have identical shapes or be assigned analogous equiva-lent shapes. The simplest approach and a useful point of departure seemed to be theassumption of equivalent spherical configurations, and hence the parameter D/2. Notethat D does not describe a purely steric interaction since the excluded volume fromwhich D is defined includes the effect of all acting intermolecular forces.The comparison of the parameter D (Eq. 9) with the Stokes radius and radius of
gyration is not meant to imply conceptual equivalence. Excluded volume is a morecomplex concept than the hydrodynamic equivalent sphere from which the Stokesradius is calculated. It is a function of intermolecular interactions, whereas thehydrodynamic measurements defining the Stokes radius are made in, or extrapolatedto, dilute solutions where intermolecular interactions are relatively insignificant (Tan-ford, 1961). The Stokes radius is a function of molecular shape and, therefore, pro-vides a comparison of interest. For random coil polymers, the difference between D/2and the Stokes radius and the radius of gyration theoretically would reflect the "com-pressibility" of the molecule (Tanford, 1961). There was empirical correspondencebetween D/2 and the ranges spanned by arithmetic and geometric means of thesequantities for BSA-Dl 10 and BSA-CHS (Table IV).
AlbuminOsmotic pressure data points taken from solutions of HSA (pooled blood banksample) closely approximate values predicted for HSA by the empirical Landis-Pappenheimer equation adjusted to 23°C: at 5% and 105/s, the respective values of18.8 i 0.5 mm Hg and 60.0 i 1.3 mm Hg were obtained where values of 19.1 mm Hgand 58 mm Hg are predicted by the Landis-Pappenheimer equation. This closeagreement presents an interesting contrast with data from the solutions of BSA, frac-tion V. The BSA data points (consistent with cross-checks by W. H. Brown) lie on alower curve, as reflected by a somewhat lower value of A2 (0.12 as compared with 0.18,Landis and Pappenheimer, 1963). One might interpret this observation in terms ofconformational or other changes occurring during purification and freeze-drying of theBSA, fraction V. Osmotic pressures developed by solutions of Armour crystallineBSA agreed closely with the data from solutions of BSA, fraction V.
D10The value of second virial coefficient (0.29 -,- 0.05) extracted from the data (Table I,column 6) is comparable with the value obtained from light-scattering experiments(Granath, 1958), since the value of the second virial coefficient determined by lightscattering is theoretically twice that obtained from osmotic pressure measurements.
M. SHAW Osmotic Pressure in Solutions ofNondiffzusible Components SS

The value quoted by Granath for Pharmacia dextran of weight average mol w 110,000,when recalculated in units (millimeters Hg per gram percent) is about 0.72 a 10%.The value of D/2 calculated from my data is smaller than the value of Stokes radiusscalculated from viscosity data and less than the radius of gyration, as expected on thebasis of molecular compressibility (Table III).
CHS
According to the extrapolated results from Wasteson (1971), CHS with weight averagemol wt 50,000 would have approximately the same elution behavior on G-200 andSepharose 6B as Ficoll with a Stokes radius of 65 A. My data together with the modeldefine an interaction radius (D/2) of about 75 A in single-solute solutions of CHS.The value of the parameter D/2 calculated from the excluded volume of CHS is sig-nificantly larger than that of either Dl 10 or BSA, which have somewhat larger molecu-lar weights (Table III). This observation may result from steric factors, reflecting arod-like configuration for the CHS molecule (Wasteson, 1971). It is apparent bothfrom the highly nonlinear character of the data and the magnitude of the calculatedexcluded volume, u, that CHS is almost twice as effective as Dl 10 in excluding BSA:CHS (M, - 39,000) excludes BSA to the same degree as Dl1O(M. 76,000).
Appreciation is expressed to the following individuals for their assistance: Professor David C. Teller, De-partment of Biochemistry, for providing the ultracentrifugation determinations for the sample of CHS andcomparison samples of BSA, as well as valuable criticism; Professor Arthur C. Brown, Department ofPhysiology and Biophysics, and Mr. David Harry, Department of Biochemistry, for critically reading themanuscript; Mr. William H. Brown, Department of Bioengineering, University of California at San Diego,for aid in the development of osmometry procedures; Mr. Henry Noble of the Computer Center for sug-gestions on programming and statistics; the staff of the Center for Research in Oral Biology for secretar-ial assistance; and Dr. Remy Moore of the Department of Physiology for editing.
This work was supported by U.S. Public Health Service NIH-NIDR grant DE-02600.
Receivedforpublication 10 March 1975 and in revisedfonn 9 June 1975.
REFERENCES
ANDEREGG, J. W., W. W. BEEMAN, S. SHULMAN, and P. KAESBERG. 1955. An investigation of the size,shape and hydration of serum albumin by small-angle X-ray scattering. J. Am. Chem. Soc. 77:2927.
CASASSA, E. F., and H. EISENBERG. 1964. Thermodynamic analysis of multicomponent solutions. Adv.Prot. Chem. 19:287.
DiXON, W. J., ed. 1970. Biomedical Computer Programs. University of California Press, Berkeley, Calif.GRANATH, K. A. 1958. Solution properties of branched dextrans. J. Colloid Sci. 13:308.HILL, T. L. 1960. An introduction to statistical mechanics. Addison-Wesley Publishing Co., Inc., Read-
ing, Mass.LANDIS, E. M., and J. R. PAPPENHEIMER. 1963. Exchange of substances through the capillary walls.Handbook Physiol. 2:(Sect. 2). 961.
LAURENT, T. C., and J. R. KILLANDER. 1964. A theory of gel filtration and its experimental verification. J.Chromatogr. 14:317.
LAURENT, T. C., and A. G. OGSTON. 1963. The interaction between polysaccharides and other macro-
3Calculated by use of the model of Laurent and Killander (1964).
56 BIOPHYSICAL JOURNAL VOLUME 16 1976
molecules. 4. The osmotic pressure of mixtures of serum albumin and hyaluronic acid. Biochem. J. 89:249.
MCMILLAN, W. G., and J. E. MAYER. 1945. The statistical thermodynamics of multicomponent systems.J. Chem. Phys. 13:276.
SCATCHARD, G., A. GEE, and J. WEEKS. 1954. Physical chemistry of protein solutions. VI. The osmoticpressures of mixtures of human serum albumin annd 7-globulins in aqueous sodium chloride. J. Phys.Chem. 58:783.
TANFORD, C. 1961. Physical Chemistry of Macromolecules. John Wiley& Sons, Inc., New York.TELLER, D. C. 1965. Sedimentation equilibrium of macromolecules. Ph.D. Thesis. University of Califor-
nia, Berkeley.WAGNER, M. L., and H. A. SCHERAGA. 1956. Gouy diffusion studies of bovine serum albumin. J. Phys.
Chem. 60:1066.WASTESON, A. 1971. Properties of fractionated chondroitin sulphate from ox nasal septa. Biochem. J.
122:477.WILSON, E. B. 1952. An Introduction to Scientific Research. McGraw-Hill Book Co., Inc., New York.YAMAKAWA, H. 1971. Modem Theory of Polymer Solutions. Harper & Row, Publishers, New York.
M. SHAW Osmotic Pressure in Solutions ofNondiffusible Components 57