Impact_of_Trade_Liberalisation_under_the_Information_Technology_Agreement_ITA_on_Asian_Electronics_Industries_A_Case_study_of_India...
49
CWS/WP/200/3 Process of Trade Liberalisation under the Information Technology Agreement (ITA): The Indian Experience Working Paper Murali Kallummal * Associate Professor, Centre for WTO Studies, IIFT April, 2012 Centre for WTO Studies (CWS) Indian Institute of Foreign Trade, New Delhi * The author would like to express his sincere gratitude to Prof. Abhijit Das (Head, Centre for WTO Studies) for the inspiration, comments and support extended. The responsibility for the contents in this paper rests solely with the author. The mail ID of the author is [email protected].
Transcript of Impact_of_Trade_Liberalisation_under_the_Information_Technology_Agreement_ITA_on_Asian_Electronics_Industries_A_Case_study_of_India...

0
CWS/WP/200/3
Process of Trade Liberalisation under the Information Technology Agreement (ITA):
The Indian Experience
Working Paper
Murali Kallummal* Associate Professor,
Centre for WTO Studies, IIFT
April, 2012
Centre for WTO Studies (CWS) Indian Institute of Foreign Trade,
New Delhi
* The author would like to express his sincere gratitude to Prof. Abhijit Das (Head, Centre for WTO Studies) for the
inspiration, comments and support extended. The responsibility for the contents in this paper rests solely with the author.
The mail ID of the author is [email protected].

i
Table of Contents
1. Introduction ............................................................................................... 1
Methodology and Section Scheme of the Paper .................................................................................. 3
2. Information Technology Agreement Negotiations ................................. 4
3. Tracing the History of India’s Information Technology Sector ........... 7
Indian Software Industry and the Role of Government ....................................................................... 8
4. Performance of Hardware Sector in India and the ITA-1 .................. 13
Tariff Elimination and Sequencing under the ITA-1 ......................................................................... 15 Technical Standards: TBT notifications under the WTO .................................................................. 17
5. Trade Liberalisation of Information Technology Products ................ 22
6. Scenario of Indian Hardware Sector - Dependence on Imports ......... 35
Estimation on the Growing Role of Imported Raw Materials in India ............................................. 35
7. Conclusion ................................................................................................ 39
List of Tables
Table 1: ITA member countries by economic status, 1996–2011 .......................................................... 5
Table 2: Software Centres of India and their Ranking .......................................................................... 11
Table 3: India’s Software Exports: A comparison Pre and Post ITA-1 ................................................ 12
Table 4: Tariff Reduction Schedules under the ITA-1 .......................................................................... 16
Table 5: TBT Measures: On Specific Four Digits Product Coverage (Top 31 Countries) ................... 18
Table 6: Top Thirty Suppliers of ITA products to India ....................................................................... 28
Table 7: Top 50 Imported Product under the ITA-1 list by India ......................................................... 29
Table 8: Top Thirty Exports of ITA products to India.......................................................................... 31
Table 9: Top 50 India’s Exported Values and Shares (164 Products of ITA-1) ................................... 32
List of Figures Figure 1: Map of ITA members of WTO ............................................................................................................... 4
Figure 2: Evolution of India’s Information Technology (IT) Hardware Industry .................................................. 7
Figure 3: Average MFN Tariffs of India on ITA Products and Count of HS 6 Digits Tariff Lines ..................... 15
Figure 4: TBT Measures: Cumulative and Product Coverage under the Yearly Notification .............................. 17
Figure 5: Usage of National Vs International TBT Measures under the ITA ....................................................... 19
Figure 6: TBT Standardised Objectives: by the Members of ITA Signatories ..................................................... 20
Figure 7: Developed and Developing Countries Usage of the Objective ............................................................. 21
Figure 8: Total Exports: Category-wise Share of ITA-1 Products ....................................................................... 22
Figure 9: Total Imports: Category-wise Share of ITA-1 Products ....................................................................... 23
ii
Figure 10: Trends in India’s Total Trade of ITA-1 Products ................................................................................ 24
Figure 11: Shares Exports and Imports of Machinery and Transport Equipment (SITC-7) to India Total .......... 25
Figure 12: Trend in India’s Exports and Imports in terms of Values ................................................................... 26
Figure 13: Import Trends in Manufacturing Sector in India (percentage shares) ................................................. 27
Figure 14: Export Trends in Manufacturing Sector in India (% shares) ............................................................... 30
Figure 15: India’s Tariff lines with IIT (GL index >0.5): total ITA-1 Products ................................................... 33
Figure 16: World Tariff lines with IIT (GL index >0.5): total ITA-1 Products .................................................... 33
Figure 17: Intra-Industry Trade: Comparison of GL Indices of World and India ................................................ 34
Figure 18: Comparative Exports and Imports of China and India to World: ........................................................ 34
Figure 19: Indian Hardware Sector: Trends in Disclosure and Imported Contents .............................................. 36
Figure 20: Unadjusted Trends in Imported Raw Material Content to Total Sales ................................................ 37
Figure 21: Adjusted Trends in Imported Raw Material and Total Sales .............................................................. 38
Figure 22: STAN Input-Output Imports content of Exports (India) ..................................................................... 39
List of Annexure Annexure 1: Broad Measure: Category-wise TBT notifications .......................................................... 44
Annexure 2: Developing Countries with Broad Criteria for ITA Products (Notifications) .................. 44
Annexure 3: Total Membership TBT Measures – (yearly notifications & Avg. Cov. per Notif’s) ...... 45
Annexure 4: Detailed Year-wise usage of National Vs International Standards in ITA-1 Products .... 45

i
Process of Trade Liberalisation under the Information Technology
Agreement (ITA):
The Indian Experience
Abstract
Information Technology Agreement (ITA) is a ‘Plurilateral’ agreement which has it roots to
the Uruguay Round and was designed to achieve lowering/elimination of all entry barriers
on information technology products. It was signed in 1996 and became operational in 1997
after the ITA achieved the critical mass of 90 percent of world trade. Presently, the trade
coverage after including the 74th
member Columbia is almost 97 percent of world trade. The
special and differential treatment (S&D) principle was integral part of ITA for addressing the
tariff elimination in the listed products by the members. This mandated differential treatment
of developed and developing countries and further the benefits of liberalisation were
extended to all WTO members. The signatories were mandated to extent the liberalisation
(zero tariffs) benefits to all the WTO members on MFN basis. The ITA-1 products belonged
to broadly six product groups: computers; telecom equipment; semiconductors;
semiconductor manufacturing and testing equipment; software and scientific instruments
One of the challenges for the WTO till date has been to address the issue of the growing gap
between the tariffs liberalisation and non-tariff measures. In general, while the average
MFN tariffs have on the decline over the years correspondingly there has been a surge in non
tariff measures - like the TBT measures. The IT Agreement too suffered the consequences of
the existence of this growing imbalance which took away the potential market access away.
All the initiatives of liberalisation were nullified due to this growing number of NTMs. The
TBT measures were initiated primarily as measure intended to protect human safety and
environmental protection but some of them were politically and economically motivated.
Hence, the process of WTO negotiations from 1996 to up until 2012, only provided market
access to few developed countries and the countries which were already the part of global
production network. A detailed examination of these measures have conducted in this paper
using the Centre for WTO Studies TBT database. In India case, there was clear case
increased dependence on imports. The trends were one of high concentration in terms of the
number of suppliers of these products to India. It also indicates toward tacit denial of
“market access” by many developed and other emerging developing countries.
The myth that India’s software exports successes was a direct outcome of the liberalisation
under the IT Agreement of 1996. This has been proved completely misplaced and has no
basis this has been clearly established in this paper. Two major objectives of the ITA was to
increase trade and competition through trade liberalization for information technology (IT)
products and secondly the global diffusion of information technology. Both these only have
only been partially achieved as there has been concentration of trade into few players after
the formation of the Agreement. Another, critical aspect which emerges from this study is the
impact on overall employment in the context of a decrease seen in indigenous contents, in a
growing export market of IT products, this only substantiates that there has a reduction in
local value addition; subsequently leading to an adverse impact on employment generation
capacity by this sector.

1
Process of Trade Liberalisation under the Information Technology
Agreement (ITA):
The Indian Experience
Murali Kallummal
1. Introduction
Information Technology Agreement (ITA), ‘Plurilateral’ agreement emerged from the
Uruguay Round and was designed to achieve lowering of all taxes and tariffs on the
indentified information technology products by signatories to zero - this was applicable on
MFN basis. During the Singapore Ministerial Conference of the WTO, a proposal for the
expansion of world trade in information technology products was adopted vide the
"Ministerial Declaration on Trade in Information Technology Products" dated 13th December
1996. The declaration was adopted by 14 parties including the QUAD Countries (USA,
Canada, Japan and EU), Singapore and Hong Kong, representing about 80% of the world
trade in these products. The agreement became effective once the number of countries joining
the agreement represented 90% of the trade in information technology products.
The two major objectives of the ITA was to increase trade and competition through trade
liberalization for information technology (IT) products and secondly the global diffusion of
information technology. Therefore, a critical and substantial mass of 90 percent was
identified as the benchmark for its implementation in 1997. The ITA-1 came into effect in
1997 with only 29 WTO members and increased to 72 signatories by 2008. The trade
coverage by 2008 was approximately $4 trillion and with a global share of 95 percentages.
Colombia became the most recent signatory of ITA and it was the 74th
member of the ITA.
The trade coverage after including Columbia almost touched 97 percent of the total world
trade. ITA completely eliminates duties on IT products of participants and these benefits are
extended to all WTO members.
The mandate of ITA-1 was to establish tariff-free trade in six product groups namely:
computers, telecom equipment, semiconductors, semiconductor manufacturing and testing
equipment, software and scientific instruments. The participating countries agreed to bind
and eliminate all customs and other duties and charges on information technology products
by the year 2000. However, the important issue of Non-tariff measures (NTMs) was left to
be investigated by the parties as part of the on-going ITA process.
The NTB work programme1 in the Doha Round was preceded by some work that the WTO
members had done on this issue with regard to the IT sector. In this sector, steps have been
taken towards the identification and subsequent development of a harmonized structure on
NTBs under the WTO work programme. The NTB work programme, which began at the end
1 The terminology of Non Tariff Barriers (NTBs) and Non Tariff Measures are inter-changeably used in this
paper and they both mean the same.

2
of 2000, had three phases. In November 2000, a “Non-Tariff Measures Work Programme”
was launched by the Committee of Participants on the Expansion of Trade in Information
Technology Products (ITA Committee) to identify NTMs and assess their impact on IT trade.
However in 20032, the ITA committee had suggested steps to be followed like: identifying
next steps, examining ways to harmonize the conformity assessment3 for ITA products on
EMC/EMI, and examining other means to facilitate the market access of ITA products. The
pilot project could ultimately contribute to how countries can choose to facilitate market
access of ITA-1 products. The successful completion of EMC/EMI Pilot Project by 2005
raised substantial hope in terms of market access gains in ITA products.
While the tariff elimination was carried-out on an MFN basis and began from July 1st, 1997
the NTMs deliberations probability continued even after 2010.4 However, the tariff
elimination was done in four stages with equal tariff reductions: the first stage when it was
initiated in July 1997 and the second began on January1st, 1998; the third from January1
st,
1999 and the fourth and the final stage was in the month of January1st, 2000.
For developing countries who were the initial signatories of ITA-1, tariff elimination
schedule agreed to be specified differently under the S&D principles: Costa Rica, Indonesia,
India, Korea, Malaysia, Chinese Taipei, and Thailand have been granted flexibility in cutting
their tariffs on a few products to zero after the year 2000 but not beyond 2005. India on its
part eliminated tariffs for all the ITA products by 2005. So the actual impact of the
agreement on India was felt only by 2005 when the tariffs on 62 % of the total products were
reduced to zero.
As the ITA-1 relates to the area of managing technology and spans a wide variety of areas
that include computer software, information systems, computer hardware, programming
languages, but are not limited to things such as processes, and data constructs. In short,
anything that renders data, information or perceived knowledge in any visual format
whatsoever, via any multimedia distribution mechanism, is considered part of the information
technology (IT) domain.
2 In the 2003, the ITA Committee after identifying and examining non-tariff measures (NTMs) for ITA
products. The workshop in 2003 suggested for a forum for regulators responsible for electromagnetic
compatibility/electromagnetic interference (EMC/EMI) measures and trade policy representatives to discuss
the survey results and consider what could be the next steps in this exercise. 3 Conformity assessment means nothing but the compliance with a very high standard as indicated by the
national compliance authority under its guidelines of Electronic Emissions Guidelines. This can be very
tricky issue for the electronic industry. 4 In 2010, the committee continued its deliberations on the non-tariff measures (NTMs) work programme, in
particular a pilot project relating to conformity assessment procedures for electromagnetic compatibility
(EMC) and electromagnetic interference (EMI). The committee noted that 24 of the 46 participants in the
EMC/EMI project had provided details of their conformity assessment procedures and encouraged those
who had not provided the information to do so without further delay. In considering ways to advance and
expand its work on other NTMs, the committee heard reports and updates by participants on their
contributions to the work programme, including in other bodies of the WTO such as the Negotiating Group
on Market Access. There is issues related EC compliance in the context of “CE Compliance Testing Delays
Launch of Raspberry Pi Mini PC”, this issue lingering even as late April 10, 2012.
3
The hardware industry is strategic for any country for a simple reason that it provides further
business opportunities for a set of core services to execute the business strategy like, business
process automation, providing information, connecting with customers, and productivity
tools.5 The other reasons could be that the government in the past invested in the
development of this sector in line with indigenisation process - realising the importance of
this IT sector and its relationship with the other sectors of the economy.
Methodology and Section Scheme of the Paper
This paper provides an overview of the IT sector and describes the level of its impact on
Indian economy from a specific point of view of the liberalisation of ITA-1. We propose to
examine three fundamental questions: firstly, whether the liberalization of ITA-1 lead to
increase in competition in the sector, trade and import dependence; secondly, whether the
global diffusion of information technology was a reality;6 and thirdly, how was the global
market access scenario for ITA products in terms of keeping a balance between tariff
liberalisation and non-tariff measures harmonisation to the international standards.
These three fundamental questions would be answered primarily using India’s case study of
ITA-1 products. The first of the three questions is rather simple and straight forward and
illustrated through tracing the history of Indian Information Technology and analysing
whether there were any major shift in the direction of trade (DOT) in these goods. However,
the second question of global diffusion would be attempted by providing some clues;
however these may not be conclusive evidences. And, the last aspect is addressed through
the Centre for WTO Studies database on the TBT and SPS measures (NTMs) in this paper.
For this paper we have extensively used various databases like, WITS COMTRADE (both
HS and SITC nomenclatures) and PROWESS of Centre for Monitoring Indian Economy
(CMIE) and reports by the Planning Commission of India and various ministries of
Government of India. We have also used GL-index to understand the trends in terms of intra
industry trade calculated at 6 digit HS level. In these lines the paper further examines DOT
of the ITA trade between 1996 and 2010, highlighting the changing composition of trade by
leading exporting and importing nations and profiles ITA trade by product segment thereafter
focusing the NTMs issues and the changing composition in terms of consumer, capital,
intermediate and raw materials.
This paper is organized into seven sections. In section two, we shall be briefly examining the
ITA negotiations process under WTO since 1996 and the additions thereafter on a yearly
basis. Section three of the paper traces the history of hardware and software sector related
policies and export success of India. Section four presents evidence on the growing
importance of non tariff measures (NTMs) in the proposed ITA-1 at HS digit 6 tariff lines,
leading to an imbalance in market access scenario. Section five explores the reasons for
India’s electronics hardware industry behind the dismal performance of India in terms of
5 The same was also expressed in the India’s Recent “National Manufacturing Policy 2011” press note.
6

4
capturing even a minuscule share of the global electronics hardware as compared to her
neighbouring Asian countries like the People’s Republic of China, Taiwan, and South Korea
etc. This is done using actual trade data, dividing it into two phase analysis: the long run
analysis was done using the SITC nomenclature while the short run analysis was done using
the HS nomenclature. Section six would be focusing on the growing import dependence of
Indian hardware sector. It would be using company level information to come to any
conclusion on the nature of import dependence on total raw material and sales. Finally,
section seven would be giving an overarching conclusion to the whole ITA-1 liberalisation
and its impact on India.
2. Information Technology Agreement Negotiations
One of the important WTO Agreements of the Singapore Ministerial Mandate has been the
Information Technology Agreement (ITA). Presently there are 74 signatories to this
plurilateral agreement which accounts for about 97 percent share of total world trade in
Information Technology (ITA-1) products.
Figure 1: Map of ITA members of WTO
Source: WTO website downloaded as on 04-04-2012, http://www.wto.org/english/tratop_e/inftec_e/ita_map_e.htm.
Considering the key role of information technology as an agent of economic and social
transformation and recognizing the need for promoting IT diffusion, the ITA aimed at
expanding world trade in information technology products. The ITA came into force in 1997
and required primarily the elimination of tariffs, other duties and charges on the goods
covered by the ITA in maximal four stages until 2000. However, as discussed earlier some
developing countries were given special and differential treatment under this agreement,
therefore these countries got some additional years over 2000.

5
The participants are required to abide by the Most Favoured Nations (MFN) principle, unlike
the Government Procurement Agreement (GPA) under the WTO. Hence, the benefits of
zero tariffs are extended to the non-ITA members of the WTO. While the ITA is open to non-
WTO members, it is not mandatory on their part to be a signatory of the plurilateral
Agreement. Even in 2012, the ITA-1 has been an agreement under which only tariff cutting
has happened successfully, as the status of national level of harmonisation on the issue of
non-tariff barriers has been inconclusive.7
Table 1: ITA member countries by economic status, 1996–2011
Source: Michael Anderson and Jacob Mohs, 2009, The Information Technology Agreement: An Assessment of World Trade in Information Technology
Products (Table 1). The 2011 information was added by the author based on WTO ITA information in order to complete the list of ITA members.
Note: EU members in italics. a= Based on World Bank income classification.
Of the total 74 signatories only a few have been active participants in this plurilateral
agreement. This is evident from the “Report on Implementation and Monitoring of the
WTO Agreements” of 2010, wherein under ITA-1 only 24 of the 46 participants in the
EMC/EMI project had provided details of their conformity assessment procedures. Other
members were also requested to follow similar conformity assessment procedures. So with
less than half of the signatories only 83 percentages of original signatories of 1997 were
active members which is not a healthy way forwards.
7 Refer to footnote 4 of this paper.

6
Till date the disputes have been limited to the developed countries only, with developing
country members being affected as third party only. Even in terms of the products choices of
the ITA-1 list, the concerns of developing countries like India were not considered, as it was
primarily based on the original membership of ITA-1 countries. Therefore, it could be said
that some of the concerns of developing countries may not have been addressed in the
process of negotiations from the very beginning.
The first dispute cases were DS 62, 67 and 68 which were all targeted against European
commission. Almost all were related to customs classification of certain computer
equipments and the complainant was the United States. The third parties to these disputes
were India; Japan; South Korea and Singapore. The product under dispute was Computer
equipment associated with LAN namely, (i) LAN equipment such as network or adaptor
cards and (ii) multimedia PCs. The ITA was brought against the European Union by the
United States, Japan and Taiwan involves three sophisticated IT products: set-top boxes, flat
screen monitors and multifunctional printers. All three have several functions and can be
used for different purposes. A TV set-top box can provide internet access, a flat screen
monitor can be plugged into a computer or be used for TV and a multifunctional printer can
make photocopies. Further the EU’s argument was partially weakened by the February 20,
2009 ruling by the European Court of Justice, which found that wide-screen LDC monitors
with multiple connection possibilities do fall under the scope ITA and thus should be
imported free of duty.8 Negotiated in 1996, the ITA eliminated tariffs on eight major
categories of ICT products such as semiconductors, computers, and telecommunication
equipment. However, as visionary as it was, the initial ITA agreement still did not cover a
number of core ICT products such as DRAMs (dynamic random access memory chips) nor
dozens of every-day consumer electronic products, including many types of audio-visual
equipment such as audio speakers, DVD players, and video cameras.9
Keeping in view the importance of information technology in international trade, fourteen
participants’ submitted proposals on expansion of trade in IT products (referred to as ITA-1I).
These proposals were discussed extensively in various meetings of the WTO during April-
June 1998 and subsequently. The updated list of products proposed to be covered under ITA
II includes a few consumer electronic items and certain security related products which is one
of the main reasons why it has not been possible for the members of ITA to come to a
consensus yet.10
Further, what may be emerging from the Doha Round is the deadlock to the
increasing role of the Plurilateral Agreements like Government Procurement Agreement
(GPA) and Anti-Counterfeiting Trade Agreement (ACTA).
8 Bridges Review, 2009, “Trade in Information Technology: Is the ITA Still Relevant?”, News and Analysis, Volume
13, Number 1, March, International Centre for Trade and Sustainable Development (ICTSD). 9 Ezell Stephen , 2012, “Boosting Exports, Jobs, and Economic Growth by Expanding the ITA”, Information Technology
Industry Foundation, March 15,
http://www.itic.org/index.php?src=blog&srctype=blog_detail_techelect&refno=180&category=TechElect&print=y 10
Department of Commerce, GoI, “Brief note on Status Regarding Information Technology Agreement (ITA-II)”
Department of Commerce, New Delhi.

7
3. Tracing the History of India’s Information Technology Sector
India’s first proximity with information technology (IT) began with the import of EVS EM
computers (hardware enabled with software) from the Soviet Union, which was used in large
companies and research laboratories. The concept of IT as an industry began to take root in
India in the late 1960’s. Roughly forty years ago in 1968, the Tata Consultancy Services was
established in Santacruz Electronics Export Processing Zone (SEEPZ)11
located in Mumbai.
It was the first by the Tata Group (a private sector) and it was the country's first largest
indigenous software producers.
Figure 2: Evolution of India’s Information Technology (IT) Hardware Industry
Source: Figure 3 from the Report Human Resource and Skill Requirements in the Electronics and IT Hardware Industry,
p.7.< http://www.mit.gov.in/sites/upload_files/dit/files/Electronics_IT_Hardware_NSDC_Report_1732011.pdf>
It should be noted that majority of such efforts were as part of direct outcome of government
supported programme and policies. These efforts were carried out by the government to
emancipate the economically beleaguered country to build a large scientific workforce. The
National Informatics Centre was established in 1975 and was followed by a boom of
indigenous IT companies such as Tata Infotech, Patni Computers and Wipro.
A series of government funded supports to institutions, both private and public sectors, since
mid 1960s made India one among the three countries to produce super computers. During the
11 Santacruz Electronics Export Processing Zone (SEEPZ) is a Special Economic Zone in Mumbai, India. Situated in the
Santacruz East area, it is subjected to liberal economic laws as compared to the rest of India to promote rapid economic
growth using tax and business incentives and attract foreign investment and technology[1]. Seepz was created in 1973
and was seen as export processing zone[2]. Since then many other SEZ’s have been created in rest of India. SEEPZ
mainly houses Electronic Hardware Manufacturing Companies, Software Companies and jewellery exporters of India.
More than 40 percent of India’s total jewelry exports ($2,222.31 million) out of $5,210.69 million during year 2006-
2007 came from units within SEEPZ[3]. Despite its name, it is not located near the suburb of Santacruz, rather it is
located closer to Andheri that lies further north.
8
sixties, India was the third country after the United States of America and the Soviet Union to
have such capacity.
After attaining independence in 1947, India invested heavily in science and technological
institutions, like the Indian Institute of Technology (IIT).12
This led to the creation of an
army of trained engineers and with the relaxed immigration law in the United States of
America (1965), it was the perfect breeding ground for today’s software successes. The US
attracted a number of skilled Indian professionals aiming for research in this new area. By
1960 as many as 10,000 Indians were estimated to have settled in the US. By the 1980s a
number of engineers from India were seeking employment in other countries. In response,
the Indian companies realigned wages to retain their experienced staff.
The United States technological lead was driven in no small part by the brain power of
brilliant immigrants, many of whom came from India. The inestimable contributions of
thousands of highly trained Indian migrants in every area of American scientific and
technological achievement culminated with the information technology revolution most
associated with California’s Silicon Valley in the 1980s and 1990s.
The Indian government created three wide-area computer networking schemes: INDONET –
which was intended to serve IBM networks across the country, NICNET- the network created
for the NIC, and Education and Research Network (ERNET) which was oriented towards
educational research; in the years 1986-1987. With the birth of the 90’s, India saw massive
changes in the IT industry. The Department of Electronics created Software Technology
Parks of India (STPI) in 1991, which is basically an export oriented scheme for the
development and export of computer software, including export of professional services. The
decade saw a massive stride in India’s economic growth, partly due to the extensive internet
connectivity provided all over the country at that time.
Indian Software Industry and the Role of Government
The first Computer Policy of 1984 and Software Policy of 1986 emphasized the concept of
software development and export through data communication links. The objective of this
policy was to develop software in India using Indian expertise on sophisticated computers,
which were being imported duty free. This way, one could make use of the low cost expertise
available in India and avoid the expense of time and cost in travelling abroad.
However, there was a substantial cost involved in the data communication links. As per the
policy, companies were allowed to establish data communication links by their own initial
investments. The ownership of the equipment and the operations of the same Gateway would
remain with VSNL and VSNL would pay back to the user over a prescribed period after
deducting the operational maintenance costs. Following the economic liberalization of 1991,
12
In August 1951, the minister of education Maulana Abul Kalam Azad inaugurated the Indian Institute of
Technology at Kharagpur in West Bengal, possibly modeled after the Massachusetts Institute of
Technology.

9
the government of India established the software technology parks of India (STPI) scheme
and opened numerous software parks around the country. These parks have played a critical
role in the growth of India’s software sector.
India’s strength lies in its availability of pool of scientists and engineers and quality of maths
and science education along with quality of business schools.13
India also ranked quite high
in terms of cluster development, foreign technology licensing and Government prioritization
of ICT. However, Information and communication technologies (ICT) have brought about
revolution in India particularly since 1990s.
The emergence of a strong Indian software industry occurred due to the concerted efforts on
the part of the Government, particularly since 1980s, and host of other factors like
Government-Diaspora relationships, private initiatives, emergence of software technology
parks, clustering and public private partnerships. Looking into the past and present trends of
the Indian IT industry has strengthened the needs of IT sector to act as a catalyst of growth
and development.
India’s software export growth does have enough lessons for other countries to model their IT
policy which may help them to shape their IT industry as driver of growth and development.
IT firms were actually required to export software in the early days of the industry. This
arose in the context of a shortage of foreign exchange in India in the 1970s and early 1980s.
Software firms that needed imported inputs were required to earn foreign exchange
themselves through export of software. This also enabled them to get an idea of global
markets at a very early stage of development.
Besides formulating the national vision to promote software industry in India in the early
1980s by the government, there were deliberate attempts by the companies to promote
software production like compilers, device drivers and operating system to cater to the
domestic hardware sector. The high tariffs for the hardware sector had meant that the
production of domestic hardware segment (including PCs which were introduced in the same
period) had to be sustained, requiring necessary software’s like operating system and drivers.
Subsequently by mid 1980s, software started coming up unbundled with the hardware. This
further gave fillip to the software industry and exports. The 1990s and early 2000 saw the
rise of Software Technology Parks and formation of the Ministry of Information Technology,
respectively. Despite liberalization of the 1991, the software industry flourished signifying
the inherent strength that it developed due to benign and enabling environment provided over
a period of time and also the fact that the 1990s saw the dramatic decline in
telecommunication costs (government explicit intervention) and the commercialization of the
internet along with the Y2K “problem”.
13
This was owing to the visionary efforts by government of India, when in August 1951, the minister of
education Maulana Abul Kalam Azad, inaugurated the Indian Institute of Technology at Kharagpur (West
Bengal) and modeled after the Massachusetts Institute of Technology.

10
Besides the external demand emanating from the Y2K problem over the years there was
considerable demand generated within the domestic economy as result of E-Governance of
the corporate sector and the government, E-Commerce and Railway and Online Air bookings
and Net banking. The role of government from facilitator to regulator continues to remain
very vital in any of the development in the Software sector in India.14
In fact, when the Govt. announced the first Software Policy in 1986, many such issues were
addressed. The STP scheme is a 100 percent export oriented scheme for the development and
export of computer software, including export of professional services using communication
links or physical media. This scheme is unique in its nature as it focuses on one
product/sector, i.e. computer software. The scheme integrates the government concept of 100
percent Export Oriented Units (EOUs) and Export Processing Zones (EPZs) and the concept
of Science Parks/Technology Parks, as operating elsewhere in the world. With STPI
presence, orderly implementation of STP Scheme and the Govt. initiatives, in general, the
offshore software exports from the country during 1991-92, which was mere 20-35% has
grown to more than 70% during 2009-10. In fact, countries like Mauritius, Sri Lanka, Nepal,
Algeria, Indonesia, etc. are taking the help of STPI to set up similar technology parks with
the same concept.
Even though, STPI Centres have come-up across the country in as many as 46 locations, the
major Industry concentration is at Bangalore, Noida, Mumbai, Chennai, Hyderabad and Pune,
reflecting the natural technology clustering effect that has taken place in other technology
clusters like Silicon Valley, Boston, Dallas, Ireland, Sweden and Tokyo. First Phase: In 1991-
92, there were very few Indian companies who were doing software exports from India.
Those exporting software included few multinational companies like Texas Instruments,
Hewlett Packard, and Digital. One could term this as the first phase of the developmental
process. Second Phase: In the second phase of the developmental process, the concept of the
"Offshore Development Work" took birth. This second phase of the development, which
started in 1993, took India, in fact Bangalore, Mumbai in particular, to greater heights by
1998-99. By the end of March 2001, the Industry has grown to US $ 5.7 billion in software
exports with 380 multinational companies establishing base here, the largest concentration of
the technology services. All the Global Leaders in Hi-Tech areas like IC Design,
Communication Software and System Software have setup a base for their operations in
India. Third Phase: The success of the 2nd phase paved the path for the third phase of
development to take place. The third phase of development led to very close and intimate
relations with the Silicon Valley start-up companies. In fact, every small Hi-Technology
Start-up Company in Silicon Valley valuated at millions of dollars in US market, started
establishing their development Centres in Bangalore, Pune, etc. Fourth Phase: During the
fourth phase of the development many Indian companies started owning the intellectual
property within India and earning the royalty from the global players.
14 Kumar, Mathur, Somesh, 2007, “Indian IT industry: a performance analysis and a model for possible adoption”,
Munich Personal RePEc Archive, RIS http://mpra.ub.uni-muenchen.de/2368/

11
The liberalisation popularly brought down the tariffs on the ITA hardware, which in turn
promoted the use of these by private industries for software exports. Analysing the year of
establishment of top 10 leading exporter in India of software services like, Infosys (1981),
WIPRO (1945), TCS (1969), Satyam computer (1987 ), Tech Mahindra (1986), HCL
(1976), Patni Computer Systems (1976), i-flex Solutions (1991), MphasiS (2000) and L&T
Infotech (1997). Thus majority of the firms were set-up before the ITA agreement came in
full existence by 2005.
Table 2: Software Centres of India and their Ranking
Source: Author based on the Wikipedia.
12
The success of the software sector has, for the most part, been a combination of factor like
resource endowments, a mixture of benign, neglect and active encouragement from a
normally intrusive government, and good timing. The substantial part of the Indian software
exports have consisted of mundane services such as low level programming and maintenance.
However, the leading Indian firms are making strong efforts to move up the value chain by
acquiring better software project management capability and deeper knowledge of business
domains, and reducing costs and improving quality by developing superior methodologies
and tools. Moreover, the greatest impact of the software industry on the Indian economy may
well be indirect, in its role as an exemplar of the new business organisational form and as an
inspiration to other entrepreneurs.15
Major developing players in the sector of “other business services” are all Asian, and many of
them reached impressive levels of exports during the last decade. During the subsequent
period, characterized by the emergence of the regional financial crisis, Singapore’s exports of
“other business services” declined, as did those of two other strong exporters: Korea and the
Philippines (exports from the latter, which had reached almost US$8bn, actually collapsed in
1995–1999). Conversely, exports of “other business services” from India, Malaysia, and
Saudi Arabia increased also in the late 1990s. “Software exports have been India’s most
dynamic export sector”, the Indian software industry, in fact, is probably the most well-
known success story of a developing country exporting highly human capital intensive
services. Software services exports from India have been growing at an extraordinary rate of
over 40 per cent per year in the late 1990s, reaching over US$8bn by the end of the decade
and they presently constitute a sizeable share of the country’s total exports.16
Paradoxically
however, India’s performance in IT software and service export in terms of the rate of growth
has been unprecedented in India’ recent economic history.
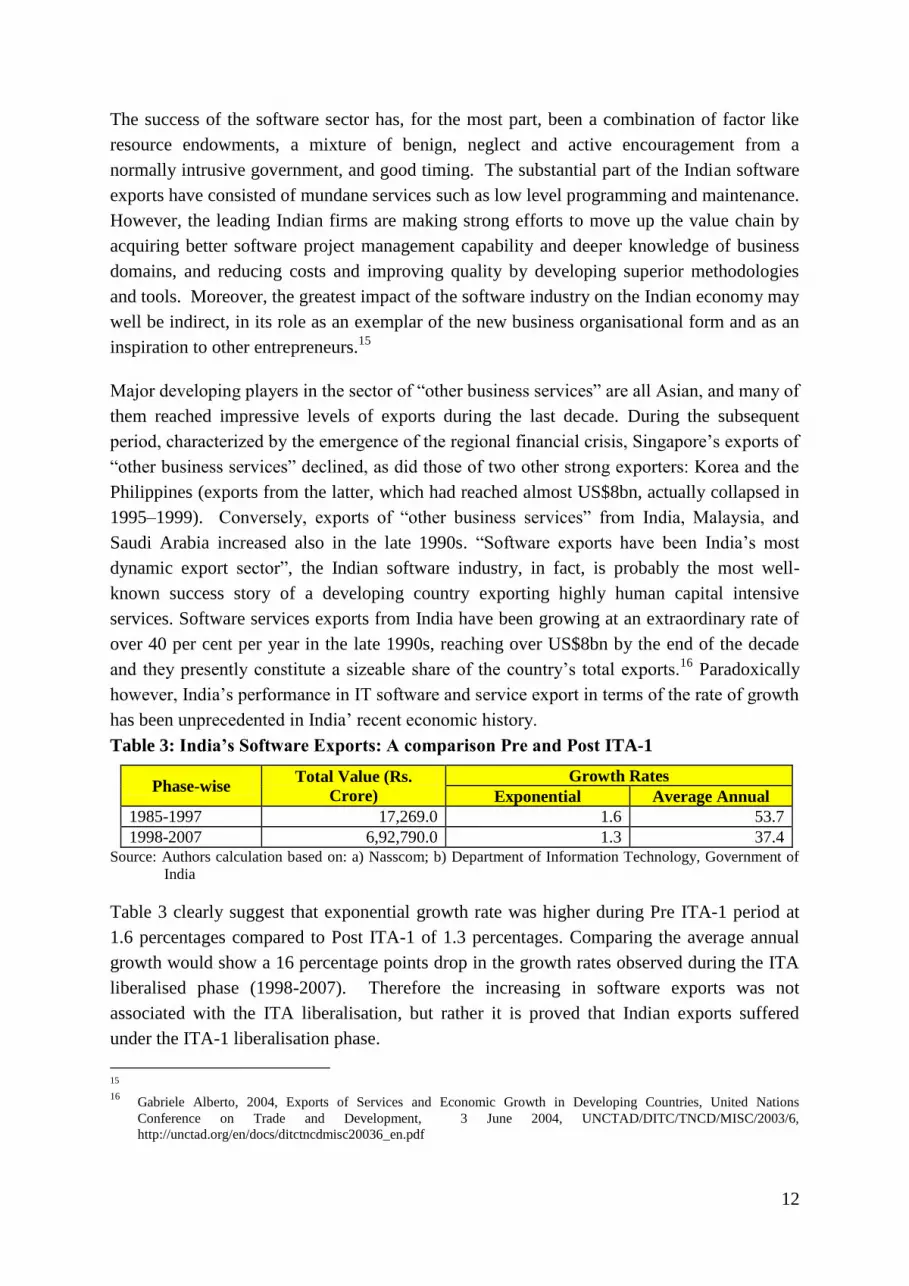
Table 3: India’s Software Exports: A comparison Pre and Post ITA-1
Phase-wise Total Value (Rs.
Crore) Growth Rates
Exponential Average Annual 1985-1997 17,269.0 1.6 53.7 1998-2007 6,92,790.0 1.3 37.4
Source: Authors calculation based on: a) Nasscom; b) Department of Information Technology, Government of
India
Table 3 clearly suggest that exponential growth rate was higher during Pre ITA-1 period at
1.6 percentages compared to Post ITA-1 of 1.3 percentages. Comparing the average annual
growth would show a 16 percentage points drop in the growth rates observed during the ITA
liberalised phase (1998-2007). Therefore the increasing in software exports was not
associated with the ITA liberalisation, but rather it is proved that Indian exports suffered
under the ITA-1 liberalisation phase.
15 16
Gabriele Alberto, 2004, Exports of Services and Economic Growth in Developing Countries, United Nations
Conference on Trade and Development, 3 June 2004, UNCTAD/DITC/TNCD/MISC/2003/6,
http://unctad.org/en/docs/ditctncdmisc20036_en.pdf

13
This so-called performance of IT software and service sector in India has, however, coincided
with the debacle of the hardware capacities in India. Therefore the “Source India” campaign
was launched by Electronic Industries Association of India (ELCINA) in 2009 to accelerate
development of the Indian electronics supply chain. ELCINA recognises that a strong supply
chain is the back bone of any engineering manufacturing industry and more so of the
electronics industry due to the huge variety of materials and components required for
electronics equipment manufacturing. The growth of India's industry and to some extent
market expansion has been restricted due to the lack of supply chain support. This situation
needs urgent correction by the government. Development of local supply sources and
increased value addition is necessary and imperative if this market is to be serviced
efficiently. “Source India” is an event which may enable this and accelerate development of
the Indian electronics supply chain.
What emerges from the above analysis is that software successes of India, in terms of
exports, cannot be directly associated to the Information Technology Agreement (ITA)
liberalisation. There is a long history of government support to the Information Technology
and related sectors as it was considered as one of the strategic industry since long. It is not
only difficult but unrealistic to give all credits to ITA-1 for the successes of India in software
export as it was only a tariff cutting mechanism. However, if liberalisation has to be given
credit for software sectors performances, it was the 1991 general liberalisation which gave
the private sector a greater say in the economic activities of India.
4. Performance of Hardware Sector in India and the ITA-1
The process of industrial de-licensing, which began in 1985 in India marked a discrete break
from a past of centrally planned industrial development. Similar liberalization episodes are
taking place across the globe. However, it is well known that firm responses, even within the
same industrial sector, are likely to be heterogeneous leading to an increase in industry
inequality.
Technologically advanced firms and those located in regions with pro-business institutions
are more likely to respond to the threat of entry by investing in new technologies and
production processes, Table 2 of earlier section provides sufficient evidence on this
account.17
Hence, the Indian liberalisation of 1991 and the industry response in term of
performances can be summarised as the debate between the limitations to minimise the
underling theoretical understanding and the grounded policies both domestically and
externally.
17 Aghion Philippe, Robin Burgess, Stephen Redding and Fabrizio Zilibotti, 2005, “Entry Liberalization and Inequality in
Industrial Performance”, Journal of the European Economic Association, volume 3, issue 2-3, pp 291–302, April-
May.

14
As a result the total organised sector employment of India saw a fall in workforce by about
15 percent between 1995-96 and 2000-01.18
The liberalisation efforts of 1991 led to certain
sectors underperforming while others sectors grew with vigour. The scenario of the IT sector
is perceived to be grimmer than the other sub-sectors of Indian manufacturing sector. This is
highlighted in the Planning Commission Report of 2001, wherein, it calls for a clear
comprehensive national policy for hardware manufacturing industry for making the Indian
manufacturing sector globally competitive.19
It further called for revival plan for the IT
hardware industry, as it is seen as strategic and core for overall manufacturing sectors long
run survival. The “Source India” scheme proposed for the electronic industry by the industry
association was an outcome of these initiatives and the new direction of thinking by the
industry association and policy makers.
The ITA-1 liberalisation is unique in the way it has preceded over the years. As we
understand liberalisation at the MFN basis would necessitate reduction/elimination of tariff
and non-tariff measures – given that the developing countries continue to enjoy the benefit of
S&D Treatment. The ground realities are that tariffs have been bought down to zero in all the
74 countries20
of the WTO members on a MFN basis. However, the sticky issues since the
1996 has been “how to address the issue of non-tariff measures (TBTs)” which till date
remain to be harmonised at the multilateral levels under the International Standards
Organisation (ISO).
It exposed the weakness of the WTO negotiation process, (even under a plurilateral setup like
the ITA-1) in addressing the tariff elimination corresponding with the harmonisation of non-
tariff measures. This was important from the point of view of the negotiations on non
agricultural market access for the leaders and laggards in the IT technology, to be brought to
a minimum common platform. It seems to have miserably failed in this process as is
discussed in this section of the paper. The market access scenario in the present ITA-1 for
the developed countries (technology leaders or those countries already linked to the
international production network- the classic case is East Asian countries) in the ITA
products vis-a-vis any developing countries with no industry level standards has proved
fatal for the domestic home grown industries in the IT hardware.
Faced with national barriers in the developed market the developing country producers may
find it unviable to produce and sell at a competitive price. The negotiations on the NTMs
were disassociated with tariffs, for a simple reason that tariffs in the developed countries
were a non issue and it was all about the national standards.21
18 Nagaraj R. , 2004, “Fall in Organised Manufacturing Employment: A Brief Note”, Economic and Political Weekly,
vol. 39, no. 30 (Jul. 24-30), pp. 3387-3390. 19 Planning Commission, 2001, “Report of the Working Group on Information Technology for the Formulation of the
Tenth Five Year Plan”, http://planningcommission.nic.in/aboutus/committee/wrkgrp/wg_it.pdf. 20 EC has been taken as individual countries and not as a block. 21
See Annexure 4 for a detailed understanding on negotiations on NTMs under the ITA Committee on
EMI/EMC and yearly notifications of National Standards Vis-a-Vis International Standards over the time.

15
Gradually, with the influx of imports into the domestic markets under the new tariff of zero
under the ITA-1, the existing domestic producers may become domestic assemblers/traders in
the IT products.22
This will have a major socio-economic impact. The minimal value
addition through the assembling activity will have an impact on both organised sector but
more importantly it may adversely impact the unorganised and Small and Medium
Enterprises (SMEs). Unfortunately for the unorganised sector we do not have regular
information flow to assess the impact. We feel this is exactly what could have happened in
the case of India as a direct outcome of unbalance approach to the sectoral Agreement of the
ITA-1.
Tariff Elimination and Sequencing under the ITA-1
A total of 165 products23
were part of the ITA Agreement in which the members were
mandated to reduce tariff and harmonise the non-tariff measures. However, for reasons
unknown, a clear-cut schedule was laid out only for tariff elimination ignoring the issue of
NTM’s completely. The average MFN applied tariff for India's 165 ITA-1 products has seen
scheduled reduction as per the commitments made under Information Technology
Agreement. India had an average base duty of 66.4 percentages in March 1998 it further
dropped to the level of 37.8 percentages half of the base rates in July of 1997. The average
tariff continued to drop at regular intervals to 12 percentages in 2000 to 10 percentages in
2004 and completely eliminated by 2005, see Figure 3.
Figure 3: Average MFN Tariffs of India on ITA Products and Count of HS 6 Digits
Tariff Lines
Source: Authors calculations based on India's commitment under the ITA-1.
Exponential growth rate of India's imports were 23.7 percentages for the period between
1996 and 2005. However, imports grew at slower pace in the first phase (1997-2000) at 18
percentages while in the second phase (2001-2005) it almost doubled to touch nearly 38
22
Empirical evidences based on firm level data provided in Section 6. 23 After removing the duplicates 165 lines, originally the numbers of tariff lines under the ITA were 217 HS 6 digit lines.
Some of these lines were ex-post belonging to the same 6-digit HS Classification.
16
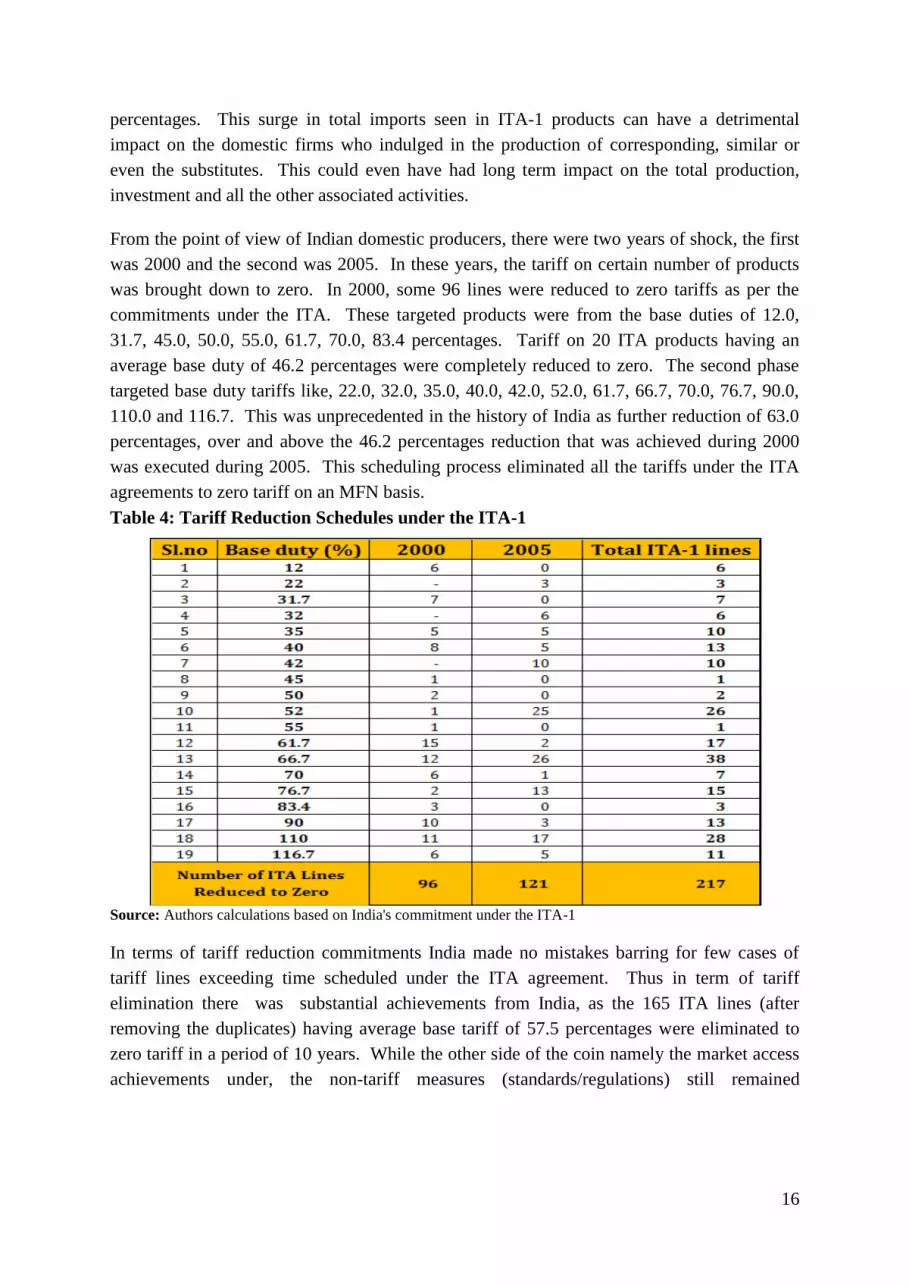
percentages. This surge in total imports seen in ITA-1 products can have a detrimental
impact on the domestic firms who indulged in the production of corresponding, similar or
even the substitutes. This could even have had long term impact on the total production,
investment and all the other associated activities.
From the point of view of Indian domestic producers, there were two years of shock, the first
was 2000 and the second was 2005. In these years, the tariff on certain number of products
was brought down to zero. In 2000, some 96 lines were reduced to zero tariffs as per the
commitments under the ITA. These targeted products were from the base duties of 12.0,
31.7, 45.0, 50.0, 55.0, 61.7, 70.0, 83.4 percentages. Tariff on 20 ITA products having an
average base duty of 46.2 percentages were completely reduced to zero. The second phase
targeted base duty tariffs like, 22.0, 32.0, 35.0, 40.0, 42.0, 52.0, 61.7, 66.7, 70.0, 76.7, 90.0,
110.0 and 116.7. This was unprecedented in the history of India as further reduction of 63.0
percentages, over and above the 46.2 percentages reduction that was achieved during 2000
was executed during 2005. This scheduling process eliminated all the tariffs under the ITA
agreements to zero tariff on an MFN basis.
Table 4: Tariff Reduction Schedules under the ITA-1
Source: Authors calculations based on India's commitment under the ITA-1
In terms of tariff reduction commitments India made no mistakes barring for few cases of
tariff lines exceeding time scheduled under the ITA agreement. Thus in term of tariff
elimination there was substantial achievements from India, as the 165 ITA lines (after
removing the duplicates) having average base tariff of 57.5 percentages were eliminated to
zero tariff in a period of 10 years. While the other side of the coin namely the market access
achievements under, the non-tariff measures (standards/regulations) still remained

17
unresolved.24
In next sub section we would be addressing some of the concerns of
liberalisation of NTMs.
Technical Standards: TBT notifications under the WTO
The Technical Barriers to Trade (TBT measures) is the most significant standard/regulations
faced by ITA-1. These can vary from standards/regulation on
mobile/radio/telecommunication services offered within the domestic market in terms of
frequency, technically referred to in hertz (Hz) whereas some of technical standard can be as
common as the labelling text details. Over the years, it is observed that the TBT notification
from all the WTO members have been increasing to replace the reductions in tariffs under
ITA commitments.
Figure 4: TBT Measures: Cumulative and Product Coverage under the Yearly
Notification
Source: Centre for WTO Studies Web Portal http://cc.iift.ac.in/tbt/index.asp
As shown in Figure 4, the total TBT notifications by the WTO membership countries (ITA
signatories and non signatories) have been increasing since 1996. This is indicated by the
exponential growth rates of year-wise notifications by nearly 3.0 percentages and on
cumulative basis by 15.0 percentages. This is significant in the context that the ITA
signatories which have been reducing the tariff downward, the standards/regulations have
been going the other way. Nearly 82 percentage of the notification by the ITA signatories,
suggests a substantial increased protectionism by way of domestic regulations, creating
market access barriers in the ITA-1 Plurilateral agreement of the WTO.
24
See the discussion of the status of the pilot project on EMC/EMI under the ITA Committee in Section 1.

18
The other aspect is the large Product Coverage25
observed in the period coinciding with a
large share of National Measures notified by developed country signatories of ITA-1. This
can be interpreted based on the Figure 4 which indicates high product coverage at 4 digits
level and the Annexure 4 which shows a larger proportion of yearly notifications by the
developed countries within the classification of National Measures. Therefore, it could be
argued that these countries were busy notifying all their national measures before any
disciplining came out of the WTO negotiation process under the ITA committee.
Table 5 analyses the TBT notifications of 31 countries on the basis of National and
International standards. The national standards/measures are those specific legislations,
which need to be adhered to operate or sell in the markets and these may be different from the
international harmonised standards by the ISO.
Table 5: TBT Measures: On Specific Four Digits Product Coverage (Top 31 Countries)
Note: * and shaded in orange colour are not ITA signatory
Source: Authors calculations from Centre for WTO Studies Web Portal http://cc.iift.ac.in/tbt/index.asp
The harmonisation process basically involves bringing different standards existing in
different countries at a point of time/periods, to a level which is agreeable by everyone as the
international level. The Table 5 indicates that the developed countries with technological
advantage had 92 percentages of national standards as compared to developing countries with
77.5 percentages. Only countries like Canada (51.7 %) and United State (69 %) had more
25 The product coverage in a single notification is the number 4 digit HS code tariff lines covered by that notification. For
example let’s take the case of the first country in Table 5, Japan has 102 notifications (including
additions/revisions/corrigendum), during the period between 1995 and 2011, then product coverage for Japan is 669
products. To put in simple terms 7 products (HS 4 digit) are being covered under each notification made by Japan.
International NationalSub Total-
Dev.gInternational National
Sub Total-
D'ped
Japan 669 669 669
Belgium 636 636 636
South Korea 7 490 497 497
European Communities 423 423 423
China 209 206 415 415
Canada 212 198 410 410
Netherlands 332 332 332
The SCT of TPKM 326 326 326
Switzerland 317 317 317
Czech Republic 256 256 256
Mexico* 2 197 199 199
Israel 189 2 191 191
Norway 191 191 191
Finland 163 163 163
Brazil* 9 149 158 158
South Africa* 89 51 140 140
France 139 139 139
Sweden 135 135 135
Philippines 8 123 131 131
Argentina* 130 130 130
Thailand 82 45 127 127
United States 86 38 124 124
Australia 111 111 111
Colombia 111 111 111
Chile* 107 107 107
Spain 104 104 104
Hungary 93 93 93
Hong Kong, China 88 88 88
Saudi Arabia 82 1 83 83
Malaysia 45 36 81 81
Slovak Republic 80 80 80
Total TBT notifications 722 2491 3213 298 3456 3754 6967
Product Coverage based
on TBT notifications
Developing Developed
Grand Total

19
share to international standards. If we eliminate these two countries, the 11 countries had 100
percent national standards. It is alarming that the ITA-1 which has been fully implemented in
terms of the tariff commitments has such an imbalance in the usage of NTMs like the TBT
measures. However, this moderately high average usage does not prove anything
substantively. One needs to look beyond this myopic view, both in terms of usage over the
years and the nature objective in the TBTs measures. The long run trends reveal a great deal
of information about the nature of protection in the developed members market for ITA-1
products in comparison to the developing country members like India who are operating on
very low technological base, especially when we try to identify the industry standards for the
masses production.26
Further it is to be observed that India does not figure in the top 31
WTO notified users of TBT measures for the selected products of ITA-1.
Figure 5: Usage of National Vs International TBT Measures under the ITA
0
200
400
600
800
1000
0
200
400
600
800
1000
1200
Total Product Coverage of TBT Notif.'s International Measures National Measures
Pro
du
ct C
overage
Source: Authors calculations form the Centre for WTO Studies Web Portal http://cc.iift.ac.in/tbt/index.asp
In terms of the usage over the years, the Figure 5 analyses this pattern across the national and
international standards for the complete WTO membership. The trends clearly suggest very
high levels of national standards in the initial years, when the developed countries were
required to bring down their tariffs at an MFN basis. It should also be noted that there was
higher product coverage during this period, suggesting that these countries were in a hurry to
notify all the measures before the disciplines on the use of NTMs are put.
What is alarming is very high use of national standards during the early period of 1997 to
2000. Of the total of 456 TBT notifications from 1995 to 2000 by all the WTO members,
the developed member had 356 TBT notifications, which was 78 percentages of the total
notifications. In terms of the product coverage around 3881 products were covered by the
456 TBT notifications, of which 3800 were protected by national measures. This is a telling
26 In the space technology India may be a leader however this has not been translated as successfully like in the US or EC
into the Information technology sector for the benefit of general consumers.
20
story of how ‘Market Access’ has been denied to the developing countries during the phase
of tariff liberalisation. It would be useful to have detailed understanding on the various types
of TBT standards.27
A closer look at the 45 different types of standardised28
standards identified as per the Centre
for WTO Studies database on the TBT measures. This exercise of standardisation was
carried out to derive meticulous observations and reading the complete nature of objectives.
The objectives were as diverse as possible, incorporating all the needs of different countries
which were the ITA members for example Technical Regulations/Standards; Safety and
Quality Standards; Labelling; Regulating Market and Consumer Health and Safety;
Revitalisation of Economy and Make use of Private Sector Capacity; Trade Facilitation;
Human Safety and Environmental Protection; Environmental Protection and National
Security; Animal and Human Health; Safety and Environmental Protection & Consumer
Protection and Fair Trade.
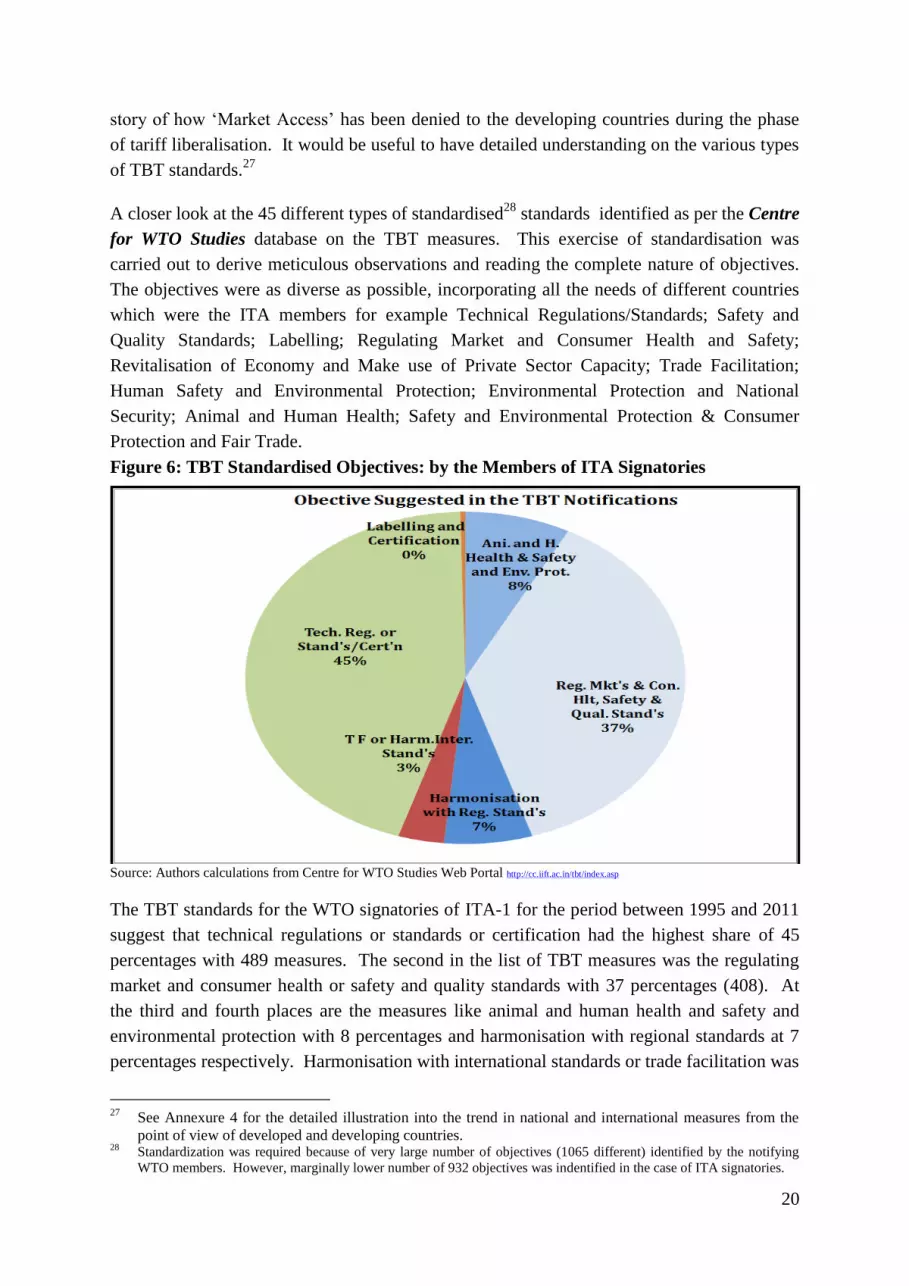
Figure 6: TBT Standardised Objectives: by the Members of ITA Signatories
Source: Authors calculations from Centre for WTO Studies Web Portal http://cc.iift.ac.in/tbt/index.asp
The TBT standards for the WTO signatories of ITA-1 for the period between 1995 and 2011
suggest that technical regulations or standards or certification had the highest share of 45
percentages with 489 measures. The second in the list of TBT measures was the regulating
market and consumer health or safety and quality standards with 37 percentages (408). At
the third and fourth places are the measures like animal and human health and safety and
environmental protection with 8 percentages and harmonisation with regional standards at 7
percentages respectively. Harmonisation with international standards or trade facilitation was
27
See Annexure 4 for the detailed illustration into the trend in national and international measures from the
point of view of developed and developing countries. 28 Standardization was required because of very large number of objectives (1065 different) identified by the notifying
WTO members. However, marginally lower number of 932 objectives was indentified in the case of ITA signatories.
21
the lowest level of measures at 3 percentages. The only other measure which was lower in
priority was labelling and certification which recorded 4 TBT measures. Clearly, the issue of
harmonisation at the international level was given the lowest priority by the ITA signatories.
However, if the signatories were serious about market access issues, this issue should have
received the highest priority.
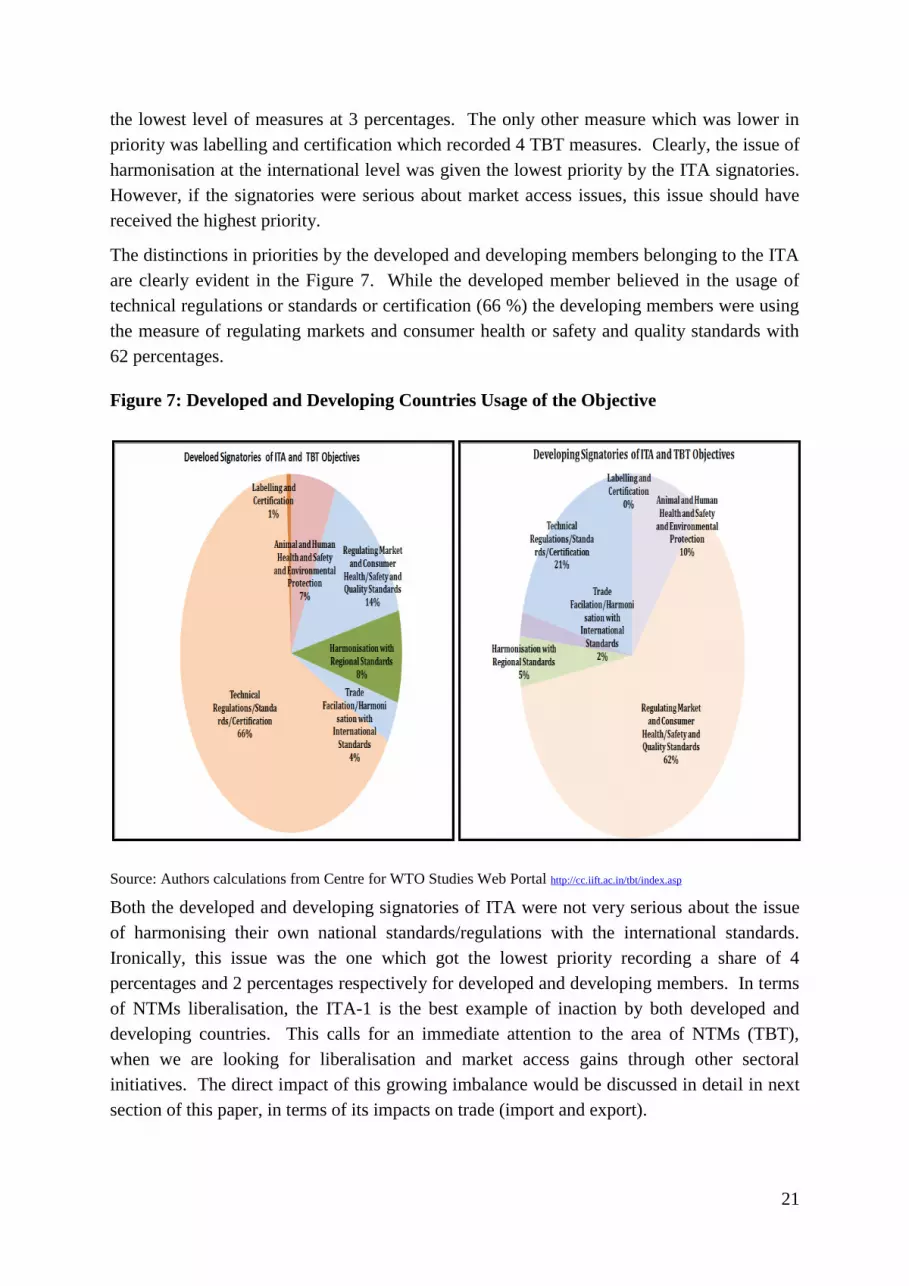
The distinctions in priorities by the developed and developing members belonging to the ITA
are clearly evident in the Figure 7. While the developed member believed in the usage of
technical regulations or standards or certification (66 %) the developing members were using
the measure of regulating markets and consumer health or safety and quality standards with
62 percentages.
Figure 7: Developed and Developing Countries Usage of the Objective
Source: Authors calculations from Centre for WTO Studies Web Portal http://cc.iift.ac.in/tbt/index.asp
Both the developed and developing signatories of ITA were not very serious about the issue
of harmonising their own national standards/regulations with the international standards.
Ironically, this issue was the one which got the lowest priority recording a share of 4
percentages and 2 percentages respectively for developed and developing members. In terms
of NTMs liberalisation, the ITA-1 is the best example of inaction by both developed and
developing countries. This calls for an immediate attention to the area of NTMs (TBT),
when we are looking for liberalisation and market access gains through other sectoral
initiatives. The direct impact of this growing imbalance would be discussed in detail in next
section of this paper, in terms of its impacts on trade (import and export).

22
5. Trade Liberalisation of Information Technology Products
We discuss the impact of trade in ITA-1 products in this paper, using two nomenclatures
Standard International Trade Classification (SITC) and the harmonised system (HS). The
SITC is used to understand the long-run dynamics and the HS is to analyse the relatively
short-run dynamics in the trade of ITA-1 products. They are then used to draw a common
understanding on the impact of ITA-1 liberalisation - specifically on Indian hardware sector
and generally on the Indian economy.
Finally, when we compare share of ITA-I products exports at the category level to understand
which category benefited the most from the information technology agreement it is evident
that the developing countries (DGs) gained the most. It was followed by the developed
countries (Ped) and finally least developed countries (LDCs). The developing countries
showed an increase by 6 percentage points, from 10 percent in 1996 to 16 percent by 2011.
However, after 2000 there has been a slide in the global shares of ITA products from 13
percent in 2005 and touching nearly 10.4 percent shares – this was the original share of ITA
products in the global exports, see Figure 8. While, both developed countries and least
developed countries have been losing market shares in the long term series analysis of 1996
to 2011. At 10 percent shares the developed country’s export was almost at the same level as
developing countries. The LDCs also suggested a declining trend in shares - the share was
0.2 percent in 1996 and declined to 0.1 percent in 2011.
Figure 8: Total Exports: Category-wise Share of ITA-1 Products
Note: DGs refer to developing countries; Ped refers to developed countries and LDCs refer to the least
developing countries grouping.
Source: Author based on online WITS COMTRADE database.

23
With the exports and imports of ITA-1 products of the world suggesting an average annual
growth of 12 percent the trends in share reflect a domination of developing countries in
correspondence with tariff liberalisation in exports.
In simple terms the market access scenario can be captured with the use of global imports
scenarios and the behaviours of three categories comparative shares. It is interesting to note
that the developed countries did not concede any additional market access as its shares
remained below 10 percent throughout the period of study.
This is clearly indicated in terms of the shares rising from 9.8 percent in 1996 to 13 percent in
2000. However, we can observe that it dropped in the later years from 11 percent in 2005 to
7 percent in 2011. This suggests that the impact of tariff liberalisation in the developed
countries was not felt as much as the impact of rising non tariff measures like the TBT
measures in these countries.
Figure 9: Total Imports: Category-wise Share of ITA-1 Products
Source: Author based on online WITS COMTRADE database.
There was a general declining trend in the overall import shares, with virtually no additional
market access in developed countries. A further deterioration was seen in the import shares of
least developed countries in the total world imports of ITA-1 product. Thus, the increasing
global trade in ITA-1 products seen in terms of trade values as observed earlier was largely
supported by a surge in the developing countries imports. The developing countries showed
an overall increasing trend in imports of ITA 1 products during the period. It increased from
11 percent in 1996 and almost doubled to 22 percent in 2000 thereafter, there was a slow
downward trend when it touched 16.3 percent share in 2011.
24
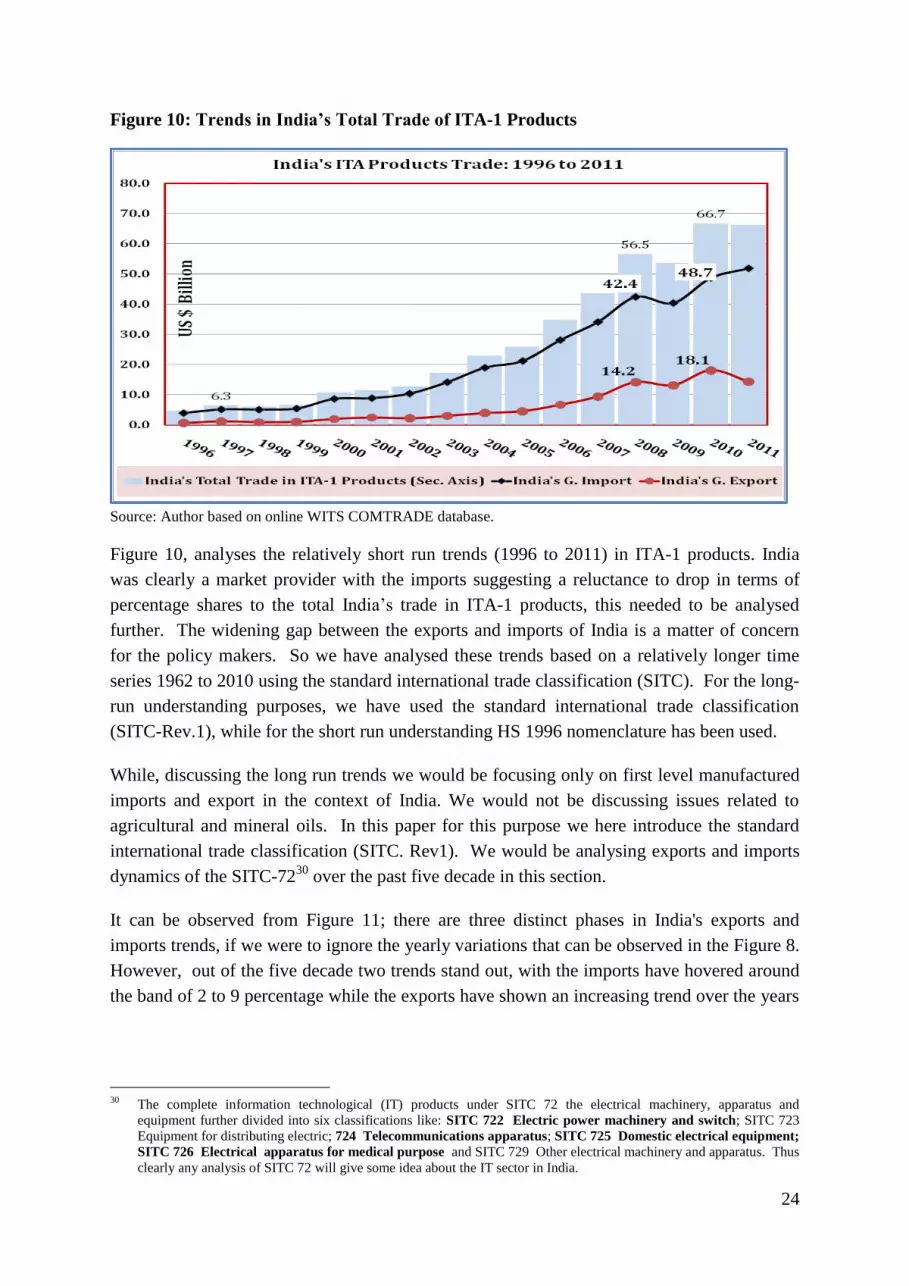
Figure 10: Trends in India’s Total Trade of ITA-1 Products
Source: Author based on online WITS COMTRADE database.
Figure 10, analyses the relatively short run trends (1996 to 2011) in ITA-1 products. India
was clearly a market provider with the imports suggesting a reluctance to drop in terms of
percentage shares to the total India’s trade in ITA-1 products, this needed to be analysed
further. The widening gap between the exports and imports of India is a matter of concern
for the policy makers. So we have analysed these trends based on a relatively longer time
series 1962 to 2010 using the standard international trade classification (SITC). For the long-
run understanding purposes, we have used the standard international trade classification
(SITC-Rev.1), while for the short run understanding HS 1996 nomenclature has been used.
While, discussing the long run trends we would be focusing only on first level manufactured
imports and export in the context of India. We would not be discussing issues related to
agricultural and mineral oils. In this paper for this purpose we here introduce the standard
international trade classification (SITC. Rev1). We would be analysing exports and imports
dynamics of the SITC-7230
over the past five decade in this section.
It can be observed from Figure 11; there are three distinct phases in India's exports and
imports trends, if we were to ignore the yearly variations that can be observed in the Figure 8.
However, out of the five decade two trends stand out, with the imports have hovered around
the band of 2 to 9 percentage while the exports have shown an increasing trend over the years
30 The complete information technological (IT) products under SITC 72 the electrical machinery, apparatus and
equipment further divided into six classifications like: SITC 722 Electric power machinery and switch; SITC 723
Equipment for distributing electric; 724 Telecommunications apparatus; SITC 725 Domestic electrical equipment;
SITC 726 Electrical apparatus for medical purpose and SITC 729 Other electrical machinery and apparatus. Thus
clearly any analysis of SITC 72 will give some idea about the IT sector in India.
25
from 0.1 to 4.5 percentages. This is clearly a good sign in terms of performance of the
industry.31
Figure 11: Shares Exports and Imports of Machinery and Transport Equipment (SITC-
7) to India Total
Source: Based on data from the WITS COMTRADE online database, extracted on 12-04-2012
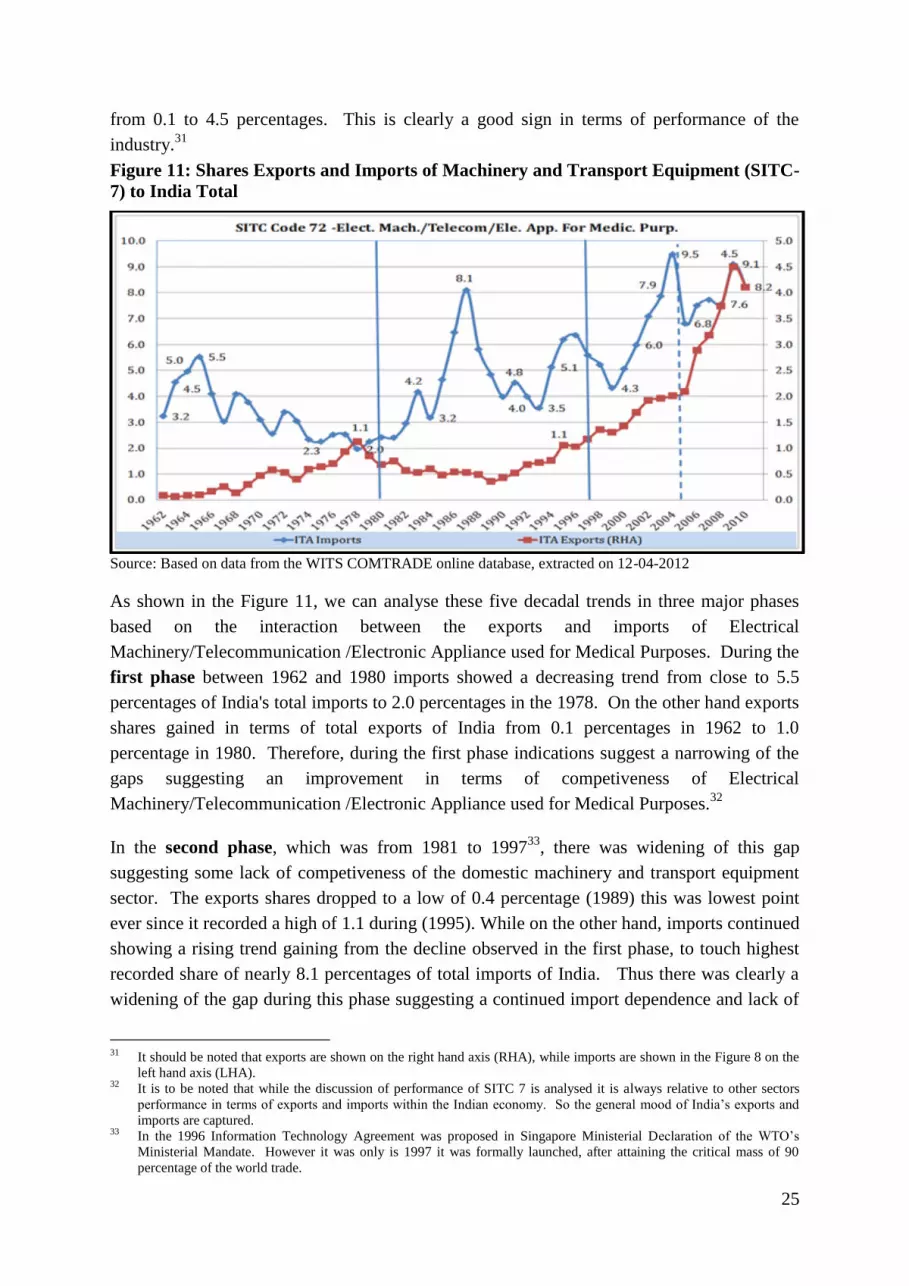
As shown in the Figure 11, we can analyse these five decadal trends in three major phases
based on the interaction between the exports and imports of Electrical
Machinery/Telecommunication /Electronic Appliance used for Medical Purposes. During the
first phase between 1962 and 1980 imports showed a decreasing trend from close to 5.5
percentages of India's total imports to 2.0 percentages in the 1978. On the other hand exports
shares gained in terms of total exports of India from 0.1 percentages in 1962 to 1.0
percentage in 1980. Therefore, during the first phase indications suggest a narrowing of the
gaps suggesting an improvement in terms of competiveness of Electrical
Machinery/Telecommunication /Electronic Appliance used for Medical Purposes.32
In the second phase, which was from 1981 to 199733
, there was widening of this gap
suggesting some lack of competiveness of the domestic machinery and transport equipment
sector. The exports shares dropped to a low of 0.4 percentage (1989) this was lowest point
ever since it recorded a high of 1.1 during (1995). While on the other hand, imports continued
showing a rising trend gaining from the decline observed in the first phase, to touch highest
recorded share of nearly 8.1 percentages of total imports of India. Thus there was clearly a
widening of the gap during this phase suggesting a continued import dependence and lack of
31 It should be noted that exports are shown on the right hand axis (RHA), while imports are shown in the Figure 8 on the
left hand axis (LHA). 32 It is to be noted that while the discussion of performance of SITC 7 is analysed it is always relative to other sectors
performance in terms of exports and imports within the Indian economy. So the general mood of India’s exports and
imports are captured. 33 In the 1996 Information Technology Agreement was proposed in Singapore Ministerial Declaration of the WTO’s
Ministerial Mandate. However it was only is 1997 it was formally launched, after attaining the critical mass of 90
percentage of the world trade.
26
exports by the Electrical Machinery/Telecommunication/Electronic Appliance used for
Medical Purposes.
Figure 12: Trend in India’s Exports and Imports in terms of Values
Source: Based on data from the WITS COMTRADE online database, extracted on 12-04-2012
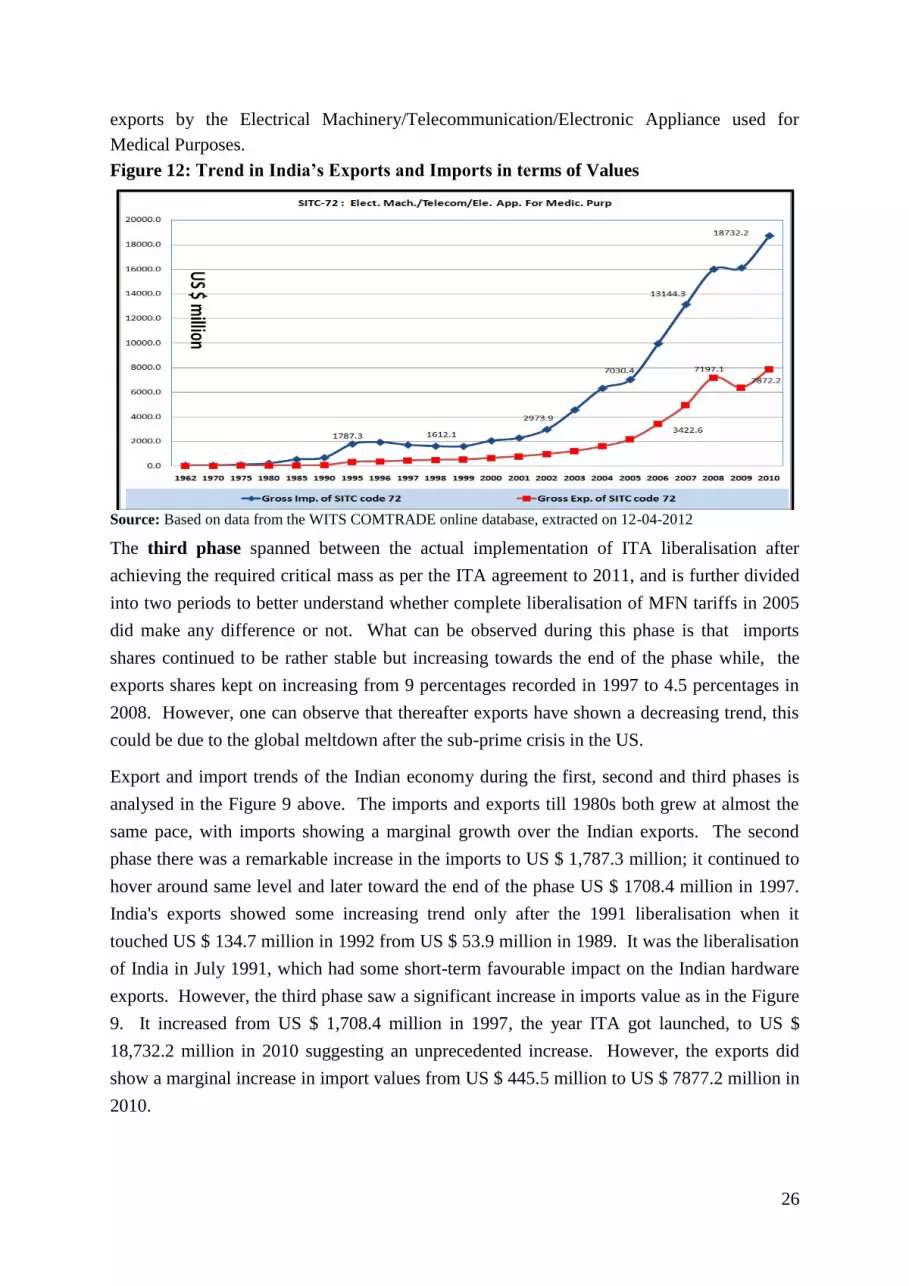
The third phase spanned between the actual implementation of ITA liberalisation after
achieving the required critical mass as per the ITA agreement to 2011, and is further divided
into two periods to better understand whether complete liberalisation of MFN tariffs in 2005
did make any difference or not. What can be observed during this phase is that imports
shares continued to be rather stable but increasing towards the end of the phase while, the
exports shares kept on increasing from 9 percentages recorded in 1997 to 4.5 percentages in
2008. However, one can observe that thereafter exports have shown a decreasing trend, this
could be due to the global meltdown after the sub-prime crisis in the US.
Export and import trends of the Indian economy during the first, second and third phases is
analysed in the Figure 9 above. The imports and exports till 1980s both grew at almost the
same pace, with imports showing a marginal growth over the Indian exports. The second
phase there was a remarkable increase in the imports to US $ 1,787.3 million; it continued to
hover around same level and later toward the end of the phase US $ 1708.4 million in 1997.
India's exports showed some increasing trend only after the 1991 liberalisation when it
touched US $ 134.7 million in 1992 from US $ 53.9 million in 1989. It was the liberalisation
of India in July 1991, which had some short-term favourable impact on the Indian hardware
exports. However, the third phase saw a significant increase in imports value as in the Figure
9. It increased from US $ 1,708.4 million in 1997, the year ITA got launched, to US $
18,732.2 million in 2010 suggesting an unprecedented increase. However, the exports did
show a marginal increase in import values from US $ 445.5 million to US $ 7877.2 million in
2010.
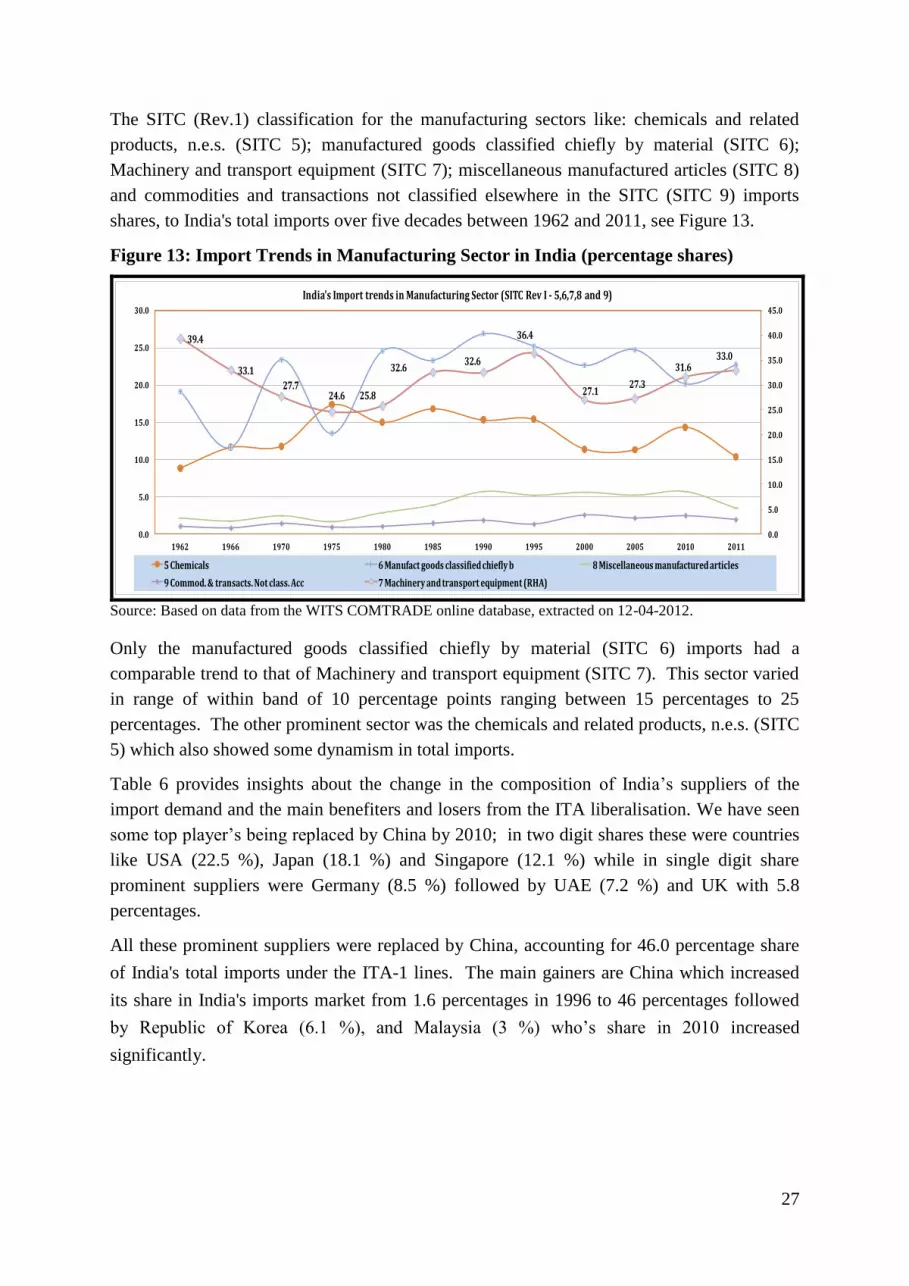
27
The SITC (Rev.1) classification for the manufacturing sectors like: chemicals and related
products, n.e.s. (SITC 5); manufactured goods classified chiefly by material (SITC 6);
Machinery and transport equipment (SITC 7); miscellaneous manufactured articles (SITC 8)
and commodities and transactions not classified elsewhere in the SITC (SITC 9) imports
shares, to India's total imports over five decades between 1962 and 2011, see Figure 13.
Figure 13: Import Trends in Manufacturing Sector in India (percentage shares)
39.4
33.1
27.724.6 25.8
32.632.6
36.4
27.127.3
31.633.0
0.0
5.0
10.0
15.0
20.0
25.0
30.0
35.0
40.0
45.0
0.0
5.0
10.0
15.0
20.0
25.0
30.0
1962 1966 1970 1975 1980 1985 1990 1995 2000 2005 2010 2011
India's Import trends in Manufacturing Sector (SITC Rev I - 5,6,7,8 and 9)
5 Chemicals 6 Manufact goods classified chiefly b 8 Miscellaneous manufactured articles
9 Commod. & transacts. Not class. Acc 7 Machinery and transport equipment (RHA)
Source: Based on data from the WITS COMTRADE online database, extracted on 12-04-2012.
Only the manufactured goods classified chiefly by material (SITC 6) imports had a
comparable trend to that of Machinery and transport equipment (SITC 7). This sector varied
in range of within band of 10 percentage points ranging between 15 percentages to 25
percentages. The other prominent sector was the chemicals and related products, n.e.s. (SITC
5) which also showed some dynamism in total imports.
Table 6 provides insights about the change in the composition of India’s suppliers of the
import demand and the main benefiters and losers from the ITA liberalisation. We have seen
some top player’s being replaced by China by 2010; in two digit shares these were countries
like USA (22.5 %), Japan (18.1 %) and Singapore (12.1 %) while in single digit share
prominent suppliers were Germany (8.5 %) followed by UAE (7.2 %) and UK with 5.8
percentages.
All these prominent suppliers were replaced by China, accounting for 46.0 percentage share
of India's total imports under the ITA-1 lines. The main gainers are China which increased
its share in India's imports market from 1.6 percentages in 1996 to 46 percentages followed
by Republic of Korea (6.1 %), and Malaysia (3 %) who’s share in 2010 increased
significantly.
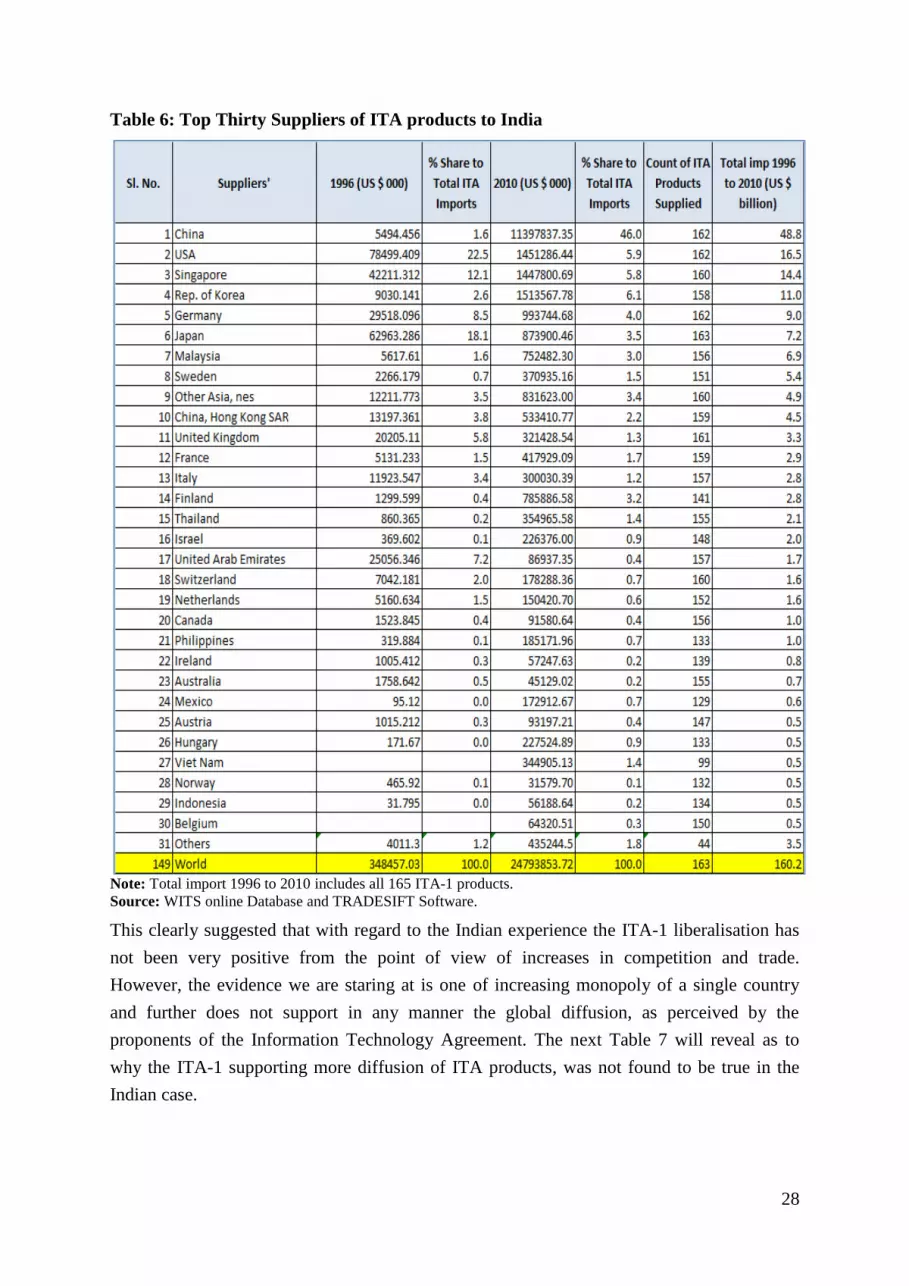
28
Table 6: Top Thirty Suppliers of ITA products to India
Note: Total import 1996 to 2010 includes all 165 ITA-1 products.
Source: WITS online Database and TRADESIFT Software.
This clearly suggested that with regard to the Indian experience the ITA-1 liberalisation has
not been very positive from the point of view of increases in competition and trade.
However, the evidence we are staring at is one of increasing monopoly of a single country
and further does not support in any manner the global diffusion, as perceived by the
proponents of the Information Technology Agreement. The next Table 7 will reveal as to
why the ITA-1 supporting more diffusion of ITA products, was not found to be true in the
Indian case.
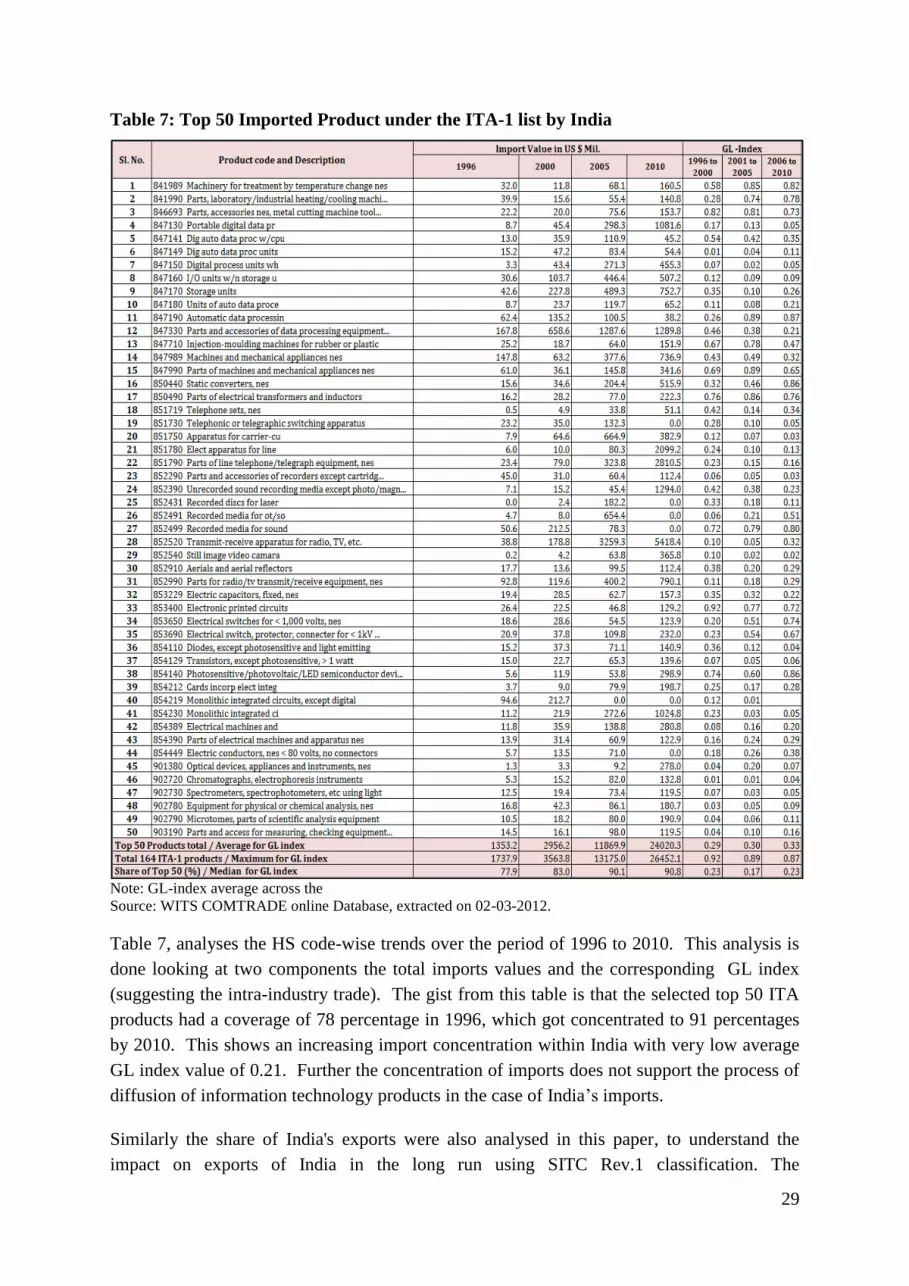
29
Table 7: Top 50 Imported Product under the ITA-1 list by India
Note: GL-index average across the
Source: WITS COMTRADE online Database, extracted on 02-03-2012.
Table 7, analyses the HS code-wise trends over the period of 1996 to 2010. This analysis is
done looking at two components the total imports values and the corresponding GL index
(suggesting the intra-industry trade). The gist from this table is that the selected top 50 ITA
products had a coverage of 78 percentage in 1996, which got concentrated to 91 percentages
by 2010. This shows an increasing import concentration within India with very low average
GL index value of 0.21. Further the concentration of imports does not support the process of
diffusion of information technology products in the case of India’s imports.
Similarly the share of India's exports were also analysed in this paper, to understand the
impact on exports of India in the long run using SITC Rev.1 classification. The
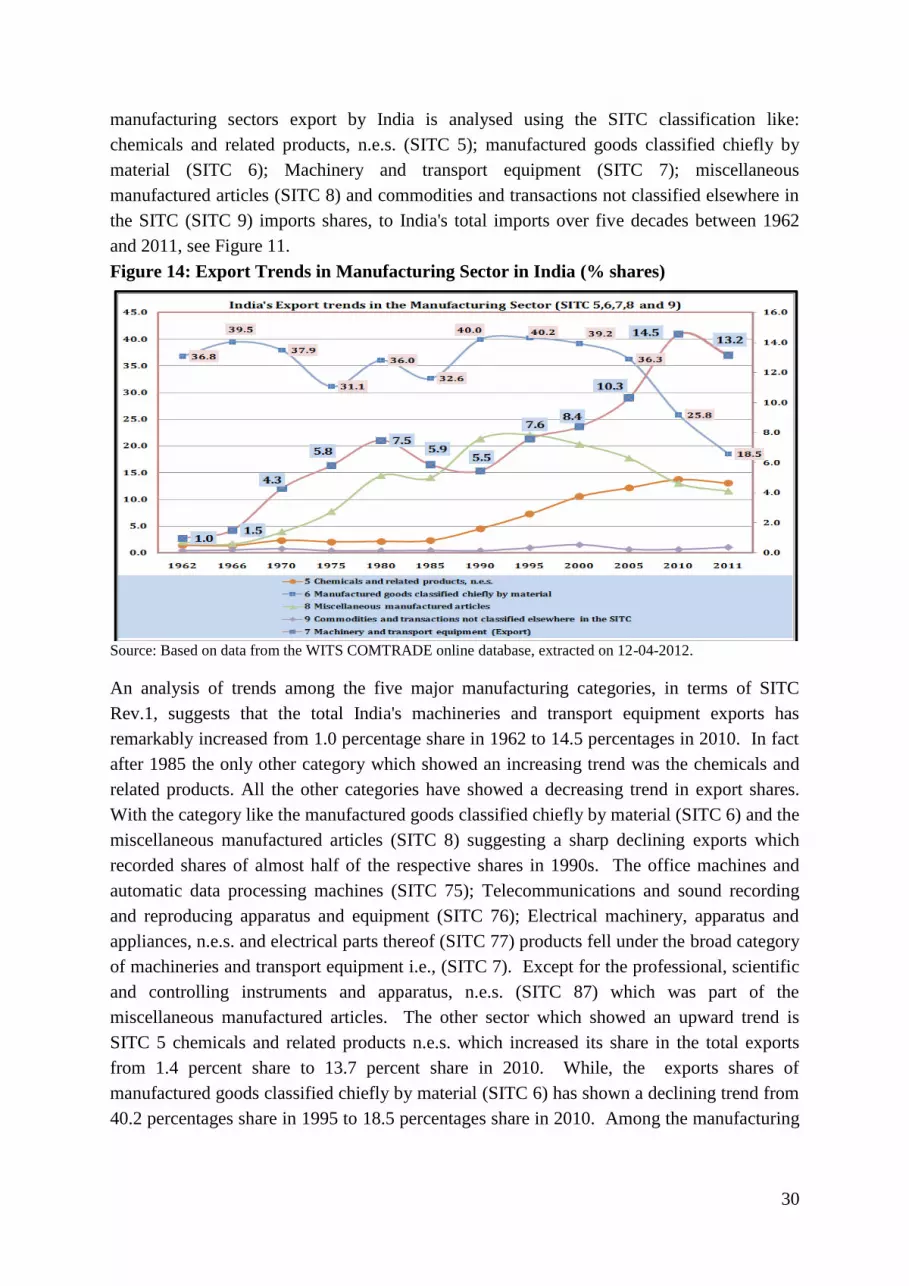
30
manufacturing sectors export by India is analysed using the SITC classification like:
chemicals and related products, n.e.s. (SITC 5); manufactured goods classified chiefly by
material (SITC 6); Machinery and transport equipment (SITC 7); miscellaneous
manufactured articles (SITC 8) and commodities and transactions not classified elsewhere in
the SITC (SITC 9) imports shares, to India's total imports over five decades between 1962
and 2011, see Figure 11.
Figure 14: Export Trends in Manufacturing Sector in India (% shares)
Source: Based on data from the WITS COMTRADE online database, extracted on 12-04-2012.
An analysis of trends among the five major manufacturing categories, in terms of SITC
Rev.1, suggests that the total India's machineries and transport equipment exports has
remarkably increased from 1.0 percentage share in 1962 to 14.5 percentages in 2010. In fact
after 1985 the only other category which showed an increasing trend was the chemicals and
related products. All the other categories have showed a decreasing trend in export shares.
With the category like the manufactured goods classified chiefly by material (SITC 6) and the
miscellaneous manufactured articles (SITC 8) suggesting a sharp declining exports which
recorded shares of almost half of the respective shares in 1990s. The office machines and
automatic data processing machines (SITC 75); Telecommunications and sound recording
and reproducing apparatus and equipment (SITC 76); Electrical machinery, apparatus and
appliances, n.e.s. and electrical parts thereof (SITC 77) products fell under the broad category
of machineries and transport equipment i.e., (SITC 7). Except for the professional, scientific
and controlling instruments and apparatus, n.e.s. (SITC 87) which was part of the
miscellaneous manufactured articles. The other sector which showed an upward trend is
SITC 5 chemicals and related products n.e.s. which increased its share in the total exports
from 1.4 percent share to 13.7 percent share in 2010. While, the exports shares of
manufactured goods classified chiefly by material (SITC 6) has shown a declining trend from
40.2 percentages share in 1995 to 18.5 percentages share in 2010. Among the manufacturing

31
sector in India only two sectors indicated competitiveness and they are the Machinery and
transport equipment (SITC 7) and chemicals and related products n.e.s. (SITC 5).
Table 8: Top Thirty Exports of ITA products to India
Note: Total Exp. 1996 to 2010 includes all 165 ITA-1 products.
Source: WITS and TRADESIFT Software
While in terms of import shares China gained a substantial part in the Indian market, like
wise India also should have had a substantial share of ITA products to Chinese market.
Hence, we should conclude that India and China has limited bilateral trade. However, if this
does not hold true then we are looking at a scenario of imports from China, a substantial
portion of which is being used for domestic consumption as India is not re-exporting these to
the world. Further this is validated by simple CAGR for 14 years of India’s import from the
world was 35.6 percentages (1996 to 2010) when compared to CAGR of India's exports to
world at 16.7 percentages.
Top 9 export destinations of India have seen substantial change over the ITA liberalisation
period. USA ranked first amongst the top export destinations of India, having a share of
about 11.9 percent in 2010 - a sharp drop from the 28 percentage in 1996. It was followed by
Singapore with 4.65 percent shares in 2010 down from 11.04 percent shares. United Arab
Emirates 7.15 percent shares in 2010 up from 2.93 shares in 1996. Germany had 4.90 percent
shares in 2010 up from the shares of 2.41 percentages in 1996. Hong Kong was at the fifth
place with 4.33 percent shares in 2010 while the share in 1996 was 6.52 percentages.
Netherlands showed marginal gains in shares during the period from 3.01 percent in 1996 to
5.49 percent shares in 2010. United Kingdom showed a sharp decline in the share of 16.54
percent in 1996 to 1.94 percent shares in 2010. Malaysia showed a decline to 1.31 percent
share of the total India's export to the world – in 1996 it had 8.43 percent shares. While,
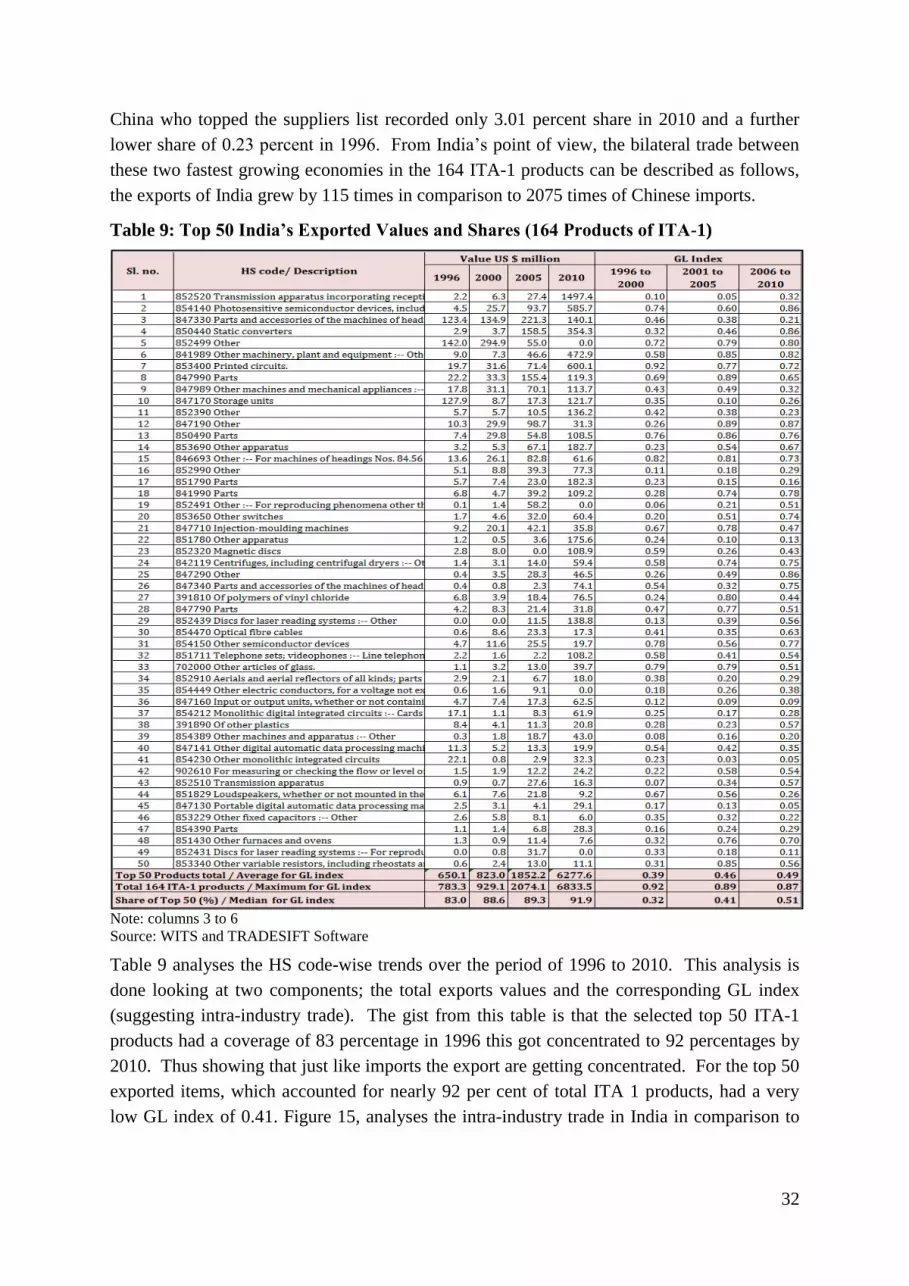
32
China who topped the suppliers list recorded only 3.01 percent share in 2010 and a further
lower share of 0.23 percent in 1996. From India’s point of view, the bilateral trade between
these two fastest growing economies in the 164 ITA-1 products can be described as follows,
the exports of India grew by 115 times in comparison to 2075 times of Chinese imports.
Table 9: Top 50 India’s Exported Values and Shares (164 Products of ITA-1)
Note: columns 3 to 6
Source: WITS and TRADESIFT Software
Table 9 analyses the HS code-wise trends over the period of 1996 to 2010. This analysis is
done looking at two components; the total exports values and the corresponding GL index
(suggesting intra-industry trade). The gist from this table is that the selected top 50 ITA-1
products had a coverage of 83 percentage in 1996 this got concentrated to 92 percentages by
2010. Thus showing that just like imports the export are getting concentrated. For the top 50
exported items, which accounted for nearly 92 per cent of total ITA 1 products, had a very
low GL index of 0.41. Figure 15, analyses the intra-industry trade in India in comparison to
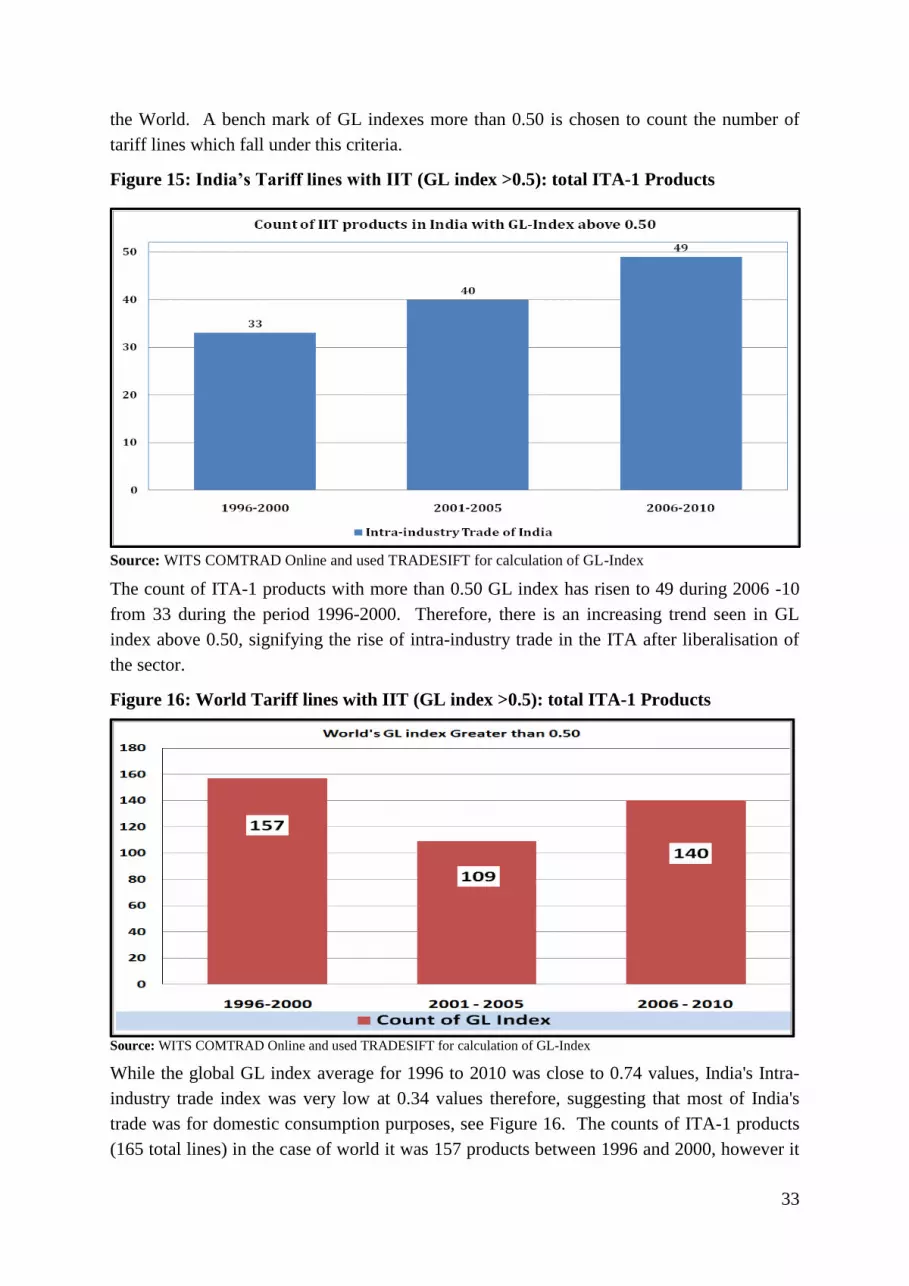
33
the World. A bench mark of GL indexes more than 0.50 is chosen to count the number of
tariff lines which fall under this criteria.
Figure 15: India’s Tariff lines with IIT (GL index >0.5): total ITA-1 Products
Source: WITS COMTRAD Online and used TRADESIFT for calculation of GL-Index
The count of ITA-1 products with more than 0.50 GL index has risen to 49 during 2006 -10
from 33 during the period 1996-2000. Therefore, there is an increasing trend seen in GL
index above 0.50, signifying the rise of intra-industry trade in the ITA after liberalisation of
the sector.
Figure 16: World Tariff lines with IIT (GL index >0.5): total ITA-1 Products
Source: WITS COMTRAD Online and used TRADESIFT for calculation of GL-Index
While the global GL index average for 1996 to 2010 was close to 0.74 values, India's Intra-
industry trade index was very low at 0.34 values therefore, suggesting that most of India's
trade was for domestic consumption purposes, see Figure 16. The counts of ITA-1 products
(165 total lines) in the case of world it was 157 products between 1996 and 2000, however it

34
fell to 109 products only to rise again to 140 products. In comparison to world, India had far
less number of tariff lines with intra-industry trade more than the value of 0.5.
Figure 17: Intra-Industry Trade: Comparison of GL Indices of World and India
Source: Calculated by the Author based on WITS COMTRADE online Database
There is a clear evidence of shifting of a significant portion of ITA trade to China while
ignoring the Eastern Europe, Japan and the United States. Anderson (2010) studied the
significant developments in global ITA trade including, increasing diversification of ITA
members’ trade and economic profiles and expanding trade participation by developing
countries. The emergence of complex global supply chains for IT products, rapid
deployment of new technologies, and technology convergence since the ITA’s inception,
shed new light on the role of the ITA in global trade.
Figure 18: Comparative Exports and Imports of China and India to World:
Source: WITS online database.

35
India's domestic demand is indicated by surge in its imports from the world, if this result has
to be read with the trends in GL indices. Such an interpretation needs to be carried out across
the 165 ITA products and for the top 50 products. It would suggest that Indian has eliminated
the tariff on the one hand but did not have sufficient industrial standards in place to protect
and maintain the national production platforms. This happened because India has not been
grounded with realities of the hardware industry. The distance between the two players
increased also due to ITA-1 implementation as for these, it could not find standards that could
be applied on national treatment basis across 165 ITA products. Hence, it could be said that
there has been clearly a replacement of Indian electronic products with externally imported
products mainly from China, see Figure 18.
6. Scenario of Indian Hardware Sector - Dependence on Imports
The growing importance of global value chains (GVCs) in the international organisation of
production increasingly challenges the traditional way of measuring countries’ export
performance and hence international competitiveness. As a result of growing production
fragmentation, a country’s export bundle nowadays incorporates imports of intermediate
goods representing a (large) part of its value. In this case, simply looking at the evolution of
exports may misrepresent the international competitive position of a country. This paper
discusses the export performance of countries along the value chain by distinguishing
upstream activities (i.e. the production of intermediate inputs) and more downstream
activities (e.g. the final assembly of products). The empirical analysis first shows how
imports of intermediates increasingly determine the export competitiveness of countries in
final products. Second, the paper analyses the developments at the intensive and extensive
margins of trade and studies how structural changes in terms of geographical and sectoral
composition, largely outside the influence of national policies, have contributed to countries’
export performance.
These global value chains creations have been happening at faster pace in the Information
and Technology sector. So the chance of exports and imports increasing because of
crisscrossing of products at various stage of production like: raw, intermediate and final
goods.
Estimation on the Growing Role of Imported Raw Materials in India
In this section, we have used the Centre for Monitoring Indian Economy (CMIE) PROWESS
corporate firm level data. This dataset has total unique coverage of 27,000 corporate firms in
India out of this close-to 5000 are listed companies. It gives a common sample size of 17000
companies that can be obtained with minor data loss for the last five years.
Indian hardware sector has a total of 483 firms belonging to organised/listed companies, of
these, 39 companies had merged status. The total raw material used in the production of the
final good is divided into two parts the imported and indigenous raw materials. While clearly
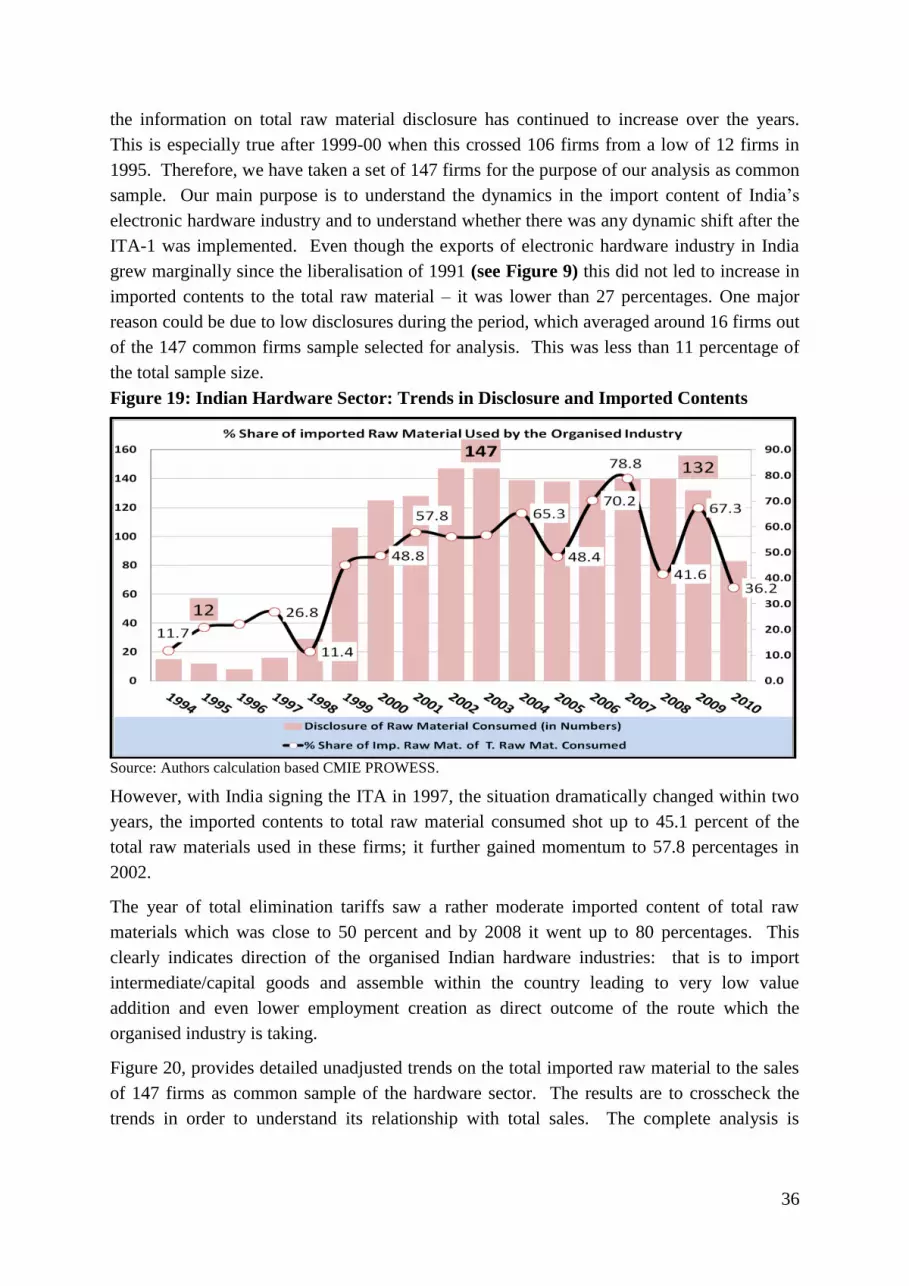
36
the information on total raw material disclosure has continued to increase over the years.
This is especially true after 1999-00 when this crossed 106 firms from a low of 12 firms in
1995. Therefore, we have taken a set of 147 firms for the purpose of our analysis as common
sample. Our main purpose is to understand the dynamics in the import content of India’s
electronic hardware industry and to understand whether there was any dynamic shift after the
ITA-1 was implemented. Even though the exports of electronic hardware industry in India
grew marginally since the liberalisation of 1991 (see Figure 9) this did not led to increase in
imported contents to the total raw material – it was lower than 27 percentages. One major
reason could be due to low disclosures during the period, which averaged around 16 firms out
of the 147 common firms sample selected for analysis. This was less than 11 percentage of
the total sample size.
Figure 19: Indian Hardware Sector: Trends in Disclosure and Imported Contents
Source: Authors calculation based CMIE PROWESS.
However, with India signing the ITA in 1997, the situation dramatically changed within two
years, the imported contents to total raw material consumed shot up to 45.1 percent of the
total raw materials used in these firms; it further gained momentum to 57.8 percentages in
2002.
The year of total elimination tariffs saw a rather moderate imported content of total raw
materials which was close to 50 percent and by 2008 it went up to 80 percentages. This
clearly indicates direction of the organised Indian hardware industries: that is to import
intermediate/capital goods and assemble within the country leading to very low value
addition and even lower employment creation as direct outcome of the route which the
organised industry is taking.
Figure 20, provides detailed unadjusted trends on the total imported raw material to the sales
of 147 firms as common sample of the hardware sector. The results are to crosscheck the
trends in order to understand its relationship with total sales. The complete analysis is

37
undertaken without taking into consideration the impact of exchange rate variations on the
sample firms.
Figure 20: Unadjusted Trends in Imported Raw Material Content to Total Sales
Source: Authors calculation based CMIE PROWESS
This showed that there was a gradual increase in the sales from 1997 to 2005 at an average
increase of 15 percentages annually. When the Tariff was eliminated completely in 2005 the
sales showed an annual average increase of nearly 30 percentages – almost ten percentage
points higher.34
It could be concluded that a complete liberalisation of a portion of the ITA
sector provided a boost to the whole Indian electronic sector.
While the sales increased, so did the raw materials imported to sales percentages. During the
ITA-1 there was spurt in the percentage from around 5 percentages to 20.2 percentages in
2000. The raw material imported to sales percentage was about 18.4 percentages in 2004,
which was the lowest value seen for the rest of the period of analysis. So clearly, while
comparison are drawn on the nature of imported raw materials consumed to the total raw
materials and total sales, the percentage to sale have been lower, see Figures 19 & 20.
We have removed the export which is a portion of total sales in each firm to arrive at
domestic sales and exports. The exports are then deflated using the currency deflator to
arrive at adjusted exports. The adjusted exports when added to the domestic sales would give
the final adjusted sales. A similar exercise is carried out on the total raw material consumed
to arrive at adjusted raw materials. Then we have calculated individual percentages of
deflated imported raw material to adjusted total raw material consumed and deflated imported
raw material to adjusted total sales, see Figure 20.
34
The total sale is inclusive of domestic sale and exports.

38
Figure 21: Adjusted Trends in Imported Raw Material and Total Sales
Source: Authors calculation based CMIE PROWESS
A relatively similar trend is observed in deflated raw material consumed to total adjusted raw
material imported to sales, as seen in Figure 21. However, the trends seen in the case of
imported raw materials to total raw materials in rupees (seen in Figure 16 as line graph) and
the deflated imported raw material to the total adjusted raw material consumed (seen in
Figure 19 in bar graph) are completely different. The difference is primarily due to low rate
of disclosers by the firms operating with an average of 16 in the Indian hardware sector for
the period 1994-05 to 1998-99. Otherwise, the industry average of deflated imported raw
material to adjusted total raw material consumed by the Indian Hardware sector was at 37
percentages, with the exception to the initial few years having an average of 44 percentages.
However, the deflated imported raw material to adjusted total sales, which is represented on
the right hand axis, was very low in the initial years but later it increased in 1999-2000 to
10.1 percentages. This again could be a problem with very low disclosure. The average after
this was around 11 percentages. What can be concluded is that while average imported raw
material to sales have shown an increasing trend, its share in percentages to total adjusted raw
material consumed have remained almost stagnant.
We have used completely independent source to verify our results of increasing import
content in the Indian exports. Using the UN International Standard Industrial Classification
(ISIC) the OECD has calculated the quantum of imported content in the total exports across
all sectors for different sectors. We have used the ITA part in order to understand the results
and put things in perspective in the Indian context. Of the report we have used, only portions
concerning the ITA segments like: (ISIC-C30) Office, accounting and computing machinery;
(ISIC-C31) Electrical machinery and apparatus n.e.s; (ISIC-C32) Radio, television and
communication equipment; (ISIC-C33) Medical, precision and optical instruments are
analysed.
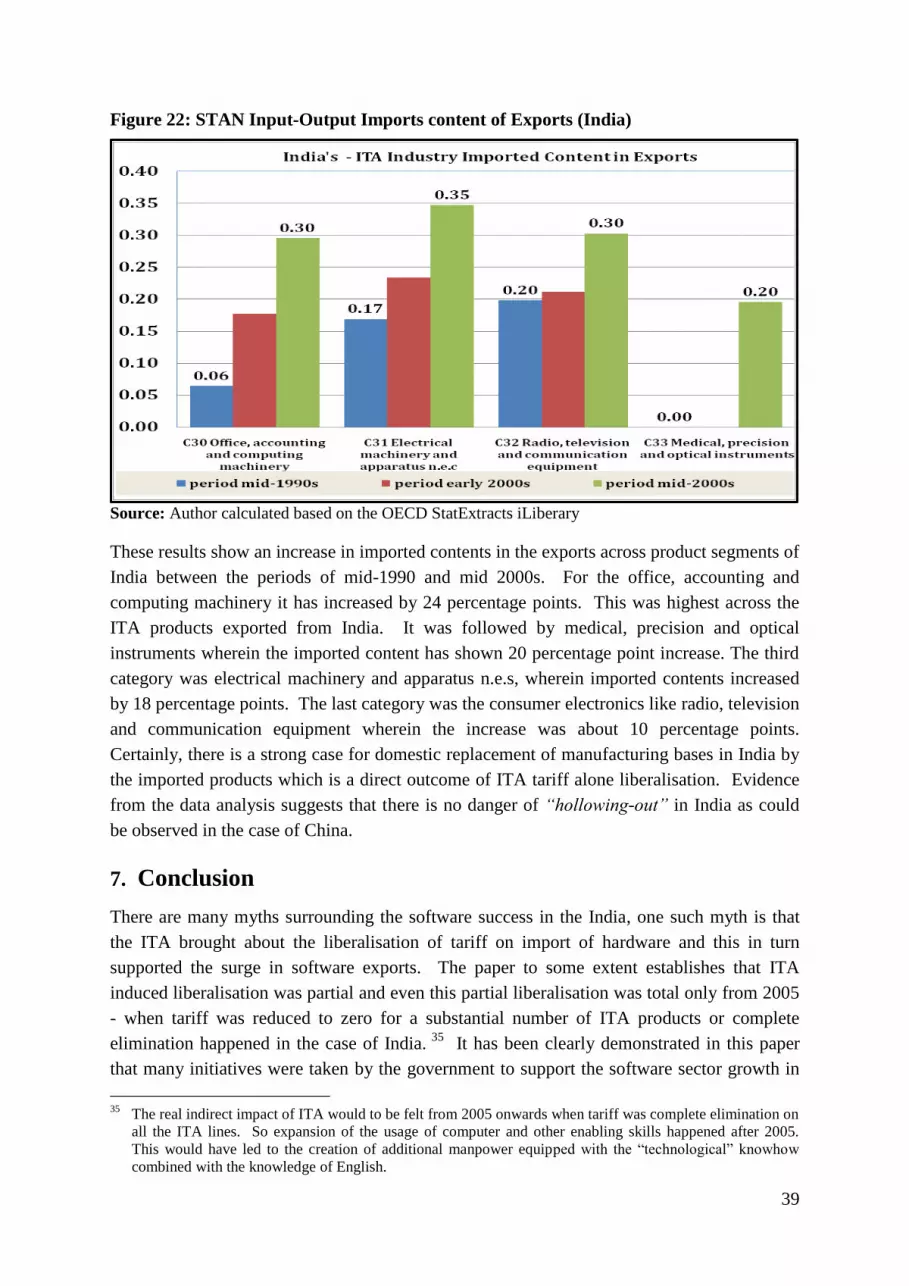
39
Figure 22: STAN Input-Output Imports content of Exports (India)
Source: Author calculated based on the OECD StatExtracts iLiberary
These results show an increase in imported contents in the exports across product segments of
India between the periods of mid-1990 and mid 2000s. For the office, accounting and
computing machinery it has increased by 24 percentage points. This was highest across the
ITA products exported from India. It was followed by medical, precision and optical
instruments wherein the imported content has shown 20 percentage point increase. The third
category was electrical machinery and apparatus n.e.s, wherein imported contents increased
by 18 percentage points. The last category was the consumer electronics like radio, television
and communication equipment wherein the increase was about 10 percentage points.
Certainly, there is a strong case for domestic replacement of manufacturing bases in India by
the imported products which is a direct outcome of ITA tariff alone liberalisation. Evidence
from the data analysis suggests that there is no danger of “hollowing-out” in India as could
be observed in the case of China.
7. Conclusion
There are many myths surrounding the software success in the India, one such myth is that
the ITA brought about the liberalisation of tariff on import of hardware and this in turn
supported the surge in software exports. The paper to some extent establishes that ITA
induced liberalisation was partial and even this partial liberalisation was total only from 2005
- when tariff was reduced to zero for a substantial number of ITA products or complete
elimination happened in the case of India. 35
It has been clearly demonstrated in this paper
that many initiatives were taken by the government to support the software sector growth in
35
The real indirect impact of ITA would to be felt from 2005 onwards when tariff was complete elimination on
all the ITA lines. So expansion of the usage of computer and other enabling skills happened after 2005.
This would have led to the creation of additional manpower equipped with the “technological” knowhow
combined with the knowledge of English.
40
India, much before the ITA-1 was even conceived in 1996 (at the Singapore Ministerial).
Thus it is clear that the Indian government had taken policy initiatives to support the software
sector much before ITA 1 (in 1996) and even before the Uruguay Round (1986-1994).
Therefore, India’s software exports success has no direct links to the ITA-1 (hardware sector)
liberalisation.36
This was further corroborated by growth rates in exports in software services
registering a higher growth during pre-ITA-1 period when compared to post-ITA-1. Besides
this the top 10 performers in the software exports had began operations in India much before
the agreement came into existence. Further, the government also supported and facilitated
the growth of software sectors which began as early as in 1960s. It should be noted that the
Information Technology Parks of today were actually created with the support from the
Government of India in the 1990s. Thereafter, the liberalisation in the 1991, which in fact
was an external liberalisation of the private sector operations, empowered them to unlock
capacity which until then was restricted by the policies of “licence raj”.
The ITA-1 was meant to be an Agreement under the WTO to eliminate tariffs and non-tariff
measures; however, it simply remained another tariff cutting mechanism like all the other
WTO Agreements.37
Its product coverage was also restricted to those products that were in
the interest of developed countries.38
There has been clearly an indication that imports have
surged in India and this has been demonstrated in this paper. India had eliminated its tariffs
as per the ITA commitments in two phases 2000 (96) and 2005 (121) ITA products.
However, on the contrary the trends on yearly basis suggest an ever increasing trend of non
tariff measures.39
It has been observed that the developed countries have put in mandatory
measures like technical regulation/standards/certification, which has led to a “domino
effect” in the developing countries. It was supported well by the increasing role of global
36
It should be noted that for projects equipments were imported at zero or very nominal duties even before
1996 information technology agreement. 37
The NTB work programme, which began at the end of 2000, had three phases. In November 2000, a “Non-
Tariff Measures Work Programme” was launched by the Committee of Participants on the Expansion of
Trade in Information Technology Products (ITA Committee) to identify NTM/Bs and assess their impact on
IT trade. In the 11 submissions to the ITA Committee, the participating countries identified wide-ranging
forms of NTM/Bs. Majority of the identified NTM/Bs fell within the standards and the conformity
assessment area, customs procedures and import licensing were some of the more prominent among the
other forms of NTBs. Following a Canadian proposal, the Committee took up a pilot project for specific
standards-related NTBs regarding conformity assessment procedures for electromagnetic
compatibility/electromagnetic interference (EMC/EMI). The EMC/EMI Pilot Project resulted in a set of
“guidelines” for EMC/EMI conformity assessment procedures, prepared by the ITA Committee. Several
participants in the ITA Committee commented on the likely linkages with the NTM/Bs agenda being
pursued by the Negotiating Group on Market Access (NGMA) (WTO, 2004 and 2005). The key issue in
this regard is the whether or not the approach followed in the EMC/EMI Pilot Project could be extended to
cover other areas. This point assumes importance in view of the fact that, so far, there is no agreement
within the ITA Committee to use the EMC/EMI Pilot Project experience in other areas. There seems to be
some divergence of opinion in this regard, with some participating countries indicating that particular areas
of concern for developing countries could be examined using the template provided by the EMC/EMI Pilot
Project. It may appear that the EMC/EMI experience has limited applicability given that the progress
achieved under ITA with regard to NTMs has not been satisfactory. The long list of unfinished standards
under the ISO and looking at the similar number of other formalized standards that require an understanding
at the multilateral level is testimony to this fact. 38
The initial proponent countries of the ITA were QUAD Countries (USA, Canada, Japan and EU) the few
developing countries proponents in list were Singapore and Hong Kong. 39
Only one project has been initiated in 2001 on the harmonization of EMC/EMI standards.

41
supply chain (GSCs) in this sector and the need to create such enabling conditions in the
developing countries. On the other hand the highest used standard among the developing
countries was the so-called “regulating market and consumer health/safety and quality
standards. The developing countries have been attempting to introduce many such measures,
but due to the consideration of “National Treatment” (NT) principle these standards are
introduced in a much diluted manner.
It has been clearly demonstrated in the paper that the global trading arena for Indian ITA
products was highly imbalanced, especially after 2005 when complete elimination of tariff
was initiated. It was also evident that India has been denied “market access” by many
developed and many other emerging developing countries. The developed countries have
increasingly been using national standards, many of which were introduced even before 2004.
The other aspect is the large product coverage observed in the period coinciding with a large
share of National Measures being notified by developed country signatories of ITA-1. This
can be interpreted based on the Figure 4, which indicates high product coverage at 4 digits
level and Annexure 4, which shows a larger proportion of yearly notifications by the
developed countries falling under the category of National Measures. Therefore, it could be
argued that these countries were busy notifying all their national measures much before any
disciplining came out of the WTO negotiation process under the ITA committee. The issue
of harmonisation at international level was at the lowest level of priority for the developed
signatories of ITA products. One other aspect which came to light in the context of trade was
the increased concentration in both suppliers and importers of India. However, the original
goal of the ITA Agreement was to create competition by increasing trade which has not been
true in the case of India. It is been observed in the case of India that there has been an
increase in concentration rather diversification of suppliers and exporters.
The last and most critical aspect which emerges from this study is the impact on the
employment in the context of a decrease seen in the indigenous content in India’s export of
the ITA sector, thus leading to a reduction in value addition and thereby subsequently leading
to an impact on employment generation capacity of this sector. It has been noticed that
during the period of mid 1990s to the period of mid 2000 the imported content in India’s
export has increased substantially. Our examination of the hardware industry in India
suggests that there is an increasing tendency of manufacturers turning into assemblers of the
same products. Further, this could also have devastating impact on the employment status of
the people employed in the ITA sector, increased casualisation of labour force. The
decreasing value addition in the electronic hardware sector is having an impact on the
employability in this sector in the long run as the IT sector has shown increase in import
dependence. Further, the results of the paper suggest a marked decline in the growth rate of
output in all the product segments wherein tariff got reduced - for both ITA and non-ITA
products. But in case of ITA-1 production where tariff reduction was faster, the rate of
deceleration was also faster. 40
40
Joseph K J. and Vinoj Abraham, 2007, “Information Technology Agreement of WTO and India’s IT
Sector”, Centre for Development Studies, memio.

42
Therefore, the National Manufacturing Policy of 2011 press note stressed the role for having
a strong IT hardware sector as that one of “strategic significance” and in the interest of
national security.41
Initiatives like “Source India” by the industry association like ELCINA
have been introduced too late to have any real impact and it could further be challenged at
the WTO. It was important in the context of building national capabilities to make India a
major force in sectors like aerospace; shipping; telecommunication equipment; defence
equipment; and solar energy. In these industries there is a need for IT products primarily
besides the others sectors. In terms of manpower and machinery usage these are industries
which require high-technological content.
Select Reference
Aghion Philippe, Robin Burgess, Stephen Redding and Fabrizio Zilibotti, 2005, “Entry
Liberalization and Inequality in Industrial Performance”, Journal of the
European Economic Association, volume 3, issue 2-3, pp 291–302, April-
May.
Aghion Philippe, Robin Burgess, Stephen Redding, Fabrizio Zilibotti, 2006, “The Unequal
Effects of Liberalization: Evidence from Dismantling the License Raj in
India”, NBER Working Paper No. 12031, February.
Anderson Michael, 2010, “The Information Technology Agreement (ITA): An Assessment of
World Trade in Information Technology Products”, U.S. International Trade
Commission, January 29.
Arora Ashish and Jai Asundi, 1999, “Quality Certification and the Economics of Contract
Software Development: A Study of the Indian Software Industry”, National
Bureau of Economic Research Working Paper 7260, July,
http://www.nber.org/papers/w7260.
Aroraa Ashish, V.S. Arunachalamb, Jai Asundic and Ronald Fernandes, 2001, “The Indian
software services industry”, Research Policy, Volume 30, Issue 8, October,
Pages 1267–1287.
Beltramello Andrea, Koen De Backer and Laurent Moussiegt, 2012, “The Export
Performance of Countries within Global Value Chains (GVCs)”, OECD
Science, Technology and Industry Working Papers, no. 02.
Bridges Review, 2009, “Trade in Information Technology: Is the ITA Still Relevant?”, News
and Analysis, Volume 13, Number 1, March, International Centre for Trade
and Sustainable Development (ICTSD).
Dhar Biswajit and Murali Kallummal, 2007, “Taming Non-Tariff Barriers: Can WTO find a
Solution?”, Studies on Trade and Investment, Trade and Investment
Division, UN-ESCAP, no. 61, pp.131-180, Bangkok.
Dicken Peter, 1998, Global Shift: Transforming the World Economy, Third Edition, Paul
Chapman Publishers Ltd, London.
Ezell Stephen, 2012, “Boosting Exports, Jobs, and Economic Growth by Expanding the
ITA”, Information Technology Industry Foundation, March 15,
41 Government of India Ministry of Commerce & Industry Department of Industrial Policy & Promotion (Manufacturing
Policy Section), “National Manufacturing Policy 2011”, Press Note no. 2 (2011 SERIES).
43
http://www.itic.org/index.php?src=blog&srctype=blog_detail_techelect&refno
=180&category=TechElect&print=y
Gabriele Alberto, 2004, Exports of Services and Economic Growth in Developing Countries,
United Nations Conference on Trade and Development, Division on
International Goods and Services, and Commodities, 3 June 2004,
http://unctad.org/en/docs/ditctncdmisc20036_en.pdf
Government of India Ministry of Commerce & Industry Department of Industrial Policy &
Promotion (Manufacturing Policy Section), “National Manufacturing Policy
2011”, Press Note no. 2 (2011 SERIES).
Grubel H. G. and Lloyd P. J., 1971, “The Empirical Measurement of Intra-Industry Trade”
Economic Record, vol. 47, Issue 4, pp. 494–517, December.
Illiyan Asheref, 2008, “Performance, Challenges and Opportunities of Indian Software
Export”, Journal of Theoretical and Applied Information Technology,
vol.4, no 11, pp.1088-1106.
Jalava Jukka and Pohjola Matti, 2007, “ICT as a source of output and productivity growth in
Finland”, Telecommunications Policy, Volume 31, Issues 8–9, September–
October 2007, Pages 463–472
Joseph K J. and Vinoj Abraham, 2007, “Information Technology Agreement of WTO and
India’s IT Sector”, draft report (mimeograph), Centre for Development
Studies, draft report (mimeograph).
Kaiser Robert, 2001, “Multi-level Governance and Global Market Liberalization: The
Interdependence of National, European and Multilateral Telecommunications
Policies”, paper prepared for the ECSA’s seventh Biennial International
conference, Wisconsin, May 21- June 2.
http://aei.pitt.edu/2114/1/002243_1.PDF
Kallummal Murali, 2007, "Non-Tariff Barriers in the Doha Round: Is a Solution in
Sight?", Focus WTO, IIFT, New Delhi, May-June 2007.
.............................,2006, "Non-Agricultural Market Access Negotiations: Real Concerns",
Social Scientist, Vol. 34, No. 9-10 September-October 2006.
.............................,2006, "Non-Agricultural Market Access Negotiations: An Analysis of
the Negotiation Dynamics", Focus WTO, IIFT, New Delhi, May-June 2006.
Nagaraj R., 2004, “Fall in Organised Manufacturing Employment: A Brief Note”, Economic
and Political Weekly, vol. 39, no. 30 (Jul. 24-30), pp. 3387-3390.
Planning Commission, 2001, “Report of the Working Group on Information Technology for
the Formulation of the Tenth Five Year Plan”,
http://planningcommission.nic.in/aboutus/committee/wrkgrp/wg_it.pdf.
WTO, 2010, “Report on Implementation and monitoring of 2010”
http://www.wto.org/english/res_e/booksp_e/anrep_e/anrep11_chap3_e.pdf
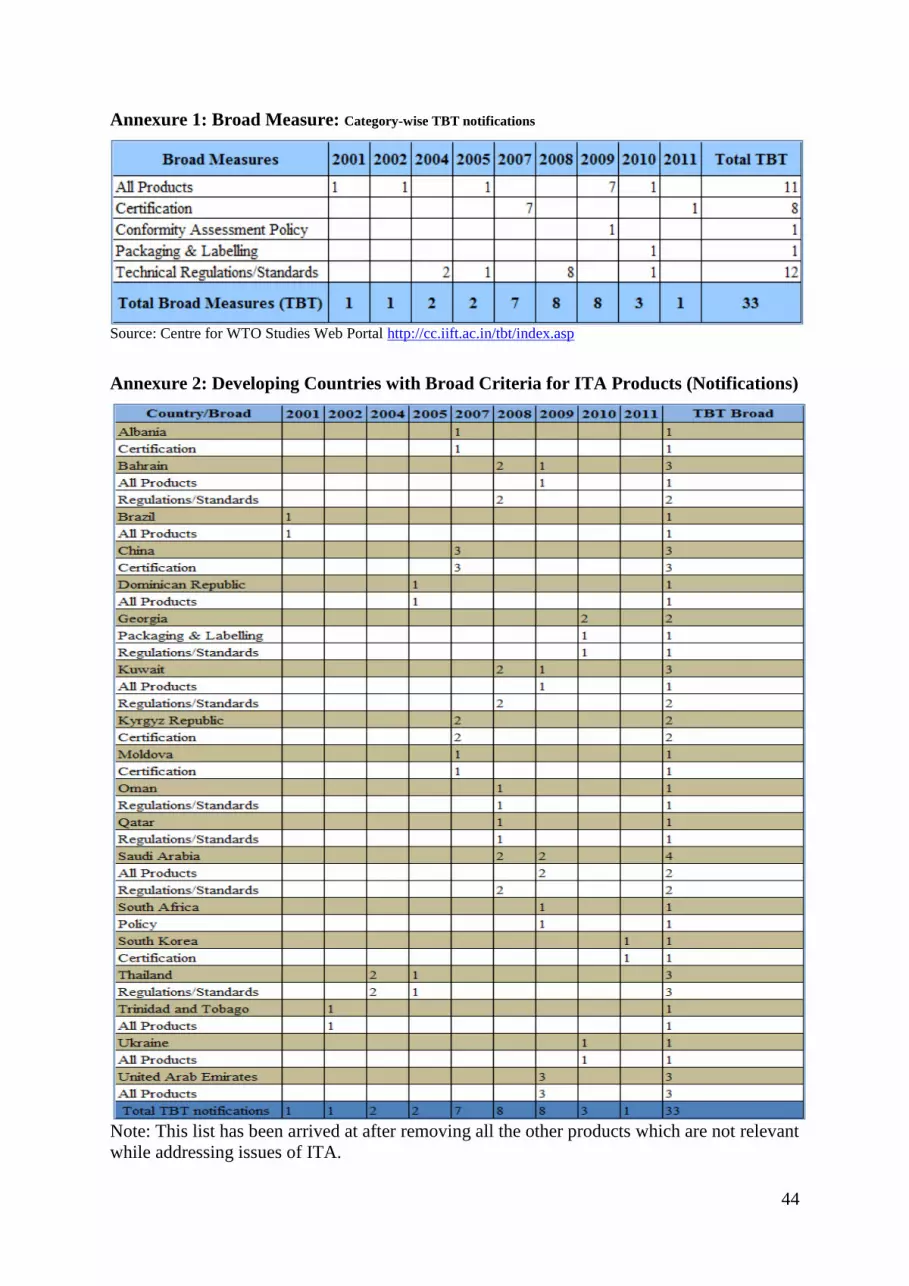
44
Annexure 1: Broad Measure: Category-wise TBT notifications
Source: Centre for WTO Studies Web Portal http://cc.iift.ac.in/tbt/index.asp
Annexure 2: Developing Countries with Broad Criteria for ITA Products (Notifications)
Note: This list has been arrived at after removing all the other products which are not relevant
while addressing issues of ITA.

45
Annexure 3: Total Membership TBT Measures – (yearly notifications & Avg. Cov. per
Notif’s)
Source: Centre for WTO Studies Web Portal http://cc.iift.ac.in/tbt/index.asp
Annexure 4: Detailed Year-wise usage of National Vs International Standards in ITA-1
Products
0
100
200
300
400
500
600
700
800
1995 1996 1997 1998 1999 2000 2001 2002 2003 2004 2005 2006 2007 2008 2009 2010 2011
Developed Vs Developing Members of WTO
National Measures (DGs) National Measures (Ped) International Measures (DGs) International Measures (Ped)
Source: Authors calculations form Centre for WTO Studies Web Portal
http://cc.iift.ac.in/tbt/index.asp