Impact of Genome Reduction on Bacterial Metabolism and Its Regulation
7
DOI: 10.1126/science.1177263 , 1263 (2009); 326 Science et al. Eva Yus, Metabolism and Its Regulation Impact of Genome Reduction on Bacterial www.sciencemag.org (this information is current as of November 27, 2009 ): The following resources related to this article are available online at http://www.sciencemag.org/cgi/content/full/326/5957/1263 version of this article at: including high-resolution figures, can be found in the online Updated information and services, http://www.sciencemag.org/cgi/content/full/326/5957/1263/DC1 can be found at: Supporting Online Material http://www.sciencemag.org/cgi/content/full/326/5957/1263#otherarticles , 16 of which can be accessed for free: cites 34 articles This article http://www.sciencemag.org/cgi/content/full/326/5957/1263#otherarticles 3 articles hosted by HighWire Press; see: cited by This article has been http://www.sciencemag.org/cgi/collection/biochem Biochemistry : subject collections This article appears in the following http://www.sciencemag.org/about/permissions.dtl in whole or in part can be found at: this article permission to reproduce of this article or about obtaining reprints Information about obtaining registered trademark of AAAS. is a Science 2009 by the American Association for the Advancement of Science; all rights reserved. The title Copyright American Association for the Advancement of Science, 1200 New York Avenue NW, Washington, DC 20005. (print ISSN 0036-8075; online ISSN 1095-9203) is published weekly, except the last week in December, by the Science on November 27, 2009 www.sciencemag.org Downloaded from
Transcript of Impact of Genome Reduction on Bacterial Metabolism and Its Regulation

DOI: 10.1126/science.1177263 , 1263 (2009); 326Science
et al.Eva Yus,Metabolism and Its RegulationImpact of Genome Reduction on Bacterial
www.sciencemag.org (this information is current as of November 27, 2009 ):The following resources related to this article are available online at
http://www.sciencemag.org/cgi/content/full/326/5957/1263version of this article at:
including high-resolution figures, can be found in the onlineUpdated information and services,
http://www.sciencemag.org/cgi/content/full/326/5957/1263/DC1 can be found at: Supporting Online Material
http://www.sciencemag.org/cgi/content/full/326/5957/1263#otherarticles, 16 of which can be accessed for free: cites 34 articlesThis article
http://www.sciencemag.org/cgi/content/full/326/5957/1263#otherarticles 3 articles hosted by HighWire Press; see: cited byThis article has been
http://www.sciencemag.org/cgi/collection/biochemBiochemistry
: subject collectionsThis article appears in the following
http://www.sciencemag.org/about/permissions.dtl in whole or in part can be found at: this article
permission to reproduce of this article or about obtaining reprintsInformation about obtaining
registered trademark of AAAS. is aScience2009 by the American Association for the Advancement of Science; all rights reserved. The title
CopyrightAmerican Association for the Advancement of Science, 1200 New York Avenue NW, Washington, DC 20005. (print ISSN 0036-8075; online ISSN 1095-9203) is published weekly, except the last week in December, by theScience
on
Nov
embe
r 27
, 200
9 w
ww
.sci
ence
mag
.org
Dow
nloa
ded
from

Impact of Genome Reductionon Bacterial Metabolismand Its RegulationEva Yus,1 Tobias Maier,1 Konstantinos Michalodimitrakis,1 Vera van Noort,2 Takuji Yamada,2Wei-Hua Chen,2 Judith A. H. Wodke,1 Marc Güell,1 Sira Martínez,1 Ronan Bourgeois,1Sebastian Kühner,2 Emanuele Raineri,1 Ivica Letunic,2 Olga V. Kalinina,2,3 Michaela Rode,2Richard Herrmann,3 Ricardo Gutiérrez-Gallego,4 Robert B. Russell,2 Anne-Claude Gavin,2Peer Bork,2* Luis Serrano1,6
To understand basic principles of bacterial metabolism organization and regulation, but alsothe impact of genome size, we systematically studied one of the smallest bacteria, Mycoplasmapneumoniae. A manually curated metabolic network of 189 reactions catalyzed by 129 enzymesallowed the design of a defined, minimal medium with 19 essential nutrients. More than 1300growth curves were recorded in the presence of various nutrient concentrations. Measurements ofbiomass indicators, metabolites, and 13C-glucose experiments provided information ondirectionality, fluxes, and energetics; integration with transcription profiling enabled the globalanalysis of metabolic regulation. Compared with more complex bacteria, the M. pneumoniaemetabolic network has a more linear topology and contains a higher fraction of multifunctionalenzymes; general features such as metabolite concentrations, cellular energetics, adaptability, andglobal gene expression responses are similar, however.
Accurate representation of cellular net-works through mathematical models is acentral goal of integrative systems biol-
ogy. For this purpose, all components and reac-tions of a target system should be listed andvalidated, and their quantitative relations shouldbe determined and analyzed in the context ofthe physiology of the organism (1). We have se-lected Mycoplasma pneumoniae, a human path-ogen that causes atypical pneumonia (2), as amodel organism for bacterial and archaeal sys-tems biology. Similar to other Mollicutes, M.pneumoniae has undergone a massive genomereduction to include only 689 protein codinggenes, 231 of which have unknown function (tableS1) (3), yet it can be cultivated in vitro withouthelper cells (4). The genome reduction of M.pneumoniae favors its suitability as a systemsbiology model because it largely follows genomesize–scaling principles (fig. S1) (5). We manuallyreconstructed and validated the metabolic networkof M. pneumoniae and studied its regulation,complementing analyses of the transcriptome(6) and the proteome organization (7).
The metabolism of M. pneumoniae has beenstudied biochemically (8) and computationally
(9). We integrated these approaches in a frame-work that maximized coverage and accuracy (10).To build a comprehensive metabolic network,we complemented the reactions from the KyotoEncyclopedia of Genes and Genomes (KEGG;www.genome.jp/kegg) with activities obtainedmanually from the literature and new annota-tions (fig. S2 and tables S1 to S5) (11). We alsoconsidered other genomic (co-occurrence in oneoperon), sequence (homology to known enzymes),and structural information (identification of cat-alytic residues to ensure enzyme functionality)(Fig. 1A and figs. S2 and S3). For example, weidentified an incomplete ascorbate pathwaythrough sequence analyses and filled the gap byassigning a critical enzyme [L-ascorbate-6-phosphatelactonase (mpn497)] on the basis of sequence ho-mology, predicted activity (metal-dependent hy-drolase), and its position in the ascorbate operon(mpn492 to mpn497). For pathways in whichonly one enzyme was missing, we closed the gapby adding an unassigned reaction (for example,transketolase activity in the pentose phosphatepathway). Putative enzymes missing conservedcatalytic residues were discarded (for example,Mpn255 and Mpn673 enzymes of the terpenoidpathway). Lastly, for enzymes that could carry outmore than one reaction, we removed the reactionsthat were decoupled from pathways and those forwhich the substrate was unavailable. The finalresult was a map without gaps, isolated reactions,or open metabolic loops (Fig. 2).
A number of alternative pathways, interac-tions between pathways, as well as missing en-zymes still needed to be validated, and reactiondirectionalities had to be inferred. For this, weused two different experimental strategies. Wefirst used the rich medium (fig. S4) to validatethe pathway functionality in various carbon
sources. As expected from the map (Fig. 2), allknown carbon sources except mannitol supportedgrowth to various extents (figs. S5 and S6) (12).Using 13C-glucose labeling, we validated (for ex-ample) the predicted connection between glycol-ysis, the pentose phosphate pathway, and lipidsynthesis (fig. S3 and table S6), and ruled out theproposed production of aspartate from pyruvate(13). For our second strategy, we developed onthe basis of the metabolic map a defined medium(Fig. 1A and table S7) with which we could val-idate other pathways (such as vitamin metabo-lism) (fig. S10) and reaction directionalities thatcould not be studied in rich medium (such as thesynthesis of uracyl and thymine nucleotides fromcytosine) (figs. S7 and S8). The low number ofamino acid permeases and transporters and theexistence of a peptide importer (oppB-F cluster)(table S1) suggested a requirement for peptidesin the medium, which we confirmed experimen-tally (fig. S9).
We systematically tested the defined mediumin more than 1300 experiments in order to prop-erly assess all the components necessary for sur-vival. We replaced these components with simplerbuilding blocks in order to obtain a defined,minimal medium that contains only 26 compo-nents (19 of which are essential) (Fig. 1A). Thismedium, as predicted from our metabolic mapand comparative analysis, also supports growthof M. genitalium (figs. S11 and S12). On thebasis of these experiments, we estimated theupper flux limits for the use of the variousnutrients (fig. S13). The medium implicitlyvalidates the reconstructed metabolic map (Fig.2), which consists of 189 reactions (table S2):169 are catalyzed by the products of 140 knowngenes, and 20 are not yet assigned to any gene(table S4). The map includes 74 essentialmetabolic genes and 34 conditionally essentialones (depending on medium composition), whichis in agreement with essentiality as determined bymeans of transposon mutagenesis analyses (witha 96% overlap) (fig. S14 and table S8) (14). Atotal of 32 enzymes (25%) are multifunctional;they have more than one activity and togethercatalyze 91 reactions (48% of the total) (tableS3). With respect to previous genome annota-tions (3, 15), we assigned new or refinedfunctions to 57 metabolic genes (plus 30 non-metabolic genes; see the new annotations in tableS1). The above strategy could more generally beused to design media to grow axenically hard-to-culture bacteria, as was done for the recalcitrantTropheryma whipplei (16) and might be appli-cable in the context of increasing metagenomicsefforts.
Analysis of the metabolism ofM. pneumoniaereveals that it is more linear than that of largerbacteria, such as Bacillus subtilis (Fig. 1B). Fur-thermore, M. pneumoniae has a wider metabolicnetwork diameter (shortest biochemical path-way averaged over all pairs of substrates), al-though the diameter has been reported to increasewith the logarithm of the network size (17). The
1Centre for Genomic Regulation (CRG) and Universitat PompeuFabra, Avenida Dr. Aiguader 88, 08003 Barcelona, Spain.2European Molecular Biology Laboratory (EMBL), Meyerhofstrasse1, D-69117 Heidelberg, Germany. 3Institute for InformationTransmission Problems, Russian Academy of Sciences, Moscow127994, Russia. 4Zentrum für Molekulare Biologie Heidelberg(ZMBH), ImNeuenheimer Feld 282, 69120Heidelberg, Germany.5Institut Municipal d’Investigació Médica–Hospital del Mar,Department of Experimental and Health Sciences, UniversitatPompeu Fabra, Avenida Dr. Aiguader 88, 08003 Barcelona,Spain. 6Institució Catalana de Recerca i Estudis Avançats, LluisCompanys 23, Barcelona 08010, Spain.
*To whom correspondence should be addressed. E-mail:[email protected], [email protected]
www.sciencemag.org SCIENCE VOL 326 27 NOVEMBER 2009 1263
REPORTS
on
Nov
embe
r 27
, 200
9 w
ww
.sci
ence
mag
.org
Dow
nloa
ded
from
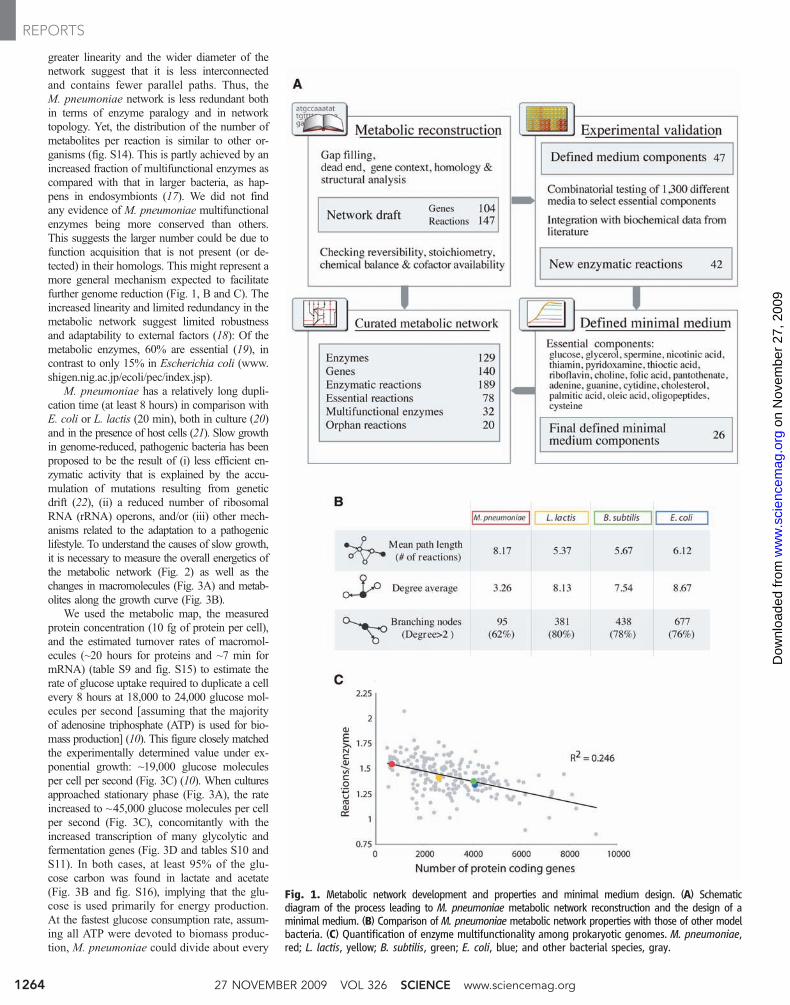
greater linearity and the wider diameter of thenetwork suggest that it is less interconnectedand contains fewer parallel paths. Thus, theM. pneumoniae network is less redundant bothin terms of enzyme paralogy and in networktopology. Yet, the distribution of the number ofmetabolites per reaction is similar to other or-ganisms (fig. S14). This is partly achieved by anincreased fraction of multifunctional enzymes ascompared with that in larger bacteria, as hap-pens in endosymbionts (17). We did not findany evidence of M. pneumoniae multifunctionalenzymes being more conserved than others.This suggests the larger number could be due tofunction acquisition that is not present (or de-tected) in their homologs. This might represent amore general mechanism expected to facilitatefurther genome reduction (Fig. 1, B and C). Theincreased linearity and limited redundancy in themetabolic network suggest limited robustnessand adaptability to external factors (18): Of themetabolic enzymes, 60% are essential (19), incontrast to only 15% in Escherichia coli (www.shigen.nig.ac.jp/ecoli/pec/index.jsp).
M. pneumoniae has a relatively long dupli-cation time (at least 8 hours) in comparison withE. coli or L. lactis (20 min), both in culture (20)and in the presence of host cells (21). Slow growthin genome-reduced, pathogenic bacteria has beenproposed to be the result of (i) less efficient en-zymatic activity that is explained by the accu-mulation of mutations resulting from geneticdrift (22), (ii) a reduced number of ribosomalRNA (rRNA) operons, and/or (iii) other mech-anisms related to the adaptation to a pathogeniclifestyle. To understand the causes of slow growth,it is necessary to measure the overall energetics ofthe metabolic network (Fig. 2) as well as thechanges in macromolecules (Fig. 3A) and metab-olites along the growth curve (Fig. 3B).
We used the metabolic map, the measuredprotein concentration (10 fg of protein per cell),and the estimated turnover rates of macromol-ecules (~20 hours for proteins and ~7 min formRNA) (table S9 and fig. S15) to estimate therate of glucose uptake required to duplicate a cellevery 8 hours at 18,000 to 24,000 glucose mol-ecules per second [assuming that the majorityof adenosine triphosphate (ATP) is used for bio-mass production] (10). This figure closely matchedthe experimentally determined value under ex-ponential growth: ~19,000 glucose moleculesper cell per second (Fig. 3C) (10). When culturesapproached stationary phase (Fig. 3A), the rateincreased to ~45,000 glucose molecules per cellper second (Fig. 3C), concomitantly with theincreased transcription of many glycolytic andfermentation genes (Fig. 3D and tables S10 andS11). In both cases, at least 95% of the glu-cose carbon was found in lactate and acetate(Fig. 3B and fig. S16), implying that the glu-cose is used primarily for energy production.At the fastest glucose consumption rate, assum-ing all ATP were devoted to biomass produc-tion, M. pneumoniae could divide about every
Fig. 1. Metabolic network development and properties and minimal medium design. (A) Schematicdiagram of the process leading to M. pneumoniae metabolic network reconstruction and the design of aminimal medium. (B) Comparison of M. pneumoniae metabolic network properties with those of other modelbacteria. (C) Quantification of enzyme multifunctionality among prokaryotic genomes. M. pneumoniae,red; L. lactis, yellow; B. subtilis, green; E. coli, blue; and other bacterial species, gray.
27 NOVEMBER 2009 VOL 326 SCIENCE www.sciencemag.org1264
REPORTS
on
Nov
embe
r 27
, 200
9 w
ww
.sci
ence
mag
.org
Dow
nloa
ded
from

Fig.
2.Metabolicmap
ofM.p
neum
oniae.
Mainmetabolitesareshow
nas
boxes,andenzymes
andtransporters
areshow
nas
pentagons.Inputmetabolitesareindicatedin
blue,andoutput
productsareindicatedin
red.New
enzymaticactivities
determ
ined
inthisstudyaredisplayedin
yellow,and
enzymes
catalyzing
multip
lereactio
nsarebold.Essentialenzym
es(according
tothe
mutagenesis
studyin
M.genitalium)areindicatedwith
ablacktriangle.Minimal
medium
componentshave
been
shadow
edin
blue.See
thebottom
-right
legend
fordetails,fig.S12
and
tableS2
fordescrip
tionof
theenzymaticreactio
nsandenzymes,a
ndtableS25formetabolite
abbreviatio
ns.aaRS,am
inoacyl-tRN
Asynthase.
www.sciencemag.org SCIENCE VOL 326 27 NOVEMBER 2009 1265
REPORTS
on
Nov
embe
r 27
, 200
9 w
ww
.sci
ence
mag
.org
Dow
nloa
ded
from
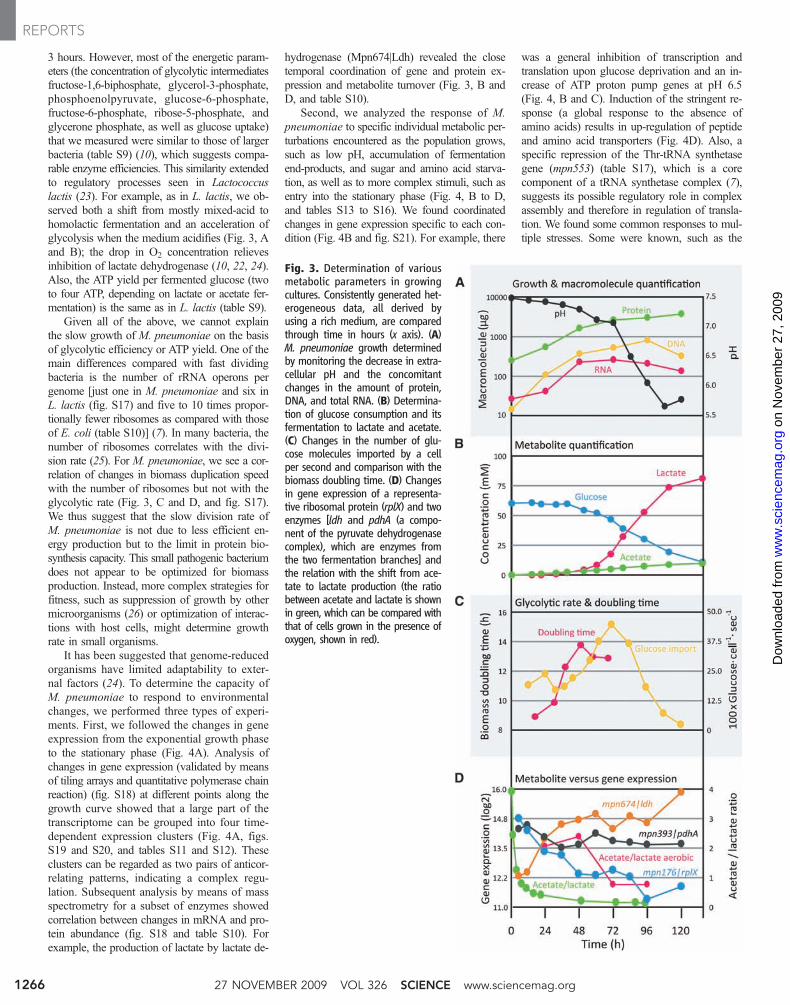
3 hours. However, most of the energetic param-eters (the concentration of glycolytic intermediatesfructose-1,6-biphosphate, glycerol-3-phosphate,phosphoenolpyruvate, glucose-6-phosphate,fructose-6-phosphate, ribose-5-phosphate, andglycerone phosphate, as well as glucose uptake)that we measured were similar to those of largerbacteria (table S9) (10), which suggests compa-rable enzyme efficiencies. This similarity extendedto regulatory processes seen in Lactococcuslactis (23). For example, as in L. lactis, we ob-served both a shift from mostly mixed-acid tohomolactic fermentation and an acceleration ofglycolysis when the medium acidifies (Fig. 3, Aand B); the drop in O2 concentration relievesinhibition of lactate dehydrogenase (10, 22, 24).Also, the ATP yield per fermented glucose (twoto four ATP, depending on lactate or acetate fer-mentation) is the same as in L. lactis (table S9).
Given all of the above, we cannot explainthe slow growth of M. pneumoniae on the basisof glycolytic efficiency or ATP yield. One of themain differences compared with fast dividingbacteria is the number of rRNA operons pergenome [just one in M. pneumoniae and six inL. lactis (fig. S17) and five to 10 times propor-tionally fewer ribosomes as compared with thoseof E. coli (table S10)] (7). In many bacteria, thenumber of ribosomes correlates with the divi-sion rate (25). For M. pneumoniae, we see a cor-relation of changes in biomass duplication speedwith the number of ribosomes but not with theglycolytic rate (Fig. 3, C and D, and fig. S17).We thus suggest that the slow division rate ofM. pneumoniae is not due to less efficient en-ergy production but to the limit in protein bio-synthesis capacity. This small pathogenic bacteriumdoes not appear to be optimized for biomassproduction. Instead, more complex strategies forfitness, such as suppression of growth by othermicroorganisms (26) or optimization of interac-tions with host cells, might determine growthrate in small organisms.
It has been suggested that genome-reducedorganisms have limited adaptability to exter-nal factors (24). To determine the capacity ofM. pneumoniae to respond to environmentalchanges, we performed three types of experi-ments. First, we followed the changes in geneexpression from the exponential growth phaseto the stationary phase (Fig. 4A). Analysis ofchanges in gene expression (validated by meansof tiling arrays and quantitative polymerase chainreaction) (fig. S18) at different points along thegrowth curve showed that a large part of thetranscriptome can be grouped into four time-dependent expression clusters (Fig. 4A, figs.S19 and S20, and tables S11 and S12). Theseclusters can be regarded as two pairs of anticor-relating patterns, indicating a complex regu-lation. Subsequent analysis by means of massspectrometry for a subset of enzymes showedcorrelation between changes in mRNA and pro-tein abundance (fig. S18 and table S10). Forexample, the production of lactate by lactate de-
hydrogenase (Mpn674|Ldh) revealed the closetemporal coordination of gene and protein ex-pression and metabolite turnover (Fig. 3, B andD, and table S10).
Second, we analyzed the response of M.pneumoniae to specific individual metabolic per-turbations encountered as the population grows,such as low pH, accumulation of fermentationend-products, and sugar and amino acid starva-tion, as well as to more complex stimuli, such asentry into the stationary phase (Fig. 4, B to D,and tables S13 to S16). We found coordinatedchanges in gene expression specific to each con-dition (Fig. 4B and fig. S21). For example, there
was a general inhibition of transcription andtranslation upon glucose deprivation and an in-crease of ATP proton pump genes at pH 6.5(Fig. 4, B and C). Induction of the stringent re-sponse (a global response to the absence ofamino acids) results in up-regulation of peptideand amino acid transporters (Fig. 4D). Also, aspecific repression of the Thr-tRNA synthetasegene (mpn553) (table S17), which is a corecomponent of a tRNA synthetase complex (7),suggests its possible regulatory role in complexassembly and therefore in regulation of transla-tion. We found some common responses to mul-tiple stresses. Some were known, such as the
Fig. 3. Determination of variousmetabolic parameters in growingcultures. Consistently generated het-erogeneous data, all derived byusing a rich medium, are comparedthrough time in hours (x axis). (A)M. pneumoniae growth determinedby monitoring the decrease in extra-cellular pH and the concomitantchanges in the amount of protein,DNA, and total RNA. (B) Determina-tion of glucose consumption and itsfermentation to lactate and acetate.(C) Changes in the number of glu-cose molecules imported by a cellper second and comparison with thebiomass doubling time. (D) Changesin gene expression of a representa-tive ribosomal protein (rplX) and twoenzymes [ldh and pdhA (a compo-nent of the pyruvate dehydrogenasecomplex), which are enzymes fromthe two fermentation branches] andthe relation with the shift from ace-tate to lactate production (the ratiobetween acetate and lactate is shownin green, which can be compared withthat of cells grown in the presence ofoxygen, shown in red).
27 NOVEMBER 2009 VOL 326 SCIENCE www.sciencemag.org1266
REPORTS
on
Nov
embe
r 27
, 200
9 w
ww
.sci
ence
mag
.org
Dow
nloa
ded
from

down-regulation of ribosomal proteins or pep-tide importers, which is common to all stresses.Others, like the up-regulation of ldh and glycerol-3-P dehydrogenase (mpn051), were unexpectedand suggest additional functions for these pro-teins during stress (Fig. 4B).
Third, we adapted the cells by means of serialpassage (15 passages) to efficient growth in othercarbon sources (fructose, mannose, and glycerol)(tables S18 to S20). Fructose adaptation re-sulted in overexpression of fruA and fruK (>3log2), and mannose-adapted cells overexpressedthe mannitol importer (>5 log2) (tables S19 andS20). Thus, M. pneumoniae shows surprising
adaptation capability similar to that reportedfor E. coli (27).
The coordinated changes in gene expressionalong the growth curve, the specific responses tomany various metabolic perturbations, and theadaptability of the cells to various carbon sourcesindicate that M. pneumoniae retains some ro-bustness and adaptability despite its extremegenome reduction.
Compared with more complex bacteria,M. pneumoniae lacks the majority of transcrip-tion factors (TFs) regulating metabolic gene fac-tors [such as the catabolite regulation protein(CRP)], major sigma factors, and other regula-
tors (28). Gene assignment on the basis of se-quence analysis (table S1), in some cases validatedthrough copurification with the RNA polymer-ase complex (such as mpn266|spxA) (7), re-vealed four TFs (mpn239|gntR, mpn329|fur, andmpn124|hrcA), the general sigma 70 factor(mpn352|sigA), two putative sigma-like factors(mpn626|sigD and mpn424|ylxM), and a puta-tive DNA-binding protein (mpn241|whiA) (fig.S2 and table S1). Despite this apparently re-duced gene regulatory toolbox, both environ-mental stresses (6) and metabolic insults inducedcomplex, specific transcriptional responses; com-parison with more complex bacteria showed sim-
Fig. 4. Regulation of metabolism. (A) Representative plot of the four maingene co-expression clusters identified along the growth curve, named afterthe main functional classes of the genes involved. (B)(Top) Overlap betweenchanges in gene expression under various stresses: lactate (80 mM bufferedlactate), low pH (pH 6.5), glucose or amino acid starvation (stringent re-sponse), and the entry into stationary phase. (Bottom) Heat map of the genesfound to be commonly up- or down-regulated under stress and growthinhibition. (C) Gene Ontology functional classification of genes significantlyregulated during exponential growth and glucose deprivation in M. pneumo-niae (Mpn) or L. lactis (Lla). The average of the significant changes within eachcategory is depicted. C, energy production and conversion; D, cell division andchromosome partitioning; E, amino acid transport and metabolism; F, nu-cleotide transport and metabolism; G, carbohydrate transport and metabolism;
H, coenzyme metabolism; I, lipid metabolism; J, translation, ribosomal struc-ture, and biogenesis; K, transcription; L, DNA replication, recombination, andrepair; M, cell envelope biogenesis, outer membrane; O, posttranslational mod-ification, protein turnover, and chaperones; P, inorganic ion transport andmetabolism; R, general function; T, signal transduction mechanisms. (D) Strin-gent response expression pattern was compared with that of L. lactis and B.subtilis (Bsu). The average of the significant changes upon stringent responseinduction (with norvaline) is shown. (E) Venn diagrams showing the overlap inM. pneumoniae and L. lactis of ortholog genes under various metabolicconditions. High P value in the case of the stringent response indicates that it isnot statistically significant. (F) (Top) Growth curve of cells growing in minimalmedium plus increasing amounts of glycerol. (Bottom) Glucose titration inHayflick is shown for comparison.
www.sciencemag.org SCIENCE VOL 326 27 NOVEMBER 2009 1267
REPORTS
on
Nov
embe
r 27
, 200
9 w
ww
.sci
ence
mag
.org
Dow
nloa
ded
from

ilarities but also some specific differences inregulation of gene expression (tables S21 to S23).For example, we observed an increase in mRNAand protein expression of glycolytic enzymesconcomitant with the increase of glycolytic rateupon medium acidification (Fig. 3, C and D, fig.S20, and table S15), very similar to what hasbeen described in L. lactis cultures (29). Re-sponse to glucose starvation was also similar tothat of L. lactis (Fig. 4, C and E, and table S21)(30). Part of the stringent response, such as theinduction of peptide and amino acid transportersand down-regulation of carbohydrate catabo-lism (31), was conserved inM. pneumoniae (tableS22); other mechanisms, such as the repressionof ribosomal protein operons or rRNA synthe-sis, were not observed (Fig. 4D and fig. S22).This is in agreement with the proposed involve-ment of the RNA polymerase omega subunit(missing in M. pneumoniae) in sensing guano-sine pentaphosphate/tetraphosphate [(p)ppGpp]and thus arresting rRNA biosynthesis (32).
We believe it unlikely that the conserved re-sponses, and the specific differences in regula-tion, can be caused only by combinations of thefew TFs that regulate operons and suboperons,even if one includes regulation through antisenseRNA (6). The presence of genes for synthesis ordegradation of a number of chemical messengers,such as (p)ppGpp (mpn397|spoT), AppppA(mpn273|hit1), or c-di-AMP (mpn244|disA) (fig.S2 and table S1) (33), implies that signalingmechanisms have been preserved despite ge-nome reduction. For example, overexpression ofthe spoT gene that regulates (p)ppGpp levels(31) results in substantial changes in gene ex-pression, mainly related to the stringent response(table S24). The presence of genes coding for aSer/Thr phosphatase (mpn247|ptc1), two proteinkinases (Ser/Thr/Tyr kinase mpn248|prkC andmpn223|hrpK, an HPr kinase), and the differen-tial phosphorylation of key metabolic enzymesunder various growth conditions (33) suggestposttranslational control. Also, metabolites suchas glycerol regulate gene expression at the baseof the fermentation branches in M. pneumoniae(34) as well as glucose import (35). This explainswhy glycerol is essential in the minimal mediumin a concentration-independent manner (Fig. 4F).
Our results suggest that complex metabolicregulation can be achieved in a streamlined ge-nome despite the absence of the respective TFsprobably because of a combination of transcrip-tional regulators, posttranslational modifications,and small molecules, including chemical mes-sengers and metabolites.
Taken together, our newly established M.pneumoniae resource, containing a manually an-notated metabolic map, full annotations, reactome,consistently measured growth curves, and geneexpression profiles corresponding to an exten-sive list of metabolites, should facilitate integra-tive systems biology studies at a high resolution.Comparison with more complex bacteria revealedsystemic features associated with genome stream-
lining, which should be examined in other smallbacteria. Despite its apparent simplicity, we haveshown that M. pneumoniae shows metabolic re-sponses and adaptation similar to more complexbacteria, providing hints that other, unknownregulatory mechanisms might exist.
References and Notes1. A. M. Feist, B. O. Palsson, Nat. Biotechnol. 26, 659 (2008).2. K. B. Waites, D. F. Talkington, Clin. Microbiol. Rev. 17,
697 (2004).3. T. Dandekar et al., Nucleic Acids Res. 28, 3278 (2000).4. T. Proft, R. Herrmann, Mol. Microbiol. 13, 337 (1994).5. E. van Nimwegen, Trends Genet. 19, 479 (2003).6. M. Güell et al., Science 326, 1268 (2009).7. S. Kühner et al., Science 326, 1235 (2009).8. J. D. Pollack, Trends Microbiol. 5, 413 (1997).9. M. Pachkov, T. Dandekar, J. Korbel, P. Bork, S. Schuster,
Gene 396, 215 (2007).10. Materials and methods are available as supporting
material on Science Online.11. J. D. Pollack, M. V. Williams, R. N. McElhaney, Crit. Rev.
Microbiol. 23, 269 (1997).12. S. Halbedel, C. Hames, J. Stulke, J. Bacteriol. 186, 7936
(2004).13. J. T. Manolukas, M. F. Barile, D. K. Chandler, J. D. Pollack,
J. Gen. Microbiol. 134, 791 (1988).14. C. A. Hutchison et al., Science 286, 2165 (1999).15. R. Himmelreich et al., Nucleic Acids Res. 24, 4420
(1996).16. P. Renesto et al., Lancet 362, 447 (2003).17. E. Zientz, T. Dandekar, R. Gross, Microbiol. Mol. Biol. Rev.
68, 745 (2004).18. L. Z. Pipe, M. J. Grimson, Mol. Biosyst. 4, 192 (2008).19. J. I. Glass et al., Proc. Natl. Acad. Sci. U.S.A. 103, 425
(2006).20. B. M. Hasselbring, J. L. Jordan, R. W. Krause, D. C. Krause,
Proc. Natl. Acad. Sci. U.S.A. 103, 16478 (2006).21. S. F. Dallo, J. B. Baseman, Microb. Pathog. 29, 301 (2000).22. J. B. Smart, T. D. Thomas, Appl. Environ. Microbiol. 53,
533 (1987).23. N. A. Moran, Cell 108, 583 (2002).
24. M. Cocaign-Bousquet, S. Even, N. D. Lindley, P. Loubiere,Appl. Microbiol. Biotechnol. 60, 24 (2002).
25. M. Nomura, J. Bacteriol. 181, 6857 (1999).26. B. Teusink et al., J. Biol. Chem. 281, 40041 (2006).27. E. Oxman, U. Alon, E. Dekel, Evolution 62, 1547
(2008).28. W. Goebel, S. Lory, Curr. Opin. Microbiol. 9, 123
(2006).29. S. Even, N. D. Lindley, M. Cocaign-Bousquet,
Microbiology 149, 1935 (2003).30. S. Even, N. D. Lindley, P. Loubiere, M. Cocaign-Bousquet,
Mol. Microbiol. 45, 1143 (2002).31. K. Potrykus, M. Cashel, Annu. Rev. Microbiol. 62, 35
(2008).32. C. E. Vrentas, T. Gaal, W. Ross, R. H. Ebright, R. L. Gourse,
Genes Dev. 19, 2378 (2005).33. H. C. Su, C. A. Hutchison 3rd, M. C. Giddings, BMC
Microbiol. 7, 63 (2007).34. S. Halbedel et al., J. Mol. Biol. 371, 596 (2007).35. S. Halbedel, C. Hames, J. Stulke, J. Mol. Microbiol.
Biotechnol. 12, 147 (2007).36. The authors thank V. Benes and S. Schmidt of the
Gene Core facility at EMBL (Heidelberg, Germany) forhybridization of samples in custom made arrays;A. Wieslander (Stockholm University, Sweden) for adviceon the lipid requirements for the minimal medium;J. Marcos del Aguila (Pompeu Fabra University, Barcelona,Spain) for conceptual and experimental input on thegas chromatography–mass spectrometry measurements;T. Doerks (EMBL, Heidelberg, Germany) for operon analysisand help in annotation; and J. Leigh-Bell for editorialhelp. L.S. is an Institució Catalana de Recerca i EstudisAvançats professor.
Supporting online Materialwww.sciencemag.org/cgi/content/full/326/5957/1263/DC1Materials and MethodsSOM TextFigures S1 to S22Tables S1 to S25References
3 June 2009; accepted 2 October 200910.1126/science.1177263
Transcriptome Complexity in aGenome-Reduced BacteriumMarc Güell,1 Vera van Noort,2 Eva Yus,1 Wei-Hua Chen,2 Justine Leigh-Bell,1Konstantinos Michalodimitrakis,1 Takuji Yamada,2 Manimozhiyan Arumugam,2Tobias Doerks,2 Sebastian Kühner,2 Michaela Rode,2 Mikita Suyama,2* Sabine Schmidt,2Anne-Claude Gavin,2 Peer Bork,2† Luis Serrano1,3†
To study basic principles of transcriptome organization in bacteria, we analyzed one of the smallestself-replicating organisms, Mycoplasma pneumoniae. We combined strand-specific tiling arrays,complemented by transcriptome sequencing, with more than 252 spotted arrays. We detected117 previously undescribed, mostly noncoding transcripts, 89 of them in antisense configuration toknown genes. We identified 341 operons, of which 139 are polycistronic; almost half of thelatter show decaying expression in a staircase-like manner. Under various conditions, operonscould be divided into 447 smaller transcriptional units, resulting in many alternative transcripts.Frequent antisense transcripts, alternative transcripts, and multiple regulators per gene imply ahighly dynamic transcriptome, more similar to that of eukaryotes than previously thought.
Although large-scale gene expressionstudies have been reported for variousbacteria (1–7), comprehensive strand-
specific data sets are still missing, limiting ourunderstanding of operon structure and regulation.Similarly, the number of classified noncoding
RNAs in bacteria has recently been expanded (8),but a complete and unbiased repertoire is still notavailable. To obtain a blueprint of bacterial tran-scription, we combined the robustness and versa-tility of spotted arrays [62 independent conditionsand 252 array experiments (9)], the superior res-
27 NOVEMBER 2009 VOL 326 SCIENCE www.sciencemag.org1268
REPORTS
on
Nov
embe
r 27
, 200
9 w
ww
.sci
ence
mag
.org
Dow
nloa
ded
from