Impact of a high-level nuclear waste repository on the regional ground-water flow
12
Int. J. Rock Mech. Min. Sci. & Geomech. Abstr. Vol. 17, pp. 253 to 264 Pergamon Press Ltd 1980. Printed in Great Britain The Impact of a High Level Nuclear Waste Repository on the Regional Ground Water Flow A. RUNCHAL* T. MAINIt Of all the alternatives suggested for the disposal of the high level nuclear waste, that of the deep underground burial in geologic formations may prove to be the most attractive. Within the constraints of economy and feasibility, the primary concern in deep underground burial is the selection of a geologic formation that will contain and isolate the wastes so that radioactive nuclides from the waste do not enter the biosphere in amounts that will endanger public health and safety. It is recognized that the primary mechanism for the likely introduction of the radioactive elements into the biosphere is that of ground water transport. It is thus imperative that the effect of nuclear waste disposal repository on ground water flow be fully explored and understood. This paper examines: (1) the problem of defining reliable hydrogeological properties of a rock mass, (2) the prediction of thermally induced ground flow on a regional scale for a crystalline rock formation. It is concluded that in the absence of major geologic discontinuities the deep disposal of radioac- tive waste may be technically feasible. However, the need for further field and theoretical studies is highlighted by the paucity of reliable data and the inadequacies of existing methodologies. INTRODUCTION Deep underground burial of High Level Nuclear Waste (HLW) implies that the HLW repositories will be located below the water table at depths in the range of 300- 1000 Ill (m) below the surface. In a crystalline rock ma,,,, the m,,',sl signilicanl mcch,anisnl for lrtlllt~l~Ol'l of HLW to the biosphere is recognized to be ground water flow (see e.g. [1] and [2]). It has been postulated that with adequate isolation, radionuclide migration from the HLW canisters to the biosphere could be minimized [3]. However, over a long period of time, of the order of tens of thousands of years, the possibility of movement of radionuclides, or the daughter products, from the HLW canisters to the surrounding ground water cannot be ruled out. An excellent dis- cussion of the issure and mechanisms related to radio- nuclide migration is available in de Marsily et al. [4]. The radionuclide migration through ground water movement involves a complex interplay of the follow- ing mechanisms: • Migration by diffusion of the radionuclides from the * Analyticand ComputationalResearch,Inc. 12029CloverAvenue, Los Angeles,CA 90066, U.S.A. t PrincipiaMechanica, Londonand ResearchFellow,Rock Mech- anics Project, Department of Mineral ResourcesEngineering,Imper- ial Collegeof ScienceTechnology, London SW7 2BP, U.K. nuclear waste to the host geologic material, and then to the ground water, Leaching by ground water from the exposed or fis- sured surface of the radioactive waste, Migration by ground water transport, and Retardation of sorption through chemical or ion- exchange interactions with the host geological medium. Migration by diffusion is usually very slow compared to direct leaching and may therefore be neglected for all practical purposes. The mechanisms of leaching, ground water transport, and retardation or sorption thus effectively control the migration of the radionuc- lides to the biosphere. Each of these exerts an influence which could eventually control the potential impact of nuclear waste on the biosphere. If the nuclear waste could be effectively isolated from the host geologic ma- terial and from ground water by impregnable barriers, then no radionuclides will be available for migration. Similarly if the ground water movement was much slower than the half-lives of the radionuclides, then they would decay sufficiently and cease to be a biological hazard. In the same vein, if the radionuclides became chemically bonded or sorbed by the host geologic medium, then none will be able to move with ground water. Since none of these isolation mechanisms or bar- riers can be fully relied upon, it is important to investi- 253
Transcript of Impact of a high-level nuclear waste repository on the regional ground-water flow

Int. J. Rock Mech. Min. Sci. & Geomech. Abstr. Vol. 17, pp. 253 to 264 Pergamon Press Ltd 1980. Printed in Great Britain
The Impact of a High Level Nuclear Waste Repository on the Regional Ground Water Flow A. RUNCHAL* T. MAINIt
Of all the alternatives suggested for the disposal of the high level nuclear waste, that of the deep underground burial in geologic formations may prove to be the most attractive. Within the constraints of economy and feasibility, the primary concern in deep underground burial is the selection of a geologic formation that will contain and isolate the wastes so that radioactive nuclides from the waste do not enter the biosphere in amounts that will endanger public health and safety. It is recognized that the primary mechanism for the likely introduction of the radioactive elements into the biosphere is that of ground water transport. It is thus imperative that the effect of nuclear waste disposal repository on ground water flow be fully explored and understood.
This paper examines: (1) the problem of defining reliable hydrogeological properties of a rock mass, (2) the prediction of thermally induced ground flow on a regional scale for a crystalline rock formation. It is concluded that in the absence of major geologic discontinuities the deep disposal of radioac- tive waste may be technically feasible. However, the need for further field and theoretical studies is highlighted by the paucity of reliable data and the inadequacies of existing methodologies.
INTRODUCTION
Deep underground burial of High Level Nuclear Waste (HLW) implies that the HLW repositories will be located below the water table at depths in the range of 300- 1000 Ill (m) below the surface. In a crystalline rock ma,,,, the m,,',sl signilicanl mcch,anisnl for lrt l l l t~l~Ol'l of HLW to the biosphere is recognized to be ground water flow (see e.g. [1] and [2]). It has been postulated that with adequate isolation, radionuclide migration from the HLW canisters to the biosphere could be minimized [3]. However, over a long period of time, of the order of tens of thousands of years, the possibility of movement of radionuclides, or the daughter products, from the HLW canisters to the surrounding ground water cannot be ruled out. An excellent dis- cussion of the issure and mechanisms related to radio- nuclide migration is available in de Marsily et al. [4].
The radionuclide migration through ground water movement involves a complex interplay of the follow- ing mechanisms:
• Migration by diffusion of the radionuclides from the
* Analytic and Computational Research, Inc. 12029 Clover Avenue, Los Angeles, CA 90066, U.S.A.
t Principia Mechanica, London and Research Fellow, Rock Mech- anics Project, Department of Mineral Resources Engineering, Imper- ial College of Science Technology, London SW7 2BP, U.K.
nuclear waste to the host geologic material, and then to the ground water, Leaching by ground water from the exposed or fis- sured surface of the radioactive waste, Migration by ground water transport, and Retardation of sorption through chemical or ion- exchange interactions with the host geological medium.
Migration by diffusion is usually very slow compared to direct leaching and may therefore be neglected for all practical purposes. The mechanisms of leaching, ground water transport, and retardation or sorption thus effectively control the migration of the radionuc- lides to the biosphere. Each of these exerts an influence which could eventually control the potential impact of nuclear waste on the biosphere. If the nuclear waste could be effectively isolated from the host geologic ma- terial and from ground water by impregnable barriers, then no radionuclides will be available for migration. Similarly if the ground water movement was much slower than the half-lives of the radionuclides, then they would decay sufficiently and cease to be a biological hazard. In the same vein, if the radionuclides became chemically bonded or sorbed by the host geologic medium, then none will be able to move with ground water. Since none of these isolation mechanisms or bar- riers can be fully relied upon, it is important to investi-
253

254 A. Runchal and T. Maini
gate and assess the likelihood of any radionuclide migration and to determine the probability and level of irradiation of usable aquifers and near-surface soils and the resulting inpact on the biosphere.
Most ground water movement under natural gradient is very slow and many sites may be found where the travel time from a potential repository site to the biosphere could be in excess of 105 yr or so pro- vided no major discontinuities exist. However, the con- struction of a repository may in itself change the ground water flow regime by acting as a sink or a source. The sink effect is due to a lower potential when the repository is in contact with the atmosphere through the access shafts and tunnels. The source effect is due to the radioactive decay of the HLW which results in generation of a considerable amount of heat; so much that the heat flux generated can be hundreds of times greater than the natural geothermal heat flux for the host geologic formation [-5]. As a result of this heat and the consequent temperature increase, the natural equilibrium may be altered in a number of ways. Among these, changes may occur in:
• The chemical reactivity between the moving ground water and the host rock,
• The physical properties of the geologic formations; • The rock stresses, leading to an altered matrix of
pores, cracks, and fissures in the repository rock, and finally,
• The ground water flow paths and patterns, the physi- cal properties of the ground water, and the radionuc- lide migration mechanisms.
It is thus imperative that the effect of the repository and the resulting thermal loading on the host geologic formation, the ground water movement and the radio- nuclide migration be extensively explored and assessed. The complex interactions of the various components involved in determining the impact of a HLW reposit- ory are shown schematically in Fig. 1. The present paper focuses only on the issue of the ground water flow as affected by the HLW emplacement.
It should be noted here that the purpose of this study was not the analysis of any specific rock formation but rather an elucidation of the (jeneral impact (~[ a H L W repository on the regional flow pattern. To this extent, emphasis is to be placed on the qualitative features of the results and on the comparative aspects brought out by parametric studies.
Although the underlying issues and principles are generally applicable to all rock types, the discussion here is centred, for purposes of illustration, on a hypo- thetical granite formation. The generic and background information related to the hydrogeological and rock properties and the issue of an adequate methodology for the analysis of ground water flow in rock forma- tions are also explored in some detail. Fuller details of pertinent studies are given in [5] and [6].
THE METHODOLOGY
The porous vs fractured media approach
Two basically different methods of predicting regio- nal ground water flow exist: the continuum or equival- ent porous medium approach and the discontinuum or distinct element fractured medium approach. The former postulates a continuous system of distributed pores or voids in the host matrix of soil and rock while the latter postulates a system of discrete fractures and fissures in the host medium.
In most crystalline rock, though some ground water flow may occur through the intact rock mass, in gen- eral, the bulk of the flow occurs through cracks, fissures and joints which are created by geological stresses [7]. For laminar flow in a single set of parallel fractures the permeability of an equivalent porous medium is related to the fissure opening by:
ye 3
where K = permeability of porous medium (m/sec),
I ' I • I J C o n v e c t i o n I ] Properties Propert,es ] I . , ,I j ~ u l . m , - - b ,
Fig. l. Interacting components for ground water flow in crystaline rock with temperature gradients.
Nuclear Waste Repository
g = acceleration due to gravity (m/sec2), e = fracture opening or aperture (m), v = kinematic viscosity at ambient temperature
and pressure (m2/sec), and A = fracture spacing (m)
The above equivalence holds provided the correct scal- ing laws are observed; i.e., there are a large number of fractures in a representative volume [8]. However, in many problems in crystalline rock this is not always the case and ground water flow is controlled primarily by a few fractures. The significance of this is discussed in detail by Maini & Hocking [9] who show, for example, that under a given gradient the amount of flow in 100 m thickness of porous medium of permeability 10 -7 m/see could be carried in a single fracture of an average aperture of 0.0002 m. Similarly, the difference in flow velocities of a fluid particle in fractured rock compared to an equivalent porous medium is extremely important. The flow velocities for the porous and frac- tured media are related by the following equation:
Vf - VpaA (2) e
where
Vf = velocity in fracture (m/see), Vp = velocity in porous media (m/see), and a = effective porosity with respect to flow through
porous medium
For example, for a porous medium of permeability 10 -8 m/see and an effective flow porosity of 0.15, the aperture of the single fissure will be 2 × 10⁻⁵ m using the above equations. Hence, the flow velocity in the fissured medium is 9400 times greater than that in the equivalent porous medium if the effective fracture poro- sity is computed on 80% of the fissure aperture. It is thus evident that the correct choice of an approach would have a serious impact on computing transport times of radionuclides to the biosphere.
Ideally, the fractured medium approach is theoreti- cally very attractive from the point of view of incorpor- ating the maximum amount of information. However, enormous practical difficulties are encountered in applying such a method. A complete analysis would therefore necessitate the specification of site-specific data on fracture spacing, orientation, aperture, and continuity [10]. At present such information is scarce and very difficult to obtain. The best alternative, there- fore, at this time (especially for parametric or sensitivity studies), is to use an equivalent approach for the bulk of the domain under study. Major features such as
and Ground Water Flow 255
faults or large joint sets should be superimposed wher- ever possible. In so doing, great care in terms of scale effects should be taken to use field measurements of permeability and porosity.
It should be pointed out that an equivalent con- tinuum approach has been widely employed for analy- sis of rock mass flow [3, 11]. Some experimental verifi- cation and limitations of such an approach have been discussed, among others, by Maini & Hocking [9].
It should be mentioned that, for the problem of con- cern here, that of HLW disposal, the scale of concern is typically a few miles in horizontal direction and a few thousand feet in depth. Thus, unless large-scale frac- tures occur, the comparatively small-scale (compared to the overall region of concern) fractures are reasonably well approximated by the above approach.
The mathematical and numerical basis
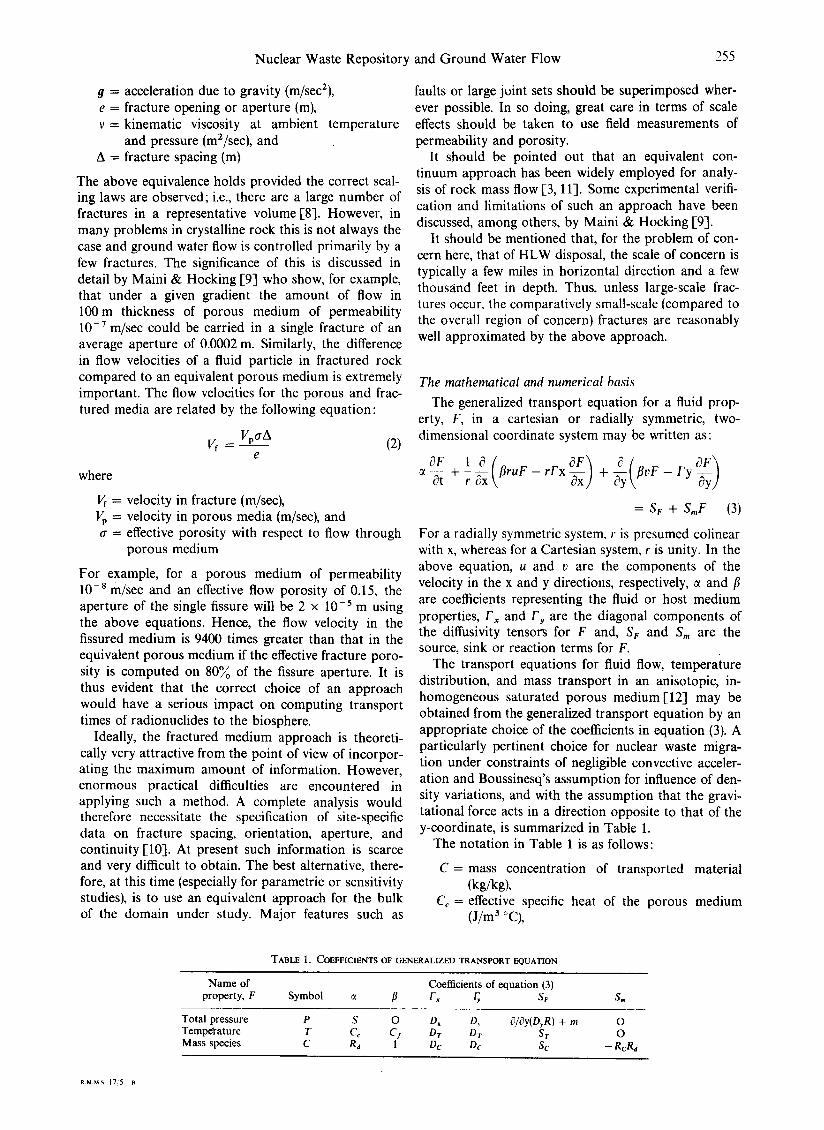
The generalized transport equation for a fluid prop- erty, F, in a cartesian or radially symmetric, two- dimensional coordinate system may be written as:
OF 1_ OF ? a ~t + r cx \f lruF - rFx ~x + flvF - Fy
= Sv + SmF (3)
For a radially symmetric system, r is presumed colinear with x, whereas for a Cartesian system, r is unity. In the above equation, u and v are the components of the velocity in the x and y directions, respectively, ~ and fl are coefficients representing the fluid or host medium properties, Fx and Fy a r e the diagonal components of the diffusivity tensors for F and, SF and Sm are the source, sink or reaction terms for F.
The transport equations for fluid flow, temperature distribution, and mass transport in an anisotopic, in- homogeneous saturated porous medium [12] may be obtained from the generalized transport equation by an appropriate choice of the coefficients in equation (3). A particularly pertinent choice for nuclear waste migra- tion under constraints of negligible convective acceler- ation and Boussinesq's assumption for influence of den- sity variations, and with the assumption that the gravi- tational force acts in a direction opposite to that of the y-coordinate, is summarized in Table 1.
The notation in Table 1 is as follows:
C = mass concentration of transported material (kg/kg),
Cc = effective specific heat of the porous medium (J/m 3 °C),
TABLE 1. COEFFICIENTS OF GENERALIZED TRANSPORT EQUATION
Name of Coefficients of equation (3) property, F Symbol c¢ fl Fx Fr Sv Sm
Total pressure P S 0 Dx D r d/dy(DyR) + m 0 Temperature T Cc C f Dr Dr Sr 0 Mass species C Rd l Dc Dc Sc - RcRn
R.M.M.S. 17:5 B

256 A. Runchal and T. Maini
C f =
O C
D r =
Dx = Dy =
m =
p
R =
a c ----
a d S =
S C =
S T =
T =
specific heat of the fluid per unit volume (J/m 3 °C), mass diffusivity (mZ/sec), thermal conductivity (W/m °C), hydraulic conductivity in x-direction (m/sec), hydraulic conductivity in y-direction (m/sec). volumetric flow injection rate per unit volume (sec- 1), total pressure (m), noiidiraensional density deficit parameter, radioactive decay or rate of reaction constant (sec- 1), nondimensional retardation coefficient, specific storativity (m- 1), mass input rate (s-1), thermal input rate (W/m3), and temperature (°C).
Some auxiliary relations for the quantities appearing in Table 1 are as follows:
P = P/(PoO) + (Y + Yo) Dx = kx Po O/I ~ Oy = ky PoO/] 1
R = P / P o - 1 (4)
where 0 is the coefficient of gravitational acceleration, kx and ky are the intrinsic permeability components of the porous medium, p is the thermodynamic pressure of the fluid,/~ and p are, respectively, the molecular visco- sity and density of the fluid and the subscript o denotes a reference value.
The velocity components u and v are related to the total pressure P by:
u = -D~OP/Ox, v = - D y ( R + OP/@) (5)
The fluid particle velocity is given by:
U = u/a, V = v/a, (6)
where ~ is the effective porosity of the porous medium. These porous media flow equations were incorpor-
ated in a computer model called GWTHERM to sig- nify Ground Water flow with THERMal gradients. The method of solution adopted was the well established Alternating Direction Implicit technique [14] with Inte- grated Finite Differences. The complete details and the assumptions inherent in the derivation of these equa- tions, the discretisation process and the validation studies are provided by Runchal et al. 1-13].
The water propert ies
For the applications of concern, the water properties, the density p and the viscosity #, are considered to be primary functions of temperature alone. In general, the effects of temperature and pressure should both be accounted for. However, typically the variations of p and # are musch stronger functions of temperature than that of pressure.
A recommended relation for extrapolation of water density p, from a known value Po at a temperature To, to a temperature T below the critical temperature T~ is
given by Perry & Chilton [15] as:
P = Po [(To - T)/T~ - To)] A. (7)
For the range of concern the best fit to the calculated values with the tabulated values was obtained with A equal to 0.20. The critical temperature for water is 647.3 K.
The effect of temperature on the viscosity of a liquid may be correlated with the de Guzman-Andrade equa- tion [15] by:
Po/# = exp (B/To - B /T) , (8)
where B is an empirical constant and Tis the tempera- ture in absolute units. For the range of concern the value of B equal to 1436 K was selected to provide a good agreement with the available data.
The hydro9eologic propert ies
Hydrogeologic properties in porous media such as the permeability tensor, porosity, storage coefficient, etc. and thermo-mechanical properties such as the ther- mal conductivity and specific heat are relatively well explored and their use has been made with a high degree of success in modeling regional ground water systems [16]. Additionally, reasonable success has been achieved with the modeling of geothermal systems [16], where thermally induced flows have been examined. However, for crystalline rock or fractured media, the need for adequate description of hydrogeological properties is highlighted by paucity of the reliable field data and inadequacies of existing methodolo- gies [1, 17]. To a large extent, actual studies in frac- tured media have relied on the formulation of equival- ent porous media properties in describing the hydro- geologic systems. Very few, if any, of these studies have been concerned with validating ground water transport methodologies in crystalline rocks. Such studies usually predict the changes in the potentiometric surface due to some sort of an artificial perturbation, be it withdrawal from a system of wells or the changes in other bound- ary conditions. The majority of the modeling studies are concerned with either the water or oil which resides in the porous matrix. The estimation of porosity in such cases does not pose as serious a problem as it does if the flow is restricted to irregular fractures.
Not surprisingly, therefore, very little data exists that is either collected under uniform conditions or can be used for predictive analysis such as those required for the HLW program. For example, Table 2, adapted from Maini & Hocking [9], shows the wide variations in equivalent porous medium hydraulic conductivity for a variety of crystalline rocks. Similarly, the variation of permeability with depth, illustrated in Fig. 2 as adapted from Snow [18], is large. Porosity, which is a key parameter in estimating transport times to the bio- sphere, has a vast variation due to the degree of fractur- ation which in crystalline rock becomes irregular, sparse, and equal in scale to the problem being investi- gated [8]. Predictions of ground water vary by up to three or four orders of magnitude [19] depending on

Nuclear Waste Repository and Ground Water Flow , . 7
0
100
1 I
10 -
I 10-8
I I I I I 1
V /
Vl v/° /00
=/°
I v/
10-7
V
° / o /
, ? O
v /
O
O
O UPPER CRYSTAL
• TWO FORKS DAblSITE
O MORROW POINT DAMSITE
BLUE MESA DAblSITE GRANITE GNEISS
i l I I I
10 -6 10 -5 10 -4 10 -3 1 PERMEABILITY K( m / s e c )
Fig. 2. Semi-log fit for permeability data from four sites in crystaline rock.
the value of porosity that is used. Similarly if the use of a fracture permeability concept is used, stress and tem- perature changes can have an enormous impact (because the relationship between the average aperture of a fracture and permeability, as shown in equation (3) is a highly nonlinear one).
The assumed stratigraphic sequence and the hydro- geologic properties employed for the present study are shown in Fig. 3. The values selected do not represent the extremes of the field measurements reported so far;
rather, keeping in mind the generic nature of the study, these values were selected to be representative of the range quoted in the literature elsewhere [5].
LONG-TERM REGIONAL G R O U N D W A T E R F L O W
Definition of study The ground water flow associated with the develop-
ment, operation and post-operational isolation of an
TABLE 2. EQUIVALENT HYDRAULIC CONDUCTIVITY OF CRYSTALLINE ROCKS DETERMINED BY IN-SITU TESTS
Rock Location K m/sec Remarks
- - 10 -8 10 -4 From Well Yields within 100m of surface
2.0 x 10⁻¹¹-5.0 × 10 -7 Typical range
Igneous Rock
Basalt Basalt
Basalt
Vesicular to Dense Basalt
Vesicular Basalt
Basalt
Basalt Granite
Oakflat Dam, California Hrazdan River, Yeravan, Armenian S.S.R. Sulky Site, Nevada N.T.S.
Sulky Site, Nevada N.T.S.
Sanke River, Idaho Oahu, Hawaii Sweden
4.0 × 10- 7
3.0 x 10⁻⁷-5.0 × 10 -5
3.0 x 10 -5
5.6 + 10 -5
1.0 x 10 -3
1.0 × 10 -3 3.0 x 10 -3 1.0 × 10 lo 3.0 x 10 -5
Varies with a degree of folding and crushing
From pack tests in holes penetrating full depth of basalt stratum Computed from packer test results from upper 20 m of basalt stratum only
100 m to 300 m thick strata Most tests conducted at depths of 50 m - - m i n permeability measured at depth of 275 m

258 A. Runchal and T. Maini
Depth, m
"-W:"
454.
1544 . . . . .
2180 12
W A T E R T A B L E SLOPE = 1 IN 1000
Ground surface f
Weathered granite K = 5 x 10 -6 m/s, a = 10 -3
Partially weathered granite K = 5 x 10 -8 m/s, ~r = 1 0 - 4
Repository 600 m depth
Unweathered granite K = 5 x 10 - I ° m/s, o = 10 -4
9 3 0 3 6 9 12
Lower model boundary considered impermeable K = 5 x 10 -II m/s, ~ = 10 - 4
I I I I I I
6
o
Distance, thousands of meters
Fig. 3. Gener ic grani te s t ra t ig raphic sec t ion in its regional sett ing.
HLW repository may be broken down into the follow- ing components:
• the natural ground water flow rates and movements prior to the construction of the repository;
• the ground water flow rates into the vertical shafts used for access to the repository during the construc- tion phase;
• the ground water flow rates into the repository dur- ing the useful lifetime of the repository which is esti- mated to be on the order of 100 yr; and
• the long-term regional ground water flow rates and patterns as affected by the repository heat load after the decommissioning and sealing of the repository.
In this paper, major emphasis is placed upon the long term thermally induced regional ground water flow. A mathematical model, described in the previous section, has been used to assess the long-term regional ground water flow patterns resulting from the HLW emplacement in a repository.
Regional hydrogeologic setting
The main purpose of our study was the generic and qualitative evaluation of the impact of an HLW repository and not that of any specific repository and rock formation. The stratigraphy selected for this evalu- ation is shown on Fig. 3. In this study, the granitic terrain is assumed to have a very low topographic relief. The granite is considered to be really extensive and of great depth relative to the scale of the reposit- ory. The plane of the stratigraphic section is aligned parallel to the long axis of the repository which is taken to be 3028 m long. The width of the repository, in a plane perpendicular to that shown on Fig. 3, is assumed to be 2422 m. The granite is divided into layers consist- ing of weathered, partially weathered, and unweathered granite.
Rainfall and evaporation patterns in the area are such that there is no significant direct rainfall recharge through the soil horizon to the water table. The water table is recharged in a distinct zone outside the area under consideration. This could be in the form of mountain front recharge, recharge naturally through
ephemeral stream channels, or recharge through a ver- tical fault or the bottom of a lake or swamp. Ground water discharge from the granite is in a distinct zone opposite from the zone of recharge and outside the area under consideration. The discharge could be to a river, vertical fault, lake, or swamp.
Natural ground water flow in the area of the generic site is primarily horizontal and parallel to the general slope of the land surface. There is no significant natural vertical ground water movement in the section being modeled. Vertical movements resulting from ground water recharge and discharge occur outside the strati- graphic section. The ground water is asumed to occur in the phreatic or water table state. The basic hydraulic gradient used was 0.001. This results in a dominant horizontal flow with a very small vertical componenL This is in keeping with the low topographic relief and gently sloping terrain specified for the generic area. In a sensitivity analysis hydraulic gradients of 0 and 0.005 were also used.
Figure 4 shows a cross section of the area being modeled and a set of streamlines depicting the flow caused by the regional hydraulic gradient. The stream- lines are lines of constant stream function and provide a measure of both the direction and the amount of flow.
The fluid particle, or approach velocities in the generic model range from 157 m per yr in the upper- most zone to 0.15 m per yr in the lowermost zone. It should be emphasized that the effective porosity in frac- tured granite is highly variable in nature even among rocks having the same effective fracture permeability. Thus, for two rocks having the same permeability but different fracture spacings, one rock section can have all of its permeability in one fracture zone while the other has its permeability distributed among many small features. In this case the rock with the single large frac- ture will have the lower effective porosity and the higher approach velocity for a given hydraylic gradient.
The baseline simulations of ground water flow
The purpose of these simulations was to obtain a general impression of the ground water flow patterns

Nuclear Waste Repository and Ground Water Flow 259
¢= 10 t -
O m ¢D
.¢: O O ne
9.17
0.46
0.092
0.009
0.005
R e p o s i t o r y ' t ::~
m 10 ~=~5 ® o ~
i5 ~'-
- 20 i I i ! i
- 90 - 60 - 3 0 0 30 60 90
Dis tance f rom repos i to ry center, hundreds of meters
Fig. 4. Stream function contours for national ground water flow in generic granite formation.
and flow rates with the passage of time subsequent to repository decommissioning. It is assumed that sub- sequent to decommissioning, the repository is sealed and backfilled and returned to a saturated state. The modeling analysis and all the time periods mentioned are thus subsequent to resaturation.
Because of a number of reasons related to the avail- ability of physical and hydrogeological data, the math- ematical model was operated in its quasi-steady-state form in a manner analogous to a sequence of still frames of a motion picture. Each simulation repre- sented a steady-state ltow pattern at a particular instant of time. Because the grot.nd temperatures are gradually changing with time, the system is never in a truly steady state in the strictest analytical sense. However, because of the long time periods involved, the long-term changes in the ground water flow patterns can be per- ceived as a succession of steady-state simulations. The thermal loading for these simulations was taken to be 24.7 W/m 2 uniformly distributed over the repository floor area.
Though the simulations extended to 12,000m (40,000 ft) on either side of the repository center, the results are shown extending to only 9084 m (30,000 ft) in either direction. The flow outside this region was seen to be little influenced and was omitted so as to present a clearer picture of the zone of maximum influence.
Plots of the resulting streamline patterns for the various simulations are given in Figs 5-8. The stream- lines are lines for equal stream function and are identi- cal with the flow or path lines for a steady flow. The stream function value is representative of the volu- metric flow from an arbitrary datum. The datum of zero flow for these simulations was chosen to be the lower boundary of the finite-difference grid shown on Fig. 3. A value of 9.17, for example, implies a volu- metric flow of 9.17m 3 per yr per m width of the repository between the lower boundary and the stream- line in question. It is also implied that, on balance, no flow crosses a given streamline.
It should be mentioned here that this method of pre- senting the results was chosen after considerable experi- mentation as being the most suited for the present study. Firstly, the streamlines provide information both about the direction of flow and the amount of flow. Secondly, the other two methods considered, namely the velocity vectors and total head contours, suffered from severe drawbacks. The velocity vectors over the stratigraphic cross section differ by two to four orders of magnitude; any presentation of these vectors on a linear scale would have been uniformative except for the highest range. The total head, as defined in its usual form, is not a conserved quantity in the presence of thermal buoyance. Thus, unless thermal energy is included in the total head definition, total head con-
9.17
0.46
WATER TABLE SLOPE = 1 IN 1000
0.092
m
o m 0.009
o.oos
i
-90 - 60
~ j - o.oo9
0
310 i I I - 0 30 60
Distance from repository center, hundreds of meters
, ' 6
-15 .c 'o
I-- 20
90
Fig. 5. Stream function contours at approximately 10 yr (after repository decommissioning).

260
g n-
- 9 0
g o m
o~
tr
- 9 0
m g
n -
- 9 0
9.17
A. Runchal and T. Ma in i
WATER T A B L E SLOPE = 1 IN 1000
0.46
0.092 " ~ ~ . . . . . . . . . . .
~ / R ~ i l t o r y I ~ "~ 0.0 - - m o
o - 6 0 l - 30 o ~o 6;
Distance from repository center, hundreds of meters
Fig. 6. S t r eam funct ion c o n t o u r s at a p p r o x i m a t e l y 1000 yr.
9.17 W A T E R T A B L E SLOPE = 1 IN 1000
- 5
10 ~E
_o~
--15 .c:'~
-- 20
90
0.46 D- f T " ~ ' ~ -
~'~ ~-epository ~ \ ~,
\ / I1
0 - 0,005 /
- .'o - ~'o o 3'0 6; ~o
Distance from repository center, hundreds of meters
Fig. 7. S t r eam funct ion c o n t o u r s at a p p r o x i m a t e l y 4000 yr.
W A T E R T A B L E SLOPE = 1 IN 1000 9.17
-5 d~ o
10 ~E U~
D f . . . .
- 2 0
0
0.092
0 . 0 0 9
0.005
sitor ~ lO ~=E
- 1 5 ~ 3 ._ g=.
a - =
- - 20
- 6 0 - 3 0 0 3 0 60 90
Distance from repository center, hundreds of meters
Fig. 8. Stream function contours at approximately 100,000 yr.
m 0;
rr
2.75
1.83
WATER T A B L E SLOPE = 1 IN 1000
Repository
10 i - 9 0 - - 3 0
O - l O ~
o
-4.58 o= --15 £'o'° m
- 2.75 ~ ~ ~ a = - 1 . 8 3 - 20
30 60 90
Distance from repository center, hundreds of meters
Fig. 9. S t r eam funct ion c o n t o u r s at a p p r o x i m a t e l y 4000 yr wi th uni form conduc t iv i ty of 5 x 10 ~ c m / s e c

Nuclear Waste Repository and Ground Water Flow 261
tours will be uninformative and will provide no direct information about the direction and quantity of ground water flow.
The flow patterns of Figs 5-8 depict a continually evolving pattern which changes from the natural hori- zontal flow (Fig. 4) to a large convection cell on the discharge side of the repository resulting from the sig- nificant thermal effects. Finally, toward the end of the modeled time period of 105 yr, the flow begins to return to its pre-repository natural pattern of Fig. 4.
A typical flow pattern in the presence of thermal buoyancy is shown in Fig. 7. The heat released by the radioactive decay of HLW results in a significant tem- perature increase in the vicinity of the repository. With a typical geothermal heat flux of 0.05W/m 2, the assumed repository heat release of 24.7 W/m 2 is seen to be hundreds of times greater than the normal geother- mal heat flux. As a consequence of this temperature increase, the water in the vicinity of the repository becomes much lighter and buoyant than the cooler water adjacent to the repository. The thermal convec- tion thus begins to move this warm water upwards toward the land surface. Cooler water adjacent to the repository then moves downward and under the repository to replace the water that has moved upwards. Because of the prevalent water table slope, a general ground water movement from left to right occurs and modifies the convection pattern to a certain extent. On the recharge side, the cooler water is sup- plied to the repository by the incoming flow. On the discharge side, however, the prevalent movement is di- rected away from the repository. A thermal convection cell is thereby formed resulting in recirculation of the repository water which rises toward the land surface, cools in the process, and sinks back to resupply the repository. The top of this convection cell is seen to be sheared by the relatively strong horizontal flow occur- ring in the top, high permeability layer of the weathered granite. These patterns are in accord with intuitive reasoning and available theoretical information [12].
The maximum thermally-induced effect, in terms of the largest thermal convection cell and the amount of flow through the repository, is reached sometime between 1000 and 4000 yr after repository sealing and resaturation. The ground water flow through the repository is in a nearly vertical direction because of the thermal buoyancy. The estimated quantities of the upward ground water flow through the repository and the minimum estimated time for water particles to reach the land surface from the repository are shown on Table 3. It is seen that these flow rates are fairly small; however, at the time of the maximum buoyancy (1000-4000 yr), the time taken for water particles to reach the ground surface is also very small compared to the timeframe of concern.
The parametric simulations of ground water flow
After completion of the baseline simulations, a para- metric study was undertaken to assess the impact of the various scenarios different from the baseline one. For
these simulations, the baseline case pertaining to 4000 yr shown in Fig. 7 was selected as the standard case.
The first set of parametric simulations concerned an investigation of the impact of hydraulic conductivity. It was assumed that the conductivity of the entire strati- graphic cross section shown on Fig. 3 is isotropic and uniform and equal to 5 x 10-Scm/sec; this corre- sponds to the value for the second layer from the top in Fig. 3. The streamline pattern for this case is shown in Fig. 9. The convection cell on the recharge side is now seen to be more fully developed than that in the base- line case. The rest of the flow pattern is, however, essen- tially similar to that of the baseline case (Fig. 7); the absence of a strong horizontal flow near the land sur- face results in smoother turning of the flow at the top of the convection cell. By comparison of the stream func- tion values it was noticed that the flow through the repository for the present case was approximately half that for the baseline case.
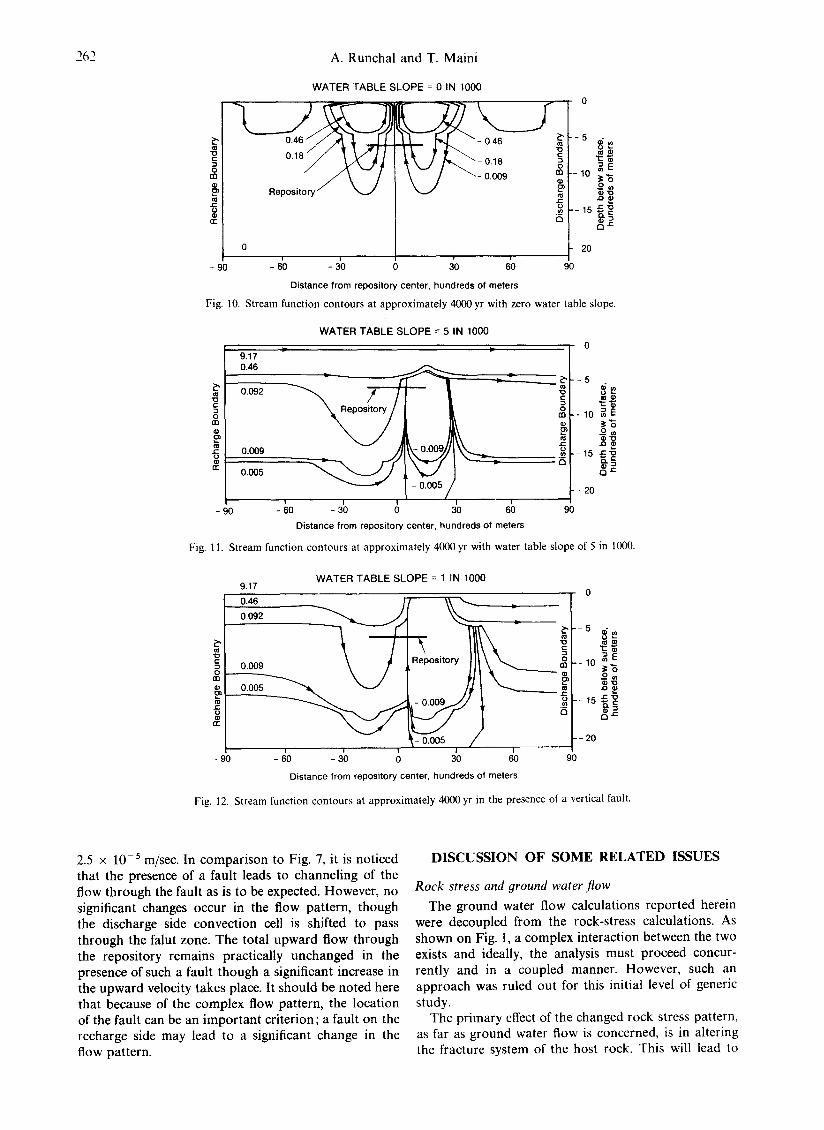
Figures 10 and 11 show the effect of the changes in the water table slope on the flow. Figure 10 shows that in the absence of a horizontal flow (i.e. zero hydraulic gradient), a flow pattern with a line of symmetry verti- cally through the centre of the repository is formed. Two identical contrarotating thermal convection cells through the repository are formed. These, in turn, lead to the formation of weaker contrarotating eddies away from the repository. Such a pattern is to be expected on theoretical grounds. In the case of a large hydraylic gradient of 0.005, shown in Fig. 11, the basic pattern of Fig. 7 remains unchanged. The stronger horizontal flow now tends to shrink both the thermal convection cells and the extent of the influence of thermal buoyancy. The changes in the water table slope, it was noticed, left the flow through the repository practically unchanged. This implies that as far as upflow through the reposit- ory is concerned, thermal loading is the dominant mechanism compared to the water table slope.
The effect of a simulated vertical fault through the middle of the discharge side of the repository is shown in Fig. 12. The fault was simulated by increasing the vertical hydraulic conductivity in that zone to
TABLE 3. ESTIMATED UPWARD FLOW AND BIOSPHERE APPROACH TIMES
Estimated biosphere Time Estimated upward approach time after (yr)* flow rate (ma/day) release (yr)*
I0 0.5 2400 100 2.2 400
1000 3.8 40 4000 3.8 40
10,000 2.7 50 50,000 0.5 400
100,000 0.5 3000
* The time quoted is assumed to be subsequent to repository sealing and resaturation and the biosphere approach time is estimated time to reach the biosphere after the release of a water particle from the repository.
262 A. Runchal and T. Maini
WATER TABLE SLOPE = 0 IN 1000
Repository ~
~ l 0 1 r
- 90 - 6 0 - 30
0
-5
~ E - 1 0 ¢"6
o =
I °' __ 15 ~ ' o • - g==
- 2 0
1 T
30 60 90
Distance from repository center, hundreds of meters
Fig. 10. Stream funct ion contours at approx imate ly 4000 yr with zero water table slope.
WATER TABLE SLOPE = 5 IN 1000
9.17 ~ =' " ' I- 0 046 |
m ~ 6
0 . 0 0 9 - 0.009 "~ ~ 1 5 _ i ~ -
0.005
- 20 1 I I I
90 - 60 - 30 0 30 60 90
Distance from repository center, hundreds of meters
Fig. 11. Stream funct ion contours at approx imate ly 4000 yr with water table slope of 5 in 1000.
WATER TABLE SLOPE = 1 IN 1000 9.17
II1 &
0 .46 m
0.092
o00 \ ;
I I 1
-90 - 60 - 30 0 90
Repository m o
U " i5
- 0.005 / I
3o 6'0
- 5 8 ~
10 ~E _o~
}! -- 20
Distance from repository center, hundreds of meters
Fig. 12. Stream function contours at approximately 4000 yr in the presence of a vertical fault.
2.5 x 10 -5 m/see. In comparison to Fig. 7, it is noticed that the presence of a fault leads to channeling of the flow through the fault as is to be expected. However, no significant changes occur in the flow pattern, though the discharge side convection cell is shifted to pass through the falut zone. The total upward flow through the repository remains practically unchanged in the presence of such a fault though a significant increase in the upward velocity takes place. It should be noted here that because of the complex flow pattern, the location of the fault can be an important criterion; a fault on the recharge side may lead to a significant change in the flow pattern.
DISCUSSION OF SOME RELATED ISSUES
Rock stress and ground water flow
The ground water flow calculations reported herein were decoupled from the rock-stress calculations. As shown on Fig. 1, a complex interaction between the two exists and ideally, the analysis must proceed concur- rently and in a coupled manner. However, such an approach was ruled out for this initial level of generic study.
The primary effect of the changed rock stress pattern, as far as ground water flow is concerned, is in altering the fracture system of the host rock. This will lead to

Nuclear Waste Repository and Ground Water Flow 263
altered paths and permeabilities for ground water flow. For the generic studies it is assumed that such changes are either relatively minor or restricted to a small zone in comparison with the overall fracture pattern. This assumption needs to be reexamined if further research currently in progress indicates that substantial alter- ation of fracture pattern is likely to occur.
The heat transfer due to ground water convection
The total thermal loading due to a nuclear repository with thermal loading of 24.7 W/m 2 is calculated to be of the order of 2 x 10⁵ kW. The total flow rate through the entire thickness of the partially weathered and unweathered granite formation is of the order of 7 x 10-Sm3/sec. The total heat convected by this ground water is calculated to be of the order of 0.3 kW per degree Celsius change in temperature. Thus, even with a 50-degree C average temperature rise for the whole ground water column, the total heat transported by convection is less than one-hundredth of a percent of the total thermal loading.
Another method of assessing the relative importance of the convective flow is in terms of the Peclet number, Pe, which represents the ratio of the convective and conductive mechanisms; symbolically:
Pe = U L/D (9)
where U and L are, respectively, the typical velocity and length scales and D is the thermal diffusivity.
For the present problem, with the order of magni- tude values for U, L and D taken as 10-1°m/sec, 10 3 and 10 -6 m2/sec, respectively, the Peclet number is of the order of 0.1. At such a low Peclet number the ther- mal convection may be considered insignificant in com- parison with thermal conduction.
In summary, therefore, it may be stated that for the present generic study, the convective heat transfer is much smaller in comparison to the conductive heat transfer. For larger flow rates and for more pervious rock formations, however, the convective effects may play a significant role.
Thermal convection and instability
One of the main features of the long-term ground water flow patterns presented in the earlier section is the development of thermal convection currents and convection cells. In general, thermal convection may develop when temperature gradients exist in a fluid. A particular type of instability arises when a fluid is heated from below such that it becomes less dense (or buoyant) than the fluid layers above. The lighter fluid then begins to move upward and is replaced by the denser fluid from the top layers moving downward. This phenomenon is sometimes referred to as Rayleigh instability. Though the discussion above is particularly relevant to fluids, the instability may also arise in porous media where fluid exists in a distributed form in a matrix of solid material.
The onset and existence of the thermal instability is governed by a combination of factors, which include
the density gradients, the typical length scales of motion, the coefficient of volumetric expansion, the conductivity of material, etc. The balance between them is generally represented by various nondimensional parameters. A convenient parameter for these purposes is the modified Rayleigh number [12] defined as:
Ra = K HflAT/D, (10)
where K = the hydraulic conductivity, fl = the coefficient of volumetric expansion
H -- the height of the fluid column, AT -- a representative temperature difference, and
D -- the thermal diffusivity.
For the present problem, the maximum thermal influence on hydraulic flow is seen to occur between 1000 and 4000yr after repository decommissioning. The representative values of the parameters H, K, and D for the porous medium column may then be taken as 10 3 m, 10 -6 m/sec and 10 -6 m2/sec, respectively, that of AT as 100°C and of fl as 10-3/°C. The value of the modified Rayleigh number, from equation (10) is then estimated to be of the order of 100. This is considerably above the critical value 1-12] which is usually taken to be of the order of 40.
Limitations of results and further investigations
As mentioned earlier, the present study is of a generic nature. Thus, the stratigraphy, regional settings, hydro- geologic properties, analytical and mathematical models, simulations, etc. were all selected on the basis of generic considerations. The primary emphasis is thus on qualitative and comparative evaluation rather than on quantitative analysis. It is, therefore, recommended that due consideration be given to this aspect of the results for drawing any site-specific conclusions.
Further, some features on the HLW repository have received little consideration in the available literature. An example is that of the complex behavior of the rocks and fluid flow under thermal loading, especially at pressures greatly exceeding normal atmospheric pressure. Though, as shown in earlier sections, the gen- eral nature of the results obtained is substantiated by available data, many specific features cannot be verified at this stage. Thus, clearly before any site-specific deci- sions are made, further detailed analyses including ex- perimental or field investigations need to be under- taken.
CONCLUSIONS
(1) Deep geologic disposal or radioactive waste may be a technically feasible and attractive alternative. However, many of the issues which relate to the long- term impact of such disposal on the biosphere are little researched and understood at this stage.
(2) Hydrogeologic and rock properties which influence the effect of the HLW on the biosphere are presently not available at the required level of detail.

264 A. Runchal and T. Maini
Theoretical and field studies need to be carried out so as to bridge the gap between continuum and disconti- nuum methodologies.
(3) At this point in time, with limited data, and as yet to be developed theoretical tools, the equivalent porous medium approach can be used for estimates of transit times of radionuclides to the biosphere provided the equivalence is carried out with due care.
(4) For a generic granite repository, a thermal load- ing of 25 W/m 2 leads to considerable effects on the existing dominant horizontal regional flow pattern. Under certain conditions, it is likely that thermal insta- bility may occur, and lead to the formation of convec- tion cells in the immediate vicinity of the repository.
(5) For the thermal loading considered, the general direction of flow through the repository may change from a largely horizontal to a largely vertical pattern. This in turn may reduce the time taken for the radioac- tive nuclides to reach the near-surface aquifers and the biosphere.
(6) The transit time from the repository to the bio- sphere, under 25 W/m 2 loading, may be as little as 40 yr at time of maximum influence (between 1000 and 4000 yr after repository decommissioning). The total amount of flow through the repository is, however, generally seen to be rather small and only of the order of 4 m3/day for the investigated range of hydrogeologic properties and repository scenarios.
(7) Parametric simulations indicate that the flow through the repository for the conditions investigated, is largely controlled by the thermal loading.
(8) The changes in ground water flow rates caused by local variations in hydrogeologic properties, water table slope or boundary conditions are rather small. Regio- nal changes of hydrogeologic properties are, however, likely to greatly influence the flow patterns and flow rates.
Acknowledgements---Some of the work reported herein was per- formed as part of a U.S. Department of Energy contract, No W7405 eng 26, managed by the Office of Work Isolation, Oak Ridge, Tennes- see. The assistance of Dr Don Supkow and Ms Geri Segal is grate- fully acknowledged.
Receil'ed 8 January 1979; in revised form 20 February 1980.
REFERENCES
I. Environmental Protection Agency. State of geological knowledge regarding potential transport of high-level radioactive waste from deep continental repositories. EPA/520/4-78-004 (1978).
2 lnteragency Review Group, Report to the Prcsidenl by the lntcr- agency Review Group on Nuclear Waste Management. U.S Department of Energy, TID-29442 (March, 19791.
3. KBS. Handling of spent nuclear fuel and final storage of vitrified high level reprocessing waste. Vol. I, General, Karnbranslesaker- het, Fack. 10240 Stockholm, Sweden (1977).
4. de Marsily G., Ledoux E., Barbreau A. & Magat J. Nuclear waste disposal: can the geologist guarantee isolation'? Science 197, (1977).
5. Dames & Moore. Technical support for GELS: Radioactive waste isolation in geologic formations/ground water movement and nuclide transport. Y/OWI/TM-36/21, U.S. Department of Energy Contract W-7450 eng 26 (1978).
6. Dames & Moore. Numerical modeling of rock stresses within a basaltic nuclear waste repository. Rockwell Hanford Operations, U.S. Department of Energy Contract, EY-77-C-06-1030 (1978).
7. Louis C. A study of ground water flow in jointed rock and its influence on the stability of rock masses. Imperial College, Rock Mechanics Report No. 10, London (1969).
8. Maini T. In situ hydraulic parameters in jointed rock, their measurement and interpretation. Ph.D. Thesis, Imperial College, London (197l).
9. Maini T. & Hocking G. An examination of the feasibility of hydrologic isolation of a high-level waste repository in crystalline rock. Geol. Soc. Am., Abstract, 1977 Annual Meeting, (November 7 9, 1977).
10. Gales J. E. & Witherspoon P. A. An approach to the fracture hydrology at Strip A: Preliminary results. Proc., In situ heating experiments in geological formations OECD Syrup., Sweden, pp. 161-175 (1978).
1 l. Dillon R. T., Lantz R. B. & Pahwa S. B. A model for calculating radioactive waste migration: SANDIA waste isolation flow and transport (SWIFT) Model. Sandia Laboratory, SAND-78-L1267 (1978).
12. Bear J. Dynamics of Fluids in Porous Media. American Elsevier, New York (1976).
13. Runchal A. K., Treger J. & Segal G. Two-dimentional fluid flow, heat, and mass transport in porous media. Dames & Moore, Advanced Technology Group, TN-LA-34, (September, 1979).
14. Yanenko N. N. The Method of Fractional Steps. Springer-Verlag, New York (1971).
15. Perry R. H. & Chilton C. H. Chemical Engineer's Handbook, 5th edn. McGraw-Hill, New York (1973).
16. Mercer J. W. & Faust C. R. Analysis of fluid flow and heat transport associated with high-level radioactive waste disposal. Geol. Soc. Am., Abstracts, 1977 Annual Meeting (November 7 9, 1977).
17. GAIN. An appraisal of underground radioactive waste disposal in Argillaceous and crystalline rocks: some geochemical, geo- mechanical, and hydrogeological questions. Geotechnical Assess- ment and Instrumentation Needs Syrup., Lawrence Berkeley Laboratory, University of California at Berkeley (July 16-20, 1978).
18. Snow D. Hydraulic characteristics of fractured metamorphic rocks of the front range and implications to the rocky mountain arsenal well. Colo. Sch. Mines Q. 63, (1968).
19. Witherspoon P., Noorishad J. & Maini T. Investigation of fluid injection rock and effect on stress distribution. Contract No. 14-08-001-12727, USGS/ARPA (1971).
20. Witherspoon P. A., Gale J. E. & Cook N. G. W. Radioactive waste storage in argillaceous and crystalline rock masses. Rock- ,store 77, Proc. of the 1st Int. Syrup., Stockholm, Sweden, No. III, p. 805 (1978).