Impact toughness and microstructure of continuous steel wire-reinforced cast iron composite
Upload
khangminh22Category
view
0download
0
�����������������
Citation: Ibrahim, T.H.; Allawi, A.A.;
El-Zohairy, A. Impact Behavior of
Composite Reinforced Concrete
Beams with Pultruded I-GFRP Beam.
Materials 2022, 15, 441. https://
doi.org/10.3390/ma15020441
Academic Editor: Giovanni Garcea
Received: 17 December 2021
Accepted: 5 January 2022
Published: 7 January 2022
Publisher’s Note: MDPI stays neutral
with regard to jurisdictional claims in
published maps and institutional affil-
iations.
Copyright: © 2022 by the authors.
Licensee MDPI, Basel, Switzerland.
This article is an open access article
distributed under the terms and
conditions of the Creative Commons
Attribution (CC BY) license (https://
creativecommons.org/licenses/by/
4.0/).
materials
Article
Impact Behavior of Composite Reinforced Concrete Beams withPultruded I-GFRP BeamTeghreed H. Ibrahim 1, Abbas A. Allawi 1 and Ayman El-Zohairy 2,*
1 Department of Civil Engineering, University of Baghdad, Baghdad 17001, Iraq;[email protected] (T.H.I.); [email protected] (A.A.A.)
2 Department of Engineering and Technology, Texas A&M University-Commerce, Commerce, TX 75429, USA* Correspondence: [email protected]; Tel.: +1-903-468-8683
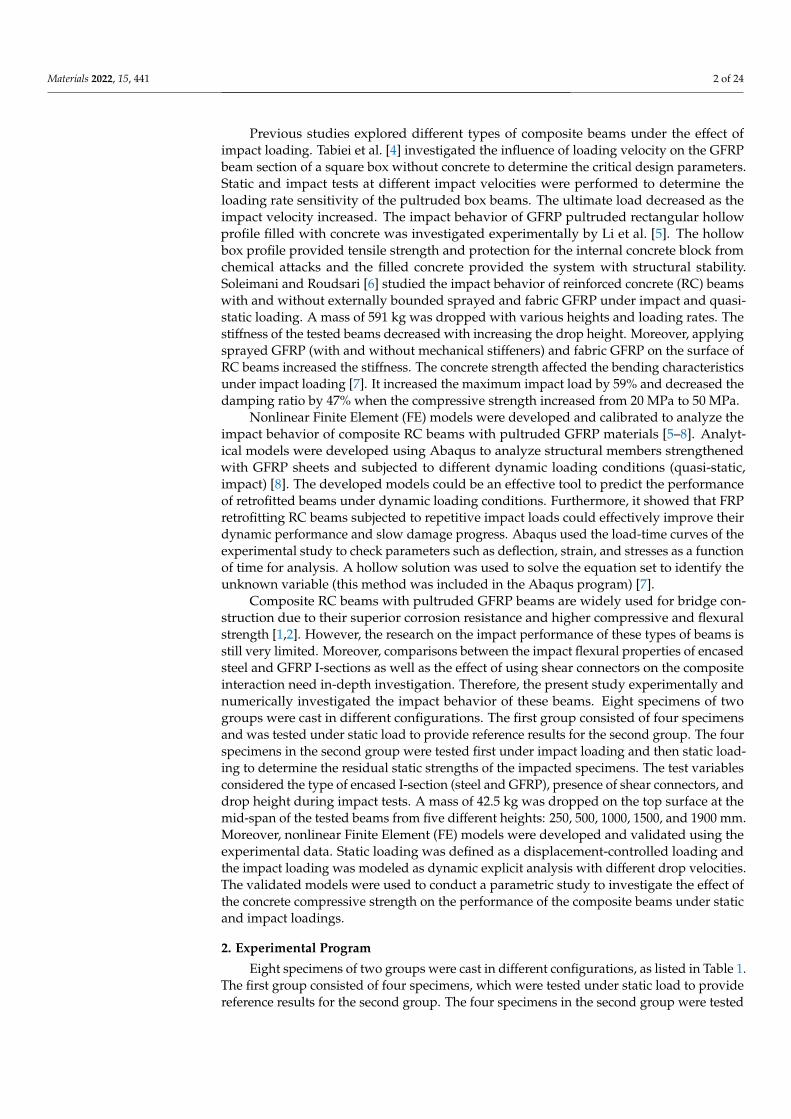
Abstract: The present study experimentally and numerically investigated the impact behavior ofcomposite reinforced concrete (RC) beams with the pultruded I-GFRP and I-steel beams. Eightspecimens of two groups were cast in different configurations. The first group consisted of fourspecimens and was tested under static load to provide reference results for the second group. Thefour specimens in the second group were tested first under impact loading and then static loadingto determine the residual static strengths of the impacted specimens. The test variables consideredthe type of encased I-section (steel and GFRP), presence of shear connectors, and drop height duringimpact tests. A mass of 42.5 kg was dropped on the top surface at the mid-span of the tested beamsfrom five different heights: 250, 500, 1000, 1500, and 1900 mm. Moreover, nonlinear Finite Element(FE) models were developed and validated using the experimental data. Static loading was defined asa displacement-controlled loading and the impact loading was modeled as dynamic explicit analysiswith different drop velocities. The validated models were used to conduct a parametric study toinvestigate the effect of the concrete compressive strength on the performance of the composite beamsunder static and impact loadings. For the composite specimen with steel I-sction, the maximumimpact force was 190% greater than the reference specimen NR-I at a drop height of 1900 mm, whereasthe maximum impact forces for the specimens composite specimens with GFRP I-sction without andwith shear connectors were 19% and 77%, respectively, more significant than the reference beamat the same drop height. The high stiffness for the steel I-beams relative to the GFRP I-beam wasthe reason for this difference in behavior. The concrete compressive strength was more effective inimproving the impact behavior of the composite specimens relative to those without GFRP I-beams.
Keywords: pultruded GFRP I-beam; composite beam; impact; static; experiments; deflections; finiteelement analysis
1. Introduction
Hybrid construction using combined materials is essential for achieving performancetargets such as durability, sustainability, seismic resistance, and speedy construction. Be-cause composite materials are simple, buildable, and cost-competitive, they give a consis-tent performance and are the best choice. Pultruded Glass Fiber Reinforced polymer (GFRP)I-beams are a new type of Fiber Reinforced Polymer (FRP) composite that are developedusing pultrusion. These new beams are recommended for bridge construction due totheir superior corrosion resistance and higher compressive and flexural strength [1,2]. Thebehavior of concrete beams under the effect of impact loading is different than under theeffect of static loading [3]. The materials are subjected to a higher strain rate when loadeddynamically than statically. There is little work in the literature on the impact and loadrate sensitivity of pultruded composite materials. Understanding the behavior of suchmaterials is becoming increasingly important as the use of these unconventional materialsfor infrastructure applications is developed.
Materials 2022, 15, 441. https://doi.org/10.3390/ma15020441 https://www.mdpi.com/journal/materials
Materials 2022, 15, 441 2 of 24
Previous studies explored different types of composite beams under the effect ofimpact loading. Tabiei et al. [4] investigated the influence of loading velocity on the GFRPbeam section of a square box without concrete to determine the critical design parameters.Static and impact tests at different impact velocities were performed to determine theloading rate sensitivity of the pultruded box beams. The ultimate load decreased as theimpact velocity increased. The impact behavior of GFRP pultruded rectangular hollowprofile filled with concrete was investigated experimentally by Li et al. [5]. The hollowbox profile provided tensile strength and protection for the internal concrete block fromchemical attacks and the filled concrete provided the system with structural stability.Soleimani and Roudsari [6] studied the impact behavior of reinforced concrete (RC) beamswith and without externally bounded sprayed and fabric GFRP under impact and quasi-static loading. A mass of 591 kg was dropped with various heights and loading rates. Thestiffness of the tested beams decreased with increasing the drop height. Moreover, applyingsprayed GFRP (with and without mechanical stiffeners) and fabric GFRP on the surface ofRC beams increased the stiffness. The concrete strength affected the bending characteristicsunder impact loading [7]. It increased the maximum impact load by 59% and decreased thedamping ratio by 47% when the compressive strength increased from 20 MPa to 50 MPa.
Nonlinear Finite Element (FE) models were developed and calibrated to analyze theimpact behavior of composite RC beams with pultruded GFRP materials [5–8]. Analyt-ical models were developed using Abaqus to analyze structural members strengthenedwith GFRP sheets and subjected to different dynamic loading conditions (quasi-static,impact) [8]. The developed models could be an effective tool to predict the performanceof retrofitted beams under dynamic loading conditions. Furthermore, it showed that FRPretrofitting RC beams subjected to repetitive impact loads could effectively improve theirdynamic performance and slow damage progress. Abaqus used the load-time curves of theexperimental study to check parameters such as deflection, strain, and stresses as a functionof time for analysis. A hollow solution was used to solve the equation set to identify theunknown variable (this method was included in the Abaqus program) [7].
Composite RC beams with pultruded GFRP beams are widely used for bridge con-struction due to their superior corrosion resistance and higher compressive and flexuralstrength [1,2]. However, the research on the impact performance of these types of beams isstill very limited. Moreover, comparisons between the impact flexural properties of encasedsteel and GFRP I-sections as well as the effect of using shear connectors on the compositeinteraction need in-depth investigation. Therefore, the present study experimentally andnumerically investigated the impact behavior of these beams. Eight specimens of twogroups were cast in different configurations. The first group consisted of four specimensand was tested under static load to provide reference results for the second group. The fourspecimens in the second group were tested first under impact loading and then static load-ing to determine the residual static strengths of the impacted specimens. The test variablesconsidered the type of encased I-section (steel and GFRP), presence of shear connectors, anddrop height during impact tests. A mass of 42.5 kg was dropped on the top surface at themid-span of the tested beams from five different heights: 250, 500, 1000, 1500, and 1900 mm.Moreover, nonlinear Finite Element (FE) models were developed and validated using theexperimental data. Static loading was defined as a displacement-controlled loading andthe impact loading was modeled as dynamic explicit analysis with different drop velocities.The validated models were used to conduct a parametric study to investigate the effect ofthe concrete compressive strength on the performance of the composite beams under staticand impact loadings.
2. Experimental Program
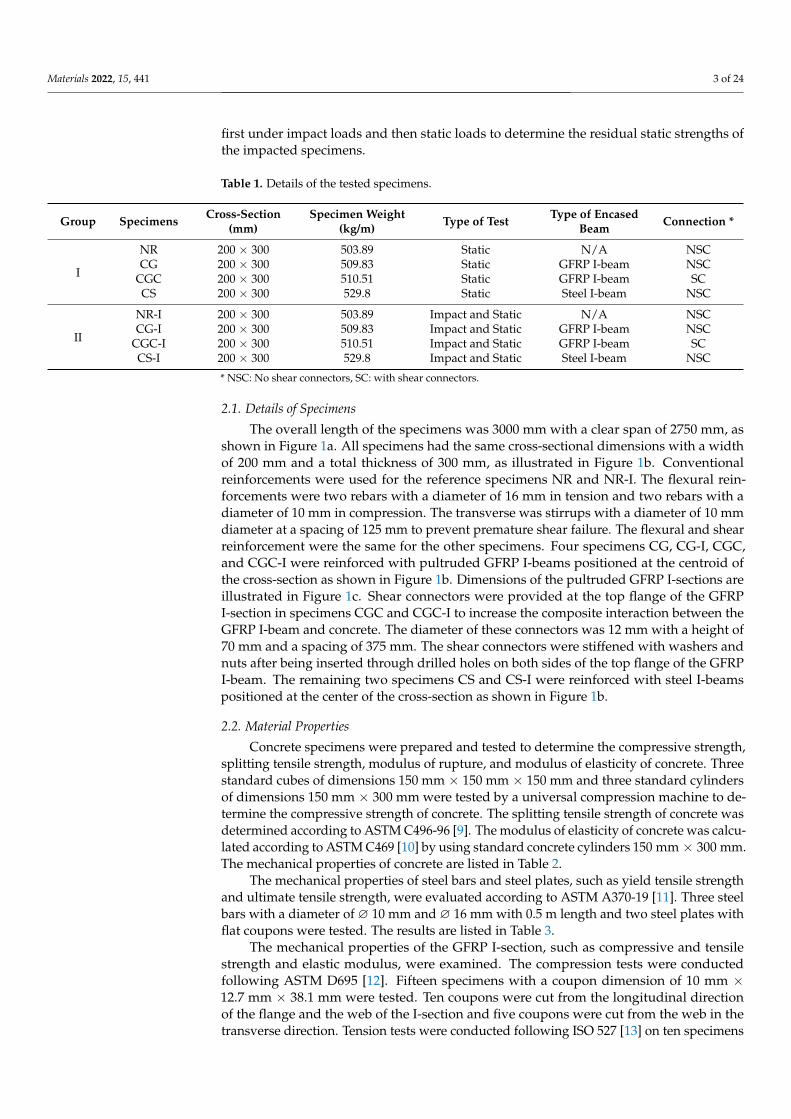
Eight specimens of two groups were cast in different configurations, as listed in Table 1.The first group consisted of four specimens, which were tested under static load to providereference results for the second group. The four specimens in the second group were tested
Materials 2022, 15, 441 3 of 24
first under impact loads and then static loads to determine the residual static strengths ofthe impacted specimens.
Table 1. Details of the tested specimens.
Group Specimens Cross-Section(mm)
Specimen Weight(kg/m) Type of Test Type of Encased
Beam Connection *
I
NR 200 × 300 503.89 Static N/A NSCCG 200 × 300 509.83 Static GFRP I-beam NSC
CGC 200 × 300 510.51 Static GFRP I-beam SCCS 200 × 300 529.8 Static Steel I-beam NSC
II
NR-I 200 × 300 503.89 Impact and Static N/A NSCCG-I 200 × 300 509.83 Impact and Static GFRP I-beam NSC
CGC-I 200 × 300 510.51 Impact and Static GFRP I-beam SCCS-I 200 × 300 529.8 Impact and Static Steel I-beam NSC
* NSC: No shear connectors, SC: with shear connectors.
2.1. Details of Specimens
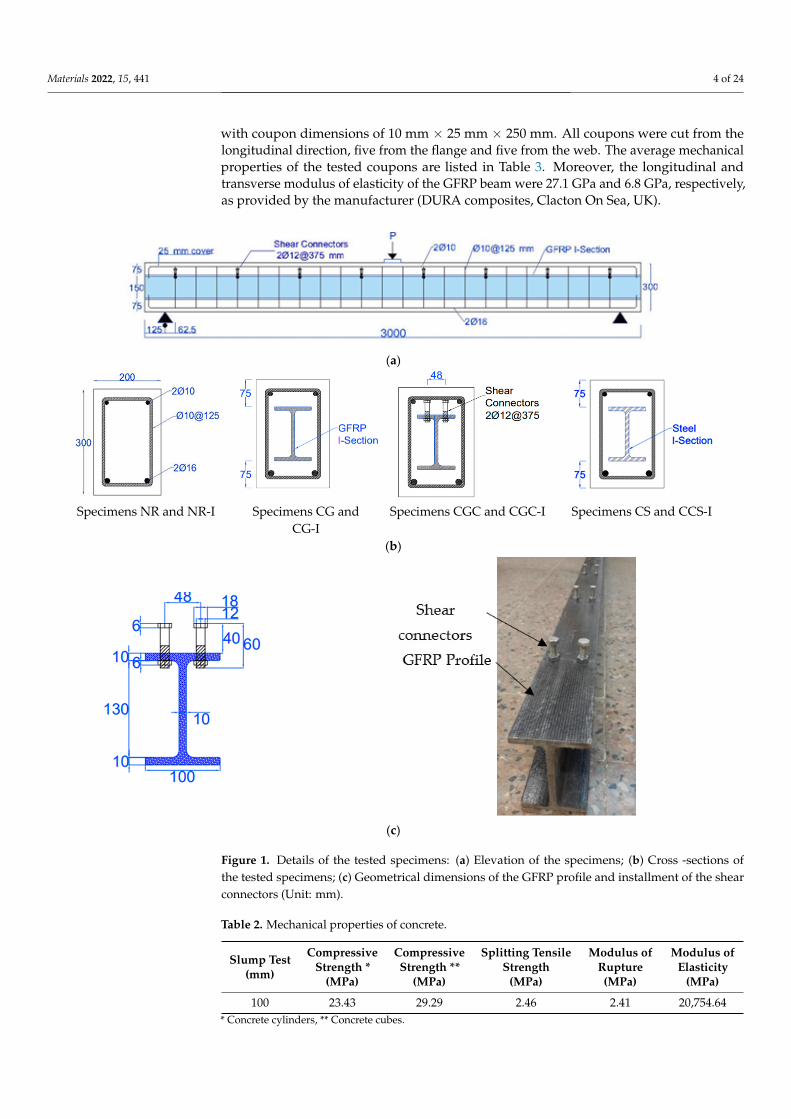
The overall length of the specimens was 3000 mm with a clear span of 2750 mm, asshown in Figure 1a. All specimens had the same cross-sectional dimensions with a widthof 200 mm and a total thickness of 300 mm, as illustrated in Figure 1b. Conventionalreinforcements were used for the reference specimens NR and NR-I. The flexural rein-forcements were two rebars with a diameter of 16 mm in tension and two rebars with adiameter of 10 mm in compression. The transverse was stirrups with a diameter of 10 mmdiameter at a spacing of 125 mm to prevent premature shear failure. The flexural and shearreinforcement were the same for the other specimens. Four specimens CG, CG-I, CGC,and CGC-I were reinforced with pultruded GFRP I-beams positioned at the centroid ofthe cross-section as shown in Figure 1b. Dimensions of the pultruded GFRP I-sections areillustrated in Figure 1c. Shear connectors were provided at the top flange of the GFRPI-section in specimens CGC and CGC-I to increase the composite interaction between theGFRP I-beam and concrete. The diameter of these connectors was 12 mm with a height of70 mm and a spacing of 375 mm. The shear connectors were stiffened with washers andnuts after being inserted through drilled holes on both sides of the top flange of the GFRPI-beam. The remaining two specimens CS and CS-I were reinforced with steel I-beamspositioned at the center of the cross-section as shown in Figure 1b.
2.2. Material Properties
Concrete specimens were prepared and tested to determine the compressive strength,splitting tensile strength, modulus of rupture, and modulus of elasticity of concrete. Threestandard cubes of dimensions 150 mm × 150 mm × 150 mm and three standard cylindersof dimensions 150 mm × 300 mm were tested by a universal compression machine to de-termine the compressive strength of concrete. The splitting tensile strength of concrete wasdetermined according to ASTM C496-96 [9]. The modulus of elasticity of concrete was calcu-lated according to ASTM C469 [10] by using standard concrete cylinders 150 mm × 300 mm.The mechanical properties of concrete are listed in Table 2.
The mechanical properties of steel bars and steel plates, such as yield tensile strengthand ultimate tensile strength, were evaluated according to ASTM A370-19 [11]. Three steelbars with a diameter of ∅ 10 mm and ∅ 16 mm with 0.5 m length and two steel plates withflat coupons were tested. The results are listed in Table 3.
The mechanical properties of the GFRP I-section, such as compressive and tensilestrength and elastic modulus, were examined. The compression tests were conductedfollowing ASTM D695 [12]. Fifteen specimens with a coupon dimension of 10 mm ×12.7 mm × 38.1 mm were tested. Ten coupons were cut from the longitudinal directionof the flange and the web of the I-section and five coupons were cut from the web in thetransverse direction. Tension tests were conducted following ISO 527 [13] on ten specimens
Materials 2022, 15, 441 4 of 24
with coupon dimensions of 10 mm × 25 mm × 250 mm. All coupons were cut from thelongitudinal direction, five from the flange and five from the web. The average mechanicalproperties of the tested coupons are listed in Table 3. Moreover, the longitudinal andtransverse modulus of elasticity of the GFRP beam were 27.1 GPa and 6.8 GPa, respectively,as provided by the manufacturer (DURA composites, Clacton On Sea, UK).
Materials 2022, 15, x FOR PEER REVIEW 4 of 26
Materials 2022, 15, x. https://doi.org/10.3390/xxxxx www.mdpi.com/journal/materials
(a)
Specimens NR and NR‐I Specimens CG and
CG‐I
Specimens CGC and CGC‐I Specimens CS and CCS‐I
(b)
(c)
Figure 1. Details of the tested specimens: (a) Elevation of the specimens; (b) Cross ‐sections of the
tested specimens; (c) Geometrical dimensions of the GFRP profile and installment of the shear con‐
nectors (Unit: mm)
2.2. Material Properties
Concrete specimens were prepared and tested to determine the compressive
strength, splitting tensile strength, modulus of rupture, and modulus of elasticity of con‐
crete. Three standard cubes of dimensions 150 mm × 150 mm × 150 mm and three standard
cylinders of dimensions 150 mm × 300 mm were tested by a universal compression ma‐
chine to determine the compressive strength of concrete. The splitting tensile strength of
concrete was determined according to ASTM C496‐96 [9]. The modulus of elasticity of
concrete was calculated according to ASTM C469 [10] by using standard concrete cylin‐
ders 150 mm × 300 mm. The mechanical properties of concrete are listed in Table 2.
Figure 1. Details of the tested specimens: (a) Elevation of the specimens; (b) Cross -sections ofthe tested specimens; (c) Geometrical dimensions of the GFRP profile and installment of the shearconnectors (Unit: mm).
Table 2. Mechanical properties of concrete.
Slump Test(mm)
CompressiveStrength *
(MPa)
CompressiveStrength **
(MPa)
Splitting TensileStrength
(MPa)
Modulus ofRupture(MPa)
Modulus ofElasticity
(MPa)
100 23.43 29.29 2.46 2.41 20,754.64* Concrete cylinders, ** Concrete cubes.
Materials 2022, 15, 441 5 of 24
Table 3. Mechanical properties of steel reinforcement and GFRP.
Material Diameter(mm)
Thickness(mm)
YieldStrength
(MPa)
TransverseCompressive
Strength(MPa)
LongitudinalCompressive
Strength(MPa)
LongitudinalTensile
Strength(MPa)
LongitudinalModulus of
Elasticity(GPa)
TransverseModulus of
Elasticity(GPa)
Steel16 - 520.73 - - 687.07 200 -10 - 407.7 - - 465.63 200 -- 10 375.9 - - 479.63 200 -
GFRP - 10 - 118.3 326.14 347.5 27.1 6.8
2.3. Instrumentation and Test Setup2.3.1. Static Test
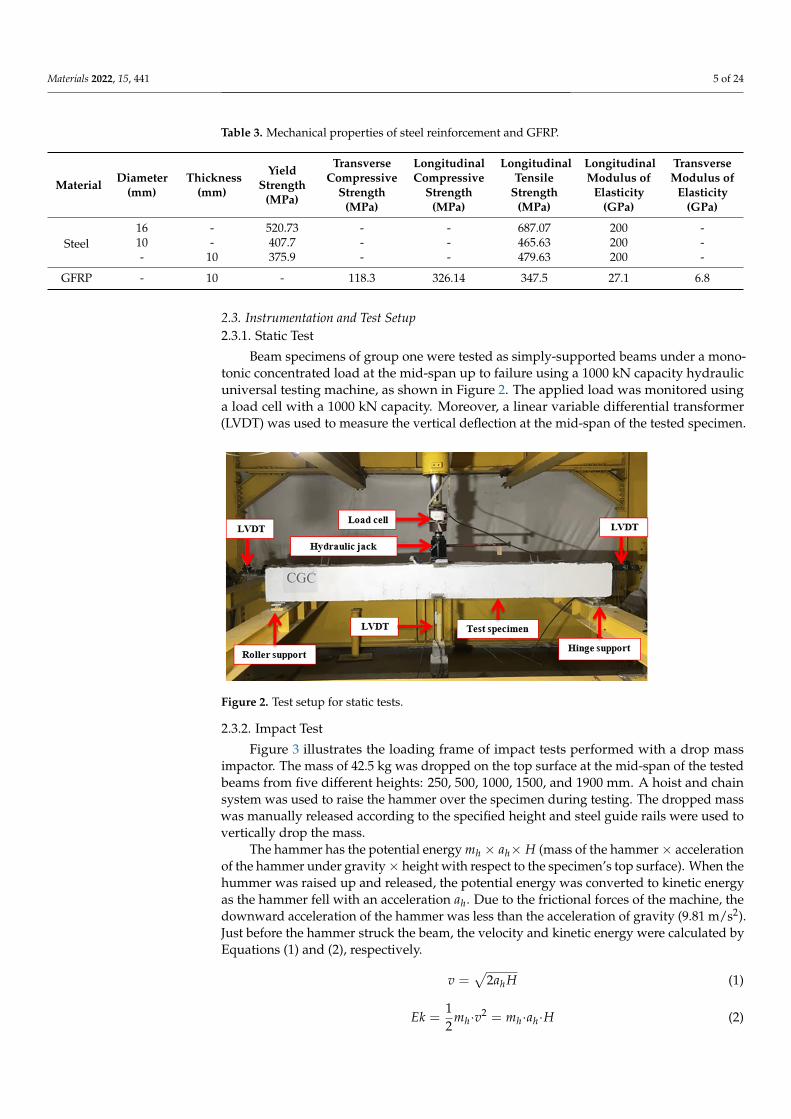
Beam specimens of group one were tested as simply-supported beams under a mono-tonic concentrated load at the mid-span up to failure using a 1000 kN capacity hydraulicuniversal testing machine, as shown in Figure 2. The applied load was monitored usinga load cell with a 1000 kN capacity. Moreover, a linear variable differential transformer(LVDT) was used to measure the vertical deflection at the mid-span of the tested specimen.
Materials 2022, 15, x FOR PEER REVIEW 6 of 26
Materials 2022, 15, x. https://doi.org/10.3390/xxxxx www.mdpi.com/journal/materials
Figure 2. Test setup for static tests.
2.3.2. Impact Test
Figure 3 illustrates the loading frame of impact tests performed with a drop mass
impactor. The mass of 42.5 kg was dropped on the top surface at the mid‐span of the tested
beams from five different heights: 250, 500, 1000, 1500, and 1900 mm. A hoist and chain
system was used to raise the hammer over the specimen during testing. The dropped mass
was manually released according to the specified height and steel guide rails were used
to vertically drop the mass.
The hammer has the potential energy × × (mass of the hammer × accelera‐
tion of the hammer under gravity × height with respect to the specimen’s top surface).
When the hummer was raised up and released, the potential energy was converted to
kinetic energy as the hammer fell with an acceleration . Due to the frictional forces of
the machine, the downward acceleration of the hammer was less than the acceleration of
gravity (9.81 m/s2). Just before the hammer struck the beam, the velocity and kinetic en‐
ergy were calculated by Equations (1) and (2), respectively.
2 (1)
12
. . . (2)
When the hammer hit the beam, the hammer’s momentum was rapidly transferred
to the beam. As a response, the hammer’s momentum was reduced. This resulted in a
reduction in the hammer’s kinetic energy and an increase in the beam’s energy. This sud‐
den energy transfer between the hammer and the beam led to a rapid build‐up of stress
in the beam. The momentum ( ) is obtained from Equation (3). The impact characteristics
of the impact tests are listed in Table 4.
. (3)
Figure 2. Test setup for static tests.
2.3.2. Impact Test
Figure 3 illustrates the loading frame of impact tests performed with a drop massimpactor. The mass of 42.5 kg was dropped on the top surface at the mid-span of the testedbeams from five different heights: 250, 500, 1000, 1500, and 1900 mm. A hoist and chainsystem was used to raise the hammer over the specimen during testing. The dropped masswas manually released according to the specified height and steel guide rails were used tovertically drop the mass.
The hammer has the potential energy mh × ah× H (mass of the hammer × accelerationof the hammer under gravity × height with respect to the specimen’s top surface). When thehummer was raised up and released, the potential energy was converted to kinetic energyas the hammer fell with an acceleration ah. Due to the frictional forces of the machine, thedownward acceleration of the hammer was less than the acceleration of gravity (9.81 m/s2).Just before the hammer struck the beam, the velocity and kinetic energy were calculated byEquations (1) and (2), respectively.
v =√
2ah H (1)
Ek =12
mh·v2 = mh·ah·H (2)
Materials 2022, 15, 441 6 of 24
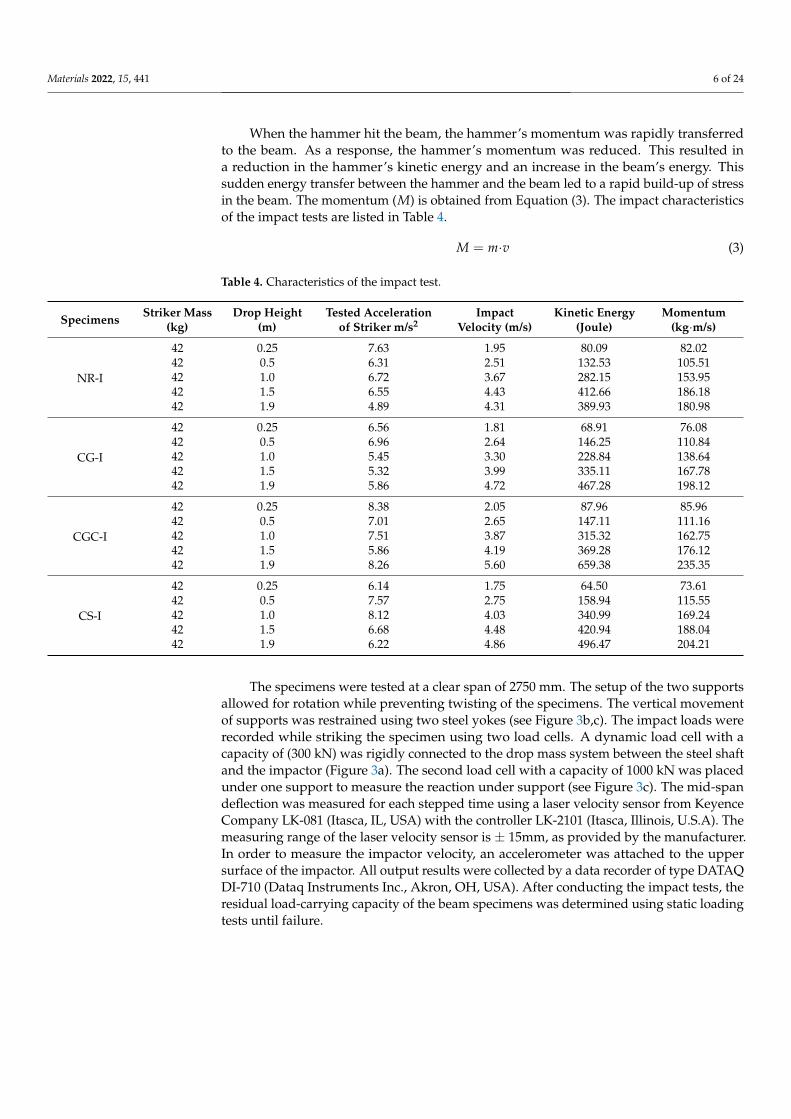
When the hammer hit the beam, the hammer’s momentum was rapidly transferredto the beam. As a response, the hammer’s momentum was reduced. This resulted ina reduction in the hammer’s kinetic energy and an increase in the beam’s energy. Thissudden energy transfer between the hammer and the beam led to a rapid build-up of stressin the beam. The momentum (M) is obtained from Equation (3). The impact characteristicsof the impact tests are listed in Table 4.
M = m·v (3)
Table 4. Characteristics of the impact test.
Specimens Striker Mass(kg)
Drop Height(m)
Tested Accelerationof Striker m/s2
ImpactVelocity (m/s)
Kinetic Energy(Joule)
Momentum(kg·m/s)
NR-I
42 0.25 7.63 1.95 80.09 82.0242 0.5 6.31 2.51 132.53 105.5142 1.0 6.72 3.67 282.15 153.9542 1.5 6.55 4.43 412.66 186.1842 1.9 4.89 4.31 389.93 180.98
CG-I
42 0.25 6.56 1.81 68.91 76.0842 0.5 6.96 2.64 146.25 110.8442 1.0 5.45 3.30 228.84 138.6442 1.5 5.32 3.99 335.11 167.7842 1.9 5.86 4.72 467.28 198.12
CGC-I
42 0.25 8.38 2.05 87.96 85.9642 0.5 7.01 2.65 147.11 111.1642 1.0 7.51 3.87 315.32 162.7542 1.5 5.86 4.19 369.28 176.1242 1.9 8.26 5.60 659.38 235.35
CS-I
42 0.25 6.14 1.75 64.50 73.6142 0.5 7.57 2.75 158.94 115.5542 1.0 8.12 4.03 340.99 169.2442 1.5 6.68 4.48 420.94 188.0442 1.9 6.22 4.86 496.47 204.21
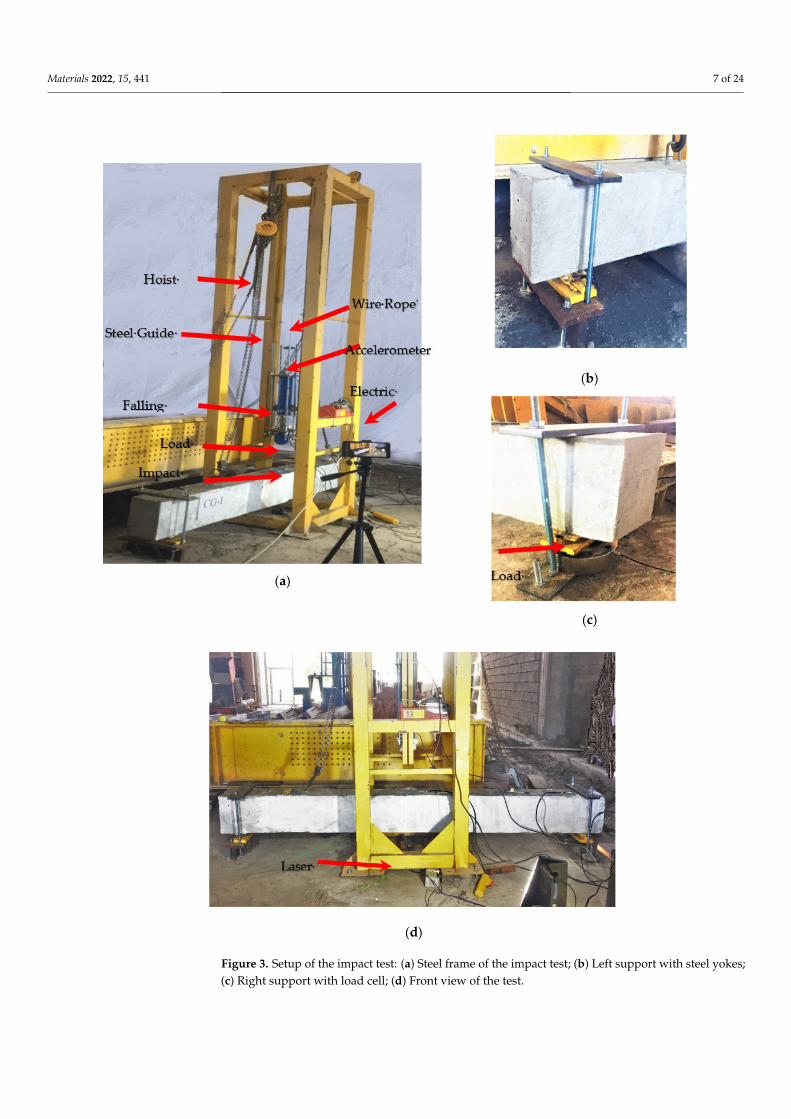
The specimens were tested at a clear span of 2750 mm. The setup of the two supportsallowed for rotation while preventing twisting of the specimens. The vertical movementof supports was restrained using two steel yokes (see Figure 3b,c). The impact loads wererecorded while striking the specimen using two load cells. A dynamic load cell with acapacity of (300 kN) was rigidly connected to the drop mass system between the steel shaftand the impactor (Figure 3a). The second load cell with a capacity of 1000 kN was placedunder one support to measure the reaction under support (see Figure 3c). The mid-spandeflection was measured for each stepped time using a laser velocity sensor from KeyenceCompany LK-081 (Itasca, IL, USA) with the controller LK-2101 (Itasca, Illinois, U.S.A). Themeasuring range of the laser velocity sensor is ± 15mm, as provided by the manufacturer.In order to measure the impactor velocity, an accelerometer was attached to the uppersurface of the impactor. All output results were collected by a data recorder of type DATAQDI-710 (Dataq Instruments Inc., Akron, OH, USA). After conducting the impact tests, theresidual load-carrying capacity of the beam specimens was determined using static loadingtests until failure.
Materials 2022, 15, 441 7 of 24Materials 2022, 15, x FOR PEER REVIEW 8 of 26
Materials 2022, 15, x. https://doi.org/10.3390/xxxxx www.mdpi.com/journal/materials
(a)
(b)
(c)
(d)
Figure 3. Setup of the impact test: (a) Steel frame of the impact test; (b) Left support with steel yokes;
(c) Right support with load cell; (d) Front view of the test.
Figure 3. Setup of the impact test: (a) Steel frame of the impact test; (b) Left support with steel yokes;(c) Right support with load cell; (d) Front view of the test.
Materials 2022, 15, 441 8 of 24
3. Experimental Results3.1. Static Test Results3.1.1. Crack Patterns and Modes of Failure
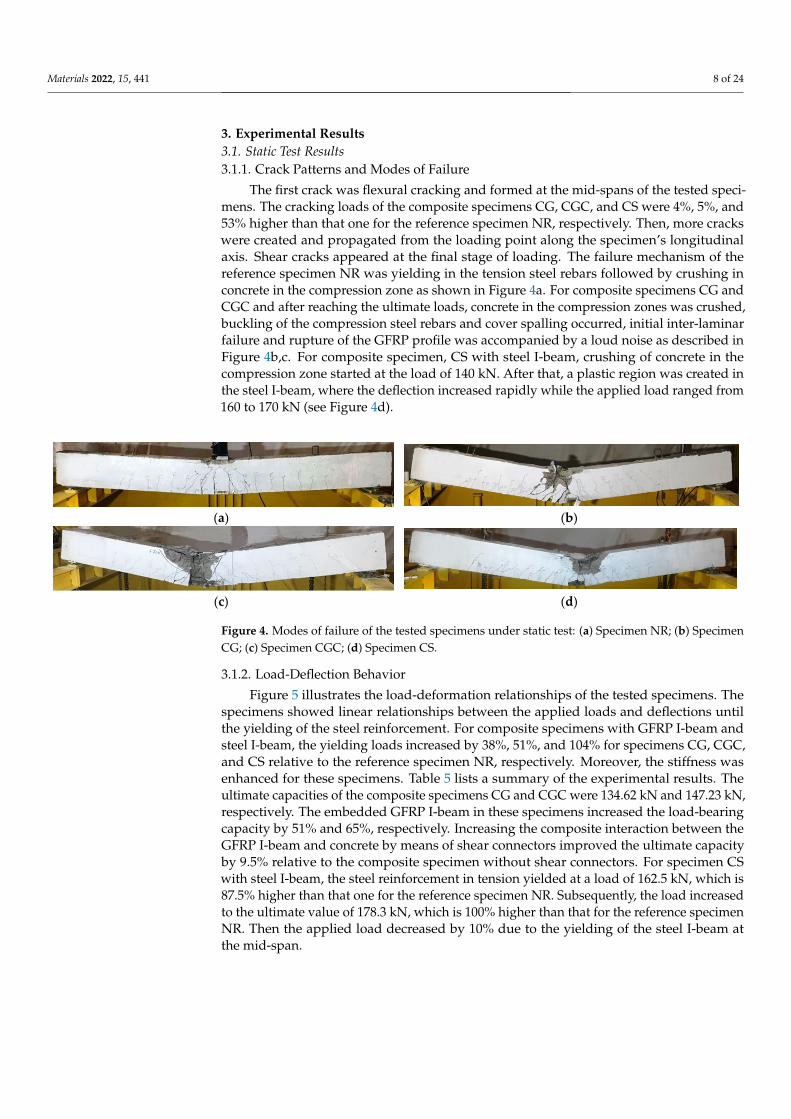
The first crack was flexural cracking and formed at the mid-spans of the tested speci-mens. The cracking loads of the composite specimens CG, CGC, and CS were 4%, 5%, and53% higher than that one for the reference specimen NR, respectively. Then, more crackswere created and propagated from the loading point along the specimen’s longitudinalaxis. Shear cracks appeared at the final stage of loading. The failure mechanism of thereference specimen NR was yielding in the tension steel rebars followed by crushing inconcrete in the compression zone as shown in Figure 4a. For composite specimens CG andCGC and after reaching the ultimate loads, concrete in the compression zones was crushed,buckling of the compression steel rebars and cover spalling occurred, initial inter-laminarfailure and rupture of the GFRP profile was accompanied by a loud noise as described inFigure 4b,c. For composite specimen, CS with steel I-beam, crushing of concrete in thecompression zone started at the load of 140 kN. After that, a plastic region was created inthe steel I-beam, where the deflection increased rapidly while the applied load ranged from160 to 170 kN (see Figure 4d).
Materials 2022, 15, x FOR PEER REVIEW 9 of 26
Materials 2022, 15, x. https://doi.org/10.3390/xxxxx www.mdpi.com/journal/materials
3. Experimental Results
3.1. Static Test Results
3.1.1. Crack Patterns and Modes of Failure
The first crack was flexural cracking and formed at the mid‐spans of the tested spec‐
imens. The cracking loads of the composite specimens CG, CGC, and CS were 4%, 5%,
and 53% higher than that one for the reference specimen NR, respectively. Then, more
cracks were created and propagated from the loading point along the specimen’s longitu‐
dinal axis. Shear cracks appeared at the final stage of loading. The failure mechanism of
the reference specimen NR was yielding in the tension steel rebars followed by crushing
in concrete in the compression zone as shown in Figure 4a. For composite specimens CG
and CGC and after reaching the ultimate loads, concrete in the compression zones was
crushed, buckling of the compression steel rebars and cover spalling occurred, initial in‐
ter‐laminar failure and rupture of the GFRP profile was accompanied by a loud noise as
described in Figure 4b,c. For composite specimen, CS with steel I‐beam, crushing of con‐
crete in the compression zone started at the load of 140 kN. After that, a plastic region was
created in the steel I‐beam, where the deflection increased rapidly while the applied load
ranged from 160 to 170 kN (see Figure 4d).
(a) (b)
(c) (d)
Figure 4. Modes of failure of the tested specimens under static test: (a) Specimen NR; (b) Specimen
CG; (c) Specimen CGC; (d) Specimen CS.
3.1.2. Load‐Deflection Behavior
Figure 5 illustrates the load‐deformation relationships of the tested specimens. The
specimens showed linear relationships between the applied loads and deflections until
the yielding of the steel reinforcement. For composite specimens with GFRP I‐beam and
steel I‐beam, the yielding loads increased by 38%, 51%, and 104% for specimens CG, CGC,
and CS relative to the reference specimen NR, respectively. Moreover, the stiffness was
enhanced for these specimens. Table 5 lists a summary of the experimental results. The
ultimate capacities of the composite specimens CG and CGC were 134.62 kN and 147.23 kN,
respectively. The embedded GFRP I‐beam in these specimens increased the load‐bearing
capacity by 51% and 65%, respectively. Increasing the composite interaction between the
GFRP I‐beam and concrete by means of shear connectors improved the ultimate capacity
by 9.5% relative to the composite specimen without shear connectors. For specimen CS
with steel I‐beam, the steel reinforcement in tension yielded at a load of 162.5 kN, which
is 87.5% higher than that one for the reference specimen NR. Subsequently, the load in‐
creased to the ultimate value of 178.3 kN, which is 100% higher than that for the reference
specimen NR. Then the applied load decreased by 10% due to the yielding of the steel I‐
beam at the mid‐span.
Figure 4. Modes of failure of the tested specimens under static test: (a) Specimen NR; (b) SpecimenCG; (c) Specimen CGC; (d) Specimen CS.
3.1.2. Load-Deflection Behavior
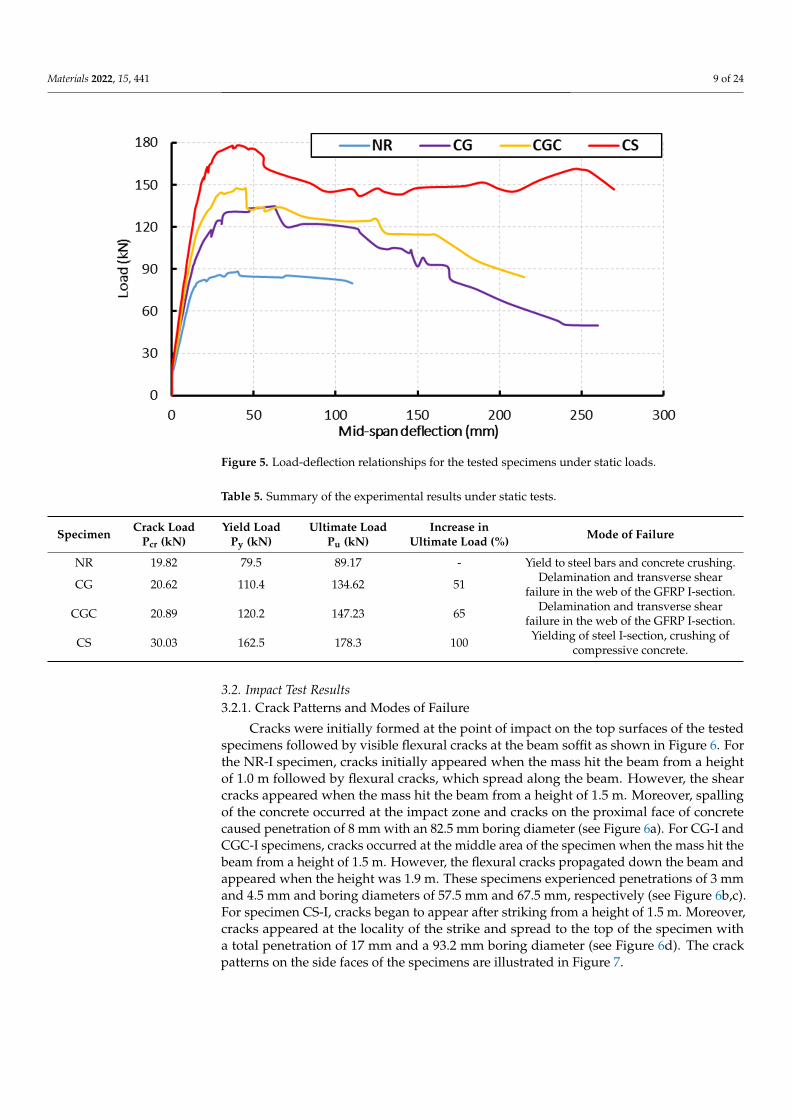
Figure 5 illustrates the load-deformation relationships of the tested specimens. Thespecimens showed linear relationships between the applied loads and deflections untilthe yielding of the steel reinforcement. For composite specimens with GFRP I-beam andsteel I-beam, the yielding loads increased by 38%, 51%, and 104% for specimens CG, CGC,and CS relative to the reference specimen NR, respectively. Moreover, the stiffness wasenhanced for these specimens. Table 5 lists a summary of the experimental results. Theultimate capacities of the composite specimens CG and CGC were 134.62 kN and 147.23 kN,respectively. The embedded GFRP I-beam in these specimens increased the load-bearingcapacity by 51% and 65%, respectively. Increasing the composite interaction between theGFRP I-beam and concrete by means of shear connectors improved the ultimate capacityby 9.5% relative to the composite specimen without shear connectors. For specimen CSwith steel I-beam, the steel reinforcement in tension yielded at a load of 162.5 kN, which is87.5% higher than that one for the reference specimen NR. Subsequently, the load increasedto the ultimate value of 178.3 kN, which is 100% higher than that for the reference specimenNR. Then the applied load decreased by 10% due to the yielding of the steel I-beam atthe mid-span.
Materials 2022, 15, 441 9 of 24
Materials 2022, 15, x FOR PEER REVIEW 10 of 26
Materials 2022, 15, x. https://doi.org/10.3390/xxxxx www.mdpi.com/journal/materials
Table 5. Summary of the experimental results under static tests.
Specimen Crack Load Pcr (kN) Yield Load Py
(kN)
Ultimate Load
Pu (kN)
Increase in
Ultimate Load
(%)
Mode of Failure
NR 19.82 79.5 89.17 ‐ Yield to steel bars and concrete crushing.
CG 20.62 110.4 134.62 51 Delamination and transverse shear failure in
the web of the GFRP I‐section.
CGC 20.89 120.2 147.23 65 Delamination and transverse shear failure in
the web of the GFRP I‐section.
CS 30.03 162.5 178.3 100 Yielding of steel I‐section, crushing of com‐
pressive concrete.
Figure 5. Load‐deflection relationships for the tested specimens under static loads.
3.2. Impact Test Results
3.2.1. Crack Patterns and Modes of Failure
Cracks were initially formed at the point of impact on the top surfaces of the tested
specimens followed by visible flexural cracks at the beam soffit as shown in Figure 6. For
the NR‐I specimen, cracks initially appeared when the mass hit the beam from a height of
1.0 m followed by flexural cracks, which spread along the beam. However, the shear
cracks appeared when the mass hit the beam from a height of 1.5 m. Moreover, spalling
of the concrete occurred at the impact zone and cracks on the proximal face of concrete
caused penetration of 8 mm with an 82.5 mm boring diameter (see Figure 6a). For CG‐I
and CGC‐I specimens, cracks occurred at the middle area of the specimen when the mass
hit the beam from a height of 1.5 m. However, the flexural cracks propagated down the
beam and appeared when the height was 1.9 m. These specimens experienced penetra‐
tions of 3 mm and 4.5 mm and boring diameters of 57.5 mm and 67.5 mm, respectively
(see Figure 6b,c). For specimen CS‐I, cracks began to appear after striking from a height
of 1.5 m. Moreover, cracks appeared at the locality of the strike and spread to the top of the
specimen with a total penetration of 17 mm and a 93.2 mm boring diameter (see Figure 6d).
The crack patterns on the side faces of the specimens are illustrated in Figure 7.
Figure 5. Load-deflection relationships for the tested specimens under static loads.
Table 5. Summary of the experimental results under static tests.
Specimen Crack LoadPcr (kN)
Yield LoadPy (kN)
Ultimate LoadPu (kN)
Increase inUltimate Load (%) Mode of Failure
NR 19.82 79.5 89.17 - Yield to steel bars and concrete crushing.
CG 20.62 110.4 134.62 51 Delamination and transverse shearfailure in the web of the GFRP I-section.
CGC 20.89 120.2 147.23 65 Delamination and transverse shearfailure in the web of the GFRP I-section.
CS 30.03 162.5 178.3 100 Yielding of steel I-section, crushing ofcompressive concrete.
3.2. Impact Test Results3.2.1. Crack Patterns and Modes of Failure
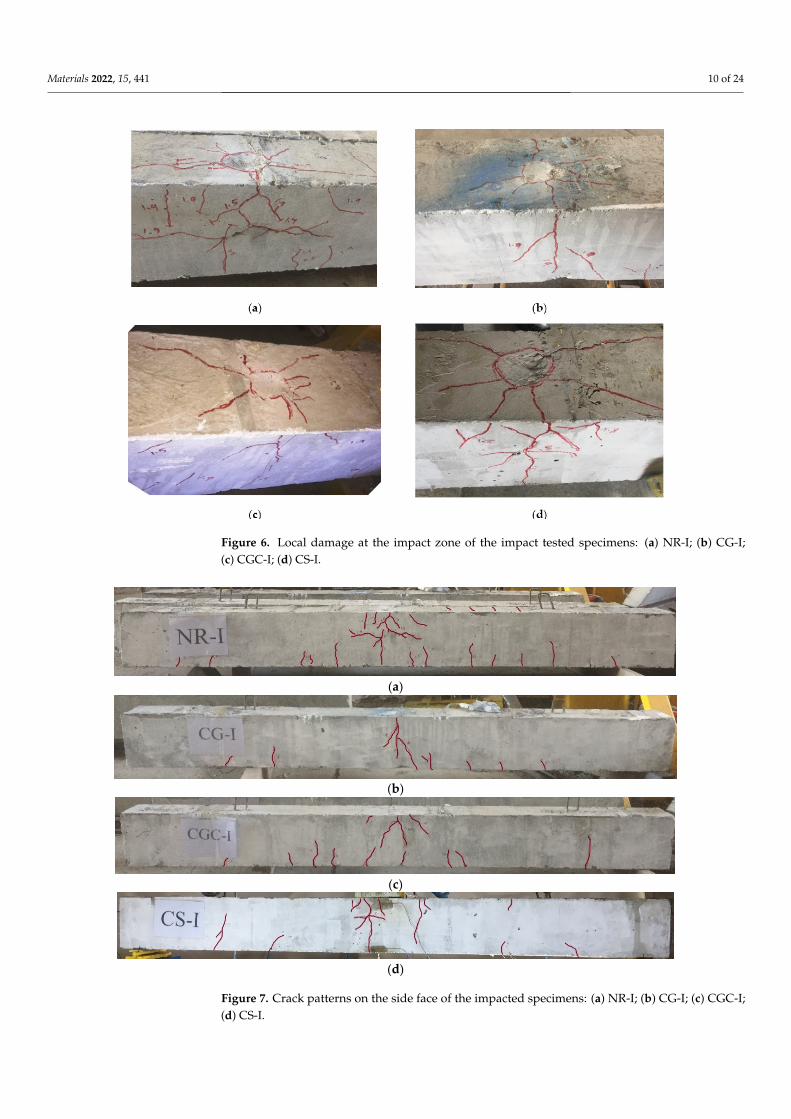
Cracks were initially formed at the point of impact on the top surfaces of the testedspecimens followed by visible flexural cracks at the beam soffit as shown in Figure 6. Forthe NR-I specimen, cracks initially appeared when the mass hit the beam from a heightof 1.0 m followed by flexural cracks, which spread along the beam. However, the shearcracks appeared when the mass hit the beam from a height of 1.5 m. Moreover, spallingof the concrete occurred at the impact zone and cracks on the proximal face of concretecaused penetration of 8 mm with an 82.5 mm boring diameter (see Figure 6a). For CG-I andCGC-I specimens, cracks occurred at the middle area of the specimen when the mass hit thebeam from a height of 1.5 m. However, the flexural cracks propagated down the beam andappeared when the height was 1.9 m. These specimens experienced penetrations of 3 mmand 4.5 mm and boring diameters of 57.5 mm and 67.5 mm, respectively (see Figure 6b,c).For specimen CS-I, cracks began to appear after striking from a height of 1.5 m. Moreover,cracks appeared at the locality of the strike and spread to the top of the specimen witha total penetration of 17 mm and a 93.2 mm boring diameter (see Figure 6d). The crackpatterns on the side faces of the specimens are illustrated in Figure 7.
Materials 2022, 15, 441 10 of 24Materials 2022, 15, x FOR PEER REVIEW 11 of 26
Materials 2022, 15, x. https://doi.org/10.3390/xxxxx www.mdpi.com/journal/materials
Figure 6. Local damage at the impact zone of the impact tested specimens: (a) NR‐I; (b) CG‐I; (c)
CGC‐I; (d) CS‐I.
(a)
(b)
(c)
(d)
Figure 7. Crack patterns on the side face of the impacted specimens: (a) NR‐I; (b) CG‐I; (c) CGC‐I;
(d) CS‐I.
Figure 6. Local damage at the impact zone of the impact tested specimens: (a) NR-I; (b) CG-I;(c) CGC-I; (d) CS-I.
Materials 2022, 15, x FOR PEER REVIEW 11 of 26
Materials 2022, 15, x. https://doi.org/10.3390/xxxxx www.mdpi.com/journal/materials
Figure 6. Local damage at the impact zone of the impact tested specimens: (a) NR‐I; (b) CG‐I; (c)
CGC‐I; (d) CS‐I.
(a)
(b)
(c)
(d)
Figure 7. Crack patterns on the side face of the impacted specimens: (a) NR‐I; (b) CG‐I; (c) CGC‐I;
(d) CS‐I. Figure 7. Crack patterns on the side face of the impacted specimens: (a) NR-I; (b) CG-I; (c) CGC-I;(d) CS-I.
Materials 2022, 15, 441 11 of 24
3.2.2. Impact Response
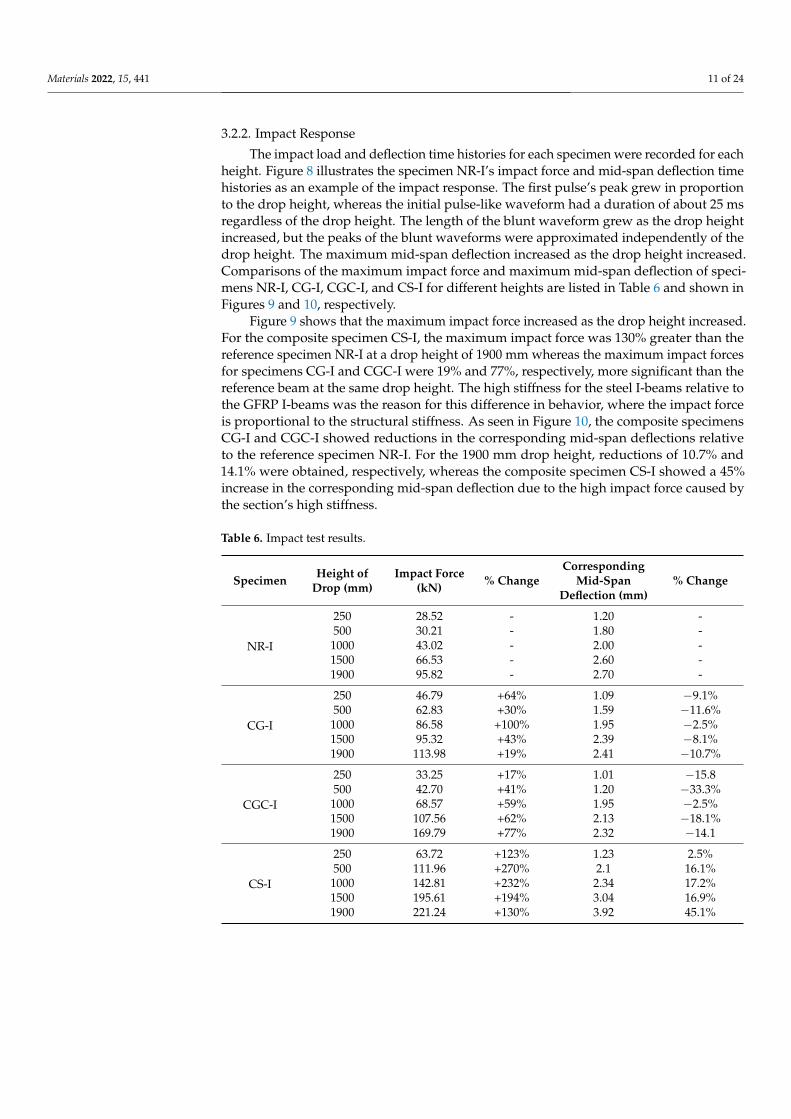
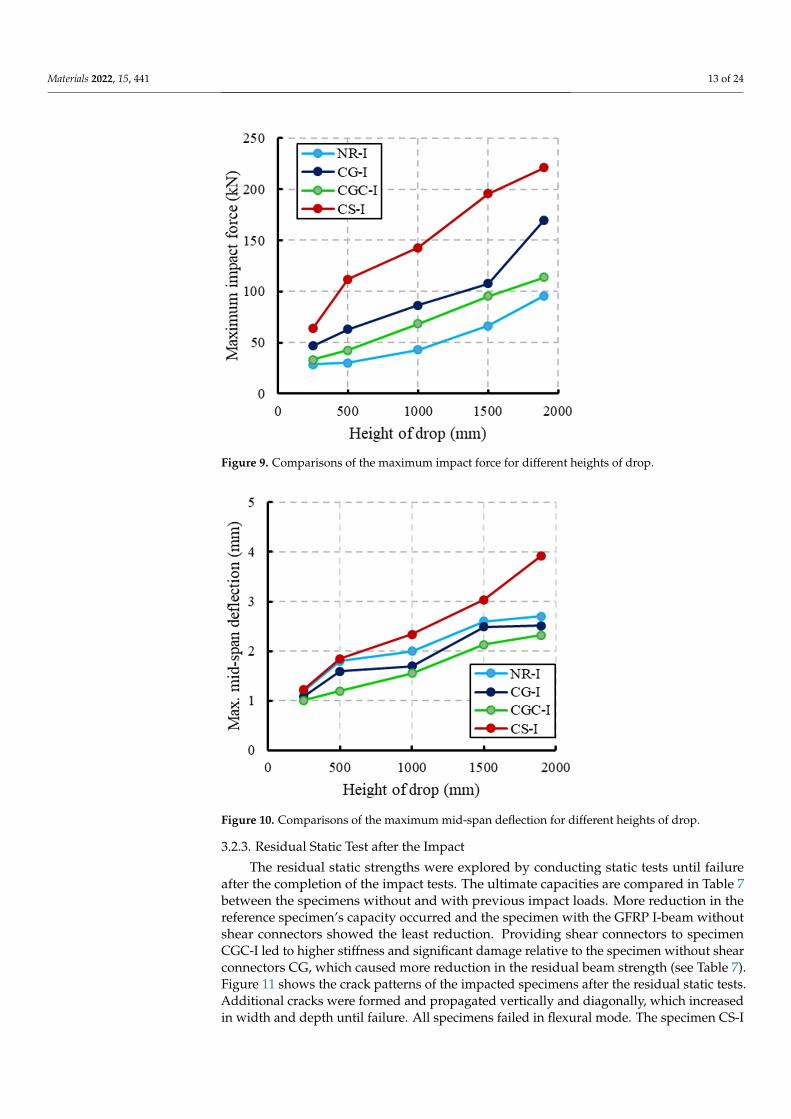
The impact load and deflection time histories for each specimen were recorded for eachheight. Figure 8 illustrates the specimen NR-I’s impact force and mid-span deflection timehistories as an example of the impact response. The first pulse’s peak grew in proportionto the drop height, whereas the initial pulse-like waveform had a duration of about 25 msregardless of the drop height. The length of the blunt waveform grew as the drop heightincreased, but the peaks of the blunt waveforms were approximated independently of thedrop height. The maximum mid-span deflection increased as the drop height increased.Comparisons of the maximum impact force and maximum mid-span deflection of speci-mens NR-I, CG-I, CGC-I, and CS-I for different heights are listed in Table 6 and shown inFigures 9 and 10, respectively.
Figure 9 shows that the maximum impact force increased as the drop height increased.For the composite specimen CS-I, the maximum impact force was 130% greater than thereference specimen NR-I at a drop height of 1900 mm whereas the maximum impact forcesfor specimens CG-I and CGC-I were 19% and 77%, respectively, more significant than thereference beam at the same drop height. The high stiffness for the steel I-beams relative tothe GFRP I-beams was the reason for this difference in behavior, where the impact forceis proportional to the structural stiffness. As seen in Figure 10, the composite specimensCG-I and CGC-I showed reductions in the corresponding mid-span deflections relativeto the reference specimen NR-I. For the 1900 mm drop height, reductions of 10.7% and14.1% were obtained, respectively, whereas the composite specimen CS-I showed a 45%increase in the corresponding mid-span deflection due to the high impact force caused bythe section’s high stiffness.
Table 6. Impact test results.
Specimen Height ofDrop (mm)
Impact Force(kN) % Change
CorrespondingMid-Span
Deflection (mm)% Change
NR-I
250 28.52 - 1.20 -500 30.21 - 1.80 -
1000 43.02 - 2.00 -1500 66.53 - 2.60 -1900 95.82 - 2.70 -
CG-I
250 46.79 +64% 1.09 −9.1%500 62.83 +30% 1.59 −11.6%
1000 86.58 +100% 1.95 −2.5%1500 95.32 +43% 2.39 −8.1%1900 113.98 +19% 2.41 −10.7%
CGC-I
250 33.25 +17% 1.01 −15.8500 42.70 +41% 1.20 −33.3%
1000 68.57 +59% 1.95 −2.5%1500 107.56 +62% 2.13 −18.1%1900 169.79 +77% 2.32 −14.1
CS-I
250 63.72 +123% 1.23 2.5%500 111.96 +270% 2.1 16.1%
1000 142.81 +232% 2.34 17.2%1500 195.61 +194% 3.04 16.9%1900 221.24 +130% 3.92 45.1%

Materials 2022, 15, 441 12 of 24Materials 2022, 15, x FOR PEER REVIEW 13 of 26
Materials 2022, 15, x. https://doi.org/10.3390/xxxxx www.mdpi.com/journal/materials
Figure 8. The specimen NR‐I’s impact force and mid‐span deflection time histories. Figure 8. The specimen NR-I’s impact force and mid-span deflection time histories.
Materials 2022, 15, 441 13 of 24Materials 2022, 15, x FOR PEER REVIEW 14 of 26
Materials 2022, 15, x. https://doi.org/10.3390/xxxxx www.mdpi.com/journal/materials
Figure 9. Comparisons of the maximum impact force for different heights of drop.
Figure 10. Comparisons of the maximum mid‐span deflection for different heights of drop.
3.2.3. Residual Static Test after the Impact
The residual static strengths were explored by conducting static tests until failure
after the completion of the impact tests. The ultimate capacities are compared in Table 7
between the specimens without and with previous impact loads. More reduction in the
reference specimen’s capacity occurred and the specimen with the GFRP I‐beam without
shear connectors showed the least reduction. Providing shear connectors to specimen
CGC‐I led to higher stiffness and significant damage relative to the specimen without
shear connectors CG, which caused more reduction in the residual beam strength (see
Table 7). Figure 11 shows the crack patterns of the impacted specimens after the residual
static tests. Additional cracks were formed and propagated vertically and diagonally,
Figure 9. Comparisons of the maximum impact force for different heights of drop.
Materials 2022, 15, x FOR PEER REVIEW 14 of 26
Materials 2022, 15, x. https://doi.org/10.3390/xxxxx www.mdpi.com/journal/materials
Figure 9. Comparisons of the maximum impact force for different heights of drop.
Figure 10. Comparisons of the maximum mid‐span deflection for different heights of drop.
3.2.3. Residual Static Test after the Impact
The residual static strengths were explored by conducting static tests until failure
after the completion of the impact tests. The ultimate capacities are compared in Table 7
between the specimens without and with previous impact loads. More reduction in the
reference specimen’s capacity occurred and the specimen with the GFRP I‐beam without
shear connectors showed the least reduction. Providing shear connectors to specimen
CGC‐I led to higher stiffness and significant damage relative to the specimen without
shear connectors CG, which caused more reduction in the residual beam strength (see
Table 7). Figure 11 shows the crack patterns of the impacted specimens after the residual
static tests. Additional cracks were formed and propagated vertically and diagonally,
Figure 10. Comparisons of the maximum mid-span deflection for different heights of drop.
3.2.3. Residual Static Test after the Impact
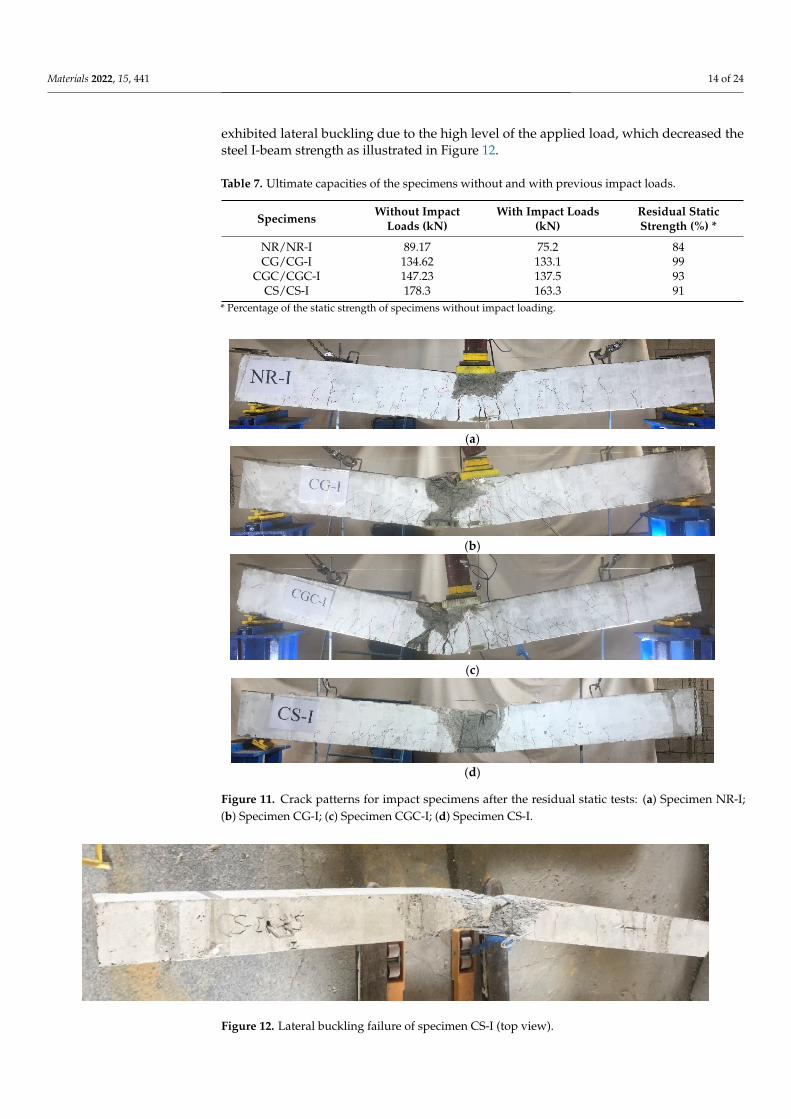
The residual static strengths were explored by conducting static tests until failureafter the completion of the impact tests. The ultimate capacities are compared in Table 7between the specimens without and with previous impact loads. More reduction in thereference specimen’s capacity occurred and the specimen with the GFRP I-beam withoutshear connectors showed the least reduction. Providing shear connectors to specimenCGC-I led to higher stiffness and significant damage relative to the specimen without shearconnectors CG, which caused more reduction in the residual beam strength (see Table 7).Figure 11 shows the crack patterns of the impacted specimens after the residual static tests.Additional cracks were formed and propagated vertically and diagonally, which increasedin width and depth until failure. All specimens failed in flexural mode. The specimen CS-I
Materials 2022, 15, 441 14 of 24
exhibited lateral buckling due to the high level of the applied load, which decreased thesteel I-beam strength as illustrated in Figure 12.
Table 7. Ultimate capacities of the specimens without and with previous impact loads.
Specimens Without ImpactLoads (kN)
With Impact Loads(kN)
Residual StaticStrength (%) *
NR/NR-I 89.17 75.2 84CG/CG-I 134.62 133.1 99
CGC/CGC-I 147.23 137.5 93CS/CS-I 178.3 163.3 91
* Percentage of the static strength of specimens without impact loading.
Materials 2022, 15, x FOR PEER REVIEW 15 of 26
Materials 2022, 15, x. https://doi.org/10.3390/xxxxx www.mdpi.com/journal/materials
which increased in width and depth until failure. All specimens failed in flexural mode.
The specimen CS‐I exhibited lateral buckling due to the high level of the applied load,
which decreased the steel I‐beam strength as illustrated in Figure 12.
Table 7. Ultimate capacities of the specimens without and with previous impact loads.
Specimens Without Impact Loads (kN) With Impact Loads (kN) Residual Static Strength (%)*
NR/NR‐I 89.17 75.2 84
CG/CG‐I 134.62 133.1 99
CGC/CGC‐I 147.23 137.5 93
CS/CS‐I 178.3 163.3 91
* Percentage of the static strength of specimens without impact loading.
(a)
(b)
(c)
(d)
Figure 11. Crack patterns for impact specimens after the residual static tests: (a) Specimen NR‐I;
(b) Specimen CG‐I; (c) Specimen CGC‐I; (d) Specimen CS‐I.
Figure 12. Lateral buckling failure of specimen CS‐I (top view).
Figure 11. Crack patterns for impact specimens after the residual static tests: (a) Specimen NR-I;(b) Specimen CG-I; (c) Specimen CGC-I; (d) Specimen CS-I.
Materials 2022, 15, x FOR PEER REVIEW 15 of 26
Materials 2022, 15, x. https://doi.org/10.3390/xxxxx www.mdpi.com/journal/materials
which increased in width and depth until failure. All specimens failed in flexural mode.
The specimen CS‐I exhibited lateral buckling due to the high level of the applied load,
which decreased the steel I‐beam strength as illustrated in Figure 12.
Table 7. Ultimate capacities of the specimens without and with previous impact loads.
Specimens Without Impact Loads (kN) With Impact Loads (kN) Residual Static Strength (%)*
NR/NR‐I 89.17 75.2 84
CG/CG‐I 134.62 133.1 99
CGC/CGC‐I 147.23 137.5 93
CS/CS‐I 178.3 163.3 91
* Percentage of the static strength of specimens without impact loading.
(a)
(b)
(c)
(d)
Figure 11. Crack patterns for impact specimens after the residual static tests: (a) Specimen NR‐I;
(b) Specimen CG‐I; (c) Specimen CGC‐I; (d) Specimen CS‐I.
Figure 12. Lateral buckling failure of specimen CS‐I (top view). Figure 12. Lateral buckling failure of specimen CS-I (top view).
Materials 2022, 15, 441 15 of 24
4. Numerical Modeling4.1. Finite Element Model
Finite element analysis was performed using the Abaqus software [14]. The developedmodel considered two groups of loading conditions. The first group was the static loadingdefined in terms of general static procedures. The loading was applied as displacement-controlled loadings at the center of the beam whereas the second group was the repeatedimpact loading determined as dynamic explicit analysis. The loading was applied usingthe impactor at the mid-spans of the beams as initial velocities. The proposed models werevalidated using the experimental test results.
The concrete, shear connectors, and steel I-profile were modeled using three-dimensionaleight-node elements with reduced integration (C3D8R). The longitudinal and transversesteel reinforcement were modeled using three-dimensional truss elements (T3D2) with alinear kinematic hardening model. The pultruded GFRP I-profile was simulated using an8-node doubly curved thick shell element with reduced integration (S8R). The impactor inthe impact loading case was modeled by a discrete rigid shell that rotated 360◦ to create thecylindrical shape.
4.2. Material Models
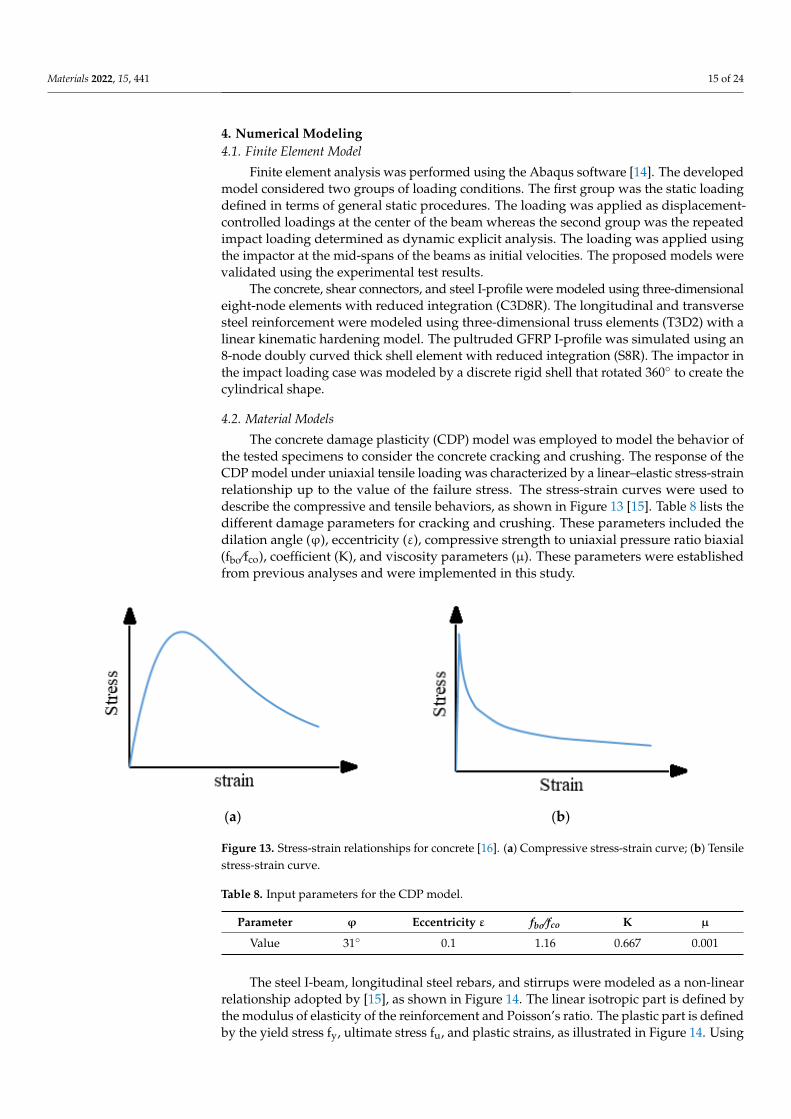
The concrete damage plasticity (CDP) model was employed to model the behavior ofthe tested specimens to consider the concrete cracking and crushing. The response of theCDP model under uniaxial tensile loading was characterized by a linear–elastic stress-strainrelationship up to the value of the failure stress. The stress-strain curves were used todescribe the compressive and tensile behaviors, as shown in Figure 13 [15]. Table 8 lists thedifferent damage parameters for cracking and crushing. These parameters included thedilation angle (ϕ), eccentricity (ε), compressive strength to uniaxial pressure ratio biaxial(fbo⁄fco), coefficient (K), and viscosity parameters (µ). These parameters were establishedfrom previous analyses and were implemented in this study.
Materials 2022, 15, x FOR PEER REVIEW 16 of 26
Materials 2022, 15, x. https://doi.org/10.3390/xxxxx www.mdpi.com/journal/materials
4. Numerical Modeling
4.1. Finite Element Model
Finite element analysis was performed using the Abaqus software [14]. The devel‐
oped model considered two groups of loading conditions. The first group was the static
loading defined in terms of general static procedures. The loading was applied as dis‐
placement‐controlled loadings at the center of the beam whereas the second group was
the repeated impact loading determined as dynamic explicit analysis. The loading was
applied using the impactor at the mid‐spans of the beams as initial velocities. The pro‐
posed models were validated using the experimental test results.
The concrete, shear connectors, and steel I‐profile were modeled using three‐dimen‐
sional eight‐node elements with reduced integration (C3D8R). The longitudinal and trans‐
verse steel reinforcement were modeled using three‐dimensional truss elements (T3D2)
with a linear kinematic hardening model. The pultruded GFRP I‐profile was simulated
using an 8‐node doubly curved thick shell element with reduced integration (S8R). The
impactor in the impact loading case was modeled by a discrete rigid shell that rotated 360°
to create the cylindrical shape.
4.2. Material Models
The concrete damage plasticity (CDP) model was employed to model the behavior
of the tested specimens to consider the concrete cracking and crushing. The response of
the CDP model under uniaxial tensile loading was characterized by a linear–elastic stress‐
strain relationship up to the value of the failure stress. The stress‐strain curves were used
to describe the compressive and tensile behaviors, as shown in Figure 13 [15]. Table 8 lists
the different damage parameters for cracking and crushing. These parameters included
the dilation angle (φ), eccentricity (ε), compressive strength to uniaxial pressure ratio bi‐
axial (fbo⁄fco), coefficient (K), and viscosity parameters (μ). These parameters were estab‐
lished from previous analyses and were implemented in this study.
(a) (b)
Figure 13. Stress‐strain relationships for concrete [16]. (a) Compressive stress‐strain curve; (b) Ten‐
sile stress‐strain curve.
Table 8. Input parameters for the CDP model.
Parameter φ Eccentricity ε fbo⁄fco K μ
Value 31o 0.1 1.16 0.667 0.001
The steel I‐beam, longitudinal steel rebars, and stirrups were modeled as a non‐linear
relationship adopted by [15], as shown in Figure 14. The linear isotropic part is defined by
the modulus of elasticity of the reinforcement and Poisson’s ratio. The plastic part is de‐
fined by the yield stress fy, ultimate stress fu, and plastic strains, as illustrated in Figure 14.
Figure 13. Stress-strain relationships for concrete [16]. (a) Compressive stress-strain curve; (b) Tensilestress-strain curve.
Table 8. Input parameters for the CDP model.
Parameter ϕ Eccentricity ε fbo ⁄fco K µ
Value 31◦ 0.1 1.16 0.667 0.001
The steel I-beam, longitudinal steel rebars, and stirrups were modeled as a non-linearrelationship adopted by [15], as shown in Figure 14. The linear isotropic part is defined bythe modulus of elasticity of the reinforcement and Poisson’s ratio. The plastic part is definedby the yield stress fy, ultimate stress fu, and plastic strains, as illustrated in Figure 14. Using

Materials 2022, 15, 441 16 of 24
a combination of damage initiation criteria, the progressive damage model was employedto characterize the behavior of the pultruded profiles. Hashin’s criteria [17] were usedto determine when the pultruded profile begins to degrade. After satisfying the damageinitiation criteria, the material stiffness of the pultruded profile degrades according to thedamage evolution law. Table 9 lists the values of engineering constants for elastic propertiesof GFRP material, the strength properties to represent the damage intuition criteria, andthe parameters for the progressive damage model presented by damage evolution (fractureenergy) and damage stabilization indicated by viscosity coefficients. The values in this tablewere determined by experimental tests and from the available works of literature [16,18]based on the type of fibers and matrix as well as trial and error.
Materials 2022, 15, x FOR PEER REVIEW 17 of 26
Materials 2022, 15, x. https://doi.org/10.3390/xxxxx www.mdpi.com/journal/materials
Using a combination of damage initiation criteria, the progressive damage model was em‐
ployed to characterize the behavior of the pultruded profiles. Hashin’s criteria [17] were
used to determine when the pultruded profile begins to degrade. After satisfying the dam‐
age initiation criteria, the material stiffness of the pultruded profile degrades according to
the damage evolution law. Table 9 lists the values of engineering constants for elastic
properties of GFRP material, the strength properties to represent the damage intuition
criteria, and the parameters for the progressive damage model presented by damage evo‐
lution (fracture energy) and damage stabilization indicated by viscosity coefficients. The
values in this table were determined by experimental tests and from the available works
of literature [16,18] based on the type of fibers and matrix as well as trial and error.
Figure 14. Stress‐strain relationship of steel I‐beam, rebars, and stirrups.
Table 9. GFRP materials properties and progressive damage parameters input in ABAQUS.
Definition Value
Engineering
Elastic Con‐
stants
Longitudinal Modulus of Elasticity (Ez)E 27.1 GPa **
Transverse Modulus of Elasticity (Ex = Ey) 6.8 GPa
Transverse Shear Modulus of Elasticity (Gxy) 17.5 GPa
In‐Plane Shear Modulus of Elasticity (Gzx = Gzy) 2.7 GPa
Major Poisson’ Ratio (υzx = υzy) 0.23
Minor Poisson’ Ratio (υxy) 0.1
Strength Val‐
ues
Longitudinal Tensile Strength 347.5MPa
Longitudinal Compressive Strength 326.14 MPa
Transverse Tensile Strength 50 MPa
Transverse Compressive Strength 118.3 MPa
Transverse Shear Strength 8.04 MPa
In‐Plane Shear Strength 104.23 MPa
Damage Evo‐
lution
Longitudinal Tensile Fracture Energy 18.3
Longitudinal Compressive Fracture Energy 5.8
Transverse Tensile Fracture Energy 5
Transverse Compressive Fracture Energy 5.5
Damage
Stabilization
Viscosity Coefficient in the Longitudinal Tensile Direction 0.001
Viscosity Coefficient in the Longitudinal Compressive Direction 0.001
Viscosity Coefficient in the Transverse Tensile Direction 0.001
Viscosity Coefficient in the Transverse Compressive Direction 0.001
Figure 14. Stress-strain relationship of steel I-beam, rebars, and stirrups.
Table 9. GFRP materials properties and progressive damage parameters input in ABAQUS.
Definition Value
EngineeringElastic
Constants
Longitudinal Modulus of Elasticity (Ez)E 27.1 GPa **Transverse Modulus of Elasticity (Ex = Ey) 6.8 GPa
Transverse Shear Modulus of Elasticity (Gxy) 17.5 GPaIn-Plane Shear Modulus of Elasticity (Gzx = Gzy) 2.7 GPa
Major Poisson’ Ratio (υzx = υzy) 0.23Minor Poisson’ Ratio (υxy) 0.1
Strength Values
Longitudinal Tensile Strength 347.5 MPaLongitudinal Compressive Strength 326.14 MPa
Transverse Tensile Strength 50 MPaTransverse Compressive Strength 118.3 MPa
Transverse Shear Strength 8.04 MPaIn-Plane Shear Strength 104.23 MPa
DamageEvolution
Longitudinal Tensile Fracture Energy 18.3Longitudinal Compressive Fracture Energy 5.8
Transverse Tensile Fracture Energy 5Transverse Compressive Fracture Energy 5.5
DamageStabilization
Viscosity Coefficient in the Longitudinal Tensile Direction 0.001Viscosity Coefficient in the Longitudinal Compressive Direction 0.001
Viscosity Coefficient in the Transverse Tensile Direction 0.001Viscosity Coefficient in the Transverse Compressive Direction 0.001
4.3. Static Analysis
The numerical model employed the general static processes by using the displacement-controlled loading. The suggested model was validated using experimental data from the

Materials 2022, 15, 441 17 of 24
tested specimens NR, CG, and CGC. The assembled FE model for the composite specimenCGC is shown in Figure 15. The embedded technique with a complete bond was employedto simulate the interaction between the steel rebars and concrete as well as the GFRP profileand concrete.
Materials 2022, 15, x FOR PEER REVIEW 18 of 26
Materials 2022, 15, x. https://doi.org/10.3390/xxxxx www.mdpi.com/journal/materials
4.3. Static Analysis
The numerical model employed the general static processes by using the displace‐
ment‐controlled loading. The suggested model was validated using experimental data
from the tested specimens NR, CG, and CGC. The assembled FE model for the composite
specimen CGC is shown in Figure 15. The embedded technique with a complete bond was
employed to simulate the interaction between the steel rebars and concrete as well as the
GFRP profile and concrete.
Figure 15. FE mesh of the analyzed specimen CGC for static analysis.
Model Verifications
Figure 16 presents comparisons between the experimental and FE results in terms of
the load‐deflection relationships. The analyzed beams showed initially linear elastic be‐
havior with a higher stiffness than the experimental results. These beams showed ±6% or
less high capacities relative to the experimental results. The perfect bond assumed be‐
tween the concrete and steel rebars as well as the GFRP profile was the main reason for
this difference in response. Moreover, the boundary conditions, as well as the material
constitutive models, were considered ideal in the numerical analyses relative to those in
the experiments. In general, there was good agreement between the experimental and FE
results under static loading.
(a) (b)
Figure 15. FE mesh of the analyzed specimen CGC for static analysis.
Model Verifications
Figure 16 presents comparisons between the experimental and FE results in termsof the load-deflection relationships. The analyzed beams showed initially linear elasticbehavior with a higher stiffness than the experimental results. These beams showed ±6%or less high capacities relative to the experimental results. The perfect bond assumedbetween the concrete and steel rebars as well as the GFRP profile was the main reason forthis difference in response. Moreover, the boundary conditions, as well as the materialconstitutive models, were considered ideal in the numerical analyses relative to those inthe experiments. In general, there was good agreement between the experimental and FEresults under static loading.
Materials 2022, 15, x FOR PEER REVIEW 18 of 26
Materials 2022, 15, x. https://doi.org/10.3390/xxxxx www.mdpi.com/journal/materials
4.3. Static Analysis
The numerical model employed the general static processes by using the displace‐
ment‐controlled loading. The suggested model was validated using experimental data
from the tested specimens NR, CG, and CGC. The assembled FE model for the composite
specimen CGC is shown in Figure 15. The embedded technique with a complete bond was
employed to simulate the interaction between the steel rebars and concrete as well as the
GFRP profile and concrete.
Figure 15. FE mesh of the analyzed specimen CGC for static analysis.
Model Verifications
Figure 16 presents comparisons between the experimental and FE results in terms of
the load‐deflection relationships. The analyzed beams showed initially linear elastic be‐
havior with a higher stiffness than the experimental results. These beams showed ±6% or
less high capacities relative to the experimental results. The perfect bond assumed be‐
tween the concrete and steel rebars as well as the GFRP profile was the main reason for
this difference in response. Moreover, the boundary conditions, as well as the material
constitutive models, were considered ideal in the numerical analyses relative to those in
the experiments. In general, there was good agreement between the experimental and FE
results under static loading.
(a) (b)
Figure 16. Cont.
Materials 2022, 15, 441 18 of 24
Materials 2022, 15, x FOR PEER REVIEW 19 of 26
Materials 2022, 15, x. https://doi.org/10.3390/xxxxx www.mdpi.com/journal/materials
(c)
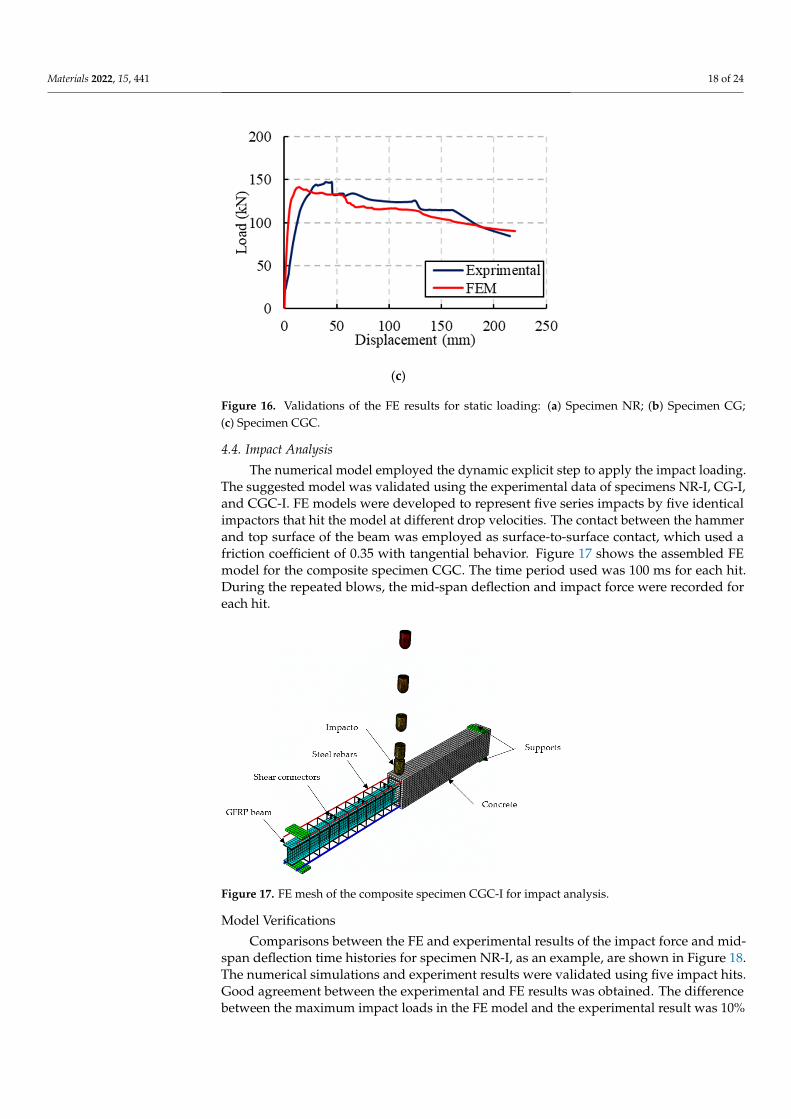
Figure 16. Validations of the FE results for static loading: (a) Specimen NR; (b) Specimen CG; (c)
Specimen CGC.
4.4. Impact Analysis
The numerical model employed the dynamic explicit step to apply the impact load‐
ing. The suggested model was validated using the experimental data of specimens NR‐I,
CG‐I, and CGC‐I. FE models were developed to represent five series impacts by five iden‐
tical impactors that hit the model at different drop velocities. The contact between the
hammer and top surface of the beam was employed as surface‐to‐surface contact, which
used a friction coefficient of 0.35 with tangential behavior. Figure 17 shows the assembled
FE model for the composite specimen CGC. The time period used was 100 ms for each hit.
During the repeated blows, the mid‐span deflection and impact force were recorded for
each hit.
Figure 17. FE mesh of the composite specimen CGC‐I for impact analysis.
Model Verifications
Comparisons between the FE and experimental results of the impact force and mid‐
span deflection time histories for specimen NR‐I, as an example, are shown in Figure 18.
The numerical simulations and experiment results were validated using five impact hits.
Good agreement between the experimental and FE results was obtained. The difference
Figure 16. Validations of the FE results for static loading: (a) Specimen NR; (b) Specimen CG;(c) Specimen CGC.
4.4. Impact Analysis
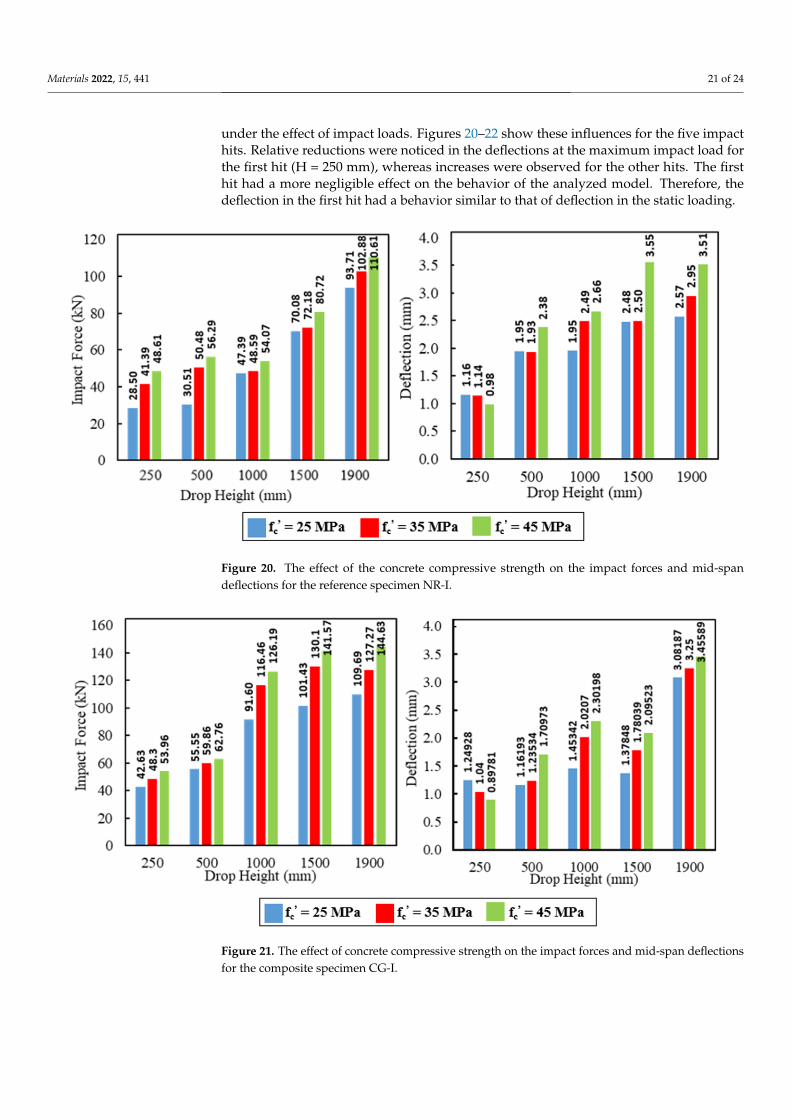
The numerical model employed the dynamic explicit step to apply the impact loading.The suggested model was validated using the experimental data of specimens NR-I, CG-I,and CGC-I. FE models were developed to represent five series impacts by five identicalimpactors that hit the model at different drop velocities. The contact between the hammerand top surface of the beam was employed as surface-to-surface contact, which used afriction coefficient of 0.35 with tangential behavior. Figure 17 shows the assembled FEmodel for the composite specimen CGC. The time period used was 100 ms for each hit.During the repeated blows, the mid-span deflection and impact force were recorded foreach hit.
Materials 2022, 15, x FOR PEER REVIEW 19 of 26
Materials 2022, 15, x. https://doi.org/10.3390/xxxxx www.mdpi.com/journal/materials
(c)
Figure 16. Validations of the FE results for static loading: (a) Specimen NR; (b) Specimen CG; (c)
Specimen CGC.
4.4. Impact Analysis
The numerical model employed the dynamic explicit step to apply the impact load‐
ing. The suggested model was validated using the experimental data of specimens NR‐I,
CG‐I, and CGC‐I. FE models were developed to represent five series impacts by five iden‐
tical impactors that hit the model at different drop velocities. The contact between the
hammer and top surface of the beam was employed as surface‐to‐surface contact, which
used a friction coefficient of 0.35 with tangential behavior. Figure 17 shows the assembled
FE model for the composite specimen CGC. The time period used was 100 ms for each hit.
During the repeated blows, the mid‐span deflection and impact force were recorded for
each hit.
Figure 17. FE mesh of the composite specimen CGC‐I for impact analysis.
Model Verifications
Comparisons between the FE and experimental results of the impact force and mid‐
span deflection time histories for specimen NR‐I, as an example, are shown in Figure 18.
The numerical simulations and experiment results were validated using five impact hits.
Good agreement between the experimental and FE results was obtained. The difference
Figure 17. FE mesh of the composite specimen CGC-I for impact analysis.
Model Verifications
Comparisons between the FE and experimental results of the impact force and mid-span deflection time histories for specimen NR-I, as an example, are shown in Figure 18.The numerical simulations and experiment results were validated using five impact hits.Good agreement between the experimental and FE results was obtained. The differencebetween the maximum impact loads in the FE model and the experimental result was 10%

Materials 2022, 15, 441 19 of 24
of all specimens. Moreover, this difference was about 6% of the mid-span deflections forall specimens.
Materials 2022, 15, x FOR PEER REVIEW 20 of 26
Materials 2022, 15, x. https://doi.org/10.3390/xxxxx www.mdpi.com/journal/materials
between the maximum impact loads in the FE model and the experimental result was 10%
of all specimens. Moreover, this difference was about 6% of the mid‐span deflections for
all specimens.
Figure 18. Validations of the experimental and FE results of the impact force and mid‐span deflec‐
tion time histories for specimen NR‐I. Figure 18. Validations of the experimental and FE results of the impact force and mid-span deflectiontime histories for specimen NR-I.
5. Parametric Study
A parametric study was carried out to investigate the influence of the concrete com-pressive strength on the ultimate strength of the composite specimens with the GFRPI-beams under the effect of static and impact loadings.

Materials 2022, 15, 441 20 of 24
5.1. Static Analysis
The influence of different concrete compressive strengths of 25 MPa, 35 MPa, and45 MPa on the static flexural behavior of the analyzed specimens was investigated. Table 10and Figure 19 illustrate the concrete compressive strength effect on the ultimate load capac-ity and the corresponding deflection. As the compressive strength increased, the ultimateload capacity increased and the corresponding deflection decreased. The increasing anddecreasing percentages were calculated based on the 25 MPa as the reference compressivestrength. For the composite specimens, the ultimate load capacity was improved by 23%and 40% for compressive strengths 35 MPa and 45 MPa, respectively. However, theseimprovements were 13% and 22% for the reference specimen NR, respectively. On the otherhand, the corresponding deflections were reduced by 60% for the specimen CG. However,these reductions were 23% and 48% for the concrete strength 35 MPa and 45 MPa, respec-tively, for the specimen CGC. These results confirmed the effectiveness of concrete strengthto improve the stiffness of the composite specimens is less pronounced when the shearconnectors were used. However, the same effect on the ultimate load capacity was obtained.For specimen NR, the corresponding mid-span deflections were reduced only by 4.4% and10.4% for the concrete strengths 35 MPa and 45 MPa, respectively. The concrete compressivestrength was more effective in improving the behavior of the composite specimens relativeto those without GFRP I-beams.
Table 10. Summary of the concrete compressive strength effects.
SpecimensCompressive
Strength(MPa)
Max. Load(kN)
Increase inMax. Load
(%)
Deflection atMax. Load
(mm)
Decrease inDeflection
(%)
NR25 94.43 - 22.63 -35 107.00 13.31 21.64 4.445 115.64 22.46 20.27 10.4
CG25 127.5 - 18 -35 156.71 23 7.28 59.645 180.1 41.8 6.84 62
CGC25 141.19 - 14.127 -35 173.88 23.15 10.83 23.345 196.73 39.33 7.28 48.47
Materials 2022, 15, x FOR PEER REVIEW 21 of 26
Materials 2022, 15, x. https://doi.org/10.3390/xxxxx www.mdpi.com/journal/materials
5. Parametric Study
A parametric study was carried out to investigate the influence of the concrete com‐
pressive strength on the ultimate strength of the composite specimens with the GFRP I‐
beams under the effect of static and impact loadings.
5.1. Static Analysis
The influence of different concrete compressive strengths of 25 MPa, 35 MPa, and 45
MPa on the static flexural behavior of the analyzed specimens was investigated. Table 10
and Figure 19 illustrate the concrete compressive strength effect on the ultimate load ca‐
pacity and the corresponding deflection. As the compressive strength increased, the ulti‐
mate load capacity increased and the corresponding deflection decreased. The increasing
and decreasing percentages were calculated based on the 25 MPa as the reference com‐
pressive strength. For the composite specimens, the ultimate load capacity was improved
by 23% and 40% for compressive strengths 35 MPa and 45 MPa, respectively. However,
these improvements were 13% and 22% for the reference specimen NR, respectively. On
the other hand, the corresponding deflections were reduced by 60% for the specimen CG.
However, these reductions were 23% and 48% for the concrete strength 35 MPa and 45
MPa, respectively, for the specimen CGC. These results confirmed the effectiveness of
concrete strength to improve the stiffness of the composite specimens is less pronounced
when the shear connectors were used. However, the same effect on the ultimate load ca‐
pacity was obtained. For specimen NR, the corresponding mid‐span deflections were re‐
duced only by 4.4% and 10.4% for the concrete strengths 35 MPa and 45 MPa, respectively.
The concrete compressive strength was more effective in improving the behavior of the
composite specimens relative to those without GFRP I‐beams.
Table 10. Summary of the concrete compressive strength effects.
Specimens Compressive Strength
(MPa) Max. Load (kN)
Increase in Max. Load
(%)
Deflection at Max. Load
(mm)
Decrease in
Deflection (%)
NR
25 94.43 ‐ 22.63 ‐
35 107.00 13.31 21.64 4.4
45 115.64 22.46 20.27 10.4
CG
25 127.5 ‐ 18 ‐
35 156.71 23 7.28 59.6
45 180.1 41.8 6.84 62
CGC
25 141.19 ‐ 14.127 ‐
35 173.88 23.15 10.83 23.3
45 196.73 39.33 7.28 48.47
Figure 19. The effect of concrete compressive strength on the ultimate load capacity and correspond‐
ing deflection for the analyzed specimens. Figure 19. The effect of concrete compressive strength on the ultimate load capacity and correspond-ing deflection for the analyzed specimens.
5.2. Impact Analysis
The concrete compressive strengths 25 MPa, 35 MPa, and 45 MPa were examined todetermine their influences on the load capacity and corresponding mid-span deflection
Materials 2022, 15, 441 21 of 24
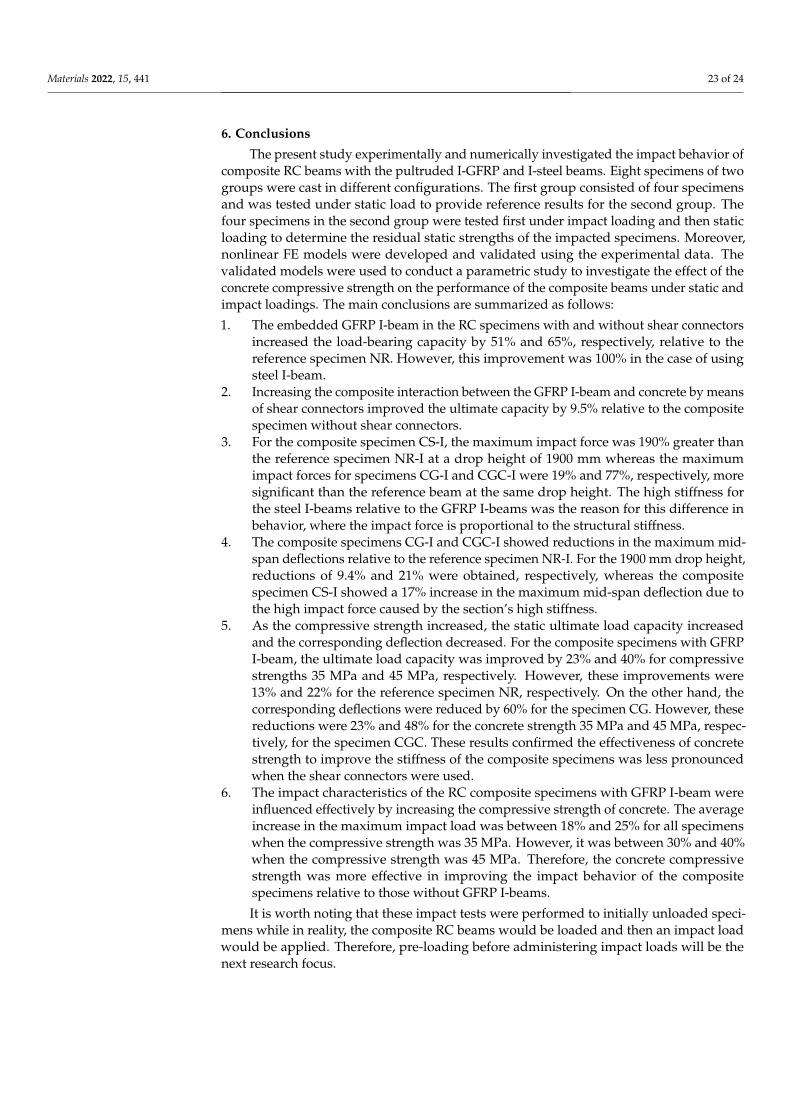
under the effect of impact loads. Figures 20–22 show these influences for the five impacthits. Relative reductions were noticed in the deflections at the maximum impact load forthe first hit (H = 250 mm), whereas increases were observed for the other hits. The firsthit had a more negligible effect on the behavior of the analyzed model. Therefore, thedeflection in the first hit had a behavior similar to that of deflection in the static loading.
Materials 2022, 15, x FOR PEER REVIEW 22 of 26
Materials 2022, 15, x. https://doi.org/10.3390/xxxxx www.mdpi.com/journal/materials
5.2. Impact Analysis
The concrete compressive strengths 25 MPa, 35 MPa, and 45 MPa were examined to
determine their influences on the load capacity and corresponding mid‐span deflection
under the effect of impact loads. Figures 20–22 show these influences for the five impact
hits. Relative reductions were noticed in the deflections at the maximum impact load for
the first hit (H = 250 mm), whereas increases were observed for the other hits. The first hit
had a more negligible effect on the behavior of the analyzed model. Therefore, the deflec‐
tion in the first hit had a behavior similar to that of deflection in the static loading.
Figure 20. The effect of the concrete compressive strength on the impact forces and mid‐span de‐
flections for the reference specimen NR‐I.
Figure 21. The effect of concrete compressive strength on the impact forces and mid‐span deflections
for the composite specimen CG‐I.
Figure 20. The effect of the concrete compressive strength on the impact forces and mid-spandeflections for the reference specimen NR-I.
Materials 2022, 15, x FOR PEER REVIEW 22 of 26
Materials 2022, 15, x. https://doi.org/10.3390/xxxxx www.mdpi.com/journal/materials
5.2. Impact Analysis
The concrete compressive strengths 25 MPa, 35 MPa, and 45 MPa were examined to
determine their influences on the load capacity and corresponding mid‐span deflection
under the effect of impact loads. Figures 20–22 show these influences for the five impact
hits. Relative reductions were noticed in the deflections at the maximum impact load for
the first hit (H = 250 mm), whereas increases were observed for the other hits. The first hit
had a more negligible effect on the behavior of the analyzed model. Therefore, the deflec‐
tion in the first hit had a behavior similar to that of deflection in the static loading.
Figure 20. The effect of the concrete compressive strength on the impact forces and mid‐span de‐
flections for the reference specimen NR‐I.
Figure 21. The effect of concrete compressive strength on the impact forces and mid‐span deflections
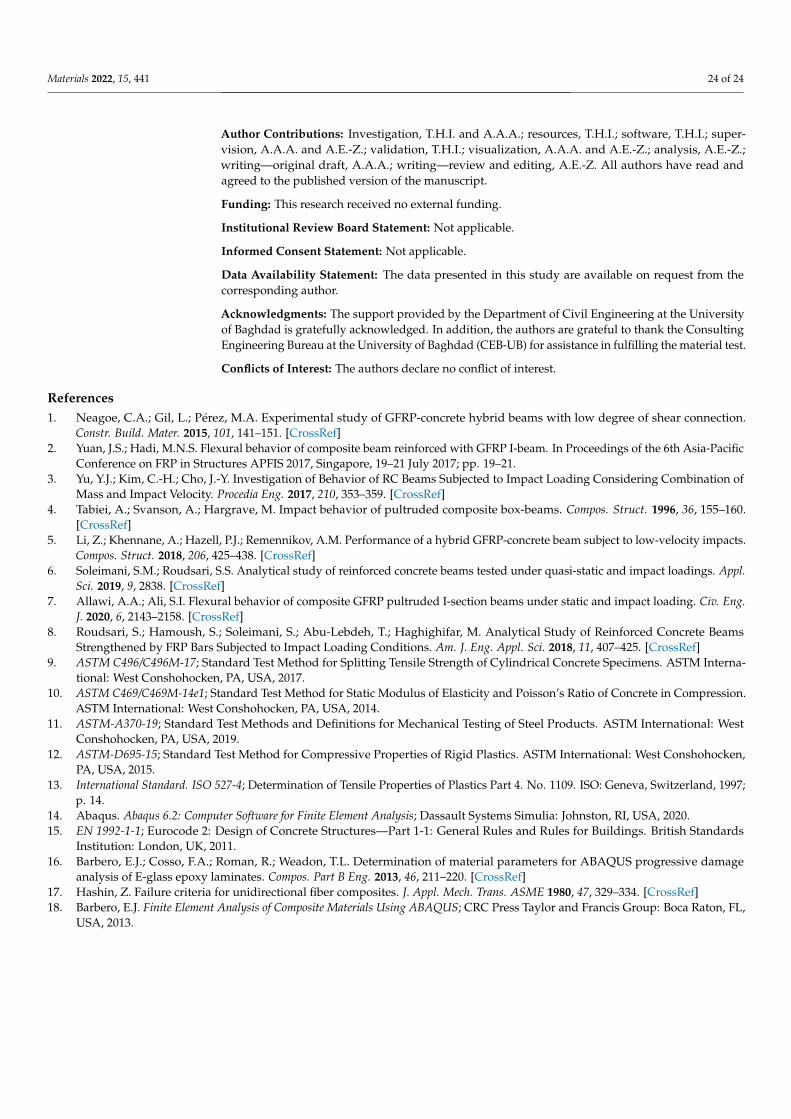
for the composite specimen CG‐I. Figure 21. The effect of concrete compressive strength on the impact forces and mid-span deflectionsfor the composite specimen CG-I.

Materials 2022, 15, 441 22 of 24Materials 2022, 15, x FOR PEER REVIEW 23 of 26
Materials 2022, 15, x. https://doi.org/10.3390/xxxxx www.mdpi.com/journal/materials
Figure 22. The effect of concrete compressive strength on the impact forces and mid‐span deflections
for the composite specimen CGC‐I.
Variation percentages in the impact load and mid‐span deflection were calculated
based on the results of the compressive strength 25 MPa as listed in Tables 11 and 12,
respectively. The average increase in the maximum impact load was between 18% and
25% for all specimens when the compressive strength was 35 MPa. However, it was be‐
tween 30% and 40% when the compressive strength was 45 MPa. Likewise, for deflection,
the average difference in the maximum deflection at the maximum impact load was be‐
tween 9% and 25% for all specimens when the compressive strength was 35 MPa. This
difference was ranged between 30% and 43% when the compressive strength was 45 MPa.
The impact characteristics of the RC composite specimens with GFRP I‐beam were influ‐
enced effectively by increasing the compressive strength of concrete.
Table 11. Summary of the concrete compressive strength effects on the impact force.
Specimens
Compressive
Strength
(MPa)
Increase in Max. Impact Load (%) for Drop Height (mm) Average
Increasing Ratio
(%) 250 500 1000 1500 1900
NR‐I 35 45.25 65.44 2.53 3 9.78 25.2
45 70.56 84.48 14.1 15.18 18.03 40.47
CG‐I 35 13.31 7.76 27.14 28.27 16.02 18.5
45 26.59 12.98 37.76 39.58 31.85 29.75
CGC‐I 35 40.83 24.87 12.06 22.91 4.57 21.05
45 75.83 48.87 27.96 38 13.54 40.84
Figure 22. The effect of concrete compressive strength on the impact forces and mid-span deflectionsfor the composite specimen CGC-I.
Variation percentages in the impact load and mid-span deflection were calculatedbased on the results of the compressive strength 25 MPa as listed in Tables 11 and 12,respectively. The average increase in the maximum impact load was between 18% and 25%for all specimens when the compressive strength was 35 MPa. However, it was between30% and 40% when the compressive strength was 45 MPa. Likewise, for deflection, theaverage difference in the maximum deflection at the maximum impact load was between9% and 25% for all specimens when the compressive strength was 35 MPa. This differencewas ranged between 30% and 43% when the compressive strength was 45 MPa. Theimpact characteristics of the RC composite specimens with GFRP I-beam were influencedeffectively by increasing the compressive strength of concrete.
Table 11. Summary of the concrete compressive strength effects on the impact force.
Specimens Compressive Strength(MPa)
Increase in Max. Impact Load (%) for Drop Height (mm) Average IncreasingRatio (%)250 500 1000 1500 1900
NR-I35 45.25 65.44 2.53 3 9.78 25.245 70.56 84.48 14.1 15.18 18.03 40.47
CG-I35 13.31 7.76 27.14 28.27 16.02 18.545 26.59 12.98 37.76 39.58 31.85 29.75
CGC-I35 40.83 24.87 12.06 22.91 4.57 21.0545 75.83 48.87 27.96 38 13.54 40.84
Table 12. Summary of the concrete compressive strength effects on the deflection.
Specimens Compressive Strength(MPa)
The Difference in Max. Deflection (%) for Drop Height (mm) Average DifferenceRatio (%)250 500 1000 1500 1900
NR-I35 −1.4 −0.9 27.27 0.89 14.59 9.0345 −14.9 22.18 36.48 43.5 36.56 30.72
CG-I35 −16.7 6.32 39.03 29.15 5.46 19.3445 −28.1 47.15 58.38 52 12.14 39.56
CGC-I35 −0.4 32.6 16.11 36.55 40.37 25.2145 −2.1 67.55 26.25 64 56.9 43.3
Materials 2022, 15, 441 23 of 24
6. Conclusions
The present study experimentally and numerically investigated the impact behavior ofcomposite RC beams with the pultruded I-GFRP and I-steel beams. Eight specimens of twogroups were cast in different configurations. The first group consisted of four specimensand was tested under static load to provide reference results for the second group. Thefour specimens in the second group were tested first under impact loading and then staticloading to determine the residual static strengths of the impacted specimens. Moreover,nonlinear FE models were developed and validated using the experimental data. Thevalidated models were used to conduct a parametric study to investigate the effect of theconcrete compressive strength on the performance of the composite beams under static andimpact loadings. The main conclusions are summarized as follows:
1. The embedded GFRP I-beam in the RC specimens with and without shear connectorsincreased the load-bearing capacity by 51% and 65%, respectively, relative to thereference specimen NR. However, this improvement was 100% in the case of usingsteel I-beam.
2. Increasing the composite interaction between the GFRP I-beam and concrete by meansof shear connectors improved the ultimate capacity by 9.5% relative to the compositespecimen without shear connectors.
3. For the composite specimen CS-I, the maximum impact force was 190% greater thanthe reference specimen NR-I at a drop height of 1900 mm whereas the maximumimpact forces for specimens CG-I and CGC-I were 19% and 77%, respectively, moresignificant than the reference beam at the same drop height. The high stiffness forthe steel I-beams relative to the GFRP I-beams was the reason for this difference inbehavior, where the impact force is proportional to the structural stiffness.
4. The composite specimens CG-I and CGC-I showed reductions in the maximum mid-span deflections relative to the reference specimen NR-I. For the 1900 mm drop height,reductions of 9.4% and 21% were obtained, respectively, whereas the compositespecimen CS-I showed a 17% increase in the maximum mid-span deflection due tothe high impact force caused by the section’s high stiffness.
5. As the compressive strength increased, the static ultimate load capacity increasedand the corresponding deflection decreased. For the composite specimens with GFRPI-beam, the ultimate load capacity was improved by 23% and 40% for compressivestrengths 35 MPa and 45 MPa, respectively. However, these improvements were13% and 22% for the reference specimen NR, respectively. On the other hand, thecorresponding deflections were reduced by 60% for the specimen CG. However, thesereductions were 23% and 48% for the concrete strength 35 MPa and 45 MPa, respec-tively, for the specimen CGC. These results confirmed the effectiveness of concretestrength to improve the stiffness of the composite specimens was less pronouncedwhen the shear connectors were used.
6. The impact characteristics of the RC composite specimens with GFRP I-beam wereinfluenced effectively by increasing the compressive strength of concrete. The averageincrease in the maximum impact load was between 18% and 25% for all specimenswhen the compressive strength was 35 MPa. However, it was between 30% and 40%when the compressive strength was 45 MPa. Therefore, the concrete compressivestrength was more effective in improving the impact behavior of the compositespecimens relative to those without GFRP I-beams.
It is worth noting that these impact tests were performed to initially unloaded speci-mens while in reality, the composite RC beams would be loaded and then an impact loadwould be applied. Therefore, pre-loading before administering impact loads will be thenext research focus.
Materials 2022, 15, 441 24 of 24
Author Contributions: Investigation, T.H.I. and A.A.A.; resources, T.H.I.; software, T.H.I.; super-vision, A.A.A. and A.E.-Z.; validation, T.H.I.; visualization, A.A.A. and A.E.-Z.; analysis, A.E.-Z.;writing—original draft, A.A.A.; writing—review and editing, A.E.-Z. All authors have read andagreed to the published version of the manuscript.
Funding: This research received no external funding.
Institutional Review Board Statement: Not applicable.
Informed Consent Statement: Not applicable.
Data Availability Statement: The data presented in this study are available on request from thecorresponding author.
Acknowledgments: The support provided by the Department of Civil Engineering at the Universityof Baghdad is gratefully acknowledged. In addition, the authors are grateful to thank the ConsultingEngineering Bureau at the University of Baghdad (CEB-UB) for assistance in fulfilling the material test.
Conflicts of Interest: The authors declare no conflict of interest.
References1. Neagoe, C.A.; Gil, L.; Pérez, M.A. Experimental study of GFRP-concrete hybrid beams with low degree of shear connection.
Constr. Build. Mater. 2015, 101, 141–151. [CrossRef]2. Yuan, J.S.; Hadi, M.N.S. Flexural behavior of composite beam reinforced with GFRP I-beam. In Proceedings of the 6th Asia-Pacific
Conference on FRP in Structures APFIS 2017, Singapore, 19–21 July 2017; pp. 19–21.3. Yu, Y.J.; Kim, C.-H.; Cho, J.-Y. Investigation of Behavior of RC Beams Subjected to Impact Loading Considering Combination of
Mass and Impact Velocity. Procedia Eng. 2017, 210, 353–359. [CrossRef]4. Tabiei, A.; Svanson, A.; Hargrave, M. Impact behavior of pultruded composite box-beams. Compos. Struct. 1996, 36, 155–160.
[CrossRef]5. Li, Z.; Khennane, A.; Hazell, P.J.; Remennikov, A.M. Performance of a hybrid GFRP-concrete beam subject to low-velocity impacts.
Compos. Struct. 2018, 206, 425–438. [CrossRef]6. Soleimani, S.M.; Roudsari, S.S. Analytical study of reinforced concrete beams tested under quasi-static and impact loadings. Appl.
Sci. 2019, 9, 2838. [CrossRef]7. Allawi, A.A.; Ali, S.I. Flexural behavior of composite GFRP pultruded I-section beams under static and impact loading. Civ. Eng.
J. 2020, 6, 2143–2158. [CrossRef]8. Roudsari, S.; Hamoush, S.; Soleimani, S.; Abu-Lebdeh, T.; Haghighifar, M. Analytical Study of Reinforced Concrete Beams
Strengthened by FRP Bars Subjected to Impact Loading Conditions. Am. J. Eng. Appl. Sci. 2018, 11, 407–425. [CrossRef]9. ASTM C496/C496M-17; Standard Test Method for Splitting Tensile Strength of Cylindrical Concrete Specimens. ASTM Interna-
tional: West Conshohocken, PA, USA, 2017.10. ASTM C469/C469M-14e1; Standard Test Method for Static Modulus of Elasticity and Poisson’s Ratio of Concrete in Compression.
ASTM International: West Conshohocken, PA, USA, 2014.11. ASTM-A370-19; Standard Test Methods and Definitions for Mechanical Testing of Steel Products. ASTM International: West
Conshohocken, PA, USA, 2019.12. ASTM-D695-15; Standard Test Method for Compressive Properties of Rigid Plastics. ASTM International: West Conshohocken,
PA, USA, 2015.13. International Standard. ISO 527-4; Determination of Tensile Properties of Plastics Part 4. No. 1109. ISO: Geneva, Switzerland, 1997;
p. 14.14. Abaqus. Abaqus 6.2: Computer Software for Finite Element Analysis; Dassault Systems Simulia: Johnston, RI, USA, 2020.15. EN 1992-1-1; Eurocode 2: Design of Concrete Structures—Part 1-1: General Rules and Rules for Buildings. British Standards
Institution: London, UK, 2011.16. Barbero, E.J.; Cosso, F.A.; Roman, R.; Weadon, T.L. Determination of material parameters for ABAQUS progressive damage
analysis of E-glass epoxy laminates. Compos. Part B Eng. 2013, 46, 211–220. [CrossRef]17. Hashin, Z. Failure criteria for unidirectional fiber composites. J. Appl. Mech. Trans. ASME 1980, 47, 329–334. [CrossRef]18. Barbero, E.J. Finite Element Analysis of Composite Materials Using ABAQUS; CRC Press Taylor and Francis Group: Boca Raton, FL,
USA, 2013.
Copyright © 2022 FDOKUMEN