Immunoregulatory Actions of Epithelial Cell PPAR γ at the Colonic Mucosa of Mice with Experimental...
11
Immunoregulatory Actions of Epithelial Cell PPAR c at the Colonic Mucosa of Mice with Experimental Inflammatory Bowel Disease Saroj K. Mohapatra, Amir J. Guri, Montse Climent, Cristina Vives, Adria Carbo, William T. Horne, Raquel Hontecillas*, Josep Bassaganya-Riera* Nutritional Immunology and Molecular Nutrition Laboratory, Virginia Bioinformatics Institute, Virginia Polytechnic Institute and State University, Blacksburg, Virginia, United States of America Abstract Background: Peroxisome proliferator-activated receptors are nuclear receptors highly expressed in intestinal epithelial cells (IEC) and immune cells within the gut mucosa and are implicated in modulating inflammation and immune responses. The objective of this study was to investigate the effect of targeted deletion of PPAR c in IEC on progression of experimental inflammatory bowel disease (IBD). Methodology/Principal Findings: In the first phase, PPAR c flfl; Villin Cre- (VC-) and PPAR c flfl; Villin Cre+ (VC+) mice in a mixed FVB/C57BL/6 background were challenged with 2.5% dextran sodium sulfate (DSS) in drinking water for 0, 2, or 7 days. VC+ mice express a transgenic recombinase under the control of the Villin-Cre promoter that causes an IEC-specific deletion of PPAR c. In the second phase, we generated VC- and VC+ mice in a C57BL/6 background that were challenged with 2.5% DSS. Mice were scored on disease severity both clinically and histopathologically. Flow cytometry was used to phenotypically characterize lymphocyte and macrophage populations in blood, spleen and mesenteric lymph nodes. Global gene expression analysis was profiled using Affymetrix microarrays. The IEC-specific deficiency of PPAR c in mice with a mixed background worsened colonic inflammatory lesions, but had no effect on disease activity (DAI) or weight loss. In contrast, the IEC-specific PPAR c null mice in C57BL/6 background exhibited more severe inflammatory lesions, DAI and weight loss in comparison to their littermates expressing PPAR c in IEC. Global gene expression profiling revealed significantly down-regulated expression of lysosomal pathway genes and flow cytometry results demonstrated suppressed production of IL-10 by CD4+ T cells in mesenteric lymph nodes (MLN) of IEC-specific PPAR c null mice. Conclusions/Significance: Our results demonstrate that adequate expression of PPAR c in IEC is required for the regulation of mucosal immune responses and prevention of experimental IBD, possibly by modulation of lysosomal and antigen presentation pathways. Citation: Mohapatra SK, Guri AJ, Climent M, Vives C, Carbo A, et al. (2010) Immunoregulatory Actions of Epithelial Cell PPAR c at the Colonic Mucosa of Mice with Experimental Inflammatory Bowel Disease. PLoS ONE 5(4): e10215. doi:10.1371/journal.pone.0010215 Editor: Stefan Bereswill, Charite ´-Universita ¨tsmedizin Berlin, Germany Received March 21, 2010; Accepted March 25, 2010; Published April 20, 2010 Copyright: ß 2010 Mohapatra et al. This is an open-access article distributed under the terms of the Creative Commons Attribution License, which permits unrestricted use, distribution, and reproduction in any medium, provided the original author and source are credited. Funding: This research was funded by a Virginia Bioinformatics Institute exploratory grant. The funders had no role in study design, data collection and analysis, decision to publish, or preparation of the manuscript. Competing Interests: The authors have declared that no competing interests exist. * E-mail: [email protected] (RH); [email protected] (JB-R) Introduction Inflammatory bowel disease (IBD), with its two clinical manifestations Crohn’s Disease (CD) and Ulcerative Colitis (UC), is a chronic gastrointestinal disorder associated with disruption of the balance between gut commensal bacteria and host responses at the mucosa. The mucosal barrier consists of epithelial tight junctions regulated by cytokines and the underlying immune cell network. Damage to the mucosal barrier is considered sufficient for causing intestinal inflammation. On the other hand, commensal bacteria dampen inflammation via nucleocytoplasmic redistribution of peroxisome proliferator-acti- vated receptor (PPAR) c and RelA subunit of transcription factor NF-kB [1]. A working model of IBD starts with alterations of the epithelial barrier followed by innate immune responses against the gut microbiota. Later changes involving lymphocytes drive the tissue damage associated with the disease [1]. PPAR c, a member of the nuclear receptor group of transcription factors, not only regulates lipid and carbohydrate metabolism, but has been recognized as playing an important role in the immune response through its ability to down-modulate the expression of inflammatory cytokines and to direct immune cell differentiation towards anti-inflammatory phenotypes [2,3]. PPAR c is highly expressed in the intestinal epithelium, immune cells and adipocytes, and regulates a number of genes participating in metabolism, proliferation, signal transduction, and cellular motility [4]. In an experimental model of IBD, activation of PPAR c by conjugated linoleic acid, abscisic acid or other agonists suppresses gut inflammatory lesions, weight loss and inflammatory mediator PLoS ONE | www.plosone.org 1 April 2010 | Volume 5 | Issue 4 | e10215
-
Upload
independent -
Category
Documents
-
view
6 -
download
0
Transcript of Immunoregulatory Actions of Epithelial Cell PPAR γ at the Colonic Mucosa of Mice with Experimental...

Immunoregulatory Actions of Epithelial Cell PPAR c atthe Colonic Mucosa of Mice with ExperimentalInflammatory Bowel DiseaseSaroj K. Mohapatra, Amir J. Guri, Montse Climent, Cristina Vives, Adria Carbo, William T. Horne, Raquel
Hontecillas*, Josep Bassaganya-Riera*
Nutritional Immunology and Molecular Nutrition Laboratory, Virginia Bioinformatics Institute, Virginia Polytechnic Institute and State University, Blacksburg, Virginia,
United States of America
Abstract
Background: Peroxisome proliferator-activated receptors are nuclear receptors highly expressed in intestinal epithelial cells(IEC) and immune cells within the gut mucosa and are implicated in modulating inflammation and immune responses. Theobjective of this study was to investigate the effect of targeted deletion of PPAR c in IEC on progression of experimentalinflammatory bowel disease (IBD).
Methodology/Principal Findings: In the first phase, PPAR c flfl; Villin Cre- (VC-) and PPAR c flfl; Villin Cre+ (VC+) mice in amixed FVB/C57BL/6 background were challenged with 2.5% dextran sodium sulfate (DSS) in drinking water for 0, 2, or 7days. VC+ mice express a transgenic recombinase under the control of the Villin-Cre promoter that causes an IEC-specificdeletion of PPAR c. In the second phase, we generated VC- and VC+ mice in a C57BL/6 background that were challengedwith 2.5% DSS. Mice were scored on disease severity both clinically and histopathologically. Flow cytometry was used tophenotypically characterize lymphocyte and macrophage populations in blood, spleen and mesenteric lymph nodes. Globalgene expression analysis was profiled using Affymetrix microarrays. The IEC-specific deficiency of PPAR c in mice with amixed background worsened colonic inflammatory lesions, but had no effect on disease activity (DAI) or weight loss. Incontrast, the IEC-specific PPAR c null mice in C57BL/6 background exhibited more severe inflammatory lesions, DAI andweight loss in comparison to their littermates expressing PPAR c in IEC. Global gene expression profiling revealedsignificantly down-regulated expression of lysosomal pathway genes and flow cytometry results demonstrated suppressedproduction of IL-10 by CD4+ T cells in mesenteric lymph nodes (MLN) of IEC-specific PPAR c null mice.
Conclusions/Significance: Our results demonstrate that adequate expression of PPAR c in IEC is required for the regulationof mucosal immune responses and prevention of experimental IBD, possibly by modulation of lysosomal and antigenpresentation pathways.
Citation: Mohapatra SK, Guri AJ, Climent M, Vives C, Carbo A, et al. (2010) Immunoregulatory Actions of Epithelial Cell PPAR c at the Colonic Mucosa of Mice withExperimental Inflammatory Bowel Disease. PLoS ONE 5(4): e10215. doi:10.1371/journal.pone.0010215
Editor: Stefan Bereswill, Charite-Universitatsmedizin Berlin, Germany
Received March 21, 2010; Accepted March 25, 2010; Published April 20, 2010
Copyright: � 2010 Mohapatra et al. This is an open-access article distributed under the terms of the Creative Commons Attribution License, which permitsunrestricted use, distribution, and reproduction in any medium, provided the original author and source are credited.
Funding: This research was funded by a Virginia Bioinformatics Institute exploratory grant. The funders had no role in study design, data collection and analysis,decision to publish, or preparation of the manuscript.
Competing Interests: The authors have declared that no competing interests exist.
* E-mail: [email protected] (RH); [email protected] (JB-R)
Introduction
Inflammatory bowel disease (IBD), with its two clinical
manifestations Crohn’s Disease (CD) and Ulcerative Colitis
(UC), is a chronic gastrointestinal disorder associated with
disruption of the balance between gut commensal bacteria and
host responses at the mucosa. The mucosal barrier consists of
epithelial tight junctions regulated by cytokines and the underlying
immune cell network. Damage to the mucosal barrier is
considered sufficient for causing intestinal inflammation. On the
other hand, commensal bacteria dampen inflammation via
nucleocytoplasmic redistribution of peroxisome proliferator-acti-
vated receptor (PPAR) c and RelA subunit of transcription factor
NF-kB [1]. A working model of IBD starts with alterations of the
epithelial barrier followed by innate immune responses against the
gut microbiota. Later changes involving lymphocytes drive the
tissue damage associated with the disease [1].
PPAR c, a member of the nuclear receptor group of
transcription factors, not only regulates lipid and carbohydrate
metabolism, but has been recognized as playing an important role
in the immune response through its ability to down-modulate the
expression of inflammatory cytokines and to direct immune cell
differentiation towards anti-inflammatory phenotypes [2,3]. PPAR
c is highly expressed in the intestinal epithelium, immune cells and
adipocytes, and regulates a number of genes participating in
metabolism, proliferation, signal transduction, and cellular motility
[4].
In an experimental model of IBD, activation of PPAR c by
conjugated linoleic acid, abscisic acid or other agonists suppresses
gut inflammatory lesions, weight loss and inflammatory mediator
PLoS ONE | www.plosone.org 1 April 2010 | Volume 5 | Issue 4 | e10215

expression [4,5,6,7,8]. Most notably, the PPAR c agonist
rosiglitazone showed therapeutic efficacy in humans with UC
[9,10]. However, rosiglitazone and other drugs belonging to the
thiazolidinedione (TZD) class of anti-diabetic drugs are unlikely to
be adopted for the treatment of IBD because of their significant
side effects (i.e., fluid retention, hepatotoxicity, weight gain and
congestive heart failure) and a U.S. Food and Drug Administra-
tion (FDA)-mandated ‘‘black box warning’’ for rosiglitazone and
pioglitazone. Thus, understanding the role of PPAR c in each cell
type involved in the pathogenesis of IBD is critical for the
informed development of novel, safer and more efficacious
therapeutic and prophylactic agents against IBD. We have
previously used a cre-lox recombination system to characterize
the immune modulatory actions of PPAR c in mice with a targeted
deletion in both immune and epithelial cells (i.e., MMTV-Cre)
[3,8] or T cells (i.e., CD4-Cre) [11]. Others have shown that mice
lacking PPAR c in the colonic epithelium displayed increased
susceptibility to dextran sodium sulfate (DSS)-induced experimen-
tal IBD, histological lesions and elevated levels of the pro-
inflammatory cytokines IL-6, IL-1b, TNF-a [12]. The objective of
this study was to use a systems approach for investigating the
underlying mechanisms by which the deletion of PPAR c in IEC
modulates the severity of experimental IBD, immune cell
distribution and global gene expression.
Results
Effect of the deficiency of PPAR c in IEC and mouse strainon susceptibility to DSS-induced colitis
To examine the affect of IEC-specific PPAR c deficiency and
mouse strain on colitis severity VC+ and VC- mice in a mixed
FVB/C57BL/6 background were treated with 2.5% DSS for 0, 2,
or 7 days. Figure 1A illustrates the deletion of PPAR c in the
duodenum, jejunum, ileum, cecum and colon of VC+ mice as well
as in IEC isolated from these tissues (Figure 1B). The results show
that the deletion is more efficient in the large intestine (i.e., cecum
and colon), compared to small intestine. Unlike findings reported
by Adachi and colleagues, we found no significant differences in
disease activity (DAI) or body weight loss between groups
(Figure 2A-B). However, the targeted deletion of IEC PPAR cin mice with a C57BL/6 background resulted in significant weight
loss and disease activity in comparison to mice expressing PPAR cin IEC (Figures 2C-D).
Despite there being no significant differences in either disease
activity or body weight between FVB VC- and FVB VC+ mice,
there were significant differences observed at the histopathological
level. FVB VC+ mice had significantly greater leukocyte
infiltration, and erosion of the mucosal epithelium was significantly
worsened in comparison to the control VC- mice (Figure 3). VC+mice with a pure C57BL/6 background showed significantly
greater signs of macroscopic inflammation in the spleen, colon,
and MLN than VC- mice (Figures 3F-H). In line with the DAI the
enhanced inflammation was evident at day 2 and was significantly
exacerbated at day 7 of the DSS challenge.
Mice expressing PPAR c in IEC have greater percentagesof CD4+IL10+ T cells in MLN
To assess whether the targeted deficiency of IEC PPAR
cinfluences the phenotype of immune cells we performed flow
cytometric analyses on cells isolated from the spleen, blood, and
MLN. Our analysis indicated that the deficiency of IEC PPAR cin FVB mice had no significant impact on the percent of CD4+or CD8+ T cells in any of the tissues analyzed (Figure 4). There
was a numerical trend towards increased F4/80+CD11b+
macrophages/monocytes in the spleen and blood on days 2
and 7, respectively, though these data were not statistically
significant.
In the MLN we also observed no significant differences
between FVB VC+ and FVB VC- mice in overall percent of
immune cells, but there were some distinct phenotypic differences
amongst the CD4+ and F4/80+CD11b+ populations (Figure 5).
First, the percentage of IL10-expressing CD4+ T cells was higher
in the VC- than the VC+ mice. Second, the percent of
macrophages expressing MHC II was significantly elevated in
the VC+ mice.
Similar to the mixed FVB strain, there were no significant
differences in F4/80+CD11b+, CD4+, or CD8+ immune cell
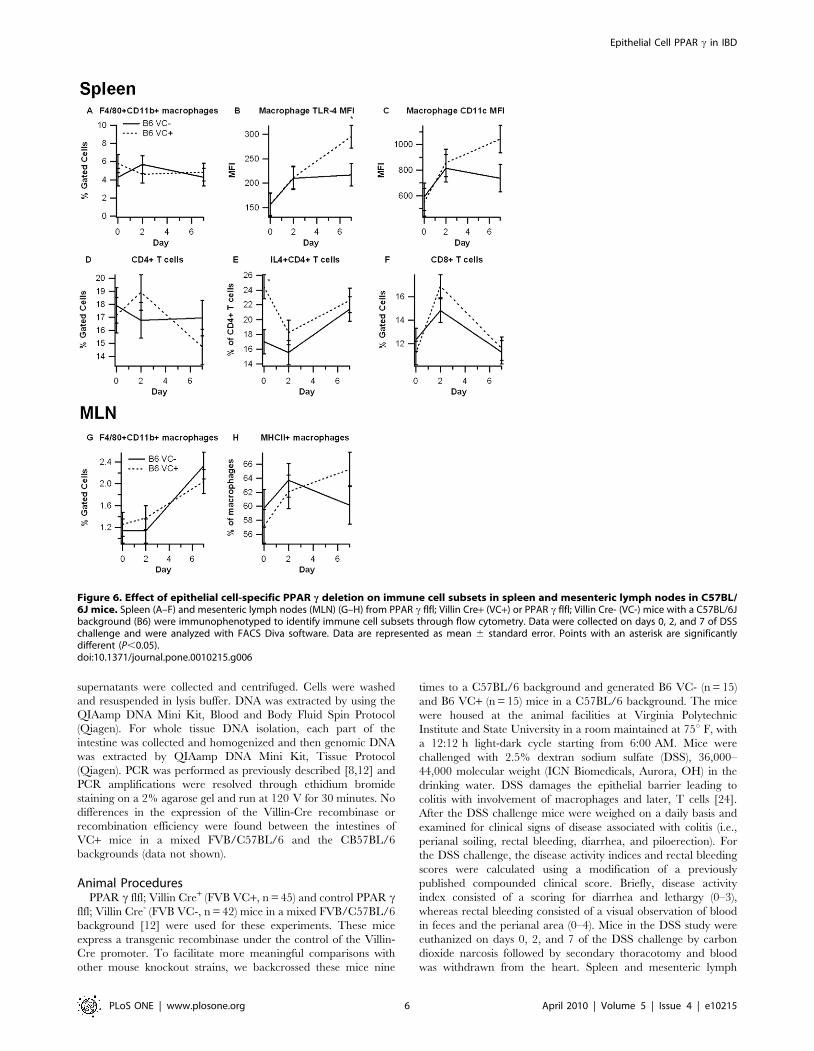
subsets between B6 VC+ and B6 VC- mice (Figure 6).
Interestingly, however, macrophages residing in the spleens of
B6 VC+ mice expressed significantly more toll-like receptor-4
(TLR-4) on day 7, and expression of CD11c trended to
significance. CD4+ T cells from B6 VC+ mice also expressed
significantly more IL-4 on day 0, but this difference was absent on
days 2 and 7. Also similar to the FVB strain, MHC II expression
was up-regulated in MLN-derived F4/80+CD11b+ macrophages
in B6 VC+ mice.
Global gene expression analysis in the colonic mucosa ofVC- and VC+ mice with DSS colitis
Pairwise comparisons revealed very few genes being modulated
in the colonic mucosa after 2 days of DSS challenge. In the VC-
mice, 1 gene was differentially expressed in the DSS-treated group
Figure 1. Genotyping of PPAR c flfl; Villin Cre+ (VC+) and VillinCre- (VC-) control mice. Conditional deletion of the PPAR c gene viaVillin Cre-mediated recombination was examined in mouse intestine byPCR analysis. The floxed (fl) allele at 275 bp and the null allele at400 bp. (A) Left to right: depicts fl/fl in homogenized whole duodenum,jejunum, ileum, cecum and colon without recombination (VC-) (lanes 1,3, 5, 7 and 9) or with recombination (VC+) (lanes 2, 4, 6, 8 and 10). (B) Leftto right: depicts fl/fl in epithelial cells isolated from duodenum,jejunum, ileum, cecum and colon without recombination (VC-) (lanes 1,3, 5, 7 and 9) or with recombination (VC+) (lanes 2, 4, 6, 8 and 10).doi:10.1371/journal.pone.0010215.g001
Epithelial Cell PPAR c in IBD
PLoS ONE | www.plosone.org 2 April 2010 | Volume 5 | Issue 4 | e10215

compared to mice that did not receive DSS. For the same
comparison in VC+ mice, 5 genes were shown to have a different
expression pattern at day 2 compared to day 0 (Figure S1).
However DSS changed the expression of a larger set of 1020 genes
at the later time point, day 7. Out of these 1020 genes, 877 genes
were differentially expressed in VC- mice only; 38 genes in VC+mice only and 105 genes differentially expressed in both genotypes
(Figure S2).
Pathways modulated after DSS challengeHypergeometric testing of the 877 genes differentially expressed
on day 7 of DSS challenge in VC- mice revealed over-
representation of six KEGG pathways: Lysosome, DNA Replica-
tion, p53 signaling and metabolic pathways (Tables S1, S2, S3, S4,
S5, S6, Figures S3, S4, S5, S6, S7). One pathway (lysosome,
KEGG Id: 04142) was found to be significantly associated with
effect of DSS. For most of the genes examined, gene expression
signals were measured to be higher at day 7 compared to day 0 in
VC- mice (positive log-fold change in Table S2). Corresponding
log-fold changes for VC+ mice were also recorded for comparison
purpose and were found to be smaller in magnitude and
statistically non-significant. KEGG pathway lysosome (Id: 04142)
was obtained and colored according to fold-change of gene
expression in VC- mice. Many genes belonging to this pathway are
observed to be up-regulated in this pathway (Figure S3). Gene
expression in the DNA replication pathway (KEGG Id: 03030)
was found to be significantly down-regulated in VC- mice (Table
S3, Figure S4). Metabolic (KEGG Ids: 00520, 00240) and
signaling (KEGG Id: 04115) pathways were significantly modu-
lated in VC- mice, with heterogeneity regarding direction of
differential expression within the same pathway (Tables S4, S5,
S6, Figures S5, S6, S7).
Colonic gene expression by real-time RT-PCRAdachi et al [12] reported that IEC-specific PPAR c knock-out
mice displayed reduced expression of the PPAR c target genes
Plin2 (ADRP), Fabp2 (FABP) and enhanced expression of pro-
inflammatory genes after DSS challenge. We observed the trends
in gene expression to be in the same direction as reported by them
(Figure 7). Additionally, Fabp2 (FABP) was significantly reduced in
VC+ mice compared to VC- mice. Despite showing a significant
increase in disease severity, there were no significant differences in
the levels of inflammatory proteins IL-1b,IL-6, and IRAK-1,
although IRAK-1 expression was numerically down-regulated on
day 2 of DSS colitis in IEC-specific PPAR c null mice (Figure 8).
Discussion
While PPARs have a well-established role in inflammation [13],
the specific contribution of intestinal epithelial cell PPAR c in IBD
is actively under investigation. Adachi et al [12] studied DSS
induced colitis in mice with a targeted disruption of PPAR cfunction in colonic epithelial cells in a mixed FVB/C57BL6
background. They reported that the lack of endogenous epithelial
cell PPAR c expression in colonic epithelial cells results in
increased susceptibility to DSS colitis. Our data demonstrate that
there are no differences in clinical parameters of disease between
IEC-specific PPAR c-expressing and null mice in the same
interbred genetic background. However, we observe an increased
susceptibility to DSS colitis in IEC-specific PPAR c null mice
when the experiment was conducted in a C57BL/6 background,
indicating strain-specific differences and suggesting that the Th1-
[14] and more pro-inflammatory-prone [15] background may
accentuate the role of IEC PPAR c in regulating mucosal
inflammation.
Figure 2. Effect of epithelial cell-specific PPAR c deletion on disease severity. PPAR c flfl; Villin Cre+ (VC+) or PPAR c flfl; Villin Cre- (VC-)mice in a mixed FVB/C57BL/6J (FVB) or C57BL/6J (B6) background were treated with 2.5% dextran sodium sulfate (DSS) or water (no DSS) for 7 days.The disease activity index (DAI), a composite score reflecting clinical signs of the disease (i.e. perianal soiling, rectal bleeding, diarrhea, andpiloerection) was assessed daily (A and C) and the average daily loss in body weights (B and D) throughout the 7-day DSS challenge was calculated.Data are represented as mean 6 standard error. Points with an asterisk are significantly different (P,0.05).doi:10.1371/journal.pone.0010215.g002
Epithelial Cell PPAR c in IBD
PLoS ONE | www.plosone.org 3 April 2010 | Volume 5 | Issue 4 | e10215

Consistent with the data from Adachi et al. [12], the PPAR ctarget Fabp2 (intestinal FABP) is significantly reduced in IEC-
specific PPAR c null mice. The impact of the IEC-specific PPAR cdeletion on pro-inflammatory cytokine gene expression was more
modest in our study when compared to Adachi and colleagues.
This is also suggested by the lack of clinical (disease activity, body
weight) differences between VC- and VC+ mice in a mixed FVB/
C57BL/6 background. However, colonic histopathology results
reveal significantly greater leukocyte infiltration and epithelial
erosion in IEC-specific PPAR c null mice on day 7 of DSS
challenge. After backcrossing the original FVB/C57BL/6 line
nine times and generating VC- and VC+ mice in a pure C57BL/6
background the deficiency of PPAR cin IEC resulted in worsened
disease activity, greater weight loss and histological differences,
suggesting that the Th1-prone genetic background of C57BL/6
mice is optimal for investigating the contribution of IEC PPAR cto the pathogenesis of IBD. The mice lacking IEC PPAR cdisplayed significantly fewer CD4+IL10+ T cells in the MLN and
their macrophages expressed greater amounts of TLR4, the
molecular target for LPS, in the spleen. Of note, IL-10-producing
CD4+ T cells exert regulatory functions, thereby suggesting that
IEC PPAR c is required for the induction of T cell regulatory
responses at the mucosal inductive sites and the prevention of
experimental IBD.
While histologically IEC-specific PPAR c null mice demon-
strated characteristic colonic inflammatory lesions after DSS
challenge, global transcriptome analysis suggests smaller number
of genes being altered in IEC-specific PPAR c null mice in
response to DSS in comparison to T cell-specific PPAR c null
mice [11]. More specifically, inflammatory cytokines, adhesion
molecules, genes involved in glucose homeostasis, apoptosis and
protein synthesis are down-regulated in the colonic mucosa of
mice lacking PPAR c in T cells [11], whereas the lysosomal gene
expression represents the primary pathway modulated in IEC-
specific PPAR c null mice. On day 7 of DSS challenge, pathway
analysis reveals six pathways to be characteristically associated
with DSS in PPAR c-expressing mice only. The same analysis
applied to IEC-specific PPAR c null mice does not reveal any
characteristic pathway to be altered in this phenotype. Because the
pathways were selected from the genes that were significantly
different between two genotypes on day 7 of DSS challenge (as
shown in the Venn Diagram on Figure S2), these pathways are
differentially modulated by DSS on day 7.
Genes of the lysosomal pathway are mostly up-regulated in
response to DSS in both VC- and VC+ mice (Figure S3, Table
S2), although the magnitude of differential expression (fold-change
on day 7 compared day 0) is smaller in VC+ mice. A link between
IBD and lysosomal alterations have been suggested earlier [16].
More recently, disruption of PPAR c in mice resulted in focal
hyperplasia, accumulation of lysosomes and dysregulation of
pathways related to lysosomal maturation in a prostatic cancer
model [17,18]. Cathepsins are lysosomal acid hydrolases whose
transcription is enhanced in colonic mucosa in response to dietary
DSS. Lysosome associated membrane proteins 1 and 2 (LAMP 1/
Figure 3. Effect of intestinal epithelial cell-specific PPAR c deletion on colon histopathology and inflammation. PPAR c flfl; Villin Cre+(VC+) or PPAR c flfl; Villin Cre- (VC-) mice with a mixed FVB/C57BL6/J (FVB) or C57BL6/J (B6) background were treated with 2.5% dextran sodiumsulfate (DSS) or water (no DSS) for 7 days. Representative photomicrographs of colonic samples from VC- (A) and VC+ (B) FVB mice with DSS colitis(Original magnification, 406). Colonic specimens from FVB mice underwent blinded histological examination and were scored (1–4) on leukocyteinfiltration (C), and mucosal wall thickening (D), and epithelial erosion (E) on day 7 of the challenge. In B6 mice spleen (F), colon (G), and mesentericlymph nodes MLN (H) were scored based on macroscopic signs of inflammation on days 2 and 7. Data are represented as mean 6 standard error.Points with an asterisk are significantly different (P,0.05).doi:10.1371/journal.pone.0010215.g003
Epithelial Cell PPAR c in IBD
PLoS ONE | www.plosone.org 4 April 2010 | Volume 5 | Issue 4 | e10215

2) are involved in phagosome maturation in which lysosomes fuse
with late phagosomes leading to removal of endocytosed microbes
[19]. Gene expression of LAMP 1/2 is increased on day 7 of DSS
challenge, with the increase being higher in VC- mice and also
statistically significant.
The lack of PPAR c in IEC interferes with lysosomal gene
expression in response to DSS, potentially leading to altered
antigen presentation. Presentation of microbe-derived peptides
along with MHC class II molecules to the T cell receptor is a
central event in induction of antigen-specific CD4+ T cell
responses. Analysis of the IBD transcriptome in human subjects
[20] revealed up-regulation of genes of immune-response and
antigen-presentation, although the mechanism by which classical
MHC class II genes exert their influence in IBD is currently
unknown [21]. IEC are in contact with intra-epithelial lympho-
cytes (IELs) and equipped with the machinery for antigen
processing and presentation [22]. On the other hand IEC PPAR cserves an important role in suppressing pro-inflammatory cytokine
expression and represents a molecular target of anti-inflammatory
commensal bacteria [23]. Since lysosomal degradation represents
an essential step in antigen presentation via MHC class II, the
finding that the targeted disruption of IEC PPAR c results in
altered expression of lysosomal pathway genes may be indicative of
a possible role of IEC PPAR c in the induction of CD4+ T cell
regulatory responses by increasing presentation of commensal
bacterial antigens.
In summary, by using an IEC-targeted loss-of-function
approach we show that expression of IEC PPAR c is required
for preventing colonic inflammatory lesions, up-regulating lyso-
somal pathway genes and increasing the production of the anti-
inflammatory cytokine, IL-10, by CD4+ T cells in the MLN of
mice with experimental IBD.
Materials and Methods
Ethics statementAll experimental procedures were approved by the Institutional
Animal Care and Use Committee (IACUC) of Virginia Polytech-
nic Institute and State University (IACUC approval number 08-
082-VBI) and met or exceeded requirements of the Public Health
Service/National Institutes of Health and the Animal Welfare Act.
Mouse GenotypingIntestinal tissue specimens and isolated intestinal epithelial cells
were obtained from tissue-specific PPAR c fl/fl; Villin Cre+ (VC+)
and Villin Cre- control mice (VC-) kindly provided by Dr. Frank
Gonzalez (NCI, Bethesda, MD). Duodenum, jejunum, ileum,
cecum and colon were excised. For cell isolation, the different
parts of the intestine were washed with PBS, minced and
incubated twice in CMF/FBS/EDTA media at 37uC for 15
minutes. The digest was passed through a nylon mesh and
Figure 4. Effect of epithelial cell-specific PPAR c deletion onimmune cell subsets in blood and spleen in FVB/C57BL/6Jmice. Blood (A–D) and spleen (E–H) from PPAR c flfl; Villin Cre+ (VC+) orPPAR c flfl; Villin Cre- (VC-) mice with a mixed FVB/C57BL/6J background(FVB) were immunophenotyped. Data were collected on days 0, 2, and7 of DSS challenge and were analyzed with FACS Diva software. Dataare represented as mean 6 standard error. There were no staticallysignificant differences between groups (P,0.05).doi:10.1371/journal.pone.0010215.g004
Figure 5. Effect of epithelial cell-specific PPAR c deletion onimmune cell subsets in mesenteric lymph nodes in FVB/C57BL/6J mice. Mesenteric lymph nodes (MLN) from PPAR c flfl; Villin Cre+(VC+) or PPAR c flfl; Villin Cre- (VC-) mice with a mixed FVB/C57BL/6Jbackground (FVB) were immunophenotyped to identify immune cellsubsets by flow cytometry. Data were collected on days 0, 2, and 7 ofDSS challenge and were analyzed with FACS Diva software. Data arerepresented as mean 6 standard error. Points with an asterisk aresignificantly different (P,0.05).doi:10.1371/journal.pone.0010215.g005
Epithelial Cell PPAR c in IBD
PLoS ONE | www.plosone.org 5 April 2010 | Volume 5 | Issue 4 | e10215
supernatants were collected and centrifuged. Cells were washed
and resuspended in lysis buffer. DNA was extracted by using the
QIAamp DNA Mini Kit, Blood and Body Fluid Spin Protocol
(Qiagen). For whole tissue DNA isolation, each part of the
intestine was collected and homogenized and then genomic DNA
was extracted by QIAamp DNA Mini Kit, Tissue Protocol
(Qiagen). PCR was performed as previously described [8,12] and
PCR amplifications were resolved through ethidium bromide
staining on a 2% agarose gel and run at 120 V for 30 minutes. No
differences in the expression of the Villin-Cre recombinase or
recombination efficiency were found between the intestines of
VC+ mice in a mixed FVB/C57BL/6 and the CB57BL/6
backgrounds (data not shown).
Animal ProceduresPPAR c flfl; Villin Cre+ (FVB VC+, n = 45) and control PPAR c
flfl; Villin Cre- (FVB VC-, n = 42) mice in a mixed FVB/C57BL/6
background [12] were used for these experiments. These mice
express a transgenic recombinase under the control of the Villin-
Cre promoter. To facilitate more meaningful comparisons with
other mouse knockout strains, we backcrossed these mice nine
times to a C57BL/6 background and generated B6 VC- (n = 15)
and B6 VC+ (n = 15) mice in a C57BL/6 background. The mice
were housed at the animal facilities at Virginia Polytechnic
Institute and State University in a room maintained at 75u F, with
a 12:12 h light-dark cycle starting from 6:00 AM. Mice were
challenged with 2.5% dextran sodium sulfate (DSS), 36,000–
44,000 molecular weight (ICN Biomedicals, Aurora, OH) in the
drinking water. DSS damages the epithelial barrier leading to
colitis with involvement of macrophages and later, T cells [24].
After the DSS challenge mice were weighed on a daily basis and
examined for clinical signs of disease associated with colitis (i.e.,
perianal soiling, rectal bleeding, diarrhea, and piloerection). For
the DSS challenge, the disease activity indices and rectal bleeding
scores were calculated using a modification of a previously
published compounded clinical score. Briefly, disease activity
index consisted of a scoring for diarrhea and lethargy (0–3),
whereas rectal bleeding consisted of a visual observation of blood
in feces and the perianal area (0–4). Mice in the DSS study were
euthanized on days 0, 2, and 7 of the DSS challenge by carbon
dioxide narcosis followed by secondary thoracotomy and blood
was withdrawn from the heart. Spleen and mesenteric lymph
Figure 6. Effect of epithelial cell-specific PPAR c deletion on immune cell subsets in spleen and mesenteric lymph nodes in C57BL/6J mice. Spleen (A–F) and mesenteric lymph nodes (MLN) (G–H) from PPAR c flfl; Villin Cre+ (VC+) or PPAR c flfl; Villin Cre- (VC-) mice with a C57BL/6Jbackground (B6) were immunophenotyped to identify immune cell subsets through flow cytometry. Data were collected on days 0, 2, and 7 of DSSchallenge and were analyzed with FACS Diva software. Data are represented as mean 6 standard error. Points with an asterisk are significantlydifferent (P,0.05).doi:10.1371/journal.pone.0010215.g006
Epithelial Cell PPAR c in IBD
PLoS ONE | www.plosone.org 6 April 2010 | Volume 5 | Issue 4 | e10215

Figure 7. Effect of epithelial cell-specific PPAR c deletion on target gene expression in colonic mucosa. Expression of PPAR c targetsPlin2 (ADRP), Fabp2 (FABP); and pro-inflammatory genes TNF-a, IL-6 and IL-1b in the colonic mucosa in VC- and VC+ mice at 0, 2 and 7 days after
Epithelial Cell PPAR c in IBD
PLoS ONE | www.plosone.org 7 April 2010 | Volume 5 | Issue 4 | e10215

nodes (MLN) were scored based on size and macroscopic
inflammatory lesions (0–3), excised, and single-cell suspensions
were prepared as previously described for flow cytometry [3].
HistopathologyColonic sections were fixed in 10% buffered neutral formalin,
later embedded in paraffin, and then sectioned (5 mm) and stained
with hematoxylin and eosin (H&E) for examination of microscopic
lesions and changes in the mucosal architecture. Colons were
graded with a compounded histologic score including the extent of
(1) leukocyte infiltration, (2) mucosal thickening, and (3) epithelial
cell erosion. The sections were graded with a score of 0–4 for each
of the previous categories and data were analyzed as a normalized
compounded score.
Immunophenoptying of blood, spleen, and MLNMLN and spleen-derived cells or whole blood were seeded
onto 96-well plates, centrifuged at 4uC at 3000 rpm for 4
minutes, and washed with PBS containing 5% serum and 0.09%
sodium azide (FACS buffer). To assess differential monocyte/
macrophage subsets, the cells were then incubated in the dark at
4uC for 20 minutes in FcBlock (20 mg/ml; BD Pharmingen), and
then for an additional 20 minutes with fluorochrome-conjugated
primary antibodies anti-F4/80-PE-Cy5 (5 mg/mL, ebioscience),
anti-CD11b-Alexa Fluor 700 (2 mg/mL, eBioscience) and anti-
MHC II-PE (2 mg/mL, eBioscience). For lymphocyte subset
assessment, cells were incubated with anti-CD4-Alexa Fluor 700
(2 mg/mL; BD Pharmingen), anti-CD8-PerCp-Cy5.5 (2 mg/mL,
eBioscience), CD3 PE-Cy5 (2 mg/mL; BD Pharmingen), anti-
FoxP3-PE (2 mg/mL, eBioscience), and anti-IL10-PE as previ-
ously shown [3]. Flow results were computed with a BD LSR II
flow cytometer and data analyses was performed with FACS Diva
software (BD).
Microarray data analysisAfter homogenization of colonic tissue, total RNA was extracted
and purified using the RNAeasy system according to manufac-
turer’s instructions (Qiagen Valencia, CA). The QIAGEN RNase-
free DNase supplement kit was used to ensure that the RNA was
free from DNA contamination. RNA was then processed and
labeled according to the standard target labeling protocols and the
samples were hybridized, stained, and scanned per standard
Affymetrix protocols at VBI core laboratory on Mouse 430 2.0
expression arrays (Affymetrix Inc., Santa Clara, CA). All statistical
analysis of the data was performed within R statistical environ-
ment - Version 2.10.1 [25] using Bioconductor packages. Raw
microarray data from CEL files were read with ‘affy’ package [26]
and pre-processed by GC-RMA algorithm that performs the three
steps: (i) adjustment of the gene expression signal against the
background caused by optical noise and non-specific binding, (ii)
robust multi-array normalization, and (iii) summarization of the
probes belonging to each probe set. At the outset, a non-specific
filter using the function nsFilter from bioconductor package
‘genefilter’ was applied to remove non-informative probe sets that
displayed low variance across all samples. Differential expression
analysis was performed using the package limma [27]. A linear
model was fit, using the function lmFit, to the expression data (log-
intensities) for each gene. The fitted coefficients were compared
(DSS versus No DSS; at two time points, day 2 and day 7) using
the function contrasts.fit. Empirical Bayes method [28,29] was
used to borrow information across genes. This has been shown to
make the analysis stable for experiments with small number of
arrays. P-values obtained for each gene was corrected for multiple
dextran sodium sulfate (DSS) challenge. Compared to VC- mice, VC+ mice show reduced expression of Plin2 (ADRP) at day 7 of DSS challenge and ofFabp2 (FABP) at earlier time points (days 0 and 2). Expression of pro-inflammatory genes TNF-a, IL-6 and IL-1b are increased in VC+ mice compared toVC- mice after DSS challenge. Statistical significance is indicated by asterisks (P,0.05).doi:10.1371/journal.pone.0010215.g007
Figure 8. Effect of epithelial cell-specific PPAR c deletion ontarget gene expression in colonic mucosa in C57BL/6J mice.Expression of IL-6 (A), IL-1b (B) and IRAK-1 (C) was assessed in thecolonic mucosa in PPAR c flfl; Villin Cre+ (VC+) or PPAR c flfl; Villin Cre-(VC-) in mice with a C57BL6/J (B6) background. Expression levels wereassessed at days 0, 2 and 7 of DSS challenge and normalized relative tothe housekeeping gene b-actin. Data are represented as mean 6standard error. There were no statistically significant differencesbetween groups (P,0.05).doi:10.1371/journal.pone.0010215.g008
Epithelial Cell PPAR c in IBD
PLoS ONE | www.plosone.org 8 April 2010 | Volume 5 | Issue 4 | e10215

comparisons [30] and a cutoff of 0.05 was applied to identify the
genes that are significantly differentially expressed between the
conditions. Venn Diagrams were drawn using the function
vennDiagram to show the number of genes differentially expressed
under different conditions. The microarray data (both raw and
normalized) have been submitted at the Gene Expression
Omnibus (GEO, http://www.ncbi.nlm.nih.gov/geo/, Series:
GSE20621).
Hypergeometric testing for over-represented pathwaysAll pathways listed at Kyoto Encylopedia for Genes and
Genomes (KEGG) were selected for analysis. Genes that were
differentially expressed after 7 days of DSS challenge were
subjected to hypergeometric testing, with the function hyperGTest
from Category package, for discovery of the over-represented
KEGG pathways. This procedure used Fisher’s exact test to find
association between interesting genes (differentially expressed after
7 days of DSS challenge) and membership to a KEGG pathway.
Selected KEGG pathways found to be significantly associated with
DSS on day 7 were accessed using the bioconductor package
KEGGSOAP. Specific gene nodes on each pathway were
‘painted’ according to the direction of differential expression of
that gene on day 7 of DSS treatment: red if up-regulated, green if
down-regulated.
Quantitative Real-Time RT-PCRTotal RNA (1 mg) from colons was used to generate a
complementary DNA (cDNA) template using the iScript cDNA
Synthesis Kit (Bio-Rad, Hercules, CA) using previously described
conditions [8]. Each gene amplicon was purified with the
MiniElute PCR Purification Kit (Qiagen) and quantitated on an
agarose gel by using a DNA mass ladder (Promega). These purified
amplicons were used to optimize real-time PCR conditions and to
generate standard curves in the real-time PCR assay. Primer
concentrations and annealing temperatures were optimized for the
iCycler iQ system (Bio-Rad) for each set of primers using the
system’s gradient protocol. PCR efficiencies were maintained
between 92 and 105% and correlation coefficients above 0.98 for
each primer set during optimization and also during the real-time
PCR of sample DNA.
Complementary DNA (cDNA) concentrations for genes of
interest were examined by real-time quantitative PCR using an
iCycler IQ System and the iQ SYBR green supermix (Bio-Rad). A
standard curve was generated for each gene using 10-fold dilutions
of purified amplicons starting at 5 pg of cDNA and used later to
calculate the starting amount of target cDNA in the unknown
samples. SYBR green I is a general double-stranded DNA
intercalating dye and may therefore detect nonspecific products
and primer/dimers in addition to the amplicon of interest. In
order to determine the number of products synthesized during the
real-time PCR, a melting curve analysis was performed on each
product. Real-time PCR was used to measure the starting amount
of nucleic acid of each unknown sample of cDNA on the same 96-
well plate. Genebank accession numbers used for the forward and
reverse primers are as follows: b-actin (X03672) forward
59CCCAGGCATTGCTGACAGG39 and reverse59TGGAAG-
GTGGACAGTGAGGC39 ; IL-6 (NM_031168) forward 59TT-
TCCTCTGGTCTTCTGGAG39 and reverse 59CTGAAG-
GACTCTGGCTTTGT39; IL-1b (NM_008361) forward GGG-
TCGGACTGTTTCTAAGTC39 and reverse 59CTTGGC-
CGAGGACTAAG39; IRAK-1 (NM_008363) forward 59CGC-
CAAGCACTTCTTGTACGA93 and reverse 59GATCAAG-
GCCGCGAACT39.
StatisticsFlow cytometry, disease activity, pathology and real-time RT-
PCR data were analyzed as a repeated measures 362 factorial
arrangement within a completely randomized design. To deter-
mine the statistical significance of the model, analysis of variance
(ANOVA) was performed using the general linear model
procedure of Statistical Analysis Software (SAS), and probability
value (P) ,0.05 was considered to be significant. When the model
was significant, ANOVA was followed by Fisher’s Protected Least
Significant Difference multiple comparison method.
Supporting Information
Figure S1 Venn diagram showing number of genes differentially
expressed on day 2 of Dextran Sodium Sulfate (DSS) challenge.
The number inside each circle refers to number of genes
differentially expressed on 2nd day of DSS challenge (compared
to control, i.e., day 0), for each genotype VC-, VC+. The number
inside overlapping region of two circles refers to the number of
genes that are common to both genotypes. The number on the
bottom right corner corresponds to genes that are not differentially
expressed.
Found at: doi:10.1371/journal.pone.0010215.s001 (0.05 MB TIF)
Figure S2 Venn diagram showing number of genes differentially
expressed on day 7 of Dextran Sodium Sulfate (DSS) challenge.
The number inside each circle refers to number of genes
differentially expressed on 7th day of DSS challenge (compared
to control, i.e., day 0), for each genotype VC-, VC+. The number
inside overlapping region of two circles refers to the number of
genes that are common to both genotypes. The number on the
bottom right corner corresponds to genes that are not differentially
expressed.
Found at: doi:10.1371/journal.pone.0010215.s002 (0.05 MB TIF)
Figure S3 Lysosomal genes differentially expressed on day 7 of
DSS challenge in VC- mice. The pathway diagram from KEGG
has been colored according to the direction of change in gene
expression. Significantly up-regulated genes are colored in red.
Found at: doi:10.1371/journal.pone.0010215.s003 (0.59 MB TIF)
Figure S4 DNA replication (KEGG) genes differentially ex-
pressed on day 7 of DSS challenge in VC- mice. The pathway
diagram from KEGG has been colored according to the direction
of change in gene expression. Significantly down-regulated genes
on day 7 in VC- mice are colored in green.
Found at: doi:10.1371/journal.pone.0010215.s004 (0.62 MB TIF)
Figure S5 Genes of the KEGG pathway "Aminosugar and
nucleotide sugar metabolism" are differentially expressed on day 7
of DSS challenge in VC- mice. The pathway diagram from
KEGG has been colored according to the direction of change in
gene expression. Significantly up-regulated genes on day 7 in VC-
mice are colored in red; down-regulated in green.
Found at: doi:10.1371/journal.pone.0010215.s005 (0.65 MB TIF)
Figure S6 Genes of the KEGG pathway "Pyrimidine metabo-
lism" are differentially expressed on day 7 of DSS challenge in
VC- mice. The pathway diagram from KEGG has been colored
according to the direction of change in gene expression.
Significantly down-regulated genes on day 7 in VC- mice are
colored in green; up-regulated in red.
Found at: doi:10.1371/journal.pone.0010215.s006 (0.57 MB TIF)
Figure S7 Genes of the KEGG "p53 Signaling Pathway" are
differentially expressed on day 7 of DSS challenge in VC- mice.
The pathway diagram from KEGG has been colored according to
Epithelial Cell PPAR c in IBD
PLoS ONE | www.plosone.org 9 April 2010 | Volume 5 | Issue 4 | e10215

the direction of change in gene expression. Significantly up-
regulated genes on day 7 in VC- mice are colored in red; down-
regulated in green.
Found at: doi:10.1371/journal.pone.0010215.s007 (0.31 MB TIF)
Table S1 KEGG pathways modulated on day 7 of DSS
challenge in VC- mice. A total of 877 genes, transcriptionally
affected on day 7 of VC- (but not VC+) mice, were subjected to
hypergeometric testing and revealed enrichment (over-represen-
tation) of six KEGG pathways. The first and last columns
correspond to the KEGG identifier and name of the pathway,
respectively. The second and third columns (Pvalue, OddsRatio)
report that there is good association between DSS challenge and
the KEGG pathway in VC- mice. The ExpCount records the
expected number of genes in the selected gene list to be found at
the KEGG pathway, which is exceeded by the actual Count (fifth
column). Sixth column (Size) corresponds to the total number of
genes in the pathway.
Found at: doi:10.1371/journal.pone.0010215.s008 (0.01 MB
XLS)
Table S2 Lysosomal genes differentially expressed on day 7 of
DSS challenge in VC- mice. Log fold-change in gene expression
on day 7 after DSS challenge in VC- and VC+ mice. Degree of
differential expression of these genes is statistically significant for
VC- mice (suggested by asterisk). Corresponding fold changes in
VC+ mice are not statistically significant. Most of the genes are up-
regulated in VC- mice.
Found at: doi:10.1371/journal.pone.0010215.s009 (0.02 MB
XLS)
Table S3 DNA replication (KEGG) genes differentially ex-
pressed on day 7 of DSS challenge in VC- mice. Log fold-change
in gene expression on day 7 after DSS challenge in VC- and VC+mice. Degree of differential expression of these genes is statistically
significant for VC- mice (suggested by asterisk). Corresponding
fold changes in VC+ mice are not statistically significant. The
genes are down-regulated in VC- mice.
Found at: doi:10.1371/journal.pone.0010215.s010 (0.02 MB
XLS)
Table S4 Genes of the KEGG pathway "Aminosugar and
nucleotide sugar metabolism" are differentially expressed on day 7
of DSS challenge in VC- mice. Log fold-change in gene expression
on day 7 after DSS challenge in VC- and VC+ mice. Degree of
differential expression of these genes is statistically significant for
VC- mice (suggested by asterisk). Corresponding fold changes in
VC+ mice are not statistically significant.
Found at: doi:10.1371/journal.pone.0010215.s011 (0.02 MB
XLS)
Table S5 Genes of the KEGG pathway "Pyrimidine metabo-
lism" are differentially expressed on day 7 of DSS challenge in
VC- mice. Log fold-change in gene expression on day 7 after DSS
challenge in VC- and VC+ mice. Degree of differential expression
of these genes is statistically significant for VC- mice (suggested by
asterisk). Corresponding fold changes in VC+ mice are not
statistically significant. The genes are mostly down-regulated in
VC- mice.
Found at: doi:10.1371/journal.pone.0010215.s012 (0.02 MB
XLS)
Table S6 Genes of the KEGG "p53 Signaling Pathway" are
differentially expressed on day 7 of DSS challenge in VC- mice.
Log fold-change in gene expression on day 7 after DSS challenge
in VC- and VC+ mice. Degree of differential expression of these
genes is statistically significant for VC- mice (suggested by asterisk).
Corresponding fold changes in VC+ mice are not statistically
significant.
Found at: doi:10.1371/journal.pone.0010215.s013 (0.02 MB
XLS)
Author Contributions
Conceived and designed the experiments: RH JBR. Performed the
experiments: AJG MC CV AC WTH RH JBR. Analyzed the data:
SKM AJG MC CV AC WTH RH JBR. Contributed reagents/materials/
analysis tools: SKM WTH RH JBR. Wrote the paper: SKM AJG RH JBR.
References
1. Xavier RJ, Podolsky DK (2007) Unravelling the pathogenesis of inflammatory
bowel disease. Nature 448: 427–434.
2. Martin H (2009) Role of PPAR-gamma in inflammation. Prospects for
therapeutic intervention by food components. Mutat Res 669: 1–7.
3. Hontecillas R, Bassaganya-Riera J (2007) Peroxisome proliferator-activated
receptor gamma is required for regulatory CD4+ T cell-mediated protection
against colitis. J Immunol 178: 2940–2949.
4. Chen L, Bush CR, Necela BM, Su W, Yanagisawa M, et al. (2006) RS5444, a
novel PPARgamma agonist, regulates aspects of the differentiated phenotype
in nontransformed intestinal epithelial cells. Mol Cell Endocrinol 251: 17–
32.
5. Bassaganya-Riera J, Hontecillas R (2006) CLA and n-3 PUFA differentially
modulate clinical activity and colonic PPAR-responsive gene expression in a pig
model of experimental IBD. Clin Nutr 25: 454–465.
6. Hontecillas R, Wannemeulher MJ, Zimmerman DR, Hutto DL, Wilson JH,
et al. (2002) Nutritional regulation of porcine bacterial-induced colitis by
conjugated linoleic acid. J Nutr 132: 2019–2027.
7. Guri AJ, Hontecillas R, Bassaganya-Riera J (2010) Abscisic acid ameliorates
experimental IBD by downregulating cellular adhesion molecule expression and
suppressing immune cell infiltration. Clinical Nutrition In Press.
8. Bassaganya-Riera J, Reynolds K, Martino-Catt S, Cui Y, Hennighausen L, et al.
(2004) Activation of PPAR gamma and delta by conjugated linoleic acid
mediates protection from experimental inflammatory bowel disease. Gastroen-
terology 127: 777–791.
9. Lewis JD, Lichtenstein GR, Deren JJ, Sands BE, Hanauer SB, et al. (2008)
Rosiglitazone for active ulcerative colitis: a randomized placebo-controlled trial.
Gastroenterology 134: 688–695.
10. Lewis JD, Lichtenstein GR, Stein RB, Deren JJ, Judge TA, et al. (2001) An
open-label trial of the PPAR-gamma ligand rosiglitazone for active ulcerative
colitis. Am J Gastroenterol 96: 3323–3328.
11. Guri AJ, Mohapatra SK, Horne WT, Hontecillas R, Bassaganya-Riera J (2010)
Immunoregulatory actions of T cell PPAR gamma at the colonic mucosa in mice
with experimental IBD. BMC Gastroenterology. In Revision.
12. Adachi M, Kurotani R, Morimura K, Shah Y, Sanford M, et al. (2006)
Peroxisome proliferator activated receptor gamma in colonic epithelial cells
protects against experimental inflammatory bowel disease. Gut 55: 1104–1113.
13. Clark RB (2002) The role of PPARs in inflammation and immunity. J Leukoc
Biol 71: 388–400.
14. Zhang WW, Mendez S, Ghosh A, Myler P, Ivens A, et al. (2003) Comparison of
the A2 gene locus in Leishmania donovani and Leishmania major and its control
over cutaneous infection. J Biol Chem 278: 35508–35515.
15. Matsutani T, Anantha Samy TS, Kang SC, Bland KI, Chaudry IH (2005)
Mouse genetic background influences severity of immune responses following
trauma-hemorrhage. Cytokine 30: 168–176.
16. O’Morain C, Smethurst P, Levi AJ, Peters TJ (1984) Organelle pathology in
ulcerative and Crohn’s colitis with special reference to the lysosomal alterations.
Gut 25: 455–459.
17. Jiang M, Fernandez S, Jerome WG, He Y, Yu X, et al. (2009) Disruption of
PPARgamma signaling results in mouse prostatic intraepithelial neoplasia
involving active autophagy. Cell Death Differ 17: 469–481.
18. Jiang M, Jerome WG, Hayward SW (2010) Autophagy in nuclear receptor
PPARgamma-deficient mouse prostatic carcinogenesis. Autophagy 6: 175–176.
19. Huynh KK, Eskelinen EL, Scott CC, Malevanets A, Saftig P, et al. (2007)
LAMP proteins are required for fusion of lysosomes with phagosomes. EMBO J
26: 313–324.
20. Costello CM, Mah N, Hasler R, Rosenstiel P, Waetzig GH, et al. (2005)
Dissection of the inflammatory bowel disease transcriptome using genome-wide
cDNA microarrays. PLoS Med 2: e199.
21. Yamamoto-Furusho JK (2007) Genetic factors associated with the development
of inflammatory bowel disease. World J Gastroenterol 13: 5594–5597.
Epithelial Cell PPAR c in IBD
PLoS ONE | www.plosone.org 10 April 2010 | Volume 5 | Issue 4 | e10215

22. Hershberg RM, Mayer LF (2000) Antigen processing and presentation by
intestinal epithelial cells - polarity and complexity. Immunol Today 21:123–128.
23. Kelly D, Campbell JI, King TP, Grant G, Jansson EA, et al. (2004) Commensal
anaerobic gut bacteria attenuate inflammation by regulating nuclear-cytoplas-mic shuttling of PPAR-gamma and RelA. Nat Immunol 5: 104–112.
24. Strober W, Fuss IJ, Blumberg RS (2002) The immunology of mucosal models ofinflammation. Annu Rev Immunol 20: 495–549.
25. R_Development_Core_Team (2009) R: A langauge and environment for
statistical computing. ViennaAustria: R Foundation for Statistical Computing.26. Gautier L, Cope L, Bolstad BM, Irizarry RA (2004) affy—analysis of Affymetrix
GeneChip data at the probe level. Bioinformatics 20: 307–315.
27. Smyth GK (2005) Limma: linear models for microarray data. In: Gentleman R,
Carey VJ, Dudoit S, Irizarry R, Huber W, eds. Bioinformatics andcomputational biology solutions using R and Bioconductor. New York: Springer.
pp 397–420.
28. Loennstedt I, Speed TP (2002) Replicated microarray data. Statistica Sinica 12:31–46.
29. Smyth GK (2004) Linear models and empirical bayes methods for assessingdifferential expression in microarray experiments. Stat Appl Genet Mol Biol 3:
Article3.
30. Benjamini Y, Hochberg Y (1995) Controlling the false discovery rate: a practicaland powerful approach to multiple testing. Journal of the Royal Statistical
Society Series B 57: 289–300.
Epithelial Cell PPAR c in IBD
PLoS ONE | www.plosone.org 11 April 2010 | Volume 5 | Issue 4 | e10215