IMF By effects in the plasma flow at the polar cap boundary
11
Ann. Geophys., 29, 1305–1315, 2011 www.ann-geophys.net/29/1305/2011/ doi:10.5194/angeo-29-1305-2011 © Author(s) 2011. CC Attribution 3.0 License. Annales Geophysicae IMF B y effects in the plasma flow at the polar cap boundary R. Lukianova 1,2 and A. Kozlovsky 3 1 Arctic and Antarctic Research Institute, St. Petersburg, Bering Str. 38, 199397, Russia 2 Space Research Institute, Moscow, Profsoyuznaya Str. 84/32, 199397, Russia 3 Sodankyl¨ a Geophysical Observatory of the University of Oulu, P.O. Box 3000, 90014, Finland Received: 5 December 2010 – Revised: 14 June 2011 – Accepted: 21 June 2011 – Published: 22 July 2011 Abstract. We used the dataset obtained from the EISCAT Svalbard Radar during 2000–2008 to study statistically the ionospheric convection in a vicinity of the polar cap bound- ary as related to IMF B y conditions separately for north- ward and southward IMF. The effect of IMF B y is mani- fested in the intensity and direction of the azimuthal com- ponent of ionospheric flow. The most significant effect is observed on the day and night sides whereas on dawn and dusk the effect is essentially less prominent. However, there is an asymmetry with respect to the noon-midnight meridian. On the day side the intensity of B y -related az- imuthal flow is maximal exactly at noon, whereas on the night side the maximum is shifted toward the post-midnight hours (∼03:00MLT). On the dusk side the relative reduc- tion of the azimuthal flow is much larger than that on the dawn side. Overall, the magnetospheric response to IMF B y seems to be stronger in the 00:00–12:00 MLT sector com- pared to the 12:00–24:00MLTs. Quantitative characteristics of the IMF B y effect are presented and partly explained by the magnetospheric electric fields generated due to the solar wind and also by the position of open-closed boundary for different IMF orientation. Keywords. Ionosphere (Plasma convection) 1 Introduction The structure of high-latitude ionospheric plasma convection is controlled by the IMF and depends primarily on the IMF strength and orientation in the GSM Y-Z plane (Heppner and Maynard, 1987). If IMF B z is directed southward or equal Correspondence to: R. Lukianova ([email protected]) to zero, the ionospheric projection of the magnetospheric plasma circulation is a two-cell convection pattern with a fairly homogenous central anti-sunward flow. The viscous processes at the magnetospheric boundary form the similar, though less intensive, convection pattern. If B z is directed northward and strong enough, additional flow cells with a sunward cross-polar cap flow are developed. The IMF B y modifies the twin-cell convection patterns and leads to the dawn-dusk asymmetry which is, in general, anti- symmetric in the opposite hemispheres. In a given hemi- sphere the effect is quasi-mirrored with respect to the noon meridian for opposite signs of B y . Basic physical ideas of the IMF B y effects on magnetospheric electrodynamics were suggested more than 30 yr ago (Nishida, 1971; Jørgensen et al., 1972; Stern, 1973; Leontyev and Lyatsky, 1974). In pre- vious studies the IMF B y -related dawn-dusk asymmetry in polar cap convection and the associated Svalgaard-Mansurov effect (Svalgaard, 1973) have been widely attributed to the magnetic tension forces acting on open field lines. The paradigm is as follows (Jørgensen et al., 1972; Khan and Cowley, 2001). The flows are believed to be due the effect of the magnetic tension force acting on the newly reconnected flux tubes in the presence of IMF B y . For B y > 0, open tubes are pulled westward in the Northern Hemisphere and added to the dawn side of the northern tail lobe, while simul- taneously being pulled eastward in the Southern Hemisphere and added to the dusk side of the southern tail lobe and vice versa for B y < 0. Thus, the anti-sunward flow over the polar cap is asymmetric with stronger flows on the dawn side in the Northern Hemisphere and on the dusk side in the South- ern Hemisphere for B y > 0, and vice versa for B y < 0. The overall effect on open field lines is an additional westward (eastward) circulation in the Northern Hemisphere if B y > 0 (B y < 0), and vice versa in the Southern Hemisphere. Published by Copernicus Publications on behalf of the European Geosciences Union.
-
Upload
independent -
Category
Documents
-
view
4 -
download
0
Transcript of IMF By effects in the plasma flow at the polar cap boundary

Ann. Geophys., 29, 1305–1315, 2011www.ann-geophys.net/29/1305/2011/doi:10.5194/angeo-29-1305-2011© Author(s) 2011. CC Attribution 3.0 License.
AnnalesGeophysicae
IMF By effects in the plasma flow at the polar cap boundary
R. Lukianova1,2 and A. Kozlovsky3
1Arctic and Antarctic Research Institute, St. Petersburg, Bering Str. 38, 199397, Russia2Space Research Institute, Moscow, Profsoyuznaya Str. 84/32, 199397, Russia3Sodankyl̈a Geophysical Observatory of the University of Oulu, P.O. Box 3000, 90014, Finland
Received: 5 December 2010 – Revised: 14 June 2011 – Accepted: 21 June 2011 – Published: 22 July 2011
Abstract. We used the dataset obtained from the EISCATSvalbard Radar during 2000–2008 to study statistically theionospheric convection in a vicinity of the polar cap bound-ary as related to IMFBy conditions separately for north-ward and southward IMF. The effect of IMFBy is mani-fested in the intensity and direction of the azimuthal com-ponent of ionospheric flow. The most significant effectis observed on the day and night sides whereas on dawnand dusk the effect is essentially less prominent. However,there is an asymmetry with respect to the noon-midnightmeridian. On the day side the intensity ofBy-related az-imuthal flow is maximal exactly at noon, whereas on thenight side the maximum is shifted toward the post-midnighthours (∼03:00 MLT). On the dusk side the relative reduc-tion of the azimuthal flow is much larger than that on thedawn side. Overall, the magnetospheric response to IMFBy
seems to be stronger in the 00:00–12:00 MLT sector com-pared to the 12:00–24:00 MLTs. Quantitative characteristicsof the IMF By effect are presented and partly explained bythe magnetospheric electric fields generated due to the solarwind and also by the position of open-closed boundary fordifferent IMF orientation.
Keywords. Ionosphere (Plasma convection)
1 Introduction
The structure of high-latitude ionospheric plasma convectionis controlled by the IMF and depends primarily on the IMFstrength and orientation in the GSM Y-Z plane (Heppner andMaynard, 1987). If IMFBz is directed southward or equal
Correspondence to:R. Lukianova([email protected])
to zero, the ionospheric projection of the magnetosphericplasma circulation is a two-cell convection pattern with afairly homogenous central anti-sunward flow. The viscousprocesses at the magnetospheric boundary form the similar,though less intensive, convection pattern. IfBz is directednorthward and strong enough, additional flow cells with asunward cross-polar cap flow are developed.
The IMFBy modifies the twin-cell convection patterns andleads to the dawn-dusk asymmetry which is, in general, anti-symmetric in the opposite hemispheres. In a given hemi-sphere the effect is quasi-mirrored with respect to the noonmeridian for opposite signs ofBy . Basic physical ideas ofthe IMFBy effects on magnetospheric electrodynamics weresuggested more than 30 yr ago (Nishida, 1971; Jørgensen etal., 1972; Stern, 1973; Leontyev and Lyatsky, 1974). In pre-vious studies the IMFBy-related dawn-dusk asymmetry inpolar cap convection and the associated Svalgaard-Mansuroveffect (Svalgaard, 1973) have been widely attributed to themagnetic tension forces acting on open field lines. Theparadigm is as follows (Jørgensen et al., 1972; Khan andCowley, 2001). The flows are believed to be due the effect ofthe magnetic tension force acting on the newly reconnectedflux tubes in the presence of IMFBy . For By > 0, opentubes are pulled westward in the Northern Hemisphere andadded to the dawn side of the northern tail lobe, while simul-taneously being pulled eastward in the Southern Hemisphereand added to the dusk side of the southern tail lobe and viceversa forBy < 0. Thus, the anti-sunward flow over the polarcap is asymmetric with stronger flows on the dawn side inthe Northern Hemisphere and on the dusk side in the South-ern Hemisphere forBy > 0, and vice versa forBy < 0. Theoverall effect on open field lines is an additional westward(eastward) circulation in the Northern Hemisphere ifBy > 0(By < 0), and vice versa in the Southern Hemisphere.
Published by Copernicus Publications on behalf of the European Geosciences Union.
1306 R. Lukianova and A. Kozlovsky: IMFBy effects in the plasma flow at the polar cap boundary
The By-related effect may be also interpreted in such away that the convection asymmetry is formed by two el-ements (Nishida, 1971; Leontyev and Lyatsky, 1974; Ko-zlovsky et al., 2003). Firstly, the IMFBy component ir-respective of its sign causes anti-sunward transpolar flowdue to reconnection at the flanks of the magnetosphere. Inthe Northern Hemisphere this flow is stronger on the dawn(dusk) side. It adds a westward (eastward) circulation whenIMF By is positive (negative). Secondly, the IMFBy gen-erates a voltage between the two magnetospheric lobes. TheIMF is frozen in the solar wind plasma that moves away fromthe Sun with a typical speed of∼300 km s−1. As a result, theIMF generates an electric fieldEsw = −Vsw× BIMF in theEarth-fixed framework. In particular, the IMFBy (positivedirection from dawn to dusk) generates an electric field di-rected from South to North. From the voltage between thetwo polar caps, one can expect a radial electric field and,consequently, an azimuthal (around the pole) plasma flow,which is opposite in the northern and Southern Hemispheres.For instance, a negative IMFBy produces an eastward (west-ward) plasma flow within the northern (southern) polar cap.
In a steady-state case, such oppositely directed flowsshould not co-exist in the closed magnetic field line regionsof the conjugate hemispheres because of high conductivityalong the magnetic field lines. Hence it was commonly be-lieved that the asymmetric plasma flows occur within theopen polar caps forming lobe convection cells. However, re-cent observations have shown that the anti-symmetric electricfield penetrates to the region of closed magnetic field lines.This phenomenon may be explained by the anomalous resis-tance associated with the inter-hemispheric field-aligned cur-rents (Kozlovsky et al., 2003). Sandholt and Farrugia (2009)showed that the situation may be even more complicated.Namely, plasma convection on open field lines can be sub-divided in two distinct stages corresponding to “newly open”and “old open” (reconnection has occurred some time ear-lier) field lines. Convection channels in the second stageplay an important role in the excitation of an IMFBy-relateddawn-dusk convection asymmetry. These flow channels in-dicate momentum transfer from the solar wind along the “oldopen” field lines associated with polar rain precipitation. Inaddition, the inter-hemispheric asymmetry may be due tothe specific mapping of the reconnection electric field to theionosphere. This was shown by Watanabe at al. (2007), whostudied a topological model of the IMF-magnetosphere re-connection in many details.
Qualitatively, the basic effects of IMFBy on thehigh-latitude ionospheric convection have been understoodby now. However, we need quantitative characteristicswhich are important for better understanding of the high-latitude magnetosphere-ionosphere coupling and for calibrat-ing models of ionospheric electrodynamics. An interest-ing study on the plasma flow related to the IMFBy wasperformed by Khan and Cowley (2001), who analyzed adatabase of 300 h of tristatic ionospheric velocity measure-
ments obtained overhead at Tromsø (66.3◦ magnetic latitude)by the EISCAT UHF radar system. The authors found thatsignificant flow variations with IMFBy occur predominantlyin the midnight sector (21:00–03:00 MLT) and also in thepre-dusk (16:00–17:00 MLT) sector. The flows are directedeastward for IMFBy positive and westward for IMFBy neg-ative, and with magnitudes of the order of 20–30 m s−1 nT−1
in the midnight sector and 10–20 m s−1 nT−1 in the pre-dusksector. At other local times the IMFBy-related perturbationflows are much smaller, less than 5 m s−1 nT−1. These ob-servations relate to the region of closed magnetic field lines.
In the present paper we study theBy effect at essentiallyhigher latitudes, in a vicinity of the polar cap boundary. Weutilize a large (more than 1300 h) database collected during8 yr at the EISCAT Svalbard Radar (around 75◦ MLat). Ouraim is to infer quantitative characteristics of the east-westionospheric plasma flow associated with IMFBy . After de-scription of the collected data (Sects. 2 and 3) we present thestatistical results of the dependence of the flow speed on IMFBy in different MLT sectors (Sect. 4). In Sect. 5 we show thedawn/dusk asymmetry feature in association with the IMFBy . Discussion is given in Sect. 6. The final section is asummary of the obtained results.
2 Data and method
The EISCAT Svalbard Radar (ESR) has a unique locationthat is convenient for monitoring the ionospheric plasma pa-rameters in a vicinity of the polar cap boundary. For thepresent study the data were obtained from the Common Pro-gram 2 (CP2) ESR measurements. During 2000–2008, theradar was working more than 1300 h in the CP2 mode withthe beam being periodically alternated between three posi-tions (one vertical and two elevated at 63◦ or 66◦ to hori-zon with azimuth angles 172◦ and 144◦, respectively). Underan assumption that the plasma flow is spatially uniform overthe region of ESR observations and does not change duringthe scanning cycle, vector of the large-scale plasma flow inthe F-region was calculated and the electric field vector wasinferred, assuming that the F-region plasma experience theE×B drift. These measurements refer to the heights of 200–300 km with spatial resolution of the order of 100 km in thehorizontal plane. These data are related to about 74.5◦ MLat.The scanning cycle was typically about 6 min. We used alltriads of consequent antenna positions to calculate the vectorflow. In this case each a measurement contributes to threedata points. Thus, although the sampling rate of the ESRdata is about 2 min, the data was averaged over the intervalof about 6 min.
The ESR data are uniformly distributed along local time.The majority of the data (57 %) were obtained near the au-tumn equinox (September and October). For summer condi-tions (June–July) there existed 24 % of the data, while 16 %of the data were obtained during February–March (spring),
Ann. Geophys., 29, 1305–1315, 2011 www.ann-geophys.net/29/1305/2011/
R. Lukianova and A. Kozlovsky: IMFBy effects in the plasma flow at the polar cap boundary 1307
and only 3 % of the data were obtained during winter (De-cember).
For the present study we have calculated the azimuthaleastward component of plasma flow,VE, (i.e. along L-shell),which is at 20 deg. from geographic East to North. Theplasma flow data were combined with the data on IMF Y- andZ-components (GSM) obtained from the OMNI database.The OMNI provides interplanetary parameters referred to theEarth’s orbit (1 AU). We utilised the data averaged over 5-min interval, which match to the radar data. The analysisis made separately for the northward IMF (Bz > 0) and thesouthward IMF (Bz < 0).
The main parameters studied are correlation and linear re-gression ofVE with IMF By . The correlation coefficientCcorrcalculated in the conventional way, and confidence intervalsfor the correlation coefficients are calculated using the fol-lowing formula:
δCcorr= tγ1−C2
corr√
n, (1)
wheren is the number of data points andtγ is the inversestandardized normal distribution (for the 95 % confidence in-terval,tγ = 1.96). The linear regression coefficientK is cal-culated by the least square method to get a linear approxima-tion
VE = VE0+KBY . (2)
whereVE0 is a background part of azimuthal flow that doesnot depend on a sign of IMFBy . This flow basically relatesto the two-cell convection pattern generated by the reconnec-tion and viscous interaction on the magnetopause.
Note that in the Northern Hemisphere, a duskward(i.e. positive) IMFBy generates a westward (i.e. negative)plasma flow and, vice versa, a negative IMFBy generates aneastward (i.e. positive) flow around the polar cap. Hence, thecoefficientK is normally negative. Because of that we usereverse axis direction for plottingK below. Strictly speak-ing, the correlation coefficients are also negative, however,we use below the absolute value of the coefficients to char-acterize just a degree of linear dependence.
3 Response time of ionospheric convection to IMFBy
The first our step is to determine the time lag between theIMF By conditions at 1 AU and the corresponding iono-spheric plasma flow at the ESR location. The ionosphericconvection response to a change in the IMF as measuredby the spacecraft is a sum of the following time intervals:(1) the propagation time for the IMF to reach the at the frontside magnetopause (assumed to be typically located at XGSE= 10 Re), (2) the magnetosphere-ionosphere communi-cation time, and (3) the ionospheric convection reconfigura-tion time (Zhang et al., 2007).
In the present study the time interval (1) is neglected be-cause we use the OMNI data which provides interplanetaryparameters referred to the Earth’s orbit. Thus we need toestimate the sum of intervals (2) and (3). There are two pos-sible approaches to determine the convection response to achange in the IMF. The first is to examine each individualevent of the IMF change to perform a search of the associ-ated details of the response. Such an analysis is more appro-priate for the study of the response to a sudden change in theIMF orientation (e.g. Hairston and Heelis, 1995; Ridley etal., 1998; Kabin et al., 2003; Lyons et al., 2003). The sec-ond approach is to average the data for revelation the mostcommon features. Such approach is used for constructionof the statistical models with binning of both IMF and iono-spheric data (e.g. Heppner and Maynard, 1987; Papitashviliand Rich, 2002; Zhang et al., 2007). In the frame of thisapproach the slow variations of the IMF may be accountedfor.
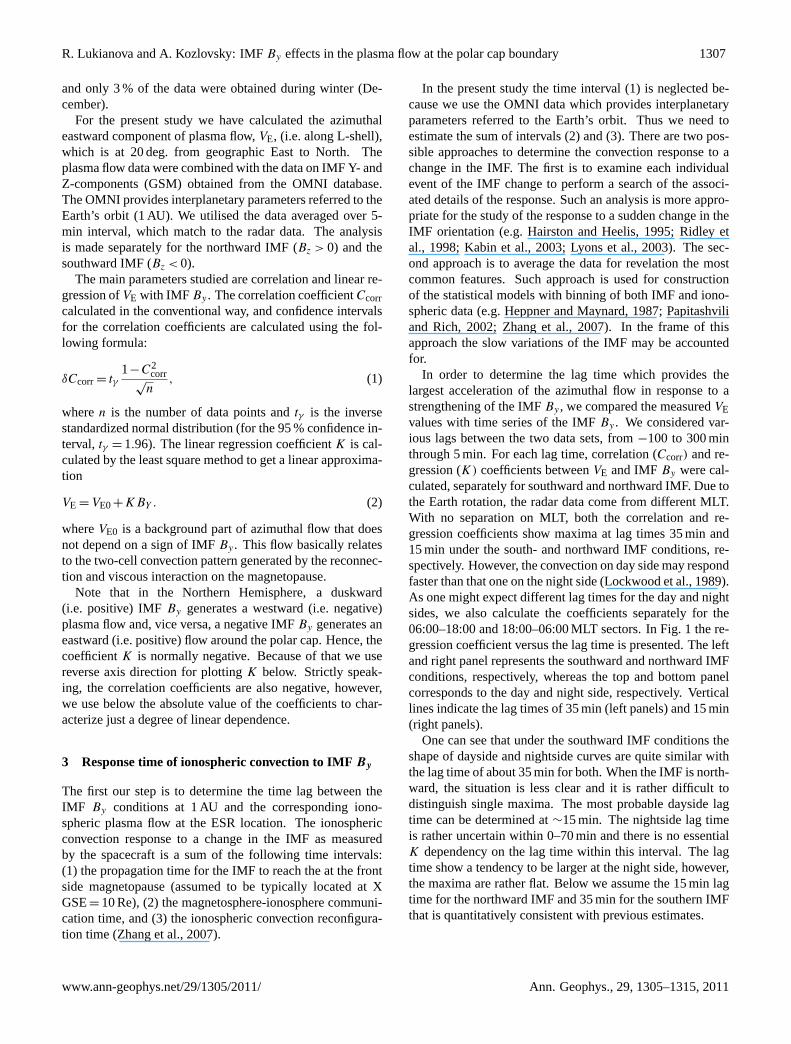
In order to determine the lag time which provides thelargest acceleration of the azimuthal flow in response to astrengthening of the IMFBy , we compared the measuredVEvalues with time series of the IMFBy . We considered var-ious lags between the two data sets, from−100 to 300 minthrough 5 min. For each lag time, correlation (Ccorr) and re-gression (K) coefficients betweenVE and IMFBy were cal-culated, separately for southward and northward IMF. Due tothe Earth rotation, the radar data come from different MLT.With no separation on MLT, both the correlation and re-gression coefficients show maxima at lag times 35 min and15 min under the south- and northward IMF conditions, re-spectively. However, the convection on day side may respondfaster than that one on the night side (Lockwood et al., 1989).As one might expect different lag times for the day and nightsides, we also calculate the coefficients separately for the06:00–18:00 and 18:00–06:00 MLT sectors. In Fig. 1 the re-gression coefficient versus the lag time is presented. The leftand right panel represents the southward and northward IMFconditions, respectively, whereas the top and bottom panelcorresponds to the day and night side, respectively. Verticallines indicate the lag times of 35 min (left panels) and 15 min(right panels).
One can see that under the southward IMF conditions theshape of dayside and nightside curves are quite similar withthe lag time of about 35 min for both. When the IMF is north-ward, the situation is less clear and it is rather difficult todistinguish single maxima. The most probable dayside lagtime can be determined at∼15 min. The nightside lag timeis rather uncertain within 0–70 min and there is no essentialK dependency on the lag time within this interval. The lagtime show a tendency to be larger at the night side, however,the maxima are rather flat. Below we assume the 15 min lagtime for the northward IMF and 35 min for the southern IMFthat is quantitatively consistent with previous estimates.
www.ann-geophys.net/29/1305/2011/ Ann. Geophys., 29, 1305–1315, 2011
1308 R. Lukianova and A. Kozlovsky: IMFBy effects in the plasma flow at the polar cap boundary
−100 0 100 200 300
−80
−60
−40
−20
0
MLT
= 1
2
ΔVE/ΔBy, <Bz> = −2.6
−100 0 100 200 300
−80
−60
−40
−20
0
MLT
= 0
Time lag after OMNI, min
−100 0 100 200 300
−80
−60
−40
−20
0
MLT
= 1
2
ΔVE/ΔBy, <Bz> = 2.8
−100 0 100 200 300
−80
−60
−40
−20
0
MLT
= 0
Time lag after OMNI, min
Fig. 1. The regression coefficients against the lag time for southward (left) and northward (right) IMF. Top and bottom panels correspond tothe day and night side, respectively. Vertical lines indicate the lag times 35 min and 15 min.
We should emphasize that our aim here is to determineonly the lag time that should be accounted for comparisonthe ionospheric data at ESR location with the OMNI data.These lags do not necessarily correspond to the rearrange-ment of the entire convection pattern in response to the IMFBy changes since at a given UT interval the radar is ableto measure the response at the particular location but notan overall change in large-scale convection. However, theabove consideration suggests that theBy-related flow aver-aged along the latitudinal circle near the polar cap boundarymay be considered as established (relative to OMNI data) af-ter a suitable lag time of 35 min and 15 min for IMFBz < 0andBz > 0, respectively.
4 IMF By control of the azimuthal plasma flow indifferent MLT sectors
The ESR measurements cover the entire MLT range witha fairly uniform local time distribution. We separated thewhole set of velocity data into 3 h wide sectors centredat 00:00, 03:00, 06:00, 09:00, 12:00, 15:00, 18:00 and
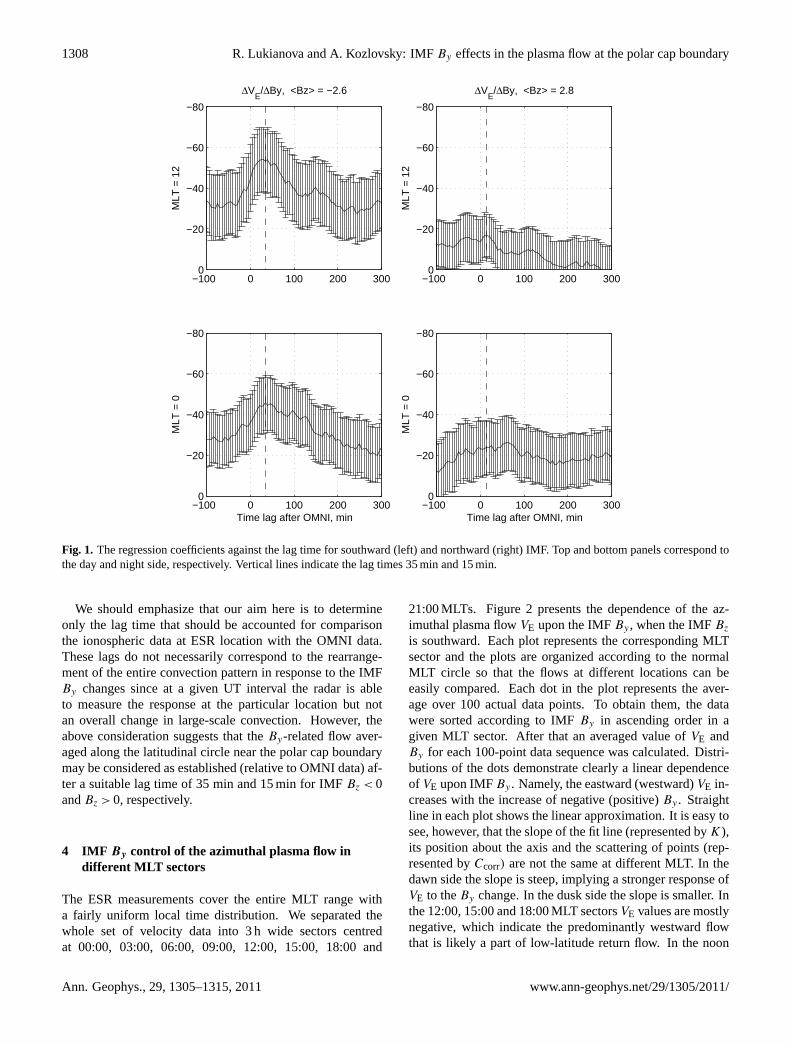
21:00 MLTs. Figure 2 presents the dependence of the az-imuthal plasma flowVE upon the IMFBy , when the IMFBz
is southward. Each plot represents the corresponding MLTsector and the plots are organized according to the normalMLT circle so that the flows at different locations can beeasily compared. Each dot in the plot represents the aver-age over 100 actual data points. To obtain them, the datawere sorted according to IMFBy in ascending order in agiven MLT sector. After that an averaged value ofVE andBy for each 100-point data sequence was calculated. Distri-butions of the dots demonstrate clearly a linear dependenceof VE upon IMFBy . Namely, the eastward (westward)VE in-creases with the increase of negative (positive)By . Straightline in each plot shows the linear approximation. It is easy tosee, however, that the slope of the fit line (represented byK),its position about the axis and the scattering of points (rep-resented byCcorr) are not the same at different MLT. In thedawn side the slope is steep, implying a stronger response ofVE to theBy change. In the dusk side the slope is smaller. Inthe 12:00, 15:00 and 18:00 MLT sectorsVE values are mostlynegative, which indicate the predominantly westward flowthat is likely a part of low-latitude return flow. In the noon
Ann. Geophys., 29, 1305–1315, 2011 www.ann-geophys.net/29/1305/2011/
R. Lukianova and A. Kozlovsky: IMFBy effects in the plasma flow at the polar cap boundary 1309
−10 0 10−600
−400
−200
0
200
400
600MLT=00
−10 0 10−600
−400
−200
0
200
400
600MLT=03
−10 0 10−600
−400
−200
0
200
400
600MLT=06
−10 0 10−600
−400
−200
0
200
400
600MLT=09
−10 0 10−600
−400
−200
0
200
400
600MLT=12
−10 0 10−600
−400
−200
0
200
400
600MLT=15
−10 0 10−600
−400
−200
0
200
400
600MLT=21
−10 0 10−600
−400
−200
0
200
400
600MLT=18
IMF
BzS
, E−
war
d flo
w (
m/s
) ve
rsus
IMF
By
(nT
) at
74.
4 C
GM
Lat
.
Fig. 2. Dependence of the eastward plasma flow (VE) on the IMFBy in the eight 3-h MLT sectors for the IMFBz < 0.
sector there are only two data points with positive (eastward)flow. This depicts the overall prevalence of the dusk cell thatadds more westward flow near the polar cap boundary.
The prevalence of the westward flow at noon may be asso-ciated with the inherent asymmetry of the two-cell convec-tion pattern observed even forBy = 0. The cells are not ex-actly symmetric, with a larger cell and a higher potential onthe dusk side. The effect was schematically described first byAtkinson and Hutchison (1978). These authors pointed outthat the day-night conductivity gradient in the polar cap E-region ionosphere squeezes the antisunward convective flowto the dawnside of the polar cap. This is a likely cause of thelack of the mirror symmetry in the flow pattern that, as theoryindicates, should exist in away and toward solar sectors in theNorthern Hemisphere in summer. The day-night conductiv-ity gradient in the E-region ionosphere causes such an effectdue to the Hall current closure of the Region 1 field-alignedcurrent. Ruohoniemi and Greenwald (2005) mentioned thefact that the statistical convection pattern forBy < 0 is mostasymmetrical during winter, whereas that for positiveBy > 0is most asymmetrical during summer. Note that the majority
of the ESR data are from summer/equinox. Sandholt and Far-rugia (2007) presented the case studies of the dynamical evo-lution of dayside poleward moving auroral forms (PMAFs)in relation to plasma convection during intervals of southeastand southwest IMF orientations when|By/Bz| > 1. The ob-servations were made during winter season in Ny Alesund,Svalbard at 76◦ MLAT, i.e. almost at the same site as theESR measurements. It was shown that PMAF activity isclosely associated with vortical flows in the dawn- and dusk-centered convection with clearBy-related dawn-dusk asym-metries. However, the large-scale convection does not showthe identically mirrored response to the opposite signs ofBy .
Thus a prevalence of the westward flow in Fig. 2 may becaused by the larger widening of the dusk convection cell incomparison with the dawn cell especially at the sunlit iono-sphere.
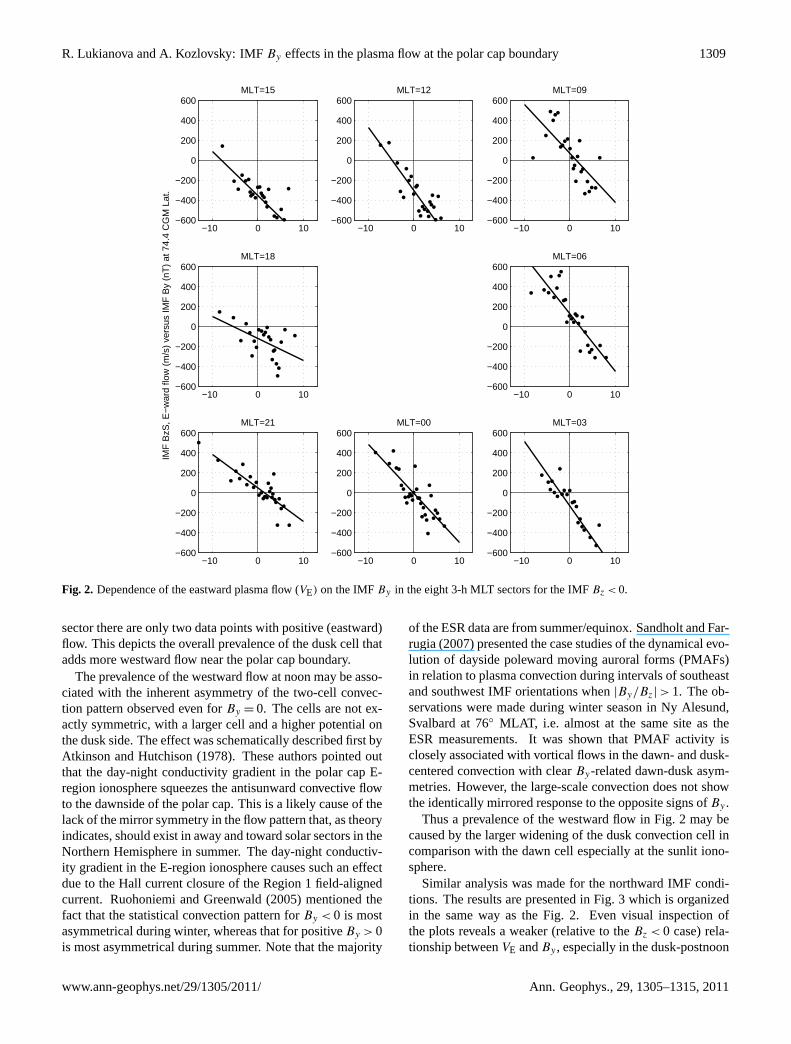
Similar analysis was made for the northward IMF condi-tions. The results are presented in Fig. 3 which is organizedin the same way as the Fig. 2. Even visual inspection ofthe plots reveals a weaker (relative to theBz < 0 case) rela-tionship betweenVE andBy , especially in the dusk-postnoon
www.ann-geophys.net/29/1305/2011/ Ann. Geophys., 29, 1305–1315, 2011
1310 R. Lukianova and A. Kozlovsky: IMFBy effects in the plasma flow at the polar cap boundary
−10 0 10−600
−400
−200
0
200
400
600MLT=00
−10 0 10−600
−400
−200
0
200
400
600MLT=03
−10 0 10−600
−400
−200
0
200
400
600MLT=06
−10 0 10−600
−400
−200
0
200
400
600MLT=09
−10 0 10−600
−400
−200
0
200
400
600MLT=12
−10 0 10−600
−400
−200
0
200
400
600MLT=15
−10 0 10−600
−400
−200
0
200
400
600MLT=21
−10 0 10−600
−400
−200
0
200
400
600MLT=18
IMF
BzN
, E−
war
d flo
w (
m/s
) ve
rsus
IMF
By
(nT
) at
74.
4 C
GM
Lat
.
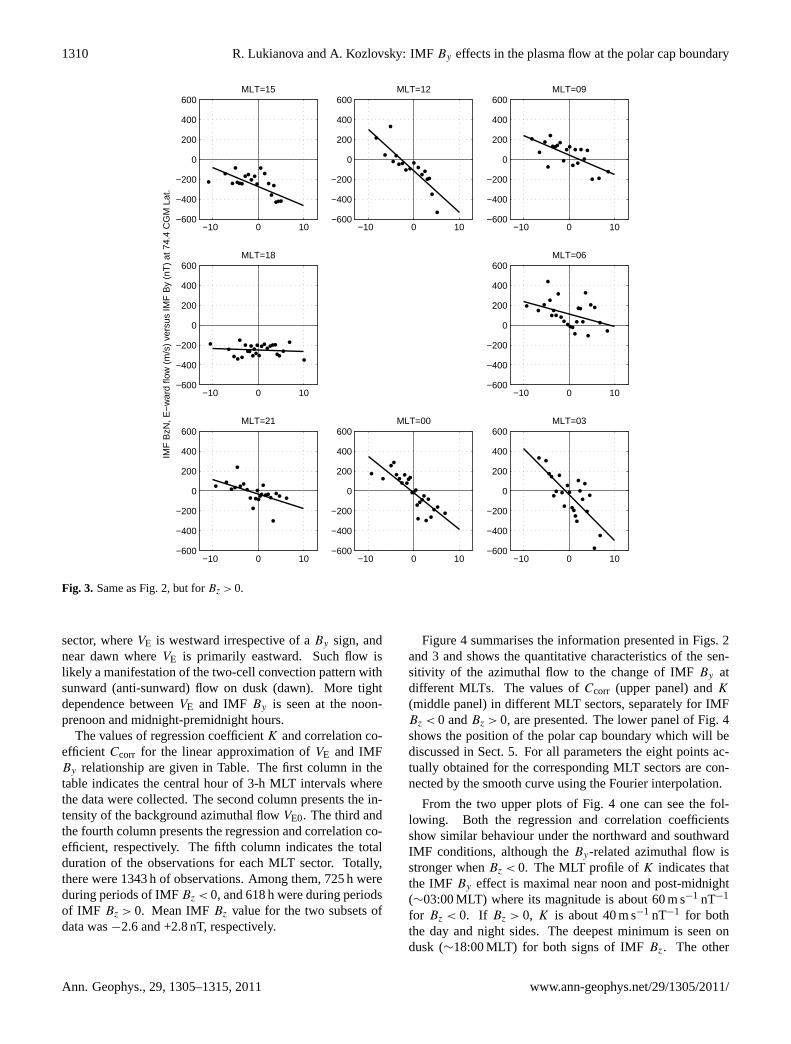
Fig. 3. Same as Fig. 2, but forBz > 0.
sector, whereVE is westward irrespective of aBy sign, andnear dawn whereVE is primarily eastward. Such flow islikely a manifestation of the two-cell convection pattern withsunward (anti-sunward) flow on dusk (dawn). More tightdependence betweenVE and IMF By is seen at the noon-prenoon and midnight-premidnight hours.
The values of regression coefficientK and correlation co-efficient Ccorr for the linear approximation ofVE and IMFBy relationship are given in Table. The first column in thetable indicates the central hour of 3-h MLT intervals wherethe data were collected. The second column presents the in-tensity of the background azimuthal flowVE0. The third andthe fourth column presents the regression and correlation co-efficient, respectively. The fifth column indicates the totalduration of the observations for each MLT sector. Totally,there were 1343 h of observations. Among them, 725 h wereduring periods of IMFBz < 0, and 618 h were during periodsof IMF Bz > 0. Mean IMFBz value for the two subsets ofdata was−2.6 and +2.8 nT, respectively.
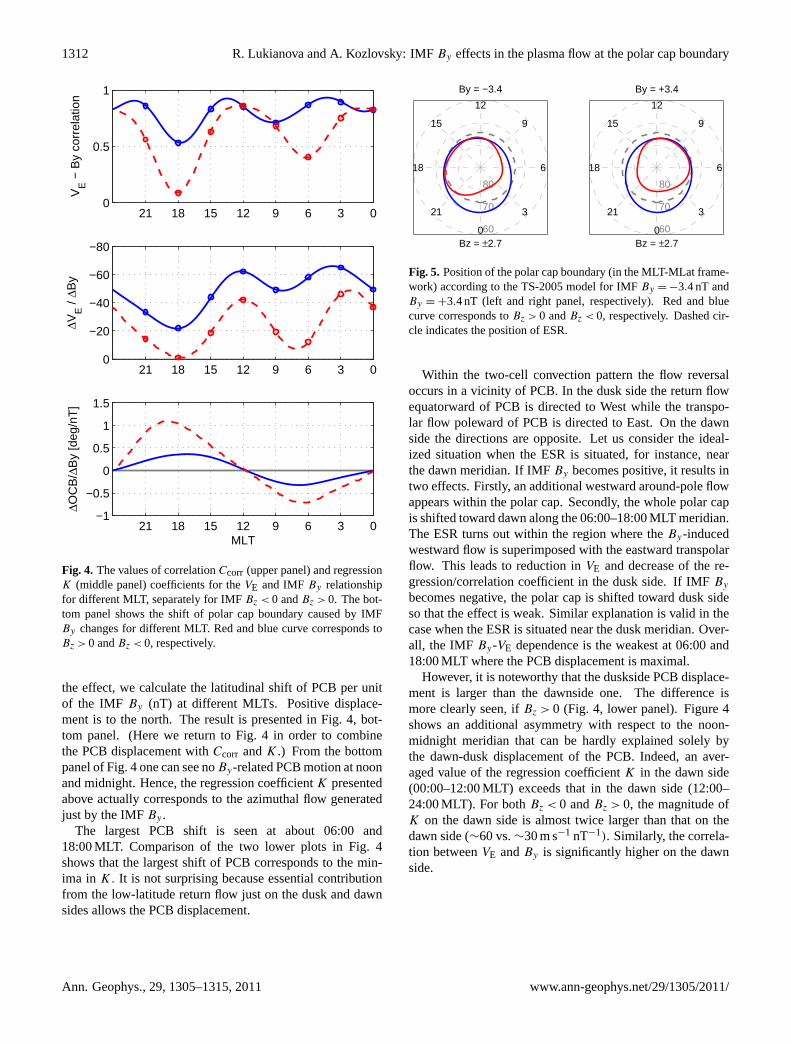
Figure 4 summarises the information presented in Figs. 2and 3 and shows the quantitative characteristics of the sen-sitivity of the azimuthal flow to the change of IMFBy atdifferent MLTs. The values ofCcorr (upper panel) andK(middle panel) in different MLT sectors, separately for IMFBz < 0 andBz > 0, are presented. The lower panel of Fig. 4shows the position of the polar cap boundary which will bediscussed in Sect. 5. For all parameters the eight points ac-tually obtained for the corresponding MLT sectors are con-nected by the smooth curve using the Fourier interpolation.
From the two upper plots of Fig. 4 one can see the fol-lowing. Both the regression and correlation coefficientsshow similar behaviour under the northward and southwardIMF conditions, although theBy-related azimuthal flow isstronger whenBz < 0. The MLT profile ofK indicates thatthe IMF By effect is maximal near noon and post-midnight(∼03:00 MLT) where its magnitude is about 60 m s−1 nT−1
for Bz < 0. If Bz > 0, K is about 40 m s−1 nT−1 for boththe day and night sides. The deepest minimum is seen ondusk (∼18:00 MLT) for both signs of IMFBz. The other
Ann. Geophys., 29, 1305–1315, 2011 www.ann-geophys.net/29/1305/2011/
R. Lukianova and A. Kozlovsky: IMFBy effects in the plasma flow at the polar cap boundary 1311
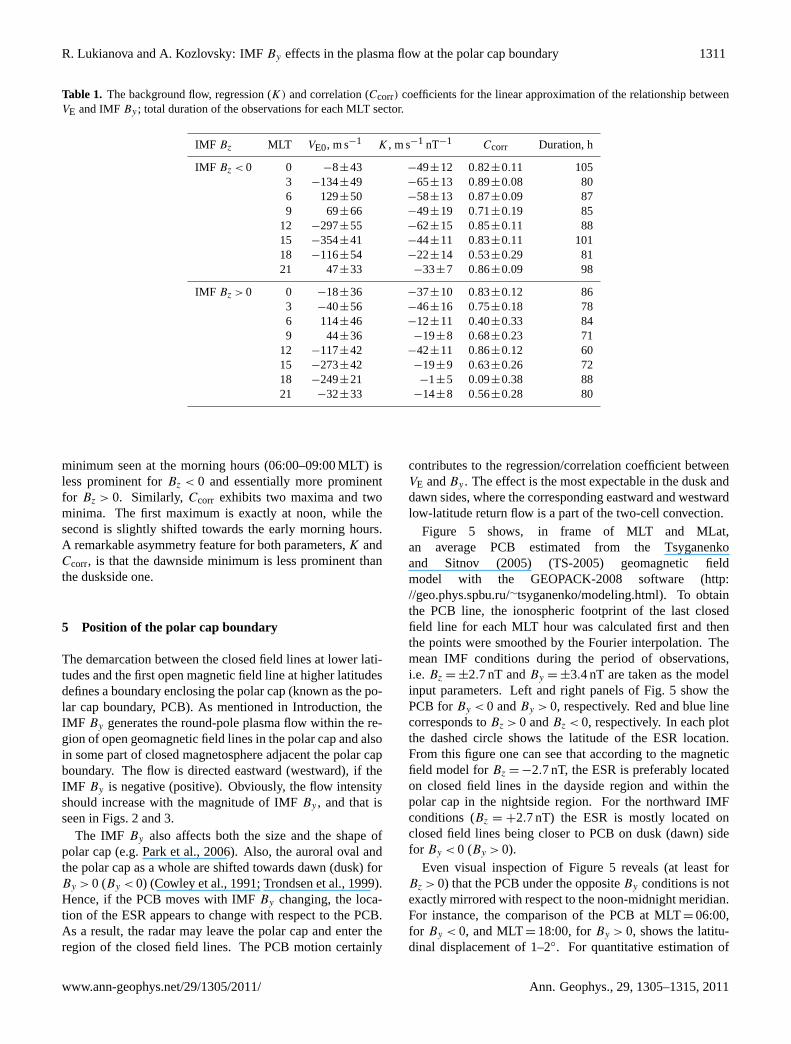
Table 1. The background flow, regression (K) and correlation (Ccorr) coefficients for the linear approximation of the relationship betweenVE and IMFBy ; total duration of the observations for each MLT sector.
IMF Bz MLT VE0, m s−1 K, m s−1 nT−1 Ccorr Duration, h
IMF Bz < 0 0 −8±43 −49±12 0.82±0.11 1053 −134±49 −65±13 0.89±0.08 806 129±50 −58±13 0.87±0.09 879 69±66 −49±19 0.71±0.19 85
12 −297±55 −62±15 0.85±0.11 8815 −354±41 −44±11 0.83±0.11 10118 −116±54 −22±14 0.53±0.29 8121 47±33 −33±7 0.86±0.09 98
IMF Bz > 0 0 −18±36 −37±10 0.83±0.12 863 −40±56 −46±16 0.75±0.18 786 114±46 −12±11 0.40±0.33 849 44±36 −19±8 0.68±0.23 71
12 −117±42 −42±11 0.86±0.12 6015 −273±42 −19±9 0.63±0.26 7218 −249±21 −1±5 0.09±0.38 8821 −32±33 −14±8 0.56±0.28 80
minimum seen at the morning hours (06:00–09:00 MLT) isless prominent forBz < 0 and essentially more prominentfor Bz > 0. Similarly, Ccorr exhibits two maxima and twominima. The first maximum is exactly at noon, while thesecond is slightly shifted towards the early morning hours.A remarkable asymmetry feature for both parameters,K andCcorr, is that the dawnside minimum is less prominent thanthe duskside one.
5 Position of the polar cap boundary
The demarcation between the closed field lines at lower lati-tudes and the first open magnetic field line at higher latitudesdefines a boundary enclosing the polar cap (known as the po-lar cap boundary, PCB). As mentioned in Introduction, theIMF By generates the round-pole plasma flow within the re-gion of open geomagnetic field lines in the polar cap and alsoin some part of closed magnetosphere adjacent the polar capboundary. The flow is directed eastward (westward), if theIMF By is negative (positive). Obviously, the flow intensityshould increase with the magnitude of IMFBy , and that isseen in Figs. 2 and 3.
The IMF By also affects both the size and the shape ofpolar cap (e.g. Park et al., 2006). Also, the auroral oval andthe polar cap as a whole are shifted towards dawn (dusk) forBy > 0 (By < 0) (Cowley et al., 1991; Trondsen et al., 1999).Hence, if the PCB moves with IMFBy changing, the loca-tion of the ESR appears to change with respect to the PCB.As a result, the radar may leave the polar cap and enter theregion of the closed field lines. The PCB motion certainly
contributes to the regression/correlation coefficient betweenVE andBy . The effect is the most expectable in the dusk anddawn sides, where the corresponding eastward and westwardlow-latitude return flow is a part of the two-cell convection.
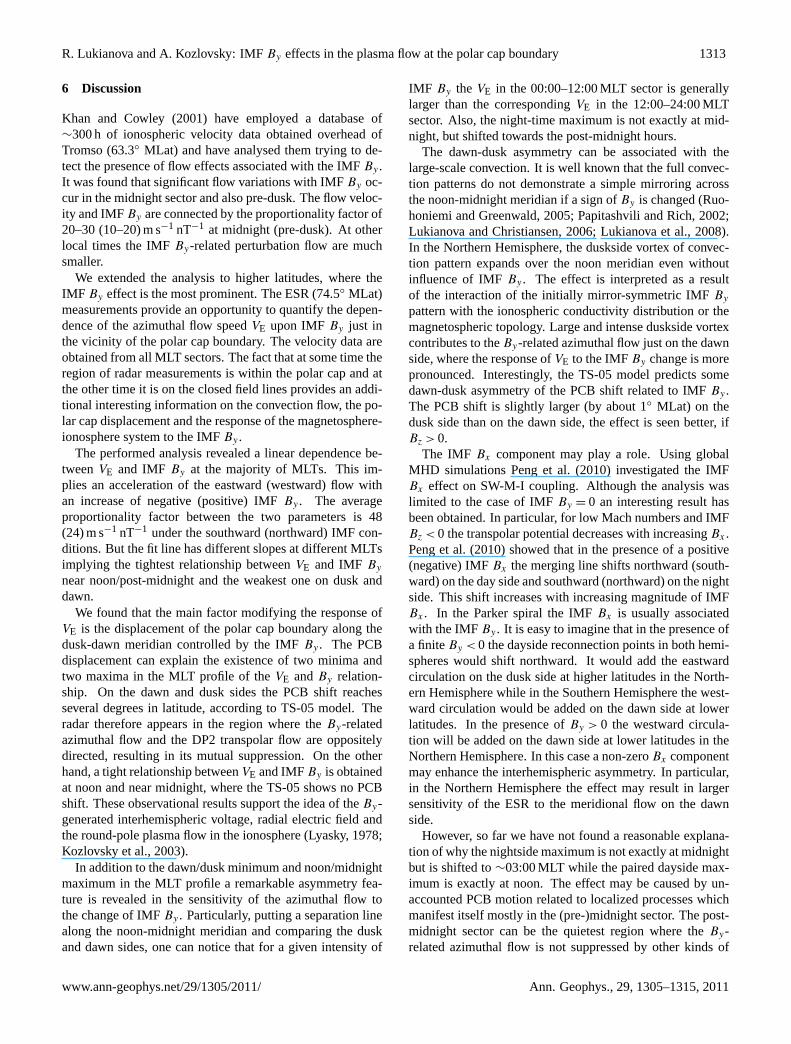
Figure 5 shows, in frame of MLT and MLat,an average PCB estimated from the Tsyganenkoand Sitnov (2005) (TS-2005) geomagnetic fieldmodel with the GEOPACK-2008 software (http://geo.phys.spbu.ru/∼tsyganenko/modeling.html). To obtainthe PCB line, the ionospheric footprint of the last closedfield line for each MLT hour was calculated first and thenthe points were smoothed by the Fourier interpolation. Themean IMF conditions during the period of observations,i.e. Bz = ±2.7 nT andBy = ±3.4 nT are taken as the modelinput parameters. Left and right panels of Fig. 5 show thePCB forBy < 0 andBy > 0, respectively. Red and blue linecorresponds toBz > 0 andBz < 0, respectively. In each plotthe dashed circle shows the latitude of the ESR location.From this figure one can see that according to the magneticfield model forBz = −2.7 nT, the ESR is preferably locatedon closed field lines in the dayside region and within thepolar cap in the nightside region. For the northward IMFconditions (Bz = +2.7 nT) the ESR is mostly located onclosed field lines being closer to PCB on dusk (dawn) sidefor By < 0 (By > 0).
Even visual inspection of Figure 5 reveals (at least forBz > 0) that the PCB under the oppositeBy conditions is notexactly mirrored with respect to the noon-midnight meridian.For instance, the comparison of the PCB at MLT= 06:00,for By < 0, and MLT= 18:00, forBy > 0, shows the latitu-dinal displacement of 1–2◦. For quantitative estimation of
www.ann-geophys.net/29/1305/2011/ Ann. Geophys., 29, 1305–1315, 2011
1312 R. Lukianova and A. Kozlovsky: IMFBy effects in the plasma flow at the polar cap boundary
036912151821−1
−0.5
0
0.5
1
1.5
ΔOC
B/Δ
By
[deg
/nT
]
MLT
036912151821
−80
−60
−40
−20
0
ΔVE /
ΔBy
0369121518210
0.5
1V
E −
By
corr
elat
ion
Fig. 4. The values of correlationCcorr (upper panel) and regressionK (middle panel) coefficients for theVE and IMFBy relationshipfor different MLT, separately for IMFBz < 0 andBz > 0. The bot-tom panel shows the shift of polar cap boundary caused by IMFBy changes for different MLT. Red and blue curve corresponds toBz > 0 andBz < 0, respectively.
the effect, we calculate the latitudinal shift of PCB per unitof the IMF By (nT) at different MLTs. Positive displace-ment is to the north. The result is presented in Fig. 4, bot-tom panel. (Here we return to Fig. 4 in order to combinethe PCB displacement withCcorr andK.) From the bottompanel of Fig. 4 one can see noBy-related PCB motion at noonand midnight. Hence, the regression coefficientK presentedabove actually corresponds to the azimuthal flow generatedjust by the IMFBy .
The largest PCB shift is seen at about 06:00 and18:00 MLT. Comparison of the two lower plots in Fig. 4shows that the largest shift of PCB corresponds to the min-ima in K. It is not surprising because essential contributionfrom the low-latitude return flow just on the dusk and dawnsides allows the PCB displacement.
80
70
600
3
6
9
12
15
18
21
By = −3.4
Bz = ±2.7
80
70
600
3
6
9
12
15
18
21
By = +3.4
Bz = ±2.7
Fig. 5. Position of the polar cap boundary (in the MLT-MLat frame-work) according to the TS-2005 model for IMFBy = −3.4 nT andBy = +3.4 nT (left and right panel, respectively). Red and bluecurve corresponds toBz > 0 andBz < 0, respectively. Dashed cir-cle indicates the position of ESR.
Within the two-cell convection pattern the flow reversaloccurs in a vicinity of PCB. In the dusk side the return flowequatorward of PCB is directed to West while the transpo-lar flow poleward of PCB is directed to East. On the dawnside the directions are opposite. Let us consider the ideal-ized situation when the ESR is situated, for instance, nearthe dawn meridian. If IMFBy becomes positive, it results intwo effects. Firstly, an additional westward around-pole flowappears within the polar cap. Secondly, the whole polar capis shifted toward dawn along the 06:00–18:00 MLT meridian.The ESR turns out within the region where theBy-inducedwestward flow is superimposed with the eastward transpolarflow. This leads to reduction inVE and decrease of the re-gression/correlation coefficient in the dusk side. If IMFBy
becomes negative, the polar cap is shifted toward dusk sideso that the effect is weak. Similar explanation is valid in thecase when the ESR is situated near the dusk meridian. Over-all, the IMF By-VE dependence is the weakest at 06:00 and18:00 MLT where the PCB displacement is maximal.
However, it is noteworthy that the duskside PCB displace-ment is larger than the dawnside one. The difference ismore clearly seen, ifBz > 0 (Fig. 4, lower panel). Figure 4shows an additional asymmetry with respect to the noon-midnight meridian that can be hardly explained solely bythe dawn-dusk displacement of the PCB. Indeed, an aver-aged value of the regression coefficientK in the dawn side(00:00–12:00 MLT) exceeds that in the dawn side (12:00–24:00 MLT). For bothBz < 0 andBz > 0, the magnitude ofK on the dawn side is almost twice larger than that on thedawn side (∼60 vs.∼30 m s−1 nT−1). Similarly, the correla-tion betweenVE andBy is significantly higher on the dawnside.
Ann. Geophys., 29, 1305–1315, 2011 www.ann-geophys.net/29/1305/2011/
R. Lukianova and A. Kozlovsky: IMFBy effects in the plasma flow at the polar cap boundary 1313
6 Discussion
Khan and Cowley (2001) have employed a database of∼300 h of ionospheric velocity data obtained overhead ofTromso (63.3◦ MLat) and have analysed them trying to de-tect the presence of flow effects associated with the IMFBy .It was found that significant flow variations with IMFBy oc-cur in the midnight sector and also pre-dusk. The flow veloc-ity and IMFBy are connected by the proportionality factor of20–30 (10–20) m s−1 nT−1 at midnight (pre-dusk). At otherlocal times the IMFBy-related perturbation flow are muchsmaller.
We extended the analysis to higher latitudes, where theIMF By effect is the most prominent. The ESR (74.5◦ MLat)measurements provide an opportunity to quantify the depen-dence of the azimuthal flow speedVE upon IMF By just inthe vicinity of the polar cap boundary. The velocity data areobtained from all MLT sectors. The fact that at some time theregion of radar measurements is within the polar cap and atthe other time it is on the closed field lines provides an addi-tional interesting information on the convection flow, the po-lar cap displacement and the response of the magnetosphere-ionosphere system to the IMFBy .
The performed analysis revealed a linear dependence be-tweenVE and IMF By at the majority of MLTs. This im-plies an acceleration of the eastward (westward) flow withan increase of negative (positive) IMFBy . The averageproportionality factor between the two parameters is 48(24) m s−1 nT−1 under the southward (northward) IMF con-ditions. But the fit line has different slopes at different MLTsimplying the tightest relationship betweenVE and IMF By
near noon/post-midnight and the weakest one on dusk anddawn.
We found that the main factor modifying the response ofVE is the displacement of the polar cap boundary along thedusk-dawn meridian controlled by the IMFBy . The PCBdisplacement can explain the existence of two minima andtwo maxima in the MLT profile of theVE andBy relation-ship. On the dawn and dusk sides the PCB shift reachesseveral degrees in latitude, according to TS-05 model. Theradar therefore appears in the region where theBy-relatedazimuthal flow and the DP2 transpolar flow are oppositelydirected, resulting in its mutual suppression. On the otherhand, a tight relationship betweenVE and IMFBy is obtainedat noon and near midnight, where the TS-05 shows no PCBshift. These observational results support the idea of theBy-generated interhemispheric voltage, radial electric field andthe round-pole plasma flow in the ionosphere (Lyasky, 1978;Kozlovsky et al., 2003).
In addition to the dawn/dusk minimum and noon/midnightmaximum in the MLT profile a remarkable asymmetry fea-ture is revealed in the sensitivity of the azimuthal flow tothe change of IMFBy . Particularly, putting a separation linealong the noon-midnight meridian and comparing the duskand dawn sides, one can notice that for a given intensity of
IMF By theVE in the 00:00–12:00 MLT sector is generallylarger than the correspondingVE in the 12:00–24:00 MLTsector. Also, the night-time maximum is not exactly at mid-night, but shifted towards the post-midnight hours.
The dawn-dusk asymmetry can be associated with thelarge-scale convection. It is well known that the full convec-tion patterns do not demonstrate a simple mirroring acrossthe noon-midnight meridian if a sign ofBy is changed (Ruo-honiemi and Greenwald, 2005; Papitashvili and Rich, 2002;Lukianova and Christiansen, 2006; Lukianova et al., 2008).In the Northern Hemisphere, the duskside vortex of convec-tion pattern expands over the noon meridian even withoutinfluence of IMFBy . The effect is interpreted as a resultof the interaction of the initially mirror-symmetric IMFBy
pattern with the ionospheric conductivity distribution or themagnetospheric topology. Large and intense duskside vortexcontributes to theBy-related azimuthal flow just on the dawnside, where the response ofVE to the IMFBy change is morepronounced. Interestingly, the TS-05 model predicts somedawn-dusk asymmetry of the PCB shift related to IMFBy .The PCB shift is slightly larger (by about 1◦ MLat) on thedusk side than on the dawn side, the effect is seen better, ifBz > 0.
The IMF Bx component may play a role. Using globalMHD simulations Peng et al. (2010) investigated the IMFBx effect on SW-M-I coupling. Although the analysis waslimited to the case of IMFBy = 0 an interesting result hasbeen obtained. In particular, for low Mach numbers and IMFBz < 0 the transpolar potential decreases with increasingBx .Peng et al. (2010) showed that in the presence of a positive(negative) IMFBx the merging line shifts northward (south-ward) on the day side and southward (northward) on the nightside. This shift increases with increasing magnitude of IMFBx . In the Parker spiral the IMFBx is usually associatedwith the IMFBy . It is easy to imagine that in the presence ofa finiteBy < 0 the dayside reconnection points in both hemi-spheres would shift northward. It would add the eastwardcirculation on the dusk side at higher latitudes in the North-ern Hemisphere while in the Southern Hemisphere the west-ward circulation would be added on the dawn side at lowerlatitudes. In the presence ofBy > 0 the westward circula-tion will be added on the dawn side at lower latitudes in theNorthern Hemisphere. In this case a non-zeroBx componentmay enhance the interhemispheric asymmetry. In particular,in the Northern Hemisphere the effect may result in largersensitivity of the ESR to the meridional flow on the dawnside.
However, so far we have not found a reasonable explana-tion of why the nightside maximum is not exactly at midnightbut is shifted to∼03:00 MLT while the paired dayside max-imum is exactly at noon. The effect may be caused by un-accounted PCB motion related to localized processes whichmanifest itself mostly in the (pre-)midnight sector. The post-midnight sector can be the quietest region where theBy-related azimuthal flow is not suppressed by other kinds of
www.ann-geophys.net/29/1305/2011/ Ann. Geophys., 29, 1305–1315, 2011
1314 R. Lukianova and A. Kozlovsky: IMFBy effects in the plasma flow at the polar cap boundary
flow. The temporal PCB motion was demonstrated recentlyby Laundal et al. (2010). The poleward boundary of thenightside auroral oval under the northward IMF conditionswere studied by Lee at al. (2010) using the DMSP data. Itwas shown that for positive IMFBy the boundary is morepoleward (equatorward) in the premidnight region and thesituation is opposite in the postmidnight region and for neg-ative IMFBy . However, the scattering of the obtained pointsis rather large. It is worth to check whether the additionalasymmetry feature revealed in the present study has been de-tected by other instruments.
7 Summary
We utilize the unique (more than 1300 h) database collectedduring 8 yr at the EISCAT Svalbard Radar (around 75 MLat)to infer quantitative characteristics of the east-west iono-spheric plasma flow associated with IMFBy . The followingmain results were obtained.
1. The effects of IMF By are manifested in the in-tensity and direction of the azimuthal componentof the ionospheric flow. The IMFBy effect ismaximal near noon (12:00 MLT) and in the post-midnight (near 03:00 MLT), where its magnitude isabout 60 m s−1 nT−1 for Bz < 0 and 40 m s−1 nT−1 forBz > 0.
2. In the dusk (near 18:00 MLT) and dawn (at 06:00–09:00 MLT) the observed effect is essentially sup-pressed because of the motion of polar cap boundaryassociated with the IMFBy changes.
3. There is indication of a dawn-dusk asymmetry ofthe magnetosphere. Indeed, forBz < 0, an aver-aged value ofK on the dawn side is twice larger (60vs. 30 m s−1 nT−1), which can not be explained solelyby the motion of PCB. The ESR observations presentedhere provide further evidence for the dawn-dusk asym-metry of the high-latitude magnetosphere-ionospherecoupling.
Acknowledgements.We are indebted to the Director and staff ofEISCAT for operating the facility and supplying the data. EISCATis an international association supported by research organisationsin China (CRIRP), Finland (SA), France (CNRS, till end 2006),Germany (DFG), Japan (NIPR and STEL), Norway (NFR), Swe-den (VR), and the United Kingdom (STFC). The OMNI data wereobtained from CDAWeb. The study was supported by the Academyof Finland projects 115920 (AK) and 132441 (RL).
Topical Editor P.-L. Blelly thanks P. E. Sandholt and anotheranonymous referee for their help in evaluating this paper.
References
Atkinson, G. and Hutchinson, D.: Effect of the day-night iono-spheric conductivity gradient on polar cap convection flow, J.Geophys. Res., 83(A2), 725–729, 1978.
Cowley, S. W. H., Morelli, J. P., and Lockwood, M.: Dependenceof convective flows and particle precipitation in the high-latitudedayside ionosphere on the X and Y components of the interplan-etary magnetic field, J. Geophys. Res., 96, 5557–5564, 1991.
Hairston, M. R. and Heelis, R. A.: Response time of the po-lar ionospheric convection pattern to changes in the north-southdirection of the IMF, Geophys. Res. Lett., 22(5), 631–634,doi:10.1029/94GL03385, 1995.
Heppner, J. P. and Maynard, N. C.: Empirical high-latitude electricfield model, J. Geophys. Res., 92, 4467–4489, 1987.
Jørgensen, T. S., Friis-Christensen, E., and Wilhjelm, J.: Interplan-etary magnetic-field direction and high-latitude ionospheric cur-rents, J. Geophys. Res., 77, 1976–1977, 1972.
Kabin, K., Rankin, R., Marchand, R., Gombosi, T. I., Clauer C. R.,Ridley, A. J., Papitashvili, V. O., and DeZeeuw, D. L.: Dynamicresponse of Earth’s magnetosphere toBy reversals, J. Geophys.Res., 108, 1132,doi:10.1029/2002JA009480, 2003.
Khan, H. and Cowley, S. W. H.: Effect of the IMFB −y component on the ionospheric flow overhead at EISCAT: observationsand theory, Ann. Geophys., 18, 1503–1522,doi:10.1007/s00585-001-1503-6, 2001.
Kozlovsky, A., Turunen, T., Koustov, A., and Parks, G.:IMF By effects in the magnetospheric convection on closedmagnetic field lines, Geophys. Res. Lett., 30(24), 2261,doi:10.1029/2003GL018457, 2003.
Laundal, K. M., Ostgaard, N., Snekvik, K., and Frey, H. U.: Inter-hemispheric observations of emergeing polar cap area, J. Geo-phys. Res., 115, A07230,doi:10.1029/2009JA015160, 2010.
Lee, D.-Y., Ohtani, S., and Lee, J. H.: On the poleward bound-ary of the nightside auroral oval under northward interplane-tary magnetic field conditions, J. Geophys. Res., 115, A08204,doi:10.1029/2009JA014906, 2010.
Leontyev, S. V. and Lyatsky, W. B.: Electric field and currentsconnected with Y-component of interplanetary magnetic field,Planet. Space Sci., 22, 811–819, 1974.
Lockwood, M., Sandholt, P. E., Cowley, S. W. H., and Oguti, T.:Interplanetary magnetic field control of dayside auroral activityand the transfer of momentum across the dayside magnetopause,Planet. Space Sci., 37, 1347–1365, 1989.
Lukianova, R. and Christiansen, F.: Modeling of the globaldistribution of ionospheric electric fields based on realisticmaps of field-aligned currents, J. Geophys. Res., 111, A03213,doi:10.1029/2005JA011465, 2006.
Lukianova, R., Kozlovsky, A. and Turunen, T.: Comparisonand validation studies related to the modeling ionosphericconvection and the European incoherent scatter observationsin the polar cap, Int. J. Geomagn. Aeron., 7(3), GI3005,doi:10.1029/2007GI000169, 2008.
Lyatsky, W. B.: Current systems of the magnetosphere-ionospheredisturbances, Nauka, St. Petersburg, Russia, 192 pp., 1978 (inRussian).
Lyons, L. R., Liu, S., Ruohoniemi, J. M., Solovyev, S. I., andSamson, J. C.: Observations of Dayside Convection ReductionLeading to Substorm Onset, J. Geophys. Res., 108(A3), 1119,doi:10.1029/2002JA009670, 2003.
Ann. Geophys., 29, 1305–1315, 2011 www.ann-geophys.net/29/1305/2011/
R. Lukianova and A. Kozlovsky: IMFBy effects in the plasma flow at the polar cap boundary 1315
Nishida, A.: Interplanetary origin of electric fields in the magneto-sphere, Cosmic Electrodyn., 2, 350–374, 1971.
Papitashvili, V. O. and Rich, F. J.: High-latitude ionospheric con-vection models derived from Defense Meteorological satelliteProgram ion drift observations and parameterized by the inter-planetary magnetic field strength and direction, J. Geophys. Res.,107(A8), 1198,doi:10.1029/2001JA000264, 2002.
Park, K. S., Ogino, T., and Walker, R. J.: On the im-portance of antiparallel reconnection when the dipole tiltand IMF By are nonzero, J. Geophys. Res., 111, A05202,doi:10.1029/2004JA010972, 2006.
Peng, Z., Wang, C., and Hu, Y. Q.: Role of IMFBx in the so-lar wind-magnetosphere-ionosphere coupling, J. Geophys. Res.,115, A08224,doi:10.1029/2010JA015454, 2010.
Ridley, A. J., Lu, G., Clauer, C. R., and Papitashvili, V. O.: A statis-tical study of the ionospheric convection response to changinginterplanetary magnetic field conditions using the assimilativemapping of ionospheric electrodynamics technique, J. Geophys.Res., 103(A3), 4023–4039,doi:10.1029/97JA03328, 1998.
Ruohoniemi, J. M. and Greenwald, R. A.: Dependencies of high-latitude plasma convection: Consideration of IMF, seasonal, andUT factors in statistical patterns, J. Geophys. Res., 110, A09204,doi:10.1029/2004JA010815, 2005.
Sandholt, P. E. and Farrugia, C. J.: Poleward moving auroral forms(PMAFs) revisited: responses of aurorae, plasma convection andBirkeland currents in the pre- and postnoon sectors under posi-tive and negative IMFBy conditions, Ann. Geophys., 25, 1629–1652,doi:10.5194/angeo-25-1629-2007, 2007.
Sandholt, P. E. and Farrugia, C. J.: Plasma flow channels at thedawn/dusk polar cap boundaries: momentum transfer on oldopen field lines and the roles of IMFBy and conductivity gra-dients, Ann. Geophys., 27, 1527–1554,doi:10.5194/angeo-27-1527-2009, 2009.
Stern, D. P.: A study of the electric field in an open magnetosphericmodel, J. Geophys. Res., 78, 7292–7305, 1973.
Svalgaard, L.: Polar cap magnetic variations and their relationshipwith the interplanetary magnetic sector structure, J. Geophys.Res., 78, 2064–2078, 1973.
Trondsen, T. S., Lyatsky, W., Cogger, L. L., and Murphree, J. S.:Interplanetary magnetic fieldBy control of dayside auroras, J.Atmos. Sol.-Terr. Phy., 61, 829–840, 1999.
Tsyganenko, N. A. and Sitnov, M. I.: Modeling the dynamics ofthe inner magnetosphere during strong geomagnetic storms, J.Geophys. Res., 110, A03208,doi:10.1029/2004JA010798, 2005.
Watanabe, M., Sofko, G. J., Kabin, K., Rankin, R., Ridley, A. J.,Clauer, C. R., and Gombosi, T. I.: Origin of the inter-hemisphericpotential mismatch of merging cells for interplanetary magneticfield By -dominated periods, J. Geophys. Res., 112, A10205,doi:10.1029/2006JA012179, 2007.
Zhang, S.-R., Holt, J. M., and McCready, M.: High latitude convec-tion based on long-term incoherent scatter radar observations inNorth America, J. Atmos. Sol.-Terr. Phy., 69, 1273–1291, 2007.
www.ann-geophys.net/29/1305/2011/ Ann. Geophys., 29, 1305–1315, 2011