Image Processing Homework
13
INTRODUCTION TO IMAGE PROCESSING HOMEWORK 1 HAKAN KAHRAMAN 151220102038 ESKISEHIR OSMANGAZI UNIVERSITESI ELECTRICAL & ELECTRONICS ENGINEERING DEPARTMENT
Transcript of Image Processing Homework

INTRODUCTION TO
IMAGE PROCESSING
HOMEWORK 1 HAKAN KAHRAMAN
151220102038
ESKISEHIR OSMANGAZI UNIVERSITESI ELECTRICAL & ELECTRONICS ENGINEERING DEPARTMENT

Part 1
Figure(1)
I generated a RGB image of size 256x256 with using these codes
A=ones(256,256,3);
A=255*A;
Firstly, I created a matrix that consist of 1’s and then multiplied the matrix by
255. Consuqently, I generated a matrix of size 256 X 256. The matrix that I have
generated is actually pure white RGB image of size 256x256.

Secondly, I created for loops to generate a circle in the 256x256 matrix. I
defined the circle equation in loop. Then I created an if else loop to draw a red
circle with radius 60 using these codes;
for i=1:256;
for j=1:256;
%center of the circle is(150,150)
R=((i-150)^2+(j-150)^2)^(0.5);
if (R<=60)
A(i,j,2)=0;
A(i,j,3)=0;
end
end
end
You clearly see that the center of circle 150,150 in the given circle equation.
R=((i-150)^2+(j-150)^2)^(0.5);
I gave the red color for my circle using if loop.
Similarly I created a rectangle with height 150 and width 80 using these codes
for i=5:155;
for j=5:85;
if((i-150)<=150&&(j-80)<=80)
A(i,j,1)=0;
A(i,j,3)=0;
end
end;
end;
I gave the green color for my rectangle using if loop. Finally , I showed that
figure using imshow function. All these processes is show that in the figure(1).

Part 2
Figure(2)
Firstly I read Lena.pmp image and converted it to grayscale using these codes.
A=imread('lena.bmp');
A=double(A);
A=A/255;
Ag = A(:,:,1)/3 + A(:,:,2)/3 + A(:,:,3)/3;

I used imread function to read Lena and I convert it double the divided by 255 to
convert gray scale and then I taked the average of RGB components of A and I
assigned this value to Ag.
Then I plotted the figure and its histogram using ;
subplot(2,2,1), imshow(Ag), title('grayscale image');
subplot(2,2,2), imhist(Ag), title('grayscale histogram');
as shown in figure(2.a).
Figure(2.a)
Secondly I applied gamma transformation
for γ = 2, γ = 3, γ = 0.5, γ = 0.2. and displayed the resulting images and their
histograms using these codes;
G=Ag*255;
G=uint8(G);
for i=1:4;
%Gamma Transformation
y=[2,3,0.5,0.2];
G=Ag.^y(i);
figure;
imshow(G);
figure;
imhist(G); end;
Firstly, I multiply Ag by 255 and assigned it to G. Then I converted G to
uninteger using uint8()function. Then I created an array which contains γ

elements 2,3,0.5 and 0.2. in for loop. Then I wrote gamma transformation
equation and assigned it to G. Using these codes.
G=Ag*255;
G=uint8(G);
for i=1:4;
%Gamma Transformation
y=[2,3,0.5,0.2];
G=Ag.^y(i);
figure;
imshow(G);
figure;
imhist(G);
end;
Finally I showed that images and histograms all for γ values that is determined
with using imshow()and imhist()functions. All figures as shown below.
Resulting image for γ =2 Histogram for γ =2
Figure(2.b)
Resulting image for γ =3 Histogram for γ =3
Figure(2.c)

Resulting image for γ =0.5 Histogram for γ =0.5
Figure(2.d)
Resulting image for γ =0.2 Histogram for γ =0.2
Figure(2.e)

Part 3
Figure(3)
Firstly, program is read the image circles.jpg and converted it to grayscale.Then
I converted A to double.
A=imread('circles.jpg');
A=rgb2gray(A);
Next,I created an array which contains elements 80,120 and 140 to applied
binarization to the image for thresholds 80,120,140. Then I defined size of A
using size()function. I assigned to size matrix to S to use in “for loop”.

I wrote if loop in for loop to define threshold of image. And then displayed all
figures . for x=1:3;
A=imread('circles.jpg');
A=rgb2gray(A);
A=double(A);
S=size(A);
a=[80,120,140];
for i=1:S(1);
for j=1:S(2);
if A(i,j)>=a(x)
A(i,j)=1;
else
A(i,j)=0;
end
end
end
figure;
imshow(A);
end
Figures are shown below.
Our original image is as shown below with size of 768x1024
Figure(3.a)
After the binarization;
Image for threeshold 80
Figure(3.b)
Image for threeshold 140
Figure(3.c)
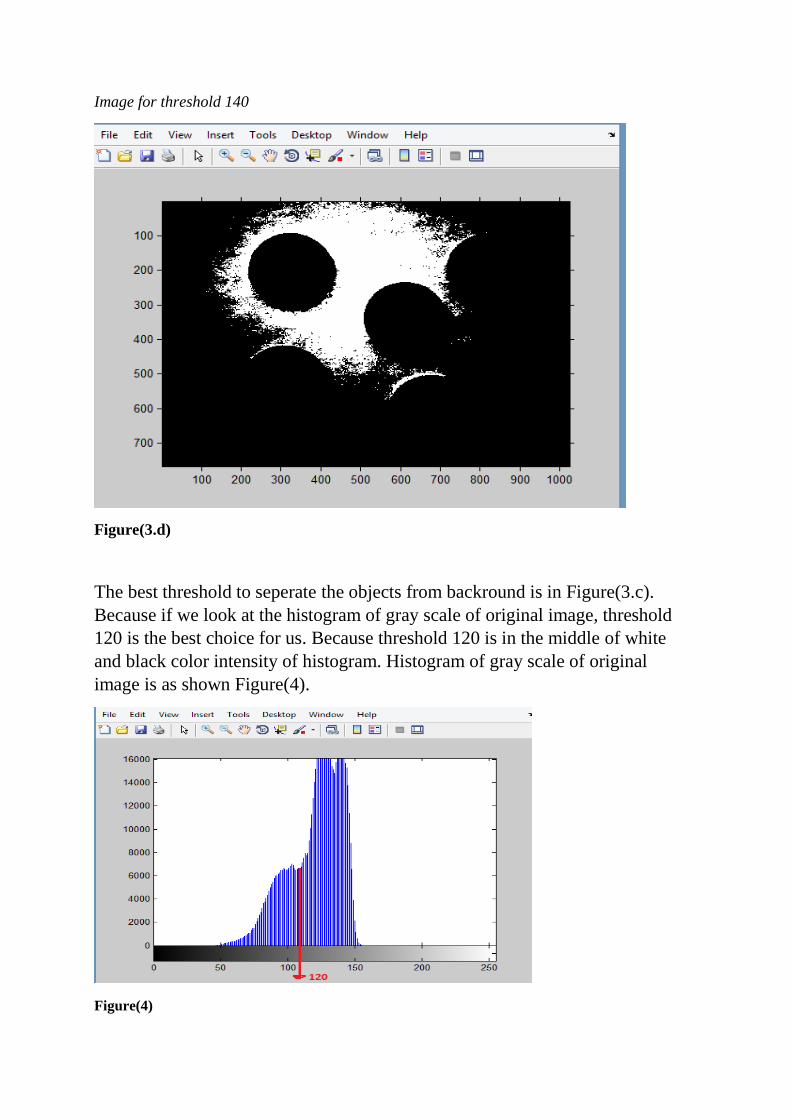
Image for threshold 140
Figure(3.d)
The best threshold to seperate the objects from backround is in Figure(3.c).
Because if we look at the histogram of gray scale of original image, threshold
120 is the best choice for us. Because threshold 120 is in the middle of white
and black color intensity of histogram. Histogram of gray scale of original
image is as shown Figure(4).
Figure(4)
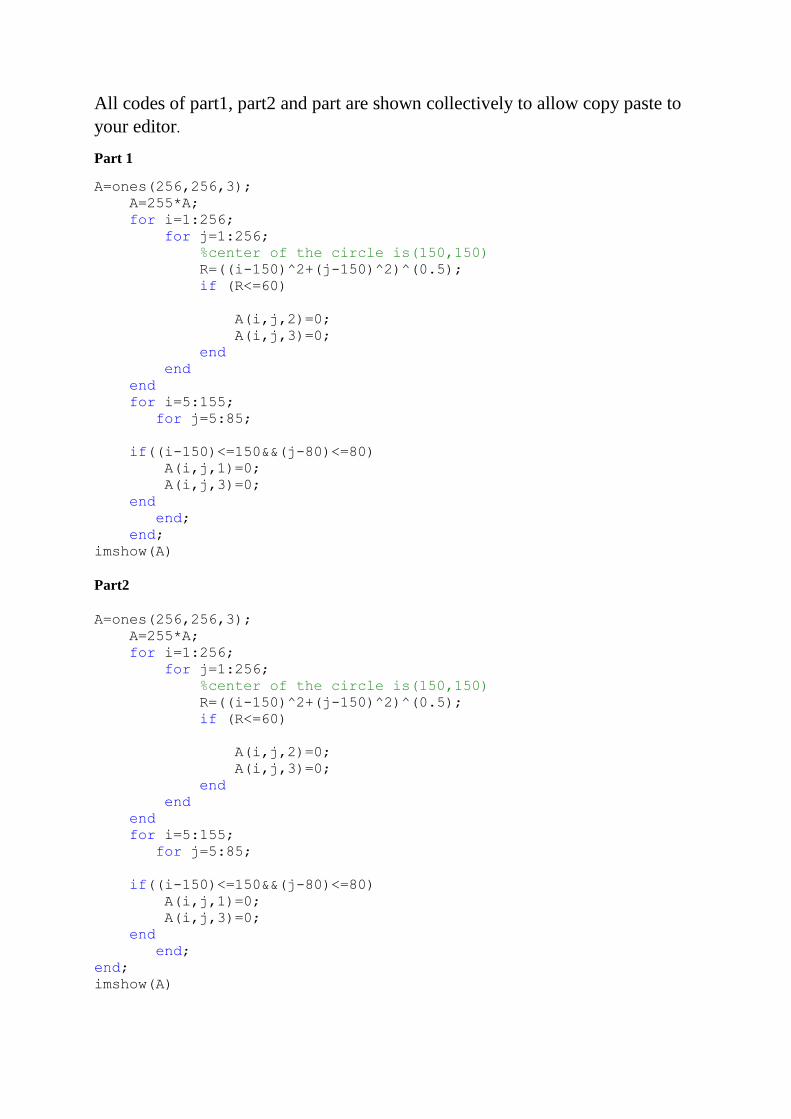
All codes of part1, part2 and part are shown collectively to allow copy paste to
your editor.
Part 1
A=ones(256,256,3);
A=255*A;
for i=1:256;
for j=1:256;
%center of the circle is(150,150)
R=((i-150)^2+(j-150)^2)^(0.5);
if (R<=60)
A(i,j,2)=0;
A(i,j,3)=0;
end
end
end
for i=5:155;
for j=5:85;
if((i-150)<=150&&(j-80)<=80)
A(i,j,1)=0;
A(i,j,3)=0;
end
end;
end;
imshow(A)
Part2
A=ones(256,256,3);
A=255*A;
for i=1:256;
for j=1:256;
%center of the circle is(150,150)
R=((i-150)^2+(j-150)^2)^(0.5);
if (R<=60)
A(i,j,2)=0;
A(i,j,3)=0;
end
end
end
for i=5:155;
for j=5:85;
if((i-150)<=150&&(j-80)<=80)
A(i,j,1)=0;
A(i,j,3)=0;
end
end;
end;
imshow(A)

Part 3
for x=1:3;
A=imread('circles.jpg');
A=rgb2gray(A);
S=size(A);
A=double(A);
a=[80,120,140];
for i=1:S(1);
for j=1:S(2);
if A(i,j)>=a(x)
A(i,j)=1;
else
A(i,j)=0;
end
end
end
figure;
imshow(A);
end