Application of image processing methodologies for fruit ...
86
Application of image processing methodologies for fruit detection and analysis Davínia Font Calafell Dipòsit Legal: L.1695-2014 http://hdl.handle.net/10803/284652 Nom/Logotip de la Universitat on s’ha llegit la tesi ADVERTIMENT. L'accés als continguts d'aquesta tesi doctoral i la seva utilització ha de respectar els drets de la persona autora. Pot ser utilitzada per a consulta o estudi personal, així com en activitats o materials d'investigació i docència en els termes establerts a l'art. 32 del Text Refós de la Llei de Propietat Intel·lectual (RDL 1/1996). Per altres utilitzacions es requereix l'autorització prèvia i expressa de la persona autora. En qualsevol cas, en la utilització dels seus continguts caldrà indicar de forma clara el nom i cognoms de la persona autora i el títol de la tesi doctoral. No s'autoritza la seva reproducció o altres formes d'explotació efectuades amb finalitats de lucre ni la seva comunicació pública des d'un lloc aliè al servei TDX. Tampoc s'autoritza la presentació del seu contingut en una finestra o marc aliè a TDX (framing). Aquesta reserva de drets afecta tant als continguts de la tesi com als seus resums i índexs. ADVERTENCIA. El acceso a los contenidos de esta tesis doctoral y su utilización debe respetar los derechos de la persona autora. Puede ser utilizada para consulta o estudio personal, así como en actividades o materiales de investigación y docencia en los términos establecidos en el art. 32 del Texto Refundido de la Ley de Propiedad Intelectual (RDL 1/1996). Para otros usos se requiere la autorización previa y expresa de la persona autora. En cualquier caso, en la utilización de sus contenidos se deberá indicar de forma clara el nombre y apellidos de la persona autora y el título de la tesis doctoral. No se autoriza su reproducción u otras formas de explotación efectuadas con fines lucrativos ni su comunicación pública desde un sitio ajeno al servicio TDR. Tampoco se autoriza la presentación de su contenido en una ventana o marco ajeno a TDR (framing). Esta reserva de derechos afecta tanto al contenido de la tesis como a sus resúmenes e índices. WARNING. Access to the contents of this doctoral thesis and its use must respect the rights of the author. It can be used for reference or private study, as well as research and learning activities or materials in the terms established by the 32nd article of the Spanish Consolidated Copyright Act (RDL 1/1996). Express and previous authorization of the author is required for any other uses. In any case, when using its content, full name of the author and title of the thesis must be clearly indicated. Reproduction or other forms of for profit use or public communication from outside TDX service is not allowed. Presentation of its content in a window or frame external to TDX (framing) is not authorized either. These rights affect both the content of the thesis and its abstracts and indexes.
-
Upload
khangminh22 -
Category
Documents
-
view
0 -
download
0
Transcript of Application of image processing methodologies for fruit ...
Application of image processing methodologies forfruit detection and analysis
Davínia Font Calafell
Dipòsit Legal: L.1695-2014http://hdl.handle.net/10803/284652
Nom/Logotip de la Universitat on s’ha
llegit la tesi
ADVERTIMENT. L'accés als continguts d'aquesta tesi doctoral i la seva utilització ha de respectar els dretsde la persona autora. Pot ser utilitzada per a consulta o estudi personal, així com en activitats o materialsd'investigació i docència en els termes establerts a l'art. 32 del Text Refós de la Llei de Propietat Intel·lectual(RDL 1/1996). Per altres utilitzacions es requereix l'autorització prèvia i expressa de la persona autora. Enqualsevol cas, en la utilització dels seus continguts caldrà indicar de forma clara el nom i cognoms de lapersona autora i el títol de la tesi doctoral. No s'autoritza la seva reproducció o altres formes d'explotacióefectuades amb finalitats de lucre ni la seva comunicació pública des d'un lloc aliè al servei TDX. Tampocs'autoritza la presentació del seu contingut en una finestra o marc aliè a TDX (framing). Aquesta reserva dedrets afecta tant als continguts de la tesi com als seus resums i índexs.
ADVERTENCIA. El acceso a los contenidos de esta tesis doctoral y su utilización debe respetar losderechos de la persona autora. Puede ser utilizada para consulta o estudio personal, así como enactividades o materiales de investigación y docencia en los términos establecidos en el art. 32 del TextoRefundido de la Ley de Propiedad Intelectual (RDL 1/1996). Para otros usos se requiere la autorizaciónprevia y expresa de la persona autora. En cualquier caso, en la utilización de sus contenidos se deberáindicar de forma clara el nombre y apellidos de la persona autora y el título de la tesis doctoral. No seautoriza su reproducción u otras formas de explotación efectuadas con fines lucrativos ni su comunicaciónpública desde un sitio ajeno al servicio TDR. Tampoco se autoriza la presentación de su contenido en unaventana o marco ajeno a TDR (framing). Esta reserva de derechos afecta tanto al contenido de la tesis comoa sus resúmenes e índices.
WARNING. Access to the contents of this doctoral thesis and its use must respect the rights of the author. Itcan be used for reference or private study, as well as research and learning activities or materials in theterms established by the 32nd article of the Spanish Consolidated Copyright Act (RDL 1/1996). Express andprevious authorization of the author is required for any other uses. In any case, when using its content, fullname of the author and title of the thesis must be clearly indicated. Reproduction or other forms of for profituse or public communication from outside TDX service is not allowed. Presentation of its content in a windowor frame external to TDX (framing) is not authorized either. These rights affect both the content of the thesisand its abstracts and indexes.

PhD Thesis Engineering and Information Technologies
Application of image processing
methodologies for fruit detection and
analysis
Author
Davínia Font Calafell
Department of Computer Science and Industrial Engineering
University of Lleida
Director of the PhD Thesis
Dr. Jorge Palacín Roca
Lleida, 30th
of July of 2014

Departament d’Informàtica i Enginyeria Industrial
Escola Politècnica Superior
Universitat de Lleida
Application of image processing
methodologies for fruit detection and
analysis
Memòria presentada per optar al grau de Doctor per la Universitat de Lleida
redactada segons els criteris establerts en l’Acord núm. 19/2002 de la Junta de
Govern del 26 de febrer de 2002 per la presentació de la tesis doctoral en format
d’articles i menció international.
Programa de doctorat: Enginyeria i Tecnologies de la Informació
Director de la Tesis: Dr. Jordí Palacin Roca
El Dr. Jordi Palacín Roca, professor titular de l’Escola Politècnica Superior de la
Universitat de Lleida
CERTIFICA:
Que la memòria “Application of image processing methodologies for fruit
detection and analysis” presentada per Davínia Font Calafell per optar al grau de
Doctor s’ha realitzat sota la seva supervisió.
Lleida, 30 de Juliol de 2014


Acknowledgements
First of all, I would like to thank Dr. Jordi Palacín for the tasks performed as
the supervisor of this thesis. All the knowledge he shared with me, his
encouragement, guidance, and persistence during the evolution of this PhD Thesis
has been essential for my development as a researcher.
I would like to thank the University of Lleida, the UdL-IMPULS project
(reference: X10020), the Government of Catalonia (Comisionat per a Universitats
i Recerca, Departament d’Innovació, Universitats i Empresa) and the European
Social Fund with references 2012FI_B 00301, 2013FI_B1 00010 and 2014FI_B2
00118 for funding this PhD Thesis.
Thanks to my family, especially to my grandparents, parents, siblings and
partner: Benjamí, Magina, Josep, Teresa, Edgard, Jessica and Samuel for their
immense support, patience and understanding. They have always transmitted great
values and principles making me to fight with perseverance, and giving me the
motivation I needed at every specific moment. They have always given me
courage and support being my strength in difficult moments and the people with
whom I wanted to share all the successes.
Thanks to all my department colleagues: Mercè, Tomàs, Marcel, Javier, and
Dani for their help and friendship, they have been essential on the development of
this PhD Thesis. Also thanks to my colleagues from CMU (Carnegie Mellon
University) and especially to Dr. Stephen Nuske, who guided me during the
research stays I performed in this institution.
Finally, I would thank to all who directly or indirectly participated in the
realization of this thesis, thank you to everyone!

Resum
En aquesta memòria es presenten diversos treballs d'investigació centrats
en l’automatització d’operacions agrícoles mitjançant l’aplicació de diverses
tècniques de processament d’imatge.
La indústria de l’agricultura està exigint solucions tecnològiques basades
en l’automatització de les tasques agrícoles amb l’objectiu d’incrementar la
producció i beneficis reduint al mateix temps el temps i els costos. Els avenços
tecnològics en l’agricultura tenen un factor rellevant i fan possible la
implementació de noves tècniques basades en les tecnologies de sensors i de
processament d’imatges. Tot i això, encara hi ha molts reptes a resoldre.
En la memòria es presenta, en primer lloc, un nou mètode de processament
d’imatge desenvolupat per detectar i comptar raïms vermells mitjançant la
localització de pics d'intensitat en superfícies esfèriques. En la mateixa línia de
treball es proposa una segona aplicació en la qual es desenvolupa un sistema de
recol·lecció automàtica de fruita mitjançant la combinació d'una càmera
estereoscòpica de baix cost i un braç robòtic. Tècniques de processament
d'imatges aplicades a les imatges extretes de la càmera de visió estereoscòpica
s'utilitzen per estimar la mida, la distància i la posició de la fruita mentre que el
braç robòtic s'utilitza per a la recol·lecció automàtica de fruita. En tercer lloc es
proposa una aplicació en què es desenvolupa un mètode de processament d'imatge
basat en l'ús de la informació de color per a la verificació d'una varietat de
nectarines de forma automàtica i individual en una línia d’embalatge de fruita. En
quart lloc s’han estudiat les correlacions entre els paràmetres de qualitat de la
fruita i el espectre visible de la seva pell amb l’objectiu de controlar la seva
qualitat de forma no destructiva durant el seu emmagatzematge. Els resultats
obtinguts en les diverses aplicacions propostes han demostrat la utilitat i
versatilitat dels sistemes de processat d'imatges utilitzats.

Resumen
En esta memoria se presentan diversos trabajos de investigación centrados
en la automatización de operaciones agrícolas mediante la aplicación de distintas
técnicas de procesado de imágenes.
La industria de la agricultura está exigiendo soluciones tecnológicas
centradas en la automatización de las tareas agrícolas con el fin de aumentar la
producción y los beneficios reduciendo al mismo tiempo el tiempo y los costes.
Los avances tecnológicos en la agricultura de precisión tienen un papel relevante
y hacen posible la implementación de nuevas técnicas basadas en las tecnologías
de sensores y en procesado de imágenes. Sin embargo, todavía hay muchos
desafíos a resolver.
En la memoria se presenta, en primer lugar, un nuevo método de
procesado de imágenes desarrollado para detectar y contar uvas rojas mediante la
identificación de picos de intensidad en las superficies esféricas. En la misma
línea de trabajo se propone una segunda aplicación en la que se desarrolla un
sistema de recolección automática de fruta mediante la combinación de una
cámara estereoscópica de bajo coste y un brazo robótico. Técnicas de procesado
de imágenes aplicadas en las imágenes extraídas de la cámara de visión
estereoscópica se utilizan para estimar el tamaño, la distancia y la posición de la
fruta mientras que el brazo robótico se utiliza para la recolección automática de
fruta. En tercer lugar se propone una aplicación en la que se desarrolla un método
de procesamiento de imágenes basado en el uso de la información de color para la
verificación de una variedad de nectarinas de forma automática e individual en
una línea de envasado de fruta. En cuarto lugar se han estudiado las correlaciones
entre los parámetros de calidad de la fruta y el espectro visible de su piel con el
fin de controlar su calidad de forma no destructiva durante el almacenamiento.
Los resultados obtenidos en las diversas aplicaciones propuestas han demostrado
la utilidad y versatilidad de los sistemas de procesado de imágenes utilizados.

Summary
This memory introduces several research works developed to automate
agricultural tasks by applying image processing techniques.
Agricultural industry is demanding technological solutions focused on
automating agricultural tasks in order to increase the production and benefits
while reducing time and costs. Technological advances in precision agriculture
have an essential role and enable the implementation of new techniques based on
sensor technologies and image processing systems. However, there are still many
challenges and problems to be solved.
This PhD Thesis presents the results of four automated agricultural tasks.
In the first place a new image processing method is proposed for detecting and
counting red grapes by identifying specular reflection peaks from spherical
surfaces. The proposal of the second application is to develop an automatic fruit
harvesting system by combining a low cost stereovision camera and a robotic arm.
Image processing techniques applied to the images from the stereovision camera
were used to estimate the size, distance and position of the fruits whereas the
robotic arm was used for the automatic fruit harvesting. The third application
proposed is to develop a novel image processing method based on the use of color
information to verify an in-line automatic and individual nectarine variety
verification in a fruit-packing line. In the fourth place a study focused on
assessing correlations between post-storage fruit quality indices and the visible
spectra of the skin of the fruit is proposed in order to control fruit quality in a non-
destructive way during the storage. The results obtained in the proposed
applications have proved the suitability and versatility of the image processing
techniques used.

i
Contents
1. Introduction 13
1.1. Soil analysis ........................................................................................ 13
1.2. Seeds, seedling, breeding, growing and state of health ...................... 15
1.3. Detection of crops and yield estimation ............................................. 16
1.4. Weed control and machinery .............................................................. 19
1.5. Positioning, navigation and safety ...................................................... 20
1.6. Microorganisms and pest control ....................................................... 20
1.7. Crop quality ........................................................................................ 21
1.8. References .......................................................................................... 23
2. Objectives 31
3. PhD Thesis structure 33
4. Image processing method applied to locate agricultural elements at pre-
harvest stage: counting red grapes 37
4.1. Introduction ........................................................................................ 37
4.2. Contributions to the state of the art .................................................... 38
4.3. References .......................................................................................... 39
4.4. Counting red grapes in vineyards by detecting specular spherical
reflection peaks in RGB images obtained at night with artificial
illumination.
D. Font et al. / Computers and Electronic in Agriculture 108 (2014)
105–111 ..................................................................................................... 41
1. Introduction .................................................................................... 41
2. Related work ................................................................................... 42
3. Materials ......................................................................................... 43
3.1. Vineyard facility ................................................................ 43
3.2. Image acquisition system ................................................... 43
4. Counting red grapes ........................................................................ 44
4.1. Manual counting for validation .......................................... 44
4.2. Automatic counting ............................................................ 44

Contents
ii
4.2.1. Automatic red grape segmentation ........................ 45
4.2.2. Image smoothing ................................................... 46
4.2.3. Automatic red grape (specular reflection peak)
counting ........................................................................... 46
4.2.4. Optimization of the parameters of the
morphological detector .................................................... 46
5. Results ............................................................................................ 49
6. Conclusions .................................................................................... 51
Acknowledgements ............................................................................ 51
References .......................................................................................... 51
5. Image processing method applied to estimate size, distance and position
of fruits at harvest stage: automatic fruit harvesting 53
5.1. Introduction ........................................................................................ 53
5.2. Contributions to the state of the art .................................................... 54
5.3. References .......................................................................................... 55
5.4. A proposal for automatic fruit harvesting by combining a low cost
stereovision camera and a robotic arm.
D. Font et al. / Sensors 2014, 14, 11557-11579 .............................................. 57
1. Introduction .................................................................................... 58
2. Related Work .................................................................................. 59
3. Materials ......................................................................................... 61
3.1. Stereovision Image Acquisition System ............................ 61
3.2. Vision Targets .................................................................... 62
3.3. Robotic Arm for Fruit Harvesting ..................................... 63
3.4. Guidance of the Robotic Arm ............................................ 65
4. Stereovision Fruit Detection Accuracy .......................................... 66
4.1. Experimental Setup ............................................................ 66
4.2. Image Processing: Target Centroid, Inclination and
Diameter Estimate..................................................................... 67
4.3. Distance, Position and Diameter Estimate ......................... 68
4.4. Experimental Results ......................................................... 70
5. Automatic Harvesting ..................................................................... 73
5.1. Initial Fruit Detection......................................................... 73
5.2. Rough Approach to a Fruit ................................................ 74
5.3. Fine Approach to a Fruit .................................................... 74

Contents
iii
5.4. Fruit Pickup ........................................................................ 76
5.5. Fruit Pickup Performances ................................................. 76
6. Conclusions and Future Work ........................................................ 80
Acknowledgements ............................................................................ 81
Author Contributions .......................................................................... 81
Conflicts of Interest ............................................................................ 81
References .......................................................................................... 81
6. Image processing method applied as a fruit quality control tool at post-
harvest stage: nectarine variety verification 85
6.1. Introduction ........................................................................................ 85
6.2. Contributions to the state of the art .................................................... 86
6.3. References .......................................................................................... 87
6.4. An image processing method for in-line nectarine variety
verification based on the comparison of skin feature histogram vectors.
D. Font et al. / Computers and Electronics in Agriculture 102 (2014)
102-119 ...................................................................................................... 89
1. Introduction .................................................................................... 89
1.1. Definition of the problem ................................................... 90
1.2. New contribution................................................................ 91
2. Related work ................................................................................... 91
3. Materials and methods .................................................................... 92
3.1. Nectarine varieties ............................................................. 92
3.2. Fruit-packing line ............................................................... 92
3.3. Image processing techniques ............................................. 93
3.4. Nectarine feature histogram vector .................................... 94
3.5. Nectarine variety dataset .................................................... 96
3.6. Comparison of nectarine variety ........................................ 96
4. Results ............................................................................................ 97
4.1. Automatic variety verification ........................................... 97
4.1.1. Stage 1. Nectarine variety dataset .......................... 97
4.1.2. Stage 2. Variety classification threshold ............... 97
4.1.3. Stage 3. Automatic variety classification .............. 98
4.2. Manual variety verification ................................................ 99
5. Conclusions .................................................................................. 102
Contents
iv
Acknowledgements .......................................................................... 102
References ........................................................................................ 103
7. Image processing method applied as a fruit quality monitoring tool at
post-harvest stage: correlation between quality indices and visible spectra
of the skin of the fruit 105
7.1. Introduction ...................................................................................... 105
7.2. Contributions to the state of the art .................................................. 106
7.3. References ........................................................................................ 107
7.4. Assessment of the correlation between post-storage fruit quality
parameters and visible spectra of the skin for ‘Golden Smoothee’ apple
D. Font et al. / Submitted to Journal of Food Engineering, July 2014 ... 108
1. Introduction .................................................................................. 109
2. Related work ................................................................................. 109
2.1. Fruit quality estimation .................................................... 109
2.2. Fruit damage estimation ................................................... 110
2.3. Fruit grading estimation ................................................... 111
3. Materials and methods .................................................................. 111
3.1. Fruit variety ...................................................................... 111
3.2. Fruit quality parameters ................................................... 112
3.2.1. Fruit diameter ...................................................... 112
3.2.2. Fruit weight ......................................................... 112
3.2.3. Fruit skin color .................................................... 112
3.2.4. Fruit flesh firmness .............................................. 113
3.2.5. Soluble solids content .......................................... 113
3.2.6. Titratable acidity .................................................. 113
3.3. Skin RGB spectra measurement ...................................... 114
3.3.1. Image acquisition................................................. 114
3.3.2. Automatic visible spectra analysis ...................... 115
4. Results and discussion .................................................................. 116
5. Conclusions .................................................................................. 122
Acknowledgements .......................................................................... 123
References ........................................................................................ 123
Contents
v
8. General discussion of the results 125
8.1. Image processing method applied to locate agricultural elements at
pre-harvest stage: counting red grapes .................................................... 125
8.2. Image processing method applied to estimate size, distance and
position of fruits at harvest stage: automatic fruit harvesting ................. 127
8.3. Image processing method applied as a fruit quality control tool at
post-harvest stage: nectarine variety verification .................................... 129
8.4. Image processing method applied as a fruit quality control tool at
post-harvest stage: correlation between post-storage fruit quality
attributes and visible spectra of the skin of the fruit................................ 131
8.5. References ........................................................................................ 134
9. Conclusions 135
10. Other research activities 137
10.1. Contributions to publications.......................................................... 137
10.2. Contributions to conferences .......................................................... 138
10.3. Scientific foreign exchange ............................................................ 139
Nomenclature 141

vii
List of Figures
Fig. 1.1. (a) ARP system; (b) Prototype soil strength sensor .........................................14
Fig. 1.2. Multisensory platform ......................................................................................16
Fig. 1.3. (a) Weed control prototype; (b) LAI prediction by using LIDAR sensors
mounted on a tractor ........................................................................................20
Fig. 1.4. Ground-based ultrasonic system ......................................................................21
Fig. 1.5. Glove-based system prototype for measuring fruit attributes ..........................23
Fig. 3.1. PhD Thesis structure ........................................................................................35
Fig. 4.1. Sample of specular reflection: (a) original vineyard image; (b) normalized
grayscale image ................................................................................................38
Fig. 5.1. Stereovision camera placed in the gripper of the robotic arm ..........................54
Fig. 6.1. Examples of nectarine skin histograms concatenating several intensity
color layers from different color spaces ...........................................................86
Fig. 7.1. Golden Delicious Smothee apple variety .......................................................106
Counting red grapes in vineyards by detecting specular spherical
reflection peaks in RGB images obtained at night with artificial
illumination
Fig. 1. Vineyard facility. .............................................................................................43
Fig. 2. Manual labeling of red grapes with different degrees of occlusion in a
sample vineyard image. ....................................................................................44
Fig. 3. Sample of specular reflection: (a) detail of an original vineyard image; (b)
colorized representation of the normalized grayscale image in order to
evidence the hot spots originated by the specular spherical reflection on the
grapes. ..............................................................................................................45
Fig. 4. Example of grape segmentation: (a) vineyard image; (b) H color layer
segmented; (c) morphologically filtered image; d) vineyard image with the
background extracted. ......................................................................................45
Fig. 5. Example of image filtering: (a) vineyard image; (b) filtered image (with the
background extracted). .....................................................................................46
Fig. 6. Three-dimensional representation of the morphological detector. ...................47
Fig. 7. Example of a red grape counting procedure: (a) filtered vineyard image; (b)
intensity peaks detected; (c) centroid of the intensity peaks plotted on the
original image. .................................................................................................47
Fig. 8. Automatic grape counting results in percentage values for different radii
(from 10 to 50) and different points (from 5 to 35) defined on the external
circumference of the morphological detector...................................................48

List of Figures
viii
Fig. 9. False positive counting results in percentage values for different radii (from
10 to 50) and different points (from 5 to 35) defined on the external
circumference of the morphological detector. ................................................. 48
Fig. 10. Example of automatic and manual red grape detection: (a) automatic
detection (red cross) and manual labeling considering three occlusion
groups: [0% occlusion], green circle; [0%-75% occlusion], red circle; and
[75%-99% occlusion], yellow circle. (b) Automatic detection results (red
cross) and false positives detected (yellow circles) ......................................... 49
A proposal for automatic fruit harvesting by combining a low cost
stereovision camera and a robotic arm
Fig. 1. Minoru 3D USB Webcam. (a) External view; (b) Detail of the two cameras . 61
Fig. 2. Experimental setup for grid measurement ....................................................... 62
Fig. 3. Pushpin: (a) original image and (b) segmented image showing the centroid
(red dot), inclination (magenta line) and diameter in pixels (green line) ........ 62
Fig. 4. Apple: (a) original image and (b) segmented image showing the centroid
(red dot), inclination (magenta line) and diameter in pixels (green line) ........ 62
Fig. 5. Pear: (a) original image and (b) segmented image showing the centroid (red
dot), inclination (magenta line) and diameter in pixels (green line) ................ 63
Fig. 6. (a) Robotic arm design; (b) Detail of the gripper tool with the imaging
device. .............................................................................................................. 64
Fig. 7. Relative grid definition and targets used in the experimental setup ................ 66
Fig. 8. Representation of the right (red point) and left camera (blue point) and their
visible area ....................................................................................................... 67
Fig. 9. Grid size in function of the distance between the camera and the target. ........ 67
Fig. 10. Schematic representation of the parameters involved in a distance estimate
with a stereovision system ............................................................................... 68
Fig. 11. Example of fruit segmentation and location in a stereovision image .............. 73
Fig. 12. Example of a rough approach to a fruit ........................................................... 74
Fig. 13. Example of a fine approach to a fruit .............................................................. 75
Fig. 14. Example of stereovision images obtained while performing a fine approach
to a fruit: (a) at the beginning of the approach; and (b) at the end of the
approach. ......................................................................................................... 75
Fig. 15. Example of fruit pickup in laboratory conditions ............................................ 76
An image processing method for in-line nectarine variety verification
based on the comparison of skin feature histogram vectors
Fig. 1. Aerial view of the distributions of orchards in Aitona, Lleida, Spain
(coordinates: 287,486, 4,598,486; scale: 1:18.898) (SIMA, 2013). ................ 90
Fig. 2. Nectarine varieties in active production from June to September 2011 in
Lleida, Spain (IRTA, 2013). ............................................................................ 90
List of Figures
ix
Fig. 3. Skin and optimal harvest period (gray rectangle) for the nectarine varieties
selected .............................................................................................................93
Fig. 4. Scheme of the fruit packing line ......................................................................93
Fig. 5. Example of normalized nectarine skin histograms (a) and its corresponding
feature histogram vectors (b) when concatenating one, two or three color
layers ................................................................................................................95
Fig. 6. Example of the alternative feature histogram vector creation. .........................96
Fig. 7. Image of the visual information shown on the display during the manual
experiment ........................................................................................................99
Assessment of the correlation between post-storage fruit quality
parameters and visible spectra of the skin for ‘Golden Smoothee’ apple
Fig. 1. ‘Golden Smoothee’ apples. ............................................................................112
Fig. 2. Detail of the experimental set-up made up of the illumination kit and the
camera.. ..........................................................................................................114
Fig. 3. Image of a ‘Golden Smoothee’ apple illuminated with the white light
source .............................................................................................................115
Fig. 4. Average evolution of the (a) weight and (b) size parameters.........................119
Fig. 5. Average evolution of the: (a) L, (b) a, and (c) b color layers .........................119
Fig. 6. Average evolution of the: (a) flesh firmness, (b) TA, and (c) SSC
parameters ......................................................................................................119
Fig. 7. Average evolution of the: (a) R, (b) G, and (c) B color layers .......................119

xi
List of Tables
Counting red grapes in vineyards by detecting specular spherical
reflection peaks in RGB images obtained at night with artificial
illumination
Table 1. Individual red grape counting results. The values in italics have been
obtained automatically; the other values require manual operation. ...............50
A proposal for automatic fruit harvesting by combining a low cost
stereovision camera and a robotic arm
Table 1. Vision target sizes ............................................................................................63
Table 2. Robotic arm dimensions ...................................................................................64
Table 3. Ranges of the parameters α and theta θ of the joints ........................................65
Table 4. Fixed D-H parameters for the robotic arm .......................................................66
Table 5. Camera calibration parameters .........................................................................69
Table 6. Error detection in terms of average (AV) and standard deviation (SD). ..........71
Table 7. Distribution of the errors in the measurement grid in case of detecting an
apple with a calibrated camera .........................................................................72
Table 8. Fruit detection: Threshold segmentation case ..................................................77
Table 9. Fruit detection: LCM segmentation [7] case ....................................................78
Table 10. Fruit pickup time-performances .......................................................................79
An image processing method for in-line nectarine variety verification
based on the comparison of skin feature histogram vectors
Table 1. Best nectarine variety classification results: correlation comparison ............100
Table 2. Best nectarine variety classification results: cumulative subtraction
comparison .....................................................................................................101
Table 3. Results of the manual classification experiment of the Nectarreve variety ...102
Assessment of the correlation between post-storage fruit quality
parameters and visible spectra of the skin for ‘Golden Smoothee’ apple
Table 1. Example of intermediate image analysis results for Fig. 4. ...........................116
Table 2. Comparative evolution of several apple parameters obtained with a contact-
based measurement ........................................................................................118
Table 3. Correlations between non-contact parameters obtained by image processing
and fruit quality parameters that require contact and non-destructive
measurements .................................................................................................121

List of Tables
xii
Table 4. Correlations between non-contact parameters obtained by image processing
and fruit quality parameters that require destructive measurements ............. 121
Table 5. Comparative correlations between apple quality parameters and skin
colorimeter measurements ............................................................................. 122
13
Chapter 1
Introduction
A large number of the tasks conducted in the agricultural field are human-
performed operations, highly time consuming and prone to produce stress and
fatigue to their human operators due to the nature of the conditions under which
they take place. Thanks to the technological advances that have appeared over the
last years, such as image processing procedures and sensor-based technologies, a
considerable number of novel techniques have been implemented allowing the
automation of many of these tasks and, thus, leading to big economic and
efficiency gains. However, there are still many challenges and problems to be
solved.
These technological solutions cover all phases of the industrial process; pre-
harvest, harvest and post-harvest. The needs to be solved identified by farmers are
focused on the following topics: 1.1) Soil analysis, 1.2) Seeds, seedling, breeding,
growing and state of health, 1.3) Location and detection of crops, and yield
estimation, 1.4) Weed control and machinery, 1.5) Positioning, navigation and
safety, 1.6) Microorganisms and pest control, and 1.7) Crop quality.
1.1. Soil analysis
Soil is a critical element in agriculture being essential for crop growth, yield
production and products quality. In this direction, the proposal of [1] was to use a
spectroradiometer sensor to perform a hyperspectral analysis based on regression
trees in order to characterize soil contents such as nitrogen, carbon and organic
matter. The results showed the suitability of the method for assessing soil
Chapter 1. Introduction
14
attributes within the electromagnetic ranges of 400 to 1,000 nm. In [2] a
frequency-domain reflectometry sensor was used for soil salinity assessment of
sandy mineral soils and bulk electrical conductivity. In [3] a time domain
reflectometry system was applied to analyze soil moisture, electrical conductivity
and temperature. In [4] image processing techniques applied to splashed particles
were designed to evaluate the impact of water drop in order to characterize soil
detachment. In [5] a low-cost capacitance-resistance probe was used to monitor
soil volumetric water content and salinity. In [6], new devices based on an
electrical penetrometer and a laser microrelief profile meter were designed to
study the effects that the transit of the tractors cause on the fields. Variations in
the dry bulk density, cone index of clayey soil and sinkage (rut depth) of the
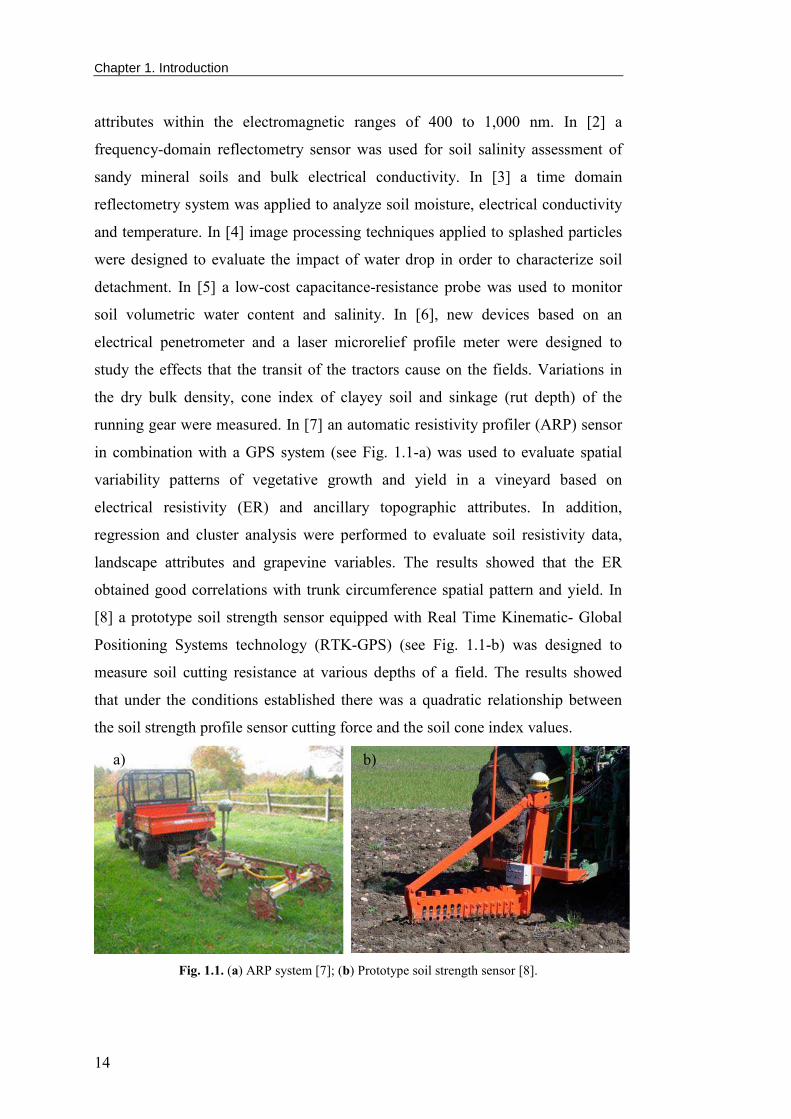
running gear were measured. In [7] an automatic resistivity profiler (ARP) sensor
in combination with a GPS system (see Fig. 1.1-a) was used to evaluate spatial
variability patterns of vegetative growth and yield in a vineyard based on
electrical resistivity (ER) and ancillary topographic attributes. In addition,
regression and cluster analysis were performed to evaluate soil resistivity data,
landscape attributes and grapevine variables. The results showed that the ER
obtained good correlations with trunk circumference spatial pattern and yield. In
[8] a prototype soil strength sensor equipped with Real Time Kinematic- Global
Positioning Systems technology (RTK-GPS) (see Fig. 1.1-b) was designed to
measure soil cutting resistance at various depths of a field. The results showed
that under the conditions established there was a quadratic relationship between
the soil strength profile sensor cutting force and the soil cone index values.
Fig. 1.1. (a) ARP system [7]; (b) Prototype soil strength sensor [8].
a) b)
Chapter 1. Introduction
15
1.2. Seeds, seedling, breeding, growing and state o f health
The control of crop seedling, breeding and growing as well as the
identification of its different growth phases are some of the main challenges in
precision agriculture. For example, in [9] hyperspectral imaging techniques
applied in the visible and near infrared region (VIS-NIR) were developed to
discriminate varieties of maize seeds achieving a success rate of 98.89%.
Techniques such as principal component analysis (PCA), kernel principal
component analysis (KPCA), least squares-support vector machine (LS-SVM)
and back propagation neural network (BPNN) were applied. A configurable
growth chamber equipped with CCD cameras and artificial illumination was
designed in [10] to control the circadian rhythm in plants. In [11] a thermal
imaging technique based on infrared sensors was evaluated to study lettuce seed
viability. It was proved that aged lettuce seeds can be distinguished from the
normal seeds by applying time-dependent thermal decay characterization in
combination with decay amplitude and delay time images. In [12] a slim and
small open-ended coaxial probe was used to detect moisture of rice grains. In [13]
shape feature generation approaches based on the approximate distance
distribution of an object were introduced to enhance the recognition of plant
seedling. In addition, plant silhouettes were used as inputs for the classifier
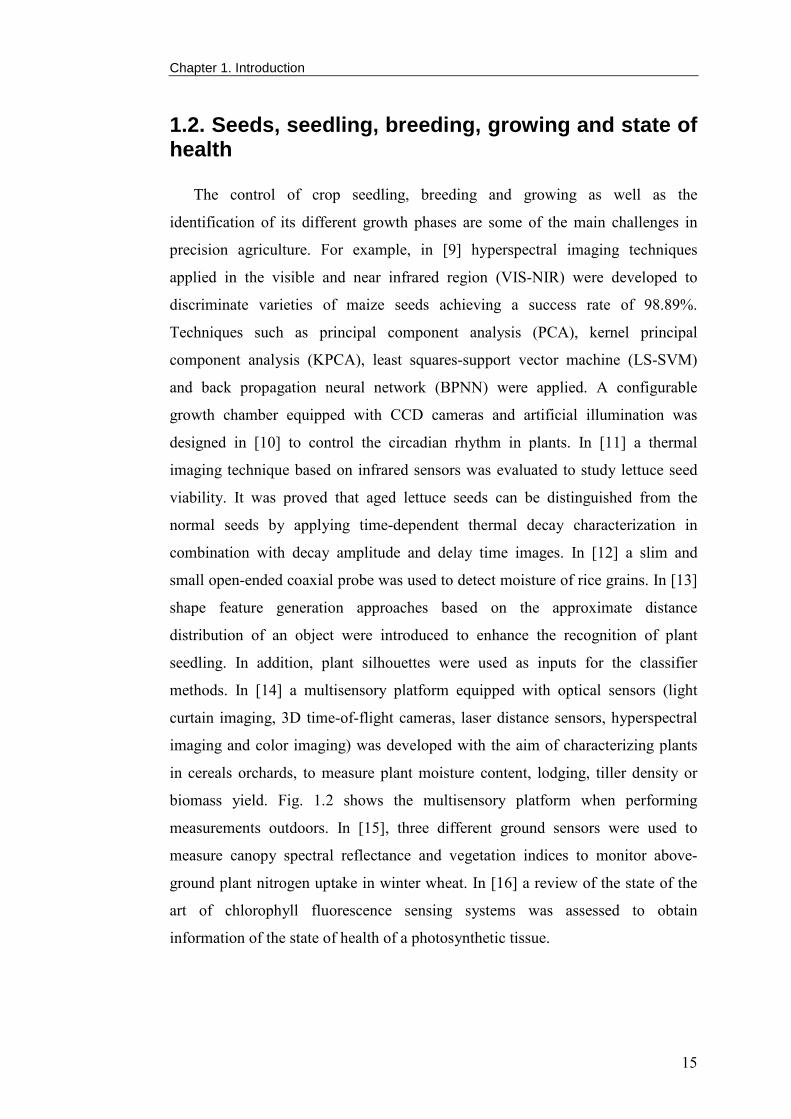
methods. In [14] a multisensory platform equipped with optical sensors (light
curtain imaging, 3D time-of-flight cameras, laser distance sensors, hyperspectral
imaging and color imaging) was developed with the aim of characterizing plants
in cereals orchards, to measure plant moisture content, lodging, tiller density or
biomass yield. Fig. 1.2 shows the multisensory platform when performing
measurements outdoors. In [15], three different ground sensors were used to
measure canopy spectral reflectance and vegetation indices to monitor above-
ground plant nitrogen uptake in winter wheat. In [16] a review of the state of the
art of chlorophyll fluorescence sensing systems was assessed to obtain
information of the state of health of a photosynthetic tissue.
Chapter 1. Introduction
16
Fig. 1.2. Multisensory platform [14].
1.3. Detection of crops and yield estimation
Tasks focused on the detection, location and counting of elements are being
automated considering different scenarios and set-up possibilities in order to
reduce costs [17] and to avoid errors produced by the fatigue and stress of human
operators by the long working hours. Additionally, one of the biggest challenges
in agricultural industry is to estimate yield with accuracy and to predict variations
in its quality, which are dependable on environmental variables (soil
characteristics, weather conditions, pests and plant diseases), farming factors
(addition of products such as water, pesticide or fertilizer), and agricultural
operations (pruning, thinning). The uncertainties about how these factors affect
crop quality make the management of orchards very complex. For this reason,
crop yield estimation is a topic of relevant interest in precision agriculture.
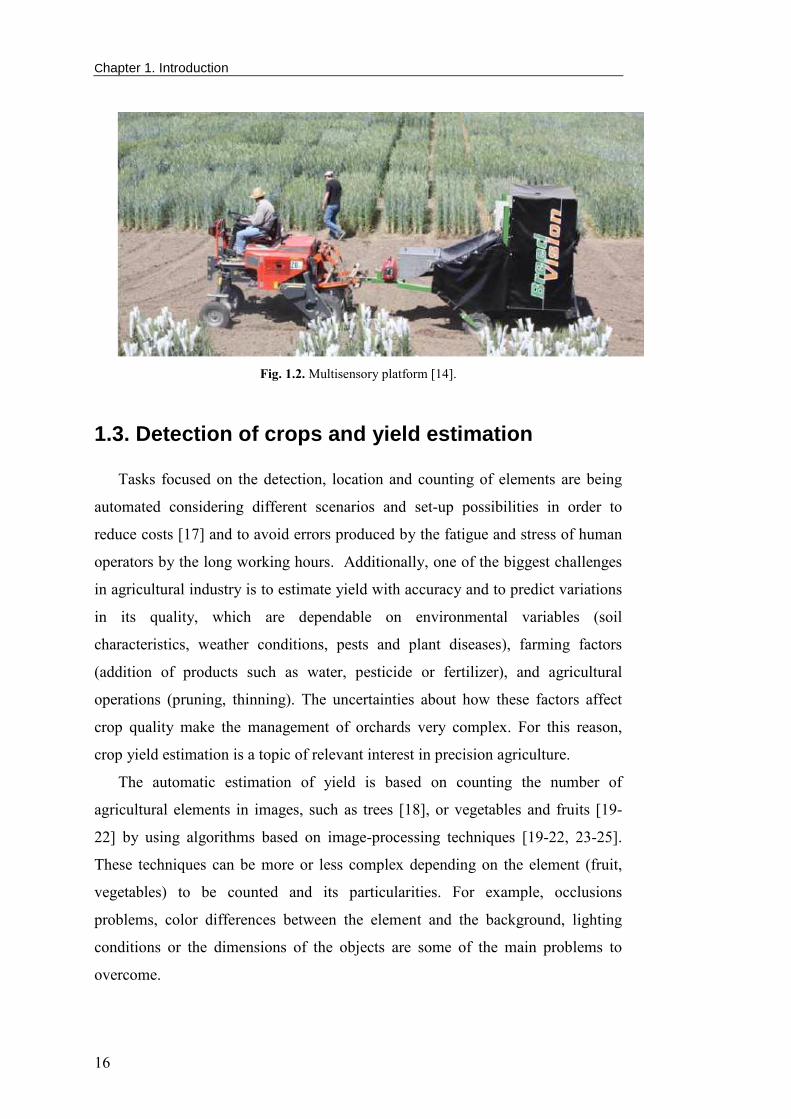
The automatic estimation of yield is based on counting the number of
agricultural elements in images, such as trees [18], or vegetables and fruits [19-
22] by using algorithms based on image-processing techniques [19-22, 23-25].
These techniques can be more or less complex depending on the element (fruit,
vegetables) to be counted and its particularities. For example, occlusions
problems, color differences between the element and the background, lighting
conditions or the dimensions of the objects are some of the main problems to
overcome.
Chapter 1. Introduction
17
The proposal of [19] was to count the number of apples in thermal images.
The method showed good accuracy between the results from the manual and
automatic procedure. In [20] a fruit counting method was presented taking into
account illumination adjustments and removing the noise from the image. First, a
segmentation procedure using the RGB and HSI color spaces was applied to the
images. Then, a K-means clustering algorithm was used to classify elements into
fruits in combination with a marker-controlled watershed function used to split
connected fruits. Finally, a blob analysis was applied in order to count individual
fruits. The development of two automatic counting methods to estimate the
number of kiwi in the CIELab color space was addressed in [21]. In this work it
was considered that the intensity of the pixels was higher at the center of the fruit
and that the number of peaks in the image corresponded to the number of fruits.
The automatic counting method used in the first technique was based on counting
the peaks in a gray color image whereas the second technique used a binary image
in order to compute the distance from a fruit pixel to the nearest background pixel.
The results showed a counting success rate of 90% and 70% in case of gold and
green varieties of kiwi, respectively. An alternative counting technique was
presented in [22]. The methodology applied was to identify the pixels belonging
to the fruit in the image, connecting these pixels into sets, and use the information
of the contours of these sets to define an apple model. The method was dependent
on lighting conditions achieving a minimum and a maximum success rate of 85%
and 95%, respectively. In [23] an automatic method to count mango fruit was
presented based on identifying the fruit pixels in the image applying a
combination of a color (in the RGB and YCbCr color spaces) and texture
segmentation and then, using a blob analysis in order to count the fruits. The
results showed a strong correlation, 0.91, when comparing the automatic with the
manual counting data. Automatic location of red peaches in daylight images were
assessed in [24] by applying linear color models in the RGB color space.
Additionally, a procedure to estimate peach diameter based on an ellipsoidal
fitting was proposed. Similarly, in [25] red peaches were also detected by
implementing algorithms based on linear color models and fruit histograms in
combination with a look-up-tables (LUT) technique applied to the RGB color
Chapter 1. Introduction
18
space. In [26] the number of individual grapes from vineyard images were
estimated by using a radial symmetry transform [27]. The method consisted in
identifying pixels with a high level of radial symmetry and in connecting the
neighboring berries into clusters in order to predict yield. The results showed that
the yield could be estimated with an error of 9.8%. More recently, in [28] the size
and weight of grapes were accurately estimate with values of 0.97 and 0.96,
respectively.
Other tasks focused on predicting yield are based on studying the effects of
the use of agricultural machinery in fields [6] or characterizing fruits and plants
[6,7, 29, 30]. In the specific case of studying the effects of the use of machinery in
fields it was proved that high values of sinkage and cone index produced a
decrement in crop yield. In [6] variations in the dry bulk density, cone index and
sinkage were measured over the same land but at five different passes of three
tractors. Two different devices were designed and tested for this specific purpose;
a laser microrelief profile and an electrical penetrometer. The results suggested
that soil compaction should be avoided by ensuring that tractors always travel
along the same tracks. In [7], vegetative growth and yield were measured by
means of soil electrical resistivity and ancillary topography. The proposal of [29]
was to estimate potential sugarcane yield using the in-season estimation of
normalized difference vegetative index (NDVI) and a GreenSeeker® device. The
results showed that in-season estimates of yield values, which were computed by
diving NDVI by thermal variables, were suitable to predict sugarcane yield. The
proposal of [30] was to use a smart one-chip camera adapted to pass red and near-
infrared spectral bands in order to detect plants by estimating NDVI. In [31] a
methodology based on a supervised classifier in combination with the
Mahalanobis distance was implemented on the RGB color space and applied to
daylight images in order to characterize grapevine canopy and evaluate leaf area
and yield. The results showed good correlations when evaluating the leaf area of
grapevines, 0.81, and when assessing yield, 0.73.
Chapter 1. Introduction
19
1.4. Weed control and machinery
Weed control is also an important step in the automation of agricultural tasks
implying the design of effective machinery. The application of agrochemicals in
orchards is very complex since canopies are spatially variable and specific doses
may be required at different areas of the orchard. Machinery is being designed to
spray at an adequate rate in order to use the adequate amount of agrochemicals.
For example, in [32] an assisted sprayer equipped with two axial fans and a 3D
sonic anemometer was designed and implemented to apply the exact quantity of
agrochemicals needed. In [33] the use of a scanning Light Detection and Ranging
(LIDAR) system during pesticide tasks to control drift in vineyard spraying was
described. In [34] a prototype of six-row mechanical weed control cultivator for
inter-row areas and band spraying for intra-row areas was implemented (see Fig.
1.3-a). The results showed a significant decrease in the herbicide application rate
and consequently a reduction in the operating cost. In [35] the reduction of weed
competition in wheat and barley was controlled using a harrow equipped with bi-
spectral cameras, which detected crop leaf cover, weed cover and soil density. In
[36] LIDAR sensors mounted on a tractor (see Fig. 1.3-b) were used to evaluate
geometric and structural parameters of vines such as the height, the cross-
sectional area, the canopy volume and the tree area index (TAI). These parameters
were used to predict the leaf area index (LAI). The results showed that the TAI
was the best estimation of the LAI achieving a strong correlation of 0.92. In [37] a
sprayer prototype was designed and implemented to regulate the volume
application rate to the canopy volume in orchards. The conclusions were that there
were strong relationships between the intended and the sprayed flow rates (R2=
0.935) and between the canopy cross-sectional areas and the sprayed flow rates
(R2= 0.926).
Other tasks that require automation are fruit harvesting and classification. For
example, in [38] a vision-based estimation and control system for robotic fruit
harvesting was presented whereas in [39] a multiarm robotic harvester was
developed to harvest melons.

Chapter 1. Introduction
20
Fig. 1.3. (a) Weed control prototype [34]; (b) LAI prediction by using LIDAR sensors mounted on
a tractor [36].
1.5. Positioning, navigation and safety
The automation of agricultural applications that involve land vehicles requires
knowing global and local positions of specific elements in an orchard. In addition,
safety while navigating is also essential. The two most commonly used methods
to estimate global and local coordinates are the GPS system and crop rows
detection systems, respectively. Nowadays, researchers focused their efforts to
integrate the inertial navigation system (INS) with GPS to enhance positioning
and navigation information for agricultural machinery. In [40] a novel inertial
sensor was developed to remove error components in order to enhance positioning
and navigation for land vehicles by applying a fast orthogonal search modeling
technique. In [41] a vehicle was guided inside greenhouses by means of a laser
sensor. The vehicle integrated several tools for a wide range of applications such
as a spray system for applying plant-protection product, a lifting platform to reach
the top part of the plants to perform pruning and harvesting tasks, and a trailer to
transport fruits, plants, and crop waste.
1.6. Microorganisms and pest control
Pests and microorganisms in plants and trees are a threat to production causing
important losses. Agricultural resources are focused on controlling and monitoring
Chapter 1. Introduction
21
them, which is a time- and cost-consuming operation since it must be performed
periodically through the field and so, its automation implies benefits in all aspects.
In [42] an autonomous system based on a low-cost image sensor was responsible
of monitoring pests by capturing and sending images of trap contents, which were
distributed through the field, to a control station. The images were processed in
the control station in order to calculate the number of insects. In [43] a
development of an immunocapture real-time reverse transcription-polymerase
chain reaction (RT-PCR) assay to detect the tobacco mosaic virus in the soil was
presented. In [44] a system to detect root colonization by microorganism in
potatoes was developed. A technique to excite material and produce fluorescence
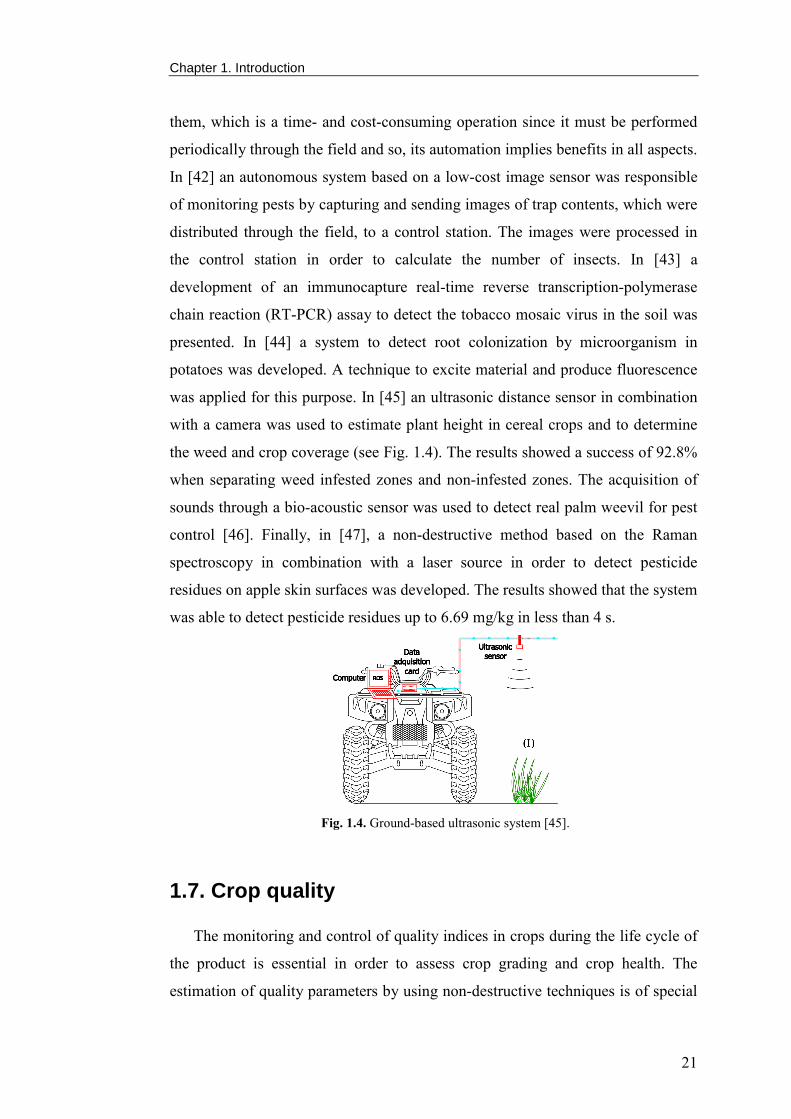
was applied for this purpose. In [45] an ultrasonic distance sensor in combination
with a camera was used to estimate plant height in cereal crops and to determine
the weed and crop coverage (see Fig. 1.4). The results showed a success of 92.8%
when separating weed infested zones and non-infested zones. The acquisition of
sounds through a bio-acoustic sensor was used to detect real palm weevil for pest
control [46]. Finally, in [47], a non-destructive method based on the Raman
spectroscopy in combination with a laser source in order to detect pesticide
residues on apple skin surfaces was developed. The results showed that the system
was able to detect pesticide residues up to 6.69 mg/kg in less than 4 s.
Fig. 1.4. Ground-based ultrasonic system [45].
1.7. Crop quality
The monitoring and control of quality indices in crops during the life cycle of
the product is essential in order to assess crop grading and crop health. The
estimation of quality parameters by using non-destructive techniques is of special
Chapter 1. Introduction
22
interest in precision agriculture. For example, in [48] a system based on Vis/NIR
spectroscopy and a polychromatic spectrometer was used in order to measure
quality indices of ‘Royal Gala’ apples such as color, starch pattern index, soluble
solids content (SSC), firmness, quantitative starch, and titratable acidity (TA). The
results showed a good estimation of the quality parameters studied and a
dependency between the SSC and soluble carbohydrates. In [49] 19 apple
cultivars were analyzed to find correlations between parameters extracted from
non-destructive measurements (Vis/NIR spectroscopy) and by destructive
measurements (penetrometer). The results showed that the parameters obtained
with destructive measurements were strong correlated with sensory textural
parameters. Another proposal was to assess physicochemical properties of two
apple varieties to assess correlations between biochemical markers and fruit
sensory properties [50]. The results showed that the galacturonic acid had a
positive correlation with mealiness but a negative one with crunchiness and
firmness. Finally, the total neutral sugar content was correlated with apple texture
properties. In [51] correlations between biospeckle activity (BA) and other
quality-attributes parameters obtained with destructive methods (firmness, SSC,
TA and starch content (SC)) were assessed in case of apple fruits. The results
showed a strong correlation between BA and SC.
The assessment of crop health is based on estimating fruit damage. For
example, in [52] NIR hyperspectral imaging techniques were used to identify
damages underneath fruit skin achieving a success rate of 92%. Another proposal
was to use Vis/NIR spectroscopy but to identify internal defects in fruits [53]. In
this case, the method showed an accuracy of 97%. In [54] two parameters (signal
to noise ratio and area change rate) extracted from the application of Vis/NIR
spectroscopic techniques were evaluated to measure internal defects. The
conclusion obtained was that there was a strong correlation between these
variables.
Changes in fruit ripening usually involve changes in the skin color caused by
synthesis of pigments [55]. This information is used to classify elements
depending on their ripeness stage. For example, in [56] color vision techniques
based on Artificial Neural Network (ANN) learning and PCA were applied for
Chapter 1. Introduction
23
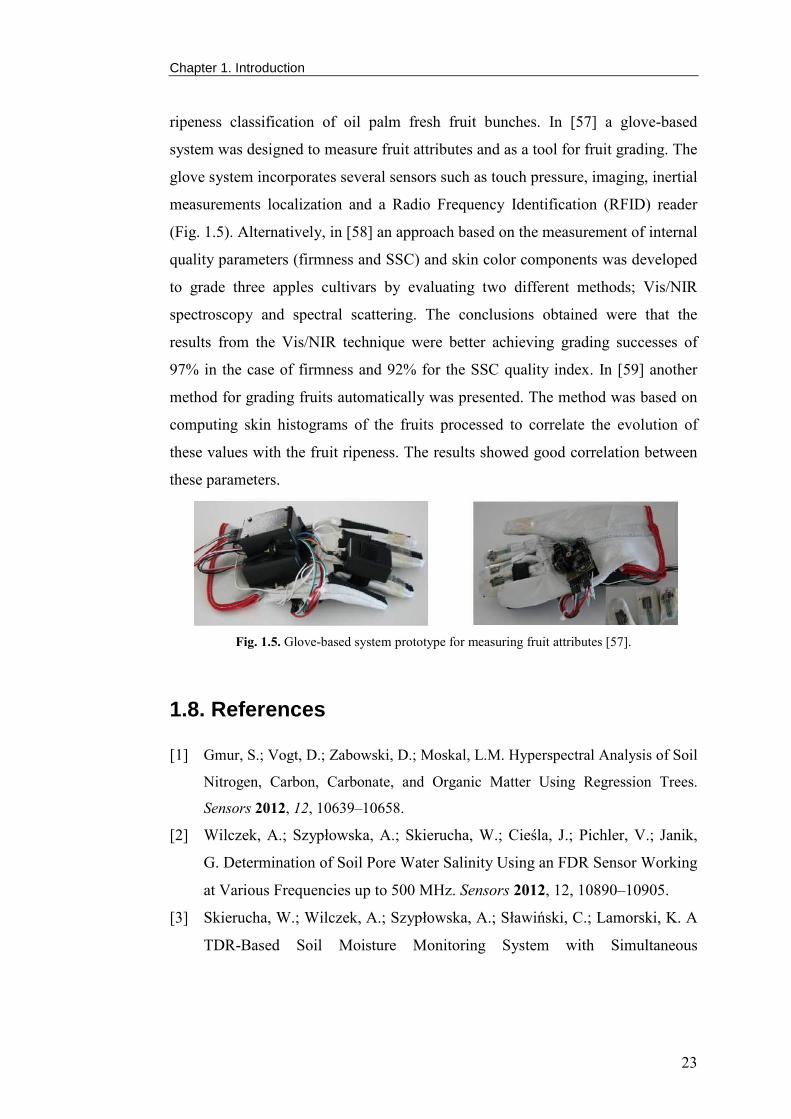
ripeness classification of oil palm fresh fruit bunches. In [57] a glove-based
system was designed to measure fruit attributes and as a tool for fruit grading. The
glove system incorporates several sensors such as touch pressure, imaging, inertial
measurements localization and a Radio Frequency Identification (RFID) reader
(Fig. 1.5). Alternatively, in [58] an approach based on the measurement of internal
quality parameters (firmness and SSC) and skin color components was developed
to grade three apples cultivars by evaluating two different methods; Vis/NIR
spectroscopy and spectral scattering. The conclusions obtained were that the
results from the Vis/NIR technique were better achieving grading successes of
97% in the case of firmness and 92% for the SSC quality index. In [59] another
method for grading fruits automatically was presented. The method was based on
computing skin histograms of the fruits processed to correlate the evolution of
these values with the fruit ripeness. The results showed good correlation between
these parameters.
Fig. 1.5. Glove-based system prototype for measuring fruit attributes [57].
1.8. References
[1] Gmur, S.; Vogt, D.; Zabowski, D.; Moskal, L.M. Hyperspectral Analysis of Soil
Nitrogen, Carbon, Carbonate, and Organic Matter Using Regression Trees.
Sensors 2012, 12, 10639–10658.
[2] Wilczek, A.; Szypłowska, A.; Skierucha, W.; Cieśla, J.; Pichler, V.; Janik,
G. Determination of Soil Pore Water Salinity Using an FDR Sensor Working
at Various Frequencies up to 500 MHz. Sensors 2012, 12, 10890–10905.
[3] Skierucha, W.; Wilczek, A.; Szypłowska, A.; Sławiński, C.; Lamorski, K. A
TDR-Based Soil Moisture Monitoring System with Simultaneous
Chapter 1. Introduction
24
Measurement of Soil Temperature and Electrical Conductivity. Sensors
2012, 12, 13545–13566.
[4] Ryżak, M.; Bieganowski, A. Using the Image Analysis Method for
Describing Soil Detachment by a Single Water Drop Impact. Sensors 2012,
12, 11527–11543.
[5] Scudiero, E.; Berti, A.; Teatini, P.; Morari, F. Simultaneous Monitoring of
Soil Water Content and Salinity with a Low-Cost Capacitance-Resistance
Probe. Sensors 2012, 12, 17588–17607.
[6] Valera, D.L.; Gil, J.; Agüera, J. Design of a New Sensor for Determination
of the Effects of Tractor Field Usage in Southern Spain: Soil Sinkage and
Alterations in the Cone Index and Dry Bulk Density. Sensors 2012, 12,
13480–13490.
[7] Rossi, R.; Pollice, A.; Diago, M.-P.; Oliveira, M.; Millan, B.; Bitella, G.;
Amato, M.; Tardaguila, J. Using an Automatic Resistivity Profiler Soil
Sensor On-The-Go in Precision Viticulture. Sensors 2013, 13, 1121–1136
[8] Agüera, J.; Carballido, J.; Gil, J.; Gliever, C.J.; Perez-Ruiz, M. Design of a
Soil Cutting Resistance Sensor for Application in Site-Specific Tillage.
Sensors 2013, 13, 5945–5957.
[9] Zhang, X.; Liu, F.; He, Y.; Li, X. Application of Hyperspectral Imaging and
Chemometric Calibrations for Variety Discrimination of Maize Seeds.
Sensors 2012, 12, 17234–17246.
[10] Navarro, P.J.; Fernández, C.; Weiss, J.; Egea-Cortines, M. Development of a
Configurable Growth Chamber with a Computer Vision System to Study
Circadian Rhythm in Plants. Sensors 2012, 12, 15356–15375.
[11] Kim, G.; Kim, G.H.; Ahn, C.-K.; Yoo, Y.; Cho, B.-K. Mid-Infrared Lifetime
Imaging for Viability Evaluation of Lettuce Seeds Based on Time-
Dependent Thermal Decay Characterization. Sensors 2013, 13, 2986–2996.
[12] You, K.Y.; Mun, H.K.; You, L.L.; Salleh, J.; Abbas, Z. A Small and Slim
Coaxial Probe for Single Rice Grain Moisture Sensing. Sensors 2013, 13,
3652–3663.
Chapter 1. Introduction
25
[13] Giselsson, T.M.; Midtiby, H.S.; Jørgensen, R.N. Seedling Discrimination
with Shape Features Derived from a Distance Transform. Sensors 2013, 13,
5585–5602.
[14] Busemeyer, L.; Mentrup, D.; Möller, K.; Wunder, E.; Alheit, K.; Hahn, V.;
Maurer, H.P.; Reif, J.C.; Würschum, T.; Müller, J.; Rahe, F.; Ruckelshausen,
A. BreedVision - A Multi-Sensor Platform for Non-Destructive Field-Based
Phenotyping in Plant Breeding. Sensors 2013, 13, 2830–2847.
[15] Yao, X.; Yao, X.; Jia, W.; Tian, Y.; Ni, J.; Cao, W.; Zhu, Y. Comparison and
Intercalibration of Vegetation Indices from Different Sensors for Monitoring
Above-Ground Plant Nitrogen Uptake in Winter Wheat. Sensors 2013, 13,
3109–3130.
[16] Fernandez-Jaramillo, A.A.; Duarte-Galvan, C.; Contreras-Medina, L.M.;
Torres-Pacheco, I.; Romero-Troncoso, R.J.; Guevara-Gonzalez, R.G.;
Millan-Almaraz, J.R. Instrumentation in Developing Chlorophyll
Fluorescence Biosensing: A Review. Sensors 2012, 12, 11853–11869.
[17] Peacock, W.L.; Vasquez, S.J.; Hashim-Buckey, J.M.; Klonsky, K.M.; De
Moura, R. L. Sample costs to establish and produce table grapes. Crimson
Seedless. University of California, Cooperative Extension, GR-VS-07-2,
2007.
[18] Recio, J.A.; Hermosilla, T.; Ruiz, L.A.; Palomar, J. Automated extraction of
tree and plot-based parameters in citrus orchards from aerial images.
Computers and Electronics in Agriculture 2013, 90, 24–34.
[19] Stajnkoa, D.; Lakotaa, M.; Hocevar, M. Estimation of number and diameter
of apple fruits in an orchard during the growing season by thermal imaging.
Computers and Electronics in Agriculture 2004, 42, 31–42.
[20] Chinchuluun, R.; Lee, W.S. Citrus yield mapping system in natural outdoor
scene using the watershed transform. ASAE, Paper No. 063010, 2006.
[21] Wijethunga, P.; Samarasinghe, S.; Kulasiri, D.; Woodhead, I. Digital Image
Analysis Based Automated Kiwifruit Counting Technique. 23rd
International Conference Image and Vision Computing New Zealand,
Christchurch, pp. 1-6, 2008.
Chapter 1. Introduction
26
[22] Linker, R.; Cohen, O.; Naor, A. Determination of the number of green apples
in RGB images recorded in orchards. Computers and Electronics in
Agriculture 2012, 81, 45–57.
[23] Payne, A.B.; Walsh, K.B.; Subedi, P.P.; Jarvis, D. Estimation of mango crop
yield using image analysis – Segmentation method. Computers and
Electronics in Agriculture 2013, 91, 57–64.
[24] Teixidó, M.; Font, D.; Pallejà, T.; Tresanchez, M.; Nogués, M.; Palacín, J.
Definition of Linear Color Models in the RGB Vector Color Space to Detect
Red Peaches in Orchard Images Taken under Natural Illumination. Sensors
2012, 12, 7701–7718.
[25] Teixidó, M.; Font, D.; Pallejà, T.; Tresanchez, M.; Nogués, M.; Palacín, J.
An Embedded Real-Time Red Peach Detection System Based on an OV7670
Camera, ARM Cortex-M4 Processor and 3D Look-Up Tables. Sensors 2012,
12, 14129–14143.
[26] Nuske, S.; Achar, S.; Bates, T.; Narasimhan, S.; Singh, S. Yield Estimation
in Vineyards by Visual Grape Detection. IEEE/RSJ International Conference
on Intelligent Robots and Systems. San Francisco, CA, USA, 2011.
[27] Loy, G., Zelinsky, A. Fast Radial Symmetry for Detecting Points of Interest.
IEEE Transactions on Pattern Analysis and Machine Intelligence 2003, 25,
959 – 973.
[28] Cubero, S.; Diago, M.P.; Blasco, J.; Tardáguila, J.; Millán, B.; Aleixos, N. A
new method for pedicel/peduncle detection and size assessment of grapevine
berries and other fruits by image analysis. Biosystems Engineering 2014,
117, 62-72.
[29] Lofton, J.; Tubana, B.S.; Kanke, Y.; Teboh, J.; Viator, H.; Dalen, M.
Estimating Sugarcane Yield Potential Using an In-Season Determination of
Normalized Difference Vegetative Index. Sensors 2012, 12, 7529–7547.
[30] Dworak, V.; Selbeck, J.; Dammer, K.-H.; Hoffmann, M.; Zarezadeh, A.A.;
Bobda, C. Strategy for the Development of a Smart NDVI Camera System
for Outdoor Plant Detection and Agricultural Embedded Systems. Sensors
2013, 13, 1523–1538.

Chapter 1. Introduction
27
[31] Diago, M.-P.; Correa, C.; Millán, B.; Barreiro, P.; Valero, C.; Tardaguila, J.
Grapevine Yield and Leaf Area Estimation Using Supervised Classification
Methodology on RGB Images Taken under Field Conditions. Sensors 2012,
12, 16988–17006.
[32] García-Ramos, F.J.; Vidal, M.; Boné, A.; Malón, H.; Aguirre, J. Analysis of
the Air Flow Generated by an Air-Assisted Sprayer Equipped with Two
Axial Fans Using a 3D Sonic Anemometer. Sensors 2012, 12, 7598–7613.
[33] Gil, E.; Llorens, J.; Llop, J.; Fàbregas, X.; Gallart, M. Use of a Terrestrial
LIDAR Sensor for Drift Detection in Vineyard Spraying. Sensors 2013, 13,
516–534.
[34] Perez-Ruiz, M.; Carballido, J.; Agüera, J.; Rodríguez-Lizana, A. Development
and Evaluation of a Combined Cultivator and Band Sprayer with a Row-
Centering RTK-GPS Guidance System. Sensors 2013, 13, 3313–3330.
[35] Rueda-Ayala, V.; Weis, M.; Keller, M.; Andújar, D.; Gerhards, R.
Development and Testing of a Decision Making Based Method to Adjust
Automatically the Harrowing Intensity. Sensors 2013, 13, 6254–6271.
[36] Arnó, J.; Escolà, A.; Vallès, J.M.; Llorens, J.; Sanz, R.; Masip, J.; Palacín, J.;
Rosell-Polo, J.R. Leaf area index estimation in vineyards using a ground-
based LiDAR scanner. Precision Agriculture 2013, 14, 290–306.
[37] Escolà, A.; Rosell-Polo, J.R.; Planas, S.; Gil, E.; Pomar, J.; Camp, F.;
Llorens, J.; Solanelles, F. Variable rate sprayer. Part 1 – Orchard prototype:
Design, implementation and validation. Computers and Electronics in
Agriculture 2013, 95, 122–135.
[38] Mehtaa, S.S.; Burks, T.F. Vision-based control of robotic manipulator for
citrus harvesting. Computers and Electronics in Agriculture 2014, 102, 146-
158.
[39] Ziona, B.; Mann M.; Levina, D.; Shilo, A.; Rubinstein, D.; Shmulevich, I.
Harvest-order planning for a multiarm robotic harvester. Computers and
Electronics in Agriculture 2014, 103, 75–81
[40] Noureldin, A.; Armstrong, J.; El-Shafie, A.; Karamat, T.; McGaughey, D.;
Korenberg, M.; Hussain, A. Accuracy Enhancement of Inertial Sensors
Chapter 1. Introduction
28
Utilizing High Resolution Spectral Analysis. Sensors 2012, 12, 11638–
11660.
[41] Sánchez-Hermosilla, J.; González, R.; Rodríguez, F.; Donaire, J.G.
Mechatronic Description of a Laser Autoguided Vehicle for Greenhouse
Operations. Sensors 2013, 13, 769–784.
[42] López, O.; Rach, M.M.; Migallon, H.; Malumbres, M.P.; Bonastre, A.;
Serrano, J.J. Monitoring Pest Insect Traps by Means of Low-Power Image
Sensor Technologies. Sensors 2012, 12, 15801–15819.
[43] Yang, J.-G.; Wang, F.-L.; Chen, D.-X.; Shen, L.-L.; Qian, Y.-M.; Liang, Z.-
Y.; Zhou, W.-C.; Yan, T.-H. Development of a One-Step Immunocapture
Real-Time RT-PCR Assay for Detection of Tobacco Mosaic Virus in Soil.
Sensors 2012, 12, 16685–16694.
[44] Krzyzanowska, D.; Obuchowski, M.; Bikowski, M.; Rychlowski, M.; Jafra,
S. Colonization of Potato Rhizosphere by GFP-Tagged Bacillus subtilis
MB73/2, Pseudomonas sp. P482 and Ochrobactrum sp. A44 Shown on
Large Sections of Roots Using Enrichment Sample Preparation and Confocal
Laser Scanning Microscopy. Sensors 2012, 12, 17608–17619.
[45] Andújar, D.; Weis, M.; Gerhards, R. An Ultrasonic System for Weed
Detection in Cereal Crops. Sensors 2012, 12, 17343–17357.
[46] Rach, M.M.; Gomis, H.M.; Granado, O.L.; Malumbres, M.P.; Campoy,
A.M.; Martín, J.J.S. On the Design of a Bioacoustic Sensor for the Early
Detection of the Red Palm Weevil. Sensors 2013, 13, 1706–1729.
[47] Dhakal, S., Li, Y., Peng, Y., Chao, K., Qin, J., Guo, L., 2014. Prototype
instrument development for non-destructive detection of pesticide residue in
apple surface using Raman technology. Journal of Food Engineering 2014,
123, 94–103.
[48] McGlone, V.A.; Jordan, R.; Martinsen, P. Vis/NIR estimation at harvest of
pre- and post-storage quality indices for ‘Royal Gala’ apple. Postharvest
Biology and Technology 2002, 25, 135–144.
[49] Mehinagic, E.; Royer, G.; Bertrand, D.; Symoneaux, R.; Laurens, F.;
Jourjon, F. Relationship between sensory analysis, penetrometry and visible–
Chapter 1. Introduction
29
NIR spectroscopy of apples belonging to different cultivars. Food Quality
and Preference 2003, 14, 473–484.
[50] Billy, L.; Mehinagic, E.; Royer, G.; Renard, C.; Arvisenet, G.; Prost, C.;
Jourjon, F. Relationship between texture and pectin composition of two
apple cultivars during storage. Postharvest Biology and Technology 2008,
47, 315–324.
[51] Zdunek, A. and Cybulska, J. Relation of Biospeckle Activity with Quality
Attributes of Apples. Sensors 2011, 11, 6317-6327.
[52] Lee, W.; Kim, M.; Lee, H.; Delwiche, S.R.; Bae, H.; Kim, D.; Cho, B.
Hyperspectral near-infrared imaging for the detection of physical damages of
pear. Journal of Food Engineering 2014, 130, 1–7.
[53] Takizawa, K.; Nakano, K.; Ohashi, S.; Yoshizawa, H.; Wang, J.; Sasaki, Y.
Development of nondestructive technique for detecting internal defects in
Japanese radishes. Journal of Food Engineering 2014, 126, 43–47.
[54] Zhang, B.; Huang, W.; Li, J.; Zhao, C.; Fan, S.; Wu, J.; Liu, C. Principles,
developments and applications of computer vision for external quality
inspection of fruits and vegetables: A review. Food Research International
2014, 62, 326–343.
[55] Bramley, P., 2002. Regulation of carotenoid formation during tomato fruit
ripening and development. Journal of Experimental Botany 53, 2107-2113.
[56] Fadilah, N.; Mohamad-Saleh, J.; Abdul Halim, Z.; Ibrahim, H.; Syed Ali,
S.S. Intelligent Color Vision System for Ripeness Classification of Oil Palm
Fresh Fruit Bunch. Sensors 2012, 12, 14179–14195.
[57] Aroca, R.V.; Gomes, R.B.; Dantas, R.R.; Calbo, A.G.; Gonçalves, L.M.G. A
Wearable Mobile Sensor Platform to Assist Fruit Grading. Sensors 2013, 13,
6109–6140.
[58] Mendoza, F.; Lu, R.; Cen, H. Grading of apples based on firmness and
soluble solids content using Vis/SWNIR spectroscopy and spectral scattering
techniques. Journal of Food Engineering 2014, 125, 59–68.
[59] Zhang, D.; Lee, D.; Tippetts, B.J.; Lillywhite, K.D. Date maturity and
quality evaluation using color distribution analysis and back projection.
Journal of Food Engineering 2014, 131, 161–169.

31
Chapter 2
Objective s
The main objective of this thesis is the development of new systems based on
image processing techniques focused on automating agricultural tasks in all the
phases of the industrial process; pre-harvest, harvest and post-harvest.
It is intended that the developed systems can be used, in the future, in
agricultural platforms as part of more complex applications with industrial interest
that may contribute to the improvement of management techniques in orchards
incrementing benefits and product quality while reducing time and costs.
The specific objectives of this PhD Thesis are:
- To develop new image processing methods in order to detect and count
objects at a pre-harvest stage based on the identification of specular
reflection peaks from spherical surfaces. The application proposed was
an automatic method for counting red grapes from high-resolution
images of vineyards taken under artificial lighting at night.
- To design an image processing method based on the use of stereovision
systems in order to estimate the location and position of objects at
harvest stage. The application proposed was the development of an
automatic fruit harvesting system by combining a low cost stereovision
camera and a robotic arm. The stereovision camera was used to
estimate the size, distance and position of the fruits whereas the robotic
arm was used for the automatic fruit harvesting.

Chapter 2. Objectives
32
- To develop novel image processing methods based on the use of color
information in order to verify objects and improve fruit quality at post-
harvest stage. The application proposed was to develop an in-line
automatic and individual nectarine variety verification in a fruit-
packing line by comparing a feature histogram vector computed from
the central part of the skin of the nectarines processed.
- To develop novel image processing methods based on the use of color
information to establish relations between post-storage fruit quality
attributes, which are obtained by performing contact non-destructive
and contact destructive experiments, and the visible spectra of the skin
of the fruit. In this work, the fruit quality parameters studied were fruit
diameter, fruit mass, skin color, fruit firmness, SSC, and TA whereas
the visible spectra of the skin of the fruit was defined with the RGB,
Grey, HSV, and CIELAB color layers.
33
Chapter 3
PhD Thesis structure
The development of this PhD Thesis has been performed in the Research Line
of Signal Processing and Robotics of the INSPIRES UdL group (Institut
Politècnic d’Innovació i Recerca en Sostenibilitat, centre de recerca de la
Universitat de Lleida) and under the UdL-IMPULS project.
This thesis proposes the use of image processing techniques that contribute to
the development of new technologies to automate agricultural applications,
leading to an improvement of management operations in all phases of the
agricultural industry. Four different agricultural applications were developed and
proposed as the basis of this work according to the needs or problems to be solved
identified by farmers.
This PhD Thesis is structured in four chapters and four SCI papers; three of
them were already published in SCI/Q1 journals and the last paper is currently
under revision in a SCI/Q1 journal. Figure 3.1 shows the structure of the PhD
Thesis. The referenced papers are:
- Font, D.; Pallejà, T.; Tresanchez, M.; Teixidó, M.; Martinez, D.;
Moreno, J.; Palacín, J. Counting red grapes in vineyards by detecting
specular spherical reflection peaks in RGB images obtained at night
with artificial illumination. Computers and Electronics in Agriculture
(journal indexed as Q1) 2014, 108, 105-111.
- Font, D.; Pallejà, T.; Tresanchez, M.; Runcan, D.; Moreno, J.; Martínez,
D.; Teixidó, M.; Palacín, J. A proposal for automatic fruit harvesting by
Chapter 3. PhD Thesis structure
34
combining a low cost stereovision camera and a robotic arm. Sensors
(journal indexed as Q1) 2014, 14, 11557-11579.
- Font, D.; Tresanchez, M.; Pallejà, T.; Teixidó, M.; Martinez, D.;
Moreno, J.; Palacín, J. An image processing method for in-line
nectarine variety verification based on the comparison of skin feature
histogram vectors. Computers and Electronics in Agriculture (journal
indexed as Q1) 2014, 102, 112–119.
- Font, D.; Teixidó, M.; Tresanchez, M.; Martínez, D.; Moreno J.; Graell
J.; Lara, I.; Palacín, J. Assessment of the correlation between post-
storage fruit quality parameters and visible spectra of the skin for
‘Golden Smoothee’ apple. Submitted to Journal of Food Engineering
(journal indexed as Q1), July 2014.
The chapters represent the different stages of the agricultural industrial
process; pre-harvest, harvest and post-harvest. The first paper, presented in
Chapter 4, is focused on counting red grapes in vineyards by detecting specular
spherical reflection peaks in RGB images obtained at night with artificial
illumination. The counting of agricultural element is essential for yield estimate at
pre-harvest stage. The proposal of the second paper, presented in Chapter 5, is the
development of an automatic fruit harvesting system by combining a low cost
stereovision camera and a robotic arm. This operation is crucial at harvest stage.
The third and fourth papers, presented in Chapter 6 and 7 respectively, are
focused on solving problems at post-harvest stage with the aim of enhancing fruit
quality, which can affect consumer acceptance. In Chapter 6 an image processing
method for in-line nectarine variety verification based on the comparison of skin
feature histogram vectors is presented, whereas in Chapter 7 the correlation
between post-storage fruit quality attributes and the visible spectra of the skin of
the ‘Golden Smoothee’ apple was studied.
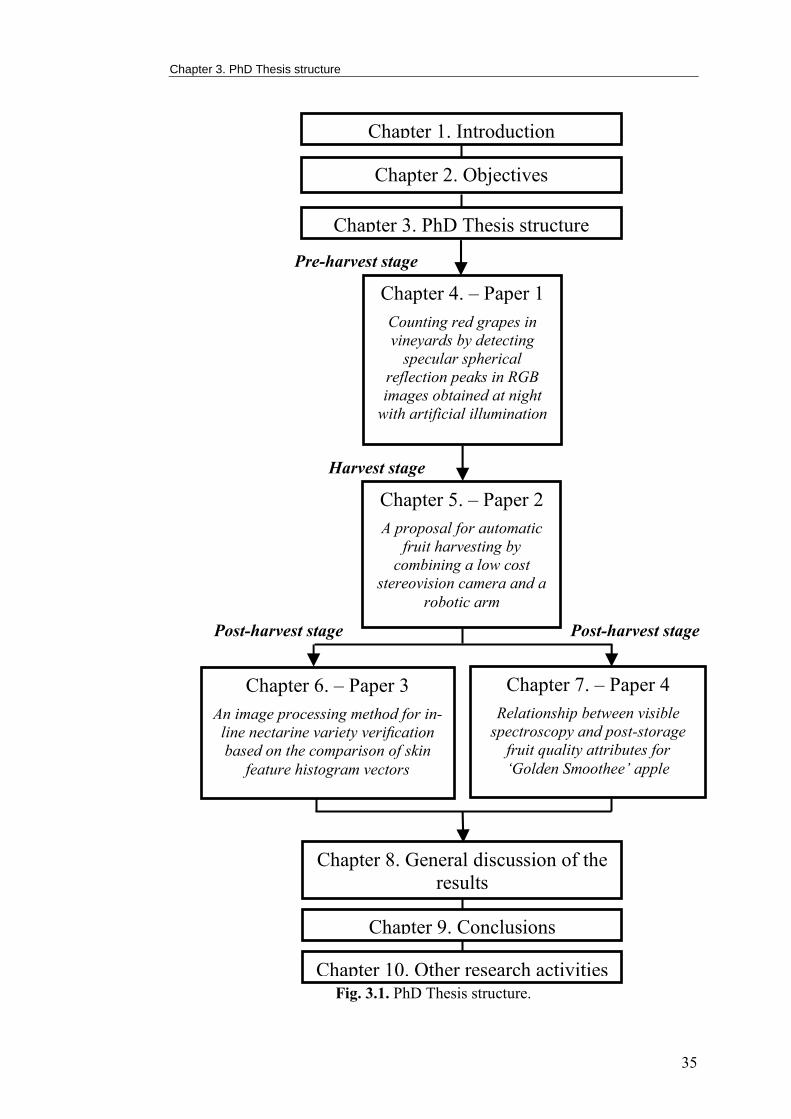
Chapter 3. PhD Thesis structure
35
Fig. 3.1. PhD Thesis structure.
Chapter 1. Introduction
Chapter 2. Objectives
Chapter 3. PhD Thesis structure
Chapter 6. – Paper 3
An image processing method for in-
line nectarine variety verification
based on the comparison of skin
feature histogram vectors
Chapter 9. Conclusions
Chapter 10. Other research activities
Chapter 8. General discussion of the
results
Chapter 7. – Paper 4
Relationship between visible
spectroscopy and post-storage
fruit quality attributes for
‘Golden Smoothee’ apple
Post-harvest stage
Pre-harvest stage
Post-harvest stage
Chapter 4. – Paper 1
Counting red grapes in
vineyards by detecting
specular spherical
reflection peaks in RGB
images obtained at night
with artificial illumination
Chapter 5. – Paper 2
A proposal for automatic
fruit harvesting by
combining a low cost
stereovision camera and a
robotic arm
Harvest stage

37
Chapter 4
Image processing method applied to locate agricultural elements at pre-harvest stage: counting red grapes
4.1. Introduction
This chapter proposes an image processing method based on detecting
intensity peaks from spherical objects. The paper presented in this chapter
proposed the design of a new procedure used at pre-harvest stage in order to count
the number of grapes in vineyard images obtained at night under artificial
lighting. The new contribution of this paper was to use the artificial lighting to
detect the specular reflection peaks originated in the spherical surface of the
grapes. Fig. 4.1 shows the specular reflection peaks detection. Fig. 4.1-a shows a
detail of an original vineyard image whereas Fig. 4.1-b shows a representation of
the normalized grayscale image, where the hot spots originated by the specular
spherical reflection on the grapes are highlighted.
Yield prediction is a topic of special interest in precision agriculture because it
leads to an improvement of management operations in orchards. Currently yield
prediction is an inaccurate, time-consuming and expensive operation since it is
performed manually by counting the number of individual fruits. Tasks focused
on counting elements in agriculture are being automated due to the application of
image-processing techniques. These automatic methods have been demonstrated
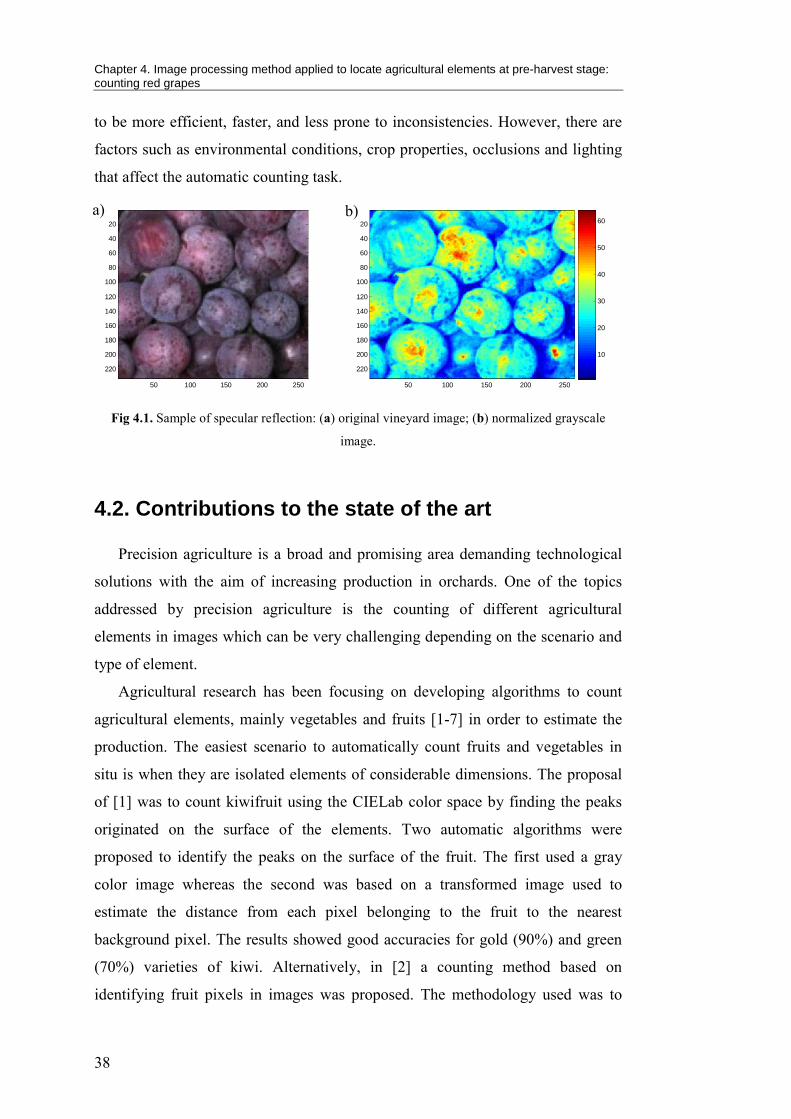
Chapter 4. Image processing method applied to locate agricultural elements at pre-harvest stage: counting red grapes
38
to be more efficient, faster, and less prone to inconsistencies. However, there are
factors such as environmental conditions, crop properties, occlusions and lighting
that affect the automatic counting task.
50 100 150 200 250
20
40
60
80
100
120
140
160
180
200
220
50 100 150 200 250
20
40
60
80
100
120
140
160
180
200
220
10
20
30
40
50
60
Fig 4.1. Sample of specular reflection: (a) original vineyard image; (b) normalized grayscale
image.
4.2. Contributions to the state of the art
Precision agriculture is a broad and promising area demanding technological
solutions with the aim of increasing production in orchards. One of the topics
addressed by precision agriculture is the counting of different agricultural
elements in images which can be very challenging depending on the scenario and
type of element.
Agricultural research has been focusing on developing algorithms to count
agricultural elements, mainly vegetables and fruits [1-7] in order to estimate the
production. The easiest scenario to automatically count fruits and vegetables in
situ is when they are isolated elements of considerable dimensions. The proposal
of [1] was to count kiwifruit using the CIELab color space by finding the peaks
originated on the surface of the elements. Two automatic algorithms were
proposed to identify the peaks on the surface of the fruit. The first used a gray
color image whereas the second was based on a transformed image used to
estimate the distance from each pixel belonging to the fruit to the nearest
background pixel. The results showed good accuracies for gold (90%) and green
(70%) varieties of kiwi. Alternatively, in [2] a counting method based on
identifying fruit pixels in images was proposed. The methodology used was to
b) a)
Chapter 4. Image processing method applied to locate agricultural elements at pre-harvest stage: counting red grapes
39
connect fruit pixels into sets, then the contours of these sets were segmented and
finally, an apple model was created by using the definition of the contours. The
conclusion obtained was that the technique proposed was not robust to lighting
changes but it achieved a success rate from 85% up to 95%. In [3] mango fruit
from orchard images were counted. The technique applied was to segment the
pixels of the images into two groups, fruit and background, by means of color and
texture information. Then, the resultant blobs were identified to count the number
of fruits in the image. The automatic results were correlated with a manual
counting achieving a strong correlation of 0.91. More recently, in [4] another
mango counting approach was proposed. The mango counting procedure was
based on combining an altered color matching with a Hessian filtering applied to
images taken at night under controlled lighting. Alternatively, in [5] a method for
identifying and counting fruits from images acquired in cluttered greenhouses was
presented. The automatic method was based on applying bag-of-words model and
statistical approaches. The results showed a strong correlation, 94.6%, between
the automatic and manual counting data.
The automatic counting in the case of grapes is a challenging task due to the
difficulty of distinguishing the grapes from the background as a consequence of
occlusions and the similarities in color. In addition, the grapes belonging to
different clusters have different scales, and the changes in lighting can also affect
the visibility of the fruit since it produces reflections and shadows. For example,
in [6] a method for counting grapes based on the application of a radial symmetry
transform was used in order to estimate yield. The results showed a good yield
accuracy estimation with only an error of 9.8%. The proposal of [7] was to design
a counting method based on the computation of the correlation between the
Gaussian profile and the neighborhood of each pixel to obtain a correlation map,
which was segmented and filtered.
4.3. References
[1] Wijethunga, P.; Samarasinghe, S.; Kulasiri, D.; Woodhead, I. Digital Image
Analysis Based Automated Kiwifruit Counting Technique. 23rd
International

Chapter 4. Image processing method applied to locate agricultural elements at pre-harvest stage: counting red grapes
40
Conference Image and Vision Computing 2008, New Zealand, Christchurch,
pp. 1-6.
[2] Linker, R.; Cohen, O.; Naor, A. Determination of the number of green apples
in RGB images recorded in orchards. Computers and Electronics in
Agriculture 2012, 81, 45–57.
[3] Payne, A.B.; Walsh, K.B.; Subedi, P.P.; Jarvis, D. Estimation of mango crop
yield using image analysis – Segmentation method. Computers and
Electronics in Agriculture 2013, 91, 57–64.
[4] Payne, A.; Walsh, K.; Subedi, P.; Jarvis, D. Estimating mango crop yield
using image analysis using fruit at ‘stone hardening’ stage and night time
imaging. Computers and Electronics in Agriculture 2014, 100, 160–167.
[5] Song, Y.; Glasbey, C.A.; Horgan, G.W.; Polder, G.; Dieleman, J.A.; van der
Heijden, G.W.A.M. Automatic fruit recognition and counting from multiple
images. Biosystems Engineering 2014, 118, 203-215.
[6] Nuske, S.; Achar, S.; Bates, T.; Narasimhan, S.; Singh, S. Yield Estimation in
Vineyards by Visual Grape Detection. IEEE/RSJ International Conference on
Intelligent Robots and Systems 2011, San Francisco, CA, USA.
[7] Grossetête, M.; Berthoumieu, Y.; Da Costa, J.P.; Germain, C.; Lavialle, O.;
Grenier, G. Early estimation of vineyard field: site specific counting of
berries by using a smartphone. International Conference of Agricultural
Engineering 2012. Abstract number C1915. Valencia.

Pages from 41 to 52 contain the following paper:
D. Font, T. Pallejà, M. Tresanchez, M. Teixidó, D. Martinez, J. Moreno, J.
Palacín. “Counting red grapes in vineyards by detecting specular spherical
reflection peaks in RGB images obtained at night with artificial illumination,”
Computers and Electronics in Agriculture 108 (2014) 105–111.
http://dx.doi.org/10.1016/j.compag.2014.07.006
ISSN: 0168-1699
53
Chapter 5
Image processing method applied to estimate size, distance and position of fruits at harvest stage: automatic fruit
harvesting
5.1. Introduction
This chapter proposes the development of an automatic fruit harvesting system
by combining a low cost stereovision camera and a robotic arm. The stereovision
camera was placed in the gripper tool of the robotic arm and had two
functionalities: 1) to estimate the size, distance and position of the fruits and 2) to
guide the automatic pickup of specific targets. The robotic arm was used as a
mechanic device to perform the pickup of the fruits. Fig. 5.1 shows a fruit pickup
performed in laboratory conditions using a pear as a target.
Agricultural industry is investing on automating agricultural tasks and the
automation of harvesting operations is crucial at harvest stage. The development
of a harvesting system is a complicated task that requires the accomplishment of
smaller operations such as the automatic detection and localization of fruits, the
estimation of fruit parameters (size, relative location and orientation) [1-3], and
finally the control of the mechanic device by considering a non-stressing pickup
methodology [4, 5].
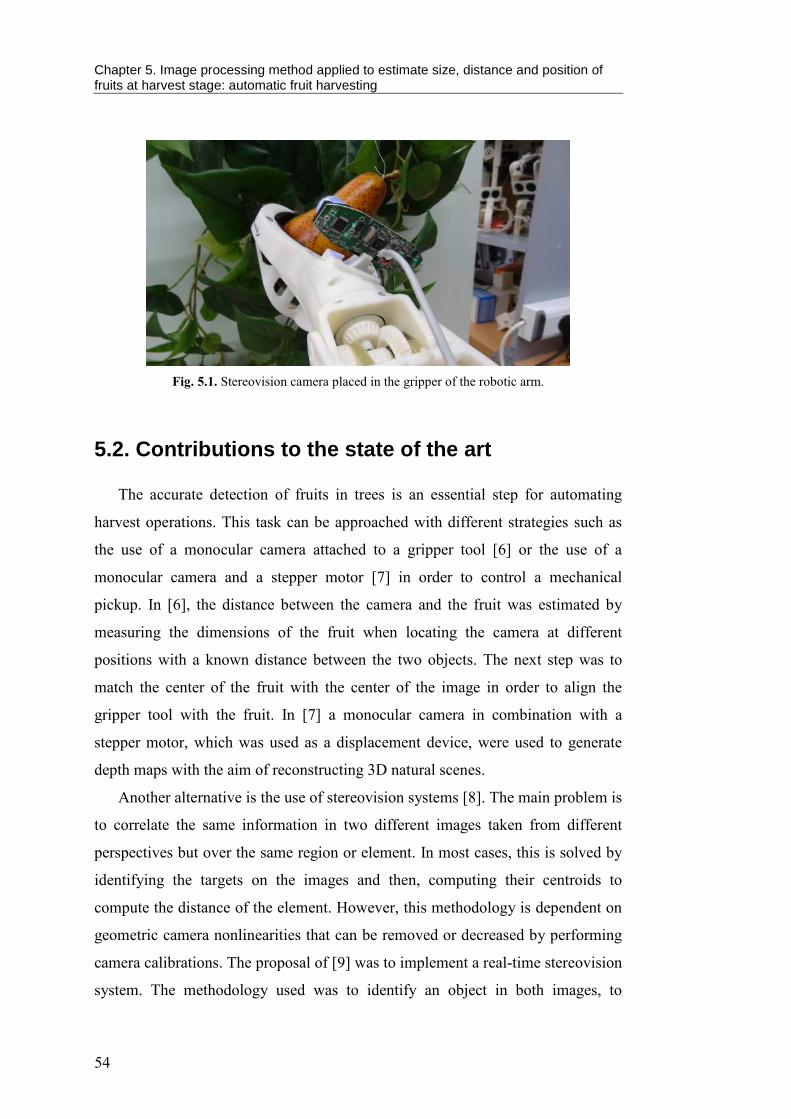
Chapter 5. Image processing method applied to estimate size, distance and position of fruits at harvest stage: automatic fruit harvesting
54
Fig. 5.1. Stereovision camera placed in the gripper of the robotic arm.
5.2. Contributions to the state of the art
The accurate detection of fruits in trees is an essential step for automating
harvest operations. This task can be approached with different strategies such as
the use of a monocular camera attached to a gripper tool [6] or the use of a
monocular camera and a stepper motor [7] in order to control a mechanical
pickup. In [6], the distance between the camera and the fruit was estimated by
measuring the dimensions of the fruit when locating the camera at different
positions with a known distance between the two objects. The next step was to
match the center of the fruit with the center of the image in order to align the
gripper tool with the fruit. In [7] a monocular camera in combination with a
stepper motor, which was used as a displacement device, were used to generate
depth maps with the aim of reconstructing 3D natural scenes.
Another alternative is the use of stereovision systems [8]. The main problem is
to correlate the same information in two different images taken from different
perspectives but over the same region or element. In most cases, this is solved by
identifying the targets on the images and then, computing their centroids to
compute the distance of the element. However, this methodology is dependent on
geometric camera nonlinearities that can be removed or decreased by performing
camera calibrations. The proposal of [9] was to implement a real-time stereovision
system. The methodology used was to identify an object in both images, to
Chapter 5. Image processing method applied to estimate size, distance and position of fruits at harvest stage: automatic fruit harvesting
55
segment the object and then, to apply a connected component analysis and a blob
extraction technique with the final objective of estimating the distance and size of
the object. In [10], two different stereovision techniques applied to apple-picking
robots were compared. The first technique was based on attaching a target to the
apples (manual operation) and the second system consisted of computing the
centroid of the segmented fruit (automatic operation) in order to estimate the
distance. The results showed an error in the distance estimate of 0.63% and 3.54%
in the first and the second techniques, respectively.
Stereovision systems are also applied to control robotized systems such as
robotic arms. However, in the literature there are very few works focused on
applying stereovision systems to develop fruit harvest operations. Some of these
examples are described in [11, 12]. In [11] a stereovision system was
implemented as part of a robotized platform in order to locate fruits and to correct
the trajectory of the robotic arm when harvesting fruits. The approach was studied
in laboratory conditions with simulated scenarios. In [12] the combination of a
fixed camera and a camera placed in the gripper tool of the robotic arm was
proposed for automatic harvest of citrus. A vision-based estimation and control
system was developed for robotic fruit harvesting whereas keeping the stability
and performances of the closed-loop system.
5.3. References
[1] Teixidó, M.; Font, D.; Pallejà, T.; Tresanchez, M.; Nogués, M.; Palacín, J. An
Embedded Real-Time Red Peach Detection System Based on an OV7670
Camera, ARM Cortex-M4 Processor and 3D Look-Up Tables. Sensors 2012,
12, 14129–14143.
[2] Teixidó, M.; Font, D.; Pallejà, T.; Tresanchez, M.; Nogués, M.; Palacín, J.
Definition of Linear Color Models in the RGB Vector Color Space to Detect
Red Peaches in Orchard Images Taken under Natural Illumination. Sensors
2012, 12, 7701–7718.
Chapter 5. Image processing method applied to estimate size, distance and position of fruits at harvest stage: automatic fruit harvesting
56
[3] Aroca, R.V.; Gomes, R.B.; Dantas, R.R.; Calbo A.G.; Gonçalves, L.M.G. A
Wearable Mobile Sensor Platform to Assist Fruit Grading. Sensors 2013, 13,
6109–6140.
[4] Zion, B.; Mann, M.; Levin, D.; Shilo, A.; Rubinstein, D.; Shmulevich. I.
Harvest-order planning for a multiarm robotic harvester. Computers and
Electronics in Agriculture 2014, 103, 75-81.
[5] Mehtaa, S.S.; Burks, T.F. Vision-based control of robotic manipulator for
citrus harvesting. Computers and Electronics in Agriculture 2014, 102, 146–
158.
[6] Lv, J.; Zhao, D-A.; Ji, W.; Chen, Y.; Shen, H. Design and Research on Vision
System of Apple Harvesting Robot. International Conference on Intelligent
Human-Machine Systems and Cybernetics 2011, vol.1, pp.177-180.
[7] Billiot, B.; Cointault, F.; Journaux, L.; Simon, J-C.; Gouton, P. 3D Image
Acquisition System Based on Shape from Focus Technique. Sensors 2013,
13, 5040-5053.
[8] Brown, M.Z.; Burschka, D.; Hager, G.D. Advances in computational stereo.
IEEE Transactions on Pattern Analysis and Machine Intelligence 2003,
vol.25, no.8, pp.993-1008.
[9] Mustafah, Y.M.; Noor, R.; Hasbi, H.; Azma, A.W. Stereo vision images
processing for real-time object distance and size measurements. International
Conference on Computer and Communication Engineering 2012, Kuala
Lumpur, pp. 659-663.
[10] Jian, L.; Shujuan, C.; Chengyan, Z.; Haifeng, C. Research on Localization of
Apples Based on Binocular Stereo Vision Marked by Cancroids Matching. 3rd
International Conference on Digital Manufacturing and Automation 2012,
GuiLin, pp.683-686.
[11] Zou, X.; Zou, H.; Lu, J. Virtual manipulator-based binocular stereo vision
positioning system and errors modeling. Machine Vision and Applications
2012, 23, 43–63.
[12] Mehtaa, S.S.; Burks, T.F. Vision-based control of robotic manipulator for
citrus harvesting. Computers and Electronics in Agriculture 2014, 102, 146–
158.
Pages from 57 to 84 contain the following paper:
D. Font, T. Pallejà, M. Tresanchez, D. Runcan, J. Moreno, D. Martínez, M.
Teixidó, J. Palacín. “A proposal for automatic fruit harvesting by combining a low
cost stereovision camera and a robotic arm,” Sensors 14 (2014) 11557-11579.
http://dx.doi.org/10.3390/s140711557
ISSN: 1424-8220
85
Chapter 6
Image processing meth od applied as a fruit quality control tool at post- harvest
stage: nectarine variety verification
6.1. Introduction
This chapter proposes an image processing method based on the use of fruit
color information for quality control in post-harvest stages. The proposal was to
develop an in-line nectarine variety verification system based on computing a
histogram vector from the surface of the analyzed fruit. The histogram vector can
be generated by a mixture of several intensity color layers from different color
spaces (Fig. 6.1). The idea of this proposal was based on the knowledge that the
comparison of two histograms from the skin of nectarine samples in the RGB
color space shows similarities when the nectarines are from the same variety and
differences when they are from different varieties.
The experimental part of this study was performed in the province of Lleida,
Spain which produces the 36% of the total Spanish nectarine production.
Moreover, the province of Lleida has mostly small orchards, less than 1ha, used to
cultivate a unique fruit variety. Another factor is that there is a broad agronomical
research based on creating new nectarine varieties optimized for specific weather
conditions and soil characteristics of a particular region, resulting in a wide range
of novel nectarine varieties with different demand [1] and market value. All these
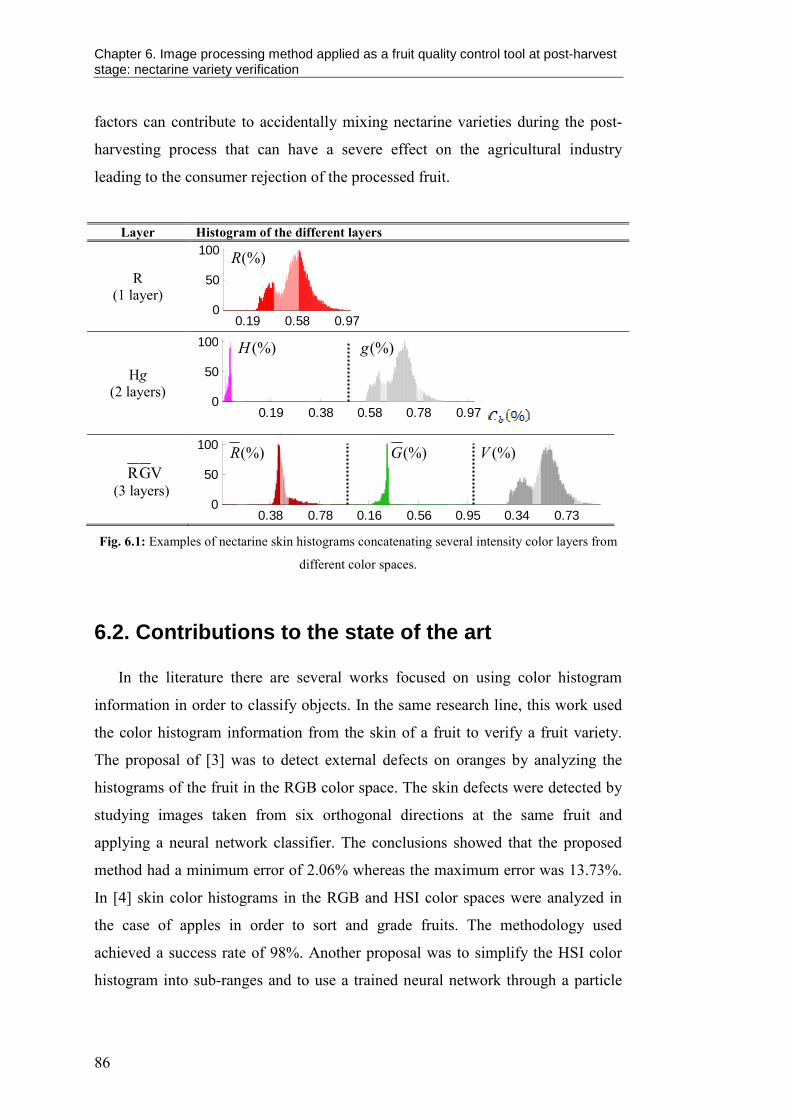
Chapter 6. Image processing method applied as a fruit quality control tool at post-harvest stage: nectarine variety verification
86
factors can contribute to accidentally mixing nectarine varieties during the post-
harvesting process that can have a severe effect on the agricultural industry
leading to the consumer rejection of the processed fruit.
Layer Histogram of the different layers
R
(1 layer)
0.19 0.58 0.970
50
100
R(%)
Hg
(2 layers)
0.19 0.38 0.58 0.78 0.970
50
100
VGR (3 layers)
0.38 0.78 0.16 0.56 0.95 0.34 0.730
50
100
Fig. 6.1: Examples of nectarine skin histograms concatenating several intensity color layers from
different color spaces.
6.2. Contributions to the state of the art
In the literature there are several works focused on using color histogram
information in order to classify objects. In the same research line, this work used
the color histogram information from the skin of a fruit to verify a fruit variety.
The proposal of [3] was to detect external defects on oranges by analyzing the
histograms of the fruit in the RGB color space. The skin defects were detected by
studying images taken from six orthogonal directions at the same fruit and
applying a neural network classifier. The conclusions showed that the proposed
method had a minimum error of 2.06% whereas the maximum error was 13.73%.
In [4] skin color histograms in the RGB and HSI color spaces were analyzed in
the case of apples in order to sort and grade fruits. The methodology used
achieved a success rate of 98%. Another proposal was to simplify the HSI color
histogram into sub-ranges and to use a trained neural network through a particle
(%)R
(%)H (%)g
(%)R (%)V(%)G
Chapter 6. Image processing method applied as a fruit quality control tool at post-harvest stage: nectarine variety verification
87
swarm optimization algorithm [5]. The method reached an accuracy of 94%. In
[6] the analysis of HSI color histograms of the skin of the fruit was proposed to
classify fruit in a system that combined a conveyor belt with a vision system. In
[7] the Mahalanobis distance algorithm was used as a method to perform
statistical analysis in order to grade oil palm fruit bunches. The technique
proposed showed a success rate of 93.53%. In [8] the HSI skin color histogram
was also applied to grade apples according to quality parameters. Similarly, in [9],
the HSI color histogram of the skin of nectarines was analyzed. The results
showed a low average classification success rate of 43%. This result showed the
difficulties when classifying and grading nectarine varieties.
6.3. References
[1] Bonany, J.; Buehler, A.; Carbó, J.; Codarin, S.; Donati, F.; Echeverria, G.;
Egger, S.; Guerra, W.; Hilaire, C.; Höller, I.; Iglesias, I.; Jesionkowska, K.;
Konopacka, D.; Kruczynska, D.; Martinelli, A.; Pitiot, C.; Sansavini, S.;
Stehr, R.; Schoorl, F. Consumer eating quality acceptance of new apple
varieties in different European countries. Food Quality and Preference 2013,
30, 250–259.
[2] IRTA: Institut de Recerca i Tecnologia Agroalimentaries, Technical report on
nectarine production. Available online: http://www.irta.cat. Accessed 11 July
2014.
[3] Recce, M.; Taylor, J.; Piebe, A.; Tropiano, G. High speed vision-based
quality grading of oranges. Proceedings on International Workshop on
Neural Networks for Identification, Control, Robotics, and Signal/Image
Processing 1996, Venice, pp. 136–144.
[4] Sudhakara, P.; Gopal, A.; Revathy, R.; Meenakshi, K. Color analysis of
fruits using machine vision system for automatic sorting and grading. Journal
of Instrument Society of India 1999, 34, 284–291.
[5] Ji, H.; Yuan, J. The application study of apple color grading by particle
swarm optimization neural networks. 6th
World Congress on Intelligent
Control and Automation 2006, Dalian, pp. 2651–2654.
Chapter 6. Image processing method applied as a fruit quality control tool at post-harvest stage: nectarine variety verification
88
[6] Buzera, M.; Groza, V.; Prostean, G.; Prostean, O. Techniques of analyzing
the colour of produces for automatic classification. International Conference
on Intelligent Engineering Systems 2008, Miami, FL., pp. 209–214.
[7] Makky, M.; Soni, P. Development of an automatic grading machine for oil
palm fresh fruits bunches (FFBs) based on machine vision. Computers and
Electronics in Agriculture 2013, 93, 129–139.
[8] D’Amato, J.P., García, C., Boroni, G., 2011. Color based fruits classification
using GPU. IEEE Latin America Transactions 2011, 3, 346–350.
[9] Font, D. ; Palleja, T.; Tresanchez, M.; Teixidó, M.; Palacin, J. Preliminary
study on color based nectarine variety classification. IEEE International and
Measurement Technology Conference 2012, Graz, pp. 2187–2190.

Pages from 89 to 103 contain the following paper:
D. Font, M. Tresanchez, T. Pallejà, M. Teixidó, D. Martinez, J. Moreno, J.
Palacín. “An image processing method for in-line nectarine variety verification
based on the comparison of skin feature histogram vectors,” Computers and
Electronics in Agriculture 102 (2014) 112–119.
http://dx.doi.org/10.1016/j.compag.2014.01.013
ISSN: 0168-1699

105
Chapter 7
Image processing method applied as a fruit quality monitoring tool at post- harvest stage: correlation between quality indices and visible spectra of the
skin of the fruit
7.1. Introduction
This chapter proposes a new image processing method applied to the visible
spectra of the skin of the fruit in order to analyze the correlation between the fruit
skin color and different fruit quality attributes. The fruit quality indices, which
were measured by performing contact and even destructive experiments, assessed
in this work were: diameter, weight, skin color, flesh firmness, soluble solids
content (SSC) and titratable acidity (TA). Conversely, the visible spectra of the
skin, which was measured by performing non-contact analysis, was defined by
using the RGB, Grey, HSV, and CIELab color spaces. The fruit evaluated was the
‘Golden Smoothee’ apple, which is a typical cultivar widely produced in Spain
(Fig. 7.1). Especially, the region of Lleida, where the experimental part of this
work was developed, represented the 38% of the total Spanish production of
apples in 2013-2014.
Fruit quality estimation is essential in fresh-market fruit production in order to
assure the best fruit appearance [1] and physicochemical properties [2]. At post-
harvest stages and during the storage of the fruit some procedures to monitor the
quality of the fruit are required. Mostly, these procedures are based on destructive
experiments leading to important production losses. The new contribution of this
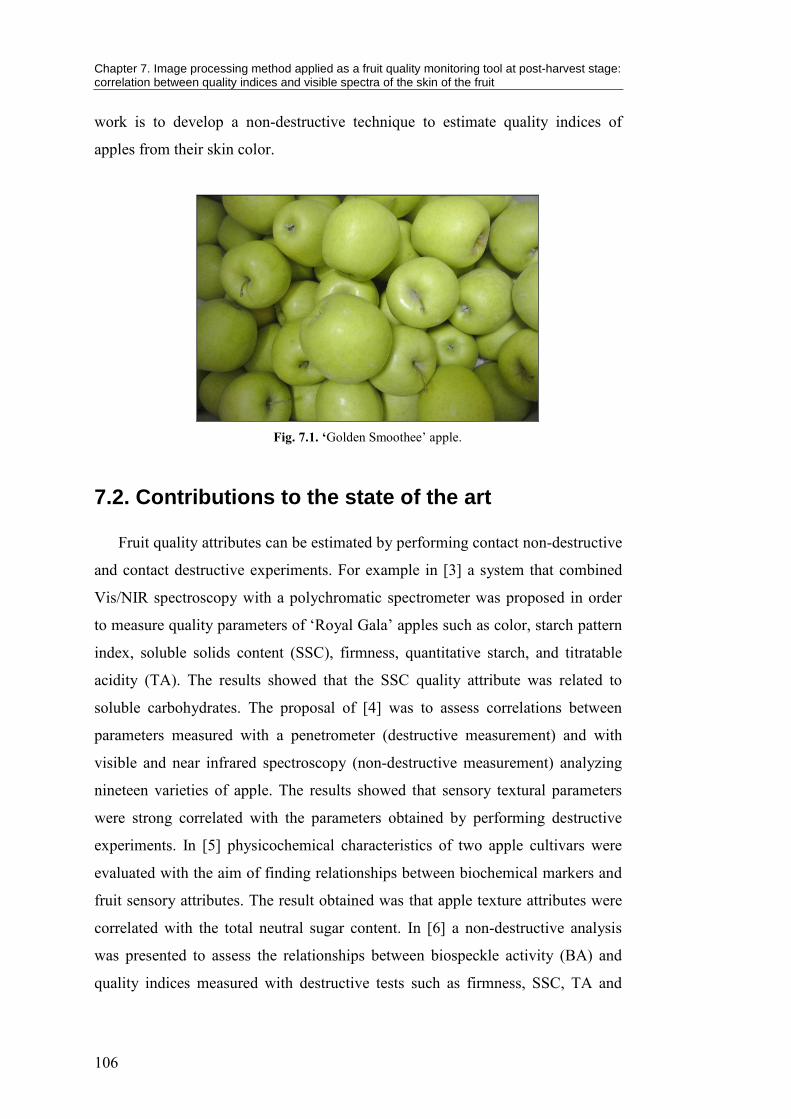
Chapter 7. Image processing method applied as a fruit quality monitoring tool at post-harvest stage: correlation between quality indices and visible spectra of the skin of the fruit
106
work is to develop a non-destructive technique to estimate quality indices of
apples from their skin color.
Fig. 7.1. ‘Golden Smoothee’ apple.
7.2. Contributions to the state of the art
Fruit quality attributes can be estimated by performing contact non-destructive
and contact destructive experiments. For example in [3] a system that combined
Vis/NIR spectroscopy with a polychromatic spectrometer was proposed in order
to measure quality parameters of ‘Royal Gala’ apples such as color, starch pattern
index, soluble solids content (SSC), firmness, quantitative starch, and titratable
acidity (TA). The results showed that the SSC quality attribute was related to
soluble carbohydrates. The proposal of [4] was to assess correlations between
parameters measured with a penetrometer (destructive measurement) and with
visible and near infrared spectroscopy (non-destructive measurement) analyzing
nineteen varieties of apple. The results showed that sensory textural parameters
were strong correlated with the parameters obtained by performing destructive
experiments. In [5] physicochemical characteristics of two apple cultivars were
evaluated with the aim of finding relationships between biochemical markers and
fruit sensory attributes. The result obtained was that apple texture attributes were
correlated with the total neutral sugar content. In [6] a non-destructive analysis
was presented to assess the relationships between biospeckle activity (BA) and
quality indices measured with destructive tests such as firmness, SSC, TA and
Chapter 7. Image processing method applied as a fruit quality monitoring tool at post-harvest stage: correlation between quality indices and visible spectra of the skin of the fruit
107
starch content (SC) was developed. The results showed a strong correlation
between BA and SC. Additionally, it was observed that the values of the quality
indices change considerably during fruit ripeness.
7.3. References
[1] Abbott, J.A. Quality measurement of fruits and vegetables. Postharvest
Biology and Technology 1999, 15, 207-225.
[2] Wu, C.; Gao, Q.; Guo, X.; Yu, J.; Wang, M. Effect of ripening stage on
physicochemical properties and antioxidant profiles of a promising table fruit
‘pear-jujube’ (Zizyphus jujuba Mill.). Scientia Horticulturae 2012, 148, 177-
184.
[3] McGlone, V.A.; Jordan, R.; Martinsen, P. Vis/NIR estimation at harvest of
pre- and post-storage quality indices for ‘Royal Gala’ apple. Postharvest
Biology and Technology 2002, 25, 135–144.
[4] Mehinagic, E.; Royer, G.; Bertrand, D.; Symoneaux, R.; Laurens, F.; Jourjon,
F. Relationship between sensory analysis, penetrometry and visible–NIR
spectroscopy of apples belonging to different cultivars. Food Quality and
Preference 2003, 14, 473–484.
[5] Billy, L.; Mehinagic, E.; Royer, G.; Renard, C.; Arvisenet, G.; Prost, C.;
Jourjon, F. Relationship between texture and pectin composition of two apple
cultivars during storage. Postharvest Biology and Technology 2008, 47, 315–
324.
[6] Zdunek, A; Cybulska, J. Relation of Biospeckle Activity with Quality
Attributes of Apples. Sensors 2011, 11, 6317-6327.

Pages from 108 to 124 contain the following paper:
D. Font, M. Teixidó, M. Tresanchez, D. Martínez, J. Moreno, J. Graell, I. Lara, J.
Palacín. “Assessment of the correlation between post-storage fruit quality
parameters and visible spectra of the skin for ‘Golden Smoothee’ apple,”
Submitted to Journal of Food Engineering, July 2014.
ISSN: 0260-8774
125
Chapter 8
General discussion of the results
This section summarizes the general discussion of the results obtained in each
of the chapters presented in this PhD Thesis.
8.1. Image processing method applied to locate agricultural elements at pre-harvest stage: counting red grapes
The general discussion and main conclusions extracted from the analysis
performed in chapter 4 are explained in this section.
The automatic counting system based on the identification of specular
reflection peaks on the spherical surface of the grapes followed a three-step
methodology: segmentation, image filtering, and peak detection and counting.
First, a segmentation procedure deeply studied in a previous work [1] was applied
in order to remove the background from the fruit. This procedure consisted in
obtaining the Hue intensity color layer from the original RGB image to apply a
threshold value before the application of morphological operations used to
eliminate the small objects in the segmented image. The second step of the
automatic counting method was to apply a smoothing procedure to the segmented
grapes image in order to reduce their color intensity variability with the practical
effects of improving the identification of detecting only one intensity peak per
fruit. The third step was to apply a morphological filter to detect the intensity
peaks in grapes. This morphological peak detector was defined with one central

Chapter 8. General discussion of the results
126
point and several radial points with the condition that the central point must have
higher intensity than the radial points. The morphological filter was optimized by
analyzing empirically two critical parameters: the number of radial points
equidistantly distributed along an external radius and the value of this external
radius. The analysis was performed by considering that the intensity peaks have
always a lower radius than the grapes (a preliminary study proved that the most
frequent radius for grapes was 75 pixels). Therefore, the range of the values of the
external radius considered was from 10 to 50 pixels being analyzed in steps of 10
pixels. Similarly, the number of radial points selected was from 5 to 35 points
being analyzed in steps of 5 points. Finally, the selected parameter combination
for the morphological filter was a radius of 30 pixels and 15 radial points
equidistantly distributed along the external radius. Moreover, the morphological
detector was applied to the R intensity color layer of the segmented and filtered
images due to the reddish nature of the grapes. The results showed that this
configuration provided a good agreement between time-performances and the
success achieved; the morphological detector was very fast achieving a success
rate of 85% when counting clusters of grapes identifying even highly occluded
grapes with a low percentage of false positives (10%).
The results of the automatic method were validated with a manual labeling
procedure, which consisted in classifying individual grapes into three categories:
totally visible grapes, grapes with an occlusion of less than 75% of their surface,
and grapes with an occlusion between 75% and 99% of their surface. The results
from the manual test showed that for the analyzed images the average number of
totally visible grapes was 18%, the average number of grapes with an occlusion of
less than 75% of their surface was 49%, and the number grapes with an occlusion
between 75% and 99% of their surface was 33%. The conclusions when
comparing both procedures were that on average the counting detection method
underestimated the number of grapes with an error of -14%. This can be
considered a good result since the 33% of the grapes in the processed images were
highly occluded (with more than the 75% of its surface occluded), being their
detection almost impossible by means of other conventional shape methods.
Moreover, on average the method provided a number of false positives of only 7%
Chapter 8. General discussion of the results
127
whereas the number of false negatives reached 21%. This means that the proposed
method can identify the non-occluded grapes and the ones with an occlusion
inferior to 75% of their surface with high accuracy, whereas the highly occluded
grapes can also be distinguished but with a lower percentage. These results
confirm that this method can count even highly occluded grapes showing the
suitability of the proposed automatic method.
Future work will be focused on implementing this automatic procedure to
other grape varieties and fruits with the final aim of predicting yield production in
orchards. Additionally, it will be studied the correlation between the automatic
grape counting results and the degree of fruit ripeness.
8.2. Image processing method applied to estimate size, distance and position of fruits at harvest stage: automatic fruit harvesting
The general discussion and main conclusions extracted from the analysis
performed in chapter 5 are explained in this section.
The proposed automatic fruit harvesting system combined a low cost
stereovision camera with a robotic arm. The stereovision camera was used to
estimate the size, distance and position of fruits whereas the robotic arm was used
to automatically harvest the selected fruits.
The image acquisition equipment used in this work was the Minoru 3D USB
Webcam, which used two cameras placed at the same plane with a distance of 60
mm from each other. In addition, a red cross laser was also used in combination
with the image acquisition device in order to accurately locate the targets. The
targets tested in this work were a blue pushpin (used as a reference element), and
two fruit targets: a green apple and a brown pear. The robotic arm was created
with a 3D rapid prototyping printer in ABS plastic material including six DC gear
motors used to control the five linked members. Additionally, the robotic arm was
equipped with an interchangeable gripper.
To automatically control the robotic arm when performing the fruit harvesting
operation it is required to estimate the fruit distances, positions and sizes. In this
Chapter 8. General discussion of the results
128
work these estimations were performed with a stereovision system. The detection
accuracy of the proposed stereovision system was tested in laboratory conditions
in the cases of correcting and not correcting geometric camera distortions. A total
of 1,470 images were analyzed corresponding to the three targets located in 49
positions of a relative grid and in 10 different distances from the camera. The
methodology used was to estimate the inclination, the centroid and the diameter of
all the targets by applying a fruit segmentation procedure. Two different
alternatives to perform the segmentation procedure were analyzed; color intensity
threshold and Linear Color Models. Then, the relative distance of the targets to
the camera, its relative position and its absolute diameter were computed by using
the advantages of the stereovision systems; which allows having two images of
the same object from different but known point of views. The results achieved
were that the average distance error was in a range from 4% to 5%, and that the
average diameter error was from 2% to 6% in the case of the fruit targets. These
results validated the use of the proposed low cost stereovision system as a tool to
estimate fruit distance and fruit size.
In this work the stereovision system was attached to the gripper element not
only to estimate the relative distance, orientation and size of the fruit but also to
provide information of the actions executed by the robotic arm. After the initial
fruit location, the automatic fruit harvesting procedure required the computation
of the inverse kinematics of the robotic arm in order to guide the gripper close to
the fruit, and then the position of the gripper was iteratively adjusted until the fruit
was harvested. The inverse kinematics computation was simplified by considering
a two-joint robotic arm. Moreover, the guidance and control of the robotic arm
was simulated and validated by using the definition of the Denavit-Hartenberg
parametric model. The complete harvest system was tested in laboratory
conditions using controlled and uniform lighting. Finally, the time-performances
of the complete harvesting cycle were analyzed resulting that the proposed
automatic system required on average 16 s to detect and pickup a pear, taking into
account that the 95% of this time was conditioned by the mechanical limitations
of the robotic arm.
Chapter 8. General discussion of the results
129
Future work will be focused on optimizing the automatic fruit harvesting
prototype in real farming operations.
8.3. Image processing method applied as a fruit quality control tool at post-harvest stage: nectari ne variety verification
The general discussion and main conclusions extracted from the analysis
performed in chapter 6 are explained in this section.
The in-line automatic and individual nectarine variety verification in a fruit-
packing line was performed by comparing a feature histogram vector computed
from the skin of a nectarine processed with the feature histogram vectors resulting
from analyzing representative nectarines from the target variety saved in a dataset.
The designed system was able to confirm that each piece of fruit analyzed in the
fruit-packing line belongs to the current fruit variety so as to avoid consumer
rejection of fruits as a consequence of accidental mixes with other varieties.
The nectarine cultivars selected for the study were varieties with similar
harvesting times because they can be picked simultaneously: Honey BlazePVC,
ASF 08.21, ASF 08.05, Queen Gem®, NectareinePVC, NectarrevePVCR. The
Nectarreve variety was selected as the representative cultivar for the industrial
production simulation because it was the variety with the most overlapped
harvesting time. The image acquisition device working under controlled artificial
lighting took non-interpolated RGB color images from each nectarine processed.
Then, the images were analyzed following a 4-step image-processing algorithm.
First, the images were segmented by applying the Otsu method fixing the
threshold at 51 in order to optimize time performances. The second step was to
compute the bounding box and the center of the segmented nectarine. The third
step consisted in defining the region of interest of the fruit, which was established
as a smaller circular area (80 pixels) of the skin of the fruit having the center at
the center of the fruit, so as to avoid the illumination changes at the edge of the
fruit. Finally, the histograms of the skin of the nectarine analyzed were computed
and created by concatenating histogram values corresponding to different
Chapter 8. General discussion of the results
130
intensity color layers such as the RGB, HSV, YCbCr, and BGR . Additionally,
these feature histograms can be tuned by applying a zero-phase digital average
filter used to modify the shape, and by changing the weight distribution to remove
noise.
The validation of the proposed method was based on comparing different skin
feature histogram vectors; one identifying the current variety and the others
representing the target variety that are saved in a dataset. Two different methods
were used to assess this comparison: the application of Pearson’s correlation
coefficient and the application of the cumulative absolute subtraction. The critical
step of the experimental procedure was the estimation of a variety classification
threshold, which represents the minimum similarity used to decide whether a
current nectarine can be accepted as a member of the processed variety. The
automatic estimate of this parameter was performed by doing a cross comparison
with all the feature histograms vectors included in the dataset.
The experimental procedure was based on analyzing 10 nectarines from each
one of the 6 varieties selected, which were placed randomly on the conveyor belt,
and analyzing all the possible color layer combinations for the creation of the skin
feature histogram vectors. All the combinations represented 268 results obtained
with Pearson correlation and 268 results obtained with the cumulative subtraction
technique. The best results obtained (achieving a success ratio of 100%) in the
case of comparing the feature histogram vectors using the Pearson correlation
were the vectors created from the Rg histograms (non-filtered and non-
normalized) and from the Y R (non-filtered and normalized) histograms.
Surprisingly, both of them were a 2-layer histogram without filtering. Considering
histograms with different number of layers, the maximum success ratio obtained
when using 1 layer was 83% in case of the Y intensity color layer and 90% when
using 3 layers in case of the RGB color components. These results proved that the
Pearson correlation method can be used to verify nectarines with high accuracy.
Conversely, the best results obtained with the cumulative subtraction were 90% in
case of using a 3-layer histogram created from the HSV color layers (filtered and
non-normalized), and 88% when using the same layers but without filtering. So,
the best results were achieved when not normalizing the shape of the histogram.
Chapter 8. General discussion of the results
131
Considering histograms with different number of layers, the maximum success
ratio obtained when using 1 layer was 70% in case of the R, H, and V color layers
and 87% using a 2-layer histogram created from the HCr case. These results
showed that the cumulative subtraction method is also a suitable method to use for
verifying nectarines with high accuracy. Additionally, the comparison using the
cumulative subtraction was faster than the Pearson correlation and could be a
more suitable alternative for a real implementation.
In all the tests performed, the nectarine varieties incorrectly accepted as the
Nectarreve variety were the ASF 08.21 and the ASF 08.05 varieties due to the
skin similarities, which were also the varieties with the most time overlapping.
Finally, the automatic method was compared with a manual experiment,
where an expert human operator classified nectarines reaching a success ratio of
87%. The conclusion obtained was that the two automatic classification methods
proposed in this work improved the success rate of a manual classification.
Future research will be focused on optimizing the industrial application
proposed and on defining additional quality attributes for creating the feature
histogram vectors of the nectarines processed.
8.4. Image processing method applied as a fruit quality monitoring tool at post-harvest stage: correlation between quality indices and visible spectra of the skin of the fruit
The general discussion and main conclusions extracted from the analysis
performed in chapter 7 are explained in this section.
The fruit quality indices, which were measured by performing contact and
even destructive experiments, assessed were: diameter, weight, skin color, flesh
firmness, soluble solids content (SSC) and titratable acidity (TA). Conversely, the
visible spectra of the skin, which was measured by performing non-contact
analysis, was defined by using the RGB, Grey, HSV, and CIELab color spaces.
The fruit variety analyzed was the ‘Golden Smoothee’ apple and the quality
parameters were measured with specific devices. For example, the size was
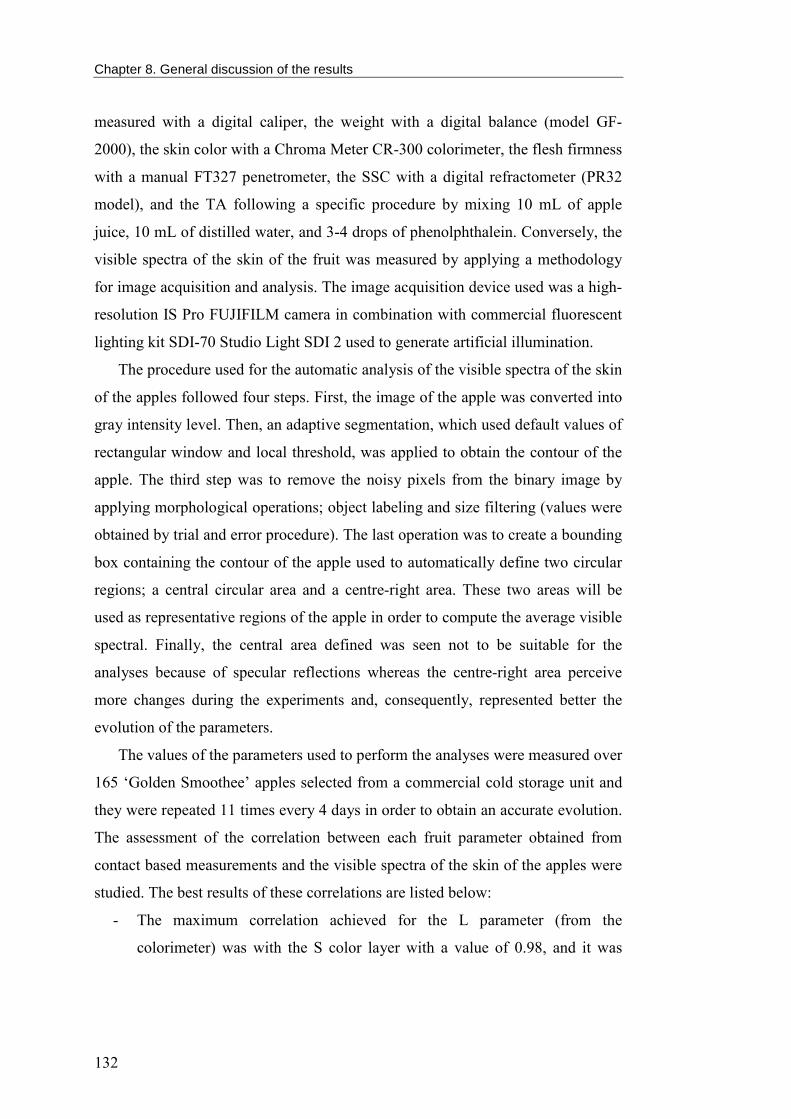
Chapter 8. General discussion of the results
132
measured with a digital caliper, the weight with a digital balance (model GF-
2000), the skin color with a Chroma Meter CR-300 colorimeter, the flesh firmness
with a manual FT327 penetrometer, the SSC with a digital refractometer (PR32
model), and the TA following a specific procedure by mixing 10 mL of apple
juice, 10 mL of distilled water, and 3-4 drops of phenolphthalein. Conversely, the
visible spectra of the skin of the fruit was measured by applying a methodology
for image acquisition and analysis. The image acquisition device used was a high-
resolution IS Pro FUJIFILM camera in combination with commercial fluorescent
lighting kit SDI-70 Studio Light SDI 2 used to generate artificial illumination.
The procedure used for the automatic analysis of the visible spectra of the skin
of the apples followed four steps. First, the image of the apple was converted into
gray intensity level. Then, an adaptive segmentation, which used default values of
rectangular window and local threshold, was applied to obtain the contour of the
apple. The third step was to remove the noisy pixels from the binary image by
applying morphological operations; object labeling and size filtering (values were
obtained by trial and error procedure). The last operation was to create a bounding
box containing the contour of the apple used to automatically define two circular
regions; a central circular area and a centre-right area. These two areas will be
used as representative regions of the apple in order to compute the average visible
spectral. Finally, the central area defined was seen not to be suitable for the
analyses because of specular reflections whereas the centre-right area perceive
more changes during the experiments and, consequently, represented better the
evolution of the parameters.
The values of the parameters used to perform the analyses were measured over
165 ‘Golden Smoothee’ apples selected from a commercial cold storage unit and
they were repeated 11 times every 4 days in order to obtain an accurate evolution.
The assessment of the correlation between each fruit parameter obtained from
contact based measurements and the visible spectra of the skin of the apples were
studied. The best results of these correlations are listed below:
- The maximum correlation achieved for the L parameter (from the
colorimeter) was with the S color layer with a value of 0.98, and it was

Chapter 8. General discussion of the results
133
strongly correlated with the L (from the RGB image), R, B, H, V, b, a, and
Gray intensity color layers.
- The maximum correlation achieved for a parameter (from the colorimeter)
was with the a and H color layers (from the RGB image) both with a value
of 0.99, and it was strongly correlated with the R, B, S, V, b, and Gray
intensity color layers.
- The maximum correlation achieved for the b parameter (from the
colorimeter) was with the R, B, H, S and V color layers with a value of
0.99, and it was strongly correlated with the b, a, L, and Gray intensity
color layers.
- The maximum correlation achieved for the size parameter with the a color
layer (from the RGB image) achieving a value of 0.93, and it was strongly
correlated with the H, B, S, R, V, and b intensity color layers.
- The maximum correlation achieved for the weight parameter was with the a
color layer (from the RGB image) obtaining a value of 0.99, and it was
strongly correlated with the H, B, R, S, and V intensity color layers.
- The TA parameter was maximally correlated with the b and S intensity
color layers (from the RGB image) reaching a value of 0.94, and it was
strongly correlated with the B, R, V, and H color components.
- The flesh firmness parameter was maximally correlated with the a color
layer (from the RGB image) achieving a value 0.92, and it was strongly
correlated with the H, B, R, V, and S intensity color layers.
- The SSC parameter was maximally correlated with the G color layer
achieving a weak correlation of 0.50. The G color layer was one of the
worst alternatives in the other cases studied.
The final conclusion is that most post-storage apple quality parameters
obtained from contact and even destructive measurements were strongly
correlated with the visible skin spectra of the fruits. The results showed that the
parameters obtained from contact-based measurements were on average strongly
correlated with the intensity color layers from the RGB color space of the apples
analyzed. However, the best correlation results were achieved when using the
CIELab color components. Therefore, most of these fruit quality attributes can be
Chapter 8. General discussion of the results
134
estimated by using techniques based on image processing analyses, which are
faster and more efficient.
Future work will be focused on the development of novel image processing
techniques for the estimation of new post-storage fruit quality parameters.
8.5. References
[1] Font, D.; Tresanchez, M.; Teixidó, M.; Pallejà, T.; Moreno, J.; Palacín, J.
Assessment of pixel-based grape detection methods in color orchard images
taken under artificial illumination at night. Submitted to Biosystems
Engineering, June 2014.
135
Chapter 9
Conclusions
This PhD Thesis is focused on the automation of agricultural tasks considering
all the stages of the industrial process.
The major achievements of this PhD are the following:
- At pre-harvest stage.
The results from the red-grape image-processing counting method indicated
the suitability of the proposed system to detect grapes with different degree
of occlusion. The automatic technique presented detected not only totally
visible grapes but also grapes with an occlusion inferior to 75% with high
accuracy. Additionally, the method was able to count grapes highly
occluded but with a lower success rate. The conclusions obtained where
that the proposed automatic method had on average a counting detection
error of -14% and a low percentage of false positives (7%).
- At harvest stage.
The results from the automatic fruit harvesting system have validated the
use of the proposed low cost stereovision system for fruit size, distance and
position estimation. Moreover, the complete harvesting prototype based on
a robotic arm was tested in laboratory conditions, being able to pickup a
pear target in 16 s.
Chapter 9. Conclusions
136
- At post-harvest stage.
The conclusions from the nectarine variety verification system were
that the automatic system presented performed the classification better
(100%) than an experienced human operator (87%). The best results
from the automatic method were obtained with the Pearson correlation
comparison achieving a success ratio of 100% whereas the cumulative
subtraction technique obtained a 90%. However, the cumulative
subtraction comparison was faster and could be a more suitable
alternative for a real implementation.
The results from the assessment of the correlation between post-storage
fruit quality indices and visible spectra of the skin of the fruit were that
most apple quality parameters (size, weight, skin color, flesh firmness,
soluble solids contents and titratable acidity), which were obtained by
performing contact and even destructive measurements, could be
estimated by means of less time-consuming technique based on image
processing analyses (non-contact based measurement). The conclusion
was that the best correlation was achieved with the components of the
CIELab color space even though the R and B intensity color layers
from the RGB color space also offered strong correlations. However,
the worst relationship was obtained in the case of the SSC parameter,
which had a plain evolution along the fruit ripening.
137
Chapter 10
Other research activities
10.1 Contribution to publications
The other research activities performed during the development of this PhD
Thesis were focused mainly on the development of agricultural applications and
control systems:
• Font, D.; Tresanchez, M.; Teixidó, M.; Pallejà, T.; Moreno, J.; Palacín, J.
Assessment of pixel-based grape detection methods in color orchard
images taken under artificial illumination at night. Submitted to
Biosystems Engineering, June 2014.
• Palleja, T.; Teixido, M.; Font, D.; Tresanchez, M.; Palacin, J. Desarrollo
de un Caso Practico de Aprendizaje Combinando Vision Artificial y un
Brazo Robot. VAEP-RITA 2013, 1, 61-68.
• Teixidó, M.; Font, D.; Pallejà, T.; Tresanchez, M.; Nogués, M.; Palacín, J.
Definition of Linear Color Models in the RGB Vector Color Space to
Detect Red Peaches in Orchard Images Taken under Natural Illumination.
Sensors 2012, 12, 7701-7718.
• Teixidó, M.; Font, D.; Pallejà, T.; Tresanchez, M.; Nogués, M.; Palacín, J.
An embedded real-time red peach detection system based on OV7670
camera, ARM Cortex-M4 processor and 3D Look-Up Tables. Sensors
2012, 12, 14129-14143.
• Font, D.; Palleja, T.; Teixido, M.; Tresanchez, M.; Palacin,
J. Development of a Virtual Humanoid Model Using the Denavit-
Chapter 10. Other research activities
138
Hartenberg Parameters as a Base for Visual Feedback Applications.
Lecture Notes in Electrical Engineering 122: Advances in Automation and
Robotics 2011, 1, 639-646.
10.2 Contribution to conferences
The research activities performed have been also presented in several national
and international conferences related to precision agriculture and control systems:
• Moreno, J.; Tresanchez, M.; Palleja, T.; Teixido, M.; Font, D.; Palacin,
J. Desarrollo de un robot cartesiano de uso docente con 5 grados de
libertad y una camara en la pinza. Annual seminary of Automatic,
Industrial Electronic and Instrumentation (SAAEI 2013), Madrid, Spain,
10-12 July, 2013.
• Font, D.; Moreno, J.; Tresanchez, M.; Teixido, M.; Palleja, T.; Palacin,
J. Compact and low cost embedded vision system for fruit detection and
tracking. 9th European Conference on Precision Agriculture (ECPA
2013), Lleida, Spain, July 8-11, 2013. ISBN: 978-84-695-8176-6.
• Font, D.; Palleja, T.; Tresanchez, M.; Teixido, M.; Palacin, J. Preliminary
study on color based nectarine variety classification. Proceedings of the
2012 IEEE International Instrumentation and Measurement Technology
Conference (2012 IEEE I2MTC), 2187-2190, Graz, Austria, May 13-16,
2012. ISBN: 978-1-4577-1771-0.
• Teixido, M.; Font, D.; Palleja, T.; Tresanchez, M.; Palacin, J. Ejemplo de
caso práctico de aprendizaje combinando visión artificial y un brazo robot.
Annual seminary of Automatic, Industrial Electronic and Instrumentation
(SAAEI 2012), 835-839, Guimaraes, Portugal, 11-13 July, 2012.
• Tresanchez, M.; Teixido, M.; Font, D.; Palleja, T.; Palacin, J. Embedded
Vision System for Real-Time Fruit Detection and Tracking. First
International Conference on Robotics and Associated High-Techonologies
and Equipment for Agriculture (RHEA 2012), 331-336, Pisa, Italy,
September 19-21, 2012.

Chapter 10. Other research activities
139
• Font, D.; Palleja, T.; Teixido, M.; Tresanchez, M.; Palacin,
J. Development of a Virtual Humanoid Model Using the Denavit-
Hartenberg Parameters as a Base for Visual Feedback Applications, 2011
International Conference on Automation and Robotics (ICAR2011),
Dubai, UAE, December 1-2, 2011. ISBN: 978-3-642-25552-6.
10.3 Scientific foreign exchange
The scientific foreign exchange performed during the development of this
PhD Thesis was in the Field Robotics Center (FRC), a department of the Robotics
Institute (RI) at Carnegie Mellon University (CMU), in Pittsburgh, PA, USA. This
exchange was performed in two consecutive years, in 2012 and 2013, in a 3 + 3
month research stay under the supervision of Dr. Stephen T. Nuske.
The research carried out in this exchange was also related with the study of the
use of robotics in agriculture. The work was focused on the automation applied to
table-grape vineyards for automatically evaluating the fruit in situ close to harvest.
The study compared different methods applied to collect and process images for
the purpose of evaluating the fruit hanging on the vines and comprised data
collection, experiment setup development and the application of different image
processing methods to process the images in order to distinguish ripe harvestable
clusters from non-harvestable clusters. Finally, the results obtained with the
automatic procedures developed were compared with manual data.

141
Nomenclature
ARP Automatic Resistivity Profiler
ER Electrical Resistivity
RTK Real Time Kinematic
GPS Global Positioning System
VIS-NIR Visible-Near-Infrared
PCA Principal Component Analysis
KPCA Kernel Principal Component Analysis
LS-SVM Least Squares-Support Vector Machine
BPNN Back Propagation Neural Network
CCD Charge Coupled Device
PIXEL Picture Element
RGB Red, Green, Blue
HSI Hue, Saturation, Intensity
CIELab L is the luminance, a is the red-green axis, and b is the blue-yellow
axis
YCbCr Y is the luminance, Cb is the blue-difference chroma component, and
Cr is the red-difference chroma component
LUT Look up Tables
NDVI Normalized Difference Vegetative Index
LIDAR Light Detection and Ranging system
TAI Tree Area Index
LAI Leaf Area Index
INS Inertial Navigation System
RT-PCR Reverse Transcription-Polymerase Chain Reaction
SSC Soluble Solids Content
TA Titratable Acidity
BA Biospeckle Activity
SC Starch Content
ANN Artificial Neural Network
RFID Radio Frequency Identification