Advanced quality assurance methodologies in image-guided ...
190
Advanced quality assurance methodologies in image-guided high-dose-rate brachytherapy Saad Aldelaijan Department of Biomedical Engineering McGill University Montréal, Québec December, 2020 A thesis submitted to McGill University in partial fulfillment of the requirements of the degree of Doctor of Philosophy © Saad Aldelaijan, 2020
-
Upload
khangminh22 -
Category
Documents
-
view
1 -
download
0
Transcript of Advanced quality assurance methodologies in image-guided ...
Advanced quality assurance methodologies in
image-guided high-dose-rate brachytherapy
Saad Aldelaijan
Department of Biomedical Engineering
McGill University
Montréal, Québec
December, 2020
A thesis submitted to McGill University in partial fulfillment of the
requirements of the degree of Doctor of Philosophy
© Saad Aldelaijan, 2020

2

3
ىل اتج راسي: أمي و أبوي.إهداء إ
(To “Taj Rasi”; Ommi o Oboi.)
To my big brother; Mohammed.
To the love of my life; my girls.
For all your sacrifices and patience.
4
ABSTRACT
Brachytherapy (BT) was the first form of radiotherapy and it is still effectively used because of
its unique physical and biological advantages. Although the principles of BT operation are con-
sidered to be relatively simple (since it is based on the correct timing and positioning of radioac-
tive sources), BT has also benefitted from technological advances. The rate of technical inven-
tions and their incorporation into BT treatments has necessitated development of more precise
quality assurance (QA) tools. The purpose of this thesis is to introduce a robust QA framework
based on radiochromic film (RCF) dosimetry for image-guided high-dose-rate (HDR) BT. These
films can be digitized allowing for high spatial resolution visualization of the source dosimetric
trace, which can be used to reconstruct the source positions and evaluate the dose distribution
simultaneously.
To increase the HDR source-tracking reliability, a film-digitization protocol was devel-
oped. This protocol evaluates issues related to film scanning and handling, and specifies parame-
ters of film response and mathematical models that relate this response to absorbed dose. The
protocol is based on a new linear response function, ‘normalized pixel value’ (nPV), and it was
designed to achieve high accuracy while maintaining practicality. It was further improved by us-
ing all RGB (Red, Green, Blue) color information available in RCF scanned images, to correct
for scanning-related issues. This protocol was tested and validated for six independent RCF do-
simetry systems in three different clinics, demonstrating robustness of the method and its ability
to mitigate systematic response shifts.
The first application of this dosimetry protocol was in the QA of Freiburg Flap (FF)
based treatments in HDR surface BT. The current standard of care in treatment planning of sur-
face BT does not take into account the lack of backscatter above the FF and patient skin, since it
assumes the HDR source is always surrounded by water. Before comparing planned and
5
delivered doses, the film response was calibrated and a detailed uncertainty budget was dis-
cussed. The RCF dosimetry system was able to report the difference between the calculated and
delivered doses for different setups and to evaluate the use of bolus to reduce these differences.
Subsequently, the source-tracking algorithm was developed to precisely localize the HDR
source within catheters based on the acquired 2D distribution from the RCF. The algorithm relies
on measured-features of the relative isodose lines (blob analysis) such as area, perimeter,
weighted-centroid, elliptic orientation, and circularity. A reference library of features was pre-
pared based on the AAPM TG-43 datasets and correlations were derived between these features
and the source coordinates (x, y, z, θy, θz). The measured features are then compared to the refer-
ence ones and the most probable source coordinates are reported. The source-tracking algorithm
was verified experimentally with an accuracy of 0.1 mm by having two film sets on opposing
ends of the source. This technique offers a novel method having the potential to be used for
source QA of commercial and customized applicators.
This thesis addressed the acquisition of accurate 2D dose maps with RCF which is essen-
tial for the detection of the HDR source dosimetric trace when using the source-tracking algo-
rithm. This included the calibration of RCF for HDR BT dosimetry and their use in dose verifi-
cation. The thesis also demonstrated the potential incorporation of these findings into a compre-
hensive image-guided HDR BT QA framework. In the future, the framework is intended to en-
compass all the software and strategies developed thus far and adapt new algorithms taking ad-
vantage of simple irradiation patterns yet revealing many QA metrics accurately.
6
RÉSUMÉ
La curiethérapie (CRT) a été la première forme de radiothérapie et elle est toujours utilisée de
manière efficace en raison de ses avantages physiques et biologiques uniques. Bien que les prin-
cipes de fonctionnement de la CRT soient considérés comme relativement simples (car ils sont
basés sur la synchronisation et le positionnement adéquats des sources radioactives), la CRT a
aussi bénéficié d'avancées technologiques. Le taux d'inventions techniques et leur incorporation
dans les traitements de CRT ont nécessité le développement d'outils d'assurance de la qualité
(AQ) plus précis. Le but de cette thèse est d'introduire un cadre d'AQ haute résolution basé sur la
dosimétrie à film radiochromique (FRC) pour la CRT à débit de dose élevé (HDR) assistée par
imagerie médicale. Ces films peuvent être numérisés et permettre une visualisation haute résolu-
tion de la trace dosimétrique source, qui peut être utilisée pour retracer les positions de la source
et évaluer sa répartition de dose de façon simultanée.
Pour augmenter la fiabilité du suivi des sources à HDR, un protocole de numérisation des
films a été développé. Ce protocole évalue et détaille tous les problèmes liés à la numérisation, à
la manipulation, à la définition de la réponse du film et aux modèles mathématiques qui associent
cette réponse à la dose absorbée. Le protocole est basé sur une nouvelle fonction de réponse
linéaire, la valeur des pixels normalisée (nPV), et il a été conçu pour obtenir une grande précision
tout en restant pratique. Il a été encore plus amélioré en utilisant toutes les informations disponi-
bles sur les couleurs RVB dans les images numérisées et les caractéristiques spécifiques d'image
pour corriger les problèmes liés à la numérisation. Ce protocole a été testé et validé pour six sys-
tèmes de dosimétrie à FRC indépendants dans trois cliniques différentes, démontrant la durabilité
de la méthode et sa capacité à diminuer les changements de réponse systémiques.
La première application de ce protocole de dosimétrie a été dans l'AQ des traitements à
base de Freiburg Flap (FF) en CRT de surface à HDR. La norme des soins actuelle dans la pla-
nification du traitement de CRT de surface ne prend pas en compte le manque de rétrodiffusion
7
au-dessus du FF et de la peau du patient, car elle suppose que la source à HDR est toujours en-
tourée d'eau. Avant de comparer les doses prévues et administrées, la réponse du film a été cali-
brée et un bilan d'incertitude détaillé a été discuté. Le système de dosimétrie à FRC a pu rap-
porter la différence entre les doses calculées et administrées pour différentes configurations et
suggérer des façons de réduire ces différences.
Par la suite, l'algorithme de suivi des sources a été développé pour localiser précisément
la source à HDR dans les cathéters en fonction de la distribution 2D acquise à partir du FCR.
L'algorithme repose sur des éléments mesurés des lignes isodose relatives (analyse de taches)
telles que l'aire, le périmètre, le centroïde pondéré, l'orientation elliptique et la circularité. Une
bibliothèque de référence d'éléments a été préparée sur la base des ensembles de données AAPM
TG-43 et des corrélations ont été déterminées entre ces éléments et les coordonnées sources (x, y,
z, θy, θz). Les éléments mesurés sont ensuite comparés à ceux de référence et les coordonnées
sources les plus probables sont rapportées. L'algorithme de suivi des sources a été vérifié à titre
expérimental avec une précision de 0,1 mm en plaçant deux films sur les extrémités opposées de
la source. Cette technique offre une nouvelle méthode pouvant être utilisée pour l'AQ source des
applicateurs commerciaux et sur mesure.
Cette thèse portait sur l'acquisition de cartes de dose 2D précises avec FRC, ce qui est es-
sentiel pour la détection de la trace dosimétrique source à HDR lors de l'utilisation de l'algo-
rithme de suivi des sources. Cela comprenait le calibrage du FRC pour la dosimétrie de CRT à
HDR et son utilisation dans la vérification de la dose. La thèse a également démontré l'intégra-
tion potentielle de ces résultats dans un cadre détaillé d'AQ de CRT à HDR assistée par imagerie
médicale. À l'avenir, le cadre vise à englober tous les logiciels et les stratégies développés
jusqu'à présent et à adapter de nouveaux algorithmes en tirant parti de modèles d'irradiation sim-
ples, mais qui révèlent avec précision de nombreuses mesures d'AQ.

8
ACKNOWLEDGMENTS
In the beginning I would like to thank Almighty Allah for his blessings, guidance, mercy and support
through all hardships. I was very lucky during my PhD to get the opportunity to work and learn from
three different academic departments (Biomedical Engineering Department of McGill University,
Medical Physics Unit (MPU) of McGill University, and Medical Physics & Biophysics Division of
Brigham & Women’s Hospital/Harvard Medical School).
I would like to thank King Faisal Specialist Hospital & Research Center for supporting me
through my studies, and specifically Dr Belal Moftah, Mr Abdulaziz AlBahkaly, all the academic and
training administration and the research center administration for their continuous support through
my scholarship, especially in unforeseen situations. I would like to thank the Saudi Arabian Cultural
Bureau in Canada, especially Dr Fawzy Bukhary, Ms Amira Atris, Dr Ali Elghirani for their care and
support throughout my PhD. Without their diligence I would not have accomplished the goals of my
PhD.
I would like to extend my sincere thanks to my supervisor Dr. Slobodan Devic for his contin-
uous support, guidance and encouragement during my PhD. I have known Dr Devic since I started
my M.Sc. at McGill, that is 12 years ago, and we have been doing research together since then. I al-
ways have felt that our research brought us closer and we indeed feel more like a family; as you
would expect in any student-supervisor relationship. That is not the same in our case because it is my
sheer belief that there is more to it. Dr Devic is a friend, a family, a mentor, a coach, and a big
brother. I cannot recall how many times he and his beautiful family (Nada, Milosh, Ana, parents in
law) welcomed me to their own home and helped me adapt. Indeed, they are my family in North
America. Dr Devic convinced me to seek my PhD and helped me countless times in unforeseen situa-
tions. He literally paved the way for my success and facilitated my admission to McGill and transfer
to Boston. He always spoke up for me, supported me, listened to all my ideas (!), guided me and
helped me see what is important no matter where I was. I owe everything to him and will never be
able to return the countless favors and hours he spent with me during all these years.

9
I would like to thank my committee members: Prof Louis Collins, Prof Jan Seuntjens, Prof
Robert Funnell, Dr Ivan Buzurovic, Dr Slobodan Devic; for their guidance, support, enthusiasm and
inspiration. I am very thankful to Prof Louis Collins for accepting me as his PhD student, warmly
welcoming me at the Biomedical Engineering Department and providing very helpful guidance dur-
ing my PhD meetings and progress reports. I am also very thankful to Prof Jan Seuntjens for always
believing in me and providing much-needed support at moments of need. He transformed the MPU
into something we are all proud of and inspired us in the process. I would like to thank Prof Funnell
for chairing my committee and professionally guiding me during the comprehensive examination
process and afterwards. I cannot thank enough Ms Pina Sorini for all the guidance she provided and
timely support during regular and unforeseen times. She always went up and beyond in the organiza-
tion of my PhD while always keeping a smile! I am also thankful to Mr Daniel Caron and Ms Sabrina
Teoli for their professional and kind support during my admission and PhD meetings. I cannot thank
enough Ms Margery Knewstubb and Ms Tatjana Nisic of the Medical Physics Unit whom I have
known since 2008. They have always supported me personally and shared smiles whenever I passed
by. I would like to thank Dr Pavlos Papaconstadopoulos, Dr Hamed Bekerat, James Schneider for all
the enlightening discussions (and fun) we had together and ideas that technically improved me a lot. I
would like to also thank all my Montreal friends and colleagues who really helped me in different
ways: Mosaab and Maryam, Nada, Liang, Krum, Phil, Francois, Alban, Nicole, Vincent, Stella, Jes-
sica, Yana, Logan, Joel, Marc, Georges, Andre, Gabriel, Haley, Ali, Judy, Veronique, Peter T.
I would like to thank Dr Ivan Buzurovic for welcoming me at the Brigham and Women’s
Hospital (BWH) in Boston and supporting me professionally and personally through very fruitful two
years. His help, inspiration and guidance was essential for me. Together, we established the radio-
chromic film dosimetry lab at BWH and we also started an in-vivo dosimetry program for HDR
brachytherapy and applicator quality assurance procedure. Dr Buzurovic understood my personality
and pushed me to achieve more at so many levels. I am so thankful and indebted to him for the many
hours he spent discussing ideas and improving my academic skills. Without his help and guidance, I
would not be where I am today. I would like to thank Prof Mike Makrigiorgos for welcoming me at
the Medical Physics & Biophysics Division of BWH and for providing continuous support and en-
thusiasm about my research. I would like to thank Dr Phillip M. Devlin for supporting my research
on in-vivo dosimetry in surface brachytherapy. He is a true inspiration in leadership and I learned
many things by watching him and his approach. I would like to thank other members of the brachy-
therapy group: Desmond, Tom, Scott, Robert, Emily, Mandar, Yasser, Marjan, Marianne, Kristin,

10
Tania, Kep, Alicia, Jennifer, Peter, Kyle. These people have truly showed me how brachytherapy can
be run at the highest levels while always keeping a smile. I learned a lot from all of them and I will
always cherish their friendships. I would like to thank Dr Matt Jacobson for all the gardening and
programing experience he shared with me. I would like to thank Carolyn Dahlberg (best smile!) and
Bonnie Baines for all the administrative help they provided me at Boston and the positive vibes they
always emit! I would like to especially thank Yasser Khouj for making my Boston experience feels
like home. I cannot express the countless laughs we shared and the fun times we spent together. I
learned a lot from him and can never repay his kindness. I would like to also thank all my Boston
friends and colleagues who taught me a lot and helped me in different ways: Jihun, Ingrid, Davide,
Christian, Romy, Dianne, Needa, Michelle, Mengying, Yiwen, Steffen, Tim, Lubna, Salameh, Sarah,
Mohsin, Johann, Nick, Caitlyn, Cindy, Yaguan, Tony, Anand, Rebecca, Noelle, Iquan, Eddie, Will,
Ross, Yulia, Elizabeth, Hyrei, Chris, Jeremy, Zhaohui, Maria, David, Piotr, Jackie, Amber, Kellie,
Marissa, Alex, Lina.
My journey included a lot of travel and no one has sacrificed more than my family during
those times. I am indebted to my wife (Laila) for all the sacrifices she’s gone through so that I get my
PhD (and still!). I am so proud of her and I sincerely believe she’s the smartest person I know. She’s
the perfect role model for our beautiful daughters. To Leen and Reema: I have not been there for you
for most of the time but your love is what made everything possible and will bring us together soon. I
hope this thesis inspire you when it is time for you to set sail on your own journeys. To my mother
(Rajaa) and father (Ibrahim): I am where I am today because of your love, tireless prayers and inspi-
ration. Growing up watching you sculpted my character and deeply paved my way with the world. I
see you in every decision I make and I cannot thank you enough. To Raneem and Emad: your love
and support kept me moving, more than you imagine.
I hope that those, whom I forgot to mention, forgive my ignorance and accept my gratitude
and apologies.

11
TABLE OF CONTNETS
ABSTRACT ................................................................................................................................... 4
RÉSUMÉ ....................................................................................................................................... 6
ACKNOWLEDGMENTS ............................................................................................................ 8
TABLE OF CONTNETS ........................................................................................................... 11
LIST OF FIGURES .................................................................................................................... 16
LIST OF TABLES ...................................................................................................................... 25
CHAPTER 1: Introduction ........................................................................................................ 26
1.1 Motivation ........................................................................................................................... 26
1.2 Overview of thesis ............................................................................................................... 27
1.3 Author contributions ........................................................................................................... 27
1.4 Scientific contributions ....................................................................................................... 29
CHAPTER 2: Background and literature review .................................................................... 31
2.1 Introduction to brachytherapy ............................................................................................. 31
2.1.1 Types of brachytherapy ................................................................................................ 31
2.1.2 Advantages of brachytherapy ....................................................................................... 32
2.1.3 Clinical outcomes of brachytherapy ............................................................................. 35
2.2 Image-guided brachytherapy ............................................................................................... 37
2.2.1 Transition from 2D to 3D image-guidance................................................................... 37
2.2.2 Process of image-guided brachytherapy ....................................................................... 41
2.3 Quality assurance in brachytherapy .................................................................................... 43
2.3.1 Importance of quality assurance ................................................................................... 43
12
2.3.2 Current practice in HDR brachytherapy quality assurance .......................................... 44
2.3.3 Temporal and positional accuracy ................................................................................ 45
2.3.4 HDR source description and absolute dose determination ........................................... 46
2.3.5 Dose distribution of HDR brachytherapy sources ........................................................ 47
2.4 Technological advancement in HDR brachytherapy QA .................................................... 49
2.4.1 Dosimetric tools ............................................................................................................ 49
2.4.2 Dose calculation and optimization ............................................................................... 50
2.4.3 Applicator fabrication and customization ..................................................................... 52
2.4.4 Intensity modulation ..................................................................................................... 52
2.5 Background on radiochromic film dosimetry ..................................................................... 54
2.5.1 General characteristics .................................................................................................. 54
2.5.2 Definition of radiochromic film dosimetry system ...................................................... 54
2.5.3 Use of radiochromic film for dosimetry ....................................................................... 56
2.6 Use of radiochromic film dosimetry for HDR brachytherapy QA ...................................... 57
CHAPTER 3: Comparison of dose response functions for EBT3 model GafChromic™ film
dosimetry system ......................................................................................................................... 58
Preface ....................................................................................................................................... 58
Abstract ..................................................................................................................................... 59
3.1 Introduction ......................................................................................................................... 60
3.2 Materials and Methods ........................................................................................................ 62
3.3 Results and Discussion ........................................................................................................ 68
3.4 Conclusions ......................................................................................................................... 72
3.5 Acknowledgement ............................................................................................................... 73
3.6 References ........................................................................................................................... 73
CHAPTER 4: Dose response linearization in radiochromic film dosimetry based on
multichannel normalized pixel value with an integrated spectral correction for scanner
response variations...................................................................................................................... 76
Preface ....................................................................................................................................... 76
Abstract ..................................................................................................................................... 77
4.1 Introduction ......................................................................................................................... 79

13
4.2 Materials and Methods ........................................................................................................ 80
4.2.A Radiochromic film dosimetry system .......................................................................... 80
4.2.B Film calibration and irradiation setups ........................................................................ 80
4.2.C Film scanning and image analysis ............................................................................... 81
4.2.D Multichannel normalized pixel value .......................................................................... 82
4.3 Results ................................................................................................................................. 88
4.3.A Multichannel normalized pixel value .......................................................................... 88
4.3.B Testing the multichannel normalized pixel value and correction protocol .................. 90
4.4 Discussion ........................................................................................................................... 96
4.4.A Advantages and limitations of linearization ................................................................ 96
4.4.B The fingerprint correction protocol .............................................................................. 98
4.4.C Short term scanner response variability ....................................................................... 99
4.4.D Scanner bed inhomogeneity and recommended film positioning .............................. 100
4.4.E Long term verification and stability ........................................................................... 100
4.5 Conclusion ......................................................................................................................... 101
4.6 Acknowledgment .............................................................................................................. 102
4.7 References ......................................................................................................................... 102
CHAPTER 5: Dose comparison between TG-43 based calculations and radiochromic film
measurements of the Freiburg flap applicator used for high-dose-rate brachytherapy
treatments of skin lesions ......................................................................................................... 106
Preface ..................................................................................................................................... 106
Abstract ................................................................................................................................... 107
5.1 Introduction ....................................................................................................................... 108
5.2 Methods and materials ...................................................................................................... 109
5.2.1 Radiochromic film dosimetry system ......................................................................... 109
5.2.2 Experimental setup ..................................................................................................... 111
5.2.3 Image processing ........................................................................................................ 112
5.3 Results ............................................................................................................................... 113
5.4 Discussion ......................................................................................................................... 116
5.5 Conclusions ....................................................................................................................... 119
5.6 Acknowledgement ............................................................................................................. 119
14
5.7 References ......................................................................................................................... 119
CHAPTER 6: Positional and angular tracking of HDR 192Ir source for brachytherapy
quality assurance using radiochromic film dosimetry .......................................................... 124
Preface ..................................................................................................................................... 124
Abstract ................................................................................................................................... 125
6.1 Introduction ....................................................................................................................... 126
6.2 Materials and methods ...................................................................................................... 128
6.2.A HDR source positional uncertainty ............................................................................ 128
6.2.B Source tracking model ............................................................................................... 133
6.2.C Source distribution digitization uncertainties ............................................................ 135
6.2.D Source tracking with radiochromic film dosimetry ................................................... 136
6.3 Results ............................................................................................................................... 136
6.3.A HDR source positional uncertainty ............................................................................ 136
6.3.B Source tracking model ............................................................................................... 140
6.3.C Source dose distribution digitization uncertainties .................................................... 144
6.3.D Source tracking with radiochromic film dosimetry ................................................... 148
6.4 Discussion ......................................................................................................................... 149
6.4.A Impact of source positional uncertainty ..................................................................... 149
6.4.B Performance of the source tracking models ............................................................... 151
6.4.C Source dose distribution digitization uncertainties .................................................... 152
6.4.D Source tracking with radiochromic film dosimetry versus other systems ................. 153
6.4.E Practical aspects, limitations and summary of the tracking algorithm ....................... 154
6.5 Conclusion ......................................................................................................................... 155
6.6 Acknowledgment .............................................................................................................. 156
6.7 References ......................................................................................................................... 156
CHAPTER 7: Conclusion and future work ........................................................................... 162
7.1 Discussion ......................................................................................................................... 162
7.2 Future work ....................................................................................................................... 166
7.2.1 Film dosimetry protocol development, validation and optimization: ......................... 166
7.2.2 Equipment QA ............................................................................................................ 167
15
7.2.3 Source QA .................................................................................................................. 170
7.2.4 Treatment planning system QA .................................................................................. 170
7.2.5 Treatment QA ............................................................................................................. 170
7.2.6 Software development and design improvement ........................................................ 172
7.3 Conclusion ......................................................................................................................... 173
OTHER PUBLICATIONS ....................................................................................................... 174
REFERENCES .......................................................................................................................... 177

16
LIST OF FIGURES
Figure 2.1: Classification of brachytherapy in accordance to source placement methodology. For
each methodology, the main treatment sites and examples of applicators are
provided. .................................................................................................................... 32
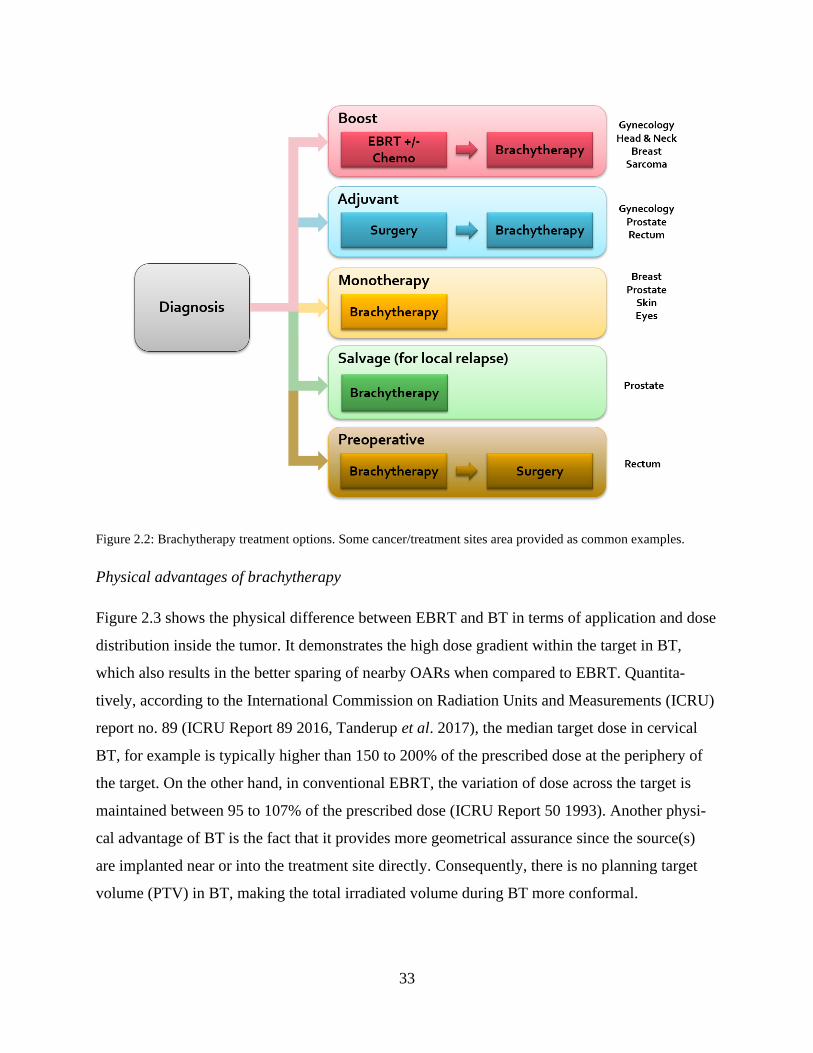
Figure 2.2: Brachytherapy treatment options. Some cancer/treatment sites area provided as
common examples. .................................................................................................... 33
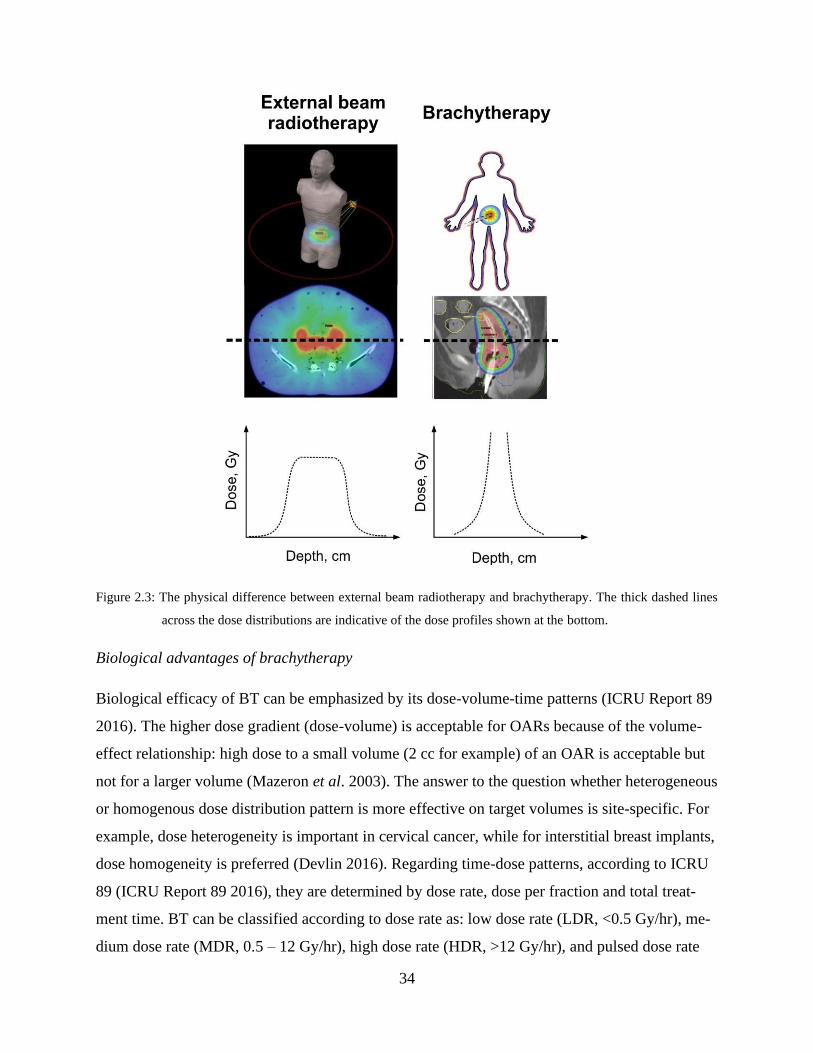
Figure 2.3: The physical difference between external beam radiotherapy and brachytherapy. The
thick dashed lines across the dose distributions are indicative of the dose profiles
shown at the bottom. ................................................................................................. 34
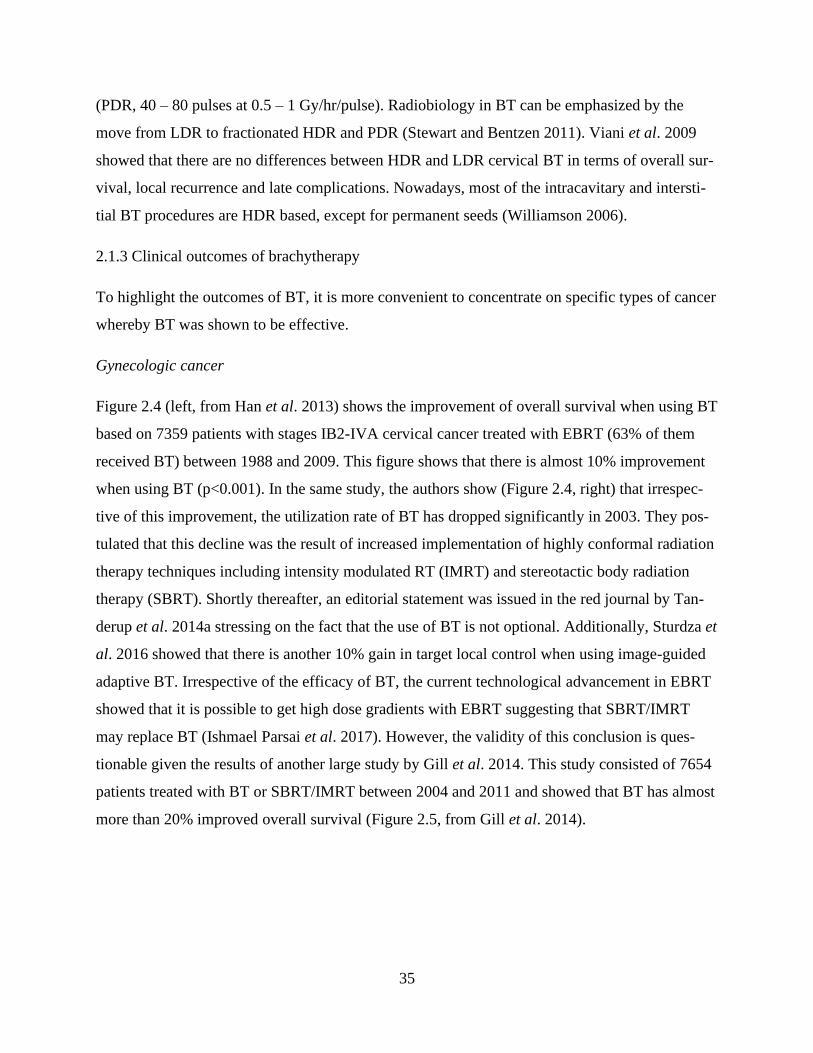
Figure 2.4: Left: the overall survival in cervical cancer with and without brachytherapy. Right:
brachytherapy utilization rate between 1988 and 2009. Figures (with permission) are
from Han et al. 2013. ................................................................................................. 36
Figure 2.5: The overall survival in cervical cancer with either brachytherapy or SBRT/IMRT
boost. SBRT: stereotactic Body Radiation Therapy, IMRT: intensity modulated
radiation therapy. Figure (with permission) from Gill et al. 2014. ........................... 36
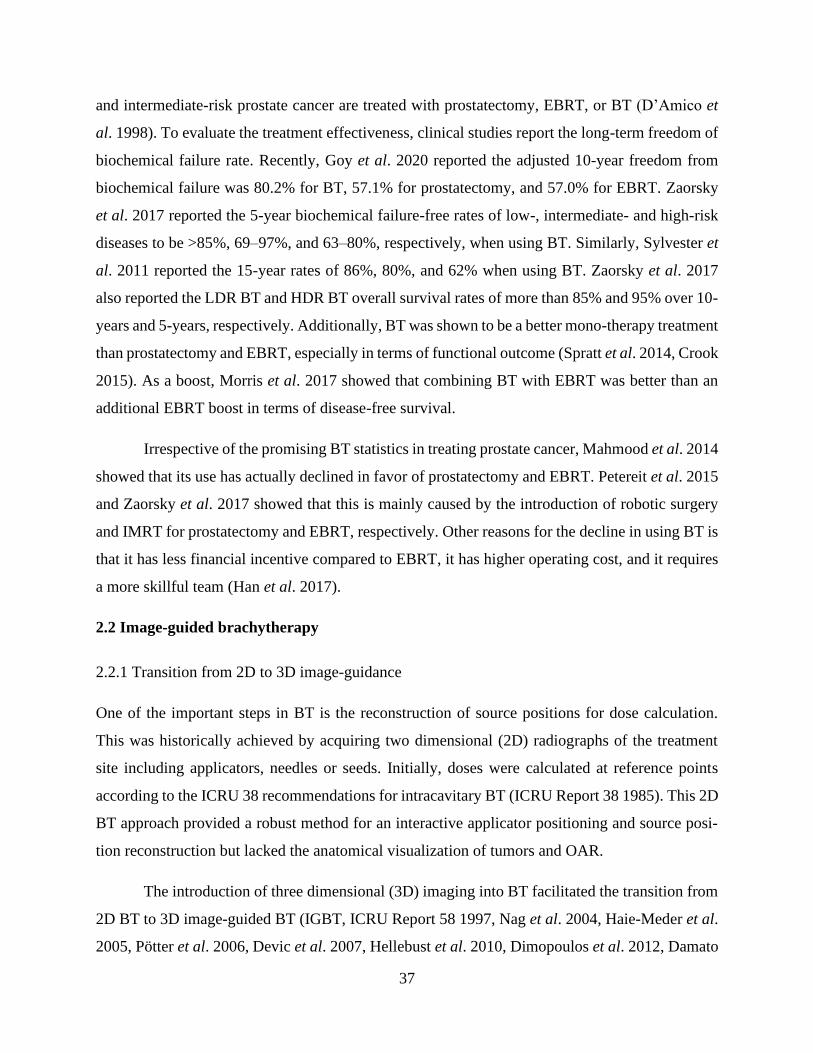
Figure 2.6: Transition from 2D to 3D image-guided brachytherapy. All figures show the superior
tissue contrast offered by MRI. Figures A, B show the dose distribution if standard
“point A” planning was performed following 2D approach. Figures C, D show that
for this specific patient it was necessary to sculpt the dose distribution by taking
extra measures i.e. use of interstitial needles. Figures (with permission) are taken
from Damato and Viswanathan 2015. ....................................................................... 38
Figure 2.7: Images of the prostate at different locations using different imaging modalities. The
figure highlights the advantage of MRI in providing superior soft tissue contrast over
ultrasound and CT. Figure (with permission) is taken from Tanderup et al. 2014b. 39
17
Figure 2.8: Adoption of image guidance modalities in HDR brachytherapy in the United States
(left) and Canada (right). Figures (with permission) were taken from Grover et al.
2016 and Taggar et al. 2017. N: number of plans. .................................................... 40
Figure 2.9: Ultrasound-based target delineation in HDR planning for GYN cases correlates well
with MRI-based delineation while CT tends to overestimate the target size. Figure
(with permission) was taken from Schmid et al. 2016. ............................................. 40
Figure 2.10: A typical treatment process in a contemporary HDR brachytherapy procedure. Steps
involving imaging procedures are highlighted in grey and solid lines. Steps involving
the use of 3D image datasets are highlighted in grey and dashed lines. EBRT:
External Beam Radiotherapy; HDR: High Dose Rate; BT: Brachytherapy; *: BT
given after surgery/EBRT as a boost; **: BT given as preoperative treatment. ...... 41
Figure 2.11: Visual illustration of the main steps involved in brachytherapy planning process. . 42
Figure 2.12: Visual illustration of the main steps involved in brachytherapy planning and
treatment verification process. Three doses are to be reported as per the ICRU 89:
planning aim during planning, prescribed dose as approved by the physician after
planning and the actual delivered dose during treatment (requiring in-vivo
dosimetry). ................................................................................................................. 43
Figure 2.13: Average passing points of 15 endorectal brachytherapy plans based on different
passing-rate criteria. Figure (with permission) was taken from Asgharizadeh et al.
2015. .......................................................................................................................... 46
Figure 2.14: Left: the Nucletron microSelectron afterloader unit (Elekta, Sweden). Right:
microSelectron b2 source specification (Elekta, Sweden). Source specification is
adapted from ref Perez-Calatayud J 2012. ................................................................ 47
Figure 2.15: Left: well-type ionization chamber used for calibration of BT sources. Right:
summary of calibration traceability from source manufacturer to the end user at the
clinic. Typical uncertainty in dose determination is provided as well. This figure
(with permission) is taken from ref DeWerd et al. 2011. .......................................... 47
Figure 2.16: Geometry assumptions in the AAPM TG-43 dose calculation formalism. Angle β is
that subtended by the active length L at point P. The reference point is represented
by 𝑃(𝑟0, 𝜃0). Figure (permission not required) is taken from Rivard et al. 2004. .... 48
18
Figure 2.17: Dosimetric tools used for quality assurance at different HDR brachytherapy process.
This figure is taken from Palmer et al. 2012. ............................................................ 49
Figure 2.18: Mass energy absorption coefficients for the indicated materials relative to those for
water for different energies, calculated with the EGSnrc Monte Carlo simulation
code. Figure (with permission) is taken from Beaulieu et al. 2012. ......................... 50
Figure 2.19: Typical 3D printing workflow for HDR brachytherapy. Figure (with permission) is
taken from Cunha et al. 2020. ................................................................................... 51
Figure 2.20: Summary of technological advancements in Intensity Modulated Brachytherapy
(IMBT) delivery. DirMBT: direction-modulated brachytherapy; DMBT: dynamic
modulated brachytherapy; RSBT: rotating-shield brachytherapy; D-RSBT: dynamic
RSBT; H-RSBT: multihelix RSBT; P-RSBT: paddle-based RSBT; eBT: electronic
brachytherapy; ICMA: intracavitary mold applicator; LDR: low-dose-rate; SAVI:
Strut-Adjusted Volume Implant. Figure (with permission) and abbreviations are
taken from Callaghan et al. 2019. ............................................................................. 53
Figure 2.21: Various radiochromic film dosimetry applications. Figure (with permission) was
taken from Devic 2011. ............................................................................................. 55
Figure 2.22: Structure and dimensions of different radiochromic film dosimetry models. Figure
(with permission) is taken from Devic et al. 2016a. ................................................. 56
Figure 2.23: Summary of radiochromic film dosimetry protocol showing the calibration and
measurement phases. Δt refers to the post exposure waiting time. ........................... 57
Figure 3.1: Sampling response of irradiated and un-irradiated film piece using both transmission
and reflection mode scanned TIFF images from a flat-bed document scanner. (ROI
sizes are for illustrative purposes and are not to scale) ............................................. 63
Figure 3.2: Measured “raw” data using flat-bed document scanners in transmission (left) and
reflection (right) scanning mode. .............................................................................. 65
Figure 3.3: Dose response curves for various response functions obtained from transmission
(top-left) and reflection (top-right) images; sensitivity curves for various dose
response functions from transmission (bottom-left) and reflection (bottom-right)
images. ....................................................................................................................... 68
Figure 3.4: Uncertainty vs error analysis for various dose response functions from transmission
images in a dose range up to 11 Gy; left column corresponds to double scan
19
functions that for their definition require scan of the film pieces prior to exposure.
Right column corresponds to single scan functions. ................................................. 71
Figure 3.5: Uncertainty vs error analysis for various dose response functions from reflection
images in a dose range up to 5 Gy; left column corresponds to double scan functions
that for their definition require scan of the film pieces prior to exposure. Right
column corresponds to single scan functions. ........................................................... 72
Figure 4.1: Introducing the concept of “fingerprint” correction. At the time of calibration,
𝑛𝑃𝑉𝑅𝐺𝐵 and the calibration “fingerprint” (𝑐𝑋=𝑅,𝐺,𝐵𝑐𝑎𝑙 ) are acquired. At the time of
measurement, 𝑛𝑃𝑉𝑅𝐺𝐵 and 𝑐𝑋=𝑅,𝐺,𝐵𝑚𝑒𝑎𝑠 are acquired for each pixel in the image,
compared to 𝑐𝑋=𝑅,𝐺,𝐵𝑐𝑎𝑙 (as described in the text), and a correction (𝑐𝑋=𝑅,𝐺,𝐵) is
generated and re-applied to 𝑛𝑃𝑉𝑅𝐺𝐵. ......................................................................... 86
Figure 4.2: Concept of dose-response linearization based on multichannel normalized pixel value
response (𝑛𝑃𝑉𝑅𝐺𝐵). (a) 𝑛𝑃𝑉𝑅𝐺𝐵 response and its constituent terms 𝑟 ∙ 𝑛𝑃𝑉𝑅, 𝑔 ∙ 𝑛𝑃𝑉𝐺
and 𝑏 ∙ 𝑛𝑃𝑉𝐵 representing individual responses in red, green and blue color channels.
(b) sensitivity curves of 𝑛𝑃𝑉𝑅𝐺𝐵 and its constituents. ............................................... 88
Figure 4.3: The impact of dose range on dose uncertainty and error analysis of one of the EBT3
GAFCHROMIC™ film dosimetry systems used in this work (lot#1, 10000 XL). (a)
Uncertainty/error analysis for the dose range 0 – 40 Gy, (b) 0 – 10 Gy focused view
of the same figure in (a), (c) Uncertainty/error analysis for the dose range 0 – 10 Gy
when the system was re-fit to maximum dose of 10 Gy (instead of 40 Gy), and (d)
the impact of dose range (maximum calibration dose, indicated by the arrows) on
linearity of the dose-response. ................................................................................... 89
Figure 4.4: Applying the concept of 𝑛𝑃𝑉𝑅𝐺𝐵 to six different EBT3 GAFCHROMIC™ film
dosimetry systems used in this work. (a) Linearization of the dose-response and
comparison to the unity curve, and (b) Achievable accuracy represented as the
percentage relative dose error at different dose levels. ............................................. 90
Figure 4.5: Visualization of the “fingerprint” at the time of calibration (𝑐𝑋=𝑅,𝐺,𝐵𝑐𝑎𝑙 ) for the six
EBT3 GAFCHROMIC™ film dosimetry systems used in this work. ...................... 91
Figure 4.6: EPSON 12000XL scanner response variability in terms of pixel values relative to the
1st scan. (a) for neutral density filters, and (b) for EBT3 GAFCHROMIC™ film. .. 92
20
Figure 4.7: EPSON 12000XL scanner response variability in terms of dose relative to the 1st
scan. (a) using 𝑛𝑃𝑉𝑅𝐺𝐵 with and without correction, and (b) using 𝑛𝑒𝑡𝑂𝐷𝑋=𝑅,𝐺,𝐵.
Global control refer to the use of control film from scan#1 image in all subsequent
measurement film images while specific control means using the control film from
the same scanned image as the measurement film. (s.ctrl: specific control, g.ctrl:
global control). .......................................................................................................... 93
Figure 4.8: EPSON 12000XL scanner bed inhomogeneity with respect to the scanner center.
First and second rows show the RGB relative responses in pixel values (PV) for a
control and an exposed film piece (8 Gy). Third and fourth rows show the RGB dose
conversion based on 𝑛𝑒𝑡𝑂𝐷𝑋=𝑅,𝐺,𝐵, when using a global or specific controls. Fifth
row shows the use of 𝑛𝑃𝑉𝑅𝐺𝐵 with global control, specific control (no correction)
and specific control (with correction). ...................................................................... 94
Figure 4.9: Box plot demonstration of the accuracy and precision of RCF dosimetry at different
time points and using different response signals. (a) at the time of calibration, using
0 – 10 Gy fit, (b) at the time of calibration, using 0 – 40 Gy fit, (c) three months after
calibration, using 0 – 40 Gy fit, and (d) six months after calibration, using 0 – 40 Gy
fit. .............................................................................................................................. 95
Figure 4.10: Changes in the values of r, g, b fitting parameters (equation 4) among the six
GAFCHROMIC™ film dosimetry systems used in this work. The figure shows that
each system has its own unique pattern of these parameters and that the values of
parameters depend on the maximum calibration dose. ............................................. 97
Figure 5.1: Experimental setup (with 3 cm bolus on top of the Freiburg Flap). Solid Water™
slabs are 30 cm × 30 cm in size. Dimensions are not to scale. ................................ 112
Figure 5.2: Reference radiochromic film dosimetry system used: calibration curve (5.2A); two-
component (experimental and fit) relative uncertainty (5.2B); and error vs.
uncertainty assessment (5.2C). ................................................................................ 115
Figure 5.3: The impact of bolus thickness on absolute dose ratio between measurements (using
radiochromic film based reference dosimetry system) and treatment planning system
(Oncentra - MasterPlan™) at the downward vertical plane to the central sphere of
the Freiburg flap for two experimental setups: dose distributions for 5 cm × 5 cm
loading (5.3A), and 11 cm × 11 cm loading (5.3B); dose ratio histograms with
21
numbers above representing dose values calculated by TPS at corresponding depths
for 5 cm × 5 cm loading (5.3C), and 11 cm × 11 cm loading (5.3D). Error bars
include the uncertainty in dose calculation and measurement per dose level. ........ 116
Figure 6.1: Geometric coordinate systems and setups. Dimensions are not to scale. a) coordinate
systems used for this work: source coordinate system is used mainly for TG-43
calculations, and phantom coordinate system is used to describe the location of the
film and the tracked source position for experimental setups. The default orientation
is when the origins of both systems are aligned (source at nominal first dwell
position) , b) sectional dimensions of different HDR brachytherapy catheters that are
typically used in the clinic seen at the default orientation. Different Solid Water®
(SW) slabs were grooved for 6F and 4F catheters in order to mitigate catheter
movement, c) the SW phantom (30 × 50 × 30 cm3) designed to satisfy TG-43 full
scattering conditions for all dosimetry points of the EBT3 GAFCHROMIC™ film.
................................................................................................................................. 130
Figure 6.2: The AAPM TG-43 protocol implementation in MATLAB. Left panels show the
distance to source (𝑟𝑖,𝑗), middle panels show the angular distribution (𝜃𝑖,𝑗), and right
panels show the relative dose rate distributions (𝐷𝑖,𝑗). Four different geometries are
shown to highlight the impact on the individual 2D maps. Pixel size for all maps is 1
by 1 mm2. The unit of the abscissas and ordinates of all images are “mm” and the
units of the pixels are “mm”, “deg”, or “%” for the left, middle or right panels,
respectively. ............................................................................................................. 138
Figure 6.3: The HDR Ir192 source positional uncertainty of a single dwell position. (a) limits of
the dosimetric error based on the AAPM TG-43 protocol calculations for different
catheter geometries, (b) experimental confirmation of source positional uncertainty
of a single dwell position repeated nine times, (c) demonstration of the surface dose
gradient difference between the 4F and 6F catheters. ............................................. 139
Figure 6.4: Impact of HDR 192Ir source positional uncertainty on a clinical surface brachytherapy
case. At two different distances to source (5 mm and 8 mm, exposed
simultaneously): the left panel shows the average dose map of five repeated EBT3-
film based dose measurements, middle panel shows the per-pixel standard deviation
of these repeats normalized to the maximum dose within the image, left panel shows
22
the 80% isodose lines of a selected dwell position (red squares, right panel) from the
five film images. ...................................................................................................... 140
Figure 6.5: Relative dose profiles at different distances away from the HDR source based on the
AAPM TG-43 protocol data of the mHDR-V2 source: (a), (b) and (c) show data
fitting with different models: Gauss, Lorentz and Pearson VII, respectively. (d)
Linear fit of the distance to source as a function of the full width at half maximum
(FWHM). ................................................................................................................. 141
Figure 6.6: Dimensions and shapes of the HDR source isodose lines at different distances away
from the HDR source based on the AAPM TG-43 protocol data for the mHDR-V2
source. ...................................................................................................................... 142
Figure 6.7: Variation of 2D features of the HDR source isodose lines: area, perimeter and
circularity, with respect to the distance to the source for 𝜃𝑦= 0 deg (left panel) and
𝜃𝑦= 15 deg (right panel). ......................................................................................... 143
Figure 6.8: Finding the HDR source center (x, y) at different distances to source based on
different dose distribution features: weighted centroids (H for high isodose lines, L
for low isodose lines), mean dose, median dose, and max dose. ............................ 144
Figure 6.9: Effect of noise on the accuracy of the source center determination at three different
noise levels: 2% (left panel), 3% (middle panel), and 5% (right panel). Top figures
are dose maps at z=10 mm and they are provided to visualize the noise only. ....... 145
Figure 6.10: Model performance in finding the source orientation 𝜃𝑧 from different isodose line
levels, at different distances to the source. Beyond 5 mm, it is not possible to
determine the orientation of the source irrespective of the IDL level. .................... 146
Figure 6.11:Effect of choosing different size regions of interest (ROI) on the standard deviation
of dose within the ROI. Data are shown for different distances to the HDR source
and digitizing resolutions. The data are generated from the AAPM TG-43 protocol
based MATLAB model. .......................................................................................... 146
Figure 6.12: Effect of Wiener filter size on the dose reading in noise-free data (left panel), and on
noise reduction in data with added noise (right panel). Data are shown for different
distances to source and digitizing resolutions. The noise-free data are generated from
the AAPM TG-43 protocol based MATLAB code. ................................................ 147

23
Figure 6.13: Noise reduction performance of a 5 by 5 pixel2 Wiener filter applied to noisy dose
rate profiles (red lines). Symbols show the noise added to the noise-free profiles
(black lines). Data are shown for different distances to source. The digitizing
resolution is 0.1 mm/pixel. ...................................................................................... 148
Figure 6.14: Using the source tracking model with a dose map measured by the EBT3
GAFCHROMICTM film model. The measured dose map (a) is converted to a curve
(b) and compared to the AAPM TG-43 protocol reference library of the isodose lines
area in this example. ................................................................................................ 149
Figure 7.1: The future framework for HDR brachytherapy QA with radiochromic film dosimetry.
The framework consists of six specific areas to be optimized (sub-circles). HDR:
high-dose-rate, QA: quality assurance. ................................................................... 167
Figure 7.2: Phantom design for afterloader quality assurance made of Solid Water™ (SW): (a)
choice of 4F or 6F catheters, (b) illustration of phantom design with EBT3
radiochromic film location. The dashed slab above the film is also made of SW but
was made transparent for visibility. (c) Photograph of the assembled phantom. The
large clamps are used to minimize the effect of air gaps. (d) Photograph of the full
setup with the phantom connected to the afterloader through five transfer tubes. .. 168
Figure 7.3: Decomposition of dose profile fit across five dwell positions using a Pearson VII
model: (a) film images at 11 mm and at the surface. (b) decomposition analysis of a
1D profile across the film at 11 mm with fixed dwell times (30 sec each). (c)
decomposition analysis of a 1D profile across TG43 data at 11 mm with fixed dwell
times. (d) decomposition analysis of a 1D profile across the film at 11 mm with fixed
dwell times. This test can reveal dwell positions, dwell times and timer linearity. 168
Figure 7.4: Demonstration of applicator QA with radiochromic film dosimetry and source
tracking. (A) applicators attached to the film with inkdots/BBs on the corners, (B)
post exposure image highlighting inkdots, (C) x-ray image highlighting registration
BBs, (D) image overlay and application of source/marker auto tracking, (D) visual
QA examples of different applicator sets, and (F) histogram of all displacements
(total of 64 applicators, 0.10 ± 0.39 mm) ................................................................ 169
24
Figure 7.5: HDR surface brachytherapy in-vivo dosimetry with EBT3 model RCF. (a) photo-
graphs of different film pieces placed on different cases. (b) highlighting inter-frac-
tional variability and ability to improve the applicator positioning. (c) comparison
between heterogeneity-corrected dose calculation, the current standard in dose calcu-
lation and film measurements. (d) how in-vivo measurements can help in adapting
radiation treatments.. ............................................................................................... 171
Figure 7.6: Histogram of dose measurements in the in-vivo study of HDR surface brachytherapy.
The figure shows that a more accurate dose calculation engine might help in improv-
ing the dose delivery accuracy (i.e. tighten the peak and push it to the right while
limiting the maximum dose to the skin). ................................................................. 171
Figure 7.7: The types of tests that can be achieved with a single irradiation session in HDR
brachytherapy QA: (1) First dwell position: a line connecting the physical points on
the phantom that represents where the FDP should be will be compared to the
measured position per catheter. (2) Dwell positions, (3) Dwell times, (4) Timer
linearity (5) Source strength (Sk) verification: via source tracking and dosimetry, (6)
Step size, (7) This can be done for multiple channels: five shown here. ................ 172
Figure 7.8: Comprehensive QA: incorporating treatment planning system quality assurance with
afterloader quality assurance. This involves scanning the phantom, creating a plan
and transferring it from planning unit to the treatment unit. Currently (top), a TG43
phantom is used. In the future (bottom), a simpler phantom will be created whereby
dose will be calculated using a Model-Based Dose Calculation Algorithms
(MBDCAs). ............................................................................................................. 173

25
LIST OF TABLES
Table 5.1: Uncertainty budget example of overall dose calculation and measurement at depth of
1 cm from the phantom surface for an 11 cm × 11 cm loading area. ....................... 114
Table 6.1: Dimensions of the 80% isodose line (IDL) of each blob in right panel of Figure 6.4.
................................................................................................................................... 137
26
CHAPTER 1: Introduction
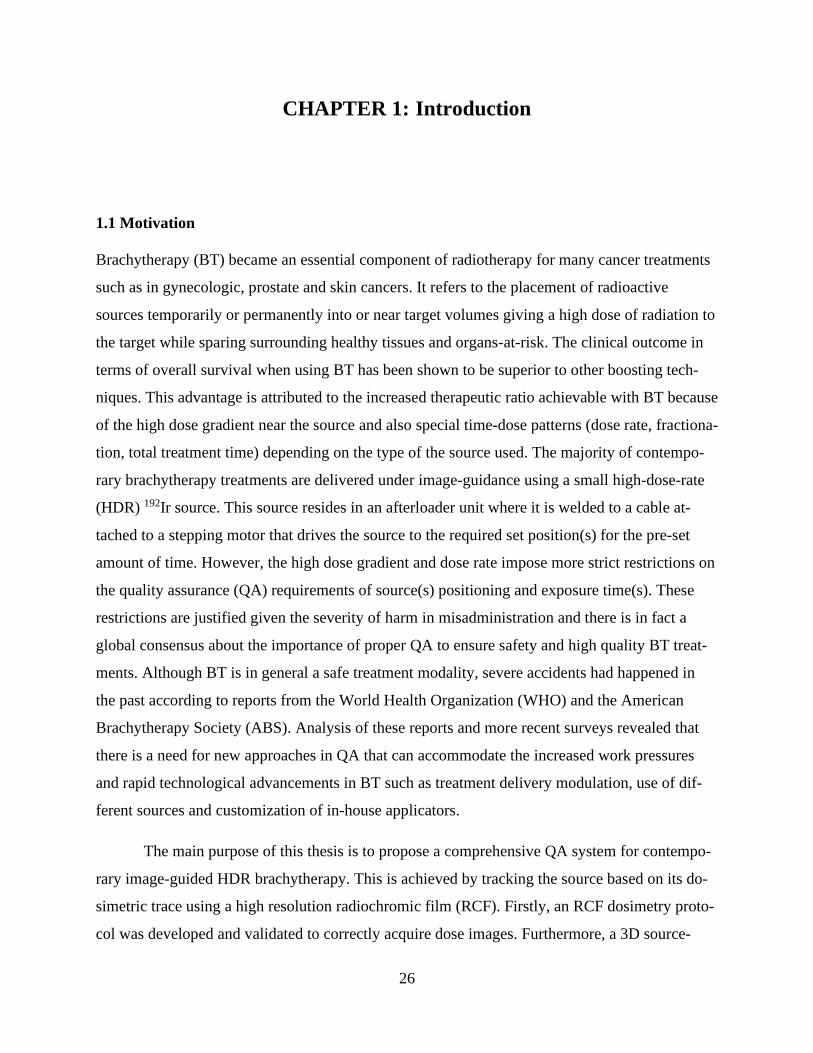
1.1 Motivation
Brachytherapy (BT) became an essential component of radiotherapy for many cancer treatments
such as in gynecologic, prostate and skin cancers. It refers to the placement of radioactive
sources temporarily or permanently into or near target volumes giving a high dose of radiation to
the target while sparing surrounding healthy tissues and organs-at-risk. The clinical outcome in
terms of overall survival when using BT has been shown to be superior to other boosting tech-
niques. This advantage is attributed to the increased therapeutic ratio achievable with BT because
of the high dose gradient near the source and also special time-dose patterns (dose rate, fractiona-
tion, total treatment time) depending on the type of the source used. The majority of contempo-
rary brachytherapy treatments are delivered under image-guidance using a small high-dose-rate
(HDR) 192Ir source. This source resides in an afterloader unit where it is welded to a cable at-
tached to a stepping motor that drives the source to the required set position(s) for the pre-set
amount of time. However, the high dose gradient and dose rate impose more strict restrictions on
the quality assurance (QA) requirements of source(s) positioning and exposure time(s). These
restrictions are justified given the severity of harm in misadministration and there is in fact a
global consensus about the importance of proper QA to ensure safety and high quality BT treat-
ments. Although BT is in general a safe treatment modality, severe accidents had happened in
the past according to reports from the World Health Organization (WHO) and the American
Brachytherapy Society (ABS). Analysis of these reports and more recent surveys revealed that
there is a need for new approaches in QA that can accommodate the increased work pressures
and rapid technological advancements in BT such as treatment delivery modulation, use of dif-
ferent sources and customization of in-house applicators.
The main purpose of this thesis is to propose a comprehensive QA system for contempo-
rary image-guided HDR brachytherapy. This is achieved by tracking the source based on its do-
simetric trace using a high resolution radiochromic film (RCF). Firstly, an RCF dosimetry proto-
col was developed and validated to correctly acquire dose images. Furthermore, a 3D source-
27
tracking algorithm was developed to localize the HDR source within catheters and consequently
used to provide a holistic QA solution at different stages of the BT treatment process.
1.2 Overview of thesis
This thesis consists of seven chapters. Chapter 2 provides a background and literature review on
brachytherapy, quality assurance in brachytherapy, radiochromic film dosimetry and its applica-
tion in brachytherapy QA.
Chapters 3-6 are individual manuscripts that are aimed to fulfill the purpose of this thesis.
Chapter 3 presents our investigation into RCF response functions, scanning modes, need for pre-
scanning, and overall achievable dosimetric uncertainty. Chapter 4 builds on results of Chapter 3
and introduces an RCF dosimetry protocol with an integrated spectral correction for scanner re-
sponse variations and inhomogeneities. The chapter also discusses validation of the protocol and
how it solved key scanning problems that were considered downfalls of the existing RCF proto-
cols. Chapter 5 presents our first paper on using the RCF dosimetry system for brachytherapy
QA. It specifically addresses the problem of assuming full-scattering conditions in all HDR
brachytherapy planning, which is not true for surface brachytherapy. In Chapter 6, a 3D source-
tracking algorithm was developed to precisely localize the HDR source within catheters based on
a 2D dose map that can be acquired with RCF. The paper discusses advantages and challenges
using RCF and its potential use for commercial and customized applicators QA.
Finally, Chapter 7 summarizes the results presented in this thesis and discusses how the
combination of RCF dosimetry and source tracking can provide an end-to-end QA solution to the
challenges associated with rapid technological advancements in HDR brachytherapy.
1.3 Author contributions
I am the first author of all four manuscripts included in this thesis and I have performed all of the
experiments, methodological developments, and the analysis. The contributions of all co-authors
included research supervision, technical discussions, data acquisition, and the review of manu-
scripts. The following summarizes the contributions of each author by manuscript:
28
Chapter 3: Comparison of dose response functions for EBT3 model GafChromicTM film
dosimetry system
• Authors: Saad Aldelaijan, and Slobodan Devic
• Contributions: Study concepts and design: S. A., S. D.; Experimental work and data collec-
tion: S. A.; Method analysis and implementations: S. A., S. D., Guidance and supervision: S.
D.; Manuscript preparation: S. A.; Manuscript revision: S. A., S. D.; Editing and final version
approval: S. A., S. D.
Chapter 4: Dose response linearization in radiochromic film dosimetry based on multi-
channel normalized pixel value with an integrated spectral correction for scanner response
variations
• Authors: Saad Aldelaijan, Slobodan Devic, Pavlos Papaconstadopoulos, Hamed Bekerat,
Robert A. Cormack, Jan Seuntjens, Ivan M. Buzurovic
• Contributions: Study concepts and design: S. A., S. D..; Experimental work and data collec-
tion: S. A., P. P., H. B., R. A. C.; Method analysis and implementations: S. A., S. D., P. P., J.
S., I. M. B.; Guidance and supervision: S. D., I. M. B.; Manuscript preparation: S. A.; Manu-
script revision: all authors.; Editing and final version approval: S. A., S. D., I. M. B.
Chapter 5: Dose comparison between TG-43 based calculations and radiochromic film
measurements of the Freiburg flap applicator used for high-dose-rate brachytherapy treat-
ments of skin lesions
• Authors: Saad Aldelaijan, Hamed Bekerat, Ivan Buzurovic, Phillip Devlin, Francois DeBlois,
Jan Seuntjens, Slobodan Devic
• Contributions: Study concepts and design: S. A., I. B., P. D., S. D.; Experimental work and
data collection: S. A., H. B., F. D.; Method analysis and implementations: S. A., J. S., S. D.,
Guidance and supervision: S. D., J. S.; Manuscript preparation: S. A.; Manuscript revision:
all authors; Editing and final version approval: S. A., S. D.

29
Chapter 6: Positional and angular tracking of HDR sources for brachytherapy quality as-
surance using radiochromic film dosimetry
• Authors: Saad Aldelaijan, Slobodan Devic, Hamed Bekerat, Pavlos Papaconstadopoulos,
James Schneider, Jan P. Seuntjens, Robert A. Cormack, Ivan M. Buzurovic
• Contributions: Study concepts and design: all authors; Model development: S. A.; Experi-
mental work and data collection: S. A., H. B., P. P., J. S., R. A. C.; Method analysis and im-
plementations: S. A., Guidance and supervision: S. D., J. P. S., I. M. B.; Manuscript prepara-
tion: S. A.; Manuscript revision: all authors; Editing and final version approval: S. A., S. D.,
I. M. B.
1.4 Scientific contributions
The original scientific contributions in this work are mainly in the areas of RCF dosimetry and
HDR brachytherapy QA. These contributions are listed below per area in chronological order:
1) Radiochromic film dosimetry:
a. Introduction of a green-channel based normalized pixel value as a linear response func-
tion for the EBT3 GAFCHROMIC™ film model to doses up to 11 Gy.
b. Development of a novel linearized RCF dosimetry protocol with extended dose range
up to 40 Gy taking advantage of all available RGB channels.
c. Development of the “fingerprint” correction; an integrated spectral correction, gener-
ated from the same scanned images, which corrects for scanner temporal and spatial re-
sponse variation between times of calibration and measurement.
2) HDR brachytherapy quality assurance:
a. Design and implementation of RCF dosimetry in phantom studies to experimentally
measure the deviation between delivered and calculated doses based on current surface
brachytherapy planning approaches that do not account for tissue heterogeneities.
b. Development and validation of a novel HDR source tracking algorithm for 3D source
positional and angular information detection based on a 2D isodose map away from the
source, obtainable from RCF.
c. Design and implementation of an automatic applicator and source marker QA proce-
dure using the source tracking algorithm and image registration.
30
d. Design of a phantom and software for end-to-end HDR brachytherapy QA based on
dose decomposition analysis of unique irradiation patterns acquired by RCF dosimetry.
The novel method decomposes source dwell positions and times for multiple channels
simultaneously and it also compares the measured pattern to the calculated one from the
treatment planning system (TPS) integrating source, afterloader and TPS QA.
e. Design and implementation of a clinical protocol to perform 2D in-vivo dose measure-
ments of surface brachytherapy based on RCF dosimetry and clinically evaluate the
need to include tissue heterogeneity corrections into the planning process.
31
CHAPTER 2: Background and literature review
2.1 Introduction to brachytherapy
Brachytherapy (BT) is a method of cancer treatment whereby radioactive sources are placed tem-
porarily or permanently into or near target volumes giving a high dose of radiation to them while
sparing surrounding healthy tissues and organs-at-risk (OARs). BT has existed for more than 100
years commencing shortly after the discovery of radioactivity in 1896 by Henry Becquerel (Bec-
querel 1896). The term “radioactivity” was coined by Marie Skłodowska Curie and she received
the Nobel Prize in 1903 jointly with Pierre Curie and Henry Becquerel for their work on radioac-
tivity. The first BT case was reported in 1901 when Pierre Curie (a French physicist) suggested
the use of radioactivity to Henri-Alexandre Danlos (a French physician) and Danlos successfully
used a Radium source to treat tuberculous skin lesions (MacKee 1921). Thereafter, BT has been
used for different types of cancer including cervical (1903, Aronowitz et al. 2007), prostate
(1909, Aronowitz 2008) and breast (1932, Keynes 1932). However, the use of BT has declined
afterwards in favor of surgery because the sources were manually placed, which raised safety
concerns about staff exposure to hazardous radiation (Williamson 2006, Aronowitz 2015). It was
not until the 1960s and 1970s that BT regained global interest due to the introduction of artificial
radioactive sources and remote afterloading systems, respectively (Williamson 2006, Aronowitz
2015). It is of note that Irene Joliot-Curie and Frédéric Joliot-Curie were jointly awarded the No-
bel Prize in Chemistry in 1935 for their discovery of artificial radioactivity. The introduction of
the single-stepping source has revolutionized the use of high-dose-rate (HDR) BT as we know it
today (Williamson 2006, Aronowitz 2015).
2.1.1 Types of brachytherapy
Depending on the source placement methodology and treatment site, BT can be categorized into
intracavitary, interstitial, intraluminal, surface, intraoperative or intravascular (Podgorsak 2005).
Most of the BT cases are intracavitary (source placement into a body cavity using specialized ap-
plicators), interstitial (surgical catheter or source placement into or near targets) and/or surface
treatments (catheter or applicator placement on top or over the tissue). Figure 2.1 shows the main
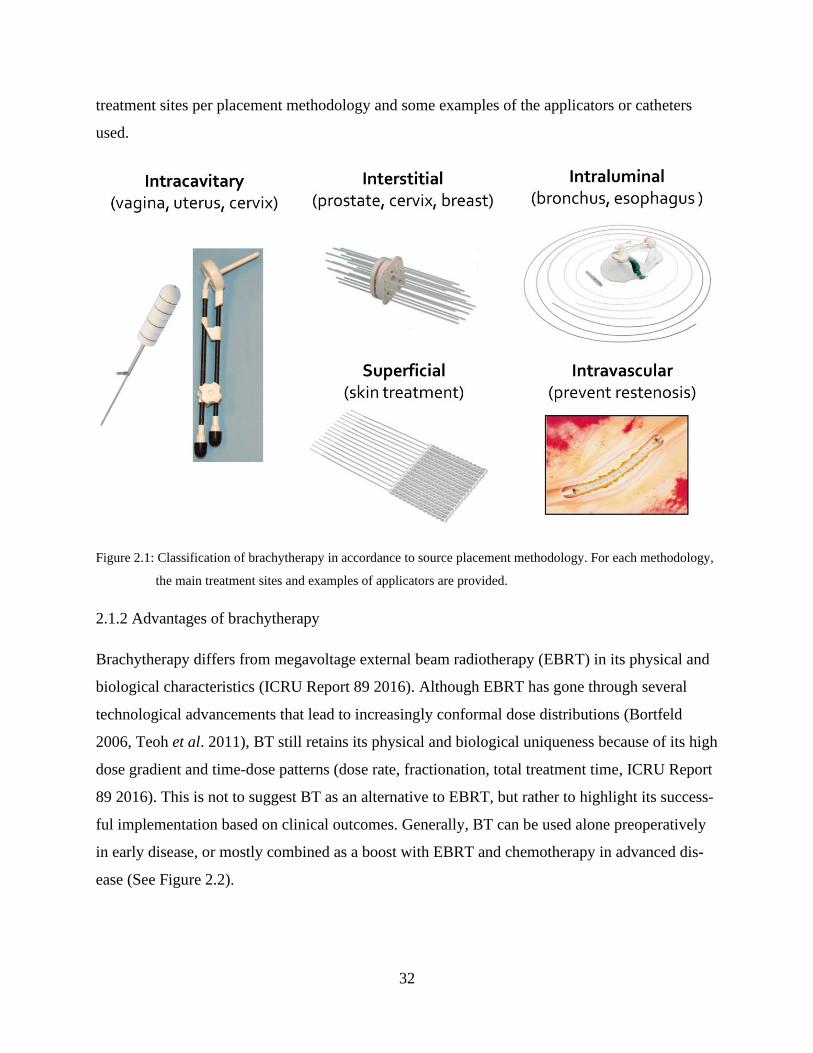
32
treatment sites per placement methodology and some examples of the applicators or catheters
used.
Figure 2.1: Classification of brachytherapy in accordance to source placement methodology. For each methodology,
the main treatment sites and examples of applicators are provided.
2.1.2 Advantages of brachytherapy
Brachytherapy differs from megavoltage external beam radiotherapy (EBRT) in its physical and
biological characteristics (ICRU Report 89 2016). Although EBRT has gone through several
technological advancements that lead to increasingly conformal dose distributions (Bortfeld
2006, Teoh et al. 2011), BT still retains its physical and biological uniqueness because of its high
dose gradient and time-dose patterns (dose rate, fractionation, total treatment time, ICRU Report
89 2016). This is not to suggest BT as an alternative to EBRT, but rather to highlight its success-
ful implementation based on clinical outcomes. Generally, BT can be used alone preoperatively
in early disease, or mostly combined as a boost with EBRT and chemotherapy in advanced dis-
ease (See Figure 2.2).
33
Figure 2.2: Brachytherapy treatment options. Some cancer/treatment sites area provided as common examples.
Physical advantages of brachytherapy
Figure 2.3 shows the physical difference between EBRT and BT in terms of application and dose
distribution inside the tumor. It demonstrates the high dose gradient within the target in BT,
which also results in the better sparing of nearby OARs when compared to EBRT. Quantita-
tively, according to the International Commission on Radiation Units and Measurements (ICRU)
report no. 89 (ICRU Report 89 2016, Tanderup et al. 2017), the median target dose in cervical
BT, for example is typically higher than 150 to 200% of the prescribed dose at the periphery of
the target. On the other hand, in conventional EBRT, the variation of dose across the target is
maintained between 95 to 107% of the prescribed dose (ICRU Report 50 1993). Another physi-
cal advantage of BT is the fact that it provides more geometrical assurance since the source(s)
are implanted near or into the treatment site directly. Consequently, there is no planning target
volume (PTV) in BT, making the total irradiated volume during BT more conformal.
34
Figure 2.3: The physical difference between external beam radiotherapy and brachytherapy. The thick dashed lines
across the dose distributions are indicative of the dose profiles shown at the bottom.
Biological advantages of brachytherapy
Biological efficacy of BT can be emphasized by its dose-volume-time patterns (ICRU Report 89
2016). The higher dose gradient (dose-volume) is acceptable for OARs because of the volume-
effect relationship: high dose to a small volume (2 cc for example) of an OAR is acceptable but
not for a larger volume (Mazeron et al. 2003). The answer to the question whether heterogeneous
or homogenous dose distribution pattern is more effective on target volumes is site-specific. For
example, dose heterogeneity is important in cervical cancer, while for interstitial breast implants,
dose homogeneity is preferred (Devlin 2016). Regarding time-dose patterns, according to ICRU
89 (ICRU Report 89 2016), they are determined by dose rate, dose per fraction and total treat-
ment time. BT can be classified according to dose rate as: low dose rate (LDR, <0.5 Gy/hr), me-
dium dose rate (MDR, 0.5 – 12 Gy/hr), high dose rate (HDR, >12 Gy/hr), and pulsed dose rate
35
(PDR, 40 – 80 pulses at 0.5 – 1 Gy/hr/pulse). Radiobiology in BT can be emphasized by the
move from LDR to fractionated HDR and PDR (Stewart and Bentzen 2011). Viani et al. 2009
showed that there are no differences between HDR and LDR cervical BT in terms of overall sur-
vival, local recurrence and late complications. Nowadays, most of the intracavitary and intersti-
tial BT procedures are HDR based, except for permanent seeds (Williamson 2006).
2.1.3 Clinical outcomes of brachytherapy
To highlight the outcomes of BT, it is more convenient to concentrate on specific types of cancer
whereby BT was shown to be effective.
Gynecologic cancer
Figure 2.4 (left, from Han et al. 2013) shows the improvement of overall survival when using BT
based on 7359 patients with stages IB2-IVA cervical cancer treated with EBRT (63% of them
received BT) between 1988 and 2009. This figure shows that there is almost 10% improvement
when using BT (p<0.001). In the same study, the authors show (Figure 2.4, right) that irrespec-
tive of this improvement, the utilization rate of BT has dropped significantly in 2003. They pos-
tulated that this decline was the result of increased implementation of highly conformal radiation
therapy techniques including intensity modulated RT (IMRT) and stereotactic body radiation
therapy (SBRT). Shortly thereafter, an editorial statement was issued in the red journal by Tan-
derup et al. 2014a stressing on the fact that the use of BT is not optional. Additionally, Sturdza et
al. 2016 showed that there is another 10% gain in target local control when using image-guided
adaptive BT. Irrespective of the efficacy of BT, the current technological advancement in EBRT
showed that it is possible to get high dose gradients with EBRT suggesting that SBRT/IMRT
may replace BT (Ishmael Parsai et al. 2017). However, the validity of this conclusion is ques-
tionable given the results of another large study by Gill et al. 2014. This study consisted of 7654
patients treated with BT or SBRT/IMRT between 2004 and 2011 and showed that BT has almost
more than 20% improved overall survival (Figure 2.5, from Gill et al. 2014).

36
Figure 2.4: Left: the overall survival in cervical cancer with and without brachytherapy. Right: brachytherapy utiliza-
tion rate between 1988 and 2009. Figures (with permission) are from Han et al. 2013.
Figure 2.5: The overall survival in cervical cancer with either brachytherapy or SBRT/IMRT boost. SBRT: stereotactic
Body Radiation Therapy, IMRT: intensity modulated radiation therapy. Figure (with permission) from Gill
et al. 2014.
Prostate Cancer
Treatment of prostate cancer depends on the cancer risk level. Depending on the level of prostate-
specific antigen (PSA), there are three main risk levels: low-, intermediate- and high-risk. Low-
37
and intermediate-risk prostate cancer are treated with prostatectomy, EBRT, or BT (D’Amico et
al. 1998). To evaluate the treatment effectiveness, clinical studies report the long-term freedom of
biochemical failure rate. Recently, Goy et al. 2020 reported the adjusted 10-year freedom from
biochemical failure was 80.2% for BT, 57.1% for prostatectomy, and 57.0% for EBRT. Zaorsky
et al. 2017 reported the 5-year biochemical failure-free rates of low-, intermediate- and high-risk
diseases to be >85%, 69–97%, and 63–80%, respectively, when using BT. Similarly, Sylvester et
al. 2011 reported the 15-year rates of 86%, 80%, and 62% when using BT. Zaorsky et al. 2017
also reported the LDR BT and HDR BT overall survival rates of more than 85% and 95% over 10-
years and 5-years, respectively. Additionally, BT was shown to be a better mono-therapy treatment
than prostatectomy and EBRT, especially in terms of functional outcome (Spratt et al. 2014, Crook
2015). As a boost, Morris et al. 2017 showed that combining BT with EBRT was better than an
additional EBRT boost in terms of disease-free survival.
Irrespective of the promising BT statistics in treating prostate cancer, Mahmood et al. 2014
showed that its use has actually declined in favor of prostatectomy and EBRT. Petereit et al. 2015
and Zaorsky et al. 2017 showed that this is mainly caused by the introduction of robotic surgery
and IMRT for prostatectomy and EBRT, respectively. Other reasons for the decline in using BT is
that it has less financial incentive compared to EBRT, it has higher operating cost, and it requires
a more skillful team (Han et al. 2017).
2.2 Image-guided brachytherapy
2.2.1 Transition from 2D to 3D image-guidance
One of the important steps in BT is the reconstruction of source positions for dose calculation.
This was historically achieved by acquiring two dimensional (2D) radiographs of the treatment
site including applicators, needles or seeds. Initially, doses were calculated at reference points
according to the ICRU 38 recommendations for intracavitary BT (ICRU Report 38 1985). This 2D
BT approach provided a robust method for an interactive applicator positioning and source posi-
tion reconstruction but lacked the anatomical visualization of tumors and OAR.
The introduction of three dimensional (3D) imaging into BT facilitated the transition from
2D BT to 3D image-guided BT (IGBT, ICRU Report 58 1997, Nag et al. 2004, Haie-Meder et al.
2005, Pötter et al. 2006, Devic et al. 2007, Hellebust et al. 2010, Dimopoulos et al. 2012, Damato
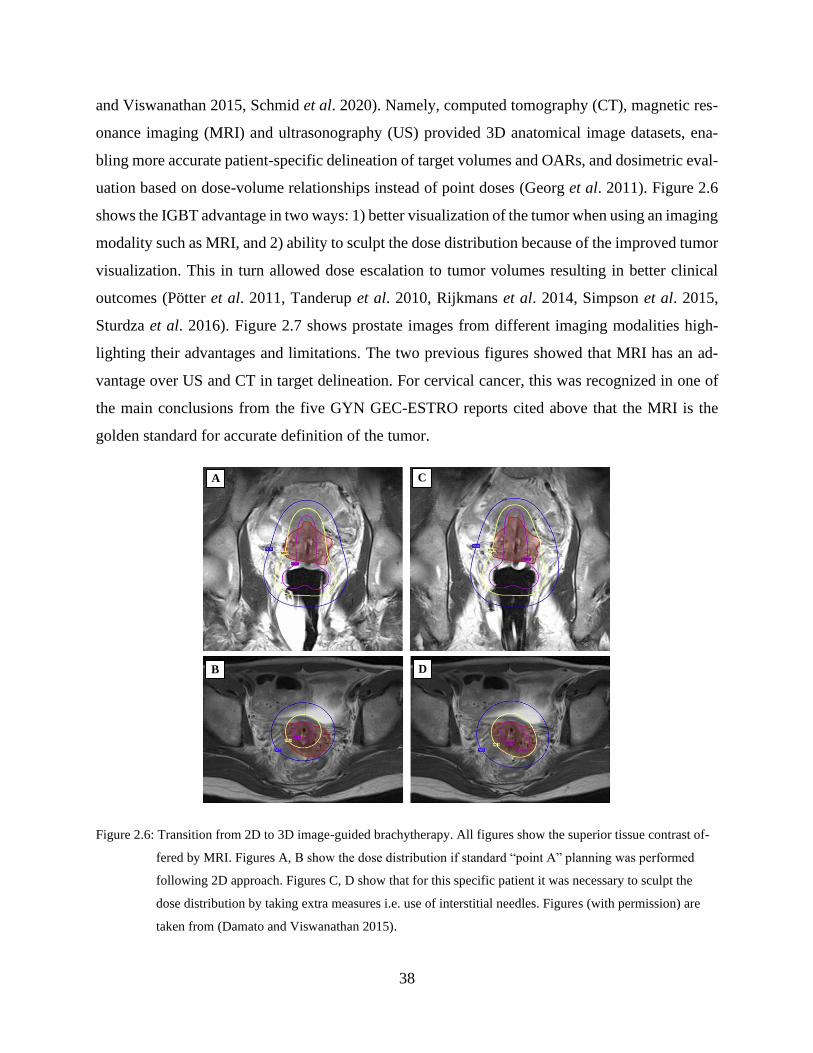
38
and Viswanathan 2015, Schmid et al. 2020). Namely, computed tomography (CT), magnetic res-
onance imaging (MRI) and ultrasonography (US) provided 3D anatomical image datasets, ena-
bling more accurate patient-specific delineation of target volumes and OARs, and dosimetric eval-
uation based on dose-volume relationships instead of point doses (Georg et al. 2011). Figure 2.6
shows the IGBT advantage in two ways: 1) better visualization of the tumor when using an imaging
modality such as MRI, and 2) ability to sculpt the dose distribution because of the improved tumor
visualization. This in turn allowed dose escalation to tumor volumes resulting in better clinical
outcomes (Pötter et al. 2011, Tanderup et al. 2010, Rijkmans et al. 2014, Simpson et al. 2015,
Sturdza et al. 2016). Figure 2.7 shows prostate images from different imaging modalities high-
lighting their advantages and limitations. The two previous figures showed that MRI has an ad-
vantage over US and CT in target delineation. For cervical cancer, this was recognized in one of
the main conclusions from the five GYN GEC-ESTRO reports cited above that the MRI is the
golden standard for accurate definition of the tumor.
Figure 2.6: Transition from 2D to 3D image-guided brachytherapy. All figures show the superior tissue contrast of-
fered by MRI. Figures A, B show the dose distribution if standard “point A” planning was performed
following 2D approach. Figures C, D show that for this specific patient it was necessary to sculpt the
dose distribution by taking extra measures i.e. use of interstitial needles. Figures (with permission) are
taken from (Damato and Viswanathan 2015).
A C
B D
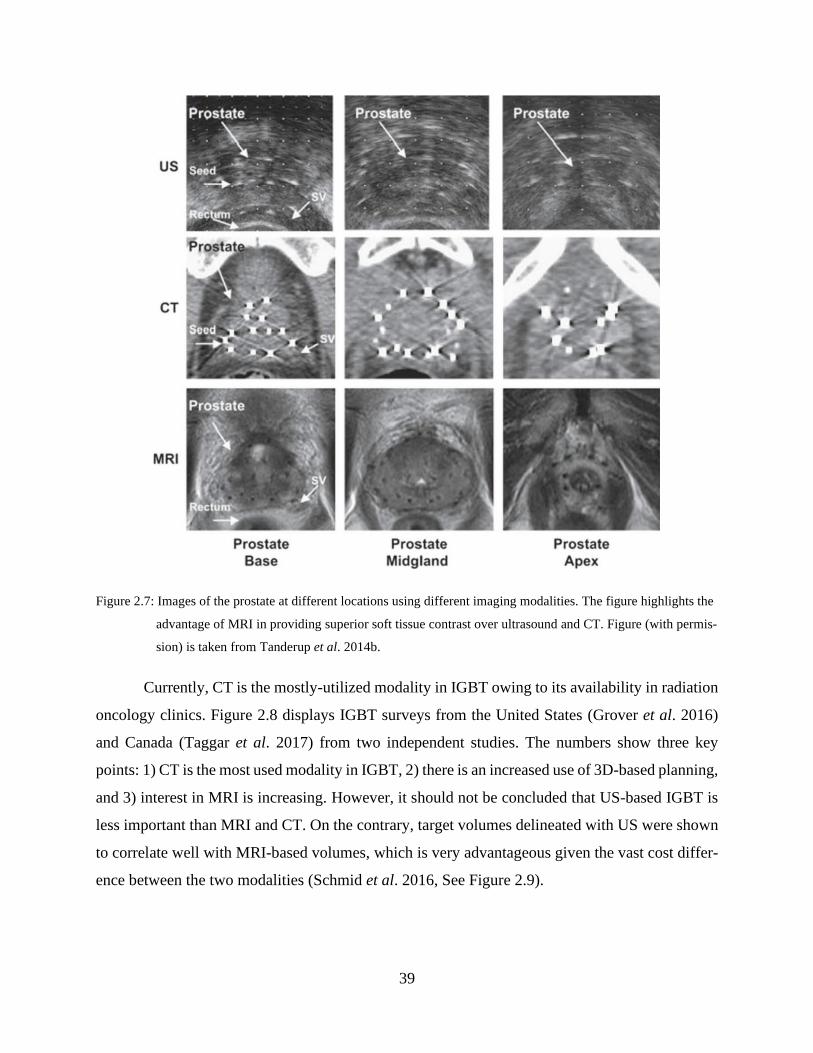
39
Figure 2.7: Images of the prostate at different locations using different imaging modalities. The figure highlights the
advantage of MRI in providing superior soft tissue contrast over ultrasound and CT. Figure (with permis-
sion) is taken from Tanderup et al. 2014b.
Currently, CT is the mostly-utilized modality in IGBT owing to its availability in radiation
oncology clinics. Figure 2.8 displays IGBT surveys from the United States (Grover et al. 2016)
and Canada (Taggar et al. 2017) from two independent studies. The numbers show three key
points: 1) CT is the most used modality in IGBT, 2) there is an increased use of 3D-based planning,
and 3) interest in MRI is increasing. However, it should not be concluded that US-based IGBT is
less important than MRI and CT. On the contrary, target volumes delineated with US were shown
to correlate well with MRI-based volumes, which is very advantageous given the vast cost differ-
ence between the two modalities (Schmid et al. 2016, See Figure 2.9).
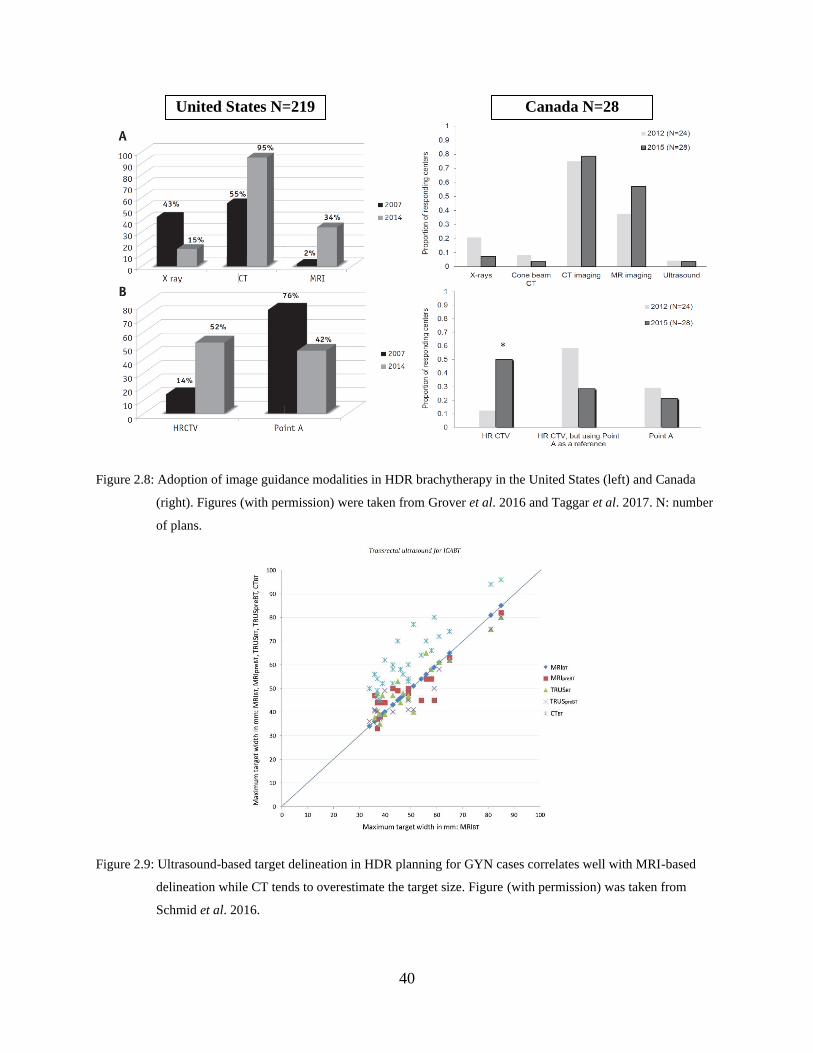
40
Figure 2.8: Adoption of image guidance modalities in HDR brachytherapy in the United States (left) and Canada
(right). Figures (with permission) were taken from Grover et al. 2016 and Taggar et al. 2017. N: number
of plans.
Figure 2.9: Ultrasound-based target delineation in HDR planning for GYN cases correlates well with MRI-based
delineation while CT tends to overestimate the target size. Figure (with permission) was taken from
Schmid et al. 2016.
United States N=219 Canada N=28
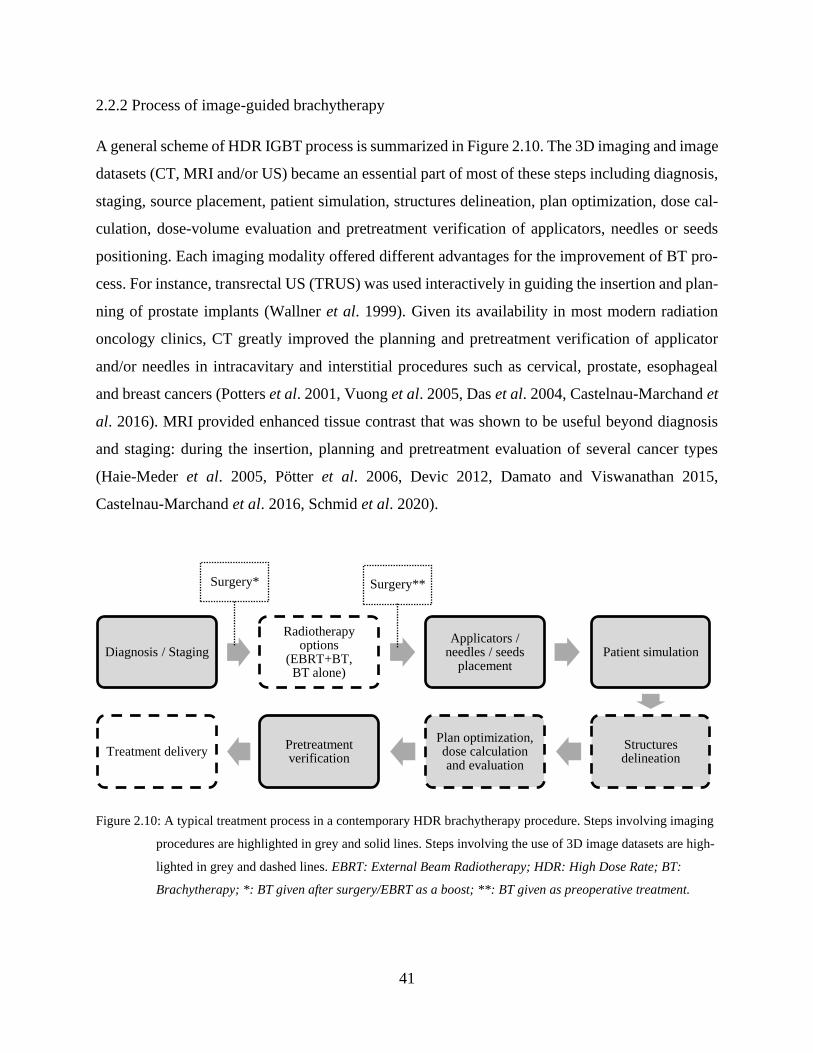
41
2.2.2 Process of image-guided brachytherapy
A general scheme of HDR IGBT process is summarized in Figure 2.10. The 3D imaging and image
datasets (CT, MRI and/or US) became an essential part of most of these steps including diagnosis,
staging, source placement, patient simulation, structures delineation, plan optimization, dose cal-
culation, dose-volume evaluation and pretreatment verification of applicators, needles or seeds
positioning. Each imaging modality offered different advantages for the improvement of BT pro-
cess. For instance, transrectal US (TRUS) was used interactively in guiding the insertion and plan-
ning of prostate implants (Wallner et al. 1999). Given its availability in most modern radiation
oncology clinics, CT greatly improved the planning and pretreatment verification of applicator
and/or needles in intracavitary and interstitial procedures such as cervical, prostate, esophageal
and breast cancers (Potters et al. 2001, Vuong et al. 2005, Das et al. 2004, Castelnau-Marchand et
al. 2016). MRI provided enhanced tissue contrast that was shown to be useful beyond diagnosis
and staging: during the insertion, planning and pretreatment evaluation of several cancer types
(Haie-Meder et al. 2005, Pötter et al. 2006, Devic 2012, Damato and Viswanathan 2015,
Castelnau-Marchand et al. 2016, Schmid et al. 2020).
Figure 2.10: A typical treatment process in a contemporary HDR brachytherapy procedure. Steps involving imaging
procedures are highlighted in grey and solid lines. Steps involving the use of 3D image datasets are high-
lighted in grey and dashed lines. EBRT: External Beam Radiotherapy; HDR: High Dose Rate; BT:
Brachytherapy; *: BT given after surgery/EBRT as a boost; **: BT given as preoperative treatment.
Diagnosis / Staging
Radiotherapyoptions
(EBRT+BT, BT alone)
Applicators / needles / seeds
placementPatient simulation
Structures delineation
Plan optimization, dose calculation and evaluation
Pretreatment verification
Treatment delivery
Surgery* Surgery**
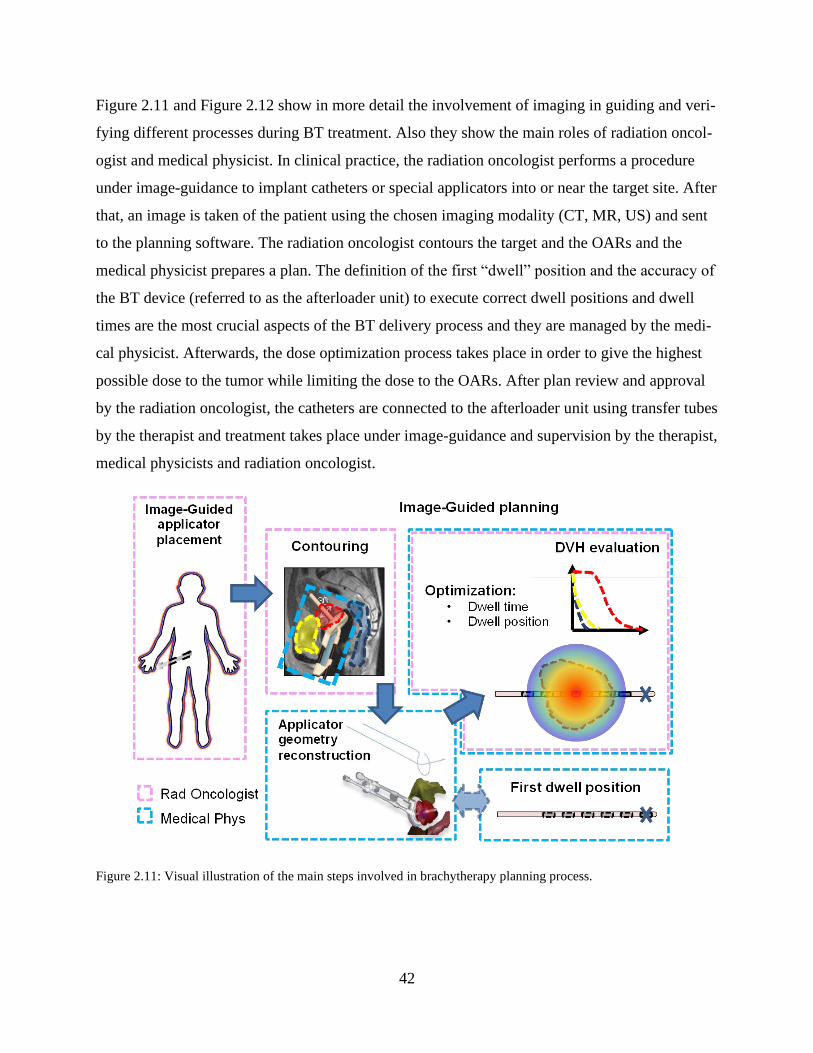
42
Figure 2.11 and Figure 2.12 show in more detail the involvement of imaging in guiding and veri-
fying different processes during BT treatment. Also they show the main roles of radiation oncol-
ogist and medical physicist. In clinical practice, the radiation oncologist performs a procedure
under image-guidance to implant catheters or special applicators into or near the target site. After
that, an image is taken of the patient using the chosen imaging modality (CT, MR, US) and sent
to the planning software. The radiation oncologist contours the target and the OARs and the
medical physicist prepares a plan. The definition of the first “dwell” position and the accuracy of
the BT device (referred to as the afterloader unit) to execute correct dwell positions and dwell
times are the most crucial aspects of the BT delivery process and they are managed by the medi-
cal physicist. Afterwards, the dose optimization process takes place in order to give the highest
possible dose to the tumor while limiting the dose to the OARs. After plan review and approval
by the radiation oncologist, the catheters are connected to the afterloader unit using transfer tubes
by the therapist and treatment takes place under image-guidance and supervision by the therapist,
medical physicists and radiation oncologist.
Figure 2.11: Visual illustration of the main steps involved in brachytherapy planning process.
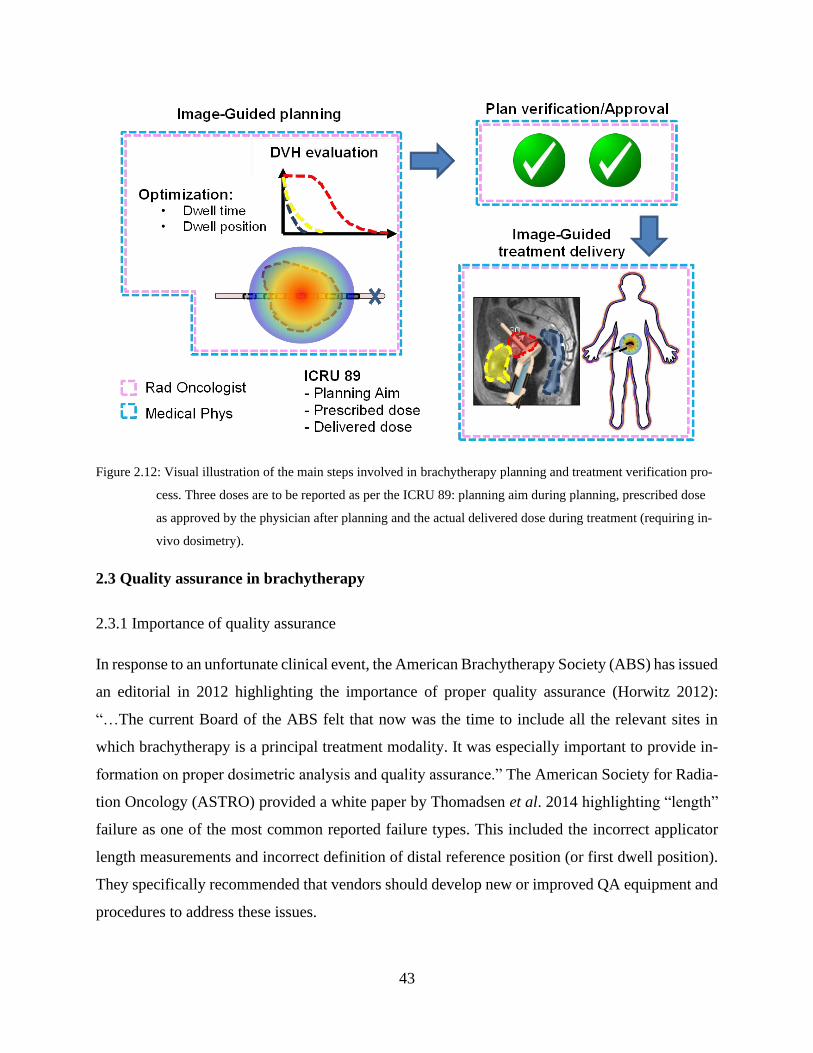
43
Figure 2.12: Visual illustration of the main steps involved in brachytherapy planning and treatment verification pro-
cess. Three doses are to be reported as per the ICRU 89: planning aim during planning, prescribed dose
as approved by the physician after planning and the actual delivered dose during treatment (requiring in-
vivo dosimetry).
2.3 Quality assurance in brachytherapy
2.3.1 Importance of quality assurance
In response to an unfortunate clinical event, the American Brachytherapy Society (ABS) has issued
an editorial in 2012 highlighting the importance of proper quality assurance (Horwitz 2012):
“…The current Board of the ABS felt that now was the time to include all the relevant sites in
which brachytherapy is a principal treatment modality. It was especially important to provide in-
formation on proper dosimetric analysis and quality assurance.” The American Society for Radia-
tion Oncology (ASTRO) provided a white paper by Thomadsen et al. 2014 highlighting “length”
failure as one of the most common reported failure types. This included the incorrect applicator
length measurements and incorrect definition of distal reference position (or first dwell position).
They specifically recommended that vendors should develop new or improved QA equipment and
procedures to address these issues.
44
There are many sources of uncertainty during the BT process (Kirisits et al. 2014) and each
has its own risk of jeopardizing the quality and/or safety of the treatment (Wadi-Ramahi et al.
2016). Some examples of errors that have happened can be found in Palmer et al. 2014, World
Health Organization 2007 and Bert et al. 2016. More recently in 2020, the American Association
of Physicists in Medicine (AAPM) presented the report of Task Group 275 (Ford et al. 2020) on
strategies for effective physics plan and chart review in radiation therapy included a detailed list
of 53 failure modes in HDR BT. The “length” related errors were among the highest five risks in
HDR BT process highlighting the importance of more-informed QA. Another advantage of proper
QA is the minimization of the number of patients required in randomized trials as was found by
Pettersen et al. 2008, since the risk of under-powering the study is minimized.
2.3.2 Current practice in HDR brachytherapy quality assurance
The standard of care in HDR BT QA is based on the AAPM reports of TG-40 (Kutcher et al.
1994), TG-56 (Nath et al. 1997), and TG-59 (Kubo et al. 1998). The AAPM TG-40 report was
the first comprehensive QA protocol in radiation therapy addressing BT as well. The TG-56 re-
port is the AAPM’s general code of practice for all types of BT detailing additional issues spe-
cific to BT that were not covered in TG-40. For example, these reports detailed the daily,
weekly, monthly, quarterly and annual QA requirements that should be performed by the BT
medical physicist. Although all of these reports deal with mitigation strategies of systematic and
random types of errors, the TG-59 report specifically addressed HDR BT treatment delivery fo-
cusing mainly on mitigation of random errors while the TG-56 report provided guidance on re-
ducing systematic errors. Systematic errors are those that would occur in all delivered fractions
for all patients. Examples are incorrect source position reconstruction procedure and a malfunc-
tioning imaging modality. Random errors are those specific to each fraction, for example: visibil-
ity of catheters and image co-registration quality.
The TG-56 report detailed the goals of the BT QA program and that is to “maximize the
likelihood that each individual treatment is administered consistently, that it accurately realizes
the radiation oncologist’s clinical intent, and that it is executed with regards to safety of the pa-
tient and others who may be exposed to radiation during the course of treatment.” However,
given the variability in practice among different centers, the TG-56 report mentioned that it is
difficult to come up with a comprehensive QA program that suits every clinic. Therefore, they
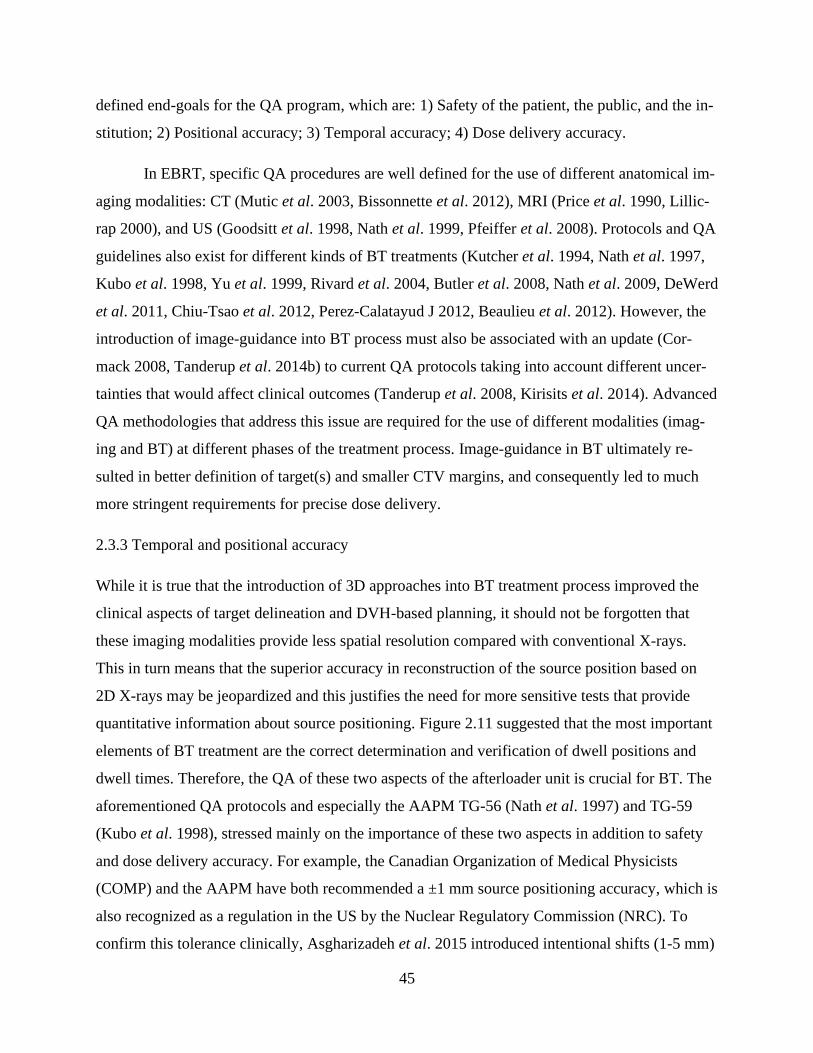
45
defined end-goals for the QA program, which are: 1) Safety of the patient, the public, and the in-
stitution; 2) Positional accuracy; 3) Temporal accuracy; 4) Dose delivery accuracy.
In EBRT, specific QA procedures are well defined for the use of different anatomical im-
aging modalities: CT (Mutic et al. 2003, Bissonnette et al. 2012), MRI (Price et al. 1990, Lillic-
rap 2000), and US (Goodsitt et al. 1998, Nath et al. 1999, Pfeiffer et al. 2008). Protocols and QA
guidelines also exist for different kinds of BT treatments (Kutcher et al. 1994, Nath et al. 1997,
Kubo et al. 1998, Yu et al. 1999, Rivard et al. 2004, Butler et al. 2008, Nath et al. 2009, DeWerd
et al. 2011, Chiu-Tsao et al. 2012, Perez-Calatayud J 2012, Beaulieu et al. 2012). However, the
introduction of image-guidance into BT process must also be associated with an update (Cor-
mack 2008, Tanderup et al. 2014b) to current QA protocols taking into account different uncer-
tainties that would affect clinical outcomes (Tanderup et al. 2008, Kirisits et al. 2014). Advanced
QA methodologies that address this issue are required for the use of different modalities (imag-
ing and BT) at different phases of the treatment process. Image-guidance in BT ultimately re-
sulted in better definition of target(s) and smaller CTV margins, and consequently led to much
more stringent requirements for precise dose delivery.
2.3.3 Temporal and positional accuracy
While it is true that the introduction of 3D approaches into BT treatment process improved the
clinical aspects of target delineation and DVH-based planning, it should not be forgotten that
these imaging modalities provide less spatial resolution compared with conventional X-rays.
This in turn means that the superior accuracy in reconstruction of the source position based on
2D X-rays may be jeopardized and this justifies the need for more sensitive tests that provide
quantitative information about source positioning. Figure 2.11 suggested that the most important
elements of BT treatment are the correct determination and verification of dwell positions and
dwell times. Therefore, the QA of these two aspects of the afterloader unit is crucial for BT. The
aforementioned QA protocols and especially the AAPM TG-56 (Nath et al. 1997) and TG-59
(Kubo et al. 1998), stressed mainly on the importance of these two aspects in addition to safety
and dose delivery accuracy. For example, the Canadian Organization of Medical Physicists
(COMP) and the AAPM have both recommended a ±1 mm source positioning accuracy, which is
also recognized as a regulation in the US by the Nuclear Regulatory Commission (NRC). To
confirm this tolerance clinically, Asgharizadeh et al. 2015 introduced intentional shifts (1-5 mm)
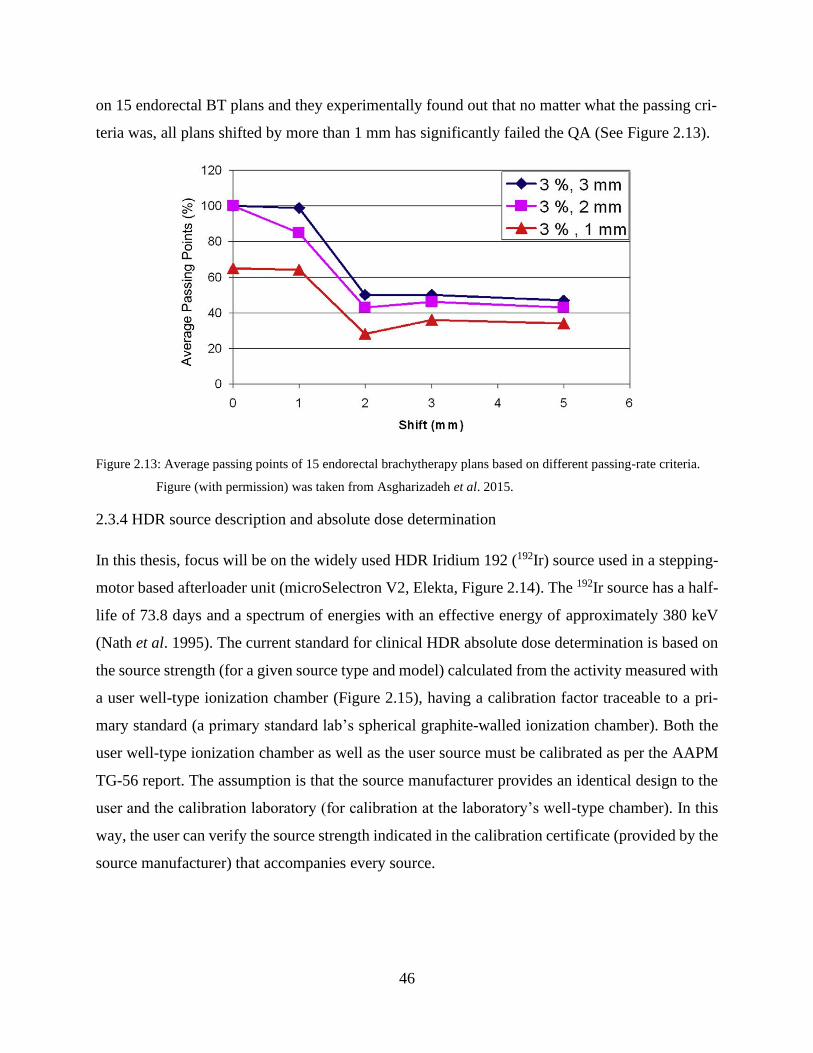
46
on 15 endorectal BT plans and they experimentally found out that no matter what the passing cri-
teria was, all plans shifted by more than 1 mm has significantly failed the QA (See Figure 2.13).
Figure 2.13: Average passing points of 15 endorectal brachytherapy plans based on different passing-rate criteria.
Figure (with permission) was taken from Asgharizadeh et al. 2015.
2.3.4 HDR source description and absolute dose determination
In this thesis, focus will be on the widely used HDR Iridium 192 (192Ir) source used in a stepping-
motor based afterloader unit (microSelectron V2, Elekta, Figure 2.14). The 192Ir source has a half-
life of 73.8 days and a spectrum of energies with an effective energy of approximately 380 keV
(Nath et al. 1995). The current standard for clinical HDR absolute dose determination is based on
the source strength (for a given source type and model) calculated from the activity measured with
a user well-type ionization chamber (Figure 2.15), having a calibration factor traceable to a pri-
mary standard (a primary standard lab’s spherical graphite-walled ionization chamber). Both the
user well-type ionization chamber as well as the user source must be calibrated as per the AAPM
TG-56 report. The assumption is that the source manufacturer provides an identical design to the
user and the calibration laboratory (for calibration at the laboratory’s well-type chamber). In this
way, the user can verify the source strength indicated in the calibration certificate (provided by the
source manufacturer) that accompanies every source.
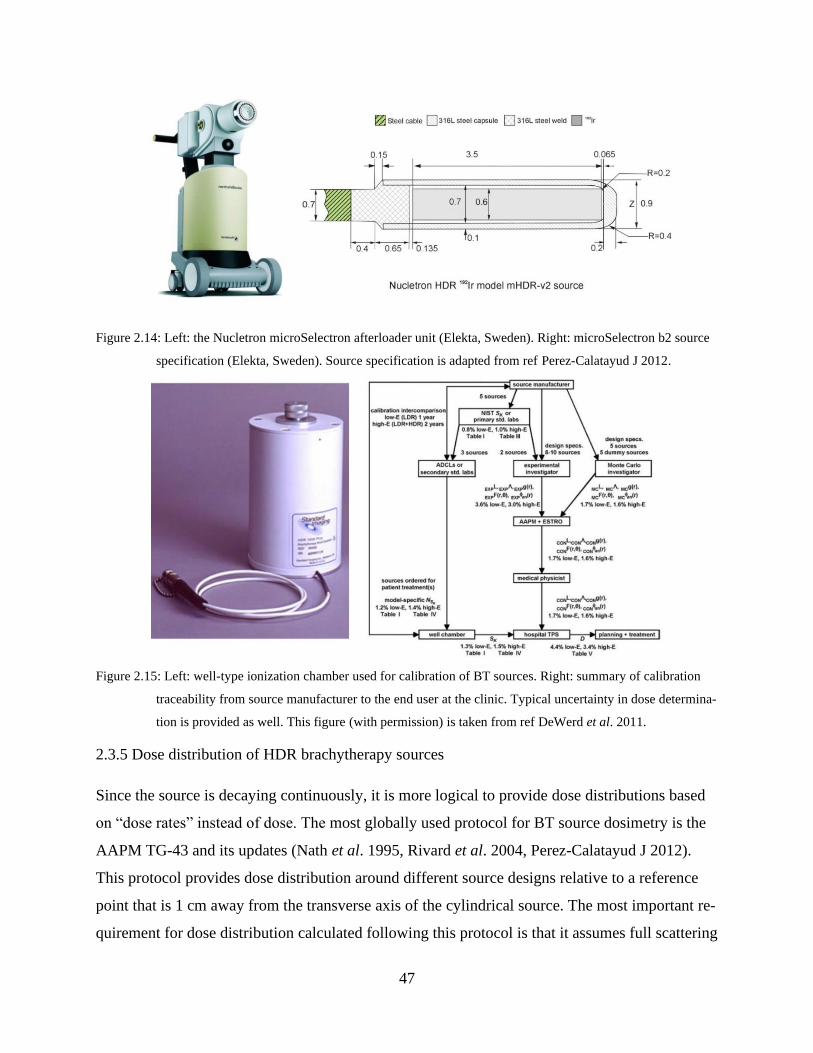
47
Figure 2.14: Left: the Nucletron microSelectron afterloader unit (Elekta, Sweden). Right: microSelectron b2 source
specification (Elekta, Sweden). Source specification is adapted from ref Perez-Calatayud J 2012.
Figure 2.15: Left: well-type ionization chamber used for calibration of BT sources. Right: summary of calibration
traceability from source manufacturer to the end user at the clinic. Typical uncertainty in dose determina-
tion is provided as well. This figure (with permission) is taken from ref DeWerd et al. 2011.
2.3.5 Dose distribution of HDR brachytherapy sources
Since the source is decaying continuously, it is more logical to provide dose distributions based
on “dose rates” instead of dose. The most globally used protocol for BT source dosimetry is the
AAPM TG-43 and its updates (Nath et al. 1995, Rivard et al. 2004, Perez-Calatayud J 2012).
This protocol provides dose distribution around different source designs relative to a reference
point that is 1 cm away from the transverse axis of the cylindrical source. The most important re-
quirement for dose distribution calculated following this protocol is that it assumes full scattering
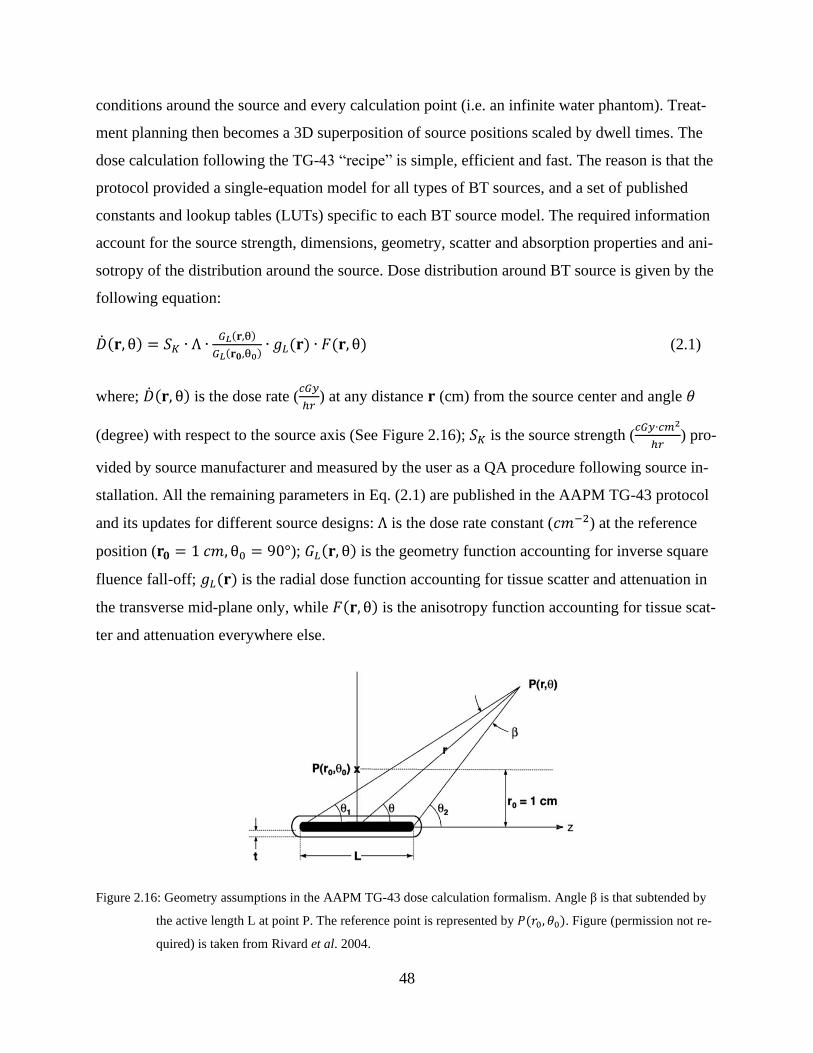
48
conditions around the source and every calculation point (i.e. an infinite water phantom). Treat-
ment planning then becomes a 3D superposition of source positions scaled by dwell times. The
dose calculation following the TG-43 “recipe” is simple, efficient and fast. The reason is that the
protocol provided a single-equation model for all types of BT sources, and a set of published
constants and lookup tables (LUTs) specific to each BT source model. The required information
account for the source strength, dimensions, geometry, scatter and absorption properties and ani-
sotropy of the distribution around the source. Dose distribution around BT source is given by the
following equation:
�̇�(𝐫, θ) = 𝑆𝐾 ∙ Λ ∙𝐺𝐿(𝐫,θ)
𝐺𝐿(𝐫𝟎,θ0)∙ 𝑔𝐿(𝐫) ∙ 𝐹(𝐫, θ) (2.1)
where; �̇�(𝐫, θ) is the dose rate (𝑐𝐺𝑦
ℎ𝑟) at any distance 𝐫 (cm) from the source center and angle 𝜃
(degree) with respect to the source axis (See Figure 2.16); 𝑆𝐾 is the source strength (𝑐𝐺𝑦∙𝑐𝑚2
ℎ𝑟) pro-
vided by source manufacturer and measured by the user as a QA procedure following source in-
stallation. All the remaining parameters in Eq. (2.1) are published in the AAPM TG-43 protocol
and its updates for different source designs: Λ is the dose rate constant (𝑐𝑚−2) at the reference
position (𝐫𝟎 = 1 𝑐𝑚, θ0 = 90°); 𝐺𝐿(𝐫, θ) is the geometry function accounting for inverse square
fluence fall-off; 𝑔𝐿(𝐫) is the radial dose function accounting for tissue scatter and attenuation in
the transverse mid-plane only, while 𝐹(𝐫, θ) is the anisotropy function accounting for tissue scat-
ter and attenuation everywhere else.
Figure 2.16: Geometry assumptions in the AAPM TG-43 dose calculation formalism. Angle β is that subtended by
the active length L at point P. The reference point is represented by 𝑃(𝑟0, 𝜃0). Figure (permission not re-
quired) is taken from Rivard et al. 2004.
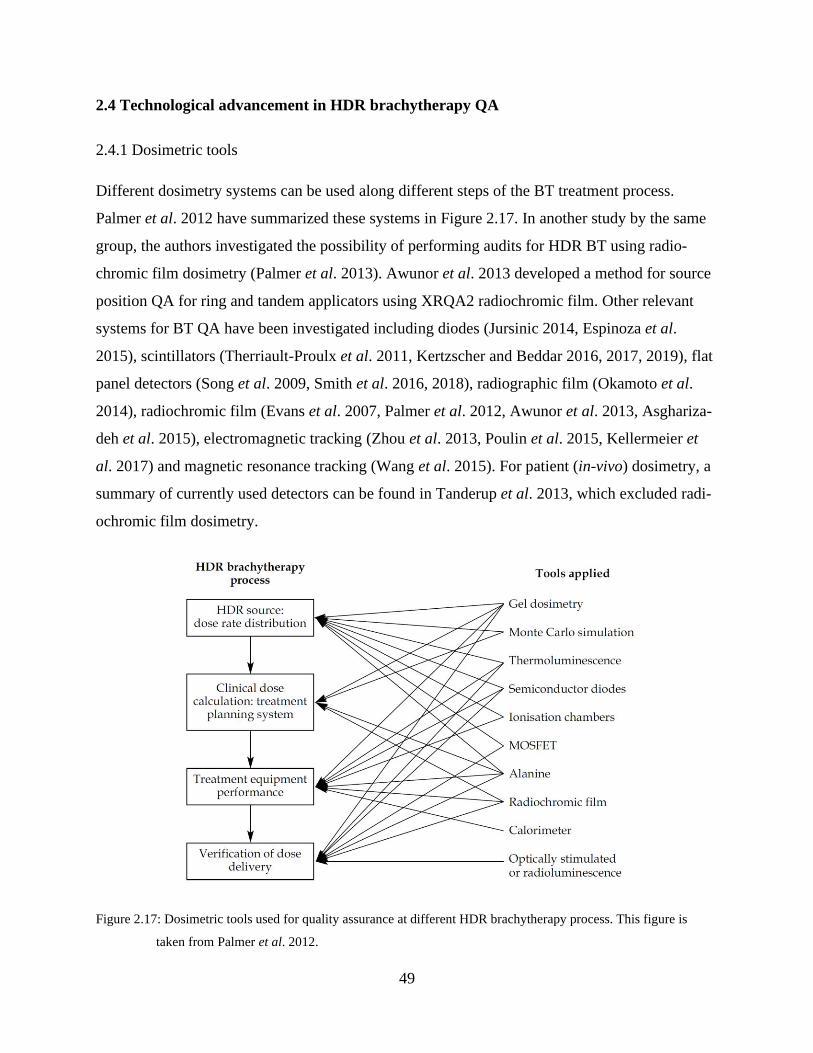
49
2.4 Technological advancement in HDR brachytherapy QA
2.4.1 Dosimetric tools
Different dosimetry systems can be used along different steps of the BT treatment process.
Palmer et al. 2012 have summarized these systems in Figure 2.17. In another study by the same
group, the authors investigated the possibility of performing audits for HDR BT using radio-
chromic film dosimetry (Palmer et al. 2013). Awunor et al. 2013 developed a method for source
position QA for ring and tandem applicators using XRQA2 radiochromic film. Other relevant
systems for BT QA have been investigated including diodes (Jursinic 2014, Espinoza et al.
2015), scintillators (Therriault-Proulx et al. 2011, Kertzscher and Beddar 2016, 2017, 2019), flat
panel detectors (Song et al. 2009, Smith et al. 2016, 2018), radiographic film (Okamoto et al.
2014), radiochromic film (Evans et al. 2007, Palmer et al. 2012, Awunor et al. 2013, Asghariza-
deh et al. 2015), electromagnetic tracking (Zhou et al. 2013, Poulin et al. 2015, Kellermeier et
al. 2017) and magnetic resonance tracking (Wang et al. 2015). For patient (in-vivo) dosimetry, a
summary of currently used detectors can be found in Tanderup et al. 2013, which excluded radi-
ochromic film dosimetry.
Figure 2.17: Dosimetric tools used for quality assurance at different HDR brachytherapy process. This figure is
taken from Palmer et al. 2012.
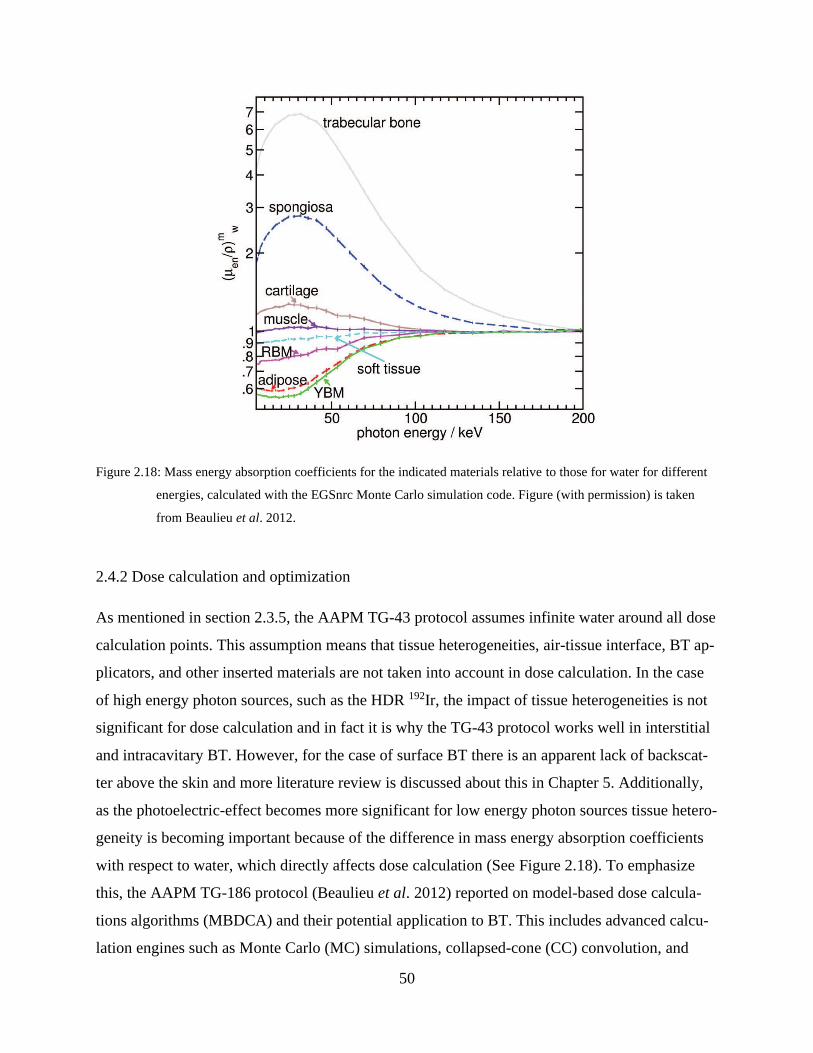
50
Figure 2.18: Mass energy absorption coefficients for the indicated materials relative to those for water for different
energies, calculated with the EGSnrc Monte Carlo simulation code. Figure (with permission) is taken
from Beaulieu et al. 2012.
2.4.2 Dose calculation and optimization
As mentioned in section 2.3.5, the AAPM TG-43 protocol assumes infinite water around all dose
calculation points. This assumption means that tissue heterogeneities, air-tissue interface, BT ap-
plicators, and other inserted materials are not taken into account in dose calculation. In the case
of high energy photon sources, such as the HDR 192Ir, the impact of tissue heterogeneities is not
significant for dose calculation and in fact it is why the TG-43 protocol works well in interstitial
and intracavitary BT. However, for the case of surface BT there is an apparent lack of backscat-
ter above the skin and more literature review is discussed about this in Chapter 5. Additionally,
as the photoelectric-effect becomes more significant for low energy photon sources tissue hetero-
geneity is becoming important because of the difference in mass energy absorption coefficients
with respect to water, which directly affects dose calculation (See Figure 2.18). To emphasize
this, the AAPM TG-186 protocol (Beaulieu et al. 2012) reported on model-based dose calcula-
tions algorithms (MBDCA) and their potential application to BT. This includes advanced calcu-
lation engines such as Monte Carlo (MC) simulations, collapsed-cone (CC) convolution, and
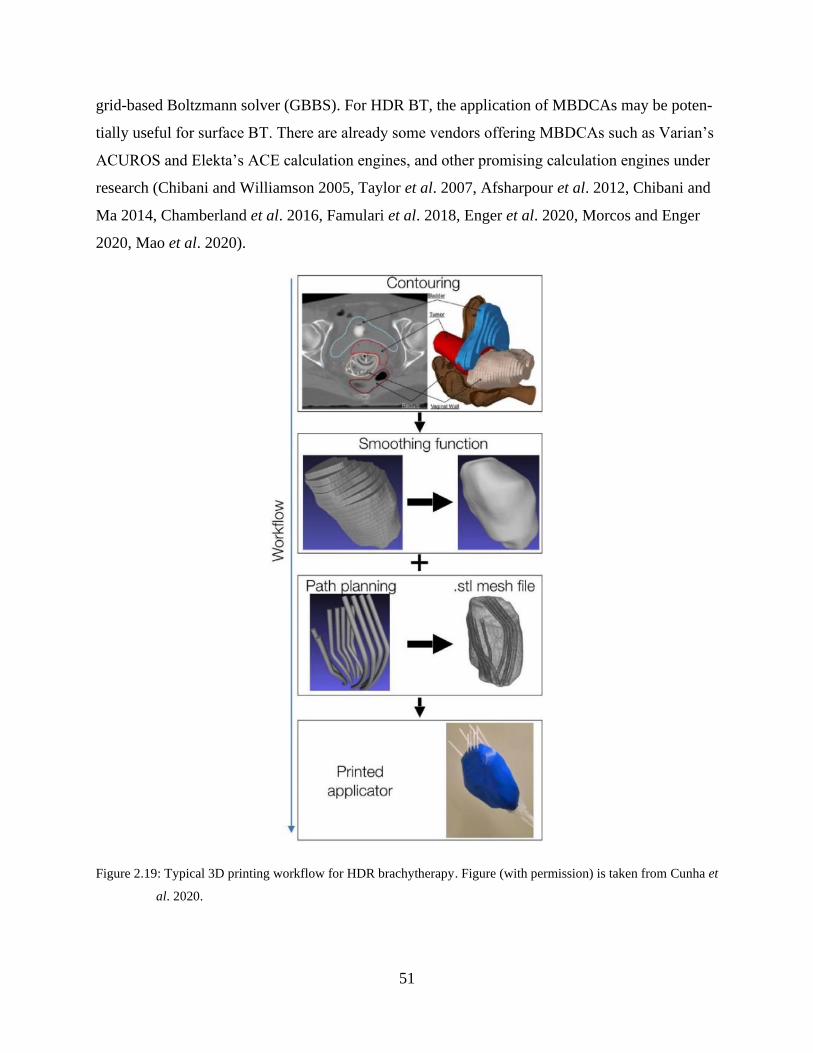
51
grid-based Boltzmann solver (GBBS). For HDR BT, the application of MBDCAs may be poten-
tially useful for surface BT. There are already some vendors offering MBDCAs such as Varian’s
ACUROS and Elekta’s ACE calculation engines, and other promising calculation engines under
research (Chibani and Williamson 2005, Taylor et al. 2007, Afsharpour et al. 2012, Chibani and
Ma 2014, Chamberland et al. 2016, Famulari et al. 2018, Enger et al. 2020, Morcos and Enger
2020, Mao et al. 2020).
Figure 2.19: Typical 3D printing workflow for HDR brachytherapy. Figure (with permission) is taken from Cunha et
al. 2020.
52
2.4.3 Applicator fabrication and customization
Although there are many applicator designs already available commercially for different BT
treatment sites, they do not necessarily fit all patient geometries. The evolution in additive manu-
facturing (AD) in the form of 3D printing (3DP) technology was adopted in BT research because
of the ability to customize applicators for specific patient needs. This has the advantage of fur-
ther dose distribution customized optimization for every patient, which would potentially im-
prove clinical outcomes, simplify the treatment process and facilitate the incorporation of BT
around different clinics (Cunha et al. 2015, Lindegaard et al. 2016, Ricotti et al. 2016, Cunha et
al. 2020). The 3DP also facilitated prototyping and innovation. An example of this is the printing
of Freiburg Flap “holders” (Guthier et al. 2020). This approach has the advantage of providing
reproducible setup between simulation and treatment, as well as an easy applicator positioning
procedure, and also provides backscatter material to improve dosimetry accuracy if heterogeneity
correction was turned off during dose calculation. Figure 2.19 summarizes the steps in 3DP fab-
rication of specialized applicators.
2.4.4 Intensity modulation
The goal of this section is to shed some light on the concept of intensity modulated BT (IMBT)
which includes directional shielding of the source and thereby modulation of the delivered dose
(Webster et al. 2013, Dadkhah et al. 2015, Seneviratne et al. 2018, Safigholi et al. 2018, DeCunha
and Enger 2018, Famulari et al. 2020, Morcos et al. 2020). According to Callaghan et al. 2019,
there are two types of IMBT with respect to the shielding/source movement during delivery: dy-
namic or static. The shielding could be part of the source or the applicator. Figure 2.20 summarize
the current emerging IMBT technologies with the note that these technologies are under develop-
ment by different research groups. While this thesis concerns only HDR sources, the rest of the
technologies seen in Figure 2.20 are provided for completeness.
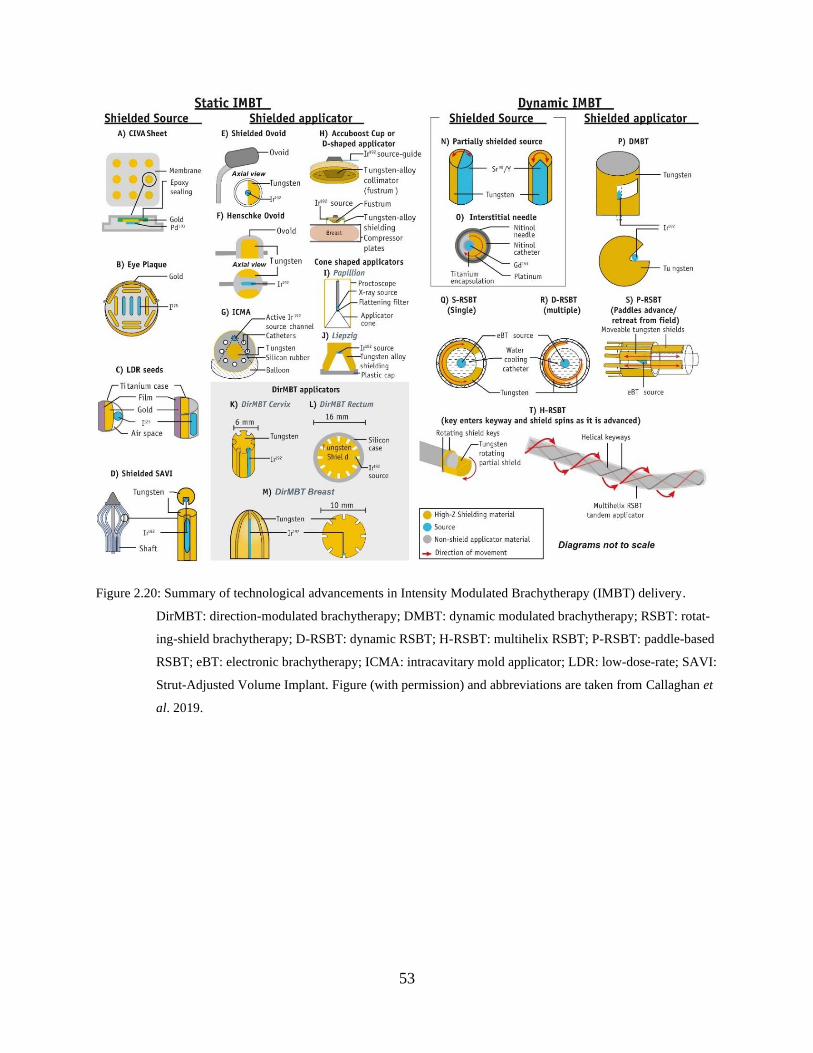
53
Figure 2.20: Summary of technological advancements in Intensity Modulated Brachytherapy (IMBT) delivery.
DirMBT: direction-modulated brachytherapy; DMBT: dynamic modulated brachytherapy; RSBT: rotat-
ing-shield brachytherapy; D-RSBT: dynamic RSBT; H-RSBT: multihelix RSBT; P-RSBT: paddle-based
RSBT; eBT: electronic brachytherapy; ICMA: intracavitary mold applicator; LDR: low-dose-rate; SAVI:
Strut-Adjusted Volume Implant. Figure (with permission) and abbreviations are taken from Callaghan et
al. 2019.
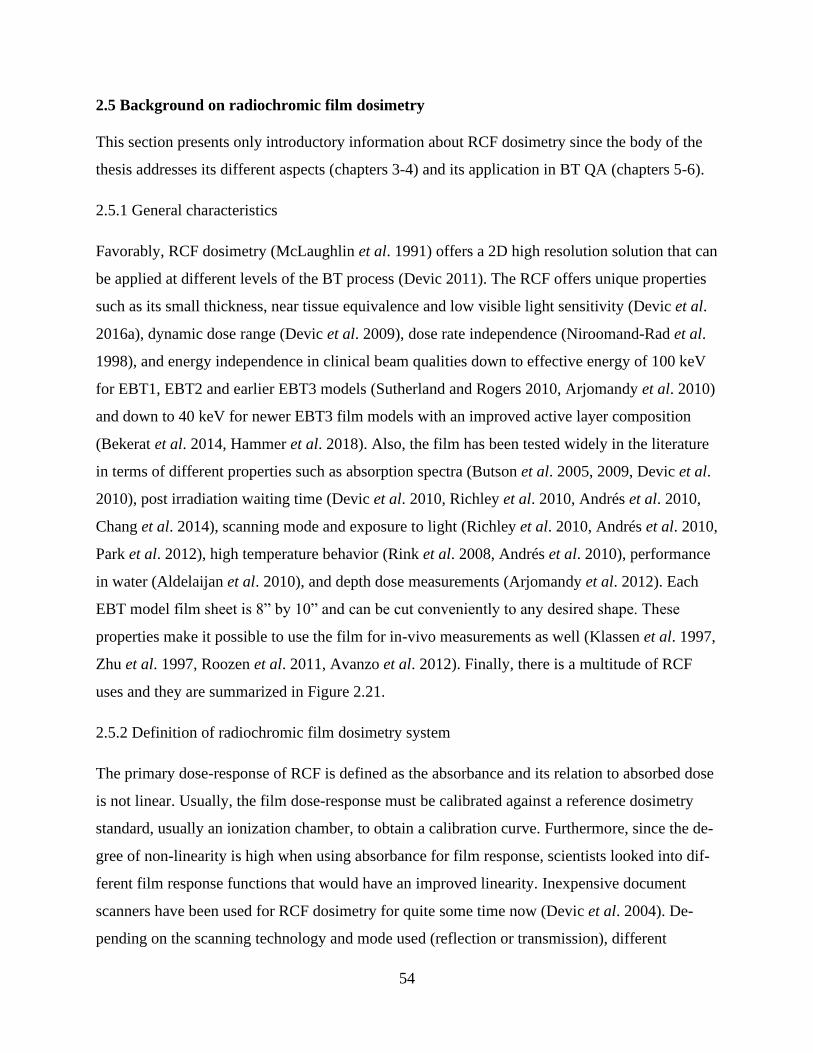
54
2.5 Background on radiochromic film dosimetry
This section presents only introductory information about RCF dosimetry since the body of the
thesis addresses its different aspects (chapters 3-4) and its application in BT QA (chapters 5-6).
2.5.1 General characteristics
Favorably, RCF dosimetry (McLaughlin et al. 1991) offers a 2D high resolution solution that can
be applied at different levels of the BT process (Devic 2011). The RCF offers unique properties
such as its small thickness, near tissue equivalence and low visible light sensitivity (Devic et al.
2016a), dynamic dose range (Devic et al. 2009), dose rate independence (Niroomand-Rad et al.
1998), and energy independence in clinical beam qualities down to effective energy of 100 keV
for EBT1, EBT2 and earlier EBT3 models (Sutherland and Rogers 2010, Arjomandy et al. 2010)
and down to 40 keV for newer EBT3 film models with an improved active layer composition
(Bekerat et al. 2014, Hammer et al. 2018). Also, the film has been tested widely in the literature
in terms of different properties such as absorption spectra (Butson et al. 2005, 2009, Devic et al.
2010), post irradiation waiting time (Devic et al. 2010, Richley et al. 2010, Andrés et al. 2010,
Chang et al. 2014), scanning mode and exposure to light (Richley et al. 2010, Andrés et al. 2010,
Park et al. 2012), high temperature behavior (Rink et al. 2008, Andrés et al. 2010), performance
in water (Aldelaijan et al. 2010), and depth dose measurements (Arjomandy et al. 2012). Each
EBT model film sheet is 8” by 10” and can be cut conveniently to any desired shape. These
properties make it possible to use the film for in-vivo measurements as well (Klassen et al. 1997,
Zhu et al. 1997, Roozen et al. 2011, Avanzo et al. 2012). Finally, there is a multitude of RCF
uses and they are summarized in Figure 2.21.
2.5.2 Definition of radiochromic film dosimetry system
The primary dose-response of RCF is defined as the absorbance and its relation to absorbed dose
is not linear. Usually, the film dose-response must be calibrated against a reference dosimetry
standard, usually an ionization chamber, to obtain a calibration curve. Furthermore, since the de-
gree of non-linearity is high when using absorbance for film response, scientists looked into dif-
ferent film response functions that would have an improved linearity. Inexpensive document
scanners have been used for RCF dosimetry for quite some time now (Devic et al. 2004). De-
pending on the scanning technology and mode used (reflection or transmission), different
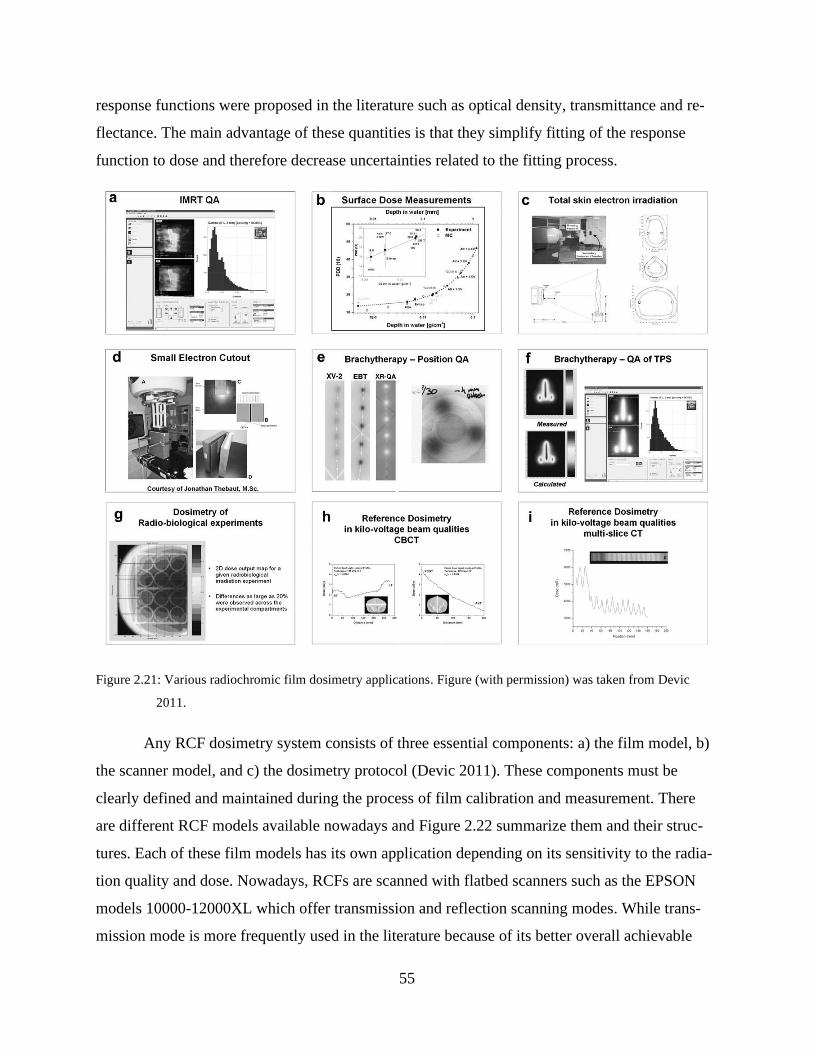
55
response functions were proposed in the literature such as optical density, transmittance and re-
flectance. The main advantage of these quantities is that they simplify fitting of the response
function to dose and therefore decrease uncertainties related to the fitting process.
Figure 2.21: Various radiochromic film dosimetry applications. Figure (with permission) was taken from Devic
2011.
Any RCF dosimetry system consists of three essential components: a) the film model, b)
the scanner model, and c) the dosimetry protocol (Devic 2011). These components must be
clearly defined and maintained during the process of film calibration and measurement. There
are different RCF models available nowadays and Figure 2.22 summarize them and their struc-
tures. Each of these film models has its own application depending on its sensitivity to the radia-
tion quality and dose. Nowadays, RCFs are scanned with flatbed scanners such as the EPSON
models 10000-12000XL which offer transmission and reflection scanning modes. While trans-
mission mode is more frequently used in the literature because of its better overall achievable
56
dosimetric uncertainty and dose range, reflection model has higher sensitivity and dose contrast
since the scanning light passes twice through the film sensitive layer. Lastly, the dosimetry pro-
tocol is a reference set of instructions that must be maintained during calibration and measure-
ment phases, as per the AAPM TG-55 recommendations (Niroomand-Rad et al. 1998). This in-
cludes all the film handling procedures, scanning instructions, image analysis, as well as dose
and its associated uncertainty calculation models.
Figure 2.22: Structure and dimensions of different radiochromic film dosimetry models. Figure (with permission) is
taken from Devic et al. 2016a.
2.5.3 Use of radiochromic film for dosimetry
Before its deployment for dose measurement, RCF response must be calibrated by delivering a
range of known doses to different film pieces to establish a calibration curve that relates the film
response to dose (See Figure 2.23, top). The film response is a convolution between the scanner
light source emission spectrum, the film absorbance spectrum and the sensitivity of the CCD-
based light detectors of the scanner. The general outline of the calibration procedure is shown in
Figure 2.23: Calibration: a) unboxing and cutting the films, b) scanning before irradiation, c) ir-
radiating films under reference conditions to known doses, d) scanning the films after a fixed
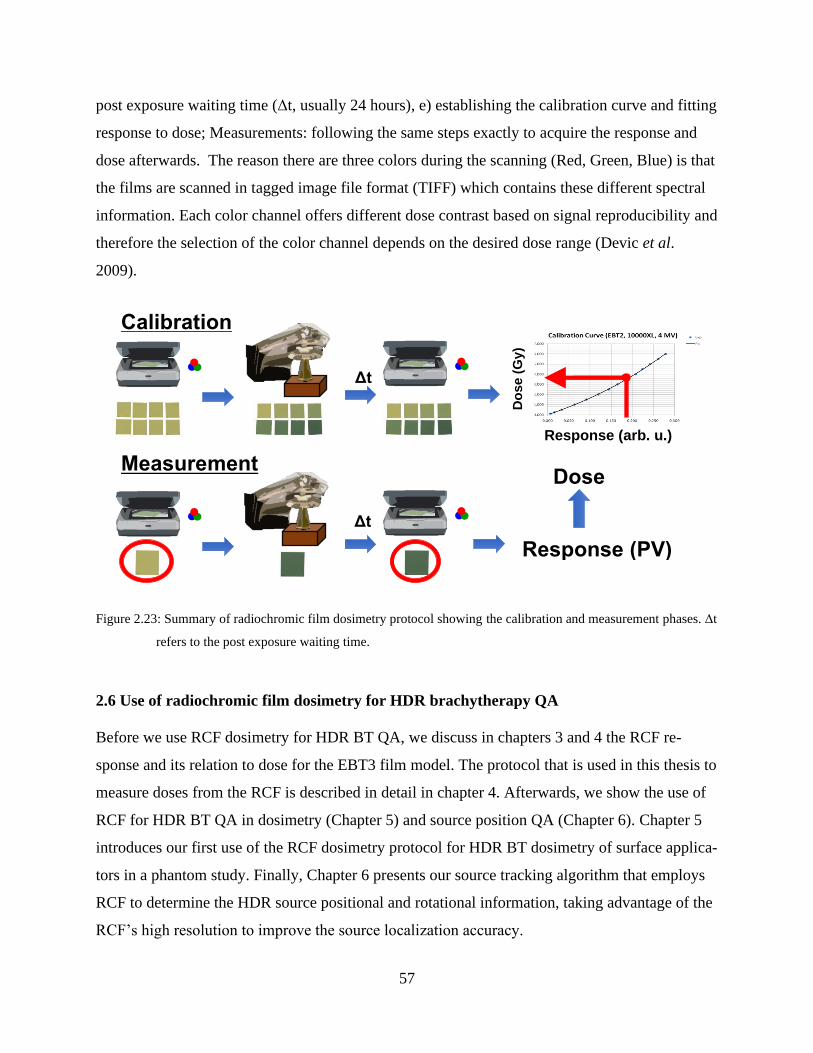
57
post exposure waiting time (Δt, usually 24 hours), e) establishing the calibration curve and fitting
response to dose; Measurements: following the same steps exactly to acquire the response and
dose afterwards. The reason there are three colors during the scanning (Red, Green, Blue) is that
the films are scanned in tagged image file format (TIFF) which contains these different spectral
information. Each color channel offers different dose contrast based on signal reproducibility and
therefore the selection of the color channel depends on the desired dose range (Devic et al.
2009).
Figure 2.23: Summary of radiochromic film dosimetry protocol showing the calibration and measurement phases. Δt
refers to the post exposure waiting time.
2.6 Use of radiochromic film dosimetry for HDR brachytherapy QA
Before we use RCF dosimetry for HDR BT QA, we discuss in chapters 3 and 4 the RCF re-
sponse and its relation to dose for the EBT3 film model. The protocol that is used in this thesis to
measure doses from the RCF is described in detail in chapter 4. Afterwards, we show the use of
RCF for HDR BT QA in dosimetry (Chapter 5) and source position QA (Chapter 6). Chapter 5
introduces our first use of the RCF dosimetry protocol for HDR BT dosimetry of surface applica-
tors in a phantom study. Finally, Chapter 6 presents our source tracking algorithm that employs
RCF to determine the HDR source positional and rotational information, taking advantage of the
RCF’s high resolution to improve the source localization accuracy.
Δt
Δt
Calibration
Measurement
Response (PV)
Dose
Do
se (
Gy)
Response (arb. u.)
58
CHAPTER 3: Comparison of dose response functions for EBT3
model GafChromic™ film dosimetry system
Preface
Any contemporary radiochromic film dosimetry system consists of three main components: the
film model (and batch number), the scanner model (and serial number), and a protocol that de-
fines a set of procedures for handling and processing film pieces. The film dose-response pri-
mary signal is referred to as the absorbance and it is quantified for flatbed scanners by the quan-
tity “pixel value,” which corresponds to the measured light intensity at any point on the scanning
bed with respect to the signal measured at the self-calibration area. To facilitate unknown dose
measurements, a film response to dose calibration is required. To improve the fitting quality of
response to dose, different response functions were proposed in the literature such as optical den-
sity, reflectance and transmittance. The use of these quantities depends on the scanning mode
(transmission vs. reflection) and also on their response to dose. In this work, we investigate these
different quantities as well as a new quantity that we introduced (normalized pixel value), in
terms of sensitivity and achievable overall dosimetric uncertainty. We also investigate the need
for pre-scanning of the same film piece (double scan protocol) and examine if a general control
film piece (single scan protocol) would be sufficient without significantly impacting the achieva-
ble dosimetric uncertainty.
This work was has been published in the European Journal of Medical Physics as:
Aldelaijan, Saad and Devic, Slobodan Comparison of dose response functions for EBT3 model
GafChromicTM film dosimetry system, Phys. Med. 49, 112-118 (2018).

59
Comparison of dose response functions for EBT3 model
GafChromicTM film dosimetry system
Saad Aldelaijan,1,2,3,4 and Slobodan Devic,1,2,5
1 Radiation Oncology Department, Jewish General Hospital, Montreal, Quebec H3T 1E2, Canada
2 Medical Physics Unit, McGill University, Montreal, Quebec H4A 3J1, Canada
3 Biological & Biomedical Engineering Department, Montreal Neurological Institute, Montréal,
Québec H3A 2B4, Canada
4 Biomedical Physics Department, King Faisal Specialist Hospital & Research Centre, Riyadh,
Saudi Arabia
5 Segal Cancer Centre, Jewish General Hospital, McGill University, Montréal, Québec, Canada
Keywords: radiochromic film dosimetry system, response function.
Abstract
Objective: Different dose response functions of EBT3 model GafChromicTM film dosimetry sys-
tem have been compared in terms of sensitivity as well as uncertainty vs. error analysis. We also
made an assessment of the necessity of scanning film pieces before and after irradiation.
Methods: Pieces of EBT3 film model were irradiated to different dose values in Solid Water (SW)
phantom. Based on images scanned in both reflection and transmission mode before and after
irradiation, twelve different response functions were calculated. For every response function, a
reference radiochromic film dosimetry system was established by generating calibration curve and
by performing the error vs. uncertainty analysis.
Results: Response functions using pixel values from the green channel demonstrated the highest
sensitivity in both transmission and reflection mode. All functions were successfully fitted with
rational functional form, and provided an overall one-sigma uncertainty of better than 2% for doses
60
above 2 Gy. Use of pre-scanned images to calculate response functions resulted in negligible im-
provement in dose measurement accuracy.
Conclusion: Although reflection scanning mode provides higher sensitivity and could lead to a
more widespread use of radiochromic film dosimetry, it has fairly limited dose range and slightly
increased uncertainty when compared to transmission scan based response functions. Double-
scanning technique, either in transmission or reflection mode, shows negligible improvement in
dose accuracy as well as a negligible increase in dose uncertainty. Normalized pixel value of the
images scanned in transmission mode shows linear response in a dose range of up to 11 Gy.
3.1 Introduction
If a piece of GafChromicTM film is exposed to ionizing radiation, charged particles will be depos-
iting energy throughout the sensitive layer and will initiate polymerization of a sensitive compo-
nent (di-acetylene monomers). The irradiated film piece will change its color due to created poly-
mers, which has the highest absorption in the red part of the optical spectrum. While the change in
absorbance measured with a spectrophotometer would be the simplest method to evaluate the
response of the film to ionizing radiation, use of such a complex instrument even for point dose
measurement (let alone two-dimensional ones) would be quite cumbersome and expensive. More
than a decade ago, a renaissance of radiochromic film dosimetry emerged with the introduction of
the EBT GafChromicTM film model [1-5]. When compared to its predecessors, the new film model
was larger in size (8” x 10”), it was less expensive and new film dosimetry protocols were emerg-
ing that were using relatively inexpensive flat-bed document scanners [2]. While the film dosim-
etry in general was performed with various optical devices [6], the use of document scanners be-
came the common practice not only due to its low cost, but also thanks to their straightforward
implementation into both clinical and research film dosimetry procedures. Following the previ-
ously established film dosimetry protocols with radiographic films, it was somewhat natural to
choose optical density as a quantity of choice to describe response of the irradiated film pieces.
Optical density change was easily calculated from the transmission images obtained with flat-bed
document scanners.
61
While there were several models of document scanners with transparency scanning op-
tions, in 2002 Alva et al. [7] suggested using reflection scanning mode to measure response of
irradiated transparent (MD-55-2 model at the time) radiochromic films. In 2008, Kalef-Ezra and
Karava [8], reported on comparative dosimetry results when using either reflection or transmission
scanning, and reported the reflection mode was superior when used with the MD-55-2 model Gaf-
ChromicTM film. Méndez et al. [9] reported on the increased robustness using a novel plan-based
method while using the reflection scanned film images.
More recently, Papaconstadopoulos et al. [10] investigated response of EBT3 model Gaf-
ChromicTM film in terms of uncertainty and spatial resolution for different color channels in both
reflection and transmission mode. While they also found the reflection mode to be superior in
terms of sensitivity (particularly at low doses up to 2 Gy based on the red channel), they observed
higher uncertainties and lower accuracy that they attributed to signal saturation effects. On the
other hand, compared to transmission scanning, they did not observe any loss of spatial resolution
despite the additional light scattering (noise) arising from the fact that light was passing twice
through the film. Use of reflection scanning mode with transparent films would further extend
implementation of radiochromic film dosimetry having in mind much wider abundance and even
lower cost of document scanners without transparency option.
Yet another method has been suggested by the film inventor and manufacturer, which is to
use only the raw pixel values provided by the document scanner [11, 12]. Commercially available
software provided by the film manufacturer was working using pixel values provided by document
scanners that correspond to the light that was transmitted through the film piece. In addition, while
some reference radiochromic film dosimetry protocols suggest scanning the film pieces before and
after irradiation (double-scanning technique) to calculate response as a change in the film’s ab-
sorbance [2], there are protocols suggesting that only one scan (single-scan technique) of irradiated
film piece together with another un-irradiated film piece provides acceptable radiochromic film
dosimetry system [12]. In the single-scan method, un-irradiated film piece serves both as a fog
(allowing for a change in the response signal to be calculated) and, at the same time, as a control
film piece, the latter being suggested [13] to correct for any changes in film absorbance due to
environmental conditions (temperature, humidity, UV-light, …).
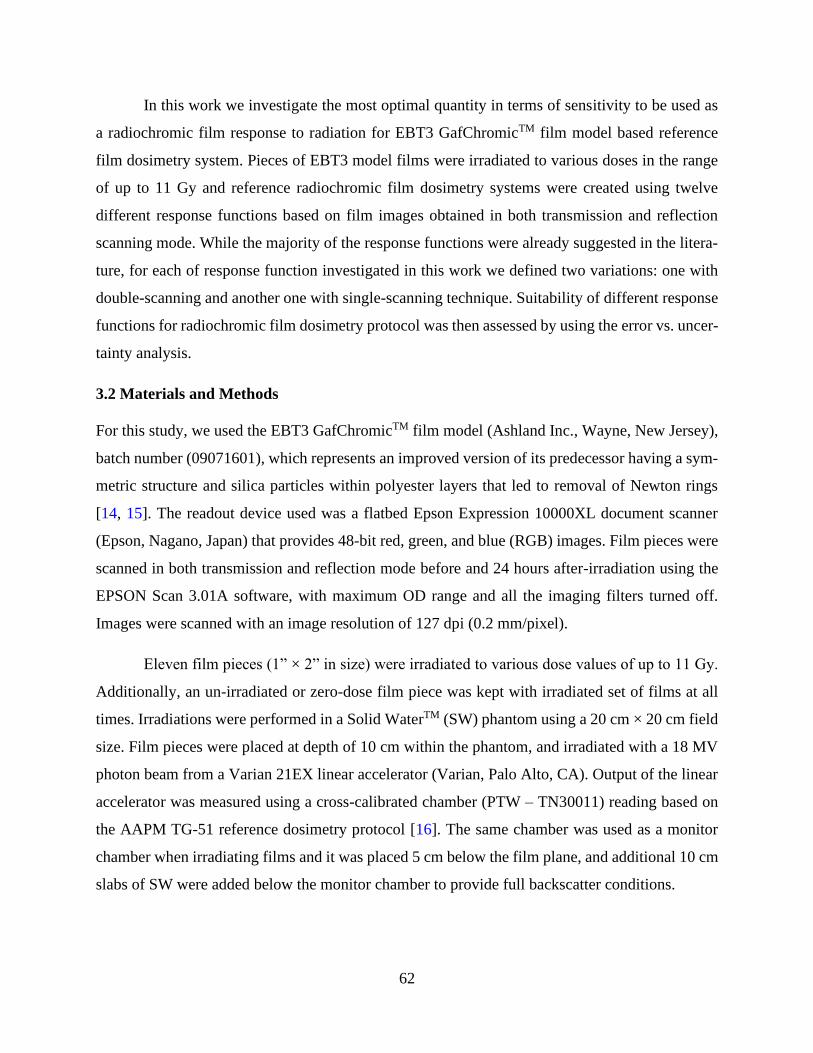
62
In this work we investigate the most optimal quantity in terms of sensitivity to be used as
a radiochromic film response to radiation for EBT3 GafChromicTM film model based reference
film dosimetry system. Pieces of EBT3 model films were irradiated to various doses in the range
of up to 11 Gy and reference radiochromic film dosimetry systems were created using twelve
different response functions based on film images obtained in both transmission and reflection
scanning mode. While the majority of the response functions were already suggested in the litera-
ture, for each of response function investigated in this work we defined two variations: one with
double-scanning and another one with single-scanning technique. Suitability of different response
functions for radiochromic film dosimetry protocol was then assessed by using the error vs. uncer-
tainty analysis.
3.2 Materials and Methods
For this study, we used the EBT3 GafChromicTM film model (Ashland Inc., Wayne, New Jersey),
batch number (09071601), which represents an improved version of its predecessor having a sym-
metric structure and silica particles within polyester layers that led to removal of Newton rings
[14, 15]. The readout device used was a flatbed Epson Expression 10000XL document scanner
(Epson, Nagano, Japan) that provides 48-bit red, green, and blue (RGB) images. Film pieces were
scanned in both transmission and reflection mode before and 24 hours after-irradiation using the
EPSON Scan 3.01A software, with maximum OD range and all the imaging filters turned off.
Images were scanned with an image resolution of 127 dpi (0.2 mm/pixel).
Eleven film pieces (1” × 2” in size) were irradiated to various dose values of up to 11 Gy.
Additionally, an un-irradiated or zero-dose film piece was kept with irradiated set of films at all
times. Irradiations were performed in a Solid WaterTM (SW) phantom using a 20 cm × 20 cm field
size. Film pieces were placed at depth of 10 cm within the phantom, and irradiated with a 18 MV
photon beam from a Varian 21EX linear accelerator (Varian, Palo Alto, CA). Output of the linear
accelerator was measured using a cross-calibrated chamber (PTW – TN30011) reading based on
the AAPM TG-51 reference dosimetry protocol [16]. The same chamber was used as a monitor
chamber when irradiating films and it was placed 5 cm below the film plane, and additional 10 cm
slabs of SW were added below the monitor chamber to provide full backscatter conditions.
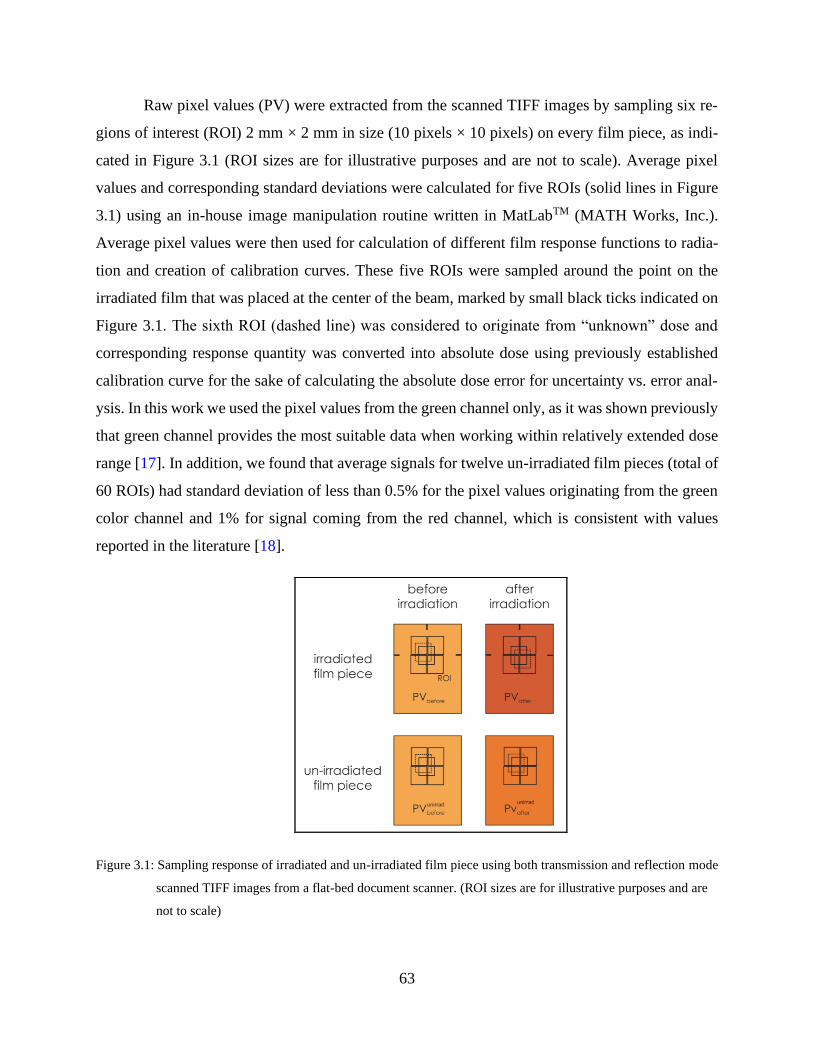
63
Raw pixel values (PV) were extracted from the scanned TIFF images by sampling six re-
gions of interest (ROI) 2 mm × 2 mm in size (10 pixels × 10 pixels) on every film piece, as indi-
cated in Figure 3.1 (ROI sizes are for illustrative purposes and are not to scale). Average pixel
values and corresponding standard deviations were calculated for five ROIs (solid lines in Figure
3.1) using an in-house image manipulation routine written in MatLabTM (MATH Works, Inc.).
Average pixel values were then used for calculation of different film response functions to radia-
tion and creation of calibration curves. These five ROIs were sampled around the point on the
irradiated film that was placed at the center of the beam, marked by small black ticks indicated on
Figure 3.1. The sixth ROI (dashed line) was considered to originate from “unknown” dose and
corresponding response quantity was converted into absolute dose using previously established
calibration curve for the sake of calculating the absolute dose error for uncertainty vs. error anal-
ysis. In this work we used the pixel values from the green channel only, as it was shown previously
that green channel provides the most suitable data when working within relatively extended dose
range [17]. In addition, we found that average signals for twelve un-irradiated film pieces (total of
60 ROIs) had standard deviation of less than 0.5% for the pixel values originating from the green
color channel and 1% for signal coming from the red channel, which is consistent with values
reported in the literature [18].
Figure 3.1: Sampling response of irradiated and un-irradiated film piece using both transmission and reflection mode
scanned TIFF images from a flat-bed document scanner. (ROI sizes are for illustrative purposes and are
not to scale)
64
According to scanning procedures depicted in Figure 3.2 and based on raw pixel data ob-
tained in accordance with Figure 3.1 we defined total of twelve (12) radiochromic film response
functions to radiation. Six functions used single-scan and another six used double-scan method. In
order to make this list of functions clear, we will list single- and double-scan method based func-
tions together.
We start with functions constructed from pixel values originating from transmission scans
(Figure 3.2.left) and the most common function encountered in the literature is the optical density
(OD):
∆𝑛𝑒𝑡𝑂𝐷𝑡𝑟𝑎𝑛𝑠 = 𝑛𝑒𝑡𝑂𝐷𝑡𝑟𝑎𝑛𝑠𝑖𝑟𝑟𝑎𝑑 − 𝑛𝑒𝑡𝑂𝐷𝑡𝑟𝑎𝑛𝑠
𝑢𝑛𝑖𝑟𝑟𝑎𝑑 = 𝑙𝑜𝑔 {𝑃𝑉𝑏𝑒𝑓𝑜𝑟𝑒
𝑖𝑟𝑟𝑎𝑑
𝑃𝑉𝑎𝑓𝑡𝑒𝑟𝑖𝑟𝑟𝑎𝑑 }
𝑡𝑟𝑎𝑛𝑠
− 𝑙𝑜𝑔 {𝑃𝑉𝑏𝑒𝑓𝑜𝑟𝑒
𝑢𝑛𝑖𝑟𝑟𝑎𝑑
𝑃𝑉𝑎𝑓𝑡𝑒𝑟𝑢𝑛𝑖𝑟𝑟𝑎𝑑}
𝑡𝑟𝑎𝑛𝑠
(3.1)
for a double-scan method, and:
𝑛𝑒𝑡𝑂𝐷𝑡𝑟𝑎𝑛𝑠 = 𝑂𝐷𝑡𝑟𝑎𝑛𝑠𝑖𝑟𝑟𝑎𝑑 − 𝑂𝐷𝑡𝑟𝑎𝑛𝑠
𝑢𝑛𝑖𝑟𝑟𝑎𝑑 = 𝑙𝑜𝑔 {𝑃𝑉𝑎𝑓𝑡𝑒𝑟
𝑢𝑛𝑖𝑟𝑟𝑎𝑑
𝑃𝑉𝑎𝑓𝑡𝑒𝑟𝑖𝑟𝑟𝑎𝑑 }
𝑡𝑟𝑎𝑛𝑠
(3.2)
for a single-scan method.
The second quantity that can be defined from transmission data is transmittance:
∆𝑛𝑒𝑡𝑇𝑡𝑟𝑎𝑛𝑠 = 𝑛𝑒𝑡𝑇𝑡𝑟𝑎𝑛𝑠𝑖𝑟𝑟𝑎𝑑 − 𝑛𝑒𝑡𝑇𝑡𝑟𝑎𝑛𝑠
𝑢𝑛𝑖𝑟𝑟𝑎𝑑 =1
216{𝑃𝑉𝑏𝑒𝑓𝑜𝑟𝑒
𝑖𝑟𝑟𝑎𝑑 − 𝑃𝑉𝑎𝑓𝑡𝑒𝑟𝑖𝑟𝑟𝑎𝑑 − [𝑃𝑉𝑏𝑒𝑓𝑜𝑟𝑒
𝑢𝑛𝑖𝑟𝑟𝑎𝑑 − 𝑃𝑉𝑎𝑓𝑡𝑒𝑟𝑢𝑛𝑖𝑟𝑟𝑎𝑑]}
𝑡𝑟𝑎𝑛𝑠 (3.3)
for a double-scan, and:
𝑛𝑒𝑡𝑇𝑡𝑟𝑎𝑛𝑠 = 𝑇𝑡𝑟𝑎𝑛𝑠𝑖𝑟𝑟𝑎𝑑 − 𝑇𝑡𝑟𝑎𝑛𝑠
𝑢𝑛𝑖𝑟𝑟𝑎𝑑 =1
216{𝑃𝑉𝑎𝑓𝑡𝑒𝑟
𝑢𝑛𝑖𝑟𝑟𝑎𝑑 − 𝑃𝑉𝑎𝑓𝑡𝑒𝑟𝑖𝑟𝑟𝑎𝑑}
𝑡𝑟𝑎𝑛𝑠 (3.4)
for a single-scan method.
Finally, as the last response function using transmission data we define a normalized pixel value
(𝑃𝑉̅̅ ̅̅ ) using double-scan method:
∆𝑃𝑉̅̅ ̅̅ 𝑡𝑟𝑎𝑛𝑠 = 𝑃𝑉̅̅ ̅̅ 𝑡𝑟𝑎𝑛𝑠𝑖𝑟𝑟𝑎𝑑 − 𝑃𝑉̅̅ ̅̅ 𝑡𝑟𝑎𝑛𝑠
𝑢𝑛𝑖𝑟𝑟𝑎𝑑 = {𝑃𝑉𝑏𝑒𝑓𝑜𝑟𝑒
𝑖𝑟𝑟𝑎𝑑
𝑃𝑉𝑎𝑓𝑡𝑒𝑟𝑖𝑟𝑟𝑎𝑑 }
𝑡𝑟𝑎𝑛𝑠
− {𝑃𝑉𝑏𝑒𝑓𝑜𝑟𝑒
𝑢𝑛𝑖𝑟𝑟𝑎𝑑
𝑃𝑉𝑎𝑓𝑡𝑒𝑟𝑢𝑛𝑖𝑟𝑟𝑎𝑑}
𝑡𝑟𝑎𝑛𝑠
(3.5)
65
which for single-scan method becomes:
𝑃𝑉̅̅ ̅̅ 𝑡𝑟𝑎𝑛𝑠 = {𝑃𝑉𝑎𝑓𝑡𝑒𝑟
𝑢𝑛𝑖𝑟𝑟𝑎𝑑
𝑃𝑉𝑎𝑓𝑡𝑒𝑟𝑖𝑟𝑟𝑎𝑑 − 1}
𝑡𝑟𝑎𝑛𝑠
(3.6)
Figure 3.2: Measured “raw” data using flat-bed document scanners in transmission (left) and reflection (right) scan-
ning mode.
The following additional six functions will be defined using pixel values obtained from
images acquired in reflection scanning mode. By using raw reflection data (Figure 3.2.right) we
start with most commonly encountered function used, the reflectance:
∆𝑛𝑒𝑡𝑅𝑟𝑒𝑓𝑙 = 𝑛𝑒𝑡𝑅𝑟𝑒𝑓𝑙𝑖𝑟𝑟𝑎𝑑 − 𝑛𝑒𝑡𝑅𝑟𝑒𝑓𝑙
𝑢𝑛𝑖𝑟𝑟𝑎𝑑 =1
216{𝑃𝑉𝑏𝑒𝑓𝑜𝑟𝑒
𝑖𝑟𝑟𝑎𝑑 − 𝑃𝑉𝑎𝑓𝑡𝑒𝑟𝑖𝑟𝑟𝑎𝑑 − [𝑃𝑉𝑏𝑒𝑓𝑜𝑟𝑒
𝑢𝑛𝑖𝑟𝑟𝑎𝑑 − 𝑃𝑉𝑎𝑓𝑡𝑒𝑟𝑢𝑛𝑖𝑟𝑟𝑎𝑑]}
𝑟𝑒𝑓𝑙 (3.7)
for double-scan, and:
𝑛𝑒𝑡𝑅𝑟𝑒𝑓𝑙 = 𝑅𝑟𝑒𝑓𝑙𝑖𝑟𝑟𝑎𝑑 − 𝑅𝑟𝑒𝑓𝑙
𝑢𝑛𝑖𝑟𝑟𝑎𝑑 =1
216{𝑃𝑉𝑎𝑓𝑡𝑒𝑟
𝑢𝑛𝑖𝑟𝑟𝑎𝑑 − 𝑃𝑉𝑎𝑓𝑡𝑒𝑟𝑖𝑟𝑟𝑎𝑑} 𝑟𝑒𝑓𝑙 (3.8)
for single-scan method. It is of note that Eqs. (3.7) and (3.8) are identical to Eqs. (3.3) and (3.4).
However, one has to keep in mind that pixel values in Eqs. (3.3) and (3.4) originate from trans-
mission scan while the later come from reflection scan. Furthermore, functions defined by Eqs.
(3.3) and (3.4) have a physical meaning of transmission while Eqs. (3.7) and (3.8) do not represent
reflectance per se, as the measured signal originates from double passage of the light through the
sensitive layer and reflection from the back-light surface of the scanner.
66
The second response function we define might not appear natural for data gathered in a
reflection mode but the optical density can be defined in the same way as for transmission scans as:
∆𝑛𝑒𝑡𝑂𝐷𝑟𝑒𝑓𝑙 = 𝑛𝑒𝑡𝑂𝐷𝑟𝑒𝑓𝑙𝑖𝑟𝑟𝑎𝑑 − 𝑛𝑒𝑡𝑂𝐷𝑟𝑒𝑓𝑙
𝑢𝑛𝑖𝑟𝑟𝑎𝑑 = 𝑙𝑜𝑔 {𝑃𝑉𝑏𝑒𝑓𝑜𝑟𝑒
𝑖𝑟𝑟𝑎𝑑
𝑃𝑉𝑎𝑓𝑡𝑒𝑟𝑖𝑟𝑟𝑎𝑑 }
𝑟𝑒𝑓𝑙
− 𝑙𝑜𝑔 {𝑃𝑉𝑏𝑒𝑓𝑜𝑟𝑒
𝑢𝑛𝑖𝑟𝑟𝑎𝑑
𝑃𝑉𝑎𝑓𝑡𝑒𝑟𝑢𝑛𝑖𝑟𝑟𝑎𝑑}
𝑟𝑒𝑓𝑙
(3.9)
for double-scan, and
𝑛𝑒𝑡𝑂𝐷𝑟𝑒𝑓𝑙 = 𝑂𝐷𝑟𝑒𝑓𝑙𝑖𝑟𝑟𝑎𝑑 − 𝑂𝐷𝑟𝑒𝑓𝑙
𝑢𝑛𝑖𝑟𝑟𝑎𝑑 = 𝑙𝑜𝑔 {𝑃𝑉𝑎𝑓𝑡𝑒𝑟
𝑢𝑛𝑖𝑟𝑟𝑎𝑑
𝑃𝑉𝑎𝑓𝑡𝑒𝑟𝑖𝑟𝑟𝑎𝑑 }
𝑟𝑒𝑓𝑙
(3.10)
for single-scan method.
Finally, as in the case of transmission scanning mode, we can define normalized pixel
value for the reflection mode:
∆𝑃𝑉̅̅ ̅̅ 𝑟𝑒𝑓𝑙 = 𝑃𝑉̅̅ ̅̅ 𝑟𝑒𝑓𝑙𝑖𝑟𝑟𝑎𝑑 − 𝑃𝑉̅̅ ̅̅ 𝑟𝑒𝑓𝑙
𝑢𝑛𝑖𝑟𝑟𝑎𝑑 = {𝑃𝑉𝑏𝑒𝑓𝑜𝑟𝑒
𝑖𝑟𝑟𝑎𝑑
𝑃𝑉𝑎𝑓𝑡𝑒𝑟𝑖𝑟𝑟𝑎𝑑 }
𝑟𝑒𝑓𝑙
− {𝑃𝑉𝑏𝑒𝑓𝑜𝑟𝑒
𝑢𝑛𝑖𝑟𝑟𝑎𝑑
𝑃𝑉𝑎𝑓𝑡𝑒𝑟𝑢𝑛𝑖𝑟𝑟𝑎𝑑}
𝑟𝑒𝑓𝑙
(3.11)
which for single-scan method becomes:
𝑃𝑉̅̅ ̅̅ 𝑟𝑒𝑓𝑙 = {𝑃𝑉𝑎𝑓𝑡𝑒𝑟
𝑢𝑛𝑖𝑟𝑟𝑎𝑑
𝑃𝑉𝑎𝑓𝑡𝑒𝑟𝑖𝑟𝑟𝑎𝑑 − 1}
𝑟𝑒𝑓𝑙
(3.12)
In Eqs. (3.1-3.12) pixel values were calculated as weighted means:
𝑃𝑉𝑎𝑣𝑒𝑟𝑎𝑔𝑒 = ∑ 𝜔𝑖 ∙ 𝑃𝑉𝑖𝑁𝑖=1 (3.13)
with normalized weights calculated as:
𝜔𝑖 =
1𝜎𝑃𝑉𝑖2⁄
∑ (1𝜎𝑃𝑉𝑖2⁄ )𝑁
𝑖=1
(3.14)
and the corresponding standard deviation on 𝑃𝑉𝑎𝑣𝑒𝑟𝑎𝑔𝑒 being:
𝜎𝑃𝑉𝑎𝑣𝑒𝑟𝑎𝑔𝑒 = √𝑁
∑ (1𝜎𝑃𝑉𝑖2⁄ )𝑁
𝑖=1
(3.15)
where in our case N = 5.
67
For each of the response functions defined by Eqs. (3.1-3.12) we generated calibration
curves following previously established reference radiochromic film dosimetry protocol [19]. We
successfully fitted all the response functions using rational analytical form:
𝐷 =𝑎∙ℱ(𝐷)
1+𝑏∙ℱ(𝐷) (3.16)
with Origin 2016 (OriginLab Corp, Northampton, MA) software using the ‘‘Levenberg–Mar-
quardt’’ quasi-Newton minimization method. In Eq. (3.16) the ℱ(𝐷) represents one of the functions
(3.1-3.12), while a and b are fitting parameters. The uncertainty analysis was performed, following
Ref 19, which separates an experimental contribution from the uncertainty contribution due to the
calibration curve fit of the film response function. On the other hand, the absolute dose error was
calculated as a difference between delivered (assumed to be known) dose and “measured” dose
using one of the appropriate response functions given by Eqs. (3.1-3.12) entered into Eq. (3.16),
whereby Eqs. (3.1-3.12) were calculated for PV sampled over the sixth ROI (Figure 3.1).
It is important to say that neither the fitting function given by Eq. (3.16) nor the green
channel selected represent the most optimal choice for every of the twelve response functions de-
fined. However, our choice of the color channel and the fitting function form was based on the
following assumption. In order to make an unbiased comparison, we searched for a function that
would provide the same (or at best the similar) uncertainty budget for all the response functions
defined. It is also important to stress that the uncertainty budget we performed in this work does
not include all the Type A and B uncertainty sources one might consider when establishing a ra-
diochromic film dosimetry system [17]. Examples of these are scanner homogeneity (type B),
scanner reproducibility and variability [18] (type A or B), absolute dose calibration (measure-
ments, calibration data, etc…, type B), and monitor chamber reproducibility (type B). However,
the uncertainty budget we used for comparison includes the estimates directly related to the re-
sponse functions (both experimental and fitting) and the two uncertainty sources (when summed
in quadrature) have shown to be larger than calculated errors in more than 2/3 of the measurement
points. Finally, as we mentioned above, the fog signal of the green channel has shown lower vari-
ation (0.5%) when compared to the red channel (1%).
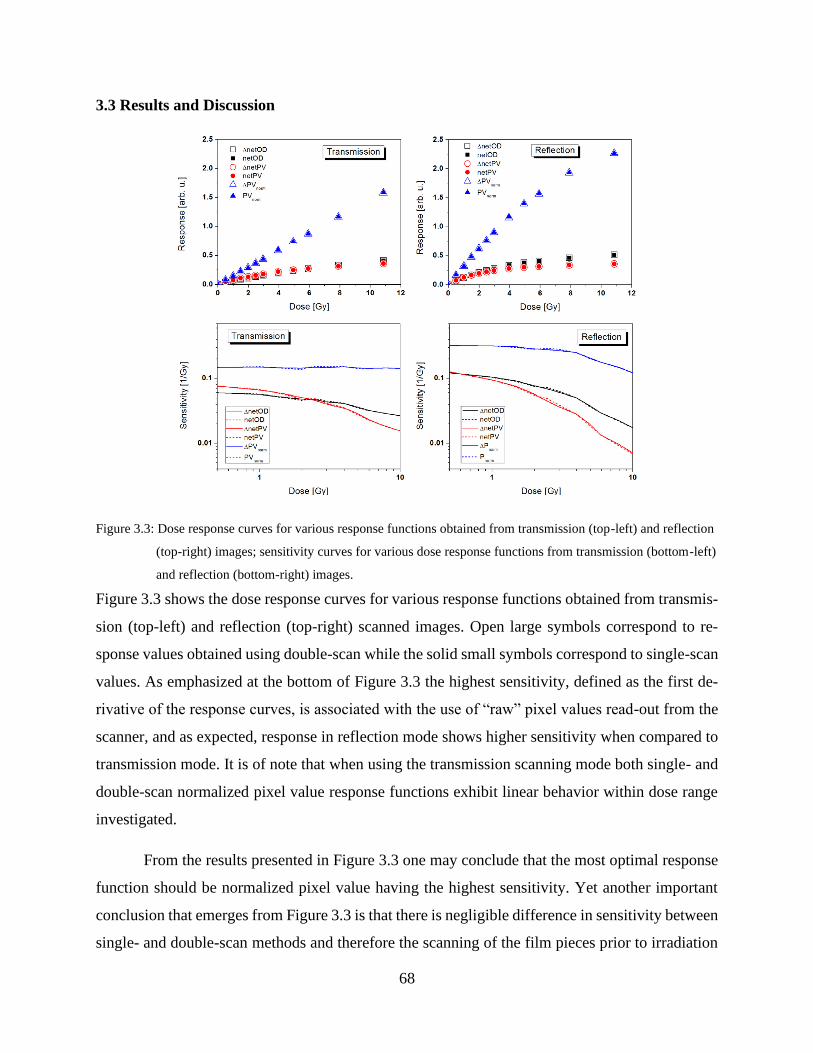
68
3.3 Results and Discussion
Figure 3.3: Dose response curves for various response functions obtained from transmission (top-left) and reflection
(top-right) images; sensitivity curves for various dose response functions from transmission (bottom-left)
and reflection (bottom-right) images.
Figure 3.3 shows the dose response curves for various response functions obtained from transmis-
sion (top-left) and reflection (top-right) scanned images. Open large symbols correspond to re-
sponse values obtained using double-scan while the solid small symbols correspond to single-scan
values. As emphasized at the bottom of Figure 3.3 the highest sensitivity, defined as the first de-
rivative of the response curves, is associated with the use of “raw” pixel values read-out from the
scanner, and as expected, response in reflection mode shows higher sensitivity when compared to
transmission mode. It is of note that when using the transmission scanning mode both single- and
double-scan normalized pixel value response functions exhibit linear behavior within dose range
investigated.
From the results presented in Figure 3.3 one may conclude that the most optimal response
function should be normalized pixel value having the highest sensitivity. Yet another important
conclusion that emerges from Figure 3.3 is that there is negligible difference in sensitivity between
single- and double-scan methods and therefore the scanning of the film pieces prior to irradiation
69
could be abandoned when designing reference radiochromic film dosimetry system. It is important
to point out that the addition of aluminum to the sensitive layer did not only improve the energy
response of the EBT3 film model [21] but also resulted in an improved lamination process leading
to very uniform thickness of the sensitive layer.1 Therefore, the unexposed piece of film scanned
together with measurement film pieces after exposure serves as both the reference film piece for
response change (also known as fog) and the control film piece for eventual environmental impacts
on the response of measurement film pieces. This was also demonstrated in this study for the green
channel (0.5%) and the red channel (1%), and a similar finding was reported in the literature by
[18].
Figure 3.4 represents results of uncertainty vs. error analysis for various dose response
functions obtained using transmission images in a dose range up to 11 Gy. Left column corre-
sponds to functions that for their definition require scans of the film pieces prior and after exposure
(double-scan method) while the right column corresponds to single-scan method. Both double-
(left column) and single-scan (right column) methods provide one sigma uncertainty better than
2% for doses above 2 Gy. It is also of note that single-scan based response functions (right column
of Figure 3.4) result in the actual errors that are somewhat higher than in the case of double-scan
based response functions (left column of Figure 3.4), as expected. When comparing double-scan
based response, unlike the ΔnetOD both pixel value based functions result in errors that are always
below the uncertainty estimates in the whole dose region investigated.
Figure 3.5 represents uncertainty vs. error analysis for different dose response functions
obtained from reflection images in a dose range up to 5 Gy. Left column corresponds to functions
created using double-scanning procedure, while the right column represent functions derived from
single-scan method. Unlike transmission mode response functions, reflection mode based re-
sponses result in dosimetry systems with higher uncertainty. Increase in uncertainty is mainly gov-
erned by the experimental component suggesting that double passage through the sensitive layer
does not only increases sensitivity of the response function but also the noise in readout signal of
images obtained in reflection scanning mode. The only exception represents single-scan netOD
response function, where the fitting uncertainty is dominant in the whole dose range investigated.
Figure 3.5 also indicates that useful dose range when working in the reflection mode becomes
1 Dave Lewis, private communication

70
narrower, and despite the fact the reflection scan based response functions could lead to more
widespread use of radiochromic film dosimetry it would come at the expense of somewhat in-
creased uncertainty when compared to response functions based on transmission scans. As in the
case of transmission scans, the single-scanning method based response functions result in slightly
larger errors.
In both Figure 3.4 and Figure 3.5 one can observe systematically higher uncertainty in
double-scanning methods, governed mainly by experimental uncertainty, which is expected as the
uncertainties of film pieces before exposure are compounded into the total experimental uncer-
tainty. One can also observe that this increase in uncertainty is accompanied by an increase in
accuracy, particularly at low doses.
It is important to emphasize that the choice of using the green channel only in this work
was for the sole reason of making an unbiased comparison between the different response func-
tions. Contemporary film dosimetry protocols are incorporating multichannel dosimetry which can
furthermore improve the accuracy achieved from film dosimetry without increasing the total un-
certainty dramatically since the signals from these color channels are correlated [22-26]. Another
important note is that the results of this study were based on the central region of the scanner and
therefore they are not affected by the lateral response effect which must be taken into account
when performing whole-sheet 2D film dosimetry [27-29].
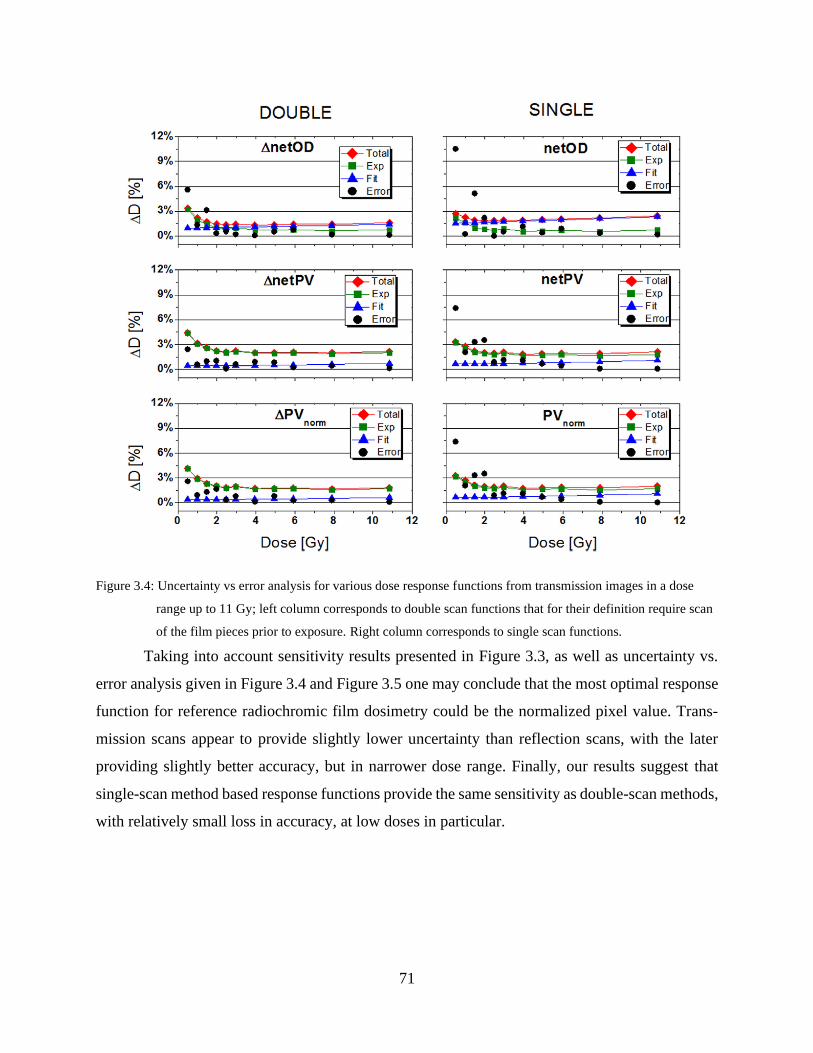
71
Figure 3.4: Uncertainty vs error analysis for various dose response functions from transmission images in a dose
range up to 11 Gy; left column corresponds to double scan functions that for their definition require scan
of the film pieces prior to exposure. Right column corresponds to single scan functions.
Taking into account sensitivity results presented in Figure 3.3, as well as uncertainty vs.
error analysis given in Figure 3.4 and Figure 3.5 one may conclude that the most optimal response
function for reference radiochromic film dosimetry could be the normalized pixel value. Trans-
mission scans appear to provide slightly lower uncertainty than reflection scans, with the later
providing slightly better accuracy, but in narrower dose range. Finally, our results suggest that
single-scan method based response functions provide the same sensitivity as double-scan methods,
with relatively small loss in accuracy, at low doses in particular.

72
Figure 3.5: Uncertainty vs error analysis for various dose response functions from reflection images in a dose range
up to 5 Gy; left column corresponds to double scan functions that for their definition require scan of the
film pieces prior to exposure. Right column corresponds to single scan functions.
3.4 Conclusions
Several radiochromic film response functions were compared in terms of dose sensitivity and un-
certainty vs. error analysis. While the use of reflection scanning mode provides higher sensitivity
and could lead to a more widespread use of radiochromic film dosimetry, it is characterized by
limited dose range and increased uncertainty when compared to transmission scanning. We
demonstrated that a single-scanning method could be adopted as sufficiently precise for most of
clinical and research applications. The unexposed film piece then serves as both background signal
definition (fog) as well as the control film piece. Having the highest sensitivity, and the linear dose
response in transmission mode, the normalized pixel values could be regarded as the optimal
choice of response function for the EBT3 model GafChromicTM film based reference dosimetry
system.
73
3.5 Acknowledgement
This work was supported in part by the Natural Sciences and Engineering Research Council of
Canada contract No. 386009. S.A. is a Ph.D. Candidate supported by the scholarship program at
King Faisal Specialist Hospital & Research Centre (KFSH&RC). S.A. acknowledges partial sup-
port by the CREATE Medical Physics Research Training Network grant of the Natural Sciences
and Engineering Research Council (Grant number: 432290).
3.6 References
1. Butson MJ, Cheung T, Yu PK., Absorption spectra variations of EBT radiochromic film
from radiation exposure. Phys Med Biol. 2005;50:N135-40.
2. Devic S, Seuntjens J, Sham E, Podgorsak EB, Schmidtlein CR, Kirov AS, Soares CG., Pre-
cise radiochromic film dosimetry using a flat-bed document scanner. Med Phys.
2005;32:2245-53.
3. Rink A, Vitkin IA, Jaffray DA. Characterization and real-time optical measurements of the
ionizing radiation dose response for a new radiochromic medium. Med Phys. 2005;32:2510-6.
4. Cheung T, Butson MJ, Yu PK. Post-irradiation colouration of Gafchromic EBT radiochromic
film. Phys Med Biol. 2005;50:N281-5.
5. Chiu-Tsao ST, Ho Y, Shankar R, Wang L, Harrison LB. Energy dependence of response of
new high sensitivity radio-chromic films for megavoltage and kilovoltage radiation energies.
Med Phys. 2005;32:3350-4.
6. Devic S, Seuntjens J, Hegyi G, Podgorsak EB, Soares CG, Kirov AS, Ali I, Williamson JF,
Elizondo A. Dosimetric properties of improved GafChromic films for seven different digitiz-
ers. Med Phys. 2004;31:2392-401.
7. Alva H, Mercado-Uribe H, Rodriguez-Villafuertre M, Brandan ME, The use of a reflective
scanner to study radiochromic film response. Phys Med Biol. 2002;47:2925–33.
8. Kalef-Ezra J, Karava K. Radiochromic film dosimetry: Reflection vs transmission scanning.
Med Phys. 2008;35;2308–11.
9. Mendez I, Hartman V, Hudej R, Strojnik A, Casar B. Gafchromic EBT2 film dosimetry in
reflection mode with a novel plan‐based calibration method. Med Phys. 2013;40:11720-9
10. Papaconstadopoulos P, Hegyi G, Seuntjens J, Devic S. A protocol for EBT3 radiochromic
film dosimetry using reflection scanning. Med Phys. 2014;41:122101.
74
11. Micke A, Lewis DF, Yu X., Multichannel film dosimetry with nonuniformity correction.
Med Phys. 2011;38:2523-34.
12. Lewis D, Micke A, Yu X, Chan MF. An efficient protocol for radiochromic film dosimetry
combining calibration and measurement in a single scan. Med Phys. 2012;39:6339-50.
13. Aldelaijan S, Alzorkany F, Moftah B, Buzurovic I, Seuntjens J, Tomic N, Devic S. Use of a
control film piece in radio-chromic film dosimetry. Phys Med. 2016;32:202-7.
14. Borca VC, Pasquino M, Russo G, Grosso P, Cante D, Sciacero P, Girelli G, Porta MRL, To-
fani S. Dosimetric characterization and use of GAFCHROMIC EBT3 film for IMRT dose
verification. J App Clin Med Phys 2013;14(2):158-71.
15. Reinhardt S, Würl M, Greubel C, Humble N, Wilkens JJ, Hillbrand M, Mairani A, Assmann
W, Parodi K. Investigation of EBT2 and EBT3 films for proton dosimetry in the 4–20 MeV
energy range. Radiat Environ Biophys, 2015;54(1):71-9.
16. Almond PR, Biggs PJ, Coursey BM, Hanson WH, Huq MS, Nath R, and Rogers DWO.
AAPM’s TG-51 protocol for clinical reference dosimetry of high-energy photon and electron
beams. Med Phys. 1999;26:1847–70.
17. Aldelaijan S, Mohammed H, Tomic N, Liang L, DeBlois F, Sarfehnia A, Abdel-Rahman W,
Seuntjens J, and Devic S. Radiochromic film dosimetry of HDR 192Ir source radiation fields.
Med Phys. 2011;38:6074-83.
18. Marroquin EYL, Herrera Gonzalez JA, Camacho Lopez MA, Barajas JEV, García‐Garduño,
OA. Evaluation of the uncertainty in an EBT3 film dosimetry system utilizing net optical
density. J App Clin Med Phys, 2016;17(5):1-16.
19. Devic S, Tomic N, Lewis D. Reference Radiochromic Film Dosimetry: Review of Technical
Aspects. Phys Med. 2016;32:541-56.
20. Lewis D and Devic S, Correcting scan-to-scan response variability for a radiochromic film-
based reference dosimetry system, Med Phys. 2015;42(10):5692-701
21. Bekerat H, Devic S, DeBlois F, Singh K, Sarfehnia A, Seuntjens J, Shih S, Yu X, Lewis D.
Improving the Energy Response of External Beam Therapy (EBT) GafChromicTM Dosimetry
Films at Low Energies (≤100 keV). Med Phys. 2014;41:022101.
22. Vera-Sanchez JC, Ruiz-Morales C, Gonzalez-Lopez A. Monte Carlo uncertainty analysis of
dose estimates in radio-chromic film dosimetry with single-channel and multichannel algo-
rithms, Phys Med. 2018;47:11.
75
23. Ruiz-Morales C, Vera-Sanchez JA, Gonzalez-Lopez A, On the re-calibration process in radi-
ochromic film dosimetry, Phys Med. 2017;42:9.
24. Mendez I, Peterlin P, Hudej R, Strojnik A, On multichannel film dosimetry with channel-in-
dependent perturbation, Med Phys. 2013;41:011705-10.
25. Mendez I, Model selection for radiochromic film dosimetry, Phys Med Biol. 2015;60:4089-
104.
26. Marrazzo L, Zani M, Pallotta S, Arilli C, Casati M, Compagnucci A, Talamonti C, Bucciolini
M. GafChromic® EBT3 films for patient specific IMRT QA using a multichannel approach.
Phys Med. 2015;31(8):1035-1042.
27. Pérez Azorin JF, Ramos Garcia LI, Ozcoidi DM, Almansa JF. Polarized dosimetry method
for Gafchromic EBT3. Phys Med. 2016;32(8):972-80.
28. Lewis D and Chan MF. Correcting lateral response artifacts from flatbed scanners for radio-
chromic film dosimetry. Med Phys. 2015;42(1):416-29.
29. Crijns W, Maes F, Van Der Heide UA, Van den Heuvel F. Calibrating page sized Gaf-
chromic EBT3 films. Med Phys. 2013;40(1):012102
76
CHAPTER 4: Dose response linearization in radiochromic film do-
simetry based on multichannel normalized pixel value with an inte-
grated spectral correction for scanner response variations
Preface
In the previous chapter, we introduced the ‘normalized pixel value’ response function based on
the green color channel of film image scanned in transmission mode, which provided a linear
dose response for the EBT3 GAFCHROMIC™ film model for doses of up to 11 Gy. In this
work, we introduce the multichannel normalized pixel value dose response to increase the dy-
namic range of dose-response linearity up to 40 Gy by utilizing all color information available in
the RGB images. This is especially useful for measurements of high doses expected in the case
of HDR brachytherapy. Additionally, this paper introduced a new spectral correction that is gen-
erated from the scanned images themselves to correct for the scanner reading variability and
scanner bed inhomogeneities with respect to calibration conditions. With these advancements, a
protocol was suggested and verified for a practical, reliable and self-corrected dosimetry proce-
dure with radiochromic films that will be utilized for quality assurance of HDR brachytherapy in
the remaining of the thesis.
This work has been published in the AAPM Medical Physics journal:
Aldelaijan, S., Devic, S., Papaconstadopoulos, P., Bekerat, H., Cormack, R.A., Seuntjens, J. and
Buzurovic, I.M., Dose–response linearization in radiochromic film dosimetry based on multi-
channel normalized pixel value with an integrated spectral correction for scanner response varia-
tions. Med. Phys., 46: 5336-5349 (2019)
77
Dose response linearization in radiochromic film dosimetry
based on multichannel normalized pixel value with an inte-
grated spectral correction for scanner response variations
Saad Aldelaijan1-5, Slobodan Devic3,4, Pavlos Papaconstadopoulos6, Hamed Bekerat4, Robert A.
Cormack1, Jan Seuntjens3, Ivan M. Buzurovic1
1Department of Radiation Oncology, Dana Farber/Brigham and Women’s Cancer Center, Har-
vard Medical School, Boston, MA, 02115, USA
2Department of Biomedical Engineering, Montreal Neurological Institute, McGill University,
Montréal, QC, H3A 2B4, Canada
3Medical Physics Unit, McGill University, Montréal, QC, H4A 3J1, Canada
4Department of Radiation Oncology, SMBD Jewish General Hospital, Montréal, QC, H3T 1E2,
Canada
5Biomedical Physics Department, King Faisal Specialist Hospital & Research Centre, Riyadh,
12713, Saudi Arabia
6Netherlands Cancer Institute, Amsterdam, 1066 CX, Netherlands
Keywords: dosimetry, linearization, multichannel film dosimetry, radiochromic film dosimetry,
scanner correction
Abstract
Purpose: To introduce a model that reproducibly linearizes the response from radiochromic film
(RCF) dosimetry systems at extended dose range. To introduce a correction method, generated
from the same scanned images, which corrects for scanner temporal response variation and scan-
ner bed inhomogeneity.
78
Methods: Six calibration curves were established for different lot numbers of EBT3 GAF-
CHROMIC™ film model based on four EPSON scanners (10000XL (2 units), 11000XL,
12000XL) at three different centers. These films were calibrated in terms of absorbed dose to
water based on TG51 protocol or TRS398 with dose ranges up to 40 Gy. The film response was
defined in terms of a proposed normalized pixel value (𝑛𝑃𝑉𝑅𝐺𝐵) as a summation of first order
equations based on information from red, green and blue channels. The fitting parameters of
these equations are chosen in a way that makes the film response equal to dose at the time of cal-
ibration. An integrated set of correction factors (one per color channel) was also introduced.
These factors account for the spatial and temporal changes in scanning states during calibration
and measurements. The combination of 𝑛𝑃𝑉𝑅𝐺𝐵 and this “fingerprint” correction formed the ba-
sis of this new protocol and it was tested against net optical density (𝑛𝑒𝑡𝑂𝐷𝑋=𝑅,𝐺,𝐵) single chan-
nel dosimetry in terms of accuracy, precision, scanner response variability, scanner bed inhomo-
geneity, noise, and long term stability.
Results: Incorporating multichannel-features (RGB) into the normalized pixel value produced
linear response to absorbed dose (slope of 1) in all six RCF dosimetry systems considered in this
study. The “fingerprint” correction factors of each of these six systems displayed unique patterns
at the time of calibration. The application of 𝑛𝑃𝑉𝑅𝐺𝐵 to all of these six systems could achieve a
level of accuracy of ±2.0% in the dose range of interest within modeled uncertainty level of 2.0–
3.0% depending on the dose level. Consistent positioning of control and measurement film
pieces and integrating the multichannel correction into the response function formalism miti-
gated possible scanner response variations of as much as ±10% at lower doses and scanner bed
inhomogeneity of ±8% to the established level of uncertainty at the time of calibration. The sys-
tem was also able to maintain the same level of accuracy after 3 and 6 months post calibration.
Conclusions: Combining response linearity with the integrated correction for scanner response
variation lead to a sustainable and practical RCF dosimetry system that mitigated systematic re-
sponse shifts and it has the potential to reduce errors in reporting relative information from the
film response.
79
4.1 Introduction
Radiochromic film1–3 (RCF) has been a dosimeter of choice when high resolution 2D dose meas-
urements are required. Any RCF dosimetry system consists of three essential components: a) the
film model, b) the scanner model, and c) the dosimetry protocol.4 Nowadays, most EBT3 model
RCF dosimetry systems utilize linear charge-coupled device (CCD) based flatbed document
scanners,2 and different scanner models may incorporate different light source technologies.5
These properties affect the film readout since the signal measured by the scanner is a convolution
between the light source emission spectrum, the film absorbance properties and the sensitivity of
the CCD-based light detectors. Most scanner models used with RCF dosimetry were based on
xenon fluorescent lamps (e.g. EPSON Expression 10000XL/11000XL, V700) and different film
response functions were well documented in the literature based on transmission or reflection ac-
quisitions using these scanners.6–8 More recently, LED based scanners (e.g. EPSON 12000XL,
V800) were introduced in the market and they are replacing older models. Therefore, it is possi-
ble that already-established accuracy levels with the current RCF dosimetry systems may be im-
pacted by such changes and these new scanners must be tested thoroughly. Lárraga-Gutiérrez et
al9 evaluated the performance of the V800 LED scanner and compared its use to the 11000XL
model. They concluded that the response of the V800 scanner was comparable to the 11000XL
but they noted some important spectral differences between the two types of lamps. Although the
LED based scanner showed better signal stability, they reported stronger non-uniformity of the
scanning bed, which might have an impact when the whole sheets of film are used, such as for
larger IMRT/VMAT dose distribution measurements.10
The third aspect of RCF dosimetry system is the dosimetry protocol11 which is a refer-
ence set of instructions that must be maintained during calibration and measurement phases, as
per the AAPM TG55 recommendations.3 This includes all the film handling procedures, scan-
ning instructions, image analysis, as well as dose and its associated uncertainty calculation mod-
els. The definition of a suitable response function is an important aspect of the dosimetry proto-
col because it directly affects prospective dose calculation accuracy and precision.12, 13 Consider-
ing transmission scanning, there are three main categories of RCF dosimetry protocols that can
be found in the literature: single channel dosimetry based on empirical models,2 single channel
dosimetry based on physical models,14, 15 and triple channel dosimetry based on empirical mod-
els.16–19 Most of the empirical models were shown to be accurate when used in conditions similar

80
to the calibration conditions, however, possible changes in the scanner-film states may lead into
significant inaccuracies if not accounted for. This in turn lead into the introduction of recalibra-
tion protocols20, 21 which took these changes into account but with the caveat that they require
extra irradiation(s) of reference dose(s) to rescale the calibration curve.
In this work, an improved response function based on normalized pixel value13 of all
color channels has been introduced using different scanner models (xenon fluorescent vs LED
lamps). This response function, referred to as the multichannel normalized pixel value (𝑛𝑃𝑉𝑅𝐺𝐵)
has the advantage of reproducibly linearizing the dose response and it allows performing direct
per-channel corrections taking into account the spatial and temporal changes between calibration
and measurement phases. Also, optimal positioning of control and measurement film pieces on
the scanning bed has been discussed. The new protocol has been tested against net optical den-
sity (𝑛𝑒𝑡𝑂𝐷𝑋=𝑅,𝐺,𝐵) single channel dosimetry protocol in terms of accuracy, precision, scanner
response variability, scanner bed inhomogeneity, noise, and long term stability.
4.2 Materials and Methods
4.2.A Radiochromic film dosimetry system
In this work, six lots of EBT3 GAFCHROMICTM film model (Ashland Inc, Wayne, NJ) were
used together with three different EPSON scanner models: two units of 10000XL (discontinued),
one unit of 11000XL (discontinued) and one unit of 12000XL (Epson, Nagano, Japan), available
at three different centers at: Montreal (EBT3 lot 1, lot 3 with 10000XL-A and lot 5 with
11000XL), Riyadh (EBT3 lot 2, lot 4 with 10000XL-B), and Boston (lot 6 with 12000XL). More
information about the structure and characteristics of the film can be found elsewhere in the liter-
ature.2
4.2.B Film calibration and irradiation setups
Three different Varian linear accelerators (linacs, Varian, Palo Alto, CA) were used for film cali-
bration under MV photon beams. These linacs and the energy used for calibration were True-
Beam™ (10 MV, Riyadh), Clinac eX (18 MV, Montreal), and Edge® (6 MV, Boston). The
beam output was calibrated in terms of absorbed dose to water based on AAPM TG51 protocol22,
23 (Montreal, Boston) or IAEA TRS39824 (Riyadh) using reference ion chambers. At all centers,
the reference ion chamber was positioned at 10 cm depth within a 30 × 30 × 30 cm3 Solid
81
Water™ phantom, and the field size was set to 10 × 10 cm2 with either a source-to-axis distance
(SAD) of 100 cm or a source-to-surface distance (SSD) of 100 cm (TrueBeam™: SSD, Clinac
eX: SAD, Edge®: SAD). To generate the calibration curves, film pieces were irradiated in the
same phantom (one piece at a time) and they were positioned at 10 cm depth in place of the ref-
erence ion chamber. During film calibration the beam was monitored by an ion chamber posi-
tioned 10 cm below the film. The six different RCF dosimetry systems used in this work had dif-
ferent dose ranges and approximately the same dose geometric distribution and the maximum de-
livered dose was 40 Gy.
4.2.C Film scanning and image analysis
Films were scanned in accordance to currently used film protocols3, 25 24 hours after irradiation
only13 at 254 dpi (0.1 mm per pixel) in transmission mode by 48-bit EPSON Expression flatbed
RGB scanner models: 10000XL, 11000XL and 12000XL as described in section (2.A.). Images
were saved as tagged image file format (TIFF) with all color correction features turned off and
all RGB color channels were used in this work. For most of the scans (except evaluation of scan-
ner bed inhomogeneity), measurement film pieces were scanned together with control film of the
same size at the middle long section of the scanner. The orientations of all film pieces were
maintained at all times and the control piece was always placed in the middle of the scanner. A
de-noising26 2D Wiener filter was applied to all images which was found effective in reducing
noise while preserving the true pixel value (PV) information.2 Since the values of all pixels are
determined with respect to the scanner calibration area, any inhomogeneities, deformities, dust
particles in that area will appear as horizontal streaks across the film image and it should be ac-
counted for. This “streaks” correction can be applied within any image by making sure to include
some space around the films when scanning. For any image of size i × j, the first and last ten pix-
els of any row n in the image were used to create two average pixel values (PVAVG): one repre-
sents the first pixel of the row [PVAVG(n, 1) = Average(PV(n, 1:10))] and the other, the last pixel
[PVAVG(n, j) = Average(PV(n, j-10:j))]. The correction along the whole row is then generated by
linear interpolation between these two points per row using the following transformation per
pixel PVAVG(1:i, 1:10∪j-10:j)/PVAVG(i, j). It is assumed that the first ten pixels and the last ten
pixels of every row do not intersect with pixels containing information about the film or any im-
perfections (dust, fingerprints etc…). After streaks and noise removal, thirty 10 mm by 10 mm

82
regions of interest (ROIs) were randomly selected within the central 20 mm by 20 mm area of
each uniformly irradiated film piece whereas the final mean and standard deviation was calcu-
lated as a weighted average of these ROIs.2
4.2.D Multichannel normalized pixel value
4.2.D.1 System definition
In a previous work,13 a dose response function was introduced that is based on normalized pixel
values from a green-channel transmission scan (𝑛𝑃𝑉𝐺). It has the form:
𝑛𝑃𝑉𝐺 = {𝑃𝑉𝑎𝑓𝑡𝑒𝑟
𝑚𝑒𝑎𝑠,𝑐𝑡𝑟𝑙
𝑃𝑉𝑎𝑓𝑡𝑒𝑟𝑚𝑒𝑎𝑠,𝐷𝑜𝑠𝑒 − 1}
𝑡𝑟𝑎𝑛𝑠
(4.1)
Where 𝑃𝑉𝑎𝑓𝑡𝑒𝑟𝑚𝑒𝑎𝑠,𝑐𝑡𝑟𝑙
and 𝑃𝑉𝑎𝑓𝑡𝑒𝑟𝑚𝑒𝑎𝑠,𝐷𝑜𝑠𝑒
are the green channel transmission pixel values of the con-
trol film piece and the measurement film piece, respectively. The subscript “after” means that
both film pieces are scanned after irradiation without the need to scan them before exposure
since the mean values of several background film pieces was found to be reproducible to within
0.3% in the green channel and confirmed by other studies.13,27 From this point onward the sub-
script “after” will be omitted assuming that all the pixel values refer to film scans after irradia-
tion. The “– 1” is added to have a response of zero when the film is not irradiated.
The advantage of 𝑛𝑃𝑉𝐺 dose response function is that it has a linear response to doses up
to 10 Gy.13 Similarly, for all color channels, one can define:
𝑛𝑃𝑉𝑋=𝑅,𝐺,𝐵 = {𝑃𝑉𝑋
𝑚𝑒𝑎𝑠,𝑐𝑡𝑟𝑙
𝑃𝑉𝑋𝑚𝑒𝑎𝑠,𝐷𝑜𝑠𝑒 − 1}
𝑡𝑟𝑎𝑛𝑠
(4.2)
Based on the fact that each color channel has an optimal dose response at a specific dose
range27,28 i.e. red channel (up to 6-8 Gy), green channel (approximately 6-40 Gy), and blue chan-
nel beyond, the concept of 𝑛𝑃𝑉 was revisited to include a single response function that is
weighted by multi-color responses in a way to achieve reproducible linear response from the film
including doses higher than 10 Gy. This concept is introduced as an improved multichannel nor-
malized pixel value response based on all color information, 𝑛𝑃𝑉𝑅𝐺𝐵, and it can be written as:
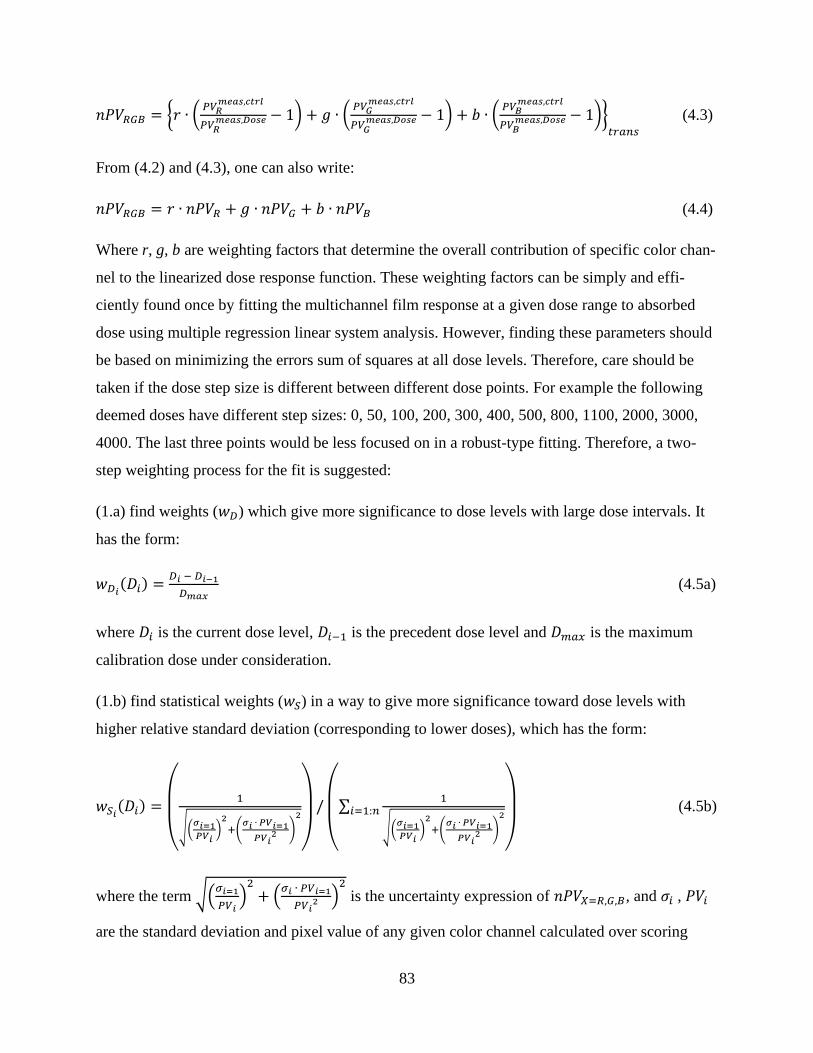
83
𝑛𝑃𝑉𝑅𝐺𝐵 = {𝑟 ∙ (𝑃𝑉𝑅
𝑚𝑒𝑎𝑠,𝑐𝑡𝑟𝑙
𝑃𝑉𝑅𝑚𝑒𝑎𝑠,𝐷𝑜𝑠𝑒 − 1) + 𝑔 ∙ (
𝑃𝑉𝐺𝑚𝑒𝑎𝑠,𝑐𝑡𝑟𝑙
𝑃𝑉𝐺𝑚𝑒𝑎𝑠,𝐷𝑜𝑠𝑒 − 1) + 𝑏 ∙ (
𝑃𝑉𝐵𝑚𝑒𝑎𝑠,𝑐𝑡𝑟𝑙
𝑃𝑉𝐵𝑚𝑒𝑎𝑠,𝐷𝑜𝑠𝑒 − 1)}
𝑡𝑟𝑎𝑛𝑠
(4.3)
From (4.2) and (4.3), one can also write:
𝑛𝑃𝑉𝑅𝐺𝐵 = 𝑟 ∙ 𝑛𝑃𝑉𝑅 + 𝑔 ∙ 𝑛𝑃𝑉𝐺 + 𝑏 ∙ 𝑛𝑃𝑉𝐵 (4.4)
Where r, g, b are weighting factors that determine the overall contribution of specific color chan-
nel to the linearized dose response function. These weighting factors can be simply and effi-
ciently found once by fitting the multichannel film response at a given dose range to absorbed
dose using multiple regression linear system analysis. However, finding these parameters should
be based on minimizing the errors sum of squares at all dose levels. Therefore, care should be
taken if the dose step size is different between different dose points. For example the following
deemed doses have different step sizes: 0, 50, 100, 200, 300, 400, 500, 800, 1100, 2000, 3000,
4000. The last three points would be less focused on in a robust-type fitting. Therefore, a two-
step weighting process for the fit is suggested:
(1.a) find weights (𝑤𝐷) which give more significance to dose levels with large dose intervals. It
has the form:
𝑤𝐷𝑖(𝐷𝑖) =𝐷𝑖 − 𝐷𝑖−1
𝐷𝑚𝑎𝑥 (4.5a)
where 𝐷𝑖 is the current dose level, 𝐷𝑖−1 is the precedent dose level and 𝐷𝑚𝑎𝑥 is the maximum
calibration dose under consideration.
(1.b) find statistical weights (𝑤𝑆) in a way to give more significance toward dose levels with
higher relative standard deviation (corresponding to lower doses), which has the form:
𝑤𝑆𝑖(𝐷𝑖) =
(
1
√(𝜎𝑖=1𝑃𝑉𝑖
)2
+(𝜎𝑖 ∙ 𝑃𝑉𝑖=1
𝑃𝑉𝑖2 )
2
)
/
(
∑
1
√(𝜎𝑖=1𝑃𝑉𝑖
)2
+(𝜎𝑖 ∙ 𝑃𝑉𝑖=1
𝑃𝑉𝑖2 )
2𝑖=1:𝑛
)
(4.5b)
where the term √(𝜎𝑖=1
𝑃𝑉𝑖)2
+ (𝜎𝑖 ∙ 𝑃𝑉𝑖=1
𝑃𝑉𝑖2 )
2
is the uncertainty expression of 𝑛𝑃𝑉𝑋=𝑅,𝐺,𝐵, and 𝜎𝑖 , 𝑃𝑉𝑖
are the standard deviation and pixel value of any given color channel calculated over scoring
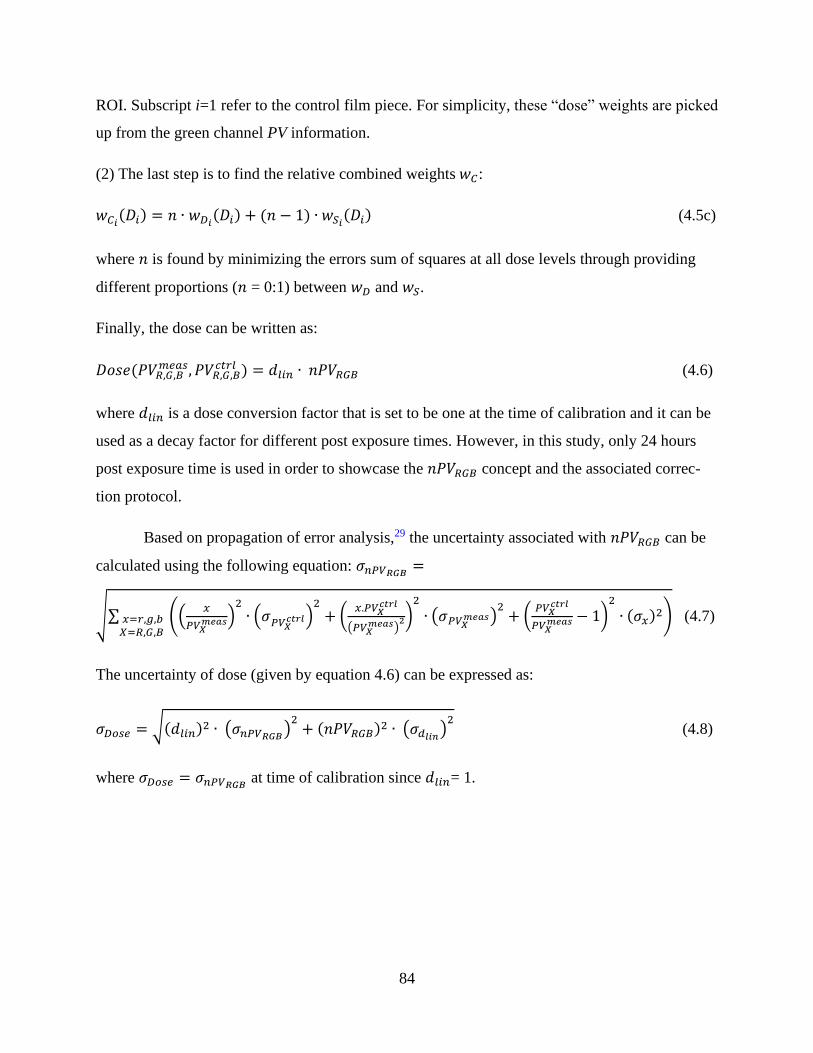
84
ROI. Subscript i=1 refer to the control film piece. For simplicity, these “dose” weights are picked
up from the green channel PV information.
(2) The last step is to find the relative combined weights 𝑤𝐶:
𝑤𝐶𝑖(𝐷𝑖) = 𝑛 ∙ 𝑤𝐷𝑖(𝐷𝑖) + (𝑛 − 1) ∙ 𝑤𝑆𝑖(𝐷𝑖) (4.5c)
where 𝑛 is found by minimizing the errors sum of squares at all dose levels through providing
different proportions (𝑛 = 0:1) between 𝑤𝐷 and 𝑤𝑆.
Finally, the dose can be written as:
𝐷𝑜𝑠𝑒(𝑃𝑉𝑅,𝐺,𝐵𝑚𝑒𝑎𝑠, 𝑃𝑉𝑅,𝐺,𝐵
𝑐𝑡𝑟𝑙 ) = 𝑑𝑙𝑖𝑛 ∙ 𝑛𝑃𝑉𝑅𝐺𝐵 (4.6)
where 𝑑𝑙𝑖𝑛 is a dose conversion factor that is set to be one at the time of calibration and it can be
used as a decay factor for different post exposure times. However, in this study, only 24 hours
post exposure time is used in order to showcase the 𝑛𝑃𝑉𝑅𝐺𝐵 concept and the associated correc-
tion protocol.
Based on propagation of error analysis,29 the uncertainty associated with 𝑛𝑃𝑉𝑅𝐺𝐵 can be
calculated using the following equation: 𝜎𝑛𝑃𝑉𝑅𝐺𝐵 =
√∑ ((𝑥
𝑃𝑉𝑋𝑚𝑒𝑎𝑠)
2
∙ (𝜎𝑃𝑉𝑋𝑐𝑡𝑟𝑙)2
+ (𝑥.𝑃𝑉𝑋
𝑐𝑡𝑟𝑙
(𝑃𝑉𝑋𝑚𝑒𝑎𝑠)
2)2
∙ (𝜎𝑃𝑉𝑋𝑚𝑒𝑎𝑠)2+ (
𝑃𝑉𝑋𝑐𝑡𝑟𝑙
𝑃𝑉𝑋𝑚𝑒𝑎𝑠 − 1)
2
∙ (𝜎𝑥)2)𝑥=𝑟,𝑔,𝑏𝑋=𝑅,𝐺,𝐵
(4.7)
The uncertainty of dose (given by equation 4.6) can be expressed as:
𝜎𝐷𝑜𝑠𝑒 = √(𝑑𝑙𝑖𝑛)2 ∙ (𝜎𝑛𝑃𝑉𝑅𝐺𝐵)2+ (𝑛𝑃𝑉𝑅𝐺𝐵)2 ∙ (𝜎𝑑𝑙𝑖𝑛)
2 (4.8)
where 𝜎𝐷𝑜𝑠𝑒 = 𝜎𝑛𝑃𝑉𝑅𝐺𝐵 at time of calibration since 𝑑𝑙𝑖𝑛= 1.
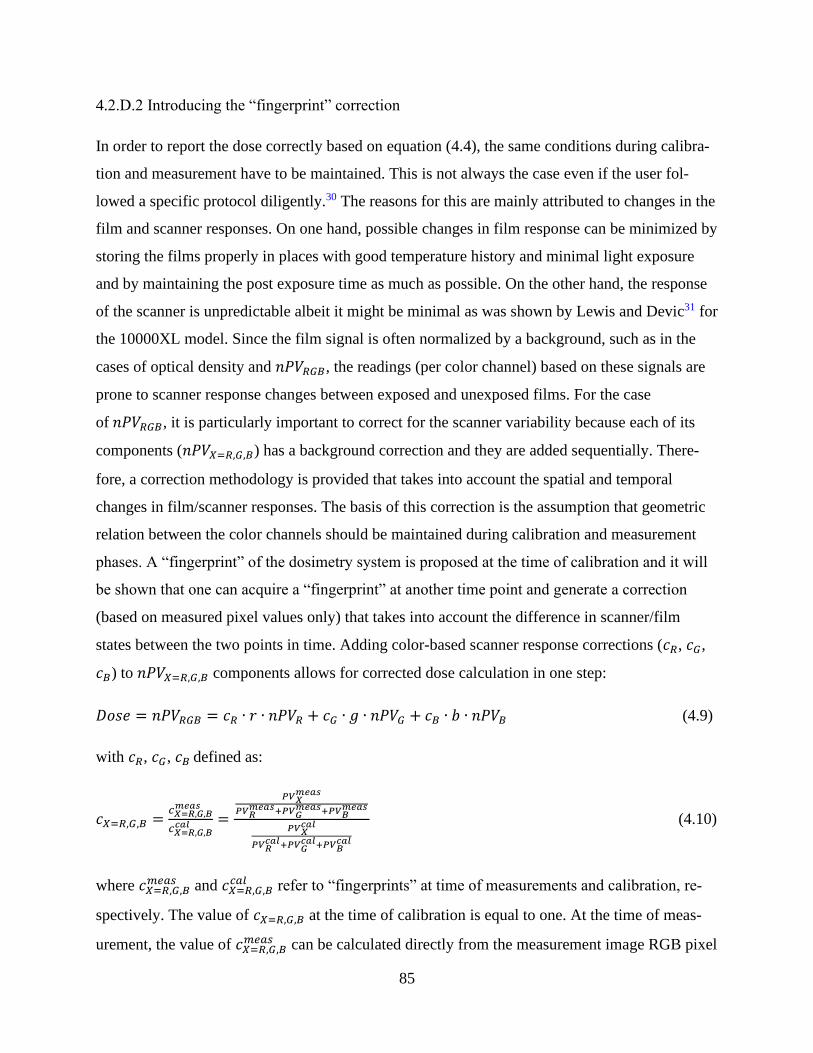
85
4.2.D.2 Introducing the “fingerprint” correction
In order to report the dose correctly based on equation (4.4), the same conditions during calibra-
tion and measurement have to be maintained. This is not always the case even if the user fol-
lowed a specific protocol diligently.30 The reasons for this are mainly attributed to changes in the
film and scanner responses. On one hand, possible changes in film response can be minimized by
storing the films properly in places with good temperature history and minimal light exposure
and by maintaining the post exposure time as much as possible. On the other hand, the response
of the scanner is unpredictable albeit it might be minimal as was shown by Lewis and Devic31 for
the 10000XL model. Since the film signal is often normalized by a background, such as in the
cases of optical density and 𝑛𝑃𝑉𝑅𝐺𝐵, the readings (per color channel) based on these signals are
prone to scanner response changes between exposed and unexposed films. For the case
of 𝑛𝑃𝑉𝑅𝐺𝐵, it is particularly important to correct for the scanner variability because each of its
components (𝑛𝑃𝑉𝑋=𝑅,𝐺,𝐵) has a background correction and they are added sequentially. There-
fore, a correction methodology is provided that takes into account the spatial and temporal
changes in film/scanner responses. The basis of this correction is the assumption that geometric
relation between the color channels should be maintained during calibration and measurement
phases. A “fingerprint” of the dosimetry system is proposed at the time of calibration and it will
be shown that one can acquire a “fingerprint” at another time point and generate a correction
(based on measured pixel values only) that takes into account the difference in scanner/film
states between the two points in time. Adding color-based scanner response corrections (𝑐𝑅, 𝑐𝐺,
𝑐𝐵) to 𝑛𝑃𝑉𝑋=𝑅,𝐺,𝐵 components allows for corrected dose calculation in one step:
𝐷𝑜𝑠𝑒 = 𝑛𝑃𝑉𝑅𝐺𝐵 = 𝑐𝑅 ∙ 𝑟 ∙ 𝑛𝑃𝑉𝑅 + 𝑐𝐺 ∙ 𝑔 ∙ 𝑛𝑃𝑉𝐺 + 𝑐𝐵 ∙ 𝑏 ∙ 𝑛𝑃𝑉𝐵 (4.9)
with 𝑐𝑅, 𝑐𝐺, 𝑐𝐵 defined as:
𝑐𝑋=𝑅,𝐺,𝐵 =𝑐𝑋=𝑅,𝐺,𝐵𝑚𝑒𝑎𝑠
𝑐𝑋=𝑅,𝐺,𝐵𝑐𝑎𝑙 =
𝑃𝑉𝑋𝑚𝑒𝑎𝑠
𝑃𝑉𝑅𝑚𝑒𝑎𝑠+𝑃𝑉𝐺
𝑚𝑒𝑎𝑠+𝑃𝑉𝐵𝑚𝑒𝑎𝑠
𝑃𝑉𝑋𝑐𝑎𝑙
𝑃𝑉𝑅𝑐𝑎𝑙+𝑃𝑉𝐺
𝑐𝑎𝑙+𝑃𝑉𝐵𝑐𝑎𝑙
(4.10)
where 𝑐𝑋=𝑅,𝐺,𝐵𝑚𝑒𝑎𝑠 and 𝑐𝑋=𝑅,𝐺,𝐵
𝑐𝑎𝑙 refer to “fingerprints” at time of measurements and calibration, re-
spectively. The value of 𝑐𝑋=𝑅,𝐺,𝐵 at the time of calibration is equal to one. At the time of meas-
urement, the value of 𝑐𝑋=𝑅,𝐺,𝐵𝑚𝑒𝑎𝑠 can be calculated directly from the measurement image RGB pixel
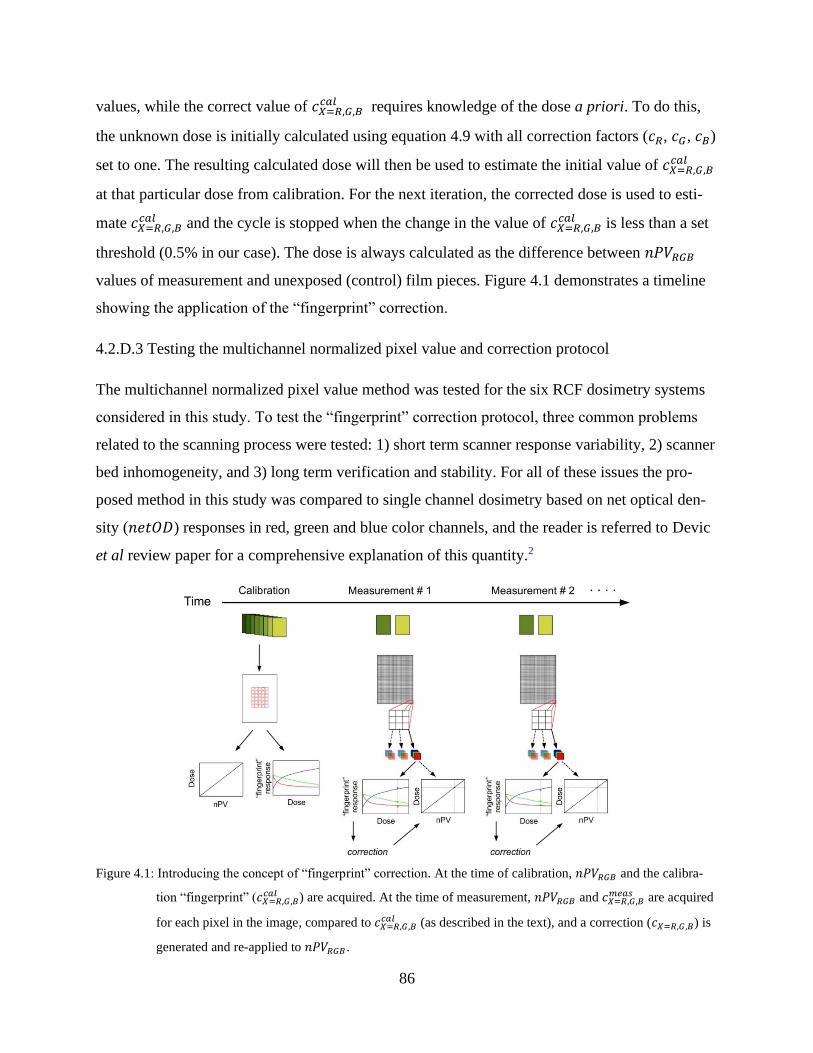
86
values, while the correct value of 𝑐𝑋=𝑅,𝐺,𝐵𝑐𝑎𝑙 requires knowledge of the dose a priori. To do this,
the unknown dose is initially calculated using equation 4.9 with all correction factors (𝑐𝑅, 𝑐𝐺, 𝑐𝐵)
set to one. The resulting calculated dose will then be used to estimate the initial value of 𝑐𝑋=𝑅,𝐺,𝐵𝑐𝑎𝑙
at that particular dose from calibration. For the next iteration, the corrected dose is used to esti-
mate 𝑐𝑋=𝑅,𝐺,𝐵𝑐𝑎𝑙 and the cycle is stopped when the change in the value of 𝑐𝑋=𝑅,𝐺,𝐵
𝑐𝑎𝑙 is less than a set
threshold (0.5% in our case). The dose is always calculated as the difference between 𝑛𝑃𝑉𝑅𝐺𝐵
values of measurement and unexposed (control) film pieces. Figure 4.1 demonstrates a timeline
showing the application of the “fingerprint” correction.
4.2.D.3 Testing the multichannel normalized pixel value and correction protocol
The multichannel normalized pixel value method was tested for the six RCF dosimetry systems
considered in this study. To test the “fingerprint” correction protocol, three common problems
related to the scanning process were tested: 1) short term scanner response variability, 2) scanner
bed inhomogeneity, and 3) long term verification and stability. For all of these issues the pro-
posed method in this study was compared to single channel dosimetry based on net optical den-
sity (𝑛𝑒𝑡𝑂𝐷) responses in red, green and blue color channels, and the reader is referred to Devic
et al review paper for a comprehensive explanation of this quantity.2
Figure 4.1: Introducing the concept of “fingerprint” correction. At the time of calibration, 𝑛𝑃𝑉𝑅𝐺𝐵 and the calibra-
tion “fingerprint” (𝑐𝑋=𝑅,𝐺,𝐵𝑐𝑎𝑙 ) are acquired. At the time of measurement, 𝑛𝑃𝑉𝑅𝐺𝐵 and 𝑐𝑋=𝑅,𝐺,𝐵
𝑚𝑒𝑎𝑠 are acquired
for each pixel in the image, compared to 𝑐𝑋=𝑅,𝐺,𝐵𝑐𝑎𝑙 (as described in the text), and a correction (𝑐𝑋=𝑅,𝐺,𝐵) is
generated and re-applied to 𝑛𝑃𝑉𝑅𝐺𝐵 .
87
Short term scanner response variability
This issue refers to scan-to-scan variability with respect to the first scan. The 12000XL EPSON
scanner was used for evaluation since it is the only scanner out of the three models that we could
not find any literature about. A similar approach to Lewis and Devic31 was followed to evaluate
scanner variability: two sets of measurands were scanned at the same time: (a) neutral density
(ND) filters (four OD levels: 2, 4, 8, 16), and (b) EBT3 film pieces (0, 0.5, 1, 3, 11 Gy). These
sets were scanned 100 consecutive times at 2 minutes intervals between scans and the scanner
cover was opened/closed at scans 71-100 while it remained unopened for scans 1-70. In order to
test the 𝑛𝑃𝑉𝑅𝐺𝐵 protocol, four relative quantities were compared in this test (relative to the value
of same quantity at scan#1): (1) PV of ND filters, (2) PV of EBT3 film pieces, (3) Dose con-
verted from 𝑛𝑃𝑉𝑅𝐺𝐵 of EBT3 film pieces, and (4) Dose converted from 𝑛𝑒𝑡𝑂𝐷𝑋=𝑅,𝐺,𝐵 of EBT3
film pieces. For quantities (3) and (4), the difference in results was shown when the control of
first scan is used for evaluation (referred to as a global control) versus using a control within the
same scan (referred to as scan-specific control).
Scanner bed inhomogeneity
This problem refers to the relative signal at different regions on the scanner bed with respect to
the scanner center. The scanning bed of the 12000XL (A3 size) was divided into 25 evaluation
regions. Two small film pieces (1” by 2”) were scanned each time next to each other within those
regions. One was a control (unexposed) film piece while the other was a film exposed to a dose
of 8 Gy. In order to test the 𝑛𝑃𝑉𝑅𝐺𝐵 protocol, three relative quantities were compared in this test
(relative to the scanner center): (1) RGB PV of EBT3 film pieces, (2) Dose converted from
𝑛𝑃𝑉𝑅𝐺𝐵 of EBT3 film pieces, and (3) Dose converted from 𝑛𝑒𝑡𝑂𝐷𝑋=𝑅,𝐺,𝐵 of EBT3 film pieces.
For quantities (2) and (3), the difference in results was shown when the control of the central re-
gion is used with measurement film pieces of all other regions (referred to as global control) ver-
sus using the control scanned at each region (referred to as region-specific controls).
Long term verification and stability
This issue refers to the accuracy and precision of the dosimetry system sometime after calibra-
tion. Here, the results of using 𝑛𝑃𝑉𝑅𝐺𝐵 with the correction protocol will be shown and compared
to regular single channel RGB net optical densities at three points in time: at calibration, after 3
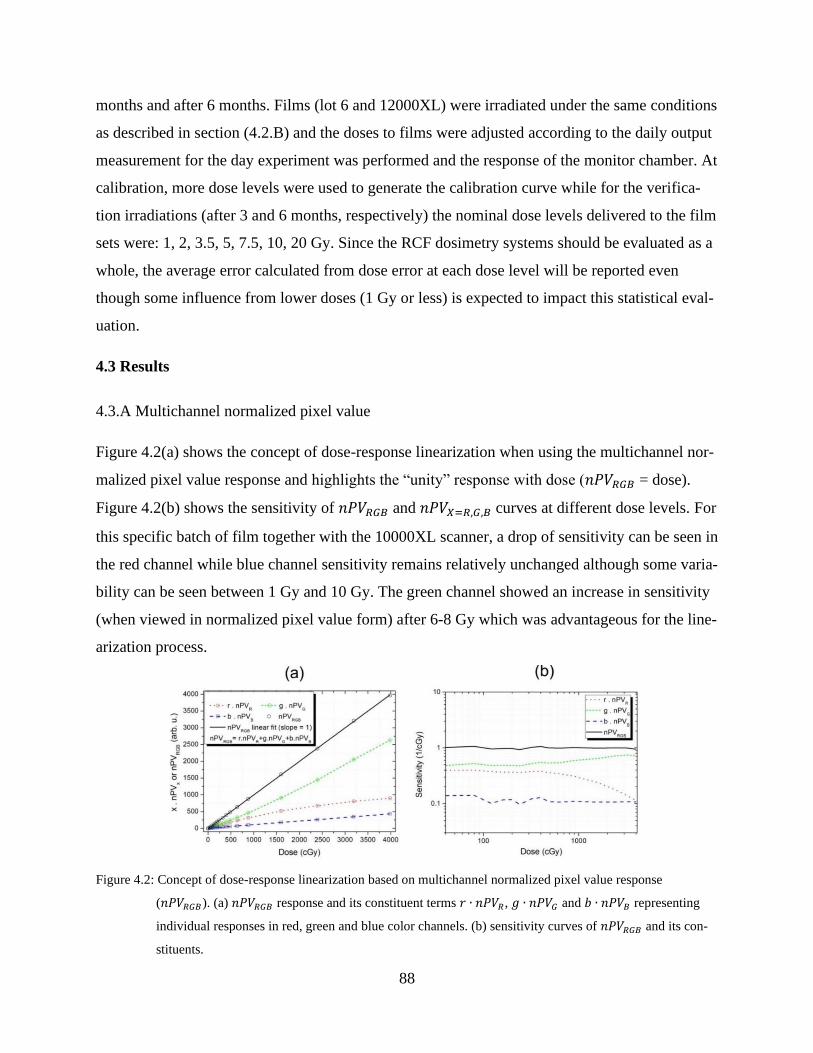
88
months and after 6 months. Films (lot 6 and 12000XL) were irradiated under the same conditions
as described in section (4.2.B) and the doses to films were adjusted according to the daily output
measurement for the day experiment was performed and the response of the monitor chamber. At
calibration, more dose levels were used to generate the calibration curve while for the verifica-
tion irradiations (after 3 and 6 months, respectively) the nominal dose levels delivered to the film
sets were: 1, 2, 3.5, 5, 7.5, 10, 20 Gy. Since the RCF dosimetry systems should be evaluated as a
whole, the average error calculated from dose error at each dose level will be reported even
though some influence from lower doses (1 Gy or less) is expected to impact this statistical eval-
uation.
4.3 Results
4.3.A Multichannel normalized pixel value
Figure 4.2(a) shows the concept of dose-response linearization when using the multichannel nor-
malized pixel value response and highlights the “unity” response with dose (𝑛𝑃𝑉𝑅𝐺𝐵 = dose).
Figure 4.2(b) shows the sensitivity of 𝑛𝑃𝑉𝑅𝐺𝐵 and 𝑛𝑃𝑉𝑋=𝑅,𝐺,𝐵 curves at different dose levels. For
this specific batch of film together with the 10000XL scanner, a drop of sensitivity can be seen in
the red channel while blue channel sensitivity remains relatively unchanged although some varia-
bility can be seen between 1 Gy and 10 Gy. The green channel showed an increase in sensitivity
(when viewed in normalized pixel value form) after 6-8 Gy which was advantageous for the line-
arization process.
Figure 4.2: Concept of dose-response linearization based on multichannel normalized pixel value response
(𝑛𝑃𝑉𝑅𝐺𝐵). (a) 𝑛𝑃𝑉𝑅𝐺𝐵 response and its constituent terms 𝑟 ∙ 𝑛𝑃𝑉𝑅, 𝑔 ∙ 𝑛𝑃𝑉𝐺 and 𝑏 ∙ 𝑛𝑃𝑉𝐵 representing
individual responses in red, green and blue color channels. (b) sensitivity curves of 𝑛𝑃𝑉𝑅𝐺𝐵 and its con-
stituents.
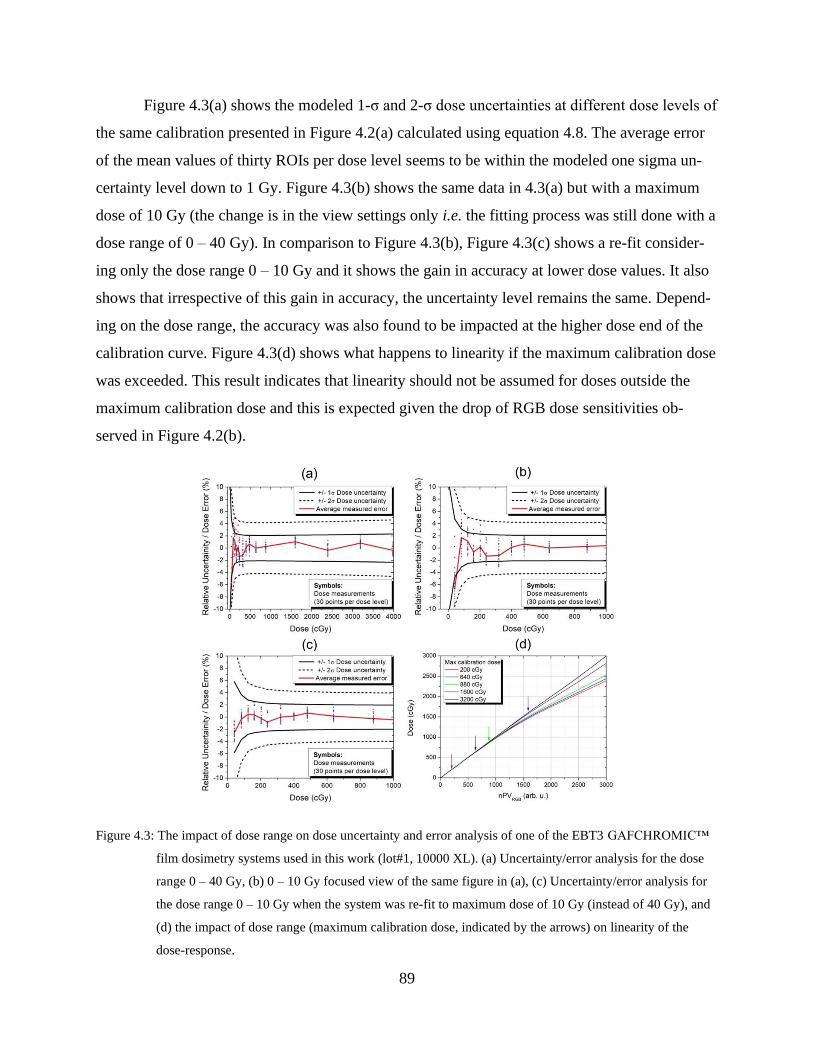
89
Figure 4.3(a) shows the modeled 1-σ and 2-σ dose uncertainties at different dose levels of
the same calibration presented in Figure 4.2(a) calculated using equation 4.8. The average error
of the mean values of thirty ROIs per dose level seems to be within the modeled one sigma un-
certainty level down to 1 Gy. Figure 4.3(b) shows the same data in 4.3(a) but with a maximum
dose of 10 Gy (the change is in the view settings only i.e. the fitting process was still done with a
dose range of 0 – 40 Gy). In comparison to Figure 4.3(b), Figure 4.3(c) shows a re-fit consider-
ing only the dose range 0 – 10 Gy and it shows the gain in accuracy at lower dose values. It also
shows that irrespective of this gain in accuracy, the uncertainty level remains the same. Depend-
ing on the dose range, the accuracy was also found to be impacted at the higher dose end of the
calibration curve. Figure 4.3(d) shows what happens to linearity if the maximum calibration dose
was exceeded. This result indicates that linearity should not be assumed for doses outside the
maximum calibration dose and this is expected given the drop of RGB dose sensitivities ob-
served in Figure 4.2(b).
Figure 4.3: The impact of dose range on dose uncertainty and error analysis of one of the EBT3 GAFCHROMIC™
film dosimetry systems used in this work (lot#1, 10000 XL). (a) Uncertainty/error analysis for the dose
range 0 – 40 Gy, (b) 0 – 10 Gy focused view of the same figure in (a), (c) Uncertainty/error analysis for
the dose range 0 – 10 Gy when the system was re-fit to maximum dose of 10 Gy (instead of 40 Gy), and
(d) the impact of dose range (maximum calibration dose, indicated by the arrows) on linearity of the
dose-response.
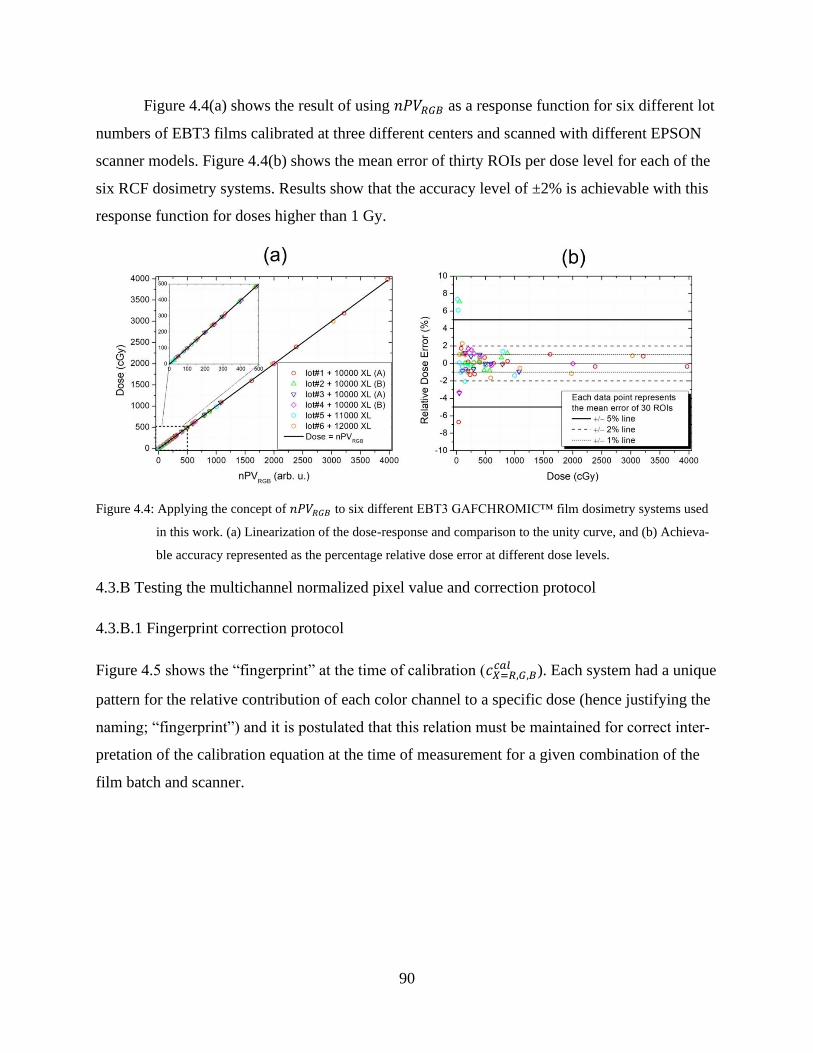
90
Figure 4.4(a) shows the result of using 𝑛𝑃𝑉𝑅𝐺𝐵 as a response function for six different lot
numbers of EBT3 films calibrated at three different centers and scanned with different EPSON
scanner models. Figure 4.4(b) shows the mean error of thirty ROIs per dose level for each of the
six RCF dosimetry systems. Results show that the accuracy level of ±2% is achievable with this
response function for doses higher than 1 Gy.
Figure 4.4: Applying the concept of 𝑛𝑃𝑉𝑅𝐺𝐵 to six different EBT3 GAFCHROMIC™ film dosimetry systems used
in this work. (a) Linearization of the dose-response and comparison to the unity curve, and (b) Achieva-
ble accuracy represented as the percentage relative dose error at different dose levels.
4.3.B Testing the multichannel normalized pixel value and correction protocol
4.3.B.1 Fingerprint correction protocol
Figure 4.5 shows the “fingerprint” at the time of calibration (𝑐𝑋=𝑅,𝐺,𝐵𝑐𝑎𝑙 ). Each system had a unique
pattern for the relative contribution of each color channel to a specific dose (hence justifying the
naming; “fingerprint”) and it is postulated that this relation must be maintained for correct inter-
pretation of the calibration equation at the time of measurement for a given combination of the
film batch and scanner.
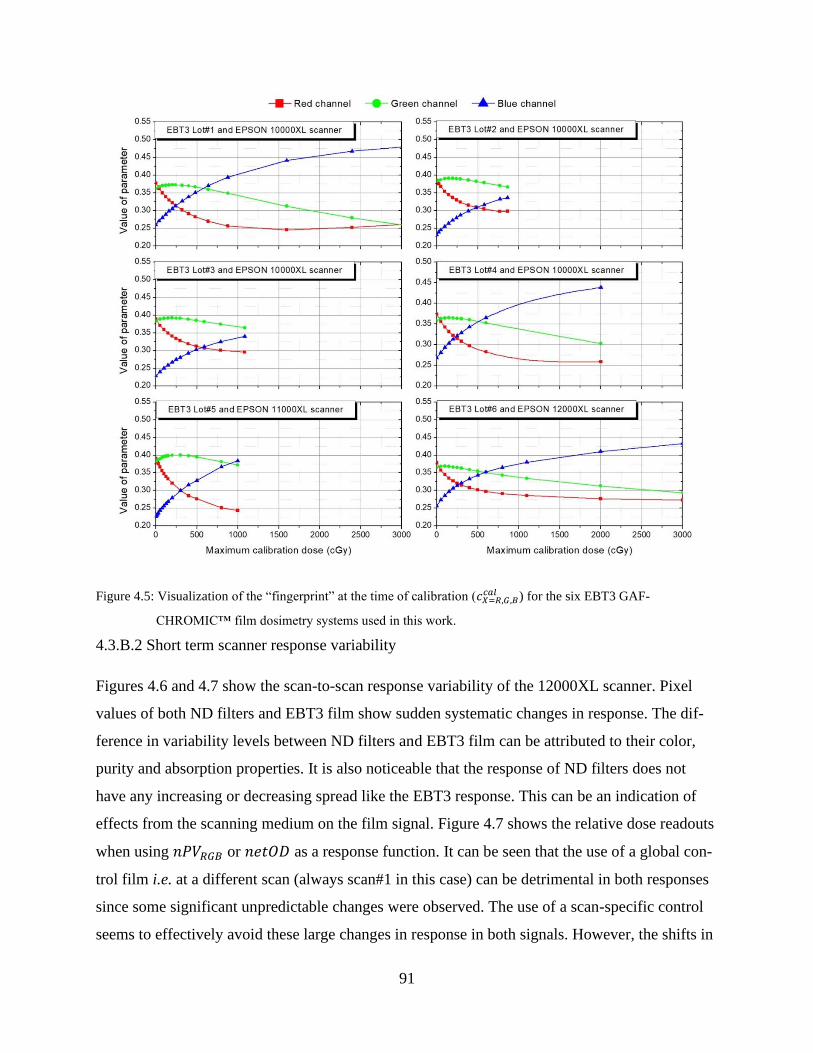
91
Figure 4.5: Visualization of the “fingerprint” at the time of calibration (𝑐𝑋=𝑅,𝐺,𝐵𝑐𝑎𝑙 ) for the six EBT3 GAF-
CHROMIC™ film dosimetry systems used in this work.
4.3.B.2 Short term scanner response variability
Figures 4.6 and 4.7 show the scan-to-scan response variability of the 12000XL scanner. Pixel
values of both ND filters and EBT3 film show sudden systematic changes in response. The dif-
ference in variability levels between ND filters and EBT3 film can be attributed to their color,
purity and absorption properties. It is also noticeable that the response of ND filters does not
have any increasing or decreasing spread like the EBT3 response. This can be an indication of
effects from the scanning medium on the film signal. Figure 4.7 shows the relative dose readouts
when using 𝑛𝑃𝑉𝑅𝐺𝐵 or 𝑛𝑒𝑡𝑂𝐷 as a response function. It can be seen that the use of a global con-
trol film i.e. at a different scan (always scan#1 in this case) can be detrimental in both responses
since some significant unpredictable changes were observed. The use of a scan-specific control
seems to effectively avoid these large changes in response in both signals. However, the shifts in
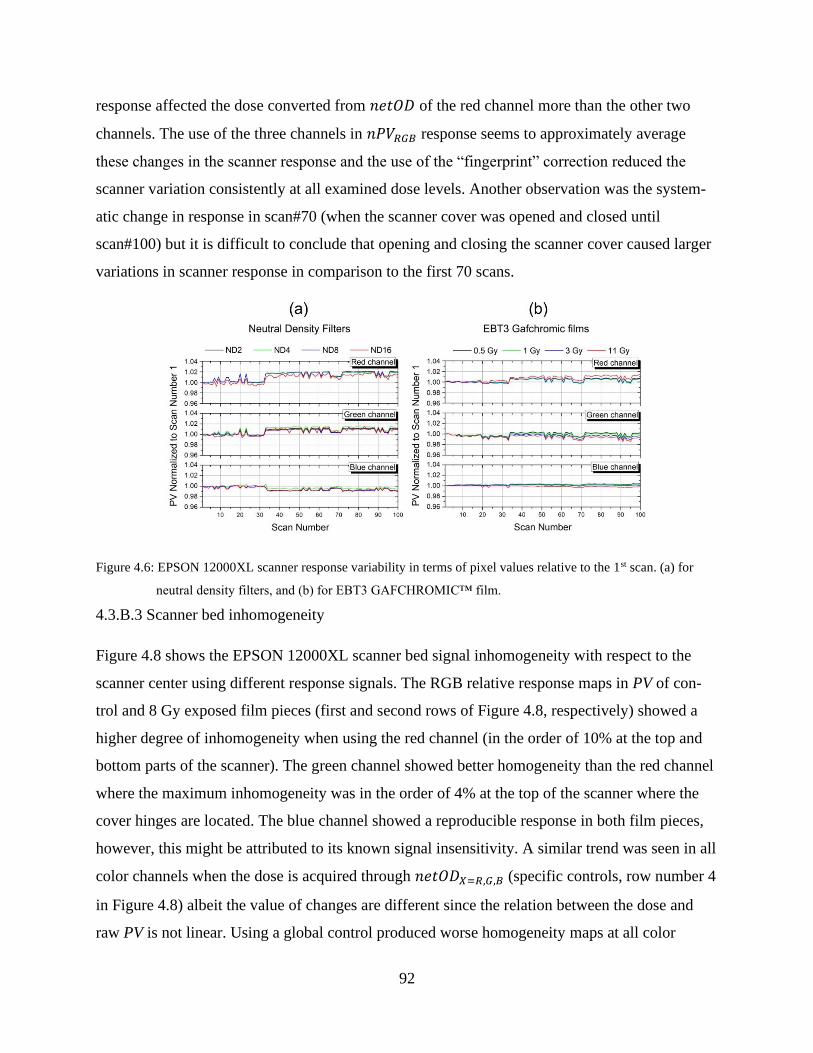
92
response affected the dose converted from 𝑛𝑒𝑡𝑂𝐷 of the red channel more than the other two
channels. The use of the three channels in 𝑛𝑃𝑉𝑅𝐺𝐵 response seems to approximately average
these changes in the scanner response and the use of the “fingerprint” correction reduced the
scanner variation consistently at all examined dose levels. Another observation was the system-
atic change in response in scan#70 (when the scanner cover was opened and closed until
scan#100) but it is difficult to conclude that opening and closing the scanner cover caused larger
variations in scanner response in comparison to the first 70 scans.
Figure 4.6: EPSON 12000XL scanner response variability in terms of pixel values relative to the 1st scan. (a) for
neutral density filters, and (b) for EBT3 GAFCHROMIC™ film.
4.3.B.3 Scanner bed inhomogeneity
Figure 4.8 shows the EPSON 12000XL scanner bed signal inhomogeneity with respect to the
scanner center using different response signals. The RGB relative response maps in PV of con-
trol and 8 Gy exposed film pieces (first and second rows of Figure 4.8, respectively) showed a
higher degree of inhomogeneity when using the red channel (in the order of 10% at the top and
bottom parts of the scanner). The green channel showed better homogeneity than the red channel
where the maximum inhomogeneity was in the order of 4% at the top of the scanner where the
cover hinges are located. The blue channel showed a reproducible response in both film pieces,
however, this might be attributed to its known signal insensitivity. A similar trend was seen in all
color channels when the dose is acquired through 𝑛𝑒𝑡𝑂𝐷𝑋=𝑅,𝐺,𝐵 (specific controls, row number 4
in Figure 4.8) albeit the value of changes are different since the relation between the dose and
raw PV is not linear. Using a global control produced worse homogeneity maps at all color
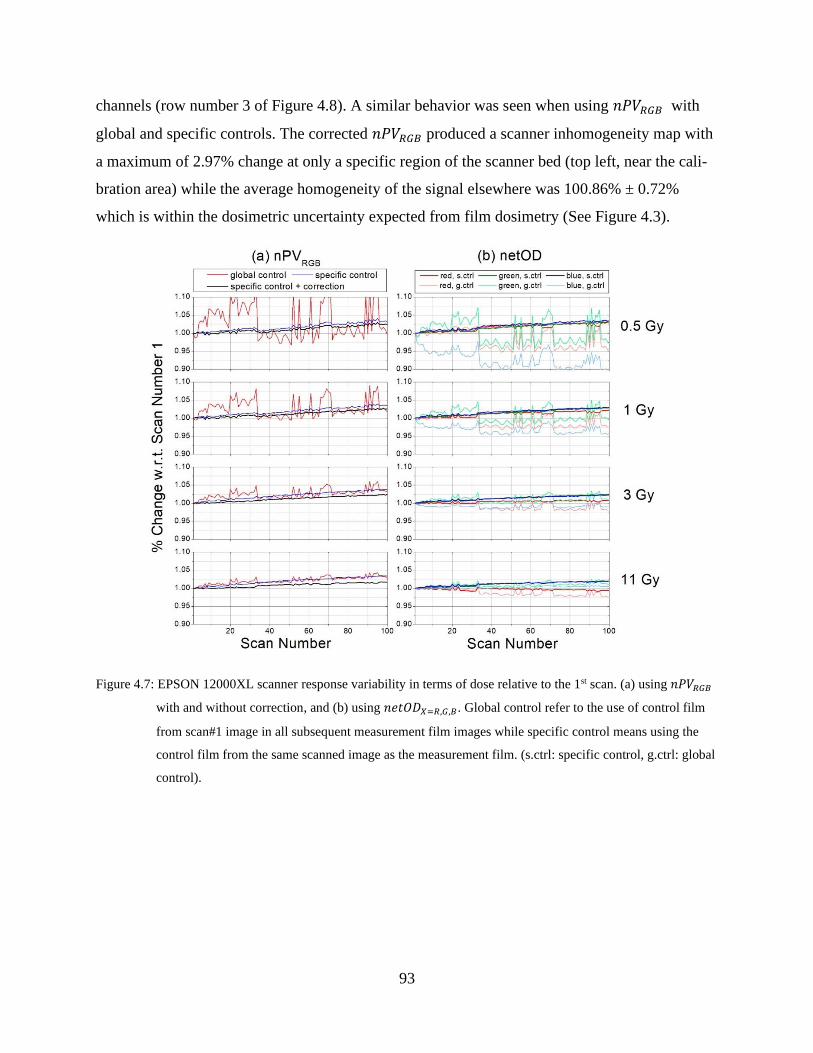
93
channels (row number 3 of Figure 4.8). A similar behavior was seen when using 𝑛𝑃𝑉𝑅𝐺𝐵 with
global and specific controls. The corrected 𝑛𝑃𝑉𝑅𝐺𝐵 produced a scanner inhomogeneity map with
a maximum of 2.97% change at only a specific region of the scanner bed (top left, near the cali-
bration area) while the average homogeneity of the signal elsewhere was 100.86% ± 0.72%
which is within the dosimetric uncertainty expected from film dosimetry (See Figure 4.3).
Figure 4.7: EPSON 12000XL scanner response variability in terms of dose relative to the 1st scan. (a) using 𝑛𝑃𝑉𝑅𝐺𝐵
with and without correction, and (b) using 𝑛𝑒𝑡𝑂𝐷𝑋=𝑅,𝐺,𝐵. Global control refer to the use of control film
from scan#1 image in all subsequent measurement film images while specific control means using the
control film from the same scanned image as the measurement film. (s.ctrl: specific control, g.ctrl: global
control).
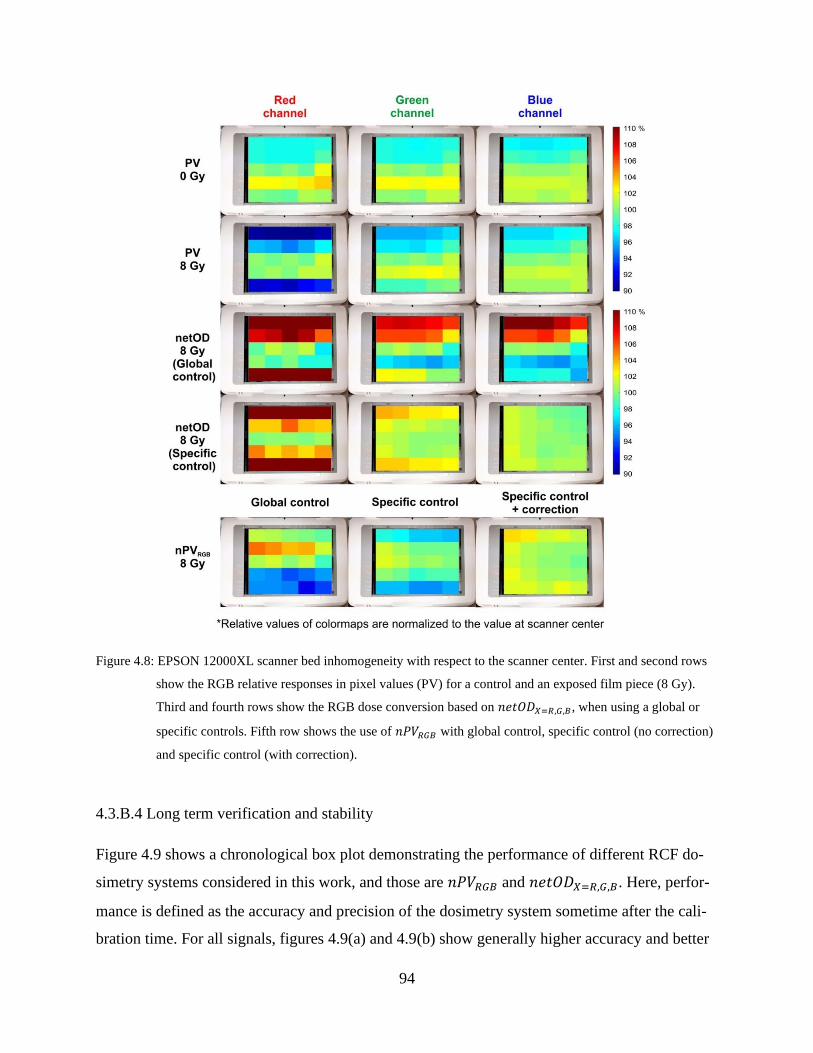
94
Figure 4.8: EPSON 12000XL scanner bed inhomogeneity with respect to the scanner center. First and second rows
show the RGB relative responses in pixel values (PV) for a control and an exposed film piece (8 Gy).
Third and fourth rows show the RGB dose conversion based on 𝑛𝑒𝑡𝑂𝐷𝑋=𝑅,𝐺,𝐵, when using a global or
specific controls. Fifth row shows the use of 𝑛𝑃𝑉𝑅𝐺𝐵 with global control, specific control (no correction)
and specific control (with correction).
4.3.B.4 Long term verification and stability
Figure 4.9 shows a chronological box plot demonstrating the performance of different RCF do-
simetry systems considered in this work, and those are 𝑛𝑃𝑉𝑅𝐺𝐵 and 𝑛𝑒𝑡𝑂𝐷𝑋=𝑅,𝐺,𝐵. Here, perfor-
mance is defined as the accuracy and precision of the dosimetry system sometime after the cali-
bration time. For all signals, figures 4.9(a) and 4.9(b) show generally higher accuracy and better
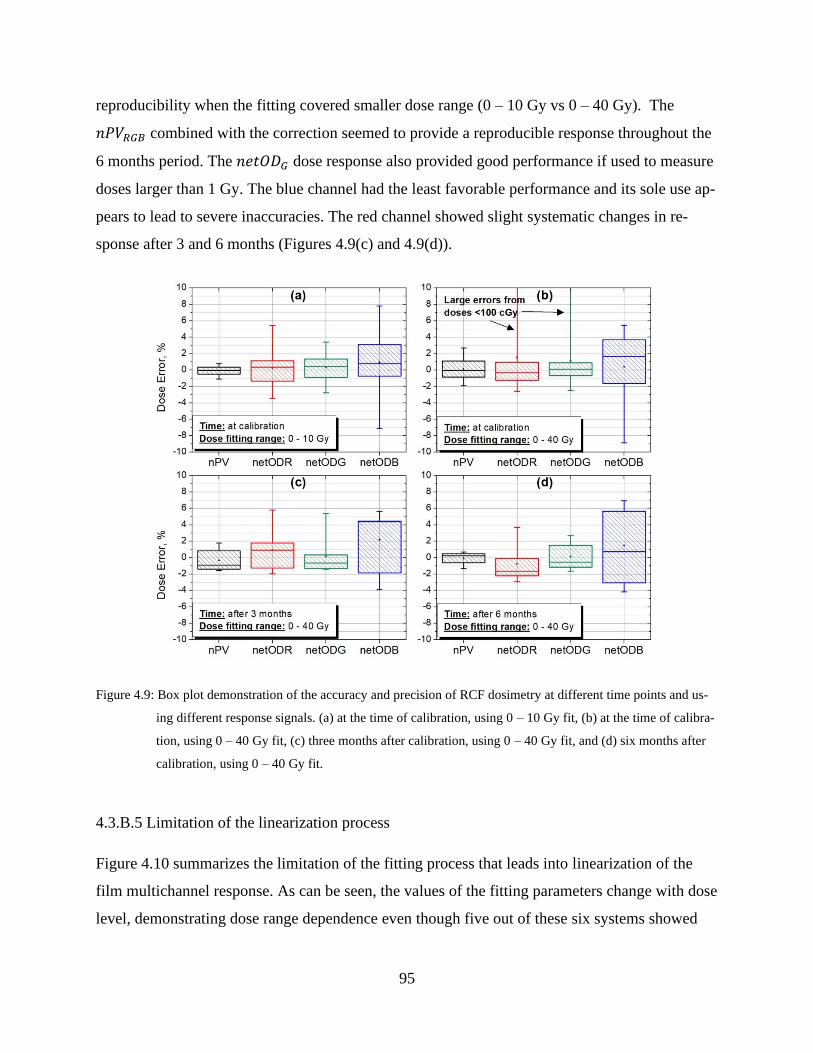
95
reproducibility when the fitting covered smaller dose range (0 – 10 Gy vs 0 – 40 Gy). The
𝑛𝑃𝑉𝑅𝐺𝐵 combined with the correction seemed to provide a reproducible response throughout the
6 months period. The 𝑛𝑒𝑡𝑂𝐷𝐺 dose response also provided good performance if used to measure
doses larger than 1 Gy. The blue channel had the least favorable performance and its sole use ap-
pears to lead to severe inaccuracies. The red channel showed slight systematic changes in re-
sponse after 3 and 6 months (Figures 4.9(c) and 4.9(d)).
Figure 4.9: Box plot demonstration of the accuracy and precision of RCF dosimetry at different time points and us-
ing different response signals. (a) at the time of calibration, using 0 – 10 Gy fit, (b) at the time of calibra-
tion, using 0 – 40 Gy fit, (c) three months after calibration, using 0 – 40 Gy fit, and (d) six months after
calibration, using 0 – 40 Gy fit.
4.3.B.5 Limitation of the linearization process
Figure 4.10 summarizes the limitation of the fitting process that leads into linearization of the
film multichannel response. As can be seen, the values of the fitting parameters change with dose
level, demonstrating dose range dependence even though five out of these six systems showed

96
consistent values of fitting parameters. These changes suggest that it is not feasible yet to find
“global” fitting parameters which necessitate the process of calibration.
4.4 Discussion
4.4.A Advantages and limitations of linearization
In this work a radiochromic film dosimetry protocol based on multichannel normalized pixel
value (𝑛𝑃𝑉𝑅𝐺𝐵,) was described. The main advantages of this system are: (a) it provides a linear-
ized response based on all color channel information available in each pixel of the image and (b)
it allows per-color correction that takes into account the difference in scanning states between the
times of calibration and measurement. The 𝑛𝑃𝑉𝑅𝐺𝐵 response function is also determined from
pixel value information extracted from transmission-scanned image(s) of two film pieces: meas-
urement film and control film and it does not require pre-scan of the same measurement film
piece. Also all corrections described in this work (“fingerprint”, filtration, streaks) are generated
and applied based on the same measurement images.
Furthermore, the calibration process is considered to be simple since equation 4.4 can be
directly solved using multiple regression analysis. The intercept values of these equations (one
per color channel) were set to zero because the dose should be equal to zero when the value of
response is equal to zero. However, the values of r, g, b fitting parameters are not always posi-
tive (as in the case of Figure 4.2) and this is attributed to signal saturation at higher doses. There-
fore, it is expected to see negative slopes for different batch numbers. Also, as demonstrated in
Figure 4.3(d), the dose range has an impact on the accuracy and precision of this protocol, and
this in turn, affects the values of the fitting parameters too. Figure 4.10 shows these two aspects
of the fitting process (negative slopes and dose range effect), for the six RCF dosimetry systems
considered in this work.
While some systems showed similar trend in the fitting parameters when using the
10000XL scanner, Figure 4.10 in fact shows that it is difficult to have “global” parameters to en-
able linearization without the need of calibration. This can be considered as a drawback for this
method; however, as was shown in previous works,13,32 linearization without calibration is possi-
ble with the use of different functional forms (equation 4.1). However, there is no guarantee that
these observations would hold true for all combinations of RCF dosimetry systems. Interestingly,
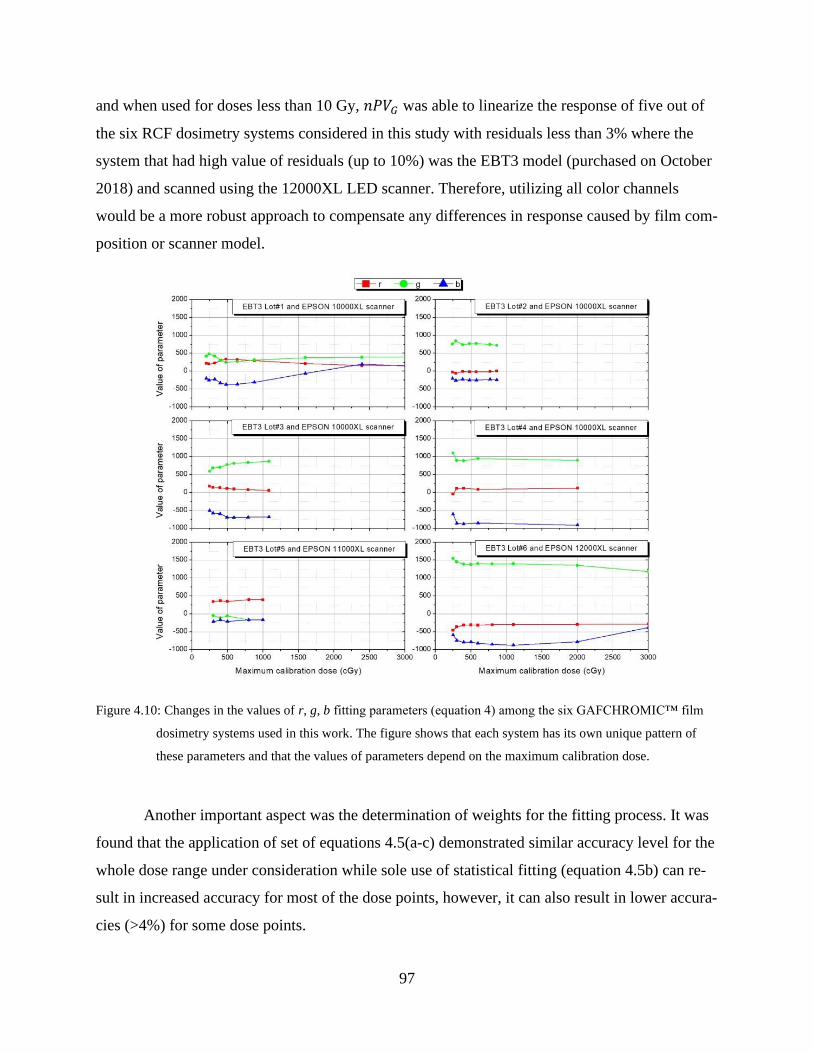
97
and when used for doses less than 10 Gy, 𝑛𝑃𝑉𝐺 was able to linearize the response of five out of
the six RCF dosimetry systems considered in this study with residuals less than 3% where the
system that had high value of residuals (up to 10%) was the EBT3 model (purchased on October
2018) and scanned using the 12000XL LED scanner. Therefore, utilizing all color channels
would be a more robust approach to compensate any differences in response caused by film com-
position or scanner model.
Figure 4.10: Changes in the values of r, g, b fitting parameters (equation 4) among the six GAFCHROMIC™ film
dosimetry systems used in this work. The figure shows that each system has its own unique pattern of
these parameters and that the values of parameters depend on the maximum calibration dose.
Another important aspect was the determination of weights for the fitting process. It was
found that the application of set of equations 4.5(a-c) demonstrated similar accuracy level for the
whole dose range under consideration while sole use of statistical fitting (equation 4.5b) can re-
sult in increased accuracy for most of the dose points, however, it can also result in lower accura-
cies (>4%) for some dose points.
98
4.4.B The fingerprint correction protocol
Although 𝑛𝑃𝑉𝑅𝐺𝐵 provided a robust and reproducible system for linearizing the RCF dosimetry
system response, the nature of this response function that is the summation of the signals also
brings unwanted features. One example is the signal sensitivity that limited the dose range (as
mentioned earlier), and another example is the inaccuracies associated with the blue channel
(Figure 4.9 and Ref 33). Assigning the slopes to the 𝑛𝑃𝑉 response per color does not take into
account the dosimetric accuracy and precision expected from that color response. Therefore, the
blue channel will compile its inaccuracies into 𝑛𝑃𝑉𝑅𝐺𝐵 as a form of increased noise and that is
another reason why the correction protocol is necessary. The “fingerprint” correction protocol
not only corrects for differences between the calibration and measurement states, but it also miti-
gates this added “blue noise”. This is an advantage in terms of spatial and temporal consistency
but also a limitation since the method does not guarantee less noise but rather similar noise level
to single channel dosimetry. However, in addition to the “fingerprint” correction, the methodol-
ogy described in section 4.2.C, that is, the use of a de-noising filter as recommended by Vera-
Sanchez et al26 and Devic et al2 for resolutions higher than 150 dpi, together with the removal of
horizontal streaks, significantly decreased the noise levels achievable with 𝑛𝑃𝑉𝑅𝐺𝐵. At 3 Gy, the
reductions in noise levels after application of the three corrections (fingerprint, streaks, filtra-
tion), for 𝑛𝑃𝑉𝑅𝐺𝐵 and (𝑛𝑒𝑡𝑂𝐷) were from 4.4% (3.2%) to 1.59% (2.01%). At 5 Gy, the reduc-
tions were 3.57% (2.3%) to 1.19% (1.12%). It was noted that the approximate relative contribu-
tion of each of these corrections to noise reduction was 10%, 3% and 87%, respectively. The
model uncertainty given by equations 4.7 and 4.8 (and demonstrated in Figure 4.3) was estab-
lished during the calibration process at the time when the “fingerprint” correction was set to
unity. Figure 4.3 clearly demonstrates that calculated dose uncertainties are always larger than
the actual dose errors (available only during calibration process) justifying the proposed refer-
ence radiochromic film dosimetry system. When performing dose measurements at a later date
with the “fingerprint” correction, dose error will become smaller, while the uncertainty, given by
equation 4.7, will remain the same. Addition of the “fingerprint” correction factor uncertainties
to equation 4.7, albeit insignificant (0.3-0.7% for all channels), would only make the overall dose
uncertainty of the method unnecessarily larger, and could be ignored.
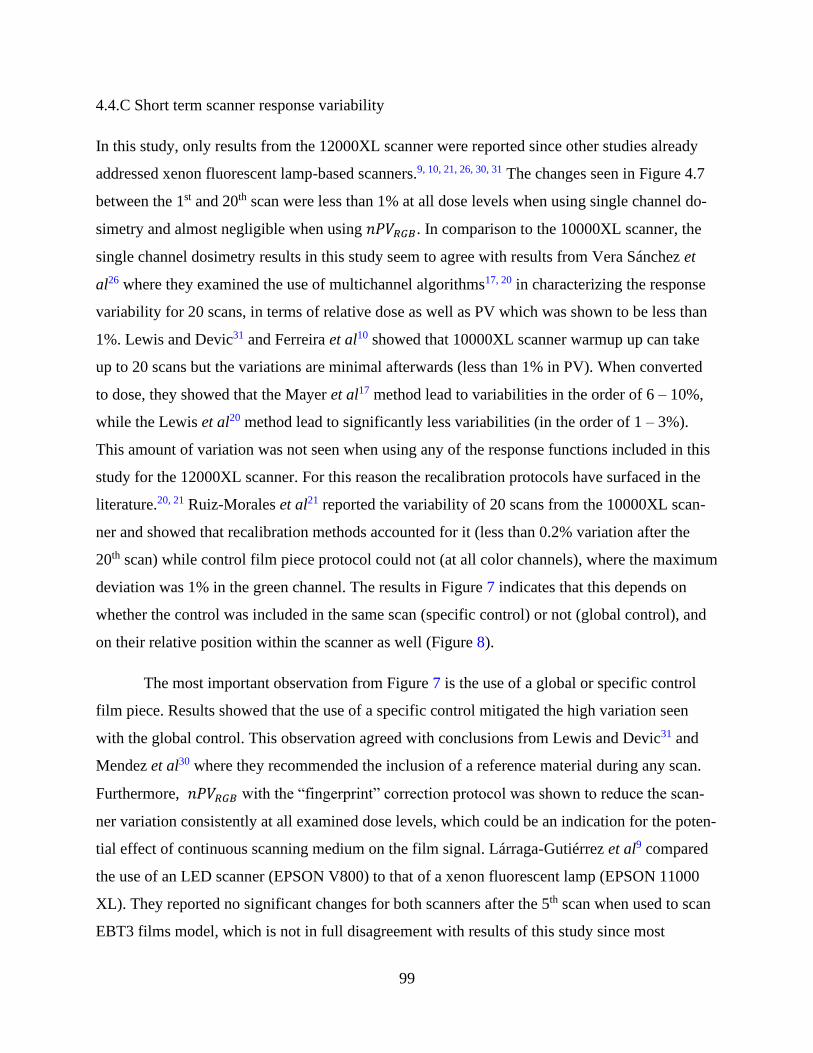
99
4.4.C Short term scanner response variability
In this study, only results from the 12000XL scanner were reported since other studies already
addressed xenon fluorescent lamp-based scanners.9, 10, 21, 26, 30, 31 The changes seen in Figure 4.7
between the 1st and 20th scan were less than 1% at all dose levels when using single channel do-
simetry and almost negligible when using 𝑛𝑃𝑉𝑅𝐺𝐵. In comparison to the 10000XL scanner, the
single channel dosimetry results in this study seem to agree with results from Vera Sánchez et
al26 where they examined the use of multichannel algorithms17, 20 in characterizing the response
variability for 20 scans, in terms of relative dose as well as PV which was shown to be less than
1%. Lewis and Devic31 and Ferreira et al10 showed that 10000XL scanner warmup up can take
up to 20 scans but the variations are minimal afterwards (less than 1% in PV). When converted
to dose, they showed that the Mayer et al17 method lead to variabilities in the order of 6 – 10%,
while the Lewis et al20 method lead to significantly less variabilities (in the order of 1 – 3%).
This amount of variation was not seen when using any of the response functions included in this
study for the 12000XL scanner. For this reason the recalibration protocols have surfaced in the
literature.20, 21 Ruiz-Morales et al21 reported the variability of 20 scans from the 10000XL scan-
ner and showed that recalibration methods accounted for it (less than 0.2% variation after the
20th scan) while control film piece protocol could not (at all color channels), where the maximum
deviation was 1% in the green channel. The results in Figure 7 indicates that this depends on
whether the control was included in the same scan (specific control) or not (global control), and
on their relative position within the scanner as well (Figure 8).
The most important observation from Figure 7 is the use of a global or specific control
film piece. Results showed that the use of a specific control mitigated the high variation seen
with the global control. This observation agreed with conclusions from Lewis and Devic31 and
Mendez et al30 where they recommended the inclusion of a reference material during any scan.
Furthermore, 𝑛𝑃𝑉𝑅𝐺𝐵 with the “fingerprint” correction protocol was shown to reduce the scan-
ner variation consistently at all examined dose levels, which could be an indication for the poten-
tial effect of continuous scanning medium on the film signal. Lárraga-Gutiérrez et al9 compared
the use of an LED scanner (EPSON V800) to that of a xenon fluorescent lamp (EPSON 11000
XL). They reported no significant changes for both scanners after the 5th scan when used to scan
EBT3 films model, which is not in full disagreement with results of this study since most
100
“appreciable” changes started to appear approximately after scan#40 in this study to a level of
2.0-2.5% after 100 scans (after correction).
4.4.D Scanner bed inhomogeneity and recommended film positioning
The relative inhomogeneity maps in Figure 8 visually summarize the bed homogeneity seen with
EBT3 film and 12000XL RCF system. The dose dependence (control vs 8 Gy film) was con-
firmed as well as the dependence on positioning of the control film. The use of a global control
at the center of the scanner lead to larger deviations at the top and bottom of the scanner but it
worked well with the central long region of the scanner.2 The use of a specific control improved
the response elsewhere. Therefore, it is always strongly recommended to use a control film piece
within the same scan and around the same position as the measurement film piece. When more
than one film piece is needed to be scanned, the control should be at the center while the other
pieces should be positioned to the left and right of the control piece. This is important since the
control is by definition included mathematically into all responses. For the case of whole sheet
scanning, the control could only be scanned in another scan and the scanner variability will limit
the uncertainty achievable this way. It is also important to note that out of all the maps presented
in Figure 8, only three maps showed good homogeneity level (within 2%) for a whole sheet
scanning: 𝑛𝑃𝑉𝑅𝐺𝐵, 𝑛𝑒𝑡𝑂𝐷𝐺 and 𝑛𝑒𝑡𝑂𝐷𝐵, although, the use of 𝑛𝑒𝑡𝑂𝐷𝐵 is discouraged because of
its inaccuracy. The red channel especially showed strong spatial dependency which agrees with
the work of Lárraga-Gutiérrez et al9 with an LED-based scanner (although to a less extent, 8%).
It is important to mention that most of the available literature on lateral scan correction9, 10, 34–37
are based on xenon fluorescent lamps so comparison to them would not be meaningful especially
that the dose levels are different. However, quantitatively, results of this study support the con-
clusion that the lateral scan correction seems to be more severe for LED based scanners in the
red channel only, since it was shown that for the green and blue channels, it is correctable with
the use of specific control.
4.4.E Long term verification and stability
The stability of the RCF dosimetry system over longer periods of time is definitely a desirable
feature. However, the inaccuracies seen in scanner variability prompted the use of recalibration
protocols20, 21 to seek more reliable dosimetry systems. In this study, 𝑛𝑃𝑉𝑅𝐺𝐵 was shown to
101
provide the same dosimetric performance seen during calibration, at later time points (Figure 9).
This is an important observation because unlike recalibration procedures, this protocol does not
require any additional irradiations and it uses the information contained within the same meas-
urement images to spatially relate the position of each pixel to the center of the scanner and de-
duce final dose values under the same conditions during calibration (Figure 1). In comparison,
Ruiz-Morales et al21 investigated three different methods for film recalibration: Lewis et al20, pa-
rameter escalation, axis escalation, and compared them to the use of control film piece25, 38 and
the case of no correction. Their results showed comparable levels of accuracy when using
red/green single channel dosimetry techniques (control film, axis escalation, and parameter esca-
lation). Palmer et al39 showed that fail rates of plans with high doses actually increased when the
quality assurance is done with triple channel dosimetry using EBT3 film model. They also show
that single channel dosimetry lead to better results at high doses. This might be explained by the
increased uncertainty level above 4 Gy when the triple channel dosimetry method was used.33
4.5 Conclusion
While the use of multichannel information, dose linearization, normalized pixel value, control
film, and scanner response correction are all features that were individually investigated by dif-
ferent research groups, a formalism that combines them into a single protocol is lacking. In this
study, a new formalism based on all of these features was introduced. It provided a linearized
dose response for six tested EBT3 film dosimetry systems, and it was shown to be self-corrected
for scanner variation issues in a sustainable way. A pixel-by-pixel “fingerprint” correction, based
on the relative contribution of each color channel at different dose levels, was proposed and it
provided a link between the film-scanner states at the time of calibration and measurements, re-
spectively, based on measured pixel values only. It was shown that this protocol can correct for
spatial and temporal changes of the scanner/film states, providing long term stability without
jeopardizing dosimetric accuracy. These features will add sustainability to film dosimetry which
is going through renaissance as a quality assurance tool for contemporary radiotherapy applica-
tions.
102
4.6 Acknowledgment
The authors have no conflicts to disclose. This work was supported in part by the Natural Sci-
ences and Engineering Research Council of Canada contract No. 386009. S.A. is a Ph.D. Candi-
date supported by the scholarship program at King Faisal Specialist Hospital & Research Centre
(KFSH&RC). S.A. acknowledges partial support by the CREATE Medical Physics Research
Training Network grant of the Natural Sciences and Engineering Research Council (Grant num-
ber: 432290).
4.7 References
1. W.L. McLaughlin, C. Yun-Dong, C.G. Soares, A. Miller, G. Van Dyk, and D.F. Lewis,
Sensitometry of the response of a new radiochromic film dosimeter to gamma radiation and
electron beams, Nucl. Inst. Methods Phys. Res. A 302(1), 165–176 (1991).
2. S. Devic, N. Tomic, and D. Lewis, Reference radiochromic film dosimetry: Review of
technical aspects, Phys. Medica 32(4), 541–556 (2016).
3. A. Niroomand-Rad, C.R. Blackwell, B.M. Coursey, et al., Radiochromic film dosimetry:
Report No. 63, Radiat. Meas. 25(63), (2006).
4. S. Devic, Radiochromic film dosimetry: Past, present, and future, Phys. Medica 27(3),
122–134 (2011).
5. S. Devic, J. Seuntjens, G. Hegyi, et al., Dosimetric properties of improved GafChromic
films for seven different digitizers, Med. Phys. 31(9), 2392–2401 (2004).
6. A.S. Aydarous, P.J. Darley, A. De Puysseleyr, and R.P. Srivastava, Physics in Medicine &
Biology The use of a reflective scanner to study radiochromic film response, (2002).
7. J. Kalef-Ezra and K. Karava, Radiochromic film dosimetry: Reflection vs transmission
scanning, Med. Phys. 35(6), 2308–2311 (2008).
8. P. Papaconstadopoulos, G. Hegyi, J. Seuntjens, and S. Devic, A protocol for EBT3
radiochromic film dosimetry using reflection scanning, Med. Phys. 41(12), (2014).
9. J.M. Lárraga-Gutiérrez, O.A. García-Garduño, C. Treviño-Palacios, and J.A. Herrera-
González, Evaluation of a LED-based flatbed document scanner for radiochromic film
dosimetry in transmission mode, Phys. Medica 47(March), 86–91 (2018).
10. B.C. Ferreira, M.C. Lopes, and M. Capela, Evaluation of an Epson flatbed scanner to read
Gafchromic EBT films for radiation dosimetry, Phys. Med. Biol. 54(4), 1073–1085 (2009).
103
11. W.L. Mclaughlin and M.F. Desrosiers, Dosimetry systems for radiation processing, Radiat.
Phys. Chem. 46(4-6 PART 2), 1163–1174 (1995).
12. I. Méndez, Model selection for radiochromic film dosimetry, Phys. Med. Biol. 60(10),
4089–4104 (2015).
13. S. Aldelaijan and S. Devic, Comparison of dose response functions for EBT3 model
GafChromicTM film dosimetry system, Phys. Medica 49, (2018).
14. F. Del Moral, J.A. Vázquez, J.J. Ferrero, et al., From the limits of the classical model of
sensitometric curves to a realistic model based on the percolation theory for GafChromic
EBT films, Med. Phys. 36(9), 4015–4026 (2009).
15. C. Rodríguez and L.C. Martínez, Radiochromic EBT2 and EBT3 sensitometry based on
growth of two color phases of the polymer, Med. Phys. 46(4), 1896–1904 (2019).
16. A. Micke, D. Lewis, and X. Yu, Multichannel film dosimetry with nonuniformity
correction, Med. Phys. 38(5), 2523–2534 (2011).
17. R.R. Mayer, Y. Chen, R.I. Miller, et al., Enhanced dosimetry procedures and assessment
for EBT2 radiochromic film., Med. Phys. 39(4), 2147–55 (2012).
18. I. Méndez, P. Peterlin, R. Hudej, A. Strojnik, and B. Casar, On multichannel film
dosimetry with channel-independent perturbations, Med. Phys. 41(1), (2014).
19. J.F. Pérez Azorín, L.I. Ramos García, and J.M. Martí-Climent, A method for multichannel
dosimetry with EBT3 radiochromic films, Med. Phys. 41(6), (2014).
20. D. Lewis, A. Micke, X. Yu, and M.F. Chan, An efficient protocol for radiochromic film
dosimetry combining calibration and measurement in a single scan, Med. Phys. 39(10),
6339–6350 (2012).
21. C. Ruiz-Morales, J.A. Vera-Sánchez, and A. González-López, On the re-calibration process
in radiochromic film dosimetry, Phys. Medica 42(2017), 67–75 (2017).
22. P.R. Almond, P.J. Biggs, B.M. Coursey, et al., AAPM’s TG-51 protocol for clinical
reference dosimetry of high-energy photon and electron beams, Med. Phys. 26(9), 1847–
1870 (1999).
23. M. McEwen, L. DeWerd, G. Ibbott, et al., Addendum to the AAPM’s TG-51 protocol for
clinical reference dosimetry of high-energy photon beams., Med. Phys. 41(4), 041501
(2014).
104
24. IAEA International Atomic Energy Agency, TRS 398: Absorbed Dose Determination in
External Beam Radiotherapy, At. Energy Agency 1–229 (2000).
25. S. Devic, J. Seuntjens, E. Sham, et al., Precise radiochromic film dosimetry using a flat-bed
document scanner, Med. Phys. 32(7), 2245–2253 (2005).
26. J.A. Vera Sánchez, C. Ruiz Morales, and A. González López, Characterization of noise and
digitizer response variability in radiochromic film dosimetry. Impact on treatment
verification, Phys. Medica 32(9), 1167–1174 (2016).
27. E.Y. León Marroquin, J.A. Herrera González, M.A. Camacho López, J.E. Villarreal
Barajas, and O.A. García-Garduño, Evaluation of the uncertainty in an EBT3 film
dosimetry system utilizing net optical density, J. Appl. Clin. Med. Phys. 17(5), 466–481
(2016).
28. S. Devic, N. Tomic, C.G. Soares, and E.B. Podgorsak, Optimizing the dynamic range
extension of a radiochromic film dosimetry system, Med. Phys. (2009).
29. D.K.R. Philip R. Bevington, Data Reduction and Error Analysis for the Physicsal Sciences,
3rd ed, 1–320 (2003).
30. I. Méndez, Šljivić, R. Hudej, A. Jenko, and B. Casar, Grid patterns, spatial inter-scan
variations and scanning reading repeatability in radiochromic film dosimetry, Phys. Medica
32(9), 1072–1081 (2016).
31. D. Lewis and S. Devic, Correcting scan-to-scan response variability for a radiochromic
film-based reference dosimetry system, Med. Phys. 42(10), 5692–5701 (2015).
32. S. Devic, N. Tomic, S. Aldelaijan, et al., Linearization of dose-response curve of the
radiochromic film dosimetry system, Med. Phys. 39(8), (2012).
33. J.A. Vera-Sánchez, C. Ruiz-Morales, and A. González-López, Monte Carlo uncertainty
analysis of dose estimates in radiochromic film dosimetry with single-channel and
multichannel algorithms, Phys. Medica 47(September 2017), 23–33 (2018).
34. L. Paelinck, W. De Neve, and C. De Wagter, Precautions and strategies in using a
commercial flatbed scanner for radiochromic film dosimetry, Phys. Med. Biol. 52(1), 231–
242 (2007).
35. A.A. Schoenfeld, S. Wieker, D. Harder, and B. Poppe, The origin of the flatbed scanner
artifacts in radiochromic film dosimetry - Key experiments and theoretical descriptions,
Phys. Med. Biol. 61(21), 7704–7724 (2016).
105
36. D. Lewis and M.F. Chan, Correcting lateral response artifacts from flatbed scanners for
radiochromic film dosimetry, Med. Phys. 42(1), 416–429 (2015).
37. S. Devic, Y.Z. Wang, N. Tomic, and E.B. Podgorsak, Sensitivity of linear CCD array based
film scanners used for film dosimetry, Med. Phys. 33(11), 3993–3996 (2006).
38. S. Aldelaijan, F. Alzorkany, B. Moftah, et al., Use of a control film piece in radiochromic
film dosimetry, Phys. Medica 32(1), (2016).
39. A.L. Palmer, A. Dimitriadis, A. Nisbet, and C.H. Clark, Evaluation of Gafchromic EBT-
XD film, with comparison to EBT3 film, and application in high dose radiotherapy
verification, Phys. Med. Biol. 60(22), 8741–8752 (2015).
106
CHAPTER 5: Dose comparison between TG-43 based calculations
and radiochromic film measurements of the Freiburg flap applica-
tor used for high-dose-rate brachytherapy treatments of skin lesions
Preface
This paper introduced the use of radiochromic film dosimetry in quality assurance of surface
brachytherapy treatment accuracy. The current standard of care in dose calculation of skin treat-
ment with HDR brachytherapy is based on the AAPM TG-43 datasets which assume full
backscatter conditions. For skin treatments with the Freiburg flap (FF) applicator, this represents
a setup different than the actual clinical situation where contributions of backscatter originating
above the applicator and air gaps between the applicator spheres are missing. The aims of this
work are twofold: to experimentally evaluate the treatment planning dose calculation accuracy
during surface treatments with the FF applicator at different depths, and to evaluate means of im-
proving the delivered dose accuracy in light of experimental results.
This work has been published in the ABS Brachytherapy Journal:
Aldelaijan, S., Bekerat, H., Buzurovic, I.M., Devlin, P.M., DeBlois, F., Seuntjens, J. and Devic,
S., Dose comparison between TG-43–based calculations and radiochromic film measurements of
the Freiburg flap applicator used for high-dose-rate brachytherapy treatments of skin lesions.
Brachytherapy, 16(5): 1065-1072 (2017)
107
Dose comparison between TG-43 based calculations and ra-
diochromic film measurements of the Freiburg flap applica-
tor used for high-dose-rate brachytherapy treatments of skin
lesions
Saad Aldelaijan,1,2,3,4,* Hamed Bekerat,2,3 Ivan Buzurovic,5 Phillip Devlin,5 Francois DeBlois,2,3
Jan Seuntjens,2 Slobodan Devic2,3
1Biological & Biomedical Engineering Department, Montreal Neurological Institute, Montréal,
Québec, Canada
2Medical Physics Unit, McGill University, Montréal, Québec, Canada
3Department of Radiation Oncology, Jewish General Hospital, Montréal, Québec, Canada
4Biomedical Physics Department, King Faisal Specialist Hospital & Research Centre, Riyadh,
Saudi Arabia
5Department of Radiation Oncology, Dana-Farber/ Brigham and Women's Cancer Center,
Harvard Medical School, Boston, MA, USA
Keywords: Freiburg flap, HDR brachytherapy, radiochromic film dosimetry, skin treatment
Abstract
Purpose: Current HDR brachytherapy skin treatments with the Freiburg flap (FF) applicator are
planned with treatment planning systems based on AAPM TG-43 datasets which assume full
backscatter conditions in dose calculations. The aim of this work is to describe an experimental
method based on radiochromic film dosimetry to evaluate dose calculation accuracy during sur-
face treatments with the FF applicator at different depths and bolus thicknesses.
Methods: Absolute doses were measured using a reference EBT3 radiochromic film dosimetry
system within a Solid Water™ phantom at different depths (0, 0.5, 1, 2 and 3 cm) with respect to
the phantom surface. The impact of bolus (up to 3 cm thickness) placed on top of the applicator
108
was investigated for two clinical loadings created using Oncentra MasterPlan™: 5 cm × 5 cm,
and 11 cm × 11 cm.
Results: For smaller loading and depths beyond 2 cm and for larger loading and depths beyond 1
cm, the dose difference was less than 3% (±4%). At shallower depths, differences of up to 6%
(±4%) at the surface were observed if no bolus was added. The addition of 2 cm bolus for the
smaller loading and 1 cm for larger loading minimized the difference to less than 3% (±4%).
Conclusions: For typical FF applicator loading sizes, the actual measured dose was 6% (±4%)
lower at the skin level when compared to TG-43. Additional bolus above the FF was shown to
decrease the dose difference. The consideration of change in clinical practice should be carefully
investigated in light of clinical reference data.
5.1 Introduction
Treatment of skin lesions with high-dose-rate (HDR) brachytherapy evolved over the years using
either Leipzig (1, 2) or the Valencia (3, 4) applicators (Elekta, Veenendaal, The Netherlands) for
relatively small treatment areas, less than 3 cm in diameter (5). The Freiburg flap (FF) applicator
(Elekta, Veenendaal, The Netherlands) can be used for small and large surface lesions as well as
intra-operative treatments (6, 7). One of the main advantages of the FF applicator is that it can
easily conform to most surface target shapes while preserving its geometry in relation to the surface
(8, 9). The FF applicator represents a mesh mold consisting of 1 cm diameter silicon spheres with
flexible catheters channeled through in one direction.
As the current (TG-43 based (10, 11, 12)) treatment planning system(s) (TPS) assume the
full water phantom approximation in dose calculations, the apparent lack of full scattering
(backscatter from above the applicator and air gaps between spheres) raises the question about
dose precision in the current clinical practice while implementing this type of applicator
(13,14,15). Recent developments in advanced methodologies in dose calculation and computa-
tional power have paved the way towards model-based brachytherapy dose calculation algorithms
(16). These algorithms employ different approaches in scatter integration into dose calculation in
heterogeneous media including tissue and applicators. For HDR 192Ir brachytherapy, numerous
solutions were explored such as analytical or semiempirical solutions (17,18), collapsed-cone su-
perposition/convolution (19), stochastic (20,21) and deterministic (22,23,24,25,26) solutions to the
109
linear Boltzmann transport equation. For skin dose during breast implants, Lymperopoulou et al
(27) and Poon et al (28) showed that the difference between Monte Carlo (MC) simulations and
TG-43 calculated dose is in the order of 5%. For superficial treatments, Granero et al (15) showed
the same difference was within 3% and 2% for superficial mould mesh and catheter in contact with
skin, respectively using GEANT4 MC simulations. For the FF, Vijande et al (13) found the dif-
ferences between PENELOPE simulations and TG-43 to be less than 5% for typical clinical load-
ings. Raina et al (14) used a linear ionization chamber array positioned just under the FF for their
measurements and concluded that the difference between a measurement under full scattering con-
ditions (15 cm added bolus material) and one without bolus material depended on the prescription
depth and it reached 8.5%, 12.5%, and 15% for prescription depths of 0.5 cm, 1.0 cm, and 1.5 cm,
respectively.
Additional experimental determination of the difference between delivered dose and TG-
43 is desirable and radiochromic film dosimetry provides appealing properties for skin dose meas-
urements (29). These properties include the small physical thickness, tissue equivalence (30, 31)
and low energy dependence down to effective energy of 100 kV for EBT, EBT2 and earlier EBT3
models (Ashland Inc., Wayne, NJ, 32,33) and down to 40 kV for newer EBT3 film models with
improved active layer (34). In this work, the absolute dose was measured using a reference radio-
chromic film dosimetry system within a Solid Water™ (SW) phantom, at different depths (down
to 3 cm depth), with a FF applicator placed on top of such phantom. The impact of additional bolus
(up to 3 cm thickness) placed on top of the applicator was investigated for two treatment plans:
one with 5 cm × 5 cm loading, and another one with 11 cm × 11 cm loading. The measured dose
values were compared to the calculated ones for each experimental setup and depth in terms of
dose ratio between film measurement and calculation by a commercially available TPS.
5.2 Methods and materials
5.2.1 Radiochromic film dosimetry system
The radiochromic film dosimetry system used in this study has been described in detail elsewhere
(31,35). GafChromicTM EBT3 film was used in this study and has three main performance im-
provements over the previous (EBT2) film model. The EBT3 radiochromic film model had a
unique polyester substrate with small silica particles that prevented the formation of Newton’s
110
Rings interference patterns in images acquired using flatbed document scanners. Moreover, as
opposed to the EBT2 film model, that had an asymmetric layer structure, the EBT3 film model has
a 30 μm thick active layer sandwiched between two matte 125 μm thick polyester sheets. Finally,
the sensitive layer of the latest batch numbers of EBT3 film model contains aluminum (36) im-
proving the energy response down to 40 kV (34).
The reference radiochromic film dosimetry system used in this work consisted of an Epson
Expression 10000XL flatbed document scanner (Epson, Nagano, Japan) and both the calibration
and measuring EBT3 model film pieces taken from the same batch number (A05151202). The
scanner provided 48-bit red, green, and blue (RGB) images scanned in transmission mode with all
filters and image enhancement options turned off. Although it was shown previously (37) that the
green color channel is the most optimal for dose measurements in the vicinity of brachytherapy
sources exhibiting high dose gradients, in this work, it was decided to use the red color channel
instead. The rationale for this decision is based on the main motivation of this study to investigate
dose deposition at different depths (from surface to 30 mm), avoiding very high dose gradients in
direct proximity to the source (first measurement point is 5 mm from the source position). In ad-
dition, by expecting relatively low doses at relatively deep measurement points, the red color chan-
nel (being more sensitive than green color channel) was assumed to be more suitable for the meas-
urements. Measurements were extended to 30 mm depth to show the mitigation of dose difference
between them and TG-43 dose calculation.
Ten calibration film pieces (2” × 2.5”) were scanned with a 127 dpi resolution (0.2
mm/pixel) prior to and 24-hours after exposure to various doses ranging from 50 to 1000 cGy.
Calibration film pieces were irradiated within a SW phantom at a depth of 10 cm with 18 MV
photon beam in a 100 cm source-to-surface distance (SSD) setup using a 20 cm × 20 cm field
defined at the isocentre of a Varian Clinac eX linear accelerator (Varian Medical Systems, Palo
Alto, CA). As shown earlier, response of the initial EBT3 film model showed minimal energy
dependence down to 100 kV (similar sensitive layer to EBT1 and EBT2 film models (32,33,34,38).
However, the latest EBT3 film model showed minimal under-response down to 40 kV effective
photon energy (34). Ten centimeters below the plane where the films were positioned, a monitor
chamber was placed, below which additional 10 cm SW slab was added to provide consistent and
reproducible scattering geometry for monitor chamber readings. The use of 18 MV photon beam
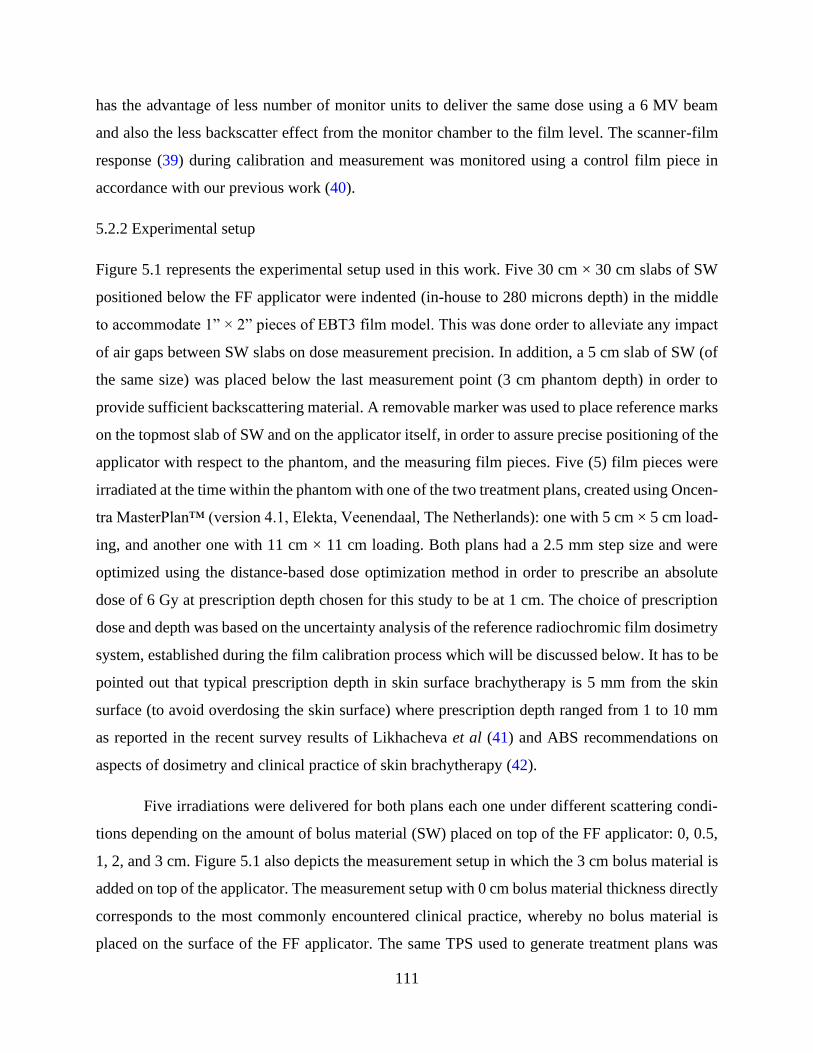
111
has the advantage of less number of monitor units to deliver the same dose using a 6 MV beam
and also the less backscatter effect from the monitor chamber to the film level. The scanner-film
response (39) during calibration and measurement was monitored using a control film piece in
accordance with our previous work (40).
5.2.2 Experimental setup
Figure 5.1 represents the experimental setup used in this work. Five 30 cm × 30 cm slabs of SW
positioned below the FF applicator were indented (in-house to 280 microns depth) in the middle
to accommodate 1” × 2” pieces of EBT3 film model. This was done order to alleviate any impact
of air gaps between SW slabs on dose measurement precision. In addition, a 5 cm slab of SW (of
the same size) was placed below the last measurement point (3 cm phantom depth) in order to
provide sufficient backscattering material. A removable marker was used to place reference marks
on the topmost slab of SW and on the applicator itself, in order to assure precise positioning of the
applicator with respect to the phantom, and the measuring film pieces. Five (5) film pieces were
irradiated at the time within the phantom with one of the two treatment plans, created using Oncen-
tra MasterPlan™ (version 4.1, Elekta, Veenendaal, The Netherlands): one with 5 cm × 5 cm load-
ing, and another one with 11 cm × 11 cm loading. Both plans had a 2.5 mm step size and were
optimized using the distance-based dose optimization method in order to prescribe an absolute
dose of 6 Gy at prescription depth chosen for this study to be at 1 cm. The choice of prescription
dose and depth was based on the uncertainty analysis of the reference radiochromic film dosimetry
system, established during the film calibration process which will be discussed below. It has to be
pointed out that typical prescription depth in skin surface brachytherapy is 5 mm from the skin
surface (to avoid overdosing the skin surface) where prescription depth ranged from 1 to 10 mm
as reported in the recent survey results of Likhacheva et al (41) and ABS recommendations on
aspects of dosimetry and clinical practice of skin brachytherapy (42).
Five irradiations were delivered for both plans each one under different scattering condi-
tions depending on the amount of bolus material (SW) placed on top of the FF applicator: 0, 0.5,
1, 2, and 3 cm. Figure 5.1 also depicts the measurement setup in which the 3 cm bolus material is
added on top of the applicator. The measurement setup with 0 cm bolus material thickness directly
corresponds to the most commonly encountered clinical practice, whereby no bolus material is
placed on the surface of the FF applicator. The same TPS used to generate treatment plans was
112
employed to register absolute dose values in the center of the treatment plans at each depth where
the film pieces were positioned. The difference between calculated dose (by the TPS) and meas-
ured dose (by the film) was reported as the dose ratio between measurement and calculation for all
depths and setups used in this study.
5.2.3 Image processing
Scanned images were saved as tagged image file format (TIFF) and as mentioned before, they
were acquired with a 127 dpi resolution (0.2 mm/pixel) and the red channel was used for dosimetry
in this work. The location of region-of-interest (ROI) on films irradiated by the HDR source was
determined using a semi-automatic localization based on Gaussian fitting as described in our pre-
vious work (37). An ROI size of 2 mm × 2 mm was used and the mathematical model we used to
convert the film signal to dose was described thoroughly elsewhere (36, 37).
Figure 5.1: Experimental setup (with 3 cm bolus on top of the Freiburg Flap). Solid Water™ slabs are 30 cm × 30
cm in size. Dimensions are not to scale.
113
5.3 Results
Figure 5.2 shows the calibration curve (subfigure 5.2A), uncertainty analysis (subfigure 5.2B) as
well as the uncertainty vs. error analysis (subfigure 5.2C) for the reference radiochromic film do-
simetry system used in this work. The line in figure 5.2A represents the calibration fit while the
closed circle symbols represent the experimental data. In subfigure 5.2B, the thick line with closed
circle symbols represents the total uncertainty which is the quadrature sum of the fit (thin line,
open square symbols) and experimental (thin line, open diamond symbols) uncertainties. The line
in subfigure 5.2C represents the total dose uncertainty while the close circle symbols represent the
dose error. As expected, dose errors (calculated as the absolute difference between known and
calculated doses) and dose uncertainties (sum of experimental and fitting uncertainties (36) are
higher at lower dose levels. Figure 5.2 suggests that the radiochromic film dosimetry system used
in this work and defined by the protocol described in Materials section can measure dose with an
uncertainty better than 3% for doses larger than 2 Gy. In this regard, the plans created for this
investigation were tailored in such a way so that the delivered dose measured by the film pieces
should have been in the range between 2 and 10 Gy.
Figure 5.3 summarizes results of investigations into the impact of additional bolus material
on top of the FF applicator on dose calculation precision using contemporary brachytherapy treat-
ment planning systems. Subfigures 5.3A and 5.3B show the dose distributions for the two loading
patterns 5 cm × 5 cm (5.3A) and 11 cm × 11 cm (5.3B) at the plane containing the central silicon
sphere (placed at the center of the coordinate system). The vertical axis represents direction (down-
wards) along which the dose values were calculated and measured at five different depths. The
corresponding isodose lines at five depths (i.e., 0, 0.5, 1, 2 and 3 cm) have been presented for the
two plans as well. It is apparent from subfigures 5.3A and 5.3B that the isodose distribution for
the 11 cm × 11 cm plan is more uniform when compared with the plan with a smaller number of
dwell positions. It was observed that for the larger treatment fields (and by engaging plans with
more dwell positions) dwell weight could be more equally distributed resulting in more uniform
dose distributions. Since the FF applicator is commonly used for larger treatment lesions, it was
decided to examine the 5 cm × 5 cm plan as the smallest size in this study. Subfigures 5.3C and
5.3D depict the influence of bolus thickness on dose ratio between measurements and treatment

114
planning system for two experimental setups: dwell positions at 5 cm × 5 cm (subfigure 5.3C), and
11 cm × 11 cm (subfigure 5.3D).
Table 5.1 shows the uncertainty budget of overall dose calculation and measurement of a
single point (film ROI of 2 mm by 2 mm) at the level of prescription depth of 1 cm from the
phantom surface, below the central sphere of the Freiburg flap for an 11 cm × 11 cm loading area.
Table 5.1: Uncertainty budget example of overall dose calculation and measurement at depth of 1 cm from the phan-
tom surface for an 11 cm × 11 cm loading area.
Source of uncertainty Uncertainty
(%)
Evaluation
Type* Remark
Dose calculation
Source strength measurement 1.5 A Sources: AAPM TG-138 (43), Kirisits
et al (44) TG-43 Cons data 1.6 B
TPS interpolation 2.6 B
Combined dose calculation uncertainty 3.4 k=1
Expanded dose calculation uncertainty 6.8 k=2
Dose measurement
Absolute dose calibration (measurements,
calibration data, influence quantities) 1.5 B
Source: AAPM TG-51 addendum (45)
Monitor chamber reproducibility 0.5 B
Film scanner homogeneity 0.2 B Source: Aldelaijan et al 2010 (37)
Film scanner reproducibility 0.2 A
Film calibration curve fitting 2 B Figure 2, prescription of 6 Gy at 1
cm depth Film netOD measurement reproducibility 0.2 A
Source-film positioning 1 B
At 15 mm from the source and in-
cludes a combined uncertainty from
FF sphere, Solid Water™, and film
thickness measurements with a digital
caliper (±0.01 mm) and the TPS ruler
tool (±0.1 mm).
Solid Water™ to water dose conversion at 192Ir
0.07 B Source: Aldelaijan et al 2010 (37)
Combined dose measurement uncertainty 2.8 k=1
Expanded dose measurement uncertainty 5.5 k=2
* Evaluation types A/B are based on the JCGM100:2008 Guide to the expression of uncertainty in measurements (46)
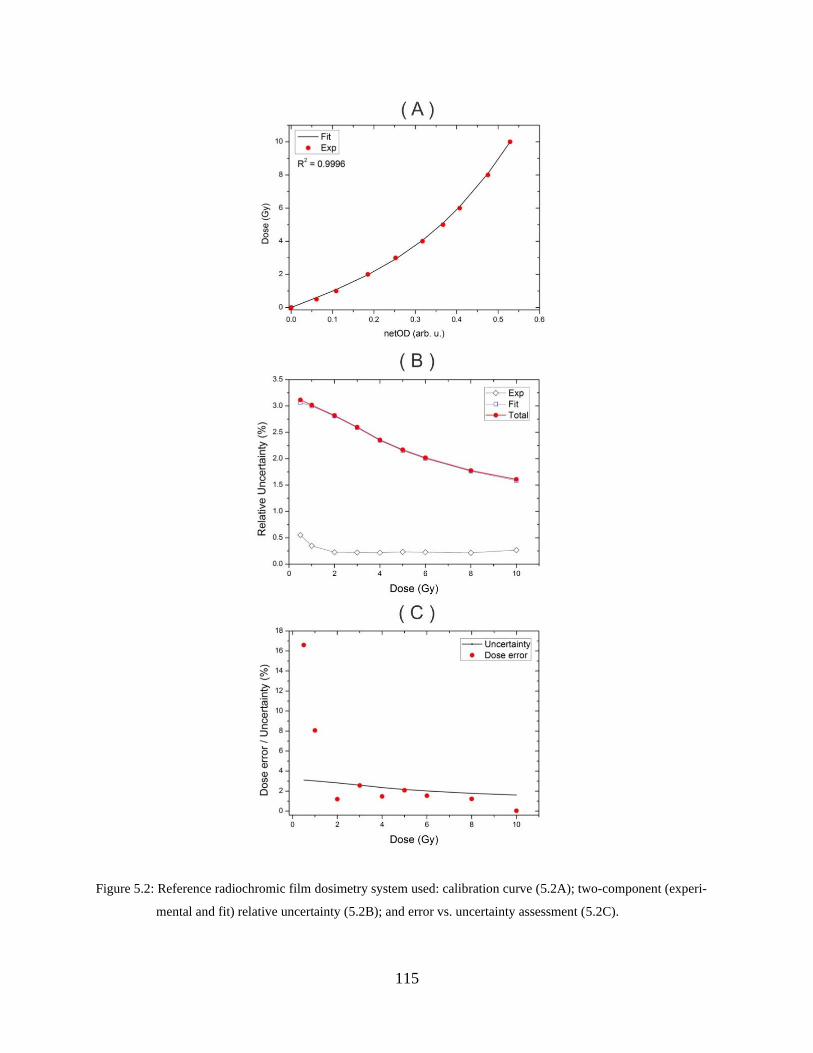
115
Figure 5.2: Reference radiochromic film dosimetry system used: calibration curve (5.2A); two-component (experi-
mental and fit) relative uncertainty (5.2B); and error vs. uncertainty assessment (5.2C).
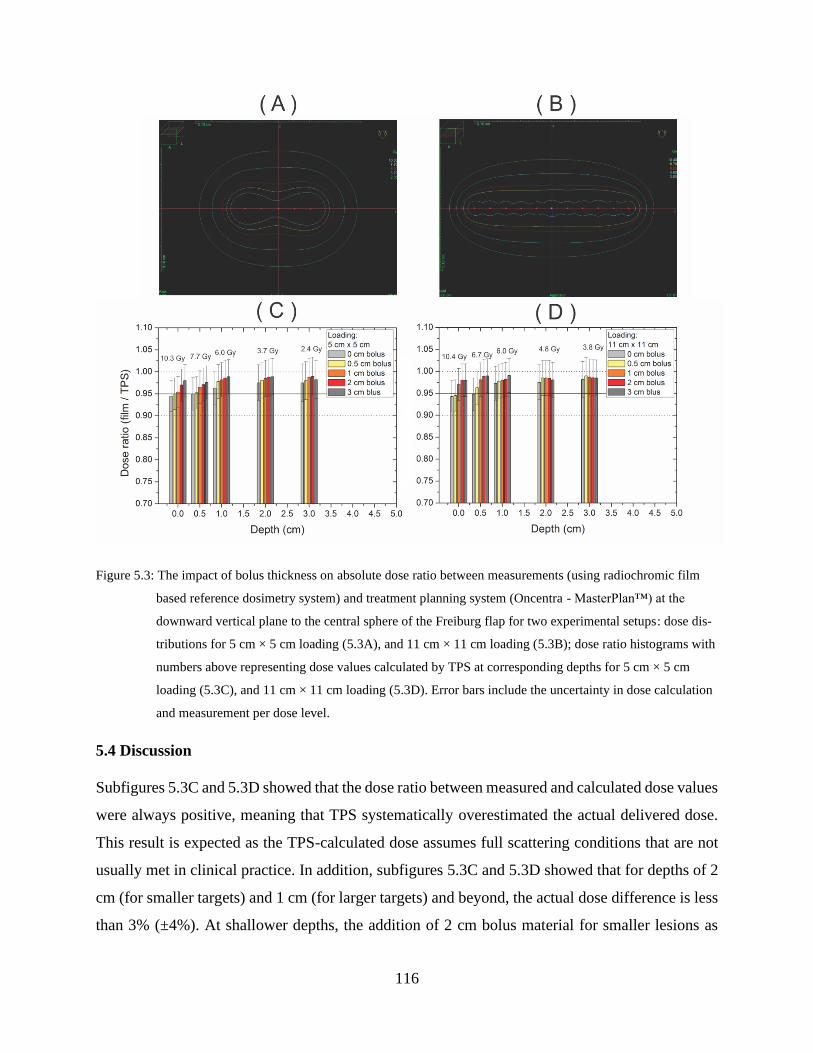
116
Figure 5.3: The impact of bolus thickness on absolute dose ratio between measurements (using radiochromic film
based reference dosimetry system) and treatment planning system (Oncentra - MasterPlan™) at the
downward vertical plane to the central sphere of the Freiburg flap for two experimental setups: dose dis-
tributions for 5 cm × 5 cm loading (5.3A), and 11 cm × 11 cm loading (5.3B); dose ratio histograms with
numbers above representing dose values calculated by TPS at corresponding depths for 5 cm × 5 cm
loading (5.3C), and 11 cm × 11 cm loading (5.3D). Error bars include the uncertainty in dose calculation
and measurement per dose level.
5.4 Discussion
Subfigures 5.3C and 5.3D showed that the dose ratio between measured and calculated dose values
were always positive, meaning that TPS systematically overestimated the actual delivered dose.
This result is expected as the TPS-calculated dose assumes full scattering conditions that are not
usually met in clinical practice. In addition, subfigures 5.3C and 5.3D showed that for depths of 2
cm (for smaller targets) and 1 cm (for larger targets) and beyond, the actual dose difference is less
than 3% (±4%). At shallower depths, the addition of 2 cm bolus material for smaller lesions as

117
well as 1 cm bolus material for larger lesions provided a dose difference (between calculated and
measured) of less than 3% (±4%). It is of note that the quoted uncertainty (±4%) is calculated for
the dose ratio between measured and calculated doses and therefore it is dominated by the TPS
dose calculation uncertainty (see Table 5.1). The uncertainty in film measurement is mostly af-
fected by the dose level (Figure 5.2C) and the difference in source-film distance between planning
and measurements (Table 5.1). To analyze the difference in source to film distance between meas-
urement and planning, we measured individual thicknesses (FF spheres, SW and films) and eval-
uated their uncertainties using a digital caliper (±0.01 mm precision). The total difference between
source-film distance during measurements and planning was 0.16 mm which corresponds to a sys-
tematic error in dose of 0.5% as determined with TG-43, that is taken into account.
Measurement-based results in Figure 3 for the 5 cm × 5 cm plan without bolus material are
slightly higher than previously published MC simulation-based results by Vijande et al (13), who
reported 1–5% difference at the skin surface and 3–5% at 0.5 cm depth. This might be attributed
to the difference in geometries and loading patterns between this study and theirs. On the other
hand, in comparison to Raina et al’s (14) work, our results in Figure 3 show a lower deviation
between TG-43 and measurements. When comparing phantom surface doses (1 cm prescription
depth) without and with bolus thickness of 0.5, 1, 2 and 3 cm, Raina et al report differences as
high as 9% for loading areas similar to our work (4 cm × 4 cm and 12 cm × 12 cm). These differ-
ences might again be attributed to difference in geometries and loading patterns, where it is of note
that Raina et al used FF sizes that were cut and fitted within tissue-equivalent material to mimic
intraoperative procedures while in our work the FF size was the same for different loading sizes.
The importance of these experimental results stems from the precision of the radiochromic
film dosimetry system used in this study. The film has the convenience of small physical size,
tissue equivalence and low energy dependence as described in Materials and methods section. The
advantage of calibrating film under a megavoltage beam quality instead of calibrating it under
HDR 192Ir is the avoidance of TG-43-associated uncertainties in dose calculation (See top section
of Table 5.1). The film energy dependence (between megavoltage and 192Ir beam qualities) was
found to be minimal as shown by Sarfehnia et al (47) for the EBT1 film. They calibrated the film
under 6 MV and calculated a 0.9971 (1σ=0.1%) dose scaling factor to account for the energy dif-
ference. As discussed earlier, Bekerat et al (34) showed that new batches of EBT3 films (with
118
improved response), resulted in a refined energy response in comparison to EBT1 film. In our
previous study (37), it was shown using MC simulations that the difference between dose to film
in SW and dose to film in water was minimal (0.9941 (1σ=0.07%)). Schoenfeld et al (48) also
analyzed the use of water equivalent phantoms for 192Ir brachytherapy and found that the maximum
deviations of absorbed dose to water between SW and water for phantoms with 5 cm and 10 cm
radii were -0.29% and -0.76%, respectively.
As was shown in subfigures 5.2B and 5.2C, the radiochromic film dosimetry system used
in this work has a limit of 3% uncertainty at doses lower than 2 Gy and this was the rationale we
prescribed a high dose (6 Gy at 1 cm depth) i.e. to lower the uncertainty in dose determination.
Figure 5.2C showed that the dose error resulting from using this system is within the uncertainty
limit except for doses lower than 2 Gy, which is not of interest in this work. On the other hand,
the lower portion of Table 5.1 summarizes the overall uncertainty achievable using this system at
a prescription depth of 1 cm. Viewing these results with subfigure 5.2C reveals that the uncer-
tainty is indeed dose-dependent (or depth-dependent in this case). It is also of note that the uncer-
tainty provided by this system is well within the recommendations of AAPM TG-138 that the
overall expanded uncertainty associated with single-photon-emitting brachytherapy sources
(from calibration in a primary standards laboratory to the clinic) should be less than 10% (k=2).
The results of Figure 3 are similar to Vijande et al’s simulations (13) within the achieva-
ble measurement precision. However, irrespective of the variability of reported values among
different studies (this study, 13, 14), they mainly show that the deviation between TG-43 and de-
livered doses is positive and the magnitude of the difference has to be analyzed locally. It is also
anticipated that modern model-based brachytherapy calculations would provide (ultimately)
more accurate dose distributions, and since the current dose prescriptions are rather evidence-
based (41), this work shows that the switch from the old calculations (TG-43 based) and even
more importantly dose prescriptions should be implemented in a cautious way. This conclusion
is in line with the recommendation of AAPM TG-186 report (16) that TG-43 formalism remains
the standard of practice for dose calculation until sufficient clinical data become available (sec-
tion VI.C. of TG-186). Finally, these experimental results justify the need for the more accurate
(model-based) dose calculations in brachytherapy in general, and for the surface brachytherapy
in particular. However, as the new, more accurate, calculation methods become clinically
119
available, any change in prescription must be weighed against current evidence-based prescribed
doses for each treatment site separately.
5.5 Conclusions
This work experimentally investigated the impact of lack of full backscatter conditions on the use
of FF applicator for HDR brachytherapy skin treatment. For depths of 2 cm and beyond, the dose
difference between measured and calculated dose distributions was below 3% (±4%) for plans
used in the treatment of small lesions. For the larger lesions, the same level of dose difference was
observed for depths of 1 cm and beyond. It was also observed that adding a 2 cm slab of bolus
material for smaller targets as well as 1 cm bolus material for larger regions, would bring the dose
difference to less than 3% (±4%) even at the surface and at 0.5 cm depth which is frequently used
for dose prescription in patients treated with FF applicator. It is not the intent of this work to
provide recommendations on policies to mitigate the difference between current TPS dose calcu-
lations (which are mostly based on TG-43), but rather to present a dosimetry system based on the
radiochromic film that provided a convenient way for local establishment of dose difference be-
tween TG-43 and actual delivered dose.
5.6 Acknowledgement
This work was supported in part by the Natural Sciences and Engineering Research Council of
Canada contract No. 386009. S.D. is a Research Scientist supported by the Fonds de Recherche en
Santé du Québec (FRSQ). S.A. is a Ph.D. Candidate supported by the scholarship program at King
Faisal Specialist Hospital & Research Centre (KFSH&RC). S.A. acknowledges partial support by
the CREATE Medical Physics Research Training Network grant of the Natural Sciences and En-
gineering Research Council (Grant number: 432290).
5.7 References
1. Perez-Calatayud J, Granero D, Ballester F, et al. A dosimetric study of Leipzig applicators.
Int J Radiat Oncol Biol Phys 2005;62:579-584.
2. Niu H, Hsi WC, Chu JC, et al. Dosimetric characteristics of the Leipzig surface applicators
used in the high dose rate brachy radiotherapy. Med Phys 2004;31:3372-3377
3. Granero D, Perez-Calatayud J, Gimeno J, et al. Design and evaluation of a HDR skin appli-
cator with flattening filter. Med Phys 2008;35:495-503
120
4. Guix B, Finestres F, Tello J et al. Treatment of skin carcinomas of the face by high-dose-
rate brachytherapy and custom-made surface moulds. Int J Radiat Oncol Biol Phys 2000;
47: 95-102.
5. Delishaj D, Laliscia C, Manfredi B, et al. Non-melanoma skin cancer treated with high-
dose-rate brachytherapy and Valencia applicator in elderly patients: a retrospective case se-
ries. J Contemp Brachytherapy 2015 Dec 1;7(6):437-44.
6. Moningi S, Armour EP, Terezakis SA, et al. High-dose-rate intraoperative radiation ther-
apy: the nuts and bolts of starting a program. J Contemp Brachytherapy. 2014 Mar;6(1):99.
7. Lloyd S, Alektiar K M, Nag S, et al. Intraoperative high-dose-rate brachytherapy: An
American Brachytherapy Society consensus report. Brachytherapy 2017; in press.
8. Gao S, Delclos ME, Tomas LC, et al. High-dose-rate remote afterloaders for intraoperative
radiation therapy. AORN. 2007;86:827–836
9. Devlin PM, editor, Cormack RA, Holloway CL, Stewart AJ, Brachytherapy: applications
and techniques, 2nd ed., Demos Medical Publishing, ISBN 9781620700822, 2016
10. Nath R, Anderson L, Luxton G, et al. Dosimetry of interstitial brachytherapy sources: Rec-
ommendations of the AAPM Radiation Therapy Committee Task Group No. 43, Med.
Phys. 1995;22, 209–234
11. Rivard MJ, Coursey BM, DeWerd LA, et al. Update of AAPM Task Group No. 43 Report:
A revised AAPM protocol for brachytherapy dose calculations, Med. Phys. 2004;31, 633–
674
12. Daskalov GM, Lo¨ffler E, and Williamson JF, Monte Carlo-aided dosimetry of a new high
dose-rate brachytherapy source, Med. Phys. 1998;25, 2200–2208
13. Vijande J, Ballester F, Ouhib Z, et al. Dosimetry comparison between TG-43 and Monte
Carlo calculations using the Freiburg flap for skin high-dose-rate brachytherapy Brachy-
therapy 2012;11:528-535
14. Raina S, Avadhani J S, Oh M, et al. Quantifying IOHDR brachytherapy underdosage re-
sulting from an incomplete scatter environment. Int J Radiat Oncol Biol Phys
2005;61:1582-1586
15. Granero D, Perez-Calatayud J, Vijande J, et al. Limitations of the TG-43 formalism for
skin high-dose-rate brachytherapy dose calculations Med. Phys. 2014; 41;021703-1
121
16. Beaulieu L, Carlsson Tedgren Å, Carrier J F, et al. Report of the Task Group 186 on model‐
based dose calculation methods in brachytherapy beyond the TG‐43 formalism: Current sta-
tus and recommendations for clinical implementation Med. Phys. 2012;39,6208-36
17. Rivard M J, Melhus C S, Granero D, et al, An approach to using conventional brachy-
therapy software for clinical treatment planning of complex, Monte Carlo‐based brachy-
therapy dose distributions. Med. Phys. 2009;36(6),1968-1975.
18. Poon E and Verhaegen F, A CT‐based analytical dose calculation method for HDR 192Ir
brachytherapy. Med. Phys., 2009;36(9),3982-3994.
19. Carlsson Tedgren Å K and Ahnesjö A, Accounting for high Z shields in brachytherapy us-
ing collapsed cone superposition for scatter dose calculation. Med, Phys., 2003;30(8),2206-
2217.
20. Yegin G and Rogers D, A fast Monte Carlo code for multi-seed brachytherapy treatments,
including inter-seed effects. Med. Phys., 2004;31(6),1771.
21. Chamberland M J, Taylor R E, Rogers D W O and Thomson R M, egs_brachy: a versatile
and fast Monte Carlo code for brachytherapy. Phys. Med. Biol., 2016;61(23), 8214.
22. Daskalov G M, Baker R S, Rogers D W O and Williamson J F, Dosimetric modeling of the
microselectron high‐dose rate 192Ir source by the multigroup discrete ordinates method.
Med. Phys., 2000;27(10),2307-2319.
23. Gifford KA, Price MJ, Horton JL, et al, Optimization of deterministic transport parameters
for the calculation of the dose distribution around a high dose‐rate 192Ir brachytherapy
source. Med Phys, 2008;35(6),2279-2285.
24. Mikell JK and Mourtada F, Dosimetric impact of an 192Ir brachytherapy source cable length
modeled using a grid‐based Boltzmann transport equation solver. Med Phys, 2010;37(9),
4733-4743.
25. Zourari K, Pantelis E, Moutsatsos A, et al, Dosimetric accuracy of a deterministic radiation
transport based 192Ir brachytherapy treatment planning system. Part I: Single sources and
bounded homogeneous geometries. Med Phys, 2010;37(2),649-661.
26. Petrokokkinos L, Zourari K, Pantelis E, et al, Dosimetric accuracy of a deterministic radia-
tion transport based 192Ir brachytherapy treatment planning system. Part II: Monte Carlo
and experimental verification of a multiple source dwell position plan employing a shielded
applicator. Med Phys, 2011;38(4),1981-1992.

122
27. Lymperopoulou G, Papagiannis P, Angelopoulos A, et al,. A dosimetric comparison of
169Yb and 192Ir for HDR brachytherapy of the breast, accounting for the effect of finite pa-
tient dimensions and tissue inhomogeneities. Med Phys, 2006;33(12), 4583-4589.
28. Poon E and Verhaegen F, Development of a scatter correction technique and its application
to HDR 192Ir multicatheter breast brachytherapy. Med Phys, 2009;36(8), 3703-3713.
29. Devic S, Seuntjens J, Abdel‐Rahman W, et al, Accurate skin dose measurements using ra-
diochromic film in clinical applications. Med Phys, 2006;33(4), 1116-1124.
30. McLaughlin WL, Chen YD, Soares CG, et al. Sensitometry of the response of a new radio-
chromic film dosimeter to gamma radiation and electron beams Nucl. Instrum. Methods
Phys. Res. 1991;A302:165–176.
31. Devic S, Radiochromic film dosimetry: Past, present, and future Phys. Med. 2011;27:122–
134.
32. Sutherland JGH and Rogers DWO, Monte Carlo calculated absorbed-dose energy depend-
ence of EBT and EBT2 film, Med. Phys. 2010;37:1110–1116.
33. Arjomandy B, Tailor R, Anand A, et al. Energy dependence and dose response of Gaf-
chromic EBT2 film over a wide range of photon, electron, and proton beam energies, Med.
Phys. 2010;37:1942–1947.
34. Bekerat H, Devic S, DeBlois F, et al. Improving the energy response of external beam ther-
apy (EBT) GafChromicTM dosimetry films at low energies (≤ 100 keV). Med. Phys.
2014;41:022101.
35. Devic S, Seuntjens J, Sham E, et al. Precise radio-chromic film dosimetry using a flat-bed
document scanner Med. Phys. 2005;32:2245–2253
36. Devic S, Tomic N, Lewis D, Reference radiochromic film dosimetry: Review of technical
aspects Phys. Med. 2016;32:541-556
37. Aldelaijan S, Mohammed H, Tomic N, et al. Radiochromic film dosimetry of HDR 192Ir
source radiation fields Med. Phys. 2011;38,6074–6083
38. Rink A, Vitkin I A and Jaffray D A Energy dependence (75kVp to 18MV) of radiochromic
films assessed using a real‐time optical dosimeter. Med. Phys. 2007;34(2),458-463.
39. Lewis D and Devic S, Correcting scan‐to‐scan response variability for a radiochromic film‐
based reference dosimetry system. Med. Phys. 2015;42(10),5692-5701
123
40. Aldelaijan, S., Alzorkany, F., Moftah B, et al Use of a control film piece in radiochromic
film dosimetry. Phys. Med. 2016;32(1),202-207.
41. Likhacheva A O, Devlin P M, Shirvani S M, et al Skin surface brachytherapy: A survey of
contemporary practice patterns Brachytherapy 2017;16:223-229
42. Ouhib Z, Kasper M, Calatayud J P, et al Aspects of dosimetry and clinical practice of skin
brachytherapy: The American Brachytherapy Society working group report. Brachytherapy
2015;14,840-858
43. DeWerd LA, Ibbott GS, Meigooni AS, et al. A dosimetric uncertainty analysis for photon-
emitting brachytherapy sources: report of AAPM Task Group No. 138 and GEC-ESTRO.
Med Phys. 2011;38(2),782-801.
44. Kirisits C, Rivard MJ, Baltas D, et al. Review of clinical brachytherapy uncertainties: anal-
ysis guidelines of GEC-ESTRO and the AAPM. Radiother Oncol. 2014;110(1),199-212.
45. McEwan M, DeWerd L, Ibbot G, et al. Addendum to the AAPM’s TG-51 protocol for clin-
ical reference dosimetry of high-energy photon beams, Med. Phys. 2014;41,041501-1-20
46. JCGM 100:2008 Evaluation of measurement data — Guide to the expression of uncertainty
in measurement 1st Edition, 2008
47. Sarfehnia A, Kawrakow I and Seuntjens J, Direct measurement of absorbed dose to water
in HDR 192Ir brachytherapy: Water calorimetry, ionization chamber, Gafchromic film, and
TG‐43. Med. Phys. 2010;37,1924-1932.
48. Schoenfeld A A, Harder D, Poppe B and Chofor N Water equivalent phantom materials for
192Ir brachytherapy. Phys Med Biol. 2015;60(24),9403.
124
CHAPTER 6: Positional and angular tracking of HDR 192Ir source
for brachytherapy quality assurance using radiochromic film
dosimetry
Preface
In chapter 5, the radiochromic film dosimetry protocol (chapters 3, 4) was employed for refer-
ence dosimetry of surface HDR brachytherapy. This paper highlights the unique physical ad-
vantage of using radiochromic film to perform HDR source quality assurance; that is the high
two-dimensional (2D) resolution. A tracking model was described to track the source positional
and angular information based on a measured 2D dose map. The source tracking model is based
on the fact that each isodose line away from the source has unique 2D features that are obtaina-
ble from “blob” analysis. Combined with the dosimetry protocol, high resolution EBT3 radio-
chromic films was able to capture these 2D dose maps, retrieve the relative isodose lines and
compare them to a reference library of features to estimate the most probable source coordinates.
This technique offers a novel multidimensional source localization methodology and has the po-
tential to be used for quality assurance of commercial and customized applicators.
This work has been accepted for publication in the AAPM Medical Physics journal:
Aldelaijan, S., Devic, S., Bekerat, H., Papaconstadopoulos, P., Schneider, J., Seuntjens, J., Cor-
mack, R.A. and Buzurovic, I.M. Positional and angular tracking of HDR 192Ir source for brachy-
therapy quality assurance using radiochromic film dosimetry. Med. Phys. Accepted Author Man-
uscript, https://doi.org/10.1002/mp.14540 (2020)
125
Positional and angular tracking of HDR 192Ir source for
brachytherapy quality assurance using radiochromic film
dosimetry
Saad Aldelaijan1-5, Slobodan Devic3,4, Hamed Bekerat4, Pavlos Papaconstadopoulos6, James
Schneider4, Jan Seuntjens3, Robert A. Cormack1, Ivan M. Buzurovic1
1Department of Radiation Oncology, Dana Farber/Brigham and Women’s Cancer Center,
Harvard Medical School, Boston, MA, 02115, USA
2Department of Biomedical Engineering, Montreal Neurological Institute, McGill University,
Montréal, QC, H3A 2B4, Canada
3Medical Physics Unit, McGill University, Montréal, QC, H4A 3J1, Canada
4Department of Radiation Oncology, Jewish General Hospital, Montréal, QC, H3T 1E2, Canada
5Biomedical Physics Department, King Faisal Specialist Hospital & Research Centre, Riyadh,
12713, Saudi Arabia
6Netherlands Cancer Institute, Amsterdam, 1066 CX, Netherlands
Abstract
Purpose: To quantify and verify the dosimetric impact of HDR source positional uncertainty in
brachytherapy, and to introduce a model for 3D position tracking of the HDR source based on a
2D measurement. This model has been utilized for development of a comprehensive source qual-
ity assurance method using radiochromic film dosimetry including assessment of different digiti-
zation uncertainties.
Methods: An algorithm was developed and verified to generate 2D dose maps of the mHDR-V2
192Ir source (Elekta, Veenendaal, Netherlands) based on the AAPM TG-43 formalism. The limits
of the dosimetric error associated with source (0.9 mm diameter) positional uncertainty were eval-
uated and experimentally verified with EBT3 film measurements for 6F (2.0 mm diameter) and
4F (1.3 mm diameter) size catheters at the surface (4F, 6F) and 10 mm further (4F only). To
126
quantify this uncertainty, a source tracking model was developed to incorporate the unique geo-
metric features of all isodose lines (IDL) within any given 2D dose map away from the source.
The tracking model normalized the dose map to its maximum, then quantified the IDLs using blob
analysis based on features such as area, perimeter, weighted-centroid, elliptic orientation, and cir-
cularity. The Pearson correlation coefficients (PCC) between these features and source coordinates
(x, y, z, θy, θz) were calculated. To experimentally verify the accuracy of the tracking model, EBT3
film pieces were positioned within a Solid Water® phantom above and below the source and they
were exposed simultaneously.
Results: The maximum measured dosimetric variations on the 6F and 4F catheter surfaces were
39.8% and 36.1%, respectively. At 10 mm further, the variation reduced to 2.6% for the 4F cath-
eter which is in agreement with the calculations. The source center (x, y) was strongly correlated
to the low IDL-weighted centroid (PCC=0.99), while the distance to source (z) was correlated
with the IDL areas (PCC=0.96) and perimeters (PCC=0.99). The source orientation θy was corre-
lated with the difference between high and low IDL-weighted centroids (PCC=0.98), while θz
was correlated with the elliptic orientation of the 60-90% IDLs (PCC=0.97) for a maximum dis-
tance of z = 5 mm. Beyond 5 mm, IDL circularity was significant, therefore limiting determina-
tion of θz (PCC≤0.48). The measured positional errors from the film sets above and below the
source indicated a source position at the bottom of the catheter (-0.24±0.07 mm).
Conclusions: Isodose line features of a 2D dose map away from the HDR source can reveal its
spatial coordinates. Radiochromic film was shown to be a suitable dosimeter for source tracking
and dosimetry. This technique offers a novel source quality assurance method and has the potential
to be used for quality assurance of commercial and customized applicators.
6.1 Introduction
According to the American Association of Physicists in Medicine (AAPM) task groups TG-40,1
TG-56,2 and TG-59,3 the source strength of new brachytherapy sources must be verified before
deployment into clinical use. The current standard for clinical high-dose-rate (HDR) 192Ir abso-
lute dose determination is based on a user well-type ionization chamber measurement with a cali-
bration traceable to a primary standard.4 The uncertainty in the distance between the source and
detector planes plays a large role in why a 4π well-type ionization chamber was chosen to verify
127
the source strength. AAPM TG-138 report4 addressed the source-to-detector positional uncer-
tainty for other detectors including radiochromic film (RCF) dosimetry. Specifically, the report
provided recommendations on how to properly verify the TG-43 datasets5–8 with measurements
and addressed different types and limits of uncertainty. However, if the problem of positional un-
certainty and source orientation can be solved, then in principle, accurate verification of the
source strength and dose rate distribution could be achieved without 4π geometry based measure-
ment.
RCF dosimetry has a strong potential to address the source positional uncertainty prob-
lems in HDR brachytherapy quality assurance (QA). Favorably, RCF dosimetry9 is a high resolu-
tion 2D solution that can be applied at different stages of the brachytherapy process.10 RCF has
unique properties such as its small thickness, near tissue equivalence and lower light sensitiv-
ity,11 dynamic dose range,12 dose rate independence,13 and energy independence in clinical beam
qualities down to an effective energy of 100 keV for EBT1, EBT2 and earlier EBT3 models14,15
and down to 40 keV for newer EBT3 film models with an improved active layer composi-
tion.16,17 Each film sheet is 8” by 10” and can be cut conveniently to any desired shape. These
properties make it possible to use the film in many aspects of HDR brachytherapy QA.18,19
Awunor et al20 developed a method for source position QA for ring and tandem applicators using
XRQA2 RCF. Palmer et al21 investigated the possibility of performing audits for HDR brachy-
therapy using RCF. They also provided a summary of other dosimetry systems as well.22 Other
systems used for brachytherapy QA have been investigated including diodes,23,24 scintillators,25,26
flat panel detectors,27,28 radiographic film, electromagnetic tracking30–32 and magnetic resonance
tracking.33 These systems showed promise mainly in source position QA; however full tracking
of the HDR source positional information including its orientation is still an open topic. Full
knowledge of the seed-like source positional information (position of the source center and angu-
lar orientation) enables QA of the brachytherapy catheters and QA of both standard and custom-
ized applicators as well.
In this work, an HDR 192Ir source tracking model is presented for 3D spatial position and
orientation detection based on a 2D plane measurement. The main aim of this work is to quanti-
tatively use the RCF to determine the source position with high accuracy. Firstly, an algorithm is
described and verified for the generation of TG-43-based relative dose rate maps. Then, the

128
source positional uncertainty of a single dwell position is evaluated based on this algorithm and
EBT3 GAFCHROMICTM film model dose measurements. Afterwards, the impact of the source
positional uncertainty is investigated for a clinical case with multiple dwell positions. Once the
positional uncertainties have been studied, the source tracking model is introduced based on 1D
and 2D approaches. Blob analysis34 was used to relate different features of the measured isodose
lines to a library of reference features based on TG-43 formalism. Also, digitization issues that
might affect dosimetry in the presence of high dose gradients are addressed. Finally, the applica-
tion of the source tracking model is presented for RCF dosimetry discussing its possible ad-
vantages and limitations.
6.2 Materials and Methods
6.2.A HDR source positional uncertainty
The dosimetric effect of source positional uncertainty was quantified and verified for different
catheter sizes typically used in superficial and interstitial HDR brachytherapy. The source used
throughout this study is the mHDR-V2 HDR Iridium 192 (192Ir) controlled by a microSelectron
V3 after-loader unit (Elekta, Veenendaal, Netherlands). The source positional uncertainty in this
case refers to the possible variation of the actual source position with respect to the nominal cen-
tral source position that is assumed in the treatment planning process. First, in order to estimate
the dose rate variation at a plane away from the source, a coordinate system is defined (Sec
6.2.A.1). Then, according to this coordinate system, an algorithm is described to generate dose
rate distributions based on AAPM TG-43 formalism which was used to estimate the dosimetric
impact of source positional uncertainty for different catheter sizes (Sec 6.2.A.2). This dosimetric
impact is then verified experimentally with EBT3 RCF dosimetry for a single source dwell posi-
tion (Sec 6.2.A.3), and for multiple dwell positions of a clinical case (Sec 6.2.A.4).
6.2.A.1. Coordinate system definition
In this work, two coordinate systems were defined for the purpose of establishing the tracking
model and for measurements (See Figure 6.1a). The first system is the source coordinate system
(x’, y’, z’) where the source center represents the origin of the system. This is used mainly to cal-
culate TG-43 dose rate maps away from the source where the distance between the origin and
129
each pixel in the calculation plane is known. The second one is the phantom coordinate system
(x, y, z) where the origin is at the nominal first dwell position within the catheter. This system is
mainly for the measurement setups. For simplicity, both systems were defined using the Carte-
sian coordinate system. The source is assumed to be in full scattering conditions, as per the TG-
43 report, and the phantom shape is assumed to be cubical. For both systems, the x- or x’- axis is
the axis of the catheter or the source with the positive direction as the direction away from the
after-loader unit; the positive y- or y’- axis refers to the transverse bisector of the nominal first
dwell position or the source in a plane parallel to the phantom “coronal” plane; the positive z- or
z’- axis refers to the transverse bisector of the nominal first dwell position or the source in a
plane parallel to the phantom “sagittal” plane. Depending on the coordinate system, the 3D
source orientation is defined by θx’, θy’, θz’ (or θx, θy, θz) where these are the rotations around the
x’-, y’-, z’- (or x-, y-, z-) axes, respectively. The unit of both systems is “mm” and the default ori-
entation is when the source is at the first dwell position within the catheter meaning that both ori-
gins are aligned i.e. x = x’, y = y’, z = z’ and all rotations are zero.
6.2.A.2. TG-43 model calculation
In order to estimate limits of possible dosimetric error associated with the source positional un-
certainty, the spatial limits within typical clinical catheters should be determined. Three plastic
catheter models (Elekta, Veenendaal, Netherlands) were included in this study: the 4F On-
coSmart catheter, the 6F ProGuide needle, and the 6F Flexible catheter (Figure 6.1b, F: French
where 3 French corresponds to 1 mm diameter). The inner dimension of each catheter was deter-
mined by fitting known-size industrial drill bits and the outer dimension was measured using a
digital caliper. The dosimetric error limits at any distance away from the source (along z’-axis),
were identified as the dose rate difference when the source is at the top or bottom sides with re-
spect to the dose rate at the center of the catheter.
The 2D dose rate map at any plane away from the source was calculated using a script
written in MATLAB (v.9.7, R2019b, Natick, MA) based on the AAPM TG-43 formalism. The
source model fixed inputs, namely; the dose rate constant (Λ), the active length of the source (L),
the radial dose function (g(r)), and the anisotropy function (F(r, θ)), were imported from pub-
lished consensus data of the mHDR-V2 HDR source.7,8,35 Since the TG-43 model is based on po-
lar coordinates, it requires knowledge of the distance to the source (𝑟𝑖,𝑗), in cm, and the
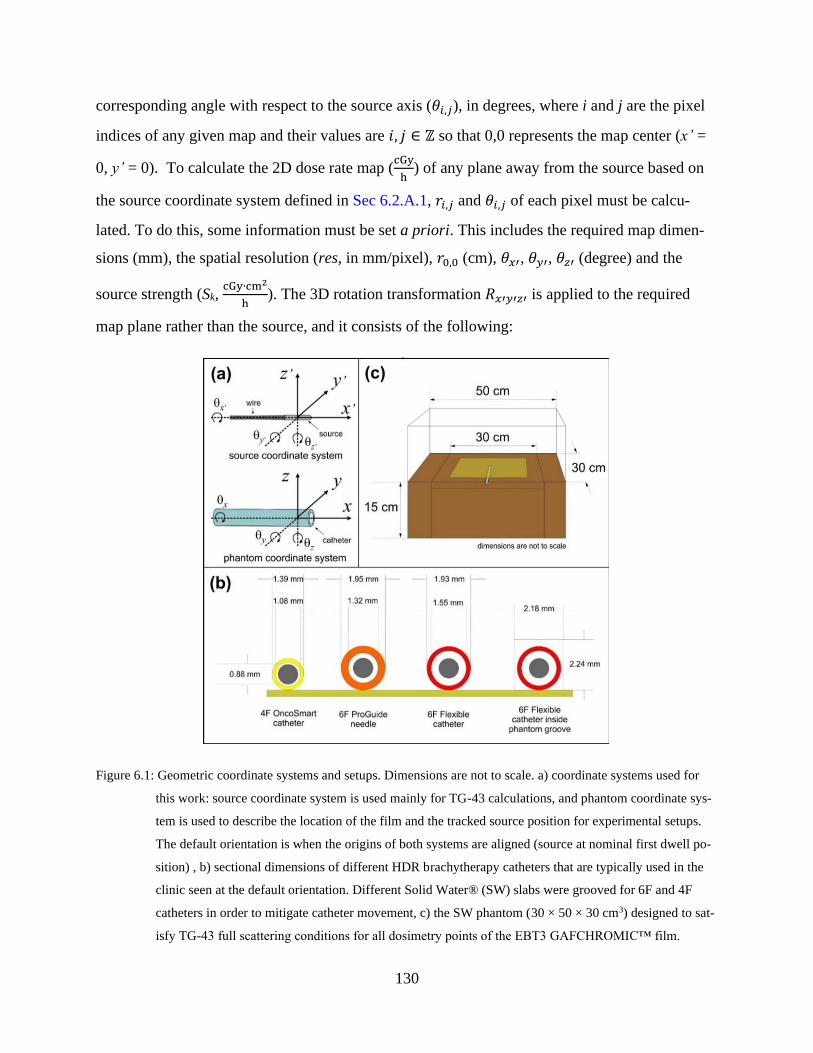
130
corresponding angle with respect to the source axis (𝜃𝑖,𝑗), in degrees, where i and j are the pixel
indices of any given map and their values are 𝑖, 𝑗 ∈ ℤ so that 0,0 represents the map center (x’ =
0, y’ = 0). To calculate the 2D dose rate map (cGy
h) of any plane away from the source based on
the source coordinate system defined in Sec 6.2.A.1, 𝑟𝑖,𝑗 and 𝜃𝑖,𝑗 of each pixel must be calcu-
lated. To do this, some information must be set a priori. This includes the required map dimen-
sions (mm), the spatial resolution (res, in mm/pixel), 𝑟0,0 (cm), 𝜃𝑥′, 𝜃𝑦′, 𝜃𝑧′ (degree) and the
source strength (Sk, cGy∙cm2
h). The 3D rotation transformation 𝑅𝑥′𝑦′𝑧′ is applied to the required
map plane rather than the source, and it consists of the following:
Figure 6.1: Geometric coordinate systems and setups. Dimensions are not to scale. a) coordinate systems used for
this work: source coordinate system is used mainly for TG-43 calculations, and phantom coordinate sys-
tem is used to describe the location of the film and the tracked source position for experimental setups.
The default orientation is when the origins of both systems are aligned (source at nominal first dwell po-
sition) , b) sectional dimensions of different HDR brachytherapy catheters that are typically used in the
clinic seen at the default orientation. Different Solid Water® (SW) slabs were grooved for 6F and 4F
catheters in order to mitigate catheter movement, c) the SW phantom (30 × 50 × 30 cm3) designed to sat-
isfy TG-43 full scattering conditions for all dosimetry points of the EBT3 GAFCHROMIC™ film.
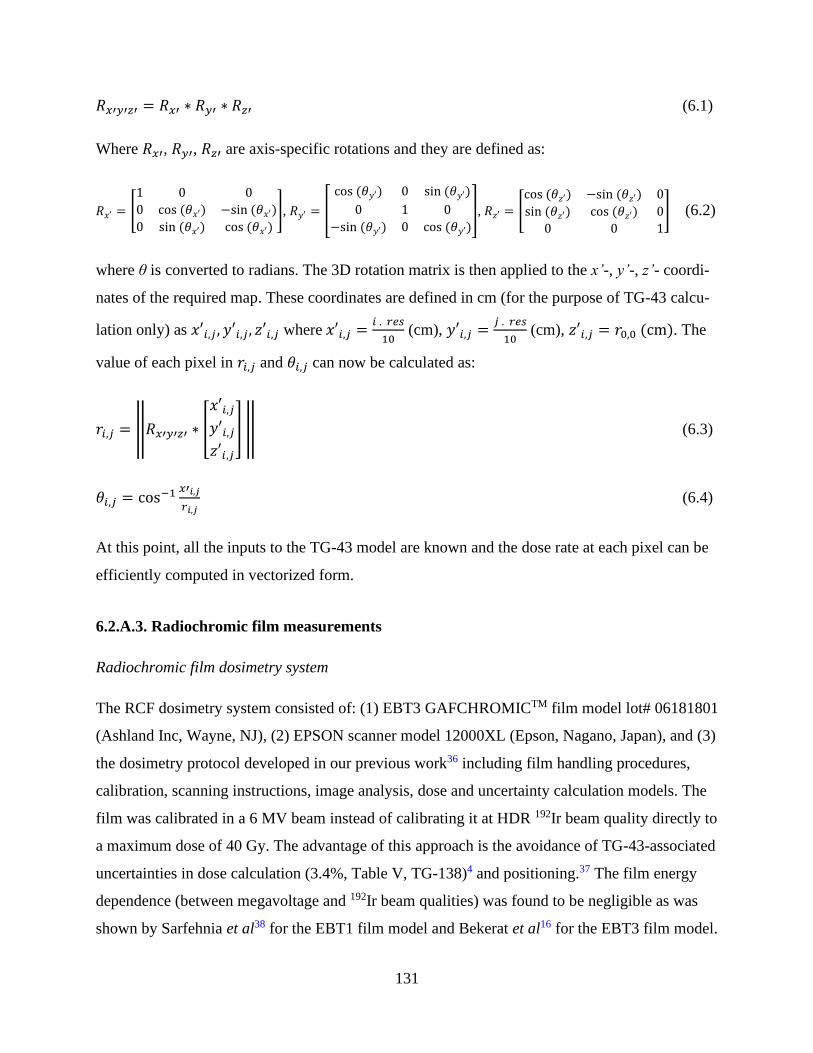
131
𝑅𝑥′𝑦′𝑧′ = 𝑅𝑥′ ∗ 𝑅𝑦′ ∗ 𝑅𝑧′ (6.1)
Where 𝑅𝑥′, 𝑅𝑦′, 𝑅𝑧′ are axis-specific rotations and they are defined as:
𝑅𝑥′ = [
1 0 0
0 cos (𝜃𝑥′) −sin (𝜃𝑥′)
0 sin (𝜃𝑥′) cos (𝜃𝑥′)], 𝑅𝑦′ = [
cos (𝜃𝑦′) 0 sin (𝜃𝑦′)
0 1 0
−sin (𝜃𝑦′) 0 cos (𝜃𝑦′)], 𝑅𝑧′ = [
cos (𝜃𝑧′) −sin (𝜃𝑧′) 0
sin (𝜃𝑧′) cos (𝜃𝑧′) 0
0 0 1
] (6.2)
where θ is converted to radians. The 3D rotation matrix is then applied to the x’-, y’-, z’- coordi-
nates of the required map. These coordinates are defined in cm (for the purpose of TG-43 calcu-
lation only) as 𝑥′𝑖,𝑗 , 𝑦′𝑖,𝑗, 𝑧′𝑖,𝑗 where 𝑥′𝑖,𝑗 =𝑖 . 𝑟𝑒𝑠
10 (cm), 𝑦′𝑖,𝑗 =
𝑗 . 𝑟𝑒𝑠
10 (cm), 𝑧′𝑖,𝑗 = 𝑟0,0 (cm). The
value of each pixel in 𝑟𝑖,𝑗 and 𝜃𝑖,𝑗 can now be calculated as:
𝑟𝑖,𝑗 = ‖𝑅𝑥′𝑦′𝑧′ ∗ [
𝑥′𝑖,𝑗𝑦′𝑖,𝑗𝑧′𝑖,𝑗
] ‖ (6.3)
𝜃𝑖,𝑗 = cos−1 𝑥′𝑖,𝑗
𝑟𝑖,𝑗 (6.4)
At this point, all the inputs to the TG-43 model are known and the dose rate at each pixel can be
efficiently computed in vectorized form.
6.2.A.3. Radiochromic film measurements
Radiochromic film dosimetry system
The RCF dosimetry system consisted of: (1) EBT3 GAFCHROMICTM film model lot# 06181801
(Ashland Inc, Wayne, NJ), (2) EPSON scanner model 12000XL (Epson, Nagano, Japan), and (3)
the dosimetry protocol developed in our previous work36 including film handling procedures,
calibration, scanning instructions, image analysis, dose and uncertainty calculation models. The
film was calibrated in a 6 MV beam instead of calibrating it at HDR 192Ir beam quality directly to
a maximum dose of 40 Gy. The advantage of this approach is the avoidance of TG-43-associated
uncertainties in dose calculation (3.4%, Table V, TG-138)4 and positioning.37 The film energy
dependence (between megavoltage and 192Ir beam qualities) was found to be negligible as was
shown by Sarfehnia et al38 for the EBT1 film model and Bekerat et al16 for the EBT3 film model.
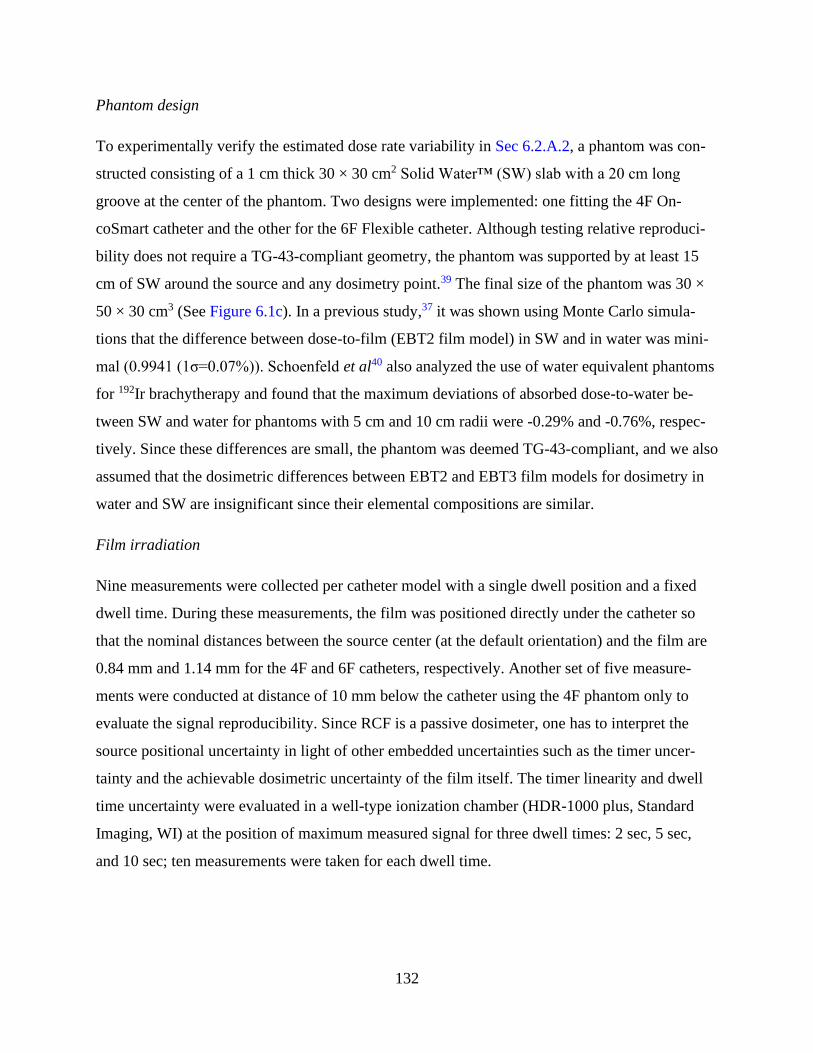
132
Phantom design
To experimentally verify the estimated dose rate variability in Sec 6.2.A.2, a phantom was con-
structed consisting of a 1 cm thick 30 × 30 cm2 Solid Water™ (SW) slab with a 20 cm long
groove at the center of the phantom. Two designs were implemented: one fitting the 4F On-
coSmart catheter and the other for the 6F Flexible catheter. Although testing relative reproduci-
bility does not require a TG-43-compliant geometry, the phantom was supported by at least 15
cm of SW around the source and any dosimetry point.39 The final size of the phantom was 30 ×
50 × 30 cm3 (See Figure 6.1c). In a previous study,37 it was shown using Monte Carlo simula-
tions that the difference between dose-to-film (EBT2 film model) in SW and in water was mini-
mal (0.9941 (1σ=0.07%)). Schoenfeld et al40 also analyzed the use of water equivalent phantoms
for 192Ir brachytherapy and found that the maximum deviations of absorbed dose-to-water be-
tween SW and water for phantoms with 5 cm and 10 cm radii were -0.29% and -0.76%, respec-
tively. Since these differences are small, the phantom was deemed TG-43-compliant, and we also
assumed that the dosimetric differences between EBT2 and EBT3 film models for dosimetry in
water and SW are insignificant since their elemental compositions are similar.
Film irradiation
Nine measurements were collected per catheter model with a single dwell position and a fixed
dwell time. During these measurements, the film was positioned directly under the catheter so
that the nominal distances between the source center (at the default orientation) and the film are
0.84 mm and 1.14 mm for the 4F and 6F catheters, respectively. Another set of five measure-
ments were conducted at distance of 10 mm below the catheter using the 4F phantom only to
evaluate the signal reproducibility. Since RCF is a passive dosimeter, one has to interpret the
source positional uncertainty in light of other embedded uncertainties such as the timer uncer-
tainty and the achievable dosimetric uncertainty of the film itself. The timer linearity and dwell
time uncertainty were evaluated in a well-type ionization chamber (HDR-1000 plus, Standard
Imaging, WI) at the position of maximum measured signal for three dwell times: 2 sec, 5 sec,
and 10 sec; ten measurements were taken for each dwell time.

133
6.2.A.4. Clinical impact of HDR source positional uncertainty
The dosimetric impact of source positional uncertainty for a typical clinical case with multiple
dwell positions and channels may be overestimated when evaluated in lieu of a single dwell posi-
tion. For completeness, a more realistic clinical evaluation of this uncertainty was conducted.
One selected case of Freiburg Flap (FF) based surface brachytherapy (17 catheters, 9 cm × 8 cm
loading, 171 dwell positions) was delivered five times in a SW phantom. One EBT3 film sheet
was positioned right below the FF (5 mm nominal distance to source) and another sheet was po-
sitioned 3 mm below the FF (8 mm nominal distance to source). For the repeats, care was taken
during the positioning of the film sheets to make sure they were always placed at the same loca-
tion within the phantom with respect to the applicator. Specifically, point marks were drawn on
each corner of the film sheet and they were reproduced at the same positions for all film sheets.
These point marks helped in image registration of the repeats. The corners of the film sheet were
also marked on the phantom at 5 mm distance from the source to reproducibly place the films on
the same position within the phantom. These marks were matched at 8 mm distance to source as
well with respect to the phantom edges. Finally, marks to relate the applicator to the phantom
were also drawn on the phantom surface and all SW pieces were aligned using a plastic base
with four edges that tightly keeps the SW in place.
6.2.B Source tracking model
If the spatial and temporal information of the source are known, then an accurate 2D dose meas-
urement at any plane away from the source can accurately recover its strength (Sk) and confirm
its dose rate distribution with respect to TG-43 data. The idea of the source tracking is based on
the fact that each dose rate map away from the source has unique features that are specific to a
single source positional and orientational information (x’, y’, z’, θy’, θz’). These features will be
defined and exploited so that a model can be created based on TG-43 calculations for source
tracking. The use of this model for tracking the source with RCF (i.e. determining x, y, z, θy, θz)
would be based on the measured version of these features. Since the source is assumed to be cy-
lindrically symmetric in the TG-43 formalism, θx’ can be chosen arbitrarily (e.g., θx’ = 0, which
makes 𝑅𝑥′ the unit matrix). In this section, two approaches will be discussed: (1) 1D approach
where some features of a dose rate profile could be used for source tracking, and (2) 2D ap-
proach utilizing different features of a dose rate map.
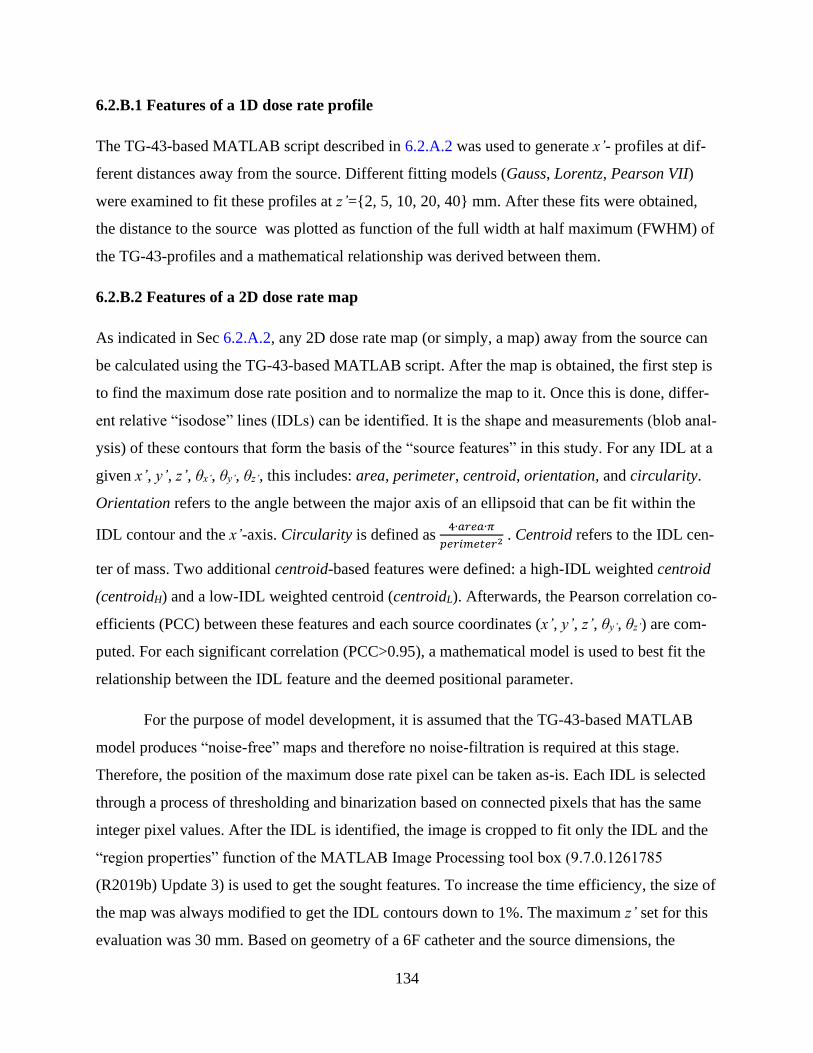
134
6.2.B.1 Features of a 1D dose rate profile
The TG-43-based MATLAB script described in 6.2.A.2 was used to generate x’- profiles at dif-
ferent distances away from the source. Different fitting models (Gauss, Lorentz, Pearson VII)
were examined to fit these profiles at z’={2, 5, 10, 20, 40} mm. After these fits were obtained,
the distance to the source was plotted as function of the full width at half maximum (FWHM) of
the TG-43-profiles and a mathematical relationship was derived between them.
6.2.B.2 Features of a 2D dose rate map
As indicated in Sec 6.2.A.2, any 2D dose rate map (or simply, a map) away from the source can
be calculated using the TG-43-based MATLAB script. After the map is obtained, the first step is
to find the maximum dose rate position and to normalize the map to it. Once this is done, differ-
ent relative “isodose” lines (IDLs) can be identified. It is the shape and measurements (blob anal-
ysis) of these contours that form the basis of the “source features” in this study. For any IDL at a
given x’, y’, z’, θx’, θy’, θz’, this includes: area, perimeter, centroid, orientation, and circularity.
Orientation refers to the angle between the major axis of an ellipsoid that can be fit within the
IDL contour and the x’-axis. Circularity is defined as 4∙𝑎𝑟𝑒𝑎∙𝜋
𝑝𝑒𝑟𝑖𝑚𝑒𝑡𝑒𝑟2 . Centroid refers to the IDL cen-
ter of mass. Two additional centroid-based features were defined: a high-IDL weighted centroid
(centroidH) and a low-IDL weighted centroid (centroidL). Afterwards, the Pearson correlation co-
efficients (PCC) between these features and each source coordinates (x’, y’, z’, θy’, θz’) are com-
puted. For each significant correlation (PCC>0.95), a mathematical model is used to best fit the
relationship between the IDL feature and the deemed positional parameter.
For the purpose of model development, it is assumed that the TG-43-based MATLAB
model produces “noise-free” maps and therefore no noise-filtration is required at this stage.
Therefore, the position of the maximum dose rate pixel can be taken as-is. Each IDL is selected
through a process of thresholding and binarization based on connected pixels that has the same
integer pixel values. After the IDL is identified, the image is cropped to fit only the IDL and the
“region properties” function of the MATLAB Image Processing tool box (9.7.0.1261785
(R2019b) Update 3) is used to get the sought features. To increase the time efficiency, the size of
the map was always modified to get the IDL contours down to 1%. The maximum z’ set for this
evaluation was 30 mm. Based on geometry of a 6F catheter and the source dimensions, the

135
maximum possible values for θy’ are between -15 to +15 degrees and therefore its value was lim-
ited between these angles.
6.2.C Source distribution digitization uncertainties
HDR brachytherapy retains its dosimetric uniqueness because of the high-dose-gradient that can
be achieved near the source.41 For measurements with RCF, the digitization choices such as
scanning resolution, size of region-of-interest (ROI), as well as image processing choices such as
the noise-filtration method and its size might be impacted by this high-dose-gradient. Therefore,
in this section, the TG-43-based MATLAB script described in Sec. 6.2.A.2 is used to character-
ize the effect of resolution, ROI size and noise-filtration on the reported dose rate maps.
6.2.C.1 Resolution and Size of Region-of-Interest (ROI)
As indicated in Sec 6.2.A.2, the resolution can be set by the user in the model. In this study, the
selected resolutions reflect typical scanning resolutions used in our RCF dosimetry protocol in-
cluding resolutions of 127 dpi and 254 dpi which correspond to 0.2 mm/pixel and 0.1 mm/pixel,
respectively. For each resolution, maps were created at z’={2, 5, 10, 20} mm distances to source.
The effect of digitization resolution on reported dose was checked in two ways: 1) when select-
ing an ROI of a certain size rather than a “pixel” to report the reading corresponding to the
source center, and 2) when selecting size of the noise-filter, as will be explained in Sec 6.2.C.2.
6.2.C.2 Noise and filtration
The tracking model explained in Sec. 6.2.B. should be tested at realistic noise levels. Typical
noise associated with RCF dosimetry was estimated to be Gaussian.42 Therefore, the use of a
Wiener filter (0.5×0.5 mm2) was shown to be effective in removing the noise while preserving
the pixel value information.11 The goal in this section is to evaluate the combined effects of high-
dose-gradient and the choice of filter size. For different filter sizes (W={3, 5, 7, 9, 11, 13, 15}
pixel) and different distances to the source (z’={2, 5, 10, 20} mm), the maximum dose rate from
the filtered image will be normalized to the maximum dose rate from the noise-free image. This
will be tested at different resolutions (res={0.1, 0.2} mm/pixel). The noise is assumed to be
Gaussian and it is added to the noise-free calculated images. For the selected resolution and filter
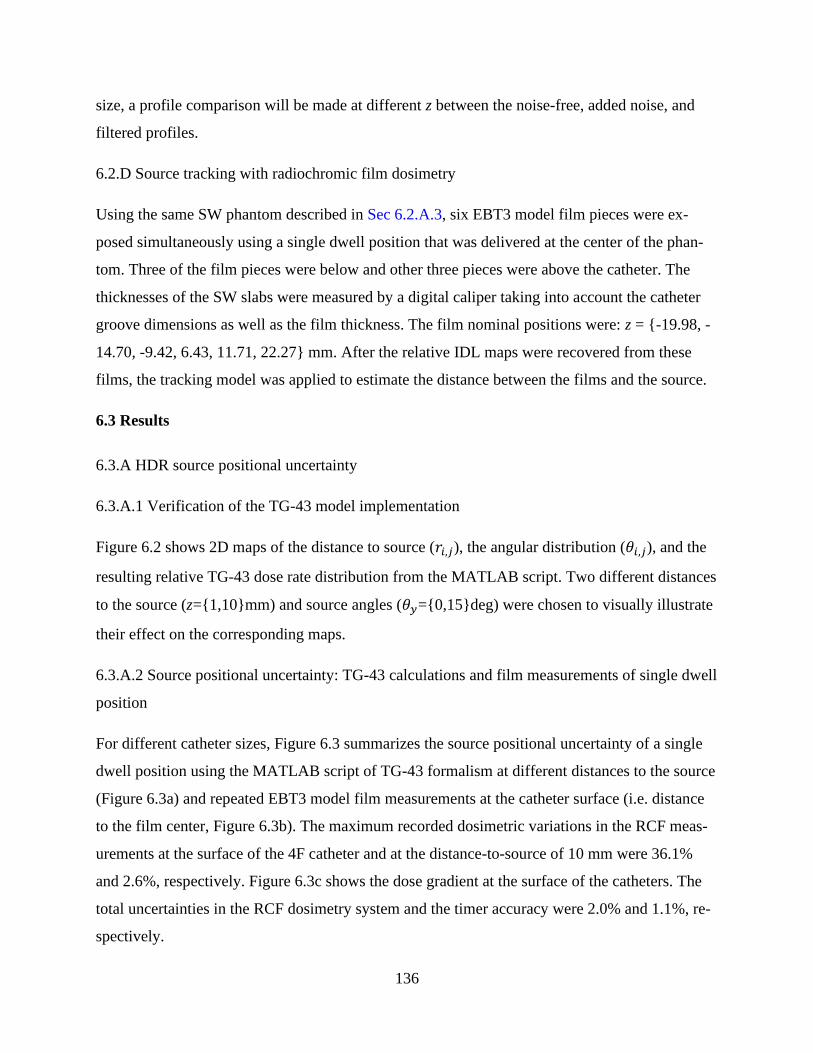
136
size, a profile comparison will be made at different z between the noise-free, added noise, and
filtered profiles.
6.2.D Source tracking with radiochromic film dosimetry
Using the same SW phantom described in Sec 6.2.A.3, six EBT3 model film pieces were ex-
posed simultaneously using a single dwell position that was delivered at the center of the phan-
tom. Three of the film pieces were below and other three pieces were above the catheter. The
thicknesses of the SW slabs were measured by a digital caliper taking into account the catheter
groove dimensions as well as the film thickness. The film nominal positions were: z = {-19.98, -
14.70, -9.42, 6.43, 11.71, 22.27} mm. After the relative IDL maps were recovered from these
films, the tracking model was applied to estimate the distance between the films and the source.
6.3 Results
6.3.A HDR source positional uncertainty
6.3.A.1 Verification of the TG-43 model implementation
Figure 6.2 shows 2D maps of the distance to source (𝑟𝑖,𝑗), the angular distribution (𝜃𝑖,𝑗), and the
resulting relative TG-43 dose rate distribution from the MATLAB script. Two different distances
to the source (z={1,10}mm) and source angles (𝜃𝑦={0,15}deg) were chosen to visually illustrate
their effect on the corresponding maps.
6.3.A.2 Source positional uncertainty: TG-43 calculations and film measurements of single dwell
position
For different catheter sizes, Figure 6.3 summarizes the source positional uncertainty of a single
dwell position using the MATLAB script of TG-43 formalism at different distances to the source
(Figure 6.3a) and repeated EBT3 model film measurements at the catheter surface (i.e. distance
to the film center, Figure 6.3b). The maximum recorded dosimetric variations in the RCF meas-
urements at the surface of the 4F catheter and at the distance-to-source of 10 mm were 36.1%
and 2.6%, respectively. Figure 6.3c shows the dose gradient at the surface of the catheters. The
total uncertainties in the RCF dosimetry system and the timer accuracy were 2.0% and 1.1%, re-
spectively.
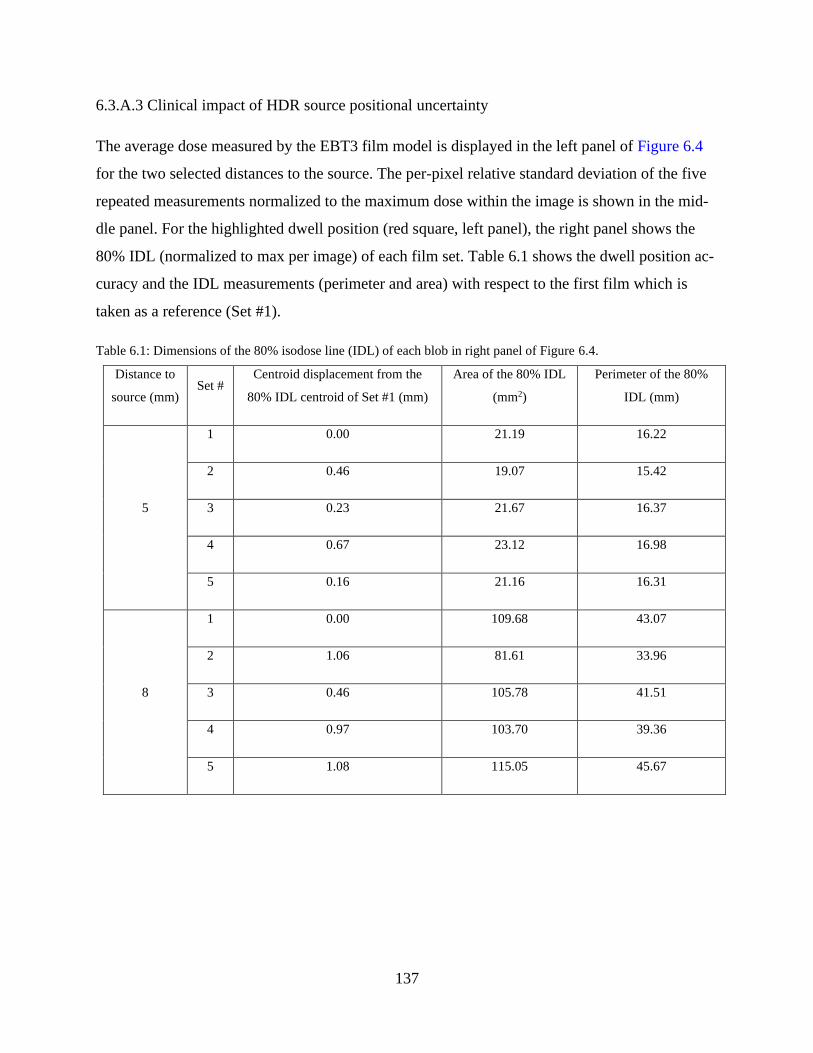
137
6.3.A.3 Clinical impact of HDR source positional uncertainty
The average dose measured by the EBT3 film model is displayed in the left panel of Figure 6.4
for the two selected distances to the source. The per-pixel relative standard deviation of the five
repeated measurements normalized to the maximum dose within the image is shown in the mid-
dle panel. For the highlighted dwell position (red square, left panel), the right panel shows the
80% IDL (normalized to max per image) of each film set. Table 6.1 shows the dwell position ac-
curacy and the IDL measurements (perimeter and area) with respect to the first film which is
taken as a reference (Set #1).
Table 6.1: Dimensions of the 80% isodose line (IDL) of each blob in right panel of Figure 6.4.
Distance to
source (mm) Set #
Centroid displacement from the
80% IDL centroid of Set #1 (mm)
Area of the 80% IDL
(mm2)
Perimeter of the 80%
IDL (mm)
5
1 0.00 21.19 16.22
2 0.46 19.07 15.42
3 0.23 21.67 16.37
4 0.67 23.12 16.98
5 0.16 21.16 16.31
8
1 0.00 109.68 43.07
2 1.06 81.61 33.96
3 0.46 105.78 41.51
4 0.97 103.70 39.36
5 1.08 115.05 45.67
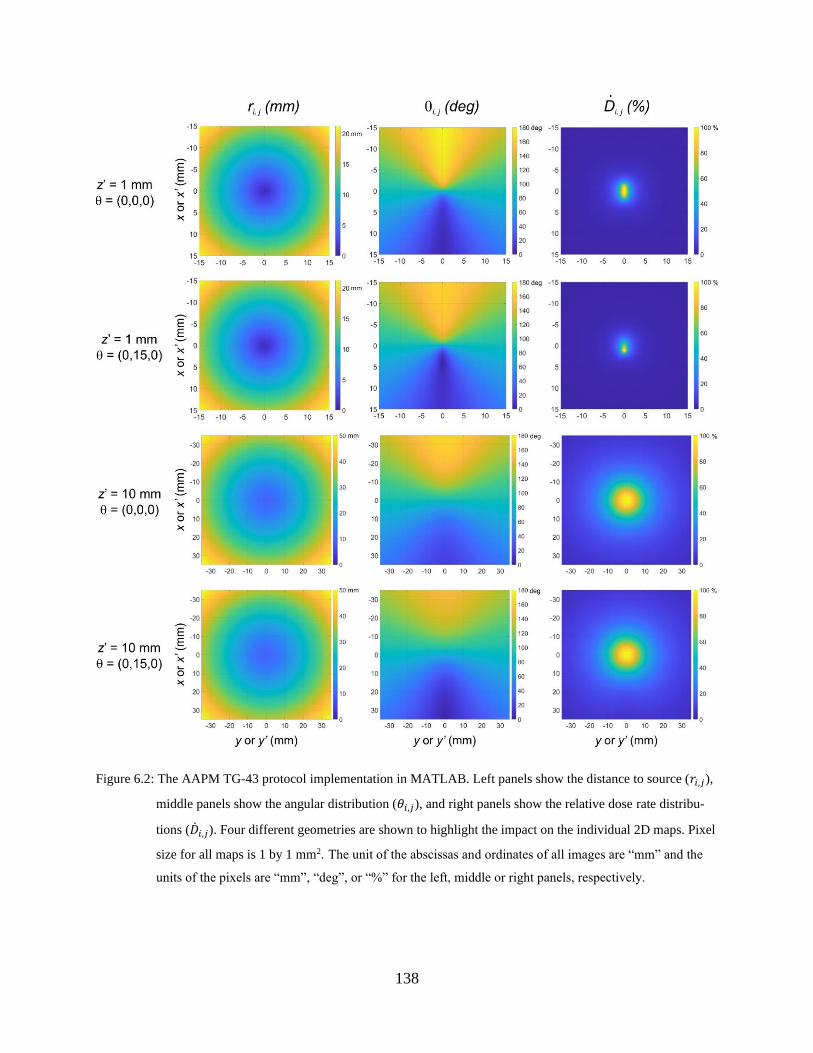
138
Figure 6.2: The AAPM TG-43 protocol implementation in MATLAB. Left panels show the distance to source (𝑟𝑖,𝑗),
middle panels show the angular distribution (𝜃𝑖,𝑗), and right panels show the relative dose rate distribu-
tions (�̇�𝑖,𝑗). Four different geometries are shown to highlight the impact on the individual 2D maps. Pixel
size for all maps is 1 by 1 mm2. The unit of the abscissas and ordinates of all images are “mm” and the
units of the pixels are “mm”, “deg”, or “%” for the left, middle or right panels, respectively.
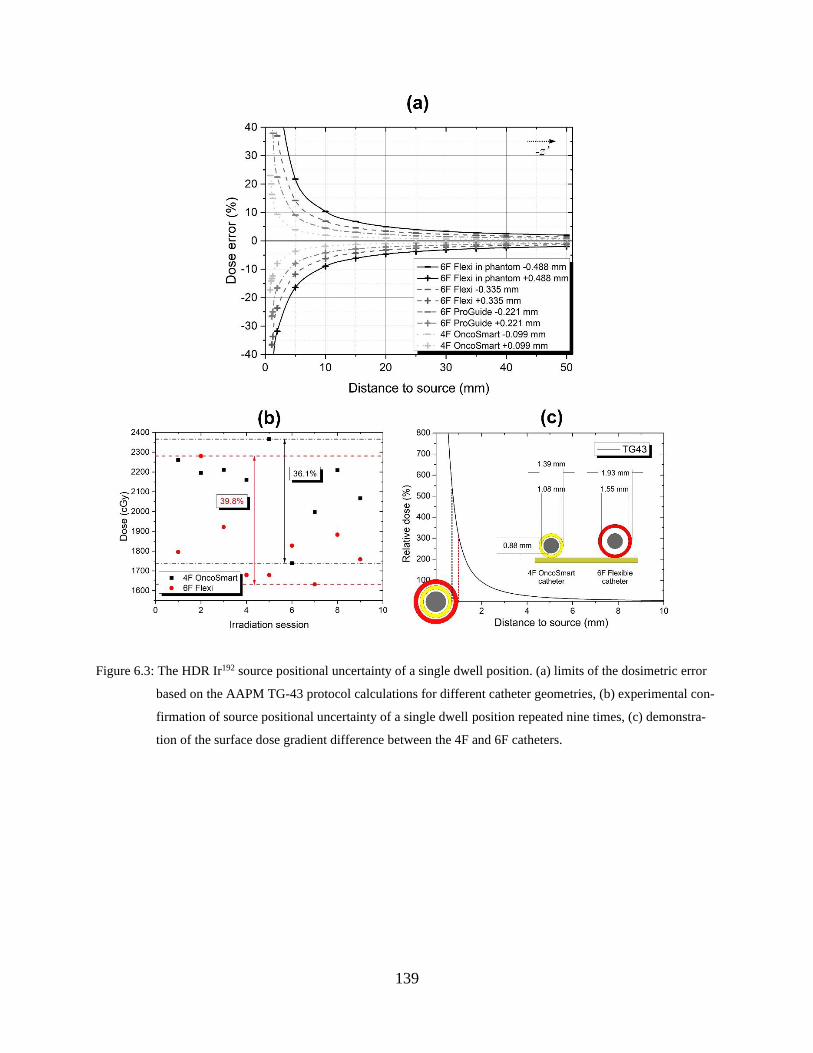
139
Figure 6.3: The HDR Ir192 source positional uncertainty of a single dwell position. (a) limits of the dosimetric error
based on the AAPM TG-43 protocol calculations for different catheter geometries, (b) experimental con-
firmation of source positional uncertainty of a single dwell position repeated nine times, (c) demonstra-
tion of the surface dose gradient difference between the 4F and 6F catheters.
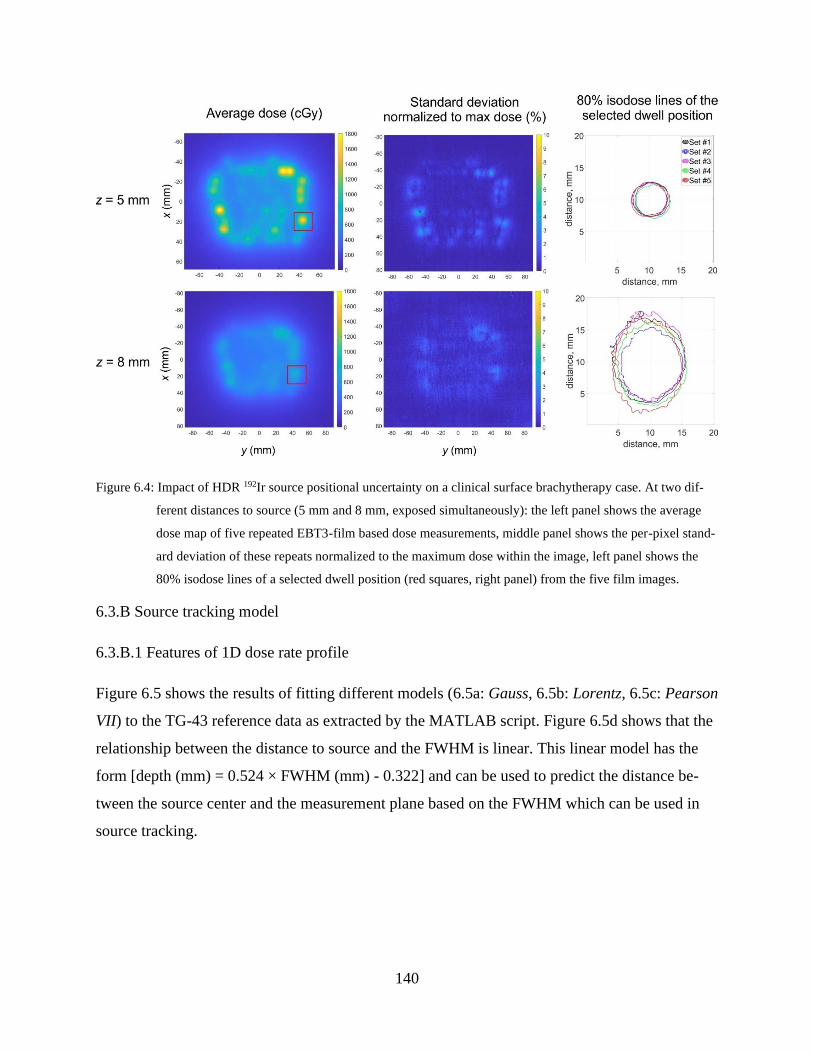
140
Figure 6.4: Impact of HDR 192Ir source positional uncertainty on a clinical surface brachytherapy case. At two dif-
ferent distances to source (5 mm and 8 mm, exposed simultaneously): the left panel shows the average
dose map of five repeated EBT3-film based dose measurements, middle panel shows the per-pixel stand-
ard deviation of these repeats normalized to the maximum dose within the image, left panel shows the
80% isodose lines of a selected dwell position (red squares, right panel) from the five film images.
6.3.B Source tracking model
6.3.B.1 Features of 1D dose rate profile
Figure 6.5 shows the results of fitting different models (6.5a: Gauss, 6.5b: Lorentz, 6.5c: Pearson
VII) to the TG-43 reference data as extracted by the MATLAB script. Figure 6.5d shows that the
relationship between the distance to source and the FWHM is linear. This linear model has the
form [depth (mm) = 0.524 × FWHM (mm) - 0.322] and can be used to predict the distance be-
tween the source center and the measurement plane based on the FWHM which can be used in
source tracking.
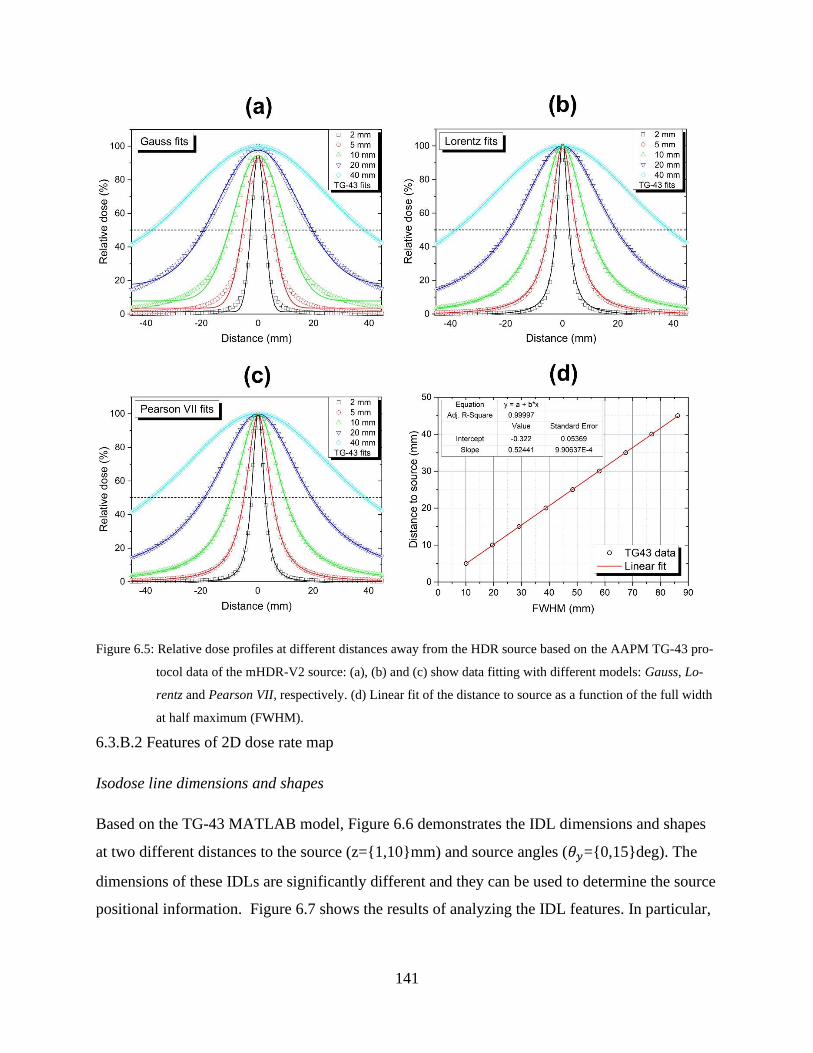
141
Figure 6.5: Relative dose profiles at different distances away from the HDR source based on the AAPM TG-43 pro-
tocol data of the mHDR-V2 source: (a), (b) and (c) show data fitting with different models: Gauss, Lo-
rentz and Pearson VII, respectively. (d) Linear fit of the distance to source as a function of the full width
at half maximum (FWHM).
6.3.B.2 Features of 2D dose rate map
Isodose line dimensions and shapes
Based on the TG-43 MATLAB model, Figure 6.6 demonstrates the IDL dimensions and shapes
at two different distances to the source (z={1,10}mm) and source angles (𝜃𝑦={0,15}deg). The
dimensions of these IDLs are significantly different and they can be used to determine the source
positional information. Figure 6.7 shows the results of analyzing the IDL features. In particular,
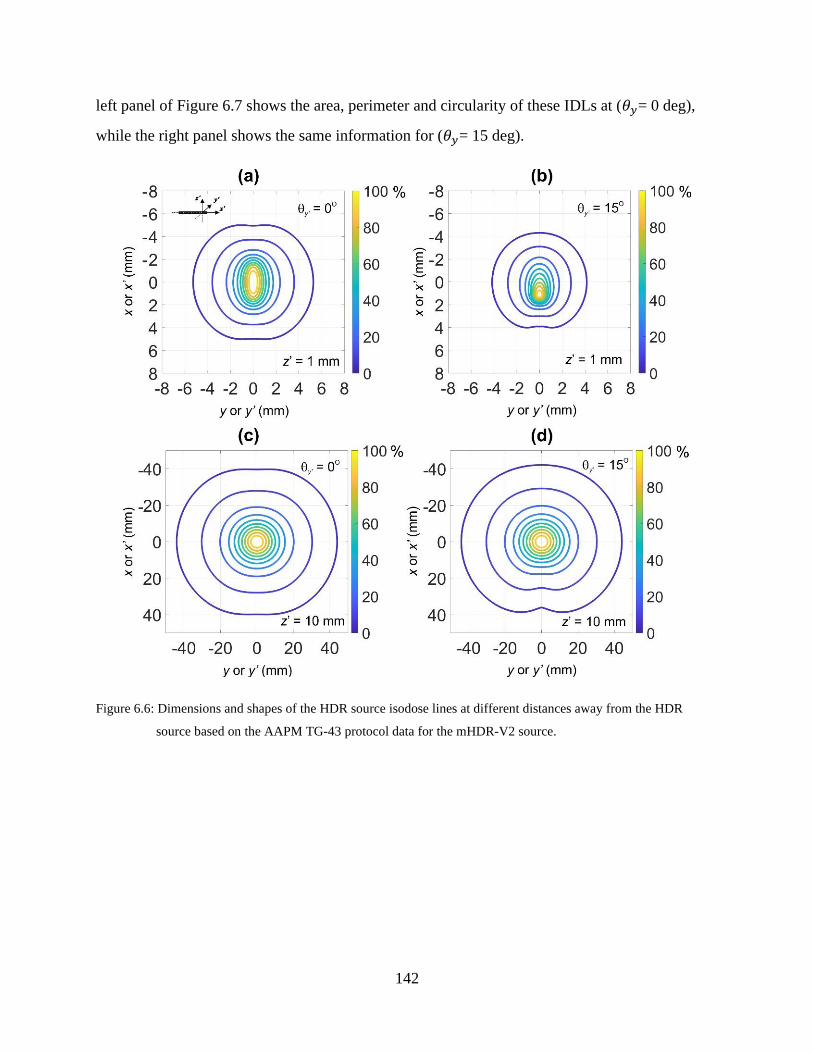
142
left panel of Figure 6.7 shows the area, perimeter and circularity of these IDLs at (𝜃𝑦= 0 deg),
while the right panel shows the same information for (𝜃𝑦= 15 deg).
Figure 6.6: Dimensions and shapes of the HDR source isodose lines at different distances away from the HDR
source based on the AAPM TG-43 protocol data for the mHDR-V2 source.
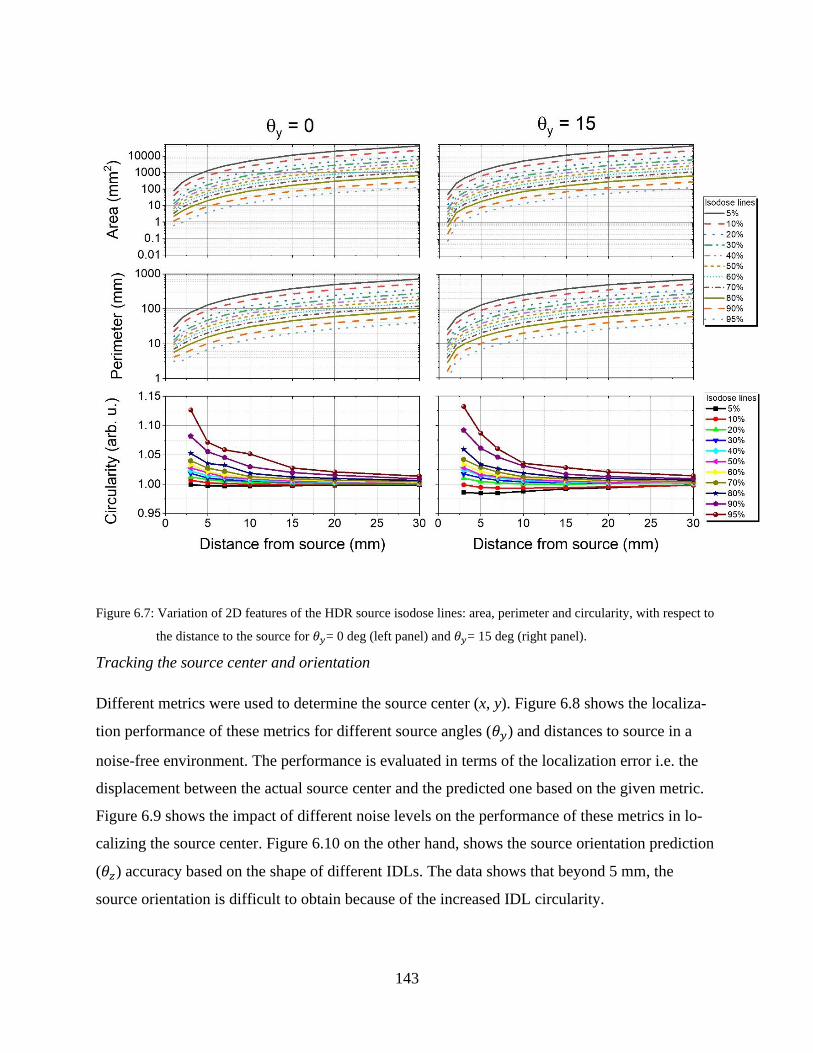
143
Figure 6.7: Variation of 2D features of the HDR source isodose lines: area, perimeter and circularity, with respect to
the distance to the source for 𝜃𝑦= 0 deg (left panel) and 𝜃𝑦= 15 deg (right panel).
Tracking the source center and orientation
Different metrics were used to determine the source center (x, y). Figure 6.8 shows the localiza-
tion performance of these metrics for different source angles (𝜃𝑦) and distances to source in a
noise-free environment. The performance is evaluated in terms of the localization error i.e. the
displacement between the actual source center and the predicted one based on the given metric.
Figure 6.9 shows the impact of different noise levels on the performance of these metrics in lo-
calizing the source center. Figure 6.10 on the other hand, shows the source orientation prediction
(𝜃𝑧) accuracy based on the shape of different IDLs. The data shows that beyond 5 mm, the
source orientation is difficult to obtain because of the increased IDL circularity.
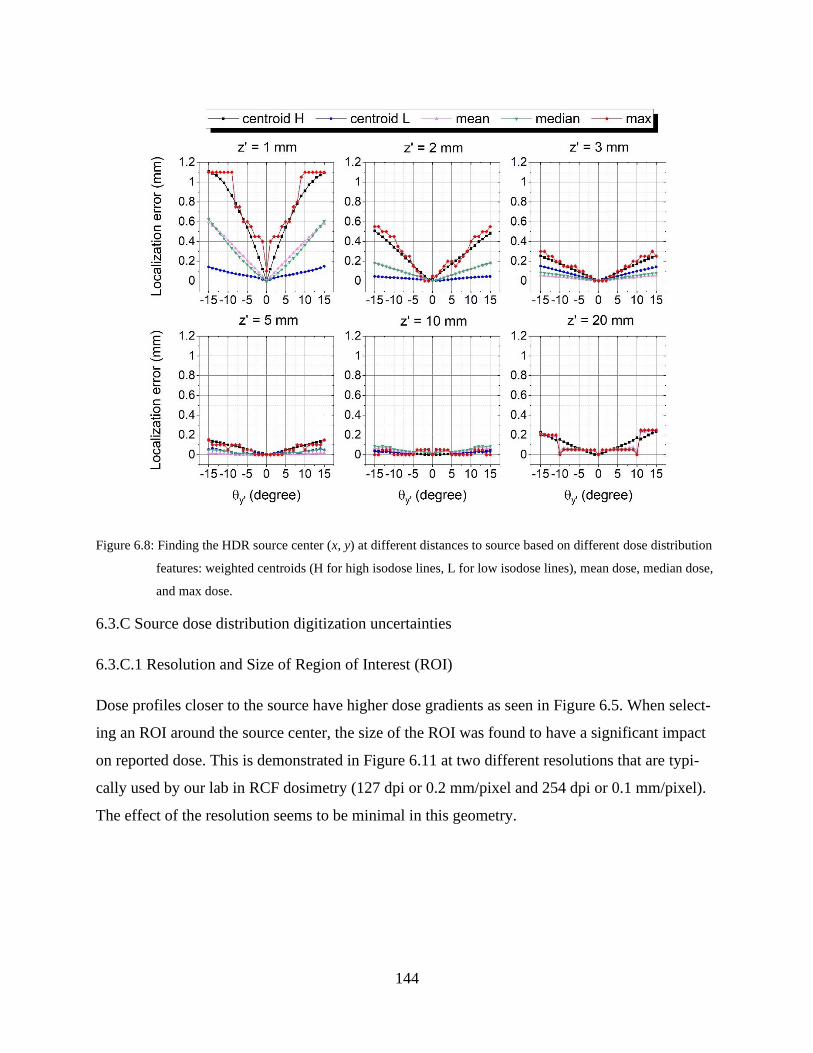
144
Figure 6.8: Finding the HDR source center (x, y) at different distances to source based on different dose distribution
features: weighted centroids (H for high isodose lines, L for low isodose lines), mean dose, median dose,
and max dose.
6.3.C Source dose distribution digitization uncertainties
6.3.C.1 Resolution and Size of Region of Interest (ROI)
Dose profiles closer to the source have higher dose gradients as seen in Figure 6.5. When select-
ing an ROI around the source center, the size of the ROI was found to have a significant impact
on reported dose. This is demonstrated in Figure 6.11 at two different resolutions that are typi-
cally used by our lab in RCF dosimetry (127 dpi or 0.2 mm/pixel and 254 dpi or 0.1 mm/pixel).
The effect of the resolution seems to be minimal in this geometry.
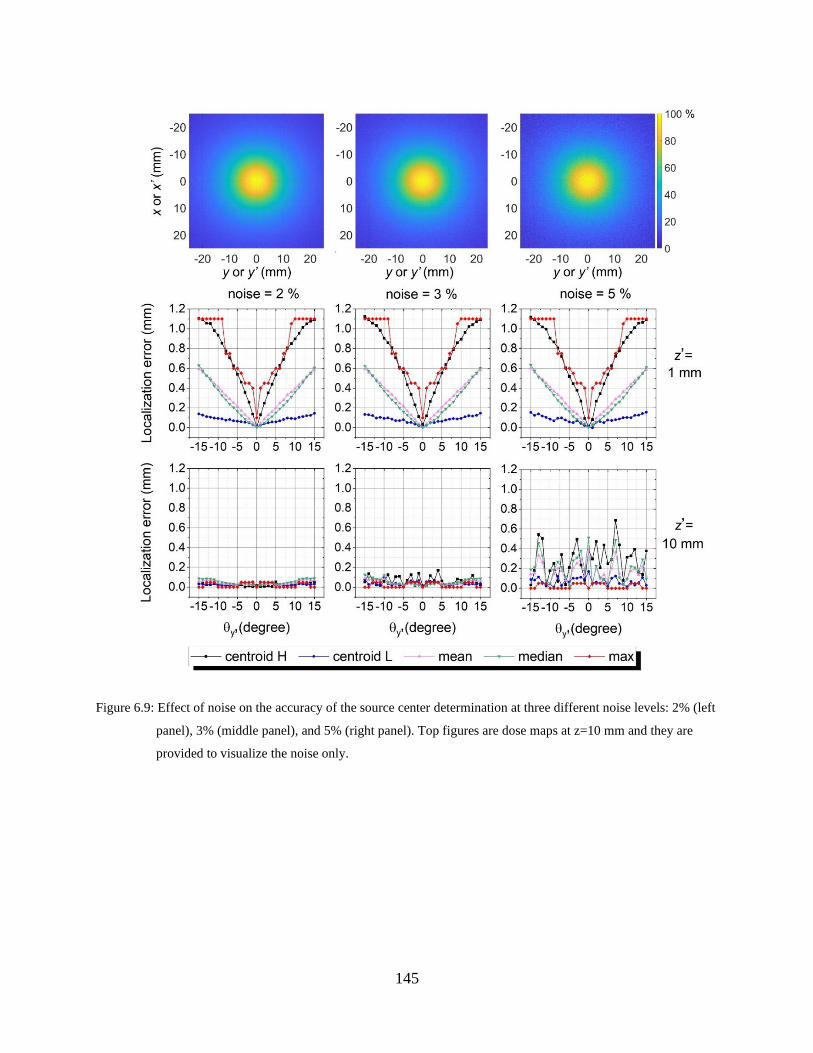
145
Figure 6.9: Effect of noise on the accuracy of the source center determination at three different noise levels: 2% (left
panel), 3% (middle panel), and 5% (right panel). Top figures are dose maps at z=10 mm and they are
provided to visualize the noise only.
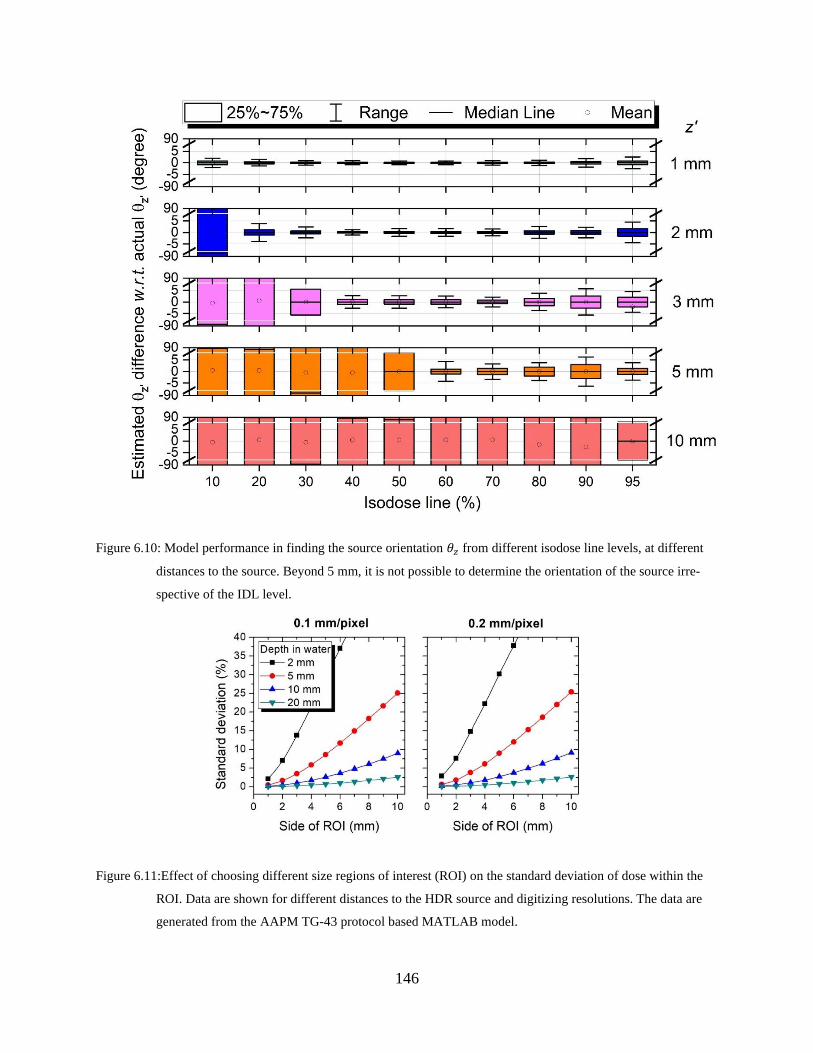
146
Figure 6.10: Model performance in finding the source orientation 𝜃𝑧 from different isodose line levels, at different
distances to the source. Beyond 5 mm, it is not possible to determine the orientation of the source irre-
spective of the IDL level.
Figure 6.11:Effect of choosing different size regions of interest (ROI) on the standard deviation of dose within the
ROI. Data are shown for different distances to the HDR source and digitizing resolutions. The data are
generated from the AAPM TG-43 protocol based MATLAB model.

147
6.3.C.2 Noise and filtration
The effect of the Wiener filter size on the reported dose at different dose gradients (i.e. distances
to source) is reported in Figure 6.12 (left panel). Right panel shows the effectiveness of the filter
in removing intentionally-added noise. For a selected filter size (5 by 5 pixel2) and resolution of
0.1 mm/pixel (corresponding to 0.5 by 0.5 mm2), Figure 6.13 shows that this filter size effec-
tively recovers the dose profiles at different distances from the source.
Figure 6.12: Effect of Wiener filter size on the dose reading in noise-free data (left panel), and on noise reduction in
data with added noise (right panel). Data are shown for different distances to source and digitizing reso-
lutions. The noise-free data are generated from the AAPM TG-43 protocol based MATLAB code.
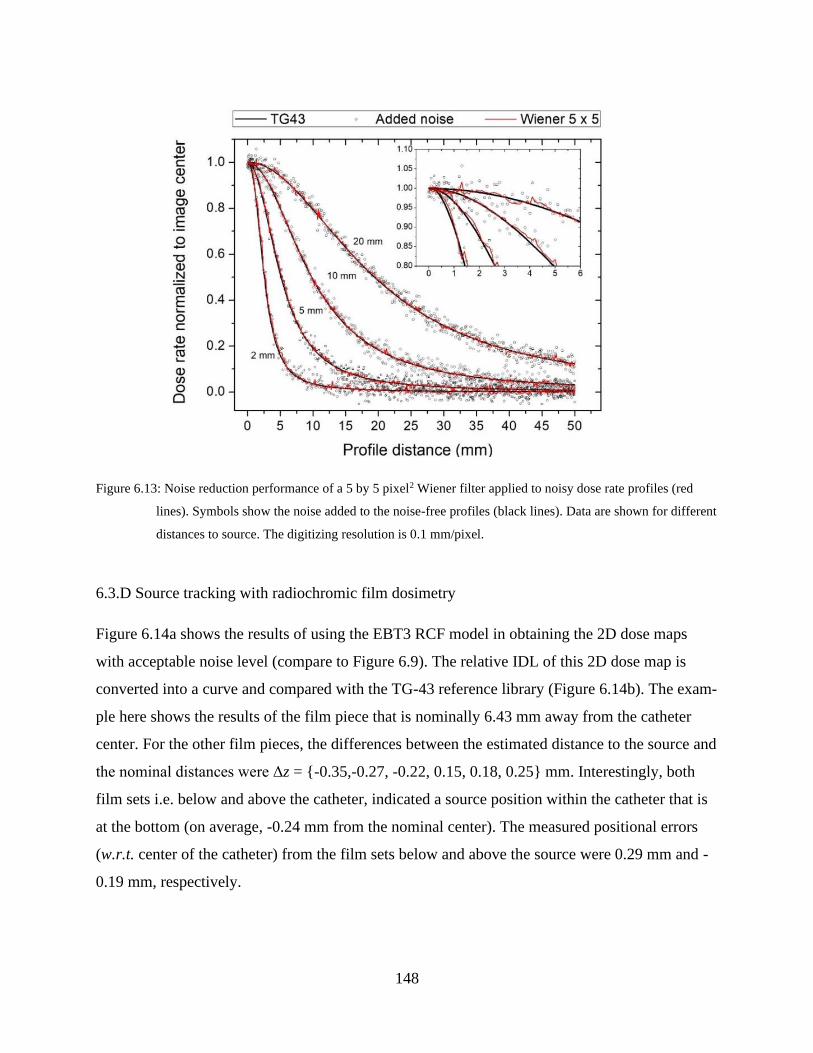
148
Figure 6.13: Noise reduction performance of a 5 by 5 pixel2 Wiener filter applied to noisy dose rate profiles (red
lines). Symbols show the noise added to the noise-free profiles (black lines). Data are shown for different
distances to source. The digitizing resolution is 0.1 mm/pixel.
6.3.D Source tracking with radiochromic film dosimetry
Figure 6.14a shows the results of using the EBT3 RCF model in obtaining the 2D dose maps
with acceptable noise level (compare to Figure 6.9). The relative IDL of this 2D dose map is
converted into a curve and compared with the TG-43 reference library (Figure 6.14b). The exam-
ple here shows the results of the film piece that is nominally 6.43 mm away from the catheter
center. For the other film pieces, the differences between the estimated distance to the source and
the nominal distances were Δz = {-0.35,-0.27, -0.22, 0.15, 0.18, 0.25} mm. Interestingly, both
film sets i.e. below and above the catheter, indicated a source position within the catheter that is
at the bottom (on average, -0.24 mm from the nominal center). The measured positional errors
(w.r.t. center of the catheter) from the film sets below and above the source were 0.29 mm and -
0.19 mm, respectively.
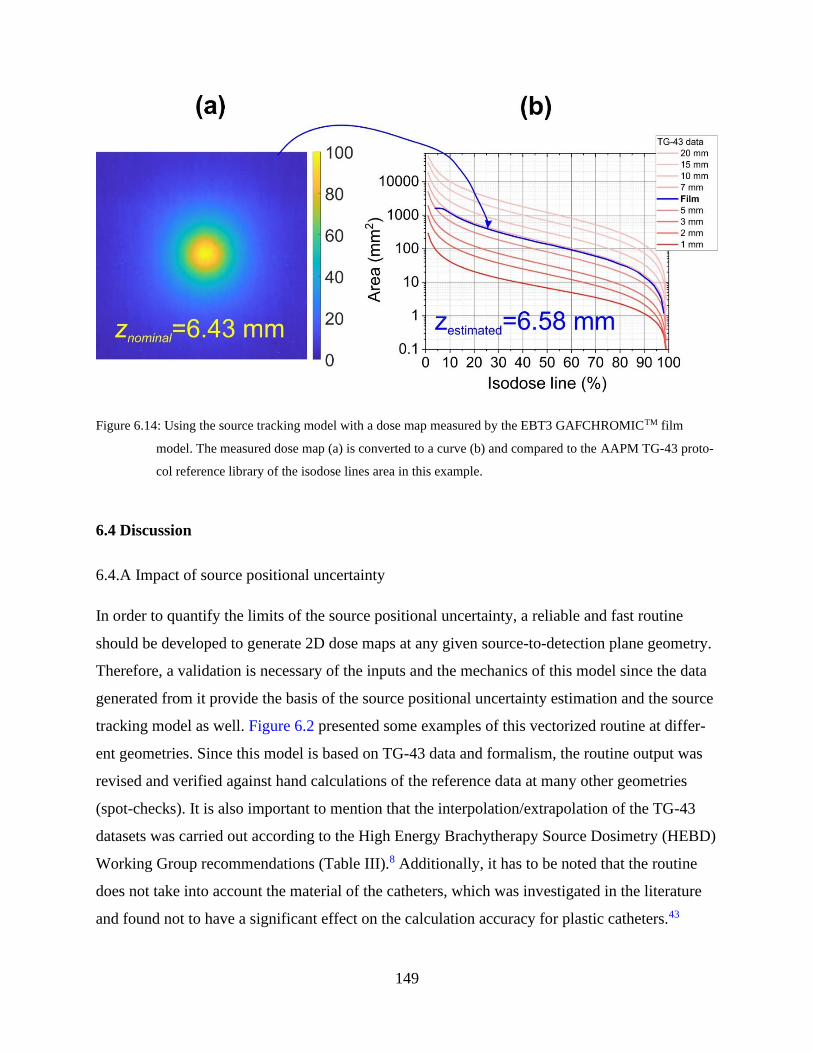
149
Figure 6.14: Using the source tracking model with a dose map measured by the EBT3 GAFCHROMICTM film
model. The measured dose map (a) is converted to a curve (b) and compared to the AAPM TG-43 proto-
col reference library of the isodose lines area in this example.
6.4 Discussion
6.4.A Impact of source positional uncertainty
In order to quantify the limits of the source positional uncertainty, a reliable and fast routine
should be developed to generate 2D dose maps at any given source-to-detection plane geometry.
Therefore, a validation is necessary of the inputs and the mechanics of this model since the data
generated from it provide the basis of the source positional uncertainty estimation and the source
tracking model as well. Figure 6.2 presented some examples of this vectorized routine at differ-
ent geometries. Since this model is based on TG-43 data and formalism, the routine output was
revised and verified against hand calculations of the reference data at many other geometries
(spot-checks). It is also important to mention that the interpolation/extrapolation of the TG-43
datasets was carried out according to the High Energy Brachytherapy Source Dosimetry (HEBD)
Working Group recommendations (Table III).8 Additionally, it has to be noted that the routine
does not take into account the material of the catheters, which was investigated in the literature
and found not to have a significant effect on the calculation accuracy for plastic catheters.43
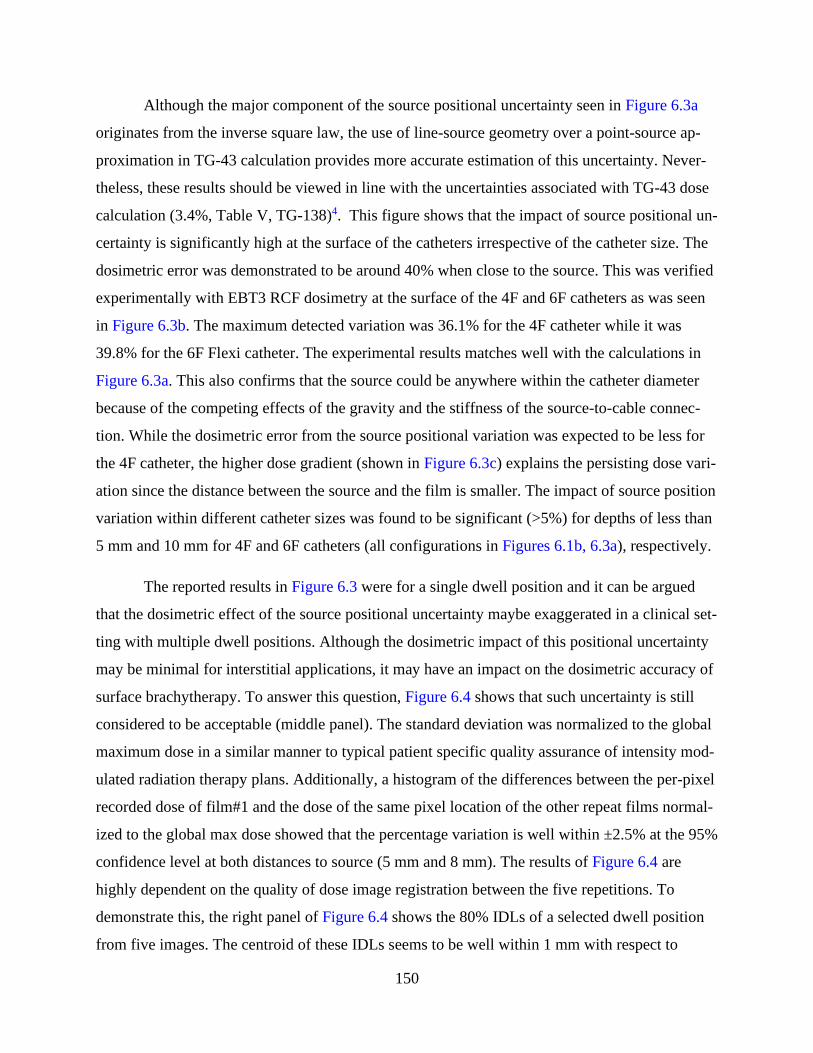
150
Although the major component of the source positional uncertainty seen in Figure 6.3a
originates from the inverse square law, the use of line-source geometry over a point-source ap-
proximation in TG-43 calculation provides more accurate estimation of this uncertainty. Never-
theless, these results should be viewed in line with the uncertainties associated with TG-43 dose
calculation (3.4%, Table V, TG-138)4. This figure shows that the impact of source positional un-
certainty is significantly high at the surface of the catheters irrespective of the catheter size. The
dosimetric error was demonstrated to be around 40% when close to the source. This was verified
experimentally with EBT3 RCF dosimetry at the surface of the 4F and 6F catheters as was seen
in Figure 6.3b. The maximum detected variation was 36.1% for the 4F catheter while it was
39.8% for the 6F Flexi catheter. The experimental results matches well with the calculations in
Figure 6.3a. This also confirms that the source could be anywhere within the catheter diameter
because of the competing effects of the gravity and the stiffness of the source-to-cable connec-
tion. While the dosimetric error from the source positional variation was expected to be less for
the 4F catheter, the higher dose gradient (shown in Figure 6.3c) explains the persisting dose vari-
ation since the distance between the source and the film is smaller. The impact of source position
variation within different catheter sizes was found to be significant (>5%) for depths of less than
5 mm and 10 mm for 4F and 6F catheters (all configurations in Figures 6.1b, 6.3a), respectively.
The reported results in Figure 6.3 were for a single dwell position and it can be argued
that the dosimetric effect of the source positional uncertainty maybe exaggerated in a clinical set-
ting with multiple dwell positions. Although the dosimetric impact of this positional uncertainty
may be minimal for interstitial applications, it may have an impact on the dosimetric accuracy of
surface brachytherapy. To answer this question, Figure 6.4 shows that such uncertainty is still
considered to be acceptable (middle panel). The standard deviation was normalized to the global
maximum dose in a similar manner to typical patient specific quality assurance of intensity mod-
ulated radiation therapy plans. Additionally, a histogram of the differences between the per-pixel
recorded dose of film#1 and the dose of the same pixel location of the other repeat films normal-
ized to the global max dose showed that the percentage variation is well within ±2.5% at the 95%
confidence level at both distances to source (5 mm and 8 mm). The results of Figure 6.4 are
highly dependent on the quality of dose image registration between the five repetitions. To
demonstrate this, the right panel of Figure 6.4 shows the 80% IDLs of a selected dwell position
from five images. The centroid of these IDLs seems to be well within 1 mm with respect to

151
film#1 at the distance of 5 mm (Table 6.I). One film set (#2) showed significantly smaller IDL
dimensions in terms of area and perimeter at both distances to source indicating that the source
may have been slightly further in this case. The results in Table 6.I for 8 mm are provided for
completeness only because the centroid positions were highly affected by the dose components
of the preceding and following dwell positions.
6.4.B Performance of the source tracking models
Two approaches, 1D and 2D, were discussed in this work for source tracking. Different features
of dose profiles (1D approach) and isodose lines (2D approach) were exploited to set the basis of
the tracking models. The FWHM of a dose profile was found to be in linear relationship with the
distance to the source center and acquiring the dose profile was the only requirement for this
technique (Figure 6.5). Film dosimetry seems to be the natural choice for such task and, in order
to avoid the effect of noise and spikes on the correct recovery of dose profiles, it was found that a
Pearson VII model can be used to fit the measured data in order to acquire the FWHM. For ex-
ample, a film exposed at a caliper-measured distance of 10.93 mm away from the source re-
ported a dose profile with a FWHM of 21.49 mm (film data) and 21.41 mm (fitted data) which
correspond to 10.94 mm and 10.90 mm, respectively. Although the source tracking model with
the 1D profile seems to yield accurate distances to source, its performance is limited to finding
“z” only. Strictly, even determining the value of z is dependent on the noise level and the fact
that the profile actually passed through the dose distribution center. Therefore, a 2D approach
would be more reliable and logical.
The dimensions and shapes of the isodose lines were found to be sensitive to the distance
to the source. Instead of utilizing the FWHM only (50% IDL in 2D), most of the IDLs could be
utilized for the purpose of source tracking. The requirement in this case is that the dose map is
normalized to the maximum value within the map. In that way, the measured IDLs features could
be compared to the reference TG-43 library of a wide range of possible source geometries. Ex-
amples of these libraries were given in Figures 6.6, 6.7 and 6.10. Analysis of the measured fea-
tures of these IDLs with respect to the reference library yielded the most probable 3D coordi-
nates of the source center with respect to the measurement plane. This was demonstrated in Fig-
ure 6.14 with the “IDL area” feature for finding the distance to source (z). To find the source
center (x, y), the performance of five different measures to localize the source center was

152
evaluated. These are the low and high IDL-weighted centroids, the max, the mean and the me-
dian (of a 1 by 1 mm2 region centered around the maximum). It can be seen from Figures 6.8 and
6.9 that the low IDL-weighted centroid can better localize the source center because of the in-
creased circularity of these IDLs (See Figure 6.7). Beyond z = 5 mm, all of these measures could
be representative of the source center. Additionally, the increased IDL circularity beyond 5 mm,
made it difficult to estimate the source orientation around the z axis (𝜃𝑧, See Figure 6.10). On the
other hand, when the measurement plane is too close to the source; a maximally tilted source
around the y axis (𝜃𝑦= ±15° for a 6F catheter, See Figure 6.6), can shift the maximum point posi-
tion to up to 1.10 mm in the worst case scenario (at z = 1 mm away from the source). Although
this situation may seem unlikely because the source is welded to a wire, more specific experi-
mental work is needed to determine the most probable 𝜃𝑦 range.
It is difficult to experimentally estimate the uncertainty in source orientation based on de-
scribed tracking model because it is not possible to establish the actual source orientation during
an experiment described in this work. Also, multiple 2D features showed promise in tracking the
source, but there are also other features that can be studied. The aim of this work is to introduce
the concept of IDL blob analysis for source tracking. The verification of the tracking perfor-
mance requires significant amount of work and is left for future projects. Instead, we present the
most correlated features with the source 3D coordinates. The source center (x, y) was signifi-
cantly correlated with the low IDL-weighted centroid (PCC=0.99), while the distance to source
(z) was correlated with the IDL areas (PCC=0.96) and perimeters (PCC=0.99). The area is pre-
ferred to the perimeter as a feature because of the possible inaccuracies in determining the perim-
eter of very small ROIs44 as in the case with high IDLs. The source orientation 𝜃𝑦 was correlated
with the difference between high and low IDL-weighted centroids (PCC=0.98), while 𝜃𝑧 was
correlated with elliptic orientation of the 60-90% IDL (PCC=0.97) for a maximum distance of z
= 5 mm. Beyond 5 mm, IDL circularity was significant, therefore limiting the determination of
𝜃𝑦 (PCC≤0.48).
6.4.C Source dose distribution digitization uncertainties
The digitization of RCF exposed to the HDR source with different recorded dose gradient levels
can impact the accuracy of the reported doses. The size of the selected ROI must be small

153
enough if the film was too close to the source. For example, if we consider placing pieces of film
at a distance of 10 mm from the source, Figure 6.11 shows that dose inhomogeneity will be less
than 2.5% if the chosen ROI size was less than 5 mm × 5 mm. It was also seen that a higher
scanning resolution (254 dpi or 0.1 mm/pixel) was preferred over the 127 dpi (0.2 mm/pixel) in
order to avoid the dose averaging effects at high dose gradients. A higher scanning resolution in-
troduces more noise,42 and therefore the application of a noise removal filter is recommended.
However, the size of the filter must be chosen carefully in order to avoid dose underestimation
around high dose gradient regions (Figure 6.12). Although the performance of the filter seems
more aggressive with the lower scanning resolution, the mm size of the filter is double that of the
0.1 mm/pixel resolution. The filter size was still presented with respect to pixels instead of mm
on the x-axis, because we believe it is more relatable in programming since the filter size is usu-
ally set by number of pixels. In summary, a scanning resolution of 0.1 mm/pixel, with a Wiener
filter size of 5 by 5 pixel2 was found to correctly recover dose profiles from noisy datasets (See
Figure 6.13).
6.4.D Source tracking with radiochromic film dosimetry versus other systems
The accuracy of the source tracking model was tested by having two film sets at opposing direc-
tions from the source. The hypothesis of this experiment was if the tracking method was sensi-
tive enough, both film sets should report the same source position within the catheter. Set #1
which was above the source reported a position that is at the bottom of the catheter (-0.19±0.05
mm) while Set #2 which was below the source reported a position that was also at the bottom of
the catheter (-0.28±0.07 mm). Both sets reported a position that is -0.24±0.07 mm at the bottom
of the catheter. This means that this method has a potential accuracy in determining the source
position in the z-direction of 0.1 mm (since the actual source position cannot be verified inside
the SW). Additionally, there seems to be a small systematic error in the method since there is a
correlation between the distance to the source and the reported position within the catheter but
this is taken into account within the uncertainty estimation.
The tracking model in this study was shown to be able to retrieve source positional infor-
mation in the “z” direction in addition to “x, y”, while most of the tracking methods available in
the literature are focused on the source positioning accuracy in the “x” or “x, y” direc-
tions.20,23,24,28,29,45–50 An exception is the study by Johansen et al48 where they reported errors in
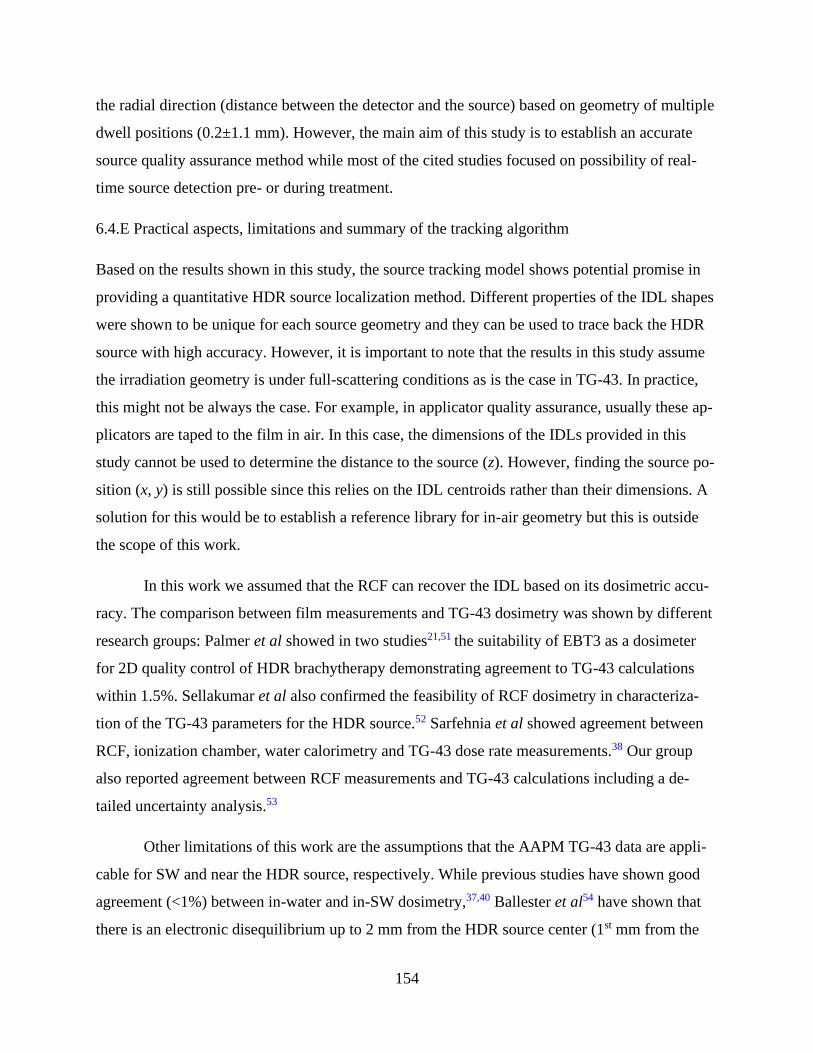
154
the radial direction (distance between the detector and the source) based on geometry of multiple
dwell positions (0.2±1.1 mm). However, the main aim of this study is to establish an accurate
source quality assurance method while most of the cited studies focused on possibility of real-
time source detection pre- or during treatment.
6.4.E Practical aspects, limitations and summary of the tracking algorithm
Based on the results shown in this study, the source tracking model shows potential promise in
providing a quantitative HDR source localization method. Different properties of the IDL shapes
were shown to be unique for each source geometry and they can be used to trace back the HDR
source with high accuracy. However, it is important to note that the results in this study assume
the irradiation geometry is under full-scattering conditions as is the case in TG-43. In practice,
this might not be always the case. For example, in applicator quality assurance, usually these ap-
plicators are taped to the film in air. In this case, the dimensions of the IDLs provided in this
study cannot be used to determine the distance to the source (z). However, finding the source po-
sition (x, y) is still possible since this relies on the IDL centroids rather than their dimensions. A
solution for this would be to establish a reference library for in-air geometry but this is outside
the scope of this work.
In this work we assumed that the RCF can recover the IDL based on its dosimetric accu-
racy. The comparison between film measurements and TG-43 dosimetry was shown by different
research groups: Palmer et al showed in two studies21,51 the suitability of EBT3 as a dosimeter
for 2D quality control of HDR brachytherapy demonstrating agreement to TG-43 calculations
within 1.5%. Sellakumar et al also confirmed the feasibility of RCF dosimetry in characteriza-
tion of the TG-43 parameters for the HDR source.52 Sarfehnia et al showed agreement between
RCF, ionization chamber, water calorimetry and TG-43 dose rate measurements.38 Our group
also reported agreement between RCF measurements and TG-43 calculations including a de-
tailed uncertainty analysis.53
Other limitations of this work are the assumptions that the AAPM TG-43 data are appli-
cable for SW and near the HDR source, respectively. While previous studies have shown good
agreement (<1%) between in-water and in-SW dosimetry,37,40 Ballester et al54 have shown that
there is an electronic disequilibrium up to 2 mm from the HDR source center (1st mm from the
155
6F catheter) leading to additional dose from electrons that is not considered in the AAPM TG-43
dose calculation formalism. Therefore, the use of the tracking model based on IDLs of >90%
within 2 mm from the HDR source may underestimate the distance to source center and therefore
should be discouraged.
The application of the 1D and 2D source tracking approaches were presented for a single
dwell position in this study. For multiple dwell positions, there would be a dose contribution to
every point from each dwell position. This necessitates the decomposition of each dwell posi-
tion’s dose profile based on the knowledge that the source dose profile can be modeled with
Pearson VII fit (1D approach, See Figure 5). However, this approach (decomposition analysis) is
currently under research and we intend to share results in a future work. The 2D approach is es-
pecially useful for applicator and x-ray marker coincidence QA. However, a large number of
QAs is necessary to evaluate the practicality of the method and it also requires validation of the
x-ray and film images co-registration process which is outside the scope of this work and will be
submitted in the future.
To summarize the results of the source tracking model: For a filtered and normalized
dose map, the source positional coordinates (x, y, z, 𝜃𝑦, 𝜃𝑧) correlated significantly with the fol-
lowing:
• Source center (x, y): with the low IDL-weighted centroid at any z, or with max-, mean-, me-
dian- of a 1 by 1 mm2, high IDL-weighted centroid ROI at z ≥ 5 mm.
• Distance to source (z): IDL area, perimeter.
• Source orientation (𝜃𝑦): the distance between high and low IDL-weighted centroids.
• Source orientation (𝜃𝑧): the elliptic orientation of the 60-90% IDL for a maximum z = 5 mm.
• Maximum point: high IDL-weighted centroid (any z).
6.5 Conclusion
An efficient method was introduced to accurately localize the HDR source based on a measured
2D isodose map away from the source, obtainable from RCF dosimetry. Blob analysis (area, pe-
rimeter, weighted centroids, elliptic orientation and circularity), could be used to compare the
measurements of the relative isodose lines (relative to max) to a reference TG-43 library. The
156
effect of the digitization process was also explored. This method optimizes the accuracy of 3D
source localization and the use of RCF to quantitatively determine the source position with high
accuracy (±0.1 mm). Accurate source localization is essential to provide a reliable QA method
for commercial and customized applicators. Additionally, the same methodology might be ex-
tended to other 2D imaging systems.
6.6 Acknowledgement
This work was supported in part by the Natural Sciences and Engineering Research Council of
Canada contract no. 386009. S.A. is a Ph.D. Candidate supported by the scholarship program at
King Faisal Specialist Hospital & Research Centre (KFSH & RC). S.A. acknowledges partial
support by the CREATE Medical Physics Research Training Network grant of the Natural Sci-
ences and Engineering Research Council (Grant number: 432290).
6.7 References
1. Kutcher GJ, Coia L, Gillin M, et al. Comprehensive QA for radiation oncology: Report of AAPM
Radiation Therapy Committee Task Group 40. Medical Physics. 1994;21(4):581-618.
2. Nath R, Anderson LL, Meli JA, Olch AJ, Stitt JA, Williamson JF. Code of practice for brachy-
therapy physics: Report of the AAPM Radiation Therapy Committee Task Group No. 56. Medical
Physics. 1997;24(10):1557-1598.
3. Kubo HD, Glasgow GP, Pethel TD, Thomadsen BR, Williamson JF. High dose-rate brachytherapy
treatment delivery: Report of the AAPM Radiation Therapy Committee Task Group No. 59. Medi-
cal Physics. 1998;25(4):375-403.
4. DeWerd LA, Ibbott GS, Meigooni AS, et al. A dosimetric uncertainty analysis for photon-emitting
brachytherapy sources: Report of AAPM Task Group No. 138 and GEC-ESTRO. Medical Physics.
2011;38(2):782-801. doi:10.1118/1.3533720
5. Nath R, Anderson LL, Luxton G, Weaver KA, Williamson JF, Meigooni AS. Dosimetry of intersti-
tial brachytherapy sources: Recommendations of the AAPM Radiation Therapy Committee Task
Group No. 43. Medical Physics. 1995;22(2):209-234. doi:10.1118/1.597458
157
6. Rivard MJ, Coursey BM, DeWerd LA, et al. Update of AAPM Task Group No. 43 Report: A re-
vised AAPM protocol for brachytherapy dose calculations. Medical Physics. 2004;31(3):633-674.
doi:10.1118/1.1646040
7. Taylor REP, Rogers DWO. EGSnrc Monte Carlo calculated dosimetry parameters for 192Ir and
169Yb brachytherapy sources. Medical Physics. 2008;35(11):4933-4944. doi:10.1118/1.2987676
8. Perez‐Calatayud J, Ballester F, Das RK, et al. Dose calculation for photon-emitting brachytherapy
sources with average energy higher than 50 keV: Report of the AAPM and ESTRO. Medical Phys-
ics. 2012;39(5):2904-2929. doi:10.1118/1.3703892
9. McLaughlin WL, Yun-Dong C, Soares CG, Miller A, Van Dyk G, Lewis DF. Sensitometry of the
response of a new radiochromic film dosimeter to gamma radiation and electron beams. Nuclear
Inst and Methods in Physics Research, A. 1991;302(1):165-176. doi:10.1016/0168-9002(91)90506-L
10. Devic S. Radiochromic film dosimetry: Past, present, and future. Physica Medica. 2011;27(3):122-
134. doi:10.1016/j.ejmp.2010.10.001
11. Devic S, Tomic N, Lewis D. Reference radiochromic film dosimetry: Review of technical aspects.
Physica Medica. 2016;32(4):541-556. doi:10.1016/j.ejmp.2016.02.008
12. Devic S, Tomic N, Soares CG, Podgorsak EB. Optimizing the dynamic range extension of a radio-
chromic film dosimetry system. Medical Physics. Published online 2009. doi:10.1118/1.3049597
13. Niroomand-Rad A, Blackwell CR, Coursey BM, et al. AAPM TG 55. Radiochromic film dosime-
try. Medical physics. 1998;25:2093-2115. doi:10.1118/1.598407
14. Sutherland JGH, Rogers DWO. Monte Carlo calculated absorbed-dose energy dependence of EBT
and EBT2 film. Medical Physics. 2010;37(3):1110-1116. doi:10.1118/1.3301574
15. Arjomandy B, Tailor R, Anand A, et al. Energy dependence and dose response of Gafchromic
EBT2 film over a wide range of photon, electron, and proton beam energies. Medical Physics.
2010;37(5):1942-1947. doi:10.1118/1.3373523
16. Bekerat H, Devic S, Deblois F, et al. Improving the energy response of external beam therapy
(EBT) GafChromicTM dosimetry films at low energies (≤100 keV). Medical Physics.
2014;41(2):022101. doi:10.1118/1.4860157
158
17. Hammer CG, Rosen BS, Fagerstrom JM, Culberson WS, DeWerd LA. Experimental investigation
of GafChromic ® EBT3 intrinsic energy dependence with kilovoltage x rays, 137 Cs, and 60 Co. Med-
ical Physics. 2018;45(1):448-459. doi:10.1002/mp.12682
18. Evans MDC, Devic S, Podgorsak EB. High dose-rate brachytherapy source position quality assur-
ance using radiochromic film. Medical Dosimetry. 2007;32(1):13-15. doi:10.1016/j.med-
dos.2006.10.001
19. Asgharizadeh S, Bekerat H, Syme A, et al. Radiochromic film-based quality assurance for CT-
based high-dose-rate brachytherapy. Brachytherapy. 2015;14(4):578-585.
doi:10.1016/j.brachy.2015.02.192
20. Awunor OA, Dixon B, Walker C. Direct reconstruction and associated uncertainties of192Ir source
dwell positions in ring applicators using gafchromic film in the treatment planning of HDR brachy-
therapy cervix patients. Physics in Medicine and Biology. 2013;58(10):3207-3225.
doi:10.1088/0031-9155/58/10/3207
21. Palmer AL, Lee C, Ratcliffe AJ, Bradley D, Nisbet A. Design and implementation of a film dosim-
etry audit tool for comparison of planned and delivered dose distributions in high dose rate (HDR)
brachytherapy. Physics in Medicine and Biology. 2013;58(19):6623-6640. doi:10.1088/0031-
9155/58/19/6623
22. Palmer A, Bradley D, Nisbet A. Physics-aspects of dose accuracy in high dose rate (HDR) brachy-
therapy: Source dosimetry, treatment planning, equipment performance and in vivo verification
techniques. Journal of Contemporary Brachytherapy. 2012;4(2):81-91. doi:10.5114/jcb.2012.29364
23. Jursinic PA. Quality assurance measurements for high-dose-rate brachytherapy without film. Jour-
nal of Applied Clinical Medical Physics. 2014;15(1):246-261. doi:10.1120/jacmp.v15i1.4586
24. Espinoza A, Petasecca M, Cutajar D, et al. Pretreatment verification of high dose rate brachy-
therapy plans using the ‘magic phantom’ system. Biomedical Physics & Engineering Express.
2015;1(2):025201. doi:10.1088/2057-1976/1/2/025201
25. Kertzscher G, Beddar S. Inorganic scintillation detectors for 192Ir brachytherapy. Physics in Medi-
cine and Biology. 2019;64(22). doi:10.1088/1361-6560/ab421f
159
26. Therriault-Proulx F, Briere TM, Mourtada F, Aubin S, Beddar S, Beaulieu L. A phantom study of
an in vivo dosimetry system using plastic scintillation detectors for real-time verification of 192Ir
HDR brachytherapy. Medical Physics. 2011;38(5):2542-2551. doi:10.1118/1.3572229
27. Song H, Bowsher J, Das S, Yin FF. Tracking brachytherapy sources using emission imaging with
one flat panel detector. Medical Physics. 2009;36(4):1109-1111. doi:10.1118/1.3081402
28. Smith RL, Haworth A, Panettieri V, Millar JL, Franich RD. A method for verification of treatment
delivery in HDR prostate brachytherapy using a flat panel detector for both imaging and source
tracking. Medical Physics. 2016;43(5):2435-2442. doi:10.1118/1.4946820
29. Okamoto H, Aikawa A, Wakita A, et al. Dose error from deviation of dwell time and source posi-
tion for high dose-rate 192Ir in remote afterloading system. Journal of Radiation Research.
2014;55(4):780-787. doi:10.1093/jrr/rru001
30. Poulin E, Racine E, Binnekamp D, Beaulieu L. Fast, automatic, and accurate catheter reconstruc-
tion in HDR brachytherapy using an electromagnetic 3D tracking system. Medical Physics.
2015;42(3):1227-1232. doi:10.1118/1.4908011
31. Zhou J, Sebastian E, Mangona V, Yan D. Real-time catheter tracking for high-dose-rate prostate
brachytherapy using an electromagnetic 3D-guidance device: A preliminary performance study.
Medical Physics. 2013;40(2). doi:10.1118/1.4788641
32. Kellermeier M, Herbolzheimer J, Kreppner S, Lotter M, Strnad V, Bert C. Electromagnetic tracking
(EMT) technology for improved treatment quality assurance in interstitial brachytherapy. Journal
of Applied Clinical Medical Physics. 2017;18(1):211-222. doi:10.1002/acm2.12021
33. Wang W, Viswanathan AN, Damato AL, et al. Evaluation of an active magnetic resonance tracking
system for interstitial brachytherapy. Medical Physics. 2015;42(12):7114-7121.
doi:10.1118/1.4935535
34. Moeslund TB. BLOB Analysis. In: Moeslund TB, ed. Introduction to Video and Image Processing:
Building Real Systems and Applications. Undergraduate Topics in Computer Science. Springer;
2012:103-115. doi:10.1007/978-1-4471-2503-7_7
35. Daskalov GM, Williamson JF, Baker R, Rogers DWO. Dosimetric Modeling of the MicroSelec-
tron High-Dose Rate Ir-192 Source by the Multigroup Discrete Ordinates Method. Med Phys (ab-
stract). 1998;25:A119.
160
36. Aldelaijan S, Devic S, Papaconstadopoulos P, et al. Dose–response linearization in radiochromic
film dosimetry based on multichannel normalized pixel value with an integrated spectral correction
for scanner response variations. Medical Physics. 2019;46(11):5336-5349. doi:10.1002/mp.13818
37. Aldelaijan S, Mohammed H, Tomic N, et al. Radiochromic film dosimetry of HDR 192Ir source ra-
diation fields. Medical Physics. 2011;38(11). doi:10.1118/1.3651482
38. Sarfehnia A, Kawrakow I, Seuntjens J. Direct measurement of absorbed dose to water in HDR 192Ir
brachytherapy: Water calorimetry, ionization chamber, Gafchromic film, and TG-43. Medical
Physics. 2010;37(4):1924-1932. doi:10.1118/1.3352685
39. Pérez-Calatayud J, Granero D, Ballester F. Phantom size in brachytherapy source dosimetric stud-
ies. Medical Physics. 2004;31(7):2075-2081. doi:10.1118/1.1759826
40. Schoenfeld AA, Harder D, Poppe B, Chofor N. Water equivalent phantom materials for192Ir
brachytherapy. Physics in Medicine and Biology. 2015;60(24):9403-9420. doi:10.1088/0031-
9155/60/24/9403
41. ICRU Report 89. Prescribing, Recording, and Reporting Brachytherapy for Cancer of the Cervix:
Journal of the International Commission on Radiation Units and Measurements; 2016.
10.1093/jicru/ndw027
42. Vera Sánchez JA, Ruiz Morales C, González López A. Characterization of noise and digitizer re-
sponse variability in radiochromic film dosimetry. Impact on treatment verification. Physica
Medica. 2016;32(9):1167-1174. doi:10.1016/j.ejmp.2016.08.019
43. Gaudreault M, Reniers B, Landry G, Verhaegen F, Beaulieu L. Dose perturbation due to catheter
materials in high-dose-rate interstitial 192Ir brachytherapy. Brachytherapy. 2014;13(6):627-631.
doi:10.1016/j.brachy.2014.05.010
44. Yang L, Albregtsen F, Lønnestad T, Grøttum P. Areas and perimeters of blob-like objects: A com-
parison. IAPR Workshop on Machine Vision Applications, Dec 13-15, 1994. Published online
1994:272276.
45. Watanabe Y, Muraishi H, Takei H, et al. Automated source tracking with a pinhole imaging system
during high-dose-rate brachytherapy treatment. Physics in Medicine and Biology. 2018;63(14).
doi:10.1088/1361-6560/aacdc9
161
46. Smith RL, Hanlon M, Panettieri V, et al. An integrated system for clinical treatment verification of
HDR prostate brachytherapy combining source tracking with pretreatment imaging. Brachytherapy.
2018;17(1):111-121. doi:10.1016/j.brachy.2017.08.004
47. Poder J, Cutajar D, Guatelli S, et al. HDR brachytherapy in vivo source position verification using a
2D diode array: A Monte Carlo study. Journal of Applied Clinical Medical Physics.
2018;19(4):163-172. doi:10.1002/acm2.12360
48. Johansen JG, Rylander S, Buus S, et al. Time-resolved in vivo dosimetry for source tracking in
brachytherapy. Brachytherapy. 2018;17(1):122-132. doi:10.1016/j.brachy.2017.08.009
49. Alnaghy S, Loo KJ, Cutajar DL, et al. BrachyView: Multiple seed position reconstruction and com-
parison with CT post-implant dosimetry. Journal of Instrumentation. 2016;11(5).
doi:10.1088/1748-0221/11/05/P05002
50. Romanyukha A, Carrara M, Mazzeo D, et al. An innovative gynecological HDR brachytherapy ap-
plicator system for treatment delivery and real-time verification. Physica Medica. 2019;59(Decem-
ber 2018):151-157. doi:10.1016/j.ejmp.2019.03.001
51. Palmer AL, Pietro PD, Alobaidli S, et al. Comparison of methods for the measurement of radiation
dose distributions in high dose rate (HDR) brachytherapy: Ge-doped optical fiber, EBT3 Gaf-
chromic film, and PRESAGE® radiochromic plastic. Medical Physics. 2013;40(6Part1):061707.
doi:10.1118/1.4805100
52. Sellakumar P, Sathish Kumar A, Supe SS, Anand MR, Nithya K, Sajitha S. Evaluation of dosimet-
ric functions for Ir-192 source using radiochromic film. Nuclear Instruments and Methods in Phys-
ics Research Section B: Beam Interactions with Materials and Atoms. 2009;267(10):1862-1866.
doi:10.1016/j.nimb.2009.03.003
53. Aldelaijan S, Wadi-Ramahi S, Nobah A, Moftah B, Devic S, Jastaniyah N. Commissioning of ap-
plicator-guided stereotactic body radiation therapy boost with high-dose-rate brachytherapy for ad-
vanced cervical cancer using radiochromic film dosimetry. Brachytherapy. 2017;16(4):893-902.
doi:10.1016/j.brachy.2017.03.009
54. Ballester F, Granero D, Pérez‐Calatayud J, Melhus CS, Rivard MJ. Evaluation of high-energy
brachytherapy source electronic disequilibrium and dose from emitted electrons. Medical Physics.
2009;36(9Part1):4250-4256. doi:10.1118/1.3194754
162
CHAPTER 7: Conclusion and future work
7.1 Discussion
The need for improved quality assurance in image-guided brachytherapy
Although brachytherapy (BT) has always been technically the simplest form of radiation therapy,
the clinical evidence had shown it to be an effective treatment that is underutilized in favor of
more complex external beam technologies aiming to create similar dose distributions. However,
the incorporation of these sophisticated external beam technologies was always associated with
the state-of-the-art quality assurance (QA) solutions that could also effectively alleviate contem-
porary work pressures. Nevertheless, as it was shown in Chapter 2, retrospective analysis of
large number of patient data in the last twenty years has shown that with all technological ad-
vancements in external beam radiotherapy, it could not yet replace the physical and biological
advantages of BT. Therefore, it is logical to see BT going through renaissance and more re-
sources are still being invested to improve it. For example: the incorporation of various imaging
modalities for both planning and daily treatment guidance, the invention of more accurate and
precise afterloading technologies, investigation of different radiation sources and their manufac-
turing processes, improvement of dose calculation engines, and incorporation of fabrication tech-
nologies such as 3D printing for more patient specific treatments. On the other hand, standard
BT QA procedures are still the same in general: the well-type ionization chamber for source ac-
tivity measurement and qualitative assessment of source positioning with film. Although there
has been development of new technologies aimed at source tracking, automatic catheter recon-
struction, digital source detection devices, their incorporation in the clinic was always hindered
by logistic justification and tangible improvements over standard QA tools that have always
worked.
163
As mentioned in Chapter 2, one of the main benefits of image-guided brachytherapy
(IGBT) is that it enabled direct implementation of dose escalation protocols and current ongoing
clinical evidence show that this in turn is improving target local control rates. It can be argued
that dose escalation should be associated with more sensitive and stringent QA procedures.
However, if one constructs an approximate timeline comparing the introduction of IGBT and
dose escalation (started within the decade 2000-2010), to the QA protocols that are still in use
nowadays (the AAPM TG-40, TG-56, TG-59, published in 1994, 1997, 1998, respectively), it
would be realized that there should be a concern about the suitability of older methods in detect-
ing errors from today’s form of BT.
Summary of the thesis outcome
The goal of this thesis was to optimize the benefits of RCF dosimetry for HDR IGBT QA re-
quirements. Chapters 3 and 4 focused on the RCF dosimetry protocol that involved signal inter-
pretation, film scanning and handling, dosimetric accuracy, precision and stability. Most im-
portantly, the “fingerprint” protocol that was introduced in Chapter 4 represents the procedure
that was used for reading the irradiated film pieces. This protocol was shown to improve dosi-
metric accuracy by accounting for the difference in scanning conditions during calibration and
measurements. It was also shown to correct for response inhomogeneities in the scanning bed
when using larger film sheets or pieces based only on information available in the same scanned
image. Another advantage of this protocol is the linearization of film response with dose and
therefore the interpretation of measured relative dose distribution would remain correct even if
the dose calibration was systematically shifted. This new “fingerprint” protocol was utilized in
Chapter 6 were the HDR source tracking algorithm relies on relative isodose lines. Chapter 5 fo-
cused on the film dosimetric aspects and showed how measurements can aid in the QA of BT
treatment planning systems (TPS). Chapter 6 represents our view on how the RCF film dosime-
try can benefit HDR IGBT QA. In that chapter all aspects that may affect QA results were taken
into account such as scanning resolution, effect of noise and filtration (especially within the high
dose gradient regions). It is our belief that the cost effectiveness and high resolution aspects of
RCF dosimetry should make it the reliable choice for HDR IGBT QA.
164
Impact of the thesis work and its implementation
The main impact of this work is that it provided a framework on how to employ the advantage of
RCF dosimetry while addressing its drawbacks and understand their impact on the QA results.
According to the AAPM Task Group 56 report on BT code of practice, the end goals of any BT
QA program are: 1) safety of the patient, the public and the institution, 2) positional accuracy, 3)
temporal accuracy, and 4) dose delivery accuracy. The methods presented in this thesis techni-
cally addressed points 2-4. Chapters 3-5 focused on the dosimetry aspects and especially in
Chapter 5 we showed examples of dose measurements of the HDR source with the EBT3 film
model. The dosimetry is important for dose delivery accuracy assessment and its correlation with
dwell times and source strength estimation. Chapter 6 focused primarily on accurate dwell posi-
tion QA. Incorporation of the multidimensional source tracking algorithm into QA was shown to
significantly improve the source localization accuracy. As will be shown in the next section,
these techniques (dosimetry and source tracking) are intended to be used in an end-to-end quanti-
tative IGBT QA program based on RCF dosimetry.
The methods explained in this thesis would aid the medical physicist in implementing an
accurate RCF dosimetry protocol (Chapter 4) that does not take much of their time since it is
based on a single scan i.e. no need for a pre-scan (as was shown in Chapter 3). Understanding
different effects that may affect film dosimetry is important and ultimately it helps in achieving
the task that the film was employed for. Combining the high resolution 2D dosimetric capability
with the source tracking algorithm could be a powerful tool that can easily be implemented in the
clinic since the whole process can be automated. This can help the clinic in quantifying their ap-
plicators performance and help reduce incidents related to the identification of the source distal
reference position (or first dwell position) which was identified as one of the most common re-
ported failure types by ASTRO (Thomadsen et al. 2014).
The utilization of RCF can also be beneficial in patient treatment delivery. In some cases
of surface BT, it would be possible to use the RCF for in-vivo dosimetry and source tracking at
the same time. An example of this is the placement of a film piece on top of the Freiburg flap
taking into account the flexibility and size limits of RCF. In order to maximize the advantages of
RCF, a registration method has to be developed to relate the spatial coordinate systems of the
RCF, the applicator and the target area. This in turn may enable reconstruction of delivered dose
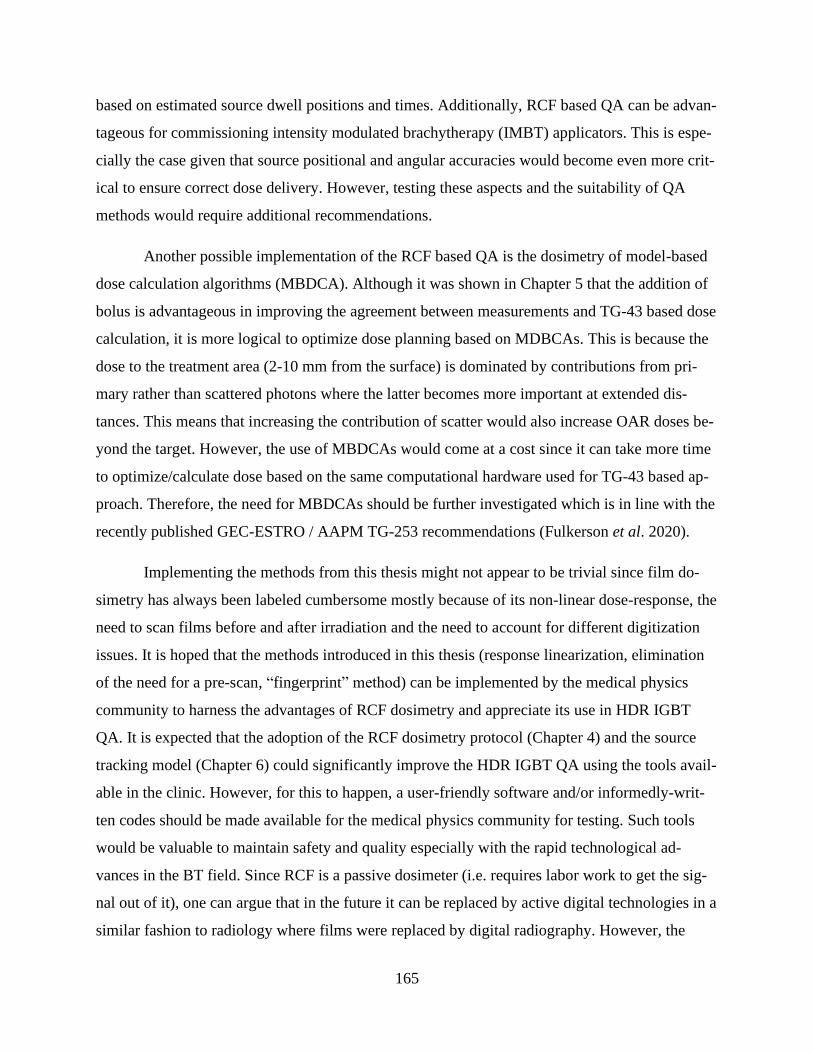
165
based on estimated source dwell positions and times. Additionally, RCF based QA can be advan-
tageous for commissioning intensity modulated brachytherapy (IMBT) applicators. This is espe-
cially the case given that source positional and angular accuracies would become even more crit-
ical to ensure correct dose delivery. However, testing these aspects and the suitability of QA
methods would require additional recommendations.
Another possible implementation of the RCF based QA is the dosimetry of model-based
dose calculation algorithms (MBDCA). Although it was shown in Chapter 5 that the addition of
bolus is advantageous in improving the agreement between measurements and TG-43 based dose
calculation, it is more logical to optimize dose planning based on MDBCAs. This is because the
dose to the treatment area (2-10 mm from the surface) is dominated by contributions from pri-
mary rather than scattered photons where the latter becomes more important at extended dis-
tances. This means that increasing the contribution of scatter would also increase OAR doses be-
yond the target. However, the use of MBDCAs would come at a cost since it can take more time
to optimize/calculate dose based on the same computational hardware used for TG-43 based ap-
proach. Therefore, the need for MBDCAs should be further investigated which is in line with the
recently published GEC-ESTRO / AAPM TG-253 recommendations (Fulkerson et al. 2020).
Implementing the methods from this thesis might not appear to be trivial since film do-
simetry has always been labeled cumbersome mostly because of its non-linear dose-response, the
need to scan films before and after irradiation and the need to account for different digitization
issues. It is hoped that the methods introduced in this thesis (response linearization, elimination
of the need for a pre-scan, “fingerprint” method) can be implemented by the medical physics
community to harness the advantages of RCF dosimetry and appreciate its use in HDR IGBT
QA. It is expected that the adoption of the RCF dosimetry protocol (Chapter 4) and the source
tracking model (Chapter 6) could significantly improve the HDR IGBT QA using the tools avail-
able in the clinic. However, for this to happen, a user-friendly software and/or informedly-writ-
ten codes should be made available for the medical physics community for testing. Such tools
would be valuable to maintain safety and quality especially with the rapid technological ad-
vances in the BT field. Since RCF is a passive dosimeter (i.e. requires labor work to get the sig-
nal out of it), one can argue that in the future it can be replaced by active digital technologies in a
similar fashion to radiology where films were replaced by digital radiography. However, the
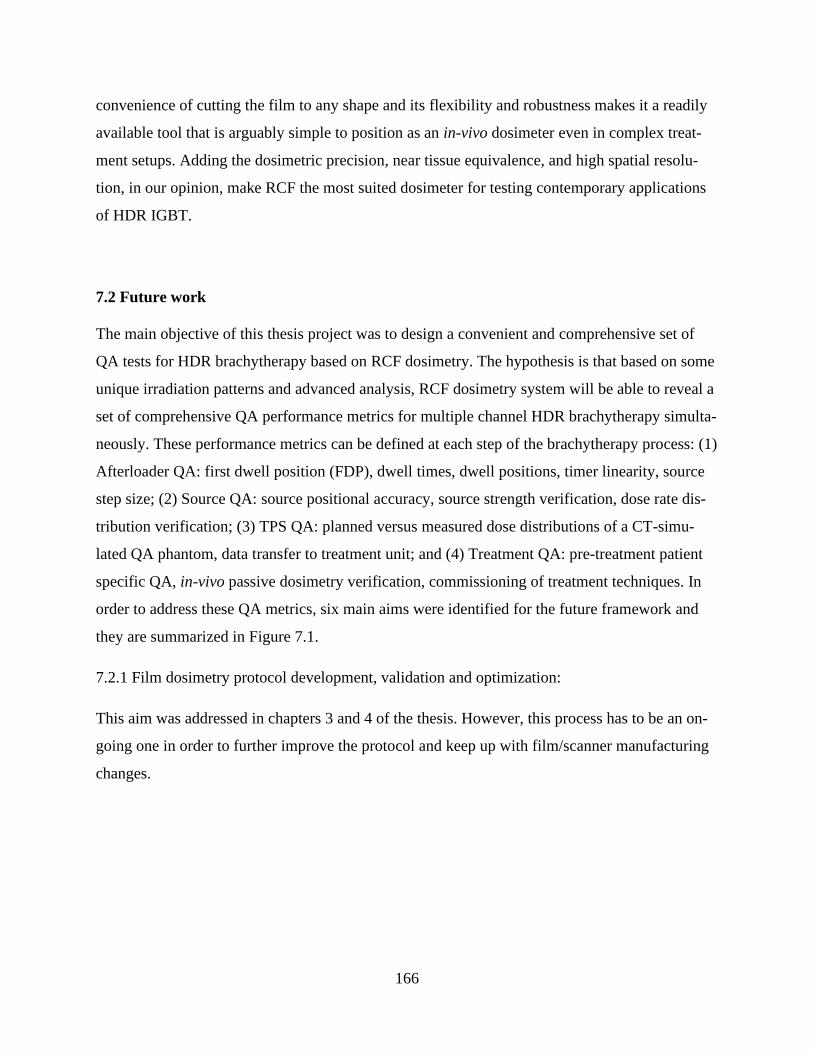
166
convenience of cutting the film to any shape and its flexibility and robustness makes it a readily
available tool that is arguably simple to position as an in-vivo dosimeter even in complex treat-
ment setups. Adding the dosimetric precision, near tissue equivalence, and high spatial resolu-
tion, in our opinion, make RCF the most suited dosimeter for testing contemporary applications
of HDR IGBT.
7.2 Future work
The main objective of this thesis project was to design a convenient and comprehensive set of
QA tests for HDR brachytherapy based on RCF dosimetry. The hypothesis is that based on some
unique irradiation patterns and advanced analysis, RCF dosimetry system will be able to reveal a
set of comprehensive QA performance metrics for multiple channel HDR brachytherapy simulta-
neously. These performance metrics can be defined at each step of the brachytherapy process: (1)
Afterloader QA: first dwell position (FDP), dwell times, dwell positions, timer linearity, source
step size; (2) Source QA: source positional accuracy, source strength verification, dose rate dis-
tribution verification; (3) TPS QA: planned versus measured dose distributions of a CT-simu-
lated QA phantom, data transfer to treatment unit; and (4) Treatment QA: pre-treatment patient
specific QA, in-vivo passive dosimetry verification, commissioning of treatment techniques. In
order to address these QA metrics, six main aims were identified for the future framework and
they are summarized in Figure 7.1.
7.2.1 Film dosimetry protocol development, validation and optimization:
This aim was addressed in chapters 3 and 4 of the thesis. However, this process has to be an on-
going one in order to further improve the protocol and keep up with film/scanner manufacturing
changes.

167
Framework for HDR brachytherapy quality assurance
Figure 7.1: The future framework for HDR brachytherapy QA with radiochromic film dosimetry. The framework
consists of six specific areas to be optimized (sub-circles). HDR: high-dose-rate, QA: quality assurance.
7.2.2 Equipment QA
This includes the QA of the afterloader unit and auxiliary components such as applicators, cathe-
ters, and simulation markers. This part was not included in the thesis because it is still under de-
velopment. For the afterloader QA: a special phantom was proposed with many design features
that mimic the conditions within the TPS and it also optimized practicality and dosimetric repro-
ducibility (See Figure 7.2).
Additionally, some unique irradiation patterns and image analysis routines were designed
to reveal the QA performance metrics indicated above. This was possible with the development
of an algorithm that can decompose source dwell positions and dwell times for multiple chan-
nels, simultaneously (See Figure 7.3).
HDR Brachytherapy
QA
with
Radiochromic film dosimetry
Film protocol
Equipment QA
Source QA
Treatment Planning System
QA
Treatment QA
Software
development& design
improvement
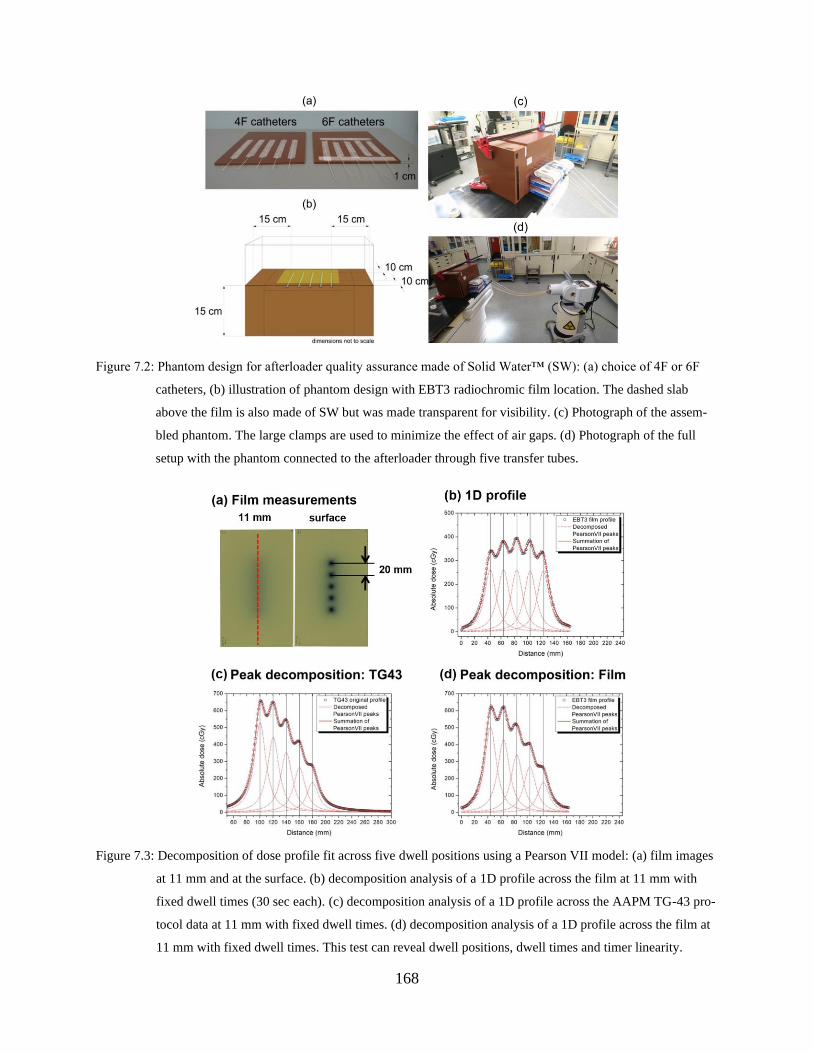
168
Figure 7.2: Phantom design for afterloader quality assurance made of Solid Water™ (SW): (a) choice of 4F or 6F
catheters, (b) illustration of phantom design with EBT3 radiochromic film location. The dashed slab
above the film is also made of SW but was made transparent for visibility. (c) Photograph of the assem-
bled phantom. The large clamps are used to minimize the effect of air gaps. (d) Photograph of the full
setup with the phantom connected to the afterloader through five transfer tubes.
Figure 7.3: Decomposition of dose profile fit across five dwell positions using a Pearson VII model: (a) film images
at 11 mm and at the surface. (b) decomposition analysis of a 1D profile across the film at 11 mm with
fixed dwell times (30 sec each). (c) decomposition analysis of a 1D profile across the AAPM TG-43 pro-
tocol data at 11 mm with fixed dwell times. (d) decomposition analysis of a 1D profile across the film at
11 mm with fixed dwell times. This test can reveal dwell positions, dwell times and timer linearity.
169
The second part is the applicator, catheters and markers QA. Based on the source tracking
algorithm introduced in Chapter 6, a QA methodology is suggested to provide a quantitative
analysis of the 192Ir HDR source first dwell position within the applicator structure and its coinci-
dence with the x-ray marker. To achieve this, an image registration method between the x-ray
and film images was developed. Figure 7.4 shows an example of the proposed method and some
preliminary analysis. More than 150 applicator QAs over two years were performed and the re-
sults will be presented in a future paper.
Figure 7.4: Demonstration of applicator QA with radiochromic film dosimetry and source tracking. (A) applicators
attached to the film with inkdots/BBs on the corners, (B) post exposure image highlighting inkdots, (C)
x-ray image highlighting registration BBs, (D) image overlay and application of source/marker auto
tracking, (D) visual QA examples of different applicator sets, and (F) histogram of all displacements (to-
tal of 64 applicators, 0.10 ± 0.39 mm)
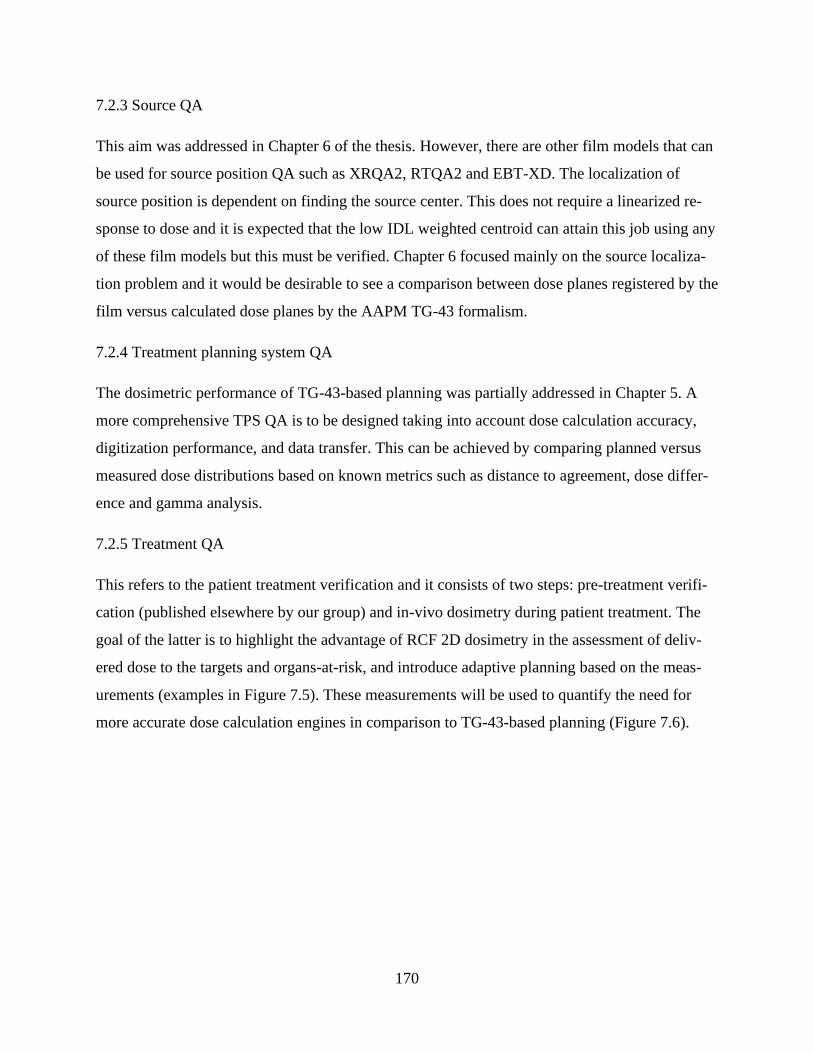
170
7.2.3 Source QA
This aim was addressed in Chapter 6 of the thesis. However, there are other film models that can
be used for source position QA such as XRQA2, RTQA2 and EBT-XD. The localization of
source position is dependent on finding the source center. This does not require a linearized re-
sponse to dose and it is expected that the low IDL weighted centroid can attain this job using any
of these film models but this must be verified. Chapter 6 focused mainly on the source localiza-
tion problem and it would be desirable to see a comparison between dose planes registered by the
film versus calculated dose planes by the AAPM TG-43 formalism.
7.2.4 Treatment planning system QA
The dosimetric performance of TG-43-based planning was partially addressed in Chapter 5. A
more comprehensive TPS QA is to be designed taking into account dose calculation accuracy,
digitization performance, and data transfer. This can be achieved by comparing planned versus
measured dose distributions based on known metrics such as distance to agreement, dose differ-
ence and gamma analysis.
7.2.5 Treatment QA
This refers to the patient treatment verification and it consists of two steps: pre-treatment verifi-
cation (published elsewhere by our group) and in-vivo dosimetry during patient treatment. The
goal of the latter is to highlight the advantage of RCF 2D dosimetry in the assessment of deliv-
ered dose to the targets and organs-at-risk, and introduce adaptive planning based on the meas-
urements (examples in Figure 7.5). These measurements will be used to quantify the need for
more accurate dose calculation engines in comparison to TG-43-based planning (Figure 7.6).

171
Figure 7.5: HDR surface brachytherapy in-vivo dosimetry with EBT3 model RCF. (a) photographs of different film
pieces placed on different cases. (b) highlighting inter-fractional variability and ability to improve the
applicator positioning. (c) comparison between heterogeneity-corrected dose calculation, the current
standard in dose calculation and film measurements. (d) how in-vivo measurements can help in adapting
radiation treatments.
Figure 7.6: Histogram of dose measurements in the in-vivo study of HDR surface brachytherapy. The figure shows
that a more accurate dose calculation engine might help in improving the dose delivery accuracy (i.e.
tighten the peak and push it to the right while limiting the maximum dose to the skin).
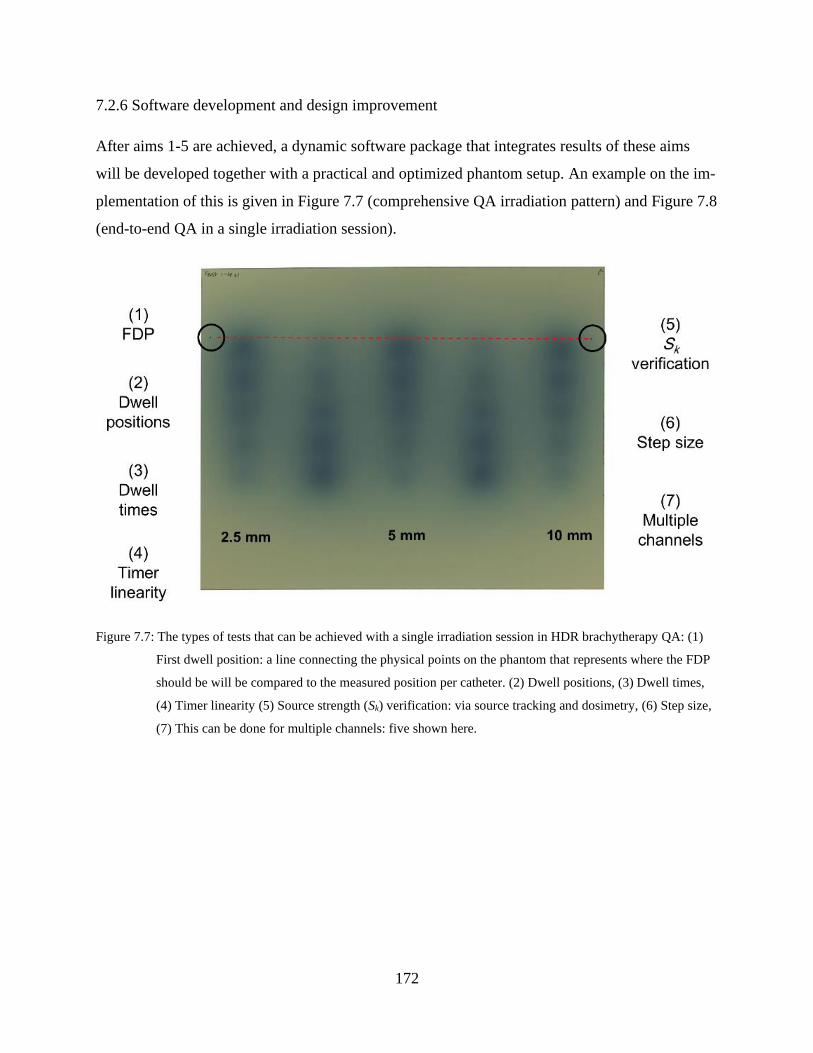
172
7.2.6 Software development and design improvement
After aims 1-5 are achieved, a dynamic software package that integrates results of these aims
will be developed together with a practical and optimized phantom setup. An example on the im-
plementation of this is given in Figure 7.7 (comprehensive QA irradiation pattern) and Figure 7.8
(end-to-end QA in a single irradiation session).
Figure 7.7: The types of tests that can be achieved with a single irradiation session in HDR brachytherapy QA: (1)
First dwell position: a line connecting the physical points on the phantom that represents where the FDP
should be will be compared to the measured position per catheter. (2) Dwell positions, (3) Dwell times,
(4) Timer linearity (5) Source strength (Sk) verification: via source tracking and dosimetry, (6) Step size,
(7) This can be done for multiple channels: five shown here.
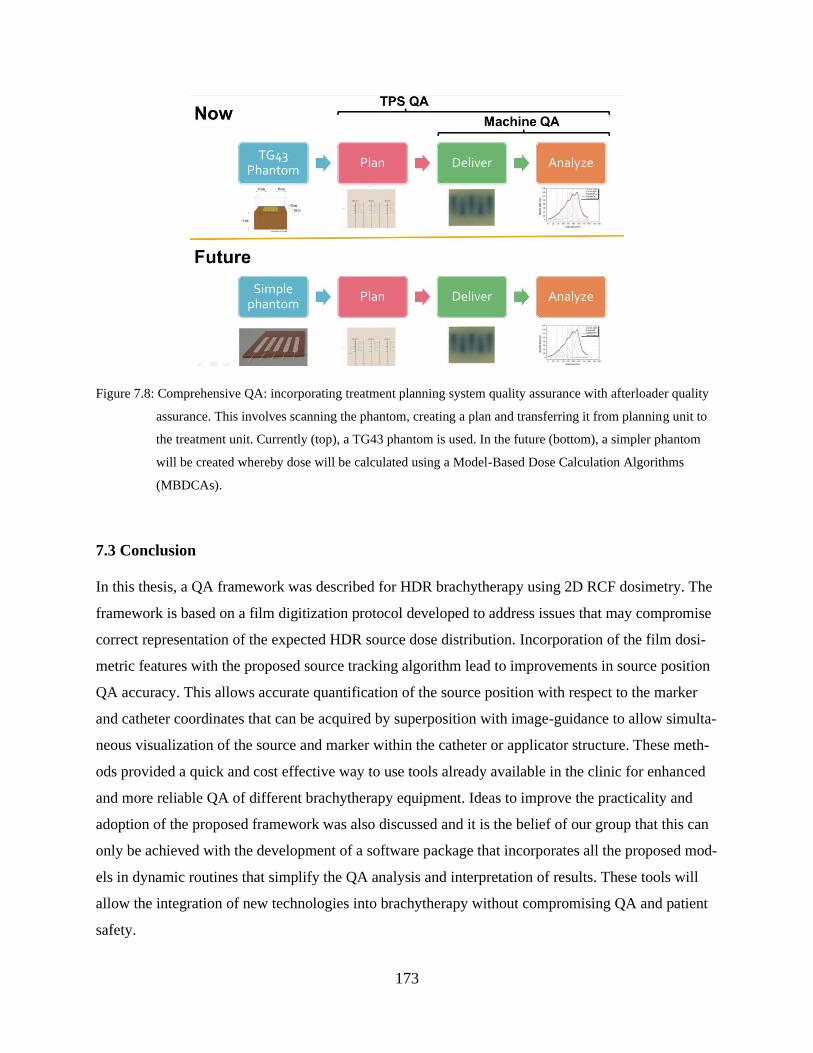
173
Figure 7.8: Comprehensive QA: incorporating treatment planning system quality assurance with afterloader quality
assurance. This involves scanning the phantom, creating a plan and transferring it from planning unit to
the treatment unit. Currently (top), a TG43 phantom is used. In the future (bottom), a simpler phantom
will be created whereby dose will be calculated using a Model-Based Dose Calculation Algorithms
(MBDCAs).
7.3 Conclusion
In this thesis, a QA framework was described for HDR brachytherapy using 2D RCF dosimetry. The
framework is based on a film digitization protocol developed to address issues that may compromise
correct representation of the expected HDR source dose distribution. Incorporation of the film dosi-
metric features with the proposed source tracking algorithm lead to improvements in source position
QA accuracy. This allows accurate quantification of the source position with respect to the marker
and catheter coordinates that can be acquired by superposition with image-guidance to allow simulta-
neous visualization of the source and marker within the catheter or applicator structure. These meth-
ods provided a quick and cost effective way to use tools already available in the clinic for enhanced
and more reliable QA of different brachytherapy equipment. Ideas to improve the practicality and
adoption of the proposed framework was also discussed and it is the belief of our group that this can
only be achieved with the development of a software package that incorporates all the proposed mod-
els in dynamic routines that simplify the QA analysis and interpretation of results. These tools will
allow the integration of new technologies into brachytherapy without compromising QA and patient
safety.
174
OTHER PUBLICATIONS
In addition to the manuscripts in chapters 3-6, the following peer-reviewed articles and confer-
ence proceedings resulted in the course of fulfilling the aims of this thesis:
Journal articles
1. Moftah B, S Aldelaijan, M Shehadeh et al., "Calibration of MTT assay in proton beams us-
ing radiochromic films," Physica Medica (2020) in press.
2. Albert S, D Brivio, S Aldelaijan, E Sajo, J Hesser, P Zygmanski (2020) “Towards customi-
zable thin-panel low-Z detector arrays: electrode design for increased spatial resolution ion
chamber arrays.” Phys Med Biol. 65(8):08NT02.
3. Devic S, S Aldelaijan, H Bekerat (2019) “Impact of inertia on possible fundamental draw-
backs in radiochromic film dosimetry.” Phys Med. 10; 66:133-134.
4. Devic S, L Liang, N Tomic, H Bekerat, M Morcos, M Popovic, P Watson, S Aldelaijan, J
Seuntjens (2019) “Dose measurements nearby low energy electronic brachytherapy sources
using radiochromic film.” Phys Med. 64:40-44.
5. Papaconstadopoulos P, IR Levesque, S Aldelaijan, K O'Grady, S Devic, J Seuntjens (2019)
“Modeling the primary source intensity distribution: reconstruction and inter-comparison of
six Varian TrueBeam sources.” Phys Med Biol. 64(13):135005.
6. Tomic N, P Papaconstadopoulos, H Bekerat, G Antunovic, S Aldelaijan, J Seuntjens, S De-
vic (2019) “Monte Carlo simulations of different CT X-ray energy spectra within CTDI
phantom and the influence of its changes on radiochromic film measurements.” Phys Med.
62:105-110.
7. Aldelaijan S, N Tomic, P Papaconstadopoulos, J Schneider, J Seuntjens, S Shih, D Lewis, S
Devic (2018) “Technical Note: Response time evolution of XR-QA2 GafChromic™ film
models.” Med Phys. 45(1):488-492.
175
8. Tomic N, P Papaconstadopoulos, S Aldelaijan, J Rajala, J Seuntjens, S Devic (2018) “Image
quality for radiotherapy CT simulators with different scanner bore size.” Phys Med. 45:65-71.
9. Liang LH, N Tomic, T Vuong, S Aldelaijan, H Bekerat, F DeBlois, J Seuntjens, S Devic
(2018) “Physics aspects of the Papillon technique-Five decades later.” Brachytherapy.
17(1):234-243.
10. Aldelaijan S, S Wadi-Ramahi, A Nobah, B Moftah, S Devic, N Jastaniyah (2017) “Commis-
sioning of applicator-guided stereotactic body radiation therapy boost with high-dose-rate
brachytherapy for advanced cervical cancer using radiochromic film dosimetry.” Brachy-
therapy. 16(4):893-902.
Conference abstracts (oral presentations)
1. Aldelaijan, S, S Devic, H Bekerat, P Papaconstadopoulos, J Schneider, J Seuntjens, R Cor-
mack, IM Buzurovic (2020) “Implementation of a novel HDR source tracking model for
source quality assurance using radiochromic film dosimetry.” Joint AAPM/COMP Virtual
Meeting
2. Aldelaijan, S, DA O’Farrell, T Harris, RA Cormack, JP Seuntjens, S Devic, PM Devlin, IM
Buzurovic (2020) “In-vivo radiochromic film dosimetry indicates a need for model-based
dose calculation in HDR surface brachytherapy.” Joint Meeting, ABS/WCB/ESTRO, Vi-
enna, Austria
3. Aldelaijan, S, P Papaconstadopoulos, H Bekerat, M Khosravi, M Bhagwat, J Seuntjens, S
Devic, IM Buzurovic (2019) “Multichannel normalized pixel value as a response function for
radiochromic film dosimetry enables simultaneous dose response linearization and scanner
response correction.” 61st AAPM Annual Meeting,
4. Aldelaijan, S, P Papaconstadopoulos, J Schneider, H Bekerat, J Seuntjens, I Buzurovic, S
Devic (2018) “WE-AB-DBRA-2: A novel source tracking method for accurate and compre-
hensive HDR brachytherapy quality assurance using radiochromic film dosimetry.” 60th
AAPM Annual Meeting, Nashville, USA
5. Aldelaijan, S, P Papaconstadopoulos, J Schneider, H Bekerat, J Seuntjens, I Buzurovic, S
Devic, (2018) “Abstract#278: Dosimetric impact of source position variation inside different
catheter sizes in HDR brachytherapy.”, ABS Annual Meeting, San Francisco, USA,
176
6. Aldelaijan, S, Wadi-Ramahi S, Nobah A, Jastaniyah N (2017) “Commissioning of applica-
tor-guided SBRT with HDR Brachytherapy for Advanced Cervical Cancer.” Radiother On-
col 123, S193-S194, ESTRO, Vienna, Austria
Conference abstracts (poster presentations)
1. Aldelaijan, S, Y Khouj, M Khosravi, T Harris, D O’Farrell, M Jacobson, J Seuntjens, S De-
vic, IM Buzurovic (2020) “Automatic HDR applicator and x-ray marker quality assurance
using radiochromic film dosimetry.” Joint AAPM/COMP Virtual Meeting
2. Aldelaijan, S, M Bhagwat, D O’Farrell, T Harris, M Weiler, C Guthier, R Cormack, J Se-
untjens, S Devic, PM Devlin, IM Buzurovic (2019) “In-vivo dose measurements for HDR
surface brachytherapy: comparing results of radiochromic film dosimetry to TG43 and ad-
vanced collapsed cone engine (ACE) dose calculations.” ABS Annual Meeting, Miami, USA
3. Aldelaijan, S, P Papaconstadopoulos, J Schneider, H Bekerat, J Seuntjens, I Buzurovic, S
Devic (2018) “Abstract#286: Decomposition of source dwell positions and dwell times: A
novel method for accurate source tracking and quality assurance in HDR brachytherapy
based on film dosimetry.”, ABS Annual Meeting, San Francisco, USA
4. Aldelaijan, S, Wadi-Ramahi S, Nobah A, Moftah B, Devic S, Jastaniyah N (2017) “Com-
missioning of HDR Brachytherapy combined with an applicator-guided SBRT boost for ad-
vanced cervical cancer,” ABS Annual Meeting, Boston, USA,
5. Aldelaijan, S, Bekerat H, Buzurovic I, Devlin P, DeBlois F, Seuntjens J, Collins L, Devic S
(2017) “Dose accuracy of HDR Brachytherapy treatment of skin lesions using Freiburg flap
applicator based on reference radiochromic film dose measurements,” ABS Annual Meeting,
Boston, USA,
177
REFERENCES
Afsharpour H, Landry G, D’Amours M, Enger S, Reniers B, Poon E, Carrier J-F, Verhaegen F
and Beaulieu L 2012 ALGEBRA: ALgorithm for the heterogeneous dosimetry based on
GEANT4 for BRAchytherapy Phys. Med. Biol. 57 3273–3280
Aldelaijan S, Devic S, Mohammed H, Tomic N, Liang L-H, DeBlois F and Seuntjens J 2010
Evaluation of EBT-2 model GAFCHROMICTM film performance in water Medical Physics 37
3687–93
Andrés C, Castillo A del, Tortosa R, Alonso D and Barquero R 2010 A comprehensive study of
the Gafchromic EBT2 radiochromic film. A comparison with EBT Medical Physics 37 6271–8
Arjomandy B, Tailor R, Anand A, Sahoo N, Gillin M, Prado K and Vicic M 2010 Energy de-
pendence and dose response of Gafchromic EBT2 film over a wide range of photon, electron,
and proton beam energies Medical Physics 37 1942–7
Arjomandy B, Tailor R, Zhao L and Devic S 2012 EBT2 film as a depth-dose measurement tool
for radiotherapy beams over a wide range of energies and modalities Medical Physics 39 912–21
Aronowitz J N 2015 Afterloading: The Technique That Rescued Brachytherapy International
Journal of Radiation Oncology*Biology*Physics 92 479–87
Aronowitz J N 2008 The “Golden Age” of prostate brachytherapy: A cautionary tale Brachy-
therapy 7 55–9
Aronowitz J N, Aronowitz S V and Robison R F 2007 Classics in brachytherapy: Margaret
Cleaves introduces gynecologic brachytherapy Brachytherapy 6 293–7
Asgharizadeh S, Bekerat H, Syme A, Aldelaijan S, DeBlois F, Vuong T, Evans M, Seuntjens J
and Devic S 2015 Radiochromic film–based quality assurance for CT-based high-dose-rate
brachytherapy Brachytherapy 14 578–85
Avanzo M, Rink A, Dassie A, Massarut S, Roncadin M, Borsatti E and Capra E 2012 In vivo do-
simetry with radiochromic films in low-voltage intraoperative radiotherapy of the breast Medical
Physics 39 2359–68
178
Awunor O A, Dixon B and Walker C 2013 Direct reconstruction and associated uncertainties of 192Ir source dwell positions in ring applicators using gafchromic film in the treatment planning of
HDR brachytherapy cervix patients Physics in Medicine and Biology 58 3207–25
Beaulieu L, Tedgren Å C, Carrier J-F, Davis S D, Mourtada F, Rivard M J, Thomson R M, Ver-
haegen F, Wareing T A and Williamson J F 2012 Report of the Task Group 186 on model-based
dose calculation methods in brachytherapy beyond the TG-43 formalism: Current status and rec-
ommendations for clinical implementation Medical Physics 39 6208–36
Becquerel H 1896 Sur les radiations émises par phosphorescence Comptes Rendus 122 501–503
Bekerat H, Devic S, Deblois F, Singh K, Sarfehnia A, Seuntjens J, Shih S, Yu X and Lewis D
2014 Improving the energy response of external beam therapy (EBT) GafChromicTM dosimetry
films at low energies (≤100 keV) Medical Physics 41 022101
Bert C, Kellermeier M and Tanderup K 2016 Electromagnetic tracking for treatment verification
in interstitial brachytherapy Journal of Contemporary Brachytherapy 8 448–53
Bissonnette J-P, Balter P A, Dong L, Langen K M, Lovelock D M, Miften M, Moseley D J,
Pouliot J, Sonke J-J and Yoo S 2012 Quality assurance for image-guided radiation therapy utiliz-
ing CT-based technologies: A report of the AAPM TG-179 Medical Physics 39 1946–63
Bortfeld T 2006 IMRT: A review and preview Physics in Medicine and Biology 51 R363–R379
Butler W M, Bice W S, DeWerd L A, Hevezi J M, Huq M S, Ibbott G S, Palta J R, Rivard M J,
Seuntjens J P and Thomadsen B R 2008 Third-party brachytherapy source calibrations and phys-
icist responsibilities: Report of the AAPM Low Energy Brachytherapy Source Calibration Work-
ing Group Medical Physics 35 3860–5
Butson M J, Cheung T and Yu P K N 2005 Absorption spectra variations of EBT radiochromic
film from radiation exposure Physics in Medicine and Biology 50 N135–N140
Butson M J, Cheung T, Yu P K N and Alnawaf H 2009 Dose and absorption spectra response of
EBT2 Gafchromic film to high energy x-rays Australas. Phys. Eng. Sci. Med. 32 196–202
Callaghan C M, Adams Q, Flynn R T, Wu X, Xu W and Kim Y 2019 Systematic Review of In-
tensity-Modulated Brachytherapy (IMBT): Static and Dynamic Techniques International Jour-
nal of Radiation Oncology*Biology*Physics 105 206–21
Castelnau-Marchand P, Chargari C, Haie-Meder C and Mazeron R 2016 Image-guided adaptive
brachytherapy in locally advanced cervical cancer: Recent advances and perspectives Current
Opinion in Oncology 28 419–28
Chamberland M J P, Taylor R E P, Rogers D W O and Thomson R M 2016 egs_brachy: a versa-
tile and fast Monte Carlo code for brachytherapy Phys. Med. Biol. 61 8214–8231

179
Chang L, Ho S Y, Ding H J, Lee T F and Chen P Y 2014 Dependency of EBT2 film calibration
curve on postirradiation time Medical Physics 41 1–8
Chibani O and Ma C C-M 2014 HDRMC, an accelerated Monte Carlo dose calculator for high
dose rate brachytherapy with CT-compatible applicators Medical Physics 41 051712
Chibani O and Williamson J F 2005 M: A sub-minute Monte Carlo dose calculation engine for
prostate implants Medical Physics 32 3688–98
Chiu-Tsao S-T, Astrahan M a, Finger P T, Followill D S, Meigooni A S, Melhus C S, Mourtada
F, Napolitano M E, Nath R, Rivard M J, Rogers D W O and Thomson R M 2012 TG-129 Do-
simetry of (125)I and (103)Pd COMS eye plaques for intraocular tumors Medical physics 39
6161–84
Cormack R A 2008 Quality Assurance Issues for Computed Tomography–, Ultrasound–, and
Magnetic Resonance Imaging–Guided Brachytherapy International Journal of Radiation Oncol-
ogy*Biology*Physics 71 S136–41
Crook J 2015 Long-term oncologic outcomes of radical prostatectomy compared with brachy-
therapy-based approaches for intermediate- and high-risk prostate cancer Brachytherapy 14 142–7
Cunha J A M, Flynn R, Bélanger C, Callaghan C, Kim Y, Jia X, Chen Z and Beaulieu L 2020
Brachytherapy Future Directions Seminars in Radiation Oncology 30 94–106
Cunha J A M, Mellis K, Sethi R, Siauw T, Sudhyadhom A, Garg A, Goldberg K, Hsu I-C and
Pouliot J 2015 Evaluation of PC-ISO for customized, 3D printed, gynecologic HDR brachy-
therapy applicators Journal of Applied Clinical Medical Physics 16 246–53
Dadkhah H, Kim Y, Wu X and Flynn R T 2015 Multihelix rotating shield brachytherapy for cer-
vical cancer Medical Physics 42 6579–88
Damato A L and Viswanathan A N 2015 Magnetic Resonance–Guided Gynecologic Brachy-
therapy Magnetic Resonance Imaging Clinics of North America 23 633–42
D’Amico A V, Whittington R, Malkowicz S B, Schultz D, Blank K, Broderick G A, To-
maszewski J E, Renshaw A A, Kaplan I, Beard C J and Wein A 1998 Biochemical Outcome Af-
ter Radical Prostatectomy, External Beam Radiation Therapy, or Interstitial Radiation Therapy
for Clinically Localized Prostate Cancer 280 6
Das R K, Patel R, Shah H, Odau H and Kuske R R 2004 3D CT–based high-dose-rate breast
brachytherapy implants: treatment planning and quality assurance International Journal of Radi-
ation Oncology*Biology*Physics 59 1224–8
DeCunha J M and Enger S A 2018 A new delivery system to resolve dosimetric issues in intra-
vascular brachytherapy Brachytherapy 17 634–43

180
Devic S 2012 MRI simulation for radiotherapy treatment planning Medical Physics 39 6701–11
Devic S 2011 Radiochromic film dosimetry: Past, present, and future Physica Medica 27 122–34
Devic S, Aldelaijan S, Mohammed H, Tomic N, Liang L-H, Deblois F and Seuntjens J 2010 Ab-
sorption spectra time evolution of EBT-2 model GAFCHROMIC film Medical Physics 37 2207–14
Devic S, Seuntjens J, Hegyi G, Podgorsak E B, Soares C G, Kirov A S, Ali I, Williamson J F and
Elizondo A 2004 Dosimetric properties of improved GafChromic films for seven different digi-
tizers Medical Physics 31 2392–401
Devic S, Tomic N and Lewis D 2016a Reference radiochromic film dosimetry: Review of tech-
nical aspects Physica Medica 32 541–56
Devic S, Tomic N and Lewis D 2016b Reference radiochromic film dosimetry: Review of tech-
nical aspects Physica Medica 32 541–56
Devic S, Tomic N, Soares C G and Podgorsak E B 2009 Optimizing the dynamic range exten-
sion of a radiochromic film dosimetry system Medical Physics 36 429–37
Devic S, Vuong T, Moftah B, Evans M, Podgorsak E B, Poon E and Verhaegen F 2007 Image-
guided high dose rate endorectal brachytherapy Medical Physics 34 4451–8
Devlin P M 2016 Brachytherapy: applications and techniques (Demos Medical Publishing)
DeWerd L A, Ibbott G S, Meigooni A S, Mitch M G, Rivard M J, Stump K E, Thomadsen B R
and Venselaar J L M 2011 A dosimetric uncertainty analysis for photon-emitting brachytherapy
sources: Report of AAPM Task Group No. 138 and GEC-ESTRO Medical Physics 38 782–801
Dimopoulos J C A, Petrow P, Tanderup K, Petric P, Berger D, Kirisits C, Pedersen E M, Van
Limbergen E, Haie-Meder C and Pötter R 2012 Recommendations from Gynaecological (GYN)
GEC-ESTRO Working Group (IV): Basic principles and parameters for MR imaging within the
frame of image based adaptive cervix cancer brachytherapy Radiotherapy and Oncology 103
113–22
Enger S A, Vijande J and Rivard M J 2020 Model-Based Dose Calculation Algorithms for
Brachytherapy Dosimetry Seminars in Radiation Oncology 30 77–86
Espinoza A, Petasecca M, Cutajar D, Fuduli I, Howie A, Bucci J, Corde S, Jackson M, Zaider M,
Lerch M L F and Rosenfeld A B 2015 Pretreatment verification of high dose rate brachytherapy
plans using the ‘magic phantom’ system Biomedical Physics & Engineering Express 1 025201–
025201
Evans M D C, Devic S and Podgorsak E B 2007 High dose-rate brachytherapy source position
quality assurance using radiochromic film Medical Dosimetry 32 13–5

181
Famulari G, Duclos M and Enger S A 2020 A novel 169Yb-based dynamic-shield intensity mod-
ulated brachytherapy delivery system for prostate cancer Medical Physics 47 859–68
Famulari G, Renaud M-A, Poole C M, Evans M D C, Seuntjens J and Enger S A 2018 Rapid-
BrachyMCTPS: a Monte Carlo-based treatment planning system for brachytherapy applications
Phys. Med. Biol. 63 175007
Ford E, Conroy L, Dong L, Santos L F de L, Greener A, Kim G G-Y, Johnson J, Johnson P, Me-
chalakos J G, Napolitano B, Parker S, Schofield D, Smith K, Yorke E and Wells M 2020 Strate-
gies for effective physics plan and chart review in radiation therapy: Report of AAPM Task
Group 275 Medical Physics 47 e236–72
Fulkerson R K, Perez‐Calatayud J, Ballester F, Buzurovic I, Kim Y, Niatsetski Y, Ouhib Z, Pai
S, Rivard M J, Rong Y, Siebert F‐A, Thomadsen B R and Weigand F 2020 Surface brachy-
therapy: Joint report of the AAPM and the GEC‐ESTRO Task Group No. 253 Medical Physics
47 e951-87
Georg P, Lang S, Dimopoulos J C A, Dörr W, Sturdza A E, Berger D, Georg D, Kirisits C and
Pötter R 2011 Dose–Volume Histogram Parameters and Late Side Effects in Magnetic Reso-
nance Image–Guided Adaptive Cervical Cancer Brachytherapy International Journal of Radia-
tion Oncology*Biology*Physics 79 356–62
Gill B S, Lin J F, Krivak T C, Sukumvanich P, Laskey R A, Ross M S, Lesnock J L and Beriwal
S 2014 National cancer data base analysis of radiation therapy consolidation modality for cervi-
cal cancer: The impact of new technological advancements International Journal of Radiation
Oncology Biology Physics 90 1083–90
Goodsitt M M, Carson P L, Witt S, Hykes D L and Kofler J M 1998 Real-time B-mode ultra-
sound quality control test procedures. Report of AAPM Ultrasound Task Group No. 1 Medical
Physics 25 1385–406
Goy B W, Burchette R, Soper M S, Chang T and Cosmatos H A 2020 Ten-Year Treatment Out-
comes of Radical Prostatectomy Vs External Beam Radiation Therapy Vs Brachytherapy for
1503 Patients With Intermediate-risk Prostate Cancer Urology 136 180–9
Grover S, Harkenrider M M, Cho L P, Erickson B, Small C, Small W and Viswanathan A N
2016 Image Guided Cervical Brachytherapy: 2014 Survey of the American Brachytherapy Soci-
ety International Journal of Radiation Oncology Biology Physics 94 598–604
Guthier C V, Devlin P M, Harris T C, O’Farrell D A, Cormack R A and Buzurovic I 2020 De-
velopment and clinical implementation of semi-automated treatment planning including 3D
printable applicator holders in complex skin brachytherapy Medical Physics 47 869–79

182
Haie-Meder C, Pötter R, Van Limbergen E, Briot E, De Brabandere M, Dimopoulos J, Dumas I,
Hellebust T P, Kirisits C, Lang S, Muschitz S, Nevinson J, Nulens A, Petrow P and Wachter-
Gerstner N 2005 Recommendations from Gynaecological (GYN) GEC-ESTRO Working Group
(I): Concepts and terms in 3D image based 3D treatment planning in cervix cancer brachytherapy
with emphasis on MRI assessment of GTV and CTV Radiotherapy and Oncology 74 235–45
Hammer C G, Rosen B S, Fagerstrom J M, Culberson W S and DeWerd L A 2018 Experimental
investigation of GafChromic ® EBT3 intrinsic energy dependence with kilovoltage x rays, 137
Cs, and 60 Co Medical Physics 45 448–59
Han K, Marchand E-L, Croke J and Vuong T 2017 EBRT or Brachytherapy? Emerging Technol-
ogies in Brachytherapy, Edited by William Y. Song, Kari Tanderup, Bradley R. Pieters (CRC
Press, Taylor & Francis Group) p 445
Han K, Milosevic M, Fyles A, Pintilie M and Viswanathan A N 2013 Trends in the utilization of
brachytherapy in cervical cancer in the United States International Journal of Radiation Oncol-
ogy Biology Physics 87 111–9
Hellebust T P, Kirisits C, Berger D, Pérez-Calatayud J, De Brabandere M, De Leeuw A, Dumas
I, Hudej R, Lowe G, Wills R and Tanderup K 2010 Recommendations from Gynaecological
(GYN) GEC-ESTRO Working Group: Considerations and pitfalls in commissioning and applica-
tor reconstruction in 3D image-based treatment planning of cervix cancer brachytherapy Radio-
therapy and Oncology 96 153–60
Horwitz E M 2012 ABS brachytherapy consensus guidelines Brachytherapy 11 4–5
ICRU Report 38 1985 Dose and Volume Specifications for Reporting Intracavitary Therapy in
Gynecology (Bethesda: International Commission on Radiation Units and Measurements)
ICRU Report 50 1993 Prescribing , recording, and reporting photon beam therapy (Bethesda:
International Commission on Radiation Units and Measurements)
ICRU Report 58 1997 Recommended Dose and Volume Specification for Reporting Interstitial
Brachytherapy (Bethesda: International Commission on Radiation Units and Measurements)
ICRU Report 89 2016 Prescribing, Recording, and Reporting Brachytherapy for Cancer of the
Cervix: (Journal of the International Commission on Radiation Units and Measurements) Online:
10.1093/jicru/ndw027
Ishmael Parsai E, Ouhib Z and Orton C G 2017 In the era of IGRT and small- and focal-field ex-
ternal beam radiotherapy, brachytherapy is a dying modality Medical Physics 44 351–4
Jursinic P A 2014 Quality assurance measurements for high-dose-rate brachytherapy without
film Journal of Applied Clinical Medical Physics 15 246–61

183
Kellermeier M, Herbolzheimer J, Kreppner S, Lotter M, Strnad V and Bert C 2017 Electromag-
netic tracking (EMT) technology for improved treatment quality assurance in interstitial brachy-
therapy Journal of Applied Clinical Medical Physics 18 211–22
Kertzscher G and Beddar S 2017 Inorganic scintillation detectors based on Eu-activated phos-
phors for 192Ir brachytherapy Physics in Medicine and Biology 62 5046–75
Kertzscher G and Beddar S 2019 Inorganic scintillation detectors for 192Ir brachytherapy Physics
in Medicine and Biology 64 225018
Kertzscher G and Beddar S 2016 Ruby-based inorganic scintillation detectors for 192Ir brachy-
therapy Physics in Medicine and Biology 61 7744–64
Keynes G 1932 The radium treatment of carcinoma of the breast Br J Surg 19 415–480
Kirisits C, Rivard M J, Baltas D, Ballester F, De Brabandere M, Van Der Laarse R, Niatsetski Y,
Papagiannis P, Hellebust T P, Perez-Calatayud J, Tanderup K, Venselaar J L M and Siebert F A
2014 Review of clinical brachytherapy uncertainties: Analysis guidelines of GEC-ESTRO and
the AAPM Radiotherapy and Oncology 110 199–212
Klassen N V, Zwan L van der and Cygler J 1997 GafChromic MD-55: Investigated as a preci-
sion dosimeter Medical Physics 24 1924–34
Kubo H D, Glasgow G P, Pethel T D, Thomadsen B R and Williamson J F 1998 High dose-rate
brachytherapy treatment delivery: Report of the AAPM Radiation Therapy Committee Task
Group No. 59 Medical Physics 25 375–403
Kutcher G J, Coia L, Gillin M, Hanson W F, Leibel S, Morton R J, Palta J R, Purdy J A, Rein-
stein L E, Svensson G K, Weller M and Wingfield L 1994 Comprehensive QA for radiation on-
cology: Report of AAPM Radiation Therapy Committee Task Group 40 Medical Physics 21
581–618
Likhacheva A O, Devlin P M, Shirvani S M, Barker C A, Beron P, Bhatnagar A, Doggett S W,
Hochman L, Hsu C, Kasper M, Keisch M, Mutyala S, Prestidge B, Villalba S R, Shukla V,
Sundararaman S and Kamrava M 2017 Skin surface brachytherapy: A survey of contemporary
practice patterns Brachytherapy 16 223–9
Lillicrap S C 2000 Physics Aspects of Quality Control in Radiotherapy (Report No. 81) Physics
in Medicine and Biology 45 815–815
Lindegaard J C, Madsen M L, Traberg A, Meisner B, Nielsen S K, Tanderup K, Spejlborg H,
Fokdal L U and Nørrevang O 2016 Individualised 3D printed vaginal template for MRI guided
brachytherapy in locally advanced cervical cancer Radiotherapy and Oncology 118 173–5
184
MacKee G M 1921 X-rays and radium in the treatment of diseases of the skin Publisher: Lea &
Febiger
Mahmood U, Pugh T, Frank S, Levy L, Walker G, Haque W, Koshy M, Graber W, Swanson D,
Hoffman K, Kuban D and Lee A 2014 Declining use of brachytherapy for the treatment of pros-
tate cancer Brachytherapy 13 157–62
Mao X, Pineau J, Keyes R and Enger S A 2020 RapidBrachyDL: Rapid Radiation Dose Calcula-
tions in Brachytherapy via Deep Learning International Journal of Radiation Oncology*Biol-
ogy*Physics Online: http://www.sciencedirect.com/science/article/pii/S0360301620311226
Mazeron J J, Scalliet P, Limbergen E V and Lartigau E 2003 Radiobiology of Brachytherapy and
the Dose-Rate Effect GEC-ESTRO handbook 1–10
McLaughlin W L, Yun-Dong C, Soares C G, Miller A, Van Dyk G and Lewis D F 1991 Sensi-
tometry of the response of a new radiochromic film dosimeter to gamma radiation and electron
beams Nuclear Inst. and Methods in Physics Research, A 302 165–76
Morcos M, Antaki M, Viswanathan A N and Enger S A 2020 A novel minimally invasive dy-
namic-shield, intensity-modulated brachytherapy system for the treatment of cervical cancer
Medical Physics Online: https://doi.org/10.1002/mp.14459
Morcos M and Enger S A 2020 Monte Carlo dosimetry study of novel rotating MRI-compatible
shielded tandems for intensity modulated cervix brachytherapy Physica Medica: European Jour-
nal of Medical Physics 71 178–84
Morris W J, Tyldesley S, Rodda S, Halperin R, Pai H, McKenzie M, Duncan G, Morton G,
Hamm J and Murray N 2017 Androgen Suppression Combined with Elective Nodal and Dose
Escalated Radiation Therapy (the ASCENDE-RT Trial): An Analysis of Survival Endpoints for a
Randomized Trial Comparing a Low-Dose-Rate Brachytherapy Boost to a Dose-Escalated Exter-
nal Beam Boost for High- and Intermediate-risk Prostate Cancer International Journal of Radia-
tion Oncology, Biology, Physics 98 275–85
Mutic S, Palta J R, Butker E K, Das I J, Huq M S, Loo L-N D, Salter B J, McCollough C H and
Dyk J V 2003 Quality assurance for computed-tomography simulators and the computed-tomog-
raphy-simulation process: Report of the AAPM Radiation Therapy Committee Task Group No.
66 Medical Physics 30 2762–92
Nag S, Cardenes H, Chang S, Das I J, Erickson B, Ibbott G S, Lowenstein J, Roll J, Thomadsen
B and Varia M 2004 Proposed guidelines for image-based intracavitary brachytherapy for cervi-
cal carcinoma: Report from Image-Guided Brachytherapy Working Group International Journal
of Radiation Oncology*Biology*Physics 60 1160–72
185
Nath R, Amols H, Coffey C, Duggan D, Jani S, Li Z, Schell M, Soares C, Whiting J, Cole P E,
Crocker I and Schwartz R 1999 Intravascular brachytherapy physics: Report of the AAPM Radi-
ation Therapy Committee Task Group No. 60 Medical Physics 26 119–52
Nath R, Anderson L L, Luxton G, Weaver K A, Williamson J F and Meigooni A S 1995 Dosim-
etry of interstitial brachytherapy sources: Recommendations of the AAPM Radiation Therapy
Committee Task Group No. 43 Medical Physics 22 209–34
Nath R, Anderson L L, Meli J A, Olch A J, Stitt J A and Williamson J F 1997 Code of practice
for brachytherapy physics: Report of the AAPM Radiation Therapy Committee Task Group No.
56 Medical Physics 24 1557–98
Nath R, Bice W S, Butler W M, Chen Z, Meigooni A S, Narayana V, Rivard M J and Yu Y 2009
AAPM recommendations on dose prescription and reporting methods for permanent interstitial
brachytherapy for prostate cancer: Report of Task Group 137 Medical Physics 36 5310–22
Niroomand-Rad A, Blackwell C R, Coursey B M, Gall K P, Galvin J M, McLaughlin W L,
Meigooni a S, Nath R, Rodgers J E and Soares C G 1998 Radiochromic film dosimetry: Recom-
mendations of AAPM Radiation Therapy Committee Task Group 55 Medical physics 25 2093–
115
Okamoto H, Aikawa A, Wakita A, Yoshio K, Murakami N, Nakamura S, Hamada M, Abe Y and
Itami J 2014 Dose error from deviation of dwell time and source position for high dose-rate
192Ir in remote afterloading system Journal of Radiation Research 55 780–7
Palmer A, Bradley D and Nisbet A 2012 Physics-aspects of dose accuracy in high dose rate
(HDR) brachytherapy: Source dosimetry, treatment planning, equipment performance and in
vivo verification techniques Journal of Contemporary Brachytherapy 4 81–91
Palmer A L, Bradley D A and Nisbet A 2014 Dosimetric audit in brachytherapy British Journal
of Radiology 87 20140105
Palmer A L, Lee C, Ratcliffe A J, Bradley D and Nisbet A 2013 Design and implementation of a
film dosimetry audit tool for comparison of planned and delivered dose distributions in high dose
rate (HDR) brachytherapy Physics in Medicine and Biology 58 6623–40
Park S, Kang S K, Cheong K H, Hwang T, Kim H, Han T, Lee M Y, Kim K, Bae H, Su Kim H,
Han Kim J, Jae Oh S and Suh J S 2012 Variations in dose distribution and optical properties of
Gafchromic TM EBT2 film according to scanning mode Medical Physics 39 2524–35
Perez-Calatayud J B F Das RK, Dewerd LA, Ibbott GS, Meigooni AS 2012 Dose Calculation for
Photon-Emitting Brachytherapy Sources with Average Energy Higher than 50 keV: Full Report
of the AAPM and ESTRO Report of the High Energy Brachytherapy Source Dosimetry (HEBD)
Working Group Med Phys 39 2904–29
186
Petereit D G, Frank S J, Viswanathan A N, Erickson B, Eifel P, Nguyen P L and Wazer D E
2015 Brachytherapy: Where Has It Gone? JCO 33 980–2
Pettersen M N, Aird E and Olsen D R 2008 Quality assurance of dosimetry and the impact on
sample size in randomized clinical trials Radiotherapy and Oncology 86 195–9
Pfeiffer D, Sutlief S, Feng W, Pierce H M and Kofler J 2008 AAPM Task Group 128: Quality
assurance tests for prostate brachytherapy ultrasound systems Medical Physics 35 5471–89
Podgorsak E B 2005 Radiation oncology physics: a handbook for teachers and students (Vienna:
International Atomic Energy Agency) Online: https://www-pub.iaea.org/mtcd/publica-
tions/pdf/pub1196_web.pdf
Pötter R, Georg P, Dimopoulos J C A, Grimm M, Berger D, Nesvacil N, Georg D, Schmid M P,
Reinthaller A, Sturdza A and Kirisits C 2011 Clinical outcome of protocol based image (MRI)
guided adaptive brachytherapy combined with 3D conformal radiotherapy with or without chemo-
therapy in patients with locally advanced cervical cancer Radiotherapy and Oncology 100 116–23
Pötter R, Haie-Meder C, Van Limbergen E, Barillot I, De Brabandere M, Dimopoulos J, Dumas
I, Erickson B, Lang S, Nulens A, Petrow P, Rownd J and Kirisits C 2006 Recommendations
from gynaecological (GYN) GEC ESTRO working group (II): Concepts and terms in 3D image-
based treatment planning in cervix cancer brachytherapy - 3D dose volume parameters and as-
pects of 3D image-based anatomy, radiation physics, radiobiolo Radiotherapy and Oncology 78
67–77
Potters L, Cao Y, Calugaru E, Torre T, Fearn P and Wang X-H 2001 A comprehensive review of
CT-based dosimetry parameters and biochemical control in patients treated with permanent pros-
tate brachytherapy International Journal of Radiation Oncology*Biology*Physics 50 605–14
Poulin E, Racine E, Binnekamp D and Beaulieu L 2015 Fast, automatic, and accurate catheter
reconstruction in HDR brachytherapy using an electromagnetic 3D tracking system Medical
Physics 42 1227–32
Price R R, Axel L, Morgan T, Newman R, Perman W, Schneiders N, Selikson M, Wood M and
Thomas S R 1990 Quality assurance methods and phantoms for magnetic resonance imaging:
Report of AAPM nuclear magnetic resonance Task Group No. 1 Medical Physics 17 287–95
Richley L, John A C, Coomber H and Fletcher S 2010 Evaluation and optimization of the new
EBT2 radiochromic film dosimetry system for patient dose verification in radiotherapy Phys.
Med. Biol. 55 2601–2617
Ricotti R, Vavassori A, Bazani A, Ciardo D, Pansini F, Spoto R, Sammarco V, Cattani F, Baroni
G, Orecchia R and Jereczek-Fossa B A 2016 3D-printed applicators for high dose rate brachy-
therapy: Dosimetric assessment at different infill percentage Physica Medica 32 1698–706

187
Rijkmans E C, Nout R A, Rutten I H H M, Ketelaars M, Neelis K J, Laman M S, Coen V L M A,
Gaarenstroom K N, Kroep J R and Creutzberg C L 2014 Improved survival of patients with cer-
vical cancer treated with image-guided brachytherapy compared with conventional brachy-
therapy Gynecologic Oncology 135 231–8
Rink A, Lewis D F, Varma S, Vitkin I A and Jaffray D A 2008 Temperature and hydration ef-
fects on absorbance spectra and radiation sensitivity of a radiochromic medium Medical Physics
35 4545–55
Rivard M J, Coursey B M, DeWerd L A, Hanson W F, Huq M S, Ibbott G S, Mitch M G, Nath R
and Williamson J F 2004 Update of AAPM Task Group No. 43 Report: A revised AAPM proto-
col for brachytherapy dose calculations Medical Physics 31 633–74
Roozen K, Kron T, Haworth A and Franich R 2011 Evaluation of EBT radiochromic film using a
multiple exposure technique Australas Phys Eng Sci Med 34 281–9
Safigholi H, Han D Y, Soliman A and Song W Y 2018 Direction modulated brachytherapy
(DMBT) tandem applicator for cervical cancer treatment: Choosing the optimal shielding mate-
rial Medical Physics 45 3524–33
Sarfehnia A, Kawrakow I and Seuntjens J 2010 Direct measurement of absorbed dose to water in
HDR 192Ir brachytherapy: Water calorimetry, ionization chamber, Gafchromic film, and TG-43
Medical Physics 37 1924–32
Schmid M P, Fokdal L, Westerveld H, Chargari C, Rohl L, Morice P, Nesvacil N, Mazeron R,
Haie-Meder C, Pötter R and Nout R A 2020 Recommendations from gynaecological (GYN)
GEC-ESTRO working group – ACROP: Target concept for image guided adaptive brachy-
therapy in primary vaginal cancer Radiotherapy and Oncology 145 36–44
Schmid M P, Nesvacil N, Pötter R, Kronreif G and Kirisits C 2016 Transrectal ultrasound for
image-guided adaptive brachytherapy in cervix cancer – An alternative to MRI for target defini-
tion? Radiotherapy and Oncology 120 467–72
Seneviratne D, McLaughlin C, Todor D, Kaplan B and Fields E C 2018 The CivaSheet: The new
frontier of intraoperative radiation therapy or a pricier alternative to LDR brachytherapy? Ad-
vances in Radiation Oncology 3 87–91
Simpson D R, Scanderbeg D J, Carmona R, McMurtrie R M, Einck J, Mell L K, McHale M T,
Saenz C C, Plaxe S C, Harrison T, Mundt A J and Yashar C M 2015 Clinical Outcomes of Com-
puted Tomography–Based Volumetric Brachytherapy Planning for Cervical Cancer International
Journal of Radiation Oncology*Biology*Physics 93 150–7
188
Smith R L, Hanlon M, Panettieri V, Millar J L, Matheson B, Haworth A and Franich R D 2018
An integrated system for clinical treatment verification of HDR prostate brachytherapy combin-
ing source tracking with pretreatment imaging Brachytherapy 17 111–21
Smith R L, Haworth A, Panettieri V, Millar J L and Franich R D 2016 A method for verification
of treatment delivery in HDR prostate brachytherapy using a flat panel detector for both imaging
and source tracking Medical Physics 43 2435–42
Song H, Bowsher J, Das S and Yin F F 2009 Tracking brachytherapy sources using emission im-
aging with one flat panel detector Medical Physics 36 1109–11
Spratt D E, Zumsteg Z S, Ghadjar P, Kollmeier M A, Pei X, Cohen G, Polkinghorn W, Yamada
Y and Zelefsky M J 2014 Comparison of high-dose (86.4 Gy) IMRT vs combined brachytherapy
plus IMRT for intermediate-risk prostate cancer BJU International 114 360–7
Stewart A J and Bentzen S M 2011 Radiobiological Aspects of Brachytherapy in the Era of 3-
Dimensional Imaging Gynecologic Radiation Therapy (Berlin: Springer) p 301
Sturdza A, Pötter R, Fokdal L U, Haie-Meder C, Tan L T, Mazeron R, Petric P, Šegedin B,
Jurgenliemk-Schulz I M, Nomden C, Gillham C, McArdle O, Van Limbergen E, Janssen H,
Hoskin P, Lowe G, Tharavichitkul E, Villafranca E, Mahantshetty U, Georg P, Kirchheiner K,
Kirisits C, Tanderup K and Lindegaard J C 2016 Image guided brachytherapy in locally ad-
vanced cervical cancer: Improved pelvic control and survival in RetroEMBRACE, a multicenter
cohort study Radiotherapy and Oncology 120 428–33
Sutherland J G H and Rogers D W O 2010 Monte Carlo calculated absorbed-dose energy de-
pendence of EBT and EBT2 film Medical Physics 37 1110–6
Sylvester J E, Grimm P D, Wong J, Galbreath R W, Merrick G and Blasko J C 2011 Fifteen-
Year Biochemical Relapse-Free Survival, Cause-Specific Survival, and Overall Survival Follow-
ing I125 Prostate Brachytherapy in Clinically Localized Prostate Cancer: Seattle Experience In-
ternational Journal of Radiation Oncology*Biology*Physics 81 376–81
Taggar A S, Phan T, Traptow L, Banerjee R and Doll C M 2017 Cervical cancer brachytherapy
in Canada: A focus on interstitial brachytherapy utilization Brachytherapy 16 161–6
Tanderup K, Beddar S, Andersen C E, Kertzscher G and Cygler J E 2013 In vivo dosimetry in
brachytherapy Medical Physics 40 070902
Tanderup K, Eifel P J, Yashar C M, Pötter R and Grigsby P W 2014a Curative Radiation Ther-
apy for Locally Advanced Cervical Cancer: Brachytherapy Is NOT Optional International Jour-
nal of Radiation Oncology*Biology*Physics 88 537–9
189
Tanderup K, Hellebust T P, Lang S, Granfeldt J, Pötter R, Lindegaard J C and Kirisits C 2008
Consequences of random and systematic reconstruction uncertainties in 3D image based brachy-
therapy in cervical cancer Radiotherapy and Oncology 89 156–63
Tanderup K, Ménard C, Polgar C, Lindegaard J C, Kirisits C and Pötter R 2017 Advancements
in brachytherapy Advanced Drug Delivery Reviews 109 15–25
Tanderup K, Nielsen S K, Nyvang G-B, Pedersen E M, Røhl L, Aagaard T, Fokdal L and
Lindegaard J C 2010 From point A to the sculpted pear: MR image guidance significantly im-
proves tumour dose and sparing of organs at risk in brachytherapy of cervical cancer Radiother-
apy and Oncology 94 173–80
Tanderup K, Viswanathan A N, Kirisits C and Frank S J 2014b Magnetic Resonance Image
Guided Brachytherapy Seminars in Radiation Oncology 24 181–91
Taylor R E P, Yegin G and Rogers D W O 2007 Benchmarking BrachyDose: Voxel based
EGSnrc Monte Carlo calculations of TG-43 dosimetry parameters Medical Physics 34 445–57
Teoh M, Clark C H, Wood K, Whitaker S and Nisbet A 2011 Volumetric modulated arc therapy:
A review of current literature and clinical use in practice British Journal of Radiology 84 967–96
Therriault-Proulx F, Briere T M, Mourtada F, Aubin S, Beddar S and Beaulieu L 2011 A phan-
tom study of an in vivo dosimetry system using plastic scintillation detectors for real-time verifi-
cation of 192Ir HDR brachytherapy Medical Physics 38 2542–51
Thomadsen B R, Erickson B A, Eifel P J, Hsu I-C, Patel R R, Petereit D G, Fraass B A and
Rivard M J 2014 A review of safety, quality management, and practice guidelines for high-dose-
rate brachytherapy: Executive summary Practical Radiation Oncology 4 65–70
Viani G A, Manta G B, Stefano E J and De Fendi L I 2009 Brachytherapy for cervix cancer:
Low-dose rate or high-dose rate brachytherapy - A meta-analysis of clinical trials Journal of Ex-
perimental and Clinical Cancer Research 28 1–12
Vuong T, Szego P, David M, Evans M, Parent J, Mayrand S, Corns R, Burtin P, Faria S and De-
vic S 2005 The safety and usefulness of high-dose-rate endoluminal brachytherapy as a boost in
the treatment of patients with esophageal cancer with external beam radiation with or without
chemotherapy International Journal of Radiation Oncology*Biology*Physics 63 758–64
Wadi-Ramahi S, Alnajjar W, Mahmood R, Jastaniyah N and Moftah B 2016 Failure modes and
effects analysis in image-guided high-dose-rate brachytherapy: Quality control optimization to
reduce errors in treatment volume Brachytherapy 15 669–78
Wallner K, Ellis W, Russell K, Cavanagh W and Blasko J 1999 Use of TRUS to predict pubic
arch interference of prostate brachytherapy International Journal of Radiation Oncology*Biol-
ogy*Physics 43 583–5

190
Wang W, Viswanathan A N, Damato A L, Chen Y, Tse Z, Pan L, Tokuda J, Seethamraju R T,
Dumoulin C L, Schmidt E J and Cormack R A 2015 Evaluation of an active magnetic resonance
tracking system for interstitial brachytherapy Medical Physics 42 7114–21
Webster M J, Devic S, Vuong T, Han D Y, Park J C, Scanderbeg D, Lawson J, Song B, Watkins
W T, Pawlicki T and Song W Y 2013 Dynamic modulated brachytherapy (DMBT) for rectal
cancer Medical Physics 40 011718
Williamson J F 2006 Brachytherapy technology and physics practice since 1950: A half-century
of progress Physics in Medicine and Biology 51 R303–R325
World Health Organization 2007 Radiotherapy Risk Profile. (Geneva: WHO Publishing) Online:
http://www.who.int/patientsafety/activities/technical/radiotherapy_risk_profile.pdf
Yu Y, Anderson L L, Li Z, Mellenberg D E, Nath R, Schell M C, Waterman F M, Wu A and
Blasko J C 1999 Permanent prostate seed implant brachytherapy: Report of the American Asso-
ciation of Physicists in Medicine Task Group No. 64 Medical Physics 26 2054–76
Zaorsky N G, Davis B J, Nguyen P L, Showalter T N, Hoskin P J, Yoshioka Y, Morton G C and
Horwitz E M 2017 The evolution of brachytherapy for prostate cancer Nat Rev Urol 14 415–39
Zhou J, Sebastian E, Mangona V and Yan D 2013 Real-time catheter tracking for high-dose-rate
prostate brachytherapy using an electromagnetic 3D-guidance device: A preliminary perfor-
mance study Medical Physics 40 021716
Zhu Y, Kirov A S, Mishra V, Meigooni A S and Williamson J F 1997 Quantitative evaluation of
radiochromic film response for two-dimensional dosimetry Medical Physics 24 223–31