
Digital Image Processing (15EC72) - KSSEM
146
Digital Image Processing (15EC72) Module - 1 Digital Image Fundamentals Ravikiran B. A. Asst. Professor, Dept. of ECE KSSEM, Bangalore K S SCHOOL OF ENGINEERING AND MANAGEMENT
-
Upload
khangminh22 -
Category
Documents
-
view
1 -
download
0
Transcript of Digital Image Processing (15EC72) - KSSEM

Digital Image
Processing (15EC72)
Module - 1Digital Image Fundamentals
Ravikiran B. A.
Asst. Professor, Dept. of ECE
KSSEM, Bangalore
K S SCHOOL OF ENGINEERING AND MANAGEMENT

2Digital Image Processing (15EC72)
Recommended Books• Text Book:
• Digital Image Processing- Rafael C Gonzalez andRichard E. Woods, PHI 3rd Edition, 2010.
• Reference Books:
1. Digital Image Processing- S. Jayaraman, S.Esakkirajan, T. Veerakumar, Tata McGraw Hill2014.
2. Fundamentals of Digital Image Processing-A. K.Jain, Pearson 2004.

3Digital Image Processing (15EC72)
What Is Digital Image Processing?• Image may be defined as a two-dimensional function, f(x, y)
where x and y are spatial (plane) coordinates
• The amplitude of f at any pair of coordinates (x, y) is called the intensity or gray level of the image at that point.
• When x, y and the intensity values of f are all finite, discrete quantities, we call the image a digital image.
• The field of digital image processing refers to processing digital images by means of a digital computer.
• Digital image is composed of a finite number of elements, each of which has a particular location and value. These elements are called picture elements, image elements, pels, and pixels.

4Digital Image Processing (15EC72)
• Human Vision is limited to Visible Spectrum. Imaging Machines cancover almost the entire EM spectrum, ranging from gamma to radiowaves.
• They can operate on images generated by sources that humans are notaccustomed to associating with images.
Eg. Ultrasound, electron microscopy, and computer-generated images.
• 3 types of computerized processes : low-, mid-, and high-level processes. Low-level processes - Primitive operations such as image
preprocessing to reduce noise, contrast enhancement, and imagesharpening.Both its inputs and outputs are images.
Mid-level processes - Tasks such as segmentation (Partitioning),description, classification (recognition) of individual objects.Inputs generally are images, but its outputs are attributes extractedfrom those images (e.g., edges, contours, and the identity of individualobjects).
Higher-level processing - “making sense” of an ensemble ofrecognized objects, as in image analysis, and at the far end of thecontinuum, performing the cognitive functions normally associatedwith vision

Origins of Digital Image Processing
6Digital Image Processing (15EC72)
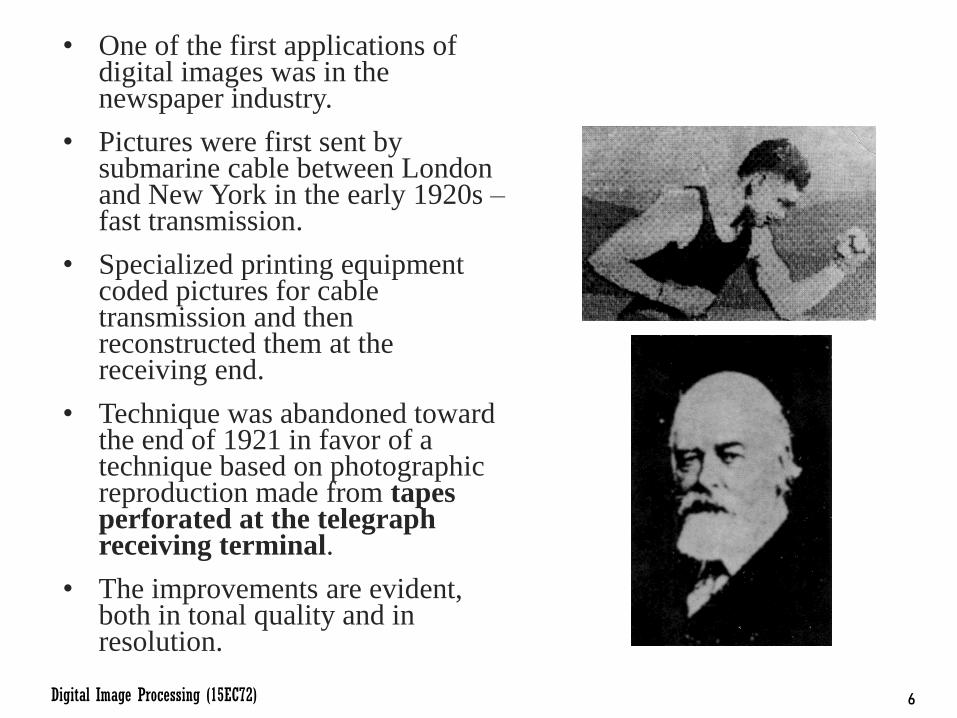
• One of the first applications of digital images was in the newspaper industry.
• Pictures were first sent by submarine cable between London and New York in the early 1920s –fast transmission.
• Specialized printing equipment coded pictures for cable transmission and then reconstructed them at the receiving end.
• Technique was abandoned toward the end of 1921 in favor of a technique based on photographic reproduction made from tapes perforated at the telegraph receiving terminal.
• The improvements are evident, both in tonal quality and in resolution.
7Digital Image Processing (15EC72)
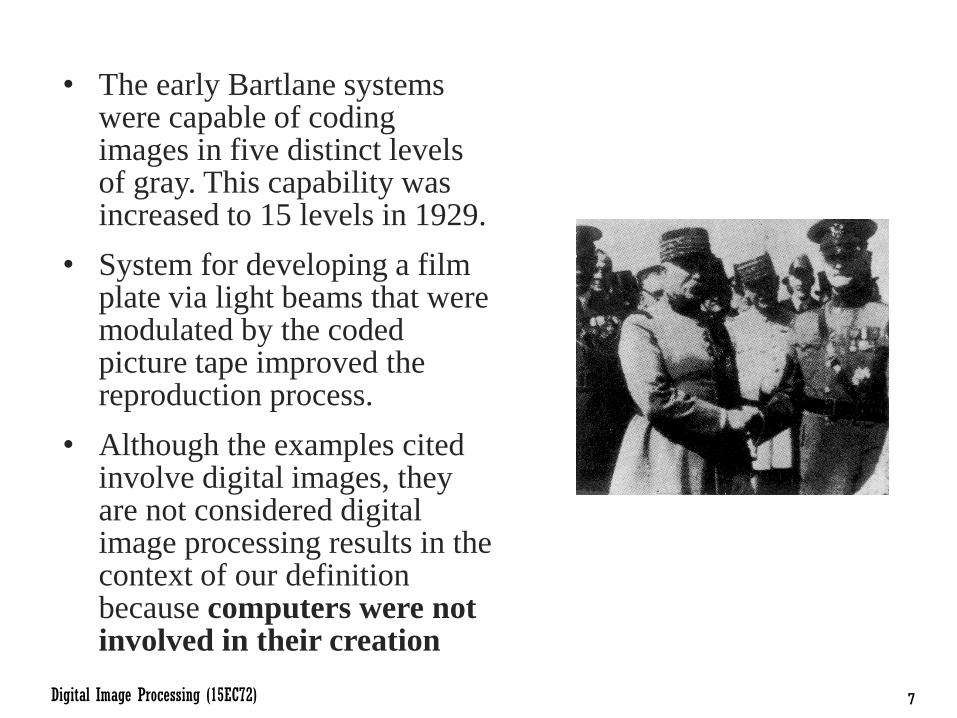
• The early Bartlane systems were capable of coding images in five distinct levels of gray. This capability was increased to 15 levels in 1929.
• System for developing a film plate via light beams that were modulated by the coded picture tape improved the reproduction process.
• Although the examples cited involve digital images, they are not considered digital image processing results in the context of our definition because computers were not involved in their creation

8Digital Image Processing (15EC72)
• The first computers powerfulenough to carry out meaningfulimage processing tasks appearedin the early 1960s.
• Work on using computertechniques for improving imagesfrom a space probe began at theJet Propulsion Laboratory in 1964
• Pictures of the moon transmittedby Ranger 7 were processed by acomputer to correct various typesof image distortion inherent in theon-board television camera.
• The imaging lessons learned withRanger 7 were used to enhanceand restore images from theSurveyor missions to the moon,the Mariner series of flybymissions to Mars, the Apollomanned flights to the moon, andothers.
(the markers, called reseau marks, are used for geometric corrections)

9Digital Image Processing (15EC72)
• Computerized Axial Tomography (CAT) aka ComputerizedTomography (CT) – invented independently by Sir Godfrey N.Hounsfield and Professor Allan M. Cormack in early 1970s, who sharedthe 1979 Nobel Prize in Medicine for their invention.
• Computer procedures are used to enhance the contrast or code the intensity levelsinto color for easier interpretation of X-rays and other images used in industry,medicine, and the biological sciences.
Geographers use the same or similar techniques to study pollution patternsfrom aerial and satellite imagery.
Image enhancement and restoration procedures are used to processdegraded images of unrecoverable objects or experimental results tooexpensive to duplicate.
In archeology, image processing methods have successfully restored blurredpictures that were the only available records of rare artifacts lost ordamaged after being photographed.
In physics and related fields, computer techniques routinely enhance imagesof experiments in areas such as high-energy plasmas and electron microscopy.
Similarly successful applications of image processing concepts can be found inastronomy, biology, nuclear medicine, law enforcement, defense, andindustry.

Fields that Use Digital Image Processing

11Digital Image Processing (15EC72)
• Almost all areas of technology now use DIP in some way oranother.
• One of the simplest ways to develop a basic understanding ofthe extent of image processing applications is to categorizeimages according to their source (e.g., visual, X-ray, and soon).
• The principal energy source for images in use today is theelectromagnetic energy spectrum.
• Other important sources of energy include acoustic,ultrasonic, and electronic (in the form of electron beamsused in electron microscopy).
• Synthetic images, used for modeling and visualization, aregenerated by computer.

12Digital Image Processing (15EC72)
EM Spectrum Imaging• Electromagnetic waves - propagating sinusoidal waves of
varying wavelengths OR stream of massless particles, each traveling in a wavelike pattern and moving at the speed of light.
• Each massless particle contains a certain amount (or bundle) of energy. Each bundle of energy is called a photon.
• If spectral bands are grouped according to energy per photon, we obtain the spectrum shown below, ranging from gamma rays (highest energy) at one end to radio waves (lowest energy) at the other.
13Digital Image Processing (15EC72)
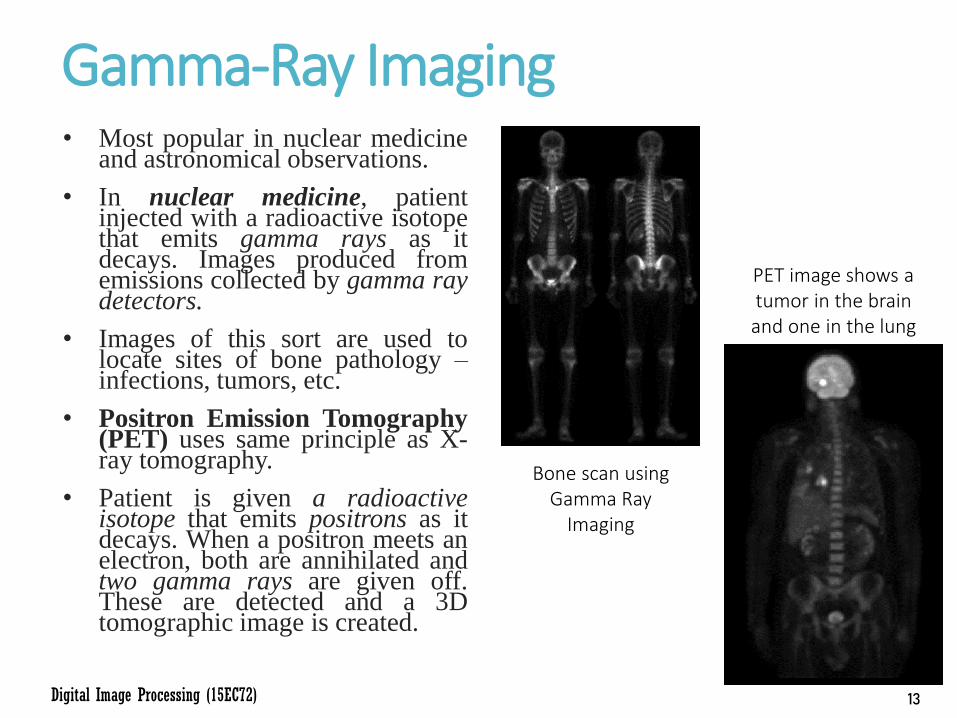
Gamma-Ray Imaging• Most popular in nuclear medicine
and astronomical observations.
• In nuclear medicine, patientinjected with a radioactive isotopethat emits gamma rays as itdecays. Images produced fromemissions collected by gamma raydetectors.
• Images of this sort are used tolocate sites of bone pathology –infections, tumors, etc.
• Positron Emission Tomography(PET) uses same principle as X-ray tomography.
• Patient is given a radioactiveisotope that emits positrons as itdecays. When a positron meets anelectron, both are annihilated andtwo gamma rays are given off.These are detected and a 3Dtomographic image is created.
Bone scan using Gamma Ray
Imaging
PET image shows a tumor in the brain and one in the lung

14Digital Image Processing (15EC72)
• Gamma Rays areproduced as naturalradiation amongcertain celestial bodieslike stars, gas clouds,supernovae, etc.
• Gamma Rays are alsoproduced duringnuclear fission andfusion reactions – canbe used in nuclearreactor monitoring.
Cygnus Loop Superheated
stationary gas cloud, created due to star
explosion in Cygnus, Imaged in Gamma
Band
Gammaradiation (bright
spot) from areactor valve.

15Digital Image Processing (15EC72)
X-Ray Imaging• Among the oldest sources of EM radiation used for imaging.
• Used in medical diagnostics, industry and other areas like astronomy.
• X-rays for medical and industrial imaging are generated using an X-ray tube, which is a vacuum tube with a cathode and anode.
• Cathode is heated, causing free electrons to be released. These electrons flow at high speed to the positively charged anode. When electrons strike nucleus, energy is released in the form of X-ray radiation.
• The energy of X-rays controlled by anode voltage and by a current applied to cathode filament.
• Object to be imaged is placed between X-ray source and X-ray sensitive film.

16Digital Image Processing (15EC72)
• In digital radiography, digital images are obtained by one of two methods: Digitizing X-ray films X-rays that pass through the
patient fall directly onto devices (such as a phosphor screen) that convert X-rays to light
• Angiography is another major application in Contrast Enhancement Radiography – images of blood vessels
• X-Ray Imaging is core part of CAT imaging. Produces High Resolution 3D images

17Digital Image Processing (15EC72)
• Similar techniques but generally involving higher energy X-rays, are applicable in industrial processes.
• See X-ray image of an electronic circuit board. Can be used to examine circuit boards for flaws in manufacturing, such as missing components or broken traces.
• Industrial CAT scans are useful when the parts can be penetrated by X-rays, such as in plastic assemblies, and even large bodies, like solid-propellant rocket motors.
• X-ray imaging in popular in astronomy. This image is the same Cygnus Loop, but imaged this time in the X-ray band.

18Digital Image Processing (15EC72)
Ultraviolet Band Imaging• Commonly used in lithography,
industrial inspection,microscopy, lasers, biologicalimaging, and astronomicalobservations.
• Fluorescence microscopy - usean excitation light to irradiate aprepared specimen. Then,separate the much weakerradiating fluorescent light fromthe brighter excitation light ontodark background.
• Excellent method for studyingmaterials that can be made tofluoresce, either in their naturalform (primary fluorescence) orwhen treated with chemicalscapable of fluorescing(secondary fluorescence).
Normal Corn in UV Diseased Corn in UV
Cygnus Loop in UV

19Digital Image Processing (15EC72)
Visible and Infrared Band Imaging• Visible Band Imaging – most popular of all.
• IR Band Imaging – used along with Visible Band Imaging.
• Common uses - light microscopy, astronomy, remote sensing,industry, and law enforcement.
• Light Microscopy – very common in pharmaceuticals andmicroinspection to materials characterization. Processingranging from enhancement to measurements.
• Another major area of visual processing is remote sensing,which usually includes several bands in the visual andinfrared regions of the spectrum.

20Digital Image Processing (15EC72)
• Multispectral Imaging from different EM bands helpsimmensely in Remote Sensing .
• Weather observation and prediction also are majorapplications of multispectral imaging from satellites
• A major area of imaging in the visual spectrum is inautomated visual inspection of manufactured goods.
• Image Processing can be used to inspect batches of goods fordefects, missing components, damage, etc.
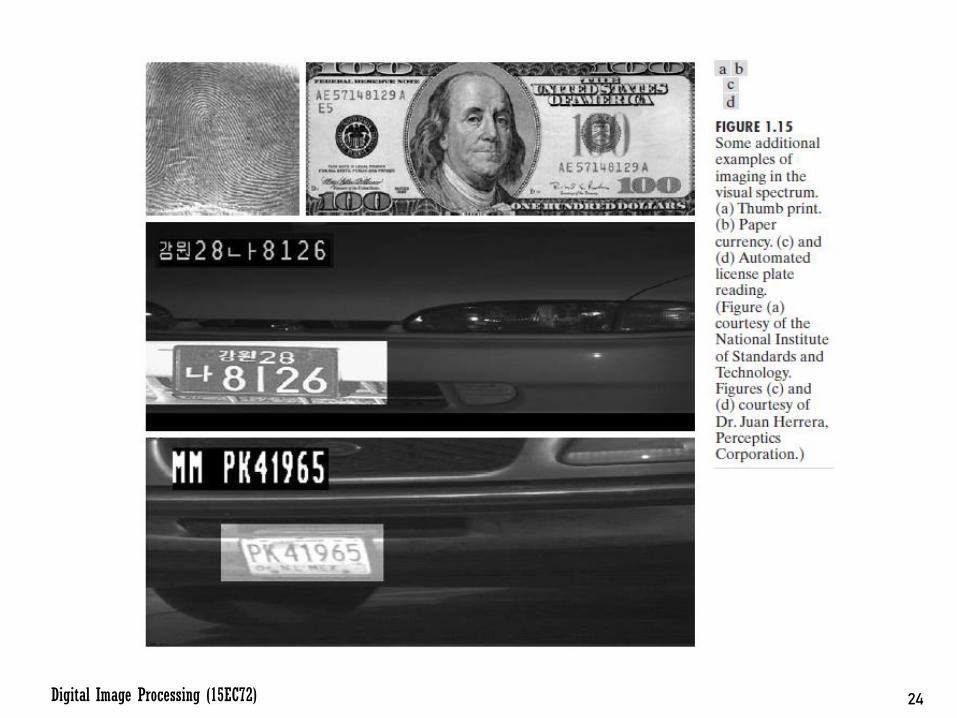
• Digital Image Processing is commonly used in LawEnforcement in the form of facial recognition, fingerprintidentification, vehicle numberplate recognition, fake currencydetection, etc.

21Digital Image Processing (15EC72)

22Digital Image Processing (15EC72)

23Digital Image Processing (15EC72)
24Digital Image Processing (15EC72)

25Digital Image Processing (15EC72)
Microwave Band Imaging• Dominant application of imaging in the microwave band is
radar.
• Can collect data over virtually any region at any time,regardless of weather or ambient lighting conditions.
• An imaging radar works provides its own illumination(microwave pulses) to illuminate an area on the ground andtake a snapshot image.
• Instead of a camera lens, a radar uses an antenna and digitalcomputer processing to record its images.
• In a radar image, one can see only the microwave energy thatwas reflected back toward the radar antenna.
• This offers high clarity and detail of the image,unencumbered by clouds or other atmospheric conditions thatnormally interfere with images in the visual band.

26Digital Image Processing (15EC72)

27Digital Image Processing (15EC72)
Radio Band Imaging• Major applications are in medicine and astronomy.
• In medicine, radio waves are used in Magnetic Resonance Imaging (MRI). This technique places a patient in a powerful magnet and passes radio waves through his or her body in short pulses. Each pulse causes a responding pulse of radio waves to be emitted by the patient’s tissues.
• Computer then produces a two-dimensional picture of a section of the patient. MRI can produce pictures in any plane
• Radio Band Imaging is useful in astronomical imaging of pulsars, quasars, etc.
• Usually, in astronomy, multispectral imaging is done to extract different information from different bands.

28Digital Image Processing (15EC72)

29Digital Image Processing (15EC72)

30Digital Image Processing (15EC72)
Centaurus A or NGC 5128 galaxy

31Digital Image Processing (15EC72)
Centaurus A Imaging- Video• https://www.youtube.com/watch?v=mKxbMtH6tFM

32Digital Image Processing (15EC72)
Other Imaging Modalities• Non- EM spectrum imaging uses other modalities like acoustic
imaging, electron microscopy, and synthetic (computer-generated) imaging.
• Imaging using sound (Acoustic Imaging) finds application in geological exploration, industry, and medicine.
• Geological applications use low frequency sound (commercial applications in mineral and oil exploration) on land or under water.

33Digital Image Processing (15EC72)
• Most common use in medicine, especially in obstetrics, whereunborn babies are imaged to determine the health of theirdevelopment. Also used for ultrasound imaging of internal organs.
• The ultrasound system (a computer, ultrasound probe consisting of asource and receiver, and a display) transmits high-frequency (1 to 5MHz) sound pulses into the body.
• The sound waves travel into the body and hit a boundary betweentissues (e.g., between fluid and soft tissue, soft tissue and bone). Someof the sound waves are reflected back to the probe, while some travelon further until they reach another boundary and get reflected.
• The reflected waves are picked up by the probe and relayed to thecomputer.
• The machine calculates the distance from the probe to the tissue ororgan boundaries using the speed of sound in tissue (1540 m/s) and thetime of each echo’s return.
• The system displays the distances and intensities of the echoes on thescreen, forming a two-dimensional image.

34Digital Image Processing (15EC72)

35Digital Image Processing (15EC72)
Electron Microscopy• Electron microscopes function as their optical counterparts,
except that they use a focused beam of electrons instead of light to image a specimen
A stream of electrons is produced by an electron source and accelerated toward the specimen using a positive electrical potential.
This stream is confined and focused using metal apertures and magnetic lenses into a thin, monochromatic beam. This beam is focused onto the sample using a magnetic lens.
Interactions occur inside the irradiated sample, affecting the electron beam.
These interactions and effects are detected and transformed into an image, much in the same way that light is reflected from, or absorbed by, objects in a scene.
• Electron microscopes are capable of very high magnification. While light microscopy is limited to magnifications on the order 1000X, electron microscopes can achieve magnification of 10,000X or more.

36Digital Image Processing (15EC72)
• Transmission Electron Microscope (TEM) works much like a slide projector. TEMs work the same way, except that they shine a beam of electrons
through a specimen (analogous to the slide).
The fraction of the beam transmitted through the specimen isprojected onto a phosphor screen.
The interaction of the electrons with the phosphor produces light and,therefore, a viewable image.
• Scanning Electron Microscope (SEM) works like a raster scan beam in a CRT. It scans the electron beam and records the interaction of beam and
sample at each location. This produces one dot on a phosphor screen.
A complete image is formed by a raster scan of the beam through thesample, much like a TV camera.
The electrons interact with a phosphor screen and produce light.
• SEMs are suitable for “bulky” samples, while TEMs require very thin samples.
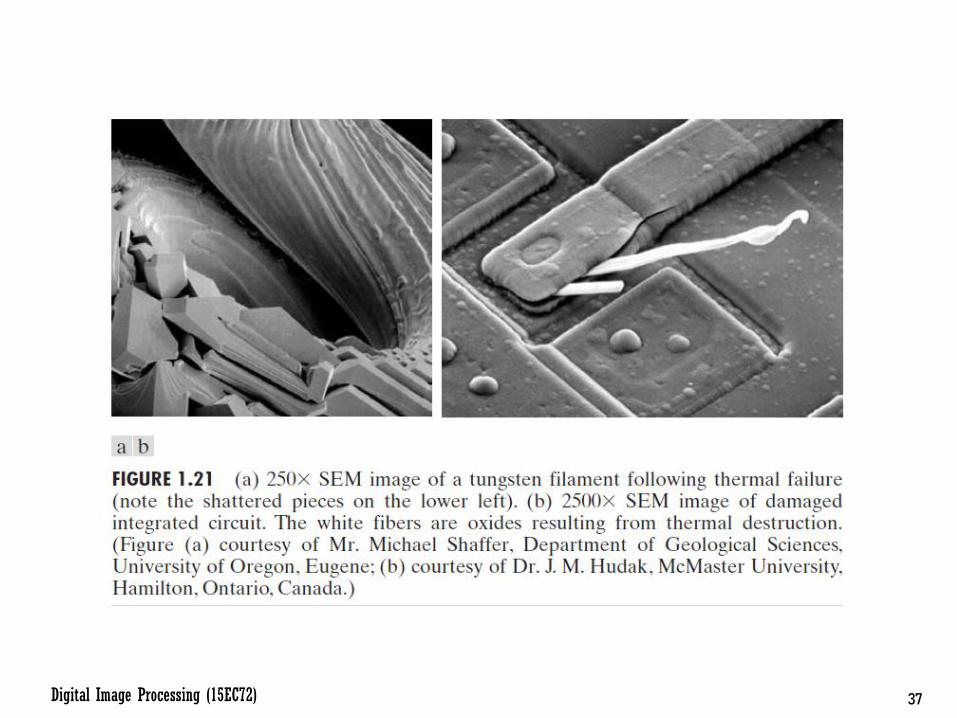
37Digital Image Processing (15EC72)

38Digital Image Processing (15EC72)
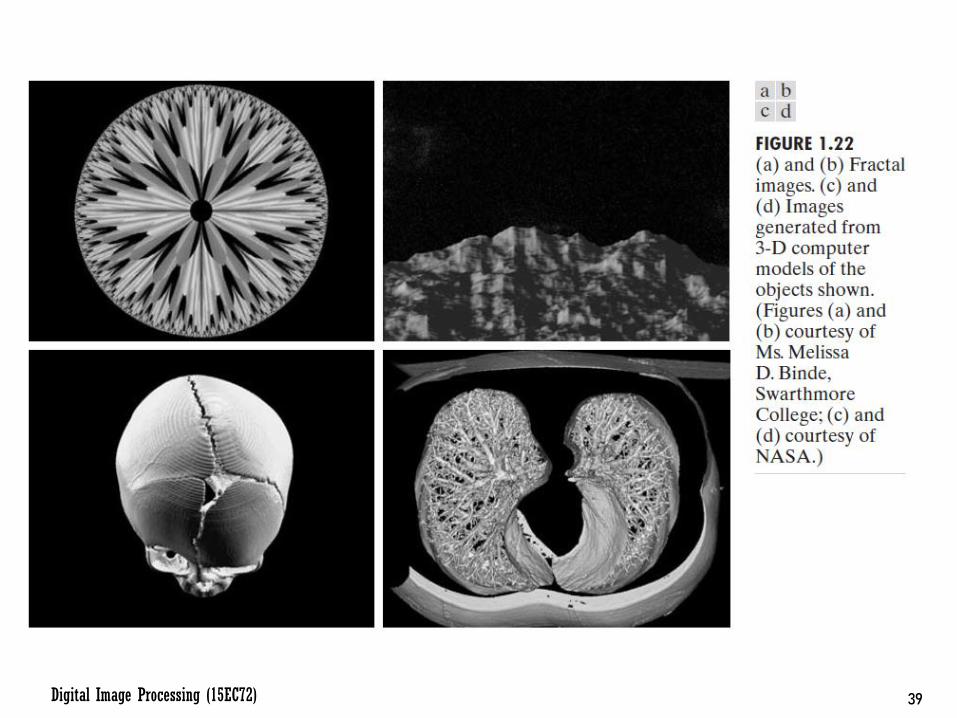
Computer Generated Images• Fractals are striking examples of computer-generated
images.
• Fractal is an iterative reproduction of a basic pattern according to some mathematical rules. They are useful sometimes as random textures.
• A more structured approach to image generation by computer lies in 3-D modeling and is the basis for many 3-D visualization systems (e.g., flight simulators).
• Images of this type can be used for medical training and for a host of other applications, such as criminal forensics and special effects.
39Digital Image Processing (15EC72)

FundamentalSteps in Digital Image Processing
41Digital Image Processing (15EC72)
42Digital Image Processing (15EC72)
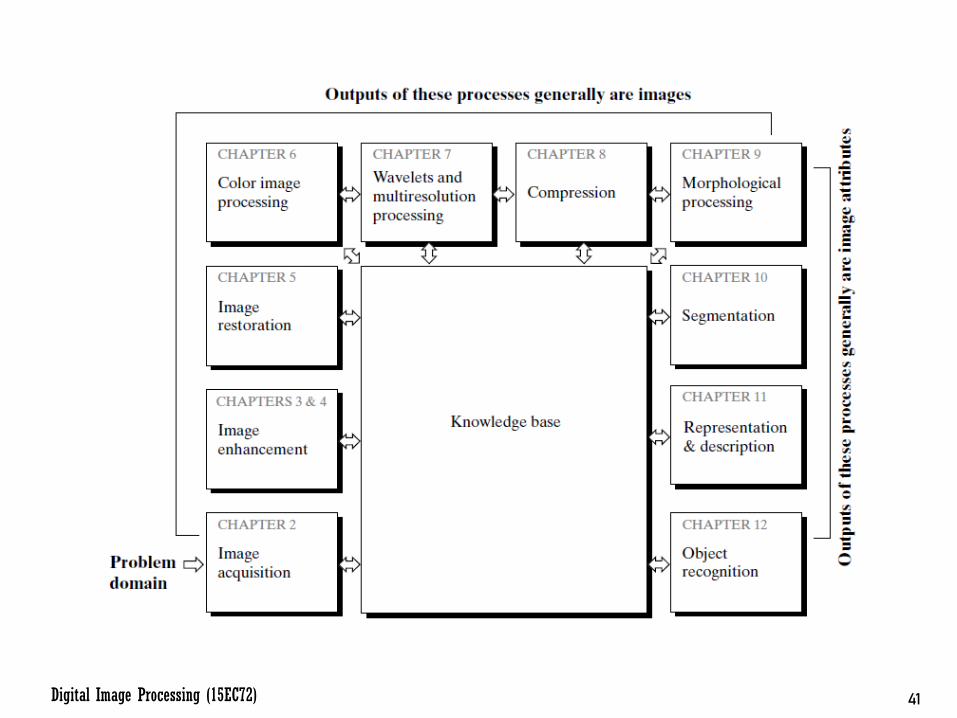
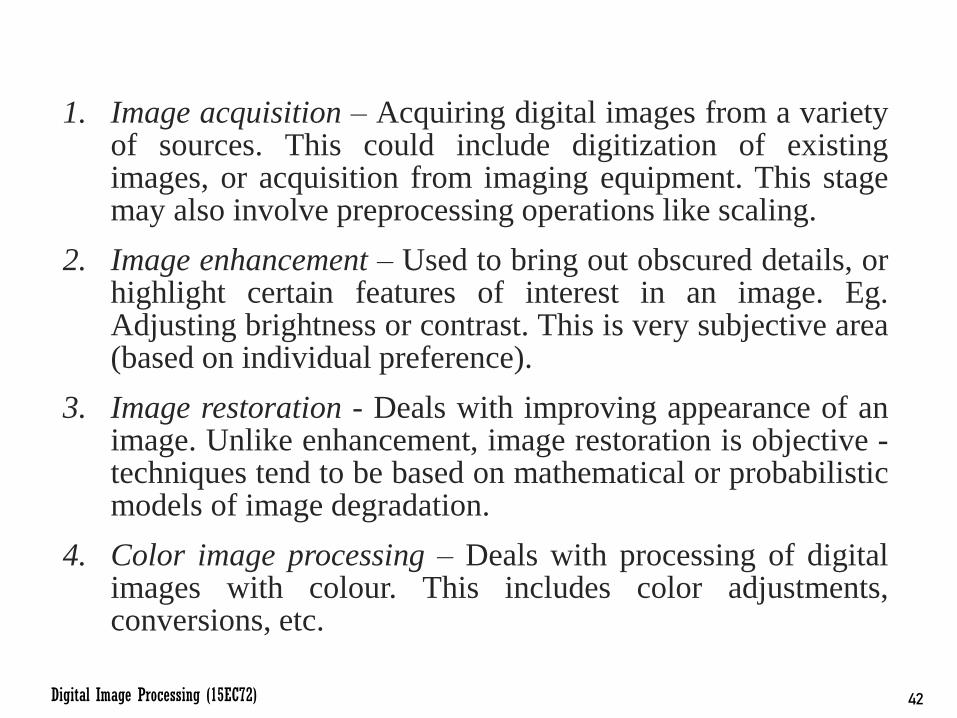
1. Image acquisition – Acquiring digital images from a varietyof sources. This could include digitization of existingimages, or acquisition from imaging equipment. This stagemay also involve preprocessing operations like scaling.
2. Image enhancement – Used to bring out obscured details, orhighlight certain features of interest in an image. Eg.Adjusting brightness or contrast. This is very subjective area(based on individual preference).
3. Image restoration - Deals with improving appearance of animage. Unlike enhancement, image restoration is objective -techniques tend to be based on mathematical or probabilisticmodels of image degradation.
4. Color image processing – Deals with processing of digitalimages with colour. This includes color adjustments,conversions, etc.

43Digital Image Processing (15EC72)
5. Wavelets - Foundation for representing images in variousdegrees of resolution. Used for image data compression andpyramidal representation (images are subdividedsuccessively into smaller regions)
6. Compression - Deals with techniques for reducing thestorage required to save an image, or the bandwidth requiredto transmit it. Very useful in case of high resolution imagesand videos of large sizes, for streaming and storageapplications.
7. Morphological processing - deals with tools for extractingimage components that are useful in the representation anddescription of shape.
44Digital Image Processing (15EC72)
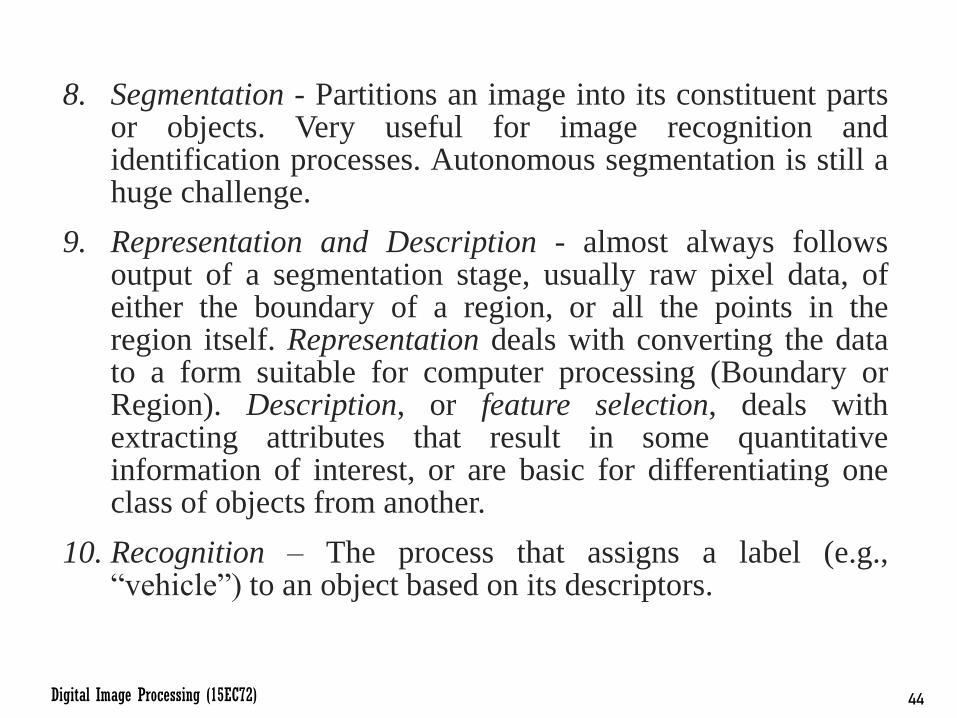
8. Segmentation - Partitions an image into its constituent partsor objects. Very useful for image recognition andidentification processes. Autonomous segmentation is still ahuge challenge.
9. Representation and Description - almost always followsoutput of a segmentation stage, usually raw pixel data, ofeither the boundary of a region, or all the points in theregion itself. Representation deals with converting the datato a form suitable for computer processing (Boundary orRegion). Description, or feature selection, deals withextracting attributes that result in some quantitativeinformation of interest, or are basic for differentiating oneclass of objects from another.
10. Recognition – The process that assigns a label (e.g.,“vehicle”) to an object based on its descriptors.

45Digital Image Processing (15EC72)
Knowledge Base• Knowledge about a problem domain is coded into an image
processing system in the form of a knowledge database.
• May be as simple as detailing regions of an image where theinformation of interest is known to be located.
• Can be quite complex, such as an interrelated list of all majorpossible defects in a materials inspection problem or animage database containing high-resolution satellite images ofa region in connection with change-detection applications.
• Knowledge Base guides operation of each processing module, and also controls the interaction between modules.
Components of an Image Processing System

48Digital Image Processing (15EC72)
• Shift from dedicated image processing hardware boardstowards personal computers and workstations.
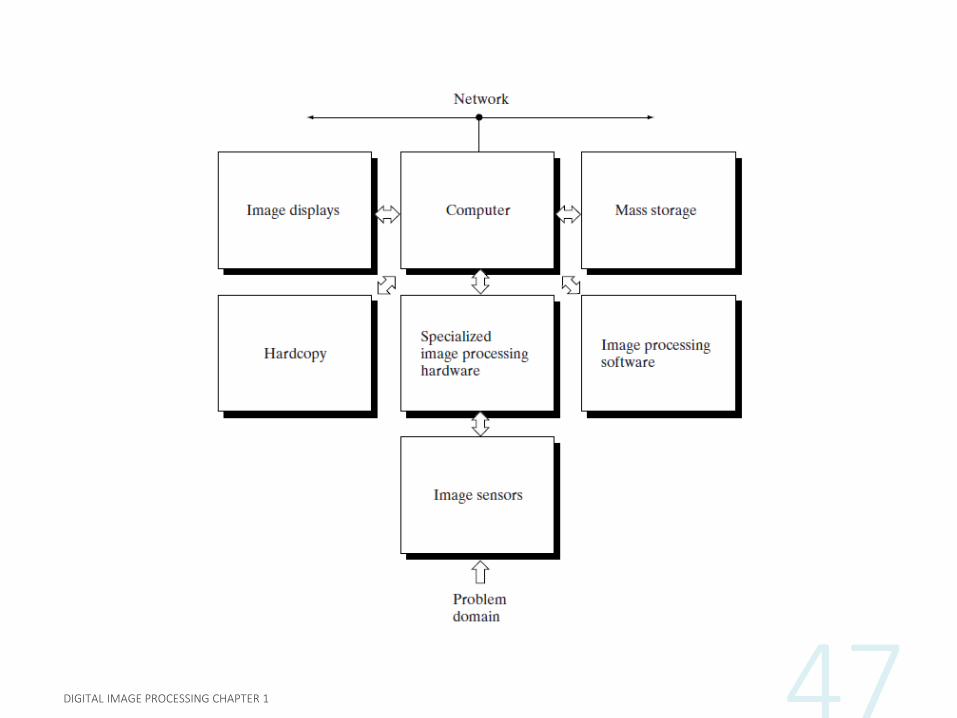
• Basic components of a general purpose digital imageprocessing system are shown:
1. Image Sensors: Two elements are required to acquire digitalimages. The first is a physical sensor, that is sensitive to theenergy radiated by the object we wish to image. The second,called a digitizer, is a device for converting the output of thephysical sensing device into digital form.
2. Specialized image processing hardware - Usually consists ofthe digitizer, plus hardware that performs other primitiveoperations, such as an arithmetic logic unit (ALU), whichperforms arithmetic and logical operations in parallel onentire images. Also called a front-end subsystem, and hashigh speed for fast data throughputs

49Digital Image Processing (15EC72)
3. Computer - General-purpose computer can range from a PCto a supercomputer. In dedicated applications, speciallydesigned computers are used, but for general purposes, a PCis sufficient.
4. Software - image processing software consists ofspecialized modules that perform specific tasks. A well-designed package also includes the capability for the user towrite code that, as a minimum, utilizes the specializedmodules.
5. Mass storage – This capability is a must in image processingapplications. Digital storage for image processingapplications falls into three principal categories:
Short Term storage for use during processing
On-line storage for relatively fast recall
Archival storage, characterized by infrequent access.

50Digital Image Processing (15EC72)
Short Term Storage is usually provided by computer memory.Sometimes, specialized boards called frame buffers are used to storeone or more images for rapid access, usually at video rates (30fps)
Online Storage is usually in the form of magnetic disks or OpticalMedia storage
Archival Data -massive storage requirements, but infrequent access.Magnetic Tapes and optical disks are used for archival applications.
6. Image displays - Mainly color (preferably flat screen) TVmonitors, driven by the outputs of image and graphicsdisplay cards.
7. Hardcopy - devices for recording images include laserprinters, film cameras, heat-sensitive devices, inkjet units,and digital units, such as optical and CD-ROM disks.
8. Networking – Due to large data sizes in images, dedicatedfast networks with high bandwidth are required for easytransmission of images to remote locations.

Elements of Visual Perception

52Digital Image Processing (15EC72)
Structure of the Human Eye

53Digital Image Processing (15EC72)
• The eye is nearly a sphere, with an average diameter of approximately 20 mm.
• Three membranes enclose the eye: the cornea and sclera outer cover; the choroid; and the retina.
Cornea - Tough, transparent tissue that covers the anterior surface of the eye.
Sclera - Continuous with the cornea, is an opaque membranethat encloses the remainder of the optic globe.
Choroid - Lies directly below the sclera. This membranecontains a network of blood vessels that serve as the majorsource of nutrition to the eye. Heavily pigmented and helps toreduce the amount of extraneous light entering the eye and thebackscatter within the optic globe. At its anterior extreme, thechoroid is divided into the ciliary body and the iris.
Iris - contracts or expands to control the amount of light thatenters the eye. The central opening of the iris (the pupil) variesin diameter from approximately 2 to 8 mm. The front of the iriscontains the visible pigment of the eye, whereas the backcontains a black pigment.
54Digital Image Processing (15EC72)
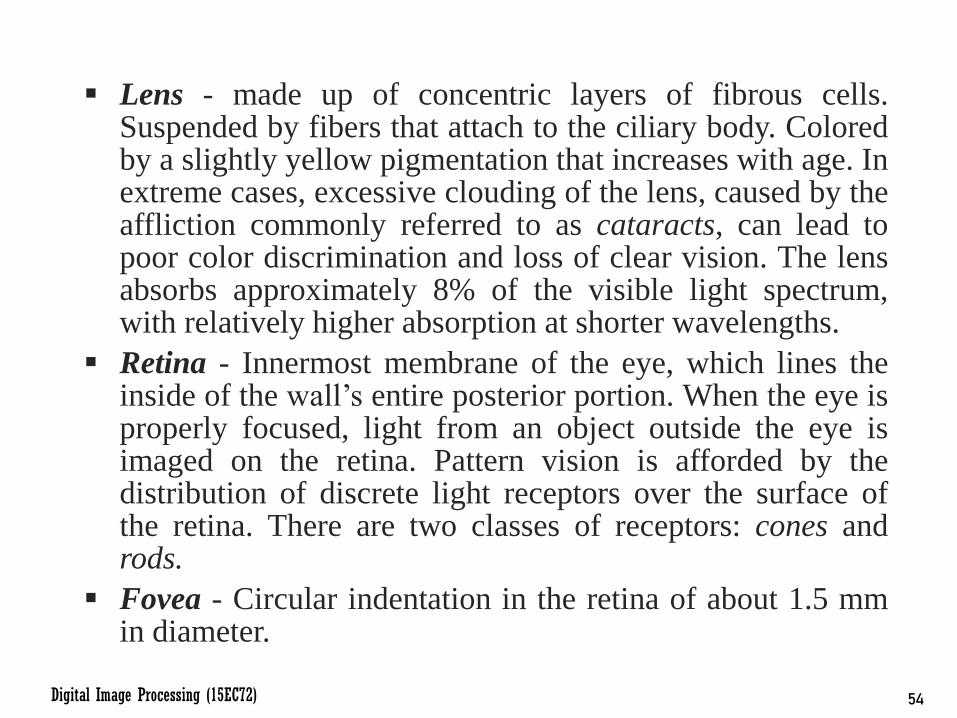
Lens - made up of concentric layers of fibrous cells.Suspended by fibers that attach to the ciliary body. Coloredby a slightly yellow pigmentation that increases with age. Inextreme cases, excessive clouding of the lens, caused by theaffliction commonly referred to as cataracts, can lead topoor color discrimination and loss of clear vision. The lensabsorbs approximately 8% of the visible light spectrum,with relatively higher absorption at shorter wavelengths.
Retina - Innermost membrane of the eye, which lines theinside of the wall’s entire posterior portion. When the eye isproperly focused, light from an object outside the eye isimaged on the retina. Pattern vision is afforded by thedistribution of discrete light receptors over the surface ofthe retina. There are two classes of receptors: cones androds.
Fovea - Circular indentation in the retina of about 1.5 mmin diameter.

55Digital Image Processing (15EC72)
Cones - The cones in each eye number between 6 and 7million. They are located primarily in the central portion ofthe retina, called the fovea, and are highly sensitive to color.Humans can resolve fine details with these cones largelybecause each one is connected to its own nerve end. Musclescontrolling the eye rotate the eyeball until the image of anobject of interest falls on the fovea. Cone vision is calledphotopic or bright-light vision.
Rods – Larger in Number - 75 to 150 million distributed overthe retinal surface. The larger area of distribution, several rodsare connected to a single nerve end reduce the amount ofdetail discernible by these receptors. Rods give a general,overall picture of the field of view. They are not involved incolor vision and are sensitive to low levels of illumination.For example, objects that appear brightly colored in daylightwhen seen by moonlight appear as colorless forms becauseonly the rods are stimulated. This phenomenon is known asscotopic or dim-light vision.

56Digital Image Processing (15EC72)
Retinal Distribution of Rods and Cones
• Figure 2.2 shows the density of rods and cones for a cross section of the right eye passing through the region of emergence of the optic nerve from the eye.
57Digital Image Processing (15EC72)
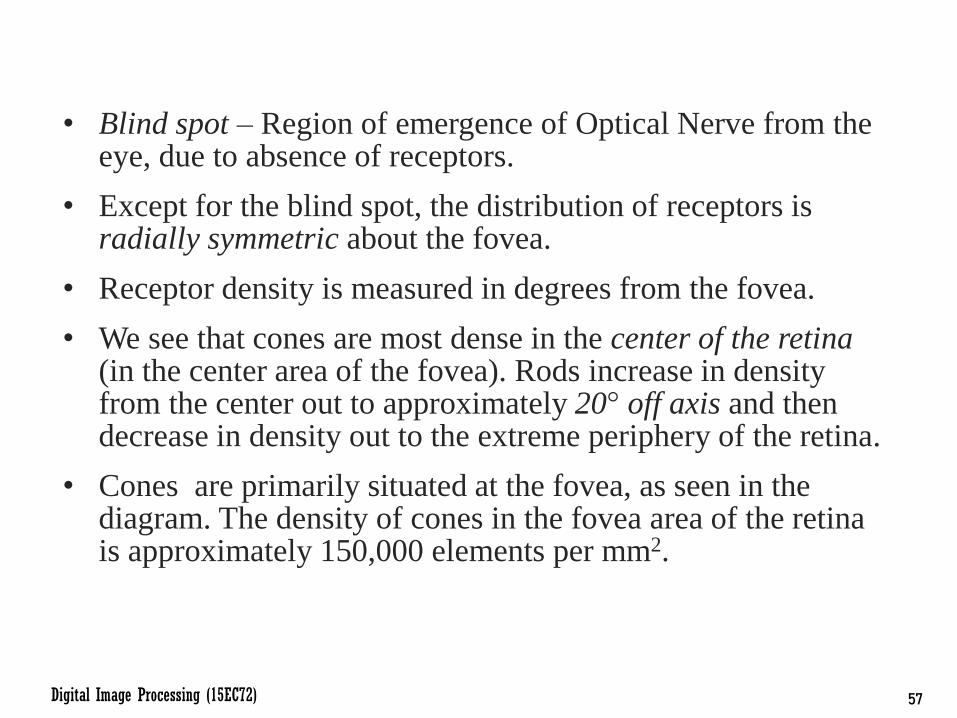
• Blind spot – Region of emergence of Optical Nerve from the eye, due to absence of receptors.
• Except for the blind spot, the distribution of receptors is radially symmetric about the fovea.
• Receptor density is measured in degrees from the fovea.
• We see that cones are most dense in the center of the retina (in the center area of the fovea). Rods increase in density from the center out to approximately 20° off axis and then decrease in density out to the extreme periphery of the retina.
• Cones are primarily situated at the fovea, as seen in the diagram. The density of cones in the fovea area of the retina is approximately 150,000 elements per mm2.

Image Formation in the Eye
59Digital Image Processing (15EC72)
• In an ordinary photographic camera, lens has a fixed focal length, and focusing is achieved by varying the distance between lens and imaging plane (film or sensor)
• In the human eye, distance between the lens and the imaging region (the retina) is fixed.
• Focal length needed to achieve proper focus is obtained by varying the shape of the lens.
• Ciliary body fibers flatten or thicken the lens, to focus image, for distant or nearby objects respectively.
• The range of focal lengths is approximately 14 mm to 17 mm, the latter taking place when the eye is relaxed and focused at distances greater than about 3 m.
• Retinal image is focused primarily on the region of the fovea.
• Perception then takes place by relative excitation of light receptors, which transform radiant energy into electrical impulses that ultimately are decoded by the brain.

60Digital Image Processing (15EC72)
• The geometry in the Figure illustrates how to obtain the dimensions of an image formed on the retina.
• For example, suppose that a person is looking at a tree 15 m high at a distance of 100 m. Letting h denote the height of that object in the retinal image, we get:
15
100=ℎ
17or h = 2.5 mm

61Digital Image Processing (15EC72)
• Structure and Working of the Human Eye (Video)
• https://www.youtube.com/watch?v=nbwPPcwknPU

Brightness Adaptation and Discrimination

63Digital Image Processing (15EC72)
• Digital images are displayed as a discrete set of intensities.
• The eye’s ability to discriminate between differentintensity levels is an important consideration in presentingimage processing results.
• Range of light intensity levels to which the human visualsystem can adapt is enormous - on the order of 1010 fromthe scotopic threshold to the glare limit.
• Experimental evidence indicates that subjective brightness(intensity as perceived by the human visual system) is alogarithmic function of the light intensity incident on theeye.
• A plot of light intensity versus subjective brightness,illustrates this characteristic.

64Digital Image Processing (15EC72)
• The long solid curve represents the range of intensities to which the visual system can adapt.
• In photopic vision alone, the range is about 106
• The transition from scotopic to photopic vision is gradual over the approximate range from 0.001 to 0.1 millilambert ( -3 to -1 mL in the log scale), as the double branches of the adaptation curve in this range show.
• Essential point of interpretation is that the visual system cannot operate over such a range simultaneously.
65Digital Image Processing (15EC72)
• Visual System accomplishes this large variation by changing its overall sensitivity, a phenomenon known as brightness adaptation.
• Total range of distinct intensity levels eye can discriminate simultaneously is rather small when compared with the total adaptation range.
• For any given set of conditions, current sensitivity level of the visual system is called the brightness adaptation level, which may correspond, for example, to brightness Ba in Figure.
• The short intersecting curve represents the range of subjective brightness that the eye can perceive when adapted to this level.
• This range is rather restricted, having a level Bb at and below which all stimuli are perceived as indistinguishable blacks.
• The upper portion of the curve is not actually restricted but, if extended too far, loses its meaning because much higher intensities would simply raise the adaptation level higher than Ba

66Digital Image Processing (15EC72)
Brightness Discrimination• The ability of the eye to discriminate
between changes in light intensity at any specific adaptation level is also of considerable interest.
• Experiment used to determine the capability of the human visual system for brightness discrimination consists of having a subject look at a flat, uniformly illuminated area large enough to occupy the entire field of view.
• This area typically is a diffuser, such as opaque glass, that is illuminated from behind by a light source whose intensity I, can be varied.
• To this field is added an increment of illumination ΔI, in the form of a short-duration flash that appears as a circle in the center of the uniformly illuminated field, as shown.

67Digital Image Processing (15EC72)
• If ΔI is not bright enough, the subject says “no” indicating no perceivable change.
• As ΔI gets stronger, the subject may give a positive response of “yes” indicating a perceived change.
• Finally, when ΔI is strong enough, the subject will give a response of “yes” all the time.
• The quantity ΔIC /I where ΔIC is the increment of illumination discriminable 50%of the time with background illumination I, is called the Weber ratio.
• A small value of ΔIC /I means that a small percentage change in intensity is discriminable. This represents “good” brightness discrimination.
• Conversely, a large value of ΔIC /I means that a large percentage change in intensity is required. This represents “poor” brightness discrimination.
68Digital Image Processing (15EC72)
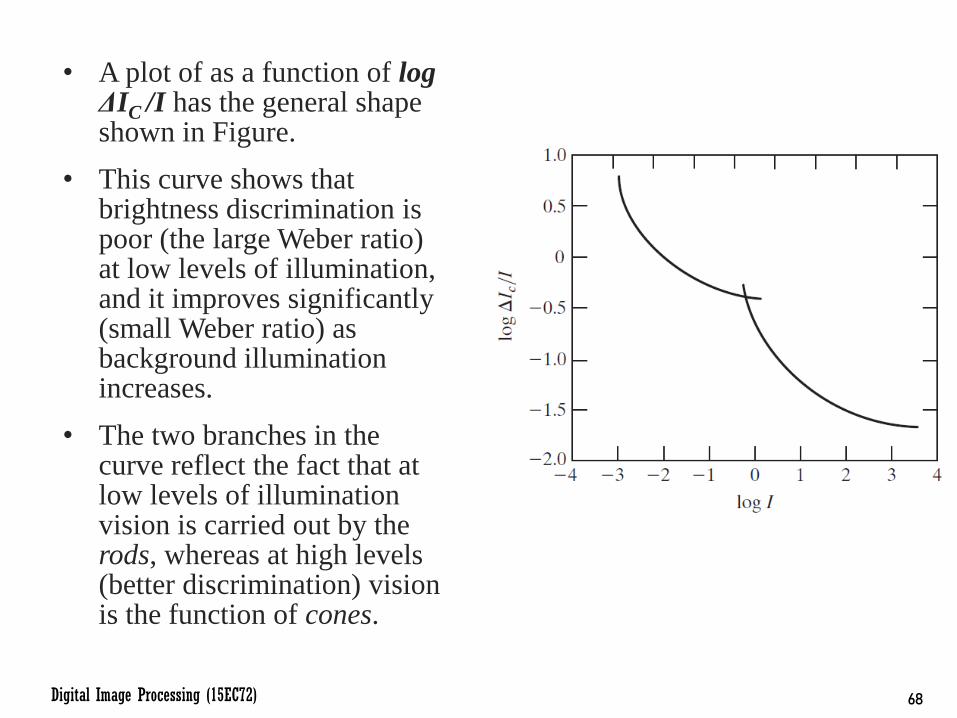
• A plot of as a function of logΔIC /I has the general shape shown in Figure.
• This curve shows that brightness discrimination is poor (the large Weber ratio) at low levels of illumination, and it improves significantly (small Weber ratio) as background illumination increases.
• The two branches in the curve reflect the fact that at low levels of illumination vision is carried out by the rods, whereas at high levels (better discrimination) vision is the function of cones.
69Digital Image Processing (15EC72)
• If background illumination is held constant and intensity of the other source is allowed to vary incrementally from never being perceived to always being perceived, the typical observer can discern a total of one to two dozen different intensity changes.
• Roughly, this result is related to the number of different intensities a person can see at any one point in a monochrome image.
• Two phenomena demonstrate that perceived brightness is not a simple function of intensity:
Mach Band Effect
Simultaneous Contrast
70Digital Image Processing (15EC72)
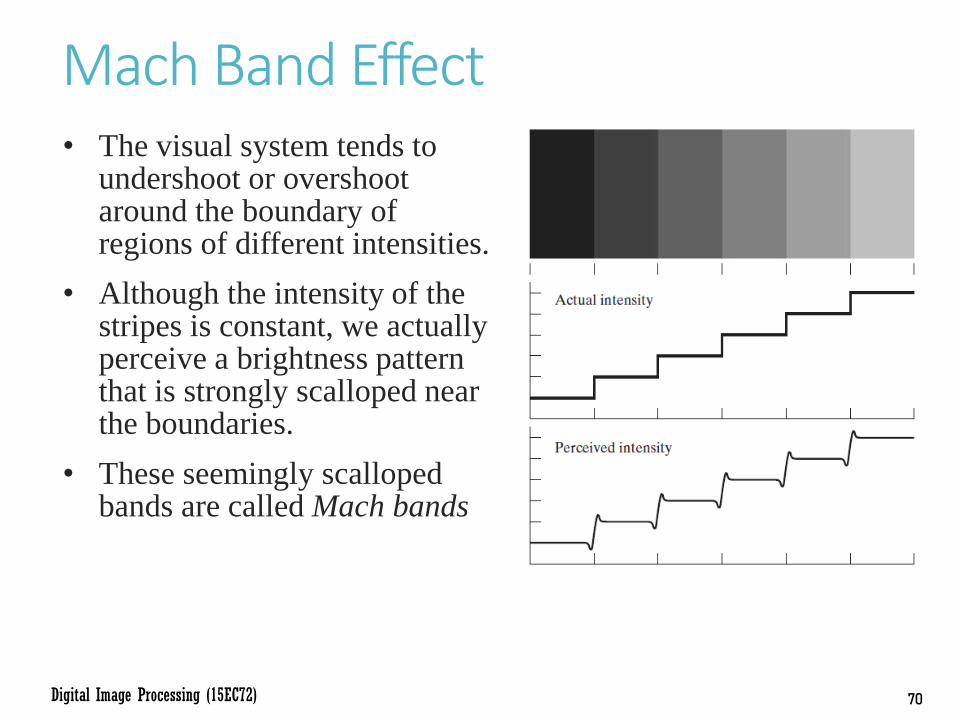
Mach Band Effect• The visual system tends to
undershoot or overshoot around the boundary of regions of different intensities.
• Although the intensity of the stripes is constant, we actually perceive a brightness pattern that is strongly scalloped near the boundaries.
• These seemingly scalloped bands are called Mach bands

71Digital Image Processing (15EC72)
Simultaneous Contrast• A region’s perceived brightness does not depend simply on
its intensity.
• All the center squares have exactly the same intensity. However, they appear to the eye to become darker as the background gets lighter.

72Digital Image Processing (15EC72)
Optical Illusions• Other examples of
human perception phenomena are optical illusions, in which the eye fills in non-existing information or wrongly perceives geometrical properties of objects.
• Optical illusions are a characteristic of the human visual system that is not fully understood.

Image Sensing and Acquisition

74Digital Image Processing (15EC72)
• Most images are generated by combination of “illumination” source and reflection or absorption of energy from the source by the elements of the “scene” being imaged.
• Depending on the nature of the source, illumination energy is reflected from (eg. Light reflected from a planar surface), or transmitted through objects (eg. X-rays pass through a patient’s
body).
• In some applications, reflected / transmitted energy is focused onto a photoconverter (eg., a phosphor screen), to convert energy into visible light (eg. Electron Microscopy, Gamma
Ray Imaging).
75Digital Image Processing (15EC72)
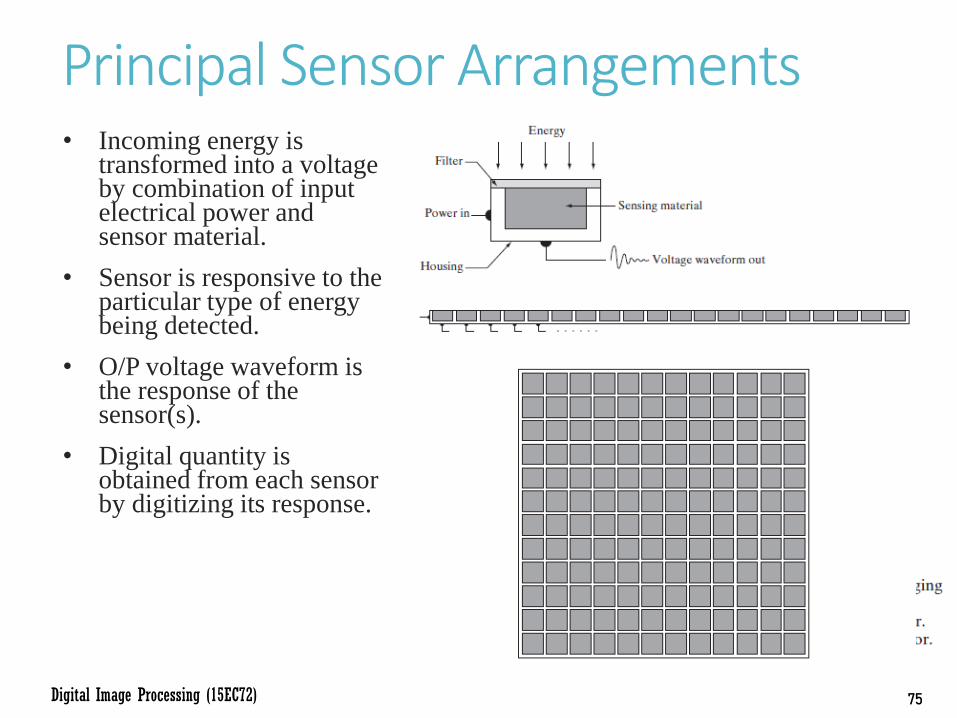
Principal Sensor Arrangements• Incoming energy is
transformed into a voltage by combination of input electrical power and sensor material.
• Sensor is responsive to the particular type of energy being detected.
• O/P voltage waveform is the response of the sensor(s).
• Digital quantity is obtained from each sensor by digitizing its response.

76Digital Image Processing (15EC72)
Image Acquisition Using Single Sensor• Most familiar sensor of this type is the
photodiode, constructed of silicon materials, whose output voltage waveform is proportional to light.
• Filter in front of sensor improves selectivity.
• In order to generate 2-D image using single sensor, there has to be relative displacements in both the x- and y- directions between the sensor and the area to be imaged.
• Figure shows high-precision scanning. Film negative is mounted onto a drum whose
mechanical rotation provides displacement in one dimension.
The single sensor is mounted on a lead screw that provides motion in the perpendicular direction.
Because mechanical motion can be controlled with high precision, this method is an inexpensive (but slow) way to obtain high-resolution images.

77Digital Image Processing (15EC72)
• Other similar mechanical arrangements use a flat bed, with the sensor moving in two linear directions. These types of mechanical digitizers sometimes are referred to as microdensitometers.
• Another example of imaging with a single sensor places a laser source coincident with the sensor.
• Moving mirrors are used to control the outgoing beam in a scanning pattern and to direct the reflected laser signal onto the sensor.
• This arrangement can be used also to acquire images using strip and array sensors.

78Digital Image Processing (15EC72)
Image Acquisition Using Sensor Strips• In-line arrangement of sensors in the
form of a sensor strip. The strip provides imaging elements in one direction. Motion perpendicular to the strip provides imaging in the other direction.
• Used in most flat bed scanners. Can provide very high resolution
• In-line sensors are used routinely in airborne imaging applications Imaging system is mounted on an aircraft
that flies at a constant altitude and speedover the geographical area to be imaged.
One-dimensional imaging sensor stripsthat respond to various bands of theelectromagnetic spectrum are mountedperpendicular to the direction of flight.
The imaging strip gives one line of animage at a time, and the motion of the stripcompletes the other dimension of a two-dimensional image.
Lenses or other focusing schemes are usedto project the area to be scanned onto thesensors.
Image acquisition using a
linear sensor strip.

79Digital Image Processing (15EC72)
• Sensor strips mounted in a ring configuration are used in medical and industrial imaging to obtain cross-sectional (“slice”) images of 3-D objects, as shown.
• A rotating X-ray source provides illumination and the sensors opposite the source collect the X-ray energy that passes through the object.
• This is the basis for medical and industrial computerized axial tomography (CAT) imaging.
• Output of the sensors must be processed by reconstruction algorithms which transform the sensed data into meaningful cross-sectional
• Images are not obtained directly from the sensors by motion alone; they require extensive processing.
• A 3-D digital volume consisting of stacked images is generated as the object is moved in a direction perpendicular to the sensor ring.
Image acquisition using a
circular sensor strip.

80Digital Image Processing (15EC72)
Image Acquisition Using Sensor Arrays
• Numerous electromagnetic and some ultrasonic sensing devices frequently are arranged in an array format.
• Also predominant arrangement found in digital cameras (CCD arrays)
• Response of each sensor is proportional to the integral of the light energy projected onto the surface of the sensor.
• Noise reduction – let the sensor integrate the input light signal over minutes or even hours.
• Since Array is 2-D, key advantage is that a complete image can be obtained by focusing the energy pattern onto the surface of the array.
• Motion is not necessary.

81Digital Image Processing (15EC72)
• Computer Tomography Working (Video)
• https://www.youtube.com/watch?v=l9swbAtRRbg
• Image Acquisition using Array of sensors (Video)
• www.youtube.com/watch?v=9vgtJJ2wwMA

A Simple Image Formation Model

83Digital Image Processing (15EC72)

84Digital Image Processing (15EC72)
• Energy from an illumination source is reflected from a scene element.
• The first function performed by the imaging system is to collect the incoming energy and focus it onto an image plane.
• If the illumination is light, the front end of the imaging system is an optical lens that projects the viewed scene onto the lens focal plane.
• The sensor array, which is coincident with the focal plane, produces outputs proportional to the integral of the light received at each sensor.
• Digital and analog circuitry sweep these outputs and convert them to an analog signal, which is then digitized by another section of the imaging system.
• The output is a digital image, as shown.

85Digital Image Processing (15EC72)
• Images can be denoted by a 2-D function f(x,y)
• Value or amplitude of f at spatial coordinates (x,y) is a +vescalar quantity whose physical meaning is determined by the image source.
• When image is generated by physical process, intensity values proportional to energy radiated by source. So, f(x, y) is non-zero and finite.
0 < f(x, y) < ∞
• The function f(x, y) has two components:
Amount of source illumination incident on the scene being viewed
Amount of illumination reflected by the objects in the scene.
• These are called the illumination and reflectance components and are denoted by i(x, y) and r(x, y) respectively.

86Digital Image Processing (15EC72)
• The two functions combine as a product to form f(x, y) :
f(x, y)= i(x, y) + r(x, y)
• Where 0 < i(x, y) < ∞
and 0 < r(x, y) < 1
• Equations indicate that reflectance is bounded by 0 (Total absorption) and 1 (total reflection).
• Nature of i(x, y) is determined by illumination source.
• Nature of r(x, y) is determined by characteristics of imagedobject.
• In case of images formed by tramission through a medium(Eg. X-rays), we use transmittivity instead of reflectivity.

87Digital Image Processing (15EC72)
Image Sampling and Quantization• O/p of most sensors is a continuous voltage waveform whose
amplitude and spatial behavior are related to the physical phenomenon being sensed.
• To create a digital image, we need to convert continuous sensed data into digital form. This involves two processes: sampling and quantization
• Consider a continuous image f that we want to convert to digital form. An image may be continuous with respect to the x- and y-coordinates, and also in amplitude.
• To convert it to digital form, we have to sample the function in both coordinates and in amplitude.
• Digitizing the coordinate values is called sampling. Digitizing the amplitude values is called quantization.

88Digital Image Processing (15EC72)
89Digital Image Processing (15EC72)
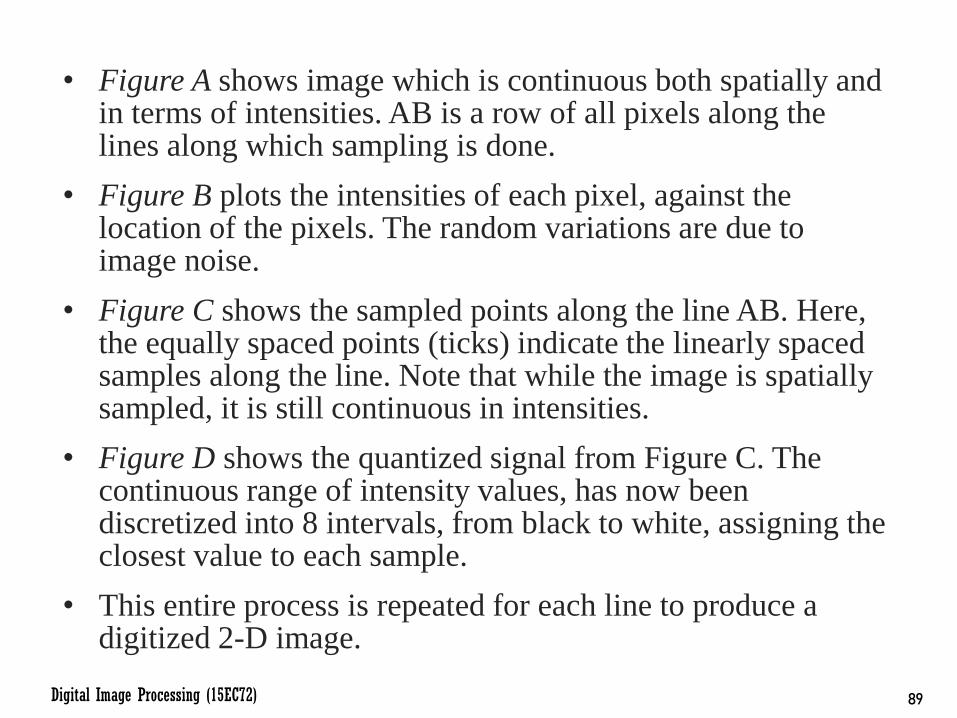
• Figure A shows image which is continuous both spatially and in terms of intensities. AB is a row of all pixels along the lines along which sampling is done.
• Figure B plots the intensities of each pixel, against the location of the pixels. The random variations are due to image noise.
• Figure C shows the sampled points along the line AB. Here, the equally spaced points (ticks) indicate the linearly spaced samples along the line. Note that while the image is spatially sampled, it is still continuous in intensities.
• Figure D shows the quantized signal from Figure C. The continuous range of intensity values, has now been discretized into 8 intervals, from black to white, assigning the closest value to each sample.
• This entire process is repeated for each line to produce a digitized 2-D image.

90Digital Image Processing (15EC72)
• In practice, spatial sampling is determined by the sensor arrangement (limited control), or by mechanical motion of sensor element (controllable), or quality of optical component (hard to control).
• When a sensing array is used for image acquisition, there is no motion and the number of sensors in the array establishes the limits of sampling in both directions.

Representing Digital Images

92Digital Image Processing (15EC72)
• Let f(s, t) represent a continuous image function of two continuous variables, s and t. This is converted to a digital image by sampling and quantization.
• Suppose that we sample the continuous image into a 2-D array, f(x, y), containing M rows and N columns, where (x, y) are discrete coordinates (0 ≤ x ≤ M-1 and 0 ≤ y ≤ N-1)
• The section of real plane spanned by the coordinates of an image is called the spatial domain, with x and y being referred to as spatial variables or spatial coordinates.
• Three basic ways to represent f(x, y):
2 axes representing spatial location, third representing intensities
As shown on monitor or photograph
Graphically, in terms of arrays of values

93Digital Image Processing (15EC72)

94Digital Image Processing (15EC72)
• Image displays are best for fast visualization.
• Numerical arrays are used for processing and algorithm development.
• M X N Numerical Array can be written as:
• Each element of this matrix is called an image element, picture element, pixel, or pel.
• Sometimes, it is advantageous to use a more traditional matrix notation to denote a digital image and its elements:
• Image can also be represented as a vector v, of size MNx1 elements, collected columnwise.

95Digital Image Processing (15EC72)
• Note that the origin of a digital image is at the top left.
• Positive x-axis extends downward and the positive y-axis extends to the right. (Convention based on Raster Scan)
• Express Sampling and Quantization mathematically:
Let Z and R denote the set of integers and the set of real numbers, respectively.
The sampling process may be viewed as partitioning the xy-plane into a grid, with the coordinates of the center of each cell in the grid being a pair of elements from the Cartesian product Z2 which is the set of all ordered pairs of elements (zi, zj), with zi and zj being integers from Z.
f(x,y) is a digital image if (x, y) are integers from Z2 and f is a function that assigns an intensity value (that is, a real number from R) to each distinct pair of coordinates (x, y). This functional assignment is the quantization process. If f(x,y) is also an integer, Zreplaces R, to get a digital image.

96Digital Image Processing (15EC72)
• M, N and L (intensity levels) have to be decided during digitization.
• M and N are to be positive integers.
• Due to quantizing hardware considerations, L is typically a power of 2. :
L = 2k
• We assume that the discrete levels are equally spaced and that they are integers in the interval [0, L - 1].
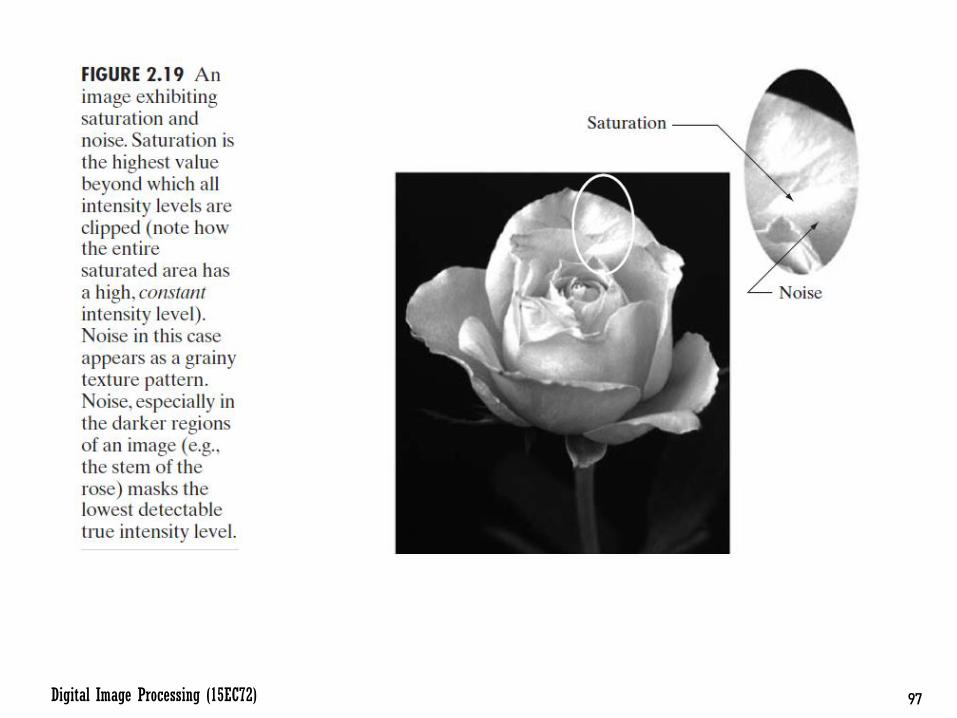
• Dynamic range of an imaging system is the ratio of the maximum measurable intensity to the minimum detectable intensity level.
• The upper limit is determined by saturation and the lower limit by noise
• Contrast is the difference in intensity between the highest and lowest intensity levels in an image
97Digital Image Processing (15EC72)

98Digital Image Processing (15EC72)
• The number, b, of bits required to store a digitized image is:
b = M * N * k
• When M = N, this equation becomes:
b = N2 k

Spatial and Intensity Resolution

100Digital Image Processing (15EC72)
• Spatial Resolution is a measure of the smallest discernible detail in an image (line pairs per unit distance, dots (pixels) per unit distance, etc)
• Alternatively, it is largest number of discernible line pairs per unit distance (alternating black and white lines)
• Dots per unit distance is a measure of image resolution used commonly in the printing and publishing industry (dpi)
• To be meaningful, measures of spatial resolution must be stated with respect to spatial units.
• Intensity (Gray Level) resolution refers to the smallest discernible change in intensity level.
• Number of intensity levels usually is an integer power of two (Usually 8, 16 or 32 bits)

101Digital Image Processing (15EC72)
Effects of Reducing Spatial Resolution
1250 dpi 300 dpi

102Digital Image Processing (15EC72)
150 dpi 72 dpi

103Digital Image Processing (15EC72)
• We observe that with a reduction in the spatial resolution, a lot of fine details in the image are lost, and the image gets degraded. These effects can be reduced by using appropriate interpolation methods.
• Checkerboard effect – When spatial resolution is very low, the images appear as blocks and ridges (Checkerboard pattern). Thus, a curve may appear as a staircase.
• The checkerboard effect is caused by pixel replication, that is, lower resolution images were duplicated in order to fill the display area.

104Digital Image Processing (15EC72)
Effects of Reducing Intensity Resolution
256-level image. 128-level image.

105Digital Image Processing (15EC72)
64-level image. 32-level image.

106Digital Image Processing (15EC72)
Image displayed
in 16, 8, 4, and 2
intensity levels.

107Digital Image Processing (15EC72)
• We notice as the intensity resolution becomes smaller, very fine ridge-like structures in areas of constant or nearly constant intensity are seen (particularly in the skull).
• This effect, caused by the use of an insufficient number of intensity levels in smooth areas of a digital image, is called false contouring.
• It appears in the image as contours of gray levels not present in the original image.
• The results illustrate the effects produced on image quality by varying N (Spatial resolution) and k (Intensity Resolution) independently.
• An early study by Huang [1965] attempted to quantify experimentally the effects on image quality produced by varying N and k simultaneously.

108Digital Image Processing (15EC72)
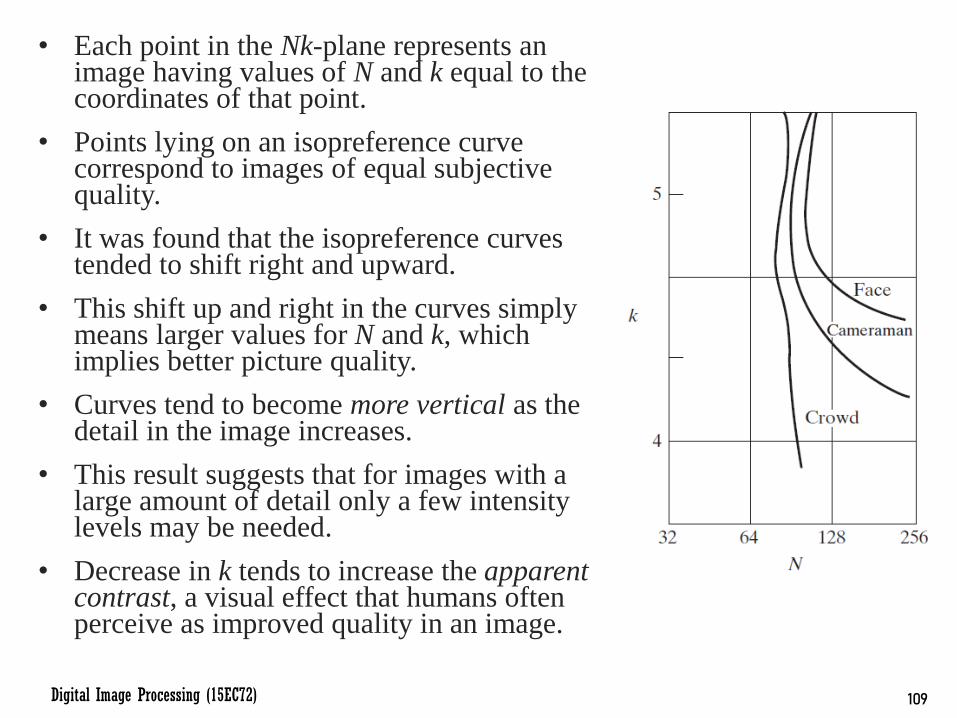
• The experiment consisted of a set of subjective tests. Images similar to those shown were used. The woman’s face - image with relatively little detail
Cameraman - intermediate amount of detail
Crowd picture - a large amount of detail.
• Sets of these three types of images were generated by varying N and k, and observers were then asked to rank them according to their subjective quality.
• Results were summarized in the form of so-called isopreference curves in the Nk-plane.
109Digital Image Processing (15EC72)
• Each point in the Nk-plane represents an image having values of N and k equal to the coordinates of that point.
• Points lying on an isopreference curve correspond to images of equal subjective quality.
• It was found that the isopreference curves tended to shift right and upward.
• This shift up and right in the curves simply means larger values for N and k, which implies better picture quality.
• Curves tend to become more vertical as the detail in the image increases.
• This result suggests that for images with a large amount of detail only a few intensity levels may be needed.
• Decrease in k tends to increase the apparent contrast, a visual effect that humans often perceive as improved quality in an image.

110Digital Image Processing (15EC72)
Image Interpolation• Used extensively in zooming, shrinking, rotating and
geometric corrections
• Shrinking and zooming – resampling methods
• Interpolation = using known data to estimate values at unknown locations (zooming)
• Shrinking = decimation = reducing the number of pixels
111Digital Image Processing (15EC72)
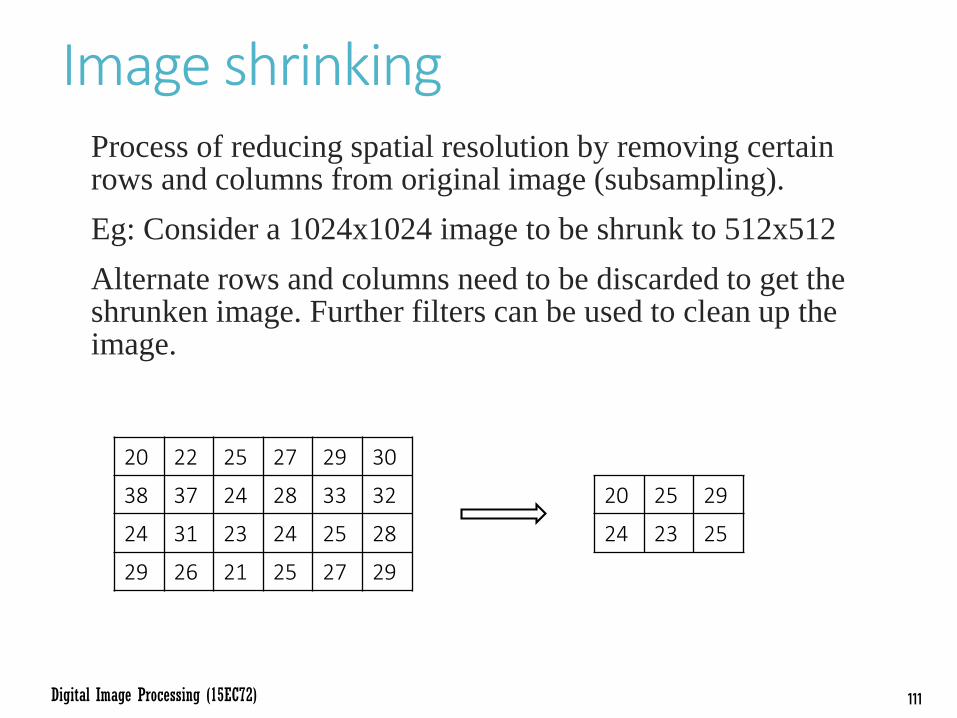
Image shrinkingProcess of reducing spatial resolution by removing certain rows and columns from original image (subsampling).
Eg: Consider a 1024x1024 image to be shrunk to 512x512
Alternate rows and columns need to be discarded to get the shrunken image. Further filters can be used to clean up the image.
20 22 25 27 29 30
38 37 24 28 33 32
24 31 23 24 25 28
29 26 21 25 27 29
20 25 29
24 23 25

112Digital Image Processing (15EC72)
Image zooming• Process of oversampling image to increase spatial
resolution.
• Increases the total number of pixels in the image.
• Similar to interpolation process.
• 2 stages:
1. creation of new pixel locations
2. Assignment of new gray level values to these locations
• Interpolation methods:
Nearest neighbour (Pixel replication)
Bilinear interpolation
Bicubic interpolation

113Digital Image Processing (15EC72)
Nearest Neighbour InterpolationFirst, extra rows and columns are created in zoomed image, and pixel values of the nearest neighbour are copied into newly created pixels.
Has tendency to produce undesirable artifacts, like severe distortion of straight edges.
Used very rarely

114Digital Image Processing (15EC72)
BiLinear InterpolationNew rows and columns are created, and values are assigned based on linear average of neighbouring pixels.
First, linear average of neighbouring row pixels are calculated, and then column pixels are used in next step.

115Digital Image Processing (15EC72)
Bilinear InterpolationExample:
In general cases, where pixel distances are not equal:
𝑣 𝑥, 𝑦 = 𝑎𝑥 + 𝑏𝑦 + 𝑐𝑥𝑦 + 𝑑
Where 𝑣 𝑥, 𝑦 is the intensity of new pixel with co-ordinates 𝑥, 𝑦 and 𝑎, 𝑏, 𝑐, 𝑑 are weights
Bilinear interpolation gives much better results than nearest neighbour interpolation
116Digital Image Processing (15EC72)
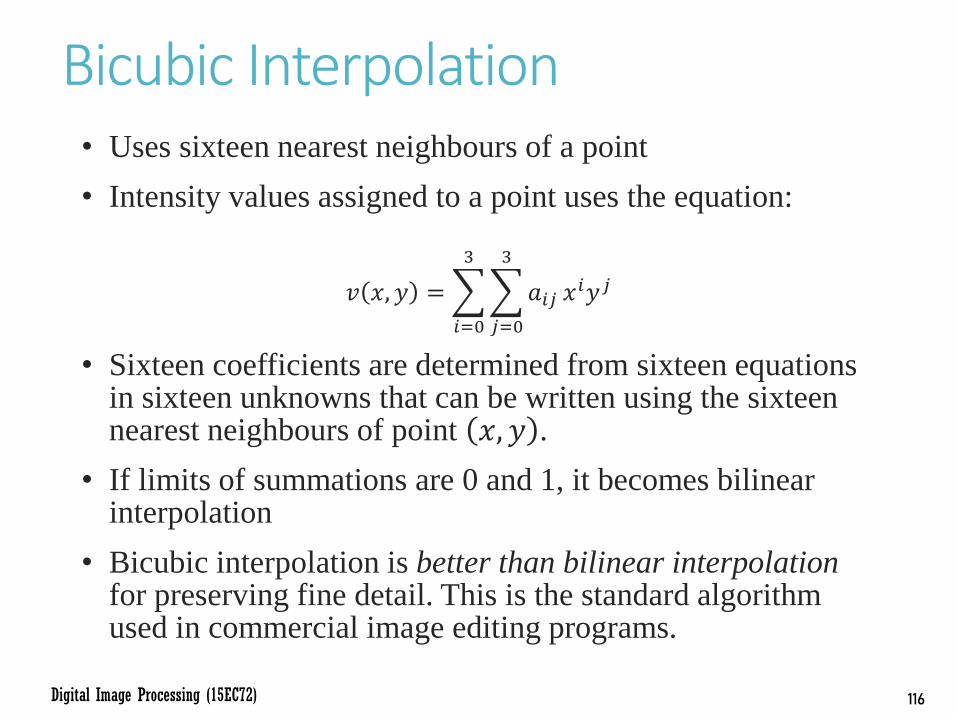
Bicubic Interpolation• Uses sixteen nearest neighbours of a point
• Intensity values assigned to a point uses the equation:
𝑣 𝑥, 𝑦 =
𝑖=0
3
𝑗=0
3
𝑎𝑖𝑗 𝑥𝑖𝑦𝑗
• Sixteen coefficients are determined from sixteen equations in sixteen unknowns that can be written using the sixteen nearest neighbours of point 𝑥, 𝑦 .
• If limits of summations are 0 and 1, it becomes bilinear interpolation
• Bicubic interpolation is better than bilinear interpolation for preserving fine detail. This is the standard algorithm used in commercial image editing programs.
117Digital Image Processing (15EC72)
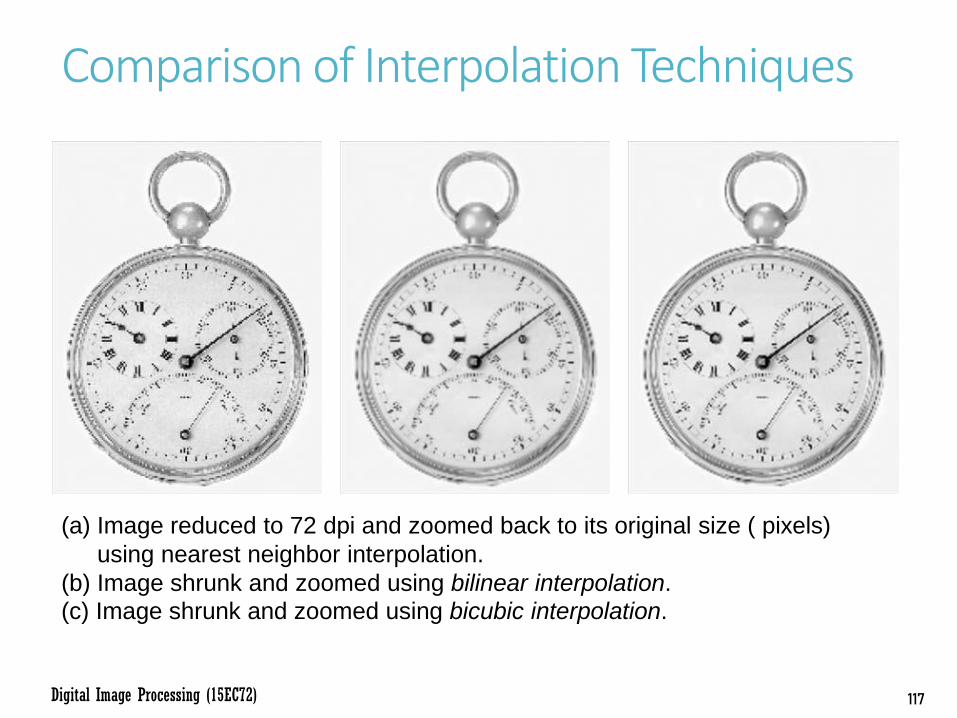
Comparison of Interpolation Techniques
(a) Image reduced to 72 dpi and zoomed back to its original size ( pixels)
using nearest neighbor interpolation.
(b) Image shrunk and zoomed using bilinear interpolation.
(c) Image shrunk and zoomed using bicubic interpolation.

118Digital Image Processing (15EC72)
(a) Image reduced to 150 dpi and zoomed back to its original size ( pixels)
using nearest neighbor interpolation.
(b) Image shrunk and zoomed using bilinear interpolation.
(c) Image shrunk and zoomed using bicubic interpolation.

Basic Relationships between Pixels

120Digital Image Processing (15EC72)
Neighbors of a Pixel• A pixel p at coordinates (x, y) has four horizontal and vertical
neighbors whose coordinates are given by:
(x + 1, y), (x - 1, y), (x, y + 1), (x, y - 1)
• This set of pixels, called the 4-neighbors of p, is denoted by N4(p).
• Each pixel is a unit distance from (x, y), and some of the neighbor locations of p lie outside the digital image if (x, y) is on the border of the image.
• The four diagonal neighbors of p are denoted by ND(p) and have coordinates:
• (x + 1, y + 1), (x + 1, y - 1), (x - 1, y + 1), (x - 1, y - 1)
• These points, together with the 4-neighbors, are called
• the 8-neighbors of p, denoted by N8(p)

121Digital Image Processing (15EC72)
(a)4-neighborhood N4(p)(b)Diagonal neighborhood ND(p) (c)8-neighborhood N8(p)

122Digital Image Processing (15EC72)
Adjacency• Let V be the set of intensity values used to define adjacency
• In a binary image, V = {1} if we are referring to adjacency of pixels with value 1.
• In a gray-scale image, the idea is the same, but set V typically contains more elements.
• (Eg: in the adjacency of pixels with a range of possible intensity values 0 to 255, set V could be any subset of these 256 values)

123Digital Image Processing (15EC72)
• 3 Types of Adjacency:
1. 4-adjacency : Two pixels p and q with values from V are 4-adjacent if q is in the set N4(p).
2. 8-adjacency : Two pixels p and q with values from V are 8-adjacent if q is in the set N8(p)
3. m-adjacency (mixed adjacency) : Two pixels p and q with values from V are m-adjacent if:
i. q is in N4(p), OR
ii. q is in ND(p), and the set N4(p) ∩ N4(q) has no pixels whose values are from V.

124Digital Image Processing (15EC72)
Path• A (digital) path (or curve) from pixel p with coordinates
(x, y) to pixel q with coordinates (s, t) is a sequence of distinct pixels with coordinates:
• (x0, y0), (x1, y1), ….. , (xn, yn)
• Where (x0, y0) = (x, y), (xn, yn) = (s, t), and pixels (xi, yi) and (xi-1, yi-1) are adjacent for 1 ≤ i ≤ n.
• In this case, n is the length of the path.
• If (x0, y0) = (xn, yn), the path is a closed path.
• We can define 4-, 8-, or m-paths depending on the type of adjacency specified.

125Digital Image Processing (15EC72)

126Digital Image Processing (15EC72)
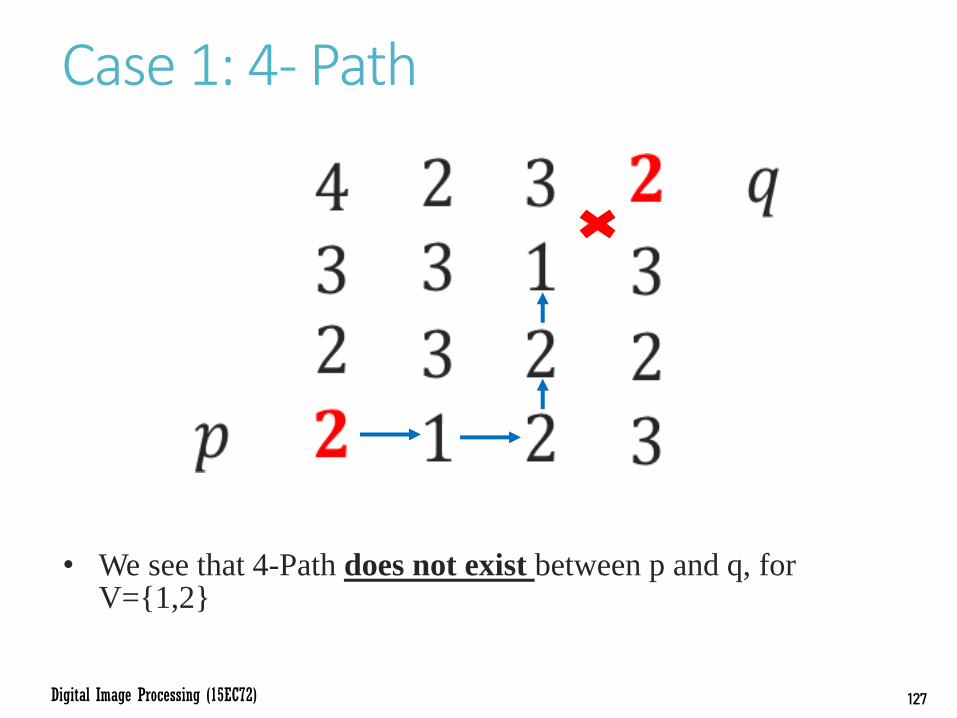
• Example: Consider the image segment shown in figure. Compute length of the shortest-4, shortest-8 & shortest-m paths between pixels p & q where, V = {1, 2}.
• V = {1, 2} means all pixels along the path have to have values 1 or 2 only.
• Let us consider each case separately:
127Digital Image Processing (15EC72)
Case 1: 4- Path
• We see that 4-Path does not exist between p and q, for V={1,2}

128Digital Image Processing (15EC72)
Case 2: 8- Path
• We see that the shortest 8-path is of length 4.
129Digital Image Processing (15EC72)
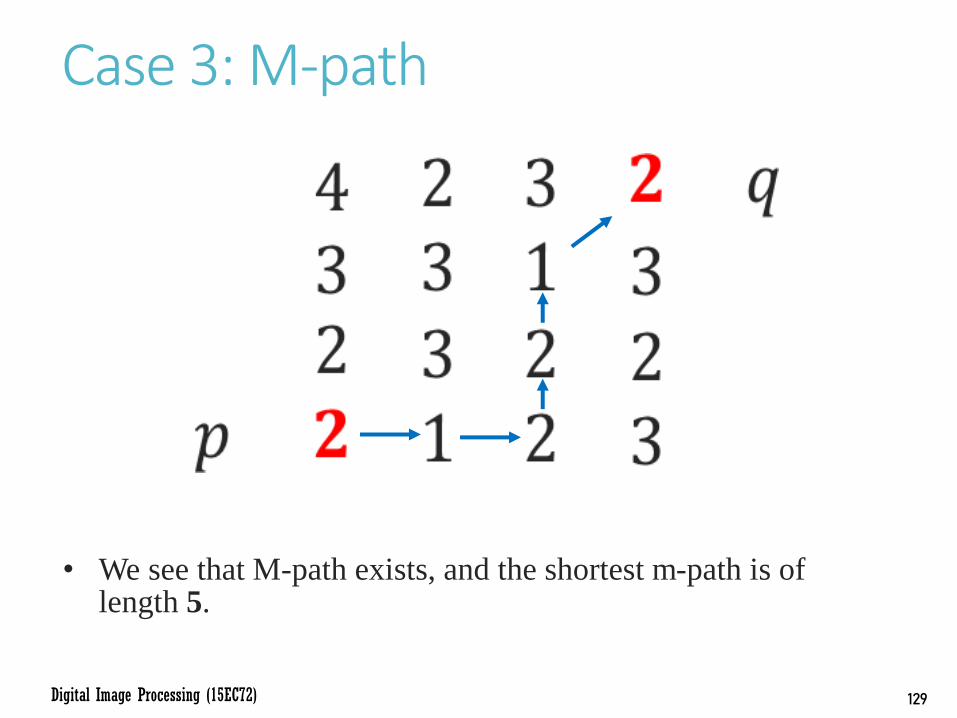
Case 3: M-path
• We see that M-path exists, and the shortest m-path is of length 5.

130Digital Image Processing (15EC72)
EXERCISE PROBLEM• For V = {2, 3, 4}, compute the length of the shortest 4-, 8-
m=paths between P and Q in the following:

131Digital Image Processing (15EC72)
Solution
No 4-Path Shortest 8-Path Length = 4
m-Path Length = 5

132Digital Image Processing (15EC72)
Connectivity and Regions• Let S represent a subset of pixels in an image.
• Two pixels p and q are said to be connected in S if there exists a path between them consisting entirely of pixels in S.
• For any pixel p in S, the set of pixels that are connected to it in S is called a connected component of S.
• If it only has one connected component, then set S is called a connected set.
• Let R be a subset of pixels in an image.
• We call R a region of the image if R is a connected set.
• Two regions, Ri and Rj are said to be adjacent if their union forms a connected set.
• Regions that are not adjacent are said to be disjoint.

133Digital Image Processing (15EC72)
• Above regions are adjacent only if 8-adjacency is used.
1 1 1
1 0 1 Ri
0 1 0
0 0 1
1 1 1 Rj
1 1 1

134Digital Image Processing (15EC72)
Exercise Problem• Consider the two image subsets, S1 and S2, shown in the
following figure. For V={1}, determine whether these two subsets are (a) 4-adjacent, (b) 8-adjacent, or (c) m-adjacent.
• Soln: Not 4-connected subsets, since the neighboring 1s are NOT 4-
adjacent.
Both 8-connected and m-connected because the neighboring 1s are both 8-adjacent and m-adjacent
135Digital Image Processing (15EC72)
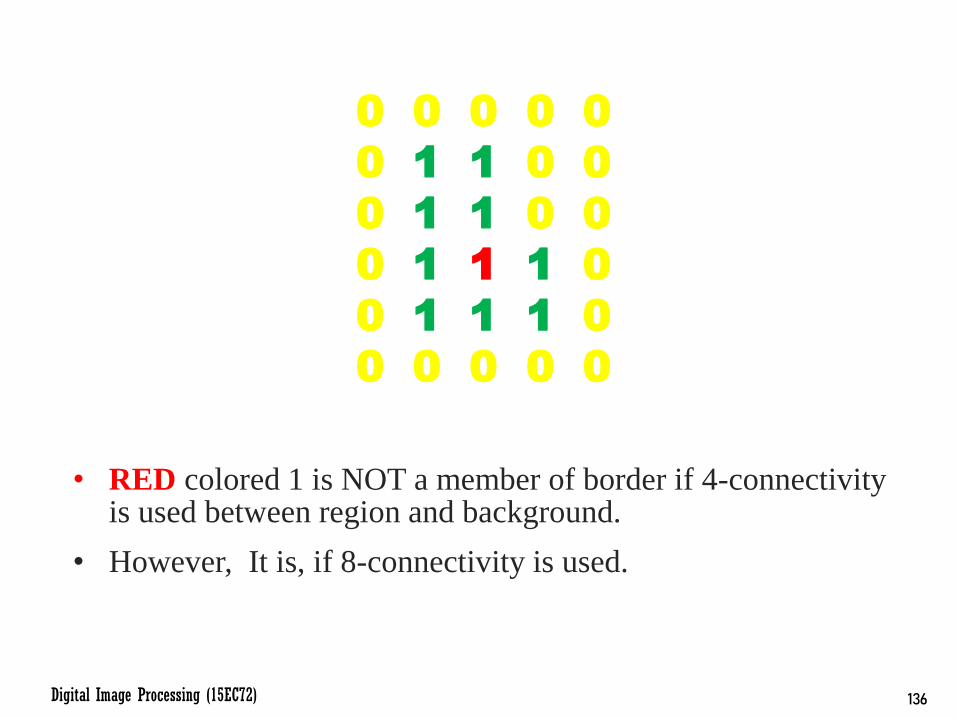
Boundary• The boundary (also called the border or contour) of a region
R is the set of points that are adjacent to points in the complement of R.
• Border of a region is the set of pixels in the region that have at least one background neighbor.
• If R happens to be an entire image, then its boundary is defined as the set of pixels in the first and last rows and columns of the image.
• An image has no neighbours beyond its border.
• Inner border of the region corresponds to boundary points along foreground.
• Outer border corresponds to boundary points along background.
136Digital Image Processing (15EC72)
• RED colored 1 is NOT a member of border if 4-connectivity is used between region and background.
• However, It is, if 8-connectivity is used.
0 0 0 0 0
0 1 1 0 0
0 1 1 0 0
0 1 1 1 0
0 1 1 1 0
0 0 0 0 0

137Digital Image Processing (15EC72)
Edges• Unlike Boundaries, which form a closed path and are
GLOBAL, Edges are formed from pixels with derivative values that exceed a preset threshold.
• The idea of an edge is a LOCAL concept that is based on a measure of gray-level discontinuity at a point.
• It is possible to link edge points into edge segments, and sometimes these segments are linked in such a way that they correspond to boundaries, but this is not always the case.
• The one exception in which edges and boundaries correspond is in binary images.

138Digital Image Processing (15EC72)
Distance Measures• For pixels p, q, and z, with co-ordinates (x, y), (s, t), and
(v, w), respectively, D is a distance function or metric if:
D(p, q) ≥ 0 (D(p, q) = 0 iff p = q)
D(p, q) = D(q, p)
D(p, z) ≤ D(p, q) + D(q, z) [Triangular
Inequality]

139Digital Image Processing (15EC72)
Euclidean Distance• The Euclidean distance between p and q is defined as:
𝐷𝑒 𝑝, 𝑞 = [(𝑥 − 𝑠)2+(𝑦 − 𝑡)2]
12
• For this distance measure, the pixels having a distance less than or equal to some value r from (x, y) are the points contained in a disk of radius r centered at (x, y).
2
𝟐 1 𝟐
2 1 0 1 2
𝟐 1 𝟐
2

140Digital Image Processing (15EC72)
City Block Distance (D4 distance)• The City-block distance between p and q is defined as:
𝐷4 𝑝, 𝑞 = 𝑥 − 𝑠| + 𝑦 − 𝑡|
• Here, the pixels having a 𝐷4 distance from (x, y) less than or equal to some value r form a diamond centered at (x, y).
• The pixels with 𝐷4=1 are the 4-neighbors of (x, y).
2
2 1 2
2 1 0 1 2
2 1 2
2

141Digital Image Processing (15EC72)
Chessboard Distance (D8 distance)• The Chessboard distance between p and q is defined as:
𝐷8 𝑝, 𝑞 = max( 𝑥 − 𝑠|, 𝑦 − 𝑡|)
• Here, the pixels having a D8 distance from (x, y) less than or equal to some value r form a square centered at (x, y).
• The pixels with 𝐷8=1 are the 8-neighbors of (x, y).
2 2 2 2 2
2 1 1 1 2
2 1 0 1 2
2 1 1 1 2
2 2 2 2 2

142Digital Image Processing (15EC72)
Example:
Let p and q are the pixels at coordinates (10,15) and (15,25) respectively. Find out which distance measure gives the minimum distance between them.
Solution:
• Euclidean Distance: 𝐷𝑒 𝑝, 𝑞 = [(𝑥 − 𝑠)2+(𝑦 − 𝑡)2]
1
2
𝐷𝑒 𝑝, 𝑞 = [(15 − 10)2+(25 − 15)2]
12 = 𝟏𝟏. 𝟏𝟖
• City-block Distance: 𝐷4 𝑝, 𝑞 = 𝑥 − 𝑠| + 𝑦 − 𝑡|
𝐷4 𝑝, 𝑞 = 15 − 10| + 25 − 15| = 𝟏𝟓
• Chessboard Distance: 𝐷8 𝑝, 𝑞 = max( 𝑥 − 𝑠|, 𝑦 − 𝑡|)
𝐷8 𝑝, 𝑞 = max( 15 − 10|, 25 − 15|) = 𝟏𝟎
• Hence we see that the Chessboard Distance of 10 is the minimum distance.

Linear and Non-Linear Operations
144Digital Image Processing (15EC72)
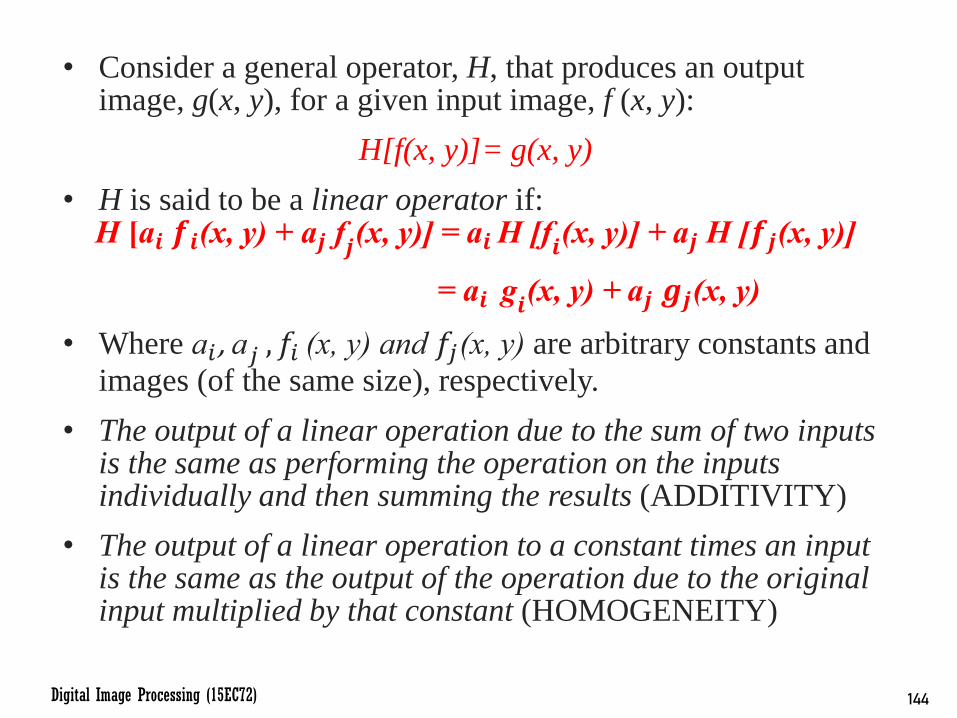
• Consider a general operator, H, that produces an output image, g(x, y), for a given input image, f (x, y):
H[f(x, y)]= g(x, y)
• H is said to be a linear operator if:H [a𝒊 𝒇𝒊(x, y) + a𝒋 f𝒋(x, y)] = a𝒊H [f
𝒊(x, y)] + a𝒋 H [𝒇𝒋(x, y)]
= a𝒊 g𝒊(x, y) + a𝒋 𝒈𝒋(x, y)
• Where a𝑖 , a𝑗 , 𝑓𝑖 (x, y) and 𝑓𝑗(x, y) are arbitrary constants and
images (of the same size), respectively.
• The output of a linear operation due to the sum of two inputs is the same as performing the operation on the inputs individually and then summing the results (ADDITIVITY)
• The output of a linear operation to a constant times an input is the same as the output of the operation due to the original input multiplied by that constant (HOMOGENEITY)
145Digital Image Processing (15EC72)
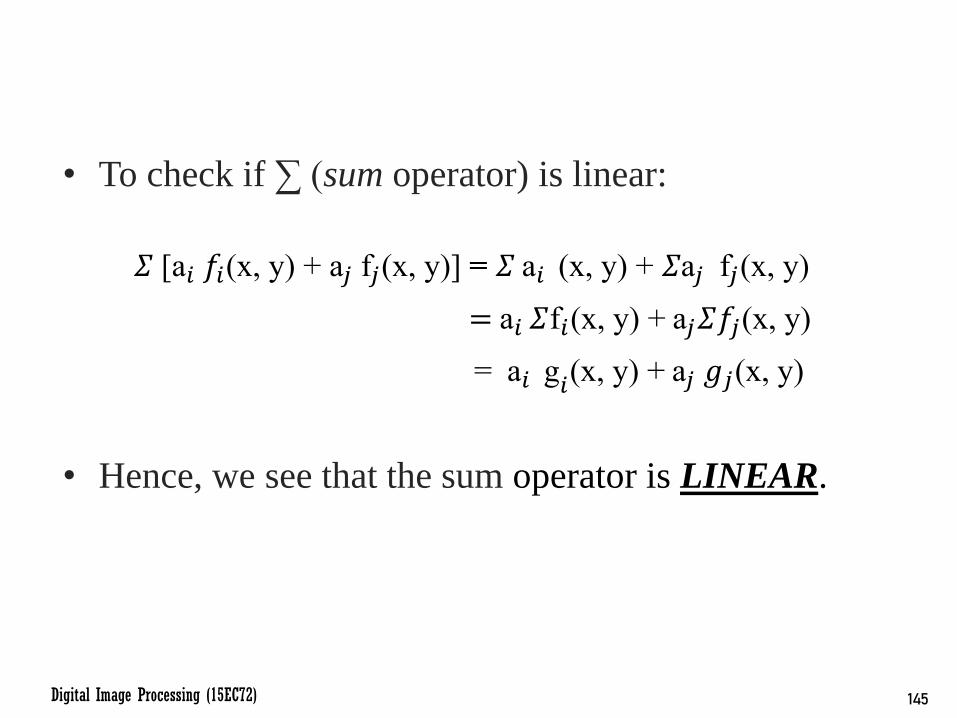
• To check if ∑ (sum operator) is linear:
𝛴 [a𝑖 𝑓𝑖(x, y) + a𝑗 f𝑗(x, y)] = 𝛴 a𝑖 (x, y) + 𝛴a𝑗 f𝑗(x, y)
= a𝑖 𝛴f𝑖(x, y) + a𝑗𝛴𝑓𝑗(x, y)
= a𝑖 g𝑖(x, y) + a𝑗 𝑔𝑗(x, y)
• Hence, we see that the sum operator is LINEAR.

146Digital Image Processing (15EC72)
• However, consider Max operation on two images:
• Suppose a1 = 1 and a2 = -1
• LHS:
• RHS:
• We see that LHS ≠ RHS, and hence, max operation is Non-Linear