
Image integration using NavX Fusion: initial experience and validation
10
Image integration using NavX fusion: Initial experience and validation Anthony G. Brooks, PhD, Lauren Wilson, BSc, Pawel Kuklik, MSc, Martin K. Stiles, MBChB, Bobby John, MD, Shashidhar, MD, Hany Dimitri, MBBS, Dennis H. Lau, MBBS, Ross L. Roberts-Thomson, BMedSc, Christopher X. Wong, Glenn D. Young, MBBS, Prashanthan Sanders, MBBS, PhD From the Cardiovascular Research Centre, Department of Cardiology, Royal Adelaide Hospital and the Disciplines of Medicine and Physiology, University of Adelaide, Adelaide, South Australia. BACKGROUND Three-dimensional virtual anatomic navigation is increasingly used during mapping and ablation of complex ar- rhythmias. NavX Fusion software aims to mold the virtual anatomy to the patient’s computed tomography (CT) image; however, the accuracy and clinical usefulness of this system have not been reported. OBJECTIVE The purpose of this study was to assess the accuracy and describe the initial experience of CT image integration using NavX Fusion for atrial fibrillation ablation. METHODS This study consisted of 55 consecutive patients under- going atrial fibrillation ablation using NavX Fusion navigation. Left atrial NavX geometries were compared to a corresponding CT for geometric match. Geometric match, expressed as the differ- ence in millimeters between CT and NavX geometry, was calculated for the original geometry (GEO-1), field scaled and primary fused geometry (GEO-2), and final secondary fused geometry (GEO-3). Navigational accuracy was assessed by moving the catheter to 10 discrete anatomic sites and determining the distance between the catheter tip and the closest GEO-2, GEO-3, and CT surface. Fusion integration time and procedural and fluoroscopic durations were recorded to assess clinical usefulness. RESULTS GEO-1, GEO-2 and GEO-3 were associated with CT–GEO errors of 6.6 2.8 mm, 4.1 0.7 mm, 1.9 0.4 mm, respec- tively. Navigational accuracy was not significantly different for GEO-2, GEO-3, and CT at 3.4 1.6 mm to any surface. A signifi- cant (P .001) inverse curvilinear relationship was present be- tween case number and the time required for image integration (r 2 0.35) and the fluoroscopic time normalized for procedural duration (r 2 0.18). CONCLUSION Image integration using the NavX Fusion software is highly accurate and is associated with a progressive reduction in fluoroscopic time relative to procedural duration. KEYWORDS Three-dimensional image integration; Computed to- mography; Atrial fibrillation (Heart Rhythm 2008;5:526 –535) © 2008 Heart Rhythm Society. All rights reserved. Introduction Catheter ablation is increasingly used as a treatment modal- ity in patients with drug-refractory atrial fibrillation (AF). Most ablation strategies have a central theme of pulmonary vein isolation. However, additional substrate modification is required to improve outcomes in some patients with parox- ysmal AF and in almost all patients with persistent or perma- nent AF. Therefore, accurate visualization of the left atrial anatomy and its variants is increasingly important in AF abla- tion. Anatomic variants with possible implications to AF ab- lation include left atrial pouches, ridges, and differences in vein number, departure angle, and ostium locations. 1– 8 These more subtle anatomic deviations are poorly defined by conventional imaging and may contribute to prolongation of radiofrequency, procedural, and fluoroscopic times. Three-dimensional (3D) virtual anatomic navigation has progressively evolved to assist complex AF ablation. Re- constructed 3D geometry using electroanatomic mapping has been demonstrated to be associated with significantly reduced fluoroscopic and procedural times for AF abla- tion. 9 –11 To improve visualization of the highly variable left atrial anatomy, significant efforts have been made to inte- grate electroanatomic mapping with computed tomographic (CT) or magnetic resonance imaging (MRI) surface geom- Dr. Brooks is supported by the Mary Overton Award from the Royal Adelaide Hospital. Dr. Stiles is supported by the National Heart Founda- tion of New Zealand and the Dawes Scholarship, Royal Adelaide Hospital. Dr. John is supported by the Biosense Webster Electrophysiology Schol- arship, University of Adelaide. Dr. Dimitri is supported by the Cardiac Society of Australia and New Zealand. Dr. Lau is supported by the Earl Bakken Electrophysiology Scholarship, University of Adelaide, and a Kidney Health Australia Biomedical Research Scholarship. Dr. Sanders is supported by the National Heart Foundation of Australia. Dr. Sanders reports having served on the advisory board of, and having received lecture fees and research funding from, St. Jude Medical, Bard Electrophysiology, and Biosense Webster. Address reprint requests and correspondence: Dr. Prashanthan Sanders, Cardiovascular Research Centre, Department of Cardiology, Level 5, McEwin Building, Royal Adelaide Hospital, Ad- elaide, SA 5000, Australia. E-mail address: prash.sanders@adelaide. edu.au. (Received December 10, 2007; accepted January 4, 2008.) 1547-5271/$ -see front matter © 2008 Heart Rhythm Society. All rights reserved. doi:10.1016/j.hrthm.2008.01.008
Transcript of Image integration using NavX Fusion: initial experience and validation
Ia
ABRP
FM
Birtar
OaN
MgLfefgNd
ICiMv
AtDaSBKsrfaDCee
1
mage integration using NavX fusion: Initial experiencend validation
nthony G. Brooks, PhD, Lauren Wilson, BSc, Pawel Kuklik, MSc, Martin K. Stiles, MBChB,obby John, MD, Shashidhar, MD, Hany Dimitri, MBBS, Dennis H. Lau, MBBS,oss L. Roberts-Thomson, BMedSc, Christopher X. Wong, Glenn D. Young, MBBS,rashanthan Sanders, MBBS, PhD
rom the Cardiovascular Research Centre, Department of Cardiology, Royal Adelaide Hospital and the Disciplines of
edicine and Physiology, University of Adelaide, Adelaide, South Australia.cir
RetGct(d
Cifl
Km
(
ACKGROUND Three-dimensional virtual anatomic navigation isncreasingly used during mapping and ablation of complex ar-hythmias. NavX Fusion software aims to mold the virtual anatomyo the patient’s computed tomography (CT) image; however, theccuracy and clinical usefulness of this system have not beeneported.
BJECTIVE The purpose of this study was to assess the accuracynd describe the initial experience of CT image integration usingavX Fusion for atrial fibrillation ablation.
ETHODS This study consisted of 55 consecutive patients under-oing atrial fibrillation ablation using NavX Fusion navigation.eft atrial NavX geometries were compared to a corresponding CTor geometric match. Geometric match, expressed as the differ-nce in millimeters between CT and NavX geometry, was calculatedor the original geometry (GEO-1), field scaled and primary fusedeometry (GEO-2), and final secondary fused geometry (GEO-3).avigational accuracy was assessed by moving the catheter to 10
rynatlnsip
pchrtag(du.au. (Received December 10, 2007; accepted January 4, 2008.)
547-5271/$ -see front matter © 2008 Heart Rhythm Society. All rights reserved
atheter tip and the closest GEO-2, GEO-3, and CT surface. Fusionntegration time and procedural and fluoroscopic durations wereecorded to assess clinical usefulness.
ESULTS GEO-1, GEO-2 and GEO-3 were associated with CT–GEOrrors of 6.6 � 2.8 mm, 4.1 � 0.7 mm, 1.9 � 0.4 mm, respec-ively. Navigational accuracy was not significantly different forEO-2, GEO-3, and CT at 3.4 � 1.6 mm to any surface. A signifi-ant (P �.001) inverse curvilinear relationship was present be-ween case number and the time required for image integrationr2 � 0.35) and the fluoroscopic time normalized for proceduraluration (r2 � 0.18).
ONCLUSION Image integration using the NavX Fusion softwares highly accurate and is associated with a progressive reduction inuoroscopic time relative to procedural duration.
EYWORDS Three-dimensional image integration; Computed to-ography; Atrial fibrillation
Heart Rhythm 2008;5:526–535) © 2008 Heart Rhythm Society. All
iscrete anatomic sites and determining the distance between the rights reserved.ntroductionatheter ablation is increasingly used as a treatment modal-
ty in patients with drug-refractory atrial fibrillation (AF).ost ablation strategies have a central theme of pulmonary
ein isolation. However, additional substrate modification is
Dr. Brooks is supported by the Mary Overton Award from the Royaldelaide Hospital. Dr. Stiles is supported by the National Heart Founda-
ion of New Zealand and the Dawes Scholarship, Royal Adelaide Hospital.r. John is supported by the Biosense Webster Electrophysiology Schol-
rship, University of Adelaide. Dr. Dimitri is supported by the Cardiacociety of Australia and New Zealand. Dr. Lau is supported by the Earlakken Electrophysiology Scholarship, University of Adelaide, and aidney Health Australia Biomedical Research Scholarship. Dr. Sanders is
upported by the National Heart Foundation of Australia. Dr. Sanderseports having served on the advisory board of, and having received lectureees and research funding from, St. Jude Medical, Bard Electrophysiology,nd Biosense Webster. Address reprint requests and correspondence:r. Prashanthan Sanders, Cardiovascular Research Centre, Department ofardiology, Level 5, McEwin Building, Royal Adelaide Hospital, Ad-laide, SA 5000, Australia. E-mail address: prash.sanders@adelaide.
equired to improve outcomes in some patients with parox-smal AF and in almost all patients with persistent or perma-ent AF. Therefore, accurate visualization of the left atrialnatomy and its variants is increasingly important in AF abla-ion. Anatomic variants with possible implications to AF ab-ation include left atrial pouches, ridges, and differences in veinumber, departure angle, and ostium locations.1–8 These moreubtle anatomic deviations are poorly defined by conventionalmaging and may contribute to prolongation of radiofrequency,rocedural, and fluoroscopic times.
Three-dimensional (3D) virtual anatomic navigation hasrogressively evolved to assist complex AF ablation. Re-onstructed 3D geometry using electroanatomic mappingas been demonstrated to be associated with significantlyeduced fluoroscopic and procedural times for AF abla-ion.9–11 To improve visualization of the highly variable lefttrial anatomy, significant efforts have been made to inte-rate electroanatomic mapping with computed tomographic
CT) or magnetic resonance imaging (MRI) surface geom-. doi:10.1016/j.hrthm.2008.01.008
eia
ettsdf
(actsaowi
MSTtNitp
rPwlr
CPd
stcst(o
i3m“oaa
d(
EEsc(Stm1WeB
pup2
TTFmasaletnfoiebfila
T
AMBLDT
NSLLLLL
�
527Brooks et al NavX Fusion Image Integration
try. Navigation using the CT image may assist the operatorn appreciating subtle left atrial anatomic variants that oftenre not apparent on electroanatomic mapping.
Until now, image integration has been able to “merge”lectroanatomic mapping by superimposing the electroana-omic map onto a reconstructed CT and hence locate in realime the ablation catheter within this anatomically correcttructure. Early experience using this system in most seriesemonstrated a degree of accuracy within the range requiredor clinical use and with potentially important outcomes.12–16
An advance in image integration entitled “NavX Fusion”St. Jude Medical, St. Paul, MN, USA) recently has becomevailable. Unlike previously available technology, the pro-ess of fusion dynamically molds the created geometry tohe CT. Although conceptually this may be considered a usefultrategy, several potential confounding factors could limit theccuracy of such a process, mandating appropriate validationf its accuracy prior to widespread clinical use. In this report,e describe the first clinical experience and validation of
mage integration using the NavX Fusion software.
ethodstudy populationhe study consisted of 55 consecutive patients with symp-
omatic-drug refractory AF undergoing ablation guided byavX Fusion. Baseline characteristics of the patients are given
n Table 1. The study protocol was approved by the institu-ional Clinical Research and Ethics Committee, and all patientsrovided written informed consent for the procedure.
All antiarrhythmic drugs, with the exception of amioda-one, were ceased at least five half-lives before the study.rior to the procedure, all patients received anticoagulationith warfarin (international normalized ratio 2–4) for at
east 6 weeks and underwent transesophageal echocardiog-aphy to exclude left atrial thrombus.
ardiac CT imagingrior to the ablation procedure, all patients underwent car-iac imaging with a Siemens Sensation 64 slice spiral CT
able 1 Baseline characteristics of all patients (n � 55)
ge (years) 56 � 11ale [n (%)] 37 (67%)ody mass index (kg/m2) 29 � 4ongest AF episode� 48 days (12 hours–12 years)uration of AF (months)� 48 (7–360)ype of AFParoxysmal 29 (53%)Persistent 14 (25%)Permanent 12 (22%)
o. of antiarrhythmic drugs failed 1.8 � 0.9tructural heart disease 14%eft atrial parasternal size (mm) 4.3 � 0.7eft atrial area (cm2) 24 � 7V end-diastolic diameter (mm) 50 � 7V end-systolic diameter (mm) 32 � 8V ejection fraction (%) 59 � 10
AF � atrial fibrillation; LV � left ventricular.
n[median (range)].canner (Siemens AG, Munich Germany) prior to the abla-ion procedure. The scanner has 32 channels with 0.6-mmollimation and oversampling in the Z-axis with flying focalpot to yield an effective 64 detector rows. Gantry rotationime was 370 ms with an x-ray tube potential of 120 kVpitch 0.24). A dose modulation algorithm was used toptimize tube currents at approximately 500 mA.
The scan was conducted in a caudocranial direction dur-ng a mild inspiration breathhold. A 70-mL bolus of Isovue70 was introduced into the antecubital vein at a rate of 5L/s, followed by 50 mL of saline. The scanner featured
bolus tracking,” which enabled left atrial images to bebtained during optimal opacification. Images were gated tomean 61 � 15% of peak QRS for patients in sinus rhythmnd arbitrarily gated to 45% of peak QRS for patients in AF.
The left atrium was segmented and reconstructed in threeimensions from CT slices using EnSite Verismo softwareSt. Jude Medical).
lectrophysiologic studylectrophysiologic study was performed in the postabsorptivetate with midazolam and fentanyl sedation. The followingatheters were utilized for mapping: (1) 10-pole catheter2-5-2 mm interelectrode spacing, Daig Electrophysiology,t. Jude Medical) positioned within the coronary sinus with
he proximal bipole at the coronary sinus ostium as deter-ined in the best septal left anterior oblique position, (2)
0-pole circumferential mapping catheter (Lasso, Biosenseebster, Diamond Bar, CA, USA), and (3) 3.5-mm-tip
xternally irrigated ablation catheter (Celsius ThermoCool,iosense Webster).
The left atrium was accessed using a single transseptaluncture, after which a bolus of unfractionated heparin (100nits/kg) was administered. Repeat boluses were infusederiodically to maintain the activated clotting time between50 and 350 seconds.
hree-dimensional geometry creationhe 3D geometry of the left atrium was created using NavXusion. In brief, NavX navigation is an impedance-basedeasure derived from the voltage gradient that appears
cross the tissue when a current is applied through a pair ofurface electrodes. For 3D navigation, six surface electrodesre placed in three pairs: anterior to posterior, left to rightateral, and superior (neck) to inferior (left leg). The threelectrode pairs form three orthogonal axes (X-Y-Z), withhe heart at the center. A “known” 5-kHz current is alter-ately delivered through each pair of surface electrodes toorm a 3D transthoracic electrical field. The absolute rangef voltage along each axis varies from each other, depend-ng on the volume and type of tissue subtended betweenach surface–electrode pair. The voltage gradient is dividedy the known applied current to determine the impedanceeld that has equal unit magnitudes in all three axes. Each
evel of impedance along each axis corresponds to a specificnatomic location within the thorax. As catheters are ma-
euvered within the chambers, each catheter electrode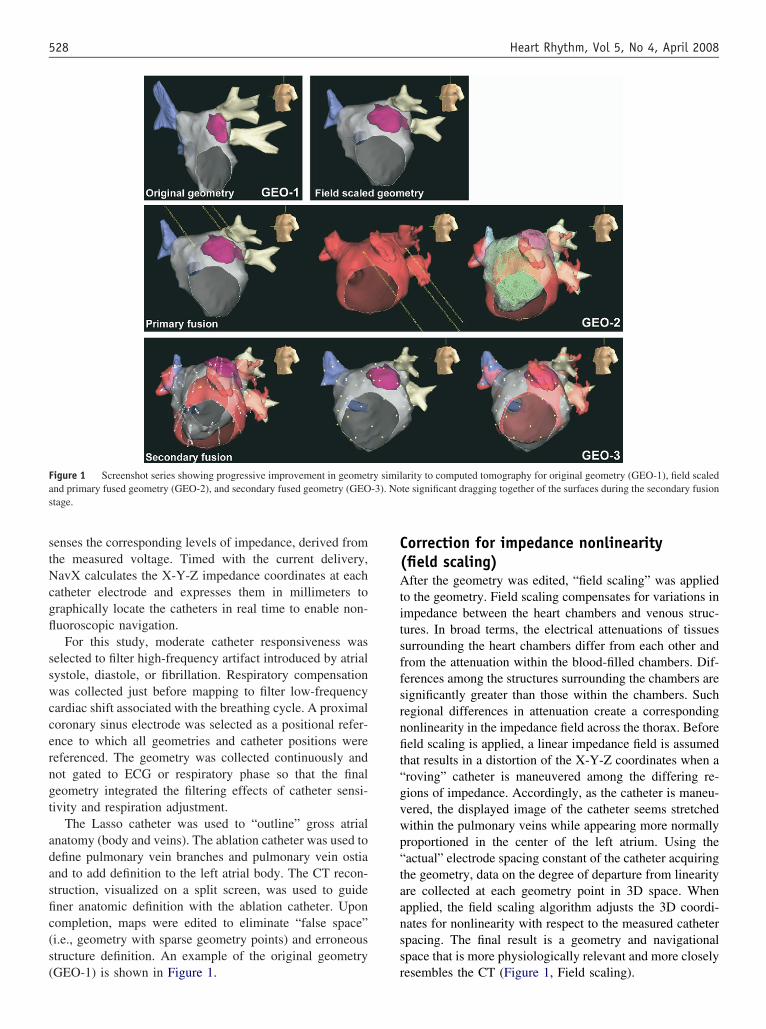
stNcgfl
sswccerngt
adasfic(s(
C(Atitsffsrnfit“gvwp“taanss
Fas
528 Heart Rhythm, Vol 5, No 4, April 2008
enses the corresponding levels of impedance, derived fromhe measured voltage. Timed with the current delivery,avX calculates the X-Y-Z impedance coordinates at each
atheter electrode and expresses them in millimeters toraphically locate the catheters in real time to enable non-uoroscopic navigation.
For this study, moderate catheter responsiveness waselected to filter high-frequency artifact introduced by atrialystole, diastole, or fibrillation. Respiratory compensationas collected just before mapping to filter low-frequency
ardiac shift associated with the breathing cycle. A proximaloronary sinus electrode was selected as a positional refer-nce to which all geometries and catheter positions wereeferenced. The geometry was collected continuously andot gated to ECG or respiratory phase so that the finaleometry integrated the filtering effects of catheter sensi-ivity and respiration adjustment.
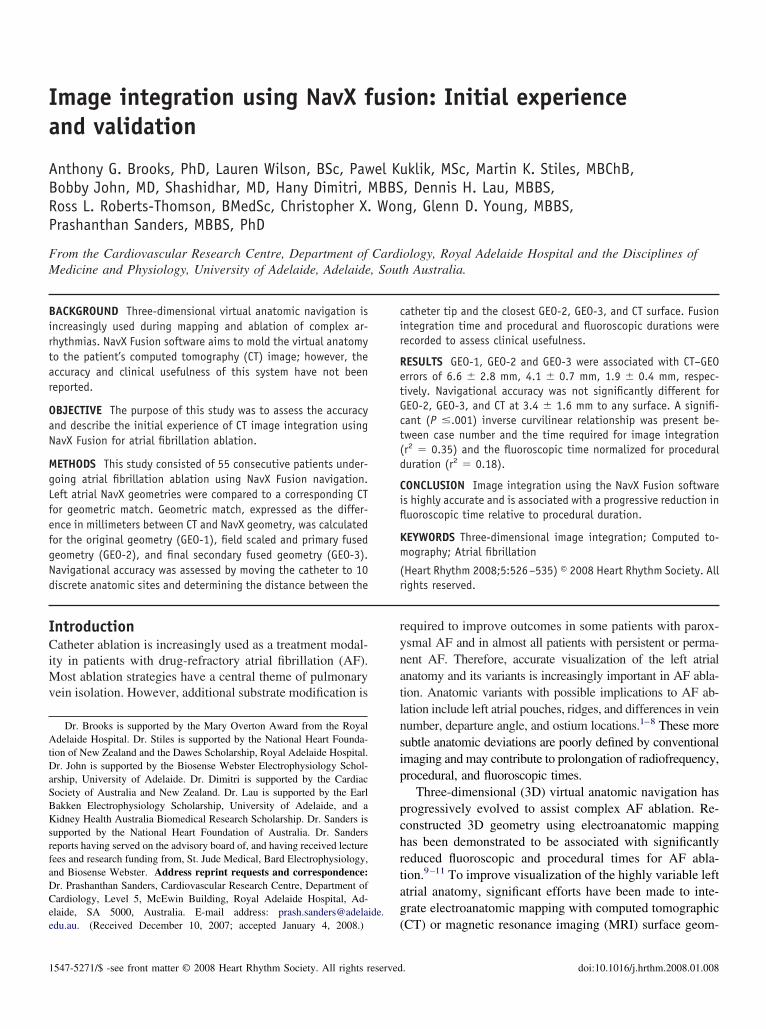
The Lasso catheter was used to “outline” gross atrialnatomy (body and veins). The ablation catheter was used toefine pulmonary vein branches and pulmonary vein ostiand to add definition to the left atrial body. The CT recon-truction, visualized on a split screen, was used to guidener anatomic definition with the ablation catheter. Uponompletion, maps were edited to eliminate “false space”i.e., geometry with sparse geometry points) and erroneoustructure definition. An example of the original geometry
igure 1 Screenshot series showing progressive improvement in geometnd primary fused geometry (GEO-2), and secondary fused geometry (GEOtage.
GEO-1) is shown in Figure 1. r
orrection for impedance nonlinearityfield scaling)fter the geometry was edited, “field scaling” was applied
o the geometry. Field scaling compensates for variations inmpedance between the heart chambers and venous struc-ures. In broad terms, the electrical attenuations of tissuesurrounding the heart chambers differ from each other androm the attenuation within the blood-filled chambers. Dif-erences among the structures surrounding the chambers areignificantly greater than those within the chambers. Suchegional differences in attenuation create a correspondingonlinearity in the impedance field across the thorax. Beforeeld scaling is applied, a linear impedance field is assumed
hat results in a distortion of the X-Y-Z coordinates when aroving” catheter is maneuvered among the differing re-ions of impedance. Accordingly, as the catheter is maneu-ered, the displayed image of the catheter seems stretchedithin the pulmonary veins while appearing more normallyroportioned in the center of the left atrium. Using theactual” electrode spacing constant of the catheter acquiringhe geometry, data on the degree of departure from linearityre collected at each geometry point in 3D space. Whenpplied, the field scaling algorithm adjusts the 3D coordi-ates for nonlinearity with respect to the measured catheterpacing. The final result is a geometry and navigationalpace that is more physiologically relevant and more closely
arity to computed tomography for original geometry (GEO-1), field scaledte significant dragging together of the surfaces during the secondary fusion
ry simil-3). No
esembles the CT (Figure 1, Field scaling).
ITtPstGaCat
wo(i
fswgaotpaaC
VVaC
Frpfi
Fo
529Brooks et al NavX Fusion Image Integration
mage integration (fusion)he field scaled geometry is “fused” to the CT in two stages,
ermed primary fusion and secondary fusion (Figure 1).rimary fusion uses three fiducial (i.e., landmark) corre-ponding points on the created geometry and the CT imageo superimpose, or lock together, both structures (Figure 1,EO-2). These points are chosen to ensure reasonable 3D
natomic separation. Based on previous experience with theARTO merge software (Biosense Webster), anterior lefttrial points were avoided for initial image registration dueo the inherent mobility of this structure.
Following primary fusion, a process of secondary fusionas performed (Figure 1, GEO-3). Secondary fusion pointsr “fiducials” were applied to the primary fused geometryGEO-2) at sites of local mismatch between the two super-mposed geometries. In this unique component of image
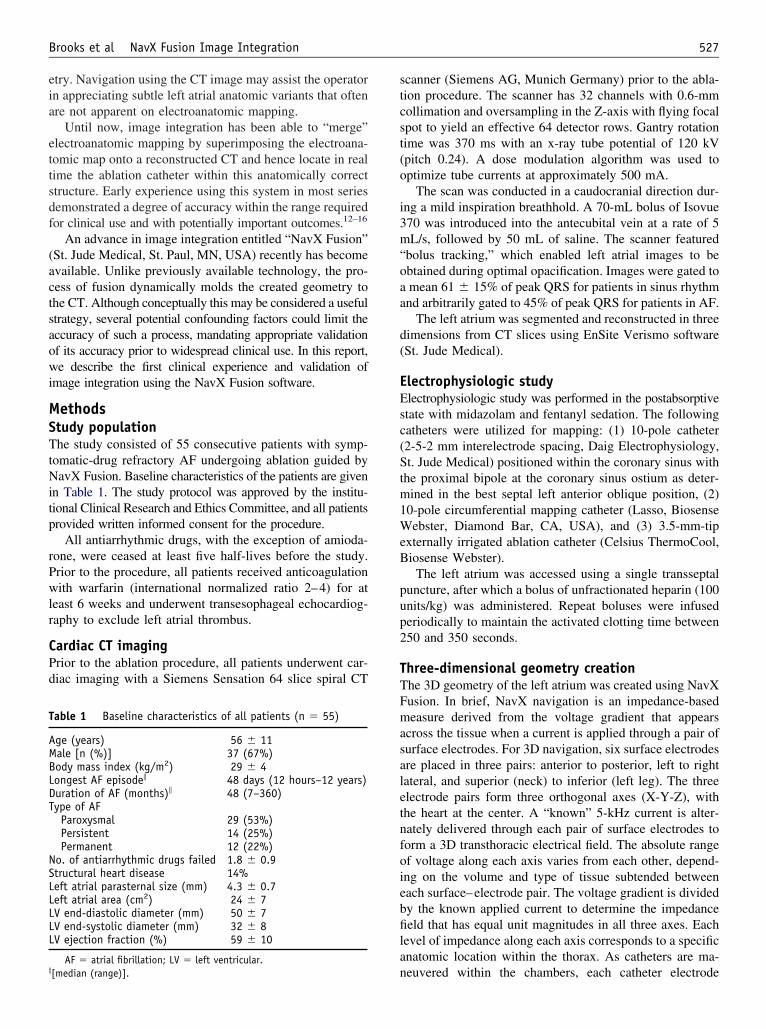
igure 2 Screenshot series showing the effect of secondary fusion on gemodeled left atrium from a previous procedure. Secondary fusion enablerior to the redo procedure. Panels from left to right indicate GE01 field scaducial points, and secondary fused geometry (GEO3).
igure 3 Screenshot of endoscopic and whole atrium views used for pulm
f the left common pulmonary vein are shown.usion, the created geometry surface is molded to the CTurface while also “bending” the 3D navigation spaceithin the geometry. For example, if the anterior wall of theeometry is fused anteriorly to the CT, the catheter locationlso will be moved so that, when the catheter is repositionedn the anterior wall post fusion, it should be visualized onhe CT surface and not within the bounds of the originalrefusion geometry (Figure 2). Upon completion of primarynd secondary fusion, the geometry display was disabled,nd all lesions, labels, and catheters were projected on theT image (Figure 3).
alidation of NavX fusionalidation of geometric match and catheter navigational
ccuracy was assessed in the first 15 patients of the study.T and procedural details are given in Table 2.
y and navigation space in a redo atrial fibrillation ablation patient with ative navigation within the original computed tomogram scanned 415 daysprimary fused geometry (GEO2), secondary fusion process demonstrating
vein isolation using NavX Fusion. Location of the catheters during ablation
eometrd effecled and
onary
eTgCte
IT((uw(po
pfcvlCadbtr
owuGanGf
NIgtrsnatOcvthwsaevp
CFwsat
F
T
C
P
V
r*†g‡�
530 Heart Rhythm, Vol 5, No 4, April 2008
The CT to GEO (CE–GEO) distance was calculated atach stage of NavX geometry (GEO-1, GEO-2, or GEO-3).hese data were used to estimate the relative change ineometry with respect to the “gold standard” structure of theT. The accuracy of navigation within GEO-2, GEO-3, or
he CT was assessed at 10 anatomically distinct sites via livestimation of the catheter tip to surface distance.
mage integration assessment (CT to GEO distance)he distance between the CT and the (1) non–field scaled
GEO-1), (2) field scaled and primary fused (GEO-2), and3) secondary fused (GEO-3) geometries was determinedsing custom-designed and previously validated softwareith the ability to perform geometric analysis of 3D objects
Medicalgorithmics, Austin, TX USA).17 This software re-roduced the CT and geometry in the same 3D space andrientation as presented in NavX.
The CT was segmented to the primary branching of theulmonary veins, and the mitral valve orifice was “cut”rom the CT surface. The left atrium match statistics werealculated for the whole left atrium and for the pulmonaryeins, left atrial appendage, and anterior, posterior, septal,ateral, and roof left atrial body segments. The number ofT triangles per left atrium was 6,569 � 1,441, with anssociated mean triangle area of 2.6 � 1.3 mm2. Euclideanistance (linear distance between two points in 3D space)etween a given CT triangle and the closest NavX geometryriangle was calculated for each CT triangle and summa-
able 2 Validation patient procedural details (n � 15)
T DetailsTime prior to procedure (days)� 25 (1–645)Rhythm at scan
SR 69%AF 31%
rocedural DetailsTime (minutes) required for map creation* 22.1 � 11.3Time (minutes) required for fusion† 12.7 � 2.6No. of veins isolated 3.7 � 0.5Pulmonary vein isolation 100%Roof line 73%Mitral isthmus line 20%Fractionated electrogram ablation 40%Tricuspid isthmus line 13%Total procedural time (min)‡ 192 � 60
alidation DetailsRhythm at fusion
SR 33%AF 67%
Different rhythm at fusion compared with CT?Yes 40%No 60%
Time between fusion and validation (min) 140 � 32
AF � atrial fibrillation; CT � computed tomography; SR � sinushythm.Including geometry creation and editing.Fusion requires stepwise addition of fiducial points to merge CT andeometry together.Transseptal puncture to completion of ablation.[median (range)].
ized using conventional methods. c
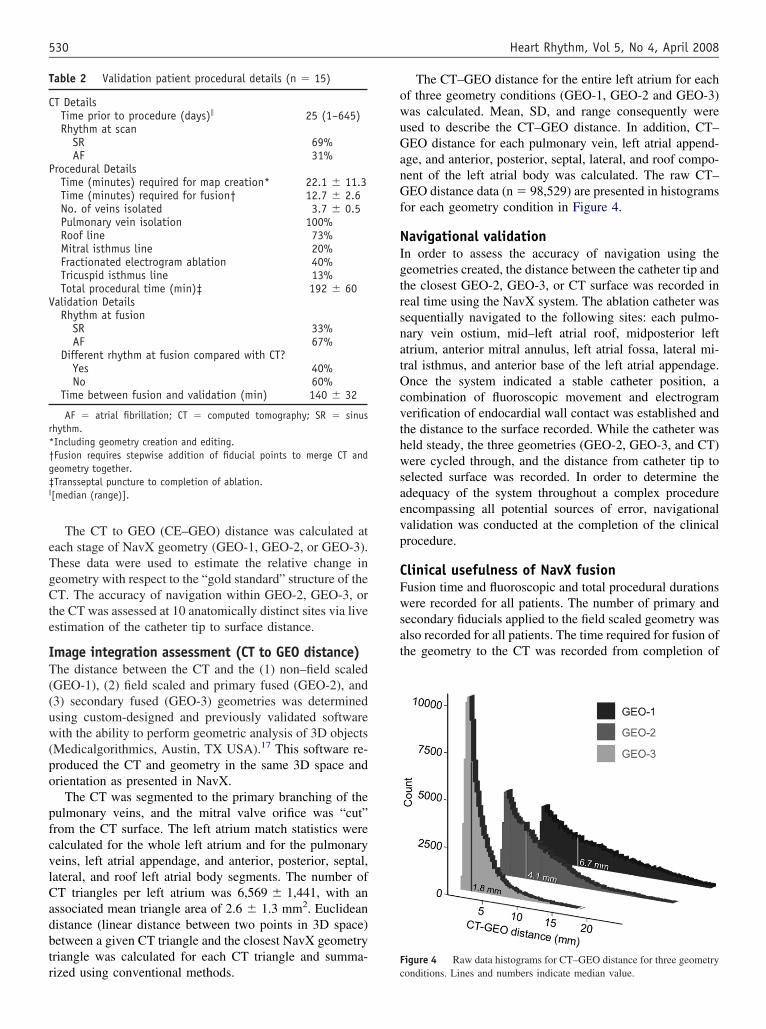
The CT–GEO distance for the entire left atrium for eachf three geometry conditions (GEO-1, GEO-2 and GEO-3)as calculated. Mean, SD, and range consequently weresed to describe the CT–GEO distance. In addition, CT–EO distance for each pulmonary vein, left atrial append-
ge, and anterior, posterior, septal, lateral, and roof compo-ent of the left atrial body was calculated. The raw CT–EO distance data (n � 98,529) are presented in histograms
or each geometry condition in Figure 4.
avigational validationn order to assess the accuracy of navigation using theeometries created, the distance between the catheter tip andhe closest GEO-2, GEO-3, or CT surface was recorded ineal time using the NavX system. The ablation catheter wasequentially navigated to the following sites: each pulmo-ary vein ostium, mid–left atrial roof, midposterior lefttrium, anterior mitral annulus, left atrial fossa, lateral mi-ral isthmus, and anterior base of the left atrial appendage.nce the system indicated a stable catheter position, a
ombination of fluoroscopic movement and electrogramerification of endocardial wall contact was established andhe distance to the surface recorded. While the catheter waseld steady, the three geometries (GEO-2, GEO-3, and CT)ere cycled through, and the distance from catheter tip to
elected surface was recorded. In order to determine thedequacy of the system throughout a complex procedurencompassing all potential sources of error, navigationalalidation was conducted at the completion of the clinicalrocedure.
linical usefulness of NavX fusionusion time and fluoroscopic and total procedural durationsere recorded for all patients. The number of primary and
econdary fiducials applied to the field scaled geometry waslso recorded for all patients. The time required for fusion ofhe geometry to the CT was recorded from completion of
igure 4 Raw data histograms for CT–GEO distance for three geometry
onditions. Lines and numbers indicate median value.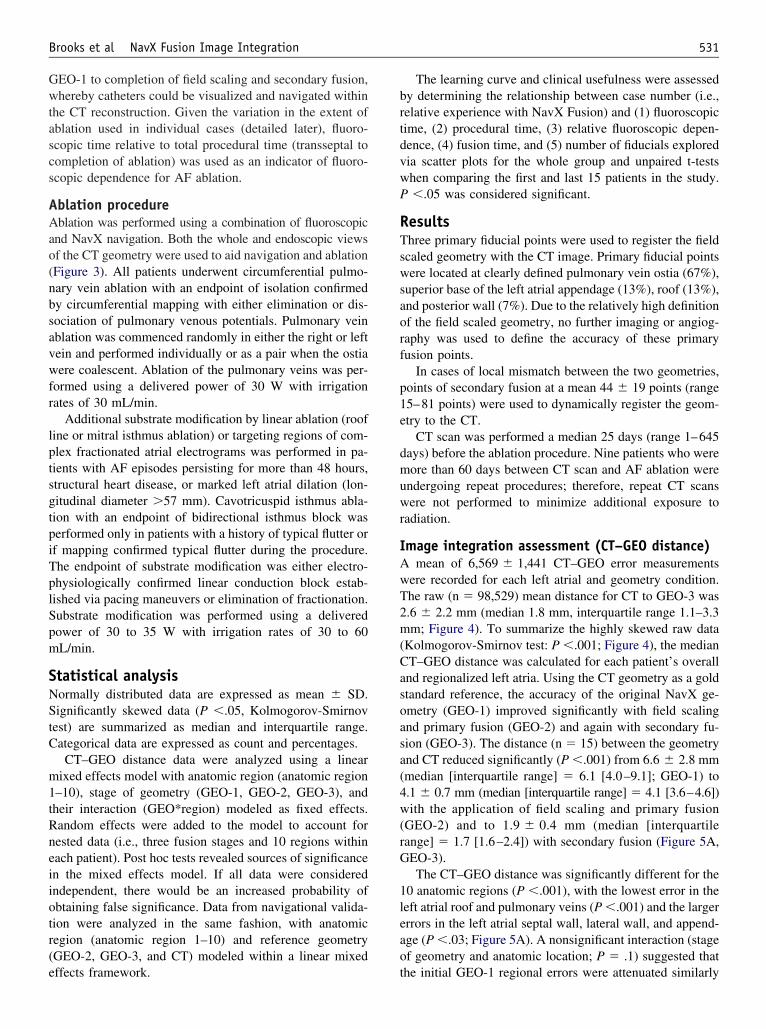
Gwtascs
AAao(nbsavwfr
lptsgtpiTplSpm
SNStC
m1tRneiiotr(e
brtdvwP
RTswsaorf
p1e
dmuwr
IAwT2m(Casoasa(4w(rG
1leao
531Brooks et al NavX Fusion Image Integration
EO-1 to completion of field scaling and secondary fusion,hereby catheters could be visualized and navigated within
he CT reconstruction. Given the variation in the extent ofblation used in individual cases (detailed later), fluoro-copic time relative to total procedural time (transseptal toompletion of ablation) was used as an indicator of fluoro-copic dependence for AF ablation.
blation procedureblation was performed using a combination of fluoroscopic
nd NavX navigation. Both the whole and endoscopic viewsf the CT geometry were used to aid navigation and ablationFigure 3). All patients underwent circumferential pulmo-ary vein ablation with an endpoint of isolation confirmedy circumferential mapping with either elimination or dis-ociation of pulmonary venous potentials. Pulmonary veinblation was commenced randomly in either the right or leftein and performed individually or as a pair when the ostiaere coalescent. Ablation of the pulmonary veins was per-
ormed using a delivered power of 30 W with irrigationates of 30 mL/min.
Additional substrate modification by linear ablation (roofine or mitral isthmus ablation) or targeting regions of com-lex fractionated atrial electrograms was performed in pa-ients with AF episodes persisting for more than 48 hours,tructural heart disease, or marked left atrial dilation (lon-itudinal diameter �57 mm). Cavotricuspid isthmus abla-ion with an endpoint of bidirectional isthmus block waserformed only in patients with a history of typical flutter orf mapping confirmed typical flutter during the procedure.he endpoint of substrate modification was either electro-hysiologically confirmed linear conduction block estab-ished via pacing maneuvers or elimination of fractionation.ubstrate modification was performed using a deliveredower of 30 to 35 W with irrigation rates of 30 to 60L/min.
tatistical analysisormally distributed data are expressed as mean � SD.ignificantly skewed data (P �.05, Kolmogorov-Smirnov
est) are summarized as median and interquartile range.ategorical data are expressed as count and percentages.
CT–GEO distance data were analyzed using a linearixed effects model with anatomic region (anatomic region
–10), stage of geometry (GEO-1, GEO-2, GEO-3), andheir interaction (GEO*region) modeled as fixed effects.andom effects were added to the model to account forested data (i.e., three fusion stages and 10 regions withinach patient). Post hoc tests revealed sources of significancen the mixed effects model. If all data were consideredndependent, there would be an increased probability ofbtaining false significance. Data from navigational valida-ion were analyzed in the same fashion, with anatomicegion (anatomic region 1–10) and reference geometryGEO-2, GEO-3, and CT) modeled within a linear mixed
ffects framework. tThe learning curve and clinical usefulness were assessedy determining the relationship between case number (i.e.,elative experience with NavX Fusion) and (1) fluoroscopicime, (2) procedural time, (3) relative fluoroscopic depen-ence, (4) fusion time, and (5) number of fiducials exploredia scatter plots for the whole group and unpaired t-testshen comparing the first and last 15 patients in the study.�.05 was considered significant.
esultshree primary fiducial points were used to register the fieldcaled geometry with the CT image. Primary fiducial pointsere located at clearly defined pulmonary vein ostia (67%),
uperior base of the left atrial appendage (13%), roof (13%),nd posterior wall (7%). Due to the relatively high definitionf the field scaled geometry, no further imaging or angiog-aphy was used to define the accuracy of these primaryusion points.
In cases of local mismatch between the two geometries,oints of secondary fusion at a mean 44 � 19 points (range5–81 points) were used to dynamically register the geom-try to the CT.
CT scan was performed a median 25 days (range 1–645ays) before the ablation procedure. Nine patients who wereore than 60 days between CT scan and AF ablation were
ndergoing repeat procedures; therefore, repeat CT scansere not performed to minimize additional exposure to
adiation.
mage integration assessment (CT–GEO distance)mean of 6,569 � 1,441 CT–GEO error measurements
ere recorded for each left atrial and geometry condition.he raw (n � 98,529) mean distance for CT to GEO-3 was.6 � 2.2 mm (median 1.8 mm, interquartile range 1.1–3.3m; Figure 4). To summarize the highly skewed raw data
Kolmogorov-Smirnov test: P �.001; Figure 4), the medianT–GEO distance was calculated for each patient’s overallnd regionalized left atria. Using the CT geometry as a goldtandard reference, the accuracy of the original NavX ge-metry (GEO-1) improved significantly with field scalingnd primary fusion (GEO-2) and again with secondary fu-ion (GEO-3). The distance (n � 15) between the geometrynd CT reduced significantly (P �.001) from 6.6 � 2.8 mmmedian [interquartile range] � 6.1 [4.0–9.1]; GEO-1) to.1 � 0.7 mm (median [interquartile range] � 4.1 [3.6–4.6])ith the application of field scaling and primary fusion
GEO-2) and to 1.9 � 0.4 mm (median [interquartileange] � 1.7 [1.6–2.4]) with secondary fusion (Figure 5A,EO-3).The CT–GEO distance was significantly different for the
0 anatomic regions (P �.001), with the lowest error in theeft atrial roof and pulmonary veins (P �.001) and the largerrrors in the left atrial septal wall, lateral wall, and append-ge (P �.03; Figure 5A). A nonsignificant interaction (stagef geometry and anatomic location; P � .1) suggested that
he initial GEO-1 regional errors were attenuated similarly
wf
spd(
STab2pavnflcpGr
NWtt
o(s(a
wds
LoAb0stHoe
sfl.id
Ftp OOF �
532 Heart Rhythm, Vol 5, No 4, April 2008
ith field scaling/primary fusion (GEO-2) and secondaryusion (GEO-3).
Forty percent of patients had a different rhythm at CTcan compared with map development and fusion. Theseatients did not have significantly different CT–GEOistance than those who had the same rhythm for bothP � .85).
econdary fusion with NavXhe mean number of secondary fusion points applied to thenterior, posterior, lateral, septal, and roof of the left atrialody were 6.5 � 3.7, 5.7 � 3.0, 2.2 � 2.2, 2.5 � 2.3,.0 � 1.8, respectively. In comparison, a mean 6.4 � 3.9oints was used to fuse each of the pulmonary veins or lefttrial appendage. One-way repeated measures analysis ofariance demonstrated significant regional difference in theumber of secondary fusion points (P �.001), with moreusion points applied to the pulmonary veins and anterioreft atrium in our initial experience. A weak inverse asso-iation was noted between the number of secondary fiducialoints applied to the field scaled geometry (conversion ofEO-2 to GEO-3) and the percent change in error to the
eference CT geometry (r � –0.21, P � .01).
avigational validationhen stabilized at 10 anatomically distinct locations within
he left atria, the mean distance from the ablation catheter
igure 5 A: Registration accuracy. CT–GEO difference for each region acip and surface of GEO-2, GEO-3, and CT. ANT � anterior; LAA � left atrial aulmonary vein; POST � posterior; RIPV � right inferior pulmonary vein; R
ip to the GEO-2 (3.6 � 1.5 mm), GEO-3 (3.3 � 1.4 mm), w
r CT surface (3.4 � 1.6 mm) did not change significantlyP � .5; Figure 5B). The mixed linear model revealed noignificant regional differences in catheter to surface errorP � .2) or in the interaction term between geometry stagend region (P � .9).
Patients with a different rhythm at CT scan comparedith map development and fusion did not have significantlyifferent catheter to surface error than those who had theame rhythm for both (P � .26).
earning curve and clinical assessmentf NavX fusionsignificant inverse curvilinear relationship was observed
etween case number and time required for fusion (r2 �.35, P �.001; Figure 6A), such that fusion time wasignificantly longer for the first 15 patients (12.7 � 2.4 min)han for the last 15 patients (8.6 � 2.6 min; P �.001).owever, there was no significant reduction in the numberf primary and secondary fiducials used for fusion over thisxperience (P � .17).
A significant inverse curvilinear relationship was ob-erved between NavX Fusion case number and the ratio ofuoroscopic time to total procedural time (r2 � 0.18, P �
001; Figure 6B), such that there was a significant reductionn the mean fluoroscopic time relative to total proceduraluration for the last 15 patients (0.34 � 0.05) compared
ee geometry conditions. B: Navigational accuracy. Distance between catheterge; LAT � lateral; LIPV � left inferior pulmonary vein; LSPV � left superior
roof; RSPV right superior pulmonary vein; SEPT � septal.
ross thrppenda
ith the first 15 patients (0.43 � 0.11, P � .009). However,

tcd
DTofs
●
●
●
Tafc
EnAsplafteswpainpa
ahCmombthvwlwc
if
RFfnCocaa(
Ftd
533Brooks et al NavX Fusion Image Integration
here was no significant relationship between NavX Fusionase number and fluoroscopic (P � .37) or proceduraluration (P � .14).
iscussionhis report describes the validation and clinical usefulnessf the new image integration software NavX Fusion, whichuses or molds the virtual anatomy to the CT surface. Thetudy demonstrates the following:
Field scaling and primary and secondary fusion signifi-cantly improve approximation of the NavX geometry tothe CT. Each step resulted in progressive improvementin the association between the created geometry and theCT. The final structure was associated with a mean errorof 1.9 � 0.4 mm to the CT (range 1.3–2.6 mm), wellwithin the range that would be considered clinically rel-evant.The change in geometry associated with secondary fusioncan be used to accurately localize catheters within the ge-ometry. This is because, in addition to morphing the shellof the structure, fusion effectively applies the same algo-rithm to the 3D navigation space (Figure 2). Independentof GEO stage, the accuracy of navigation within NavXgeometry is maintained. Mean absolute catheter errorover 10 anatomically discrete locations of the left atrium
igure 6 Scatter plots showing decline in time required for CT integra-ion (A) and reduction in fluoroscopic dependence relative to proceduraluration (B).
was 3.4 � 1.6 mm. i
Greater NavX Fusion experience was associated with asignificant decline in the time required for CT integrationand fluoroscopic dependence.
his latest addition to the repertoire of navigational toolsvailable to the electrophysiologist is highly accurate andacilitates nonfluoroscopic navigation within an anatomi-ally accurate virtual structure.
fficacy and validation of virtual cardiacavigation in AF ablationlthough early clinical validation studies on 3D mapping
ystems (CARTO or NavX) have suggested a limited im-act on pulmonary vein isolation success rates,9–11 the evo-ution of more complex AF ablation that uses anatomic linesnd focal burns at sites of fractionation or highest dominantrequency would be difficult to perform without the assis-ance of virtual navigation. Furthermore, there is compellingvidence for reduced fluoroscopy dependence using theseystems.9–11 These systems provide a permanent record ofhere ablation was performed, and they can be used toresent timing and signal data, which are critical for testingnatomic lines of block, mapping flutter circuits, and direct-ng focal complex fractionated electrogram ablation. A 3Davigation system to assist the targeted substrate ablation ofersistent and permanent AF is an important component ofmodern electrophysiology laboratory.To improve visualization of the highly variable atrial
natomy and pulmonary venous structure, significant effortsave been made to integrate the electroanatomic map toT/MRI surface geometry. Albeit an appealing concept,erging virtual geometry and CT/MRI anatomy is scan and
perator dependent. It relies upon the subjective selection ofatching “landmark” pairs on CT and virtual geometry to
ring together the two structures. In addition, differences iniming, respiratory phase, rhythm, hemodynamic status, andeart rate between the CT scan and the development ofirtual geometry are potential sources of CT–GEO error,18
ith resultant navigational inaccuracy. Regardless of theseimitations, CARTO merge CT integration has been associatedith reduced fluoroscopic times and suggestions of improved
linical success compared with CARTO alone.13,14
This study is the first to describe the further iteration ofmage integration using NavX Fusion, which has the uniqueeature of molding the geometry to the CT/MRI surface.
egistration accuracy (CT–GEO distance)ield scaling and primary and secondary fusion are neweatures that allow the NavX geometry to be adjusted foronlinearity, anchored and locally fitted to a reconstructedT. Field scaling adjusts for the nonlinear impedance fieldver the left atrium in reference to a known constant ofatheter electrode spacing. In effect, field scaling of the lefttrial geometry (GEO-2) consistently resulted in a morenatomically correct left atrium than that mapped originallyGEO-1). NavX Fusion encompasses the procedure of add-
ng primary fiducials to initially anchor the geometry to the
Cf
9dp(Afwfgsmbi
t1Cbfsrstl6mmrm
NWr(ttamatv1smcsmwnvttoC
rnr
impataaadegCem(misluslritmaatsjotCCebc
CIicft6nsf
ef
534 Heart Rhythm, Vol 5, No 4, April 2008
T and then multiple secondary fiducial points to locallyuse the geometry to the CT structure (Figure 1).
Using the CT as a gold standard reference, both raw (n �8,529) and summary (n � 15) CT–GEO distance dataemonstrate a stepwise improvement in original GEO mor-hology (GEO-1) with (1) field scaling and primary fusionGEO-2) and with (2) secondary fusion (GEO-3, Figure 1).djustment of the geometry by field scaling and primary
usion resulted in a 40% improvement in match error,hereas secondary fusion with a mean 44 � 19 fiducials
urther reduced the error by 54%. Given that the originaleometry is equivalent to that 19 produced by Version 6oftware, NavX Fusion represents a significant improve-ent in anatomical relevance. A change in cardiac rhythm
etween the CT scan and fusion was not associated withncreased geometry error.
Data on the final NavX geometry (GEO-3) demonstratehat on average the geometry departs from the CT by.9 � 0.4 mm (range 1.3–2.6 mm). Given the complexity ofT left atrial anatomy, this represents high concordanceetween NavX and CT geometries. These results compareavorably to data obtained with the CARTO system usingurface registration, where published geometric differencesange from 1.7 to 2.7 mm.13–16,19,20 Given that GEO-2 (fieldcaled and primary fused) is similar to the landmark-regis-ered CARTO merge image, NavX match statistics areower (n � 15, mean error 4.1 � 0.7 mm) compared with.4 mm16 and 5.6 mm20 mean errors reported for CARTOerge. Finally, CT to GEO-3 errors were approximately 1.7m in the veins compared with approximately 6 mm errors
eported by Kistler et al16 for 39-point left atrial CARTOaps.
avigational accuracyith real-time 3D mapping systems, the generated geomet-
ic map should resemble the CT image as closely as possibleminimized CT–GEO distance). Equally if not more impor-ant to the clinician is how accurately the fused map reflectshe real-time position of the catheter in the heart during theblation procedure. A high concordance between the geo-etric and CT maps is of limited relevance if it does not
ccurately represent the true location of the catheter withinhe heart. The navigational accuracy of NavX Fusion wasalidated at the end of the AF ablation procedure at a mean40 � 32 minutes after fusion. The catheter was navigatedequentially to 10 anatomically discrete locations as deter-ined by the operator using fluoroscopic and electrogram
riteria. The distance to the field scaled geometry (GEO-2),econdary fused GEO (GEO-3), and the CT surfaces waseasured. The error, or distance from catheter tip to surface,as measured as an absolute value so that positive andegative errors did not negate each other. Furthermore, thealidation occurred at the end of the procedure. Therefore,he measured error integrated anatomic navigation error andhat associated with impedance drift and patient movementver the case. The absolute distance to GEO-2, GEO-3, and
T surface error of 3 to 4 mm (Figure 5B) is within the tequirements for clinical procedures. Furthermore, catheteravigational error was independent of changes in cardiachythm between CT scan, fusion, and catheter validation.
Dong et al12 reported that with assistance of radiograph-cally and CT visible pericardial reference markers for land-ark registration, CARTO merge was able to direct ablation
oints to within 1.8 � 1.0 mm mean accuracy of the truenatomic location as assessed postmortem. Unfortunately,he technique they used to register electroanatomic mappingnd CT geometries with pericardial markers is not clinicallypplicable. In vivo accuracy of CARTO merge has beenssessed with less impressive results when using intracar-iac echocardiography as the gold standard anatomical ref-rence.19,20 Zhong et al19 rehearsed intracardiac echocardio-raphy-guided pulmonary vein isolation, blinded to theARTO merge image developed just prior. The absoluterror of ablation points to the nearest CT surface was 3 to 5m; however, the distance to the exact anatomic location
as estimated by intracardiac echocardiography) was 9 to 10m. Fahmy et al20 reported that ICE-guided landmark reg-
stration of the CARTO electroanatomic map and CT, re-ulted in a mean landmark error of 5.6 mm for posteriorandmarks only, or 9.1 mm, when anterior landmarks weretilized. Furthermore, when the electroanatomic map wasurface registered, landmark errors significantly increased,eading the authors to conclude that an “an accurate surfaceegistration does not guarantee an accurate alignment withmportant anatomical structures.”20 This study highlightedhe difference between anatomic (CT–electroanatomicapping match) and navigational (catheter–surface error)
ccuracy. Taken together, the accuracy achieved by Dong etl12 with defined CT and radiographic markers with whicho select landmark pairs and the relative inaccuracy demon-trated in the in vivo validations19,20 suggest that the ma-ority of in vivo error is attributed to the incorrect selectionf landmark pairs on the electroanatomic map and CT. Evenhough primary fusion of field scaled NavX geometry andT is plagued by the same subjective inaccuracies asARTO, the high-resolution structure of the NavX geom-try may more accurately define particular landmark pointsy which to fuse the two structures, resulting in a smalleratheter navigational error.
linical assessment of NavX fusionn our early experience, NavX Fusion has proved to bentuitive to use, with only a short “run in time” or learningurve. The curvilinear relationship between time requiredor CT integration and experience demonstrates that “fusionime” has significantly reduced over our experience (FigureA). The fact that the same trend was not apparent for theumber of fiducials applied to GEO-2 suggests that thehortened time for CT integration is due more to a fasterusion process rather than less fusion points being applied.
It is apparent from our clinical experience that the majorffectors of structural change, after field scaling and primaryusion, are the initial secondary fusion points. It is important
o anchor the most important regions of interest, such as the
pdltmosin(iict
flgN6Nrflag
PTbpeeta
gcbpts
STfitcdibbaCdt
CIg1tctr
R
1
1
1
1
1
1
1
1
1
1
2
535Brooks et al NavX Fusion Image Integration
ulmonary veins, to ensure their structural alignment. Ad-itional secondary fusion points then can be placed in theeft atrial body to mold the geometry and navigation spaceo the CT surface. Finally, further fiducial points are used toatch mapped pulmonary vein branching to that visualized
n CT. The final result is catheter navigation within a CTuch that navigation into individual pulmonary vein branch-ng is possible. The inverse regional correlation betweenumber of fiducials and change in geometry morphologyr � –0.21, P � .01) is an indicator that the law of dimin-shing returns may apply to fiducial placement, such thatnitial fiducials elicit gross geometric structure change andonsequent applications are associated with fine structuraluning.
The reduced fluoroscopic dependence, as estimated byuoroscopy to procedure time ratio, was suggestive ofreater confidence in nonfluoroscopic navigation withavX Fusion as experience with the system grew (FigureB); an important indicator for an increase in efficacy ofavX fusion as a nonfluoroscopic navigation system. No
elationship between experience (i.e., case number) anduoroscopic or procedural duration was observed and prob-bly is representative of the variant procedure complexityiven the tailored AF ablation approach used.
itfalls when using NavX Fusionwo patients were excluded from the validation cohortecause applying field scaling to GEO-1 resulted in a non-hysiologic structure. The cause of the problem was that thelectrode spacing of the catheter used to collect the geom-try were entered incorrectly into the NavX system. Hence,he adjustment of impedance nonlinearity was made againstn incorrect standard.
In our experience, insufficiently mapped anatomic re-ions should not be fused to the CT surface because if theatheter does reach the “true endocardium,” the catheter wille projected outside the CT. Nevertheless, real-time fiduciallacement at the active catheter tip can expeditiously correcthis problem by “dragging” the catheter back to the CTurface. No data were excluded because of this error.
tudy limitationshis study performed a validation of CT–GEO closeness oft and catheter navigational accuracy but did not evaluate
he potential impact on clinical outcome. Navigational ac-uracy was not evaluated against a real-time imaging mo-ality such as intracardiac echocardiography. In addition, its important to note that CARTO match statistics form theenchmark for comparing CT–GEO errors in this studyecause, until now, the former has been the only systemble to merge electroanatomic mapping and CT structures.ARTO and NavX CT–GEO errors are estimated usingiffering methodologies, so our indirect comparisons be-
ween the two should be interpreted with caution.onclusionmage integration using NavX Fusion software to mold theeometry to the CT image is highly accurate, with a mean.9 � 0.4 mm difference between the final geometry andhe CT and a navigational error of 3.4 � 1.6 mm. Ourlinical experience demonstrates reasonable CT integrationimes (8.6 � 2.6 min) and a reduced dependence on fluo-oscopic navigation for AF ablation.
eferences1. Malchano ZJ, Neuzil P, Cury RC, et al. Integration of cardiac CT/MR imaging
with three-dimensional electroanatomical mapping to guide catheter manipula-tion in the left atrium: implications for catheter ablation of atrial fibrillation.J Cardiovasc Electrophysiol 2006;17:1221–1229.
2. Wongcharoen W, Tsao HM, Wu MH, et al. Morphologic characteristics of theleft atrial appendage, roof, and septum: implications for the ablation of atrialfibrillation. J Cardiovasc Electrophysiol 2006;17:951–956.
3. Wittkampf FH, Vonken EJ, Derksen R, et al. Pulmonary vein ostium geometry:analysis by magnetic resonance angiography. Circulation 2003;107:21–23.
4. Mansour M, Holmvang G, Sosnovik D, et al. Assessment of pulmonary veinanatomic variability by magnetic resonance imaging: implications for catheterablation techniques for atrial fibrillation. J Cardiovasc Electrophysiol 2004;15:387–393.
5. Noseworthy PA, Malchano ZJ, Ahmed J, et al: The impact of respiration on leftatrial and pulmonary venous anatomy: implications for image-guided interven-tion. Heart Rhythm 2005;2:1173–1178.
6. Sanders P, Stiles MK, Young GD. Virtual anatomy for atrial fibrillation ablation.J Cardiovasc Electrophysiol 2006;17:349–351.
7. Kato R, Lickfett L, Meininger G, et al. Pulmonary vein anatomy in patientsundergoing catheter ablation of atrial fibrillation: lessons learned by use ofmagnetic resonance imaging. Circulation 2003;107:2004–2010.
8. Lemola K, Sneider M, Desjardins B, et al. Computed tomographic analysis ofthe anatomy of the left atrium and the esophagus: implications for left atrialcatheter ablation. Circulation 2004;110:3655–3660.
9. Tse HF, Lee KL, Fan K, et al. Nonfluoroscopic magnetic electroanatomicmapping to facilitate focal pulmonary veins ablation for paroxysmal atrialfibrillation. Pacing Clin Electrophysiol 2002;25:57–61.
0. Tondo C, Mantica M, Russo G, et al. A new nonfluoroscopic navigation systemto guide pulmonary vein isolation. Pacing Clin Electrophysiol 2005;28:S102–S105.
1. Rotter M, Takahashi Y, Sanders P, et al. Reduction of fluoroscopy exposure andprocedure duration during ablation of atrial fibrillation using a novel anatomicalnavigation system. Eur Heart J 2005;26:1415–1421.
2. Dong J, Calkins H, Solomon SB, et al. Integrated electroanatomic mapping withthree-dimensional computed tomographic images for real-time guided ablations.Circulation 2006;113:186–194.
3. Kistler PM, Rajappan K, Jahngir M, et al. The impact of CT image integrationinto an electroanatomic mapping system on clinical outcomes of catheter abla-tion of atrial fibrillation. J Cardiovasc Electrophysiol 2006;17:1093–1101.
4. Martinek M, Nesser HJ, Aichinger J, et al. Impact of integration of multislicecomputed tomography imaging into three-dimensional electroanatomic mappingon clinical outcomes, safety, and efficacy using radiofrequency ablation for atrialfibrillation. Pacing Clin Electrophysiol 2007;30:1215–1223.
5. Dong J, Dickfeld T, Dalal D, et al. Initial experience in the use of integratedelectroanatomic mapping with three-dimensional MR/CT images to guide cath-eter ablation of atrial fibrillation. J Cardiovasc Electrophysiol 2006;17:459–466.
6. Kistler PM, Earley MJ, Harris S, et al. Validation of three-dimensional cardiacimage integration: use of integrated CT image into electroanatomic mappingsystem to perform catheter ablation of atrial fibrillation. J Cardiovasc Electro-physiol 2006;17:341–348.
7. Kuklik P, Szumowski L, Zebrowski JJ, et al. The reconstruction, from a set ofpoints, and analysis of the interior surface of the heart chamber. Physiol Meas2004;25:617–627.
8. Kistler PM, Schilling RJ, Rajappan K, et al. Image integration for AF ablation:pearls and pitfalls. Heart Rhythm 2007;4:1216–1221.
9. Zhong H, Lacomis JM, Schwartzman D. On the accuracy of CartoMerge forguiding posterior left atrial ablation in man. Heart Rhythm 2007;4:595–602.
0. Fahmy TS, Mlcochova H, Wazni OM, et al. Intracardiac echo-guided image
integration: optimizing strategies for registration. J Cardiovasc Electrophysiol2007;18:276–282.