An instrument to assess quality of life in relation to nutrition: item generation, item reduction...
13
RESEARCH Open Access An instrument to assess quality of life in relation to nutrition: item generation, item reduction and initial validation Holger J Schünemann 1* , Francesca Sperati 2 , Maddalena Barba 2 , Nancy Santesso 3 , Camilla Melegari 4 , Elie A Akl 1 , Gordon Guyatt 3 , Paola Muti 2 Abstract Background: It is arguable that modification of diet, given its potential for positive health outcomes, should be widely advocated and adopted. However, food intake, as a basic human need, and its modification may be accompanied by sensations of both pleasure and despondency and may consequently affect to quality of life (QoL). Thus, the feasibility and success of dietary changes will depend, at least partly, on whether potential negative influences on QoL can be avoided. This is of particular importance in the context of dietary intervention studies and in the development of new food products to improve health and well being. Instruments to measure the impact of nutrition on quality of life in the general population, however, are few and far between. Therefore, the aim of this project was to develop an instrument for measuring QoL related to nutrition in the general population. Methods and results: We recruited participants from the general population and followed standard methodology for quality of life instrument development (identification of population, item selection, n = 24; item reduction, n = 81; item presentation, n = 12; pretesting of questionnaire and initial validation, n = 2576; construct validation n = 128; and test-retest reliability n = 20). Of 187 initial items, 29 were selected for final presentation. Factor analysis revealed an instrument with 5 domains. The instrument demonstrated good cross-sectional divergent and convergent construct validity when correlated with scores of the 8 domains of the SF-36 (ranging from -0.078 to 0.562, 19 out of 40 tested correlations were statistically significant and 24 correlations were predicted correctly) and good test-retest reliability (intra-class correlation coefficients from 0.71 for symptoms to 0.90). Conclusions: We developed and validated an instrument with 29 items across 5 domains to assess quality of life related to nutrition and other aspects of food intake. The instrument demonstrated good face and construct validity as well as good reliability. Future work will focus on the evaluation of longitudinal construct validity and responsiveness. Background The intake of food is a basic human need. This basic need is accompanied by sensations of both pleasure (e.g. related to taste, social interaction) and despondency (e.g. related to indigestion, gastrointestinal disturbances, weight gain). These sensations may affect quality of life (QoL) and may be influenced by different composition and nutrient content of food stuff. Furthermore, certain nutrients and types of diets may be associated with other patient important outcomes such as longevity, mortality and morbidity. For instance, the Mediterranean diet and high fruit and vegetable intake may lead to a range of positive health outcomes (e.g. reduction in myocardial infarction, stroke and pul- monary disease) [1]. One could therefore argue that modification of diet, given its potential for positive health outcomes, should be widely advocated and adopted. However, the feasibility and success of dietary changes will depend, at least partly, on whether poten- tial negative influences on QoL can be avoided. It is * Correspondence: [email protected] 1 Department of Medicine, University at Buffalo, State University of New York, Buffalo, New York, USA Schünemann et al. Health and Quality of Life Outcomes 2010, 8:26 http://www.hqlo.com/content/8/1/26 © 2010 Schünemann et al; licensee BioMed Central Ltd. This is an Open Access article distributed under the terms of the Creative Commons Attribution License (http://creativecommons.org/licenses/by/2.0), which permits unrestricted use, distribution, and reproduction in any medium, provided the original work is properly cited.
Transcript of An instrument to assess quality of life in relation to nutrition: item generation, item reduction...
RESEARCH Open Access
An instrument to assess quality of life in relationto nutrition: item generation, item reduction andinitial validationHolger J Schünemann1*, Francesca Sperati2, Maddalena Barba2, Nancy Santesso3, Camilla Melegari4, Elie A Akl1,Gordon Guyatt3, Paola Muti2
Abstract
Background: It is arguable that modification of diet, given its potential for positive health outcomes, should bewidely advocated and adopted. However, food intake, as a basic human need, and its modification may beaccompanied by sensations of both pleasure and despondency and may consequently affect to quality of life(QoL). Thus, the feasibility and success of dietary changes will depend, at least partly, on whether potentialnegative influences on QoL can be avoided. This is of particular importance in the context of dietary interventionstudies and in the development of new food products to improve health and well being. Instruments to measurethe impact of nutrition on quality of life in the general population, however, are few and far between. Therefore,the aim of this project was to develop an instrument for measuring QoL related to nutrition in the generalpopulation.
Methods and results: We recruited participants from the general population and followed standard methodologyfor quality of life instrument development (identification of population, item selection, n = 24; item reduction, n =81; item presentation, n = 12; pretesting of questionnaire and initial validation, n = 2576; construct validation n =128; and test-retest reliability n = 20). Of 187 initial items, 29 were selected for final presentation. Factor analysisrevealed an instrument with 5 domains. The instrument demonstrated good cross-sectional divergent andconvergent construct validity when correlated with scores of the 8 domains of the SF-36 (ranging from -0.078 to0.562, 19 out of 40 tested correlations were statistically significant and 24 correlations were predicted correctly) andgood test-retest reliability (intra-class correlation coefficients from 0.71 for symptoms to 0.90).
Conclusions: We developed and validated an instrument with 29 items across 5 domains to assess quality of liferelated to nutrition and other aspects of food intake. The instrument demonstrated good face and constructvalidity as well as good reliability. Future work will focus on the evaluation of longitudinal construct validity andresponsiveness.
BackgroundThe intake of food is a basic human need. This basicneed is accompanied by sensations of both pleasure (e.g.related to taste, social interaction) and despondency (e.g.related to indigestion, gastrointestinal disturbances,weight gain). These sensations may affect quality of life(QoL) and may be influenced by different compositionand nutrient content of food stuff.
Furthermore, certain nutrients and types of diets maybe associated with other patient important outcomessuch as longevity, mortality and morbidity. For instance,the Mediterranean diet and high fruit and vegetableintake may lead to a range of positive health outcomes(e.g. reduction in myocardial infarction, stroke and pul-monary disease) [1]. One could therefore argue thatmodification of diet, given its potential for positivehealth outcomes, should be widely advocated andadopted. However, the feasibility and success of dietarychanges will depend, at least partly, on whether poten-tial negative influences on QoL can be avoided. It is
* Correspondence: [email protected] of Medicine, University at Buffalo, State University of New York,Buffalo, New York, USA
Schünemann et al. Health and Quality of Life Outcomes 2010, 8:26http://www.hqlo.com/content/8/1/26
© 2010 Schünemann et al; licensee BioMed Central Ltd. This is an Open Access article distributed under the terms of the CreativeCommons Attribution License (http://creativecommons.org/licenses/by/2.0), which permits unrestricted use, distribution, andreproduction in any medium, provided the original work is properly cited.
therefore important to assess how food intake and diet-ary changes relate to QoL. This is of particular impor-tance in the context of dietary intervention studies andfor the development of new food products to improvehealth and well being. In addition, QoL related to nutri-tion may potentially serve as a predictor of compliancewith specific dietary interventions. Social context ofnutrition, such as eating together, may impact ondomains such as satisfaction and happiness [2].Instruments to measure the impact of nutrition on
quality of life in the general population, however, arefew and far between [3]. For example, Hatton et al.found that a prepared diet improved nutritional healthperceptions and affect and reduced hassles related tonutrition in patients with cardiovascular disease [4]. Theauthors used four tools that were modeled on diseasespecific quality of life and well-being instruments. Whilethe instruments showed face validity and indicated thatthe measured outcomes improved, details of item gen-eration and item reduction for these instruments werenot described. Furthermore Hatton did not addressquality of life related to social aspects of life, such asinteraction with others during meals, in particular insocieties that place high emphasis on diet and foodintake.Therefore, the aim of this project was to develop an
instrument for measuring QoL related to nutrition andfood intake in the general population.
MethodsWe followed standard methodology for quality of lifeinstrument development based on the following sixphases described in the framework by Guyatt and Kirsh-ner [5]:a. Identification of Populationb. Item Selectionc. Item Reductiond. Item Presentatione. Pretesting of Questionnairef. Validation of QuestionnaireWe focused on discriminative properties in this study,
but aimed to develop an instrument that eventually willbe also useable for evaluative purposes. However, we didnot investigate evaluative properties in this study. Theflow of the study is described in figure 1.
Search for existing instruments and identification of thepopulationWe began our work by searching the literature forinstruments measuring QoL related to food and foodinstruments related to QoL that could inform our work.We searched three databases (Medline, Health and Psy-chosocial Instruments (HAPI), CAB Abstracts) up toNovember 2007 and reviewed references from relevant
articles (see search strategies in appendix 1). Of the2083 citations resulting from the electronic search, therewere two food related quality of life scales of particularinterest that we reviewed prior to beginning the workon item generation [6,7]. Another citation described theuse of questionnaires related to the impact of prepareddiets on quality of life [4]. We also identified an abstractdescribing a nutrition QOL survey [8]. While providingpotentially relevant items, these scales primarily focuson quality of life related to dietary therapy. Otherinstruments related to food provided potentially relevantthemes such as food involvement, preparation, purchase,food diversity and social constraints related to food, butthey focused on special populations. However, our focuswas on the general population that might be exposed togeneral health messages regarding food intake and dietchanges. Thus, we aimed to recruit a representativesample of the general population applying the followinginclusion criteria: age greater than 18; no dietary restric-tions (with the exception of vegetarian diet); able toread and speak Italian. We excluded participants withpsychiatric, emotional or cognitive problems that couldprevent reliable completion of the questionnaire; a diag-nosis of a disease that is likely to influence completionof the questionnaire or selection of items; a major illnessthat substantially influences the patient’s quality of life;distance of residence from recruitment centre of greaterthan 1 hour drive.
Item generation and selectionThis phase consisted of extraction of items from thereviewed literature, feedback from nutrition experts andsemi-structured personal interviews (figure 1). Threeinvestigators interviewed participants using a semi-structured questionnaire allocating up to 90 minutes toeach interview. We recruited 24 participants in Novem-ber and December 2007 through a consumer researchagency in Rome, Italy. This consumer research agencyholds a database of approximately 7000 individualsrecruited since 1995 through public relation and publi-cally available databases. Potential candidates wereselected at random and invited by telephone or email toparticipate. Exclusion criteria for this phase of the studywere work activity in the following professions: publicrelation, journalism, market research, marketing, foodproduction or sales, psychology or sociology. Partici-pants should not have participated in other interviewsfor at least 3 months prior to recruitment in this study.Participants received reimbursement for their travelexpenses and provided informed consent. Table 1shows the demographic characteristics of theseparticipants.The item generation phase generated 187 items that
were partially overlapping.
Schünemann et al. Health and Quality of Life Outcomes 2010, 8:26http://www.hqlo.com/content/8/1/26
Page 2 of 13

Item reduction and pretestingWe grouped the collected items into similar themesbefore recruiting 81 participants in four Italian cities(Rome, Naples, Parma and Milan) for item reduction andinitial item presentation using the same agency as for theitem generation phase in addition to participants whoworked in food production and sales (figure 1). Table 2shows the demographic characteristics of these partici-pants. Participants used 7 point Likert-type scales to ratethe relative importance (not important (1) to extremelyimportant (7)), agreement with (complete disagreement(1) to complete agreement (7)), or frequency of occur-rence (never (1) to always (7)) for each of the selecteditems. We also began testing comprehension of draftitems in the final third of the 81 participants by obtainingfeedback about readability and clarity of question.We then conducted descriptive analysis, factor analy-
sis, bivariate correlations and item-item correlations.After eliminating items of low importance, low agree-ment between participants about the importance orinfrequent occurrence, we grouped the remaining 105
Figure 1 Flow chart of phases in the study and recruited participants.
Table 1 Demographic characteristics: item generationand selection phase (n = 24)
mean SD Lowest - Highest
Age 30.5 7.53 19 - 44
Weight 70.7 16.1 46 - 112
Height 172.5 9.3 158 - 190
N %
24
Gender
M 12 50.0
F 12 50.0
Level of education
Middle school 14 58.3
High school 8 33.3
Masters’ level education 1 4.2
No Information 1 4.2
Marital status
Married 9 37.5
Separated or divorced 1 4.2
Not married 14 58.3
Schünemann et al. Health and Quality of Life Outcomes 2010, 8:26http://www.hqlo.com/content/8/1/26
Page 3 of 13
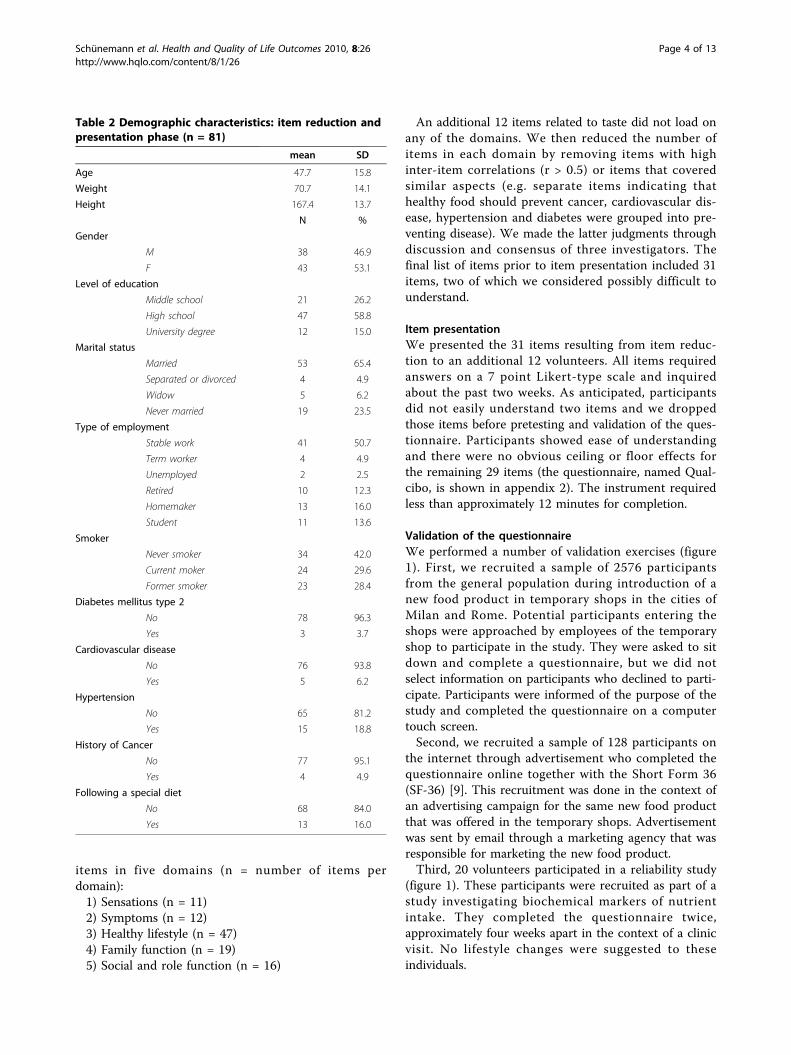
items in five domains (n = number of items perdomain):1) Sensations (n = 11)2) Symptoms (n = 12)3) Healthy lifestyle (n = 47)4) Family function (n = 19)5) Social and role function (n = 16)
An additional 12 items related to taste did not load onany of the domains. We then reduced the number ofitems in each domain by removing items with highinter-item correlations (r > 0.5) or items that coveredsimilar aspects (e.g. separate items indicating thathealthy food should prevent cancer, cardiovascular dis-ease, hypertension and diabetes were grouped into pre-venting disease). We made the latter judgments throughdiscussion and consensus of three investigators. Thefinal list of items prior to item presentation included 31items, two of which we considered possibly difficult tounderstand.
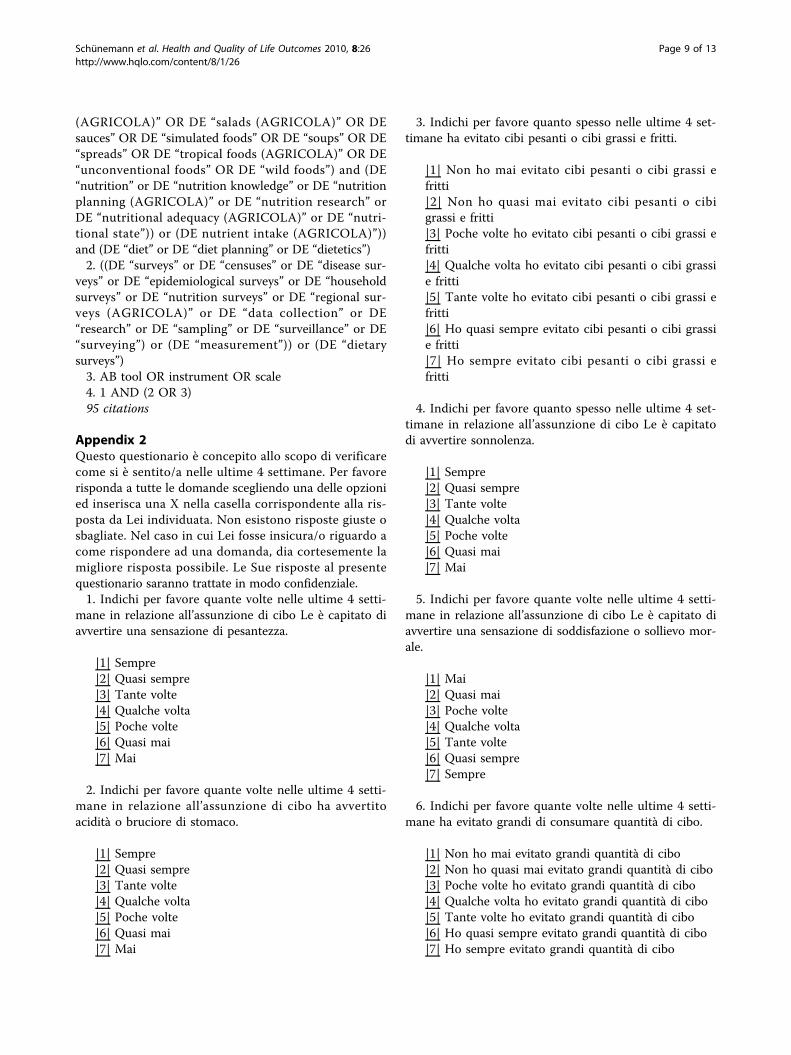
Item presentationWe presented the 31 items resulting from item reduc-tion to an additional 12 volunteers. All items requiredanswers on a 7 point Likert-type scale and inquiredabout the past two weeks. As anticipated, participantsdid not easily understand two items and we droppedthose items before pretesting and validation of the ques-tionnaire. Participants showed ease of understandingand there were no obvious ceiling or floor effects forthe remaining 29 items (the questionnaire, named Qual-cibo, is shown in appendix 2). The instrument requiredless than approximately 12 minutes for completion.
Validation of the questionnaireWe performed a number of validation exercises (figure1). First, we recruited a sample of 2576 participantsfrom the general population during introduction of anew food product in temporary shops in the cities ofMilan and Rome. Potential participants entering theshops were approached by employees of the temporaryshop to participate in the study. They were asked to sitdown and complete a questionnaire, but we did notselect information on participants who declined to parti-cipate. Participants were informed of the purpose of thestudy and completed the questionnaire on a computertouch screen.Second, we recruited a sample of 128 participants on
the internet through advertisement who completed thequestionnaire online together with the Short Form 36(SF-36) [9]. This recruitment was done in the context ofan advertising campaign for the same new food productthat was offered in the temporary shops. Advertisementwas sent by email through a marketing agency that wasresponsible for marketing the new food product.Third, 20 volunteers participated in a reliability study
(figure 1). These participants were recruited as part of astudy investigating biochemical markers of nutrientintake. They completed the questionnaire twice,approximately four weeks apart in the context of a clinicvisit. No lifestyle changes were suggested to theseindividuals.
Table 2 Demographic characteristics: item reduction andpresentation phase (n = 81)
mean SD
Age 47.7 15.8
Weight 70.7 14.1
Height 167.4 13.7
N %
Gender
M 38 46.9
F 43 53.1
Level of education
Middle school 21 26.2
High school 47 58.8
University degree 12 15.0
Marital status
Married 53 65.4
Separated or divorced 4 4.9
Widow 5 6.2
Never married 19 23.5
Type of employment
Stable work 41 50.7
Term worker 4 4.9
Unemployed 2 2.5
Retired 10 12.3
Homemaker 13 16.0
Student 11 13.6
Smoker
Never smoker 34 42.0
Current moker 24 29.6
Former smoker 23 28.4
Diabetes mellitus type 2
No 78 96.3
Yes 3 3.7
Cardiovascular disease
No 76 93.8
Yes 5 6.2
Hypertension
No 65 81.2
Yes 15 18.8
History of Cancer
No 77 95.1
Yes 4 4.9
Following a special diet
No 68 84.0
Yes 13 16.0
Schünemann et al. Health and Quality of Life Outcomes 2010, 8:26http://www.hqlo.com/content/8/1/26
Page 4 of 13
Statistical analysis for validation and reliability studyWe calculated Pearson correlation coefficients betweenthe items selected for presentation of the initial valida-tion set of 2576 participants. We based the allocation ofthe items of Qualcibo into domains on factor analysis(principal component analysis with varimax rotation)and face validity as judged by the investigators [10]. Toinvestigate the internal consistency of Qualcibodomains, we calculated Cronbach alpha values [10]. Weevaluated convergent and discriminant cross sectionalconstruct validity by calculating Pearson’s correlationcoefficients between Qualcibo domains and the SF-36domains in 128 participants. We considered correlationsof less than 0.2 as very weak, from 0.2 to 0.35 as weak,from greater than 0.35 to 0.5 as moderate, and of morethan 0.5 as strong. For interpretation of the data, weused blinded a priori ratings about the strength of thecorrelation between the 8 domains on the SF36 and theQualcibo from four of the authors with significantexperience in quality of life research. Finally, we evalu-ated the test-retest reliability of Qualcibo using repeatedmeasurements in the sample of 20 individuals who com-pleted the instrument twice. We calculated mean scoresat the two administrations and compared these scoresfor all 29 questions using a paired t-test and calculatedPearson’s correlation coefficient. We then calculatedintra-class correlation coefficients by domain where thebetween-rater variance estimates at the two times ofadministration were in the numerator and the between-rater variance in addition to the within-rater variance ofthe two ratings in the denominator [11,12]. We usedSPSS for Windows 14.0 and 17.0 for the statistical ana-lyses (SPSS, Inc, Chicago, Ill).
EthicsThe item generation and item reduction phase wasapproved by the ethics board of the Italian NationalCancer Institute “Regina Elena” in Rome, Italy.Recruited participants signed an informed consent. Forthe latter part of the study, the requirement forinformed consents was waived by the institutionalreview board and the reliability data were provided byone of the investigators (CM) as part of an ongoingstudy that had received ethics approval by the Universityof Parma.
ResultsDevelopmentDescriptive characteristics of the participants enrolledfor the item generation and selection phase (n = 24) areshown in Table 1. 81 participants completed theextended item questionnaire of 187 items and theirdescriptive characteristics are shown in Table 2. Wereduced this set of items to 29 through statistical
analyses, discussion and item presentation in the itemreduction phase.
Pretesting and validationThirty-nine percent of the 2576 participants were men.The mean age of the recruited participants was 42.2years, with a mean weight of 66.2 kg and height of169.7 cm.Table 3 shows the results of the factor analysis for the
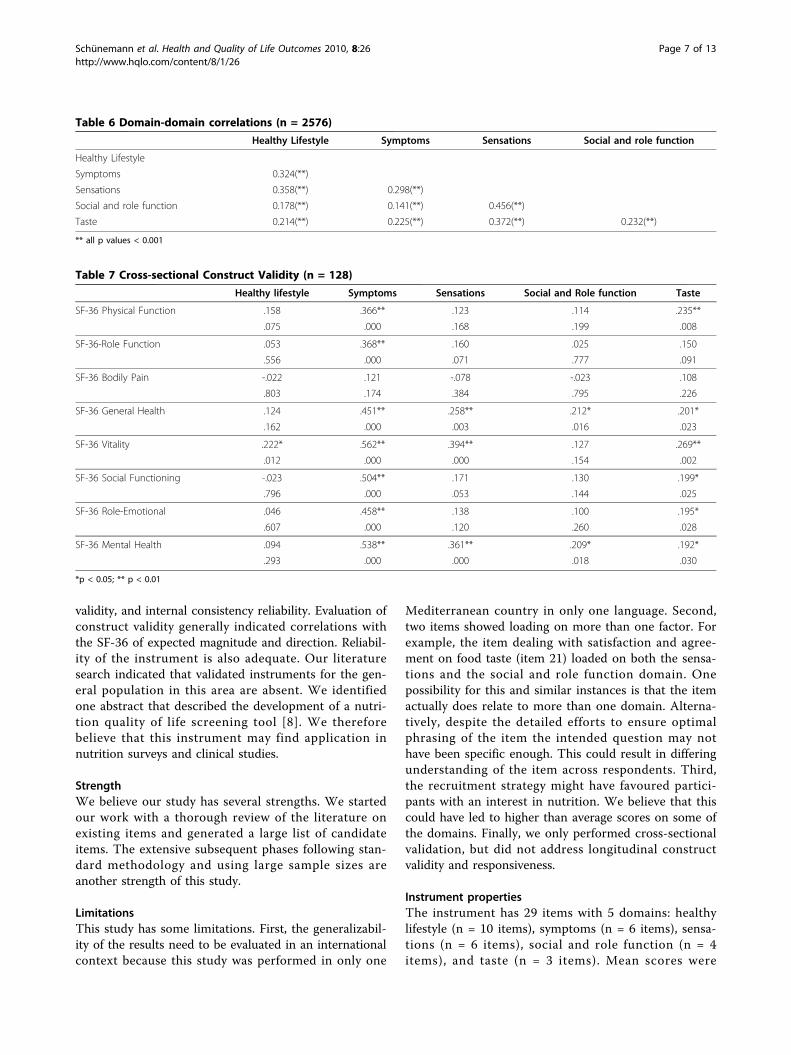
29 items. The items loaded on five factors that wererelated to the initial clusters we identified: healthy life-style (n = 10 items), symptoms (n = 6), sensations (n =6), social and role function (n = 4), taste (n = 3). Table4 shows the internal consistency reliability for the entireset of questions and the single domains. Table 5 showsthe mean scores for the five domains and table 6 thecorrelations among domains. The mean scores wereabove 4 (the mean of the score range) but the standarddeviation was approximately 1.0 for all domains. Wefound that two items (becoming upset in relation tofood intake and a feeling of happiness after a rich break-fast) were not loading uniquely on only one factor.Furthermore, one of these items (becoming upset inrelation to food intake) showed a flat distribution indi-cating that this item may have been misunderstood byparticipants.
Cross-sectional construct validityThe 128 participants (35.9% male) who participated inthe internet survey and completed both the Qualciboand the SF-36 had a mean age of 35.3 (SD 10.2) years,mean weight of 63.9 (SD 13.2) kg, and were 169.7 (SD8.9, data missing on 14 individuals) cm tall. The correla-tions between the domains on the Qualcibo and the SF-36 ranged from -0.078 to 0.562 (table 7). Of the 40tested correlations, 19 were statistically significant (p <0.01 for 12 correlations and p < 0.05 for 7 correlations).The correlations in the Qualcibo symptoms domainwith all of the SF36 domains were higher (primarily inthe moderate to strong category) than the other Qual-cibo domains. Most of the correlations were weak tovery weak. However, except for the correlations with thesymptoms domain for which we expected slightly lowercorrelations, the direction and magnitude of the associa-tions were generally in line with the predictions by theauthors with expertise in quality of life research. In fact,24 correlations were predicted correctly, 15 were eitherhigher or lower by one category and one lower by twocategories (predicted as moderate correlation butresulted as very weak).
ReliabilityThe 20 participants who completed the Qualcibo twicehad a mean age of 65.7 (SD 4.4) years, weighted 76.6
Schünemann et al. Health and Quality of Life Outcomes 2010, 8:26http://www.hqlo.com/content/8/1/26
Page 5 of 13
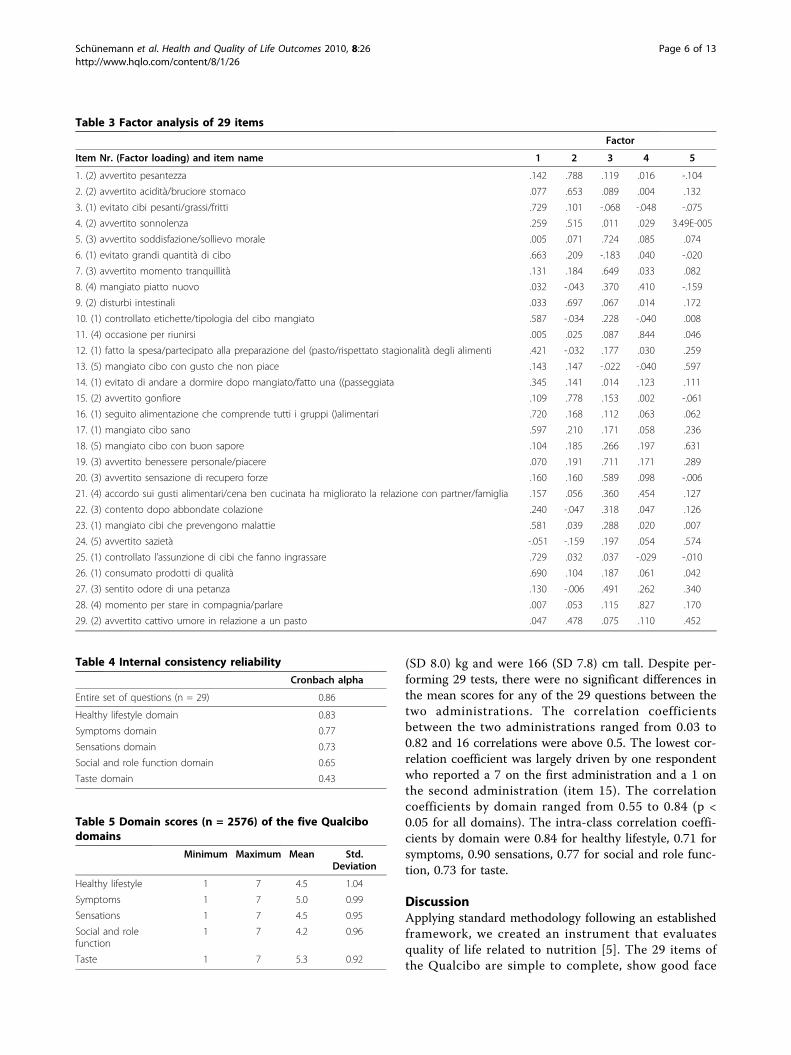
(SD 8.0) kg and were 166 (SD 7.8) cm tall. Despite per-forming 29 tests, there were no significant differences inthe mean scores for any of the 29 questions between thetwo administrations. The correlation coefficientsbetween the two administrations ranged from 0.03 to0.82 and 16 correlations were above 0.5. The lowest cor-relation coefficient was largely driven by one respondentwho reported a 7 on the first administration and a 1 onthe second administration (item 15). The correlationcoefficients by domain ranged from 0.55 to 0.84 (p <0.05 for all domains). The intra-class correlation coeffi-cients by domain were 0.84 for healthy lifestyle, 0.71 forsymptoms, 0.90 sensations, 0.77 for social and role func-tion, 0.73 for taste.
DiscussionApplying standard methodology following an establishedframework, we created an instrument that evaluatesquality of life related to nutrition [5]. The 29 items ofthe Qualcibo are simple to complete, show good face
Table 3 Factor analysis of 29 items
Factor
Item Nr. (Factor loading) and item name 1 2 3 4 5
1. (2) avvertito pesantezza .142 .788 .119 .016 -.104
2. (2) avvertito acidità/bruciore stomaco .077 .653 .089 .004 .132
3. (1) evitato cibi pesanti/grassi/fritti .729 .101 -.068 -.048 -.075
4. (2) avvertito sonnolenza .259 .515 .011 .029 3.49E-005
5. (3) avvertito soddisfazione/sollievo morale .005 .071 .724 .085 .074
6. (1) evitato grandi quantità di cibo .663 .209 -.183 .040 -.020
7. (3) avvertito momento tranquillità .131 .184 .649 .033 .082
8. (4) mangiato piatto nuovo .032 -.043 .370 .410 -.159
9. (2) disturbi intestinali .033 .697 .067 .014 .172
10. (1) controllato etichette/tipologia del cibo mangiato .587 -.034 .228 -.040 .008
11. (4) occasione per riunirsi .005 .025 .087 .844 .046
12. (1) fatto la spesa/partecipato alla preparazione del (pasto/rispettato stagionalità degli alimenti .421 -.032 .177 .030 .259
13. (5) mangiato cibo con gusto che non piace .143 .147 -.022 -.040 .597
14. (1) evitato di andare a dormire dopo mangiato/fatto una ((passeggiata .345 .141 .014 .123 .111
15. (2) avvertito gonfiore .109 .778 .153 .002 -.061
16. (1) seguito alimentazione che comprende tutti i gruppi ()alimentari .720 .168 .112 .063 .062
17. (1) mangiato cibo sano .597 .210 .171 .058 .236
18. (5) mangiato cibo con buon sapore .104 .185 .266 .197 .631
19. (3) avvertito benessere personale/piacere .070 .191 .711 .171 .289
20. (3) avvertito sensazione di recupero forze .160 .160 .589 .098 -.006
21. (4) accordo sui gusti alimentari/cena ben cucinata ha migliorato la relazione con partner/famiglia .157 .056 .360 .454 .127
22. (3) contento dopo abbondate colazione .240 -.047 .318 .047 .126
23. (1) mangiato cibi che prevengono malattie .581 .039 .288 .020 .007
24. (5) avvertito sazietà -.051 -.159 .197 .054 .574
25. (1) controllato l’assunzione di cibi che fanno ingrassare .729 .032 .037 -.029 -.010
26. (1) consumato prodotti di qualità .690 .104 .187 .061 .042
27. (3) sentito odore di una petanza .130 -.006 .491 .262 .340
28. (4) momento per stare in compagnia/parlare .007 .053 .115 .827 .170
29. (2) avvertito cattivo umore in relazione a un pasto .047 .478 .075 .110 .452
Table 4 Internal consistency reliability
Cronbach alpha
Entire set of questions (n = 29) 0.86
Healthy lifestyle domain 0.83
Symptoms domain 0.77
Sensations domain 0.73
Social and role function domain 0.65
Taste domain 0.43
Table 5 Domain scores (n = 2576) of the five Qualcibodomains
Minimum Maximum Mean Std.Deviation
Healthy lifestyle 1 7 4.5 1.04
Symptoms 1 7 5.0 0.99
Sensations 1 7 4.5 0.95
Social and rolefunction
1 7 4.2 0.96
Taste 1 7 5.3 0.92
Schünemann et al. Health and Quality of Life Outcomes 2010, 8:26http://www.hqlo.com/content/8/1/26
Page 6 of 13
validity, and internal consistency reliability. Evaluation ofconstruct validity generally indicated correlations withthe SF-36 of expected magnitude and direction. Reliabil-ity of the instrument is also adequate. Our literaturesearch indicated that validated instruments for the gen-eral population in this area are absent. We identifiedone abstract that described the development of a nutri-tion quality of life screening tool [8]. We thereforebelieve that this instrument may find application innutrition surveys and clinical studies.
StrengthWe believe our study has several strengths. We startedour work with a thorough review of the literature onexisting items and generated a large list of candidateitems. The extensive subsequent phases following stan-dard methodology and using large sample sizes areanother strength of this study.
LimitationsThis study has some limitations. First, the generalizabil-ity of the results need to be evaluated in an internationalcontext because this study was performed in only one
Mediterranean country in only one language. Second,two items showed loading on more than one factor. Forexample, the item dealing with satisfaction and agree-ment on food taste (item 21) loaded on both the sensa-tions and the social and role function domain. Onepossibility for this and similar instances is that the itemactually does relate to more than one domain. Alterna-tively, despite the detailed efforts to ensure optimalphrasing of the item the intended question may nothave been specific enough. This could result in differingunderstanding of the item across respondents. Third,the recruitment strategy might have favoured partici-pants with an interest in nutrition. We believe that thiscould have led to higher than average scores on some ofthe domains. Finally, we only performed cross-sectionalvalidation, but did not address longitudinal constructvalidity and responsiveness.
Instrument propertiesThe instrument has 29 items with 5 domains: healthylifestyle (n = 10 items), symptoms (n = 6 items), sensa-tions (n = 6 items), social and role function (n = 4items), and taste (n = 3 items). Mean scores were
Table 6 Domain-domain correlations (n = 2576)
Healthy Lifestyle Symptoms Sensations Social and role function
Healthy Lifestyle
Symptoms 0.324(**)
Sensations 0.358(**) 0.298(**)
Social and role function 0.178(**) 0.141(**) 0.456(**)
Taste 0.214(**) 0.225(**) 0.372(**) 0.232(**)
** all p values < 0.001
Table 7 Cross-sectional Construct Validity (n = 128)
Healthy lifestyle Symptoms Sensations Social and Role function Taste
SF-36 Physical Function .158 .366** .123 .114 .235**
.075 .000 .168 .199 .008
SF-36-Role Function .053 .368** .160 .025 .150
.556 .000 .071 .777 .091
SF-36 Bodily Pain -.022 .121 -.078 -.023 .108
.803 .174 .384 .795 .226
SF-36 General Health .124 .451** .258** .212* .201*
.162 .000 .003 .016 .023
SF-36 Vitality .222* .562** .394** .127 .269**
.012 .000 .000 .154 .002
SF-36 Social Functioning -.023 .504** .171 .130 .199*
.796 .000 .053 .144 .025
SF-36 Role-Emotional .046 .458** .138 .100 .195*
.607 .000 .120 .260 .028
SF-36 Mental Health .094 .538** .361** .209* .192*
.293 .000 .000 .018 .030
*p < 0.05; ** p < 0.01
Schünemann et al. Health and Quality of Life Outcomes 2010, 8:26http://www.hqlo.com/content/8/1/26
Page 7 of 13
above 4 in the large validation set of 2576 participantswho likely possessed above average interest in nutri-tion. Further work in other large representative popu-lations is required to establish the mean score in thegeneral population. However, we believe that the scoredistribution indicates that both deterioration andimprovement will be detectable in most populations.Correlations with the SF-36 domains were very weakto strong. Although most of the correlations wereweak, we expected these low correlations because ourinstrument focuses on domains that are only partiallyrelated to those of the SF-36 and more specific forfood intake. Given that we made a priori predictionsabout the strength of the associations, the observedcorrelations indicated good construct validity. Finally,both internal consistency reliability and test-retestreliability indicate that this instrument has good psy-chometric properties.
ContextIn the context of recommendations about diet and clini-cal interventions to alter risk factors, the need forinstruments to assess the impact of nutrition relatedlifestyle changes exists [3]. This instrument is one of thefirst to tackle the gap of validated tools to assess therelation between nutrition and quality of life. We foundthat sensations, symptoms healthy lifestyle, family func-tion, social and role function are important in the con-text of nutrition. The impact on those domains shouldbe considered in the prescription of dietary interven-tions to patients in both the clinical and the researchsettings. It will be important to explore whether poten-tial small benefits in morbidity outcomes as a result ofdietary interventions studies outweigh potential negativeoutcomes on quality of life and vice versa. Our instru-ment should allow this assessment. The instrumentmight also be able to predict the compliance of subjectswith specific dietary interventions based on reportedchange in QoL with the introduction of those diets. Theinstrument will require additional work to ensure propertranslation and cultural adaptation.
ConclusionsWe developed and validated an instrument to assessquality of life related to nutrition and other aspects offood intake. The instrument demonstrates promisingvalidity and will be a suitable questionnaire for popula-tion based research on diet changes and the impact ofnutrition on Qol. It can be used to determine whetherdietary interventions negatively or positively influenceindividuals’ perception of QoL related to nutrition.Further work will focus on the instruments longitudinalconstruct validity and responsiveness.
Appendix 1Search Strategies and ResultsHealth and Psychosocial Instruments 1985 to November20071. (food$ or nutri$ or eat$ or feed$ or meal$ or diet$).m_titl.2. (life or behavio$ or habit$ or practice$ or activit$ or
attitud$ or belie$ or emotion$ or psych$).mp. [mp =title, acronym, descriptors, abstract]3. (content$ or happ$ or satisf$ or quality or enjoy$ or
pleas$).mp. [mp = title, acronym, descriptors, abstract]4. 1 and (2 or 3)1305 citations
Medline 1950 - November 20071. exp food/2. exp nutrition therapy/3. exp diet/4. exp feeding behavior/5. or/1-46. quality of life.tw.7. quality of life/8. ((content or contented$ or happy or happiness or
happily or satisfy or satisfied or satisfaction or enjoy$ orpleas$) and life).tw.9. or/6-810. psychometrics/11. questionnaires/12. (scale$ or questionnaire$).tw.13. “Outcome Assessment (Health Care)"/14. or/10-1315. 5 and 9 and 14683 citations
CAB Abstracts (1973 - November 2007)1. (((DE “food” OR DE “food products” OR DE “foods”or DE “food beliefs” or DE “food intake” or DE “foodintolerance (AGRICOLA)” or DE “food preferences” orDE “food preparation” or DE “food purchasing (AGRI-COLA)” or DE “food quality” or DE “food research” orDE “food sciences” or DE “foods” OR DE “beverages”OR DE “carbohydrate-rich foods” OR DE “chewinggum” OR DE “confectionery” OR DE “conveniencefoods” OR DE “desserts” OR DE “dietetic foods” OR DE“ethnic foods (AGRICOLA)” OR DE “fast foods” OR DE“food pastes” OR DE “food supplements” OR DE “friedfoods (AGRICOLA)” OR DE “functional foods” OR DE“garnishes (AGRICOLA)” OR DE “health foods” OR DE“infant foods” OR DE “kosher food (AGRICOLA)” ORDE “low acid foods (AGRICOLA)” OR DE “low caloriefoods (AGRICOLA)” OR DE “low fat products” OR DE“natural foods (AGRICOLA)” OR DE “novel foods(AGRICOLA)” OR DE “organic foods” OR DE “pickledfoods (AGRICOLA)” OR DE “precooked foods (AGRI-COLA)” OR DE “protein foods” OR DE “salad dressings
Schünemann et al. Health and Quality of Life Outcomes 2010, 8:26http://www.hqlo.com/content/8/1/26
Page 8 of 13
(AGRICOLA)” OR DE “salads (AGRICOLA)” OR DEsauces” OR DE “simulated foods” OR DE “soups” OR DE“spreads” OR DE “tropical foods (AGRICOLA)” OR DE“unconventional foods” OR DE “wild foods”) and (DE“nutrition” or DE “nutrition knowledge” or DE “nutritionplanning (AGRICOLA)” or DE “nutrition research” orDE “nutritional adequacy (AGRICOLA)” or DE “nutri-tional state”)) or (DE nutrient intake (AGRICOLA)”))and (DE “diet” or DE “diet planning” or DE “dietetics”)2. ((DE “surveys” or DE “censuses” or DE “disease sur-
veys” or DE “epidemiological surveys” or DE “householdsurveys” or DE “nutrition surveys” or DE “regional sur-veys (AGRICOLA)” or DE “data collection” or DE“research” or DE “sampling” or DE “surveillance” or DE“surveying”) or (DE “measurement”)) or (DE “dietarysurveys”)3. AB tool OR instrument OR scale4. 1 AND (2 OR 3)95 citations
Appendix 2Questo questionario è concepito allo scopo di verificarecome si è sentito/a nelle ultime 4 settimane. Per favorerisponda a tutte le domande scegliendo una delle opzionied inserisca una X nella casella corrispondente alla ris-posta da Lei individuata. Non esistono risposte giuste osbagliate. Nel caso in cui Lei fosse insicura/o riguardo acome rispondere ad una domanda, dia cortesemente lamigliore risposta possibile. Le Sue risposte al presentequestionario saranno trattate in modo confidenziale.1. Indichi per favore quante volte nelle ultime 4 setti-
mane in relazione all’assunzione di cibo Le è capitato diavvertire una sensazione di pesantezza.
|1| Sempre|2| Quasi sempre|3| Tante volte|4| Qualche volta|5| Poche volte|6| Quasi mai|7| Mai
2. Indichi per favore quante volte nelle ultime 4 setti-mane in relazione all’assunzione di cibo ha avvertitoacidità o bruciore di stomaco.
|1| Sempre|2| Quasi sempre|3| Tante volte|4| Qualche volta|5| Poche volte|6| Quasi mai|7| Mai
3. Indichi per favore quanto spesso nelle ultime 4 set-timane ha evitato cibi pesanti o cibi grassi e fritti.
|1| Non ho mai evitato cibi pesanti o cibi grassi efritti|2| Non ho quasi mai evitato cibi pesanti o cibigrassi e fritti|3| Poche volte ho evitato cibi pesanti o cibi grassi efritti|4| Qualche volta ho evitato cibi pesanti o cibi grassie fritti|5| Tante volte ho evitato cibi pesanti o cibi grassi efritti|6| Ho quasi sempre evitato cibi pesanti o cibi grassie fritti|7| Ho sempre evitato cibi pesanti o cibi grassi efritti
4. Indichi per favore quanto spesso nelle ultime 4 set-timane in relazione all’assunzione di cibo Le è capitatodi avvertire sonnolenza.
|1| Sempre|2| Quasi sempre|3| Tante volte|4| Qualche volta|5| Poche volte|6| Quasi mai|7| Mai
5. Indichi per favore quante volte nelle ultime 4 setti-mane in relazione all’assunzione di cibo Le è capitato diavvertire una sensazione di soddisfazione o sollievo mor-ale.
|1| Mai|2| Quasi mai|3| Poche volte|4| Qualche volta|5| Tante volte|6| Quasi sempre|7| Sempre
6. Indichi per favore quante volte nelle ultime 4 setti-mane ha evitato grandi di consumare quantità di cibo.
|1| Non ho mai evitato grandi quantità di cibo|2| Non ho quasi mai evitato grandi quantità di cibo|3| Poche volte ho evitato grandi quantità di cibo|4| Qualche volta ho evitato grandi quantità di cibo|5| Tante volte ho evitato grandi quantità di cibo|6| Ho quasi sempre evitato grandi quantità di cibo|7| Ho sempre evitato grandi quantità di cibo
Schünemann et al. Health and Quality of Life Outcomes 2010, 8:26http://www.hqlo.com/content/8/1/26
Page 9 of 13
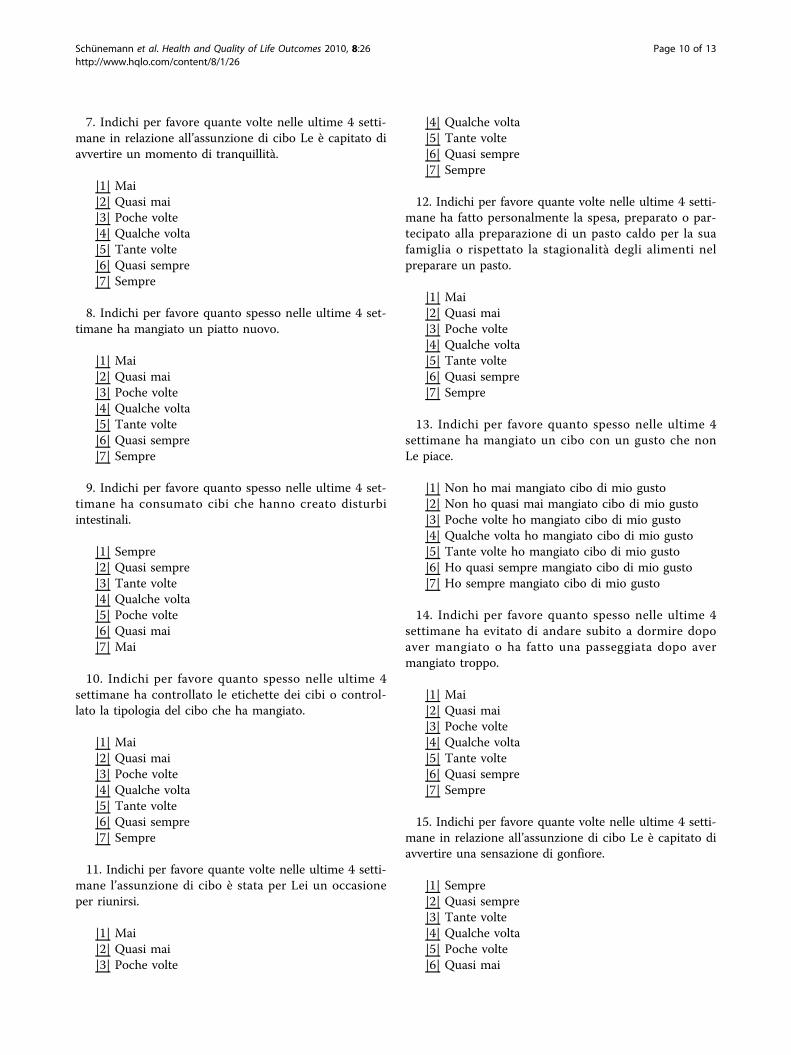
7. Indichi per favore quante volte nelle ultime 4 setti-mane in relazione all’assunzione di cibo Le è capitato diavvertire un momento di tranquillità.
|1| Mai|2| Quasi mai|3| Poche volte|4| Qualche volta|5| Tante volte|6| Quasi sempre|7| Sempre
8. Indichi per favore quanto spesso nelle ultime 4 set-timane ha mangiato un piatto nuovo.
|1| Mai|2| Quasi mai|3| Poche volte|4| Qualche volta|5| Tante volte|6| Quasi sempre|7| Sempre
9. Indichi per favore quanto spesso nelle ultime 4 set-timane ha consumato cibi che hanno creato disturbiintestinali.
|1| Sempre|2| Quasi sempre|3| Tante volte|4| Qualche volta|5| Poche volte|6| Quasi mai|7| Mai
10. Indichi per favore quanto spesso nelle ultime 4settimane ha controllato le etichette dei cibi o control-lato la tipologia del cibo che ha mangiato.
|1| Mai|2| Quasi mai|3| Poche volte|4| Qualche volta|5| Tante volte|6| Quasi sempre|7| Sempre
11. Indichi per favore quante volte nelle ultime 4 setti-mane l’assunzione di cibo è stata per Lei un occasioneper riunirsi.
|1| Mai|2| Quasi mai|3| Poche volte
|4| Qualche volta|5| Tante volte|6| Quasi sempre|7| Sempre
12. Indichi per favore quante volte nelle ultime 4 setti-mane ha fatto personalmente la spesa, preparato o par-tecipato alla preparazione di un pasto caldo per la suafamiglia o rispettato la stagionalità degli alimenti nelpreparare un pasto.
|1| Mai|2| Quasi mai|3| Poche volte|4| Qualche volta|5| Tante volte|6| Quasi sempre|7| Sempre
13. Indichi per favore quanto spesso nelle ultime 4settimane ha mangiato un cibo con un gusto che nonLe piace.
|1| Non ho mai mangiato cibo di mio gusto|2| Non ho quasi mai mangiato cibo di mio gusto|3| Poche volte ho mangiato cibo di mio gusto|4| Qualche volta ho mangiato cibo di mio gusto|5| Tante volte ho mangiato cibo di mio gusto|6| Ho quasi sempre mangiato cibo di mio gusto|7| Ho sempre mangiato cibo di mio gusto
14. Indichi per favore quanto spesso nelle ultime 4settimane ha evitato di andare subito a dormire dopoaver mangiato o ha fatto una passeggiata dopo avermangiato troppo.
|1| Mai|2| Quasi mai|3| Poche volte|4| Qualche volta|5| Tante volte|6| Quasi sempre|7| Sempre
15. Indichi per favore quante volte nelle ultime 4 setti-mane in relazione all’assunzione di cibo Le è capitato diavvertire una sensazione di gonfiore.
|1| Sempre|2| Quasi sempre|3| Tante volte|4| Qualche volta|5| Poche volte|6| Quasi mai
Schünemann et al. Health and Quality of Life Outcomes 2010, 8:26http://www.hqlo.com/content/8/1/26
Page 10 of 13
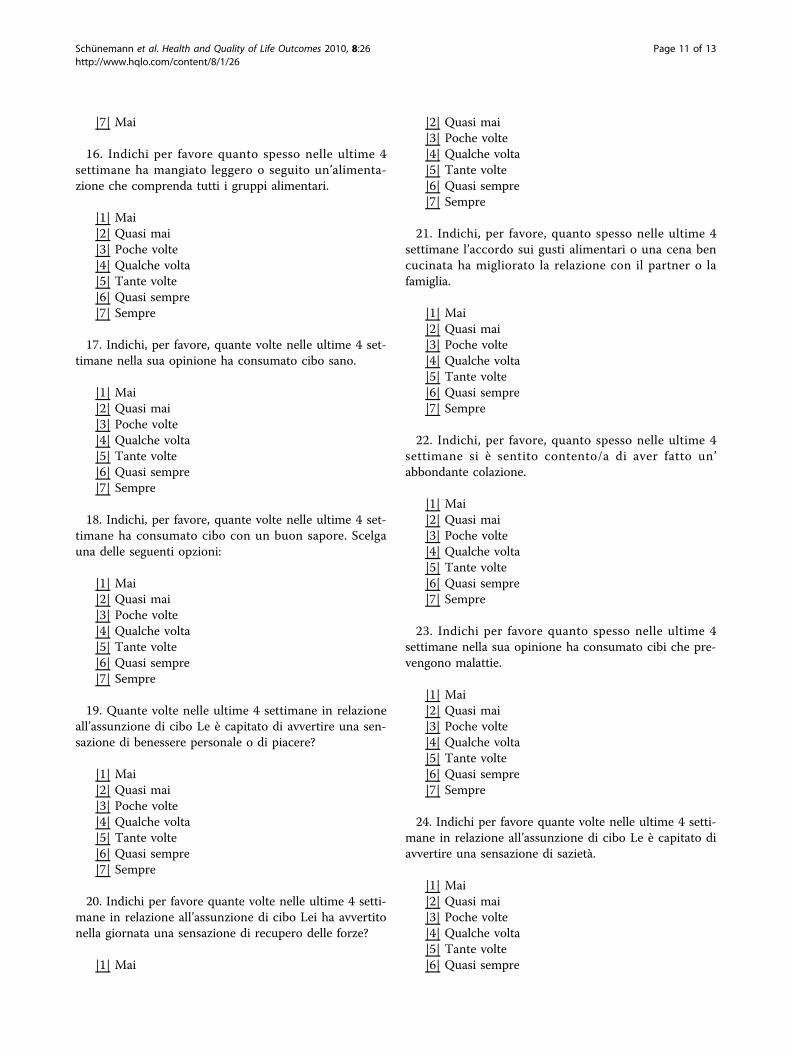
|7| Mai
16. Indichi per favore quanto spesso nelle ultime 4settimane ha mangiato leggero o seguito un’alimenta-zione che comprenda tutti i gruppi alimentari.
|1| Mai|2| Quasi mai|3| Poche volte|4| Qualche volta|5| Tante volte|6| Quasi sempre|7| Sempre
17. Indichi, per favore, quante volte nelle ultime 4 set-timane nella sua opinione ha consumato cibo sano.
|1| Mai|2| Quasi mai|3| Poche volte|4| Qualche volta|5| Tante volte|6| Quasi sempre|7| Sempre
18. Indichi, per favore, quante volte nelle ultime 4 set-timane ha consumato cibo con un buon sapore. Scelgauna delle seguenti opzioni:
|1| Mai|2| Quasi mai|3| Poche volte|4| Qualche volta|5| Tante volte|6| Quasi sempre|7| Sempre
19. Quante volte nelle ultime 4 settimane in relazioneall’assunzione di cibo Le è capitato di avvertire una sen-sazione di benessere personale o di piacere?
|1| Mai|2| Quasi mai|3| Poche volte|4| Qualche volta|5| Tante volte|6| Quasi sempre|7| Sempre
20. Indichi per favore quante volte nelle ultime 4 setti-mane in relazione all’assunzione di cibo Lei ha avvertitonella giornata una sensazione di recupero delle forze?
|1| Mai
|2| Quasi mai|3| Poche volte|4| Qualche volta|5| Tante volte|6| Quasi sempre|7| Sempre
21. Indichi, per favore, quanto spesso nelle ultime 4settimane l’accordo sui gusti alimentari o una cena bencucinata ha migliorato la relazione con il partner o lafamiglia.
|1| Mai|2| Quasi mai|3| Poche volte|4| Qualche volta|5| Tante volte|6| Quasi sempre|7| Sempre
22. Indichi, per favore, quanto spesso nelle ultime 4settimane si è sentito contento/a di aver fatto un’abbondante colazione.
|1| Mai|2| Quasi mai|3| Poche volte|4| Qualche volta|5| Tante volte|6| Quasi sempre|7| Sempre
23. Indichi per favore quanto spesso nelle ultime 4settimane nella sua opinione ha consumato cibi che pre-vengono malattie.
|1| Mai|2| Quasi mai|3| Poche volte|4| Qualche volta|5| Tante volte|6| Quasi sempre|7| Sempre
24. Indichi per favore quante volte nelle ultime 4 setti-mane in relazione all’assunzione di cibo Le è capitato diavvertire una sensazione di sazietà.
|1| Mai|2| Quasi mai|3| Poche volte|4| Qualche volta|5| Tante volte|6| Quasi sempre
Schünemann et al. Health and Quality of Life Outcomes 2010, 8:26http://www.hqlo.com/content/8/1/26
Page 11 of 13
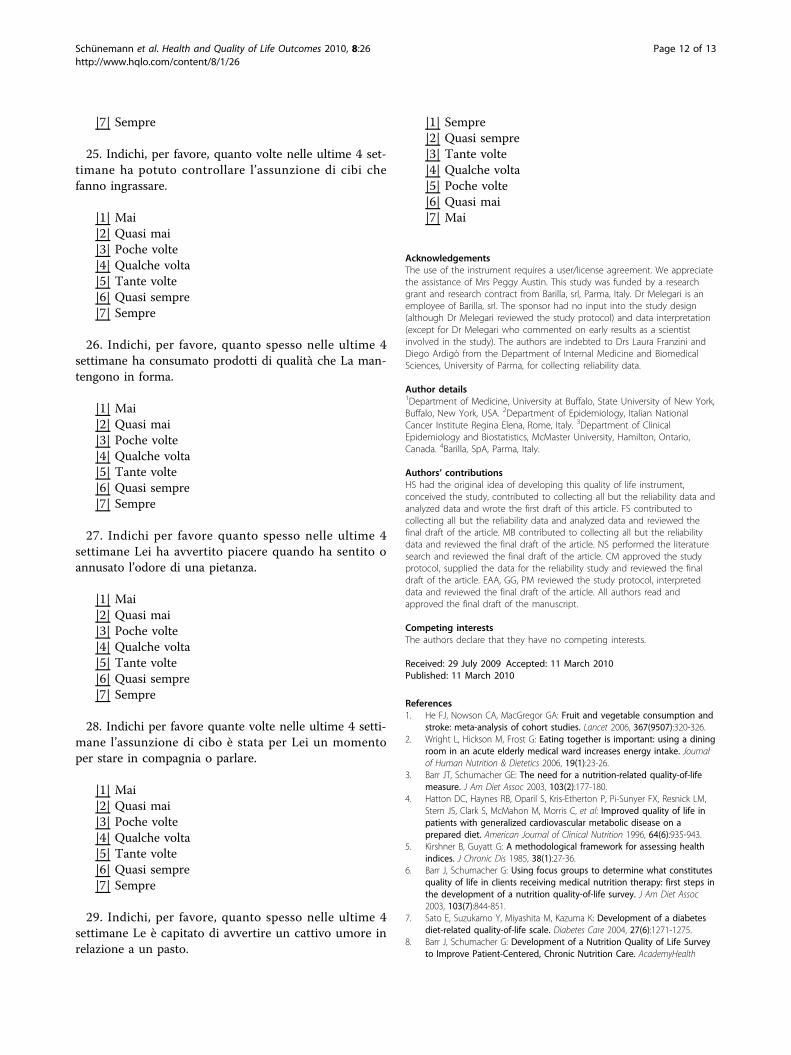
|7| Sempre
25. Indichi, per favore, quanto volte nelle ultime 4 set-timane ha potuto controllare l’assunzione di cibi chefanno ingrassare.
|1| Mai|2| Quasi mai|3| Poche volte|4| Qualche volta|5| Tante volte|6| Quasi sempre|7| Sempre
26. Indichi, per favore, quanto spesso nelle ultime 4settimane ha consumato prodotti di qualità che La man-tengono in forma.
|1| Mai|2| Quasi mai|3| Poche volte|4| Qualche volta|5| Tante volte|6| Quasi sempre|7| Sempre
27. Indichi per favore quanto spesso nelle ultime 4settimane Lei ha avvertito piacere quando ha sentito oannusato l’odore di una pietanza.
|1| Mai|2| Quasi mai|3| Poche volte|4| Qualche volta|5| Tante volte|6| Quasi sempre|7| Sempre
28. Indichi per favore quante volte nelle ultime 4 setti-mane l’assunzione di cibo è stata per Lei un momentoper stare in compagnia o parlare.
|1| Mai|2| Quasi mai|3| Poche volte|4| Qualche volta|5| Tante volte|6| Quasi sempre|7| Sempre
29. Indichi, per favore, quanto spesso nelle ultime 4settimane Le è capitato di avvertire un cattivo umore inrelazione a un pasto.
|1| Sempre|2| Quasi sempre|3| Tante volte|4| Qualche volta|5| Poche volte|6| Quasi mai|7| Mai
AcknowledgementsThe use of the instrument requires a user/license agreement. We appreciatethe assistance of Mrs Peggy Austin. This study was funded by a researchgrant and research contract from Barilla, srl, Parma, Italy. Dr Melegari is anemployee of Barilla, srl. The sponsor had no input into the study design(although Dr Melegari reviewed the study protocol) and data interpretation(except for Dr Melegari who commented on early results as a scientistinvolved in the study). The authors are indebted to Drs Laura Franzini andDiego Ardigò from the Department of Internal Medicine and BiomedicalSciences, University of Parma, for collecting reliability data.
Author details1Department of Medicine, University at Buffalo, State University of New York,Buffalo, New York, USA. 2Department of Epidemiology, Italian NationalCancer Institute Regina Elena, Rome, Italy. 3Department of ClinicalEpidemiology and Biostatistics, McMaster University, Hamilton, Ontario,Canada. 4Barilla, SpA, Parma, Italy.
Authors’ contributionsHS had the original idea of developing this quality of life instrument,conceived the study, contributed to collecting all but the reliability data andanalyzed data and wrote the first draft of this article. FS contributed tocollecting all but the reliability data and analyzed data and reviewed thefinal draft of the article. MB contributed to collecting all but the reliabilitydata and reviewed the final draft of the article. NS performed the literaturesearch and reviewed the final draft of the article. CM approved the studyprotocol, supplied the data for the reliability study and reviewed the finaldraft of the article. EAA, GG, PM reviewed the study protocol, interpreteddata and reviewed the final draft of the article. All authors read andapproved the final draft of the manuscript.
Competing interestsThe authors declare that they have no competing interests.
Received: 29 July 2009 Accepted: 11 March 2010Published: 11 March 2010
References1. He FJ, Nowson CA, MacGregor GA: Fruit and vegetable consumption and
stroke: meta-analysis of cohort studies. Lancet 2006, 367(9507):320-326.2. Wright L, Hickson M, Frost G: Eating together is important: using a dining
room in an acute elderly medical ward increases energy intake. Journalof Human Nutrition & Dietetics 2006, 19(1):23-26.
3. Barr JT, Schumacher GE: The need for a nutrition-related quality-of-lifemeasure. J Am Diet Assoc 2003, 103(2):177-180.
4. Hatton DC, Haynes RB, Oparil S, Kris-Etherton P, Pi-Sunyer FX, Resnick LM,Stern JS, Clark S, McMahon M, Morris C, et al: Improved quality of life inpatients with generalized cardiovascular metabolic disease on aprepared diet. American Journal of Clinical Nutrition 1996, 64(6):935-943.
5. Kirshner B, Guyatt G: A methodological framework for assessing healthindices. J Chronic Dis 1985, 38(1):27-36.
6. Barr J, Schumacher G: Using focus groups to determine what constitutesquality of life in clients receiving medical nutrition therapy: first steps inthe development of a nutrition quality-of-life survey. J Am Diet Assoc2003, 103(7):844-851.
7. Sato E, Suzukamo Y, Miyashita M, Kazuma K: Development of a diabetesdiet-related quality-of-life scale. Diabetes Care 2004, 27(6):1271-1275.
8. Barr J, Schumacher G: Development of a Nutrition Quality of Life Surveyto Improve Patient-Centered, Chronic Nutrition Care. AcademyHealth
Schünemann et al. Health and Quality of Life Outcomes 2010, 8:26http://www.hqlo.com/content/8/1/26
Page 12 of 13
Meeting (2005 : Boston, Mass) Abstr Academy Health Meet 2005, abstract no.4347.
9. Ware JE Jr, Kosinski M, Bayliss MS, McHorney CA, Rogers WH, Raczek A:Comparison of methods for the scoring and statistical analysis of SF-36health profile and summary measures: summary of results from theMedical Outcomes Study. Med Care 1995, 33(Suppl 4):AS264-279.
10. Streiner DL, Norman GR: Health Measurement Scales. Oxford: OxfordUniversity Press 2003.
11. Puhan MA, Guyatt GH, Montori VM, Bhandari M, Devereaux PJ, Griffith L,Goldstein R, Schunemann HJ: The standard gamble demonstrated lowerreliability than the feeling thermometer. J Clin Epidemiol 2005,58(5):458-465.
12. Schunemann HJ, Norman G, Puhan MA, Stahl E, Griffith L, Heels-Ansdell D,Montori VM, Wiklund I, Goldstein R, Mador MJ, et al: Application ofgeneralizability theory confirmed lower reliability of the standardgamble than the feeling thermometer. J Clin Epidemiol 2007,60(12):1256-1262.
doi:10.1186/1477-7525-8-26Cite this article as: Schünemann et al.: An instrument to assess qualityof life in relation to nutrition: item generation, item reduction andinitial validation. Health and Quality of Life Outcomes 2010 8:26.
Submit your next manuscript to BioMed Centraland take full advantage of:
• Convenient online submission
• Thorough peer review
• No space constraints or color figure charges
• Immediate publication on acceptance
• Inclusion in PubMed, CAS, Scopus and Google Scholar
• Research which is freely available for redistribution
Submit your manuscript at www.biomedcentral.com/submit
Schünemann et al. Health and Quality of Life Outcomes 2010, 8:26http://www.hqlo.com/content/8/1/26
Page 13 of 13