Agenda Item 7 - Merton Council
384
Committee: Cabinet Date: 13 February 2017 Agenda item: Wards: All Subject: Business Plan 2016-20 Lead officer: Caroline Holland, Director of Corporate Services Lead member: Councillor Mark Allison, Deputy Leader and Cabinet Member for Finance Urgent report: Reason for urgency: The chairman has approved the submission of this report as a matter of urgency as it provides the latest available information on the Business Plan and Budget 2017/18 and requires consideration of issues relating to the Budget process and Medium Term Financial Strategy 2017-2021. It is important that this consideration is not delayed in order that the Council can work towards a balanced budget at its meeting on 1 March 2017 and set a Council Tax as appropriate for 2017/18. Key Decision Reference Number: This report is written and any decisions taken are within the Budget and Policy Framework Procedure Rules as laid out in Part 4-C of the Constitution. Contact officer: Paul Dale Recommendations: 1. That Cabinet considers and agrees the response to the Overview and Scrutiny Commission; 2. That the Cabinet resolves that, having considered all of the information in this report and noted the positive assurance statement given by the Director of Corporate Services based on the proposed strategy, the Council Tax in 2017/18, equating to a Band D Council Tax of £1,135.31 be approved and recommended to Council for approval. 3. That the Cabinet considers all of the latest information and the comments from the scrutiny process, and makes recommendations to Council as appropriate 4. That Cabinet resolves that the Business Plan 2017-21 including the General Fund Budget and Council Tax Strategy for 2017/18, and the Medium Term Financial Strategy (MTFS) for 2017-2021 as submitted, along with the Equality Assessments (EAs), be approved and 1 Page 1 Agenda Item 7
-
Upload
khangminh22 -
Category
Documents
-
view
0 -
download
0
Transcript of Agenda Item 7 - Merton Council
Committee: Cabinet Date: 13 February 2017 Agenda item: Wards: All Subject: Business Plan 2016-20 Lead officer: Caroline Holland, Director of Corporate Services
Lead member: Councillor Mark Allison, Deputy Leader and Cabinet
Member for Finance Urgent report: Reason for urgency: The chairman has approved the submission of this report as a matter of urgency as it provides the latest available information on the Business Plan and Budget 2017/18 and requires consideration of issues relating to the Budget process and Medium Term Financial Strategy 2017-2021. It is important that this consideration is not delayed in order that the Council can work towards a balanced budget at its meeting on 1 March 2017 and set a Council Tax as appropriate for 2017/18. Key Decision Reference Number: This report is written and any decisions taken are within the Budget and Policy Framework Procedure Rules as laid out in Part 4-C of the Constitution. Contact officer: Paul Dale
Recommendations:
1. That Cabinet considers and agrees the response to the Overview and Scrutiny Commission;
2. That the Cabinet resolves that, having considered all of the information in
this report and noted the positive assurance statement given by the Director of Corporate Services based on the proposed strategy, the Council Tax in 2017/18, equating to a Band D Council Tax of £1,135.31 be approved and recommended to Council for approval.
3. That the Cabinet considers all of the latest information and the comments
from the scrutiny process, and makes recommendations to Council as appropriate
4. That Cabinet resolves that the Business Plan 2017-21 including the
General Fund Budget and Council Tax Strategy for 2017/18, and the Medium Term Financial Strategy (MTFS) for 2017-2021 as submitted, along with the Equality Assessments (EAs), be approved and
1 Page 1
Agenda Item 7
recommended to Council for approval subject to any proposed amendments agreed at this meeting;
5. That the Cabinet resolves that, having considered all of the latest information and the comments from the scrutiny process, the Capital Investment Programme (as detailed in Annex 1 to the Capital Strategy); the Treasury Management Strategy (Section 5), including the detailed recommendations in that Section, incorporating the Prudential Indicators and the Capital Strategy (Section 4) as submitted and reported upon be approved and recommended to Council for approval, subject to any proposed amendments agreed at this meeting;
6. That Cabinet notes that the GLA precept will not be agreed by the
London Assembly until the 22 February 2017, but the provisional figure has been incorporated into the draft MTFS
7. That Cabinet request officers to review the savings proposals agreed and
where possible bring them forward to the earliest possible implementation date
8. That Cabinet note that there may be minor amendments to figures in this
report as a result of new information being received after the deadline for dispatch and that this will be amended for the report to Council in March
9. That Cabinet consider and approve the Risk Management Strategy 1. Purpose of report and Executive Summary 1.1 This report summarises the work that has been undertaken since April
2016 towards formulating the Business Plan 2017-21 including the Budget for 2017/18, Medium Term Financial Strategy 2017-21 and Capital Strategy 2017-21. It describes the steps taken to ensure that business planning is integrated with financial planning. It sets out details of how the budget has been structured to ensure that a balanced budget is set for 2017/18 and progress towards a balanced budget over the medium term. A separate section is provided for Schools budgets.
1.2 The report sets out the draft Capital Programme 2017-2021. It details the
work that has been undertaken to produce a programme that is aligned with business planning requirements and also integrated with the revenue budget.
1.3 The Medium Term Financial Strategy (MTFS) is updated to reflect the
Council’s anticipated financial outlook over the period 2017-2021. 1.4 The Cabinet is being invited to consider the various responses from
scrutiny bodies to the draft budget proposals as set out in a separate report on the agenda for this meeting. The Overview and Scrutiny Commission and panels considered the budget savings and growth proposals agreed by Cabinet on 12 December 2016 and the Overview
2 Page 2

and Scrutiny Commission also considered the additional information provided in the report to Cabinet on 16 January 2017.
2. Introduction 2.1 At this Cabinet meeting, Members are presented with reports that
provide a comprehensive presentation of all issues relevant to the formulation of the Council’s Business Plan for the period 2017-2021.
2.2 The report includes details about the General Fund revenue budget and
explains how this information has been used to produce a draft budget and Council Tax levy.
2.3 The Council’s Business Plan 2017-21 consists of a number of key
elements and the report is structured into five sections for ease of reference :-
• Section 1: Business Plan 2017-21 including the Medium Term
Financial Strategy, the overarching financial strategy, which brings together individual elements of the budget and reviews the strategic aims and key issues and assumptions.
• Section 2: The General Fund Revenue Budget and Council Tax
strategy; • Section 3: Schools budgets – funded by Dedicated Schools Grant
(DSG) • Section 4: The Capital Programme and the Capital Strategy; • Section 5: The Treasury Management Strategy
2.4 The Scrutiny Function 2.4.1 The Overview and Scrutiny Commission and Panels considered some
proposed amendments to previously agreed savings and the draft capital programme 2017-21 during the November 2016 cycle of meetings and feedback from this scrutiny process was considered by Cabinet on 12 December 2016. Cabinet considered revenue savings and growth proposals at its meeting on 12 December 2016 and referred them, along with draft EAs, the capital programme and service plans as part of a pack of measures, to the Overview and Scrutiny Panels and Commission for consideration during the January 2017 cycle of meetings.
During the January 2017 cycle of meetings the available details relating to the MTFS, revenue and capital budgets and the Business Plan have been considered by the Scrutiny Panels on the following dates:-
3 Page 3

Healthier Communities & Older People Overview & Scrutiny Panel
10 January 2017
Children and Young People Overview & Scrutiny Panel 11 January 2017
Sustainable Communities Overview & Scrutiny Panel 12 January 2017
Overview and Scrutiny Commission 26 January 2017 2.5 Feedback from Scrutiny Process
A summary of findings and recommendations from the Overview and Scrutiny Commission is provided in a comprehensive report on the scrutiny of the Business Plan 2017-21 as a separate report on the agenda for this meeting.
2.6 This report incorporates the outcome of the Provisional Local
Government Finance Settlement. Appendix 1 provides the Council Tax resolutions.
2.7 The meeting of the Council, to set the Council Tax and General Fund
budget (revenue and capital) for 2017/18, and agree the Business Plan 2017-21 including the MTFS, will be on 1 March 2017.
2.8 Delivery of the Business Plan, including the budget and service plans,
will be monitored throughout the year in line with the corporate Performance Management Framework.
3. Business Planning 3.1 Further information about the Business Plan 2017-21 is included in
Section 1 of this report. 3.2 The financial impact of the Business Plan is reflected in the budget
proposals in this report. 4. Financial, resource and property implications 4.1 All relevant implications are included in the report with further details in
the appendices. 5. Legal and statutory implications 5.1 The Local Government Act 2003 requires the Chief Finance Officer to
report to Council as part of the budget process on the robustness of the estimates and the adequacy of the proposed financial reserves. The Council is required by the Local Government Finance Act 1992 to make specific estimates of gross revenue expenditure and anticipated income leading to the setting of the overall budget and council tax. The amount of council tax must be sufficient to meet the council's legal and financial
4 Page 4

commitments, ensure the proper discharge of its statutory duties and lead to a balanced budget.
5.2 The Localism Act 2011 amended the legislation regarding the calculation
of council tax. It also provides for a council tax referendum to be held if an authority increases its relevant basis amount of council tax in excess of principles determined by the Secretary of State. The Secretary of State has ruled that most principal authorities, which includes Merton council, proposing increases which exceed 2% or more will need to hold a referendum. Within the provisional Local Government Finance Settlement it was also announced that there would be an increase to the flexibility offered on the use of the Adult Social Care precept so that social care authorities can charge a precept of up to 3% in 2017/18 and 2018/19 with an overall limit of 6% over three years up to and including 2019/20.
5.3 In considering the budget for 2017/18, members must consider the on-
going duties under the Equality Act 2010 to have due regard to the need to eliminate unlawful discrimination, harassment and victimisation; and advance equality of opportunity between people who share a protected characteristic and those who do not; and foster good relations between those who share a protected characteristic and those who do not. Members must consider how the decisions will contribute to meeting these duties in light of other relevant circumstances such as economic and practical considerations.
5.4 The Council's processes for the development and adoption of the budget
are set out in the Budget and Policy Framework Procedure Rules contained in Part 4C of the Constitution.
6. Human Rights, Equalities and Community Cohesion Implications 6.1 In identifying spending reductions, services where at all feasible, have
sought to minimise the impact of the reductions on traditionally disadvantaged groups. The proposed budget reflects the Council’s spending priorities for the year and the Council’s core commitment to equal opportunities in employment and service delivery. The Council has a corporate policy of endeavouring to redeploy staff affected by reorganisation and other staffing changes. Every effort is therefore made to redeploy any staff affected by spending reductions.
6.2 A number of meetings with Staff Side have taken place and they have
been advised of the Council’s savings proposals and consultation is ongoing and they will be further involved in any proposals affecting staff when they are to be implemented.
6.3 It is anticipated that the Budget will be set at a level which enables the
Council to continue to be Human Rights compliant.
5 Page 5
6.4 Equality and community issues are also addressed in savings proposals. Equalities assessments of savings proposals have been provided and these were discussed at Scrutiny meetings.
7. Risk Management and Health and Safety Implications 7.1 Each saving proposal has been assessed in terms of service impact and
reputational impact and these have been included in reports to the Scrutiny Panels.
7.2 In setting the budget the level of risk has been an important factor in
setting the assumptions on which the overall budget is based. The level of reserves and balances, as well as the level of contingencies available have been taken into account as well as an assessment of pressures identified as part of current year monitoring. Account has also been taken, as far as possible, of the likely impact of expected legislative and technical changes.
7.3 Risk management and health and safety implications were considered as
part of the Capital Strategy. 8. Consultation undertaken or proposed 8.1 Regular reports have been made on progress on the Business Plan to
Cabinet on 19 September 2016, 12 October 2016, 12 December 2016, and 16 January 2017.
8.2 In addition, Scrutiny Panels and the Overview and Scrutiny Commission
have had two rounds of scrutiny on the proposed budget and Business Plan;
8.3 There have been further detailed consultations held by Community and
Housing and Children, Schools and Families in relation to some of their proposals.
8.4 The Council launched a consultation with residents on council tax and
council spending on 9 September 2016. Residents had until 4 November 2016 to respond and the outcome will be taken into consideration when the decisions are to be made with respect to the council tax and MTFS for 2017-21 as part of the Business Planning Process. The outcomes from the consultation were detailed in a report to Cabinet in December 2016.
8.5 As part of the response, the CCG have indicated that there would be a
reduction in funding of approximately £2m if there was not an increase in Council Tax.
6 Page 6
8.6 In accordance with statute, consultation has taken place with business ratepayers and a meeting was held on 7 February 2017.. A verbal update will be provided at the Cabinet meeting.
8.5 Further, regarding the capital programme, meetings of the Capital
Programme Board were held, consisting of key officers from each department.
9. Appendices – the following documents are to be published with this report and form part of the report
SECTION 1: BUSINESS PLAN 2017-21
SECTION 2: GENERAL FUND BUDGET AND COUNCIL TAX STRATEGY Appendix 1: Draft Resolutions to Council Appendix 2: Local Government Finance Settlement 2017-2018 Appendix 3: Collection Fund, Council Tax Base, NNDR1 and Funding
Methodology Appendix 4: Other Corporate items in the MTFS Appendix 5: Analysis of the transition from Council in March 2016 to a
balanced budget Appendix 6: Statement of Council Tax requirements and balances Appendix 7: Revised MTFS incorporating changes Appendix 8: Reserves Appendix 9: Budget summaries – These replace the version included in the
pack issued to Members in December 2016 Appendix 9a: Standard Subjective Analysis Appendix 10: Risk Analysis for the General Fund Appendix 11: Savings brought forward from new savings in 2019/20 SECTION 3: Schools budget No appendices
SECTION 4: Capital budget Draft Capital Strategy 2017-21 (includes Annexes 1-5) SECTION 5: Treasury Management Strategy including Prudential Indicators
Background Papers – the following documents have been relied on in drawing up this report but do not form part of the report Reports to Cabinet
Budget files in Corporate Services department
7 Page 7

www.merton.gov.uk
MERTON COUNCIL
Business Plan2017 / 2021
Page 8

CONTENTS Page
Introduction
Transformation statement
National Policy Context
The council
Merton Partnership
A) Financial Resources
Medium Term Financial Strategy – This is the Covering Report and Section 2 Capital Strategy – This is Section 4 Treasury Management Policy Statement – This is Section 5
B) Other Key Resources
Workforce Strategy and Planning Procurement Plan Information Technology Strategy
C) Risk Management
D) Performance Management Framework
E) Service Planning
F) Savings and Growth 2017-21 –In the Members Budget Consultation Pack
G) Revenue Estimates 2017-18 - This is Section 2
Glossary of Terms
List of Acronyms
Page 9

INTRODUCTION Welcome to Merton Council’s Business Plan for 2017/21, which brings together financial information in the form of the council’s budget and the Medium Term Financial Strategy, along with the service planning of all of the council’s operational services over the next four years. Although it is a four year plan, it will be refreshed every year to ensure we are on target and to take account of changing needs and priorities. As the work of the council encompasses such a wide and diverse range of services, we have tried to include all the necessary information needed to understand what we are doing and why we are doing it. This information should give you a detailed picture of how the council will operate over the next four years. To help understand some of the more complex areas of the council’s business a Glossary of Terms has been included. The Background and Context section sets the scene for the Business Plan, with some of the key facts relating to Merton. The Medium Term Financial Strategy incorporates details of the money the council has coming in (revenue) and the money and assets it has in place (capital) and how it will spend and invest this money over the four year planning period, through the Capital and Treasury Management Strategies. Other key resources in place to enable the council to manage the Business Plan include how we:
• manage and develop staff, through the Workforce Strategy; • obtain goods and services, through the Procurement Plan; • design and develop information technology, through the IT Strategy; • identify and manage the risks the council may face in delivering services, through the
Risk Management Strategy; and • manage and monitor performance against objectives, through the Performance
Management Framework. Each major work area in the council completes a service plan or commissioning plan, to give a high level overview of its financial position, what it exists to do, what it hopes to achieve and how it will achieve its major work programmes over the next four years. We appreciate that there is a huge level of detail in the plan, but hope it helps you to understand what the council is trying to achieve and how we intend to succeed. If you have any comments or questions on the content of this plan, then please contact [email protected]
Page 10

TRANSFORMATION STATEMENT By 2020 Merton Council will be transformed by the fruition of a number of change projects which will maximise the use of information technology and streamline processes and service provision. Providing value for money services to our residents is at the heart of our business and we must be able to demonstrate that all of our services represent best value for money. We will do this by continuing to finding innovative solutions to maximise future efficiency. The financial reality facing local government dominates the choices the council will make for the future of the borough. The development of the Business Plan 2017/21 is therefore based on the set of guiding strategic priorities and principles, as adopted by the council on 13 July 2011: • Merton should continue to provide a certain level of essential services for residents. The
order of priority of ‘must’ services should be: i) Continue to provide everything that is statutory. ii) Maintain services – within limits – to the vulnerable and elderly.
• After meeting these obligations Merton should do all that it can to help residents who aspire. This means we should address the following as priorities in this order: i) Maintain clean streets and keep council tax low. ii) Keep Merton as a good place for young people to go to school and grow up. iii) Be the best it can for the local environment. iv) All the rest should be open for discussion.
The financial pressures facing Merton mean we should no longer aim to be a ‘place-maker’ but be a ‘place-shaper’. The council should be an enabler, working with partners to provide services. Our top priority will continue to be to provide safe services of the best possible quality within financial constraints and the July 2011 principles. We will deliver services that customers want and need and, where possible, involve our customers in service specification and design. The Authority is utilising best practice in project management/ transformation to assess the future direction of services and the required staff, process and IT development to deliver this change. Internal decision making structures have been established to maximise Authority wide assessment and development.
Page 11

NATIONAL POLICY CONTEXT Local government continues to be affected by reductions in the level of funding that it receives from central government. It will also be impacted by the steps being taken to reshape the way local authorities are financed through the proposal that councils will retain 100% of their business rates by 2020. These are part of steps towards a proposed devolution of powers from central to local government. Proposed changes around funding and devolution will have a significant impact on the services that the council provides over the lifetime of this Business Plan. In addition, the decision for the United Kingdom to leave the European Union means continued uncertainty for local government around the loss of European funding after the guarantees to replace it run out, what the impact for members of the EU workforce could be and how challenges for the economy could affect local budgets. The 2016 Budget announcement and 2016 Autumn Statement both contain policy updates that will have a significant effect on the council and its work, although a lot of the detail about how these will be implemented continues to be unclear. Some of the key announcements include: • The Government will find a further £3.5 billion of savings from public spending in 2019/20.
According to London Councils, the impact on local government is likely to be a reduction of around 30% between 2015 and 2020 in its level of resources;
• The Treasury will lead an efficiency review, to report in 2018, into the efficiency of all departmental spending to inform future expenditure decisions;
• Confirmation that the Revenue Support Grant will be phased out by 2020; • An aim to introduce more frequent business rate revaluations (at least every 3 years); • Central government to work with local authorities to standardise business rates bills; • Local government to be compensated for the loss of income as a result of changes to the
business rates and the implementation of 100 per cent business rates retention; • Devolution of power to school leaders, expecting all schools to become academies by 2020,
or to have an academy order in place to convert by 2022. Forced academisation has subsequently been dropped as a policy, but the Government continues to push academies as the favoured models for schools;
• £50 million of new capital funding to support the expansion of existing grammar schools in each year from 2017-18;
• An apprenticeship levy to be introduced in April 2017, with employers, including local authorities helping to fund a national apprenticeship programme;
• The green light for Crossrail 2, which will include the rebuilding of Wimbledon station to deal with the extra tracks required as part of the programme;
• The launch of the Starter Homes Land Fund prospectus, inviting local authorities to access £1.2 billion of funding to remediate brownfield land to be used for housing, to deliver at least 30,000 Starter Homes;
• Measures to speed up the planning system, including minimising the delays caused by planning conditions, and ensuring the delivery of local plans by 2017;
• Investment in a major house-building programme, which will involve the scrapping of one of the Help to Buy schemes; through a new £2.3bn Housing Infrastructure Fund
• Mayoral combined authorities to be given borrowing powers, with London receiving £3.15bn for over 90,000 new affordable homes and devolution of the adult skills budget;
• The new mandatory National Living Wage coming into effect from April 2016, set at £7.20 an hour for workers aged 25 and above, which will have an impact on a number of council providers and partners.
Page 12

THE COUNCIL The Council comprises of 60 elected councillors representing 20 wards. The current political composition of the Council as at February 2017 is: • Labour: 36 councillors • Conservative: 19 councillors • Merton Park Ward Independent Residents: Three councillors • Liberal Democrats: One councillor • No Affiliation: One councillor
The full Council usually meets five times a year, and is responsible for setting the overall direction of the council, including agreeing the rate of council tax. A Cabinet of nine councillors from the administration makes the majority of decisions throughout the year, with Overview and Scrutiny committees in place to hold the Cabinet’s decision making to account. Regulatory committees are appointed by Council and carry out planning and licensing functions. The Organisation As at 30 September 2016 the council, excluding schools, has 1,746 FTE (head count 1,937 employees) who work across four departments. • Children, Schools and Families • Community and Housing • Corporate Services • Environment and Regeneration
Broken down, Environment and Regeneration has the largest number of employees (531 FTE), followed by Children, Schools and Families (447 FTE), Corporate Services (426 FTE) and the Community and Housing (340 FTE). Overall, 59.7% of the council’s workforce is female, while 26.4% are from an ethnic minority background. Both these figures are below the London average, which are 62.2% and 36.3% respectively. 6.7% of the workforce is recorded as having a disability, which is above the London average of 4.4%. The majority of employees (42.8%) are aged between 50 and 64, with 24.3% aged between 25 and 39 and 26.4% aged between 40 and 49.
Page 13

Merton: the people and the place Merton is an outer London borough situated to the south west of central London, neighbouring the boroughs of Croydon, Kingston, Lambeth, Sutton and Wandsworth. Comprising of 20 wards, it covers an area of approximately 14.7 square miles and has a population of just over 200,000 residents living in around 80,000 properties. Served by 7,500 businesses, the borough’s main commercial centres are Mitcham, Morden and Wimbledon, of which Wimbledon is the largest. Other smaller centres include Raynes Park, Colliers Wood, South Wimbledon, Wimbledon Park and Pollards Hill. The borough is predominantly suburban in character, with high levels of commuter flows in and out of central London. Merton has a large number of parks and green spaces, including Wimbledon and Mitcham commons, and almost twice as much of the borough is open space compared to the average in London. Every year Merton plays host to one of the country’s most famous sporting events – the Wimbledon Tennis Championships held at the All England Lawn Tennis and Croquet Club, which brings an extra 500,000 people into the borough. Merton: the people Population and demographics • Merton’s population according to the Greater London Authority (GLA) 2016
projection is 207,141 people, living in 83,446 occupied households • Population density is higher in the wards of the east of the borough compared
to the wards in the west • The average age of residents in the borough is 36.6, above the London
average of 35.9. The proportion of the population that is working-age (16-64) is 87.9
• GLA 2013 round population projections records Merton’s BAME population as 74,971, meaning Black, Asian and Minority Ethnic (BAME) groups make up around 36.7% of the population. This is lower than the London average of 42.5%
• Based on GLA trend-based projections, Merton’s population is projected to increase by 13,245 between 2014 and 2020. During this time the boroughs age profile is also projected to change, with the most notable growth coming in the numbers of those aged under 16 and those over 50. This will be against a projected decline in the proportion of people aged 25-35
• Merton’s ethnic composition is also forecast to change, with the BAME proportion set to increase to 40%
Deprivation • The Indices of Multiple Deprivation (IMD) sets out a relative position for each
local authority in the country, reflecting the multidimensional nature of deprivation by giving an overall score for each area. The indices were updated in September 2015 and show that Merton ranks as ‘very low’ in terms of overall social deprivation compared to other London boroughs.
Page 14

Merton ranks as 7th least deprived out of the 33 London boroughs and ranks 212 out of 354 (where 1 is the most deprived) for the rest of England
• This overall lack of deprivation does, however, hide inequalities in the borough between deprived wards in the east of the borough (Mitcham) and the more affluent wards in the west (Wimbledon). Three wards are more deprived than the average for London: Cricket Green, Figge’s Marsh and Pollards Hill
• The GLA Pay-check 2011 dataset illustrates there are large disparities in the distribution of income within Merton. In general the west of the borough is more affluent, notably Wimbledon Park, Village, and Hillside wards. These wards have a median income range of £41-£50,000. By comparison wards in the east such as Figge’s Marsh, Pollards Hill, St. Helier, and Cricket Green have a median income range of £24-28,000
Health • Health outcomes in Merton are generally better than those in London, and in
line with or above the rest of England, however, there is a difference between the most and least deprived areas within the borough for life expectancy of 7.9 years for men and 5.2 years for women
• Linked to deprivation, those in the east of the borough have a much higher chance of serious illness and early deaths from illnesses such as cancer and heart disease
Education • As at January 2016 the borough had 29,119 pupils across state funded
primary, secondary and special schools and pupil referral units • In 2016 72% of students in Merton achieved A*-C in Maths and English.
This is up 10% on 2015 and our priority is to continue this trajectory of improvement. 34.9% of pupils in Merton have a first language known or believed to be other than English. This is below the London average of 38.7%
• The percentage of children known to be eligible for and claiming free school meals is 14.8%, below the London average of 17.6%
• 47 out of the 52 schools (including maintained, academies and special schools) in the borough are judged as ‘Good’ or ‘Outstanding’ by Ofsted as at November 2016
Employment • Merton residents who are in active full-time employment are distributed all
over the borough, however, unemployed residents are concentrated towards the east of Merton, and self-employed residents are concentrated toward the west
• Although unemployment in the borough is below the national average, it rises significantly in some of the eastern wards, and 63% of all benefit claimants live in the east of the borough
Page 15

• The average annual income for residents in Merton as at 2015 is £33,122, slightly below the London average of £33,203, but above the national average of £27,869
Merton: the place Green environment • Merton has more than 100 parks and green spaces, including Wimbledon
and Mitcham commons, with 99.6% of Merton’s area within less than 400m distance from a publicly accessible open space. 18% of the borough is open space, compared to a London average of 10%
Housing and the built environment • The 2011 Census shows that there are 78,757 households within Merton.
This number is projected to rise to 99,000 (15%) by 2021, an average annual household growth of 2.2%. This is the fourth highest projected household growth in England with much of the increase expected to be in single person households
• Merton’s social housing stock is amongst the lowest in London at 14%, compared to a London average of 22%. 58% of social housing and 63% of private rented homes are flats, compared with only 24% in the owner-occupied sector
• The median average house price in Merton in 2015 was £415,000, the fifteenth highest in London and an increase of 8% on the figure for 2014. The average house price in London was £399,950 an increase of 10%
• The ratio of house prices to earnings in Merton is 14.27, which is the twelfth highest in London and above the London average of 11.32
Transport • Merton has good connections with the London transport network with
Wimbledon being a central transport hub in the South London area. Regular suburban rail services run into central London and both the District and Northern underground lines run through the borough
• The Tramlink provides connections between Wimbledon and Croydon via Mitcham and Morden, while numerous other over ground stations and bus routes provide easy access to neighbouring boroughs
Crime • The crime rate per 100,000 of the population for 2015/16 was 57.6, which
is below the London average of 79.3 and the Outer London average of 65.4.This is the sixth lowest in London
Page 16

MERTON PARTNERSHIP Merton Partnership brings together a range of key partners from the public, private and community and voluntary sectors in Merton, including the council, Clinical Commissioning Group, and Police. In 2009 the Partnership developed the Community Plan that set out the overall direction and vision for the borough until 2019. The plan was then refreshed by the partnership in 2013. The document sits above each of the different partner’s own Business Plan. The Partnership is chaired by the Leader of the Council and hosts an annual themed conference. It has an Executive Board, also chaired by the Leader of the Council that meets bi-monthly and whose role is to set the strategic direction of the Partnership and manage the delivery of the priorities and targets set out in the Community Plan and Neighbourhood Renewal Strategy. Within the Partnership there are four thematic subgroups that co-ordinate the activities of their members to ensure that the strategy agreed by the Executive Board is carried out through the relevant Boards and Trusts. These four thematic subgroups mirror the themes of the Community Plan. Children’s Trust Merton's Children's Trust arrangements began in 2005 in order to bring together all partners involved in providing services to children and families in Merton. The Board encompasses a wide range of different groups and partnerships, overseeing their performance and activities. The Children's Trust is designed to deliver the outcomes set out in Merton's Children & Young People Plan 2016-19 which includes improving outcomes for those subject to the effects of disadvantage, safeguarding children and young people and closing the gap in educational outcomes and opportunity. Health and Wellbeing Board Merton Health and Wellbeing Board’s full statutory responsibilities have been in place since April 2013, bringing together the Council, Clinical Commissioning Group, HealthWatch and the voluntary and community sector. Health and Wellbeing Boards deliver strategic local leadership to improve health outcomes. The work of the Board is also central in helping to informing the commissioning of health and social care services in Merton. It has a core role in encouraging that services across the NHS, social care, public health and other local partners are joined-up and work together to reduce health inequalities and support independent living. Safer and Stronger Communities The Safer and Stronger Partnership incorporates the statutory Community Safety Partnership and is responsible for setting and overseeing the strategic direction for community safety and the community cohesion agenda in the borough. The Community Safety Partnership has a statutory duty to undertake a strategic assessment to inform priority setting to address crime and disorder issues in the local area. Key themes for the partnership include reducing the fear of crime, reducing alcohol related violence and supporting those who are effected by alcohol misuse and reducing anti-social behaviour and its effects on communities as well as individuals. The Partnership looks to empower local people to have a greater choice and influence over local decision-making and to increase community cohesion and integration.
Page 17

Sustainable Communities and Transport The Sustainable Communities and Transport partnership was established to create a more sustainable borough, one which is less reliant on fossil fuel and which reduces its negative impact on the environment and climate change. The Partnership promotes investment into the borough in order to create new jobs, improve the skills and capacity of residents and to improve the condition and supply of housing including affordable housing. The Partnership also works to promote the development of sustainable transport including cycling and walking, as well as public transport in and around Merton. Corporate Capacity In addition to the four thematic partnerships, Merton Council has added the theme of Corporate Capacity which looks at ensuring that the council has sound financial management and high standards of governance, effectively recruits, develops and manages staff and that it is continually reviewing its processes to improve them and provide value for money. The theme ensures that customer access, customer services and customer care as well as equalities, diversity and community cohesion underpin the work of the council.
Corporate Strategies The council has a number of corporate and service-specific strategies and plans that support the work of the council, the Merton Partnership and the four Thematic Partnerships. These strategies and plans draw heavily on the aims set out in the Merton Community Plan, but also reflect central Government policy changes, sub-regional policies (e.g. set by the Mayor of London), new legislative requirements and short term changes to local priorities. The following list is not exhaustive but shows the diversity of strategies and plans currently in place: http://www.merton.gov.uk/council/plansandpolicies.htm
Page 18

Section B
Other Key Resources
Page 19
B. WORKFORCE STRATEGY
The workforce strategy will be reviewed again following the completion of the Target Operating Model development process within the council. A refreshed draft will be ready in 2017 and in the meantime we will continue to deliver the actions identified in the current strategy. However some information has been updated.
1. INTRODUCTION
Welcome to Merton’s Workforce strategy, which outlines our aims for the period 2014 – 2018 and shows how we will support, engage with and develop our workforce, so they are equipped to meet the challenges of continuing to deliver high quality services to our customers and local communities.
The people, who work for, work with, volunteer with, and wish to work for Merton Council, are vital for us to reach our goals. All of our achievements as a council, and the excellent services we deliver to our public, are reliant on us having a suitably skilled, able and equipped workforce, who demonstrates our values and behaviours. Our MJ Award for the Best Achieving Council in 2013 is testament to the commitment and professionalism of our people. This strategy aims to build on the success and dedication of the current workforce, and ensure that we have the structures and resources to meet the challenges of the future.
Through our Merton 2015 programme we have already begun to transform the way we work and what we do - successfully delivering savings and new approaches to the services we offer our residents, while maintaining customer satisfaction. In order to achieve further changes, council departments have designed Target Operating Models which are focussed on providing the highest quality services to the public, operating with efficiency and accountability.
The workforce strategy will underpin the delivery of these Target Operating Models. Our workforce is at the heart of everything we do, and this strategy ensures that we have the right staff in the right place, with the right skills and tools to enable the transformation of council services to meet future challenges. This means in some areas the council will diminish in size and in other areas it may expand, depending upon the needs of that service to operate efficiently
and effective for our residents.
The strategy has been developed in consultation with staff from across the council, harnessing their knowledge and experience to identify the measures and actions that will enable Merton Council to meet its aspirations and continue to provide our public with high-quality services, environment and facilities.
The strategy shows how departments, managers and human resources will jointly contribute
Page 20

towards achieving our organisational priorities, and addresses four key areas:
• Workforce planning
• Recruitment and retention
• Organisational and workforce development
• Morale, health and wellbeing
Through the action plans and outcome measures that we are proposing, we believe that we will equip Merton Council with the modern and dynamic workforce that is needed to take on the challenges of delivering excellent public services for years to come.
Ged Curran
Chief Executive
Page 21

2. BACKGROUND
Merton Council is undergoing a period of sustained and conscious transformation in order to best respond to the changing environment (especially financial) and customer expectations. We are working together to shape services and the organisation to ensure a successful future for our residents and staff.
2.1 Key Council priorities
The key priorities for the borough are captured within the Community Plan, developed by the
Merton Partnership. The Plan sets the overall long-term direction and vision for the borough to
2019.
The Community Plan identified the first four priority areas, with Corporate Capacity having been added by the Council.
• Children and Young People – Better opportunities for youngsters
• Health and Well Being – A healthy and fulfilling life
• Sustainable Communities and Transport – Keeping Merton moving
• Safer and Stronger – Being safe and strong
• Corporate Capacity
Page 22

The theme of Corporate Capacity encompasses the effective recruitment, development and management of staff. This Workforce Strategy outlines how we will transform the Council’s workforce and be fit for purpose in 2018.
2.2 How the Council has changed in the last 3 years
We take a proactive approach to planning for our future. Since 2010 our transformation programme Merton 2015 has delivered savings of £70 million, or one third of our budget. It is to our employees’ credit that through this time we have maintained high levels of resident satisfaction.
We are particularly proud of winning over 40 industry awards across a range of sectors and having achieved the MJ Award for the Best Achieving Council in 2013 against the backdrop of such a challenging financial environment.
Continued delivery of quality and value for money services for our residents has been achieved through reviewing our service delivery models and developing innovative solutions, including shared services, partnership working and the development of volunteering in the borough. Continuous improvement is at the heart of our approach and we have introduced lean methodology to drive out waste from our processes and now work in a highly focused and lean operation.
Our employees have shown themselves equal to the challenges, and as we plan the future shape of our services and organisation, we are laying the foundations to ensure that the workforce continues to enable the Council to best serve our residents.
Page 23

3. HIGH LEVEL SHAPE OF THE WORKFORCE
Merton Council has a workforce of 2,003 people in 1,787 full-time equivalent posts, with an additional 3,307 (2,253 FTE) Schools employees, not including casual staff.
We work across five Departments: Environment and Regeneration (30%), Children, Schools and Families (25%), Community and Housing (25%), Corporate Services (20%) and the Chief Executive’s Department. We work over a number of sites across the Borough, and we have recently undertaken a project to move more colleagues to the Civic Centre to free up premises space.
Within Schools (68.55%) of employees work part-time, outside of the Schools we mainly work full time (74.43%).
While some groups are unevenly represented across pay levels, there are no significant discrepancies in pay by protected characteristics.
The Council has a pay ratio of 1:12 between the lowest and highest paid employees, well within the ratio level of 1:20 that was established for the Hutton Fair Pay Review (March 2011), with the Council positioned in the bottom quartile for senior pay for the 32 London boroughs.
The decision has been taken to implement the London Living Wage, increasing the salary of the lowest paid staff to £9.15 per hour from 1 April 2015. We are working on calculating the full value of the pay and benefits package to be able to accurately communicate the reward for working at the Council.
Agency workers are a key part of our workforce plan providing resource and business-critical skills as and when it is needed, with agency workers making up 5.6% of our workforce in 2013. Through the workforce planning element of this strategy, agency use will be reviewed and reconfigured to provide best value for money and consistent service delivery, while maintaining the agility of the workforce.
We have a diverse workforce, the majority, 60% are female (88% in Schools) and 5.84% are disabled, which compares positively to the London Councils’ median of 4.6% but this ratio is only 1.03% in Schools. A quarter of our workforce (23.26%) are from a Black, Asian and Minority Ethnic (BAME) background, which compares favourably to our 23% target.
However, only 5.8% of employees are from the Asian or Asian British community. In Schools
Page 24

there are 15% BAME employees, and 6.4% of an Asian or Asian British background, in both groups somewhat lower than the London Councils’ median of 7.6%. Of more concern is the fact that within the resident community 35% are of Black, Asian and Minority Ethnic background as
18% of the community is of Asian background (2011 Census).
As is characteristic of local government, we have a mature workforce as 60.6 % of us are over the age of 45, while only 17.6% are 16-34, but only 2.21% are 16-24 of age. In recent years the numbers of younger workers have increased due to the rollout of apprenticeships.
Our turnover rate is traditionally very low with natural turnover (resignations) in 2013 at 5.5% with full staff turnover at 14.37% annually, which compares favourably with other London boroughs. In some areas however it is agreed that some turnover may actually be beneficial to service delivery and could be achieved through transformation.
In 2013 we recruited to 254 posts and the time to hire, from identification of a vacancy to the post being filled, is now at 90 days, having recently been reduced through a recruitment process review and the implementation of an applicant tracking system in April 2013.
Merton has a consistently higher than expected rate of sickness, with an average of 9.29 days per person lost to sickness, which compares unfavourably to the London Councils’ average of less than 8, which is also our own target. Particularly high levels of sickness are present in Environment and Regeneration (12 days) and Community and Housing (11 days). Within these Departments, the high areas for sickness absence are Street Scene and Waste, and Access and Assessment and Direct Provision respectively. In these areas sickness is more prevalent due to the nature of the work which includes more physically demanding roles and work with vulnerable residents.
Merton Council performs well overall on analysis of our workforce data against information from London local government organisations as well as recommendations for good practice.
The following areas have been identified as requiring action through the Strategy:
o Communicating the full value of the pay and benefits package
o Spans of control (e.g. who has responsibility for what)
o The review of agency use as part of workforce planning: reducing costs, while maintaining flexibility and sufficient resource
Page 25

o Representation of the Asian community within the workforce
o Ageing workforce – succession planning and talent management
o Sickness absence – managing a reduction in the number of days lost to sickness
4. STRATEGY
4.1 The Council’s strategic direction
We are rightly proud of our achievements over the past years, including the MJ Award for Best
Achieving Council 2013, which is testament to the quality of dedication of our workforce.
We are committed to continue making Merton a great place for people to live, work and learn. The Council provides high quality services and we work with the community to enhance resident satisfaction. In the face of the economic climate, we set out to provide excellent value for money and continue to challenge the way we deliver our services to improve outcomes for our
residents. We aim to do this by finding innovative solutions to maximise future efficiency. Our
customers must be at the heart of our service planning. We will deliver services that customers want and need and involve our customers in service specification and design.
We are continuously reviewing and updating our delivery models and are at the forefront of new developments, such as partnership working including shared services and flexible working. The financial pressures facing Merton mean we will now take on the role of ‘place-shaper’ whereby the Council should be an enabler, working with partners to provide services.
By 2015 the core Merton Council workforce will be smaller than it was in 2010. However, some service areas may remain unchanged others have experience growth in this time, for example through becoming the hosts of shared services or expanding our volunteering schemes. We want to employ people who are resilient, ambitious, disciplined in thought and action, people who can take us from ‘good to great’. We will reward and celebrate great individuals and team performance, but not tolerate sustained poor performance.
We build on the principles of the disciplined people, disciplined thought and disciplined action to take Merton Council from ‘Good to Great’ (Collins 2006). We work to a clear direction with high ambition, a strong vision and shared values. The Council has a strong leadership at its helm, setting high expectations and driving continuous performance improvement.
Page 26

4.2 Model for achieving the strategy
Since 2010 we have been working on a major transformation programme Merton 2015, which will radically transform our services by 2015 to meet resource constraints, while still delivering quality and value for money services for our residents.
To set the future vision for the Council and its services, we work on developing a Target Operating Model (TOM). TOM documents set a vision for each of the departments and detail the shape of our future business model, covering all aspects of the organisation, including: services, processes, structures, people and technology.
Through this process, the Departments have identified the main developments we will have to make to best deliver our services in the future. These include:
o Strategic modernisation of service delivery, including review of direct service delivery and management e.g. reduction in resources, externalisation / remodelling of services, changes to terms and conditions;
o Workforce that meets the demands of the future working environment, managing flexible working, more agile and responsive workforce, adaptability e.g. appropriate agency usage, review of the skill mix and spans of control;
o Workforce demographics, knowledge transfer and new approaches e.g. partnership working, apprenticeships and the use of volunteers;
o New and improved skills, responding to legislative changes, competency / behaviour based approach for staff management, leadership and management skills to embed a performance approach and quality assurance e.g. technical management skills, such as workforce mapping, and people management skills e.g. performance management conversations and effective staff engagement;
o ‘Good to Great’ principles of disciplined people, thought and action. Effective management of performance, capability and sickness, in policy as well as practice;
o Morale and engagement, further enhancing commitment to the organisation, clarifying what the Council expects of us and what we can expect of the Council. Effectively managing the impact of changes on the workforce;
o Ensuring that supporting resources and the relevant infrastructure are available, e.g.
IT systems, and management information;
Additional programmes that have been designed to identify how we can provide better value for money services e.g service reviews, including Public Value Reviews, Target Operating Models
Page 27

and lean processes will have an impact on how we work. The reviews look to reduce costs while maintaining the quality of services and we apply the Lean methodology to best utilise our resources.
Through the Customer Contact Programme we are exploring better, cheaper contact with customers maximising the use of innovative technology to make it easier for us to do business, for customers to report service requests and for us to keep them informed of progress. This will require staff to implement and learn new systems and new ways of working to achieve this change.
The Flexible Working Programme will provide us with greater flexibility for staff and save time and money by making better use of technology.
5. KEY WORKFORCE PRIORITIES FOR THE FUTURE
We have identified four priorities for workforce transformation to support the realisation of the
Council’s plans for the future:
o Workforce planning
o Recruitment and retention
o Organisational and workforce development
o Morale, health and wellbeing
To understand and define the priorities, key requirements and the corresponding actions, we triangulated statistical and comparative workforce data, departmental information through discussions with DMTs and information in the TOMs, to establish the future position of the Organisational and People Layers and associated requirements, and undertook a series of employee engagement focus groups.
What we want to achieve, why this is a priority, what actions we will take and who will be responsible to lead each action are outlined in the following sections and in the accompanying action plan in Appendices B and C in more detail.
Merton Council has a diverse workforce, but there is more work to ensure it is done to be fully representative of the resident community. As these changes can take time and are not fully within the Council’s control, we will work to develop awareness and skills to enable employees – particularly those delivering services on the front line – to effectively work with diverse communities.
The Council’s structure, its terms and conditions and therefore its workforce reflect the traditional local authority model and are fairly rigid. While much development is already underway, we will
Page 28
need to carry out significant further work to modernise the organisation, its service delivery and workforce. A key element of this modernisation will be embedding a flexible approach to work, which is a newly introduced concept to the organisation. Flexible working will require new skills of managers, better performance management practice and a more outcomes based and accountability-driven approach from staff.
Highly responsive workforce planning is a new concept to some areas of the business, therefore skills to be able to do this successfully need to be developed. We will offer managers the support to accurately determine future workforce need, both in terms of employee numbers, volunteers and skills requirements. Once demand is determined, we will need an agile workforce, where employees are multi-skilled, and able to deploy their specialist skills in a range of settings.
In recent years, we have reduced management costs to minimise the number of front line job losses. We need to ensure that we have appropriate management spans of control and flexible and lean organisational structures. In 2009 Merton had 1.46 managers to direct reports. In 2012, our ratio of managers to staff was 1:6. We should aspire to develop Merton to reach the optimum span of control structure of 1:8 according to the Deloitte report to maximise efficiency and continue to reduce headcount, where it is safe and reasonable to do so. It is recognised that in some service areas, notably social care, direct practice with children has appropriate ratios, as governed by our regulators.
These transformation changes are having a significant impact on staff, which we need to proactively manage. We want everyone to feel supported to embrace these changes and will need to provide effective change management practice, engagement and communication activities, building on recent successes in this arena e.g. shared legal services reorganisation.
In order to maintain commitment to the organisation and positive morale, we will have to communicate a new ‘psychological contract’ (what we can expect of the Council and what it can expect of us). We can no longer offer a job for life, or, with flatter structures, necessarily a progression through the ranks, but can provide opportunities for on-going development of skills on the job and in formal training, leading to increased professional confidence and competence and better employability for the future.
5.1 Workforce planning
The Council has effective mechanisms for successful workforce planning. The shape of the workforce reflects service delivery models and supports the organisation to achieve its business objectives and outcomes.
Page 29

What we want to achieve
• Correct alignment of workforce size, skills base, and behavioural competencies to future business models
• An agile workforce, which is responsive to changing needs
• A workforce which is representative of and sensitive to the community which is serves
Why this is a priority
The workforce is truly our most important asset, and one of the largest resources, as most Council services are delivered directly by our staff. The composition of Merton’s current workforce requires some changes to ensure our continued success, meet future requirements and to better reflect our communities. We need to be able to accurately predict the shape of the workforce we will need to deliver our strategic plans and our services.
Actions
• Based on departmental TOMs, design the future shape of the workforce to best match its service delivery plans and financial context;
• Determine organisational structures, which support future delivery models - determine the desired combination of directly employed staff, shared services, externalised work, agency workers and volunteers, as well as appropriate spans of control for each service area;
• Review and action requirements to reflect legislative and regulatory changes as they emerge
(e.g. Care Bill, BSF and Children and Families Act);
• Manage the transition from the current to the future structure;
• Establish on-going monitoring for workforce arrangements through accurate and relevant management information for decision-making e.g. workforce, equality, productivity and financial data;
Key outcomes
• A new workforce structure is in place supporting future service plans
• Appropriate organisational structures, including spans of control, are designed and implemented for each service area, reflecting best practice and local requirements
Page 30
• Enhanced service delivery – as reported through the residents’ survey - through improved workforce planning practice, including better training needs analysis
• Review and consideration of modernised terms and conditions
5.2 Recruitment and retention
The organisation has a clear and effective recruitment and retention focus and plan of key workforce skills and behaviours. This includes succession planning, and managing turnover.
What we want to achieve
• Make Merton an employer of choice through creating all innovative and positive brand image;
• Ensure future key talent is successfully recruited retained and developed in appropriate roles within the Council to deliver effective services to residents and that capacity is built across the future workforce to implement new service delivery models;
• Establish inter-organisational collaboration to ensure that Merton’s residents are served by
the best people, whether within the Council or through our partners;
• Reduce recruitment and turnover costs and agency use;
Why this is a priority
We want to recruit, develop and retain talented people to enable us to deliver outstanding services to our residents. As our requirements and service delivery models change, our recruitment activity needs to evolve and respond to meet demand as cost effectively as possible. We want to attract the right people with the right skills and behaviours. We want to build leadership and strategic capacity. In specific divisions within the Council we have a high level of turnover, retention needs to be understood and stabilized.
Actions
• Implement the recommendations of the Recruitment Review 2013/14 ensuring that we optimise technological solutions, employer brand and embed the functionality of our applicant tracking system to meet hiring managers’ and candidates’ needs;
• Develop our employer brand, value proposition and talent wave to become an employer of choice, building on the success of recent awards;
• Analyse market trends, consider and find solutions for their impact on the current pay
Page 31

model, and communicate the value of the full benefits package;
• Sustain effective recruitment and retention of key staff groups, e.g. qualified social workers
and children’s specialist functions;
• Work to reflect our communities profile: review potential initiatives to address where the workforce is insufficiently representative of the community. In the interim, provide skills development to equip staff with knowledge and insight to effectively and sensitively work with diverse communities;
• Collaborate with strategic partners to develop a mobile and agile workforce serving the
residents of Merton, develop new models, such as inter-organisational working, partnerships and volunteering;
• Develop career paths to support the optimum organisational design, build on opportunities
for in-house professional development to grow leadership and strategic capacity e.g. apprenticeships, training contracts, secondments;
Key outcomes
• Balanced workforce in terms of skills, age and experience, addressing current concerns in workforce demographics and community representation;
• Merton Council perceived to be an employer of choice, attracting high quality candidates;
• Employees are more satisfied with opportunities to develop themselves and progress their employability;
• The structure and size of the Council meets current requirements and is adaptable to future
needs
• Core professional and business critical skills are retained and available within the Council
• Reduction and better targeting in the use of agency staff – reduction in agency rates in social work roles;
• Talented people are delivering our services through direct employment or other service delivery models including partnership working, shared services or volunteering;
5.3 Organisational and workforce development
The workforce is equipped with the skills, competencies and infrastructure to achieve cultural change and the desired organisational behaviours when creating and delivering new and improved service delivery models (e.g. flexible working, customer service, IT). To support this the Council will provide new skills, abilities and competencies for the workforce including learning and
Page 32

development of key skills for future service delivery.
What we want to achieve
• Accurate mapping future workforce function, form, skills and behaviours to alternative business delivery models
• Ensure staff work in a modern, flexible way to improve productivity and efficiency and equip them with key future skills and behaviours to enable them to do so
• Provide first class customer service to meet our residents’ needs, through new service
channels where appropriate
• Best practice in safeguarding is embedded in all relevant roles and activities
Why this is a priority
It is crucial for Merton’s success that our workforce has the right skills, behaviours and adaptability to meet the demands of the transformation and new service delivery models. Our managers need the skills and resources to effectively lead our teams and we need to be able to respond to organisational as well as legislative changes.
The requirements on organisational and workforce development are changing, with more focused and flexible options becoming the norm.
Actions
• Engender the ‘Good to Great’ principles of disciplined thought and action through the
organisation;
• Managers’ capability development specifically on building strategic capacity through future planning, accurate workforce planning and designing spans of control
o Train managers to strategically plan for service transformation and improvement i.e.
TOM’s including:
Train managers to map future workforce profile to business need
Train managers to undertake development needs analysis of the workforce to improve skills and behavioural competencies
• Develop first class customer service behaviours to meet our residents’ needs, through new
service channels where appropriate;
• Develop a workforce that’s self-disciplined, enabled with both tools and skills to deliver excellence and held accountable for outcomes;
Page 33

• Engender effective change management and communication practice to support the workforce to embrace changes and minimise the impact of changes;
• Embed the management behaviours across the organisation to support performance
o Service inputs, outputs & outcomes – performance
o People
o Communication – stakeholder scanning
o Resources – money, assets, technology
o Change
o Self-awareness and personal responsibility
• Maintain the golden thread of Council objectives – departmental objectives – team objectives – individual objectives to guide everyone’s work;
• Provide a flexible and responsive suite of development options;
• Ensure that all statutory CPD requirements are met;
• Establish effective change management practices to support employees through the transformation;
• Prioritise learning and development spending to best support the Council’s objectives and
transformation;
• Leverage the opportunities for development arising from shared services and partnerships;
Key outcomes
• Correlate the development of first class workforce to deliver resident satisfaction, reflective
of the ‘Good to Great’ culture, as measured by improvements on the Mori residents’ survey;
• Employees feel supported through organisational change and report that communication was effective;
• Learning needs are effectively identified and support the organisations’ overall objectives in the most cost effective way;
• Leaderships competencies are clearly demonstrated and performance improved;
Page 34

• Potential future leaders have been identified, the diversity profile of the group is representative of the workforce and people are engaged on a talent management programme (Bringing on Talent Programme);
• Outcomes of learning and development activity can be clearly linked to the delivery of our
priorities and key workforce objectives;
• Learning and development accessible to all staff and partners where appropriate;
• Performance of staff is increased through development of key skills and behaviours supported through honest performance appraisal conversations;
• Staff understand the Council and their own priorities and know what they need to do to achieve these;
• Staff are more satisfied with the opportunities for them to contribute to how the Council
works;
• Increased customer satisfaction with effectively delivered services.
5.4 Morale, health and wellbeing
We need to ensure that the organisation understands what a healthy workforce looks like and supports staff to achieve this.
What we want to achieve
• An improved understanding of the issues underpinning workforce wellbeing, and develop actions to optimise wellbeing, productivity, engagement and attendance.
• Improved morale and employee engagement
Why this is a priority
We want to be a healthy and motivated workforce, able to meet the demands of the Council, its residents and customers. We want to understand and address the root causes of sickness and act to enhance engagement and support the wellbeing of staff and improve attendance rates.
Actions
• Carry out a research project with Public Health on the root causes of sickness absence and consider its recommendations for implementation, including the option of using the London Workplace Charter
• Improve access to data and information for managers, to help them manage sickness better
Page 35

– embedding an attendance and performance culture
• Provide flexible working arrangements that support employee wellbeing
• Provide policies and practices that reflect the requirement for new ways of working and service delivery
• Effectively manage the impact of changes on the workforce, including appropriate supervision, direction and support from managers
• Review employee engagement initiatives and develop ways to increase engagement and
Morale
• Release the capacity of staff and managers away from bureaucratic administrative practice using innovative technological solutions such as channel migration and self service.
Key outcomes
• A healthier workforce with a reduction in number of days lost through sickness – a stretch target of moving to the upper quartile from bottom quartile, with differential targets for frontline and back office
• Employees report that they feel supported in performing their roles in a day-to-day basis
and through organisational changes
• Employees are more satisfied with their work / life balance
• Flexible working practices are effectively implemented and have a positive impact on morale
• Employees are aware of available support structures and make use of these as required e.g.
Employee Assistance Helpline
• We have a culture of employee engagement: Staff Attitude Survey results improving each time with a stretch target of 80% satisfaction reported in 2018
• We have a culture of improved productivity as reflected in the Mori residents’ survey
Page 36

COMMERCIAL SERVICES BUSINESS PLAN
PROCUREMENT PLAN Section
1 – Introduction
Procurement is defined in the National Procurement Strategy as:
“The process of acquiring goods, works and services, covering both acquisition from third parties and from in-house providers. The process spans the whole cycle from identification of need, through to the end of a service contract or the end of the useful life cycle of an asset. It involves options appraisal and the critical ‘make or buy’ decision which may result in the provision of services in house in appropriate circumstances”
Although the definition is primarily about procurement, it also about the need to secure sustainable services, products and outcomes which meet the needs of the community we serve. Strategic procurement also encompasses collaboration, including the need to develop partnerships, consider delivery options and ensure value for money for every pound spent.
This document sets out the Council’s strategic approach to procurement for the next three years. It is not intended to be a procurement manual; however, the principles should be applied to all procurement and commissioning, recognising that procurement must work closely with our health and social care colleagues to deliver value for money from all commissioning and procurement.
Consideration of this strategy is not optional and it should be read in conjunction with the Council’s Contract Standing Orders (CSO’s).
The Procurement Strategy emphasises the continuing importance of sustainable procurement being used to support wider social, economic and environmental objectives in ways that offer real long term benefits to the residents of this borough.
Cost reduction and efficiency targets will not be achieved if the Council fails to approach competition positively, taking full account of the opportunities for innovation and genuine partnerships which are available from working with others in the public, private and Voluntary, Community and Faith Sectors (“VCFS”).
This strategy provides a corporate focus for procurement. It embraces the Council’s commitment to strategic procurement and sets out the Council’s aspirations. It is not a ‘user manual’; more detail on procurement processes and issues will be found in the Contract Standing Orders and on the procurement intranet.
Working to be London’s Best Council 1 Page 37

COMMERCIAL SERVICES BUSINESS PLAN The strategy will contribute to delivering the long term goals of:
The Business Plan 2017-21 Community Plan London’s Best Council by 2020
The principal means of disseminating detailed procurement guidance are the Commercial Services Team (CST), and the intranet.
Working to be London’s Best Council 2 Page 38

COMMERCIAL SERVICES BUSINESS PLAN
Section 2 – Objectives and Benefits
The overarching objectives of this strategy are:
• To evaluate and improve current procurement practices to achieve better value for money and to ensure customer/client needs are met
• To ensure best practice examples are identified and applied consistently across the organisation.
• To align procurement activities with other strategies adopted and to ensure that corporate objectives are addressed
• To ensure that current and future procurement activities are planned, monitored, and reviewed effectively including identifying opportunities for collaboration with both private and public sector bodies and the VCFS
In taking this strategy forward, the Council expects to realise the following benefits:
Demonstrate continuous improvement and achieve value for money through the efficient procurement of goods and services
Encourage communication and interaction with local and national suppliers to understand their views
Develop relationships between the Council, the business community and the broader voluntary sector which create mutually advantageous, flexible and long term relations
More efficient procurement processes Better risk management Strategic procurement planning Effective spend analysis and measurable cash savings Proactive contract management Greater use of standard processes and templates Compliance with appropriate legislation Compliance with Contract Standing Orders Collaboration, including with other authorities, local businesses and the VCFS Greater use of the E-Tendering system
Our vision for procurement is to provide a first class service for our residents whilst we build on best practice to ensure value for money in all our procurement exercises.
Working to be London’s Best Council 3 Page 39

COMMERCIAL SERVICES BUSINESS PLAN
Section 3 - Overview of Procurement The London Borough of Merton spends approximately £200m each year on goods and services on behalf of Merton’s residents. Of that £200m, the Council can influence approximately £160m. The range of goods and services is varied, but includes services for schools, waste collection, care services for children and adults, maintaining the highways, parks and services, encouraging business growth and major construction works.
Updated expenditure 1 April 2015 – 31 March 2016
Working to be London’s Best Council 4 Page 40

COMMERCIAL SERVICES BUSINESS PLAN Procurement in the Council takes place across all departments and is undertaken in what is called a ‘devolved’ model. This means that responsible officers in the departments undertake day to day operational procurement.
CST is part of the Infrastructure & Transactions division of Corporate Services department and was set up specifically to provide procurement support, advice and guidance to the departments and responsible officers. The devolved system means that the responsibility and accountability for operational procurement decisions and actions remain firmly with each responsible officer in the departments. This operating model for procurement is currently under review.
CST provides the following services:
Provision of strategic commercial advice as requested Specific advice on EU Regulations and associated areas, including latest
case law
Benchmarking, identification and promulgation of best practice Involvement in high profile tender exercises as agreed Spend analysis and the Identification of potential savings opportunities and
areas of collaboration
Participation in key commercial exercises, such as make/buy reviews
Maintenance of the contracts register. However, responsibility for entering information onto the contracts register and ensuring that the information is up to date and accurate, rests with the departments
Undertaking a skills matrix and training of officers and elected members Engagement with partners and potential partners with the objective of
streamlining the procurement process, i.e. making the Council an easier organisation with which to deal
Providing up to date support via the intranet, toolkits, procurement guidance and advice.
Procurement is not simply about lowest price; instead it is a strategic tool to ensure that we receive best value whilst putting the needs of Merton’s residents first.
Effective procurement is about managing the whole life cycle of the goods and services we procure, and also ensuring that specifications are right and fit for purpose with clear outcomes and purposes.
From January 2012 to May 2013, a number of improvements were made, including a strengthened Procurement Board, an enhanced Contracts Register and the implementation of a new e-Tendering system.
Furthermore, the Council also adopted a Procurement Governance and Gateway process which comprises four key elements, the Procurement Board, the Procurement Gateways, the
Working to be London’s Best Council 5 Page 41

COMMERCIAL SERVICES BUSINESS PLAN Operational Procurement Groups and the Risk Assessment Tool. These four elements are designed to work together to enable the Procurement Board to exercise effective oversight, control and to provide direction to procurement activity Council wide.
Working to be London’s Best Council 6 Page 42

COMMERCIAL SERVICES BUSINESS PLAN
Section 4 – Key Themes
a. Value for Money (VFM)
In the unprecedented economic climate, the Council will need to make substantial year on year savings for the foreseeable future. Every pound spent must deliver true value to the community, whether that is by better management of our existing contracts, proactive spend analysis, being more commercially aware, or through reviewing current services and potential delivery models.
Knowing how, where and on what our money is spent will be used to drive a supplier review to maximise savings. Furthermore, we intend to review the supply base and drive additional efficiencies by reducing the overall number o f suppliers and to utilise the additional leverage obtained. This exercise will also help us to develop and shape supply markets, define the skills to develop the market and to negotiate better outcomes for the Council and service users.
b. Category Management
By grouping together products and services according to their function (e.g. care, construction, transport, professional services etc.) the Council can better manage the overall spend, whilst maximising our buying power and achieving economies of scale.
A ‘Category’ is an area of spend determined by known market boundaries separating different products or services. Category Management recognises that suppliers within a certain market are likely to have similarities which enable a tailored approach to procurement.
We will develop our capacity and capability in Category Management to support the major commercial decisions the Council is facing. We will add value to projects we support, bringing commercial insight and support throughout the commissioning lifecycle. Recognising this challenge, we will also develop our staff through a revised professional training programme. It will also enhance their relationship and partnership building skills. This means they will spend less time involved in the administrative task of running tenders and spend more time with customers, commissioners and our major suppliers.
Principal Objectives Undertake regular spend analysis of the Council’s full non-pay
spend with recommendations in how to identify and capture efficiencies
Supply base review and rationalisation Make/buy reviews of services Challenge specifications and assumptions around strategic
contracts
Working to be London’s Best Council 7 Page 43
COMMERCIAL SERVICES BUSINESS PLAN
c. Contract Management
We will manage our major contracts more actively to drive continuous improvement in performance and efficiency and further develop contract management across the Council. We will provide greater visibility of the performance of our top contracts to help to improve the management of major suppliers and ensure they are delivering against the agreed performance standards.
By reviewing strategic contracts and adopting a more commercial approach to the management of our key contracts we will ensure that improvements and efficiencies are delivered.
We will also work with operational contract managers in departments to build on best practice and provide training in contract management techniques.
The outcome of this change will be measured by the monitoring of contract performance and by the identification of improvements in performance levels and additional efficiencies during the life of a contract. Furthermore, as we develop stronger relationships with our key suppliers, we will be recognised as their ‘customer of choice’ which may lead to increased market intelligence and therefore improve our opportunities for innovation in the marketplace.
Through a clear commercially led approach to contract management, we will ensure a greater focus is directed towards obtaining the required outcomes. This will include increased monitoring and management of supplier performance through robust SLA’s and KPI’s (including the delivery of community benefits) and where performance is not being achieved, an action and improvement plan will be implemented.
d. Partnering and Collaboration
Principal Objectives Reduce non-contracted spend Embed contract management principles across the Council Hold regular performance meetings with suppliers Set clear and proportionate KPI and SLA targets for suppliers Link payment to performance (where appropriate)
Principal Objectives Develop a suite of category strategies to drive further savings and
efficiencies Embed a category management approach across the Council Category Management specific training programme
Working to be London’s Best Council 8 Page 44

COMMERCIAL SERVICES BUSINESS PLAN
Partnering means the creation of sustainable, collaborative relationships with suppliers in the public, private, social enterprise and voluntary sectors to deliver services; carry out major projects; or acquire supplies and equipment.
Partnerships can be beneficial and integrated in service delivery, but it needs to be recognised that this is not an easier contract style; indeed, partnering agreements are likely to be more challenging than traditional contracts. A partnership agreement will therefore require careful preparation and procurement. Partnering should be considered when engaging in best value reviews of services as a potential alternative to established methods of service delivery.
When formulating our procurement strategies, we will ensure that we take account of potential opportunities afforded by partnering and collaborating. We will also look at existing framework agreements when considering any future options for procurement and where appropriate the use of any national, regional or pan London procurement arrangements that fit with the Council’s strategy.
Collaboration describes the various ways in which councils and other public bodies come together to combine their buying power, to procure or commission goods, works or services jointly or to create shared services.
Collaboration is a form of public partnership; its major benefits are economies of scale and accelerated learning.
We will ensure that contractors and partners have priorities which align with those of the Council and that they understand how they contribute to the Council’s performance.
The Council will actively participate with other authorities and organisations where appropriate and feasible, to seek economies through joint procurement, joint commissioning, framework agreements and shared services.
Principal Objectives Work with other public bodies to seek joint partnering and collaboration
opportunities Investigate the greater use of collaborative contracts Look to use existing framework agreements where appropriate
Working to be London’s Best Council 9 Page 45

COMMERCIAL SERVICES BUSINESS PLAN
e. Market Management
The Council will continue to work with more diverse providers of services. In some areas there are strong markets but in others they are either small or not yet developed. The Council will make full use of all the different methods of delivery available, including joint ventures, public, private and VCFS options. Through procurement, we will support the growth of local businesses and other organisations by encouraging the use of local suppliers. While staying within the legal constraints of public sector procurement, the Council will encourage local suppliers to work with us, recognising and exploiting the ability to create a positive climate for firms based in Merton. The Council will endeavour to support a thriving local business sector, providing opportunities for suppliers to develop the capacity to win future contracts from the Council and other public sector partners.
This approach recognises that by encouraging sustainable high quality local employment, the Council is reducing the demand and thus cost of other public services. The Council will seek to encourage innovation, improve skill levels in Merton, create jobs and retain money in the local economy.
f. Supplier Relationship Management
The Council will build strong, long term, positive relationships with suppliers across all sectors, not just when actively procuring goods and services but also when considering alternative delivery models e.g. social enterprises.
The Council will establish strategic relationships with suppliers to ensure that both parties are delivering against the commitments within the contract and also build upon mutual experience and knowledge to embed continuous improvement practices throughout the contracted period. Effective engagement with suppliers will also inform future specifications. This will ensure that the Council is approaching the market place with requirements which meet clearly defined needs and are commercially attractive to potential bidders.
The Council commits to making all procurement activity fair and transparent and to encourage a diverse range of potential bidders to participate.
Principal Objectives Identify where market capacity may be weak and where new
markets may need to be developed Encourage suppliers to develop innovative approaches Foster a collaborative approach to procurement Work to increase the proportion of spend with SME’s and VCFS Take steps to promote and encourage local economic growth e.g.
reducing the barriers to SME and VCFS participation Hold regular supplier engagement events
Working to be London’s Best Council 10 Page 46

COMMERCIAL SERVICES BUSINESS PLAN
A suite of standardised documents and contracts will be developed for use across the Council to ensure consistency and to make the procurement process more accessible to suppliers.
g. Developing People and Improving Skills
Procurement is a key activity in sourcing the skills, services and supplies required by the Council to deliver community outcomes. The officers who undertake procurement and contract management activity are vital to the successful delivery of the Councils strategic procurement objectives.
The required capacity and skills will continue to be developed in departments with support and guidance from CST.
CST will develop other ideas to encourage officer participation. These will include the offering of regular ‘drop-in’ sessions which will allow any topic of interest to be discussed informally. Also, specific targeted training will be developed and made available to officers/teams and divisions as required.
Regular procurement forums for all Merton responsible officers will continue to be offered. Active participation will be encouraged by the use of focus and working groups on specific topics of interest; such as toolkits, market engagement and benchmarking.
The forums will:
Bring together all professionals across the Council working on procurement activity into a single forum
Provide a platform for evidence sharing and best practice (both internal and external)
Introduce and embed a co-ordinated and consistent Merton approach to procurement
Identify savings and efficiencies opportunities
The forum is a reference group, accountable to the Procurement Board, with recommendations and updates to be fed bilaterally.
Principal Objectives Engage with key suppliers in all sectors Robust contract management Explore new models of service delivery and welcome dialogue with
communities and suppliers to establish new and innovative procurement practices
Encourage a diverse range of suppliers to work with the Council
Working to be London’s Best Council 11 Page 47

COMMERCIAL SERVICES BUSINESS PLAN
h. Systems and Processes
Continued use of the e-Tendering system has improved compliance and at the same time it has streamlined the tendering processes.
The contracts register has received a refresh and is now part of the e-Tendering suite which is in the public domain so that any interested parties may view it. This has led to greater visibility of Council spend which will be fed into procurement and resource planning and should lead to greater opportunities for efficiency savings.
It will also make it easier for members of the public to have their requests under the Freedom of Information Act 2000 (FoI’s) answered quickly and efficiently.
Ensure council and departmental rolling 1-3-year procurement plans are produced each financial year and kept up to date.
Principal Objectives Maintain an up to date contracts register Increased use of the e-Tendering system Investigating the strategic use of e-Auctions Training in the use of the procurement toolkit Develop a comprehensive rolling 1-3-year procurement plan
Principal Objectives Provide a career path for practitioners of procurement with
clear roles and responsibilities Provide skills and training and learning & development
opportunities for officers Ensure that procurement best practice advice is available via
the Procurement Toolkit
Working to be London’s Best Council 12 Page 48

COMMERCIAL SERVICES BUSINESS PLAN
Section 5 - Governance Framework
Merton’s procurement is governed by EU law, UK Law and by Merton’s Contract Standing Orders. These are mandatory for officers of Merton to follow.
a. The Corporate Management Team
The Corporate Management Team (CMT) will continue to initiate and lead all procurement activity and endorse and support adherence to the procurement strategy across the Council. CMT will set the strategic direction of the Council, empower officers and hold officers to account in the delivery of the strategy.
b. Contract Standing Orders
The Council will comply with the wide range of legislation, regulation and guidance which governs procurement. The Council’s Contract Standing Orders, last fundamentally revised in April 2012 in line with the latest legal and operational requirements, are currently under review again, to take into account the Public Contracts Regulation 2015 (PCR2015), the Social Value Act 2012, lessons learnt over the past three years as well as emerging best practice principles.
Adherence to the Contract Standing Orders will be enforced to ensure the highest standards of probity and compliance, one of Merton’s principles underpinning procurement activity.
c. The Procurement Board
The Procurement Board is the primary strategic agent through which procurement activity is governed. The Procurement Board is made up of senior management officers and procurement professionals and is chaired by a Director.
The main functions of the Procurement Board are:
Oversee the production and management of the procurement strategy Assure that procurement is managed competently and legally Ensure changes in legislation e.g. The Social Value Act (2012) and best
practice are embedded in the Councils procurement practices
Assessing whether procurement is achieving best value for the Council Ensuring that staff engaged in procurement have the required skills To be responsible for the Operational Procurement Groups (OPG)
Working to be London’s Best Council 13 Page 49

COMMERCIAL SERVICES BUSINESS PLAN
d. Departmental Management Teams
Departmental Management Teams will receive regular reports from their procurement champions and ensure that the Procurement Strategy is being delivered effectively within their respective departments.
e. Operational Procurement Group
The OPG’s are the operational arm of the Procurement Board, and are the means through which departmental procurement activity is planned and co- ordinated. One OPG exists for each department and the Groups co-ordinate, risk assess and manage the flow of all procurement activity. Each group is championed by a departmental procurement lead who also attends the Procurement Board.
f. Procurement Gateway process
It is a risk based approach which uses a series of minimum criteria and risk triggers to determine which procurement activities will come to the Procurement Board.
Currently projects need to be brought to the Procurement Board for review where:
the total value is over £3m (or annual value over £750k) (Thresholds under review) or the decision to award the contract is to be made by Cabinet or three or more risk triggers are assessed at amber level or greater. These
include; political or reputational risk, impact of failure on service user and maturity or volatility of the market.
g. Financial Regulations and Procedures
The Financial Regulations and Procedures are the internal rules applicable to Merton’s financial processes and these have also been reviewed to take account of current and recent changes in procurement practice e.g. use of Framework Agreements. Within the options appraisal carried out for each procurement project there will be included due consideration to the methods of financing the project available i.e. capital borrowing, leasing, and other alternatives.
h. Procurement Plans
These plans identify the required strategic procurement activities for a period extending 1-3 years into the future. The departmental procurement plans inform the Corporate Procurement Plan, which will encompass all major procurements due in the following 1-3 years. This will allow for enhanced planning and scheduling, improved visibility and improved risk management for the Council’s major procurement activities. The Corporate Procurement Plan is overseen by the Procurement Board.
Working to be London’s Best Council 14 Page 50

COMMERCIAL SERVICES BUSINESS PLAN i. Procurement Templates and Toolkits
The ‘Procurement Toolkit’ is available to officers via the Procurement Intranet pages and it provides specific procedural guidance and templates for procurement activity.
The Council will review and keep these up to date. It is against this procedural guidance that individual compliance will be measured to ensure best practice, legal compliance and whether there is any off contract spend.
The CST will be working with departments to improve the current toolkit and templates.
j. The Contracts Register
The Contracts Register is a Council-wide record of all contracts that the Council has entered into above the value of £5,000.
The Contracts Register is currently part-hosted via the London Tenders Portal as part of the Council’s e-Tendering system. Responsible Officers must ensure that all contracts are entered onto it and that they are kept up to date.
The Contracts Register will continue to be a key component to co-ordinate and risk manage procurement activity at the corporate level and will assist with FoIs.
k. e-Procurement
During 2015 the Council re-let its contract for Pro-Contract. The system provides officers and suppliers with an effective and efficient way to electronically manage tender and quote processes. The system is designed to allow staff to conduct requests for quotations and tenders online, much more quickly and also to allow potential suppliers to respond without the need to complete numerous paper forms.
We will ensure that the benefits of e-Tendering continue by the promotion and monitoring of the system. The use of the e-Tendering system was made mandatory as of 1 April 2012.
Improved use of the e-Tendering system will provide corporate visibility on spend and prevent duplication of processes. Improved corporate visibility will in turn allow greater scrutiny of the management of spend across the Council.
l. Looking to the Future
We are investigating the use of e-Auctions as a way of saving additional monies.
Working to be London’s Best Council 15 Page 51

COMMERCIAL SERVICES BUSINESS PLAN
Section 6 – Key Actions
A procurement action plan will cover the principal objectives detailed in this strategy document.
To help us achieve our vision, there are five key actions we are taking:
1. Implement our people development plan, putting in place a new programme of training, coaching and mentoring
2. Roll out stronger contract and supplier management across the Council for key contracts, identifying clear roles and responsibilities and providing professional support for service teams
3. Develop a rolling three-year corporate procurement plan, incorporating robust departmental plans
4. Provide an updated procurement toolkit and templates for responsible officers 5. Increased use of partnerships and collaboration with other organisations to
drive greater efficiencies
By 2021, we will have:
Delivered substantial cost savings through strategic contracting, to help meet the Council’s budget targets
Developed a best-in-class service which is highly responsive to the needs of customers, and is valued by them as a strategic partner in developing their own plans
Encouraged greater levels of spend with local suppliers and have thriving relationships with local businesses and VCFS communities
Established strong partnerships with other public sector bodies to leverage best value for money
Working to be London’s Best Council 16 Page 52

COMMERCIAL SERVICES BUSINESS PLAN
Contacting Us
Please contact us if you have any questions, comments or feedback about the Procurement Strategy:
E-mail: [email protected]
Phone: 020 8545 3736
Other useful websites Audit Commission http://www.audit-commission.gov.uk Comprehensive Performance Assessment http://www.audit-commission.gov.uk/cpa Department for Communities and Local Government http://www.communities.gov.uk Improvement and Development Agency, (I&DeA) http://www.idea.gov.uk Local Government Association http://www.lga.gov.uk Regional Centre of Excellence http://www.rcoe.gov.uk
Working to be London’s Best Council 17 Page 53

ICT STRATEGY 2016-20 EXECUTIVE SUMMARY This document sets out the Council’s vision – articulated as a series of strategic objectives – for its information, communication and technology infrastructure and architecture. The development of the document is a result of a comprehensive planning and consultation exercise involving all services across the organisation. This was guided by a number of design principles that provide a broad framework within which the strategic priorities have been developed. The aim of these principles is to ensure that the management and development of IT and systems complies with necessary standards and protocols and aligns with the wider strategic direction of the council by:
• organising information and systems around customers; • automating processes wherever possible; • consolidating and rationalising master data sets wherever possible • supporting joint working and shared services; and • reducing, as far as possible, reliance on highly technical support.
Importantly, the strategy introduced a Technical Design Authority to ensure a controlled, disciplined approach to changes to the technical architecture and infrastructure. This is designed to accommodate the demands and requirements that will inevitably arise during the lifetime of this strategy but are not currently known. The role of this body is to manage and agree any alterations that are proposed to the agreed implementation plan that supports this strategy. The terms of reference for the group are appended to this strategy (Appendix 2), and these are designed to ensure it operates in a collaborative, agile way to mitigate against the risk of unnecessary bureaucracy and business interruption, The strategic priorities that this strategy seeks to deliver are:
• Customer focused systems • Integrated and joined-up systems and infrastructure • Single source of master data sets • IT that is fit for purpose now and into the future • The ability to operate from multiple locations and devices (flexible and mobile
working) • Increased self-service • Automation where it’s efficient and effective to do so • Systems and infrastructure that are resilient, compliant and experience minimal
downtime All of these outcomes need to be delivered within an overarching strategic aim of becoming London’s Best Council with an efficient organisation and reduced operating costs. These high level outcomes shape and prioritise the activity set out in the supporting implementation plan for the strategy.
Page 54
ABOUT THIS STRATEGY This document sets out Merton’s vision and strategy for its Information, Communication and Technology infrastructure and systems architecture. In developing the strategy, officers have drawn on the target operating models (TOM) and associated delivery plans developed by the Council’s businesses throughout 2015/6. This ensures that Merton continues to take a business-led (and therefore customer-led) approach to the development, improvement and maintenance of its IT assets. The strategy also reflects the more technical guiding principles and constraints that frame our IT ambitions, either because of legislative requirements or as part of our commitment to adhere to industry standards and best practice. In striking the balance between responding to business needs and managing IT assets effectively and efficiently this strategy is designed to provide a broad strategic framework for the maintenance and improvement of the Council’s IT and business systems. It is supported by a more detailed implementation plan that sets out the operational tasks associated with achieving the strategy. The implementation plan will be reviewed annually; the content of the plan and progress against it will be assured and managed through Corporate Services DMT and the Merton Improvement Board. The Assistant Directors of Infrastructure & Transactions and Business Improvement will be jointly accountable for its delivery. BUSINESS CONTEXT As a high achieving authority, Merton is single minded in its commitment to continuous improvement. The organisation recognises that this will require IT infrastructure and systems that support excellent services and – in the context of a decreasing financial envelope – greater automation and self-service. The financial context in which we operate requires that the organisation finds ever more efficient ways to manage and improve its IT assets. Where judicious investment is required in order to transition the organisation towards more efficient ways of working on an ‘invest to save’ basis, the Council allocates funding from reserves earmarked specifically for this purpose. The Merton Improvement and Capital Programme Boards manage this process, awarding funding on the basis of sound business cases and overseeing their implementation to ensure benefits are realised. Through the development of TOMs each business has set out its future state and the role that IT will play in enabling this. It is this information that, drawn together, forms the basis of this strategy and supporting implementation plans. The activities reflect the development, improvement and maintenance of IT and business systems needed by services in order to achieve their stated ambitions. In addition, the strategy incorporates the activity that will be required to deliver cross-cutting transformational projects and programmes of change and improvement. The most notable of these are:
• Flexible Working – a programme of coordinated activity designed to introduce modern working practices that make the most effective and efficient use of office space and officer time.
• Customer Contact – a three-year programme that will enable and drive channel shift, the transition of customer interaction to cheaper (usually online) channels and self-service wherever possible. Page 55

• Mobile working – the integration of systems and introduction of mobile devices and mobile-enabled systems so that officers can work from any location.
• SCIS – the re-procurement of the Council’s social care information system. • Financial systems – the re-procurement of the Council’s financial information
management systems. STRATEGIC DESIGN PRINCIPLES As this strategy has already acknowledged, Merton must be judicious in its management and development of IT and systems – changes to our infrastructure and architecture have cost implications beyond the initial investment as they will require support and maintenance. In addition, there are a suite of technical standards and protocols with which the Council needs to comply. To ensure that all of these factors are taken into account, the organisation has adopted a holistic approach to developing this strategy. Businesses have worked with target operating models to clarify and articulate their current and future IT needs; but to help frame their thinking and ensure development proposals are realistic a series of design principles have been applied to the process. These will continue to inform our IT development:
• IT systems must be customer centric and support the Council’s Customer Channel Design principles.
• IT systems should consolidate information around the citizen, reduce reliance on paper and provide automated workflows wherever possible.
• IT systems must support social inclusion and be user friendly.
• IT systems must improve information use and sharing with Merton partners, where appropriate, and comply with the Information Strategy.
• IT systems must support the Council’s Information Channel Design Principles.
• IT systems will maximise use of configuration to ensure they are readily upgradable
and supported by the vendor. System customisation should be avoided.
• IT systems and Service delivery will be designed with shared function/service in mind.
• All significant IT developments, improvements and technology purchases will be
governed and controlled through the Technical Design Authority to ensure technology compliance and maximum value is achieved.
STRATEGIC PRIORITIES Drawing on the TOMs and transformation delivery plans of the organisation, as well as developments in the world of IT, legislative requirements and industry good practice, we have developed a set of strategic priorities that clarify where scarce resources will be focused over the life of the strategy. Page 56

These are the high level outcomes this strategy aims to deliver:
• Customer focused systems • Integrated and joined-up systems and infrastructure • Single source of master data sets (master data management) • IT that is fit for purpose now and into the future • The ability to operate from multiple locations and devices (flexible and mobile
working) • Increased self-service • Automation where it’s efficient and effective to do so • Systems and infrastructure that are resilient, compliant and experience minimal
downtime All of these outcomes need to be delivered within an overarching strategic aim of becoming London’s Best Council with an efficient organisation and reduced operating costs . These high level outcomes shape and prioritise the activity set in the supporting implementation plan for the strategy. The following objectives set out in more detail how each will be achieved. Customer focused systems • Council systems that support the Customer Contact Strategy and programme, enabling
a customer centric approach, with information consolidated around the service users. • Support social inclusion by maximising access to IT resources by members of the
community and community groups, and by providing user-friendly systems, systems that cater for a wide range of needs in support of the Digital Inclusion Strategy.
• Support the customer contact strategy by providing a consistent customer experience through a variety of channels.
• Customer data stored consistently across various systems. • System and IT infrastructure enhancements and implementation informed by business
need (which in turn articulates customer need). • Where feasible and beneficial, maximise the benefits of mobile working by gathering
multi-agency data at each interaction thereby reducing multiple contacts with customers. Integrated and joined-up systems and infrastructure • System integration wherever possible and beneficial. • Actively consider the potential for joint working with partnering boroughs and agencies in
all IT decisions. • Improved – through IT systems/infrastructure – information use and sharing with Merton
partners. • IT infrastructure and systems that support, enable and promote shared services. • Support business transformation through end- to-end integration of processes,
consolidated customer databases and exploiting e-enabling services and improved service delivery within the council.
Page 57

• Create and maintain a ‘single version of the truth’ with appropriate arrangements in place to improve and maintain primary data sources that feed secondary sets with minimal manual intervention.
• Maximise existing investments.
Fit for purpose now and into the future • Create a clear vision and target operating model for the IT infrastructure and systems
architecture that is based on businesses’ plans for the future. • Create and maintain IT infrastructure and systems that support business agility. • Lead and promote business change through innovation and technology. • Actively maintain good market intelligence and scan for new opportunities. Operating from multiple locations and devices • Provide business solutions and IT infrastructure that support the flexible working
programme and accommodation strategy through mobile and home working. • Documents available electronically at point of use; reduced reliance on paper. • Telephone systems and printing follow the worker. • Deploy, wherever possible, device and operating system agnostic solutions Increased self service • Introduce and improve the functionality of web-enabled services and systems. • Better use and quality of geospatial data. • Support stronger clienting of the IT service by businesses by raising IT skills. Systems and infrastructure that are resilient, compliant and experience minimal downtime • Establish and maintain a programme for effective disaster recovery. • Develop and regularly test business continuity plans. • Achieve and maintain compliancy with PSN, N3 and CJSM regulations. • Manage and monitor ‘downtime’ that is as close to zero as possible. • Introduce, develop and maintain change control mechanisms. • Adopt a ‘cloud first’ managed/hosted infrastructure approach wherever appropriate CHANGE MANAGEMENT A key factor in delivering this strategy will be the introduction and maintenance of effective change management mechanisms. As the Council increases its reliance on technology through programmes such as Customer Contact and Flexible Working but also seeks, in parallel, to reduce the cost of maintaining and supporting systems and IT infrastructure, establishing effective governance and control of IT assets will become even more important. The uncontrolled and ungoverned development of systems and IT infrastructure risks not only confusing and disrupting the system and IT architectures, but also carries a cost implication: improvements will be inefficient where technical support and maintenance resource implications have not been correctly understood. This could, in the longer term, counteract business benefit/efficiencies if not properly planned for. Page 58

It is therefore important that explicit arrangements are put in place that guarantee that appropriate discipline will be consistently applied to the development of the organisation’s system architecture and IT infrastructure. Whilst this strategy and implementation plan provides a route map for investment over the coming four years, it cannot be expected that the requirements of the organisation will remain static over its lifetime. New business demands are likely to emerge that are not currently understood, or are driven by changes in policy or statutory frameworks. For this reason, this strategy introduced a Technical Design Authority. The role of this body will be to manage and agree any alterations that are proposed to the agreed implementation plan that supports this strategy. It will govern and manage development of the Council’s systems and IT and ensure changes and improvements are compliant with not only necessary technical and security standards, but also Council strategy, i.e. rationalisation and integration of systems, reduction in support overheads etc. This will ensure that there is full collaboration and consultation on any significant proposal to amend the Council’s technology architecture (outside those improvements and activities already agreed as part of this strategy and implementation plan). The terms of reference for the group are appended to this strategy (Appendix 2). OPERATIONAL DELIVERY The core delivery plans for the Infrastructure and Transactions and Business Improvement divisions will incorporate activity required for the routine maintenance of the Council’s IT infrastructure and systems. This strategy and supporting implementation plan captures the activity over and above this core offer, relating to improvements outside those that are routinely expected. For each of these, a business case has been prepared to secure investment from earmarked reserves. This will enable the necessary resources to ensure timely and effective delivery to be made available. To provide consolidated and resilient support arrangements, any system that is being supported by individuals within service teams, the support arrangements will be migrated to the IT infrastructure and business systems team. Prioritisation and sequencing of the programme will be managed through Merton Improvement Board to ensure that it takes account of pan-organisation imperatives and priorities. Regular reports on progress and resource management will be submitted to the Merton Improvement Board, in addition to Corporate Services DMT. A series of Service Level Agreements will sit alongside the strategy and set out agreed metrics and service standards to enable departments to assure and monitor delivery. BUSINESS CONTINUITY Business continuity will be assured through the deployment of four planned maintenance windows per year. These will allow crucial system and infrastructure updates and improvements to be made with minimum impact on service provision. It will also be enhanced through the provision of suitable Wide Area Network (WAN) links to the designated Business Continuity centre; and we will ensure that connectivity to Business Page 59

Critical systems is maintained in the event that we were no longer able to occupy the Civic Centre. We will continue to ensure that the remote access infrastructure is available with diverse internet routes. Business continuity plans will be routinely reviewed and tested. DISASTER RECOVERY The Council’s IT infrastructure and business systems underpin many of the Council’s critical activities. In the event that an incident occurred that interrupted the availability of IT and systems – for example a fire, or borough emergency that affected the Civic Centre – it would be essential that systems were restored as quickly as possible. This is particularly true given the potential for some systems to support civic recovery. In order to ensure this is the case, we will complete Phase 1 Disaster Recovery arrangements, which include the identification of the Council’s core business critical IT systems and the relocation of hardware to the new Disaster Recovery facility located at London Borough of Wandsworth. We will also review departmental IT Disaster Recovery plans and provide some critical challenge to ensure that they are robust and fit for purpose. Utilising agreed planned maintenance periods we will undertake regular testing of Disaster Recovery arrangements including operational infrastructure, hardware and emergency backup systems to ensure that they are fully operational. We will develop phase 2 Disaster Recovery arrangements including the procurement of new Active/Active Storage Area Network equipment (SAN) and install the new infrastructure and equipment at the Civic centre and Wandsworth sites. Finally, we will properly map and document the new Disaster Recovery processes and produce an operational maintenance manual. All of these activities – along with timescales – are included in the Implementation Plan that supports this strategy. APPENDICES:
1. Implementation plan 2. Technical Design Authority terms of reference
RELATED DOCUMENTS Information Technology (IT) Policy Social Media Protocol Information Strategy
Page 60

Authors Sophie Ellis, AD Business Improvement Mark Humphries, AD Infrastructure & Transactions Richard Warren, Head of IT Services Clive Cooke, Head of IT Systems
Version 3.1 Final
Date Issued August 2016
Document Status Approved by MIB
Page 61
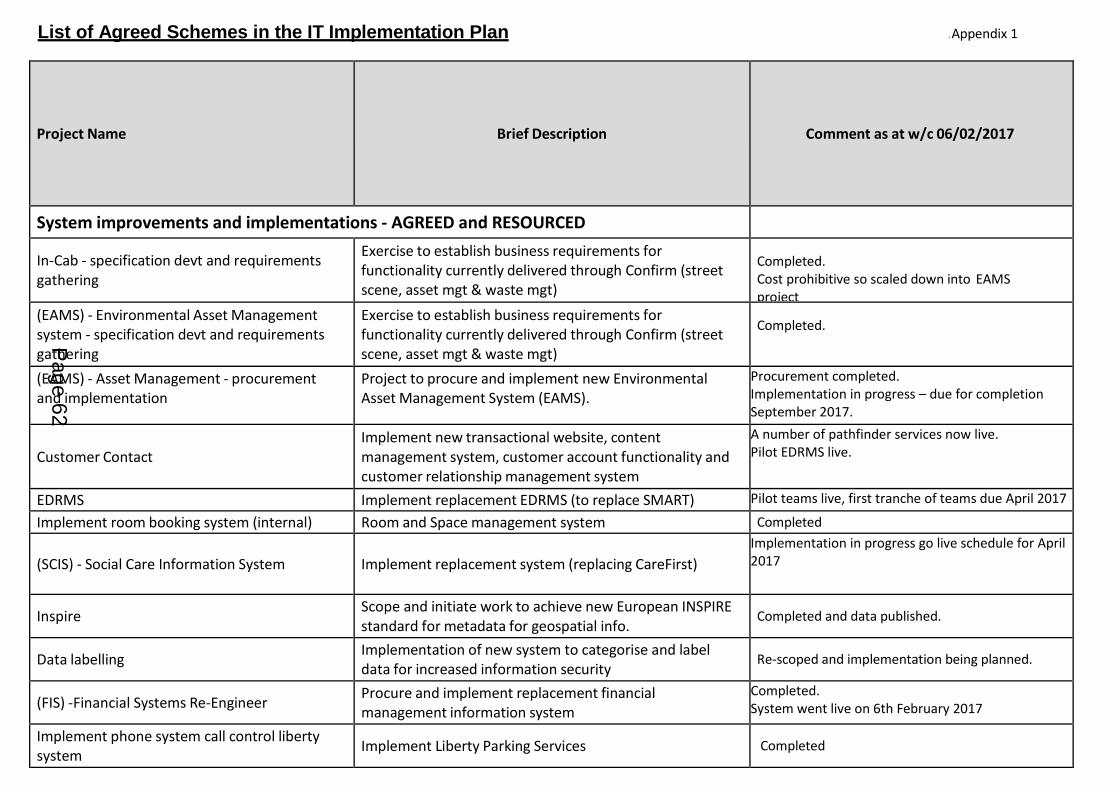
List of Agreed Schemes in the IT Implementation Plan .Appendix 1
Project Name
Brief Description
Comment as at w/c 06/02/2017
System improvements and implementations - AGREED and RESOURCED
In-Cab - specification devt and requirements gathering
Exercise to establish business requirements for functionality currently delivered through Confirm (street scene, asset mgt & waste mgt)
Completed. Cost prohibitive so scaled down into EAMS project
(EAMS) - Environmental Asset Management system - specification devt and requirements gathering
Exercise to establish business requirements for functionality currently delivered through Confirm (street scene, asset mgt & waste mgt)
Completed.
(EAMS) - Asset Management - procurement and implementation
Project to procure and implement new Environmental Asset Management System (EAMS).
Procurement completed. Implementation in progress – due for completion September 2017.
Customer Contact
Implement new transactional website, content management system, customer account functionality and customer relationship management system
A number of pathfinder services now live. Pilot EDRMS live.
EDRMS Implement replacement EDRMS (to replace SMART) Pilot teams live, first tranche of teams due April 2017 Implement room booking system (internal) Room and Space management system Completed
(SCIS) - Social Care Information System
Implement replacement system (replacing CareFirst)
Implementation in progress go live schedule for April 2017
Inspire Scope and initiate work to achieve new European INSPIRE standard for metadata for geospatial info. Completed and data published.
Data labelling Implementation of new system to categorise and label data for increased information security Re-scoped and implementation being planned.
(FIS) -Financial Systems Re-Engineer Procure and implement replacement financial
management information system Completed. System went live on 6th February 2017 Implement phone system call control liberty
system Implement Liberty Parking Services Completed
Page 62

Project Name
Brief Description
Comment as at w/c 06/02/2017
Implement Planet Press Implement new system for automated payment letters
and printing
Completed for initial scope, further opportunities for automation to be investigated.
Automated Council Tax forms Implement (pilot) new revenue and benefits ePayment portal solution to automate Council Tax payments Completed
ANPR - Specification
A consultant to write the specification and provide expert advice and support in respect of the project to procure new ANPR CCTV cameras to be used for traffic enforcement.
Completed
GIS requirements review A consultant to assess and prioritise the GIS requirements
of the Authority.
Completed
Pop Up Libraries
Completed
NHS Number as URN To introduce the NHS number as the URN within our Social Care
System. Already under way and in CareFirst action plan
De-scoped for phase 1. To be reviewed in phase 2.
Tree Survey Remote Solution
Provision of remote survey solution for tree survey work (underway).
Short-term solution in place. Longer term solution will be addressed by EAMS implementation.
Schools Admissions System
Procurement exercise and implementation of new schools admissions system (Currently Impulse system) as current contracts expire - No shared service, so use of Framework.
Complete. Went live on 30th September 2015
Mapping and Data Improvement Geocode and integrate a range of datasets into the GIS database - prioritised by business benefit.
Mostly completed. Minor issues remain, due for completion March 2017
Page 63

Project Name
Brief Description
Comment as at w/c 06/02/2017
Firmstep e-forms
Develop and implement a range of new eForms (using existing system) to provide automation for businesses pending replacement eForm solution becoming available through Customer Contact programme.
Completed. Prioritised forms completed, on-going urgent requirements being funded as and when required.
Libraries Self Service Machines
To replace the current self-service kiosks in libraries
Tender completed - implementation started
ANPR - Implementation Following successful trial, Implement automatic number plate recognition system. Now to be combined with CCTV maintenance contract.
Implementation in progress.
Library system Enhancements
A series of enhancements included within the LLC (London Libraries Consortium) development plan.
Completed.
ePayments re-procurement and implementation
Civica icon epayments contract expires 31st March 2016, Re- procure and implement new solution by 31st March 2016.
Completed.
Infrastructure improvements and implementations - AGREED
Replace all photocopier / printers Replace all MFD on floors and print room and install
integrated system
Completed
Replace corporate Storage Area Network and backup solution Replace SAN and Backup to near zero downtime Completed
Replace desktop devices Replacement desktop devices Continuous replacement program in place
Replace out of warranty servers Replace out of warranty servers Servers are replaced as required on a five year cycle Replace UPS batteries replace UPS batteries Completed
Page 64
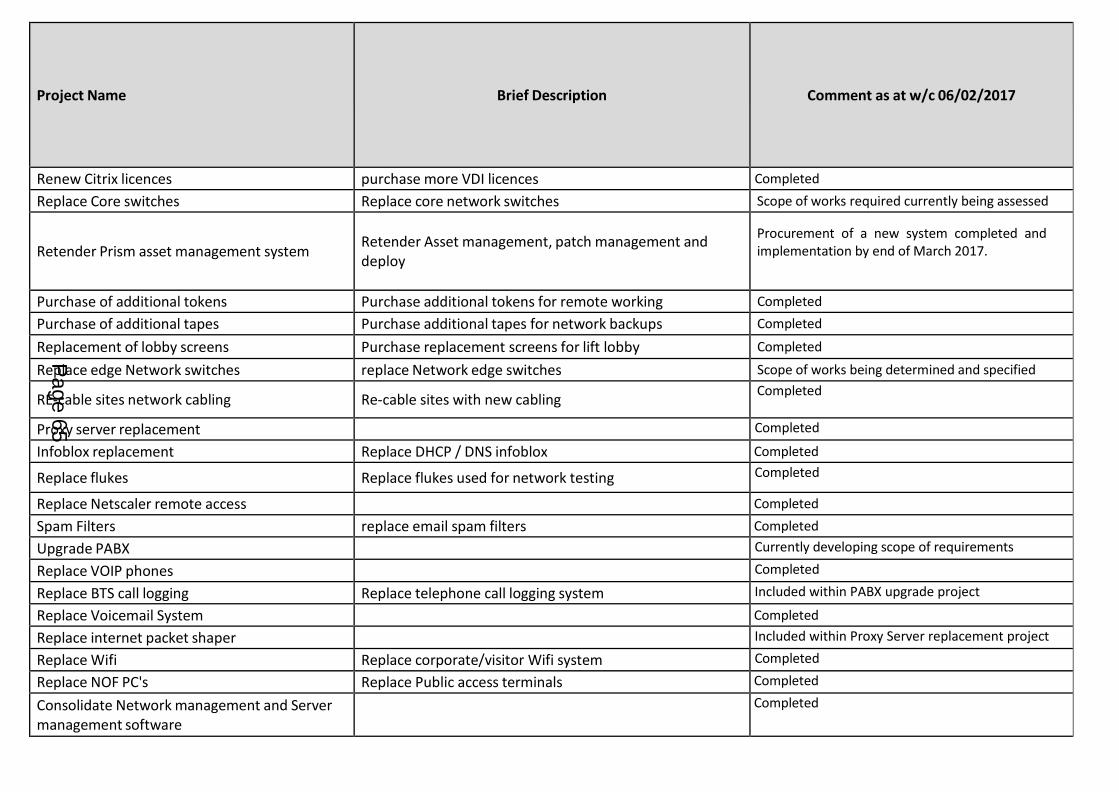
Project Name
Brief Description
Comment as at w/c 06/02/2017
Renew Citrix licences purchase more VDI licences Completed Replace Core switches Replace core network switches Scope of works required currently being assessed
Retender Prism asset management system
Retender Asset management, patch management and deploy
Procurement of a new system completed and implementation by end of March 2017.
Purchase of additional tokens Purchase additional tokens for remote working Completed Purchase of additional tapes Purchase additional tapes for network backups Completed Replacement of lobby screens Purchase replacement screens for lift lobby Completed Replace edge Network switches replace Network edge switches Scope of works being determined and specified
RE-cable sites network cabling Re-cable sites with new cabling Completed
Proxy server replacement Completed Infoblox replacement Replace DHCP / DNS infoblox Completed
Replace flukes Replace flukes used for network testing Completed
Replace Netscaler remote access Completed Spam Filters replace email spam filters Completed Upgrade PABX Currently developing scope of requirements Replace VOIP phones Completed Replace BTS call logging Replace telephone call logging system Included within PABX upgrade project
Replace Voicemail System Completed Replace internet packet shaper Included within Proxy Server replacement project Replace Wifi Replace corporate/visitor Wifi system Completed Replace NOF PC's Replace Public access terminals Completed Consolidate Network management and Server management software
Completed
Page 65

Project Name
Brief Description
Comment as at w/c 06/02/2017
Retender Source One email archiving Replace corporate email archiving facility Included within upgrade to Office 365
Renew Microsoft Enterprise agreement Renewal of Microsoft software Enterprise Agreement Upgrading to Office 365 as part of next renewal Replace MASCOT system Replace current MASCOT system with new product which
includes enhanced telephony and data facilities New replacement system is currently being procured
Page 66

Appendix 2
Technical Design Authority Terms of Reference January 2017 1. Purpose The Technical Design Authority (TDA) is the strategic body which ensures that an appropriate level of governance and control is applied to changes or improvements in the council’s IT infrastructure or systems. Its role is to facilitate appropriate challenge, assurance and support to ensure all proposals for major upgrades, or new systems, modules, or services, are fit for purpose. The Technical Design Authority will;
• govern and manage the IT systems architecture and IT infrastructure for the London Borough of Merton;
• maintain and lead on supporting IT policies and standards; • agree and manage changes to the IT Strategy and Implementation Plan;
incorporating changes and development to the systems architecture and IT infrastructure for the council such that it complies with strategic objectives, relevant legislation, appropriate quality standards, and good practice;
• oversee changes to, and development of, the systems architecture and IT infrastructure for the council set out within the IT Strategy and Implementation Plan in order to ensure that these are well managed and meet agreed business objectives;
• implement and maintain a scheme of delegation that allows for effective and timely decisions on changes to the IT Strategy and Implementation Plan at a level proportionate to their significance and impact;
• review its Terms of Reference annually.
2. Functions
The overarching objective of the TDA is to ensure that the appropriate level of discipline and control is applied to changes or improvements to the council’s IT infrastructure and systems. The ultimate aim is to enhance IT performance and flexibility and ensure that the council’s technology is fit for purpose, the likelihood and predictability of success is increased, and the likelihood and cost of non-conformance is decreased. This is to be achieved by ensuring that all proposed significant changes are approved by the TDA prior to funding being allocated or implementation agreed. This extends to technical aspects of wider transformation and improvement projects and programmes commissioned across the council. The TDA defines significant change as; Page 67

Appendix 2
• any new system, module or service; • any major upgrade to current infrastructure or; • any major system upgrades, enhancements or configuration.
The scope of the TDA does not extend to routine maintenance and upgrades, nor any activity already agreed as part of the IT Strategy and Implementation Plan. The TDA operates closely with the Continuous Improvement Team and Business Partners to ensure that it is engaged at appropriate gateways in the project / programme cycle, and provides advice, guidance, and support to projects / programmes, and services to enable benefits to be secured through well managed and disciplined technical improvements. In considering proposed amendments and alterations to the systems architecture and infrastructure, the TDA will consider; • selection and design of technology for systems development / maintenance and
production operations; • alignment of proposals with the council’s strategic direction, including the IT Strategy,
Information Strategy, and corresponding enterprise architecture principles, architectures and roadmaps;
• guidance and advice on leading practices, industry standards and conventions and frameworks and methods;
• technical risks and mitigation strategies; • integration with existing systems and infrastructure so that the overall solution meets a
combined set of user requirements; • impacts on existing infrastructure capacity and systems; • software licensing impacts (where relevant); • data integrity and quality and, specifically, alignment with agreed master datasets; • future support requirements and the capacity of the council to respond to these; • feasibility in relation to costs, resources, impacts and business benefits; • design to meet technical goals in relation to compatibility, usability, security, reliability,
maintainability, reusability, supportability and recoverability in operations; • implementation plans to increase the likelihood of success, e.g. project / programme
management that complies with MAP, scheduled user testing, etc.; • ability to meet business continuity and disaster recovery arrangements of the council.
The TDA will also regularly review the relevant council policies and standards to ensure they are fit for purpose. 3. Membership
The membership of the TDA will be drawn from Corporate Services to ensure the appropriate level of technical expertise. The Board will be considered quorate if the Chair (or their delegate) plus four other members, including the Head of IT Systems and Head of IT Delivery (or their delegates), are present. Page 68

Appendix 2 The table below outlines the TDA membership and expected roles. Post Role in the TDA Director of Corporate Services Chair Assistant Director of Infrastructure and Transactions
Ensure proposals align with strategic direction of the organisation in relation to IT Infrastructure
Assistant Director of Business Improvement
Ensure proposals align with strategic direction of the organisation in relation to transformation and change and IT systems
Head of IT Service Delivery Ensure proposals align with IT strategy in relation to operational management of IT Infrastructure
Head of IT Systems Ensure proposals align with IT strategy in relation to operational management of IT Systems Architecture
Head of Continuous Improvement Ensure proposals align with the Merton Improvement Portfolio and Merton Approach to Projects (MAP) methodology
Head of Information Governance Ensure proposals align with the council’s data protection and information governance policies
Business Partners are considered optional attendees unless their Department is bringing a proposal to the TDA, in which case their attendance is mandated. The Business Partners will support the Department in the preparation and delivery of their proposal for the TDA. They will ensure business interests are represented in technical decisions. Additional temporary members will be invited to join the board for individual meetings where a particular item requires their expert input. These will usually be Heads of Profession for a given area or subject. The TDA will always seek to reach a decision on any proposal through consensus and collaboration; looking to reach a conclusion that is in the best interests of the organisation as a whole as well as the service seeking to introduce change. In the event that such a decision cannot be reached then the TDA will escalate the decision to the Merton Improvement Board or CMT as appropriate, providing all necessary information to ensure a swift resolution can be achieved. 4. Board support
Page 69

Appendix 2 The Continuous Improvement Team will organise and service all TDA meetings. This will include scheduling meetings and circulation of documentation, maintaining an online document library, keeping a decision log and summary notes of all meetings, and monitoring actions arising from the meeting, including escalating issues / out of date actions to Merton Improvement Board as required. Each meeting will adopt the following broad format: • A representative from the relevant business area, preferably the owner of the proposed
initiative / project, will present their proposal, including any options appraisal undertaken, the anticipated business benefits, and the overarching plan.
• Board members will ask questions and clarify the proposal as required. • The Board will reach a decision on the proposal which may be to;
a) approve as currently set out; b) approve subject to certain amendments or additions; c) refer it for further development on the basis of guidance provided by the board, or; d) reject the proposal altogether with a clear rationale for the decision.
5. Accountability The TDA will report all decisions to the Merton Improvement Board (MIB) on a monthly basis. In addition, the TDA may escalate issues and risks to MIB as required. The TDA will work in conjunction with the other established change control mechanisms within the organisation as follows: Governance Role Relationship to TDA Departmental Management Teams (DMT)
Business leadership and management; agree, prioritise and resource transformational activity.
Refer requests / proposals for significant system / IT changes to the TDA for advice prior to approval.
Senior Management Teams (SMT)
Manage discrete business functions, propose, prioritise and manage transformational activity.
Consult the TDA on proposals for significant system / IT changes for advice prior to approval.
Merton Improvement Board (MIB)
Oversees cross cutting transformation and secures assurance on quality and progress against delivery.
Refer requests / proposals for significant system / IT changes to the TDA for advice prior to approval.
Capital Programme Board Oversees, determines and directs activity (projects and programmes) undertaken as part of the council’s capital programme.
Refer requests / proposals for significant system / IT changes to the TDA for advice prior to approval.
Carefirst Programme Oversees and directs Significant improvements Page 70
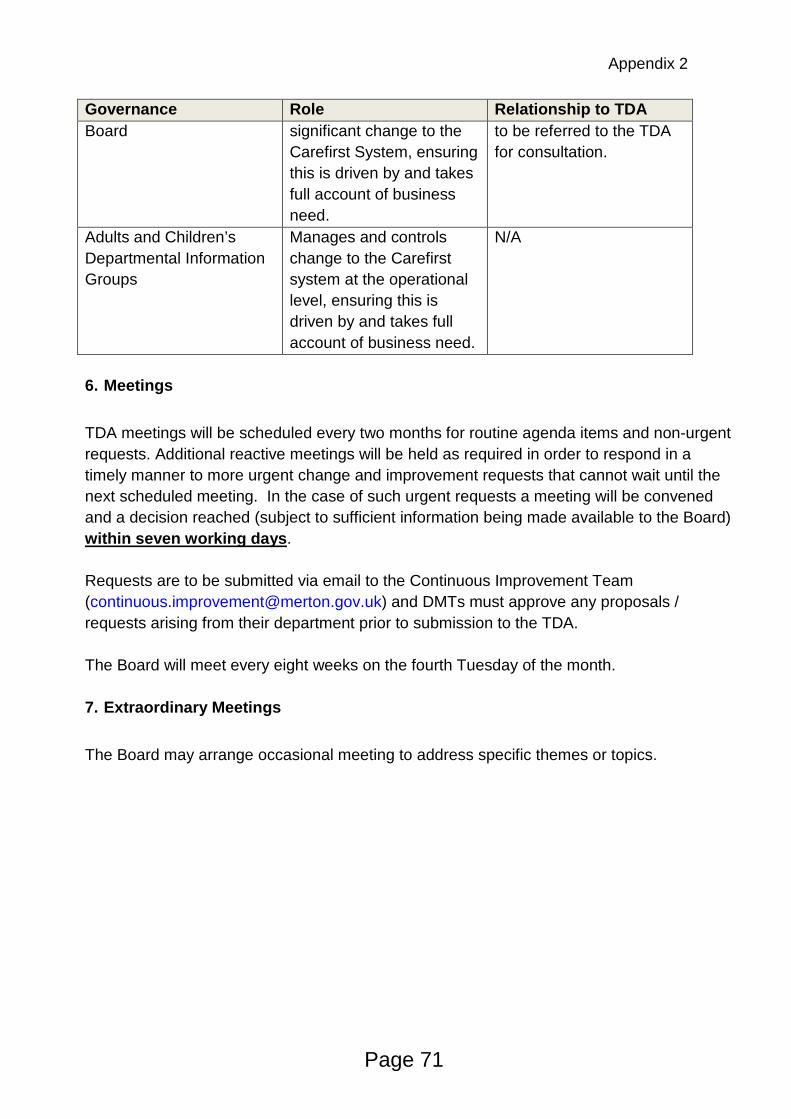
Appendix 2 Governance Role Relationship to TDA Board significant change to the
Carefirst System, ensuring this is driven by and takes full account of business need.
to be referred to the TDA for consultation.
Adults and Children’s Departmental Information Groups
Manages and controls change to the Carefirst system at the operational level, ensuring this is driven by and takes full account of business need.
N/A
6. Meetings
TDA meetings will be scheduled every two months for routine agenda items and non-urgent requests. Additional reactive meetings will be held as required in order to respond in a timely manner to more urgent change and improvement requests that cannot wait until the next scheduled meeting. In the case of such urgent requests a meeting will be convened and a decision reached (subject to sufficient information being made available to the Board) within seven working days. Requests are to be submitted via email to the Continuous Improvement Team ([email protected]) and DMTs must approve any proposals / requests arising from their department prior to submission to the TDA. The Board will meet every eight weeks on the fourth Tuesday of the month. 7. Extraordinary Meetings
The Board may arrange occasional meeting to address specific themes or topics.
Page 71
Section C
Risk Management
Page 72

C. RISK MANAGEMENT STRATEGY
Policy Statement
Merton’s policy is to manage our risks by identifying, assessing and controlling them, with the aim of eliminating or reducing them to acceptable levels whilst being mindful that some risks will always exist and will never be eliminated.
The council recognises its responsibility to risk management by supporting a structured, systematic and focussed approach to risk management through the approval of our risk management strategy.
The effective management of risk is at the core of our approach to delivering cost effective and efficient services as well as sound corporate governance and is a continuous and evolving process, running through our strategies and service delivery arrangements. As risk is very much concerned with our objectives, the management of it will be closely linked to the creation of our strategic, service, project and partnership objectives and plans.
Our risk management process will be continuous and will support internal and external change. The risk management process will be fully integrated with the normal business management processes across the authority.
Merton’s aims and objectives in relation to risk management are to:
• Establish and maintain a robust framework and procedures for theidentification, analysis, assessment and management of risk, includingreporting and recording.
• Minimise the council’s exposure to unacceptable levels of risk, minimiseinjury, damage, loss and inconvenience to staff, residents and serviceusers.
• Integrate risk management into the day to day activities of staff and theculture of the organisation, raising awareness of the importance and needfor risk management.
• Assign clear roles and responsibilities for councillors and officersresponsible for risk management
• Ensure consistent application of our methodology across all of ouractivities, including partnerships and projects.
• Effectively manage the total cost of risk.
We will achieve this by:
• Having a clear and concise risk management strategy which underpinsour approach and responsibilities to risk
• Incorporating risk management into business planning, projectmanagement and service delivery
• Monitoring risk on a regular basis through the Corporate RiskManagement Group (CRMG)
• Reporting on risk on a regular basis to the Corporate ManagementTeam (CMT), Cabinet and General Purposes Committee
Page 73

Risk Management Strategy The process of identifying and evaluating risks is known as risk assessment. By understanding the risks we face, we are better able to actively recognise where uncertainty surrounding events or outcomes exists, and identify measures which can be taken to protect the council, its staff, residents, customers and assets from these risks. This strategy provides a structured approach to identifying emerging risks as well as assessing and managing current risks. It also incorporates a process for regularly reviewing and updating identified risks. This strategy will be reviewed on an annual basis, and updated where required. What is risk? Risk is the threat that an event or action may adversely affect an organisation’s ability to achieve its objectives and successfully execute its strategies. A risk can be a threat, obstacle, barrier, concern, problem or event that may prevent us fulfilling our objectives. Our risk management processes also include the assessment of Issues. Issues are current problems, questions, outstanding items, tasks or a request that exists in the immediate present. There is a strong element of fact surrounding it. An issue becomes a risk when the issue cannot be addressed and could continue or get worse. Definition of Risk Management Organisations exist to achieve their ambitions, aims and objectives. Risk Management is the process by which organisations methodically address and identify the risks that may prevent them from achieving these ambitions, aims and objectives. The intention is to achieve sustained benefit within each of their activities, and across the portfolio of all their activities. Ultimately, risk management is about creating a better understanding of the most important problems facing organisations. Risk is also implicit in the decisions all organisations take; how those decisions are taken will affect how successful they are in achieving their objectives. Decision making is, in turn, an integral part of the day to day existence and is particularly significant in times of change. Risk management therefore is a key component in the management of change and helps to support effective decision making. We endeavour to identify all risks facing the council and to monitor, manage and mitigate (where possible) all those risks which are deemed to be high (scored Amber or Red). Risks are monitored via Departmental Risk Registers, and key crosscutting risks to the council are also placed on the Key Strategic Risk Register (KSRR). The benefits of risk management In addition to the business and service benefits of our approach, we are required to undertake risk management because it forms part of the Annual Governance Statement. We must, therefore, demonstrate that we have a systematic strategy, framework and process for managing risk.
Page 74
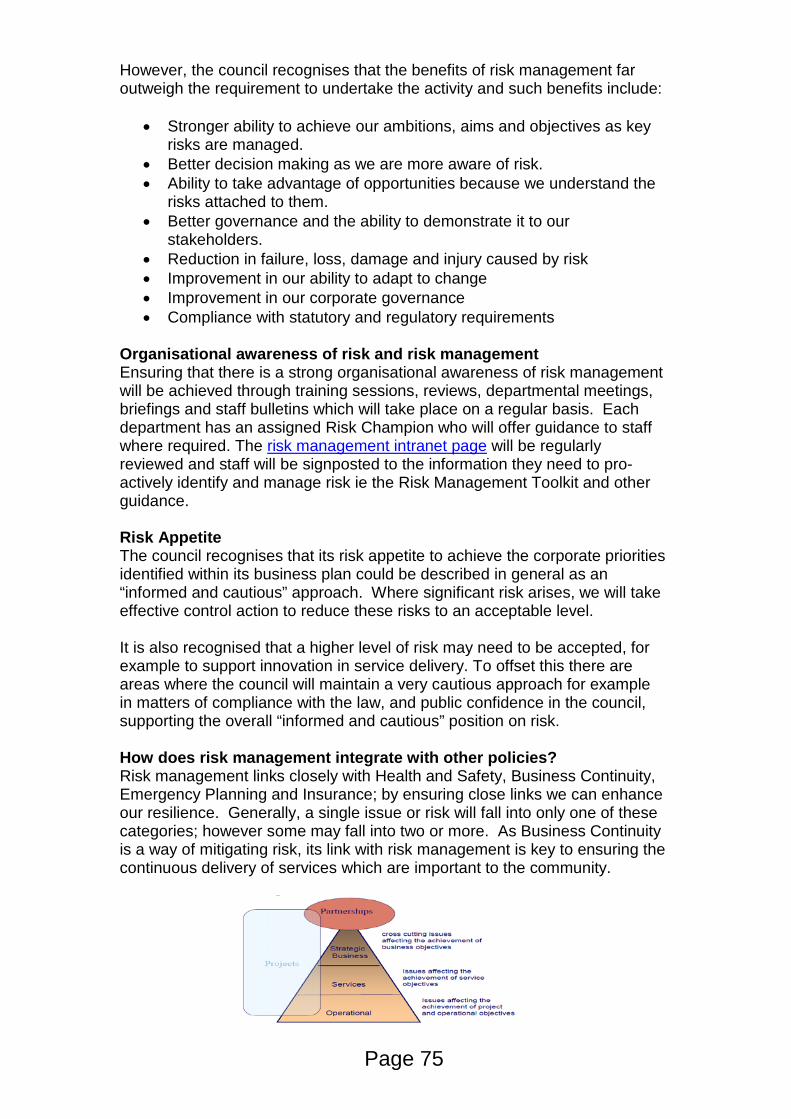
However, the council recognises that the benefits of risk management far outweigh the requirement to undertake the activity and such benefits include:
• Stronger ability to achieve our ambitions, aims and objectives as key risks are managed.
• Better decision making as we are more aware of risk. • Ability to take advantage of opportunities because we understand the
risks attached to them. • Better governance and the ability to demonstrate it to our
stakeholders. • Reduction in failure, loss, damage and injury caused by risk • Improvement in our ability to adapt to change • Improvement in our corporate governance • Compliance with statutory and regulatory requirements
Organisational awareness of risk and risk management Ensuring that there is a strong organisational awareness of risk management will be achieved through training sessions, reviews, departmental meetings, briefings and staff bulletins which will take place on a regular basis. Each department has an assigned Risk Champion who will offer guidance to staff where required. The risk management intranet page will be regularly reviewed and staff will be signposted to the information they need to pro-actively identify and manage risk ie the Risk Management Toolkit and other guidance. Risk Appetite The council recognises that its risk appetite to achieve the corporate priorities identified within its business plan could be described in general as an “informed and cautious” approach. Where significant risk arises, we will take effective control action to reduce these risks to an acceptable level. It is also recognised that a higher level of risk may need to be accepted, for example to support innovation in service delivery. To offset this there are areas where the council will maintain a very cautious approach for example in matters of compliance with the law, and public confidence in the council, supporting the overall “informed and cautious” position on risk. How does risk management integrate with other policies? Risk management links closely with Health and Safety, Business Continuity, Emergency Planning and Insurance; by ensuring close links we can enhance our resilience. Generally, a single issue or risk will fall into only one of these categories; however some may fall into two or more. As Business Continuity is a way of mitigating risk, its link with risk management is key to ensuring the continuous delivery of services which are important to the community.
Page 75
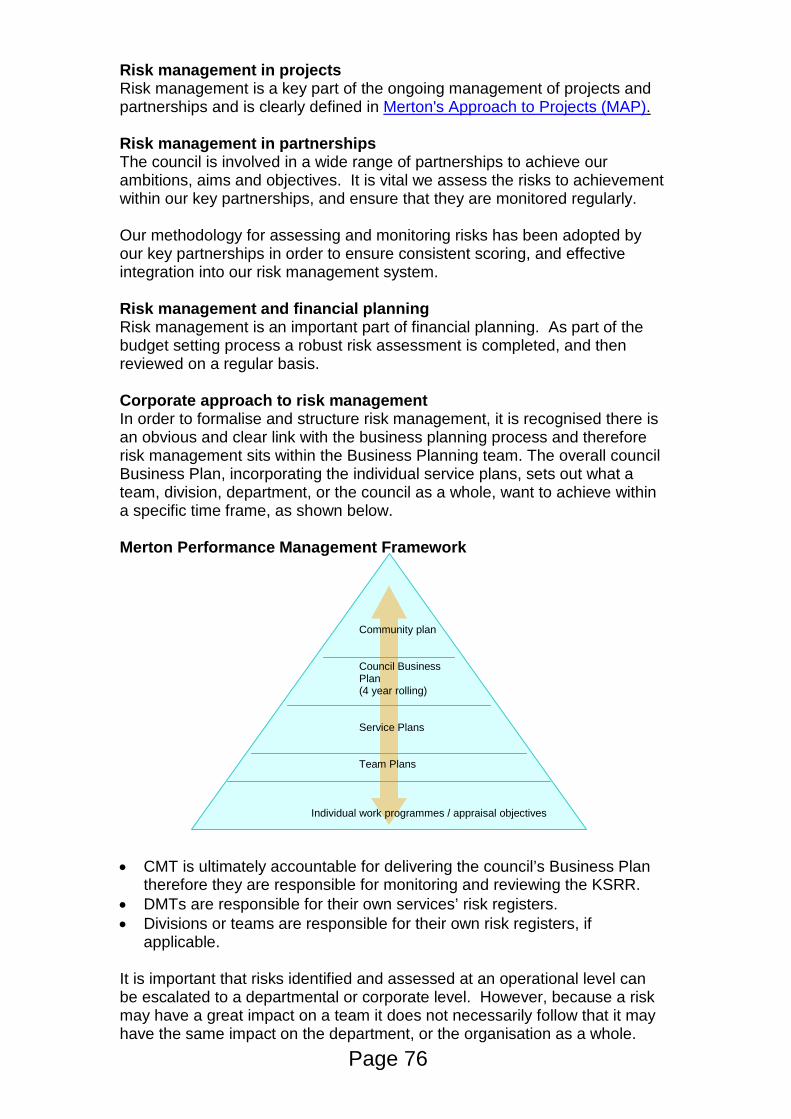
Risk management in projects Risk management is a key part of the ongoing management of projects and partnerships and is clearly defined in Merton's Approach to Projects (MAP). Risk management in partnerships The council is involved in a wide range of partnerships to achieve our ambitions, aims and objectives. It is vital we assess the risks to achievement within our key partnerships, and ensure that they are monitored regularly. Our methodology for assessing and monitoring risks has been adopted by our key partnerships in order to ensure consistent scoring, and effective integration into our risk management system. Risk management and financial planning Risk management is an important part of financial planning. As part of the budget setting process a robust risk assessment is completed, and then reviewed on a regular basis. Corporate approach to risk management In order to formalise and structure risk management, it is recognised there is an obvious and clear link with the business planning process and therefore risk management sits within the Business Planning team. The overall council Business Plan, incorporating the individual service plans, sets out what a team, division, department, or the council as a whole, want to achieve within a specific time frame, as shown below. Merton Performance Management Framework
Community plan
Council Business Plan (4 year rolling)
Service Plans
Team Plans Individual work programmes / appraisal objectives
• CMT is ultimately accountable for delivering the council’s Business Plan therefore they are responsible for monitoring and reviewing the KSRR.
• DMTs are responsible for their own services’ risk registers. • Divisions or teams are responsible for their own risk registers, if
applicable. It is important that risks identified and assessed at an operational level can be escalated to a departmental or corporate level. However, because a risk may have a great impact on a team it does not necessarily follow that it may have the same impact on the department, or the organisation as a whole.
Page 76

Ultimately, it is the respective management team which decides if a risk is an appropriate inclusion on its risk register. Scoring Risk In conjunction with this strategy, more detailed guidance will be issued to assist officers in identifying risks and issues, and the scoring, managing and reporting of those risks identified. When determining a score for service level risks, definitions of likelihood and impact of risk (Service Level) should be used in conjunction with the matrix below. Therefore, if the likelihood of a risk is 4, significant, (occurs or likely to occur more than 25%, and up to 50% of the time) and the impact is 3, critical, (service provision - service suspended short term) – then the risk rating will be 12 (4x3) which is amber.
Defining the Likelihood of Risk
Classification Definition 6 - Very High Occurs or likely to occur more than 90% of the time
5 - High Occurs or likely to occur more than 50%, and up to 90% of the time
4 - Significant Occurs or likely to occur more than 25%, and up to 50% of the time
3 - Possible Occurs or likely to occur more than 5% and up to 25% of the time 2 - Low Occurs or likely to occur more than 1% and up to 5% of the time 1 - Almost Impossible Occurs or likely to occur up to 1% of the time
Defining the Impact of Risk (Service Level)
Categories 1
Marginal 2
Significant 3
Critical 4
Catastrophic
Financial Impact - FI
Up to 15% gross budget or turnover
Over 15% and up to 50% of gross
budget or turnover
Over 50% and up to 75% of gross
budget or turnover
Over 75% of gross budget or
turnover
Service Provision -
SP Reduced service Significant
reduction
Service suspended short
term
Service suspended long term / statutory
duties not delivered
Health and Safety -
HS Broken bones /
illness
Major illness / threat not life threatening
Loss of life / major illness
Major loss of life / large scale
illness (pandemic)
Objectives - O
Objectives of one service area not
met
Departmental objectives not met
Corporate objectives not met
Statutory objectives not
met
Reputation - R
Adverse local media lead story
short term
Adverse local media story long
term. Adverse national
publicity short term.
Adverse national publicity longer
term
Remembered for years
Page 77

Risk Matrix
6 6 12 18 24
6 = Very High 5 5 10 15 20 4 = Catastrophic
5 = High 4 4 8 12 16 3 = Critical
4 = Significant 3 3 6 9 12 2 = Significant
3 = Possible 2 2 4 6 8 1 = Marginal
2 = Low 1 1 2 3 4
1 = Almost Impossible 1 2 3 4
Like
lihoo
d
Impact
Likelihood Impact
Reporting and escalating risks All risks on individual service risk registers are reviewed at Departmental Managers Team (DMT) meetings with particular attention given to red or increasing amber risks. Risks are also checked for any cross cutting implications. If the risk is high scoring and/or could have an impact across the organisation, then it must be rescored using the Defining the Impact of Risk (corporate level) criteria below, prior to inclusion on the Key Strategic Risk Register.
Defining the Impact of Risk (Corporate Level)
Categories 1
Marginal 2
Significant 3
Critical 4
Catastrophic
Financial Impact - FI
Up to £2.5m per annum or up to £10m one off
£2.5m up to £5m per annum or up
to £20m one off
£5m up to £7.5m per annum or up
to £30m one off
£7.5m up to £10m per annum
or above £30m one off
Service Provision -
SP Reduced service Significant
reduction
Service suspended short
term
Service suspended long term / statutory
duties not delivered
Health and Safety -
HS Broken bones /
illness
Major illness / threat not life threatening
Loss of life / major illness
Major loss of life / large scale
illness (pandemic)
Objectives - O
Objectives of one service area not
met
Departmental objectives not met
Corporate objectives not met
Statutory objectives not
met
Reputation - R
Adverse local media lead story
short term
Adverse local media story long
term. Adverse national
publicity short term.
Adverse national publicity longer
term
Remembered for years
Page 78

Monitoring and Managing During the year, new risks will arise that have not previously been considered and there may be changes to existing risks. Therefore the risk registers need to be regularly managed, with risk owners re-assessing their risks, re-scoring them if appropriate, and providing sufficient narrative in respect of the Control Measures they have in place (ie the actions which they are taking to mitigate against the risk). The reviews of risk registers should be managed by exception. The reporting cycle as detailed below, takes place during April, July, October and January. 1st week 2nd week 4th week DMT – review operational service risks and propose KSRs as per the definitions of likelihood and impact for crosscutting risks
Corporate Risk Management Group (CRMG) – review service risks and proposed KSRs
CMT – identify and review KSRs
All risks are reviewed according to the quarterly cycle shown above, with a particular focus upon red risks, and also upon amber risks which have increased their risk score since the previous quarterly review. There are no rigid guidelines for dropping risks from the registers because clear parameters are not always possible. Removal of any risks from the registers must be approved by DMTs and then CRMG. A decision is sometimes taken to keep a low-scoring risk in view on the basis that its status might change over a short period, or so that those with an assurance role can be confident that mitigation against a risk can be sustained. A flowchart showing how service, departmental, corporate and partnership risks are escalated and reported is shown on the final page of this Strategy. Roles, Responsibilities and Governance Councillors Elected councillors are responsible for governing the delivery of services to the local community. Councillors have a responsibility to understand the key risks the council faces and will be made aware of how these risks are being managed through the annual business planning process. All Councillors will have a responsibility to consider the risks associated with the decisions they undertake and will be informed of these risks in the plans and reports submitted to them. Chief Executive and CMT The Chief Executive and CMT are ultimately accountable in ensuring that risk management is fully embedded in the council’s business planning and monitoring processes as well as having overall accountability and responsibility for leading the delivery of the council’s Risk Management Strategy and Framework. CMT will take a leading role in the risk management process, ensuring that risk management is communicated, understood and implemented by Councillors, managers and staff. CMT will also play an important role in establishing a supportive culture.
Page 79

CMT will submit an annual report on risk to the General Purposes Committee and Cabinet.
Directors Each Director is accountable for proper monitoring of their departmental risk register, action plans and the embedding of risk management into the business planning process of their directorate. They will need to be actively involved in the risk management process within their department and CMT, including nominating an appropriate Risk Champion for their department. Directors are also accountable and responsible for leading the delivery of the council’s Risk Management Framework in their respective Directorate.
Section 151 Officer / Internal Audit The Section 151 officer and Internal Audit will be responsible for carrying out independent reviews of the risk management strategy and processes. They will provide assurance and give an independent and objective opinion to the council on the adequacy of its risk management strategy, control procedures and governance.
An annual Audit Plan, based on a reasonable evaluation of risk, will be carried out and an annual assurance statement will be provided to the council based upon work undertaken in the previous year. The section 151 officer will chair the CRMG group.
Risk Champions Risk champions will work with their Director, Heads of Service, Managers and Team Leaders to ensure the RM Strategy and Framework is embedded in the Directorate and departmental planning, performance, project and partnership management, offering support and challenge. They will also represent their directorate at CRMG meetings.
Risk Champions will ensure that risks are identified, assessed and scored correctly by the Risk Owners, offering advice and guidance where appropriate. They will also challenge risk scores where they do not appear to be reasonable, or where they contradict the Control Measures narrative or the corporate Risk Scoring Guidance.
All Risk Champions will receive appropriate training to ensure that they can perform their role effectively. Training needs will be regularly evaluated.
Service Managers Managers have a responsibility not only for the risks for which they are the risk owner, but are also accountable for those risks, within their service, which are owned / managed by others.
They are required to maintain an awareness of risk and ensure that any risks they identify are captured by the risk management process, understanding and responding to the key risks which could significantly impact on the achievement of their service and/or team objectives. Managers should encourage staff to be open about risk so that appropriate mitigation actions and control measures can be agreed.
Page 80

Risk Owners Risk owners are responsible for identifying and implementing appropriate actions which will mitigate against risks they own and reduce these risks to an level acceptable to the organisation. They are required to regularly review the effectiveness of their control measures and provide a formal update to DMTs and CRMG on a quarterly basis as part of the risk review cycle.
Individual Employees Individual employees need to have an understanding of risks and consider risk management as part of their everyday activities, identifying risks deriving from their everyday work, processes and environment. Risks which could impact on service delivery, the achievement of objectives, or their own or others’ wellbeing must be identified and actively managed, with mitigating actions in place where appropriate.
Business Planning team The business planning team is responsible for ensuring that risk management is embedded throughout the council, as well facilitating and supporting the risk management process and supporting risk owners.
The team will ensure risk management documentation and intranet pages remain up to date and relevant, as well as updating the KSRR with emerging risks, new risks and updating existing risks.
In addition the Business Planning team will ensure risk is part of the annual service planning process, facilitate the CRMG meetings, and submit strategic updates and reports on risk management to CMT, Cabinet, Audit and Assurance Committee etc. as required.
Corporate Risk Management Group The Corporate Risk Management Group will provide strategic direction and leadership to ensure our risk strategy is maintained and updated and that risks are appropriately identified and managed within the organisation. It will provide a forum for the detailed discussion and monitoring of organisational risks for the benefit of the council, its staff and the wider community.
CRMG will strive to ensure that the risk management framework is embedded within the council’s overall strategic and operational policies, practices and processes in a consistent and standardised manner.
In addition it will provide assurance that all risk systems and processes are operating effectively to minimise the Council’s overall exposure to risk. The headline departmental risks and planned mitigation activity reported by each department will be discussed by CRMG on a quarterly basis. CRMG will then report its conclusions and recommendations for discussion at CMT.
Cabinet Cabinet will receive reports on the risk management strategy to determine whether corporate risks are being actively managed. They are responsible for agreeing the strategy on an annual basis, or when significant changes are made, and to report to full Council on the adequacy of the risk management framework.
Page 81

Standards and General Purposes Committee To provide an independent oversight of the adequacy of the risk management framework and the associated control environment. The committee will receive an annual review of internal controls and be satisfied it properly reflects the risk environment and any actions required to improve it. Reports will also be provided regarding the KSRR in order that the committee can determine whether strategic risks are being actively managed.
On an annual basis, the committee will review and recommend the adoption of the risk management strategy to cabinet, or if significant changes are identified, to request a revision.
Risk management in committee reports When a report is submitted to a committee the author is required to complete a section on Risk Management and Health and Safety Implications. The committee should be informed of any significant risks involved in taking a recommended course of action, or if it decides not to follow the recommended course of action. The risk assessment should follow the corporate risk management procedures and be scored using the risk matrix. The report should also give details of any control measures (either proposed or existing) to manage any significant risks identified. Where appropriate, reference should be made to any existing risk(s).
Report authors are advised to consult with the Business Planning team or their departmental Risk Champion, for further advice and to propose any risks to be considered for inclusion in the departmental or KSRR.
Risk Management Strategy: Revised January 2016, reviewed January 2017.
Page 82

Risk identified by any member of staff
Risk reviewed at DMT
Yes No
DMT agree a risk score (likelihood
& impact)Does DMT recognise the risk?
No
Yes
Yes No
CRMG and CMT monitor Key Strategic Risks at least
quarterly
Business Planning notified of possible new Key Strategic
Risk
Business Planning escalate potential Key Strategic Risk to
CRMG
CRMG decide if risk is an appropriate inclusion on KSRR
Risk remains on departmental risk register
only
CRMG make recommendations to CMT in
respect of any changes to KSRR
London Borough of Merton Risk Management Process
Risk analysed with Risk Champion and/or line manager
No further action required unless something changes
Include risk on Departmental Risk Register and assign risk
owner
Monitor risk and review risk's "direction of travel" at
least quarterly
Does risk have significantcross-cutting implications?
Is
Page 83
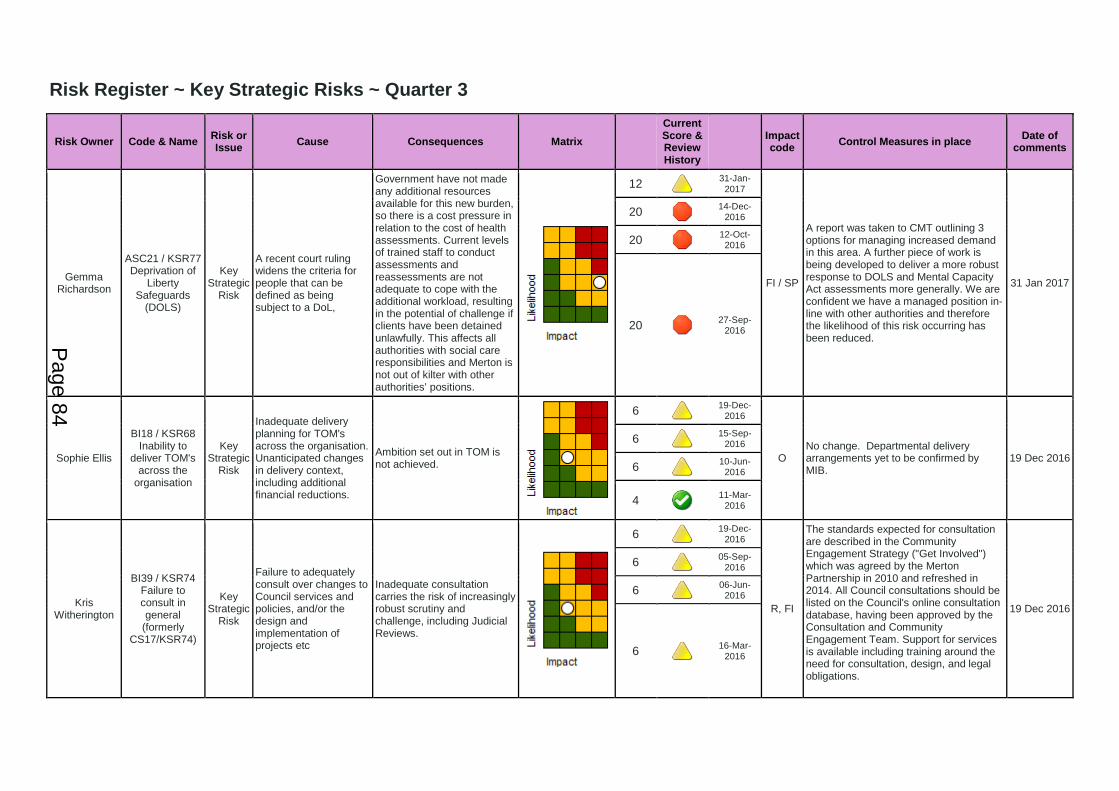
Risk Register ~ Key Strategic Risks ~ Quarter 3
Risk Owner Code & Name Risk or Issue Cause Consequences Matrix
Current Score & Review History
Impact code Control Measures in place Date of
comments
Gemma Richardson
ASC21 / KSR77 Deprivation of
Liberty Safeguards
(DOLS)
Key Strategic
Risk
A recent court ruling widens the criteria for people that can be defined as being subject to a DoL,
Government have not made any additional resources available for this new burden, so there is a cost pressure in relation to the cost of health assessments. Current levels of trained staff to conduct assessments and reassessments are not adequate to cope with the additional workload, resulting in the potential of challenge if clients have been detained unlawfully. This affects all authorities with social care responsibilities and Merton is not out of kilter with other authorities’ positions.
12 31-Jan-
2017
FI / SP
A report was taken to CMT outlining 3 options for managing increased demand in this area. A further piece of work is being developed to deliver a more robust response to DOLS and Mental Capacity Act assessments more generally. We are confident we have a managed position in-line with other authorities and therefore the likelihood of this risk occurring has been reduced.
31 Jan 2017
20 14-Dec-
2016
20 12-Oct-2016
20 27-Sep-
2016
Sophie Ellis
BI18 / KSR68 Inability to
deliver TOM's across the
organisation
Key Strategic
Risk
Inadequate delivery planning for TOM's across the organisation. Unanticipated changes in delivery context, including additional financial reductions.
Ambition set out in TOM is not achieved.
6 19-Dec-
2016
O No change. Departmental delivery arrangements yet to be confirmed by MIB.
19 Dec 2016
6 15-Sep-
2016
6 10-Jun-
2016
4 11-Mar-
2016
Kris Witherington
BI39 / KSR74 Failure to consult in general
(formerly CS17/KSR74)
Key Strategic
Risk
Failure to adequately consult over changes to Council services and policies, and/or the design and implementation of projects etc
Inadequate consultation carries the risk of increasingly robust scrutiny and challenge, including Judicial Reviews.
6 19-Dec-
2016
R, FI
The standards expected for consultation are described in the Community Engagement Strategy ("Get Involved") which was agreed by the Merton Partnership in 2010 and refreshed in 2014. All Council consultations should be listed on the Council's online consultation database, having been approved by the Consultation and Community Engagement Team. Support for services is available including training around the need for consultation, design, and legal obligations.
19 Dec 2016
6 05-Sep-
2016
6 06-Jun-
2016
6 16-Mar-
2016
Page 84

Risk Owner Code & Name Risk or Issue Cause Consequences Matrix
Current Score & Review History
Impact code Control Measures in place Date of
comments
Yvette Stanley CSF01 / KSR35
Safeguarding children
Key Strategic
Risk
Potential for less effective inter-agency working. Changing expectations & updated regulatory framework. Ongoing budget pressures across all agencies could undermine Merton Model.
Child protection & safeguarding issues including possible child death or serious harm. Possible increase for high cost interventions.
12 21-Dec-
2016
R
LSCB Business Plan & refreshed CYPP. Reconstituted CYP partnership board. Strengthened MSCB governance. Launched refresh of the Merton Health and Well-Being Model to be implemented by April 2017. Ongoing rigour in conversations with partner agencies and third sector to improve understanding and responsibility of safeguarding has been formalised and a task and finish group was set up and agreed by the MSCB in October 2016. Three sessions were planned and agreed for January/February 2017 (two of which have taken place). The outcome from the task and finish will then inform the content of a wider multi agency workshop to be held on 1st March at the MCCB conference.
20 Jan 2017
12 25-Oct-2016
16 30-Sep-
2016
16 04-Jul-2016
Charles Baker;
Cormac Stokes
ER112 / KSR73 KSR - Waste
disposal overarching risk (sub risks ER
113 to ER 117)
Key Strategic
Risk
1. Increase in waste disposal costs 2. Increase of waste to landfill 3. Construction work at Beddington Lane Sub-risks ER113 to ER117 provide additional detail to this overarching risk
1. Increased costs for waste disposal 2. Operational difficulties 3. Performance may be affected (more landfill, less recycling and more missed bins) 4. Political fallout
12 07-Dec-
2016
FI/R/O
Indexation for 2016/17 has been agreed and communicated. Fuel indices have gone down for a second year .Landfill costs are capped in line with interim arrangements. This will be increased in line with Phase B contractual agreements in 2017.Waste flows continued to be monitored monthly and forecast amended accordingly. Additional budget is being allocated for 2017/18.
19 Jan 2017
12 26-Sep-
2016
12 30-Jun-
2016
12 21-Mar-
2016
Paul McGarry; James
McGinlay
ER118 / KSR75 Impact of
Crossrail 2
Key Strategic
Risk
Impact on councils income, commercial activity in Wimbledon Town centre and Weir Road
1. Financial impact on council and services 2. Economic impact on Wimbledon Town Centre and the borough (potential loss of businesses and jobs) 3. Council reputation
12 09-Dec-
2016
FI The Government have delayed the process until early next year 09 Dec 2016
12 26-Sep-
2016
12 15-Jun-
2016
12 21-Mar-
2016
Page 85

Risk Owner Code & Name Risk or Issue Cause Consequences Matrix
Current Score & Review History
Impact code Control Measures in place Date of
comments
Kim Brown HR09 / KSR42 Single status
Key Strategic
Risk
Post single status challenge
Cost of settlement; cost of litigation & resources to contest; impact on staff morale; reputational & political impact
4 19-Dec-
2016
R
Single status issues are nearly all resolved with negotiations having taken place with the TUs. The risk rating has remained the same until the three remaining cases are resolved/completed.
19 Dec 2016
4 19-Sep-
2016
6 16-Jun-
2016
6 22-Mar-
2016
Mark Humphries
IT03 /KSR48 IT Systems
Key Strategic
Risk
Major disruption in the civic centre causing 6th floor data centre to become unusable
IT failure leading to unavailability of IT services impacting on organisational service delivery.
12 06-Dec-
2016
SP
Current IT Disaster Recovery network architecture now provides limited functionality, but following recent equipment failure a further review is now being undertaken in order to improve resilience of systems. This will be completed by March 2017.
06 Dec 2016
12 19-Sep-
2016
8 09-Jun-
2016
8 09-Mar-
2016
Caroline Holland
IT24 / KSR21 Failure to
adhere to Public Contract
Regulations 2015 and Contract
Standing Orders (previously
RE03)
Key Strategic
Risk
Lack of awareness in some areas that procurement is a tightly regulated area of council activity.
Impact on strategy and time for procurement exercises. Adverse budget and service implications if not carried out correctly in accordance with regulations and standing orders such as legal challenges and slower identification, capture and delivery of savings. Reputational risk.
15 06-Dec-
2016
R
New head of Commercial Services is currently reviewing and updating the councils current procurement related governance processes and procedures which includes a review of Contract Standing Orders.
06 Dec 2016
15 12-Sep-
2016
15 20-Jun-
2016
15 04-Apr-
2016
Caroline Holland
MPF11 / KSR72 Failure to procure
investment managers in
good time and so not improving
Fund performance
Key Strategic
Risk
Failure to review investment strategy and investment management arrangement within appropriate timescales resulting in failure to improve performance of investments.
Investment mandates incompatible with incumbent fund managers to the detriment of investment performance, fund may fail to meet its investment and funding objectives in the short and medium term.
12 19-Dec-
2016
FI, R
Review of Pension Fund investment strategy, mandates and investment management arrangement discussed at the Pension Fund Advisory Panel meeting on 1 December. Special meeting of the Panel is proposed for mid-February 2017 to consider strategy options and get some momentum behind the review process. Funding cashflows have been provided to JLT, the investment advisers. Investment Strategy Statement will be developed and published by no later than 1 April 2017. Monitor developments at the CIV. Engage manager with complementing strategies. Appropriate balance between passive and active
16 Jan 2017
12 19-Sep-
2016
12 04-Jul-2016
12 11-Dec-
2015
Page 86

Risk Owner Code & Name Risk or Issue Cause Consequences Matrix
Current Score & Review History
Impact code Control Measures in place Date of
comments
investment styles. Review IMAs and ensure fund managers adhere to the mandate. Comprehensive ongoing monitoring of investment guidelines, benchmarks and performance.
Paul Dale; Caroline Holland
RE02 / KSR49 Developing corporate
Business Plan & setting a balanced
budget for 17/21 & beyond
Key Strategic
Risk
Reduced budgets may impact negatively on service delivery levels
Impact on service provision, reputation, staff morale & internal & external customers satisfaction
15 05-Dec-
2016
FI
Risk has been updated to reflect the fact that extending the period to 2021 is likely to increase anticipated shortfalls, especially given receipt of any revenue support grant will cease and the details of retained Business Rates are unclear.
20 Dec 2016
15 22-Sep-
2016
12 12-Sep-
2016
12 17-Jun-
2016
Caroline Holland
RE16 / KSR61 Failure to
deliver the multi-year Savings Programme
Key Strategic
Risk
Savings of £30m have been agreed for the period 2016/17 to 2019/20, the period of budget decisions required by this council.
Non achievement of any significant saving would adversely impact on the authorities ability to balance its budget in the medium to long term if larger than the contingency and could require reserves to be reinstated.
15 31-Jan-
2017
F
The monthly monitoring report for the financial year 2016/17 will continue to monitor the delivery of 16/17 savings and projections of out-turn spending. Progress on 14/15 and 15/16 savings unachieved will be reported to Cabinet. A series of remedial measures have been put in place with departments to compensate for non-delivery of savings. Central measures will also be taken. The budget gap is currently being reviewed due to growth requirements and the setting of Council Tax.
31 Jan 2017
18 05-Dec-
2016
18 03-Oct-2016
18 17-Jun-
2016
Corporate Management
Team
RE20 / KSR76 Inability to respond
effectively to post-Brexit changes
Key Strategic
Risk
Inefficient response to the inevitable changes brought about by Brexit ie inability to demonstrate flexibility, organisational resilience, or ability to capitalise on potential opportunities.
Inadequate budget management and planning in a period of rapid change, negative impact upon service delivery across all areas of the council's work, failure to identify and respond to positive opportunities arising from Brexit.
8 19-Dec-
2016
FI, R, P, SD
In late 2016 the Finance & Pensions team took the decision to suspend its weekly discussion meetings pending clarification of the government’s negotiating position. Following the PM’s speech on 17 Jan 2017 when a number of key details were revealed, the regular Monday meetings have been resumed.
19 Jan 2017
8 16-Sep-
2016
8 14-Jul-2016
Page 87

Risk Register ~ Key Strategic Issues ~ Quarter 3
Risk Owner Code & Name Risk or Issue Cause Consequences Matrix
Current Score & Review History
Impact code Control Measures in place Date of
comments
Yvette Stanley CSF04 / KSR55
Changing Borough
Demographics
Key Strategic
Issue
Increases in both the total population in the borough, including in particular families with young children, & also in the mix of the population with respect to ethnicity, disability & deprivation.
Additional demand for services for children with special educational needs & disabilities, as well as pressure for growth in children’s social care & child protection interventions including support for families with no recourse to public funds.
12 26-Jan-
2017
O
CSF Service Plans identify current control measures, these include reviewing and strengthening the eligibility criteria, step up step down process and consistently managing demand. The SENDIS Improvement plan continues to be regularly reviewed and updated with clear actions set out to strengthen the service delivery.
26 Jan 2017
15 21-Dec-
2016
15 30-Sep-
2016
15 04-Jul-2016
Paul Ballatt; Yvette Stanley
CSF05 / KSR34 School places
Key Strategic
Issue
Although primary numbers are now expected to plateau, the increase in birth-rate & numbers of children reaching secondary age puts continued pressure on special school places.
Lack of land availability for secondary expansion prevents LA delivering in the major growth years, resulting in insufficient capacity to meet demand.
9 21-Dec-
2016
R
Secondary school places need now addressed by new Free School in Wimbledon and expansion of at least one existing school. Plans now in place for additional special school places supported by funding in capital programme.
21 Dec 2016
9 30-Sep-
2016
9 04-Jul-2016
9 30-Mar-
2016
Children, Schools & Families
CSF06 / KSR56 CS&F funding
changes, budget savings
& resource management
Key Strategic
Issue
Continued uncertainty regarding changes to funding regimes & external grants, & concurrent additional statutory duties & demographic pressures. Move to national funding formula for DSG expected from 2017/18 onwards, & the impact of maintained schools becoming academies through to 2022. Insufficient funding for new burdens: C&F Act; NRTPF; Leaving Care. Requirement to make significant savings over the next 3-4 years. Need to balance competing & increasing demands at a time of contracting resources & extensive change.
Impact on ability to provide statutory services, possibility of undermining the Merton Model, causing additional spend pressures in targeted services. Low staff morale, difficulties in managing the impact of the Workforce Management Strategy. Time & effort required to manage change & meet expectations of members & central government may lead to failures in the management of ongoing operational work.
9 31-Jan-
2017
FI
Monitor Government proposals, consultation response & implications fed into budget & MTFS. Budget savings identified & analysed for impact including equality assessments, TOM & Service Planning work. All CSF Divisional Service Plans, School Improvement Strategy, NRTPF Working Group Strategy Plan, and Children and Family Act Implementation Plan. NRTPF demand management plan in place. TOMS and MTFS savings all progressing. Budgeted growth agreed for future years in MTFS.
31 Jan 2017
20 21-Dec-
2016
20 30-Sep-
2016
20 04-Jul-2016
Page 88

Risk Owner Code & Name Risk or Issue Cause Consequences Matrix
Current Score & Review History
Impact code Control Measures in place Date of
comments
Paul Ballatt
CSF09 / KSR62 Recommission-
ing Early Intervention and
Prevention (Partnership)
Key Strategic
Issue
Likely reduction in contracting with local third sector leads to reputational & political risk.
Destabilisation of the Local Strategic Partnership & Children's Trust Board partnership arrangements.
10 21-Dec-
2016
R
Ongoing engagement with sector re: reductions in commissioning budgets. Current procurement exercise for residual commissioned services for 2017-20 advertised widely to local sector.
21 Dec 2016
10 30-Sep-
2016
10 04-Jul-2016
10 30-Mar-
2016
Kim Brown
HR13 / KSR44 Change to staff
terms & conditions
Key Strategic
Issue
Impact of review of T&Cs & ongoing staffing reductions
Impact on staff morale, recruitment & sickness - this will also lead to more financial implications.
6 19-Dec-
2016
SP
T & C's to be reviewed as part of the new workforce strategy and options to be considered in line with the TOM refresh. Support for staff and services going through change is available as part of the ongoing learning and development offer. The work currently being undertaken to support Merton becoming London's Best Council is vital to staff engagement so will have a positive impact on staff morale.
19 Dec 2016
6 19-Sep-
2016
8 16-Jun-
2016
8 22-Mar-
2016
John Dimmer; Yvette Stanley
RE11 / KSR53 Failure to
comply with equalities duties
Key Strategic
Issue
Failure to evidence how equalities implications have been considered in developing new policy, designing services & decision making
Reputational impact for council, risk of judicial review & litigation, negative impact on service users and loss of savings.
9 16-Dec-
2016
O/R/FI/SP
Equality Analysis has been incorporated into the budget process and the equalities impact assessment of savings proposals are systematically undertaken. A revised draft of the Equalities Strategy is going to LSG w/c 23 Jan 2017, which will then go out to consultation.
16 Jan 2017
9 15-Sep-
2016
9 06-Jun-
2016
9 18-Mar-
2016
Page 89

Section D
Performance Management Framework
Page 90
D. PERFORMANCE MANAGEMENT FRAMEWORK Introduction Merton launched its Performance Management Framework in 2004. Whilst the main principles of performance management remain the same, the framework undergoes annual review and updating when required, to ensure that it remains up to date and reflects changes within the organisation and outside. We are committed to delivering customer-focused services. To achieve this, it is essential that we measure our performance, both against our own intentions, and the performance of others, and that we use that information to improve local services. Performance management enables us to ensure that we are constantly meeting our goals, whilst simultaneously allowing us to identify best practice and address areas of concern. It provides the framework for consistently planning and managing improvements to our services to ensure continuous improvement in line with Lean principles. Sustainable improvements in services are unlikely to happen without this framework. Everyone in the organisation has a part to play in monitoring our services and achieving our ambition. Why measure performance?
• It highlights areas where we are doing well, and areas which need improving; • It enables our managers to monitor performance, manage effectively, and plan for the future of
the service; • Performance data assists the decisions makers within the council and helps to inform their
decisions; • Timely and accurate performance data allows for early identification of problems and enables
us to put actions in place to address / rectify the situation; • It assists improvement by telling us where we are now and ensuring that we are doing the right
things for the right reasons; • Performance Management provides the evidence required for change and improvement, and
lastly; • What gets measured is more likely to be actioned
Why do we need a Performance Management Framework? Central Government introduced the Single Data List in April 2011. This reduced the burden of performance monitoring and audit and inspection by central government, placing greater responsibility for this on local government. As a result, it becomes even more important that we manage and monitor our performance. We must ensure that our Performance Measures are robust, challenging and realistic, enabling us to achieve and deliver our priorities. What is our Performance Management Framework? Our Performance Management Framework has been created to clarify the overall approach the council takes to managing performance. The Framework should also be considered alongside the council’s Risk Management and Data Quality Strategies. Our framework will help us all to understand:
• what we are trying to achieve as an organisation • how we are going to achieve this • how we will monitor and report progress • how the contribution of staff, managers, teams and departments relate to each other to help
deliver the targets set for the whole organisation Page 91

The framework has three parts
1. The planning framework 2. The planning, monitoring and review cycle 3. Taking responsibility for results
The planning framework - how the plans fit together, the ‘Golden Thread’ The performance management framework is represented by the performance triangle
Community plan
Council Business Plan
(4 year rolling)
Service Plans
Team Plans
Individual work programmes / appraisal objectives
The key aspects of the Golden Thread are:
• The Community Plan has been developed by the Merton Partnership and sets the overall direction and vision for the borough until 2019.
• Business Plan sets out the council’s priorities for improvement over the next four years. The plan is reviewed every year to ensure that it always reflects the most important improvement priorities.
• Service Plans are reviewed every year to ensure they outline the key issues and priorities for the department.
• Medium Term Financial Strategy (MTFS) outlines how much money we expect to receive over the next four years and in broad terms what we expect to be spending this on.
• Workforce Development Plan is focused on making the best use of the skills of staff to deliver the services residents demand and deserve
• Individual Appraisals take place twice a year and are used to agree individual work programmes and targets.
The planning, monitoring and review cycle - what happens, when and how? The planning, monitoring and review cycle shows how we continuously review and revise our performance in order to improve our services.
Page 92

The cycle has four phases and takes place on an annual basis as part of the development of the next four year rolling Business Plan and agreement of the next year’s budget.
Planning - Where are we now and where do we want to be?
Where we are now is provided by our results against our performance indicators detailed in our service plans, the results of satisfaction surveys such as the Annual Residents Survey (ARS), and other inspection results. Our corporate ambitions and objectives describing where we want to be are laid out in the Community Plan and the Business Plan, and are reflected at a more local level in service plans, and targets in annual appraisals.
Doing - How do we get there?
To get to where we want to be, we need to maximise our capacity to deliver the actions laid out in the various plans, and use our performance management and appraisals systems to ensure that we remain on course.
Reviewing - How are we doing and are we there yet?
By monitoring and managing performance, consulting with our partners and service users, and benchmarking against other providers, we can assess our progress towards achieving our ambitions and learn from the good practice of others.
Revising - What do we do next?
It is important that our services evolve to meet the needs of our residents. Having reviewed our performance we may find that we need to change what we are doing, or that we need to revise our ambitions and objectives so that we can continuously improve as an organisation.
To maximise the cycle’s effectiveness we have an agreed timetable for the process which takes into account both performance and financial considerations. This timetable enables Councillors to agree priorities and allocate resources based on community views and needs, and accurate performance information. These priorities are translated into planned outcomes and performance targets to make sure that the right things get done.
Page 93

Taking responsibility for results – how we go about doing it
Everyone has a responsibility to contribute towards improving Merton, working within and using the performance management framework. This ensures that measurable activities at individual, team and service levels translate into outcomes.
It is the responsibility of the owner of each performance measure to ensure that details of the measure are clearly defined. They must also ensure that adequate collection, recording and validation processes are in place to enable effective monitoring and reporting in line with the council’s Data Quality Strategy.
Performance Management Systems and Collection Arrangements Since June 2013, performance against service plan measures has been captured and reported via our Performance Management System (Covalent). On the first day of each month departmental performance leads are notified that performance data must be uploaded onto the system by a specified deadline. Performance Monitoring reports are presented to CMT on the fourth Tuesday of every month, Cabinet receives quarterly reports and Full Council an annual report. In addition, a monthly performance dashboard is published on both the internet and intranet giving staff, Members, residents and the public access to up to date performance data detailing how the council is performing against its targets. Roles and responsibilities The roles and responsibilities are outlined below:
Individuals All staff have a responsibility to deliver the tasks / actions which have been agreed in their appraisal, and to understand how their work contributes to team, departmental and council goals.
Managers All managers have responsibility for supporting their staff through the appraisal process and regular reviews. They must also show commitment Page 94

and accountability by leading through example. Managers should ensure that their team have regular meetings to share information, review progress of their divisional and team plans, develop ideas, identify areas for the next plan and agree the way forward on a variety of team and work issues. Managers should use these meetings to raise issues around corporate priorities, tell staff about developments within the department and the council, and to cascade information about performance to staff.
Heads of service
Heads of service report to Directors and are responsible for overseeing the performance of service units within their remit. They take a key role in the development and monitoring of their service plan at their DMT. They may also take on or contribute to wider corporate projects.
Departmental Management
Teams (DMT’s)
DMT’s monitor their department’s performance information and are responsible for taking action to deal with under-performance. DMT’s make sure that every manager in the department knows and understands the planning cycle and performance management framework
Directors
Each Director is responsible for the performance of their department. They must make sure that appropriate reporting arrangements are in place with their DMT’s to enable them to monitor performance. Directors demonstrate commitment to the performance management framework by leading its implementation within their department. They make sure their service plans are monitored at least every two months and regularly provide progress reports to the Chief Executive and appropriate Cabinet portfolio holder(s). Directors also have collective responsibility for corporate improvement as members of Corporate Management Team (CMT)
Corporate Management Team (CMT)
CMT is made up of the Chief Executive and Directors of the four departments. Its role is to focus on the ‘big issues’ facing the council and develop the organisation’s strategic approach and service delivery. CMT reviews performance monthly and it can ask DMT’s to review areas of concern and agree management action to address under-performance.
Cabinet and Elected
Members
Ultimately, councillors are responsible for setting the direction of the Council and developing priorities. They do this by developing policy, setting strategic targets, monitoring progress, and agreeing the framework for continuous improvement.
Full Council Members receive regular reports on progress against the strategic themes, including any relevant performance information and can use these meetings as an opportunity to ask Cabinet members questions about performance issues.
Overview and Scrutiny
Overview and Scrutiny panels have regular performance monitoring task groups to examine performance data, detect trends and identify key areas of concern. They are responsible for challenging Cabinet to ensure that they are fulfilling their responsibilities. If they have areas of concern then they can ask Cabinet members and officers to attend meetings to answer questions. If they have wider concerns about the performance of a service area then they could carry out a scrutiny review into a particular area.
Help and advice
If you require any guidance or advice with regards to Performance Management or have any queries please contact a member of the Business Planning team.
Page 95

Corporate Indicator Set The Corporate Indicator set is a set of key measures from each of the four departments, which are monitored on a monthly basis by the Corporate Management Team (CMT). The corporate set for 2017/18 is shown in the table below. Included in the table are the 2016/17 and 2017/18 performance targets. Indicators shaded grey represent new additions to the corporate set. Corporate Indicator Set for 2017/18 – Monthly
Dept Monthly PI Codes & Description Polarity 2016/17 Target
2017/18 Target
Corporate Services
CRP 013 / SP 431 % of positive and neutral coverage tone
High 92% 92%
Corporate Services
CRP 014 / SP 426 % Ombudsman complaints answered in time
High 90% 90%
Corporate Services
CRP 018 / SP 154 % Council Tax collected High 97.25% 97.25%
Corporate Services
CRP 036 / SP 155 % Business Rates collected High 97.5% 97.5%
Corporate Services
CRP 041 / SP 192 % FOI requests dealt with in time
High 90% 85%
Environment & Regeneration
CRP 044 Parking services estimated revenue
High 17,250,762 TBC
Environment & Regeneration
CRP 045 / SP 118 Income (Development and Building Control)
High 2,110,000 2,110,000
Environment & Regeneration
CRP 047 / SP 068 No. of refuse collections including recycling and kitchen waste missed per 100,000
Low 50.00 50.00
Environment & Regeneration
CRP 048 % of sites surveyed on local street inspections for litter that are below standard
Low 8% 8%
Environment & Regeneration
CRP 049 / SP 059 No. of fly tips reported in streets and parks
Low 3,600 3,600
Environment & Regeneration
CRP 051 / SP 114 % Major applications processed within 13 weeks
High 55% 67%
Environment & Regeneration
CRP 052 / SP 115 % of minor planning applications determined within 8 weeks
High 60% 66%
Environment & Regeneration
CRP 053 / SP 116 % of 'other' planning applications determined within 8 weeks High 82% 82%
Community & Housing
CRP 054 / SP039 % People with 'long term' services receiving Self-Directed Support (SDS) High 95% 95%
Page 96

Dept Monthly PI Codes & Description Polarity 2016/17 Target
2017/18 Target
Community & Housing
CRP 055 / SP275 The rate of delayed transfers of care from hospital (both Merton & NHS responsible)
Low 5 5
Community & Housing
CRP 056 / SP 054 No. of Carers receiving services and / or information and advice High 996 1,000
Community & Housing
CRP 057 / SP274 % people receiving 'long term' community services High 72% 78.8%
Community & Housing
CRP 059 / SP 008 No. of people accessing the library by borrowing an item or using a peoples network terminal at least once in the previous 12 months
High 56,000 56,000
Community & Housing
CRP 060 / SP 009 No. of visitors accessing the library service on line High 200,000 210,000
Community & Housing
CRP 061 / SP 036 No. of households in temporary accommodation Low 225 225
Community & Housing
CRP 062 / SP 035 No. of homelessness preventions High 338 450
Children, Schools & Families
CRP 64SP075MP030 % of children who become subject of a Child Protection Plan for a second or subsequent time
Low 16% 16%
Children, Schools & Families
CRP 69SP078MP052 % outcome of Ofsted Inspection schools rated Good or Outstanding High 91% 91%
Children, Schools & Families
CRP 72SP319MP034 % 16-19 year olds Not in Education, Employment or Training (NEET) Low 4.7% 3.5%
Corporate Services
CRP 080 / SP 413 No. of working days per FTE lost to sickness absence excluding schools Low 8 7
Children, Schools & Families
CRP 081 / SP 415 % of Looked After Children (2.5 years or more) in same placement for 2 years
High 66% 66%
Corporate Services
CRP 085 / SP 410 % of on-line transactions (HB Claims)
High 60% 60%
Corporate Services
CRP 086 / SP 411 Time taken to process new Housing Benefit claims
Low 21 days 16 days
Corporate Services
CRP 087 / SP 412 Time taken to process Housing Benefit change of circumstances
Low 11 days 9 days
Page 97
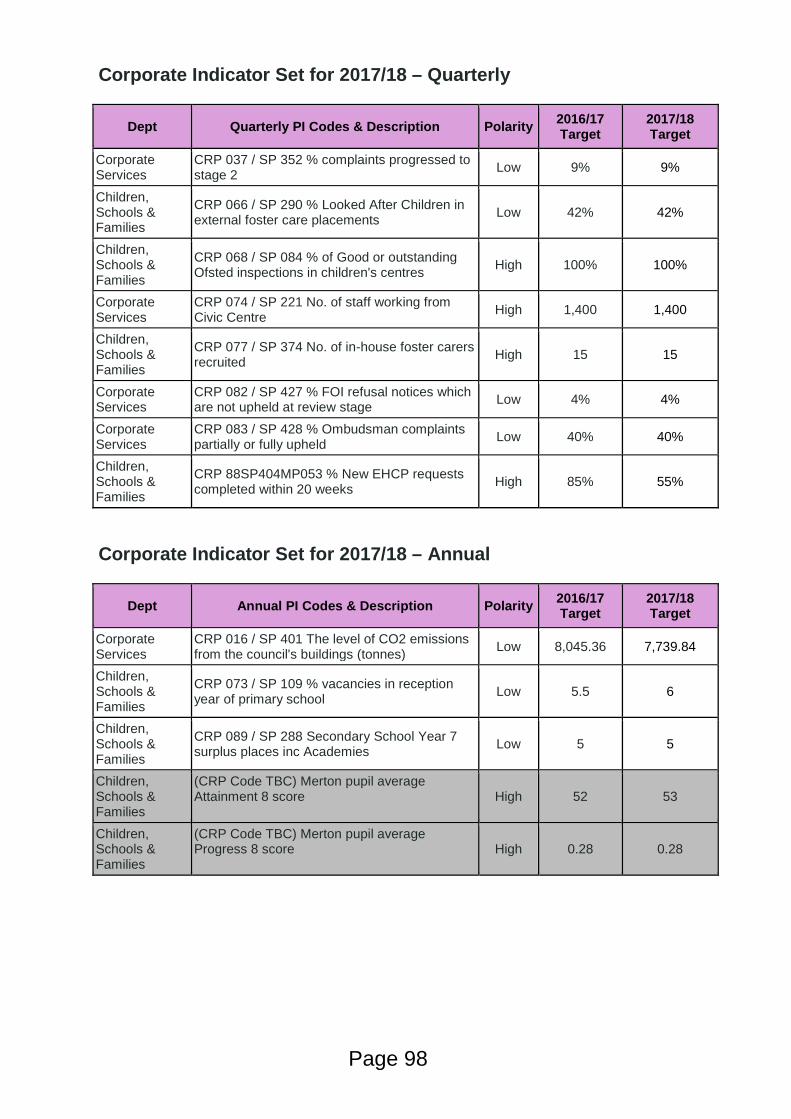
Corporate Indicator Set for 2017/18 – Quarterly
Dept Quarterly PI Codes & Description Polarity 2016/17 Target
2017/18 Target
Corporate Services
CRP 037 / SP 352 % complaints progressed to stage 2 Low 9% 9%
Children, Schools & Families
CRP 066 / SP 290 % Looked After Children in external foster care placements Low 42% 42%
Children, Schools & Families
CRP 068 / SP 084 % of Good or outstanding Ofsted inspections in children's centres High 100% 100%
Corporate Services
CRP 074 / SP 221 No. of staff working from Civic Centre High 1,400 1,400
Children, Schools & Families
CRP 077 / SP 374 No. of in-house foster carers recruited High 15 15
Corporate Services
CRP 082 / SP 427 % FOI refusal notices which are not upheld at review stage Low 4% 4%
Corporate Services
CRP 083 / SP 428 % Ombudsman complaints partially or fully upheld Low 40% 40%
Children, Schools & Families
CRP 88SP404MP053 % New EHCP requests completed within 20 weeks High 85% 55%
Corporate Indicator Set for 2017/18 – Annual
Dept Annual PI Codes & Description Polarity 2016/17 Target
2017/18 Target
Corporate Services
CRP 016 / SP 401 The level of CO2 emissions from the council's buildings (tonnes) Low 8,045.36 7,739.84
Children, Schools & Families
CRP 073 / SP 109 % vacancies in reception year of primary school Low 5.5 6
Children, Schools & Families
CRP 089 / SP 288 Secondary School Year 7 surplus places inc Academies Low 5 5
Children, Schools & Families
(CRP Code TBC) Merton pupil average Attainment 8 score
High 52 53
Children, Schools & Families
(CRP Code TBC) Merton pupil average Progress 8 score
High 0.28 0.28
Page 98

Section E
Service Planning
Page 99

E. SERVICE PLANNING Our proposed 21 Final Service Plans, and three Final Commissioning Plans for our commissioned services, are set out in the following pages. The three Commissioning Plans are:
• Merton Adult Education • Waste Management and Cleansing • Parks and Green Spaces
Service Plans were developed by service departments during the 2017/21 Business Planning process. Second Draft Service Plans were considered by Cabinet on 12 December 2016 and incorporated into the Consultation Pack for scrutiny by the Overview and Scrutiny Commission and Panels during the January 2017 cycle of meetings. The proposed Final Service Plans being presented here will be considered for approval by Council on 1 March 2017. The service plan is designed to be a two page document. The first page summarises key resources, drivers, performance and budgets and the second page focusses on the outcomes and benefits of major projects. Departmental managers were issued with guidance to clarify their understanding of the process and to ensure quality and consistency of submitted plans, and each department reviewed the appropriateness of their service plans during the process. An overview of this guidance is provided below: Front Page
• Service description: Concise description of the service’s key activities and how they might change over the next four years
• Anticipated demand: Details of the demands on the service • Anticipated non-financial resources: Details of the key resources used to deliver
the service • Corporate strategies: The key strategies to which the service contributes • Performance indicators: The key monthly, quarterly, or annual performance
indicators for the service including their targets • Budget information: Full details of previous, current and future years’ budget,
including future anticipated budgetary changes Back page Details of major projects and/or procurement being undertaken during 2017/18, including
• Project timeframe • Project description • Major expected benefits of the project (consistent with the benefit categories used
by the Merton Improvement Board) • Risk assessment relating to the project’s completion
Page 100

Below are our Service Plans for 2017/21 in departmental order:
Index of Departmental Service and Commissioning Plans Children, Schools
and Families Community and
Housing Corporate Services Environment and Regeneration
Children’s Social Care Adult Social Care Business Improvement Development & Building Control
Education Housing Needs & Enabling Corporate Governance Future Merton & Traffic
and Highways
Libraries Customer Services Leisure & Cultural Development
Merton Adult Education* Human Resources Parking and CCTV
Services
Public Health Infrastructure & Transactions
Parks & Green Spaces*
(Phase C - Lot 2)
Resources Property
Shared Legal Services Regulatory Service Partnership
Safer Merton
Transport
Waste Management
and Cleansing* (Phase C - Lot 1)
*Commissioning Plan
Page 101

Children Schools & Families
Page 102

2015/16(A) 2016/17(T) 2017/18(P) 2018/19(P) 2019/20(P) 2020/21(P)92% 85 90 9130 35 27 26
24% 16 16 163.60% 4.7 3.5 3.0
61 70 50 50n/a 66 66 69n/a 12 12 11
37.2% 42 42 4013 15 15 15n/a 66 68 70
Final Budget2015/16
Actual 2015/16
Budget2016/17
Forecast Variance
2016/17 P8
Budget 2017/18
Budget 2018/19
Budget 2019/20
Budget 2020/21
24,735 26,428 23,800 2,466 25,546 25,563 25,890 26,59510,775 10,921 9,878 520 10,469 10,371 10,083 10,175
47 48 43 37 59 60 60 60163 204 164 (2) 184 186 188 190
3,830 4,033 3,509 245 3,577 3,624 3,920 3,9667,839 8,769 7,751 1,663 8,781 8,842 9,152 9,713
359 437 369 4 374 380 385 3911,723 2,016 2,085 0 2,101 2,101 2,101 2,101
0 0 0 0 0 0 0 0
Final Budget2015/16
Actual 2015/16
Budget2016/17
Variance 2016/17 P8
Budget 2017/18
Budget 2018/19
Budget 2019/20
Budget 2020/21
1,763 2,305 1,163 (132) 1,061 1,061 1,061 1,0611,134 1,114 806 (49) 826 826 826 826
508 646 236 (151) 114 114 114 114121 544 121 68 121 121 121 121
22,972 24,123 22,637 2,334 24,485 24,502 24,829 25,535
Final Budget2015/16
Actual 2015/16
Budget2016/17
Variance 2016/17 P8
Budget 2017/18
Budget 2018/19
Budget 2019/20
Budget 2020/21
0 0 0 0 0 0 0 0
2020/21
210209 198
2018/19
198
Low
Social ExclusionOutcomeQuarterly
Safeguarding issues
Business critical Increased costs
MonthlyMonthly
Outcome
OutcomeMonthly
Outcome
High
EmployeesPremises
LowOutcome% LAC (2.5 years or more) in same placement for 2 years
Increased costs
Revenue £'000s
IncomeGovernment grants
Transfer payments
Reimbursements
% CYP on Child Protection Plan for 2nd or subsequent time% NEET aged 16-17
2020/21
Council Funded Net Budget
2017/18
2018/19
Capital Budget £'000s
QuarterlyHigh High
Quarterly
2019/20
QualityNumber of in house foster carers recruited
LowLow
High Low
Reporting cycle
MonthlyQuarterly
Polarity
2020/21
Cllr Katy Neep: Cabinet Member for Children’s Services
Staff (FTE)(FTE subject to change as a result of restructures)
2019/202018/19UASC - increased numbers and impact on resources
Anticipated non financial resources
DEPARTMENTAL BUDGET AND RESOURCES
2015/16 2016/17 2017/18
Performance indicatorActual Performance (A) Performance Target (T) Proposed Target (P)
Monthly
Number YJS first time entrants
Depreciation
% single assessments completed within agreed timescales Care application average duration (national target 26 weeks)
% fostered LAC in external agency FC placements
3rd party payments
Expenditure
Supplies & Services
Support services
The Corporate strategies your service contributes toAnticipated demand
Population growth - looked after children & Care leaversPopulation growth - Child Protection Plans
Enter a brief description of your main activities and objectives below
Planning Assumptions2019/202015/16 2016/17 2017/18
Children's Social Care & Youth Inclusion
Increase in 0-19 population
Looked after Children & Care Leavers Strategy
Social exclusion
204
Transport
Safeguarding issues
Safeguarding Children’s Board Annual Plan
Children and Young People’s Plan
Safeguarding issuesSafeguarding issues
Indicator type
Business criticalQuality
Care Leavers who are ETE
% LAC experiencing 3 or more placements moves Monthly
High
Revenue £'000s
ReservesCapital Funded
Customer & client receipts
Social exclusion
Main impact if indicator not met
QualitySocial exclusion
15-3030-603,21030-32
(Deletion of 1 AD, 1 Head of Service and half an admin post: £224,000 to be split across CSC/YI and Education).
(Review of CSF staffing structure beneath management level: £189,000 to be split across CSC/YI and Education). (Data review & centralisation: £40,000 to be split across CSC/YI and Education).
(Review of CSF staffing structure beneath management level: £201,000 to be split across CSC/YI and Education). (Review of CSF management staffing structure: £150,000 to be split across CSC/YI and Education). (Reduced cost/offer through the national centralised adoption initiative: £75,000).
2017/18 Expenditure
Employees
Premises
Transport
Supplies & Services
3rd party payments
Transfer payments
Support services
2017/18 Income
Government grants
Reimbursements
Customer & client receipts
20,000
22,000
24,000
26,000
2015 2016 2017 2018 2019 2020
£'00
0s
Budget Actual
Children's Social Care (CSC) delivers a range of government prescribed & legislated functions to children at risk of harm, children in care, care leavers & young offenders, as well as wider services for families. CSC works within an integrated context co-ordinating multi agency support to those families at all levels of Merton's Child & Young Person (CYP) Well-being Model. The service works with approximately 1,300 children at any one time who have the greatest needs in the borough across a range of outcomes: safety, well-being, health, education & life chances. Merton's CYP Well-being Model sets out Merton's approach to supporting families which seeks to provide services at the time they are needed to prevent further need arising & escalation up the model. This is the most efficient use of resources & CSC undertakes a range of family support activity to prevent children entering either child protection or care systems at every stage of childhood. This necessitates a strong commitment to robust assessment & thresholds, which require a quality assurance function to ensure on-going success of the model. Merton has lower numbers of children subject to child protection plans in the care system than the majority of London Boroughs, as well as lower numbers of first time entrants, and seeks to continue this approach, therefore ensuring that we minimise the use of costly high end interventions with our families & promote family strengths to enable them to care for their own children. Youth Inclusion provides a targeted service to support vulnerable young people & their parents to prevent offending & re-offending. It also supports the transforming families programme, helping targeted families to get back into work, & improve the outcomes for their children by preventing reoffending or going into care. It also leads on participation for CSF. Access to resources for looked after children/external placement provision Recruitment of in house foster carers.
Page 103
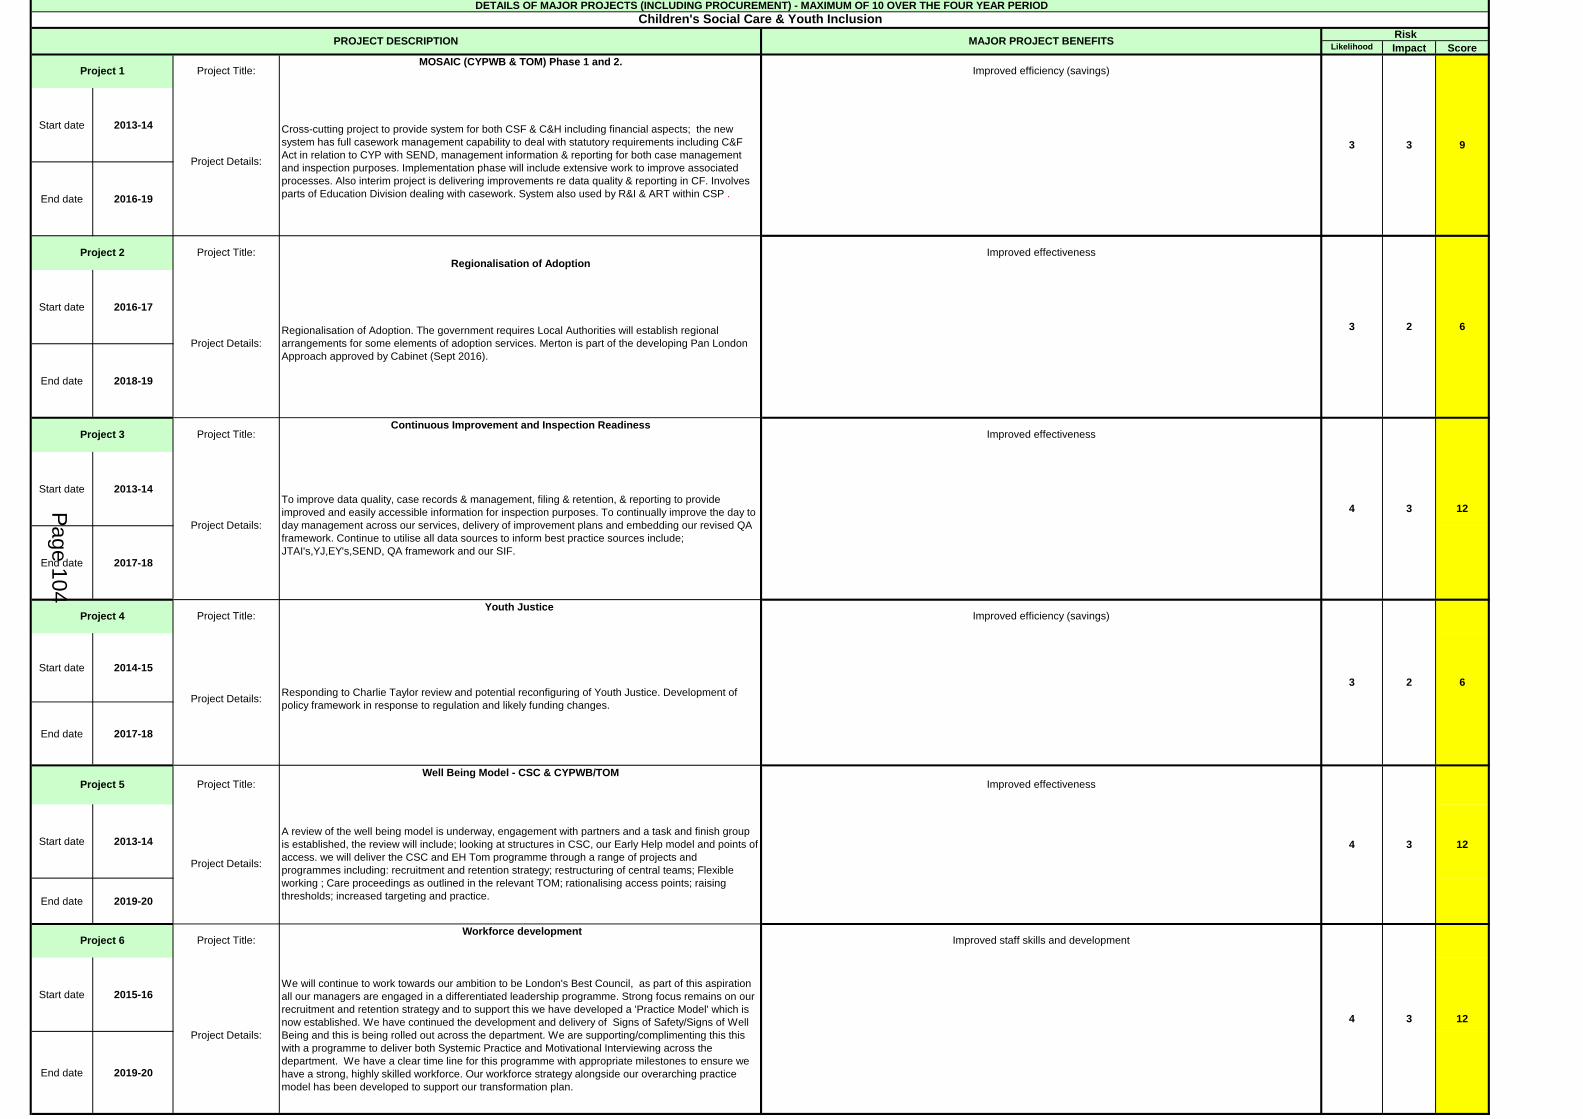
Likelihood Impact Score
Start date 2013-14
End date 2016-19
Start date 2016-17
End date 2018-19
Start date 2013-14
End date 2017-18
Start date 2014-15
End date 2017-18
Start date 2013-14
End date 2019-20
Start date 2015-16
End date 2019-20
Improved staff skills and development
12
DETAILS OF MAJOR PROJECTS (INCLUDING PROCUREMENT) - MAXIMUM OF 10 OVER THE FOUR YEAR PERIODChildren's Social Care & Youth Inclusion
PROJECT DESCRIPTION MAJOR PROJECT BENEFITS
Improved efficiency (savings)
Cross-cutting project to provide system for both CSF & C&H including financial aspects; the new system has full casework management capability to deal with statutory requirements including C&F Act in relation to CYP with SEND, management information & reporting for both case management and inspection purposes. Implementation phase will include extensive work to improve associated processes. Also interim project is delivering improvements re data quality & reporting in CF. Involves parts of Education Division dealing with casework. System also used by R&I & ART within CSP .
12
Project Title:
Project Details:34
Well Being Model - CSC & CYPWB/TOM
A review of the well being model is underway, engagement with partners and a task and finish group is established, the review will include; looking at structures in CSC, our Early Help model and points of access. we will deliver the CSC and EH Tom programme through a range of projects and programmes including: recruitment and retention strategy; restructuring of central teams; Flexible working ; Care proceedings as outlined in the relevant TOM; rationalising access points; raising thresholds; increased targeting and practice.
Workforce development
4
Project Title:
Project 6
We will continue to work towards our ambition to be London's Best Council, as part of this aspiration all our managers are engaged in a differentiated leadership programme. Strong focus remains on our recruitment and retention strategy and to support this we have developed a 'Practice Model' which is now established. We have continued the development and delivery of Signs of Safety/Signs of Well Being and this is being rolled out across the department. We are supporting/complimenting this this with a programme to deliver both Systemic Practice and Motivational Interviewing across the department. We have a clear time line for this programme with appropriate milestones to ensure we have a strong, highly skilled workforce. Our workforce strategy alongside our overarching practice model has been developed to support our transformation plan.
12
Project Details:23
Project Title:
4To improve data quality, case records & management, filing & retention, & reporting to provide improved and easily accessible information for inspection purposes. To continually improve the day to day management across our services, delivery of improvement plans and embedding our revised QA framework. Continue to utilise all data sources to inform best practice sources include; JTAI's,YJ,EY's,SEND, QA framework and our SIF.
Project Details:
Project 5
Project Title:
Project Details:
3
Improved effectiveness
Regionalisation of Adoption. The government requires Local Authorities will establish regional arrangements for some elements of adoption services. Merton is part of the developing Pan London Approach approved by Cabinet (Sept 2016).
Project 1
Project 2
Project 3
Project Details:
Project Title:
3
3
MOSAIC (CYPWB & TOM) Phase 1 and 2.
Project 4Youth Justice
Project Details:
Project Title:
Risk
2 6
93
Responding to Charlie Taylor review and potential reconfiguring of Youth Justice. Development of policy framework in response to regulation and likely funding changes.
3
Continuous Improvement and Inspection ReadinessImproved effectiveness
6
Improved efficiency (savings)
Improved effectivenessRegionalisation of Adoption
Page 104

2015/16(A) 2016/17(T) 2017/18(P) 2018/19(P) 2019/20(P) 2020/21(P)n/a 52 53 54n/a 0.28 0.28 0.2889 89 91 9282 57 58 59
95.2 95.1 95.2 95.396 96.1 96.1 96.267 85 55 55
100 100 100 1006.2 5.5 6 85.5 5 5 5
89.28% 90 90 90n/a 80 80 80
DEPARTMENTAL BUDGET AND RESOURCES
Final Budget2015/16
Actual 2015/16
Budget2016/17
Forecast Variance
2016/17 P8
Budget 2017/18
Budget 2018/19
Budget 2019/20
Budget 2020/21
47,569 47,004 44,977 484 49,496 49,504 49,650 49,84512,473 12,023 12,465 (299) 12,715 12,656 12,710 12,814
1,436 1,281 1,450 (191) 1,121 1,124 1,127 1,1294,144 4,415 4,132 194 4,168 4,229 4,289 4,349
16,731 16,257 14,402 (374) 17,840 17,854 17,868 17,8829,926 9,924 9,835 1,155 10,798 10,787 10,801 10,816
19 34 19 0 19 20 20 202,664 2,895 2,498 0 2,668 2,668 2,668 2,668
175 175 176 0 167 167 167 167Final Budget
2015/16Actual
2015/16Budget2016/17
Variance 2016/17 P8
Budget 2017/18
Budget 2018/19
Budget 2019/20
Budget 2020/21
6,224 6,644 5,220 (394) 5,154 5,304 5,304 5,304365 221 150 (9) 232 232 232 232
2,343 2,741 2,397 (462) 1,897 1,897 1,897 1,8973,516 3,682 2,673 77 3,025 3,175 3,175 3,175
41,345 40,359 39,758 90 44,342 44,200 44,346 44,542Final Budget
2015/16Actual
2015/16Budget2016/17
Variance 2016/17 P8
Budget 2017/18
Budget 2018/19
Budget 2019/20
Budget 2020/21
10,548 3,799 0 30 0 0 0183 7,798 0 8,919 6,156 4,481 0362 368 0 0 0 0 0723 986 0 670 650 650 650
2,244 317 0 3,196 5,310 1,000 0288 129 (104) 104 0 105 0
0 14,348 13,396 (104) 12,919 12,116 6,236 650
Increased costsHigh
Annual
Annual
Breach statutory duty
OutcomeOutcome
High
2017/18
Annual
292
Reporting cycle
282
Business critical
Performance indicator
High
High
Business critical
% secondary school attendance
% of new EHCP requests completed within 20 weeks
% outcome of Ofsted school inspections good or outstanding Merton pupil Average Progress 8 score
High
Capital Funded
2018/19
Other
Capital Budget £'000s
Devolved Formula CapitalSecondary ExpansionPrimary Expansion
2017/18
High % spend on approved capital programme
2019/20
Schools Capital Maintenance
Council Funded Net Budget
Revenue £'000s
Income
SEN Expansion
Quarterly
Interest
EmployeesPremises
Expenditure
Revenue £'000s
%secondary school Yr7 surplus places Inc. Academies
Annual
Depreciation
3rd party payments
Reserves
Government grantsReimbursements
Support servicesTransfer payments
TransportSupplies & Services
Customer & client receipts
Education The Corporate strategies your service contributes to
Children and Young People’s PlanForecast increase in population 0-4
Business critical
Cllr Katy Neep: Cabinet Member for Children’s Services Anticipated demand
Raise in Participation age 16-18
Cllr Caroline Cooper-Marbiah: Cabinet Member for Education
2016/17297
Planning Assumptions
Staff (FTE subject to change as a result of restructures)
1-3fte 4-6 fte (cumulative) 10-14 fte (cumulative)
SEN and Disabilities StrategySchool Expansion Strategy
Reputational risk
Main impact if indicator not met
Reputational risk
2020/21
Increased costs
Inspection outcomes
Actual performance (A) Performance Target (T) Proposed Target (P)
Safeguarding issues
Increased costs
Business criticalParental choiceParental choice
Reputational risk
Annual
Inspection outcomes
Outcome
% reception year surplus places
% primary school attendance
Quarterly% major capital projects green/amber to time
Outcome
OutcomeOutcome
Outcome
2018/19 2020/212016/17 2019/202017/18
% Good or Outstanding children's centres per Ofsted
High
% pupils achieving expected standard in reading, writing and maths at KS2
2015/16
LowAnnual
Monthly
High
Enter a brief description of your main activities and objectives below
282
1fte
Increased demand for special school places (total across all schools)
High
Increased demand for secondary school (total across all schools)
Quarterly
2020/21
Polarity
High
2019/20
Low
Indicator type
OutcomeAnnual
288
200-400
2018/19
Forecast increase in population 5-19
2015/16
Annual
Anticipated non financial resources
Merton pupil average Attainment 8 score
Forecast increase in Children & Y/P with EHCPIncreased demand for primary school (total across all schools)
100 more SEN places by 18-19
7802400160Merton School Improvement (MSI) will improve outcomes for all pupils in Merton Schools by:
monitoring, analysing & evaluating pupil & school performance developing skills in planning, teaching, assessment, leadership & management working with schools to reduce inequality & improve achievement for vulnerable groups strengthening partnership working and school to school support Special Education Needs & Disabilities Integrated Service (SENDIS) will improve outcomes for CYP with SEND by: building early help capacity in schools & settings, families & the community focus on safeguarding, early intervention & prevention as well as direct support for families implementing the requirements of the Children and Families Act ensuring that families are central and receive a joined up service Specialist placement provision for pupils with SEN. Early Years Services will improve outcomes for all children aged 0-5 by: � managing the childcare market to ensure the supply of good quality funded early education provision for children aged 2, 3 and 4 in accordance with statutory duties . delivering Children’s Centre services through a locality model with a focus on early help & targeted services for vulnerable families � using the CASA to inform robust planning and case work for identified families . working with the early years sector to improve quality, reduce inequality and improve outcomes for vulnerable children and their families . Developing the work force to deliver holistically to vulnerable families and young children introducing a more robust performance management framework Education Inclusion will improve outcomes for Young People by: providing universal & targeted in house & commissioned services for YP & schools providing support to prevent bullying, substance misuse & teenage pregnancy, to improve attendance & to encourage emotional & social development developing alternative education offerings to enable YP to stay in education, training & employment leading on the council's partnership with the police & CAMHS for education improving attendance and reduce PA in Merton schools - My Futures Service School Org Pupil place planning, & schools admissions School expansion & capital programme management.
Substantial reduction in EY budgets whilst retaining existing Children's Centres targeted work in areas of higher deprivation: £546,000 Reduced service offer from school improvement: £75,000 Increased income from schools/ reduced LA service offer: £200,000 Property and contracts: £65,000 (Deletion of 1AD, 1 HOS and half and admin post £224,000) spilt across CSC/YI and Education).
Increased income from schools/ reduced LA service offer: £200,000 Commissioning rationalisation: £60,000 (Review of CSF staffing structure beneath management level £189,00) split across CSC/YI and Education). Data review & centralisation £40,000) split across CSC/YI and Education).
(Review of CSF staffing structure beneath management level £200,000 (split across CSC/YI and Education).
2017/18 Expenditure
Employees
Premises
Transport
Supplies & Services
3rd party payments
Transfer payments
Support services
Depreciation
2017/18 Income
Government grants
Reimbursements
Customer & client receipts
37,000
38,000
39,000
40,000
41,000
42,000
43,000
44,000
45,000
2015 2016 2017 2018 2019 2020
£'00
0s
Budget Actual
Page 105

Likelihood Impact Score
Start date 2013-14
End date 2018-19
Start date 2013-14
End date 2019-20
Start date 2013-14
End date 2019-20
Start date 2013-14
End date 2018-19
Start date 2013-14
End date 2017-18
Start date 2015-16
End date 2018-2019
8Project Details:
Continue liaison with Education Funding Agency and Harris Federation to deliver a new secondary (Free) school in the Wimbledon area. Implement expansion of 2/3 secondary schools in east of the borough to achieve overall additional places needed. Undertake statutory processes and procure/plan/deliver construction contracts. Develop overall strategy for provision of sufficient and suitable SEN places in Merton; undertake capital bidding and procure/plan/deliver construction contracts.
Project 6 Project Title:Implementation of Secondary & Special School (SEN) Places Strategy (EducationTOM)
Infrastructure renewal
4 2
Improved effectiveness
Improved efficiency (savings)
Improved customer experience
DETAILS OF MAJOR PROJECTS (INCLUDING PROCUREMENT) - MAXIMUM OF 10 OVER THE FOUR YEAR PERIODEducation
PROJECT DESCRIPTION MAJOR PROJECTS BENEFITS
2
Rigorous support and challenge for schools in RI or vulnerable to RI including implementation of Support and Challenge Groups. Training and briefings on Ofsted, assessment, curriculum and improving teaching. Maintenance of outstanding teacher courses for primary and secondary teachers. Ongoing support for all schools on the basis of the new School Improvement Strategy from Merton Education Partners. The development of strengthened school to school support through the School Improvement Steering Group, ongoing support for the Merton Education Partnership and brokerage of school to school support through Merton Leaders of Education, primary expert teachers and liaison with Teaching Schools. Partnership with schools on redefining LA functions as part of Education TOM.
Project 4 Project Title:
Implementation of requirements of Children & Families Act (Edn TOM & CYPWB) & Education TOM/CYPWB Model & Personal Budgets (Education TOM/C+F Act)
Implementation of legislative requirements including assessment framework, Ed, Health & Care Plan, development of the local offer, preparation for adulthood pathways, secure web portal, personal budgets for those families that want them. Related to SCIS Programme. Addressing new statutory duty for age 19-25. Develop plan and manage process within available funding streams. Develop and deliver the Education TOM & CYPWB Model across CSF Services, Including implementation of MOSAIC phases 1 & 2. Progress further rollout of Personal Budgets for families of children subject to education, health and care plans (ex SEN Statements). Work with SENDIS service to maintain focus of encouraging Personal Budgets for SEN travel assistance and support implementation of next phase of PBs for Short Breaks services.
Securing supply of good quality sufficient number of funded education places for 2, 3 and 4 year olds.; On-going development of the Locality Model to reorganise Children’s Centre provision to maximise outcomes within available funding. Service realignment and standardisation across back office functions. Develop further alternative / shared / mixed use for the centres to include an accommodation review and ICT infrastructure review. To increase income and develop a charging framework across the service, includes customer contact and self serve options for fee paying customers.
Project Title:
Implementation of new funding models for Phipps Bridge & Pollards Hill. Expanding community partnerships to achieve a more self funding community model in each locality. The plan for each area will evolve from these partnerships.
2
3
Improved customer experience
4
Development of Adolescent offer including My Futures (NEET's) & linked provision
Development of Melbury College and commissioning of AltEd provision. Including addressing new statutory duty for age 19-25. Develop plan and manage process within available funding streams.
Youth transformation phases 3 & 4 (Edn TOM)
63
12
Project Title:
3
Project Details:
Project Details:
Improved efficiency (savings)
4 3
Transforming Early Years (EY's TOM)
Risk
6
12
2 6
3
Improving pupil outcomes at KS2 & KS4 (Edn TOM) & School Improvement through partnership (Edn TOM)
Project 5
Project Title:
Project 1
Project 2
Project 3
Project Details:
Project Details:
Project Details:
Project Title:
Page 106

Community & Housing
Page 107

2015/16(A) 2016/17(T) 2017/18(P) 2018/19(P) 2019/20(P) 2020/21(P)967 996 1000 1010 1020 1040
81.5% 73.2 78.8 78.8 78.8 78.880% 72 72 72 72 72
98% 95 95 95 95 95
8.4 5 7 7 7 7
Final Budget2015/16
Actual 2015/16
Budget2016/17
Forecast Variance
2016/17 P8
Budget 2017/18
Budget 2018/19
Budget 2019/20
Budget 2020/21
78,569 81,959 73,925 8,409 80,475 78,278 76,328 77,569 14,600 14,742 12,948 1,022 13,320 12,082 12,194 12,305
370 297 363 40 361 366 371 376 1,303 1,397 1,406 5 1,442 1,463 1,484 1,505 4,206 2,590 3,976 (963) 3,491 2,196 2,255 2,314
41,655 45,456 38,927 8,303 46,297 46,157 43,560 44,155 9,551 9,490 9,763 2 9,514 9,964 10,414 10,864 6,808 7,912 6,466 - 5,972 5,972 5,972 5,972
76 76 76 - 78 78 78 78 Final Budget
2015/16Actual
2015/16Budget2016/17
Variance 2016/17 P8
Budget 2017/18
Budget 2018/19
Budget 2019/20
Budget 2020/21
22,782 24,124 22,908 (148) 21,477 21,477 21,477 21,477 1,059 1,317 882 (315) 17 17 17 17 8,275 10,144 8,613 (1,100) 9,191 9,191 9,191 9,191
10,327 9,058 10,453 1,266 9,563 9,563 9,563 9,563 3,121 3,606 2,960 - 2,706 2,706 2,706 2,706
-
55,787 57,835 51,017 8,262 58,998 56,801 54,851 56,092
Final Budget2015/16
Actual 2015/16
Budget2016/17
Variance 2016/17 P8
Budget 2017/18
Budget 2018/19
Budget 2019/20
Budget 2020/21
2 132 591
0 593 132 0 0 0 0 0
375 335221 195 185385 395 419
The rate of Delayed Transfers of care from hospital (both NHS and Merton)
383.53 335.26 324.50 313.50 313.50
2015/16 2016/17 2018/19
2015/16 2016/17 2018/19
3331 3307 3252407
% People with 'long term' services receiving Self-Directed Support
2020/21
Council Funded Net Budget
Revenue £'000s
Income
Summary of major budget etc. changes ~ 2017/18
2018/19
2019/20
The Gables Mitcham
Reserves
IT Schemes
Capital Budget £'000s
Capital Funded
Supplies & Services
2017/18
Reimbursements
PremisesEmployees
Recharges
DepreciationSupport services
Government grants
Customer & client receipts
Business critical
Unit cost
Business criticalMonthly
MonthlyLow
Increased costs
Main impact if indicator not met
Breach statutory duty
Polarity Reporting cycle
Annual
Indicator type
Health & Wellbeing Strategy
407
358
Adult Social Care
People aged 95+No. of people aged 65+ with dementiaAnticipated non financial resources
Cllr Tobin Byers: Cabinet Member for Adult Social Care
% Older people still at home following Reablement
Anticipated demandEnter a brief description of your main activities and objectives below
People aged 85-89
Planning Assumptions The Corporate strategies your service contributes to
3278
3rd party payments
DEPARTMENTAL BUDGET AND RESOURCES
Revenue £'000s
Transport
No. of people requiring services
Staff (FTE)
Transfer Payments
Actual Performance (A) Performance Target (T) Proposed Target (T)
190
Expenditure
Performance indicator
Increased costs No of carers receiving a service
% People receiving 'long term' Community Services
Government intervention
Increased costs
Monthly
High
Monthly
High
Business criticalOutcome
High High
2017/18
2017/18313.50
2019/20
3191315180431
2019/20 2020/21
2020/21
3170293175448
Adult Social Care is a statutory service, underpinned by several pieces of legislation, whereby the council has a duty to provide or commission support, based on an assessment of need for people over the age of 18. People who are in need /at risk due to disability or illness. Once a need has been defined, there is a duty to meet it. There are eligibility criteria to define need and to keep this in line with resources as far as possible. Our approach to redesign the service and find savings is based on a model for using resources. This means maintaining some focussed investment in prevention and recovery in order to limit spend on long term support. Where long term support is needed, we do this in a person centred way which encourages maximum independence, minimises processes if they don't add value for customers or taxpayers, to work in partnership to achieve these goals, and to enable and encourage everyone to contribute to their own or others' support alongside what is funded by the taxpayer. Looking ahead there is a key national policy challenge to incorporate in our redesign, namely the integration with health services.
Growth in Placement budget - £ 9.3m Total Savings - £2.248m (CH1,CH2,,CH3,CH35,CH36,CH37,CH38,CH52&CH53 & CH57)
Growth for Concessionary fares increase - £0.450m Growth in Placement budget - £0.252m. Total Savings - £2.988m (CH20,CH36,CH39,CH54&CH55 & CH57 - a further £918k to be identified)
Growth for Concessionary fares increase - £0.450m Reduction of growth in placement budget - £2.8m due to increased improved Better Care Fund
Growth for Concessionary fares increase - £0.450m
2017/18 Expenditure
Employees
Premises
Transport
Supplies & Services
3rd party payments
Transfer Payments
Support services
Depreciation
2017/18 Income
Government grants
Reimbursements
Customer & client receipts
Recharges
46,000
48,000
50,000
52,000
54,000
56,000
58,000
60,000
2015 2016 2017 2018 2019 2020
£'00
0s
Budget Actual
Page 108

Likelihood Impact Score
Start date 01/04/2017
End date 31/03/2018
Start date 01/04/2017
End date 01/11/2017
Start date 01/04/2017
End date 31/12/2017
Start date 01/04/2017
End date 31/03/2018
Start date 01/04/2017
End date 30/09/2017
Start date 01/04/2017
End date 30/09/2017
Start date 01/04/2017
End date 31/03/2018
Start date 01/04/2017
End date 31/03/2018
Start date 01/04/2017
End date 30/06/2017
Start date 01/04/2017
End date 31/03/2018
12Project Details: Develop a commissioning strategy for bed based care, working with the sector, health and
neighbouring authorities to develop a sustainable offer and range of solutions.
2 6Project Details:
Priorities for 2017/18 will be - co-location with CLCH and MCCG - embedding joint working with CLCH - developing joint commissioning approach with MCCG
Project 10 Project Title: Bed based care Improved effectiveness
4
2
3
6Project Details: Develop the offer through Merton Link and the voluntary sector to provide earlier advice, self service
and referral to non-statutory interventions.
Project 9 Project Title: Integration Improved effectiveness
3
2 4Project Details: Develop and implement business plans to expand the provision of alternatives to traditional care, such
as telecare, shard lives, supported living and short term interventions.
Project 8 Project Title: Information, access & advice Improved efficiency (savings)
3
2 4Project Details: Develop a refreshed early intervention strategy that builds on the existing hub service models
Project 7 Project Title: Business Development Improved effectiveness
2
2 6Project Details:
Undertake and implement a review of the transitions pathway to ensure that the transition to adulthood is planned in a timely manner with the service user and their family, that upcoming transitions are reflected in the commissioning and financial plans.
Project 6 Project Title: Early intervention Improved customer experience
2
2 6Project Details:
Ensure that the new Core Logic Mosaic social care information system (SCIS) is fit for purpose for the foreseeable future. Achieve this by ensuring that processes, data quality and outcomes are kept under constant review.
Project 5 Project Title: Transitions Improved customer experience
3
3 9Project Details:
Continue the review, redesign and delivery of a plan to ensure that all assessment and care management processes including those related to safeguarding, the Mental Capacity Act and DOLS are efficient, effective, consistently promote independence and adequately resourced.
Project 4 Project Title: SCIS Improved effectiveness
3
2 8Project Details: Re-commissioning of SP contracts due to expire in November 2017 with the aim of supporting the
council's homelessness prevention duties and financial plans.
Project 3 Project Title: Assessment & Care Management Processes Improved effectiveness
3
3 9Project Details:
Implementation of new Home Care model post tender. The contract will have two tiers. Tier 1 will be for 3 prime providers who will be our core partners. Tier 2 will be small local and specialist providers who will provide back-up supply or meet niche requirements.
Project 2 Project Title: Supporting People re-commissioning Improved efficiency (savings)
4
DETAILS OF MAJOR PROJECTS (INCLUDING PROCUREMENT) - MAXIMUM OF 10 OVER THE FOUR YEAR PERIODAdult Social Care
PROJECT DESCRIPTION MAJOR PROJECTS BENEFITS Risk
Project 1 Project Title: Home Care re-commissioning Improved effectiveness
3
Page 109

2015/16(A) 2016/17(T) 2017/18(P) 2018/19(P) 2019/20(P) 2020/21(P)561 450 450 450 450 450158 225 230 235 250 2504 10 10 10 10 10
4.75 10 10 10 10 1081 30 70 60 40 50353 375 360 350 340 34549 50 40 40 40 40107 55 70 70 60 6034 60 60 60 60 60
Final Budget2015/16
Actual 2015/16
Budget2016/17
Forecast Variance
2016/17 P8
Budget 2017/18
Budget 2018/19
Budget 2019/20
Budget 2020/21
3,490 4,658 4,207 1,312 4,422 4,412 4,463 4,5141,226 1,156 1,119 (48) 1,014 976 1,000 1,024
43 42 39 0 39 40 40 4128 26 28 (3) 29 30 31 31
242 604 219 (21) 186 190 194 1981,396 2,278 2,262 542 2,614 2,598 2,616 2,634
304 288 249 842 253 291 295 299
251 265 292 0 287 287 287 287
Final Budget2015/16
Actual 2015/16
Budget2016/17
Variance 2016/17 P8
Budget 2017/18
Budget 2018/19
Budget 2019/20
Budget 2020/21
1,337 3,028 2,198 (854) 2,198 2,198 2,198 2,1981,185 2,543 2,000 0 2,000 2,000 2,000 2,000
5 191 20 (606) 20 20 20 20147 294 178 (249) 178 178 178 178
0 0 0 0 0 0 0 00 0 0 0 0 0 0 00 0 0 0 0 0 0 0
2,154 1,630 2,009 458 2,224 2,214 2,265 2,316 Final Budget
2015/16Actual
2015/16Budget2016/17
Variance 2016/17 P8
Budget 2017/18
Budget 2018/19
Budget 2019/20
Budget 2020/21
447 1,043 (543) 755 629 280 28060 00 760 0
0 507 1,803 (543) 755 629 280 280
Affordable homes deliveredSocial housing lets
Increased costsHighest no. of adults in B&BOutcomeOutcome Increased waiting timesOutcome
Reduced enforcementCustomer hardship
High High
Business critical
Increased waiting times
1000
2017/18
Main impact if indicator not met
Increased costsIncreased costs
Reputational risk
Increased costs
Housing Needs and Enabling Services
Housing options caseworkDemand for temporary accommodationAnticipated non financial resources
Cllr Martin Whelton: Cabinet Member for Regeneration, Environment & Housing Anticipated demandHousing advice, options, private tenants & landlords adviceEnter a brief description of your main activities and objectives below
Planning Assumptions2017/18
4.03
Highest no. of families in B&B
Performance indicator
Housing Needs Staff (FTE)Environmental Health (Housing)
2016/1724.5
2019/20
6.03
2015/16
26.8230.535.0320.30
25.33 23.334.03
TOTALS
420
No. of households in temporary accommodation
2015/16 2016/17
1000
21.795.03
810011000
Housing register applicants
380
Homeless Placements Policy (Interim)
2020/21
8150100010250
10009600
2020/211100011000
445
The Corporate strategies your service contributes to2018/19
10900 11550 Homelessness StrategyHousing Strategy
435
19.30
Actual Performance (A) Performance Target (T) Proposed Target (P)
2019/2011000 11000
1000
11000
4.03
2018/19455
19.30
1000470
19.30
Low
Reporting cycle
23.33
MonthlyMonthly
23.33
Polarity
Business criticalBusiness critical
High Low
No. of homelessness preventions
Indicator type
MonthlyBusiness critical
High
LowHigh Annual
Quarterly
Monthly
Recharges
Council Funded Net Budget
Reserves
PremisesTransport
Government grantsReimbursementsCustomer & client receipts
3rd party payments
Depreciation
Revenue £'000s
Support services
AnnualRent deposit - new tenanciesNo. of enforcement/improvement notices
DEPARTMENTAL BUDGET AND RESOURCES
Revenue £'000s
Employees
Supplies & Services
Number of Disabled Facilities Grants approved
Disabled Facilities Grant8 Wilton RoadWestern Road
Income
2020/21
Capital Funded
2017/18
2018/19
2019/20
Capital Budget £'000s
Transfer Payments
Expenditure
OutcomeHigh Quarterly Outcome
Quarterly
Transfer Payments
To fulfil statutory housing functions to prevent homelessness and avoid the use of temporary accommodation. To plan services in response to changes in national policies and in the housing market, and to develop innovative projects or models of delivery that maximise the use of resources and deliver services that minimise costs to the council. The purpose of this service is to - Prevent homelessness in accordance with statutory housing law - Provide homes to people in housing need - Plan for the future delivery of housing via general conformity with the London Housing Strategy - Formulate and deliver statutory housing strategies for the borough - Maintain the housing register and choice based lettings process and nominate households to vacant housing association homes - Maximise supply of affordable homes with registered providers and private landlords - Provide care and housing support to vulnerable adults - Relationship management between the council and stock transfer housing associations - Carry out a statutory duty to enforce Environmental Health (Housing) legislation - Provide grant assistance for improvements and adaptations
Savings £30k Rationalisation of admin budget (CH9) Savings -£36k - Deletion of one staffing post ((CH10) Savings -£100k Further Staff reductions (Any areas of HNES & EHH) (CH43) Savings £50k - Staff reduction in Housing Services ( CH57) -- Savings to be transferred to Adult Social Care
Savings -£62k Further Staff reductions (Any areas of HNES & EHH) (CH43) Savings- £118k Staff reduction - savings to be transferred to Adult Social Care
2017/18 Expenditure
Employees
Premises
Transport
Supplies & Services
Transfer Payments
3rd party payments
Transfer Payments
Support services
2017/18 Income
Reimbursements
Customer & client receipts
0
500
1,000
1,500
2,000
2,500
2015 2016 2017 2018 2019 2020
£'00
0s
Budget Actual
Page 110

Likelihood Impact Score
Start date 2016-17
End date 2017-18
Start date 2016-17
End date 2017-18
Start date 2014-15
End date 2018-19
Start date 2016-17
End date 2018-19
Start date 2015-16
End date 2017-18
Start date 2016-17
End date 2017-18
Start date 2017-18
End date 2018-19
Start date 2016-17
End date 2017-18
Project 8 Project Title: EDRMS Workflow Improved effectiveness
2 2
Work with IT / E&R on re-procurement / replacement of M3PP.
Improved effectivenessProject Title:
4Project Details: Work with Corporate to implement EDRMS in Housing and then update workflow processes
accordingly
2 21
Homeless Placement Policy
Project Details:
CHMP Regeneration (CLARION)
Project 6
Improved efficiency (savings)
Shared Lives DevelopmentProject 5
Technology Review
Improved effectiveness
3
Project Title:
2
Project Title:
Implement and monitor the Homeless Placement policy
Project Details:
Project Details:
Improved reputation
Project Title:
Project 7
12
1
Produce a business case to consider selective licencing and/or additional licencing in parts of the borough and progress any actions arising where necessary.(Government is currently consulting on whether or not mandatory licensing of HMOs should be extended to 2 story dwellings. Accordingly it is sensible to await the outcome of governments consultation before embarking upon this project.)
Project Title:
Project Details:
2
3
3
2
22
3
6
1
4
3
Improved effectiveness
Project Details:
2
Improved effectiveness
Develop plans in 2016/17 to re-structure the service in 2017/18 and 2018/19 in light of the need to continue to provide a service with a reduced workforce.
Project Title: Risk reduction and compliance
Project 1 Project Title:
Project Details:
Explore ways to potentially develop the Shared Lives range of services, considering the business case for any service developments and liaise with the appropriate referring agencies to provide any additional funding where necessary
Implement on-line Housing Register pre-application assessment tool.
Deliver on-line self-assessment tools
Project 2
Project 3
Project 4
Project Details:
Input to CHMP regeneration with Future Merton.
Selective Licencing
Service re-structure
DETAILS OF MAJOR PROJECTS (INCLUDING PROCUREMENT) - MAXIMUM OF 10 OVER THE FOUR YEAR PERIODHousing Needs and Enabling Services
PROJECT DESCRIPTION MAJOR PROJECTS BENEFITS Risk
1
Page 111

2015/16(T) 2016/17(T) 2017/18(P) 2018/19(P) 2019/20(P) 2020/21(P)232472 200,000 210,000 220,000 230,000 230,00065269 56,000 56,000 56,000 56,000 56,000
96 96 97 97 97 98337 210 220 230 230 230
361,000 £316,000 £346,000 £346,000 £346,000 £346,00062 30 30 30 30 30n/a 78 78 78 78 78
Final Budget2015/16
Actual 2015/16
Budget2016/17
Forecast Variance
2016/17 P8
Budget2017/18
Budget 2018/19
Budget 2019/20
Budget 2020/21
3,296 3,190 3,221 (141) 2,971 2,966 3,009 3,0521,350 1,265 1,348 (64) 1,076 1,057 1,086 1,115
399 406 403 (36) 485 493 501 5094 5 4 (1) 4 4 4 4
508 454 449 (40) 399 404 409 41437 30 27 0 18 19 20 21
0 0 0 0 0 0696 727 688 0 688 688 688 688303 303 303 0 301 301 301 301
Final Budget2015/16
Actual 2015/16
Budget2016/17
Variance 2016/17 P8
Budget2017/18
Budget 2018/19
Budget 2019/20
Budget 2020/21
357 396 357 (8) 309 339 377 3770 0 0 0 0 0 0
41 34 41 0 0 0 0316 361 316 (8) 309 339 377 377
0 0 0 0 0 0 00 0 0 0 0 0 00 0 0 0 0 0 0
2,939 2,794 2,864 (148) 2,662 2,627 2,632 2,675
Final Budget2015/16
Actual 2015/16
Budget2016/17
Variance 2016/17 P8
Budget2017/18
Budget 2018/19
Budget 2019/20
Budget 2020/21
200255 95 0 350
200100
0 255 95 0 500 0 0 350
Council Funded Net Budget
Revenue £'000s
Income
Summary of major budget etc. changes2017/18
Support services
Customer & client receipts
2018/19
Capital Budget £'000s
Colliers Wood Library Re-FitLibrary Self Service
2019/20
West Barnes Library Re-fitLibrary Management System
2020/21
ReservesCapital Funded
Supplies & Services
Expenditure
3rd party payments
Perception
DEPARTMENTAL BUDGET AND RESOURCES
QualityAnnual% customer satisfaction (ARS)
Monthly
High High
High High Monthly
Monthly
Business criticalUnit cost
Indicator type
QualityOutcome
High
Reporting cycle
MonthlyMonthlyMonthly Business critical
7
PolarityPolarity
High High
7144
7144144
33.30
1447
43.71
1,210,000
45.717
144
2017/18 2018/1933.30 33.30
135,0001,210,000
900,000135,000
1,210,000
950,000 900,000135,000
1,200,000135,000
1,200,000
56,000950,000
56,000
135,000
2019/20
56,0001,000,000
2015/16 2016/17
2015/16 2016/17 2017/18 2018/19 2019/2056,00055,000
The Corporate strategies your service contributes to
Customer Contact Strategy
Premises
Performance indicator
Revenue £'000s
Staff (FTE)
Maintain IncomePartnership numbers
Reduced uptake of service
Transport
Accommodation (Libraries)Equipment (PC's)
Government grantsReimbursements
Depreciation
Active volunteers in libraries
Transfer payments
Employees
Libraries
Registered membersVisitor figures
Anticipated non financial resources
Cllr Nick Draper: Cabinet Member for Community & Culture Anticipated demandActive usersStock issues
Enter a brief description of your main activities and objectives below
Main impact if indicator not met
Planning Assumptions
Actual Performance (A) performance target (T) Proposed Target (P)
Number of visitors accessing the library service onlineActive users - peoples network terminal
% self service usage for stock transactionsReduced uptake of service
Recharges
Increased costsReduced service delivery
Increased costsReduced service delivery
Reduced customer service
2020/2133.30
7144
2020/21
56,000900,000135,000
1,210,000
The purpose of the service is to provide a 'comprehensive and efficient' library service, addressing the 'needs of adults and children' according to the Public Libraries and Museums Act 1964. Local authorities have a statutory duty to make provision for a library service but may decide on how this is delivered. Certain aspects of the service must be provided for free: Free lending of books Free access to information Free library membership The Library Service aims to provide a modern, high quality and cost effective service that is responsive to the needs of customers. Our vision is to remain the most efficient library service in London whilst continuing to achieve some of the highest customer satisfaction levels.
Savings - Introduce self-serve libraries at off peak times - £90k Savings - Staffing - £38k Savings - Additional staff savings - £62k Savings - Reduction in ICT contracts - £40k
Savings - Letting of space for coffee shop franchise in libraries - £30k
2017/18 Expenditure
Employees
Premises
Transport
Supplies & Services
3rd party payments
Transfer payments
Support services
Depreciation
2017/18 Income
Customer & client receipts
2,000
2,500
3,000
2015 2016 2017 2018 2019 2020
£'00
0s
Budget Actual
Page 112

Likelihood Impact Score
Start date 2015-16
End date 2017-18
Start date 2015-16
End date 2019-20
Start date 2015-16
End date 2017-18
Start date 2013-14
End date 2017-18
Start date 2016-17
End date 2020-21
Start date 2016-17
End date 2017-18
Start date 2013-14
End date 2017-18
Start date 2015-16
End date 2018-19
Start date 2015-16
End date 2018-19
Start date 2015-16
Projects 2018-19
DETAILS OF MAJOR PROJECTS (INCLUDING PROCUREMENT) - MAXIMUM OF 10 OVER THE FOUR YEAR PERIODLibraries
PROJECT DESCRIPTION MAJOR PROJECTS BENEFITS
Project 2
Implement agreed savings through the consolidation of staffing and the implementation of self-service libraries at off peak times in branch libraries.
3
2
Partnership development
Continue to develop partnership approach to delivering services in libraries. Increase health partnerships along with developing projects such as Merton Arts Space and the integration of adult education services.
Heritage Strategy
Continue to deliver efficiencies in the way that stock is managed. Deliver media fund savings and consolidate team structure. Maximise usage of e-resources.
Promote the Heritage Strategy and increase community participation in heritage activities. Continue to draw in external funding and improve income streams.
Undertake a new customer survey to gain user views and consult on any significant changes to service delivery. Continue to develop e-marketing services and undertake promotional activities such as Library Connect.
Customer consultation, marketing and promotion
3
Improved efficiency (savings)
2
23On-going monitoring of performance. Develop security guard services to play a more active role in service transformation and to support with new lone working arrangements.
Security services contract Improved efficiency (savings)
Improved customer experience
Project Title:
2 6
Project Title:
3Open the new Colliers Wood Library and maximise the use of space in existing libraries.
Library redevelopments
Project Details
London Libraries Consortium
Implement actions in the LLC Strategy and procure a new library management system.
Project Title:
Project Details6
2
6Project Details
Assisted digital supportProject Title:
Project Details1
22
Increase volunteer numbers and skills in supporting customers with more complex IT needs. Support national initiatives to improve literacy and support the Customer Contact project.
2
Project 6
Project Details
Project Title: Frontline Transformation
Project Details
Project Title:
1
1
2
Stock efficiency program
Project Details3
33
Improved efficiency (savings)
6
Project Title:
Continue to deliver the Schools and Libraries Membership scheme for primary school children and promote reading through a variety of projects. Rollout the Schools and Libraries Membership scheme to high schools.
Children & Young People's projects
1 3
Risk
Project 7
Project 8
Project Title:
2
1 33Project Details
1
Project 9
Project 10
Project Title:Project 1
Project 3
Project 4
Project Title:
Project Details
Project Details
Project 5
Improved customer experience
Improved effectiveness
Improved customer experience
Improved customer experience
Improved efficiency (savings)
Improved customer experience
Page 113

2015/16(T) 2016/17(T) 2017/18(P) 2018/19(P) 2019/20(P) 2020/21(P)
3964 3964 3964 3964
50% 45% 40% 40%
93% 94% 95% 95%85% 86% 88% 90%
95% 95% 95% 95%
27% 30% 32% 35%£247 £247 £247 £247
Budget2017/18
Budget2018/19
Budget2019/20
Budget2020/21
1,410 1,413 1,419 1,425891 891 891 891184 186 191 196
46 47 48 49289 289 289 289
Budget2017/18
Budget2018/19
Budget2019/20
Budget2020/21
1,381 1,381 1,381 1,3811,347 1,347 1,347 1,347
27 27 27 277 7 7 7
Budget2017/18
Budget2018/19
Budget2019/20
Budget2020/21
High
Revenue
Capital Expenditure
Employees (Commissioning Team)
Revenue
Other Costs
Other Income
1467
Adult Apprenticeships Grant
Expenditure
IncomeAdult Education Block Grant
Employees (LDD Curriculum Manager)
Quarterly
Annual
High
Sufficient resources to provide service
3964
Contractor's Fee
Sufficient resources to provide service
3.661
Average cost per learner
High
2020/21
3964
Commissioned Service
Service Providers:
South Thames College
3285
3964
14671467 1467
Quarterly
Annual
High
2018/19
3.66
High
AnnualLow Unit cost% of enrolments from deprived wards High
Indicator type
Outcome
Outcome
Outcome
Quality
Annual
Reporting cycle
Outcome
Quarterly
0
Polarity
1 111
2015/16 2016/17 2017/18 2019/20
3.663.663.660
4256
1467
3964 3964
1397
Staff (Commissioning Team)
% of end of course evaluations where teaching and learning is rated as good or above
Staff (LDD Curriculum manager)South Thames College
Groundwork London
Performance indicator
% overall success rate of accredited courses per annum
2016/17
3285 328532853129 3285
2017/18 2019/202018/19 2020/21
Financial Information Additional Expenditure Information
Number of new learners per annum (not registered as learners in previous year)
Number of completers (% retention rate per annum)
Perception
Planning Assumptions
Performance Targets (T) & Provisional Performance Targets (P)
Number of enrolments per annum
Reduced uptake of service
Cllr Nick Draper Cabinet Member for Community & CultureMerton Adult Education
Total number of enrolments
Anticipated non financial resources
Anticipated demand
Total number of learners
Groundwork London
Reduced uptake of service
Reduced service delivery
Reduced uptake of serviceReduced service delivery
Reduced uptake of service
Number of accredited learners
2015/16
Reduced uptake of service
Main impact if indicator not met
The Corporate strategies the service contributes to
Culture and Sport Framework
Employment and Skills Action Plan
Medium term Financial StrategySpecial Educational Needs and
Disabilities Strategy
Description of main activities and objectives The London Borough of Merton is committed to providing high quality and sustainable adult learning in order to improve the social, economic, health and wellbeing of our residents. The service is delivered through a commissioning model, contracting services to the best providers in the field and by developing sophisticated evidence based approaches to what we deliver. The service will continue to provide popular courses whilst expanding provision for families and enhancing our range of maths, English and employability courses.
Page 114
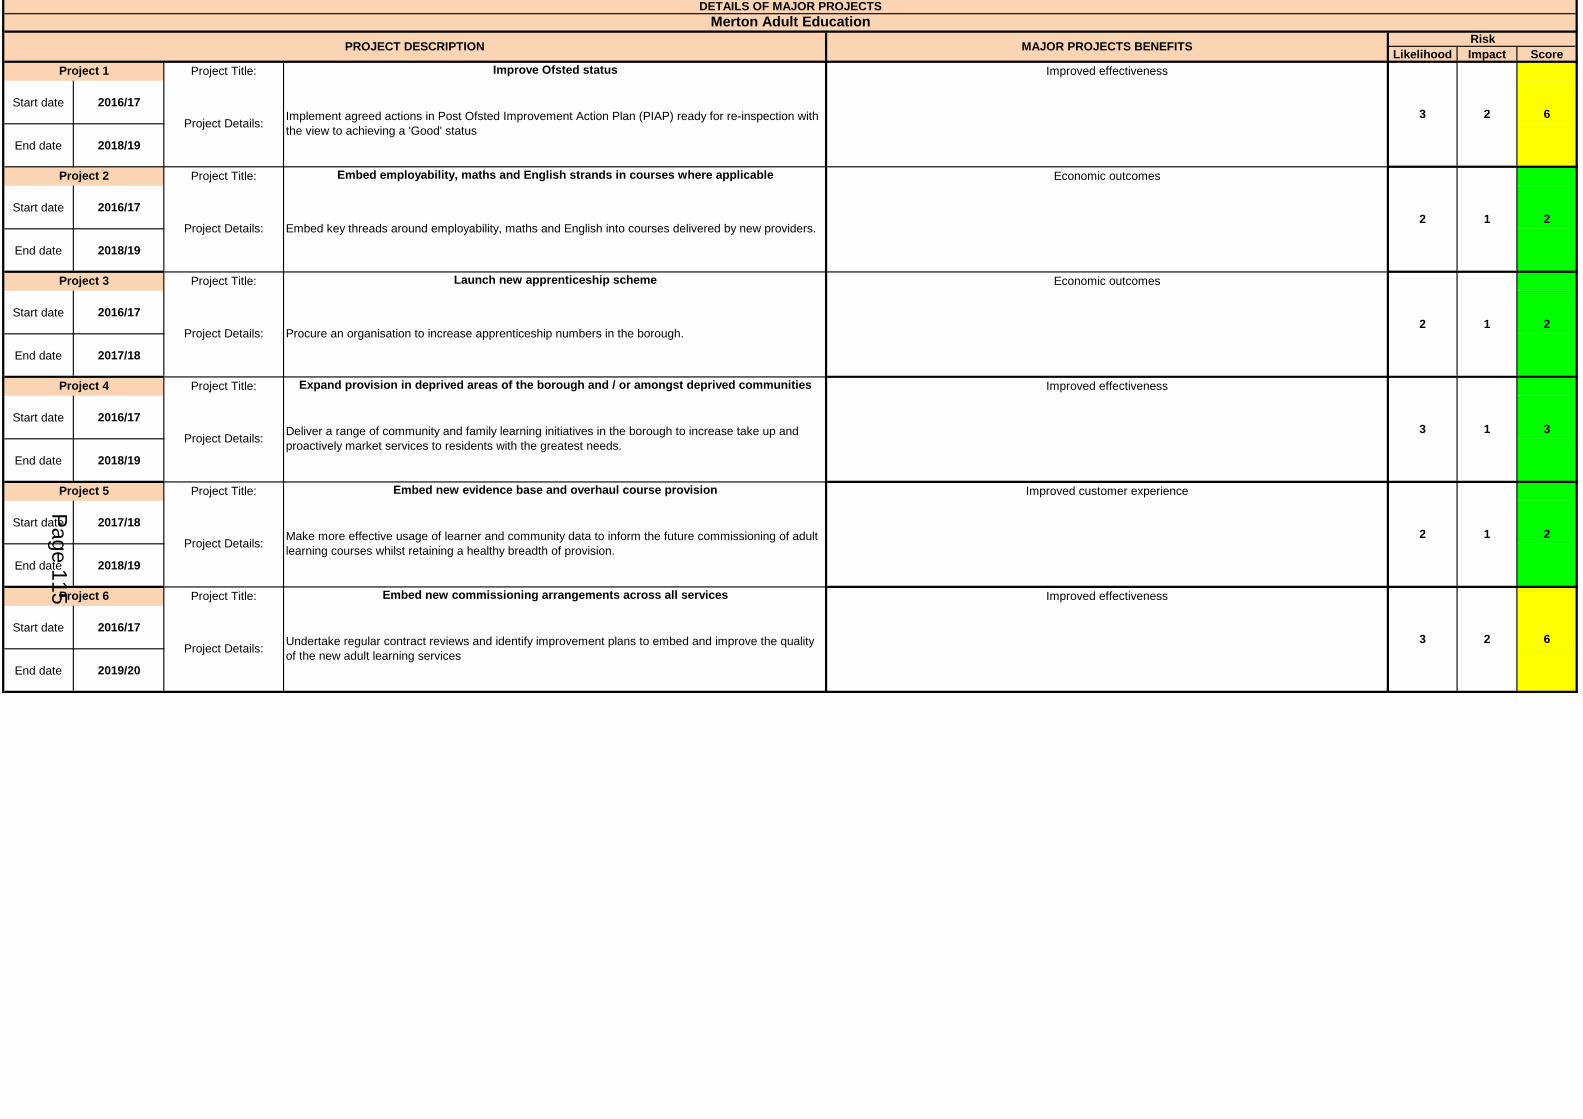
Likelihood Impact Score
Start date 2016/17
End date 2018/19
Start date 2016/17
End date 2018/19
Start date 2016/17
End date 2017/18
Start date 2016/17
End date 2018/19
Start date 2017/18
End date 2018/19
Start date 2016/17
End date 2019/20
DETAILS OF MAJOR PROJECTS Merton Adult Education
PROJECT DESCRIPTION MAJOR PROJECTS BENEFITS Risk
Project 1 Project Title: Improve Ofsted status Improved effectiveness
3 2 6Project Details: Implement agreed actions in Post Ofsted Improvement Action Plan (PIAP) ready for re-inspection with
the view to achieving a 'Good' status
Project 2 Project Title: Embed employability, maths and English strands in courses where applicable Economic outcomes
2 1 2Project Details: Embed key threads around employability, maths and English into courses delivered by new providers.
Project 3 Project Title: Launch new apprenticeship scheme Economic outcomes
2 1 2Project Details: Procure an organisation to increase apprenticeship numbers in the borough.
Project 4 Project Title: Expand provision in deprived areas of the borough and / or amongst deprived communities Improved effectiveness
3 1 3Project Details: Deliver a range of community and family learning initiatives in the borough to increase take up and
proactively market services to residents with the greatest needs.
Project 5 Project Title: Embed new evidence base and overhaul course provision Improved customer experience
2
Project 6 Project Title: Embed new commissioning arrangements across all services Improved effectiveness
3 2 6Project Details: Undertake regular contract reviews and identify improvement plans to embed and improve the quality
of the new adult learning services
2Project Details: Make more effective usage of learner and community data to inform the future commissioning of adult
learning courses whilst retaining a healthy breadth of provision.1
Page 115

2015/16(A) 2016/17(T) 2017/18(P) 2018/19(P) 2019/20(P) 2020/21(P)
TBC 1103.1 1141.7 1181.6 1222.9 1265.7
N/a 75% 80% 86% 92% 97%N/a 69% 73% 79% 84% 90%
9.4% 9.0% 9.0% 9.0% 9.0% 9.0%
60.2% 60% 60% 60% 60% 60%34.7% 35.6% 34.7% 34.2% 33.7% TBC
N/a 9.2% 9.2% 8.0% 8.0% TBC85.4% 90% 90% 90% 90% 90%
95.7% 95% 95% 95% 95% 95%
Final Budget2015/16
Actual 2015/16
Budget2016/17
Forecast Variance
2016/17 P8
Budget 2017/18
Budget 2018/19
Budget 2019/20
Budget 2020/21
11,536 10,926 11,897 21 10,948 10,948 10,948 10,9481,133 1,044 1,090 (12) 1,117 1,117 1,117 1,117
2 1 2 (1) 2 2 2 22 2 2 1 2 2 2 2
5,019 4,544 3,750 89 3,476 3,476 3,476 3,4765,208 5,156 6,886 (56) 6,200 6,200 6,200 6,200
0 0 0 0 0 0 0 0172 178 167 0 151 151 151 151
0 0 0 0 0 0 0 0
Final Budget2015/16
Actual 2015/16
Budget2016/17
Variance 2016/17 P8
Budget 2017/18
Budget 2018/19
Budget 2019/20
Budget 2020/21
11,069 10,458 11,481 (120) 10,948 10,948 10,948 10,94810,712 10,071 11,181 (15) 10,727 10,727 10,727 10,727
356 388 300 (105) 221 221 221 221
467 467 416 (99) 0 0 0 0 Final Budget
2015/16Actual
2015/16Budget2016/17
Variance 2016/17 P8
Budget 2017/18
Budget 2018/19
Budget 2019/20
Budget 2020/21
0 0 0 0 0 0 0 0
High
Reduce % gap in age 10-11 obesity between East & West Merton
Successful completion of drug treatment (opiates)High
Employees
Revenue £'000s
% participation in National Child Measurement Programme of Year 6 children
High
High
LowLow
Expenditure
Successful completion of alcohol treatment
% excess weight in children age 10 - 11 years
DEPARTMENTAL BUDGET AND RESOURCES
Health Visiting – % of New Birth Reviews within 14 days of birth
2020/21
AnnualOutcome
Breach statutory duty
Output
Annual
2019/20
Outcome
Government grantsIncome
Recharges
Support services
Premises
Transfer payments
TransportSupplies & Services
Depreciation
3rd party payments
% of people who accept offer of HIV test at first attendanceReduced quality of service
Quarterly
Quarterly
Quarterly Detrimental to public health
16.5614.771
2017/1816.56
TBC
2016/17
2
2018/19
Capital Budget £'000s
Capital Funded
Revenue £'000s
2017/18
Reserves
Summary of major budget etc. changesCouncil Funded Net Budget
Customer & client receiptsReimbursements
% of people offered HIV test at first attendance
Staff (Trainees)
2015/16
Performance indicator
16.5615.932
Actual performance (A) Performance Target (T) Proposed Target (P)Polarity
New STI diagnosis per 100,000 pop. (excl. Chlamydia, under 25's)
Public Health
Support to CCG (% of PH staff capacity)NHS Health Checks
Cllr Tobin Byers:Cabinet Member for Adult Social Care Anticipated demandSexual health
Drugs & alcohol
Enter a brief description of your main activities and objectives below
Reception Cohort : 2,655Year 6 Cohort: 2,068
6300
2015/16 2016/17
Health Visiting New Birth Visits: estimated new births
20,554
40% 452 Drugs/253 Alcohol
6211
467 Drugs/280 Alcohol
2,60040%
20,913 21,645
National Child Measurement Programme Reception Cohort : 2,610Year 6 Cohort: 2,012
11683237
NHS Smoking Cessation 10003170
OutcomeOutcome
16.56TBC
Indicator type Main impact if indicator not met
Quarterly
TBC
Outcome
Failure to meet PHOF targetQuarterly
Reporting cycle
High
Increase prevalence of long term conditions
OutcomeQuarterly
Poor childhood outcomesMonthly
High OutcomeOutcome
High
22,4032017/18
2,600
TBC40%
Reception Cohort : 2,700Year 6 Cohort: 2,125
400 drugs/340 alcohol
TBC30373104
TBC40%
TBC
2018/19 2019/20 2020/21
23,187
TBC
TBC
TBC
2971
2020/21
TBCTBC
The Corporate strategies your service contributes to
Planning Assumptions
TBC
Reception Cohort : 2,745Year 6 Cohort: 2,182
Sexual Health StrategyHealth & Wellbeing Strategy
40%
2018/19 2019/20
Anticipated non financial resourcesStaff (FTE)
Funding for PH will continue to be allocated through the ring-fenced grant. Following a national decision to reduce the total PH grant a 2.5% cut is required in 2017/18. That means the national PH Grant is £10.7m in 2017/18. In addition the Council's medium term financial strategy has committed PH to transfer recurrently £400k to CSF and £600k to C&H. This reduces the budget available for PH to £9.7m. For 2017/18 there is a total of £870k required savings. The approach to savings will be to minimise the negative impact from shrinking resources on population health, protection of vulnerable residents and reduction of inequalities, and to avoid savings in one budget having inadvertently shifting cost pressures to another part of the Council.
For 2018/19 the national grant remains the same and there are no additional transfer requirements in the MYFS over an above the £1 million (£400k CSF & £600k C&H) . if there is no other change the budget available for PH will be £9.7m. Dependent on Government grant, exact figures to be confirmed (CSR in Nov 2015 announced: Ring Fence removed; from 2018/19 Recurrent 6.2% savings (2015/16) plus 2.2% in 2016/17 plus 2.5% in 2017/18 plus additional 2.6% in 2018/19)
From 2019/20 the national public health grant will end and funding will be via local business rates. Work is underway at national , regional and local levels to understand the implications of this change on the PH budget.
Public Health budget will be funded from local business rates.
2017/18 Expenditure
Employees
Premises
Transport
Supplies & Services
3rd party payments
Transfer payments
Support services
2017/18 Income
Government grants
Reimbursements
0
50
100
150
200
250
300
350
400
450
500
2015 2016 2017 2018 2019 2020
£'00
0s
Budget Actual
Public Health services currently comprise: • Services to improve health and wellbeing that are the commissioning responsibility of PH in LA
(including the following mandatory services: sexual health, NHS health checks, Healthy Child 0-5 services, National Child Measurement Programme)
• Commissioning support function to the CCG (mandatory)and council; • Health protection oversight function (mandatory) • Health intelligence including JSNA (mandatory) Our vision for public health in Merton over the next five years is to: • Protect and improve physical and mental health outcomes for the whole population in Merton
throughout the life course, and reduce health inequalities, especially between the West and East of the borough, within the shrinking financial envelope available.
• Fulfil our statutory PH duties. • Contribute to Merton becoming London’s best council in 2020 Our strategic objectives are: Objective 1: Service transformation - Deliver East Merton Model of Health and Wellbeing and Wilson health and community campus as blueprint for borough-wide health and care transformation Objective 2: Embedding health & wellbeing into council business - Embed health and wellbeing as relevant outcome across the whole council business (and partners) including establishing health as marker for good government and as investment rather than expenditure, integral to 2020 vision of best London council Objective 3: Strengthening commissioning and commissioning support – Develop public health strategic commissioning (end-to-end) & public health support to commissioning for health and wellbeing outcomes using a range of specific purposefully chosen collaborative commissioning approaches for development and delivery of integrated service models
Page 116

Likelihood Impact Score
Start date 2016/17
End date 2020-21
Start date 2016-17
End date 2020-21
Start date 2016-17
End date 2018-19
Start date 2015-2016
End date 2017-18
Start date 2014-15
End date 2017-18
Start date 2016-17
End date 2018-19
Start date 2016-17
End date 2018-19
Start date 2016/17
End date 2020/21
Start date 2016-17
End date 2020-21
Start date 2016-17
End date 2020-21
Improved effectiveness
Improved effectiveness
Improved effectiveness
Improved effectiveness
DETAILS OF MAJOR PROJECTS (INCLUDING PROCUREMENT) - MAXIMUM OF 10 OVER THE FOUR YEAR PERIODPublic Health
PROJECT DESCRIPTION MAJOR PROJECTS BENEFITS
Project 2
42Commission a redesigned integrated lifestyle and NHS Health checks programme as part of taking forward the Merton Prevention Framework. The healthy lifestyle will comprise four related components: outreach and community resilience, a universal digital gateway and offer, stop smoking, and front line training. This is combined with a redesigned NHS Health Checks programme comprising primary and community based elements, underpinned by risk stratification. PH Lead: Amanda Killoran
Embed Health and Wellbeing in all policies (TOM URN: PH2)
3
3
Project Title:
Commission on a sub-regional level fully integrated sexual health services, joining up community pharmacy and GP practice level services with Level 2 CaSH services and Level 3 GUM services in a seamless provision. PH Lead: Anjan Ghosh
3
Integrated sexual health services (TOM URN: PH6)
9
Project 3
Project 4
Project Details:
9
93
Project 1 Improved effectiveness
2
Project Title:
Project Details:
Project Details:
2
Develop a programmatic approach to public health intelligence covering: the JSNA analysis and support to strategy and commissioning decisions through a range of accessible outputs /products; Performance measurement and monitoring in support of continuous improvement of strategies and services in achieving outcomes; and Information management including sharing /linkages of data across the council/CCG. PH Lead: Amanda Killoran
2
2
Project Details:
Dementia Friendly Merton (TOM URN: PH3)
Relaunch the Dementia Action Alliance (DAA) in Merton, as the principal vehicle for the development of Dementia Friendly Merton. This partnership will have strategic steer from the Dementia Strategy Steering Group. Governance structures and terms of reference will be developed and formalised and an action plan will be developed to roll out the DAA and ensure the sustainability of the programme, exploring the feasiblity of having a designated coordinator or an alternative mechanism. PH Lead: Anjan Ghosh
Project Title: Improved effectiveness
Improved effectiveness
Improved efficiency (savings)
4
2 4
4
2
2
2
Project Details:
Redesign of Prevention and Health improvement Services (TOM URN: PH6)
Develop and evaluate a service model for social prescribing in Merton that improves health and wellbeing of patients through providing access to non-medical support that increase self help, self management and social engagement and healthy behaviours, and prevent ill health. Social prescribing is part of the EMMHWB and a major component in the CCG's Primary Care Strategy and the development of the model of multi-speciality community provider, strengthening relationships between primary care and the voluntary and community sector and services. PH Lead: Amanda Killoran
Deliver a whole systems childhood obesity action plan to reduce childhood obesity and health inequalities. This will address the wider social and environmental influences, and include leadership, the food environment, physical environment, early years and schools as well as community and staff engagement. PH Lead: Julia Groom
Joint Strategic Needs Assessment Plus/Intelligence Hub (TOM URN: PH11)
Development of social prescribing (TOM URN: PH5)
Childhood Obesity Action Plan (TOM URN: PH4)
3
Improved effectiveness
Improved effectiveness
4
2Project Details:
2
6
Development of integrated Children's Services (TOM URN: PH7)
Lead transformation of the Community health services towards a Healthy Child 0-19 years service, embedding health visiting and school nursing locality teams; develop a shared vision and development programme for closer integration Early Years services including 0-19 Healthy Child and Children's Centres, to provide seamless care pathways for children and young people. Develop a CYP joint commissioning function between PH, CSF and MCCG. PH Lead: Julia Groom
Project Title:
Risk
Project Title:
4
3 3
East Merton Model of Health and Wellbeing
22
Public Health, Merton CCG and the East Merton GP Locality are working in partnership to develop and deliver the East Merton Model of Health and Wellbeing and Wilson health and community campus as blueprint for borough-wide health and care transformation. This is a major programme aimed at co-creating a model for East Merton, incorporating design of health and community campus, community engagement, better use of wider public sector estates and development of social investment funding models . PH Lead: Anjan Ghosh
Project Details:
Commission a redesigned adult substance misuse service based on a preventative and recovery orientated model, that is aligned with mental health services for Merton working in conjunction with CCG. Develop a comprehensive substance misuse prevention framework that encompasses community safety, licensing and regulation. PH Lead: Amanda Killoran
Project Details:
Project Details:
Project Title:
Embed health and wellbeing in all policies programme as a relevant outcome across the whole council business (and partners) incl establish health as marker for good government and as investment rather than expenditure work in partnership with HR to deliver Healthy Workplace Programme; engage in growth and regeneration agenda, including optimising health improvement through the planning process. PH lead: Clarissa Larsen
Redesign of Adult substance misuse treatment services (drugs and alcohol) (TOM URN: PH6)
Project 9
Project 10
Project Title:
Project Title:
Project Title:
Project Details:
Project 6
Project 7
Project 8
Project Title:Project 5
Page 117

Corporate Services
Page 118
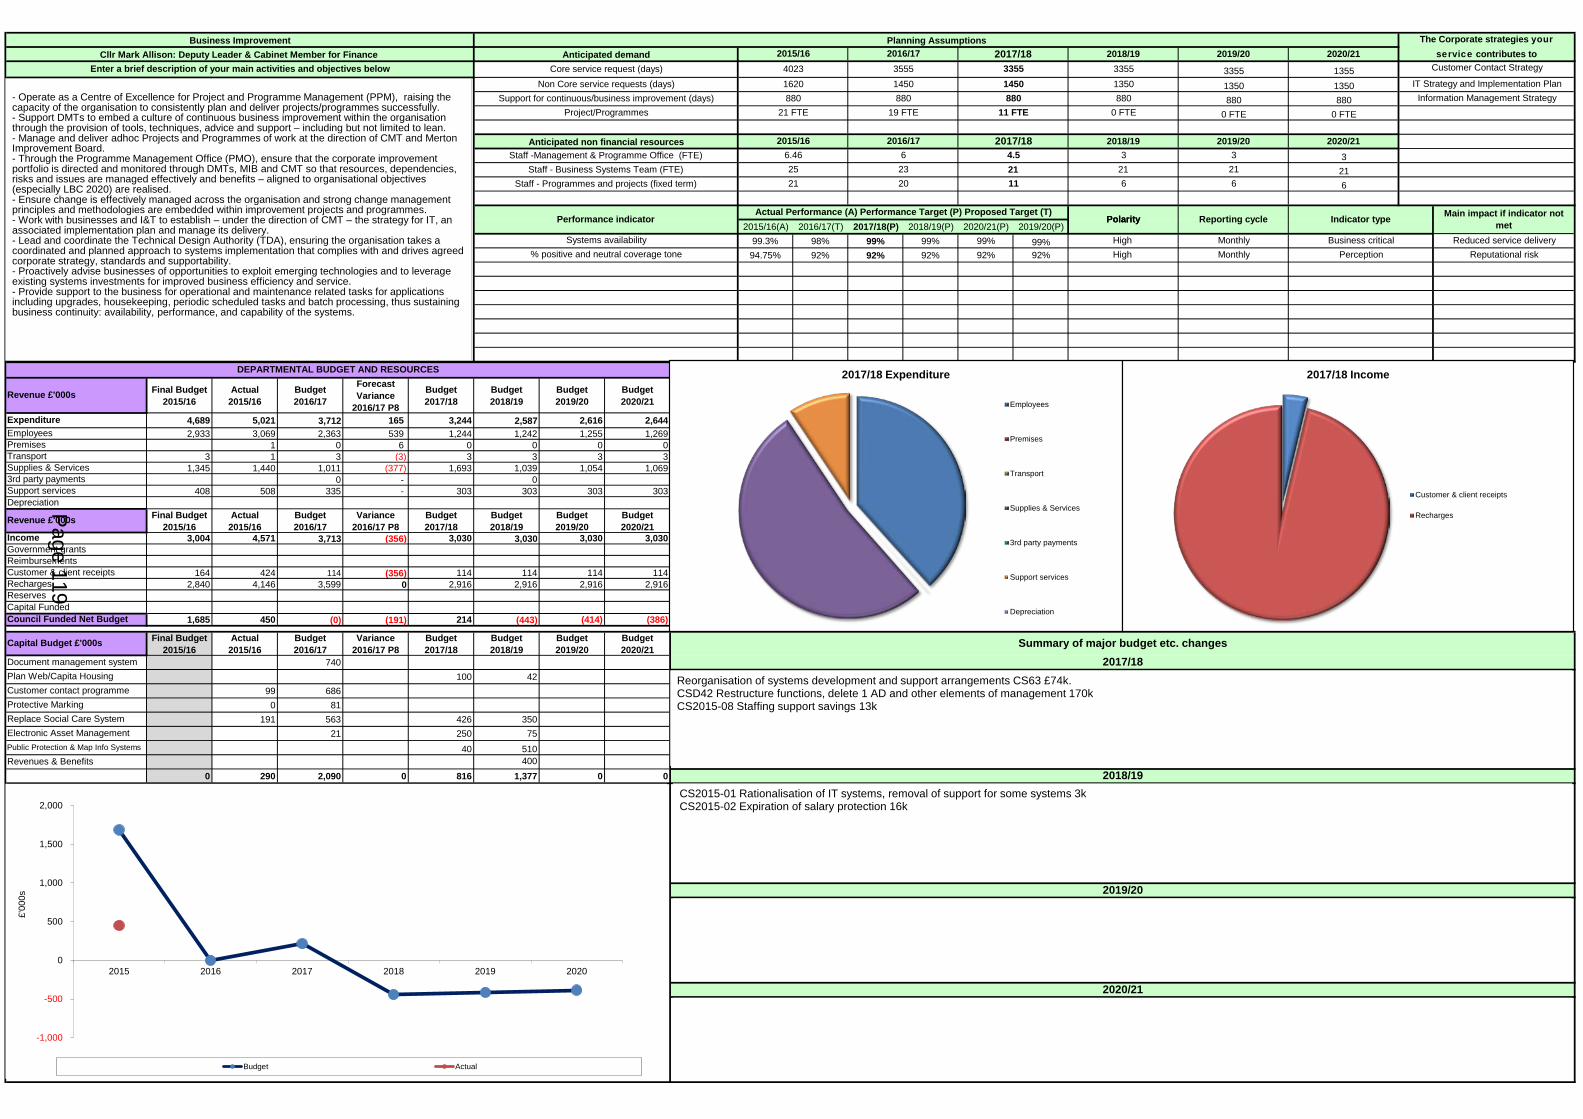
2015/16(A) 2016/17(T) 2017/18(P) 2018/19(P) 2020/21(P) 2019/20(P)99.3% 98% 99% 99% 99% 99%94.75% 92% 92% 92% 92% 92%
Final Budget2015/16
Actual 2015/16
Budget2016/17
Forecast Variance
2016/17 P8
Budget2017/18
Budget2018/19
Budget2019/20
Budget2020/21
4,689 5,021 3,712 165 3,244 2,587 2,616 2,6442,933 3,069 2,363 539 1,244 1,242 1,255 1,269
1 0 6 0 0 0 03 1 3 (3) 3 3 3 3
1,345 1,440 1,011 (377) 1,693 1,039 1,054 1,0690 - 0
408 508 335 - 303 303 303 303
Final Budget2015/16
Actual 2015/16
Budget2016/17
Variance 2016/17 P8
Budget2017/18
Budget2018/19
Budget2019/20
Budget2020/21
3,004 4,571 3,713 (356) 3,030 3,030 3,030 3,030
164 424 114 (356) 114 114 114 1142,840 4,146 3,599 0 2,916 2,916 2,916 2,916
1,685 450 (0) (191) 214 (443) (414) (386)
Final Budget2015/16
Actual 2015/16
Budget2016/17
Variance 2016/17 P8
Budget2017/18
Budget2018/19
Budget2019/20
Budget2020/21
740100 42
99 6860 81
191 563 426 35021 250 75
40 510400
0 290 2,090 0 816 1,377 0 0
Recharges
Reputational risk
Main impact if indicator not met
Planning Assumptions
Actual Performance (A) Performance Target (P) Proposed Target (T)
Systems availability
Customer contact programme
21 FTE
Business Improvement
Support for continuous/business improvement (days)
Anticipated non financial resources
Cllr Mark Allison: Deputy Leader & Cabinet Member for Finance Anticipated demandCore service request (days)
Non Core service requests (days)Enter a brief description of your main activities and objectives below
Project/Programmes
Reduced service delivery
3rd party paymentsSupport services
Customer & client receipts
Transport
Staff - Business Systems Team (FTE)Staff - Programmes and projects (fixed term)
Government grantsReimbursements
Depreciation
EmployeesPremises
Performance indicator
Revenue £'000s
Staff -Management & Programme Office (FTE)
% positive and neutral coverage tone
Customer Contact Strategy
IT Strategy and Implementation PlanInformation Management Strategy
6
1450
2017/182016/17
3555
19 FTE
1450880
2018/19
3355
11 FTE
4023
2015/16
621
1350880
3
0 FTE
211121 20
PolarityPolarity
High High
Reporting cycle
MonthlyMonthly
2019/20
2017/18
2018/19
2020/21
Revenues & Benefits
ReservesCapital Funded
Supplies & Services
Expenditure
Summary of major budget etc. changes
Public Protection & Map Info Systems
Capital Budget £'000s
Document management systemPlan Web/Capita Housing
Protective MarkingReplace Social Care SystemElectronic Asset Management
Council Funded Net Budget
Revenue £'000s
Income
DEPARTMENTAL BUDGET AND RESOURCES
2016/17
23
2019/202017/18 2018/193355
The Corporate strategies your service contributes to
880
33551350880
0 FTE
2019/20
Business criticalPerception
Indicator type
3216
2020/21
2020/21
13551350880
0 FTE
2015/16
3216
8801620
4.56.4625
Reorganisation of systems development and support arrangements CS63 £74k. CSD42 Restructure functions, delete 1 AD and other elements of management 170k CS2015-08 Staffing support savings 13k
CS2015-01 Rationalisation of IT systems, removal of support for some systems 3k CS2015-02 Expiration of salary protection 16k
2017/18 Expenditure
Employees
Premises
Transport
Supplies & Services
3rd party payments
Support services
Depreciation
2017/18 Income
Customer & client receipts
Recharges
-1,000
-500
0
500
1,000
1,500
2,000
2015 2016 2017 2018 2019 2020
£'00
0s
Budget Actual
- Operate as a Centre of Excellence for Project and Programme Management (PPM), raising the capacity of the organisation to consistently plan and deliver projects/programmes successfully. - Support DMTs to embed a culture of continuous business improvement within the organisation through the provision of tools, techniques, advice and support – including but not limited to lean. - Manage and deliver adhoc Projects and Programmes of work at the direction of CMT and Merton Improvement Board. - Through the Programme Management Office (PMO), ensure that the corporate improvement portfolio is directed and monitored through DMTs, MIB and CMT so that resources, dependencies, risks and issues are managed effectively and benefits – aligned to organisational objectives (especially LBC 2020) are realised. - Ensure change is effectively managed across the organisation and strong change management principles and methodologies are embedded within improvement projects and programmes. - Work with businesses and I&T to establish – under the direction of CMT – the strategy for IT, an associated implementation plan and manage its delivery. - Lead and coordinate the Technical Design Authority (TDA), ensuring the organisation takes a coordinated and planned approach to systems implementation that complies with and drives agreed corporate strategy, standards and supportability. - Proactively advise businesses of opportunities to exploit emerging technologies and to leverage existing systems investments for improved business efficiency and service. - Provide support to the business for operational and maintenance related tasks for applications including upgrades, housekeeping, periodic scheduled tasks and batch processing, thus sustaining business continuity: availability, performance, and capability of the systems.
Page 119

Likelihood Impact Score
Start date 2013-14
End date 2017-18
Start date 2013-14
End date 2017-18
Start date 2014-15
End date 2017-18
Start date 2017-18
End date 2018-19
Start date 2017-18
End date 2017-18
Start date 2015-16
End date 2017-18
Risk
1
Improved efficiency (savings)
A fit for purpose system that supports efficient business practices and care management now and into the future
Social Care Information System
4
2 63EDRMS will enable flexible and remote working, more efficient and cost effective storage and retrieval of documentation.
Project 1
Project 3
Project 4
Project Details:
Project 6
Project Details:
Project Title:
Project Details:
Project Details:2 2
Project Title:
Project Title:
3
Customer Contact programme Improved customer experience
The programme is part of the move to a 21st Century organisation, with technology that supports a more comprehensive and cohesive service to customers and recognises the new, modern ways in which they wish to access services. Through channel shift and a reduction in avoidable contact/failure demand we expect the programme to support and enable the achievement of savings and efficiencies within individual services.
Electronic document and records management system
Project Title:
Lead and deliver CC programme; to deliver improvements (technology and service redesign) set out in CC Strategy.
Procure and implement a replacement EDRMS to support and enable flexible/remote working and Customer Contact.
Improved efficiency (savings)
Procure and implement a Social Care Information system to support adults social and children and families integrated care.
6
Project Title:
2
3 3
Project Title: SCIS Phase 2
Project Details:
Improved efficiency (savings)
A fit for purpose system that supports efficient business practices and care management now and into the future
Project 5
Improved effectiveness
Expand the new SCIS solution into other business areas and develop integration with EDRMS and Customer Contact solutions.
Reprocure and implement the council's Asset Management solution and ensure end-to-end channel shift is achieved.
Improved efficiency (savings)
A fit for purpose system that supports channel shift and end-to-end process improvement
1
2
EAMS
MADI
Cleansing and geocoding the council's geospatial data and establishing arrangements for the ongoing maintenance of data. Customers can access and interact with geospatial data to achieve online reporting.
DETAILS OF MAJOR PROJECTS (INCLUDING PROCUREMENT) - MAXIMUM OF 10 OVER THE FOUR YEAR PERIODBusiness Improvement
PROJECT DESCRIPTION MAJOR PROJECT BENEFIT
Project 2
Project Details:2 2
21Page 120
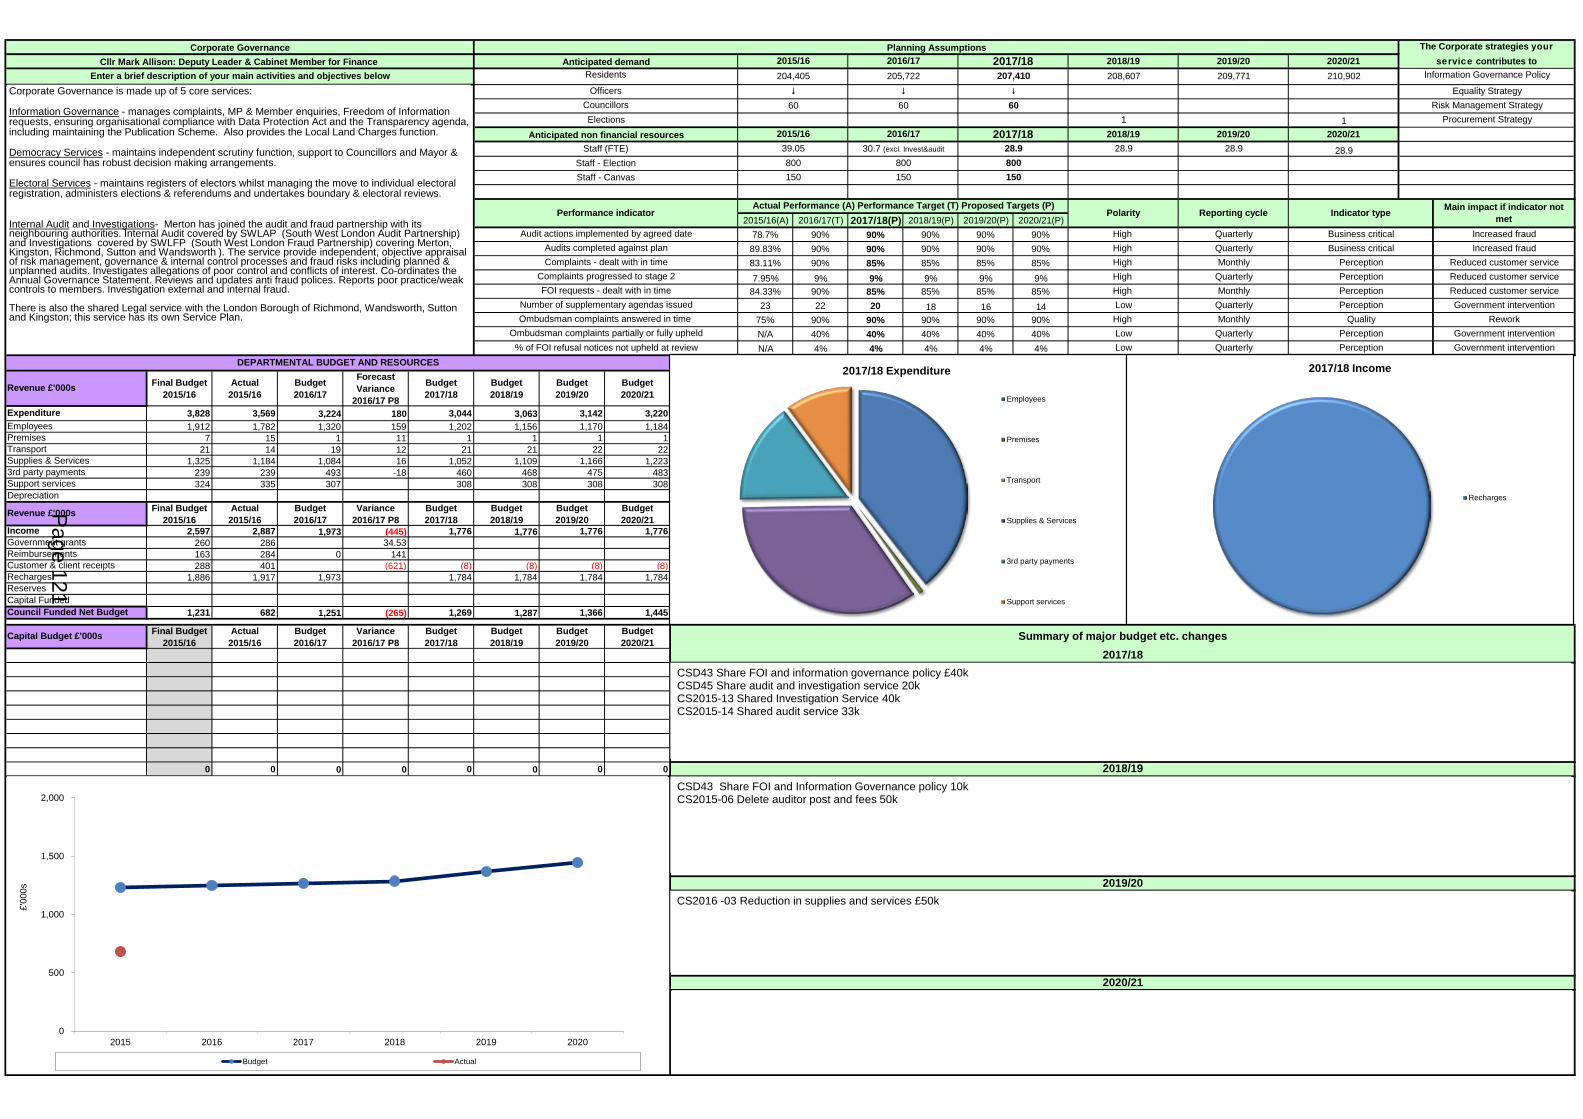
2015/16(A) 2016/17(T) 2017/18(P) 2018/19(P) 2019/20(P) 2020/21(P)78.7% 90% 90% 90% 90% 90%89.83% 90% 90% 90% 90% 90%83.11% 90% 85% 85% 85% 85%7.95% 9% 9% 9% 9% 9%
84.33% 90% 85% 85% 85% 85%23 22 20 18 16 14
75% 90% 90% 90% 90% 90%N/A 40% 40% 40% 40% 40%N/A 4% 4% 4% 4% 4%
Final Budget2015/16
Actual 2015/16
Budget2016/17
Forecast Variance
2016/17 P8
Budget2017/18
Budget2018/19
Budget2019/20
Budget2020/21
3,828 3,569 3,224 180 3,044 3,063 3,142 3,2201,912 1,782 1,320 159 1,202 1,156 1,170 1,184
7 15 1 11 1 1 1 121 14 19 12 21 21 22 22
1,325 1,184 1,084 16 1,052 1,109 1,166 1,223239 239 493 -18 460 468 475 483324 335 307 308 308 308 308
Final Budget2015/16
Actual 2015/16
Budget2016/17
Variance 2016/17 P8
Budget2017/18
Budget2018/19
Budget2019/20
Budget2020/21
2,597 2,887 1,973 (445) 1,776 1,776 1,776 1,776260 286 34.53163 284 0 141288 401 (621) (8) (8) (8) (8)
1,886 1,917 1,973 1,784 1,784 1,784 1,784
1,231 682 1,251 (265) 1,269 1,287 1,366 1,445
Final Budget2015/16
Actual 2015/16
Budget2016/17
Variance 2016/17 P8
Budget2017/18
Budget2018/19
Budget2019/20
Budget2020/21
0 0 0 0 0 0 0 0
2015/16 2016/1728.9
80080028.9
2019/20
2019/20
207,410 209,771
60
205,722 208,607
High Quarterly
Government interventionPerceptionQuarterlyLow
Audit actions implemented by agreed date
Performance indicator
Staff (FTE)
High Monthly
Officers
Staff - Canvas
Residents
39.05
150800
204,405Enter a brief description of your main activities and objectives below
Planning Assumptions
Reduced customer serviceComplaints - dealt with in time
28.9
Information Governance Policy2018/19
Staff - Election
1
Corporate Governance
CouncillorsElections
Anticipated non financial resources
Cllr Mark Allison: Deputy Leader & Cabinet Member for Finance 2015/16
Revenue £'000s
Complaints progressed to stage 2
Audits completed against plan
Anticipated demand 2016/17
60
30.7 (excl. Invest&audit
2017/18
2017/18
The Corporate strategies your service contributes to
2018/19
Equality StrategyRisk Management Strategy
Procurement Strategy
60
High Business critical
Increased fraudIncreased fraud
Main impact if indicator not met
Monthly
High High
150
QuarterlyQuarterly
Actual Performance (A) Performance Target (T) Proposed Targets (P)Reporting cycle
150
Polarity
Low
PerceptionPerception
Indicator type
Business critical
Support services
EmployeesPremises
DEPARTMENTAL BUDGET AND RESOURCES
PerceptionMonthly
Number of supplementary agendas issued
Council Funded Net Budget
Revenue £'000s
FOI requests - dealt with in time
2019/20
Capital Budget £'000s Summary of major budget etc. changes
2020/21
2018/19
2017/18
3rd party payments
Income
Perception
Reserves
Quarterly% of FOI refusal notices not upheld at review
Recharges
Expenditure
Government grants
Capital Funded
Supplies & Services
Reduced customer service
Government intervention
Customer & client receipts
Transport
Reimbursements
Depreciation
Ombudsman complaints answered in time Ombudsman complaints partially or fully upheld
Quarterly
Government intervention
High
Low
Perception
Reduced customer service
Quality Rework
28.9
2020/21
2020/21
210,902
1
CSD43 Share FOI and information governance policy £40k CSD45 Share audit and investigation service 20k CS2015-13 Shared Investigation Service 40k CS2015-14 Shared audit service 33k
CSD43 Share FOI and Information Governance policy 10k CS2015-06 Delete auditor post and fees 50k
CS2016 -03 Reduction in supplies and services £50k
2017/18 Expenditure
Employees
Premises
Transport
Supplies & Services
3rd party payments
Support services
2017/18 Income
Recharges
0
500
1,000
1,500
2,000
2015 2016 2017 2018 2019 2020
£'00
0s
Budget Actual
Corporate Governance is made up of 5 core services: Information Governance - manages complaints, MP & Member enquiries, Freedom of Information requests, ensuring organisational compliance with Data Protection Act and the Transparency agenda, including maintaining the Publication Scheme. Also provides the Local Land Charges function. Democracy Services - maintains independent scrutiny function, support to Councillors and Mayor & ensures council has robust decision making arrangements. Electoral Services - maintains registers of electors whilst managing the move to individual electoral registration, administers elections & referendums and undertakes boundary & electoral reviews. Internal Audit and Investigations- Merton has joined the audit and fraud partnership with its neighbouring authorities. Internal Audit covered by SWLAP (South West London Audit Partnership) and Investigations covered by SWLFP (South West London Fraud Partnership) covering Merton, Kingston, Richmond, Sutton and Wandsworth ). The service provide independent, objective appraisal of risk management, governance & internal control processes and fraud risks including planned & unplanned audits. Investigates allegations of poor control and conflicts of interest. Co-ordinates the Annual Governance Statement. Reviews and updates anti fraud polices. Reports poor practice/weak controls to members. Investigation external and internal fraud. There is also the shared Legal service with the London Borough of Richmond, Wandsworth, Sutton and Kingston; this service has its own Service Plan.
Page 121
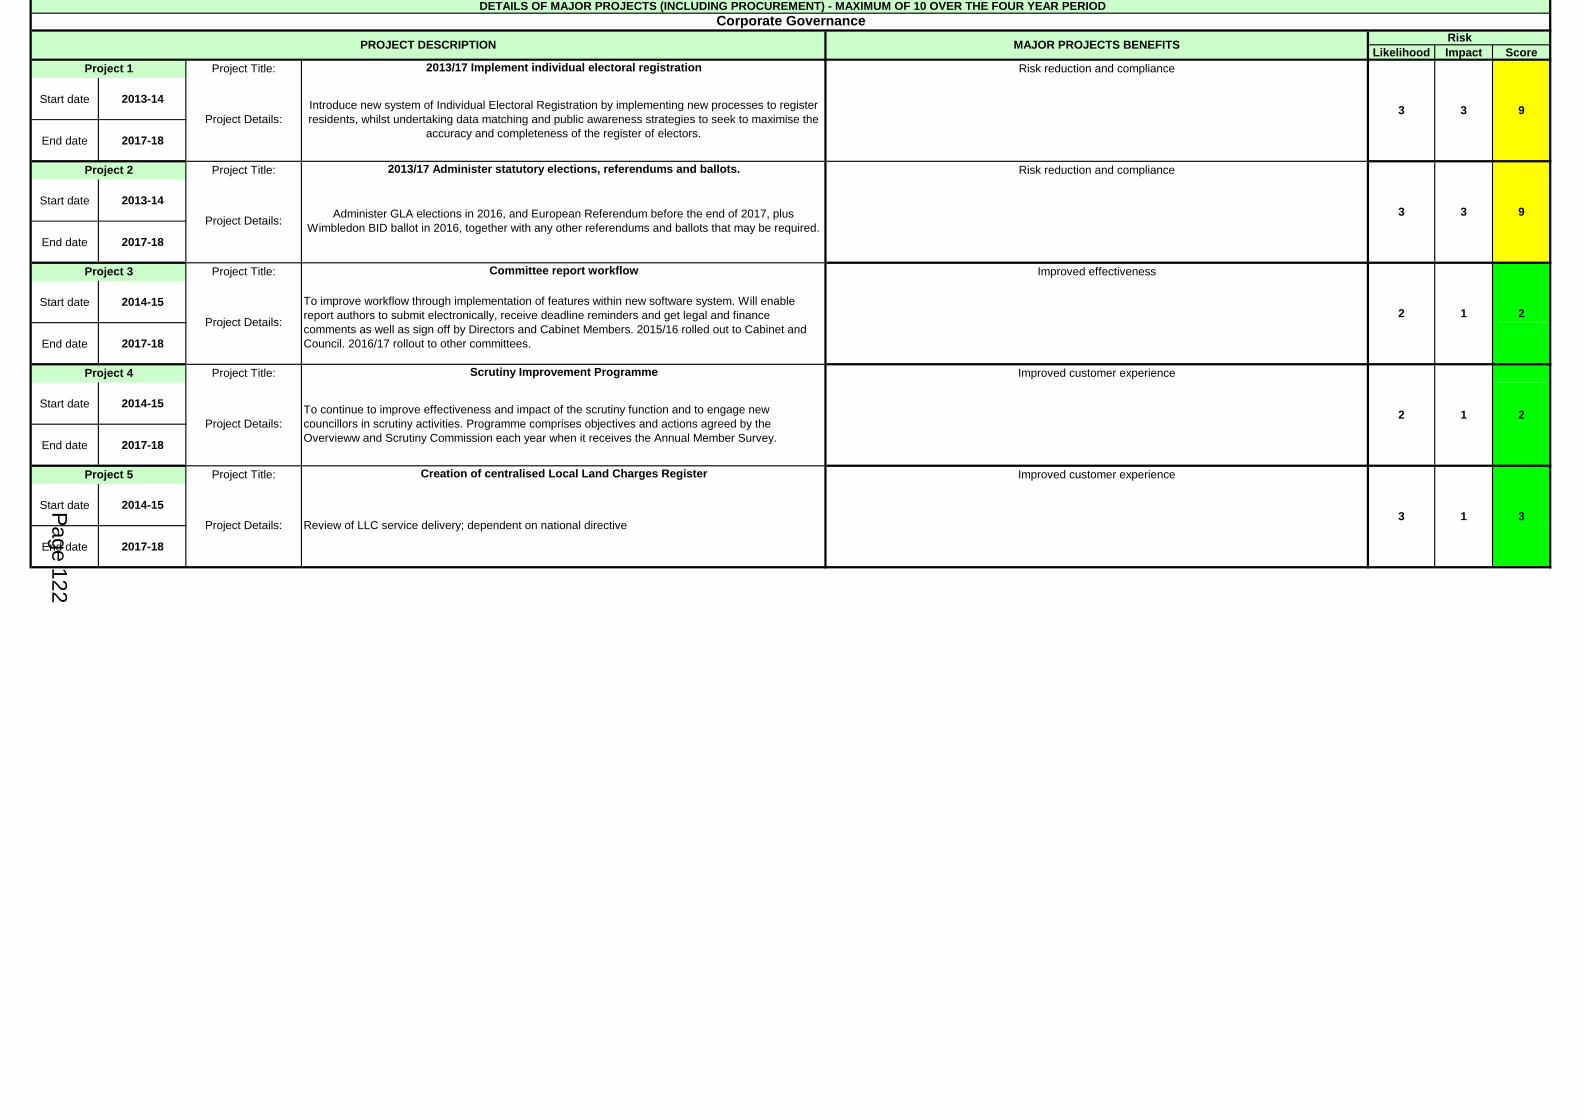
Likelihood Impact Score
Start date 2013-14
End date 2017-18
Start date 2013-14
End date 2017-18
Start date 2014-15
End date 2017-18
Start date 2014-15
End date 2017-18
Start date 2014-15
End date 2017-18
Project 3
Project Title:Project 4
Project Details:
Project Title:
Project 1
Project Details:
Project Title:
Project Details:
Risk reduction and compliance
Project Title:
Project Details:
Project Details:
Project 2
Scrutiny Improvement Programme
To continue to improve effectiveness and impact of the scrutiny function and to engage new councillors in scrutiny activities. Programme comprises objectives and actions agreed by the Overvieww and Scrutiny Commission each year when it receives the Annual Member Survey.
Project 5
Project Title:
3 93
Risk reduction and compliance
Improved effectiveness
1 2
Improved customer experience
22
3
1
3
3
Review of LLC service delivery; dependent on national directive
Creation of centralised Local Land Charges Register Improved customer experience
1
2
2013/17 Administer statutory elections, referendums and ballots.
Administer GLA elections in 2016, and European Referendum before the end of 2017, plus Wimbledon BID ballot in 2016, together with any other referendums and ballots that may be required.
Committee report workflow
Introduce new system of Individual Electoral Registration by implementing new processes to register residents, whilst undertaking data matching and public awareness strategies to seek to maximise the
accuracy and completeness of the register of electors.
To improve workflow through implementation of features within new software system. Will enable report authors to submit electronically, receive deadline reminders and get legal and finance comments as well as sign off by Directors and Cabinet Members. 2015/16 rolled out to Cabinet and Council. 2016/17 rollout to other committees.
DETAILS OF MAJOR PROJECTS (INCLUDING PROCUREMENT) - MAXIMUM OF 10 OVER THE FOUR YEAR PERIODCorporate Governance
PROJECT DESCRIPTION MAJOR PROJECTS BENEFITS Risk
2013/17 Implement individual electoral registration
93
Page 122
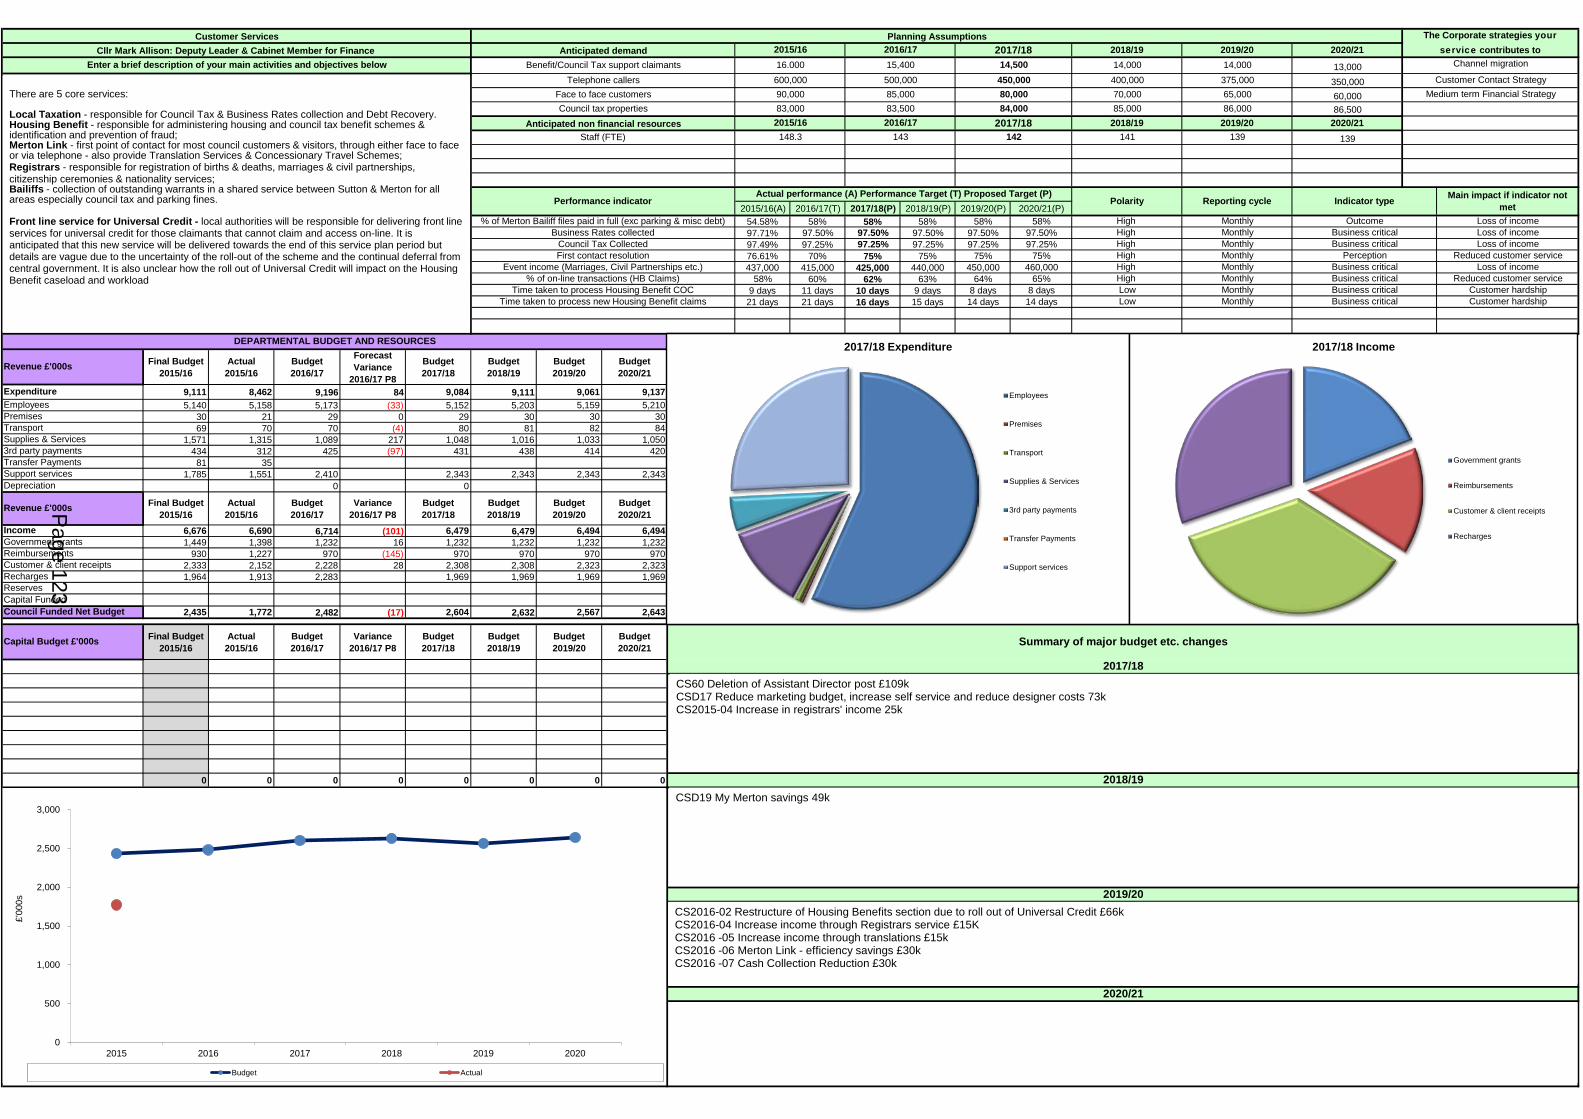
2015/16(A) 2016/17(T) 2017/18(P) 2018/19(P) 2019/20(P) 2020/21(P)54.58% 58% 58% 58% 58% 58%97.71% 97.50% 97.50% 97.50% 97.50% 97.50%97.49% 97.25% 97.25% 97.25% 97.25% 97.25%76.61% 70% 75% 75% 75% 75%437,000 415,000 425,000 440,000 450,000 460,000
58% 60% 62% 63% 64% 65%9 days 11 days 10 days 9 days 8 days 8 days21 days 21 days 16 days 15 days 14 days 14 days
Final Budget2015/16
Actual 2015/16
Budget2016/17
Forecast Variance
2016/17 P8
Budget2017/18
Budget2018/19
Budget2019/20
Budget2020/21
9,111 8,462 9,196 84 9,084 9,111 9,061 9,1375,140 5,158 5,173 (33) 5,152 5,203 5,159 5,210
30 21 29 0 29 30 30 3069 70 70 (4) 80 81 82 84
1,571 1,315 1,089 217 1,048 1,016 1,033 1,050434 312 425 (97) 431 438 414 42081 35
1,785 1,551 2,410 2,343 2,343 2,343 2,3430 0
Final Budget2015/16
Actual 2015/16
Budget2016/17
Variance 2016/17 P8
Budget2017/18
Budget2018/19
Budget2019/20
Budget2020/21
6,676 6,690 6,714 (101) 6,479 6,479 6,494 6,4941,449 1,398 1,232 16 1,232 1,232 1,232 1,232 16 15.5 15.5 15.5 15.5 15.5 15.5
930 1,227 970 (145) 970 970 970 970 -145 -144.78 -144.78 -144.78 -144.78 -144.78 -144.782,333 2,152 2,228 28 2,308 2,308 2,323 2,323 28 28.253 28.253 28.253 28.253 28.253 28.2531,964 1,913 2,283 1,969 1,969 1,969 1,969
2,435 1,772 2,482 (17) 2,604 2,632 2,567 2,643
Final Budget2015/16
Actual 2015/16
Budget2016/17
Variance 2016/17 P8
Budget2017/18
Budget2018/19
Budget2019/20
Budget2020/21
0 0 0 0 0 0 0 0
139
Loss of income
2020/21
2020/21
13,000350,00060,00086,500
High
Perception
Low
High High
MonthlyMonthly
Business criticalMonthly
Indicator type
OutcomeMonthly Loss of income
High Monthly Business critical
Reporting cycle
Monthly
Polarity
High High Business critical
2019/20
14,000375,00065,00086,000
139
Recharges
Council Funded Net Budget
Revenue £'000s
Income
Business criticalBusiness critical
% of on-line transactions (HB Claims)Monthly
3rd party payments
Support services
Summary of major budget etc. changes
2017/18
2018/19
Capital Budget £'000s
2019/20
2020/21
ReservesCapital Funded
Supplies & Services
ExpenditureEmployees
70,00084,000
500,000 450,000
85,00080,00085,000
400,000
143
83,0002015/16 2016/17 2018/19
1411422017/18
148.3
2017/1814,500
83,500
600,00090,000
The Corporate strategies your service contributes to2015/16 2016/17
15,4002019/20
DEPARTMENTAL BUDGET AND RESOURCES
16.000 14,0002018/19
Channel migration
Medium term Financial Strategy
Transfer Payments
Staff (FTE)
First contact resolution
Performance indicator
Revenue £'000s
Cllr Mark Allison: Deputy Leader & Cabinet Member for Finance Anticipated demandBenefit/Council Tax support claimants
Telephone callersEnter a brief description of your main activities and objectives below
Time taken to process Housing Benefit COC
Council Tax Collected
Customer & client receipts
Transport
Government grantsReimbursements
Depreciation
Customer Services
Premises
Planning Assumptions
Actual performance (A) Performance Target (T) Proposed Target (P)
% of Merton Bailiff files paid in full (exc parking & misc debt)
Loss of incomeReduced customer service
Customer Contact Strategy
Low Monthly Customer hardshipTime taken to process new Housing Benefit claims Business critical
Business Rates collected Loss of income
Reduced customer service
Main impact if indicator not met
Face to face customersCouncil tax properties
Anticipated non financial resources
Customer hardship
Event income (Marriages, Civil Partnerships etc.)
CS60 Deletion of Assistant Director post £109k CSD17 Reduce marketing budget, increase self service and reduce designer costs 73k CS2015-04 Increase in registrars' income 25k
CSD19 My Merton savings 49k
CS2016-02 Restructure of Housing Benefits section due to roll out of Universal Credit £66k CS2016-04 Increase income through Registrars service £15K CS2016 -05 Increase income through translations £15k CS2016 -06 Merton Link - efficiency savings £30k CS2016 -07 Cash Collection Reduction £30k
2017/18 Expenditure
Employees
Premises
Transport
Supplies & Services
3rd party payments
Transfer Payments
Support services
2017/18 Income
Government grants
Reimbursements
Customer & client receipts
Recharges
0
500
1,000
1,500
2,000
2,500
3,000
2015 2016 2017 2018 2019 2020
£'00
0s
Budget Actual
There are 5 core services:
Local Taxation - responsible for Council Tax & Business Rates collection and Debt Recovery. Housing Benefit - responsible for administering housing and council tax benefit schemes & identification and prevention of fraud; Merton Link - first point of contact for most council customers & visitors, through either face to face or via telephone - also provide Translation Services & Concessionary Travel Schemes; Registrars - responsible for registration of births & deaths, marriages & civil partnerships, citizenship ceremonies & nationality services; Bailiffs - collection of outstanding warrants in a shared service between Sutton & Merton for all areas especially council tax and parking fines.
Front line service for Universal Credit - local authorities will be responsible for delivering front line services for universal credit for those claimants that cannot claim and access on-line. It is anticipated that this new service will be delivered towards the end of this service plan period but details are vague due to the uncertainty of the roll-out of the scheme and the continual deferral from central government. It is also unclear how the roll out of Universal Credit will impact on the Housing Benefit caseload and workload
Page 123

Likelihood Impact Score
Start date 2015-16
End date 2019-20
Start date 2013-14
End date 2017-18
Start date 2017-18
End date 2017-18
Start date 2015-16
End date 2017-18
Start date 2015-16
End date 2017-18
DETAILS OF MAJOR PROJECTS (INCLUDING PROCUREMENT) - MAXIMUM OF 10 OVER THE FOUR YEAR PERIODCustomer Services
PROJECT DESCRIPTION MAJOR PROJECT BENEFIT Risk
Planning permission approved for outside wedding venue at Morden Park House. Funding to be agreed.
Implement the re-design of Merton Link area to improve the customer experience and increase self service
1 22Project Details:
Project 5 Redesign of Merton Link
During 17/18 options for a revised scheme will be reviewed for Council decision and possible implementation for 18/19. Moving forward we will review our discretionary relief and exemptions for
implementation in 2018/19.
Improved effectiveness
1 2
22
2
2 42
1
2
Economic outcomes
Economic outcomes
Review Debt Collection Processes
Project Title:
Project Details: With the implementation of the new Financial management computer systems a review of the existing debt collection processes will be undertaken as part of the system implementation.
Improved customer experience
2 1
Project Title: Economic outcomesCouncil Tax support scheme
Project Title:
Project Details:
Universal Credit Implementation
Implement an Outside Wedding Venue
Implement the role out of UC in Merton and provide a support framework to assist claimants claim UC and receive budgeting advice. Process has been delayed by Central Government
Project 1
Project 3
Project 4
Project Title:
Project Details:
Project 2
Project Details:
Project Title:
Page 124

2015/16(A) 2016/17(T) 2017/18(P) 2018/19(P) 2019/20(P) 2020/21(P)94 90 90 90
9.37 8 7.5 7.5 7 798% 98% 98% 98%93% 83% 83% 83%n/a n/a 35 46
74% (14/15) 76% n/a 76%
Final Budget2015/16
Actual 2015/16
Budget2016/17
Forecast Variance
2016/17 P8
Budget2017/18
Budget2018/19
Budget2019/20
Budget2020/21
3,199 3,252 3,285 (138) 2,984 2,509 2,540 2,5712,380 2,315 2,372 (170) 2,027 1,594 1,616 1,639
15 42 15 (1) 47 48 48 495 4 0 (2) (3) (3) (3) (3)
234 206 207 (20) 226 179 182 185263 324 224 54 290 294 298 303303 361 467 398 398 398 398
Final Budget2015/16
Actual 2015/16
Budget2016/17
Variance 2016/17 P8
Budget2017/18
Budget2018/19
Budget2019/20
Budget2020/21
3,164 3,570 3,284 (4) 2,953 3,105 3,105 3,10513 1320 83 20 14 79 79 79 79
569 555 569 (18) 560 712 712 7122,562 2,919 2,695 2,315 2,315 2,315 2,315
35 (318) 1 (143) 31 (596) (565) (534)
Final Budget2015/16
Actual 2015/16
Budget2016/17
Variance 2016/17 P8
Budget2017/18
Budget2018/19
Budget2019/20
Budget2020/21
0 0 0 0 0 0 0 0
2020/21
2020/2127
2020/21
2019/20
2019/20
RechargesReserves
2018/19
Capital Budget £'000s
Council Funded Net Budget
Summary of major budget etc. changes2017/18
Capital Funded
Supplies & Services
Expenditure
Support services
Customer & client receipts
TransportPremises
3rd party payments
High
High High Quarterly
Biennial Outcome
Indicator type
OutcomeOutcome
Increased costsIncreased costs
Main impact if indicator not met
MonthlyMonthlyAnnual
Polarity
LowLowHigh
Reporting cycle
2016/17
1604,400
2017/18
2017/18
4.200
Performance indicator
33
The Corporate strategies your service contributes to
2018/1933
160Workforce Strategy
2018/19
Economic Development Strategy
35
14033
2015/16 2016/172727
Human Resources
150
Revenue £'000s
Staff (FTE)
No. of Apprentices (Govt Apprenticeship Levy Scheme)
% Staff Satisfaction (Staff Survey)
Actual Performance (A) Performance Target (T) Proposed Target (P)
New recruits to be appointed
Planning Assumptions
2019/20
4.000
35Anticipated non financial resources
2015/16
Revenue £'000s
Income
Employees
Time to hire (days)
DEPARTMENTAL BUDGET AND RESOURCES
% Members L&D satisfaction
New Apprentices to be appointed
Cllr Mark Allison: Deputy Leader & Cabinet Member for Finance Anticipated demandEmployees in Merton for HR, payroll, advice, L&D, EAP etc.Enter a brief description of your main activities and objectives below
Reputational risk
4,400
Government grantsReimbursements
Depreciation
No. of working days lost to sickness, excluding schools% Appraisals completed Outcome
OutcomeQuarterlyIncreased costsOutcome
Poor decision makingPoor decision making
CSD34 L&D Admin Support 18k CSD35 L&D Budget 134k
CS75 Review of COT staffing 58k CSD30 Schools COT support (delivery of schools buy-back service) £152k CS48 Further rationalisation of HR services 130k CS51 HR Transactions including COT 90k CS49 HR Business Partners - Further consolidation of HR advisory work 140k CSD17 COT Review 38k
2017/18 Expenditure
Employees
Premises
Transport
Supplies & Services
3rd party payments
Support services
2017/18 Income
Reimbursements
Customer & client receipts
Recharges
-700
-600
-500
-400
-300
-200
-100
0
100
2015 2016 2017 2018 2019 2020
£'00
0s
Budget Actual
1) Support effective people management across the organisation through development of a workforce strategy/TOM people layer 2) Implement and maintain efficient HR transactions for recruitment, induction, employee data, payroll, performance management, appraisal, learning and development 3) Provide HR business partner support across the Council 4) Produce HR metrics, analyse people-related problems and take appropriate actions 5) Produce HR strategies, policy frameworks and systems to support effective people management 6) Support and develop capacity building in Members
Page 125

Likelihood Impact Score
Start date 2014-15
End date 2017-18
Start date 2015-16
End date 2017-18
Start date 2015-16
End date 2017-18
Start date 2016-17
End date 2017-18
9Project Details: Commission Occupational Health, Agency contract, Eteach and Kingston/Sutton SLA and Schools
SLA
Project 4 Project Title: Review and retender key HR contracts Improved effectiveness
3 3
DETAILS OF MAJOR PROJECTS (INCLUDING PROCUREMENT) - MAXIMUM OF 10 OVER THE FOUR YEAR PERIODHuman Resources
PROJECT DESCRIPTION MAJOR PROJECT BENEFIT
Embed a new suite of simplified and business-focussed HR policies, supported by appropriate management development
Review HR policies
9
Deliver the 5 key strands of the Council's workforce strategy to support the wider TOM programme for organisational change
Establishment and workforce Improved staff skills and development
3
Improved staff skills and development
9
43
3
Embed systems to maintain, monitor and control an accurate establishment and vacancy position across the Council for both permanent and interim staff
Project 1
Project 3 Project Title:
Project Details:
Project Details:
Project Title:
3
Project 2
Project Details:
Risk
Project Title:
3
Improved effectiveness
Workforce Strategy
12
Page 126

2015/16(A) 2016/17(T) 2017/18(P) 2018/19(P) 2019/20(P) 2020/21(P)96% 90% 90% 90% 90% 90%71% 70% 72% 75% 75% 75%43 60 60 50 50 50
286,348 285,000 320,000 320,000 320,000 320,00092% 95% 95% 95% 95% 95%
95% 95% 95% 95% 95% 95%
1,100 1,400 1,400 1,400 1,400 1,40033/67 30/70 30/70 30/70 30/70 30/70100% 92% 93% 94% 95% 95%
0 0 0 0 0 0n/a n/a 70% 85% 95% 100%n/a n/a 70% 60% 50% 40%
5,158 8045.36 7739.84 7434.32 7128.8 6914.94
Final Budget2015/16
Actual 2015/16
Budget2016/17
Forecast Variance
2016/17 P8
Budget2017/18
Budget2018/19
Budget2019/20
Budget 2020/21
14,052 14,264 12,511 (61) 12,845 12,136 12,263 12,3903,921 4,016 3,738 72 4,114 3,935 3,976 4,0173,072 3,121 2,673 (121) 2,651 2,077 2,118 2,159
29 20 29 (4) 30 31 31 313,040 3,155 2,547 127 2,678 2,718 2,758 2,798
364 168 317 (142) 312 316 321 3259 18 9 7 9 9 9 9
1,419 1,569 875 911 911 911 9112,198 2,198 2,322 2,140 2,140 2,140 2,140
Final Budget2015/16
Actual 2015/16
Budget2016/17
Variance 2016/17 P8
Budget2017/18
Budget2018/19
Budget2019/20
Budget 2020/21
12,140 13,056 12,193 (35) 12,638 12,638 12,828 12,828
6 (21)2,626 2,931 2,469 (14) 2,674 2,674 2,864 2,8649,513 10,119 9,724 9,964 9,964 9,964 9,964
1,913 1,208 317 (96) 207 (502) (565) (438)
Final Budget2015/16
Actual 2015/16
Budget2016/17
Variance 2016/17 P8
Budget2017/18
Budget2018/19
Budget2019/20
Budget 2020/21
402 1,358 0 1,946 1,085 630 1,060
557 917 0 3,050 950 1,550 650338 705 0 900 300 300 300
0 1,296 2,980 0 5,896 2,335 2,480 2,010
Output Increased costs
5 5 5 5 5
High
High
High Quarterly Outcome Reputational risk
Customer Satisfaction - IT incident resolution
New referrals processed within 21 daysRepairs & Maintenance ratio of Reactive to Planned
Number of staff working from Civic Centre
Invoices paid within 30 days of receipt by LBM
Health and Safety workplace inspections completed on time
47
Quarterly Breach statutory dutyOutcomeHigh
Transactions requested by departmentsNumber of Client Affairs cases being managed 250
Medium term Financial StrategyLocal Plan250 250
120,000
7 7
2
2017/18 2018/19
57 7
29
Income
DEPARTMENTAL BUDGET AND RESOURCES
Output
Outcome
AnnualCO2 emissions from corporate buildings (tonnes) LowLow
Income - External Fees
% of influencible spend published on contracts register
Summary of major budget etc. changes
2017/18
2018/19
Capital Budget £'000s
Information TechnologyFacilities Management
2019/20
2020/21
High
ReservesCapital Funded
Supplies & Services
EmployeesExpenditure
3rd party payments
Monthly
QuarterlyOutcomeOutcome
Biennial
Indicator type
Business critical
OutcomeMonthly
Outcome
High
2
Reporting cycle
31.9 32.9 30.932.913.332 30
780,00027,800
100
50
13.329
13.3
85,000250
115,000
25,500100
28,500100
45
700,00
75,000100
75,000250
2020/21
700,0025,000
42
10.330.910.3
2019/20
42
75,000
2015/16 2016/17 2017/18 2018/19
0
740,000 700,00740,00028,500 27,800
The Corporate strategies your service contributes to
Civic Centre Accommodation Strategy
IT Strategy and Implementation PlanRisk Management Strategy
Procurement StrategyWorkforce Strategy
Infrastructure and Transactions
Health & Safety Statutory Inspections
Procurement Support (Number of projects)Anticipated non financial resources
Cllr Mark Allison: Deputy Leader & Cabinet Member for Finance Anticipated demandRepairs & Maintenance of Corporate Buildings (Revenue)
IT Service Calls Enter a brief description of your main activities and objectives below
Planning Assumptions
100
42
30.9FM (FTE)2020/21
100
2015/16 2016/17 2019/20
220
Transactional Services (FTE)
Invest to Save
Recharges
Loss of income
Reduced service delivery
10.329
2
Reduced customer service
Transport
Government grantsReimbursements
Depreciation
Customer & client receipts
Transfer PaymentsSupport services
Council Funded Net Budget
Revenue £'000s
Premises
IT Service Delivery (FTE)
First time fix rate for IT Service Desk
Main impact if indicator not met
Underused resource
29
2 2 2
High
Performance indicator
Business critical
Output
Monthly
High
Reduced service delivery
Reduced service delivery
65.5 5
Outcome
Increased costsAnnual
High Monthly
Quarterly
Customer hardship
Environmental issues
4 4Safety Services (FTE)Client Financial Affairs (FTE)
5.5
Reduced customer serviceHigh
Management
Revenue £'000s
% of suppliers accounting for the 20% of influencible spend
Commercial Services & Procurement (FTE)
Client Post Office voucher acc't balance falls below £2.5K Low MonthlyMonthly
Actual Performance Target (A) Performance Target (T) Proposed Target (P)
Invoices paid within 30 days from invoice date
Polarity
Infrastructure & Transactions Division (I&T) is a support service made up of six functions which are:- IT Service Delivery - IT(SD) supports the councils operations by providing IT infrastructure, desktop equipment and associated software. Fixed and mobile telecommunications, Service Desk facilities, IT Disaster Recovery and Business Continuity arrangements together with IT governance and data security. Facilities Management - FM provides the infrastructure to deliver services through accommodation, building repairs and maintenance for the portfolio of corporate buildings, energy management and conservation, cleaning, catering, print and post room services, security and other associated hard and soft FM services. Transactional Services - Incorporates Accounts Payable, Accounts Receivable, Carefirst Administration and Vendor Maintenance. Ensuring prompt and accurate payment for all goods and services provided to LBM. Raise and issue invoices promptly and accurately to maximise revenue received. Ensuring that Vendor Maintenance database is controlled, accurate and cleansed, Providing training and support for all users of the systems required for payments or invoicing Safety Services - Provides Health and Safety, Emergency Planning and Business Continuity services across the Council as required by duties imposed under the Health and Safety At Work Etc. Act 1974, The Management of Health and Safety At Work Regulations 1999, The Civil Contingencies Act 2004 and all sister regulations. Client Financial Affairs - Act as court appointed deputy's for vulnerable clients who do not have the capacity to make their own decisions or manage their own personal financial affairs. These decisions are for issues involving the person’s property, financial affairs and health and welfare working in accordance with the statutory principles set out in the Mental Capacity Act Code of Practice to ensure that they act in the best interests of the person who lacks capacity. Commercial Services & Procurement - Are the strategic centre of excellence for procurement and contract management, guidance, training and advice including ownership of the Council's Procurement Strategy, involvement in key tender processes, identification of savings opportunities and commercial benefits, compliance with EU and UK procurement legislation, benchmarking and best practice and ownership of the contracts register.
CS70 Apply admin charge to customer requesting hard copy paper invoice 35k CS71 Deletion of two posts 42k (deferred by 6 months) CS72 Consolidation of budgets 34k CS2015-09 Restructure of Safety Services and Emergency Planning 18k
CS71 Deletion of two posts 43k (deferred by 6 months) CSD2 Energy savings 150k CS2015-03 Restructure of Transactional Services team 100k CS2015-09 Restructure of Safety Services and Emergency Planning 30k CS2015-10 Facilities Management - Energy 'Invest to Save' Initiatives 465K CSD7 Restructure Print and Post service and delete two posts 47k
CS2016-08 Income from letting two floors vacant space in Civic Centre £280k
2017/18 Expenditure
Employees
Premises
Transport
Supplies & Services
3rd party payments
Transfer Payments
Support services
Depreciation
2017/18 Income
Customer & client receipts
Recharges
-1,000
-500
0
500
1,000
1,500
2,000
2,500
2015 2016 2017 2018 2019 2020
£'00
0s
Budget Actual
Page 127

Likelihood Impact Score
Start date 2016-17
End date 2018-19
Start date 2014-15
End date 2017-18
Start date 2013-14
End date 2017-18
Start date 2016-17
End date 2017-18
Start date 2016-17
End date 2017-18
Start date 2017-18
End date 2018-19
Start date 2017-18
End date 2018-19
Start date 2016-17
End date 2017-18
Start date 2016-17
End date 2017-18
4
Online Safety Inspection system
Risk reduction and compliance
Undertake 'Make/Buy/Share' reviews of key service provision
Review of current operational service delivery models to ensure that the Council is utilising the most cost effective and efficient means of providing services to both internal and external customers.
Review Departmental Business Continuity/Disaster Recovery plans
2
2
DETAILS OF MAJOR PROJECTS (INCLUDING PROCUREMENT) - MAXIMUM OF 10 OVER THE FOUR YEAR PERIODInfrastructure and Transactions
PROJECT DESCRIPTION MAJOR PROJECT BENEFIT
Project 2
Project Title:
2
2
3 12
Project Title:
2Project Details:
Improved efficiency (savings)
Improved effectiveness
2
Development of an 'Online' data capture system for recording and uploading information from safety inspections directly into a back office system to reduce the double handling of data.
Risk reduction and compliance
Undertake a review and refresh of the Councils Business Continuity and Disaster Recovery plans and arrangements in order to ensure that they are robust and fit for purpose.
6
Project Title:
Project Details:4
3
2 6
Project Title:
Project Details:2
Project 6
Project Details:
Project Title:
Project Details:
Project 5 Review Options for Procurement Service Delivery Model
Undertake a review of the various delivery model options for the provision of procurement across the Council and make a recommendation to CMT on the suggested way forward.
Energy "Invest to Save" Initiatives
Completion of a range of projects across the councils entire portfolio of properties which will reduce energy consumption and associated CO2 emissions and that are designed to have a maximum financial pay back of between 7 and 10 years.
Project Title:
2 63
Improved efficiency (savings)
2 4
Implementation of CASPAR system
Project Details:
Scanning of paper records into a digital format which will be prioritised in order to support the roll out of the Flexible Working Programme. This project also links directly to the Customer Contact programme which includes the implementation of a new Electronic Documents and Records Management System (EDRMS).
Improved efficiency (savings)
3
The new client money and case management program for Client Financial Affairs will capture all information relating to both appointeeship and deputyship clients and will link to CFA's new online banking system.
Project Title:
Project Details:3
Implementation of IT Strategy & Plan Improved efficiency (savings)
Digital Archiving of existing paper records
Project Title:
Implementation of corporate IT Strategy & Plan which has been developed on the basis of information derived from departmental Target Operating Models.
Project 1
Project 3
Project 4
4
Risk reduction and complianceUpgrading of IT Disaster Recovery ArrangementsProject Title:
1
Improved efficiency (savings)
Risk
Project 7
Project 8
Project Title:
Project 9
Project Details: Complete works to improve disaster recovery arrangements for the Councils main IT systems and minimise any potential loss of service in the event of a major incident or IT equipment failure.
6
2 2
Page 128

2015/16(A) 2016/17(T) 2017/18(P) 2018/19(P) 2019/20(P) 2021/21(P)98.9% 90% 90% 90% 90% 90%79.6% 90% 90% 90% 90% 90%
0 0 0 0 0 093.75% 90% 90% 90% 90% 90%89.39% 92% 92% 93% 94% 94%64.92% 65% 65% 65% 65% 65%
92% 93% 94% 95% 96% 96%
Final Budget2015/16
Actual 2015/16
Budget2016/17
Forecast Variance
2016/17 P8
Budget 2017/18
Budget 2018/19
Budget 2019/20
Budget 2020/21
8,449 8,653 8,361 188 7,715 7,476 7,572 7,6683,838 3,949 3,645 61 3,229 2,946 2,980 3,013
101 102 100 8 103 105 106 1084 7 2 2 2 2 2 2
4,003 4,078 3,906 115 3,807 3,847 3,905 3,964171 157 171 2 108 110 113 115333 360 537 466 466 466 466
Final Budget2015/16
Actual 2015/16
Budget2016/17
Variance 2016/17 P8
Budget 2017/18
Budget 2018/19
Budget 2019/20
Budget 2020/21
6,864 7,285 6,030 (141) 5,674 5,690 5,690 5,6901054 115 54 (47) 54 54 54 54
765 1,077 726 (94) 726 742 742 7426,036 6,092 5,250 4,894 4,894 4,894 4,894
1,585 1,368 2,331 47 2,041 1,786 1,882 1,978 Final Budget
2015/16Actual
2015/16Budget2016/17
Variance 2016/17 P8
Budget 2017/18
Budget 2018/19
Budget 2019/20
Budget 2020/21
397 50618 107 125
464 1,533 (1,372)1,839 (1,839)
41
0 880 4,026 (3,211) 0 0 0 125
Low
Council Funded Net Budget
Annual
DEPARTMENTAL BUDGET AND RESOURCES
High Number of Adjustments to Draft Accounts
% of Claims Settled within 6 Months High % of Claims Responded to within 5 Working Days High
2020/21
Premises
Annual
OutcomeQuarterly
High
Revenue £'000s
Summary of major budget etc changes
Expenditure
Income
Supplies & Services
Employees
Acquisitions Budget
Revenue £'000s
Transport
Customer & client receipts
Capital Budget £'000s
Government grants
Civica Icon
2020/21
Reimbursements
Recharges
3rd party paymentsSupport services
Full EDRMS solution SCIS/FISCapital Bidding Fund
Financial System re-engineering
2019/20
Outcome
2018/19
2017/18
Quarterly% of Loans Paid on Time Quarterly
Quarterly
PolarityPolarity
High Outcome
Reporting cycle
High Business critical
44.62
Outcome
44.62
Indicator type
Annual
2
20
28
2020/212
82
88
147/23
8
147/23150+ 150+150+
147/23150+
8
2015/16
8
2018/19
88
2017/18
147/23
Equality Strategy
150+
2015/16 2016/17The Corporate strategies your
service contributes to
2019/20
147/23
Planning Assumptions2017/18 2019/20
Corporate Asset Management Plan
Capital ProgrammeCentral Government
Staff (Apprentices)Staff (Trainees)
82 Procurement Strategy
Budget, Service, Performance & Risk Monitoring Reports
Performance indicator
Voluntary Sector Strategy04
44.6Risk Management Strategy
Treasury Management Strategy
Actual Performance (A) Performance Target (T) Proposed Target (P)
02
63.3Staff (FTE)4
0
54.6 51.62
Resources
Budget, Service, Performance & Risk Setting Reports
Budget, Service, Performance & Risk Closing ReportsAnticipated non financial resources
Cllr Mark Allison: Deputy Leader & Cabinet Member for Finance Enter a brief description of your main activities and objectives below
Anticipated demandRevenue/Capital Budget Managers
Voluntary Sector Organisations Supported
Business critical
Accuracy of P8 Revenue Forecast (compared to outturn)Accuracy of P8 Capital Forecast
Action plans in place for 'red' risks Outcome
2018/192016/17
Poor decision making
Reduced customer service
Poor decision making
Increased costsReputational risk
Government interventionPoor decision making
Main impact if indicator not met
Savings: Savings of £78k previously deferred will be delivered from the deletion of two posts (CS46). A review of recharges to the Pension fund will make savings of 47k (CS6). Increased income of 16k (CSD20) and a reduction in running costs 3k (CSD23). One Business Partner to be deleted 78k (CSD26). Reduction of LGCS budget to match contribution 81k (CSD46) CS2015-07 Reduction in running costs budgets £28k.
Savings: Savings of 100k will made from further restructuring of the service (CSD27), and a further 16k of increased income (CSD20). Further review of staffing budgets across the division saving 216k (CS2015-05). Reduction of 19k in Corporate Grants budget (CS2015-11)
CS2016-01 A reduction in the contribution to the self insurance fund in line with the actuarial valuation £100k.
2017/18 Expenditure
Employees
Premises
Transport
Supplies & Services
3rd party payments
Support services
2017/18 Income
Reimbursements
Customer & client receipts
Recharges
1,000
1,200
1,400
1,600
1,800
2,000
2,200
2,400
2015 2016 2017 2018 2019 2020
£'00
0s
Budget
Actual
Resources is made up of four major areas of activity:
Accountancy - manage financial health of the council through advice & support to officers and Members, production of council’s financial accounts, revenue & budget setting, profiling and reporting & monitoring. Over the next four years we will transform by improving use of technology /reviewing processes /how information is stored in our financial systems.
Business planning - manage Financial Strategy & Capital Strategy/Monitoring, Financial Systems Liaison & Development, Business & Service Planning, Performance Management (PM) & Risk Management, developing key business metrics to help services transform & facilitate multi-year planning, target resources, manage risk & integrate financial, business & performance information. Over the next four years we will improve robustness of our systems & projections, challenge services to improve their performance management to facilitate transformation, data quality and risk management
Policy and strategy - coordinate corporate strategy & policy; ensure effective & high-quality policy development across the council; promote a positive relationship with the voluntary and community sector; ensure the council meets its responsibilities under equalities & community cohesion policy; lead on effective partnership working by managing the local strategic partnership, including leading on the Stronger Communities agenda and delivery of the Sustainable Community Strategy; and provide a secretariat function for CMT and LSG.
Treasury and pensions - to manage the Council's treasury (including the day to day cashflow, banking and cash), pension and insurance funds and oversee the contract for pensions administration.
Page 129

Likelihood Impact Score
Start date 2015-16
End date 2019-20
Start date 2013-14
End date 2017-18
Start date 2016-17
End date 2017-18
Start date 2016-17
End date 2017-18
Start date 2014-15
End date 2017-18
Start date 2016-17
End date 2017-18
Start date 2015-16
End date 2017-18
Start date 2016-17
End date 2017-18
Start date 2015-16
End date 2018-19
Improved effectiveness
Improved efficiency (savings)Project 8
Project 7
Improved effectiveness
Infrastructure Assets Accounting
A model has been developed but it needs refining to facilitate option appraisal, produce clear outcomes that can easily be understood and increase the funding streams. The performance of this work will be judged directly by the AD Resources and Director of Corporate Services.
Improved effectiveness
Project 10
DETAILS OF MAJOR PROJECTS (INCLUDING PROCUREMENT) - MAXIMUM OF 10 OVER THE FOUR YEAR PERIODResources
PROJECT DESCRIPTION MAJOR PROJECT BENEFIT
Project 2
Develop and implement whole life costing for capital projects
3
2 4
3 3Project Details: Current performance indicators will be adjusted for this.
In 2012 there was a comprehensive review of the management of the capital programme. This led to the production of an action plan. It would be appropriate to undertake a follow-up review now. Outstanding work on Benefits Realisation to be completed
Annual reviews of recharges have been undertaken. These have tended to be tactical. In 2016/18 a full scale strategic review will be undertaken. The project will need to dovetail with work undertaken to develop and implement the new financial system.
Project Details:
Legislative requirement for asset accounting of highways and associated assets which will have a huge impact on our balance sheet. Financial officers will need to work closely with technical staff within Environment and Regeneration to gather the required information for account closure and presentation.
For the financial year 2017/18 the Authority will have to close its accounts approximately six weeks earlier. This will require very careful planning and will require a different approach to be adopted. The authority is piloting earlier account closure over the next two financial years in preparation for 2017/18
The computer systems used to record information will be reviewed by Internal Audit and assessed for the adequacy asap.
1
Project Title:
2
Project Title: Capital - Benefits Realisation
Recharge ReviewProject Title:
Project Details:
Pilot Early closure of Accounts
Improved effectiveness
6
Project Title:
Project Details:2
3
2 4
2
21
2
Project Details:
Improved effectiveness
Project Details:
Improve joint finance and business planning
Project Details:
Evaluation of different models of funding the capital programme Improved effectiveness
2
2 4
Project Title:
2
2 6
Project Title:
Improved effectiveness
Two performance indicators are likely to be developed around the time taken to produce reporting information compared to now and the system downtime compared to now
2Requires considerable horizon spotting activity a performance indicator would be developed comparing the estimated grant levels compared to those actually received.
Financial systems re-engineering programmeProject Title:
Evaluation of future funding levels Risk reduction and complianceProject Title:
Risk
Analysis of all relevant information relating to local government finance. This will include details provided in annual Local Government Finance Settlements, Annual Budgets, Spending Reviews and other financial information published by the Government. This information is incorporated into the Council's MTFS and updated as part of annual Budget Setting Procedures. Modelling of the retained NNDR system will be undertaken along with sensitivity analysis.
Procurement of a single integrated financial system to replace the suite of products that are current used to provide GL, AP, P2P & AR functions. This will involve a new chart of accounts and new ways of working, driving efficiencies throughout the organisation. The potential for joint working with neighbour boroughs is currently being investigated. Current estimates of the Go live date are 31/03/2017 - project length allows for post implementation review
This project will be undertaken in four stages1) Develop a template to capture appropriate information2) Pilot the template on two selected schemes3) Amend the template4) Apply the temple to selected schemes
In recent years there has been no need to borrow externally to fund capital expenditure, it is anticipated that some external funding will be needed towards the end of the current planning period and therefore a detailed consideration of all reasonable options needs to be done, including leasing, renting and borrowing or any other suitable methods of funding capital expenditure.
4
The project requires the quarterly update of service plans scheduled to start with September 2014 information following the implementation of the new performance and risk management system
3 62
Project 5
Project 9
Project 1
Project 3
Project 4
Project Title:
Project Details:
Project Details:
Page 130

2015/16(A) 2016/17(T) 2017/18(P) 2018/19(P) 2019/20(P) 2020/21(P)79,965 81,125 103,722 103,722 103,722 103,722
n/a £100,000 £100,000 £100,000 £100,000n/a 90% 90% 90% 90%n/a 80% 80% 80% 80%n/a 80% 80% 80% 80%
Final Budget2015/16
Actual 2015/16
Budget2016/17
Forecast Variance
2016/17 P8
Budget2017/18
Budget2018/19
Budget2019/20
Budget2020/21
4,794 6,694 5,084 134 6,740 6,699 6,699 6,6994,168 4,463 4,461 112 5,924 5,924 5,924 5,924 4144.28
5 2 5 0 5 5 5 513 21 14 10 14 14 14 14
422 2,022 418 11 556 515 515 5151 0 0
185 185 185 240 240 240 240
Final Budget2015/16
Actual 2015/16
Budget2016/17
Variance 2016/17 P8
Budget2017/18
Budget2018/19
Budget2019/20
Budget2020/21
4,897 6,695 5,084 (135) 6,759 6,759 6,759 6,759
0 04,897 6,695 5,084 (135) 6,759 6,759 6,759 6,759
0 0 0 0 0 0 0
(103) (0) 0 (2) (20) (61) (61) (61)
Final Budget2015/16
Actual 2015/16
Budget2016/17
Variance 2016/17 P8
Budget2017/18
Budget2018/19
Budget2019/20
Budget2020/21
0 0 0 0 0 0 0 0
Chargeable hours for Wandsworth 22,487 22,487
108.32020/21
2,516 2,51611583 11583 11,222
2019/20
Council Funded Net Budget
Revenue £'000s
Income
Summary of major budget etc. changes2017/18
2018/19
Capital Budget £'000s
2019/20
2020/21
RechargesCapital Funded
Supplies & Services
Expenditure
DEPARTMENTAL BUDGET AND RESOURCES
Perception
Indicator type
Business criticalOutcome
Quarterly
PolarityPolarity
High High High
Reporting cycle
MonthlyQuarterlyQuarterly
11,329
13895 13,828
20
2017/18 2018/1987.5
1 2108.3 108.3
19500138951981911382
2015/16 2016/17
19500
2528 2528
2015/16 2016/17 2017/1819,125
2018/19
13,82822,835
2020/21
19819
2019/20
19,125
11,32922,835
11,222
92.3
11382
1st draft S106 agreement sent to client dept within 10 days
The Corporate strategies your service contributes to
Contribute to all Corporate Strategies
Government grantsReimbursements
Depreciation
EmployeesPremises
Performance indicator
Revenue £'000s
Prosecutions - number of successful outcomesProvide FOI/EIR reviews within 20 working days
Shared Legal Services
Chargeable hours for SuttonChargeable hours for Kingston
Anticipated non financial resources
Cllr Mark Allison: Deputy Leader & Cabinet Member for Finance Anticipated demand
Chargeable hours for RichmondChargeable hours for MertonEnter a brief description of your main activities and objectives below
Chargeable hours for Achieving for Children
High
Planning Assumptions
Actual performance (A) Performance Target (T) Proposed Target (P)
Chargeable hoursIncome for SLLP
108.3ApprenticesStaff (FTE)
3rd party paymentsSupport services
Customer & client receipts
Transport
Quarterly
Chargeable hours for Sutton Housing Partnership
High Breach statutory duty
Main impact if indicator not met
2
Reputational riskReputational risk
Loss of incomeLoss of income
PerceptionPerception
CS73 £20k savings for Merton are required. Further savings for Sutton, Kingston and Richmond may be required.
CS2015-12 £41,000 savings for Merton from expansion of service. Further savings for Sutton, Kingston and Richmond may be required.
2017/18 Expenditure
Employees
Premises
Transport
Supplies & Services
3rd party payments
Support services
2017/18 Income
Customer & clientreceipts
-310
-260
-210
-160
-110
-60
-10
40
2015 2016 2017 2018 2019 2020
£'00
0s
Budget Actual
From 1 April 2017 this will be a shared legal service with the London Boroughs of Richmond , Wandsworth , Sutton and the Royal Borough of Kingston upon Thames. The service will deliver legal advice, support and representation to all services across all five councils, including to arms length delivery vehicles (Achieving for Children and currently ,Sutton Housing Partnership) and council owned companies. The service also provides advice in relation to the constitution and decision making in all councils and advice to members in relation to their roles.
Page 131

Likelihood Impact Score
Start date 2017-18
End date 2018-19
Start date 2017-18
End date 2018-19
Start date 2017-18
End date 2017-18
DETAILS OF MAJOR PROJECTS (INCLUDING PROCUREMENT) - MAXIMUM OF 10 OVER THE FOUR YEAR PERIODShared Legal Services
PROJECT DESCRIPTION MAJOR PROJECTS BENEFITS
Project 2
Shared service Improved customer experience
Smarter Working
4
2
Improved sustainability
Improved effectiveness
2 4
Risk
Project Title:
Project Title:
2
To ensure the service is maximising the use of IT systems and software in order to enable mobile working across five authorities, reduce costs and increase the effectiveness and efficiency of the officers in the service
To embed the expanded shared service with Wandsworth , to identify and exploit the efficiencies of the new service in order to improve the customer experience and to identify further savingsProject Details:
22
Subject to Governance Board approval to obtain a licence from the Solicitors Regulatory Authority to be an Alternative Business Structure
8
1
Project 1
Project 3 Future ModelProject Title:
Project Details:
Project Details:
Page 132

Environment & Regeneration
Page 133
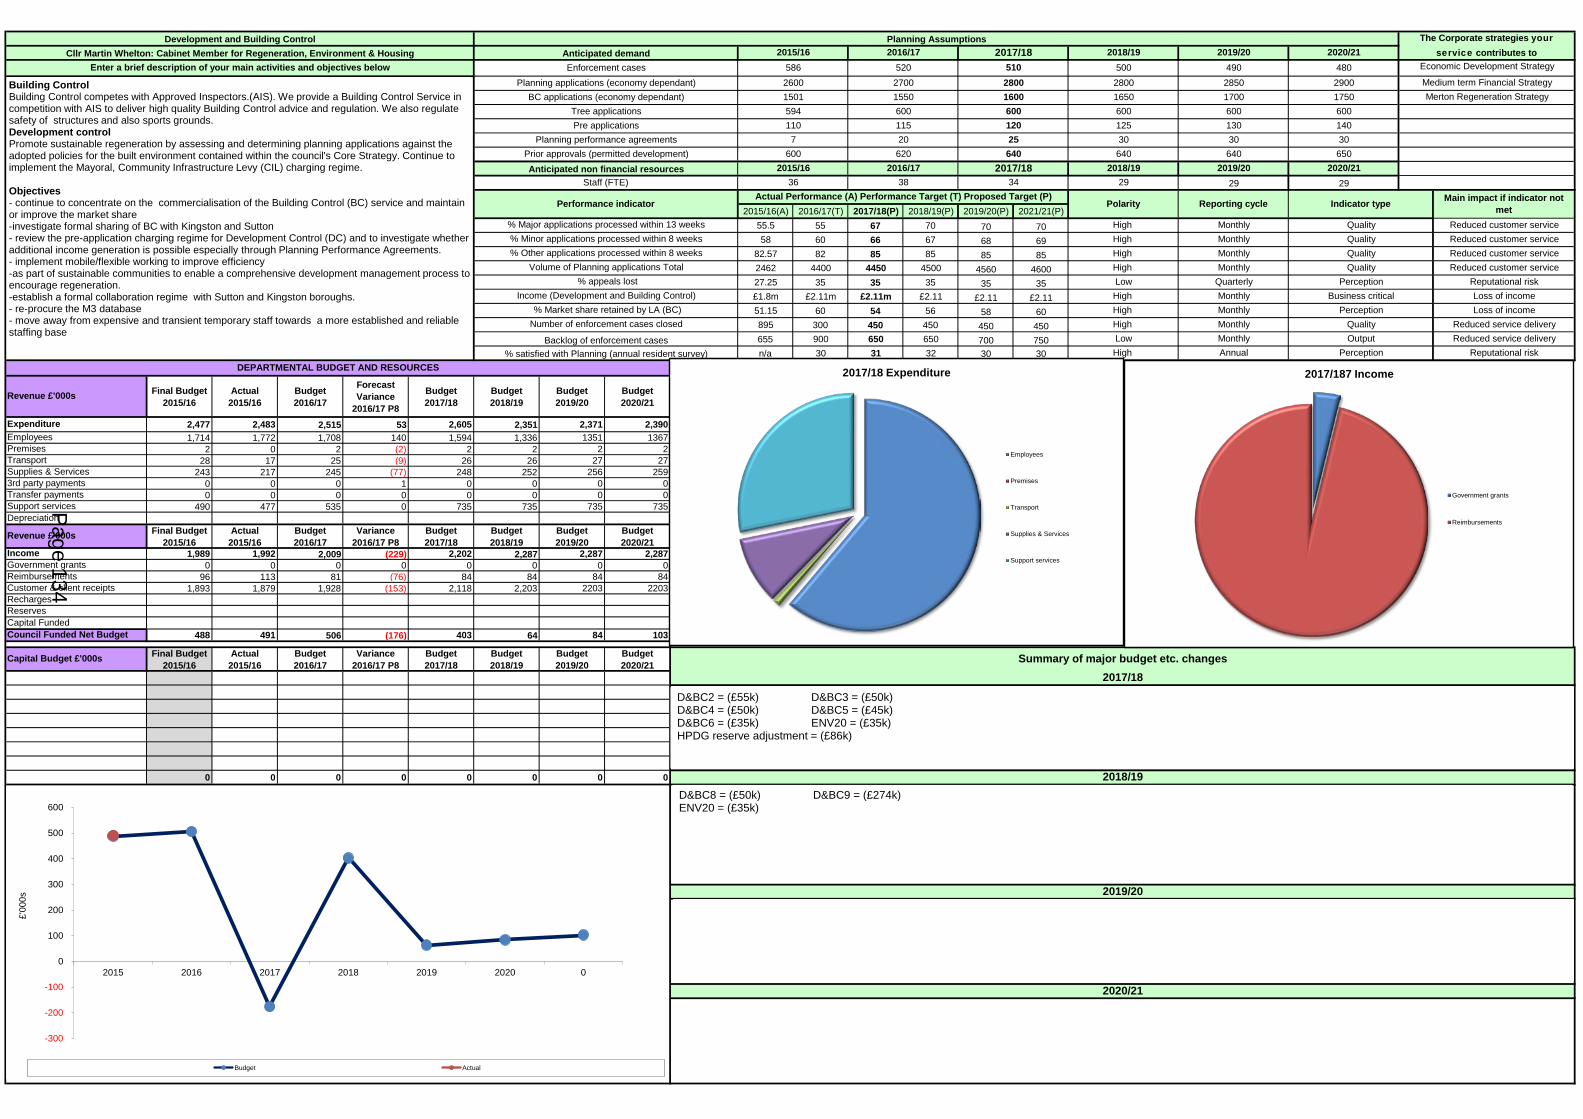
2015/16(A) 2016/17(T) 2017/18(P) 2018/19(P) 2019/20(P) 2021/21(P)55.5 55 67 70 70 7058 60 66 67 68 69
82.57 82 85 85 85 852462 4400 4450 4500 4560 460027.25 35 35 35 35 35£1.8m £2.11m £2.11m £2.11 £2.11 £2.1151.15 60 54 56 58 60895 300 450 450 450 450655 900 650 650 700 750n/a 30 31 32 30 30
Final Budget2015/16
Actual 2015/16
Budget2016/17
Forecast Variance
2016/17 P8
Budget 2017/18
Budget 2018/19
Budget 2019/20
Budget 2020/21
2,477 2,483 2,515 53 2,605 2,351 2,371 2,3901,714 1,772 1,708 140 1,594 1,336 1351 1367
2 0 2 (2) 2 2 2 228 17 25 (9) 26 26 27 27
243 217 245 (77) 248 252 256 2590 0 0 1 0 0 0 00 0 0 0 0 0 0 0
490 477 535 0 735 735 735 735
Final Budget2015/16
Actual 2015/16
Budget2016/17
Variance 2016/17 P8
Budget 2017/18
Budget 2018/19
Budget 2019/20
Budget 2020/21
1,989 1,992 2,009 (229) 2,202 2,287 2,287 2,2870 0 0 0 0 0 0 0
96 113 81 (76) 84 84 84 841,893 1,879 1,928 (153) 2,118 2,203 2203 2203
488 491 506 (176) 403 64 84 103
Final Budget2015/16
Actual 2015/16
Budget2016/17
Variance 2016/17 P8
Budget 2017/18
Budget 2018/19
Budget 2019/20
Budget 2020/21
0 0 0 0 0 0 0 0
30650
2020/2129
2020/2148029001750600140
ReservesCapital FundedCouncil Funded Net Budget
Revenue £'000s
Income
Customer & client receipts
Government grantsReimbursements
Summary of major budget etc. changesCapital Budget £'000s
2017/18
2018/19
2020/21
Reputational risk
High High
% Market share retained by LA (BC)High Reduced service delivery
Loss of incomeMonthly Quality
MonthlyMonthly Perception
Business critical
2019/20
MonthlyMonthlyMonthly
High High High Monthly
38
640
12525
2017/18
Polarity
110 115
6202015/16
600594
20
2016/17
Recharges
Depreciation
% appeals lost
EmployeesPremises
3rd party payments
Support services
Planning performance agreements
Supplies & Services
Expenditure
Transport
Transfer payments
Revenue £'000s
DEPARTMENTAL BUDGET AND RESOURCES
Economic Development Strategy
Medium term Financial Strategy
Reputational risk
Reduced customer service
Perception
36
500
600
26001501
Income (Development and Building Control)
Reduced customer service% Minor applications processed within 8 weeks
Actual Performance (A) Performance Target (T) Proposed Target (P)
Volume of Planning applications Total
Indicator type Main impact if indicator not met
34
Number of enforcement cases closed
% satisfied with Planning (annual resident survey) Annual
600
Low
Anticipated non financial resources
% Major applications processed within 13 weeks
% Other applications processed within 8 weeks
640Prior approvals (permitted development)
BC applications (economy dependant)Tree applications
Staff (FTE)
Performance indicator
2018/1929
640
Quality
Pre applications
1650
120
285028001550
Cllr Martin Whelton: Cabinet Member for Regeneration, Environment & HousingEnter a brief description of your main activities and objectives below
Anticipated demandEnforcement cases
Planning applications (economy dependant)
Planning AssumptionsDevelopment and Building Control2016/172015/16 2018/19
4902019/20
510520
The Corporate strategies your service contributes to
Reduced customer service
Merton Regeneration Strategy
7
586
Quality
Loss of income
Low Monthly Output Reduced service delivery
QualityHigh
Quarterly
Reporting cycle
High Perception
2800
Quality
30
Reduced customer service
30
Backlog of enforcement cases
2017/18
29
1700
2019/20
2700
600 600130
1600Building Control Building Control competes with Approved Inspectors.(AIS). We provide a Building Control Service in competition with AIS to deliver high quality Building Control advice and regulation. We also regulate safety of structures and also sports grounds. Development control Promote sustainable regeneration by assessing and determining planning applications against the adopted policies for the built environment contained within the council's Core Strategy. Continue to implement the Mayoral, Community Infrastructure Levy (CIL) charging regime. Objectives - continue to concentrate on the commercialisation of the Building Control (BC) service and maintain or improve the market share -investigate formal sharing of BC with Kingston and Sutton - review the pre-application charging regime for Development Control (DC) and to investigate whether additional income generation is possible especially through Planning Performance Agreements. - implement mobile/flexible working to improve efficiency -as part of sustainable communities to enable a comprehensive development management process to encourage regeneration. -establish a formal collaboration regime with Sutton and Kingston boroughs. - re-procure the M3 database - move away from expensive and transient temporary staff towards a more established and reliable staffing base
D&BC8 = (£50k) D&BC9 = (£274k) ENV20 = (£35k)
2017/18 Expenditure
Employees
Premises
Transport
Supplies & Services
Support services
2017/187 Income
Government grants
Reimbursements
-300
-200
-100
0
100
200
300
400
500
600
2015 2016 2017 2018 2019 2020 0
£'00
0s
Budget Actual
D&BC2 = (£55k) D&BC3 = (£50k) D&BC4 = (£50k) D&BC5 = (£45k) D&BC6 = (£35k) ENV20 = (£35k) HPDG reserve adjustment = (£86k)
Page 134

Likelihood Impact Score
Start date 2013-14
End date 2017-18
Start date 2014-15
End date 2017-18
Start date 2014-3
End date 2017-18
Start date 2014-5
End date 2017-18
Start date 2014-15
End date 2017-18
Start date 2014/15
End date 2017-18
Start date 2016-17
End date 2017-18
Start date 2014/15
End date 2017-18
Start date 2014/15
End date 2017-18
Project 6
Project Details:
Project Title:
Project Details:
Project 7
Project Title:Project 5
Project Title:
Project Details:
DETAILS OF MAJOR PROJECTS (INCLUDING PROCUREMENT) - MAXIMUM OF 10 OVER THE FOUR YEAR PERIODDevelopment and Building Control
PROJECT DESCRIPTION MAJOR PROJECT BENEFIT Risk
Project 2
Project Details:
Commercialisation of Building Control
Project Title:
This is introducing mobile and home working to the teams.
As part of sustainable communities to provide an end to end development management process to deliver regeneration objectives.
developing eforms and M3 capability and e-payments
Enforcement eforms, BC eforms and DC e-payments
Improved effectiveness
Section review looking at the structure and interaction with other services
Section review
Shared services review with other LA's (part of TOM)
Looking at opportunities for sharing householder and /or admin back office services with adjoining authorities
Lean review of pre-application process (part of TOM)
This is to ensure Building Control is more commercially aware in a more competitive market.
Project Details:
3
6
Project Title:
1
13savings through contract negotiation.
Economic outcomes
Regeneration certainty2 2
6
Either M3 engage cloud based system or equivalent. Potentially shared with nearby authorities
Ensure cost neutral or better staffing levels to ensure this can be delivered
Further develop Planning Performance agreements potential
To ensure the process is efficient and robust from a customer perspective and to investigate any further income opportunities.
Re-procurement of M3 or equivalent IT system
Improved effectiveness
1
Improved efficiency (savings)
Efficiencies and savings
63
4
Improved efficiency (savings)
Efficiencies and savings
2
income generation opportunities
4
4
2
2
14
2
Improved efficiency (savings)
Additional income generation12
2 42
2
Improved efficiency (savings)
To allow reduced office space an efficient working practices
6
Project 9
Project Title:Project 1
Project 3
Project 4
Project Details:
Project Title:
Project Details:
Project Details:
Project Details:
Project 8
Project Title:
2
Improved effectiveness
Improve regeneration opportunities
Improving the development management processes
Improved customer experience
Channel shift
Mobile/Home working
Project Title:
Page 135
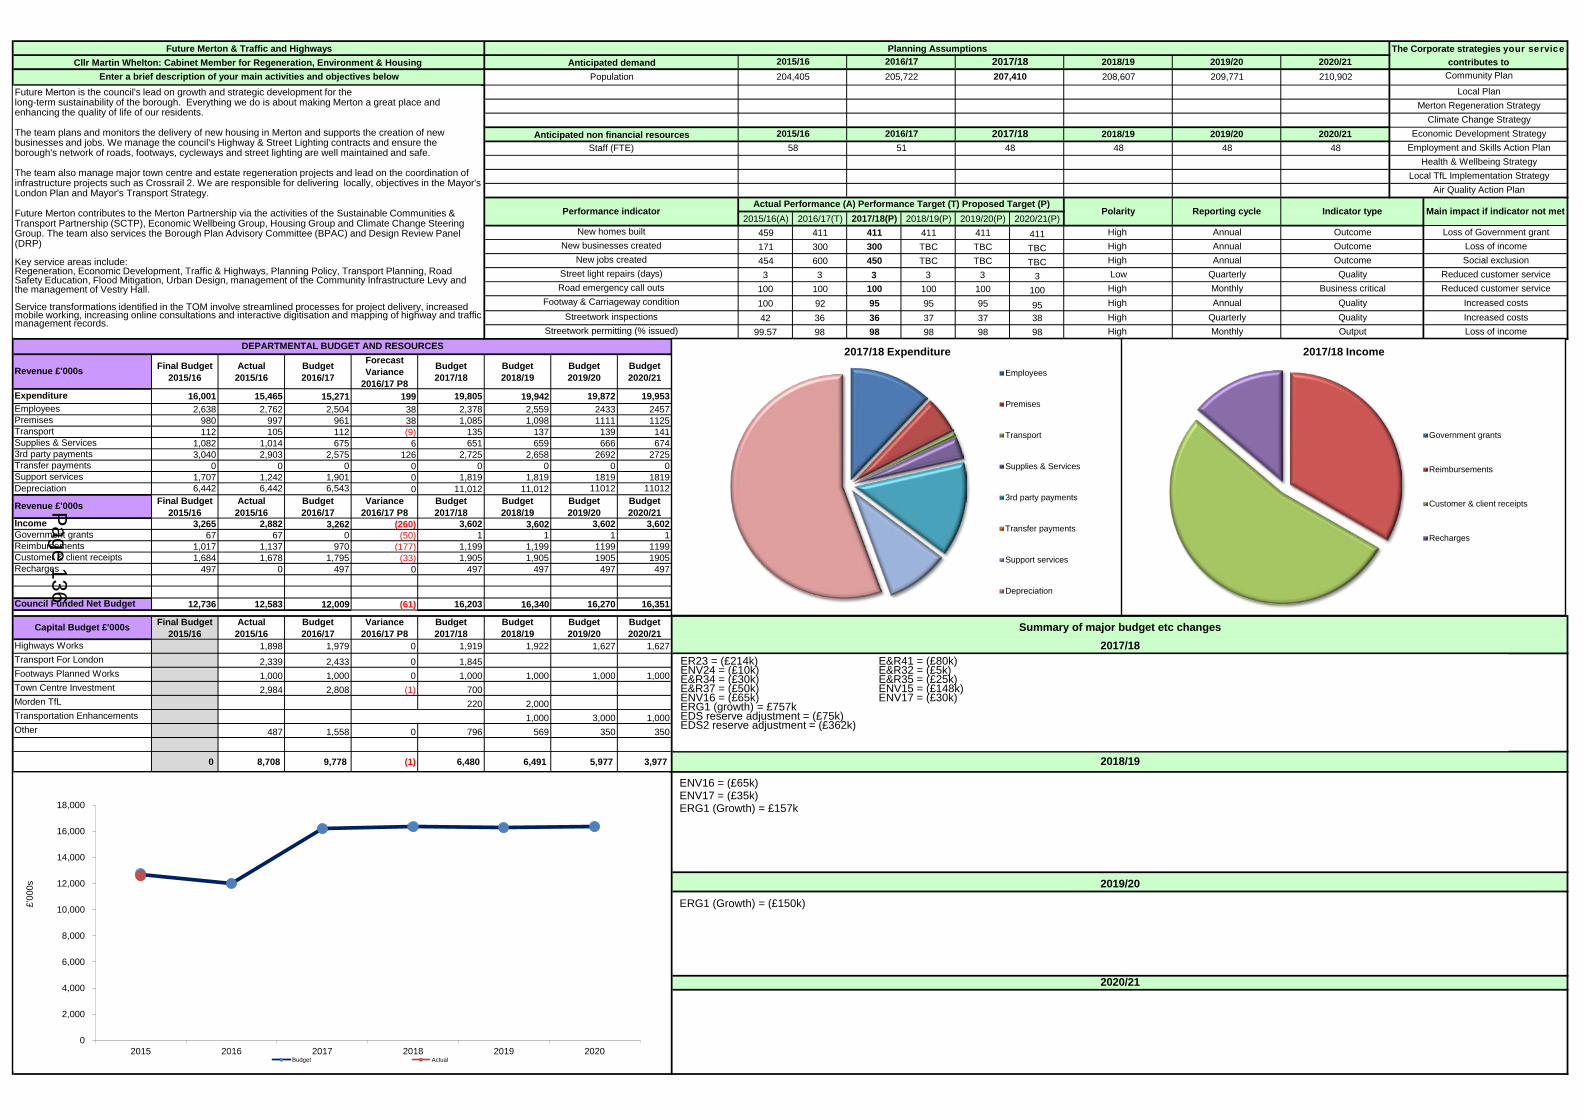
2015/16(A) 2016/17(T) 2017/18(P) 2018/19(P) 2019/20(P) 2020/21(P)459 411 411 411 411 411171 300 300 TBC TBC TBC454 600 450 TBC TBC TBC3 3 3 3 3 3
100 100 100 100 100 100100 92 95 95 95 9542 36 36 37 37 38
99.57 98 98 98 98 98
Final Budget2015/16
Actual 2015/16
Budget2016/17
Forecast Variance
2016/17 P8
Budget 2017/18
Budget 2018/19
Budget 2019/20
Budget 2020/21
16,001 15,465 15,271 199 19,805 19,942 19,872 19,9532,638 2,762 2,504 38 2,378 2,559 2433 2457
980 997 961 38 1,085 1,098 1111 1125112 105 112 (9) 135 137 139 141
1,082 1,014 675 6 651 659 666 6743,040 2,903 2,575 126 2,725 2,658 2692 2725
0 0 0 0 0 0 0 01,707 1,242 1,901 0 1,819 1,819 1819 18196,442 6,442 6,543 0 11,012 11,012 11012 11012
Final Budget2015/16
Actual 2015/16
Budget2016/17
Variance 2016/17 P8
Budget 2017/18
Budget 2018/19
Budget 2019/20
Budget 2020/21
3,265 2,882 3,262 (260) 3,602 3,602 3,602 3,60267 67 0 (50) 1 1 1 1
1,017 1,137 970 (177) 1,199 1,199 1199 11991,684 1,678 1,795 (33) 1,905 1,905 1905 1905
497 0 497 0 497 497 497 497
12,736 12,583 12,009 (61) 16,203 16,340 16,270 16,351
Final Budget2015/16
Actual 2015/16
Budget2016/17
Variance 2016/17 P8
Budget 2017/18
Budget 2018/19
Budget 2019/20
Budget 2020/21
1,898 1,979 0 1,919 1,922 1,627 1,627
2,339 2,433 0 1,8451,000 1,000 0 1,000 1,000 1,000 1,0002,984 2,808 (1) 700
220 2,0001,000 3,000 1,000
487 1,558 0 796 569 350 350
0 8,708 9,778 (1) 6,480 6,491 5,977 3,977
Low
AnnualMonthlyHigh
2018/19
2019/20
2020/21
2020/21
210,902
48
Monthly
Business criticalQualityFootway & Carriageway condition
Supplies & Services
Expenditure
Annual
Output
Transport
Quarterly
Revenue £'000s
3rd party payments
Council Funded Net Budget
Income
Recharges
Government grants
Customer & client receiptsReimbursements
Support services
Premises
Revenue £'000s
Road emergency call outs
Air Quality Action Plan
Summary of major budget etc changes
High Reduced customer service
Increased costs
High
2017/18
Streetwork permitting (% issued) High Streetwork inspections QuarterlyHigh
Loss of income
High
Reporting cycle
Annual
Annual
Indicator type
OutcomeOutcome
Polarity
High
2018/194848 4858
2019/20
The Corporate strategies your service contributes to
208,607
Health & Wellbeing StrategyLocal TfL Implementation Strategy
Community Plan
Local PlanMerton Regeneration Strategy
Climate Change StrategyEconomic Development Strategy
Performance indicator
Staff (FTE)2015/16
Employment and Skills Action Plan51
Street light repairs (days)
New homes built
Future Merton & Traffic and Highways
Anticipated non financial resources
Cllr Martin Whelton: Cabinet Member for Regeneration, Environment & Housing Anticipated demandPlanning Assumptions
2015/16 2016/17 2017/18 2019/202018/19209,771
Transport For LondonFootways Planned WorksTown Centre Investment
DEPARTMENTAL BUDGET AND RESOURCES
Transportation Enhancements
Highways Works
Morden TfL
Capital Budget £'000s
Enter a brief description of your main activities and objectives below
Main impact if indicator not met
Loss of Government grant
207,410
2016/17 2017/18
205,722204,405
New jobs created
Actual Performance (A) Performance Target (T) Proposed Target (P)
Quality
Population
New businesses created
Quality
Social exclusionReduced customer service
Outcome
Depreciation
Transfer payments
Loss of income
Employees
2020/21
Other
Increased costs
Future Merton is the council's lead on growth and strategic development for the long-term sustainability of the borough. Everything we do is about making Merton a great place and enhancing the quality of life of our residents. The team plans and monitors the delivery of new housing in Merton and supports the creation of new businesses and jobs. We manage the council's Highway & Street Lighting contracts and ensure the borough's network of roads, footways, cycleways and street lighting are well maintained and safe. The team also manage major town centre and estate regeneration projects and lead on the coordination of infrastructure projects such as Crossrail 2. We are responsible for delivering locally, objectives in the Mayor's London Plan and Mayor's Transport Strategy. Future Merton contributes to the Merton Partnership via the activities of the Sustainable Communities & Transport Partnership (SCTP), Economic Wellbeing Group, Housing Group and Climate Change Steering Group. The team also services the Borough Plan Advisory Committee (BPAC) and Design Review Panel (DRP) Key service areas include: Regeneration, Economic Development, Traffic & Highways, Planning Policy, Transport Planning, Road Safety Education, Flood Mitigation, Urban Design, management of the Community Infrastructure Levy and the management of Vestry Hall. Service transformations identified in the TOM involve streamlined processes for project delivery, increased mobile working, increasing online consultations and interactive digitisation and mapping of highway and traffic management records.
ER23 = (£214k) E&R41 = (£80k) ENV24 = (£10k) E&R32 = (£5k) E&R34 = (£30k) E&R35 = (£25k) E&R37 = (£50k) ENV15 = (£148k) ENV16 = (£65k) ENV17 = (£30k) ERG1 (growth) = £757k EDS reserve adjustment = (£75k) EDS2 reserve adjustment = (£362k)
ENV16 = (£65k) ENV17 = (£35k) ERG1 (Growth) = £157k
ERG1 (Growth) = (£150k)
2017/18 Expenditure
Employees
Premises
Transport
Supplies & Services
3rd party payments
Transfer payments
Support services
Depreciation
2017/18 Income
Government grants
Reimbursements
Customer & client receipts
Recharges
0
2,000
4,000
6,000
8,000
10,000
12,000
14,000
16,000
18,000
2015 2016 2017 2018 2019 2020
£'00
0s
Budget Actual
Page 136

Likelihood Impact Score
Start date 2014/15
End date 2024/25
Start date 2012-13
End date 2017-18
Start date 2014-15
End date 2022-23
Start date 2011-12
End date 2017-18
Start date 2016-17
End date 2020-21
Start date 2011/12
End date 2019-20
Start date 2013-14
End date 2017-18
DETAILS OF MAJOR PROJECTS (INCLUDING PROCUREMENT) - MAXIMUM OF 10 OVER THE FOUR YEAR PERIODFuture Merton & Traffic and Highways
PROJECT DESCRIPTION MAJOR PROJECT BENEFITS
2
Project 5 Local Authority Property Company
Identifiying the growth potential of Wimbledon as the premier business hub in South London. Explore investment and development opprtunities linked to Crossrail 2 and improving the quality of architecure, design and placemaking. Conference (2013) Ideas Competition (2014) Masterplan linked to Crossrail 2 (2017/18)
3
Project Title:
Running various programmes to improve road safety and encourage smarter and healthier travel choices, including adult and children cycle training, walk to school, motorcycle and learner driver training. Reduces road related injuries and helps Merton deliver its share of the Mayor's Transport Strategy.
Project Details:
Smarter travel: road safety
Establish a Local Authority owned Property Company to develop sites to generate revenue income to assist the MTFS
Project 2
3
Economic outcomes
Project Details:
Delivery of a new stadium and associated developments, working with stakeholders on a masterplan for the site following the outcome of the Sites and Policies Plan
12
4
Morden Town Centre Regeneration
Growth, investment and intensification to support regeneration in Morden. Strategic Planning Policies (2011-2013) Development Brief with TFL for Morden Station (2014) Major scheme bid to TFL for public realm overhaul and gyratory removal (2015/16) GLA Housing Zone bid (2014/2016) Development Partner selection (2015/16-2016/17) Physical project delivery c2017/18
Project Title:
Project Details:62
Project Title:
2
42
Project Details:
3
Local Plan: Estate Regeneration
Working with Circle Merton Priory to deliver investment in new homes and the regeneration of High Path, Eastfields and Ravensbury estates. Supported by the preparation of a Local Plan (DPD) Also working with Moat housing to coordinate investment in regenerating Pollards Hill.
3
Infrastructure renewalWimbledon Stadium
42
2 6
2
Infrastructure renewal
Infrastructure renewal
Project 7
Project Title:Project 1
Project 3
Project 4
Project Details:
Project Details:
Project Title:
Project Details:
Project Title:
Economic outcomes
Risk
Project 6
Project Title:
3
Future Wimbledon & Crossrail 2
Rediscover Mitcham
Revitalising Mitcham Fair Green and surrounding streets by investing c£6m in the public realm, local businesses, and transport proposals, working closely with Transport for London.
4
2
Improved reputation
Improved reputation
1
Page 137
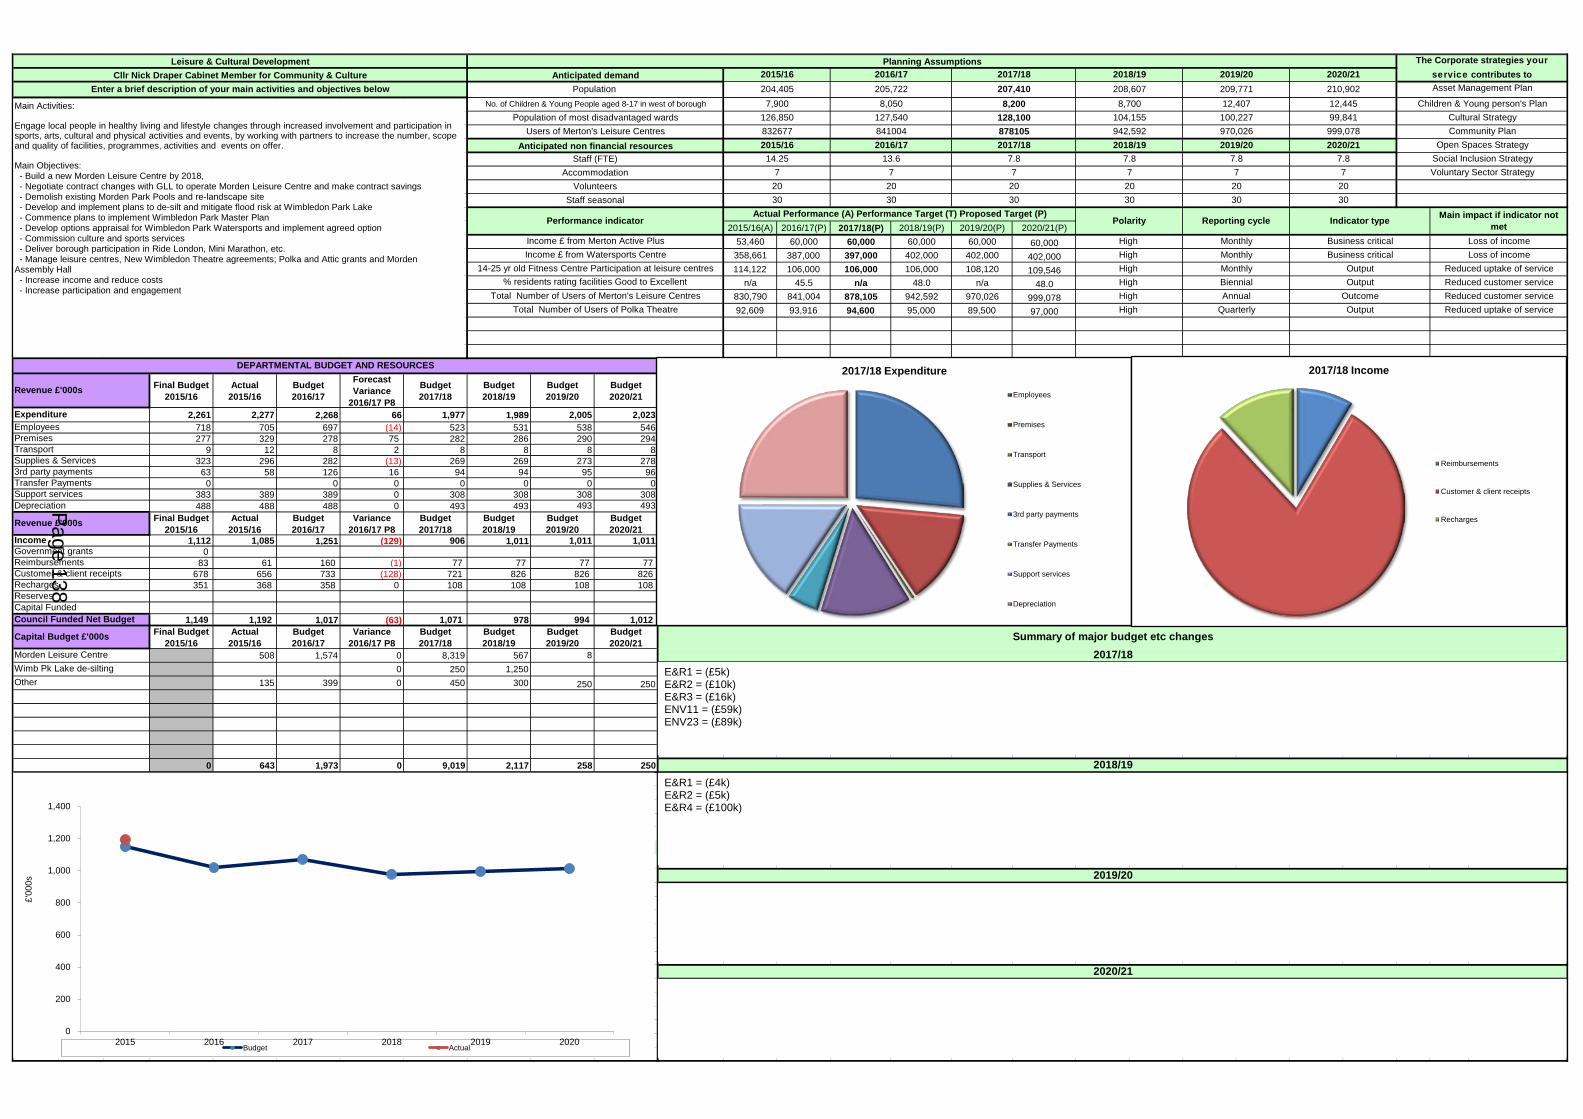
2015/16(A) 2016/17(P) 2017/18(P) 2018/19(P) 2019/20(P) 2020/21(P)53,460 60,000 60,000 60,000 60,000 60,000
358,661 387,000 397,000 402,000 402,000 402,000114,122 106,000 106,000 106,000 108,120 109,546
n/a 45.5 n/a 48.0 n/a 48.0830,790 841,004 878,105 942,592 970,026 999,07892,609 93,916 94,600 95,000 89,500 97,000
Final Budget2015/16
Actual 2015/16
Budget2016/17
Forecast Variance
2016/17 P8
Budget 2017/18
Budget 2018/19
Budget 2019/20
Budget 2020/21
2,261 2,277 2,268 66 1,977 1,989 2,005 2,023718 705 697 (14) 523 531 538 546277 329 278 75 282 286 290 294
9 12 8 2 8 8 8 8323 296 282 (13) 269 269 273 278
63 58 126 16 94 94 95 960 0 0 0 0 0 0
383 389 389 0 308 308 308 308488 488 488 0 493 493 493 493
Final Budget2015/16
Actual 2015/16
Budget2016/17
Variance 2016/17 P8
Budget 2017/18
Budget 2018/19
Budget 2019/20
Budget 2020/21
1,112 1,085 1,251 (129) 906 1,011 1,011 1,0110
83 61 160 (1) 77 77 77 77 678 656 733 (128) 721 826 826 826 351 368 358 0 108 108 108 108
1,149 1,192 1,017 (63) 1,071 978 994 1,012 Final Budget
2015/16Actual
2015/16Budget2016/17
Variance 2016/17 P8
Budget 2017/18
Budget 2018/19
Budget 2019/20
Budget 2020/21
508 1,574 0 8,319 567 80 250 1,250
135 399 0 450 300 250 250
0 643 1,973 0 9,019 2,117 258 250 2018/19
2020/217.87
20 2030
7
2019/20
Reporting cycle
210,90212,44599,841
999,078
205,722 207,410 208,6078,050 8,200
Reduced uptake of service
209,771
7.8
12,407
970,026
Main impact if indicator not met
Reduced customer service
Revenue £'000s
Monthly
Reduced uptake of service
Leisure & Cultural Development
Loss of income
Reduced customer service
Loss of income
Planning Assumptions
Actual Performance (A) Performance Target (T) Proposed Target (P)
Income £ from Merton Active Plus
No. of Children & Young People aged 8-17 in west of borough
AccommodationVolunteers
204,405
Staff seasonal20
2020/21
Population of most disadvantaged wardsUsers of Merton's Leisure Centres
Anticipated non financial resources
Cllr Nick Draper Cabinet Member for Community & Culture Anticipated demandPopulation Enter a brief description of your main activities and objectives below
Cultural StrategyCommunity Plan
Social Inclusion StrategyOpen Spaces Strategy
Staff (FTE)
Income £ from Watersports Centre
Performance indicator
100,227127,540
2015/16
2015/16 2016/17 2017/18 2018/19
104,155
Voluntary Sector Strategy7.8 7.8
The Corporate strategies your service contributes to2019/20Asset Management Plan
Children & Young person's Plan7,900126,850832677
128,100878105 942,592841004
8,700
2016/1714.25
720
2018/192017/18
7 720
30
13.67
2030 30 30
Indicator type
Business critical
Polarity
BiennialMonthly
30
High
OutputOutput
High Monthly Business critical
Total Number of Users of Merton's Leisure CentresTotal Number of Users of Polka Theatre
% residents rating facilities Good to Excellent14-25 yr old Fitness Centre Participation at leisure centres
Output
2020/21
Council Funded Net Budget
Summary of major budget etc changes
Supplies & Services
2019/20
Capital Budget £'000s
Other
Recharges
Government grants
High
Transfer Payments
Revenue £'000s
High
Income
Reimbursements
High
DEPARTMENTAL BUDGET AND RESOURCES
Employees
2017/18
3rd party payments
Support services
QuarterlyAnnual Outcome
Wimb Pk Lake de-silting
ReservesCapital Funded
Customer & client receipts
Transport
Morden Leisure Centre
High
Depreciation
Premises
Expenditure
Main Activities: Engage local people in healthy living and lifestyle changes through increased involvement and participation in sports, arts, cultural and physical activities and events, by working with partners to increase the number, scope and quality of facilities, programmes, activities and events on offer. Main Objectives: - Build a new Morden Leisure Centre by 2018, - Negotiate contract changes with GLL to operate Morden Leisure Centre and make contract savings - Demolish existing Morden Park Pools and re-landscape site - Develop and implement plans to de-silt and mitigate flood risk at Wimbledon Park Lake - Commence plans to implement Wimbledon Park Master Plan - Develop options appraisal for Wimbledon Park Watersports and implement agreed option - Commission culture and sports services - Deliver borough participation in Ride London, Mini Marathon, etc. - Manage leisure centres, New Wimbledon Theatre agreements; Polka and Attic grants and Morden Assembly Hall - Increase income and reduce costs - Increase participation and engagement
E&R1 = (£5k) E&R2 = (£10k) E&R3 = (£16k) ENV11 = (£59k) ENV23 = (£89k)
E&R1 = (£4k) E&R2 = (£5k) E&R4 = (£100k)
2017/18 Expenditure
Employees
Premises
Transport
Supplies & Services
3rd party payments
Transfer Payments
Support services
Depreciation
2017/18 Income
Reimbursements
Customer & client receipts
Recharges
0
200
400
600
800
1,000
1,200
1,400
2015 2016 2017 2018 2019 2020
£'00
0s
Budget Actual
Page 138
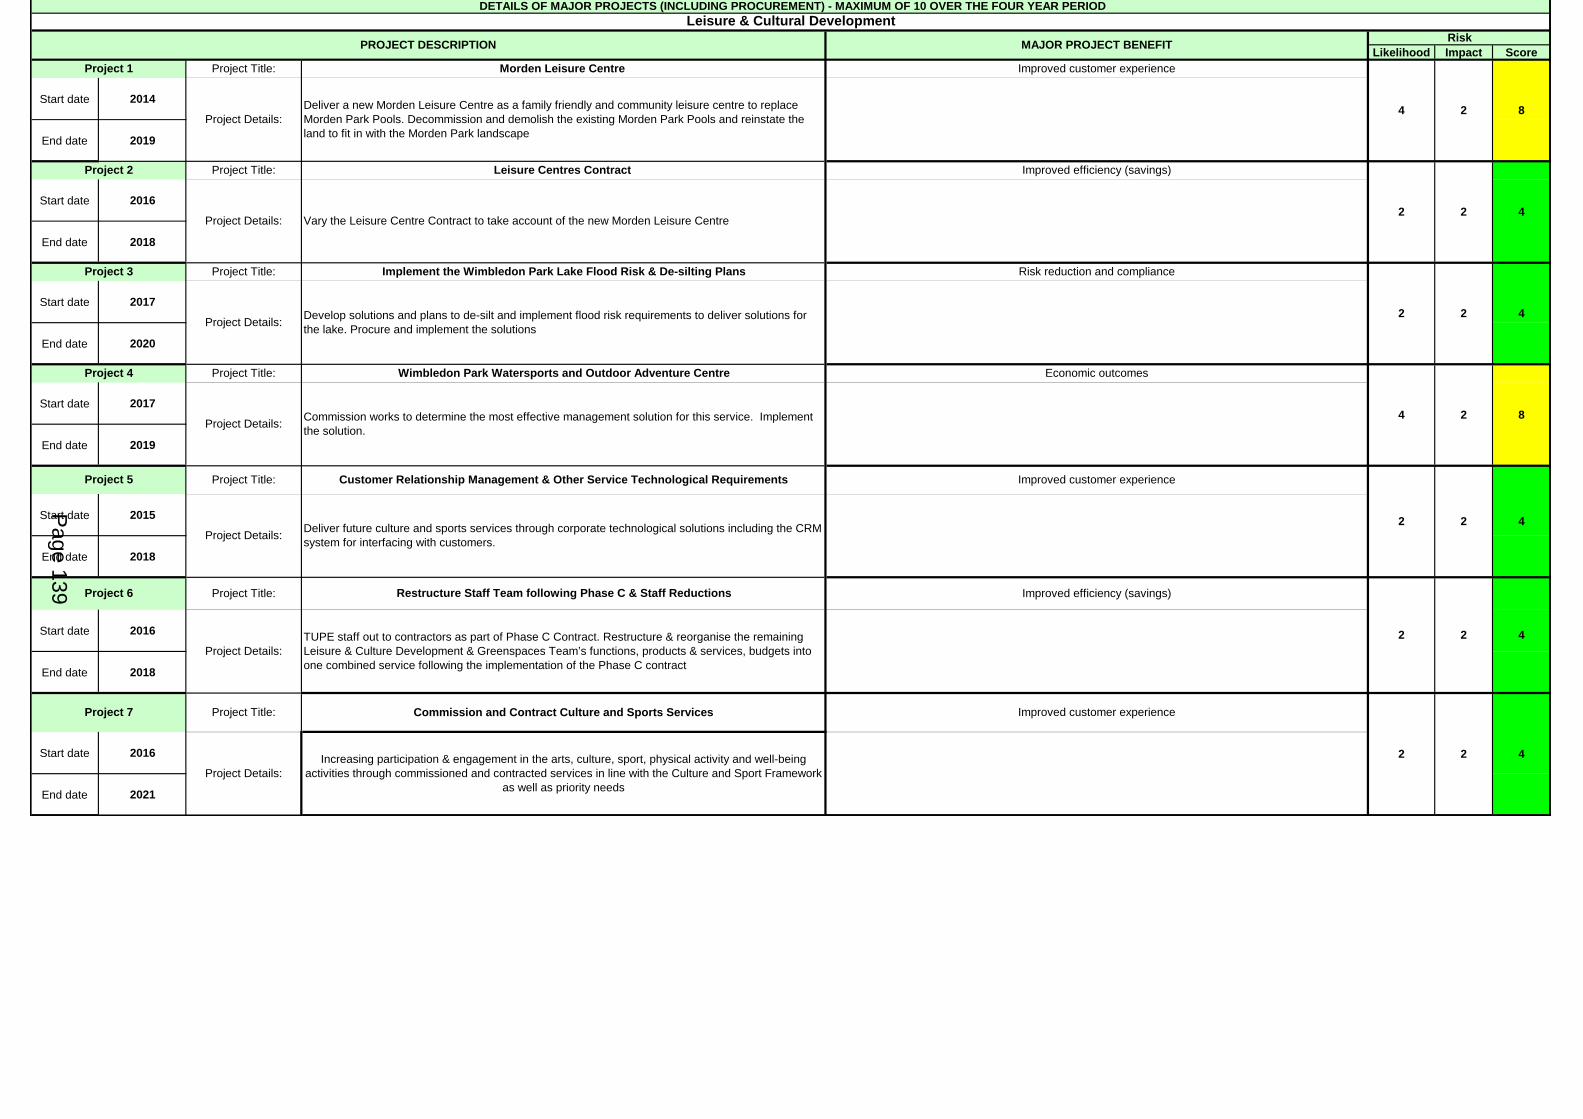
Likelihood Impact Score
Start date 2014
End date 2019
Start date 2016
End date 2018
Start date 2017
End date 2020
Start date 2017
End date 2019
Start date 2015
End date 2018
Start date 2016
End date 2018
Start date 2016
End date 2021
Increasing participation & engagement in the arts, culture, sport, physical activity and well-being activities through commissioned and contracted services in line with the Culture and Sport Framework
as well as priority needs
Risk
Improved efficiency (savings)
4
4
Improved customer experience
Commission and Contract Culture and Sports Services
4
2
2
Restructure Staff Team following Phase C & Staff Reductions
2
Leisure Centres Contract
Vary the Leisure Centre Contract to take account of the new Morden Leisure Centre2
2
2
Project Details:
4
2
2 8
2
Project Title:
4
Project Title:
Project Details:
22
Project Details:4
Morden Leisure Centre
Deliver a new Morden Leisure Centre as a family friendly and community leisure centre to replace Morden Park Pools. Decommission and demolish the existing Morden Park Pools and reinstate the land to fit in with the Morden Park landscape
Improved customer experience
Project Details:
DETAILS OF MAJOR PROJECTS (INCLUDING PROCUREMENT) - MAXIMUM OF 10 OVER THE FOUR YEAR PERIODLeisure & Cultural Development
PROJECT DESCRIPTION MAJOR PROJECT BENEFIT
Project Title:
Project Title:
Project 1
8
2 4
Project 7
Improved efficiency (savings)
Develop solutions and plans to de-silt and implement flood risk requirements to deliver solutions for the lake. Procure and implement the solutions
Wimbledon Park Watersports and Outdoor Adventure Centre
Project Title:
Risk reduction and compliance
Economic outcomes
Project 2
Improved customer experience
Project 3
Project 4
Project Details:
TUPE staff out to contractors as part of Phase C Contract. Restructure & reorganise the remaining Leisure & Culture Development & Greenspaces Team’s functions, products & services, budgets into one combined service following the implementation of the Phase C contract
Project Title:
Project Title:
Project 6
Project Details:
Project 5 Customer Relationship Management & Other Service Technological Requirements
Deliver future culture and sports services through corporate technological solutions including the CRM system for interfacing with customers.
Implement the Wimbledon Park Lake Flood Risk & De-silting Plans
Project Details:
Commission works to determine the most effective management solution for this service. Implement the solution.
Page 139

2015/16(A) 2016/17(T) 2017/18(P) 2018/19(P) 2019/20(P) 2020/21(P)94% 90% 90% 90% 90% 90%15.50 9 8 8 8 8
56.47% 54% 54% 54% 54% 54%23% 21% 21% 21% 21% 21%
20.8% 25% 25% 25% 25% 25%
n/a 95% 95% 95% 95% 95%
Final Budget2015/16
Actual 2015/16
Budget2016/17
Forecast Variance
2016/17 P8
Budget 2017/18
Budget 2018/19
Budget 2019/20
Budget 2020/21
5,872 6,426 5,426 190 6,043 6,034 6,086 6,1363,177 3,106 2,945 72 3,078 3,109 3,141 3,172
641 639 619 17 646 652 659 665124 106 124 22 82 84 85 87503 1,108 377 79 477 425 433 440264 227 265 0 268 272 276 280
0 0 0 0 0 0 0 01,031 1,108 1,020 0 1,380 1,380 1,380 1,380
132 132 76 0 112 112 112 112Final Budget
2015/16Actual
2015/16Budget2016/17
Variance 2016/17 P8
Budget 2017/18
Budget 2018/19
Budget 2019/20
Budget 2020/21
15,604 12,331 17,188 272 16,286 15,949 16,126 16,1260 0 0 0 0 0 0 0
118 126 0 38 118 118 118 11815,486 12,205 17,188 234 16,168 15,831 16,008 16,008
(9,732) (5,905) (11,762) 462 (10,243) (9,915) (10,040) (9,990)Final Budget
2015/16Actual
2015/16Budget2016/17
Variance 2016/17 P8
Budget 2017/18
Budget 2018/19
Budget 2019/20
Budget 2020/21
100 756 (20) 60150 174 0 156 150 150 150
0 250 930 (20) 156 150 210 150
Summary of major budget etc. changes2017/18
2018/19
Capital Budget £'000s
Other
Parking
2019/20
Customer & client receipts
Transport
2020/21
Council Funded Net Budget
Revenue £'000s
Income
Support servicesTransfer payments
ReservesCapital Funded
Supplies & Services
ExpenditureEmployees
Recharges
Government grantsReimbursements
Depreciation
DEPARTMENTAL BUDGET AND RESOURCES
3rd party payments
Revenue £'000s
Premises
Business critical
Business critical
Business critical
Monthly
High
Low
Low
High
Polarity
High Low Quality
Business criticalMonthly
Reporting cycle
MonthlyMonthly
12
86.20
15 12
93.27
251,204 263,764
83.57
12
276,952
83.572020/212017/18 2018/19
Transport Plan
239,242
2016/17
The Corporate strategies your service contributes to2018/19
21,043 22,0952017/18
Planning Assumptions
18,320 20,00412019/202015/16
Enter a brief description of your main activities and objectives below Number of resident permits issued2020/21
Percentage of cases where council does not contest at PATAS due to new evidence
Transport
Percentage of cases lost at PATAS
Sickness- No of days per FTE (12 month rolling average)Percentage of cases won at PATAS
Staff (FTE)
2016/17Parking & CCTV Services
Anticipated non financial resources
Cllr Ross Garrod: Cabinet Member for Street Cleanliness & Parking Anticipated demand
227,000
Actual Performance (A) Performance Target (T) Proposed Target (P)
% of parking permits issued within 5-7 days
Performance indicator
Number of visitors permits issued23,199
2015/16
Safer & Stronger Strategic Assessment24,358
Outcome
Loss of income
12
Indicator type
Loss of income
Main impact if indicator not met
Loss of incomeLoss of income
Percentage of Public Space CCTV cameras working
Loss of income
Reduced service delivery
Monthly
Monthly
290,799
1283.57
2019/2083.57
The service is required to enforce the parking regulations to ensure the through flow of traffic can be maintained and ensuring residents and blue badge holders have the ability to park in bays they have a permit or badge for. Surplus income generated by traffic management must be used for transport related areas. Objectives ● enforce parking regulations across the borough including Controlled Parking Zones and bus lanes ● to implement measures to improve traffic enforcement efficiency , specifically the introduction of Automatic Number Plate Recognition (ANPR) cameras at bus lane and moving traffic locations. This will improve compliance and ease congestion at key points across the borough ● to maintain a survey of parking needs, hours of operation, the availability of parking spaces and the charging structure ● to monitor the borough 's parking infrastructure to ensure that locations subject to regulatory controls can be effectively enforced thus improving compliance and ultimately congestion ● to take account in business planning of the increase in population and changes in planning legislation allowing business premises to be changed to residential use which could result in an increase in demand for parking spaces in existing CPZ's and pressure in areas with no controlled parking to introduce CPZ's. Since January 2016 Public Space CCTV camera team, whose core activity is to review the operational structure , processes and number of CCTV cameras throughout the borough with the aim of achieving efficiencies without reducing the level of service to the residents, customers and our partners, was amalgamated with Parking Services.
Now includes CCTV budgets (previously within Safer Merton) EV11 = (£125k) E&R7 = (£163k) E&R8 = £1,540k ENV02 = (£190k) ENV03 = (£45k) ENV04 = (£250k) ENV05 = (£70k) ENV06 = (£46k) ENV33 = (£250k)
E&R7 = (£163k) E&R8 = £500k ENV07 = (£60k)
ENR2 = (£44k) ENR3 = (£33k) ENR4 = (£100k)
2017/18 Expenditure Employees
Premises
Transport
Supplies & Services
3rd party payments
Transfer payments
Support services
Depreciation
2017/18 Income
Government grants
Reimbursements
-14,000
-12,000
-10,000
-8,000
-6,000
-4,000
-2,000
02015 2016 2017 2018 2019 2020
£'00
0s
Budget Actual
Page 140

Likelihood Impact Score
Start date 2015-2016
End date 2017-18
Start date 2015-2016
End date 2017-18
Start date 2016-17
End date 2017-18
Start date 2016-17
End date 2017-18
2
DETAILS OF MAJOR PROJECTS (INCLUDING PROCUREMENT) - MAXIMUM OF 10 OVER THE FOUR YEAR PERIODParking & CCTV Services
PROJECT DESCRIPTION MAJOR PROJECT BENEFIT
1 2
Project 1
Risk
Project 2
Review CEO Shift Patterns
Project Title:
1
Project Title:
Project Details:
Tackling Traffic Congestion
Replace the existing Bus Lane and Moving Traffic enforcement cameras and back office system with an Automatic Number Plate Recognition (ANPR) to enable unmanned enforcement of the above type of enforcement contraventions. The improvement of traffic congestion will lead to improved bus journey times, traffic flows, pollution and the safety of pedestrians and cyclists.
Improved effectiveness
Project Title:
Project 3
Project 4
2
2Consult on the introduction of a more efficient shift patterns
Review CCTV Shift Patterns
Project Details:
Project Details:
Project Details:22
Project Title:
1
1
Improved effectiveness
2Consult on the introduction of a more efficient shift patterns
Infrastructure renewalInvestment in Public Space CCTV
Replace existing public space CCTV equipment On Street and in the back office CCTV suite
2
Improved effectiveness
Page 141

2015/16(T) 2016/17(T) 2017/18(P) 2018/19(P) 2019/20(P) 2020/21(P)
73 74 75 76 77 77
72 73 74 75 76 76
5 5 5 5 6 6130 130 130 130 130 130
Final Budget2015/16
Actual 2015/16
Budget2016/17
Forecast Variance
2016/17 P8
Budget 2017/18
Budget 2018/19
Budget 2019/20
Budget 2020/21
5,975 5,990 5,118 80 3,144 3,212 3,278 3,3462,370 2,450 2,231 83 462 505 547 590
744 678 742 -8 367 378 388 399272 275 274 21 16 20 24 27612 557 556 -24 303 313 322 332
50 48 40 8 1,132 1,132 1,133 1,1340 0 0 0 0 0 0 0
1,583 1,638 925 0 532 532 532 532344 344 350 0 332 332 332 332
Final Budget2015/16
Actual 2015/16
Budget2016/17
Variance 2016/17 P8
Budget 2017/18
Budget 2018/19
Budget 2019/20
Budget 2020/21
2,808 2,525 2,261 123 1,258 1,358 1,358 1,3588 9 8 (1) 0 0 0 0
221 235 94 (111) 174 174 174 1741,979 1,701 2,159 235 1,084 1,184 1,184 1,184
600 580
3,167 3,465 2,857 203 1,886 1,854 1,920 1,988
Final Budget2015/16
Actual 2015/16
Budget2016/17
Variance 2016/17 P8
Budget 2017/18
Budget 2018/19
Budget 2019/20
Budget 2020/21
201 308 295 30034 28
0 0 0 0 235 336 295 300
Additional Expenditure Information Financial Information
The Corporate strategies the service contributes to
Open Space Strategy
Reputational riskReputational risk
Reputational risk
Attendance at major community outdoor events (No. of people)
2015/16
Reputational risk
Main impact if indicator not met
Cllr Nick Draper Cabinet Member for Community & CultureParks & Green Spaces
Number of funerals at LBM cemeteries
Anticipated non financial resources
Anticipated demand
Increased sports pitch demand (Total number of bookings)
Planning Assumptions
Performance Targets (T) & Provisional Performance Targets (P)
Residents % satisfaction with parks & green spaces
2016/17
1%
Young peoples % satisfaction with parks & green spaces
Number of outdoor events in parks
1%1%1% 1%
2017/18 2019/202018/19 2020/21
Idverde UK Ltd
Number of Green Flags
Performance indicator
55,000
215 220
55,000 60,000
Quality
Biennial Perception
Reporting cycle
60,000
240
2018/192015/16 2016/17 2017/18 2019/20
210
OutputHigh Annual
2020/21
Polarity Indicator type
Perception
Sufficient resources to provide service
260
Commissioned Service
Service Provider:
i dverde UK Ltd
1%
260
60,00060,000
Government grants
High
Expenditure
3rd party paymentsTransfer payments
Transport
Biennial
Monthly
High
High
Customer & client receipts
Revenue £'000s
Revenue £'000s
Premises
Supplies & Services
Support services
Reimbursements
Employees
Income
Depreciation
Parks InvestmentOther
RechargesReserves
Council Funded Net Budget
Capital Budget £'000s
The service maintains and develops Merton's numerous parks & open spaces (more than 115 separate sites), including sports facilities (including pavilions), gardens, playgrounds (more than 40), the borough's highways verges, and the management of its cemetery and allotments services. The portfolio also includes support for, and the production of, a varied programme of outdoor events from small community to large commercial ones in parks, including the annual civic fireworks displays, Mitcham Carnival and elements of the Wimbledon (tennis) Championships. The service manages more than 50,000 Council-owned trees and several nature reserves. Greenspaces serves as the managing agent for Mitcham Common (for the Mitcham Common Conservators) and the Merton & Sutton Joint Cemetery (for the Merton & Sutton Joint Cemetery Board). The grounds maintenance elements of the service are outsourced to idverde UK Limited, overseen by the Greenspaces client team who, in addition, retain overall responsibility for policy, strategy & investment in parks & open spaces.
Page 142

Likelihood Impact Score
Start date 01/07/2016
End date 01/07/2018
Start date 01/04/2017
End date 31/03/2018
Start date 01/07/2017
End date 31/03/2018
Start date 01/04/2017
End date 31/03/2018
Start date 01/02/2017
End date 31/03/2018
6Project Details: Embedding new systems & processes and ensuring quality & performance standards in relation to Phase C, Lot 2 grounds maintenance contract
Working with our new gounds maintenance service provider, idverde, to maintain & improve Greenspaces services ata a lower cost
Project 5 Project Title: Phase C, Lot 2 Contract
3 2
6Project Details: Increased commecialisation across a range of Greenspaces services, including sport provisions &
outdoor events in particular
Diversifying the outdoor events portfolio, including new commercial events to increase income. Working with our new grounds maintenance service provider, idverde, to increase income for the service, especially
from sport & recreational activities
6Project Details: Target Operating Model covering the full range of Greenspaces services Various benefits across a range of services/themes as outlined in Greenspaces TOM 2016-2018
Project 2 Project Title: Greenspaces Commercialisation
3 2
Project 1 Project Title: Greenspaces TOM
3 2
DETAILS OF MAJOR PROJECTS Parks & Green Spaces
PROJECT DESCRIPTION MAJOR PROJECTS BENEFITS Risk
Project 3 Project Title: Canons Rec Restoration
3
Project 4 Project Title: Morley Park
3 2 6Project Details: Transfer, opening & establishment of Morley Park Opening of a brand new public open space in West Wimbledon, comprising informal recreational areas, nature conservation features and sports facilities, including a large new sports pavilion/educational facility.
6Project Details: Management & delivery of Canons Lottery Bid and Canons restoration (Phase 1) (Pending securing funding from Heritage Lottery Fund bid)
Major multi-million pound investment project to restore, conserve and improve recreational opportunities at Canons Recreation Ground and Canons House.
2
Page 143
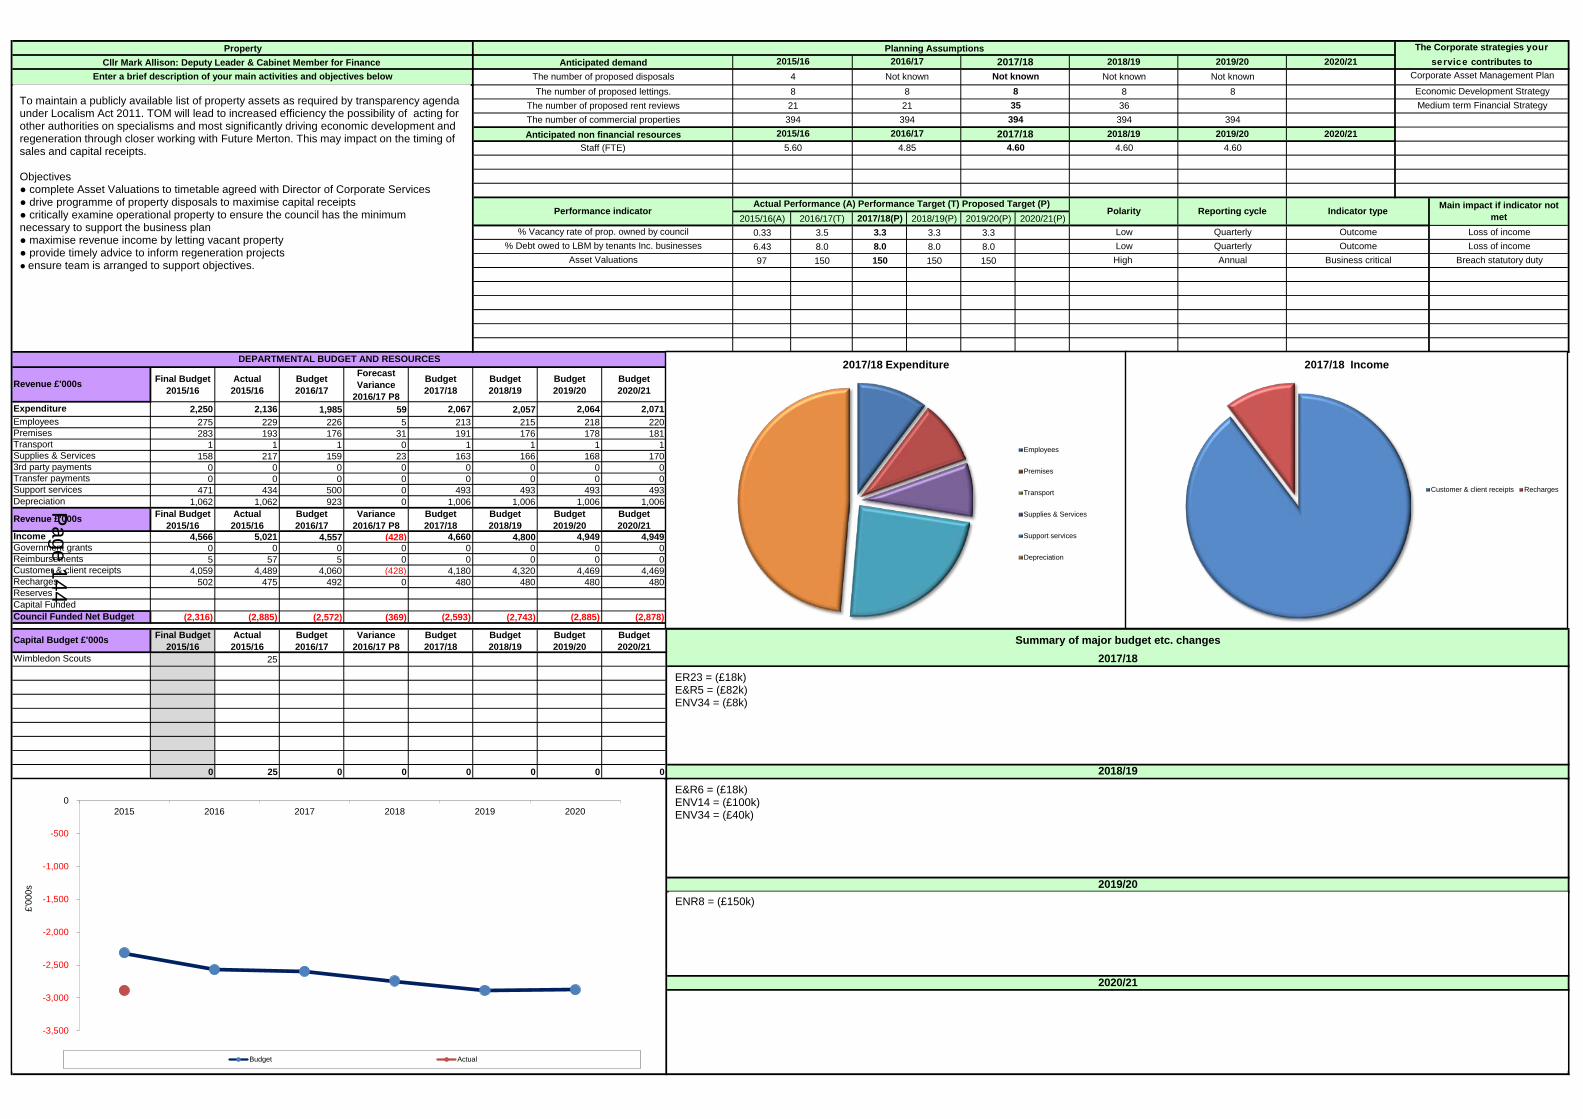
2015/16(A) 2016/17(T) 2017/18(P) 2018/19(P) 2019/20(P) 2020/21(P)0.33 3.5 3.3 3.3 3.36.43 8.0 8.0 8.0 8.097 150 150 150 150
Final Budget2015/16
Actual 2015/16
Budget2016/17
Forecast Variance
2016/17 P8
Budget 2017/18
Budget 2018/19
Budget 2019/20
Budget 2020/21
2,250 2,136 1,985 59 2,067 2,057 2,064 2,071275 229 226 5 213 215 218 220283 193 176 31 191 176 178 181
1 1 1 0 1 1 1 1158 217 159 23 163 166 168 170
0 0 0 0 0 0 0 00 0 0 0 0 0 0 0
471 434 500 0 493 493 493 4931,062 1,062 923 0 1,006 1,006 1,006 1,006
Final Budget2015/16
Actual 2015/16
Budget2016/17
Variance 2016/17 P8
Budget 2017/18
Budget 2018/19
Budget 2019/20
Budget 2020/21
4,566 5,021 4,557 (428) 4,660 4,800 4,949 4,9490 0 0 0 0 0 0 05 57 5 0 0 0 0 0
4,059 4,489 4,060 (428) 4,180 4,320 4,469 4,469502 475 492 0 480 480 480 480
(2,316) (2,885) (2,572) (369) (2,593) (2,743) (2,885) (2,878)
Final Budget2015/16
Actual 2015/16
Budget2016/17
Variance 2016/17 P8
Budget 2017/18
Budget 2018/19
Budget 2019/20
Budget 2020/21
25
0 25 0 0 0 0 0 0
Council Funded Net Budget
Revenue £'000s
Income
Summary of major budget etc. changes2017/18
2018/19
Capital Budget £'000s
Wimbledon Scouts
2019/20
2020/21
Revenue £'000s
Capital Funded
Supplies & Services
ExpenditureEmployeesPremises
Customer & client receipts
Transport
Support services
Reserves
3rd party payments
Depreciation
Recharges
Government grantsReimbursements
DEPARTMENTAL BUDGET AND RESOURCES
Indicator type
Outcome
AnnualHigh
Polarity
LowLow
Reporting cycle
8
4.602020/21
3943942017/18
Medium term Financial Strategy394
4.60
21 36
4.85 4.60
3942015/16
5.60
Not known Not knownEconomic Development Strategy8
2018/19394
358 8
2016/17
Transfer payments
4821
The Corporate strategies your service contributes to2015/16 2016/17 2017/18
Not known
Asset Valuations
Corporate Asset Management Plan2019/20
Not known2018/19
% Debt owed to LBM by tenants Inc. businessesQuarterlyQuarterly
Performance indicator
Staff (FTE)
Main impact if indicator not met
2019/20
Planning Assumptions
Actual Performance (A) Performance Target (T) Proposed Target (P)
Property
The number of proposed rent reviewsThe number of commercial propertiesAnticipated non financial resources
Cllr Mark Allison: Deputy Leader & Cabinet Member for Finance Enter a brief description of your main activities and objectives below
Anticipated demand 2020/21
Loss of incomeBreach statutory duty
OutcomeBusiness critical
The number of proposed disposalsThe number of proposed lettings.
Loss of income% Vacancy rate of prop. owned by council
To maintain a publicly available list of property assets as required by transparency agenda under Localism Act 2011. TOM will lead to increased efficiency the possibility of acting for other authorities on specialisms and most significantly driving economic development and regeneration through closer working with Future Merton. This may impact on the timing of sales and capital receipts. Objectives ● complete Asset Valuations to timetable agreed with Director of Corporate Services ● drive programme of property disposals to maximise capital receipts ● critically examine operational property to ensure the council has the minimum necessary to support the business plan ● maximise revenue income by letting vacant property ● provide timely advice to inform regeneration projects ● ensure team is arranged to support objectives.
ER23 = (£18k) E&R5 = (£82k) ENV34 = (£8k)
E&R6 = (£18k) ENV14 = (£100k) ENV34 = (£40k)
ENR8 = (£150k)
2017/18 Expenditure
Employees
Premises
Transport
Supplies & Services
Support services
Depreciation
2017/18 Income
Customer & client receipts Recharges
-3,500
-3,000
-2,500
-2,000
-1,500
-1,000
-500
02015 2016 2017 2018 2019 2020
£'00
0s
Budget Actual
Page 144

Likelihood Impact Score
Start date 2016-17
End date on going
Start date 2012-13
End date on going
DETAILS OF MAJOR PROJECTS (INCLUDING PROCUREMENT) - MAXIMUM OF 10 OVER THE FOUR YEAR PERIODProperty
PROJECT DESCRIPTION MAJOR PROJECT BENEFIT
Project 2
Risk
Improved efficiency (savings)
4
2 21
2 2
Infrastructure renewalProject Title:Project 1
Project Title: P4/Broadway Car Park
Disposal of public car park to regenerate prominent town centre site.
New secondary school
Project Details:
Project Details: Land acquisition and granting of new leases.
Page 145

2015/16(A) 2016/17(T) 2017/18(P) 2018/19(P) 2019/20(P) 2020/21(P)92 95 96 96 96
£381,257 £345,000 £345,000 £345,000 £345,00087 97 98 98 98105 100 100 100 100
N/A 40 40 40 40
N/A 18 18 18 18N/A 40 40 40 40N/A 35 35 35 35
100% 96% 95% 95% 95%N/A 15% 15% 15% 15%
Final Budget2015/16
Actual 2015/16
Budget2016/17
Forecast Variance
2016/17 P8
Budget 2017/18
Budget 2018/19
Budget 2019/20
Budget 2020/21
2,573 2,747 2,678 (86) 3,009 2,993 3,014 3,0111,872 2,075 1,975 (79) 2,026 2,006 2,025 2,019
0 0 0 1 0 0 0 039 37 39 (9) 47 48 48 49
189 173 54 (12) 61 62 62 63139 139 98 13 99 101 103 104
0 0 0 0 0 0 0 0334 323 512 0 776 776 776 776
Final Budget2015/16
Actual 2015/16
Budget2016/17
Variance 2016/17 P8
Budget 2017/18
Budget 2018/19
Budget 2019/20
Budget 2020/21
1,460 1,505 1,427 94 1,606 1,656 1,756 1,7560 1 0 0 0 0 0 0
1,116 1,125 1,003 51 1,132 1,132 1232 1232344 379 424 43 474 524 524 524
1,113 1,242 1,251 8 1,403 1,337 1,258 1,255 Final Budget
2015/16Actual
2015/16Budget2016/17
Variance 2016/17 P8
Budget 2017/18
Budget 2018/19
Budget 2019/20
Budget 2020/21
0 45 0
0 0 45 0 0 0 0 0
Summary of major budget etc. changes
Transfer payments
Capital Budget £'000s
Council Funded Net Budget
Revenue £'000s
Reimbursements
Recharges
Capital Funded
2019/20
182963571900
39.48
Reserves
Quarterly
Quarterly
Mortuary
2020/21
Low
2017/18
2018/19
OutcomeQuarterly% of food premises rated 2 or below
Main impact if indicator not metPolarity
High Reduced customer service
Loss of income
Income
Annual
Political risk
2019/20
Reputational risk
Monthly
Annual average amount of Particulates per m3Days particulate levels exceed 50 micrograms per m3
Days Nitrogen Dioxide levels exceed 200 micrograms per m3Low
Outcome
Low
Low
High
Low
Annual
6234
High High
5880 61131900
Total number of food premises2016/17 2017/182015/16
1803
1880
1816
Anticipated non financial resources38.48
2015/16
Licence/permit applications
2018/1941.7 39.48
Cllr Ross Garrod: Cabinet Member for Street Cleanliness & Parking 17905995
Political risk
Income generation by EHTSL
Medium term Financial Strategy
Performance indicator
No. of underage sales test purchases
EmployeesPremises
Revenue £'000s
Staff (FTE)
DEPARTMENTAL BUDGET AND RESOURCES
3rd party payments
Support services
Supplies & Services
Expenditure
Transport
High Quarterly Business critical
Business critical
Cllr Nick Draper: Cabinet Member for Community & Culture Anticipated demandThe Corporate strategies your
service contributes to
2019/20
Indicator type
Perception
Air Quality Action Plan
Climate Change Strategy
% of category A,B & non-compliant C food premises inspected
Planning Assumptions
Actual Performance (A) Performance Target (T) Proposed Target(P)
% service requests replied in 5 working days
Total number of service requests
Regulatory Services Partnership
Business critical
38.48
Merton Regeneration Strategy
Government interventionAnti social behaviour
Customer & client receipts
Government grants
Reputational risk
Political risk
Political riskAnnual average amount of Nitrogen Dioxide per m3
Number of licence applications determined within 28 days
2018/19
AnnualQuarterly
OutcomeOutcome
Monthly
Reporting cycle
OutcomeOutcome
2020/21
182963571900
2020/2138.48
1777
1890 1900
2016/17 2017/18
A brief description of your main activities and objectives:
Provide statutory environmental health, trading standards and licensing functions across those councils that make up the Regulatory Services Partnership (currently LB Merton and LB Richmond).
Deliver savings and efficiencies by:
• reducing overheads
• generating additional income
• attracting new business
• rationalising ICT systems
Transform the service by:
• demand management
• streamlining business processes
• implementing new ways of working
E&R14 = (£100k) ENV09 = (£50k) ENV10 = (£10k)
ENV08 = (£40k) ENV09 = (£50k)
ENR1 = (£100k)
2017/18 Expenditure
Employees
Premises
Transport
Supplies & Services
3rd party payments
Transfer payments
Support services
2017/18 Income
Government grants
Reimbursements
800
900
1,000
1,100
1,200
1,300
1,400
1,500
2015 2016 2017 2018 2019 2020
£'00
0s
Budget Actual
Page 146

Likelihood Impact Score
Start date 2016-17
End date 2017-18
Start date 2015-16
End date 2017-18
Start date 2015-16
End date 2017-18
Start date 2014-15
End date 2017-18
DETAILS OF MAJOR PROJECTS (INCLUDING PROCUREMENT) - MAXIMUM OF 10 OVER THE FOUR YEAR PERIODRegulatory Services Partnership
PROJECT DESCRIPTION MAJOR PROJECT BENEFITSRisk
Economic outcomes
3
Project Title:Project 1
Project Details:
Improved efficiency (savings)
Rationalisation of administration and licensing teams Improved effectiveness
Project Details:
Project Title:
Project Details:
Project Title:
Design and implement a joint Merton/Richmond budget Project 4
2
Project 3
Potential expansion of the Regulatory Services Partnership to include the London Borough of Wandsworth in 2017.6
Expansion of shared 'regulatory' service
2Contribution to the ICT led procurement of a new computer system for E&R and potential joint procurement with Richmond and Wandsworth
Procurement of a new ICT case management system
2
Project 2
1 22Project Details: Rationalisation of the Merton and Richmond administration and licensing teams to improve business processes, generate
efficiencies and improve the outcomes for customers
12
1
Project Title: Economic outcomes
2Design and implement a joint revenue (income & expenditure) budget on a to be determined costs apportionment model
Page 147

2015/16(A) 2016/17(T) 2017/18(P) 2018/19(P) 2019/20(P) 2020/21(P)n/a 100 150 150 150n/a 5 8 8 8278 153 153 153 153n/a 10 10 10 10n/a 884 850 850 850n/a 1373 1373 1373 1373
Final Budget2015/16
Actual 2015/16
Budget2016/17
Forecast Variance
2016/17 P8
Budget 2017/18
Budget 2018/19
Budget 2019/20
Budget 2020/21
790 567 799 (80) 644 652 659 656360 270 377 (32) 346 350 354 358
2 0 2 (1) 0 0 0 06 1 7 (3) 1 1 1 1
62 50 21 1 10 11 11 dave251 139 252 (45) 168 171 174 178
0 0 0 0 0 0 0 0109 107 140 0 119 119 119 119
0 0 0 0 0 0 0 0Final Budget
2015/16Actual
2015/16Budget2016/17
Variance 2016/17 P8
Budget 2017/18
Budget 2018/19
Budget 2019/20
Budget 2020/21
200 162 155 (32) 76 76 76 76154 102 108 (27) 76 76 76 7646 60 47 (5) 0 0 0 00 0 0 0 0 0 0 0
590 405 644 (112) 568 576 583 580
Final Budget2015/16
Actual 2015/16
Budget2016/17
Variance 2016/17 P8
Budget 2017/18
Budget 2018/19
Budget 2019/20
Budget 2020/21
86 514 0 0 0 0 0
0 86 514 0 0 0 0 0
38%2015/16
2020/212015/16 2016/17 2017/18 2018/19
2020/21
400210,902
Low Quarterly Quality
Safeguarding issuesReduced service delivery
Customer hardshipCustomer hardship
Reduced enforcement
Main impact if indicator not met
Planning Assumptions
Actual Performance (A) Performance Target (T) Proposed Target (P)
Number of Community Protection Warnings Issued Reduced enforcement
Transfer payments
Safer Merton
No. Multi Agency Risk Assessment cases (domestic abuse)
% of all residents actively engaged in Neighbourhood Watch schemes
Anticipated non financial resources
Cllr Edith Macauley: Cabinet Member for Community Safety, Engagement & Equalities Anticipated demandNumber of new, actionable, ASB cases
PopulationEnter a brief description of your main activities and objectives below
2019/20
Support services
Customer & client receipts
Transport
Government grantsReimbursements
Depreciation
Number of Community Protection Notices Issued
EmployeesPremises
Performance indicator
Revenue £'000s
DEPARTMENTAL BUDGET AND RESOURCES
Reduction in residential burglary
Staff (FTE)
Multi Agency Risk Assessment cases - domestic abuseNumber of new Neighbourhood Watch schemes
Total Violence with Injury
The Corporate strategies your service contributes to
Safer & Stronger Strategic Assessment4003502019/20
400
7.99
204,405160
360205,722
162207,410
17040%
209,77117043%
208,607170
2016/17 2017/18 2018/1940%
7.999.10
38%
18.83 7.99
Annual
PolarityPolarity
Low
Reporting cycle
LowHigh
Indicator type
OutcomeQuarterlyQuarterlyMonthly
Perception
PerceptionBusiness critical
PerceptionQuarterlyLow
Low
2020/21
ReservesCapital Funded
Supplies & Services
Expenditure
3rd party payments
2018/19
Capital Budget £'000s
CCTV
Revenue £'000s
Income
2019/20
Recharges
Council Funded Net Budget
Summary of major budget etc. changes2017/18
E&R43 = (£70k)
2017/18 Expenditure
Employees
Premises
Transport
Supplies & Services
3rd party payments
Transfer payments
Support services
2017/18 Income
Government grants
0
100
200
300
400
500
600
700
2015 2016 2017 2018 2019 2020
£'00
0s
Budget Actual
Safer Merton delivers the council's statutory Community Safety Partnership function to tackle crime and disorder. The team consists of eight officers working across several themes: 1) Tackling anti-social behaviour in non social housing 2) Protecting victims of Domestic Violence and Abuse and taking action against perpetrators 3) Managing and delivering a borough wide Neighbourhood Watch programme 4) Delivering the partnerships analytical functions The service also ensures that MOPACs priorities are delivered, appropriate support services are commissioned (which fall within Safer Merton's remit) as well as ensuring that the Community Safety Partnership is compliant with legislation. Safer Merton is managed through the councils Public Protection service, and its work delivered in partnership with Police, London Fire Brigade, Probation services, alongside other statutory and non statutory partners The statutory duty for Safer Merton consists of the following: 1) A duty to establish a crime and disorder partnership and deliver an annual partnership plan 2) Completion of an annual strategic assessment governed by the Community Safety Partnership 3) Respond to and deal with crime and disorder through evidence based analytical work in a timely and effective manner
Page 148

Likelihood Impact Score
Start date 01/04/2017
End date 31/03/2018
Start date
End date
0Project Details:
Project 2 Project Title: Select one major benefit
Roll out of wider NO MORE campaign
Improved victim awareness, increased profile for Merton as a pro-active borough in addressing crime and ASB and associated reputational benefits across London
Risk
42 2Building on the success of the UK SAYS NO MORE launch in September 2016, where Merton was the second London borough to launch the campaign to condemn Domestic Violence and Sexual Violence,
the Community Safety Partnership wish to roll the programme out across other strands of key business. This will ensure that Merton's residents and businesses are fully aware of the Community
Safety Partnership's commitment to tackling a range of issues affecting our residents
DETAILS OF MAJOR PROJECTS (INCLUDING PROCUREMENT) - MAXIMUM OF 10 OVER THE FOUR YEAR PERIODSafer Merton
PROJECT DESCRIPTION MAJOR PROJECT BENEFITS
Merton says NO MORE Improved customer experienceProject Title:Project 1
Page 149
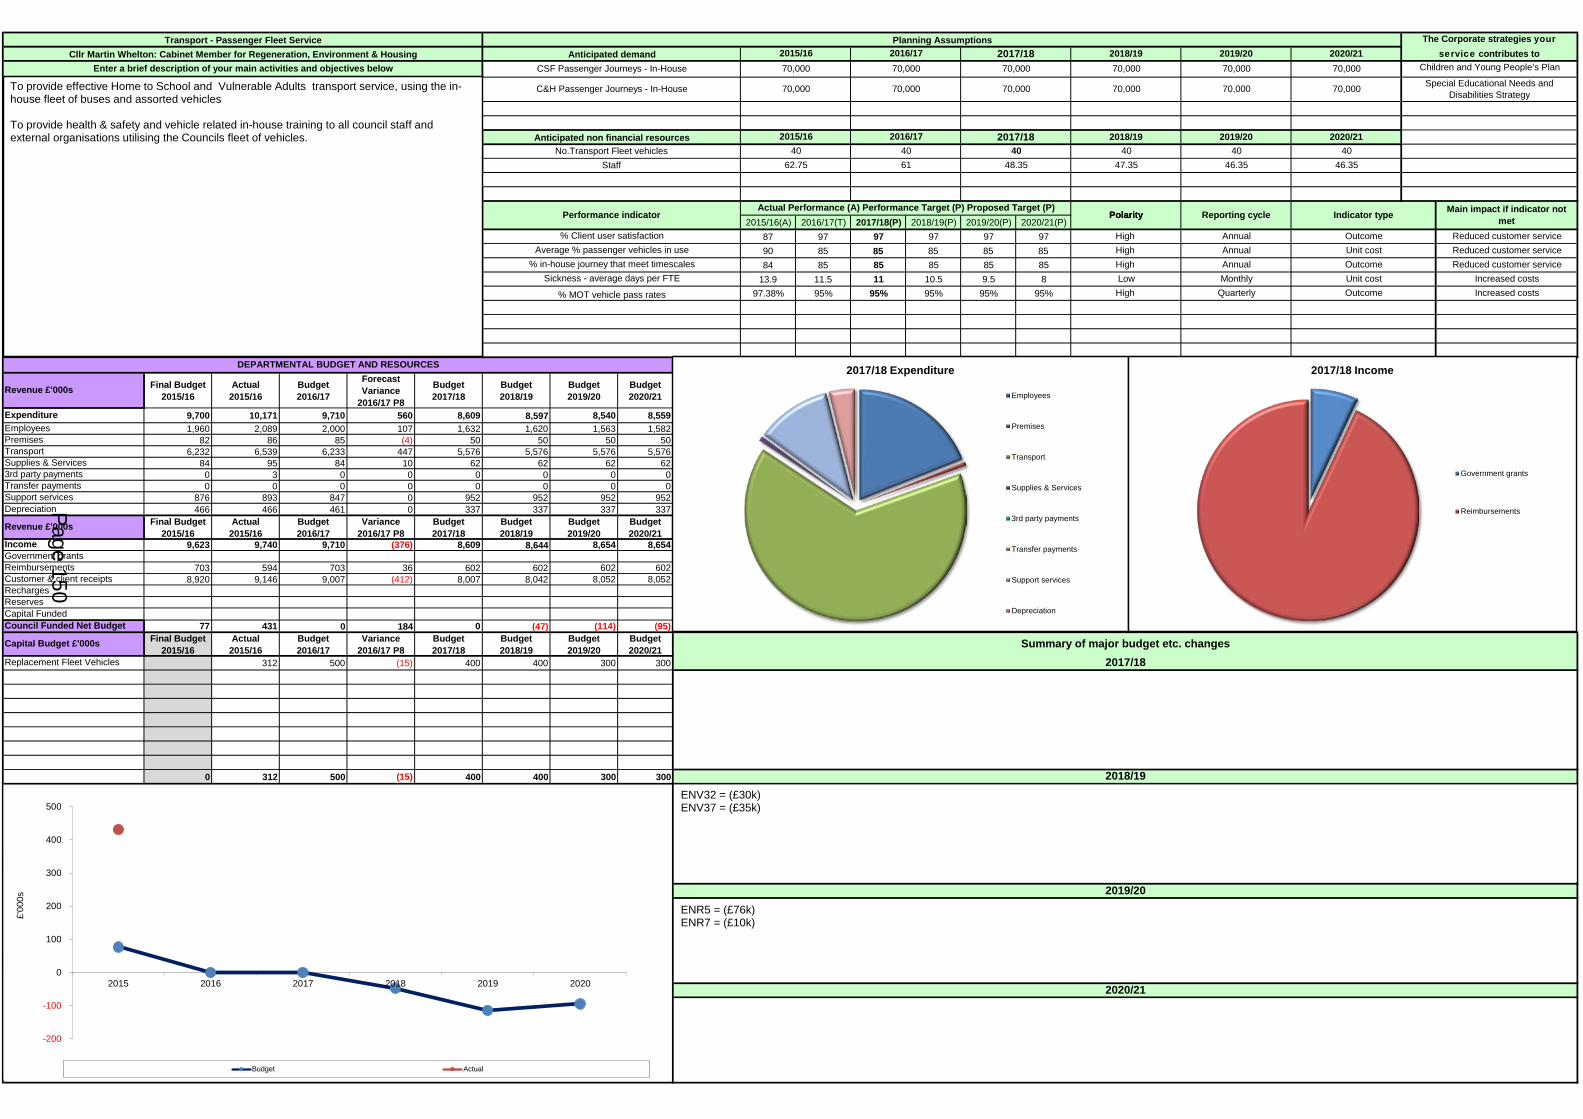
2015/16(A) 2016/17(T) 2017/18(P) 2018/19(P) 2019/20(P) 2020/21(P)87 97 97 97 97 9790 85 85 85 85 8584 85 85 85 85 85
13.9 11.5 11 10.5 9.5 897.38% 95% 95% 95% 95% 95%
Final Budget2015/16
Actual 2015/16
Budget2016/17
Forecast Variance
2016/17 P8
Budget 2017/18
Budget 2018/19
Budget 2019/20
Budget 2020/21
9,700 10,171 9,710 560 8,609 8,597 8,540 8,5591,960 2,089 2,000 107 1,632 1,620 1,563 1,582
82 86 85 (4) 50 50 50 506,232 6,539 6,233 447 5,576 5,576 5,576 5,576
84 95 84 10 62 62 62 620 3 0 0 0 0 0 00 0 0 0 0 0 0 0
876 893 847 0 952 952 952 952466 466 461 0 337 337 337 337
Final Budget2015/16
Actual 2015/16
Budget2016/17
Variance 2016/17 P8
Budget 2017/18
Budget 2018/19
Budget 2019/20
Budget 2020/21
9,623 9,740 9,710 (376) 8,609 8,644 8,654 8,654
703 594 703 36 602 602 602 6028,920 9,146 9,007 (412) 8,007 8,042 8,052 8,052
77 431 0 184 0 (47) (114) (95)Final Budget
2015/16Actual
2015/16Budget2016/17
Variance 2016/17 P8
Budget 2017/18
Budget 2018/19
Budget 2019/20
Budget 2020/21
312 500 (15) 400 400 300 300
0 312 500 (15) 400 400 300 300
Outcome Increased costs
2020/2140
Reporting cycle
OutcomeAnnualHigh
High QuarterlyLow Monthly
Transport
Reduced customer service
Increased costs
Revenue £'000s
The Corporate strategies your service contributes to
Recharges
Reduced customer serviceReduced customer service
PolarityPolarity
Annual Unit cost
Transport - Passenger Fleet Service
C&H Passenger Journeys - In-House
Anticipated non financial resources
Cllr Martin Whelton: Cabinet Member for Regeneration, Environment & Housing Anticipated demandCSF Passenger Journeys - In-HouseEnter a brief description of your main activities and objectives below
Planning Assumptions
Transfer payments
DEPARTMENTAL BUDGET AND RESOURCES
EmployeesPremises
Actual Performance (A) Performance Target (P) Proposed Target (P)
% Client user satisfaction
Staff No.Transport Fleet vehicles
Sickness - average days per FTE% in-house journey that meet timescales
Average % passenger vehicles in use
Performance indicator
% MOT vehicle pass rates
Main impact if indicator not met
High
Children and Young People’s Plan
Special Educational Needs and Disabilities Strategy70,000
2015/16 2016/17 2017/18 2018/19 2019/2070,000 70,000
2020/2170,000
70,00070,000
70,000 70,000
70,000
2015/16 2016/17 2017/18 2018/19 2019/20
46.3540 40
62.75 46.35
70,000
6140
47.3540 40
48.35
Indicator type
Annual OutcomeHigh Unit cost
2019/20
ReservesCapital Funded
2020/21
2018/19
Capital Budget £'000s
Replacement Fleet Vehicles
Summary of major budget etc. changes2017/18
Support services
Customer & client receipts
Supplies & Services
Expenditure
3rd party payments
Reimbursements
Depreciation
Government grants
70,000
70,000
Council Funded Net Budget
Revenue £'000s
Income
ENV32 = (£30k) ENV37 = (£35k)
ENR5 = (£76k) ENR7 = (£10k)
2017/18 Expenditure
Employees
Premises
Transport
Supplies & Services
3rd party payments
Transfer payments
Support services
Depreciation
2017/18 Income
Government grants
Reimbursements
-200
-100
0
100
200
300
400
500
2015 2016 2017 2018 2019 2020
£'00
0s
Budget Actual
To provide effective Home to School and Vulnerable Adults transport service, using the in-house fleet of buses and assorted vehicles To provide health & safety and vehicle related in-house training to all council staff and external organisations utilising the Councils fleet of vehicles.
Page 150

Likelihood Impact Score
Start date
End date
Start date
End date
Start date
End date
Select one major benefit
0
0
Select one major benefit
DETAILS OF MAJOR PROJECTS (INCLUDING PROCUREMENT) - MAXIMUM OF 10 OVER THE FOUR YEAR PERIODTransport - Passenger Fleet Service
PROJECT DESCRIPTION MAJOR PROJECT BENEFIT
Project Title:
Project Title:
Project 2
Risk
Project 1
Project 3 Project Title: Select one major benefit
0Project Details:
Project Details: NO PROJECTS AT PRESENT
Project Details:
Page 151

2015/16(T) 2016/17(T) 2017/18(P) 2018/19(P) 2019/20(P) 2020/21(P)56 57 57 57 58 609.5 9 8.5 8 6 315 14.5 13 10 9 85.5 5.5 5.0 5.0 5.0 5.0
13.50 12.00 12 11 10 93700 3600 3600 3600 3500 3400
- - 90% 90% 95% 95%1 1 1 1 1 1
65% 68% 68% 68% 69% 70%38 38 42 46 48 5072 74 72 73 74 75
580 580 540 500 475 43560 59 59 65% 10% 5%55 50 50 50 40 30
910 910 910 910 910 91073 74 70 72 74 75
Outcome Reputational risk
Main impact if indicator not met
OutcomePerception
Outcome
Outcome
Reporting cyclePolarity
Noah's Ark (Stray Dogs / Enforcement)
Community Engagement and Enforcement
Client Neighbourhood team
6.69
Indicator type
2020/21
2020/21
1.5
210,902
Waste Management Strategy
Sufficient resources to provide service
Waste Management and Cleansing
Anticipated non financial resources
Anticipated demand 2015/16
Kingdom Ltd (Environmental Protection)
Service Providers:
Population 204,405
Planning Assumptions
Performance Targets (T) & Provisional Performance Targets (P)
6.69 6.69
% Sites surveyed below standard for weeds
2016/17 2017/18 2019/20
6.69
Veolia UK Ltd
The Corporate strategies the service contributes to2018/19
6.699 9 9 9
2018/192015/16
6.69
Noah's Ark
Performance indicator
% Sites surveyed below standard for Detritus% Sites surveyed below standard for graffiti
% Sites surveyed below standard for litter% Residents satisfied with street cleanliness
0 0 1.5 1.5 1.5
Viridor
High Low
Commissioned Service
Veolia UK Ltd
Cllr Ross Garrod Cabinet Member for Street Cleanliness & Parking
Clienting and Commissioning Team
Cllr Martin Whelton Cabinet Member for Regeneration, Environment & Housing
Viridor Waste Management
2016/17 2017/18
High
375
Number of fly tips reported
High % Residents satisfied with refuse collection
% Sites surveyed below standard for flyposting% of FPNs issued that have been paid
% Household waste recycled
LowHigh % of fly tips removed within 24 hours
High
Total waste arising per household Kg% Residents satisfied with recycling facilities
Residual waste kg per household pa% Municipal solid waste landfilled
Number of missed bins per 100,000
LowLowLow
Quarterly
Monthly
Monthly
Low
High
Monthly
AnnualQuarterlyQuarterlyQuarterlyQuarterly
AnnualMonthly
Monthly
LowLow
LowLow
PerceptionPerceptionPerceptionPerceptionPerception
OutcomeOutcome
OutputBusiness critical Reputational risk
Reputational riskIncreased costs
Reputational risk
MonthlyMonthlyMonthlyAnnual
Reputational riskReputational riskReputational riskReputational riskReputational risk
Kilometers of RoadsHousing Properties 83,000
Increased costsReduced customer service
Reputational risk
Reputational risk
Reputational riskLoss of income
Perception
83,500375 375 375 375 375
86,50084,000 85,000 86,000
207,410 208,607 209,77171,000
Perception
71,000 71,000205,722
Kingdom Ltd
Total household waste tonnage 71,000 71,000 71,000
2019/20
9 94SLWP 0 0 4 4 4
The London Borough of Merton is committed to managing the provision of high quality and sustainable waste management and cleansing services to residents, businesses and those passing through the borough. The service ambition is to maintain a clean, green and safe environment that meet the standards of London's Best Council. These services are delivered through a combination of commissioned services and in-house engagement and enforcement activities. The key objectives of the service are: To fulfil the council’s statutory responsibilities and duties with respect to waste management, street cleaning, waste enforcement and the management of stray animals. To provide value for money services that meet the needs of the community To provide a safe and supportive environment for our community and all employees engaged in delivering services. To promote and encourage sustainable waste management activities, maximising resource efficiency and securing value from all waste streams as far as practicably possible
Page 152

Final Budget2015/16
Actual 2015/16
Budget2016/17
Forecast Variance
2016/17 P8
Budget 2017/18
Budget 2018/19
Budget 2019/20
Budget 2020/21
21,088 21,467 20,025 698 15,457 15,777 15,767 16,1737,545 7,758 7,371 309 1,042 1,101 1,109 1,317
172 153 169 -13 146 147 148 1501,901 1,755 1,860 148 26 55 84 113
869 798 610 -108 301 310 319 3287,000 7,347 6,542 364 12,989 13,211 13,154 13,312
2 0 2 -2 2 2 2 22,956 3,013 2,828 0 366 366 366 366
643 643 643 0 585 585 585 585Final Budget
2015/16Actual
2015/16Budget2016/17
Variance 2016/17 P8
Budget 2017/18
Budget 2018/19
Budget 2019/20
Budget 2020/21
3,678 3,873 3,266 (293) 956 963 1,163 1,163333 357 0 0 0 0 0 0328 274 171 (102) 448 448 448 448
2,357 2,521 2,352 (191) 508 515 715 715660 721 743 0 0 0 0 0
17,410 17,594 16,759 405 14,501 14,814 14,604 15,010Final Budget
2015/16Actual
2015/16Budget2016/17
Variance 2016/17 P8
Budget 2017/18
Budget 2018/19
Budget 2019/20
Budget 2020/21
1,401 5,34446 46 40 40
0 0 0 0 1,447 5,390 40 40
Likelihood Impact Score
Start date
End date
Start date
End date
Start date
End date
Start date
End date
Start date
End date
Additional Expenditure Information Financial Information - Waste Management and Cleansing
TransportSupplies & Services3rd party payments
Customer & client receipts
Transfer paymentsSupport servicesDepreciation
Revenue £'000s
IncomeGovernment grants
DETAILS OF MAJOR PROJECTS
PROJECT DESCRIPTION Major Projects Benefits
Council Funded Net Budget
Capital Budget £'000s
Risk
Select one major benefit
0
0
0
Select one major benefit
Select one major benefit
0
Select one major benefit
Select one major benefit
Project Details:
Project Details:
Project 5 Project Title:
Project Details:
Project 4 Project Title:
Project Details:
Project 3 Project Title:
0Project Details:
Project 2 Project Title:
Project 1 Project Title:
Capital Funded
Revenue £'000s
Other
RechargesReserves
ExpenditureEmployeesPremises
Reimbursements
SLWP
NO PROJECTS AT PRESENT
Page 153

BUSINESS PLAN - GLOSSARY OF TERMS
ASSET MANAGEMENT PLAN / REVIEW An Asset Management Plan (AMP) is a tactical plan for managing an organisation's infrastructure and other assets to deliver an agreed standard of service. The plan is reviewed annually as part of the budget cycle..
BALANCES Balances are maintained to meet expenditure pending the receipt of income and to provide a cushion against expenditure being higher or income lower than expected. Contributions to balances can be either a planned contribution from the revenue budget or a transfer of any revenue surplus at the year end. The maintenance of an appropriate level of balances is a fundamental part of prudent financial management.
BASELINE FUNDING LEVEL The amount of an individual council’s Start-up Funding Assessment for 2013-14 provided through the local share of the Estimated Business Rates Aggregate, uprated in line with the small business rates multiplier (set at the September forecast of the Retail Price Index, unless otherwise decided).
BILLING AUTHORITIES A unitary council, or a lower tier council in a two-tier area, which collects the council tax for its own activities, and for those of the precepting authorities in its area. The billing authority passes on the precept receipts to each precepting authority in its area. These are the 326 billing authorities that collect council tax and business rates: district councils, London boroughs, and unitary councils. Before 1 April 2009 there were 354.
BORROWING STRATEGY A borrowing strategy set up the parameters within which money may be borrowed by the Authority. These parameters are designed to manage the risk taken by the authority within best practice.
BUDGET Statement of the spending plans for the year.
BUDGET PROFILE An allocated annual budget is split over the months in which it is estimated that expenditure will be incurred. For example, utility bills may well be spilt into four and entered into the months in which quarterly payments are due.
BUSINESS RATES These rates, formally called non-domestic rates, are the means by which local businesses contribute to the cost of providing local council services.
BUSINESS RATE BASELINE Determined for individual councils at the outset of the business rates retention scheme by dividing the local share of the Estimated Business Rates Aggregate (England) between billing authorities on the basis of their proportionate shares, before the payment of any major precepting authority share.
Page 154

BUSINESS PLAN - GLOSSARY OF TERMS Continued…
BUSINESS RATE RETENTION SCHEME The name given to the current system of funding local authorities through the local government finance settlement, set out in the Local Government Finance Act 2013. The local government sector retains 50% of the business rates they collect. In addition they also receive Revenue Support Grant to help support their services.
CAPITAL EXPENDITURE Expenditure on the acquisition of a fixed asset or expenditure, which adds to, and not merely maintains, the value of an existing fixed asset.
CAPITAL FINANCING REQUIREMENT (CFR) The total historical outstanding capital expenditure which has not yet been paid for from either revenue or capital resources i.e. a measure of the underlying borrowing need. See Minimum Revenue Provision
CAPITAL PROGRAMME Documentation which summarises the outcome of priority allocations contained in the capital strategy and details individual schemes for approval by Council / Cabinet.
CAPITAL PROGRAMME BOARD The Capital Programme Board ensures: • that the overall capital investment strategy is consistent with strategic objectives,
is affordable within the revenue budget strategy, examining potential funding options
• that bids are submitted in accordance with set framework and guidelines (including business cases, value for money and options appraisal) and prioritised in accordance of agreed criteria
• compiles and manages a multi-year capital programme for consideration by CMT and approval by Cabinet
CAPITAL PROJECTS / SCHEMES Capital Projects / Schemes is the level at which Member approval is obtained.
CAPITAL RECEIPTS Proceeds from the sale of fixed assets and repayments of capital grants and loans. These are divided into reserved and usable parts.
CAPITAL MONITORING The monthly comparison of actual spend against the anticipated spend (profiled budget) and the revision of projected year end spend where necessary. Periodically budget managers will be required to review their in year budget requirement and re-profile their projected expenditure over subsequent financial years.
CAPITAL STRATEGY A Capital Strategy is a core planning document designed to dovetail with the MTFS and Treasury Strategy to ensure that limited capital resources are deployed in accordance with corporate priorities / achieving our vision. The document will also detail how the proposed capital programme will be funded.
CASH FLOW MANAGEMENT Cash flow is the movement of money into or out of a business. Cash flow management optimises activity and investment around these cash flows.
Page 155
BUSINESS PLAN - GLOSSARY OF TERMS Continued… CHARTERED INSTITUTE OF PUBLIC FINANCE AND ACCOUNTANCY (CIPFA) The Institute produces standards and codes of practice that must be followed in preparing the Council’s financial statements.
CODE OF PRACTICE ON LOCAL AUTHORITY ACCOUNTING The Code of Practice on Local Authority Accounting (‘The Code’) applies International Financial Reporting Standards (IFRS) to the Local Authority context. The Code supports consistent financial reporting and Local Authorities must adhere to it when producing the annual Statement of Accounts.
COLLECTION FUND This is a statutory ‘ring fenced’ account. It records income and expenditure on Council Tax, Non Domestic Rates, payments to the precepting authorities and transfer to the Council’s General Fund.
COMMUNITY ORGANISATION An organisation with benevolent or philanthropic purposes.
COMPACT Compacts are partnership agreements between statutory bodies and the voluntary and community sector to improve their relationships and provide a framework within which the sectors can understand what to expect from each other. Compacts offer the means of supporting the development of the voluntary and community sector’s capacity so that groups can do more to meet both their aims and those of their statutory partners, thereby enhancing their contribution to the local community. The national compact (between central government and the voluntary and community sector) was launched in 1998 and it is now a requirement for all local authorities and PCTs to develop a compact with the voluntary and community sector. They are not legally binding documents but the Compact is approved and signed policy and affects the conduct of all partners.
COMPREHENSIVE SPENDING REVIEW (CSR) The CSR is a governmental process carried out by HM Treasury which sets out fixed three-year departmental expenditure limits and, through public sector service agreements, defines key service improvements.
CONTINGENCY A contingency is the setting aside of a finite sum to offset the cost of a future event or circumstance which may or may not occur. So is a reserve. You need to make distinction clearer. A reserve is a sum in the accounts whereas a contingency is a sum in in a budget and the budget does not follow accounting conventions. A cpntingency can also be drawn more widely. The Govt has one to cover events dear boy, events. (Macmillan)
CORE SPENDING POWER To provide some certainty for the period 2016-17 through to 2019-20, the local authority core spending power as from the following core components: • The Modified Settlement Funding Assessment as set out in the provisional local government
finance settlement consultation. • The council tax requirement estimated by applying the average annual growth in the council
tax base between 2013-14 and 2015-16 and assuming that local authorities increase their Band D council tax in line with the OBR’s forecast for CPI for each year.
• The potential additional council tax available from the adult social care council tax flexibility. • The potential additional council tax available from a £5 cash principle for districts with a lower
quartile Band D council tax level. • The Improved Better Care Fund. • Rural Services Delivery Grant.
Page 156

BUSINESS PLAN - GLOSSARY OF TERMS Continued… CORPORATE AND DEMOCRATIC CORE The corporate and democratic core comprises all activities which local authorities engage in specifically because they are elected, multi-purpose authorities. It has two elements - corporate management and democratic representation and management. The activities within the corporate and democratic core are in addition to those which would be carried out by a series of independent, single purpose bodies managing the same services. There is, therefore, no logical basis for apportioning these costs to services.
CORPORATE GOVERNANCE Corporate Governance is the system by which local authorities direct and control their functions and communicate to their communities.
COUNCIL TAX A local tax on domestic property, set by councils – calculated by deducting any funding from reserves, income it expects to raise and general funding it will receive from the Government – in order to meet its planned spending.
COUNCIL TAX BASE This is the number of Band D equivalent dwellings in a council area. To calculate the tax base for an area, the number of dwellings in each council tax band is reduced to take account of discounts and exemptions. The resulting figure for each band is then multiplied by its proportion relative to Band D (from 6/9 for Band A to 18/9 for Band H) and the total across all eight bands is calculated. An adjustment is then made for the collection rate.
COUNCIL TAX BANDS There are eight council tax bands. How much council tax each household pays depends on the value of the homes.
COUNTRY LIMITS The current economic climate has not only affected companies and financial institutions; it has affected sovereigns (lending to countries[government bonds]) as well. This will be incorporated into counterparty selection.
CREDIT APPROVAL The permission to borrow given to each local authority annually by the Secretary of State. Local authorities can obtain supplementary credit approvals during the year for particular projects.
CREDITORS The individual or organisation to whom the Authority owes money. Accordingly, it does not include money on taxation to the Council.
COUNCIL’S BORROWING REQUIREMENT Based on projected spend, this is the amount of money a local authority will need to borrow to finance this projected spend.
COUNTERPARTIES The organisation in respect of which the Authority borrows from or invests money with. A counterparty will be removed, suspended or kept on close watch from the council’s approved list if it fails to meet the Council’s criteria.
CORPORATE BONDS Is a bond that a company issues to raise money in order to expand its business.
Page 157

BUSINESS PLAN - GLOSSARY OF TERMS Continued… COUPON Is the interest rate stated on a bond at the time it is issued.
CREDITWORTHINESS An assessment of the likelihood that a borrower will default on their debt obligations. It is based upon factors, such as their history of repayment and their credit score. Lending institutions also consider the availability of assets and extent of liabilities to determine the probability of default.
DEBTORS A debtor is an organisation or individual that owes the Authority money and the debt is legally enforceable
DEBT RESCHEDULING See rescheduling of debt Where certain debt may be redeemed and a further loan obtained. This may be undertaken to provide an even spread of debt redemption date and terms, It may also be used to optimise beneficial borrowing rates in the market while maintaining activity within acceptable risk levels.
DEPRECIATION Depreciation is a charge to the revenue account to reflect the reduction in the useful economic life of a fixed asset, reducing the value of the fixed asset in the balance sheet. It is not a charge to the General Fund as it is reversed in the Movement in Reserves Statement and replaced with the Minimum Revenue Provision.
EARMARKED CAPITAL RESOURCES / GRANTS Overlaps with reserves Money received by the Authority which has certain conditions / restrictions (loose terminology) over its use limiting the type of expenditure that it may be applied against. IFRS refers to Stipulations and sub divides them into Condiitions and Restrictions. Earmarked grants (revenue or capital) are grants which are subject to restrictions. I
ESTIMATED BUSINESS RATES AGGREGATE The total business rates forecast at the outset of the business rate retention scheme to be collected by all billing authorities in England in 2013-14. The Estimated Business Rates Aggregate is uprated year on year in line with the change in the small business multiplier (usually the September Retail Price Index). FINANCE LEASE A lease is classified as a finance lease if it transfers substantially all the risks and rewards incidental to ownership. Situations that would normally lead to a lease being classified as a finance lease include the following:
• the lease transfers ownership of the asset to the lessee by the end of the lease term • the lessee has the option to purchase the asset at a price which is expected to be
sufficiently lower than fair value at the date the option becomes exercisable and that, at the inception of the lease, it is reasonably certain that the option will be exercised
• the lease term is for the major part of the economic life of the asset, even if title is not transferred
• at the inception of the lease, the present value of the minimum lease payments amounts to at least substantially all of the fair value of the leased asset
• the leased assets are of a specialised nature such that only the lessee can use them without major modifications being made
Page 158

BUSINESS PLAN - GLOSSARY OF TERMS Continued… FINANCIAL INSTRUMENT A real or virtual document representing a legal agreement involving some sort of monetary value. In today's financial marketplace, financial instruments can be classified generally as equity based, representing ownership of the asset, or debt based, representing a loan made by an investor to the owner of the asset.
FINANCIAL YEAR The financial year runs from 1 April to the following 31 March.
FIXED ASSETS Assets that yield benefits to the local authority and the services it provides for a period of more than one year. These assets can be tangible or intangible.
FLOOR DAMPING A method by which stability in funding is protected through limiting the effect of wide variations in grant. A floor guarantees a lower limit to a year-on-year change in grant. The grant amounts of councils who receive changes above the floor are scaled back by a fixed proportion to help pay for the floor.
FTSE 100 This is the index of the top 100 UK listed companies by market capitalisation.
GENERAL FUND The main fund of the Council, from which all expenditure is met and all income is paid, with the exception of those items, which by statute have to be taken to some other account.
GOVERNMENT GRANTS (Overlaps with Earmarked capital resurces) Financial assistance by government and other bodies, in the form of cash transfers to an authority, issued in return for compliance with certain conditions relating to the activities of the authority.
GROSS EXPENDITURE The total expenditure of a fund or account.
GROUP LIMITS This is a limit on the amount of money that may be invested with or borrowed from a particular conglomerate. IMPAIRMENT (Rewrite, someone should hang their head in shame for this sentence ) The loss of value in a fixed asset arising from physical damage, deterioration in the quality of service provided by the asset or from a general fall in prices. When this occurs the asset must be written down to the recoverable value. The charge is then reversed out from the General Fund in the Movement in Reserves Statement and replaced with the Minimum Revenue Provision.
Page 159

BUSINESS PLAN - GLOSSARY OF TERMS Continued… INTERNATIONAL FINANCIAL REPORTING STANDARD (IFRS) International Financial Reporting Standards are a single set of accounting standards, developed and maintained by the IASB (International Accounting Standards Board) for the purposes of being applied on a globally consistent basis by developed, emerging and developing economies. The Code of Practice on Local Authority Accounting is based on IFRSs
INVESTMENT POLICY The London Borough of Merton’s investment policy has regard to the CLG’s Guidance on Local Government Investments and the 2011 revised CIPFA Treasury Management in Public Services Code of Practice and Cross Sectoral Guidance Notes. The council’s investment priorities will be security first, liquidity second, then return.
INVESTMENT STRATEGY The investment of the Authority’s cash balances to optimise its strategic and operational needs Surely we should include reference to maximising investment income and minimising cost of borrowing. Otherwise this is too vague.
INVESTMENT TREASURY INDICATOR AND LIMIT This is a prudential indicator for funds invested for more than 364 days, designed to measure the need for early investment redemption against the Authority’s liquidity requirement.
LENDERS OPTION BORROWERS OPTION (LOBO) When borrowing or lending money, certain time related limits may be established when the arrangement is made e.g. at a certain point in time the interest rate of a loan will increase; at this point both parties have the opportunity to opt in / out of the arrangement.
LEVY Mechanism to limit disproportionate benefit from business rates. The levy is applied proportionally on a 1:1 basis (i.e. a 1% increase in business rates income results in an council getting a 1% increase in revenue from the rates retention scheme) but with a limit on the maximum levy rate that is imposed, at 50p in the pound. Levy payments are used to fund the safety net.
LIABILITIES A legally enforceable sum owed to a third a Party
LOCAL GOVERNMENT FINANCE SETTLEMENT The local government finance settlement is the annual determination of funding distribution as made by the Government and debated by Parliament.
LOCAL GOVERNMENT SPENDING CONTROL TOTAL The total amount of expenditure for Revenue Support Grant in the Department for Communities and Local Government’s Local Government Departmental Expenditure Limit plus the local share of the Estimated Business Rates Aggregate that is allocated to the local government sector by Government for each year of a Spending Review.
Page 160

BUSINESS PLAN - GLOSSARY OF TERMS Continued…
LOCAL SHARE The percentage share of locally collected business rates that is retained by local government. This is set at 50%.
LOCALISM ACT 2011 It sets out a series of proposals with the potential to achieve a substantial and lasting shift in power away from central government and towards local people. They include: new freedoms and flexibilities for local government; new rights and powers for communities and individuals; reform to make the planning system more democratic and more effective
LOWER TIER COUNCILS Councils that carry out the functions which in shire areas with two tiers of local government are carried out by shire districts. They are the same councils as billing authorities.
MERTON IMPROVEMENT BOARD Merton Improvement Board oversees the management and monitoring of the Merton improvement programme and the promotion of best practices within the Council. Its work falls into four main areas: • manage and monitor the Merton improvement programme including giving the
“go ahead” for new projects and project closure; • steer the implementation and future development of the Merton
improvement programme; • lead on developing and maintaining cross-cutting initiatives; and • manage, co-ordinate and monitor business improvement activity across the council.
MINIMUM REVENUE PROVISION A provision, via a revenue charge, in respect of historical capital expenditure which has been financed by borrowing , as required by the Local Authorities (Capital Finance and Accounting) (England) (Amendment) Regulations 2008.
MULTIPLIER The business rates multiplier which, when multiplied by the rateable value of a property, determines a ratepayer’s business rate bill. There are two multipliers – one for small businesses and one for larger businesses. These are set nationally. The small business multiplier is uprated annually by the Retail Price Index, unless the Government decides otherwise and the other multiplier adjusted accordingly, to fund rate relief for small businesses.
NATIONAL CONTROL TOTALS These are the national totals for each of the individual elements within the local spending control total. They are determined as part of the Spending Review. It is also the name given to the size of each of the different elements within the Settlement Funding Assessment.
NON-DOMESTIC RATE (NDR) A levy on businesses based on national ‘rateable value’ of the premises occupied. NDR is collected by the Council in line with national criteria, paid into a national pool and then redistributed to all local and police authorities on the basis of population.
NON-SPECIFIED INVESTMENTS A body which has been provided with a government issued guarantee for wholesale deposits within specific timeframes.
Page 161

BUSINESS PLAN - GLOSSARY OF TERMS Continued…
OPERATIONAL BOUNDARY The operational boundary is a prudential indicator for monitoring the total external debt, gross of investments, and separately identifying borrowing from other long term liabilities. OPERATING LEASE A contract that allows for the use of an asset, but does not convey rights of ownership of the asset. An operating lease is not capitalised; it is accounted for as a rental expense in what is known as "off balance sheet financing." For the lessor, the asset being leased is accounted for as an asset and is depreciated as such.
PENSION FUND The Local Government Pension Scheme (LGPS) is a scheme established by statute to provide death and retirement benefits for all eligible employees. The scheme’s benefits are defined in the LGPS Regulations, and are geared to a scheme member’s Career Average Revalued Earnings (CARE). The scheme is financed by a combination of employee and employer contributions, together with income from a fund of investments. The employee contribution rate ranging from 5.5% to 12.5% of pensionable pay in nine salary bands. The contribution percentage that a member pays is based on their estimated actual annual pensionable salary from 1 April to 31 March each year. Whilst the employer’s rate varies according to an assessment of the funds current and forecast pension/benefit costs, (the fund’s liabilities), relative to its income. This assessment is undertaken, in accordance with LGPS Regulations, every three years by the Fund’s appointed actuary, who sets the necessary level of employer contribution into the fund so that the fund’s liabilities can be paid.
PERFORMANCE MANAGEMENT FRAMEWORK Performance management is about how an organisation consistently plans and manages to ensure continuous improvement. Sustainable improvements in services are unlikely to happen without it. A performance framework is designed to help individuals, teams, divisions etc. understand : • what the organisation is trying to achieve (golden thread), • the planning, monitoring and review cycle • their responsibilities.
PRECEPT This is the amount of council tax income all billing and precepting authorities need to provide their services. The amounts for all authorities providing services in an area appear on one council tax bill, which is administered by the billing authority.
PRECEPTING AUTHORITY An authority or body that does not collect council tax or business rates but is part of the business rates retention scheme. This is an authority which sets a precept to be collected by billing authorities. County councils, police authorities, the Greater London Authority, single purpose fire and rescue authorities and parish councils are all precepting authorities.
Page 162

BUSINESS PLAN - GLOSSARY OF TERMS Continued… PRIVATE FINANCE INITIATIVE (PFI) PFI contracts are agreements with private sector organisations to refurbish, maintain and operate fixed assets on behalf of public sector organisations such as local authorities.
PROCUREMENT BOARD The Procurement Board provides a corporate focus for procurement issues and oversees the procurement development in Merton. The Board also provides both strategic direction for, and effective governance of, the procurement arrangements across the Authority, ensuring they are effective, efficient and utilised.
PROPORTIONATE SHARE This is the percentage of the national business rates yield which a council has collected on the basis of the average rates collected by councils over the two years to 2011-12. This percentage was applied to the local share of the 2013-14 Estimated Business Rates Aggregate to determine the billing authority business rates baseline. PROVISIONS Amounts set aside for any liabilities or losses which are likely to be incurred, but which are uncertain as to the amounts or the dates on which they will arise.
PRUDENTIAL CODE The Local Government Act2003 requires the Council to have regard to the CIPFA Prudential Code for Capital Finance in Local Authorities. In doing so, the Council is required to set and monitor a series of Prudential Indicators, the key objectives of which are to ensure that, within a clear framework, the capital investment and borrowing plans of the council are affordable, prudent and sustainable. RESCHEDULING OF DEBT See debt resceduling The switching of debt between the short term and the longer term and vice versa to obtain favourable borrowing rates.
REVENUE EXPENDITURE Expenditure incurred on day to day running costs and confined to accounts within one financial year.
REVENUE MONITORING The monthly comparison of actual expenditure and income spend against the anticipated spend (profiled budget). A budget manager will then allow for known income/expenditure to project the year end position.
RESERVES This is a council’s accumulated surplus income (in excess of expenditure) which can be used to finance future spending. Reserves can be either capital or revenue
REVENUE SUPPORT GRANT A Government grant which can be used to finance revenue expenditure on any service.
RINGFENCED GRANT A grant paid to councils which has conditions attached to it, which restrict the purposes for which it may be spent.
Page 163
BUSINESS PLAN - GLOSSARY OF TERMS Continued… RISK MANAGEMENT A risk is a threat, obstacle or, barrier, that will stop the Authority from achieving its ambitions, aims and objectives. Risk management is the process of managing the risks that may prevent delivery of desired outcomes so that the organisation can anticipate and respond positively to change. Merton’s approach to risk management is to raise awareness, integrate it into day to day operations and establish a robust framework and procedures to identify, analyse, assess and manage risk. SECTION 151 OFFICER Section 151 of the Local Government Act 1972 requires every local authority to make arrangements for the proper administration of their financial affairs and requires one officer to be nominated to take responsibility for the administration of those affairs. The Section 151 officer is usually the local authority’s treasurer and must be a qualified accountant belonging to one of the recognised chartered accountancy bodies. The Section 151 officer has a number of statutory duties, including the duty to report any unlawful financial activity involving the authority (past, present or proposed) or failure to set or keep to a balanced budget.
SECURITISATION ‘Securitisation’ as used in this context means the disposal of future revenues. For
example, someone receiving rents from properties might transfer the entitlement to that income to a bank for (e.g.) 20 years, in exchange for an immediate lump-sum payment.
SAFETY NET Mechanism to protect any council which sees its business rates income drop, in any year, by more than 7.5% below its baseline funding level (with baseline funding levels being uprated by the small business rates multiplier for the purposes of assessing eligibility for support).
SETS OF SERVICES There are four sets of services, corresponding to the services supplied by the four types of local authorities (although some councils may provide more than one tier of service). These are: • upper-tier services – those services, other than fire, supplied by county councils in
two- tier areas, and described in this consultation as relating to ‘social care councils’
• police services • fire and rescue services lower-tier services – those services supplied by district
councils (‘non-social care councils’ in the consultation) in two-tier areas. SETTLEMENT CORE FUNDING The definition of settlement core funding for this purpose takes into account the main resources available to councils, which for this purpose comprise: • council tax income from 2015-16 (including any Council Tax Freeze Grant) • the Settlement Funding Assessment, comprising:
– estimated business rates income (baseline funding level under the rates retention scheme)
– Revenue Support Grant.
Page 164
BUSINESS PLAN - GLOSSARY OF TERMS Continued… SETTLEMENT FUNDING ASSESSMENT Previously referred to as Start-Up Funding Assessment. It comprises at a national level the total Revenue Support Grant and the local share of Estimated Business Rates Aggregate for the year in question. On an individual council level it comprises each council’s Revenue Support Grant for the year in question and its baseline funding level, uprated year-on-year in line with the September forecast of the Retail Price Index, unless otherwise decided
SPECIFIC GRANT Grants paid under various specific powers, but excluding Revenue Support Grant or area- based grant. Some specific grants are ringfenced. SPECIFIED BODY This is the term used for a body or bodies which are directly funded from Revenue Support Grant, and which provide services centrally for local government as a whole.
SPECIFIED INVESTMENTS These are to be sterling investments of a maturity period of not more than 364 days, or those which could be for a longer period but where the Council has the right to be repaid within 364 days if it wishes. These are low risk assets where the possibility of loss of principal or investment income is considered negligible.
SUPER OUTPUT AREA A Super Output Area (SOA) is a geographical area designed for the collection and publication of small area statistics. It is used on the Neighbourhood Statistics site, and has a wider application throughout national statistics. SOAs give an improved basis for comparison throughout the country because the units are more similar in size of population than, for example, electoral wards
SUPPORT SERVICES These are services that are not statutory local authority services but which give support to those services.
TARIFFS AND TOP UPS Calculated by comparing at the outset of the business rate retention scheme an individual council’s business rates baseline against its baseline funding level. Tariffs and top ups are self-funding, fixed at the start of the scheme and uprated year-on-year in line with the September forecast of the Retail Price Index, unless otherwise decided.
TAX INCREMENTAL FINANCING The Local Government Finance Bill was passed in December 2011 and introduces a rate retention scheme enabling local authorities to retain a proportion of the business rates generated in their area. The Bill also includes a framework for the localisation of support for council tax in England, which alongside other council tax measures will give councils increased financial autonomy and a greater stake in the economic future of their local area, while providing continuation of council tax support for the most vulnerable in society. In determining the affordability of borrowing for capital purposes, authorities currently take account of their current income streams and forecast future income.
Page 165
BUSINESS PLAN - GLOSSARY OF TERMS Continued… TREASURY MANAGEMENT The management of the local authority’s investments and cash flows, its banking, money market and capital market transactions; the effective control of the risks associated with those activities; and the pursuit of optimum performance consistent with those risks. TREASURY MANAGEMENT PRACTICES / TREASURY MANAGEMENT CODE OF PRACTICE The Local Government Act 2003 requires the Council to adopt the CIPFA Prudential Code for Capital Finance in Local Authorities. In doing so, the Council is required to set and monitor a series of Prudential Indicators, the key objectives of which are to ensure that, within a clear framework, the capital investment plans of the council are affordable, prudent and sustainable.
USEFUL LIFE This is the period over which the local authority derives benefit from the use of a fixed asset.
Page 166

BUSINESS PLAN – LIST OF ACRONYMS
Acronym Definition AD Assistant Director ADASS Association of Directors of Adult Social Services Apps Applications ASB Anti Social Behaviour ASC Adult Social Care ASH Our miscellaneous income, invoicing and recovery system BC Building Control BESD Behavioural Emotional and Social Difficulties BME Black Minority Ethnic C & YP Children and Young People CAF Common Assessment framework CAMHS Child and Adolescent Mental Health Services CC Children’s Centre CCTV Close Circuit Television CEN Creative Environmental Networks CEO Civil Enforcement Officer CFR Capital Financing Requirement CIPFA Chartered Institute of Public Finance and Accountancy CMT Corporate Management Team CNEA Clean Neighbourhood and Environment Act COM Current Operating Model CPD Centre for Professional Development CPD Continuing Professional Development CPZ Controlled Parking Zone CRB Criminal Records Bureau CRM Customer Relationship Management CSC Children’s Social Care CSF Children Schools & Families CYP Children and Young People CYPP Children and Young peoples Plan DC Development Control DEFRA Department for Environment Food and Rural Affairs DFG Disabled Facilities grant DMT Departmental Management Team DSG Dedicated Schools Grant E&R Environment and Regeneration EA Equality Analysis EAL English as an Additional Language EH Environmental Health EIA Equalities Impact Assessment EIG Early Intervention Grant ERTG Enforcement Review Task Group ESOL English for Speakers of Other Languages EU European Union EY Early Years FACS Fair Access to Care Services FM Facilities Management FOI Freedom Of Information FPN Fixed Penalty Notice FTE Full Time Equivalent GLA Greater London Authority HB Housing Benefits HC&OP Healthier Communities and older People Page 167

BUSINESS PLAN – LIST OF ACRONYMS Continued……
Acronym Definition HCA Homes and Community Agency HNES Housing Needs and Enabling Services HRRC Household Reuse and Recycling Centre ICT Information and Communications Technology IFRS International Financial Reporting Standard IP Intellectual Property IT Information Technology iTrent The Council’s payroll system JD Job Description K £ Thousand L & D Learning and Development LA Local Authority LAC Looked After Children LALO Local Authority Liaison Officer LATS Landfill Allowances and Trading Scheme LB London Borough LBM London Borough of Merton LCGS London Councils Grant Scheme LDD Learning Development and Diversity LGA Local Government Association LLC Local Land Charges LSC Learning Skills Council LSCB Local Safeguarding Children’s Board LSP Local Strategic Partnership LOBO Lenders Option Borrowers Option MAE Merton Adult Education MARAC/DV
Multi Agency Risk Assessment Case Conference / Domestic Violence MCIL Merton Centre for Independent Living MIS Management Information System MP Member of Parliament MRP Minimum Revenue Provision MSLT1&2 Merton’s Senior Leadership Team Levels 1 and 2 MTFS Medium Term Financial Strategy MVSC Merton Voluntary Service Council NEET Not in Education Employment or Training NDR Non Domestic Rate O&S Overview and Scrutiny OJEU Official Journal of the European Union OT Occupational Therapy PATAS Parking And Traffic Appeals Service PC Police Constable
PCN Penalty Charge Notice PCT Primary Care Trust PFI Private Finance Initiative PM&R Pavement Maintenance and Repair PPD Public Protection and Development
Page 168

BUSINESS PLAN – LIST OF ACRONYMS Continued……
Acronym Definition PPP Policy Planning and Performance PRS Private Rented Sector PVI Private Voluntary and Independent QA Quality Assurance SC Sustainable Communities SEN Special Educational Needs SEND Special Educational Needs and Disabilities SFA Skills Funding Agency SLA Service Level Agreement SLWP South West London Partnership SME Subject Matter Expert SMT SOAs Senior Management team Super Output Areas SSQ School Standards and Quality SW South West SWLSG South West London and St George's Mental Health NHS Trust TBC To Be Confirmed TEC Transport and Environment Committee TFL Transport For London TOM Target Operating Model TUPE The Transfer of Undertaking (Protection of Employment) Regulations VAT Value Added Tax VLE Virtual Learning Environment VS Voluntary Sector YOT Youth Offending Team
Page 169
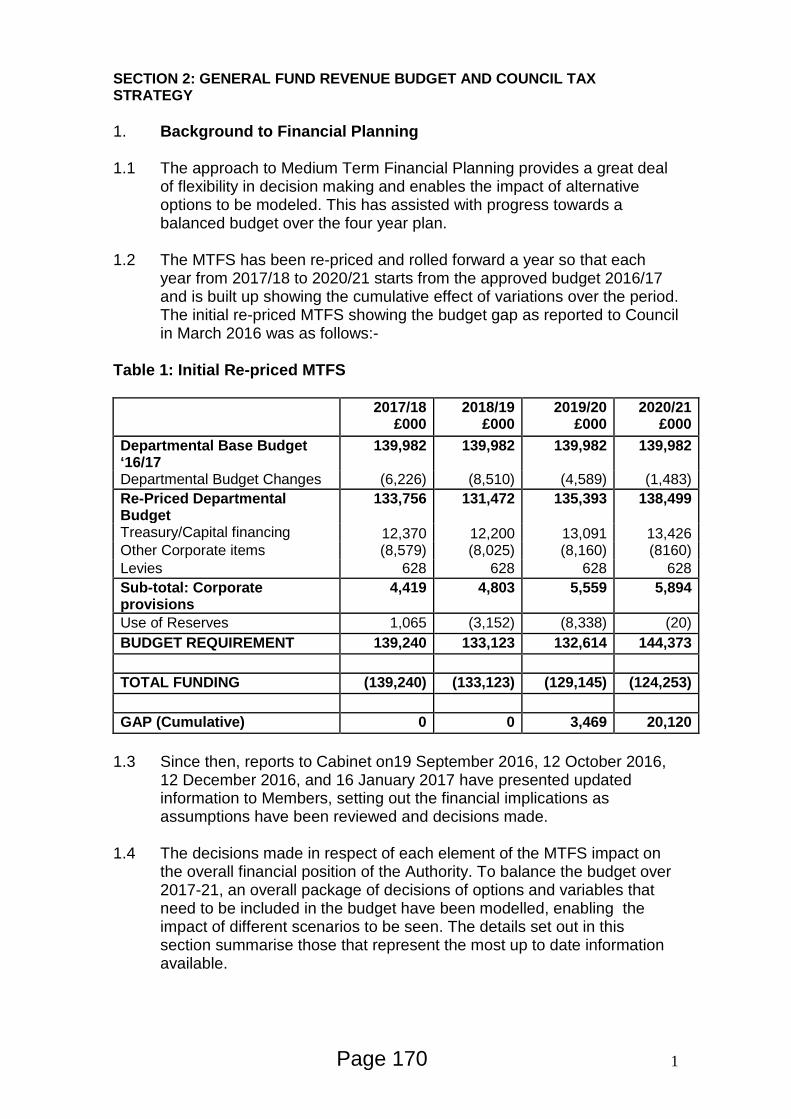
SECTION 2: GENERAL FUND REVENUE BUDGET AND COUNCIL TAX STRATEGY 1. Background to Financial Planning 1.1 The approach to Medium Term Financial Planning provides a great deal
of flexibility in decision making and enables the impact of alternative options to be modeled. This has assisted with progress towards a balanced budget over the four year plan.
1.2 The MTFS has been re-priced and rolled forward a year so that each
year from 2017/18 to 2020/21 starts from the approved budget 2016/17 and is built up showing the cumulative effect of variations over the period. The initial re-priced MTFS showing the budget gap as reported to Council in March 2016 was as follows:-
Table 1: Initial Re-priced MTFS 2017/18
£000 2018/19
£000 2019/20
£000 2020/21
£000 Departmental Base Budget ‘16/17
139,982 139,982 139,982 139,982
Departmental Budget Changes (6,226) (8,510) (4,589) (1,483) Re-Priced Departmental Budget
133,756 131,472 135,393 138,499
Treasury/Capital financing 12,370 12,200 13,091 13,426 Other Corporate items (8,579) (8,025) (8,160) (8160) Levies 628 628 628 628 Sub-total: Corporate provisions
4,419 4,803 5,559 5,894
Use of Reserves 1,065 (3,152) (8,338) (20) BUDGET REQUIREMENT 139,240 133,123 132,614 144,373 TOTAL FUNDING (139,240) (133,123) (129,145) (124,253) GAP (Cumulative) 0 0 3,469 20,120
1.3 Since then, reports to Cabinet on19 September 2016, 12 October 2016,
12 December 2016, and 16 January 2017 have presented updated information to Members, setting out the financial implications as assumptions have been reviewed and decisions made.
1.4 The decisions made in respect of each element of the MTFS impact on
the overall financial position of the Authority. To balance the budget over 2017-21, an overall package of decisions of options and variables that need to be included in the budget have been modelled, enabling the impact of different scenarios to be seen. The details set out in this section summarise those that represent the most up to date information available.
1 Page 170

1.5 Setting a Balanced Budget 1.5.1 Resource and expenditure projections have been continually updated
throughout the year to inform Members and officers of the overall position for 2017-2021. A four-year forward plan is presented, but it is still a legal requirement that a balanced (i.e. fully funded) budget is achieved for 2017/18. There are a number of ways in which a balanced budget is achieved:
• Reducing expenditure/costs; • Identifying new savings or additional income; • Adjusting the level of Council Tax ; • Using unallocated reserves as a temporary measure pending the
implementation of the options above. 1.5.2 Budget savings and growth proposals have been formulated within the
overall constraints of the resource projections. The proposals have been approved in principle by the Cabinet and then considered by Overview and Scrutiny Panels as part of the scrutiny process. Scrutiny Panels have met again during January 2017 and their feedback on the Council’s spending proposals is set out in a separate report elsewhere on the agenda for this meeting.
1.5.3 The Medium Term Financial Strategy (MTFS) for the Council supports
the achievement of the business plan and any financial implications arising from the agreed plan are included in financial planning for 2017/18 and beyond. The MTFS brings together all of the key elements relating to the Council’s financial position which are reflected in the General Fund, and the Capital Programme.
1.5.4 The last detailed MTFS which was reported to Cabinet on 16 January
2017 showed that the budget gap was:-
Table 2: Budget Gap Cabinet 16 January 2017
Cumulative 2017/18
£000 2018/19
£000 2019/20
£000 2020/21
£000 Gap exc. Savings/Growth (1,925) 15,162 20,878 27,304 Savings (8,888) (14,929) (17,446) (17,446) Growth 11,927 12,901 10,395 10,895 Gap Net of Savings/Growth 1,114 13,134 13,827 20,753
1.5.5 There have been further changes to some of the key budget variables as
more information has become available and the details are set out in this report.
2 Page 171

1.6 Review of previous year’s Savings 1.6.1 As with previous years, the business planning process is a multi-year
approach and this includes a review of total expenditure and income over the period 2017-21.
1.6.2 Cabinet on 12 October 2016 and 12 December 2016 considered
revisions to current savings proposals . The overall impact of these proposed amendments on the MTFS is as follows:-
Table 3: Net Revisions to current savings Net Revisions to current savings (cumulative)
2017/18 £000
2018/19 £000
2019/20 £000
2020/21 £000
Total £000
Corporate Services 0 0 0 0 0 Children, Schools & Families
(60) 27 (201) 0 (234)*
Environment and Regeneration
574 (324) (250) 0 0
Community and Housing 27 0 0 0 27** Total 541 (297) (451) 0 (207) Net Cumulative total 541 244 (207) (207)
* The net increase in savings will be applied against the CSF target set. ** The net shortfall in savings will be added to C&H savings target set.
1.6.3 The current MTFS includes the following amounts in respect of the full
year effects of previous year’s savings, including those in Table 3 above. Table 4: Full Year Effects of previous years savings
Full Year Effects of previous years savings
2017/18 £000
2018/19 £000
2019/20 £000
2020/21 £000
Total £000
Corporate Services (1,679) (1,563) 0 0 (3,242) Children, Schools & Families (1,110) (489) (201) 0 (1,800) Environment and Regeneration (3,426) (861) (250) 0 (4,537) Community and Housing (2,673) (3,128) 0 0 (5,801) Total (8,888) (6,041) (451) 0 (15,380) Total - Cumulative (8,888) (14,929) (15,380) (15,380)
1.6.4 One of the key objectives is to balance the budget and there has been a
major improvement in recent years in the ability to look over a long-term period and identify significant savings over more than one year.
1.6.5 The Business planning framework aims to enable strategic resource
allocation and investment decisions to be made that allow for services to transform and change at different times in the future and which would otherwise be very difficult to plan under an annual planning framework. This improved long-term financial planning process is the best way to ensure that budgets are robust and sustainable.
3 Page 172

1.7 Growth 1.7.1 In response to budget pressures identified as a result of budget
monitoring as well as anticipated future pressures, Cabinet in December approved growth proposals in the following services:-
• Adult Social Care • Waste • Children’s Services
1.7.2 These proposals have been considered further by Overview and Scrutiny panels and the Commission in the January 2017 round of meetings. In terms of addressing issues which have been identified as pressures that need to be addressed in 2017/18 the following budget growth is proposed:-
Table 5: Growth
2017/18 £000
2018/19 £000
2019/20 £000
2020/21 £000
Adult Social Care 9,345 252 (2,891)* 0* Waste and Regeneration 1,582 222 (115) 0 Children’s Services 1,000 500 500 500 Total 11,927 974 (2,506) 500 Cumulative total 11,927 12,901 10,395 10,895
* Subject to the Improved Better Care Funding remaining as stated
1.7.3 Details of the growth proposals are included in the consultation pack. 2. Local Government Finance Settlement 2017-18 2.1 Local Government Finance Settlement
2.1.1 The financial projections in the report to Cabinet on 16 January 2017 were based on the information as announced in the provisional Local Government Finance Settlement on 15 December 2016. Information in this report has been updated as more information has become available.
2.1.2 The final Settlement allocations will be confirmed by the Minister for Local Government on 23 February 2017 and any changes will be incorporated into the Business Plan report to Council on 1 March 2017.
2.1.3 Details of the Provisional Local Government Settlement are included in Appendix 2.
4 Page 173

2.2 Business Rates As was reported to the January 2017 Cabinet meeting, with respect to
estimates of Business Rates, the NNDR (Baseline Funding) figures in the Core Spending calculation in the Settlement are derived from the 2013/14 baseline figure and uprated by the September change in RPI. Merton will remain a top-up authority, as are the majority of other London Boroughs, although this position has changed for some London boroughs. This means that on top of its 30% share of the Business Rates yield, Merton receives a top-up payment to bring it up to the Baseline funding level. The top-up is also increased in line with the small business non-domestic rating multiplier each year and this was originally planned to continue until the Business Rates system is reset in 2020 but the Government have now indicated that they propose to use them to adjust for new burdens, and changes in needs assessments and changes arising from revaluation. The figures in the Settlement for Merton are:- Table 6: 2016/17
£m 2017/18
£m 2018/19
£m 2019/20
£m Business Rates Baseline 25.0 24.5 25.3 26.2 Top-Up 7.9 9.1 9.4 9.7 Baseline Funding 32.9 33.6 34.7 35.9 This can be a bit misleading when assessing the resources available to the authority because the funding for Business Rates is based on the forecast included in the Council’s NNDR1 return (which is required to be submitted by 31 January 2017). This can be seen by reference to the Council’s share of Business Rates based on the NNDR1 returns over the past four years since Business Rates Retention began Table 7: 2013/14
£m 2014/15
£m 2015/16
£m 2016/17
£m NNDR1 Share (30%) 24.5 25.6 25.8 26.3 Top-Up 7.5 7.7 7.8 7.9 Section 31 payments 0 1.1 1.2 0.8 Total Business Rates inc. in Budget 32.0 34.4 34.8 35.0 Therefore, projections of the Council’s share of Business Rates funding over the next four years are starting from a higher level than the Baseline Funding projections in the Provisional Settlement. The following table compares the business Rates figures in the Provisional Settlement with the forecast based on the latest submitted NNDR1 form:-
5 Page 174

Table 8: Business Rates 2017/18 2018/19 2019/20 £'000 £'000 £'000 Forecast included in Settlement (24,500) (25,288) (26,188) Forecast in MTFS based on NNDR1 (26,401) (26,929) (27,468) Additional NNDR assumed in MTFS (1,901) (1,641) (1,280)
2.2.7 Over the MTFS period, a high level of uncertainty will remain with respect to the NNDR projections due to the effects of the revaluation and the move to 100% rates retention. The later years projections also do not take into consideration any impact of Crossrail 2 at this stage.
2.2.8 The figures included in the MTFS have now been reviewed following the
submission of the NNDR1 for 2017/18 on 31 January. The Business Rates implications are summarised in the following table:-
Table 9: Implications of NNDR1 2017/18 for Merton in 2017/18
MTFS (January
2017) NNDR1 Difference £000 £000 £000 NNDR 2017/18 26,128 26,401 273 - Top-Up 2017/18 9,083 9,083 0
35,211 35,484 273 Collection Fund Surplus/(Deficit) 2016/17
417 380 (37)
35,628 35,864 236 Section 31 Grant 0 1,035 1,035 Total 35,628 36,899 1,271
2.2 Details of the Council Tax Base calculation, the resource implications
arising from current business rates projections and impact on the Collection Fund are included elsewhere in this report and in Appendix 3.
2.3 Following recent developments with Surrey County Council (SCC) abandoning its proposals to increase Council Tax by 15% in 2017/18 it has been announced that it is set to take part in a new government pilot scheme which would see the local authority retain 100% of business rates raised in the county. In a statement Sajid Javid, Communities and Local Government Secretary of State, revealed SCC has been in talks with the government about taking part in a pilot scheme in 2018/19 which would see the council retain 100% of business rates in a bid to offset cuts to its grant from central government. The Local Government Finance Bill, which parliament is considering at present, will legislate to deliver reforms to business rates.
6 Page 175
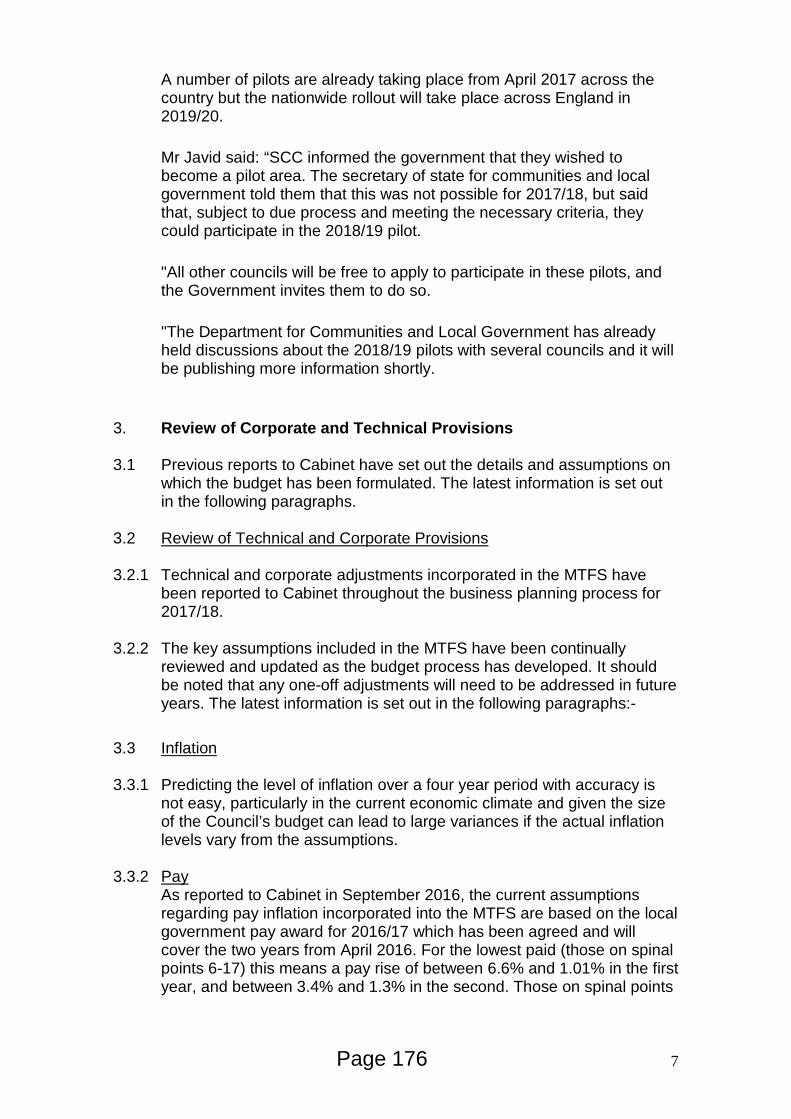
A number of pilots are already taking place from April 2017 across the country but the nationwide rollout will take place across England in 2019/20.
Mr Javid said: “SCC informed the government that they wished to become a pilot area. The secretary of state for communities and local government told them that this was not possible for 2017/18, but said that, subject to due process and meeting the necessary criteria, they could participate in the 2018/19 pilot.
"All other councils will be free to apply to participate in these pilots, and the Government invites them to do so.
"The Department for Communities and Local Government has already held discussions about the 2018/19 pilots with several councils and it will be publishing more information shortly.
3. Review of Corporate and Technical Provisions 3.1 Previous reports to Cabinet have set out the details and assumptions on
which the budget has been formulated. The latest information is set out in the following paragraphs.
3.2 Review of Technical and Corporate Provisions 3.2.1 Technical and corporate adjustments incorporated in the MTFS have
been reported to Cabinet throughout the business planning process for 2017/18.
3.2.2 The key assumptions included in the MTFS have been continually
reviewed and updated as the budget process has developed. It should be noted that any one-off adjustments will need to be addressed in future years. The latest information is set out in the following paragraphs:-
3.3 Inflation
3.3.1 Predicting the level of inflation over a four year period with accuracy is
not easy, particularly in the current economic climate and given the size of the Council’s budget can lead to large variances if the actual inflation levels vary from the assumptions.
3.3.2 Pay
As reported to Cabinet in September 2016, the current assumptions regarding pay inflation incorporated into the MTFS are based on the local government pay award for 2016/17 which has been agreed and will cover the two years from April 2016. For the lowest paid (those on spinal points 6-17) this means a pay rise of between 6.6% and 1.01% in the first year, and between 3.4% and 1.3% in the second. Those on spinal points
7 Page 176

18-49 will receive 1% in year one and the same again the following year. The offer also includes a joint review of the NJC pay spine and term-time working for school support staff. The provision for pay inflation has been reviewed and the following amounts are forecast to be required in the updated MTFS:- Table 10: Provision for Pay Inflation: (Cumulative) 2017/18 2018/19 2019/20 2020/21 Pay inflation (%) 1.0% 1.0% 1.0% 1.0% Provision for Pay inflation (cumulative £000)
984 1,969 2,953 3,938
3.3.3 Prices The Consumer Prices Index (CPI) rose to 1.6% in the year to December 2016, compared with a 1.2% rise in the year to November. The rate in December was the highest since July 2014, when it was also 1.6%. Price movements for the majority of the broad groups of goods and services acted to increase the rate between November 2016 and December 2016. The main contributors to the increase in the rate were rises in air fares and the price of food, along with prices for motor fuels, which fell by less than they did a year ago.
CPIH, a measure of UK consumer price inflation that includes owner occupiers’ housing costs, rose by 1.7% in the year to December 2016, up from 1.4% in November.
The RPI 12-month rate for December 2016 stood at 2.5%, up from 2.2% in November 2016. Outlook for inflation:
The Bank of England’s Monetary Policy Committee (MPC) sets monetary policy to meet the 2% inflation target and in a way that helps to sustain growth and employment. At its meeting ending on 1 February 2017, the MPC voted unanimously to maintain Bank Rate at 0.25%. The MPC voted unanimously to continue with the programme of sterling non- financial investment-grade corporate bond purchases, financed by the issuance of central bank reserves, totalling up to £10 billion. The MPC also voted unanimously to maintain the stock of UK government bond purchases, financed by the issuance of central bank reserves, at £435 billion. The MPC’s latest economic projections are contained in the February Inflation Report. The MPC has increased its central expectation for growth in 2017 to 2.0% and expects growth of 1.6% in 2018 and 1.7% in 2019. CPI inflation rose to 1.6% in December and further substantial increases are very likely over the coming months. In the central projection, conditioned on market yields that are somewhat higher than in
8 Page 177

November, inflation is expected to increase to 2.8% in the first half of 2018, before falling back gradually to 2.4% in three years’ time. Inflation is judged likely to return to close to the target over the subsequent year. Measures of inflation compensation derived from financial markets have stabilised at around average historical levels, having increased during late 2016 as concerns about a period of unusually low inflation faded.
As the MPC has previously noted, however, there are limits to the extent that above-target inflation can be tolerated. The continuing suitability of the current policy stance depends on the trade-off between above-target inflation and slack in the economy. The projections described in the Inflation Report depend in good part on three main judgements: that the lower level of sterling continues to boost consumer prices broadly as expected, and without adverse consequences for expectations of inflation further ahead; that regular pay growth does indeed remain modest, consistent with the MPC’s updated assessment of the remaining degree of slack in the labour market; and that the hitherto resilient rates of household spending growth slow as real income gains weaken. Prospects for inflation - UK economic activity remained resilient in the second half of 2016. Growth is likely to slow over 2017 as households adjust their spending to lower real income growth resulting in large part from the 18% fall in sterling since late 2015. That fall in sterling will raise CPI inflation, which is likely to return to around the 2% target by February and then rise above it over the following months. Conditioned on a market path for Bank Rate that rises to just under 0.75% by early 2020, the MPC projects CPI inflation to fall back gradually from the middle of 2018. Continued pass-through of higher import prices means, however, that inflation is projected to remain somewhat above the 2% target at the end of the MPC’s three-year forecast period.
The latest inflation and unemployment forecasts for the UK economy, based on a summary of independent forecasts are set out in the following table:-
Table 11: Forecasts for the UK Economy Source: HM Treasury - Forecasts for the UK Economy (January 2017) 2016 (Quarter 4) Lowest % Highest % Average % CPI 0.6 1.8 1.2 RPI 1.7 3.0 2.2 LFS Unemployment Rate 4.7 5.2 4.9 2017 (Quarter 4) Lowest % Highest % Average % CPI 1.7 3.8 2.8 RPI 2.3 5.2 3.5 LFS Unemployment Rate 4.5 5.7 5.3
9 Page 178

The MPC’s forecasts of Bank Base Rate in the February 2017 Quarterly Inflation Report is summarised in the following table:- End
Q.1 2017
End Q,2
2017
End Q,3
2017
End Q,4
2017
End Q.1
2018
End Q.2
2018
End Q.3
2018
End Q.4
2018
End Q.1
2019
End Q.2
2019
End Q.3
2019
End Q.4
2019
End Q.1
2020 Feb.’17 0.2 0.2 0.3 0.3 0.3 0.4 0.4 0.4 0.5 0.5 0.6 0.6 0.7
The current assumptions regarding price inflation incorporated into the MTFS are
Table 12: Price inflation assumptions in MTFS
2017/18 2018/19 2019/20 2020/21
Price inflation in MTFS (%) 1.5% 1.5% 1.5% 1.5% Revised estimate (cumulative £000)
2,200 4,400 6,599 8,799
As indicated in the Treasury’s Outlook for inflation in paragraph 3.3.3 above it is anticipated that inflation will be above the 2% target later in 2017 and through 2018. However, it is anticipated that the current provision in the MTFS is adequate. Clearly, this will be treated as a cash limit and if the level of inflation during the year exceeds the amount provided for in the budget, this will put pressure on services to stay within budget and will require effective monitoring and control.
3.3.4 Excess Inflation on volatile budgets
There is also a corporate provision which is held to assist services that may experience increases greatly in excess of the inflation allowance provided when setting the budget. This will only be released for specific demonstrable demand. There is no further change proposed. Table 13: Excess Inflation Provision
2017/18
£000 2018/19
£000 2019/20
£000 2020/21
£000 Excess Inflation provision 451 457 468 472
The cash limiting strategy is not without risks but if current levels of inflation were applied un-damped across the period then the budget gap would change by c.£0.6m by 2020/21.
3.3.5 Income The MTFS does not include any specific provision for inflation on income
from fees and charges. However, service departments can identify increased income as part of their savings proposals.
10 Page 179

3.4 Collection Fund 3.4.1 The Collection Fund is a statutory fund separate from the General Fund.
It accounts for income from Council Tax and from NNDR (Business Rates).
3.4.2 The Collection Fund accounts are kept on an accrual basis and a surplus
or deficit for the year in the collection fund is estimated accordingly. The audited accounts for 2015/16 include the following surplus/deficit for Council Tax and NNDR as at 31 March 2016:-
Table 14: Collection Fund Surplus/Deficit as at 31 March 2016
Surplus/
(deficit) as at 31/03/16
Outturn
Surplus/ (deficit) as at
31/03/16 Outturn
Total surplus/
(deficit) as at 31/03/16
Council Tax NNDR £000 £000 £000 Central Government N/A (2,174) (2,174) GLA 803 (869) (66) Merton 3,007 (1,304) 1,703 Total 3,810 (4,347) (537)
3.4.3 A review of the Collection Fund, related bad debt provisions, write offs,
and collection rates in 2016/17 and anticipated collection rates in 2017/18 has been undertaken. With respect to Business Rates, the NNDR1 return has been submitted (31 January 2017 deadline) which analyses the estimated Business Rates for 2017/18, estimated surplus/deficit as at 31st March 2017 and estimated Section 31 Grant for 2017/18, and the allocations between Merton, Central Government, and the GLA. As part of the Government’s intentions to reform the business rates retention system and move to 100% retention by 2020, the Government is piloting the proposals in some areas (Manchester, Liverpool, London, West of England, Cornwall and the West Midlands. In London the pilot relates to Transport for London (TfL) capital grant and the GLA’s RSG will also be funded from the central share of business rates. This will result in a change in shares of funding currently anticipated to be 33% central government (-17%), 37% GLA (+17%) and 30% Merton (unchanged). This change is expected to be reflected in the final Local Government Finance Settlement and secondary legislation will be laid before Parliament in early 2017 to implement the increase in the GLA’s business rates share.
3.4.4 As a result of the further analysis, the estimated surplus/deficit on the
Collection Fund as at 31st March 2017 is as follows:-
11 Page 180
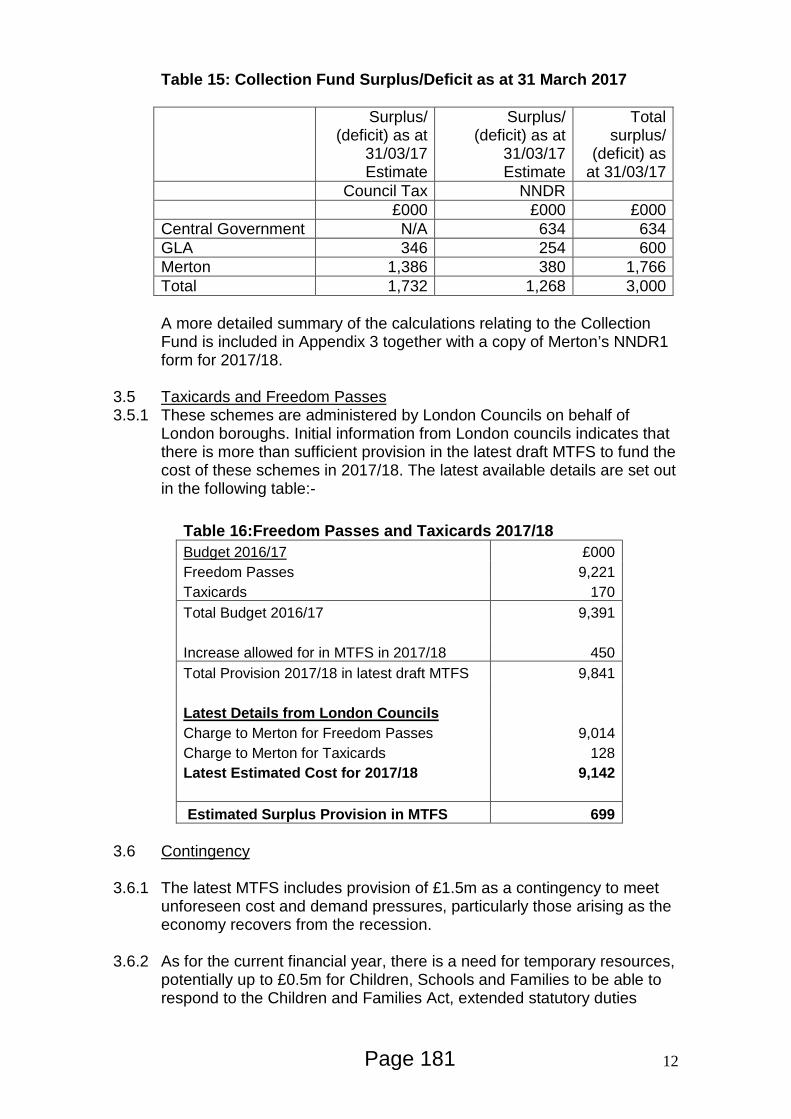
Table 15: Collection Fund Surplus/Deficit as at 31 March 2017
Surplus/ (deficit) as at
31/03/17 Estimate
Surplus/ (deficit) as at
31/03/17 Estimate
Total surplus/
(deficit) as at 31/03/17
Council Tax NNDR £000 £000 £000 Central Government N/A 634 634 GLA 346 254 600 Merton 1,386 380 1,766 Total 1,732 1,268 3,000
A more detailed summary of the calculations relating to the Collection Fund is included in Appendix 3 together with a copy of Merton’s NNDR1 form for 2017/18.
3.5 Taxicards and Freedom Passes 3.5.1 These schemes are administered by London Councils on behalf of
London boroughs. Initial information from London councils indicates that there is more than sufficient provision in the latest draft MTFS to fund the cost of these schemes in 2017/18. The latest available details are set out in the following table:-
Table 16:Freedom Passes and Taxicards 2017/18 Budget 2016/17 £000 Freedom Passes 9,221 Taxicards 170 Total Budget 2016/17 9,391 Increase allowed for in MTFS in 2017/18 450 Total Provision 2017/18 in latest draft MTFS 9,841 Latest Details from London Councils Charge to Merton for Freedom Passes 9,014 Charge to Merton for Taxicards 128 Latest Estimated Cost for 2017/18 9,142 Estimated Surplus Provision in MTFS 699
3.6 Contingency 3.6.1 The latest MTFS includes provision of £1.5m as a contingency to meet
unforeseen cost and demand pressures, particularly those arising as the economy recovers from the recession.
3.6.2 As for the current financial year, there is a need for temporary resources,
potentially up to £0.5m for Children, Schools and Families to be able to respond to the Children and Families Act, extended statutory duties
12 Page 181

associated with 0-25 agenda and transition. This need will be kept under quarterly review.
3.7 Bad Debt Provision 3.7.1 The bad debt provision is calculated on the basis of an examination of
debts within the council’s financial systems to assess the probability of their collection. Due to effective and proactive debt management it is not considered that an increase in contribution will be necessary for 2017/18, even under the current economic circumstances. The level of provision will be kept under review within the MTFS.
3.8 Revenuisation
In recent budgets it has been recognised that some expenditure formerly included in the capital programme could no longer be justified as it did not meet the definition of expenditure for capital purposes. Nevertheless, it is important that some of this expenditure takes place and the following amounts have been included in the latest MTFS for 2017-21:- Table 17: Revenuisation
2017/18 £000
2018/19 £000
2019/20 £000
2020/21 £000
Revenuisation 2,129 2,129 2,129 2,129 The expenditure charged to capital during the current year is being closely monitored and is being reported through the monitoring report.
3.9 Pensions 3.9.1 By law the Superannuation Fund is valued every 3 years. The new valuation is based on the position at 31 March 2016 and is implemented in the 2017/18 financial year. The fund has shown an increase in funding level from 89% to c.94%. Discussions during the current financial year
have been held with the actuary Barnett Waddingham LLP and they have undertaken the revaluation based on a deficit recovery period of 12 years. This produces a reduction in the annual deficit recovery payment compared to the provision in the MTFS as set out in the following table:-
Table 18: Pension Deficit Recovery 2017/18
£000 2018/19
£000 2019/20
£000 2020/21
£000 MTFS (Based on 2013 valuation) 4,592 4,799 5,015 5,015 12 year recovery (2016 valuation) 3,338 3,469 3,552 3,635 Reduction (1,254) (1,330) (1,463) (1,380)
3.9.2 Oncost In addition, following the changes to the way national insurance
contributions are calculated as a result of the move to introduce the Single Tier State Pension from April 2016, the actuary has indicated that
13 Page 182

the future service contribution rate will be 15.2% fixed for 2017/18, 2018/19 and 2019/20, an increase from 13.9% in the current year. The estimated additional cost in each department’s salary costs from 2017/18 is as follows:-
Table 19: Increased oncost contribution rate
Increase in
contribution £000
Corporate Services 173 Children, Schools and Families 242 Environment and Regeneration 148 Community and Housing 205 Total 768
3.10 Summary of Corporate and Technical Adjustments 3.10.1 The financial implications of the corporate and technical adjustments
discussed in this report are summarised in Appendix 4. 4. Departmental Savings Proposals 2017-21 and Service Planning 4.1 The approach to setting savings targets for departments for this year’s
Business Planning process was again based on using controllable budgets and aimed to protect front-line services and services to the vulnerable in line with the ‘July principles’. Weightings for each department; Corporate Services, Environment and Regeneration, Community and Housing, and Children, Schools and Families in the ratio (100%) : (100%) : (67%) : (50%), were applied which reduces the impact on Adult Social Care, Children’s Social Care and vulnerable groups. The targets set also take into account the level to which departments have identified savings against targets set for previous years.
4.2 Initial targets to balance the MTFS agreed by Council in March 2016 to
2019/20 at this stage were calculated for each department based on controllable spend and shortfalls in previously identified targets, and are set out in the following table:-
14 Page 183

Table 20: Savings targets agreed by Cabinet
SERVICE DEPARTMENT’s SAVINGS TARGETS FOR 2017-2021 BUSINESS PLANNING PROCESS
Total £000
Corporate Services 586 Children, Schools & Families 912 Environment & Regeneration 1,659 Community & Housing 312 Total Savings/Income Proposals 3,469
4.3 Service departments reviewed their budgets and formulated proposals to address their targets. These were considered by Cabinet on 12 December 2016 and referred to Overview and Scrutiny Panels and the Commission for scrutiny in January 2017 as part of the overall Budget Consultation pack circulated to all Members.
4.4 The proposals submitted to Cabinet in December 2016 by each
department are summarised in the following table and set out in detail in the consultation pack.
Table 21: Savings Proposals to Cabinet on 12 December 2016
SUMMARY (cumulative) 2017/18
£000 2018/19
£000 2019/20
£000 2020/21
£000 Total £000
Corporate Services 0 0 586 0 586 Children, Schools & Families 0 0 228 0 228 Environment & Regeneration 0 0 913 0 913 Community & Housing 0 0 339 0 339 Total 0 0 2,066 0 2,066 Net Cumulative total 0 0 2,066 2,066
If all of the proposals are accepted, the balance remaining to find is:- Table 22: Savings Proposals compared with Targets
Proposals Targets Balance £'000 £'000 £'000 Corporate Services 586 (586) 0 Children, Schools & Families 678 (228) 450 Environment & Regeneration 1,659 (913) 746 Community & Housing 339 (339) 0 Total 3,262 2,066 1,196
15 Page 184

4.5 Where departments have not met their target or put forward options that are deemed not to be acceptable then the shortfall will be carried forward to later meetings and future years budget processes to be made good.
4.6 At the Overview and Scrutiny Commission meeting on 26 January 2017, the Commission resolved to forward the comment and recommendation to Cabinet that Cabinet “continue to focus on the savings that will still have to be made, and to bring forward savings where it has been identified that these could be achieved sooner”. As a result the following changes are proposed to departmental savings:- Table 23: Savings Brought Forward
Savings brought forward 2017/18
£000 2018/19
£000 2019/20
£000 2020/21
£000 Total £000
Corporate Services 255 30 (285) 0 0 Children, Schools & Families 0 0 0 0 0 Environment & Regeneration 16 497 (513) 0 0 Community & Housing 0 0 0 0 0 Total 271 527 (798) 0 0 Net Cumulative total 271 798 0 0
Table 24: Revised Savings Proposals
SUMMARY (cumulative) 2017/18
£000 2018/19
£000 2019/20
£000 2020/21
£000 Total £000
Corporate Services 255 30 301 0 586 Children, Schools & Families 0 0 228 0 228 Environment & Regeneration 16 497 400 0 913 Community & Housing 0 0 339 0 339 Total 271 527 1,268 0 2,066 Net Cumulative total 271 798 2,066 2,066
4.7 Details of the proposed amendments to savings proposals are set out in
Appendix 11, which shows the savings where sums have been brought forward.
4.8 Feedback from the Scrutiny Process:- 4.8.1 Comments from the Overview and Scrutiny Commission on 26 January
2017 are provided in a separate report on the agenda for this meeting. 4.8.2 Cabinet are asked to review the feedback from the Scrutiny process and
make recommendations as appropriate. 4.8.3 The Overview and Scrutiny Commission’s recommendation to reconsider the proposal (D&BC6) within Building and Development Control to stop sending consultation letters on applications and erect site notices only
16 Page 185

would increase costs by £10k in 2017/18 and future years. This is currently not reflected in the MTFS. If Cabinet decide to agree this recommendation the budget papers will be amended for Council at the budget meeting on 1 March 2017. 4.9 Financial Implications of Changes arising from response to Scrutiny 4.9.1 The draft MTFS shown in Appendix 7 does not include the impact of any
changes recommended by Overview and Scrutiny Commission but does include the impact of savings brought forward (paragraph 4.6 and Appendix 11 refers) . If Cabinet decide to accept any or all of the recommendations the MTFS reported to Council will be amended to reflect this.
5. Budgetary Control 2016/17 5.1 The revenue budgetary control information below summarises the
corporate position using the latest available information as at 31 December 2016 as shown in a separate report on the agenda for this meeting. As at 31 December 2016, there is a forecast overspend for the Council of £6.021m.
5.2 The overspend of £6.02m is made up as follows :-
Net Service Department overspend £10.576m Appropriation from Reserves (£0.665m) Corporate underspend (£3.890m)
£6.021m 5.3 Where appropriate these projections are being incorporated into the
Medium Term Financial Strategy for 2017-21. 5.4 In terms of addressing issues which have been identified as pressures
that need to be addressed in 2017/18 this report includes details of growth proposals that have been put forward as part of an overall package that is designed to do this within the overall constraints of setting a balanced budget.
6. Capital Financing and Treasury Management
Treasury Management, Capital Financing and Investment Income: 6.1 Details are included in Section 5 of this report. Capital financing costs are
derived from the draft capital programme which is discussed in Section 4 and estimated revenue funding is built into the MTFS for the level of borrowing that is expected.
17 Page 186

6.2 Details relating to how the capital programme has changed from that approved by Council in March 2016 to the capital programme for 2017-21 are discussed in Section 4 of this report and related appendices. The capital programme has continued to be subject to major review as part of monthly monitoring and the process of developing the Business Plan for 2017-21.
6.3 In addition to reviewing the capital programme, focus has also been maintained on the treasury management aspects of funding the programme, to improve forecasts of available funding and to minimise as far as possible the costs of funding capital. This has included improved cash flow forecasting to enable the programme to be funded from capital receipts and internal resources for as long as possible to take advantage of current low levels of interest. Work is also continuing to ensure that grants and contributions are utilised effectively and this work will continue into the closing of accounts process for 2016/17 to ensure that the revenue impact of the capital programme is minimised in 2017/18 and beyond.
6.4 The revenue budget implications of the capital programme 2017-21
compared to those included in the MTFS approved by Council in March 2016 are summarised in the following table:-
Table 25: Summary of Capital Financing Costs and movement since 2016/17
2017/18 £000
2018/19 £000
2019/20 £000
2020/21 £000
Budgeted Capital financing costs of Programme approved by Council 2/03/2016
12,370 12,200 13,091 13,426
Change arising from recalculation of charges including financing and review and re-profiling of capital programme as set out in Section 4
(141) (1,283) (801) (509)
Estimated capital financing costs of Capital Programme 2017-21
12,229 10,917 12,290 12,917
6.5 The analysis of the budget for capital financing costs and investment
income is set out in the following table:-
18 Page 187

Table 26: Details of Budgets for capital financing costs
2017/18 £000
2018/19 £000
2019/20 £000
2020/21 £000
MRP 6,713 5,537 6,751 7,113 Interest 6,702 6,321 6,321 6,321 Capital financing costs 13,415 11,858 13,072 13,434 Investment Income (1,186) (941) (782) (517) Net 12,229 10,917 12,403 12,917
7 GENERAL FUND BALANCES AND RESERVES 7.1 In determining an appropriate level of general fund balances previously,
an analysis of the overall expenditure of the authority had been prepared. An updated version of this analysis has been prepared and is attached as Appendix 10. The overall level of balances is summarised below and compares with current GF balances of £15.151m as shown in the final accounts for 2015/16, but will need to be adjusted for outturn, with a projected overspend of £6.020m and a forecast contribution of £2.327m from GF balances, leaving a balance of £12.824m at 31 March 2017.
Table 27: Indicative range of balances
Min Medium Max £m £m £m Level of balances 12.3 18.1 24.0
7.2 An alternative approach would be to look at a percentage based on the
net spending of the authority. From the Audit Commission’s report “Striking a Balance”, most Chief Officers regarded an amount of between 3 and 5 per cent as a prudent level and the minimum the auditors would consider prudent. There are also some other areas of risk and unknowns in relation to the localisation of business rates and how this impact will flow thorough, in particular in relation to appeals. There is now an amount calculated for Merton called the safety net, below which income must fall before Merton becomes entitled to funding from central government. This approach is set out below, using an amount of 5 per cent.
Table 28: Indicative level of balances
£m Net spending 7.3 Safety Net 2.3 Appeals 0.5 Level of balances 10.1
19 Page 188

7.3 The average level of General Fund balances for outer London boroughs
for 2015/16 was £16.7m, with a low of £8.0m and a high of £41.1m. Merton, with £15.2m is ranked 10th lowest out of 20 outer London boroughs.
7.4 An initial review of earmarked reserves use over the MTFS period has
been undertaken as is shown in Appendix 8. This shows the level of earmarked reserves falling from £28.7m to £5.3m by 31 March 2021.
7.5 The average level of earmarked reserves for outer London boroughs for
2015/16 was £62.9m, with a low of £22.9m and a high of £149.0m. Merton, with £32.6m (excluding schools) is ranked 16th lowest out of 20 outer London boroughs.
8. Revenue Support Grant and Baseline Funding (Non-Domestic
Rates) 8.1 In 2013/14 there was a fundamental change in the funding methodology
for local government services. This introduced the Business Rates Retention Scheme. Estimates of business rates receivable for 2017/18 have been produced and a summary is provided in Appendix 3.
8.2 The overall changes in formula grant compared to 2016/17, the original
MTFS estimate for 2017/18 and the funding announced in the Final Local Government Finance Settlement will be reported to Council in March:-
Table 29: Changes in Local Government Finance Settlement
Final Original Final 2016/17 2017/18 2017/18 £000 £000 £000 RSG 22,589 14,963 TBA RSG – Transition Grant 567 557 TBA NNDR 34,230 34,847 35,484* NNDR - Section 31 Grant 822 0 1,035* Total 57,641 50,367 TBA
* Based on NNDR1 9. Council Tax Strategy 9.1 Merton council held a consultation on a Council Tax and Council Spending. The consultation took place between 9 September and 4 November 2016 and involved a survey included in the autumn edition of My Merton and available online. The results were reported to Cabinet in
20 Page 189

December 2016 and are also included in the Savings Proposals Consultation pack for Members. 9.2 Council Tax 9.2.1 The Settlement sets out the Government’s council tax
referendum principles for 2017/18. As for previous years, the core threshold for triggering the requirement for a local referendum is 2%.
9.2.2 The Settlement also increased the flexibility offered on the use of the Adult Social Care precept. The policy intention set out in the 2016/17 Settlement was that this would be 2% per year up to 2019/20. However, in recognition of the particular pressures on adult social care services, social care authorities will be able to increase by up to 3% per year subject to an overall limit of 6% over the three years up to and including 2019/20. The additional 1% must be for the improvement of Adult Social Care, the details of how this is defined are still awaited.
9.2.3 The maximum increase in either 2017/18, 2018/19, or 2019/20 is
therefore currently 5%, subject to the overall limit of 6% over the three years on Adult Social Care and assuming a core threshold of 2% per year.
9.2.4 The financial projections in this report are based on the following levels
of council tax increase:-
2017/18 %
2018/19 %
2019/20 %
2020/21 %
Council Tax increase - General 0 0 2* 2* Council Tax increase - ASC 3 3 0 0 Total 3 3 2 2 * A charge based on the assumption in the calculation of core spending power in the
Provisional Local Government Finance Settlement 10. Council Tax Base 10.1 Cabinet on 12 December 2016 agreed the Council Tax Base calculation
for 2017/18. Details of the calculation are included as Appendix 3. 10.2 For 2017/18 the Council Tax Base has been calculated as:-
Table 30: Council Tax Base 2017/18 Council Tax Base 2017/18 72,442.3
10.3 A separate council tax base calculation has been produced for the
properties covered by the Wimbledon and Putney Common Conservators (WPCC) area. For 2017/18 the Council Tax Base for
21 Page 190

Wimbledon and Putney Commons Conservators has been calculated as:-
Table 31: WPCC Council Tax Base 2017/18
WPCC Council Tax Base 2017/18 11,131.2
11. Greater London Authority Precept and Other Levies 11.1 The Greater London Authority (GLA) sets a budget for itself and each of
the four functional bodies: Transport for London, the London Development Agency, the Metropolitan Police Authority, and the London Fire and Emergency Planning Authority. These budgets together form the consolidated budget.
11.2 On 21 December 2016, the Mayor of London published his draft revenue
budget and capital spending plan for 2017-18 for consultation. This includes his draft budget proposals for the GLA (Mayor and Assembly), the Mayor's Office for Policing and Crime (MOPAC), the London Fire and Emergency Planning Authority (LFEPA), Transport for London (TfL), the London Legacy Development Corporation (LLDC) and the new Old Oak and Park Royal Development Corporation (OPDC).
11.3 The GLA’s consultation budget proposes an increase in the Mayor's
Band D council tax precept of £4.02 (1.5 percent) from £276.00 to £280.02 in 2017-18 for council taxpayers in the 32 London boroughs.
11.4 The Mayor’s draft budget was considered by the London Assembly on 25 January 2017. The final draft budget is scheduled to be published by 10 February 2017 and will be considered by the Assembly on Monday 22 February 2017 following which the Mayor will confirm formally the final precept and GLA group budget for 2017-18.
11.5 Other Levies 11.5.1 The Council is required by statute to pay certain levies to the
organisations listed below. The levies for 2017/18 are still to be confirmed but the latest estimates are set out in the following table:- Table 32: Other Levies
2016/17
£000 2017/18
£000 2017/18
Change % London Pension Fund Authority 262 TBA TBA Lee Valley Regional Park 204 TBA TBA Environment Agency 162 164 1.4%
22 Page 191

11.5.2 LPFA – Update on a proposed arrangement with regard to the pension deficit arising from the Former Pensioner sub-fund operated by the LPFA
Following the abolition of the GLC in 1986 and the ILEA in 1990, the LPFA was established to take over the former GLC/ILEA Pensions fund and associated liabilities of the London Residuary Body (the successor body to the GLC/ILEA). The LPFA divided the fund into two sub funds with the staff in the two groups being in the pensioner sub fund.
Following the 2007 actuarial revaluation the LPFA notified boroughs that
they intended to issue a further charge on the boroughs due to the deficit that had arisen on the pensioner sub fund. Discussions were then held with the SLT and draft regulations prepared by the DCLG (or its predecessor) to give effect to the proposed levy. This was challenged by two London boroughs and has remained unresolved. The Government’s preference was for London boroughs and the LPFA to try to resolve the issue and subsequently the LPFA abolished the two sub funds which with other changes to the investment strategy has led to an improvement to the deficit position.
The overall total deficit on these liabilities is now £177m and discussions
with SLT representatives and the LPFA have clarified that a fair proportion of any deficit for the London boroughs to be responsible for is 90% and this will form the basis of further negotiations on future proposals.
The proposal is that the GLC/ILEA deficit is apportioned to each borough
in line with the current levy allocation(i.e. 2016/17 Council Tax Base with a Greater London spread for group 1 and Inner London spread for group 2. Each borough can agree individual plans with the LPFA around recovery arrangements for their specific part of the deficit and the situation will be reviewed every three years at subsequent valuations to assess the current position and agree future contribution recovery.
The LPFA have indicated that they are prepared to be as flexible as
possible in agreeing terms with individual boroughs. The proposals currently being discussed represent a significant change and reduction in contributions compared to the original proposals put forward for consultation in 2009 and recognise the statutory nature of London boroughs to meet these liabilities over the long term (i.e. up to 30 years)
Merton’s share of the deficit has been notified as £1.779m. If the Council
was to borrow this amount over 30 years it would cost c. £86k per year. 11.6 Wimbledon and Putney Commons Conservators (WPCC) 11.6.1 A separate precept is levied in respect of those residents of properties
bordering the Wimbledon and Putney Commons. The amount is calculated on the basis of the amount levied by the Commons Conservators and the Band D Council Tax in respect of the WPCC precept in 2017/18 will be £318,443, an increase of £18,401 (6.1%) from the 2016/17 levy of £300,042.
23 Page 192

Table 33: Wimbledon and Putney Commons Conservators Precept
2016/17
£000 2017/18
£000 Change
% Wimbledon & Putney Commons Conservators 300 318 6.1%
11.6.2 The average Band D cost to a council taxpayer in the WPCC area has
changed from £26.97 in 2016/17 to £28.61 in 2017/18. 12. CONCLUSIONS 12.1 It is a statutory requirement that the council sets a balanced budget in
2017/18. 12.2 In accordance with sections 52ZY and 68 of the Local Government
Finance Act 1992 (’the 1992 Act’), section 139A of the Local Government Finance Act 1988, and section 230 of the Local Government Act 1972 authorities are required to supply information required to measure whether any proposed Council Tax increase is in excess of the principles laid down requiring a local referendum.
12.3 The Government return is the Council Tax Requirement form CTR1 and
the DCLG have notified authorities that they are planning to send out the CTR1 2017-18 form in February after the publication of the Final Settlement.
12.4 The Government are changing the form in response to changes in
legislation and in particular the changes relating to potential increases in council tax to fund adult social care.
12.5 The Medium Term Financial Strategy assumes that all of the corporate
provisions, proposals for growth and proposals for savings, in 2017/18 discussed in this report are agreed and if this is the case, the following financial position is achieved:-
Table 34: Average Band D Council Tax
Average Council Tax Calculation at Band D
2016/17 £m
2017/18 £m
Budget Requirement 147.596 145.314 RSG + Business Rates + Transition (57.386) (51.004) Section 31 Grant (NNDR) (0.822) (1.035) New Homes Bonus (4.192) (4.150) PFI Grant (4.797) (4.797) Collection Fund Surplus (1.479) (1.766) Council Tax Requirement 78.920 82.562 Council Tax Base 71,327.0 72,442.3 Average Council Tax 1,106.45 1,139.71
24 Page 193
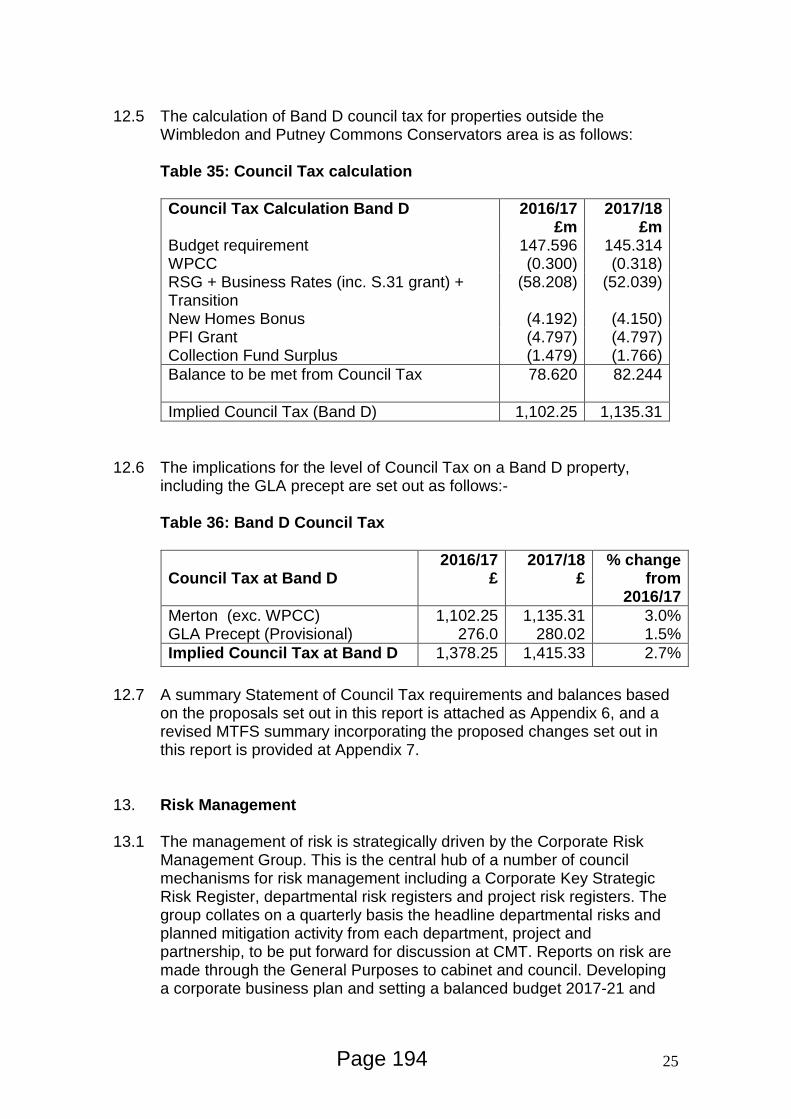
12.5 The calculation of Band D council tax for properties outside the
Wimbledon and Putney Commons Conservators area is as follows:
Table 35: Council Tax calculation Council Tax Calculation Band D 2016/17
£m 2017/18
£m Budget requirement 147.596 145.314 WPCC (0.300) (0.318) RSG + Business Rates (inc. S.31 grant) + Transition
(58.208) (52.039)
New Homes Bonus (4.192) (4.150) PFI Grant (4.797) (4.797) Collection Fund Surplus (1.479) (1.766) Balance to be met from Council Tax
78.620 82.244
Implied Council Tax (Band D) 1,102.25 1,135.31 12.6 The implications for the level of Council Tax on a Band D property,
including the GLA precept are set out as follows:-
Table 36: Band D Council Tax
Council Tax at Band D
2016/17 £
2017/18 £
% change from
2016/17 Merton (exc. WPCC) GLA Precept (Provisional)
1,102.25 276.0
1,135.31 280.02
3.0% 1.5%
Implied Council Tax at Band D 1,378.25 1,415.33 2.7% 12.7 A summary Statement of Council Tax requirements and balances based
on the proposals set out in this report is attached as Appendix 6, and a revised MTFS summary incorporating the proposed changes set out in this report is provided at Appendix 7.
13. Risk Management 13.1 The management of risk is strategically driven by the Corporate Risk
Management Group. This is the central hub of a number of council mechanisms for risk management including a Corporate Key Strategic Risk Register, departmental risk registers and project risk registers. The group collates on a quarterly basis the headline departmental risks and planned mitigation activity from each department, project and partnership, to be put forward for discussion at CMT. Reports on risk are made through the General Purposes to cabinet and council. Developing a corporate business plan and setting a balanced budget 2017-21 and
25 Page 194

beyond has been highlighted as a key strategic risk on the corporate risk register.
13.2 Currently £15 million of savings are being progressed for 2016-17,
coupled with a further £17m of savings identified for 2017-21. Current practice is to monitor delivery of savings as part of the monthly Business Plan Monitoring, it is envisaged that given the size of the savings target over the next three years, additional mechanisms may need to be established to monitor more transformational and longer term projects.
14. Summary 14.1 Taking into account the changes that have taken place since the Cabinet
meeting in January, before taking into account any changes that Cabinet are minded to make following the feedback from Scrutiny, the budget gap in the MTFS has changed to the following:-
Table 37: Cumulative MTFS Gap 2016-2020
Cumulative 2017/18
£000 2018/19
£000 2019/20
£000 2020/21
£000 Gap exc. Savings/Growth (2,768) 6,343 16,775 24,654 Savings (9,159) (15,727) (17,446) (17,446) Growth 11,927 12,901 10,395 10,895 Gap Net of Savings/Growth 0 3,517 9,724 18,103
15. Future Years 15.1 As indicated in the updated MTFS there is a gap between the forecast
level of resources and budget requirements for later years which will need to be addressed if balanced budgets are to be set for those years. The updated MTFS is set out in Appendix 7.
15.2 The budget process for 2018/19 will commence in the new financial year
and some of the options available to the Council to eliminate the budget gaps include:-
• Savings – reduction/deletion of services • Savings – efficiencies including procurement • Income – increase in fees and charges/new sources of income • Council Tax increase – currently assumed as 2% for 2019/20 and
2020/21for planning purposes • Adult Social Care Precept – currently assumed as 3% for 2018/19 for
planning purposes. • Use of balances
26 Page 195

16. Positive Assurance Statement 16.1 Section 25(2) of the Local Government Act 2003 requires the Chief
Financial Officer of an authority to report on:
(a) the robustness of the estimates made for the purposes of the calculations, and
(b) the adequacy of the proposed financial reserves. 16.2 In doing so, the Director of Corporate Services has had particular regard
to the guidance offered by the Chartered Institute of Public Finance and Accountancy and the views of the Council’s external auditor.
16.3 One of the Council’s stated priorities is to keep council tax low. To
achieve this, the Council must have regard to the major risks to its financial position and in particular: • The current economic position • Whether budget setting and monitoring processes are robust and
effective • Demand pressures on the budget • Identifying and achieving cost and income improvements • Risks to Government funding levels • Risks to other income streams
16.4 Local government finance issues had been dominated since 2010 by
cuts in government funding and pressure to keep council tax increases down, with the offer of government grant to help do so. The draft Settlement confirmed the 2% Council Tax referendum threshold in order to keep bills down for hard working people, and changed the Spending Power assumptions increase in Council Tax from CPI to the Council Tax threshold, an increase of 0.25%. Alongside this, the longer term position is also made more uncertain by the changes in the way Government Funding is calculated and the changes proposed to Business Rates. Previously the MTFS showed significant progress to date towards a balanced budget over the medium term, the addition of growth, particularly for Adult Social Care (ASC) has significantly impacted on this, making the medium and longer term position extremely challenging. The additional 2% flexibility has been amended to allow for an increase of 3% but can still not be more than 6% up to 2019/20, i.e. there is no overall change to the amount that can be raised from the precept over the next three years. The additional 1% has to be used to improve ASC, but details of how this is to be demonstrated are still yet to be released. It is hoped that this will be available in the final settlement. This flexibility is being offered in recognition of demographic changes which are leading to growing demand for adult social care, and increased pressure on council budgets, but a longer, more permanent funding solution is required to address the issues.
27 Page 196

16.5 With the significant growth in ASC and the ongoing unfunded burdens in Children’s Social Care, it becomes more difficult to find additional savings in these areas in the short to medium term and therefore a significant impact potentially on the Environment & Regeneration and Corporate Services department, without an increase in the Merton element of Council Tax. Members should also note that freezing Council Tax levels produces a permanent real terms reduction in Council Tax yield.
16.6 With the allowance for demand growth, uncertainty over
Government funding, increased concerns over income funding streams, and the need to achieve challenging savings targets, the risks inherent in the revenue budget are inevitably increased. The Council has used its reserves to deal with the position in the short term and will be reviewing further transformation of the authority and bringing forward the timescales for options to address the shortfall now identified in 2018/19 and beyond.
16.7 The Council’s reserves and their usage is linked to both the capital and
revenue budget. A list of the current reserves held by the Council is attached at Appendix 8. Reserves are likely to reduce overall, and this is a result of their use for the purposes they were established and in order to address pressures in demand-led budgets. The overall level therefore remains adequate, but is reducing over the MTFS, which limits further flexibility and one off support if required.
16.8 There has been a revaluation of the Pension Fund, the impact of which
has been set out in Section 3.9. This has shown an increase in the funding level to 94%, in the ongoing contribution rate to 15.2% and a reduction in lump sum deficit contributions deficit. The recovery period remains at 12 years to enable the Council to optimise its options at the next revaluation in 2019/20. There are still discussions regarding Government’s changes to public sector pension schemes, but there are no timescales indicated. Work continues in the Council’s Pension Fund Committee to address this and the improving the investment position of the fund.
16.9 Chief Officers have reviewed their budgets in line with departmental
finance officers and are confident that the budgets set for their services are robust and with the corporate contingency will meet the strategic objectives and performance targets set out in the Business Plan.
16.10 In summary, it is the view of the Chief Financial Officer (being the
Director of Corporate Services) that the estimates are robust for the purposes of the required budget/council tax calculations and that the Council’s reserves are adequate.
28 Page 197

DRAFT RESOLUTIONS Revenue Report: 1. Members consider the views of the Overview and Scrutiny Commission set
out in a separate report on the agenda (Item 6), and approve the proposed budget for 2017/18 set out in Section 2 of the revenue report, together with the proposed Council Tax levy in 2017/18.
2. That it be noted that at its meeting on 12 December 2016 the Council
calculated its Council Tax Base for the year as 72,442.3 in accordance with regulation 3 of the Local Authorities (Calculation of Council Tax Base) Regulations 2012(SI 2012: 2914).
3. That it be noted that the Council calculated the Wimbledon and Putney
Commons Conservators (WPCC) Tax Base for the year as 11,131.2 in accordance with regulation 6 of the Regulations, as the amounts of its Council Tax base for the year for dwellings in those parts of its area to which one or more special items relate.
4. That the Council agrees 4(a) - 4(i) below, which are calculated in accordance
with Section 31A to 49B of the Localism Act 2011, amending Section 32 of the Local Government Finance Act 1992.
a) being the aggregate of the amounts which the Council estimates for the
items set out in Section 31A (2) (a) to (f) of the Act
£m Gross Revenue Expenditure of Service Committees Corporate Provisions Amounts Payable to the Levying Bodies Contribution to/(from) Financial Reserves Gross Expenditure
522.985 0.318 0.948
(3.549) 520.702
b) being the aggregate of the amounts which the Council estimates for the
items set out in Section 31A (3) (a) to (d) of the Act £m Gross Income 438.139
NB: The final analysis of gross expenditure and income may vary from the figures shown
above as a result of some minor changes in allocations e.g. Final LGF Settlement c) being the amount by which the aggregate at 4(a) above exceeds the
aggregate at 4(b) above, calculated by the Council, in accordance with Section 31(4) of the Act, as its Council Tax Requirement for the year
APPENDIX 1
Page 198

£m Council Tax Requirement for the Council’s own purposes for 2017/18 (including special expenses re WPCC)
82.563
d) being the aggregate of the sums which the Council estimates will be payable for the year into its General Fund in respect of revenue support grant, and baseline funding (NNDR) to constitute the Council’s formula grant £m Revenue Support Grant including Transition Grant 15.520 Baseline funding NNDR inc. top-up & Section 31 Grant 36.518 Settlement Funding Assessment 52.038
e) being the amount at 4(c) above, divided by the amount for Council Tax
Base at 2 above, calculated by the Council above, in accordance with Section 31B of the Act as the basic amount of its Council Tax for the year (including special items (WPCC)).
£ Merton’s General Band D Council Tax Levy (including properties within Wimbledon and Putney Commons Conservators area)
1,139.71
f) being the aggregate amount of all special items referred to in Section
34(1) of the Act
£ Wimbledon and Putney Commons Conservators Special Levy
318,443
g) being the amount at 4(e) above, less the result given by dividing the amount at 4(f) above by the amount of the Council Tax Base at 2 above in accordance with Section 34 (2) of the Act, as the basic amount of its Council Tax for the year for dwellings in those parts of its area to which no special items (WPCC special levy) relates.
£ Merton’s General Band D Council Tax Levy (excluding WPCC)
1,135.31
h) being the amounts given by adding to the amount at 4(g) above, the amounts of the special item or items relating to dwellings in the area of Wimbledon and Putney Commons Conservators (WPCC) mentioned above at 4(f) divided by the amount at 3 above, calculated in
APPENDIX 1
Page 199

accordance with Section 34(1) of the Act, as the basic amounts of its Council Tax for the year for dwellings in the area of WPCC.
£ Wimbledon and Putney Commons Conservators Band D
1,163.92
i) being the amounts given by multiplying the amounts at 4(g) and 4(h)
above by the number which, in the proportion set out in Section 5(1) of the Act, is applicable to dwellings listed in a particular valuation band divided by the number which in that proportion is applicable to dwellings listed in valuation band D, calculated by the Council, in accordance with Section 30 and 36 of the Local Government Finance Act 1992, as the amounts to be taken into account for the year in respect of categories of dwellings listed in different valuation bands.
Valuation Bands
Part of the Councils Area
A £
756.87
B £
883.02
C £
1,009.16
D £
1,135.31
E £
1,387.60
F £
1,639.89
G £
1,892.18
H £
2,270.62
Parts inc. WPCC
775.95 905.27 1,034.60 1,163.92 1,422.57 1,681.22 1,939.87 2,327.84
5. To note that the Greater London Authority have issued precepts to the Council in
accordance with Section 40 of the Local Government Finance Act 1992 for each category of dwellings in the Council’s area as indicated in the table below, and that the Council agrees the Council Tax levy for 2017/18 by taking the aggregate of 4(i) above and the Greater London Authority precept.
Valuation Bands Precepting Authority
A £
B £
C £
D £
E £
F £
G £
H £
G L A 186.68 217.79 248.91 280.02 342.25 404.47 466.70 560.04 For information purposes this would result in the following Council Tax Levy for Merton residents:-
Valuation Bands
Part of the
Council’s Area
A £
943.55
B £
1,100.81
C £
1,258.07
D £
1,415.33
E £
1,729.85
F £
2,044.36
G £
2,358.88
H £
2,830.66
Parts inc. WPCC
962.63 1,123.06 1,283.51 1,443.94 1,764.82 2,085.69 2,406.57 2,887.88
APPENDIX 1
Page 200
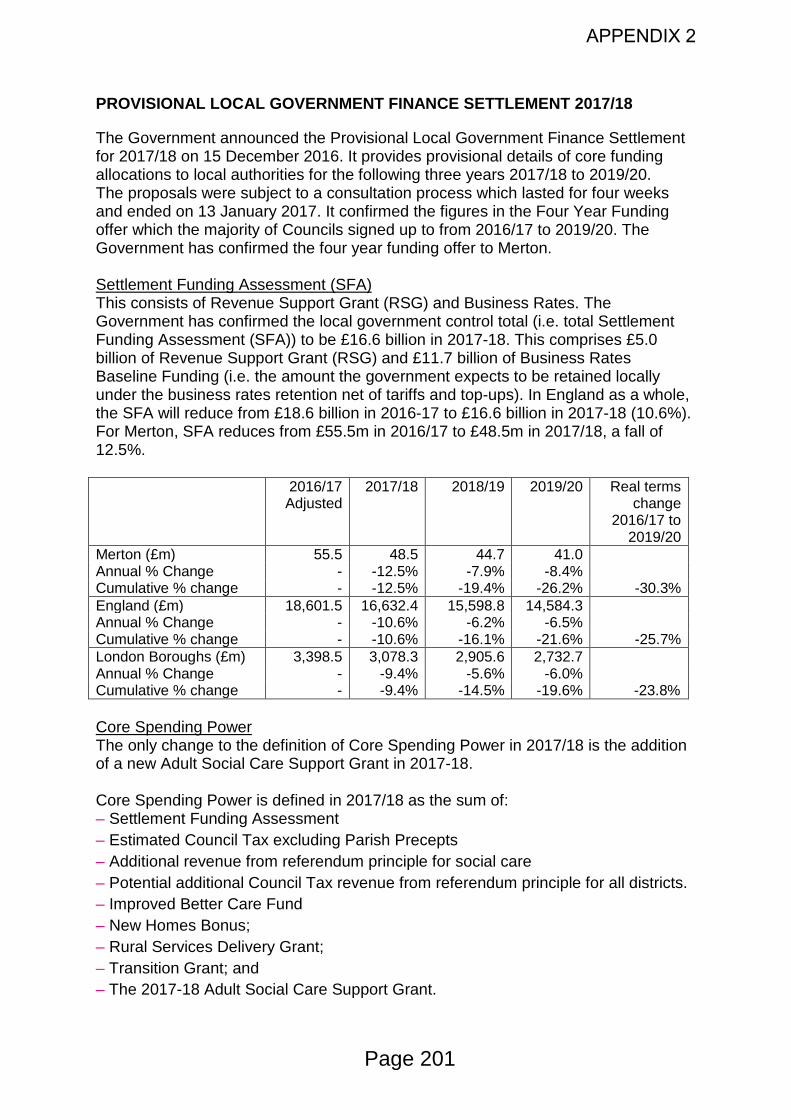
PROVISIONAL LOCAL GOVERNMENT FINANCE SETTLEMENT 2017/18
The Government announced the Provisional Local Government Finance Settlement for 2017/18 on 15 December 2016. It provides provisional details of core funding allocations to local authorities for the following three years 2017/18 to 2019/20. The proposals were subject to a consultation process which lasted for four weeks and ended on 13 January 2017. It confirmed the figures in the Four Year Funding offer which the majority of Councils signed up to from 2016/17 to 2019/20. The Government has confirmed the four year funding offer to Merton. Settlement Funding Assessment (SFA) This consists of Revenue Support Grant (RSG) and Business Rates. The Government has confirmed the local government control total (i.e. total Settlement Funding Assessment (SFA)) to be £16.6 billion in 2017-18. This comprises £5.0 billion of Revenue Support Grant (RSG) and £11.7 billion of Business Rates Baseline Funding (i.e. the amount the government expects to be retained locally under the business rates retention net of tariffs and top-ups). In England as a whole, the SFA will reduce from £18.6 billion in 2016-17 to £16.6 billion in 2017-18 (10.6%). For Merton, SFA reduces from £55.5m in 2016/17 to £48.5m in 2017/18, a fall of 12.5%. 2016/17
Adjusted 2017/18 2018/19 2019/20 Real terms
change 2016/17 to
2019/20 Merton (£m) 55.5 48.5 44.7 41.0 Annual % Change - -12.5% -7.9% -8.4% Cumulative % change - -12.5% -19.4% -26.2% -30.3% England (£m) 18,601.5 16,632.4 15,598.8 14,584.3 Annual % Change - -10.6% -6.2% -6.5% Cumulative % change - -10.6% -16.1% -21.6% -25.7% London Boroughs (£m) 3,398.5 3,078.3 2,905.6 2,732.7 Annual % Change - -9.4% -5.6% -6.0% Cumulative % change - -9.4% -14.5% -19.6% -23.8% Core Spending Power The only change to the definition of Core Spending Power in 2017/18 is the addition of a new Adult Social Care Support Grant in 2017-18. Core Spending Power is defined in 2017/18 as the sum of: – Settlement Funding Assessment – Estimated Council Tax excluding Parish Precepts – Additional revenue from referendum principle for social care – Potential additional Council Tax revenue from referendum principle for all districts. – Improved Better Care Fund – New Homes Bonus; – Rural Services Delivery Grant; – Transition Grant; and – The 2017-18 Adult Social Care Support Grant.
APPENDIX 2
Page 201

The table below shows Merton’s breakdown of ‘Core Spending Power’ by funding element. This is the Government’s calculation and the Council Tax figures assume growth in the Council Tax Base at the average annual growth between 2013-14 and 2016-17 throughout the period to 2019-20. It also assumes that Council Tax Band D will increase in line with the 2% referendum limit for each year up to 2019-20. In addition, the Government assume potential additional council tax will be available from Adult Social Care flexibility. For 2016-17 this is based on actual take up (i.e. 0% for Merton) but 2% for years 2017-18 to 2019-20 is assumed. At the England level across the four years, spending power will increase by £1.1 billion from £43.6 billion to £44.7 billion (2.6% cash increase). Within this, Settlement Funding Analysis (SFA) will reduce by £4.0 billion (22%) and New Homes Bonus (NHB) by £0.6 billion (39%), which is largely offset by the government’s estimate of council tax increasing by £4.4 billion (19%). For Merton, the analysis is Baseline Provisional Illustrative Illustrative Change (16-17 to
19/20 2016-17 2017-18 2018/19 2019/20 £m % Council Tax - Council Tax Requirement 78.920 82.203 85.622 89.184 10.264 13.01 - Assumed revenue from
ASC precept 0.000 1.612 3.391 5.350 5.350 -
Sub-total: Council Tax 78.920 83.815 89.013 94.534 15.614 19.78 Settlement Funding Assessment
Of which: Baseline Funding (NNDR) 32.911 33.582 34.663 35.896 2.985 9.07 Revenue Support Grant 22.589 14.963 10.071 5.076 (17.513) (77.53) Sub-total: SFA 55.500 48.545 44.734 40.972 (14.528) (26.17) Improved Better Care Fund 0.000 0.000 1.408 3.061 3.061 - New Homes Bonus 4.734 4.150 3.110 2.984 (1.750) (36.97) Transition Grant 0.567 0.557 0.000 0.000 (0.567) (100.00) The 2017-18 Adult Social Care Support Grant
0.000 0.751 0.000 0.000 0.000 0.000
Core Spending Power 139.721 137.817 138.265 141.551 1.830 1.310 Change over Spending Review period (i.e. 2015/16 to 2019/20) (4.222) (2.90)
The Settlement Funding Assessment is the total of Revenue Support Grant (RSG) and Baseline Funding (BF) from Business Rates.
2016/17 Adjusted
2017/18 2018/19 2019/20 Real terms change
‘16/17 to ‘19/20
Merton (£m) 55.5 48.5 44.7 41.0 Annual % Change - -12.5% -7.9% -8.4% Cumulative % change - -12.5% -19.4% -26.2% -30.3% England (£m) 18,601.5 16,632.4 15,598.8 14,584.3 Annual % Change - -10.6% -6.2% -6.5% Cumulative % change - -10.6% -16.1% -21.6% -25.7% London Boroughs (£m) 3,398.5 3,078.3 2,905.6 2,732.7 Annual % Change - -9.4% -5.6% -6.0% Cumulative % change - -9.4% -14.5% -19.6% -23.8%
APPENDIX 2
Page 202

Business Rates Retention There has been significant change to the business rates retention scheme as a result of the adjustments for the 2017 Revaluation, which alter both tariff and top ups and business rates baselines for individual authorities. The business rates revaluation adjustment ensures, as far as is practicable, that an authority’s retained income is the same after revaluation as immediately before. The Government has revised the methodology from that set out in the settlement technical consultation to reflect two changes:
• Including the value of section 31 grants that authorities are paid to compensate them for changes to the rating system introduced at successive Autumn Statements.
• Adjusting the calculation to take account of inflation only after the revaluation adjustment to tariff and top ups has been made.
No adjustment has been made for areas where there are a large proportion of charities (e.g. schools or universities) whose rateable values change in a way that is significantly different from the general revaluation effect in the area. Government will keep the situation under review and will discuss further with local government devising a fair basis for further adjustments that could be introduced at the time of when the final adjustments are made in the 2018-19 Settlement. DCLG will keep the overall methodology under review in order to allow scope for further adjustments to be made in 2018/19. This has resulted in London Boroughs’ changing from being an overall £14 million top up in 2016-17 to now paying an overall tariff in 2017-18 of £223 million. At an individual authority level, both Hounslow and Tower Hamlets are tariff authorities for 2017-18 and join the existing eight boroughs that were tariff authorities, leaving 23 top up authorities. Merton remains a top-up authority.
With respect to estimates of Business Rates, the NNDR (Baseline Funding) figures in the Core Spending calculation in the Settlement are derived from the 2013/14 baseline figure and uprated by the September change in RPI. Merton remains a top-up authority and this means that on top of its 30% share of the Business Rates yield, Merton receives a top-up payment to bring it up to the Baseline funding level. The top-up is also increased in line with the small business non-domestic rating multiplier each year and this was originally planned to continue until the Business Rates system is reset in 2020 but the Government have now indicated that they propose to use them to adjust for new burdens, and changes in needs assessments and changes arising from revaluation.
The figures in the Settlement for Merton are:-
APPENDIX 2
Page 203

2015/16
£m
2016/17
£m
2017/18
£m
2018/19
£m
2019/20
£m
Business Rates Baseline 24.8 25.0 24.5 25.3 26.2
Top-Up 7.8 7.9 9.1 9.4 9.7
Baseline Funding 32.6 32.9 33.6 34.7 35.9
This can be a bit misleading when assessing the resources available to the authority because the funding for Business Rates is based on the forecast included in the Council’s NNDR1 return (which was submitted by the deadline of 31 January 2017).
This can be seen by reference to the Council’s share of Business Rates based on the NNDR1 returns over the past three years since Business Rates Retention began
2013/14
£m
2014/15
£m
2015/16
£m
2016/17
£m
NNDR1 Share (30%) 24.5 25.6 25.8 26.3
Top-Up 7.5 7.7 7.8 7.9
Section 31 payments 0 1.1 1.2 0.8
Total Business Rates inc. in Budget 32.0 34.4 34.8 35.0
Therefore, projections of the Council’s share of Business Rates funding over the next four years are starting from a higher level than the Baseline Funding projections in the Provisional Settlement.
Business Rates 2017/18 2018/19 2019/20 £'000 £'000 £'000 Forecast included in Settlement (24,500) (25,288) (26,188) Forecast in MTFS based on NNDR1 (26,401) (26,929) (27,468) Additional NNDR assumed in MTFS (1,901) (1,641) (1,280)
Over the MTFS period, a high level of uncertainty will remain with respect to the NNDR projections due to the effects of the revaluation and the move to 100% rates retention.
APPENDIX 2
Page 204

Special and specific grants The provisional settlement provided details of a number of special and specific grants (included within the Core Spending Power calculation): the Improved Better Care Fund; New Homes Bonus ; Rural Services Delivery Grant (not applicable to Merton), Transition Grant; and 2017-18 Adult Social Care Support Grant.
Improved Better Care Fund
There is no change to the figures set out in the 2016-17 Settlement. The allocations take into account Council’s ability to raise Social Care precept and the allocation methodology, through a separate grant to local government, benefits those councils who benefit less from the additional council tax flexibility for social care. However, the settlement does not confirm how the new flexibility to raise the Social Care Precept will impact the calculation of future year’s Improved Better Care Fund allocations. The core spending power projections for this grant assume the original 2% for the social care precept each year to determine allocations.
Improved Better Care Fund
2017-18 £m
2018-19 £m
2019-20 £m
Total
£m
Merton - 1.408 3.061 4.469
New Homes Bonus
The Government has confirmed that it will implement its proposal to reduce future allocations to Councils from 6 years to 5 years in 2017/18 and then to 4 years from 2018/19. The Government has decided to introduce an initial baseline of 0.4% below which the bonus will not be paid to “focus on local authorities demonstrating a stronger than average commitment to growth.” The 0.4% baseline is expected to reduce the income of councils in receipt of the New Homes Bonus by £241 million in 2017/18 in comparison to indicative figures released in February 2016. This money will be used to fund the Social Care Support Grant. The Government will retain the option of making adjustments to the baseline in future years in the event of a significant increase in housing growth.
The Government has decided to delay implementing proposals to withhold payments for areas without a local plan in 2017-18. However, it will revisit the case for withholding New Homes Bonus from 2018-19 from local authorities that are deemed not to be planning effectively, making positive decisions on planning applications and delivering housing growth. To encourage more effective local planning the Government will also consider withholding payments for homes that are built following an appeal.
APPENDIX 2
Page 205

New Homes Bonus
2017-18 £m
2018-19 £m
2019-20 £m
Total
£m
Merton 4.150 3.110 2.984 10.244
Transition Grant
Transition Grant was announced in the final 2016/17 Settlement and is being provided to authorities to ease the change from a system based on central government grant to one in which local sources determine a council’s revenue. The 2016/17 local government finance settlement allocated Revenue Support Grant by looking at the main resources available to councils, ensuring that councils delivering the same set of services receive the same percentage change in funding for those sets of services. As a result of this change, authorities with relatively more income from council tax and business rates received less revenue support grant in total. The transition grant compensates authorities who are estimated to have lost out.
Transition Grant 2017-18
£m 2018-19
£m 2019-20
£m Total
£m
Merton 0.557 0.000 0.000 0.557
2017-18 Adult Social Care Support Grant
This is a one-off grant that distributes the £241.1 million New Homes Bonus “0.4% Baseline cut off” in proportion to the adult social care relative needs formula from 2013-14 so that all authorities with responsibility for social care receive a share of this funding. Merton’s share of the national total is £0.751m.
2017-18 Adult Social Care Support Grant
2017-18 £m
2018-19 £m
2019-20 £m
Total
£m
Merton 0.751 0.000 0.000 0.751
Council Tax The provisional settlement sets out the Government’s council tax referendum principles for 2017-185. The core principle of a 2% referendum trigger remains in place for the portion of the authority’s council tax increase that has not been hypothecated for ASC. The main change to Council Tax announced as part of the 2017-18 settlement is the increase in the flexibility permitted in the use of the Social Care Precept (SCP). Social care authorities will have the freedom to increase by up
APPENDIX 2
Page 206

to 3% in 2017-18 or 2018-19, but cannot exceed 6% in total over the three-year period. To ensure that councils are using income from the precept for adult social care, they will be required to publish a description of their plans, including changing levels of spend on adult social care and other services. This must be signed off by the Chief Finance Officer (section 151 officer). Councils wishing to use the extra freedom to raise their precept by 3% instead of 2% in 2017-18 must also show how they plan to use this extra money to improve social care. This suggests an increasing burden compared with what was announced in 2016-17 – where local authorities were only required to show that the funding raise was spent on adult social care. The DCLG will write to adult social care authorities with further details on the conditions of the scheme in the near future. Schools Funding Details of School Funding in 2017/18 are included in Section 3 of the report.
APPENDIX 2
Page 207

THE COLLECTION FUND, COUNCIL TAX BASE AND BUSINESS RATES 1. Introduction
1.1 This appendix summarises three key areas which are fundamental to the
Council’s revenue resource generation. It sets out the procedures and calculations that underpin each of them.
2. Collection Fund 2.1 The Collection Fund is a statutory fund separate from the General Fund. It
accounts for income from Council Tax, including those properties within the Wimbledon and Putney Commons Conservators area. The bodies on whose behalf the council tax income has been raised are the Council and the Greater London Authority (which includes the services of the Metropolitan Police and the London Fire and Emergency Planning Authority (LFEPA). The Council's demand on the Collection Fund is by its General Fund. The Greater London Authority's demand is expressed as a precept.
2.2 Under the localised arrangements for council tax support, the Collection Fund
entries for council tax remain unchanged, and council tax discounts reduce the council tax base and the amount of collectable council tax income.
2.3 The Collection Fund also accounts for National Non-Domestic Rates and
there have been significant changes to the treatment of NNDR due to the changes to local government funding arising from business rates retention and the Local Government Finance Act 2012 (Section 3, part 2)
2.4 The Collection Fund will account for receipts from business ratepayers, together with payments: • to central government in respect of the central share • to/from central government in respect of transitional protection payments
where applicable • to relevant precepting authorities in respect of their share of rating income, in
Merton’s case this is the GLA. 2.5 While there remains a single Collection Fund, local authorities now have to
be able to separate the elements relating to council tax and non-domestic . rates and calculate separate surpluses and deficits on each.
2.6 A billing authority needs to ensure that its collection fund has sufficient
resources to meet the demands on it at all times. To the extent that there is insufficient in the collection fund to meet those demands at any time, the billing authority has temporarily to "borrow" from its general fund.
2.7 The Collection Fund accounts are kept on an accrual basis and a surplus or
deficit for the year in the collection fund is estimated accordingly.
APPENDIX 3
Page 208

2.8 The audited accounts for 2015/16 include the following surplus/deficit for
Council Tax and NNDR as at 31 March 2016:-
Surplus/ (deficit) as at
31/03/16 Outturn
Surplus/ (deficit) as at
31/03/16 Outturn
Total surplus/
(deficit) as at 31/03/16
Council Tax NNDR £000 £000 £000 Central Government N/A (2,174) (2,174) GLA 803 (869) (66) Merton 3,007 (1,304) 1,703 Total 3,810 (4,347) (537)
2.9 Council Tax
The estimated surplus on the Collection Fund as at 31st March 2017 due to Council Tax is £1.732m. This is to be shared £1.386m (80%) to Merton and £0.346m (20 %) to the GLA.
2.10 NNDR Since 2013/14, it is necessary to calculate the estimated surplus/deficit on the
Collection Fund arising from Business Rates. This estimation is required as part of the council’s NNDR1 Return which has to be submitted to the Department for Communities and Local Government (DCLG) by 31 January 2017. Part 4 of this return relates to the calculation of the estimated Collection Fund balance as at 31/3/17.
Based on the calculation in the Council’s NNDR1 (Part 4) there is an estimated surplus on the Collection Fund as at 31st March 2017 due to NNDR of £1.268m. This is to be shared £0.419m (33%) to Central Government, £0.380m (30% to Merton) and £0.469m (37%) to the GLA.
3. Council Tax Base 2017/18
3.1 The council tax base is the measure of the number of dwellings to which council tax is chargeable in an area or part of an area. The Council Tax base is calculated using the properties from the Valuation List together with information held within Council Tax records. The properties are adjusted to reflect the number of properties within different bands in order to produce the Council Tax Base (Band D equivalent).
3.2 Since 2013/14 the Council Tax Base calculation has been affected by the introduction of the new local council tax support scheme and technical reforms to council tax. On 30 November 2012, new regulations set out in the Local Authorities (Calculation of council Tax Base) Regulations 2012 (SI 2012:2914) came into force. These regulations ensure that new local council
APPENDIX 3
Page 209

tax support schemes, implemented under the Local Government Finance Act 2012, are fully reflected in the council tax base for all authorities.
3.3 Under the regulations, the council tax base is the aggregate of the relevant amounts calculated for each valuation band multiplied by the authority’s estimated collection rate for the year.
3.4 The relevant amounts are calculated as
• number of chargeable dwellings in each band shown on the valuation list on a specified day of the previous year,
• adjusted for the number of discounts, and reductions for disability, that apply to those Dwellings
3.5 All authorities notify the DCLG of their unadjusted Council Tax Base using a
CTB Form and the deadline for return was 14 October 2016 and Merton met this deadline.
3.6 The CTB form for 2017/18 includes the latest details about the Council Tax
Support Scheme and the technical reforms which impacted on discounts and exemptions.
3.7 There is a separate council tax base for those properties within the area
covered by Wimbledon and Putney Commons Conservators. The Conservators use this, together with the Council Tax bases from RB Kingston, and Wandsworth to calculate the levy which is charged each year.
3.8 Assumptions in the MTFS for calculating the 2017/18 Council Tax Base 3.8.1 In producing a forecast of council tax yield in future years, there are two key
variables to be considered:-
• the year on year change in Council Tax Base
• the council tax collection rate
3.8.2 The draft MTFS reported to Cabinet assumes that the Council Tax Base
increases 0.5% per year and that the collection rate is 97.25% in each of the years.
3.9 Details of the Council’s Tax Base calculation for 2017/18 were reported to
Cabinet on 12 December 2016 and a Council Tax Base for Merton as a whole and for the Wimbledon and Putney Commons Conservators area was agreed as follows:-
APPENDIX 3
Page 210

Council Tax Base 2016/17 2017/18 Change % Whole Area 71,327.0 72,442.3 1.6% Wimbledon & Putney Common Conservators
11,127.2 11,131.2 0.4%
3.10 Council Tax Yield 2017/18 3.10.1 Based on the latest information about Council Tax proposals for 2017/18 the
estimated Council Tax yield for 2017/18 is:-
Council Tax: Whole area
Tax Base Band D 2017/18
Council Tax Yield
2017/18
Council Tax Yield
2016/17 Merton - General 72,442.3 £1,102.25 £79.850m £78.620m Merton – Adult Social Care
72,442.3 £33.06 £2.395m N/A
WPCC 11,131.2 £28.61 £0.318m £0.300m GLA 72,442.3 £280.02 £20.285m £19.686m
The amounts collected for the GLA and WPCC are paid over to each of them
as precepts. 4. Business Rates 4.1 Introduction
The Local Government Finance Act 2012 entailed major changes to the funding of local government. From April 2013, the Government reformed the way in which local government is funded through the introduction of the business rates retention scheme. 2017-18 will be the fifth year of the rates retention scheme. From 2013/14 to 2016/17 for London boroughs, 50% of the income was paid to central government, the Greater London Authority (GLA) received 20%, leaving London boroughs with the remaining 30%. This is changing in 2017/18 as part of the London pilot arrangements towards 100% retention of Business Rates by 2020. There are two changes which will impact on the amount of Business Rates the Council will receive in 2017/18:-
• As part of the Government’s intentions to reform the business rates retention system and move to 100% retention by 2020, the Government is piloting the proposals in some areas (Manchester, Liverpool, London, West of England, Cornwall and the West Midlands. In London the pilot relates to Transport for London (TfL) capital grant and the GLA’s RSG will also be funded from the central share of business rates. This will result in a change in shares of funding currently anticipated to be 33% central government (-17%), 37% GLA (+17%) and 30% Merton (unchanged).
APPENDIX 3
Page 211

• The next business rates revaluation takes effect from 1 April 2017 and
will update rateable values to reflect the market as at 1 April 2015. This will ensure business rate bills more closely reflect the property market and that all businesses are getting a fair deal. The revaluation will not raise any more or less tax in total but there will be variations from authority to authority. In September the Government announced the multiplier would reduce to ensure the revaluation does not raise any more in rates. Using the latest data on the revaluation the government has provisionally reduced the small business non-domestic multiplier for 2017/18 from 48.4p to 46.6p. The national non-domestic multiplier has fallen from 49.7p to 47.9p. The multipliers will be confirmed after either the Local Government Finance Report for 2017-18 has been approved by the House of Commons or 1 March 2017, whichever is earlier.
4.2 The 2013-14 local government finance settlement was the first under the new
arrangements. It provided each local authority with its starting position under the business rates retention scheme. These are fixed until the first system reset, that the Government intends will take place in 2020. However, they will be uprated for inflation using the annual increase in the small business rates multiplier which is usually based on September RPI.
For 2013/14, the Department for Communities and Local Government (DCLG) calculated a baseline funding level of £31.415m and a “top-up” payment of £7.547m in 2013/14. Based on the uprate for inflation, Merton’s baseline funding level for 2017/18 announced in the Provisional Local Government Finance Settlement is £33.583m and the top-up is £9.083m.
4.3 The estimates for NNDR income included in the MTFS will be based on Merton’s share of the estimated NNDR income submitted on the NNDR1 form. Merton keeps 30% of any growth in the total business rates collected in the borough but if there is a decline in yield Merton will need to meet 30% of the shortfall. Based on the NNDR1 return for 2017/18 Merton’s share is £26.401m which when added to the top-up payment for 2017/18, produces an NNDR estimate for 2017/18 of £35.484m.
4.4 NNDR1 The statutory framework effectively requires a billing authority, before the beginning of a financial year, to forecast the amount of business rates that it will collect during the course of the year and, from this, to make a number of allowable deductions in order to arrive at a figure for its non-domestic rating income. It is the non-domestic rating income that is shared between the parties to the scheme. The framework also sets out how the billing authority is to treat allowable deductions – requiring that either they are paid to major precepting authorities, or transferred to the authority’s General Fund.
4.5 The calculations that authorities make before the start of the financial year determine how much they must pay to central government and their major
APPENDIX 3
Page 212

precepting authorities during the course of the year. Since these payments are fixed at the outset of the year, it follows that any difference between forecast amounts and final outturns will result in a surplus, or deficit on the billing authority’s Collection Fund. Any such surplus or deficit is shared between government, billing authorities and their major preceptors (excluding policing bodies) in line with their share of the business rates baseline.
4.6 The estimate for the actual income figure (or net rate yield) for 2017/18 is based on the NNDR1 return to the DCLG. This had to be finalised by 31January 2017, and calculates the amounts to be paid to central government, to the GLA and the amount to be retained by Merton to be used as part of the budget setting process.
4.7 Latest developments 4.7.1 Business Rates Retention There has been significant change to the business rates retention scheme as a result of the adjustments for the 2017 Revaluation, which alter both tariff and top ups and business rates baselines for individual authorities. The business rates revaluation adjustment ensures, as far as is practicable, that an authority’s retained income is the same after revaluation as immediately before. The Government has revised the methodology from that set out in the settlement technical consultation to reflect two changes:
• Including the value of section 31 grants that authorities are paid to compensate them for changes to the rating system introduced at successive Autumn Statements.
• Adjusting the calculation to take account of inflation only after the revaluation adjustment to tariff and top ups has been made.
No adjustment has been made for areas where there are a large proportion of charities (e.g. schools or universities) whose rateable values change in a way that is significantly different from the general revaluation effect in the area. Government will keep the situation under review and will discuss further with local government devising a fair basis for further adjustments that could be introduced at the time of when the final adjustments are made in the 2018-19 Settlement. DCLG will keep the overall methodology under review in order to allow scope for further adjustments to be made in 2018/19. This has resulted in London Boroughs’ changing from being an overall £14 million top up in 2016-17 to now paying an overall tariff in 2017-18 of £223 million. At an individual authority level, both Hounslow and Tower Hamlets are tariff authorities for 2017-18 and join the existing eight boroughs that were tariff authorities, leaving 23 top up authorities. The GLA’s tariff has increased from £359 million in 2016-17 to £555 million in 2017-18, (however, this will increase to £720 million when the TfL capital grant and RSG switch are reflected in the final settlement).
APPENDIX 3
Page 213
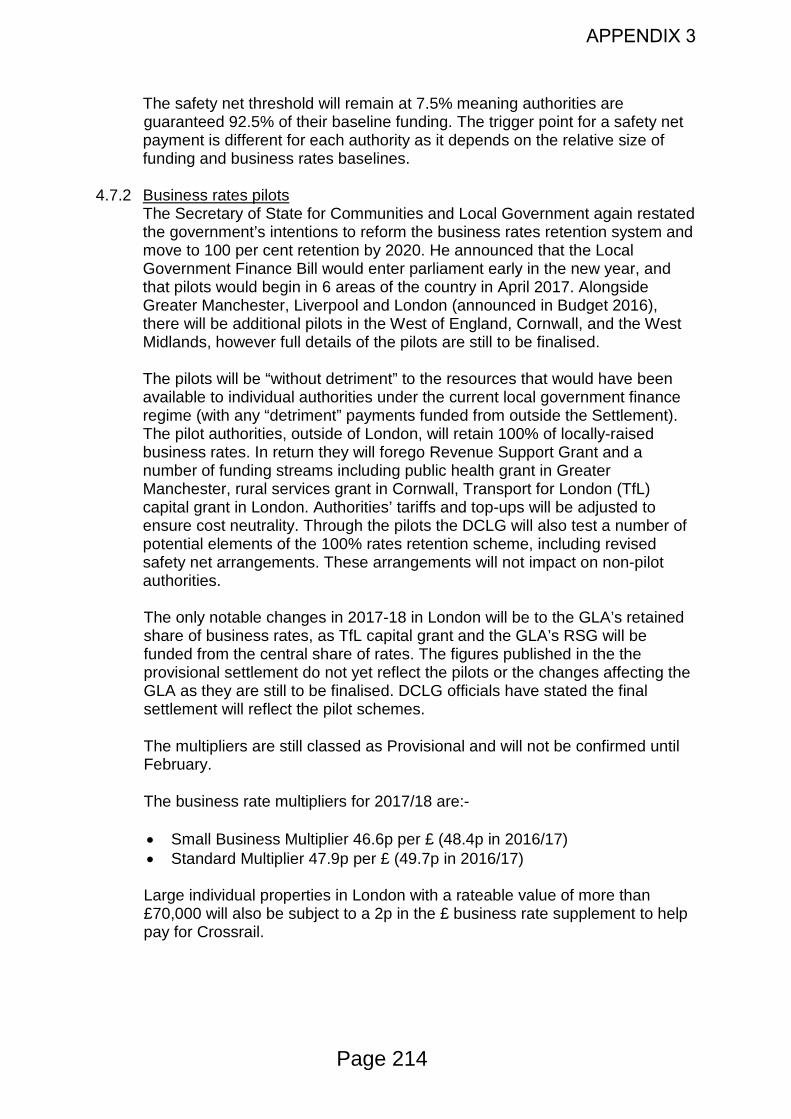
The safety net threshold will remain at 7.5% meaning authorities are guaranteed 92.5% of their baseline funding. The trigger point for a safety net payment is different for each authority as it depends on the relative size of funding and business rates baselines.
4.7.2 Business rates pilots The Secretary of State for Communities and Local Government again restated
the government’s intentions to reform the business rates retention system and move to 100 per cent retention by 2020. He announced that the Local Government Finance Bill would enter parliament early in the new year, and that pilots would begin in 6 areas of the country in April 2017. Alongside Greater Manchester, Liverpool and London (announced in Budget 2016), there will be additional pilots in the West of England, Cornwall, and the West Midlands, however full details of the pilots are still to be finalised.
The pilots will be “without detriment” to the resources that would have been
available to individual authorities under the current local government finance regime (with any “detriment” payments funded from outside the Settlement). The pilot authorities, outside of London, will retain 100% of locally-raised business rates. In return they will forego Revenue Support Grant and a number of funding streams including public health grant in Greater Manchester, rural services grant in Cornwall, Transport for London (TfL) capital grant in London. Authorities’ tariffs and top-ups will be adjusted to ensure cost neutrality. Through the pilots the DCLG will also test a number of potential elements of the 100% rates retention scheme, including revised safety net arrangements. These arrangements will not impact on non-pilot authorities. The only notable changes in 2017-18 in London will be to the GLA’s retained share of business rates, as TfL capital grant and the GLA’s RSG will be funded from the central share of rates. The figures published in the the provisional settlement do not yet reflect the pilots or the changes affecting the GLA as they are still to be finalised. DCLG officials have stated the final settlement will reflect the pilot schemes.
The multipliers are still classed as Provisional and will not be confirmed until February.
The business rate multipliers for 2017/18 are:-
• Small Business Multiplier 46.6p per £ (48.4p in 2016/17) • Standard Multiplier 47.9p per £ (49.7p in 2016/17) Large individual properties in London with a rateable value of more than £70,000 will also be subject to a 2p in the £ business rate supplement to help pay for Crossrail.
APPENDIX 3
Page 214

4.8 Estimating the net rate yield for 2017/18 The starting point is the aggregate rateable value for Merton as at 31 December 2017. (£213.930m) This is a fixed figure based on the VO’s valuations for all business properties in Merton at that date. A multiplier is then applied to this rateable value as set by central government (the rate in the pound charged for that year, which for 2017/18 will be 46.6p in the £). This gives a gross rates figure of £99.691m.
4.9 Estimating the income figure is extremely difficult, as there are many factors which can significantly affect the overall figure. These include:
• Changes in rateable value from new properties entering rating or
properties being taken out of rating • Revaluations due to the backlog of appeals which, if successful, will be
backdated in most cases to April 2010. This will change to 2017 following the revaluation.
• Empty and charitable reliefs • Losses in collection
4.10 Estimated Surplus or Deficit
Due to the variability of some of the factors, it is inevitable that the final figure at the end of each year will be different to the estimate. Therefore, a further calculation is required at the end of each year to estimate the surplus or deficit on the Collection Fund (as is also done for Council Tax).
4.11 2015-16 was the first year for which authorities had to estimate the non-domestic rating surplus, or deficit on the Collection Fund. The Non-Domestic Rating (Rates Retention) Regulations 2013 (SI 2013/452) require billing authorities to notify the Secretary of State and their major precepting authorities of their calculation of non-domestic rating income for 2017-18 and estimate the surplus/deficit on the Collection Fund by 31 January 2017.
Regulation 13 effectively requires an estimate of the surplus/deficit that the authority believes will exist at 31 March 2017, on the basis of a statutory calculation set out in Schedule 4 to the Regulations. The estimated amount will be shared between the authority, its major preceptors and central Government and will be added (or subtracted) from each party’s share of 2017-18 non-domestic rating income.
4.12 A copy of Merton’s NNDR1 for 2017/18 is attached. 4.13 The following table summarises the difference between the estimates from the
NNDR1 for 2017/18 and the figures included in the MTFS at the January 2017 Cabinet:-
APPENDIX 3
Page 215

Implications of NNDR1 2017/18 for Merton in 2017/18
MTFS (January
2017) NNDR1 Difference £000 £000 £000 NNDR 2017/18 26,128 26,401 273 - Top-Up 2017/18 9,083 9,083 0
35,211 35,484 273 Collection Fund Surplus/(Deficit) 2016/17
417 380 (37)
35,628 35,864 Section 31 Grant 0 1,035 1035 Total 35,628 36,899 1,271
APPENDIX 3
Page 216

APPENDIX 3
Page 217

APPENDIX 3
Page 218
APPENDIX 3
Page 219

APPENDIX 3
Page 220

APPENDIX 3
Page 221

APPENDIX 3
Page 222

APPENDIX 3
Page 223

APPENDIX 3
Page 224

APPENDIX 3
Page 225
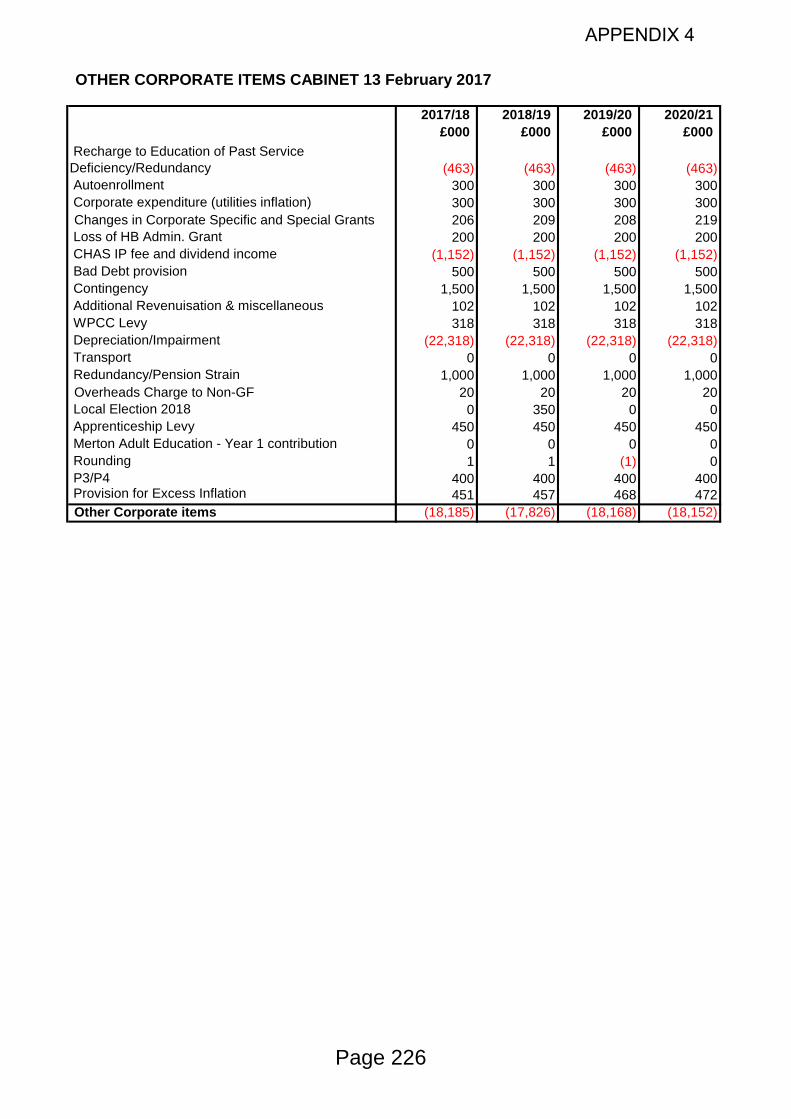
OTHER CORPORATE ITEMS CABINET 13 February 2017
2017/18 2018/19 2019/20 2020/21£000 £000 £000 £000
Recharge to Education of Past Service Deficiency/Redundancy (463) (463) (463) (463) Autoenrollment 300 300 300 300 Corporate expenditure (utilities inflation) 300 300 300 300Changes in Corporate Specific and Special Grants 206 209 208 219
Loss of HB Admin. Grant 200 200 200 200 CHAS IP fee and dividend income (1,152) (1,152) (1,152) (1,152) Bad Debt provision 500 500 500 500 Contingency 1,500 1,500 1,500 1,500 Additional Revenuisation & miscellaneous 102 102 102 102 WPCC Levy 318 318 318 318 Depreciation/Impairment (22,318) (22,318) (22,318) (22,318) Transport 0 0 0 0 Redundancy/Pension Strain 1,000 1,000 1,000 1,000Overheads Charge to Non-GF 20 20 20 20
Local Election 2018 0 350 0 0 Apprenticeship Levy 450 450 450 450 Merton Adult Education - Year 1 contribution 0 0 0 0 Rounding 1 1 (1) 0 P3/P4 400 400 400 400 Provision for Excess Inflation 451 457 468 472Other Corporate items (18,185) (17,826) (18,168) (18,152)
APPENDIX 4
Page 226

BUDGET TRANSITION FROM COUNCIL MARCH 2016 TO CABINET 13 FEBRUARY 2017
2017/18 2018/19 2019/20 2020/21£000 £000 £000 £000
Budget Gap Council 2 March 2016 - - 3,469 20,120
ANALYSIS OF CHANGE:Change in Appropriations to/from Reserves (4,244) (488) 7,815 (1) Adult Social Care Support Grant 2017-18 (751) - - - Changes in Corporate Specific and Special Grants - - (1) - LPFA Pension Deficit 86 86 86 86 Collection Fund - Council Tax surplus(-)/deficit (1,386) - - - Collection Fund: NNDR Surplus/Deficit (380) - - - Taxicards and Concessionary Fares (699) (700) (700) (700) Council Tax - Change in General Council Tax Yield (836) (840) (2,458) (4,091) Council Tax: 3% Adult Social Care Flexibility (2,395) (4,815) (4,839) (4,863) Change in departmental overheads (20) (20) (20) (20) Change in departmental business rates (37) (37) (37) (37) Permanent Virements in Service Departments 2016/17 138 126 116 100 Education Services Grant 1,053 1,521 1,521 1,521 External Borrowing Costs 318 (937) (506) (475) Investment Income (459) (346) (295) (34) Proposed Growth 11,927 12,901 10,395 10,895 Pay Inflation 101 202 303 404 Price Inflation (23) (47) (70) (93) Inflation > 1.5% (85) (79) (68) (64) New Homes Bonus 613 (117) (113) - Additional Business Rates - Based on NNDR1 (637) (751) (880) (773) Overheads (105) (99) (99) (88) Change in Levies 2 2 2 2 Pensions Deficit: Funding over 15 years (1,254) (1,330) (1,463) (1,380) PFI Affordability - - - 29 Additional Revenuisation & miscellaneous (162) (162) (162) (162) Full Year Effect - Amendments to existing savings 541 244 (207) (207) New Savings (271) (798) (2,066) (2,066) Section 31 Grant - Based on NNDR1 (1,035) - - - Rounding 1 1 - -
Budget Gap Cabinet February 2017 0 3,517 9,724 18,103
APPENDIX 5
Page 227

APPENDIX 6
STATEMENT OF COUNCIL TAX REQUIREMENTS AND BALANCES
ORIGINAL BUDGET
2010/11
ORIGINAL BUDGET
2011/12
ORIGINAL BUDGET
2012/13
ORIGINAL BUDGET
2013/14
ORIGINAL BUDGET
2014/15
ORIGINAL BUDGET
2015/16
ORIGINAL BUDGET
2016/17
ORIGINAL BUDGET
2017/18
2010/11 Band D
Council Tax Equivalent
2011/12 Band D
Council Tax Equivalent
2012/13 Band D
Council Tax Equivalent
2013/14 Band D
Council Tax Equivalent
2014/15 Band D
Council Tax Equivalent
2015/16 Band D
Council Tax Equivalent
2016/17 Band D
Council Tax Equivalent
2017/18 Band D Council
Tax £m £m £m £m £m £m £m £m £ £ £ £ £ £ £ £
MertonNet Cost of General Fund Services 148.599 148.193 145.820 153.491 151.258 149.062 134.496 138.098 2,001.34 1,989.55 1,949.04 2,291.55 2,221.53 2,140.53 1,885.63 1,906.31Contingency 2.900 1.820 2.000 1.500 1.500 1.500 1.500 1.500 39.06 24.43 26.73 22.39 22.03 21.54 21.03 20.71
151.499 150.013 147.820 154.991 152.758 150.562 135.996 139.598 2,040.39 2,013.98 1,975.77 2,313.95 2,243.56 2,162.07 1,906.66 1,927.02LeviesLee Valley 0.227 0.220 0.215 0.220 0.214 0.209 0.204 0.204 3.06 2.95 2.87 3.28 3.14 3.00 2.86 2.82London Pensions Fund 0.283 0.254 0.253 0.268 0.266 0.264 0.262 0.262 3.81 3.41 3.38 4.00 3.91 3.79 3.67 3.62Environment Agency 0.148 0.146 0.146 0.157 0.157 0.159 0.162 0.164 1.99 1.96 1.95 2.34 2.31 2.28 2.27 2.26Total Levies 0.658 0.620 0.614 0.645 0.637 0.632 0.628 0.630 8.86 8.32 8.21 9.63 9.36 9.08 8.80 8.70
TOTAL BUDGET (before balances, etc adjustment) 152.157 150.633 148.434 155.636 153.395 151.194 136.624 140.228 2,049.25 2,022.31 1,983.98 2,323.58 2,252.91 2,171.14 1,915.46 1,935.71
Provisions, Contributions and BalancesAppropriations to/from Reserves 0.000 0.000 0.000 0.000 0.000 (4.771) 1.683 (3.427) 0.00 0.00 0.00 0.00 0.00 -68.51 23.60 (47.31)
TOTAL BUDGET REQUIREMENT 152.157 150.633 148.434 155.636 153.395 146.423 138.307 136.801 2,049.25 2,022.31 1,983.98 2,323.58 2,252.91 2,102.63 1,939.06 1,888.41
Less: Central Government Support
Government (Formula) Grant:Revenue Support Grant (including Transition Grant) (8.588) (15.730) (1.180) (47.221) (39.738) (30.425) (23.156) (15.520) (115.66) (211.17) (15.77) (704.99) (583.63) (436.90) (324.65) (214.24)National Non-Domestic Rates inc. Section 31 Grant (59.145) (50.888) (60.841) (32.020) (34.371) (34.820) (35.052) (36.519) (796.56) (683.19) (813.21) (478.04) (504.81) (500.01) (491.43) (504.11)Adult Social Care Support Grant 2017/18 0.000 0.000 0.000 0.000 0.000 0.000 0.000 (0.751) 0.00 0.00 0.00 0.00 0.00 0.00 0.00 (10.37)
Total Revenue Support Grant + Baseline NNDR Funding: (67.733) (66.617) (62.021) (79.241) (74.109) (65.245) (58.208) (52.790) (912.23) (894.36) (828.98) (1,183.03) (1,088.44) (936.92) (816.07) (728.72)
Contribution to/(from) Collection Fund (2.519) (1.859) (3.891) (2.545) (4.236) (4.420) (1.479) (1.766) (33.93) (24.96) (52.01) (38.00) (62.21) (63.47) (20.74) (24.38)
Council Tax RequirementMerton - General (excluding WPCC) 81.905 82.157 82.522 73.850 75.049 76.758 78.620 82.245 1,103.10 1,102.99 1,102.99 1,102.55 1,102.25 1,102.25 1,102.25 1,135.31Merton - COUNCIL TAX FUNDING REQUIREMENT 81.905 82.157 82.522 73.850 75.049 76.758 78.620 82.245 1,103.10 1,102.99 1,102.99 1,102.55 1,102.25 1,102.25 1,102.25 1,135.31
Greater London Authority PreceptMetropolitan Police Authority 16.657 16.979 17.467 14.753 14.903 14.939 14.750 14.933 224.34 227.95 233.46 220.25 218.88 214.52 206.79 206.13Other Non-Police Services 6.347 6.098 5.481 5.543 5.455 5.604 4.937 5.353 85.48 81.87 73.26 82.75 80.12 80.48 69.21 73.89Greater London Authority Precept 23.004 23.077 22.948 20.295 20.358 20.543 19.686 20.285 309.82 309.82 306.72 303.00 299.00 295.00 276.00 280.02
TOTAL COUNCIL TAX REQUIREMENT 104.909 105.234 105.469 94.145 95.407 97.302 98.306 102.530 1,412.92 1,412.81 1,409.71 1,405.55 1,401.25 1,397.25 1,378.25 1,415.33
Page 228

DRAFT MTFS 2017-21: 2017/18
£0002018/19
£0002019/20
£0002020/21
£000Departmental Base Budget 2016/17 139,982 139,982 139,982 139,982Inflation (Pay, Prices) 3,184 6,368 9,553 12,737Autoenrolment/Nat. ins changes 857 1,172 1,172 1,172FYE – Previous Years Savings (9,429) (15,173) (15,173) (15,173)Amendments to previously agreed savings 541 244 (207) (207)Change in Net Appropriations to/(from) Reserves (916) (2,174) (1,909) (1,767)Taxi card/Concessionary Fares (249) 201 651 1,101Change in depreciation/Impairment (Contra Other Corporate items)
4,681 4,681 4,681 4,681
Growth 11,927 12,901 10,395 10,895Other 1,291 1,820 1,886 1,951Re-Priced Departmental Budget 151,869 150,023 151,030 155,371Treasury/Capital financing 12,229 10,917 12,290 12,917Pensions 3,338 3,469 3,552 3,635Other Corporate items (18,185) (17,826) (18,168) (18,152)Levies 630 630 630 630Sub-total: Corporate provisions (1,988) (2,810) (1,696) (970)
Sub-total: Repriced Departmental Budget + Corporate Provisions
149,881 147,213 149,334 154,401
Savings/Income Proposals 2017/18 (271) (798) (2,066) (2,066)
Sub-total 149,610 146,415 147,268 152,335
Appropriation to/from departmental reserves (1,085) 173 (92) (234)
Appropriation to/from Balancing the Budget Reserve (2,459) (3,406) 0 0
BUDGET REQUIREMENT 146,066 143,181 147,176 152,102
Funded by:Revenue Support Grant (15,520) (10,071) (5,076) 0Business Rates (inc. Section 31 grant) (36,519) (36,304) (37,176) (37,725)Adult Social Care Support Grant 2017/18 (751) 0 0 0PFI Grant (4,797) (4,797) (4,797) (4,797)New Homes Bonus (4,150) (3,110) (2,984) (2,000)Council Tax inc. WPCC (82,563) (85,382) (87,420) (89,477)Collection Fund – (Surplus)/Deficit (1,766) 0 0 0TOTAL FUNDING (146,066) (139,664) (137,453) (133,999)
GAP including Use of Reserves (Cumulative) 0 3,517 9,724 18,103
Potential Loss of Better Care Funding 2,100 2,100
APPENDIX 7
Page 229
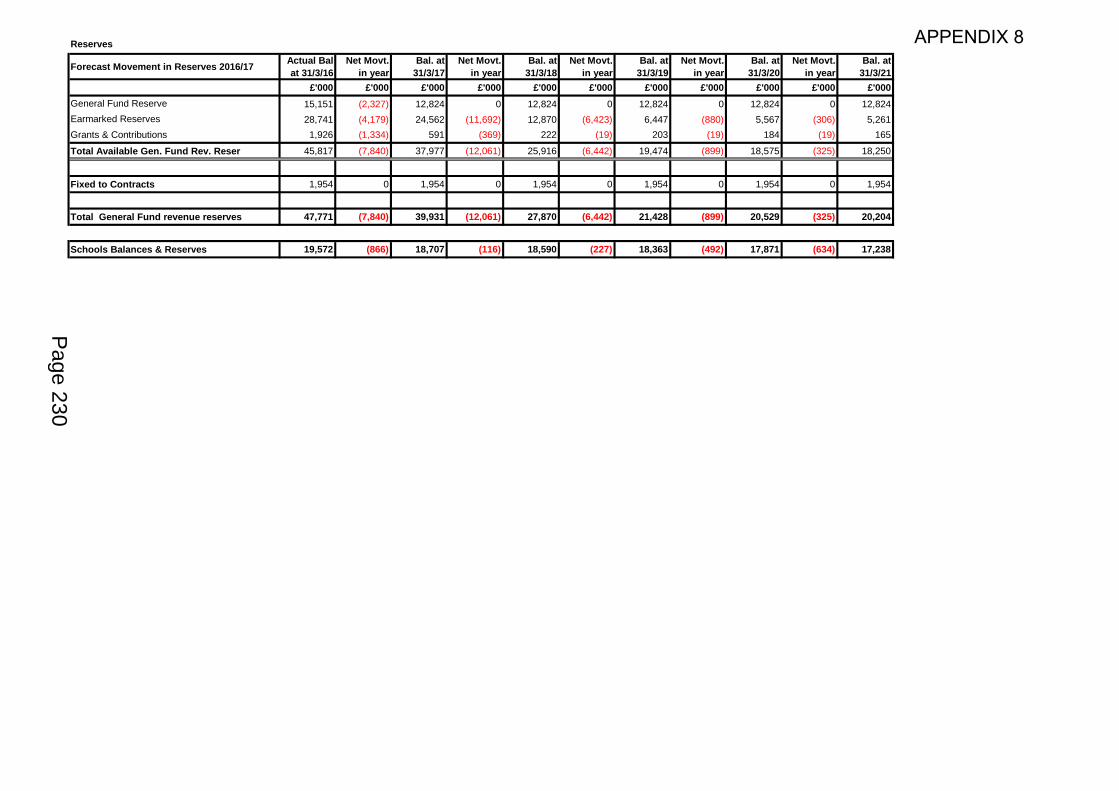
Reserves
Forecast Movement in Reserves 2016/17 Actual Bal at 31/3/16
Net Movt. in year
Bal. at 31/3/17
Net Movt. in year
Bal. at 31/3/18
Net Movt. in year
Bal. at 31/3/19
Net Movt. in year
Bal. at 31/3/20
Net Movt. in year
Bal. at 31/3/21
£'000 £'000 £'000 £'000 £'000 £'000 £'000 £'000 £'000 £'000 £'000General Fund Reserve 15,151 (2,327) 12,824 0 12,824 0 12,824 0 12,824 0 12,824Earmarked Reserves 28,741 (4,179) 24,562 (11,692) 12,870 (6,423) 6,447 (880) 5,567 (306) 5,261Grants & Contributions 1,926 (1,334) 591 (369) 222 (19) 203 (19) 184 (19) 165
Total Available Gen. Fund Rev. Reser 45,817 (7,840) 37,977 (12,061) 25,916 (6,442) 19,474 (899) 18,575 (325) 18,250
Fixed to Contracts 1,954 0 1,954 0 1,954 0 1,954 0 1,954 0 1,954
Total General Fund revenue reserves 47,771 (7,840) 39,931 (12,061) 27,870 (6,442) 21,428 (899) 20,529 (325) 20,204
Schools Balances & Reserves 19,572 (866) 18,707 (116) 18,590 (227) 18,363 (492) 17,871 (634) 17,238
APPENDIX 8
Page 230

Analysis Actual Bal at 31/3/16
Net Movt. in year
Bal. at 31/3/17
Net Movt. in year
Bal. at 31/3/18
Net Movt. in year
Bal. at 31/3/19
Net Movt. in year
Bal. at 31/3/20
Net Movt. in year
Bal. at 31/3/21
£'000 £'000 £'000 £'000 £'000 £'000 £'000 £'000 £'000 £'000 £'000Earmarked ReservesOutstanding Council Programme Board 6,282 (2,606) 3,675 (1,214) 2,461 (384) 2,077 (201) 1,876 0 1,876Savings Mitigation Fund 0 0 0 0 0 0 0 0 0 0 0For use in future years for budget 5,865 0 5,865 (2,459) 3,406 (3,406) 0 0 0 0 0Revenue Reserves for Capital / Revn. 7,747 (867) 6,880 (5,354) 1,526 (1,524) 2 (2) 0 0 0Energy renewable reserve 1,523 0 1,523 (650) 873 (450) 423 (423) 0 0 0Repairs & Renewal Fund 1,224 0 1,224 (500) 724 (224) 500 (224) 276 (276) 0Pension Fund additional contribution 63 0 63 (63) 0 0 0 0 0 0 0Local Land Charges Reserve 1,645 194 1,839 0 1,839 0 1,839 0 1,839 0 1,839Apprenticeships 406 (75) 331 (210) 121 (121) 0 0 0 0 0Community Care Reserve 1,385 0 1,385 0 1,385 0 1,385 0 1,385 0 1,385Local Welfare Support Reserve 533 (200) 333 (200) 133 (133) 0 0 0 0 0Economic Development Strategy 620 (619) 0 0 0 0 0 0 0 0 0Wimbledon Tennis Courts Renewal 101 25 126 25 151 (151) 0 0 0 0 0Governor Support Reserve 19 0 19 0 19 0 19 0 19 0 19Corporate Services Reserves 290 (30) 260 (30) 230 (30) 200 (30) 170 (30) 140New Homes Bonus Scheme 1,037 0 1,037 (1,037) 0 0 0 0 0 0 0
Earmarked Reserves 28,741 (4,179) 24,562 (11,692) 12,870 (6,423) 6,447 (880) 5,567 (306) 5,261
Adult Social care contributions 350 (350) 0 0 0 0 0 0 0 0 0Culture and Environment contributions 134 (96) 38 (38) 0 0 0 0 0 0 0Culture and Environment grant 413 (225) 188 (93) 95 (19) 76 (19) 57 (19) 38Childrens & Education grant 371 (233) 138 (138) 0 0 0 0 0 0 0Supporting People Grants 65 (65) 0 0 0 0 0 0 0 0 0Housing Planning Development grant 101 (101) 0 0 0 0 0 0 0 0 0Housing GF grants 106 0 106 0 106 0 106 0 106 0 106Public Health 22 100 122 (100) 22 0 22 0 22 0 22CSF Reserve 365 (365) 0 0 0 0 0 0 0 0 0
Grants & Contributions 1,926 (1,334) 591 (369) 222 (19) 203 (19) 184 (19) 165
Total 30,666 (5,513) 25,153 (12,061) 13,092 0 13,092 0 13,092 0 13,092
Insurance Reserve 1,954 0 1,954 0 1,954 0 1,954 0 1,954 0 1,954
Fixed to Contracts 1,954 0 1,954 0 1,954 0 1,954 0 1,954 0 1,954
DSG Reserve 4,368 (1,092) 3,276 (537) 2,740 (500) 2,240 (500) 1,740 (500) 1,240Refund of School PFI contributions 100 0 100 0 100 0 100 0 100 0 100Schools own reserves 10,504 0 10,504 0 10,504 0 10,504 0 10,504 0 10,504Schools PFI Fund 4,600 226 4,826 421 5,247 273 5,520 8 5,528 (134) 5,394
Schools Reserves 19,572 (866) 18,707 (116) 18,590 (227) 18,363 (492) 17,871 (634) 17,238
APPENDIX 8
Page 231

Forecast Movement in Reserves 2016/17
Actual Bal at 31/3/16
Net Movt. in year
Bal. at 31/3/17
Net Movt. in year
Bal. at 31/3/18
Net Movt. in year
Bal. at 31/3/19
Net Movt. in year
Bal. at 31/3/20
Net Movt. in year
Bal. at 31/3/21
£'000 £'000 £'000 £'000 £'000 £'000 £'000 £'000 £'000 £'000 £'000Capital Grants 1,143 (329) 814 (407) 407 (386) 21 (21) 0 0 0Capital Contributions 3,011 3,509 6,520 0 6,520 0 6,520 0 6,520 0 6,520Capital Receipts 29,582 (11,182) 18,400 (18,400) 0 0 0 0 0 0 0
Capital Reserves 33,736 (8,002) 25,734 (18,807) 6,927 (386) 6,541 (21) 6,520 0 6,520
APPENDIX 8
Page 232
Draft Departmental Budget Summaries 2017-18
APPENDIX 9
Page 233

FULL TIME EQUIVALENTS 2016/17 2017/18Total FTE Staff 2,128.5 1,726.2
SERVICE AREA ANALYSIS 2016/17 Other 2017/18Estimate Inflation Variations Estimate
£000 £000 £000 £000
Corporate Services 11,359 458 (952) 10,865
Education Services ]] CSF 50,183 1,084 1,312 52,579
Children's Services ]
Environment and Regeneration 21,230 708 1,246 23,184
Adult Social Care ]Cultural Services ] C&H 56,219 929 7,170 64,318Housing General Fund ]
Single Status 100 0 1 100National insurances changes/autoenrolment 0 0 90 90Pay Award 883 0 (883) 0
TOTAL NET SERVICE EXPENDITURE 139,973 3,179 7,984 151,136
Corporate Provisions/Appropriations 7,625 0 (12,695) (5,071)
NET EXPENDITURE 147,597 3,179 (4,712) 146,065Funded by:Revenue Support Grant (23,156) 0 7,636 (15,520)Business Rates (35,052) 0 (1,466) (36,518)New Homes Bonus (4,192) 0 42 (4,150)Council Tax (78,620) 0 (3,625) (82,244)WPCC Levy (300) 0 (18) (318)Collection Fund (1,479) 0 (287) (1,766)PFI Grant (4,797) 0 0 (4,797)Adult Social Care Support Grant 2017/18 0 0 (751) (751)
(147,597) 0 1,531 (146,065)
NET 0 3,179 (3,181) 0
NBPublic Health 416 0 (416) 0Appropriations to/from reserves (416) 416 0Net Public Health 0 0 0 0
Other Variations: Contingency/OtherMajor Items: Corporate Provisions £000 fte
Corporate borrowing and Investment (675) 0.0Further provision for revenuisation/RCCO (1,109) 0.0Pension Fund and Auto-enrolment (1,057) 0.0Contingency and centrally held provisions (87) 0.0Change in Grants 2 0.0Appropriation to/from Reserves (3,942) 0.0Depreciation and impairment (4,681) 0.0Service Mitigation Fund - Appropriation to Reserve (1,300) 0.0Overheads - Charge to non-general fund (134) 0.0Transport - Additional provision (39) 0.0Merton Adult Education (600) 0.0Apprenticeship Levy 450 0.0Balance Sheet Management CT & HB (450) 0.0LPFA - Provision for deficit contribution 86 0.0Reduction in Education Services Grant 819 0.0Change in Levies 21 0.0TOTAL (12,695) 0
SUMMARY
APPENDIX 9
Page 234

FULL TIME EQUIVALENTS 2016/17 2017/18Total FTE Staff 2,128.5 1,726.2
SUBJECTIVE ANALYSIS OF ESTIMATES 2016/17 Other 2017/18Estimate Inflation Variations Estimate
£000 £000 £000 £000ExpenditureEmployees 91,525 995 (11,078) 81,442Premises 8,376 99 (711) 7,765Transport 14,569 122 (2,785) 11,906Supplies and Services 164,376 875 3,078 168,328Third Party Payments 81,400 1,081 16,663 99,145Transfer Payments 104,112 6 (248) 103,870Support Services 30,378 0 (2,169) 28,209Depreciation and Impairment Losses 17,637 0 4,680 22,318
GROSS EXPENDITURE 512,373 3,179 7,431 522,983
IncomeGovernment Grants (256,548) 0 (2,495) (259,043)Other Reimbursements and Contributions (19,210) 0 (2,455) (21,665)Customer and Client Receipts (65,432) 0 3,641 (61,791)Interest (46) 0 0 (46)Recharges (30,927) 0 2,161 (28,766)Reserves (238) 0 (299) (537)
GROSS INCOME (372,401) 0 553 (371,848)
NET EXPENDITURE 139,972 3,179 7,984 151,134Corporate Provisions 7,625 0 (12,695) (5,071)
NET EXPENDITURE 147,597 3,179 (4,712) 146,065
Funded by:Revenue Support Grant (23,156) 0 7,636 (15,520)Business Rates (35,052) 0 (1,466) (36,518)New Homes Bonus (4,192) 0 42 (4,150)Council Tax (78,620) 0 (3,625) (82,244)WPCC Levy (300) 0 (18) (318)Collection Fund (1,479) 0 (287) (1,766)PFI Grant (4,797) 0 0 (4,797)Adult Social Care Support Grant 2017/18 0 (751) (751)
(147,597) 0 1,531 (146,065)
NET 0 3,179 (3,180) 0Other Variations: Contingency/Other
Major Items: Corporate Provisions £000 fte
Corporate borrowing and Investment (675) 0.0Further provision for revenuisation/RCCO (1,109) 0.0Pension Fund and Auto-enrolment (1,057) 0.0Contingency and centrally held provisions (87) 0.0Change in Grants 2 0.0Appropriation to/from Reserves (3,942) 0.0Depreciation and impairment (4,681) 0.0Service Mitigation Fund - Appropriation to Reserve (1,300) 0.0Overheads - Charge to non-general fund (134) 0.0Transport - Additional provision (39) 0.0Contingency (600) 0.0Apprenticeship Levy 450 0.0Balance Sheet Management CT & HB (450) 0.0LPFA - Provision for deficit contribution 86 0.0Reduction in Education Services Grant 819 0.0Change in Levies 21 0.0TOTAL (12,695) 0
SUMMARY - SUBJECTIVE ANALYSIS
APPENDIX 9
Page 235

2016/17 Other 2017/18Estimate Inflation Variations Estimate
£000 £000 £000 £000ExpenditureCost of Borrowing including Minimum Revenue Provision 13,643 0 (228) 13,415Further provision for revenuisation/RCCO 1,134 0 (1,109) 25Pension Fund 3,932 0 (1,057) 2,875Pensions: Auto-enrolment 300 0 0 300Centrally held provision for Utilities inflation 300 0 0 300Adjustment re Income re P3/P4 400 0 0 400Overheads - Charge to non-general fund 150 0 (134) 16Provision for excess inflation 540 0 (87) 453Bad Debt Provision 500 0 0 500Redundancy/Pension Strain 1,000 0 0 1,000Transport - Additional provision 130 0 (39) 91Contingency 1,500 0 0 1,500Apprenticeship Levy 0 0 450 450Merton Adult Education 600 0 (600) 0Loss of HB Admin. Grant 200 0 0 200Change in Corporate Specific and Special Grants 204 0 2 206Service Mitigation Fund - Appropriation to Reserve 1,300 0 (1,300) 0LPFA - Provision for deficit contribution 0 0 86 86Reduction in Education Services Grant 0 0 819 819
Levies:-Lee Valley 204 0 204London Pensions Fund 262 0 262Environment Agency 162 2 164WPCC 300 18 318
GROSS EXPENDITURE 26,760 0 (3,176) 23,584
IncomeInvestment Income (739) (447) (1,186)Depreciation & Impairment (17,638) (4,681) (22,318)Appropriations to/from reserves (excluding Public Health) 393 (3,942) (3,549)Balance Sheet Management CT & HB 0 (450) (450)CHAS - IP/Dividend (1,152) 0 (1,152)
GROSS INCOME (19,136) 0 (9,519) (28,655)NET EXPENDITURE 7,625 0 (12,695) (5,071)
CORPORATE ITEMS ANALYSIS
APPENDIX 9
Page 236

2017/2018 ESTIMATES
CORPORATE SERVICES
DEPARTMENT
APPENDIX 9
Page 237

FULL TIME EQUIVALENTS (FTE) 2016/17 2017/18Number of Permanent Staff 474.9 471.1Number of Fixed term contracts 57.0 25.0Number of FTE Richmond TUPE staff 6.0 6.0Total FTE 537.9 502.1
SUBJECTIVE ANALYSIS OF ESTIMATES 2016/17 Other 2017/18Estimate Inflation Variations Estimate
£000 £000 £000 £000ExpenditureEmployees 23,768 188 (145) 23,811Premises 2,823 44 (8) 2,859Transport 137 2 9 148Supplies and Services 10,565 195 592 11,353Third Party Payments 1,873 29 (54) 1,848Transfer Payments 93,710 0 (322) 93,388Support Services 8,789 0 (304) 8,485Depreciation and Impairment Losses 2,322 0 (182) 2,140
GROSS EXPENDITURE 143,986 458 (412) 144,032
IncomeGovernment Grants (94,878) 0 0 (94,878)Other Reimbursements and Contributions (1,044) 0 (59) (1,103)Customer and Client Receipts (11,181) 0 (2,163) (13,344)Interest 0 0 0 0Recharges (25,524) 0 1,682 (23,842)Reserves 0 0 0 0
GROSS INCOME (132,628) 0 (539) (133,167)
NET EXPENDITURE 11,359 458 (952) 10,865
SUMMARY: CORPORATE SERVICES DEPARTMENT
APPENDIX 9
Page 238

FULL TIME EQUIVALENTS (FTE) 2016/17 2017/18Number of Permanent Staff 474.9 471.1Number of Fixed term contracts 57.0 25.0Number of FTE Richmond TUPE staff 6.0 6.0Total FTE 537.9 502.1
SERVICE AREA ANALYSIS 2016/17 Other 2017/18Original Estimate Inflation Variations Estimate
£000 £000 £000 £000
Customer Services 2,483 76 45 2,604
Infrastructure & Transactions 317 127 (237) 207
Business Improvement (0) 29 186 214
Corporate Governance 1,252 78 (81) 1,249
Resources 2,331 96 (387) 2,041
HR 1 31 (0) 32
Corporate Items 4,976 21 (479) 4,518
TOTAL EXPENDITURE 11,359 458 (952) 10,865
Contingency / Other 0 0 0 0
Capital Financing Adjustment 0 0 0 0
Levies 0 0 0 0
NET EXPENDITURE 11,359 458 (952) 10,865
SUMMARY: CORPORATE SERVICES DEPARTMENT
CHANGE BETWEEN YEARS
APPENDIX 9
Page 239

FULL TIME EQUIVALENTS (FTE) 2016/17 2017/18Number of Permanent Staff 88.7 90.7Number of Fixed term contracts 0.0 0.0Total FTE 88.7 90.7
SUBJECTIVE ANALYSIS OF ESTIMATES 2016/17 Other 2017/18Original Estimate Inflation Variations Estimate
£000 £000 £000 £000ExpenditureEmployees 3,738 41 335 4,113Premises 2,673 41 (41) 2,674Transport 29 0 1 30Supplies and Services 2,547 40 68 2,655Third Party Payments 317 4 (9) 312Transfer Payments 9 0 0 9Support Services 875 0 36 911Depreciation and Impairment Losses 2,322 0 (182) 2,140
0
GROSS EXPENDITURE 12,510 127 208 12,845
IncomeGovernment Grants 0 0 0 0Other Reimbursements and Contributions 0 0 0 0Customer and Client Receipts (2,469) 0 (205) (2,674)Interest 0 0 0 0Recharges (9,724) 0 (240) (9,964)Reserves 0 0 0 0
GROSS INCOME (12,193) 0 (445) (12,638)
NET EXPENDITURE 317 127 (237) 207
Other Variations are analysed as follows:
Major Items £000 fte
Savings (219) (3.0)Transfer between departments 300 5.0Technical adjustments 68Depreciation adjustments (182)Overheads adjustments (204)Use of reservesTOTAL (237) 2.0
INFRASTRUCTURE & TRANSACTIONS
The Infrastructure & Transactions Division consists of Facilities Management, IT Service Delivery, Post & Print Room, Transactional services and Commercial Services which was transferred in from the Resources division.
APPENDIX 9
Page 240

FULL TIME EQUIVALENTS (FTE) 2016/17 2017/18Number of Permanent Staff 134.0 133.0Number of Fixed term contracts 9.0 9.0Total FTE 143.0 142.0
SUBJECTIVE ANALYSIS OF ESTIMATES 2016/17 Other 2017/18Original Estimate Inflation Variations Estimate
£000 £000 £000 £000ExpenditureEmployees 5,173 51 (72) 5,152Premises 29 0 0 29Transport 70 1 9 80Supplies and Services 1,089 17 (58) 1,048Third Party Payments 425 6 0 431Transfer Payments 0 0 0 0Support Services 2,410 0 (67) 2,343Depreciation and Impairment Losses 0 0 0 0
GROSS EXPENDITURE 9,196 76 (189) 9,083
IncomeGovernment Grants (1,232) 0 0 (1,232)Other Reimbursements and Contributions (970) 0 0 (970)Customer and Client Receipts (2,228) 0 (80) (2,308)Interest 0 0 0 0Recharges (2,283) 0 314 (1,969)Reserves 0 0 0 0
GROSS INCOME (6,713) 0 234 (6,479)
NET EXPENDITURE 2,483 76 45 2,604
Other Variations are analysed as follows:
Major Items £000 fte
(232) (1.0)Transfer between departmentsTechnical adjustments 125Depreciation adjustmentsOverhead adjustments 247Use of Reserves (95)TOTAL 45 (1.0)
Savings
CUSTOMER SERVICES
The Customer Services Division consists of: Merton Link (including the Cash Office, Translation Services and Contact Centre), Support Team, Local Taxation (including Business Rates, Baliff Team and Recovery Team), Benefits Administration, Registrars, Debt Recovery, Corporate Communications, Web Team and Consultation & Community Engagement
APPENDIX 9
Page 241

FULL TIME EQUIVALENTS (FTE) 2016/17 2017/18Number of Permanent Staff 121.0 136.2Number of Fixed term contracts 2.0 1.0Number of Richmond TUPE staff 6.0 6.0Total FTE 129.0 143.2
SUBJECTIVE ANALYSIS OF ESTIMATES 2016/17 Other 2017/18Original Estimate Inflation Variations Estimate
£000 £000 £000 £000ExpenditureEmployees 5,781 14 1,542 7,337Premises 6 0 0 6Transport 33 0 2 35Supplies and Services 1,494 57 57 1,608Third Party Payments 493 7 (40) 461Transfer Payments 0 0 0 0Support Services 492 0 56 548Depreciation and Impairment Losses 0 0 0 0
GROSS EXPENDITURE 8,299 78 1,617 9,995
IncomeGovernment Grants 0 0 0 0Other Reimbursements and Contributions 0 0 0Customer and Client Receipts (5,075) 0 (1,887) (6,962)Interest 0 0 0 0Recharges (1,973) 0 189 (1,784)Reserves 0 0 0 0
GROSS INCOME (7,048) 0 (1,698) (8,746)
NET EXPENDITURE 1,252 78 (81) 1,249
Other Variations are analysed as follows:
Major Items £000 fte
(303) (1.6)Transfer between departments Technical adjustments (23) 15.8Depreciation adjustmentsOverhead adjustments 245Use of ReservesTOTAL (81) 14.2
CORPORATE GOVERNANCE
The Corporate Governance Division consists of the South London Legal Partnership including Wandsworth who joined the service in October 2016, Shared Internal Audit, Investigations, Democracy Services, Electoral Services and Information Governance.
New savingsPrevious years savings
APPENDIX 9
Page 242

FULL TIME EQUIVALENTS 2016/17 2017/18Number of Permanent Staff 29.0 25.5Number of Fixed term contracts 20.0 11.0Total FTE 49.0 36.5
SUBJECTIVE ANALYSIS OF ESTIMATES 2016/17 Other 2017/18Original Estimate Inflation Variations Estimate
£000 £000 £000 £000ExpenditureEmployees 2,363 14 (1,132) 1,244Premises 0 0 0 0Transport 3 0 0 3Supplies and Services 1,011 15 667 1,693Third Party Payments 0 0 0 0Transfer Payments 0 0 0 0Support Services 335 0 (32) 303Depreciation and Impairment Losses 0 0 0 0
GROSS EXPENDITURE 3,712 29 (497) 3,244
IncomeGovernment Grants 0 0 0 0Other Reimbursements and Contributions 0 0 0 0Customer and Client Receipts (114) 0 0 (114)Interest 0 0 0 0Recharges (3,599) 0 683 (2,916)Reserves 0 0 0 0
GROSS INCOME (3,713) 0 683 (3,030)
NET EXPENDITURE (0) 29 186 214
Other Variations are analysed as follows:
Major Items £000 fte
(147) (3.5)Transfer between departments Technical adjustments 29Depreciation adjustmentsOverheads adjustments 651Use of reserves (347) (9.0)TOTAL 186 (12.5)
Savings
BUSINESS IMPROVEMENT
The Business Improvement Division consists of IT Business Systems, IT Business Process Re-engineering and Continuous Improvement
APPENDIX 9
Page 243
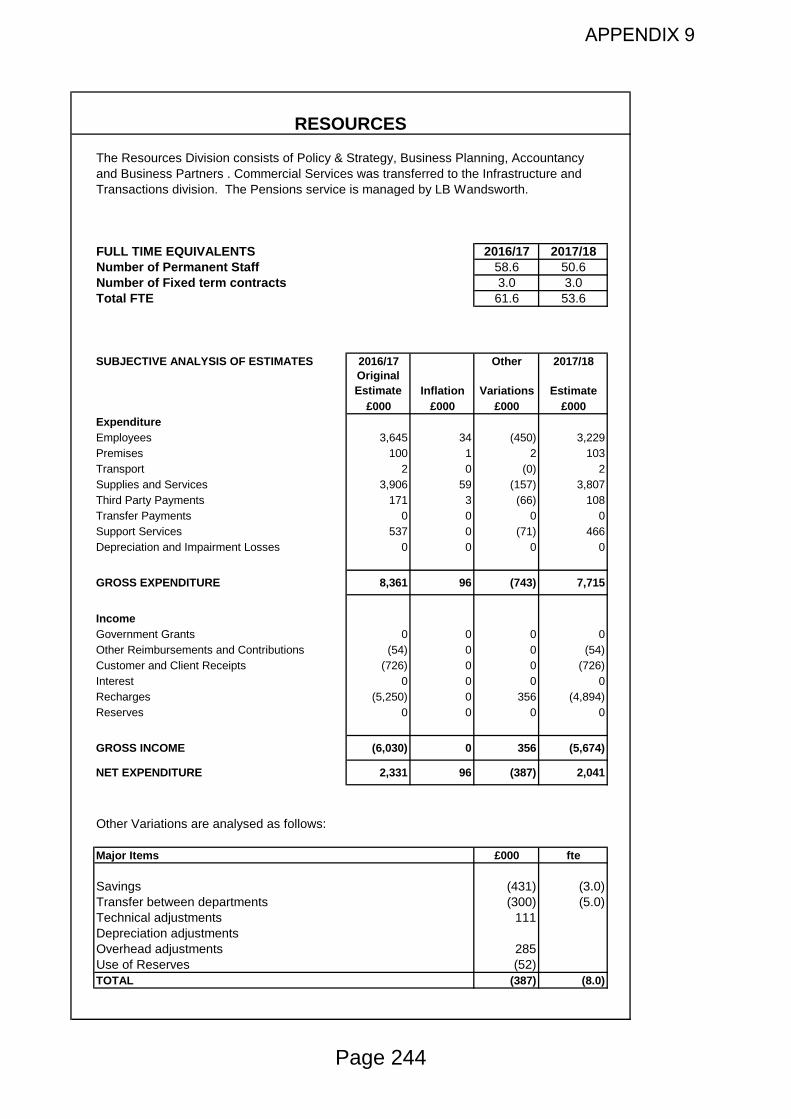
FULL TIME EQUIVALENTS 2016/17 2017/18Number of Permanent Staff 58.6 50.6Number of Fixed term contracts 3.0 3.0Total FTE 61.6 53.6
SUBJECTIVE ANALYSIS OF ESTIMATES 2016/17 Other 2017/18Original Estimate Inflation Variations Estimate
£000 £000 £000 £000ExpenditureEmployees 3,645 34 (450) 3,229Premises 100 1 2 103Transport 2 0 (0) 2Supplies and Services 3,906 59 (157) 3,807Third Party Payments 171 3 (66) 108Transfer Payments 0 0 0 0Support Services 537 0 (71) 466Depreciation and Impairment Losses 0 0 0 0
GROSS EXPENDITURE 8,361 96 (743) 7,715
IncomeGovernment Grants 0 0 0 0Other Reimbursements and Contributions (54) 0 0 (54)Customer and Client Receipts (726) 0 0 (726)Interest 0 0 0 0Recharges (5,250) 0 356 (4,894)Reserves 0 0 0 0
GROSS INCOME (6,030) 0 356 (5,674)
NET EXPENDITURE 2,331 96 (387) 2,041
Other Variations are analysed as follows:
Major Items £000 fte
(431) (3.0)Transfer between departments (300) (5.0)Technical adjustments 111Depreciation adjustmentsOverhead adjustments 285Use of Reserves (52)TOTAL (387) (8.0)
Savings
RESOURCES
The Resources Division consists of Policy & Strategy, Business Planning, Accountancy and Business Partners . Commercial Services was transferred to the Infrastructure and Transactions division. The Pensions service is managed by LB Wandsworth.
APPENDIX 9
Page 244
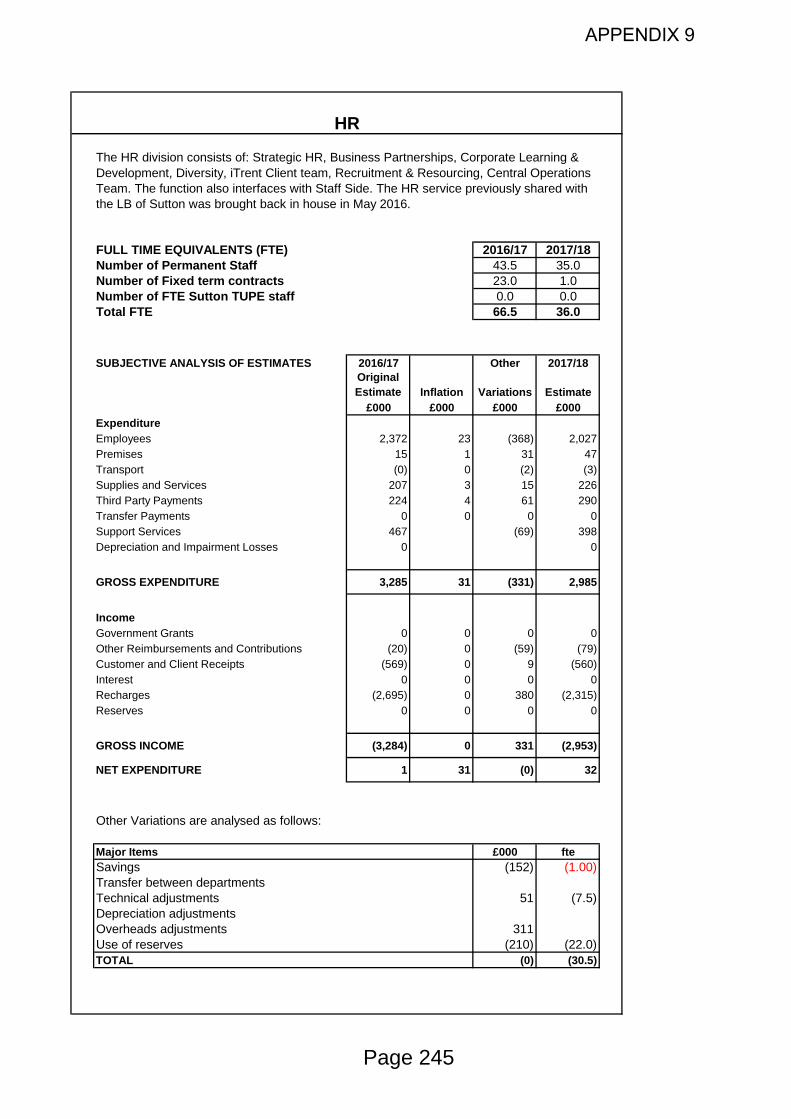
FULL TIME EQUIVALENTS (FTE) 2016/17 2017/18Number of Permanent Staff 43.5 35.0Number of Fixed term contracts 23.0 1.0Number of FTE Sutton TUPE staff 0.0 0.0Total FTE 66.5 36.0
SUBJECTIVE ANALYSIS OF ESTIMATES 2016/17 Other 2017/18Original Estimate Inflation Variations Estimate
£000 £000 £000 £000ExpenditureEmployees 2,372 23 (368) 2,027Premises 15 1 31 47Transport (0) 0 (2) (3)Supplies and Services 207 3 15 226Third Party Payments 224 4 61 290Transfer Payments 0 0 0 0Support Services 467 (69) 398Depreciation and Impairment Losses 0 0
GROSS EXPENDITURE 3,285 31 (331) 2,985
IncomeGovernment Grants 0 0 0 0Other Reimbursements and Contributions (20) 0 (59) (79)Customer and Client Receipts (569) 0 9 (560)Interest 0 0 0 0Recharges (2,695) 0 380 (2,315)Reserves 0 0 0 0
GROSS INCOME (3,284) 0 331 (2,953)
NET EXPENDITURE 1 31 (0) 32
Other Variations are analysed as follows:
Major Items £000 fteSavings (152) (1.00)Transfer between departments Technical adjustments 51 (7.5)Depreciation adjustmentsOverheads adjustments 311Use of reserves (210) (22.0)TOTAL (0) (30.5)
HR
The HR division consists of: Strategic HR, Business Partnerships, Corporate Learning & Development, Diversity, iTrent Client team, Recruitment & Resourcing, Central Operations Team. The function also interfaces with Staff Side. The HR service previously shared with the LB of Sutton was brought back in house in May 2016.
APPENDIX 9
Page 245
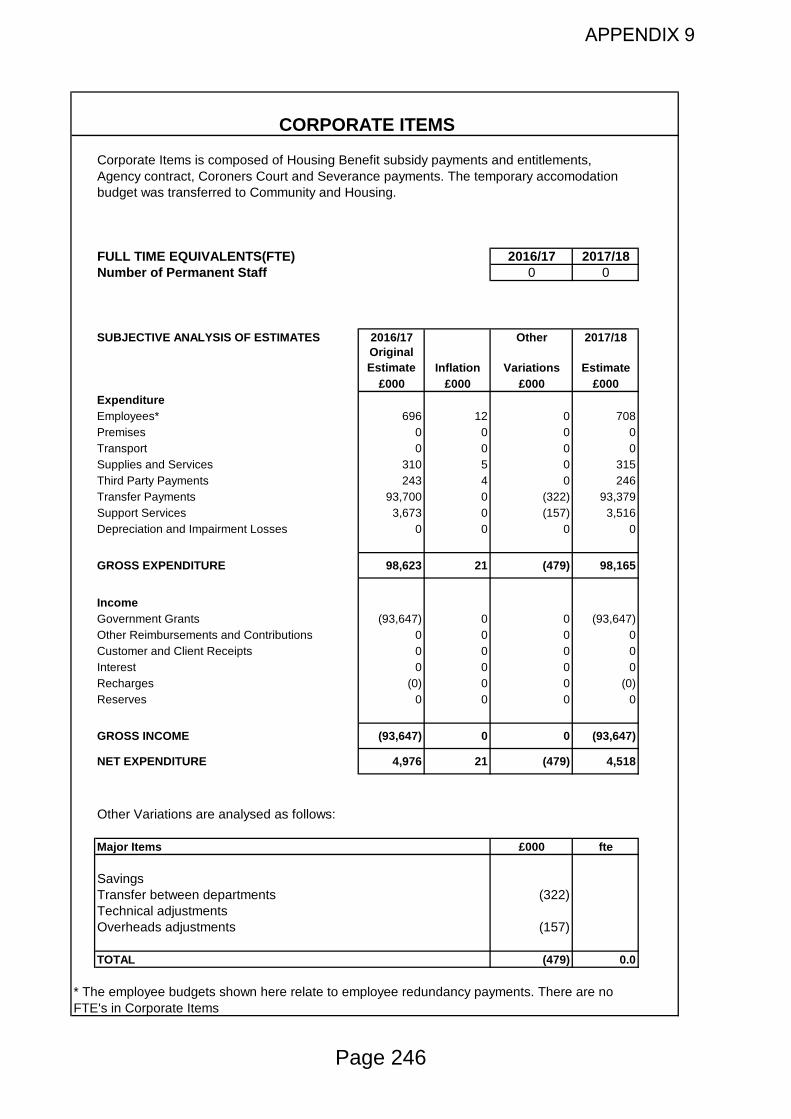
FULL TIME EQUIVALENTS(FTE) 2016/17 2017/18Number of Permanent Staff 0 0
SUBJECTIVE ANALYSIS OF ESTIMATES 2016/17 Other 2017/18Original Estimate Inflation Variations Estimate
£000 £000 £000 £000ExpenditureEmployees* 696 12 0 708Premises 0 0 0 0Transport 0 0 0 0Supplies and Services 310 5 0 315Third Party Payments 243 4 0 246Transfer Payments 93,700 0 (322) 93,379Support Services 3,673 0 (157) 3,516Depreciation and Impairment Losses 0 0 0 0
GROSS EXPENDITURE 98,623 21 (479) 98,165
IncomeGovernment Grants (93,647) 0 0 (93,647)Other Reimbursements and Contributions 0 0 0 0Customer and Client Receipts 0 0 0 0Interest 0 0 0 0Recharges (0) 0 0 (0)Reserves 0 0 0 0
GROSS INCOME (93,647) 0 0 (93,647)
NET EXPENDITURE 4,976 21 (479) 4,518
Other Variations are analysed as follows:
Major Items £000 fte
SavingsTransfer between departments (322)Technical adjustmentsOverheads adjustments (157)
TOTAL (479) 0.0
* The employee budgets shown here relate to employee redundancy payments. There are no FTE's in Corporate Items
CORPORATE ITEMS
Corporate Items is composed of Housing Benefit subsidy payments and entitlements, Agency contract, Coroners Court and Severance payments. The temporary accomodation budget was transferred to Community and Housing.
APPENDIX 9
Page 246

2017/2018 ESTIMATES
CHILDREN, SCHOOLS AND FAMILIESDEPARTMENT
APPENDIX 9
Page 247

FULL TIME EQUIVALENTS 2016/17 2017/18Number of Permanent Staff 430.6 433.2Number of DSG Staff 75.4 78.2Number of Fixed term contracts 22.4 12.2Total FTE 528.4 523.6
SUBJECTIVE ANALYSIS OF ESTIMATES 2016/17 Other 2017/18 2017/18 2017/18
Estimate Inflation Variations EstimateDSG
EstimateLA
Estimate£000 £000 £000 £000 £000 £000
ExpenditureEmployees 26,573 240 630 27,443 4,715 22,728Premises 1,548 3 (318) 1,233 77 1,156Transport 4,301 62 (6) 4,357 78 4,279Supplies and Services 145,293 545 4,016 149,854 134,214 15,640Third Party Payments 28,412 228 1,674 30,314 13,274 17,040Transfer Payments 388 6 0 394 0 394Support Services 4,837 0 229 5,066 233 4,833Depreciation and Impairment Losses 5,311 0 611 5,922 0 5,922
GROSS EXPENDITURE 216,663 1,084 6,836 224,583 152,591 71,992
IncomeGovernment Grants (157,209) 0 (5,489) (162,698) (150,275) (12,423)Other Reimbursements and Contributions (6,139) 0 623 (5,516) (1,464) (4,052)Customer and Client Receipts (2,848) 0 (359) (3,207) (315) (2,892)Interest (46) 0 0 (46) 0 (46)Recharges 0 0 0 0 0 0Reserves (238) 0 (299) (537) 202 0
GROSS INCOME (166,480) 0 (5,524) (172,004) (151,852) (19,413)
NET EXPENDITURE 50,183 1,084 1,312 52,579 739 52,579
Other Variations are analysed as follows:
Major Items £000 fteSavings (1,110) (13.0)Overhead adjustments 229Depreciation adjustments 612Technical adjustments 790Transfer between departments 29Growth 1,000
(238)TOTAL 1,312 (13.0)
CHILDREN, SCHOOLS AND FAMILIES DEPARTMENT
This Page contains the Budget for the whole Children, Schools and Families Department including funding provided directly to Merton's Schools
Use of Reserves adjustment
APPENDIX 9
Page 248
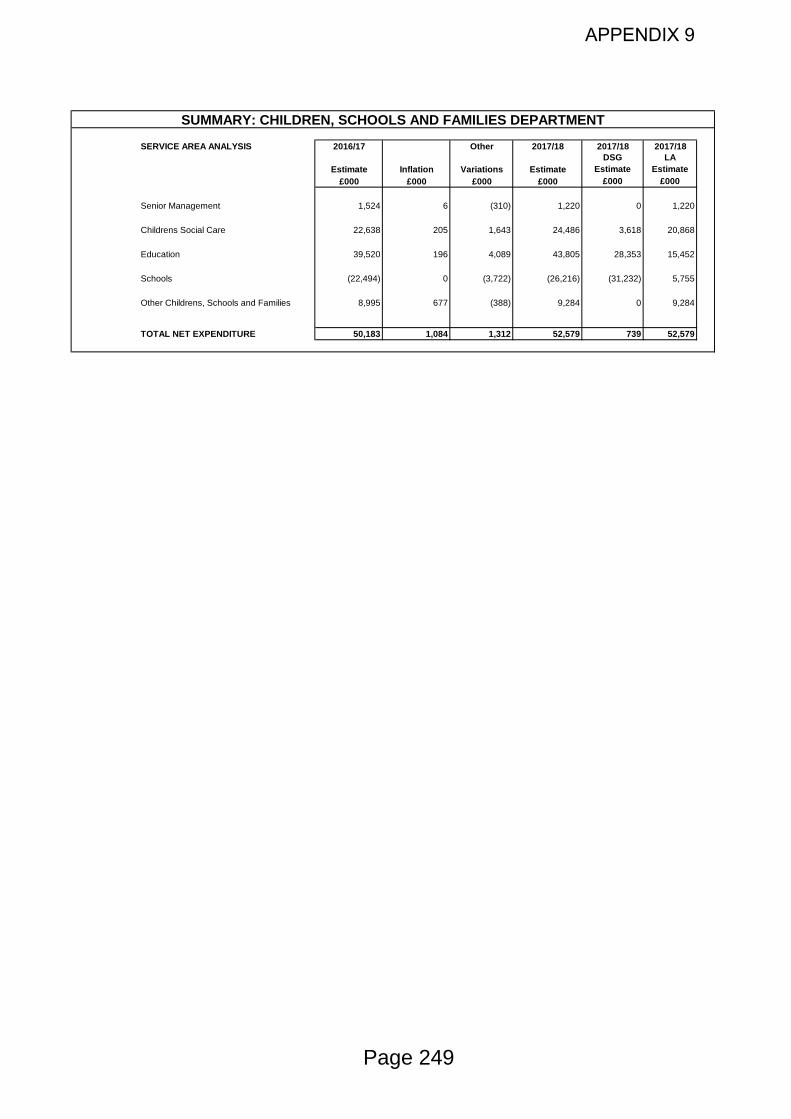
SERVICE AREA ANALYSIS 2016/17 Other 2017/18 2017/18 2017/18
Estimate Inflation Variations EstimateDSG
EstimateLA
Estimate£000 £000 £000 £000 £000 £000
Senior Management 1,524 6 (310) 1,220 0 1,220
Childrens Social Care 22,638 205 1,643 24,486 3,618 20,868
Education 39,520 196 4,089 43,805 28,353 15,452
Schools (22,494) 0 (3,722) (26,216) (31,232) 5,755
Other Childrens, Schools and Families 8,995 677 (388) 9,284 0 9,284
TOTAL NET EXPENDITURE 50,183 1,084 1,312 52,579 739 52,579
SUMMARY: CHILDREN, SCHOOLS AND FAMILIES DEPARTMENT
APPENDIX 9
Page 249

FULL TIME EQUIVALENTS 2016/17 2017/18Number of Permanent Staff 4.0 3.0Number of DSG Staff 0.0 0.0Number of Fixed term contracts 0.0 0.0Total FTE 4.0 3.0
SUBJECTIVE ANALYSIS OF ESTIMATES 2016/17 Other 2017/18 2017/18 2017/18
Estimate Inflation Variations EstimateDSG
EstimateLA
Estimate£000 £000 £000 £000 £000 £000
ExpenditureEmployees 614 5 (112) 507 0 507Premises 0 0 0 0 0 0Transport 1 0 0 1 0 1Supplies and Services 855 1 (192) 664 0 664Third Party Payments 7 0 0 7 0 7Transfer Payments 0 0 0 0 0 0Support Services 47 0 (6) 41 0 41Depreciation and Impairment Losses 0 0 0 0 0 0
GROSS EXPENDITURE 1,524 6 (310) 1,220 0 1,220
IncomeGovernment Grants 0 0 0 0 0 0Other Reimbursements and Contributions 0 0 0 0 0 0Customer and Client Receipts 0 0 0 0 0 0Interest 0 0 0 0 0 0Recharges 0 0 0 0 0 0Reserves 0 0 0 0 0 0
GROSS INCOME 0 0 0 0 0 0NET EXPENDITURE 1,524 6 (310) 1,220 0 1,220
Other Variations are analysed as follows:
Major Items £000 fte (34)
Transfer between departments 0Savings (117) (1.0)Technical adjustments (159)TOTAL (310) 0.0
Senior Management
CHILDREN, SCHOOLS AND FAMILIES DEPARTMENT
This budget contains provision for the Senior Management of Children, Schools and Familes Department.
Overhead adjustments
APPENDIX 9
Page 250

FULL TIME EQUIVALENTS 2016/17 2017/18Number of Permanent Staff 188.5 196.0Number of DSG Staff 2.0 2.0Number of Fixed term contracts 18.2 12.2Total FTE 208.7 210.2
SUBJECTIVE ANALYSIS OF ESTIMATES 2016/17 Other 2017/18 2017/18 2017/18
Estimate Inflation Variations EstimateDSG
EstimateLA
Estimate£000 £000 £000 £000 £000 £000
ExpenditureEmployees 9,878 90 500 10,468 111 10,357Premises 43 0 16 59 0 59Transport 164 2 18 184 1 183Supplies and Services 3,510 46 22 3,578 4 3,574Third Party Payments 7,751 61 970 8,782 3,495 5,287Transfer Payments 369 6 (1) 374 0 374Support Services 2,086 0 15 2,101 7 2,094Depreciation and Impairment Losses 0 0 0 0 0 0
GROSS EXPENDITURE 23,801 205 1,540 25,546 3,618 21,928
IncomeGovernment Grants (806) 0 (19) (825) 0 (825)Other Reimbursements and Contributions (236) 0 122 (114) 0 (114)Customer and Client Receipts (121) 0 0 (121) 0 (121)Interest 0 0 0 0 0 0Recharges 0 0 0 0 0 0Reserves 0 0 0 0 0 0
GROSS INCOME (1,163) 0 103 (1,060) 0 (1,060)NET EXPENDITURE 22,638 205 1,643 24,486 3,618 20,868
Other Variations are analysed as follows:
Major Items £000 fteSavings (91) (1.0)Growth 1,000
15Depreciation adjustments 0Use of Reserves adjustment (132)Technical adjustments 851TOTAL 1,643 (1.0)
CHILDREN, SCHOOLS AND FAMILIES DEPARTMENT
Children's Social CareThis budget contains the funding for central sosial work; family and adolescent servicee; Mash and child protection; permanency,
Overhead adjustments
APPENDIX 9
Page 251

FULL TIME EQUIVALENTS 2016/17 2017/18Number of Permanent Staff 219.5 215.6Number of DSG Staff 73.4 76.2Number of Fixed term contracts 4.2 0.0Total FTE 297.1 291.7
SUBJECTIVE ANALYSIS OF ESTIMATES 2016/17 Other 2017/18 2017/18 2017/18
Estimate Inflation Variations EstimateDSG
EstimateLA
Estimate£000 £000 £000 £000 £000 £000
ExpenditureEmployees 12,465 105 145 12,715 3,836 8,879Premises 1,450 3 (332) 1,121 29 1,092Transport 4,132 60 (24) 4,168 76 4,092Supplies and Services 14,402 14 3,424 17,840 15,562 2,278Third Party Payments 9,835 14 949 10,798 9,780 1,018Transfer Payments 19 0 0 19 0 19Support Services 2,498 0 170 2,668 227 2,441Depreciation and Impairment Losses 176 0 (9) 167 0 167
GROSS EXPENDITURE 44,977 196 4,323 49,496 29,510 19,986
IncomeGovernment Grants (150) 0 (82) (232) 0 (232)Other Reimbursements and Contributions (2,397) 0 500 (1,897) (305) (1,592)Customer and Client Receipts (2,673) 0 (352) (3,025) (315) (2,710)Interest 0 0 0 0 0 0Recharges 0 0 0 0 0 0Reserves (237) 0 (300) (537) (537) 0
GROSS INCOME (5,457) 0 (234) (5,691) (1,157) (4,534)NET EXPENDITURE 39,520 196 4,089 43,805 28,353 15,452
Other Variations are analysed as follows:
Major Items £000 fteSavings (747) (10.6)
198Transfer between departments 29Use of Reserves adjustment (284)Depreciation adjustments (9)Technical adjustments 4,902TOTAL 4,089 (10.6)
To page contains the budgets for school improvement; early years and children's centres; education inclusion; as well as special
CHILDREN, SCHOOLS AND FAMILIES DEPARTMENT
Education
Overhead adjustments
APPENDIX 9
Page 252

FULL TIME EQUIVALENTS 2016/17 2017/18Number of Permanent Staff 0.0 0.0Number of DSG Staff 0.0 0.0Number of Fixed term contracts 0.0 0.0Total FTE 0.0 0.0
SUBJECTIVE ANALYSIS OF ESTIMATES 2016/17 Other 2017/18 2017/18 2017/18
Estimate Inflation Variations EstimateDSG
EstimateLA
Estimate£000 £000 £000 £000 £000 £000
ExpenditureEmployees 674 0 94 768 768 0Premises 48 0 0 48 48 0Transport 0 0 0 0 0 0Supplies and Services 126,138 0 1,039 127,177 118,647 8,530Third Party Payments 0 0 0 0 0 0Transfer Payments 0 0 0 0 0 0Support Services 0 0 0 0 0 0Depreciation and Impairment Losses 5,135 0 620 5,755 0 5,755
GROSS EXPENDITURE 131,995 0 1,753 133,748 119,463 14,285
IncomeGovernment Grants (153,330) 0 (5,475) (158,805) (150,275) (8,530)Other Reimbursements and Contributions (1,159) 0 0 (1,159) (1,159) 0Customer and Client Receipts 0 0 0 0 0 0Interest 0 0 0 0 0 0Recharges 0 0 0 0 0 0Reserves 0 0 0 0 739 0
GROSS INCOME (154,489) 0 (5,475) (159,964) (150,695) (8,530)NET EXPENDITURE (22,494) 0 (3,722) (26,216) (31,232) 5,755
Other Variations are analysed as follows:
Major Items £000 fteDepreciation adjustments 621Use of Reserves adjustment 372Technical adjustments (4,715)TOTAL (3,722) 0.0
SchoolsThis budget covers schools funding as well as some centrally retained DSG money to support the schools function.
CHILDREN, SCHOOLS AND FAMILIES DEPARTMENT
APPENDIX 9
Page 253

FULL TIME EQUIVALENTS 2016/17 2017/18Number of Permanent Staff 18.6 18.7Number of DSG Staff 0.0 0.0Number of Fixed term contracts 0.0 0.0Total FTE 18.6 18.7
SUBJECTIVE ANALYSIS OF ESTIMATES 2016/17 Other 2017/18 2017/18 2017/18
Estimate Inflation Variations EstimateDSG
EstimateLA
Estimate£000 £000 £000 £000 £000 £000
ExpenditureEmployees 2,942 40 4 2,986 0 2,986Premises 7 0 (2) 5 0 5Transport 4 0 0 4 0 4Supplies and Services 388 484 (277) 595 0 595Third Party Payments 10,819 153 (245) 10,727 0 10,727Transfer Payments 0 0 0 0 0 0Support Services 206 0 50 256 0 256Depreciation and Impairment Losses 0 0 0 0 0 0
GROSS EXPENDITURE 14,366 677 (470) 14,573 0 14,573
IncomeGovernment Grants (2,923) 0 88 (2,835) 0 (2,835)Other Reimbursements and Contributions (2,347) 0 0 (2,347) 0 (2,347)Customer and Client Receipts (55) 0 (6) (61) 0 (61)Interest (46) 0 0 (46) 0 (46)Recharges 0 0 0 0 0 0Reserves 0 0 0 0 0 0
GROSS INCOME (5,371) 0 82 (5,289) 0 (5,289)NET EXPENDITURE 8,995 677 (388) 9,284 0 9,284
Other Variations are analysed as follows:
Major Items £000 fteSavings (155) (0.4)
50Use of Reserves adjustment (194)Technical adjustments (89)TOTAL (388) 0.0
Overhead adjustments
CHILDREN, SCHOOLS AND FAMILIES DEPARTMENT
Other Children Schools and Families BudgetsThis budget covers asylum seeker costs, past and present pension and redundancy costs, ESG income and PFI unitary charges.
APPENDIX 9
Page 254

2017/2018 ESTIMATES
ENVIRONMENT AND REGENERATION
DEPARTMENT
APPENDIX 9
Page 255

NB: The financial information included above is the latest available but may change as the budget process develops and more up to date details become available.
FULL TIME EQUIVALENTS (FTE) 2016/17 2017/18Permanent Staff 620 308Fixed Term Contract 9 5Total FTE 628 313
SERVICE AREA ANALYSIS 2016/2017 Other 2017/2018Original Estimate Inflation Variations Estimate
£000 £000 £000 £000
Street Scene and Waste 16,759 425 (2,683) 14,501
Public Protection and Development (9,346) 81 978 (8,287)
Sustainable Communities 13,817 183 2,970 16,970
Senior Management and Support 0 19 (19) 0
TOTAL EXPENDITURE 21,230 708 1,246 23,184
SUMMARY: ENVIRONMENT & REGENERATION
CHANGE BETWEEN YEARS
APPENDIX 9
Page 256

NB: The financial information included above is the latest available but may change as the budget process develops and more up to date details become available.
FULL TIME EQUIVALENTS (FTE) 2016/17 2017/18Permanent Staff 619.6 308.0Fixed Term Contract 8.6 4.6Total FTE 628.2 312.6
SUBJECTIVE ANALYSIS OF ESTIMATES 2016/2017 Other 2017/2018Original Estimate Inflation Variations Estimate
£000 £000 £000 £000ExpenditureEmployees 23,153 369 (9,466) 14,056Premises 3,034 37 (301) 2,770Transport 8,690 37 (2,800) 5,927Supplies and Services 3,385 58 (704) 2,739Third Party Payments 9,899 207 7,375 17,481Transfer Payments 2 0 0 2Support Services 9,092 0 (1,446) 7,646Depreciation and Impairment Losses 9,539 0 4,337 13,876
GROSS EXPENDITURE 66,794 708 (3,005) 64,497
IncomeGovernment Grants (116) 0 40 (76)Other Reimbursements and Contributions (3,351) 0 (484) (3,835)Customer and Client Receipts (39,653) 0 4,470 (35,183)Recharges (2,443) 0 225 (2,218)Reserves 0 0 0 0
GROSS INCOME (45,563) 0 4,251 (41,312)
NET EXPENDITURE 21,230 708 1,246 23,184
Other variations are analysed as follows:
Major Items £000 fte
(3,426) (310)Growth 1,582 9Depreciation adjustments 4,336Overheads adjustments (1,221)Transfer between departments (23)Technical adjustments 537Use of Reserves adjustments (523) (5)
TOTAL 1,262 (306.3)
ENVIRONMENT AND REGENERATION DEPARTMENT
Savings
Departmental Summary
APPENDIX 9
Page 257

NB: The financial information included above is the latest available but may change as the budget process develops and more up to date details become available.
FULL TIME EQUIVALENTS (FTE) 2016/17 2017/18Permanent Staff 302 71Fixed Term Contract 0 0Total FTE 302 71
SUBJECTIVE ANALYSIS OF ESTIMATES 2016/2017 Other 2017/2018Original Estimate Inflation Variations Estimate
£000 £000 £000 £000ExpenditureEmployees 9,371 223 (6,920) 2,674Premises 254 1 (59) 196Transport 8,092 29 (2,520) 5,601Supplies and Services 694 9 (339) 364Third Party Payments 6,543 163 6,283 12,989Transfer Payments 2 0 0 2Support Services 2,932 0 (1,614) 1,318Depreciation and Impairment Losses 1,104 0 (182) 922
GROSS EXPENDITURE 28,992 425 (5,351) 24,066
IncomeGovernment Grants 0 0 0 0Other Reimbursements and Contributions (874) 0 (176) (1,050)Customer and Client Receipts (11,359) 0 2,844 (8,515)Recharges 0 0 0 0Reserves 0 0 0 0
GROSS INCOME (12,233) 0 2,668 (9,565)
NET EXPENDITURE 16,759 425 (2,683) 14,501
Other variations are analysed as follows:
Major Items £000 fte
(1,763) (223.2)Growth 825Depreciation adjustments (183)Overheads adjustments (1,614)Transfer between departments 1
51Use of reserves adjustments 0
TOTAL (2,683) (223.2)
ENVIRONMENT AND REGENERATION DEPARTMENT
Technical adjustments
Savings
Street Scene and Waste: Transport Services, Waste Management and Operations.
APPENDIX 9
Page 258
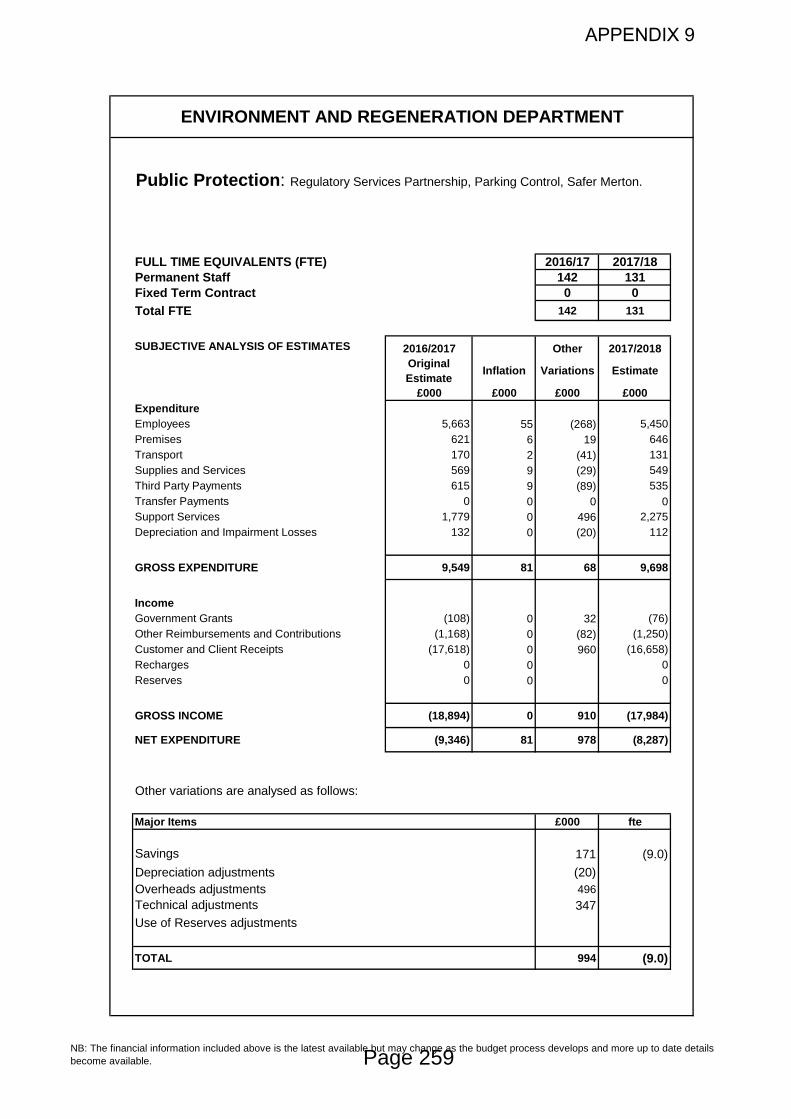
NB: The financial information included above is the latest available but may change as the budget process develops and more up to date details become available.
FULL TIME EQUIVALENTS (FTE) 2016/17 2017/18Permanent Staff 142 131Fixed Term Contract 0 0Total FTE 142 131
SUBJECTIVE ANALYSIS OF ESTIMATES 2016/2017 Other 2017/2018Original Estimate Inflation Variations Estimate
£000 £000 £000 £000ExpenditureEmployees 5,663 55 (268) 5,450Premises 621 6 19 646Transport 170 2 (41) 131Supplies and Services 569 9 (29) 549Third Party Payments 615 9 (89) 535Transfer Payments 0 0 0 0Support Services 1,779 0 496 2,275Depreciation and Impairment Losses 132 0 (20) 112
GROSS EXPENDITURE 9,549 81 68 9,698
IncomeGovernment Grants (108) 0 32 (76)Other Reimbursements and Contributions (1,168) 0 (82) (1,250)Customer and Client Receipts (17,618) 0 960 (16,658)Recharges 0 0 0Reserves 0 0 0
GROSS INCOME (18,894) 0 910 (17,984)
NET EXPENDITURE (9,346) 81 978 (8,287)
Other variations are analysed as follows:
Major Items £000 fte
171 (9.0)Depreciation adjustments (20)Overheads adjustments 496
347Use of Reserves adjustments
TOTAL 994 (9.0)
Public Protection: Regulatory Services Partnership, Parking Control, Safer Merton.
ENVIRONMENT AND REGENERATION DEPARTMENT
Savings
Technical adjustments
APPENDIX 9
Page 259

NB: The financial information included above is the latest available but may change as the budget process develops and more up to date details become available.
FULL TIME EQUIVALENTS (FTE) 2016/17 2017/18Permanent Staff 166 98Fixed Term Contract 9 5Total FTE 175 103
SUBJECTIVE ANALYSIS OF ESTIMATES 2016/2017 Other 2017/2018Original Estimate Inflation Variations Estimate
£000 £000 £000 £000ExpenditureEmployees 7,366 75 (2,271) 5,170Premises 2,158 30 (261) 1,927Transport 420 6 (240) 186Supplies and Services 1,918 37 (319) 1,636Third Party Payments 2,741 35 1,175 3,951Transfer Payments 0 0 0 0Support Services 4,250 0 (363) 3,887Depreciation and Impairment Losses 8,304 0 4,539 12,843
GROSS EXPENDITURE 27,157 183 2,260 29,600
IncomeGovernment Grants (8) 0 8 (0)Other Reimbursements and Contributions (1,309) 0 (226) (1,535)Customer and Client Receipts (10,675) 0 666 (10,009)Recharges (1,347) 0 262 (1,085)Reserves (0) 0 0 (0)
GROSS INCOME (13,340) 0 710 (12,630)
NET EXPENDITURE 13,817 183 2,970 16,970
Other variations are analysed as follows:
Major Items £000 fte
(1,805) (77.0)Growth 757 8.5Depreciation adjustments 4,539Overheads adjustments (101)Transfer between departments (24)
127Use of Reserves adjustments (523) -5.0
TOTAL 2,970 (73.5)
ENVIRONMENT AND REGENERATION DEPARTMENT
Savings
Sustainable Communities: Traffic and Highway Services, Development Control, Building Control, Physical Regeneration, Spatial Planning and Policy, Regeneration Partnerships, Property Management, Greenspaces, Leisure and Culture Development, Transport Planning & Safety Education, Business Performance.
Technical adjustments
APPENDIX 9
Page 260
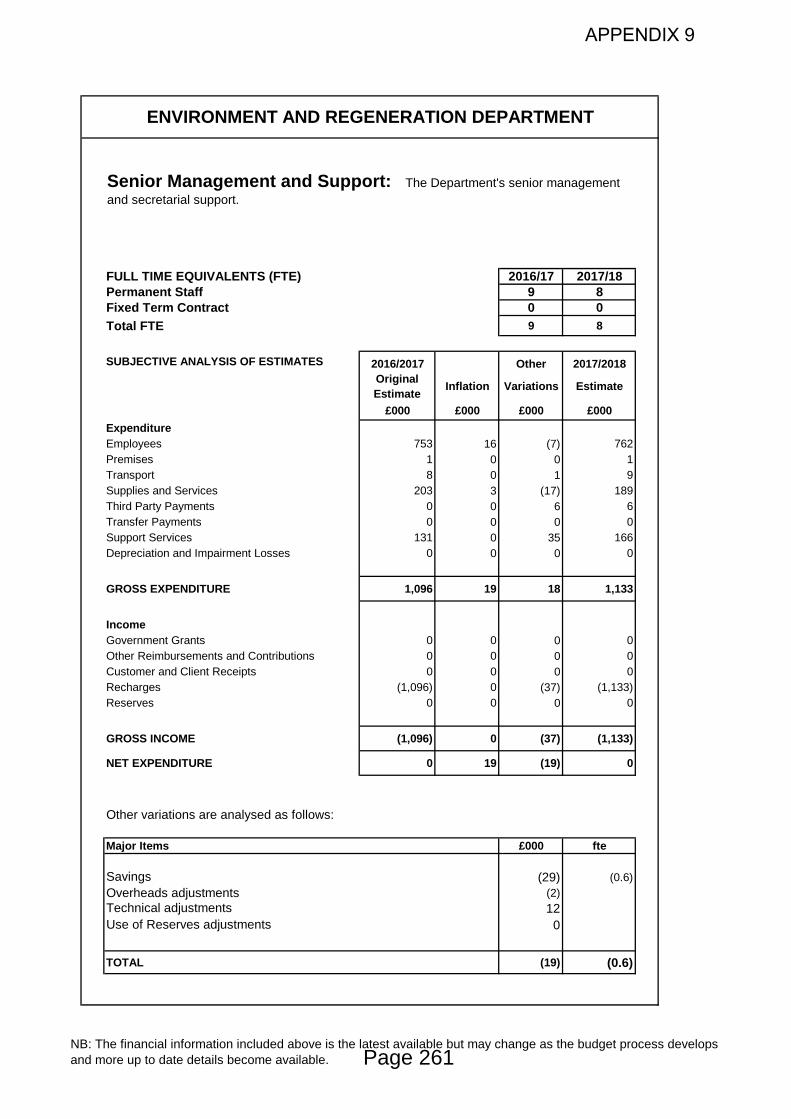
NB: The financial information included above is the latest available but may change as the budget process develops and more up to date details become available.
FULL TIME EQUIVALENTS (FTE) 2016/17 2017/18Permanent Staff 9 8Fixed Term Contract 0 0Total FTE 9 8
SUBJECTIVE ANALYSIS OF ESTIMATES 2016/2017 Other 2017/2018Original Estimate Inflation Variations Estimate
£000 £000 £000 £000ExpenditureEmployees 753 16 (7) 762Premises 1 0 0 1Transport 8 0 1 9Supplies and Services 203 3 (17) 189Third Party Payments 0 0 6 6Transfer Payments 0 0 0 0Support Services 131 0 35 166Depreciation and Impairment Losses 0 0 0 0
GROSS EXPENDITURE 1,096 19 18 1,133
IncomeGovernment Grants 0 0 0 0Other Reimbursements and Contributions 0 0 0 0Customer and Client Receipts 0 0 0 0Recharges (1,096) 0 (37) (1,133)Reserves 0 0 0 0
GROSS INCOME (1,096) 0 (37) (1,133)
NET EXPENDITURE 0 19 (19) 0
Other variations are analysed as follows:
Major Items £000 fte
(29) (0.6)Overheads adjustments (2)
120
TOTAL (19) (0.6)
Use of Reserves adjustments
ENVIRONMENT AND REGENERATION DEPARTMENT
Savings
Senior Management and Support: The Department's senior management and secretarial support.
Technical adjustments
APPENDIX 9
Page 261

2017/2018 ESTIMATES
COMMUNITY AND HOUSING
DEPARTMENT
APPENDIX 9
Page 262

2016/17 2017/18Number of FTE Staff 417.8 374.1Number of FTE PCT TUPE staff 16.3 13.7Total FTE 434.1 387.8
SERVICE AREA ANALYSIS 2016/17 2017/18Original OtherEstimate Inflation Variations Estimate
£000 £000 £000 £000Adult Social Care 51,017 792 7,189 58,998
Libraries and Heritage 2,864 43 (244) 2,662
Merton Adult Education (68) 21 76 29
Housing General Fund 2,010 51 163 2,224
Senior Management 396 22 (14) 404
NET EXPENDITURE 56,219 929 7,170 64,318
SUMMARY: COMMUNITY AND HOUSING
APPENDIX 9
Page 263

NB:The financial information included above is the latest available but may change as the budget process develops amd more up to date details become available.
FULL TIME EQUIVALENTS 2016/17 2017/18Number of FTE Staff 417.77 374.06Number of FTE PCT TUPE staff 16.28 13.73Total 434.05 387.79
SUBJECTIVE ANALYSIS OF ESTIMATES 2016/17 2017/18Original OtherEstimate Inflation Variations Estimate
£000 £000 £000 £000ExpenditureEmployees 17,051 198 (1,304) 15,945Premises 971 16 (84) 902Transport 1,441 22 12 1,475Supplies and Services 5,133 76 (827) 4,382Third Party Payments 41,216 618 7,668 49,502Transfer Payments 10,012 0 73 10,085Support Services 7,660 0 (648) 7,012Depreciation and Impairment Losses 465 0 (86) 379
GROSS EXPENDITURE 83,949 929 4,805 89,683
IncomeGovernment Grants (4,345) 0 2,954 (1,391)Other Reimbursements and Contributions (8,675) 0 (2,536) (11,211)Customer and Client Receipts (11,750) 0 1,693 (10,057)Interest 0 0 0 0Recharges (2,960) 0 254 (2,706)
GROSS INCOME (27,730) 0 2,365 (25,365)
NET EXPENDITURE 56,219 929 7,170 64,318
Other Variations are analysed as follows:
Major Items £000 £000 fteCurrent Year savings (2,175)Salary Savings (498) (46.26)Growth 9,345Overheads adjustments (328)Depreciation adjustments (86)Rebasing of Income 7Technical adjustments 251Transfers between departments 361Grants 89Other 204TOTAL 0 7,170 (46.26)
COMMUNITY AND HOUSING DEPARTMENT Total
The department includes Adult Social Care, Housing, Libraries and Merton Adult Education.
APPENDIX 9
Page 264
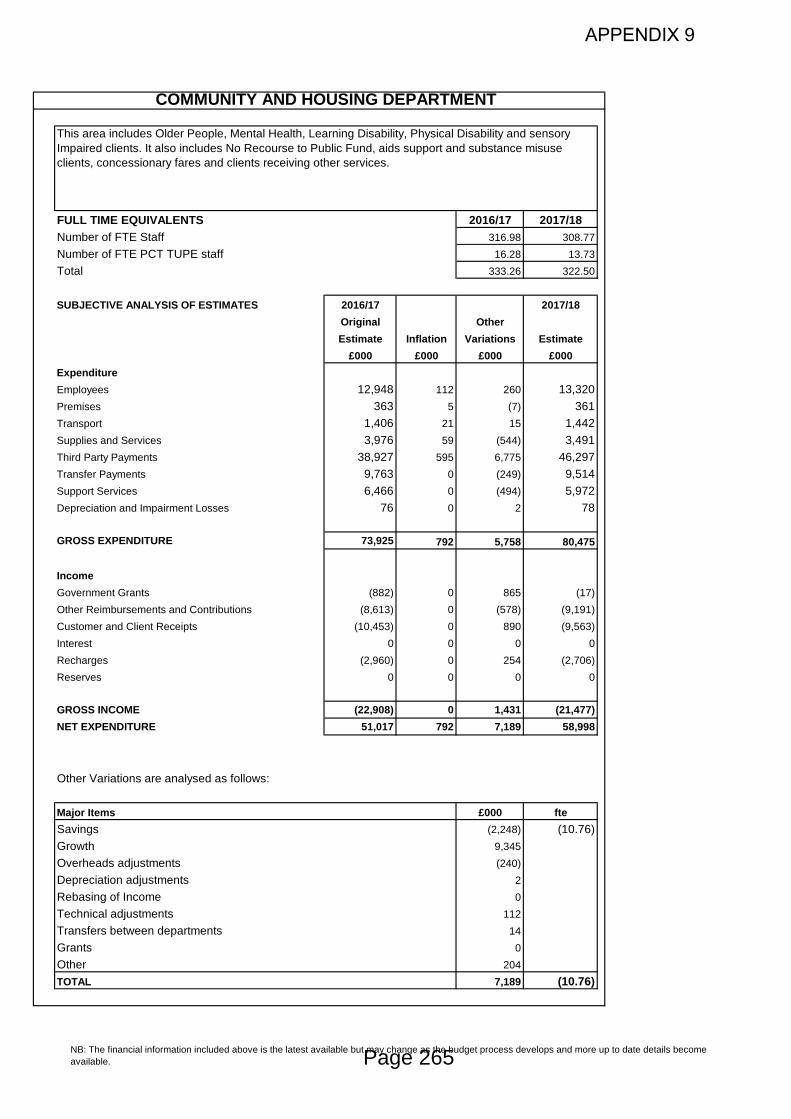
NB: The financial information included above is the latest available but may change as the budget process develops and more up to date details become available.
FULL TIME EQUIVALENTS 2016/17 2017/18Number of FTE Staff 316.98 308.77Number of FTE PCT TUPE staff 16.28 13.73Total 333.26 322.50
SUBJECTIVE ANALYSIS OF ESTIMATES 2016/17 2017/18Original OtherEstimate Inflation Variations Estimate
£000 £000 £000 £000ExpenditureEmployees 12,948 112 260 13,320Premises 363 5 (7) 361Transport 1,406 21 15 1,442Supplies and Services 3,976 59 (544) 3,491Third Party Payments 38,927 595 6,775 46,297Transfer Payments 9,763 0 (249) 9,514Support Services 6,466 0 (494) 5,972Depreciation and Impairment Losses 76 0 2 78
GROSS EXPENDITURE 73,925 792 5,758 80,475
IncomeGovernment Grants (882) 0 865 (17)Other Reimbursements and Contributions (8,613) 0 (578) (9,191)Customer and Client Receipts (10,453) 0 890 (9,563)Interest 0 0 0 0Recharges (2,960) 0 254 (2,706)Reserves 0 0 0 0
GROSS INCOME (22,908) 0 1,431 (21,477)NET EXPENDITURE 51,017 792 7,189 58,998
Other Variations are analysed as follows:
Major Items £000 fteSavings (2,248) (10.76)Growth 9,345Overheads adjustments (240)Depreciation adjustments 2Rebasing of Income 0Technical adjustments 112Transfers between departments 14Grants 0Other 204TOTAL 7,189 (10.76)
COMMUNITY AND HOUSING DEPARTMENT
This area includes Older People, Mental Health, Learning Disability, Physical Disability and sensory Impaired clients. It also includes No Recourse to Public Fund, aids support and substance misuse clients, concessionary fares and clients receiving other services.
APPENDIX 9
Page 265
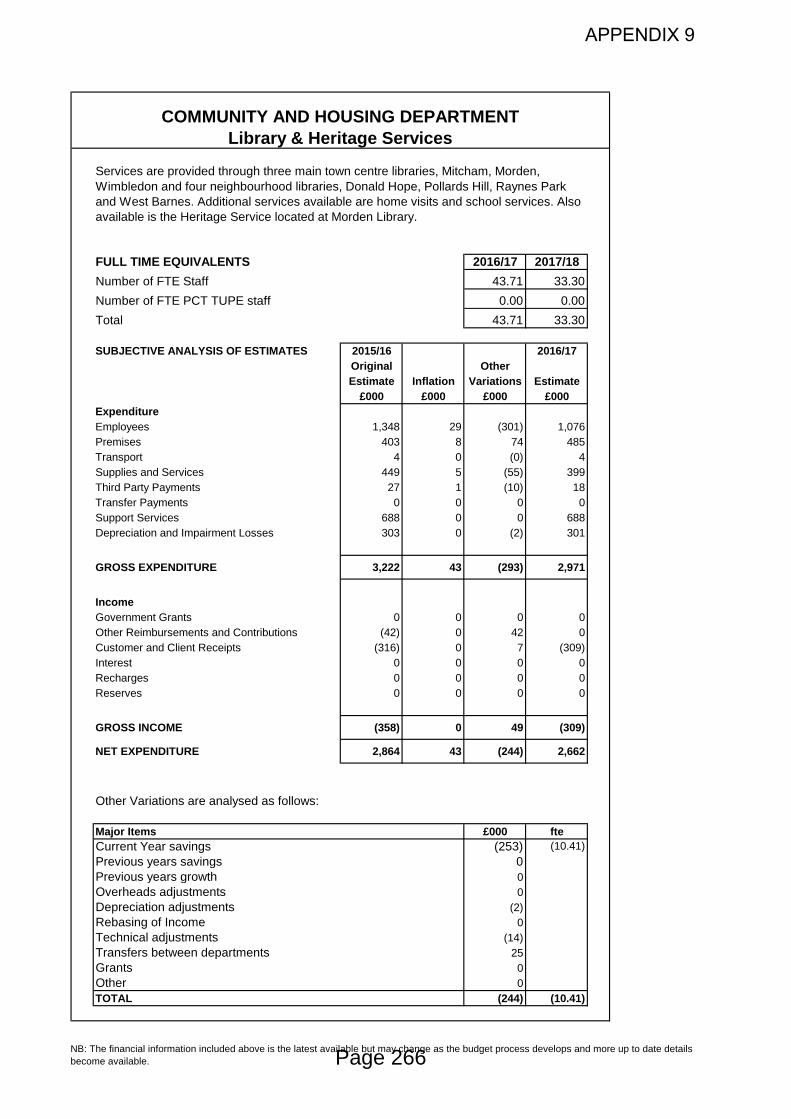
NB: The financial information included above is the latest available but may change as the budget process develops and more up to date details become available.
FULL TIME EQUIVALENTS 2016/17 2017/18Number of FTE Staff 43.71 33.30Number of FTE PCT TUPE staff 0.00 0.00Total 43.71 33.30
SUBJECTIVE ANALYSIS OF ESTIMATES 2015/16 2016/17Original OtherEstimate Inflation Variations Estimate
£000 £000 £000 £000ExpenditureEmployees 1,348 29 (301) 1,076Premises 403 8 74 485Transport 4 0 (0) 4Supplies and Services 449 5 (55) 399Third Party Payments 27 1 (10) 18Transfer Payments 0 0 0 0Support Services 688 0 0 688Depreciation and Impairment Losses 303 0 (2) 301
GROSS EXPENDITURE 3,222 43 (293) 2,971
IncomeGovernment Grants 0 0 0 0Other Reimbursements and Contributions (42) 0 42 0Customer and Client Receipts (316) 0 7 (309)Interest 0 0 0 0Recharges 0 0 0 0Reserves 0 0 0 0
GROSS INCOME (358) 0 49 (309)
NET EXPENDITURE 2,864 43 (244) 2,662
Other Variations are analysed as follows:
Major Items £000 fteCurrent Year savings (253) (10.41)Previous years savings 0Previous years growth 0Overheads adjustments 0Depreciation adjustments (2)Rebasing of Income 0Technical adjustments (14)Transfers between departments 25Grants 0Other 0TOTAL (244) (10.41)
COMMUNITY AND HOUSING DEPARTMENT Library & Heritage Services
Services are provided through three main town centre libraries, Mitcham, Morden, Wimbledon and four neighbourhood libraries, Donald Hope, Pollards Hill, Raynes Park and West Barnes. Additional services available are home visits and school services. Also available is the Heritage Service located at Morden Library.
APPENDIX 9
Page 266

NB: The financial information included above is the latest available but may change as the budget process develops and more up to date details become available.
FULL TIME EQUIVALENTS 2016/17 2017/18Number of FTE Staff 28.26 4.66Number of FTE PCT TUPE staff 0.00 0.00Total 28.26 4.66
SUBJECTIVE ANALYSIS OF ESTIMATES 2016/17 2017/18Original Other CurrentEstimate Inflation Variations Estimate
£000 £000 £000 £000ExpenditureEmployees 1,412 14 (1,120) 306Premises 166 2 (151) 17Transport 3 0 (3) 0Supplies and Services 352 5 (189) 168Third Party Payments 0 0 891 891Transfer Payments 0 0 0 0Support Services 179 0 (151) 28Depreciation and Impairment Losses 86 0 (86) 0
GROSS EXPENDITURE 2,198 21 (809) 1,410
IncomeGovernment Grants (1,463) 0 89 (1,374)Other Reimbursements and Contributions 0 0 0 0Customer and Client Receipts (803) 0 796 (7)Interest 0 0 0 0Recharges 0 0 0 0Reserves 0 0 0 0
GROSS INCOME (2,266) 0 885 (1,381)
NET EXPENDITURE (68) 21 76 29
Other Variations are analysed as follows:
Major Items £000 fteSavings 0Salaries (1,120) (23.60)Overheads adjustments (151)Depreciation adjustments (86)Rebasing of Income 0Technical adjustments 613Transfers between departments 0Grants 89Customer receipts 796Use of Reserves Adjustment 0TOTAL 141 (23.60)
COMMUNITY AND HOUSING DEPARTMENT Adult Education
Cabinet have approved decision to move the Adult Education model to a Commissioing model. This has become effective as of September 2016. Service Providers are South Thames College and Groundwork London
APPENDIX 9
Page 267

NB: The financial information included above is the latest available but may change as the budget process develops and more up to date details become available.
FULL TIME EQUIVALENTS 2016/17 2017/18Number of FTE Staff 26.82 25.33Number of FTE PCT TUPE staff 0.00 0.00Total 26.82 25.33
SUBJECTIVE ANALYSIS OF ESTIMATES 2016/17 2017/18Original OtherEstimate Inflation Variations Estimate
£000 £000 £000 £000ExpenditureEmployees 1,119 24 (129) 1,014Premises 39 1 (1) 39Transport 28 1 0 29Supplies and Services 219 4 (37) 186Third Party Payments 2,262 22 12 2,296Transfer Payments 249 0 322 571Support Services 292 0 (5) 287Depreciation and Impairment Losses 0 0 0 0
GROSS EXPENDITURE 4,208 51 163 4,422
IncomeGovernment Grants (2,000) 0 2,000 0Other Reimbursements and Contributions (20) 0 (2,000) (2,020)Customer and Client Receipts (178) 0 0 (178)Interest 0 0 0 0Recharges 0 0 0 0Reserves 0 0 0 0
GROSS INCOME (2,198) 0 0 (2,198)
NET EXPENDITURE 2,010 51 163 2,224
Other Variations are analysed as follows:
Major Items £000 fteCurrent Year savings (172) (1.49)Previous years savings 0Growth 0Overheads adjustments (5)Depreciation adjustments 0Rebasing of Income 0Technical adjustments 18Income Adjustment 0Transfers between departments 322Grants 0Other 0TOTAL 163 (1.49)
COMMUNITY AND HOUSING DEPARTMENT Housing
Housing Needs and Enabling Service
APPENDIX 9
Page 268

NB: The financial information included above is the latest available but may change as the budget process develops and more up to date details become available.
FULL TIME EQUIVALENTS 2016/17 2017/18Number of FTE Staff 2.00 2.00
Number of FTE PCT TUPE staff 0.00 0.00
Total 2.00 2.00
SUBJECTIVE ANALYSIS OF ESTIMATES 2016/17 2017/18Original OtherEstimate Inflation Variations Estimate
£000 £000 £000 £000ExpenditureEmployees 224 19 (15) 228Premises 0 0 0 0Transport 0 0 0 0Supplies and Services 137 3 (1) 139Third Party Payments 0 0 0 0Transfer Payments 0 0 0 0Support Services 35 0 3 38Depreciation and Impairment Losses 0 0 0 0
GROSS EXPENDITURE 396 22 (14) 404
IncomeGovernment Grants 0 0 0 0Other Reimbursements and Contributions 0 0 0 0Customer and Client Receipts 0 0 0 0Interest 0 0 0 0Recharges 0 0 0 0Reserves 0 0 0 0
GROSS INCOME 0 0 0 0
NET EXPENDITURE 396 22 (14) 404
Other Variations are analysed as follows:
Major Items £000 fteCurrent Year savings 0Previous years savings 0Growth 0Overheads adjustments 3Depreciation adjustments 0Rebasing of Income 0Technical adjustments (17)Transfers between departments 0Grants 0Other 0TOTAL (14) 0.00
COMMUNITY AND HOUSING DEPARTMENT Adult Social Care
Senior Management - Director & PA Only( W0AA01)
APPENDIX 9
Page 269
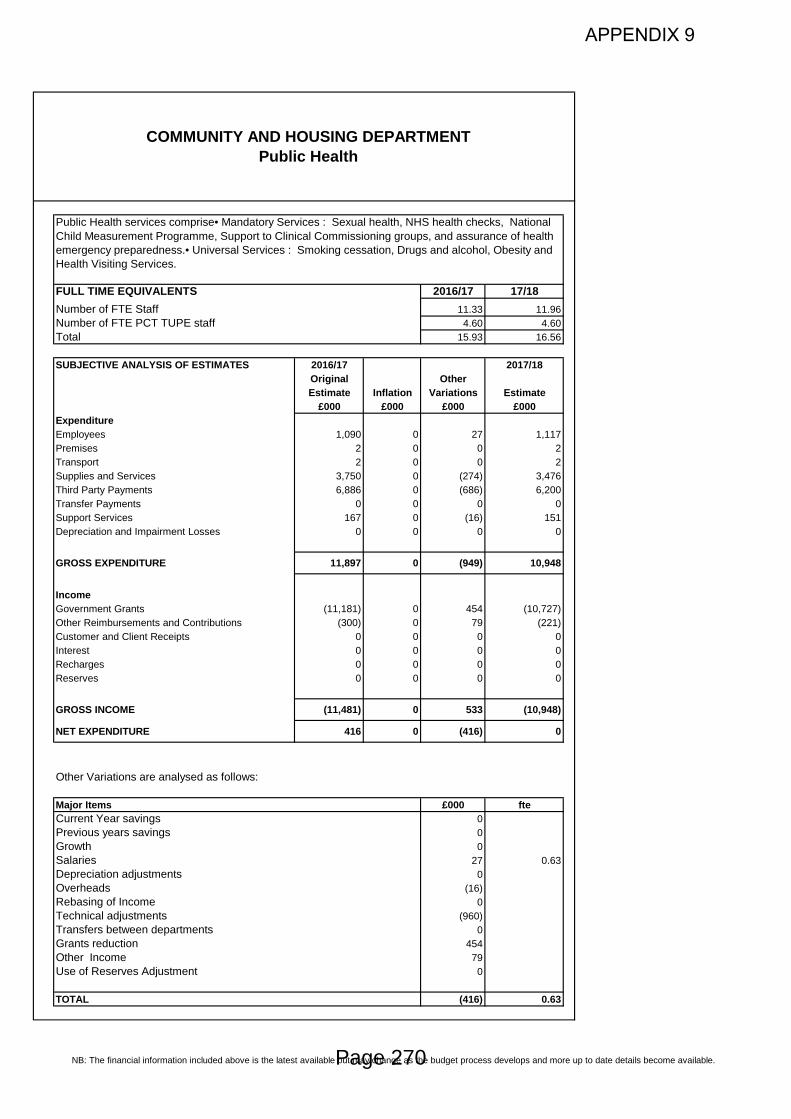
NB: The financial information included above is the latest available but may change as the budget process develops and more up to date details become available.
FULL TIME EQUIVALENTS 2016/17 17/18Number of FTE Staff 11.33 11.96Number of FTE PCT TUPE staff 4.60 4.60Total 15.93 16.56
SUBJECTIVE ANALYSIS OF ESTIMATES 2016/17 2017/18Original OtherEstimate Inflation Variations Estimate
£000 £000 £000 £000ExpenditureEmployees 1,090 0 27 1,117Premises 2 0 0 2Transport 2 0 0 2Supplies and Services 3,750 0 (274) 3,476Third Party Payments 6,886 0 (686) 6,200Transfer Payments 0 0 0 0Support Services 167 0 (16) 151Depreciation and Impairment Losses 0 0 0 0
GROSS EXPENDITURE 11,897 0 (949) 10,948
IncomeGovernment Grants (11,181) 0 454 (10,727)Other Reimbursements and Contributions (300) 0 79 (221)Customer and Client Receipts 0 0 0 0Interest 0 0 0 0Recharges 0 0 0 0Reserves 0 0 0 0
GROSS INCOME (11,481) 0 533 (10,948)
NET EXPENDITURE 416 0 (416) 0
Other Variations are analysed as follows:
Major Items £000 fteCurrent Year savings 0Previous years savings 0Growth 0Salaries 27 0.63Depreciation adjustments 0Overheads (16)Rebasing of Income 0Technical adjustments (960)Transfers between departments 0Grants reduction 454Other Income 79Use of Reserves Adjustment 0
TOTAL (416) 0.63
Public Health services comprise• Mandatory Services : Sexual health, NHS health checks, National Child Measurement Programme, Support to Clinical Commissioning groups, and assurance of health emergency preparedness.• Universal Services : Smoking cessation, Drugs and alcohol, Obesity and Health Visiting Services.
COMMUNITY AND HOUSING DEPARTMENT Public Health
APPENDIX 9
Page 270

Standard Subjective Analysis – The Key
The CIPFA Service Reporting Code of Practice (SeRCOP) replaced the previous Best Value Accounting Code of Practice (BVACOP). SeRCOP applies to all local authority services throughout the United Kingdom from 1 April 2017 for the preparation of 2017/18 Budgets, Performance Indicators and Statements of Accounts.
The Service Reporting Code of Practice (SeRCOP) sets out guidelines for financial reporting, supplementing the principles and practice set out in the Code of Practice on Local Authority Accounting in the United Kingdom. It establishes proper practice with regard to consistent financial reporting below the statement of accounts level. It is prepared under International Financial Reporting Standards (IFRS) in accordance with the Code of Practice on Local Authority Accounting.
The aim is to ensure that there is consistent reporting of service costs and income across different service areas, thus building the framework for the production of comparative performance indicators. The code is revised annually to reflect changing circumstances across local authority services and changes in accounting standards.
The SeRCOP provides guidance in following areas:
• the definition of total cost • service expenditure analysis – this provides service classifications and defines the
mandatory divisions of service to which costs must be aggregated • the recommended standard subjective analysis.
The Recommended Standard Subjective Analysis provides an analysis that is consistent with the subjective analysis required by government returns such as the Whole of Government Accounts.
APPENDIX 9a
Page 271

Subjective Analysis 2016-17 and 2017-18 Final (Source: Cipfa SeRCOP)
Groups Sub-groups
Employees This group includes the cost of employee expenses, both direct and indirect,
to the authority.
Direct employee expenses and benefits Salaries Employer’s National Insurance contributions Employer’s retirement benefit costs: - current service costs - past service costs - settlements Agency staff Employee allowances (not including travel and subsistence)
Indirect employee expenses Relocation Interview Training Advertising Severance payments Employee-related schemes (eg welfare schemes, discount schemes)
Contributions to employee-related provisions
Debits relating from soft loans - employees
Employee expenses and benefits - Schools
Premises-related expenditure This group includes expenses directly related to the running of premises and land.
Repairs, alterations and maintenance of buildings
Energy costs
CRC allowances
Rents
Rates
Water services
Fixtures and fittings
Apportionment of expenses of operational buildings
Cleaning and domestic supplies
Grounds maintenance costs
Premises insurance
Contributions to premises-related provisions
APPENDIX 9a
Page 272

Transport-related expenditure
This group includes all costs associated with the provision, hire or use of transport, including travelling allowances and home to school transport.
Direct transport costs
- Repairs and maintenance, running costs and contributions to provisions in respect of vehicles, for example.
- Repairs and maintenance of (for example) roads are not included in this heading, but should be included in the relevant subjective headings (such as staff costs, supplies and services, etc).
- This could include the write-off in the year of any assets not deemed material by the authority’s capital accounting policies (i.e.below de minimis thresholds set).
Recharges
Contract hire and operating leases
Public transport
Transport insurance
Car allowances
Contributions to transport-related provisions
Supplies and services This group includes all direct supplies and service expenses to the authority.
Equipment, furniture and materials - All items used in the operation or administration of the
service, unless specifically contained in another sub- group (e.g. communications and computing). This could include the write-off in the year of any assets not deemed material by the authority’s capital accounting policies (i.e.below de minimis thresholds set).
Catering
Clothes, uniform and laundry
Printing, stationery and general office expenses
Services
Communications and computing
Members' allowances
Expenses
Grants and subscriptions
Private Finance Initiative and Public Private Partnership schemes
Contributions to provisions
Miscellaneous expenses
APPENDIX 9a
Page 273

Third party payments A third party payment is a payment to an external provider or an internal service delivery unit defined as a trading operation – categories (a) to (d) in paragraph 2.30 of SeRCOP – which is operating independently, in return for the provision of a service or a subdivision of service as defined by Section 3 of SeRCOP.
Independent units within the council; include services defined as category (a) to (d) in paragraph 2.30 of SeRCOP
Joint authorities
Other local authorities
Health authorities
Government departments
Voluntary associations
Other establishments
Private contractors
Other agencies
Transport operators (in respect of concessionary fares)
Debits relating from soft loans - third party payments
Transfer payments This includes the cost of payments to individuals for which no goods or services are received in return by the local authority. Four sub-groups are suggested; however, this list is not exhaustive.
Schoolchildren and students
Adult Social Services clients
Housing benefits
Debits relating from soft loans - transfer payments
Support services Charges for services that support the provision of services to the public. The charges should be apportioned or allocated to the service divisions which they support on the basis of the seven principles of apportionment specified in Section 2 of SeRCOP.
Finance
IT
Human Resources
Property Management/Office Accommodation
Legal Services
Procurement Services
Corporate Services
Transport Functions
Depreciation and impairment losses This provides the subjective analysis that will record the revenue impact of capital items in the service revenue accounts of the authority.
Depreciation
Revaluation losses
Loss on impairment of assets
APPENDIX 9a
Page 274
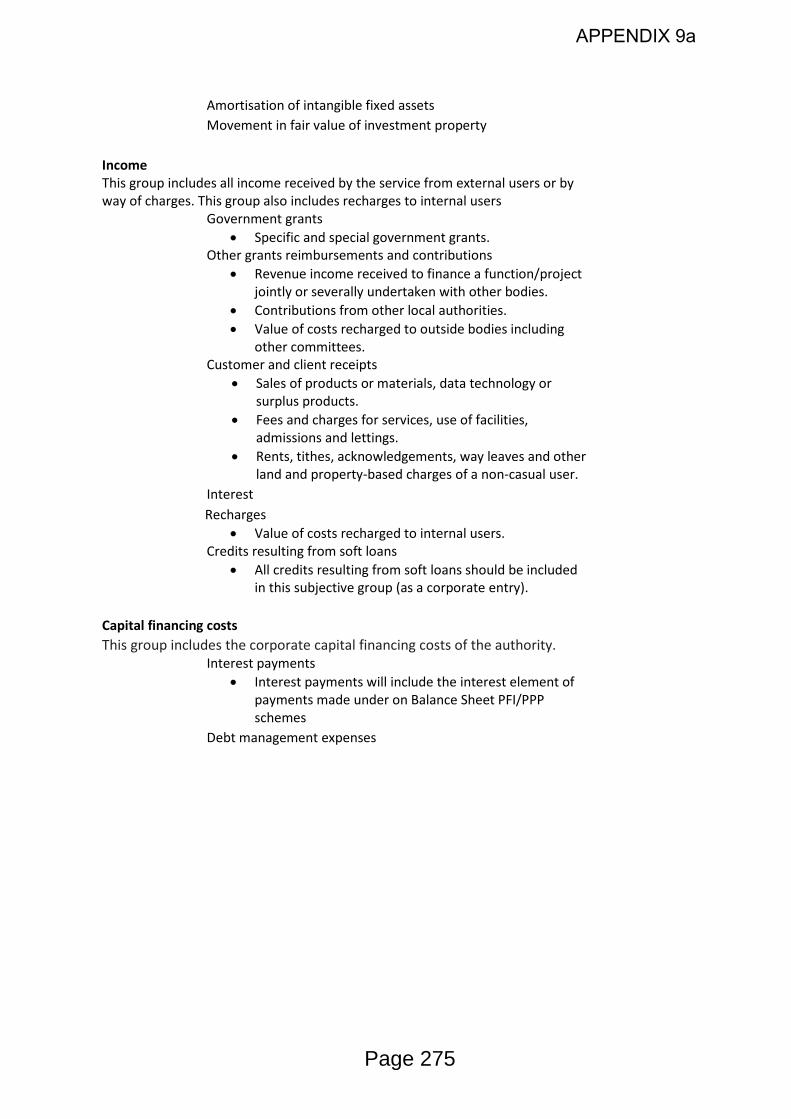
Amortisation of intangible fixed assets
Movement in fair value of investment property
Income This group includes all income received by the service from external users or by
way of charges. This group also includes recharges to internal users
Government grants • Specific and special government grants.
Other grants reimbursements and contributions • Revenue income received to finance a function/project
jointly or severally undertaken with other bodies. • Contributions from other local authorities. • Value of costs recharged to outside bodies including
other committees.
Customer and client receipts • Sales of products or materials, data technology or
surplus products. • Fees and charges for services, use of facilities,
admissions and lettings. • Rents, tithes, acknowledgements, way leaves and other
land and property-based charges of a non-casual user.
Interest
Recharges
• Value of costs recharged to internal users.
Credits resulting from soft loans • All credits resulting from soft loans should be included
in this subjective group (as a corporate entry).
Capital financing costs This group includes the corporate capital financing costs of the authority.
Interest payments • Interest payments will include the interest element of
payments made under on Balance Sheet PFI/PPP schemes
Debt management expenses
APPENDIX 9a
Page 275

Risk Analysis for General Fund
1 The Council’s draft budget for 2017/18, has been analysed to identify key areas of risk. Costs that are regarded as fixed have been disregarded along with Schools’ budgets.
£m Expenditure Employees 81.4 Premises Related Expenditure 7.8 Transport Related Expenditure 11.9 Supplies and Services 34.1 Third Party Payments 99.1 Transfer Payments 103.9 Support Services 28.2 Depreciation and Impairment Costs 22.3 Cost of Borrowing 13.2 Pension Fund 2.8 Contingency 1.5 Corporate Provisions 2.6 Incomes Government Grants 108.7 Other Grants, Reimbursements and Contributions 21.7 Customer and Client Receipts 61.8 Interest 0.1 Recharges 28.8 Reserves 0.5 Asset Rentals: Depreciation & Impairment 22.3 Overall Total 652.7
2. In addition the savings proposals for 2017-21 have been assessed in terms of deliverable risk. The level of deliverable risk is:
Risk Rating
2017/18
£000
2018/19
£000
2019/20
£000
2020/21
£000
Total 2017-21
£000
Low 2,937 1,488 0 0 4,425 Medium 5,581 1,181 501 0 7,263 High 1,440 3,602 767 0 5,809 Total 9,958 6,271 1,268 0 17,497
3. Using the data available the levels of risk for the key areas have been
assessed as shown in the following table:
APPENDIX 10
Page 276

£m Min % Mid % Max % Expenditure Employees 81.4 0.25 0.50 0.75 Premises Related Expenditure 7.8 1.50 2.50 3.50 Transport Related Expenditure 11.9 2.00 3.00 4.00 Supplies and Services 34.1 1.50 2.50 3.50 Third Party Payments 99.1 3.50 5.50 7.50 Transfer Payments 103.9 3.00 4.00 5.00 Incomes Government Grants 108.7 1.00 2.00 3.00 Other Grants, Reimbursements and Contributions 21.7 1.00 2.00 3.00 Customer and Client Receipts 61.8 1.50 2.50 3.50 Savings Low Deliverability Risk 4.4 1.50 Medium Deliverability Risk 7.3 3.00 High Deliverability Risk 5.8 7.50 Safety Net Threshold 2.3 100.00 100.00 100.00
4. Applying the risk levels in the table above produces the following level of
addressed risk:
£m Min £m Mid £m Max £m
Employees exc. DSG 81.4 0.20 0.41 0.61 Premises Related Expenditure 7.8 0.12 0.20 0.27 Transport Related Expenditure 11.9 0.24 0.36 0.48 Supplies and Services exc. DSG 34.1 0.51 0.85 1.19 Third Party Payments 99.1 3.47 5.45 7.43 Transfer Payments 103.9 3.12 4.16 5.20 Incomes Government Grants 108.7 1.09 2.17 3.26 Other Grants, Reimbursements and Contributions 21.7 0.22 0.43 0.65 Customer and Client Receipts 61.8 0.93 1.55 2.16 Savings Low Deliverability Risk 4.4 0.07 Medium Deliverability Risk 7.3 0.22 High Deliverability Risk 5.8 0.44 Safety Net Threshold 2.3 2.30 2.30 2.30 Total 12.27 18.10 23.99
APPENDIX 10
Page 277
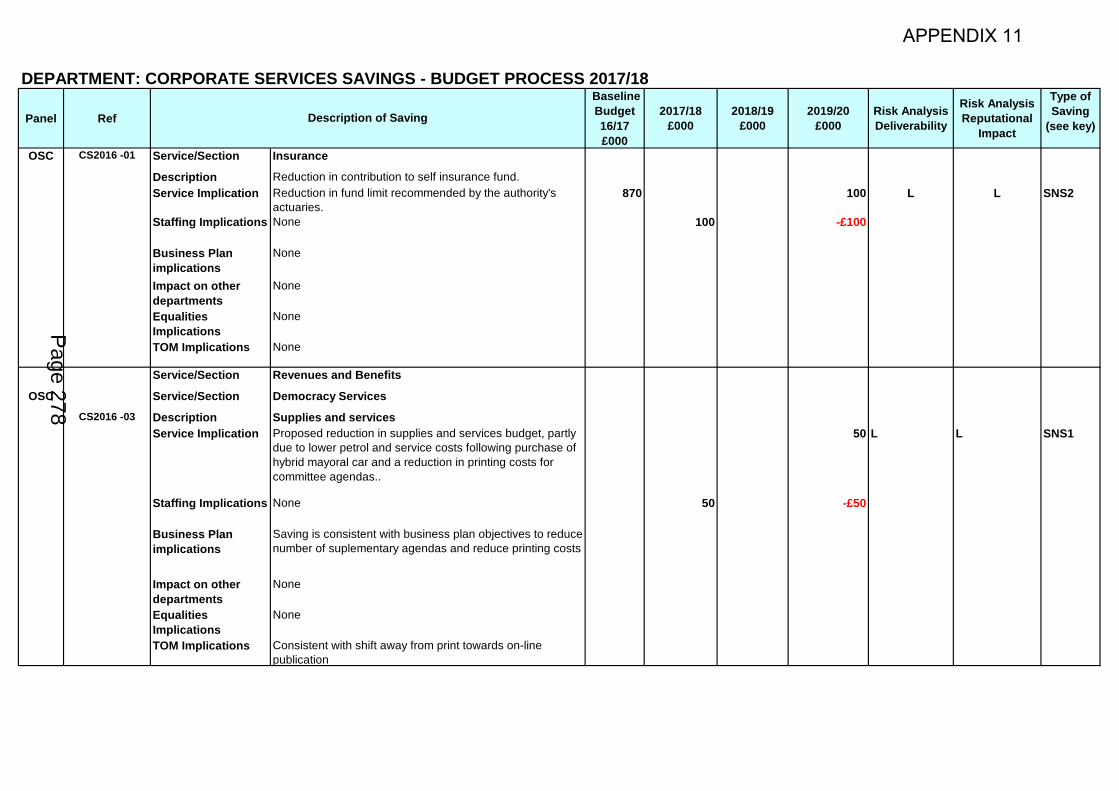
DEPARTMENT: CORPORATE SERVICES SAVINGS - BUDGET PROCESS 2017/18
Panel Ref
Baseline Budget 16/17 £000
2017/18 £000
2018/19 £000
2019/20 £000
Risk Analysis Deliverability
Risk Analysis Reputational
Impact
Type of Saving
(see key)
OSC CS2016 -01 Service/Section Insurance
Description Reduction in contribution to self insurance fund.Service Implication Reduction in fund limit recommended by the authority's
actuaries.870 100 L L SNS2
Staffing Implications None 100 -£100
Business Plan implications
None
Impact on other departments
None
Equalities Implications
None
TOM Implications None
Service/Section Revenues and Benefits
OSC Service/Section Democracy ServicesCS2016 -03 Description Supplies and services
Service Implication Proposed reduction in supplies and services budget, partly due to lower petrol and service costs following purchase of hybrid mayoral car and a reduction in printing costs for committee agendas..
50 L L SNS1
Staffing Implications None 50 -£50
Business Plan implications
Saving is consistent with business plan objectives to reduce number of suplementary agendas and reduce printing costs
Impact on other departments
None
Equalities Implications
None
TOM Implications Consistent with shift away from print towards on-line publication
Description of Saving
APPENDIX 11
Page 278
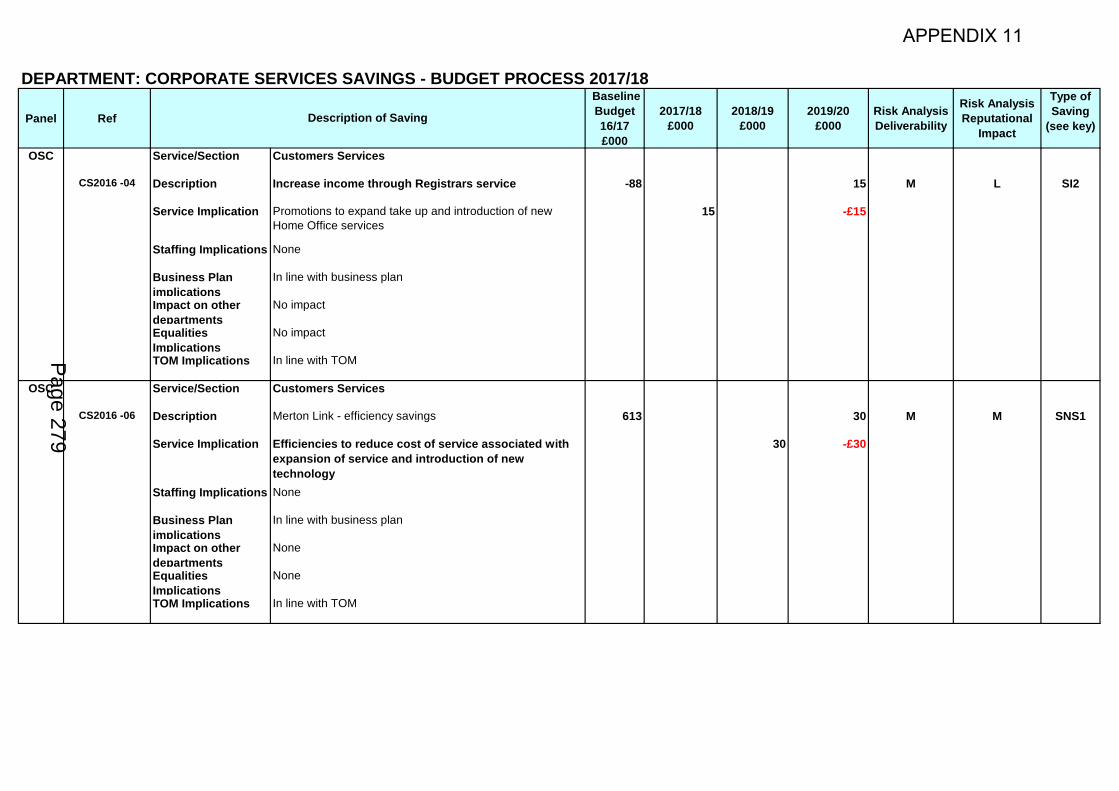
DEPARTMENT: CORPORATE SERVICES SAVINGS - BUDGET PROCESS 2017/18
Panel Ref
Baseline Budget 16/17 £000
2017/18 £000
2018/19 £000
2019/20 £000
Risk Analysis Deliverability
Risk Analysis Reputational
Impact
Type of Saving
(see key)Description of Saving
OSC Service/Section Customers Services
CS2016 -04 Description Increase income through Registrars service -88 15 M L SI2
Service Implication Promotions to expand take up and introduction of new Home Office services
15 -£15
Staffing Implications None
Business Plan implications
In line with business plan
Impact on other departments
No impact
Equalities Implications
No impact
TOM Implications In line with TOM
OSC Service/Section Customers Services
CS2016 -06 Description Merton Link - efficiency savings 613 30 M M SNS1
Service Implication Efficiencies to reduce cost of service associated with expansion of service and introduction of new technology
30 -£30
Staffing Implications None
Business Plan implications
In line with business plan
Impact on other departments
None
Equalities Implications
None
TOM Implications In line with TOM
APPENDIX 11
Page 279

DEPARTMENT: CORPORATE SERVICES SAVINGS - BUDGET PROCESS 2017/18
Panel Ref
Baseline Budget 16/17 £000
2017/18 £000
2018/19 £000
2019/20 £000
Risk Analysis Deliverability
Risk Analysis Reputational
Impact
Type of Saving
(see key)Description of Saving
OSC CS2016 -08 Service/Section Infrastructure & Transactions/Facilities Management 280 M L SI2
Description Potential income derived from letting two floors of vacant office space within the Civic centre to external/partner organisations.
90 -£90
Service Implication None as the arrangements will be supported using existing resources within the restructured FM team
Staffing Implications None.
Business Plan implications
None
Impact on other departments
New arrangements should improve outcomes for residents through a more integrated and efficient approach to the delivery of services that will be bought about through the co-location of health teams with Community & Housing and Children, Schools & Families.
Equalities Implications
None
TOM Implications None as this is an agreed objective within the Corporate Services TOM impementation plan.
255 30 190Savings Type PanelSI1 Income - increase in current level of charges OSCSI2 Income - increase arising from expansion of existing service/new service SS2 Staffing: reduction in costs due to deletion/reduction in serviceSNS1 Non - Staffing: reduction in costs due to efficiencySNS2 Non - Staffing: reduction in costs due to deletion/reduction in serviceSP1 Procurement / Third Party arrangements - efficiency SP2 Procurement / Third Party arrangements - deletion/reduction in serviceSG1 Grants: Existing service funded by new grantSG2 Grants: Improved Efficiency of existing service currently funded by unringfenced grantSPROP Reduction in Property related costs
Total Corporate Services Savings
APPENDIX 11
Page 280

DEPARTMENT: ENVIRONMENT AND REGENERATION SAVINGS - BUDGET PROCESS 2016/17
Panel Ref 2017/18 £000
2018/19 £000
2019/20 £000
Risk Analysis Deliverability
Risk Analysis Reputational
Impact
Type of Saving
(see key)
SC ENR2 Service/Section Parking & CCTV ServicesDescription Pay & Display Bays (On and off street) 44 Low High SI1Service Implication This proposal involves the introduction of a charge for
something that is provided for free at the moment. Currently we make provision for motor cycle and Blue Badge holders to park for free in pay and display bays both on and off street.
44 -44
Staffing Implications None
Business Plan implications
None
Impact on other departments
None
Equalities Implications
This will have a negative implication for persons who are RDP.
TOM Implications Would not be consistent with overall aspiration of improved service to customers.
SC ENR3 Service/Section Parking & CCTV ServicesDescription Increase the cost of existing Town Centre Season Tickets in
Morden, Mitcham and Wimbledon.33 Low Med SI2
Service Implication None 16 17 -33
Staffing Implications Modest implications related to administration and enforcement associated with permits.
Business Plan implications
None
Impact on other departments
None
Equalities Implications
None
TOM Implications Broadly consistent with TOM
Description of Saving
APPENDIX 11
Page 281

DEPARTMENT: ENVIRONMENT AND REGENERATION SAVINGS - BUDGET PROCESS 2016/17
Panel Ref 2017/18 £000
2018/19 £000
2019/20 £000
Risk Analysis Deliverability
Risk Analysis Reputational
Impact
Type of Saving
(see key)Description of Saving
SC ENR5 Service/Section Transport ServicesDescription Delete 1 Senior Management post 76 Med Low SS2Service Implication 76 -76
Staffing Implications reduction of 1 fte
Business Plan implications
None
Impact on other departments
dependant on new clienting structure in 'Public Space, Contracting and commissioning dept'
Equalities Implications
NONE
TOM Implications dependant on outcome of Fleet ReviewSC ENR6 Service/Section Waste Services
Description Wider Department restructure 200 High Low SS2Service Implication Moving from a support function towards a commercialised
commissioning and clienting service across the wider Public Space and Commissioning / Contract management team.
200 -200
Staffing Implications Equivalent of a reduction of c5 -6FTE across a range of grades
Business Plan implications
To be assessed following service changes and mobilisation of Phase C contracts.
Impact on other departments
TBC
Equalities Implications
TBC
TOM Implications Consistent with TOM direction of travel
APPENDIX 11
Page 282
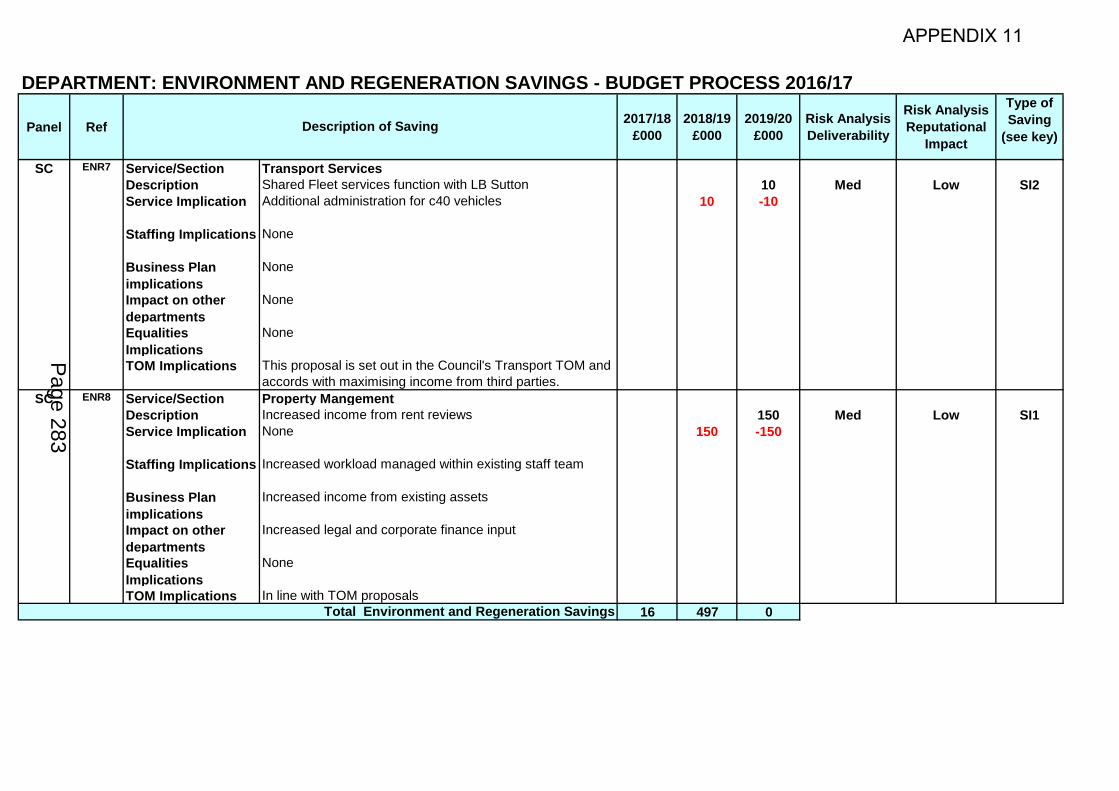
DEPARTMENT: ENVIRONMENT AND REGENERATION SAVINGS - BUDGET PROCESS 2016/17
Panel Ref 2017/18 £000
2018/19 £000
2019/20 £000
Risk Analysis Deliverability
Risk Analysis Reputational
Impact
Type of Saving
(see key)Description of Saving
SC ENR7 Service/Section Transport ServicesDescription Shared Fleet services function with LB Sutton 10 Med Low SI2Service Implication Additional administration for c40 vehicles 10 -10
Staffing Implications None
Business Plan implications
None
Impact on other departments
None
Equalities Implications
None
TOM Implications This proposal is set out in the Council's Transport TOM and accords with maximising income from third parties.
SC ENR8 Service/Section Property MangementDescription Increased income from rent reviews 150 Med Low SI1Service Implication None 150 -150
Staffing Implications Increased workload managed within existing staff team
Business Plan implications
Increased income from existing assets
Impact on other departments
Increased legal and corporate finance input
Equalities Implications
None
TOM Implications In line with TOM proposals16 497 0Total Environment and Regeneration Savings
APPENDIX 11
Page 283

SECTION 3: Schools Funding 2017/18 1. Introduction 1.1 The Government announced the Dedicated Schools Grant allocation on 20th
December 2016. Merton’s allocation split over the three blocks is as follows: Description
2017/18 £000
2016/17 £000
Schools Block 116,421 119,026 Early Years Block 15,061 11,122 High Needs Block 31,632 26,833 Total as at Schools Forum meeting 163,114 156,981 Academy recoupment (18,263) (17,272) Final allocation for the year 144,851 139,709
1.2 A description of the costs included in each funding block is detailed in the
sections below.
2. Schools Block 2.1 The Schools Block allocation of £116.421m is split into the following sub-
groups: Description
2017/18 £000
2016/17 £000
Centrally Retained Items 999 600 September bulge growth requirement 940 1,380 Transfers to other blocks 250 4,183 De-delegated items 1,808 1,717 Central duties to maintained schools (ESG) 489 0 Individual School Budgets 112,307 111,146 One-off funding allocated from reserves not DSG (372) Total Schools Block 116,421 119,026
2.2 The centrally retained items are detailed in the table below. Schools forum
agreed the continuation of each of these items for 2017/18. Description
2017/18 £000
2016/17 £000
School Admissions 266 269 Cost of Schools Forum 12 12 National Copyright Licences 114 112 Prudential borrowing 207 207 Central duties to all schools 400 0 Total Schools Block 999 600
2.3 The September growth requirement was reduced to £940k for 2017/18. The
fund is used to support Primary schools with £60k and Secondary schools with £80k additional funding to expand above their existing published admission number from September.
1 Page 284

2.4 This growth fund was reduced to take account of the underspend for 2016/17 identified through budget monitoring. The funding will be used to increase AWPU and top-up rates to primary, secondary and special schools and academies to support the contribution to statutory central duties Merton and academies have to continue to support following the changes to the ESG.
2.5 Following the re-baselining of the DSG, it is no longer necessary to make
adjustments to the blocks for changes which were agreed for the years up to 2016/17. In order to align the DSG with expected spend for 2017/18 the following transfer is required.
Description
Schools
£000
Early Years £000
High Needs
£000 Increase in out of borough statement/EHCP placements
(250) 250
Net Transfer between blocks (250) 250 2.6 As highlighted in the December budget monitoring report to Schools Forum,
there is a cost pressure from more of Merton’s pupils being placed in out of borough maintained settings. In order to fund this increase we need to move £250k from the schools block to the high needs block.
2.7 Both Primary and Secondary schools de-delegated budgets have been set
based on the decisions made by the relevant phase representatives at Schools Forum on the 13th October 2016. The total de-delegated budget for 2017/18 is £1.808m. The table below details the total allocation to de-delegated services as well as the unit cost for each of these services.
Service
Total £000
2017/18 Unit Cost
2016/17 Unit Cost
Measure
Licences and Subscriptions 115 £5.41 £5.29 NOR School Meals Subsidy 19 £1.21 £1.21 NOR Schools in Challenging Circumstances 294 £13.87 £13.87 NOR Marketing in Schools 29 £1.39 £3.24 NOR Merton Education Partnership 130 £6.14 £6.14 NOR Parenting and TU cover 751 £35.5 £31.17 NOR Refugee Service and EMAG 204 £43.29 £42.01 EAL Tree work 45 £2.13 £2.13 NOR Behaviour Support 191 £33.09 £35.34 Low Att School Improvement 30 £1.43 new NOR Total budget 1,808
(NOR= Number on Roll; EAL factor= English as an Additional Language; Low Att= Lower Attainment factor for low cost, high incidence SEN)
2.8 In order to fund the additional school improvement provision for maintained schools we require £31k for the seven months in 2017/18 and an estimsted £57k for the full year in 2018/19. Schools were not consulted on this change in September 2016 as the details were not available at that stage. Both Primary and Secondary phase representatives agreed for this to be de-delegated at the Schools Forum meeting on the 31st January 2017.
2 Page 285

2.9 In order to maintain the statutory central duties to Merton maintained schools (old ESG funded services), schools are required to make a contribution towards these services based on numbers on roll through the AWPU factor (top-up NOR for special schools). The cost to primary, secondary and special schools will be £23.11 per pupil on roll to provide an overall de-delegated budget of £500k in 2017/18 (£489k for schools block and £11k from high needs block). This is estimated to increase to £38.27 in 2018/19 to provide an overall budget of £828k.
2.10 The total amount to be paid to schools and academies for 2017/18 as part of
the Individual Schools Budget is £112.307m. 2.11 The amount allocated to schools in 2017/18 was increased by a one-off reserve
allocation of £372k. This relates to the 2015/16 DSG underspend and was agreed by schools forum at their meeting on the 16th June 2016.
3. School Funding Formula Factors
3.1 A summary of the factors used and the total budgets allocated against each
factor for all schools is set out in the funding pro-forma which is submitted to the EFA for compliance checks..
3.2 AWPU rates for Primary and Secondary KS3 and KS4 has been uplifted this
year to take account of the additional £1.43 cost to schools for school improvement, £23.11 for the statutory central education function reduction and an additional £28.20 through using the one-off reserves and other movements in the schools block budget. We were able to do this in the anticipation of a higher national funding formula allocation to schools in 2018/19 which should enable us to maintain these rates in future.
Description
2017/18 2016/17
Primary £3,305 £3,253 Secondary Key Stage 3 £4,326 £4,274 Secondary Key Stage 4 £5,229 £5,177
3.3 The Free School Meals factor unit values were kept the same as 2016/17 at
£683.52 for Primary and £632.69 for Secondary schools. Through the formula this resulted in a total budget allocation of £2.368m (£2.399m in 2016/17) and £1.442m (£1.521m in 2016/17) for Primary and Secondary schools respectively.
3.4 The Income Deprivation Affecting Children Index (IDACI) is a subset of the
Indices of Multiple Deprivation (IMD). It is an area-based measure which is interpreted as the proportion of families with children under 16 which is income deprived.
3.5 We have kept the IDACI unit values the same as 2016/17. Through the formula
this resulted in a total budget allocation of £452k (£417k in 2016/17) and £248k (£227k in 2016/17) for Primary and Secondary schools respectively.
3 Page 286
3.6 The unit value for Looked After Children (LAC) has been kept the same as in 2016/17 at £1,000. The total allocation through this formula for 2017/18 is £63k (£72k in 2016/17).
3.7 The English as an Additional Language (EAL) factor unit values were kept the
same as the previous year at £376.5 and £906.6 for Primary and Secondary schools respectively. This resulted in a total budget allocation of £1.774m (£1.758m in 2016/17) and £477k (£454k in 2016/17) for Primary and Secondary schools respectively.
3.8 Due to the change in the Primary school prior attainment factor, the total budget
and unit cost for this factor are adjusted annually. The overall Primary school budget for this factor, which supports Low Cost, High Incidence SEN students, was maintained at £3.862m as there was only a slight reduction in student numbers from last year. The total budget for Secondary schools for 2016/17 is £2.927m (£2.919m for 2016/17). This resulted in unit values of £759.27 (£840.98 in 2016/17) and £1,627.69 (the same as in 2016/17) for Primary and Secondary schools respectively.
3.9 The lump sum factor was kept the same as in 2016/17 at £150k and the split
site factor was also kept at the 2016/17level of £72k.
3.10 The rates factor was decreased by £177k to £1.780m (£1.957m in 2016/17) reflecting the expected cost for 2017/18.
3.11 The minimum funding guarantee floor was set at -1.5% by the DfE. Due to the
overall changes in factors, the requirement for MFG decreased from £478k in 2016/17 to £269k in 2017/18.
3.12 These figures exclude the 6th form funding which still needs to be provided by
the EFA and does not form part of the schools funding formula. It also excludes additional resource provision and individual pupil statement funding which forms part of the high needs block and will be reported on separately.
3.13 The figures in Appendix 1 also exclude the bulge class funding which is held
centrally and will be paid to schools as part of their monthly advances.
3.14 Pupil Premium funding is not included in these figures and estimated figures will be provided separately when schools are informed of their budgets for 2017/18.
4 Page 287

4. Early Years Block 4.1 The Early Years Block allocation is split into the following areas:
Description
2017/18 £000
2016/17 £000
3&4 YO universal funding- maintained schools 6,624 5,726 3&4 YO universal funding - PVIs 3,544 2,722 3&4 YO working parents funding 1,050 0 2 Year Old Offer 1,465 1,607 Centrally Retained Items 895 694 Contingency 1,370 174 Pupil Premium 76 199 Disability Access Fund 37 0 Total Early Years Block 15,061 11,122
4.2 Based on the 2016 calendar year pupil counts, the estimated funding relating to
3 and 4 year old children for Merton maintained schools and PVI settings is expected to be in line with indicative budgets above. However, these are estimated budgets and the figures will be updated every term following the actual pupil counts. The formula used to allocate this funding, following on from consultation, is detailed in section 3.
4.3 The budget for the working parents additional 15 hours support which comes
into effect from September was set using borough wide estimated take-up. Further work is under way to allocate setting level indicative budgets in the summer term.
4.4 Based on the 2016 calendar year pupil counts, the estimated funding relating to
2 year old children for Merton settings is shown above. The formula used to allocate this funding is detailed in section 3.
4.5 The £895k allocation for centrally retained items includes funding for training,
inclusion and SEN support and advisory work, market management/ sufficiency and information, and back office/administrative functions. This represents 7% of the expected 3&4 year old grant as well as £30k of 2 year old grant. LAs are capped at 7% of total budget of 2017/18 and at 5% from April 2018 of their 3&4 year old grant with no limit on the 2 year old grant. The amount of funding that must pass through to providers is called the “High Pass Through Rate”. Schools Forum agreed that these funds can be centrally retained for 2017/18.
4.6 The contingency for 2017/18 has been set at £1.370m. The majority of the
contingency is to account for the difference between the initial grant allocation and Merton’s expected grant allocation which is based on anticipated take-up. The actual grant will be based on 5/12ths of the January 2017 count and 7/12ths of the January 2018 count. The table below sets out both the expected contingency available and the expected grant reduction.
5 Page 288

Contingency
2017/18 £000
Grant reduction- 3&4 YO universal funding 427 Grant reduction- 3&4 YO working parents funding 628 Grant reduction- 2 Year Old Offer 40 Grant reduction- Centrally Retained Items 73 Available contingency 202 Total contingency 1,370
4.7 The EFA will continue to pay Early Years Pupil Premium as a separate funding
stream. This is paid to settings and schools after each term’s headcount at £0.53 pence per hour. Any underspend on EYPP is expected to be clawed back. Total budget is £76k.
4.8 The EFA have added a new further fund outside of the formula called Disability
Access Fund. This is a one off lump sum payment of £615, any underspend is expected to be clawed back. The total budget is £37k.
4.9 Following the re-baselining of the DSG, it is no longer necessary to make
adjustments to the blocks for changes which were agreed for the years up to 2016/17. There are no transfers proposed to or from the Early Years Block for 2017/18.The financial implications are detailed in the main body of this report.
5. Early Years Funding Formula Factors 3 and 4 year old formula
5.1 In line with the new direction of travel Merton has set only one new base rate in the formula for 3 and 4 year olds (universal and extended entitlement) for all setting as per the table below.
Description
2017/18 Rate
£
2016/17 Rate
£ All settings £4.60 Ranged between
£3.68 and £5.40
5.2 Criteria for EYPP will be used as a measure of deprivation for 2017/16. The unit values are shown below. The previous measure was IDACI, which used a suite of bands aligned to a unit cost used in accordance with postcode of where chid lived.
Description
2017/18 Rate
£
2016/17 Rate
£ Criteria for EYPP 70p Ranged between 15p
and 40p (IDACI)
6 Page 289

5.3 The table below shows the optional supplementary supplement for “sparsity” Description
2017/18 Rate
£
2016/17 Rate
£ Sparsity/small providers child-minders 80p N/A
Outside of formula: SEN Inclusion Fund
5.4 The table below shows the new mandatory SEN inclusion Fund pupil rates (3
and 4 year olds) Description
2017/18 Rate
£
2016/17 Rate
£ SEN Inclusion Fund SEN Support Level 1a (local offer) nil nil SEN Support Level 1b £2.50 £2.50 SEN Support Level 1c £5.26 + 1b
(£7.76) £5.26 + 1b
(£7.76)
5.5 SEN funding is allocated in accordance with the agreed process. This ceases when the EHCP is issued and funding is allocated in accordance with the EHCP EY banding through the High Needs Block. EHCP are funded on a pro-rata basis and based on actual hours and number of weeks of attendance. This will ensure SEN funding for children is seamless and on a continuum as they progress through each stage.
Outside of formula: Contingency
5.6 There are several components to the contingency for 3 and 4 year olds:
• A contingency to support any in year growth for SEN support and or deprivation supplements and includes an element for late starters (not on headcount).
• The budget this year has an indicative allocation for the new Extended Entitlement (EE) from September 2017. Our anticipated take-up is much less than the government allocation and as this budget has not been allocated to the sector this will be held within contingency.
• The DFE have allocated indicative budgets based on a specific point in time and based on an estimated number of taking up the Universal Entitlement (UE) as well as the EE. Local estimates indicate that not all places will be taken up as specified by DfE and the estimated grant that will be paid back to the DfE is also held in contingency.
5.7 The contingency is included as part of the high pass through rate and as such will be allocated across the sector in accordance with agreed methodology. See table in paragraph 2.6 for each part of the contingency budget
Outside of formula: Retained Items
5.8 Within the grant allocation LAs can retain up to 7% of the total 3 and 4 year old
allocation for 2017/18 and up to 5% from 2018-19 and onwards.
7 Page 290
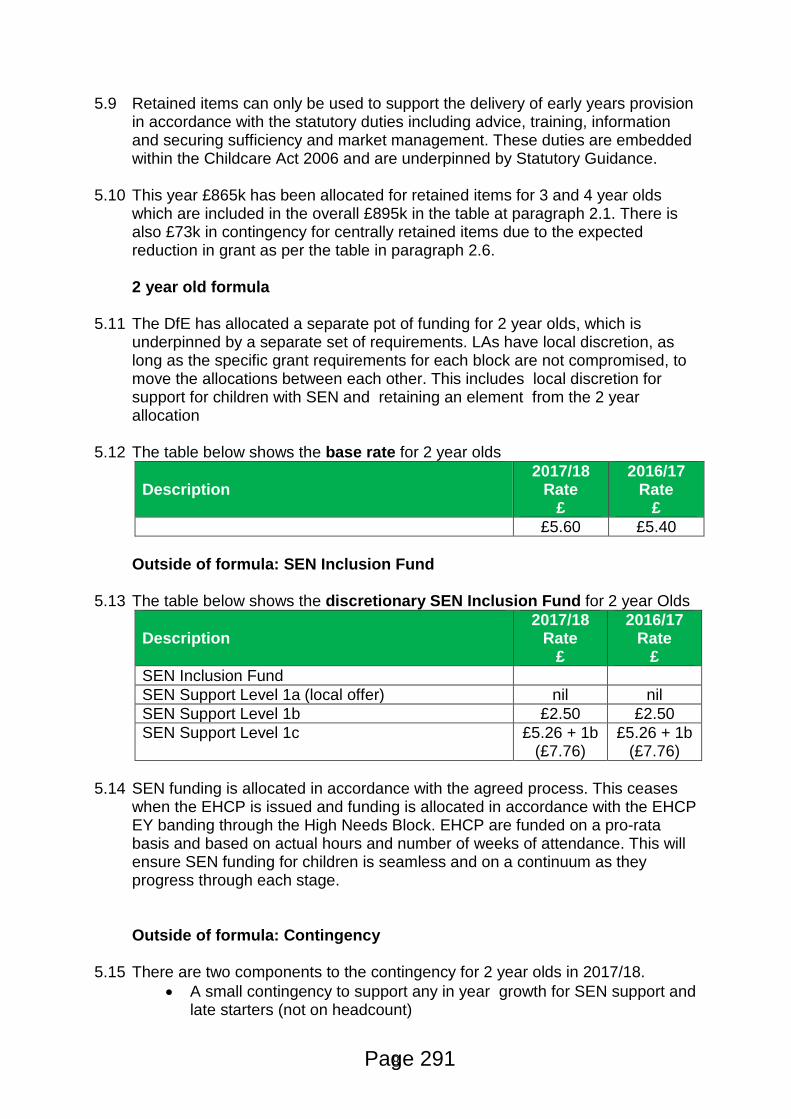
5.9 Retained items can only be used to support the delivery of early years provision in accordance with the statutory duties including advice, training, information and securing sufficiency and market management. These duties are embedded within the Childcare Act 2006 and are underpinned by Statutory Guidance.
5.10 This year £865k has been allocated for retained items for 3 and 4 year olds
which are included in the overall £895k in the table at paragraph 2.1. There is also £73k in contingency for centrally retained items due to the expected reduction in grant as per the table in paragraph 2.6.
2 year old formula
5.11 The DfE has allocated a separate pot of funding for 2 year olds, which is
underpinned by a separate set of requirements. LAs have local discretion, as long as the specific grant requirements for each block are not compromised, to move the allocations between each other. This includes local discretion for support for children with SEN and retaining an element from the 2 year allocation
5.12 The table below shows the base rate for 2 year olds Description
2017/18 Rate
£
2016/17 Rate
£ £5.60 £5.40
Outside of formula: SEN Inclusion Fund
5.13 The table below shows the discretionary SEN Inclusion Fund for 2 year Olds
Description
2017/18 Rate
£
2016/17 Rate
£ SEN Inclusion Fund SEN Support Level 1a (local offer) nil nil SEN Support Level 1b £2.50 £2.50 SEN Support Level 1c £5.26 + 1b
(£7.76) £5.26 + 1b
(£7.76) 5.14 SEN funding is allocated in accordance with the agreed process. This ceases
when the EHCP is issued and funding is allocated in accordance with the EHCP EY banding through the High Needs Block. EHCP are funded on a pro-rata basis and based on actual hours and number of weeks of attendance. This will ensure SEN funding for children is seamless and on a continuum as they progress through each stage.
Outside of formula: Contingency 5.15 There are two components to the contingency for 2 year olds in 2017/18.
• A small contingency to support any in year growth for SEN support and late starters (not on headcount)
8 Page 291

• The DFE have allocated indicative budgets based on a specific point in time and based on an estimated number of taking up the 2 year old places. Local estimates indicate that not all places will be taken up as specified by DfE and the estimated grant that will be paid back to the DfE is also held in contingency.
5.16 The contingency will be allocated across the sector in accordance with agreed
methodology. See table above for each part of the contingency budget
Outside of formula: Retained Items 5.17 There are no specific parameters for retained elements within the 2 year old
formula and historically the retained element has been funded from reserves. This year £30k has been allocated for retained items which are included in the overall £895k in the table at paragraph 2.1. An additional £165k is earmarked from reserves to provide an overall 2 year old retained budget of £195k..
6. High Needs Block
6.1 High Needs Block funding 6.1.1 The high needs funding system is designed to support a continuum of
provision for pupils and students with Special Educational Needs (SEN), learning difficulties and disabilities, from their early years to age 25.
6.1.2 Base funding (“place funding”) is given to local authorities to distribute to institutions for them to provide places on an on-going basis. This is supplemented with “top-up funding” which follows individual pupils and students. The top-up funding provided to local authorities includes funding for central services to support these high cost places.
6.1.3 The table on the next page shows how Merton’s High Needs Block funding is allocated. Description
2017/18 £000
2016/17 £000
Mainstream settings (Individual SEN statements) 3,711 3,666 Special Schools 8,097 7,877 Additional Resource Provision bases 2,542 2,671 Pupil Referral Unit (PRU) 1,788 1,788 Centrally retained High Needs funding for commissioned services
13,636 12,851
Post 16 FE and ISP funding 2,060 2,060 Centrally retained High Needs funding for special schools
37 35
Central duties to maintained schools (ESG) 11 0 Transfers from other blocks (250) (4,115) Total Funding 31,632 26,833
9 Page 292

6.2 Mainstream settings 6.2.1 Schools are expected to contribute the first £6,000 of additional educational
support for High Needs pupils and students. This additional support is for a provision over and above the standard offer of teaching and learning for all pupils or students in a setting. Pre-16, schools and Academies will continue to receive a clearly identified notional SEN budget from which to make this contribution. Merton will provide this budget for maintained schools while the EFA will provide it for Academies. The notional SEN will comprise three elements as detailed below.
Formula factor 2017/18 Age Weighted Pupil Allowance (AWPU) 2.5% Deprivation (Free School Meals & IDACI) 10% Low cost, high incidence SEN (Low Attainment) 100%
6.2.2 The notional SEN budget should be used to support pupils with low cost, high
incidence SEN as well as the first £6,000 support for pupils with statements. 6.2.3 The notional allocation is only a guide and schools are expected to set their
budgets in such a way to meet the needs of all their pupils, including those with additional needs, within the resources they receive.
6.2.4 Where schools have a high number of SEN students, the allocation to support
these pupils through the schools formula might not be sufficient. Funding will be set aside in the High Needs Block to support such schools. If more than 2.5% of a school's NOR are pupils with statements, the excess percentage will be multiplied by the school's NOR and multiplied by £6,000 to calculate additional support for the school. Example 9 pupils as a percentage of 186 4.84% Less 2.5% threshold 2.34% 186 x 2.34% 4.35 pupils 4.35 pupils x £6,000 £26,100
In 2017/18 £267k will be allocated to schools through this mechanism.
6.2.5 The NOR will be based on the October count and the numbers of SEN statements will be based on the numbers as per the October SEN statement payment to schools. The number of statements used will exclude pupils funded in special units.
6.2.6 Merton’s statement funding will remain at the same levels as in 2016/17 and is
detailed in the table below.
10 Page 293

Reception onwards 2, 3 and 4 year olds Band 2017/18 2016/17 2017/18 2016/17 Band1 Part of
£6,000 notional SEN
funding
Part of £6,000
notional SEN funding
Part of SEN support funding
Part of SEN support funding
Band 2 £5,691 £5,691 £5,846 £5,846 Band 3 £7,826 £7,826 £6,913 £6,913 Band 4 £9,961 £9,961 £7,981 £7,981 Band 5 £12,096 £12,096 £9,048 £9,048
6.3 Special Schools 6.3.1 Specialist SEN and LDD schools will continue to receive a base level of
funding on the basis of an agreed number of planned places at £10,000 per place. Top-up funding above this level will be set as the 2016/17 values and uplifted this year to take account of the additional £1.43 cost to schools for school improvement, £23.11 for the statutory central education function reduction.
6.3.2 Due to the increase in pupil numbers at special schools by 8 to 367, the
special school budget will be increased by £220k to cover the cost pressure of supporting these additional children.
6.3.3 The total for specialist SEN and LDD settings includes the school budgets for
Cricket Green, Perseid, and Melrose special schools. 6.4 Additional Resource Provision bases 6.4.1 Places in special units and resourced provision will attract a base level of
funding of £10,000 per place as well as top-up funding. Where the numbers in the base have stayed the same, we have kept the top-up funding at the same rate as 2016/17. Where numbers have increased/decreased, top-up funding has been adjusted to reflect these adjustments. Any additional funding to the base totals will be equal to band 5 (£12,096) of statement funding as agreed by the SEN manager.
6.4.2 Due to the reduction in numbers of children supported in bases, the overall
ARP budget will decrease by £129k to £2.542m in 2017/18. 6.5 Pupil Referral Unit (SMART Centre) 6.5.1 The PRU will receive a base level of funding of £10,000 per place. Top-up
funding above this level is set at £6,504 which has been uplifted this year to take account of the additional £1.43 cost to schools for school improvement, £23.11 for the statutory central education function reduction.
6.5.2 Mainstream schools and Academies have important commissioning
responsibilities with regard to pupils of compulsory school age who are placed in Alternative Provision for the purpose of early intervention or as a result of
11 Page 294

fixed-term exclusion. In such instances, under the new funding arrangements, mainstream schools and Academies will be responsible for paying top-up funding to the AP settings in which they place pupils.
6.5.3 Alternative education and medical service provision are also delivered through
the SMART Centre. 6.5.4 The exclusion process currently involves a deduction of AWPU against a
national criteria and a local agreement to pay £3,000 per excluded pupil and receive £3,000 for a re-integrated pupil. This agreement is between all secondary maintained schools and academies and will continue in 2017/18.
6.6 Centrally retained funding for commissioned services 6.6.1 These services are retained centrally by the Local Authority to deliver direct
services or procure services from external providers to ensure the most economic use of resources. The table below details these services.
Description
2017/18 £000
2016/17 £000
Non-Delegated Statements 9,532 8,921 Cost of Merton pupils in other LA maintained schools
2,313 2,069
Cost to other LAs for their children in Merton maintained schools
(1,159) (1,159)
Sensory Team 392 376 Virtual School 373 361 SSQ Core Offer 359 350 Language and Learning therapy 354 635 Education psychology 266 41 Behaviour Support 235 206 Education welfare 168 163 SEN referral & early help 0-25 team 164 206 Social Inclusion 136 142 Vulnerable Children's Education 123 110 Therapy in Special schools 112 112 Merton Autism Outreach Service (MAOS) 100 100 SEN support 81 56 Portage 37 62 Independent hospital provision 50 50 Education support for Looked After Children 0 50 Total Cost 13,636 12,851
6.6.2 The £686k growth received on the HNB is not sufficient to cover the cost
pressures. For 2017/18 the increase was allocated to the non-delegated statement budgets to address the expected overspend on Independent Day school provision.
12 Page 295
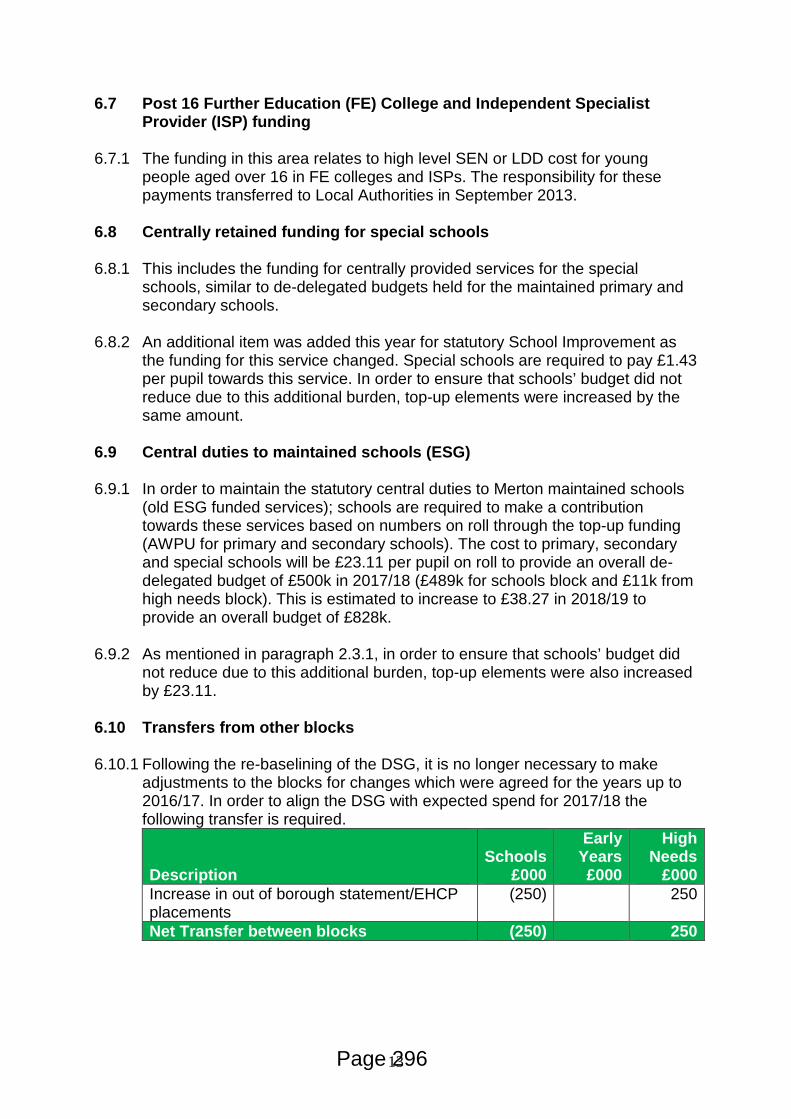
6.7 Post 16 Further Education (FE) College and Independent Specialist Provider (ISP) funding
6.7.1 The funding in this area relates to high level SEN or LDD cost for young
people aged over 16 in FE colleges and ISPs. The responsibility for these payments transferred to Local Authorities in September 2013.
6.8 Centrally retained funding for special schools 6.8.1 This includes the funding for centrally provided services for the special
schools, similar to de-delegated budgets held for the maintained primary and secondary schools.
6.8.2 An additional item was added this year for statutory School Improvement as the funding for this service changed. Special schools are required to pay £1.43 per pupil towards this service. In order to ensure that schools’ budget did not reduce due to this additional burden, top-up elements were increased by the same amount.
6.9 Central duties to maintained schools (ESG) 6.9.1 In order to maintain the statutory central duties to Merton maintained schools
(old ESG funded services); schools are required to make a contribution towards these services based on numbers on roll through the top-up funding (AWPU for primary and secondary schools). The cost to primary, secondary and special schools will be £23.11 per pupil on roll to provide an overall de-delegated budget of £500k in 2017/18 (£489k for schools block and £11k from high needs block). This is estimated to increase to £38.27 in 2018/19 to provide an overall budget of £828k.
6.9.2 As mentioned in paragraph 2.3.1, in order to ensure that schools’ budget did not reduce due to this additional burden, top-up elements were also increased by £23.11.
6.10 Transfers from other blocks 6.10.1 Following the re-baselining of the DSG, it is no longer necessary to make
adjustments to the blocks for changes which were agreed for the years up to 2016/17. In order to align the DSG with expected spend for 2017/18 the following transfer is required. Description
Schools
£000
Early Years £000
High Needs
£000 Increase in out of borough statement/EHCP placements
(250) 250
Net Transfer between blocks (250) 250
13 Page 296

7. Schools general
7.1 On 31 March 2016 Merton held balances for 50 schools to the value of £9.009m. Of the 50 schools, 2 had deficit balances with a total value of £37k. The other 48 schools had balances ranging from £22k to £1.228m.
7.2 For 2016/17, 5 schools submitted deficit balances and the Local Authority is
working closely with these schools to review their progress. We are anticipating that 5 to 6 schools will again request deficit budgets for 2017/18, and we will require deficit recovery plans to accompany these requests.
14 Page 297

SECTION 4: CAPITAL STRATEGY 2017-21 1 Introduction 1.1 Merton’s Capital Strategy for 2017-21 has been aligned and integrated with
the Business Plan for the period 2017-21. The Business Plan sets out how the Authority’s objectives have been shaped by Merton Partnership in the Community Plan. The Community Plan sets out the overall vision and strategic direction of Merton which are embodied into five strategic themes:- • Children’s Trusts; • Health and Wellbeing Board; • Safer and Stronger Communities; • Sustainable Communities and Transport; • Corporate Capacity
1.2 Merton Partnership works towards improving the outcomes for people who
work, live and learn in the borough and, in particular, to ‘bridge the gap’ between the eastern and western wards in the borough.
1.3 The financial reality facing local government dominates the choices the
council will make for the future of the borough. The development of the Business Plan 2017/21 is therefore based on the set of guiding strategic priorities and principles, as adopted by the council on 13 July 2011:
• Merton should continue to provide a certain level of essential services for
residents. The order of priority of ‘must’ services should be: i) Continue to provide everything that is statutory. ii) Maintain services – within limits – to the vulnerable and elderly.
• After meeting these obligations Merton should do all that it can to help residents who aspire. This means we should address the following as priorities in this order: i) Maintain clean streets and keep council tax low. ii) Keep Merton as a good place for young people to go to school and
grow up. iii) Be the best it can for the local environment. iv) All the rest should be open for discussion.
The financial pressures facing Merton mean we should no longer aim to be a ‘place-maker’ but be a ‘place-shaper’. The council should be an enabler, working with partners to provide services.
1.4 Merton’s scrutiny function reflects the five strategic themes above and the themes have been incorporated into the bidding process for capital funding to ensure that scarce financial resources are targeted towards strategic objectives.
Page 298

2 Planning Infrastructure 2.1 Business Plan 2017-2021 2.1.1 The Business Plan sets out the council’s vision and ambitions for
improvement over the next four years and how this will be achieved. Business Planning and financial planning frameworks are closely aligned and integrated.
2.2 Target Operating Models (TOMs) 2.2.1 TOMs, or Target Operating Models are a series of strategy documents that
set out how the organisation will respond to and manage change over the coming months and years. TOMs have been produced for Service Areas or Departments throughout the Council.
2.2.2 A TOM is a statement of how an organisation will deliver its services within a
certain structure as a future point in time, TOMs are living documents and will change as the organisation develops. There are a number of elements to a TOM, for Merton these are – Customer Segments, Channels, Services, Organisation, Processes, Information, Technology, Physical Location and People
2.2.3 Developing a TOM is about planning and preparing for change and
improvement in a given service. Delivering contexts change and opportunities for improvement are always available, so taking the time to prepare/refresh a TOM allows those within a service to consider its many facets and dependencies and determine how these will change over the coming years. Having an ambitious vision for what the future looks like for the service (which is what a TOM provides), ensures that improvement activity will be more disciplined and controlled and therefore more likely to succeed.
2.3 Service Plans 2.3.1 In developing the Capital Strategy, clear linkages have also been identified
with not only the Business Plan, TOMs but also departmental service and commissioning plans beneath this. It reflects the capital investment implications of the approved objectives of those plans, which themselves reflect the council’s proposals set out in service based strategies such as the Primary Places Strategy, Local Implementation Plan (Transport), and Asset Management Plans. Priorities for the Corporate Services department are based around how the council manages its resources effectively and how it carries out its wider community leadership role.
Page 299

2.3.2 This Capital Strategy is a fundamental component of our approach since it
reflects our strategic priorities across the council and endeavours to maximise the contribution of the council’s limited capital resources to achieving our vision. We will work closely with residents, community organisations and businesses to focus our resources and those of our partners effectively. The strategy also sets out the management arrangements for allocating resources to individual schemes, establishing funding for projects, monitoring progress, managing performance and ensuring that scarce capital resources are allocated efficiently.
3 Accounting Definitions and Practices 3.1 The council’s approach to Capital Accounting follows the Code of Practice on
Local Authority Accounting, which itself is based on the International Financial Reporting Standards (IFRS) and guidance issued by CIPFA and professional accounting networks.
3.2 As in previous years, there has been continual review of the Capital Programme to ensure that expenditure meets the strict definition and to identify any items which would be more appropriate to be charged to revenue. This has not resulted in any major changes to the future programme.
3.3 The de-minimis of capital expenditure for the authority is set at £10,000 per project. This applies to all schemes within our capital programme, however in exceptional circumstances thresholds below this may be considered where specific items of expenditure are below this de-minimis level but meet proper accounting definitions of capital expenditure.
3.4 Individual schools may choose to adopt the above de-minimis limit or use the limit of £2,000 as mentioned in some Department for Education and HMRC guidance for various types of school.
4 Corporate and strategic capital expenditure appraisal planning and
control
4.1 Capital Programme Board
4.1.1 Merton’s Capital Strategy is coordinated by the Capital Programme Board. The board, which is effectively a sub-group of the Corporate Management Team (CMT). The composition of the Board and it’s Terms of Reference were reviewed in 2015/16. The revisions are designed to make the board more strategic and improve communication flows throughout the organisation. The Board now comprises the Directors of Corporate and Environment and Regeneration Services with selected Level 2 managers from each service department.
Page 300

4.1.2 The Terms of Reference of the Board are:
o Lead on the development and maintenance of the capital investment
strategy and ensure it is consistent with the Council’s strategic objectives, TOMs and service plans.
o Ensure that the capital investment strategy informs and is informed by
the asset management plan.
o Ensure there is a transparent and clearly communicated process for allocation of capital funds with clear and well documented criteria and decision making process.
o Monitor progress of capital funded schemes and any other critical
schemes as determined by CMT. Receive joint reports from Finance/departmental staff on progress against deliverables, milestones and budget forecasts.
o In conjunction with other governing bodies, consider/approve business
cases that involve capital investment.
o Monitor issues arising as a result of changes in accounting treatment of capital expenditure and ensure the organisation responds accordingly.
o Assess capital schemes in the context of the Medium Term Financial
Strategy to ensure they are affordable in revenue terms.
o Receive reports from the Property Management and Review Manager relating to capital funds coming from the disposal of property, in collaboration with the Property and Asset Management Board.
o Receive benefits reports from Programme/Project Managers when
capital projects/programmes are closed. Monitor key benefits to ensure they are realised for large capital schemes.
4.1.3 The role of the Board is to:
o Set framework and guidelines for capital bids;
o Draft the capital programme for consideration by CMT and Cabinet;
o Review capital bids and prioritise in accordance with the Council’s strategic objectives;
o Identify and allocate capital funds;
o Monitor progress of capital programmes/projects and key variances between plans and performance;
Page 301

o Monitor budgets of capital programmes/projects against forecasts;
o Monitor benefits and ensure they are realised. Monitor capital receipts
o Develop and share good practice
4.1.4 The Board will be accountable to the Corporate Management Team who will receive reports and escalated matters from the Board on a regular basis. CMT will set the strategy and direction, the Capital Programme Board will operationalise this and escalate concerns and ideas. The Board will refer to, and take advice from, the Procurement Board on any proposals and/or decisions that have a procurement dimension. The Board will work closely with the Property and Asset Management Board on any property/asset related proposals.
4.1.5 The Board will make agendas and minutes available to the other Governance
Boards within 5 working days of the meeting. 4.1.6 During the budget process the Director of Corporate Services recommends to
cabinet an initial view as to how the Capital Programme should be funded. However, this recommendation will be informed by the Capital Programme Board’s consideration of the capital receipts available and the forecast of future property disposals and the final funding during the closure of accounts will depend on the precise financial position. At this stage it is intended to utilise internal borrowing, capital grant, direct revenue financing, capital receipts and earmarked reserves. Any capital loans given out by the authority, dependent on the size, will be funded from capital receipts as the repayments will be received as capital receipts. It will be reported to Members as and when it is proposed to use external borrowing.
4.1.7 The council has had a robust policy for many years of reviewing its property holding and disposing of surplus property, detailed in the Asset Management Plan (AMP) which also includes policy and procedures for land and property acquisition. All capital receipts are pooled, unless earmarked by cabinet, and are used either to finance further capital investment or for the payment of premiums on repayment of higher interest loans.
4.2 Capital Programme Approval and Amendment
4.2.1 The Capital Programme is approved by Council each year. Any change which substantially alters the programme (and therefore the Prudential Indicators) requires full council approval. Rules for changes to the Capital Programme are detailed in the Council’s Constitution Financial Regulations and Financial Procedures and the key points are summarised here.
Page 302

4.2.2 For virements which do not substantially alter the programme the below approval limits apply:
• Virements up to £5k can be signed off by the budget manager, the Chief Financial Officer (CFO) is informed of these changes as part of the monthly financial monitoring
• Virements £5k up to £100k must be approved by the Chief Officer of the area or areas affected along with the Chief Financial Officer, typically this will be as part of the monthly financial monitoring report to CMT however approval can be sought from these officers at any time if necessary
• Virements £100k and upwards go to Cabinet • Any virement which diverts resources from a scheme not started, resulting
in a delay to that scheme, will be reported to Cabinet (Please note virement rules are cumulative i.e. two virements of £5,000 from one code; the latter would require the approval of Chief Officers)
4.2.3 For increases to the programme for existing schemes up to £100,000 must be approved by the Director of Corporate Services. Increases above this threshold must be approved by Cabinet. In accordance with the Prudential Code if the increase in the Capital Programme will substantially change prudential indicators it must be approved by Council.
4.2.4 For new schemes, the source of funding and any other financial or non-
financial impacts must be reported and the limits below apply: • Budgets of up to £50k can be approved by the Chief Financial Officer in
consultation with the relevant Chief Officer • Budgets of £50k up £500k will be submitted to Cabinet for approval • Budgets over £500k will be submitted to full Council for approval Approval thresholds are being reviewed as part of the review of processes for the implementation of the new Financial Information System.
4.3 Capital Monitoring 4.3.1 The Council approves the four year Capital Programme in March each
financial year. Amendments to the programme are approved appropriately by CMT, Cabinet and Council. Budget managers are required to monitor their budget monthly, key reviews are undertaken in September and November. December monitoring provides the final opportunity for budget managers to re-profile their budgets for the current financial year.
4.3.2 November monitoring information feeds into the Authority’s Medium Term Financial Strategy (MTFS) and is used to access the revenue impact over the period of the strategy with minor amendments in the later months. November monitoring is also used to measure the accuracy of year end projections.
Page 303

4.3.3 Councillors receive regular monitoring reports on the overall position of capital expenditure in relation to the budget. They also receive separate progress reports on key spend areas.
4.4 Risk Management
4.4.1 The management of risk is strategically driven by the Corporate Risk
Management group. The group collates on a quarterly basis the headline departmental risks and planned mitigation activity from each department, project and partnership. From this information a Key Strategic Risk Register is compiled and presented to CMT quarterly for discussion as part of the financial monitoring report. The Authority’s Risk Management Strategy is reviewed and updated annually and presented to CMT, cabinet and Council.
5 Revenue budget implications of capital investment 5.1 Revenue cost or savings
5.1.1 The capital strategy recognises that the prudential framework provides the
council with flexibility, subject to the constraints of the council’s revenue budget. This flexible ability to borrow, either from internal cash resources or by external borrowing, coupled with the revised treatment of finance leases with effect from 1 April 2010, means that prudential borrowing is used for the acquisition of equipment, where it is prudent, affordable and sustainable. In 2012/13, 2013/14, 2014/15, 2015/16 and 2016/17, it was possible to borrow from internal cash resources rather than external borrowing and it is forecast that this will continue to be the case alongside the use of capital receipts within the current planning period (up to 2020/21). This will be kept under review as part of general Treasury Management.
5.1.2 The revenue effects of the capital programme are from capital financing
charges and from additional revenue costs such as annual maintenance charges. The capital financing charges are made up of interest payable on loans to finance the expenditure and of principal repayments on those loans. The principal repayments commence in the year after the expenditure is incurred and are calculated by the application of the statutory Minimum Revenue Provision. The interest commences immediately the expenditure is incurred. The revenue effects of the capital programme are fully taken account of in the MTFS, with appropriate adjustments for slippage, timing of capital payments and the use of internal investment funds.
Page 304

The revenue effects of the capital programme are built into the MTFS and are summarised below:
2017/18 £000
2018/19 £000
2019/20 £000
2020/21 £000
MRP 6,713 5,537 6,751 7,113 Interest 6,702 6,321 6,321 6,321 Capital financing costs 13,415 11,858 13,072 13,434 Investment Income (1,186) (941) (782) (517) Net 12,229 10,917 12,290 12,917
6 Capital resources 2017-21
6.1 Variety of sources 6.1.1 Capital expenditure is funded from a variety of sources:-
• Grants which are not ring-fenced to be spent on a specific project or service
• Specific grants - earmarked for a specific project or purpose • Capital receipts from the disposal of surplus and under-utilised land and
property • Other contributions such as Section 106/CIL • Council Funding – through revenue funding, use of reserves or borrowing.
6.2 Annual Minimum Revenue Provision (MRP) Statement 6.2.1 Under guidance from the Department for Communities and Local
Government, authorities are required to prepare an annual statement on their policy on making MRP. This mirrors the existing requirements to report to the council on the Prudential borrowing limit and investment policy.
6.2.2 The statement is set out in the Treasury Management Strategy. This
approach is under active review.
7 Asset management review 7.1 Capital receipts 7.1.1 Capital receipts generated from the disposal of surplus and under-utilised land
and property are a major source of funding and the potential available capital resources are under constant review and revision. The forecast of capital receipts included in this report are based on a multi-year forecast of planned land and property disposals. In addition, after the transfer of the housing stock to Merton Priory Homes, the council continues to receive a share of the receipts from Right to Buy applications and through future sharing arrangements, receipts from the sales of void properties, sales of development land and VAT saving on expenditure on stock enhancements.
Page 305

7.2 Property as a corporate resource 7.2.1 The council treats its property as a corporate resource, oriented towards
achieving its overall goals, underpinned by:
• Clear links to financial plans and budgets. • Effective arrangements for cross-service working. • Champions at senior officer and member level. • Significant scrutiny by councilors.
7.2.2 It ensures that its properties are fit for purpose by making proper provision and action for maintenance and repair. The organisation makes investment and disposal decisions based on thorough option appraisal. The capital programme gives priority to potential capital projects based on a formal objective approval process.
7.2.3 Whole life project costing was used at the design stage for significant projects where appropriate, incorporating future periodic capital replacement costs, projected maintenance and decommissioning costs.
7.2.4 Whole life costing of significant projects, which span more than one year, also forms part of the regular monitoring reports.
7.2.5 The Asset Management Plan is being reviewed and will include greater emphasis on the use of the Council’s property assets to support the Council’s Transformation Programme, regeneration and increased income/revenue generation.
7.2.6 A new IT system for asset accounting has been brought into use and the possibility of this system being used for more widespread asset management will be explored.
8 Summary of estimated disposals 2017-2021 8.1.1 New guidance has been issued from the DCLG on the flexible use of
capital receipts which comes into effect from 1 April 2016 to 31 March 2019. This gives local authorities flexibility to spend capital receipts (excluding Right to Buy receipts) from planned new asset sales on the revenue costs of reform projects, subject to the condition that the projects generate on going revenue savings e.g. transforming service delivery to reduce costs or to improve the quality of service delivery in future years. Below is a plan of activities to which the new treatment of capital receipts could be applied: • Sharing back-office and administrative services with one or more other
council or public sector bodies; • Investment in service reform feasibility work, e.g. setting up pilot schemes; • Collaboration between local authorities and central government
departments to free up land for economic use; • Funding the cost of service reconfiguration, restructuring or
rationalisation (staff or non- staff), where this leads to ongoing efficiency savings or service transformation;
• Sharing Chief-Executives, management teams or staffing structures;
Page 306
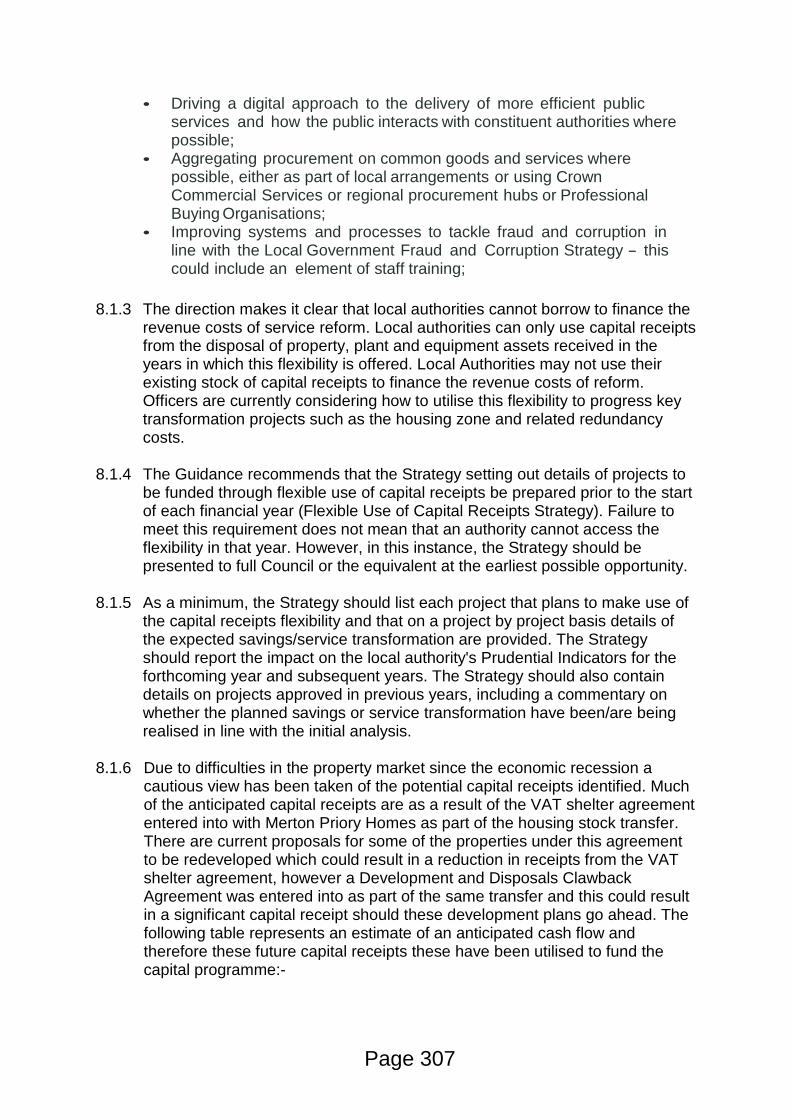
• Driving a digital approach to the delivery of more efficient public services and how the public interacts with constituent authorities where possible;
• Aggregating procurement on common goods and services where possible, either as part of local arrangements or using Crown Commercial Services or regional procurement hubs or Professional Buying Organisations;
• Improving systems and processes to tackle fraud and corruption in line with the Local Government Fraud and Corruption Strategy - this could include an element of staff training;
8.1.3 The direction makes it clear that local authorities cannot borrow to finance the revenue costs of service reform. Local authorities can only use capital receipts from the disposal of property, plant and equipment assets received in the years in which this flexibility is offered. Local Authorities may not use their existing stock of capital receipts to finance the revenue costs of reform. Officers are currently considering how to utilise this flexibility to progress key transformation projects such as the housing zone and related redundancy costs.
8.1.4 The Guidance recommends that the Strategy setting out details of projects to
be funded through flexible use of capital receipts be prepared prior to the start of each financial year (Flexible Use of Capital Receipts Strategy). Failure to meet this requirement does not mean that an authority cannot access the flexibility in that year. However, in this instance, the Strategy should be presented to full Council or the equivalent at the earliest possible opportunity.
8.1.5 As a minimum, the Strategy should list each project that plans to make use of
the capital receipts flexibility and that on a project by project basis details of the expected savings/service transformation are provided. The Strategy should report the impact on the local authority's Prudential Indicators for the forthcoming year and subsequent years. The Strategy should also contain details on projects approved in previous years, including a commentary on whether the planned savings or service transformation have been/are being realised in line with the initial analysis.
8.1.6 Due to difficulties in the property market since the economic recession a
cautious view has been taken of the potential capital receipts identified. Much of the anticipated capital receipts are as a result of the VAT shelter agreement entered into with Merton Priory Homes as part of the housing stock transfer. There are current proposals for some of the properties under this agreement to be redeveloped which could result in a reduction in receipts from the VAT shelter agreement, however a Development and Disposals Clawback Agreement was entered into as part of the same transfer and this could result in a significant capital receipt should these development plans go ahead. The following table represents an estimate of an anticipated cash flow and therefore these future capital receipts these have been utilised to fund the capital programme:-
Page 307
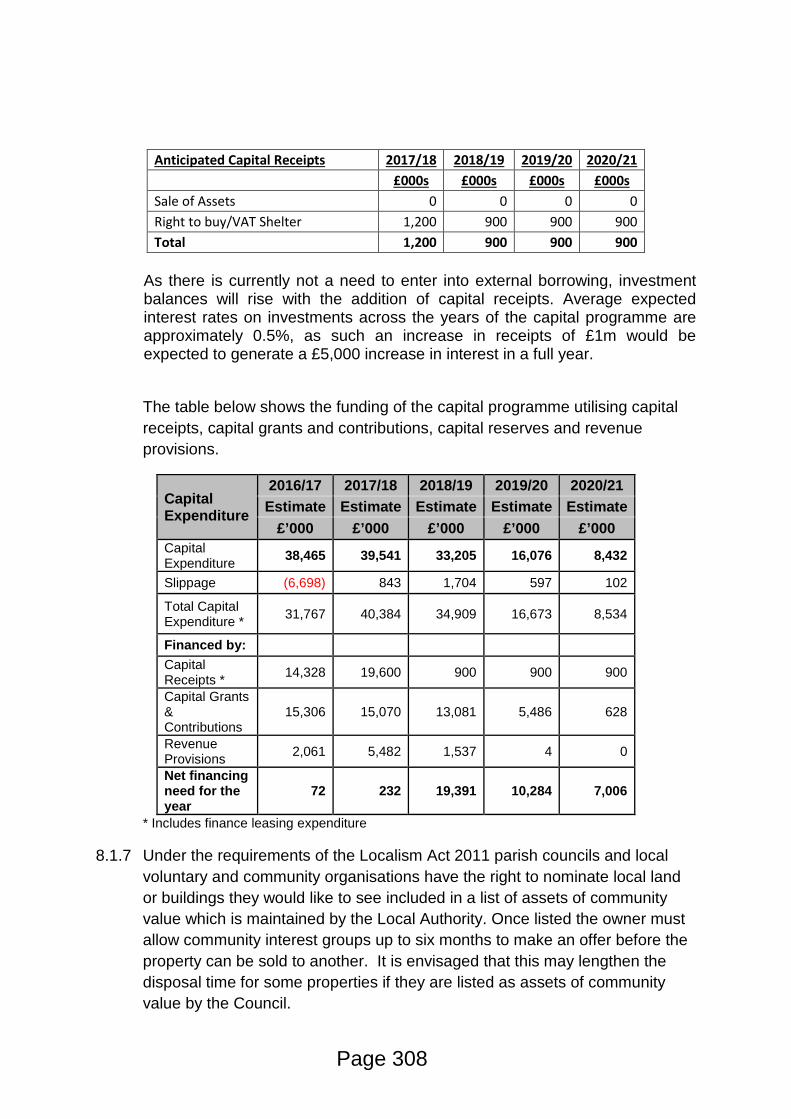
Anticipated Capital Receipts 2017/18 2018/19 2019/20 2020/21 £000s £000s £000s £000s Sale of Assets 0 0 0 0 Right to buy/VAT Shelter 1,200 900 900 900 Total 1,200 900 900 900
As there is currently not a need to enter into external borrowing, investment balances will rise with the addition of capital receipts. Average expected interest rates on investments across the years of the capital programme are approximately 0.5%, as such an increase in receipts of £1m would be expected to generate a £5,000 increase in interest in a full year.
The table below shows the funding of the capital programme utilising capital receipts, capital grants and contributions, capital reserves and revenue provisions.
Capital Expenditure
2016/17 2017/18 2018/19 2019/20 2020/21 Estimate Estimate Estimate Estimate Estimate
£’000 £’000 £’000 £’000 £’000 Capital Expenditure 38,465 39,541 33,205 16,076 8,432
Slippage (6,698) 843 1,704 597 102
Total Capital Expenditure * 31,767 40,384 34,909 16,673 8,534
Financed by: Capital Receipts * 14,328 19,600 900 900 900
Capital Grants & Contributions
15,306 15,070 13,081 5,486 628
Revenue Provisions 2,061 5,482 1,537 4 0
Net financing need for the year
72 232 19,391 10,284 7,006
* Includes finance leasing expenditure
8.1.7 Under the requirements of the Localism Act 2011 parish councils and local voluntary and community organisations have the right to nominate local land or buildings they would like to see included in a list of assets of community value which is maintained by the Local Authority. Once listed the owner must allow community interest groups up to six months to make an offer before the property can be sold to another. It is envisaged that this may lengthen the disposal time for some properties if they are listed as assets of community value by the Council.
Page 308

8.2 Debt repayment
8.2.1 The council has had a strategy to reduce its level of debt when opportunity arises in the market. The average interest payable on outstanding debt is 5.72%. For the period 2017-21, capital receipts may continue to be used to pay the premiums on the repayment of those authority debts which have high fixed interest charges, if the terms offered will result in appropriate revenue savings. Any decision to repay debt early will be considered alongside the funding however, this is unlikely to be the case in the short to medium term requirement of the programme.
9 Grant Funding Capital Resources 9.1 Environmental and Regeneration
2017/18 2018/19 2019/20 2020/21
£000s £000s £000s £000s Transport for London LIP (earmarked) Capital 2,765 *3,865 TBA TBA
Total: E&R 2,755 2,765 TBA TBA
* Indicative and likely to reduce TBA – To Be Advised
9.2 Children, Schools and Families
CSF 2017/18 2018/19 2019/20 2020/21
£000s £000s £000s £000s School Condition (non-ringfenced)* 1,800 TBA TBA TBA Basic Need (non-ringfenced) 6,063 7,471 TBA TBA Total Grant Funding 7,863 7,471 TBA TBA New School (Expected Ringfenced)* 4,850 0 0 0 Devolved Formula Capital (Earmarked) TBA TBA TBA TBA
TOTAL: CS&F 12,713 7,471 TBA TBA Balance added for outstanding grant allocations - CSF 0 529 5,000 650
* Based on Indicative Information TBA – To Be Advised
Page 309

9.3 Community and Housing
2017/18 2018/19 2019/20 2020/21 £0 £0 £0 £0 Better Care Fund – Minimum Allocation for Disabled Facilities Grant)
TBA TBA TBA TBA
9.4 Summary of Grant Funding 2017-2021 9.4.1 The new resources notified to date are summarised in the following table. It is
expected that there will be additional earmarked resources notified during the financial year 2016/17:-
Grant Funding 2017/18 2018/19 2019/20 2020/21
£000s £000s £000s £000s Environment and Regeneration 2,765 3,865 TBA TBA Children, Schools and Families 12,713 7,471 TBA TBA Community and Housing TBA TBA TBA TBA Total Grant Funding* 15,478 11,336 0 0 Balance added for outstanding grant allocations - CSF 0 529 5,000 650
* This shows the grant funding being received by the authority 10 Summary of Total Resources 2017-21:
10.1 Summary 10.1.1 The total anticipated resources over the plan period 2017-21, including
existing grant funding and anticipated CS&F grants, is summarised in the following table:-
2017/18 2018/19 2019/20 2020/21
£000s £000s £000s £000s
Grant & Contributions * 15,070 13,081 5,486 628 Council Funding 25,313 21,827 11,188 7,906 Total 40,384 34,909 16,673 8,534
* This table shows the grants and contributions applied to fund the programme allowing for slippage.
10.1.2 Projects for which earmarked resources have been notified have been given authority to proceed, subject to a detailed specification and programme of works being agreed which ensures that the maximum benefits accrue to the council within the overall constraints of the approved funding. Those schemes, on their own, represent a considerable capital investment.
Page 310
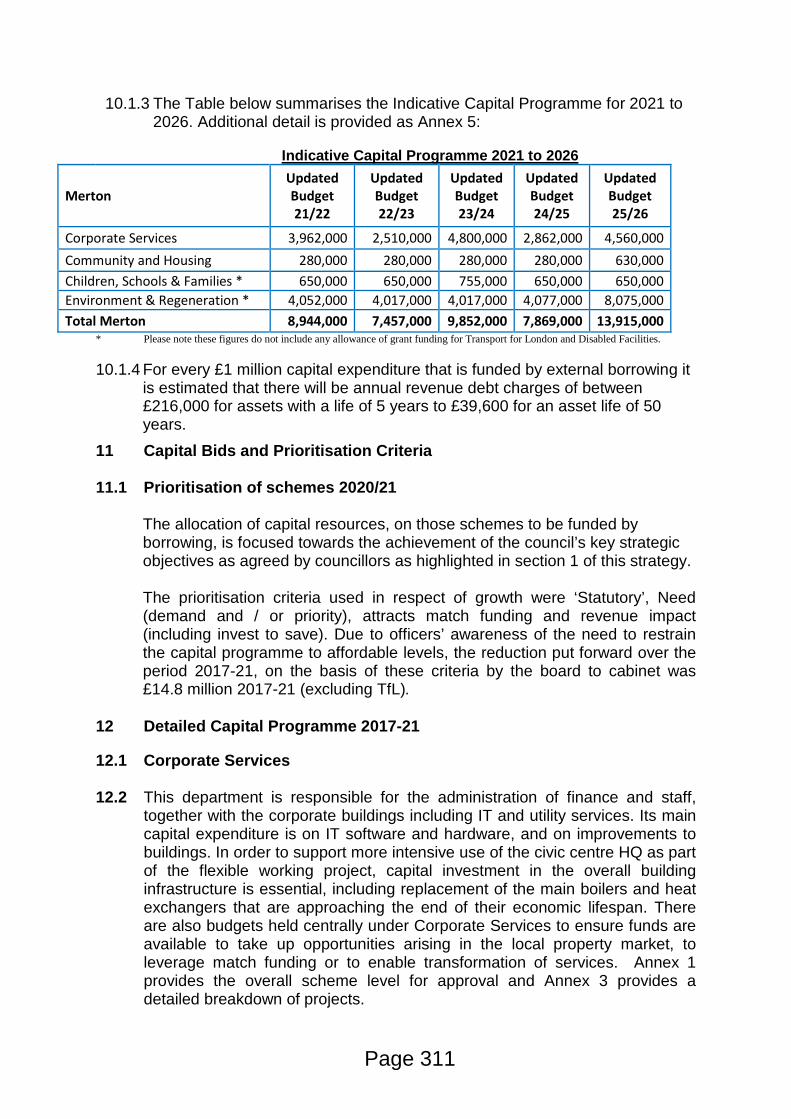
10.1.3 The Table below summarises the Indicative Capital Programme for 2021 to 2026. Additional detail is provided as Annex 5:
Indicative Capital Programme 2021 to 2026
Merton Updated Budget 21/22
Updated Budget 22/23
Updated Budget 23/24
Updated Budget 24/25
Updated Budget 25/26
Corporate Services 3,962,000 2,510,000 4,800,000 2,862,000 4,560,000 Community and Housing 280,000 280,000 280,000 280,000 630,000 Children, Schools & Families * 650,000 650,000 755,000 650,000 650,000 Environment & Regeneration * 4,052,000 4,017,000 4,017,000 4,077,000 8,075,000 Total Merton 8,944,000 7,457,000 9,852,000 7,869,000 13,915,000
* Please note these figures do not include any allowance of grant funding for Transport for London and Disabled Facilities.
10.1.4 For every £1 million capital expenditure that is funded by external borrowing it is estimated that there will be annual revenue debt charges of between £216,000 for assets with a life of 5 years to £39,600 for an asset life of 50 years.
11 Capital Bids and Prioritisation Criteria 11.1 Prioritisation of schemes 2020/21
The allocation of capital resources, on those schemes to be funded by borrowing, is focused towards the achievement of the council’s key strategic objectives as agreed by councillors as highlighted in section 1 of this strategy. The prioritisation criteria used in respect of growth were ‘Statutory’, Need (demand and / or priority), attracts match funding and revenue impact (including invest to save). Due to officers’ awareness of the need to restrain the capital programme to affordable levels, the reduction put forward over the period 2017-21, on the basis of these criteria by the board to cabinet was £14.8 million 2017-21 (excluding TfL).
12 Detailed Capital Programme 2017-21
12.1 Corporate Services 12.2 This department is responsible for the administration of finance and staff,
together with the corporate buildings including IT and utility services. Its main capital expenditure is on IT software and hardware, and on improvements to buildings. In order to support more intensive use of the civic centre HQ as part of the flexible working project, capital investment in the overall building infrastructure is essential, including replacement of the main boilers and heat exchangers that are approaching the end of their economic lifespan. There are also budgets held centrally under Corporate Services to ensure funds are available to take up opportunities arising in the local property market, to leverage match funding or to enable transformation of services. Annex 1 provides the overall scheme level for approval and Annex 3 provides a detailed breakdown of projects.
Page 311

12.3 Children, Schools and Families
This department’s main capital focus is the need for increased provision for pupils, with the major spend shifting from primary to secondary in 2016/17. The provision in the 2017-21 programme has been revised to that shown in the table below:
Children, Schools & Families
Updated Budget 17/18 £000s
Updated Budget 18/19 £000s
Updated Budget 19/20 £000s
Updated Budget 20/21 £000s
Primary School Expansions
30 0 0 0
Secondary School Expansions
8,889 6,156 4,481 0
SEN 3,196 5,310 1,000 0
Other 804 650 755 650
Children, Schools & Families
12,920 12,116 6,236 650
Please note £1million has moved from Secondary Expansions to SEN since November Cabinet
CSF capital programme 2017-21 The requirement to provide sufficient school places is a key statutory requirement. The government provides capital grant to meet some of this need, but there is a significant shortfall for the council to fund primary school places The capital programme in 2017/18 provides the finance to complete the expansion of Dundonald Primary School. This will complete a primary school expansion programme over eight years that is providing an additional 4,410 places (21 additional forms of entry since 2007/08). Following the latest demographic information and admissions data, no further primary school expansions are planned or funded in the capital programme. Secondary school places The significant increase in demand for school places reached the secondary phase from September 2015, with significant increases at secondary age transfer up to 2018/19 that will flow into all secondary age groups. However, it is expected the extra demand for places can be met through existing accommodation for the first two years. School expansion and a new school will be required to provide sufficient places thereafter so significant budget is proposed for this from 2016-17. The capital programme for 2017/21 includes £19.6 million for expansions in the borough’s existing secondary schools and the first phase of a new secondary school. However, the council is working with the Education Funding Agency to ensure that significant funding for the new ‘Harris Wimbledon’ school is provided by central government.
Page 312

Due to the difficulty of accurately forecasting the specific level of pupil transfer from the last year of primary school to secondary school the level of secondary school expansion required will be subject to regular reviews over the capital programme period. There is therefore uncertainty over the size, timing and cost of the secondary expansion, this includes a lack of clarity regarding government funding. Special school places The increase in demand for special school provision is proportionally greater for special schools than mainstream schools, though the numbers involved are significantly smaller. Capital funding is provided in the 2017/21 programme for expansion, including ensuring the numbers in the Perseid upper school will match the lower school. Further decisions on specific expansion schemes for special school provision are subject to review. Other schemes With regard to other capital schemes, £650,000 per annum is provided for schools this will be limited to urgent health and safety related needs, with the council expecting schools to fund all works below £20,000.
12.3 Environment and Regeneration
This department provides a co-ordinated approach to managing the public realm (all borough areas to which the public has access), as well as the regeneration of our town centres and neighbourhoods. The individual projects for this department are all listed in Annex 3. Other than the grant funded Transport for London scheme for the upgrade of principal roads, the departments main schemes relate to 12 main areas:
Environment & Regeneration Updated Budget 17/18
Updated Budget 18/19
Updated Budget 19/20
Updated Budget 20/21
Footways Planned Works 1,000,000 1,000,000 1,000,000 1,000,000 Greenspaces 325,590 335,000 355,000 300,000 Highways General Planned Works 419,000 422,000 427,000 427,000 Highways Planned Road Works 1,500,000 1,500,000 1,200,000 1,200,000 Leisure Centres 9,018,670 2,117,450 257,950 250,000 Other E&R 45,000 0 0 0 Regeneration Partnerships 1,145,870 1,000,000 3,000,000 1,000,000 Street Lighting 290,000 509,000 290,000 290,000 Street Scene 60,000 60,000 60,000 60,000 Transport for London 2,064,800 3,864,800 0 0 Traffic and Parking Management 620,470 150,000 150,000 150,000 Transport and Plant 1,686,000 3,070,000 300,000 300,000 Waste Operations 290,500 2,719,500 40,000 40,000 Environment & Regeneration 18,465,900 16,747,750 7,079,950 5,017,000
Page 313

12.3.1 Highways Planned Road Works and Footways Planned Works These works are based on annual condition surveys of the whole of the borough. As a result, items are prioritised and drawn up in programmes of works. These programmes may be amended as circumstances alter.
12.3.2 Highways General Planned Works
An indicative list of the major works to be done under this budgeted scheme is as follows:
Leisure Centres Updated Budget 17/18 £000s
Updated Budget 18/19 £000s
Updated Budget 19/20 £000s
Updated Budget 20/21 £000s
Surface Water Drainage 69 72 77 77 Highways bridges & structures 260 260 260 260 Maintain AntiSkid and Coloured 90 90 90 90 Total Highways General Planned Works 419 422 427 427
12.3.3 Leisure
The major works relate to the authority’s three Leisure Centres. The first scheme is for general improvements to the three Leisure Centres. The second scheme, Morden Park Pools, is a major investment for the council, with the replacement of the current centre with a new facility.
Leisure Centres Updated Budget 17/18 £000s
Updated Budget 18/19 £000s
Updated Budget 19/20 £000s
Updated Budget 20/21 £000s
Leisure Centre Plant & Machine 450 300 250 250 Morden Leisure Centre 8,319 567 8 0 Wimbledon Park Lake De-Silting 250 1,250 0 0 Total Leisure Centres 9,019 2,117 258 250
12.3.4 Future Merton
Regeneration is a major part of the council’s strategy. A vision for Morden town centre is being developed and Mitcham town centre will be sustainably developed. The main areas of expenditure over the Capital Programme period will be those below.
Environment and Regeneration Updated Budget 17/18 £000s
Updated Budget 18/19 £000s
Updated Budget 19/20 £000s
Updated Budget 20/21 £000s
Regeneration Partnerships Mitcham Major Schemes - TfL 700 0 0 0 Industrial Estate Investment 446 0 0 0 Transportation Enhancements 0 1,000 3,000 1,000 Total Regeneration Partnerships 1,146 1,000 3,000 1,000
Page 314
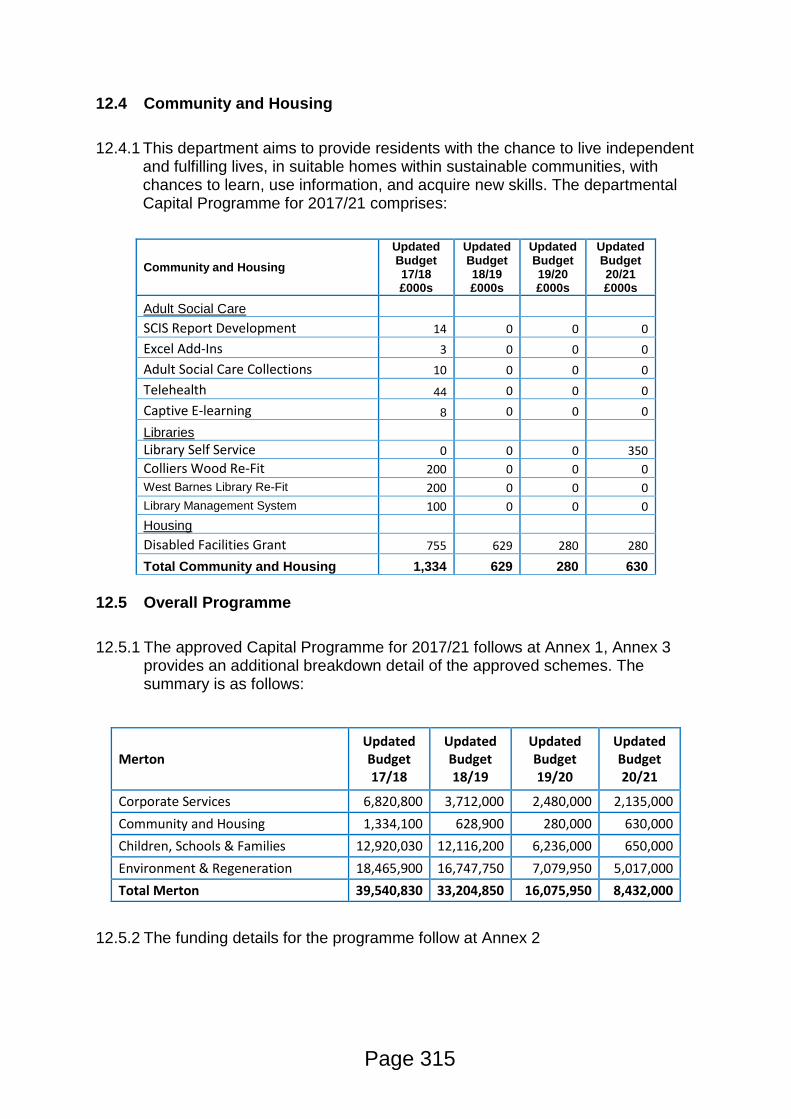
12.4 Community and Housing 12.4.1 This department aims to provide residents with the chance to live independent
and fulfilling lives, in suitable homes within sustainable communities, with chances to learn, use information, and acquire new skills. The departmental Capital Programme for 2017/21 comprises:
Community and Housing Updated Budget 17/18 £000s
Updated Budget 18/19 £000s
Updated Budget 19/20 £000s
Updated Budget 20/21 £000s
Adult Social Care SCIS Report Development 14 0 0 0 Excel Add-Ins 3 0 0 0 Adult Social Care Collections 10 0 0 0 Telehealth 44 0 0 0 Captive E-learning 8 0 0 0
Libraries Library Self Service 0 0 0 350 Colliers Wood Re-Fit 200 0 0 0 West Barnes Library Re-Fit 200 0 0 0 Library Management System 100 0 0 0 Housing Disabled Facilities Grant 755 629 280 280
Total Community and Housing 1,334 629 280 630 12.5 Overall Programme 12.5.1 The approved Capital Programme for 2017/21 follows at Annex 1, Annex 3
provides an additional breakdown detail of the approved schemes. The summary is as follows:
Merton Updated Budget 17/18
Updated Budget 18/19
Updated Budget 19/20
Updated Budget 20/21
Corporate Services 6,820,800 3,712,000 2,480,000 2,135,000 Community and Housing 1,334,100 628,900 280,000 630,000 Children, Schools & Families 12,920,030 12,116,200 6,236,000 650,000 Environment & Regeneration 18,465,900 16,747,750 7,079,950 5,017,000 Total Merton 39,540,830 33,204,850 16,075,950 8,432,000
12.5.2 The funding details for the programme follow at Annex 2
Page 315

12.5.3 Within the funding details the authority has anticipated some slippage for schemes that require a consultation process or a planning application or where the implementation timetable is not certain. The slippage anticipated reduces the spend in the year it is budgeted but increases the spend in the following year when it is incurred. When slippage from 2016/17 is approved, the 2017/18 Capital Programme will be adjusted accordingly.
12.5.4 Annexe 1 Capital Investment Programme - Schemes for Approval
Annexe 2 Funding the Capital Programme 2017-21 Annexe 3 Detailed Capital Programme 2017-21 Annexe 4 Analysis of Growth/(Reduction) from current approved
programme Annexe 5 Indicative Capital Programme 2021-26
Page 316

CAPITAL INVESTMENT PROGRAMME - SCHEMES FOR APPROVAL - ANNEX 1
Merton Updated Budget 17/18
Updated Budget 18/19
Updated Budget 19/20
Updated Budget 20/21
Corporate Services 6,820,800 3,712,000 2,480,000 2,135,000 Community and Housing 1,334,100 628,900 280,000 630,000 Children, Schools & Families 12,920,030 12,116,200 6,236,000 650,000 Environment & Regeneration 18,465,900 16,747,750 7,079,950 5,017,000 Total Merton 39,540,830 33,204,850 16,075,950 8,432,000
Merton
Updated Budget 17/18
Updated Budget 18/19
Updated Budget 19/20
Updated Budget 20/21
Total Business Improvement 816,000 1,377,000 0 0 Total Resources 147,800 0 0 125,000 Total Information Technology 1,946,000 1,085,000 630,000 1,060,000 Total Facilities Management 3,911,000 1,250,000 1,850,000 950,000 Total Corporate Services 6,820,800 3,712,000 2,480,000 2,135,000 Community and Housing Adult Social Care 79,100 0 0 0 Housing 755,000 628,900 280,000 280,000 Libraries 500,000 0 0 350,000 Total Community and Housing 1,334,100 628,900 280,000 630,000 Children, Schools and Families Primary School Expansions 30,000 0 0 0 Secondary School Expansions 8,889,290 6,156,200 4,481,000 0 SEN 3,196,290 5,310,000 1,000,000 0 Other 804,450 650,000 755,000 650,000 Children, Schools & Families 12,920,030 12,116,200 6,236,000 650,000
Page 317

CAPITAL INVESTMENT PROGRAMME - SCHEMES FOR APPROVAL - ANNEX 1 Continued……
Environment & Regeneration Updated Budget 17/18
Updated Budget 18/19
Updated Budget 19/20
Updated Budget 20/21
Footways Planned Works 1,000,000 1,000,000 1,000,000 1,000,000 Greenspaces 325,590 335,000 355,000 300,000 Highways General Planned Works 419,000 422,000 427,000 427,000 Highways Planned Road Works 1,500,000 1,500,000 1,200,000 1,200,000 Leisure Centres 9,018,670 2,117,450 257,950 250,000 Other E&R 45,000 0 0 0 Regeneration Partnerships 1,145,870 1,000,000 3,000,000 1,000,000 Street Lighting 290,000 509,000 290,000 290,000 Street Scene 60,000 60,000 60,000 60,000 Transport for London 2,064,800 3,864,800 0 0 Traffic and Parking Management 620,470 150,000 150,000 150,000 Transport and Plant 1,686,000 3,070,000 300,000 300,000 Waste Operations 290,500 2,719,500 40,000 40,000 Environment & Regeneration 18,465,900 16,747,750 7,079,950 5,017,000
Please Note
1) Excludes expenditure budgets relating to Disabled Facilities Grant funding from 2017/18.
2) Excludes expenditure budgets relating to Transport for London Grant from 19/20 as grant funding has not been announced. 3) Excludes expenditure budgets relating to Devolved Formula Capital for schools from 2017/18 as grant funding has not been announced. 4) Excludes any expenditure budgets relating to a Housing Company
Page 318
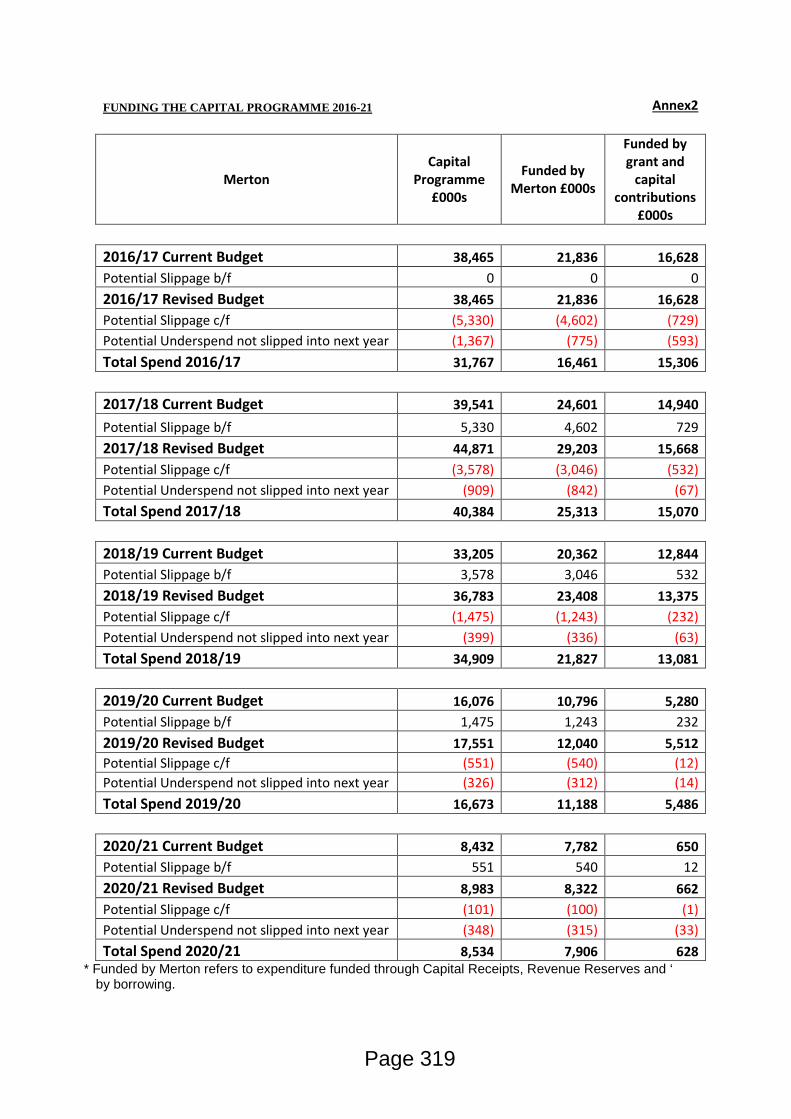
FUNDING THE CAPITAL PROGRAMME 2016-21
Annex2
Merton Capital
Programme £000s
Funded by Merton £000s
Funded by grant and
capital contributions
£000s
2016/17 Current Budget 38,465 21,836 16,628 Potential Slippage b/f 0 0 0 2016/17 Revised Budget 38,465 21,836 16,628 Potential Slippage c/f (5,330) (4,602) (729) Potential Underspend not slipped into next year (1,367) (775) (593) Total Spend 2016/17 31,767 16,461 15,306
2017/18 Current Budget 39,541 24,601 14,940 Potential Slippage b/f 5,330 4,602 729 2017/18 Revised Budget 44,871 29,203 15,668 Potential Slippage c/f (3,578) (3,046) (532) Potential Underspend not slipped into next year (909) (842) (67) Total Spend 2017/18 40,384 25,313 15,070
2018/19 Current Budget 33,205 20,362 12,844 Potential Slippage b/f 3,578 3,046 532 2018/19 Revised Budget 36,783 23,408 13,375 Potential Slippage c/f (1,475) (1,243) (232) Potential Underspend not slipped into next year (399) (336) (63) Total Spend 2018/19 34,909 21,827 13,081
2019/20 Current Budget 16,076 10,796 5,280 Potential Slippage b/f 1,475 1,243 232 2019/20 Revised Budget 17,551 12,040 5,512 Potential Slippage c/f (551) (540) (12) Potential Underspend not slipped into next year (326) (312) (14) Total Spend 2019/20 16,673 11,188 5,486
2020/21 Current Budget 8,432 7,782 650 Potential Slippage b/f 551 540 12 2020/21 Revised Budget 8,983 8,322 662 Potential Slippage c/f (101) (100) (1) Potential Underspend not slipped into next year (348) (315) (33) Total Spend 2020/21 8,534 7,906 628
* Funded by Merton refers to expenditure funded through Capital Receipts, Revenue Reserves and ‘ by borrowing.
Page 319

DETAILED CAPITAL PROGRAMME 2017-21 ANNEX 3
Department Scrutiny 2017-18 2018-19 2019-20 2020-21 Corporate Services Business Improvement Replacement Social Care System OSC 425,540 350,000 0 0 Planning&Public Protection Sys OSC 40,000 510,000 0 0 Revenue and Benefits OSC 0 400,000 0 0 Spectrum Spatial Analyst Replacement OSC 0 42,000 0 0 Capita Housing OSC 100,000 0 0 0 Aligned Assets OSC 0 75,000 0 0 Replacement Document Management System
OSC 0 0 0 0
Electronic Asset Management OSC 250,460 0 0 0 Customer Contact OSC 0 0 0 0 Corporate Facilities Management Invest to Save Schemes OSC 900,000 300,000 300,000 300,000 Capital Works Facilities OSC 300,000 300,000 650,000 650,000 Water Safety Works OSC 150,000 100,000 0 0 Asbestos Safety Works OSC 250,000 250,000 0 0 Schools PV&Energy conservation OSC 2,000,000 0 0 0 Civic Centre Boilers OSC 0 300,000 0 0 Civic Centre Staff Entrance Improvements OSC 200,000 0 0 0 Civic Centre Lightning Upgrade OSC 0 0 300,000 0 Civic Centre Block Paving OSC 75,000 0 0 0 Multi-Function Device OSC 36,000 0 600,000 0 Information Technology Planned Replacement Programme OSC 1,746,000 510,000 430,000 860,000 IT Enhancements OSC 200,000 275,000 200,000 200,000 Data Centre Support Equipment OSC 0 300,000 0 0 Resources Full EDRMS Invoice Solution SCIS/FIS OSC 41,000 Replacement of Civica Icon OSC 106,800 0 0 125,000 Total Corporate Services 6,820,800 3,712,000 2,480,000 2,135,000
* OSC= Overview and Scrutiny Commission, CYP = Children and Young People, HCOP = Healthier Communities and Older People SC = Sustainable Communities,
Page 320

DETAILED CAPITAL PROGRAMME 2017-21 Continued…. ANNEX 3
Department Scrutiny 2017-18 2018-19 2019-20 2020-21 Community and Housing Adult Social Care SCIS Report Development HCOP 14,000 0 0 0 Excel Add-Ins HCOP 3,000 0 0 0 Adult Social Care Collections HCOP 10,000 0 0 0 Telehealth HCOP 43,450 0 0 0 Captive E-Learning HCOP 8,350 0 0 0 Libraries Library Self Service SC 0 0 0 350,000 Colliers Wood Re-Fit SC 200,000 0 0 0 West Barnes Library Re-Fit SC 200,000 0 0 0 Library Management System SC 100,000 0 0 0 Housing Disabled Facilities Grant SC 755,000 628,900 280,000 280,000 Total Community and Housing 1,334,100 628,900 280,000 630,000
Department Scrutiny 2017-18 2018-19 2019-20 2020-21 Children, Schools and Families Primary Expansions Dundonald CYP 30,000 0 0 0 Secondary Expansion Secondary School expansion CYP 30,000 0 0 0 St Marks CYP 200,000 1,423,600 3,681,000 0 New 6fe School CYP 5,116,250 2,689,100 0 0 Harris merton CYP 3,372,980 0 0 0 Harris Morden CYP 200,060 2,043,500 800,000 0 SEN Expansion Perseid CYP 931,930 650,000 0 0 Secondary School Autism Unit CYP 200,000 1,160,000 0 0 Further SEN CYP 2,064,360 3,500,000 1,000,000 0 Other CSF Schools Capital Maintenance CYP 670,000 650,000 650,000 650,000 School Loans CYP 104,450 0 0 0 Admissions IT CYP 0 0 105,000 0 Total Children, Schools and Families 12,920,030 12,116,200 6,236,000 650,000
* OSC= Overview and Scrutiny Commission, CYP = Children and Young People, HCOP = Healthier Communities and Older People SC = Sustainable Communities,
Please note £1million has moved from St Marks Secondary to Further SEN since November Cabinet
Please Note 1) Excludes expenditure budgets relating to Disabled Facilities Grant from 17/18. 2) Excludes expenditure budgets relating to Transport for London Grant from 19/20 as grant funding has not been announced. 3) Excludes expenditure budgets relating to Devolved Formula Capital for schools from 2016/17 as grant funding has not been
announced. 4) Excludes any expenditure budgets relating to a Housing Company
Page 321
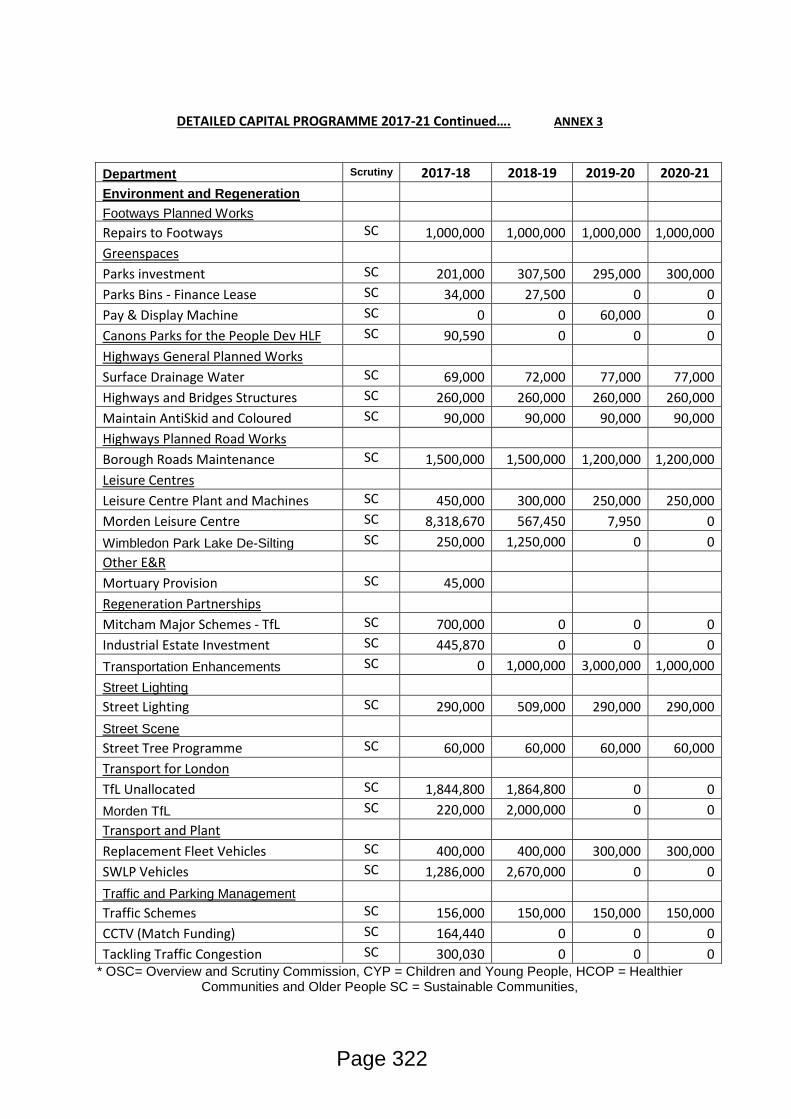
DETAILED CAPITAL PROGRAMME 2017-21 Continued…. ANNEX 3
Department Scrutiny 2017-18 2018-19 2019-20 2020-21 Environment and Regeneration Footways Planned Works Repairs to Footways SC 1,000,000 1,000,000 1,000,000 1,000,000 Greenspaces Parks investment SC 201,000 307,500 295,000 300,000 Parks Bins - Finance Lease SC 34,000 27,500 0 0 Pay & Display Machine SC 0 0 60,000 0 Canons Parks for the People Dev HLF SC 90,590 0 0 0 Highways General Planned Works Surface Drainage Water SC 69,000 72,000 77,000 77,000 Highways and Bridges Structures SC 260,000 260,000 260,000 260,000 Maintain AntiSkid and Coloured SC 90,000 90,000 90,000 90,000 Highways Planned Road Works Borough Roads Maintenance SC 1,500,000 1,500,000 1,200,000 1,200,000 Leisure Centres Leisure Centre Plant and Machines SC 450,000 300,000 250,000 250,000 Morden Leisure Centre SC 8,318,670 567,450 7,950 0 Wimbledon Park Lake De-Silting SC 250,000 1,250,000 0 0 Other E&R Mortuary Provision SC 45,000 Regeneration Partnerships Mitcham Major Schemes - TfL SC 700,000 0 0 0 Industrial Estate Investment SC 445,870 0 0 0 Transportation Enhancements SC 0 1,000,000 3,000,000 1,000,000 Street Lighting Street Lighting SC 290,000 509,000 290,000 290,000 Street Scene Street Tree Programme SC 60,000 60,000 60,000 60,000 Transport for London TfL Unallocated SC 1,844,800 1,864,800 0 0 Morden TfL SC 220,000 2,000,000 0 0 Transport and Plant Replacement Fleet Vehicles SC 400,000 400,000 300,000 300,000 SWLP Vehicles SC 1,286,000 2,670,000 0 0 Traffic and Parking Management Traffic Schemes SC 156,000 150,000 150,000 150,000 CCTV (Match Funding) SC 164,440 0 0 0 Tackling Traffic Congestion SC 300,030 0 0 0
* OSC= Overview and Scrutiny Commission, CYP = Children and Young People, HCOP = Healthier Communities and Older People SC = Sustainable Communities,
Page 322

DETAILED CAPITAL PROGRAMME 2017-21 Continued…. ANNEX 3
Department Scrutiny 2017-18 2018-19 2019-20 2020-21 Environment and Regeneration Cont Waste Operations Alley Gating SC 40,000 40,000 40,000 40,000 Waste Bins - Finance Lease SC 5,500 5,500 0 0 GPS Vehicle Tracking SC 130,000 0 0 0 SWLP IT SC 42,000 0 0 0 SWLP Depot SC 73,000 0 0 0 SWLP Wheelie Bins SC 0 2,674,000 0 0 Total Environment and Regeneration 18,465,900 16,747,750 7,079,950 5,017,000
Page 323

Analysis of Growth against Approved Programme 2017/20 and Indicative Programme 2020/21 ANNEX 4
Department 2017-18 2018-19 2019-20 2020-21 Corporate Services Business Improvement Replacement Social Care System 200,000 350,000 0 (150,000) Planning&Public Protection Sys (510,000) 510,000 0 0 Electronic Asset Management 0 0 (190,000) 0 Customer Contact 0 0 0 (200,000) Corporate Facilities Management Capital Works Facilities 0 0 (50,000) (50,000) Resources Improving Financial Systems 0 0 0 (700,000) Total Corporate Services (310,000) 860,000 (240,000) (1,100,000) Children, Schools and Families Secondary Expansion St Marks (911,800) (1,257,400) 1,681,000 0 New 6fe School 0 0 (1,979,100) (6,000,000) Harris Morden (1,643,500) 1,343,500 800,000 0 Raynes Park (100,000) (1,530,000) (4,200,000) 0 SEN Expansion Secondary School Autism Unit (960,000) 1,160,000 0 0 Further SEN (500,000) 500,000 0 0 Total Children, Schools and Families (4,115,300) 216,100 (3,698,100) (6,000,000) Environment and Regeneration Greenspaces Parks investment 0 0 0 (25,000) Highways Planned Road Works Borough Roads Maintenance 0 0 (50,000) (50,000) Leisure Centres Leisure Centre Plant and Machines 0 0 (50,000) (50,000) Regeneration Partnerships Transportation Enhancements 0 (4,000,000) 3,000,000 1,000,000 Transport and Plant Replacement Fleet Vehicles (100,000) (100,000) (50,000) (50,000) Traffic and Parking Management Traffic Schemes 0 (25,000) (25,000) (25,000) Total Environment and Regeneration (100,000) (4,125,000) 2,825,000 800,000 Total Merton (4,525,300) (3,048,900) (1,113,100) (6,300,000)
* OSC= Overview and Scrutiny Commission, CYP = Children and Young People, HCOP = Healthier Communities and Older People SC = Sustainable Communities, ** Negative growth in the capital programme is as a result of reduction when compared to the approved (17/20) and indicative (20/21)
Page 324

INDICATIVE CAPITAL PROGRAMME 2021-26 ANNEX 5
Department 2021-22 2022-23 2023-24 2024-25 2025-26 Corporate Services Business Improvement Replacement Social Care System 0 0 2,100,000 0 0 Planning&Public Protection Sys 0 0 0 0 550,000 Revenue and Benefits 0 0 0 400,000 0 Spectrum Spatial Analyst Replacement 42,000 0 0 42,000 0 Capita Housing 0 100,000 0 0 0 Aligned Assets 0 0 75,000 0 0 Replacement Document Management System 0 0 900,000 0 0 Electronic Asset Management 0 0 0 240,000 0 Customer Contact 2,000,000 0 0 0 2,000,000 Facilities Management Invest to Save Schemes 300,000 300,000 300,000 300,000 300,000 Capital Works Facilities 650,000 650,000 650,000 650,000 650,000 Multi-Function Device 0 0 0 600,000 0 Information Tecnology Planned Replacement Programme 770,000 560,000 575,000 430,000 860,000 IT Enhancements 200,000 200,000 200,000 200,000 200,000 Resources Improving Financial Systems 0 700,000 0 0 0 Total Corporate Services 3,962,000 2,510,000 4,800,000 2,862,000 4,560,000 Community and Housing Libraries Library Self Service 0 0 0 0 350,000 Housing Disabled Facilities Grant 280,000 280,000 280,000 280,000 280,000 Total Community and Housing 280,000 280,000 280,000 280,000 630,000 Children, Schools and Families Other CSF Schools Capital Maintenance 650,000 650,000 650,000 650,000 650,000 Admissions IT 0 0 105,000 0 0 Total Children, Schools and Families 650,000 650,000 755,000 650,000 650,000
Page 325
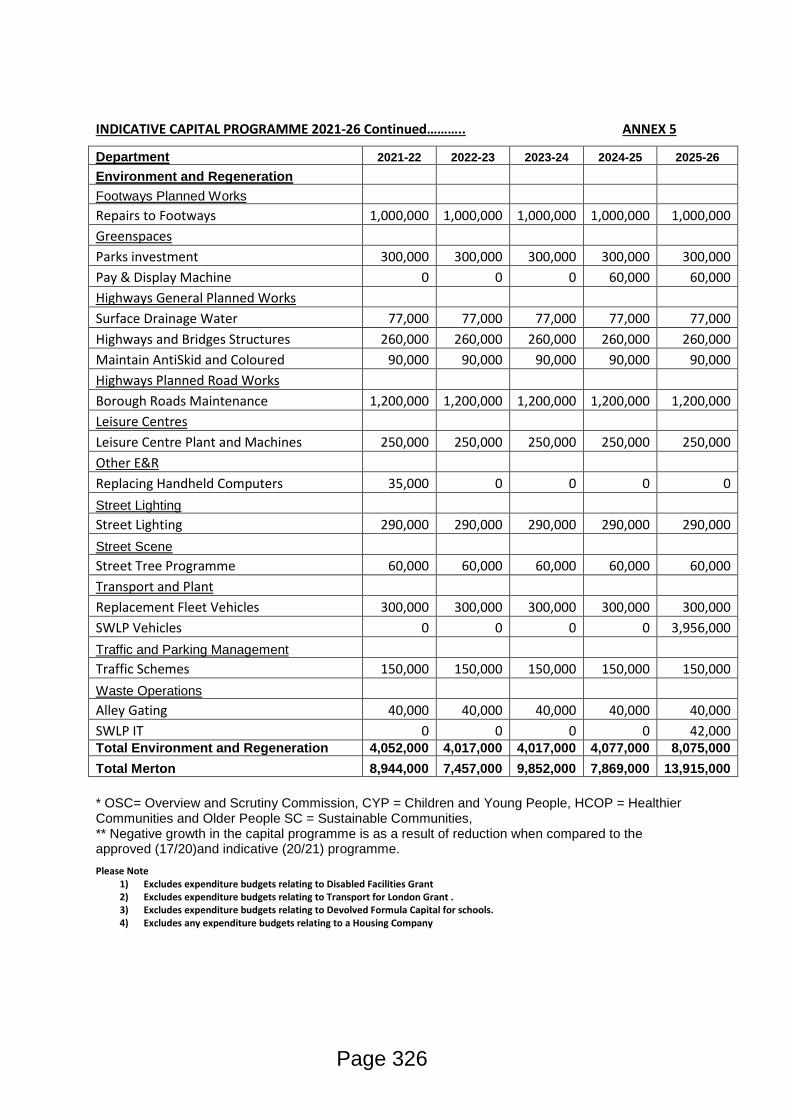
INDICATIVE CAPITAL PROGRAMME 2021-26 Continued……….. ANNEX 5
Department 2021-22 2022-23 2023-24 2024-25 2025-26 Environment and Regeneration Footways Planned Works Repairs to Footways 1,000,000 1,000,000 1,000,000 1,000,000 1,000,000 Greenspaces Parks investment 300,000 300,000 300,000 300,000 300,000 Pay & Display Machine 0 0 0 60,000 60,000 Highways General Planned Works Surface Drainage Water 77,000 77,000 77,000 77,000 77,000 Highways and Bridges Structures 260,000 260,000 260,000 260,000 260,000 Maintain AntiSkid and Coloured 90,000 90,000 90,000 90,000 90,000 Highways Planned Road Works Borough Roads Maintenance 1,200,000 1,200,000 1,200,000 1,200,000 1,200,000 Leisure Centres Leisure Centre Plant and Machines 250,000 250,000 250,000 250,000 250,000 Other E&R Replacing Handheld Computers 35,000 0 0 0 0 Street Lighting Street Lighting 290,000 290,000 290,000 290,000 290,000 Street Scene Street Tree Programme 60,000 60,000 60,000 60,000 60,000 Transport and Plant Replacement Fleet Vehicles 300,000 300,000 300,000 300,000 300,000 SWLP Vehicles 0 0 0 0 3,956,000 Traffic and Parking Management Traffic Schemes 150,000 150,000 150,000 150,000 150,000 Waste Operations Alley Gating 40,000 40,000 40,000 40,000 40,000 SWLP IT 0 0 0 0 42,000 Total Environment and Regeneration 4,052,000 4,017,000 4,017,000 4,077,000 8,075,000 Total Merton 8,944,000 7,457,000 9,852,000 7,869,000 13,915,000 * OSC= Overview and Scrutiny Commission, CYP = Children and Young People, HCOP = Healthier Communities and Older People SC = Sustainable Communities, ** Negative growth in the capital programme is as a result of reduction when compared to the approved (17/20)and indicative (20/21) programme. Please Note
1) Excludes expenditure budgets relating to Disabled Facilities Grant 2) Excludes expenditure budgets relating to Transport for London Grant . 3) Excludes expenditure budgets relating to Devolved Formula Capital for schools. 4) Excludes any expenditure budgets relating to a Housing Company
Page 326
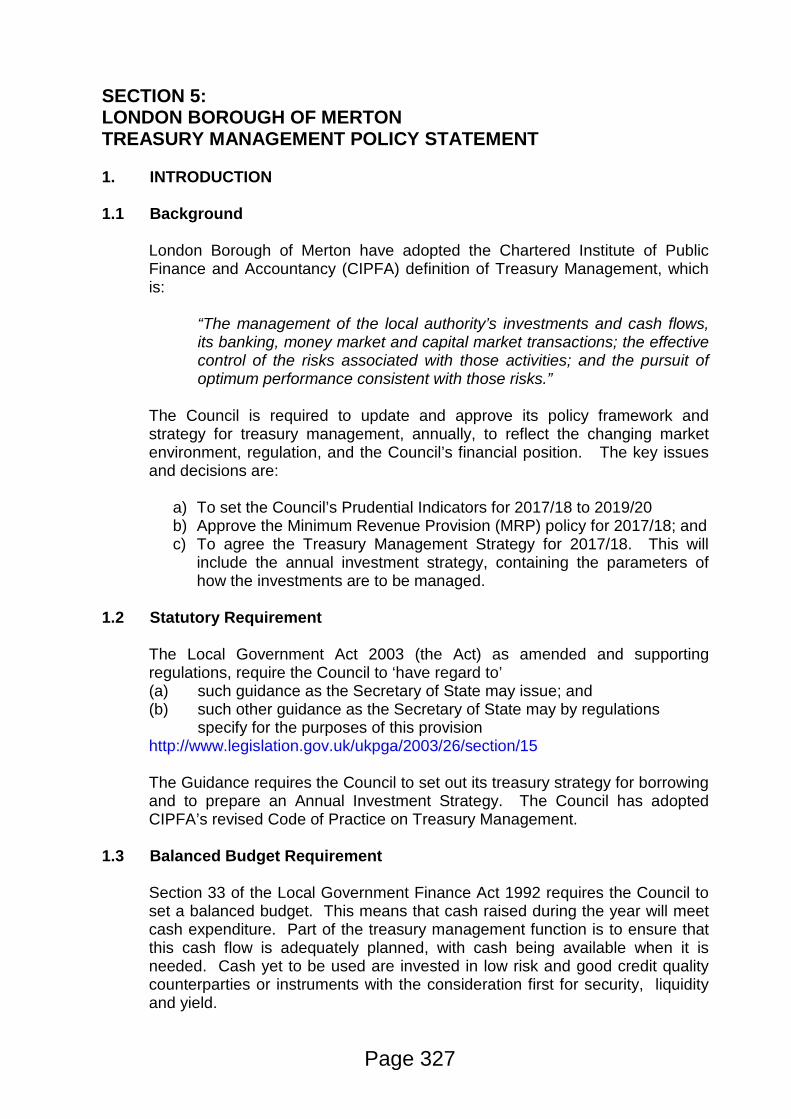
SECTION 5: LONDON BOROUGH OF MERTON TREASURY MANAGEMENT POLICY STATEMENT 1. INTRODUCTION 1.1 Background
London Borough of Merton have adopted the Chartered Institute of Public Finance and Accountancy (CIPFA) definition of Treasury Management, which is: “The management of the local authority’s investments and cash flows, its banking, money market and capital market transactions; the effective control of the risks associated with those activities; and the pursuit of optimum performance consistent with those risks.” The Council is required to update and approve its policy framework and strategy for treasury management, annually, to reflect the changing market environment, regulation, and the Council’s financial position. The key issues and decisions are:
a) To set the Council’s Prudential Indicators for 2017/18 to 2019/20 b) Approve the Minimum Revenue Provision (MRP) policy for 2017/18; and c) To agree the Treasury Management Strategy for 2017/18. This will
include the annual investment strategy, containing the parameters of how the investments are to be managed.
1.2 Statutory Requirement
The Local Government Act 2003 (the Act) as amended and supporting regulations, require the Council to ‘have regard to’ (a) such guidance as the Secretary of State may issue; and (b) such other guidance as the Secretary of State may by regulations specify for the purposes of this provision http://www.legislation.gov.uk/ukpga/2003/26/section/15 The Guidance requires the Council to set out its treasury strategy for borrowing and to prepare an Annual Investment Strategy. The Council has adopted CIPFA’s revised Code of Practice on Treasury Management.
1.3 Balanced Budget Requirement
Section 33 of the Local Government Finance Act 1992 requires the Council to set a balanced budget. This means that cash raised during the year will meet cash expenditure. Part of the treasury management function is to ensure that this cash flow is adequately planned, with cash being available when it is needed. Cash yet to be used are invested in low risk and good credit quality counterparties or instruments with the consideration first for security, liquidity and yield.
Page 327

The other main function of treasury management is the funding of the Council’s capital plans. These capital plans provide a guide to the long or short-term borrowing need of the Council, essentially the longer term cashflow planning, to ensure that the Council can meet its capital spending obligations. The management of longer term cash may involve arranging long or short dated loans, or using longer term cashflow surpluses. Subject to S151 Officer’s approval, any debt previously drawn may be restructured or repaid to meet the Council’s risk or cost objectives.
1.4 Treasury Management Strategy for 2017/18 The strategy for 2017/18 covers two main areas:
Capital Issues • To determine the Council’s capital plans and prudential indicators for
2017/18 to 2019/20; • To approve the Minimum Revenue Provision (MRP) policy for 2017/18. The LG Act 2003 require local authorities to set an affordable borrowing limit (http://www.legislation.gov.uk/ukpga/2003/26/section/3). Treasury Management Issues • To agree the Council’s treasury management strategy for 2017/18
• current treasury position as at 30 November 2016; • treasury indicators which limit the treasury risk and activities of the
Council; • prospects for interest rates; • borrowing strategy; • policy on borrowing in advance of need; • debt rescheduling and early repayment of debt review; • Annual Investment Strategy and alternative investment instruments
(Policy on new lending and borrowing instruments); • creditworthiness policy; • Treasury Management Practices (Appendix 5);and • cash flow policy
These elements cover the requirements of the Local Government Act 2003, the CIFPA Prudential Code, the Communities and Local Government (CLG) MRP Guidance, the CIPFA Treasury Management Code and the CLG Investment Guidance.
Page 328

2. CURRENT TREASURY POSITION 2.1 Use of the Council’s Resources and the Investment Position
The application of resources (capital receipts and reserves etc.) to either finance capital expenditure or other budget decisions to support the revenue budget will have an ongoing impact on investments unless resources are supplemented each year from new sources, for example, asset sales. The table below shows the position as at 30 November 2016.
Year End Resources
2015/16 Actual £’000
30 November
2016 Actual £’000
31 March 2016/17
Estimate £’000
31 March 2017/18 Estimate
£’000
Investments 85,400 107,200 79,166 58,381 Interest on investments 1,140 451 1,262 1,186 Borrowing Long-term Borrowing Short-term Borrowing
Total External Debt
116,976
116,976
116,976
116,976
116,976
116,976
113,010
113,010 Interest on External Debt Long-term Short-term Total Interest on External Debt
6,686 1
6,687
6,702 1
6,703
6,702
6,702
6,315
6,315 Interest on investments figures above do not include interest from policy investments.
3. CAPITAL PRUDENTIAL INDICATORS 2017/18 - 2020/21 The Council is required to calculate various indicators for the next 3 years. The
aim of prudential indicators is to ensure that the Council’s capital investment plans are affordable, prudent and sustainable. The prudential indicators set out in Appendix 6 are calculated for the Medium Term Financial Strategy (MTFS) period. The indicators relate to capital expenditure, external debt and treasury management.
The Council will monitor performance against the indicators and prepare indicators based on the Statement of Accounts (SoA) at year end.
3.1 Capital Expenditure The Council’s capital expenditure plans are fundamental to its treasury
management activity. The output of the capital expenditure plans is reflected in prudential indicators, which are designed to provide Council members an overview and confirm the impact of capital expenditure plans. This indicator is a summary of the Council’s capital expenditure plans, both those agreed previously, and those forming part of this budget cycle as reported in the MTFS. Environment and Regeneration figures include projects relating to Public Health programs however these are fully funded and do not have any MRP implications.
Page 329

Members are asked to approve the capital expenditure forecasts:
Capital Expenditure
2015/16 Actual £’000
2016/17 Estimate £’000
2017/18 Estimate £’000
2018/19 Estimate £’000
2019/20 Estimate £’000
2020/21 Estimate £’000
Children Schools & Families
14,348 13,396 12,920 12,116 6,236 650
Community & Housing
1,355 1,951 1,334 629 280 630
Corporate Services 2,466 8,975 6,821 3,712 2,480 2,135 Environment & Regeneration
10,910 14,143 18,466 16,748 7,080 5,017
- - - - - -
Total 29,079 38,465 39,541 33,205 16,076 8,432
The above financing need excludes other long-term liabilities, such as PFI and leasing arrangements which already include borrowing instruments. The table below shows how the capital expenditure plans are being financed by revenue or capital resources. A shortfall of resources means a borrowing need. The capital programme expenditure figures used in calculating the financing costs have been adjusted for slippage in the programme as at 30 November 2016.
Capital Expenditure 2015/16 2016/17 2017/18 2018/19 2019/20 2020/21 Actual Estimate Estimate Estimate Estimate Estimate £’000 £’000 £’000 £’000 £’000 £’000
Capital Expenditure 29,079 38,465 39,541 33,205 16,076 8,432 Slippage* - -6,698 843 1,704 597 102 Leasing Budgets in Programme after Slippage
-223 -125 -45 -572 -29
Total Capital Expenditure 29,079 31,544 40,259 34,864 16,101 8,505
Financed by:
Capital Receipts 9,082 14,105 19,475 855 328 871 Capital Grants & Contributions 18,869 15,306 15,070 13,081 5,486 628
Capital Reserves 607 - - - - - Revenue Provisions 429 2,061 5,482 1,537 4 0 Other Financing Sources - - - - - -
Net financing need for the year 92 72 232 19,391 10,284 7,006
*In the above table slippage includes slippage in from the previous year and out to the following year.
Page 330

3.2 The Council’s Borrowing Need (the Capital Financing Requirement)
The second prudential indicator, Capital Financing Requirement (CFR), is the total historical outstanding capital expenditure which has not yet been paid for from either revenue or capital resources. In other words, a measure of the Council’s underlying borrowing need. Any capital expenditure above, which has not immediately been paid for, will increase the CFR. The CFR includes any other long-term liabilities like PFI schemes and finance leases which have been brought onto the balance sheet. Whilst this increases the CFR, and therefore the Council’s borrowing requirement, it should be noted that these types of scheme include a borrowing facility and so the Council is not required to separately borrow for these schemes. The Council has no Housing Revenue Account (HRA) and no new PFI scheme in 2017/18 is expected. Public Health capital projects are fully funded therefore have no CFR implications. The 2016/17 forecast movement in CFR shows a decrease of £8,638k because the expenditure to be funded from borrowing in 2016/17 is less than the amount of MRP charged in the year. The current cashflow projection as at 30 November 2016 for 2016/17 year end is an estimated cash balance of £79.6m. The current forecast has been based on assumptions in the MTFS and capital programme spend forecast after slippage. The 2016/17 forecast £31.5m, 2017/18 £40.3m, and 2018/19 £34.9m are based on best estimates which may slip due to unforeseen circumstances and the nature of large projects and the level of grant income. Also, fees and charges for the Council may change. Based on current forecasts the earliest the Council may borrow is in 2017/18 in anticipation for 2018/19. However, the Council can borrow in advance of need if rates fall and borrowing becomes a lot more advantageous than it currently is. The Council is asked to approve the CFR projections in the following table:
Page 331

2015/16 2016/17 2017/18 2018/19 2019/20 2020/21 Actual £'000
Estimate £'000
Estimate £'000
Estimate £'000
Estimate £'000
Estimate £'000
Capital Financing Requirement CFR (non-housing) 198,616 189,978 181,644 192,997 193,274 190,553 Total CFR 198,616 189,978 181,644 192,997 193,274 190,553 Movement in CFR (9,210) (8,638) (8,334) 11,353 277 (2,721) Movement in CFR represented by Net financing need for the year (above) 92 72 232 19,931 10,284 7,006
Less Capital MRP/VRP 7,587 7,154 7,004 6,579 7,634 7,987
Less Other MRP/VRP (leasing, PFI)
1,118 916 876 724 1,585 897
Less Other MRP/VRP – PFI – Partial termination
597 640 686 735 788 844
Less Other financing movements • Adjustment of
PFI Liability • Adjustment of
MRP
Movement in CFR (9,210) (8,638) (8,334) 11,353 277 (2,721) Actual and estimates of the ratio of financing costs to net revenue stream This indicator identifies the trend in the cost of capital (borrowing and other long-term obligation costs net of investment income) against the net revenue stream. The indicator shows the proportion of the income received from Council tax, Revenue Support Grant (RSG) and National Non-Domestic Rate (NNDR) that is spent on paying the borrowing associated with delivery of capital investment i.e. principal and interest charges of long-term borrowing. The table below shows the monetary values for the above ratio
2015/16 Actual
£’000
2016/17 Estimate
£’000
2017/18 Estimate
£’000
2018/19 Estimate
£’000
2019/20 Estimate
£’000
2020/21 Estimate
£’000
Net Revenue Financing Costs
19,575 16,731 16,791 16,074 18,908 18,373
Net Financing Stream 155,662 148,139 146,066 139,664 137,453 133,999
Ratio of Financing Costs to Net Revenue Stream (Non HRA)
12.58% 11.29% 11.50% 11.51% 13.76% 13.71%
Page 332
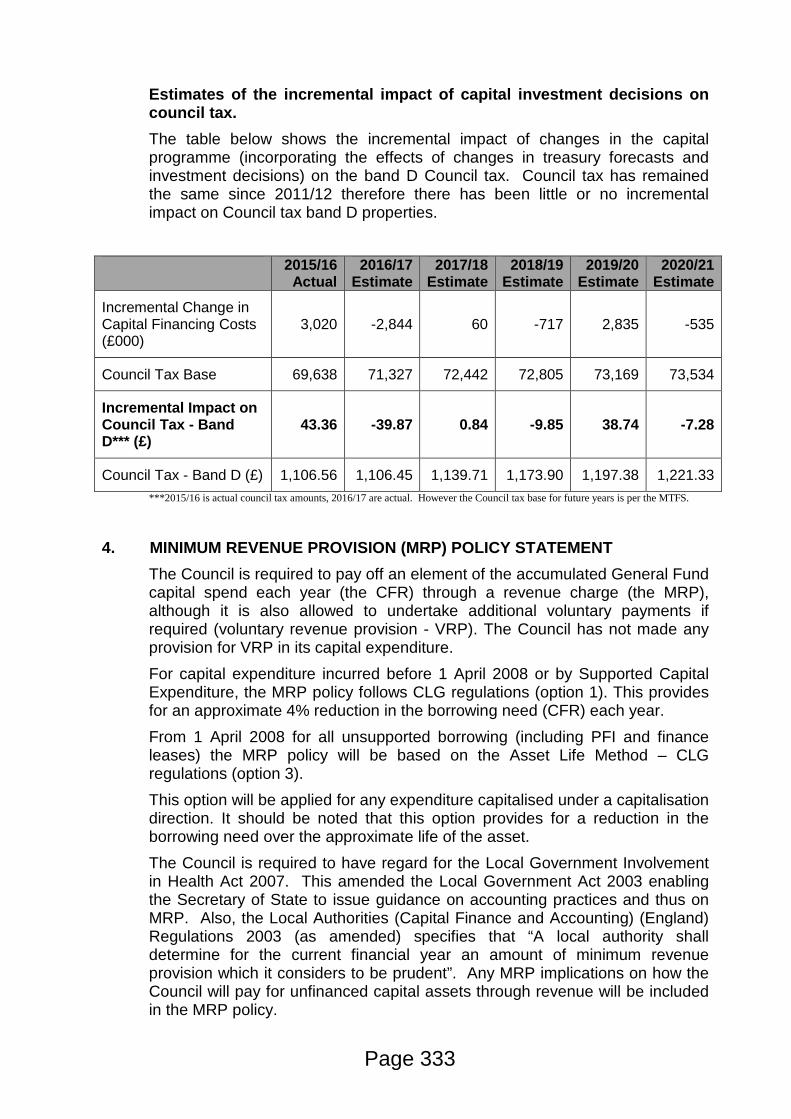
Estimates of the incremental impact of capital investment decisions on council tax. The table below shows the incremental impact of changes in the capital programme (incorporating the effects of changes in treasury forecasts and investment decisions) on the band D Council tax. Council tax has remained the same since 2011/12 therefore there has been little or no incremental impact on Council tax band D properties.
2015/16 Actual
2016/17 Estimate
2017/18 Estimate
2018/19 Estimate
2019/20 Estimate
2020/21 Estimate
Incremental Change in Capital Financing Costs (£000)
3,020 -2,844 60 -717 2,835 -535
Council Tax Base 69,638 71,327 72,442 72,805 73,169 73,534
Incremental Impact on Council Tax - Band D*** (£)
43.36 -39.87 0.84 -9.85 38.74 -7.28
Council Tax - Band D (£) 1,106.56 1,106.45 1,139.71 1,173.90 1,197.38 1,221.33 ***2015/16 is actual council tax amounts, 2016/17 are actual. However the Council tax base for future years is per the MTFS.
4. MINIMUM REVENUE PROVISION (MRP) POLICY STATEMENT The Council is required to pay off an element of the accumulated General Fund
capital spend each year (the CFR) through a revenue charge (the MRP), although it is also allowed to undertake additional voluntary payments if required (voluntary revenue provision - VRP). The Council has not made any provision for VRP in its capital expenditure. For capital expenditure incurred before 1 April 2008 or by Supported Capital Expenditure, the MRP policy follows CLG regulations (option 1). This provides for an approximate 4% reduction in the borrowing need (CFR) each year. From 1 April 2008 for all unsupported borrowing (including PFI and finance leases) the MRP policy will be based on the Asset Life Method – CLG regulations (option 3). This option will be applied for any expenditure capitalised under a capitalisation direction. It should be noted that this option provides for a reduction in the borrowing need over the approximate life of the asset. The Council is required to have regard for the Local Government Involvement in Health Act 2007. This amended the Local Government Act 2003 enabling the Secretary of State to issue guidance on accounting practices and thus on MRP. Also, the Local Authorities (Capital Finance and Accounting) (England) Regulations 2003 (as amended) specifies that “A local authority shall determine for the current financial year an amount of minimum revenue provision which it considers to be prudent”. Any MRP implications on how the Council will pay for unfinanced capital assets through revenue will be included in the MRP policy.
Page 333

Category Depreciation (Years)
Assets valued over £1m Buildings 50 Mechanical & Electrical 20 External 20
Assets valued under £1m Buildings 40 Infrastructure (roads etc) 25 15 Year Asset 15 10 Year Asset 10 Computer software 5 Computer hardware 5 Large vehicles – e.g. buses, RCVs 7 Small vehicles – e.g. cars, vans 5 Other equipment e.g. CCTV 5
MRP years where there is no depreciation equivalent Land 50 Revenue Expenditure Funded by capital Under Statute e.g. Redundancy costs
20
5. TREASURY MANAGEMENT STRATEGY
5.1 The Prospects for Interest Rates and Economic Forecasts Consideration is given to economic and interest rate forecasts because they
provide likely investment rates (bank rates), likely borrowing rates (PWLB), credit risk profile thereby giving some latitude on when to borrow, repay and invest. However as with every forecast there is also the likelihood of economic factors not following forecasts. The following table gives the central position on the Council’s treasury management adviser’s view on interest rates.
Page 334

Annual Average % Bank Rate (%)
PWLB Borrowing Rates (%)
5 year 10 year 25 year 50 year March 2017 0.25 1.60 2.30 2.90 2.70 June 2017 0.25 1.60 2.30 2.90 2.70 Sept 2017 0.25 1.60 2.30 2.90 2.70 Dec 2017 0.25 1.60 2.30 3.00 2.80 March 2018 0.25 1.70 2.30 3.00 2.80 June 2018 0.25 1.70 2.40 3.00 2.80 Sept 2018 0.25 1.70 2.40 3.10 2.90 Dec 2018 0.25 1.80 2.40 3.10 2.90 March 2019 0.25 1.80 2.50 3.20 3.00 June 2019 0.50 1.90 2.50 3.20 3.00 Sept 2019 0.50 1.90 2.60 3.30 3.10 Dec 2019 0.75 2.00 2.60 3.30 3.10 Mar 2020 0.75 2.00 2.70 3.40 3.20
Source: Capita Asset Services
The above forecasts reflect broad stimulus measures the Bank of England’s Monetary Policy Committee (MPC) took following the vote for the UK to exit the EU (Brexit) at the Referendum on 23rd June 2016, including a cut in base rate from 0.50% to 0.25% on 4th August 2016. Since then, economic statistics suggest that the sharp fall in Sterling strengthened growth and raised inflation forecasts significantly. During the two-year period (2017 – 2019) post triggering of Article 50, when the UK is negotiating the terms for withdrawal from the EU, it is likely that the MPC will do nothing to dampen growth prospects already adversely impacted by the uncertainties of Brexit. Accordingly, a first increase to 0.50% is not tentatively pencilled in, as above, until Q2 2019, after those negotiations have been concluded, (though the period for negotiations could be extended). However, if strong domestically generated inflation, (e.g. from wage increases within the UK), were to emerge, then the pace and timing of increases in Bank Rate could be brought forward. Economic forecasting remains difficult with so many external influences weighing on the UK. The above forecasts, (and MPC decisions), will be liable to further amendment depending on how economic data and developments in financial markets transpire over the next year. Forecasts for average investment earnings beyond the three-year time horizon will be heavily dependent on economic and political developments. Major volatility in bond yields is likely to endure as investor fears and confidence ebb and flow between favouring more risky assets i.e. equities, or the safe haven of bonds. The overall longer run trend is for gilt yields and PWLB rates to rise, albeit gently. An eventual world economic recovery may also see investors switching from the safe haven of bonds to equities. The overall balance of risks to economic recovery in the UK remains to the downside. PWLB rates and gilt yields have been experiencing exceptional levels of volatility that are highly correlated to geo-political, sovereign debt crisis and emerging market developments.
Page 335

Apart from the above uncertainties, downside risks to current forecasts for UK gilt yields and PWLB rates currently include:
• Monetary policy action by central banks reaching its limit of effectiveness and failing to stimulate significant sustainable growth, combat the threat of deflation and reduce high levels of debt in some major developed economies, combined with a lack of adequate action from national governments to promote growth through structural reforms, fiscal policy and investment expenditure.
• Major national polls: • US presidential election was held on 8th November 2016. Bank
funding costs have risen since the US election and markets believe the policies of Mr Donald Trump, the President-elect, could push up interest rates;
• Italian constitutional referendum was held on 4th December 2016 with the Prime Minister, Matteo Renzi resigning after his defeat sparking fears about the stability of the Italian banking system;
• Spain has held two inconclusive general elections and is still unable to form a workable government with a coalition holding a majority of seats; the impasse could lead to a third general election – currently tentatively scheduled for 25th December 2016;
• Dutch general election 15th March 2017; • French presidential election April/May 2017; • French National Assembly election June 2017; • German Federal election August – October 2017.
• A resurgence of the Eurozone sovereign debt crisis.
• Weak capitalisation of some European banks.
• Geopolitical risks in Europe, the Middle East and Asia, increasing safe haven flows.
• UK economic growth and increases in inflation are weaker than we currently anticipate.
• Weak growth or recession in the UK’s main trading partners - the EU and US.
The potential for upside risks to current forecasts for UK gilt yields and PWLB rates, especially for longer term PWLB rates, include: -
• UK inflation rising to significantly higher levels than in the wider EU and US, causing an increase in the inflation premium in gilt yields.
• A rise in US Treasury yields as a result of Fed funds rate increases and rising inflation expectations in the USA, pushing UK gilt yields upwards.
• The pace and timing of increases in the Fed funds rate causing a fundamental reassessment by investors of the relative risks of holding bonds as opposed to equities and leading to a major flight from bonds to equities.
• A downward revision to the UK’s sovereign credit rating undermining investor confidence in holding sovereign debt (gilts).
Page 336

5.2 Borrowing Strategy Current Borrowing Portfolio Position The table below shows the CFR as at 30 November 2016 against the gross debt position of the Council. The gross debt includes other long-term liabilities like PFI and finance lease obligations. Gross debt should not exceed CFR in the medium to long-term. Estimated debt may change as the capital programme spends and financing changes. The lease balances do not include adjustments for new implications in 2016/17.
2015/16 2016/17 2017/18 2018/19 2019/20 2020/21 Actual Estimate Estimate Estimate Estimate Estimate £’000 £’000 £’000 £’000 £’000 £’000 External Debt at 1 April
116,976 116,976 116,976 113,010 113,010 113,010
Expected change in Debt (repayment and new debt)****
0 0 (3,966) 0 0 (2,000)
Closing External Debt
116,976 116,976 113,010 113,010 113,010 111,010
PFI Balance b/f 19,524 18,664 17,959 17,164 16,480 14,926 In year movement -860 -705 -795 -684 -1,554 -805 Closing Balance PFI 18,664 17,959 17,164 16,480 14,926 14,121 PFI Partial Termination Balance b/f
15,210 14,613 13,973 13,287 12,552 11,764
In year movement -597 -640 -686 -735 -788 -844 Closing Balance Partial Termination PFI
14,613 13,973 13,287 12,552 11,764 10,920
TOTAL PFI 33,277 31,932 30,451 29,032 26,690 25,041 Finance Leases at 1 April
219 211 81 39 31 92
Expected Change in Finance Leases
-8 -130 -42 -8 60 42
Closing Balance Finance Leases
211 81 39 31 92 134
Salix Loan 44 34 25 15 5 0 Salix in year movement
-10 -10 -10 -10 -5 0
Closing Balance Salix
34 25 15 5 0 0
Actual gross debt at 31 March
150,498 149,014 143,515 142,078 139,792 136,185
Capital Financing Requirement
198,616 189,978 181,644 192,997 193,274 190,553
(Under)/over borrowing
-48,118 -40,964 -38,131 -50,919 -53,482 -52,368 ****£3.966m of long-term debt matures in 2017/18
Page 337

The table above shows the CFR forecast for 2016/17 to 2020/21. Also, there is no maturing debt until 2017/18 hence little borrowing pressure therefore the Council is currently maintaining an under-borrowed position. This means that the capital borrowing need (the CFR), has not been fully funded with loan debt as cash supporting the Council’s reserves, balances and cashflow has been used as a temporary measure. PFI and finance lease portion of the CFR will not be funded by additional loan. Capital forecasts relating to 2018/19, 2019/20 and 2020/21 are very much subject to change at this stage. The Council’s decision to use internal borrowing is prudent as it eliminates the revenue cost of carry as investment returns remain low, there is sometimes slippage on capital programme budgets and counterparty risks remain to a degree. The Council can fund its entire borrowing requirement now if this is affordable. In which case, borrowing will be up to CFR.
Borrowing interest rates have been on a downward trend since 2016. Against this background, the Director of Corporate Services will continue to monitor interest rates in financial markets and adopt a pragmatic approach to changing circumstances to maximise short-term savings. However when interest rates begin to rise, the Council will consider borrowing in advance of need than current forecast requirements show. The duration of loans will be driven by the current loan portfolio, affordability, the position on internal borrowing and borrowing rates. The policy of avoiding new borrowing by using spare cash balances, has served well over the last few years. However, this needs to be reviewed carefully to avoid incurring higher borrowing costs in future when the Council will not be able to avoid new borrowing to finance capital expenditure and/or to refinance maturing debt. Council’s Year End Balance Sheet Position at 31 March 2016
2014/15 2015/16 Change
£'000 £'000 £'000
CFR 207,826 198,616 9,210 PFI and LEASES -35,553 -34,123 -1,430 Underlying Borrowing Requirement 172,273 164,493 7,780 External Borrowing 116,676 116,976 300 Under borrowing / Internal borrowing to date -55,597 -47,517 -8,080
Strategy to ‘Unwind’ Internal Borrowing Internal borrowing at 31 March 2016 remains at sustainable levels. However, the Council will commence a review of its strategy to ‘unwind’ internal borrowing.
Page 338

Debt Liability Benchmarking In defining its borrowing strategy, the Council considered the true characteristics of all of the debt instruments in its portfolio, most especially the LOBOs and the various options available to the Council.
Consideration was given to the fact that in the current economic climate the LOBOs in the Council’s portfolio will not be called due to their very high interest rate. Should they be called, replacement borrowing will not be required because the council will have cash available in 2017/18 to meet the call options based on the current estimates of the use of internal borrowing for the capital programme.
If all LOBOs are called at once (an unlikely event) then future estimated use of cash to temporarily fund the capital programme may be affected.
All counterparties were contacted in 2016 and most responded and cited a minimum rate they would consider reviewing the call option on the LOBO as being over 3%. Bank of England rate is currently 0.25% with rates not expected to rise to 0.75% before Q4 2019.
The borrowing strategy to temporarily finance its capital programme, led the Council to consider setting a minimum amount of projected liquid cash of £10m. This means that cash outflows for capital purposes would primarily be met from cash investments until £10m was reached, and only at that point, would external borrowing be undertaken except if interest rates were advantageous for long-term loans, then the Council will borrow in advance of need or where interest rates are expected to rise significantly and quickly. The Council will continue to review, throughout the year, its options around higher and lower levels of cash-backed balances. Treasury Risk Analysis - Debt Whilst it is not mandatory for Local Authorities to adopt the CIPFA Risk Toolkit produced by CIPFA’s Treasury Management Panel, the Council will continue to utilise and adopt the risk tool kit and participate in the risk study in 2017/18 as there are some merits for the Council in managing its integrated treasury management portfolio and in considering risk mitigation options for its treasury management review process and benchmarking with its peers.
5.3 Treasury Indicators: Limits to Borrowing Activity
Operational Boundary - this is the limit beyond which external borrowing is not normally expected to exceed.
Page 339

Operational boundary
£’000
2015/16 Actual £’000
2016/17 Estimate
£’000
2017/18 Estimate
£’000
2018/19 Estimate
£’000
2019/20 Estimate
£’000
2020/21 Estimate
£’000 External Debt 116,976 116,976 113,010 113,010 113,010 111,010 Other Long-term Liabilities 34,123 32,013
30,490
29,063 26,782
25,175
Operational Boundary 151,099 148,989 143,500 142,073 139,792 136,185 Authorised Limit for External Borrowing This is the statutory limit determined under section 3 (1) of the Local Government Act 2003. It represents a limit beyond which external borrowing must not go over in the 3 years, and this limit when set is to be revised annually by Council. It reflects the level of external borrowing which, while not desired, could be afforded in the short-term, but is not sustainable in the longer term. The Council is asked to approve the following authorised limit:
2015/16 Actual £’000
2016/17 Estimate
£’000
2017/18 Estimate
£’000
2018/19 Estimate
£’000
2019/20 Estimate
£’000
2020/21 Estimate
£’000 External Debt 151,099 148,989 143,500 142,073 139,792 136,185 Other Long-term Liabilities
60,000 70,000 80,000 80,000 80,000 80,000
Authorised Limit 211,099 218,989 223,500 222,073 219,792 216,185
Members are required to note that these authorised limits shows the gross maximum borrowing for the year and, in year regulatory accounting changes which may affect the level of debt in the balance sheet as well as allow for any potential overdraft position and short-term borrowing for cashflow purposes. All of which will be counted against the overall borrowing. The authorised limit also provides headroom for any debt rescheduling which may occur during the year and any borrowing in advance of need. The following graph shows projection of the CFR and borrowing.
Page 340

Within the prudential indicators, there are a number of key indicators to ensure that the Council operates its activities within well-defined limits. One of these is that the Council should ensure that its gross debt does not (except in the short term) exceed the total of the CFR in the preceding year plus the estimates of any additional CFR for 2017/18 and the following two financial years. This allows some flexibility for limited early borrowing for future years, but ensures that borrowing is not undertaken for revenue purposes. The Director of Corporate Services reports that the Council complied with this key prudential indicator in the current year and does not envisage difficulties for the future. This view takes into account current commitments, existing plans, and the proposals in the budget.
Page 341

5.4 Treasury Management Limits on Activity
The table below shows the debt related treasury activity limits. Members are asked to note that the maturity structure guidance changed in the CIPFA 2011 guidance notes for Lenders Option Borrowers Option (LOBO) Loans, the maturity dates is now deemed to be the next call date. As interest rates begin to rise, it may be beneficial for the Council to go into some variable rate investments to avoid being locked into long-term investments at low rates in a period of rising interest rates or shorter duration borrowing to gain advantage of low rates.
Page 342

The table below shows the fixed and variable interest rate exposure
2016/17 2017/18 2018/19 2019/20 2020/21 Interest Rate Exposures Upper
Estimate Upper
Estimate Upper
Estimate Upper
Estimate Upper
Estimate Upper limit for fixed interest rates based on net debt
100% 100% 100% 100% 100%
Upper limit for variable interest rates based on net debt
50% 50% 50% 50% 50%
Limits on fixed interest rates: • Debt only • Investments only
100% 100%
100% 100%
100% 100%
100% 100%
100% 100%
Limits on variable interest rates • Debt only • Investments only
50% 50%
50% 50%
50% 50%
50% 50%
50% 50%
The table below shows the Limits on the Maturity Structure of Borrowing Maturity Structure of fixed
interest rate borrowing 2017/18 Maturity Structure of variable
interest rate borrowing 2017/18 Actual at
30/11/2016 Lower Upper Actual
30/11/2016 Lower Upper
Under 12 months 3.39% 0% 60% 0% 0% 50% 12 months to 2 years 0% 0% 60% 0% 0% 50%
2 years to 5 years 3.42% 0% 60% 0% 0% 50% 5 years to 10 years 22.66% 0% 80% 0% 0% 50% 10 years to 20 years 14.53% 0% 100% 0% 0% 50%
20 years to 30 years 11.54% 0% 100% 0% 0% 50%
30 years to 40 years 27.36% 0% 100% 0% 0% 50%
40 years to 50 years 17.10% 0% 100% 0% 0% 50%
Local Indicators In setting the indicators below, the Council has taken into consideration investment risks and returns. The table below shows target borrowing and investment rates 2015/16
Actual %
2016/17 Estimate
%
2017/18 Estimate
%
2018/19 Estimate
%
2019/20 Estimate
%
2020/21 Estimate
%
Average Investment Target Return
0.78% 0.84% 0.75% 0.75% 1.00% 1.25%
Average Investment Target – Property Fund
n/a 3.5% 3.5% 3.5% 3.5% 3.5%
Long Term Borrowing Target
• Current Portfolio
5.72%
5.72%
5.70%
5.72%
5.72%
5.72%
Page 343

The average investment target return above is based on the expected target
return for the stated periods. 5.5 Policy on Borrowing in Advance of Need
London Borough of Merton will not borrow more than, or in advance of its need, purely in order to profit from the investment of the extra sums borrowed. Any decision to borrow in advance will be within forward approved CFR estimates, and will be considered carefully to ensure that value for money can be demonstrated and that the Council can ensure the security of such funds. Borrowing in advance could be made within the constraints that:
• It will be limited to no more than 50% of the expected increase in borrowing need (CFR) over the three year planning period; and
• Would not look to borrow more than 24 months in advance of need. Where possible rates will be locked using forward borrowing to reduce the risk of the Council holding cash in low interest rate environment.
Risks associated with any borrowing in advance activity will be subject to prior appraisal and subsequent reporting through the mid-year or annual reporting mechanism. The probability of this happening is low. However should the Council need to borrow in advance of need, then the following will apply.
Year Maximum Borrowing in advance Notes 2017/18 No more than 50% of under
borrowing requirement Borrowing in advance will be limited to no more than 50% of the expected increase in borrowing need (CFR) over the period of the approved Medium Term Capital Programme, a maximum of 2 years in advance to reduce carrying costs.
2018-19 No more than 50% of under borrowing requirement
2019-20 No more than 50% of under borrowing requirement
2020-21 No more than 50% of under borrowing requirement
5.6. Debt Rescheduling
Long-term fixed rates have remained relatively unchanged over the past three years. Although borrowing costs remain historically attractive, redemption rates are prohibitive. The following table shows the maturity profile of the Council’s current debt as at 30 November 2016.
Page 344

Duration £'000 % of Debt Portfolio
less than 1 year 3,966 3.39 1 - 2 years 0 0 2 - 5 years 4,000 3.42
5 -10 years 26,510 22.66 10 -15 years 4,500 3.85 15- 20 years 12,500 10.69 20 - 25 years 0 0.00 25-30 years 13,500 11.54
30 - 35 years 0 0.00 35-40 years 32,000 27.36
40 -45 years 0 0.00 45-50 years 20,000 17.10
Total 116,976 100.00 All of the Council’s LOBOs are past their non call period, however, should all LOBOs be called at their next interest due date then the maturity profile will be as shown in the table below, an event which is very unlikely in the current low interest rate environment.
Duration £'000 % of Debt Portfolio
less than 1 year 63,000 53.86 1 - 2 years 1,966 1.68 2 - 5 years 0 0.00
5 -10 years 26,510 22.66 10 -15 years 0 0.00 15- 20 years 3,500 2.99 20 - 25 years 0 0.00 25-30 years 0 0.00
30 - 35 years 0 0.00 35-40 years 22,000 18.81
40 -45 years 0 0.00 45-50 years 0 0.00
Total 116,976 100.00 As short term borrowing rates will be considerably cheaper than longer term fixed interest rates, there may be potential opportunities to generate savings by switching from long term debt to short term debt. However, these savings will need to be considered in the light of the current treasury position and the size of the cost of debt repayment (premiums incurred). The reasons for any rescheduling to take place will include: • the generation of cash savings and / or discounted cash flow savings; • helping to fulfil the treasury strategy; • enhancing the balance of the portfolio (amend the maturity profile and/or the
balance of volatility).
Page 345
Consideration will also be given to identify if there is any residual potential for making savings by running down investment balances to repay debt prematurely as short term rates on investments are likely to be lower than rates paid on current debt. The Council tests the markets for redemption opportunities should they exist. The PWLB loans portfolio was elected for the early redemption review as at 30 November 2016. A total loan value of £52m would incur redemption costs of £25million in addition to any accrued interest due. The high cost of early redemption is not economically viable in current markets. However there may be cases where the Council is able to negotiate with the counterparty (Appendix 1). The Director of Corporate Services will continue to review and identify any potential for making savings and provide Cabinet with updates when such opportunities arise. Any rescheduling activity will be reported to Cabinet at the earliest meeting following the transaction. Use of Derivatives The Council may use derivatives for risk management purposes in line with relevant statutory powers, recommended accounting practices and legal opinions on the use of derivatives by Local Authorities in the UK.
5.7 Borrowing Options
The Council will use a number of borrowing sources. These include the Public Works Loans Board (PWLB maturity, EIP or annuity loans), Market loans, Municipal Bond Agency, Retail Bonds, Loans from other Local Authorities and temporary loans. It is hoped that borrowing rates will be lower than those offered by the PWLB. The Council intends to make use of this new source of borrowing as and when appropriate.
5.8 Changes Which May Affect Treasury Management
- Future Regulatory Changes to Money Market Fund Valuation Proposed EU legislative changes will require money market funds with constant net asset value to change to variable net asset value. This will mean that investors in the fund will be liable for their share of losses as a result of counterparty failure. Consultation continues on the expected changes.
- Proposed Changes to Leasing Future changes to accounting for leasing may mean that the cost of service will increase along with increases in MRP and CFR which will affect the Council’s underlying borrowing requirement. It is anticipated that there may be some impact on both capital and revenue income and the changes will require all leases to be included on the balance sheet and be measured on PV of future lease payments. The new lease standard (IFRS 13) issued in 2015 is not anticipated to be adopted until 2019/20. - Municipal Bond Agency
Page 346

It is likely that the Municipal Bond Agency currently in the process of being set up will be offering loans to local authorities in the near future. It is also hoped that borrowing rates will be lower than those offered by the PWLB.
- Future Challenges to Local Government Funding Future challenges to local government funding and their effect on cash flow remains a challenge.
6. ANNUAL INVESTMENT STRATEGY
6.1 Investment Policy
London Borough of Merton’s investment policy has regard to the CLG’s Guidance on Local Government Investments (“the Guidance”) and the revised CIPFA Treasury Management in Public Services Code of Practice and Cross Sectoral Guidance Notes (“the CIPFA TM Code”). The Council’s investment priorities will be security first, liquidity second, then return.
6.2 Investment Strategy
The Council does not place cash with fund managers as all of its cash is managed in-house. Base rate is forecast to remain at 0.25% till Q4 2019. The forecast rates have been built on the basis that bank rate is expected to remain unchanged until around the fourth quarter of 2019, however if interest rates do not rise then future income expectations may not be met. Local indicators /benchmark for investments set is included in paragraph 5.4 of this report. In order to maximise returns, cash available for investments will be split into three categories; • Operational cash (under 3 months) • Core cash (available for 3 to 6 months) • Strategic cash (available for over 6 months)
The aim is to invest strategic cash for a minimum period of 12 months to enable the Council to secure advantageous rates, taking account of counterparty risk. However this is also constrained by counterparty risk. Operational cash will predominantly be lent overnight or for periods less than three months.
6.3 Alternative Investment Instruments The Council has in the past restricted its treasury activities to simple investment structures like fixed deposits and money market funds. However, in the current market, regulatory and economic environment, the Council may be required to utilise various instruments. Appendix 5 of this report gives a detailed overview of the types of instrument and investment options available to the Council. The global financial crisis of 2008 led to a major overhaul of regulation, market practices and financial institutions across the world. The changes have been aimed at promoting greater transparency and investor confidence.
Page 347

Some of these measures include more institution-level regulatory changes like stringent capital, leverage and liquidity requirements in addition to The European Union (EU) Directives on Bank Recovery and Resolution (BRRD) and Deposit Guarantee Schemes (DGSD) among a few are key in this reform. Although these changes are ultimately designed to make financial systems more robust, they are not expected to have a fundamental impact on insolvency creditor hierarchy. Although the Council does not expect a fundamental change in type of instruments it uses in the delivery of its treasury management activities, a number of new instruments have been included to provide flexibility should there be changes in the economic environment which may warrant their use. As with any investment, there are varying degrees of risk associated with each instrument or investment options. Should the Council decide to invest in any asset class a comprehensive analysis will be conducted to understand the associated risk and each instrument will be signed off by the Director of Corporate Services prior to any activity.
6.4 Investment Treasury Indicator and Limit - total principal funds invested for greater than 364 days. These limits are set with regard to the Council’s liquidity requirements and are based on the availability of funds after each year-end.
31 Dec
2016 Actual £’m
2016/17 Estimate £’m
2017/18 Estimate £’m
2018/19 Estimate £’m
2019/20 Estimate £’m
2020/21 Estimate £’m
Estimated Principal sums invested greater than 364 days
5m 18m 40m 40m 30m 30m
In addition to fixed deposits, a number of other financial instruments like Property funds will fall under the category of investments with duration exceeding 364 days. In addition to using money market funds, call accounts and notice accounts, the Council will seek to utilise other liquid and transferable instruments like certificate of deposits and gilts for its cashflow balances.
6.5 Use of Specified and Non-Specified Investments
Investment instruments identified for use in the financial year are as follows: Specified Investments These are sterling investments of not more than one-year maturity, or those which could be for a longer period where the Council has the right to be repaid within 12 months if it wishes. These are considered low risk assets where the possibility of loss of principal or investment income is small. These would include sterling investments which would not be defined as capital expenditure by virtue of regulation 25(1)(d) of the Local Authorities (Capital Finance and Accounting) (England) Regulations 2003 [SI 3146 as amended with: • The investment is denominated in sterling and any payments or
repayments in respect of the investment are payable only in sterling;
Page 348

• The investment is not a long-term investment; • The making of the investment is not defined as capital expenditure]; and • The investment is made with a body or in an investment scheme of high
credit quality or with one of the following public-sector bodies: o The United Kingdom Government; o A local authority in England or Wales (as defined under section 23 of the
2003 Act).
Non-Specified Investments Non-Specified investments are defined as those not meeting the above criteria and exceeding 365 days in duration.
6.6 Investment Risk Benchmarking These benchmarks are simple guides to maximum risk, so they may be breached from time to time, depending on movements in interest rates and counterparty criteria. The purpose of the benchmark is that officers will monitor the current and trend position and amend the operational strategy to manage risk as conditions change Revenue Pressures – 0.1% improvement on £20m is £20k income generated and the cost of no risk is lost revenue therefore risks must be balanced to the Council’s risk appetite. Security - The Council’s maximum security risk benchmark for the current portfolio:
• Liquidity – in respect of this area the Council seeks to maintain: o Bank overdraft - £1m o Liquid short-term deposits of around £5m or more available with one
day access. 6.7 Risk Management and Creditworthiness Policy
This Council applies the creditworthiness service provided by Capita Asset Services. This service employs a sophisticated modelling approach utilising credit ratings from the three main credit rating agencies - Fitch, Moody’s and Standard and Poor’s. The credit ratings of counterparties are supplemented with the following overlays: • Credit watches and credit outlooks from credit rating agencies; • CDS spreads to give early warning of likely changes in credit ratings; • Sovereign ratings to select counterparties from only the most creditworthy
countries.
This modelling approach combines credit ratings, credit Watches and credit Outlooks in a weighted scoring system which is then combined with an overlay of CDS spreads for which the end product is a series of colour coded bands which indicate the relative creditworthiness of counterparties. These colour codes are used by the Council to determine the suggested duration for investments. The Council will therefore use counterparties within the following durational bands:
Page 349

Y Pi1 Pi2 P B O R G N/C1 1.25 1.5 2 3 4 5 6 7
Up to 5yrs Up to 5yrs Up to 5yrs Up to 2yrs Up to 1yr Up to 1yr Up to 6mths Up to 100days No Colour
• Yellow 5 years • Dark pink 5 years for Enhanced money market funds (EMMFs) with a credit
score of 1.25 • Light pink 5 years for Enhanced money market funds (EMMFs) with a credit
score of 1.5 • Purple 2 years • Blue 1 year (only applies to nationalised or semi nationalised UK Banks) • Orange 1 year • Red 6 months • Green 100 days • No colour not to be used
Colour (and long term rating where
applicable)
Money Limit
Time Limit
Banks yellow £35m 5yrs
Banks purple £25m 2 yrs
Banks orange £25m 1 yr
Banks – part nationalised blue £25m 1 yr
Banks red £10m 6 mths
Banks green £5m 100 days
Banks No colour Not to be used
Limit 3 category – Council’s banker Lloyds bank £5m 1 day
Other institutions limit - £5m 1yrs
DMADF AAA unlimited 6 months
Local authorities n/a £5m 1yrs
Fund rating Money Limit
Time Limit
Money market funds AAA £35m Instant
Enhanced money market funds with a credit score of 1.25
Dark pink / AAA £25m Instant
Enhanced money market funds with a credit score of 1.5
Light pink / AAA £10m Instant
Page 350

The Capita Asset Services’ creditworthiness service uses a wider array of information than just primary ratings. Furthermore, by using a risk weighted scoring system, it does not give undue preponderance to just one agency’s ratings.
Typically the minimum credit ratings criteria the Council use will be a Short Term rating (Fitch or equivalents) of F1 and a Long Term rating of A-. There may be occasions when the counterparty ratings from one rating agency are marginally lower than these ratings but may still be used. In these instances consideration will be given to the whole range of ratings available, or other topical market information, to support their use.
All credit ratings will be monitored regularly. The Council is alerted to changes to ratings of all three agencies through its use of the Capita Asset Services’ creditworthiness service. • if a downgrade results in the counterparty / investment scheme no longer
meeting the Council’s minimum criteria, its further use as a new investment will be withdrawn immediately.
• in addition to the use of credit ratings the Council will be advised of information in movements in credit default swap spreads against the iTraxx benchmark and other market data on a daily basis via its Passport website, provided exclusively to it by Capita Asset Services. Extreme market movements may result in downgrade of an institution or removal from the Council’s lending list.
Sole reliance will not be placed on the use of this external service. In addition this Council will also use market data and market information, information on any external support for banks to help support its decision making process.
6.8 Country and Sector Limits The Council has determined that it will only use approved counterparties from
countries with a minimum sovereign credit rating of AA- from Fitch (or equivalent). The list of countries that qualify using this credit criteria as at the date of this report are shown in Appendix 3. This list will be added to, or deducted from by officers should ratings change in accordance with this policy.
6.9 Banking Arrangements The Council’s bankers are Lloyds bank. The Council’s bank accounts include some school accounts and client bank accounts managed as part of its Appointeeship role for residents that require this support. All schools are responsible for the management of their bank accounts. From time to time the Council may open bank accounts with other banks for specific reasons, subject to approval by the Director of Corporate Services.
6.10 Lending to Community Organisations, Other Third Parties and RSLs - Any loans to or investments in third parties will be made under the Well Being powers of the Council conferred by section 2 of the Local Government Act 2000 or Localism Act of 2011. The Well Being power can be exercised for the benefit of some or all of the residents or visitors to a local authority’s area. The power may also be used to benefit organisations, schools, local enterprises, local companies or even
Page 351

individuals. Loans of this nature will be under exceptional circumstances and must be approved by Cabinet or by delegated authority to the Director of Corporate Services. Authorisation from the Financial Conduct Authority (FCA) will also be sought where applicable. Where it is deemed necessary, additional guarantees will be sought. This will be via security against assets and/or through guarantees from a parent company. The Council will also consider other factors like the statutory powers in place, reasonableness of the investment, FCA, objective and revenue earnings for the Council, MRP requirements, accounting issues and categorisation of the expenditure as capital or revenue. In other instances, the Council may receive soft loans from government agencies.
6.11 Non-Treasury Investment Lending The Council may be required to make policy investments for the good of its community by lending to local organisations and in some cases schools. Legal agreements are drawn which stipulate the terms of the loan which includes the ability of the organisation to make repayments. The Council may also lend to its wholly owned companies.
6.12 Comparative Reviews - The Council participates in various comparative and
benchmarking clubs. 7. Cashflow Management 7.1 CIPFA requires all monies to be under the control of the responsible officer and
for cashflow projections to be prepared on a regular and timely basis. Cashflow provides outline of operations. Actuals and forecast are recorded using Logotech systems. At the end of each day the net receipts and payments is either invested or borrowed to ensure that the Council’s bank account is kept at a minimum. Forecasts are based on best estimates which may slip due to unforeseen circumstances and the nature of large projects. The Council can borrow in advance of need if rates fall and borrowing becomes a lot more advantageous than it currently is.
7.2 Purchase and Corporate Credit Cards
The use of corporate credit cards like other accounts payable methods carries significant risks. The Director of Corporate Services is responsible for ensuring that the Council has appropriate controls in place to protect the Council’s funds.
8. Policy on the use of External Service Providers
The Council recognises CIPFA’s guidance on Treasury Management that the responsibility for Treasury Management cannot be delegated outside the authority and recognises that any external service provider used by the Council is to support the in-house Treasury Management function. The Council will
Page 352

ensure that the terms of their appointment and the methods by which their value will be assessed are properly agreed and documented, and subjected to regular review. The Council is aware of the CIPFA Treasury Management Advisors Regulation and Services issued in March 2010.
The Council is also mindful of the requirements of the Bribery Act 2011 as amended in its dealings with external providers. A copy of the Council’s policy can be found in the link below. http://www.merton.gov.uk/democratic_services/w-agendas/w-nonexecreports/1115.pdf
9. Training
A key outcome of the recent investigations into Local Authority investments is the need to ensure that all relevant Treasury Management staff receive appropriate training and knowledge in relation to these activities. Training is provided in-house on the job, via CIPFA seminars and training courses, treasury adviser seminars and training courses and sometimes counterparties conduct training. In addition, members of the team attend national forums and practitioner user groups.
10. The Localism Act 10.1 A key element of the Act is the “General Power of Competence”: “A local
authority has power to do anything that individuals generally may do.” CIPFA emphasise that where the legality of the use of derivatives is confirmed, then there is a need for a framework for their use. The Council currently does not use derivatives. Should the need for the use of derivatives arise as a requirement for managing its interest rate exposure or hedging its investments, the Council will take legal advice and report to members before use.
11. Treasury Management Practices 11.1 The 2011 Code reinforces a framework of 12 Treasury Management practices
(TMPs), which define the manner in which authorities seek to achieve the policies and objectives outlined in their Treasury Management policy statement. The Council’s detailed Treasury Management practices approved in March 2012/13 can be found on the Council’s intranet. An updated version is included as Appendix 5
12. Appendices 12.1 Appendix 1– Early Repayment of Debt Estimate
Appendix 2 – Policy Investments (Non-Treasury Management Investments) Appendix 3 – Approved Countries for Investment
Appendix 4 – The Treasury Management Role of the S151 Officer Appendix 5 – Treasury Management Practices 2017/18
Page 353

Appendix 6 – Prudential Indicators for 2016/17 to 2019/20 Appendix 7 – Glossary Appendix 8 – Cashflow Forecast
13. Background Papers
• CIPFA Prudential Code for Capital Finance in Local Authorities 2013 Edition
• 2016/17 Treasury Management Strategy report • The Guide to Local Government Finance (2013 Edition) Module 4:
Treasury Management • CIPFA Practical Considerations in Using Financial Instruments to Manage
Risk in the Public Sector • London Borough of Merton Capital Strategy 2017/21
Page 354

APPENDIX 1 – Early Repayment of Debt Estimates for a Selection of Debt
PWLB loan Early Redemption Estimates at 30 November 2016
Internal Reference No. Lender
Last Date Interest was Paid
Loan Start Date
Loan Term (yrs)
Loan Maturity Date
Loan Principal Outstanding (£)
Loan Rate (%)
Term left on Loan (Yrs)
Next Interest Due Date
Discount Rate (%)
Accrued Interest to 30 Nov 2016 (£)
Premium/Discount (£) Total Due (£)
1000484711 PWLB 31/10/2016 13/11/2000 24 31/10/2024 5,000,000 5.000 7.9 30/04/2017 0.97 20,547.95 1,532,107.50 6,552,655.45 1000484981 PWLB 31/10/2016 30/11/2000 24 31/10/2024 1,500,000 4.750 7.9 30/04/2017 0.97 5,856.16 431,119.08 1,936,975.24 1005489969 PWLB 20/11/2016 20/05/2005 30 20/05/2035 2,500,000 4.450 18.4 20/05/2017 1.85 3,047.95 1,013,124.14 3,516,172.09 1005490706 PWLB 21/11/2016 21/11/2005 26 21/11/2031 1,000,000 4.250 14.9 21/05/2017 1.69 1,047.95 337,449.67 1,338,497.62 1005490967 PWLB 25/07/2016 10/01/2006 50 25/07/2055 10,000,000 3.950 38.6 25/01/2017 1.74 138,520.55 6,199,143.25 16,337,663.80 1005490976 PWLB 25/07/2016 10/01/2006 50 25/07/2055 5,000,000 3.950 38.6 25/01/2017 1.74 69,260.27 3,099,571.62 8,168,831.89 1006491475 PWLB 28/10/2016 28/04/2006 45.5 28/10/2051 7,000,000 4.400 34.8 28/04/2017 1.81 27,846.58 4,676,574.39 11,704,420.97 1097480120 PWLB 30/09/2016 15/10/1997 25.5 31/03/2023 310,000 6.625 6.3 31/03/2017 0.72 3,432.29 113,120.87 426,553.16 1097480121 PWLB 30/09/2016 15/10/1997 26.5 31/03/2024 12,000,000 6.500 7.3 31/03/2017 0.89 130,356.16 4,768,440.63 16,898,796.79 1097480232 PWLB 30/09/2016 11/11/1997 26.5 31/03/2024 1,700,000 6.750 7.3 31/03/2017 0.89 19,177.40 705,632.88 2,424,810.28 1098480925 PWLB 31/10/2016 30/04/1998 26 30/04/2024 6,000,000 5.875 7.4 30/04/2017 0.89 28,972.60 2,142,364.86 8,171,337.46 52,010,000 448,065.86 25,018,648.89 77,476,714.75
Page 355

APPENDIX 2 – Policy Investments (Non-Treasury Management Investments) Type
Duration
Joint Development Companies One month to 10 years Subject to specific terms Loans to Registered Landlords One month to 5 years Subject to specific terms Open Loan Facility to RCL’s with an affiliation with Merton One month to 5 years Subject to specific terms Loans to wholly owned companies One month to 30 years Subject to specific terms Loan to any other type of organisation One month to 10 years Subject to specific terms
Page 356

APPENDIX 3 – APPROVED COUNTRIES FOR INVESTMENTS (as at 30 November 2016) Below is the current list of approved countries for investments for use by the Council’s treasury team. The countries on the Council’s approved list may change from time to time as Sovereign ratings change. This list is based on those countries which have sovereign ratings of AA- or higher and also, (except - at the time of writing - for Norway and Luxembourg), have banks operating in sterling markets which have credit ratings of green or above in the Capita Asset Services credit worthiness service. AAA
• Australia • Canada • Denmark • Germany • Luxembourg • Netherlands • Norway • Singapore • Sweden • Switzerland
AA+
• Finland • U.K. • U.S.A.
AA
• Abu Dhabi (UAE) • France • Qatar
AA-
• Belgium
Page 357

APPENDIX 4
Treasury Management Role of the Section 151 Officer The S151 Officer (Director of Corporate Services)
• recommending clauses, Treasury Management policy / practices for approval, reviewing the same regularly, and monitoring compliance;
• submitting regular Treasury Management policy reports; • submitting budgets and budget variations; • receiving and reviewing management information reports; • reviewing the performance of the Treasury Management function; • ensuring the adequacy of Treasury Management resources and skills, and the
effective division of responsibilities within the Treasury Management function; • ensuring the adequacy of internal audit, and liaising with external audit; • recommending the appointment of Treasury Management external service providers. • Approval of appropriate money market funds for the Council to invest in.
Page 358

APPENDIX 5
LONDON BOROUGH OF MERTON TREASURY MANAGEMENT PRACTICES 2017/18
TMP 1: RISK MANAGEMENT The Director of Corporate Services – the responsible officer will implement and monitor all arrangements for the identification, management and control of treasury management risk, will report at least annually on the adequacy / suitability thereof, and will report, as a matter of urgency, the circumstances of any actual or likely difficulty in achieving the organisation’s objectives in this respect, all in accordance with the procedures set out in TMP6 Reporting requirements and management information arrangements. In respect of each of the following risks, the arrangements which seek to ensure compliance with these objectives are set out in the schedule to this document.
1.1 Credit and Counterparty Risk Management The Council regards a key objective of its treasury management activities to be the security of the principal sums it invests. Accordingly, it will ensure that its counterparty lists and limits reflect a prudent attitude towards organisations with which funds may be deposited, and will limit its investment activities to the instruments, methods and techniques referred to in TMP4 Approved Instruments Methods and Techniques and listed in the schedule to this document. It also recognises the need to have, and will therefore maintain, a formal counterparty policy in respect of those organisations from which it may borrow, or with whom it may enter into other financing or derivative arrangements. Policy on the use of credit risk analysis techniques
• The Council will use credit criteria in order to select creditworthy counterparties for placing investments with.
• Credit ratings will be used as supplied from all three rating agencies - Fitch, Moody’s and Standard & Poor’s.
• Treasury management consultants will provide regular updates of changes to all ratings relevant to the Council.
• The treasury manager will formulate suitable criteria for assessing and monitoring the credit risk of investment counterparties and shall construct a lending list comprising maturity periods, type, group, sector, country and counterparty limits.
1.2 Liquidity Risk Management The Council will ensure it has adequate, though not excessive cash resources, borrowing arrangements, overdraft or standby facilities to enable it, at all times, to have the level of funds available to it which are necessary for the achievement of its business/service objectives. The Council will only borrow in advance of need where there is a clear business
Page 359

case for doing so and will only do so for the current capital programme or to finance future debt maturities. The treasury management team shall seek to minimise the balance held in the Council’s main bank accounts at the close of each working day. Borrowing or lending shall be arranged in order to achieve this aim. At the end of each financial day any unexpected surplus funds are transferred to the main bank account. Bank overdraft arrangements – A £1 million net overdraft at 2% over base rate on debit balances has been agreed as part of the banking services contract. The overdraft is assessed on a group basis for the Council’s accounts. Separate facilities are available for the Pension Fund bank account.
a. Short-term borrowing facilities The Council accesses temporary loans through approved brokers on the London money market.
b. Special payments Where an urgent clearing house automated payment system (CHAPS) payment is required, a CHAPS payment request form must be completed and forwarded to the Head of Transactional Services who then checks for correct required signatures and supporting paperwork. Further guidance can be found on the Council’s intranet.
c. Inter account transfer
From time to time, transactions occur between the Pension Fund and the Council. Reimbursement where necessary is by inter-account transfers between both bank accounts.
1.3 Interest Rate Risk Management and use of Derivatives The Council will manage its exposure to fluctuations in interest rates with a view to containing its interest costs, or securing its interest revenues, in accordance with the amounts provided in its budgetary arrangements as amended in accordance with TMP6 Reporting requirements and management information arrangements. It will achieve this by the prudent use of its approved financing and investment instruments, methods and techniques, primarily to create stability and certainty of costs and revenues, but at the same time retaining a sufficient degree of flexibility to take advantage of unexpected, potentially advantageous changes in the level or structure of interest rates. This should be the subject to the consideration and, if required, approval of any policy or budgetary implications. The Council does not use derivatives, the Council’s S151 Officer will ensure that any hedging tools such as derivatives are only used for the management of risk and the prudent management of financial affairs and that the policy for the use of derivatives when used will be clearly stated to members. The treasury management strategy has full details of interest rate exposure limits. Policies concerning the use of instruments for interest rate management.
Page 360

• Forward Dealing Consideration will be given to dealing for forward periods depending on market conditions. When forward dealing is more than a 364 day period forward, the approval of the Director of Corporate Services is required.
• Callable Deposits
The council may use callable deposits as part as of its Annual Investment Strategy (AIS). The credit criteria and maximum periods are set out in the Schedule of Specified and Non Specified Investments appended to the AIS.
Policy on Use of Lender’s Option Borrower’s Option (LOBO) Loans LOBOs give the lender the option to propose an increase in the interest rate at pre-determined dates, and the borrower, the option to accept the new rate or redeem the loan without penalty. Use of LOBOs is considered as part of the Council’s annual borrowing strategy. All long-term borrowing must be approved by the S151 Officer. 1.4 Exchange Rate Risk Management Occasionally, the Council has to make foreign exchange payments, the Council will manage its exposure to fluctuations in exchange rates so as to minimise any detrimental impact on its budgeted income/expenditure.
1.5 Refinancing Risk Management The Council will ensure that its borrowing, private financing and partnership arrangements are negotiated, structured and documented, and the maturity profile of the monies raised are managed, with a view to obtaining offer terms at renewal or refinancing, if required, which are competitive and as favourable to the organisation as can reasonably be achieved in the light of market conditions prevailing at the time.
The Council will actively manage the relationships with counterparties in such a manner as to secure the above objective, and will avoid overreliance on any one source of funding if this might jeopardise achievement of the above. The Council will establish through its Prudential and Treasury Indicators the amount of debt maturing in any year. Any debt rescheduling will be considered when the difference between the refinancing rate and the redemption rate is most advantageous and the situation will be continually monitored in order to take advantage of any perceived anomalies in the yield curve. The reasons for rescheduling include:
a) to generate cash savings at minimum risk; b) to reduce the average interest rate; and c) to amend the maturity profile and/or the balance of volatility of the debt portfolio
Page 361

Any rescheduling will be reported to the Council at the meeting immediately following the action. 1.6 Legal and Regulatory Risk Management The Council will ensure that all of its treasury management activities comply with its statutory powers and regulatory requirements. It will demonstrate such compliance, if required to do so, to all parties with whom it deals in such activities. In framing its credit and counterparty policy under TMP1 1.1 Credit and Counterparty Risk Management, it will ensure that there is evidence of counterparties powers, authority and compliance in respect of the transactions they may effect with the organisation, particularly with regard to duty of care and fees charged. The Council recognises that future legislative or regulatory changes may impact on its treasury management activities and, so far as it is reasonably able to do so, will seek to minimise the risk of these impacting adversely on the organisation. The Council will ensure that its treasury management activities comply fully with legal statute, guidance, Codes of Practice and the regulations of the Council.
The Council’s powers to borrow and invest are contained in the Local Government Act 2003, section 12 and Local Government Act 2003, section 1. The treasury management scheme of delegation is contained in the Corporate Services Scheme of Delegation. This document contains the officers who are authorised signatories. The Council’s monitoring officer is the Assistant Director Corporate Resources while the S151 Officer is the Director of Corporate Services.
1.7 Fraud, Error and Corruption, and Contingency Management Treasury tasks are segregated and adequate internal checks have been implemented to minimise risks and fraud. Procedures are documented and staff will not be allowed to take up treasury management activities until they have had proper training and are subject to an adequate and appropriate level of supervision. Records will be maintained of all treasury management transactions so that there is a full audit trail and evidence of the appropriate checks being carried out. Periodic backups will be made to ensure contingency of systems is available. Details of Systems and Procedures to be Followed, Including Internet Services The Council uses Logotech Treasury systems as its treasury management recording tool.
• The Corporate Services Scheme of Delegation sets out the delegation of duties to officers and the Council’s constitution details delegated authority of treasury management to the Section 151 Officer.
• All loans and investments are negotiated by the Treasury Manager or other authorised persons.
• All long-term loans must be authorised by the Section 151 Officer.
Page 362

1.8 Market Risk Management The Council will seek to ensure that its stated treasury management policies and objectives will not be compromised by adverse market fluctuations in the value of the principal sums it invests, and will accordingly seek to protect it from the effects of such fluctuations. This is controlled mainly by setting limits on investment instruments where the principal value can fluctuate. The limits are detailed in the Treasury Management Strategy TMP 1: SCHEDULE 1 – SPECIFIED AND NON SPECIFIED INVESTMENTS This is included in the Treasury Management Strategy. TMP 2: PERFORMANCE MEASUREMENT 2.1 Evaluation and Review of Treasury Management Decisions
Periodic Review During the Financial Year The Director of Corporate Services will hold treasury management review meetings with the Treasury Manager, periodically or as required to review actual activity against the Treasury Management Strategy Statement (TMSS) and cashflow forecasts. This will include: Total debt (both on-and off- balance sheet) including average rate and maturity profile. Total investments including average rate and maturity profile and changes to the
above from the previous review and against the TMSS. Cashflow forecast against the actual.
Annual Review After the end of the Financial Year Annual Treasury Report will be submitted to the Full Council each year after the close of the financial year.
Comparative Review Each year or on a quarterly basis, comparative review is undertaken to see how the Council’s performance on debt and investments compares to other authorities with similar size portfolios (but allowing for the fact that Prudential and Treasury Indicators are set locally). Such reviews are: - CIPFA Treasury Management statistics published each year for the last complete
financial year CIPFA Benchmarking Club CIPFA Risk Study Other
Page 363

2.2 Benchmarks and Calculation Methodology 2.2.1 Debt management
• Average rate on all external debt • Average rate on external debt borrowed in previous financial year • Average period to maturity of external debt • Average period to maturity of new loans in previous year
2.2.2 Investment The performance of investment earnings will be measured against any of the following benchmarks:
• In-house benchmark and when necessary other benchmarks such as Bank of England base rate, 7-day LIBID uncompounded, 7-day LIBID compounded weekly, 1-month LIBID and 3-month LIBID compounded quarterly
Performance will also be measured against other local authority funds with similar benchmark and parameters managed by other fund managers using the CIPFA treasury management benchmark service. 2.3 Policy Concerning Methods for Testing Value-for-money in Treasury
Management The process for advertising and awarding contracts will be in-line with the Council’s Contract Standing Orders and procurement guidelines.
2.3.1 Money-broking Services From time to time, the Council will use money-broking services in order to make deposits or to borrow, and will establish charges for all services prior to using them. An approved list of firm of brokers is maintained by the Treasury Manager. The list takes account of both prices and quality of service. No firm of brokers will be given undue preference.
2.3.2 Consultants / Advisers Services The Council’s treasury management adviser is Capita Asset Services. TMP 3: DECISION-MAKING AND ANALYSIS 3.1 Funding, Borrowing, Lending, and New Instruments/Techniques
3.1.1 Records to be kept The following records will be retained: • Daily cash balance forecasts for the day and previous day • Money market deal booking and deal approval confirmation emails • Dealing slips for all investment and borrowing transactions • Brokers’ confirmations for all investment and temporary borrowing transactions
made through brokers
Page 364
• Confirmations from borrowing / lending institutions including money market fund portals
• PWLB loan confirmations • PWLB interest due schedule • Certificates for market loans, local bonds and other loans • Deal confirmation letters for deals over one month • Banking and other contract documents which the treasury team has
responsibility for.
3.1.2 Processes to be pursued • Cashflow analysis • Debt and investment maturity analysis • Ledger/Logotech/Bank reconciliations • Review of counterparty limits in addition to monitoring of counterparties • Review of opportunities for debt restructuring • Review of borrowing requirement to finance capital expenditure (and other forms
of financing where those offer value for money) • Performance information (e.g. monitoring of actuals against budget for debt
charges, interest earned, debt management; also monitoring of average pool rate, investment returns, etc)
• Treasury contracts management
3.1.3 Issues to be addressed
3.1.3.1 In respect of all treasury management decisions made the Council will: a) Above all be clear about the nature and extent of the risks to which the
Council may become exposed b) Be certain about the legality of the decision reached and the nature of the
transaction, and that all authorities to proceed have been obtained c) Be content that the documentation is adequate both to deliver the Council’s
objectives and protect the Council’s interests, and to deliver good housekeeping
d) Ensure that third parties are judged satisfactory in the context of the council’s creditworthiness policies, and that limits have not been exceeded
e) Be content that the terms of any transactions have been fully checked against the market, and have been found to be competitive; and
f) Ensure that adequate investigation on security of the Council’s funds has been conducted
3.1.3.2 In respect of borrowing and other funding decisions, the Council will:
a) Consider the ongoing revenue liabilities created, and the implications for the organisation’s future plans and budgets
b) Evaluate the economic and market factors that might influence the manner and timing of any decision to fund
Page 365

c) Consider the merits and demerits of alternative forms of funding, including funding from revenue, use of reserves, leasing and private partnerships; and
d) Consider the alternative interest rate bases available, the most appropriate periods to fund and repayment profiles to use.
3.1.3.3 In respect of investment decisions, the Council will:
a) Consider the optimum period, in the light of cash flow availability and prevailing market conditions; and
b) Consider the alternative investment products and techniques available, especially the implications of using any which may expose the Council to changes in the value of its capital
TMP 4: APPROVED INSTRUMENTS, METHODS AND TECHNIQUES 4.1 Approved Activities of the Treasury Management Operation
• Borrowing; • Lending; • Debt repayment and rescheduling; • Consideration, approval and use of new financial instruments and treasury
management techniques; • Managing the underlying risk associated with the Council’s capital financing and
surplus funds activities; • Managing cash flow; • Banking activities; • Use of external fund managers (other than Pension Fund) • Leasing; • Undertaking all treasury management activities for the Pension Fund including its
strategy setting. 4.2 Approved Instruments for Investments
English and Welsh authorities: The Annual Investment Strategy has a list of approved instruments.
4.3 Approved Techniques
• Forward dealing • LOBOs – Lender’s Option, Borrower’s Option borrowing instrument • Structured products such as callable deposits
Page 366

4.4 Approved Methods and Sources of Raising Capital Finance Finance will only be raised in accordance with the Local Government Act 2003 and within this limit the Council has a number of approved methods and sources of raising capital finance. These are:
On Balance Sheet Fixed Variable PWLB • • EIB • • Market (long-term) • • Market (temporary) • • Market (LOBOs) • • Bonds administered by the Municipal Bond Agency • • Stock issues • • Local (temporary) • • Local Bonds • Overdraft • Negotiable Bonds • • Internal (capital receipts & revenue balances) • • Commercial Paper • Medium Term Notes • Leasing (not operating leases) • • Deferred Purchase • •
Other Methods of Financing Government and EC Capital Grants Lottery monies PFI/PPP Operating and Finance leases Revenue Contributions
Borrowing will only be done in British Pound Sterling. All forms of funding will be considered dependent on the prevailing economic climate, regulations and local considerations. The Director of Corporate Governance has delegated powers in accordance with Financial Regulations, Standing Orders and Scheme of Delegation to Officers to take the most appropriate form of borrowing from the approved sources.
4.5 Investment Limits
The Annual Investment Strategy sets out the limits and the guidelines for use of each type of investment instrument.
4.6 Borrowing Limits The Treasury Management Strategy Statement and Prudential and Treasury Indicators state all appropriate limits.
Page 367

TMP 5: ORGANISATION, CLARITY AND SEGREGATION OF RESPONSIBILITIES, AND DEALING ARRANGEMENTS 5.1 Allocation of Responsibilities
(i) Council (Budget)
• Receiving and reviewing reports on treasury management policy, practice and activity; and
• Approval of annual strategy (ii) Cabinet
• Approval of/amendments to the Council’s adopted clauses, treasury management policy statement and treasury management practice;
• Budget consideration and approval; • Approval of the division of responsibilities; and • Receiving and reviewing regular monitoring reports and acting on
recommendations. (iii) Overview and Scrutiny Commission (Financial Monitoring Task Group)
• Reviewing all treasury management reports and making recommendations to the Cabinet
5.2 Principles and Practices Concerning Segregation of Duties
5.2.1 The following duties are undertaken by separate officers: -
Tasks Duties Responsible Officer
Dealing • Negotiation and approval of deal • Entering of deal into Logotech • Sending confirmation letter to
counterparty (to be signed by authorised signatory)
• Checking of brokers and
counterparty confirmation notes against Logotech
• Reconciliation of FMIS Codes and reconciliation to bank statement
• Sign off of reconciliations
Treasury manager Treasury manager/ Fund officer Treasury manager/Fund officer Fund officer Fund officer Treasury manager Fund officer
Page 368

Accounting Entry
• Processing of accounting entry into FMIS (bank reconciliation team)
Bank reconciliation team
Authorisation / Payment of Deal
• Inputting CHAPS on Lloyds link • Approval of CHAPS on Lloyds link
and CHAPS form authorisation
Treasury manager/Fund officer Authorisers per bank mandate
5.3 Statement of the Treasury Management Duties/Responsibilities of Each Treasury Post
5.3.1 Responsible Officer
The Responsible Officer is the person charged with professional responsibility for the treasury management function and in this Council it is the Director of Corporate Services and is also the S151 Officer This person or delegated persons will carry out the following duties: -
a) Recommending clauses, treasury management policy / practices for
approval, reviewing the same regularly, and monitoring compliance b) Submitting regular treasury management policy reports c) Submitting budgets and budget variations d) Receiving and reviewing management information reports e) Reviewing the performance of the treasury management function f) Ensuring the adequacy of treasury management resources and skills, and
the effective division of responsibilities within the treasury management function
g) Ensuring the adequacy of internal audit, and liaising with external audit h) Recommending the appointment of external service providers. i) The Responsible Officer has delegated powers through this policy to take the
most appropriate form of borrowing from the approved sources, and to make the most appropriate form of investments in approved instruments.
j) The Responsible Officer may delegate her power to borrow and invest to members of her staff. The Treasury Manager, the fund officer. Treasury management team staff must conduct all dealing transactions, or staff authorised by the responsible officer to act as temporary cover for leave / sickness.
k) The Responsible Officer will ensure that Treasury Management Policy is adhered to, and if not will bring the matter to the attention of elected members as soon as possible.
l) Prior to entering into any capital financing, lending or investment transaction, it is the responsibility of the responsible officer to be satisfied, by reference to the Council’s legal department and external advisors as appropriate, that
Page 369

the proposed transaction does not breach any statute, external regulation or the Council’s Financial Regulations
m) It is also the responsibility of the responsible officer to ensure that the council complies with the requirements of The Non-Investment Products Code (formerly known as The London Code of Conduct) for principals and broking firms in the wholesale markets.
5.3.2 Treasury Manager
The responsibilities of this post will be: - a) Drafting the treasury management strategy and annual report b) Execution of transactions c) Adherence to agreed policies and practices on a day-to-day basis d) Maintaining relationships with counterparties and external service providers e) Supervising treasury management staff f) Monitoring performance on a day-to-day basis g) Submitting management information reports to the Responsible Officer; and h) Identifying and recommending opportunities for improved practices
5.3.3 Head of the Paid Service – the Chief Executive
The responsibilities of this post will be: - a) Ensuring that the system is specified and implemented; and b) Ensuring that the Responsible Officer reports regularly to the full Council /
Cabinet or General Purpose Committee on treasury policy, activity and performance.
5.3.4 Monitoring Officer
The responsibilities of this post will be: - a) Ensuring compliance by the Responsible Officer with the treasury
management policy statement and treasury management practice and that they comply with the law
b) Being satisfied that any proposal to vary treasury policy or practice complies with law or any code of practice; and
c) Giving advice to the Responsible Officer when advice is sought
5.3.5 Internal Audit The responsibilities of Internal Audit will be: -
a) Reviewing compliance with approved policy and treasury management practice
b) Reviewing division of duties and operational practice c) Assessing value for money from treasury activity; and d) Undertaking probity audit of the treasury function
5.4 Absence Cover Arrangements
Cover for treasury management staff will be to specific delegated staff.
Page 370

5.5 Dealing Limits o No investment deal must exceed £5million per transaction o No borrowing deal at any point in time must exceed £10 million except when
existing loans are being repaid.
5.6 List of Approved Brokers A list of approved brokers is maintained by the Treasury team and a record of all transactions conducted with them can be obtained from Logotech. Policy on Brokers’ Services It is the Council’s policy to rotate business between brokers.
5.7 Policy on Taping of Conversations
The Council currently does not tape conversations with brokers but ensures that confirmations are received from counterparties.
5.8 Direct Dealing Practices The Council will deal direct with counterparties if it is appropriate and the Council believes that better terms will be available. There are certain types of accounts and facilities, however, where direct dealing is required, as follows; • Business Reserve Accounts • Call Accounts • Money Market Funds • Gilt/CD purchase via custodian; and • Fixed period account e.g. 15-day fixed period account
5.9 Settlement Transmission Procedures
A confirmation letter signed by an authorised signatory per the Council’s bank mandate must be sent to the counterparty if the deal period exceeds one month. Copy of forms folder located in H:/techaccy/treasury/Daily Treasury for PF For payments, any transfer to be made via Lloyds link CHAPS system must be completed by 2.00 p.m. on the same day to ensure it is authorised. Money market funds may have earlier cut-off time/deadlines.
5.10 Documentation Requirements
For each deal undertaken, a record should be prepared giving details of dealer, amount, period, counterparty, interest rate, dealing date, payment date(s), broker and confirmation fax, email or letter.
5.11 Arrangements Concerning the Management of Third-Party Funds.
The Council holds a number of trust funds, appointeeship and custody bank accounts. The cash in respect of these funds is held in the Council’s bank account but transactions are separately coded.
Page 371

TMP 6: REPORTING REQUIREMENTS AND MANAGEMENT INFORMATION ARRANGEMENTS
6.1 Annual Treasury Management Strategy Statement
1. The Treasury Management Strategy Statement sets out the specific expected treasury activities for the forthcoming financial year. This strategy will be submitted the cabinet and then to the Council (budget) for approval before the commencement of each financial year.
2. The formulation of the annual Treasury Management Strategy Statement involves determining the appropriate borrowing and investment decisions in the light of the anticipated movement in both fixed and shorter-term variable interest rates. For instance, this council may decide to postpone borrowing if fixed interest rates are expected to fall, or borrow early if fixed interest rates are expected to rise.
3. The Treasury Management Strategy Statement is concerned with the following elements: a) Prudential and Treasury Indicators b) Current Treasury portfolio position c) Borrowing requirement d) Prospects for interest rates e) Borrowing strategy f) Policy on borrowing in advance of need g) Debt rescheduling h) Investment strategy i) Creditworthiness policy j) Policy on the use of external service providers k) Any extraordinary treasury issue l) MRP strategy
4. The Treasury Management Strategy Statement will establish the expected move in interest rates against alternatives.
6.2 Annual Investment Strategy Statement
At the same time as the Council receives the Treasury Management Strategy Statement it will also receive a report on the Annual Investment Strategy which will set out the following: - a) The Council’s risk appetite in respect of security, liquidity and optimum
performance b) Which specified and non specified instruments the Council will use c) The Council’s policy on the use of credit ratings and other credit risk analysis
techniques to determine creditworthy counterparties for its approved lending list d) Which credit rating agencies the Council will use e) How the Council will deal with changes in ratings, rating watches and rating
outlooks
Page 372
f) Limits for individual counterparties and group limits g) Country limits h) Levels of cash balances i) Interest rate outlook j) Budget for investment earnings k) Policy on the use of external service providers
6.3 Annual Minimum Revenue Provision Statement
This statement sets out how the Council will make revenue provision for repayment of its borrowing using the four options for so doing and will be submitted at the same time as the Annual Treasury Management Strategy Statement.
6.4 Policy on Prudential and Treasury Indicators
1. The Council approves before the beginning of each financial year a number of treasury limits which are set through Prudential and Treasury Indicators.
2. The Responsible Officer is responsible for incorporating these limits into the Annual Treasury Management Strategy Statement, and for ensuring compliance with the limits. Should it prove necessary to amend these limits, the Responsible Officer shall submit the changes for approval to the full Council.
6.5 Other Reporting
• Annual report on treasury management activity • Other management information reports
TMP 7: BUDGETING, ACCOUNTING AND AUDIT ARRANGEMENTS 7.1 Statutory / Regulatory Requirements The accounts are drawn up in accordance with IFRS. The Council has adopted in full
the principles set out in CIPFA’s ‘Treasury Management in the Public Services - Code of Practice’ (the ‘CIPFA Code’), together with those of its specific recommendations that are relevant to the Council’s treasury management activity.
TMP 8: CASH AND CASHFLOW MANAGEMENT 8.1 Arrangements for Preparing Cashflow
Cashflow projections are prepared annually, monthly and daily. The annual and monthly cash flow projections are prepared from the previous year’s cashflow records, adjusted for known changes in levels of income and expenditure, new grant allocations and changes in payments and receipts dates. These details are supplemented on an ongoing basis by information received of new or revised
Page 373

amounts to be paid or received as and when they are known. Logotech is used to record cashflow.
8.2 Bank Statements Procedures
The Council receives daily bank statements on a daily basis, download into the folder below. Estimates on Logotech cashflow is updated with actuals from bank statement. H:\TECHACCY\TREASURY\Daily Treasury for GF General Fund Daily
TMP 9: MONEY LAUNDERING 9.1 Proceeds of Crime Act 2002 and Amendments
See Council’s website and intranet for money laundering process and associated policies http://intranet/anti_money_laundering_policy.pdf
9.2 The Terrorism Act 2000 and Amendment order
See Council’s website and staff intranet on policy. Staff should note that all individuals and businesses in the UK have an obligation to report knowledge, reasonable grounds for belief or suspicion about the proceeds from, or finance likely to be used for, terrorism or its laundering, where it relates to information that comes to them in the course of their business or employment.
9.3 The Money Laundering Regulations 2007 and Updates
The Council’s money laundering officer is the Head of Audit. See Council’s website and intranet for details http://intranet/anti_money_laundering_policy.pdf
Treasury management and banking staff are required to familiarise themselves with all money laundering regulations.
9.4 Procedures for Establishing Identity / Authenticity of Lenders
It is not a requirement under Proceeds of Crime Act (POCA) for local authorities to require identification from every person or organisation it deals with. However, in respect of treasury management transactions, the Council does not accept loans from individuals except during a bond issue.
All loans are obtained from the PWLB, other local authorities or from authorised institutions under the Financial Services and Markets Act 2000. This register can be accessed through the FCA website on www.fca.gov.uk.
9.5 Methodologies for identifying Deposit Takers
Other than those organisations mentioned in para section 6.10 and Appendix 2 of the treasury strategy, in the course of its Treasury activities, the Council will only lend money to or invest with those counterparties that are on its approved lending list.
Page 374

These will be local authorities, the PWLB, Bank of England and authorised deposit takers under the Financial Services and Markets Act 2000. The FCA Register can be accessed through their website on www.fca.gov.uk.
All transactions will be carried out by CHAPS, faster payments or BACS for making deposits or repaying loans.
TMP 10: TRAINING AND QUALIFICATIONS The Council recognises that relevant individuals will need appropriate levels of training in treasury management due to its increasing complexity. All treasury management staff should receive appropriate training relevant to the requirements of their duties at the appropriate time. In addition, training may be provided on-the-job, and it is the treasury manager’s responsibility to ensure that treasury management staff receive appropriate training. 10.1 Details of Approved Training Courses
Treasury management staff and members will go on courses provided by the Council’s treasury management consultants, CIPFA, money brokers etc.
10.2 Records of Training Received by Treasury Staff Staff will keep records on their training.
10.3 Member Training Record Member training will be provided as required.
TMP 11: USE OF EXTERNAL SERVICE PROVIDERS 11.1 Details of Contracts with Service Providers, Including Bankers, Brokers,
Custodian Banks, Consultants, Advisers This Council may employ the services of other organisations to assist it in the field of treasury management. However, it will ensure that it fully understands what services are being provided and that they meet the needs of the Council, especially in terms of being objective and free from conflicts of interest.
11.1.1 Banking Services
a) The Council’s supplier of banking services is Lloyds Bank. The bank is an authorised banking institution authorised to undertake banking activities in the UK by the FCA
b) The branch address is: Lloyds Banking Group 25 Gresham Street, London EC2V 7HN
Page 375

11.1.2 Money-Broking Services The Council will use money brokers for temporary borrowing and investment and
long-term borrowing. It will seek to give an even spread of business amongst the approved brokers.
11.1.3 Consultants’/Advisers’ Services
Treasury Consultancy Services The Council receives mail shots on credit ratings, economic market data and borrowing data. In addition, interest rate forecasts, annual treasury management strategy templates, and from time to time, the Council may receive advice on the timing of borrowing, lending and debt rescheduling. The performance of consultants will be reviewed by the treasury manager to check whether performance has met expectations.
11.1.4 Custodian Banks
The Council will use the services of custodian banks when trading in most transferable instruments like treasury bills. Due procurement process will be followed in the procurement of this service. It should be noted that it is the borrower that pays in most cases and not the lender. Property fund on the other hand do not require custody services, the investor pays all fee.
11.1.5 Credit Rating Information
The Council receives notifications of credit ratings from Capita Asset Services. 11.2 Procedures and Frequency for Tendering Services See TMP2 TMP 12: CORPORATE GOVERNANCE 12.1 List of Documents to be Made Available for Public Inspection
a. The Council is committed to the principle of openness and transparency in its treasury management function and in all of its functions.
b. The Council has adopted the CIPFA Code of Practice on Treasury Management
and implemented key recommendations on developing Treasury Management Practices, formulating a Treasury Management Policy Statement and implementing the other principles of the Code.
Page 376

APPENDIX 6
PRUDENTIAL INDICATORS FOR 2016/17 TO 2019/20 PRUDENTIAL INDICATORS
2016/17 Probable Outturn £’000
2017/18 Forecast
£’000
2018/19 Forecast
£’000
2019/20 Forecast
£’000
1. CAPITAL EXPENDITURE
a) Capital Expenditure (includes expenditure funded by supported, unsupported borrowing and other sources) i) General Fund estimated as at
30/11/16 (Net of Leasing)
31,544
40,259
34,864
16,101
Total as at 30/11/16
31,544
40,259
34,864
16,101
b) In year Capital Financing Requirement (CFR) i) General Fund (Gross of MRP
costs)
7,154
7,004
6,579
7,634
Total in year CFR
7,154
7,004
6,579
7,634
c) Capital Financing Requirement as at 31 March (Balance Sheet figures) i) General Fund (Net of MRP costs)
189,978
181,644
192,997
193,274
Total
189,978
181,644
192,997
193,274
Page 377

2. AFFORDABILITY
a) Ratio of Financing Costs to net Revenue Streams i) General Fund
b) General Fund Impact of Prudential
(Unsupported) Borrowing on Band D Council Tax Levels (per annum) i) In year Increase ii) Cumulative Increase (includes MRP
costs)
11.29% -£39.87
11.50% £0.84 -£39.03
11.51% -£9.85 -£48.88
13.76% £38.74 -£10.14
3. LONG-TERM EXTERNAL DEBT
a) Debt Brought Forward 1 April Debt Carried Forward 31 March
116,976 116,976
113,010 113,010
113,010 113,010
113,010 113,010
Additional Borrowing
0
(3,966)
0
0
b) Operational Boundary for External Debt
(Excludes Revenue Borrowing) i) Borrowing ii) Other Long-term Liabilities
148,989 32,013
143,500 30,490
142,073 29,063
139,792 26,782
c) Total Operating Debt (Excludes Revenue
Borrowing) Add margin for cashflow contingency Affordable Borrowing Limit (Includes Revenue Borrowing) Authorised Limit for External Debt (Includes Revenue Borrowing)
• Borrowing • Other Long-term Liabilities
181,002 37,987 218,989 148,989 70,000
173,990 49,510 223,500 143,500 80,000
171,136 50,937 222,073 142,073 80,000
166,574 53,218 219,792 139,792 80,000
Page 378

Authorised Borrowing Limit
218,989
223,500
222,073
219,792
4. TREASURY MANAGEMENT
a) Borrowing Limit – Upper Limit for Fixed Interest Rate Exposure Expressed as: Net Principal re Fixed Rate Borrowing/Investments
b) Borrowing Limit – Upper Limit for Variable Interest Rate Exposure Expressed as a %: Net Principal re Variable Rate Borrowing/Investments
c) Lending Limit – Upper Limit for Total Principal Sums Invested for Over 364 Days Expressed as a % of Total Investments
218,989 50% 50%
223,500 50% 50%
222,073 50% 50%
219,792 50% 50%
d) Maturity Structure of new Fixed Rate Borrowing, if Taken During 2017/18 i) Under 12 Months ii) 12 Months to 24 Months iii) 24 Months to 5 Years iv) 5 Years to 10 Years v) 10 Years and Above
LOWER LIMIT
0 0 0 0 0
UPPER LIMIT
10% 20% 30% 40%
100%
Page 379

APPENDIX 7 GLOSSARY OF TREASURY MANAGEMENT TERMS Accrued Interest Any interest that has accrued since the initial purchase or since the last coupon payment date, up to the date of sale/purchase Basis Point One hundredth of 1% e.g. 0.01% Certificate of Deposit (CD) A Tradable form of fixed deposit. They can be sold before maturity via the secondary market at a rate that is negotiable. Often issued by banks and Building Societies in any period from 1 month to 5 years. Coupon The total amount of interest a security will pay on a yearly basis. The coupon payment period depends on the security. Covered Bond Covered bonds are conventional bonds (fixed or floating) issued by financial institutions that are backed by a separate group of loans, usually prime residential mortgages or public sector loans. Credit Rating A measure of credit worthiness of a borrower. A credit rating can be assigned to a country, organisation or specific debt issue/ financial obligation. There are a number of credit ratings agencies but the main 3 are Standard & Poor’s, Fitch and Moody’s. Credit risk This is the risk that the issuer of a security becomes temporarily or permanently insolvent, resulting in its inability to repay the interest or to redeem the bond. The solvency of the issuer may change over time due to various factors. Debt Management Office (DMO) Debt Management Office is an executive agency of HM Treasury. They are responsible for debt management in the UK, in the form of issuing Treasury Bills and Gilts. Financial Strength Rating Rating criteria used by Moody’s ratings agency to measure a bank’s intrinsic safety and soundness.
Page 380

Floating Rate Note (FRN) An instrument issued by Banks, Building Societies and Supranational organisations which has a coupon that re-sets usually every 3 months. The refix will often be set at a premium to 3 month LIBOR. Gilt A UK Government Bond, sterling denominated, issued by HM Treasury Index Linked Gilts A government bond issued by the DMO whose coupon and final redemption payment are related to movement in the RPI (Retail Price Index) Interest Rate Risk The risk that an investment’s value will change due to a change in the absolute level of interest rate. Interest rate risk affects the value of bonds more directly than stocks, and it’s a major risk to all bond holders. As interest rates rise, bond prices fall and vise versa. The rationale is that as interest rates increase, the opportunity cost of holding a bond decreases since investors are able to realise greater yields by switching to other investments that reflect the higher interest rate LIBOR London Interbank Offered Rate: set on a daily basis. The rate at which banks lend to each other for different periods Long Term Duration in excess of 1 year Net Asset Value (NAV) Often used when funds or investment assets are valued. This term generally means the total assets less total liabilities. Premium The sale/purchase of an asset at a level that is above the par value or original price. If a security is trading at a premium, current market interest rates are likely to be below the coupon rate of the security. Short Term Duration of up to1 year Support Rating Fitch Ratings Agency’s assessment of extraordinary support given to a financial institution either by the parent and or sovereign.
Page 381

Supranational Bond A bond issued by a Supranational organisation (multi-lateral development banks). They are AAA rated organisations in which the share capital is jointly owned and guaranteed by leading developed nations in their respective region. Treasury Bill (T-Bills) A Treasury Bills is a short dated instrument issued by HM Treasury. They are issued at a discount, therefore they are not coupon bearing. Viability Ratings Assessment of a bank’s intrinsic creditworthiness applied by Fitch Ratings Agency. Its aim was to enhance visibility on benefits of support. This replaced the individual ratings. Yield Curve The yield curve represents the relationship between yield and maturity. The conventional shape being that as the maturity lengthens, the yield will increase. Each security will have its own yield curve, depending on the yield in every time period available.
Page 382
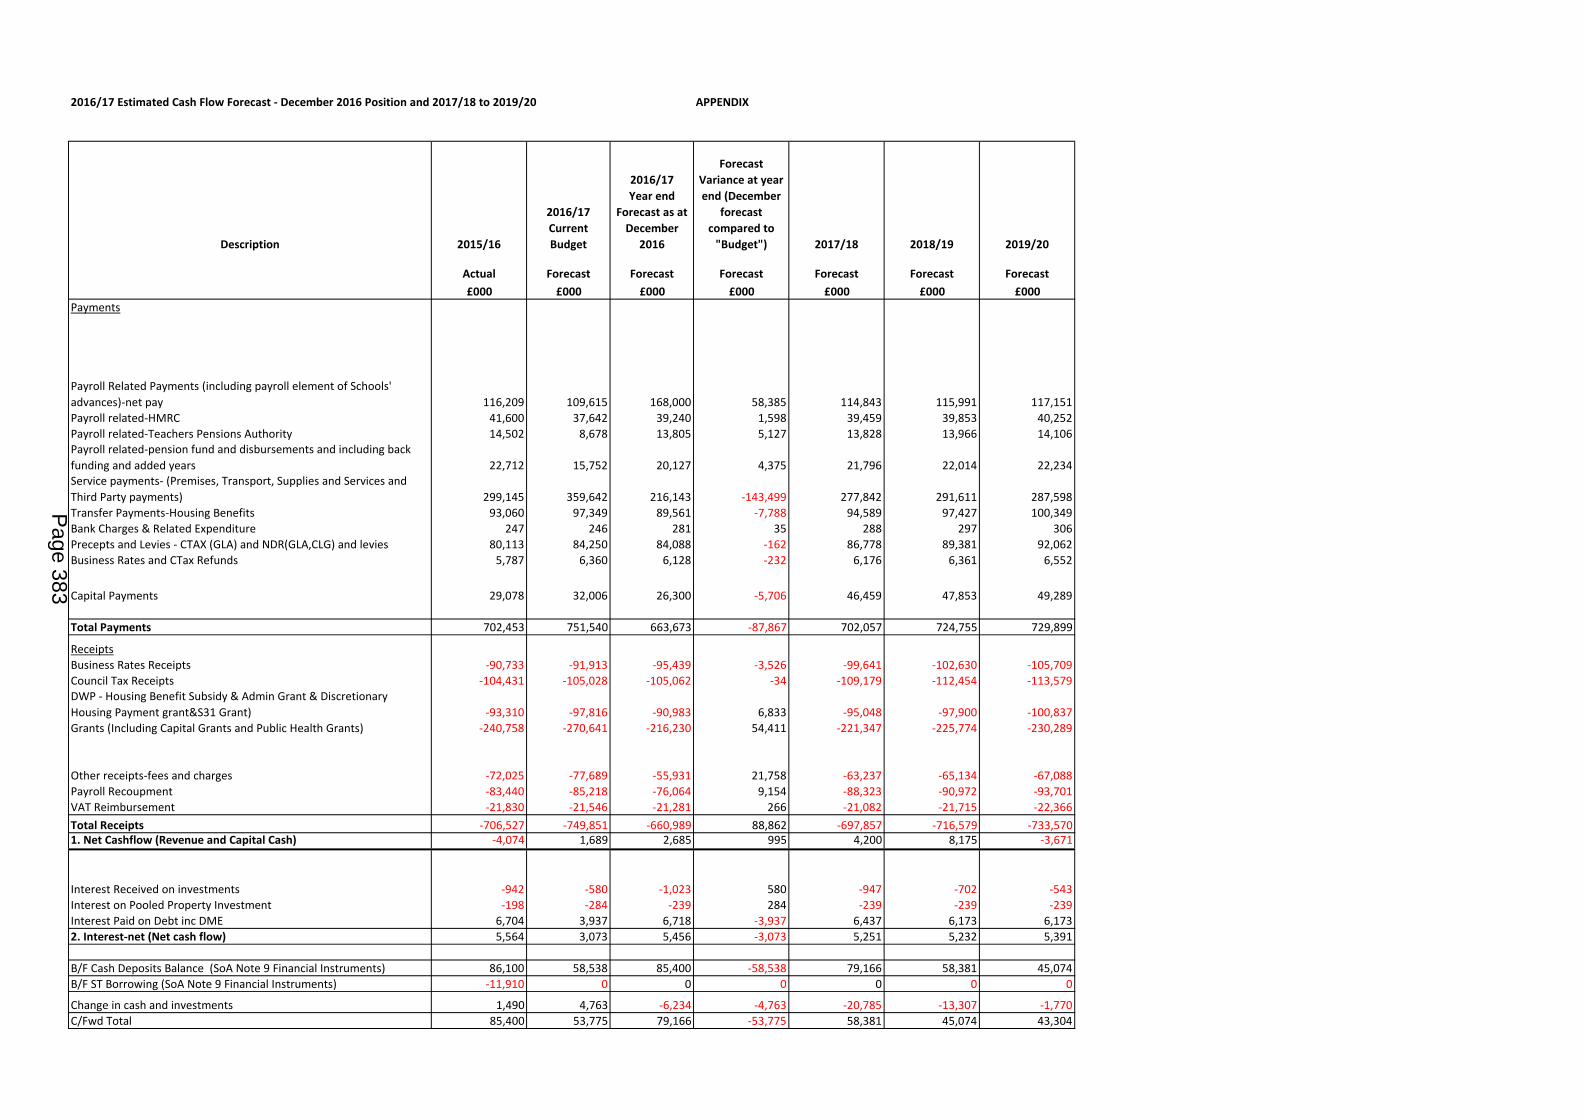
APPENDIX
Description 2015/16
2016/17
Current
Budget
2016/17
Year end
Forecast as at
December
2016
Forecast
Variance at year
end (December
forecast
compared to
"Budget") 2017/18 2018/19 2019/20
Actual Forecast Forecast Forecast Forecast Forecast Forecast
£000 £000 £000 £000 £000 £000 £000
Payments
Payroll Related Payments (including payroll element of Schools'
advances)-net pay 116,209 109,615 168,000 58,385 114,843 115,991 117,151
Payroll related-HMRC 41,600 37,642 39,240 1,598 39,459 39,853 40,252
Payroll related-Teachers Pensions Authority 14,502 8,678 13,805 5,127 13,828 13,966 14,106Payroll related-pension fund and disbursements and including back
funding and added years 22,712 15,752 20,127 4,375 21,796 22,014 22,234Service payments- (Premises, Transport, Supplies and Services and
Third Party payments) 299,145 359,642 216,143 -143,499 277,842 291,611 287,598
Transfer Payments-Housing Benefits 93,060 97,349 89,561 -7,788 94,589 97,427 100,349
Bank Charges & Related Expenditure 247 246 281 35 288 297 306
Precepts and Levies - CTAX (GLA) and NDR(GLA,CLG) and levies 80,113 84,250 84,088 -162 86,778 89,381 92,062
Business Rates and CTax Refunds 5,787 6,360 6,128 -232 6,176 6,361 6,552
Capital Payments 29,078 32,006 26,300 -5,706 46,459 47,853 49,289
Total Payments 702,453 751,540 663,673 -87,867 702,057 724,755 729,899
Receipts
Business Rates Receipts -90,733 -91,913 -95,439 -3,526 -99,641 -102,630 -105,709
Council Tax Receipts -104,431 -105,028 -105,062 -34 -109,179 -112,454 -113,579DWP - Housing Benefit Subsidy & Admin Grant & Discretionary
Housing Payment grant&S31 Grant) -93,310 -97,816 -90,983 6,833 -95,048 -97,900 -100,837
Grants (Including Capital Grants and Public Health Grants) -240,758 -270,641 -216,230 54,411 -221,347 -225,774 -230,289
Other receipts-fees and charges -72,025 -77,689 -55,931 21,758 -63,237 -65,134 -67,088
Payroll Recoupment -83,440 -85,218 -76,064 9,154 -88,323 -90,972 -93,701
VAT Reimbursement -21,830 -21,546 -21,281 266 -21,082 -21,715 -22,366
Total Receipts -706,527 -749,851 -660,989 88,862 -697,857 -716,579 -733,5701. Net Cashflow (Revenue and Capital Cash) -4,074 1,689 2,685 995 4,200 8,175 -3,671
Interest Received on investments -942 -580 -1,023 580 -947 -702 -543
Interest on Pooled Property Investment -198 -284 -239 284 -239 -239 -239
Interest Paid on Debt inc DME 6,704 3,937 6,718 -3,937 6,437 6,173 6,173
2. Interest-net (Net cash flow) 5,564 3,073 5,456 -3,073 5,251 5,232 5,391
B/F Cash Deposits Balance (SoA Note 9 Financial Instruments) 86,100 58,538 85,400 -58,538 79,166 58,381 45,074
B/F ST Borrowing (SoA Note 9 Financial Instruments) -11,910 0 0 0 0 0 0
Change in cash and investments 1,490 4,763 -6,234 -4,763 -20,785 -13,307 -1,770
C/Fwd Total 85,400 53,775 79,166 -53,775 58,381 45,074 43,304
2016/17 Estimated Cash Flow Forecast - December 2016 Position and 2017/18 to 2019/20
Page 383

This page is intentionally left blank