A non arbitrary definition of rain event: the case of stratiform rain
Upload
khangminh22Category
view
1download
0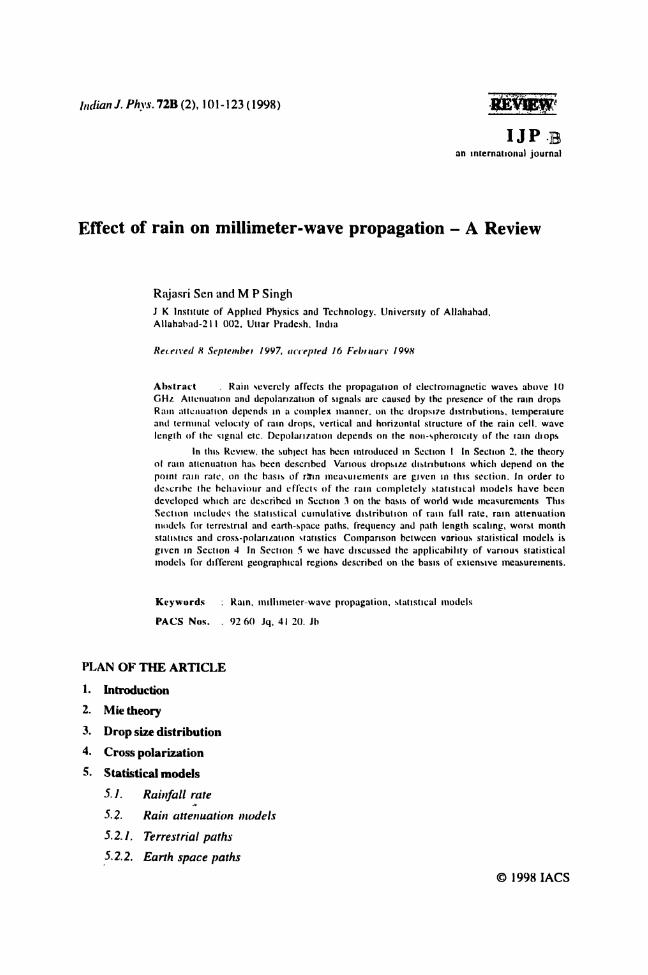
Indian J. Phys. 72B (2), 101-123 (1998)
IJ P Ban international journal
Effect of rain on millimeter-wave propagation - A Review
Rajasri Sen and M P SinghJ K Institute of Applied Physics and Technology, University of Allahabad, Allahabad-211 002, Uttar Pradesh, India
Received H September 1997, accepted JO February J99H
A b strac t . Rain severely affects the propagation of electromagnetic waves above 10 GHz Attenuation and depolarization of signals are caused by the presence of the rain drops Rain attenuation depends in a complex manner, on the dropsize distributions, temperature and terminal velocity of ram drops, vertical and horizontal structure of the rain cell, wave length of the signal etc. Depolarization depends on the non-spheroicity of the tain diops
In this Review, the subject has been introduced in Section I In Section 2, the theory ol ram attenuation has been described Various dropsize distributions which depend on the point rain rate, on the basis of rain mcasuiernents are given in this section. Jn order to describe the behaviour and effects of the rain completely statistical models have been developed which are described in Section 3 on the basis of world wide measurements This Section includes the statistical cumulative distribution of rain fall rate, rain attenuation models for terrestrial and earth-space paths, frequency and path length scaling, worst month statistics and cross-polarization statistics Comparison between various statistical models is given in Section 4 In Section 5 we have discussed the applicability of various statistical models for different geographical regions described on the basis of extensive measurements.
K eyw ords ; Ram, millimeter-wave propagation, statistical models
PACS Nos. . 92 60 Jq, 41 20. Jb
PLAN OF THE ARTICLE
L Introduction2. Mie theory
3. Drop size distribution4. Cross polarization 5- Statistical models
5.1. Rainfall rate
5.2. Rain attenuation models5.2.1. Terrestrial paths5.2.2. Earth space paths
© 1998 IACS
brought to you by COREView metadata, citation and similar papers at core.ac.uk
provided by IACS Institutional Repository
102 Rajas ri Sen and M P Singh
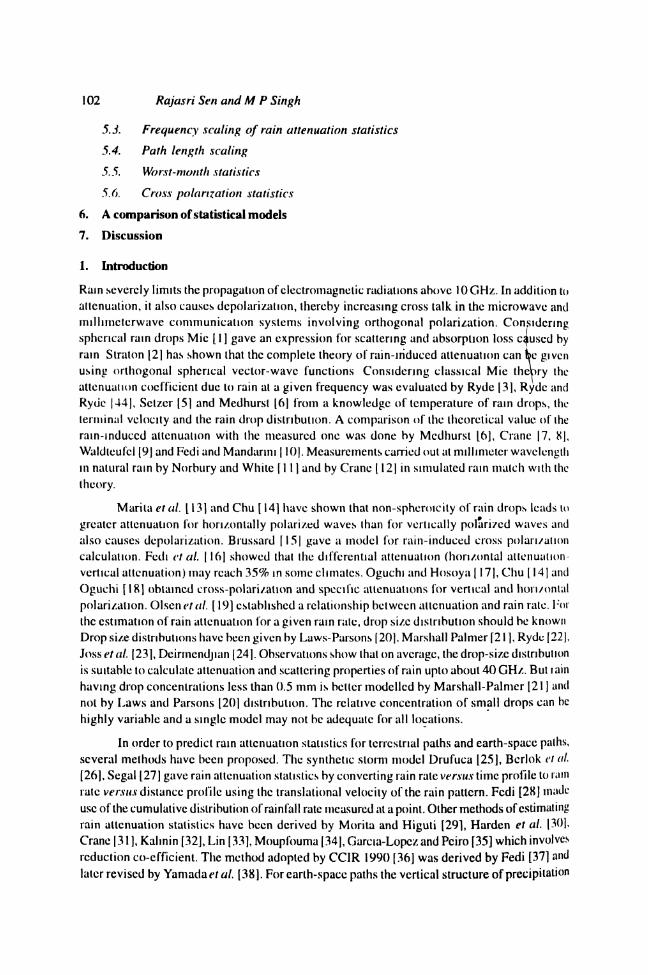
5.3. Frequency scaling o f rain attenuation statistics5.4. Path length scaling
5.5. Worst-month statistics
5.6. Cross polarization statistics
6. A comparison of statistical models
7. Discussion
1. Introduction
Ram severely limits the propagation of electromagnetic radiations above 10 GHz. In addition to attenuation, it also causes depolarization, thereby increasing cross talk in the microwave and millimctcrwave communication systems involving orthogonal polarization. Considering spherical ram drops Mie 11] gave an expression for scattering and absorption loss caused by ram Straton [2] has shown that the complete theory of rain-induced attenuation can fee given using orthogonal spherical vector-wave functions Considering classical Mie theory the attenuation coefficient due to rain at a given frequency was evaluated by Ryde [3], Rydc and Ryde 144], Sctzer [5] and Medhurst [6] from a knowledge of temperature of ram drops, the terminal velocity and the rain drop distribution. A comparison of the theoretical value of the ram-induced attenuation with the measured one was done by Medhurst Lb], Crane |7, 8], Waldleufcl [9] and Fedi and Mandanni [ 10]. Measurements carried out at millimeter wavelength in natural ram by Norbury and While f 11 ] and by Crane [ 12] in simulated ram match with the theory.
Marita et a i 1131 and Chu [ 14] have shown that non-spheroicity of rain drops leads to greater attenuation for horizontally polarized waves than for vertically polarized waves and also causes depolarization. Brussard f 151 gave a model for rain-induced cross polarization calculation. Fedi et a i 116] showed that the differential attenuation (horizontal attenuation vertical attenuation) may reach 35% in some climates. Oguchi and Hosoya [17], Chu [14] and Oguchi [18] obtained cross-polarization and specific attenuations for vertical and hon/onlal polarization. Olsei\etal. [19] established a relationship between attenuation and rain rale. For the estimation of rain attenuation fora given ram rale, drop size distribution should be known Drop size distributions have been given by Laws-Parsons [20], Marshall Palmer f21 ], Ryde [22], Joss etal. [23], Deirrnendjian [24]. Observations show that on average, the drop-size distribution is suitable to calculate attenuation and scattering properties of rain upto about 40 GHz. But tain having drop concentrations less than 0.5 mm is better modelled by Marshall-Palmer [21 ] and not by Laws and Parsons [20] distribution. The relative concentration of small drops can be highly variable and a single model may not be adequate for all locations.
In order to predict ram attenuation statistics for terrestrial paths and earth-space paths, several methods have been proposed. The synthetic storm model Drufuca [25], Berlok et al. [26], Segal 127] gave rain attenuation statistics by converting rain rale versus time profile to rain rate versus distance profile using the translational velocity of the rain pattern. Fedi [28] made use of the cumulative distribution of rainfall rate measured al a point. Other methods of estimating rain attenuation statistics have been derived by Morita and Higuti [29], Harden et al. [30], Crane [31 ], Kalinin [32J, Lin [33], Moupfouma [341, Garcia-Lopcz and Pciro [35] which involves reduction co-efficient. The method adopted by CC1R 1990 [36] was derived by Fedi [37] and later revised by Yamadarf al. [38]. For earth-space paths the vertical structure of precipitation
Effect o f rain on millimeter-wave propagation - A Review 103
is also involved in addition to the horizontal structure for rain attenuation statistics. Considering vertical structure of the rain drops a number of techniques have been proposed by Kalinin [391, Morita and Higuti [40], Misme and Waldteufel [41 ], Fedi [42,38] and revision by Yamada et a i [43], Rue [44],CCIR [45,36], Garcia-Lopeze/ al [46], Crane [31], Fedi and Paraboni [47], Lcitao and Watson [48], Rue [49], Li et a i [50] have derived the statistical model on the basis of extensive studies on the rain structure, the height of the 0°C isotherm and its latitudinal variation and the cumulative rain rate distribution measured at the point. Fukuchi and Otsu [51] have given time statistics of rain attenuation on earth space paths.
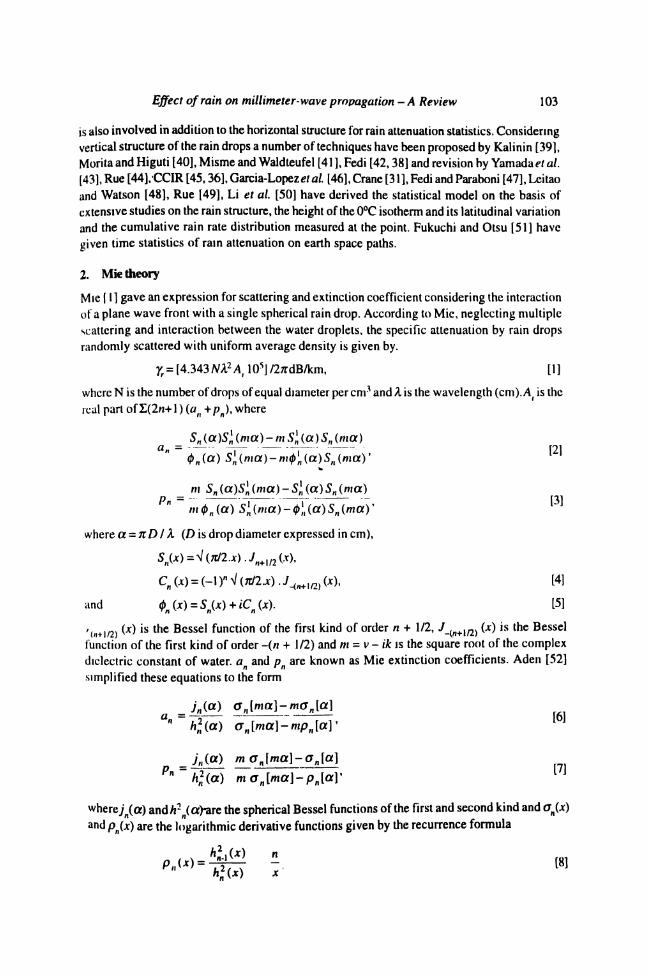
2. Mie theory
Mie [ 1] gave an expression for scattering and extinction coefficient considering the interaction of a plane wave front with a single spherical rain drop. According to Mie, neglecting multiple scattering and interaction between the water droplets, the specific attenuation by rain drops randomly scattered with uniform average density is given by.
yr- [4.343 NX1 A 10 s] /27rdB/km, [1]
where N is the number of drops of equal diameter per cm3 and A is the wavelength (cm). Af is the real part o fI(2 n + l) (an +pH), where
Sn ( q ) ^ (ma) - m S\ (a )S n (ma)0 ;i(a ) S\{ma)-m<t>'n(a )S n(m a y
*
m S„ (cQSn (m a) - S'„ (a ) S„ (ma)Pn m <t>„ (a ) S'„ (ma) - <t>'„ (a ) S„(m a)'
where a - n D ! A (D is drop diameter expressed in cm),
5„(jc)=V(rt/2.A).Jfl+|/2(.T)1
and <pn (x) = Sn(x) + iCn (jc).
'(n+i/2) M *s the Bessel function of the first kind of order n + 1/2, J_{n+i/2) (■*) is the Bessel function of the first kind of order -(« + 1/2) and m = v - ik is the square root of the complex dielectric constant of water, a and p are known as Mie extinction coefficients. Aden [52] simplified these equations to the form
a = A.(g > o n[m a]-m a„[a]0" (a) a„[m a]-m p„[a]'
[21
[3]
[4]
[5]
_ ,/„ (« ) m a n\ma]-an[a)
Pn h}, (a) m a n[ma]-pn[a)'[7]
where jn(a) and/i2fl(a)^re the spherical Bessel functions of the first and second kind and an(x) and pn(x) are the logarithmic derivative functions given by the recurrence formula
P,M) *£.(*>h2n(x)
nx
[8]

104 Rajasri Sen and M P Singh
19]
for real arguments. For complex arguments, the recurrence formula derived by Infeld [53] is used. This formula is
n x - x 2a n̂ ( x )
If x is complex, sayx = c -jd .
<T„[xl = col \c - jd ] = sin 2c + j sinh 2d cos 2d —cos 2c
[101
[111
A knowledge of the drops of equal diameter N (D) can be obtained from the corresponding rain rate R [£)] given as
/?[D |= 15.08 x 10⁶/V[D1 v [01D1 mm/hr. [i:or conversely
R(D) (10) 6 N{D)= — - -
15.08 v(D) D ' ’[ 13]
v(/)) is the terminal velocity i.c. fall velocity in cm/sec, D is the drop diameter in cm. The fall speed [54] is given by
Mv, (D ) = 1 (X )£ c ,£>
i- O114]
where C \s are the coefficients to be determined by least square fit method and M is the degree of the polynomial. Lqs. (1), (12) and (14) show that the calculation of specific attenuation requires a knowledge of drop size distribution, the terminal velocity, the rainfall rate and a knowledge of the complex index of refraction of water at the temperature of the raindrops. Ray [55] has developed equations to calculate refractive index of distilled water over a wide range of frequencies and temperatures. These equations arc valid over the 3 MHz -1000 GHz range for temperatures between - 20°C and 50°C.
3. Drop size distribution
Within a storm the size, shape and orientation distribution of rain drops may vary. It is an observed fact that on average the drop size distribution is relatively stable, and changes with the rain rate. Mainly at higher frequencies (above 30 GHz) lor the same value of ground rainfall intensity, the drop size distribution vanes widely. So in the prediction of rain attenuation of mm - waves drop size distribution plays a vital role. Several scientists have predicted simple mathematical function for drop size distribution. Among them are Laws - Parsons [21], Marshall Palmer [22], Ryde [23], Jossetai 124], Deirmendjian [25] etc.
(i). Lows-Parsons [21] distribution
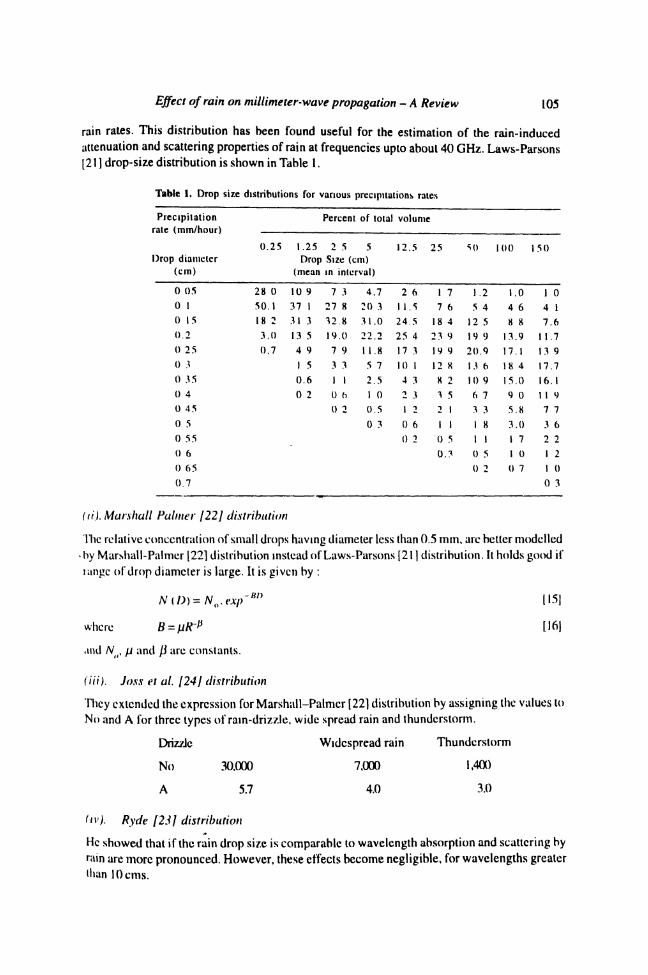
It gives the percentage of the total volume of rain contributed by a given drop size for various
Effect o f rain on millimeter-wave propagation - A Review 105
rain rates. This distribution has been found useful for the estimation of the rain-induced attenuation and scattering properties of rain at frequencies upto about 40 GHz. Laws-Parsons [21 ] drop-size distribution is shown in Table 1.
Table 1, Drop size distributions for various precipitations rates
Precipitation rale (mm/hour)
Percent of total volume
Drop diameter (cm)
0.2 5 1.25Drop
(mean
2 5 5 vSize (cm) in interval)
12.5 25 5 0 100 150
0 05 28 0 10 9 7 3 4.7 2 6 1 7 1.2 1.0 1 00 1 50.1 37 1 27 8 20 3 1 1.5 7 6 5 4 4 6 4 10 15 18 2 31 3 32.8 31.0 24,5 18 4 12 5 8 8 7.60.2 3.0 13 5 19.0 22.2 25 4 23 9 19 9 13.9 1 1.70 25 0.7 4 9 7 9 1 1.8 17 3 19 9 20.9 17.1 1.3 90 3 1 5 3 3 5 7 10 1 12 8 13 6 18 4 17.70 35 0.6 1 1 2.5 4 3 8 2 10 9 15.0 16.10 4 0 2 l) h 1 0 2 3 3 5 6 7 9 0 1 1 90 45 0 2 0.5 1 2 2 1 3 3 5.8 7 70 5 0 3 0 6 1 1 1 8 3.0 3 60 55 0 2 0 5 l 1 1 7 2 20 6 0.3 0 5 1 0 1 20 65 0 2 0 7 1 00.7 0 3
(li). Marshall Palmer [22] distribution
The relative concentration of small drops having diameter less than 0.5 mm, arc better modelled 'by Marshall-Palmer 122] distribution instead of Laws-Parsons [21 ] distribution. It holds good if range of drop diameter is large. It is given by :
N ll» = N „ .exp -* n 1151
where B = nR-P L16J
and yv , p and /I are constants.
(Hi). Joss et a i [24] distribution
They extended the expression for Marshall-Palmer [221 distribution by assigning the values to No and A for three types of rain-drizzle, wide spread rain and thunderstorm.
Drizzle Widespread rain Thunderstorm
No 30.000 7,000 1,400
A 5.7 4.0 3.0
Ryde [23] distribution
He showed that if the rain drop size is comparable to wavelength absorption and scattering by rain are more pronounced. However, these effects become negligible, for wavelengths greater Ilian lOcms.
106 Rajasri Sen and M P Singh
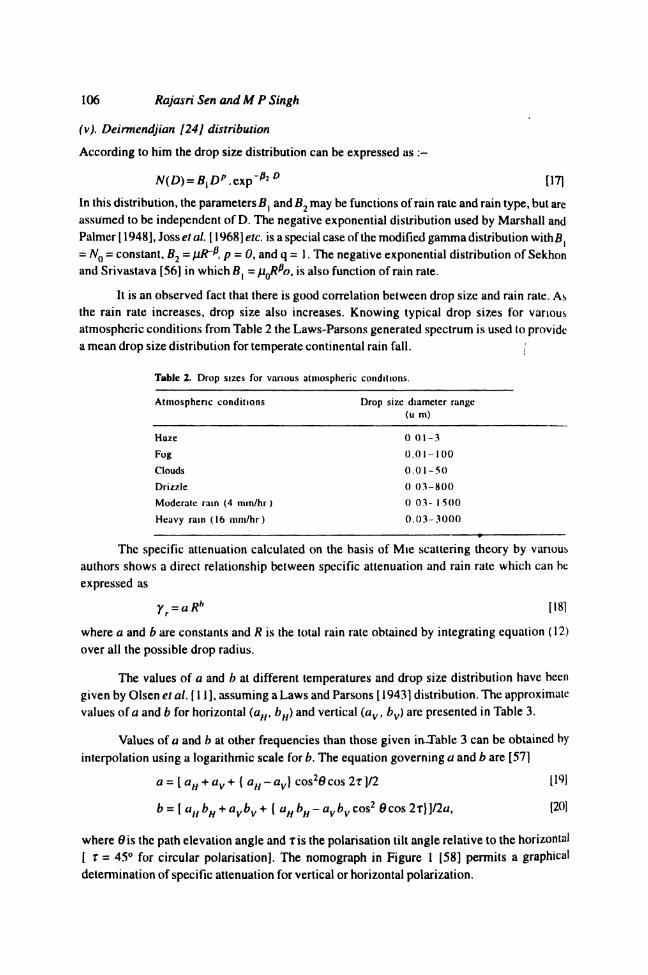
(v). Deirmendjian [24] distribution
According to him the drop size distribution can be expressed as
N(D) = BlD p .exp-PlD [171
In this distribution, the parameters B } and#2 may be functions of rain rate and rain type, but arc assumed to be independent of D. The negative exponential distribution used by Marshall and Palmer [1948], Joss et al [ 1968] etc. is a special case of the modified gamma distribution with Bl = N0 = constant, B2 = p - 0 , and q = 1. The negative exponential distribution of Sekhonand Srivastava [56] in which B{ = is also function of rain rate.
It is an observed fact that there is good correlation between drop size and rain rate. As the rain rate increases, drop size also increases. Knowing typical drop sizes for various atmospheric conditions from Table 2 the Laws-Parsons generated spectrum is used to provide a mean drop size distribution for temperate continental rain fall.
Tabic 2. Drop sizes for various atmospheric conditions.
Atmospheric conditions Drop size diameter range (u m)
Haze 0 01-3Fog 0 .01 -100Clouds 0 .0 1 -5 0Drizzle 0 03-800Moderate rain (4 inin/hr) 0 03 -1500Heavy rain (16 mni/hr) 0 .0 3 -3 0 0 0
The specific attenuation calculated on the basis of Mie scattering theory by various authors shows a direct relationship between specific attenuation and rain rate which can he expressed as
y r = a R h [181
where a and b are constants and R is the total rain rate obtained by integrating equation (12) over all the possible drop radius.
The values of a and b at different temperatures and drop size distribution have been given by Olsen et al. [11], assuming a Laws and Parsons [19431 distribution. The approximate values of a and b for horizontal (aH, bH) and vertical (av , by) are presented in Table 3.
Values of a and b at other frequencies than those given in~Table 3 can be obtained by interpolation using a logarithmic scale for b. The equation governing a and b are [57]
a = [ aH + av + { aH - ay] cos20 cos 2 r ]/2 [19]
b - [ au bH + ay by + { aH bH - ay by cos2 0cos 2t}]/2ay [20]
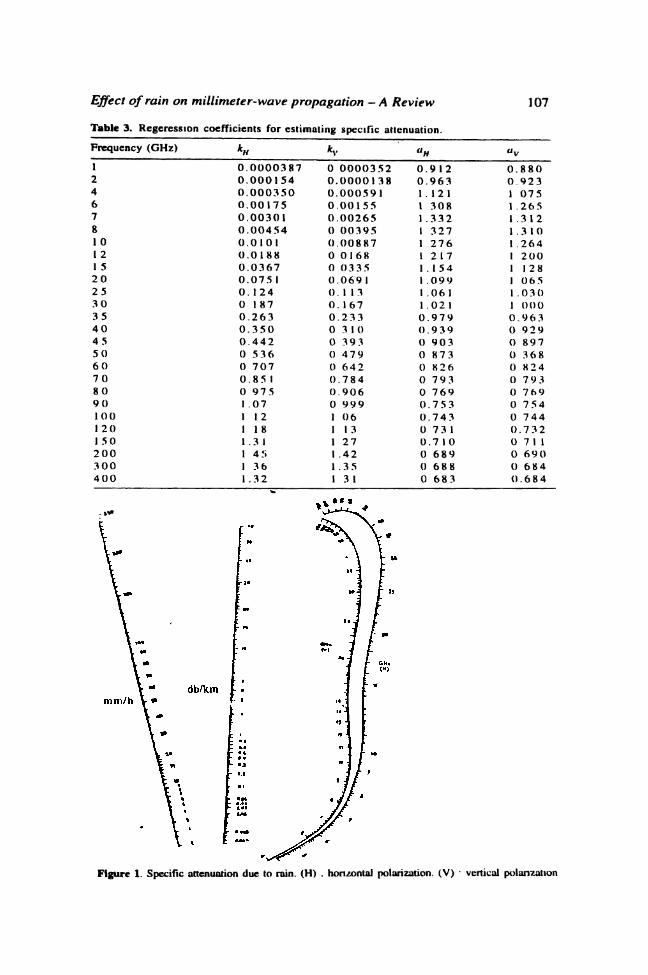
where 0is the path elevation angle and ris the polarisation tilt angle relative to the horizontal [ r = 45° for circular polarisation]. The nomograph in Figure 1 [58] permits a graphical determination of specific attenuation for vertical or horizontal polarization.
E ffec t o f ra in o n m il l im e te r -w a v e p r o p a g a tio n - A R e v ie w
Table 3. Regeression coefficients for estimating specific attenuation.
107
Frequency (GHz) “h
1 0 .0 0 0 0 3 8 7 0 0 0 0 0 3 5 2 0 . 9 1 2 0 . 8 8 02 0 . 0 0 0 1 54 0 . 0 0 0 0 1 3 8 0 . 9 6 3 0 9 2 34 0 . 0 0 0 3 5 0 0 . 0 0 0 5 9 1 1 . 121 1 07 56 0 . 0 0 1 7 5 0 . 0 0 1 5 5 1 3 0 8 1 . 2 6 57 0 . 0 0 3 0 1 0 . 0 0 2 6 5 1 . 3 3 2 1 . 3 1 2S 0 . 0 0 4 5 4 0 0 0 3 9 5 1 3 2 7 1 . 3 1 01 0 0 . 0 1 0 1 0 . 0 0 8 8 7 1 2 7 6 1 . 2 6 4l 2 0 . 0 1 8 8 0 0 168 1 2 17 1 2 0 01 5 0 . 0 3 6 7 0 03 3 5 1 . 15 4 1 1282 0 0 . 0 7 5 1 0 . 0 6 9 1 1 . 0 9 9 1 0 6 52 5 0. 124 0.1 13 1 . 061 1 . 0 3 03 0 0 1 87 0. 1 67 1 . 021 1 0 0 03 5 0 . 2 6 3 0 . 2 3 3 0 . 9 7 9 0 . 9 6 34 0 0 . 3 5 0 0 3 10 0 . 9 39 0 9 294 5 0 . 4 4 2 0 39 3 0 9 0 3 0 89 75 0 0 5 36 0 4 7 9 0 8 7 3 0 36 86 0 0 7 0 7 0 6 4 2 0 8 2 6 0 8 247 0 0 . 8 5 1 0 . 7 8 4 0 7 9 3 0 79 38 0 0 97 5 0 . 9 0 6 0 7 6 9 0 7 6 99 0 1 . 07 0 9 9 9 0 . 7 5 3 0 7 541 0 0 1 1 2 1 0 6 0 . 7 4 3 0 7 4 41 2 0 1 1 8 1 1 3 0 73 1 0 . 7 321 5 0 1.3 1 1 27 0 . 7 1 0 0 7 112 0 0 1 4 5 1 . 42 0 6 8 9 0 6 9 03 0 0 1 3 6 1 . 35 0 68 8 0 68 44 0 0 1 . 32 1 3 l 0 6 8 3 0 . 6 8 4
Figure 1. Specific attenuation due to rain. (H) . horizontal polarization. (V) * vertical polarization
108 Rajasri Sen and M P Singh
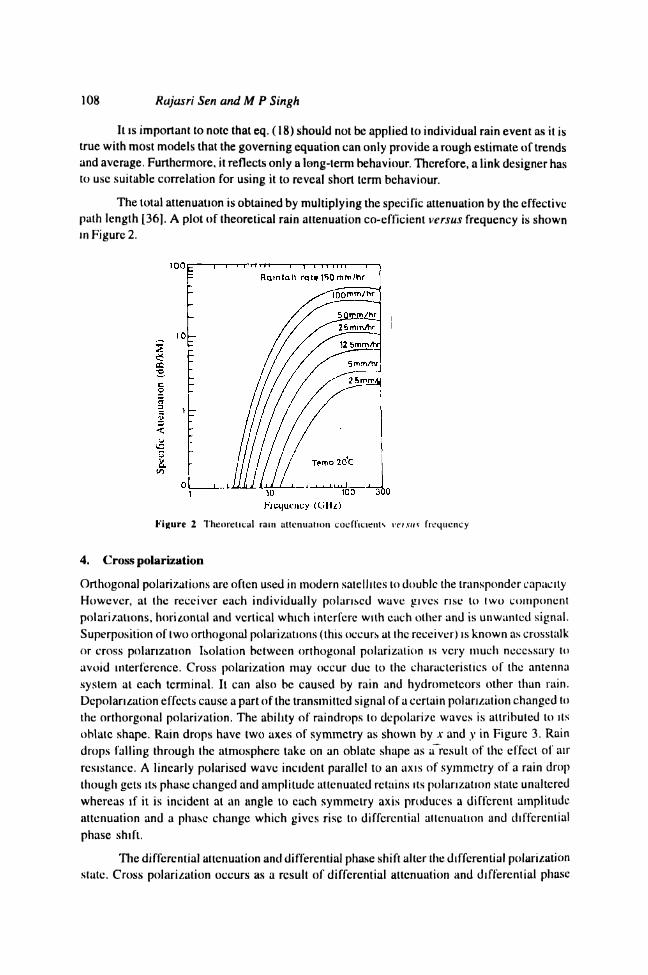
It is important to note that eq. (18) should not be applied to individual rain event as it is true with most models that the governing equation can only provide a rough estimate of trends and average. Furthermore, it reflects only a long-term behaviour. Therefore, a link designer has to use suitable correlation for using it to reveal short term behaviour.
The total attenuation is obtained by multiplying the specific attenuation by the effective path length [36]. A plot of theoretical rain attenuation co-efficient versus frequency is shown in Figure 2.
Figure 2 Theoretical rain attenuation coefficients v e r s u s frequency
4. Cross polarization
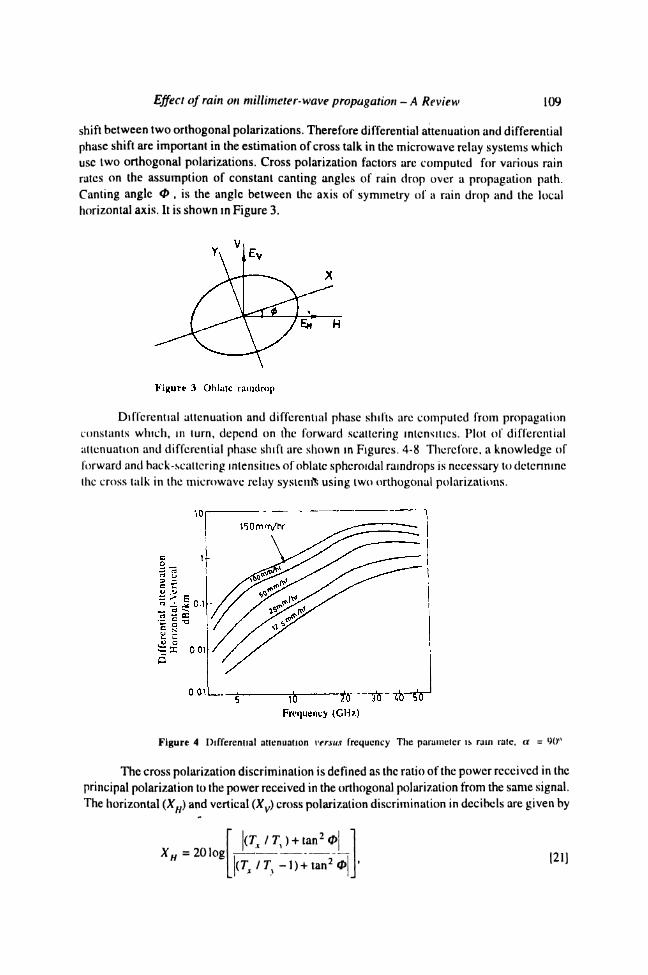
Orthogonal polarizations are often used in modern satellites to double the transponder capacity However, at the receiver each individually polarised wave gives rise to two component polarizations, horizontal and vertical which interfere with each other and is unwanted signal. Superposition of two orthogonal polarizations (this occurs at the receiver) is known as crosstalk or cross polarization Isolation between orthogonal polarization is very much necessary to avoid interference. Cross polarization may occur due to the characteristics of the antenna system at each terminal. It can also be caused by rain and hydrometeors other than rain. Depolarization effects cause a part of the transmitted signal of a certain polarization changed to the orthorgonal polarization. The ability of raindrops to depolarize waves is attributed to its oblate shape. Rain drops have two axes of symmetry as shown by a* and y in Figure 3. Rain drops falling through the atmosphere take on an oblate shape as a result of the effect of air resistance. A linearly polarised wave incident parallel to an axis of symmetry of a rain drop though gets its phase changed and amplitude attenuated retains its polarization slate unaltered whereas if it is incident at an angle to each symmetry axis produces a different amplitude attenuation and a phase change which gives rise to differential attenuation and differential phase shift.
The differential attenuation and differential phase shift alter the differential polarization state. Cross polarization occurs as a result of differential attenuation and differential phase
Effect o f rain on millimeter-wave propagation - A Review 109
shift between two orthogonal polarizations. Therefore differential attenuation and differential phase shift are important in the estimation of cross talk in the microwave relay systems which use two orthogonal polarizations. Cross polarization factors are computed for various rain rates on the assumption of constant canting angles of rain drop over a propagation path. Canting angle <t> , is the angle between the axis of symmetry of a rain drop and the local horizontal axis. It is shown in Figure 3.
Differential attenuation and differential phase shifts are computed from propagation constants which, in turn, depend on the forward scattering intensities. Plot of differential attenuation and differential phase shift are shown in Figures. 4-8 Therefore, a knowledge of forward and back-scattering intensities of oblate spheroidal raindrops is necessary to determine the cross talk in the microwave relay system's using two orthogonal polarizations.
Figure 4 Differential attenuation v er s u s frequency The parameter is rain rate, a - 90°
The cross polarization discrimination is defined as the ratio of the power received in the principal polarization to the power received in the orthogonal polarization from the same signal. The horizontal (XH) and vertical (Xy) cross polarization discrimination in decibels are given by
|(7t /7 ,) + tan2 4>|
1(7̂ / Tj -1 )+ tan2 tf>|X H =20 log 121]

110 Rajasri Sen and M P Singh
X v =20 log|(rx / r v)tan20 + l|
|(rj /7 ’y -l)tan<P [22]
where
Tx / Ty = exp [-(A4 - iA V )L eJf ], [23]
A A = A r -A „ m [24]
A'F = ' f ' x - ' f ' y . [25]A A is the differential attenuation (nepers/km) and is commonly given in dB/Km (=8.686 nepers/ km). AH' is differential phase shift (rad/km) and is commonly given in dB/km and (=180/;rrad/ km). Lejj is the effective path length and is defined as the ratio of the total path attenuation to the rain attenuation per unit length.
Figure 5 Normalized differential attenuation v e r s u s Irequency. The parameter is rqin rate a = 90°
Experimental evidence shows that as the size of the raindrops increases, their shape departs from spherical and is similar to that of oblate Spheroids with an increasingly pronounced flat base in which a concave depression develops for very large drop sizes. Pruppacher and Beard [59] ; Pruppacher and Pitter [60]. Furthermore, rain drops may also be inclined to the horizontal [61]. The phenomenon of rain drop canting may be explained in terms of vertical
Figure 6 Differential attenuation versus rain rate. The parameter is elevation angle
Effect o f rain on millimeter-wave propagation - A Review 111
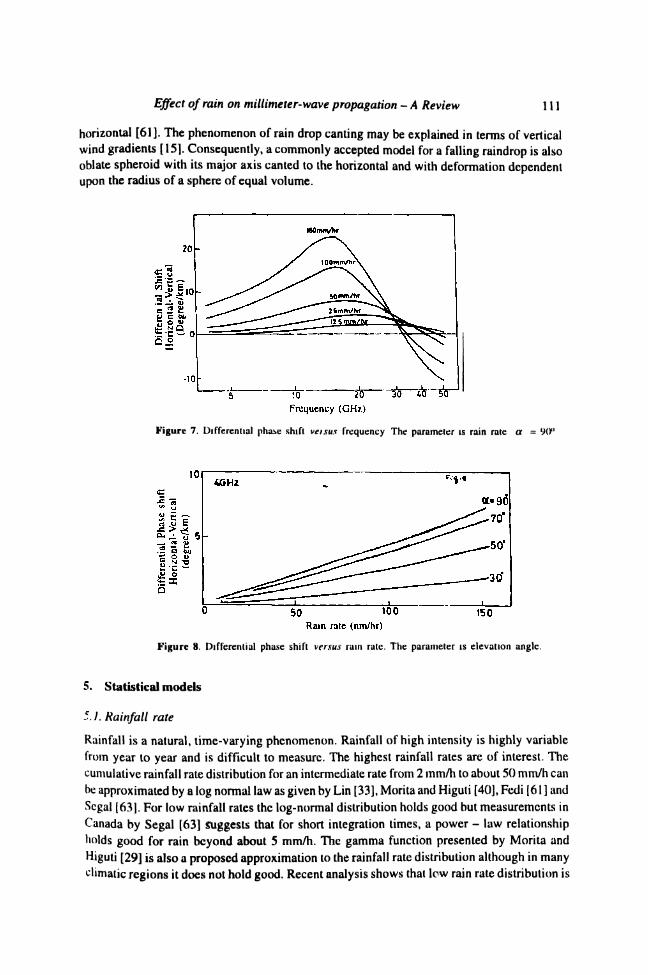
horizontal [61]. The phenomenon of rain drop canting may be explained in terms of vertical wind gradients [15]. Consequently, a commonly accepted model for a falling raindrop is also oblate spheroid with its major axis canted to the horizontal and with deformation dependent upon the radius of a sphere of equal volume.
Figure 7, Differential phase shifl versus frequency The parameter is rain rate a = 90°
Figure 8. Differential phase shift versus rain rate. The parameter is elevation angle.
5. Statistical models
5.7. Rainfall rate
Rainfall is a natural, time-varying phenomenon. Rainfall of high intensity is highly variable from year to year and is difficult to measure. The highest rainfall rates are of interest. The cumulative rainfall rate distribution for an intermediate rate from 2 mm/h to about 50 mm/h can be approximated by a log normal law as given by Lin [33], Morita and Higuti [40], Fedi [61] and Segal [631. For low rainfall rates the log-normal distribution holds good but measurements in Canada by Segal [63] Suggests that for short integration times, a power - law relationship holds good for rain beyond about 5 mm/h. The gamma function presented by Morita and Higuti [29] is also a proposed approximation to the rainfall rate distribution although in many climatic regions it does not hold good. Recent analysis shows that lew rain rate distribution is
112 Rajasri Sen and M P Singh
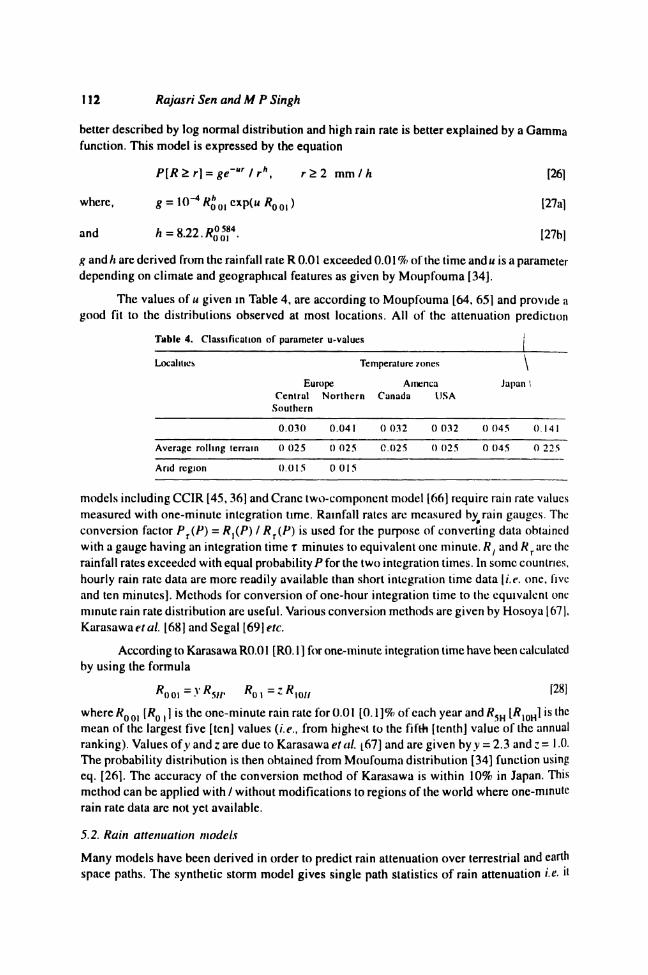
better described by log normal distribution and high rain rate is better explained by a Gamma function. This model is expressed by the equation
P[ R£ r] = ge ur f r h, 2 m m //i [261
where, g = 1 0 -4 «5 0 1CXp(M/J00 |) [27al
and h = 8.2 2 . [27b]
g and h arc derived from the rainfall rate R 0.01 exceeded 0.01 % of the time and w is a parameter depending on climate and geographical features as given by Moupfouma [34].
The values of u given in Table 4, are according to Moupfouma [64, 651 and provide a good fit to the distributions observed at most locations. All of the attenuation prediction
Table 4. Classification of parameter u-values
Localities Temperature zones
Europe America Central Northern Canada USA
vSouthcrn
\Japan \
0.030 0.041 0 032 0 032 0 045 0.141
Average rolling terrain 0 025 0 025 0.025 0 025 0 045 0 225
Arid region 0.015 0 015
models including CCIR [45, 36] and Crane two-component model [6 6] require rain rate values measured with one-minute integration time. Rainfall rales are measured by^rain gauges. The conversion factor PT(P) = /?,(P) / R T(P) is used for the purpose of converting data obtained with a gauge having an integration time T minutes to equivalent one minute. Rt and R r arc the rainfall rates exceeded with equal probability P for the two integration times. In some countries, hourly rain rate data are more readily available than short integration time data [z>. one, five and ten minutes]. Methods for conversion of one-hour integration time to the equivalent one minute rain rate distribution are useful. Various conversion methods are given by Hosoya [67 ], Karasawa ef a/. 168] and Segal [69] etc.
According to Karasawa R0.01 [R0.1 ] for one-minute integration lime have been calculated by using the formula
*ooi = v *5H ' 1 = z *10II ^where/^0Q1 [RQ]] is the one-minute rain rate for 0 .0 1 [0 . 1 ]% of each year and tf5H L^10H I *s ihc mean of the largest five [ten] values (/>., from highest to the fifth [tenth] value of the annual ranking). Values ofy and z are due to Karasawa et al. [67] and are given by v = 2.3 and z - 1.0. The probability distribution is then obtained from Moufouma distribution [34] function using eq. [26]. The accuracy of the conversion method of Karasawa is within 10% in Japan. This method can be applied with / without modifications to regions of the world where one-minute rain rate data are not yet available.
5.2. Rain attenuation models
Many models have been derived in order to predict rain attenuation over terrestrial and earth space paths. The synthetic storm model gives single path statistics of rain attenuation i.e. ii

Effect o f rain on millimeter-wave propagation - A Review 113
generates attenuation statistics converting rain rate / time profiles recorded at a point to rain rate/distance profiles. This technique can be utilized to give other attenuation statistics, frequency scaling methods and effective path length conversion. Misme and Fimbel [70] assumed a single rain cell of suitable shape to derive statistical rain profile. This method gives good result with European data set. Rue [44] has extended the above method by considering a statistical distribution of rain cell sizes instead of a single rain cell. In other methods the statistical rain profiles are characterized by a reduction coefficient which is derivable from the spatial auto correlation function of rainfall from measurements as given by Morita and Higuti[29] or from a semi-emipirical law as given by Battesti and Boithias [71]. The method adopted by CCIR was derived by Fcdi [37] and Yamadae/c//. [38].
Terrestrial paths :
Several methods provide rain attenuation statistics for terrestrial paths from the rain fall rate measurements. All these methods use the relationship between the specific attenuation and rain rale which depends on the rain fall microstructurc. The basic difference in these methods is in the models used to describe the time space structure of the rain fall rate 128].
The synthetic storm model generates attenuation statistics by converting cumulative distribution of rain rate profiles with time recorded at the point to cumulative distribution of ram rate versus distance profiles, using the translational velocity of rain pattern. The translational velocity of rain pattern is estimated from wind speed derived at the 700 mb level from radiosonde as given by Drufuca [25], Bertoketal. [26], Segal [27]. This technique represents a high degree ot physical realism. Other methods use the cumulative distribution of rain fall rate measured at a point. Misme and Fimbel [70] derived the statistical profile of rain along the path by assuming a single rain cell of suitable shape which has shown to give good results for European countries. Rue [44] replaced the single cell concept by a statistical distribution of rain cell sizes which
‘ remove the sensitivity of model to the log-normal approximation for rainfall intensity distribution. Morita and Higuti, [29] characterize the statistical rain profile by reduction coefficient which may be derived either from the spatial autocorrelation function of rain fall from measurements using rapid response rain gauges spaced along the line. Multiplying point rain rate by this reduction coefficients give the equivalent path averaged rain rate. For very short paths, the reduction coefficients may be larger than unity as pointed out by Moupfouma [72], Garcia- Lopez and Peiro [351, CCIR [45]. By assuming the constant rain intensity along the path and reducing the actual path length to effective path length to incorporate the spatial distribution of rain fall rate has been described in detail in the next section.
Earth space paths :
In the earth space paths, the vertical structure of rain cell is taken into account in addition to (he horizontal structure. A schematic presentation of earth-space path is shown in Figure 9. A number of techniques have been proposed by Kalinin [39], Morita and Higuti [40], Misme and Waldteufel [41 ], Fedi [42], Lin [73], Rue [43], CCIR-1986 [45]; Garcia-Lopezef a/. [46] which are extension of those developed for terrestrial paths. Crane [31], Fedi and Paraboni [47]; Leitao and Watson [48], Rue [49]; Li et ai [50] have developed the technique on the basis of extensive studies of the rain structure. To obtain the slant path attenuation the steps followed are as follows
(a) obtain the rain rate exceeded for 0.01 % of the time with an integration time of
one-minute. If rainfall rate with an integration time of 1 min is not available, the conversion factor is used to convert the rain rate data with a particular integration time to that of 1 min.
(b) the specific attenuation is calculated for the particular frequency, polarization and rain rate used using the relations (I), (12) and (14).
(c) the total attenuation for 0.01 % of the lime is calculated using the relation
^ o o j = X^sro . o i 1 2 9 ]
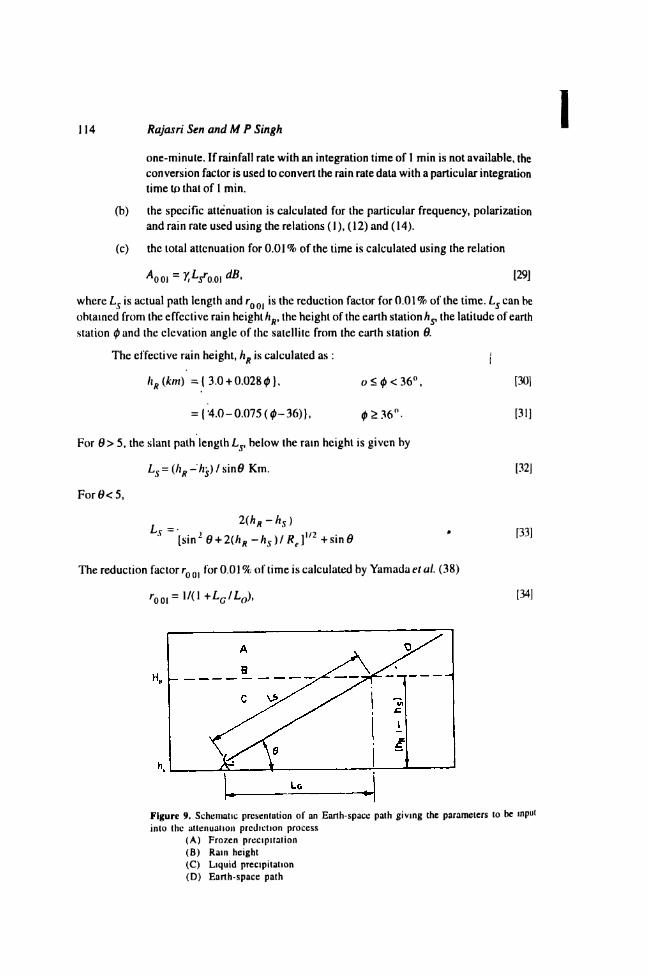
where Ls is actual path length and rQQl is the reduction factor for 0.01 % of the time. Ls can be obtained from the effective rain height hR, the height of the earth station/is, the latitude of earth station 0 and the elevation angle of the satellite from the earth station 6.
The effective rain height, hR is calculated as : j
hR (km) = { 3.0 + 0.028 0}, o < 0 < 36°, [30]
114 Rajas ri Sen and M P Singh
= ( ’4.0-0.075(0-36)], 0 > 36°■ [31]
For 9> 5, the slant path length Ly below the rain height is given by
Ls = (hR - h s) / sin0 Km. [32]
For0< 5,
^ _ 2(/iR- h s )S ~ [sin1 9 + 2(hR - h s )/Re]'n + sin0 * f33]
The reduction factor r0(), for 0.01% of time is calculated by Yamada etai (38)
r00l = \ / ( \ +Lc ILo), [34]
Figure 9. Schematic presentation of an Earth-space path giving the parameters to be input into the attenuation prediction process
(A) Frozen precipitation(B) Rain height(C) Liquid precipitation(D) Earth-space path

Effect o f rain on millimeter-wave propagation - A Review 115
whereI o =35exp(-0.015/?a0l) [35]
and Lc = Ls cos 0,
Lg being the horizontal projection of the slant path length (Figure 9).
(d) the attenuation to be exceeded for another percentages of time in the range0.001 % to 1 .0 % may be estimated from the attenuation exceeded for 0.01 % of time by the relation
V ^o .o i = 0 ,2 p - (0,46 - 0 04' ,% «^ [361
5.3. Frequency scaling o f rain attenuation statistics
Frequency scaling technique is used to predict attenuation at a second frequency with the help of attenuation at a first frequency. Frequency scaling technique can be of two classes such as single-frequency scaling and multi parameter scaling.
Single-frequency scaling method again has got two categories :
(a) Constant attenuation ratio,
(b) Variable attenuation ratio.
In constant attenuation ratio method [58], the following formula is used for frequency scaling:
V * 2 =£(/,) W 2). 137]where
g ( f ) = f , 72/ l + 3 x l 0 - 7/ 344. [38]
A, and A2 are the values of attenuation at frequencies/, and f 2 respectively and are exceeded with equal probability. In variable attenuation ratio method the ratio A {/A2 of attenuations at two different frequencies is not a constant but is dependent on attenuation. Using a and b parameters, dependence of the scaling ratio on attenuation, is shown as
A2 = 4a2 [ A l l 4a l]b2 / b r [39]
using k and a values given in Table 3. The above formula is valid for frequencies below 60 HGz. The above formula does not hold good, may be due to the inaccuracy of a and b values [Table 3] for frequencies above about 40 GHz.
To account for the inaccuracy of a and b values above 40 GHz, an empirical expression for scaling ratio has been given in terms of frequency and attenuation. [Boithias, 1989].
^ - A , u a / z , r ,x , , *v - [40]
* ( / ) = / 2 / ( l + 1 0 " 7 2) and [41]
« (* . •*!■*. ) = 1 .1 2 . l 0 -3( * 2 / * , ) ft5 (;r,it,) ,,5S. [42]
5.4. Path length scaling
If the attenuation statistics are dominated by the occurrence of relatively small cells of heavy

116 Rajasri Sen and M P Singh
rain fall or by the events of widespread precipitations then their dependence on path length can be described by simple formula [74]. In the first case, the probability P2[A2) that the attenuation A is exceeded on a path length L2 is proportional to the probability P ,(A } on the path L y It is shown as
P2[A] =L2 . P,{A)/Lr [43]In the second case, the attenuation A exceeded with a given probability P is proportional to the path length
P2[A2)= Px[LxA2IL2). [44]
5.5. Worst-month statistics
Recognizing the need to be able to convert annual statistics to those corresponding to the worst month or vice versa, CCIR [36] has adopted a formula
iP = 0.3 P 1.15%, I [45]
expressing a general relationship for global planning purposes. P represents the lime percentage that the attenuation value exceeded for the worst month and P represents the annual time percentage that the attenuation value exceeded. Available measurement data indicate that the ratio of the average yearly worst month time percentage to the average yearly percentage is dependent on climate and in particular on the degree of the seasonal variation in the climatic effect influencing the propagation.
5.6. Cross polarization statistics
CCIR [36] contains a method for the prediction of cross-polarization statistics due to rain. The method requires a knowledge of the rain attenuation exceeded for the required percentage of time, P for the required path called co-polar attenuation CPA, the tilt angle of the linearly polarized electric field vector w.r.t. the horizontal, the frequency and the path elevation angle. For paths on which more detaited predictions or measurements are not available above estimate of cross polarization discrimination [XPD] can be obtained from a cumulative distribution of the co-polarized rain attenuation using the equi-probabihty relation
XPD= U -V{f) log (CPA) dB [46]
which applies for both linear and circular polarizations. The coefficients U and V(f) are dependent on a number of variables and empirical parameters including frequency/. For line of sight paths with small elevation angles and horizontal or verticle polarization, these coefficients may be approximated by
l /= f /o + 30log/, __ [47]
V(J) = 20. 148]
In the frequency range 8 < /< 35 GHz and average value of Ua of about 15 dB with a lower limit of 9 dB, has been obtained for attenuation measurements greater than 15 dB. Long term statistics at one frequency can be scaled to another frequency using the semi-empirical formula
XPD, = XPD{ - 20 log {f j fx), [49]
where XPD{ and XPD2 and XPD values not exceeded for the same percentage of time as frequencies/, and f 2 respectively.
Effect o f rain on millimeter-wave propagation - A Review M l
The relative importance of ice depolarization as compared with that due to rain is found to vary considerably. The contribution from ice decreases with increasing attenuation and can be ignored for time percentages of less than 0.1 percent. This does not appear to be the case for mid latitude.
6. A comparison of statistical models
Many methods have been proposed for the prediction of rain attenuation statistics. All the methods utilize the relationship between rain rate and specific attenuation. The methods differ mostly in the models used to describe the time-space structure of rain rate. Basically the models are of two general types. One relies on rain gauge or radar observations to convert the attenuation statistics of one path to another path. The other type uses meteorological information like intensity and rain structure for the same purpose. The former method is useful for the prediction of rain attenuation in the same climatic region within narrow frequency limits. The other type is required for different climatic regions, different geometries and over wide frequency limits. The Crane global model [31 ] and the two-component Crane model [66] belong to the first category. Models presented by Goldhrish [75] and Lin [33] are of the second type.
The synthetic storm method is a highly realistic model which alongwith attenuation statistics helps to generate other attenuation statistics such as duration statistics, effective path length conversion and frequency scaling. The method adopted in CCIR 1990 [36] is due to l;cdi and the accuracy is about 25-30% on a global basis for percentage of times 0.001% and0.1%. Above 0.1% gaseous attenuation should also be taken into account at these time percentages.
For earth space paths the accuracy of the method adopted by CCIR 1990 [36] is of about 35-^40% on a global basis. In order to improve the accuracy long term statistics data are necessary, especially for tropical regions. A comparison between the CCIR model [36], the Crane global model and the two-component Crane model for path length 1.3 to 53 km. for frequencies 7 to 82 GHz using terrestrial path data shows that the two-component model predicted the attenuation values observed in the 0.1 to 0.01 of the year with an r.m.s. deviation of 35%, whereas for global model the deviation is 34% and for CCIR model it is 18%.
A comparison between the models using satellite beacon data shows that the iwo- componcnl model predicts the attenuation within an r.m.s. deviation of 79% whereas for CCIR the value is 58%. For paths in the United States the r.m.s. deviation for the two-component model is 48%, whereas for global model it is 45%' and for CCIR it is 42%. The two-component model gave better result outside Europe than inside it in comparison to the CCIR model [36]. For overall terrestrial paths, at 0.01% of the year, the r.m.s. deviation for the two-component model and CCIR model [36] are 30.3% and 13.3%' respectively. For earth space paths, the two models arc nearly identical in the United States.
7. Discussion
Since the first estimate of rain attenuation has been published, efforts are being made to confirm it with the help of experimental observations. The first theoretical estimate of rain attenuation was done by Rydc [3]. Medhurst 16] compared the attenuation estimated with the observed ones. He has shown that experimental results do not agree with the theoretical estimates. Crane [66] suggested that the discrepancy was mainly due to rainfall measurements. Aden [52] has compared the theoretical results for the scattering of a plane electromagnetic
118 Rajasri Sen and M P Singh
wave by a sphere wilh the experimental results using the standing wave method of King [76]. It is seen that there is very good agreement between the theoretical and experimental results. Maitra et al. [77] have compared the radiometric rain attenuation values taken over Calcutta wilh that derived from a model yr = a R h dB / km and have seen that the radiometric observations closely correspond to model calculations with J-T distribution. Crane [6 6 ] has established a two-componenl model for the prediction of rain attenuation statistics. This model was tested against observations using the procedure proposed by the CCIR [36] and it has matched the observations better than the CCIR model outside Europe than within Europe. TheaRh relation to calculate the rain attenuation shows that the agreement between the calculated and the experimental method is the best for observations taken with closely spaced rain gauges.
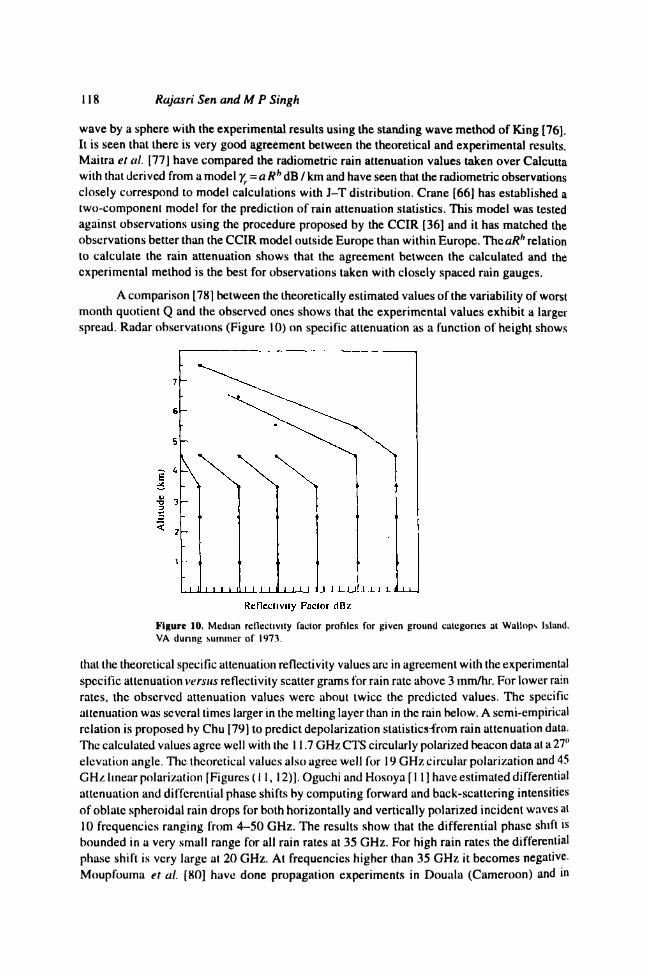
A comparison [78] between the theoretically estimated values of the variability of worst month quotient Q and the observed ones shows that the experimental values exhibit a larger spread. Radar observations (Figure 10) on specific attenuation as a function of height shows
Figure 10. Median reflectivity factor profiles for given ground categories at Wallops Island.VA during summer of 1973.
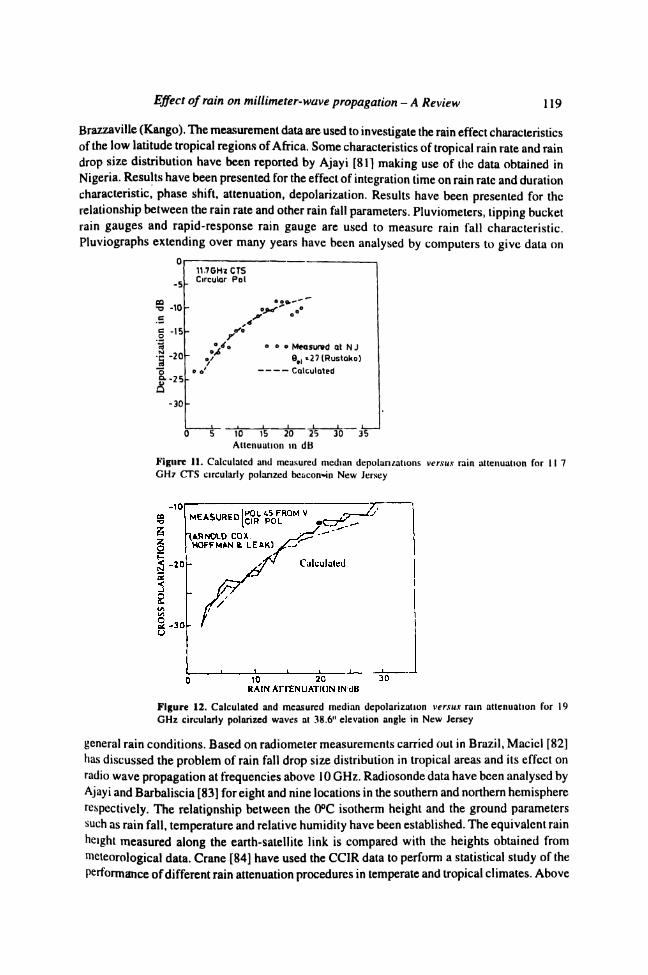
that the theoretical specific attenuation reflectivity values arc in agreement with the experimental specific attenuation versus reflectivity scatter grams for rain rate above 3 mm/hr. For lower rain rates, the observed attenuation values were about twice the predicted values. The specific attenuation was several times larger in the melting layer than in the rain below. A semi-empirical relation is proposed by Chu [79] to predict depolarization statisticsTrom rain attenuation data. The calculated values agree well with the 1 1 .7 GHz CTS circularly polarized beacon data at a 27° elevation angle. The theoretical values also agree well for 19 GHz circular polarization and 45 GHz linear polarization [Figures (11,12)]. Oguchi and Hosoya [II] have estimated differential attenuation and differential phase shifts by computing forward and back-scattering intensities of oblate spheroidal rain drops for both horizontally and vertically polarized incident waves at 10 frequencies ranging from 4-50 GHz. The results show that the differential phase shift is bounded in a very small range for all rain rates at 35 GHz. For high rain rates the differential phase shift is very large at 20 GHz. At frequencies higher than 35 GHz it becomes negative. Moupfouma et al. [80] have done propagation experiments in Douala (Cameroon) and in
Effect o f rain on millimeter-wave propagation - A Review 119
Brazzaville (Kango), The measurement data are used to investigate the rain effect characteristics of the low latitude tropical regions of Africa. Some characteristics of tropical rain rate and rain drop size distribution have been reported by Ajayi [81] making use of the data obtained in Nigeria. Results have been presented for the effect of integration time on rain rate and duration characteristic, phase shift, attenuation, depolarization. Results have been presented for the relationship between the rain rate and other rain fall parameters. Pluviometers, tipping bucket rain gauges and rapid-response rain gauge are used to measure rain fall characteristic. Pluviographs extending over many years have been analysed by computers to give data on
o-
- 5 -
11,7GHz CTS Circular Pol
- 10 -
■g-20|-oa. . 7 5 . & ̂
-30h
r°/o
»/° • ® Measured at N J
09, *27 l R us toko) ----------Calculated
10 15 20 25Attenuation in dB
30 35
Figure 11. Calculated and measured median depolarizations versus rain attenuation for 117 GHz CTS circularly polarized bcacoiMn New Jersey
Figure 12. Calculated and measured median depolarization versus rain attenuation for 19 GHz circularly polarized waves at 38.6° elevation angle in New Jersey
general rain conditions. Based on radiometer measurements carried out in Brazil, Maciel [82] has discussed the problem of rain fall drop size distribution in tropical areas and its effect on radio wave propagation at frequencies above 10 GHz. Radiosonde data have been analysed by Ajayi and Barbaliscia [83] for eight and nine locations in the southern and northern hemisphere respectively. The relationship between the 0°C isotherm height and the ground parameters such as rain fall, temperature and relative humidity have been established. The equivalent rain height measured along the earth-satellite link is compared with the heights obtained from meteorological data. Crane [84] have used the CCIR data to perform a statistical study of the performance of different rain attenuation procedures in temperate and tropical climates. Above
120 Rajasri Sen and M P Singh
most important error recorded is the use of few rain climate zones to cover the wide range of rain conditions present in the equatorial regions. The second source of error is an inadequate procedure for taking into account the vertical variations of specific attenuation. Thirdly, for the CCIR prediction method the use of a universal shape of cumulative distribution path attenuation must be called into question. An experiment has been carried out by Bowthorpe [85] in the tropica] region of North Australia to investigate the elevation angle dependence of rain attenuation. The results show that for tropical regions, especially for high rain rates, the cosecant law is inappropriate for elevation angle dependence of path attenuation. Haidra etai[86] have performed experiments that will provide new and useful data in Africa. In stratus rainfall events, the effects of ice depolarization are evaluated using the CS-2 beacon signal and X-band radar observations. A new method [87] of predicting cumulative distributions of XPD is proposed taking into account the effect of the ice depolarization. A model [88] for calculating the total depolarization due to the melting layer and rain is proposed under the assumption that oblate spheroidal melting particle and rain drops have the same orientation. In order tojimprovc the availability of propagation data at frequencies above 30 GHz the Rutherford Appleton Laboratory has built and operated 500 meter Mm-wave experimental range at ChilbolGon [89] Measurements of rain height has been carried out in Malaysiya by Zainal et al [90]. Radiosonde data have been analysed in Brazil to provide an estimation of the 0°C isotherm height. A simple model [91] has been developed for direct conversion of hourly rainfall rates into equally - probable one minute data for use in attenuation prediction technique. Gibbins [92] has studied the atmospheric effect, especially that of rain on the propagation of radio waves in the 30-60 GHz bands. Elcctromagnatic scattering from rain drops at 94 and 140 GHz frequencies is investigated. A new procedure has been proposed by Crane [931 for the estimation of the distribution of annual worst-month statistics. Karmakare/a/. [94] have shown that in Calcutta (latitude 23° N, longitude 88.5°E) the rain rate distribution fils well with a normal distribution. Atmospheric attenuation statistics of 11 years measured by a 12 GHz radiometer in Finland has been given by Karhu et ai [95]. A new rain map for radio propagation in Saudi Arabia has been given by Al-Kadi [96],
CCIR aims to select the best method by means of testing procedures and declares a method to be the ‘best’, which gives rise to smallest discrepency. CCIR also aims to increase the accuracy of a method and to extend its applicability. Adoption of a method for a particular region needs data in that region. Where measurement data are not available extrapolation is possible provided the behaviour of the phenomenon is well understood in that particular region. Over the two CCIR study periods (1982-1986, 1986-1990) extensive data banks have been formed throughout the world. But for tropical areas due to lack of experimental measurements, accumulation of data is not large. To predict attenuation, depolarization and scattering effect due to rain a knowledge of spatial and temporal behaviour of the rain storms and the specific attenuation due to rain is necessary. Such data are available in temperate regions but in low-latitude regions such data arc not available.
In order to calculate rain attenuation, a knowledge of effective path length is necessary. Effective path length in turn depends on the rain height, hR.hR is assumed to correspond to the height of the 0°C isotherm in rainy condition hfR, the average value of which is given by
and
hFR = 5 for 0 < 0 < 23°
hFR= S - 0 .0 7 5 (0 -2 3 ) for 0 > 23,
[50]
[51]

Effect o f rain on millimeter-wave propagation - A Review 121
where 0 is the latitude (degrees). At mid-latitudes, the average value of the 0°C isotherm hFR is found to give good results. For low latitudes, the predictions overestimate the experimental results. As a result CCIR study group 5 has introduced the concept of an effective rain height described earlier in Section 2. The attenuation prediction methods give good results above a latitude of 30° but al low latitudes a smaller database of measurements give a larger standard deviation. With an eye to predict rain attenuation at low latitudes, a two layer rain model has been established by Malricciani [97] and it is found that at equatorial region this model gives good probability distribution results al each of three sites in Brazil (Belem, Mahaus and Rio). A semiempirical model has been suggested by Moupfouma et al. [80] to calculate the rain rale distribution in diflerent geographical locations of Asia and Europe by varying the parameters used in the model for different geographical locations. For terrestrial path the two-component rain model [66] did better outside Europe than the CCIR model [38]. For Earth-space path both the CCIR model [36] and the two-component model did equally well in the United States. The two-component model [6 6] did better in Europe than the CCIR model 136].
References
[I] G Mie Ann. Physik 25 377 (1908)[21 J A Straton Electromagneta Theory (New York Mcgraw-Hill) p 563 (1944)[3] I Rydc G. E Co Repott No. 7831 (1941)[41 I Ryde and D Ryde G E Co Report No. 8516 (1944)[5J S D Setzer Bell System Tech J 49 1873 (1970)[6] P Mcdhurst IEEE Trans. Antennas Propag AP-13 p 550 (1965)17J R K Crane Ptoi. IEEE 59 p 173 (1971)[8] R K Crane IEEE Trans Antennas Propag AP-23 750 (1975)[9J P Waldteufcl Ann des Telecomm 28 255 (1973)
[101 F Fedi and P Mandanm Analysts of the Influence o f the Various Parameters on the Attenuation-Ram Rate Relation 1 Modern Topu m Microwave Propagation and air Sea Interaction (Holland ■ D Reidel) (1973)
[I I] J R Norbury and W J R White Electron. Lett 8 (1972)[12] R K Crane IEEE Trans Antennas Propag AP-22 321 (1974)[13] K Monla. T Inoue, A Akeyama. Y Hosoya, S Kato. T Fujita. M Kikusima, and O Sasaki Rev Elec
Comm. Labs. 22 619 (1974)[14] T S Chu Bell System Tech J. vol. 53 1557 (1974)[15] G A Brussard IEEE Trans. Antennas Propax AP-24 5 (1976)116] F Fedi, U Merlo and P Migliorim Ann des Telecomm 32 11 (1977)[17] T Oguchi and Y Hosoya J. Radio Res. Lab 21 191 (1974)[18] T Oguchi R a d i o Set 12 41 (1977)119] R L Olsen, D V Rogers and D B Hodge IEEE Trans. Antennas Pmpag. AP-26 318 (1978)120] J O Laws and D A Parsons Trans. American Geophys. Union 24 452 (1943)f2l] J S Marshall and M C K W Palmer J. Meteorol, 5 165 (1948)(221 I Ryde Propagation of Short Radio Waves (Rad. Lab Series, 13) (New York ■ McGraw-Hill) (1942)[23] J Joss, J C Thams and A Waldvogel Proc Int. Conf. on Cloud Physics (Toronto, Canada) p.369
(1968)[24] D Deimendjian, Complete Microwave Stuttering and Extinction Properties of Poly Dispersed Cloud
and Rain Elements (Jhc Rand Corp. Report) R-422-PR (1963).[25] G Drufuca J. de Researches Atm. 399 (1974).[26] E Bertok, G De Renzis and G Drufuca G Proc SI. Open Symp on Propagation in Non-Ionized media
(Baute, France) (1977)

[27] B Segal Report CRC 1351 (Department of Communications, Ottawa, Canada) (1982)[28] F Fedi Radio Sn . 16 731 (1981a)[29] K Monta and I Higuti Rev. Elec. Comm. Labs NTT 24 (1976)[30] B N Harden, J R Norbury and W J R White IEE J. Microwaves Optics Acous. 2 97 (1978)[31] R K Crane, IEEE Trans. Comm. COM-28 (ISSN 0090-6778), 1717 (1980)[32] A 1 Kalinin Elektrosviaz 12 (1974)[33] S H Lin Bell System Tech J 54 p 1051 (1975)[34] F Moupfouma IEE Proc. 132 Part H. 39 (1985)[35] 1 A Garcia-Lopez and J Peiro Electron Lett Vol 19 p. 879-880 (1983)[36] CCIR Report 564-4. Section 5F ■ Aspects Relative to Space Telecommunication System s, p. 447
(1990)[37] F Fedi Fondazione Ugo Bordoni Report 1B1081 (1981)[38] M Yamada, Y Karasawa, M Yasunaga and B Arbesser-Rastburg Radio Sci. 22, (1987)[39] A 1 Kalinin Elektrosviaz 5 (1976)[40] K Monta and I Higuti Trans. Inst. Electron Comm Engg (Japan) E61 425 (1978) I[41] P Mis me and P Waldteufel hit Symp. on Effects on the Lower Atmosphere on Radio Propagation at
Frequencies above I GHz (Canada) (1980) ^[42] F Fedi International Symposium on Effects of the Lower Atmosphere on Radio Propagation at
Frequencies above I GHz (Lennokville. Canada) (1980)[43] M Yamada, A Ogawa, O Furuta and H Yokoi hit. Symp. on Antennas and Propagation (Sendai.
Japan) (1978).[44] O Rue, Central Administration o f the Swedish Telecommunication Report RI 16/80 (1981)[45] CCIR Report 564-3 (1986)[46] J A Garcia-Lopez. J M Hernando and J M Selga IEEE Trans Antennas Propug 36 444 (1989)[47] F Fedi and A Paraboni Proc URSTF (Durham, US). Modification as in CCIR IWP 5/2 Document
87/19 (1986)[48] M J Leitao and P A Watson IEE Proc 133 429 (1986)[49] () Rue Swedish Telecomn. Radio Report RI 01/88 (1988)[50] H J Li, C Q Zhang, L Liao and G F Jhang Proi ICAP, p. 226 (1987)[511 H Fukuchi and Y Olsu IEE Conf Pub No 274 (ICAP R7), p. 129 (1987)[52] A L Aden J Appl Phys 22 601 (1950)[53] Infeld Quart Appl Math 5 113, 1947[54] R Gunn and G D Kinzer J Metorol 285 243 (1949)[55] P S Roy Appl Opt 11 1836 (1972)[56] R S Sekhon and R C Snvastava J Atoms. Sci.,28 883 Sept (1971)[57] W L Nowland, R L Olsen and I P Shakarofsky Electron Lett, 13 676 (1977)[58] L Boithias and L Battcsli Ann. des Telecomm. 36 483 (1981)[59] H R Pruppacher and K V Beard Quart. J. Roy Meteor Soc. 96 247 (1970)[60] H R Pruppacher and R L Putcr J. Atmos. Sci. 28 86 (1971)[61] M J Saunders IEEE Trans Antennas Propagation 19 273 (1971)[62] F Fedi Alta Frequenza Vol. XLVID 167 (1979)[63] B Segal Ann des Telecomm. Vol. 35 411 (1980)[64J F Moupfouma, Atlas Mondial Des Intensites de Pluie en / Minute. Note Tech. CNET (MER/RPE)
France (1985b)[65] F Moupfouma and Dr Eng IEE Proc 134 pi. H p.527 (1987)[66] R K Crane Radio Phys. 206 1371 (1982)[67] Y Hosoya Trans Inst. Electron Inform. Comm Engrs. J71-B 256 (1988)[68] Y Karasawa, T Matsudo and T Shiokawa, Proc. ISAP, ld2 -l p. 165 (1989)
122 Rajasri Sen and M P Singh
Effect o f rain on millimeter-wave propagation - A Review 123
[69] B Segal J. Atmos. Oceanic Tech. 3 no 4 (1986)[70] P Misme and J Fimbel Ann. des Telecomm 30 p.149 (1975)[71] J Bailesti and L Boithias, 6th Colloq. on Microwave Communications (Budapest, Hungary) (1978)[72] F Moupfouma IEEE Trans Ant, Prop. AP-32 1368 (1984)[73] S H Lin. Bell System Tech. J 59 (1980)[74] R R Rogers IEEE Trans. Ant. Prop. AP-11 547 (1976)[75] J Goldhirsh IEEE Trans. Ant. Prop. AP-30 1121 (1982)[76] D King Proc. Inst Radio Engrs. 37 770 (1949)[77] A Maitra, R Bern, S K Datta, M K Dasgupta, A K Sen and A K Dcvgupta Proc. Ini. Conf on Millimeter
Wave and Microwave (1990)[78] A Mawira Electronic Lett 21 1073 (1985)[79] T S Chu IEEE Trans on Commun. com-30 2550 (1982)[80] F Moupfouma, I Martin, N Spanjnurd and K Hughes Ini J. Satell. Commnun. (UK) 8 151 (1990)[81] G O Ajayi, Int J. Satell. Commun. (UK) 8 163 (1990)[82] L R Maciel Int. J Satell, Commun. (UK), 8 181 (1990)[83] G O Ajayi and F Barbatiscia hit. J Satell, Commun. (UK) 8 187 (1990)[84] R K Crane Int. J. Satell, Commun. (UK) 8 197 (1990)[85] B J Bowthorpe, F B Andrews, C 1 Kikkcrt and P I Arlett Int. J Satell. Commun (UK) 8 211 (1990)[86] F Haidara, T Pratt, C W Bostian, D J Harris and E Milner hit. J. Satell, Commun (UK) 8 269 (1990) 187] Y Maekawa Electron Lett (UKK 26 2006 (1990)[88] W Zhang. E Salonen and S Karhu hit. J. Infiared Millim Waves. 12 543 (1991)[89] C J Gibbins, Seventh Int. Conf on Antennas and Propagation ICAP 91 Vol. 2 p 673 (1991)[90] A R Zainal, Seventh Int Conf. on Antennas and Propagation ICAP 91 Vol, 2 p 742 (1991)[91] Y Karasawa and T Matsudo IEEE Trans on Geosn. and Remote Sensing 29 890 (1991)[92] C J Gibbins 1EE Colloquim on Radiocommunications in the Range 30-60 GHz (Digest No. 012) p
1/1/-4 (1991)[931 R K Crane Radio Set (USA) 26 801 (1991)[941 P K Kamiakar, R Bera, G Tarafdar, A Maitra and A K Sen J. Infrared Millim. Waves 20 1333 (1991)[95] S I Karhu, P Jokcla and E T Salomon Proc. 21st European Microwave Conference. 9-12 Sept p. 1229
(1991)[961 1 A Al-Kadi and Arab Gurcy J Sc i Res (Saudi Arabia) 9 23 (1991)[97] E Matncciam Electronic Lett. 29 72 (1993).
ABOUT THE REVIEWERS
Rajasri Sen
Ms. Rajasri Sen pursued her study at the University of Calcutta and obtained her M.Sc. (Physics) and M. Tech. (Atmospheric Sciences) degrees from University College of Science and Technology, Calcutta. Presently, pursuing her doctoral dissertation on ‘Effect of rain on millimeter-wave propagation’ from J. K. Institute of Applied Physics and Technology, Allahabad University.
M. P. Singh
Prof. M. P. Singh is irf the Faculty of the Department of Electronics and Telecommunication, J- K. Institute of Applied Physics and Technology, Allahabad University. He obtained his M. Tech, degree in Electronics Engineering in 1972 and D. Phil, on ‘Incoherent Back scatter Radar for atmospheric studies’ in 1984 from the University of Allahabad.
Copyright © 2022 FDOKUMEN