Ensemble et pratiques funéraires au Liban au IVème millénaire
arX
iv:0
909.
4131
v2 [
nucl
-ex]
4 J
un 2
010
Identified particle production, azimuthal anisotropy, and interferometry
measurements in Au+Au collisions at√sNN = 9.2 GeV
B. I. Abelev,8 M. M. Aggarwal,30 Z. Ahammed,47 A. V. Alakhverdyants,17 B. D. Anderson,18
D. Arkhipkin,3 G. S. Averichev,17 J. Balewski,22 O. Barannikova,8 L. S. Barnby,2 S. Baumgart,52
D. R. Beavis,3 R. Bellwied,50 F. Benedosso,27 M. J. Betancourt,22 R. R. Betts,8 A. Bhasin,16
A. K. Bhati,30 H. Bichsel,49 J. Bielcik,10 J. Bielcikova,11 B. Biritz,6 L. C. Bland,3 I. Bnzarov,17
B. E. Bonner,36 J. Bouchet,18 E. Braidot,27 A. V. Brandin,25 A. Bridgeman,1 E. Bruna,52 S. Bueltmann,29
T. P. Burton,2 X. Z. Cai,40 H. Caines,52 M. Calderon de la Barca Sanchez,5 O. Catu,52 D. Cebra,5
R. Cendejas,6 M. C. Cervantes,42 Z. Chajecki,28 P. Chaloupka,11 S. Chattopadhyay,47 H. F. Chen,38
J. H. Chen,40 J. Y. Chen,51 J. Cheng,44 M. Cherney,9 A. Chikanian,52 K. E. Choi,34 W. Christie,3
P. Chung,11 R. F. Clarke,42 M. J. M. Codrington,42 R. Corliss,22 J. G. Cramer,49 H. J. Crawford,4 D. Das,5
S. Dash,13 L. C. De Silva,50 R. R. Debbe,3 T. G. Dedovich,17 M. DePhillips,3 A. A. Derevschikov,32
R. Derradi de Souza,7 L. Didenko,3 P. Djawotho,42 S. M. Dogra,16 X. Dong,21 J. L. Drachenberg,42
J. E. Draper,5 J. C. Dunlop,3 M. R. Dutta Mazumdar,47 L. G. Efimov,17 E. Elhalhuli,2 M. Elnimr,50
J. Engelage,4 G. Eppley,36 B. Erazmus,41 M. Estienne,41 L. Eun,31 P. Fachini,3 R. Fatemi,19 J. Fedorisin,17
R. G. Fersch,19 P. Filip,17 E. Finch,52 V. Fine,3 Y. Fisyak,3 C. A. Gagliardi,42 D. R. Gangadharan,6
M. S. Ganti,47 E. J. Garcia-Solis,8 A. Geromitsos,41 F. Geurts,36 V. Ghazikhanian,6 P. Ghosh,47
Y. N. Gorbunov,9 A. Gordon,3 O. Grebenyuk,21 D. Grosnick,46 B. Grube,34 S. M. Guertin,6 A. Gupta,16
N. Gupta,16 W. Guryn,3 B. Haag,5 T. J. Hallman,3 A. Hamed,42 L-X. Han,40 J. W. Harris,52
J. P. Hays-Wehle,22 M. Heinz,52 S. Heppelmann,31 A. Hirsch,33 E. Hjort,21 A. M. Hoffman,22
G. W. Hoffmann,43 D. J. Hofman,8 R. S. Hollis,8 H. Z. Huang,6 T. J. Humanic,28 L. Huo,42 G. Igo,6
A. Iordanova,8 P. Jacobs,21 W. W. Jacobs,15 P. Jakl,11 C. Jena,13 F. Jin,40 C. L. Jones,22 P. G. Jones,2
J. Joseph,18 E. G. Judd,4 S. Kabana,41 K. Kajimoto,43 K. Kang,44 J. Kapitan,11 K. Kauder,8 D. Keane,18
A. Kechechyan,17 D. Kettler,49 V. Yu. Khodyrev,32 D. P. Kikola,21 J. Kiryluk,21 A. Kisiel,48 S. R. Klein,21
A. G. Knospe,52 A. Kocoloski,22 D. D. Koetke,46 T. Kollegger,12 J. Konzer,33 M. Kopytine,18 IKoralt,29
W. Korsch,19 L. Kotchenda,25 V. Kouchpil,11 P. Kravtsov,25 V. I. Kravtsov,32 K. Krueger,1
M. Krus,10 L. Kumar,30 P. Kurnadi,6 M. A. C. Lamont,3 J. M. Landgraf,3 S. LaPointe,50 J. Lauret,3
A. Lebedev,3 R. Lednicky,17 C-H. Lee,34 J. H. Lee,3 W. Leight,22 M. J. LeVine,3 C. Li,38 N. Li,51
Y. Li,44 Z. Li,51 G. Lin,52 X. Lin,33 S. J. Lindenbaum,26 M. A. Lisa,28 F. Liu,51 H. Liu,5 J. Liu,36
T. Ljubicic,3 W. J. Llope,36 R. S. Longacre,3 W. A. Love,3 Y. Lu,38 T. Ludlam,3 G. L. Ma,40 Y. G. Ma,40
D. P. Mahapatra,13 R. Majka,52 O. I. Mall,5 L. K. Mangotra,16 R. Manweiler,46 S. Margetis,18
C. Markert,43 H. Masui,21 H. S. Matis,21 Yu. A. Matulenko,32 D. McDonald,36 T. S. McShane,9
A. Meschanin,32 R. Milner,22 N. G. Minaev,32 S. Mioduszewski,42 A. Mischke,27 M. K. Mitrovski,12
B. Mohanty,47 D. A. Morozov,32 M. G. Munhoz,37 B. K. Nandi,14 C. Nattrass,52 T. K. Nayak,47
J. M. Nelson,2 P. K. Netrakanti,33 M. J. Ng,4 L. V. Nogach,32 S. B. Nurushev,32 G. Odyniec,21
A. Ogawa,3 H. Okada,3 V. Okorokov,25 D. Olson,21 M. Pachr,10 B. S. Page,15 S. K. Pal,47 Y. Pandit,18
Y. Panebratsev,17 T. Pawlak,48 T. Peitzmann,27 V. Perevoztchikov,3 C. Perkins,4 W. Peryt,48
S. C. Phatak,13 P. Pile,3 M. Planinic,53 M. A. Ploskon,21 J. Pluta,48 D. Plyku,29 N. Poljak,53
A. M. Poskanzer,21 B. V. K. S. Potukuchi,16 D. Prindle,49 C. Pruneau,50 N. K. Pruthi,30 P. R. Pujahari,14
J. Putschke,52 R. Raniwala,35 S. Raniwala,35 R. L. Ray,43 R. Redwine,22 R. Reed,5 J. M. Rehberg,12
A. Ridiger,25 H. G. Ritter,21 J. B. Roberts,36 O. V. Rogachevskiy,17 J. L. Romero,5 A. Rose,21 C. Roy,41
L. Ruan,3 M. J. Russcher,27 R. Sahoo,41 S. Sakai,6 I. Sakrejda,21 T. Sakuma,22 S. Salur,21 J. Sandweiss,52
J. Schambach,43 R. P. Scharenberg,33 N. Schmitz,23 T. R. Schuster,12 J. Seele,22 J. Seger,9
I. Selyuzhenkov,15 P. Seyboth,23 E. Shahaliev,17 M. Shao,38 M. Sharma,50 S. S. Shi,51 E. P. Sichtermann,21
F. Simon,23 R. N. Singaraju,47 M. J. Skoby,33 N. Smirnov,52 P. Sorensen,3 J. Sowinski,15 H. M. Spinka,1
B. Srivastava,33 T. D. S. Stanislaus,46 D. Staszak,6 G. S. F. Stephans,22 R. Stock,12 M. Strikhanov,25
B. Stringfellow,33 A. A. P. Suaide,37 M. C. Suarez,8 N. L. Subba,18 M. Sumbera,11 X. M. Sun,21 Y. Sun,38
Z. Sun,20 B. Surrow,22 T. J. M. Symons,21 A. Szanto de Toledo,37 J. Takahashi,7 A. H. Tang,3 Z. Tang,38
L. H. Tarini,50 T. Tarnowsky,24 D. Thein,43 J. H. Thomas,21 J. Tian,40 A. R. Timmins,50 S. Timoshenko,25
D. Tlusty,11 M. Tokarev,17 T. A. Trainor,49 V. N. Tram,21 S. Trentalange,6 R. E. Tribble,42 O. D. Tsai,6
J. Ulery,33 T. Ullrich,3 D. G. Underwood,1 G. Van Buren,3 G. van Nieuwenhuizen,22 J. A. Vanfossen, Jr.,18
R. Varma,14 G. M. S. Vasconcelos,7 A. N. Vasiliev,32 F. Videbaek,3 Y. P. Viyogi,47 S. Vokal,17
2
S. A. Voloshin,50 M. Wada,43 M. Walker,22 F. Wang,33 G. Wang,6 H. Wang,24 J. S. Wang,20 Q. Wang,33
X. Wang,44 X. L. Wang,38 Y. Wang,44 G. Webb,19 J. C. Webb,46 G. D. Westfall,24 C. Whitten Jr.,6
H. Wieman,21 S. W. Wissink,15 R. Witt,45 Y. Wu,51 W. Xie,33 N. Xu,21 Q. H. Xu,39 W. Xu,6 Y. Xu,38
Z. Xu,3 L. Xue,40 Y. Yang,20 P. Yepes,36 K. Yip,3 I-K. Yoo,34 Q. Yue,44 M. Zawisza,48 H. Zbroszczyk,48
W. Zhan,20 S. Zhang,40 W. M. Zhang,18 X. P. Zhang,21 Y. Zhang,21 Z. P. Zhang,38 Y. Zhao,38
C. Zhong,40 J. Zhou,36 W. Zhou,39 X. Zhu,44 Y-H. Zhu,40 R. Zoulkarneev,17 and Y. Zoulkarneeva17
(STAR Collaboration)1Argonne National Laboratory, Argonne, Illinois 60439, USA2University of Birmingham, Birmingham, United Kingdom
3Brookhaven National Laboratory, Upton, New York 11973, USA4University of California, Berkeley, California 94720, USA5University of California, Davis, California 95616, USA
6University of California, Los Angeles, California 90095, USA7Universidade Estadual de Campinas, Sao Paulo, Brazil
8University of Illinois at Chicago, Chicago, Illinois 60607, USA9Creighton University, Omaha, Nebraska 68178, USA
10Czech Technical University in Prague, FNSPE, Prague, 115 19, Czech Republic11Nuclear Physics Institute AS CR, 250 68 Rez/Prague, Czech Republic
12University of Frankfurt, Frankfurt, Germany13Institute of Physics, Bhubaneswar 751005, India14Indian Institute of Technology, Mumbai, India
15Indiana University, Bloomington, Indiana 47408, USA16University of Jammu, Jammu 180001, India
17Joint Institute for Nuclear Research, Dubna, 141 980, Russia18Kent State University, Kent, Ohio 44242, USA
19University of Kentucky, Lexington, Kentucky, 40506-0055, USA20Institute of Modern Physics, Lanzhou, China
21Lawrence Berkeley National Laboratory, Berkeley, California 94720, USA22Massachusetts Institute of Technology, Cambridge, MA 02139-4307, USA
23Max-Planck-Institut fur Physik, Munich, Germany24Michigan State University, East Lansing, Michigan 48824, USA
25Moscow Engineering Physics Institute, Moscow Russia26City College of New York, New York City, New York 10031, USA
27NIKHEF and Utrecht University, Amsterdam, The Netherlands28Ohio State University, Columbus, Ohio 43210, USA29Old Dominion University, Norfolk, VA, 23529, USA
30Panjab University, Chandigarh 160014, India31Pennsylvania State University, University Park, Pennsylvania 16802, USA
32Institute of High Energy Physics, Protvino, Russia33Purdue University, West Lafayette, Indiana 47907, USA
34Pusan National University, Pusan, Republic of Korea35University of Rajasthan, Jaipur 302004, India36Rice University, Houston, Texas 77251, USA37Universidade de Sao Paulo, Sao Paulo, Brazil
38University of Science & Technology of China, Hefei 230026, China39Shandong University, Jinan, Shandong 250100, China
40Shanghai Institute of Applied Physics, Shanghai 201800, China41SUBATECH, Nantes, France
42Texas A&M University, College Station, Texas 77843, USA43University of Texas, Austin, Texas 78712, USA
44Tsinghua University, Beijing 100084, China45United States Naval Academy, Annapolis, MD 21402, USA
46Valparaiso University, Valparaiso, Indiana 46383, USA47Variable Energy Cyclotron Centre, Kolkata 700064, India
48Warsaw University of Technology, Warsaw, Poland49University of Washington, Seattle, Washington 98195, USA
50Wayne State University, Detroit, Michigan 48201, USA51Institute of Particle Physics, CCNU (HZNU), Wuhan 430079, China
52Yale University, New Haven, Connecticut 06520, USA53University of Zagreb, Zagreb, HR-10002, Croatia
(Dated: August 11, 2012)
3
We present the first measurements of identified hadron production, azimuthal anisotropy, andpion interferometry from Au+Au collisions below the nominal injection energy at the RelativisticHeavy-Ion Collider (RHIC) facility. The data were collected using the large acceptance STARdetector at
√sNN = 9.2 GeV from a test run of the collider in the year 2008. Midrapidity results on
multiplicity density (dN/dy) in rapidity (y), average transverse momentum (〈pT 〉), particle ratios,elliptic flow, and HBT radii are consistent with the corresponding results at similar
√sNN from fixed
target experiments. Directed flow measurements are presented for both midrapidity and forwardrapidity regions. Furthermore the collision centrality dependence of identified particle dN/dy, 〈pT 〉,and particle ratios are discussed. These results also demonstrate that the capabilities of the STARdetector, although optimized for
√sNN = 200 GeV, are suitable for the proposed QCD critical point
search and exploration of the QCD phase diagram at RHIC.
PACS numbers: 25.75.-q; 25.75.Dw; 24.85.+p; 25.75.Ld; 25.75.Gz
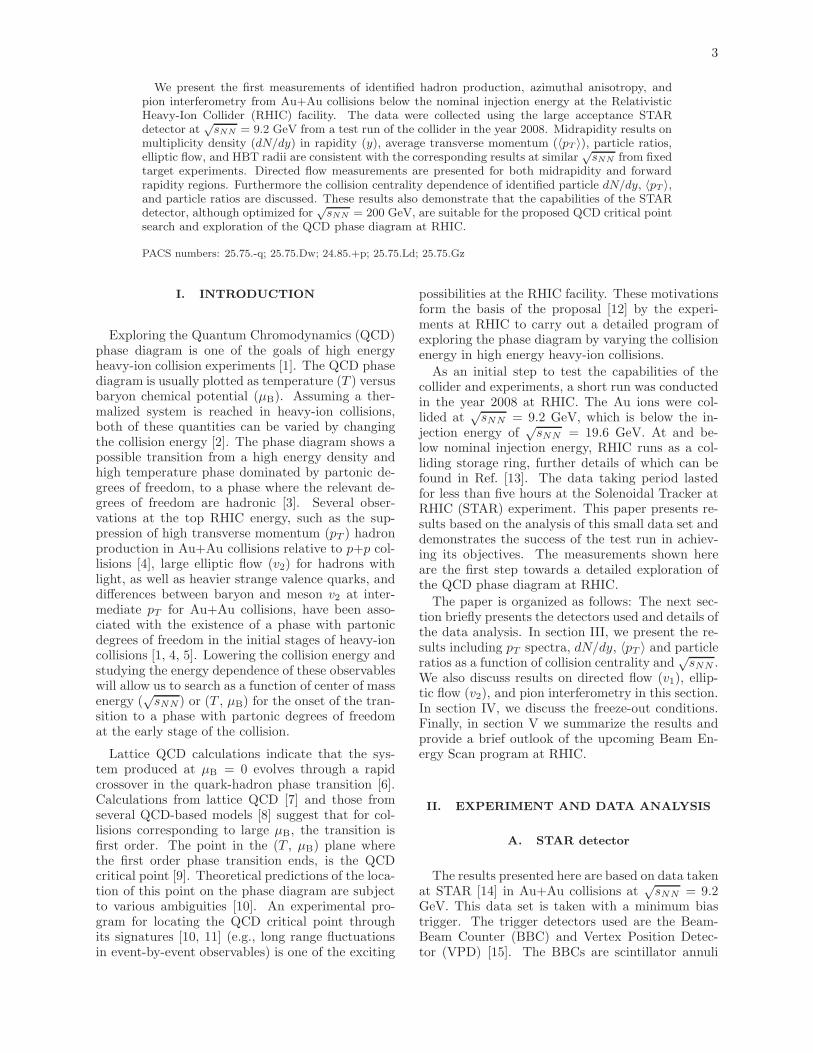
I. INTRODUCTION
Exploring the Quantum Chromodynamics (QCD)phase diagram is one of the goals of high energyheavy-ion collision experiments [1]. The QCD phasediagram is usually plotted as temperature (T ) versusbaryon chemical potential (µB). Assuming a ther-malized system is reached in heavy-ion collisions,both of these quantities can be varied by changingthe collision energy [2]. The phase diagram shows apossible transition from a high energy density andhigh temperature phase dominated by partonic de-grees of freedom, to a phase where the relevant de-grees of freedom are hadronic [3]. Several obser-vations at the top RHIC energy, such as the sup-pression of high transverse momentum (pT ) hadronproduction in Au+Au collisions relative to p+p col-lisions [4], large elliptic flow (v2) for hadrons withlight, as well as heavier strange valence quarks, anddifferences between baryon and meson v2 at inter-mediate pT for Au+Au collisions, have been asso-ciated with the existence of a phase with partonicdegrees of freedom in the initial stages of heavy-ioncollisions [1, 4, 5]. Lowering the collision energy andstudying the energy dependence of these observableswill allow us to search as a function of center of massenergy (
√sNN) or (T , µB) for the onset of the tran-
sition to a phase with partonic degrees of freedomat the early stage of the collision.
Lattice QCD calculations indicate that the sys-tem produced at µB = 0 evolves through a rapidcrossover in the quark-hadron phase transition [6].Calculations from lattice QCD [7] and those fromseveral QCD-based models [8] suggest that for col-lisions corresponding to large µB, the transition isfirst order. The point in the (T , µB) plane wherethe first order phase transition ends, is the QCDcritical point [9]. Theoretical predictions of the loca-tion of this point on the phase diagram are subjectto various ambiguities [10]. An experimental pro-gram for locating the QCD critical point throughits signatures [10, 11] (e.g., long range fluctuationsin event-by-event observables) is one of the exciting
possibilities at the RHIC facility. These motivationsform the basis of the proposal [12] by the experi-ments at RHIC to carry out a detailed program ofexploring the phase diagram by varying the collisionenergy in high energy heavy-ion collisions.
As an initial step to test the capabilities of thecollider and experiments, a short run was conductedin the year 2008 at RHIC. The Au ions were col-lided at
√sNN = 9.2 GeV, which is below the in-
jection energy of√sNN = 19.6 GeV. At and be-
low nominal injection energy, RHIC runs as a col-liding storage ring, further details of which can befound in Ref. [13]. The data taking period lastedfor less than five hours at the Solenoidal Tracker atRHIC (STAR) experiment. This paper presents re-sults based on the analysis of this small data set anddemonstrates the success of the test run in achiev-ing its objectives. The measurements shown hereare the first step towards a detailed exploration ofthe QCD phase diagram at RHIC.
The paper is organized as follows: The next sec-tion briefly presents the detectors used and details ofthe data analysis. In section III, we present the re-sults including pT spectra, dN/dy, 〈pT 〉 and particleratios as a function of collision centrality and
√sNN .
We also discuss results on directed flow (v1), ellip-tic flow (v2), and pion interferometry in this section.In section IV, we discuss the freeze-out conditions.Finally, in section V we summarize the results andprovide a brief outlook of the upcoming Beam En-ergy Scan program at RHIC.
II. EXPERIMENT AND DATA ANALYSIS
A. STAR detector
The results presented here are based on data takenat STAR [14] in Au+Au collisions at
√sNN = 9.2
GeV. This data set is taken with a minimum biastrigger. The trigger detectors used are the Beam-Beam Counter (BBC) and Vertex Position Detec-tor (VPD) [15]. The BBCs are scintillator annuli
4
mounted around the beam pipe beyond the east andwest pole-tips of the STAR magnet at about 375 cmfrom the center of the nominal interaction region(IR). The inner tiles of the BBCs, with a pseudo-rapidity (η) range of 3.8 < |η| < 5.2 and full az-imuthal coverage ∆φ = 2π, are used to reconstructthe first-order event plane for the directed flow anal-ysis. The VPDs are based on the conventional tech-nology of plastic scintillator read-out by photomul-tiplier tubes. They consist of two identical detectorassemblies very close to the beam pipe, one on eachside at a distance of |Vz| = 5.6 m from the centerof the IR. The main detector used to obtain the re-sults on pT spectra, yields, particle ratios, azimuthalanisotropy parameters, and pion interferometry forcharged hadrons is the Time Projection Chamber(TPC) [16]. The TPC is the primary tracking de-vice at STAR. It is 4.2 m long and 4 m in diameter.Its acceptance covers ±1.8 units of pseudorapidity(η) and the full azimuthal angle. The sensitive vol-ume of the TPC contains P10 gas (10% methane,90% argon) regulated at 2 mbar above atmosphericpressure. The TPC data are used to determine parti-cle trajectories, momenta, and particle-type throughionization energy loss (dE/dx). STAR’s solenoidalmagnet field used for this low energy Au+Au testrun was 0.5T. In addition we present directed flowmeasurements from forward rapidities. These resultsused the data taken by the Forward Time ProjectionChambers (FTPCs) [17]. There are two FTPCs lo-cated around the beam axis on both sides of the col-lision point. The sensitive medium is a gas mixtureof equal parts Ar and CO2 by weight. The FTPCsdetect charged particles in the pseudorapidity region2.5 ≤ |η| ≤ 4.0, with full azimuthal coverage. Thedetails of the design and other characteristics of theSTAR detectors can be found in Ref. [14].
B. Event selection
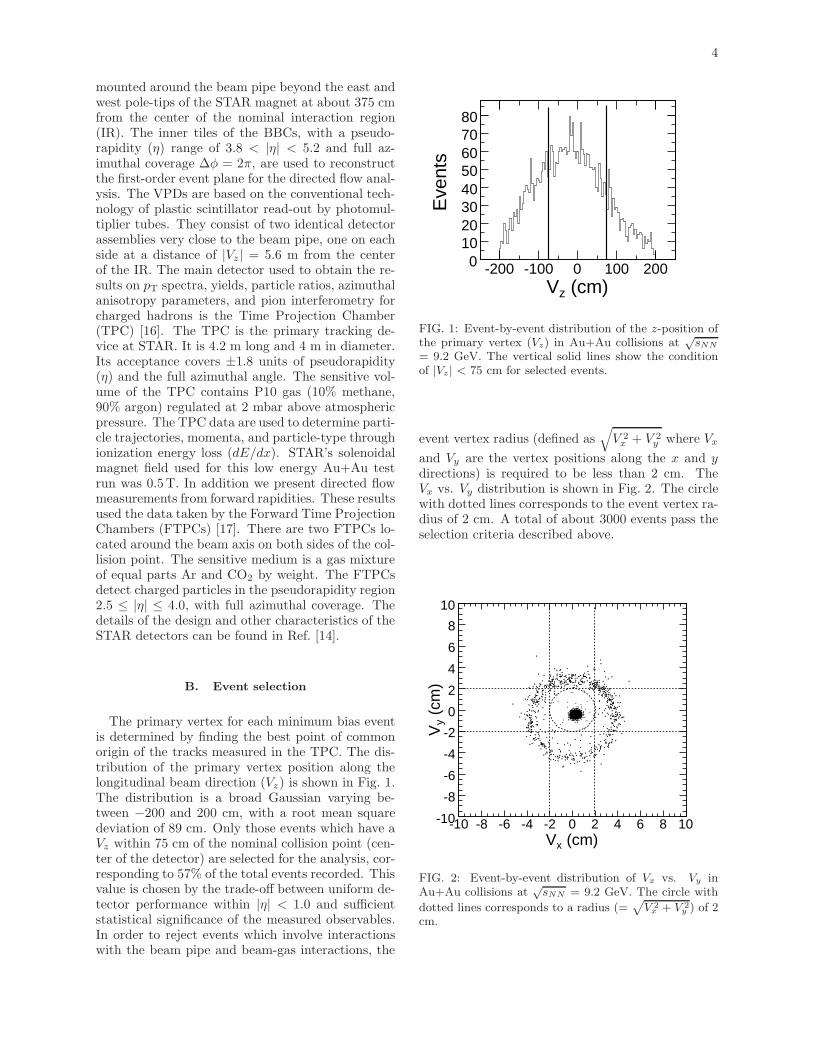
The primary vertex for each minimum bias eventis determined by finding the best point of commonorigin of the tracks measured in the TPC. The dis-tribution of the primary vertex position along thelongitudinal beam direction (Vz) is shown in Fig. 1.The distribution is a broad Gaussian varying be-tween −200 and 200 cm, with a root mean squaredeviation of 89 cm. Only those events which have aVz within 75 cm of the nominal collision point (cen-ter of the detector) are selected for the analysis, cor-responding to 57% of the total events recorded. Thisvalue is chosen by the trade-off between uniform de-tector performance within |η| < 1.0 and sufficientstatistical significance of the measured observables.In order to reject events which involve interactionswith the beam pipe and beam-gas interactions, the
(cm)zV-200 -100 0 100 200
Eve
nts
01020304050607080
FIG. 1: Event-by-event distribution of the z-position ofthe primary vertex (Vz) in Au+Au collisions at
√sNN
= 9.2 GeV. The vertical solid lines show the conditionof |Vz| < 75 cm for selected events.
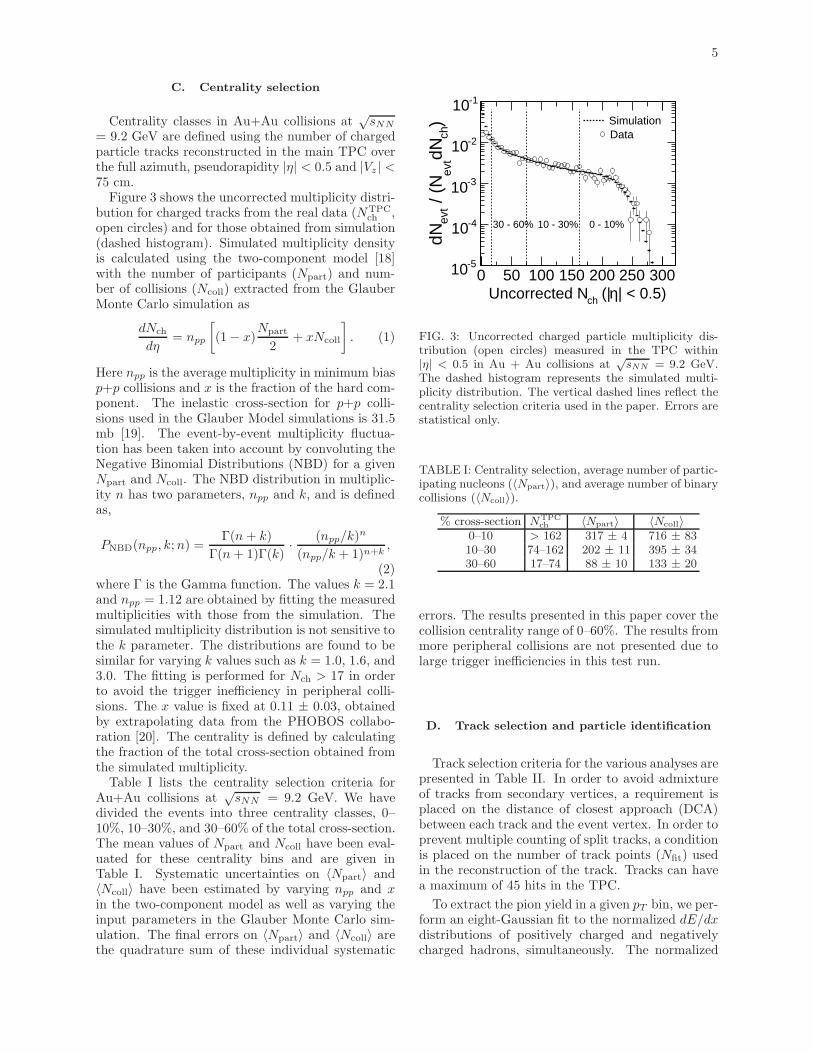
event vertex radius (defined as√
V 2x + V 2
y where Vx
and Vy are the vertex positions along the x and ydirections) is required to be less than 2 cm. TheVx vs. Vy distribution is shown in Fig. 2. The circlewith dotted lines corresponds to the event vertex ra-dius of 2 cm. A total of about 3000 events pass theselection criteria described above.
(cm)xV-10 -8 -6 -4 -2 0 2 4 6 8 10
(cm
)y
V
-10
-8
-6
-4
-2
0
2
4
6
8
10
FIG. 2: Event-by-event distribution of Vx vs. Vy inAu+Au collisions at
√sNN = 9.2 GeV. The circle with
dotted lines corresponds to a radius (=√
V 2x + V 2
y ) of 2cm.
5
C. Centrality selection
Centrality classes in Au+Au collisions at√sNN
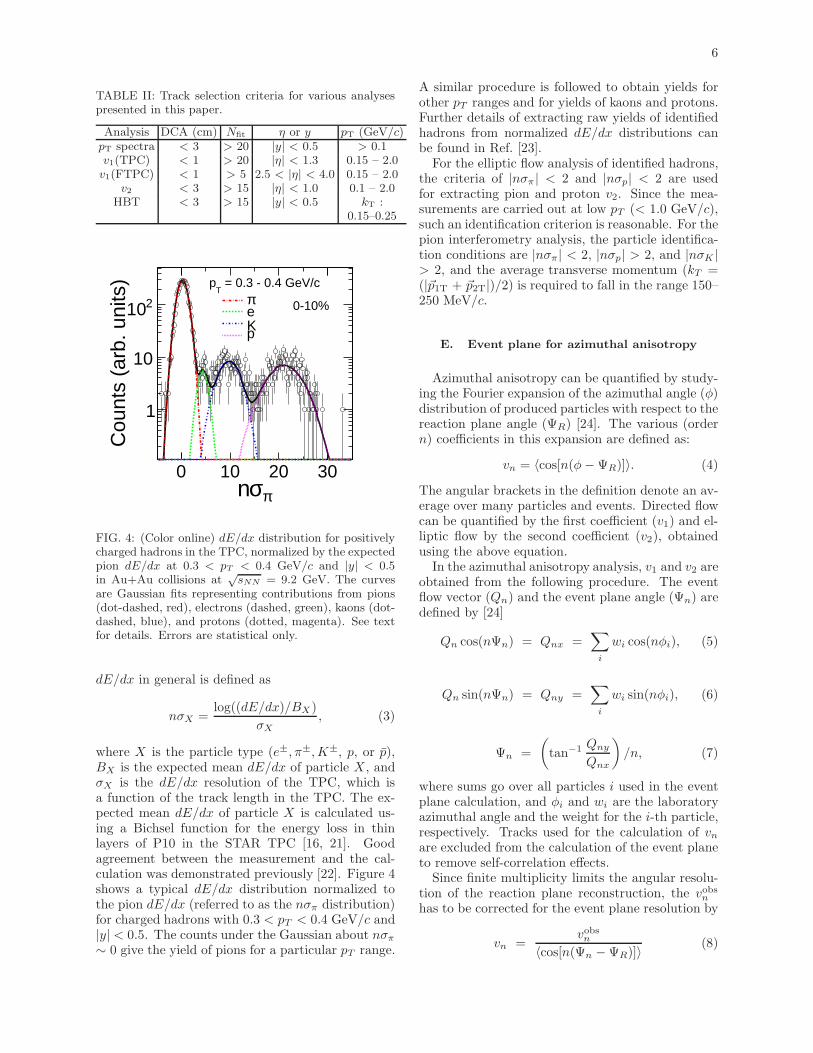
= 9.2 GeV are defined using the number of chargedparticle tracks reconstructed in the main TPC overthe full azimuth, pseudorapidity |η| < 0.5 and |Vz | <75 cm.Figure 3 shows the uncorrected multiplicity distri-
bution for charged tracks from the real data (NTPCch ,
open circles) and for those obtained from simulation(dashed histogram). Simulated multiplicity densityis calculated using the two-component model [18]with the number of participants (Npart) and num-ber of collisions (Ncoll) extracted from the GlauberMonte Carlo simulation as
dNch
dη= npp
[
(1− x)Npart
2+ xNcoll
]
. (1)
Here npp is the average multiplicity in minimum biasp+p collisions and x is the fraction of the hard com-ponent. The inelastic cross-section for p+p colli-sions used in the Glauber Model simulations is 31.5mb [19]. The event-by-event multiplicity fluctua-tion has been taken into account by convoluting theNegative Binomial Distributions (NBD) for a givenNpart and Ncoll. The NBD distribution in multiplic-ity n has two parameters, npp and k, and is definedas,
PNBD(npp, k;n) =Γ(n+ k)
Γ(n+ 1)Γ(k)· (npp/k)
n
(npp/k + 1)n+k,
(2)where Γ is the Gamma function. The values k = 2.1and npp = 1.12 are obtained by fitting the measuredmultiplicities with those from the simulation. Thesimulated multiplicity distribution is not sensitive tothe k parameter. The distributions are found to besimilar for varying k values such as k = 1.0, 1.6, and3.0. The fitting is performed for Nch > 17 in orderto avoid the trigger inefficiency in peripheral colli-sions. The x value is fixed at 0.11 ± 0.03, obtainedby extrapolating data from the PHOBOS collabo-ration [20]. The centrality is defined by calculatingthe fraction of the total cross-section obtained fromthe simulated multiplicity.Table I lists the centrality selection criteria for
Au+Au collisions at√sNN = 9.2 GeV. We have
divided the events into three centrality classes, 0–10%, 10–30%, and 30–60% of the total cross-section.The mean values of Npart and Ncoll have been eval-uated for these centrality bins and are given inTable I. Systematic uncertainties on 〈Npart〉 and〈Ncoll〉 have been estimated by varying npp and xin the two-component model as well as varying theinput parameters in the Glauber Monte Carlo sim-ulation. The final errors on 〈Npart〉 and 〈Ncoll〉 arethe quadrature sum of these individual systematic
| < 0.5)η (|chUncorrected N0 50 100 150 200 250 300
)ch
dNev
t /
(Nev
tdN
-510
-410
-310
-210
-110
0 - 10%10 - 30%30 - 60%
SimulationData
FIG. 3: Uncorrected charged particle multiplicity dis-tribution (open circles) measured in the TPC within|η| < 0.5 in Au + Au collisions at
√sNN = 9.2 GeV.
The dashed histogram represents the simulated multi-plicity distribution. The vertical dashed lines reflect thecentrality selection criteria used in the paper. Errors arestatistical only.
TABLE I: Centrality selection, average number of partic-ipating nucleons (〈Npart〉), and average number of binarycollisions (〈Ncoll〉).
% cross-section NTPCch 〈Npart〉 〈Ncoll〉
0–10 > 162 317 ± 4 716 ± 8310–30 74–162 202 ± 11 395 ± 3430–60 17–74 88 ± 10 133 ± 20
errors. The results presented in this paper cover thecollision centrality range of 0–60%. The results frommore peripheral collisions are not presented due tolarge trigger inefficiencies in this test run.
D. Track selection and particle identification
Track selection criteria for the various analyses arepresented in Table II. In order to avoid admixtureof tracks from secondary vertices, a requirement isplaced on the distance of closest approach (DCA)between each track and the event vertex. In order toprevent multiple counting of split tracks, a conditionis placed on the number of track points (Nfit) usedin the reconstruction of the track. Tracks can havea maximum of 45 hits in the TPC.
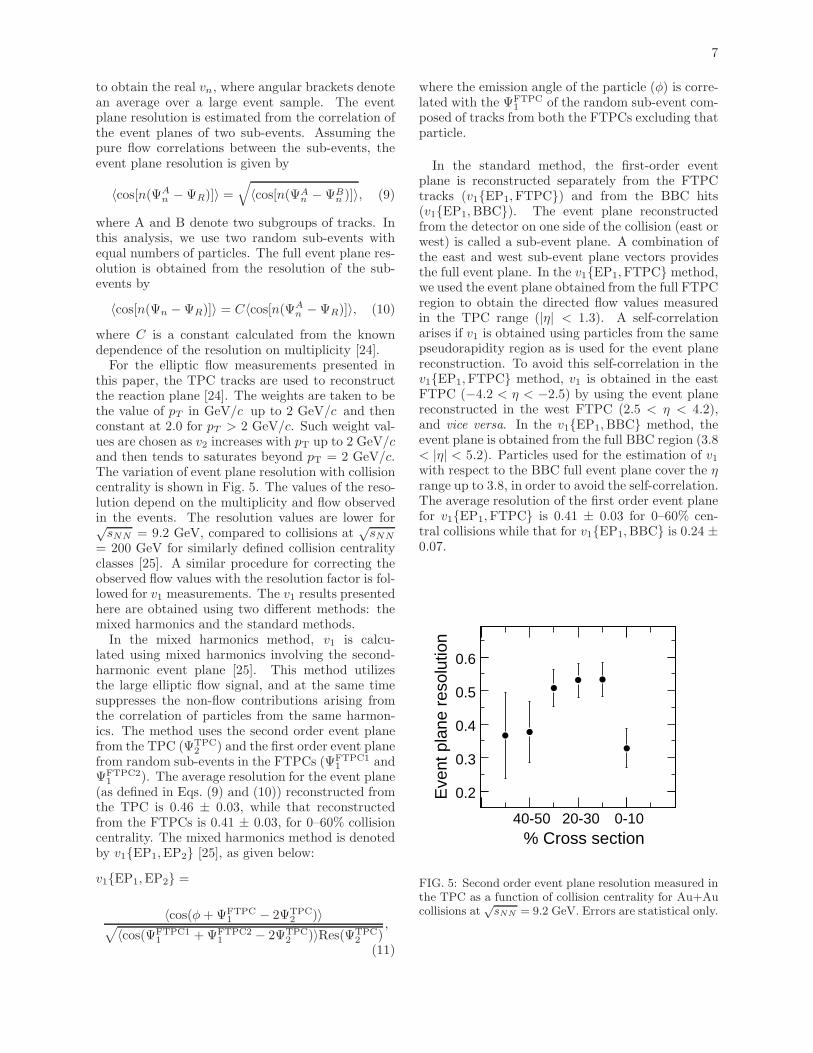
To extract the pion yield in a given pT bin, we per-form an eight-Gaussian fit to the normalized dE/dxdistributions of positively charged and negativelycharged hadrons, simultaneously. The normalized
6
TABLE II: Track selection criteria for various analysespresented in this paper.
Analysis DCA (cm) Nfit η or y pT (GeV/c)pT spectra < 3 > 20 |y| < 0.5 > 0.1v1(TPC) < 1 > 20 |η| < 1.3 0.15 – 2.0v1(FTPC) < 1 > 5 2.5 < |η| < 4.0 0.15 – 2.0
v2 < 3 > 15 |η| < 1.0 0.1 – 2.0HBT < 3 > 15 |y| < 0.5 kT :
0.15–0.25
πσn0 10 20 30
Cou
nts
(arb
. uni
ts)
1
10
210πeKp
0-10%
= 0.3 - 0.4 GeV/cT
p
FIG. 4: (Color online) dE/dx distribution for positivelycharged hadrons in the TPC, normalized by the expectedpion dE/dx at 0.3 < pT < 0.4 GeV/c and |y| < 0.5in Au+Au collisions at
√sNN = 9.2 GeV. The curves
are Gaussian fits representing contributions from pions(dot-dashed, red), electrons (dashed, green), kaons (dot-dashed, blue), and protons (dotted, magenta). See textfor details. Errors are statistical only.
dE/dx in general is defined as
nσX =log((dE/dx)/BX)
σX
, (3)
where X is the particle type (e±, π±,K±, p, or p),BX is the expected mean dE/dx of particle X , andσX is the dE/dx resolution of the TPC, which isa function of the track length in the TPC. The ex-pected mean dE/dx of particle X is calculated us-ing a Bichsel function for the energy loss in thinlayers of P10 in the STAR TPC [16, 21]. Goodagreement between the measurement and the cal-culation was demonstrated previously [22]. Figure 4shows a typical dE/dx distribution normalized tothe pion dE/dx (referred to as the nσπ distribution)for charged hadrons with 0.3 < pT < 0.4 GeV/c and|y| < 0.5. The counts under the Gaussian about nσπ
∼ 0 give the yield of pions for a particular pT range.
A similar procedure is followed to obtain yields forother pT ranges and for yields of kaons and protons.Further details of extracting raw yields of identifiedhadrons from normalized dE/dx distributions canbe found in Ref. [23].For the elliptic flow analysis of identified hadrons,
the criteria of |nσπ | < 2 and |nσp| < 2 are usedfor extracting pion and proton v2. Since the mea-surements are carried out at low pT (< 1.0 GeV/c),such an identification criterion is reasonable. For thepion interferometry analysis, the particle identifica-tion conditions are |nσπ| < 2, |nσp| > 2, and |nσK |> 2, and the average transverse momentum (kT =(|~p1T + ~p2T|)/2) is required to fall in the range 150–250 MeV/c.
E. Event plane for azimuthal anisotropy
Azimuthal anisotropy can be quantified by study-ing the Fourier expansion of the azimuthal angle (φ)distribution of produced particles with respect to thereaction plane angle (ΨR) [24]. The various (ordern) coefficients in this expansion are defined as:
vn = 〈cos[n(φ−ΨR)]〉. (4)
The angular brackets in the definition denote an av-erage over many particles and events. Directed flowcan be quantified by the first coefficient (v1) and el-liptic flow by the second coefficient (v2), obtainedusing the above equation.In the azimuthal anisotropy analysis, v1 and v2 are
obtained from the following procedure. The eventflow vector (Qn) and the event plane angle (Ψn) aredefined by [24]
Qn cos(nΨn) = Qnx =∑
i
wi cos(nφi), (5)
Qn sin(nΨn) = Qny =∑
i
wi sin(nφi), (6)
Ψn =
(
tan−1 Qny
Qnx
)
/n, (7)
where sums go over all particles i used in the eventplane calculation, and φi and wi are the laboratoryazimuthal angle and the weight for the i-th particle,respectively. Tracks used for the calculation of vnare excluded from the calculation of the event planeto remove self-correlation effects.Since finite multiplicity limits the angular resolu-
tion of the reaction plane reconstruction, the vobsn
has to be corrected for the event plane resolution by
vn =vobsn
〈cos[n(Ψn −ΨR)]〉(8)
7
to obtain the real vn, where angular brackets denotean average over a large event sample. The eventplane resolution is estimated from the correlation ofthe event planes of two sub-events. Assuming thepure flow correlations between the sub-events, theevent plane resolution is given by
〈cos[n(ΨAn −ΨR)]〉 =
√
〈cos[n(ΨAn −ΨB
n )]〉, (9)
where A and B denote two subgroups of tracks. Inthis analysis, we use two random sub-events withequal numbers of particles. The full event plane res-olution is obtained from the resolution of the sub-events by
〈cos[n(Ψn −ΨR)]〉 = C〈cos[n(ΨAn −ΨR)]〉, (10)
where C is a constant calculated from the knowndependence of the resolution on multiplicity [24].For the elliptic flow measurements presented in
this paper, the TPC tracks are used to reconstructthe reaction plane [24]. The weights are taken to bethe value of pT in GeV/c up to 2 GeV/c and thenconstant at 2.0 for pT > 2 GeV/c. Such weight val-ues are chosen as v2 increases with pT up to 2 GeV/cand then tends to saturates beyond pT = 2 GeV/c.The variation of event plane resolution with collisioncentrality is shown in Fig. 5. The values of the reso-lution depend on the multiplicity and flow observedin the events. The resolution values are lower for√sNN = 9.2 GeV, compared to collisions at
√sNN
= 200 GeV for similarly defined collision centralityclasses [25]. A similar procedure for correcting theobserved flow values with the resolution factor is fol-lowed for v1 measurements. The v1 results presentedhere are obtained using two different methods: themixed harmonics and the standard methods.In the mixed harmonics method, v1 is calcu-
lated using mixed harmonics involving the second-harmonic event plane [25]. This method utilizesthe large elliptic flow signal, and at the same timesuppresses the non-flow contributions arising fromthe correlation of particles from the same harmon-ics. The method uses the second order event planefrom the TPC (ΨTPC
2 ) and the first order event planefrom random sub-events in the FTPCs (ΨFTPC1
1 andΨFTPC2
1 ). The average resolution for the event plane(as defined in Eqs. (9) and (10)) reconstructed fromthe TPC is 0.46 ± 0.03, while that reconstructedfrom the FTPCs is 0.41 ± 0.03, for 0–60% collisioncentrality. The mixed harmonics method is denotedby v1{EP1,EP2} [25], as given below:
v1{EP1,EP2} =
〈cos(φ+ΨFTPC1 − 2ΨTPC
2 )〉√
〈cos(ΨFTPC11 +ΨFTPC2
1 − 2ΨTPC2 )〉Res(ΨTPC
2 ),
(11)
where the emission angle of the particle (φ) is corre-lated with the ΨFTPC
1 of the random sub-event com-posed of tracks from both the FTPCs excluding thatparticle.
In the standard method, the first-order eventplane is reconstructed separately from the FTPCtracks (v1{EP1,FTPC}) and from the BBC hits(v1{EP1,BBC}). The event plane reconstructedfrom the detector on one side of the collision (east orwest) is called a sub-event plane. A combination ofthe east and west sub-event plane vectors providesthe full event plane. In the v1{EP1,FTPC} method,we used the event plane obtained from the full FTPCregion to obtain the directed flow values measuredin the TPC range (|η| < 1.3). A self-correlationarises if v1 is obtained using particles from the samepseudorapidity region as is used for the event planereconstruction. To avoid this self-correlation in thev1{EP1,FTPC} method, v1 is obtained in the eastFTPC (−4.2 < η < −2.5) by using the event planereconstructed in the west FTPC (2.5 < η < 4.2),and vice versa. In the v1{EP1,BBC} method, theevent plane is obtained from the full BBC region (3.8< |η| < 5.2). Particles used for the estimation of v1with respect to the BBC full event plane cover the ηrange up to 3.8, in order to avoid the self-correlation.The average resolution of the first order event planefor v1{EP1,FTPC} is 0.41 ± 0.03 for 0–60% cen-tral collisions while that for v1{EP1,BBC} is 0.24 ±0.07.
Eve
nt p
lane
res
olut
ion
0.2
0.3
0.4
0.5
0.6
0-1020-3040-50% Cross section
FIG. 5: Second order event plane resolution measured inthe TPC as a function of collision centrality for Au+Aucollisions at
√sNN = 9.2 GeV. Errors are statistical only.
8
F. Correlation function in π interferometry
Experimentally, the two-particle correlation func-tion is obtained from the ratio,
C(~q,~k) =A(~q,~k)
B(~q,~k), (12)
where A(~q,~k) is the distribution of particle pairswith relative momentum ~q = ~p1 − ~p2 and average
momentum ~k = (~p1+ ~p2)/2 from the same event, and
B(~q,~k) is the corresponding distribution for pairs ofparticles taken from different events [26, 27]. Thecorrelation function is normalized to unity at large~q. In the mixed events, each particle in a given eventis mixed with all particles (π− for the results pre-sented in this paper) from other events, within acollection of 50 similar events. Similar events are se-lected within the centrality bin and further binned tohave primary vertex z positions within 10 cm. Withthe availability of high statistics data and develop-ment of new techniques, it has become possible tohave a three-dimensional decomposition of ~q [28–30],providing better insight into the collision geometry.The relative momentum ~q can be decomposed ac-
cording to the Bertsch-Pratt (also known as “out-side-long”) convention [31]. The relative momentum~q is decomposed into the variables along the beamdirection (qlong), parallel (qout) to the transverse mo-
mentum of the pair ~kT = (~p1T + ~p2T)/2, and perpen-dicular (qside) to qlong and qout. In addition to thecorrelation arising from quantum statistics of twoidentical particles, correlations can also arise fromtwo-particle final state interactions. For identicalpions, the effects of strong interactions are negligi-ble, but the long range Coulomb repulsion causes asuppression of the measured correlation function atsmall ~q.In this analysis, we follow the same procedure as
was used in the previous analysis of Au+Au colli-sions at
√sNN = 200 GeV [32]. For an azimuthally-
integrated analysis at midrapidity in the longitudi-nal co-moving system (LCMS), the correlation func-tion in Eq. (12) can be decomposed as [33]:
C(qout, qside, qlong) = (1−λ)+
λKcoul(qinv)(1 + e−q2outR2out−q2sideR
2side−q2longR
2long),
(13)where Kcoul is to a good approximation the squarednonsymmetrized Coulomb wave function integratedover a Gaussian source (corresponding to the LCMSGaussian radii Rout, Rside, Rlong) [34]. Assumingparticle identification is perfect and the source ispurely chaotic, λ represents the fraction of corre-lated pairs emitted from the collision.
We assume a spherical Gaussian source of 5fm [31, 32] for Au+Au collisions at
√sNN = 9.2
GeV. The first term (1 − λ) in Eq.(13) accountsfor those pairs which do not interact or interfere.The second term represents those pairs where bothBose-Einstein effects and Coulomb interactions arepresent [32].
DCA (cm)0 0.5 1 1.5 2 2.5
Nor
mal
ized
cou
nts
(arb
. uni
ts)
0
0.05
0.1
0.15
0.2
p Embeddingp Data Datap
: 0.4 - 0.7 GeV/cT
p
(a)
Number of fit points20 25 30 35 40 45 50
Nor
mal
ized
cou
nts
(arb
. uni
ts)
0
0.02
0.04
0.06
0.08
0.1
0.12
Embedding
Data
π : 0.4 - 0.7 GeV/cT
p
(b)
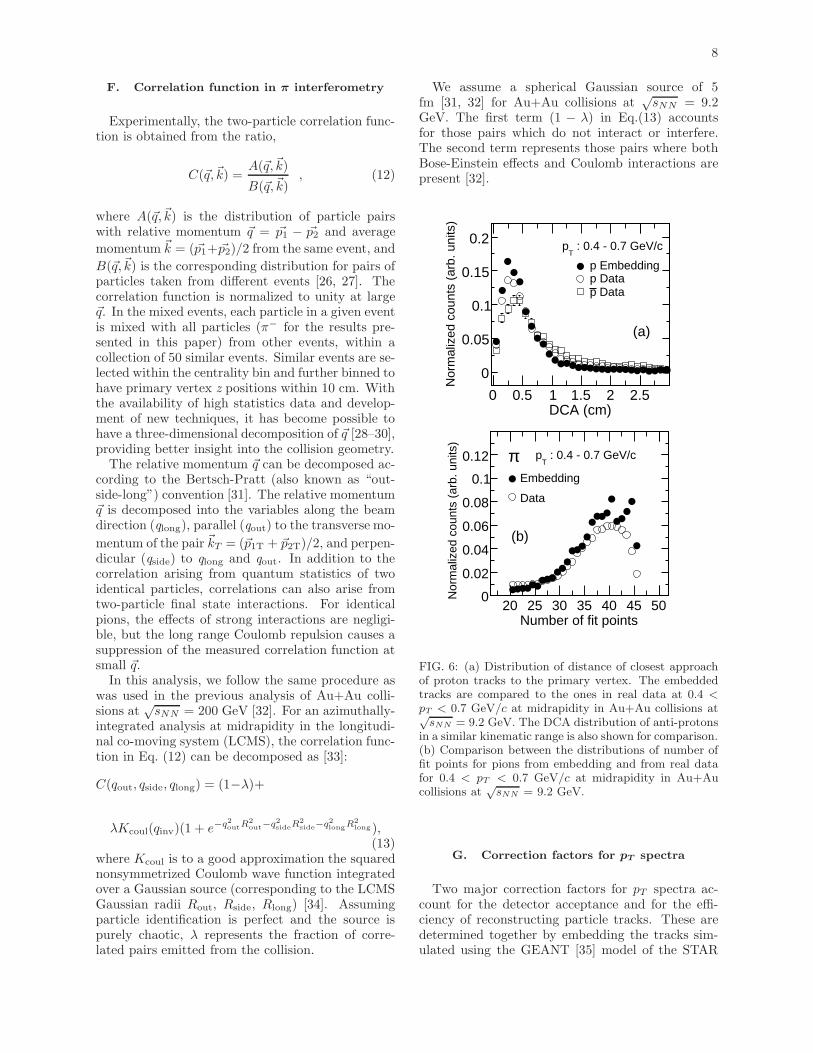
FIG. 6: (a) Distribution of distance of closest approachof proton tracks to the primary vertex. The embeddedtracks are compared to the ones in real data at 0.4 <pT < 0.7 GeV/c at midrapidity in Au+Au collisions at√sNN = 9.2 GeV. The DCA distribution of anti-protons
in a similar kinematic range is also shown for comparison.(b) Comparison between the distributions of number offit points for pions from embedding and from real datafor 0.4 < pT < 0.7 GeV/c at midrapidity in Au+Aucollisions at
√sNN = 9.2 GeV.
G. Correction factors for pT spectra
Two major correction factors for pT spectra ac-count for the detector acceptance and for the effi-ciency of reconstructing particle tracks. These aredetermined together by embedding the tracks sim-ulated using the GEANT [35] model of the STAR
9
(GeV/c)MCT
p0 0.5 1 1.5
Acc
epta
nce
×E
ffici
ency
0
0.2
0.4
0.6
0.8
+π+K
p(a)
(GeV/c)T
p0 0.5 1 1.5
Bac
kgro
und
(%)
π
0
5
10
15
20
25 backgroundπTotal πWeak decay
Muon contamination
(b)
HIJING+GEANT
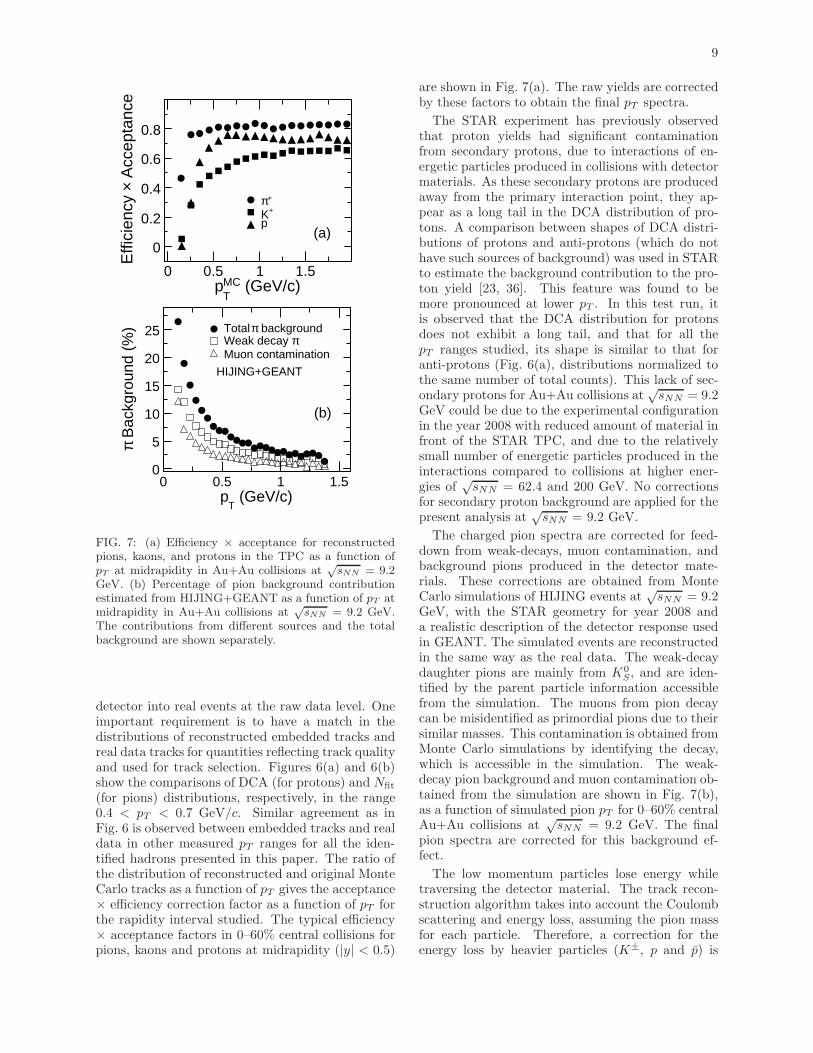
FIG. 7: (a) Efficiency × acceptance for reconstructedpions, kaons, and protons in the TPC as a function ofpT at midrapidity in Au+Au collisions at
√sNN = 9.2
GeV. (b) Percentage of pion background contributionestimated from HIJING+GEANT as a function of pT atmidrapidity in Au+Au collisions at
√sNN = 9.2 GeV.
The contributions from different sources and the totalbackground are shown separately.
detector into real events at the raw data level. Oneimportant requirement is to have a match in thedistributions of reconstructed embedded tracks andreal data tracks for quantities reflecting track qualityand used for track selection. Figures 6(a) and 6(b)show the comparisons of DCA (for protons) and Nfit
(for pions) distributions, respectively, in the range0.4 < pT < 0.7 GeV/c. Similar agreement as inFig. 6 is observed between embedded tracks and realdata in other measured pT ranges for all the iden-tified hadrons presented in this paper. The ratio ofthe distribution of reconstructed and original MonteCarlo tracks as a function of pT gives the acceptance× efficiency correction factor as a function of pT forthe rapidity interval studied. The typical efficiency× acceptance factors in 0–60% central collisions forpions, kaons and protons at midrapidity (|y| < 0.5)
are shown in Fig. 7(a). The raw yields are correctedby these factors to obtain the final pT spectra.
The STAR experiment has previously observedthat proton yields had significant contaminationfrom secondary protons, due to interactions of en-ergetic particles produced in collisions with detectormaterials. As these secondary protons are producedaway from the primary interaction point, they ap-pear as a long tail in the DCA distribution of pro-tons. A comparison between shapes of DCA distri-butions of protons and anti-protons (which do nothave such sources of background) was used in STARto estimate the background contribution to the pro-ton yield [23, 36]. This feature was found to bemore pronounced at lower pT . In this test run, itis observed that the DCA distribution for protonsdoes not exhibit a long tail, and that for all thepT ranges studied, its shape is similar to that foranti-protons (Fig. 6(a), distributions normalized tothe same number of total counts). This lack of sec-ondary protons for Au+Au collisions at
√sNN = 9.2
GeV could be due to the experimental configurationin the year 2008 with reduced amount of material infront of the STAR TPC, and due to the relativelysmall number of energetic particles produced in theinteractions compared to collisions at higher ener-gies of
√sNN = 62.4 and 200 GeV. No corrections
for secondary proton background are applied for thepresent analysis at
√sNN = 9.2 GeV.
The charged pion spectra are corrected for feed-down from weak-decays, muon contamination, andbackground pions produced in the detector mate-rials. These corrections are obtained from MonteCarlo simulations of HIJING events at
√sNN = 9.2
GeV, with the STAR geometry for year 2008 anda realistic description of the detector response usedin GEANT. The simulated events are reconstructedin the same way as the real data. The weak-decaydaughter pions are mainly from K0
S, and are iden-tified by the parent particle information accessiblefrom the simulation. The muons from pion decaycan be misidentified as primordial pions due to theirsimilar masses. This contamination is obtained fromMonte Carlo simulations by identifying the decay,which is accessible in the simulation. The weak-decay pion background and muon contamination ob-tained from the simulation are shown in Fig. 7(b),as a function of simulated pion pT for 0–60% centralAu+Au collisions at
√sNN = 9.2 GeV. The final
pion spectra are corrected for this background ef-fect.
The low momentum particles lose energy whiletraversing the detector material. The track recon-struction algorithm takes into account the Coulombscattering and energy loss, assuming the pion massfor each particle. Therefore, a correction for theenergy loss by heavier particles (K±, p and p) is
10
TABLE III: Sources of systematic errors on yields of var-ious produced hadrons. See section II H for more details.
Hadron Vz cuts y correction PID extrapolationπ 3% 3.2% 2% 5% 5% 3%K 3% 6.2% 2% 5% 10% 8%p 3% 5.4% 10% 5% 4% 15%
needed. This correction is obtained from embeddingMonte Carlo simulations. The largest change in re-constructed pT is found to be ∼20 MeV/c at pT =200 MeV/c. For all results presented in this paper,the track pT is corrected for this energy loss effect.
H. Systematic errors
Systematic uncertainties on the spectra are esti-mated by varying cuts, and by assessing the purity ofidentified hadron sample from dE/dxmeasurements.In addition, the Gaussian fit ranges are varied to es-timate the systematic uncertainty on the extractedraw spectra. The point-to-point systematic errorsare quoted in figure captions. The statistical andsystematic errors are added in quadrature and plot-ted for most of the results unless otherwise specified.For integrated particle yields, extrapolating yields tounmeasured regions in pT is an additional source ofsystematic error. These are estimated by comparingthe extrapolations using different fit functions to thepT spectra. The detailed procedure is described inRef. [23]. A summary of various sources of system-atic errors on the identified hadron yields for 0–60%centrality in Au+Au collisions at
√sNN = 9.2 GeV
is given in Table III. The column titled “Vz” inTable III represents the systematic errors obtainedby varying the Vz range in the analysis, “cuts” listssystematic errors due to variation of DCA and Nfit
cut values, “y” represents the systematic effect onyields due to a variation in rapidity range from ±0.5 to ± 0.2, “correction” includes the contributionto systematic errors from track reconstruction effi-ciency and acceptance estimates, “PID” representsthe systematic errors associated with particle iden-tification (obtained by varying the dE/dx cuts andthe range of Gaussian fits to normalized dE/dx dis-tributions), and “extrapolation” refers to the con-tribution of systematic errors from the different fitfunctions used for obtaining yields in unmeasuredpT ranges. In addition, the systematic error arisingdue to the pion background estimation (discussed inthe previous subsection) is also calculated. It is ofthe order of 6%. The total systematic errors are ofthe order of 11%, 16%, and 20% for pion, kaon, andproton yields respectively.
The systematic errors in the directed flow anal-ysis are obtained, (a) by exploiting the symmetryin the measurements for forward and backward re-gions with respect to η = 0, and (b) by compar-ing v1 calculated from different methods with var-ious sensitivities to non-flow effects [25]. In (a),we average v1 from the mixed harmonics method(v1{EP1,EP2}) and from the two standard methods(v1{EP1,FTPC} and v1{EP1,BBC}), as discussedin section II E, and take the difference between themagnitude of v1 in the forward and backward regionas the systematic error due to the unbalanced detec-tor response. We report an absolute error of ∼7.8%in the FTPC range (2.5 < |η| < 4.2), and negligibleerror in the TPC range. In (b), we average the mag-nitude of v1 in the forward and backward region, andtake the maximum difference between results fromthe three methods as the systematic uncertainty. Anabsolute error of ∼10% is found for the FTPC range,and ∼50% relative error for the TPC range. Thev1{EP1,BBC} method in the TPC range (|η| < 1.3)is more reliable compared to the other two methods.This is due to the large η gap between the BBC andTPC detectors, which helps subtract the non-floweffect. The η gap between the BBC and the TPC isup to 2.6 units, while it is only 1.3 units between theFTPC and the TPC. The total absolute systematicerror on the v1 estimate is calculated as the quadra-ture sum of components (a) and (b), which is ∼10%(absolute error), for the FTPC range and ∼50% (rel-ative value) for the TPC range.The systematic errors on the elliptic flow param-
eter are evaluated by varying the event vertex selec-tion along the beam direction, varying the DCA cutvalue, and by using the η sub-event method. Thetotal systematic error on v2 is approximately 10%.For the pion interferometry analysis, we study the
following sources of systematic error: track merging,track splitting, size of the source used for Coulombcorrection, particle identification, and pair accep-tance for pions of opposite charges. The estimatedsystematic errors are less than 10% for all radii inthe 0–60% centrality bin for 150 < kT < 250 MeV/c,similar to those in Refs. [31, 32].
III. RESULTS
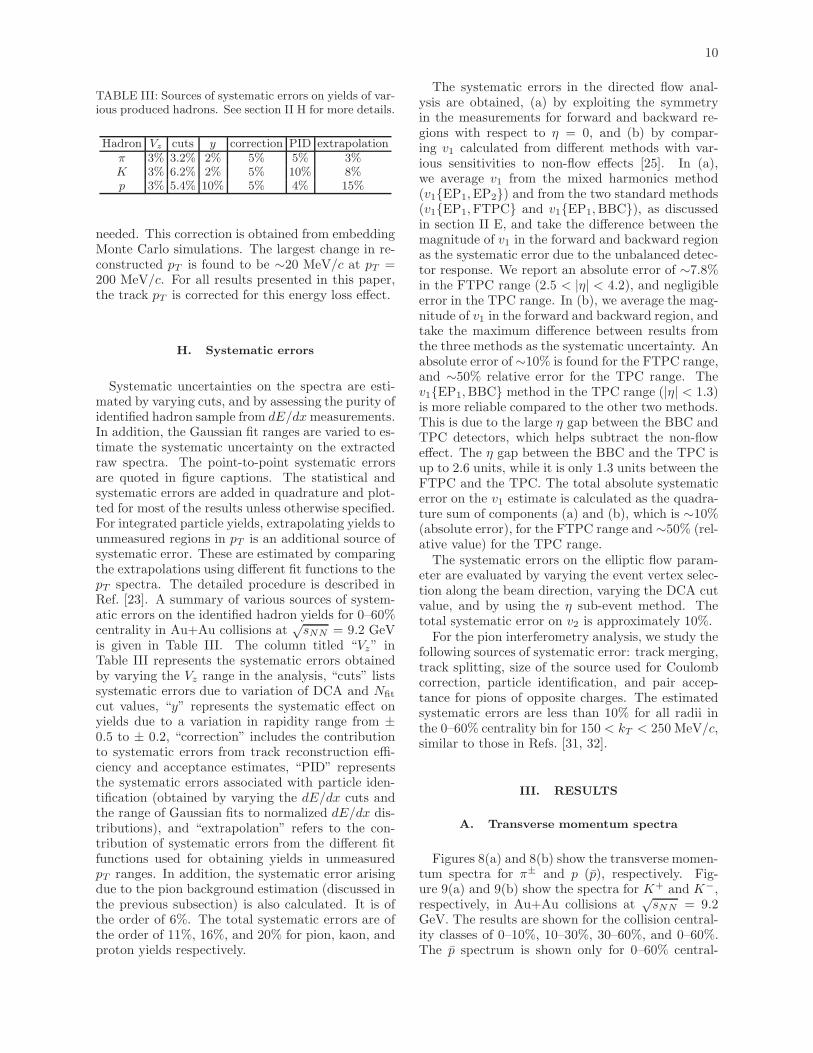
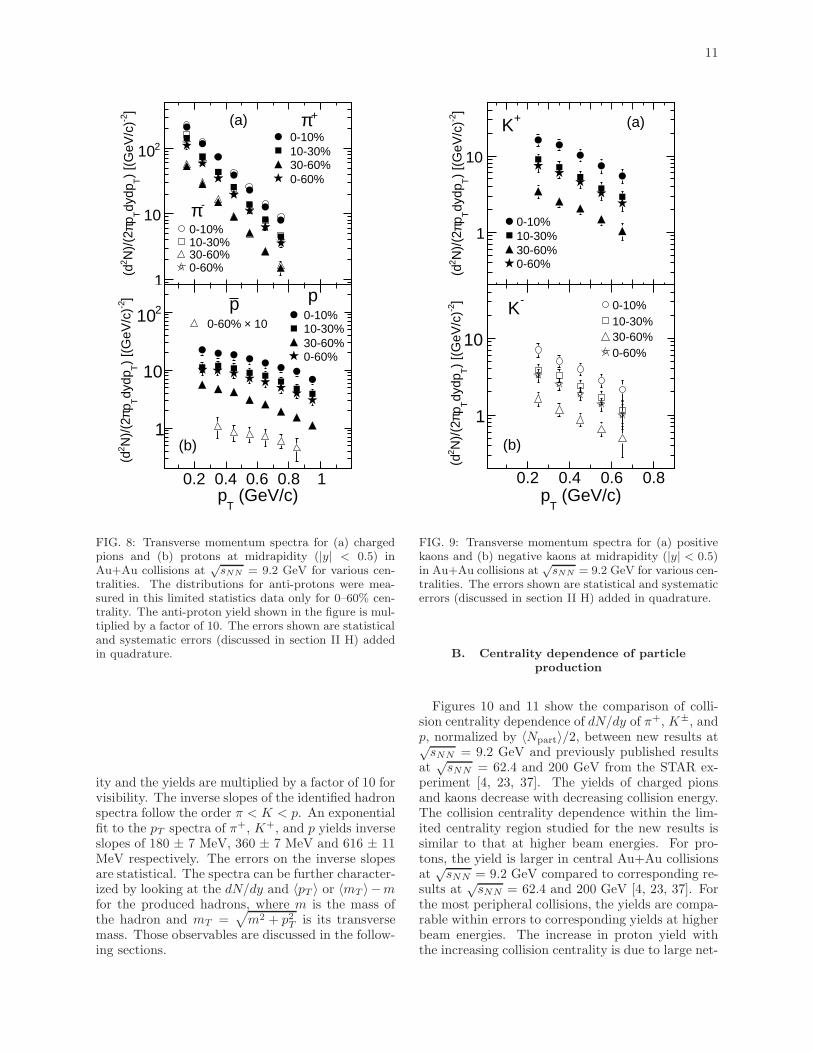
A. Transverse momentum spectra
Figures 8(a) and 8(b) show the transverse momen-tum spectra for π± and p (p), respectively. Fig-ure 9(a) and 9(b) show the spectra for K+ and K−,respectively, in Au+Au collisions at
√sNN = 9.2
GeV. The results are shown for the collision central-ity classes of 0–10%, 10–30%, 30–60%, and 0–60%.The p spectrum is shown only for 0–60% central-
11
]-2
) [(
GeV
/c)
Tdy
dpTpπ
N)/
(22
(d
1
10
210 0-10% 10-30% 30-60% 0-60%
0-10% 10-30% 30-60% 0-60%
+π
-π
(a)
(GeV/c)T
p0.2 0.4 0.6 0.8 1
]
-2)
[(G
eV/c
)T
dydp
TpπN
)/(2
2(d
1
10
210 0-10% 10-30% 30-60% 0-60%
10× 0-60%
pp
(b)
FIG. 8: Transverse momentum spectra for (a) chargedpions and (b) protons at midrapidity (|y| < 0.5) inAu+Au collisions at
√sNN = 9.2 GeV for various cen-
tralities. The distributions for anti-protons were mea-sured in this limited statistics data only for 0–60% cen-trality. The anti-proton yield shown in the figure is mul-tiplied by a factor of 10. The errors shown are statisticaland systematic errors (discussed in section II H) addedin quadrature.
ity and the yields are multiplied by a factor of 10 forvisibility. The inverse slopes of the identified hadronspectra follow the order π < K < p. An exponentialfit to the pT spectra of π+, K+, and p yields inverseslopes of 180 ± 7 MeV, 360 ± 7 MeV and 616 ± 11MeV respectively. The errors on the inverse slopesare statistical. The spectra can be further character-ized by looking at the dN/dy and 〈pT 〉 or 〈mT 〉 −mfor the produced hadrons, where m is the mass ofthe hadron and mT =
√
m2 + p2T is its transversemass. Those observables are discussed in the follow-ing sections.
]-2
) [(
GeV
/c)
Tdy
dpTpπ
N)/
(22
(d
1
10
0-10%10-30%30-60%0-60%
+K (a)
(GeV/c)T
p0.2 0.4 0.6 0.8
]
-2)
[(G
eV/c
)T
dydp
TpπN
)/(2
2(d
1
10
0-10%10-30%30-60%0-60%
-K
(b)
FIG. 9: Transverse momentum spectra for (a) positivekaons and (b) negative kaons at midrapidity (|y| < 0.5)in Au+Au collisions at
√sNN = 9.2 GeV for various cen-
tralities. The errors shown are statistical and systematicerrors (discussed in section II H) added in quadrature.
B. Centrality dependence of particle
production
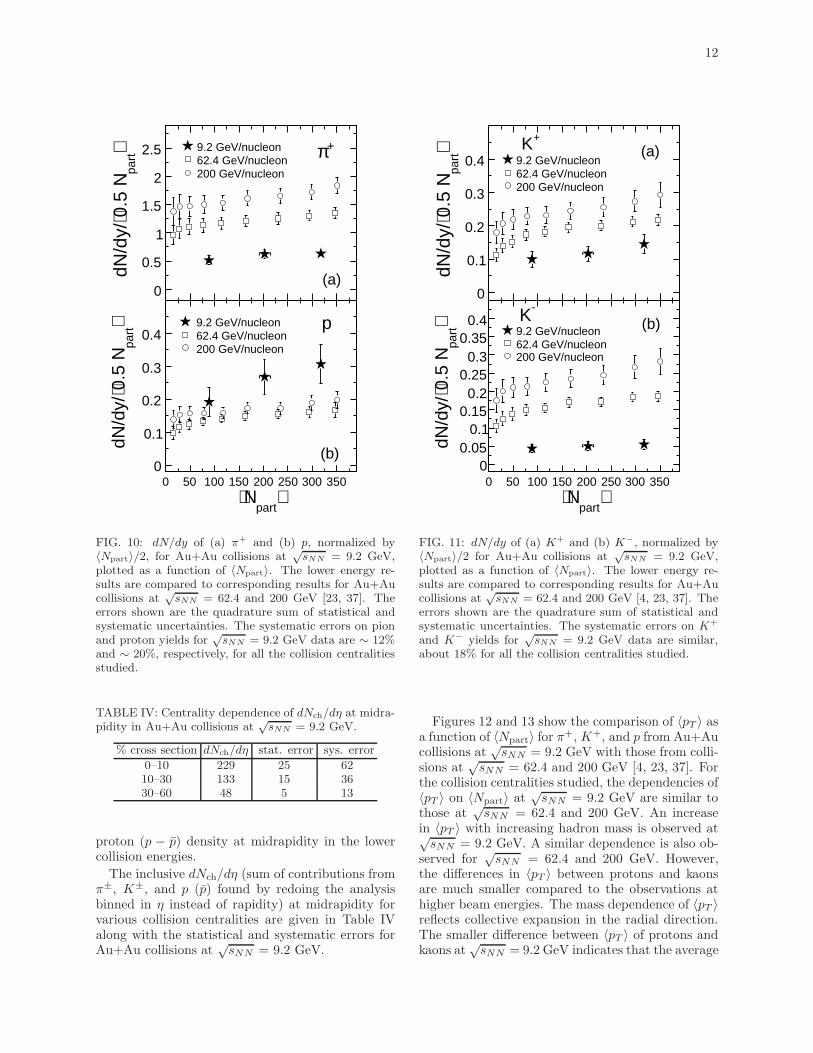
Figures 10 and 11 show the comparison of colli-sion centrality dependence of dN/dy of π+, K±, andp, normalized by 〈Npart〉/2, between new results at√sNN = 9.2 GeV and previously published results
at√sNN = 62.4 and 200 GeV from the STAR ex-
periment [4, 23, 37]. The yields of charged pionsand kaons decrease with decreasing collision energy.The collision centrality dependence within the lim-ited centrality region studied for the new results issimilar to that at higher beam energies. For pro-tons, the yield is larger in central Au+Au collisionsat
√sNN = 9.2 GeV compared to corresponding re-
sults at√sNN = 62.4 and 200 GeV [4, 23, 37]. For
the most peripheral collisions, the yields are compa-rable within errors to corresponding yields at higherbeam energies. The increase in proton yield withthe increasing collision centrality is due to large net-
12
⟩pa
rt0.
5 N
⟨dN
/dy/
0
0.5
1
1.5
2
2.5 9.2 GeV/nucleon62.4 GeV/nucleon200 GeV/nucleon
+π
(a)
⟩part
N⟨0 50 100 150 200 250 300 350
⟩pa
rt0.
5 N
⟨dN
/dy/
0
0.1
0.2
0.3
0.49.2 GeV/nucleon62.4 GeV/nucleon200 GeV/nucleon
p
(b)
FIG. 10: dN/dy of (a) π+ and (b) p, normalized by〈Npart〉/2, for Au+Au collisions at
√sNN = 9.2 GeV,
plotted as a function of 〈Npart〉. The lower energy re-sults are compared to corresponding results for Au+Aucollisions at
√sNN = 62.4 and 200 GeV [23, 37]. The
errors shown are the quadrature sum of statistical andsystematic uncertainties. The systematic errors on pionand proton yields for
√sNN = 9.2 GeV data are ∼ 12%
and ∼ 20%, respectively, for all the collision centralitiesstudied.
TABLE IV: Centrality dependence of dNch/dη at midra-pidity in Au+Au collisions at
√sNN = 9.2 GeV.
% cross section dNch/dη stat. error sys. error
0–10 229 25 6210–30 133 15 3630–60 48 5 13
proton (p − p) density at midrapidity in the lowercollision energies.
The inclusive dNch/dη (sum of contributions fromπ±, K±, and p (p) found by redoing the analysisbinned in η instead of rapidity) at midrapidity forvarious collision centralities are given in Table IValong with the statistical and systematic errors forAu+Au collisions at
√sNN = 9.2 GeV.
⟩pa
rt0.
5 N
⟨dN
/dy/
0
0.1
0.2
0.3
0.4 9.2 GeV/nucleon62.4 GeV/nucleon200 GeV/nucleon
+K (a)
⟩part
N⟨0 50 100 150 200 250 300 350
⟩pa
rt0.
5 N
⟨dN
/dy/
00.05
0.10.15
0.20.25
0.30.35
0.49.2 GeV/nucleon62.4 GeV/nucleon200 GeV/nucleon
-K (b)
FIG. 11: dN/dy of (a) K+ and (b) K−, normalized by〈Npart〉/2 for Au+Au collisions at
√sNN = 9.2 GeV,
plotted as a function of 〈Npart〉. The lower energy re-sults are compared to corresponding results for Au+Aucollisions at
√sNN = 62.4 and 200 GeV [4, 23, 37]. The
errors shown are the quadrature sum of statistical andsystematic uncertainties. The systematic errors on K+
and K− yields for√sNN = 9.2 GeV data are similar,
about 18% for all the collision centralities studied.
Figures 12 and 13 show the comparison of 〈pT 〉 asa function of 〈Npart〉 for π+, K+, and p from Au+Aucollisions at
√sNN = 9.2 GeV with those from colli-
sions at√sNN = 62.4 and 200 GeV [4, 23, 37]. For
the collision centralities studied, the dependencies of〈pT 〉 on 〈Npart〉 at
√sNN = 9.2 GeV are similar to
those at√sNN = 62.4 and 200 GeV. An increase
in 〈pT 〉 with increasing hadron mass is observed at√sNN = 9.2 GeV. A similar dependence is also ob-
served for√sNN = 62.4 and 200 GeV. However,
the differences in 〈pT 〉 between protons and kaonsare much smaller compared to the observations athigher beam energies. The mass dependence of 〈pT 〉reflects collective expansion in the radial direction.The smaller difference between 〈pT 〉 of protons andkaons at
√sNN = 9.2 GeV indicates that the average
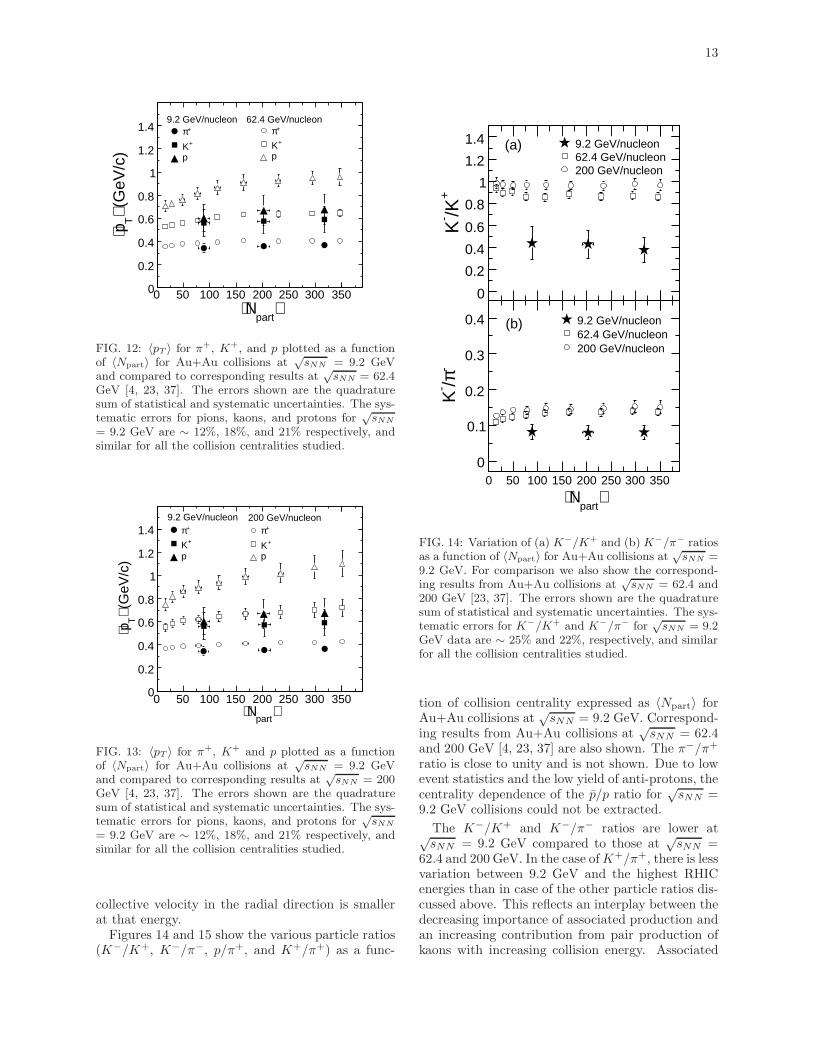
13
⟩part
N⟨0 50 100 150 200 250 300 350
(G
eV/c
)⟩
Tp⟨
0
0.2
0.4
0.6
0.8
1
1.2
1.4 +π +K
p
+π +K
p
9.2 GeV/nucleon 62.4 GeV/nucleon
FIG. 12: 〈pT 〉 for π+, K+, and p plotted as a functionof 〈Npart〉 for Au+Au collisions at
√sNN = 9.2 GeV
and compared to corresponding results at√sNN = 62.4
GeV [4, 23, 37]. The errors shown are the quadraturesum of statistical and systematic uncertainties. The sys-tematic errors for pions, kaons, and protons for
√sNN
= 9.2 GeV are ∼ 12%, 18%, and 21% respectively, andsimilar for all the collision centralities studied.
⟩part
N⟨0 50 100 150 200 250 300 350
(G
eV/c
)⟩
Tp⟨
0
0.2
0.4
0.6
0.8
1
1.2
1.4 +π +K
p
+π +K
p
9.2 GeV/nucleon 200 GeV/nucleon
FIG. 13: 〈pT 〉 for π+, K+ and p plotted as a functionof 〈Npart〉 for Au+Au collisions at
√sNN = 9.2 GeV
and compared to corresponding results at√sNN = 200
GeV [4, 23, 37]. The errors shown are the quadraturesum of statistical and systematic uncertainties. The sys-tematic errors for pions, kaons, and protons for
√sNN
= 9.2 GeV are ∼ 12%, 18%, and 21% respectively, andsimilar for all the collision centralities studied.
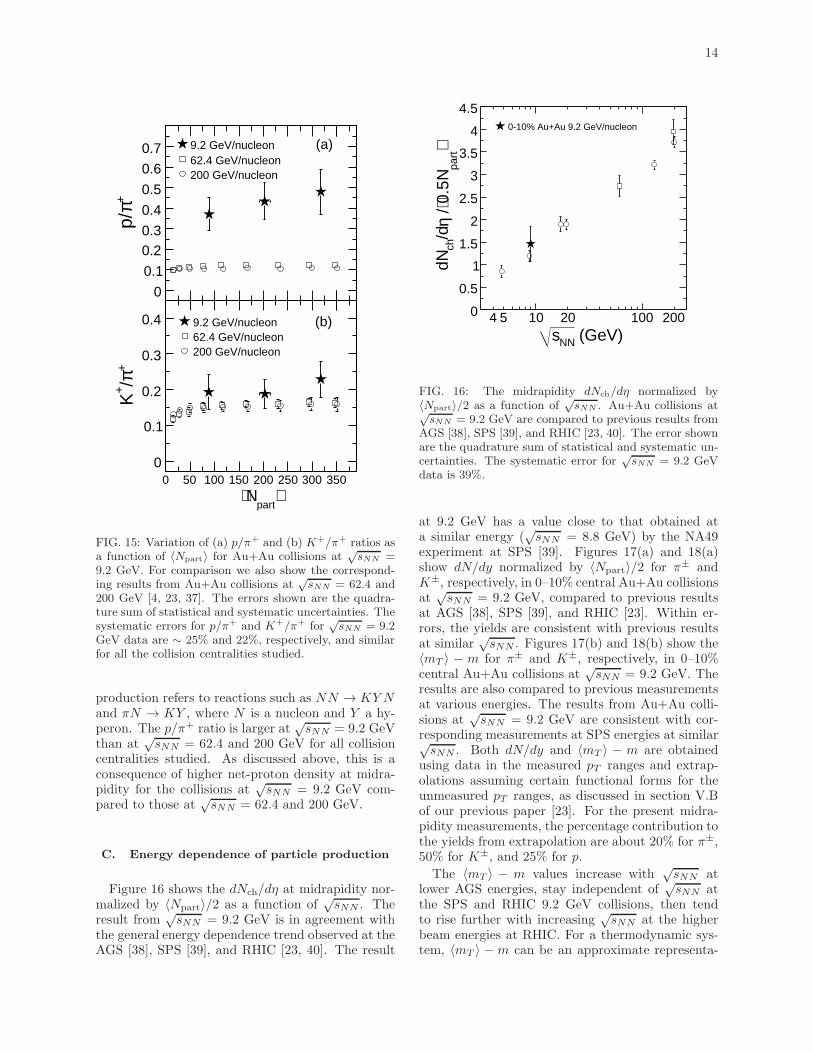
collective velocity in the radial direction is smallerat that energy.Figures 14 and 15 show the various particle ratios
(K−/K+, K−/π−, p/π+, and K+/π+) as a func-
+/K-
K
0
0.2
0.4
0.6
0.8
1
1.2
1.4 9.2 GeV/nucleon62.4 GeV/nucleon200 GeV/nucleon
(a)
⟩part
N⟨0 50 100 150 200 250 300 350
- π/-K
0
0.1
0.2
0.3
0.4 9.2 GeV/nucleon62.4 GeV/nucleon200 GeV/nucleon
(b)
FIG. 14: Variation of (a) K−/K+ and (b) K−/π− ratiosas a function of 〈Npart〉 for Au+Au collisions at
√sNN =
9.2 GeV. For comparison we also show the correspond-ing results from Au+Au collisions at
√sNN = 62.4 and
200 GeV [23, 37]. The errors shown are the quadraturesum of statistical and systematic uncertainties. The sys-tematic errors for K−/K+ and K−/π− for
√sNN = 9.2
GeV data are ∼ 25% and 22%, respectively, and similarfor all the collision centralities studied.
tion of collision centrality expressed as 〈Npart〉 forAu+Au collisions at
√sNN = 9.2 GeV. Correspond-
ing results from Au+Au collisions at√sNN = 62.4
and 200 GeV [4, 23, 37] are also shown. The π−/π+
ratio is close to unity and is not shown. Due to lowevent statistics and the low yield of anti-protons, thecentrality dependence of the p/p ratio for
√sNN =
9.2 GeV collisions could not be extracted.
The K−/K+ and K−/π− ratios are lower at√sNN = 9.2 GeV compared to those at
√sNN =
62.4 and 200 GeV. In the case ofK+/π+, there is lessvariation between 9.2 GeV and the highest RHICenergies than in case of the other particle ratios dis-cussed above. This reflects an interplay between thedecreasing importance of associated production andan increasing contribution from pair production ofkaons with increasing collision energy. Associated
14
+ πp/
0
0.1
0.20.3
0.4
0.5
0.6
0.7 9.2 GeV/nucleon62.4 GeV/nucleon200 GeV/nucleon
(a)
⟩part
N⟨0 50 100 150 200 250 300 350
+ π/+K
0
0.1
0.2
0.3
0.4 9.2 GeV/nucleon62.4 GeV/nucleon200 GeV/nucleon
(b)
FIG. 15: Variation of (a) p/π+ and (b) K+/π+ ratios asa function of 〈Npart〉 for Au+Au collisions at
√sNN =
9.2 GeV. For comparison we also show the correspond-ing results from Au+Au collisions at
√sNN = 62.4 and
200 GeV [4, 23, 37]. The errors shown are the quadra-ture sum of statistical and systematic uncertainties. Thesystematic errors for p/π+ and K+/π+ for
√sNN = 9.2
GeV data are ∼ 25% and 22%, respectively, and similarfor all the collision centralities studied.
production refers to reactions such as NN → KYNand πN → KY , where N is a nucleon and Y a hy-peron. The p/π+ ratio is larger at
√sNN = 9.2 GeV
than at√sNN = 62.4 and 200 GeV for all collision
centralities studied. As discussed above, this is aconsequence of higher net-proton density at midra-pidity for the collisions at
√sNN = 9.2 GeV com-
pared to those at√sNN = 62.4 and 200 GeV.
C. Energy dependence of particle production
Figure 16 shows the dNch/dη at midrapidity nor-malized by 〈Npart〉/2 as a function of
√sNN . The
result from√sNN = 9.2 GeV is in agreement with
the general energy dependence trend observed at theAGS [38], SPS [39], and RHIC [23, 40]. The result
(GeV)NNs4 5 10 20 100 200
⟩pa
rt0.
5N⟨ /η
/dch
dN
0
0.5
1
1.5
2
2.5
3
3.5
4
4.50-10% Au+Au 9.2 GeV/nucleon
FIG. 16: The midrapidity dNch/dη normalized by〈Npart〉/2 as a function of
√sNN . Au+Au collisions at√
sNN = 9.2 GeV are compared to previous results fromAGS [38], SPS [39], and RHIC [23, 40]. The error shownare the quadrature sum of statistical and systematic un-certainties. The systematic error for
√sNN = 9.2 GeV
data is 39%.
at 9.2 GeV has a value close to that obtained ata similar energy (
√sNN = 8.8 GeV) by the NA49
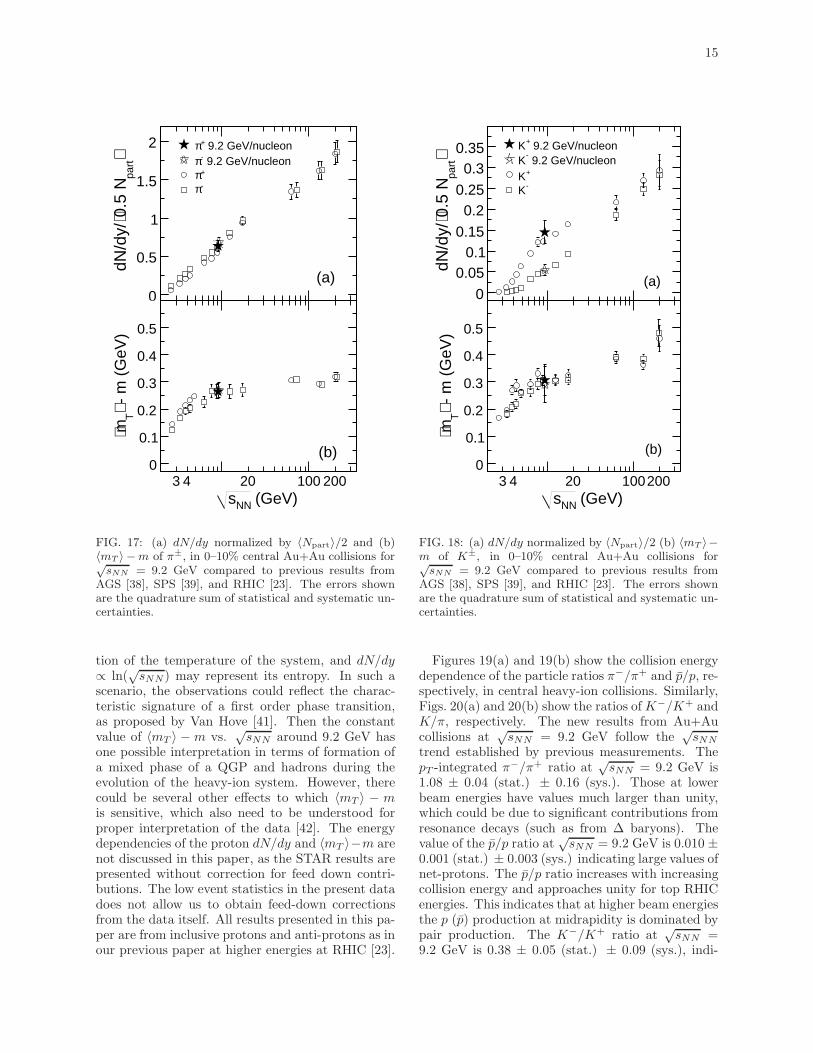
experiment at SPS [39]. Figures 17(a) and 18(a)show dN/dy normalized by 〈Npart〉/2 for π± andK±, respectively, in 0–10% central Au+Au collisionsat
√sNN = 9.2 GeV, compared to previous results
at AGS [38], SPS [39], and RHIC [23]. Within er-rors, the yields are consistent with previous resultsat similar
√sNN . Figures 17(b) and 18(b) show the
〈mT 〉 − m for π± and K±, respectively, in 0–10%central Au+Au collisions at
√sNN = 9.2 GeV. The
results are also compared to previous measurementsat various energies. The results from Au+Au colli-sions at
√sNN = 9.2 GeV are consistent with cor-
responding measurements at SPS energies at similar√sNN . Both dN/dy and 〈mT 〉 − m are obtained
using data in the measured pT ranges and extrap-olations assuming certain functional forms for theunmeasured pT ranges, as discussed in section V.Bof our previous paper [23]. For the present midra-pidity measurements, the percentage contribution tothe yields from extrapolation are about 20% for π±,50% for K±, and 25% for p.
The 〈mT 〉 − m values increase with√sNN at
lower AGS energies, stay independent of√sNN at
the SPS and RHIC 9.2 GeV collisions, then tendto rise further with increasing
√sNN at the higher
beam energies at RHIC. For a thermodynamic sys-tem, 〈mT 〉 − m can be an approximate representa-
15
⟩pa
rt0.
5 N
⟨dN
/dy/
0
0.5
1
1.5
2 9.2 GeV/nucleon+π 9.2 GeV/nucleon-π
+π-π
(a)
(GeV)NNs3 4 20 100 200
- m
(G
eV)
⟩T
m⟨
0
0.1
0.2
0.3
0.4
0.5
(b)
FIG. 17: (a) dN/dy normalized by 〈Npart〉/2 and (b)〈mT 〉 −m of π±, in 0–10% central Au+Au collisions for√sNN = 9.2 GeV compared to previous results from
AGS [38], SPS [39], and RHIC [23]. The errors shownare the quadrature sum of statistical and systematic un-certainties.
tion of the temperature of the system, and dN/dy∝ ln(
√sNN) may represent its entropy. In such a
scenario, the observations could reflect the charac-teristic signature of a first order phase transition,as proposed by Van Hove [41]. Then the constantvalue of 〈mT 〉 − m vs.
√sNN around 9.2 GeV has
one possible interpretation in terms of formation ofa mixed phase of a QGP and hadrons during theevolution of the heavy-ion system. However, therecould be several other effects to which 〈mT 〉 − mis sensitive, which also need to be understood forproper interpretation of the data [42]. The energydependencies of the proton dN/dy and 〈mT 〉−m arenot discussed in this paper, as the STAR results arepresented without correction for feed down contri-butions. The low event statistics in the present datadoes not allow us to obtain feed-down correctionsfrom the data itself. All results presented in this pa-per are from inclusive protons and anti-protons as inour previous paper at higher energies at RHIC [23].
+π-π
Au+Au 9.2 GeV+π
Au+Au 9.2 GeV-π
⟩pa
rt0.
5 N
⟨dN
/dy/
0
0.050.1
0.15
0.20.25
0.30.35 9.2 GeV/nucleon+K
9.2 GeV/nucleon-
K+K-K
(a)
(GeV)NNs3 4 20 100200
- m
(G
eV)
⟩T
m⟨0
0.1
0.2
0.3
0.4
0.5
(b)
FIG. 18: (a) dN/dy normalized by 〈Npart〉/2 (b) 〈mT 〉−m of K±, in 0–10% central Au+Au collisions for√sNN = 9.2 GeV compared to previous results from
AGS [38], SPS [39], and RHIC [23]. The errors shownare the quadrature sum of statistical and systematic un-certainties.
Figures 19(a) and 19(b) show the collision energydependence of the particle ratios π−/π+ and p/p, re-spectively, in central heavy-ion collisions. Similarly,Figs. 20(a) and 20(b) show the ratios ofK−/K+ andK/π, respectively. The new results from Au+Aucollisions at
√sNN = 9.2 GeV follow the
√sNN
trend established by previous measurements. ThepT -integrated π−/π+ ratio at
√sNN = 9.2 GeV is
1.08 ± 0.04 (stat.) ± 0.16 (sys.). Those at lowerbeam energies have values much larger than unity,which could be due to significant contributions fromresonance decays (such as from ∆ baryons). Thevalue of the p/p ratio at
√sNN = 9.2 GeV is 0.010 ±
0.001 (stat.) ± 0.003 (sys.) indicating large values ofnet-protons. The p/p ratio increases with increasingcollision energy and approaches unity for top RHICenergies. This indicates that at higher beam energiesthe p (p) production at midrapidity is dominated bypair production. The K−/K+ ratio at
√sNN =
9.2 GeV is 0.38 ± 0.05 (stat.) ± 0.09 (sys.), indi-
16
+ π/- π
0.5
1
1.5
2
2.5 9.2 GeV/nucleon
(a)
(GeV)NNs3 4 20 100 200
/pp
-310
-210
-110
19.2 GeV/nucleon
(b)
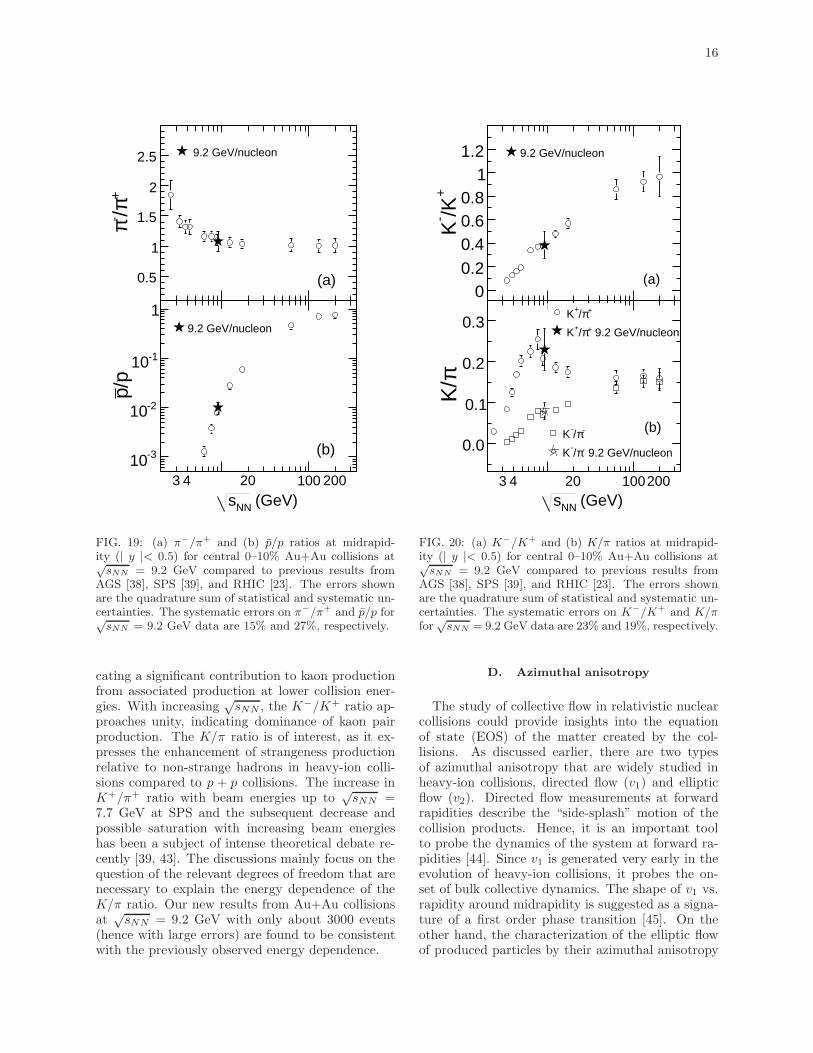
FIG. 19: (a) π−/π+ and (b) p/p ratios at midrapid-ity (| y |< 0.5) for central 0–10% Au+Au collisions at√sNN = 9.2 GeV compared to previous results from
AGS [38], SPS [39], and RHIC [23]. The errors shownare the quadrature sum of statistical and systematic un-certainties. The systematic errors on π−/π+ and p/p for√sNN = 9.2 GeV data are 15% and 27%, respectively.
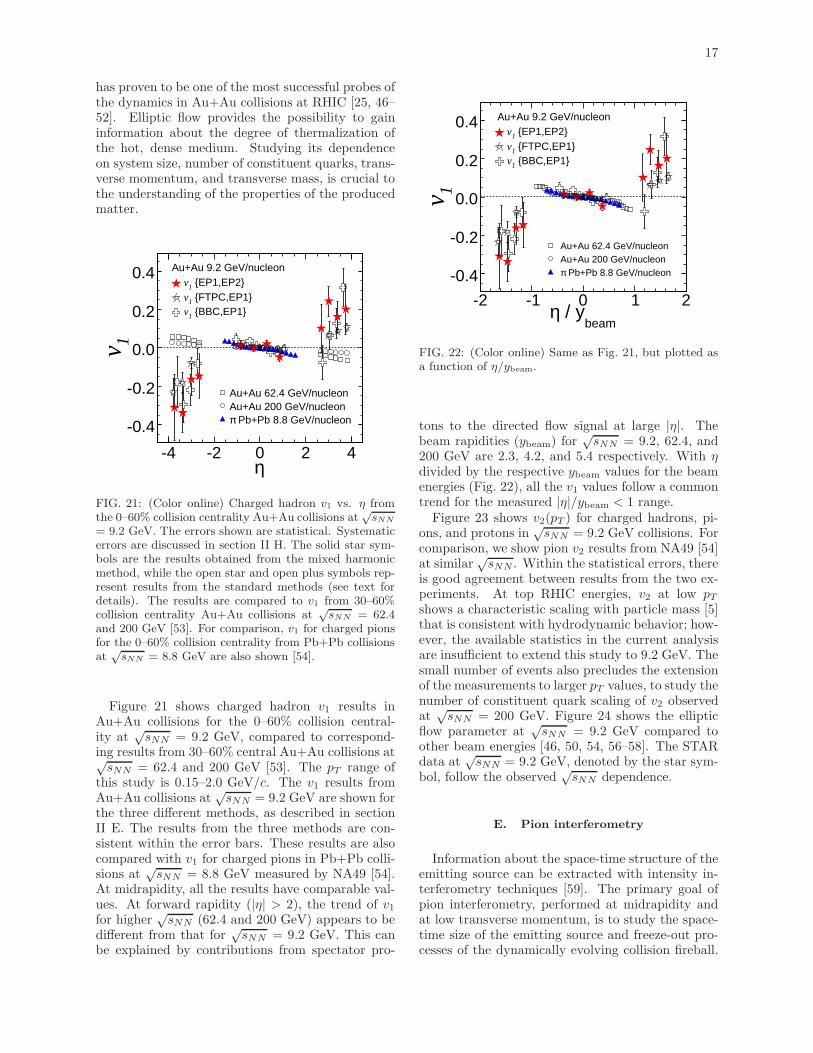
cating a significant contribution to kaon productionfrom associated production at lower collision ener-gies. With increasing
√sNN , the K−/K+ ratio ap-
proaches unity, indicating dominance of kaon pairproduction. The K/π ratio is of interest, as it ex-presses the enhancement of strangeness productionrelative to non-strange hadrons in heavy-ion colli-sions compared to p + p collisions. The increase inK+/π+ ratio with beam energies up to
√sNN =
7.7 GeV at SPS and the subsequent decrease andpossible saturation with increasing beam energieshas been a subject of intense theoretical debate re-cently [39, 43]. The discussions mainly focus on thequestion of the relevant degrees of freedom that arenecessary to explain the energy dependence of theK/π ratio. Our new results from Au+Au collisionsat
√sNN = 9.2 GeV with only about 3000 events
(hence with large errors) are found to be consistentwith the previously observed energy dependence.
+/K-
K
00.20.40.60.8
11.2 9.2 GeV/nucleon
(a)
(GeV)NNs3 4 20 100200
πK
/0.0
0.1
0.2
0.3+π/+K
9.2 GeV/nucleon+π/+K
-π/-K
9.2 GeV/nucleon-π/-K
(b)
FIG. 20: (a) K−/K+ and (b) K/π ratios at midrapid-ity (| y |< 0.5) for central 0–10% Au+Au collisions at√sNN = 9.2 GeV compared to previous results from
AGS [38], SPS [39], and RHIC [23]. The errors shownare the quadrature sum of statistical and systematic un-certainties. The systematic errors on K−/K+ and K/πfor
√sNN = 9.2 GeV data are 23% and 19%, respectively.
D. Azimuthal anisotropy
The study of collective flow in relativistic nuclearcollisions could provide insights into the equationof state (EOS) of the matter created by the col-lisions. As discussed earlier, there are two typesof azimuthal anisotropy that are widely studied inheavy-ion collisions, directed flow (v1) and ellipticflow (v2). Directed flow measurements at forwardrapidities describe the “side-splash” motion of thecollision products. Hence, it is an important toolto probe the dynamics of the system at forward ra-pidities [44]. Since v1 is generated very early in theevolution of heavy-ion collisions, it probes the on-set of bulk collective dynamics. The shape of v1 vs.rapidity around midrapidity is suggested as a signa-ture of a first order phase transition [45]. On theother hand, the characterization of the elliptic flowof produced particles by their azimuthal anisotropy
17
has proven to be one of the most successful probes ofthe dynamics in Au+Au collisions at RHIC [25, 46–52]. Elliptic flow provides the possibility to gaininformation about the degree of thermalization ofthe hot, dense medium. Studying its dependenceon system size, number of constituent quarks, trans-verse momentum, and transverse mass, is crucial tothe understanding of the properties of the producedmatter.
η-4 -2 0 2 4
1v
-0.4
-0.2
0.0
0.2
0.4 {EP1,EP2}1v
{FTPC,EP1}1v {BBC,EP1}1v
Au+Au 62.4 GeV/nucleonAu+Au 200 GeV/nucleon Pb+Pb 8.8 GeV/nucleonπ
Au+Au 9.2 GeV/nucleon
FIG. 21: (Color online) Charged hadron v1 vs. η fromthe 0–60% collision centrality Au+Au collisions at
√sNN
= 9.2 GeV. The errors shown are statistical. Systematicerrors are discussed in section II H. The solid star sym-bols are the results obtained from the mixed harmonicmethod, while the open star and open plus symbols rep-resent results from the standard methods (see text fordetails). The results are compared to v1 from 30–60%collision centrality Au+Au collisions at
√sNN = 62.4
and 200 GeV [53]. For comparison, v1 for charged pionsfor the 0–60% collision centrality from Pb+Pb collisionsat
√sNN = 8.8 GeV are also shown [54].
Figure 21 shows charged hadron v1 results inAu+Au collisions for the 0–60% collision central-ity at
√sNN = 9.2 GeV, compared to correspond-
ing results from 30–60% central Au+Au collisions at√sNN = 62.4 and 200 GeV [53]. The pT range of
this study is 0.15–2.0 GeV/c. The v1 results fromAu+Au collisions at
√sNN = 9.2 GeV are shown for
the three different methods, as described in sectionII E. The results from the three methods are con-sistent within the error bars. These results are alsocompared with v1 for charged pions in Pb+Pb colli-sions at
√sNN = 8.8 GeV measured by NA49 [54].
At midrapidity, all the results have comparable val-ues. At forward rapidity (|η| > 2), the trend of v1for higher
√sNN (62.4 and 200 GeV) appears to be
different from that for√sNN = 9.2 GeV. This can
be explained by contributions from spectator pro-
beam / yη
-2 -1 0 1 2
1v
-0.4
-0.2
0.0
0.2
0.4 {EP1,EP2}1v
{FTPC,EP1}1v {BBC,EP1}1v
Au+Au 62.4 GeV/nucleonAu+Au 200 GeV/nucleon
Pb+Pb 8.8 GeV/nucleonπ
Au+Au 9.2 GeV/nucleon
FIG. 22: (Color online) Same as Fig. 21, but plotted asa function of η/ybeam.
tons to the directed flow signal at large |η|. Thebeam rapidities (ybeam) for
√sNN = 9.2, 62.4, and
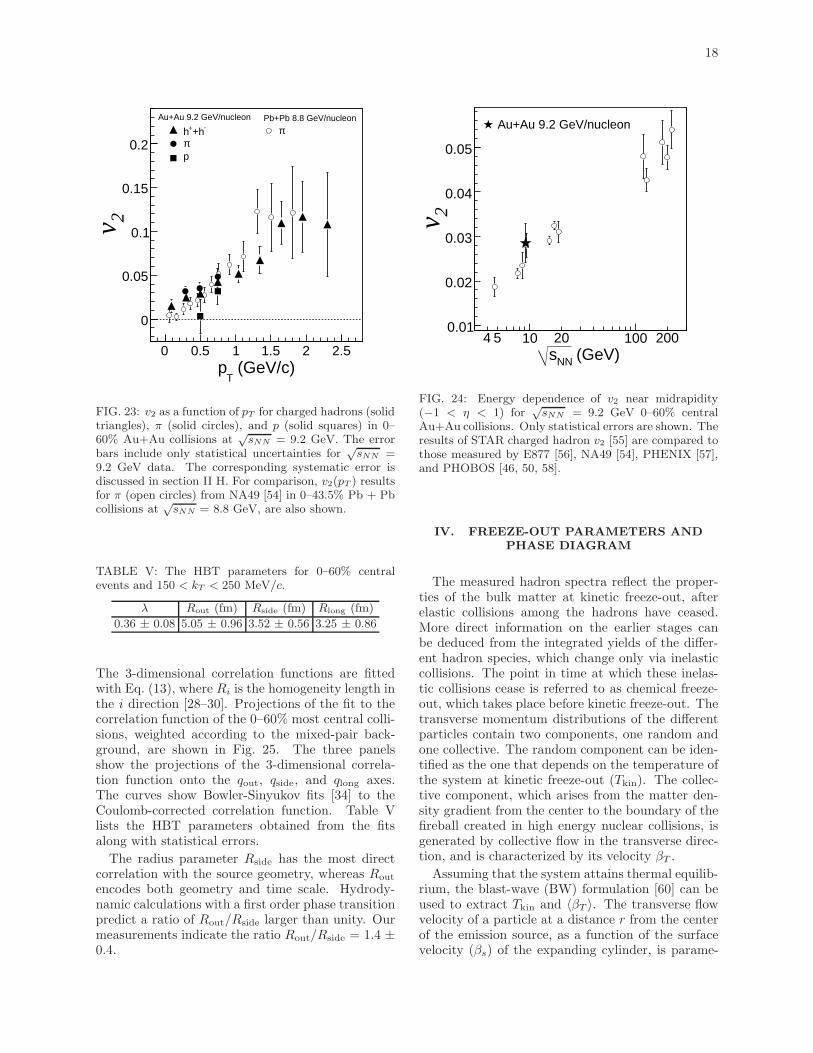
200 GeV are 2.3, 4.2, and 5.4 respectively. With ηdivided by the respective ybeam values for the beamenergies (Fig. 22), all the v1 values follow a commontrend for the measured |η|/ybeam < 1 range.Figure 23 shows v2(pT ) for charged hadrons, pi-
ons, and protons in√sNN = 9.2 GeV collisions. For
comparison, we show pion v2 results from NA49 [54]at similar
√sNN . Within the statistical errors, there
is good agreement between results from the two ex-periments. At top RHIC energies, v2 at low pTshows a characteristic scaling with particle mass [5]that is consistent with hydrodynamic behavior; how-ever, the available statistics in the current analysisare insufficient to extend this study to 9.2 GeV. Thesmall number of events also precludes the extensionof the measurements to larger pT values, to study thenumber of constituent quark scaling of v2 observedat
√sNN = 200 GeV. Figure 24 shows the elliptic
flow parameter at√sNN = 9.2 GeV compared to
other beam energies [46, 50, 54, 56–58]. The STARdata at
√sNN = 9.2 GeV, denoted by the star sym-
bol, follow the observed√sNN dependence.
E. Pion interferometry
Information about the space-time structure of theemitting source can be extracted with intensity in-terferometry techniques [59]. The primary goal ofpion interferometry, performed at midrapidity andat low transverse momentum, is to study the space-time size of the emitting source and freeze-out pro-cesses of the dynamically evolving collision fireball.
18
(GeV/c)T
p0 0.5 1 1.5 2 2.5
2v
0
0.05
0.1
0.15
0.2
-+h+hπp
πAu+Au 9.2 GeV/nucleon Pb+Pb 8.8 GeV/nucleon
FIG. 23: v2 as a function of pT for charged hadrons (solidtriangles), π (solid circles), and p (solid squares) in 0–60% Au+Au collisions at
√sNN = 9.2 GeV. The error
bars include only statistical uncertainties for√sNN =
9.2 GeV data. The corresponding systematic error isdiscussed in section II H. For comparison, v2(pT ) resultsfor π (open circles) from NA49 [54] in 0–43.5% Pb + Pbcollisions at
√sNN = 8.8 GeV, are also shown.
TABLE V: The HBT parameters for 0–60% centralevents and 150 < kT < 250 MeV/c.
λ Rout (fm) Rside (fm) Rlong (fm)
0.36 ± 0.08 5.05 ± 0.96 3.52 ± 0.56 3.25 ± 0.86
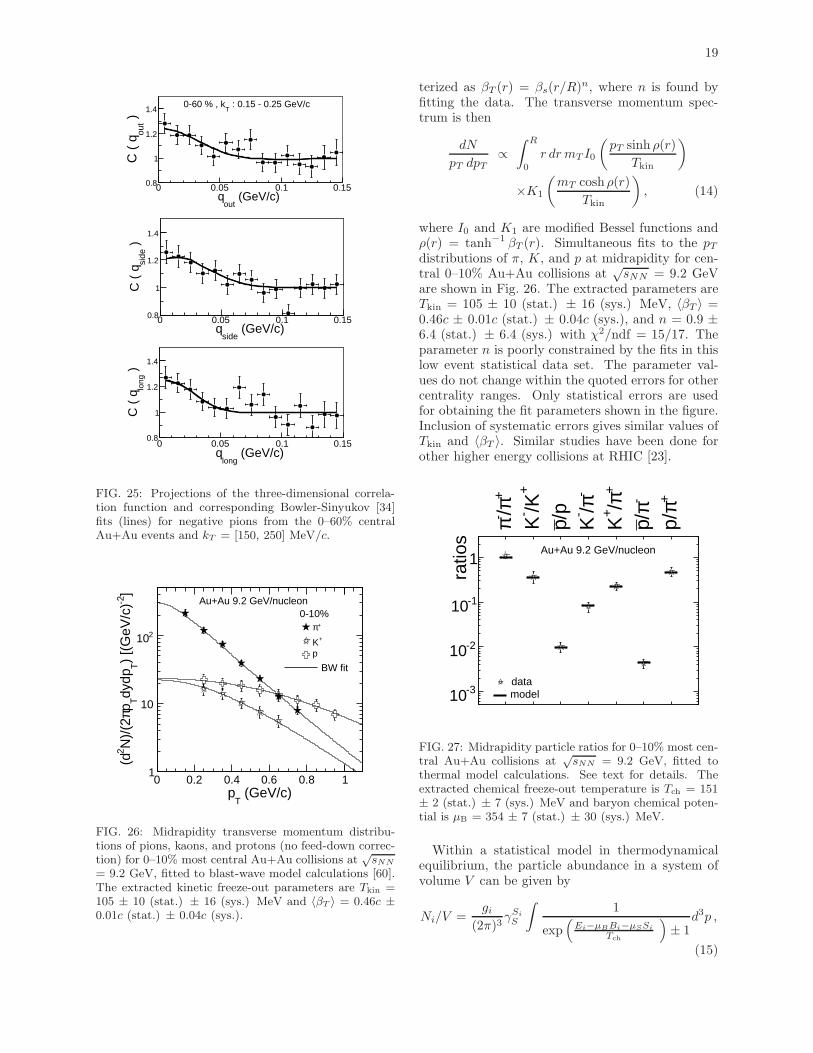
The 3-dimensional correlation functions are fittedwith Eq. (13), where Ri is the homogeneity length inthe i direction [28–30]. Projections of the fit to thecorrelation function of the 0–60% most central colli-sions, weighted according to the mixed-pair back-ground, are shown in Fig. 25. The three panelsshow the projections of the 3-dimensional correla-tion function onto the qout, qside, and qlong axes.The curves show Bowler-Sinyukov fits [34] to theCoulomb-corrected correlation function. Table Vlists the HBT parameters obtained from the fitsalong with statistical errors.
The radius parameter Rside has the most directcorrelation with the source geometry, whereas Rout
encodes both geometry and time scale. Hydrody-namic calculations with a first order phase transitionpredict a ratio of Rout/Rside larger than unity. Ourmeasurements indicate the ratio Rout/Rside = 1.4 ±0.4.
(GeV)NNs4 5 10 20 100 200
2v
0.01
0.02
0.03
0.04
0.05
Au+Au 9.2 GeV/nucleon
FIG. 24: Energy dependence of v2 near midrapidity(−1 < η < 1) for
√sNN = 9.2 GeV 0–60% central
Au+Au collisions. Only statistical errors are shown. Theresults of STAR charged hadron v2 [55] are compared tothose measured by E877 [56], NA49 [54], PHENIX [57],and PHOBOS [46, 50, 58].
IV. FREEZE-OUT PARAMETERS AND
PHASE DIAGRAM
The measured hadron spectra reflect the proper-ties of the bulk matter at kinetic freeze-out, afterelastic collisions among the hadrons have ceased.More direct information on the earlier stages canbe deduced from the integrated yields of the differ-ent hadron species, which change only via inelasticcollisions. The point in time at which these inelas-tic collisions cease is referred to as chemical freeze-out, which takes place before kinetic freeze-out. Thetransverse momentum distributions of the differentparticles contain two components, one random andone collective. The random component can be iden-tified as the one that depends on the temperature ofthe system at kinetic freeze-out (Tkin). The collec-tive component, which arises from the matter den-sity gradient from the center to the boundary of thefireball created in high energy nuclear collisions, isgenerated by collective flow in the transverse direc-tion, and is characterized by its velocity βT .
Assuming that the system attains thermal equilib-rium, the blast-wave (BW) formulation [60] can beused to extract Tkin and 〈βT 〉. The transverse flowvelocity of a particle at a distance r from the centerof the emission source, as a function of the surfacevelocity (βs) of the expanding cylinder, is parame-
19
(GeV/c) out
q0 0.05 0.1 0.15
)ou
tC
( q
0.8
1
1.2
1.4 : 0.15 - 0.25 GeV/c
T0-60 % , k
(GeV/c) side
q0 0.05 0.1 0.15
)si
deC
( q
0.8
1
1.2
1.4
(GeV/c) long
q0 0.05 0.1 0.15
)lo
ngC
( q
0.8
1
1.2
1.4
FIG. 25: Projections of the three-dimensional correla-tion function and corresponding Bowler-Sinyukov [34]fits (lines) for negative pions from the 0–60% centralAu+Au events and kT = [150, 250] MeV/c.
(GeV/c)T
p0 0.2 0.4 0.6 0.8 1
]-2
) [(
GeV
/c)
Tdy
dpTpπ
N)/
(22
(d
1
10
210 +π
+Kp
Au+Au 9.2 GeV/nucleon0-10%
BW fit
FIG. 26: Midrapidity transverse momentum distribu-tions of pions, kaons, and protons (no feed-down correc-tion) for 0–10% most central Au+Au collisions at
√sNN
= 9.2 GeV, fitted to blast-wave model calculations [60].The extracted kinetic freeze-out parameters are Tkin =105 ± 10 (stat.) ± 16 (sys.) MeV and 〈βT 〉 = 0.46c ±0.01c (stat.) ± 0.04c (sys.).
terized as βT (r) = βs(r/R)n, where n is found byfitting the data. The transverse momentum spec-trum is then
dN
pT dpT∝
∫ R
0
r drmT I0
(
pT sinh ρ(r)
Tkin
)
×K1
(
mT cosh ρ(r)
Tkin
)
, (14)
where I0 and K1 are modified Bessel functions andρ(r) = tanh−1 βT (r). Simultaneous fits to the pTdistributions of π, K, and p at midrapidity for cen-tral 0–10% Au+Au collisions at
√sNN = 9.2 GeV
are shown in Fig. 26. The extracted parameters areTkin = 105 ± 10 (stat.) ± 16 (sys.) MeV, 〈βT 〉 =0.46c ± 0.01c (stat.) ± 0.04c (sys.), and n = 0.9 ±6.4 (stat.) ± 6.4 (sys.) with χ2/ndf = 15/17. Theparameter n is poorly constrained by the fits in thislow event statistical data set. The parameter val-ues do not change within the quoted errors for othercentrality ranges. Only statistical errors are usedfor obtaining the fit parameters shown in the figure.Inclusion of systematic errors gives similar values ofTkin and 〈βT 〉. Similar studies have been done forother higher energy collisions at RHIC [23].
ratio
s
-310
-210
-110
1
+ π/- π+
/K-K /pp
- π/-K
+ π/+K
- π/p+ π
p/
- π/Λ
Au+Au 9.2 GeV/nucleon
datamodel
FIG. 27: Midrapidity particle ratios for 0–10% most cen-tral Au+Au collisions at
√sNN = 9.2 GeV, fitted to
thermal model calculations. See text for details. Theextracted chemical freeze-out temperature is Tch = 151± 2 (stat.) ± 7 (sys.) MeV and baryon chemical poten-tial is µB = 354 ± 7 (stat.) ± 30 (sys.) MeV.
Within a statistical model in thermodynamicalequilibrium, the particle abundance in a system ofvolume V can be given by
Ni/V =gi
(2π)3γSi
S
∫
1
exp(
Ei−µBBi−µSSi
Tch
)
± 1d3p ,
(15)
20
where Ni is the abundance of particle species i, giis the spin degeneracy, Bi and Si are the baryonnumber and strangeness number, respectively, Ei isthe particle energy, and the integral is taken overall momentum space [23]. The model parametersare the chemical freeze-out temperature (Tch), thebaryon (µB) and strangeness (µS) chemical poten-tials, and the ad hoc strangeness suppression factor(γS). Measured particle ratios are used to constrainthe values of temperature (Tch) and baryon chemicalpotential (µB) at chemical freeze-out using the sta-tistical model assumption that the system is in ther-mal and chemical equilibrium at that stage. Fits areperformed to the various ratios for midrapidity cen-tral 0–10% Au+Au collisions at
√sNN = 9.2 GeV
using such a model, and are shown in Fig. 27. Theanalysis is done within the framework of a statisti-cal model as discussed in Ref. [61]. This model hasbeen used to extract chemical freeze-out parametersat higher RHIC energies [23]. The extracted param-eter values are Tch = 151 ± 2 (stat.) ± 7 (sys.)MeV, µB = 354 ± 7 (stat.) ± 30 (sys.) MeV, µS =25 ± 9 (stat.) ± 14 (sys.) MeV, and γS = 0.9 ± 0.7(stat.) ± 0.1 (sys.) for 9.2 GeV data. These valuesare very close to those extracted from the measure-ments at SPS for similar
√sNN [62]. Only statistical
errors on the particle production ratios are used forobtaining the fit parameters. Inclusion of systematicerrors gives similar values of Tch and µB.
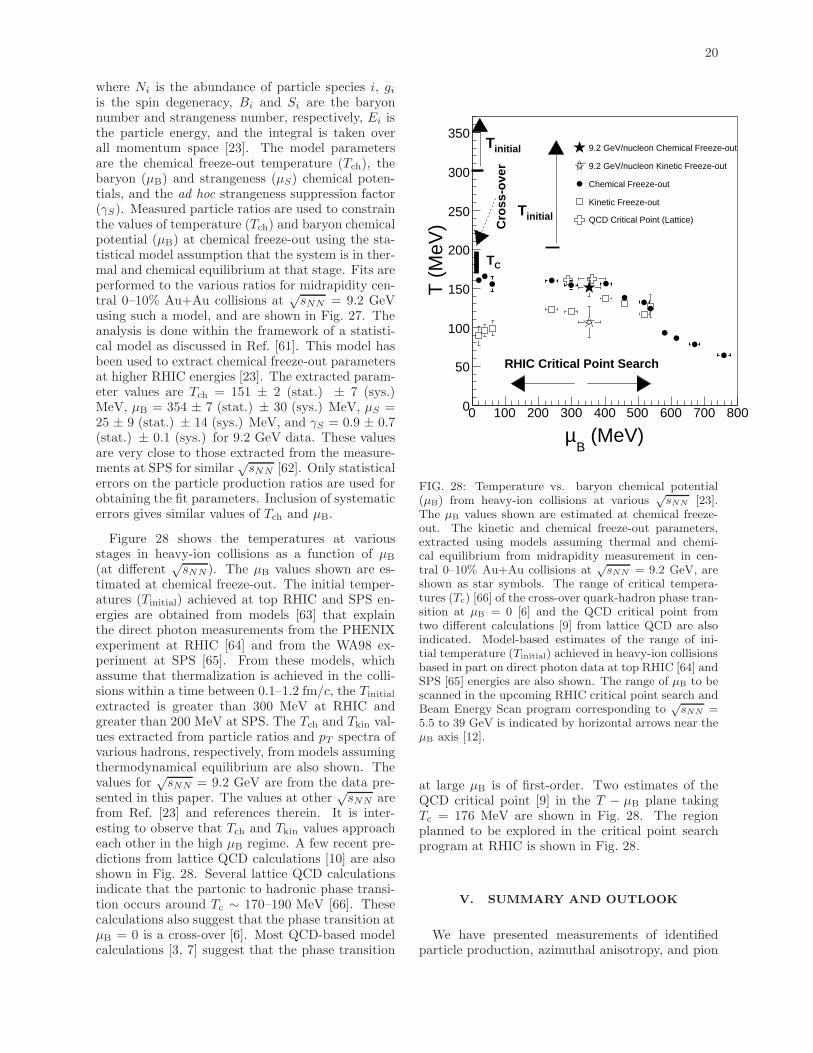
Figure 28 shows the temperatures at variousstages in heavy-ion collisions as a function of µB
(at different√sNN ). The µB values shown are es-
timated at chemical freeze-out. The initial temper-atures (Tinitial) achieved at top RHIC and SPS en-ergies are obtained from models [63] that explainthe direct photon measurements from the PHENIXexperiment at RHIC [64] and from the WA98 ex-periment at SPS [65]. From these models, whichassume that thermalization is achieved in the colli-sions within a time between 0.1–1.2 fm/c, the Tinitial
extracted is greater than 300 MeV at RHIC andgreater than 200 MeV at SPS. The Tch and Tkin val-ues extracted from particle ratios and pT spectra ofvarious hadrons, respectively, from models assumingthermodynamical equilibrium are also shown. Thevalues for
√sNN = 9.2 GeV are from the data pre-
sented in this paper. The values at other√sNN are
from Ref. [23] and references therein. It is inter-esting to observe that Tch and Tkin values approacheach other in the high µB regime. A few recent pre-dictions from lattice QCD calculations [10] are alsoshown in Fig. 28. Several lattice QCD calculationsindicate that the partonic to hadronic phase transi-tion occurs around Tc ∼ 170–190 MeV [66]. Thesecalculations also suggest that the phase transition atµB = 0 is a cross-over [6]. Most QCD-based modelcalculations [3, 7] suggest that the phase transition
(MeV)B
µ0 100 200 300 400 500 600 700 800
T (
MeV
)
0
50
100
150
200
250
300
3509.2 GeV/nucleon Chemical Freeze-out
9.2 GeV/nucleon Kinetic Freeze-out
Chemical Freeze-out
Kinetic Freeze-out
QCD Critical Point (Lattice)
CT
Cro
ss-o
ver
initialT
initialT
RHIC Critical Point Search
FIG. 28: Temperature vs. baryon chemical potential(µB) from heavy-ion collisions at various
√sNN [23].
The µB values shown are estimated at chemical freeze-out. The kinetic and chemical freeze-out parameters,extracted using models assuming thermal and chemi-cal equilibrium from midrapidity measurement in cen-tral 0–10% Au+Au collisions at
√sNN = 9.2 GeV, are
shown as star symbols. The range of critical tempera-tures (Tc) [66] of the cross-over quark-hadron phase tran-sition at µB = 0 [6] and the QCD critical point fromtwo different calculations [9] from lattice QCD are alsoindicated. Model-based estimates of the range of ini-tial temperature (Tinitial) achieved in heavy-ion collisionsbased in part on direct photon data at top RHIC [64] andSPS [65] energies are also shown. The range of µB to bescanned in the upcoming RHIC critical point search andBeam Energy Scan program corresponding to
√sNN =
5.5 to 39 GeV is indicated by horizontal arrows near theµB axis [12].
at large µB is of first-order. Two estimates of theQCD critical point [9] in the T − µB plane takingTc = 176 MeV are shown in Fig. 28. The regionplanned to be explored in the critical point searchprogram at RHIC is shown in Fig. 28.
V. SUMMARY AND OUTLOOK
We have presented measurements of identifiedparticle production, azimuthal anisotropy, and pion
21
interferometry in Au+Au collisions at√sNN = 9.2
GeV. The results are obtained from only about 3000events from the lowest beam energy run to date atthe RHIC facility. The transverse momentum spec-tra of pions, kaons, and protons are presented for0–10%, 10–30%, 30–60%, and 0–60% collision cen-trality classes. The bulk properties are studied bymeasuring the identified hadron dN/dy, 〈pT 〉, parti-cle ratios, v1 (also at forward rapidity), v2, and HBTradii (Rout, Rside, and Rlong). All measurements areconsistent with corresponding previous results fromfixed target experiments at similar
√sNN .
The 〈pT 〉 for protons is higher than that for pi-ons, indicating some degree of collective flow in theradial direction. However, the difference between〈pT 〉 for protons and kaons is considerably smallerat
√sNN = 9.2 GeV than at
√sNN = 62.4 and 200
GeV at RHIC. This suggests that the average col-lective velocity in the radial direction at the lowerbeam energy is smaller compared to 62.4 and 200GeV collisions.The p/p ratio at midrapidity for
√sNN = 9.2
GeV collisions is much smaller, with a value of0.010 ± 0.001 (stat.) ± 0.003 (sys.), and the p/π+
ratio is larger compared to Au+Au collisions at√sNN = 200 GeV. These measurements indicate
large net-proton density at midrapidity in collisionsat
√sNN = 9.2 GeV. In this region of high net-
baryon density for 9.2 GeV collisions, the dominantchannel for kaon production is the associated pro-duction. The K−/K+ ratio has a value of 0.38 ±0.05 (stat.) ± 0.09 (sys.) and the K+/π+ ratiois slightly higher compared to that in collisions at√sNN = 200 GeV.The directed flow measurements, plotted as a
function of pseudorapidity scaled by the beam ra-pidity, have similar values for three collision energies(√sNN = 9.2, 62.4, and 200 GeV). A large v1 sig-
nal is observed at forward rapidities at√sNN = 9.2
GeV. These collisions could have significant contri-bution from protons that dominate at large |η| (spec-tator effects). The v2 measurements for chargedhadrons, pions, and protons are also presented for√sNN = 9.2 GeV Au+Au collisions at RHIC. The
charged pion v2 as a function of pT is observed tobe comparable with that from NA49 at similar col-lision energy. The STAR data at
√sNN = 9.2 GeV
are also found to follow the existing beam energydependence of v2 for charged hadrons.
The pion interferometry results give informationof the size of the homogeneity region of the source.The pion HBT radii Rout, Rside, and Rlong have val-ues 5.05 ± 0.96 fm, 3.52 ± 0.56 fm, and 3.25 ± 0.86fm, respectively.
The kinetic freeze-out parameters are extractedfrom a blast-wavemodel fit to pion, kaon, and protonpT spectra. We obtain Tkin = 105 ± 10 (stat.) ±16 (sys.) MeV and 〈βT 〉 = 0.46c ± 0.01c (stat.) ±0.04c (sys.). The chemical freeze-out parameters areextracted from a thermal model fit to the particleratios at midrapidity. We extract Tch = 151 ± 2(stat.) ± 7 (sys.) MeV and µB = 354 ± 7 (stat.) ±30 (sys.) MeV for 0–10% central Au+Au collisionsat
√sNN = 9.2 GeV.
These results from the lowest energy collisionsstudied up to now at RHIC demonstrate the capa-bilities of the STAR detector to pursue the proposedBeam Energy Scan. Large and uniform acceptancefor all beam energies in a collider set up, excellentparticle identification (augmented by the inclusion ofa full barrel Time-Of-Flight [67] in addition to thelarge acceptance TPC), and higher statistics will of-fer significant quantitative and qualitative improve-ment over existing data. The QCD critical pointprogram at RHIC will allow us to extensively ex-plore the QCD phase diagram. It will also allow usto search for the onset of various observations relatedto partonic matter that have already been uncoveredat the highest RHIC energies.
We thank the RHIC Operations Group and RCFat BNL, and the NERSC Center at LBNL and theresources provided by the Open Science Grid con-sortium for their support. This work was supportedin part by the Offices of NP and HEP within theU.S. DOE Office of Science, the U.S. NSF, the SloanFoundation, the DFG cluster of excellence ‘Originand Structure of the Universe’, CNRS/IN2P3, RA,RPL, and EMN of France, STFC and EPSRC ofthe United Kingdom, FAPESP of Brazil, the Rus-sian Ministry of Sci. and Tech., the NNSFC, CAS,MoST, and MoE of China, IRP and GA of the CzechRepublic, FOM of the Netherlands, DAE, DST, andCSIR of the Government of India, the Polish StateCommittee for Scientific Research, and the KoreaSci. & Eng. Foundation and Korea Research Foun-dation.
[1] J. Adams et al. (STAR Collaboration), Nucl. Phys.A 757, 102 (2005).
[2] A. Andronic, P. Braun-Munzinger and J. Stachel,Nucl. Phys. A 772, 167 (2006); J. Cleymans and K.Redlich, Phys. Rev. C 60, 054908 (1999); F. Becat-
tini, J. Manninen and M. Gazdzicki, Phys. Rev. C73, 044905 (2006).
[3] E. Laerman and O. Philipsen, Ann. Rev. Nucl.Part. Sci. 53, 163 (2003); K. Rajagopal and F.Wilczek, arXiv: hep-ph/0011333; M. A. Stephanov,
22
PoS LAT2006, 024 (2006).[4] J. Adams et al. (STAR Collaboration), Phys. Rev.
Lett. 91, 072304 (2003); Phys. Rev. Lett. 91, 172302(2003); B. I. Abelev et al. (STAR Collaboration),Phys. Rev. Lett. 97, 152301 (2006); Phys. Lett. B655, 104 (2007); S. S. Adler et al. (PHENIX Col-laboration), Phys. Rev. Lett. 91, 072301 (2003).
[5] B. I. Abelev et al. (STAR Collaboration), Phys.Rev. Lett. 99, 112301 (2007); Phys. Rev. C 77,054901 (2008).
[6] Y. Aoki et al., Nature 443, 675 (2006); M. Chenget al., Phys. Rev. D 77, 014511 (2008).
[7] S. Ejiri, Phys. Rev. D 78, 074507 (2008).[8] M. Asakawa and K. Yazaki, Nucl. Phys. A 504, 668
(1989); A. Barducci et al., Phys. Lett. B 231, 463(1989); A. Barducci et al., Phys. Rev. D 41, 1610(1990); M. A. Stephanov, Int. J. Mod. Phys. A 20,4387 (2005).
[9] R. Gavai and S. Gupta, Phys. Rev. D 78, 114503(2008); Z. Fodor and S. D. Katz, JHEP 0404, 050(2004).
[10] B. Mohanty, e-Print: arXiv:0907.4476 [nucl-ex].[11] M. A. Stephanov, K. Rajagopal, E. V. Shuryak,
Phys. Rev. Lett. 81, 4816 (1998); Y. Hattaand M. A. Stephanov, Phys. Rev. Lett. 91,102003 (2003); M. A. Stephanov, Phys. Rev. Lett.102, 032301 (2009); F. Karsch, D. Kharzeevand K. Tuchin, Phys. Lett. B 663, 217 (2008)[arXiv:0711.0914 [hep-ph]].
[12] B. I. Abelev et al. (STAR Collaboration), STARInternal Note - SN0493, 2009.
[13] T. Satogata et al. PoS CPOD 07, 051 (2007).[14] K. H. Ackermann et al., Nucl. Instr. Meth. A 499,
624 (2003).[15] W. J. Llope et al., Nucl. Instr. Meth. A 522, 252
(2004).[16] M. Anderson et al., Nucl. Instr. Meth. A 499, 659
(2003).[17] K. H. Ackermann et al., Nucl. Instr. Meth. A 499,
713 (2003).[18] D. Kharzeev and M. Nardi, Phys. Lett. B 507, 121
(2001).[19] C. Amsler et al., Phys. Lett. B 667, 1 (2008).[20] B. B. Back et al. (PHOBOS collaboration), Phys.
Rev. C 70, 021902 (2004).[21] H. Bichsel, Nucl. Instr. Meth. A 562, 154 (2006);
S. Eidelman et al. (Particle Data Group), Phys.Lett. B 592, 1 (2004); Proceedings of 8th Interna-tional Conference on Advance Technology and Par-ticle Physics, ICATPP 2003, p. 448.
[22] M. Shao et al., Nucl. Instr. Meth. A 558, 419 (2006);Y. Xu et al., arXiv: 0807.4303 [physics. ins-det].
[23] B. I. Abelev et al. (STAR Collaboration), Phys.Rev. C 79, 034909 (2009).
[24] A. M. Poskanzer and S. A. Voloshin, Phys. Rev. C58, 1671 (1998).
[25] J. Adams et al. (STAR Collaboration), Phys. Rev.C 72, 014904 (2005).
[26] G. I. Kopylov and M. I. Podgoretsky, Sov. J. Nucl.Phys. 15, 219 (1972) [Yad. Fiz. 15, 392 (1972)].
[27] U. W. Heinz and B. V. Jacak, Ann. Rev. Nucl. Part.Sci. 49, 529 (1999).
[28] G. Bertsch, M. Gong and M. Tohyama, Phys. Rev.
C 37, 1896 (1988).[29] S. Pratt, Phys. Rev. D 33, 1314 (1986).[30] S. Chapman, P. Scotto and U. W. Heinz, Phys. Rev.
Lett. 74, 4400 (1995).[31] B. I. Abelev et al. (STAR Collaboration), Phys.
Rev. C 80, 024905 (2009), arXiv: 0903.1296 [nucl-ex].
[32] J. Adams et al. (STAR Collaboration), Phys. Rev.C 71, 044906 (2005).
[33] M. A. Lisa, S. Pratt, R. Soltz and U. Wiedemann,Ann. Rev. Nucl. Part. Sci. 55, 357 (2005).
[34] M. G. Bowler, Phys. Lett. B 270, 69 (1991); Yu.Sinyukov, R. Lednicky, S. V. Akkelin, J. Pluta andB. Erazmus, Phys. Lett. B 432, 248 (1998); R. Led-nicky, arXiv: nucl-th/0212089.
[35] V. Fine and P. Nevski, in Proceedings of CHEP-2000, Padova, Italy, p. 143.
[36] J. Adams et al. (STAR Collaboration), Phys. Rev.C 70, 041901 (2004).
[37] J. Adams et al. (STAR Collaboration), Phys. Rev.Lett. 92, 112301 (2004).
[38] L. Ahle et al. (E866 Collaboration and E917 Col-laboration), Phys. Lett. B 490, 53 (2000); L. Ahleet al. (E866 Collaboration and E917 Collaboration)Phys. Lett. B 476, 1 (2000); J. L. Klay et al. (E895Collaboration), Phys. Rev. Lett. 88, 102301 (2002);J. Barrette et al. (E877 Collaboration), Phys. Rev.C 62, 024901 (2000); Y. Akiba et al. (E802 Collab-oration), Nucl. Phys. A 610, 139c (1996); L. Ahle etal. (E802 Collaboration), Phys. Rev. C 60, 064901(1999); L. Ahle et al. (E802 Collaboration and E866Collaboration), Phys. Rev. C 60, 044904 (1999); L.Ahle et al. (E802 Collaboration), Phys. Rev. C 57,466 (1998).
[39] S. V. Afanasiev et al. (NA49 Collaboration), Phys.Rev. C 66, 054902 (2002); C. Alt et al. (NA49 Col-laboration), Phys. Rev. C 77, 024903 (2008); Phys.Rev. C 73, 044910 (2006); T. Anticic et al. (NA49Collaboration), Phys. Rev. C 69, 024902 (2004).
[40] S. S. Adler et al. (PHENIX Collaboration), Phys.Rev. C 71, 034908 (2005).
[41] L. Van Hove, Phys. Lett. B 118, 138 (1982).[42] B. Mohanty et al., Phys. Rev. C 68, 021901 (2008)
and references therein.[43] S. Chatterjee, R. M. Godbole and S. Gupta,
arXiv:0906.2523v1 [hep-ph]; A. Andronic, P. Braun-Munzinger and J. Stachel, Phys. Lett. B 673, 142(2009); J. K. Nayak, J. Alam, P. Roy, A. K. Dutt-Mazumder and B. Mohanty, Acta Phys. Slov. 56,27 (2006); B. Tomasik and E. E. Kolomeitsev, Eur.Phys. J. C 49, 115 (2007); J. Cleymans, H. Oeschler,K. Redlich and S. Wheaton, Eur. Phys. J. A 29, 119(2006); J. Rafelski, I. Kuznetsova and J. Letessier,J. Phys. G 35, 044011 (2008).
[44] A. H. Tang, J. Phys. G 34, S277 (2007).[45] R. Snellings et al., Phys. Rev. Lett. 84, 2803 (2000);
J. Brachmann et al., Phys. Rev. C 61, 024909(2000); L. P. Csernai and D. Rohrich, Phys. Lett.B 458, 454 (1999); H. Stoecker, Nucl. Phys. A 750,121 (2005).
[46] B. B. Back et al. (PHOBOS Collaboration), Phys.Rev. C 72, 051901 (2005).
[47] B. B. Back et al. (PHOBOS Collaboration), Phys.
23
Rev. Lett. 94, 122303 (2005).[48] C. Adler et al. (STAR Collaboration), Phys. Rev. C
66, 034904 (2002).[49] J. Adams et al. (STAR Collaboration), Phys. Rev.
Lett. 93, 252301 (2004).[50] B. B. Back et al. (PHOBOS Collaboration), Phys.
Rev. Lett. 89, 222301 (2002).[51] S. S. Adler et al. (PHENIX Collaboration), Phys.
Rev. Lett. 91, 182301 (2003).[52] S. S. Adler et al. (PHENIX Collaboration), Phys.
Rev. Lett. 94, 232302 (2005).[53] B. I. Abelev et al. (STAR Collaboration), Phys.
Rev. Lett. 101, 252301 (2008).[54] C. Alt et al. (NA49 Collaboration), Phys. Rev. C
68, 034903 (2003).[55] B. I. Abelev et al. (STAR Collaboration), Phys.
Rev. C 75, 054906 (2007).[56] J. Barrette et al. (E877 Collaboration), Phys. Rev.
C 55, 1420 (1997).[57] A. Adare et al. (PHENIX Collaboration), Phys.
Rev. Lett. 98, 162301 (2007).[58] B. Alver et al. (PHOBOS Collaboration), Phys.
Rev. Lett. 98, 242302 (2007).[59] G. Goldhaber, S. Goldhaber, W. Y. Lee and A. Pais,
Phys. Rev. 120, 300 (1960).[60] E. Schnedermann, J. Sollfrank, and U. Heinz, Phys.
Rev. C 48, 2462 (1993).
[61] P. Braun-Munzinger, I. Heppe and J. Stachel, Phys.Lett. B 465, 15 (1999).
[62] J. Cleymans et al., Phys. Rev. C 73, 034905 (2006);F. Becattini, J. Manninen and M. Gazdzicki, Phys.Rev. C 73, 044905 (2006); A. Andronic, P. Braun-Munzinger and J. Stachel, Nucl. Phys. A 772, 167(2006).
[63] R. Chatterjee, D. K. Srivastava and S. Jeon, Phys.Rev. C 79, 034906 (2009); P. Huovinen, P.V. Ru-uskanen and S. S. Rasanen, Phys. Lett. B 535, 109(2002); A. K. Chaudhuri, J. Phys. G 29, 235 (2003);J. Alam et al., Phys. Rev. C 63, 021901 (2001); D.d’Enterria and D. Peressounko, Eur. Phys. J. C 46,451 (2006); J. Alam et al., J. Phys. G 34, 871 (2007).
[64] A. Adare et al. (PHENIX Collaboration), arXiv:0804.4168 [nucl-ex].
[65] M. M. Aggarwal et al. (WA98 Collaboration), Phys.Rev. Lett. 85, 3595 (2000).
[66] Y. Aoki et al., Phys. Lett. B 643, 46 (2006); M.Cheng et al., Phys. Rev. D 74, 054507 (2006).
[67] B. Bonner et al., Nucl. Instr. Meth. A 508, 181(2003); M. Shao et al., Nucl. Instr. Meth. A 492,344 (2002); J. Wu et al., Nucl. Instr. Meth. A 538,243 (2005); J. Adams et al., Phys. Lett. B 616, 8(2005).
Copyright © 2022 FDOKUMEN