
Identification of Serum Regression Signs in Infantile ...
8
Identification of Serum Regression Signs in Infantile Hemangioma Daniela D’Arcangelo 1. , Ezio M. Nicodemi 2. , Stefania Rossi 3 , Claudia Giampietri 4 , Francesco Facchiano 3 , Antonio Facchiano 1 * 1 Istituto Dermopatico dell’Immacolata, IDI-IRCCS, Rome, Italy, 2 Divisione Chirurgia Plastica, Centro Anomalie Vascolari, Istituto Dermopatico dell’Immacolata, IDI-IRCCS, Rome, Italy, 3 Dipartimento Ematologia, Oncologia e Medicina Molecolare, Istituto Superiore di Sanita `, Rome, Italy, 4 Department of Anatomy, Histology, Forensic Medicine and Orthopedics - Section of Histology and Medical Embryology, Sapienza University, Rome, Italy Abstract Vessel proliferation underlies a number of serious pathological conditions. Infantile Hemangioma (IH) is a low-aggressive vascular tumor, interesting as an in vivo model of spontaneous tumor regression. Identifying mechanisms underlying IH spontaneous regression may then help to elucidate vessel-growth control, strongly deregulated in other serious conditions such as sarcoma, melanoma, diabetic retinopathy. The present study was aimed at identifying early regression indicators within hematological parameters. Thirty-four blood samples were collected from IH diagnosed babies (20-months median age), spontaneously regressing with age. Nineteen serum standard blood-tests were carried out using diagnostic reagents; in addition, serum-expression of 27 cytokine/chemokines was measured. Samples were divided in three age-groups, namely #12, 13 to 24 and .24 months-age, respectively. Red-cells count, Hemoglobin, Hematocrit, Neutrophils, Lymphocytes, MCP-1 and MIP-1beta were significantly different in the three age-groups, according to one-way ANOVA analysis. The same parameters showed a significant Pearson-correlation with age, supporting the direct link of age with IH-regression. ROC analysis showed that red-cells count, Hemoglobin, Hematocrit, MCP-1 and MIP-1beta levels significantly discriminate IH in the proliferating-phase from IH in the regressing-phase. Such data indicate for the first time that standard hematological tests and cytokine serum-expression values may effectively discriminate proliferating- from regressing-IH, unrevealing early regression signs, and demonstrate that standard blood-tests may have novel unsuspected diagnostic/prognostic relevance in altered vessel-growth conditions. Citation: D’Arcangelo D, Nicodemi EM, Rossi S, Giampietri C, Facchiano F, Facchiano A (2014) Identification of Serum Regression Signs in Infantile Hemangioma. PLoS ONE 9(3): e88545. doi:10.1371/journal.pone.0088545 Editor: Domenico Ribatti, University of Bari Medical School, Italy Received October 24, 2013; Accepted January 8, 2014; Published March 5, 2014 Copyright: ß 2014 D’Arcangelo et al. This is an open-access article distributed under the terms of the Creative Commons Attribution License, which permits unrestricted use, distribution, and reproduction in any medium, provided the original author and source are credited. Funding: This work was funded by the Italian Ministry of Health [grant # RC12 3.5 and grant RF07ONC-25/3) and Italy-USA Oncoproteomics Program. The funders had no role in study design, data collection and analysis, decision to publish, or preparation of the manuscript. Competing Interests: Co-author Antonio Facchiano is a PLOS ONE Editorial Board member. This does not alter the authors’ adherence to all the PLOS ONE policies on sharing data and materials. * E-mail: [email protected] Introduction Neo-vascularisation is a key process regulating tumor growth, in fact the anti-angiogenic approach is a useful therapeutic strategy in many solid tumors. Therefore, investigating growth and regression of vascular tumors may help clarification of key mechanisms deregulated in cancer onset as well as in other serious diseases [1]. Investigating serum-soluble factors in children may represent a favourable condition, as compared to adults, due to the higher proportional mass of the disease as compared to the body weight. Infantile hemangioma (IH) is a vascular tumor with unique characteristics, particularly interesting from both clinical and biological point of views. Despite its low-aggressiveness it is of large interest since it may be considered as a human in vivo model of spontaneous cancer regression. Therefore a thorough investigation in such model may reveal mechanisms underlying its regression not evident in adults, where soluble factors are highly diluted in the blood. IH represents the most frequent vascular tumor of early childhood [2,3], occurring in 3 to 10% of white infants [4] mostly in Caucasian infants, female, premature, low-weight babies [5]. Such vascular lesions usually evolve with the baby age, from an initial proliferation phase toward a final regression phase [6]. Differently from other classical vascular malformations exhibiting developmental defects with a quiescent endothelium, IH grows by a clear hyperplastic mechanism [7]. In addition, classical vascular malformations are evident at the birth, while IH becomes manifest 1 week to 1 month after birth. A differential diagnosis of IH with vascular abnormalities or other serious vascular tumors is currently based on the inspection and clinical history; early molecular markers able to discriminate IH from other more serious diseases are currently lacking and may help the physician to plan the correct therapeutic approach. A peculiar IH feature is the spontaneous regression over time. In hemangioma three phases occur within the 5 th to the 7 th year of age, namely proliferating phase (typically lasting up to the 9–12 th month of age), involuting phase and involuted phase. IH arises from multipotent stem cells leading to endothelial cells in the proliferating phase and to adipocytes during the involution/ involuted phase and molecular mechanisms underlying hemangi- oma onset and involution are only partially defined [8]. Messenger RNA level of b-adrenoceptor has been indicated as possibly involved and such level may represent a potential molecular PLOS ONE | www.plosone.org 1 March 2014 | Volume 9 | Issue 3 | e88545
-
Upload
khangminh22 -
Category
Documents
-
view
3 -
download
0
Transcript of Identification of Serum Regression Signs in Infantile ...

Identification of Serum Regression Signs in InfantileHemangiomaDaniela D’Arcangelo1., Ezio M. Nicodemi2., Stefania Rossi3, Claudia Giampietri4, Francesco Facchiano3,
Antonio Facchiano1*
1 Istituto Dermopatico dell’Immacolata, IDI-IRCCS, Rome, Italy, 2 Divisione Chirurgia Plastica, Centro Anomalie Vascolari, Istituto Dermopatico dell’Immacolata, IDI-IRCCS,
Rome, Italy, 3 Dipartimento Ematologia, Oncologia e Medicina Molecolare, Istituto Superiore di Sanita, Rome, Italy, 4 Department of Anatomy, Histology, Forensic
Medicine and Orthopedics - Section of Histology and Medical Embryology, Sapienza University, Rome, Italy
Abstract
Vessel proliferation underlies a number of serious pathological conditions. Infantile Hemangioma (IH) is a low-aggressivevascular tumor, interesting as an in vivo model of spontaneous tumor regression. Identifying mechanisms underlying IHspontaneous regression may then help to elucidate vessel-growth control, strongly deregulated in other serious conditionssuch as sarcoma, melanoma, diabetic retinopathy. The present study was aimed at identifying early regression indicatorswithin hematological parameters. Thirty-four blood samples were collected from IH diagnosed babies (20-months medianage), spontaneously regressing with age. Nineteen serum standard blood-tests were carried out using diagnostic reagents;in addition, serum-expression of 27 cytokine/chemokines was measured. Samples were divided in three age-groups, namely#12, 13 to 24 and .24 months-age, respectively. Red-cells count, Hemoglobin, Hematocrit, Neutrophils, Lymphocytes,MCP-1 and MIP-1beta were significantly different in the three age-groups, according to one-way ANOVA analysis. The sameparameters showed a significant Pearson-correlation with age, supporting the direct link of age with IH-regression. ROCanalysis showed that red-cells count, Hemoglobin, Hematocrit, MCP-1 and MIP-1beta levels significantly discriminate IH inthe proliferating-phase from IH in the regressing-phase. Such data indicate for the first time that standard hematologicaltests and cytokine serum-expression values may effectively discriminate proliferating- from regressing-IH, unrevealing earlyregression signs, and demonstrate that standard blood-tests may have novel unsuspected diagnostic/prognostic relevancein altered vessel-growth conditions.
Citation: D’Arcangelo D, Nicodemi EM, Rossi S, Giampietri C, Facchiano F, Facchiano A (2014) Identification of Serum Regression Signs in InfantileHemangioma. PLoS ONE 9(3): e88545. doi:10.1371/journal.pone.0088545
Editor: Domenico Ribatti, University of Bari Medical School, Italy
Received October 24, 2013; Accepted January 8, 2014; Published March 5, 2014
Copyright: � 2014 D’Arcangelo et al. This is an open-access article distributed under the terms of the Creative Commons Attribution License, which permitsunrestricted use, distribution, and reproduction in any medium, provided the original author and source are credited.
Funding: This work was funded by the Italian Ministry of Health [grant # RC12 3.5 and grant RF07ONC-25/3) and Italy-USA Oncoproteomics Program. Thefunders had no role in study design, data collection and analysis, decision to publish, or preparation of the manuscript.
Competing Interests: Co-author Antonio Facchiano is a PLOS ONE Editorial Board member. This does not alter the authors’ adherence to all the PLOS ONEpolicies on sharing data and materials.
* E-mail: [email protected]
Introduction
Neo-vascularisation is a key process regulating tumor growth, in
fact the anti-angiogenic approach is a useful therapeutic strategy in
many solid tumors. Therefore, investigating growth and regression
of vascular tumors may help clarification of key mechanisms
deregulated in cancer onset as well as in other serious diseases [1].
Investigating serum-soluble factors in children may represent a
favourable condition, as compared to adults, due to the higher
proportional mass of the disease as compared to the body weight.
Infantile hemangioma (IH) is a vascular tumor with unique
characteristics, particularly interesting from both clinical and
biological point of views. Despite its low-aggressiveness it is of large
interest since it may be considered as a human in vivo model of
spontaneous cancer regression. Therefore a thorough investigation
in such model may reveal mechanisms underlying its regression
not evident in adults, where soluble factors are highly diluted in
the blood.
IH represents the most frequent vascular tumor of early
childhood [2,3], occurring in 3 to 10% of white infants [4] mostly
in Caucasian infants, female, premature, low-weight babies [5].
Such vascular lesions usually evolve with the baby age, from an
initial proliferation phase toward a final regression phase [6].
Differently from other classical vascular malformations exhibiting
developmental defects with a quiescent endothelium, IH grows by
a clear hyperplastic mechanism [7]. In addition, classical vascular
malformations are evident at the birth, while IH becomes manifest
1 week to 1 month after birth. A differential diagnosis of IH with
vascular abnormalities or other serious vascular tumors is currently
based on the inspection and clinical history; early molecular
markers able to discriminate IH from other more serious diseases
are currently lacking and may help the physician to plan the
correct therapeutic approach.
A peculiar IH feature is the spontaneous regression over time.
In hemangioma three phases occur within the 5th to the 7th year of
age, namely proliferating phase (typically lasting up to the 9–12th
month of age), involuting phase and involuted phase. IH arises
from multipotent stem cells leading to endothelial cells in the
proliferating phase and to adipocytes during the involution/
involuted phase and molecular mechanisms underlying hemangi-
oma onset and involution are only partially defined [8]. Messenger
RNA level of b-adrenoceptor has been indicated as possibly
involved and such level may represent a potential molecular
PLOS ONE | www.plosone.org 1 March 2014 | Volume 9 | Issue 3 | e88545
marker useful to discriminate IH from other vascular malforma-
tions [9]. Furthermore, Glucose transporter-1 (Glut-1) may also
represent an useful diagnostic marker [10]. It is a transporter
protein, commonly associated with erythrocytes, giving unique
immunoreactivity in IH specimens and suggests a possible link of
IH with placenta growth [11]. IH clinical features have been
recently reviewed [12].
The IH growing phase lasts usually until about the 9th–12th
month of life followed by a slow regression. In most cases by
adolescence the tumor is completely regressed, appearing as a
fibrotic mass with fatty components [13], therefore IH usually does
not require specific surgical intervention. However, in about 20%
of cases IH occurs in vital organs surrounding areas (e.g. airway,
eyes or nasal region); in such cases a surgical or medical
intervention is necessary. In other cases internal bleeding or
ulceration must be avoided to rule out possible complications [14].
Propranolol, a non-selective inhibitor of b(1)- and b(2)-adreno-
ceptor has been recently introduced as medical intervention to
treat severe proliferating IH; it may act mostly via a vasoconstric-
tor action on pericytes, however its exact mechanism of action is
still poorly understood [15].
We have previously shown that blood itself may contain
unsuspected prognostic or diagnostic information associated to
serum parameters. For instance we showed that the fine balance of
PDGF-BB and TGF-beta1 blood levels may represent an early
predictive sign of kidney-transplant failure [16]. More recently we
reported potential diagnostic relevance related to the presence of
alpha-2-macroblbulin and apo-lipoproteins in the sera of melano-
ma patients [17]. We are currently further investigating the
presence of specific markers with diagnostic relevance in
melanoma patients sera. Finally, in collaboration with other
groups, we demonstrated the association of a specific hematolog-
ical cytokine-profile in chronic heart failure patients [18]. These,
and many other, data fully support the hypothesis that specific
hematological parameters, under particular conditions, may
acquire unsuspected diagnostic/prognostic relevance. In the
present study 34 blood samples were obtained from babies
showing IH in the proliferating phase as well as in the involuting/
involuted phase, and 46 different serum parameters were analyzed
(including 19 standard hematological analyses such as total red
blood cells, total white blood cells, Hemoglobin related values,
leukocytes formula, plus other serum values such as 27 cytokine/
chemokines serum expression levels).
The very low age made it difficult to recruit a larger number of
patients. However, results presented in the current study show
strong statistical significance, and represent the first study
reporting an extensive serum profiling in IH, reporting indicators
and molecules clearly related to IH regression.
Materials and Methods
Patient recruitmentThis was a prospective study. Thirty four samples were analyzed
in the present study. Twenty eight different babies with median
age of 20 months, affected by IH, were consecutively recruited
(from 2009–2012) at Centro Anomalie Vascolari of IDI-IRCCS,
according to a protocol approved by the IDI-IRCCS Ethic
Committee (protocol n. 2009-303/1), with written informed
consent signed by the parent of the children enrolled. A total of
34 samples were collected from babies at different ages. Inclusion
criteria were: IH diagnosis, no other evident pathologies. Sample
size was taken as large as possible, given the objective difficulties at
recruiting small babies, affected by a spontaneously regressing
benign disease. Size of the hemangioma lesions ranged from 0.5 to
6.5 cm diameter. Each patient showed typically one major lesion
and all patients showed a spontaneous regression without any
systemic or topic treatment.
Data in the present manuscript are only reported in aggregated
anonymous form.
Blood collection and handlingAll babies underwent blood collection; blood was carefully
collected in a vial lacking any chemical or mechanical additive.
Coagulation was allowed to naturally occur for two hours at room
temperature. Blood was then centrifuged at 2500 rpm for 15 min;
serum was collected and immediately frozen at 280uC in 100 ml
aliquots. Aliquots were thawed, used once and never refrozen or
re-used.
Standard hematological analysesNineteen standard blood tests were carried out using diagnostic
reagents at the diagnostic service of IDI-IRCCS hospital. Such
analyses included total red blood cells, total white blood cells, total
Hemoglobin content, Hematocrit (HCT), mean volume of red
cells (MCV), mean cell Hemoglobin content (MCH), mean
corpuscular Hemoglobin concentration (MCHC), Red blood cell
distribution width (RDW), Hemoglobin Distribution Width
(HDW), Platelets content, mean platelets volume (MPV), platelet
hematocrit (PCT), platelet distribution width (PDW), Neutrophils
%, Lymphocytes %, Monocytes %, Eosinophils %, Basophils %,
Large Unstained Cells (LUC) %.
Cytokine profilingSerum expression of 27 human different cytokine/chemokines
was measured with the 27-Bio-Plex assay kit (BioRad Laborato-
ries, Milan, Italy), a magnetic-bead based multiplex immunoassay,
carried out according to manufacturer guidelines. The following
factors were measured:
IL-1ß, IL-1Ra, IL-2, IL-4, IL-5, IL-6, IL-7, IL-8, IL-9, IL-10,
IL-12, IL-13, IL-15, IL-17, Eotaxin, FGF-2, G-CSF, GM-CSF,
IFN-c; IP-10; MCP-1, MIP-1a, MIP-1ß, PDGF-BB, RANTES,
TNF-a, VEGF. Bio-Plex200 instrument, equipped with the Bio-
Plex Manager Software 4.1, was used. Calibration, validation and
fluidics washing were carried out before running the assays, as
requested. Sample dilution (1:4 in the sample-dilution buffer) and
handling was carried out strictly according to manufacturer
instructions. The logistic 5PL five-parameters not-linear regression
type equation was carried out for raw data analysis, according to
standard procedures in Bio-Plex Manager. Measurements were
carried out in duplicates.
Statistical analysisData were analyzed with GraphPad Prism for Windows, version
5.04 (GraphPad Software Inc.).
Samples were divided in three groups with similar numerosity:
babies with IH in the proliferating phase (#12 months; N = 10);
babies with IH in the early regressing phase (age between 13 and
24 months; N = 12); babies with IH in the advanced regressing
phase (age.24 months, N = 12). One-way ANOVA analysis was
carried to measure the significant differences. Significant linear
trends were also identified with a post hoc analysis by GraphPad
Prism software.
In an additional statistical analysis the 46 parameters were
directly analyzed as function of age according to Pearson
correlation. Reference data-points for healthy babies were retrieved
from the Mayo clinic site http://www.mayomedicallaboratories.
com/test-info/pediatric/refvalues/reference.ph. Each data-point
Markers of Infantile Hemangioma Regression
PLOS ONE | www.plosone.org 2 March 2014 | Volume 9 | Issue 3 | e88545

was exploded to three data-points containing the lowest, the median
and the highest point, in order to obtain ‘‘distributed’’ data.
Finally, Receiver Operating Characteristic (ROC) analysis was
also carried out to verify whether values were able to significantly
discriminate proliferating IH samples (age#12 months) from
samples in the regressing phase (age.12 months). ROC analysis
takes into account sensitivity and specificity accuracy. A signifi-
cance threshold of p,0.05 was considered. Data were expressed as
median 6 Standard Error.
The present manuscript reports results obtained with paramet-
ric analyses since the normality test performed according to
Kolmogorov-Smirnov (as well as to D’Agostino and Pearson test)
computed a normal distribution for MIP-1ß, MCP-1, RBG,
Hemoglobin, HCT, Neutrophils, Lymphocytes values. In order to
take into account the relatively small sample size, the non
parametric Kruskal-Wallis test was also carried out, as an
alternative to the one-way ANOVA analysis. Results were similar
to the parametric analyses.
Results
Samples characteristicsTable S1 reports the general characteristics of the population
under study. Thirty four blood samples were collected from babies
affected by IH with a median age of 2064 months (11 male and
23 female, median age 1867 months and 2064, respectively).
Samples were divided in groups according to the clinical phase:
proliferating phase (#12 months age), early regressing (involuting)
phase (13 to 24 months age), and advanced regressing (involuted)
phase (.24 months age). Table S1 also reports size and median
age of each group. All recruited babies showed a spontaneous IH
regression with age.
Significant differences by one-way ANOVA, in serumprofiling, as function of IH phase
Table 1 reports the 19 standard hematological values measured
in the three groups. A one-way ANOVA analysis indicated strong
and significant differences for 5 values, namely: red blood cells,
HCT, Hemoglobin, Neutrophils % and Lymphocytes % (high-
lighted in grey). In all cases such values also show a significant
increasing or decreasing linear trend (see right hand site of
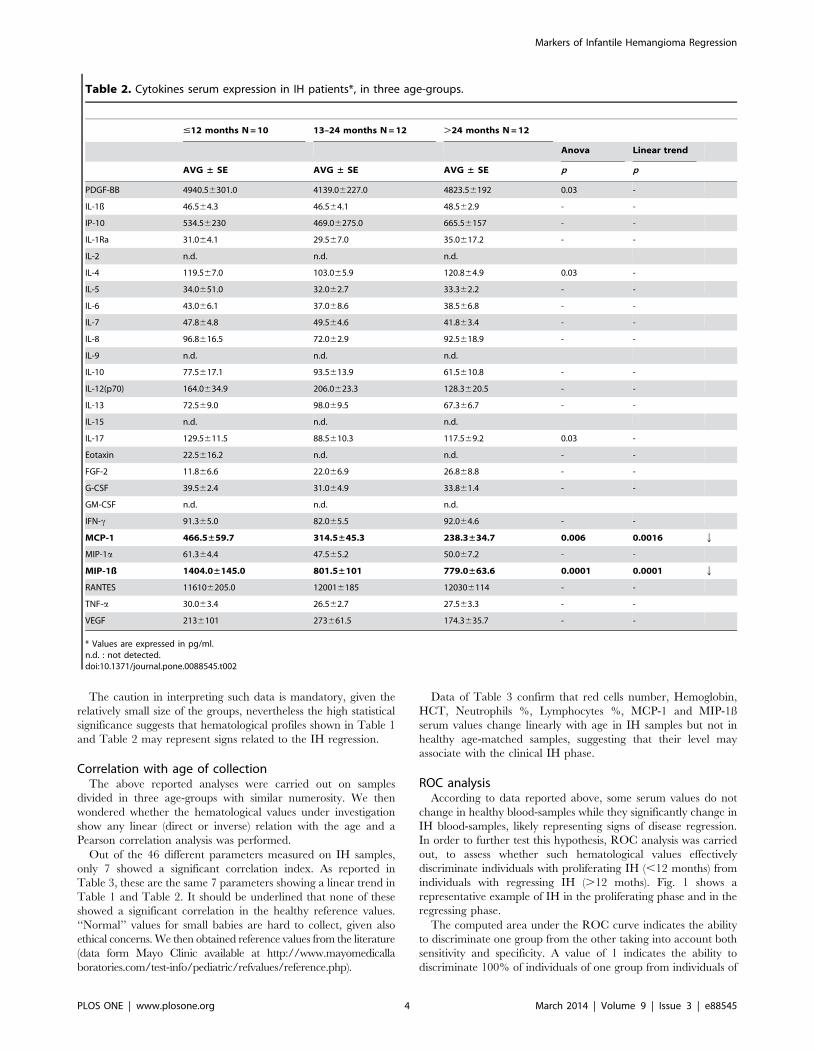
Table 1). Table 2 reports serum expression of 27 cytokine/
chemokines (expressed in pg/ml) measured by a multiplex
magnetic-beads based ELISA assay, in the same three age-groups.
Significant differences, according to one-way ANOVA analysis,
are highlighted in grey and indicate that PDGF-BB, IL-4, IL-17,
MCP-1 and MIP-1ß show strongly significant differences within
the groups. The most relevant and most significant changes were
observed for MCP-1 and MIP-1ß showing also a significant linear
decreasing trend (p = 0.0016 and p = 0.001, respectively), leading
to about 50% reduction throughout the groups (see right hand site
of Table 2). The significant linear trend indicated in Table 1 and
Table 2 suggests a direct relation with the age and with the IH
phase.
Expression of other key factors appears to be strongly changed
in Table 2, although in a not-significant and not-linear way, for
instance IP-10, IL-12, FGF-2 and VEGF. On the contrary, others
appear almost identically expressed in the three groups (namely
IL-5, IL-6, IL-7, G-CSF, IFN-c, TNFa).
Table 1. Hematologic profile in hemangioma patients, in three age-groups.
#12 months N = 1013–24 monthsN = 12 .24 months N = 12
Anova Linear trend
AVG ± SE AVG ± SE AVG ± SE P p
White cells/ml(*103) 9.361.0 10.160.8 8.860.5 - -
Red cells/ml(*106) 4.3±0.1 5.0±0.1 5.1±0.1 0.002 0.0008 q
Hemoglobin (g/dl) 11.5±0.2 12.5±0.3 13.1±0.2 0.0004 0.0001 q
HCT (%) 32.3±0.7 36.9±1.0 38.3±0.6 0.0001 0.0001 q
MCV (f/L) 74.761.3 74.761.3 74.161.0 - -
MCH (pg) 25.960.7 25.660.6 25.160.3 - -
MCHC (g/dl) 35.260.4 33.860.4 33.960.4 - -
RDW (%) 12.860.2 12.760.3 12.460.2 - -
HDW (g/dl) 2.860.1 2.760.1 2.860.1 - -
Platelets/ml(*103) 421.0660 382.0631 351.0617 - -
MPV (fl) 8.560.4 7.360.3 7.560.3 - -
PCT (%) 0.460.1 0.360.0 0.360.0 - -
PDW (%) 38.661.7 35.961.3 37.161.0 - -
Neutrophiles (%) 25.5±2.6 29.4±3.2 36.9±3.7 0.04 0.01 q
Lymphocytes (%) 63.4±3.0 58.0±3.4 49.7±3.5 0.02 0.009 Q
Monocytes (%) 6.060.7 5.660.4 6.660.5 - -
Eosinophils (%) 2.860.5 1.760.4 2.760.8 - -
Basofils (%) 0.460.1 0.660.1 0.660.1 - -
LUC (%) 3.360.2 3.760.2 3.260.4 - -
doi:10.1371/journal.pone.0088545.t001
Markers of Infantile Hemangioma Regression
PLOS ONE | www.plosone.org 3 March 2014 | Volume 9 | Issue 3 | e88545
The caution in interpreting such data is mandatory, given the
relatively small size of the groups, nevertheless the high statistical
significance suggests that hematological profiles shown in Table 1
and Table 2 may represent signs related to the IH regression.
Correlation with age of collectionThe above reported analyses were carried out on samples
divided in three age-groups with similar numerosity. We then
wondered whether the hematological values under investigation
show any linear (direct or inverse) relation with the age and a
Pearson correlation analysis was performed.
Out of the 46 different parameters measured on IH samples,
only 7 showed a significant correlation index. As reported in
Table 3, these are the same 7 parameters showing a linear trend in
Table 1 and Table 2. It should be underlined that none of these
showed a significant correlation in the healthy reference values.
‘‘Normal’’ values for small babies are hard to collect, given also
ethical concerns. We then obtained reference values from the literature
(data form Mayo Clinic available at http://www.mayomedicalla
boratories.com/test-info/pediatric/refvalues/reference.php).
Data of Table 3 confirm that red cells number, Hemoglobin,
HCT, Neutrophils %, Lymphocytes %, MCP-1 and MIP-1ß
serum values change linearly with age in IH samples but not in
healthy age-matched samples, suggesting that their level may
associate with the clinical IH phase.
ROC analysisAccording to data reported above, some serum values do not
change in healthy blood-samples while they significantly change in
IH blood-samples, likely representing signs of disease regression.
In order to further test this hypothesis, ROC analysis was carried
out, to assess whether such hematological values effectively
discriminate individuals with proliferating IH (,12 months) from
individuals with regressing IH (.12 moths). Fig. 1 shows a
representative example of IH in the proliferating phase and in the
regressing phase.
The computed area under the ROC curve indicates the ability
to discriminate one group from the other taking into account both
sensitivity and specificity. A value of 1 indicates the ability to
discriminate 100% of individuals of one group from individuals of
Table 2. Cytokines serum expression in IH patients*, in three age-groups.
#12 months N = 10 13–24 months N = 12 .24 months N = 12
Anova Linear trend
AVG ± SE AVG ± SE AVG ± SE p p
PDGF-BB 4940.56301.0 4139.06227.0 4823.56192 0.03 -
IL-1ß 46.564.3 46.564.1 48.562.9 - -
IP-10 534.56230 469.06275.0 665.56157 - -
IL-1Ra 31.064.1 29.567.0 35.0617.2 - -
IL-2 n.d. n.d. n.d.
IL-4 119.567.0 103.065.9 120.864.9 0.03 -
IL-5 34.0651.0 32.062.7 33.362.2 - -
IL-6 43.066.1 37.068.6 38.566.8 - -
IL-7 47.864.8 49.564.6 41.863.4 - -
IL-8 96.8616.5 72.062.9 92.5618.9 - -
IL-9 n.d. n.d. n.d.
IL-10 77.5617.1 93.5613.9 61.5610.8 - -
IL-12(p70) 164.0634.9 206.0623.3 128.3620.5 - -
IL-13 72.569.0 98.069.5 67.366.7 - -
IL-15 n.d. n.d. n.d.
IL-17 129.5611.5 88.5610.3 117.569.2 0.03 -
Eotaxin 22.5616.2 n.d. n.d. - -
FGF-2 11.866.6 22.066.9 26.868.8 - -
G-CSF 39.562.4 31.064.9 33.861.4 - -
GM-CSF n.d. n.d. n.d.
IFN-c 91.365.0 82.065.5 92.064.6 - -
MCP-1 466.5±59.7 314.5±45.3 238.3±34.7 0.006 0.0016 Q
MIP-1a 61.364.4 47.565.2 50.067.2 - -
MIP-1ß 1404.0±145.0 801.5±101 779.0±63.6 0.0001 0.0001 Q
RANTES 116106205.0 120016185 120306114 - -
TNF-a 30.063.4 26.562.7 27.563.3 - -
VEGF 2136101 273661.5 174.3635.7 - -
* Values are expressed in pg/ml.n.d. : not detected.doi:10.1371/journal.pone.0088545.t002
Markers of Infantile Hemangioma Regression
PLOS ONE | www.plosone.org 4 March 2014 | Volume 9 | Issue 3 | e88545

the other. Such analysis was carried out on all 46 measured
parameters: red cells count, Hemoglobin, HCT, MCP-1 and MIP-
1ß were the only parameters able to significantly discriminate
proliferating IH from regressing IH showing a ROC area .0.80
and a strongly significant p value (Fig. 2).
Discussion
A general aim of this study was to investigate whether standard
hematological parameters or the cytokine serum profile may help
identification of signs or mechanisms underlying the spontaneous
regression of vascular tumors (namely IH). This may help
clarifying, at least to some extent, the molecular machinery
involved in tumor angiogenesis and cancer growth. IH is an
interesting model of regression, since it regresses spontaneously as
function of age, usually. In addition, babies show a lower dilution
of serum factors given the smaller blood volume as compared to
adults. Therefore, clarifying mechanisms underlying IH sponta-
neous regression may be of relevance for other human diseases
showing deregulated angiogenic processes (e.g. solid tumors,
diabetic retinopathy and myocardial infarction).
In the present pilot study routine diagnostic blood tests and non-
standard measurements (namely cytokine/chemokines levels) were
carried out in IH babies at proliferating and regressing phases.
Clinical regression represents a key event allowing to rule out
vascular malformations or other more malignant lesions, therefore
identification of early molecular markers of regression may be
useful to perform early differential diagnosis.
Blood samples from babies with a clinical IH diagnosis were
collected and spontaneous regression over time was observed in all
selected cases. Hematological values were profiled according to
routine diagnostic analyses and a number of interesting and
significant changes was found, summarized in the cartoon
reported in Fig. 3. The significant increase of red blood cells,
Hemoglobin and HCT in involuting IH was rather interesting. In
the involuting phase, reduction of the vascular lesions occurs;
diseased vessel undergoes vasoconstriction leading to a slow
progressive regression. Propanolol, a non-selective inhibitor of
ß(1)- and ß(2)-adrenoceptor, is known to show a good therapeutic
effect [8,9], likely due, at least in part, to its ability to induce such
vasoconstriction. In small babies vessel reduction occurring during
the IH involuting phase may give a significant reduction of the
vascular bed, relevant as compared to the body mass, with a
Figure 1. Representative image of IH at the proliferating phase (at month 6) and at regressing phase (at month 24).doi:10.1371/journal.pone.0088545.g001
Table 3. Correlation with age*.
Pediatric healthy population1 Pediatric IH population"
R* p R p
Red cells 0.2 n.s. 0.36 0.03
Hemoglobin 20.3 n.s. 0.54 0.003
HCT 20.2 n.s. 0.54 0.009
Neutrophils 0.09 n.s. 0.46 0.004
Lymphocytes 20.1 n.s. 20.47 0.004
MCP-1 n.a. 20.35 0.05
MIP-1ß n.a. 20.45 0.008
* Correlation index R according to Pearson analysis and p value.1Values from Mayo Medical Laboratories at http://www.mayomedicallaboratories.com/test-info/pediatric/refvalues/reference.php."Values from patients of the present study.n.s. : not significant; n.a. : not available.doi:10.1371/journal.pone.0088545.t003
Markers of Infantile Hemangioma Regression
PLOS ONE | www.plosone.org 5 March 2014 | Volume 9 | Issue 3 | e88545

consequent blood-concentration. This may explain to some extent
the observed strong and significant increase of red blood cells,
Hemoglobin and HCT as well as of Neutrophils %. However,
blood concentration may not explain other unchanged or
decreased hematological values. Interpretation of such data should
take into account the half life of different molecules and cells. Red
blood cells have 13 to 21 weeks life span [19,20], while platelets
last about 5 days [21]. Therefore blood cells content at a given
time depends on the complex interaction of blood volume, cells
half life and expression of chemokines with either pro- or anti-
proliferating/chemoattractant/activating features. Therefore re-
sponse latency to soluble factors may be very different for different
cells. PDGF-BB is one of the growth factors known to be directly
involved in the hemangioma onset and to inhibit hemangioma
involution [22] along with FGF-2, a known potent regulator of
endothelial cells and mast cells, both strongly involved in
hemangioma onset [23]. Our group has previously shown the
complex PDGF-BB/FGF-2 network being likely involved in the
angiogenesis balance [24–27]. Data reported in Table 3 indicate a
relevant (although not significant) variation of FGF-2 expression
(more than 2 fold increase) counteracted by strong but less relevant
change of PDGF-BB and VEGF, indicating a strong change of the
PDGF-BB/FGF-2/VEGF balance and of their angiogenic poten-
tial.
Chemokines in general, and MCP-1 in particular, are known to
control vessel distribution and branching points; their direct
targets such as monocytes and macrophages have been called
‘‘architects’’ of vessel development [28]. The strong and significant
decrease of serum MCP-1 and MIP-1ß was observed in IH
involuting samples, either in ANOVA age-grouped analysis
(Table 2) and in ungrouped samples (Table 3) and in ROC
analysis (Fig. 2). MCP-1 action may underlie the observed effects
on circulating cells. It is a chemoattractant molecule and
represents the main stimulus for macrophage chemotaxis. MCP-
1 activates monocytes, T cells and basophils [29] and belongs to
the MCP (Monocyte Chemoattractant Proteins) family, a CC
chemokine family, signalling via the CCR2 receptor. MCP-1
Figure 3. Cartoon summarizing the parameters characterizingIH regression.doi:10.1371/journal.pone.0088545.g003
Figure 2. ROC analysis indicating that red blood cells, Hemoglobin, HCT, MCP-1 and MIP-1ß values significantly discriminateproliferating-IH samples (age#12 months) from regressing -IH samples (.12 months age).doi:10.1371/journal.pone.0088545.g002
Markers of Infantile Hemangioma Regression
PLOS ONE | www.plosone.org 6 March 2014 | Volume 9 | Issue 3 | e88545

mRNA has been previously shown to be elevated in hemangioma
tissues [30] and related to hemangioma onset [31]. Gordillo et al
[31] carried out in vitro studies onto mouse EOMA endothelial
cells, relating the endothelial response to their redox state. More
recently Greenberger and colleagues [32] showed that MCP-1 is
differentially expressed in proliferating vs regressed tissue IH
specimens, by RT-qPCR, suggesting a role of NF-kB and VEGF-
A in the IH pathogenesis. MCP-1 mRNA was found to be clearly
reduced in 3 cases of involuting IH as compared to 6 proliferating
cases. As compared to such previous data, our study is carried out
on a larger sample size, reports a serum reduction of MCP-1,
rather than a mRNA tissue reduction, and evidences the reduction
at an earlier stage (mean age of the regressing IH in the present
study is 34 months, vs 40 months mean age in the Greenberger
study), supporting the conclusion that MCP-1 may represent a
relevant early non invasive marker of regression. Given the
observed spontaneous early modification and the known function-
al features of MCP-1, we hypothesize that MCP-1 besides a
marker of regression, may also represent a potential therapeutic
target to induce IH regression and control of vascular growth in
other more serious angiogenic disorders. Anthocyanins antioxi-
dant molecules such as OptiBerry have been shown [33] to exert
clear anti-hemangioma effects and to reduce MCP-1 levels, further
supporting the potential role of MCP-1 and the hypothesis that the
redox state may represent a key mechanism controlling IH
regression. Early molecular indicators of angiogenesis regression,
such as MCP-1 as shown in Fig. 2, may represent putative
therapeutic targets in other serious conditions showing deregulated
angiogenesis, such as diabetes. In fact, MCP-1 role in cardiovas-
cular diseases and diabetic retinopathy has been recently reviewed
[34] and blood levels such as glycaemia have been directly related
to pro-angiogenic features of circulating factors [35].
The other key factor found to be strongly changed in the present
study is the CC chemokine Macrophage inflammatory protein-1b(MIP-1b), the specific ligand of CCR5 receptor. It is chemoat-
tractant for monocytes and natural killer cells and induces
monocytes adhesion to endothelial cells in atherosclerosis
[36,37]. MIP-1ß is involved in the transendothelial migration of
in vitro cultured dendritic cells [38,39] and is known to maintain
the inflammatory/angiogenesis balance. Inflammation and angio-
genesis are under the control of several common molecular
mechanisms; inflammation can stimulate angiogenesis and, on the
other hand, may facilitate inflammation. Either mechanisms have
been shown to be involved in carcinogenesis. MIP-1ß is up-
regulated in blood vessel tumors and its contribution to endothelial
tumor initiation and/or progression has been indicated [40–42].
For instance MIP-1ß expression is known to characterize
hemangiosarcomas (a tumor with an endothelial origin) while it
is absent in urothelial carcinomas, i.e., an epithelial-origin tumor.
In fact, in hemangiosarcoma MIP-1ß expression correlates with
infiltrating leukocytes, tumor proliferation index and tumor
angiogenesis [43]. All together these studies may confirm the
hypothesis coming from the present study, suggesting MIP-1ß as a
marker of IH regression and as key factor to control the
angiogenesis balance.
Strong and significant differences were identified within the
samples divided in three age-groups (#12 month age, 13 to 24
months and .24 age) (see Table 1 and Table 2). Such differences
were mostly confirmed when a correlation with the time as a
continuous variable was used (right hand side in Table 3). This
indicates that such parameters vary linearly with the age in IH
samples (all showing spontaneous regression with time), while the
same parameters do not show any correlation with age in healthy
samples taken form the literature (left hand side in Table 3).
Finally, ROC analysis mostly confirmed these parameters as
effective values to discriminate early (proliferating) IH from late
(regressing) IH, indicating a potential diagnostic/prognostic
application of such measures.
In the present study we show for the first time i) the significant
change of several blood parameters as early serum indicators of IH
regression and ii) potentially useful signs to monitor vascular
growth occurring in other diseases such as solid tumors and
diabetic retinopathy.
Supporting Information
Table S1 Clinical characteristics of the samples understudy.
(DOC)
Acknowledgments
The authors are grateful to the Proteomic Facility for Complex Protein
Mixture (CPM) Analysis and the Telethon Proteomics Service at Istituto
Superiore di Sanita, Rome, and for the AIRC-FIRC support.
Author Contributions
Conceived and designed the experiments: DD EMN FF AF. Performed the
experiments: DD EMN SR. Analyzed the data: DD CG FF AF.
Contributed reagents/materials/analysis tools: EMN SR CG FF. Wrote
the paper: DD EMN FF AF.
References
1. Carmeliet P, Jain RK (2011) Principles and mechanisms of vessel normalization
for cancer and other angiogenic diseases. Nat Rev Drug Discov 10: 417–427.
2. Holland KE, Drolet BA (2013) Approach to the patient with an infantile
hemangioma. Dermatol Clin 31: 289–301.
3. Bruckner AL, Frieden IJ (2005) Infantile hemangiomas. J Am Acad Dermatol
2006, 55: 671–682.
4. Krol A, MacArthur CJ (2005) Congenital hemangiomas: rapidly involuting and
noninvoluting congenital hemangiomas. Arch Facial Plas Surg 7: 307–311.
5. Chiller KG, Passaro D, Frieden IJ (2002) Hemangiomas of infancy: clinical
characteristics, morphologic subtypes, and their relationship to race, ethnicity,
and sex. Arch Dermatol 138: 1567–1576.
6. Ritter MR, Butschek RA, Friedlander M, Friedlander SF (2007) Pathogenesis of
infantile haemangioma: new molecular and cellular insights. Expert Rev Mol
Med 9: 1–19.
7. Mulliken JB, Glowacki J (1982) Hemangiomas and vascular malformations in
infants and children: a classification based on endothelial characteristics. Plast
Reconstr Surg 69: 412–422.
8. Kleiman A, Keats EC, Chan NG, Khan ZA (2012) Evolution of hemangioma
endothelium. Exp Mol Pathol 93: 264–272.
9. Rossler J, Haubold M, Gilsbach R, Juttner E, Schmitt D, et al. (2013)
b1-Adrenoceptor mRNA level reveals distinctions between infantile hemangi-
oma and vascular malformations. Pediatr Res 73: 409–413.
10. Khan ZA, Boscolo E, Picard A, Psutka S, Melero-Martin JM, et al. (2008)
Multipotential stem cells recapitulate human infantile hemangioma in
immunodeficient mice. J Clin Invest 118: 2592–2599.
11. North PE, Waner M, James CA, Mizeracki A, Frieden IJ, et al. (2001)
Congenital nonprogressivehemangioma: a distinct clinicopathologic entity unlike
infantile hemangioma. Arch Dermatol 137:1607–1620.
12. North PE, Waner M, Mizeracki A, Mihm Jr MC (2000) GLUT1: a newly
discovered immunohistochemical marker for juvenile hemangiomas. Hum
Pathol 31:11–22.
13. Chang LC, Haggstrom AN, Drolet BA, Baselga E, Chamlin SL, et al. (2008)
Growth characteristics of infantile hemangiomas: implications for management.
Pediatrics 122: 360–367.
14. Haggstrom AN, Drolet BA, Baselga E, Chamlin SL, Garzon MC, et al. (2006)
Prospective study of infantile hemangiomas: clinical characteristics predicting
complications and treatment. Pediatrics 118: 882–887.
15. Nguyen J, Fay A (2009) Pharmacologic therapy for periocular infantile
hemangiomas: a review of the literature. Semin Ophthalmol 24: 178–184.
Markers of Infantile Hemangioma Regression
PLOS ONE | www.plosone.org 7 March 2014 | Volume 9 | Issue 3 | e88545
16. Pozzetto U, Abeni D, Citterio F, Castagneto M, Capogrossi MC, et al. (2008)
Balance of transforming growth factor-beta1 and platelet-derived growth factor-BB is associated with kidney allograft rejection. Ann Clin Biochem 45:213–214.
17. Verdoliva V, Senatore C, Polci ML, Rossi S, Cordella M, et al. (2013)
Differential denaturation of serum proteome reveals a significant amount ofhidden information in complex mixtures of proteins. PLoS One 8:e57104.
18. Cappuzzello C, Di Vito L, Melchionna R, Melillo G, Silvestri L, et al. (2011)Increase of plasma IL-9 and decrease of plasma IL-5, IL-7, and IFN-c in patients
with chronic heart failure. J Transl Med 9:28.
19. Landaw SA (1991) Homeostasis, survival, and red cell kinetics: measurementand imaging of red cell production. In: Hoffman R, Benz EJ, Shattil SJ, Furie B,
Cohen HJ editors. Hematology: basic principles and practice. New York, NY:Churchill Livingston. pp.274–290.
20. Quinlivan EP (2008) Calculation of steady state conditions and eliminationkinetics of red blood cell folate in women of childbearing age after daily
supplementation with various forms and doses of folate. Am J Clin Nutr 87:
1537–1538.21. Fritz E, Ludwig H, Scheithauer W, Sinzinger H (1986) Shortened platelet half-
life in multiple myeloma. Blood 68: 514–520.22. Roach EE, Chakrabarti R, Park NI, Keats EC, Yip J, et al. (2012) Intrinsic
regulation of hemangioma involution by platelet-derived growth factor. Cell
Death Dis, 3: e328.23. Tan ST, Wallis RA, He Y, Davis PF (2004) Mast cells and hemangioma. Plast
Reconstr Surg 113: 999–1011.24. Faraone D, Aguzzi MS, Ragone G, Russo K, Capogrossi MC, et al. (2006)
Heterodimerization of FGF-receptor 1 and PDGF-receptor-alpha: a novelmechanism underlying the inhibitory effect of PDGF-BB on FGF-2 in human
cells. Blood 107: 1896–1902.
25. Faraone D, Aguzzi MS, Toietta G, Facchiano AM, Facchiano F, et al. (2009)Platelet Derived Growth Factor-Receptor alpha strongly inhibits melanoma
growth in vitro and in vivo. Neoplasia 11: 732–742.26. Aguzzi MS, Faraone D, D’Arcangelo D, De Marchis F, Toietta G, et al. (2011)
The FGF-2-derived peptide FREG inhibits melanoma growth in vitro and in
vivo. Mol Ther 19: 266–273.27. Russo K, Ragone R, Facchiano AM, Capogrossi MC, Facchiano A (2002)
Platelet-derived Growth Factor -BB and basic Fibroblast Growth Factor directlyinteract in vitro with high affinity. J Biol Chem 277: 1284–1291.
28. Anghelina M, Krishnan P, Moldovan L, Moldovan NI (2004) Monocytes andmacrophages form branched cell columns in matrigel: implications for a role in
neovascularization. Stem Cells Dev 13: 665–676.
29. Deshmane SL, Kremlev S, Amini S, Sawaya BE (2009) Monocyte chemoat-tractant protein-1 (MCP-1): an overview. J Interferon Cytokine Res 29: 313–
326.
30. Isik FF, Rand RP, Gruss JS, Benjamin D, Alpers CE (1996) Monocyte
chemoattractant protein-1 mRNA expression in hemangiomas and vascular
malformations. J Surg Res 61: 71–76.
31. Gordillo GM, Atalay M, Roy S, Sen CK (2002) Hemangioma model for in vivo
angiogenesis: inducible oxidative stress and MCP-1 expression in EOMA cells.
Methods Enzymol, 352: 422–432.
32. Greenberger S, Adini I, Boscolo E, Mulliken JB, Bischoff J (2010) Targeting NF-
kB in infantile hemangioma-derived stem cells reduces VEGF-A expression.
Angiogenesis 13: 327–335.
33. Zafra-Stone S, Yasmin T, Bagchi M, Chatterjee A, Vinson JA, et al. (2007)
Berry anthocyanins as novel antioxidants in human health and disease
prevention. Mol Nutr Food Res 51: 675–683.
34. Panee J (2012) Monocyte Chemoattractant Protein 1 (MCP-1) in obesity and
diabetes. Cytokine 60: 1–12.
35. Facchiano F, D’Arcangelo D, Russo K, Fogliano V, Mennella C, et al. (2006)
Glycated-FGF-2 is quickly produced in vitro upon low-millimolar glucose
treatment and detected in vivo in diabetic mice. Mol Endocrinol 20: 2806–2818.
36. Tatara Y, Ohishi M, Yamamoto K, Shiota A, Hayashi N, et al. (2009)
Macrophage inflammatory protein-1beta induced cell adhesion with increased
intracellular reactive oxygen species. J Mol Cell Cardiol 47: 104–111.
37. Gonsalves C, Kalra VK (2010) Endothelin-1-induced macrophage inflammatory
protein-1beta expression in monocytic cells involves hypoxia-inducible factor-
1alpha and AP-1 and is negatively regulated by microRNA-195. J Immunol 185:
6253–6264.
38. D’Amico G, Bianchi G, Bernasconi S, Bersani L, Piemonti L, et al. (1998)
Adhesion, transendothelial migration, and reverse transmigration of in vitro
cultured dendritic cells. Blood 92: 207–214.
39. Bianchi G, D’Amico G, Varone L, Sozzani S, Mantovani A, et al. (2000) In vitro
studies on the trafficking of dendritic cells through endothelial cells and extra-
cellular matrix. Dev Immunol 7: 143–153.
40. Hammerling GJ, Ganss R (2006) Vascular integration of endothelial progenitors
during multistep tumor progression. Cell Cycle 5: 509–511.
41. Horuk R (2001) Chemokine receptors. Cytokine Growth Factor Rev 12: 313–
335.
42. Spring H, Schuler T, Arnold B, Hammerling GJ, Ganss R (2005) Chemokines
direct endothelial progenitors into tumor neovessels. Proc Natl Acad Sci USA
102:18111–18116.
43. Carvalho T, Elias AP, Nunes T, Peleteiro MC, Dias S (2008) Chemo-angiogenic
profile of bovine urinary bladder tumors distinguishes urothelial carcinomas
from hemangiosarcomas. Vet Immunol Immunopathol 121: 344–358.
Markers of Infantile Hemangioma Regression
PLOS ONE | www.plosone.org 8 March 2014 | Volume 9 | Issue 3 | e88545