
Identification of Novel miR-21 Target Proteins in Multiple ...
13
Identification of Novel miR-21 Target Proteins in Multiple Myeloma Cells by Quantitative Proteomics Qian Xiong, †,⊥ Qiu Zhong, ‡,⊥ Jia Zhang, †,§ Mingkun Yang, † Chongyang Li, † Peng Zheng, † Li-Jun Bi,* ,§ and Feng Ge* ,† † Institute of Hydrobiology, Chinese Academy of Sciences, Wuhan, 430072, China ‡ IBP-ARI Joint Center for Research on Tuberculosis, Antituberculosis Research Institute of Guangdong Province, Guangzhou 510630, China § Key Laboratory of Non-coding RNA, Institute of Biophysics, Chinese Academy of Sciences, Beijing 100101, China * S Supporting Information ABSTRACT: Substantial evidence indicates that microRNA- 21 (miR-21) is a key oncomiR in carcinogenesis and is significantly elevated in multiple myeloma (MM). In this study, we explored the role of miR-21 in human MM cells and searched for miR-21 targets. By knocking down the expression of endogenous miR-21 in U266 myeloma cells, we observed reduced growth, an arrested cell cycle, and increased apoptosis. To further understand its molecular mechanism in the pathogenesis of MM, we employed a SILAC (stable isotope labeling by amino acids in cell culture)-based quantitative proteomic strategy to systematically identify potential targets of miR-21. In total, we found that the expression of 178 proteins was up-regulated significantly by miR-21 inhibition, implying that they could be potential targets of miR-21. Among these, the protein inhibitor of activated STAT3 (PIAS3) was confirmed as a direct miR-21 target by Western blotting and reporter gene assays. We further demonstrated that miR-21 enhances the STAT3-dependent signal pathway by inhibiting the function of PIAS3 and that down-regulation of PIAS3 contributes to the oncogenic function of miR-21. This elucidation of the role of PIAS3 in the miR-21-STAT3 positive regulatory loop not only may shed light on the molecular basis of the biological effects of miR-21 observed in MM cells but also has direct implications for the development of novel anti-MM therapeutic strategies. KEYWORDS: microRNA-21 (miR-21), multiple myeloma (MM), stable isotope labeling by amino acids in cell culture (SILAC), signal transducer and activator of transcription 3 (STAT3), protein inhibitor of activated STAT3 (PIAS3) ■ INTRODUCTION Multiple myeloma (MM) is a clonal B-cell malignancy characterized by the accumulation of terminally differentiated, antibody-producing plasma cells in the bone marrow 1 and is the leading cause of death in hematologic malignancies. 2 Its incidence varies globally from 1 per 100000 people in China to about 4 per 100000 people in most developed countries. 1,2 Despite advances in understanding the molecular pathogenesis of MM and promising new therapies, MM remains incurable and the majority of patients eventually succumb to their cancer. 3 Current models assume that MM evolves through a multistep transformation process and accumulation of genetic and epigenetic alterations. Deregulation of hundreds of genes and multiple signaling pathways leads to MM pathogenesis and disease progression. As many of these genes and signaling pathways are regulated by microRNAs (miRNAs), miRNAs either as tumor suppressors or oncogenes play an important role in the progression and pathogenesis of MM. 4 miRNAs are small, noncoding RNAs of 19−25 nucleotides in length found in diverse organisms. 5 miRNAs act as negative regulators of gene expression by binding to the 3′-untranslated region (UTR) of their target mRNAs with partial or full sequence complementarity, thereby leading to mRNA transla- tional inhibition or degradation. 6 To date, 1424 human miRNAs have so far been identified (http://www.mirbase.org, miRBase v.17.0) and are predicted to regulate the expression of around 60% of all human protein-encoding genes. 7 By silencing various target mRNAs, miRNAs have key roles in diverse regulatory pathways, including control of development, cell differentiation, apoptosis, cell proliferation, and protein secretion. 8−11 Importantly, miRNAs have been reported to play crucial roles in the pathogenesis of MM. 12−14 miR-21 is an oncogenic miRNA that is overexpressed in MM cells 4 and Received: June 1, 2011 Published: February 8, 2012 Article pubs.acs.org/jpr © 2012 American Chemical Society 2078 dx.doi.org/10.1021/pr201079y | J. Proteome Res. 2012, 11, 2078−2090
-
Upload
khangminh22 -
Category
Documents
-
view
4 -
download
0
Transcript of Identification of Novel miR-21 Target Proteins in Multiple ...

Identification of Novel miR-21 Target Proteins in Multiple MyelomaCells by Quantitative ProteomicsQian Xiong,†,⊥ Qiu Zhong,‡,⊥ Jia Zhang,†,§ Mingkun Yang,† Chongyang Li,† Peng Zheng,† Li-Jun Bi,*,§
and Feng Ge*,†
†Institute of Hydrobiology, Chinese Academy of Sciences, Wuhan, 430072, China‡IBP-ARI Joint Center for Research on Tuberculosis, Antituberculosis Research Institute of Guangdong Province, Guangzhou510630, China§Key Laboratory of Non-coding RNA, Institute of Biophysics, Chinese Academy of Sciences, Beijing 100101, China
*S Supporting Information
ABSTRACT: Substantial evidence indicates that microRNA-21 (miR-21) is a key oncomiR in carcinogenesis and issignificantly elevated in multiple myeloma (MM). In thisstudy, we explored the role of miR-21 in human MM cells andsearched for miR-21 targets. By knocking down the expressionof endogenous miR-21 in U266 myeloma cells, we observedreduced growth, an arrested cell cycle, and increased apoptosis.To further understand its molecular mechanism in thepathogenesis of MM, we employed a SILAC (stable isotopelabeling by amino acids in cell culture)-based quantitativeproteomic strategy to systematically identify potential targetsof miR-21. In total, we found that the expression of 178proteins was up-regulated significantly by miR-21 inhibition, implying that they could be potential targets of miR-21. Amongthese, the protein inhibitor of activated STAT3 (PIAS3) was confirmed as a direct miR-21 target by Western blotting andreporter gene assays. We further demonstrated that miR-21 enhances the STAT3-dependent signal pathway by inhibiting thefunction of PIAS3 and that down-regulation of PIAS3 contributes to the oncogenic function of miR-21. This elucidation of therole of PIAS3 in the miR-21-STAT3 positive regulatory loop not only may shed light on the molecular basis of the biologicaleffects of miR-21 observed in MM cells but also has direct implications for the development of novel anti-MM therapeuticstrategies.
KEYWORDS: microRNA-21 (miR-21), multiple myeloma (MM), stable isotope labeling by amino acids in cell culture (SILAC),signal transducer and activator of transcription 3 (STAT3), protein inhibitor of activated STAT3 (PIAS3)
■ INTRODUCTIONMultiple myeloma (MM) is a clonal B-cell malignancycharacterized by the accumulation of terminally differentiated,antibody-producing plasma cells in the bone marrow1 and is theleading cause of death in hematologic malignancies.2 Itsincidence varies globally from 1 per 100000 people in Chinato about 4 per 100000 people in most developed countries.1,2
Despite advances in understanding the molecular pathogenesisof MM and promising new therapies, MM remains incurableand the majority of patients eventually succumb to theircancer.3 Current models assume that MM evolves through amultistep transformation process and accumulation of geneticand epigenetic alterations. Deregulation of hundreds of genesand multiple signaling pathways leads to MM pathogenesis anddisease progression. As many of these genes and signalingpathways are regulated by microRNAs (miRNAs), miRNAseither as tumor suppressors or oncogenes play an importantrole in the progression and pathogenesis of MM.4
miRNAs are small, noncoding RNAs of 19−25 nucleotides inlength found in diverse organisms.5 miRNAs act as negativeregulators of gene expression by binding to the 3′-untranslatedregion (UTR) of their target mRNAs with partial or fullsequence complementarity, thereby leading to mRNA transla-tional inhibition or degradation.6 To date, 1424 humanmiRNAs have so far been identified (http://www.mirbase.org,miRBase v.17.0) and are predicted to regulate the expression ofaround 60% of all human protein-encoding genes.7 By silencingvarious target mRNAs, miRNAs have key roles in diverseregulatory pathways, including control of development, celldifferentiation, apoptosis, cell proliferation, and proteinsecretion.8−11 Importantly, miRNAs have been reported toplay crucial roles in the pathogenesis of MM.12−14 miR-21 is anoncogenic miRNA that is overexpressed in MM cells4 and
Received: June 1, 2011Published: February 8, 2012
Article
pubs.acs.org/jpr
© 2012 American Chemical Society 2078 dx.doi.org/10.1021/pr201079y | J. Proteome Res. 2012, 11, 2078−2090

whose elevation significantly promotes survival of multiplemyeloma.15
miR-21 is a unique miRNA in that it is overexpressed in thevast majority of cancer types analyzed so far16 and has thusbeen recognized as an oncomiR.17 Inhibition of miR-21 wasshown to cause decreased cell growth in vitro and decreasedtumor growth in a xenograft mouse model,18 increasedapoptosis and reduced invasiveness in glioblastoma,19 andreduced cell proliferation, migration and tumor growth inbreast cancer.20 Recently, Medina et al. showed that over-expression of miR-21 leads to a pre-B malignant lymphoid-likephenotype and that inhibiting miR-21 alone induces completetumor regression in a few days, demonstrating that miR-21 is acentral oncomiR in tumor formation.21
miR-21 is clearly an important miRNA and there areemerging data on the role of miR-21 in many malignancies,including MM. In this study, we show that miR-21 inhibitioncauses increased apoptosis, reduced growth and an arrested cellcycle in human MM U266 cells. To further understand itsmolecular mechanism in the pathogenesis of MM, we carriedout global proteomic profiling to identify targets of miR-21 inU266 cells. Using SILAC-based quantitative mass spectrometrywe found that the expression of 178 out of 1498 proteinsinvestigated was up-regulated by miR-21 inhibition. Thepredicted miR-21 targets (based on three different algorithms:miRBase,22 TargetScan23 and PicTar24) were highly enrichedamong the 178 up-regulated proteins. Using luciferase assays,we demonstrated that PIAS3 and PCBP1 identified from theproteomic screen are direct targets of miR-21 and that PIAS3contributes to various phenotypic effects observed after miR-21inhibition.
■ EXPERIMENTAL PROCEDURESCell Culture and Transfection
The human myeloma cell line U266 was purchased fromAmerican Type Culture Collections (Rockville, MD). U266cells were cultured in RPMI 1640 supplemented with 1%penicillin/streptomycin, 1 mmol/L L-glutamine, and 10% fetalbovine serum at 37 °C, 5% CO2 in air. For miR-21 inhibition,Locked nucleic acid (LNA)-modified anti-miR-21 oligonucleo-tides (designated as LNA-21) and negative control oligos(designated as LNA-cont) were purchased from Exiqon(Vedbaek, Denmark). For miR-21 enhancement, a miRIDIANmicroRNA Mimic for miR-21 (designated as MIM-21) and anegative control (designated as MIM-cont) were purchasedfrom Dharmacon (Chicago, IL). Transfection with 100 nMMIM-21/MIM-cont or LNA-21/LNA-cont was performedusing Nucleofector X005 (Amaxa, Cologne, Germany),according to an optimized protocol for the U266B1 cell line(http://www.lonzabio.com/fileadmin/groups/marketing/Downloads/Protocols/Generated/Optimized_Protocol_121.pdf). miRNA expression was verified after 72 h by quantitativereal-time PCR (qRT-PCR) as described below.
RNA Extraction and qRT-PCR
Total RNA was extracted from cultured cells using TrizolReagent (Invitrogen) according to the manufacturer’s protocol.Reverse transcription was performed according to the protocolof the Improm-II Reverse Transcriptase System (Promega).qPCR was performed as described in the SYBR premix Ex Taqinstructions (TaKaRa, Dalian, China) with an ABI Prism 7000System (Applied Biosystems, Foster City, CA). GAPDHmRNA levels were used for normalization. For detection of
miRNAs, miRNA was first isolated with an Ambion mirVanamiRNA isolation kit (Ambion). A Nanodrop 2000 spectropho-tometer (Thermo Scientific, Wilmington, DE) was used todetect the concentration of total miRNA. Quantitative analysisof miR-21 expression was assayed using a Hairpin-it miRNAreal-time PCR Quantitation Kit (GenePharma, Shanghai,China). Each sample was analyzed in triplicate. U6 snRNAwas used for normalization. The oligonucleotides used asprimers were: miR-21-RT: 5 ′-GTCGTATCCAGTG-CAGGGTCCGA GGTATTCGCACTGGATACGACTCAA-CA-3 ′ , m iR -21 -F : 5 ′ -GCCGCTAGCTTATCAGACTGATGT-3′, miR-21-R: 5′-GTGCAGGGTCCGAGGT-3′;U6-RT: 5 ′-GTCGTATCCAGTG CAGGGTCCGAGG-TATTCGCACTGGATACGACAAAAATATG-3′, U6−F: 5′-G CGCGT CGTGAAGCGTTC - 3 ′ , U 6 - R : 5 ′ -GTGCAGGGTCCGAGGT-3′; PIAS3-F: 5′-GCCGACATG G A C G T G T C C T G T G - 3 ′ , P I A S 3 - R : 5 ′ -TTCCCTCCTGGACTGCGCTGTAC-3 ′; CUL2-F: 5′-GTTCGTATCATGAAAGCACGAAAA-3′, CUL2-R: 5′-TTAAACCTAGCTCTTGACTG GCTAATC-3′; PCBP1-F:5 ′-CAGAGGTGAAAGGCTATTGG-3 ′ , PCBP1-R: 5 ′-GGCAGCA GAGCCAGTGATAG-3′; GAPDH-F: 5′-CCACC-CATGGCAAATTCCATGGCA-3′, GAPDH -R: 5′-TCTA-GACGGCAGGTCAGGTCCACC-3′; and CAPN2-F: 5′-GATTCATCCAGAAC GTGTAGG-3 ′ , CAPN2-R: 5 ′-GGTTAAACACTGGAGCGTGTC-3′.
Cell Growth Assay
A Cell Counting Kit-8 (Dojindo Laboratories, Japan) was usedto determine the viability of cells. In brief, cells were plated in96-well plates at a density of one thousand cells per well. Thecell proliferation reagent WST-8 (10 μL) was added to eachwell and cells were incubated for 3 h at 37 °C. Viable cellnumbers were estimated by measuring the optical density(OD) at 450 nm. Absorbance of untreated U266 cells was setas 100% viability, and absorbance of cell-free wells containingmedium was set as zero.
Detection of Apoptosis
Apoptosis was detected using Annexin V/PI (propidiumiodide) staining. In brief, cells (1 × 10⁶) were washed oncein phosphate-buffered saline (PBS) and then stained withAnnexin V-FITC and PI (2 mg/mL) (Biovision). Samples wereacquired on a FACScan flow cytometer (Becton Dickinson, SanJose, CA) and analyzed with the WinMDI 2.8 softwareprogram.
Cell Cycle Analysis
Cells were harvested, washed with ice-cold PBS, fixed with 70%ethanol for 1 h at 4 °C, and pretreated with RNase(Worthington, Lakewood, NJ) for 30 min at 37 °C. Cellswere stained with PI (Sigma Chemicals, St. Louis, MO), and acell cycle profile was determined using a FACScan flowcytometer (Becton Dickinson). For each sample, 20000 eventswere acquired, and cell cycle distributions were determinedusing cell cycle analysis software (Modfit). Experiments wereperformed in triplicate. Results are presented as the percentageof cells in a particular phase.
SILAC Labeling
U266 cells were grown in SILAC RPMI 1640 Medium (PierceBiotechnology, Rockford, IL) containing 10% v/v dialyzed FBS,and either 0.1 mg/mL heavy [13C6] or light [12C6] L-lysine(Pierce Biotechnology). Cells were propagated in SILACmedium for more than six generations to ensure nearly 100%
Journal of Proteome Research Article
dx.doi.org/10.1021/pr201079y | J. Proteome Res. 2012, 11, 2078−20902079
incorporation of labeled amino acids. “Heavy” labeled cellswere transfected with 100 nM LNA-21 using a NucleofectorX005 (Amaxa, Cologne, Germany), according to an optimizedprotocol for the U266B1 cell line. “Light” labeled U266 cellswere transfected with 100 nM negative control LNA-cont. After72 h, cells were washed three times with ice-cold washing buffer(10 μM Tris−HCl, 250 μM sucrose, pH 7.0), transferred to aclean 1.5 mL eppendorf tube and lysed with RIPA lysis buffer(50 mM Tris-HCl, 150 mM NaCl, 0.1% SDS, 1% NP-40, 0.5%sodium deoxycholate, 1 mM PMSF, 100 mM leupeptin, and 2mg/mL aprotinin, pH 8.0). Cellular debris was removed bycentrifugation for 30 min at 13200× g, 4 °C. Proteinconcentrations were measured in duplicate using the RC DCprotein assay (BioRad, Hercules, CA) and confirmed by SDS-PAGE.
Protein Separation and In-gel Digestion
The “light” and “heavy” lysates were mixed in a 1:1 ratio basedon protein weight (50 μg of each), boiled in SDS-PAGE samplebuffer, separated by 10% SDS-PAGE and stained withCoomassie Brilliant Blue (CBB). The entire gel lane was cutinto 50 sections for in-gel tryptic digestion. Excised sectionswere chopped into small pieces, washed in water andcompletely destained using 100 mM ammonium bicarbonatein 50% ACN. A reduction step was performed by adding 100μL 10 mM DTT at 37 °C for 3 h. Proteins were alkylated byadding 100 μL 50 mM iodoacetamide, and then were left in thedark at 20 °C to react for 30 min. The small gel pieces werefirst washed in water, then acetonitrile, and finally dried bySpeedVac for 30 min. Digestion was carried out using 20 μg/mL sequencing grade modified trypsin (Promega, Madison,WI) in 50 mM ammonium bicarbonate. Sufficient trypsinsolution was added to swell the gel pieces, which were kept at 4°C for 45 min and then incubated at 37 °C overnight. The gelswere extracted once with extraction buffer (67% acetonitrilecontaining 2.5% trifluoroacetic acid). The peptide extract andthe supernatant of the gel slice were combined and thencompletely dried in a SpeedVac centrifuge.
Protein Identification and Quantification
The dried peptides from each gel slice were reconstituted in 5%ACN/0.1% formic acid and analyzed with an Ultimate3000nano HPLC system (Dionex, Sunnyvale, CA) coupled to anLTQ Orbitrap mass spectrometer (Thermo Fisher Scientific)via a nanoelectrospray ion source (Proxeon Biosystems).Peptide mixtures from each gel slice were loaded at a flowrate of 30 μL/min in 95% buffer C (2% acetonitrile, 0.1%trifluoroacetic acid in HPLC grade water) and 5% buffer B(98% acetonitrile, 0.1% formic acid in HPLC grade water) ontoa PepMap100 trapping column (0.3 mm × 5 mm). After 5 min,peptides were eluted and separated on an LC Packings PepMapC18 column (3 μm, 0.075 × 150 mm) by a linear gradient from5% to 40% of buffer B in buffer A (2% acetonitrile and 0.1%formic acid) at a flow rate of 300 nL/min over 120 min. Theremaining peptides were eluted by a gradient from 40 to 100%buffer B over 5 min. The general mass spectrometricparameters were as follows: spray voltage, 1.8 kV; capillaryvoltage, 4 V; ion transfer tube temperature, 200 °C; tube lensvoltage, 100 V. Data-dependent acquisition was performed onLTQ-Orbitrap using Xcalibur 2.07 software (Thermo FisherScientific). Full scan MS spectra (m/z 300 to 2000; resolutionof 60000 at m/z 400) were acquired with the Orbitrap.Automatic gain control (AGC) was set to 5 × 10⁵ ions and amaximum fill time of 750 ms. After a brief survey scan, the six
most intense multiply charged ions were selected forfragmentation by low energy collision-induced dissociation(CID) in the linear ion trap, simultaneous with the completionof the MS scan in the Orbitrap. The AGC of the LTQ was setto 10000 ions and a maximum fill time of 150 ms.Fragmentation was carried out at a normalized collision energyof 35% with an activation q = 0.25 and an activation time of 30ms. The ion selection threshold was set to 5000. Fragmentationof previously selected precursor ions was dynamically excludedfor the following 45 s. The raw MS/MS data were searchedusing TurboSEQUEST (ThermoElectron, San Jose, CA)against a real and against a reverse IPI Human 3.47 database(each database including 72082 protein entries) to identifypeptides. The following search criteria were employed: fulltryptic specificity was required; two missed cleavages wereallowed; parent ion mass tolerance 20 ppm; fragment iontolerance 0.5 Da; Cys (+57.0215 Da, Carbamidomethylation)was set as a fixed modification, whereas Met (+15.9949 Da,Oxidation), and Lys (+6.0201 Da, SILAC heavy amino acid)were considered as variable modifications. SEQUEST criteriawere Xcorr ≥1.9 for [M + H]1+ ions, ≥ 2.4 for [M + 2H]2+
ions, and ≥3.5 for [M + 3H]3+ ions, and ΔCn ≥ 0.1 for theidentification of fully tryptic peptides. Using this combinationof filters, the protein false discovery rate was less than 1%. Ifpeptide charge and peptide sequence in the same group werethe same, we selected the peptide with the highest Xcorr value.Proteins matching at least two reliable unique peptides wereconsidered as positively identified proteins. All identifiedpeptides were subjected to relative quantification analysisusing the program Census.25 This program quantifies relativeabundances of light and heavy versions of precursor peptidesidentified by MS2 spectra. Only proteins with a minimum oftwo quantifiable peptides were included in our final data set.The protein ratios were calculated from the average of allquantified peptides.
Bioinformatic Analysis
Predicted miR-21 targets were identified using the algorithmsof miRBase,22 TargetScan23 and PicTar.24 Lists of predictedtargets from each prediction program were compared to lists ofup-regulated proteins. Enrichment of predicted targets wascalculated by comparing the proportion of predicted targetsamong the up-regulated proteins to predicted targets among allproteins identified in the SILAC experiments.mir-21-regulated proteins were classified based on the
PANTHER (protein analysis through evolutionary relation-ships) system (http://www.pantherdb.org), a unique resourcethat classifies genes and proteins by their functions.26 Someproteins were annotated manually based on literature searchesand closely related homologues.To determine if a given type of protein was overrepresented,
enrichment analysis of Gene Ontology (GO) terms27 andKyoto Encyclopedia of Genes and Genomes (KEGG) path-ways28 was performed using DAVID (Database for Annotation,Visualization and Integrated Discovery) 6.7 (http://david.abcc.ncifcrf.gov/).29,30 The default human proteome was used as thebackground list. The significance of enrichments was statisti-cally evaluated with a modified Fisher’s exact test (EASE score),and a p-value for each term was calculated by applying aBenjamini-Hochberg false discovery rate correction.29,30 ForGO term enrichments, the GO fat annotation available inDAVID was used. GO fat is a subset of the GO term set createdby filtering out the broadest ontology terms to not overlook
Journal of Proteome Research Article
dx.doi.org/10.1021/pr201079y | J. Proteome Res. 2012, 11, 2078−20902080

more specific ones. The enrichment of GO biological processterms was also analyzed using Cytoscape and its Plugin, theBiological Networks Gene Ontology tool (BiNGO) 2.3,31 usingthe complete GO term set and a hypergeometric statistical testwith Benjamini-Hochberg false discovery rate correction. TheGO slim generic assignment, the distribution of cellularcomponents, molecular functions and biological processes ofthe mir-21 regulated proteins were analyzed (Table 1).
Western Blotting
Protein extracts (30 μg) prepared with RIPA lysis buffer (50mM Tris-HCl, 150 mM NaCl, 0.1% SDS, 1% NP-40, 0.5%sodium deoxycholate, 1 mM PMSF, 100 mM leupeptin, and 2mg/mL aprotinin, pH 8.0) were resolved on a 10% SDS-PAGEgel, and transferred to an Immobilon-P PVDF transfermembrane (Millipore, Bedford, MA) by electroblotting. Afterblocking with 5% nonfat milk, membranes were probed withrabbit anti-CUL2 polyclonal, mouse anti-CAPN2 monoclonal(Santa Cruz Biotechnology, Santa Cruz, CA), mouse anti-PIAS3 monoclonal, rabbit anti-PCBP1 polyclonal, rabbit anti-ACTIN polyclonal (Abcam, Cambridge, MA), rabbit anti-STAT3-pY705 polyclonal, and rabbit anti-STAT3 polyclonalantibodies (Cell Signaling, Danvers, MA). Blots were thenincubated with peroxidase-conjugated antimouse or antirabbitIgG (KPL, Gaithersburg, MD) for 1 h at room temperature at a1:1000 dilution and then developed using a SuperSignal WestPico kit (Pierce Biotechnology, Rockford, IL). Immunoblotswere scanned using an Image Scanner (GE healthcare, Uppsala,Sweden). Blot densitometry analysis was performed usingImageJ (National Institutes of Health).
Luciferase Assays
For reporter gene assays, the 3′-UTR fragments of CUL2,CAPN2, PCBP1 and PIAS3 were PCR-amplified from U266total cDNA and cloned into a pGL3-control vector (Promega,Madison, WI) at the BglII restriction site and designated aspGL3-CUL2-WT, pGL3-CAPN2-WT, pGL3-PCBP1-WT andpGL3-PIAS3-WT, respectively. Mutated plasmids pGL3-PIAS3-Mut (the UAAGCU sequence in the complementarysite for the seed region of miR-21 was mutated to UCCUAU),pGL3-PCBP1-Mut (AUAAGCU to AGCCUAU), pGL3-CAPN2-Mut (UAAGCU to UCCUAU) and pGL3-CUL2-Mut (GAUAAC to GCGCCC) were generated from pGL3-PIAS3-WT, pGL3-PCBP1-WT, pGL3-CAPN2-WT and pGL3-CUL2-WT, respectively, using a QuikChange kit (Stratagene,La Jolla, CA). Mutations are underlined. All pGL3 constructswere confirmed by DNA sequence analysis. pGL3 constructsand the Renilla luciferase plasmid phRL-SV40 (Promega) werecotransfected with 100 nM LNA-21 oligo or control LNA-contoligo using a Nucleofector X005 (Amaxa). 48 h aftertransfection, luciferase assays were performed using a dualluciferase reporter assay system (Promega). Firefly luciferaseactivity was normalized to Renilla luciferase activity for eachtransfected well. Values from LNA-21 oligos were normalizedto control LNA-cont oligos. P-values were calculated using two-tailed t-tests to compare relative luciferase activities for eachconstruct.
siRNA Transfection
For PIAS3 gene silencing, an siRNA duplex (designated as si-PIAS3) targeted against PIAS3 (sense, 5′-GGAGCCAAAUGU-GAUUAUAUU-3′; antisense, 5′-UAUAAUC ACAUUUGG-CUCCUU-3′) and a negative control (designated as si-cont)siRNA duplex (sense, 5′-UUCUCCGAACGUGUCACGUTT-3′; antisense, 5′-ACGUGACAC GUUCGGAGAATT-3′) werepurchased from Shanghai GenePharma Co. (Shanghai, China).Transfection with 100 nM si-PIAS3 or si-cont was performedusinga Nucleofector X005 (Amaxa) as described above. Cellswere collected 72 h later and PIAS3 gene knockdown wasassessed by Western blotting. STAT3 gene silencing wasachieved by transfecting U266 cells with pSiStrike/STAT3 orpSiStrike/control vectors as described earlier.32 Plasmidtransfection was performed using a Nucleofector X005(Amaxa). The resulting STAT3 knockdown and control celllines were designated as U266-KD and U266-NC, respectively.Stat3 gene knockdown was assessed by Western blotting. Cellviability and apoptosis were assessed as described above.
Plasmid Constructs and Transient Transfection
The human PIAS3 expression plasmid (pPIAS3) (Catalog No.:EX-P0028-M77) and blank plasmid (pVector) were purchasedfrom GeneCopoeia, Inc. (Germantown, MD). The PIAS3 andcontrol plasmids were expressed in U266 cells by transienttransfection using Nucleofector X005 as described above. Cellswere collected 72 h later and overexpression of PIAS3 wasconfirmed by Western blotting. Cell viability and apoptosiswere assessed as described above.
Confocal Fluorescence Microscopy
U266 cells were transfected with the LNA-21/cont oligo orMIM-21/cont as described above and grown on poly-L-lysine-treated glass coverslips. Cells were fixed 72 h after culture with4% paraformaldehyde and permeabilized by 0.1% Triton X-100.After washing briefly in PBS, slides were blocked with 1% BSAfor 1 h and then incubated with rabbit anti-STAT3 or anti-
Table 1. GO Terms Enriched in miR-21-Regulated Proteinsa
GO term description countb %c P-valued
GO:0006412 Translation 17 9.82 3.48 × 10⁻⁷
GO:0000723 Telomere maintenance 7 4.04 3.59 × 10⁻⁷
GO:0032200 Telomere organization 7 4.04 4.49 × 10⁻⁷
GO:0006417 Regulation oftranslation
10 5.78 1.30 × 10⁻⁵
GO:0046907 Intracellular transport 21 12.13 1.53 × 10⁻⁵
GO:0000166 Nucleotide binding 61 35.26 1.04 × 10⁻¹²
GO:0003723 RNA binding 31 17.91 1.03 × 10⁻¹⁰GO:0032553 Ribonucleotide binding 51 29.47 1.15 × 10⁻¹⁰
GO:0032555 Purine ribonucleotidebinding
51 29.47 1.15 × 10⁻¹⁰
GO:0017076 Purine nucleotidebinding
52 30.05 1.64 × 10⁻¹⁰
GO:0005829 Cytosol 39 22.54 3.97 × 10⁻⁹
GO:0043232 Intracellularnonmembrane-bounded organelle
54 31.21 1.73 × 10⁻⁷
GO:0043228 Nonmembrane-bounded organelle
54 31.21 1.73 × 10⁻⁷
GO:0070013 Intracellular organellelumen
40 23.12 2.82 × 10⁻⁶
GO:0043233 Organelle lumen 40 23.12 4.95 × 10⁻⁶
aTop 5 GO biological process, molecular function and cellularcomponent terms enriched in the miR-21-regulated proteins are listed.A complete list can be found in Table S3−S5, Supporting Information.bNumber of miR-21-regulated proteins. cPercentage of mappedproteins associated with each term. dStatistical significance of thedifference between the fraction of miR-21-regulated proteins assignedto this GO term and the fraction of all proteins within the humanprotein set assigned to this GO term.
Journal of Proteome Research Article
dx.doi.org/10.1021/pr201079y | J. Proteome Res. 2012, 11, 2078−20902081

STAT3-pY705 polyclonal and mouse anti-PIAS3 monoclonalantibodies at a dilution of 1:400. Cells were then washed threetimes with PBS and incubated with Cy5-conjugated goatantirabbit and rhodamine-conjugated goat antimouse IgGs(Pierce Biotechnology) at a dilution of 1:200 for 1 h. Afterwashing and mounting, cells were examined using a LSM 510laser scanning confocal microscope (Carl Zeiss, Jena,Germany). Images were taken with a 63× oil immersionobjective lense at identical settings.
STAT3 Luciferase Reporter Assay
STAT3 luciferase reporter assay was performed essentially asdescribed earlier.33 In brief, U266 cells were transfected withthe LNA-21 and/or pPIAS3 plasmids, a Stat3 firefly luciferasereporter plasmid pStat3-TA-luc (Clontech, Mountain View,CA) and a control Renilla luciferase reporter plasmid pRL-TK(Clontech) using a Nucleofector X005 (Amaxa). Luciferase
activity was determined 48 h after transfection using a Dual-Luciferase Reporter Assay kit (Promega, Madison, WI)according to the manufacturer’s protocol. Experiments wereperformed in triplicate. Luciferase values were normalized bytransfection efficiency as measured by β-galactosidase. All datarepresent mean values ± s.d. of three independent experiments.
■ RESULTS
Effects of miR-21 Inhibition on U266 Cell Growth, CellCycle and Apoptosis
miR-21 is overexpressed in many human cancers and has beenreported to be associated with multiple cancer-related processesincluding proliferation, apoptosis, invasion, and metastasis. Inaddition, other studies have shown that miR-21 is overex-pressed in multiple myeloma cells.4 To address the biologicalfunction of miR-21 in U266 cells, we used LNA-21 to
Figure 1. Effects of miR-21 inhibition on U266 cells. (A) miR-21 expression levels were significantly inhibited by more than 80% in LNA-21transfected U266 cells relative to LNA-cont transfected cells. Relative miR-21 expression levels were examined by qRT-PCR (mean ± S.D., *p <0.01). U6 snRNA was used as an internal standard. (B) Cell growth assays showed that miR-21 inhibition led to slower growth in U266 cells (mean± S.D., *p < 0.05). (C) Flow cytometry showed that miR-21 inhibition produced a G1-phase arrest in U266 cells. (D) miR-21 inhibition resulted ina marked increase in the number of apoptotic cells. X-axis, AnnexinV; Y-axis, PI staining. Cell percentages are quantified in each quadrant. (E)Quantification of apoptosis induced by miR-21 inhibition in U266 cells as determined by flow cytometry. Data are expressed as means ± SD ofapoptotic cells from at least three experiments, *p < 0.05.
Journal of Proteome Research Article
dx.doi.org/10.1021/pr201079y | J. Proteome Res. 2012, 11, 2078−20902082
downregulate miR-21. Optimal doses and time points fortransfection of LNA reagents were determined by evaluatingmiR-21 levels using qRT-PCR (data not shown). As shown inFigure 1A, transfection of LNA-21 reduced miR-21 levels morethan 80% in U266 cells, compared with cells transfected withnegative control LNA-cont or untreated cells. MiR-21inhibition significantly suppressed cell growth (Figure 1B)compared to untreated cells and those transfected with negativecontrol LNA-cont. After 72 h, 48.0% of LNA-transfected U266cells were in the G1 cell phase, 4.9% in G2 and 47.1% were inthe S phase. Cells in G1 phase were significantly increased (p <0.05). This demonstrates that miR-21 inhibition produced aG1-phase arrest in U266 cells (Figure 1C). We next examinedwhether miR-21 inhibition induced apoptosis in U266 cellsusing flow cytometry. Flow cytometry demonstrated thattransfection of U266 cells with LNA-21 for 72 h resulted in asignificant increase in the percentage of apoptotic cells,compared with cells transfected with negative control oruntreated cells (Figure 1D). Quantitative analysis indicated thatthe percentage of apoptotic cells in LNA-21-transfected cells(7.4 ± 1.2%) was significantly higher (p < 0.05; Figure 1E)than that of the negative control-transfected group (2.3 ±1.1%). These data demonstrate the tumorigenic properties ofmiR-21 in regulating cell growth, the cell cycle and apoptosis inmyeloma cells.
Identification of miR-21 Targets using a QuantitativeProteomic Approach
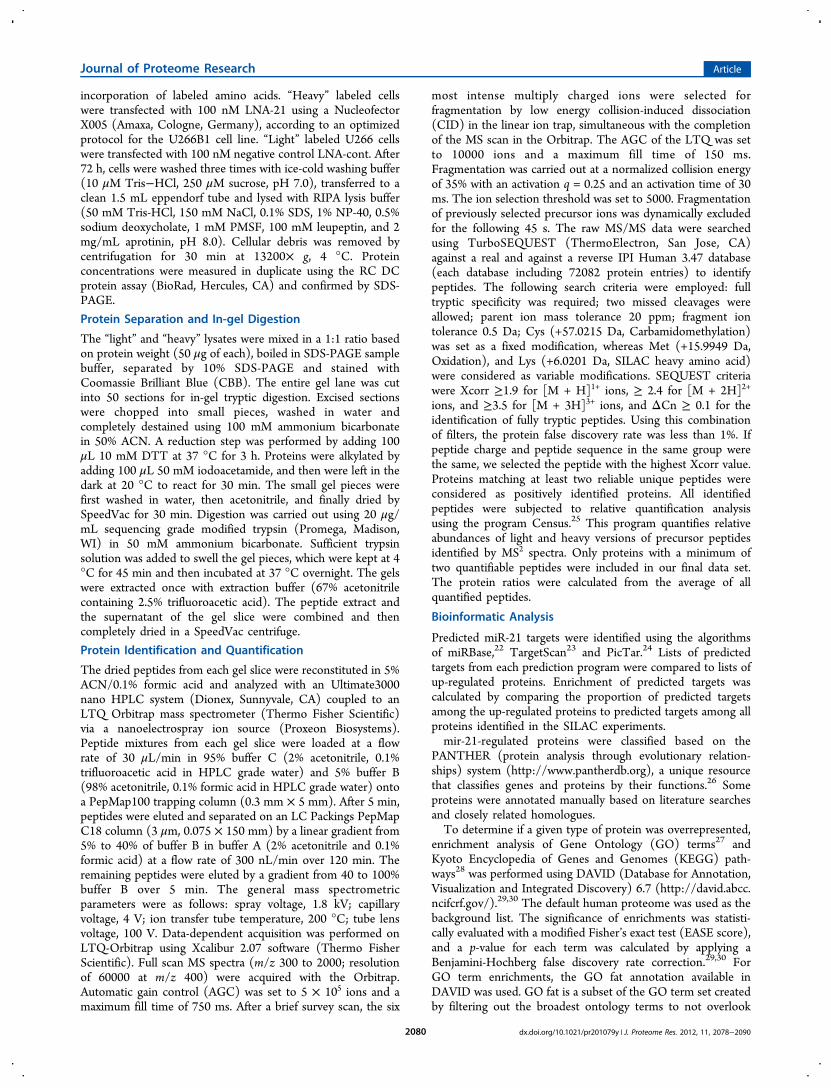
Since miR-21 is expressed at high levels in the myeloma cellline U266, we reasoned that downregulation of miR-21 wouldincrease the expression of its targets. To identify potential miR-21 target genes, we used quantitative proteomics and SILAC toidentify proteins differentially expressed in U266 cells with orwithout miR-21 overexpression. Figure 2A shows the workflowin this quantitative proteomic approach. According to thecriteria described in the Experimental Procedures, a total of1498 nonredundant proteins were quantified (Table S1,Supporting Information). In line with common approachesfor SILAC analyses,34,35 we set the threshold for up- or down-
regulated proteins at 2.0-fold. We found 178 up-regulated and25 down-regulated proteins in U266 cells 72 h followingtransfection of LNA-21 (Table S2, Supporting Information).This overall increase in the levels of regulated proteins isconsistent with the concept of microRNA-mediated transla-tional inhibition.To understand the biological relevance of miR-21 regulated
proteins, the PANTHER classification system was used tocategorize these proteins according to their biologicalprocesses. miR-21 regulated proteins were classified into 14groups according to biological processes (Figure 2B). Thelargest group is involved in metabolic processes (29%).Significant numbers of miR-21-regulated proteins were alsoimplicated in cellular processes (17%), cell communication(9%), the cell cycle (8%), and apoptosis (4%), indicating thatmiR-21 regulates diverse cellular functions involving wide-spread biological processes. It should be stated that many ofthese proteins are multifunctional and are assigned to morethan one functional class. For example, the cell cycle andapoptosis classes contain 30 and 14 proteins, respectively(Table S3, Supporting Information). Of these, six proteins,including CUL2, EIF4G2, FKBP5, PRKDC, PTK2, andUBE2O, are involved in the regulation of both the cell cycleand apoptosis. This may partly explain why miR-21 inhibitionresulted in an arrested cell cycle and in increased apoptosis.Next, we tested how miRNA target predictions correlate with
our data. miR-21 target predictions were obtained with threedifferent algorithms: miRBase,22 TargetScan23 and PicTar.24 Asshown in Figure S1A (Supporting Information), predictedtargets for miR-21 were highly enriched among the up-regulated proteins, compared to all the proteins identified inour SILAC experiments. Comparison of our data set with twoprevious proteomic studies revealed significant overlap but alsodifferences (Figure S1B). Of the 178 upregulated proteinsreported in this study, 15 (8.4%) and 25 (13.5%) were alsoreported as potential targets of miR-21 by Schramedei et al.36
and Yang et al.,37 respectively (Figure S1B). It is worthmentioning that 15 out of 16 potential targets of miR-21reported by Schramedei et al.36 were also identified in our
Figure 2. Quantitative proteomic identification of miR-21 targets in U266 cells. (A) Workflow for the identification of miR-21 targets. U266 cellswere differentially labeled by growing them in medium containing light or heavy amino acids (SILAC). After transfection with anti-miR-21 lockednucleic acid (LNA-21) or control LNA (LNA-cont), cells were lysed, combined, and analyzed by quantitative proteomics. (B) Pie chartrepresentations of the distribution of identified miR-21 regulated proteins according to their biological processes. Categorizations were based oninformation provided by the online resource PANTHER classification system.
Journal of Proteome Research Article
dx.doi.org/10.1021/pr201079y | J. Proteome Res. 2012, 11, 2078−20902083
experiment, indicating the reliability of our results (FigureS1B). One of the most frequently validated miR-21 targets,PDCD4, was among the upregulated proteins (Table S2,Supporting Information), further supporting the reliability ofour data. Differences between our results and those reported byothers may be due to differences in cell lines, cell cultureconditions, quantitative methods, or mass spectrometry plat-forms used. The limited overlap between our SILAC and Yanget al.’s iTRAQ results is not unexpected, as previous studieshave shown that SILAC and iTRAQ both possess distinctstrengths and weaknesses and provide complementary types ofinformation.38 Therefore, the current proteomic study based onthe SILAC method represents a complementary strategy foridentifying miR-21 target genes.
GO and Signaling Pathway Analysis of miR-21 TargetProteins
To gain insights into the functional roles of miR-21, the over-representation (enrichment) of ontology terms and compo-nents of molecular pathways among miR-21 regulated proteinswas compared with their occurrence in the human proteome.First, a GO slim generic assignment gave us an overview of theGO distribution (Figure S2, Supporting Information). Next, we
performed GO biological process, molecular function andcellular component analyses (Tables S4−S6, SupportingInformation). GO biological process analysis provided acomprehensive picture of miR-21 regulated proteins; trans-lation, telomere maintenance and organization, intracellulartransport, mRNA metabolic processes, post transcriptionalregulation of gene expression, cytoskeleton organization, andRNA processing categories were all overrepresented. SincemiR-21 acts as a negative regulator of gene expression bybinding to the 3′-untranslated region (UTR) of its targetmRNA, a large number of proteins (17; GO term: 0006396)which were annotated as involved in RNA processing (p-value= 1.84 × 10⁻⁴) were identified in our study. The biologicalprocess terms were visualized as a network diagram wheredirect links describe the hierarchy and relationships betweenterms (Figure S3, Supporting Information). The colored nodesare those determined to be significantly overrepresented. Bylooking at the closest branch points of the overrepresented GObiological processes, we found six main functional groups thatwere strongly enriched in miR-21 regulated proteins, includingthree clusters of metabolic processes and three clusters ofcellular processes (Figure S3). In the GO molecular functions
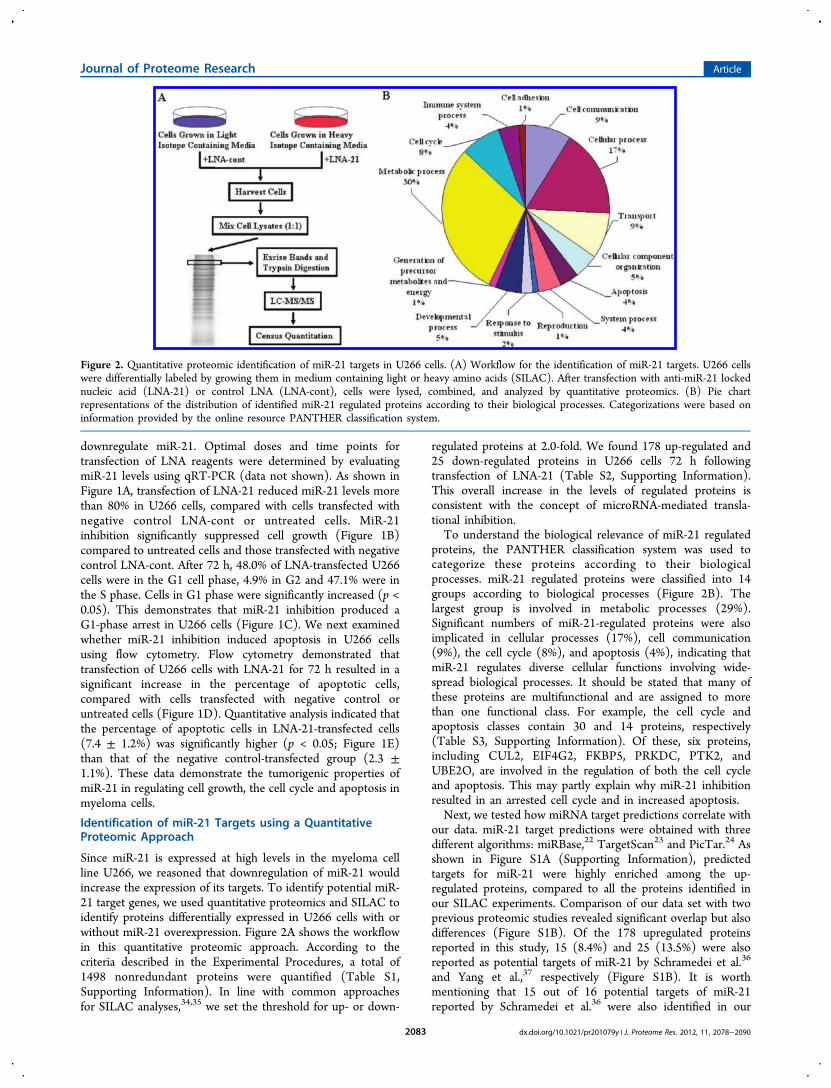
Figure 3. Validation of candidate miR-21 target genes. (A) Western blot showing LNA-21-mediated upregulation of CUL2, CAPN2, PCBP1 andPIAS3. U266 cells were transfected with LNA-21 or negative control LNA-cont, and incubated for 72 h. Thereafter, cell lysates were analyzed byWestern blotting. Equal loading was confirmed by probing the same filters with actin. Numbers indicate quantification relative to the correspondingactin loading control and were determined using ImageJ. (B) U266 cells were transfected with LNA-21 or negative control LNA-cont and incubatedfor 72 h. Thereafter, total cellular RNAwas isolated and analyzed by qRT-PCR for the expression of CUL2, CAPN2, PCBP1 and PIAS3 mRNAs.Results, normalized for GAPDH, are shown as relative expression using the negative control miRNA as a reference. Data were collected from threeindependent experiments, which were run with three replicates (mean ± S.D.). (C) Putative miR-21-binding sites within the 3′-UTRs of CUL2,CAPN2, PCBP1 and PIAS3 genes. Perfect matches are indicated by a line, and G:U pairs by a colon. Nucleotides mutated for the reporter geneassays are underlined. (D) Activity of luciferase reporters containing wild type (WT) or mutated (Mut) putative miR-21 target sites in the 3′-UTRsof CUL2, CAPN2, PCBP1 and PIAS3. The relative luciferase activities normalized to corresponding transfections with LNA-cont oligos are shown.Data are shown as the mean ± SD of three replicates and are representative of three independent experiments. *p < 0.05.
Journal of Proteome Research Article
dx.doi.org/10.1021/pr201079y | J. Proteome Res. 2012, 11, 2078−20902084

category, we found that the most overrepresented functionswere involved in nucleic acid binding, and included nucleotidebinding, RNA binding, ribonucleotide binding, purineribonucleotide binding, and purine nucleotide binding (TableS5, Supporting Information). In addition, functions includingATP binding, protein C-terminus binding, GTP binding,cytoskeletal protein binding, and structure-specific DNAbinding were also significantly overrepresented (p < 0.01). Inthe GO cellular component category, we found that most of themiR-21 regulated proteins were enriched in nonmembrane-bound organelles (p-value =1.73 × 10⁻⁷), the cytosol (p-value=3.97 × 10⁻⁹) and organelle lumens (p-value = 4.95 × 10⁻⁶)(Table S6, Supporting Information). In addition, 22 miR-21regulated proteins were attributed to the mitochondrion (p-value =0.004).To reveal pathways in which miR-21 regulated proteins
might be involved, we performed a search against the humanKEGG pathways database (http://www.genome.jp/kegg/tool/color_pathway.html). As shown in Table S7 (SupportingInformation, miR-21 regulated proteins are involved inpathways responsible for the control of key physiological andpathological processes. In particular, the pathways listed inTable S7 highlight the role of miR-21 regulated proteins in keymechanisms implicated in RNA processing. Of these, 11proteins were mapped to RNA transport and 8 to thespliceosome. The deregulation of these pathways can lead tothe establishment of pathological conditions such as cancer(e.g., “renal cell carcinoma”) and neurodegenerative disorders(e.g., “Huntington’s disease”). Interestingly, we found 3 miR-21regulated proteins, CRKL, PAK2 and PTK2, which take part inthe ErbB signaling pathway (Table S7), a pathway which
couples the binding of extracellular growth factor ligands tointracellular signaling pathways regulating diverse biologicalresponses, including proliferation, differentiation, cell motility,and survival. These results may imply a direct involvement ofmiR-21 in complex physiological and pathological systems, suchas cell proliferation, differentiation, motility, cancers andneurodegenerative disorders.
Validation of Candidate miR-21 Target Genes
We selected four candidates of biological interest (CUL2,CAPN2, PCBP1 and PIAS3) from among the 178 genes up-regulated by LNA-21 transfection for further validation. CUL2,CAPN2 and PCBP1 were chosen for their role in inducingapoptosis. In addition, PIAS3 was selected as it showed thestrongest up-regulation (6.3-fold; Table S2, SupportingInformation) and is involved in myeloma pathogenesis.39
First, differential regulation of these candidate target genesby miR-21 in U266 cells was validated at the protein level byWestern blotting. As shown in Figure 3A, increased expressionof all these genes at the protein level was induced by miR-21inhibition and their pattern of expression was the same as thatobtained from SILAC experiments.Second, we used qRT-PCR to examine changes in mRNA
abundance for these candidate target genes. As shown in Figure3B, none of the genes showed significantly increased mRNAexpression as a result of miR-21 inhibition. Our results suggestthat it is likely that these four targets are regulated by miR-21mainly through translational inhibition instead of mRNAdegradation.Third, we performed luciferase assays to determine if miR-21
regulates these candidate targets directly. The 3′-UTR seedsequences of these candidate targets were predicted using the
Figure 4. miR-21 negatively regulates PIAS3 protein expression in U266 cells. (A) qRT-PCR of miR-21 in U266 cells following transfection withLNA-21 or LNA-cont or with MIM-21 or MIM-cont. (B) U266 cell lysates were prepared and Western blotting of PIAS3 was performed 72 h posttransfection. Overexpression and knock down of miR-21 had opposite effect on PIAS3 protein expression in U266 cells. (C) miR-21 inhibitionincreased the expression of PIAS3 and decreased STAT3 phosphorylation. The protein levels of PIAS3, total and phosphorylated STAT3 weremonitored using confocal laser scanning.
Journal of Proteome Research Article
dx.doi.org/10.1021/pr201079y | J. Proteome Res. 2012, 11, 2078−20902085

algorithms of miRanda40,41 (Figure 3C) and then cloneddownstream of the luciferase ORF. The constructs werecotransfected with LNA-21 or control LNA-cont into U266cells. As shown in Figure 3D, significantly increased luciferaseactivity was observed in pGL3-PIAS3-WT or pGL3-PCBP1-WT transfected cells upon miR-21 inhibition. In contrast, therewas no significant change in luciferase activity in cellstransfected with pGL3-CAPN2-WT or pGL3-CUL2-WT.Furthermore, miR-21 did not affect the luciferase activity ofthese four genes when their 3′-UTR sequences were mutated atthe site complementary to the seed region of miR-21 (Figure3D). Taken together, our results indicate that PIAS3 andPCBP1 are direct targets of miR-21 in U266 cells, whileCAPN2 and CUL2 are regulated by miR-21 indirectly.
Silencing of PIAS3 Reverses the Effect of miR-21 Inhibitionon Activated STAT3, Cell Growth and Apoptosis
The role of the newly identified miR-21 target, PIAS3, on thegrowth and/or apoptosis of U266 cells was evaluated, aftersilencing and overexpression of PIAS3 by transient transfectionof validated siRNAs and cDNAs. First, we studied the miR-21-mediated negative regulation of PIAS3 expression in U266 cellsby Western blotting. We used an miR-21 mimic (MIM-21) orLNA-21 to enhance or reduce cellular miR-21 levels,respectively. Reduction or enhancement of miR-21 levels wasconfirmed by qRT-PCR (Figure 4A). PIAS3 protein levels wereexamined by Western blotting. As shown in Figure 4B,overexpression and knockdown of miR-21 had opposite effecton PIAS3 protein expression in U266 cells. Since previousstudies have shown that STAT3 activation is downregulated bymiR-21 knockdown42,43 and increasing concentrations ofPIAS3 result in a proportional decrease in STAT3 phosphor-ylation,44 the interactions between miR-21, PIAS3 and STAT3
were examined in LNA-21 or LNA-cont transfected U266 cellsusing confocal laser scanning. As shown in Figure 4C, nosignificant change was noted in total STAT3 expression inU266 cells transfected with LNA-21 or control oligos. Incontrast, compared with cells transfected with control oligos,miR-21 inhibition significantly increased expression of PIAS3and decreased STAT3 phosphorylation (Figure 4C). Interest-ingly, PIAS3 and STAT3 were colocalized in the nucleus ofcells that were transfected with LNA-21 (Figure 4C). Theseresults indicate that miR-21 negatively regulates PIAS3 proteinexpression in U266 cells.To further explore if silencing PIAS3 reverses the effect of
LNA-21 on STAT3 activation, cell viability, apoptosis andtranscriptional activity, U266 cells were cotransfected withLNA-21 and siRNA against PIAS3 to inhibit miR-21 and PIAS3expression, respectively. As shown in Figure 5A lane 4,transfection of LNA-21 resulted in the up-regulation ofPIAS3 expression in U266 cells compared to LNA-cont-transfected cells (lane 2), while siRNA against PIAS3 inhibitedPIAS3 expression in LNA-21-transfected (lane 5) and LNA-cont transfected cells (lane 3) compared to control siRNA-transfected cells (lane 2). No significant change was noted inSTAT3-pTyr705 and total STAT3 expression in U266 cellstransfected with PIAS3 siRNA (lane 3) or control oligos (lane2). In contrast, a decrease in STAT3-pTyr705 was observed inLNA-21-transfected cells (lane 4) and an increase in STAT3-pTyr705 was seen in cells cotransfected with PIAS3 and LNA-21 siRNA (lane 5). Furthermore, cotransfection of U266 cellswith siRNA of PIAS3 and LNA-21 partially abrogated LNA-21-induced cell growth inhibition and apoptosis (Figures 5B andC). We further measured the effects of miR-21 on STAT3activity using luciferase reporter gene assays. As shown in
Figure 5. PIAS3 contributes to the oncogenic potential of miR-21 and STAT3 activity in U266 cells. (A) miR-21 knockdown inhibits constitutivelyactive STAT3 in U266 cells and silencing of PIAS3 in LNA-21 treated cells and reverses the effect of miR-21 inhibition on STAT3 phosphorylation.U266 cells transfected with LNA-21 and/or PIAS3-specific small-interfering RNA (siRNA) and their corresponding controls for 72 h. Cell lysateswere analyzed for protein levels of PIAS3, and total and phosphorylated STAT3, as indicated. Cell growth, apoptosis and luciferase reporter geneassays further revealed that silencing PIAS3 partially abrogated LNA-21-induced (B) cell growth, (C) apoptosis and (D) Stat3-mediatedtranscriptional activity. LNA-21, the PIAS3-expressing plasmid and their corresponding controls were introduced into U266 cells, as indicated, and(E) protein levels of PIAS3, and total and phosphorylated STAT3, (F) cell growth, (G) apoptosis and (H) Stat3-mediated transcriptional activitywere assayed.
Journal of Proteome Research Article
dx.doi.org/10.1021/pr201079y | J. Proteome Res. 2012, 11, 2078−20902086

Figure 5D, knockdown of miR-21 in U266 cells yielded asignificant decrease in STAT3-dependent relative luciferaseactivity, while cotransfection of U266 cells with PIAS3 siRNAand LNA-21 markedly enhanced Stat3-mediated transcriptionalactivity in U266 cells. Overexpression experiments conductedby transfection of cDNAs corresponding to the codingsequences of PIAS3 gave similar results. PIAS3 overexpressionresulted in decreased STAT3 phosphorylation, cell viability,increased apoptosis and transcriptional activity (Figure 5E−H).To investigate whether STAT3 plays a role in cell growth andapoptosis, we used RNAi to reduce cellular STAT3 levels. Astable U266 cell line was established by expressing shRNA thattargets STAT3 mRNA, termed U266-KD. Western blottingdemonstrated a reduction in the expression level of STAT3 andphospho-STAT3 (pY705) proteins in this cell line (Figure S4A,Supporting Information). We next studied the consequences ofSTAT3 inhibition, as shown in Figure S4B; suppression ofSTAT3 led to a significant decrease in the proliferation of U266cells compared with control cells. This decrease in STAT3 alsoled to an increased rate of apoptosis (Figure S4C). Based onthese data, we propose that miR-21 functions as a negativeregulator of PIAS3 and that at least some of the variousbiological effects of miR-21 are mediated by regulation ofPIAS3 expression in myeloma cells.With regards to PCBP1, silencing or overexpression of
PCBP1 did not affect the growth and apoptosis of U266 cells inbasal conditions or after treatment with LNA-21 (data notshown).
■ DISCUSSIONmiR-21 is overexpressed in multiple types of cancer, includingbreast, pancreatic, colorectal, and multiple myeloma16 and hasemerged as a key regulator of oncogenic processes.45
Considerable attention has thus been given to determining itsfunctions as well as to identifying its target genes. Here, sincemiR-21 is upregulated in MM cells, we performed a loss-of-function study by knocking down miR-21 in MM cells. Thefunction of miR-21 in U266 cells was examined by depletingmature miR-21 using LNA oligonucleotides complementary tomiR-21. We found that knocking down miR-21 inducesapoptosis and inhibits cell growth in myeloma cells (Figure1), suggesting that miR-21 plays an important role in MMtumorigenesis.It is well-known that miRNAs regulate biological processes
by suppressing the expression of their target proteins.46 Tounderstand the mechanism underlying the potential role ofmiR-21 in MM, it is essential to first identify its target proteins.Previous studies have shown that one miRNA can modulate thelevels of hundreds of proteins.7 High-throughput methods arethus required for miRNA target identification. In the presentstudy, we performed quantitative SILAC experiments togetherwith bioinformatic predictions, and functional assays to identifymiR-21 protein targets in MM cells. Using this approach, weidentified 178 proteins that are up-regulated by miR-21knockdown.Of all the miR-21 regulated proteins, PIAS3 (protein
inhibitor of activated STAT3) showed the strongest up-regulation (6.3-fold; Table S2, Supporting Information)following miR-21 inhibition in our study. Western blottingand luciferase assays further confirmed it as a direct target.PIAS3 was originally identified as a specific inhibitor of theSTAT3 signaling pathway and plays an important role as adirect negative regulator of STAT3 activity.47 Recent data have
shown that PIAS3 and STAT3 function as transcriptionalcoregulators to modulate the activity of a diverse set oftranscription factors, including NF-κB,48 a zinc finger proteinGfi-1,49 microphthalmia transcription factor,50 nuclear receptorcoactivator TIF2,51 and Smads.52 The mechanisms involved inthe binding of PIAS3 to its targets and its modulation of theirtranscription are being explored. For example, PIAS3 was foundto suppress NF-κB -mediated transcription by interacting withits p65/RelA subunit48 and to inhibit gene induction throughactivated STAT3 by blocking its DNA binding activity.53 It is ofparticular interest that PIAS3 has been shown to inhibit the IL-6-triggered STAT3 signaling pathway in MM cells,39 sinceconstitutive activation of STAT3 signaling has long beenassociated with MM cells.54 Furthermore, loss of PIAS3expression at the protein but not the mRNA level has beenshown to occur in glioblastoma multiforme when STAT3phosphorylation and activity increases.55 Recently, Dabir et al.demonstrated that increasing concentrations of PIAS3 result ina proportional decrease in STAT3 phosphorylation andtranscription activity.44 Their results suggest that PIAS3 mayinhibit STAT3 by accelerating the dephosphorylation process.44
Consistent with these reports, our results show that PIAS3overexpression results in decreased STAT3 phosphorylationand transcription activity (Figure 5), suggesting that PIAS3 mayplay a role in the dephosphorylation process of STAT3 inmyeloma cells. However, the precise role of PIAS3 in theregulation of STAT3 phosphorylation and transcription activityin MM cells remains unclear.A growing body of evidence has shown that miR-21 is
involved in the regulation of STAT3 signaling pathways.15,42
Recently, miR-21 was reported to upregulate STAT3expression in a positive feedback loop.43 miR-21 is overex-pressed in all types of human cancers.16 Interestingly,constitutively activated STAT3 has been reported in all ofthese cancers,15 underscoring the pivotal role of miR-21 in theoncogenic potential of STAT3 and its involvement in thepathogenesis of MM and other cancers.It is thus highly interesting that we found that miR-21
functions as a negative regulator of PIAS3 and that at leastsome of the various biological effects of miR-21 are mediatedby the regulation of PIAS3 expression in U266 cells. Byinvestigating the impact of STAT3 inhibition and PIAS3knockdown/overexpression in U266 cells, we have shown thatthe apoptosis and cell growth inhibition induced by miR-21knockdown appear to be mediated in part by up-regulatedPIAS3. In contrast to the knockdown of PIAS3 that reduces theeffects of miR-21 inhibition on U266 cells, overexpression ofPIAS3 enhances the effects of miR-21 inhibition on U266 cells.Since overexpression of PIAS3 alone can lead to the inductionof apoptosis, development of inhibitors of miR-21 or activatorsof PIAS3 may find therapeutic applications on MM.In our study, we also identified 25 proteins that are
downregulated >2.0-fold due to the inhibition of miR-21(Table S2, Supporting Information). These downregulatedproteins may represent potential targets or may be due to theindirect effects of miR-21. Although miRNAs are generallyknown to down-regulate gene expression by inhibitingtranslation or inducing target mRNA degradation, a growingnumber of studies have demonstrated that miRNAs can alsoupregulate the expression of their targets under certaincircumstances.56,57 For example, miR-346 activates the activityof receptor-interacting protein 14 by increasing its proteinexpression57 and miR-373 has been reported to target the
Journal of Proteome Research Article
dx.doi.org/10.1021/pr201079y | J. Proteome Res. 2012, 11, 2078−20902087
promoter sequences of E-cadherin and cold-shock domain-containing protein C2 to induce their expression.58 Therefore,further experiments are required to determine whether any ofthese LNA-21-downregulated proteins are direct targets ofmiR-21.In conclusion, we have demonstrated that SILAC is an
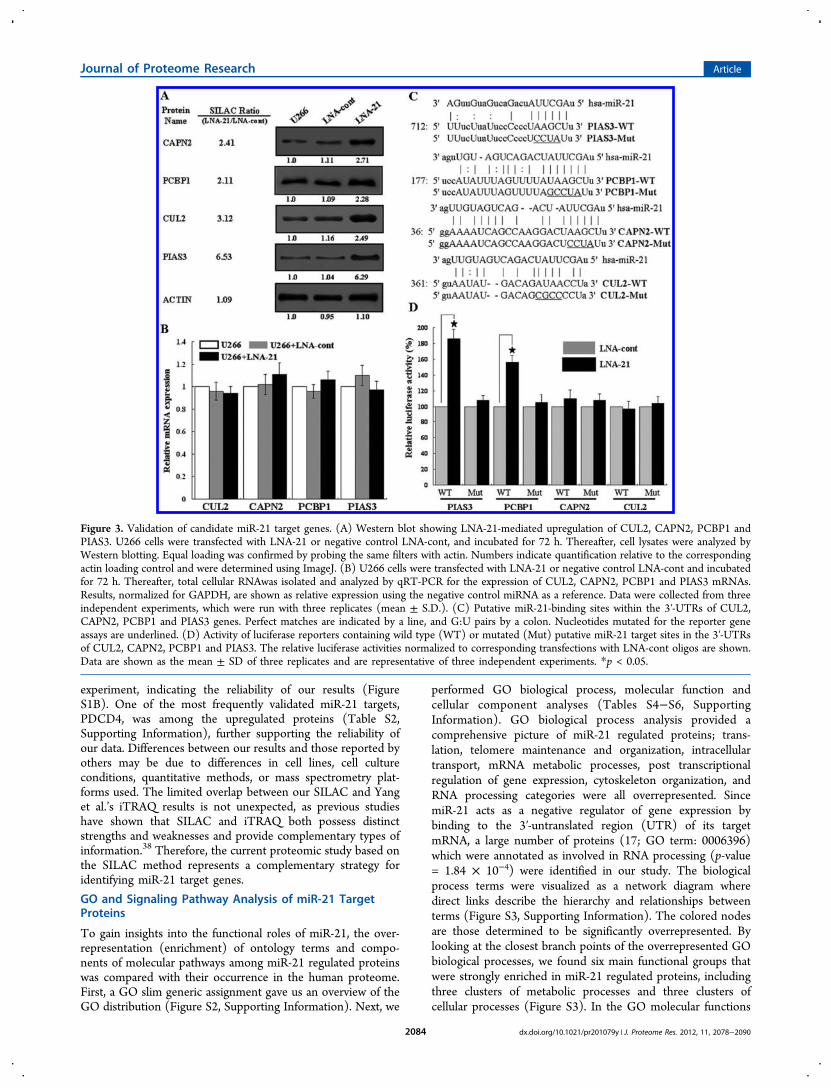
efficient and reliable method for functionally identifyingmiRNA targets. Using this proteomic approach we identifiedproteins regulated by miR-21 in myeloma cells and showed byfurther experiments that PIAS3 is a direct target of miR-21. Thecross talk between miR-21, PIAS3, and STAT3 are summarizedschematically in Figure 6. In U266 cells, constitutively activated
Stat3 induces miR-21 overexpression, and in a positive feedbackloop, miR-21 upregulates STAT3 activity by inhibiting PIAS3.MiR-21 targets PIAS3 directly, and PIAS3 is a negativeregulator of STAT3 activation. The elucidation of the role ofPIAS3 in the miR-21-Stat3 positive regulatory loop, therefore,may not only shed light into the molecular basis of thebiological effects of miR-21 observed in MM cells, but alsoprovides a direct target for the development of novel anti-MMtherapeutic strategies. It is now important to further character-ize the interactions between miR-21 and individual targetproteins and to determine the full significance of generegulation by miR-21 in MM cells.
■ ASSOCIATED CONTENT
*S Supporting Information
Supplemental figures and tables. This material is available freeof charge via the Internet at http://pubs.acs.org.
■ AUTHOR INFORMATIONCorresponding Author
*Prof. Feng Ge, Institute of Hydrobiology, Chinese Academyof Sciences. E-mail: [email protected]. Phone/Fax: +86-27-68780500. Prof. Li-Jun Bi, Institute of Biophysics, ChineseAcademy of Sciences. E-mail: [email protected]. Phone/Fax:+86-10-64871293.
Author Contributions⊥These authors contributed equally to this work.
Notes
The authors declare no competing financial interest.
■ ACKNOWLEDGMENTSThis work was supported by the National Basic ResearchProgram of China (973 Program, 2012CB518700), theHundred Talents Program of the Chinese Academy of Sciences,and the Open Research Fund of the National Laboratory ofBiomacromolecules.
■ ABBREVIATIONSMM, multiple myeloma; SILAC, stable isotope labeling byamino acids in cell culture; STAT3, signal transducer andactivator of transcription 3; PIAS3, protein inhibitor ofactivated STAT3; UTR, untranslated region; LNA, lockednucleic acid; PANTHER, protein analysis through evolutionaryrelationships
■ REFERENCES(1) Raab, M. S.; Podar, K.; Breitkreutz, I.; Richardson, P. G.;Anderson, K. C. Multiple myeloma. Lancet 2009, 374 (9686), 324−39.(2) Ge, F.; Bi, L. J.; Tao, S. C.; Xu, X. D.; Zhang, Z. P.; Kitazato, K.;Zhang, X. E. Proteomic analysis of multiple myeloma: current statusand future perspectives. Proteomics Clin. Appl. 2011, 5 (1−2), 30−7.(3) Caers, J.; Vande broek, I.; De Raeve, H.; Michaux, L.; Trullemans,F.; Schots, R.; Van Camp, B.; Vanderkerken, K. Multiple myeloma--anupdate on diagnosis and treatment. Eur. J. Haematol. 2008, 81 (5),329−43.(4) Pichiorri, F.; Suh, S. S.; Ladetto, M.; Kuehl, M.; Palumbo, T.;Drandi, D.; Taccioli, C.; Zanesi, N.; Alder, H.; Hagan, J. P.; Munker,R.; Volinia, S.; Boccadoro, M.; Garzon, R.; Palumbo, A.; Aqeilan, R. I.;Croce, C. M. MicroRNAs regulate critical genes associated withmultiple myeloma pathogenesis. Proc. Natl. Acad. Sci. U.S.A. 2008, 105(35), 12885−90.(5) Carthew, R. W.; Sontheimer, E. J. Origins and Mechanisms ofmiRNAs and siRNAs. Cell 2009, 136 (4), 642−55.(6) Brodersen, P.; Voinnet, O. Revisiting the principles of microRNAtarget recognition and mode of action. Nat. Rev. Mol. Cell. Biol. 2009,10 (2), 141−8.(7) Baek, D.; Villen, J.; Shin, C.; Camargo, F. D.; Gygi, S. P.; Bartel,D. P. The impact of microRNAs on protein output. Nature 2008, 455(7209), 64−71.(8) Iorio, M. V.; Croce, C. M. MicroRNAs in cancer: small moleculeswith a huge impact. J. Clin. Oncol. 2009, 27 (34), 5848−56.(9) Lu, J.; Getz, G.; Miska, E. A.; Alvarez-Saavedra, E.; Lamb, J.; Peck,D.; Sweet-Cordero, A.; Ebert, B. L.; Mak, R. H.; Ferrando, A. A.;Downing, J. R.; Jacks, T.; Horvitz, H. R.; Golub, T. R. MicroRNAexpression profiles classify human cancers. Nature 2005, 435 (7043),834−8.(10) Esquela-Kerscher, A.; Slack, F. J. Oncomirs - microRNAs with arole in cancer. Nat. Rev. Cancer 2006, 6 (4), 259−69.(11) Djuranovic, S.; Nahvi, A.; Green, R. A parsimonious model forgene regulation by miRNAs. Science 2011, 331 (6017), 550−3.(12) Pichiorri, F.; Suh, S. S.; Rocci, A.; De Luca, L.; Taccioli, C.;Santhanam, R.; Zhou, W.; Benson, D. M. Jr.; Hofmainster, C.; Alder,
Figure 6. Putative model of the cross talk between miR-21, PIAS3 andSTAT3 in U266 cells. STAT3 is activated by IL-6 or other cytokinesthrough phosphorylation of the tyrosine residue of STAT3 by JanusKinase (JAK) or other kinases. Phosphorylation of the tyrosine residueof STAT3 results in homodimerization of STAT3 and its translocationinto the nucleus to function as a transcription factor. In the nucleus,activated STAT3 induces the overexpression of miR-21, and in apositive feedback loop, the overexpression of miR-21 directly targetsPIAS3 and activates STAT3-dependent transcription throughinhibition of PIAS3. ISRE stands for Interferon Stimulated ResponseElement.
Journal of Proteome Research Article
dx.doi.org/10.1021/pr201079y | J. Proteome Res. 2012, 11, 2078−20902088

H.; Garofalo, M.; Di Leva, G.; Volinia, S.; Lin, H. J.; Perrotti, D.;Kuehl, M.; Aqeilan, R. I.; Palumbo, A.; Croce, C. M. Downregulationof p53-inducible microRNAs 192, 194, and 215 impairs the p53/MDM2 autoregulatory loop in multiple myeloma development. CancerCell 2010, 18 (4), 367−81.(13) Zhou, Y.; Chen, L.; Barlogie, B.; Stephens, O.; Wu, X.; Williams,D. R.; Cartron, M. A.; van Rhee, F.; Nair, B.; Waheed, S.; Pineda-Roman, M.; Alsayed, Y.; Anaissie, E.; Shaughnessy, J. D. Jr. High-riskmyeloma is associated with global elevation of miRNAs andoverexpression of EIF2C2/AGO2. Proc. Natl. Acad. Sci. U.S.A. 2010,107 (17), 7904−9.(14) Gutierrez, N. C.; Sarasquete, M. E.; Misiewicz-Krzeminska, I.;Delgado, M.; De Las Rivas, J.; Ticona, F. V.; Ferminan, E.; Martin-Jimenez, P.; Chillon, C.; Risueno, A.; Hernandez, J. M.; Garcia-Sanz,R.; Gonzalez, M.; San Miguel, J. F. Deregulation of microRNAexpression in the different genetic subtypes of multiple myeloma andcorrelation with gene expression profiling. Leukemia 2010, 24 (3),629−37.(15) Loffler, D.; Brocke-Heidrich, K.; Pfeifer, G.; Stocsits, C.;Hackermuller, J.; Kretzschmar, A. K.; Burger, R.; Gramatzki, M.;Blumert, C.; Bauer, K.; Cvijic, H.; Ullmann, A. K.; Stadler, P. F.; Horn,F. Interleukin-6 dependent survival of multiple myeloma cells involvesthe Stat3-mediated induction of microRNA-21 through a highlyconserved enhancer. Blood 2007, 110 (4), 1330−3.(16) Krichevsky, A. M.; Gabriely, G. miR-21: a small multi-facetedRNA. J. Cell. Mol. Med. 2009, 13 (1), 39−53.(17) Folini, M.; Gandellini, P.; Longoni, N.; Profumo, V.; Callari, M.;Pennati, M.; Colecchia, M.; Supino, R.; Veneroni, S.; Salvioni, R.;Valdagni, R.; Daidone, M. G.; Zaffaroni, N. miR-21: an oncomir onstrike in prostate cancer. Mol. Cancer 2010, 9, 12.(18) Si, M. L.; Zhu, S.; Wu, H.; Lu, Z.; Wu, F.; Mo, Y. Y. miR-21-mediated tumor growth. Oncogene 2007, 26 (19), 2799−803.(19) Chan, J. A.; Krichevsky, A. M.; Kosik, K. S. MicroRNA-21 is anantiapoptotic factor in human glioblastoma cells. Cancer Res. 2005, 65(14), 6029−33.(20) Yan, L. X.; Wu, Q. N.; Zhang, Y.; Li, Y. Y.; Liao, D. Z.; Hou, J.H.; Fu, J.; Zeng, M. S.; Yun, J. P.; Wu, Q. L.; Zeng, Y. X.; Shao, J. Y.Knockdown of miR-21 in human breast cancer cell lines inhibitsproliferation, in vitro migration and in vivo tumor growth. BreastCancer Res. 2011, 13 (1), R2.(21) Medina, P. P.; Nolde, M.; Slack, F. J. OncomiR addiction in anin vivo model of microRNA-21-induced pre-B-cell lymphoma. Nature2010, 467 (7311), 86−90.(22) Griffiths-Jones, S.; Saini, H. K.; van Dongen, S.; Enright, A. J.miRBase: tools for microRNA genomics. Nucleic Acids Res. 2008, 36(Database issue), D154−8.(23) Lewis, B. P.; Burge, C. B.; Bartel, D. P. Conserved seed pairing,often flanked by adenosines, indicates that thousands of human genesare microRNA targets. Cell 2005, 120 (1), 15−20.(24) Krek, A.; Grun, D.; Poy, M. N.; Wolf, R.; Rosenberg, L.; Epstein,E. J.; MacMenamin, P.; da Piedade, I.; Gunsalus, K. C.; Stoffel, M.;Rajewsky, N. Combinatorial microRNA target predictions. Nat. Genet.2005, 37 (5), 495−500.(25) Park, S. K.; Venable, J. D.; Xu, T.; Yates, J. R. 3rd A quantitativeanalysis software tool for mass spectrometry-based proteomics. Nat.Methods 2008, 5 (4), 319−22.(26) Mi, H.; Guo, N.; Kejariwal, A.; Thomas, P. D. PANTHERversion 6: protein sequence and function evolution data with expandedrepresentation of biological pathways. Nucleic Acids Res. 2007, 35(Database issue), D247−52.(27) Ashburner, M.; Ball, C. A.; Blake, J. A.; Botstein, D.; Butler, H.;Cherry, J. M.; Davis, A. P.; Dolinski, K.; Dwight, S. S.; Eppig, J. T.;Harris, M. A.; Hill, D. P.; Issel-Tarver, L.; Kasarskis, A.; Lewis, S.;Matese, J. C.; Richardson, J. E.; Ringwald, M.; Rubin, G. M.; Sherlock,G. Gene ontology: tool for the unification of biology. The GeneOntology Consortium. Nat. Genet. 2000, 25 (1), 25−9.(28) Kanehisa, M.; Goto, S. KEGG: kyoto encyclopedia of genes andgenomes. Nucleic Acids Res. 2000, 28 (1), 27−30.
(29) Huang da, W.; Sherman, B. T.; Lempicki, R. A. Systematic andintegrative analysis of large gene lists using DAVID bioinformaticsresources. Nat. Protoc. 2009, 4 (1), 44−57.(30) Huang da, W.; Sherman, B. T.; Lempicki, R. A. Bioinformaticsenrichment tools: paths toward the comprehensive functional analysisof large gene lists. Nucleic Acids Res. 2009, 37 (1), 1−13.(31) Maere, S.; Heymans, K.; Kuiper, M. BiNGO: a Cytoscape pluginto assess overrepresentation of gene ontology categories in biologicalnetworks. Bioinformatics 2005, 21 (16), 3448−9.(32) Ge, F.; Zhang, L.; Tao, S. C.; Kitazato, K.; Zhang, Z. P.; Zhang,X. E.; Bi, L. J. Quantitative proteomic analysis of tumor reversion inmultiple myeloma cells. J. Proteome Res. 2011, 10 (2), 845−55.(33) Zhang, J.; Chen, F.; Li, W.; Xiong, Q.; Yang, M.; Zheng, P.; Li,C.; Pei, J.; Ge, F. 14-3-3ζ Interacts with Stat3 and Regulates ItsConstitutive Activation in Multiple Myeloma Cells. PLoS One 2012, 7(1), e29554.(34) Pan, C.; Olsen, J. V.; Daub, H.; Mann, M. Global effects ofkinase inhibitors on signaling networks revealed by quantitativephosphoproteomics. Mol. Cell. Proteomics 2009, 8 (12), 2796−808.(35) Lam, Y. W.; Evans, V. C.; Heesom, K. J.; Lamond, A. I.;Matthews, D. A. Proteomics analysis of the nucleolus in adenovirus-infected cells. Mol. Cell. Proteomics 2010, 9 (1), 117−30.(36) Schramedei, K.; Morbt, N.; Pfeifer, G.; Lauter, J.; Rosolowski,M.; Tomm, J. M.; von Bergen, M.; Horn, F.; Brocke-Heidrich, K.MicroRNA-21 targets tumor suppressor genes ANP32A andSMARCA4. Oncogene 2011, 30, 2975−85.(37) Yang, Y.; Chaerkady, R.; Beer, M. A.; Mendell, J. T.; Pandey, A.Identification of miR-21 targets in breast cancer cells using aquantitative proteomic approach. Proteomics 2009, 9 (5), 1374−84.(38) Shui, W.; Gilmore, S. A.; Sheu, L.; Liu, J.; Keasling, J. D.;Bertozzi, C. R. Quantitative proteomic profiling of host-pathogeninteractions: the macrophage response to Mycobacterium tuberculosislipids. J. Proteome Res. 2009, 8 (1), 282−9.(39) Wang, L. H.; Yang, X. Y.; Mihalic, K.; Xiao, W.; Li, D.; Farrar,W. L. Activation of estrogen receptor blocks interleukin-6-induciblecell growth of human multiple myeloma involving molecular cross-talkbetween estrogen receptor and STAT3 mediated by co-regulatorPIAS3. J. Biol. Chem. 2001, 276 (34), 31839−44.(40) Enright, A. J.; John, B.; Gaul, U.; Tuschl, T.; Sander, C.; Marks,D. S. MicroRNA targets in Drosophila. Genome Biol. 2003, 5 (1), R1.(41) John, B.; Enright, A. J.; Aravin, A.; Tuschl, T.; Sander, C.; Marks,D. S. Human MicroRNA targets. PLoS Biol. 2004, 2 (11), e363.(42) Zhou, X.; Ren, Y.; Moore, L.; Mei, M.; You, Y.; Xu, P.; Wang,B.; Wang, G.; Jia, Z.; Pu, P.; Zhang, W.; Kang, C. Downregulation ofmiR-21 inhibits EGFR pathway and suppresses the growth of humanglioblastoma cells independent of PTEN status. Lab. Invest. 2010, 90(2), 144−55.(43) Yang, C. H.; Yue, J.; Fan, M.; Pfeffer, L. M. IFN induces miR-21through a signal transducer and activator of transcription 3-dependentpathway as a suppressive negative feedback on IFN-induced apoptosis.Cancer Res. 2010, 70 (20), 8108−16.(44) Dabir, S.; Kluge, A.; Dowlati, A. The association and nucleartranslocation of the PIAS3-STAT3 complex is ligand and timedependent. Mol. Cancer Res. 2009, 7 (11), 1854−60.(45) Selcuklu, S. D.; Donoghue, M. T.; Spillane, C. miR-21 as a keyregulator of oncogenic processes. Biochem. Soc. Trans. 2009, 37 (Pt 4),918−25.(46) Bartel, D. P. MicroRNAs: target recognition and regulatoryfunctions. Cell 2009, 136 (2), 215−33.(47) Chung, C. D.; Liao, J.; Liu, B.; Rao, X.; Jay, P.; Berta, P.; Shuai,K. Specific inhibition of Stat3 signal transduction by PIAS3. Science1997, 278 (5344), 1803−5.(48) Jang, H. D.; Yoon, K.; Shin, Y. J.; Kim, J.; Lee, S. Y. PIAS3suppresses NF-kappaB-mediated transcription by interacting with thep65/RelA subunit. J. Biol. Chem. 2004, 279 (23), 24873−80.(49) Rodel, B.; Tavassoli, K.; Karsunky, H.; Schmidt, T.; Bachmann,M.; Schaper, F.; Heinrich, P.; Shuai, K.; Elsasser, H. P.; Moroy, T. Thezinc finger protein Gfi-1 can enhance STAT3 signaling by interactingwith the STAT3 inhibitor PIAS3. EMBO J. 2000, 19 (21), 5845−55.
Journal of Proteome Research Article
dx.doi.org/10.1021/pr201079y | J. Proteome Res. 2012, 11, 2078−20902089

(50) Levy, C.; Nechushtan, H.; Razin, E. A new role for the STAT3inhibitor, PIAS3: a repressor of microphthalmia transcription factor. J.Biol. Chem. 2002, 277 (3), 1962−6.(51) Jimenez-Lara, A. M.; Heine, M. J.; Gronemeyer, H. PIAS3(protein inhibitor of activated STAT-3) modulates the transcriptionalactivation mediated by the nuclear receptor coactivator TIF2. FEBSLett. 2002, 526 (1−3), 142−6.(52) Long, J.; Wang, G.; Matsuura, I.; He, D.; Liu, F. Activation ofSmad transcriptional activity by protein inhibitor of activated STAT3(PIAS3). Proc. Natl. Acad. Sci. U.S.A. 2004, 101 (1), 99−104.(53) Levy, C.; Lee, Y. N.; Nechushtan, H.; Schueler-Furman, O.;Sonnenblick, A.; Hacohen, S.; Razin, E. Identifying a commonmolecular mechanism for inhibition of MITF and STAT3 by PIAS3.Blood 2006, 107 (7), 2839−45.(54) Catlett-Falcone, R.; Landowski, T. H.; Oshiro, M. M.; Turkson,J.; Levitzki, A.; Savino, R.; Ciliberto, G.; Moscinski, L.; Fernandez-Luna, J. L.; Nunez, G.; Dalton, W. S.; Jove, R. Constitutive activationof Stat3 signaling confers resistance to apoptosis in human U266myeloma cells. Immunity 1999, 10 (1), 105−15.(55) Brantley, E. C.; Nabors, L. B.; Gillespie, G. Y.; Choi, Y. H.;Palmer, C. A.; Harrison, K.; Roarty, K.; Benveniste, E. N. Loss ofprotein inhibitors of activated STAT-3 expression in glioblastomamultiforme tumors: implications for STAT-3 activation and geneexpression. Clin. Cancer Res. 2008, 14 (15), 4694−704.(56) Henke, J. I.; Goergen, D.; Zheng, J.; Song, Y.; Schuttler, C. G.;Fehr, C.; Junemann, C.; Niepmann, M. microRNA-122 stimulatestranslation of hepatitis C virus RNA. EMBO J. 2008, 27 (24), 3300−10.(57) Tsai, N. P.; Lin, Y. L.; Wei, L. N. MicroRNA mir-346 targets the5′-untranslated region of receptor-interacting protein 140 (RIP140)mRNA and up-regulates its protein expression. Biochem. J. 2009, 424(3), 411−8.(58) Place, R. F.; Li, L. C.; Pookot, D.; Noonan, E. J.; Dahiya, R.MicroRNA-373 induces expression of genes with complementarypromoter sequences. Proc. Natl. Acad. Sci. U.S.A. 2008, 105 (5), 1608−13.
Journal of Proteome Research Article
dx.doi.org/10.1021/pr201079y | J. Proteome Res. 2012, 11, 2078−20902090