Identification of novel high-frequency DNA methylation changes in breast cancer
12
Identification of Novel High-Frequency DNA Methylation Changes in Breast Cancer Jared M. Ordway 1 *, Muhammad A. Budiman 1 , Yulia Korshunova 1 , Rebecca K. Maloney 1 , Joseph A. Bedell 1 , Robert W. Citek 1 , Blaire Bacher 1 , Seth Peterson 1 , Tracy Rohlfing 1 , Jacqueline Hall 2 , Robert Brown 3 , Nathan Lakey 1 , Rebecca W. Doerge 4,5 , Robert A. Martienssen 6 , Jorge Leon 1 , John D. McPherson 7 , Jeffrey A. Jeddeloh 1¤ 1 Orion Genomics, St. Louis, Missouri, United States of America, 2 Centre for Bioinformatics, McGill University, Montreal, Quebec, Canada, 3 Imperial College, Hammersmith Hospital, London, United Kingdom, 4 Department of Agronomy, Purdue University, Lafayette, Indiana, United States of America, 5 Department of Statistics, Purdue University, Lafayette, Indiana, United States of America, 6 Cold Spring Harbor Laboratory, Cold Spring Harbor, New York, United States of America, 7 Ontario Institute for Cancer Research, Toronto, Ontario, Canada Recent data have revealed that epigenetic alterations, including DNA methylation and chromatin structure changes, are among the earliest molecular abnormalities to occur during tumorigenesis. The inherent thermodynamic stability of cytosine methylation and the apparent high specificity of the alterations for disease may accelerate the development of powerful molecular diagnostics for cancer. We report a genome-wide analysis of DNA methylation alterations in breast cancer. The approach efficiently identified a large collection of novel differentially DNA methylated loci (,200), a subset of which was independently validated across a panel of over 230 clinical samples. The differential cytosine methylation events were independent of patient age, tumor stage, estrogen receptor status or family history of breast cancer. The power of the global approach for discovery is underscored by the identification of a single differentially methylated locus, associated with the GHSR gene, capable of distinguishing infiltrating ductal breast carcinoma from normal and benign breast tissues with a sensitivity and specificity of 90% and 96%, respectively. Notably, the frequency of these molecular abnormalities in breast tumors substantially exceeds the frequency of any other single genetic or epigenetic change reported to date. The discovery of over 50 novel DNA methylation-based biomarkers of breast cancer may provide new routes for development of DNA methylation-based diagnostics and prognostics, as well as reveal epigenetically regulated mechanism involved in breast tumorigenesis. Citation: Ordway JM, Budiman MA, Korshunova Y, Maloney RK, Bedell JA, et al (2007) Identification of Novel High-Frequency DNA Methylation Changes in Breast Cancer. PLoS ONE 2(12): e1314. doi:10.1371/journal.pone.0001314 INTRODUCTION Breast cancer is the second leading cause of cancer-related deaths among women in the United States. Recent declines in breast cancer-associated mortality are partly attributed to the use of screening mammography, however, the benefit is significant only for women over 40 years of age [1,2]. Approximately 33% of breast cancers detected by screening mammography represent overdiagnosis, leading to unnecessary treatment [3]. Furthermore, false positive results are estimated to occur in 50% of women screened annually for 10 years, 25% of whom will go on to have biopsies [4] and false negative results are a major concern, especially in younger women [5,6]. Recently, MRI has proved to be a superior method to detect breast cancer in high risk patients; however the improvement in detection comes at the cost of an increased number of false positive cases [7]. Therefore, there is a critical need for improved molecular biomarkers that are capable of detecting early stage disease, indicating recurrence of disease, as well as predicting the progression of benign high-risk lesions and intraductal carcinoma in situ to invasive carcinoma. Genetic mutations in BRCA1 and BRCA2 [8,9], BRIP1 [10], CHEK2 [11], ATM [12] and TP53 [13,14] result in increased risk of breast cancer. However, these are estimated to account for only 5% to 10% of breast cancer cases [15,16,17] A recent large-scale sequencing analysis of over 13,000 genes in a small collection of breast tumors identified 122 genes with somatic mutation frequencies higher than the background frequency. However, each tumor harbored only a few mutations, and no single mutation or combination of mutations predominated across the tumor samples [18]. In addition to genetic alterations, epigenetic abnormalities such as changes in genomic DNA cytosine methylation patterns are associated with all cancer types. The spectrum of alterations includes both gain and loss of DNA methylation involving multi-copy elements as well as single-copy genes (reviewed in [19]). Many of the changes affect gene expression and genome stability through inappropriate regulation of local chromatin structure (reviewed in [20]). Furthermore, recent data suggest that epigenetic changes are involved in the earliest phases of tumorigenesis, and that they may predispose stem/progenitor cells to subsequent genetic and epigenetic changes involved in tumor promotion [21]. Given the observed frequency of DNA methylation changes in tumorigenesis and the inherent stability of the molecular abnormality, these events Academic Editor: Dong-Yan Jin, University of Hong Kong, China Received July 3, 2007; Accepted November 6, 2007; Published December 19, 2007 Copyright: ß 2007 Ordway et al. This is an open-access article distributed under the terms of the Creative Commons Attribution License, which permits unrestricted use, distribution, and reproduction in any medium, provided the original author and source are credited. Funding: This work was entirely privately funded. Funding parties were not involved in the conduct of the study, interpretation of data, or preparation of the manuscript. Competing Interests: Orion Genomics, LLC markets the described MethylSco- peTm (array based) and MethylScreenTm (qPCR based) technologies. R.A. Martienssen, J.D. McPherson, and the authors from Orion Genomics recognize a financial interest in the company. This work was entirely privately funded. * To whom correspondence should be addressed. E-mail: jordway@ oriongenomics.com ¤ Current address: Roche NimbleGen, Madison, Wisconsin, United States of America PLoS ONE | www.plosone.org 1 December 2007 | Issue 12 | e1314
-
Upload
massgeneral -
Category
Documents
-
view
0 -
download
0
Transcript of Identification of novel high-frequency DNA methylation changes in breast cancer

Identification of Novel High-Frequency DNA MethylationChanges in Breast CancerJared M. Ordway1*, Muhammad A. Budiman1, Yulia Korshunova1, Rebecca K. Maloney1, Joseph A. Bedell1, Robert W. Citek1, Blaire Bacher1, SethPeterson1, Tracy Rohlfing1, Jacqueline Hall2, Robert Brown3, Nathan Lakey1, Rebecca W. Doerge4,5, Robert A. Martienssen6, Jorge Leon1, John D.McPherson7, Jeffrey A. Jeddeloh1¤
1 Orion Genomics, St. Louis, Missouri, United States of America, 2 Centre for Bioinformatics, McGill University, Montreal, Quebec, Canada, 3 ImperialCollege, Hammersmith Hospital, London, United Kingdom, 4 Department of Agronomy, Purdue University, Lafayette, Indiana, United States ofAmerica, 5 Department of Statistics, Purdue University, Lafayette, Indiana, United States of America, 6 Cold Spring Harbor Laboratory, Cold SpringHarbor, New York, United States of America, 7 Ontario Institute for Cancer Research, Toronto, Ontario, Canada
Recent data have revealed that epigenetic alterations, including DNA methylation and chromatin structure changes, areamong the earliest molecular abnormalities to occur during tumorigenesis. The inherent thermodynamic stability of cytosinemethylation and the apparent high specificity of the alterations for disease may accelerate the development of powerfulmolecular diagnostics for cancer. We report a genome-wide analysis of DNA methylation alterations in breast cancer. Theapproach efficiently identified a large collection of novel differentially DNA methylated loci (,200), a subset of which wasindependently validated across a panel of over 230 clinical samples. The differential cytosine methylation events wereindependent of patient age, tumor stage, estrogen receptor status or family history of breast cancer. The power of the globalapproach for discovery is underscored by the identification of a single differentially methylated locus, associated with theGHSR gene, capable of distinguishing infiltrating ductal breast carcinoma from normal and benign breast tissues with asensitivity and specificity of 90% and 96%, respectively. Notably, the frequency of these molecular abnormalities in breasttumors substantially exceeds the frequency of any other single genetic or epigenetic change reported to date. The discovery ofover 50 novel DNA methylation-based biomarkers of breast cancer may provide new routes for development of DNAmethylation-based diagnostics and prognostics, as well as reveal epigenetically regulated mechanism involved in breasttumorigenesis.
Citation: Ordway JM, Budiman MA, Korshunova Y, Maloney RK, Bedell JA, et al (2007) Identification of Novel High-Frequency DNA MethylationChanges in Breast Cancer. PLoS ONE 2(12): e1314. doi:10.1371/journal.pone.0001314
INTRODUCTIONBreast cancer is the second leading cause of cancer-related deaths
among women in the United States. Recent declines in breast
cancer-associated mortality are partly attributed to the use of
screening mammography, however, the benefit is significant only
for women over 40 years of age [1,2]. Approximately 33% of
breast cancers detected by screening mammography represent
overdiagnosis, leading to unnecessary treatment [3]. Furthermore,
false positive results are estimated to occur in 50% of women
screened annually for 10 years, 25% of whom will go on to have
biopsies [4] and false negative results are a major concern,
especially in younger women [5,6]. Recently, MRI has proved to
be a superior method to detect breast cancer in high risk patients;
however the improvement in detection comes at the cost of an
increased number of false positive cases [7]. Therefore, there is a
critical need for improved molecular biomarkers that are capable
of detecting early stage disease, indicating recurrence of disease, as
well as predicting the progression of benign high-risk lesions and
intraductal carcinoma in situ to invasive carcinoma.
Genetic mutations in BRCA1 and BRCA2 [8,9], BRIP1 [10],
CHEK2 [11], ATM [12] and TP53 [13,14] result in increased risk
of breast cancer. However, these are estimated to account for only
5% to 10% of breast cancer cases [15,16,17] A recent large-scale
sequencing analysis of over 13,000 genes in a small collection of
breast tumors identified 122 genes with somatic mutation
frequencies higher than the background frequency. However,
each tumor harbored only a few mutations, and no single
mutation or combination of mutations predominated across the
tumor samples [18].
In addition to genetic alterations, epigenetic abnormalities such as
changes in genomic DNA cytosine methylation patterns are
associated with all cancer types. The spectrum of alterations includes
both gain and loss of DNA methylation involving multi-copy
elements as well as single-copy genes (reviewed in [19]). Many of the
changes affect gene expression and genome stability through
inappropriate regulation of local chromatin structure (reviewed in
[20]). Furthermore, recent data suggest that epigenetic changes are
involved in the earliest phases of tumorigenesis, and that they may
predispose stem/progenitor cells to subsequent genetic and
epigenetic changes involved in tumor promotion [21]. Given the
observed frequency of DNA methylation changes in tumorigenesis
and the inherent stability of the molecular abnormality, these events
Academic Editor: Dong-Yan Jin, University of Hong Kong, China
Received July 3, 2007; Accepted November 6, 2007; Published December 19,2007
Copyright: � 2007 Ordway et al. This is an open-access article distributed underthe terms of the Creative Commons Attribution License, which permitsunrestricted use, distribution, and reproduction in any medium, provided theoriginal author and source are credited.
Funding: This work was entirely privately funded. Funding parties were notinvolved in the conduct of the study, interpretation of data, or preparation of themanuscript.
Competing Interests: Orion Genomics, LLC markets the described MethylSco-peTm (array based) and MethylScreenTm (qPCR based) technologies. R.A.Martienssen, J.D. McPherson, and the authors from Orion Genomics recognize afinancial interest in the company. This work was entirely privately funded.
* To whom correspondence should be addressed. E-mail: [email protected]
¤ Current address: Roche NimbleGen, Madison, Wisconsin, United States ofAmerica
PLoS ONE | www.plosone.org 1 December 2007 | Issue 12 | e1314
may provide ideal biomarkers for molecular diagnostics and early
detection of cancer.
Several genes have previously been shown to be aberrantly
methylated in breast cancer (reviewed in [22]). The majority of these
have been identified through candidate gene approaches, and their
observed frequency and disease specificity vary between independent
studies. For example, RASSF1A is among the most commonly
reported differentially methylated genes for numerous cancer types.
Comparing two independent studies of RASSF1A methylation in
breast cancer, the average frequency at which hypermethylation was
detected in breast tumors is 56% [23,24]. Approaches for genome-
wide DNA methylation analysis hold promise to identify novel
epigenetic targets with improved clinical sensitivity and specificity
and, therefore, provide superior candidates for development of DNA
methylation-based molecular diagnostics.
We have applied a microarray-based strategy for comprehen-
sive DNA methylation profiling to discover differentially methyl-
ated loci in breast cancer. The approach is based upon the loose
site specificity (purine-5mC) of the cytosine methylation dependent
restriction enzyme McrBC and, therefore, is capable of determin-
ing the regional DNA methylation density associated with the
plurality of molecules present. In the present study, the approach
revealed numerous novel epigenetic biomarkers capable of distin-
guishing infiltrating ductal breast carcinomas from normal and
benign breast tissues. A subset were extensively validated by
screening a panel of over 230 clinical samples, revealing biomarkers
that display clinical sensitivity and specificity up to 90% and 96%,
respectively. Bisulphite sequencing analyses confirmed the DNA
methylation changes and validated the qPCR-based assay adapted
for high-throughput DNA methylation screening. In addition to
identifying exceptionally promising biomarkers for improved disease
detection, the functions of the associated genes suggest that the
approach may also provide critical insights into molecular
mechanisms of breast tumorigenesis.
RESULTS
Genome-Wide Approach Identifies High-Frequency
DNA Methylation ChangesGenome-wide DNA methylation analysis at more than 21,000 loci
was performed in nine infiltrating ductal breast carcinoma (IDC)
and nine patient-matched adjacent histology normal samples. The
IDC panel included six stage IIA and three stage IIB tumors from
women ranging from 32 to 57 years of age (median age 47).
Tumor and adjacent normal samples contained $65% and 0%
neoplastic cellularity by H&E histology, respectively. Tumor
samples included three IDCs positive for both estrogen and
progesterone receptors and six IDCs negative for both receptors.
Demographic information for these patients is provided in Table
S1. DNA methylation profiles were generated using the previously
described McrBC-based approach [25,26,27],
Following statistical analyses, 220 loci were identified that
provided optimal distinction between tumor and adjacent normal
DNA samples. As expected, unsupervised hierarchical clustering of
the data derived from these microarray features divided samples
into two major clusters (Fig. 1A). All nine tumor samples were
grouped into one major cluster, while eight of nine adjacent
normal samples were grouped into the other cluster. The adjacent
normal sample assigned to the tumor cluster was most closely
related to its matched tumor sample (matched pair 2). The
identified differentially methylated loci included both hyper- and
hypomethylation events in tumor relative to adjacent normal
samples. Raw and normalized array data for these loci are
provided in Table S2.
A powerful novel discovery approach should recapitulate
previous findings, as well as identify novel molecular abnormalities
that offer advantages relative to what is known. The log2 ratios of
DNA methylation measurements for 16 genes reported to be
differentially methylated in breast cancer are depicted in Fig. 1B
(‘‘Known Epigenetic Targets’’). By way of comparison, 16 novel
differentially methylated loci discovered in this experiment are also
shown (corresponding to the 16 loci described in Table 1; ‘‘Novel
Epigenetic Targets’’). Although the known epigenetic targets were
occasionally differentially methylated, the novel epigenetic targets
were differentially methylated in a larger number of tissue pairs.
Importantly, for tissue pairs in which the loci reported differential
methylation, the load of differentially methylated molecules
reported was not significantly different for the known and
novel targets (data not shown), indicating that there was no
difference in the ability of the respective microarray features to
report DNA methylation changes. For known epigenetic targets,
differences between previously reported frequencies of DNA
methylation changes and those predicted by this discovery
experiment may be a consequence of the relatively small sample
size or technical differences in the methods used to detect DNA
methylation.
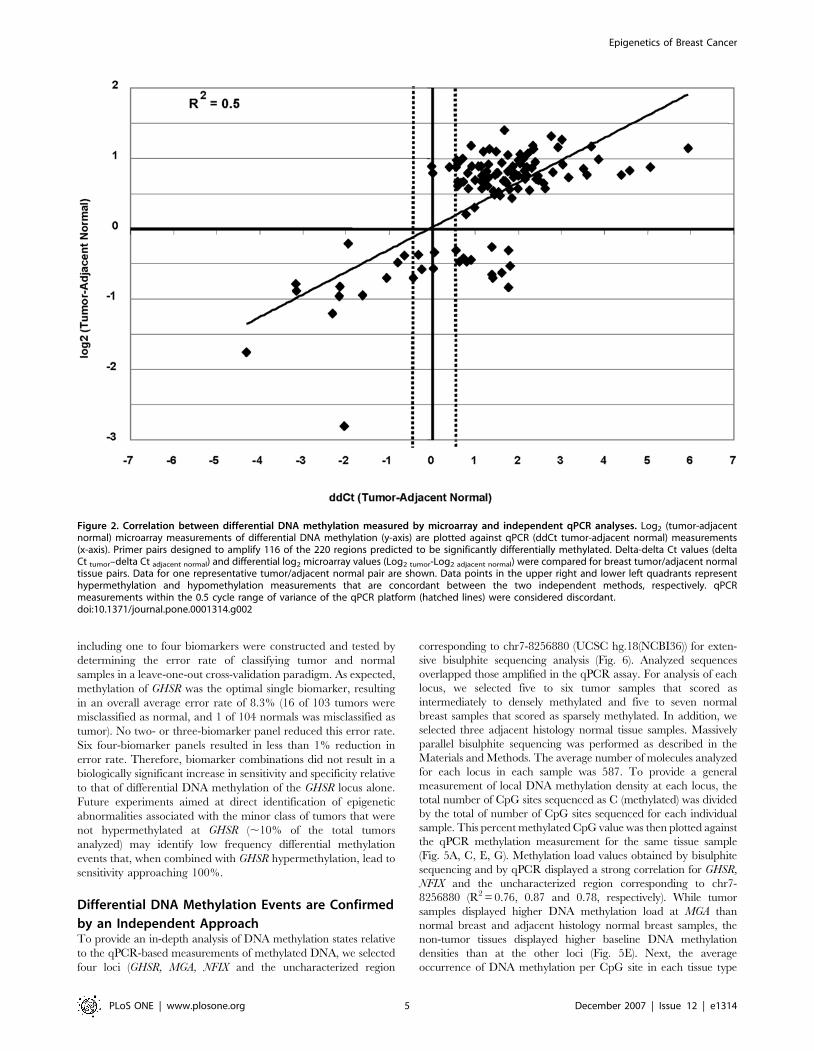
Accuracy of the microarray-based DNA methylation measure-
ments was assessed by a quantitative PCR (qPCR) [27] as
described in the Materials and Methods. The presence of purine-
5mC sites within an amplified region results in digestion by
McrBC and a higher cycle number at which the McrBC-treated
sample crosses threshold. Therefore, higher delta Ct measure-
ments correlate with a larger proportion of the molecules
containing DNA methylation between the priming sites (Fig. 2).
In total, 96 of 116 (83%) measurements were concordant between
the two methods (12 hypomethylation and 84 hypermethylation
events). Nine qPCR measurements fell within the 0.5 cycle region
of variability of the real-time PCR platform itself, and these
measurements were considered discordant. Seventeen measure-
ments reported an increase in DNA methylation by the qPCR
method that was not detected by the microarray method
(approximately 15% false negative rate in the microarray
experiment). Three hypermethylation microarray predictions fell
within the 0.5 cycle qPCR range that was considered discordant
(approximately 2% false positive rate). An overall accuracy of 83%
and a higher false negative than false positive rate are consistent
with results obtained in numerous independent microarray
analyses ([27] and data not shown). A precisely linear relationship
between the microarray and qPCR measurements is not
necessarily expected because the microarray features are capable
of measuring methylation of a larger local region (1 to 4 Kb) than
the qPCR amplicons were designed to interrogate (400–600 bp).
Validation of Differential DNA Methylation Events in
Large Panels of Clinical Tissue SamplesAs an initial validation, qPCR assays for 53 loci hypermethylated
in at least 70% of tissue pairs were conducted across a panel of 16
independent IDCs (Stage II) and 25 normal or benign breast
tissues. We focused on hypermethylation events because hypo-
methylation events were considerably less frequent than hyper-
methylation events (i.e. ,40% sensitivity). This observation has
been made previously by Bestor and colleagues (A. O’Donnell, R.
Rollins, and T.H. Bestor (personal communication)). As shown in
Fig. 3, differential DNA methylation between tumor and non-
tumor breast samples was confirmed in an independent tissue
panel. The differentially methylated regions displayed a range of
clinical sensitivity (i.e. the percentage of tumors displaying
Epigenetics of Breast Cancer
PLoS ONE | www.plosone.org 2 December 2007 | Issue 12 | e1314

intermediate to dense DNA methylation) and clinical specificity
(i.e. the percentage of normals displaying sparse DNA methyla-
tion). Among loci displaying 100% specificity relative to normal
breast tissue, sensitivities ranged from 6% (1 of 16 tumors were
methylated; IGF-II mRNA binding protein 3) to 81% (13 of 16 tumors
were methylated; GHSR) (Table S3). Because these differentially
methylated loci may be useful for disease detection in peripheral
fluids such as plasma or serum, the methylation status of each
locus was analyzed in a panel of 19 blood samples from cancer-free
women. Although the majority of the 53 loci demonstrated greater
than 80% specificity relative to normal peripheral blood, 21 loci
(40%) were methylated in at least half of the normal blood samples
(Table S3). Therefore, these results indicate that a subset of loci
that become hypermethylated in breast cancer take on a DNA
methylation state that is similar to the normal methylation state in
circulating blood cells. Similar results were obtained in a recent
DNA methylation analysis of lung tumors and peripheral blood
[28]. Although the biological mechanisms and consequences of the
DNA methylation similarities between tumor and normal
peripheral blood cells are yet to be determined, these findings
are important in terms of the applicability of differentially
methylated loci for use as potential biomarkers for early detection
of cancer using peripheral fluids such as serum or plasma
The 16 differentially methylated regions that displayed greater
than 95% specificity relative to normal and benign breast tissue
and normal blood were analyzed in a larger validation panel,
including a total of 103 IDC samples (8 Stage I, 65 Stage IIA, 28
Stage IIB, 2 Stage III), 104 normal or benign breast samples and
25 peripheral blood samples from cancer-free women (Table 1).
Demographic information for the patients included in this panel is
provided in Table S4. Sensitivity and specificity calculations across
the expanded validation panel were consistent with those obtained
from the initial panel. Of the 103 IDC samples, 96 scored as
methylated for at least one of the 16 differentially methylated loci
(93%), and 94 (91%) scored as methylated for more than one
locus. The seven samples that scored as sparsely methylated for all
16 loci included 4 Stage IIA tumors and 3 Stage IIB samples.
Therefore, the absence of hypermethylation at these loci was not
exclusively associated with the earliest tumor stage. Furthermore,
patient age was not associated with the lack of differential
methylation (p = 0.804, t test). These tumors may represent a
minor subclass that do not undergo extensive epigenetic
rearrangements or that undergo a different epigenetic alteration
program than the majority of tumors. Global DNA methylation
profiling of these tumors directly may identify alternative tumor-
specific epigenetic abnormalities common to this small group.
Figure 1. Comparison of previously identified and novel epigenetic targets in breast cancer. (A) Hierarchical clustering of differentially methylatedloci identified by microarray analysis. DNA methylation measurements of 220 loci identified to be significantly differentially methylated by statisticalanalysis of global DNA methylation profiles are shown. The color scale of the heatmap represents densely methylated loci (red) to sparselymethylated loci (green). Unsupervised clustering (top dendrogram) distinguishes adjacent histology normal breast tissues (green branches) frombreast cancer tissues (red branches). Individual matched tumor/adjacent histology normal tissues pairs are indicated by a number assigned to eachindividual (Matched pair). (B) Differential DNA methylation in individual tumor and adjacent histology normal tissue pairs. Differences between log2
ratios for individual tumor and adjacent histology normal pairs are shown for known and novel epigenetic targets. Because the experimentalprocedure compares total genome representations to those depleted for fragments containing DNA methylation, methylated sequences have auntreated:depleted ratio near or above 1.0 while unmethylated sequences have a ratio approaching zero due to mass normalization of target DNA[27]. Log2 differences $0.7 (red), 0.5 to 0.6 (yellow) and #0.5 (green) are shown. The annotated genes associated with the differential DNAmethylation events are indicated at the left.doi:10.1371/journal.pone.0001314.g001
Epigenetics of Breast Cancer
PLoS ONE | www.plosone.org 3 December 2007 | Issue 12 | e1314

Fig. 4A shows a plot of the frequency of hypermethylation of the
16 loci in the 8 Stage I tumors (i.e. the percentage of Stage I tumors
scoring as intermediately to densely methylated) versus the Stage II
and III tumors. The directly proportional relationship between the
two sensitivity calculations (R2 = 0.887; slope = 0.9815) indicates
that the frequency of hypermethylation of these loci is similar
regardless of tumor stage. Therefore, for the majority of loci, the
differential methylation events are just as likely to be present in a
Stage I tumor as they are in later stage tumors. The proportion of
methylated molecules in tumors at each stage was then analyzed
for three selected loci (Fig. 4B). While there was a trend for
increased methylation density at these loci with increasing tumor
stage, methylation density of Stage I tumors was not significantly
different than Stage II–III tumors, yet dramatically different than
normal samples. Therefore, differential methylation of these loci is
independent of tumor stage in regards to both frequency and
density of hypermethylation.
Novel Differential DNA Methylation Events Display
Exceptionally High Sensitivity and Specificity for
Breast TumorsReceiver-operator characteristic (ROC) analysis was performed
for each of the 16 loci to determine optimal thresholds for
calculation of sensitivity and specificity of the differential DNA
methylation event. Examples of the primary qPCR data for four
selected loci are shown in Fig. 5A. The frequency at which tumor
tissues were scored as differentially methylated at these loci was not
significantly associated with patient, age, estrogen receptor status
or family history of breast cancer (data not shown). BRCA1 or
BRCA2 mutation status was unknown for these patients. ROC
curves for the corresponding four datasets are shown in Fig. 5B.
Optimal thresholds were identified as the maximum sum of
sensitivity and specificity calculated at each observed delta Ct
value. Results are summarized in Table 1. Sensitivity and
specificity calculations based on optimal thresholds are similar to
those calculated using a standard delta Ct threshold of 1.0
(compare Table 1 and Table S4). As hypothesized, the direct
global profiling of DNA methylation identified numerous novel
DNA methylation-based biomarkers that display substantially
improved sensitivity and specificity relative to the vast majority of
previously identified differentially methylated genes in breast
cancer. In fact, a single differentially methylated biomarker,
located in the upstream region of GHSR, was capable of
distinguishing IDC from normal and benign breast tissue with
sensitivity of 90% and specificity of 96%.
Quantitative PCR (like other technical platforms) involves an
inherent level of technical variability. This variability could
potentially have an impact on calculated sensitivity and specificity
when ROC-based thresholds are close to the 0.5 cycle variability
range of the qPCR platform. We addressed this issue first by
performing technical replicates of all measurements, and excluding
measurements with standard deviations $1.0. To further
investigate the impact of this variability, we repeated the GHSR
qPCR measurements for the 16 samples near the 0.64 dCt
threshold (0.5–1.5). Three replicates were preformed using a
different lot of McrBC. All 11 tumor samples again scored above
the dCt threshold in all three replicates (Fig. S1). Three of five
normal samples that originally scored just above the dCt threshold
scored below the threshold in all three replicates. Therefore,
repeating measurements near the ROC established thresholds had
no impact on the calculated sensitivity, but had a relatively minor
impact on specificity (increased from 96% to 99%).
Other biomarkers displayed similar specificity, with decreasing
sensitivity. Discriminant analysis was performed (including all 16
biomarkers screened against 103 IDC samples and 104 normal
breast tissues) to identify potential biomarker panels with greater
sensitivity and specificity than methylation of GHSR alone. Models
Table 1. Breast Cancer Biomarker Validation.. . . . . . . . . . . . . . . . . . . . . . . . . . . . . . . . . . . . . . . . . . . . . . . . . . . . . . . . . . . . . . . . . . . . . . . . . . . . . . . . . . . . . . . . . . . . . . . . . . . . . . . . . . . . . . . . . . . . . . . . . . . . . . . . . . . . . . . . . . . . . . . . . .
BREAST TUMOR VS. NORMAL BREAST BREAST TUMOR VS. NORMAL BLOOD
Description Sensitivity Pos. (Total) Specificity Neg. (Total) Thresholdb SpecificityNeg.(Total) Thresholdb
GHSR 90% 92 (102) 96% 99 (103) 0.64 100% 24 (24) 1.22
no description (chr7-8256880)a 89% 90 (101) 92% 96 (104) 0.555 100% 25 (25) 0.695
LMTK3 77% 78 (101) 87% 89 (102) 0.755 96% 23 (24) 1.06
MGA 70% 69 (99) 92% 86 (93) 1.11 95% 18 (19) 0.935
no description (chr1-203610783)a 69% 69 (100) 82% 84 (103) 0.615 87% 20 (23) 0.63
CD9 65% 66 (102) 97% 101 (104) 0.705 100% 25 (25) 0.535
hATH1 63% 64 (101) 97% 101 (104) 0.525 100% 25 (25) 0.57
STK36 63% 64 (101) 93% 96 (103) 0.5 71% 17 (24) 0.55
h3-OST-2 60% 61 (101) 98% 102 (104) 0.51 96% 23 (24) 0.51
FLRT2 58% 59 (102) 100% 104 (104) 0.515 100% 23 (23) 0.515
PRDM 12 56% 51 (91) 97% 96 (99) 0.545 95% 20 (21) 0.545
NFIX 53% 52 (98) 97% 94 (97) 0.61 96% 23 (24) 0.855
CDX-2 48% 49 (103) 97% 100 (103) 0.51 100% 24 (24) 0.51
CXCL1 42% 42 (101) 99% 98 (99) 0.545 100% 24 (24) 0.71
ZBTB 8 38% 39 (103) 97% 101 (104) 0.5 100% 25 (25) 0.72
Hox-A7 34% 35 (102) 97% 100 (103) 0.535 100% 22 (22) 0.535
aLoci not within the vicinity of a known annotated gene (no description) are described by chromosome number and nucleotide position of the microarray feature(Ensembl 36).
bThresholds indicate the optimal average dCt value for distinction between tumor and non-tumor tissues.doi:10.1371/journal.pone.0001314.t001..
....
....
....
....
....
....
....
....
....
....
....
....
....
....
....
....
....
....
....
....
....
....
Epigenetics of Breast Cancer
PLoS ONE | www.plosone.org 4 December 2007 | Issue 12 | e1314
including one to four biomarkers were constructed and tested by
determining the error rate of classifying tumor and normal
samples in a leave-one-out cross-validation paradigm. As expected,
methylation of GHSR was the optimal single biomarker, resulting
in an overall average error rate of 8.3% (16 of 103 tumors were
misclassified as normal, and 1 of 104 normals was misclassified as
tumor). No two- or three-biomarker panel reduced this error rate.
Six four-biomarker panels resulted in less than 1% reduction in
error rate. Therefore, biomarker combinations did not result in a
biologically significant increase in sensitivity and specificity relative
to that of differential DNA methylation of the GHSR locus alone.
Future experiments aimed at direct identification of epigenetic
abnormalities associated with the minor class of tumors that were
not hypermethylated at GHSR (,10% of the total tumors
analyzed) may identify low frequency differential methylation
events that, when combined with GHSR hypermethylation, lead to
sensitivity approaching 100%.
Differential DNA Methylation Events are Confirmed
by an Independent ApproachTo provide an in-depth analysis of DNA methylation states relative
to the qPCR-based measurements of methylated DNA, we selected
four loci (GHSR, MGA, NFIX and the uncharacterized region
corresponding to chr7-8256880 (UCSC hg.18(NCBI36)) for exten-
sive bisulphite sequencing analysis (Fig. 6). Analyzed sequences
overlapped those amplified in the qPCR assay. For analysis of each
locus, we selected five to six tumor samples that scored as
intermediately to densely methylated and five to seven normal
breast samples that scored as sparsely methylated. In addition, we
selected three adjacent histology normal tissue samples. Massively
parallel bisulphite sequencing was performed as described in the
Materials and Methods. The average number of molecules analyzed
for each locus in each sample was 587. To provide a general
measurement of local DNA methylation density at each locus, the
total number of CpG sites sequenced as C (methylated) was divided
by the total of number of CpG sites sequenced for each individual
sample. This percent methylated CpG value was then plotted against
the qPCR methylation measurement for the same tissue sample
(Fig. 5A, C, E, G). Methylation load values obtained by bisulphite
sequencing and by qPCR displayed a strong correlation for GHSR,
NFIX and the uncharacterized region corresponding to chr7-
8256880 (R2 = 0.76, 0.87 and 0.78, respectively). While tumor
samples displayed higher DNA methylation load at MGA than
normal breast and adjacent histology normal breast samples, the
non-tumor tissues displayed higher baseline DNA methylation
densities than at the other loci (Fig. 5E). Next, the average
occurrence of DNA methylation per CpG site in each tissue type
Figure 2. Correlation between differential DNA methylation measured by microarray and independent qPCR analyses. Log2 (tumor-adjacentnormal) microarray measurements of differential DNA methylation (y-axis) are plotted against qPCR (ddCt tumor-adjacent normal) measurements(x-axis). Primer pairs designed to amplify 116 of the 220 regions predicted to be significantly differentially methylated. Delta-delta Ct values (deltaCt tumor–delta Ct adjacent normal) and differential log2 microarray values (Log2 tumor-Log2 adjacent normal) were compared for breast tumor/adjacent normaltissue pairs. Data for one representative tumor/adjacent normal pair are shown. Data points in the upper right and lower left quadrants representhypermethylation and hypomethylation measurements that are concordant between the two independent methods, respectively. qPCRmeasurements within the 0.5 cycle range of variance of the qPCR platform (hatched lines) were considered discordant.doi:10.1371/journal.pone.0001314.g002
Epigenetics of Breast Cancer
PLoS ONE | www.plosone.org 5 December 2007 | Issue 12 | e1314

was calculated (Fig. 5B, D, F, H). In general, tumor samples
displayed higher variability in methylation per CpG site than non-
tumor samples (indicated by higher standard deviations for the
average percent methylated CpGs). At each locus, the DNA
methylation pattern was significantly hypermethylated relative to
non-tumor samples. Furthermore, analysis of DNA methylation per
CpG site provided an explanation for the higher non-tumor baseline
DNA methylation densities detected at the MGA locus (Fig. 5F). In
non-tumor samples, methylation densities at the first three CpG
dinucleotides of the analyzed region were greater than 50%, while
methylation of the following four CpG dinucleotides fell to lower
densities more consistent with the baseline levels at the other
analyzed loci. Interestingly, tumor samples displayed the same
general methylation density pattern, but with significantly higher
methylation density per CpG across the entire analyzed region.
Together, these results confirm the hypermethylated state of these
loci in breast cancer and provide an extensive validation of the
accuracy of the qPCR-based method used to screen for DNA
methylation changes.
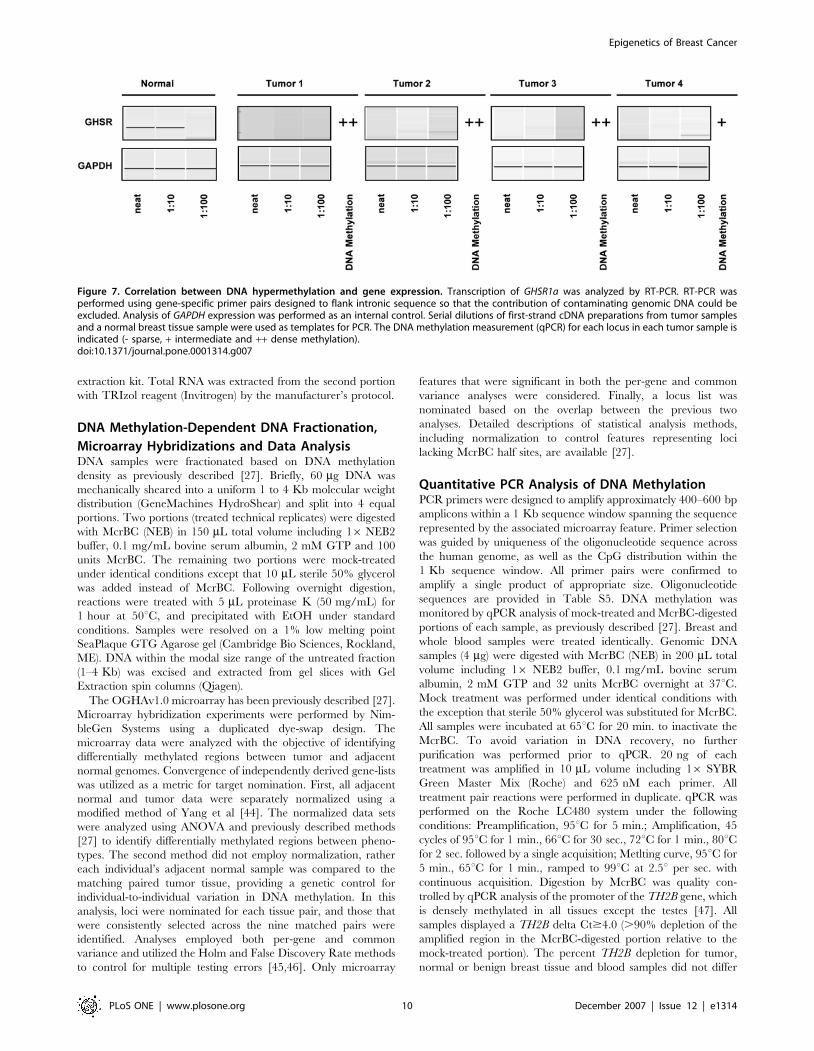
GHSR Hypermethylation Correlates with Decreased
Gene ExpressionTo address the association between hypermethylation and tran-
scription repression, we performed RT-PCR analyses of the GHSR
gene (Fig. 7). Four breast IDC samples (.90% neoplastic cellularity)
were analyzed for both DNA methylation and transcription.
Expression of GHSR1a (see Discussion) was undetectable in all four
tumor samples, while expression was detected at 1:10 dilution of the
normal breast cDNA. Consistent with the high sensitivity of
hypermethylation at the GHSR locus, all four tumor samples
demonstrated intermediate to dense DNA methylation at this locus.
DISCUSSIONWe have combined the use of high-content DNA microarrays
designed specifically for analysis of DNA methylation patterns with a
sensitive DNA methylation-dependent enzymatic approach to
generate genome-wide DNA methylation density profiles in breast
tumor and unaffected breast tissue. This approach proved to be both
Figure 3. Differential DNA methylation of identified loci within an initial validation panel of clinical samples. qPCR measurements of DNAmethylation density were obtained for 53 loci across 16 IDC tumor samples and 25 normal or benign breast samples. An average delta Ct (Ct McrBC–Ct Mock) less than 1.0 was scored as sparsely methylated (green cells). A delta Ct of 1.0 indicates that approximately half of the DNA in the reaction wascleaved by McrBC within the amplified region and therefore contained a measurable density of DNA methylation. An average delta Ct greater than orequal to 1.0, but less than 2.0 was scored as intermediately methylated (yellow cells). Finally, an average delta Ct$2.0 ($75% of DNA molecules werecleaved by McrBC) was scored as densely methylated (red cells).doi:10.1371/journal.pone.0001314.g003
Epigenetics of Breast Cancer
PLoS ONE | www.plosone.org 6 December 2007 | Issue 12 | e1314

efficient and effective, in that global profiling of a small number of
tissue samples identified several novel epigenetic targets that were
extensively validated within a panel of over 230 clinical samples.
Strikingly, the approach identified a single locus within the
promoter region of the GHSR gene that is hypermethylated in 90%
(92 of 102) of infiltrating ductal breast carcinomas, independently
of patient age or tumor stage. Conversely, 4 of 103 cancer-free
breast tissues reported a DNA methylation density measurement
slightly above the ROC curve-established threshold (96%
specificity). To our knowledge, this locus represents the highest
combined sensitivity and specificity for a DNA-based (genetic or
epigenetic) biomarker of breast cancer reported to date.
Clinical applications of these DNA methylation based biomark-
ers range from early, possibly non-invasive cancer detection to
more accurate molecular classification of confirmed breast
cancers. For example, we focused on novel biomarker loci
displaying high clinical specificity for disease, yet the level of
sensitivity of the differential DNA methylation events vary among
the loci. Those with exceptionally high sensitivity are candidates
for future development of screening diagnostics for the early
detection of cancer and for the prediction of progression of high
risk lesions such as ductal or lobular carcinoma in situ to
malignancy. Notably, we have confirmed the ability to detect
tumor-associated hypermethylation of several loci in fine needle
aspirate specimens collected from breast cancer patients. The
frequency of detection of hypermethylation of these loci is similar
regardless of whether the tested DNA is derived from primary
tumors or from fine needle aspirates (Fig. S2). The detection of
circulating tumor-associated DNA methylation-based biomarkers
in serum has also been explored for early, non-invasive screening
applications. However, the molecular complexity of DNA
methylation patterns in sera from cancer-free individuals indicates
that a comprehensive understanding of precise methylation
configurations is essential for the future development of such
diagnostics [29]. On the other hand, biomarker loci that display
high specificity yet lower sensitivity are candidates for potential
applications aimed at sub-classifying tumors by disease prognosis
or responsiveness to certain therapies. Given the exceptional
performance of these novel biomarkers within this discovery and
validation study, analyses of clinical samples collected to
specifically address these applications are clearly warranted.
In addition to revealing novel and powerful epigenetic
biomarkers of breast cancer, our results provide insights into
potential epigenetic mechanisms of breast tumorigenesis. As
described above, hypermethylation of the promoter region of
GHSR was detected in primary breast tumors at an exceptionally
high frequency. Furthermore, reduced GHSR 1a mRNA expres-
sion was associated with hypermethylation. GHSR encodes a seven
transmembrane-spanning G protein-coupled receptor (GHSR 1a)
for the circulating peptide hormone, ghrelin. A second transcript
encodes a truncated form of the receptor (GHSR 1b), presumably
via alternative splicing and polyadenylation within the single
intron [30]. However, transcripts initiating from upstream
transcriptional start sites have also been reported [31]. Recent
evidence suggests that alterations of the ghrelin/GHSR axis may
play an important autocrine/paracrine role in hormone-depen-
dent cancers (reviewed in [32]), however potential mechanisms
appear to be complex. For example, a recent immunohistochem-
istry (IHC) study indicated that the GHSR 1b isoform is
undetectable in normal breast tissue, but dramatically up-
regulated in all breast tumors analyzed [33]. The GHSR 1a
isoform was detected by IHC in the cytoplasm of glandular
epithelial cells of breast tumor tissue. However, RT-PCR analyses
of breast tumor cell lines demonstrated dramatic reduction of
Figure 4. Differential DNA methylation relative to tumor stage. (A) Comparison of the frequency of differential DNA methylation of 16 loci in stage Ibreast tumors relative to stage II–III breast tumors. (B) DNA methylation density of 3 selected loci relative to tumor stage. The percent depletion byMcrBC for each sample in which a given locus scored as methylated was calculated [1-(1/2^delta Ct (McrBC digested – Mock treated)) * 100] toprovide a measure of the load of methylated molecules within the sample. The % depletion is plotted (from left to right) for normal and benignsamples, stage I tumors, stage IIA tumors, stage IIB tumors and stage III tumors.doi:10.1371/journal.pone.0001314.g004
Epigenetics of Breast Cancer
PLoS ONE | www.plosone.org 7 December 2007 | Issue 12 | e1314

GHSR 1a mRNA expression in 3 of 4 cell lines tested (consistent
with the frequency of GHSR hypermethylation reported here).
Loss of GHSR 1a expression and overexpression of GHSR 1b has
also been reported in adrenocortical carcinomas [34]. Whether the
high-frequency hypermethylation event detected at the GHSR
locus is involved in the switch between GHSR 1a and GHSR 1b
isoform expression, potentially by directing a switch to alternative
upstream transcription start sites, is a focus of future research.
Furthermore, since GHSR 1b is reported to be an inactive isoform
of the receptor [35], loss of expression of GHSR 1a and
overexpression of GHSR 1b may be functionally equivalent
mechanisms of altering the ghrelin/GHSR axis in breast cancer.
Another high-frequency hypermethylation event is associated with
the MGA gene, encoding a transcriptional repressor that intersects
with the Myc pathway. Myc gene amplification occurs in
approximately 15–20% of breast cancer patients [36] and has been
reported to be an independent predictor of survival in patients treated
with tamoxifen [37]. Overexpression of c-myc occurs in up to 50% of
tumors [38,39,40]. When heterodimerized with Max, Myc regulates
the expression of numerous target genes involved in aspects of
tumorigenesis including cell cycle regulation, cell growth, cell
adhesion, immortalization and genomic stability (reviewed in [41]).
MGA (Max Gene Associated) also forms hetero-dimers with Max to
form a transcriptional repressor co-complex that antagonizes the
activity of Myc. MGA-Max complexes have been identified as part of
the E2F6 repression complex that occupies and represses E2F- and
Myc-responsive promoters at G0 [42]. Therefore, epigenetic
repression of MGA expression may contribute to breast tumorigenesis
by shifting the balance between activating and repressing signals
upstream of Myc function. Importantly, ectopic expression of MGA
can block Myc-dependent cellular transformation in cell culture assays
[43], implying that it may itself provide a tumor suppressor function in
vivo. The frequency of MGA hypermethylation in breast tumors
suggests that it may serve to accentuate the activity of Myc, even in the
absence of Myc amplification or overexpression. Future studies of the
association between MGA hypermethyaltion, transcriptional repres-
sion and Myc amplification/overexpression may reveal directly
cooperative mechanisms involving oncogene activation and epige-
netic inactivation of negative regulators of oncogene activity.
Finally, our approach identified previously uncharacterized loci
subject to aberrant DNA methylation in breast cancer. For example,
the uncharacterized locus corresponding to chr7-8256680 was
hypermethylated at a similar frequency to GHSR (90 of 101 tumors;
89%). This region is located on chromosome 7, from approximate
nucleotide 8449665 to 8450724 (hg18 (Ensembl 43, NCBI 36)), and
includes an annotated CpG island. The region is devoid of confirmed
genes within approximately 0.2 Mb upstream or downstream of this
sequence, however the sequence falls within the 39 regions of two
juxtaposed predicted transcripts (Fig. S3). The exceptionally high
sensitivity and specificity of this differentially methylated locus for
breast cancer suggests that it imparts some functional consequence.
Therefore, our approach for DNA methylation profiling may
ultimately lead to the discovery of previously uncharacterized
genomic elements that are important in tumorigenesis.
Figure 5. Differential DNA methylation of selected loci. (A) DNA methylation measurements for selected loci in normal blood, normal or benignbreast tissue and breast tumors. Each data point represents the averaged delta Ct value for an independent clinical sample. (B) ROC curve analyses ofthe four loci shown in (A). Sensitivity (percentage of tumor samples scoring above a methylation threshold) and specificity (percentage of non-tumorsamples scoring below that same threshold) were calculated for all observed delta Ct values. The minimum allowed threshold was set at 0.5 so thatcalculations could not be based on thresholds within the variability range of the qPCR platform.doi:10.1371/journal.pone.0001314.g005
Epigenetics of Breast Cancer
PLoS ONE | www.plosone.org 8 December 2007 | Issue 12 | e1314

MATERIALS AND METHODSTissues and Nucleic Acid PreparationsBreast tissue samples were obtained from Genomics Collaborative
Institute (Essex IRB, Protocol Number 99-501.04) or provided
through North Glasgow NHS Trust. Whole blood samples were
obtained from Research Blood Components. All samples were
collected with appropriate institute ethics approval and written
consent was provided by each patient. Demographic and source
information for patients included in this study is provided in
Tables S1 and S4. Neoplastic cellularity of all breast samples was
confirmed by H&E histology. Genomic DNA from both breast
tissues and whole blood samples was extracted with the
MasterPure DNA extraction kit (EpiCentre) by the manufacturer’s
protocol. For gene expression studies, 4 IDC samples were
homogenized in PBS and split into two portions. Genomic DNA
was extracted from one portion with the MasterPure DNA
Figure 6. Bisulphite sequencing analysis of DNA methylation. Analyzed loci included GHSR (A, B), the uncharacterized locus corresponding to chr7-8256880 (C, D), MGA (E, F) and NFIX (G, H). Bisulphite sequencing was performed by 454 Life Sciences technology as described in Materials andMethods. The average number of molecules sequenced for each locus within each sample was 587. The calculated DNA methylation density (numberof methylated CpGs divided by the total number of CpGs sequenced) for each sample is plotted versus the qPCR DNA methylation measurement forthe same sample (A, C, E, G). Analyzed samples included normal breast tissues (open circles), tumor-adjacent histology normal breast tissues (filledcircles) and breast tumors (filled squares). The number of samples analyzed and the qPCR-based methylation score are as follows: GHSR, 6 tumor (5densely and 1 intermediately methylated), 3 adjacent normal (sparsely methylated) and 5 normal (sparsely methylated); chr7-8256880, 6 tumor (3densely and 3 intermediately methylated), 3 adjacent normal (sparsely methylated) and 7 normal (sparsely methylated); MGA, 6 tumor (2 densely and4 intermediately methylated), 3 adjacent normal (2 sparsely and 1 intermediately methylated) and 5 normal (sparsely methylated); NFIX, 5 tumor(densely methylated), 3 adjacent normal (sparsely methylated) and 5 normal (sparsely methylated). In addition, the percent methylation occupancy ateach analyzed CpG dinucleotide is shown (B, D, F, H).doi:10.1371/journal.pone.0001314.g006
Epigenetics of Breast Cancer
PLoS ONE | www.plosone.org 9 December 2007 | Issue 12 | e1314
extraction kit. Total RNA was extracted from the second portion
with TRIzol reagent (Invitrogen) by the manufacturer’s protocol.
DNA Methylation-Dependent DNA Fractionation,
Microarray Hybridizations and Data AnalysisDNA samples were fractionated based on DNA methylation
density as previously described [27]. Briefly, 60 mg DNA was
mechanically sheared into a uniform 1 to 4 Kb molecular weight
distribution (GeneMachines HydroShear) and split into 4 equal
portions. Two portions (treated technical replicates) were digested
with McrBC (NEB) in 150 mL total volume including 16 NEB2
buffer, 0.1 mg/mL bovine serum albumin, 2 mM GTP and 100
units McrBC. The remaining two portions were mock-treated
under identical conditions except that 10 mL sterile 50% glycerol
was added instead of McrBC. Following overnight digestion,
reactions were treated with 5 mL proteinase K (50 mg/mL) for
1 hour at 50uC, and precipitated with EtOH under standard
conditions. Samples were resolved on a 1% low melting point
SeaPlaque GTG Agarose gel (Cambridge Bio Sciences, Rockland,
ME). DNA within the modal size range of the untreated fraction
(1–4 Kb) was excised and extracted from gel slices with Gel
Extraction spin columns (Qiagen).
The OGHAv1.0 microarray has been previously described [27].
Microarray hybridization experiments were performed by Nim-
bleGen Systems using a duplicated dye-swap design. The
microarray data were analyzed with the objective of identifying
differentially methylated regions between tumor and adjacent
normal genomes. Convergence of independently derived gene-lists
was utilized as a metric for target nomination. First, all adjacent
normal and tumor data were separately normalized using a
modified method of Yang et al [44]. The normalized data sets
were analyzed using ANOVA and previously described methods
[27] to identify differentially methylated regions between pheno-
types. The second method did not employ normalization, rather
each individual’s adjacent normal sample was compared to the
matching paired tumor tissue, providing a genetic control for
individual-to-individual variation in DNA methylation. In this
analysis, loci were nominated for each tissue pair, and those that
were consistently selected across the nine matched pairs were
identified. Analyses employed both per-gene and common
variance and utilized the Holm and False Discovery Rate methods
to control for multiple testing errors [45,46]. Only microarray
features that were significant in both the per-gene and common
variance analyses were considered. Finally, a locus list was
nominated based on the overlap between the previous two
analyses. Detailed descriptions of statistical analysis methods,
including normalization to control features representing loci
lacking McrBC half sites, are available [27].
Quantitative PCR Analysis of DNA MethylationPCR primers were designed to amplify approximately 400–600 bp
amplicons within a 1 Kb sequence window spanning the sequence
represented by the associated microarray feature. Primer selection
was guided by uniqueness of the oligonucleotide sequence across
the human genome, as well as the CpG distribution within the
1 Kb sequence window. All primer pairs were confirmed to
amplify a single product of appropriate size. Oligonucleotide
sequences are provided in Table S5. DNA methylation was
monitored by qPCR analysis of mock-treated and McrBC-digested
portions of each sample, as previously described [27]. Breast and
whole blood samples were treated identically. Genomic DNA
samples (4 mg) were digested with McrBC (NEB) in 200 mL total
volume including 16 NEB2 buffer, 0.1 mg/mL bovine serum
albumin, 2 mM GTP and 32 units McrBC overnight at 37uC.
Mock treatment was performed under identical conditions with
the exception that sterile 50% glycerol was substituted for McrBC.
All samples were incubated at 65uC for 20 min. to inactivate the
McrBC. To avoid variation in DNA recovery, no further
purification was performed prior to qPCR. 20 ng of each
treatment was amplified in 10 mL volume including 16 SYBR
Green Master Mix (Roche) and 625 nM each primer. All
treatment pair reactions were performed in duplicate. qPCR was
performed on the Roche LC480 system under the following
conditions: Preamplification, 95uC for 5 min.; Amplification, 45
cycles of 95uC for 1 min., 66uC for 30 sec., 72uC for 1 min., 80uCfor 2 sec. followed by a single acquisition; Metlting curve, 95uC for
5 min., 65uC for 1 min., ramped to 99uC at 2.5u per sec. with
continuous acquisition. Digestion by McrBC was quality con-
trolled by qPCR analysis of the promoter of the TH2B gene, which
is densely methylated in all tissues except the testes [47]. All
samples displayed a TH2B delta Ct$4.0 (.90% depletion of the
amplified region in the McrBC-digested portion relative to the
mock-treated portion). The percent TH2B depletion for tumor,
normal or benign breast tissue and blood samples did not differ
Figure 7. Correlation between DNA hypermethylation and gene expression. Transcription of GHSR1a was analyzed by RT-PCR. RT-PCR wasperformed using gene-specific primer pairs designed to flank intronic sequence so that the contribution of contaminating genomic DNA could beexcluded. Analysis of GAPDH expression was performed as an internal control. Serial dilutions of first-strand cDNA preparations from tumor samplesand a normal breast tissue sample were used as templates for PCR. The DNA methylation measurement (qPCR) for each locus in each tumor sample isindicated (- sparse, + intermediate and ++ dense methylation).doi:10.1371/journal.pone.0001314.g007
Epigenetics of Breast Cancer
PLoS ONE | www.plosone.org 10 December 2007 | Issue 12 | e1314

significantly (p.0.5 for all pair wise combinations). For each
McrBC-digested/mock-treated reaction pair, a delta Ct
(Ct McrBC–Ct Mock) was calculated. Duplicate delta Ct values were
averaged, and the standard deviations between delta Ct values
were determined. All reported average delta Ct values had
standard deviations less than 1 cycle.
Bisulphite Sequencing AnalysesBisulphite sequencing primers were designed to amplify DNA
corresponding to the amplicons used for quantitative PCR
analyses. Primer pairs (Table S5) flanked, but did not include,
CpG dinucleotides [48]. For each analyzed DNA sample, 1–2 mg
was bisulphite converted using EZ DNA Methylation Kits (Zymo
Research) following the manufacturer’s protocol. In-depth bisul-
phite sequencing was performed using the 454 Life Sciences
platform. One oligonucleotide of each primer pair included a
59patient-specific four-to-five base sequence tag [29]. Each tissue
sample was amplified with a primer pair including a unique
sequence tag. Amplicons were gel purified and quantified, then
combined in equal molar concentrations. DNA sequencing was
performed by the Washington University Genome Sequencing
Center. To control for bisulphite conversion efficiency, incom-
pletely converted molecules were identified and eliminated using
the MethylMapper BisY control [49]. This excluded approxi-
mately 2% of the eligible reads. The next level of quality control
assessed each read by ensuring that it exhibited a single-hit with a
long high-scoring BLAST pair. Greater than 80% of the data
passed both quality control metrics. Each amplicon and each
patient were adequately represented in the final data collection,
confirming that no single patient or amplicon dominated the
analysis. MethylMapper BisT analysis [49] was used to generate
DNA methylation data by CpG position and by molecule.
GHSR Gene Expression AnalysesFor IDC samples, 5 mg total RNA was used as template for cDNA
synthesis by the Superscript III First Strand Synthesis System
(Invitrogen) using the manufacturer’s protocol. Prior to cDNA
synthesis, RNA samples were treated with recombinant DNase I
(Ambion) by the manufacturer’s protocol. Normal breast cDNA
was obtained from Invitrogen and was prepared using the same
protocol. cDNA concentrations were normalized between samples
and serial dilutions were used as template for PCR amplification.
PCR primers (Table S5) were designed to flank intronic sequence
so that amplification from contaminating genomic DNA could be
excluded. Each reaction was performed in 10 mL total volume
including 16SYBR Green I Master mix (Roche) and 625 nM of
each primer. PCR conditions for GHSR were as described [33].
Cycling conditions for GAPDH were 1 cycle of 95uC for 5 min., 30
cycles of 95uC for 30 sec., 65uC for 15 sec., 72uC for 15 sec., and
1 cycle of 72uC for 10 min. Amplification products (1 mL) were
visualized and quantified using an Agilent Bioanalyzer 3100 and
DNA 1000 LabChips (Agilent). All reactions were performed at
least three times using two independently synthesized cDNA
preparations.
SUPPORTING INFORMATION
Figure S1 Repeated GHSR qPCR analyses for samples near the
0.64 threshold for sensitivity and specificity calculations. 16
samples were analyzed three times (REP1, REP2, REP3).
Digestions were performed using a different lot of McrBC enzyme
than that used for the experiments summarized in Table 1
(ORIGINAL). Each value is an averaged dCt between two qPCR
technical replicates. Samples scoring above the threshold are
indicated in red, and those scoring below the threshold are
indicated in green.
Found at: doi:10.1371/journal.pone.0001314.s001 (0.01 MB
PDF)
Figure S2 Detection of tumor-specific DNA hypermethylation
in fine needle aspirate specimens. Eight biomarker loci were
screened in seven FNA samples obtained from confirmed breast
cancer cases. For each locus, the percentage of FNA samples that
reported hypermethylation was plotted against the percentage of
independent tumor samples that reported hypermethylation. If the
biomarkers are detecting breast cancer at the same frequency as in
tissue samples the expectation is that the two results should be
directly proportional (i.e. exhibit a sensitivity slope of 1.0). This
theoretical maxim is indicated by the dashed y = x line. The actual
slope (solid line) and its R2 are indicated. The theoretical and
experimental results are not significantly different (n = 8 data
points).
Found at: doi:10.1371/journal.pone.0001314.s002 (0.01 MB
PDF)
Figure S3 Ensembl contig view of the uncharacterized locus
corresponding to chr7-8256680(NCBI35). The position of the
microarray feature that reported differential DNA methylation
and Ensembl annotated CpG islands are indicated by arrows
(NCBI36(hg18)).
Found at: doi:10.1371/journal.pone.0001314.s003 (0.16 MB
PDF)
Table S1 Patient demographics for samples used in microarray
analyses
Found at: doi:10.1371/journal.pone.0001314.s004 (0.04 MB
DOC)
Table S2 Microarray data.
Found at: doi:10.1371/journal.pone.0001314.s005 (1.06 MB
XLS)
Table S3 Sensitivity/Specificity of Breast Cancer Biomarkers in
Initial Validation Panel.
Found at: doi:10.1371/journal.pone.0001314.s006 (0.03 MB
XLS)
Table S4 Patient demographics for samples used in validation
analyses.
Found at: doi:10.1371/journal.pone.0001314.s007 (0.08 MB
DOC)
Table S5 Oligo sequences
Found at: doi:10.1371/journal.pone.0001314.s008 (0.03 MB
XLS)
ACKNOWLEDGMENTSC. Tatham, A. Garrido A. Nunberg, and D. Robbins provided
programming, database and networking support. J. Monte, J.I.T. Jones,
J. Fries, M. Smith, J. McMenamy and H. Holemon contributed to
technology implementation and technical support.
Author Contributions
Conceived and designed the experiments: RM NL JJ YK JO MB RB JL
JM RD. Performed the experiments: YK BB JO MB SP. Analyzed the
data: JJ YK RM BB JO MB JB JH SP RC RD. Contributed reagents/
materials/analysis tools: JH RB. Wrote the paper: JJ RM JO. Other:
Project management: TR. Sample acquisition oversight: TR. Designed the
the study: JO. Lead role in writing of the paper: JO.
Epigenetics of Breast Cancer
PLoS ONE | www.plosone.org 11 December 2007 | Issue 12 | e1314

REFERENCES1. Nystrom L, Andersson I, Bjurstam N, Frisell J, Nordenskjold B, et al. (2002)
Long-term effects of mammography screening: updated overview of the Swedishrandomised trials. Lancet 359: 909–919.
2. Miller AB, To T, Baines CJ, Wall C (2002) The Canadian National Breast
Screening Study-1: breast cancer mortality after 11 to 16 years of follow-up. Arandomized screening trial of mammography in women age 40 to 49 years. Ann
Intern Med 137: 305–312.3. Zahl PH, Strand BH, Maehlen J (2004) Incidence of breast cancer in Norway
and Sweden during introduction of nationwide screening: prospective cohortstudy. Bmj 328: 921–924.
4. Elmore JG, Barton MB, Moceri VM, Polk S, Arena PJ, et al. (1998) Ten-year
risk of false positive screening mammograms and clinical breast examinations.N Engl J Med 338: 1089–1096.
5. Rosenberg RD, Hunt WC, Williamson MR, Gilliland FD, Wiest PW, et al.(1998) Effects of age, breast density, ethnicity, and estrogen replacement therapy
on screening mammographic sensitivity and cancer stage at diagnosis: review of
183,134 screening mammograms in Albuquerque, New Mexico. Radiology 209:511–518.
6. Kerlikowske K, Grady D, Barclay J, Sickles EA, Ernster V (1996) Likelihoodratios for modern screening mammography. Risk of breast cancer based on age
and mammographic interpretation. Jama 276: 39–43.7. Kriege M, Brekelmans CT, Boetes C, Besnard PE, Zonderland HM, et al. (2004)
Efficacy of MRI and mammography for breast-cancer screening in women with
a familial or genetic predisposition. N Engl J Med 351: 427–437.8. Miki Y, Swensen J, Shattuck-Eidens D, Futreal PA, Harshman K, et al. (1994) A
strong candidate for the breast and ovarian cancer susceptibility gene BRCA1.Science 266: 66–71.
9. Wooster R, Bignell G, Lancaster J, Swift S, Seal S, et al. (1995) Identification of
the breast cancer susceptibility gene BRCA2. Nature 378: 789–792.10. Seal S, Thompson D, Renwick A, Elliott A, Kelly P, et al. (2006) Truncating
mutations in the Fanconi anemia J gene BRIP1 are low-penetrance breastcancer susceptibility alleles. Nat Genet 38: 1239–1241.
11. Weischer M, Bojesen SE, Tybjaerg-Hansen A, Axelsson CK, Nordestgaard BG(2007) Increased risk of breast cancer associated with CHEK2*1100delC. J Clin
Oncol 25: 57–63.
12. Renwick A, Thompson D, Seal S, Kelly P, Chagtai T, et al. (2006) ATMmutations that cause ataxia-telangiectasia are breast cancer susceptibility alleles.
Nat Genet 38: 873–875.13. Akashi M, Koeffler HP (1998) Li-Fraumeni syndrome and the role of the p53
tumor suppressor gene in cancer susceptibility. Clin Obstet Gynecol 41:
172–199.14. Coles C, Condie A, Chetty U, Steel CM, Evans HJ, et al. (1992) p53 mutations
in breast cancer. Cancer Res 52: 5291–5298.15. Colditz GA, Willett WC, Hunter DJ, Stampfer MJ, Manson JE, et al. (1993)
Family history, age, and risk of breast cancer. Prospective data from the Nurses’
Health Study. Jama 270: 338–343.16. Slattery ML, Kerber RA (1993) A comprehensive evaluation of family history
and breast cancer risk. The Utah Population Database. Jama 270: 1563–1568.17. Johnson N, Lancaster T, Fuller A, Hodgson SV (1995) The prevalence of a
family history of cancer in general practice. Fam Pract 12: 287–289.18. Sjoblom T, Jones S, Wood LD, Parsons DW, Lin J, et al. (2006) The consensus
coding sequences of human breast and colorectal cancers. Science 314: 268–274.
19. Jones PA, Baylin SB (2002) The fundamental role of epigenetic events in cancer.Nat Rev Genet 3: 415–428.
20. Ting AH, McGarvey KM, Baylin SB (2006) The cancer epigenome–components and functional correlates. Genes Dev 20: 3215–3231.
21. Feinberg AP, Ohlsson R, Henikoff S (2006) The epigenetic progenitor origin of
human cancer. Nat Rev Genet 7: 21–33.22. Miyamoto K, Ushijima T (2005) Diagnostic and therapeutic applications of
epigenetics. Jpn J Clin Oncol 35: 293–301.23. Hoque MO, Feng Q, Toure P, Dem A, Critchlow CW, et al. (2006) Detection of
aberrant methylation of four genes in plasma DNA for the detection of breastcancer. J Clin Oncol 24: 4262–4269.
24. Fackler MJ, McVeigh M, Mehrotra J, Blum MA, Lange J, et al. (2004)
Quantitative multiplex methylation-specific PCR assay for the detection ofpromoter hypermethylation in multiple genes in breast cancer. Cancer Res 64:
4442–4452.25. Lippman Z, Gendrel AV, Black M, Vaughn MW, Dedhia N, et al. (2004) Role
of transposable elements in heterochromatin and epigenetic control. Nature 430:
471–476.26. Lippman Z, Gendrel AV, Colot V, Martienssen R (2005) Profiling DNA
methylation patterns using genomic tiling microarrays. Nat Methods 2:219–224.
27. Ordway JM, Bedell JA, Citek RW, Nunberg A, Garrido A, et al. (2006)
Comprehensive DNA methylation profiling in a human cancer genome
identifies novel epigenetic targets. Carcinogenesis 27: 2409–2423.
28. Shames DS, Girard L, Gao B, Sato M, Lewis CM, et al. (2006) A genome-wide
screen for promoter methylation in lung cancer identifies novel methylation
markers for multiple malignancies. PLoS Med 3: e486.
29. Korshunova K, Maloney RK, Lakey N, Citek RW, Bacher B, et al. Massively
Parallel Bisulphite Pyrosequencing Reveals the Molecular Complexity of Breast
Cancer Associated Cytosine Methylation Patterns Obtained from Tissue and
Serum DNA. Genome Research. In press.
30. McKee KK, Palyha OC, Feighner SD, Hreniuk DL, Tan CP, et al. (1997)
Molecular analysis of rat pituitary and hypothalamic growth hormone
secretagogue receptors. Mol Endocrinol 11: 415–423.
31. Petersenn S, Rasch AC, Penshorn M, Beil FU, Schulte HM (2001) Genomic
structure and transcriptional regulation of the human growth hormone
secretagogue receptor. Endocrinology 142: 2649–2659.
32. Jeffery PL, Herington AC, Chopin LK (2003) The potential autocrine/paracrine
roles of ghrelin and its receptor in hormone-dependent cancer. Cytokine Growth
Factor Rev 14: 113–122.
33. Jeffery PL, Murray RE, Yeh AH, McNamara JF, Duncan RP, et al. (2005)
Expression and function of the ghrelin axis, including a novel preproghrelin
isoform, in human breast cancer tissues and cell lines. Endocr Relat Cancer 12:
839–850.
34. Barzon L, Pacenti M, Masi G, Stefani AL, Fincati K, et al. (2005) Loss of growth
hormone secretagogue receptor 1a and overexpression of type 1b receptor
transcripts in human adrenocortical tumors. Oncology 68: 414–421.
35. Howard AD, Feighner SD, Cully DF, Arena JP, Liberator PA, et al. (1996) A
receptor in pituitary and hypothalamus that functions in growth hormone
release. Science 273: 974–977.
36. Deming SL, Nass SJ, Dickson RB, Trock BJ (2000) C-myc amplification in
breast cancer: a meta-analysis of its occurrence and prognostic relevance.
Br J Cancer 83: 1688–1695.
37. Linke SP, Bremer TM, Herold CD, Sauter G, Diamond C (2006) A
multimarker model to predict outcome in tamoxifen-treated breast cancer
patients. Clin Cancer Res 12: 1175–1183.
38. Scorilas A, Trangas T, Yotis J, Pateras C, Talieri M (1999) Determination of c-
myc amplification and overexpression in breast cancer patients: evaluation of its
prognostic value against c-erbB-2, cathepsin-D and clinicopathological charac-
teristics using univariate and multivariate analysis. Br J Cancer 81: 1385–1391.
39. Naidu R, Wahab NA, Yadav M, Kutty MK (2002) Protein expression and
molecular analysis of c-myc gene in primary breast carcinomas using
immunohistochemistry and differential polymerase chain reaction. Int J Mol
Med 9: 189–196.
40. Chrzan P, Skokowski J, Karmolinski A, Pawelczyk T (2001) Amplification of c-
myc gene and overexpression of c-Myc protein in breast cancer and adjacent
non-neoplastic tissue. Clin Biochem 34: 557–562.
41. Grandori C, Cowley SM, James LP, Eisenman RN (2000) The Myc/Max/Mad
network and the transcriptional control of cell behavior. Annu Rev Cell Dev Biol
16: 653–699.
42. Ogawa H, Ishiguro K, Gaubatz S, Livingston DM, Nakatani Y (2002) A
complex with chromatin modifiers that occupies E2F- and Myc-responsive genes
in G0 cells. Science 296: 1132–1136.
43. Hurlin PJ, Huang J (2006) The MAX-interacting transcription factor network.
Semin Cancer Biol 16: 265–274.
44. Yang YH, Dudoit S, Luu P, Lin DM, Peng V, et al. (2002) Normalization for
cDNA microarray data: a robust composite method addressing single and
multiple slide systematic variation. Nucleic Acids Res 30: e15.
45. Wolfinger RD, Gibson G, Wolfinger ED, Bennett L, Hamadeh H, et al. (2001)
Assessing gene significance from cDNA microarray expression data via mixed
models. J Comput Biol 8: 625–637.
46. Hochberg Y, Benjamini Y (1990) More powerful procedures for multiple
significance testing. Stat Med 9: 811–818.
47. Choi YC, Chae CB (1991) DNA hypomethylation and germ cell-specific
expression of testis-specific H2B histone gene. J Biol Chem 266: 20504–20511.
48. Frommer M, McDonald LE, Millar DS, Collis CM, Watt F, et al. (1992) A
genomic sequencing protocol that yields a positive display of 5-methylcytosine
residues in individual DNA strands. Proc Natl Acad Sci U S A 89: 1827–1831.
49. Ordway JM, Bedell JA, Citek RW, Nunberg AN, Jeddeloh JA (2005)
MethylMapper: a method for high-throughput, multilocus bisulfite sequence
analysis and reporting. Biotechniques 39: 464, 466, 468 passim.
Epigenetics of Breast Cancer
PLoS ONE | www.plosone.org 12 December 2007 | Issue 12 | e1314