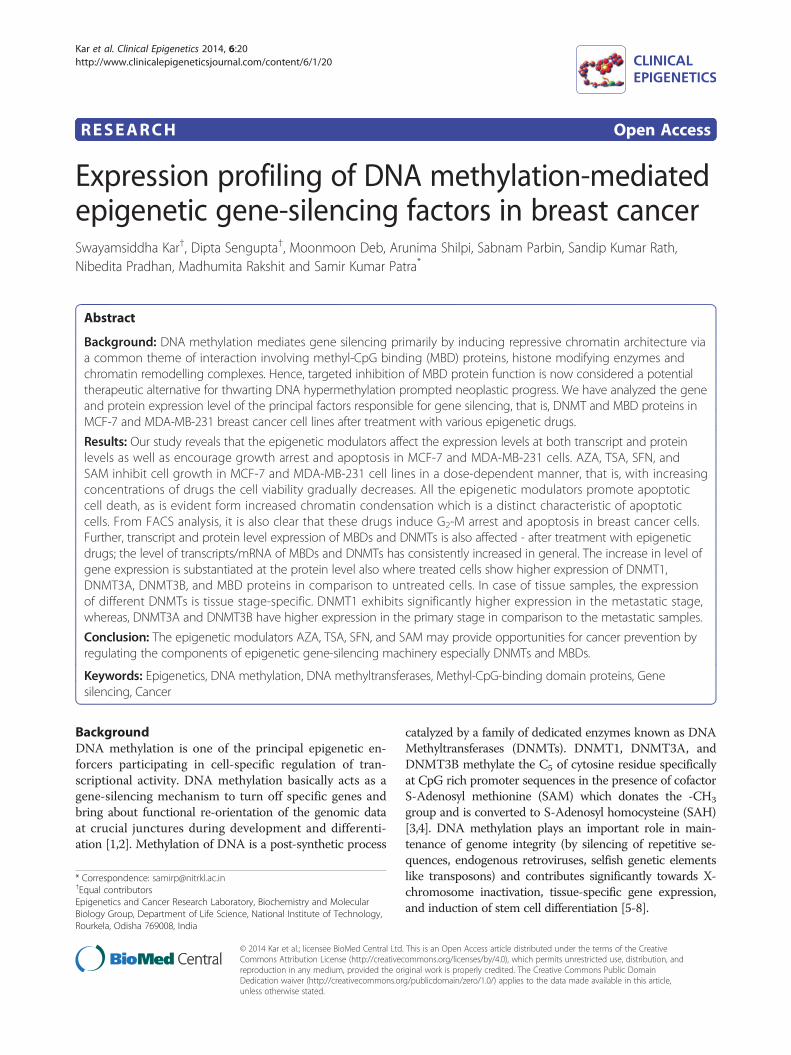
Expression profiling of DNA methylation-mediated epigenetic gene-silencing factors in breast cancer
13
RESEARCH Open Access Expression profiling of DNA methylation-mediated epigenetic gene-silencing factors in breast cancer Swayamsiddha Kar † , Dipta Sengupta † , Moonmoon Deb, Arunima Shilpi, Sabnam Parbin, Sandip Kumar Rath, Nibedita Pradhan, Madhumita Rakshit and Samir Kumar Patra * Abstract Background: DNA methylation mediates gene silencing primarily by inducing repressive chromatin architecture via a common theme of interaction involving methyl-CpG binding (MBD) proteins, histone modifying enzymes and chromatin remodelling complexes. Hence, targeted inhibition of MBD protein function is now considered a potential therapeutic alternative for thwarting DNA hypermethylation prompted neoplastic progress. We have analyzed the gene and protein expression level of the principal factors responsible for gene silencing, that is, DNMT and MBD proteins in MCF-7 and MDA-MB-231 breast cancer cell lines after treatment with various epigenetic drugs. Results: Our study reveals that the epigenetic modulators affect the expression levels at both transcript and protein levels as well as encourage growth arrest and apoptosis in MCF-7 and MDA-MB-231 cells. AZA, TSA, SFN, and SAM inhibit cell growth in MCF-7 and MDA-MB-231 cell lines in a dose-dependent manner, that is, with increasing concentrations of drugs the cell viability gradually decreases. All the epigenetic modulators promote apoptotic cell death, as is evident form increased chromatin condensation which is a distinct characteristic of apoptotic cells. From FACS analysis, it is also clear that these drugs induce G 2 -M arrest and apoptosis in breast cancer cells. Further, transcript and protein level expression of MBDs and DNMTs is also affected - after treatment with epigenetic drugs; the level of transcripts/mRNA of MBDs and DNMTs has consistently increased in general. The increase in level of gene expression is substantiated at the protein level also where treated cells show higher expression of DNMT1, DNMT3A, DNMT3B, and MBD proteins in comparison to untreated cells. In case of tissue samples, the expression of different DNMTs is tissue stage-specific. DNMT1 exhibits significantly higher expression in the metastatic stage, whereas, DNMT3A and DNMT3B have higher expression in the primary stage in comparison to the metastatic samples. Conclusion: The epigenetic modulators AZA, TSA, SFN, and SAM may provide opportunities for cancer prevention by regulating the components of epigenetic gene-silencing machinery especially DNMTs and MBDs. Keywords: Epigenetics, DNA methylation, DNA methyltransferases, Methyl-CpG-binding domain proteins, Gene silencing, Cancer Background DNA methylation is one of the principal epigenetic en- forcers participating in cell-specific regulation of tran- scriptional activity. DNA methylation basically acts as a gene-silencing mechanism to turn off specific genes and bring about functional re-orientation of the genomic data at crucial junctures during development and differenti- ation [1,2]. Methylation of DNA is a post-synthetic process catalyzed by a family of dedicated enzymes known as DNA Methyltransferases (DNMTs). DNMT1, DNMT3A, and DNMT3B methylate the C 5 of cytosine residue specifically at CpG rich promoter sequences in the presence of cofactor S-Adenosyl methionine (SAM) which donates the -CH 3 group and is converted to S-Adenosyl homocysteine (SAH) [3,4]. DNA methylation plays an important role in main- tenance of genome integrity (by silencing of repetitive se- quences, endogenous retroviruses, selfish genetic elements like transposons) and contributes significantly towards X- chromosome inactivation, tissue-specific gene expression, and induction of stem cell differentiation [5-8]. * Correspondence: [email protected] † Equal contributors Epigenetics and Cancer Research Laboratory, Biochemistry and Molecular Biology Group, Department of Life Science, National Institute of Technology, Rourkela, Odisha 769008, India © 2014 Kar et al.; licensee BioMed Central Ltd. This is an Open Access article distributed under the terms of the Creative Commons Attribution License (http://creativecommons.org/licenses/by/4.0), which permits unrestricted use, distribution, and reproduction in any medium, provided the original work is properly credited. The Creative Commons Public Domain Dedication waiver (http://creativecommons.org/publicdomain/zero/1.0/) applies to the data made available in this article, unless otherwise stated. Kar et al. Clinical Epigenetics 2014, 6:20 http://www.clinicalepigeneticsjournal.com/content/6/1/20
-
Upload
independent -
Category
Documents
-
view
0 -
download
0
Transcript of Expression profiling of DNA methylation-mediated epigenetic gene-silencing factors in breast cancer
Kar et al. Clinical Epigenetics 2014, 6:20http://www.clinicalepigeneticsjournal.com/content/6/1/20
RESEARCH Open Access
Expression profiling of DNA methylation-mediatedepigenetic gene-silencing factors in breast cancerSwayamsiddha Kar†, Dipta Sengupta†, Moonmoon Deb, Arunima Shilpi, Sabnam Parbin, Sandip Kumar Rath,Nibedita Pradhan, Madhumita Rakshit and Samir Kumar Patra*
Abstract
Background: DNA methylation mediates gene silencing primarily by inducing repressive chromatin architecture viaa common theme of interaction involving methyl-CpG binding (MBD) proteins, histone modifying enzymes andchromatin remodelling complexes. Hence, targeted inhibition of MBD protein function is now considered a potentialtherapeutic alternative for thwarting DNA hypermethylation prompted neoplastic progress. We have analyzed the geneand protein expression level of the principal factors responsible for gene silencing, that is, DNMT and MBD proteins inMCF-7 and MDA-MB-231 breast cancer cell lines after treatment with various epigenetic drugs.
Results: Our study reveals that the epigenetic modulators affect the expression levels at both transcript and proteinlevels as well as encourage growth arrest and apoptosis in MCF-7 and MDA-MB-231 cells. AZA, TSA, SFN, andSAM inhibit cell growth in MCF-7 and MDA-MB-231 cell lines in a dose-dependent manner, that is, with increasingconcentrations of drugs the cell viability gradually decreases. All the epigenetic modulators promote apoptoticcell death, as is evident form increased chromatin condensation which is a distinct characteristic of apoptoticcells. From FACS analysis, it is also clear that these drugs induce G2-M arrest and apoptosis in breast cancer cells.Further, transcript and protein level expression of MBDs and DNMTs is also affected - after treatment with epigeneticdrugs; the level of transcripts/mRNA of MBDs and DNMTs has consistently increased in general. The increase in level ofgene expression is substantiated at the protein level also where treated cells show higher expression of DNMT1,DNMT3A, DNMT3B, and MBD proteins in comparison to untreated cells. In case of tissue samples, the expressionof different DNMTs is tissue stage-specific. DNMT1 exhibits significantly higher expression in the metastatic stage,whereas, DNMT3A and DNMT3B have higher expression in the primary stage in comparison to the metastatic samples.
Conclusion: The epigenetic modulators AZA, TSA, SFN, and SAM may provide opportunities for cancer prevention byregulating the components of epigenetic gene-silencing machinery especially DNMTs and MBDs.
Keywords: Epigenetics, DNA methylation, DNA methyltransferases, Methyl-CpG-binding domain proteins, Genesilencing, Cancer
BackgroundDNA methylation is one of the principal epigenetic en-forcers participating in cell-specific regulation of tran-scriptional activity. DNA methylation basically acts as agene-silencing mechanism to turn off specific genes andbring about functional re-orientation of the genomic dataat crucial junctures during development and differenti-ation [1,2]. Methylation of DNA is a post-synthetic process
* Correspondence: [email protected]†Equal contributorsEpigenetics and Cancer Research Laboratory, Biochemistry and MolecularBiology Group, Department of Life Science, National Institute of Technology,Rourkela, Odisha 769008, India
© 2014 Kar et al.; licensee BioMed Central LtdCommons Attribution License (http://creativecreproduction in any medium, provided the orDedication waiver (http://creativecommons.orunless otherwise stated.
catalyzed by a family of dedicated enzymes known as DNAMethyltransferases (DNMTs). DNMT1, DNMT3A, andDNMT3B methylate the C5 of cytosine residue specificallyat CpG rich promoter sequences in the presence of cofactorS-Adenosyl methionine (SAM) which donates the -CH3
group and is converted to S-Adenosyl homocysteine (SAH)[3,4]. DNA methylation plays an important role in main-tenance of genome integrity (by silencing of repetitive se-quences, endogenous retroviruses, selfish genetic elementslike transposons) and contributes significantly towards X-chromosome inactivation, tissue-specific gene expression,and induction of stem cell differentiation [5-8].
. This is an Open Access article distributed under the terms of the Creativeommons.org/licenses/by/4.0), which permits unrestricted use, distribution, andiginal work is properly credited. The Creative Commons Public Domaing/publicdomain/zero/1.0/) applies to the data made available in this article,
Kar et al. Clinical Epigenetics 2014, 6:20 Page 2 of 13http://www.clinicalepigeneticsjournal.com/content/6/1/20
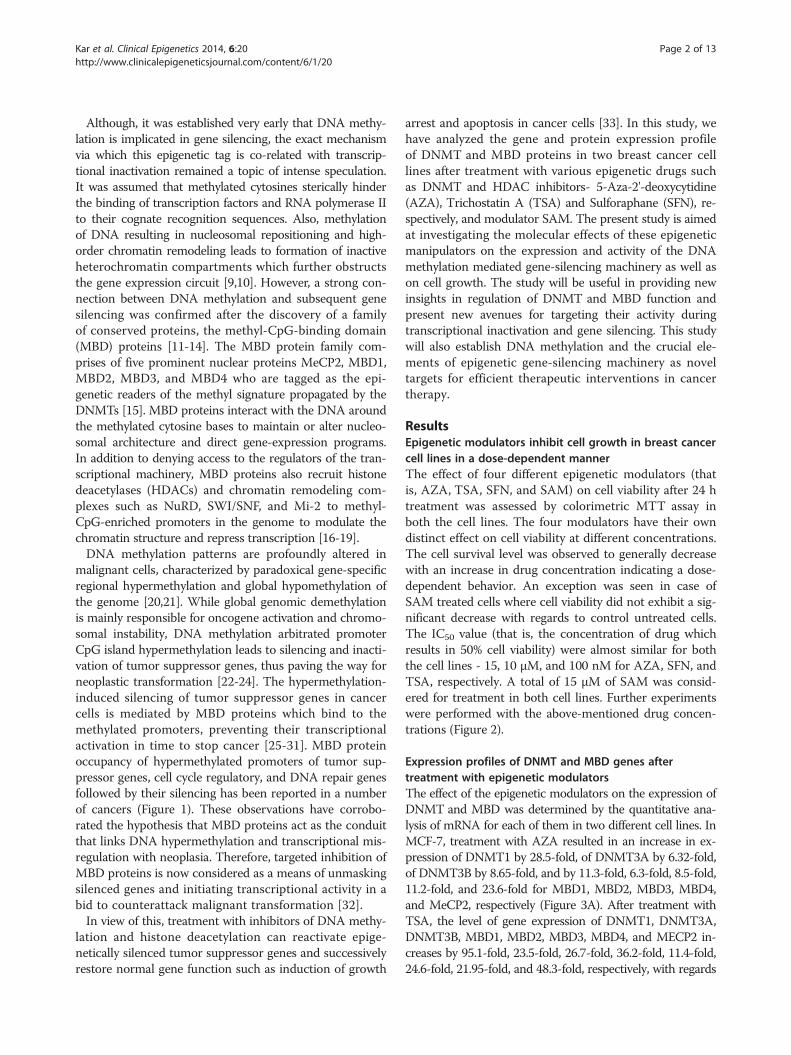
Although, it was established very early that DNA methy-lation is implicated in gene silencing, the exact mechanismvia which this epigenetic tag is co-related with transcrip-tional inactivation remained a topic of intense speculation.It was assumed that methylated cytosines sterically hinderthe binding of transcription factors and RNA polymerase IIto their cognate recognition sequences. Also, methylationof DNA resulting in nucleosomal repositioning and high-order chromatin remodeling leads to formation of inactiveheterochromatin compartments which further obstructsthe gene expression circuit [9,10]. However, a strong con-nection between DNA methylation and subsequent genesilencing was confirmed after the discovery of a familyof conserved proteins, the methyl-CpG-binding domain(MBD) proteins [11-14]. The MBD protein family com-prises of five prominent nuclear proteins MeCP2, MBD1,MBD2, MBD3, and MBD4 who are tagged as the epi-genetic readers of the methyl signature propagated by theDNMTs [15]. MBD proteins interact with the DNA aroundthe methylated cytosine bases to maintain or alter nucleo-somal architecture and direct gene-expression programs.In addition to denying access to the regulators of the tran-scriptional machinery, MBD proteins also recruit histonedeacetylases (HDACs) and chromatin remodeling com-plexes such as NuRD, SWI/SNF, and Mi-2 to methyl-CpG-enriched promoters in the genome to modulate thechromatin structure and repress transcription [16-19].DNA methylation patterns are profoundly altered in
malignant cells, characterized by paradoxical gene-specificregional hypermethylation and global hypomethylation ofthe genome [20,21]. While global genomic demethylationis mainly responsible for oncogene activation and chromo-somal instability, DNA methylation arbitrated promoterCpG island hypermethylation leads to silencing and inacti-vation of tumor suppressor genes, thus paving the way forneoplastic transformation [22-24]. The hypermethylation-induced silencing of tumor suppressor genes in cancercells is mediated by MBD proteins which bind to themethylated promoters, preventing their transcriptionalactivation in time to stop cancer [25-31]. MBD proteinoccupancy of hypermethylated promoters of tumor sup-pressor genes, cell cycle regulatory, and DNA repair genesfollowed by their silencing has been reported in a numberof cancers (Figure 1). These observations have corrobo-rated the hypothesis that MBD proteins act as the conduitthat links DNA hypermethylation and transcriptional mis-regulation with neoplasia. Therefore, targeted inhibition ofMBD proteins is now considered as a means of unmaskingsilenced genes and initiating transcriptional activity in abid to counterattack malignant transformation [32].In view of this, treatment with inhibitors of DNA methy-
lation and histone deacetylation can reactivate epige-netically silenced tumor suppressor genes and successivelyrestore normal gene function such as induction of growth
arrest and apoptosis in cancer cells [33]. In this study, wehave analyzed the gene and protein expression profileof DNMT and MBD proteins in two breast cancer celllines after treatment with various epigenetic drugs suchas DNMT and HDAC inhibitors- 5-Aza-2'-deoxycytidine(AZA), Trichostatin A (TSA) and Sulforaphane (SFN), re-spectively, and modulator SAM. The present study is aimedat investigating the molecular effects of these epigeneticmanipulators on the expression and activity of the DNAmethylation mediated gene-silencing machinery as well ason cell growth. The study will be useful in providing newinsights in regulation of DNMT and MBD function andpresent new avenues for targeting their activity duringtranscriptional inactivation and gene silencing. This studywill also establish DNA methylation and the crucial ele-ments of epigenetic gene-silencing machinery as noveltargets for efficient therapeutic interventions in cancertherapy.
ResultsEpigenetic modulators inhibit cell growth in breast cancercell lines in a dose-dependent mannerThe effect of four different epigenetic modulators (thatis, AZA, TSA, SFN, and SAM) on cell viability after 24 htreatment was assessed by colorimetric MTT assay inboth the cell lines. The four modulators have their owndistinct effect on cell viability at different concentrations.The cell survival level was observed to generally decreasewith an increase in drug concentration indicating a dose-dependent behavior. An exception was seen in case ofSAM treated cells where cell viability did not exhibit a sig-nificant decrease with regards to control untreated cells.The IC50 value (that is, the concentration of drug whichresults in 50% cell viability) were almost similar for boththe cell lines - 15, 10 μM, and 100 nM for AZA, SFN, andTSA, respectively. A total of 15 μM of SAM was consid-ered for treatment in both cell lines. Further experimentswere performed with the above-mentioned drug concen-trations (Figure 2).
Expression profiles of DNMT and MBD genes aftertreatment with epigenetic modulatorsThe effect of the epigenetic modulators on the expression ofDNMT and MBD was determined by the quantitative ana-lysis of mRNA for each of them in two different cell lines. InMCF-7, treatment with AZA resulted in an increase in ex-pression of DNMT1 by 28.5-fold, of DNMT3A by 6.32-fold,of DNMT3B by 8.65-fold, and by 11.3-fold, 6.3-fold, 8.5-fold,11.2-fold, and 23.6-fold for MBD1, MBD2, MBD3, MBD4,and MeCP2, respectively (Figure 3A). After treatment withTSA, the level of gene expression of DNMT1, DNMT3A,DNMT3B, MBD1, MBD2, MBD3, MBD4, and MECP2 in-creases by 95.1-fold, 23.5-fold, 26.7-fold, 36.2-fold, 11.4-fold,24.6-fold, 21.95-fold, and 48.3-fold, respectively, with regards
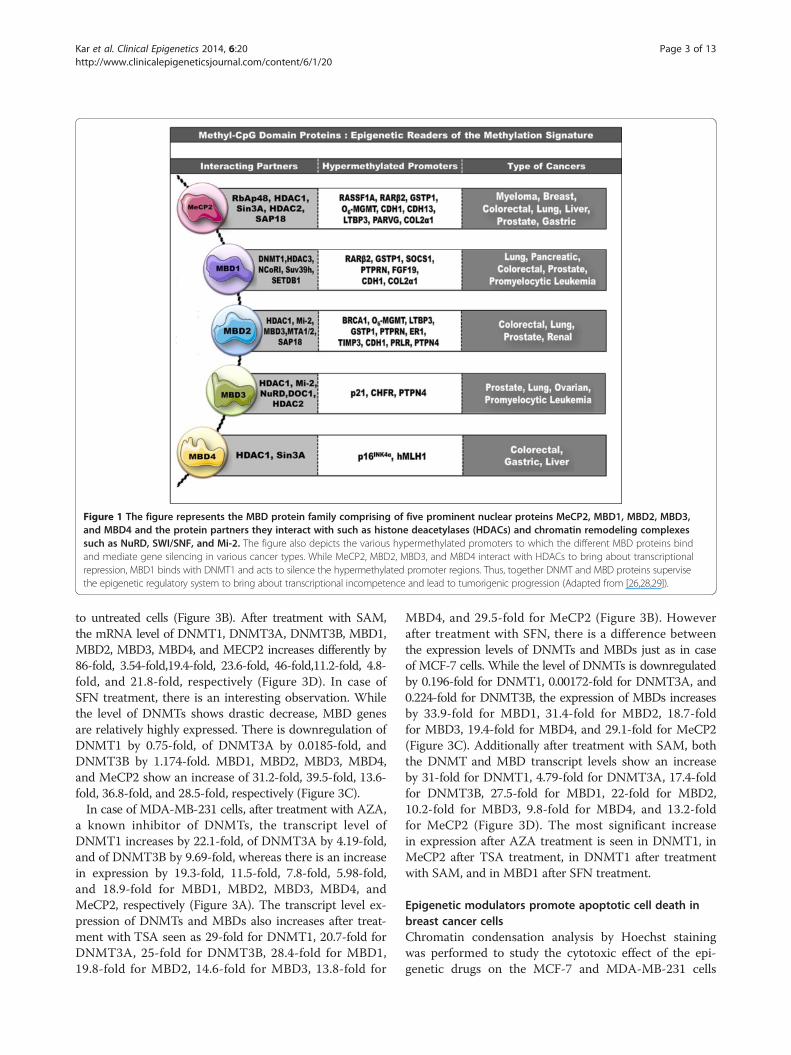
Figure 1 The figure represents the MBD protein family comprising of five prominent nuclear proteins MeCP2, MBD1, MBD2, MBD3,and MBD4 and the protein partners they interact with such as histone deacetylases (HDACs) and chromatin remodeling complexessuch as NuRD, SWI/SNF, and Mi-2. The figure also depicts the various hypermethylated promoters to which the different MBD proteins bindand mediate gene silencing in various cancer types. While MeCP2, MBD2, MBD3, and MBD4 interact with HDACs to bring about transcriptionalrepression, MBD1 binds with DNMT1 and acts to silence the hypermethylated promoter regions. Thus, together DNMT and MBD proteins supervisethe epigenetic regulatory system to bring about transcriptional incompetence and lead to tumorigenic progression (Adapted from [26,28,29]).
Kar et al. Clinical Epigenetics 2014, 6:20 Page 3 of 13http://www.clinicalepigeneticsjournal.com/content/6/1/20
to untreated cells (Figure 3B). After treatment with SAM,the mRNA level of DNMT1, DNMT3A, DNMT3B, MBD1,MBD2, MBD3, MBD4, and MECP2 increases differently by86-fold, 3.54-fold,19.4-fold, 23.6-fold, 46-fold,11.2-fold, 4.8-fold, and 21.8-fold, respectively (Figure 3D). In case ofSFN treatment, there is an interesting observation. Whilethe level of DNMTs shows drastic decrease, MBD genesare relatively highly expressed. There is downregulation ofDNMT1 by 0.75-fold, of DNMT3A by 0.0185-fold, andDNMT3B by 1.174-fold. MBD1, MBD2, MBD3, MBD4,and MeCP2 show an increase of 31.2-fold, 39.5-fold, 13.6-fold, 36.8-fold, and 28.5-fold, respectively (Figure 3C).In case of MDA-MB-231 cells, after treatment with AZA,
a known inhibitor of DNMTs, the transcript level ofDNMT1 increases by 22.1-fold, of DNMT3A by 4.19-fold,and of DNMT3B by 9.69-fold, whereas there is an increasein expression by 19.3-fold, 11.5-fold, 7.8-fold, 5.98-fold,and 18.9-fold for MBD1, MBD2, MBD3, MBD4, andMeCP2, respectively (Figure 3A). The transcript level ex-pression of DNMTs and MBDs also increases after treat-ment with TSA seen as 29-fold for DNMT1, 20.7-fold forDNMT3A, 25-fold for DNMT3B, 28.4-fold for MBD1,19.8-fold for MBD2, 14.6-fold for MBD3, 13.8-fold for
MBD4, and 29.5-fold for MeCP2 (Figure 3B). Howeverafter treatment with SFN, there is a difference betweenthe expression levels of DNMTs and MBDs just as in caseof MCF-7 cells. While the level of DNMTs is downregulatedby 0.196-fold for DNMT1, 0.00172-fold for DNMT3A, and0.224-fold for DNMT3B, the expression of MBDs increasesby 33.9-fold for MBD1, 31.4-fold for MBD2, 18.7-foldfor MBD3, 19.4-fold for MBD4, and 29.1-fold for MeCP2(Figure 3C). Additionally after treatment with SAM, boththe DNMT and MBD transcript levels show an increaseby 31-fold for DNMT1, 4.79-fold for DNMT3A, 17.4-foldfor DNMT3B, 27.5-fold for MBD1, 22-fold for MBD2,10.2-fold for MBD3, 9.8-fold for MBD4, and 13.2-foldfor MeCP2 (Figure 3D). The most significant increasein expression after AZA treatment is seen in DNMT1, inMeCP2 after TSA treatment, in DNMT1 after treatmentwith SAM, and in MBD1 after SFN treatment.
Epigenetic modulators promote apoptotic cell death inbreast cancer cellsChromatin condensation analysis by Hoechst stainingwas performed to study the cytotoxic effect of the epi-genetic drugs on the MCF-7 and MDA-MB-231 cells
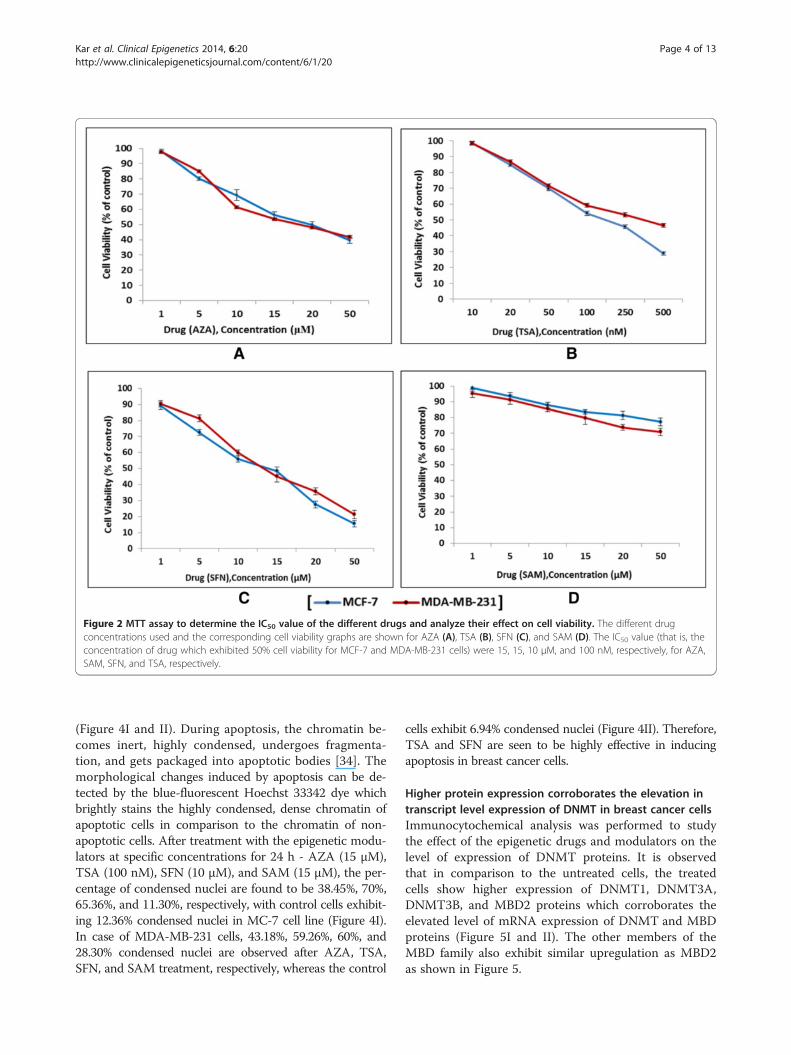
Figure 2 MTT assay to determine the IC50 value of the different drugs and analyze their effect on cell viability. The different drugconcentrations used and the corresponding cell viability graphs are shown for AZA (A), TSA (B), SFN (C), and SAM (D). The IC50 value (that is, theconcentration of drug which exhibited 50% cell viability for MCF-7 and MDA-MB-231 cells) were 15, 15, 10 μM, and 100 nM, respectively, for AZA,SAM, SFN, and TSA, respectively.
Kar et al. Clinical Epigenetics 2014, 6:20 Page 4 of 13http://www.clinicalepigeneticsjournal.com/content/6/1/20
(Figure 4I and II). During apoptosis, the chromatin be-comes inert, highly condensed, undergoes fragmenta-tion, and gets packaged into apoptotic bodies [34]. Themorphological changes induced by apoptosis can be de-tected by the blue-fluorescent Hoechst 33342 dye whichbrightly stains the highly condensed, dense chromatin ofapoptotic cells in comparison to the chromatin of non-apoptotic cells. After treatment with the epigenetic modu-lators at specific concentrations for 24 h - AZA (15 μM),TSA (100 nM), SFN (10 μM), and SAM (15 μM), the per-centage of condensed nuclei are found to be 38.45%, 70%,65.36%, and 11.30%, respectively, with control cells exhibit-ing 12.36% condensed nuclei in MC-7 cell line (Figure 4I).In case of MDA-MB-231 cells, 43.18%, 59.26%, 60%, and28.30% condensed nuclei are observed after AZA, TSA,SFN, and SAM treatment, respectively, whereas the control
cells exhibit 6.94% condensed nuclei (Figure 4II). Therefore,TSA and SFN are seen to be highly effective in inducingapoptosis in breast cancer cells.
Higher protein expression corroborates the elevation intranscript level expression of DNMT in breast cancer cellsImmunocytochemical analysis was performed to studythe effect of the epigenetic drugs and modulators on thelevel of expression of DNMT proteins. It is observedthat in comparison to the untreated cells, the treatedcells show higher expression of DNMT1, DNMT3A,DNMT3B, and MBD2 proteins which corroborates theelevated level of mRNA expression of DNMT and MBDproteins (Figure 5I and II). The other members of theMBD family also exhibit similar upregulation as MBD2as shown in Figure 5.
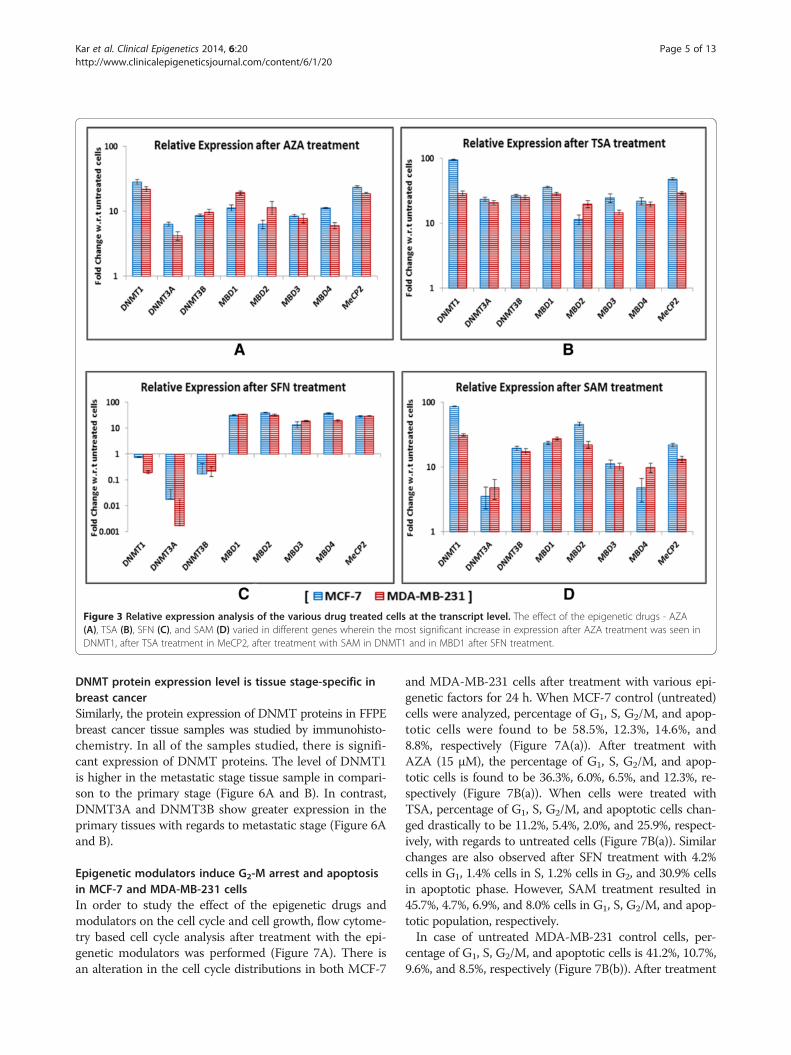
Figure 3 Relative expression analysis of the various drug treated cells at the transcript level. The effect of the epigenetic drugs - AZA(A), TSA (B), SFN (C), and SAM (D) varied in different genes wherein the most significant increase in expression after AZA treatment was seen inDNMT1, after TSA treatment in MeCP2, after treatment with SAM in DNMT1 and in MBD1 after SFN treatment.
Kar et al. Clinical Epigenetics 2014, 6:20 Page 5 of 13http://www.clinicalepigeneticsjournal.com/content/6/1/20
DNMT protein expression level is tissue stage-specific inbreast cancerSimilarly, the protein expression of DNMT proteins in FFPEbreast cancer tissue samples was studied by immunohisto-chemistry. In all of the samples studied, there is signifi-cant expression of DNMT proteins. The level of DNMT1is higher in the metastatic stage tissue sample in compari-son to the primary stage (Figure 6A and B). In contrast,DNMT3A and DNMT3B show greater expression in theprimary tissues with regards to metastatic stage (Figure 6Aand B).
Epigenetic modulators induce G2-M arrest and apoptosisin MCF-7 and MDA-MB-231 cellsIn order to study the effect of the epigenetic drugs andmodulators on the cell cycle and cell growth, flow cytome-try based cell cycle analysis after treatment with the epi-genetic modulators was performed (Figure 7A). There isan alteration in the cell cycle distributions in both MCF-7
and MDA-MB-231 cells after treatment with various epi-genetic factors for 24 h. When MCF-7 control (untreated)cells were analyzed, percentage of G1, S, G2/M, and apop-totic cells were found to be 58.5%, 12.3%, 14.6%, and8.8%, respectively (Figure 7A(a)). After treatment withAZA (15 μM), the percentage of G1, S, G2/M, and apop-totic cells is found to be 36.3%, 6.0%, 6.5%, and 12.3%, re-spectively (Figure 7B(a)). When cells were treated withTSA, percentage of G1, S, G2/M, and apoptotic cells chan-ged drastically to be 11.2%, 5.4%, 2.0%, and 25.9%, respect-ively, with regards to untreated cells (Figure 7B(a)). Similarchanges are also observed after SFN treatment with 4.2%cells in G1, 1.4% cells in S, 1.2% cells in G2, and 30.9% cellsin apoptotic phase. However, SAM treatment resulted in45.7%, 4.7%, 6.9%, and 8.0% cells in G1, S, G2/M, and apop-totic population, respectively.In case of untreated MDA-MB-231 control cells, per-
centage of G1, S, G2/M, and apoptotic cells is 41.2%, 10.7%,9.6%, and 8.5%, respectively (Figure 7B(b)). After treatment
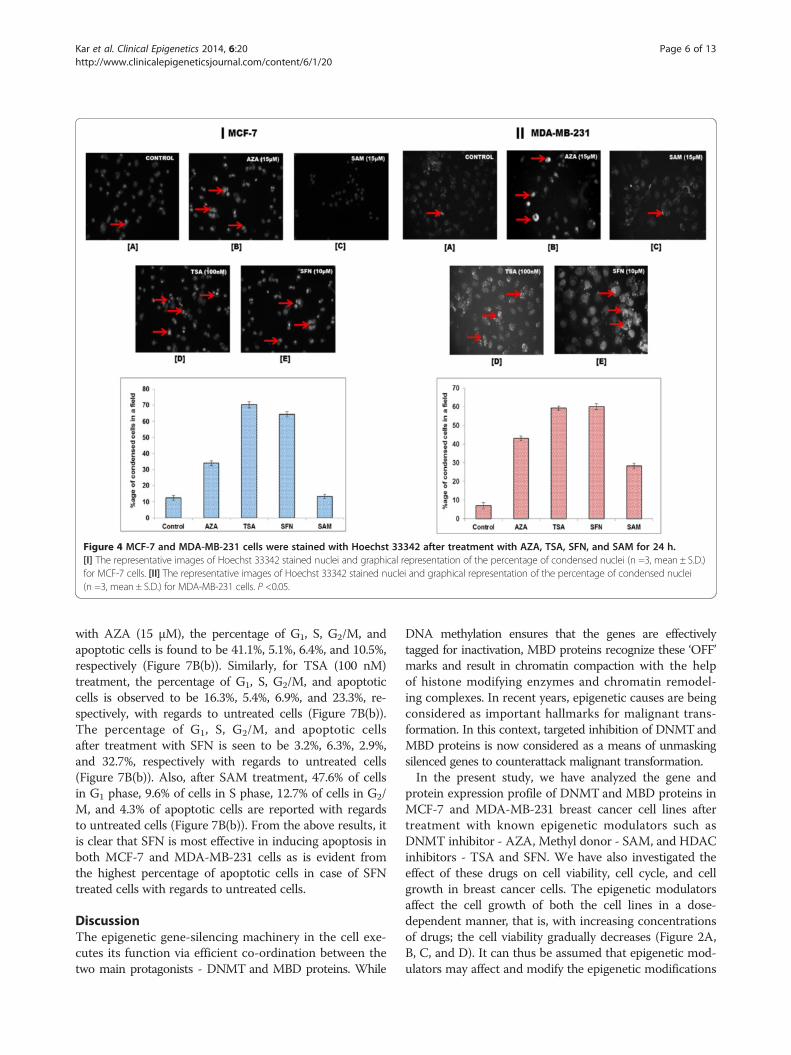
Figure 4 MCF-7 and MDA-MB-231 cells were stained with Hoechst 33342 after treatment with AZA, TSA, SFN, and SAM for 24 h.[I] The representative images of Hoechst 33342 stained nuclei and graphical representation of the percentage of condensed nuclei (n =3, mean ± S.D.)for MCF-7 cells. [II] The representative images of Hoechst 33342 stained nuclei and graphical representation of the percentage of condensed nuclei(n =3, mean ± S.D.) for MDA-MB-231 cells. P <0.05.
Kar et al. Clinical Epigenetics 2014, 6:20 Page 6 of 13http://www.clinicalepigeneticsjournal.com/content/6/1/20
with AZA (15 μM), the percentage of G1, S, G2/M, andapoptotic cells is found to be 41.1%, 5.1%, 6.4%, and 10.5%,respectively (Figure 7B(b)). Similarly, for TSA (100 nM)treatment, the percentage of G1, S, G2/M, and apoptoticcells is observed to be 16.3%, 5.4%, 6.9%, and 23.3%, re-spectively, with regards to untreated cells (Figure 7B(b)).The percentage of G1, S, G2/M, and apoptotic cellsafter treatment with SFN is seen to be 3.2%, 6.3%, 2.9%,and 32.7%, respectively with regards to untreated cells(Figure 7B(b)). Also, after SAM treatment, 47.6% of cellsin G1 phase, 9.6% of cells in S phase, 12.7% of cells in G2/M, and 4.3% of apoptotic cells are reported with regardsto untreated cells (Figure 7B(b)). From the above results, itis clear that SFN is most effective in inducing apoptosis inboth MCF-7 and MDA-MB-231 cells as is evident fromthe highest percentage of apoptotic cells in case of SFNtreated cells with regards to untreated cells.
DiscussionThe epigenetic gene-silencing machinery in the cell exe-cutes its function via efficient co-ordination between thetwo main protagonists - DNMT and MBD proteins. While
DNA methylation ensures that the genes are effectivelytagged for inactivation, MBD proteins recognize these ‘OFF’marks and result in chromatin compaction with the helpof histone modifying enzymes and chromatin remodel-ing complexes. In recent years, epigenetic causes are beingconsidered as important hallmarks for malignant trans-formation. In this context, targeted inhibition of DNMTandMBD proteins is now considered as a means of unmaskingsilenced genes to counterattack malignant transformation.In the present study, we have analyzed the gene and
protein expression profile of DNMT and MBD proteins inMCF-7 and MDA-MB-231 breast cancer cell lines aftertreatment with known epigenetic modulators such asDNMT inhibitor - AZA, Methyl donor - SAM, and HDACinhibitors - TSA and SFN. We have also investigated theeffect of these drugs on cell viability, cell cycle, and cellgrowth in breast cancer cells. The epigenetic modulatorsaffect the cell growth of both the cell lines in a dose-dependent manner, that is, with increasing concentrationsof drugs; the cell viability gradually decreases (Figure 2A,B, C, and D). It can thus be assumed that epigenetic mod-ulators may affect and modify the epigenetic modifications
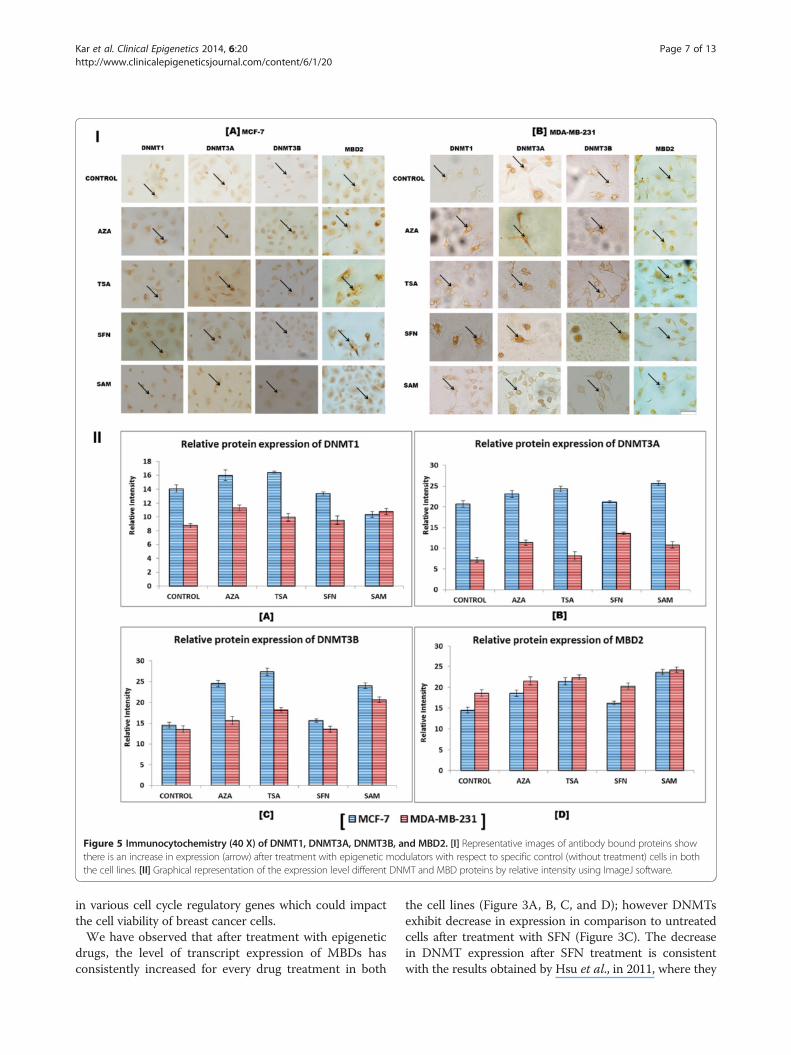
Figure 5 Immunocytochemistry (40 X) of DNMT1, DNMT3A, DNMT3B, and MBD2. [I] Representative images of antibody bound proteins showthere is an increase in expression (arrow) after treatment with epigenetic modulators with respect to specific control (without treatment) cells in boththe cell lines. [II] Graphical representation of the expression level different DNMT and MBD proteins by relative intensity using ImageJ software.
Kar et al. Clinical Epigenetics 2014, 6:20 Page 7 of 13http://www.clinicalepigeneticsjournal.com/content/6/1/20
in various cell cycle regulatory genes which could impactthe cell viability of breast cancer cells.We have observed that after treatment with epigenetic
drugs, the level of transcript expression of MBDs hasconsistently increased for every drug treatment in both
the cell lines (Figure 3A, B, C, and D); however DNMTsexhibit decrease in expression in comparison to untreatedcells after treatment with SFN (Figure 3C). The decreasein DNMT expression after SFN treatment is consistentwith the results obtained by Hsu et al., in 2011, where they
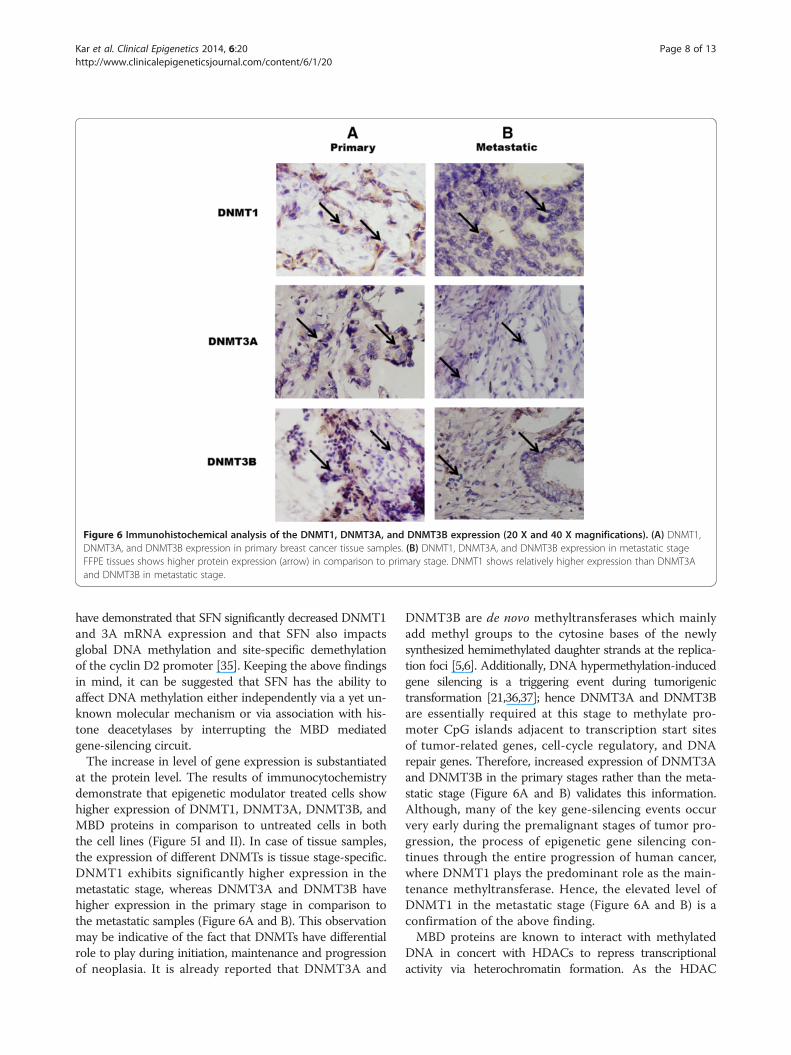
Figure 6 Immunohistochemical analysis of the DNMT1, DNMT3A, and DNMT3B expression (20 X and 40 X magnifications). (A) DNMT1,DNMT3A, and DNMT3B expression in primary breast cancer tissue samples. (B) DNMT1, DNMT3A, and DNMT3B expression in metastatic stageFFPE tissues shows higher protein expression (arrow) in comparison to primary stage. DNMT1 shows relatively higher expression than DNMT3Aand DNMT3B in metastatic stage.
Kar et al. Clinical Epigenetics 2014, 6:20 Page 8 of 13http://www.clinicalepigeneticsjournal.com/content/6/1/20
have demonstrated that SFN significantly decreased DNMT1and 3A mRNA expression and that SFN also impactsglobal DNA methylation and site-specific demethylationof the cyclin D2 promoter [35]. Keeping the above findingsin mind, it can be suggested that SFN has the ability toaffect DNA methylation either independently via a yet un-known molecular mechanism or via association with his-tone deacetylases by interrupting the MBD mediatedgene-silencing circuit.The increase in level of gene expression is substantiated
at the protein level. The results of immunocytochemistrydemonstrate that epigenetic modulator treated cells showhigher expression of DNMT1, DNMT3A, DNMT3B, andMBD proteins in comparison to untreated cells in boththe cell lines (Figure 5I and II). In case of tissue samples,the expression of different DNMTs is tissue stage-specific.DNMT1 exhibits significantly higher expression in themetastatic stage, whereas DNMT3A and DNMT3B havehigher expression in the primary stage in comparison tothe metastatic samples (Figure 6A and B). This observationmay be indicative of the fact that DNMTs have differentialrole to play during initiation, maintenance and progressionof neoplasia. It is already reported that DNMT3A and
DNMT3B are de novo methyltransferases which mainlyadd methyl groups to the cytosine bases of the newlysynthesized hemimethylated daughter strands at the replica-tion foci [5,6]. Additionally, DNA hypermethylation-inducedgene silencing is a triggering event during tumorigenictransformation [21,36,37]; hence DNMT3A and DNMT3Bare essentially required at this stage to methylate pro-moter CpG islands adjacent to transcription start sitesof tumor-related genes, cell-cycle regulatory, and DNArepair genes. Therefore, increased expression of DNMT3Aand DNMT3B in the primary stages rather than the meta-static stage (Figure 6A and B) validates this information.Although, many of the key gene-silencing events occurvery early during the premalignant stages of tumor pro-gression, the process of epigenetic gene silencing con-tinues through the entire progression of human cancer,where DNMT1 plays the predominant role as the main-tenance methyltransferase. Hence, the elevated level ofDNMT1 in the metastatic stage (Figure 6A and B) is aconfirmation of the above finding.MBD proteins are known to interact with methylated
DNA in concert with HDACs to repress transcriptionalactivity via heterochromatin formation. As the HDAC
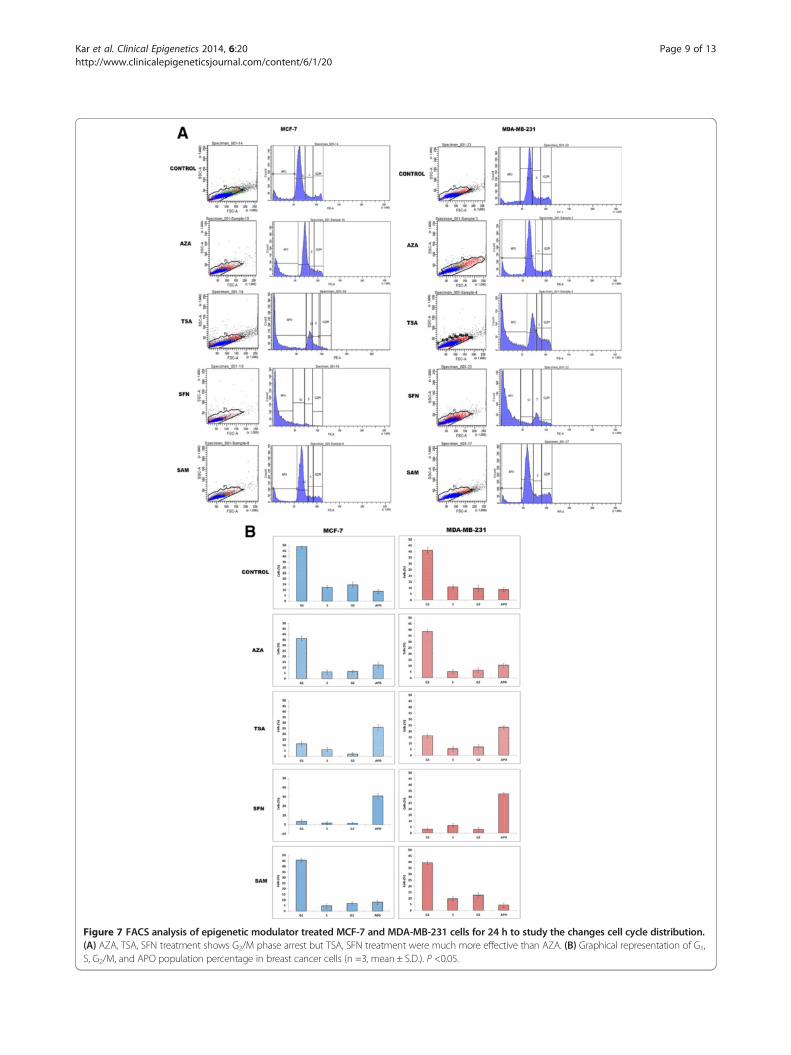
Figure 7 FACS analysis of epigenetic modulator treated MCF-7 and MDA-MB-231 cells for 24 h to study the changes cell cycle distribution.(A) AZA, TSA, SFN treatment shows G2/M phase arrest but TSA, SFN treatment were much more effective than AZA. (B) Graphical representation of G1,S, G2/M, and APO population percentage in breast cancer cells (n =3, mean ± S.D.). P <0.05.
Kar et al. Clinical Epigenetics 2014, 6:20 Page 9 of 13http://www.clinicalepigeneticsjournal.com/content/6/1/20
Kar et al. Clinical Epigenetics 2014, 6:20 Page 10 of 13http://www.clinicalepigeneticsjournal.com/content/6/1/20
inhibitors effectively trap HDAC and prevent them to asso-ciate with MBD proteins, there is a possibility that the ac-tion of MBD proteins can be disrupted. If the activity ofMBD proteins is disrupted, then DNMT mediated hyper-methylation and gene silencing can also be effectively hin-dered. Based on this assumption, MCF-7 and MDA-MB-231 cells were treated with IC50 concentration of the epi-genetic drugs - AZA (15 μM), TSA (100 nM), SFN(10 μM), and SAM (15 μM) to study their effect on cellcycle and cell growth. It is observed that all the epigeneticmodulators promote apoptotic cell death as is evident formincreased chromatin condensation which is a distinct char-acteristic of apoptotic cells (Figure 4I and II). The percent-age of condensed nuclei is highest in TSA and SFN treatedcells (Figure 4I and II), thus these two modulators are moreeffective in inducing apoptotic cell death. On further ana-lysis of the effect of these modulators on cell cycle, it is seenthat in comparison to control untreated cells, cells treatedwith AZA and SAM, show increase in G1-phase cells, de-creased percentage of S and G2 population as well as in-crease in apoptotic cells (Figure 7A and B). Additionally,cells treated with TSA and SFN exhibit reduction in G1
phase cells, decrease in percentage of G2 population anddrastic increase in apoptotic cell population (Figure 7A andB). Thus, TSA and SFN affect all the stages of cell cycle, ar-resting cell progression in each successive stage and ultim-ately increasing the rate of apoptosis in the cellpopulation. From the above results, it is clear that theepigenetic modulators - AZA, TSA, SFN, and SAM inducedifferentiation, growth arrest, and apoptosis in breastcancer cells.The current work has significantly established that
epigenetic modulators such as DNMT and HDACinhibitors can indirectly affect the methylation mediatedgene-silencing machinery by directly targeting theDNMTs and HDACs and thus affecting the expression ofDNMTs and MBDs. The findings of the study indicatethat the epigenetic modulators AZA, TSA, SFN, and SAMaffect the cell growth, viability, and apoptosis rate in breastcancer cells. Previously, Mirza et al. had demonstratedhow natural polyphenols can modulate the expression ofDNMT proteins in breast cancer patients [38]. In lieu oftheir analysis, we targeted both DNMTs and MBDs, thecrucial elements in the gene-silencing machinery viaepigenetic modulators. The current study for the firsttime showcases a direct approach for targeting the gene-silencing machinery during malignant transformation.However, in-depth mechanistic studies should be carriedout to elucidate how these compounds affect the genetranscription as the above drugs act at the protein level.The study reinforces the view that these epigeneticagents can induce cancer inhibitory activity and maybe useful in investigating epigenetic sources of cancertreatment.
ConclusionsAs translational research in the field of cancer epigenomicsis increasingly focusing its attention towards achieving epi-genetic therapies for cancer treatment, targeting the DNAmethylation-based gene-silencing machinery assumes greatsignificance. In this study, we have revealed the effectof various epigenetic modulators on the gene and proteinlevel expression of DNMTs and MBD proteins. We havealso demonstrated how these modulators inhibit cellgrowth, affect cell cycle by blocking G2-M progress and in-duce apoptotic cell death. This study has demonstrated thesignificance of targeting DNA methylation, histone modifi-cation, especially, histone deacetylation and MBD proteins,all of which concomitantly act to induce gene silencingand transcriptional incompetence. The targeted inhibitionof MBD function via DNMT and HDAC inhibitors is thusa promising therapeutic option for efficient treatment ofneoplastic progression.
MethodsIn vitro cell culture and drug treatmentHuman breast carcinoma cell lines MCF-7 and MDA-MB-231 were obtained from ATCC through NCCS, Pune,India. The cells were cultured and maintained in ModifiedEagle’s Medium (MEM) and Dulbecco’s Modified Eagle’sMedium (DMEM), respectively, supplemented with 10%(v/v) Fetal Bovine Serum (FBS) and 100 IU/mL Penicillinand 0.1 mg/mL streptomycin in a humified atmosphere of5% CO2 at 37°C. Stock solutions of AZA (Sigma), TSA(Sigma), and SFN (Sigma) were prepared in dimethyl-sulphoxide (DMSO) whereas SAM (Sigma) was dissolvedin milli-Q water. Stock solutions were further diluted toworking concentrations in DMEM prior to use. Cells wereharvested by trypsinization and cell number was countedby hemocytometer. The number of living cells was calcu-lated by Trypan blue staining (0.2% v/v). For determiningthe concentration of drug that inhibited cell proliferationby 50% (IC50), 5 X 10³ cells per well were seeded in a 96-well microtiter plates and after 24 h incubation, weretreated with the epigenetic modulators at different con-centrations (AZA, SAM, SFN (1, 5, 10, 15, 20, 50 μM)and TSA (10, 20, 50, 100, 250, 500 nM)) mixed in respect-ive medias supplemented with 5% FBS. Control cells weretreated with DMSO only.
Cell viability analysis by colometric MTT assayThe effect of the epigenetic modulators, DNMT andHDAC inhibitors on cellular proliferation was assessedby 3-(4, 5-Dimethylthiazol-2-yl)-2, 5-DiphenyltetrazoliumBromide (MTT) assay, using standard protocol. Briefly, thedrug-treated cells in each of the 96 wells were washedtwice with PBS. 0.8 mg/mL MTT solution was preparedfrom stock MTT solution (5 mg/mL PBS, pH 7.2). A totalof 100 μL MTT solution was added to each well and
Kar et al. Clinical Epigenetics 2014, 6:20 Page 11 of 13http://www.clinicalepigeneticsjournal.com/content/6/1/20
incubated at 37°C for 4 h in dark. The supernatant was re-moved and 100 μL of DMSO was added into each well todissolve the formazan crystals. The absorbance was mea-sured at 570 nm and results were expressed as the mean ofthree replicates as a percentage of control (taken as 100%).The extent of cytotoxicity was defined as the relative re-duction of the optical density (OD), which correlated tothe amount of viable cells in relation to cell control(100%). The cell viability was plotted in a graph and theIC50 was calculated accordingly to decide the optimumdosage of the drugs for further studies.
Relative gene expression analysis after drug treatment byreal-time PCRMCF-7 and MDA-MB-231 cell lines were treated withsub lethal dosages of AZA (15 μM), TSA (100 nM), SFN(10 μM), and SAM (15 μM) for 24 h. After treatment forthe required time, total cellular RNA was extracted withTriReagent (Sigma) according to the manufacturer’s in-structions. qRT-PCR was performed using cDNA pre-pared from 1 μg of total RNA prepared using RevertAidFirst Strand cDNA Synthesis Kit (Thermo Scientific) andSYBR® Green JumpStart™ Taq ReadyMix in the Realplex4-
Eppendorf system. The mRNA level was normalized toβ-actin, as described earlier [39]. The primer sequencesare provided in Table 1.
Table 1 List of sequence and product length of thereal-time PCR primers used in this study
Gene Primer sequence Productlength (bp)
DNMT1 F 5′-GGCTGAGATGAGGCAAAAAG -3′ 112
R 5′-ACCAACTCGGTACAGGATGC -3′
DNMT3A F 5′-TATTGATGAGCGCACAAGAGAGC -3′ 111
R 5′-GGGTGTTCCAGGGTAACATTGAG -3′
DNMT3B F 5′-AATGTGAATCCAGCCAGGAAAGGC -3′ 191
R 5′-ACTGGATTACACTCCAGGAACCGT -3′
MeCP2 F 5′-TGACCGGGGACCCATGTAT -3′ 145
R 5′- CTCCACTTTAGAGCGAAAGGC -3′
MBD1 F 5′- CCTGGGTGCTGTGAGAACTGT -3′ 107
R 5′- TTGAAGGCAATTCTCTGTGCTC -3′
MBD2 F 5′- AGGTAGCAATGATGAGACCCTTTTA -3′ 116
R 5′- TAAGCCAAACAGCAGGGTTCTT -3′
MBD3 F 5′- CCGCTCTCCTTCAGTAAATGTAAC -3′ 101
R 5′- GGCTGGAGTTTGGTTTTCAGAA -3′
MBD4 F 5′- AGACCCGCCGAATGACCT -3′ 144
R 5′- GCACCAAACTGAGCAGAAGCG -3′
β-ACTIN F 5′- CTGGAACGGTGAAGGTGACA -3′ 140
R 5′- AAGGGACTTCCTGTAACAACGCA -3′
Chromatin condensation analysis by Hoechst stainingAfter treatment with epigenetic modulators, cells werestained with Hoechst 33342 stain (1 mg/mL, Invitrogen)followed by incubation for 10 min at 37°C. Images weretaken under UV filter using Epi-fluorescent Microscope(Olympus IX71) at 400 X magnification with an excitationwavelength of 355 to 366 nm and an emission wavelengthof 465 to 480 nm. Condensed nuclei were counted againsttotal number of nuclei in the field, and the percentage ofapoptotic nuclei were calculated and plotted graphically.
ImmunocytochemistryImmunocytochemistry was performed as per our previousprotocol with some modifications [39-43]. In brief, MCF-7and MDA-MB-231 cells were grown on glass coverslipsand treated with AZA (15 μM), SAM (15 μM), TSA (100nM), and SFN (10 μM) for 24 h. The treated cells werefixed by ice cold methanol and permeabilized by 0.25%triton X-100 in PBS. Cells were incubated with 1% BSAin PBST for 30 min to block non-specific binding ofthe antibodies. The endogenous peroxidase activity wasblocked by incubating in 5% H2O2 in methanol for20 min followed by incubation in primary antibodiesfor DNMT1, DNMT3A, and DNMT3B overnight at4°C. The cells were then washed in PBS and incubatedwith HRP-conjugated anti-rabbit secondary antibody(Santa Cruz Biotech) for 1 h followed by another wash.Finally, reactions were visualized by incubation with 3,3′-Diaminobenzidine (DAB, substrate and chromogen,Sigma) and counterstained with Mayer’s hematoxylin.For negative control, cells were incubated overnightwith dilution buffer (no primary antibody) [37].
ImmunohistochemistryTwenty formalin-fixed paraffin-embedded (FFPE) breasttissue samples were collected from Drs. Tribedi & RoyDiagnostic Laboratory (Kolkata, India). Of these samples,two were cancer adjacent tissues whereas the rest of themwere cancerous tissues. Of the eighteen tumor tissues, tenwere primary stage and eight were metastatic stage breasttissues. FFPE blocks were sliced into 0.5 μM thin slicesand subjected to antigen retrieval with tris-EDTA buffer,endogenous peroxidase blocking, and rinsed with tris-buffered saline (TBS) containing 0.025% Triton X-100(TBS-T). Rabbit polyclonal anti-DNMT1 (Santa Cruz),rabbit polyclonal anti-DNMT3A (Santa Cruz), rabbit poly-clonal anti-DNMT3B (Santa Cruz), and rabbit polyclonalanti-DNMT3B (Santa Cruz) were used as primary anti-bodies. The secondary antibody used was anti-rabbit (Invi-trogen). After incubation with primary antibodies at4°C overnight, the specimens were rinsed with TBS andincubated at room temperature for 1 h with secondaryantibody. After rinsing with TBS, all specimens werecolor-developed with DAB.
Kar et al. Clinical Epigenetics 2014, 6:20 Page 12 of 13http://www.clinicalepigeneticsjournal.com/content/6/1/20
Cell cycle analysis by FACSFlow cytometry analysis of Propidium Iodide (PI) stainednuclei was done to assess the effect of epigenetic drugs onthe cell cycle distribution. AZA (15 μM), SAM (15 μM),TSA (100 nM), and SFN (10 μM) treated cells were incu-bated in respective media with 5% FBS for 24 h. The cellswere then trypsinized, collected by centrifugation (500 × gfor 5 mins at 4°C), washed twice with PBS and then fixedin 90% ice-cold methanol. After incubation at -20°C for1 h, cells were centrifuged and resuspended in PBS followedby treatment with RNaseA (500 U/mL) to digest the residualRNAs and stained with PI (10 μg/mL). Samples were incu-bated for 30 min at 4°C and cell cycle analysis was per-formed with a Becton-Dickinson fluorescence-activated cellsorter (FACS).
Statistical analysisAll data are presented as means ± SD. Statistical analysiswas performed using the Student’s t-test by SPSS software.Values of P <0.05 were considered as significant value.
AbbreviationsAZA: 5-Aza-2′-deoxycytidine; DMEM: Dulbecco’s Modified Eagle’s Medium;DNMTs: DNA Methyltransferases; DMSO: Dimethylsulphoxide; FBS: FetalBovine Serum; FACS: Fluorescence-Activated Cell Sorter; FFPE: Formalin-FixedParaffin-Embedded; HDAC: Histone Deacetylase; MBD: Methyl-CpG-BindingDomain; MEM: Modified Eagle’s Medium; MTT: 3-(4 5-Dimethylthiazol-2-yl)-2,5-Diphenyltetrazolium Bromide; PI: Propidium Iodide; SAH: S-AdenosylHomocysteine; SAM: S-Adenosyl Methionine; SFN: Sulforaphane; TBS: Tris-Buffered Saline; TSA: Trichostatin A.
Competing interestsThe authors declare that they have no competing interests.
Authors’ contributionsSKP, SK, and DS conceived the project and wrote the manuscript; SK andDS performed the experimental works on MTT assays, RT-PCR, FACS, andchromatin condensation in the two different cell lines; MD carried out theimmunocytochemistry and immunohistochemistry; AS and SP participated inthe data representation; SR and NP performed the statistical analysis. MD, AS,SP, SKR, NP, and MR helped in collecting information and literature survey, inpreparing the figures and tables; all the authors critically commented on themanuscript and took part in discussion. SKP edited the final version of themanuscript. All authors read and approved the final manuscript.
AcknowledgementsSK, DS, MD, AS, and SR are thankful to NIT-Rourkela for granting them fellowshipsunder the Institute Research Scheme. SP and NP are thankful to DST, Govt. ofIndia for INSPIRE fellowship. This research was supported in part by Departmentaloperating grants of LS, NIT-Rourkela. We apologize to those whose worksand related publications we have not been able to discuss and cite due tospace limitations.
Received: 16 May 2014 Accepted: 29 September 2014Published: 13 October 2014
References1. Jaenisch R, Bird A: Epigenetic regulation of gene expression: how the
genome integrates intrinsic and environmental signals. Nat Genet 2003,33:245–254.
2. Klose RJ, Bird AP: Genomic DNA methylation: the mark and its mediators.Trends Biochem Sci 2006, 31:89–97.
3. Patra SK, Deb M, Patra A: Molecular marks for epigenetic identification ofdevelopmental and cancer stem cells. Clin Epigenet 2011, 2:27–53.
4. Kar S, Deb M, Sengupta D, Shilpi A, Parbin S, Torrisani J, Pradhan S, Patra SK:An insight into the various regulatory mechanisms modulating HumanDNA Methyltransferase 1 stability and function. Epigenetics 2012,7:994–1007.
5. Jones PA, Liang G: Rethinking how DNA methylation patterns aremaintained. Nat Rev Gen 2009, 10:805–811.
6. Denis H, Ndlovu MN, Fuks F: Regulation of mammalian methyltransferase:a route to new mechanisms. EMBO Rep 2011, 12:647–656.
7. Weber M, Schubeler D: Genomic patterns of DNA methylation: targetsand function of an epigenetic mark. Curr Opin Cell Biol 2007, 19:273–280.
8. Jeltsch A: Reading and writing DNA methylation. Nat Struct Mol Biol 2008,15:1003–1004.
9. Wade PA: Methyl CpG binding proteins: coupling chromatin architectureto gene regulation. Oncogene 2001, 20:3166–3173.
10. Deb M, Kar S, Sengupta D, Shilpi A, Parbin S, Rath SK, Londhe V, Patra SK:Chromatin dynamics: H3K4 methylation and H3 variant replacementduring development and in cancer. Cell Mol Life Sci 2014, 71:3439–3463.
11. Ballestar E, Esteller M: The impact of chromatin in human cancer: linkingDNA methylation to gene silencing. Carcinogenesis 2002, 23:1103–1109.
12. Fatemi M, Wade PA: MBD family proteins: reading the epigenetic code.J Cell Sci 2006, 119:3033–3037.
13. Dhasarathy A, Wade PA: The MBD protein family-reading an epigeneticmark? Mutat Res 2008, 647:39–43.
14. Bogdanovic O, Veenstra GJ: DNA methylation and methyl-CpG bindingproteins: developmental requirements and function. Chromosoma 2009,118:549–565.
15. Sasai N, Defossez PA: Many paths to one goal? The proteins thatrecognize methylated DNA in eukaryotes. Int J Dev Biol 2009, 53:323–334.
16. Wade PA: Methyl CpG-binding protiens and transcriptional repression.Bioessays 2001, 23:1131–1137.
17. Patra SK, Patra A, Zhao H, Carroll P, Dahiya R: Methyl-CpG-DNA bindingproteins in human prostate cancer: expression of CXXC sequencecontaining MBD1 and repression of MBD2 and MeCP2. Biochem BiophysRes Commun 2003, 302:759–766.
18. Clouaire T, Stancheva I: Methyl-CpG binding proteins: specializedtranscriptional repressors or structural components of chromatin?Cell Mol Life Sci 2008, 65:1509–1522.
19. Vaissiere T, Sawan C, Herceg Z: Epigenetic interplay between histonemodifications and DNA methylation in gene silencing. Mutat Res 2008,659:40–48.
20. Baylin SB: DNA methylation and gene silencing in cancer. Nat Clin PractOncol 2005, 2:S4–S11.
21. Esteller M: Epigenetic gene silencing in cancer: the DNAhypermethylome. Hum Mol Genet 2007, 16:50–59.
22. Strathdee G, Brown R: Aberrant DNA methylation in cancer: potentialclinical interventions. Expert Rev Mol Med 2002, 4:1–17.
23. Das PM, Singal R: DNA methylation and cancer. J Clin Oncol 2004,22:4632–4642.
24. Luczak MW, Jagodzinski PP: The role of DNA methylation in cancerdevelopment. Folia Histochem Cytobiol 2006, 44:143–154.
25. McCabe MT, Brandes JC, Vertino PM: Cancer DNA methylation: molecularmechanisms and clinical implications. Clin Cancer Res 2009,15:3927–3937.
26. Lopez-Serra L, Esteller M: Proteins that bind methylated DNA and humancancer: reading the wrong words. Br J Cancer 2008, 98:1881–1885.
27. Lopez-Serra L, Ballestar E, Fraga MF, Alaminos M, Setien F, Esteller M:A profile of methyl-CpG binding domain protein occupancy ofhypermethylated promoter CpG islands of tumor suppressor genesin human cancer. Cancer Res 2006, 66:8342–8346.
28. Parry L, Clarke AR: The roles of the methyl-CpG binding proteins incancer. Genes Cancer 2011, 2:618–630.
29. Sansom OJ, Maddison K, Clarke AR: Mechanisms of disease: methyl-bindingdomain proteins as potential therapeutic targets in cancer. Nat Clin PractOncol 2007, 4:305–315.
30. Ballestar E, Paz MF, Valle L, Wei S, Fraga MF, Espada J, Cigudosa JC, Huang TH,Esteller M: Methyl-CpG binding proteins identify novel sites of epigeneticinactivation in human cancer. EMBO J 2003, 22:6335–6345.
31. Lopez-Serra L, Ballestar E, Ropero S, Setien F, Billard LM, Fraga MF,Lopez-Nieva P, Alaminos M, Guerrero D, Dante R, Esteller M: Unmasking ofepigenetically silenced candidate tumor suppressor genes by removal ofMethyl-CpG binding domain proteins. Oncogene 2008, 27:3556–3566.
Kar et al. Clinical Epigenetics 2014, 6:20 Page 13 of 13http://www.clinicalepigeneticsjournal.com/content/6/1/20
32. Egger G, Liang G, Aparicio A, Jones PA: Epigenetics in human disease andprospects for epigenetic therapy. Nature 2004, 429:457–463.
33. Rodenhiser D, Mann M: Epigenetics and human disease: translating basicbiology into clinical applications. Can Med Assoc J 2006, 174:341–348.
34. Tone S, Sugimoto K, Tanda K, Suda T, Uehira K, Kanouchi H, Samejima K,Minatogawa Y, Earnshaw WC: Three distinct stages of apoptoticnuclear condensation revealed by time-lapse imaging, biochemicaland electron microscopy analysis of cell-free apoptosis. Exp Cell Res 2007,313:3635–3644.
35. Hsu A, Wong CP, Yu Z, Williams DE, Dashwood RH, Ho E: Promoterde-methylation of cyclin D2 by sulforaphane in prostate cancer cells.Clin Epigenetics 2011, 3:3.
36. Jones PA, Baylin SB: The epigenomics of cancer. Cell 2007, 128:683–692.37. Vilain A, Vogt N, Dutrillaux B, Malfoy B: DNA methylation and chromosome
instability in breast cancer cell lines. FEBS Lett 1999, 460:231–234.38. Mirza S, Sharma G, Parshad R, Gupta SD, Pandya P, Ralhan R: Expression of
DNA methyltransferases in breast cancer patients and to analyze theeffect of naturalcompounds on DNA methyltransferases and associatedproteins. J Breast Cancer 2013, 16:23–31.
39. Schmittgen TD, Livak KJ: Analyzing real-time PCR data by the comparativeC(T) method. Nat Protoc 2008, 3:1101–1108.
40. Patra A, Deb M, Dahiya R, Patra SK: 5-Aza-2'-deoxycytidine stress responseand apoptosis in prostate cancer. Clin Epigenetics 2011, 2:339–348.
41. Patra SK, Patra A, Dahiya R: Histone deacetylase and DNAmethyltransferase in human prostate cancer. Biochem Biophys ResCommun 2001, 287:705–713.
42. Patra SK, Patra A, Zhao H, Dahiya R: DNA methyltransferase anddemethylase in human prostate cancer. Mol Carcinog 2002, 33:163–171.
43. Patra SK, Bettuzzi S: Epigenetic DNA-(Cytosine-5-Carbon) Modifications:5-Aza-2'-Deoxycytidine and DNA-Demethylation. Biochem Mosc 2009,74:613–619.
doi:10.1186/1868-7083-6-20Cite this article as: Kar et al.: Expression profiling of DNAmethylation-mediated epigenetic gene-silencing factors in breast cancer.Clinical Epigenetics 2014 6:20.
Submit your next manuscript to BioMed Centraland take full advantage of:
• Convenient online submission
• Thorough peer review
• No space constraints or color figure charges
• Immediate publication on acceptance
• Inclusion in PubMed, CAS, Scopus and Google Scholar
• Research which is freely available for redistribution
Submit your manuscript at www.biomedcentral.com/submit