Redox status of dogs with non-hodgkin lymphomas. An ESR study

GENES, CHROMOSOMES & CANCER 00:000–000 (2011)
Identification of Altered MicroRNA Expression inCanine Lymphoid Cell Lines and Cases of B- andT-Cell Lymphomas
Elizabeth Uhl,1 Paula Krimer,1 Paul Schliekelman,2 S. Mark Tompkins,3 and Steven Suter4,5,6*
1Departmentof Pathology,College of Veterinary Medicine,The Universityof Georgia,Athens,GA2Departmentof Statistics,The Universityof Georgia,Athens,GA3Departmentof Infectious Diseases,College of Veterinary Medicine,The Universityof Georgia,Athens,GA4Departmentof Clinical Sciences,North Carolina State College of Veterinary Medicine,Raleigh,NC5Center for Comparative Medicine and Translational Research,North Carolina State University,Raleigh,NC6Lineberger Comprehensive Cancer Center,Universityof North Carolina,Chapel Hill,NC
Canine lymphoma is a common spontaneous tumor with many similarities to human lymphoma, and thus has potential to
be an important animal model of lymphomagenesis. This study determined that microRNA (miRNA) expression in canine
tumors can be assessed using a commercially available human cancer miRNA qPCR array. miRNA expression in six differ-
ent canine lymphoid cell lines and in naturally occurring canine B- and T-cell lymphomas was compared using RNA har-
vested from normal canine peripheral blood mononuclear cells (PBMC) and normal lymph nodes (LN) as controls. We
found that false discovery rate (FDR) correction for multiple testing after quantile normalization controlled for variation
across arrays and that they were the best methods for normalization and statistical analysis. Increases in miRNAs known
to upregulate oncogenes (miR19aþb, miR17-5p) and decreased expression of miRNAs with tumor suppressor functions
(miR-203, miR-218, and miR-181a) also seen in human lymphoid malignancies were observed. However, there were few
similarities between canine groups. The results of this study indicate that the use of both PBMC and LN cells as controls
provides different, but potentially equally important targets for further analysis. Our findings of miRNA dysregulation in
canine lymphoid cell lines and clinical cases of lymphoma emphasize the potential of canine lymphoma as an important
spontaneous, large animal model of human B- and T-cell lymphomas. VVC 2011 Wiley-Liss, Inc.
INTRODUCTION
MicroRNAs (miRNAs) are small noncoding
RNAs of �18–24 nucleotides in length that regu-
late gene expression through mRNA degradation
or translation inhibition (Lee et al., 1993) that are
very highly conserved across species (Harfe,
2005). It is estimated that up to 33% of all
messenger RNAs (mRNAs) are regulated by
miRNAs, and evidence is accumulating that they
have critical roles in many cell processes, includ-
ing cell differentiation, proliferation, death, stress
resistance, and fat metabolism (Ambros, 2003;
Harfe, 2005; Xi et al., 2006). miRNAs have been
shown to regulate many well-known oncogenes
such as RASA1 (Johnson, et al. 2005) and MYC(Xi et al., 2007) and tumor suppressor genes such
as RB1 (Kobayashi et al., 1998). They have also
been localized to chromosomal loci in the human
genome associated with cancer, including fragile
sites and areas of gene amplification. For exam-
ple, Calin et al. reported that downregulation or
outright deletions of miR-15a and miR-16-1 are
associated with genomic instability at the 13q14
locus in most patients diagnosed with chronic
lymphocytic leukemia (Calin et al., 2002). In
addition, deletions of miRNA-regulated genes
such as DLEU2 have been detected in more than
65% of chronic lymphocytic leukemia cases (Stil-
genbauer et al., 1998), in 50% of mantle-cell lym-
phomas (Elnenaei et al., 2003), and 16–40% of
multiple myelomas (Elnenaei et al., 2003).
Finally, miRNA signatures are increasingly being
used to detect, classify, and predict the severity
of the disease in a variety of human cancers,
including B-cell non-Hodgkin’s lymphoma,
chronic lymphocytic leukemia, breast cancer,
Supported by: UGA Veterinary Medical Experimental Station;NC State Center for Comparative Medicine and TranslationalResearch.
*Correspondence to: Steven E. Suter, VMD, MS, PhD,ACVIM, (Oncology), Department of Clinical Sciences, North Car-olina State University, College of Veterinary Medicine, 4700Hillsborough Street, CVM Research #308, Raleigh, NC 27606,USA. E-mail: [email protected]
Received 2 February 2011; Accepted 12 July 2011
DOI 10.1002/gcc.20917
Published online inWiley Online Library (wileyonlinelibrary.com).
RESEARCH ARTICLE
VVC 2011 Wiley-Liss, Inc.
thyroid cancer, brain cancer, colorectal cancer,
and non-small cell lung cancer (Ross et al., 2007).
Canine lymphoma is one of the most common
malignant tumors of dogs (up to 25% of all can-
cers) and the most common hematopoietic tumor
of the dog (83%) (Kaiser, 1981; Moulton and Har-
vey, 1990). In the veterinary literature, canine high
grade B-cell lymphoma reportedly accounts for
�70–75% of canine cases (Fournel-Fleury et al.,
1997). The notion that the incidence of canine
lymphoma is increasing, mirroring the human ex-
perience in developed countries, is supported by a
report documenting an increasing caseload of ca-
nine lymphoma patients presenting to 20 US vet-
erinary institutions from 1987 to 1997 (Vail and
Young, 2007). Although not definitively proven, it
is now generally accepted that canine nodal B-cell
lymphoma is a heterogeneous population of B-cell
neoplasms, with the majority being similar to a var-
iant of human non-Hodgkin’s lymphoma (NHL)
called diffuse large B-cell lymphoma (DLBCL)
(Khanna et al., 2006). Because canine lymphoma is
a spontaneous neoplasm in a large, long-lived ani-
mal, it can be used to investigate a variety of diag-
nostic tests and therapeutic regimes with potential
benefits to both canine and human patients.
The purpose of this study was to characterize
miRNA expression in widely utilized canine lymph-
oid cell lines and neoplastic lymphoblasts isolated
from dogs diagnosed with both B- and T-cell lym-
phomas. To do this, we determined that a commer-
cially available human cancer miRNA qPCR array
also detects canine miRNAs, and compared both
PBMC and LN cells as controls for neoplastic ca-
nine lymphoid samples. We also established that
quantile normalization followed by determinations
of the false discovery rate (FDR) and the family
wise error rate (FWER) controlled for variation
across arrays and was the best method for normaliza-
tion and statistical analysis. Finally, we demon-
strated that aberrant miRNA expression is
associated with both the transformed phenotype of
the cell lines and clinical lymphoma samples, and
noted similarities between the types of aberrancies
noted in naturally occurring canine lymphomas and
those reported in human lymphoid malignancies.
MATERIALS AND METHODS
Cell Lines
The six nonadherent canine lymphoid cell lines,
GL-1 (B-cell leukemia; Nakaichi et al., 1996), CL-
1 (T-cell leukemia; Momoi et al., 1997), 17-71 (B-
cell lymphoma; Steplewski et al., 1987), CLL-
1390 (primitive T-lymphoblastoid cell line; Suter
et al., 2005; kind gift from Dr. Peter Moore, UC,
Davis), CLGL-90 (large granular T-cell leukemia;
Suter et al., 2005; kind gift from Dr. Maxey Well-
man, Ohio State University), and OSW (T-cell
lymphoma/leukemia; Kisseberth et al., 2007), were
maintained in RPMI 1640 culture medium (Medi-
atech, Hendon, VA) supplemented with 10% fetal
bovine serum (FBS, Mediatech), 2 mM L-gluta-
mine (Mediatech) and 100 mg ml�1 Primocin
(Invivogen, San Diego, CA) at 37�C/5% CO2. All
cell lines tested negative for mycoplasma infection
using a PCR-based test kit (AppliChem, Cheshire,
CT). The GL-1, CLGL-90, and OSW cell lines
exhibit near normal ploidy (2n ¼ 78 for the
domestic dog), with a range of 75–77, 77–82, and
73–78 chromosomes, respectively. The CL-1 cell
line is hypoploid, with a range of 65–68 chromo-
somes. The 17–71 and CLL-1390 cell lines are
hyperploid, with a range of 102–108 and 118–140
chromosomes, respectively. These cell lines were
verified to match available published karyotypic
and immunophenotyping information (Seiser
et al., 2011). Human Burkitt lymphoma cell lines
used were Daudi (ATCC #CCL-213) and Ramos
(ATCC #CRL-1596).
Clinical Samples
PBMC were isolated using gradient centrifuga-
tion from six normal dogs as previously described
(Wunderli and Felsburg, 1989). Lymph nodes
were excised from 12 normal dogs that did not
have lymphoma, while enlarged lymph nodes
were excised from 29 client-owned dogs diagnosed
histologically with either B-cell (20) or T-cell (9)
high-grade lymphoma. All clients signed a client
consent form. The study protocol was approved by
the Institutional Animal Care and Use Committee
of North Carolina State University.
All lymph nodes were immediately placed in
ice-cold RPMI 1640 culture medium (Mediatech)
and manually homogenized into single cell sus-
pensions. After passing through a 70-lm cell
strainer (BD Falcon, BD Biosciences, Bedford,
MA), the cells were washed twice with ice-cold
Dulbecco’s phosphate buffered saline (PBS,
Mediatech), incubated in 7-ml RBC lysis buffer
(Roche, Indianapolis, IN) at 37�C for 3 min, and
washed an additional two times with PBS. The
cells were quantitated using an automatic cell
counter (CellometerTM Auto T4, Nexcelom Bio-
science, Lawrence, MA).
2 UHL ET AL.
Genes, Chromosomes & Cancer DOI 10.1002/gcc

RNA Isolation
Total RNA was isolated from 1 � 107 cells per
the manufacturers’ instructions (Trizol, Invitrogen,
Carlsbad, CA), quantitated (NanoDrop Technolo-
gies, Wilmington, DE), and stored at �80�C.Total RNA integrity was assessed using the 2100
Bioanalyzer RNA 6000 Nano Kit (Agilent Tech-
nologies, Santa Clara, CA). Only samples with
RINs (RNA integrity number) >9 were used.
miRNA Arrays
A MicroRNA qPCR Array with QuantiMirTM
(System Biosciences, Mountain View, CA) was
used to tag and convert all small RNAs into de-
tectable cDNA for qPCR. Each sample (5 ll of
RNA) was then run on the modified Cancer
MicroRNA qPCR Array per manufacturer’s
instructions (System Biosciences), which simulta-
neously profiles 95 different human miRNAs
known to be involved in apoptosis, differentiation,
and cancer. The modified assay uses a SNORD43(formally RNU43) endogenous control in place of a
Human RNU6-1 (formally U6) assay for miRNA
expression normalization. SNORD43, a small nu-
cleolar RNA, is highly conserved in mammals and
the probe cross-reacts with human, murine, feline
and canine SNORD43. Initially, microRNA analysis
was performed on total RNA isolated from the
Daudi and Ramos cell lines to confirm the activity
of the qPCR array in our hands. We next analyzed
the expression of these 95 miRNAs in the canine
lymphoid cell lines and compared their expression
to normal canine PBMC. Many samples were
assayed more than once to determine the consis-
tency of the arrays and establish the best method
of statistical analysis.
Statistical Analyses
Initial normalization of data was to the internal
control (SNORD43), but because of both inconsis-
tency in amplification and variability in expres-
sion of SNORD43, alternative methods of
normalization were pursued. Normalization to
miRNAs consistently expressed with low variabil-
ity across all samples was then attempted but this
method was also rejected due to inconsistent
results. The necessity for normalization was veri-
fied using Q-Q plots of the cycle threshold (Ct)
values, and quantile normalization was performed
using the normalize.quantile function from the
Affy package for R produced by the Bioconductor
project (http://www.bioconductor.org, accessed
March 5, 2010; Bolstad et al., 2003). For each
sample run on multiple arrays, the average
expression value across those arrays was used as a
single value for the miRNA. Individual T tests
for each miRNA were conducted between
selected groups. To control for multiple testing,
both the Family Wise Error Rate (FWER) with a
Bonferroni correction and the False Discovery
Rate (FDR) methods were used (Benjamini and
Hochberg, 1995). To produce an experiment-
wide FWER of 5%, the significance threshold for
each individual miRNA was determined by divid-
ing 0.05 by the number of tests (0.05/96 ¼0.00052). Thus, a miRNA was only significant if
its P-value was less than 0.00052. The result of
this approach was that if no miRNA was truly dif-
ferent between two sample groups, then there
was only a 5% chance of having any false posi-
tives. The FDR is the expected proportion of
positive results that are false positives at the vari-
ous levels of significance and was controlled using
the step-up method of Benjamini and Hochberg
(1995). In this analysis, at any selected FDR
level, the expected proportion of false positives
was determined, but not which specific miRNA
were false positives. For this study, FDR of 5
and 10% were evaluated. The normalized Ct
value was converted to miRNA expression with
the formula 2�(x) to convert PCR cycles back into
expression levels, and the fold difference was cal-
culated as 2�(sample-control).
RESULTS
Detection of Canine miRNAs
Although the Cancer MicroRNA qPCR Array
with QuantiMirTM was designed to detect human
miRNAs, most of the probes cross-reacted well
with the canine miRNAs in all of the different
types of samples (Appendix A). Only six of the
miRNA probes were expressed in less than 75%
of the runs: miR-190 (5.2%), miR-153 (11.5%),
miR-1-1 (33.3%), miR-26b (56.3%), miR-101-1
(74.0%), and miR-137 (75.0%). The internal con-
trol (SNORD43) only amplified 77% of the time
overall and was below 75% in both PBMC and
lymph node samples. However, failure to amplify
was more common in PBMC than in any other
cell type where 23 of the 96 (24.0%) miRNA did
not amplify in 75% of the runs, while in the other
groups only five to eight of the miRNA failed to
amplify routinely. These results indicate that
there is enough homology between canine and
CANINE LYMPHOID CELL miRNA EXPRESSION 3
Genes, Chromosomes & Cancer DOI 10.1002/gcc

human miRNAs that arrays designed for use on
human tissues can be used to characterize
miRNA expression in canine samples. They also
indicate that SNORD43 was an inadequate inter-
nal control for this study.
Comparisons of Normalization Methods
Plots of the data from the samples run on dif-
ferent arrays confirmed the need for normaliza-
tion to control for variability between arrays
(Fig. 1, left panel). There was wide variation in
expression of the internal control (SNORD43), aswell as inconsistency in its amplification between
arrays. This required that the same samples had
to be run repeatedly. To overcome this problem,
five other miRNAs included in the array were
assessed for their potential use as internal con-
trols. These miRNAs: miR-373, miR-181d, miR-
198, miR-203, and miR-135b were chosen
because they had a low coefficient of variation
(<15%) and were amplified in over 95% of the
runs. All five were individually evaluated as
potential internal controls by analyzing for differ-
ences of miRNA expression between groups,
using each as a reference. However, this analysis
revealed that all five miRNAs had significantly
different expression between groups with little
overlap and none reliably normalized the data
suitably for further evaluation (data not shown).
Quantile normalization was then performed, and
Q-Q plots (data not shown) and box and whisker
plots confirmed the data was normalized (Fig. 1,
right panel). Normalized Ct means for each com-
parison with PBMC are presented in Appendix B
and for LN in Appendix C. Results of FWER
5%, FDR 5%, and FDR 10% comparing cell
lines, B-cell lymphoma, and T-cell lymphoma to
PMBC and LN are presented in Tables 1–3,
respectively.
miRNA Expression in Canine Lymphoid Cell Lines
To determine whether there were consistent
changes in miRNA associated with transformed ca-
nine lymphoid cells, and whether these differences
are similar to those observed in natural tumors,
miRNA expression in six immortalized canine
lymphoid cell lines was compared to that of both
PBMC and LN cells. The results are shown in Ta-
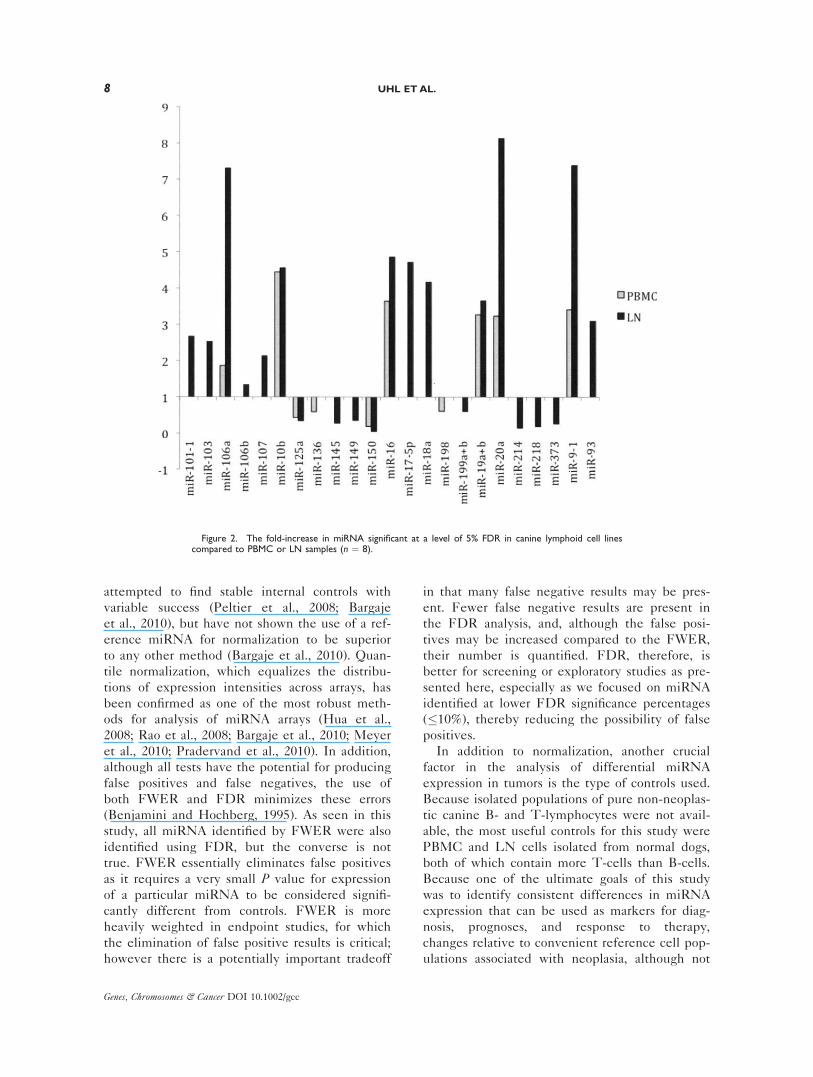
ble 1 and Figure 2. Overall, when expression was
different, more miRNA were found to have
increased rather than decreased expression in the
lymphoid cell lines (19 of 36). At 10% FDR there
were more differences in expression between the
LN and cell lines, where 31 were significant (16
higher: 15 lower), than between PBMC and cell
lines where 21 were significant (13 higher: 8 lower).
Comparisons of the fold-increases in miRNA in the
cell lines using both PBMC and LN cells as con-
trols at 5% FDR is presented in Figure 2. Only
eight of these are common to both groups, namely
Figure 1. Expression of miRNA qRT-PCR cycles for all miRNA in PBMC (includes replicates) before(left) and after (right) quantile normalization. The plots show the average of all the PBMC miRNA rawCT data. The left graph indicates substantial variation between arrays and that normalization is needed.Quantile normalization (right graph) was used to control for the variation between arrays.
4 UHL ET AL.
Genes, Chromosomes & Cancer DOI 10.1002/gcc

miR-106a, miR-10b, miR-125a, miR-150, miR-16,
miR-19aþb, miR-20, and miR-9-1. As expected,
fewer were identified at 5% FWER, where miR150
was significantly decreased and miR19aþb was
increased relative to PBMC. However five: miR-
106, miR-17-5p, miR-18a, miR-20, and miR-93 had
TABLE 1. Differential Expression of miRNAs in Canine Lymphoid Cell Lines Compared with PBMC and LN Cells as DeterminedUsing Multiple Statistical Methods
Analysis method
Percentexpressionrelativeto PBMC
Analysis method
Percentexpressionrelativeto LN
PBMCa;FWERb 5%
PBMC;
FDRc 5%
PBMC
FDR 10%
LNd;FWER 5%
LN
FDR 5%
LN
FDR 10%
Number of
significant
miRNA 2 10 21 7 21 31
Expected
number of
false positives 0 0.5 2.1 0 1.05 3.1
miRNA miRNA miRNA miRNA miRNA miRNA
miR-101-1 233.50% miR-101-1 miR-101-1 267.16%miR-103 258.57% miR-103 miR-103 252.32%
miR-106a miR-106a 186.91% miR-106a miR-106a miR-106a 730.60%miR-106b miR-106b 133.58%miR-107 miR-107 213.26%
miR-10b miR-10b 444.62% miR-10b miR-10b 456.03%miR-125a miR-125a 43.10% miR-125a miR-125a 34.46%
miR-132 37.50%miR-136 miR-136 59.07%
miR-145 50.64% miR-145 miR-145 miR-145 27.81%miR-149 miR-149 35.36%
miR-150 miR-150 miR-150 18.29% miR-150 miR-150 miR-150 5.30%miR-151 43.71%
miR-15a 182.36% miR-15a 210.79%miR-15b 424.02%
miR-16 miR-16 363.83% miR-16 miR-16 485.89%miR-17-5p 267.96% miR-17-5p miR-17-5p miR-17-5p 471.07%
miR-186 68.29%miR-18a 368.84% miR-18a miR-18a miR-18a 416.23%miR-197 63.57% miR-197 51.01%
miR-198 miR-198 60.43%miR-199aþb miR-199aþb 60.22%
miR-19aþb miR-19aþb miR-19aþb 326.96% miR-19aþb miR-19aþb 364.98%miR-200a 41.63%miR-202 37.86%
miR-206 55.46%miR-20a miR-20a 323.52% miR-20a miR-20a miR-20a 812.68%
miR-21 297.67%miR-214 miR-214 14.53%miR-218 miR-218 18.69%
miR-221 196.59%miR-30b 225.33%miR-373 49.85% miR-373 miR-373 26.64%
miR-488 53.92%miR-9-1 miR-9-1 340.84% miR-9-1 miR-9-1 738.24%
miR-93 miR-93 miR-93 309.40%
An expression level less than 100% indicates lower miRNA expression in cell lines relative to PBMC or LN, while an expression level above 100%
indicates higher expression.aPBMC—normal peripheral blood mononuclear cells.bFWER—family wise error rate.cFDR—false discovery rate.dNormal lymph node cells.
CANINE LYMPHOID CELL miRNA EXPRESSION 5
Genes, Chromosomes & Cancer DOI 10.1002/gcc

increased expression and 2 (miR145 and miR150)
had decreased expression compared to LN cells.
Compared with clinical cases of canine B- and T-
cell lymphomas there were more significant differ-
ences in miRNA expression between the cell lines
and both PBMC and LN cells.
miRNA Expression in Canine B-Cell Lymphomas
At 10% FDR, miR-181a, miR203, and miR204
had decreased and miR-19aþb had increased
expression in canine B-cell lymphomas compared
to PBMC. Only miR-218 was differentially
expressed (decreased) between B cell tumors and
LN cells and only at 10% FDR (Table 2). miR-
181a, miR203, and miR-19aþb were also differen-
tially expressed at both 5% FDR and 5% FWER,
and their fold-differences at 5% FDR compared
to PBMC are illustrated in Figure 3.
miRNA Expression in Canine T-Cell Lymphomas
At the 10% FDR level, there was differential
expression of 14 different miRNAs between T-
cell lymphomas and PBMC, but none were found
at 5%; while 13, with 7 also at the 5% level were
identified compared to LN cells (Table 3). As
was observed with the cell lines and B-cell
tumors, most of the relative changes in miRNA
expression were increases as 8 of 14 were higher
than in the PBMC and 8 of 13 were increased
compared to LN cells. Overall 14 of the 25
unique miRNAs with differential expression in
the T-cell lymphomas were increased. Of the
seven identified at the 5% FDR level compared
to LN cells, the four increased were miR-106a,
miR-17-5p, miR-183 and miR-20a, while the
three decreased were miR-149, 186, and miR-218
(Table 3 and Fig. 4). miR-17-5p (increased) and
miR-218 (decreased) were also significant at 5%
FWER. Out of the 14 miRNA differentially
expressed in T-cell lymphomas compared to
PBMCs, only 3: miR-17-5p, miR181b, and miR-
20a were also differentially expressed compared
to LN cells and all were increased (FDR 10%).
PBMC Versus LN as Controls
There were no significant differences identified
when miRNA expression in LN and PBMC were
compared with each other at FWER 5% or FDR
up to 15% (Appendix B, C). However, the use of
PBMC and LN cells as controls produced very
different results. When comparing cell lines to
PBMC and LN cells, only 16 of the 36 miRNA
found to be differentially expressed were identi-
fied by both controls. Analysis of canine B-cell
lymphomas revealed no differentially expressed
miRNAs at 5% FDR and only one at 10% using
LN cells as a control, while four were identified
using PBMC. In contrast, for T-cell tumors, seven
TABLE 2. Differential Expression of miRNA in Canine B-Cell Lymphomas
Analysis method
Percentexpressionrelativeto PBMC
Analysis method
Percentexpressionrelativeto LN
PBMCa;FWERb 5%
PBMC;FDRc 5%
PBMCFDR 10%
LNd;FWER 5%
LNFDR 5%
LNFDR 10%
Number of
significant
miRNA 3 3 4 0 0 1
Expected
number of
false positives 0 0.15 0.4 0 0 0.1
miRNA miRNA miRNA miRNA miRNA miRNA
miR-181a miR-181a miR-181a 67.84%miR-19aþb miR-19aþb miR-19aþb 178.44%miR-203 miR-203 miR-203 49.01%
miR-204 65.25%miR-218 43.32%
An expression level less than 100% indicates lower miRNA expression in the tumors relative to PBMC or LN cells, while an expression level above
100% indicates higher expression.aPBMC-normal peripheral blood mononuclear cells.bFWER—family wise error rate.cFDR—false discovery rate.dNormal lymph node cells.
6 UHL ET AL.
Genes, Chromosomes & Cancer DOI 10.1002/gcc

differentially expressed miRNAs were identified
at 5% FDR and FWER using LN cells as a con-
trol, but not when PBMC were used. At 10%
FDR several differentially expressed miRNAs
were identified using both controls, but only three
were the same. However, in all cases in which
both controls identified the same miRNA, the
direction of differential expression was the same,
although the actual percent change was variable.
DISCUSSION
Accurate miRNA expression profiling of tumors
is critical to identifying meaningful targets for
studies of pathogenesis and the development of
diagnostic and therapeutic tests. All of the widely
used profiling methods, including the real-time
quantitative PCR-qPCR assays used in these
studies, introduce significant bias and must be
normalized (Meyer et al., 2010). However, there
currently is no consensus normalization method
for miRNA studies, and those based upon meth-
ods used for mRNA studies do not take into
account the unique features of miRNA (Meyer
et al., 2010). For example, as was the case in
these studies, an internal endogenous control
(i.e., housekeeping gene) is not always an effec-
tive normalizer for miRNA. Other studies have
TABLE 3. Differential Expression of miRNA in Canine T-Cell Lymphomas
Analysis method
Percentexpressionrelativeto PBMC
Analysis method
Percentexpressionrelativeto LN
PBMCa;FWERb 5%
PBMC
FDRc 5%
PBMC
FDR 10%
LNd
FWER 5%
LN
FDR 5%
LN
FDR 10%
Number of
significant
miRNA 0 0 14 2 7 13
Expected
number of
false positives 0 0 1.4 0 0.35 1.3
miRNA miRNA miRNA miRNA miRNA miRNA
miR-106a miR-106a 380.63%miR-136 64.76%miR-146a 362.79%
miR-149 miR-149 27.06%miR-15b 535.39%
miR-16 715.65%miR-17-5p 294.12% miR-17-5p miR-17-5p miR-17-5p 325.39%miR-181b 234.60% miR-181b 212.04%miR-181d 225.82%
miR-183 miR-183 319.64%miR-186 miR-186 49.80%
miR-198 55.59%miR-19aþb 316.26%
miR-200b 61.59%miR-203 40.40%miR-204 36.54%miR-206 46.92%miR-20a 442.07% miR-20a miR-20a 401.13%
miR-218 miR-218 miR-218 18.93%miR-30b 264.78%miR-372 61.99%
miR-373 20.60%miR-9-1 378.36%miR-93 319.53%
An expression level less than 100% indicates lower miRNA expression in tumors relative to PBMC or LN cells, while an expression level above
100% indicates higher expression.aPBMC-normal peripheral blood mononuclear cells.bFWER—family wise error rate.cFDR—false discovery rate.dNormal lymph node cells.
CANINE LYMPHOID CELL miRNA EXPRESSION 7
Genes, Chromosomes & Cancer DOI 10.1002/gcc
attempted to find stable internal controls with
variable success (Peltier et al., 2008; Bargaje
et al., 2010), but have not shown the use of a ref-
erence miRNA for normalization to be superior
to any other method (Bargaje et al., 2010). Quan-
tile normalization, which equalizes the distribu-
tions of expression intensities across arrays, has
been confirmed as one of the most robust meth-
ods for analysis of miRNA arrays (Hua et al.,
2008; Rao et al., 2008; Bargaje et al., 2010; Meyer
et al., 2010; Pradervand et al., 2010). In addition,
although all tests have the potential for producing
false positives and false negatives, the use of
both FWER and FDR minimizes these errors
(Benjamini and Hochberg, 1995). As seen in this
study, all miRNA identified by FWER were also
identified using FDR, but the converse is not
true. FWER essentially eliminates false positives
as it requires a very small P value for expression
of a particular miRNA to be considered signifi-
cantly different from controls. FWER is more
heavily weighted in endpoint studies, for which
the elimination of false positive results is critical;
however there is a potentially important tradeoff
in that many false negative results may be pres-
ent. Fewer false negative results are present in
the FDR analysis, and, although the false posi-
tives may be increased compared to the FWER,
their number is quantified. FDR, therefore, is
better for screening or exploratory studies as pre-
sented here, especially as we focused on miRNA
identified at lower FDR significance percentages
(�10%), thereby reducing the possibility of false
positives.
In addition to normalization, another crucial
factor in the analysis of differential miRNA
expression in tumors is the type of controls used.
Because isolated populations of pure non-neoplas-
tic canine B- and T-lymphocytes were not avail-
able, the most useful controls for this study were
PBMC and LN cells isolated from normal dogs,
both of which contain more T-cells than B-cells.
Because one of the ultimate goals of this study
was to identify consistent differences in miRNA
expression that can be used as markers for diag-
nosis, prognoses, and response to therapy,
changes relative to convenient reference cell pop-
ulations associated with neoplasia, although not
Figure 2. The fold-increase in miRNA significant at a level of 5% FDR in canine lymphoid cell linescompared to PBMC or LN samples (n ¼ 8).
8 UHL ET AL.
Genes, Chromosomes & Cancer DOI 10.1002/gcc

necessarily causative, are of importance. Our
results indicate that the miRNAs identified as
having differential expression in the immortalized
lymphoid cell lines and naturally occurring
tumors varied with whether the comparison was
made against PBMC or LN cells. While in the
cell lines eight miRNAs were differentially
expressed compared to both PBMC and LN
cells, none of the miRNAs identified in the anal-
ysis of canine B-cell tumors were identified by
both controls (Tables 1 and 2). For naturally
occurring canine T cell tumors, only one (miR-
17-5p) was upregulated compared with both
PBMC and LN cells (Table 3). In addition, in
contrast to the cell lines, which had about the
same number of miRNAs differentially expressed
against each control, more miRNAs were identi-
fied using PBMC as controls for B-cell tumors
and LN cells as controls for T-cell tumors. These
results emphasize the relative nature of differen-
tial miRNA expression in tumors and demon-
strate the value of using more than one control.
Because most normal tissues, including peripheral
blood, lymph nodes, spleen, and bone marrow,
contain relatively small numbers of B-cells, one
of the major limitations of this study was our
inability to analyze miRNA expression of purified
populations of normal B and T-cells. Although
our results suggest that PBMC may be more use-
ful for the analysis of B-cell tumors and LN cells
are a better control for T-cell tumors, these find-
ings could be significantly biased. In the future,
additional functional assays and/or miRNA analy-
sis of purified populations of normal B- and T-
cells will be needed to determine the relevance
of the dysregulated miRNAs we’ve identified.
Several miRNAs were differentially expressed
in these studies. Expression of miR-19aþb was
increased in all groups (cell lines, B-cell, and T-
cell tumors) when using PBMC as a control, as
well as in cell lines when compared to LN cells.
The miR-19 aþb is part of the miR17-92 cluster
(oncomir-1), an oncogene acting primarily through
inhibition of apoptosis (He et al., 2005). This
cluster is expressed in lymphocyte precursors,
and its expression is upregulated in many tumors
including lymphomas (Mendell, 2008). Other
members of this cluster include: miR-17, miR-
18a, miR20a, miR-92, all of which were included
in the array. Upregulation of all but miR-92 was
observed in the tumor cell lines at 5% FDR
when compared to both PBMC and LN cells.
Compared to PBMC, miR19aþb was also upregu-
lated at 5% FWER, while miR17-5p, miR-18,
and miR-20a were significantly increased at 5%
FWER when comparing the cell lines to LN
Figure 3. The fold-increase in miRNA significant at a level of 5% FDR in B cell tumors compared toPBMC. None were significant at 5% FDR compared to LN cells (n ¼ 20).
CANINE LYMPHOID CELL miRNA EXPRESSION 9
Genes, Chromosomes & Cancer DOI 10.1002/gcc

cells. Of the members of the miR17-92 cluster,
only miR19aþb was increased in B-cell tumors
and only compared to PBMC (5% FWER), while
for T-cell tumors, miR19aþb was increased at
10% FDR compared to PBMC with miR17-5p
(5% FWER) and miR20a (5% FDR) increased
compared to LN cells. Interestingly, increased
expression of this miRNA cluster has been associ-
ated with significant enhancement of radioresist-
ance in human mantle cell lymphoma cells
(Jiang, et al. 2010). Finally, our results differ from
a previous study (Mortarino et al., 2010) where
miR-17-5p was reported to be upregulated in ca-
nine B-cell tumors when compared to normal LN
cells. Although that study had fewer samples
(13), and the normalization and data analysis
methods were less robust than those used in this
study, the difference between their findings and
ours suggest that canine as well as human B-cell
lymphomas are a heterogeneous group of tumors
that may be better characterized in terms of prog-
nosis and response to therapy by miRNA profiles
than by current methods of phenotyping (Lenz
et al., 2008; Kotani et al., 2010). Overall, our
results emphasize the usefulness of using two
controls, since together they better profiled
expression of this important oncomir, especially
in the naturally occurring tumors.
Although upregulation of miRNAs is more
commonly reported, decreased miRNA expres-
sion was also found in this study. miRNA-218,
which is a tumor suppressor (Martinez et al.,
2008), was decreased in all groups compared to
LN cells. The most robust significance of the
decrease (5% FWER) was observed in T-cell
tumors, followed by B-cell tumors (5% FDR),
and cell lines (10% FDR). Interestingly, most
reports of decreased regulation of miR-218 have
been in epithelial tumors (Martinez et al., 2008;
Davidson et al., 2010). In gastric cancer,
decreased miR-218 has been associated with
increased activation of Nuclear Factor-jB(NFKB1), a transcription factor originally identi-
fied in B-cells and frequently implicated in the
pathogenesis of a variety of tumors (Gao et al.,
2010). Decreased expression of miR-203, which
has been described in lymphoid and epithelial
tumors (Bueno et al., 2008), was also observed in
both B- (5% FWER) and T- (10% FDR) cell
tumors compared to PBMC. miR-203 controls
expression of the oncogene ABL1, which is com-
monly involved in hematopoietic tumors, and
Figure 4. The fold-increases in miRNA expression significant at a level of 5% FDR in T cell lympho-mas compared to LN cells. None were significant at 5% FDR compared to PBMC (n ¼ 9).
10 UHL ET AL.
Genes, Chromosomes & Cancer DOI 10.1002/gcc

both genetic and epigenetic mechanisms have
been implicated in its inactivation in naturally
occurring tumors (Bueno et al., 2008). miR-181a,
another miRNA with tumor suppressor activities
(Zhu et al., 2010), was significantly decreased
(5% FWER) in B-cell tumors compared to
PBMC. This is interesting since decreased
expression of miR-181a has been observed in
patients with chronic lymphoid leukemia and is
associated with a poorer prognosis (Zhu et al.,
2010). Higher expression of miR-181a was also
the only change in a single miRNA that associ-
ated with a higher remission rate and longer over-
all survival in a study of patients with
cytogenetically normal acute myeloid leukemia
(Schwind et al., 2010). Finally, our finding of
decreased expression of miR-181a in T-cell
tumors is also different from a previous canine
study where miR-181a was found to be upregu-
lated in T-cell tumors (Mortarino et al., 2010).
Once again, the discrepancy in our findings is
likely due to a combination of biological varia-
tion, number of cases, number of miRNA eval-
uated, and differences in statistical methods.
Despite differences in the miRNAs identified
using PBMC versus LN cells as controls, a review
of the miRNAs identified indicates that poten-
tially useful markers were found in both analyses.
There were also distinctive differences present
between those miRNAs identified as being differ-
entially expressed in the cell lines versus the nat-
urally occurring B- and T-cell tumors even using
the same control. However, for those identified
by both controls the direction of the differential
expression was always the same (i.e., up in both
or down in both). Of the miRNAs identified as
differentially expressed in naturally occurring
tumors, only two were unique to the tumors.
miR-181a, which was discussed above, was
decreased in B-cell tumors compared to PBMC
(5% FWER), but was not identified as being dif-
ferentially regulated at 5 or 10% FDR in either
the cell lines or the T-cell tumors. Similarly,
miR-183, which downregulates EGR1 (Sarver
2010), a tumor suppressor gene, was only upregu-
lated in T-cell tumors.
To date, there have been very few studies of
miRNA expression in canine tissues. As men-
tioned previously, our results differ from a previ-
ous report (Mortarino et al., 2010), although there
are significant differences between these studies.
Biological variation between lymphoma subtypes
may be one possible explanation (Robertus et al.,
2010). In the Mortarino et al. study, both B and
T-cell tumors were classified morphologically
according to an updated Kiel classification sys-
tem, while no attempt at morphological classifica-
tion was made here. In addition, although our
rigorous statistical analysis most likely minimized
this variation, the aforementioned study utilized a
Human MicroRNA TaqManVR Assay, while a
SYBR green based assay was used in our study.
Theoretically, the use of different assays can con-
tribute to experimental bias (Benes and Castoldi,
2010). And finally, as we observed when we tried
different normalization methods, results can also
vary with the type of normalization used. In the
previously reported study, expression levels of
only 11 miRNAs were examined and the three
(let-7, miR-26b, and miR-16) determined to be
most stably expressed using two different algo-
rithms in a type of scaling or invariant set method
were used to normalize the data by taking the
geometric mean of the relative difference
between all three internal controls and the
miRNA of interest. Although scaling can be help-
ful when most of the miRNA are not differen-
tially expressed between groups and the
appropriate miRNA are selected, it is not possible
to objectively measure the actual stability (Meyer
et al., 2010). This method also has limited ability
to control for overall signal intensity between
PCR runs and multiple testing (Sarver, 2010). In
contrast, quantile normalization, which we used
in this study, is considered one of the best nor-
malization methods for miRNA analysis, since it
does not depend on individual miRNA stability
and does control for overall signal intensity
between runs.
In summary, miRNA expression in canine neo-
plastic cells can be assessed using miRNA qPCR
array kits designed to characterize human tumors.
However, the quality and usefulness of the
results are dependent on both the type of con-
trols and the form of analysis used. Quantile nor-
malization followed by correction for multiple
testing using the FDR technique was determined
to be the best type of analysis for this kind of
data, and, based upon the previously described
roles of miRNA in tumor pathogenesis, the use
of PBMC and LN cells provided different, but
potentially equally important targets for further
analysis. Ongoing studies in our laboratory
include examining miRNA expression in a much
larger population of canine lymphomas and deter-
mining if canine miRNA targets are conserved
between humans and canines. This study further
emphasizes the usefulness of canine lymphoma
CANINE LYMPHOID CELL miRNA EXPRESSION 11
Genes, Chromosomes & Cancer DOI 10.1002/gcc

as a spontaneous, large animal model of human
lymphoid malignancies with findings that may be
applicable to both human and canine patients.
ACKNOWLEDGMENTS
The authors acknowledge Travis Antes, Frank
Michel, Chantel Lester, and Systems BioSciences
for their excellent technical support and assistance.
REFERENCES
Ambros V. 2003. MicroRNA pathways in flies and worms: Growth,death, fat, stress, and timing. Cell 113:673–676.
Bargaje R, Hariharan M, Scaria V, Pillai B. 2010. ConsensusmiRNA expression profiles derived from interplatform normal-ization of microarray data. RNA 16:16–25.
Benes V, Castoldi M. 2010. Expression profiling of microRNAusing real-time quantitative PCR, how to use it and what isavailable. Methods 50:244–249.
Benjamini Y, Hochberg Y. 1995. Controlling the false discoveryrate—A practical and powerful approach to multiple testing. J RStat Soc Ser B Methodol 57:289–300.
Bolstad BM, Irizarry RA, Astrand M, Speed TP. 2003. A compari-son of normalization methods for high density oligonucleotidearray data based on variance and bias. Bioinformatics 19:185–193.
Bueno MJ, Perez de Castro I, Gomez de Cedron M, Santos J,Calin GA, Cigudosa JC, Croce CM, Fernandez-Piqueras J,Malumbres M. 2008. Genetic and epigenetic silencing of micro-RNA-203 enhances ABL1 and BCR-ABL1 oncogene expres-sion. Cancer Cell 13:496–506.
Calin GA, Dumitru CD, Shimizu M, Bichi R, Zupo S, Noch E,Aldler H, Rattan S, Keating M, Rai K, Rassenti L, Kipps T,Negrini M, Bullrich F, Croce CM. 2002. Frequent deletionsand down-regulation of micro- RNA genes miR15 and miR16 at13q14 in chronic lymphocytic leukemia. Proc Natl Acad SciUSA 99:15524–15529.
Davidson MR, Larsen JE, Yang IA, Hayward NK, Clarke BE,Duhig EE, Passmore LH, Bowman RV, Fong KM. 2010. Micro-RNA-218 is deleted and downregulated in lung squamous cellcarcinoma. PLoS One 5:e12560.
Elnenaei MO, Hamoudi RA, Swansbury J, Gruszka-WestwoodAM, Brito-Babapulle V, Matutes E, Catovsky D. 2003. Delinea-tion of the minimal region of loss at 13q14 in multiple my-eloma. Genes Chromosomes Cancer 36:99–106.
Fournel-Fleury C, Magnol JP, Bricaire P, Marchal T, ChabanneL, Delverdier A, Bryon PA, Felman P. 1997. Cytohistologicaland immunological classification of canine malignant lympho-mas: Comparison with human non-Hodgkin’s lymphomas. JComp Pathol 117:35–59.
Gao C, Zhang Z, Liu W, Xiao S, Gu W, Lu H. 2010. ReducedmicroRNA-218 expression is associated with high nuclear factorkappa B activation in gastric cancer. Cancer 116:41–49.
Harfe BD. 2005. MicroRNAs in vertebrate development. CurrOpin Genet Dev 15:410–415.
He L, Thomson JM, Hemann MT, Hernando-Monge E, Mu D,Goodson S, Powers S, Cordon-Cardo C, Lowe SW, Hannon GJ,et al. 2005. A microRNA polycistron as a potential human onco-gene. Nature 435:828–833.
Hua YJ, Tu K, Tang ZY, Li YX, Xiao HS. 2008. Comparison ofnormalization methods with microRNA microarray. Genomics92:122–128.
Jacobs RM, Messnick JB, Valli VE. 2002. Tumors of the SkinHemolymphatic System. In: Meuten DJ, editor. Tumors inDomestic Animals. Iowa: Iowa State Press. p 128–133.
Jiang P, Rao EY, Meng N, Zhao Y, Wang JJ. 2010. MicroRNA-17-92 significantly enhances radioresistance in human mantlecell lymphoma cells. Radiat Oncol 5:100.
Johnson SM, Grosshans H, Shingara J, Byrom M, Jarvis R, ChengA, Labourier E, Reinert KL, Brown D, Slack FJ. 2005. RAS isregulated by the let-7 microRNA family. Cell 120:635–647.
Kaiser HE. 1981. Animal neoplasms: A systemic review. In: KaiserHE, editor. Neoplasms: Comparative Pathology in Animals,Plants, and Man. Baltimore: Williams and Wilkins. p 47–751.
Khanna C, Lindblad-Toh K, Vail D, London C, Bergman P, Bar-ber L, Breen M, Kitchell B, McNeil E, Modiano JF, Neimi S,Comstock KE, Ostrander E, Westmoreland S, Withrow S. 2006.The dog as a cancer model. Nat Biotechnol 24:1065–1066.
Kisseberth WC, Nadella MV, Breen M, Thomas R, Duke SE,Murahari S, Kosarek CE, Vernau W, Avery AC, Burkhard MJ,Rosol TJ. 2007. A novel canine lymphoma cell line: A transla-tional and comparative model for lymphoma research. LeukRes 31:1709–1720.
Kobayashi M, Yamauchi Y, Tanaka A. 1998. Stable expression ofantisense Rb-1 RNA inhibits terminal differentiation of mousemyoblast C2 cells. Exp Cell Res 239:40–49.
Kotani A, Harnprasopwat R, Toyoshima T, Kawamata T, Tojo A.2010. miRNAs in normal and malignant B cells. Int J Hematol92:255–261.
Lee RC, Feinbaum RL, Ambros V. 1993. The C. elegans hetero-chronic gene lin-4 encodes small RNAs with antisense comple-mentarity to lin-14. Cell 75:843–854.
Lenz G, Wright GW, Emre NC, Kohlhammer H, Dave SS, DavisRE, Carty S, Lam LT, Shaffer AL, Xiao W, Powell J, Rosen-wald A, Ott G, Muller-Hermelink HK, Gascoyne RD, ConnorsJM, Campo E, Jaffe ES, Delabie J, Smeland EB, Rimsza LM,Fisher RI, Weisenburger DD, Chan WC, Staudt LM. 2008.Molecular subtypes of diffuse large B-cell lymphoma arise bydistinct genetic pathways. Proc Natl Acad Sci USA 105:13520–13525.
Martinez I, Gardiner AS, Board KF, Monzon FA, Edwards RP,Khan SA. 2008. Human papillomavirus type 16 reduces theexpression of microRNA-218 in cervical carcinoma cells. Onco-gene 27:2575–2582.
Mendell JT. 2008. miRiad roles for the miR-17-92 cluster in de-velopment and disease. Cell 133:217–222.
Meyer SU, Pfaffl MW, Ulbrich SE. 2010. Normalization strategiesfor microRNA profiling experiments: A ‘‘normal’’ way to a hid-den layer of complexity? Biotechnol Lett 32:1777–1788.
Momoi Y, Okai Y, Watari T, Goitsuka R, Tsujimoto H, HasegawaA. 1997. Establishment and characterization of a canine T-lym-phoblastoid cell line derived from malignant lymphoma. VetImmunol Immunopathol 59:11–20.
Mortarino M, Gioia G, Gelain ME, Albonico F, Roccabianca P,Ferri E, Comazzi S. 2010. Identification of suitable endogenouscontrols and differentially expressed microRNAs in caninefresh-frozen and FFPE lymphoma samples. Leuk Res 34:1070–1077.
Nakaichi M, Taura Y, Kanki M, Mamba K, Momoi Y, TsujimotoH, Nakama S. 1996. Establishment and characterization of anew canine B-cell leukemia cell line. J Vet Med Sci 58:469–471.
Peltier HJ, Latham GJ. 2008. Normalization of microRNA expres-sion levels in quantitative RT-PCR assays: Identification ofsuitable reference RNA targets in normal and cancerous humansolid tissues. RNA 14:844–852.
Pradervand S, Weber J, Lemoine F, Consales F, Paillusson A,Dupasquier M, Thomas J, Richter H, Kaesmann H, BeaudoingE, Haganbuchle O, Harshman K. 2010. Concordance amongdigital gene expression microarrays, and qPCR when measuringdifferential expression of microRNAs. Biotechniques 48:219–222.
Rao Y, Lee Y, Jarjoura D, Ruppert ASl, Liu CG, Hsu JC, HaganJP. 2008. A comparison of normalization techniques for micro-RNA microarray data. Stat Appl Genet Mol Biol 7:Article 22.
Robertus JL, Kluiver J, Weggemans C, Harms G, Reijmers RM,Swart Y, Kok K, Rosati S, Schuuring E, van Imhoff G, Pals ST,Kluin P, van den Berg A. 2010. MiRNA profiling in B non-Hodgkin lymphoma: A MYC-related miRNA profile character-izes Burkitt lymphoma. Br J Haematol 149:896–899.
Ross JS, Carlson JA, Brock G. 2007. miRNA: The new gene si-lencer. Am J Clin Pathol 128:830–836.
Sarver AL. 2010. Toward understanding the informatics and statis-tical aspects of micro-RNA profiling. J Cardiovasc Transl Res3:204–211.
Schwind S, Maharry K, Radmacher MD, Mrozek K, Holland KB,Margeson D, Whitman SP, Hickey C, Becker H, Metzeler KH,Paschka P, Baldus CD, Liu S, Garzon R, Powell BL, Kolitz JE,Carroll AJ, Caligiuri MA, Larson RA, Marcucci G, BloomfieldCD. 2010. Prognostic significance of expression of a singlemicroRNA, miR-181a, in cytogenetically normal acute myeloidleukemia: A Cancer and Leukemia Group B study. J ClinOncol 28:5257–5264.
12 UHL ET AL.
Genes, Chromosomes & Cancer DOI 10.1002/gcc

Seiser EL, Thomas R, Richards KL, Kelley MK, Moore P, SuterSE, Breen M. 2000. Reading between the lines: Molecular char-acterization of five widely utilized canine lymphoid tumor celllines. Vet Comp Oncol (Accepted).
Steplewski Z, Jeglum KA, Rosales C, Weintraub N. 1987. Ca-nine lymphoma-associated antigens defined by murinemonoclonal antibodies. Cancer Immunol Immunother24:197–201.
Stilgenbauer S, Nickolenko J, Wilhelm J, Wolf S, Weitz S, Doh-ner K, Boehm T, Dohner H, Lichter P. 1998. Expressedsequences as candidates for a novel tumor suppressor gene atband 13q14 in B-cell chronic lymphocytic leukemia and mantlecell lymphoma. Oncogene 16:1891–1897.
Suter SE, Chein MB, von Messling V, Yip B, Cattaneo R, Ver-nau W, Madewell BR, London CA. 2005. In vitro canine dis-temper virus infection of canine lymphoid cells: A prelude tooncolytic therapy for lymphoma. Clin Cancer Res 11:1579–1587.
Vail DM, Young KM. 2007. Hematopoietic tumors. In: WithrowSJ, Vail DM, editors. Small Animal Clinical Oncology, 4th ed.Philadelphia: WB Saunders. p.699.
Wunderli PS, Felsburg PJ. 1989. An improved method for the iso-lation of enriched canine peripheral blood mononuclear cell andperipheral blood lymphocyte preparations. Vet Immunol Immu-nopathol 20:335–344.
Xi Y, Edwards JR, Ju J. 2007. Investigation of miRNA biology bybioinformatic tools and impact of miRNAs in colorectal can-cer—Regulatory relationship of c-Myc and p53 with miRNAs.Cancer Inform 3:245–253.
Xi Y, Formentini A, Chien M, Weir DB, Russo JJ, Ju J, KornmannM. 2006. Prognostic values of microRNAs in colorectal cancer.Biomark Insights 2:113–121.
Zhu DX, Miao KR, Fang C, Fan L, Zhu W, Zhu HY, Zhuang Y,Hong M, Liu P, Xu W, Li JY. 2010. Aberrant microRNAexpression in Chinese patients with chronic lymphocytic leuke-mia. Leuk Res. Dec 2 [Epub ahead of print].
APPENDIX
TABLE A1. Percentage Amplification of Canine microRNA in All Runs Using the QuantiMirTM cDNA Synthesis Kit
PBMC LN Lines B cell L T cell L Overall
Total runs (includes repeated samples) 14 12 18 36 16 96Unique samples 6 12 8 20 9 88MicroRNAlet-7-family 57.1 100.0 83.3 97.2 100.0 89.6miR-7 71.4 100.0 100.0 91.7 100.0 92.7miR-92 78.6 100.0 94.4 97.2 100.0 94.8miR-93 85.7 91.7 100.0 94.4 100.0 94.8miR-9-1 57.1 91.7 94.4 75.0 87.5 80.2miR-101-1 57.1 91.7 83.3 69.4 75.0 74.0miR-103 78.6 100.0 100.0 97.2 100.0 95.8miR-106a 71.4 100.0 88.9 91.7 100.0 90.6miR-106b 92.9 100.0 100.0 94.4 100.0 96.9miR-107 85.7 100.0 94.4 94.4 100.0 94.8miR-10b 64.3 75.0 94.4 86.1 87.5 83.3miR-1-1 14.3 66.7 33.3 30.6 31.3 33.3miR-122a 78.6 100.0 100.0 83.3 93.8 89.6miR-125a 100.0 100.0 100.0 97.2 100.0 99.0miR-125b 92.9 100.0 94.4 91.7 100.0 94.8miR-126 85.7 100.0 94.4 91.7 100.0 93.8miR-128b 85.7 91.7 94.4 97.2 100.0 94.8miR-132 100.0 100.0 100.0 94.4 100.0 97.9miR-133a 85.7 100.0 100.0 94.4 100.0 95.8miR-134 100.0 100.0 100.0 94.4 100.0 97.9miR-135b 100.0 100.0 100.0 97.2 93.8 97.9miR-136 85.7 100.0 94.4 91.7 87.5 91.7miR-137 35.7 91.7 88.9 77.8 75.0 75.0miR-140 85.7 91.7 100.0 94.4 93.8 93.8miR-141 78.6 83.3 94.4 91.7 100.0 90.6miR-142-3p 71.4 91.7 100.0 94.4 100.0 92.7miR-143 85.7 100.0 94.4 97.2 100.0 95.8miR-145 85.7 100.0 88.9 91.7 100.0 92.7miR-146a 85.7 100.0 100.0 94.4 100.0 95.8miR-149 92.9 100.0 100.0 94.4 100.0 96.9miR-150 100.0 100.0 100.0 94.4 100.0 97.9miR-151 92.9 100.0 100.0 94.4 100.0 96.9miR-153 14.3 8.3 0.0 13.9 18.8 11.5miR-154 92.9 100.0 100.0 91.7 100.0 95.8miR-155 64.3 91.7 94.4 91.7 93.8 88.5miR-15a 78.6 91.7 94.4 94.4 87.5 90.6miR-15b 78.6 100.0 94.4 94.4 100.0 93.8miR-16 78.6 100.0 94.4 100.0 100.0 95.8
(Continued)
Genes, Chromosomes & Cancer DOI 10.1002/gcc
CANINE LYMPHOID CELL miRNA EXPRESSION 13

TABLE A1. Percentage Amplification of Canine microRNA in All Runs Using the QuantiMirTM cDNA Synthesis Kit (Continued)
PBMC LN Lines B cell L T cell L Overall
miR-17-3p 85.7 91.7 94.4 94.4 100.0 93.8miR-17-5p 100.0 100.0 100.0 94.4 100.0 97.9miR-181a 92.9 100.0 100.0 94.4 100.0 96.9miR-181b 92.9 91.7 100.0 94.4 100.0 95.8miR-181c 92.9 100.0 100.0 94.4 100.0 96.9miR-181d 100.0 100.0 100.0 100.0 100.0 100.0miR-183 92.9 100.0 100.0 94.4 100.0 96.9miR-185 92.9 91.7 94.4 94.4 100.0 94.8miR-186 78.6 91.7 100.0 94.4 93.8 92.7miR-188 85.7 91.7 100.0 97.2 87.5 93.8miR-18a 78.6 100.0 100.0 94.4 100.0 94.8miR-190 14.3 8.3 0.0 5.6 0.0 5.2miR-191 92.9 100.0 100.0 94.4 100.0 96.9miR-192 85.7 91.7 100.0 94.4 100.0 94.8miR-194 85.7 100.0 100.0 88.9 100.0 93.8miR-195 78.6 100.0 94.4 91.7 100.0 92.7miR-196a 85.7 83.3 100.0 94.4 93.8 92.7miR-197 92.9 100.0 94.4 94.4 100.0 95.8miR-198 100.0 100.0 100.0 97.2 100.0 99.0miR-199aþb 85.7 91.7 94.4 91.7 100.0 92.7miR-30b 92.9 100.0 100.0 94.4 93.8 95.8miR-19aþb 85.7 100.0 94.4 94.4 93.8 93.8miR-95 64.3 91.7 100.0 91.7 100.0 90.6miR-20a 92.9 100.0 94.4 97.2 100.0 96.9miR-200a 71.4 100.0 77.8 91.7 93.8 87.5miR-200b 71.4 100.0 94.4 86.1 100.0 89.6miR-200c 100.0 100.0 100.0 94.4 100.0 97.9miR-202 100.0 100.0 100.0 94.4 100.0 97.9miR-203 92.9 100.0 94.4 97.2 100.0 96.9miR-204 78.6 100.0 100.0 94.4 100.0 94.8miR-205 85.7 91.7 100.0 94.4 100.0 94.8miR-206 92.9 91.7 100.0 86.1 100.0 92.7miR-21 85.7 100.0 100.0 91.7 100.0 94.8miR-210 92.9 100.0 94.4 97.2 93.8 95.8miR-214 100.0 100.0 94.4 97.2 93.8 96.9miR-215 57.1 100.0 100.0 91.7 100.0 90.6miR-372 92.9 100.0 94.4 100.0 100.0 97.9miR-373 100.0 100.0 100.0 100.0 100.0 100.0miR-218 100.0 100.0 100.0 94.4 100.0 97.9miR-219 78.6 91.7 100.0 94.4 100.0 93.8miR-22 85.7 100.0 94.4 97.2 100.0 95.8miR-488 92.9 100.0 100.0 97.2 93.8 96.9miR-221 71.4 100.0 100.0 97.2 100.0 94.8miR-222 100.0 100.0 94.4 97.2 100.0 97.9miR-223 92.9 100.0 100.0 97.2 93.8 96.9miR-224 50.0 100.0 83.3 94.4 87.5 85.4miR-23a 78.6 100.0 77.8 91.7 100.0 89.6miR-24 78.6 100.0 83.3 91.7 100.0 90.6miR-25 85.7 91.7 94.4 86.1 100.0 90.6miR-26a 85.7 91.7 83.3 83.3 100.0 87.5miR-26b 42.9 58.3 55.6 61.1 56.3 56.3miR-27aþb 100.0 100.0 94.4 94.4 100.0 96.9miR-30c 78.6 100.0 88.9 94.4 100.0 92.7miR-29aþbþc 64.3 75.0 83.3 94.4 93.8 85.4miR-30a-3p 85.7 91.7 94.4 94.4 100.0 93.8miR-30a-5p 71.4 75.0 94.4 94.4 93.8 88.5miR-296 71.4 100.0 72.2 91.7 75.0 83.3RNU 43 71.4 66.7 83.3 83.3 68.8 77.1
Genes, Chromosomes & Cancer DOI 10.1002/gcc
14 UHL ET AL.

TABLE A2. Normalized Raw Means for miRNA Expression Comparisons of PBMC with Cell Lines, Lymph Nodes, B-CellLymphoma, and T-Cell Lymphomas
miRNA PBMC LN PBMC Cell PBMC B cell PBMC T cell
let-7-family 32.07866 31.65379 32.59066 31.96841 31.20217 30.66340 31.25751 30.81915miR-7 30.75537 31.61080 31.01644 31.16500 29.75158 30.12502 29.37375 29.78563miR-92 28.23118 29.23734 29.32836 29.71294 28.77585 28.98336 26.27391 26.88376miR-93 30.48268 30.50997 30.72485 29.90382 29.68719 29.49531 28.95741 27.83006miR-9-1 32.48590 32.59758 33.23719 31.46810 31.92374 31.09727 31.90705 30.72138miR-101-1 32.56301 32.52878 33.52005 32.29665 32.16889 31.42366 32.24332 31.59237miR-103 31.12398 30.68697 31.43359 30.06306 30.11946 29.74807 29.88879 28.72271miR-106a 30.30063 30.86916 30.48494 29.58257 29.59151 29.23204 28.73188 28.29113miR-106b 30.73559 30.71559 30.88997 30.43225 29.93706 29.66202 29.23303 29.45076miR-107 31.13119 31.24924 31.26017 30.68924 30.03233 30.04671 29.79002 29.82760miR-10b 32.36757 31.96588 33.16491 31.01235 31.79836 30.74265 31.83612 30.60668miR-1-1 32.07651 32.40187 33.14897 31.81004 31.51184 30.46186 31.84017 30.92168miR-122a 31.72755 31.62687 32.24877 32.31991 30.83066 30.88139 30.83050 30.95240miR-125a 30.79969 31.02356 30.99023 32.20439 29.82743 30.26776 29.40850 29.56231miR-125b 31.28225 31.55210 31.45498 31.93264 30.18688 30.38488 29.97415 30.07693miR-126 31.23509 31.33251 31.49371 31.75323 30.09542 30.51450 30.01819 30.09521miR-128b 31.34095 31.54632 31.56835 31.80255 30.12760 30.42447 30.17049 30.64229miR-132 29.87545 30.05184 30.32483 31.26674 29.34197 29.73179 28.20344 29.48626miR-133a 30.81869 30.97908 31.06640 31.94789 29.86917 30.27801 29.44712 30.50291miR-134 31.10844 30.89073 31.44033 31.80193 30.13118 30.20829 29.92980 30.38783miR-135b 30.51908 30.93849 30.82923 31.64886 29.72061 30.70024 29.01434 30.77568miR-136 32.28959 32.46428 32.68353 33.44303 31.37628 31.77876 31.33126 31.95806miR-137 32.66212 31.84953 33.74654 32.59837 32.38789 31.77233 32.48173 31.44516miR-140 31.48978 31.31582 31.72424 31.75593 30.43817 30.79083 30.24193 30.75297miR-141 31.43564 31.91074 31.68803 32.30406 30.37032 30.77456 30.23901 30.95029miR-142-3p 30.83675 29.41085 31.05998 29.96664 30.00388 29.07221 29.37279 27.48220miR-143 31.60660 31.43403 31.82503 31.98840 30.54867 30.10570 30.41593 30.47338miR-145 31.61387 31.39002 31.86152 32.84312 30.44786 30.29973 30.43234 30.06179miR-146a 31.54833 30.87029 31.80882 31.18218 30.39037 30.17673 30.40398 28.54485miR-149 31.13642 30.60262 31.23127 31.66042 30.14616 29.93080 29.73007 30.26501miR-150 28.52697 28.87748 29.51324 31.96411 28.90224 29.39053 26.63542 27.15350miR-151 31.47444 30.63769 31.82323 31.59655 30.39271 29.98454 30.45080 29.73734miR-153 31.97660 32.69885 32.14656 NaN 30.93055 30.17863 30.79864 32.96108miR-154 30.99389 31.05815 31.27155 31.84991 29.95329 30.12321 29.70153 30.59854miR-155 30.95817 30.43576 31.25201 31.17573 29.94958 29.67425 29.68462 28.46475miR-15a 31.40621 31.18476 31.61326 30.74650 30.17579 29.99925 30.22189 29.54804miR-15b 29.46431 29.94942 30.06870 29.44712 29.28506 29.16503 27.69518 26.49922miR-16 30.91868 29.86278 31.19709 29.33382 29.98776 29.05795 29.51970 26.68045miR-17-3p 31.02853 30.76312 31.22922 31.25887 30.06669 29.91053 29.73327 29.98911miR-17-5p 31.10621 30.75710 31.21320 29.79121 30.08149 29.39092 29.74199 28.18559miR-181a 28.31981 28.74221 29.37519 29.86417 28.81282 29.37254 26.35873 26.43197miR-181b 30.17508 29.84360 30.42591 30.27106 29.54471 29.53469 28.54011 27.30990miR-181c 28.24320 28.19158 29.38951 29.58840 28.82970 29.16186 26.27721 26.24024miR-181d 31.07458 30.75425 31.26514 30.69612 30.01236 29.88336 29.78262 28.60743miR-183 31.29077 31.80334 31.50984 31.44098 30.13177 30.49729 30.05467 29.80726miR-185 30.97097 30.67285 31.17457 31.20924 29.86794 29.68305 29.66914 29.72492miR-186 31.41375 30.65470 31.52569 31.06879 30.22072 29.81853 30.18352 29.76884miR-188 30.87778 30.61689 31.13249 31.28498 29.94573 29.79146 29.53130 29.91288miR-18a 31.81284 31.31130 32.14841 30.26543 30.88248 29.81785 30.82158 29.85207miR-190 30.99404 32.68575 31.00509 NaN 29.84097 31.25529 29.66340 NaNmiR-191 29.41399 28.96170 29.97078 29.59035 29.13980 28.82251 27.61570 26.59585miR-192 31.04169 31.15432 31.14116 31.06913 29.95022 29.89927 29.69014 29.75175miR-194 31.57522 31.52213 31.79660 31.64549 30.25623 30.31685 30.45030 30.35155miR-195 30.77600 30.69471 31.09608 30.24398 29.99360 29.57218 29.43675 28.40954miR-196a 30.26354 31.05945 30.81315 31.41592 29.77056 29.69418 28.71640 30.08156miR-197 29.73398 29.92233 30.14407 30.79767 29.30526 29.54834 28.00900 28.91716miR-198 31.31324 31.23482 31.52147 32.24821 30.11388 30.64923 30.11755 30.96457miR-199aþb 32.14302 31.84582 32.51887 32.57433 31.16121 30.84649 31.17153 30.78080miR-30b 31.15153 30.29475 31.28949 30.11744 30.03065 29.35680 29.84674 28.44194
(Continued)
Genes, Chromosomes & Cancer DOI 10.1002/gcc
CANINE LYMPHOID CELL miRNA EXPRESSION 15

TABLE A2. Normalized Raw Means for miRNA Expression Comparisons of PBMC with Cell Lines, Lymph Nodes, B-Cell Lym-phoma, and T-Cell Lymphomas (Continued)
miRNA PBMC LN PBMC Cell PBMC B cell PBMC T cell
miR-19aþb 31.38809 30.66528 31.62469 29.91557 30.12678 29.29135 30.24644 28.58532miR-95 30.83384 32.15995 31.07243 32.50636 30.07942 30.93327 29.33025 31.12816miR-20a 30.54643 30.08299 30.80139 29.10754 29.74705 29.08473 29.02100 26.87673miR-200a 32.06707 32.15966 32.54016 33.69767 31.37956 32.02677 31.12712 32.07507miR-200b 31.64674 31.56960 31.99333 32.11635 30.53897 30.37421 30.67025 30.89424miR-200c 31.34660 31.07881 31.44839 31.65998 30.02404 29.94863 30.10220 29.94464miR-202 30.31424 30.35426 30.66014 31.44788 29.67658 29.87256 28.78500 29.95615miR-203 31.33332 32.06117 31.52374 32.01850 30.13929 31.16815 30.11013 31.41754miR-204 30.59004 31.51777 30.82593 31.68823 29.68497 30.30089 29.14279 30.59540miR-205 31.08026 31.28974 31.25924 31.54846 29.96418 30.06592 29.77922 30.44464miR-206 30.61373 30.77173 30.83890 31.68930 29.73856 29.86090 29.20603 30.29781miR-21 30.36416 28.90080 30.96138 29.38767 29.94915 28.87211 29.02873 26.62588miR-210 30.04031 30.24146 30.43891 30.87837 29.51173 29.68129 28.40429 29.35672miR-214 30.25067 29.23063 30.59809 31.32147 29.69043 29.52086 28.65822 28.96015miR-215 32.47163 32.42400 32.86255 32.78217 31.66390 31.79860 31.50326 31.95468miR-372 31.08546 31.21948 31.21878 31.29557 29.92282 30.19271 29.79115 30.48111miR-373 30.68917 30.55991 30.97856 31.98296 29.70370 30.08083 29.25240 30.56007miR-218 31.87569 31.15335 32.23417 33.10513 30.94475 31.51932 30.84744 31.44805miR-219 32.07582 32.15279 32.40504 32.07728 31.18980 30.76303 31.02144 30.92769miR-22 31.09252 31.27532 31.37425 31.52605 29.99201 30.04521 29.82049 30.11991miR-488 31.86825 31.92443 32.12277 32.57541 30.77104 31.25970 30.76581 31.37711miR-221 30.24469 30.94830 30.53900 30.37197 29.57930 29.80931 28.67235 29.40851miR-222 30.34898 30.35060 30.58083 30.52890 29.57477 29.69515 28.82268 28.89235miR-223 30.24970 30.55306 30.68880 31.33327 29.65137 30.07291 28.79138 29.23750miR-224 32.47957 32.43318 33.11184 33.48044 31.84461 31.72111 31.81108 32.27999miR-23a 30.00851 30.37218 30.52313 30.18825 29.52649 29.71902 28.39557 27.22706miR-24 30.44428 30.12616 30.71391 30.39368 29.66775 29.53668 28.90510 28.14062miR-25 30.58113 30.19114 30.86895 30.04926 29.70730 29.30258 29.11901 27.47309miR-26a 31.39480 30.67489 31.72969 30.72576 30.67053 29.90398 30.27300 29.24388miR-26b 32.21107 32.19866 32.86529 33.44758 31.49072 31.61207 31.56660 30.87487miR-27aþb 31.33376 30.74329 31.58369 30.77196 30.27356 29.66066 30.11602 29.12685miR-30c 30.63026 30.00015 30.94327 29.98622 29.74183 29.33295 29.16883 28.18428miR-29aþbþc 31.59928 29.66933 31.93913 30.64297 30.69750 29.63811 30.46428 29.60815miR-30a-3p 29.45681 29.74524 30.24609 31.03531 29.42536 29.63607 27.85546 29.80556miR-30a-5p 29.85178 30.83252 30.26449 30.58628 29.37304 29.58680 28.20093 28.94215miR-296 31.52717 32.11391 32.14892 33.10351 30.79062 31.22759 30.59377 31.66721RNU43 30.70363 31.48847 31.36781 31.56553 30.23433 30.08977 29.52584 30.41610
TABLE A3. Normalized Raw Means of miRNA Expression for Comparisons Between LN and PBMC, Cell Lines, B-CellLymphoma, and T-Cell Lymphomas
miRNA LN PBMC LN Cell LN B cell LN T cell
let-7-family 31.65379 32.07866 31.14981 31.04508 30.49718 30.69445 29.33861 29.84278miR-7 31.61080 30.75537 30.80210 29.76088 30.25031 29.99097 29.04336 27.97597miR-92 29.23734 28.23118 27.34740 26.85244 28.62932 28.63886 24.60734 24.22441miR-93 30.50997 30.48268 29.08810 27.45861 29.21167 29.11160 26.78329 25.10736miR-9-1 32.59758 32.48590 33.13230 30.24822 32.41308 31.18707 31.56072 29.64097miR-101-1 32.52878 32.56301 33.01100 31.59329 32.17042 31.67369 31.44997 30.88397miR-103 30.68697 31.12398 29.38833 28.05307 29.42883 29.41464 27.23229 26.29707miR-106a 30.86916 30.30063 29.57430 26.70521 29.53838 28.87893 27.58109 25.65269miR-106b 30.71559 30.73559 29.11803 28.70031 29.14866 29.14582 27.08939 27.47194miR-107 31.24924 31.13119 30.18805 29.09542 29.89584 29.78732 28.40046 28.09611miR-10b 31.96588 32.36757 31.75499 29.56585 31.06074 30.80030 30.07539 29.43263miR-1-1 32.40187 32.07651 32.77859 30.80379 32.21889 30.80817 31.28056 29.92780miR-122a 31.62687 31.72755 31.00919 31.75844 30.35805 30.80410 29.13400 29.99939miR-125a 31.02356 30.79969 30.00855 31.54538 29.85570 30.20912 28.04249 27.70132miR-125b 31.55210 31.28225 30.81445 31.10956 30.28545 30.39637 29.05469 28.52544
(Continued)
Genes, Chromosomes & Cancer DOI 10.1002/gcc
16 UHL ET AL.
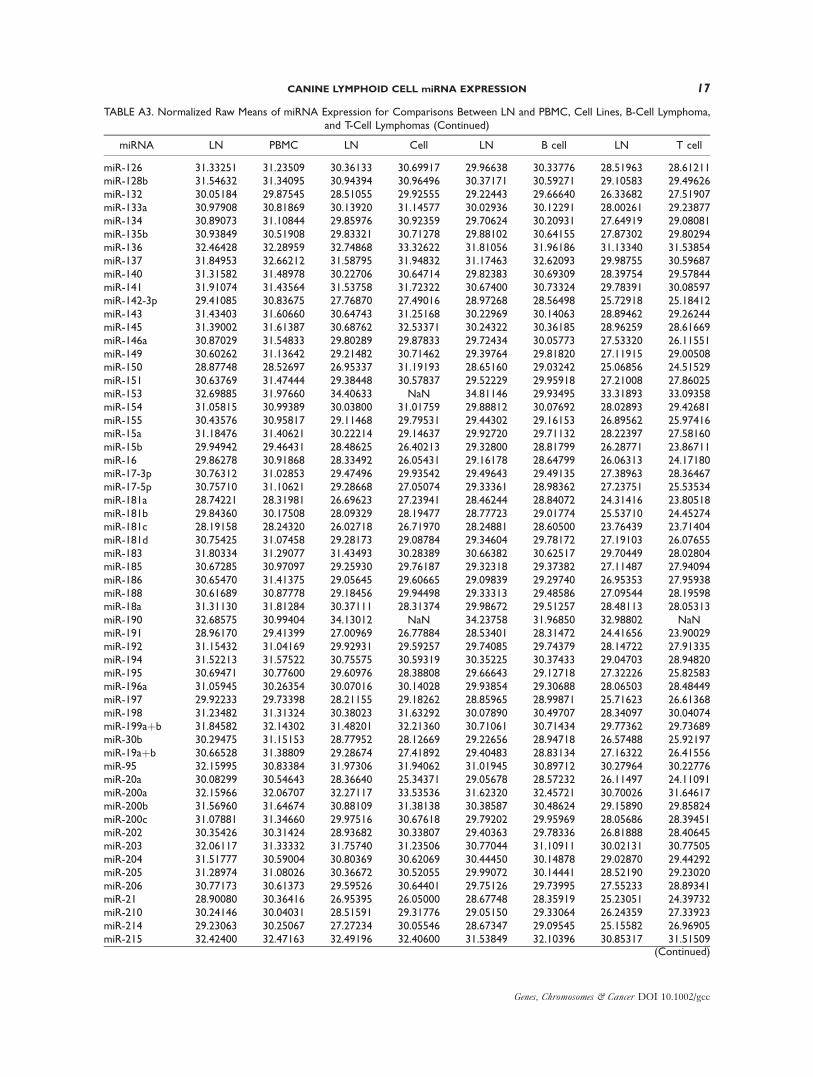
TABLE A3. Normalized Raw Means of miRNA Expression for Comparisons Between LN and PBMC, Cell Lines, B-Cell Lymphoma,and T-Cell Lymphomas (Continued)
miRNA LN PBMC LN Cell LN B cell LN T cell
miR-126 31.33251 31.23509 30.36133 30.69917 29.96638 30.33776 28.51963 28.61211miR-128b 31.54632 31.34095 30.94394 30.96496 30.37171 30.59271 29.10583 29.49626miR-132 30.05184 29.87545 28.51055 29.92555 29.22443 29.66640 26.33682 27.51907miR-133a 30.97908 30.81869 30.13920 31.14577 30.02936 30.12291 28.00261 29.23877miR-134 30.89073 31.10844 29.85976 30.92359 29.70624 30.20931 27.64919 29.08081miR-135b 30.93849 30.51908 29.83321 30.71278 29.88102 30.64155 27.87302 29.80294miR-136 32.46428 32.28959 32.74868 33.32622 31.81056 31.96186 31.13340 31.53854miR-137 31.84953 32.66212 31.58795 31.94832 31.17463 32.62093 29.98755 30.59687miR-140 31.31582 31.48978 30.22706 30.64714 29.82383 30.69309 28.39754 29.57844miR-141 31.91074 31.43564 31.53758 31.72322 30.67400 30.73324 29.78391 30.08597miR-142-3p 29.41085 30.83675 27.76870 27.49016 28.97268 28.56498 25.72918 25.18412miR-143 31.43403 31.60660 30.64743 31.25168 30.22969 30.14063 28.89462 29.26244miR-145 31.39002 31.61387 30.68762 32.53371 30.24322 30.36185 28.96259 28.61669miR-146a 30.87029 31.54833 29.80289 29.87833 29.72434 30.05773 27.53320 26.11551miR-149 30.60262 31.13642 29.21482 30.71462 29.39764 29.81820 27.11915 29.00508miR-150 28.87748 28.52697 26.95337 31.19193 28.65160 29.03242 25.06856 24.51529miR-151 30.63769 31.47444 29.38448 30.57837 29.52229 29.95918 27.21008 27.86025miR-153 32.69885 31.97660 34.40633 NaN 34.81146 29.93495 33.31893 33.09358miR-154 31.05815 30.99389 30.03800 31.01759 29.88812 30.07692 28.02893 29.42681miR-155 30.43576 30.95817 29.11468 29.79531 29.44302 29.16153 26.89562 25.97416miR-15a 31.18476 31.40621 30.22214 29.14637 29.92720 29.71132 28.22397 27.58160miR-15b 29.94942 29.46431 28.48625 26.40213 29.32800 28.81799 26.28771 23.86711miR-16 29.86278 30.91868 28.33492 26.05431 29.16178 28.64799 26.06313 24.17180miR-17-3p 30.76312 31.02853 29.47496 29.93542 29.49643 29.49135 27.38963 28.36467miR-17-5p 30.75710 31.10621 29.28668 27.05074 29.33361 28.98362 27.23751 25.53534miR-181a 28.74221 28.31981 26.69623 27.23941 28.46244 28.84072 24.31416 23.80518miR-181b 29.84360 30.17508 28.09329 28.19477 28.77723 29.01774 25.53710 24.45274miR-181c 28.19158 28.24320 26.02718 26.71970 28.24881 28.60500 23.76439 23.71404miR-181d 30.75425 31.07458 29.28173 29.08784 29.34604 29.78172 27.19103 26.07655miR-183 31.80334 31.29077 31.43493 30.28389 30.66382 30.62517 29.70449 28.02804miR-185 30.67285 30.97097 29.25930 29.76187 29.32318 29.37382 27.11487 27.94094miR-186 30.65470 31.41375 29.05645 29.60665 29.09839 29.29740 26.95353 27.95938miR-188 30.61689 30.87778 29.18456 29.94498 29.33313 29.48586 27.09544 28.19598miR-18a 31.31130 31.81284 30.37111 28.31374 29.98672 29.51257 28.48113 28.05313miR-190 32.68575 30.99404 34.13012 NaN 34.23758 31.96850 32.98802 NaNmiR-191 28.96170 29.41399 27.00969 26.77884 28.53401 28.31472 24.41656 23.90029miR-192 31.15432 31.04169 29.92931 29.59257 29.74085 29.74379 28.14722 27.91335miR-194 31.52213 31.57522 30.75575 30.59319 30.35225 30.37433 29.04703 28.94820miR-195 30.69471 30.77600 29.60976 28.38808 29.66643 29.12718 27.32226 25.82583miR-196a 31.05945 30.26354 30.07016 30.14028 29.93854 29.30688 28.06503 28.48449miR-197 29.92233 29.73398 28.21155 29.18262 28.85965 28.99871 25.71623 26.61368miR-198 31.23482 31.31324 30.38023 31.63292 30.07890 30.49707 28.34097 30.04074miR-199aþb 31.84582 32.14302 31.48201 32.21360 30.71061 30.71434 29.77362 29.73689miR-30b 30.29475 31.15153 28.77952 28.12669 29.22656 28.94718 26.57488 25.92197miR-19aþb 30.66528 31.38809 29.28674 27.41892 29.40483 28.83134 27.16322 26.41556miR-95 32.15995 30.83384 31.97306 31.94062 31.01945 30.89712 30.27964 30.22776miR-20a 30.08299 30.54643 28.36640 25.34371 29.05678 28.57232 26.11497 24.11091miR-200a 32.15966 32.06707 32.27117 33.53536 31.62320 32.45721 30.70026 31.64617miR-200b 31.56960 31.64674 30.88109 31.38138 30.38587 30.48624 29.15890 29.85824miR-200c 31.07881 31.34660 29.97516 30.67618 29.79202 29.95969 28.05686 28.39451miR-202 30.35426 30.31424 28.93682 30.33807 29.40363 29.78336 26.81888 28.40645miR-203 32.06117 31.33332 31.75740 31.23506 30.77044 31.10911 30.02131 30.77505miR-204 31.51777 30.59004 30.80369 30.62069 30.44450 30.14878 29.02870 29.44292miR-205 31.28974 31.08026 30.36672 30.52055 29.99072 30.14441 28.52190 29.23020miR-206 30.77173 30.61373 29.59526 30.64401 29.75126 29.73995 27.55233 28.89341miR-21 28.90080 30.36416 26.95395 26.05000 28.67748 28.35919 25.23051 24.39732miR-210 30.24146 30.04031 28.51591 29.31776 29.05150 29.33064 26.24359 27.33923miR-214 29.23063 30.25067 27.27234 30.05546 28.67347 29.09545 25.15582 26.96905miR-215 32.42400 32.47163 32.49196 32.40600 31.53849 32.10396 30.85317 31.51509
(Continued)
Genes, Chromosomes & Cancer DOI 10.1002/gcc
CANINE LYMPHOID CELL miRNA EXPRESSION 17

TABLE A3. Normalized Raw Means of miRNA Expression for Comparisons Between LN and PBMC, Cell Lines, B-Cell Lymphoma,and T-Cell Lymphomas (Continued)
miRNA LN PBMC LN Cell LN B cell LN T cell
miR-372 31.21948 31.08546 30.28926 29.93463 30.01681 30.20069 28.55084 29.29937miR-373 30.55991 30.68917 29.24592 31.15414 29.60196 30.00800 27.11372 29.39275miR-218 31.15335 31.87569 30.33288 32.75265 30.00780 31.21479 28.31736 30.71895miR-219 32.15279 32.07582 32.04292 31.32434 31.05910 30.54832 30.30969 29.90611miR-22 31.27532 31.09252 30.31323 30.41732 29.97371 29.97080 28.45537 28.65291miR-488 31.92443 31.86825 31.42493 32.31594 30.58992 31.00431 29.69654 30.74283miR-221 30.94830 30.24469 29.60518 28.62999 29.47857 29.39413 27.64889 27.39925miR-222 30.35060 30.34898 28.72274 28.87900 29.04621 29.20063 26.44313 26.53614miR-223 30.55306 30.24970 29.37462 29.84392 29.67102 29.88883 27.15475 27.50348miR-224 32.43318 32.47957 33.11120 33.32535 32.80210 32.02142 31.65412 32.00335miR-23a 30.37218 30.00851 29.24709 27.84572 29.86514 29.46860 26.92913 24.63381miR-24 30.12616 30.44428 28.46506 28.45597 28.91939 28.98941 26.04000 25.43941miR-25 30.19114 30.58113 28.45220 27.85707 29.18467 28.93956 26.19498 24.76935miR-26a 30.67489 31.39480 29.78264 29.12693 29.98609 29.52490 27.42553 27.08541miR-26b 32.19866 32.21107 32.35375 33.26464 31.78589 32.34114 30.81501 29.87204miR-27aþb 30.74329 31.33376 29.38602 29.21490 29.38380 29.07784 27.16983 26.90327miR-30c 30.00015 30.63026 28.38309 27.88976 29.07943 28.94559 25.96494 25.54141miR-29aþbþc 29.66933 31.59928 27.94650 29.03482 29.07307 29.20453 25.60062 27.73675miR-30a-3p 29.74524 29.45681 27.99482 29.59549 29.04740 29.44087 26.14743 28.13028miR-30a-5p 30.83252 29.85178 29.33923 28.94624 29.31228 29.12639 27.29432 26.60130miR-296 32.11391 31.52717 32.07896 32.79857 31.34847 31.01388 30.36662 31.20315RNU43 31.48847 30.70363 31.00517 30.54536 30.79646 30.02662 29.25868 29.07235
Genes, Chromosomes & Cancer DOI 10.1002/gcc
18 UHL ET AL.
Copyright © 2022 FDOKUMEN