Genomic alterations and gene expression in primary diffuse large B-cell lymphomas of...
16
79 Chapter � Genomic alterations and gene expression in primary diffuse large B-cell lymphomas of immune-privileged sites: the importance of apoptosis and immunomodulatory pathways Marije Booman, Karoly Szuhai, Andreas Rosenwald, Elena Hartmann, Hanneke C Kluin-Nelemans, Daphne de Jong, Ed Schuuring and Philip M Kluin A shorter version of this chapter has been submi�ed to Journal of Pathology
Transcript of Genomic alterations and gene expression in primary diffuse large B-cell lymphomas of...

79
Chapter �
Genomic alterations and gene expression in primary diffuse large B-cell lymphomas of immune-privileged sites: the importance of
apoptosis and immunomodulatory pathways
Marije Booman, Karoly Szuhai, Andreas Rosenwald, Elena Hartmann, Hanneke C Kluin-Nelemans, Daphne de Jong, Ed
Schuuring and Philip M Kluin
A shorter version of this chapter has been submi�ed to Journal of Pathology

80
Abstract
Primary diffuse large B-cell lymphomas of different immune-privileged sites (IP-DLBCL) share many clinical and biological features, such as a relatively poor prognosis, preferential dissemination to other immune-privileged sites and deletion of the HLA region, which sug-gests that IP-DLBCL represents a separate entity.
To further investigate the nature of IP-DLBCL, we investigated site-specific genomic aber-rations in �� testicular, � central nervous system (CNS) and �� nodal DLBCL using array-CGH. We also determined minimal common regions of gain and loss. Using robust algorithms, the array-CGH data were combined with gene expression data to explore pathways deregulated by chromosomal aberrations.
Loss of �p��.�� – p��.�, including the HLA genes, was associated with both types of IP-DLBCL, whereas gain of �p��.�-p��.� was associated with nodal DLBCL. Gain of ��q�� – q��.� and ��q��.�� – q��.�� was associated with CNS DLBCL and gain of ��q��.�� – q��.�� with testicular DLBCL. Analysis of candidate genes in site-specific regions and minimal common regions revealed two major groups of genes: one involved in the immune response, including regulation of HLA expression and another involved in apoptosis, including the p�� pathway. Many of these genes were also involved in homozygous deletions or high level gains.
The presence of both shared and site-specific aberrations in CNS and testicular DLBCL underlines the concept of IP-DLBCL but also indicates that IP-DLBCL of the CNS and testis do not form a single entity. The observed aberrations emphasize the importance of the deregula-tion of anti-tumor immune response and apoptosis pathways.
Chapter �

81
Introduction
Primary diffuse large B-cell lymphoma (DLBCL) represents a heterogeneous group of lymphomas, which is reflected by clinical features, (histo)pathology, genomic aberrations and gene expression profiles (reviewed in ref. �). Two major subtypes of DLBCL are recognized, associated with differences in prognosis: the activated B cell-like (ABC) and germinal centre B cell-like (GCB).² These subtypes can be distinguished by gene expression profile³�⁴ or immuno-histochemistry⁵ and are associated with specific genomic aberrations.⁶ – ⁸
Primary testicular DLBCL and primary DLBCL of the central nervous system (CNS) are part of the immune-privileged site-associated DLBCL (IP-DLBCL) and share characteristics that separate them from nodal (non-IP) DLBCL. Besides having a different clinical behavior⁹�¹⁰ and being predominantly of the ABC subtype,¹¹ – ¹³ we demonstrated a prominent loss of HLA class I and II (gene) expression, o�en caused by small interstitial deletions of chromosome �p��.�.¹⁴�¹⁵ This is associated with a downregulation of many immune-associated genes and a diminished infiltration of T cells.¹⁵ Deletions at �p��.� account for loss of HLA expression in approximately ��% of IP-DLBCL and in much less non-IP DLBCL cases,¹⁶ indicating the pres-ence of alternative mechanisms.¹⁵
The shared characteristics between testicular and CNS DLBCL suggest that these IP-DLBCL subtypes belong to the same homogeneous entity, that is separate from nodal non-IP DLBCL. So far no studies have compared genomic aberrations and gene expression between these groups of DLBCL. To that end, we explored genomic aberrations in testicular, CNS and nodal DLBCL. We combined these data with gene expression data obtained from the same cases and used robust algorithms to identify deregulated candidate genes in the aberrant chromosomal regions.
Materials and methods
Tissue sample collection and selectionFi�y frozen samples from �� primary testicular, �� primary CNS and �� primary nodal
DLBCL were collected from tissue banks at the University Medical Center Groningen, Leiden University Medical Center, Josefine Ne�ens Institute, Ro�erdam; Netherlands Cancer Insti-tute, Amsterdam, The Netherlands and University of Würzburg, Germany. Only samples from patients with Ann Arbor stage I or II were selected; the minimum number of tumor cells was ��%. All �� cases were used for gene expression analysis. Due to insufficient quality of
Genomic alterations and gene expression in IP-DLBCL
82
array-comparative genomic hybridization (CGH) results we performed array-CGH analysis on �� of the �� cases: �� testicular, � CNS and �� nodal DLBCL. This study was approved by the institutional board of the UMCG and carried out in accordance with the modified Declara-tion of Helsinki.
Gene expression microarray hybridizationTotal RNA was isolated using TRIzol reagent (Invitrogen, Carlsbad, CA, USA) according
to the manufacturers’ instructions. The samples were processed and hybridized on Affymetrix HG U��� plus �.� oligonucleotide arrays (Affymetrix, Santa Clara, CA, USA) following the protocol for eukaryotic samples in the Expression Analysis Technical Manual (h�p://www.affymetrix.com/support/technical/manual/expression_manual.affx). The average probe array signals were scaled to a target signal of ��� using the GeneChip operating so�ware GCOS (Affymetrix). Probesets with a signal below �� were discarded, leaving a final dataset of ����� probesets.
ABC/GCB analysisArray expression data of �� genes were used to determine the ABC/GCB subtype of the
lymphomas with the linear predictor score (LPS) method.⁴ Nineteen testicular and � of the nodal DLBCL cases were previously characterized for ABC/GCB subtype on another micro-array platform.¹¹ Of these, only � testicular DLBCL was reclassified from GCB to ABC.
Global gene expression analysisGlobal gene expression comparison was performed using SAM analysis¹⁷ in the R package
Siggenes (h�p://bioconductor.org/packages/�.�/bioc/html/siggenes.html). Before comparing global gene expression between testicular, CNS and nodal DLBCL, we excluded � datasets from the analysis: one ABC/GCB-specific set to avoid bias due to the skewed ABC/GCB pro-portions in IP-DLBCL, and one set of genes that are differently expressed between normal CNS and normal testis to minimize the effect of ‘contaminating’ normal tissue. The ABC/GCB-specific dataset was determined by SAM analysis of the �� nodal DLBCL (� ABC and �� GCB) using a FDR cutoff of �.��, and consisted of ��� genes (��� probesets). The genes that are differently expressed between normal testis and CNS tissue were identified using the GNF Human HG���A/GNF�H Tissue Atlas dataset.¹⁸ For each gene, the average expression values in normal testis and normal CNS tissue were determined. A�er testing several fold difference cutoffs (data not shown), ��� genes (��� probesets) that showed an �-fold or higher difference in expression between normal testis and normal CNS tissue were removed from the dataset for global gene expression analysis. The final global gene expression comparison was per-formed on a dataset of ����� probesets, using an FDR cutoff of �.��.
Chapter �

83
Array-CGH analysisGenomic DNA was isolated using high salt a�er overnight SDS/proteinase K digestion and
hybridized on an in house printed CGH array containing ~���� large genomic insert clones (provided by Dr. N. Carter, Welcome Trust Sanger Institute, UK), as previously described.¹⁹ Log� ratio values were analyzed using R packages DNACopy²⁰ and aCGH/MergeLevels²¹ to determine regions and levels of gain and loss. Hemi- and homozygous loss were defined as one and two levels lower than normal respectively, gain as one or two levels higher than normal, and high level gain as three or more levels higher than normal.²¹ Chromosomes X and Y were excluded from further analysis, as well as heterochromatic regions, centromeres, ribosomal gene clusters and regions with known segmental duplications (grey areas in F��-��� �). Minimal common regions (MCR) were defined as the smallest regions of overlap that were smaller than �� Mb and present in at least � cases, of which at least � showed a limited aberration smaller than a whole chromosome or chromosomal arm. Overrepresentation of aberrations in different localizations was assessed using the Fisher Exact test.
Combining expression and array-CGH dataACE-it version �.�²² was used to find genes for which expression levels correlate with
genomic gain or loss. In short, for each lymphoma a status of gain, normal or loss was assigned (without distinction between hemi- and homozygous loss, or between single copy and high level gain) to each base pair position based on the array-CGH data. This status was mapped to the Affymetrix probesets. The correlation of expression levels with genomic loss/gain was analyzed for each probe set by comparing expression in cases with loss/gain with expression in cases without aberrations using a one-sided non-parametric Wilcoxon test with Benjamini and Hochberg multiplicity correction. Genes for which expression correlated with gain or loss were annotated through the Entrez ID using DAVID (h�p://david.abcc.ncifcrf.gov/home.jsp), focusing on candidate genes with a known function in oncogenesis, normal B cells or B-cell neoplasms for which loss or gain would be functionally relevant for the tumor cells.
Genomic alterations and gene expression in IP-DLBCL

84
Results
Differences in gene expression and genomic aberrations between testicular, CNS and nodal DLBCL
Using the LPS method, most testicular (�� of ��) and CNS (� of �) DLBCL were determined as ABC subtype, whereas in nodal DLBCL the balance was more equal: � of �� ABC and �� of �� GCB subtype. A�er removal of genes that were significantly associated with the ABC/GCB subtype or differently expressed between normal testis and CNS, global gene expres-sion analysis of the � DLBCL groups revealed significant differences: ���� genes were dif-ferentially expressed between testicular and CNS DLBCL, ���� between testicular and nodal DLBCL, and ��� between CNS and nodal DLBCL. As expected,¹⁵ the expression of HLA class I and class II genes was significantly lower in both testicular and CNS DLBCL, however Gene Set Enrichment Analysis²³ did not disclose any other biologically/functionally interesting pat-terns (data not shown).
To investigate specific genomic aberrations in testicular and CNS DLBCL we performed array-CGH analysis (F����� �). The average number of aberrations per case was �.� in testicu-lar, �.� in CNS and �.� in nodal DLBCL. Homozygous losses were found in �� regions, high level gains in � regions. The most common aberrations, present in at least ��% of CNS, testicu-lar or nodal DLBCL cases, are shown in T���� �. T���� � summarizes the � regions showing significant overrepresentation in one or more localizations.
To identify candidate genes in these � localization-specific regions we combined gene expression analysis with array-CGH analysis using ACE-it. Significant genes whose expres-sion levels correlated with genomic loss or gain were screened for a known function in oncogenesis, normal B cells or B-cell neoplasms (T���� �; full list of all significant genes in S������������ T���� S�). We described alterations of HLA and other genes at �p��.�� – p��.� previously;¹⁵ this region is not further discussed here. Gain of �p��.� – p��.� was associated exclusively with nodal DLBCL. This region contained �� significantly altered genes includ-ing candidates SUPT�L and anti-apoptotic BIRC� and BRE. Gain of both ��q�� – q��.� and ��q��.�� – q��.�� was associated with CNS DLBCL. The ��q�� – q��.� region contained � sig-nificantly altered genes including candidates MDM� and YEATS� that are tightly associated with p��. The ��q��.�� – q��.�� region contained �� significantly altered genes but none with a relevant function. Gain of ��q��.�� – q��.�� was associated with testicular DLBCL. This region is very gene dense and contained �� significantly altered genes, including � candidates LILRA�, SPIB, BCL�L��, PAK� and PPP�C.
Analysis of gene expression in minimal common regionsWe extended the combined array-CGH/expression analysis to the minimal common
regions (MCR). In all �� DLBCL combined, �� regions met our criteria for an MCR: �� with
Chapter �

85
Genomic alterations and gene expression in IP-DLBCL
1 2 3 4 5
6 7 8 9
10 11 12 13 14 15 16
17 18 19 20 21 22
Figure 1. Genomic aberrations found in CNS, testicular and nodal DLBCL using array-CGH analysisLosses (left) and gains (right) in testicular (orange), CNS (green) or nodal DLBCL (blue). Homozygous deletions and high level gains are indicated by thick colored bars. MCRs are indicated by thick black bars on the left- and rightmost side for each chro-mosome. Grayed out areas were excluded.

86
Chapter �
All cases (n = 40)
CNS DLBCL (n = 9)
Testicular DLBCL (n = 16)
Nodal DLBCL (n = 15)
Loss
6p21.32 – p25.2 18 (45%) 5 (56%) 11 (69%) 2 (13%)
6q 20 (50%) 5 (56%) 10 (63%) 5 (33%)
15q12 – q21.1 12 (30%) 2 (22%) 5 (31%) 5 (33%)
17p12 – p13.3 13 (33%) 5 (56%) 4 (25%) 4 (27%)
Gain
1q21.3 – q32.1 15 (38%) 3 (33%) 7 (44%) 5 (33%)
7/7q 14 (35%) 2 (22%) 6 (38%) 6 (40%)
12 9 (23%) 4 (44%) 3 (19%) 2 (13%)
18p 11 (28%) 1 (11%) 4 (25%) 6 (40%)
18q 15 (38%) 2 (22%) 7 (44%) 6 (40%)
19q13.12 – q13.43 13 (33%) 2 (22%) 11 (69%) 0 (0%)
Location (Mb)
All cases (n = 40)
CNS (n = 9)
Testicular (n = 16)
Nodal (n = 15)
Significant higher frequency in*:
Candidate genes
Loss
6p21.32 – p25.2 1 – 34,919 18 (45%) 5 (56%) 11 (69%) 2 (13%) IP-DLBCL †
Gain
2p16.1 – p25.3 1 – 60,560 4 (10%) 0 (0%) 0 (0%) 4 (27%) nodal DLBCL SUPT7L, BIRC6, BRE
12q15 – q21.1 66,251 – 71,743 10 (25%) 5 (56%) 3 (19%) 2 (13%) CNS DLBCL MDM2, YEATS4
12q24.32 – q24.33 125,033 – 132,450 10 (25%) 5 (56%) 3 (19%) 2 (13%) CNS DLBCL —
19q13.12 – q13.43 37,665 – 63,812 13 (33%) 2 (22%) 11 (69%) 0 (0%) testicular DLBCL LILRA3, SPIB, BCL2L12, PAK4, PPP5C
Table 1. Most common genomic aberrations in CNS, testicular and nodal DLBCL
Aberrations in 30% or more of CNS, testicular or nodal DLBCL are listed. For each site the number of cases (and percentage) in which an aberration occurs is indicated.
Table 2. Site-specific aberrations and candidate genes
Aberrations that differ in frequency between CNS, testicular and nodal DLBCL, and the candidate genes located therein. The number of cases (and percentage) in which an aberration occurs is indicated for each site. * p=< 0.05 using Fisher Exact test† Gene expression in this region has been studied previously.15 Mb: megabase.
87
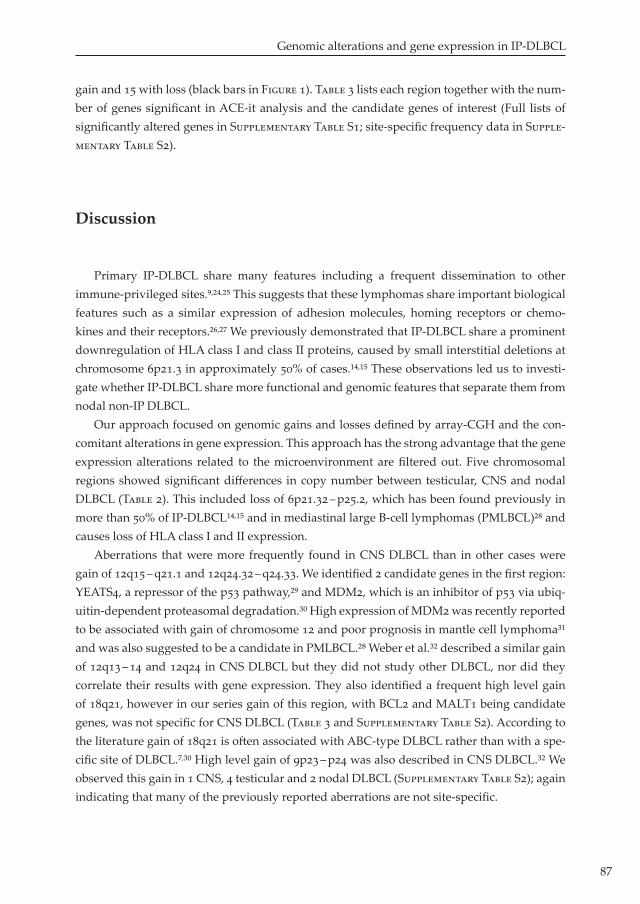
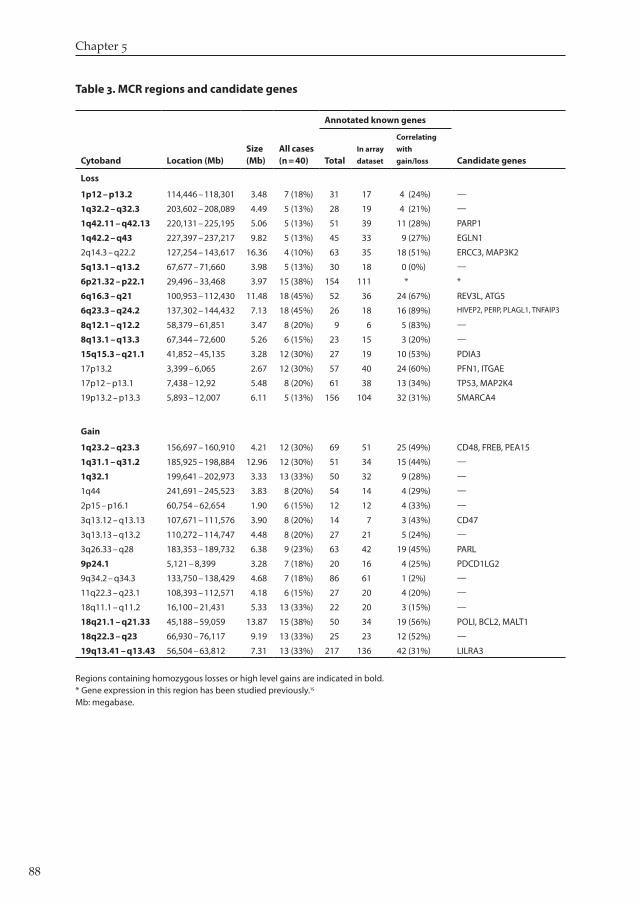
gain and �� with loss (black bars in F����� �). T���� � lists each region together with the num-ber of genes significant in ACE-it analysis and the candidate genes of interest (Full lists of significantly altered genes in S������������ T���� S�; site-specific frequency data in S�����-������� T���� S�).
Discussion
Primary IP-DLBCL share many features including a frequent dissemination to other immune-privileged sites.⁹�²⁴�²⁵ This suggests that these lymphomas share important biological features such as a similar expression of adhesion molecules, homing receptors or chemo-kines and their receptors.²⁶�²⁷ We previously demonstrated that IP-DLBCL share a prominent downregulation of HLA class I and class II proteins, caused by small interstitial deletions at chromosome �p��.� in approximately ��% of cases.¹⁴�¹⁵ These observations led us to investi-gate whether IP-DLBCL share more functional and genomic features that separate them from nodal non-IP DLBCL.
Our approach focused on genomic gains and losses defined by array-CGH and the con-comitant alterations in gene expression. This approach has the strong advantage that the gene expression alterations related to the microenvironment are filtered out. Five chromosomal regions showed significant differences in copy number between testicular, CNS and nodal DLBCL (T���� �). This included loss of �p��.�� – p��.�, which has been found previously in more than ��% of IP-DLBCL¹⁴�¹⁵ and in mediastinal large B-cell lymphomas (PMLBCL)²⁸ and causes loss of HLA class I and II expression.
Aberrations that were more frequently found in CNS DLBCL than in other cases were gain of ��q�� – q��.� and ��q��.�� – q��.��. We identified � candidate genes in the first region: YEATS�, a repressor of the p�� pathway,²⁹ and MDM�, which is an inhibitor of p�� via ubiq-uitin-dependent proteasomal degradation.³⁰ High expression of MDM� was recently reported to be associated with gain of chromosome �� and poor prognosis in mantle cell lymphoma³¹ and was also suggested to be a candidate in PMLBCL.²⁸ Weber et al.³² described a similar gain of ��q�� – �� and ��q�� in CNS DLBCL but they did not study other DLBCL, nor did they correlate their results with gene expression. They also identified a frequent high level gain of ��q��, however in our series gain of this region, with BCL� and MALT� being candidate genes, was not specific for CNS DLBCL (T���� � and S������������ T���� S�). According to the literature gain of ��q�� is o�en associated with ABC-type DLBCL rather than with a spe-cific site of DLBCL.⁷�³⁰ High level gain of �p�� – p�� was also described in CNS DLBCL.³² We observed this gain in � CNS, � testicular and � nodal DLBCL (S������������ T���� S�); again indicating that many of the previously reported aberrations are not site-specific.
Genomic alterations and gene expression in IP-DLBCL
88
Chapter �
Annotated known genes
Cytoband Location (Mb)Size (Mb)
All cases (n = 40) Total
In array
dataset
Correlating
with
gain/loss Candidate genes
Loss
1p12 – p13.2 114,446 – 118,301 3.48 7 (18%) 31 17 4 (24%) —
1q32.2 – q32.3 203,602 – 208,089 4.49 5 (13%) 28 19 4 (21%) —
1q42.11 – q42.13 220,131 – 225,195 5.06 5 (13%) 51 39 11 (28%) PARP1
1q42.2 – q43 227,397 – 237,217 9.82 5 (13%) 45 33 9 (27%) EGLN1
2q14.3 – q22.2 127,254 – 143,617 16.36 4 (10%) 63 35 18 (51%) ERCC3, MAP3K2
5q13.1 – q13.2 67,677 – 71,660 3.98 5 (13%) 30 18 0 (0%) —
6p21.32 – p22.1 29,496 – 33,468 3.97 15 (38%) 154 111 * *
6q16.3 – q21 100,953 – 112,430 11.48 18 (45%) 52 36 24 (67%) REV3L, ATG5
6q23.3 – q24.2 137,302 – 144,432 7.13 18 (45%) 26 18 16 (89%) HIVEP2, PERP, PLAGL1, TNFAIP3
8q12.1 – q12.2 58,379 – 61,851 3.47 8 (20%) 9 6 5 (83%) —
8q13.1 – q13.3 67,344 – 72,600 5.26 6 (15%) 23 15 3 (20%) —
15q15.3 – q21.1 41,852 – 45,135 3.28 12 (30%) 27 19 10 (53%) PDIA3
17p13.2 3,399 – 6,065 2.67 12 (30%) 57 40 24 (60%) PFN1, ITGAE
17p12 – p13.1 7,438 – 12,92 5.48 8 (20%) 61 38 13 (34%) TP53, MAP2K4
19p13.2 – p13.3 5,893 – 12,007 6.11 5 (13%) 156 104 32 (31%) SMARCA4
Gain
1q23.2 – q23.3 156,697 – 160,910 4.21 12 (30%) 69 51 25 (49%) CD48, FREB, PEA15
1q31.1 – q31.2 185,925 – 198,884 12.96 12 (30%) 51 34 15 (44%) —
1q32.1 199,641 – 202,973 3.33 13 (33%) 50 32 9 (28%) —
1q44 241,691 – 245,523 3.83 8 (20%) 54 14 4 (29%) —
2p15 – p16.1 60,754 – 62,654 1.90 6 (15%) 12 12 4 (33%) —
3q13.12 – q13.13 107,671 – 111,576 3.90 8 (20%) 14 7 3 (43%) CD47
3q13.13 – q13.2 110,272 – 114,747 4.48 8 (20%) 27 21 5 (24%) —
3q26.33 – q28 183,353 – 189,732 6.38 9 (23%) 63 42 19 (45%) PARL
9p24.1 5,121 – 8,399 3.28 7 (18%) 20 16 4 (25%) PDCD1LG2
9q34.2 – q34.3 133,750 – 138,429 4.68 7 (18%) 86 61 1 (2%) —
11q22.3 – q23.1 108,393 – 112,571 4.18 6 (15%) 27 20 4 (20%) —
18q11.1 – q11.2 16,100 – 21,431 5.33 13 (33%) 22 20 3 (15%) —
18q21.1 – q21.33 45,188 – 59,059 13.87 15 (38%) 50 34 19 (56%) POLI, BCL2, MALT1
18q22.3 – q23 66,930 – 76,117 9.19 13 (33%) 25 23 12 (52%) —
19q13.41 – q13.43 56,504 – 63,812 7.31 13 (33%) 217 136 42 (31%) LILRA3
Table 3. MCR regions and candidate genes
Regions containing homozygous losses or high level gains are indicated in bold. * Gene expression in this region has been studied previously.15 Mb: megabase.

89
An aberration that was more frequently found in testicular DLBCL than in other cases was gain of ��q��.�� – q��.��. One array-CGH study⁷ reported on this gain in approximately ��% of nodal ABC-type DLBCL, which could not be confirmed in our nodal cases and was rarely identified in other series of B-cell lymphomas analyzed by array-CGH (ref. �� and Pro-genetix database h�p://www.progenetix.de). Eighty-three genes in this region were higher expressed in cases with gain, of which � were interesting candidate genes. LILRA� is part of the leukocyte immunoglobulin-like receptor (LILR) gene family that contains both activating and inhibitory LIRL genes (reviewed in ref. ��). LILRA� exists in a soluble form. High expres-sion by the lymphoma cells might therefore act as an antagonist (by competing for ligand) for activating LILRs on tumor-infiltrating lymphocytes. Three other candidate genes have a role in inhibition of apoptosis: BCL�L��, a recently discovered member of the BCL� gene family,³⁴ PAK�, which functions in TNFalpha-induced pro-survival pathways³⁵ and PPP�C, which inhibits p��-induced apoptosis as well as the MAP�K�/JNK pathway.³⁶ The fi�h poten-tial target gene is SPIB, which is deregulated by chromosomal translocation t(��;��) in the ABC-type DLBCL cell lineOCI-Ly�³⁷ and is a direct target of the transcription factor BOB� in normal B cells.³⁸ Interestingly, in two of our testicular DLBCL SPIB is located at the transition point of normal gain to high level gain, suggesting that deregulated expression is triggered by this rearrangement.
An aberration that was more frequently found in nodal DLBCL than in other cases was gain of �p��.� – p��.�. The candidates BIRC� and BRE are anti-apoptotic genes³⁹�⁴⁰ and SUPT�L (ARTC�) has been reported to be a ligand for anti-tumor regulatory T cells in melanoma,⁴¹ overexpression leading to suppression of the local anti-tumor immune response. Two well known targets of �p amplification in DLBCL, REL and BCL��A,⁴² were not marked as poten-tial targets in our series since REL expression did not correlate with gain, and BCL��A was located outside both the nodal-specific region and the MCR of �p�� – p��.�.
Apart from these site-specific chromosomal regions we identified MCRs and the candi-date genes therein. Interestingly, a large proportion of the candidate genes from both analyses is involved in either apoptosis or regulation of the immune response/HLA (T���� �).
Regarding apoptosis, interesting candidates showing loss are PARP� (at �q��.��) that is fundamentally involved in DNA damage control and apoptosis in B-cell lymphomas,⁴³ the pro-apoptotic tumor suppressor gene MAP�K�⁴⁴ and TP�� (both located in the MCR at ��p�� – p��.�). Loss of TP�� in DLBCL is associated with an aggressive clinical behavior.⁴⁵ Loss of �q��.� – q��.� (including homozygous deletion in � IP-DLBCL) was associated with down-regulation of PERP, a direct effector of apoptosis downstream of TP��. Using SNP analysis PERP was recently described as a candidate tumor suppressor gene for follicular lymphoma.⁴⁶ Interestingly, in our series �� of �� cases (� of � CNS, �� of �� testicular, �o f �� nodal) showed genomic aberrations affecting the p�� pathway (loss of TP�� or PERP or gain of MDM�), sug-gesting that this pathway is an important target for deregulation in DLBCL.
Genomic alterations and gene expression in IP-DLBCL

90
Deletion of �p��.�� is the major mechanism by which HLA class II expression is lost in IP-DLBCL.¹⁴�¹⁵ However, low expression without deletion is also found in IP-DLBCL and nodal DLBCL.¹⁵�¹⁶ Loss of SMARCA� and disruption of the interferon gamma pathway might be an alternative mechanism for loss of HLA expression. SMARCA� is located in the MCR at ��p��.� and is essential for the interferon gamma-induced chromatin remodeling of class II transactivator (CIITA), which is the major regulator of HLA class II expression.⁴⁷ Another fac-tor in the interferon gamma pathway, IFNGR�, is located in the MCR at �q��.� – q��, but its expression did not correlate with genomic loss in our data. We also observed loss (including homozygous deletion in two cases) of PDIA� at ��q��.�, which interacts with calnexin/calre-ticulin and tapasin in the MHC class I peptide loading complex.⁴⁸
Apart from downregulation of HLA, other mechanisms are deployed to escape the anti-tumor immune response. Gain (including high level gain) of �p��.� was associated with higher expression of PDCD�LG�, which is a ligand of the ‘programmed cell death receptor’ on T cells; binding to this receptor inhibits T-cell activation.⁴⁹ A consistently increased expres-sion of this gene, o�en caused by gain of �p��, has been described in PMLBCL.⁵⁰ Also gain of LILRA� at ��q��, discussed earlier, belongs in this category.
In conclusion, genomic differences between IP-DLBCL and nodal DLBCL exist, the most prominent being the hemi- and homozygous deletions of �p��.�� in IP-DLBCL. The presence of different aberrations in CNS and testicular DLBCL implies that these DLBCL do not form a homogeneous entity. Using robust algorithms that selected for alterations within tumor cells
Chapter �
ApoptosisATG5 BCL2 BCL2L12 BIRC6 BRE EGLN1 MALT1 MAP2K4 MAP3K2 MDM2 PAK4 PARL PARP1 PEA15 PERP PPP5C TP53 YEATS4
Immune response and HLA regula-tion
CD47 CD48 ITGAE LILRA3 PDCD1LG2 PDIA3 SMARCA4 SUPT7L
B-cell signalingFREB SPIB
Somatic hypermutationPOLI REV3L
Proliferation and migrationPFN1 PLAGL1
DNA repairERCC3
NFκB pathwayTNFAIP3
Table 4. Functionally interesting genes whose expression correlate with gain or loss
Genes involved in homozygous loss or high level gain are indicated in bold type. The genes are derived from Tables 2 and 3.

91
we found a striking selection for genes involved in apoptosis, including the p�� pathway, as well as for genes that can modulate the anti-tumor immune response.
AcknowledgementsThe authors would like to thank Marja van der Burg for hybridizing the CGH arrays. EH
is supported by the Interdisciplinary Center for Clinical Research (IZKF).
Genomic alterations and gene expression in IP-DLBCL

92
References
�. De Paepe P, De Wolf-Peeters C. Diffuse large B-cell lymphoma: a heterogeneous group of non-Hodgkin lympho-mas comprising several distinct clinicopathological entities. Leukemia ����; ��: �� – ��.
�. Alizadeh AA, Eisen MB, Davis RE, et al. Distinct types of diffuse large B-cell lymphoma identified by gene expression profiling. Nature ����; ���: ��� – ��.
�. Rosenwald A, Wright G, Chan WC, et al. The use of molecular profiling to predict survival a�er chemotherapy for diffuse large-B-cell lymphoma. N Engl J Med ����; ���: ���� – ��.
�. Wright G, Tan B, Rosenwald A, Hurt EH, Wiestner A, Staudt LM. A gene expression-based method to diagnose clinically distinct subgroups of diffuse large B cell lymphoma. Proc Natl Acad Sci U S A ����; ���: ���� – �.
�. Hans CP, Weisenburger DD, Greiner TC, et al. Confirmation of the molecular classification of diffuse large B-cell lymphoma by immunohistochemistry using a tissue microarray. Blood ����; ���: ��� – ��.
�. Bea S, Ze�l A, Wright G, et al. Diffuse large B-cell lymphoma subgroups have distinct genetic profiles that influ-ence tumor biology and improve gene-expression-based survival prediction. Blood ����; ���: ���� – ��.
�. Tagawa H, Suguro M, Tsuzuki S, et al. Comparison of genome profiles for identification of distinct subgroups of diffuse large B-cell lymphoma. Blood ����; ���: ���� – �.
�. Iqbal J, Sanger WG, Horsman DE, et al. BCL� translocation defines a unique tumor subset within the germinal center B-cell-like diffuse large B-cell lymphoma. Am J Pathol ����; ���: ��� – ��.
�. Zucca E, Conconi A, Mughal TI, et al. Pa�erns of outcome and prognostic factors in primary large-cell lymphoma of the testis in a survey by the International Extranodal Lymphoma Study Group. J Clin Oncol ����; ��: �� – �.
��. Schlegel U, Schmidt-Wolf IGH, Deckert M. Primary CNS lymphoma: clinical presentation, pathological classifi-cation, molecular pathogenesis and treatment. J Neurol Sci ����; ���: � – ��.
��. Booman M, Douwes J, Glas AM, de Jong D, Schuuring E, Kluin PM. Primary testicular diffuse large B cell lym-phomas have activated B cell-like subtype characteristics. J Pathol ����; ���: ��� – ��.
��. Camilleri-Broet S, Criniere E, Broet P, et al. A uniform activated B-cell-like immunophenotype might explain the poor prognosis of primary central nervous system lymphomas: Analysis of �� cases. Blood ����; ���: ��� – �.
��. Lin CH, Kuo KT, Chuang SS, et al. Comparison of the expression and prognostic significance of differentiation markers between diffuse large B-cell lymphoma of central nervous system origin and peripheral nodal origin. Clin Cancer Res ����; ��: ���� – �.
��. Riemersma SA, Jordanova ES, Schop RF, et al. Extensive genetic alterations of the HLA region, including homozygous deletions of HLA class II genes in B-cell lymphomas arising in immune- privileged sites. Blood ����; ��: ���� – ��.
��. Booman M, Douwes J, Glas AM, et al. Mechanisms and effects of loss of HLA class II expression in immune privileged site-associated B-cell lymphoma. Clin Cancer Res ����; ��: ���� – ���.
��. Rimsza LM, Roberts RA, Campo E, et al. Loss of major histocompatibility class II expression in non-immune privileged site diffuse large B cell lymphoma is highly coordinated and not due to chromosomal deletions. Blood ����; ���: ���� – �.
��. Tusher VG, Tibshirani R, Chu G. Significance analysis of microarrays applied to the ionizing radiation response. Proc Natl Acad Sci U S A ����; ��: ���� – ��.
��. Su AI, Wiltshire T, Batalov S, et al. A gene atlas of the mouse and human protein-encoding transcriptomes. Proc Natl Acad Sci U S A ����; ���: ���� – �.
��. Knijnenburg J, Szuhai K, Giltay J, et al. Insights from genomic microarrays into structural chromosome rear-rangements. Am J Med Genet A ����; ���: �� – ��.
��. Venkatraman ES, Olshen AB. A faster circular binary segmentation algorithm for the analysis of array CGH data. Bioinformatics ����; ��: ��� – ��.
��. Willenbrock H, Fridlyand J. A comparison study: applying segmentation to array CGH data for downstream analyses. Bioinformatics ����; ��: ���� – ��.
��. van Wieringen WN, Belien JAM, Vosse SJ, Achame EM, Ylstra B. ACE-it: a tool for genome-wide integration of gene dosage and RNA expression data. Bioinformatics ����; ��: ���� – ��.
Chapter �

93
��. Subramanian A, Tamayo P, Mootha VK, et al. Gene set enrichment analysis: A knowledge-based approach for interpreting genome-wide expression profiles. Proc Natl Acad Sci U S A ����; ���: ����� – ��.
��. Fonseca R, Habermann TM, Colgan JP, et al. Testicular lymphoma is associated with a high incidence of extra-nodal recurrence. Cancer ����; ��: ��� – ��.
��. Rajappa SJ, Uppin SG, Digumarti R. Testicular relapse of primary central nervous system lymphoma. Leuk Lymphoma ����; ��: ���� – �.
��. Smith JR, Braziel RM, Paole�i S, Lipp M, Uguccioni M, Rosenbaum JT. Expression of B-cell-a�racting chemokine � (CXCL��) by malignant lymphocytes and vascular endothelium in primary central nervous system lymphoma. Blood ����; ���: ��� – ��.
��. Rubenstein J, Fridlyand J, Shen A, et al. Gene expression and angiotropism in primary CNS lymphoma. Blood ����; ���: ���� – ��.
��. Wessendorf S, Barth TFE, Viardot A, et al. Further delineation of chromosomal consensus regions in primary mediastinal B-cell lymphomas: an analysis of �� tumor samples using high-resolution genomic profiling (array-CGH). Leukemia ����; DOI: ��.����/sj.leu.�������.
��. Park JH, Roeder RG. GAS�� is required for repression of the p�� tumor suppressor pathway during normal cel-lular proliferation. Mol Cell Biol ����; ��: ���� – ��.
��. Rao PH, Houldsworth J, Dyomina K, et al. Chromosomal and gene amplification in diffuse large B-cell lym-phoma. Blood ����; ��: ��� – ��.
��. Hartmann E, Fernandez V, Stoecklein H, Hernandez L, Campo E, Rosenwald A. Increased MDM� expression is associated with inferior survival in mantle-cell lymphoma, but not related to the MDM� SNP���. Haematologica ����; ��: ��� – �.
��. Weber T, Weber RG, Kaulich K, et al. Characteristic chromosomal imbalances in primary central nervous system lymphomas of the diffuse large B-cell type. Brain Pathol ����; ��: �� – ��.
��. Brown D, Trowsdale J, Allen R. The LILR family: modulators of innate and adaptive immune pathways in health and disease. Tissue Antigens ����; ��: ��� – ��.
��. Stegh AH, Kim H, Bachoo RM, et al. Bcl�L�� inhibits post-mitochondrial apoptosis signaling in glioblastoma. Genes Dev ����; ��: �� – ���.
��. Li X, Minden A. PAK� functions in tumor necrosis factor (TNF) alpha-induced survival pathways by facilitating TRADD binding to the TNF receptor. J Biol Chem ����; ���: ����� – ���.
��. Zhou G, Golden T, Aragon IV, Honkanen RE. Ser/Thr protein phosphatase � inactivates hypoxia-induced activa-tion of an apoptosis signal-regulating kinase �/MKK-�/JNK signaling cascade. J Biol Chem ����; ���: ����� – ���.
��. Lenz G, Nagel I, Siebert R, et al. Aberrant immunoglobulin class switch recombination and switch translocations in activated B cell-like diffuse large B cell lymphoma. J Exp Med ����; ���: ��� – ��.
��. Bartholdy B, Du Roure C, Bordon A, Emslie D, Corcoran LM, Ma�hias P. The Ets factor Spi-B is a direct critical target of the coactivator OBF-�. Proc Natl Acad Sci U S A ����; ���: ����� – ��.
��. Hao Y, Sekine K, Kawabata A, et al. Apollon ubiquitinates SMAC and caspase-�, and has an essential cytoprotec-tion function. Nat Cell Biol ����; �: ��� – ��.
��. Li Q, Ching AK , Chan BC, et al. A death receptor-associated anti-apoptotic protein, BRE, inhibits mitochondrial apoptotic pathway. J Biol Chem ����; ���: ����� – ��.
��. Wang HY, Peng G, Guo Z, Shevach EM, Wang RF. Recognition of a new ARTC� peptide ligand uniquely expressed in tumor cells by antigen-specific CD�+ regulatory T cells. J Immunol ����; ���: ���� – ��.
��. Fukuhara N, Tagawa H, Kameoka Y, et al. Characterization of target genes at the �p��-�� amplicon in diffuse large B-cell lymphoma. Cancer Sci ����; ��: ��� – ���.
��. Dukers DF, Oudejans JJ, Vos W, ten Berge RL, Meijer CJ. Apoptosis in B-cell lymphomas and reactive lym-phoid tissues always involves activation of caspase � as determined by a new in situ detection method. J Pathol ����; ���: ��� – ��.
��. Teng DHF, Perry III WL, Hogan JK, et al. Human mitogen-activated protein kinase kinase � as a candidate tumor suppressor. Cancer Res ����; ��: ���� – ��.
��. Bea S, Colomo L, Lopez-Guillermo A, et al. Clinicopathologic significance and prognostic value of chromosomal imbalances in diffuse large B-cell lymphomas. J Clin Oncol ����; ��: ���� – ���.
Genomic alterations and gene expression in IP-DLBCL

94
��. Ross CW, Ouille�e PD, Saddler CM, Shedden KA, Malek SN. Comprehensive analysis of copy number and allele status identifies multiple chromosome defects underlying follicular lymphoma pathogenesis. Clin Cancer Res ����; ��: ���� – ��.
��. Ni Z, Karaskov E, Yu T, et al. Apical role for BRG� in cytokine-induced promoter assembly. Proc Natl Acad Sci U S A ����; ���: ����� – �.
��. Zhang Y, Williams DB. Assembly of MHC class I molecules within the endoplasmic reticulum. Immunol Res ����; ��: ��� – ��.
��. Saunders PA, Hendrycks VR, Lidinsky WA, Woods ML. PD-L�:PD-� involvement in T cell proliferation, cyto-kine production, and integrin-mediated adhesion. Eur J Immunol ����; ��: ���� – �.
��. Rosenwald A, Wright G, Leroy K, et al. Molecular diagnosis of primary mediastinal B cell lymphoma identi-fies a clinically favorable subgroup of diffuse large B cell lymphoma related to Hodgkin lymphoma. J Exp Med ����; ���: ��� – ��.
Chapter �