Identifiability of diffusion and sorption parameters from in situ diffusion experiments by using...
13
(This is a sample cover image for this issue. The actual cover is not yet available at this time.) This article appeared in a journal published by Elsevier. The attached copy is furnished to the author for internal non-commercial research and education use, including for instruction at the authors institution and sharing with colleagues. Other uses, including reproduction and distribution, or selling or licensing copies, or posting to personal, institutional or third party websites are prohibited. In most cases authors are permitted to post their version of the article (e.g. in Word or Tex form) to their personal website or institutional repository. Authors requiring further information regarding Elsevier’s archiving and manuscript policies are encouraged to visit: http://www.elsevier.com/copyright
-
Upload
people-environment-udc -
Category
Documents
-
view
0 -
download
0
Transcript of Identifiability of diffusion and sorption parameters from in situ diffusion experiments by using...

(This is a sample cover image for this issue. The actual cover is not yet available at this time.)
This article appeared in a journal published by Elsevier. The attachedcopy is furnished to the author for internal non-commercial researchand education use, including for instruction at the authors institution
and sharing with colleagues.
Other uses, including reproduction and distribution, or selling orlicensing copies, or posting to personal, institutional or third party
websites are prohibited.
In most cases authors are permitted to post their version of thearticle (e.g. in Word or Tex form) to their personal website orinstitutional repository. Authors requiring further information
regarding Elsevier’s archiving and manuscript policies areencouraged to visit:
http://www.elsevier.com/copyright
Author's personal copy
Identifiability of diffusion and sorption parameters from in situ diffusionexperiments by using simultaneously tracer dilution and claystone data
Acacia Naves a, Javier Samper a,⁎, Thomas Gimmi b,c
a Escuela Técnica Superior de Ingenieros de Caminos, Canales y Puertos, Universidad de A Coruña, Campus de Elviña, ES-15192, A Coruña, Spainb Institute of Geological Sciences, University of Bern, CH-3012 Bern, Switzerlandc Paul Scherrer Institut, CH-5232 Villigen, Switzerland
a r t i c l e i n f o a b s t r a c t
Article history:Received 17 April 2012Received in revised form 10 August 2012Accepted 7 September 2012Available online 20 September 2012
In situ diffusion experiments are performed in geological formations at underground researchlaboratories to overcome the limitations of laboratory diffusion experiments and investigatescale effects. Tracer concentrations are monitored at the injection interval during theexperiment (dilution data) and measured from host rock samples around the injectioninterval at the end of the experiment (overcoring data). Diffusion and sorption parameters arederived from the inverse numerical modeling of the measured tracer data. The identifiabilityand the uncertainties of tritium and 22Na+ diffusion and sorption parameters are studied hereby synthetic experiments having the same characteristics as the in situ diffusion and retention(DR) experiment performed on Opalinus Clay. Contrary to previous identifiability analyses ofin situ diffusion experiments, which used either dilution or overcoring data at approximatelocations, our analysis of the parameter identifiability relies simultaneously on dilution andovercoring data, accounts for the actual position of the overcoring samples in the claystone,uses realistic values of the standard deviation of the measurement errors, relies on modelidentification criteria to select the most appropriate hypothesis about the existence of aborehole disturbed zone and addresses the effect of errors in the location of the samplingprofiles. The simultaneous use of dilution and overcoring data provides accurate parameterestimates in the presence of measurement errors, allows the identification of the righthypothesis about the borehole disturbed zone and diminishes other model uncertainties suchas those caused by errors in the volume of the circulation system and the effective diffusioncoefficient of the filter. The proper interpretation of the experiment requires the right hypothesisabout the borehole disturbed zone. A wrong assumption leads to large estimation errors. The useofmodel identification criteria helps in the selection of the bestmodel. Small errors in the depth ofthe overcoring samples lead to large parameter estimation errors. Therefore, attention should bepaid to minimize the errors in positioning the depth of the samples. The results of theidentifiability analysis do not depend on the particular realization of random numbers.
© 2012 Elsevier B.V. All rights reserved.
Keywords:DiffusionSorptionNumerical modelIdentifiability analysisDR experimentModel identification criteria
1. Introduction
In situ diffusion experiments are performed in clay forma-tions at underground research laboratories (URL) to verify theparameters obtained in small-scale laboratory diffusion exper-iments and investigate possible scale effects. They are useful to
link laboratory experiments to observations at the formationscale (e.g., Gimmi et al., 2007; Patriarche et al., 2004), andprovide support for the large-scale predictions involved inperformance assessment calculations (e.g., Andra, 2005;Mallants et al., 2001). In situ experiments have beenperformed in the Boom clay at the HADES URL (Aertsens etal., 2008; De Cannière et al., 1996), the Opalinus clay at theMont Terri URL (Palut et al., 2003; Tevissen et al., 2004; VanLoon et al., 2004; Wersin et al., 2004, 2008; Yllera et al.,
Journal of Contaminant Hydrology 142-143 (2012) 63–74
⁎ Corresponding author.E-mail addresses: [email protected] (A. Naves), [email protected] (J. Samper).
0169-7722/$ – see front matter © 2012 Elsevier B.V. All rights reserved.http://dx.doi.org/10.1016/j.jconhyd.2012.09.005
Contents lists available at SciVerse ScienceDirect
Journal of Contaminant Hydrology
j ourna l homepage: www.e lsev ie r .com/ locate / jconhyd
Author's personal copy
2004) and the Callovo-Oxfordian clay at the Meuse/HauteMarne URL (Dewonck et al., 2010). Numerical models havebeen used to derive diffusion and sorption parameters fromthese experiments (Appelo and Wersin, 2007;Samper et al.,2006b; Soler et al., 2008; Van Loon et al., 2004; Wersin et al.,2006). The in situ diffusion and retention (DR) experimentwas designed to study the transport and retention proper-ties of the Opalinus clay formation (Thury and Bossart,1999). This experiment is similar to previous in situ diffusionexperiments, although it was optimized to determine in situthe diffusion anisotropy caused by the natural bedding of theOpalinus Clay (Fierz, 2006; Leupin et al., 2010; Wersin andVan Dorp, 2005). The DR experiment was performed in aborehole drilled perpendicular to the bedding at the MontTerri URL. The following tracers were allowed to diffuse fromtwo injection packed intervals into the host formationthrough a porous Teflon filter: tritium (HTO), deuterium(HDO), 18O, I−, Br−, 22Na+, 85Sr2+, Cs+, 137Cs+, 133Ba2+,60Co2+, 152Eu3+ and 75Se6+. The fading tracer concentra-tions and activities in the injection system, denoted here as“dilution data”, were monitored with a gamma spectrometerand by taking water samples at increasing time intervalsstarting from hours at the beginning to several days at the endof the experiment (Leupin et al., 2010). The claystone aroundthe injection intervals was overcored at the end of the test andtracer concentrations were analyzed along several radialprofiles (“overcoring data”). A more detailed description ofthe DR experiment can be found in Gimmi et al. (2010, 2011),Leupin et al. (2010) and Samper et al. (2010).
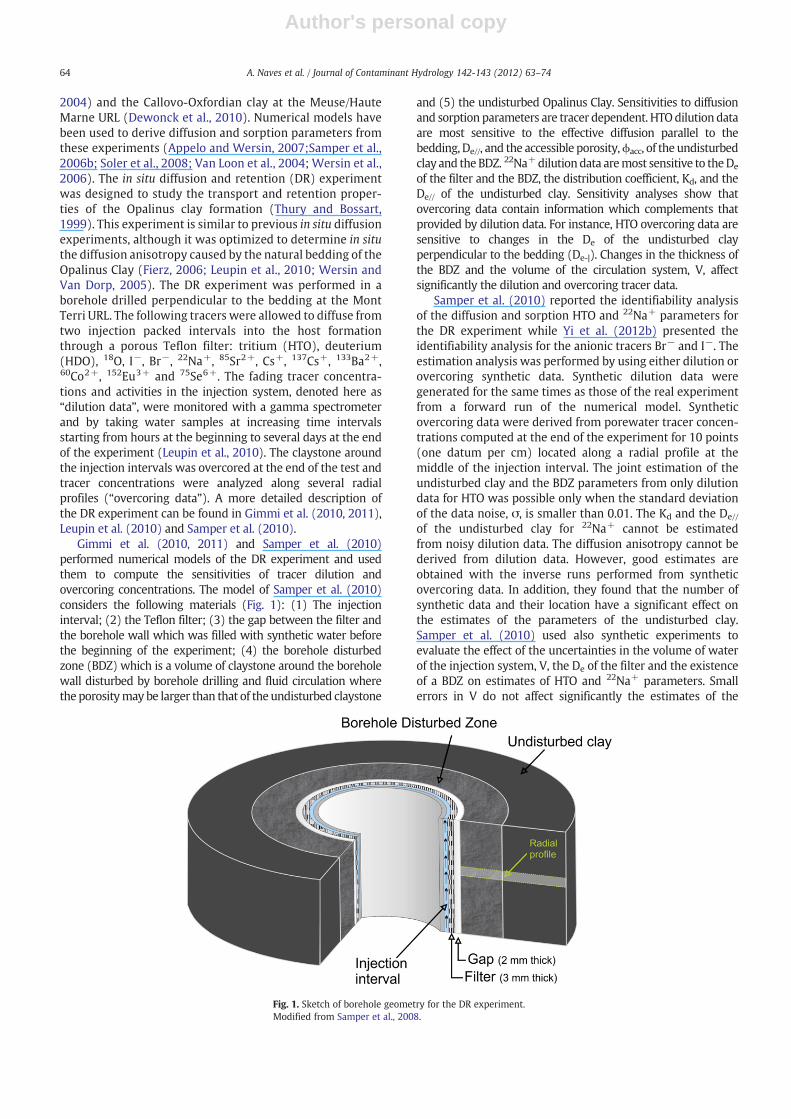
Gimmi et al. (2010, 2011) and Samper et al. (2010)performed numerical models of the DR experiment and usedthem to compute the sensitivities of tracer dilution andovercoring concentrations. The model of Samper et al. (2010)considers the following materials (Fig. 1): (1) The injectioninterval; (2) the Teflon filter; (3) the gap between the filter andthe borehole wall which was filled with synthetic water beforethe beginning of the experiment; (4) the borehole disturbedzone (BDZ) which is a volume of claystone around the boreholewall disturbed by borehole drilling and fluid circulation wherethe porositymay be larger than that of the undisturbed claystone
and (5) the undisturbed Opalinus Clay. Sensitivities to diffusionand sorption parameters are tracer dependent. HTOdilution dataare most sensitive to the effective diffusion parallel to thebedding, De//, and the accessible porosity,ϕacc, of the undisturbedclay and the BDZ. 22Na+dilutiondata aremost sensitive to theDe
of the filter and the BDZ, the distribution coefficient, Kd, and theDe// of the undisturbed clay. Sensitivity analyses show thatovercoring data contain information which complements thatprovided by dilution data. For instance, HTO overcoring data aresensitive to changes in the De of the undisturbed clayperpendicular to the bedding (De-|). Changes in the thickness ofthe BDZ and the volume of the circulation system, V, affectsignificantly the dilution and overcoring tracer data.
Samper et al. (2010) reported the identifiability analysisof the diffusion and sorption HTO and 22Na+ parameters forthe DR experiment while Yi et al. (2012b) presented theidentifiability analysis for the anionic tracers Br− and I−. Theestimation analysis was performed by using either dilution orovercoring synthetic data. Synthetic dilution data weregenerated for the same times as those of the real experimentfrom a forward run of the numerical model. Syntheticovercoring data were derived from porewater tracer concen-trations computed at the end of the experiment for 10 points(one datum per cm) located along a radial profile at themiddle of the injection interval. The joint estimation of theundisturbed clay and the BDZ parameters from only dilutiondata for HTO was possible only when the standard deviationof the data noise, σ, is smaller than 0.01. The Kd and the De//
of the undisturbed clay for 22Na+ cannot be estimatedfrom noisy dilution data. The diffusion anisotropy cannot bederived from dilution data. However, good estimates areobtained with the inverse runs performed from syntheticovercoring data. In addition, they found that the number ofsynthetic data and their location have a significant effect onthe estimates of the parameters of the undisturbed clay.Samper et al. (2010) used also synthetic experiments toevaluate the effect of the uncertainties in the volume of waterof the injection system, V, the De of the filter and the existenceof a BDZ on estimates of HTO and 22Na+ parameters. Smallerrors in V do not affect significantly the estimates of the
Fig. 1. Sketch of borehole geometry for the DR experiment.Modified from Samper et al., 2008.
64 A. Naves et al. / Journal of Contaminant Hydrology 142-143 (2012) 63–74
Author's personal copy
clay parameters. Parameter estimates deviate from their truevalues in the inverse runs in which a significant error isintroduced in theDe of the filter when they are performed fromdilution data, while acceptable estimates are obtained fromovercoring data. The uncertainty in the existence of theBDZhasa large effect on parameter estimates. The proper interpreta-tion of the experiment requires the right hypothesis about theBDZ. The uncertainties in V and the De of the filter play a muchlarger role on the estimates from dilution data than they dofrom overcoring data.
Here we extend and improve the identifiability analysis ofSamper et al. (2010) and Yi et al. (2012b) by: (1) Usingsimultaneously dilution and overcoring synthetic data;(2) accounting for the actual position of the overcoringsamples in the claystone (Fig. 2); (3) using syntheticovercoring data in terms of total concentrations whichaccount for both dissolved and sorbed tracer concentrations;(4) adopting realistic values of σ which were derived fromactual data from previous diffusion experiments; (5) usingmodel identification criteria to select the most appropriatehypothesis about the existence of a borehole disturbed zone;(6) studying the effect on parameter estimates of errors inthe location of the overcoring profiles; and (7) analyzing theinfluence of the number of realizations of random noisesequences.
2. Numerical model
The numerical model of the DR experiment is similar tothat of Samper et al. (2010). Symmetry with respect to theborehole axis is simulated with a 2D axi-symmetric grid. Thefinite element mesh was designed so that the nodes of thegrid coincide with the center of each claystone sample along
the overcoring profiles to minimize interpolation errors. Thefollowing five material zones were considered: the injectioninterval, the 3 mm thick Teflon filter, the 2 mm gap betweenthe filter and the borehole wall, a borehole disturbed zone(BDZ) which is assumed to have a thickness of 20 mm andthe undisturbed Opalinus Clay (Fig. 1).
The effective diffusion coefficient, the distribution coeffi-cient and the accessible porosity for HTO and 22Na+ in theundisturbed Opalinus Clay were derived from availablelaboratory and field experiments (Table 1). An anisotropyratio of 4 was considered (Van Loon et al., 2003). Van Loonand Glaus (2008) measured the De and the capacity factor, α,of these tracers in Teflon filters using a through-diffusionmethod. They found that the De of the filter is about 7% of thediffusion coefficient in free water while its porosity is about0.3. The De of the gap and the BDZ were derived from those ofthe undisturbed Opalinus Clay by using Archie's law withan exponent of 1.33. As an educated guess, the porosity ofthe BDZ was assumed to be twice that of the undisturbedclay. Prior to tracer injection, the system was subjected tohydraulic equilibration. The gap was then filled withsynthetic water. A viscous mud probably formed when thewater contacted the claystone. The porosity of the gap isassumed to be 0.6. The undisturbed clay and the BDZ areassumed to have the same distribution coefficient. Nosorption takes place in the filter and the gap.
3. Methodology for parameter identifiability
Parameter identifiability refers to the question of whether itis possible to obtain unique and accurate estimates of themodel parameters from available data. Identifiability dependson the assumed model and the experimental data. Whenparameters are strongly correlated, a change in a parametermay be balanced by a corresponding change in the correlatedparameter, with the result that neither one can be determinedaccurately. On the other hand, even when model parametersare independent, available data may lead to an objectivefunction that lacks sensitivity to one ormore of the parameters,again with the result that these parameters will have largeestimation variances. Instability, on the other hand, occurswhen the estimated parameters are excessively sensitive tochanges in data. Small measurement errors may lead tosignificant errors in the estimated parameters (Yeh, 1986).
Synthetic experiments having the same geometric proper-ties as the real experiments are used to study parameteridentifiability and model uncertainties. The method forperforming the identifiably study with synthetic data involvesthe following steps: (1) Generating synthetic data from aforward run of the numerical model by assuming referencevalues of the diffusion and sorption parameters; (2) addingrandomnoise to the synthetic data; (3) estimating key diffusionparameters from noisy synthetic data in several stages; and(4) evaluating the effect of various uncertainties such as theexistence of the BDZ and the uncertainties in the volume ofwater in the injection system, V and the De of the filter. Sincethe true values of the parameters are known, one can clearlyidentify which parameters can be estimated, how reliableparameter estimates really are and how model uncertaintiesaffect the parameter estimation errors.
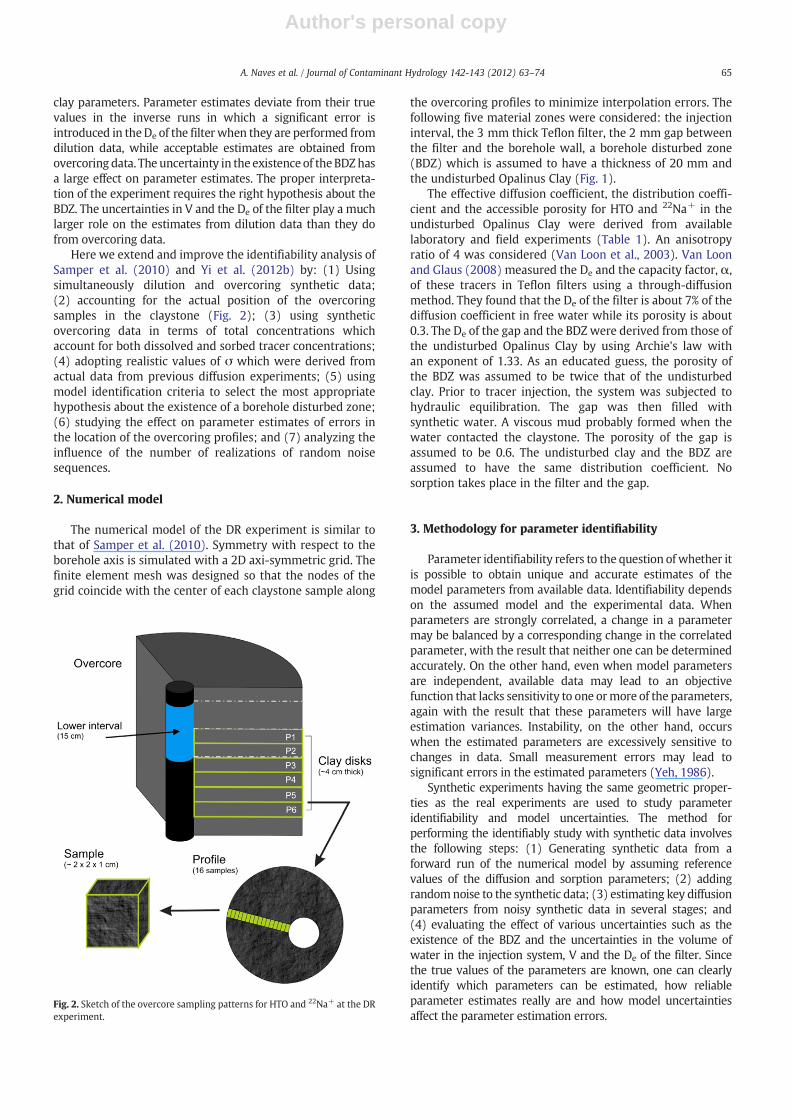
Fig. 2. Sketch of the overcore sampling patterns for HTO and 22Na+ at the DRexperiment.
65A. Naves et al. / Journal of Contaminant Hydrology 142-143 (2012) 63–74
Author's personal copy
3.1. Synthetic data generation
The identifiability analysis of diffusion and sorptionparameters for HTO and 22Na+ accounts simultaneously fordilution and overcoring synthetic data. Synthetic dilutiondata were generated from a forward run of the numericalmodel at the same times as those of the real experiment andcoincide with those presented by Samper et al. (2010).Synthetic overcoring data were derived from concentrationscomputed at the end of the experiment at the actual locationof the overcoring samples in the claystone instead of theunrealistic radial profiles used by Samper et al. (2010).
HTO and 22Na+ samples were taken from six disks ofclaystone cut from the overcore, having a thickness of 4 cm(Fig. 2). They were located below the middle of the lowerinjection interval. Claystone samples were taken along radialprofiles from the disks with a saw. The surface of the smallsamples was cut away to discard the clay affected by thedrilling and desaturation. Each profile was sliced into 1 cmthick samples. 16 samples were taken in each profile, exceptfor one which had only 12 samples. The claystone sampleswere immediately transferred into polyethylene bottles andcarried to the laboratory for analysis. The total concentrationof the tracers was measured in each sample.
The average tracer concentration in the sample isassumed to be equal to the concentration at the center ofthe sample. This hypothesis was tested by comparing thecomputed tracer concentration at the center of the samplewith the average of the computed concentrations at pointsspaced 1 mm within the sample. The concentration at thecenter of the sample deviates less than 0.4% from the averageconcentration.
Tracer concentrations of the claystone samples in the realDR experiment were measured in terms of total concentra-tions and expressed as tracer mass per unit mass of sample.Contrary to Samper et al. (2008, 2010) who used syntheticporewater concentration overcoring data, here we useovercoring total concentration, CT, which accounts for thedissolved and sorbed tracer and is related to the porewaterconcentration, CP, through (Samper et al., 2006a,b):
CT ¼ CPϕacc þ ρdKd
ϕaccρw þ ρdð1Þ
where ϕacc is the accessible porosity of the claystone which isequal to 0.15, ρw is the density of the porewater (1000 kg/m3),andρd is the dry density of the claystone (2329 kg/m3). TheKd ofHTO is zero while that of 22Na+ is 0.205 L/kg (see Table 1).
3.2. Random noise
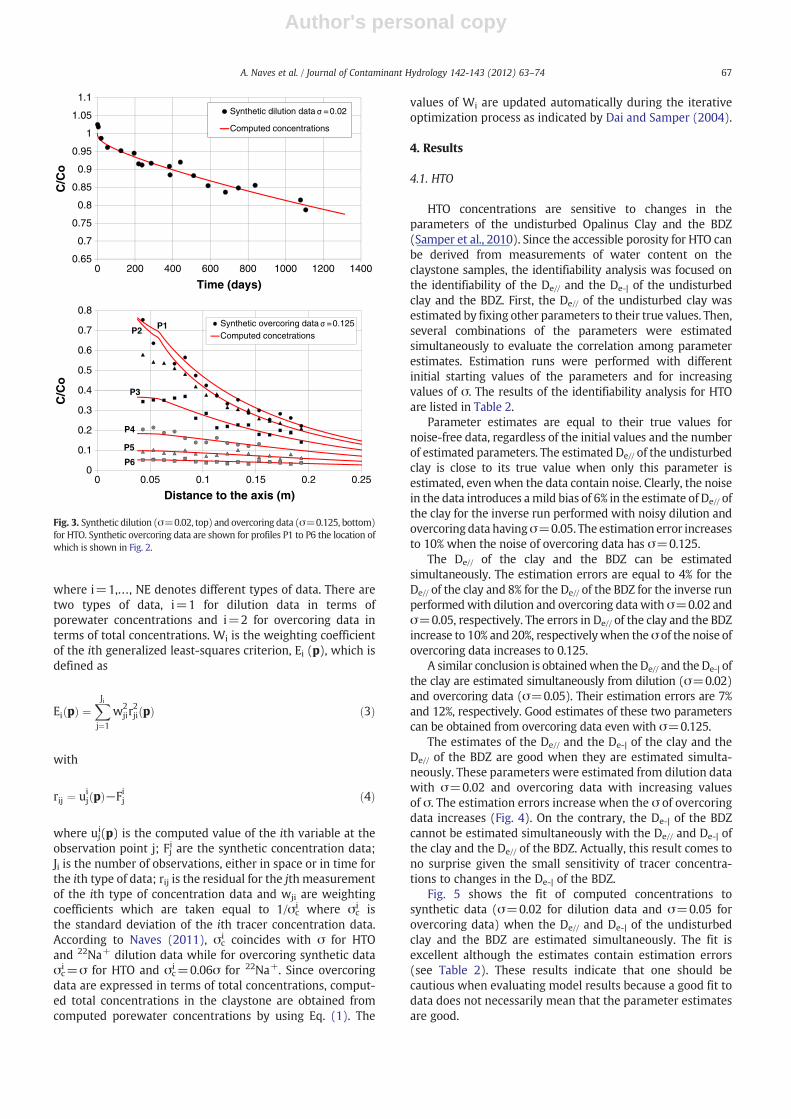
Measured tracer data from in situ diffusion experimentsusually show fluctuations due to various errors. Dilutiondata contain sampling and analytical errors. Overcoringdata generally show fluctuations caused by local claystoneheterogeneities, disturbances of the claystone conditionsduring the overcoring and sampling errors. Similar toSamper et al. (2010), dilution and overcoring tracer concen-tration data are assumed to lack spatial and temporalcorrelation and follow a zero-mean lognormal distributionwith a standard deviation, σ. The use of a lognormaldistribution for concentration errors is convenient because itensures that synthetic concentration data are always positive.The standard deviation σ of experimental dilution data of theDR experiment is 0.028 for HTO and 0.054 for 22Na+ (Gimmi etal., submitted for publication). The standard deviations of HTOand 22Na+ experimental overcoring data from other in situdiffusion experiments at the Mont Terri URL such as the DI-Aand DI-B experiments (Samper et al., 2006b; Soler et al., 2008;Wersin et al., 2006) show some scatter and range from 0 to0.125 for HTO and from 0 to 0.4 for 22Na+. The σ of thesynthetic dilution data was taken equal to that of the actualdilution data: σ=0.02 for HTO and σ=0.05 for 22Na+. Giventhe uncertainties in the value ofσ for overcoring data, syntheticovercoring tracer data were generated for the following cases:1) Noise-free data (σ=0); 2) Data with the most likely noisecorresponding to σ=0.05 for HTO and σ=0.24 for 22Na+; and3)Datawith “larger than expected” noise corresponding toσ=0.125 for HTO and σ=0.4 for 22Na+. Fig. 3 shows the HTOsynthetic dilution (σ=0.02) and overcoring data (σ=0.125).
The identifiability analysis is performed on relative tracerconcentrations which are calculated by dividing tracer concen-trations by the initial tracer concentration at the injectioninterval. Therefore, data errors are dimensionless.
3.3. Automatic parameter estimation
Synthetic data were interpreted automatically by solvingthe inverse problem with INVERSE-CORE2D (Dai and Samper,2004). Optimum parameters were derived by minimizing aleast-squares objective function with the Gauss–Newton–Levenberg–Marquardt method. Let p=(p1, p2, p3,…, pm) bethe vector of m unknown parameters. The objective function,E(p), is expressed as
E pð Þ ¼XNE
i¼1
WiEi pð Þ ð2Þ
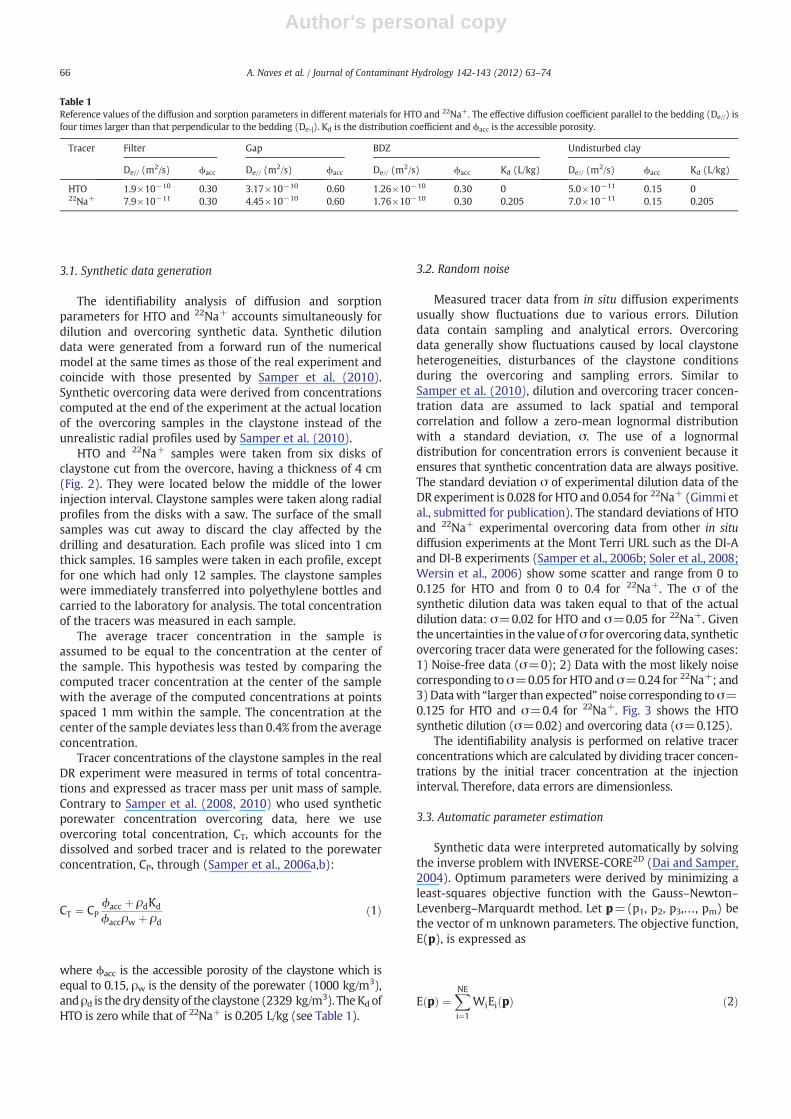
Table 1Reference values of the diffusion and sorption parameters in different materials for HTO and 22Na+. The effective diffusion coefficient parallel to the bedding (De//) isfour times larger than that perpendicular to the bedding (De-|). Kd is the distribution coefficient and ϕacc is the accessible porosity.
Tracer Filter Gap BDZ Undisturbed clay
De// (m2/s) ϕacc De// (m2/s) ϕacc De// (m2/s) ϕacc Kd (L/kg) De// (m2/s) ϕacc Kd (L/kg)
HTO 1.9×10⁻¹⁰ 0.30 3.17×10⁻¹⁰ 0.60 1.26×10⁻¹⁰ 0.30 0 5.0×10⁻¹¹ 0.15 022Na+ 7.9×10⁻¹¹ 0.30 4.45×10⁻¹⁰ 0.60 1.76×10⁻¹⁰ 0.30 0.205 7.0×10⁻¹¹ 0.15 0.205
66 A. Naves et al. / Journal of Contaminant Hydrology 142-143 (2012) 63–74
Author's personal copy
where i=1,…, NE denotes different types of data. There aretwo types of data, i=1 for dilution data in terms ofporewater concentrations and i=2 for overcoring data interms of total concentrations. Wi is the weighting coefficientof the ith generalized least-squares criterion, Ei (p), which isdefined as
Ei pð Þ ¼XJi
j¼1
w2jir
2ji pð Þ ð3Þ
with
rij ¼ uij pð Þ−Fij ð4Þ
where uji(p) is the computed value of the ith variable at theobservation point j; Fji are the synthetic concentration data;Ji is the number of observations, either in space or in time forthe ith type of data; rij is the residual for the jth measurementof the ith type of concentration data and wji are weightingcoefficients which are taken equal to 1/σc
i where σci is
the standard deviation of the ith tracer concentration data.According to Naves (2011), σc
i coincides with σ for HTOand 22Na+ dilution data while for overcoring synthetic dataσci =σ for HTO and σc
i =0.06σ for 22Na+. Since overcoringdata are expressed in terms of total concentrations, comput-ed total concentrations in the claystone are obtained fromcomputed porewater concentrations by using Eq. (1). The
values of Wi are updated automatically during the iterativeoptimization process as indicated by Dai and Samper (2004).
4. Results
4.1. HTO
HTO concentrations are sensitive to changes in theparameters of the undisturbed Opalinus Clay and the BDZ(Samper et al., 2010). Since the accessible porosity for HTO canbe derived from measurements of water content on theclaystone samples, the identifiability analysis was focused onthe identifiability of the De// and the De-| of the undisturbedclay and the BDZ. First, the De// of the undisturbed clay wasestimated by fixing other parameters to their true values. Then,several combinations of the parameters were estimatedsimultaneously to evaluate the correlation among parameterestimates. Estimation runs were performed with differentinitial starting values of the parameters and for increasingvalues of σ. The results of the identifiability analysis for HTOare listed in Table 2.
Parameter estimates are equal to their true values fornoise-free data, regardless of the initial values and the numberof estimated parameters. The estimated De// of the undisturbedclay is close to its true value when only this parameter isestimated, even when the data contain noise. Clearly, the noisein the data introduces amild bias of 6% in the estimate of De// ofthe clay for the inverse run performed with noisy dilution andovercoring data havingσ=0.05. The estimation error increasesto 10% when the noise of overcoring data has σ=0.125.
The De// of the clay and the BDZ can be estimatedsimultaneously. The estimation errors are equal to 4% for theDe// of the clay and 8% for the De// of the BDZ for the inverse runperformedwith dilution and overcoring data with σ=0.02 andσ=0.05, respectively. The errors in De// of the clay and the BDZincrease to 10% and 20%, respectivelywhen the σ of the noise ofovercoring data increases to 0.125.
A similar conclusion is obtainedwhen the De// and the De-| ofthe clay are estimated simultaneously from dilution (σ=0.02)and overcoring data (σ=0.05). Their estimation errors are 7%and 12%, respectively. Good estimates of these two parameterscan be obtained from overcoring data even with σ=0.125.
The estimates of the De// and the De-| of the clay and theDe// of the BDZ are good when they are estimated simulta-neously. These parameters were estimated from dilution datawith σ=0.02 and overcoring data with increasing valuesof σ. The estimation errors increase when the σ of overcoringdata increases (Fig. 4). On the contrary, the De-| of the BDZcannot be estimated simultaneously with the De// and De-| ofthe clay and the De// of the BDZ. Actually, this result comes tono surprise given the small sensitivity of tracer concentra-tions to changes in the De-| of the BDZ.
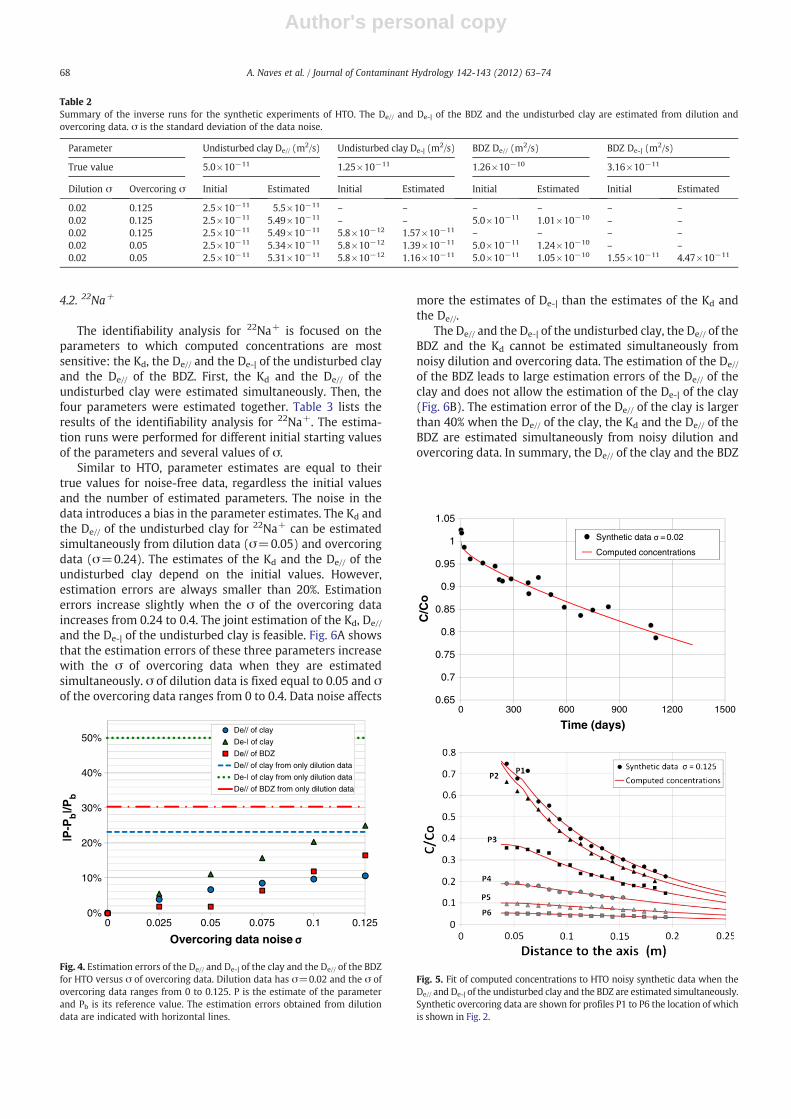
Fig. 5 shows the fit of computed concentrations tosynthetic data (σ=0.02 for dilution data and σ=0.05 forovercoring data) when the De// and De-| of the undisturbedclay and the BDZ are estimated simultaneously. The fit isexcellent although the estimates contain estimation errors(see Table 2). These results indicate that one should becautious when evaluating model results because a good fit todata does not necessarily mean that the parameter estimatesare good.
0
0.1
0.2
0.3
0.4
0.5
0.6
0.7
0.8
0 0.05 0.1 0.15 0.2 0.25
C/C
o
Distance to the axis (m)
Synthetic overcoring data =0.125Computed concetrationsP2
P6
P5
P4
P3
P1
0.65
0.7
0.75
0.8
0.85
0.9
0.95
1
1.05
1.1
0 200 400 600 800 1000 1200 1400
C/C
o
Time (days)
Synthetic dilution data =0.02
Computed concentrations
Fig. 3. Synthetic dilution (σ=0.02, top) and overcoring data (σ=0.125, bottom)for HTO. Synthetic overcoring data are shown for profiles P1 to P6 the location ofwhich is shown in Fig. 2.
67A. Naves et al. / Journal of Contaminant Hydrology 142-143 (2012) 63–74
Author's personal copy
4.2. 22Na+
The identifiability analysis for 22Na+ is focused on theparameters to which computed concentrations are mostsensitive: the Kd, the De// and the De-| of the undisturbed clayand the De// of the BDZ. First, the Kd and the De// of theundisturbed clay were estimated simultaneously. Then, thefour parameters were estimated together. Table 3 lists theresults of the identifiability analysis for 22Na+. The estima-tion runs were performed for different initial starting valuesof the parameters and several values of σ.
Similar to HTO, parameter estimates are equal to theirtrue values for noise-free data, regardless the initial valuesand the number of estimated parameters. The noise in thedata introduces a bias in the parameter estimates. The Kd andthe De// of the undisturbed clay for 22Na+ can be estimatedsimultaneously from dilution data (σ=0.05) and overcoringdata (σ=0.24). The estimates of the Kd and the De// of theundisturbed clay depend on the initial values. However,estimation errors are always smaller than 20%. Estimationerrors increase slightly when the σ of the overcoring dataincreases from 0.24 to 0.4. The joint estimation of the Kd, De//
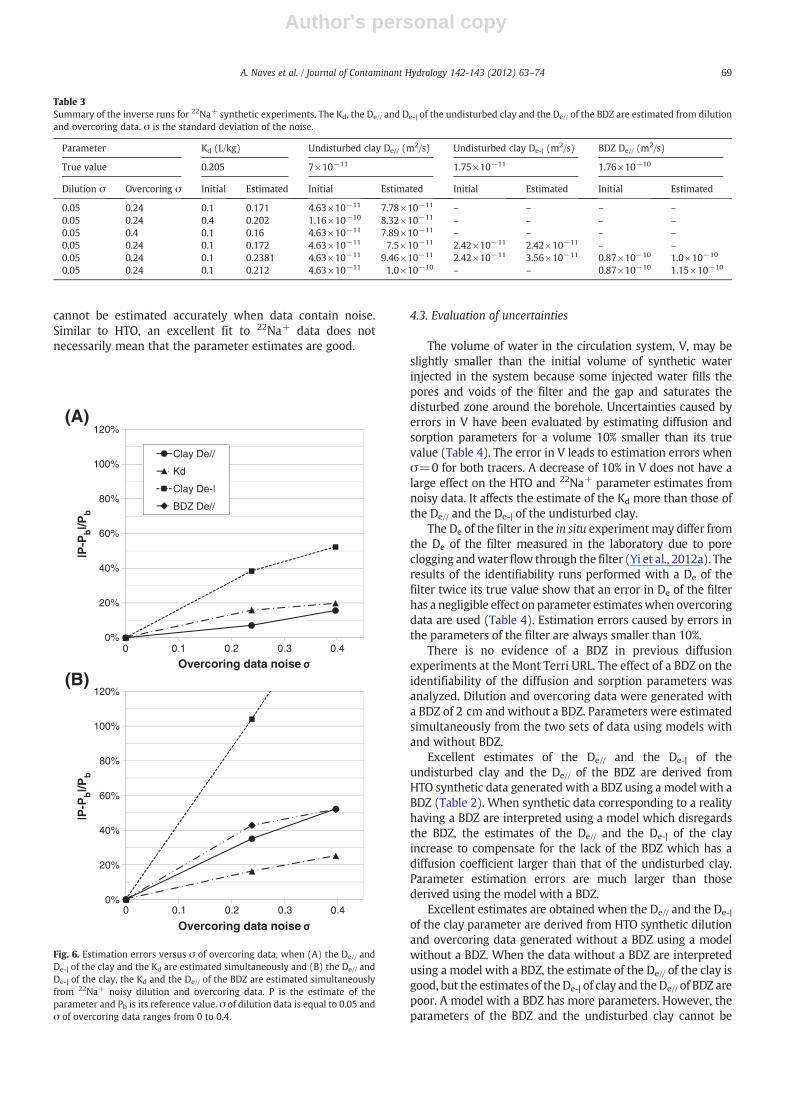
and the De-| of the undisturbed clay is feasible. Fig. 6A showsthat the estimation errors of these three parameters increasewith the σ of overcoring data when they are estimatedsimultaneously. σ of dilution data is fixed equal to 0.05 and σof the overcoring data ranges from 0 to 0.4. Data noise affects
more the estimates of De-| than the estimates of the Kd andthe De//.
The De// and the De-| of the undisturbed clay, the De// of theBDZ and the Kd cannot be estimated simultaneously fromnoisy dilution and overcoring data. The estimation of the De//
of the BDZ leads to large estimation errors of the De// of theclay and does not allow the estimation of the De-| of the clay(Fig. 6B). The estimation error of the De// of the clay is largerthan 40% when the De// of the clay, the Kd and the De// of theBDZ are estimated simultaneously from noisy dilution andovercoring data. In summary, the De// of the clay and the BDZ
Table 2Summary of the inverse runs for the synthetic experiments of HTO. The De// and De-| of the BDZ and the undisturbed clay are estimated from dilution andovercoring data. σ is the standard deviation of the data noise.
Parameter Undisturbed clay De// (m2/s) Undisturbed clay De-| (m2/s) BDZ De// (m2/s) BDZ De-| (m2/s)
True value 5.0×10⁻¹¹ 1.25×10⁻¹¹ 1.26×10⁻¹⁰ 3.16×10⁻¹¹
Dilution σ Overcoring σ Initial Estimated Initial Estimated Initial Estimated Initial Estimated
0.02 0.125 2.5×10⁻¹¹ 5.5×10⁻¹¹ – – – – – –
0.02 0.125 2.5×10⁻¹¹ 5.49×10⁻¹¹ – – 5.0×10⁻¹¹ 1.01×10⁻¹⁰ – –
0.02 0.125 2.5×10⁻¹¹ 5.49×10⁻¹¹ 5.8×10⁻¹² 1.57×10⁻¹¹ – – – –
0.02 0.05 2.5×10⁻¹¹ 5.34×10⁻¹¹ 5.8×10⁻¹² 1.39×10⁻¹¹ 5.0×10⁻¹¹ 1.24×10⁻¹⁰ – –
0.02 0.05 2.5×10⁻¹¹ 5.31×10⁻¹¹ 5.8×10⁻¹² 1.16×10⁻¹¹ 5.0×10⁻¹¹ 1.05×10⁻¹⁰ 1.55×10⁻¹¹ 4.47×10⁻¹¹
0%
10%
20%
30%
40%
50%
0 0.025 0.05 0.075 0.1 0.125
|P-P
b|/P
b
Overcoring data noise
De// of clay
De-| of clay
De// of BDZ
De// of clay from only dilution data
De-| of clay from only dilution data
De// of BDZ from only dilution data
Fig. 4. Estimation errors of the De// and De-| of the clay and the De// of the BDZfor HTO versus σ of overcoring data. Dilution data has σ=0.02 and the σ ofovercoring data ranges from 0 to 0.125. P is the estimate of the parameterand Pb is its reference value. The estimation errors obtained from dilutiondata are indicated with horizontal lines.
0.65
0.7
0.75
0.8
0.85
0.9
0.95
1
1.05
0 300 600 900 1200 1500
C/C
o
Time (days)
Synthetic data =0.02
Computed concentrations
Fig. 5. Fit of computed concentrations to HTO noisy synthetic data when theDe// and De-| of the undisturbed clay and the BDZ are estimated simultaneously.Synthetic overcoring data are shown for profiles P1 to P6 the location of whichis shown in Fig. 2.
68 A. Naves et al. / Journal of Contaminant Hydrology 142-143 (2012) 63–74
Author's personal copy
cannot be estimated accurately when data contain noise.Similar to HTO, an excellent fit to 22Na+ data does notnecessarily mean that the parameter estimates are good.
4.3. Evaluation of uncertainties
The volume of water in the circulation system, V, may beslightly smaller than the initial volume of synthetic waterinjected in the system because some injected water fills thepores and voids of the filter and the gap and saturates thedisturbed zone around the borehole. Uncertainties caused byerrors in V have been evaluated by estimating diffusion andsorption parameters for a volume 10% smaller than its truevalue (Table 4). The error in V leads to estimation errors whenσ=0 for both tracers. A decrease of 10% in V does not have alarge effect on the HTO and 22Na+ parameter estimates fromnoisy data. It affects the estimate of the Kd more than those ofthe De// and the De-| of the undisturbed clay.
The De of the filter in the in situ experimentmay differ fromthe De of the filter measured in the laboratory due to poreclogging andwater flow through the filter (Yi et al., 2012a). Theresults of the identifiability runs performed with a De of thefilter twice its true value show that an error in De of the filterhas a negligible effect on parameter estimateswhen overcoringdata are used (Table 4). Estimation errors caused by errors inthe parameters of the filter are always smaller than 10%.
There is no evidence of a BDZ in previous diffusionexperiments at the Mont Terri URL. The effect of a BDZ on theidentifiability of the diffusion and sorption parameters wasanalyzed. Dilution and overcoring data were generated witha BDZ of 2 cm and without a BDZ. Parameters were estimatedsimultaneously from the two sets of data using models withand without BDZ.
Excellent estimates of the De// and the De-| of theundisturbed clay and the De// of the BDZ are derived fromHTO synthetic data generated with a BDZ using a model with aBDZ (Table 2). When synthetic data corresponding to a realityhaving a BDZ are interpreted using a model which disregardsthe BDZ, the estimates of the De// and the De-| of the clayincrease to compensate for the lack of the BDZ which has adiffusion coefficient larger than that of the undisturbed clay.Parameter estimation errors are much larger than thosederived using the model with a BDZ.
Excellent estimates are obtained when the De// and the De-|
of the clay parameter are derived from HTO synthetic dilutionand overcoring data generated without a BDZ using a modelwithout a BDZ. When the data without a BDZ are interpretedusing a model with a BDZ, the estimate of the De// of the clay isgood, but the estimates of theDe-| of clay and theDe// of BDZ arepoor. A model with a BDZ has more parameters. However, theparameters of the BDZ and the undisturbed clay cannot be
Table 3Summary of the inverse runs for 22Na+ synthetic experiments. The Kd, the De// and De-| of the undisturbed clay and the De// of the BDZ are estimated from dilutionand overcoring data. σ is the standard deviation of the noise.
Parameter Kd (L/kg) Undisturbed clay De// (m2/s) Undisturbed clay De-| (m2/s) BDZ De// (m2/s)
True value 0.205 7×10⁻¹¹ 1.75×10⁻¹¹ 1.76×10⁻¹⁰
Dilution σ Overcoring σ Initial Estimated Initial Estimated Initial Estimated Initial Estimated
0.05 0.24 0.1 0.171 4.63×10⁻¹¹ 7.78×10⁻¹¹ – – – –
0.05 0.24 0.4 0.202 1.16×10⁻¹⁰ 8.32×10⁻¹¹ – – – –
0.05 0.4 0.1 0.16 4.63×10⁻¹¹ 7.89×10⁻¹¹ – – – –
0.05 0.24 0.1 0.172 4.63×10⁻¹¹ 7.5×10⁻¹¹ 2.42×10⁻¹¹ 2.42×10⁻¹¹ – –
0.05 0.24 0.1 0.2381 4.63×10⁻¹¹ 9.46×10⁻¹¹ 2.42×10⁻¹¹ 3.56×10⁻¹¹ 0.87×10⁻¹⁰ 1.0×10⁻¹⁰
0.05 0.24 0.1 0.212 4.63×10⁻¹¹ 1.0×10⁻¹⁰ – – 0.87×10⁻¹⁰ 1.15×10⁻¹⁰
0%
20%
40%
60%
80%
100%
120%
0 0.1 0.2 0.3 0.4
Overcoring data noise
Overcoring data noise
Clay De//
Kd
Clay De-|
BDZ De//
0%
20%
40%
60%
80%
100%
120%
0 0.1 0.2 0.3 0.4
(A)
(B)
|P-P
b|/P
b|P
-Pb|/P
b
Fig. 6. Estimation errors versus σ of overcoring data, when (A) the De// andDe-| of the clay and the Kd are estimated simultaneously and (B) the De// andDe-| of the clay, the Kd and the De// of the BDZ are estimated simultaneouslyfrom 22Na+ noisy dilution and overcoring data. P is the estimate of theparameter and Pb is its reference value. σ of dilution data is equal to 0.05 andσ of overcoring data ranges from 0 to 0.4.
69A. Naves et al. / Journal of Contaminant Hydrology 142-143 (2012) 63–74
Author's personal copy
simultaneously estimated. The values of ϕacc and the De-| of theBDZwere fixed to their reference valueswhich are significantlylarger than those of the undisturbed clay.
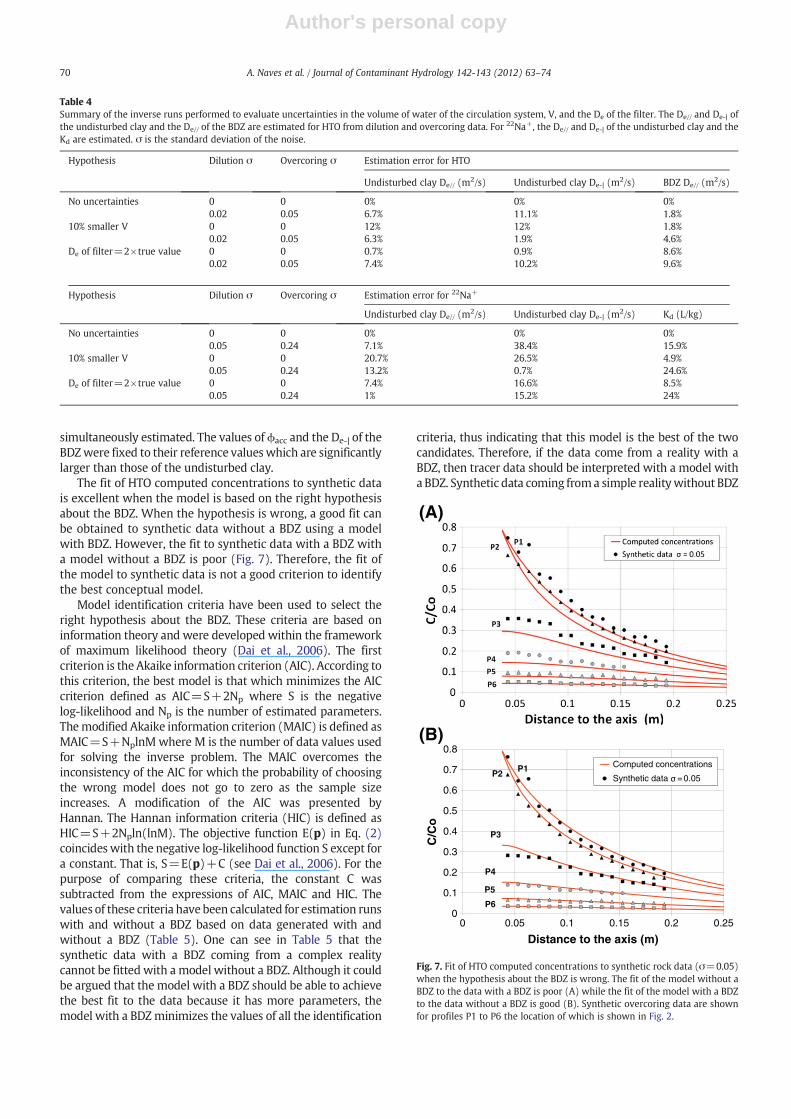
The fit of HTO computed concentrations to synthetic datais excellent when the model is based on the right hypothesisabout the BDZ. When the hypothesis is wrong, a good fit canbe obtained to synthetic data without a BDZ using a modelwith BDZ. However, the fit to synthetic data with a BDZ witha model without a BDZ is poor (Fig. 7). Therefore, the fit ofthe model to synthetic data is not a good criterion to identifythe best conceptual model.
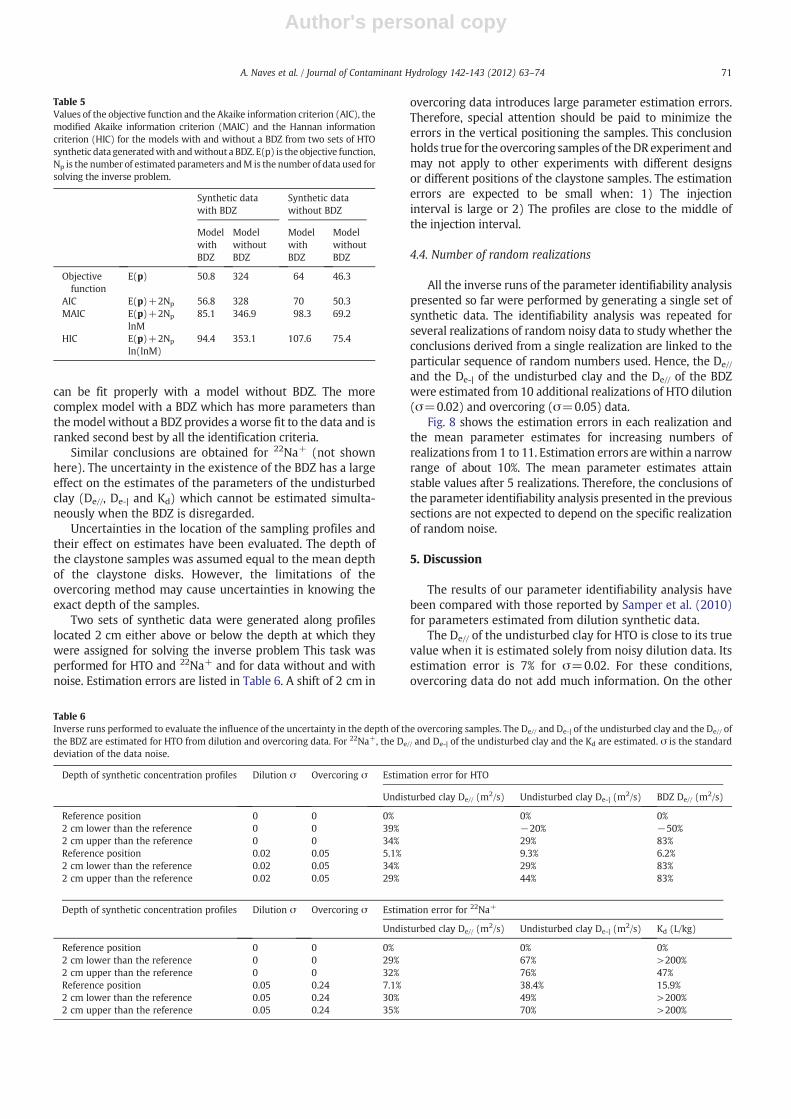
Model identification criteria have been used to select theright hypothesis about the BDZ. These criteria are based oninformation theory and were developed within the frameworkof maximum likelihood theory (Dai et al., 2006). The firstcriterion is the Akaike information criterion (AIC). According tothis criterion, the best model is that which minimizes the AICcriterion defined as AIC=S+2Np where S is the negativelog-likelihood and Np is the number of estimated parameters.Themodified Akaike information criterion (MAIC) is defined asMAIC=S+NplnMwhere M is the number of data values usedfor solving the inverse problem. The MAIC overcomes theinconsistency of the AIC for which the probability of choosingthe wrong model does not go to zero as the sample sizeincreases. A modification of the AIC was presented byHannan. The Hannan information criteria (HIC) is defined asHIC=S+2Npln(lnM). The objective function E(p) in Eq. (2)coincides with the negative log-likelihood function S except fora constant. That is, S=E(p)+C (see Dai et al., 2006). For thepurpose of comparing these criteria, the constant C wassubtracted from the expressions of AIC, MAIC and HIC. Thevalues of these criteria have been calculated for estimation runswith and without a BDZ based on data generated with andwithout a BDZ (Table 5). One can see in Table 5 that thesynthetic data with a BDZ coming from a complex realitycannot be fitted with a model without a BDZ. Although it couldbe argued that the model with a BDZ should be able to achievethe best fit to the data because it has more parameters, themodel with a BDZminimizes the values of all the identification
criteria, thus indicating that this model is the best of the twocandidates. Therefore, if the data come from a reality with aBDZ, then tracer data should be interpreted with a model witha BDZ. Synthetic data coming froma simple realitywithout BDZ
0
0.1
0.2
0.3
0.4
0.5
0.6
0.7
0.8
C/C
o
Distance to the axis (m)
Computed concentrations
Synthetic data =0.05P2
P6
P5
P4
P3
P1
(B)
(A)
0 0.05 0.1 0.15 0.2 0.25
Fig. 7. Fit of HTO computed concentrations to synthetic rock data (σ=0.05)when the hypothesis about the BDZ is wrong. The fit of the model without aBDZ to the data with a BDZ is poor (A) while the fit of the model with a BDZto the data without a BDZ is good (B). Synthetic overcoring data are shownfor profiles P1 to P6 the location of which is shown in Fig. 2.
Table 4Summary of the inverse runs performed to evaluate uncertainties in the volume of water of the circulation system, V, and the De of the filter. The De// and De-| ofthe undisturbed clay and the De// of the BDZ are estimated for HTO from dilution and overcoring data. For 22Na+, the De// and De-| of the undisturbed clay and theKd are estimated. σ is the standard deviation of the noise.
Hypothesis Dilution σ Overcoring σ Estimation error for HTO
Undisturbed clay De// (m2/s) Undisturbed clay De-| (m2/s) BDZ De// (m2/s)
No uncertainties 0 0 0% 0% 0%0.02 0.05 6.7% 11.1% 1.8%
10% smaller V 0 0 12% 12% 1.8%0.02 0.05 6.3% 1.9% 4.6%
De of filter=2×true value 0 0 0.7% 0.9% 8.6%0.02 0.05 7.4% 10.2% 9.6%
Hypothesis Dilution σ Overcoring σ Estimation error for 22Na+
Undisturbed clay De// (m2/s) Undisturbed clay De-| (m2/s) Kd (L/kg)
No uncertainties 0 0 0% 0% 0%0.05 0.24 7.1% 38.4% 15.9%
10% smaller V 0 0 20.7% 26.5% 4.9%0.05 0.24 13.2% 0.7% 24.6%
De of filter=2×true value 0 0 7.4% 16.6% 8.5%0.05 0.24 1% 15.2% 24%
70 A. Naves et al. / Journal of Contaminant Hydrology 142-143 (2012) 63–74
Author's personal copy
can be fit properly with a model without BDZ. The morecomplex model with a BDZ which has more parameters thanthemodel without a BDZ provides a worse fit to the data and isranked second best by all the identification criteria.
Similar conclusions are obtained for 22Na+ (not shownhere). The uncertainty in the existence of the BDZ has a largeeffect on the estimates of the parameters of the undisturbedclay (De//, De-| and Kd) which cannot be estimated simulta-neously when the BDZ is disregarded.
Uncertainties in the location of the sampling profiles andtheir effect on estimates have been evaluated. The depth ofthe claystone samples was assumed equal to the mean depthof the claystone disks. However, the limitations of theovercoring method may cause uncertainties in knowing theexact depth of the samples.
Two sets of synthetic data were generated along profileslocated 2 cm either above or below the depth at which theywere assigned for solving the inverse problem This task wasperformed for HTO and 22Na+ and for data without and withnoise. Estimation errors are listed in Table 6. A shift of 2 cm in
overcoring data introduces large parameter estimation errors.Therefore, special attention should be paid to minimize theerrors in the vertical positioning the samples. This conclusionholds true for the overcoring samples of theDR experiment andmay not apply to other experiments with different designsor different positions of the claystone samples. The estimationerrors are expected to be small when: 1) The injectioninterval is large or 2) The profiles are close to the middle ofthe injection interval.
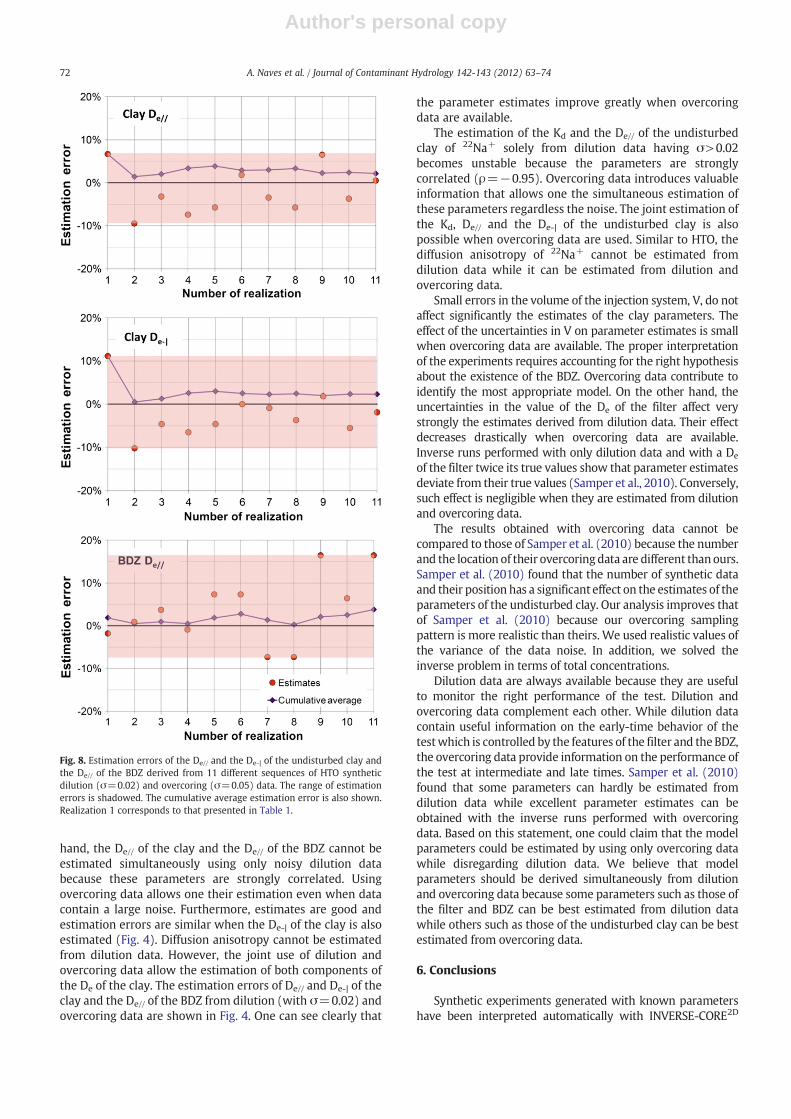
4.4. Number of random realizations
All the inverse runs of the parameter identifiability analysispresented so far were performed by generating a single set ofsynthetic data. The identifiability analysis was repeated forseveral realizations of random noisy data to study whether theconclusions derived from a single realization are linked to theparticular sequence of random numbers used. Hence, the De//
and the De-| of the undisturbed clay and the De// of the BDZwere estimated from 10 additional realizations of HTO dilution(σ=0.02) and overcoring (σ=0.05) data.
Fig. 8 shows the estimation errors in each realization andthe mean parameter estimates for increasing numbers ofrealizations from 1 to 11. Estimation errors arewithin a narrowrange of about 10%. The mean parameter estimates attainstable values after 5 realizations. Therefore, the conclusions ofthe parameter identifiability analysis presented in the previoussections are not expected to depend on the specific realizationof random noise.
5. Discussion
The results of our parameter identifiability analysis havebeen compared with those reported by Samper et al. (2010)for parameters estimated from dilution synthetic data.
The De// of the undisturbed clay for HTO is close to its truevalue when it is estimated solely from noisy dilution data. Itsestimation error is 7% for σ=0.02. For these conditions,overcoring data do not add much information. On the other
Table 6Inverse runs performed to evaluate the influence of the uncertainty in the depth of the overcoring samples. The De// and De-| of the undisturbed clay and the De// ofthe BDZ are estimated for HTO from dilution and overcoring data. For 22Na+, the De// and De-| of the undisturbed clay and the Kd are estimated. σ is the standarddeviation of the data noise.
Depth of synthetic concentration profiles Dilution σ Overcoring σ Estimation error for HTO
Undisturbed clay De// (m2/s) Undisturbed clay De-| (m2/s) BDZ De// (m2/s)
Reference position 0 0 0% 0% 0%2 cm lower than the reference 0 0 39% −20% −50%2 cm upper than the reference 0 0 34% 29% 83%Reference position 0.02 0.05 5.1% 9.3% 6.2%2 cm lower than the reference 0.02 0.05 34% 29% 83%2 cm upper than the reference 0.02 0.05 29% 44% 83%
Depth of synthetic concentration profiles Dilution σ Overcoring σ Estimation error for 22Na+
Undisturbed clay De// (m2/s) Undisturbed clay De-| (m2/s) Kd (L/kg)
Reference position 0 0 0% 0% 0%2 cm lower than the reference 0 0 29% 67% >200%2 cm upper than the reference 0 0 32% 76% 47%Reference position 0.05 0.24 7.1% 38.4% 15.9%2 cm lower than the reference 0.05 0.24 30% 49% >200%2 cm upper than the reference 0.05 0.24 35% 70% >200%
Table 5Values of the objective function and the Akaike information criterion (AIC), themodified Akaike information criterion (MAIC) and the Hannan informationcriterion (HIC) for the models with and without a BDZ from two sets of HTOsynthetic data generatedwith andwithout a BDZ. E(p) is the objective function,Np is the number of estimated parameters andM is the number of data used forsolving the inverse problem.
Synthetic datawith BDZ
Synthetic datawithout BDZ
ModelwithBDZ
ModelwithoutBDZ
ModelwithBDZ
ModelwithoutBDZ
Objectivefunction
E(p) 50.8 324 64 46.3
AIC E(p)+2Np 56.8 328 70 50.3MAIC E(p)+2Np
lnM85.1 346.9 98.3 69.2
HIC E(p)+2Np
ln(lnM)94.4 353.1 107.6 75.4
71A. Naves et al. / Journal of Contaminant Hydrology 142-143 (2012) 63–74
Author's personal copy
hand, the De// of the clay and the De// of the BDZ cannot beestimated simultaneously using only noisy dilution databecause these parameters are strongly correlated. Usingovercoring data allows one their estimation even when datacontain a large noise. Furthermore, estimates are good andestimation errors are similar when the De-| of the clay is alsoestimated (Fig. 4). Diffusion anisotropy cannot be estimatedfrom dilution data. However, the joint use of dilution andovercoring data allow the estimation of both components ofthe De of the clay. The estimation errors of De// and De-| of theclay and the De// of the BDZ from dilution (with σ=0.02) andovercoring data are shown in Fig. 4. One can see clearly that
the parameter estimates improve greatly when overcoringdata are available.
The estimation of the Kd and the De// of the undisturbedclay of 22Na+ solely from dilution data having σ>0.02becomes unstable because the parameters are stronglycorrelated (ρ=−0.95). Overcoring data introduces valuableinformation that allows one the simultaneous estimation ofthese parameters regardless the noise. The joint estimation ofthe Kd, De// and the De-| of the undisturbed clay is alsopossible when overcoring data are used. Similar to HTO, thediffusion anisotropy of 22Na+ cannot be estimated fromdilution data while it can be estimated from dilution andovercoring data.
Small errors in the volume of the injection system, V, do notaffect significantly the estimates of the clay parameters. Theeffect of the uncertainties in V on parameter estimates is smallwhen overcoring data are available. The proper interpretationof the experiments requires accounting for the right hypothesisabout the existence of the BDZ. Overcoring data contribute toidentify the most appropriate model. On the other hand, theuncertainties in the value of the De of the filter affect verystrongly the estimates derived from dilution data. Their effectdecreases drastically when overcoring data are available.Inverse runs performed with only dilution data and with a De
of the filter twice its true values show that parameter estimatesdeviate from their true values (Samper et al., 2010). Conversely,such effect is negligible when they are estimated from dilutionand overcoring data.
The results obtained with overcoring data cannot becompared to those of Samper et al. (2010) because the numberand the location of their overcoringdata are different thanours.Samper et al. (2010) found that the number of synthetic dataand their position has a significant effect on the estimates of theparameters of the undisturbed clay. Our analysis improves thatof Samper et al. (2010) because our overcoring samplingpattern is more realistic than theirs. We used realistic values ofthe variance of the data noise. In addition, we solved theinverse problem in terms of total concentrations.
Dilution data are always available because they are usefulto monitor the right performance of the test. Dilution andovercoring data complement each other. While dilution datacontain useful information on the early-time behavior of thetestwhich is controlled by the features of the filter and the BDZ,the overcoring data provide information on the performance ofthe test at intermediate and late times. Samper et al. (2010)found that some parameters can hardly be estimated fromdilution data while excellent parameter estimates can beobtained with the inverse runs performed with overcoringdata. Based on this statement, one could claim that the modelparameters could be estimated by using only overcoring datawhile disregarding dilution data. We believe that modelparameters should be derived simultaneously from dilutionand overcoring data because some parameters such as those ofthe filter and BDZ can be best estimated from dilution datawhile others such as those of the undisturbed clay can be bestestimated from overcoring data.
6. Conclusions
Synthetic experiments generated with known parametershave been interpreted automatically with INVERSE-CORE2D
Fig. 8. Estimation errors of the De// and the De-| of the undisturbed clay andthe De// of the BDZ derived from 11 different sequences of HTO syntheticdilution (σ=0.02) and overcoring (σ=0.05) data. The range of estimationerrors is shadowed. The cumulative average estimation error is also shown.Realization 1 corresponds to that presented in Table 1.
72 A. Naves et al. / Journal of Contaminant Hydrology 142-143 (2012) 63–74
Author's personal copy
and have been used to study the parameter identifiability ofHTO and 22Na+ parameters in the presence of random mea-surement errors and evaluatemodel uncertainties. The analysisaccounts for the actual position of the overcoring samples ofthe DR experiment in the claystone instead of assuming anunrealistic radial profile. The standard deviation of the noiseadded to synthetic data has been derived from real data of theDR experiment and other similar experiments. The inverseproblem has been solved by using simultaneously concentra-tion data in terms of dissolved and total concentrations.
Estimation errors of the De// and De-| of the BDZ and theundisturbed clay for HTO are negligible when the estimationis performed with noise-free data. Noise in the dataintroduces a bias in the parameter estimates. The De// ofboth materials cannot be simultaneously estimated and thediffusion anisotropy cannot be derived solely from noisydilution data. Accounting for overcoring data allows one toestimate simultaneously the De// and the De-| of the clay andthe De// of the BDZ. On the contrary, the De-| of the BDZ cannotbe estimated from HTO noisy synthetic data. The estimates ofKd, the De// and the De-| of the undisturbed clay and the De// ofthe BDZ of 22Na+ derived from noise-free data coincide withtheir true values. These parameters cannot be estimatedsimultaneously from only noisy dilution data.
Overcoring data provide valuable information that allowsone the joint estimation of the Kd, De// and the De-| of theundisturbed claystone from noisy data. Good estimates of theDe// of the BDZ cannot be derived when data contain noise. Agood fit of the model to synthetic data does not necessarilyensure that parameter estimates are good. Small errors in thevolume of the circulation system do not affect significantly theestimates of the clay parameter. Good estimates and fits to dataare obtained in the identifiability runs performed with noisydilution and overcoring datawith a De of the filter twice its truevalue. Overcoring data, which are less sensitive to the De of thefilter than dilution data, prevent deviations from the truevalues that occur when only dilution data are available. Theproper interpretation of the experiment requires the righthypothesis about the BDZ. A wrong assumption leads to largeestimation errors. The use of model identification criteria willhelp in the selection of the best model. Uncertainties in theexact depth of the overcoring profiles may introduce largeerrors on parameter estimates. Therefore, attention should bepaid to minimize the errors in positioning the depth of thesamples.
The conclusions of the parameter identifiability analysisare independent of the particular realization of randomnumbers used to generate the data noise.
Acknowledgments
Thisworkwas supported by theMont Terri Consortium andthe Spanish Ministry of Science and Technology through aresearch scholarship awarded to the first author. Parts of thiswork were performed during the stay of Acacia Naves at thePaul Scherrer Institute (Switzerland) from May to Septemberof 2010. We thank Shuping Yi, Josep Soler, Olivier Leupinand Sarah Dewonck for fruitful discussions on the interpreta-tion of the experiment. The comments and suggestions of twoanonymous reviewers which improved the paper are greatlyappreciated.
References
Aertsens, M., De Cannière, P., Lemmens, K., Maes, N., Moors, H., 2008.Overview and consistency of migration experiments in clay. Physics andChemistry of the Earth 1, 2–4.
Andra, 2005. Dossier 2005 Argile – Synthèse: Evaluation de la Faisabilité duStockage Géologique en Formation Argileuse.
Appelo, C.A.J., Wersin, P., 2007. Multicomponent diffusion modeling in claysystems with application to diffusion of tritium, iodide and sodium inOpalinus clay. Environmental Science and Technology 41, 5002–5007.
Dai, Z., Samper, J., 2004. Inverse problem of multicomponent reactivechemical transport in porous media: formulation and applications.Water Resources Research 40, W07407.
Dai, Z., Samper, J., Ritzi, R., 2006. Identifying geochemical processes by inversemodeling of multicomponent reactive transport in Aquia aquifer.Geosphere 4 (4), 210–219. http://dx.doi.org/10.1130/GES00021.1.
De Cannière, P., Moors, H., Lolivier, P., De Preter, P., Put, M., 1996. Laboratoryand in situ migration experiments in the Boom Clay. EuropeanCommission, Luxembourg, Report EUR 16 927 EN.
Dewonck, S., Blin, V., Radwan, J., Filippi, M., Landesman, C., Ribet, S., 2010.Long term in situ tracer diffusion tests in the Callovo-Oxfordian clay:results and modeling. Clays In Natural & Engineered Barriers forRadioactive Waste Confinement 4th International Meeting in March2010, Nantes, France, pp. 629–630.
Fierz, T., 2006. Diffusion and retention (DR) experiment. Field activitiesphase 11: instrumentation and tracer injection. Mont Terri ProjectTechnical Note TN 2006‐18.
Gimmi, Th., Waber, H.N., Gautschi, A., Rubel, A., 2007. Stable water isotopesin pore water of Jurassic argillaceous rocks as tracers for solute transportover large spatial and temporal scales. Water Resources Research 43‐4,W04410.
Gimmi, Th, Soler, J.M., Samper, J., Naves, A., Yi, S., Leupin, O.X., Wersin, P., VanLoon, L.R., Eikenberg, J., Dewonck, S., Wittebroodt, Ch, 2010. Insightsfrommodelling the diffusion and retention experiment at the Mont TerriURL. Clays In Natural & Engineered Barriers for Radioactive WasteConfinement 4th International Meeting in March 2010, Nantes, France,pp. 169–170.
Gimmi, Th, Leupin, O.X., Eikenberg, J., Glaus, M.A., Van Loon, L.R., Waber,H.N., Soler, J.M., Naves, A., Samper, J., Dewonck, S., Wittebroodt, Ch,2011. Results and modeling of the 4-year diffusion and retention (DR)experiment in Opalinus clay in the Mont Terri URL. EGU GeneralAssembly, Geophysical Research Abstracts 13, EGU2011–12919-1.
Gimmi, Th, Leupin, O.X., Eikenberg, J., Glaus, M.A., Van Loon, L.R., Waber,H.N., Wersin, P., Dewonck, S., Wittebroodt, C., submitted for publication.Anisotropic diffusion at the field scale – I: A four-year multi-tracerdiffusion and retention experiment at the Mont Terri URL (Switzerland).
Leupin, O.X., Wersin, P., Gimmi, Th, Soler, J.M., Dewonck, S., Wittebroodt, C.,Van Loon, L., Eikenberg, J., Baeyens, B., Samper, J., Yi, S., Naves, A., 2010.Diffusion and retention experiment at the Mont Terri underground rocklaboratory in St. Ursanne. Clays In Natural & Engineered Barriers forRadioactiveWaste Confinement 4th International Meeting in March 2010,Nantes, France, pp. 167–168.
Mallants, D., Marivoet, J., Sillen, X., 2001. Performance assessment of thedisposal of vitrified high-level waste in a clay layer. Journal of NuclearMaterials 298, 125–135.
Naves, A., 2011. Numerical Models of Diffusion and Sorption Through theOpalinus and Callovo-Oxfordian Clays. Ph.D. Dissertation. Universidadeda Coruña.
Palut, J.M., Montarnal, Ph., Gautschi, A., Tevissen, E., Mouche, E., 2003.Characterisation of HTO diffusion properties by an in situ tracerexperiment in Opalinus clay at Mont Terri. Journal of ContaminantHydrology 61, 203–218.
Patriarche, D., Ledoux, E., Simon-Coinçona, R., Michelot, J.-L., Cabrera, J., 2004.Characterization and modeling of diffusion process for mass transportthrough the Tournemire argillites (Aveyron, France). Applied Clay Science26, 109–122.
Samper, J., Dai, Z., Molinero, J., García-Gutiérrez, M., Missana, T., Mingarro,M., 2006a. Inverse modeling of tracer experiments in FEBEX compactedCa-bentonite. Physics and Chemistry of the Earth 31, 640–648.
Samper, J., Yang, C., Naves, A., Yllera, A., Hernández, A., Molinero, J., Soler,J.M., Hernán, P., Mayor, J.C., Astudillo, J., 2006b. A fully 3-D anisotropicnumerical model of the DI-B in situ diffusion experiment in the Opalinusclay formation. Physics and Chemistry of the Earth 31, 531–540.
Samper, F.J., Dewonck, S., Zheng, L., Yang, Q., Naves, A., 2008. Normalizedsensitivities and parameter identifiability of in situ diffusion experimentson Callovo–Oxfordian clay at Bure site. Physics and Chemistry of the Earth33, 1000–1008.
Samper, J., Yi, S., Naves, A., 2010. Analysis of the parameter identifiability ofthe in situ diffusion and retention (DR) experiment. Physics andChemistry of the Earth 35, 207–216.
73A. Naves et al. / Journal of Contaminant Hydrology 142-143 (2012) 63–74

Author's personal copy
Soler, J.M., Samper, J., Yllera, A., Hernández, A., Quejido, A., Fernández, M.,Yang, C., Naves, A., Hernán, P., Wersin, P., 2008. The DI_B in situ diffusionexperiment at Mont Terri: results and modeling. Physics and Chemistryof the Earth 33, S196–S207.
Tevissen, E., Soler, J.M., Montarnal, Ph., Gautschi, A., Van Loon, L.R., 2004.Comparison between in situ laboratory characterization of HTO andhalides diffusion in Opalinus clay at the Mont Terri URL. RadiochimicaActa 92, 781–786.
Thury, M., Bossart, P., 1999. Mont Terri Rock Laboratory, a new internationalresearch project in a Mesozoic shale formation in Switzerland.Engineering Geology 52, 347–359.
Van Loon, L.R., Glaus, M.A., 2008. Effective diffusion coefficient of severaltracers in Teflon filters. PSI Technical Note, Switzerland.
Van Loon, L., Soler, J.M., Jakob, A., Bradbury, M.H., 2003. Effect of confiningpressure on the diffusion of HTO, 36Cl− and 125I− in a layeredargillaceous rock (Opalinus clay): perpendicular to the fabric. AppliedGeochemistry 18, 1653–1662.
Van Loon, L.R., Wersin, P., Soler, J.M., Eikenberg, J., Gimmi, T., Hernán, P.,Dewonck, S., Savoye, S., 2004. In-situ diffusion of HTO, 22Na+, Cs+ and I−
in Opalinus clay at the Mont Terri underground rock laboratory.Radiochimica Acta 92, 757–763.
Wersin, P., van Dorp, F., 2005. Diffusion and retention (DR) experiment inborehole BDR-1 Phase 11 (1 July 2005–30 June 2006): radiation protectionand working plan. Mont Terri Project Technical Note 2005‐47.
Wersin, P., Van Loon, L.R., Soler, J.M., Yllera, A., Eikenberg, J., Gimmi, Th.,Hernán, P., Boisson, J.-Y., 2004. Long-term diffusion experiment at Mont
Terri: first results from field and laboratory data. Applied Clay Science26, 123–135.
Wersin, P., Baeyens, B., Bossart, P., Cartalade, A., Dewonck, S., Eikenberg, J.,Fierz, T., Fisch, H.R., Gimmi, T., Grolimund, D., Hernán, P., Möri, A., Savoye,S., Soler, J.M., van Dorp, F., Van Loon, L., 2006. Long-term diffusionexperiment (DI-A): diffusion of HTO, I−, 22Na+ and Cs+. Field activities,data and modeling. Mont Terri Technical Report TR 2003‐06.
Wersin, P., Soler, J.M., Van Loon, L., Eikenberg, J., Baeyens, B., Grolimund, D.,Gimmi, Th., Dewonck, S., 2008. Diffusion of HTO, Br−, I−, Cs+, 85Sr2+ and60Co2+ in a clay formation: results andmodeling from an in situ experimentin Opalinus clay. Applied Geochemistry 23, 678–691.
Yeh, W.W.-G., 1986. Review of parameter identification procedures ingroundwater hydrology: the inverse problem. Water Resources Research22 (2), 95–108.
Yi, S., Samper, J., Naves, A., Soler, J.M., 2012a. Inverse estimation of the effectivediffusion of the filter in the in situ diffusion and retention (DR) experiment.Transport in Porous Media. http://dx.doi.org/10.1007/s11242-012-9960-9.
Yi, S., Samper, J., Naves, A., Soler, J.M., 2012b. Identifiability of diffusion andretention parameters of anionic tracers from the diffusion andretention, DR, experiment. Journal of Hydrology. http://dx.doi.org/10.1016/j.jhydrol.2012.04.032.
Yllera, A., Hernández, A., Mingarro, M., Quejido, A., Sedano, L.A., Soler, J.M.,Samper, J., Molinero, J., Barcala, J.M., Martín, P.L., Fernández, M., Wersin,P., Rivas, P., Hernán, P., 2004. DI-B experiment: planning, design andperformance of an in situ diffusion experiment in the Opalinus clayformation. Applied Clay Science 26, 181–196.
74 A. Naves et al. / Journal of Contaminant Hydrology 142-143 (2012) 63–74