
ICT4S 2013 Proceedings of the First International Conference ...
264
Research Collection Conference Proceedings ICT4S 2013 Proceedings of the First International Conference on Information and Communication Technologies for Sustainability, ETH Zurich, February 14-16, 2013 Author(s): Hilty, Lorenz M.; Aebischer, Bernard; Andersson, Göran; Lohmann, Wolfgang Publication Date: 2013 Permanent Link: https://doi.org/10.3929/ethz-a-007337628 Rights / License: In Copyright - Non-Commercial Use Permitted This page was generated automatically upon download from the ETH Zurich Research Collection . For more information please consult the Terms of use . ETH Library
-
Upload
khangminh22 -
Category
Documents
-
view
0 -
download
0
Transcript of ICT4S 2013 Proceedings of the First International Conference ...

Research Collection
Conference Proceedings
ICT4S 2013Proceedings of the First International Conference on Informationand Communication Technologies for Sustainability, ETH Zurich,February 14-16, 2013
Author(s): Hilty, Lorenz M.; Aebischer, Bernard; Andersson, Göran; Lohmann, Wolfgang
Publication Date: 2013
Permanent Link: https://doi.org/10.3929/ethz-a-007337628
Rights / License: In Copyright - Non-Commercial Use Permitted
This page was generated automatically upon download from the ETH Zurich Research Collection. For moreinformation please consult the Terms of use.
ETH Library

Proceedings of the First International Conference
on Information and Communication Technologiesfor Sustainability ETH Zurich, February 14-16, 2013
Lorenz M. HiltyBernard AebischerGöran Andersson
Wolfgang Lohmann (Eds.)
ISBN I978-3-906031-24-8DOI 10.3929/ethz-a-007337628
This volume contains the final contributions to ICT4S 2013, the First International Conference on Information and Communication Technologies for Sustainability, held at ETH Zurich on February 14-16, 2013, organized by: - Department of Informatics, University of Zurich - Energy Science Center, ETH Zurich - Technology and Society Lab, Empa, Swiss Federal Laboratories for Materials Science and Technology All contributions except the invited papers were selected by a two-stage blind peer-review process. Published online in the E-Collection, the institutional repository of ETH Zurich for open access publishing. ISBN 978-3-906031-24-8 DOI 10.3929/ethz-a-007337628 Proceedings of the First International Conference on Information and Communication Technologies for Sustainability, ETH Zurich, February 14-16, 2013, edited by Lorenz M. Hilty, Bernard Aebischer, Göran Andersson and Wolfgang Lohmann.
Cover design: Alexandra Hietz
© 2013 by the authors.

PREFACE: HOW TO IMPROVE THE CONTRIBUTION OF ICT TO SUSTAINABILITY
Our world is getting smarter: smart homes, smart cities, smart grids, smart vehicles and logistics, cloud computing, crowdsourcing. Many smart solutions are today designed in a “Green IT” context and proposed with the intention to contribute to environmental or social sustainability. Such claims include, for example, reducing greenhouse gas emissions, saving energy, finding the most sustainable alternative in a decision situation, optimising a process with regard to sustainability criteria, or enabling participation and reducing poverty. However, it is difficult to determine whether the potential net benefit of the smart solution will materialize under real-world conditions, in particular when considering the dynamics of markets, possible rebound effects and other systemic effects. "Smarter" does not necessarily imply "more sustainable". The First International Conference of Information and Communication Technologies for Sustainability (ICT4S), held in Zurich on February 14-16, 2013, gathered more than 200 researchers and decision makers from 50 countries to exchange their insights about an effective contribution of ICT to sustainable development. The papers presented at the conference are contained in this volume. These contributions show the multi-facetted relationship between Information and Communication Technologies (ICTs) and issues of sustainability. First, although creating virtual worlds, these technologies are physically dependent on the supply of energy and scarce materials. How can we reduce the ecological footprint of ICT? (Sustainability in ICT) Second, ICTs are enabling technologies with the potential to increase the energy and material efficiency of production and consumption patterns and processes. Essentially depending on the socio-economic framework, they can support the decoupling of value creation from resource use instead of accelerating resource-intensive processes (Sustainability by ICT). Third, the computational models we can design and implement with the aid of ICT contribute to our understanding of complex systems. These models and the applications based on them support the creation and assessment of potential solutions to urgent problems, among them climate change (Sustainability Research by ICT). The following cross-cutting issues have been repeatedly addressed in the contributions to the ICT4S 2013 conference, thus defining the outline of a research agenda in the emerging field of ICT for Sustainability: 1. The power of software: How can we use the power of software to reduce hardware
energy consumption? 2. Scarce materials used in ICT hardware: How can we reduce hardware obsolescence and
close material cycles? 3. Smart energy use in buildings: How can we manage the energy used in buildings smarter
and thereby reduce this largest fraction of our total energy consumption? 4. Sustainable behaviours and lifestyles: How can ICT be used to support users in making
choices that contribute to sustainable development? The presentations and discussions of the conference are also available as podcasts and visual protocols via the website http://www.ict4s.org. Lorenz M. Hilty, General Chair, ICT4S 2013

I
TABLE OF CONTENTS Invited Lectures Harnessing Collective Intelligence to Address Climate Change: The Climate CoLab Robert Laubacher ................................................................................................................................................................... 1
Defining an Agenda for Computational Sustainability Jennifer Mankoff ..................................................................................................................................................................... 4
Interactions between Energy, Information and Growth Daniel Spreng ......................................................................................................................................................................... 6
A1: ICT Hardware – Energy The Development of ICT Sector Guidance: Rationale, Development and Outcomes Andie Stephens and Mark Didden .............................................................................................................................. 8
The Future Carbon Footprint of the ICT and E&M sectors Jens Malmodin, Pernilla Bergmark and Dag Lundén .......................................................................................................... 12
The Greenhouse Gas Abatement Potential of Enterprise Cloud Computing Daniel R. Williams, Peter Thomond and Ian Mackenzie ...................................................................................................... 21
Capabilities and Limitations of Direct Free Cooling in Data Centers Peter Gysel, Rolf Morf, Cyrill Grüter and Matthias Krebs .................................................................................................. 29
Energy Consumption of Smart Meters Michael Preisel, Adriana Diaz and Wolfgang Wimmer ....................................................................................................... 37
A2: ICT Hardware – Materials Insights from a Decade of Development Cooperation in E-Waste Management Mathias Schluep, Esther Müller, Lorenz M. Hilty, Daniel Ott, Rolf Widmer and Heinz Böni ............................................. 45
Social Life Cycle Inventory and Impact Assessment of Informal Recycling of Electronic ICT Waste in Pakistan Shakila Umair, Anna Björklund and Elisabeth Ekener Petersen ......................................................................................... 52
Acceptance of Mobile Phone Return Programs: A Case Study Based Analysis Britta Bookhagen, Julia Nordmann, Inger Dyrnes, Oliver Stengel and Nils-Holger Schmidt ............................................. 59
A3: Smart Energy Solutions Makahiki+WattDepot: An Open Source Software Stack for Next Generation Energy Research and Education Philip M. Johnson, Yongwen Xu, Robert S. Brewer, George A. Lee and Andrea Connell ................................................... 65
When Looking out of the Window is not Enough: Informing the Design of In-Home Technologies for Domestic Energy Microgeneration Blaine A. Price, Janet van der Linden, Jacky Bourgeois and Gerd Kortuem ...................................................................... 73
Developing a Strategy for the Implementation of ICT in Energy Efficient Neighbourhoods Max Blöchle, Branislav Iglar, Daniele Basciotti and Jessen Page ...................................................................................... 81
A4: ICT-Software – Energy Green Software and Green Software Engineering – Definitions, Measurements, and Quality Aspects Eva Kern, Markus Dick, Stefan Naumann, Achim Guldner and Timo Johann .................................................................... 87
II
The Impact of Improving Software Functionality on Environmental Sustainability Sedef Akınlı Koçak, Andriy Miranskyy, Gülfem Işıklar Alptekin, Ayşe Başar Bener and Enzo Cialini ............................... 95
Identification of Application-Level Energy-Optimizations Kay Grosskop and Joost Visser .......................................................................................................................................... 101
Pilot Result Monitoring Energy Usage by Software Frank van Bokhoven and Jarno Bloem ............................................................................................................................... 108
B1: Smart Resource Management Smart Metering Infrastructure for Residential Water Efficiency: Results of a Trial in a Behavioural Change Program in Perth, Western Australia Martin Anda, Fabian Le Gay Brereton and Elise Paskett .................................................................................................. 116
IT System for Computer Aided Management of Communal Water Networks by Means of GIS, SCADA, Mathematical Models and Optimization Algorithms Jan Studziński ...................................................................................................................................................................... 123
Using ICT for Climate Adaptation and Mitigation through Agro-Ecology in the Developing World Helena Grunfeld and John Houghton ................................................................................................................................. 128
EcoLogTex: a Software Tool Supporting the Design of Sustainable Supply Chains for Textiles Andrea-Emilio Rizzoli, Heinz Zeller, Mireille Faist, Roberto Montemanni, Michela Gioacchini and Nicola Nembrini .. 138
Incentives for Inter-Organizational Environmental Information Systems Hans Thies and Katarina Stanoevska-Slabeva ................................................................................................................... 143
B2: Smart Buildings and Cities Building Sustainable Smart Homes Marco Blumendorf .............................................................................................................................................................. 151
BubbleSense: Wireless Sensor Network Based Intelligent Building Monitoring Cheng Li, Forrest Meggers, Mo Li, Jithendrian Sundaravaradan, Fei Xue, HockBeng Lim and Arno Schlueter ............ 159
Urban Social Sustainability through the Web: Using ICTs to Build a Community for Prospective Neighbors Eun Ji Cho and Liat Rogel .................................................................................................................................................. 167
Evaluating Sustainability of Using ICT Solutions in Smart Cities – Methodology Requirements Nina Lövehagen and Anna Bondesson ............................................................................................................................... 175
ICT for Sustainable Cities: How ICT Can Support Environmentally Sustainable Development in Cities Anna Kramers, Mattias Höjer, Nina Lövehagen and Josefin Wangel ................................................................................ 183
Energy Efficiency in Hammarby Sjöstad, Stockholm through ICT and Smarter Infrastructure – Survey and Potentials Örjan Svane ........................................................................................................................................................................ 190
B3: Societal Aspects From Fixed, Mobile to Complex – The Social Shaping of ICT for Sustainable Travel Carlos Cano Viktorsson ...................................................................................................................................................... 197
National Collaboration on Green ICT in the Dutch Higher Education: Lessons Learned Albert Hankel ...................................................................................................................................................................... 203
Translating Green IT: The Case of the Swedish Green IT Audit Per Fors and Thomas Taro Lennerfors .............................................................................................................................. 208
III
B4: Smart Decisions Data Mining in the Closed-Loop CRM-Approach for Improving Sustainable Intermodal Mobility Thees Gieselmann, Marcel Severith, Benjamin Wagner Vom Berg and Jorge Marx Gómez ............................................ 217
mat – an ICT Application to Support a More Sustainable Use of Print Products and ICT Devices Roland Hischier, Michael Keller, Rudolf Lisibach and Lorenz M. Hilty ........................................................................... 223
Climate Change Impact of Electronic Media Solutions: Case Study of the Tablet Edition of a Magazine Mohammad Ahmadi Achachlouei, Åsa Moberg and Elisabeth Hochschorner .................................................................. 231
Small Community Media for Sustainable Consumption Gergely Lukács ................................................................................................................................................................... 237
Biometrics for Sustainability Jigisha Pardeshi and Dinesh Singh Pardeshi ..................................................................................................................... 242
An Awareness Based Approach to Avoid Rebound Effects in ICT Giovanna Sissa .................................................................................................................................................................... 248
Harnessing Collective Intelligence to Address Climate Change: The Climate CoLab
Robert Laubacher
MIT Center for Collective Intelligence, MIT Sloan School of Management,
5 Cambridge Center NE25-753, Cambridge, MA [email protected]
ABSTRACT Climate change is a problem of daunting scope and complexity. But the past decade-and-a-half has seen the emergence of new forms of Internet-enabled collaboration, in which large numbers of people, making contributions from all around the world, can work together to tackle big problems. Notable examples include open source software and Wikipedia.
Inspired by these systems, the Climate CoLab applies an open source, crowdsourcing-based approach to develop proposals for what to do about climate change.
1. HOW THE CLIMATE COLAB WORKS The Climate CoLab is a web platform where an online community—with support from experts in climate science and policy—develops, analyzes, and selects detailed proposals for what humanity can do to address global climate change. Anyone who is interested can join the community. Activity on the site is structured through online contests.
In these contests, members of the community are invited to submit proposals that address key aspects of climate change. The 2010 contest, for example, focused on international climate diplomacy; last year’s addressed the transition to a green economy at the global and national levels.
Proposals may be developed by individual community members or teams. Each proposal describes a set of actions to address climate change; an outline of how these actions could be accomplished; and an explanation of why the approach set out represents a desirable path forward.
Proposal authors also have access to computerized simulation models that project the anticipated impact of the actions on:
earth systems (concentration of greenhouse gases in the atmosphere; average global temperature; sea level rise; and effects in such realms as food and water supply, storms and coastal flooding, and impact on disease vectors, vulnerable ecosystems, and endangered species);
the economy (cost of proposed actions to address climate change; costs of damages to the economy caused by climate change).
Other members of the community are invited to support and
comment upon proposals. After the deadline for submittal, a panel of exert judges select the most promising entries as finalists. Some judges are members of the Climate CoLab’s Expert Council, a group of distinguished climate scientists, economists, and policy experts; others are recruited separately, often based on recommendations from the Expert Council.
After the selection of finalists, proposal authors can refine their proposals. Winners are then chosen through a combination of wisdom of the crowd and expert judgment. The community is invited to vote for the finalist proposals they like best, and the entries that obtain the most votes receive Popular Choice Awards. Judges’ Choice Awards are also given, based on a separate selection undertaken by the Judges.
At the end of the contest, the winning proposals are presented to groups in a position to implement good ideas: policy makers, business executives and investors, and officials at non-government organizations.
2. WORK TO DATE The Climate CoLab web site was launched publicly in 2009. Since then, more than 40,000 people from 183 countries have visited, and more than 4,000 of those have registered.
The Climate CoLab’s 2010 contest asked for proposals on the question, what international climate agreements should the world community make? The contest attracted 29 entries from North America, Europe, and Asia. Three winners were selected; the main ideas behind them were:
North/South approach for negotiating agreements on emission reductions;
less stringent initial mitigation targets;
emphasis on technologies and policies that remove greenhouse gases from the atmosphere to augment the current emphasis on emission-reduction technologies and policies.
In December 2010, the winning teams presented their proposals to the UN Secretary General’s Climate Change Support Team and to the staff of the Select Committee on Energy Independence and Global Warming of the U.S. House of Representatives.
The 2011 contest focused on the green economy, one of the key themes of the Rio+20 conference held in May 2012. It invited proposals that answered the question: How should the 21st century economy evolve bearing in mind the risks of climate change?
ICT4S 2013: Proceedings of the First International Conference on Information and Communication Technologies for Sustainability, ETH Zurich, February 14-16, 2013. Edited by Lorenz M. Hilty, Bernard Aebischer, Göran Andersson and Wolfgang Lohmann. DOI: http://dx.doi.org/10.3929/ethz-a-007337628
1

More than 60 entries were received from Africa, Asia, Australia, Europe, and North America. Six winners were chosen in global and national categories, with members of the winning teams hailing from the United States, Australia, India, and Nigeria.
The winning global proposal in 2011 combined the best ideas from the 2010 contest (as described above). The global runner-up called for reduced meat consumption to lower emissions of short-lived greenhouse gases (especially methane and carbon black) immediately, with a longer term vision that the land now used for grazing could being turned back into forests that could serve as a carbon sink.
In the national category, the proposal with the most votes called for rapid deployment of next generation nuclear technology by the U.S. The runner up described a plan for reducing India’s future emissions that featured extensive use of information technology to monitor compliance. There were also two Judge’s Choice awards in the national category. One called for university students to work with subsistence farmers in sub-Saharan Africa to adapt agricultural practices to changing climatic conditions. The other called for construction of personal rapid transit systems, powered by magnetic levitation, in United States metro areas.
Winners of the 2011 contest presented their ideas in January 2012 during a series of briefings with policy makers, including staff members of the United Nations Framework Convention on Climate Change (UNFCCC) Secretariat; UN Undersecretaries General Brice Lalonde and Elizabeth Thompson, who were the executive coordinators for the Rio+20 conference ; and staff members of the U.S. House of Representatives Natural Resources Committee, along with the ranking Democratic Representative on the Committee, Edward Markey.
3. BREAKING UP THE PROBLEM In its 2012-13 contests, the Climate CoLab will break down the large, complex problem of climate change into a series of more manageable sub-problems. These sub-problems will be defined by three key dimensions:
What actions will be taken to address climate change?
Where will these actions be taken?
Who will take the actions? The What dimension describes the kinds of interventions that can occur, for example, reducing emissions (mitigation), figuring out ways to live with climate change (adaptation) or intentionally modifying the climate at large scale (geoengineering). The Where dimension takes into account that proposed actions can be focused at different geographic levels and locations: global, national, state/provincial, city/metro region, neighborhood, even household. The Who dimension describes the primary social group or person expected to undertake the proposed actions; it encompasses government; business; civil society organizations such as universities, non-profits, community groups, and churches; and individual citizens. The Climate CoLab team developed a detailed taxonomy of the What, Where, Who dimensions, based on work by the Intergovernmental Panel on Climate Change (IPCC) and consultations with members of the Climate CoLab Expert Council.
Contests were chosen for 2012-13 with several goals in mind. First, the mix of contests seeks to provide full coverage of all potential kinds of action along the What dimension. Sample contests designed to achieve the goal of full coverage include most of the ones that address aspects of mitigation, several contests on adaptation, and one on geoengineering. In addition, contests have been launched to address particularly interesting or important aspects of the climate change challenge. An example of a contest chosen to meet this objective is one on changing cultural attitudes toward climate change. Finally, some contest topics were chosen based on collaboration between the CoLab and an outside organization already working on climate change. Such collaborations can ensure that a contest addresses an issue already identified as important by working professionals in the field; in addition, they can ensure a pre-existing audience for contest results. Examples of contests selected on this basis include sustainable cement (in collaboration with Carbon War Room), and urban adaptation (in collaboration with ICLEI, the International Council for Local Environmental Initiatives). An innovation for this year is that each contest will be overseen by a senior expert in the field, known as a Climate CoLab Advisor. The Advisor shapes the contest topic, recruits judges, and helps to bring the best ideas from the contest to the attention of potential implementers. Advisors are assisted by Climate CoLab Fellows, who oversee day-to-day contest activity; Fellows are post-docs, graduate students, or working professionals. The current round of contests, addressing approximately twenty focused topics, will last through the first half of 2013. After these contests are completed and their results presented to prospective implementers, the Climate CoLab plans to launch a subsequent round of activity. In the latter round, the community will be invited to assemble combinations of focused solutions into broad, integrated proposals at the national and global level. The CoLab team anticipates that simulation models will be a key tool for enabling development of these integrated proposals. The team is working with collaborators to build the modeling infrastructure to support integrated proposals: MIT’s System Dynamic Group; Climate Interactive, which builds fast running simulations of energy and climate systems; and several of the groups that bring together the community of researchers working on integrated assessment models (which combine energy/economic models with short-form climate models). The CoLab team is also working on innovative new approaches for evaluating proposals. In particular, we are seeking to leverage expert talent, which is in short supply, by using a collective intelligence approach, in which less demanding aspects of the evaluation task are undertaken by semi-experts or even potentially crowds of non-experts or computational algorithms.
4. LONG TERM ASPIRATIONS At the least, the Climate CoLab can help to educate citizens around the world about global climate change. But if the project achieves its highest aspirations, it will also engage scientists, policy makers, business executives, investors, and concerned citizens in helping to generate, and gain support for, proposals to address climate change that are better than any that would have been developed otherwise. We believe that the approach embodied in the Climate CoLab also has potential for solving other large social problems and
2

complex challenge in other domains, such as drug discovery or corporate strategic planning.
5. ABOUT THE AUTHOR Robert Laubacher is a Research Scientist and Associate Director at the MIT Center for Collective Intelligence. His presentation at
the 2013 ICT4S conference is based on research done in collaboration with Thomas W. Malone, John Sterman, Hal Abelson, Joshua Introne, and Erik Duhaime of MIT; Gary Olson of University of California Irvine; and Jeff Nickerson and Winter Mason of Stephens Institute of Technology.
3

Defining an Agenda for Computational Sustainability
Jennifer Mankoff
Carnegie Mellon, 5000 Forbes Ave, Pittsburgh, PA [email protected]
ABSTRACT What significant role can computation have in the sustainability domain? A rather unsatisfying implied answer can be found based on what work is prominent in interactive computing up until recently. That work focuses on changing individual behavior so that people (read as individuals) do less damage to the environment. Examples of this approach are summarized in Froehlich’s survey on eco-feedback technology [6] and the series of related papers that have studied how people conceptualize and act out sustainability (e.g., Woodruff et al. [7], Pierce et al. [8]). This approach has been critiqued in articles such as Dourish [1] and Mankoff [2].
Using my own work as an illustrative example, which began in 2006 with social feedback, sensing and self-reporting around green actions, I will explore and critique the question of impact. The basis for these critiques is the assumption that change lies in the hands of individuals at all (especially the relatively affluent uni-cultural individuals usually the focus of existing work), and the question of whether the changes that we focus on are likely to be substantial enough to make a difference. If we discard the focus on individual behavior change, what is left? I argue that we should focus on scale (and scalability) of impact across socio-economic groups, across cultures, and across organizational levels (moving the focus up from individuals to institutions, cities, and even national policy). This also leads to the idea that we develop a new set of metrics for judging IT for sustainability, and a new set of perspectives on what role IT may need to play going forward.
But what role does computation have to play in these settings? I will review the recent literature in computational sustainability. The answer to this question potentially includes many things:
• Machine learning can find optimal solutions to complex problems that are difficulty for humans alone to model. For example: Golovin et al. [3] used machine learning to select patches of land for species conservation that optimize species survival. There is a nice synergy here as the problem being solved led to advances in machine learning. There must be dozens of similar problems waiting to be tackled.
• Big data meets big visualization in a number of projects. Urbmet.org provides data about energy use, population, and so on via a map supporting exploration, comparison, and so on. Data is also made available via an API. In a similar vein, Paulos et al. [4] visualize air quality using data sense from the tops of taxi cabs and buses. SourceMap visualizes where things come from on a map, using crowdsourced data. While
maps are very powerful, especially when it comes to community action, it would be nice to see this data used in other ways as well. For example, one could imagine that air quality sensors and data of this fidelity could have huge political and medical impacts for those asthma.
• Modeling and prediction aren’t just useful for climate change. For example, UrbanSim, an interdisciplinary project led by Waddell, Borning, and others uses geometric and behavioral modeling in the “interactive design of urban spaces” [5].
• Cross-cultural studies looking at low income communities, developing countries, and so on can shed light on the diverse technology and information needs that exist, and highlight assumptions that may not generalize widely. Examples include Dillahunt et al.’s study of energy use in low income communities [9] and Shrinivasan et al.’s study of conservation in urban India [10].
Computational sustainability is clearly a diverse and important topic that can already be seen to include multiple types of computation (more examples of this can also be found in Mankoff et al.[11]. As a community we need to define the metrics for success and the breadth of topics that fit within the goal of reducing energy use and, more generally, increasing worldwide sustainability.
REFERENCES [1] Dourish, P. (2010). HCI and Environmental
Sustainability: The Politics of Design and the Design of Politics. Proc. DIS 2010, pp. 1-10.
[2] Mankoff, J. 2012. HCI and sustainability: a tale of two motivations. interactions 19, 3 (May 2012), 16-19. DOI=10.1145/2168931.2168937 http://doi.acm.org/10.1145/2168931.2168937
[3] Golovin, D., Krause, A., Gardner, B., Converse, S. J. & Morey, S. Dynamic Resource Allocation in Conservation Planning. AAAI 2011
[4] Eric Paulos, R.J. Honicky, and Ben Hooker, Citizen Science: Enabling Participatory Urbanism, in Handbook of Research on Urban Informatics: The Practice and Promise of the Real-Time City. Edited by Marcus Foth, Hershey, PA: Information Science Reference, IGI Global, 2008
[5] Vanegas, Carlos, Daniel Aliaga, Bedrich Beneš, Paul Waddell (2009) Interactive Design of Urban Spaces using Geometrical and Behavioral Modeling. ACM Transactions on Graphics (TOG), also ACM SIGGRAPH Asia, 28(5): 10 pages, 2009. Series. ACM,
ICT4S 2013: Proceedings of the First International Conference on Information and Communication Technologies for Sustainability, ETH Zurich, February 14-16, 2013. Edited by Lorenz M. Hilty, Bernard Aebischer, Göran Andersson and Wolfgang Lohmann. DOI: http://dx.doi.org/10.3929/ethz-a-007337628
4

New York, NY, 19-33. DOI= http://doi.acm.org/10.1145/90417.90738.
[6] Jon Froehlich, Leah Findlater, and James Landay. 2010. The design of eco-feedback technology. In Proceedings of the SIGCHI Conference on Human Factors in Computing Systems (CHI '10). ACM, New York, NY, USA, 1999-2008. DOI=10.1145/1753326.1753629 http://doi.acm.org/10.1145/1753326.1753629
[7] Woodruff, A., Hasbrouck, J., and Augustin. S. A bright green perspective on sustainable choices. CHI 2008, 313–322.
[8] Pierce, J., Schiano, D.J., and Paulos, E. Home, habits, and energy: examining domestic interactions and energy consumption. CHI 2010, 1985-1994.
[9] Dillahunt, T., Mankoff, J., Paulos, E., and Fussell, S. It's not all about "Green": energy use in low-income communities. Ubicomp 2009, 255-264.
[10] Shrinivasan, Y. B., Jain, M., Seetharam, D., Choudhary, A., Huang, E., Dillahunt, T. & Mankoff, J. Deep Conservation in Urban India and its Implications for the Design of Conservation Technologies. In submission to CHI 2013.
[11] J. Mankoff, R. Kravets, E. Blevis. Some computer science issues in creating a sustainable world, IEEE Computer 41(8):102-105, August, 2008 (also published in the IEEE e-zine on energy and sustainability, www.earthzine.net, 11/17/0
5

Interactions between Energy, Information and Growth
Daniel Spreng
ETH Zurich, Zürichbergstrasse 188032 Zurich
ABSTRACTMy talk will have four sections. The introduction connects my topic to the conference theme. In part two, I will talk about energy conservation; the mutual substitutability of energy, time and information; and some fundamental aspects of the nature of thesethree quantities. In the third part I will present some results of empirical analyses of this mutual substitutability. Finally, in the fourth section, I will speculate on what these results may mean in term of ICT’s effects on sustainability, mindful of the role of time and economic growth in this interaction.
ICT holds great potential to contribute to sustainable development. Doing things in a more controlled and intelligent manner can be an essential ingredient for a long-term viable future. Often energy consumption is used as a proxy for sustainability. The theme of this conference, then, is the effect of ICT on energy consumption.
In the 1970s I thought about energy conservation and postulated that in order to conserve energy, either time or information or both were needed. To do any given job, some amounts of energy, time, and information are required. Reducing the energy input is achieved by increasing the time and/or information input for the job. The various ways of doing a job are then represented by points in an equilateral triangle, the distance to the sides measuring the amounts of the three inputs applied to the job.
I will present one application of this idea in order to give the audience a feel for this triangle. It involves positioning economic sectors within this equilateral triangle by calculating for each sector the cumulated energy and cumulated time (labor) input to produce a good or service worth a dollar and then examining what the relative, cumulative information input is, assuming no other input is necessary. Standard economic theory would suggest that besides labor, capital is the most important input, supplemented perhaps by additional resources other than energy. However, focusing on physical inputs at the level of the triangle, one can argue that energy is reasonably good proxy for any resource and that capital is money earned at some earlier time period and therefore not much different from cumulated labor. Marx called capital “geronnene Arbeit,” labor hardened like blood.
The result of plotting economic sectors in such a triangle (Fig. 1) is supportive of the idea of substitutability and also hints at the meaning of cumulated information [1]. Cumulated information turns out to be high in modern, high-tech industrial sectors.
Research my group did in the 1980s involved looking carefully at the effect of introducing computers in various parts of textile industry. The heart of the research, the PhD thesis of Rolf Bergrath, was an examination of the energy conservation potential of electronics used for air conditioning spinning mills. As it turned out, the energy conservation potential was huge.
Figure 1: Industrial activities require the energy, time and information inputs in various proportions [1].
The automated control in all corners of the mill allowed the safety margins to be reduced and thus the temperature at which the climate had to be set could be increased. As the electricity requirement for air conditioning is a large part of the cost of spinning, this reduction in the cooling requirement proved to be economically important.
However, as it turned out, electronics also improved the spinning machines. The much more tightly controlled spinning process allowed higher speeds without increasing the frequency of yarn ruptures, a decisive factor for the productivity of the mill. The higher speed caused much more heat, and thus the energy requirement for air conditioning did not decrease. The energy requirement per yarn may have decreased, but the energy requirement in the now more productive mill increased rather than decreased.
ICT4S 2013: Proceedings of the First International Conference on Information and Communication Technologies for Sustainability, ETH Zurich, February 14-16, 2013. Edited by Lorenz M. Hilty, Bernard Aebischer, Göran Andersson and Wolfgang Lohmann.DOI: http://dx.doi.org/10.3929/ethz-a-007337628
6

Similar effects could be observed in all parts of the textile industry. However, with the introduction of computers everywhere in the industry, including the commercial side, the industry as a whole could react more quickly to the wishes and whims of the market, thus greatly speeding-up fashion cycles and increasing demand. The overall effect of the early introduction of modern IT in the textile industry was so profound that it could not be rigorously quantified. It was difficult to isolate the effect from changes that occurred in the global economy as a whole [2]. The only definite conclusion is that IT — and certainly also ICT — greatly amplifies the potential for both increases and decreases in energy consumption; they enable both significant energy conservation measures, on the one hand, and new business opportunities and new ways of speeding-up production and demand on the other.
A technology assessment of the potential for new power electronics to reduce energy demand came to the same conclusion: although power electronics does reduce the energy requirement of a given application, on the level of the economy as a whole the effect is more likely to be a speeding-up of industrial production, travel and consumption and thus an overall increase in economic activity and energy demand, even if energy efficiency has been improved at many points [3].
In my opinion many discussions of the rebound effect do not pass a reality check. Pure energy conservation measures are rare. Most technological innovations called energy efficiency innovations are innovations that among other things improve energy efficiency. Often the innovation also includes some co-benefits such as reduced cost and higher convenience (e.g., time savings for the user) which will generate economic growth. More often than not, as with ICT in the textile industry or power electronics, the energy
efficiency effect at the level of one application does not lead to energy conservation on the macro level.
Time is money. As long as time costs more than energy, ICT will likely be applied to save time rather than energy. The time saved may be labor on the production side or it may be time saved, i.e. greater convenience, on the consumer side. Economic growth is often regarded as the remedy for unemployment. However, promoting ICT applications indiscriminately is not a good way to combat unemployment. ICT, although very suitable to push economic growth, often contributes to growth by saving labor.
Only if ICT is applied discriminately to do things smarter, wary of automation and higher speeds, will its increased use lead to higher economic growth, without reducing the labor intensity of products and services. This type of growth has the potential to be less resource intensive as well. The debate on aiming at qualitative growth rather than quantitative growth held in the 1980s has almost been forgotten but needs to be revived.
REFERENCES [1] Spreng, D. 1993. Possibility for Substitution between
Energy, Time and Information. In Energy Policy Vol. 21, Nr. 1, January.
[2] Spreng, D. and Hediger, W. 1987. Energiebedarf der Informationsgesellschaft. Verlag der Fachvereine, Zürich.
[3] Spreng, D. 2002. Technology Assessment: Impact of High-tech Engineering Research on Energy Consumption. Technological Forecasting and Social Change 69, 819-831.
7

The development of ICT Sector Guidance: rationale, development and outcomes
Andie Stephens1, Mark Didden2
1Carbon Trust, 4th Floor, Dorset House, 27-45 Stamford Street, London, SE1 9NT, United Kingdom
2 World Business Council for Sustainable Development (WBCSD), 4, chemin de Conches, 1231 Conches, Geneva, Switzerland [email protected]
ABSTRACT This paper presents an overview of the GHG Protocol ICT Sector Guidance and a rationale for its development.
Keywords ICT, Greenhouse Gas measurement, Sector Guidance, GHG Protocol, Greenhouse Gas standards.
1. INTRODUCTION The initiative to develop the Greenhouse Gas (GHG) Protocol ICT Sector Guidance was set up in response to a growing concern to have a more consistent and detailed approach to measuring the GHG emissions of ICT goods and services. The initiative was formally started in March 2011, with the completed guidance document due to be published in early 2013. The GHG Protocol ICT Sector Guidance will provide specific guidance for the ICT sector on using the GHG Protocol Product Life Cycle Accounting and Reporting Standard (the Product Standard) [6]. The initiative is jointly convened through the World Resources Institute (WRI), the World Business Council for Sustainable Development (WBCSD), the Carbon Trust and the Global e-Sustainability Initiative (GeSI).
2. HISTORY OF THE GHG PROTOCOL AND THE ICT SECTOR GUIDANCE The GHG Protocol was founded in 1998 by the WRI and WBCSD. In 2001 the GHG Protocol Corporate Standard [4] was published (and revised in 2004); this is now the most widely-used accounting and reporting standard for corporate GHG emissions. In October 2011 the Product Standard [6] and Scope 3 Standard [5] were published. The motivation to develop the ICT Sector Guidance came largely from ICT companies that were involved in the development of the Product and Scope 3 Standards. These companies were increasingly receiving demands from their customers (both corporate and government) to provide information on the GHG impact of the ICT goods and services that they are purchasing. Companies involved in the development of the Sector Guidance see a clear advantage in understanding the technical details and
being in a position to respond to their customer demands and to demonstrate their leadership. The following companies are formal members of the ICT Sector Technical Working Group: Alcatel Lucent, BT, Capgemini, Cisco, Deutsche Telekom, EMC, Ericsson, Fujitsu, HP, Microsoft, NetApp, and Telstra.
3. MEASURING GHG EMISSIONS FROM ICT GOODS AND SERVICES There are a number of typical reasons why an ICT company would want to measure the GHG emissions of its products:
• To understand emissions through the life cycle of the product, and where in the life cycle the majority of the emissions occur (e.g. understanding the proportion of embodied to in-use emissions). This can help to direct efforts to reduce emissions of the product such as:
o Reduction of emissions due to changes in the design of the product
o Reduction of emissions due to changes in the manufacture of a good, or provision of a service
o Reduction of emissions in the use stage of a product
o Reacting to behavioural changes in the use of the product
• Track changes over time, to monitor the impact of product enhancements and new versions of products
• To respond to customer questions on the GHG emissions of the product offering
• Public reporting of the GHG emissions of a product
4. RATIONALE AND FOCUS FOR THE ICT SECTOR GUIDANCE 4.1 The need for ICT specific guidance The need for ICT Sector Guidance is due to the specific nature of ICT products. ICT equipment is characterised by extensive Bills of Material consisting of hundreds of individual components with long and complex global supply chains often using multiple and alternative sources. This makes it inherently challenging to execute a detailed Life Cycle Assessment (LCA) for typical ICT equipment. The ICT sector is also characterised by a large number of extensive services. These services are generally complex solutions including potentially thousands of items of ICT
ICT4S 2013: Proceedings of the First International Conference on Information and Communication Technologies for Sustainability, ETH Zurich, February 14-16, 2013. Edited by Lorenz M. Hilty, Bernard Aebischer, Göran Andersson and Wolfgang Lohmann. DOI: http://dx.doi.org/10.3929/ethz-a-007337628
8
equipment and have significant use stages, where understanding the use profile and behavioural aspects of the use of the service are important in assessing the service. The Sector Guidance has specific focus on the assessment of ICT services rather than physical goods. The ICT Sector Guidance aims to provide a practical approach to the GHG assessment of ICT products, by providing a consistent and pragmatic approach. It is important that the level of precision employed in an assessment matches the goal of the assessment and recognises the context in which the results will be interpreted. Therefore the Sector Guidance presents alternative approaches and estimation techniques, and where appropriate a hierarchy of approaches is provided. The specific approach to be taken by the practitioner will depend on the goal of the assessment, the level of precision that is required, and the data that is available (and the associated cost of collecting further data). ICT products may also have the potential for avoiding GHG emissions through the ‘enabling effect’. (Where the ‘enabling effect’ is the opportunity that an ICT solution has to avoid GHG emissions in other sectors, which can be attributed back to the ICT solution as the prime cause of that avoidance). The ICT Sector Guidance provides guidance for assessing the ‘enabling effect’ of ICT. Thus the purpose of this ICT Sector Guidance is to address the inherent nature of ICT products and particularly the following points:
• Multiple components for ICT equipment
• Complex and long supply chains for ICT equipment
• Complex nature of ICT services
• ICT services are often bespoke and tailored to meet specific customer requirements
• ICT services typically share resources, which need to be allocated
• Significant in-use stage of ICT products (emissions occurring when a product is used by a customer)
• Uncertainty surrounding measurement of use stage
• Potential enabling effect of ICT products
4.2 Current ‘State of the Art’ The ICT industry is very conscious of the impact of ICT in terms of GHG emissions. A number of ICT companies are performing LCAs and GHG assessments on their products and related research is being carried out by the ICT industry and academia. However, the current state of this work is still in development and has limitations. It is far from routine for ICT companies to automatically carry out GHG assessments on all their products. Generally, data collection systems cannot readily provide the data needed to carry out an assessment. Reliable and consistent sources of secondary emission factors for ICT components are not easily available. Reliable data on the actual use of ICT products is difficult to determine. Therefore, currently, GHG assessments are typically carried out as individual projects, rather than being a routine business activity. As the work of measuring GHG emissions continues, more comprehensive datasets will be developed allowing more wide spread practice of GHG assessments of products.
4.3 Evolving technology A further significant issue for the ICT sector is the rapidly changing and evolving nature of the technology. This potentially has a number of effects, for example: development of new products; technology being used in new and unexpected ways; new technologies driving different user and social behaviours; development of more energy efficient ICT equipment changing underlying assumptions between in-use and embodied emissions; development of equipment with built-in measurement capabilities (e.g. device energy consumption, network traffic monitoring and reporting, power saving mode monitoring and reporting).
5. WIDER ISSUES FOR ICT There is a growing interest in ICT with respect to GHG emissions, this is both because of the significant emissions associated with the manufacture and use of ICT products, and also because of the opportunity for ICT products to reduce emissions elsewhere (the so called ‘enabling effect’). In 2008, the SMART 2020 report [3] catalysed the debate about the GHG impact of ICT, estimating that ICT is responsible for 2% of global GHG emissions, and also that ICT has the potential to reduce emissions equivalent to five times its own emissions through the ‘enabling effect’. The following are some of the issues and questions being raised in relation to ICT on both the positive and negative ‘carbon account’:
• Rapid growth of ICT (e.g. driven by use of social networking, smart phones, mobile data usage, internet usage, internet TV, music and video streaming)
• Exponential growth in the usage of data centres
• Increasing energy efficiency of computing and telecommunications
• Social changes driven by ICT
• Opportunities to reduce business related travel through Tele-working, Tele-commuting and Remote Collaboration.
• Opportunities to indirectly reduce emissions through the use of various smart technologies
• Rapid changes in technology and promises of new technology development leading to new unknown opportunities and challenges
• Considering when is the best time to replace ICT equipment, taking account of the improvements in energy efficiency of new equipment vs. the embodied emissions
• As ICT equipment becomes more energy efficient the embodied emissions of the equipment become proportionately more significant compared to the use stage emissions.
6. SCOPE AND COVERAGE OF THE ICT SECTOR GUIDANCE 6.1 Structure of the ICT Sector Guidance document The document is organised into specific chapters that provide guidance on the measurement of a specific ICT product (or group of products). There is a focus on ICT services rather than physical goods. The guidance document does not provide exhaustive cover of all ICT products; the approach taken has been
9

to prioritise those which have a significant impact in terms of GHG emissions.
6.2 Key drivers for each chapterThe choice of chapters to include in the guidance was based on those ICT services which are widely adopted and/or may have a significant impact in terms of GHG emissions. The following summarises the key drivers behind each chapter:
6.2.1 Telecommunications Network Services (TNS)Telecommunication networks provide the fundamental support to all modern communications and due to the rapid growth in use of the internet, data transfers, mobile communications etc. this is leading to significant increases in associated GHG emissions. At the same time, advances in technologies are leading to more energy efficient networks. The aim of the TNS chapter is to provide guidance, methodologies and options to enable practitioners to assess the GHG emissions associated with a TNS. This helps to identify the relative size and scale of emission sources within different life cycle stages. Understanding this enables telecoms providers to communicate and collaborate withsuppliers and customers on ways to reduce GHG emissions.
6.2.2 Desktop Managed Services (DMS)DMS is the provision of computing facilities, usually in a corporate environment. It is very broad in scope, encompassing the equipment on customer premises (e.g. desktops, laptops, printers), the data centre, the LAN and WAN, and the supporting human services (e.g. break-fix support, help desk). Desktop Managed Services account for a major part of the ICT sector outsourcing market and a major portion of overall ICT carbon emissions. Customers of DMS are increasingly demanding accurate and transparent information on the GHG emissions of the DMS provided to them, for reporting purposes and for identification of areas for potential emissions reduction.
6.2.3 Cloud and Data Centre ServicesCloud computing, which is a model for efficiently providing ICT services from a shared pool of remote computing resources (i.e. hardware, data centres, networks, and software applications), can potentially reduce GHG emissions associated with ICT services. This chapter allows cloud and data centre service providers and customers to benchmark and report the GHG emissions from cloud and data centre services in a consistent manner and make informed choices to reduce greenhouse gas emissions.
6.2.4 Hardware ICT Hardware is a fundamental component of any ICT system or service. The hardware chapter provides guidance on the GHG assessment of ICT hardware. The methodologies described in the chapter cover different calculation methods and provide guidance on different estimation techniques. The chapter also references other standards that cover the GHG assessment of ICT hardware.
6.2.5 Software Software controls more than 90% of the energy used by ICT hardware. The design of software for energy efficiency can reduce the GHG emissions of ICT services. This chapter provides software developers and architects guidance to benchmark and report the GHG emissions from software use in a consistent manner and make informed choices to reduce greenhouse gas emissions. The chapter is in two parts: Part A provides guidance on the full life cycle assessment of software; Part B relates specifically to the energy use of software, and covers the three
categories of software: Operating Systems (OS), Applications and Virtualisation.
6.2.6 Transport Avoidance The application of ICT for remote collaboration and remote working (such as teleconferencing and telecommuting) can reduce, in absolute terms, GHG emissions by avoiding business travel and employee commuting. The Transport Avoidancechapter provides guidance and methodologies for the calculation and reporting of the avoided emissions due to the use of the ICT product.
7. OTHER RELATED STANDARDSThere are a number of other related standards for the measurement of the greenhouse gases of products. Some of these are described here, categorised as generic standards and ICT specific standards.
7.1 Generic product life cycle standardsThe ICT Sector Guidance provides additional guidance for ICT products to the GHG Protocol Product Standard. The Product Standard follows a life cycle approach to the GHG assessment of products and builds on the framework and requirements established in the ISO LCA standards: 14040:2006, Life Cycle Assessment: Principles and Framework [8] and 14044:2006, Life Cycle Assessment: Requirements and Guidelines [9]. ISO 14040 and ISO 14044 are considered the base standards for LCA, which other standards are built on.Two other generic standards for the life cycle assessment of GHG emissions are the PAS 2050 [1] and the ISO 14067 [10]. These generic standards are applicable to any kind of products, but do not give specific guidance for ICT products.The PAS 2050 is a Publicly Available Specification (PAS) for the assessment of life cycle greenhouse gas emissions of goods andservices. It was first published in October 2008 by the British Standards Institution (BSI), in partnership with the UK Department of Environment Food and Rural Affairs (DEFRA) and the Carbon Trust. A revised edition (PAS 2050:2011) was released in October 2011.The ISO standard 14067 “Carbon footprint of products --Requirements and guidelines for quantification and communication” is under development at the time of writing, and is expected to be published in 2014. The relationship between the ICT Sector Guidance and these generic product standards is shown in Figure 1.
Figure 1: Relationship of the ICT Sector Guidance to generic product standards
7.2 Other ICT specific standardsIn addition to the generic standards mentioned above, and the ICT Sector Guidance, there are three ICT specific standards relating to the life cycle assessment of products. These are also all based on the ISO 14040 and 14044 standards.
10

ETSI – TS 103 199 “Life Cycle Assessment (LCA) of ICT equipment, networks and services: General methodology and common requirements”. (Published October 2011) [2].
ITU-T L.1410 “Methodology for environmental impacts assessment of information and communication technologies (ICT) goods, networks and services”. (Consented September 2011, published March 2012) [11]..
IEC TR 62725 “Quantification methodology of greenhouse gas emissions for electrical and electronic products and systems”. (In development, planned to be published 2013) [7].
8. CONCLUSION The GHG Protocol ICT Sector Guidance is being developed through a collaboration of ICT companies, academics, consultants, advocates, NGOs and other stakeholders, to meet a growing demand for clearer guidance in measuring the greenhouse gas emissions of ICT products. The development process is highly consultative and has successfully brought together a wide range of stakeholders from across the world. Draft versions have been published for public comment, with the completed guidance document due to be published in early 2013.
9. REFERENCES [1] British Standards Institution et al. 2011. PAS 2050:2011:
Specification for the assessment of life cycle greenhouse gas emissions of goods and services.
[2] European Telecommunications Standards Institute (ETSI). 2011. TS 103 199, Life Cycle Assessment (LCA) of ICT equipment, networks and services: General methodology and common requirements
[3] Global eSustainability Initiative (GeSI), The Climate Group. 2008. SMART 2020: Enabling the low carbon economy in the information age.
[4] Greenhouse Gas Protocol. 2004. Corporate Accounting and Reporting Standard.
[5] Greenhouse Gas Protocol. 2011. Corporate Value Chain (Scope 3) Accounting and Reporting Standard.
[6] Greenhouse Gas Protocol. 2011. Product Life Cycle Accounting and Reporting Standard.
[7] International Electrotechnical Commission (IEC). To be published 2013. TR 62725, Quantification methodology of greenhouse gas emissions for electrical and electronic products and systems.
[8] International Organization for Standardization. 2006. ISO14040:2006, Life Cycle Assessment: Principles and Framework
[9] International Organization for Standardization. 2006. ISO14044:2006, Life Cycle Assessment: Requirements and Guidelines.
[10] International Organization for Standardization. Under development, target publication date 2014. ISO14067, Carbon footprint of products -- Requirements and guidelines for quantification and communication.
[11] International Telecommunication Union (ITU). 2012. L.1410, Methodology for environmental impacts assessment of information and communication technologies (ICT) goods, networks and services.
11
The future carbon footprint of the ICT and E&M sectors Jens Malmodin1, Pernilla Bergmark1, Dag Lundén2
1Ericsson AB, Ericsson Research, 164 80 Stockholm, Sweden 2TeliaSonera AB, Business area Broadband, 123 86 Farsta, Sweden
[email protected], [email protected], [email protected]
ABSTRACT In this paper, we forecast the future carbon footprint of the Information and Communication Technology (ICT) and Entertainment and Media (E&M) sectors in the year 2020 including the ICT and E&M related impact from a networked society, i.e. a society where both people and things are connected and communicate with each other. We also discuss sector boundaries, the full impact from the networked society, uncertainty, use of the Carbon Disclosure Project (CDP) as data source and important perspectives when assessing ICT.
Keywords Carbon footprint, life cycle assessment (LCA), information and communication technology (ICT), entertainment & media (E&M), ICT sector
1. INTRODUCTION The positive and negative environmental impacts of the ICT sector – i.e. ICT’s own carbon footprint and how ICT can enable carbon footprint reductions in other sectors – have been studied and discussed by many stakeholders over the last few years. The focus of this paper is the future carbon footprint of the ICT sector itself. In addition, the enablement potential is addressed to some extent in the discussion part. In 2010, the Centre for Sustainable Communications (CESC) at the Royal Institute of Technology (Stockholm, Sweden) together with the ICT vendor Ericsson and the telecom operator TeliaSonera, published a study entitled: “Greenhouse gas emissions and operational electricity use in the ICT and Entertainment & Media sectors” [1] (hereafter “the reference study”). In 2011, Ericsson and TeliaSonera continued the research, aiming to estimate the ICT and E&M sectors’ energy use and carbon footprint until 2020. In addition to the reference study, the new study described in this paper also investigated historic and prognosticated changes over time related to number and types of devices, number of users and their generated data traffic, and also related to the changes in greenhouse gas (GHG) emissions for different types of equipment. It is anticipated that by 2020 machine-to-machine (M2M) communication is widely adopted i.e. full connectivity of all electronic devices applies and a high number of sensors that are expected to be integrated into various applications e.g. buildings, vehicles, infrastructure etc. This scenario, described in Section 3 and further discussed in Section 4.1, is hereafter referred to as the networked society and this study tries to embrace the related GHG impacts.
The discussion part of this paper looks further into the ICT sector system boundary definition and especially relates the system boundaries of this study to the ICT sector definition of Organisation for Economic Co-operation and Development (OECD) [2]. It also looks into some important uncertainty sources. Additionally it elaborates on how the results of this study compares with those of other studies related to the ICT sector footprint, and also on implications of applying a sector perspective as such. Further the potential use of organizational reporting data as a source for sector studies is investigated.
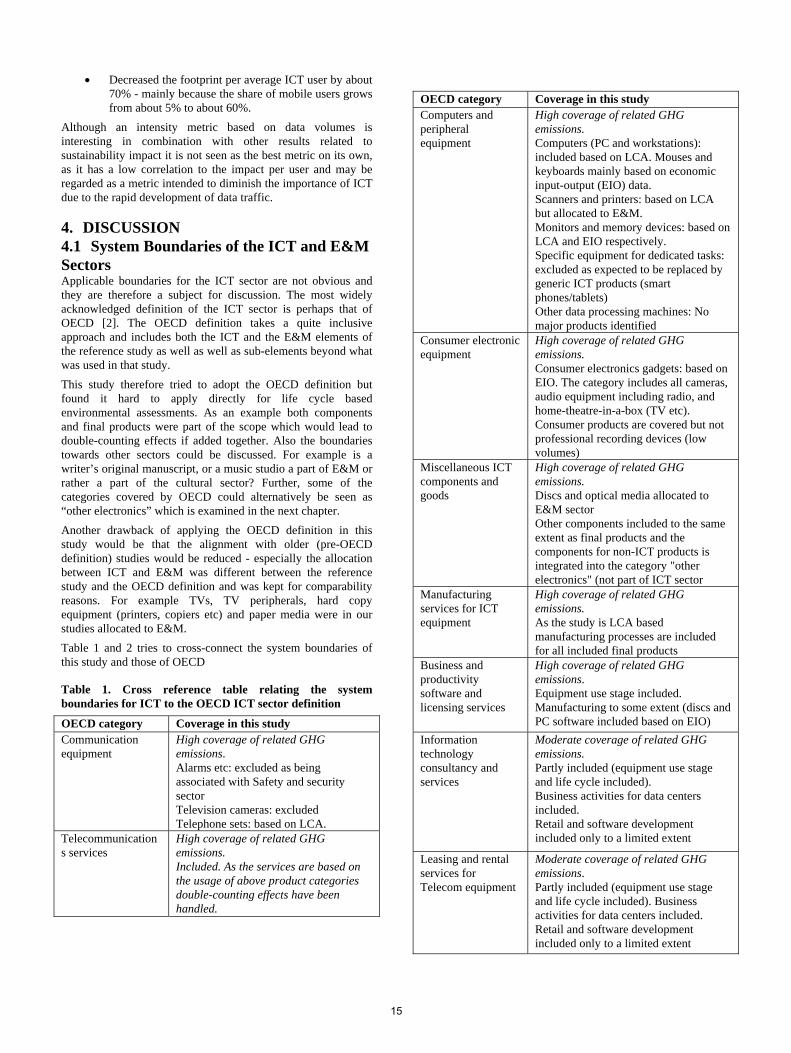
2. METHODOLOGY In this study the ICT sector footprint includes impacts from mobile and fixed telecommunication networks, enterprise data networks, data transport networks, data centers and all user equipment connected to the networks such as phones, PCs and modems. A more detailed discussion of the assessed ICT sector boundaries including further details regarding the ICT network and services is given in the reference study [1]. The reference study also includes a definition of the assessment boundaries for the entertainment and media sector, which in summary includes TVs and TV peripherals (including game consoles), a wide range of electronic “gadgets” (e.g. cameras, audio devices, car infotainment etc.), PC peripherals (e.g. audio, storage and gaming products, mainly used for entertainment and media and therefore included in E&M), optical discs and paper media. The boundary between the two sectors is not unambiguous and it is also changing over time. Further discussion on the selected system boundaries is therefore included in the discussion part. In particular a comparison is made between the sector boundaries used in this study and those defined by OECD [2].
A “carbon footprint” of a product is defined as the sum of all relevant GHG emissions which occur during its complete life cycle as determined by a life cycle assessment (LCA). See reference [3] for a more extensive definition and discussion about carbon footprints. A carbon footprint thus includes raw materials acquisition, production and transports of materials, components and the final assembly and transport of the product itself, as well as use and end-of-life treatment of the product. For ICT products a carbon footprint - interpreted as one single value used to represent the carbon emissions associated with a product - usually gives only limited information and could not capture the full impact from different use patterns and a dynamic and complex supply chain. The carbon footprint of the ICT sector is principally the sum of the footprints of all individual ICT devices and network products, but it also includes overhead activities like operator activities needed to run the networks (offices, stores, service vehicles etc.). ICT4S 2013: Proceedings of the First International Conference on
Information and Communication Technologies for Sustainability, ETH Zurich, February 14-16, 2013. Edited by Lorenz M. Hilty, Bernard Aebischer, Göran Andersson and Wolfgang Lohmann. DOI: http://dx.doi.org/10.3929/ethz-a-007337628
The limitations of product carbon footprints are thus inherited so any life cycle based sector carbon footprint could only give a coarse indication of the real carbon emissions. Still such
12

numbers are considered to be of interest to better understand the potential impact at a sector level. For the production stage, which includes construction and manufacturing activities, a large number of LCAs have been reviewed and benchmarked in order to create representative averages for each product category and to see trends over time. This work started already in the reference study. Production data for antenna towers, cable deployment, shelters and other infrastructure were based on LCA studies performed by Ericsson and TeliaSonera, summarized in [4]. For the use stage of user equipment, measurements have been prioritized over estimates, e.g. the unique measurements of electronic device use in 400 Swedish households over a whole year [5], was used as a main data source. For the use stage of networks, measurements by operators and service providers have been used as reported to CDP and in corporate reporting as well as other publically available technical data (e.g. number of lines and subscriptions). The global average electricity model described in the reference study [1] was reused. Another important part of the methodology was to forecast type and number of all devices related to the ICT sector between now and 2020. Large industry analysts’ market research and future market projections have been used as data sources, e.g. International Data Corporation (IDC) (PCs, servers) [6] and Display Search (TVs, monitors) [7]. Subscription information was based on prognoses from ITU [8]. For the mobile subsector’s carbon footprint 2007-2020, a detailed previous study by the European Union (EU) research project EARTH [9] was used as a data source. The data traffic was based on Cisco’s Visual Networking Index [10]. Other more specific studies like Koomey’s studies of servers [11] and data centers energy consumption globally were also used as input. As these sources do not make prognosis as far ahead as 2020 extrapolations were made for the sake of the study.
3. RESULTS AND OBSERVATIONS The global carbon footprint of the ICT sector in the reference study [1] in 2007 was estimated to 620 Mtonne CO2e which is about 1.3% of the total global carbon footprint, 47 Gtonne CO2e (the figure includes all CO2 equivalent emissions and effects). Often, but less correctly, the ICT sector’s footprint is related to global CO2 emissions (31 Gtonne) which excludes other green house gases and effects, and would then equal 2%. The corresponding figures for the E&M sector were 1,7% and 2,6% respectively (excluding the uncertain forestry impact of paper media shown in Figure 1).
The future prognoses for the ICT sector indicates that the carbon footprint (in CO2e) increases slightly (about 4%/year), and is estimated to increase by approximately 70% between 2007 and 2020, to a total of about 1100 Mtonne. This figure is expected to correspond to 1,9% of the global CO2e emissions. The E&M sector’s carbon footprint is estimated to increase to a level of 1300Mtonne (2,4% of global CO2e emissions) or 1100 Mtonne and 2% if paper media is excluded. Use of paper media was not changed compared to the 2007 estimate in the reference study, due to the large uncertainties related to paper media production volumes observed in that study and to the uncertainty in market development. According to [12] this approach seems reasonable. In Figure 1, the total predicted carbon footprints for ICT and E&M (including paper media) sectors is presented based on the
outcome of the reference study (2007 values) and this study (2020 values).
0200400600800
10001200
Mto
nne
CO
2e
0200400600800
1000120014001600
ICT E&M (incl. paper media)
Mto
nne
CO
2e
PCs anddata centers
2007
2020
TVs and TVperipherals
1.3% 1.3%
1.9%
Uncertain forestry impact
PCs anddata centers
TVs and TVperipherals
2%
TVs and TVperipherals
Uncertain forestry impact
ICT networks,phones and CPE
ICT networks,phones and CPE
Other electronicproducts
Other electronicproducts
Paper media, 0.4%
Paper media, 0.4%
Figure 1. Total carbon footprint of the ICT and E&M sectors in 2007 (results from the reference study) and the forecasted impact of 2020.
The increase in number of devices, from about 6 to 12,5 billion, and thereby in subscriptions, is the main reason for ICT’s increased carbon footprint. PCs and servers in data centers are the largest subsectors. At the same time there are other trends that have been considered for the modeling of end user and network equipment which are expected to limit the increase of the ICT sector impact beyond the predicted levels. Such trends are
• Energy efficiency improvements of network equipment in constant operation.
• Change from cathode ray tube screens to flat panels and from desktops to laptops for PCs give large reductions per PC.
• Better power management and lower stand-by power consumption of user equipment.
• Data center virtualizations and modernizations, including more efficiently used servers with better supporting infrastructure.
• Decrease in carbon footprint per device over time observed in LCA studies.
More detailed distribution of results within the ICT sector is given in Figure 2.
In addition to the predicted amount of devices in 2020 for device categories in use today, this paper also includes additional new network equipment categories associated with the networked society which is further discussed in Section 4.1. Thus, in addition to 12,5 billion traditional ICT devices and 16 billion E&M devices, 1 billion new ICT devices were included in the assessment. These devices were modeled based on fixed broadband gateways, e.g. fixed wireless gateways connected through mobile broadband which enable connection possibilities for devices in a household and in other buildings/sites. Further
13

the impact of connectivity of the 16 billion E&M devices were included in the E&M results.
0
200
400
600
800
1000
1200
1400
2007 2008 2009 2010 2011 2012 2013 2014 2015 2016 2017 2018 2019 2020
Mobile networks and mobile devices (incl. tablets)
PCs (all forms, not incl. tablets)Data centers, data transmission & enterprise networks
Home devices (fixed phones, CPE)Fixed networks
Networked society scenario
Mtonne CO2e12.5 billion devices/users
50x more data
6 billion devices/users
Figure 2. The carbon footprint development of the main ICT subsectors 2007-2020. To put the overall sector results in context, they were also normalized based on number of users. This part of the results does not include the specific impact related to the networked society due to difficulties in modeling the machine-to-machine users. “Users” is here to be understood as number of mobile subscriptions (mobile devices), number of fixed subscriptions (fixed phones and Customer Premises Equipment (CPE) per fixed line) and number of PCs. This means that number of users nearly equals number of devices. Based on an analysis of historic data for number of devices for example International Telecommunication Union (ITU) statistics of PCs in use and telephone lines [13], and earlier LCA studies performed by Ericsson and TeliaSonera, we found that the ICT sector’s total carbon footprint per average user, including also impact from shared resources such as data centers and network equipment, has decreased from about 300 kg CO2e/year in 1995 to about 100 kg in 2007 and is estimated to decrease further to about 80 kg in 2020, see Figure 3.
0
100
200
300
400
1990 2000 2010 2020
kg CO2e/user
Mobile user
Fixed user
AverageICT user
Figure 3. The ICT sector carbon footprint expressed per user. For mobile users, the small increase 2010-2020 is due to the introduction of more advanced mobile phones and PCs.
The main reason for the decreased footprint per average ICT user, shown in Figure 3, is that more and more users use mobile devices and mobile access technologies which have lower footprints per user than fixed PCs and always on-devices like modems/routers. The reason for this is the higher energy efficiency of battery-operated mobile user devices. Fixed networks, on the other hand, have a lower impact per GByte (GB) as shown in Figure 4.
0
20
40
60
80
100
120
1990 2000 2010 2020
fixed data(~ total data) Mobile data
kg CO2e/GB
Figure 4. The carbon footprint per GB sent in access networks. Another metric of carbon footprint intensity is thus the carbon footprint per amount of data (including voice) which has already been reduced from about 75 kg/GB 1995 down to about 7 kg/GB in 2007 due to the technical development and high increase in amount of data. This metric is predicted to further decrease by a factor of 35 by 2020, based on Cisco’s [10] prognosis for data traffic growth up to 2015 which was extrapolated to 2020 for this study. This source was chosen as it is a well recognized source for data traffic numbers and also as it transparently describes its methodology although its background data is not available. Note that all user equipment (phones, PCs, etc), network components such as Internet Protocol (IP) core network and transmission networks such as fiber communication, copper networks and all data services (servers / data centers) are included in the data related to Figure 4. Thus the results are more comprehensive than what is seen in other studies that only look at the IP core network parts, such as [14], and are therefore not directly comparable to such studies. Based on described data sources and future prognoses, the ICT sector in 2020 compared to 1995 is estimated to have:
• Increased number of users about 10 times to about 12,5 billion PCs, phones, etc.
• Increased total data traffic volumes (including voice) about 1000 times. It is to be noted that in 1995 voice was dominating the total data traffic). The mobile data traffic is estimated to show the same increase, 1000 times, between 2007 and 2010, i.e. during a considerably shorter time frame than the fixed traffic.
• Increased its total absolute carbon footprint by a factor of about 3, but will remain a continued reasonably low relative footprint, less than 2% of the total global carbon footprint (CO2e) The increase in absolute numbers is due to dramatic increase in number of capabilities and users, especially in the developing countries, and a foreseen additional impact from new devices associated with a networked society.
14
• Decreased the footprint per average ICT user by about 70% - mainly because the share of mobile users grows from about 5% to about 60%.
Although an intensity metric based on data volumes is interesting in combination with other results related to sustainability impact it is not seen as the best metric on its own, as it has a low correlation to the impact per user and may be regarded as a metric intended to diminish the importance of ICT due to the rapid development of data traffic.
4. DISCUSSION 4.1 System Boundaries of the ICT and E&M Sectors Applicable boundaries for the ICT sector are not obvious and they are therefore a subject for discussion. The most widely acknowledged definition of the ICT sector is perhaps that of OECD [2]. The OECD definition takes a quite inclusive approach and includes both the ICT and the E&M elements of the reference study as well as well as sub-elements beyond what was used in that study. This study therefore tried to adopt the OECD definition but found it hard to apply directly for life cycle based environmental assessments. As an example both components and final products were part of the scope which would lead to double-counting effects if added together. Also the boundaries towards other sectors could be discussed. For example is a writer’s original manuscript, or a music studio a part of E&M or rather a part of the cultural sector? Further, some of the categories covered by OECD could alternatively be seen as “other electronics” which is examined in the next chapter. Another drawback of applying the OECD definition in this study would be that the alignment with older (pre-OECD definition) studies would be reduced - especially the allocation between ICT and E&M was different between the reference study and the OECD definition and was kept for comparability reasons. For example TVs, TV peripherals, hard copy equipment (printers, copiers etc) and paper media were in our studies allocated to E&M. Table 1 and 2 tries to cross-connect the system boundaries of this study and those of OECD
Table 1. Cross reference table relating the system boundaries for ICT to the OECD ICT sector definition
OECD category Coverage in this study Communication equipment
High coverage of related GHG emissions. Alarms etc: excluded as being associated with Safety and security sector Television cameras: excluded Telephone sets: based on LCA.
Telecommunications services
High coverage of related GHG emissions. Included. As the services are based on the usage of above product categories double-counting effects have been handled.
OECD category Coverage in this study Computers and peripheral equipment
High coverage of related GHG emissions. Computers (PC and workstations): included based on LCA. Mouses and keyboards mainly based on economic input-output (EIO) data. Scanners and printers: based on LCA but allocated to E&M. Monitors and memory devices: based on LCA and EIO respectively. Specific equipment for dedicated tasks: excluded as expected to be replaced by generic ICT products (smart phones/tablets) Other data processing machines: No major products identified
Consumer electronic equipment
High coverage of related GHG emissions. Consumer electronics gadgets: based on EIO. The category includes all cameras, audio equipment including radio, and home-theatre-in-a-box (TV etc). Consumer products are covered but not professional recording devices (low volumes)
Miscellaneous ICT components and goods
High coverage of related GHG emissions. Discs and optical media allocated to E&M sector Other components included to the same extent as final products and the components for non-ICT products is integrated into the category "other electronics" (not part of ICT sector
Manufacturing services for ICT equipment
High coverage of related GHG emissions. As the study is LCA based manufacturing processes are included for all included final products
Business and productivity software and licensing services
High coverage of related GHG emissions. Equipment use stage included. Manufacturing to some extent (discs and PC software included based on EIO)
Information technology consultancy and services
Moderate coverage of related GHG emissions. Partly included (equipment use stage and life cycle included). Business activities for data centers included. Retail and software development included only to a limited extent
Leasing and rental services for Telecom equipment
Moderate coverage of related GHG emissions. Partly included (equipment use stage and life cycle included). Business activities for data centers included. Retail and software development included only to a limited extent
15
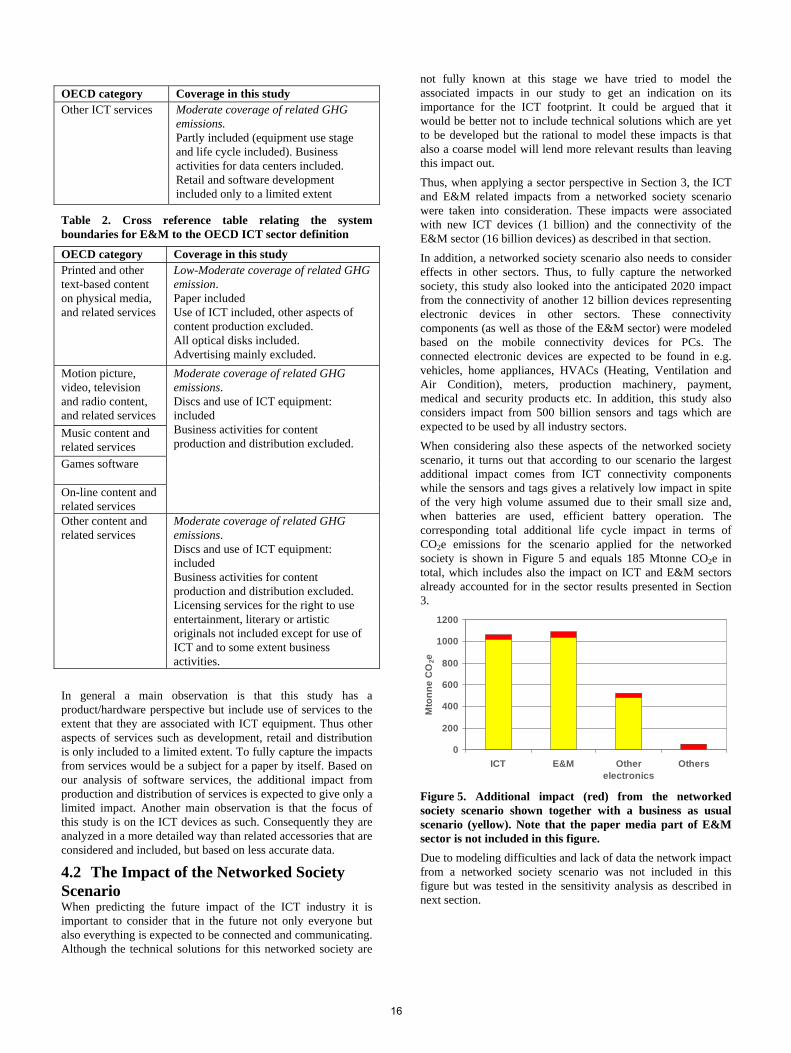
OECD category Coverage in this study Other ICT services Moderate coverage of related GHG
emissions. Partly included (equipment use stage and life cycle included). Business activities for data centers included. Retail and software development included only to a limited extent
Table 2. Cross reference table relating the system boundaries for E&M to the OECD ICT sector definition
OECD category Coverage in this study Printed and other text-based content on physical media, and related services
Low-Moderate coverage of related GHG emission. Paper included Use of ICT included, other aspects of content production excluded. All optical disks included. Advertising mainly excluded.
Motion picture, video, television and radio content, and related services Music content and related services Games software
On-line content and related services
Moderate coverage of related GHG emissions. Discs and use of ICT equipment: included Business activities for content production and distribution excluded.
Other content and related services
Moderate coverage of related GHG emissions. Discs and use of ICT equipment: included Business activities for content production and distribution excluded. Licensing services for the right to use entertainment, literary or artistic originals not included except for use of ICT and to some extent business activities.
In general a main observation is that this study has a product/hardware perspective but include use of services to the extent that they are associated with ICT equipment. Thus other aspects of services such as development, retail and distribution is only included to a limited extent. To fully capture the impacts from services would be a subject for a paper by itself. Based on our analysis of software services, the additional impact from production and distribution of services is expected to give only a limited impact. Another main observation is that the focus of this study is on the ICT devices as such. Consequently they are analyzed in a more detailed way than related accessories that are considered and included, but based on less accurate data.
4.2 The Impact of the Networked Society Scenario When predicting the future impact of the ICT industry it is important to consider that in the future not only everyone but also everything is expected to be connected and communicating. Although the technical solutions for this networked society are
not fully known at this stage we have tried to model the associated impacts in our study to get an indication on its importance for the ICT footprint. It could be argued that it would be better not to include technical solutions which are yet to be developed but the rational to model these impacts is that also a coarse model will lend more relevant results than leaving this impact out. Thus, when applying a sector perspective in Section 3, the ICT and E&M related impacts from a networked society scenario were taken into consideration. These impacts were associated with new ICT devices (1 billion) and the connectivity of the E&M sector (16 billion devices) as described in that section. In addition, a networked society scenario also needs to consider effects in other sectors. Thus, to fully capture the networked society, this study also looked into the anticipated 2020 impact from the connectivity of another 12 billion devices representing electronic devices in other sectors. These connectivity components (as well as those of the E&M sector) were modeled based on the mobile connectivity devices for PCs. The connected electronic devices are expected to be found in e.g. vehicles, home appliances, HVACs (Heating, Ventilation and Air Condition), meters, production machinery, payment, medical and security products etc. In addition, this study also considers impact from 500 billion sensors and tags which are expected to be used by all industry sectors. When considering also these aspects of the networked society scenario, it turns out that according to our scenario the largest additional impact comes from ICT connectivity components while the sensors and tags gives a relatively low impact in spite of the very high volume assumed due to their small size and, when batteries are used, efficient battery operation. The corresponding total additional life cycle impact in terms of CO2e emissions for the scenario applied for the networked society is shown in Figure 5 and equals 185 Mtonne CO2e in total, which includes also the impact on ICT and E&M sectors already accounted for in the sector results presented in Section 3.
0
200
400
600
800
1000
1200
ICT E&M Otherelectronics
Others
Mto
nne
CO
2e
Figure 5. Additional impact (red) from the networked society scenario shown together with a business as usual scenario (yellow). Note that the paper media part of E&M sector is not included in this figure. Due to modeling difficulties and lack of data the network impact from a networked society scenario was not included in this figure but was tested in the sensitivity analysis as described in next section.
16
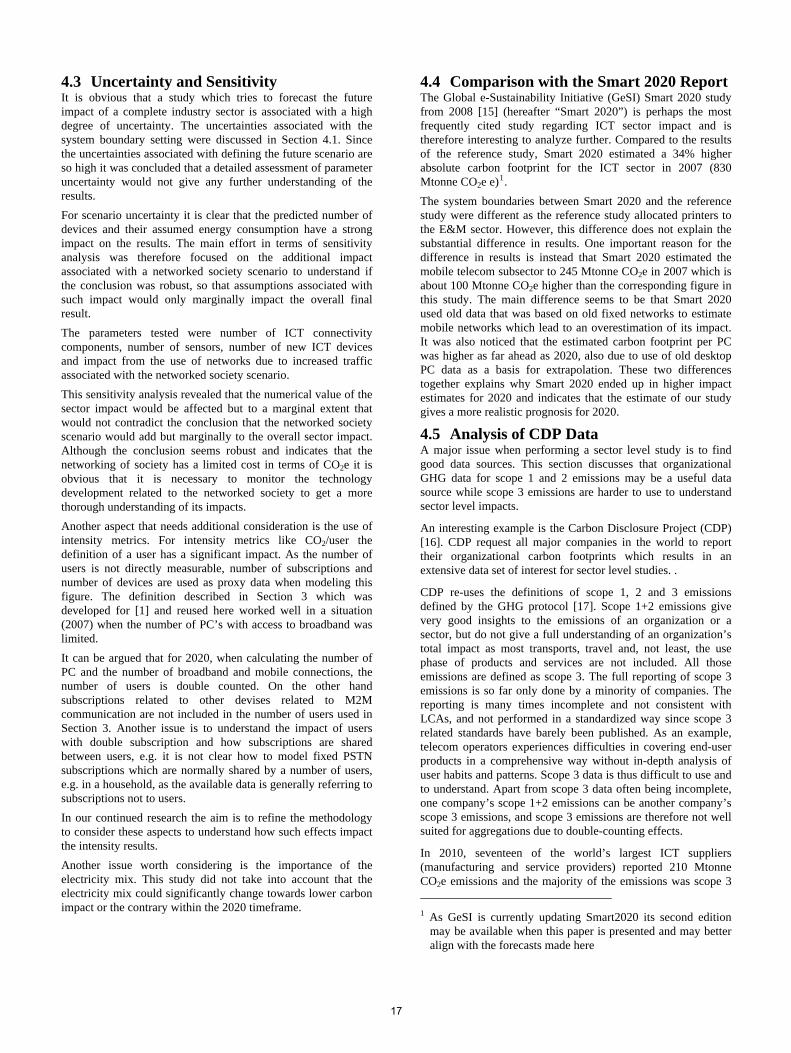
4.3 Uncertainty and Sensitivity It is obvious that a study which tries to forecast the future impact of a complete industry sector is associated with a high degree of uncertainty. The uncertainties associated with the system boundary setting were discussed in Section 4.1. Since the uncertainties associated with defining the future scenario are so high it was concluded that a detailed assessment of parameter uncertainty would not give any further understanding of the results. For scenario uncertainty it is clear that the predicted number of devices and their assumed energy consumption have a strong impact on the results. The main effort in terms of sensitivity analysis was therefore focused on the additional impact associated with a networked society scenario to understand if the conclusion was robust, so that assumptions associated with such impact would only marginally impact the overall final result. The parameters tested were number of ICT connectivity components, number of sensors, number of new ICT devices and impact from the use of networks due to increased traffic associated with the networked society scenario. This sensitivity analysis revealed that the numerical value of the sector impact would be affected but to a marginal extent that would not contradict the conclusion that the networked society scenario would add but marginally to the overall sector impact. Although the conclusion seems robust and indicates that the networking of society has a limited cost in terms of CO2e it is obvious that it is necessary to monitor the technology development related to the networked society to get a more thorough understanding of its impacts. Another aspect that needs additional consideration is the use of intensity metrics. For intensity metrics like CO2/user the definition of a user has a significant impact. As the number of users is not directly measurable, number of subscriptions and number of devices are used as proxy data when modeling this figure. The definition described in Section 3 which was developed for [1] and reused here worked well in a situation (2007) when the number of PC’s with access to broadband was limited. It can be argued that for 2020, when calculating the number of PC and the number of broadband and mobile connections, the number of users is double counted. On the other hand subscriptions related to other devises related to M2M communication are not included in the number of users used in Section 3. Another issue is to understand the impact of users with double subscription and how subscriptions are shared between users, e.g. it is not clear how to model fixed PSTN subscriptions which are normally shared by a number of users, e.g. in a household, as the available data is generally referring to subscriptions not to users. In our continued research the aim is to refine the methodology to consider these aspects to understand how such effects impact the intensity results. Another issue worth considering is the importance of the electricity mix. This study did not take into account that the electricity mix could significantly change towards lower carbon impact or the contrary within the 2020 timeframe.
4.4 Comparison with the Smart 2020 Report The Global e-Sustainability Initiative (GeSI) Smart 2020 study from 2008 [15] (hereafter “Smart 2020”) is perhaps the most frequently cited study regarding ICT sector impact and is therefore interesting to analyze further. Compared to the results of the reference study, Smart 2020 estimated a 34% higher absolute carbon footprint for the ICT sector in 2007 (830 Mtonne CO2e e)1. The system boundaries between Smart 2020 and the reference study were different as the reference study allocated printers to the E&M sector. However, this difference does not explain the substantial difference in results. One important reason for the difference in results is instead that Smart 2020 estimated the mobile telecom subsector to 245 Mtonne CO2e in 2007 which is about 100 Mtonne CO2e higher than the corresponding figure in this study. The main difference seems to be that Smart 2020 used old data that was based on old fixed networks to estimate mobile networks which lead to an overestimation of its impact. It was also noticed that the estimated carbon footprint per PC was higher as far ahead as 2020, also due to use of old desktop PC data as a basis for extrapolation. These two differences together explains why Smart 2020 ended up in higher impact estimates for 2020 and indicates that the estimate of our study gives a more realistic prognosis for 2020.
4.5 Analysis of CDP Data A major issue when performing a sector level study is to find good data sources. This section discusses that organizational GHG data for scope 1 and 2 emissions may be a useful data source while scope 3 emissions are harder to use to understand sector level impacts.
An interesting example is the Carbon Disclosure Project (CDP) [16]. CDP request all major companies in the world to report their organizational carbon footprints which results in an extensive data set of interest for sector level studies. .
CDP re-uses the definitions of scope 1, 2 and 3 emissions defined by the GHG protocol [17]. Scope 1+2 emissions give very good insights to the emissions of an organization or a sector, but do not give a full understanding of an organization’s total impact as most transports, travel and, not least, the use phase of products and services are not included. All those emissions are defined as scope 3. The full reporting of scope 3 emissions is so far only done by a minority of companies. The reporting is many times incomplete and not consistent with LCAs, and not performed in a standardized way since scope 3 related standards have barely been published. As an example, telecom operators experiences difficulties in covering end-user products in a comprehensive way without in-depth analysis of user habits and patterns. Scope 3 data is thus difficult to use and to understand. Apart from scope 3 data often being incomplete, one company’s scope 1+2 emissions can be another company’s scope 3 emissions, and scope 3 emissions are therefore not well suited for aggregations due to double-counting effects.
In 2010, seventeen of the world’s largest ICT suppliers (manufacturing and service providers) reported 210 Mtonne CO2e emissions and the majority of the emissions was scope 3 1 As GeSI is currently updating Smart2020 its second edition
may be available when this paper is presented and may better align with the forecasts made here
17
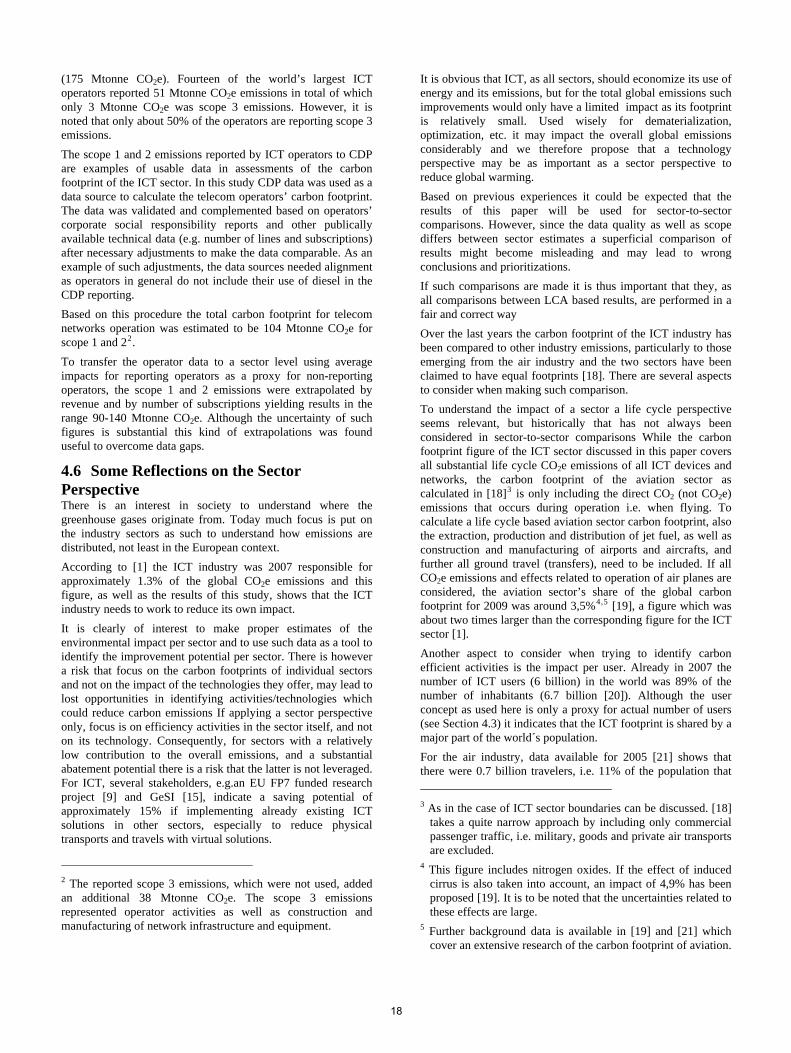
(175 Mtonne CO2e). Fourteen of the world’s largest ICT operators reported 51 Mtonne CO2e emissions in total of which only 3 Mtonne CO2e was scope 3 emissions. However, it is noted that only about 50% of the operators are reporting scope 3 emissions. The scope 1 and 2 emissions reported by ICT operators to CDP are examples of usable data in assessments of the carbon footprint of the ICT sector. In this study CDP data was used as a data source to calculate the telecom operators’ carbon footprint. The data was validated and complemented based on operators’ corporate social responsibility reports and other publically available technical data (e.g. number of lines and subscriptions) after necessary adjustments to make the data comparable. As an example of such adjustments, the data sources needed alignment as operators in general do not include their use of diesel in the CDP reporting. Based on this procedure the total carbon footprint for telecom networks operation was estimated to be 104 Mtonne CO2e for scope 1 and 22. To transfer the operator data to a sector level using average impacts for reporting operators as a proxy for non-reporting operators, the scope 1 and 2 emissions were extrapolated by revenue and by number of subscriptions yielding results in the range 90-140 Mtonne CO2e. Although the uncertainty of such figures is substantial this kind of extrapolations was found useful to overcome data gaps.
4.6 Some Reflections on the Sector Perspective There is an interest in society to understand where the greenhouse gases originate from. Today much focus is put on the industry sectors as such to understand how emissions are distributed, not least in the European context. According to [1] the ICT industry was 2007 responsible for approximately 1.3% of the global CO2e emissions and this figure, as well as the results of this study, shows that the ICT industry needs to work to reduce its own impact. It is clearly of interest to make proper estimates of the environmental impact per sector and to use such data as a tool to identify the improvement potential per sector. There is however a risk that focus on the carbon footprints of individual sectors and not on the impact of the technologies they offer, may lead to lost opportunities in identifying activities/technologies which could reduce carbon emissions If applying a sector perspective only, focus is on efficiency activities in the sector itself, and not on its technology. Consequently, for sectors with a relatively low contribution to the overall emissions, and a substantial abatement potential there is a risk that the latter is not leveraged. For ICT, several stakeholders, e.g.an EU FP7 funded research project [9] and GeSI [15], indicate a saving potential of approximately 15% if implementing already existing ICT solutions in other sectors, especially to reduce physical transports and travels with virtual solutions.
2 The reported scope 3 emissions, which were not used, added an additional 38 Mtonne CO2e. The scope 3 emissions represented operator activities as well as construction and manufacturing of network infrastructure and equipment.
It is obvious that ICT, as all sectors, should economize its use of energy and its emissions, but for the total global emissions such improvements would only have a limited impact as its footprint is relatively small. Used wisely for dematerialization, optimization, etc. it may impact the overall global emissions considerably and we therefore propose that a technology perspective may be as important as a sector perspective to reduce global warming. Based on previous experiences it could be expected that the results of this paper will be used for sector-to-sector comparisons. However, since the data quality as well as scope differs between sector estimates a superficial comparison of results might become misleading and may lead to wrong conclusions and prioritizations. If such comparisons are made it is thus important that they, as all comparisons between LCA based results, are performed in a fair and correct way Over the last years the carbon footprint of the ICT industry has been compared to other industry emissions, particularly to those emerging from the air industry and the two sectors have been claimed to have equal footprints [18]. There are several aspects to consider when making such comparison. To understand the impact of a sector a life cycle perspective seems relevant, but historically that has not always been considered in sector-to-sector comparisons While the carbon footprint figure of the ICT sector discussed in this paper covers all substantial life cycle CO2e emissions of all ICT devices and networks, the carbon footprint of the aviation sector as calculated in [18]3 is only including the direct CO2 (not CO2e) emissions that occurs during operation i.e. when flying. To calculate a life cycle based aviation sector carbon footprint, also the extraction, production and distribution of jet fuel, as well as construction and manufacturing of airports and aircrafts, and further all ground travel (transfers), need to be included. If all CO2e emissions and effects related to operation of air planes are considered, the aviation sector’s share of the global carbon footprint for 2009 was around 3,5%4,5 [19], a figure which was about two times larger than the corresponding figure for the ICT sector [1]. Another aspect to consider when trying to identify carbon efficient activities is the impact per user. Already in 2007 the number of ICT users (6 billion) in the world was 89% of the number of inhabitants (6.7 billion [20]). Although the user concept as used here is only a proxy for actual number of users (see Section 4.3) it indicates that the ICT footprint is shared by a major part of the world´s population. For the air industry, data available for 2005 [21] shows that there were 0.7 billion travelers, i.e. 11% of the population that
3 As in the case of ICT sector boundaries can be discussed. [18]
takes a quite narrow approach by including only commercial passenger traffic, i.e. military, goods and private air transports are excluded.
4 This figure includes nitrogen oxides. If the effect of induced cirrus is also taken into account, an impact of 4,9% has been proposed [19]. It is to be noted that the uncertainties related to these effects are large.
5 Further background data is available in [19] and [21] which cover an extensive research of the carbon footprint of aviation.
18
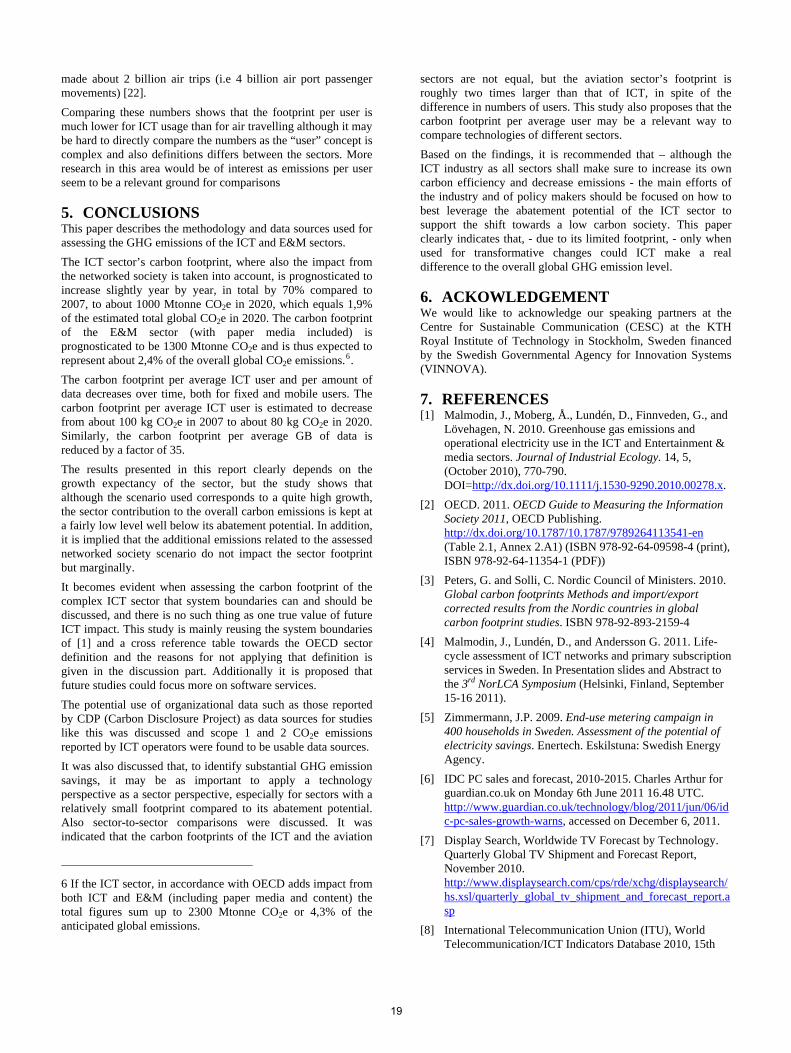
made about 2 billion air trips (i.e 4 billion air port passenger movements) [22]. Comparing these numbers shows that the footprint per user is much lower for ICT usage than for air travelling although it may be hard to directly compare the numbers as the “user” concept is complex and also definitions differs between the sectors. More research in this area would be of interest as emissions per user seem to be a relevant ground for comparisons
5. CONCLUSIONS This paper describes the methodology and data sources used for assessing the GHG emissions of the ICT and E&M sectors. The ICT sector’s carbon footprint, where also the impact from the networked society is taken into account, is prognosticated to increase slightly year by year, in total by 70% compared to 2007, to about 1000 Mtonne CO2e in 2020, which equals 1,9% of the estimated total global CO2e in 2020. The carbon footprint of the E&M sector (with paper media included) is prognosticated to be 1300 Mtonne CO2e and is thus expected to represent about 2,4% of the overall global CO2e emissions.6. The carbon footprint per average ICT user and per amount of data decreases over time, both for fixed and mobile users. The carbon footprint per average ICT user is estimated to decrease from about 100 kg CO2e in 2007 to about 80 kg CO2e in 2020. Similarly, the carbon footprint per average GB of data is reduced by a factor of 35. The results presented in this report clearly depends on the growth expectancy of the sector, but the study shows that although the scenario used corresponds to a quite high growth, the sector contribution to the overall carbon emissions is kept at a fairly low level well below its abatement potential. In addition, it is implied that the additional emissions related to the assessed networked society scenario do not impact the sector footprint but marginally. It becomes evident when assessing the carbon footprint of the complex ICT sector that system boundaries can and should be discussed, and there is no such thing as one true value of future ICT impact. This study is mainly reusing the system boundaries of [1] and a cross reference table towards the OECD sector definition and the reasons for not applying that definition is given in the discussion part. Additionally it is proposed that future studies could focus more on software services. The potential use of organizational data such as those reported by CDP (Carbon Disclosure Project) as data sources for studies like this was discussed and scope 1 and 2 CO2e emissions reported by ICT operators were found to be usable data sources. It was also discussed that, to identify substantial GHG emission savings, it may be as important to apply a technology perspective as a sector perspective, especially for sectors with a relatively small footprint compared to its abatement potential. Also sector-to-sector comparisons were discussed. It was indicated that the carbon footprints of the ICT and the aviation
6 If the ICT sector, in accordance with OECD adds impact from both ICT and E&M (including paper media and content) the total figures sum up to 2300 Mtonne CO2e or 4,3% of the anticipated global emissions.
sectors are not equal, but the aviation sector’s footprint is roughly two times larger than that of ICT, in spite of the difference in numbers of users. This study also proposes that the carbon footprint per average user may be a relevant way to compare technologies of different sectors. Based on the findings, it is recommended that – although the ICT industry as all sectors shall make sure to increase its own carbon efficiency and decrease emissions - the main efforts of the industry and of policy makers should be focused on how to best leverage the abatement potential of the ICT sector to support the shift towards a low carbon society. This paper clearly indicates that, - due to its limited footprint, - only when used for transformative changes could ICT make a real difference to the overall global GHG emission level.
6. ACKOWLEDGEMENT We would like to acknowledge our speaking partners at the Centre for Sustainable Communication (CESC) at the KTH Royal Institute of Technology in Stockholm, Sweden financed by the Swedish Governmental Agency for Innovation Systems (VINNOVA).
7. REFERENCES [1] Malmodin, J., Moberg, Å., Lundén, D., Finnveden, G., and
Lövehagen, N. 2010. Greenhouse gas emissions and operational electricity use in the ICT and Entertainment & media sectors. Journal of Industrial Ecology. 14, 5, (October 2010), 770-790. DOI=http://dx.doi.org/10.1111/j.1530-9290.2010.00278.x.
[2] OECD. 2011. OECD Guide to Measuring the Information Society 2011, OECD Publishing. http://dx.doi.org/10.1787/10.1787/9789264113541-en (Table 2.1, Annex 2.A1) (ISBN 978-92-64-09598-4 (print), ISBN 978-92-64-11354-1 (PDF))
[3] Peters, G. and Solli, C. Nordic Council of Ministers. 2010. Global carbon footprints Methods and import/export corrected results from the Nordic countries in global carbon footprint studies. ISBN 978-92-893-2159-4
[4] Malmodin, J., Lundén, D., and Andersson G. 2011. Life-cycle assessment of ICT networks and primary subscription services in Sweden. In Presentation slides and Abstract to the 3rd NorLCA Symposium (Helsinki, Finland, September 15-16 2011).
[5] Zimmermann, J.P. 2009. End-use metering campaign in 400 households in Sweden. Assessment of the potential of electricity savings. Enertech. Eskilstuna: Swedish Energy Agency.
[6] IDC PC sales and forecast, 2010-2015. Charles Arthur for guardian.co.uk on Monday 6th June 2011 16.48 UTC. http://www.guardian.co.uk/technology/blog/2011/jun/06/idc-pc-sales-growth-warns, accessed on December 6, 2011.
[7] Display Search, Worldwide TV Forecast by Technology. Quarterly Global TV Shipment and Forecast Report, November 2010. http://www.displaysearch.com/cps/rde/xchg/displaysearch/hs.xsl/quarterly_global_tv_shipment_and_forecast_report.asp
[8] International Telecommunication Union (ITU), World Telecommunication/ICT Indicators Database 2010, 15th
19
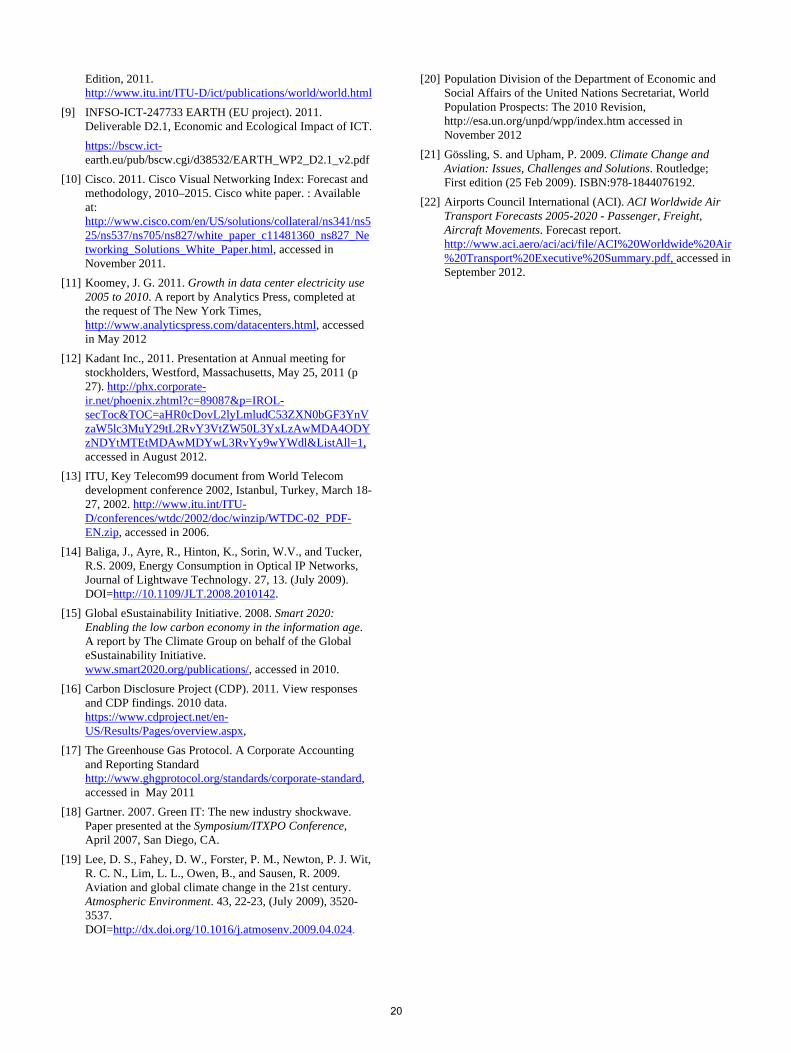
Edition, 2011. http://www.itu.int/ITU-D/ict/publications/world/world.html
[9] INFSO-ICT-247733 EARTH (EU project). 2011. Deliverable D2.1, Economic and Ecological Impact of ICT. https://bscw.ict-earth.eu/pub/bscw.cgi/d38532/EARTH_WP2_D2.1_v2.pdf
[10] Cisco. 2011. Cisco Visual Networking Index: Forecast and methodology, 2010–2015. Cisco white paper. : Available at: http://www.cisco.com/en/US/solutions/collateral/ns341/ns525/ns537/ns705/ns827/white_paper_c11481360_ns827_Networking_Solutions_White_Paper.html, accessed in November 2011.
[11] Koomey, J. G. 2011. Growth in data center electricity use 2005 to 2010. A report by Analytics Press, completed at the request of The New York Times, http://www.analyticspress.com/datacenters.html, accessed in May 2012
[12] Kadant Inc., 2011. Presentation at Annual meeting for stockholders, Westford, Massachusetts, May 25, 2011 (p 27). http://phx.corporate-ir.net/phoenix.zhtml?c=89087&p=IROL-secToc&TOC=aHR0cDovL2lyLmludC53ZXN0bGF3YnVzaW5lc3MuY29tL2RvY3VtZW50L3YxLzAwMDA4ODYzNDYtMTEtMDAwMDYwL3RvYy9wYWdl&ListAll=1, accessed in August 2012.
[13] ITU, Key Telecom99 document from World Telecom development conference 2002, Istanbul, Turkey, March 18-27, 2002. http://www.itu.int/ITU-D/conferences/wtdc/2002/doc/winzip/WTDC-02_PDF-EN.zip, accessed in 2006.
[14] Baliga, J., Ayre, R., Hinton, K., Sorin, W.V., and Tucker, R.S. 2009, Energy Consumption in Optical IP Networks, Journal of Lightwave Technology. 27, 13. (July 2009). DOI=http://10.1109/JLT.2008.2010142.
[15] Global eSustainability Initiative. 2008. Smart 2020: Enabling the low carbon economy in the information age. A report by The Climate Group on behalf of the Global eSustainability Initiative. www.smart2020.org/publications/, accessed in 2010.
[16] Carbon Disclosure Project (CDP). 2011. View responses and CDP findings. 2010 data. https://www.cdproject.net/en-US/Results/Pages/overview.aspx,
[17] The Greenhouse Gas Protocol. A Corporate Accounting and Reporting Standard http://www.ghgprotocol.org/standards/corporate-standard, accessed in May 2011
[18] Gartner. 2007. Green IT: The new industry shockwave. Paper presented at the Symposium/ITXPO Conference, April 2007, San Diego, CA.
[19] Lee, D. S., Fahey, D. W., Forster, P. M., Newton, P. J. Wit, R. C. N., Lim, L. L., Owen, B., and Sausen, R. 2009. Aviation and global climate change in the 21st century. Atmospheric Environment. 43, 22-23, (July 2009), 3520-3537. DOI=http://dx.doi.org/10.1016/j.atmosenv.2009.04.024.
[20] Population Division of the Department of Economic and Social Affairs of the United Nations Secretariat, World Population Prospects: The 2010 Revision, http://esa.un.org/unpd/wpp/index.htm accessed in November 2012
[21] Gössling, S. and Upham, P. 2009. Climate Change and Aviation: Issues, Challenges and Solutions. Routledge; First edition (25 Feb 2009). ISBN:978-1844076192.
[22] Airports Council International (ACI). ACI Worldwide Air Transport Forecasts 2005-2020 - Passenger, Freight, Aircraft Movements. Forecast report. http://www.aci.aero/aci/aci/file/ACI%20Worldwide%20Air%20Transport%20Executive%20Summary.pdf, accessed in September 2012.
20

The Greenhouse Gas Abatement Potential of Enterprise Cloud Computing
Daniel R Williams1, Peter Thomond2, Ian Mackenzie3
1Technologies for Sustainable Built Environments (TSBE) Centre, University of Reading, Reading, RG6 6AF, UK.
2Clever Together LLP, 5A Maltings Place, 169 Tower Bridge Road, London, SE1 3JB, UK.
3 Harvard Business School, Soldiers Field, Boston, MA 02163. USA.
ABSTRACT In this paper we present a dynamic, country level model and methodology to determine the energy related Green House Gas (GHG) abatement potential of cloud computing. The methodology presented includes variables for market penetration, organisation size and organisational adoption of on-premise and cloud computing. Using the current enterprise cloud service applications of email, customer relationship management (CRM) and groupware against selected global countries we have calculated that 4.5 million tonnes of CO2e could be reduced with an 80% market penetration. The majority of savings were calculated to be from small and medium size organisations. A sensitivity analysis of the market penetration and current organisational cloud adoption highlights the possible large variability in overall energy and GHG reductions. An analysis of the model and data used within this study illustrates a requirement for industry and academia to work closely in order to reach the large energy reductions possible with enterprise cloud computing.
Keywords Energy, Environment, Cloud Computing, Greenhouse Gas, ICT.
1. INTRODUCTION Cloud computing enables computing services (software, platforms, infrastructures etc.) that are traditionally provisioned on-premise within organisations to be delivered on-demand from purpose built data centres across the internet. Past commercial studies [1, 2] have presented how a shift from on-premise to cloud computing offers the prospect of reduced energy consumption. The main enabler of these reductions being the provision of computing resources in large centralised data centres which can be considerably more efficient than individual or small groups of servers typical of on-premise computing. Additionally, large centralised data centres can be located where energy costs are lower. Therefore a shift to cloud computing could deliver significant reductions in energy related Green House Gas (GHG) emissions. Whilst these commercial studies have made a valuable start in quantifying the GHG abatement potential of cloud computing applications (calculating 50%-90% abatement) they leave questions unanswered. They do not consider how energy
and GHG reductions are likely to vary by country, fail to present scientifically appraised analysis methods and fail to fully disclose market penetration assumptions. These issues limit their usefulness for future model development and have created the need for an open scientific analysis.
This research aims to address the identified issues of previous research in two ways, by conducting country specific analyses and openly presenting the methodology and data used. Firstly, to achieve country specific analysis we aim to build a model to estimate the energy and GHG emission reductions at the level of the individual county. The model will be created to take into account that the efficiency of current on-premise computing varies by the size of computing resource which in turn varies by the size of the organisation. This is important because the mix of organisation sizes varies by country. Moreover, the carbon intensity of energy provision varies by country as some countries have relatively high carbon energy (e.g. where coal fired power stations are significant) while others have relatively low carbon energy. Hence, our model will take into account the profile of organisation sizes, their mix within the countries being analysed and the national energy mix of each, thus providing more accurate country specific estimates. Secondly, we will present our model in an open and transparent manner, whilst also exposing our data and assumptions. This makes a useful contribution to future model development and helps us to identify where there are significant uncertainties around the data and thus results.
This paper seeks to make two novel contributions. Firstly, we aim to highlight the value of a move to cloud computing in a more tangible, scientific manner through the application of our model to create country specific estimates of energy and GHG reductions. The bespoke and scientific results aimed as informing decision makers from ICT vendors, users and governments alike. Secondly, we describe our model methodology in detail and explore the sensitivity of our results to changes in key variables where scientifically derived data are not available. By presenting our open methodology in this way we hope to encourage further development of the approach by practitioners and other research teams.
2. MODEL METHODOLOGY 2.1 Model background Our work builds on an industry derived methodology developed by the Global e-Sustainability Initiative (GeSI) [3] by integrating some of the latest academic insight produced in this area [4-7].
ICT4S 2013: Proceedings of the First International Conference on Information and Communication Technologies for Sustainability, ETH Zurich, February 14-16, 2013. Edited by Lorenz M. Hilty, Bernard Aebischer, Göran Andersson and Wolfgang Lohmann. DOI: http://dx.doi.org/10.3929/ethz-a-007337628
21

This creates a methodology that can be used to assess the energy and GHG impact of new information and communications technologies in three steps;
1. Define the goal and scope of the study; 2. Limit the assessment:
a. Define a business as usual (BAU) baseline; b. Identify those parts of the overall life-cycle
which would significantly impact GHG emissions;
3. Rigorously assess the significant processes that would be changed through the replacement of the BAU technology with an alternative and carefully interpret the results.
2.2 Research goal and scope The goal of this research is to understand the GHG abatement potential of enterprise cloud computing. We set out to produce conservative, reliable estimates of the impact of cloud computing, this meant creating a tight scope. Our chosen scope follows prior industry work [1], which is important in two respects. Firstly, we focus our analysis on three common applications: email, customer relationship management (CRM) and groupware. While these are clearly a sub-set of all applications that businesses and individuals use, they are readily available as cloud based services and believed to represent a likely first phase in a shift towards cloud computing. Secondly, we focus attention on business computing which accounts for a large majority of computing usage, and richer data sets are available. We modelled the impact of the broad adoption of the three cloud-based services in Canada, China, Brazil, the Czech Republic, France, Germany, Indonesia, Poland, Portugal, Sweden and the UK. These countries were selected as together they represent abroad mix of economies and for their variance in the GHG intensity of their country-level energy supply. Baseline country data was collected for the year 2007 or 2009. More recent data for all countries and variables was not available at the time the analysis was carried out.
2.3 Limiting the assessment Cloud and traditional on-premise networked data services follow a logical three stage data process involving a server (within a data centre), network transmission and end user devices (e.g. laptops, mobile devices). Previous research has found the data centre stage of a digital process accounts for the bulk of the energy demand compared to the network or user device stage [7]. We assume the populations and demands for end use devices will remain relatively unchanged by a shift to the three cloud based services. Whilst the importance of the communications networks will by enhanced under a cloud computing scenario, preliminary estimates indicate that energy consumption within the network for the purposes in our scope would not materially impact overall energy consumption because of the small data sizes involved [5].
Hence, as cloud computing offers servers that are utilised more efficiently than standard on-premise servers [4-6], we limit our assessment to the impact of on-premise servers being switched off in favour of cloud bases services.
Further to this, our analysis focused on the energy usage involved in running servers. The embedded carbon content of the servers, the associated server maintenance and the energy implications of end-of-life decommissioning were all deemed to have small impacts relative to direct energy consumption. Nevertheless, the
embedded energy content of servers included in (new) cloud facilities was estimated through a life cycle approach.
2.4 Assessing energy consumption reduction Our approach was to calculate the annual emissions of on-premise computing and compare it to the energy required to operate the equivalent services in a cloud computing scenario (Figure 1) for a specific county assuming an adoption rate of 80%. This ‘high’ penetration rate was selected to highlight a ‘best case scenario’[8], one that is likely to take some years to achieve. A sensitivity analysis of this rate was included to highlight the impact of a lower adoption rate. The current (baseline) adoption of cloud computing was also factored into the calculations so as to exclude impact already created by early adopters.
2.4.1Annual Energy Consumption of On-Premise
Computing
2.4.3Cloud
Aggregate Adoption Rate
2.4.2Annual Energy Consumption
of Cloud Computing
On-Premise energy reduced from a move to
Cloud Computing
Cloud Computing’s
created energy consumption
2.5Total Emissions
Difference
X X
-
Figure 1 - The basic steps to calculate the energy and GHG emissions of a move to cloud computing. Numbering relates to the following sections. To make the inclusion of organisation size tractable, we simplified the profile of organisations in each country into a split between three sizes of small, medium and large (s, m, l), drawing the boundaries from national statistics offices [9-13]. Each size was attributed a different on-premise server utilisation, a current different adoption of each of the three services under examination and therefore different targets to achieve the desired 80% cloud adoption rate.Only organisations where most people actively use internet connected computers during their normal work routine were included in the analysis. An Excel based model using the developed methodology was created in order to analyse the energy and related GHG emission impact of a move to cloud computing from on-premise computing. This approach taken from that developed by Williams and Tang [7].
2.4.1 Energy Consumption for On-Premise Servers This section calculated the annual energy (kWh) consumption for all on-premise servers according to each on-premise service ( . This was calculated using equation 1.
( ) (1)
Where is the number of servers per organisation, is the number of organisations using an on-premise server and
is the annual power consumption of the on-premise server. In order to understand the scale of on-premise server power consumption the number of servers per organisation size was required. The exact number of servers per organisation per
22
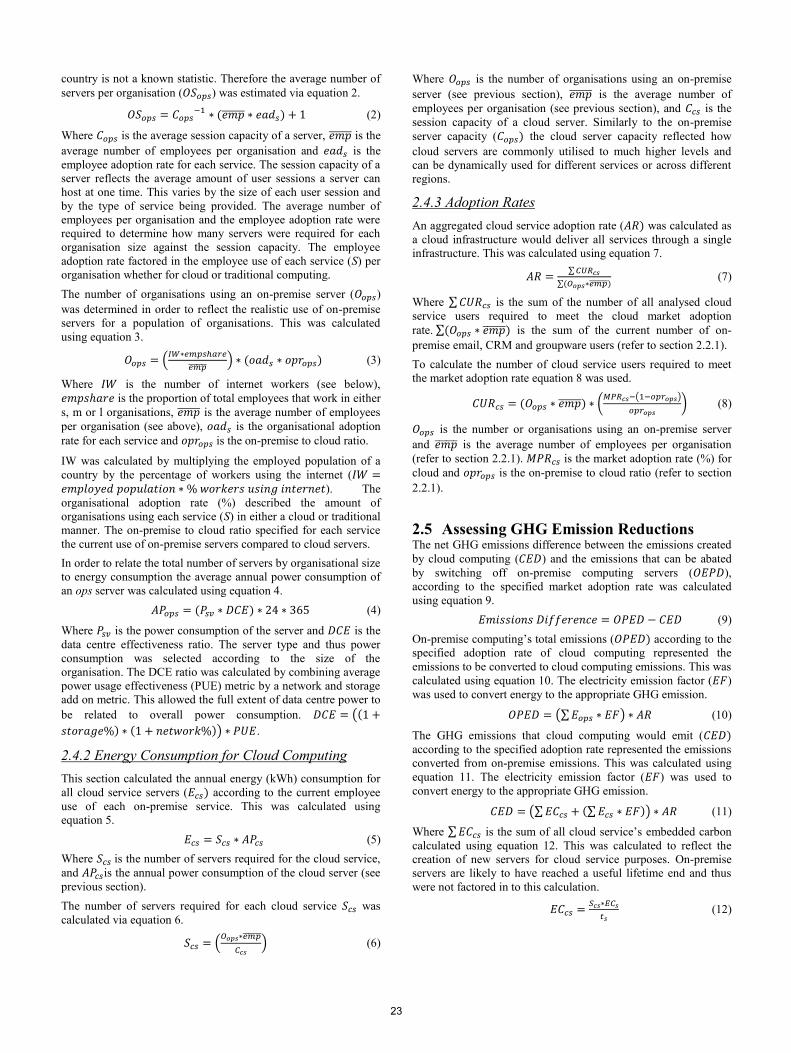
country is not a known statistic. Therefore the average number of servers per organisation ( ) was estimated via equation 2.
(2)
Where is the average session capacity of a server, is the average number of employees per organisation and is the employee adoption rate for each service. The session capacity of a server reflects the average amount of user sessions a server can host at one time. This varies by the size of each user session and by the type of service being provided. The average number of employees per organisation and the employee adoption rate were required to determine how many servers were required for each organisation size against the session capacity. The employee adoption rate factored in the employee use of each service (S) per organisation whether for cloud or traditional computing. The number of organisations using an on-premise server ( ) was determined in order to reflect the realistic use of on-premise servers for a population of organisations. This was calculated using equation 3.
(
) (3)
Where is the number of internet workers (see below), is the proportion of total employees that work in either s, m or l organisations, is the average number of employees per organisation (see above), is the organisational adoption rate for each service and is the on-premise to cloud ratio.
IW was calculated by multiplying the employed population of a country by the percentage of workers using the internet ( ). The organisational adoption rate (%) described the amount of organisations using each service (S) in either a cloud or traditional manner. The on-premise to cloud ratio specified for each service the current use of on-premise servers compared to cloud servers. In order to relate the total number of servers by organisational size to energy consumption the average annual power consumption of an ops server was calculated using equation 4.
(4)
Where is the power consumption of the server and is the data centre effectiveness ratio. The server type and thus power consumption was selected according to the size of the organisation. The DCE ratio was calculated by combining average power usage effectiveness (PUE) metric by a network and storage add on metric. This allowed the full extent of data centre power to be related to overall power consumption. (
) .
2.4.2 Energy Consumption for Cloud Computing This section calculated the annual energy (kWh) consumption for all cloud service servers ( according to the current employee use of each on-premise service. This was calculated using equation 5.
(5) Where is the number of servers required for the cloud service, and is the annual power consumption of the cloud server (see previous section). The number of servers required for each cloud service was calculated via equation 6.
(
) (6)
Where is the number of organisations using an on-premise server (see previous section), is the average number of employees per organisation (see previous section), and is the session capacity of a cloud server. Similarly to the on-premise server capacity ( the cloud server capacity reflected how cloud servers are commonly utilised to much higher levels and can be dynamically used for different services or across different regions.
2.4.3 Adoption Rates An aggregated cloud service adoption rate ( was calculated as a cloud infrastructure would deliver all services through a single infrastructure. This was calculated using equation 7.
∑
∑ (7)
Where ∑ is the sum of the number of all analysed cloud service users required to meet the cloud market adoption rate. ∑ is the sum of the current number of on-premise email, CRM and groupware users (refer to section 2.2.1). To calculate the number of cloud service users required to meet the market adoption rate equation 8 was used.
( ( )
) (8)
is the number or organisations using an on-premise server and is the average number of employees per organisation (refer to section 2.2.1). is the market adoption rate (%) for cloud and is the on-premise to cloud ratio (refer to section 2.2.1).
2.5 Assessing GHG Emission Reductions The net GHG emissions difference between the emissions created by cloud computing ( ) and the emissions that can be abated by switching off on-premise computing servers ( ), according to the specified market adoption rate was calculated using equation 9.
(9) On-premise computing’s total emissions ( according to the specified adoption rate of cloud computing represented the emissions to be converted to cloud computing emissions. This was calculated using equation 10. The electricity emission factor ( ) was used to convert energy to the appropriate GHG emission.
(∑ ) (10)
The GHG emissions that cloud computing would emit ( according to the specified adoption rate represented the emissions converted from on-premise emissions. This was calculated using equation 11. The electricity emission factor ( ) was used to convert energy to the appropriate GHG emission.
(∑ ∑ ) (11)
Where ∑ is the sum of all cloud service’s embedded carbon calculated using equation 12. This was calculated to reflect the creation of new servers for cloud service purposes. On-premise servers are likely to have reached a useful lifetime end and thus were not factored in to this calculation.
(12)
23

Where is the number of servers required for the cloud service, is the embedded carbon for a server and is the useful lifetime of the server.
3. MODEL DATA Data for each model variable was collected from a variety of sources. Where reliable data could not be found or was commercially sensitive, estimates were generated through a series of five multi-business, expert workshops with senior personnel from the ICT sector. Although a consensus was reached around all such estimated parameters, the most conservative ranges were used. Full model data is not presented here due to size constraints; this is freely available from the authors. The average session capacity of an on-premise server was estimated at a conservative 250 sessions per server for each service. It was recognised that this value was a low estimate but reflected the probable wide range of technical support and knowledge across an entire range of company types and sizes. For cloud servers an estimate of 1000 sessions per server was used. This value was agreed to be at the middle to low end of size estimates especially for email services. Data for the employed population of a country, percentage of workers in small, medium or large organisations, and the average number of employees by organisation by size (s, m, l) for each country were sourced from leading national and international suppliers of such data [9-11, 14, 15]. We note for China, Brazil and Indonesia primary data could not always sourced and was inferred from a mix of averages. The percentage of workers using the internet was estimated and inferred from a variety of sources [12, 13, 16-20]. This variable did not differentiate between internet access for an on-premise service or other work and personal related internet access; however, this was the best data available. Consistent adoption rates to demonstrate the current on-premise to cloud ratio could not be sourced; this was estimated for each service during expert workshops and interviews. The average power consumption of a server and associated networking and storage add on metrics were determined using methods and data from Williams and Tang [7]. A PUE of 1.3, 1.8 and 2.1 was used for small, medium and large organisations and 2.0 were used for cloud services. These PUE values were aconservative estimate of current PUE values. For small and medium size organisations a mid-range server type was used. For large organisations and all cloud services a volume server type was used. The embedded carbon of each server was difficult to source, so we used values from Bottner [21]. The emissions factors used in this research were sourced from World Resources Institute [22].
4. RESULTS The presented methodology was developed into an Excel based model and run against the scope and data from previous sections.Table 1 and Figure 2 present country summary results of on-premise emissions reduced and cloud emissions created and the associated net GHG emission reductions. In all cases the model indicated significant emission reductions. For all countries 4.5 million tonnes of CO2e could be reduced from the move to cloud computing. On average a move to cloud-based email, CRM and groupware was calculated to reduce emissions by 95%.
Table 1 – Country summary results of running the model against an 80% cloud adoption rate.
Country
Annual emissions (t CO2e)
On-premise emissions reduced
Cloud emissions increase
Net emissions reduced
Brazil 188,376 9,240 179,136
Canada 94,647 7,985 86,662 China 1,982,625 124,777 1,857,848
Czech Rep 111,877 4,435 107,442
France 99,387 5,454 93,933
Germany 1,056,538 49,147 1,007,391
Indonesia 178,005 6,800 171,205
Poland 283,470 11,020 272,450
Portugal 81,029 2,305 78,724
Sweden 6,732 557 6,175 UK 709,012 36,006 673,006
Total 4,791,699 257,726 4,533,973
Figure 2 – The net emission reductions ranked high to low.The average proportion of emission reductions and the current average assumed use of cloud services in Table 2 highlights onaverage the majority of reductions (68%) were realised by smaller organisations. This was despite the fact that we assumed 60% of small organisations had already adopted cloud services.
-
400
800
1,200
1,600
2,000
Ch
ina
Ger
man
y
UK
Po
lan
d
Bra
zil
Ind
on
esi
a
Cze
ch R
ep
Fran
ce
Po
rtu
gal
Can
ada
Swed
en
GH
G E
mis
sio
ns
Red
uct
ion
(Th
ou
san
d t
on
nes
C
O2
e)
24
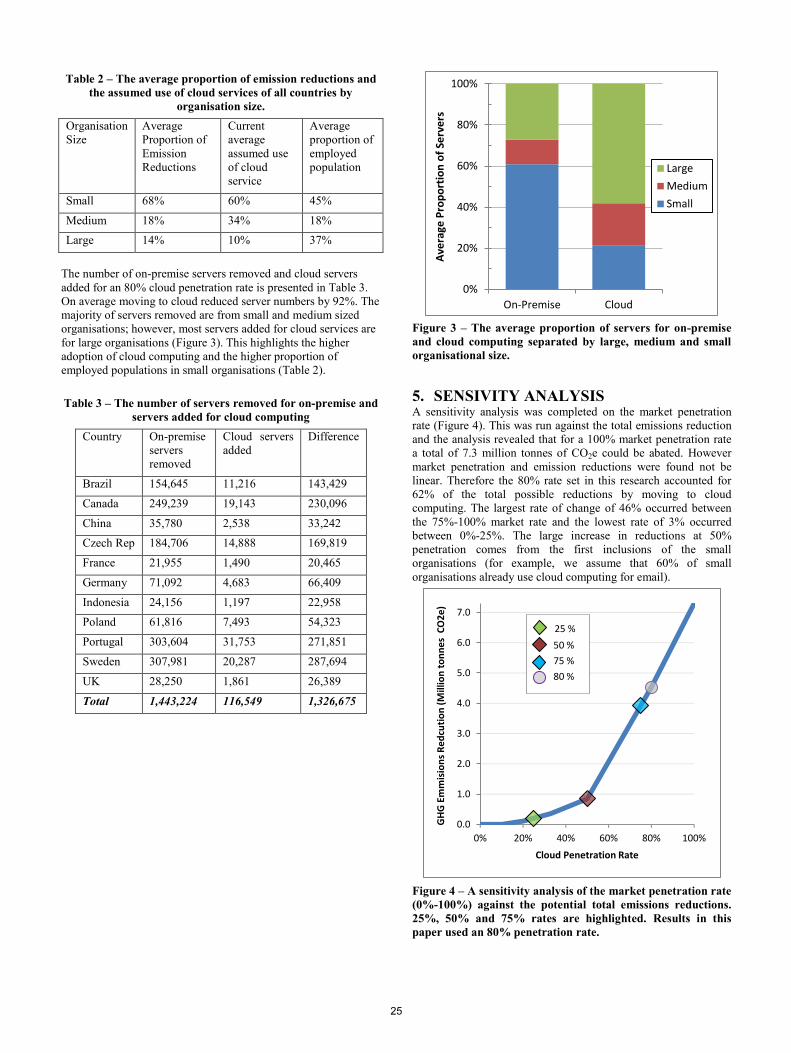
Table 2 – The average proportion of emission reductions and the assumed use of cloud services of all countries by
organisation size. Organisation Size
Average Proportion of Emission Reductions
Current average assumed use of cloud service
Average proportion of employed population
Small 68% 60% 45%
Medium 18% 34% 18%Large 14% 10% 37%
The number of on-premise servers removed and cloud servers added for an 80% cloud penetration rate is presented in Table 3.On average moving to cloud reduced server numbers by 92%. The majority of servers removed are from small and medium sized organisations; however, most servers added for cloud services are for large organisations (Figure 3). This highlights the higher adoption of cloud computing and the higher proportion of employed populations in small organisations (Table 2).
Table 3 – The number of servers removed for on-premise and servers added for cloud computing
Country On-premise serversremoved
Cloud serversadded
Difference
Brazil 154,645 11,216 143,429
Canada 249,239 19,143 230,096
China 35,780 2,538 33,242 Czech Rep 184,706 14,888 169,819
France 21,955 1,490 20,465
Germany 71,092 4,683 66,409
Indonesia 24,156 1,197 22,958 Poland 61,816 7,493 54,323
Portugal 303,604 31,753 271,851
Sweden 307,981 20,287 287,694
UK 28,250 1,861 26,389
Total 1,443,224 116,549 1,326,675
Figure 3 – The average proportion of servers for on-premise and cloud computing separated by large, medium and small organisational size.
5. SENSIVITY ANALYSIS A sensitivity analysis was completed on the market penetration rate (Figure 4). This was run against the total emissions reduction and the analysis revealed that for a 100% market penetration rate a total of 7.3 million tonnes of CO2e could be abated. However market penetration and emission reductions were found not belinear. Therefore the 80% rate set in this research accounted for 62% of the total possible reductions by moving to cloud computing. The largest rate of change of 46% occurred between the 75%-100% market rate and the lowest rate of 3% occurred between 0%-25%. The large increase in reductions at 50% penetration comes from the first inclusions of the small organisations (for example, we assume that 60% of small organisations already use cloud computing for email).
Figure 4 – A sensitivity analysis of the market penetration rate (0%-100%) against the potential total emissions reductions. 25%, 50% and 75% rates are highlighted. Results in this paper used an 80% penetration rate.
0%
20%
40%
60%
80%
100%
On-Premise Cloud
Ave
rage
Pro
po
rtio
n o
f Se
rve
rs
Large
Medium
Small
0.0
1.0
2.0
3.0
4.0
5.0
6.0
7.0
0% 20% 40% 60% 80% 100%
GH
G E
mm
isio
ns
Re
dcu
tio
n (
Mill
ion
to
nn
es
CO
2e
)
Cloud Penetration Rate
25 %
50 %
75 %
80 %
25
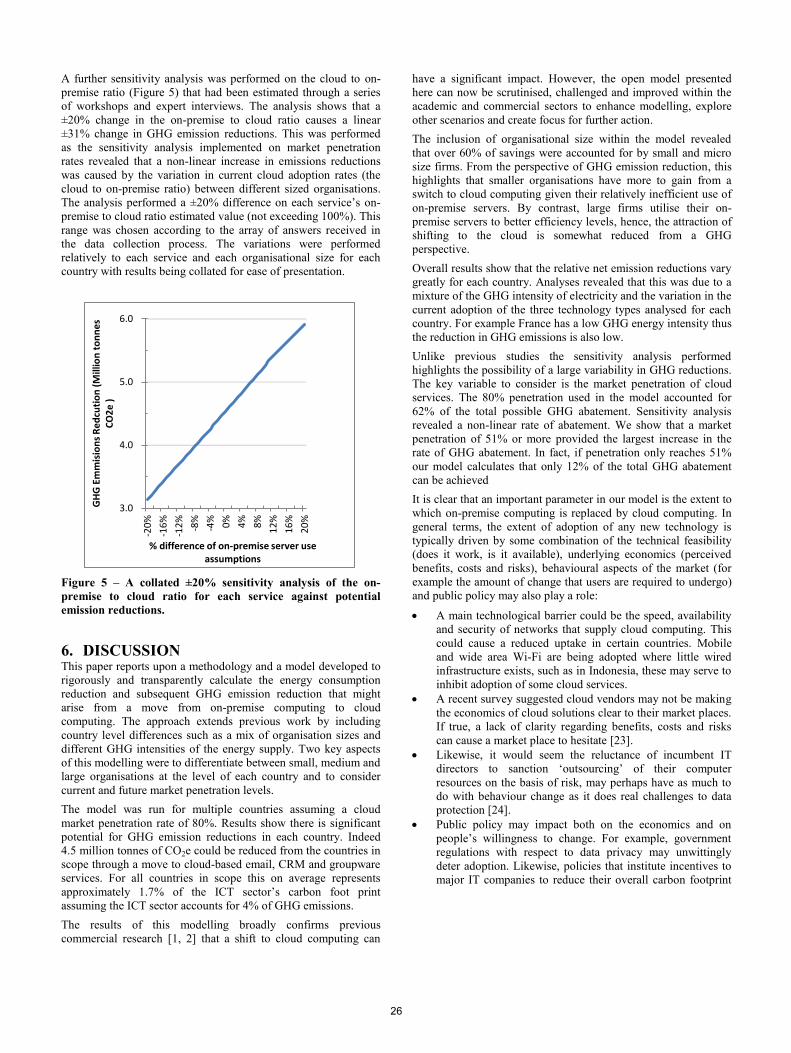
A further sensitivity analysis was performed on the cloud to on-premise ratio (Figure 5) that had been estimated through a series of workshops and expert interviews. The analysis shows that a ±20% change in the on-premise to cloud ratio causes a linear ±31% change in GHG emission reductions. This was performed as the sensitivity analysis implemented on market penetration rates revealed that a non-linear increase in emissions reductions was caused by the variation in current cloud adoption rates (the cloud to on-premise ratio) between different sized organisations.The analysis performed a ±20% difference on each service’s on-premise to cloud ratio estimated value (not exceeding 100%). This range was chosen according to the array of answers received in the data collection process. The variations were performed relatively to each service and each organisational size for each country with results being collated for ease of presentation.
Figure 5 – A collated ±20% sensitivity analysis of the on-premise to cloud ratio for each service against potential emission reductions.
6. DISCUSSION This paper reports upon a methodology and a model developed to rigorously and transparently calculate the energy consumption reduction and subsequent GHG emission reduction that might arise from a move from on-premise computing to cloud computing. The approach extends previous work by including country level differences such as a mix of organisation sizes and different GHG intensities of the energy supply. Two key aspects of this modelling were to differentiate between small, medium and large organisations at the level of each country and to consider current and future market penetration levels. The model was run for multiple countries assuming a cloud market penetration rate of 80%. Results show there is significant potential for GHG emission reductions in each country. Indeed 4.5 million tonnes of CO2e could be reduced from the countries in scope through a move to cloud-based email, CRM and groupware services. For all countries in scope this on average represents approximately 1.7% of the ICT sector’s carbon foot print assuming the ICT sector accounts for 4% of GHG emissions. The results of this modelling broadly confirms previous commercial research [1, 2] that a shift to cloud computing can
have a significant impact. However, the open model presented here can now be scrutinised, challenged and improved within the academic and commercial sectors to enhance modelling, explore other scenarios and create focus for further action.The inclusion of organisational size within the model revealed that over 60% of savings were accounted for by small and micro size firms. From the perspective of GHG emission reduction, this highlights that smaller organisations have more to gain from a switch to cloud computing given their relatively inefficient use of on-premise servers. By contrast, large firms utilise their on-premise servers to better efficiency levels, hence, the attraction of shifting to the cloud is somewhat reduced from a GHG perspective. Overall results show that the relative net emission reductions vary greatly for each country. Analyses revealed that this was due to a mixture of the GHG intensity of electricity and the variation in the current adoption of the three technology types analysed for each country. For example France has a low GHG energy intensity thus the reduction in GHG emissions is also low. Unlike previous studies the sensitivity analysis performed highlights the possibility of a large variability in GHG reductions. The key variable to consider is the market penetration of cloud services. The 80% penetration used in the model accounted for 62% of the total possible GHG abatement. Sensitivity analysis revealed a non-linear rate of abatement. We show that a market penetration of 51% or more provided the largest increase in the rate of GHG abatement. In fact, if penetration only reaches 51%our model calculates that only 12% of the total GHG abatement can be achievedIt is clear that an important parameter in our model is the extent to which on-premise computing is replaced by cloud computing. In general terms, the extent of adoption of any new technology is typically driven by some combination of the technical feasibility (does it work, is it available), underlying economics (perceived benefits, costs and risks), behavioural aspects of the market (for example the amount of change that users are required to undergo) and public policy may also play a role:
A main technological barrier could be the speed, availability and security of networks that supply cloud computing. This could cause a reduced uptake in certain countries. Mobile and wide area Wi-Fi are being adopted where little wired infrastructure exists, such as in Indonesia, these may serve to inhibit adoption of some cloud services.
A recent survey suggested cloud vendors may not be makingthe economics of cloud solutions clear to their market places. If true, a lack of clarity regarding benefits, costs and risks can cause a market place to hesitate [23].
Likewise, it would seem the reluctance of incumbent IT directors to sanction ‘outsourcing’ of their computer resources on the basis of risk, may perhaps have as much to do with behaviour change as it does real challenges to data protection [24].
Public policy may impact both on the economics and on people’s willingness to change. For example, government regulations with respect to data privacy may unwittingly deter adoption. Likewise, policies that institute incentives to major IT companies to reduce their overall carbon footprint
3.0
4.0
5.0
6.0
-20
%
-16
%
-12
%
-8%
-4%
0%
4%
8%
12
%
16
%
20
%
GH
G E
mm
isio
ns
Re
dcu
tio
n (
Mill
ion
to
nn
es
CO
2e
)
% difference of on-premise server use assumptions
26

fail to adequately take into account their potential to enable carbon abatement1.
The importance of understanding technology adoption, and topics such as those discussed above, is enhanced by the model described in this paper. Simply highlighting potential barriers to adoption and being able to estimate the impact of failed adoption on lost energy and GHG reductions can provide valuable inputs to policy debate for example. Indeed, we propose to complete research into these areas for a subsequent paper. Our modelling confirmed our prior belief about the relative importance of direct energy consumption compared to embedded carbon (i.e. the carbon generated in making servers in the first place). For cloud servers the impact of embedded carbon was included. Overall this accounted for 5% of the created GHG emissions related to cloud computing. The amortisation period used (5 years) was considered to be a conservative estimate and therefore this level may be lower. This reinforces the idea direct energy consumption in the key driver of GHG reductions. We identified five potential limitations of this study which when overcome would greatly enhance results and applicability. i. Our analysis has highlighted that the primary driver of the
emission reductions is the net reduction of server devices being used. Results have indicated a 1:20 ratio for cloud to on-premise servers which factors in the capacity of cloud servers and the multi-tenancy aspect of cloud servers. Yet, realised savings rely upon on-premise servers being turned off and not being utilised for other purposes such as backup. It is likely that some on-premise servers will continue to be used for other purposes, dependent upon age and capabilities. Hence the estimates put forward in this paper may be an over estimate, though the conservative nature of our method will go some way to counter balance these claims.
ii. The analysis covers the shifting of three services; email, CRM and groupware applications. As such this work underestimates the full potential of a shift to cloud computing. Further research is needed to understand the propensity to switch for other computing applications. We speculate that there might be a spectrum of such services from high propensity (e.g. the three applications included in the model) to low propensity (e.g. applications where security or latency concerns are paramount) suited for different business types. Indeed for large data sizes cloud computing may be less energy efficient than traditional computing [5].
iii. Although our model considers user devices to remain unchanged for both types of computing scenarios, the availability of cheaper, cloud-based computing services could stimulate growth in the use of computing in the long term. This might drive an off-setting increase in carbon emissions. Any such conclusion must await an assessment as to whether the expansion of computing has a net positive or net negative impact on energy consumption and GHG emissions.
iv. As stated in the method, where some parameters could not be directly or scientifically sourced, a series of expert workshops were conducted. This naturally leaves potential weaknesses in estimates. We are happy to expose all data;
1 Policy frameworks such as the progressive CRC Energy Efficiency Scheme in the UK consider
the ICT sector as a consumer of energy, this risks the opportunity to embrace the ICT sector as an enabler of energy reduction too.
indeed, we would relish the opportunity to engage further with industry or academia to strengthen the numbers.
v. This study has examined the impact of shifting on-premise computing to off-premise cloud computing. However, a third scenario of a ‘private cloud’ has not been examined. This type of cloud scenario places the efficient servers and know-how into the hands of the organisation to create their own on-premise private cloud. This method may become more prominent to address security and legal concerns. Although more efficient than traditional service servers, on-premise cloud servers may not be as efficient as off-premise servers because of the lack of service volume and data centre specialisms.
7. ACKNOWLEDGMENTS This research was funded and supported by The Global e-Sustainability Initiative (GeSI) and Microsoft. We would like to thank Alice Valvodova of GeSI and Ray Pinto of Microsoft, in particular, for their encouragement, frank feedback and commitment to academic rigour as well as industrial relevance. We would also like to thank Professor David Gann of Imperial College London and John Vassallo of Microsoft for championing research into the technologies that can enable carbon abetment and encouraging our research team.
8. REFERENCES [1] Accenture. Cloud Computing and Sustainability: The Environmental Benefits of Moving to the Cloud. Accenture & WSP, 2011. [2] Carbon Disclosure Project. Cloud Computing – The IT Solution for the 21st Century. Carbon Disclosure Project & Verdantix, London, UK, 2011. [3] GeSI. Evaluating the carbon-reducing impacts of ICT - An assessment methodology. Global e-sustainability Initiative, 2011. [4] Berl, A., Gelenbe, E., Di Girolamo, M., Giuliani, G., De Meer, H., Dang, M. Q. and Pentikousis, K. Energy-Efficient Cloud Computing. The Computer Journal, 53, 7 (September 1, 2010 2010), 1045-1051. [5] Baliga, J., Ayre, R. W. A., Hinton, K. and Tucker, R. S. Green Cloud Computing: Balancing Energy in Processing, Storage, and Transport. Proceedings of the IEEE, 99, 1 2011), 149-167. [6] Kumar, K. and Yung-Hsiang, L. Cloud Computing for Mobile Users: Can Offloading Computation Save Energy? Computer, 43, 4 2010), 51-56. [7] Williams, D. R. and Tang, Y. Methodology To Model the Energy and Greenhouse Gas Emissions of Electronic Software Distributions. Environmental Science & Technology, 46, 2 (Jan 17 2012), 1087-1095. [8] Rogers, E. M. Diffusion of innovations (5th ed.). NY:Free Press, New York, USA., 2003. [9] Statistics Canada. Employment by Enterprise Size 2007. Satistics Canada, Ottawa, http://www40.statcan.ca/l01/cst01/labr75h-eng.htm, 2007. [10] US Census Bureau. Employment size by Employer and Nonemployer Firms 2007. US Census Bureau, Washington, http://www.census.gov/econ/smallbus.html 2007. [11] LABORSTA. Employment General Level Switzerland: International Labour Office., http://laborsta.ilo.org, 2007. [12] Eurostat. Persons employed using computers connected to the Internet in their normal work routine at least once a week. Eurostat, Luxembourg, http://appsso.eurostat.ec.europa.eu, 2010.
27

[13] Statistics Canada. Canadian Internet Use Survey. Satistics Canada, Ottawa, http://www.statcan.gc.ca/daily-quotidien/100510/dq100510a-eng.htm, 2009. [14] Eurostat. Enterprises by size class - overview of SMEs in EU., Eurostat, Luxembourg, http://epp.eurostat.ec.europa.eu 2008. [15] Eurostat. Employment breakdown by enterprise size class, non-financial business economy in 2007. Eurostat, Luxembourg, http://epp.eurostat.ec.europa.eu/, 2008. [16] China Internet Network Information Center. Statistical Survey Report on The Internet Development in China. China Internet Network Information Center, China., http://www.cnnic.net.cn/, 2007. [17] DePaul CDM University. Network Society of Brazil. DePaul CDM University, Brazil, http://facweb.cs.depaul.edu/yele/Course/BrazilDecember08/society.html, 2008. [18] Designative. Internet in Brazil: 33% of Brazilians have Internet access at home Designative, Brazil, http://designative.info/2012/05/17/internet-in-brazil-33-of-brazilians-have-internet-access-at-home/, 2012.
[19] Coolfounders. A Broader Look at Indonesian Startups and Internet Business Prospects. Coolfounders, Indonesia, http://coolfounders.com/indonesia-now-a-broader-look-at-indonesian-startups-and-internet-business-prospects/, 2009. [20] JakartaGlobe. Internet Users in Indonesia to Triple by 2015: Report. JakartaGlobe, Jakarta, Indonesia, http://www.thejakartaglobe.com/business/internet-users-in-indonesia-to-triple-by-2015-report/394066, 2010. [21] Bottner, H. Product Carbon Footprint Project at Fujitsu Technology Solutions. Fujitsu Corporate Quality, Fujitsu Europe, 2010. [22] World Resources Institute. Carbon Intensity of Electricity Production in 2007. . World Resources Institute, Washington, USA, http://cait.wri.org, 2007. [23] Everett, C. Cloud computing – A question of trust. Computer Fraud & Security, 6, June 2009), 5-7. [24] Narasimhan, B. and Nichols, R. State of Cloud Applications and Platforms: The Cloud Adopters' View. Computer, 44, 3 2011), 24-28.
28

Capabilities and Limitations of Direct Free Cooling in Data Centers
Peter Gysel1, Rolf Morf2, Cyrill Grüter3, Matthias Krebs1
1Fachhochschule Nordwestschweiz, CH-5210 Brugg-Windisch
[email protected], [email protected]
2Swisscom, Datacenter Management, CH-8048 Zürich
3R+B Engineering AG, CH-8005 Zürich
ABSTRACT The IT industry has undertaken strong efforts to reduce the energy consumption of IT services. Data center operators have two goals, why to reduce the energy usage: Reduce the carbon dioxide footprint and reduce the operational costs of the data center. First an overview on different approaches to optimize the energy efficiency of cooling a data center is presented. We then focus on direct free cooling, DFC. We list implications of DFC on the infrastructure of the data center due to regulation and standards.
Two variants for cooling a distinct data center of Swisscom in Zurich are compared: Optimized conventional cooling and DFC. The two variants are simulated for temperatures in Zurich. We give figures for potential savings for both variants. Finally, the potential savings by optimizing the efficiency of cooling are compared to savings by reducing the energy consumed by servers e.g. with virtualization.
Keywords Data center, energy efficiency, energy consumption, cooling.
1. INTRODUCTION The IT industry accounts for 2 percent of the world's total carbon dioxide emissions. This is a large amount - according to [1] as much as is released by global air traffic. The total energy consumption of ICT services is the sum of three contributions: Energy usage of servers, of clients and of transmission equipment. Considerable effort has been taken by the IT industry to reduce the electrical energy consumption. In this article we concentrate on usage of electrical energy in data centers (DC). The DC operators pursue two goals. First, there is a real concern about the carbon dioxide footprint and, second, they are looking for reduction of the operating costs. Operators have noticed that the costs for electricity are a serious part of the operation costs. Therefore, the energy efficiency of a data center has got much attention and many operators are trying to optimize the efficiency of their DC. Investments in newer, more efficient equipment, however, are usually only made if an economic justification can be demonstrated. The industry needs a rating to qualify the efficiency of a given data center. The green grid introduced the
Power Usage Effectiveness
, (1)
a measure for the efficiency of the infrastructure of a data center. It should allow to compare different data centers [2]. The total facility energy usage is the sum of the energy consumed in the transformers, in the uninterruptable power supply (UPS), in IT equipment, cooling, lighting and infrastructure systems (e.g. surveillance). In older data centers the PUE was often above 2. Newer data centers with conventional cooling systems designed according to the guidelines given by the green grid [3] will reach values for the PUE typically in between 1.5 and 2. The PUE, however, does not reflect wasting of energy in the IT equipment. It can even tempt the operator to minimize the consumption of cooling to the expense of the energy used in the IT equipment, thus optimizing the PUE, but wasting energy on the whole. Therefore, green grid introduced first the concept of a family of Data Center Productivity metrics (DCxP) that measure useful work divided by a resource consumed to produce that work [4]. If the consumed resource is energy, the metric is
. (2)
Unfortunately, DCeP is difficult to evaluate in a operational data center. Therefore, green grid subsequently proposed to use a simple indicator, or proxy, while less accurate, much easier to implement. The document [5] presents eight different proxies to estimate data center productivity. Operators who want to optimize energy efficiency of their DC must make a choice out of many options and generally do not exactly know in advance the potential savings before making an investment. Neither do they know the actual risk of a new approach in their actual environment. It is therefore important that an operator is able to evaluate as well savings as risks of several options before making a choice. We suggest to simulate DCs [6] and to compare different variants. We use a simulation tool developed for that purpose: The EoDD (Energy Optimized Data center Designer [7]). Thus we can provide figures for decision-makers and replace trial and error by systematic approaches. The goal of this project was to twofold. First, investigate whether there are potential savings in the total energy used in a given data center run by Swisscom in Zurich. Second, we want to clarify
ICT4S 2013: Proceedings of the First International Conference on Information and Communication Technologies for Sustainability, ETH Zurich, February 14-16, 2013. Edited by Lorenz M. Hilty, Bernard Aebischer, Göran Andersson and Wolfgang Lohmann. DOI: http://dx.doi.org/10.3929/ethz-a-007337628
29
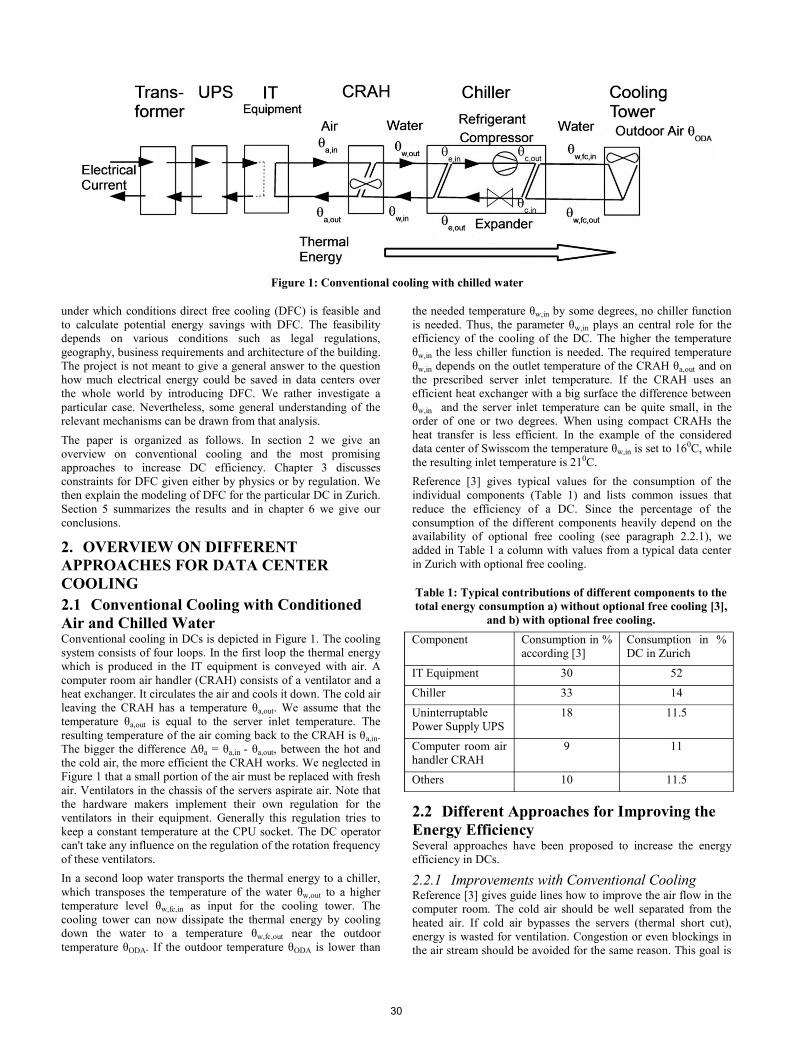
under which conditions direct free cooling (DFC) is feasible and to calculate potential energy savings with DFC. The feasibility depends on various conditions such as legal regulations, geography, business requirements and architecture of the building.The project is not meant to give a general answer to the question how much electrical energy could be saved in data centers over the whole world by introducing DFC. We rather investigate a particular case. Nevertheless, some general understanding of the relevant mechanisms can be drawn from that analysis. The paper is organized as follows. In section 2 we give an overview on conventional cooling and the most promising approaches to increase DC efficiency. Chapter 3 discusses constraints for DFC given either by physics or by regulation. We then explain the modeling of DFC for the particular DC in Zurich. Section 5 summarizes the results and in chapter 6 we give our conclusions.
2. OVERVIEW ON DIFFERENT APPROACHES FOR DATA CENTER COOLING 2.1 Conventional Cooling with Conditioned Air and Chilled Water Conventional cooling in DCs is depicted in Figure 1. The cooling system consists of four loops. In the first loop the thermal energywhich is produced in the IT equipment is conveyed with air. Acomputer room air handler (CRAH) consists of a ventilator and aheat exchanger. It circulates the air and cools it down. The cold air leaving the CRAH has a temperature θa,out. We assume that the temperature θa,out is equal to the server inlet temperature. The resulting temperature of the air coming back to the CRAH is θa,in. The bigger the difference Δθa = θa,in - θa,out, between the hot and the cold air, the more efficient the CRAH works. We neglected in Figure 1 that a small portion of the air must be replaced with fresh air. Ventilators in the chassis of the servers aspirate air. Note that the hardware makers implement their own regulation for the ventilators in their equipment. Generally this regulation tries to keep a constant temperature at the CPU socket. The DC operator can't take any influence on the regulation of the rotation frequency of these ventilators. In a second loop water transports the thermal energy to a chiller, which transposes the temperature of the water θw,out to a higher temperature level θw,fc,in as input for the cooling tower. The cooling tower can now dissipate the thermal energy by cooling down the water to a temperature θw,fc,out near the outdoor temperature θODA. If the outdoor temperature θODA is lower than
the needed temperature θw,in by some degrees, no chiller function is needed. Thus, the parameter θw,in plays an central role for the efficiency of the cooling of the DC. The higher the temperature θw,in the less chiller function is needed. The required temperature θw,in depends on the outlet temperature of the CRAH θa,out and on the prescribed server inlet temperature. If the CRAH uses an efficient heat exchanger with a big surface the difference between θw,in and the server inlet temperature can be quite small, in the order of one or two degrees. When using compact CRAHs the heat transfer is less efficient. In the example of the considered data center of Swisscom the temperature θw,in is set to 160C, while the resulting inlet temperature is 210C. Reference [3] gives typical values for the consumption of the individual components (Table 1) and lists common issues that reduce the efficiency of a DC. Since the percentage of the consumption of the different components heavily depend on the availability of optional free cooling (see paragraph 2.2.1), we added in Table 1 a column with values from a typical data center in Zurich with optional free cooling.
2.2 Different Approaches for Improving the Energy Efficiency Several approaches have been proposed to increase the energy efficiency in DCs.
2.2.1 Improvements with Conventional Cooling Reference [3] gives guide lines how to improve the air flow in the computer room. The cold air should be well separated from the heated air. If cold air bypasses the servers (thermal short cut), energy is wasted for ventilation. Congestion or even blockings in the air stream should be avoided for the same reason. This goal is
Figure 1: Conventional cooling with chilled water
Table 1: Typical contributions of different components to the total energy consumption a) without optional free cooling [3],
and b) with optional free cooling. Component Consumption in %
according [3]Consumption in % DC in Zurich
IT Equipment 30 52
Chiller 33 14
Uninterruptable Power Supply UPS
18 11.5
Computer room air handler CRAH
9 11
Others 10 11.5
30

best reached with proper implementation of a cold and/or warm aisle [3].A further improvement can be reached by regulation the air stream with temperature and pressure sensors at various points [8]. With the aid of temperature sensors hot spots in a rack can be avoided while pressure sensors help to regulate the air stream so that the CRAH and the ventilators in the servers work well together. Another approach is placing the first heat exchanger very near to the servers. Short loops for the cooling air reduce issues with thermal short cuts and with congestion. This is the goal of in-row cooling equipment. There is a "CRAH" placed in between the racks. The resulting air loop is very short. However, a lot of CRAH equipment is needed and water has to be transported into the DC.Optimizing the temperature θa,out of the cold air produced by the CRAH (the "ambient set point") was discussed by Patterson [9].He found, that increasing the set point up to the limit given by ASHRAE [10], [11] improves the efficiency significantly only if an economizer is used. Figure 2 depicts this case. We call it "optional free cooling". Depending on the outdoor temperature, the chiller is bypassed and switched off when not needed. By increasing the set point, free cooling is possible during significantly more hours per year. Yet, cooling still takes place with conditioned air. The strategy for optimizing conventional cooling can be summarized as follows
a) Optimize the air flow from the CRAH to the servers and back to the CRAH.
b) Optimize the inlet temperature of the servers c) Minimize the difference between the cold water
temperature θw,in and server inlet temperature. d) Use the chiller only when the outdoor temperature
demands it.
2.2.2 Improvement with water cooling The strategy to reduce the number of loops and heat exchangers ultimately leads to a configuration without any loops and heat exchangers. Cooling servers directly with water [13], [1], [14] has been studied e.g. at IBM research in Zurich. Three important characteristics for a coolant are its thermal conductivity, its specific heat capacity and the temperature difference needed between chip and coolant. It is well known that water has a higher heat conductivity and specific capacity than air. Zimmerman et al. [13] report, that a temperature difference chip-coolant of 150C is enough for cooling a chip with water. So the authors were able to increase the inlet temperature of the water up
to 600C. With these conditions the energy in the output water can directly be reused.The price for these advantages is that water must be guided not only into the DC, but very close to the CPU of the server hardware. An alternative for the cooling liquid water is the use of oil [15] .The future will show whether there is an acceptance for such changes in a DC or not.
2.2.3 Improvement with Direct Free Cooling The strategy of direct free cooling, DFC, [16], [17], [18], is similar to that one of water cooling: Omit all the loops and heat exchangers. DFC differs from optional free cooling by using primarily outside air directly. Figure 3 shows DFC. Simply take outdoor air directly and transport the hot air outside again.For the case that the outside air is too cold or too warm, generally an option to loop back and to cool down the air is foreseen. In winter time a fraction of the heated air may be looped back, so that the inlet temperature to the servers is above 100C. This does not consume additional energy. For few hours in summer, when the outside temperature is higher than a threshold, the warm air is looped back and a chiller is switched on to cool it down.
3. CONSTRAINTS A number of issues need to be addressed when cooling of ITequipment with fresh air is applied instead of conventional cooling.
3.1 Air Filtering Unfiltered fresh air is potentially contaminated with corrosive gases, dust and other particles which could result in malfunction of devices due to corrosion on printed circuit boards [19] or as a consequence of contamination of the radiators. Hence an adequate filtering is absolutely essential. However, since air filtering certainly reduces the air flow, some extra fans have to be installed in order to supply the required air stream.
3.2 Prevention of Sabotage The inlets provide excellent physical access. Potential risks are further identified through the channelling of harmful materials such as gases or smoke balls.
3.3 Fire Security Early smoke and fire detectors are installed in high performance data centers. A fire alarm triggers an extinction by gas. Usually, nitrogen is used to reduce the amount of oxygen in the air to prevent fire in the data center. It is not feasible to implement this
Figure 2: Conventional cooling with optional free cooling
31

measure in fresh air cooling systems as nitrogen would instantly escape. Thus, rooms have to be shut in case of a fire incident. However, rooms must not be shut in fresh air cooling systems because of overheating. This challenge is solved by the installation of mechanical chillers.
3.4 Regulation and Political Issues With regard to the investment, free cooling without cooling machines would be the most attractive option. If the ASHRAEdefined maximum inlet temperatures have to be met, this option can be applied in regions with ambient temperatures below the maximum inlet temperatures. That implies IT equipment or its services of a client in hotter countries have to transferred to cooler areas. This is not a favorable measure in every case due to various reasons. For companies subject to regulations from Swiss Financial Market Supervisory Authority, FINMA [20], clients have to be notified about the relocation of services (FINMA RS, Abschnitt F. Grundsatz 6). The question whether clients are capable to assess the applied safety measures remains unsolved. Paragraph G, Grundsatz 7 says: ‘The relocating organization needs to grant full and unrestricted access to their internal audit, external revision as well as the FINMA organization at any time.’ Political stability of the data center location is of elevated relevance even without statutory restrictions. Many organizations cannot afford to transfer business-critical data to countries where unauthorized access by the government or by third parties cannot be omitted. Furthermore, numerous hard facts support respectively undermine the operation of a data center abroad: Land price, rental charges, wage level, electricity costs, power availability, accessibility of the location, availability of local experts.
4. MODELLING OF DIRECT FREE COOLING IN A DATA CENTER In order to run simulations and to compute potential savings we made a choice for commercially available equipment. We chose the equipment from Stulz [21] and introduced performance data from the company into our simulation tool. With an assumed power of 400 kW of the IT equipment one needs six pieces of equipment.
4.1 Different modes in Direct Free Cooling DFC equipment consists of two parts:
a CRAH which makes the air stream strong enough to convey the thermal energy out of the computer room
a chiller for the case that the outdoor air is too hotIn order to simulate a DC with DFC depending on the outdoor temperature different modes of operation can be distinguished. Case I: θODA ≤ θmin Partial loopback of the air,
The chiller is switched off. θmin typically is 180C.Case II: θmin ≤ θODA ≤ θODA,DFC,max DFC without loopback,
The chiller is switched off.Case III: θODA > θODA,DFC,max total loopback of the air.
The chiller is working. For the energy consumption the cases I and II are nearly equal. The ventilator produces a certain air stream. We neglect the little difference due to where the air comes from. Our simulation distinguishes the two cases: θODA < θODA,DFC,max without chiller operation, θODA > θODA,DFC,max with chiller operation.
4.2 Modeling the Required Air Stream A crucial point for the results of the simulation is the choice of the parameter for the air stream needed to cool the servers. The basic equation for heat transport is
(3)
where Pth is the thermal power from the servers, the density of air, qV the air stream by volume in m3/s and cp the specific heat capacity of air in Ws/kg. If the thermal power and the temperature difference of the air before and after the server are known, the needed air stream qv and thus the operating point of the equipment can be calculated. We made the following assumptions: For temperatures below 260C the fans of the servers are in normal mode and Δθ is 100C. For inlet temperatures above that threshold the fans go faster. Measurements with our own servers showed that the fan speed may nearly double at 320C. We therefore applied a model with a Δθ of 100C up to 260C, followed by a linear decrease down to Δθ = 50C at 320C. We assume that the DFC equipment follows the regulation in the servers and produces the higher air stream at higher temperatures.
Figure 3: Direct free cooling
32

In the simulations the threshold temperature θmax for switching on the chiller was increased from 10 to 320C.
4.3 Case Study: DFC in a Swisscom Data CenterBoth the DFC case and the conventional cooling were simulated with our EoD Designer tool [7] and then compared. We have chosen the simulation parameters within range of the ASHRAE specification [11] and the environmental characteristics of the Swisscom data center in Zurich. All simulations are computed for the duration of one year. For the outdoor temperature θODA we use the temperature for Zurich with a resolution of one hour. The price for electricity is assumed to be CHF 0.16 per kWh.
We assume a constant IT equipment power PIT of 400 kW, i.e. our simulations do not reflect the increase of PIT with augmenting inlet temperature to the servers. Transformers, UPS and facility equipment are deliberately omitted in our simulations, because they are equal in all simulation variants and thus have no effect on potential savings. As a consequence, the sum of the energy used by IT, CRAH and chiller is not the total energy used for calculation of the PUE. One should not try to calculate a PUE value from the figures in chapter five.
5. RESULTS 5.1 Optimization of Conventional Cooling We simulate the optimization of conventional data center cooling by raising the allowed CRAH outlet air temperature θa,out (see Figure 1), which is equivalent to the server inlet air temperature, up to a maximum of 32°C, as specified by ASHRAE. Our simulation uses the same cooling equipment currently used in the Swisscom data center in Zurich, which consists of 12 CRAHs of type Stulz ASD 1900 CW, and one combined chiller/free cooler of type FOCS FC B 2722. It should be mentioned that the CRAH equipment is used at a very low operation point. The reason is that the DC was designed for 1 MW of IT load. Results for different server inlet temperatures ranging from 10°C up to 32°C, are shown in Figure 4. When the server inlet temperature is increased, so is the amount of time within the year where free cooling is possible and the chiller can be switched off. This leads to a reduction of the energy required for cooling, which is also noticeable in the sum of the energy consumption of IT, CRAH and chiller.
Longer free cooling is possible, because along with the increased server inlet air temperature, the temperature of the circulating water inside the free cooler can also be increased. Therefore, free cooling becomes possible at higher outdoor temperatures and thus during more hours of the year. Figure 5 shows the absolute contribution of IT, CRAH and cooling equipment to the combined energy consumption within a year. When the server inlet temperature is increased, the energy consumed by the cooling equipment (chiller, free cooler) is decreased. The energy consumption of the IT equipment is constant in the simulation. The CRAHs consume a relatively low amount of energy, since we assume a constant server inlet temperature Δθa of 10°C in the simulation, which allows the CRAHs to run on a low operating point.
As expected, the amount of energy that could be saved through optimization of the conventional cooling depends exclusively on energy savings of the chiller. Figure 5 shows that the chiller only contributes between 10.8% and 5.0% to the "total" energy consumption. Remember that contributions from power distribution and UPS are not included in our model. The IT equipment contributes from 87.7% to 93.3%. This fact indicates that only a small fraction of the total energy can actually be saved. Table 2 shows the potential savings when increasing the server inlet temperature θa,out, compared to a θa,out of 15°C. Even if θa,outis increased to 32°C, only 5% of the cost that is caused by IT, CRAH, and chiller can be saved.
Table 2: Savings through optimization of conventional cooling, as a function of the server inlet temperature θa,out.
The savings are relative to an inlet temperature θa,out of 15°C. Temp. (°C) IT, CRAH, chiller energy (kWh) Savings
15 3’947’952 -
20 3’901’132 1.2 %
25 3’844’206 2.6 %26 3’831’518 3.0 %
30 3’779’385 4.3 %
32 3’754’562 4.9 %
Figure 5: Contribution of IT, CRAH and chillers to the energy usage for the case of conventional cooling, as a
function of the server inlet temperature.
Figure 4: Conventional cooling in function of server inlet temperature. Blue: Energy usage of IT, CRAH and chillers.
Red: Free cooling hours in one year.
33

5.2 Direct Free Cooling We simulate the direct free cooling method (DFC) for data center cooling for various thresholds θODA,DFC,max for outdoor air temperature. When the outdoor air temperature θODA is above the threshold, the air is looped back (see Figure 3) and the chiller is switched on. The threshold is increased from 10 to 32 0C, the limit given by ASHRAE [11]. We assume that the cooling equipment consists of six DFC coolers of type Stulz DFC2. We choose a number of six devices, because it is reasonable for cooling down up to 400 kW, as the Stulz DFC2 can cool up to 110 kW and we do not want to run it at its limit. The difference between server outlet and inlet air temperature Δθa,C is assumed to be 10°C when the chiller is used. Figure 6 shows the sum of the energy consumption of IT, CRAH and chiller and the amount of direct free cooling hours within a year. Compared to Figure 4, we notice a more significant reduction of the energy consumption.
Figure 7 shows the contribution of different components. The IT equipment energy consumption is again considered constant.
Table 3 gives a comparison of the DFC approach versus the conventional cooling. Potential savings of DFC relative to conventional cooling are listed. At all simulated temperatures, DFC provides more savings than the optimization of conventional cooling.
The simulation first computes the air stream required to cool the data center using DFC with equation (3). Given the air stream, the required size of the air intakes can be calculated, which is an indicator for the feasibility of DFC in a given building. If the air intake size exceeds the tolerance for building modifications, DFC is not feasible. The air stream has to be computed for the maximal thermal power to be cooled, which is 1 MW for the Swisscom data center in Zurich. Considering the thermal power and a temperature difference between server outlet and inlet Δθa of 10°C, our simulation computes a total air stream of approximately 82 m3/s. With a given air speed of 3 m/s, the area that has to be covered by the air intakes in order to allow the aforementioned air stream is approximately 27 m2. In the case of the Swisscom data center in Zurich, it is not possible to integrate such large air intakes into the existing building. Therefore, replacing the conventional cooling equipment with a DFC solution is not a feasible approach.
5.3 Minimizing the Consumption of the IT Equipment As an alternative to replacing the cooling equipment, one can try to reduce the energy consumption of the IT equipment. There are several ways to reduce the consumption of the IT equipment:
a) Hardware makers have improved the efficiency of their equipment considerably in the last years. The number of operations per kWh consumed has been augmented by factors.
b) Reduction of IT load by improving software quality. c) Switching off old equipment and forcing virtualization
of servers. Virtualization reduces the number of physical machines and thus the energy consumption.
Virtualization is a viable option for a company running their own services in their own DC, but not for an operator offering server housing to customers. Keep in mind that all three approaches may lead to a temporarily reduction of the DC efficiency if the infrastructure is not built up in a modular way. Measurements in the Swisscom data center in Zurich have shown that various physical machines have an average CPU load of less than 1% (!) and RAM usage of only 20%, yet the services are provided by individual physical servers. These measurements
Table 3: Savings of DFC relative to optimized conventional cooling, as a function of threshold temperature θODA,DFC,max
Temp. (°C) Conv. (kWh) DFC (kWh) Savings
15 3’947’952 3’874’940 1.9 %
20 3’901’132 3’726’783 4.5 %25 3’844’206 3’663’603 4.7 %
26 3’831’518 3’656’854 4.6 %
30 3’779’385 3’638’360 3.7 %
32 3’754’562 3’636’021 3.2 %
Figure 7: Contribution of different components to the energy usage as a function of the threshold outdoor air temperature
for DFC θODA,DFC,max, using direct free cooling
Figure 6: Direct free cooling. Blue: Energy usage of IT and DFC equipment. Red: Direct free cooling hours. Both curves
as a function of the threshold outdoor air temperature for DFC θODA,DFC,max
34
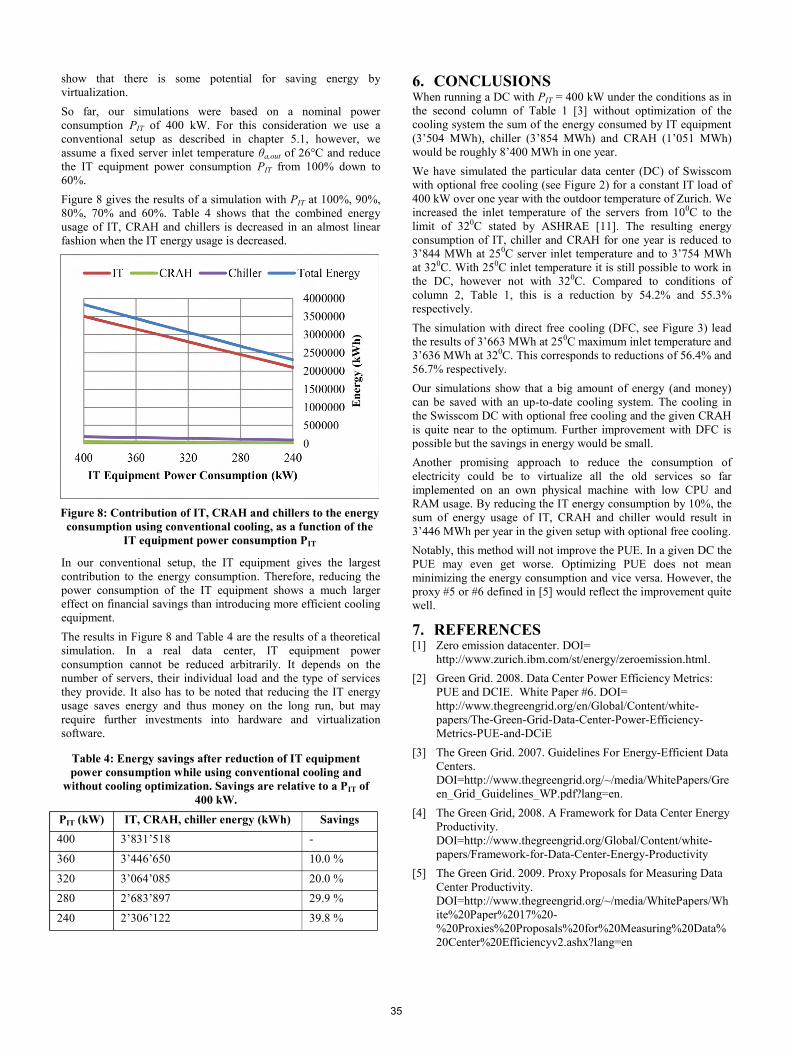
show that there is some potential for saving energy by virtualization. So far, our simulations were based on a nominal power consumption PIT of 400 kW. For this consideration we use a conventional setup as described in chapter 5.1, however, we assume a fixed server inlet temperature θa,out of 26°C and reduce the IT equipment power consumption PIT from 100% down to 60%. Figure 8 gives the results of a simulation with PIT at 100%, 90%, 80%, 70% and 60%. Table 4 shows that the combined energy usage of IT, CRAH and chillers is decreased in an almost linear fashion when the IT energy usage is decreased.
In our conventional setup, the IT equipment gives the largest contribution to the energy consumption. Therefore, reducing the power consumption of the IT equipment shows a much larger effect on financial savings than introducing more efficient cooling equipment. The results in Figure 8 and Table 4 are the results of a theoretical simulation. In a real data center, IT equipment power consumption cannot be reduced arbitrarily. It depends on the number of servers, their individual load and the type of services they provide. It also has to be noted that reducing the IT energy usage saves energy and thus money on the long run, but may require further investments into hardware and virtualization software.
6. CONCLUSIONS When running a DC with PIT = 400 kW under the conditions as in the second column of Table 1 [3] without optimization of the cooling system the sum of the energy consumed by IT equipment (3’504 MWh), chiller (3’854 MWh) and CRAH (1’051 MWh) would be roughly 8’400 MWh in one year. We have simulated the particular data center (DC) of Swisscom with optional free cooling (see Figure 2) for a constant IT load of 400 kW over one year with the outdoor temperature of Zurich. We increased the inlet temperature of the servers from 100C to the limit of 320C stated by ASHRAE [11]. The resulting energy consumption of IT, chiller and CRAH for one year is reduced to 3’844 MWh at 250C server inlet temperature and to 3’754 MWh at 320C. With 250C inlet temperature it is still possible to work in the DC, however not with 320C. Compared to conditions of column 2, Table 1, this is a reduction by 54.2% and 55.3%respectively. The simulation with direct free cooling (DFC, see Figure 3) lead the results of 3’663 MWh at 250C maximum inlet temperature and 3’636 MWh at 320C. This corresponds to reductions of 56.4% and 56.7% respectively. Our simulations show that a big amount of energy (and money) can be saved with an up-to-date cooling system. The cooling in the Swisscom DC with optional free cooling and the given CRAH is quite near to the optimum. Further improvement with DFC is possible but the savings in energy would be small. Another promising approach to reduce the consumption of electricity could be to virtualize all the old services so far implemented on an own physical machine with low CPU and RAM usage. By reducing the IT energy consumption by 10%, the sum of energy usage of IT, CRAH and chiller would result in 3’446 MWh per year in the given setup with optional free cooling. Notably, this method will not improve the PUE. In a given DC the PUE may even get worse. Optimizing PUE does not mean minimizing the energy consumption and vice versa. However, the proxy #5 or #6 defined in [5] would reflect the improvement quite well.
7. REFERENCES [1] Zero emission datacenter. DOI=
http://www.zurich.ibm.com/st/energy/zeroemission.html.[2] Green Grid. 2008. Data Center Power Efficiency Metrics:
PUE and DCIE. White Paper #6. DOI=http://www.thegreengrid.org/en/Global/Content/white-papers/The-Green-Grid-Data-Center-Power-Efficiency-Metrics-PUE-and-DCiE
[3] The Green Grid. 2007. Guidelines For Energy-Efficient Data Centers. DOI=http://www.thegreengrid.org/~/media/WhitePapers/Green_Grid_Guidelines_WP.pdf?lang=en.
[4] The Green Grid, 2008. A Framework for Data Center Energy Productivity. DOI=http://www.thegreengrid.org/Global/Content/white-papers/Framework-for-Data-Center-Energy-Productivity
[5] The Green Grid. 2009. Proxy Proposals for Measuring Data Center Productivity. DOI=http://www.thegreengrid.org/~/media/WhitePapers/White%20Paper%2017%20-%20Proxies%20Proposals%20for%20Measuring%20Data%20Center%20Efficiencyv2.ashx?lang=en
Table 4: Energy savings after reduction of IT equipment power consumption while using conventional cooling and
without cooling optimization. Savings are relative to a PIT of 400 kW.
PIT (kW) IT, CRAH, chiller energy (kWh) Savings400 3’831’518 -
360 3’446’650 10.0 %
320 3’064’085 20.0 %280 2’683’897 29.9 %
240 2’306’122 39.8 %
Figure 8: Contribution of IT, CRAH and chillers to the energy consumption using conventional cooling, as a function of the
IT equipment power consumption PIT
35

[6] C. Grüter et al. 2012. EoD Designer: A Computation Tool for Energy Optimization of Data Centers. First International Workshop on Green and Sustainable Software, Zurich.
[7] The EoD Designer. DOI= https://www.eodd.ch/ [8] Ahuja N. et al. 2011. Data Center Efficiency with Higher
Ambient Temperatures and Optimized Cooling Control. Proceedings of the 27th Annual IEEE Semiconductor Thermal Measurement and Management Symposium, San Jose, CA.
[9] Patterson M.K. 2008. The effect of data center temperature on energy efficiency. 11th Intersociety Conference on Thermal and Thermomechanical Phenomena in Electronic Systems. P. 1167 - 1174.
[10] ASHRAE (American Society of Heating, Refrigerating and Air-Conditioning Engineers). 2008. Environmental Guidelines for Datacom Equipment -Expanding the Recommended Environmental Envelope. DOI= http://tc99.ashraetcs.org/documents/ASHRAE_Extended_Environmental_Envelope_Final_Aug_1_2008.pdf
[11] ASHRAE. 2011. Thermal Guidelines for Data Processing Environments – Expanded Data Center Classes and Usage Guidance. DOI=http://tc99.ashraetcs.org/documents/ASHRAE%20Whitepaper%20-%202011%20Thermal%20Guidelines%20for%20Data%20Processing%20Environments.pdf
[12] Y. Jin et al. 2012. Energy Efficiency and Server Virtualization in Data Centers: An Empirical Investigation. IEEE conference on Computer Communications Workshops (INFOCOM WKSHPS), Orlando, FL.
[13] Zimmermann S. et al. 2012. Aquasar: A hot water cooled data center with direct energy reuse. Energy. 43. 237-245.
[14] M. Iyengar et al. 2012. Server Liquid Cooling with Chiller-less Data Center Design to Enable Significant Energy Savings. Proceedings of the 28th Annual IEEE Semiconductor Thermal Measurement and Management Symposium, San Jose, CA.
[15] Green Revolution Cooling. DOI= http://www.grcooling.com/ [16] J. Dai et al, 2011. Prognostics-based Health Management for
Free Air Cooling of Data Centers. International Conference on Computer as a Tool (EUROCON), Lisbon, Portugal.
[17] C. Sujatha, S. Abimannan. 2011. Energy Efficient Free Cooling System for Data Centers. Third IEEE International Conference on Cloud Computing Technology and Science (CloudCom), Athens.
[18] M. Pawlish and A. Warde. 2010. Free Cooling: A Paradigm Shift in Data Centers. Proceeding of the Fifth International Conference on Information and Automation for Sustainability, Sri Lanka, 2010.
[19] ASHRAE. 2009. Particulate and Gaseous Contamination in Datacom Environments.
[20] Swiss Financial Market Supervisory Authority, FINMA. DOI= http://www.finma.ch/e/pages/default.aspx
[21] Stulz, DFC2 Direkte freie Kühlung. DOI=http://www.stulz.de/de/news-events/presse/2010/dfc2-direkte-freie-kuehlung/
36

Energy Consumption of Smart Meters
Michael Preisel1, Adriana Diaz1, Wolfgang Wimmer1
1ECODESIGN company GmbH, Neubaugasse 25/2/3, 1070 Wien, [email protected], [email protected], [email protected]
ABSTRACTThe project SMART METERING consumption focuses on theenergy consumption needed for the operation of smartmetering infrastructure - an issue not widely discusseduntil now. An analysis of state of the art smart meteringsolutions have been performed to provide a technology-basedmapping of technical properties that are relevant forenergy consumption. A flexible methodology was developedto enable comparability for differently organized smartmetering solutions. Field and laboratory consumptionmeasurements have been carried out to estimate totalannual energy consumptions of the whole smart meteringinfrastructure of a country. The measured data has beencombined to build representative real operation cases whichwere then used for extrapolation, according to underlyingnational scenarios for Switzerland and Austria.
KeywordsSmart meter, data concentrator, own energy consumption,technical scenarios, roll out.
1. INTRODUCTIONThe European Union as well as many countries in the worlddecided to implement smart metering infrastructure, andhave defined timelines for roll out plans. Main efforts in thearea of smart metering are targeting improvements in theefficiency of the energy supply. A comprehensive estimateof efficiency has to include, aside from the energy changesin the supply and end-use, the power that the infrastructureitself demands for its operation. This led to the centralidea of the binational SMART METERING consumption (SMc)project, which was started on behalf of the Swiss FederalOffice of Energy and the Austrian Federal Ministry ofTransport, Innovation, and Technology in September 2010.After a two-year project period results had been deliveredin May 2012.
2. RELATED WORKThere is no related work that could be considered as directlyrelated background for the SMc project. It is known thatmeter manufacturers and some utilities perform energyconsumption measurements, but the resulting data is not
ICT4S 2013: Proceedings of the First International Conference onInformation and Communication Technologies for Sustainability, ETHZurich, February 14-16, 2013. Edited by Lorenz M. Hilty, BernardAebischer, Göran Andersson and Wolfgang Lohmann.DOI: http://dx.doi.org/10.3929/ethz-a-007337628
publicly available. Furthermore, there are so far no researchor applied studies covering assessments of smart meter’sown energy consumption. Some available references arecost-benefit analyses, which partly deal with the topic ofcosts to run metering infrastructure and indirectly with ownenergy consumption.
3. PROBLEM STATEMENTThe transfer of data from metering point to the head-endsystem of a utility requires suitable hardware. These aresmart meters at the metering point, optionally additionalgateways, but also devices at other locations such as dataconcentrators, bridges, and servers throughout the wholenetwork. For the proper operation of all of these componentswithin the communication system, electric energy has to besteadily provided at distributed places. The central ideafor the SMc project was to conduct an assessment of thecorresponding total energy consumption of smart meteringhardware.
Following this idea the key questions were:
• Which device and system characteristics areresponsible for the energy consumption of thesmart meters?
• What is the best available technology with regard toown energy consumption (of smart meters)?
• How high is the estimated energy consumption ofthe likely smart metering systems for Austria andSwitzerland, also in comparison to the yet installedtechnology?
4. DERIVED METHODOLOGY4.1 Analysis of ProductsIn collaboration with key stakeholders, mainlymanufacturers and power utilities, different availablestate-of-the-art smart metering solutions have beenidentified and analyzed. In the first period of theproject an experts workshop with five different smartmeter manufacturers was organized to help identify,aggregate, and categorize main influencing parameters ofthe performance of smart meters (see figure 1). Some of themore important aspects are listed as follows:
• Measurement: refers to the physical principle inthe current path, the sampling frequency and the
37
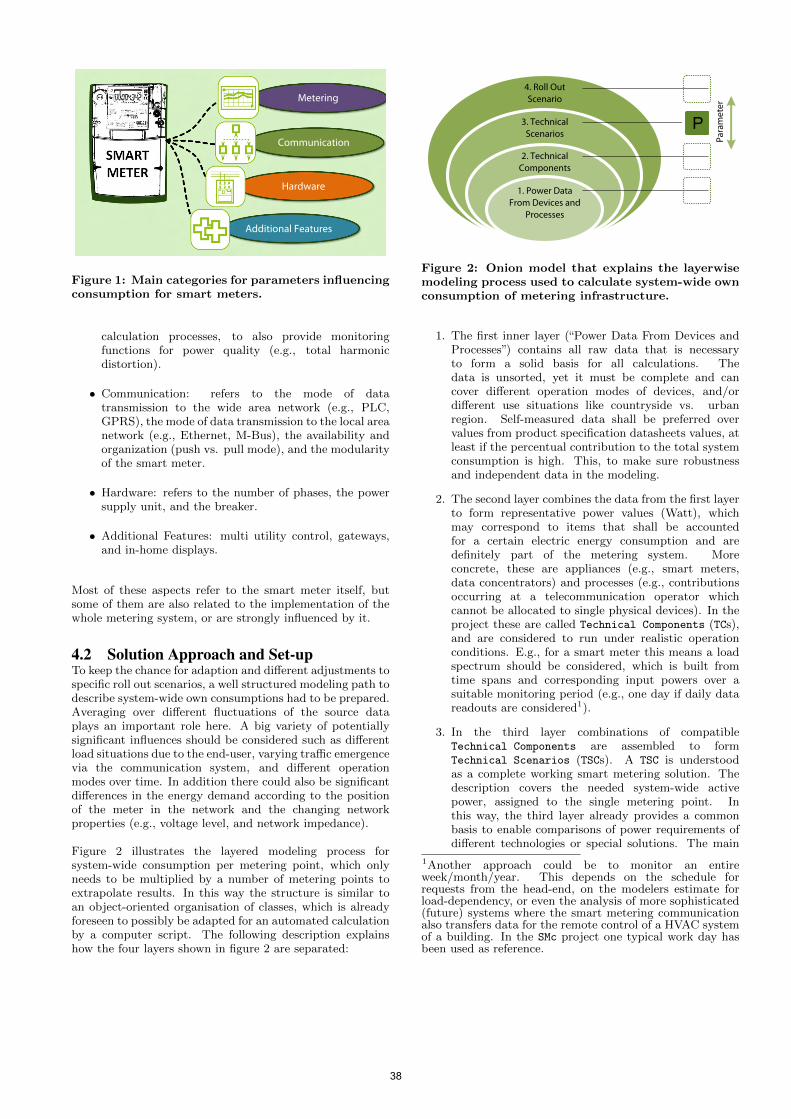
Figure 1: Main categories for parameters influencingconsumption for smart meters.
calculation processes, to also provide monitoringfunctions for power quality (e.g., total harmonicdistortion).
• Communication: refers to the mode of datatransmission to the wide area network (e.g., PLC,GPRS), the mode of data transmission to the local areanetwork (e.g., Ethernet, M-Bus), the availability andorganization (push vs. pull mode), and the modularityof the smart meter.
• Hardware: refers to the number of phases, the powersupply unit, and the breaker.
• Additional Features: multi utility control, gateways,and in-home displays.
Most of these aspects refer to the smart meter itself, butsome of them are also related to the implementation of thewhole metering system, or are strongly influenced by it.
4.2 Solution Approach and Set-upTo keep the chance for adaption and different adjustments tospecific roll out scenarios, a well structured modeling path todescribe system-wide own consumptions had to be prepared.Averaging over different fluctuations of the source dataplays an important role here. A big variety of potentiallysignificant influences should be considered such as differentload situations due to the end-user, varying traffic emergencevia the communication system, and different operationmodes over time. In addition there could also be significantdifferences in the energy demand according to the positionof the meter in the network and the changing networkproperties (e.g., voltage level, and network impedance).
Figure 2 illustrates the layered modeling process forsystem-wide consumption per metering point, which onlyneeds to be multiplied by a number of metering points toextrapolate results. In this way the structure is similar toan object-oriented organisation of classes, which is alreadyforeseen to possibly be adapted for an automated calculationby a computer script. The following description explainshow the four layers shown in figure 2 are separated:
Figure 2: Onion model that explains the layerwisemodeling process used to calculate system-wide ownconsumption of metering infrastructure.
1. The first inner layer (“Power Data From Devices andProcesses”) contains all raw data that is necessaryto form a solid basis for all calculations. Thedata is unsorted, yet it must be complete and cancover different operation modes of devices, and/ordifferent use situations like countryside vs. urbanregion. Self-measured data shall be preferred overvalues from product specification datasheets values, atleast if the percentual contribution to the total systemconsumption is high. This, to make sure robustnessand independent data in the modeling.
2. The second layer combines the data from the first layerto form representative power values (Watt), whichmay correspond to items that shall be accountedfor a certain electric energy consumption and aredefinitely part of the metering system. Moreconcrete, these are appliances (e.g., smart meters,data concentrators) and processes (e.g., contributionsoccurring at a telecommunication operator whichcannot be allocated to single physical devices). In theproject these are called Technical Components (TCs),and are considered to run under realistic operationconditions. E.g., for a smart meter this means a loadspectrum should be considered, which is built fromtime spans and corresponding input powers over asuitable monitoring period (e.g., one day if daily datareadouts are considered1).
3. In the third layer combinations of compatibleTechnical Components are assembled to formTechnical Scenarios (TSCs). A TSC is understoodas a complete working smart metering solution. Thedescription covers the needed system-wide activepower, assigned to the single metering point. Inthis way, the third layer already provides a commonbasis to enable comparisons of power requirements ofdifferent technologies or special solutions. The main
1Another approach could be to monitor an entireweek/month/year. This depends on the schedule forrequests from the head-end, on the modelers estimate forload-dependency, or even the analysis of more sophisticated(future) systems where the smart metering communicationalso transfers data for the remote control of a HVAC systemof a building. In the SMc project one typical work day hasbeen used as reference.
38

property for differentiation is the technology used toconnect the smart meters along the so called “lastmile”2.
4. Finally at the fourth layer the results from thethird layer are put together in linear combinationsto derive realistic and/or interesting Roll Out
Scenarios (ROSs). For the ROSs for Switzerlandand Austria, exemplary TSCs addressing the currentmost popular technologies such as PLC, GPRS, RadioTransmission and M-Bus have been created. Figure 3gives an overview of how these are organized.
Key remark for figure 2: On the right side a parameter Pis shown which stands for any influencing parameter. Thisshall provide more flexibility at the very outer modeling layerthan achievable through the only combination of TechnicalScenarios. A good example is the mandatory separationbetween 1- and 3-phase meters when the region to bemodeled happens to include a certain amount of 1-phaseconnected households. This parameter would be situated asshown in layer 3, if a 1-phase and a 3-phase version of theTSC have been prepared. This is the case in the modelingprocess undertaken for Austria.
Key remark for figure 3, on categories for Technical
Scenarios:
• TSC A covers systems that carry data on a conductorthat is also used for electric power transmission inthe distribution network. These systems are organizedas meshed networks, which means the nodes (smartmeters) communicate all with each other, and alsoact as repeaters to bridge higher distances to thedata concentrator. The data concentrator then sendsaccumulated data over only one connection to thehead-end system. PLC systems are currently the mostpopular cable-based technology, as they use existinginfrastructure. Moreover, PLC systems compriseabout 70% of both in Swiss and Austrian runningsmart metering pilot projects.
• TSC B describes systems that make use of servicesprovided by a telecommunication operator. Similar asfor mobile communication systems, the technologiesand protocols are the same.
• TSC C stands for proprietary radio transmissionsystems developed by meter manufacturers. These arealso organized as networks using repeating functions.In this case, some selected meters act as dataconcentrators (in parallel).
• TSC D has been introduced to evaluate special solutionsadjusted for congested areas. The standardizedwireless M-Bus protocol is used to gather meter
2This is the distance between an end node and the nexthigher level node of the network (data concentrator).It is small in relation to the distances in the datatransfer network, nevertheless high technical challenges areassociated to reaching every end node in reasonable timeand for the high number of connections. As a consequencethe overhead to operate this data collection network isoften higher than for the data transfer network.
data from e.g., one building complex with severalappartments. A gateway transmits the bundled datapackages to the head-end system.
4.3 Laboratory Stand Setup andMeasurements
Measurements of the active energy consumptions in thelaboratory as well as in field tests have been carried outto support all the following work with reliable data. Thetest series was set to cover a representative variety of smartmetering solutions available on the market. TCs which havethe greatest occurrence in the metering system were givenpriority. These are the smart meters and their correspondingmodules, and on second place, the data concentrators.The metrological work has been performed by a competentproject partner, the Institute of Electrical Power Systems ofthe Graz University of Technology. The measurements wereaddressing the main drivers for energy consumption listedin figure 1, and have been completed in four blocks:
1. Approval of the measurement equipment andarrangement: Figure 4 shows the test circuit usedto measure without any load. This means only thevoltage and current signals located at the net sideof the meter have to be registered. As the currentis low a simple shunt test circuit is sufficient. Thisarrangement allows measurements with high accuracy,but can only be used without the presence of load onthe user side of the meter. Figure 5 shows the circuitfor measurements with load of up to 16 A. This circuitwas used to analyze the sensitivity in the laboratory,and also for live measurements in the field.
Figure 4: Test circuit using shunts - for powermeasurements at the meter when it is operatedwithout load.
Figure 5: Test circuit using current transducers - forpower measurements at the meter in real use cases,when there is a certain load, caused by the end-user.
39
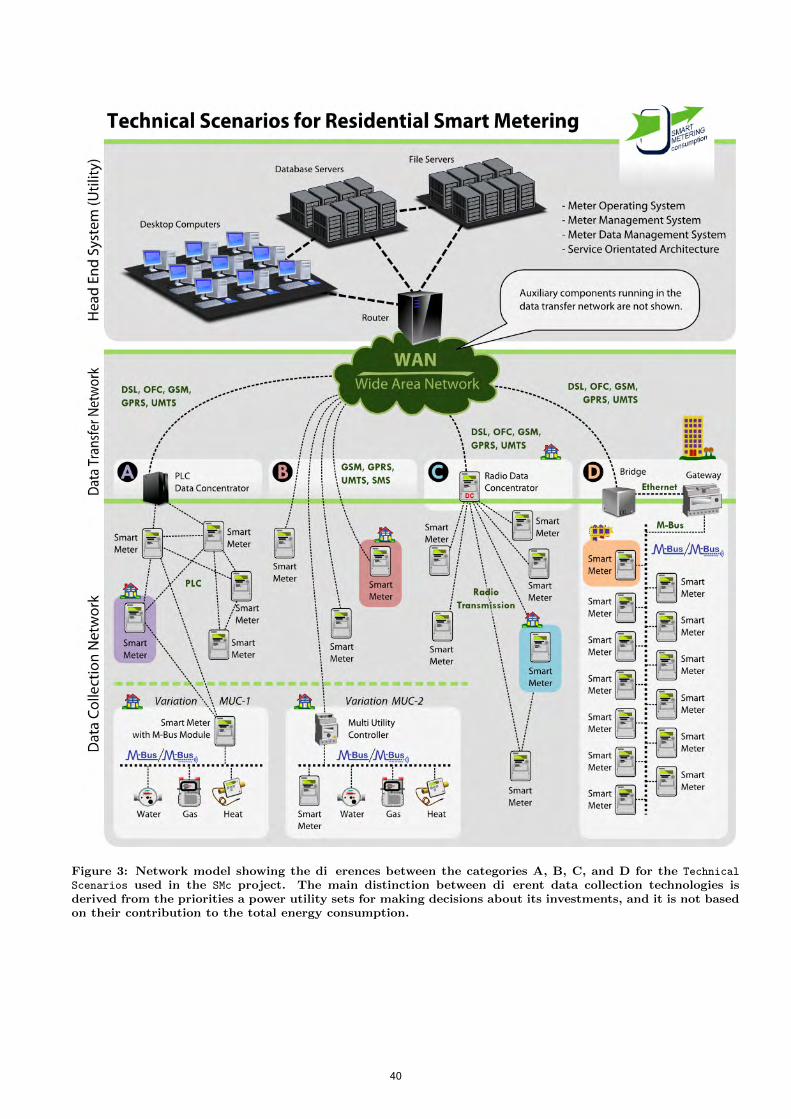
Figure 3: Network model showing the di�erences between the categories A, B, C, and D for the Technical
Scenarios used in the SMc project. The main distinction between di�erent data collection technologies isderived from the priorities a power utility sets for making decisions about its investments, and it is not basedon their contribution to the total energy consumption.
40

2. Sensitivity analysis at two 3-phase smart meterproducts that are well represented in theSwiss-Austrian market for: mains voltage, totalharmonic distortion (both coming from the netsource), load current, and power factor (both causedby different types of loads). As an example figure6 shows the relative change of own consumptionas a function of load, for smart meter productsfrom different manufacturers. The circuits used formeasuring under different circumstances (that iswithout or under load) were evaluated in parallel.
Figure 6: Anonymized comparison of sensitivity forload of different manufacturer-specific smart meterproducts, normalized to state without load.
3. Performing measurements of own energy consumptionof different smart meter products without load andunder load, in laboratory conditions.
4. Capturing live measurement data over 24 hrs: Realhouseholds situated in regions of power utilitiescooperating in the SMc project facilitated this work.The most important additional data coming from thesereal application cases was the consumption profile overtime, in connection to the remote controlled datarequests to the meters.
Figure 7: Input power curve of a 3-phaseGPRS-connected smart meter - extract of a datatransfer event (whole data log lasted for 24 hrs).
Figure 7 shows that the readout of data over the testedGPRS system (as described for TSC B) showed an inputpower increase during a timespan of about five minutes. Thereadout process over the tested PLC system lasted for 6 hrs,as shown in figure 8.
Figure 8: Input power curve of a 3-phasePLC-connected smart meter - during 24 hrs.
5. DISCUSSION OF RESULTS5.1 Comparison of Smart Meters and
Metering SystemsThe project results show a large bandwith of possible ownenergy consumption for the smart meter types used inAustrian and Swiss pilot projects so far.The measured (and derived) energy consumption rangedfrom 1.41 W to 4.64 W for a 3-phase smart meter comparedto the energy consumption of a 3-phase Ferraris meter of3.92 W, and respectively from 4.16 W to 4.65 W for a 3-phaseelectronic meter without communication.
For the SMc project TCs based on seven different technicalsolutions have been compiled. Not all of the previouslydetermined input power values are presented in a way thatthey could be directly assigned to a single metering point.The necessary calculations are performed in an extra step.To give an example, for TSC B 23 the result is:
• 1-phase metering point ... 1.83 W
• 3-phase metering point ... 2.38 W
As described above, the number of phases is kept as avariable. In the TSCs B there are no data concentratorsinvolved (see figure 3). For TSCs A the averageratio of meters connected to one data concentrator isalso used for the different subcases. For example theabbreviation “100MP” means that hundred metering pointsare managed by one data concentrator. To provide a quick
3The index 2 stands for a special solution that is memberof category B.
41
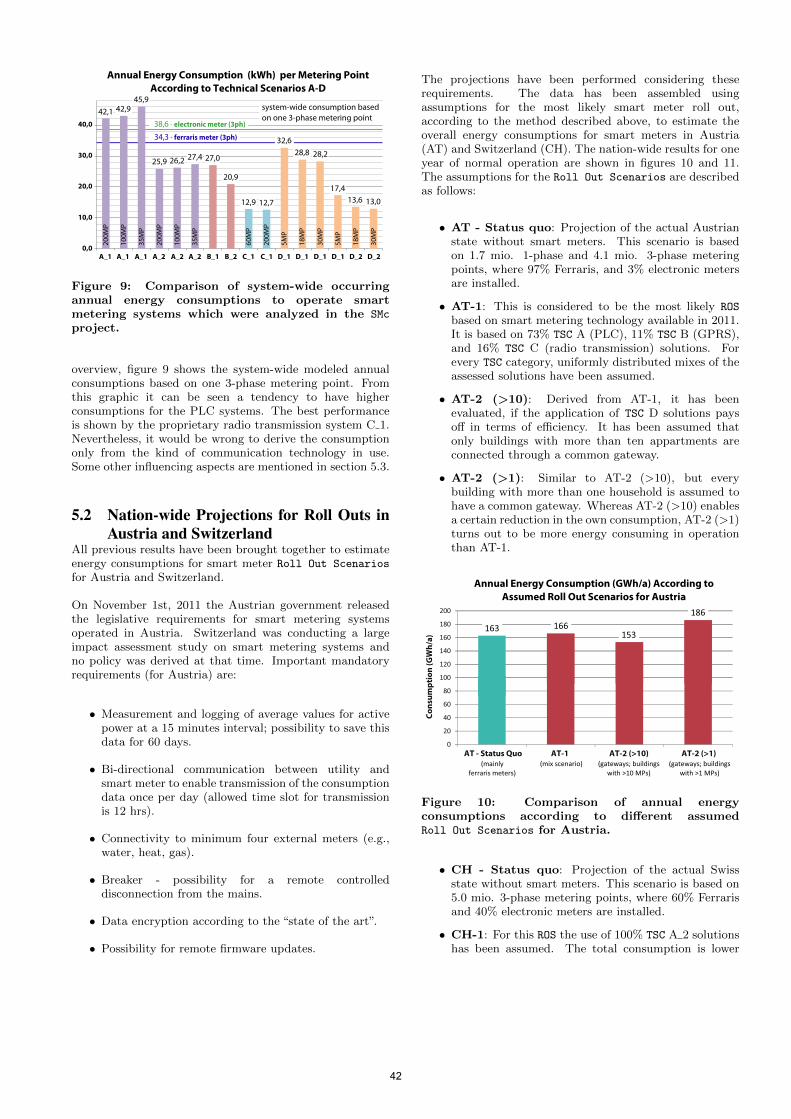
Figure 9: Comparison of system-wide occurringannual energy consumptions to operate smartmetering systems which were analyzed in the SMc
project.
overview, figure 9 shows the system-wide modeled annualconsumptions based on one 3-phase metering point. Fromthis graphic it can be seen a tendency to have higherconsumptions for the PLC systems. The best performanceis shown by the proprietary radio transmission system C 1.Nevertheless, it would be wrong to derive the consumptiononly from the kind of communication technology in use.Some other influencing aspects are mentioned in section 5.3.
5.2 Nation-wide Projections for Roll Outs inAustria and Switzerland
All previous results have been brought together to estimateenergy consumptions for smart meter Roll Out Scenarios
for Austria and Switzerland.
On November 1st, 2011 the Austrian government releasedthe legislative requirements for smart metering systemsoperated in Austria. Switzerland was conducting a largeimpact assessment study on smart metering systems andno policy was derived at that time. Important mandatoryrequirements (for Austria) are:
• Measurement and logging of average values for activepower at a 15 minutes interval; possibility to save thisdata for 60 days.
• Bi-directional communication between utility andsmart meter to enable transmission of the consumptiondata once per day (allowed time slot for transmissionis 12 hrs).
• Connectivity to minimum four external meters (e.g.,water, heat, gas).
• Breaker - possibility for a remote controlleddisconnection from the mains.
• Data encryption according to the “state of the art”.
• Possibility for remote firmware updates.
The projections have been performed considering theserequirements. The data has been assembled usingassumptions for the most likely smart meter roll out,according to the method described above, to estimate theoverall energy consumptions for smart meters in Austria(AT) and Switzerland (CH). The nation-wide results for oneyear of normal operation are shown in figures 10 and 11.The assumptions for the Roll Out Scenarios are describedas follows:
• AT - Status quo: Projection of the actual Austrianstate without smart meters. This scenario is basedon 1.7 mio. 1-phase and 4.1 mio. 3-phase meteringpoints, where 97% Ferraris, and 3% electronic metersare installed.
• AT-1: This is considered to be the most likely ROS
based on smart metering technology available in 2011.It is based on 73% TSC A (PLC), 11% TSC B (GPRS),and 16% TSC C (radio transmission) solutions. Forevery TSC category, uniformly distributed mixes of theassessed solutions have been assumed.
• AT-2 (>10): Derived from AT-1, it has beenevaluated, if the application of TSC D solutions paysoff in terms of efficiency. It has been assumed thatonly buildings with more than ten appartments areconnected through a common gateway.
• AT-2 (>1): Similar to AT-2 (>10), but everybuilding with more than one household is assumed tohave a common gateway. Whereas AT-2 (>10) enablesa certain reduction in the own consumption, AT-2 (>1)turns out to be more energy consuming in operationthan AT-1.
Figure 10: Comparison of annual energyconsumptions according to different assumedRoll Out Scenarios for Austria.
• CH - Status quo: Projection of the actual Swissstate without smart meters. This scenario is based on5.0 mio. 3-phase metering points, where 60% Ferrarisand 40% electronic meters are installed.
• CH-1: For this ROS the use of 100% TSC A 2 solutionshas been assumed. The total consumption is lower
42

Figure 11: Comparison of annual energyconsumptions according to different assumedRoll Out Scenarios for Switzerland.
than in ROS AT-1, although there are more 3-phasemetering points in Switzerland than in Austria.
• CH-2: Here it is assumed that only the Ferraris metersare exchanged by modern electronic meters. Both,the old installed and the new electronic meters donot directly communicate to the wide area network.This is realized through an auxiliary device, a gateway(see variation MUC-2 in figure 3). In comparison withCH-1 this causes an increase in the consumption.
• CH-3: In this scenario 100% metering solutions fromTSC C 1 are installed. The comparison above showedthat this is the most efficient TSC, therefore an energysaving of nearly two thirds with reference to the statusquo could be achieved.
• CH-4: With reference to the Austrian scenario AT-1,a mix of 70% TSC A (PLC) and 30% TSC B (GPRS)has been projected here. Again, like for CH-1, -2, and-3, the homogeneous application of only one solutionper category has been assumed (TSC A 2 and TSC B 1).
The calculated scenarios show that the roll out could leadto an overall reduction in the energy consumption forthe metering hardware, provided that the most efficienttechnical solutions would be rolled out, respectively, wouldstay in the range of the energy consumption of thecurrently implemented solutions, namely, Ferraris metersand electronic meters without communication system.The comparisons in the SMc project show, that the energyefficient smart metering technologies seem not to beenprevalently chosen in the Austrian implementation plansso far. This refers to the currently represented andevaluated smart metering systems in Austrian pilot projects.Moreover, there are no specific policy measures limitingconsumption per metering point, although a reduction bynearly two thirds could be achieved.Although not all possible or imaginable smart meteringtechnologies have been analyzed in the SMc project, thereare indications that higher potential for low consumptionexists, when considering technologies already established formeters of the gas or water sector (battery driven).
5.3 Identification of Aspects Causing EnergyConsumption
Within the entire smart metering infrastructure the smartmeter itself shows the highest energy consumption (76%- 98% contribution to the system-wide consumption;according to the Swiss ROSs). The main driver for the energyperformance of a smart meter is the technology used to carryout the communication of the data. Among other technicalaspects this can be explained with the permanent executionof“keep-alive functions” in PLC systems which are necessaryto keep the network stable. The corresponding overheadin radio transmission systems is much lower. Other thanelectromechanical meters which only measure and display anaccumulated consumption value, the smart meters have toprovide a couple of functionalities in parallel. This followinglist shows some aspects which are related to these.
• Number of phases: The ratio of 3-phase meterto 1-phase meter consumptions is for the analyzedsolutions ranging from 1,13 to 1,69.
• Measurement principle of the meter: There aredifferent principles in use like shunts, hall sensors,or rogowski coils which may cause different energyconsumptions.
• Integration of single functions: As the metersmay even use additional sensors (like for anti-fraudprotection) it is a question of the integration level, withhow much energy consumption every single functioncan be associated. For the signal processing in modemsthis is also an issue.
• Breaker: Some manufacturers use relays thatpermanently need energy to hold the current switchingstate. On the other hand bi-stable relays only need anegligible portion of energy in the moment the state isbeing alternated.
• Power quality features: Many meters measure notonly the basic energy consumption but are also capableof analysing the shape of the voltage signal usingfast fourier transformation algorithms. This helpsutilities understand in which actual condition the netat different locations is. These and other computationstaking place in the smart meter could cause significantadditional energy consumption.
Referring only to these few examples described above, itis already clear that the technical requirements for smartmeters, especially with focus on detailed solutions, playan important role when aiming at roll outs using efficienthardware.
Sensitivity for influencing electrical parameters fromthe network and the user sideOther than for older generations of electronic meters the twoevaluated state of the art smart meters only showed minorsensitivity to load current, mains voltage, total harmonicdistortion, or power factor of the load. Therefore, theseeffects have been neglected in the modeling approach of theSMc project.
43

6. CONCLUSIONS AND OUTLOOKThe SMc project results presented system-wide modeledenergy consumptions demanded by different smart meteringtechnologies, based on measurements of currently availablesolutions. There are big saving potentials of a factor 3through the choice of technology.A flexible and broadly applicable assessment methodologyfor performing energy measurements of Smart Meters hasbeen developed in this project. The modeling path isdesigned to easily accommodate other scenarios of roll outimplementations. Based on this, projections have beencarried out on the energy consumption of changing to smartmetering infrastructure at the national level for Austriaand Switzerland have been carried out. As there is nostandardized methodology for assessments nor plans fora harmonized international collaboration, the presentedmethodology could be the basis for further developmentsin terms of:
1. Expanded system boundaries towards the homearea of the end-user. This could include homemonitoring and home automation systems which areoften discussed in parallel with smart metering systemsand smart grids. Energy saving suggestions could beprovided to the user by the utility, or even third partycompanies, when monitoring data would be transferredover the smart metering network4. It is assumed thatthe own consumptions of such systems could exceedby far the smart metering consumption assessed inthe SMc project. These home systems are normallypurchased and installed by the end-user, therefore thecost due to the accompanying electric energy thesesystems demand are beared by them. Many differentsystems are under discussion or already on the market,e.g., in-home displays, applications for smart phonesor tablet PCs, web portals (eventually coupled witha monitoring and/or control system consisting of socalled “smart plugs” distributed in the home area,connected to an own data server, and running on anown communication system, e.g., ZigBee or broadbandPLC). There are projections for 20 to 30 nodes for aone family house, so the energy demand to performpermanent monitoring and communication throughthis home network becomes potentially relevant.Expanded system boundaries could also includealternating current converters of private photovoltaicsystems or loading stations for electric vehicles. Theseare two additional devices which are thought tobe somehow integrated in future distributed powergenerating smart grid systems.
2. International cooperation to evaluate and compareroll out plans to be set under different boundaryconditions (legal, topographical, in terms of policy,and methodologically). From the experience with thebinational SMc project, leverages and synergies forprojects between various countries could be exploredin the future.International standards which define consumptionparameters and possible limits per metering point
4In the SMc project the focus was strictly kept on themetering system itself, that only has to fulfil the corefunctionalities measuring, logging, and transferring of data.
still need to be developed (concerning system-wideoccurring consumptions).Likewise, collaboration at the international level isneeded to develop policies regarding consumption ofsmart metering.
7. REFERENCES[1] Bundesgesetzblatt fur die Republik Osterreich. 339.
Verordnung: Intelligente Messgerate-EinfuhrungsVO2012 - IME-VO 2012
[2] Bundesgesetzblatt fur die Republik Osterreich. 339.Verordnung: Intelligente Messgerate-AnforderungsVO2011 - IMA-VO 2011
[3] A. Diaz, Stephan Tomek. Scoping Study. EnergyEfficient Smart Metering. ECODESIGN company,iHomeLab Research Centre. 2012http://www.iea-4e.org/new-4e-projects
[4] Elzinga, D. and S. Heinen. Technology Roadmap SmartGrids, International Energy Agency - IEA. 2011.http://www.iea.org/Papers/2011/SmartGrids roadmap.pdf. (last accessed March 2012).
[5] Rob van Gerwen, Saskia Jaarsma and Rob Wilhite.Smart Metering. KEMA, The Netherlands. July 2006.
[6] M. Holzinger. Smart Metering und sein Einsatz inOsterreich. Master Thesis. Institut fur Verfahrens-und Energietechnik der Universitat fur Bodenkultur,Vienna, Austria. January 2011.
[7] Office of the Gas and Electricity Markets - OfgemE-Serve. Smart Metering Implementation Programme:Statement of Design Requirements. July 2010.http://www.ofgem.gov.uk/Pages/MoreInformation.aspx?docid=40&refer=e-serve/sm/Documentation.
[8] KEMA Consulting GmbH. Endbericht:Endenergieein-sparungen durch den Einsatzintelligenter Messverfahren (Smart Metering).Bonn, Germany. 2009.
[9] M. Preisel. SMART METERING consumption- Eigenverbrauch von Stromzahlern. ECODESIGNcompany GmbH. August 2012http://www.bfe.admin.ch/dokumentation/energieforschung/index.html?lang=de&publication=10937
[10] Erwin Smole. Studie zur Analyse der Kosten-Nutzeneiner osterreichweiten Einfuhrung von SmartMetering. PwC Osterreich. June 2010.
[11] J. Stromback, C. Dromacque, and M.H. Yassin.The potential of smart meter enabled programs toincrease energy and systems efficiency: a masspilot comparison (Short name: Empower Demand).VaasaETT Global Energy Think Tank. 2011.http://www.esmig.eu/press/filestor/empower-demand-report.pdf. (last accessed April 2012).
[12] Swiss Federal Office of Energy. Folgeabschatzung einerEinfuhrung von Smart Metering im Zusammenhangmit Smart Grids in der Schweiz. 2012.http://www.news.admin.ch/NSBSubscriber/message/attachments/27519.pdf
44

Insights from a decade of development cooperation in e-waste management
Mathias Schluep, Esther Müller, Lorenz M. Hilty, Daniel Ott, Rolf Widmer, Heinz Böni
Technology and Society Laboratory, Swiss Federal Laboratories for Materials Science and Technology (Empa)
Lerchenfeldstrasse 5, 9014 St. Gallen, Switzerland +41 58 765 7857
ABSTRACT
This paper presents insights from a decade of development cooperation projects in electrical and electronic waste (e-waste) management and associated research activities, conducted by Empa’s Technology and Society Lab together with a number of international partners. The quantification of e-waste volumes is a prerequisite for the development of sustainable solutions in developing countries. Challenges include getting an understanding of the accuracy of data and the dynamic behavior of e-waste flows and their constituents. In addition, the thermodynamic and physical properties of the material mix found in e-waste needs to be understood in order to achieve efficient recovery of the material resources. The past and still on-going application of hazardous substances in electrical and electronic equipment will remain a dominant issue in sustainable e-waste management systems in the future, if environmental, health and safety hazards, as well as cross-contamination into recovered secondary resources, are to be avoided. Furthermore, tailored solutions will have to take into account the informal nature of e-waste recycling in developing countries. Although continuing miniaturization of electronic devices can be observed, overall volumes and mass flows are expected to increase steadily in the future, as appliances are getting cheaper and hence more accessible, especially in the non-saturated markets of developing countries.
Keywords
Waste electrical and electronic equipment, e-waste, ICT hardware, developing countries, informal sector, recycling, hazardous waste, waste flows, waste management
1. INTRODUCTION Access to Information and Communication Technology (ICT) is pivotal for a country’s economic and social development and is currently improving throughout the developed, but also the developing world. However, ICT is also contributing to the ever growing amount of electronic waste (e-waste). E-waste has been recognized as a complex waste stream containing both hazardous substances and valuable secondary resources [1]. Serious health, socio-economic, and environmental problems that arise from the improper management of e-waste have been widely documented [2]. While in OECD countries the paradigms of a "closed loop economy" and "extended producer responsibility (EPR)" have
paved the ground for a professionalizing e-waste recycling sector [3], developing countries and countries in transition often lack the infrastructure as well as the financial and institutional resources for the sustainable management of e-waste.
Investigations by NGOs such as The Basel Action Network [4], [5], Toxics Link [6] or Greenpeace [7], [8] about informal e-waste recycling in developing countries started to make their way to the mass media in the early 2000s. Poor people in the slums of megacities in developing countries started to recover valuables from the e-waste stream, putting themselves and their environ-ment at considerable risk [2]. As a result of the public attention, various international cooperation projects in e-waste management were launched by multilateral (UN) organizations (e.g. in Africa [9–11]), producers from the ICT industry (e.g. Hewlett Packard [12]), NGOs and governmental organizations, mainly between 2003 and 2010. Amongst them was the Swiss e-Waste Programme, initiated by the Swiss State Secretariat of Economic Affairs (SECO) and implemented by Empa together with local organizations in the partner countries. It has been a pioneering initiative, addressing the challenges of sustainable e-waste management in various developing countries and countries in transition. In synergy with this initiative, the following supporting research activities, grouped into four topical areas, were pursued in order to address the main challenges and issues that were identified in the first years of development co-operation:
Assessing e-waste volumes Assessing and treating hazardous substances in e-waste Understanding informal recycling and assessing its efficiency
and impacts Understanding and predicting long-term trends This paper recapitulates the lessons learned from a decade of research and implementation activities in e-waste management in the context of Empa’s programmes in developing countries and related projects. Each of the chapters 2-5 relates to one of the four challenges mentioned above.
2. E-WASTE VOLUMES Experiences in developing countries have shown that e-waste management has to meet a number of requirements which go beyond pure technical implementation and which demand for a comprehensive and structured approach. The starting point for any approach to e-waste management is to understand the current framework conditions, with the quantification of current and prospective e-waste volumes being the most important piece of information on which tailored and sustainable solutions can be
ICT4S 2013: Proceedings of the First International Conference on Information and Communication Technologies for Sustainability, ETH Zurich, February 14-16, 2013. Edited by Lorenz M. Hilty, Bernard Aebischer, Göran Andersson and Wolfgang Lohmann. DOI: http://dx.doi.org/10.3929/ethz-a-007337628
45

built. Hence Empa developed an e-waste country assessment methodology [12] which has been applied in various countries (Table 1).
Prior to the quantification of e-waste volumes, the assessment methodology requires the definition of scope (geographical focus, product categories) and objective (e.g. obtain a reliable overview of the e-waste landscape in the selected country). A thorough stakeholder assessment, considering the processes import/ production, consumption, repair, refurbishment, collection, dismantling, recycling, refining and final disposal, identifies all actors involved and their role and interest in the management of electrical and electronic equipment (EEE) and the resulting e-waste. Along with the knowledge of how stakeholders are interlinked, a material flow system can be developed that forms the basis for the material flow analysis (MFA). For concrete examples, please refer to the sources cited in Table 1.
Table 1: Available e-waste country assessment according to the Empa methodology.
Country Year References Benin 2010/11 [13] Burkina Faso 2010/11 [14] Côte d’Ivoire 2010/11 [15] Ghana 2010/11 [16] Nigeria 2010/11 [17] Tanzania 2010 [10] Uganda 2008 [11] South Africa 2008 [18] Morocco 2008 [19] Chile 2007 [20], [21] Colombia 2008 [22] Peru 2008 [23] Brazil 2009 [24] Kenya 2008 [25]
Due to limited data availability, the quantification of e-waste volumes in developing countries is an iterative process, often based on a mixed 'top-down' and 'bottom-up' approach. Figures on imports or production of EEE are commonly available from statistical data while the consumers' stock of EEE is best quantified by surveys. The predominantly informal waste collection and management systems are the least documented, for which reason e-waste quantities are often assessed by assigning lifetimes to specific products (for details see e.g. [12], [26]). Through additional field investigations and interviews, meetings and workshops with the stakeholders, valuable information such as transfer coefficients between processes, downstream processes of materials and material quality can be obtained.
Challenges related to the quantification of e-waste volumes in developing countries are, among others, the absence of previous studies to serve as local reference and baseline information for purposes of comparison, poor reliability of data from official sources and the informal nature of the e-waste sector. Furthermore, surveys are often conducted in a limited area not always representative for the assessed country as a whole. E-waste assessment studies thus often highly rely on expert judgments or assumptions to arrive at coherent mass flow quantification. In literature, data uncertainty of MFA is often dealt with by
propagation of uncertainty, least square fitting, sensitivity analysis or uncertainty intervals [27], [28]. If most available data are single values from different sources (measurements, interviews, official statistics), as in our case, it is even difficult to estimate the uncertainty. Most of the existing e-waste assessment studies thus limit this discussion to plausibility considerations in order to confirm the results (e.g. [16], [17]).
The studies listed in Table 1 are all static MFAs that present only a snapshot in time. Dynamic MFAs of e-waste in developing countries are difficult to accomplish due to limited data availability. Production or import quantities of selected EEE are often the only data available as time series. Although this information, together with lifetime distributions assigned to the different types of EEE, is in principle sufficient to calculate the resulting e-waste volumes [12], [26], the reliability of the data is often low and thus provides a poor basis for extrapolations (e.g. [10], [11], [16], [17]). In developed countries, dynamic MFAs of e-waste exist, but are usually limited to one or a few products, such as computers in the U.S. [29] or computers, TVs, washing machines, refrigerators and air conditioners in Beijing [30]. A new study from the Netherlands presents results based on dynamic MFA for all e-waste categories [31].
Quantitative models for predicting e-waste flows based on diffusion and obsolescence were developed and discussed in [32], namely the “delay model” and the “reverse diffusion model”. Using the example of CRT monitors crowded out by flat screen technologies, the models were validated based on data for Switzerland. These models can be used to forecast the disposal of durable hardware products in the market that are rendered obsolete by the next technological generation [32], [33].
At a global level, free available data such as the ITU World Telecommunication/ICT Indicators Database [34] give valuable information on penetration rates of selected products. Based on these indicators, a study on global e-waste generation from computers was built [26].
However, it is not sufficient to know the e-waste flows alone to find ways for efficient resource recovery. Products entering the e-waste stream are featuring a variety and complex material mixes. Regarding the various metals contained in e-waste fractions, for example, it is of great advantage if they are mutually compatible with respect to their thermodynamic and physical properties, or to other impurities, so that the metallurgical processing technologies used by metals producers and refiners can recover the metals well economically. If not, mixed alloys, sludges, slimes and slags of low economic value are produced, which have a dumping or storing cost attached to them [35]. Hence, assessed e-waste flows also need to be attributed with information about their material composition and their thermodynamic and physical properties, as well as the uncertainties related to this information.
3. HAZARDOUS SUBSTANCES E-waste can contain a broad variety of hazardous substances, including heavy metals and Persistent Organic Pollutants (POPs) [36]. Although some of these substances were regulated and phased out over the past years, they are still present in older equipment. Other hazardous substances are still legally used in new products, such as mercury, which can be found in a range of today’s EEE. Due to the presence of these substances, e-waste is generally considered hazardous waste under the Basel Convention [37]. If improperly managed, as often happens in the informal sectors of developing countries and countries in transition, e-waste may pose significant human and environmental health risks.
46
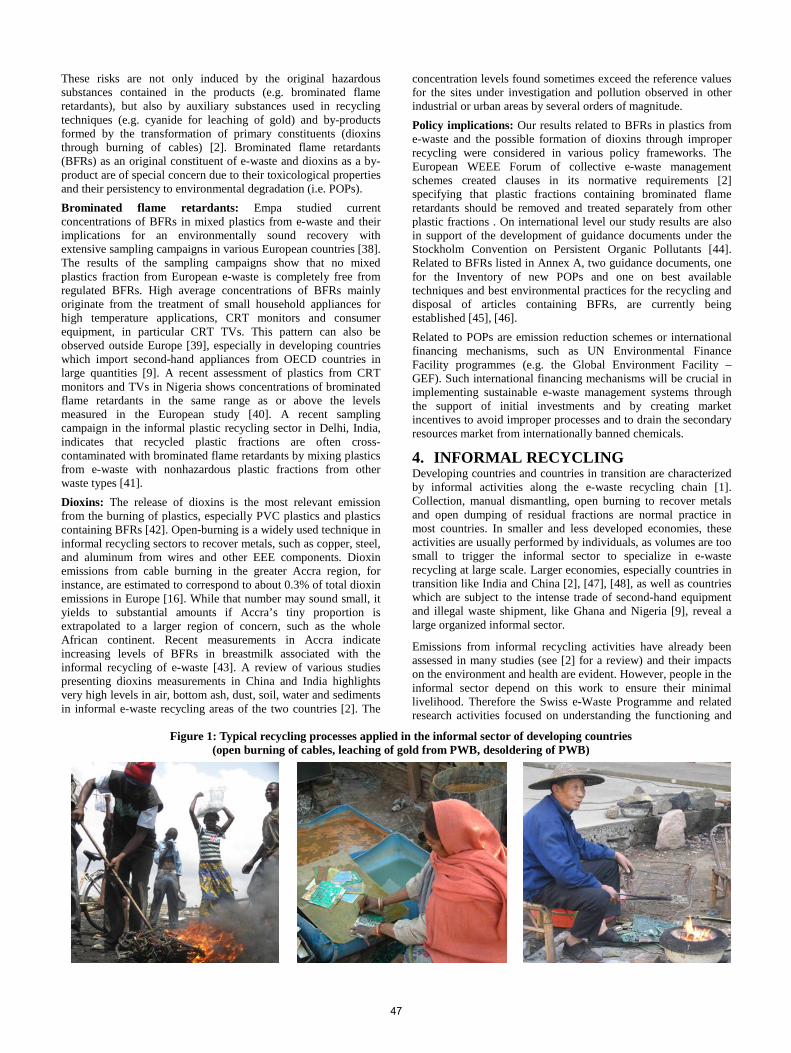
These risks are not only induced by the original hazardous substances contained in the products (e.g. brominated flame retardants), but also by auxiliary substances used in recycling techniques (e.g. cyanide for leaching of gold) and by-products formed by the transformation of primary constituents (dioxins through burning of cables) [2]. Brominated flame retardants (BFRs) as an original constituent of e-waste and dioxins as a by-product are of special concern due to their toxicological properties and their persistency to environmental degradation (i.e. POPs). Brominated flame retardants: Empa studied current concentrations of BFRs in mixed plastics from e-waste and their implications for an environmentally sound recovery with extensive sampling campaigns in various European countries [38]. The results of the sampling campaigns show that no mixed plastics fraction from European e-waste is completely free from regulated BFRs. High average concentrations of BFRs mainly originate from the treatment of small household appliances for high temperature applications, CRT monitors and consumer equipment, in particular CRT TVs. This pattern can also be observed outside Europe [39], especially in developing countries which import second-hand appliances from OECD countries in large quantities [9]. A recent assessment of plastics from CRT monitors and TVs in Nigeria shows concentrations of brominated flame retardants in the same range as or above the levels measured in the European study [40]. A recent sampling campaign in the informal plastic recycling sector in Delhi, India, indicates that recycled plastic fractions are often cross-contaminated with brominated flame retardants by mixing plastics from e-waste with nonhazardous plastic fractions from other waste types [41]. Dioxins: The release of dioxins is the most relevant emission from the burning of plastics, especially PVC plastics and plastics containing BFRs [42]. Open-burning is a widely used technique in informal recycling sectors to recover metals, such as copper, steel, and aluminum from wires and other EEE components. Dioxin emissions from cable burning in the greater Accra region, for instance, are estimated to correspond to about 0.3% of total dioxin emissions in Europe [16]. While that number may sound small, it yields to substantial amounts if Accra’s tiny proportion is extrapolated to a larger region of concern, such as the whole African continent. Recent measurements in Accra indicate increasing levels of BFRs in breastmilk associated with the informal recycling of e-waste [43]. A review of various studies presenting dioxins measurements in China and India highlights very high levels in air, bottom ash, dust, soil, water and sediments in informal e-waste recycling areas of the two countries [2]. The
concentration levels found sometimes exceed the reference values for the sites under investigation and pollution observed in other industrial or urban areas by several orders of magnitude. Policy implications: Our results related to BFRs in plastics from e-waste and the possible formation of dioxins through improper recycling were considered in various policy frameworks. The European WEEE Forum of collective e-waste management schemes created clauses in its normative requirements [2] specifying that plastic fractions containing brominated flame retardants should be removed and treated separately from other plastic fractions . On international level our study results are also in support of the development of guidance documents under the Stockholm Convention on Persistent Organic Pollutants [44]. Related to BFRs listed in Annex A, two guidance documents, one for the Inventory of new POPs and one on best available techniques and best environmental practices for the recycling and disposal of articles containing BFRs, are currently being established [45], [46]. Related to POPs are emission reduction schemes or international financing mechanisms, such as UN Environmental Finance Facility programmes (e.g. the Global Environment Facility – GEF). Such international financing mechanisms will be crucial in implementing sustainable e-waste management systems through the support of initial investments and by creating market incentives to avoid improper processes and to drain the secondary resources market from internationally banned chemicals.
4. INFORMAL RECYCLING Developing countries and countries in transition are characterized by informal activities along the e-waste recycling chain [1]. Collection, manual dismantling, open burning to recover metals and open dumping of residual fractions are normal practice in most countries. In smaller and less developed economies, these activities are usually performed by individuals, as volumes are too small to trigger the informal sector to specialize in e-waste recycling at large scale. Larger economies, especially countries in transition like India and China [2], [47], [48], as well as countries which are subject to the intense trade of second-hand equipment and illegal waste shipment, like Ghana and Nigeria [9], reveal a large organized informal sector.
Emissions from informal recycling activities have already been assessed in many studies (see [2] for a review) and their impacts on the environment and health are evident. However, people in the informal sector depend on this work to ensure their minimal livelihood. Therefore the Swiss e-Waste Programme and related research activities focused on understanding the functioning and
Figure 1: Typical recycling processes applied in the informal sector of developing countries (open burning of cables, leaching of gold from PWB, desoldering of PWB)
47
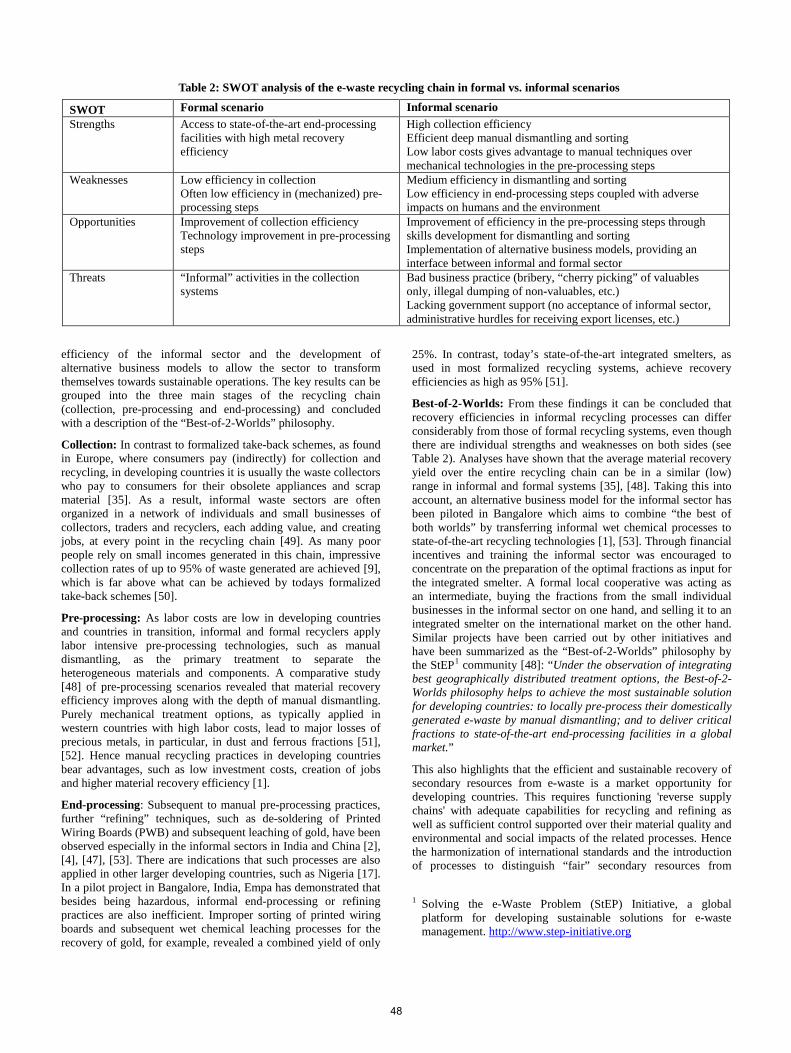
efficiency of the informal sector and the development of alternative business models to allow the sector to transform themselves towards sustainable operations. The key results can be grouped into the three main stages of the recycling chain (collection, pre-processing and end-processing) and concluded with a description of the “Best-of-2-Worlds” philosophy.
Collection: In contrast to formalized take-back schemes, as found in Europe, where consumers pay (indirectly) for collection and recycling, in developing countries it is usually the waste collectors who pay to consumers for their obsolete appliances and scrap material [35]. As a result, informal waste sectors are often organized in a network of individuals and small businesses of collectors, traders and recyclers, each adding value, and creating jobs, at every point in the recycling chain [49]. As many poor people rely on small incomes generated in this chain, impressive collection rates of up to 95% of waste generated are achieved [9], which is far above what can be achieved by todays formalized take-back schemes [50].
Pre-processing: As labor costs are low in developing countries and countries in transition, informal and formal recyclers apply labor intensive pre-processing technologies, such as manual dismantling, as the primary treatment to separate the heterogeneous materials and components. A comparative study [48] of pre-processing scenarios revealed that material recovery efficiency improves along with the depth of manual dismantling. Purely mechanical treatment options, as typically applied in western countries with high labor costs, lead to major losses of precious metals, in particular, in dust and ferrous fractions [51], [52]. Hence manual recycling practices in developing countries bear advantages, such as low investment costs, creation of jobs and higher material recovery efficiency [1].
End-processing: Subsequent to manual pre-processing practices, further “refining” techniques, such as de-soldering of Printed Wiring Boards (PWB) and subsequent leaching of gold, have been observed especially in the informal sectors in India and China [2], [4], [47], [53]. There are indications that such processes are also applied in other larger developing countries, such as Nigeria [17]. In a pilot project in Bangalore, India, Empa has demonstrated that besides being hazardous, informal end-processing or refining practices are also inefficient. Improper sorting of printed wiring boards and subsequent wet chemical leaching processes for the recovery of gold, for example, revealed a combined yield of only
25%. In contrast, today’s state-of-the-art integrated smelters, as used in most formalized recycling systems, achieve recovery efficiencies as high as 95% [51].
Best-of-2-Worlds: From these findings it can be concluded that recovery efficiencies in informal recycling processes can differ considerably from those of formal recycling systems, even though there are individual strengths and weaknesses on both sides (see Table 2). Analyses have shown that the average material recovery yield over the entire recycling chain can be in a similar (low) range in informal and formal systems [35], [48]. Taking this into account, an alternative business model for the informal sector has been piloted in Bangalore which aims to combine “the best of both worlds” by transferring informal wet chemical processes to state-of-the-art recycling technologies [1], [53]. Through financial incentives and training the informal sector was encouraged to concentrate on the preparation of the optimal fractions as input for the integrated smelter. A formal local cooperative was acting as an intermediate, buying the fractions from the small individual businesses in the informal sector on one hand, and selling it to an integrated smelter on the international market on the other hand. Similar projects have been carried out by other initiatives and have been summarized as the “Best-of-2-Worlds” philosophy by the StEP1 community [48]: “Under the observation of integrating best geographically distributed treatment options, the Best-of-2-Worlds philosophy helps to achieve the most sustainable solution for developing countries: to locally pre-process their domestically generated e-waste by manual dismantling; and to deliver critical fractions to state-of-the-art end-processing facilities in a global market.”
This also highlights that the efficient and sustainable recovery of secondary resources from e-waste is a market opportunity for developing countries. This requires functioning 'reverse supply chains' with adequate capabilities for recycling and refining as well as sufficient control supported over their material quality and environmental and social impacts of the related processes. Hence the harmonization of international standards and the introduction of processes to distinguish “fair” secondary resources from
1 Solving the e-Waste Problem (StEP) Initiative, a global platform for developing sustainable solutions for e-waste management. http://www.step-initiative.org
Table 2: SWOT analysis of the e-waste recycling chain in formal vs. informal scenarios
SWOT Formal scenario Informal scenario Strengths Access to state-of-the-art end-processing
facilities with high metal recovery efficiency
High collection efficiency Efficient deep manual dismantling and sorting Low labor costs gives advantage to manual techniques over mechanical technologies in the pre-processing steps
Weaknesses Low efficiency in collection Often low efficiency in (mechanized) pre-processing steps
Medium efficiency in dismantling and sorting Low efficiency in end-processing steps coupled with adverse impacts on humans and the environment
Opportunities Improvement of collection efficiency Technology improvement in pre-processing steps
Improvement of efficiency in the pre-processing steps through skills development for dismantling and sorting Implementation of alternative business models, providing an interface between informal and formal sector
Threats “Informal” activities in the collection systems
Bad business practice (bribery, “cherry picking” of valuables only, illegal dumping of non-valuables, etc.) Lacking government support (no acceptance of informal sector, administrative hurdles for receiving export licenses, etc.)
48

materials recovered under sub-standard conditions (e. g., burning cables to recover copper) will be instrumental to leverage these opportunities.
5. LONG-TERM TRENDS It is likely that the quantities of discarded electronics will increase substantially in the foreseeable future as a result of fast innovation cycles and increased market penetration of cheap electronics, the latter being the main driver of e-waste volumes in developing countries and countries in transition.
An important long-term trend that affects the waste flows is the ever-higher integration and miniaturization of digital electronics and, related to this, an increasing complexity of the material composition. The physical mass needed to provide capacities for storing, processing and transmitting data is decreasing at a rapid pace (roughly along the lines of Moore’s Law), which leads to a decrease of the average physical mass per device in use, despite increasing functionality. It has been observed using the example of mobile phones that this trend does not lead to a decrease in total mass flow, because at the same time the number of devices is increasing faster [54]. Historically, this “miniaturization paradox” can be explained by the general trend that processing capacity “is getting cheaper faster than it is getting smaller” [55] (p. 95). The miniaturization paradox has three effects on e-waste streams:
1. Total mass flow increases despite of smaller and more lightweight devices;
2. More devices enter other waste streams because they are small and unremarkable; this trend increases with embedded electronics [56–58];
3. Informal recycling becomes more difficult because of the higher integration density of the devices.
E-waste treatment and even the definition of e-waste will have to adapt to this general trend if the dissipation of valuable materials is to be slowed down in the long term.
Besides the development at the hardware level, software trends are affecting e-waste streams as well. The software innovation cycle usually renders hardware obsolete much faster than physical deterioration. Consumer lock-in can force the users to buy new software and hardware due to software compatibility issues. In an early study on desktop computers, Empa has shown that software innovation not only creates demand for new hardware, but in some cases even bilks the users of the higher performance they could theoretically expect from the new hardware [59], [60]. The external effects of e-waste are a high price we pay for a sometimes relatively low benefit.
These dynamics are slowly but steadily changing the nature of e-waste and requiring continuous adaptation of the formal and informal recycling industries around the world.
6. REFERENCES [1] M. Schluep, C. Hagelueken, R. Kuehr, F. Magalini, C.
Maurer, C. Meskers, E. Mueller, and F. Wang, “Recycling - from e-waste to resources, Sustainable innovation and technology transfer industrial sector studies,” United Nations Environment Programme (UNEP), Paris, France, 2009.
[2] A. Sepúlveda, M. Schluep, F. G. Renaud, M. Streicher, R. Kuehr, C. Hagelüken, and A. C. Gerecke, “A review of the
environmental fate and effects of hazardous substances released from electrical and electronic equipments during recycling: Examples from China and India,” Environmental Impact Assessment Review, vol. 30, no. 1, pp. 28–41, 2010.
[3] D. Sinha-Khetriwal, P. Kraeuchi, and R. Widmer, “Producer responsibility for e-waste management: Key issues for consideration - Learning from the Swiss experience,” Journal of Environmental Management, vol. 90, no. 1, pp. 153–165, 2009.
[4] J. Puckett, L. Byster, S. Westervelt, R. Gutierrez, S. Davis, A. Hussain, and M. Dutta, “Exporting harm, the high-tech trashing of Asia,” The Basel Action Network (BAN)Silicon Valley Toxics Coalition (SVTC), Seattle, WA., USA, 2002.
[5] J. Puckett, S. Westervelt, R. Gutierrez, and Y. Takamyia, “The digital dump, exporting re-use and abuse to Africa,” The Basel Action Network (BAN), Seattle, WA., USA, 2005.
[6] R. Agarwal, R. Ranjan, and P. Sarkar, “Scrapping the hi-tech myth: computer waste in India,” Toxics Link, New Delhi, 2003.
[7] K. Brigden, I. Labunska, D. Santillo, and M. Allsopp, “Recycling of electronic waste in china and india: workplace & environmental contamination,” Greenpeace International, 2005.
[8] K. Brigden, I. Labunska, D. Santillo, and P. Johnston, “Chemical contamination at e-waste recycling and disposal sites in Accra and Korforidua, Ghana,” Greenpeace International, Amsterdam, The Netherlands, 2008.
[9] Secretariat of the Basel Convention, “Where are WEee in Africa? Findings from the Basel Convention e-Waste Africa Programme,” Geneva / Switzerland, 2011.
[10] A. Magashi and M. Schluep, “e-Waste Assessment Tanzania,” Cleaner Production Centre of Tanzania & Empa Switzerland, 2011.
[11] J. Wasswa and M. Schluep, “e-Waste assessment in Uganda: A situational analysis of e-waste management and generation with special emphasis on personal computers,” Uganda Cleaner Production Center, Empa, Kampala/Uganda, St.Gallen/Switzerland, 2008.
[12] M. Schluep, “e-Waste Assessment Methodology - Training & Reference Manual,” 2012. [Online]. Available: http://www.ewasteguide.info/Empa_2012_Assmt-Methodology.
[13] M. Aina, I. O. Djeri, M. Seck, D. Rochat, and M. Schluep, “Rapport technique d’étude de diagnostic sur la gestion des DEEE au Bénin,” CSEE, MEPN, BCRC-S, SOFIES, Empa, Cotonou, Benin, 2011.
[14] PACE, “Rapport technique de diagnostic national de la gestion des DEEE au Burkina Faso,” Partnership for Action on Computing Equipment (PACE), Secretariat of the Basel Convention (SBC-UNEP) and United Nations Development Organization (UNDP), Geneva / Switzerland, 2011.
[15] A. Messou, Y. B. Koffi, M. Seck, D. Rochat, and M. Schluep, “Rapport technique d’étude de diagnostic sur la gestion des DEEE en Côte d’Ivoire,” CECAF, MINEEF, BCRC-S, SOFIES, Empa, Abidjan, Côte d’Ivoire, 2011.
[16] Y. Amoyaw-Osei, O. O. Agyekum, J. A. Pwamang, E. Mueller, R. Fasko, and M. Schluep, “Ghana e-Waste Country Assessment,” Green Advocacy, Ghana & Empa, Switzerland, Accra, Ghana, 2011.
49

[17] O. Ogungbuyi, I. C. Nnorom, O. Osibanjo, and M. Schluep, “Nigeria e-Waste Country Assessment,” Basel Convention Coordinating Centre for Africa (BCCC-Nigeria) and Swiss Federal Laboratories for Materials Science and Technology (Empa), Ibadan/Nigeria and St.Gallen/Switzerland, 2012.
[18] A. Finlay and D. Liechti, “e-Waste assessment South Africa,” Openresearch, Empa, Johannesburg / South Africa, 2008.
[19] S. E. Laissaoui and D. Rochat, “Morocco: e-waste country assessment (2008),” in Waste Management Conference (WasteCon2008), Durban, South Africa, 2008.
[20] B. Steubing, “e-Waste generation in Chile, situation analysis and estimation of actual and future computer waste quantities using material flow analysis,” Master Thesis, Swiss Federal Institute of Technology (EPFL) / Swiss Federal Laboratories for Materials Testing and Research (Empa), Lausanne / St.Gallen Switzerland, 2007.
[21] B. Steubing, H. Böni, M. Schluep, U. Silva, and C. Ludwig, “Assessing computer waste generation in Chile using material flow analysis,” Waste Management, vol. 30, pp. 473–482, 2010.
[22] D. Ott, “Gestión de Residuos Electrónicos en Colombia: Diagnóstico de Computadores y Teléfonos Celulares,” Swiss Federal Laboratories for Materials Testing and Research (Empa), Centro Nacional de Produccion Mas Limpia (CNPMLTA), Medellin, Colombia, Informe Final, 2008.
[23] O. Espinoza, L. Villar, T. Postigo, and H. Villaverde, “Diagnóstico del Manejo de los Residuos Electrónicos en el Perú,” Institute for the Development of Social Economy (IPES), Swiss Federal Laboratories for Materials Testing and Research (Empa), Lima, Peru, 2008.
[24] G. Rocha, “Diagnosis of Waste Electric and Electronic Equipment Generation in the State of Minas Gerais,” Fundacao Estadual do Meio Ambiente (FEAM), Governo Minas, Minas Gerais, Brazil, 2009.
[25] T. Waema and M. Mureithi, “E-waste Management in Kenya,” Kenya ICT Action Network (KICTANet), Nairobi, Kenya, 2008.
[26] E. Mueller, M. Schluep, R. Widmer, F. Gottschalk, and H. Böni, “Assessment of e-waste flows: a probabilistic approach to quantify e-waste based on world ICT and development indicators,” in R’09 World Congress, Davos, Switzerland, 2009.
[27] P. H. Brunner and H. Rechberger, Practical Handbook of Material Flow Analysis. Lewis Publishers, 2004.
[28] J. Hedbrant and L. Sörme, “Data Vagueness and Uncertainties in Urban Heavy-Metal Data Collection,” Water, Air, & Soil Pollution: Focus, vol. 1, no. 3, pp. 43–53, 2001.
[29] Y. Yang and E. Williams, “Logistic model-based forecast of sales and generation of obsolete computers in the U.S.,” Technological Forecasting and Social Change, vol. 76, no. 8, pp. 1105–1114, Oct. 2009.
[30] X. B. Liu, M. Tanaka, and Y. Matsui, “Generation amount prediction and material flow analysis of electronic waste: a case study in Beijing, China,” Waste Management & Research, vol. 24, pp. 434–445, 2006.
[31] J. Huisman, M. van der Maesen, R. J. J. Eijsbouts, F. Wang, C. P. Baldé, and C. A. Wielenga, “The Dutch WEEE Flows,” United Nations University, ISP – SCYCLE, Bonn, Germany, Mar. 2012.
[32] D. Sinha-Khetriwal, “Diffusion, Obsolescence and Disposal of Consumer Durables: Models for Forecasting Waste Flows of End-of-Life Consumer Durables,” University of St.Gallen HSG, 2012.
[33] D. Sinha-Khetriwal, R. Widmer, M. Schwaninger, and L. M. Hilty, “Application of System Dynamics to Assess Mass Flows of Waste Electrical and Electronic Equipment (WEEE),” presented at the The 30th International Conference of the System Dynamics Society, St.Gallen / Switzerland, 2012.
[34] ITU, “World Telecommunication ICT Indicators Database, Chronological Time Series 1960-2007,” Information Technology Union (ITU), Geneva / Switzerland, 12th Edition 2008, 2008.
[35] UNEP, “Metal Recycling - Opportunities, Limits, Infrastructure,” United Nations Environment Programme (UNEP), Paris / France, Draft #3, 2012.
[36] O. Tsydenova and M. Bengtsson, “Chemical hazards associated with treatment of waste electrical and electronic equipment,” Waste Management, vol. 31, no. 1, pp. 45 – 58, 2011.
[37] UNEP, “Basel Convention on the Control of Transboundary Movements of Hazardous Wastes and Their Disposal.” United Nations Environment Programme / Secretariat of the Basel Convention, 1989.
[38] P. A. Wäger, M. Schluep, E. Müller, and R. Gloor, “RoHS regulated Substances in Mixed Plastics from Waste Electrical and Electronic Equipment,” Environmental Science & Technology, vol. 46, no. 2, pp. 628–635, 2012.
[39] E. Müller, M. Schluep, P. Wäger, and P. Leroy, “RoHS - regulated substances in mixed plastics from Waste Electrical and Electronic Equipment,” presented at the Electronic Goes Green 2012+, Berlin, Germany, 2012.
[40] O. Sindiku, J. O. Babyemi, O. Osibanjo, M. Schlummer, M. Schluep, and R. Weber, “Assessing BFRs and POP-PBDEs in e-waste polymers in Nigeria,” presented at the DIOXIN 2012, 32nd International Symposium on Halogenated Persisten Organic Pollutants, Cairns, 2012.
[41] Toxics Link and Empa, “Improving plastic management in Delhi. A report on WEEE plastic recycling,” Delhi, India, 2012.
[42] N. Lubick, “Shifting Mountains of Electronic Waste,” Environ Health Perspect, vol. 120, no. 4, 2012.
[43] K. A. Asante, S. Adu-Kumi, K. Nakahiro, S. Takahashi, T. Isobe, A. Sudaryanto, G. Devanathan, E. Clarke, O. D. Ansa-Asare, S. Dapaah-Siakwan, and S. Tanabe, “Human exposure to PCBs, PBDEs and HBCDs in Ghana: Temporal variation, sources of exposure and estimation of daily intakes by infants,” Environment International, vol. 37, no. 5, pp. 921 – 928, 2011.
[44] Stockholm Convention, “Stockholm Convention on Persistent Organic Pollutants (POPs),” United Nations Environment Programme, Secretariat of the Stockholm Convention, 2010.
[45] Stockholm Convention, “Guidelines on Best Available Techniques and Best Environmental Practice for the Recycling and Disposal of Articles containing Polybrominated Diphenyl Ethers (PBDEs) under the Stockholm Convention on Persistent Organic Pollutants,” UNEP, UNIDO, unitar, Vienna, Austria, draft v1 2012.
[46] Stockholm Convention, “Guidance for the Inventory of Polybrominated Diphenyl Ethers (PBDEs) listed under the Stockholm Convention on Persistent Organic Pollutants -
50

DRAFT,” United Nations Environment Programme , Secretariat of the Stockholm Convention, draft v1 2012.
[47] X. Chi, M. Streicher-Porte, M. Y. L. Wang, and M. A. Reuter, “Informal electronic waste recycling: A sector review with special focus on China,” Waste Management, vol. 31, no. 4, pp. 731 – 742, 2011.
[48] F. Wang, J. Huisman, C. Meskers, M. Schluep, A. Stevels, and C. Hagelueken, “The Best-of-2-Worlds philosophy: Developing local dismantling and global infrastructure network for sustainable e-waste treatment in emerging economies,” Waste Management, vol. 32, pp. 2134–2146, 2012.
[49] D. Sinha-Khetriwal, P. Kraeuchi, and M. Schwaninger, “A comparison of electronic waste recycling in Switzerland and in India,” Environmental Impact Assessment Review, vol. 25, pp. 492–504, 2005.
[50] J. Huisman, F. Magalini, R. Kuehr, C. Maurer, S. Ogilvie, J. Poll, C. Delgado, E. Artim, J. Szlezak, and A. Stevels, “2008 Review of Directive 2002/96 on Waste Electrical and Electronic Equipment (WEEE), Final Report,” United Nations University, 2008.
[51] P. Chancerel, C. E. M. Meskers, C. Hagelüken, and V. S. Rotter, “Assessment of Precious Metal Flows During Preprocessing of Waste Electrical and Electronic Equipment,” Journal of Industrial Ecology, vol. 13, no. 5, pp. 791–810, Oct. 2009.
[52] C. Meskers, C. Hagelueken, S. Salhofer, and M. Spitzbart, “Impact of pre-processing routes on precious metal recovery from PCs,” presented at the European Metallurgical Conference EMC, 2009.
[53] D. Rochat, W. Rodrigues, and A. Gantenbein, “India: Including the Existing Informal Sector in a Clean e-Waste Channel,” in Waste Management Conference (WasteCon2008), Durban, South Africa, 2008.
[54] L. M. Hilty, S. Behrendt, M. Binswanger, A. Bruinink, L. Erdmann, J. Froehlich, A. Koehler, N. Kuster, C. Som, and F. Wuertenberger, The precautionary principle in the information society – effects of pervasive computing on health and environment, Second Revised ed. Edited by the Swiss Center for Technology Assessment (TA-SWISS), Bern, Switzerland (TA46e/2005) and the Scientific Technology Options Assessment at the European Parliament (STOA 125 EN), 2005.
[55] L. M. Hilty, Information technology and sustainability: essays on the relationship between ICT and sustainable development. Norderstedt: Books on Demand, 2008.
[56] L. M. Hilty, “Electronic waste: an emerging risk?,” Environmental Impact Assessment Review, vol. 25, pp. 431–435, 2005.
[57] P. Kraeuchi, P. A. Waeger, M. Eugster, G. Grossmann, and L. M. Hilty, “End-of-Life Impacts of Pervasive Computing - Are RFID tags a threat to waste management processes?,” IEEE Technology and Society Magazine, vol. 24, pp. 45–53, 2005.
[58] A. Koehler and L. M. Hilty, “Prospective Impacts of Electronic Textiles on Recycling and Disposal,” Journal of Industrial Ecology, vol. 15, no. 4, pp. 496–511, 2011.
[59] L. M. Hilty, A. Koehler, F. von Schéele, R. Zah, and T. Ruddy, “Rebound Effects of Progress in Information Technology. Poiesis & Praxis,” International Journal of Technology Assessment and Ethics of Science, vol. 1, no. 4, pp. 19–38, 2006.
[60] L. M. Hilty, A. Koehler, F. von Schéele, and R. Zah, “Working Slower with More Powerful Computers,” ERCIM News, vol. 62, pp. 58–59, 2005.
51

Social Life Cycle Inventory and Impact Assessment of
Informal recycling of Electronic ICT Waste in Pakistan
Shakila Umair1, Anna Björklund2, Elisabeth Ekener Petersen1
1Centre for Sustainable Communications (CESC), KTH, SE-100 44 Stockholm, Sweden
[email protected], [email protected]
2Division of Environmental Strategies Research – fms, KTH, SE-100 44, Stockholm, Sweden
ABSTRACT In order to meet the growing needs of information and communication technology, companies are producing new and improved products every day. With every new product in the market another product becomes obsolete. These obsolete products are being added to the world’s fastest growing waste stream. 20-50 million computers become waste each year. It has been estimated that 20% of electronic waste is formally recycled, while 80% is shipped to developing countries where it is recycled informally through crude process. It’s manually dismantled, burned, dumped and dipped in acids to extract precious metals. One such nation which is at the receiving end of this waste stream is Pakistan. This business has become a very profitable business and requires very little expertise to conduct these crude procedures. These activities do not just add toxics to the environment but has great social and health impact on its workers. There lies a great need to study the impacts of these processes on environment, workers, community and the society. In order to study this, a detailed on-site inventory and assessment of informal electronic waste recycling has been conducted using the UNEP guidelines on Social Life Cycle Assessment. This study shows that apart from income generation and recovery of various metals and materials, informal recycling has drastic impacts on its workers and the local community.
Keywords Electronic waste, Informal recycling, Social Life Cycle Assessment, Pakistan.
1. INTRODUCTION Information and communication technology (ICT) has helped develop the world into what it can be seen as today. People are connected to one another while they are sitting at two extreme ends of the world. Penetration of ICT has played its role in development of humans socially as well as economically. Mobiles and computers have reached the remotest parts of the world. Around the globe, more and more electronic equipment,
such as computers and mobile phones, are being produced and used every year. At the same time, the life time of such devices, before they are replaced by new ones, is decreasing.
Cell phones now have an average life span of less than two years in the industrialized world, and computers two to four years (SEPA, 2011). As a consequence, the amounts of electronic waste are increasing rapidly, and it is now one of the fastest growing waste streams (SEPA, 2011).
Electronic waste, or WEEE (Waste Electrical and Electronic Equipment), is at the same time a valuable and problematic waste stream. For instance, every ton of discarded electronic equipment contains 17 times more gold than gold ore and 40 times more copper than copper ore (CRN, 2007) but it also contains many toxic substances (Sepulveda, et.al. 2010). Therefore, it needs to be collected and recycled properly, both to avoid losing valuable resources, spreading hazardous substances to the environment, and causing serious health problems.
Strong international regulation has been put in place to limit the content of hazardous substances in electronic equipment and to ensure proper handling and recycling. Still, studies show that globally only 20% of the waste is recycled properly (Takeback coalition, 2009). Large amounts are exported illegally to developing countries, where poor people recycle it manually at a much lower cost. This informal recycling process involves manual dismantling of electronic waste, burning of wires, and extraction of precious metals through acid dipping. Most of these processes are carried out in densely populated areas and has its impacts not only on the environment but on people involved in this process and living in the vicinity (Umair and Anderberg, 2011).
Used electronic equipment makes its way into Pakistan by several means. One of them is as second hand material, some sent as donations. However, the second hand market is also used as a loophole in the legislation, illegally disguising electronic waste as functioning second hand products (Umair and Anderberg, 2011). Many who are living below the poverty line in Pakistan have found informal electronic waste recycling as a source of income. Families have created cottage industries in their homes where women and children contribute equally in earning a livelihood (Umair and Anderberg, 2011). Despite the fact that the country has signed international agreements to avoid this, it is happening
ICT4S 2013: Proceedings of the First International Conference on Information and Communication Technologies for Sustainability, ETH Zurich, February 14-16, 2013. Edited by Lorenz M. Hilty, Bernard Aebischer, Göran Andersson and Wolfgang Lohmann. DOI: http://dx.doi.org/10.3929/ethz-a-007337628
52
because of lack of national legislation and enforcement and probably much because of lack of awareness among authorities. As this is an illegal sector, there is also lack of good information about the flows and impacts of the waste.
From the perspective of developed countries, from which electronic waste is exported illegally, there also remains much to be done to address this problem. The so-called WEEE Directive (2002/96/EU) sets collection and recycling targets for electronic waste for countries within the EU. This Directive has been assessed as being successfully implemented in Sweden (SEPA, 2009) and in an overall environmental life cycle perspective by e.g. Wäger et al (2011). But since the flows of illegal trade are not known, and Life Cycle Assessment (LCA) emission data for informal recycling processes are not available, illegal trade is mentioned as a known problem, but it is omitted from the analysis due to lack of data.
Lack of good information on the adverse end-of-life impacts of ICT equipment sometimes leads to underestimated life cycle impacts, and to inadequate local legislation and enforcement. One means to alleviate the problems of illegal trade and informal recycling of electronic waste may be to make better data on the extent of this business and its impacts available. If included in environmental assessments of the ICT sector, electronic equipment, and evaluations of the performance of take-back policies and recycling systems, this may put pressure on authorities to develop better policy instruments and monitoring systems, and on companies to develop strategies, business models or products with less impact over the entire life cycle.
2. AIM AND RATIONALE The overall aim of this study was to contribute to a less skewed picture on the overall life cycle impacts of ICT and electronic equipment. Despite the fact that the truly unsustainable conditions under which informal recycling of electronic waste is taking place in developing countries has been documented and debated for quite some time, there is as yet often a lack of integration of this knowledge when assessing the overall life cycle impacts of ICT, electronics, and even when looking at its end-of-life (WEEE) in particular.
Our specific objective was to collect data on the social impacts of informal electronic waste recycling in Pakistan, using the framework for Social and Socio-Economic Life Cycle Assessment (SLCA) as defined in by UNEP (Benoît and Mazijn, 2009).
By providing a systematic inventory and impact assessment of informal electronic waste recycling, this study will help in creating a more realistic view of the impacts of ICT equipment in a complete life cycle perspective. New regulations, economic incentives, or business models need to be developed to address this problem in a sustainable manner. As more and better data of this kind becomes available, governmental and corporate policies and strategies may be developed on a more well-informed basis.
This study has been conducted in Pakistan but its results can be applicable in many developing countries where the situation is similar. The data that has been collected is based on empirical data collected by interview and close observation of informal electronic waste recycling sites in Pakistan.
3. METHODOLOGY 3.1 Social LCA This study is based on the UNEP guidelines (Benoît and Mazijn, 2009) for SLCA. These guidelines are developed in accordance with the ISO 14040 and 14044 standards for environmental LCA (ELCA), but for inventory and assessment of social and socio-economic inventory and impact assessment.
SLCA is a social impact (and potential impact) assessment technique that aims to assess the social aspects of product and services and their potential positive and negative impacts along their life cycle, encompassing extraction and processing of raw material, manufacturing, distribution, use, reuse, maintenance, recycling and final disposal (Benoît and Mazijn, 2009). SLCA does not provide the information whether a product should be made or not. It can only provide elements of thought for a decision on production of a product.
Similar to ELCA, a quantified functional unit is defined as the starting point to determine the product system, but impacts may not be expressed per functional unit if semi quantitative or qualitative data is used. The geographical location of unit processes needs to be defined. The inventory data and impact data are specified in relation to different stakeholders. Stakeholders include all key players involved in the life cycle process of the product. Impacts are studied on the basis of social subcategories (issues of concern) which may help in identifying various impacts on the stakeholder. Impact assessment is carried out using various impact categories including health and safety, development of country, human rights etc. (ibid.).
3.2 Field Trip A field trip was conducted to seven cities and one town of Pakistan where electronic waste recycling is carried out at large. Interviews were conducted with various stakeholders that included officials, import officers, importers, sellers, waste collectors, manual dismantlers (scrappers), refurbisher, gold extractors, etc. The cities visited during this trip were Islamabad, Rawalpindi, Lahore, Faisalabad, Gujranwala, Peshawar, Karachi and Shadahra (town).
The interviews conducted with the officials, importers, and sellers were informal conversational interviews apart from one or two questions that were decided before hand. The interview conducted with the scrappers, gold extractors, and collectors were based on a open ended questionnaire developed according to the sub categories of the Social LCA based on UNEP Guidelines (UNEP, 2009).
4. CASE STUDY 4.1 Goal The goal of this study was to improve decision making related to ICT, electronic equipment, and electronic waste, by providing better data on the social impacts of informal electronic waste recycling in Pakistan, using the framework of SLCA as described in the UNEP guidelines.
4.2 Functional unit The functional unit of this study, which measures the product/service utility of the system, is the handling of electronic waste that enters the informal recycling sector in Pakistan in 2012. This study covers only electronic waste coming from the ICT sector (mobile phones, personal stationary computers and laptops, telephone exchanges, and printers).
53
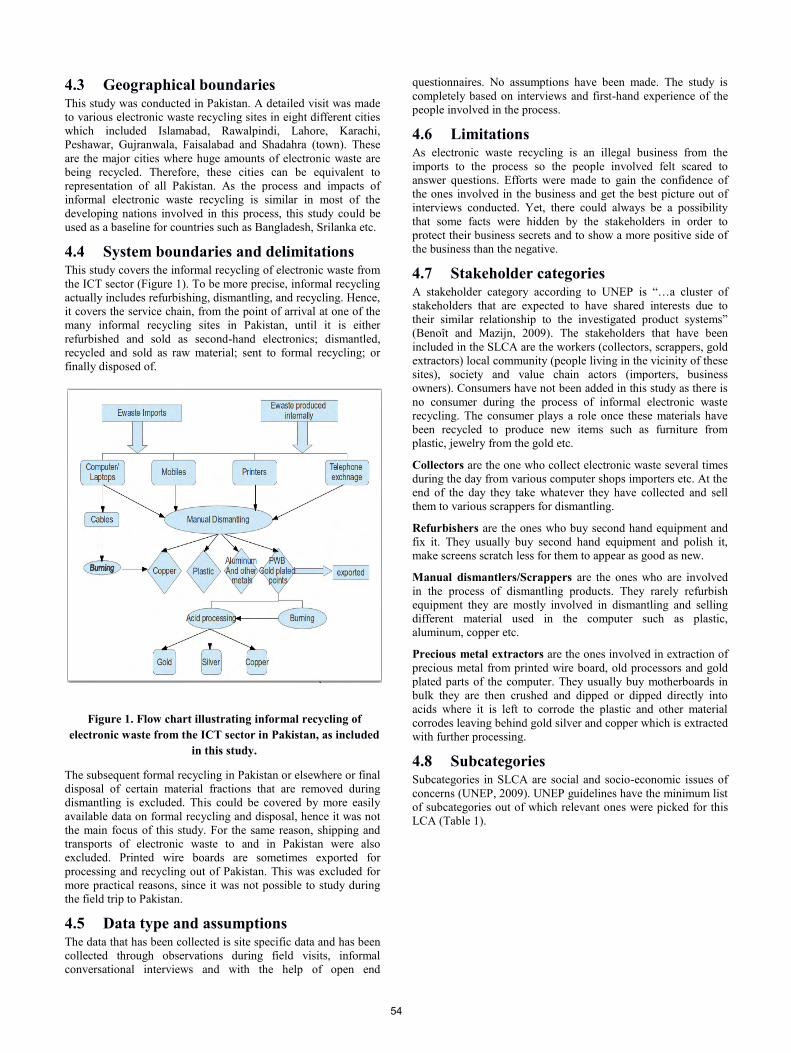
4.3 Geographical boundaries This study was conducted in Pakistan. A detailed visit was made to various electronic waste recycling sites in eight different cities which included Islamabad, Rawalpindi, Lahore, Karachi, Peshawar, Gujranwala, Faisalabad and Shadahra (town). These are the major cities where huge amounts of electronic waste are being recycled. Therefore, these cities can be equivalent to representation of all Pakistan. As the process and impacts of informal electronic waste recycling is similar in most of the developing nations involved in this process, this study could be used as a baseline for countries such as Bangladesh, Srilanka etc.
4.4 System boundaries and delimitations This study covers the informal recycling of electronic waste from the ICT sector (Figure 1). To be more precise, informal recycling actually includes refurbishing, dismantling, and recycling. Hence, it covers the service chain, from the point of arrival at one of the many informal recycling sites in Pakistan, until it is either refurbished and sold as second-hand electronics; dismantled, recycled and sold as raw material; sent to formal recycling; or finally disposed of.
The subsequent formal recycling in Pakistan or elsewhere or final disposal of certain material fractions that are removed during dismantling is excluded. This could be covered by more easily available data on formal recycling and disposal, hence it was not the main focus of this study. For the same reason, shipping and transports of electronic waste to and in Pakistan were also excluded. Printed wire boards are sometimes exported for processing and recycling out of Pakistan. This was excluded for more practical reasons, since it was not possible to study during the field trip to Pakistan.
4.5 Data type and assumptions The data that has been collected is site specific data and has been collected through observations during field visits, informal conversational interviews and with the help of open end
questionnaires. No assumptions have been made. The study is completely based on interviews and first-hand experience of the people involved in the process.
4.6 Limitations As electronic waste recycling is an illegal business from the imports to the process so the people involved felt scared to answer questions. Efforts were made to gain the confidence of the ones involved in the business and get the best picture out of interviews conducted. Yet, there could always be a possibility that some facts were hidden by the stakeholders in order to protect their business secrets and to show a more positive side of the business than the negative.
4.7 Stakeholder categories A stakeholder category according to UNEP is “…a cluster of stakeholders that are expected to have shared interests due to their similar relationship to the investigated product systems” (Benoît and Mazijn, 2009). The stakeholders that have been included in the SLCA are the workers (collectors, scrappers, gold extractors) local community (people living in the vicinity of these sites), society and value chain actors (importers, business owners). Consumers have not been added in this study as there is no consumer during the process of informal electronic waste recycling. The consumer plays a role once these materials have been recycled to produce new items such as furniture from plastic, jewelry from the gold etc.
Collectors are the one who collect electronic waste several times during the day from various computer shops importers etc. At the end of the day they take whatever they have collected and sell them to various scrappers for dismantling.
Refurbishers are the ones who buy second hand equipment and fix it. They usually buy second hand equipment and polish it, make screens scratch less for them to appear as good as new.
Manual dismantlers/Scrappers are the ones who are involved in the process of dismantling products. They rarely refurbish equipment they are mostly involved in dismantling and selling different material used in the computer such as plastic, aluminum, copper etc.
Precious metal extractors are the ones involved in extraction of precious metal from printed wire board, old processors and gold plated parts of the computer. They usually buy motherboards in bulk they are then crushed and dipped or dipped directly into acids where it is left to corrode the plastic and other material corrodes leaving behind gold silver and copper which is extracted with further processing.
4.8 Subcategories Subcategories in SLCA are social and socio-economic issues of concerns (UNEP, 2009). UNEP guidelines have the minimum list of subcategories out of which relevant ones were picked for this LCA (Table 1).
Figure 1. Flow chart illustrating informal recycling of electronic waste from the ICT sector in Pakistan, as included
in this study.
54

Table 1 Subcategories identified in informal recycling
Stakeholder category
Subcategories
Workers Forced labour Child labour Social security Wage/benefits Freedom of association and
collective bargaining Work hours Equal opportunity/discrimination Health and safety
Local community
Health and safety Community engagement Local employment
Society Contribution to economic development
Public commitments to sustainability issues
Value chain actors
Promoting social responsibility Fair competition
5. INVENTORY ANALYSIS 5.1 Workers 5.1.1 Working hours Pakistan has ratified to International Labour Organization (ILO) conventions:
C001: Hours of Work (Industry) Convention, 1919 (No.1). This convention supports application of the principle of the 8-hours day or of the 48-hours week.
C014: Weekly Rest (Industry) Convention, 1921 (No.14). This convention supports application of weekly rest.
The workers spend more than 12 hours per day at work which is more than the desired working of the ILO conventions. Not everyone have weekly breaks. These working hours are applied on workers of all ages. They take very short lunch breaks and tea is mostly supplied at their work stations during the day.
5.1.2 Child labour Pakistan has ratified the following conventions:
C138: Minimum Age Convention, 1973 (No.138). This convention concerns the minimum age for admission to employment. The convention advocates that the minimum age of a child for admission to any type of employment or work which by its nature or the circumstances in which it is carried out is likely to jeopardize the health, safety or morals of young persons shall not be less than 18 years.
C182: Worst Forms of Child Labour Convention, 1999 (No.182). This convention concerns the prohibition and immediate action for the elimination of the worst forms of child labour. According to article 3 of this convention work which, by its nature or the circumstances in which it is carried out, is likely to harm the health, safety or morals of children is included in worst forms of child labour.
Child labour is common sight in this business. As it is a profitable business and requires less expertise, children coming from poor backgrounds find it an easier way to support their families. Apart from this in many cases where people have set up home businesses, the whole family works in processing this equipment. So the children do not get much choice than to come into the business of electronic waste recycling. They try to help parents with their work just like in any other cottage industry. They look through toxic ash to find what could be of some value and can be sold. Children working in this business are from the age of 6-18. Some attend school, while others have left school to work. They help collecting equipment, dismantling, burning of wires, burning of motherboards, separation of metals, melting of solders and acid processes. Their work is equally laborious as that of an adult. The working hours are also similar. Working under the same conditions for same duration being exposed to same amount of toxic with their higher vulnerability and lower immunity makes it a more dangerous business.
According to the ILO convention each member who ratifies convention C182 shall take immediate and effective measures to secure the prohibition and elimination of the worst forms of child labour as a matter of urgency. Similarly convention 138 states that each member for which this Convention is in force undertakes to pursue a national policy designed to ensure the effective abolition of child labour and to raise progressively the minimum age for admission to employment or work to a level consistent with the fullest physical and mental development of young persons. In this case, despite ratification of these conventions, Pakistan authorities have not taken any action. This could mostly be because of lack of knowledge in this field.
5.1.3 Health and Safety The workers may be 6-50+ of age. They have no protective gears while working. Many of them knew that gloves and masks are good for protection but some think they could not afford good quality ones. While they handle extremely toxic waste with their bare hands, some say they never need any protection, that it is a clean business.
The process of dismantling, open burning of cables, and extraction of precious metal are extremely toxic. It exposes workers to various toxics such as lead, barium oxide, mercury, brominated flame retardants, dioxins, furans, various POPS , carbon black. These affect various human organs and are known carcinogens. They have no information about the toxicity of this business and very few complain about possibility of ailments related to their exposure to these toxics.
Some complain about having breathing problems due to smoke while burning or because of inhaling acid fumes. They say it is usually a temporary condition which goes away once they eat gur (traditional unrefined sugar cane sugar) that clears their breathing track. This is very hard to believe that these people who are exposed to such toxic material everyday would not have any ailments.
Skin patches (white) are a common site in these workers. Cuts, burns are also very common. In collectors and people who were involved in crushing computer chassis it is very common that they have muscular pains, fever and tiredness.
The shops of these workers are usually located within or close to computer markets. Most are located in basements that are badly lit, and workers have to focus hard while working. Due to being in basements the air circulation is not good as well. Therefore exposure to toxic dust is prolonged. Most of these shops are very
55

close to or inside residential areas thus introducing a vulnerable group of people to these toxics 24 hours a day.
In some cases workers have setups with in their homes. While they sleep on the roof tops with their families the motherboards processors melt in acid baths. This is where gold extraction takes place. Similarly they and their families are exposed to toxic fumes.
The shops where gold is purified are extremely dark shops with very little air circulation. The shops are very small to accommodate one or two people at a time.
In many cases these activities take place in open spaces away from the cities when the city's development authorities would not allow such activities to take place within the cities. Such activities include burning of plastic, wires etc.
5.1.4 Social Benefits/Social Security There is no concept of social security. Mostly businesses are run by families so there is no one to ensure social security and in cases where labour is hired to do this work the owner does not ensure any social benefits. There is no concept of pensions or some sort of fund that covers their health or accidents etc. In case of emergency workers and employers will help each other in their limited means.
5.1.5 Forced labour There were no case indications of forced labour. Everyone states to be working willingly in this business. The profitability of this business attracts many.
5.1.6 Wages/Fair Salary A collector may earn from 500-1000 PKR (Pakistan rupees) per day, corresponding to US$5.5-11.1 per day. This is in case the collector is self employed and is not working for any one. An average wage of a scrapper or collector working on daily wage is 250 PKR (US$2.7) per day. They hardly manage to cross the extreme poverty line that is defined by the World Bank that states extreme poverty as living on less than US$1.25 a day (World Bank, 2005).
Small-business owners (refurbisher included) may earn from 1000-1500 PKR (US$11- 16) per day, while bigger business owners may earn up to 20-30 kPKR (US$213-320) per day.
The people who work as employed labour on a monthly wage may earn from 7-12 kPKR (US$74-127) per month.
5.1.7 Freedom of Association and Collective Bargaining
There are no labour unions in this business, except for Karachi where there exists one workers union which is not specifically for the scrappers but all the workers in that area.
5.1.8 Equal opportunities /discrimination Christians are religious minority in Pakistan. Many people working are in informal recycling are Christian but there has been no discrimination against them. They work in a very peaceful manner with the Muslims. Women and children also have equal opportunity to work in this business especially in case of the cottage industry. This is one place where equal opportunity for women and children may introduce a vulnerable group of individual to very toxic working environment.
5.2 Local Community 5.2.1 Safe and Healthy Living Conditions Informal electronic waste recycling techniques are extremely toxic. These activities add pollutants to the air, soil and waters. Few of the impacts have been mentioned before. They have similar impacts on the local community. They get exposed to similar toxins for longer duration as they reside close to these sites. A study showed that pregnant women who live in areas close to electronic waste dismantling sites have higher exposures to persistent organic pollutants and depressed thyroid hormone levels than those who live farther away from the facilities. This study compared women in two regions of China (Zhao, 2010). In another study in 2007, children from one to six years old in Guiyu were compared to those living in a neighbouring town where no e-waste processing was done. Children in Guiyu were found to have blood lead levels (BLL) that were significantly higher than those in the neighbouring village. The study concluded that elevated BLLs in Guiyu children were common as a result of exposure to lead contamination caused by primitive e-waste recycling activities (Huo, 2007).
5.2.2 Community Engagement The local community lacks awareness of these processes. They are not aware of the impacts of the processes that go on in their neighbourhood. These places are densely populated, and this population has become very used to the noise pollution, smoke etc. Gold extraction is a secretive business and mostly people living in the vicinity of these gold extractors are not aware of what might be happening in their backyard. There is a great need to raise awareness among these people to promote community engagement.
Apart from the workers and owners there is no community engagement in this business. Community is not aware of the activities and the impacts, therefore they do not indulge to improve or to worsen the situation.
5.2.3 Local Employment This is a profitable business with less expertise required than other businesses, so many have found their livelihoods in this work. Many jobless youngsters have found it an easy way of earning. Many students work at these workshops after school to support their education and families. Many of the workers are ex-army soldiers who after retirement have found this as well paying occupation.
5.3 Society 5.3.1 Public Commitment to Sustainability Issues Informal electronic waste recycling has recently come into the limelight, but still very few officials know about it. A very small number is aware of its processes and impacts. This is more of an illegal business. There remains a great need to get the government to look into the issue and suggest cleaner mechanisms to keep the lives of the workers and community safe. There should be government initiated awareness programme to protect the community. Regular monitoring of the local water bodies, soil samples need to be tested. No such activities are taking place, thus government is lacking initiative, maybe due to lack of awareness or maybe due to negligence or no incentives.
5.3.2 Contribution to Economic Development Electronic waste imports or second hand computer imports play a positive role both socially and economically. In a country where 60% of the population lives below the poverty line second hand
56
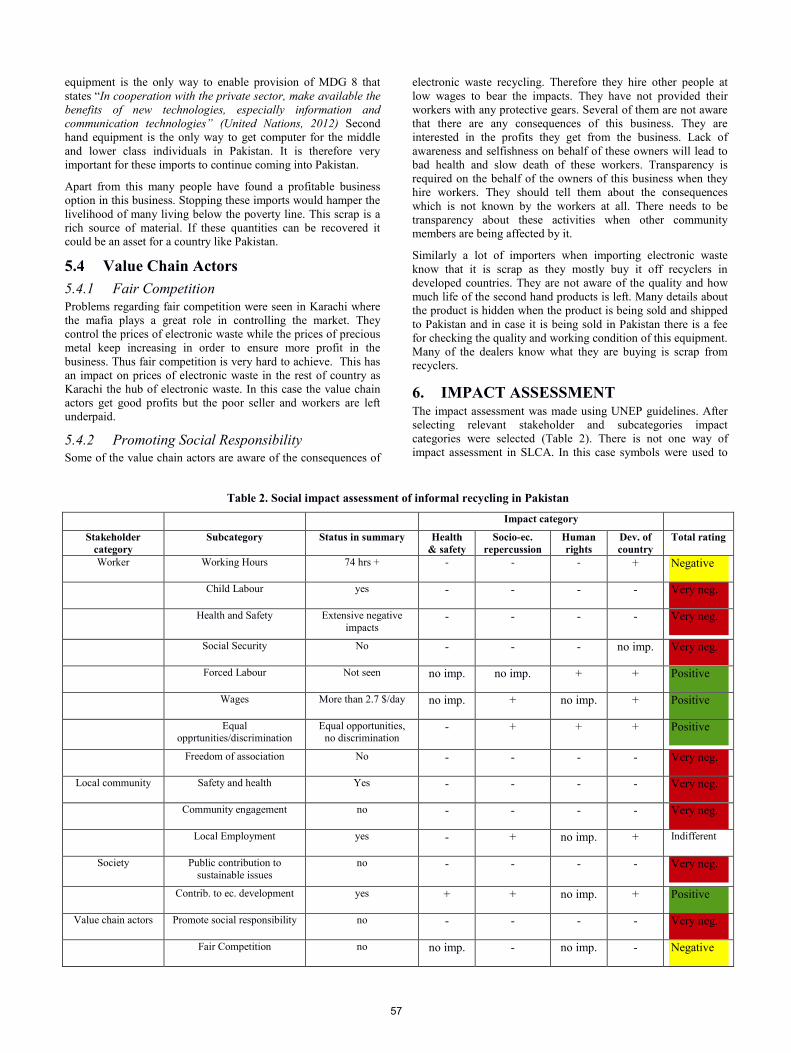
equipment is the only way to enable provision of MDG 8 that states “In cooperation with the private sector, make available the benefits of new technologies, especially information and communication technologies” (United Nations, 2012) Second hand equipment is the only way to get computer for the middle and lower class individuals in Pakistan. It is therefore very important for these imports to continue coming into Pakistan.
Apart from this many people have found a profitable business option in this business. Stopping these imports would hamper the livelihood of many living below the poverty line. This scrap is a rich source of material. If these quantities can be recovered it could be an asset for a country like Pakistan.
5.4 Value Chain Actors 5.4.1 Fair Competition Problems regarding fair competition were seen in Karachi where the mafia plays a great role in controlling the market. They control the prices of electronic waste while the prices of precious metal keep increasing in order to ensure more profit in the business. Thus fair competition is very hard to achieve. This has an impact on prices of electronic waste in the rest of country as Karachi the hub of electronic waste. In this case the value chain actors get good profits but the poor seller and workers are left underpaid.
5.4.2 Promoting Social Responsibility Some of the value chain actors are aware of the consequences of
electronic waste recycling. Therefore they hire other people at low wages to bear the impacts. They have not provided their workers with any protective gears. Several of them are not aware that there are any consequences of this business. They are interested in the profits they get from the business. Lack of awareness and selfishness on behalf of these owners will lead to bad health and slow death of these workers. Transparency is required on the behalf of the owners of this business when they hire workers. They should tell them about the consequences which is not known by the workers at all. There needs to be transparency about these activities when other community members are being affected by it.
Similarly a lot of importers when importing electronic waste know that it is scrap as they mostly buy it off recyclers in developed countries. They are not aware of the quality and how much life of the second hand products is left. Many details about the product is hidden when the product is being sold and shipped to Pakistan and in case it is being sold in Pakistan there is a fee for checking the quality and working condition of this equipment. Many of the dealers know what they are buying is scrap from recyclers.
6. IMPACT ASSESSMENT The impact assessment was made using UNEP guidelines. After selecting relevant stakeholder and subcategories impact categories were selected (Table 2). There is not one way of impact assessment in SLCA. In this case symbols were used to
Table 2. Social impact assessment of informal recycling in Pakistan
Impact category
Stakeholder category
Subcategory Status in summary Health & safety
Socio-ec. repercussion
Human rights
Dev. of country
Total rating
Worker Working Hours 74 hrs + - - - + Negative
Child Labour yes - - - - Very neg.
Health and Safety Extensive negative impacts
- - - - Very neg.
Social Security No - - - no imp. Very neg.
Forced Labour Not seen no imp. no imp. + + Positive
Wages More than 2.7 $/day no imp. + no imp. + Positive
Equal opprtunities/discrimination
Equal opportunities, no discrimination
- + + + Positive
Freedom of association No - - - - Very neg.
Local community Safety and health Yes - - - - Very neg.
Community engagement no - - - - Very neg.
Local Employment yes - + no imp. + Indifferent
Society Public contribution to sustainable issues
no - - - - Very neg.
Contrib. to ec. development yes + + no imp. + Positive
Value chain actors Promote social responsibility no - - - - Very neg.
Fair Competition no no imp. - no imp. - Negative
57

show if subcategories had a relation to the impact category, using “+” to indicate positive impact and “-“ negative impact of the subcategory, and “no impact” to indicate when an impact category is not at all affected by a certain subcategory. A simple colour system, inspired by Ciroth and Firanze (2011) was used that evaluates the overall social impacts of each subcategory.
7. CONCLUSIONS Earlier studies have been performed on the adverse impacts on informal recycling of WEEE, but none in Pakistan. More importantly, only one study was found which tried to incorporate the impacts in an S-LCA framework (Manhart et al, 2011). This paper contributes data on social impacts of informal WEEE recycling, in a format which should be help easily incorporate assessments of ICT systems, equipment, and WEEE recycling, providing a more realistic picture of the life cycle impacts. This paper has sketched a picture of impacts of informal recycling on various stakeholders and it shows that it has mostly negative impacts on its workers and community but at the same time helps in decreasing poverty and is playing a vital role in economic development. The scrapper plays a great role in recycling of WEEE, but his/her health and benefits needs to be covered under the corporate social responsibility schemes of ICT developers and manufacturers. This paper will share the facts, impacts and importance of the unjust trans-boundary movement of WEEE. It also highlights the need of strengthening of Extended Producer Responsibility not only in developed countries, but also in developing countries. It also emphasizes the need for awareness rising among the workers community and the government officials.
The experience from on using the UNEP/SETAC guidelines (Benoît and Mazijn, 2009) in a supply chain of informal activities shows that some of the listed subcategories are hard to apply under these circumstances. Still, some of the negative social impacts in supply chains may very well originate from informal activities in developing countries. This needs to be considered when further developing the UNEP/SETAC guidelines.
8. RECOMMENDATIONS One of the main reasons why this business causes so many impacts is lack of awareness among the various stakeholders. There lies a great need to share these findings with the Government officials and authorities and help them create awareness among different stakeholder from the value chain actors to the worker. This is the first such study conducted for informal electronic waste in Pakistan. The results of this study should be shared with different producer and manufactures of ICTs. Efforts should be made by them to include these distant workers and their benefit in their policies as a part of their Corporate Social Responsibility. A study needs to be undertaken to improve weaknesses of UNEP guidelines when applied on informal sector such as this one.
9. ACKNOWLEDGMENTS Our most sincere thanks are to all the workers, importers, sellers, and various government authorities who cooperated with us and helped us conduct this study.
10. REFERENCES [1] Benoît C, Mazijn B (eds) (2009) Guidelines for social life
cyclessessment of products, UNEP/SETAC Life Cycle Initiative.Available at http://www.unep.fr/shared/publications/pdf/DTIx1164xPA-guidelines_sLCA.pdf
[2] Ciroth, A. & Franze, J. 2011. Conducting a Social LCA Workshop Social Aspects of Products Over the Whole Life Cycle.http://www.greendeltatc.com/uploads/media/GreenDeltaTC_Franze_Ciroth.pdf
[3] CRN, 2007 E-waste worth more than gold. http://www.crn.com.au/News/81684,e-waste-worth-more-than-gold.aspx. Retrieved on June 21, 2011.
[4] Huo, X. Peng, L., Xu, X., Zheng, L.,Qiu, B., Qi, Z., Zhang, B., Han, D. and Piao, Z. 2007. Elevated Blood Lead Levels of Children in Guiyu, an Electronic Waste Recycling Town in China. Environ Health Perspect. 2007 July; 115(7): 1113–1117. Published online 2007 March 28. doi: 10.1289/ehp.9697
[5] Manhart, A., Osibanjo, O., Aderinto, A., & Prakash, S. 2011 Informal e-waste management in Lagos, Nigeria – socio-economic impacts and feasibility of inter-national recycling co- operations. Institute for Applied Ecology, Final report of component 3 of the UNEP SBC E-waste Africa Project, Lagos and Freiburg.
[6] SEPA. 2009. WEEE Directive in Sweden– Evaluation with future study. Swedish Environmental Protection Agency, Information facts.
[7] SEPA. 2011. Recycling and disposal of electronic waste Health hazards and environmental impacts. Swedish Environmental Protection Agency, Report 647.
[8] Sepulveda, A., Schluep, M., Renaud, G.F., Streicher, M., Kuehr, R., Hageluken, C. and Gerecke, C.A. 2010 A Review of Environmental Fate and Effects of Hazardous Substances Release from Electrical and Electronic Equipment During Recycling. Examples from China and India. Environmental Impact Assessment Review 30, 28-41.
[9] Takeback Coalition. 2009. What Happens To Our E-Waste? http://www.electronicstakeback.com/. Retrieved on 26 April 2011.
[10] Umair, S., Anderberg, S. (2012) Informal Electronic Waste Recycling in Pakistan. Sida project report, submitted to SIDA.
[11] Wäger. P.A., Hischier, R., and Eugster, M. (2011 Environmental impacts of the Swiss collection and recovery systems for Waste Electrical and Electronic Equipment (WEEE): A follow-up. Science of the Total Environment, 409, 1746-1756.
[12] World Bank . 2005. Poverty and Equity Data. http://povertydata.worldbank.org/poverty/home/
[13] United Nations . 2012. Millenium Development Goals. http://www.un.org/millenniumgoals/global.shtml
[14] Zhao, B., Zheng, M. and Jiang, G. 2011. Dioxin Emissions and Human Exposure in China: A Brief History of Policy and Research. Environ Health Perspect. 2011 March; 119(3): A112–A113.doi: 10.1289/ehp.1103535
58

Acceptance of Mobile Phone Return Programs:
A Case Study Based Analysis
Britta Bookhagen
1, Julia Nordmann
2, Inger Dyrnes
1, Oliver Stengel
2, Nils-Holger Schmidt
1
1 Institute for Advanced Sustainability Studies - IASS
Berliner Str. 130, 14467 Potsdam, Germany [email protected], [email protected], [email protected]
2 Wuppertal Institute for Climate, Environment and Energy
Döppersberg 19, 42103 Wuppertal [email protected], [email protected]
ABSTRACT The need of recycling obsolete mobile phones has significantly increased with the worldwide propagation of mobile phones and their inherent rapid turnover. In this article, we examine the acceptance of mobile phone return programs by using the Technology Acceptance Model and multiple case studies. Our findings can provide valuable recommendations for the setup of future mobile phone return programs.
Keywords Sustainability, Mobile Phones, Return Programs, Technology Acceptance Model, Green IT, Green IS
1. INTRODUCTION The increasing utilization and proliferation of information
and communication technology (ICT) has drawn attention to the related economic and environmental sustainability effects [2][16] [40], especially when it comes to end-of-life management of the devices as stated in the WEEE-directive [39]. Each year, approx. 560 thousand tons of ICT waste is being collected in Europe [11]. Mobile phones, like computers and other ICT devices, contain many valuable and rare metals [15][23][25][27][32]. Due to the large quantity of mobile phones sold worldwide, the relatively small constituent per single device total to a significant amount of highly valuable, non-renewable resources [32]. Moreover, incorrect disposal of mobile phones can release toxic leftovers into the environment [31][32][39] and pose potential health risks [30]. Nevertheless, mobile phone recycling still only accounts to a few percentage of recycled material [23][31].
Studies show that substantial amounts of unused mobile phones are being stored in people’s drawers [3]. To increase the return rates, organizations and institutions have implemented various mobile phone return programs. Some of the programs are more successful than others. The success rate highly depends on the acceptance of a program by the mobile phone owners. Revealing the drivers and barriers influencing the acceptance of a
mobile phone return program would help developing more successful mobile phone return programs. This article therefore aims to answer the research question:
Which factors explain the acceptance of mobile phone return programs?
To answer this question we analyze mobile phone return programs and their accomplishments from various countries. The theoretical basis is provided by a modified version of the Technology Acceptance Model (TAM) [7]. We assess the possibility to transfer the factors of TAM to explain acceptance of mobile phone return programs. Results of this study can help to enhance future projects and thereby increase sustaining valuable resources.
2. RELATED RESEARCH
2.1 Recycling and Return Programs For this paper, the term “return program” takes all actions into account where mobile phones can be returned to ensure reuse or their proper recycling. Mobile phone return programs have different scopes, time frames, execution models and participating groups, e.g. ranging from charity events to bridging information and awareness for resources programs. Although electronic waste recycling is a relatively new issue that evolved over the past years, research on determining the operative factors for recycling programs started in the 1980s and 1990s [12] [37]. According to [12], the success of return programs depends much on the policies chosen, how they are selected, and how they are implemented. Lacking knowledge is seen as one important barrier that prevents the separation of waste [5]. [17] summarize results of previous literature and identify the following variables as factors of recycling behavior: extrinsic incentives, intrinsic incentives, internal facilitators, and external facilitators. Compared to other electronic waste, the recycling chain of mobile phones seems to be especially wedged when it comes to customers returning the mobile phone to any type of take back program (see for example Tanskanen and Butler [28]).
2.2 Basis of the Technology Acceptance Model This paper uses TAM to investigate the acceptance of mobile phone return programs. An adopted model of the Unified Theory
ICT4S 2013: Proceedings of the First International Conference on Information and Communication Technologies for Sustainability, ETH Zurich, February 14-16, 2013. Edited by Lorenz M. Hilty, Bernard Aebischer, Göran Andersson and Wolfgang Lohmann. DOI: http://dx.doi.org/10.3929/ethz-a-007337628
59
of Acceptance and Use of Technology (UTAUT) provides the theoretical background to increase the expressiveness of our results. The UTAUT was developed by [34] and evolved from previous versions of the original TAM 1 [7] and the later TAM 2 [36] version. The TAM concepts are well-known and widely applied in information systems (IS) research literature, articles of highly rated scientific journals [19] and proceedings of actual IS conferences, for example [18].
Figure 1: Theory of Acceptance and Use of Mobile Phone Return Programs Based on [34]
The TAM models describe why people use certain technologies. Their original objective was to explain the acceptance of computer technology. But the concept has proven to be applicable to various IT related topics, e.g. explaining the acceptance of cloud computing [26].The model can be used both for explanations and forecasts [7]. A characteristic of the model is the high level of abstraction and the consequent low number of model variables.
For our research we apply the latest TAM concept, the UTAUT to the scope of mobile phone return programs. Based on the original UTAUT the following factors are used to explain the acceptance of mobile phone return programs (see Figure 1) [33]:
Performance expectancy: The degree to which an individual believes that using the system will help him or her to attain a personal objective, such as environmental protection
Effort expectancy: The degree of ease associated with the use of the program
Social influence: The degree to which an individual perceives that important others believe he or she should use the program
Facilitating conditions: The degree to which an individual believes that an organizational and technical infrastructure exists to support program
Behavioral intention: The degree to which a person has formulated conscious plans to perform or not perform some specified future behavior
Gender, age, experience, and voluntariness of use serve as moderating variables. They affect the strength of the relation between the independent and the dependent variables [4].
3. METHODOLGY To answer the research question we use case study research.
Case study research is a widely known and accepted research methodology in IS [8]. It generates insights by examining a phenomenon in its usual setting [5].
Case study research can be applied to describe phenomena, test theories or develop new theories and hypotheses [5][9]. This corresponds with the paper’s objective to describe the phenomenon of varying acceptance of mobile phone return programs in multiple settings. Case study research employs various data collection methods, such as document and literature analysis, interviews, observations or questionnaires [8]. Our investigation is based on:
A comprehensive market and media research regarding mobile phone return programs
An extensive literature research
An in-depth case study regarding the return program of the Austrian Ö3 Wundertüte (literally: “wonderbag”) and two programs of the Deutsche Telekom (German Telekom)
These tasks were performed between October 2011 and Mai 2012. We avoided using a numerical numerical performance rating, instead, we will summarize the results from our case study as recommendations based on the UTAUT-concepts of Performance Expectancy, Effort Expectancy, Social Influence and Facilitating Conditions. Due to the limitations of case study research our findings demand further validation through quantitative and qualitative research regarding the applicability of UTAUT to explain the acceptance of mobile phone return programs.
4. FINDINGS The data collected is shown in Table 1, listed by regional and
worldwide return programs. We sorted the information by region and initiator, followed by a short description of the return process. We analyzed the programs by comparing the advertisement and effort used to introduce the return program, the year or period it took place and the incentive provided to make the return program attractive to users. The success of the programs was measured by the amount of returned mobile phones.
All European production and network companies take back mobile phones in their shops, as the WEEE directive has been asking since 2003 [39]. Therefore, this option is not explicitly listed in the table.
Charity includes all supportive actions (e.g.donations) for charity or social organizations. Environmental protection accounts to all actions taken to support environmental projects or active organizations.
In general, the governmental run or supported programs in the USA and UK seem to be relatively successful [13] [10], while company-run programs seem to be less effective, regardless of the incentives.
To deepen the comparison and give better implications, programs from two initiators were closer investigated about how the program was set up, and how well their collection of mobile
60
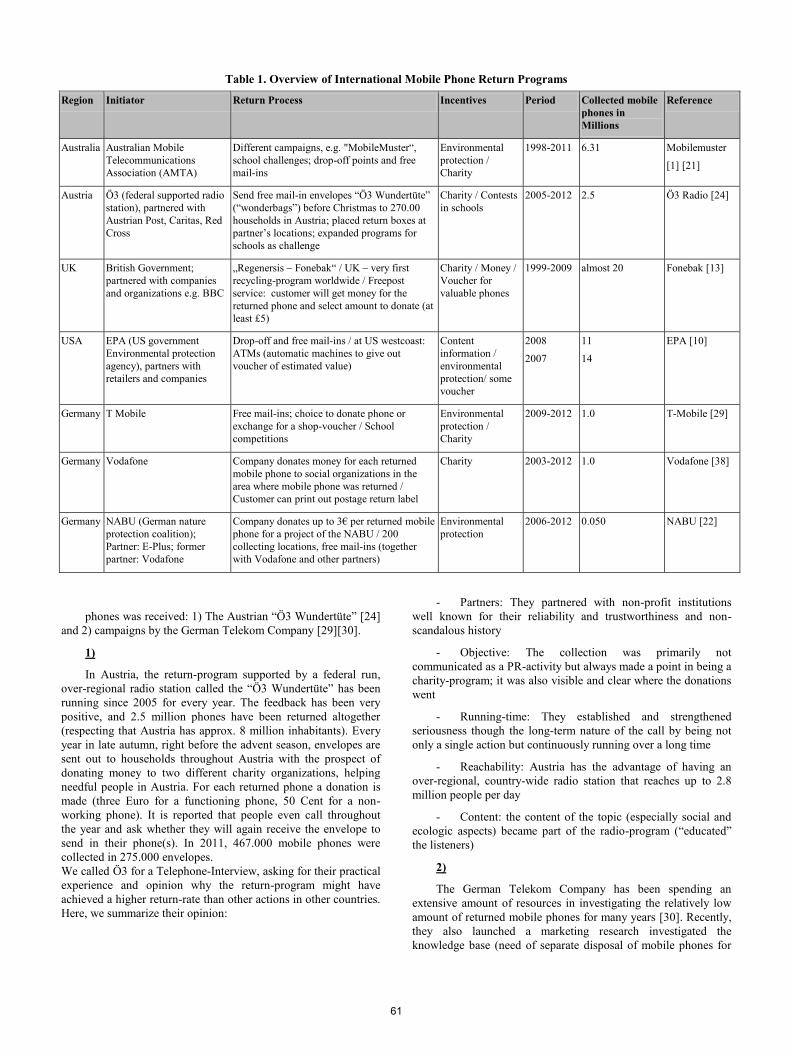
Table 1. Overview of International Mobile Phone Return Programs
Region Initiator Return Process Incentives Period Collected mobile phones in Millions
Reference
Australia Australian Mobile Telecommunications Association (AMTA)
Different campaigns, e.g. "MobileMuster“, school challenges; drop-off points and free mail-ins
Environmental protection / Charity
1998-2011 6.31 Mobilemuster
[1] [21]
Austria Ö3 (federal supported radio station), partnered with Austrian Post, Caritas, Red Cross
Send free mail-in envelopes “Ö3 Wundertüte” (“wonderbags”) before Christmas to 270.00 households in Austria; placed return boxes at partner’s locations; expanded programs for schools as challenge
Charity / Contests in schools
2005-2012 2.5 Ö3 Radio [24]
UK British Government; partnered with companies and organizations e.g. BBC
„Regenersis – Fonebak“ / UK – very first recycling-program worldwide / Freepost service: customer will get money for the returned phone and select amount to donate (at least £5)
Charity / Money / Voucher for valuable phones
1999-2009 almost 20 Fonebak [13]
USA EPA (US government Environmental protection agency), partners with retailers and companies
Drop-off and free mail-ins / at US westcoast: ATMs (automatic machines to give out voucher of estimated value)
Content information / environmental protection/ some voucher
2008
2007
11
14
EPA [10]
Germany T Mobile Free mail-ins; choice to donate phone or exchange for a shop-voucher / School competitions
Environmental protection / Charity
2009-2012 1.0 T-Mobile [29]
Germany Vodafone Company donates money for each returned mobile phone to social organizations in the area where mobile phone was returned / Customer can print out postage return label
Charity 2003-2012 1.0 Vodafone [38]
Germany NABU (German nature protection coalition); Partner: E-Plus; former partner: Vodafone
Company donates up to 3€ per returned mobile phone for a project of the NABU / 200 collecting locations, free mail-ins (together with Vodafone and other partners)
Environmental protection
2006-2012 0.050 NABU [22]
phones was received: 1) The Austrian “Ö3 Wundertüte” [24] and 2) campaigns by the German Telekom Company [29][30].
1)
In Austria, the return-program supported by a federal run, over-regional radio station called the “Ö3 Wundertüte” has been running since 2005 for every year. The feedback has been very positive, and 2.5 million phones have been returned altogether (respecting that Austria has approx. 8 million inhabitants). Every year in late autumn, right before the advent season, envelopes are sent out to households throughout Austria with the prospect of donating money to two different charity organizations, helping needful people in Austria. For each returned phone a donation is made (three Euro for a functioning phone, 50 Cent for a non-working phone). It is reported that people even call throughout the year and ask whether they will again receive the envelope to send in their phone(s). In 2011, 467.000 mobile phones were collected in 275.000 envelopes. We called Ö3 for a Telephone-Interview, asking for their practical experience and opinion why the return-program might have achieved a higher return-rate than other actions in other countries. Here, we summarize their opinion:
- Partners: They partnered with non-profit institutions well known for their reliability and trustworthiness and non-scandalous history
- Objective: The collection was primarily not communicated as a PR-activity but always made a point in being a charity-program; it was also visible and clear where the donations went
- Running-time: They established and strengthened seriousness though the long-term nature of the call by being not only a single action but continuously running over a long time
- Reachability: Austria has the advantage of having an over-regional, country-wide radio station that reaches up to 2.8 million people per day
- Content: the content of the topic (especially social and ecologic aspects) became part of the radio-program (“educated” the listeners)
2)
The German Telekom Company has been spending an extensive amount of resources in investigating the relatively low amount of returned mobile phones for many years [30]. Recently, they also launched a marketing research investigated the knowledge base (need of separate disposal of mobile phones for
61

preservation of resources) in German households. Here, we included two of their prominent take-back campaigns in our paper:
Winning game (raffle for 5 cars), year 2010: collected 62.000 mobile phones in 3 months (total 2010 collected: approx. 200,000)
Charity event (donation for children), year 2011: collected 585,700 mobile phones in 3 months (total 2011 collected: 762,000)
These are only two of recent German campaigns, but they seem to undermine the trend that we believe to see: the most effective activity has been the medial attentive and widely advertised activity in 2011 with a prominent German entertainer for a well-known children donation project. From the second campaign, we can draw some similar conclusions as success factors compared to the activities in Austria. The second program included in our analysis was clearly marked as a charity event, even though coming from a large corporation; an aspect, which might raise some suspicions from people as this is often seen as marketing activity. However, it was made clear where the donations went (a quite well known charity organization in Germany). Furthermore, the corporation chose a set or media known of reaching quite a large part of the German population. Therefore the setting is close to the Austrian case, even though the campaign was embedded in a different country-specific situation. In terms of educational measures supporting the campaign as seen in Austria, both activities in Germany did not really include such communication efforts. The content of the topic, such as environmental effects of mobile phone production, use and recycling, was presented to a limited extend; information about these issues was included but no deeper explanation of the whole picture of sustainability and mobile phones. This, however, would not have been the type of information and in-depth content suitable for the media chosen in both campaigns – thus, the content was quite fitting for the chosen communication channels. Another aspect which was not discussed in the Austrian case but which we see as quite important in the German campaigns was the selection of take-back channels and possibilities for people interested in participating. Both German campaigns provided tools for returning the mobile phone as easy as possible, including special postal envelops, which could be returned free of charge and with as little effort as possible. In our research underlying this paper, we found some articles discussing this aspect as quite important for such campaigns to succeed. Table 2. Measures Influencing the Return Program Acceptance Factors; in bold the seemingly most inductive factors
5. IMPLICATIONS Summarizing the results to promote recommendations for return-programs, we would like to stress that no single factor accounts for a successful program. Rather, a combination of proposed conditions appears to be the key. Here, we give an overview of aspects that seem to have influenced the investigated worldwide programs, concentrating on the two further investigated programs in Austria and Germany, and referring the results to the UTAUT measures. An overview of all identified success factors can be seen in table 2 below, the most important ones being explained in the following paragraphs. - Performance expectancy: Charity objectives seem to have a stronger impact than other intentions (raffle, price-winning for returned phones etc.); also, clear and visible goals are important. Still, programs offering money for returned phones also could have a noticeable influence but only account to newer mobile phones that can still be used and therefore rather support the category of re-use, which is not the topic of our investigation. - Effort expectancy: minimum effort seems to be the key factor in this category, so that no cost or extra-ways arise and participating people can easily drop off or mail in their mobile phones. E.g. free envelopes sent to households showed a reasonable positive impact. Still, one of the German campaigns showed clearly that this factor is indeed important but not sufficient on its own for a successful campaign. - Facilitating Conditions: Reliable and trustworthy partner: The fact that governmental or non-profit organizations and well-known NGO’s were involved seemed to have a positive impact. In general, governmental supported actions seemed to run well, implicating that a legal and trustworthy factor might also be one of the key factors in these programs. It seems to influence people that reliable partner reduce the chance of misconduct of their mobile phones; trustworthy partner seemed to give a certainty that the mobile phones get treated correctly (e.g.in terms of possible deletion of private content as well as being sent to reliable recycling processes and not being sold to deceptive businesses, nor making money in any way with it). This way, the program does not have the character of a business or selling program but rather a trustworthy idea with a clear incentive. - Social Influence: The image of the initiator and their partners seem to influence people’s decision in returning their mobile phones. Therefore, an activity initiated by a large corporation might get a less positive reaction than one initiated by a local radio station, as included here in this paper (see facilitating conditions).
Performance Expectancy Effort Expectancy Social Influence Facilitating Conditions
Donations to charity
Vouchers or money for returned phone
Games/competitive character
Verifiable environmental protection measures (e.g. planting trees)
Minimizing the effort in terms of time and costs for using a return program (e.g. free mail ins, return boxes at favorite and frequented locations, pick-up services)
Enabling easy ways to save and delete own data from mobile phones
Image of the initiator
Raising awareness in groups (e.g. school competitions, social media networks)
Testimonials (e.g. people from politics, culture and sports)
Trust in the initiator of the program by high levels of transparency
Providing information and knowledge on why, where, how, when (e.g. TV, radio, internet ads)
62
6. CONCLUSION By combing the UTAUT theory with the investigated case studies we can assign different measures to specific factors of technology acceptance (see Table 2). This provides decision makers with a structured overview of possible measure to successfully implement mobile phone return programs. Researchers can use the model, included in this paper and extended by the identified success factors, to evaluate return programs and to determine drivers and barriers of adoption. Depending on the context (country, target group, duration of the campaign, etc.) some of the identified factors here can take a more prominent role than others. This may change according to the different campaigns, therefore, there is no universal “check list” for setting up a successful mobile phone return program. Still, based on the results from this paper, we can recommend taking into account these findings and applying them according to the characteristics of the defined target group. In order to refine the recommendations deducted from the model and its aligned success factors, needing more research, the model can be further developed and refined for explaining and understanding human behavior in terms of responding to such campaigns and changing their behavior accordingly. Such
campaigns in this context of mobile phone recycling are just starting, thus, more empirical data is needed besides the theoretical background gathered for this paper. Therefore, to refine the results from our research so far, our future research will follow these next steps:
In depth case studies and continuing expert interviews
Small and large scale surveys with users and non-users of mobile phone return programs
Given the rising prices for rare materials and the increasing awareness regarding environmental protection, the topic of mobile phone recycling is destined to gain more importance in the future. Hence, related concepts and measures have an increased relevance for policy makers, practitioners, and researchers. Here, again, it is important to design, implement and evaluate respective campaigns successfully in order to reach expected outcomes and behavioral changes and avoid wasting resources. This paper is a first tentative step towards such concept for both designing a successful campaign and evaluating it for further improvements in this context.
7. REFERENCES [1] AMTA (Australian Mobile Telecommunications
Association) http://www.amta.org.au/pages/amta/Check.the.Status.of.your.Handset
[2] Arnfalk, P.; Erdmann, L.; Goodman, J.; Hilty, L. M. (2004): The future impact of ICT on environmental Sustainability. European Commission Technical Report EUR 21384 EN
[3] BITKOM (Bundesverband Informationswirtschaft, Telekommunikation und neue Medien e.V.) http://www.bitkom.org/ retrieved Sep 2012
[4] Baron, R. M., & Kenny, D. A. (1986). The moderator-mediator variable distinction in social psychological research: Conceptual, strategic, and statistical considerations. Journal of Personality and Social Psychology, 51, 1173-1182.
[5] Benbasat I., Goldstein D. K., Mead M. (1987): The Case Research Strategy in Studies of Information Systems. In: MIS Quarterly, 11 (1987), pp. 369-386
[6] Cardoso, A. & Carvalho, J. (2011). Using green is to encourage recycling behavior. MCIS 2011 Proceedings. Available at: http://aisel.aisnet.org/mcis2011/23. Retrieved Sep 2012
[7] Davis, F. D., Bagozzi, R. P., and Warshaw, P. R. (1989): User Acceptance of Computer Technology: A Comparison of Two Theoretical Models. Management Science, 35, 982-1003.
[8] Dubé L, Paré G (2003): Rigor in Information Systems Positivist Case Research: Current Practices. MIS Quarterly 27(4): 597-635
[9] Eisenhardt, K.M. (1989). Building Theories from Case Study Research. The Academy of Management Review, 14(4), S.532–550.
[10] EPA (US Environmental Protection Agency). Plugin to cell phones. http://www.epa.gov/osw/partnerships/plugin/cellphone/ retrieved Sep 2012
[11] Eurostat (2008). Statistical office of the European Union http://epp.eurostat.ec.europa.eu/portal/page/portal/waste/data/wastestreams/weee retrieved Sep 2012
[12] Folz, Hazlett (1991): Public Participation and Recycling Performance: Explaining Program Success. Public Administration Review, Vol. 51, No. 6, pp. 526-532,
[13] Fonebak. UK Cell Phone recycling. http://www.fonebak.com/ retrieved Sep 2012
[14] Geyer, Blass (2010): The economics of cell phone reuse and recycling. International Journal of Advanced Manufacturing Technology. 47:515–525
[15] Hagelüken (2010): Wir brauchen ein globale Recyclingwirtschaft, exerts from a talk given in Vienna, retrieved Sep 2012 http://www.nachhaltigwirtschaften.at/nw_pdf/events/20101011_rohstoffversorgung_christian_hagelueken.pdf
[16] Hilty, Arnfalk, Erdmann, Goodman, Lehmann, Wäger (2006): The relevance of information and communication technologies for environmental sustainability – a prospective simulation study. Environmental Modelling & Software, 11, pp. 1618–1629
[17] Hornik, J., Cherian, J., Madansky, M. and Narayana, C. (1995). Determinants of Recycling Behavior: A Synthesis of Research Results. Journal of Socio-Economics, 24(1), 105-127
[18] Kim, Y, Zhang, P (2010): “Continued Use of Technology: Combining Controlled and Automatic Processes,” in
63

Proceedings of the 31st International Conference on Information Systems, St.Louis, paper 214.
[19] King, W.R. (2006): A meta-analysis of the technology acceptance model. Information & Management (43:6), pp. 740-755.
[20] McLaren J, Wright L, Parkinson S, Jackson T (1999): A dynamic life-cycle energy model of mobile phone take-back and recycling. Journal of Industrial Ecology 2(1):77–91
[21] Mobilemuster. Australian recycling program http://www.mobilemuster.com.au/ retrieved Sep, 2012
[22] Nabu. Naturschutzbund. http://www.nabu.de/themen/konsumressourcenmuell/waskannichtun/handyrecycling/index.html retrieved Sep 2012
[23] Nokia (2005): Integrated Product Policy Pilot Project: Life Cycle Environmental Issues of Mobile Phones. http://ec.europa.eu/environment/ipp/pdf/nokia_mobile_05_04.pdf retrieved Sep 2012
[24] Ö3 Radio. Austrian radio station. http://oe3.orf.at/aktionen/stories/542230/ and http://www.wundertuete-macht-schule.at/ retrieved Sep 2012
[25] OECD (2010): Materials Case Study 1: Critical Metals and Mobile Devices. Working Document by the OECD Environment Directorate,available at http://www.oecd.org/dataoecd/26/45/46132634.pdf retrieved Sep 2012
[26] Opitz, N., Langkau, T. F., Schmidt, N.-H., Kolbe,L. M. (2012, accepted). Technology Acceptance of Cloud Computing: Empirical Evidence from German IT Departments. Proceedings of the Hawaii International Conference on System Sciences (HICSS), Maui, Hawaii, 2012
[27] Reller A, Bublies T, Staudinger T, Oswald I, Meißner S, Allen M (2009): The Mobile Phone: Powerful Communicator and Potential Metal Dissipator. GAIA - Ökologische Perspektiven für Wissenschaft und Gesellschaft"
[28] Tanskanen und Butler (2007): Mobile phone take back learning's from various initiatives. Proceedings of the 2007 IEEE International Symposium on Electronics and the Environment, pp.206-209
[29] Telekom. Deutsche Telekom Recycling http://www.t-mobile.de/handy-ruecknahme/0,22762,24795-_,00.html retrieved Sep 2012
[30] Telekom. Deutsche Telekom CR-report http://www.cr-bericht.telekom.com/site12/kennzahlen/oekologische-kennzahlen/handy-ruecknahme-abfallaufkommen , retrieved Sep 2012
[31] UNEP (2008): United Nations Environment Program and the
Mobile Phone Partnership Initiative (MPPI): Guidance document on the environmentally sound management of used and end-of-life mobile phones. http://archive.basel.int/meetings/oewg/oewg7/docs/oewg07-inf07.pdf retrieved Sep, 2012
[32] USGS (2006). US Geological Survey: Fact Sheet Recycled cell phones http://pubs.usgs.gov/fs/2006/3097/ retrieved Sep 2012
[33] Venkatesh (2012): http://www.vvenkatesh.com/it/organizations/Theoretical_Models.asp#Con=structdefs):
[34] Venkatesh V, Morris MG, Davis FD, Davis GB (2003): User Acceptance of Information Technology: Toward a Unified View. MIS Quarterly, 27, 425-478.
[35] Venkatesh V and Bala H : TAM 3: Advancing the Technology Acceptance Model with a Focus on Interventions. Manuscript in-preparation
[36] Venkatesh, V. and Davis, F.D (2000): A Theoretical Extension of the Technology Acceptance Model: Four Longitudinal Field Studies," Management Science, 46, 186-204.
[37] Vining, Joanne and Angela Ebreo, 1990. "What Makes a Recycler? A Comparison of Recyclers and Nonrecyclers."Environment and Bebavior, Vol. 22, pp. 55-73.
[38] Vodafone. Company data. http://www.vodafone.de/unternehmen/recycling/handy-recycling-engagement.html retrieved Sep 2012
[39] WEEE directive. European Commission. http://ec.europa.eu/environment/waste/weee/index_en.htm retrieved Sep 2012
[40] Widmer, Oswald-Krapf, Sinha-Khetriwalb, Schnellmann, Boeni (2005). Global perspectives on ewaste. Environmental Impact Assessment Review 25 (2005) 436– 458
64

Makahiki+WattDepot: An Open Source Software Stack forNext Generation Energy Research and Education
Philip M. Johnson, Yongwen Xu, Robert S. Brewer,Carleton A. Moore, George E. Lee, Andrea Connell
Collaborative Software Development Laboratory, University of Hawaii at Manoa, Honolulu, HI 96822 USA[johnson, yxu, rbrewer, cmoore, gelee, connell4]@hawaii.edu
ABSTRACTThe accelerating world-wide growth in demand for energyhas led to the conceptualization of a “smart grid”, wherea variety of decentralized, intermittent, renewable energysources (for example, wind, solar, and wave) would pro-vide most or all of the power required by small-scale “micro-grids” servicing hundreds to thousands of consumers. Sucha smart grid will require consumers to transition from pas-sive to active participation in order to optimize the effi-ciency and effectiveness of the grid’s electrical capabilities.This paper presents a software stack comprised of two opensource software systems, Makahiki and WattDepot, whichtogether are designed to engage consumers in energy issuesthrough a combination of education, real-time feedback, in-centives, and game mechanics. We detail the novel featuresof Makahiki and WattDepot, along with our initial experi-ences using them to implement an energy challenge calledthe Kukui Cup.
Keywordssmart grid, energy research, open source, game engine, en-ergy repositories
1. INTRODUCTIONSeveral characteristics of the traditional electrical energy in-frastructure of industrial societies have remained unchangedfor almost 100 years. First, energy production has beencentralized in power plants using “firm” energy sources suchas coal, oil, nuclear, or hydro. Second, centralized produc-tion has promoted centralized control of the grid, typicallythrough a single or small number of utilities with public reg-ulation over their policies and rates. Third, centralized pro-duction and control has led to the predominance of “macro-grids”, or grid infrastructures designed to service hundredsof thousands to millions of consumers. Finally, traditionalgrids have been designed to minimize the information aboutenergy required by consumers to utilize the service. Thetypical consumer needs to know almost nothing more thanhow to plug an appliance into an outlet, and can assume thatthis exceedingly simple “user interface”will provide virtuallyunlimited amounts of high quality energy at any time for arelatively small cost.
ICT4S 2013: Proceedings of the First International Conference on Infor-
mation and Communication Technologies for Sustainability, ETH Zurich,
February 14-16, 2013. Edited by Lorenz M. Hilty, Bernard Aebischer,Göran Andersson and Wolfgang Lohmann.
DOI: http://dx.doi.org/10.3929/ethz-a-007337628
Unfortunately, the accelerating world-wide growth in de-mand for energy is leading to a breakdown in this approachto electrical energy infrastructure. Petroleum products suchas coal and oil are nonrenewable, are no longer reliably in-expensive, and have been found to have a variety of adverseenvironmental effects. Nuclear energy, while low in emis-sions, has risks that have caused countries such as Japanand Germany to reevaluate this approach to energy genera-tion.
Addressing these emergent problems has led to the concep-tualization of a “smart grid”, where a variety of decentral-ized, intermittent, renewable energy sources (for example,wind, solar, and wave) would provide most or all of thepower required by small-scale “micro-grids” servicing hun-dreds to thousands of consumers. Such a smart grid willrequire consumers to transition from passive to active partic-ipation in maintaining efficient and effective use of the grid’selectrical capabilities. For example, these“smart consumers”should be able to tailor their use of electrical energy to thetypes and amount of energy available in the grid at anypoint in time; minimizing the overall use of non-renewableresources as well as peak loads on the grid.
Satisfying the radically different requirements and operat-ing assumptions of this next generation grid requires newkinds of software that enable research and experimentationinto the ways that electrical energy production and con-sumption can be collected, analyzed, visualized, and pro-vided to consumers in a way that enables a transition frompassive to active participation. Since 2009, we have been de-signing, implementing, and evaluating an open source soft-ware “stack” to facilitate this research. This software stackconsists of two custom systems called WattDepot [1] andMakahiki [11], along with the open source components theyrely upon (Java, Restlet, Postgres, Python, Django, Mem-cache).
In this paper, we detail the novel features of WattDepot andMakahiki, along with our initial experiences using them toimplement an energy challenge called the Kukui Cup.
2. WATTDEPOTSoftware for energy collection, storage, and analysis tendsto come in two flavors that support two ends of the scala-bility spectrum. At one end are utility-scale SCADA sys-tems and protocols which are intended to manage macro-grid data [14, 15, 18]. At the other end are “personal scale”
65
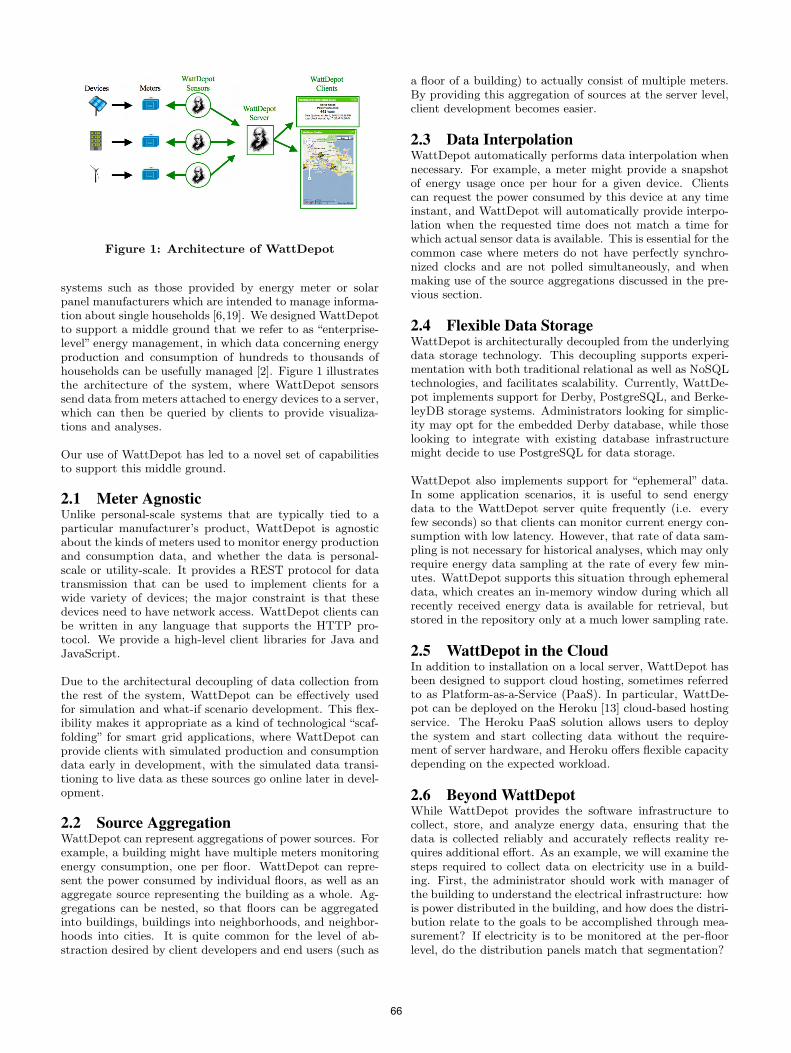
Figure 1: Architecture of WattDepot
systems such as those provided by energy meter or solarpanel manufacturers which are intended to manage informa-tion about single households [6,19]. We designed WattDepotto support a middle ground that we refer to as “enterprise-level” energy management, in which data concerning energyproduction and consumption of hundreds to thousands ofhouseholds can be usefully managed [2]. Figure 1 illustratesthe architecture of the system, where WattDepot sensorssend data from meters attached to energy devices to a server,which can then be queried by clients to provide visualiza-tions and analyses.
Our use of WattDepot has led to a novel set of capabilitiesto support this middle ground.
2.1 Meter AgnosticUnlike personal-scale systems that are typically tied to aparticular manufacturer’s product, WattDepot is agnosticabout the kinds of meters used to monitor energy productionand consumption data, and whether the data is personal-scale or utility-scale. It provides a REST protocol for datatransmission that can be used to implement clients for awide variety of devices; the major constraint is that thesedevices need to have network access. WattDepot clients canbe written in any language that supports the HTTP pro-tocol. We provide a high-level client libraries for Java andJavaScript.
Due to the architectural decoupling of data collection fromthe rest of the system, WattDepot can be effectively usedfor simulation and what-if scenario development. This flex-ibility makes it appropriate as a kind of technological “scaf-folding” for smart grid applications, where WattDepot canprovide clients with simulated production and consumptiondata early in development, with the simulated data transi-tioning to live data as these sources go online later in devel-opment.
2.2 Source AggregationWattDepot can represent aggregations of power sources. Forexample, a building might have multiple meters monitoringenergy consumption, one per floor. WattDepot can repre-sent the power consumed by individual floors, as well as anaggregate source representing the building as a whole. Ag-gregations can be nested, so that floors can be aggregatedinto buildings, buildings into neighborhoods, and neighbor-hoods into cities. It is quite common for the level of ab-straction desired by client developers and end users (such as
a floor of a building) to actually consist of multiple meters.By providing this aggregation of sources at the server level,client development becomes easier.
2.3 Data InterpolationWattDepot automatically performs data interpolation whennecessary. For example, a meter might provide a snapshotof energy usage once per hour for a given device. Clientscan request the power consumed by this device at any timeinstant, and WattDepot will automatically provide interpo-lation when the requested time does not match a time forwhich actual sensor data is available. This is essential for thecommon case where meters do not have perfectly synchro-nized clocks and are not polled simultaneously, and whenmaking use of the source aggregations discussed in the pre-vious section.
2.4 Flexible Data StorageWattDepot is architecturally decoupled from the underlyingdata storage technology. This decoupling supports experi-mentation with both traditional relational as well as NoSQLtechnologies, and facilitates scalability. Currently, WattDe-pot implements support for Derby, PostgreSQL, and Berke-leyDB storage systems. Administrators looking for simplic-ity may opt for the embedded Derby database, while thoselooking to integrate with existing database infrastructuremight decide to use PostgreSQL for data storage.
WattDepot also implements support for “ephemeral” data.In some application scenarios, it is useful to send energydata to the WattDepot server quite frequently (i.e. everyfew seconds) so that clients can monitor current energy con-sumption with low latency. However, that rate of data sam-pling is not necessary for historical analyses, which may onlyrequire energy data sampling at the rate of every few min-utes. WattDepot supports this situation through ephemeraldata, which creates an in-memory window during which allrecently received energy data is available for retrieval, butstored in the repository only at a much lower sampling rate.
2.5 WattDepot in the CloudIn addition to installation on a local server, WattDepot hasbeen designed to support cloud hosting, sometimes referredto as Platform-as-a-Service (PaaS). In particular, WattDe-pot can be deployed on the Heroku [13] cloud-based hostingservice. The Heroku PaaS solution allows users to deploythe system and start collecting data without the require-ment of server hardware, and Heroku offers flexible capacitydepending on the expected workload.
2.6 Beyond WattDepotWhile WattDepot provides the software infrastructure tocollect, store, and analyze energy data, ensuring that thedata is collected reliably and accurately reflects reality re-quires additional effort. As an example, we will examine thesteps required to collect data on electricity use in a build-ing. First, the administrator should work with manager ofthe building to understand the electrical infrastructure: howis power distributed in the building, and how does the distri-bution relate to the goals to be accomplished through mea-surement? If electricity is to be monitored at the per-floorlevel, do the distribution panels match that segmentation?
66
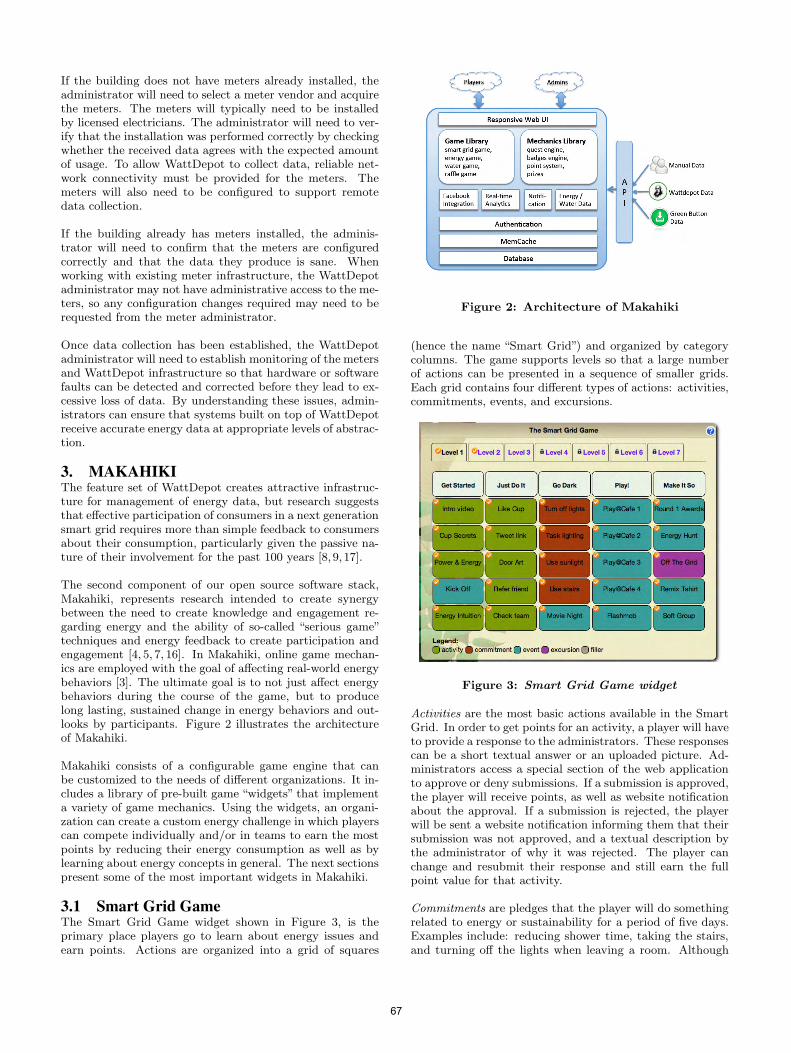
If the building does not have meters already installed, theadministrator will need to select a meter vendor and acquirethe meters. The meters will typically need to be installedby licensed electricians. The administrator will need to ver-ify that the installation was performed correctly by checkingwhether the received data agrees with the expected amountof usage. To allow WattDepot to collect data, reliable net-work connectivity must be provided for the meters. Themeters will also need to be configured to support remotedata collection.
If the building already has meters installed, the adminis-trator will need to confirm that the meters are configuredcorrectly and that the data they produce is sane. Whenworking with existing meter infrastructure, the WattDepotadministrator may not have administrative access to the me-ters, so any configuration changes required may need to berequested from the meter administrator.
Once data collection has been established, the WattDepotadministrator will need to establish monitoring of the metersand WattDepot infrastructure so that hardware or softwarefaults can be detected and corrected before they lead to ex-cessive loss of data. By understanding these issues, admin-istrators can ensure that systems built on top of WattDepotreceive accurate energy data at appropriate levels of abstrac-tion.
3. MAKAHIKIThe feature set of WattDepot creates attractive infrastruc-ture for management of energy data, but research suggeststhat effective participation of consumers in a next generationsmart grid requires more than simple feedback to consumersabout their consumption, particularly given the passive na-ture of their involvement for the past 100 years [8,9,17].
The second component of our open source software stack,Makahiki, represents research intended to create synergybetween the need to create knowledge and engagement re-garding energy and the ability of so-called “serious game”techniques and energy feedback to create participation andengagement [4, 5, 7, 16]. In Makahiki, online game mechan-ics are employed with the goal of affecting real-world energybehaviors [3]. The ultimate goal is to not just affect energybehaviors during the course of the game, but to producelong lasting, sustained change in energy behaviors and out-looks by participants. Figure 2 illustrates the architectureof Makahiki.
Makahiki consists of a configurable game engine that canbe customized to the needs of different organizations. It in-cludes a library of pre-built game “widgets” that implementa variety of game mechanics. Using the widgets, an organi-zation can create a custom energy challenge in which playerscan compete individually and/or in teams to earn the mostpoints by reducing their energy consumption as well as bylearning about energy concepts in general. The next sectionspresent some of the most important widgets in Makahiki.
3.1 Smart Grid GameThe Smart Grid Game widget shown in Figure 3, is theprimary place players go to learn about energy issues andearn points. Actions are organized into a grid of squares
Figure 2: Architecture of Makahiki
(hence the name “Smart Grid”) and organized by categorycolumns. The game supports levels so that a large numberof actions can be presented in a sequence of smaller grids.Each grid contains four different types of actions: activities,commitments, events, and excursions.
Figure 3: Smart Grid Game widget
Activities are the most basic actions available in the SmartGrid. In order to get points for an activity, a player will haveto provide a response to the administrators. These responsescan be a short textual answer or an uploaded picture. Ad-ministrators access a special section of the web applicationto approve or deny submissions. If a submission is approved,the player will receive points, as well as website notificationabout the approval. If a submission is rejected, the playerwill be sent a website notification informing them that theirsubmission was not approved, and a textual description bythe administrator of why it was rejected. The player canchange and resubmit their response and still earn the fullpoint value for that activity.
Commitments are pledges that the player will do somethingrelated to energy or sustainability for a period of five days.Examples include: reducing shower time, taking the stairs,and turning off the lights when leaving a room. Although
67

these commitments are not verifiable, they are public andvisible to other players in the same team and worth fewerpoints than activities. Furthermore, a player is limited tofive active commitments at any given time. After the fiveday period is up, the player can then declare that they com-pleted the commitment and immediately earn their points.They can then sign up for another commitment, includingthe one they just completed.
Events and excursions are tied to real world activities. Eventsare held locally while excursions require transportation. Seat-ing is limited, so players are asked to sign up for events orexcursions they wish to attend. Players that do so are pro-vided with a 2 point signup bonus. Players can also set upa reminder that is sent to their email and/or their mobilephone before the event takes place. At the event, an admin-istrator will hand out attendance codes printed on slips ofpaper that can be entered on the website. These attendancecodes are generated by Makahiki and can only be used once.To discourage players from signing up and not attending,a 2 point penalty is applied to players who do not submitan attendance code. If the player submits an attendancecode for the event after receiving this penalty, the penaltyis reversed.
Not all of the actions and levels in the Smart Grid Game arenecessarily available at the start of the game. We provide aset of predicates that can be used to determine if an actionor level is locked or unlocked for a player. These predicatesinclude: completed a certain number of actions within acategory, completed all actions within a category, completeda certain action, and unlocking of an action or level after acertain date.
These predicates are implemented using a limited subset ofPython and can be changed within the administrative inter-face. Challenge designers can use logical operators to com-bine any of these functions in order to organize the players’path through the Smart Grid Game.
3.2 Power MeterA fundamental requirement for enabling more active partici-pation by consumers in the smart grid is feedback regardingtheir energy usage. One of the most simple mechanismsprovided by Makahiki for this purpose is the Power Meterwidget, illustrated in Figure 4.
Figure 4: Power Meter widget
The Power Meter widget provides basic feedback on energy
consumption via a display of the team’s power consumption,updated every few seconds. The visualization can normal-ized using baseline values so that when the needle is pointingstraight up, the power consumption is the average for thatteam during that specific hour of that specific day of theweek. Thus, if the needle leans left toward the green side,the team’s power consumption at that moment in time isbelow average, while if the needle leans right toward the redside, the team’s power consumption at that moment in timeis above average.
The Power Meter widget obtains its values by querying theWattDepot system for the latest power data consumed bythe associated team. The use of WattDepot, rather than di-rectly querying the meter(s), simplifies the widget design sig-nificantly. First, the physical meters can vary significantly inthe protocol implemented to obtain current power consump-tion. These protocol variations are handled by the WattDe-pot sensors, so this widget can simply query the WattDepotserver using a single HTTP request that is independent ofthe physical meter characteristics. Second, the power con-sumed by a team might be measured by one or multiple me-ters. Again, the WattDepot source aggregation capabilitymeans that this physical difference can be abstracted awayby WattDepot, enabling the widget to obtain the aggregatepower for the team through a single HTTP request.
The Power Meter widget is a useful, though simple mecha-nism for energy feedback that uses theWattDepot+Makahikistack. The next section presents a more sophisticated mech-anism called the Daily Energy Goal Game.
3.3 Daily Energy Goal GameThe Daily Energy Goal Game widget provides a way forplayers to earn points by reducing their current energy con-sumption from a baseline. This baseline can be calculatedusing historical data or dynamically throughout the compe-tition. Both the baseline data and the current consumptionis typically provided by API calls from Makahiki to an un-derlying WattDepot server. Figure 5 illustrates this widget.
Figure 5: Daily Energy Goal Game widget
The goal for each team is typically a percent reduction fromtheir baseline usage. When a player goes to the energy pageof Makahiki, they can view their team’s current progresstoward their daily energy goal. Near the end of the day,Makahiki checks the energy data from Wattdepot to see if a
68

floor reached their goal. If the floor did reach their goal, eachmember of the floor that is participating in the game receivespoints. The energy goal game provides a link between theenergy conservation competition and the point competition.
The Daily Energy Goal display shows both their currentprogress and their goal so far. We have noticed that ourparticipants use more energy at night rather than duringthe day. Thus, it is easy to be under their actual energygoal for most of the day and then jump over the goal at thevery end. Displaying their progress toward the goal so farprovides a pace for players to follow.
3.4 Raffle GameThe Raffle Game widget provides a way to incentivize par-ticipation from all individuals, even those who are not inthe running for a top prize. For every 25 points a playerearns, they receive one virtual raffle ticket. Players can dy-namically allocate their tickets to any raffle prizes they areinterested in at any time, up to the end of the raffle. Figure6 shows an example of the Raffle Game.
Figure 6: Raffle Game widget
Each round of the competition has its own set of raffle prizesand any unused raffle tickets carry over to the next round.Raffle tickets are independent from a player’s score, and al-locating a raffle ticket does not affect their rank. The systemprovides random selection of the winner of each raffle itemat the end of a round.
3.5 Social and Referral BonusesThe Social and Referral Bonus widgets are the game me-chanics that help encourage participation by providing ad-ditional points to players who participate in activities withother players, and facilitate the entry of new players into anenergy challenge.
The social bonus is an configurable option when an action iscreated in the Smart Grid Game. Players earn extra pointsif they perform the action with another player. Examplesof actions with a social bonus include attending an event,recording a song related to energy, or measuring a showerwater flow rate. When a player submits a response for an ac-tion with a social bonus, the player can provide the email ad-dress of the person who jointly completed the action. Once
the other player completes the action, the social bonus isawarded. Social bonuses are not bi-directional; if the secondplayer doesn’t provide the first player’s email address, onlythe first player will get the social bonus.
Players are led through a setup process when logging intoMakahiki for the first time. One of the steps in this processis the referral bonus. If a player was referred by anotherplayer in the system, they can use this step to input theiremail address. Once the new player earns a certain num-ber of points in the competition, both players are awardeda referral bonus of a configurable number of points. Typi-cally, going through the setup process gives you 25 points,so setting a point threshold of 30 points encourages the newplayer to at least complete one additional action in order toget the referral bonus.
3.6 Quest EngineOne challenge we faced when designing Makahiki was pro-viding adequate help to the player. The game needed to beintuitive, even if a new player is not familiar with energychallenges. Unlike many web applications, such as email,Makahiki players generally do not know in advance whatspecific actions they wish to accomplish. In an effort toprovide a player with guidance through Makahiki after thesetup process, we implemented the Quest Engine. Questsare used to guide the player through the various workflowsof the site, such as completing a action, signing up for anevent, or allocating a raffle ticket. These quests can be cre-ated using the administrative interface. Quests use a set ofpredicates to determine unlock and completion conditions.These predicates include: participating in a action or typeof action, completing an action or type of action, having acertain number of points (in a round or overall), completinga certain number of actions in a category or of a given type,being awarded a badge, and adding a picture to their profile.
3.7 Game AnalyticsMakahiki is designed to support energy challenges involvinghundreds or thousands of users lasting weeks or months. Inthese circumstances, effective use of the technology requiresthe ability to understand the state of the game, such as:Who is using it? What are they doing? What is the playerresponse to activities, commitments, excursions, and events?Such state information is important for planning purposes,such as assessing the transportation needs for an upcomingexcursion by seeing how many players signed up. It canalso be used for making in-game changes to game design,such as changing the point values associated with activitiesto encourage or discourage participation. It can also helpidentify breakdowns in game play, such as significant num-bers of unallocated raffle tickets indicating that users do notunderstand the nature of that game mechanic.
To address these needs and others, Makahiki includes a va-riety of widgets that work together to provide high leveloverview of game play state to the administrators of a chal-lenge. Figure 7 shows an example of two game analyticwidgets.
The top widget, User Stats, shows trends in the total numberof players, the total number of new users, and the total num-ber of players visiting the site each day. The bottom widget
69
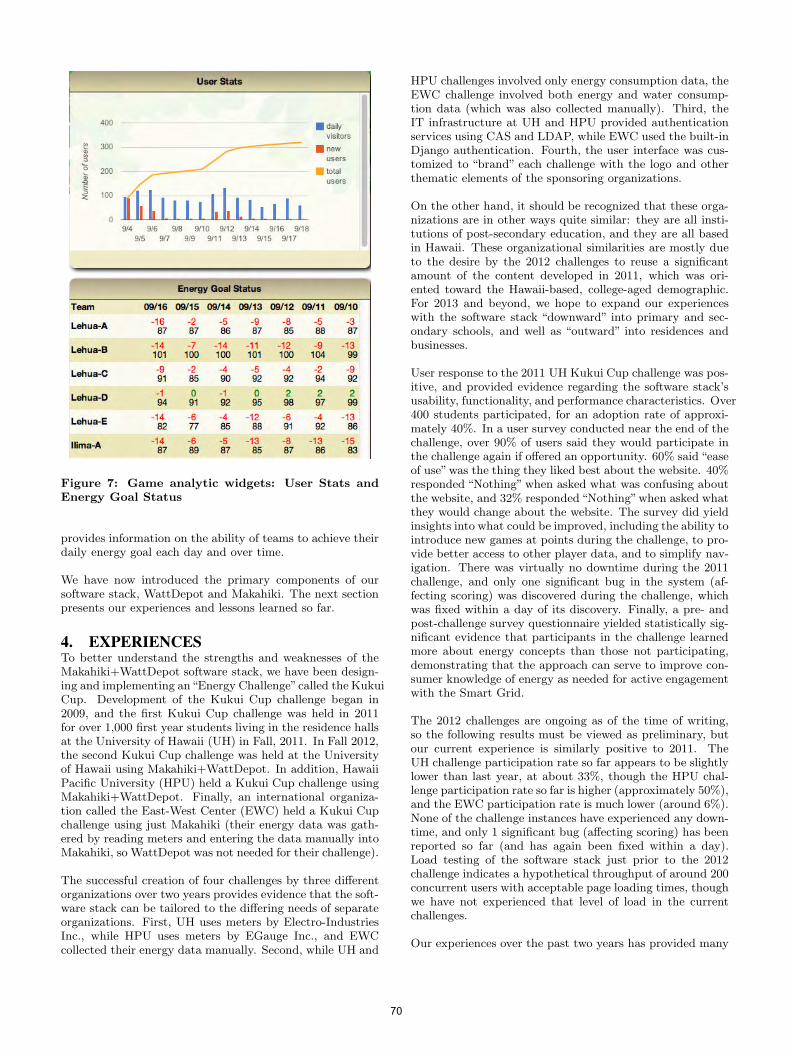
Figure 7: Game analytic widgets: User Stats and
Energy Goal Status
provides information on the ability of teams to achieve theirdaily energy goal each day and over time.
We have now introduced the primary components of oursoftware stack, WattDepot and Makahiki. The next sectionpresents our experiences and lessons learned so far.
4. EXPERIENCESTo better understand the strengths and weaknesses of theMakahiki+WattDepot software stack, we have been design-ing and implementing an“Energy Challenge”called the KukuiCup. Development of the Kukui Cup challenge began in2009, and the first Kukui Cup challenge was held in 2011for over 1,000 first year students living in the residence hallsat the University of Hawaii (UH) in Fall, 2011. In Fall 2012,the second Kukui Cup challenge was held at the Universityof Hawaii using Makahiki+WattDepot. In addition, HawaiiPacific University (HPU) held a Kukui Cup challenge usingMakahiki+WattDepot. Finally, an international organiza-tion called the East-West Center (EWC) held a Kukui Cupchallenge using just Makahiki (their energy data was gath-ered by reading meters and entering the data manually intoMakahiki, so WattDepot was not needed for their challenge).
The successful creation of four challenges by three differentorganizations over two years provides evidence that the soft-ware stack can be tailored to the differing needs of separateorganizations. First, UH uses meters by Electro-IndustriesInc., while HPU uses meters by EGauge Inc., and EWCcollected their energy data manually. Second, while UH and
HPU challenges involved only energy consumption data, theEWC challenge involved both energy and water consump-tion data (which was also collected manually). Third, theIT infrastructure at UH and HPU provided authenticationservices using CAS and LDAP, while EWC used the built-inDjango authentication. Fourth, the user interface was cus-tomized to “brand” each challenge with the logo and otherthematic elements of the sponsoring organizations.
On the other hand, it should be recognized that these orga-nizations are in other ways quite similar: they are all insti-tutions of post-secondary education, and they are all basedin Hawaii. These organizational similarities are mostly dueto the desire by the 2012 challenges to reuse a significantamount of the content developed in 2011, which was ori-ented toward the Hawaii-based, college-aged demographic.For 2013 and beyond, we hope to expand our experienceswith the software stack “downward” into primary and sec-ondary schools, and well as “outward” into residences andbusinesses.
User response to the 2011 UH Kukui Cup challenge was pos-itive, and provided evidence regarding the software stack’susability, functionality, and performance characteristics. Over400 students participated, for an adoption rate of approxi-mately 40%. In a user survey conducted near the end of thechallenge, over 90% of users said they would participate inthe challenge again if offered an opportunity. 60% said “easeof use”was the thing they liked best about the website. 40%responded “Nothing” when asked what was confusing aboutthe website, and 32% responded“Nothing”when asked whatthey would change about the website. The survey did yieldinsights into what could be improved, including the ability tointroduce new games at points during the challenge, to pro-vide better access to other player data, and to simplify nav-igation. There was virtually no downtime during the 2011challenge, and only one significant bug in the system (af-fecting scoring) was discovered during the challenge, whichwas fixed within a day of its discovery. Finally, a pre- andpost-challenge survey questionnaire yielded statistically sig-nificant evidence that participants in the challenge learnedmore about energy concepts than those not participating,demonstrating that the approach can serve to improve con-sumer knowledge of energy as needed for active engagementwith the Smart Grid.
The 2012 challenges are ongoing as of the time of writing,so the following results must be viewed as preliminary, butour current experience is similarly positive to 2011. TheUH challenge participation rate so far appears to be slightlylower than last year, at about 33%, though the HPU chal-lenge participation rate so far is higher (approximately 50%),and the EWC participation rate is much lower (around 6%).None of the challenge instances have experienced any down-time, and only 1 significant bug (affecting scoring) has beenreported so far (and has again been fixed within a day).Load testing of the software stack just prior to the 2012challenge indicates a hypothetical throughput of around 200concurrent users with acceptable page loading times, thoughwe have not experienced that level of load in the currentchallenges.
Our experiences over the past two years has provided many
70

lessons learned, and some of the most important regardingthe Makahiki+WattDepot software stack are:
Collecting energy data is challenging. As alluded to in ourdiscussion of WattDepot, collecting accurate energy data re-quires significant planning and effort. The process of in-stalling meters for the 2011 UH Kukui Cup started overone year before the meters were finally installed and readyfor use, despite the cooperation and goodwill of all involvedparties. Gaining an understanding of the electrical infras-tructure of the residence halls proved crucial in the success ofthe UH Kukui Cup, as a renovation project led to the instal-lation of additional distribution panels and thereby doubledthe number of meters that were needed to measure elec-tricity use. Due to delays in the installation of the metersfor the 2011 UH Kukui Cup, a meter installation problemthat led to inflated energy readings for one floor was notdiscovered until after the competition was complete and anenergy audit of the building could be performed. Manualdata collection also poses a variety of challenges. Exist-ing meters for electricity and water may be configured forcoarse monthly readings rather than the daily readings thatare needed for a competition. Existing meters may also beinstalled in dirty or difficult to reach areas that make dailydata collection unpleasant. If the challenge administratorswish to examine energy or water use after the challenge iscomplete, to determine if behavior changes made during thechallenge are sustainable, daily manual data collection re-quires a long-term commitment. The lesson learned is forchallenge administrators to start planning how they will ob-tain energy or water data as early as possible, since they arelikely to encounter many challenges in collecting the data.
Cloud-based hosting simplifies installation. During 2012, wehave gained experience with both cloud-based hosting aswell as local installation for the Makahiki+WattDepot soft-ware stack. We have found that cloud-based hosting signif-icantly simplifies the installation process and avoids certaintypes of installation-related bugs from occurring, particu-larly when system administrators are not familiar with thestack components that Makahiki+WattDepot depend upon(Django, Java, Python, git, etc.) On the other hand, cloud-based hosting incurs costs (in our experience, between $50-$100/month for these challenges) and may incur constraints(for example, the Heroku hosting platform currently hasminimal support for LDAP authentication). The MakahikiManual [12] provides instructions for both cloud-based andlocal installation, providing some idea of the differences be-tween the two approaches. The lesson learned is to usecloud-based hosting when possible, or allow plenty of timefor administrators to work through the software stack instal-lation issues. Makahiki+WattDepot is not yet a “plug-and-play” system.
Challenge design and administration is time consuming. De-spite the freely providing the Makahiki+WattDepot soft-ware stack to HPU and EWC, along with content developedspecifically for college-age residents of Hawaii, the adminis-trators still expressed surprise at how time consuming it wasto design and administrate the running of their respectivechallenges. This appears to be due to the fact that the soft-ware stack enables a variety of game mechanics (such as theSmart Grid Game, Raffle Game, Badges, and point-based
Prizes) not present in more simplistic energy challenges. Forexample, the Smart Grid Game requires configuration of thewidget including what activities to include and when/wherethey appear in the game. The Raffle Game and point-basedawards requires the collection of appropriate prizes. Whilewe provided a library of almost 100 activities from 2011,all of the 2012 challenges required the definition of at leasta few new events. Thus, although the result is a more so-phisticated experience for the participants, the up front de-sign and overhead during execution was generally surprisingto the administrators. The Kukui Cup Challenge PlanningGuide [10] provides more details on this process. The les-son learned is to make sure that potential organizationalsponsors understand that the use of this software technol-ogy is not intended to make it more simple for them to runan energy challenge, but rather to enable them to create amore sophisticated energy challenge than would otherwisebe possible.
Scalability cuts across both design and implementation. Sofar, the use of the Makahiki+WattDepot software stack hasbeen limited to relatively small user communities of 1,000participants or less. We believe that the system and ap-proach would scale relatively well to some small number ofmultiples of that number, say to a maximum of 10,000 chal-lenge participants. On the other hand, there are both designand implementation challenges in scaling the software stackto communities of significantly larger than 10,000 partici-pants.
On the design side, Makahiki currently requires administra-tors to approve each submission by a participant in orderfor that participant to receive points. In the UH challenges,that results in administrative approval of around 4,000 in-dividual submissions over the course of the challenge. Thisincurs administrative overhead, but makes it easier to ver-ify that players are actually taking part in activities andimproves the sense of fairness in the game. On the otherhand, we do not believe this approach would be practical ifthere were an order of magnitude more submissions to pro-cess. To scale, the current manual approval process must beautomated, and must be done in a manner that preserves es-sential game mechanics. For example, simply changing thecurrent short answer verification format by multiple choicecould result in players just randomly selecting values untilthey find the right one. Multiple choice also does not sup-port certain types of activities where the submission consistsof a link, a photo, or even a poem. So, scaling up by an or-der of magnitude might affect the types of activities thatcan be supported in the challenge. Peer review of actionsubmissions is one possible solution, but would require care-ful design and testing to ensure the competitive nature ofthe challenge does not encourage unfair evaluation of sub-missions.
On the implementation side, our current performance test-ing indicates a maximal throughput of approximately 200concurrent users. Interestingly, increasing the number ofserver/web processing resources available through cloud-basedhosting does not appear to appreciably increase maximalthroughput. Thus, it does not appear to be true that cloud-based hosting will magically “solve” the scalability problemfor the Makahiki+WattDepot software stack. Because the
71

current level of throughput is adequate for the communitieswe are current targeting, we have not investigated this is-sue further. The lesson learned is that if an organizationwants to perform an energy challenge for a community ofmore than 10,000 users, significant design and implementa-tion challenges must be addressed.
5. CONCLUSIONS/FUTURE DIRECTIONSOur experiences thus far with the Makahiki+WattDepotsoftware stack have shown it to be a reliable and performantsystem for the provision of sophisticated energy challengesto address the need for informed consumers in the develop-ment of the Smart Grid. Its tailorability and game analyticsprovides a useful platform for research on gamification, en-ergy education, and behavior change.
One future direction involves the development of a consor-tium of local organizations in order to explore the use of thissoftware stack in new settings. This will create challengesat both the design and implementation levels. Moving out-side of the context of either Hawaii or college-aged users willnecessitate development of significant new forms of content,including activities, workshops, events, and videos. Thischallenge, while significant, does not necessitate significantchanges to the Makahiki+WattDepot software stack.
A far more challenging future direction is an island-wideKukui Cup, in which all of the residents of Oahu would beable to login to the system and play the game. This createschallenges on multiple levels: providing content appropri-ate to the user (an elementary school student should haveactivities different from her mother and father), obtainingenergy data for residential users from the local utility in amanner appropriate for the challenge and interfacing thisdata with the system, and finally resolving the scalabilityproblem identified in the last section. We will require theengagement of multiple stakeholders from across the com-munity spectrum to identify and resolve these issues.
6. ACKNOWLEDGMENTSThis research is supported in part by grant IIS-1017126 fromthe National Science Foundation; the HEI Charitable Foun-dation; Hawaiian Electric Company; the State of Hawaii De-partment of Business, Economic Development and Tourism.We are also thankful for the support from the followingorganizations at the University of Hawai‘i: the Center forRenewable Energy and Island Sustainability, Student Hous-ing Services, Facilities Management, and the Departmentof Information and Computer Sciences. We gratefully ac-knowledge the players of the 2011 and 2012 Kukui Cupsand the members of the Kukui Cup team in addition to theauthors who made the vision a reality: Kaveh Abhari, HanaBowers, Greg Burgess, Caterina Desiato, Michelle Katchuck,Risa Khamsi, Amanda Pacholok, Morgan de Partee, AlyseRutherford, Alex Young, and Chris Zorn.
7. REFERENCES[1] R. Brewer. Wattdepot home page.
http://wattdepot.googlecode.com, 2010.
[2] R. S. Brewer and P. M. Johnson. WattDepot: Anopen source software ecosystem for enterprise-scaleenergy data collection, storage, analysis, and
visualization. In Proceedings of the First International
Conference on Smart Grid Communications, pages91–95, Gaithersburg, MD, October 2010.
[3] R. S. Brewer, G. E. Lee, and P. M. Johnson. TheKukui Cup: a dorm energy competition focused onsustainable behavior change and energy literacy. InProceedings of the 44th Hawaii International
Conference on System Sciences, pages 1–10, January2011.
[4] S. Darby. The effectiveness of feedback on energyconsumption. Technical report, Environmental ChangeInstitute, University of Oxford, 2006.
[5] S. Deterding, D. Dixon, R. Khaled, and L. Nacke.From game design elements to gamefulness: Defining“gamification”. In Proceedings of MindTrek, 2011.
[6] Control4 EMS 100. http://news.cnet.com/8301-11128_3-20000731-54.html.
[7] A. Faruqui, S. Sergici, and A. Sharif. The impact ofinformational feedback on energy consumption–asurvey of the experimental evidence. Energy,35(4):1598–1608, 2010.
[8] J. Froehlich. Moving beyond line graphs: The historyand future of eco-feedback design. Presentation at the2010 Behavior Energy and Climate Changeconference, 2010.
[9] S. Houde, A. Todd, A. Sudarshan, J. A. Flora, andK. C. Armel. Real-time feedback and electricityconsumption: A field experiment assessing thepotential for savings and persistence. The Energy
Journal, 34(1):87–102, 2013.
[10] P. Johnson. Kukui cup challenge planning guide.http://www.kukuicup.org/planning-guide, 2011.
[11] G. Lee and Y. Xu. Makahiki home page.http://github.com/csdl/makahiki, 2011.
[12] G. Lee and Y. Xu. Makahiki manual.http://makahiki.readthedocs.org, 2011.
[13] J. Lindenbaum. Heroku home page.http://heroku.com, 2011.
[14] Open Phasor Data Concentrator (OpenPDC).http://openpdc.codeplex.com/.
[15] Open Source Home Area Network (OSHAN).http://sourceforge.net/projects/oshan/.
[16] J. E. Petersen, V. Shunturov, K. Janda, G. Platt, andK. Weinberger. Dormitory residents reduce electricityconsumption when exposed to real-time visualfeedback and incentives. International Journal ofSustainability in Higher Education, 8(1):16–33, 2007.
[17] J. Pierce and E. Paulos. Beyond energy monitors:interaction, energy, and emerging energy systems. InProceedings of the 2012 ACM annual conference on
Human Factors in Computing Systems, CHI ’12, pages665–674, New York, NY, USA, 2012. ACM.
[18] Smart energy 2.0.http://www.zigbee.org/SmartEnergy.
[19] The Energy Detective (TED) Home Energy Meter.http://www.theenergydetective.com/.
72
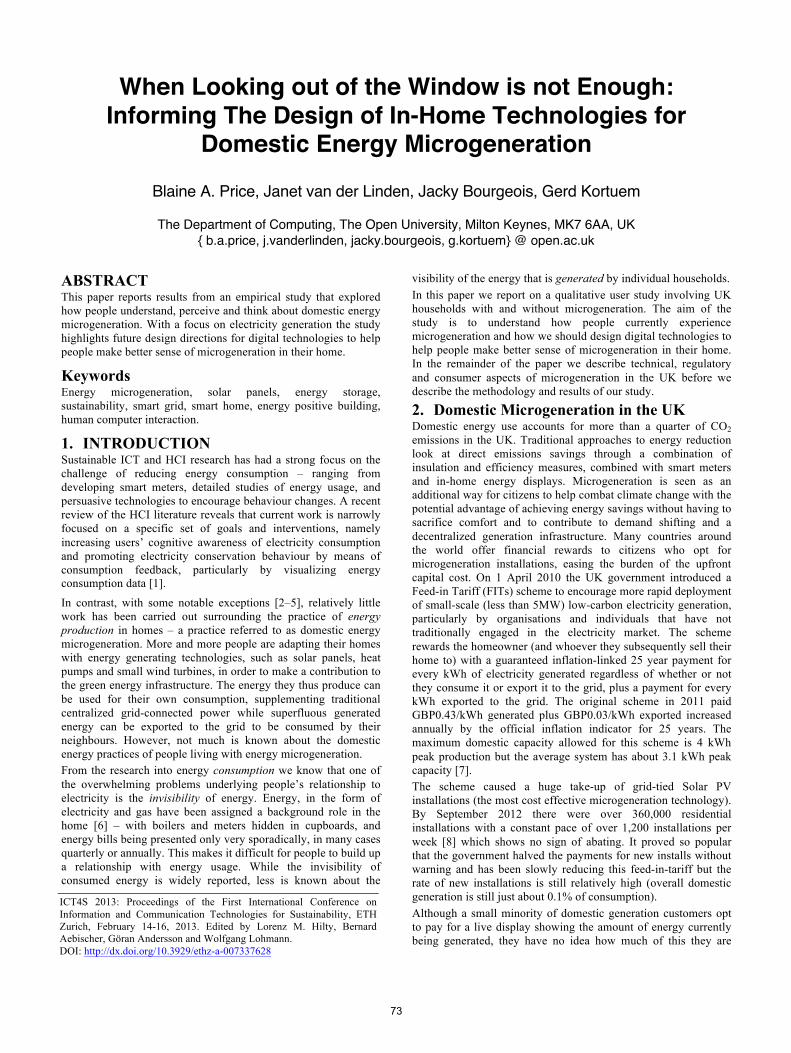
When Looking out of the Window is not Enough: Informing The Design of In-Home Technologies for
Domestic Energy Microgeneration
Blaine A. Price, Janet van der Linden, Jacky Bourgeois, Gerd Kortuem
The Department of Computing, The Open University, Milton Keynes, MK7 6AA, UK { b.a.price, j.vanderlinden, jacky.bourgeois, g.kortuem} @ open.ac.uk
ABSTRACT This paper reports results from an empirical study that explored how people understand, perceive and think about domestic energy microgeneration. With a focus on electricity generation the study highlights future design directions for digital technologies to help people make better sense of microgeneration in their home.
Keywords Energy microgeneration, solar panels, energy storage, sustainability, smart grid, smart home, energy positive building, human computer interaction.
1. INTRODUCTION Sustainable ICT and HCI research has had a strong focus on the challenge of reducing energy consumption – ranging from developing smart meters, detailed studies of energy usage, and persuasive technologies to encourage behaviour changes. A recent review of the HCI literature reveals that current work is narrowly focused on a specific set of goals and interventions, namely increasing users’ cognitive awareness of electricity consumption and promoting electricity conservation behaviour by means of consumption feedback, particularly by visualizing energy consumption data [1].
In contrast, with some notable exceptions [2–5], relatively little work has been carried out surrounding the practice of energy production in homes – a practice referred to as domestic energy microgeneration. More and more people are adapting their homes with energy generating technologies, such as solar panels, heat pumps and small wind turbines, in order to make a contribution to the green energy infrastructure. The energy they thus produce can be used for their own consumption, supplementing traditional centralized grid-connected power while superfluous generated energy can be exported to the grid to be consumed by their neighbours. However, not much is known about the domestic energy practices of people living with energy microgeneration. From the research into energy consumption we know that one of the overwhelming problems underlying people’s relationship to electricity is the invisibility of energy. Energy, in the form of electricity and gas have been assigned a background role in the home [6] – with boilers and meters hidden in cupboards, and energy bills being presented only very sporadically, in many cases quarterly or annually. This makes it difficult for people to build up a relationship with energy usage. While the invisibility of consumed energy is widely reported, less is known about the
visibility of the energy that is generated by individual households. In this paper we report on a qualitative user study involving UK households with and without microgeneration. The aim of the study is to understand how people currently experience microgeneration and how we should design digital technologies to help people make better sense of microgeneration in their home. In the remainder of the paper we describe technical, regulatory and consumer aspects of microgeneration in the UK before we describe the methodology and results of our study.
2. Domestic Microgeneration in the UK Domestic energy use accounts for more than a quarter of CO2 emissions in the UK. Traditional approaches to energy reduction look at direct emissions savings through a combination of insulation and efficiency measures, combined with smart meters and in-home energy displays. Microgeneration is seen as an additional way for citizens to help combat climate change with the potential advantage of achieving energy savings without having to sacrifice comfort and to contribute to demand shifting and a decentralized generation infrastructure. Many countries around the world offer financial rewards to citizens who opt for microgeneration installations, easing the burden of the upfront capital cost. On 1 April 2010 the UK government introduced a Feed-in Tariff (FITs) scheme to encourage more rapid deployment of small-scale (less than 5MW) low-carbon electricity generation, particularly by organisations and individuals that have not traditionally engaged in the electricity market. The scheme rewards the homeowner (and whoever they subsequently sell their home to) with a guaranteed inflation-linked 25 year payment for every kWh of electricity generated regardless of whether or not they consume it or export it to the grid, plus a payment for every kWh exported to the grid. The original scheme in 2011 paid GBP0.43/kWh generated plus GBP0.03/kWh exported increased annually by the official inflation indicator for 25 years. The maximum domestic capacity allowed for this scheme is 4 kWh peak production but the average system has about 3.1 kWh peak capacity [7]. The scheme caused a huge take-up of grid-tied Solar PV installations (the most cost effective microgeneration technology). By September 2012 there were over 360,000 residential installations with a constant pace of over 1,200 installations per week [8] which shows no sign of abating. It proved so popular that the government halved the payments for new installs without warning and has been slowly reducing this feed-in-tariff but the rate of new installations is still relatively high (overall domestic generation is still just about 0.1% of consumption). Although a small minority of domestic generation customers opt to pay for a live display showing the amount of energy currently being generated, they have no idea how much of this they are
ICT4S 2013: Proceedings of the First International Conference on Information and Communication Technologies for Sustainability, ETH Zurich, February 14-16, 2013. Edited by Lorenz M. Hilty, Bernard Aebischer, Göran Andersson and Wolfgang Lohmann. DOI: http://dx.doi.org/10.3929/ethz-a-007337628
73
consuming or exporting because export meters are not normally installed: the export payments assume that the home consumes 50% of the generated power and exports the rest. Even where they are installed, export meters simply show a cumulative total number as the consumption meter does (Figure 1), so there is no real time or historical data available. Even the quarterly electricity bill does not help as it shows how much energy was purchased from the grid (or the monthly or quarterly estimate) with no information about PV generation, consumption or export. Under the rules of the FIT scheme, consumers read their own generation meter every quarter and send this reading to their electricity company who then send a payment for the electricity generated that quarter. The consumer should see a lower electricity bill in the year after PV is installed, but there is no other indication available to them connecting generation and consumption. Thus there is a strong motivation to use all of the energy generated because the consumer will be paid for an assumed 50% export even if they consume all the microgenerated power and the payment for export is relatively small. To provide a concrete example of the numbers involved: one UK household we looked at with a 3.3kWh peak system generated 3215 kWh in 2011 and in return received £1543 in FIT payments for generation and export. Yet how much kWh of the generated kWh was exported and how much was consumed is unknown to the household.
Figure 1: PV Generation Meter
(showing total accumulated energy)
3. People and Domestic Microgeneration Motivations and Adoption. Adoption of domestic micro-generation is still relatively low and not much is known why households choose to buy them, what households think about producing their own electricity, and how they perceive them. A 2006 study by the Open University on the drivers for adoption of micro-combined heat/power systems (before feed-in tariffs came into effect) uncovered that for users of solar PV environmental concerns topped the agenda, with a significant portion of the respondents mentioning “pleasure of using a renewable energy” (31%) [9]. Similarly, [10] discovered that environmental concerns are the main motive for adopting PVs or micro wind turbines. Some household adoption represents a way to reduce fossil-fuel use. For others, this investment is symbolic and provides a way to display environmental consciousness or to set an example. For still others, adoption is a protest against “the system,” or a step toward self-sufficiency [11]. Conversely, some households reject microgeneration installations because of financial considerations, respect for neighbors who might object, and/or difficulties finding an appropriate site. Among our participants with PV installations, all had been inclined towards installing PV due to ecological awareness but had hesitated because of cost. Once the feed-in-tariff was introduced, it became, in the words of one participant, “a no-brainer.” Behaviour Change. In 2004 the Green Alliance’s Micro-generation Manifesto [12] argued that the small-scale nature of
micro-generation means that individuals can play an active part in attaining the UK’s environmental goals:
‘Micro-generation will make the public co-producers of climate change solutions rather than passive consumers of energy, helping to combat the ‘what can I do?’ apathy that undermines so many well- meaning public education campaigns’ [12]
Indeed the literature provides evidence that microgeneration technologies encourage energy efficient behavior. Keirstead [2] describes microgeneration as delivering a ‘double dividend’ – that is, not only does microgeneration produce green energy but also give rise to reduced electricity consumption behaviour. A UK study [13] observed that 88% of consumers who installed microgeneration found that household behaviour was significantly altered to reduce energy consumption after installation (including lifestyle changes as well as traditional energy saving measures). Keirstead [2] highlights that some households with microgeneration engage in ‘demand-shifting’ - a particular form of behaviour change where energy consumption is shifted towards times of the day when production is at its highest. Other research has noted a heightened energy consciousness among consumers, even those merely in contact with microgeneration:
“Beyond the sheer excitement and pleasure of DIY energy generation, the impact is seen in householders' shifting attitudes to energy conservation and consumption ... there starts to develop a strong sense of which behaviours are free and self-provided, versus ones that cost money and are supplier-dependent.” [14] p. 6.
Keirstead’s study [5] states that “micro-generation provides a tangible hook to engage householders emotionally with the issue of energy use”. The emotional resonance appears to be connected to the “sheer pleasure of creation and of self-sufficiency” reported by participants. Understanding Microgeneration. The reported behaviour changes, especially those related to purposeful demand-shifting, are surprising given the lack of concrete information people have about their own electricity generation. As indicated above, even with currently available energy monitors the generated energy is essentially invisible to home occupants. Users “experience” the energy primarily through a lowered energy bill (only by manually comparing bills for the same period one year after installation). The problem is that a consumer, who wants to shift demand (e.g. the use of a high energy device such as the washing machine, oven, or dishwasher) to a time when free solar energy is available, has no data to base this decision on and is thus left to guess the relationship between demand and supply. Energy demand reduction and behavior change has been linked to energy feedback systems, such as smart meters or in-home displays [15]. Yet while early studies have speculated about potential synergies between feedback and microgeneration [16], and while households seems to express desire for energy monitors that show consumption and production [2], we have no real understanding about the link between microgeneration, feedback and behavior change. Energy Savings. While some studies have reported net energy savings related to the use of microgeneration [13], [14], [17], other studies question if the theoretical possible savings from installing microgeneration can be realized in practice, and claim that savings are considerably lower than the ‘potential’ savings predicted by the industry. For example, a recent study of solar thermal water heating in the UK found that the majority of systems surveyed achieved no more than 6% of their potential
74

heating energy savings [18], while [10] claim that the low savings are due to a complex mixture of behavioural, institutional, economic, cultural and technical reasons and the lack of a ‘whole-system approach’ to provisioning microgeneration solutions, resulting in sub-optimal products and installations, as well as a knowledge gap by consumers. Future innovations like domestic energy storage and electric vehicles will certainly complicate the situation.
4. Microgeneration Study How can people get more out of their own microgeneration installations? How can they better understand microgeneration in relation to their own habits and energy consumption patterns? And how can digital technology help? In the case of consumption there is a clear case that digital technology can help alleviate the knowledge gap and help people become aware of their own consumption habits – and thus help them to develop more energy efficient practices. Does the same apply to microgeneration? There are several possible angles for the design of digital technologies: A recent study on domestic heat pumps [17] discovered that people who had more information about the working of their pumps were gaining more efficiency from their installation – pointing to the power of information and knowledge. Pierce, in contrast, developed recommendations for default settings on appliances, so that users tend to use them more energy efficiently, even without realizing – essentially arguing for smart design over knowledge [1]. With microgeneration we have no clear indication in which direction to go. Thus we designed and conducted a study with two aims: 1) the first aim is to understand how people currently experience microgenerated energy; 2) the second aim is to understand what roles ICT can play in mediating the relationship between people, microgeneration technology and the energy people generate. Ultimately our goal is to design novel ways of experiencing energy to inspire a positive chance in energy consumption habits. Answers to these two questions will be a first step towards informing the design of digital technologies for the home that helps people use their own generated energy in a more efficient and effective way. In the following we describe the study design and provide an outlook on the results.
4.1 Study Context We are working in collaboration with E.ON, a major European energy retailer, who is running a multi-year trial of smart energy home technologies involving 75 homes in a medium-sized UK suburban city. Participating homes have been fitted with wireless electricity and gas meters and room temperature sensors. Participants can access precise consumption data from their mobile phone or through a web application (in-home display are also provided but because of poor design most participants have stopped using them). In later stages of the trial participants’ homes will be set up with additional energy technologies such as electricity storage to store excess solar power for use at night, electric cars, smart washing machines and smart heating controllers (none of these were available during our study). Some of the participating households already have solar panels installed (or soon will have), and most thus have a keen awareness of energy issues and energy bills.
4.2 Research Methodology For our study we used a two-stage methodology. The first stage consisted of focus group meetings with a large number of
participants. The second stage consisted of a one week home study with technology probes. The focus groups were organised as part of the larger trial and used to discuss various topics including technical problems, people’s experiences during the trial and ideas about novel technologies. Focus groups were run by professional facilitators with us as researchers acting as observers. We used video recordings and written transcripts to analyse the discussions with respect to concerns, attitudes, perceptions, motivation, and requirements of participants. Insights gained from the first stage informed the second stage in which we used technology probes [19] installed at the homes of a small number specially selected participants. The aim was to let people explore their own attitudes, understanding, experiences and opinions about microgeneration in the comfort of their own home, without researchers being present. The technology probes, a set of interactive displays showing energy data and controls, were intended to stimulate the discussion. Our engagement with participating households comprised four steps: 1) recruitment; 2) installation of technology probes at participants’ households 3) week-long living with technology probes by participants (without presence of researchers) 4) debriefing. After installation of the probes, participants were asked to “live” with them, i.e. to observe and use them and to contemplate their meaning and purpose. A rudimentary explanation of the context and objectives of the study was provided in written form, as well as supporting materials such as audio recorders, cardboard and sketchbooks so that participants could capture thoughts and ideas. A week later a debriefing session took place at the home where two researchers sat down with inhabitants to go over the collected materials (sketches, recording) and to discuss the users’ experience. Participants were prompted to reflect upon their experience with the probes and recollect discussion that took place in the household during that week. Each home visit was recorded for later transcription and analysis.
4.3 Technology Probes As technology probes we used a set of custom-designed interactive displays that provided participants with 16 different data visualisations and user interfaces related to microgeneration (Table 1 and Figure 2). The design of the probes was purposefully kept incomplete and rudimentary: rather than as design endpoints that participants were supposed to criticize, they were intended to spur freewheeling discussions and collaborative exploration by members of a household. The design of the probes explored several dimensions (see Column 5 in Table 1): • The amount of energy a household generates: We used
metaphors such as the dial or the battery to represent abstract, concrete, absolute and relative quantities.
• The locality of energy: whether energy is available for the whole home or dedicated to specific appliances and uses.
• Interactivity: some displays simply visualize energy production while others allow users to influence how this energy is used in the home.
• Temporal aspects: Some displays explore the temporal dimension of production and generation while others focus on momentary available energy.
• Future technologies: Some displays assume technology that is currently not available in homes. In particular, we explored issues around domestic energy storage.
• Environmental conditions: some displays featured icons representing current or forecast weather conditions (Figure 2a and 2f).
75
Each household was given two iPads as displays: one iPad was showing information to the house as a whole, while the second display referred to one specific appliance - the washing machine. Participants were invited to place the iPads in locations were they felt they would be most useful to them. We did not specifically
indicate where this should be, but did suggest that the one relating to the whole house production/consumption should be in a place where all members of the households would have easy access to them. The display relating to the washing machine was to be placed near the washing machine.
Table 1. Technology Probe Design Probe Explanation Metaphor Focus Issues that this probe raises a) Dial A probe that displays the
amount of currently generated energy.
Analog Dial
House - currently generated energy
Probe focuses on momentary availability of energy (here and now), and peek production. It deliberately makes it difficult to see temporal fluctuations in energy generation.
b) Battery (House)
A probe that conceptualizes a house as a battery that can be charged and drained.
Battery House – available generated energy
Probe focuses on near term availability of energy. Introduces temporal aspects: How long does it take to ‘charge’ a house? How long does a ‘charge’ last?
c) Battery (Appliance)
A probe that conceptualizes energy as being available or reserved for a particular appliance
Battery Appliance – available energy
Probe focuses on every day tasks such as doing laundry. Moves away from whole house issues to appliance-level issues. Uses relative energy measures (full-empty): Can I use this appliance now? Raises questions about future availability: If not now, when will I be able to use it?
d) Potential Use
A probe that indicates how often an appliance (for example, a washing machine) can be used before the available energy is used up.
Analog Dial
Appliance – potential tasks
Probe focuses every day tasks and moves away from abstract energy quantities. It relates energy to family life and accomplishing everyday tasks: “Can I get my washing done?” “How often can I use the washing machine?”
e) Generation and Consumption
A probe that visualizes the gap between energy used by a household and the energy generated by the house.
(graph) House - total energy generated and consumed by a household
Probe focuses on two issues: 1) the fact that there tends to be a gap between the amounts of generated and used energy 2) the fact that energy generation fluctuates over time. Discussions around this probe might highlight questions such as: “How large is the energy gap?” “How can we minimize the energy gap?” “What factors influence energy generation?”
f) Energy Forecast
A probe that visualizes expected future energy generation.
Weather forecast
House – potential tasks
Probe focuses on future availability of energy. Highlights temporal fluctuation of energy generation: “How much energy will we generate tomorrow/next week?”
g) Switch A probe that allows users to decide how an appliance is powered: from grid power, from self-generated power, or from both.
Switch Appliance – energy source
Probe enables users to decide the energy source of individual appliances and thus enables them to use generated energy for a particular purpose. Implicitly enables users to express priorities, importance or values. “Only enable this appliance if there is enough energy available.” “Enable this appliance now regardless of availability of generated energy”.
2a. Dial
2b. Battery (House)
2c. Battery (Appliance)
2d. Potential Appliance Usage
2e. Generation and Consumption
2f. Energy Forecast
2g. Switch
Figure 2. Technology Probe Interfaces (displayed on iPad and Android tablets that were placed in participants’ homes)
76

In this study we are using semi-functional technology probes: the displays exhibited realistic data and behaviour but this behaviour was scripted and unconnected to the existing energy infrastructure in the participants household. This was necessary because data feeds provided by the energy company were unreliable and incomplete and because some probes visualised data that assumed not yet existing technology (notably energy storage). In order to minimise discrepancies between energy displays and real world we created realistic simulated data by using historic data from an existing yet unrelated home and by harvesting live data feeds (weather and PV energy production) from other local sources.
4.4 Participants For the technology probe study we selected six participating households to take part. Four households were also participating in the wider trial, and two households were selected through informal contacts, such as friends and neighbours of the researchers. Four of the six households had solar panels fitted – within the last 6 to 24 months - and two households were actively contemplating doing so and had done much background research into the issues. The six households were all middle to upper-middle class households, with different family structures: some without children, some with teenage children or children who had left home. In total a group of twenty participants were involved, spread out over six households.
Table 2 – Participating households. Household set-up Solar power HH1 Two parents with 3
children aged 13 to 17 3.7 kWh peak for 18 months, 20% reduction in bill
HH2 Two parents and one 14 year old child
2.7 kWh peak, for 24 months, 27% reduction in bill
HH3 Two parents and two children aged 17 to 19
Considering installation
HH4 Husband (scientist) and wife with occasional visiting grandchildren
1.9 kWh peak for 6 months
HH5 Two adult females Install pending HH6 Husband and Wife
(scientist) 3.3 kWh peak for 9 months
5. Focus Groups The focus group delivered a wide range of insights about peoples’ energy practices, attitudes and experiences with various energy technologies, some of which was directly related to microgeneration. In particular we were able to identify practices that resemble what [5] described as demand shifting. People reported that they base their decision about if they can switch on their appliances by looking out of the window to see if the sun is shining. Participants in the focus groups reflect on when they use their appliances:
“We now switch on (appliances) when the sun is out – so that’s happened with the introduction of solar panels…”
While this is showing that participants are changing their behaviour, there is also uncertainty about what they can or can’t do, due to a lack of information:
“the sun was out, so the washing machine was on. It would be nice if I could do the ironing – but I don’t know how much …” “My wife now asks: Can I put the washing machine on? She’s starting to think how she could use it separately – not all at the same time, because she know there’s not enough coming in…”
While looking out of the window can give an approximation of amounts of energy being generated – it is not straightforward for consumers to work out exactly how much “spare” energy they have to play with. To do this properly they would need to know: (i) the precise power consumption pattern of the appliance in kW over time and (ii) the actual current net exported power from the microgeneration installation (and ideally how long it will be maintained). Few participants knew what the wattages of their appliances were, let alone the pattern of consumption. For example, a typical coffee maker might be rated at 2.7 kW but only draws this for the first minute of operation and subsequently draws very little power, which is not obvious. None of the participants really understood how actual energy production is influenced by the peak capacity of their installation and environmental aspects. Even knowing the peak generation capacity is fraught with problems: the peak capacity of a PV installation only applies under cloudless conditions, around noon for an installation under perfect conditions: south facing roof, 30 degree roof pitch, no shading. As we discovered few installations satisfy all five of these condition. Figure 3 shows one of the participant’s homes with a less than ideal PV installation due to partial shading by trees, orientation and roof pitch.
Figure 3: PV panels (2.7 kWh peak) on Participant's roof
facing south-east, shaded by trees, at 42 degree pitch
6. Results of the Technology Probe Study Our analysis of the interviews with six households involved in the technology probe study showed a general high level of engagement with the probes and lively family discussions during the week-long installation. Some individuals had clear favourite displays that they would return to often to look at, pointing it out to other members of the family, while other displays had puzzled them. Most participants had rather enjoyed the idea and look of the shiny iPads in the house although they were also worried that the iPads themselves were consuming energy (in fact this is negligible). In most households there had also been clearly one or more individuals who had interacted with the displays more than the others - comparable to people taking the roles of home technology drivers versus passive users in Mennicken’s study on people living in smart homes [3]. Furthermore, visitors such as the children’s friends or grandchildren took a keen interest in the displays and were eager to report their opinions to the researchers. Some people were not sure how long the interest would be kept up for such displays mentioning – “after four days we didn’t notice it any more”, or “the girls didn’t even look up to ask what they were, they’re so used to all this technology…” But this would be argued against by others saying “I loved walking through the room, and then the display would change, and it would just catch my eye, I’d see it just out of the corner of my eye…” People were eager to discuss their habits, and discussions went well outside the precise discussion of the displays themselves, and reflected on their own awareness of electricity consumption as
77

well as production. Below we present our findings in terms of a set of themes related to energy production in the home: (i) level of abstraction (ii) locality (iii) information detail.
6.1 Abstractions and Representations Some of the displays we used were hinting at future technologies such as energy storage, which are not implemented in any participants’ homes yet. In particular we had put forward the idea of a battery (Figure 2b/c) – representing the total available energy for the whole house, or representing the ‘number of washes’ available for the washing machine. The battery abstraction caused the most controversy amongst participants, with them almost holding opposing views from each other. In HH1, participants were concerned about this display, as it appeared completely wrong to them. When we explained it was meant to be imagined as a future technology, the reaction was:
“It’s interesting, because I didn’t realize that that was now a possibility. We were very early on adopting the solar panels. But one of the first things I asked the guys when they installed it, was where the power was going to be stored. He seemed very surprised about my question. So it’s good if you think that that is moving forward…”
The participants appeared to be struggling with imagining future scenarios with novel features. In contrast, the participants in HH2 were quite happy to imagine the scenario – also knowing that they may have an opportunity to have the technology installed in a few months as part of the wider trial. One member of HH2 particularly liked the battery icon, ‘because of its simplicity’. On the other hand, for the participants in HH4 it was an almost useless notion:
“We didn’t quite fathom this one …” and in notes written for day 2:
“Discussed washing machine display with wife, but can’t convince her that a real ‘battery’ storage would be of any use to us. Failed, probably because I’m not convinced myself. In future, could the display be used so that if enough solar energy had been accumulated in the battery it would automatically start the washing machine?”
So although the participants in HH4 had grasped that the idea was to think of a future possibility they could not see its usefulness – unless it was tied to automatically starting the washing machine, whereas without this possibility:
“At the moment, an empty battery would show me that we’d have to wait to run the dishwasher till the battery is recharged. Well, there is no benefit for us having to do that. Whether in the future there’ll be benefit to that I don’t know….”
This view – of there not being any benefit in ‘having to wait’ - was not echoed among other participants, most of whom considered this to be a very plausible and appropriate behaviour. In HH6 participants were keen to explain how they do their planning – partly referring to the weather forecast displays, but also partly explaining how they do so at the moment anyway. This was the only household with a special generation meter that was displaying currently generated power, on a handy display in the kitchen:
“I might think, OK, I’ll wait till it goes up to 2kWatts, before I put the washing machine on, because I know the washing machine uses about 2.5 KW at its peak consumption… So if it looks like a sunny day, and I think it will get up higher, I will wait till lunch time, because that’s when it might be at that point. If it looks sunny in the morning, and it looks like it will get foul in the afternoon, I might put it on in the morning,
knowing that although it won’t cover the peak consumption period, I get more out of it. So trying to work out what the weather is doing at the moment, what’s going to happen later in the day, later in the week, how much you’re getting and what the best time is to put it on…”
And then continuing to reflect on what the battery display might add to this process, she reflects on the additional pieces of information she needs to make a balanced decision:
“Part of the problem is, you don’t now how much is being used by other things. We got these smart plugs – but it’s too much of a hassle to go upstairs to the computer, and go to the website, and work out what everything is consuming… and then adding it all up, and subtracting it from what you are generating, and by the time you’ve done that – the sun will have gone in anyway…. So you need something instantaneously…so If we have the battery – that would be ideal. I could see, OK I have enough so that I can do about two washes… that would be great”.
Although this participant was also someone who considered herself to be someone who was very at home with figures (being a scientist), and would always want to see concrete numerical representations – she did not voluntary criticize the lack of numbers on this particular display. Whereas this was a complaint form a number of participants:
“The battery one for the house as a whole is lacking some kind of unit – you don’t know what full means, or two/third.. Whereas the battery with the washing machine works better – because I can imagine that it refers to a certain amount of wash loads.” [husband HH2]
In common with others, this participant couldn’t imagine what a half-full battery might correspond to. Interestingly, the participants from HH5 could also see an additional side of the potential of this metaphor:
“just like battery on phone, I get used to it.”
6.2 Locality All the participants had placed the ‘whole house’ displays on the wall or on the table nearby to where they shared meals. All households were happy about this location – feeling that this was the best place to see it, discuss regularly and where it would catch their eye in a natural way:
“Having it next to the table is definitely the best place. That’s where we are spending most of our time together, and talk about things. Probably on the wall, rather than directly on the table … Having it on this table is good – we always put our cups of tea and coffee here, so you look at it the whole time, and then yes, we’d talk about it.”
The location chosen for display for the washing machine turned out to be more varied. Most participants had either placed the display directly on top of the washing machine or as close to it as possible, but in one household the washing machine is hidden in the garage. They felt that to have better use of the display they should put it in a location where it could be seen, hence they put it upstairs, next to the laundry basket, where dirty laundry gets collected. This variety in locations brought out interesting points of discussion – where some participants felt it was a good idea to have the source of energy displayed immediately near the washing machine, imagining how at some point such a display would be an integral of the washing machines:
“I think the washing machine can also be displayed on the one in the living room [showing whole house
78

generation/consumption]. By the time you’ve walked to the kitchen to look at the washing machine, you’ve made the decision. So having it in a central place, gives you a better idea on planning when to use it.”
For HH6, the issue of having several displays and where they should be had been bothering them much – and was the very first thing they mentioned on being interviewed:
“It was too much to have two things! Too much of a faff. I would always look at the kitchen display [showing whole house generation/consumption], which had certain amount of information – and then I’d look at the washing machine display [in the utility room], which had other information... and then I’d decide whether to do a load, and then I’d do it. So there was no point, from my point of view, of having two things - I would have preferred to have it all in one place. All the information there. The only thing I can imagine being useful next to the washing machine would be the switch – to say it is going to be on generated or on the grid. But ideally I’d have one display…“
So it would seem that location and energy use are concepts that are intertwined in interesting ways. The energy can be associated with (i) the particular device – i.e. at the location of the washing machine; (ii) it can be associated with where the planning, and thinking about various jobs in the house takes place, such as the central dining room table or some other central place, or (iii) it can be in the place where the objects associated with the appliance reside – i.e. here the dirty clothes. The dirty clothes can be some way away from the washing machine, or the planning place. There is currently a lot of interest in designing new interfaces for appliances. Although numerous people have reported on how appliances may require novel displays to take account of different usages, and to influence through different default setting [1] most of our participants felt that centrally visible information was more important than presenting information near the relevant appliance.
6.3 The right kind of information The displays aimed to create an awareness of generated energy: how much there was, how much there was in comparison with how much was being consumed, and how much useful work (e.g. washing machine loads) could be done with the excess generated energy. In the conversations we tried to get a grip on how well people felt the displays served their needs in terms of information: was this the sort of information they wanted? Regarding the display that showed 24-hour consumption and production combined graph (Figure 2b) participants in HH1 felt that
“Yes, it would be useful to have that information. Yes, at the moment I do have that information, but I need to go to the garage to see it. But it would be useful to have it in the kitchen to see it clearly. That would be useful.”
The participant is actually referring to the simple LCD reading on their DC to AC grid-tied inverter which converts DC power from the solar panels to AC power for the home (usually installed in a loft or garage as it is not intended for consumer interaction). It has the ability to display how much energy has been generated in total for that day as well as the current generation level but it cannot display the energy being consumed or exported, so this participant had a misunderstanding about the data available to her. However, later she reflects on what the precise benefit is of having this information displayed, and whether they would be more informed:
“if you look at that picture, it does map closely to the picture you have in your mind. You know, that in a lot of big households most of your consumption will be during the
evening and into the dark hours. And you know roughly when your energy is being generated. So I don’t think that having a picture can change that – you have that picture anyway. And I think if I asked the girls – if you asked them – draw me a picture, of when you think we are using, and when we are consuming, I think you would get this picture. It would be quite accurate. But it is good to have this picture.”
Here the participants are reflecting on the models they have – themselves – of their own energy behaviour. However, what is interesting is that we know that much of that information is not actually available to them, as the precise levels of energy generated are determined by the precise roof and cloud coverage that day. One of the displays (Figure 2a) showed the currently generated amount of solar power:
“That display an instant, or relatively quick, we think .., display of the amount of sunshine, which is interesting in its own right, but it doesn’t add anything beyond looking out of the window!”
Clearly this participant felt that he had sufficient information to be able to make informed decisions – and that using common sense was sufficient. Looking out of the window, seeing the sun shining, should be enough information about the amount of generated information. However, as we outlined earlier, this is only a rough indication of the amount of energy potentially being exported or spare. In the focus groups for the wider trial, people discussed a need for more precisely knowing what they can do with the generated energy. If I have the washing machine on, can I also do the ironing when the sun is out? So people’s perception of the levels of information that they require in order to adjust their behaviour to maximize their energy balancing behaviour is different from household to household.
7. Discussion The interviews revealed a number of insights that are important for the design of information technologies related to microgeneration. Microgeneration does change energy consumption behaviour. There is clear evidence that the mere presence of microgeneration in a home make people question their energy consumption behaviour and in many case makes them adjust their behaviour. Some engage on concerted efforts to shift demand to times of peak generation while others alter their habits in a less directed ways. Thus the impact of microgeneration lies not just in the energy that is generated but in the ability to use microgeneration to motivate people and to change their view of themselves from being a passive (even informed) consumer of energy to an active participant. Conclusion: Digital technology should focus on creating opportunities for people to adjust their behaviours rather than simply informing them about the state of energy production in the home. Furthermore digital technology should be designed to support people’s changing perception of themselves as active participants and energy custodians rather than supporting a self-image of smart and informed consumer. People believe they know, but they don’t. Although this was a highly motivated group of individuals who had taken the time to try to understand their consumption, there were many misconceptions about how generation is influenced by external factors and how to reduce energy consumption. For example, most people felt familiar enough with the graph display which shows periodic spikes. Most people wanted to see more details and be able to work out exactly when the spikes occur. However, the narrow spikes are almost meaningless for getting a sense of the amount of energy generated. More importantly, however is
79

that some people believed they had a good understanding of how to estimate current generation when in reality they didn’t. Looking out of the window is a very unreliable means of determining energy production as seasonal variations (height of the sun above the horizon, shading from leafy/leafless trees) can have a tremendous influence. Conclusion: Digital technology should be designed to help people form an appropriate coherent model of microgeneration, not just inform about individual aspects such as current generation. One way of doing this is by using metaphors that help people understand their role with respect to microgeneration, in the same way metaphors have enabled laypeople to make effective use of computers. There is a wide variation of how and why people engage with microgeneration. Within this group of highly motivated people there was still a wide variation as to how far they were prepared to go in terms of making adjustment to lifestyles to meet the energy balance. For some people the fact that delaying one action only saves 30 p (by using excess PV energy) is not worth it – for others there are other motivations beside the monetary value, that make them go the extra mile. As with Pierce and Paulos [6] we found a wide range of motivations for engaging with energy. There are those who are keen to think of all of the minute ways in which they can adjust their behaviour – like cooking during the day, when the sun is out, rather than wait till the evening, or buying an electric lawnmower instead of petrol – versus someone else who says “but that battery won’t mean anything for me, because there is no advantage!” (HH4). Conclusion: There seems to be the potential to design specialised solutions for specific subgroups of users of microgeneration. However, while we have some rough understanding of possible subgroups (for example detail-oriented vs whole issue oriented) we have no understanding of the specific technology requirements of these subgroups. Rather than looking for a single generic design approach it might be better to focus on each subgroup separately.
8. Conclusion Microgeneration can be an effective way for people to do their part in living a more sustainable life. Yet microgeneration is a complex technical system that is not easily understood by users. Clearly more work is required to investigate the behavioural aspects of living with microgeneration. As Keirstead puts it “there is a danger that if behavioural responses to microgeneration technologies are not considered now, when consumer technologies and protocols are still being developed, then the industry could find that households become locked into behaviours that may be undesirable in the longer term” [2]. Our study highlights important aspects for the design of digital technologies to help people make sense of and live with microgeneration.
9. Acknowledgements We gratefully acknowledge the support of E.ON New Build and Technology Ltd for access to the Thinking Energy study infrastructure and participants.
10. References [1] J. Pierce and E. Paulos, “Beyond energy monitors:
interaction, energy, and emerging energy systems,” in Proc. ACM SIGCHI 2012, 2012, pp. 665–674.
[2] J. Keirstead, “Behavioural responses to photovoltaic systems in the UK domestic sector,” Energy Policy, vol. 35, no. 8, pp. 4128–4141, Aug. 2007.
[3] S. Mennicken and E. Huang, “Hacking the natural habitat: an in-the-wild study of smart homes, their development, and the people who live in them,” Pervasive Computing, pp. 143–160, 2012.
[4] E. Paulos and J. Pierce, “Citizen Energy: Towards Populist Interactive Micro-Energy Production,” in 44th Hawaii International Conference on System Sciences, 2011, pp. 1–10.
[5] J. Pierce and E. Paulos, “The local energy indicator,” in Proceeding DIS ’12 Proceedings of the Designing Interactive Systems Conference, 2012, pp. 631–634.
[6] J. Pierce and E. Paulos, “A phenomenology of human-electricity relations,” in Proceedings of the 2011 annual conference on Human factors in computing systems, 2011, pp. 2405–2408.
[7] Feed-In Tariffs, “FI Tariffs,” Feed-in Tariffs, 2012. [Online]. Available: http://www.fitariffs.co.uk/statistics/. [Accessed: 19-Sep-2012].
[8] DECC, “Feed-in Tariff statistics - Department of Energy and Climate Change,” 2012. [Online]. Available: http://www.decc.gov.uk/en/content/cms/statistics/energy_stats/source/fits. [Accessed: 25-Sep-2012].
[9] S. Caird, R. Roy, and H. Herring, “Improving the energy performance of UK households: Results from surveys of consumer adoption and use of low- and zero-carbon technologies,” Energy Efficiency, vol. 1, no. 2, pp. 149–166, Jun. 2008.
[10] N. Bergman and N. Eyre, “What role for microgeneration in a shift to a low carbon domestic energy sector in the UK?,” Energy Efficiency, vol. 4, no. 3, pp. 335–353, Jan. 2011.
[11] A. Woodruff, J. Hasbrouck, and S. Augustin, “A bright green perspective on sustainable choices,” in Proc. ACM SIGCHI 2008, New York, NY, USA, 2008, pp. 313–322.
[12] J. Collins, A Micro-Generation Manifesto. London: Green Alliance, 2004.
[13] Element Energy, TNS, K. Willis, R. Scarpa, and A. Munro, “Element Energy–The growth potential for Microgeneration in England, Wales and Scotland,” Element Energy Ltd, Cambridge, 2008.
[14] J. Dobbyn and G. Thomas, “Seeing the light: the impact of micro-generation on the way we use energy,” The Hub Research Consultants, London, UK, 2005.
[15] S. Darby, “The effectiveness of feedback on energy consumption,” Environmental Change Institute, University of Oxford, Oxford, UK, Apr. 2006.
[16] N. Eyre, “Micro-CHP, energy services and smart metering—technological innovation and systemic change,” in Micro energy systems : review of technology, issues of scale and integration, M. Knowles, I. Burdon, and R. Beith, Eds. Bury St Edmunds: Professional Engineering Pub., 2004.
[17] S. Caird, R. Roy, and S. Potter, “Domestic heat pumps in the UK: user behaviour, satisfaction and performance,” Energy Efficiency, vol. 5, no. 3, pp. 283–301, Feb. 2012.
[18] F. Hill, H. Lynch, and G. Levermore, “Consumer impacts on dividends from solar water heating,” Energy Efficiency, vol. 4, no. 1, pp. 1–8, Jun. 2010.
[19] H. Hutchinson, W. Mackay, B. Westerlund, B. B. Bederson, A. Druin, C. Plaisant, M. Beaudouin-Lafon, S. Conversy, H. Evans, H. Hansen, and others, “Technology probes: inspiring design for and with families,” in Proc. of ACM SIGCHI 2003, 2003, pp. 17–24.
80

Developing a Strategy for the Implementation of ICT inEnergy Efficient Neighbourhoods
Max Blöchle, Branislav Iglár, Daniele Basciotti, Jessen PageAIT Austrian Institute of Technology
Energy Department, Sustainable Building TechnologiesGiefinggasse 2, 1210 Vienna, Austria
ABSTRACTA support and coordination project called IREEN was set upto explore potentials of Internet Communication Technolo-gies (ICT) to increase energy efficiency for neighbourhoodsand large scale urban and rural areas. The outcome is adetailed strategy for the innovation process and an EuropeanICT roadmap for innovation and take-up. Activities includeanalysis of state of the art and best practises as well as thedescription of relevant visions and scenarios. A group ofselected experts from a broad range of fields different fieldsvalidates the outcomes of the project. Representatives fromcities are involved at early stage to ensure the practicality ofoutcomes. Both the strategy and roadmap will result in anICT reference guide which should help urban planners in thedevelopment of energy efficient districts and neighbourhoods.The outcomes of IREEN are expected to provide input tothe next EU research initiative Horizon 2020.
KeywordsICT for energy efficiency, neighbourhoods, strategy, roadmap
1. INTRODUCTIONOne of the main challenges in developing a strategy for ICTimplementation arises from the fact that the developmentand implementation of ICT is scattered over different fieldsand disciplines. In the case of energy efficient neighbour-hoods the focus lies clearly on energy as the central factor.However, not so many changes related to the integration ofICT in everyday practices are motivated by energy consid-erations [9]. Therefore different fields have to be consideredin a holistic view. IREEN covers the scope of various fields,namely ICT, construction, neighbourhoods and energy withtopics of smart buildings, ecodistricts, smart cities, energystorage and trading, distributed energy generation, smartlighting, smart grids and smart meters. The activities aretargeted towards the construction research community andindustry, the suppliers of ICT technology, local authoritiesincluding large facility managers and owners, energy produc-ers and providers developing new services, as well as endusers profiting of local benefits and utilization of new ICTservices.
ICT4S 2013: Proceedings of the First International Conference on Infor-mation and Communication Technologies for Sustainability, ETH Zurich,February 14-16, 2013. Edited by Lorenz M. Hilty, Bernard Aebischer,Göran Andersson and Wolfgang Lohmann.DOI: http://dx.doi.org/10.3929/ethz-a-007337628
The consortium comprises of various European actors in thefield of ICT, construction, energy efficiency and environmen-tal management as well as representatives from neighbour-hoods. This allows a comprehensive view on the subjecttogether with stakeholders on the approach developed inIREEN. As IREEN follows a holistic approach, it coverstechnology areas in design, planning and realisation, decisionsupport, energy management and integration technologiesat a high interdisciplinary level. As a result, the commonlanguage must stay general, allowing experts from differentfields to discuss about the topics. This is also the reason whythe approach used in IREEN cannot go into too much detailwithin the different disciplines. The technology areas coverapplications in neighbourhoods, transport systems, build-ing and public spaces, energy production and storage, andenergy distribution. Finally, end-user involvement plays acrucial role as the quality of a neighbourhood energy systemis not only defined by the energy supply perspective, and theenergy use is highly dependent on end-user behaviour. Alsoenergy savings through behavioural change are recognised tobe as high as those achieved using technological solutions [6].
The overall objective is to deliver an ICT strategy of innova-tion comprising of actions to be taken to ensure successfulimplementation. It covers an analysis of drivers and barriers,impacts and stakeholders at various time horizons and a def-inition of priorities. The ICT strategy is followed by an ICTroadmap of innovation for energy efficient neighbourhoods asa step wise approach to meet the ICT strategy of innovation.Practical measures and quantification of their impacts arenot in the scope of IREEN. Consequently they will follow asone of next major actions after the strategy and roadmap areavailable. As we recognize the importance of understandinghow this should happen, we deal with those matters in thesection impact (see Page 5).
The objectives are supported by building a community ofinterest through regular expert hearings. The advisory expertgroup feeds back to the outcomes for the purpose of revisionand validation [4]. The participation of experts from relevantfields is open and we will be happy to welcome new experts tothe workshops. An events calendar, newsletter registrationand further information for participation can be found onthe official IREEN website [5].
The following chapter explains the method used in IREEN.It is followed by preliminary results as the project is in midphase of completion. These consist of a description of the
81
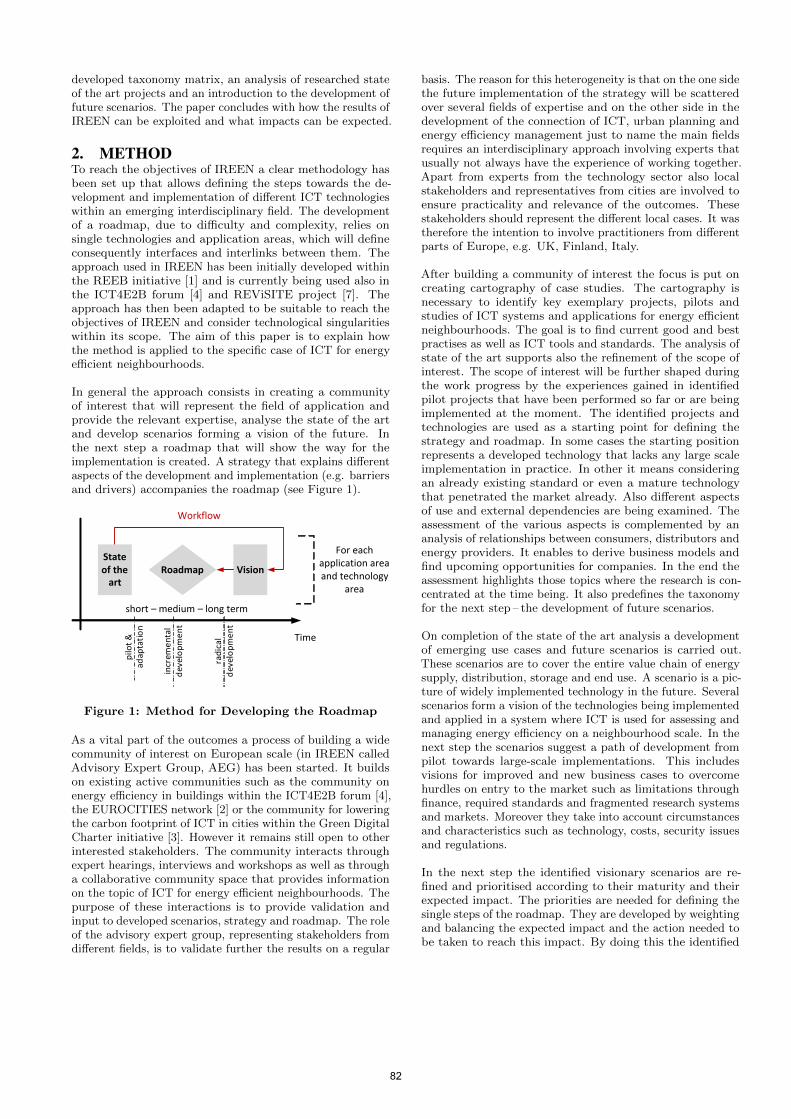
developed taxonomy matrix, an analysis of researched stateof the art projects and an introduction to the development offuture scenarios. The paper concludes with how the results ofIREEN can be exploited and what impacts can be expected.
2. METHODTo reach the objectives of IREEN a clear methodology hasbeen set up that allows defining the steps towards the de-velopment and implementation of different ICT technologieswithin an emerging interdisciplinary field. The developmentof a roadmap, due to difficulty and complexity, relies onsingle technologies and application areas, which will defineconsequently interfaces and interlinks between them. Theapproach used in IREEN has been initially developed withinthe REEB initiative [1] and is currently being used also inthe ICT4E2B forum [4] and REViSITE project [7]. Theapproach has then been adapted to be suitable to reach theobjectives of IREEN and consider technological singularitieswithin its scope. The aim of this paper is to explain howthe method is applied to the specific case of ICT for energyefficient neighbourhoods.
In general the approach consists in creating a communityof interest that will represent the field of application andprovide the relevant expertise, analyse the state of the artand develop scenarios forming a vision of the future. Inthe next step a roadmap that will show the way for theimplementation is created. A strategy that explains differentaspects of the development and implementation (e.g. barriersand drivers) accompanies the roadmap (see Figure 1).
Time
short – medium – long term
VisionRoadmap
For each application area and technology
area
Workflow
State of the
art
rad
ical
d
evel
op
me
nt
pilo
t &
ad
apta
tio
n
incr
eme
nta
l d
evel
op
me
nt
Figure 1: Method for Developing the Roadmap
As a vital part of the outcomes a process of building a widecommunity of interest on European scale (in IREEN calledAdvisory Expert Group, AEG) has been started. It buildson existing active communities such as the community onenergy efficiency in buildings within the ICT4E2B forum [4],the EUROCITIES network [2] or the community for loweringthe carbon footprint of ICT in cities within the Green DigitalCharter initiative [3]. However it remains still open to otherinterested stakeholders. The community interacts throughexpert hearings, interviews and workshops as well as througha collaborative community space that provides informationon the topic of ICT for energy efficient neighbourhoods. Thepurpose of these interactions is to provide validation andinput to developed scenarios, strategy and roadmap. The roleof the advisory expert group, representing stakeholders fromdifferent fields, is to validate further the results on a regular
basis. The reason for this heterogeneity is that on the one sidethe future implementation of the strategy will be scatteredover several fields of expertise and on the other side in thedevelopment of the connection of ICT, urban planning andenergy efficiency management just to name the main fieldsrequires an interdisciplinary approach involving experts thatusually not always have the experience of working together.Apart from experts from the technology sector also localstakeholders and representatives from cities are involved toensure practicality and relevance of the outcomes. Thesestakeholders should represent the different local cases. It wastherefore the intention to involve practitioners from differentparts of Europe, e.g. UK, Finland, Italy.
After building a community of interest the focus is put oncreating cartography of case studies. The cartography isnecessary to identify key exemplary projects, pilots andstudies of ICT systems and applications for energy efficientneighbourhoods. The goal is to find current good and bestpractises as well as ICT tools and standards. The analysis ofstate of the art supports also the refinement of the scope ofinterest. The scope of interest will be further shaped duringthe work progress by the experiences gained in identifiedpilot projects that have been performed so far or are beingimplemented at the moment. The identified projects andtechnologies are used as a starting point for defining thestrategy and roadmap. In some cases the starting positionrepresents a developed technology that lacks any large scaleimplementation in practice. In other it means consideringan already existing standard or even a mature technologythat penetrated the market already. Also different aspectsof use and external dependencies are being examined. Theassessment of the various aspects is complemented by ananalysis of relationships between consumers, distributors andenergy providers. It enables to derive business models andfind upcoming opportunities for companies. In the end theassessment highlights those topics where the research is con-centrated at the time being. It also predefines the taxonomyfor the next step – the development of future scenarios.
On completion of the state of the art analysis a developmentof emerging use cases and future scenarios is carried out.These scenarios are to cover the entire value chain of energysupply, distribution, storage and end use. A scenario is a pic-ture of widely implemented technology in the future. Severalscenarios form a vision of the technologies being implementedand applied in a system where ICT is used for assessing andmanaging energy efficiency on a neighbourhood scale. In thenext step the scenarios suggest a path of development frompilot towards large-scale implementations. This includesvisions for improved and new business cases to overcomehurdles on entry to the market such as limitations throughfinance, required standards and fragmented research systemsand markets. Moreover they take into account circumstancesand characteristics such as technology, costs, security issuesand regulations.
In the next step the identified visionary scenarios are re-fined and prioritised according to their maturity and theirexpected impact. The priorities are needed for defining thesingle steps of the roadmap. They are developed by weightingand balancing the expected impact and the action needed tobe taken to reach this impact. By doing this the identified
82
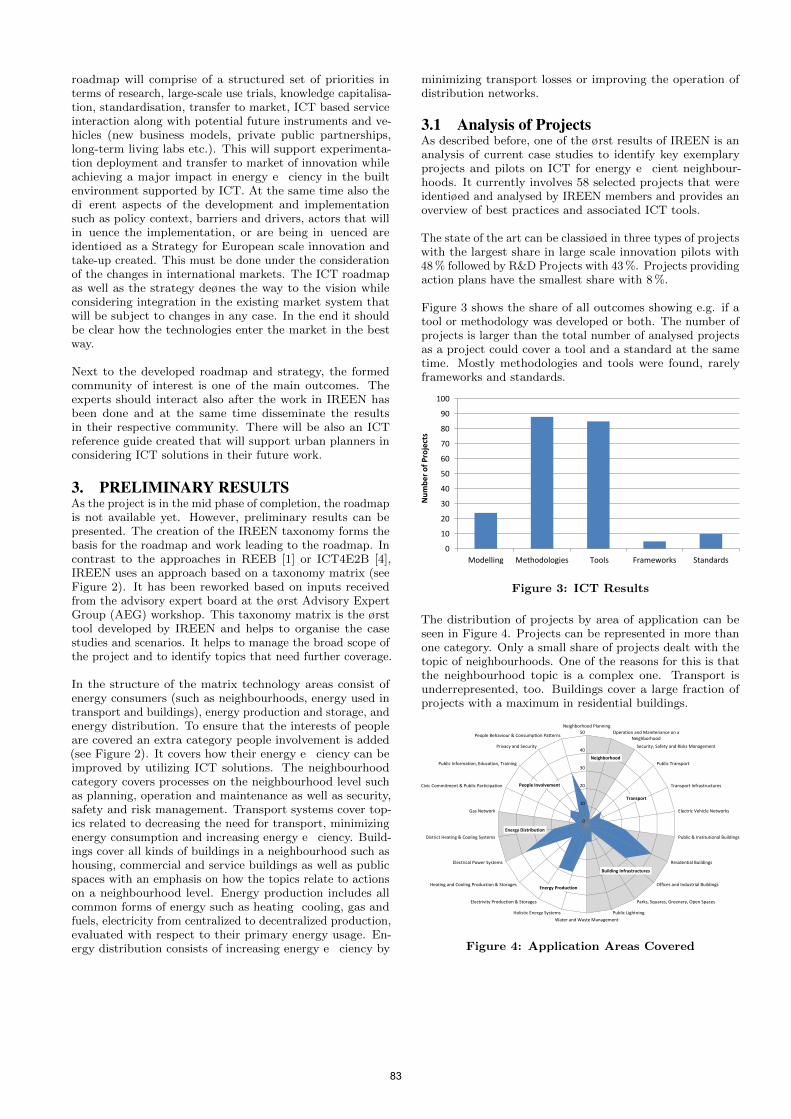
roadmap will comprise of a structured set of priorities interms of research, large-scale use trials, knowledge capitalisa-tion, standardisation, transfer to market, ICT based serviceinteraction along with potential future instruments and ve-hicles (new business models, private public partnerships,long-term living labs etc.). This will support experimenta-tion deployment and transfer to market of innovation whileachieving a major impact in energy e�ciency in the builtenvironment supported by ICT. At the same time also thedi�erent aspects of the development and implementationsuch as policy context, barriers and drivers, actors that willin�uence the implementation, or are being in�uenced areidentiøed as a Strategy for European scale innovation andtake-up created. This must be done under the considerationof the changes in international markets. The ICT roadmapas well as the strategy deønes the way to the vision whileconsidering integration in the existing market system thatwill be subject to changes in any case. In the end it shouldbe clear how the technologies enter the market in the bestway.
Next to the developed roadmap and strategy, the formedcommunity of interest is one of the main outcomes. Theexperts should interact also after the work in IREEN hasbeen done and at the same time disseminate the resultsin their respective community. There will be also an ICTreference guide created that will support urban planners inconsidering ICT solutions in their future work.
3. PRELIMINARY RESULTSAs the project is in the mid phase of completion, the roadmapis not available yet. However, preliminary results can bepresented. The creation of the IREEN taxonomy forms thebasis for the roadmap and work leading to the roadmap. Incontrast to the approaches in REEB [1] or ICT4E2B [4],IREEN uses an approach based on a taxonomy matrix (seeFigure 2). It has been reworked based on inputs receivedfrom the advisory expert board at the ørst Advisory ExpertGroup (AEG) workshop. This taxonomy matrix is the ørsttool developed by IREEN and helps to organise the casestudies and scenarios. It helps to manage the broad scope ofthe project and to identify topics that need further coverage.
In the structure of the matrix technology areas consist ofenergy consumers (such as neighbourhoods, energy used intransport and buildings), energy production and storage, andenergy distribution. To ensure that the interests of peopleare covered an extra category people involvement is added(see Figure 2). It covers how their energy e�ciency can beimproved by utilizing ICT solutions. The neighbourhoodcategory covers processes on the neighbourhood level suchas planning, operation and maintenance as well as security,safety and risk management. Transport systems cover top-ics related to decreasing the need for transport, minimizingenergy consumption and increasing energy e�ciency. Build-ings cover all kinds of buildings in a neighbourhood such ashousing, commercial and service buildings as well as publicspaces with an emphasis on how the topics relate to actionson a neighbourhood level. Energy production includes allcommon forms of energy such as heating cooling, gas andfuels, electricity from centralized to decentralized production,evaluated with respect to their primary energy usage. En-ergy distribution consists of increasing energy e�ciency by
minimizing transport losses or improving the operation ofdistribution networks.
3.1 Analysis of ProjectsAs described before, one of the ørst results of IREEN is ananalysis of current case studies to identify key exemplaryprojects and pilots on ICT for energy e�cient neighbour-hoods. It currently involves 58 selected projects that wereidentiøed and analysed by IREEN members and provides anoverview of best practices and associated ICT tools.
The state of the art can be classiøed in three types of projectswith the largest share in large scale innovation pilots with48 % followed by R&D Projects with 43 %. Projects providingaction plans have the smallest share with 8 %.
Figure 3 shows the share of all outcomes showing e.g. if atool or methodology was developed or both. The number ofprojects is larger than the total number of analysed projectsas a project could cover a tool and a standard at the sametime. Mostly methodologies and tools were found, rarelyframeworks and standards.
0
10
20
30
40
50
60
70
80
90
100
Modelling Methodologies Tools Frameworks Standards
Nu
mb
er
of
Pro
ject
s
Figure 3: ICT Results
The distribution of projects by area of application can beseen in Figure 4. Projects can be represented in more thanone category. Only a small share of projects dealt with thetopic of neighbourhoods. One of the reasons for this is thatthe neighbourhood topic is a complex one. Transport isunderrepresented, too. Buildings cover a large fraction ofprojects with a maximum in residential buildings.
Neighborhood
Transport
Building Infrastructures
Energy Production
Energy Distribution
People Involvement
C
DC
2C
3C
4C
5C
NeighborhoodsPlanning
OperationsandsMaintenancesonsaNeighborhood
SecurityLsSafetysandsRiskssManagement
PublicsTransport
TransportsInfrastructures
ElectricsVehiclesNetworks
PublicsVsInstitutionalsBuildings
ResidentialsBuildings
OfficessandsIndustrialsBuildings
ParksLsSquaresLsGreeneryLsOpensSpaces
PublicsLightning
WatersandsWastesManagement
HolisticsEnergysSystems
ElectrivitysProductionsVsStorages
HeatingsandsCoolingsProductionsVsStorages
ElectricalsPowersSystems
DistrictsHeatingsVsCoolingsSystems
GassNetwork
CivicsCommitmentsVsPublicsParticipation
PublicsInformationLsEducationLsTraining
PrivacysandsSecurity
PeoplesBehavioursVsConsumptionsPatterns
Figure 4: Application Areas Covered
83
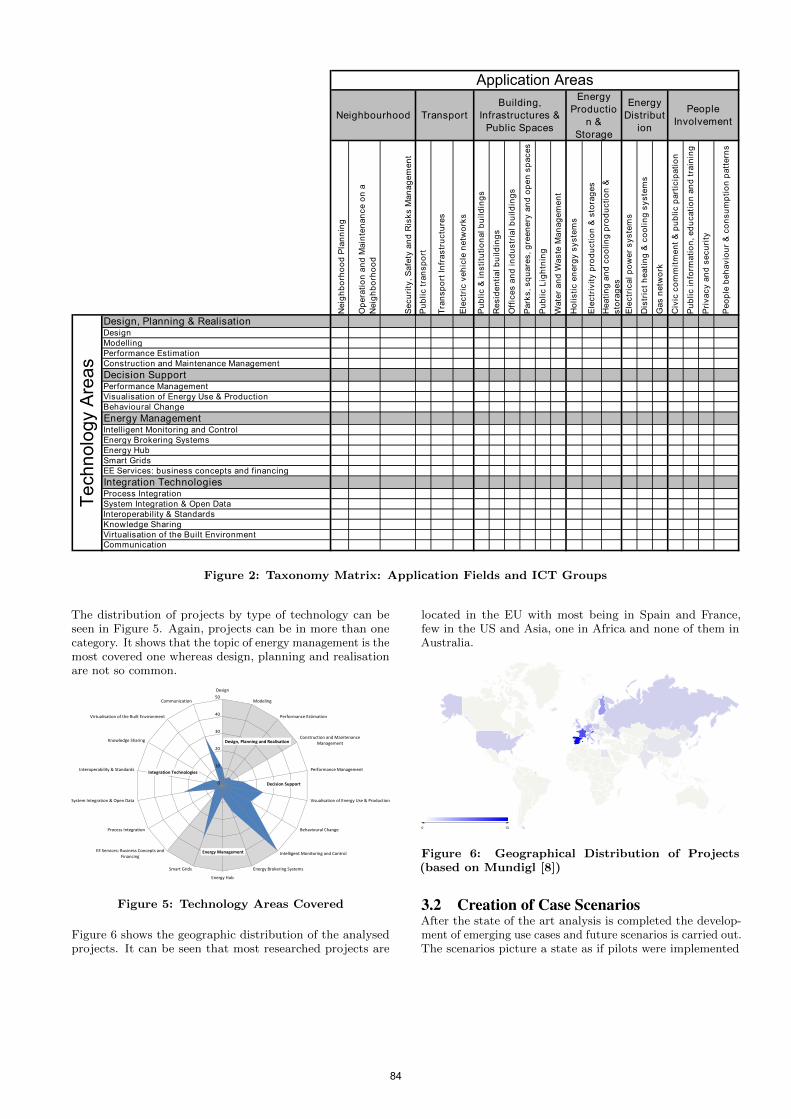
Ne
igh
bo
rho
od
vPla
nn
ing
Op
era
tio
nva
nd
vMa
inte
na
nc
evo
nva
Ne
igh
bo
rho
od
Se
cu
rity
VvSa
fety
van
dvR
isk
svM
an
ag
em
en
t
Pu
bli
cvt
ran
sp
ort
Tra
ns
po
rtvI
nfr
as
tru
ctu
res
Ele
ctr
icvv
eh
icle
vne
two
rks
Pu
bli
cvH
vin
sti
tuti
on
alv
bu
ild
ing
s
Re
sid
en
tia
lvb
uil
din
gs
Off
ice
sva
nd
vin
du
str
ialvb
uil
din
gs
Pa
rks
Vvsq
ua
res
Vvgre
en
ery
van
dvo
pe
nvs
pa
ce
s
Pu
bli
cvL
igh
tnin
g
Wa
terv
an
dvW
as
tevM
an
ag
em
en
t
Ho
lis
tic
ven
erg
yvs
ys
tem
s
Ele
ctr
ivit
yvp
rod
uc
tio
nvH
vsto
rag
es
He
ati
ng
van
dvc
oo
lin
gvp
rod
uc
tio
nvH
sto
rag
es
Ele
ctr
ica
lvpo
we
rvs
ys
tem
s
Dis
tric
tvh
ea
tin
gvH
vco
oli
ng
vsy
ste
ms
Ga
svn
etw
ork
Civ
icvc
om
mit
me
ntv
Hvp
ub
lic
vpa
rtic
ipa
tio
n
Pu
bli
cvi
nfo
rma
tio
nVv
ed
uc
ati
on
van
dvt
rain
ing
Pri
va
cy
van
dvs
ec
uri
ty
Pe
op
levb
eh
av
iou
rvH
vco
ns
um
pti
on
vpa
tte
rns
DesignVvPlanningvHvRealisationDesignModellingPerformancevEstimationConstructionvandvMaintenancevManagement
DecisionvSupportPerformancevManagementVisualisationvofvEnergyvUsevHvProductionBehaviouralvChange
EnergyvManagementIntelligentvMonitoringvandvControlEnergyvBrokeringvSystemsEnergyvHubSmartvGridsEEvServices:vbusinessvconceptsvandvfinancing
IntegrationvTechnologiesProcessvIntegrationSystemvIntegrationvHvOpenvDataInteroperabilityvHvStandardsKnowledgevSharingVirtualisationvofvthevBuiltvEnvironmentCommunication
Te
chn
olog
yvA
reas
ApplicationvAreas
Neighbourhood TransportBuildingV
InfrastructuresvHPublicvSpaces
EnergyProductio
nvHStorage
PeopleInvolvement
EnergyDistribut
ion
Figure 2: Taxonomy Matrix: Application Fields and ICT Groups
The distribution of projects by type of technology can beseen in Figure 5. Again, projects can be in more than onecategory. It shows that the topic of energy management is themost covered one whereas design, planning and realisationare not so common.
Design, Planning and Realisation
Decision Support
Energy Management
Integration Technologies
0
10
20
30
40
50
Design
Modeling
PerformanceBEstimation
ConstructionBandBMaintenanceManagement
PerformanceBManagement
VisualisationBofBEnergyBUseBHBProduction
BehaviouralBChange
IntelligentBMonitoringBandBControl
EnergyBBrokeringBSystems
EnergyBHub
SmartBGrids
EEBServices:BBusinessBConceptsBandFinancing
ProcessBIntegration
SystemBIntegrationBHBOpenBData
InteroperabilityBHBStandards
KnowledgeBSharing
VirtualisationBofBtheBBuiltBEnvironment
Communication
Figure 5: Technology Areas Covered
Figure 6 shows the geographic distribution of the analysedprojects. It can be seen that most researched projects are
located in the EU with most being in Spain and France,few in the US and Asia, one in Africa and none of them inAustralia.
0 13
Figure 6: Geographical Distribution of Projects(based on Mundigl [8])
3.2 Creation of Case ScenariosAfter the state of the art analysis is completed the develop-ment of emerging use cases and future scenarios is carried out.The scenarios picture a state as if pilots were implemented
84

in larger deployments with a time horizon of ten years. Atthe time of writing 15 scenarios exist with more being indevelopment. The goal is to have at least one scenario perapplication area from the matrix (see Figure 2) to coverthe broad range of topics. Scenarios are reviewed with aniterative process, involving AEG members, the communityof interest and consortium partners.
Each scenario relies on the previous state of the art researchand is written as a visionary story that describes a timewhere today’s state of the art has successfully been imple-mented on a large scale. Scenarios start by providing somebackground to the vision as an introduction. They progressto describe additional factors that help with the acceptanceof the technology. The vision ends by providing a furtheroutlook and a conclusion to the vision to describe the impact.Each scenario contains:
• Visionary description
• Expected impacts
• Stakeholders and beneficiaries
• Expected progress beyond state of the art
• Application within the taxonomy matrix
An excerpt from a scenario is provided as example (see Fig-ure 7). It envisions a building controlled on a neighbourhoodlevel to provide energy for heating and domestic hot water(DHW). It begins by providing some background of thismanagement tool and continues to narrate its effects on theconsumer from his point of view. This example comes to theconclusion that the scenario would impact on a reductionof energy consumption and CO2 emissions achieved througha better utilization of resources (optimization achieved col-lecting information at utility company level). In addition itincreases awareness of people for energy/ICT related topics.People living in the districts as well as energy service com-panies are identified as stakeholders and beneficiaries. Theexpected progress beyond state of the art is the extension ofthe basic monitoring system, to go beyond the accountingutilization (e.g. bills) and develop a platform to use informa-tion of heating and cooling loads to optimize the operationof power plants.
Scenario Title Heating(and(DHW(in(buildings(controlled(on(a(neighbourhood(level((from(the(consumer(point(of(view)
Description The( municipality( of( Smartburg( implemented( together( with( the( local(utility( and( several( building owners( a( local( management( system( for( the(distribution( and( use( of( thermal( energy( in( buildings.( This( measure( was(implemented(during(the(installation(of(smart(meters(for(electricity(in(the(buildings(of(a(neighbourhood(to(reduce(the(investment(cost.Hannah(has(recently(moved(to(the(neighbourhood.(During(her(first(view(on( the( flat( she( saw( a( display( next( to( the( bathroom( door( showing( the(current(temperature,(DHW(consumption(and(weather(forecast(for(the(next(days.(She(liked(this(idea(very(much(and(because(the(flat was(not(far(away(from(her(work(as(well,(she(decided(to(rent(it.
Figure 7: Excerpt of an Exemplary Scenario
The taxonomy matrix helps as a tool to visualize, com-pare, prioritize and classify the scenario, such as behaviouralchange in technology areas and residential buildings in ap-plication areas within this example scenario. This helps to
identify which scenarios are missing still and which topicsneed further coverage.
Finally, the detailed scenarios are analysed for key technolo-gies and with feedback of the AEG used to create the IREENroadmap.
4. EXPLOITATION OF RESULTSThe main impact of the IREEN project is ensured by enablingthe exploitation of results, by establishing a collaborationframework between the ICT sector, the building sector andthe energy sector and disseminate the outcomes (e.g. stateof the art in Section 3). A large number of activities havebeen used, including new formats such as LinkedIn group,the IREEN forum, stakeholder and AEG workshops. Ex-ploitation of results is considered as a priority within theproject and is done at three levels:
1. IREEN core partners.
2. AEG members and other relevant external expertsinvited by the IREEN consortium.
3. Potential new technology programmes where projectpartners, AEG members and other relevant externalexperts together with the relevant stakeholders are ableto develop new strategic projects.
The IREEN consortium and the AEG members make surethat the results are continuously disseminated and updatedbased on feedback by the IREEN community. It is further-more expected that the roadmap in particular will evolveand be developed further. This results in:
• Engagement with potentially interested stakeholders inorder to generate a broad awareness of the activitiesand to obtain feedback on the work in progress to en-sure that a comprehensive validation from stakeholderscovering all market sectors is addressed at all stages ofthe project.
• Disseminate information about the international stateof the art in terms of large scale pilots and supplyside ICT standards, ICT based innovation projects,methodologies & tools, and building upon this, developan effective knowledge exchange about good practices.
• Promoting emerging technologies and ICT solutionswhich are being developed by European innovationprojects and companies to early bird innovative citiesin Europe, as well as to industrial stakeholders.
• Stimulating dialogue with key actors, allowing themto actively participate in the elaboration of the vision,priorities and innovation roadmap.
5. IMPACTThe global impact of IREEN includes improved participation,more effective involvement, networking and cross fertilisa-tion of industrial organisations, academia / RTD institutes,companies (including SMEs) and local and regional authori-ties in terms of defining future RTD and priorities for ICT
85

based energy efficiency in the built environment. IREENwill encourage and facilitate the participation of industrialorganisations in future European ICT research activitiesthrough their involvement in the broad IREEN community.One specific impact is to create new markets for ICT-basedcustomized solutions:
• IREEN identifies best practices, results from recentand ongoing European and national RTD projects, andpotentially new novel ICT solutions and disseminatesthese to relevant stakeholders.
• IREEN contributes to open markets for ICT solutionsalso through engagement of key ICT players from dif-ferent fields and promotion of ICT standards.
Secondly, it reduces energy consumption and CO2 emissionsthrough ICT:
• IREEN identifies ICT and automation applications,and integration opportunities both at building andneighbourhood levels.
• With the support of the AEG the greatest impactpotential and recommended actions to exploit theseopportunities are gathered.
• IREEN harmonizes methodologies for assessing energyefficiency impacts of ICT in quantifiable terms andrecommends usable metrics or further work on suchmethodologies as may be needed. Quantification ofmeasures and implementation of ICT technologies aredestined to be conducted afterwards.
In addition, IREEN establishes a collaboration frameworkbetween the ICT sector, the buildings and construction sector,and the energy sector.
The overall goal of developing an ICT energy efficient neigh-bourhoods roadmap is brought into the real world throughthe provision of recommendations and information on futuredevelopments in order to support strategic decisions. IREENprovides inputs to the industry for the identification as wellas development of products and services identified within theroadmap as gaps. In addition, IREEN is of importance for
public authorities that can use the IREEN roadmap to con-sider ICT implementation in energy efficient neighbourhoodswithin their local low carbon action plans. Finally, IREENhelps focusing the research topics by providing input for thenext EU research initiative Horizon 2020. This will have alsoan indirect influence on the industry dealing with innovationand public authorities implementing first demonstrators.
6. ACKNOWLEDGMENTSThe research leading to these results has received fundingfrom the European Union’s Seventh Framework Programme(FP7/2007–2013) under grant agreement No 285627. Ad-ditionally the authors thank in particular the consortiumpartners for their valuable inputs.
7. REFERENCES[1] ICT Supported Energy Efficiency in Construction,
Strategic Research Roadmap and ImplementationRecommendations. REEB Consortium, 2010.
[2] EUROCITIES. The network of major european cities.http://www.eurocities.eu/, September 2012.
[3] Green Digital Charter. Ict for sustainable growth. http://ec.europa.eu/information_society/activities/
sustainable_growth/green_digital_charter/,September 2012.
[4] ICT4E2B Forum project. European stakeholders’ forumcrossing value and innovation chains to explore needs,challenges and opportunities in further research andintegration of ict systems for energy efficiency inbuildings. http://www.ict4e2b.eu/, September 2012.
[5] IREEN. Ict roadmap for energy efficient neighbourhoods.http://www.ireenproject.eu/, September 2012.
[6] M. Lopes, C. Antunes, and N. Martins. Energybehaviours as promoters of energy efficiency: A 21stcentury review. Renewable and Sustainable EnergyReviews, 16(6):4095 – 4104, 2012.
[7] REViSITE Consortium. Roadmap enabling vision andstrategy for ict-enabled energy efficiency.http://www.revisite.eu/, September 2012.
[8] Robert Mundigl. Choropleth maps with excel.http://www.clearlyandsimply.com/clearly_and_
simply/2009/06/choropleth-maps-with-excel.html,June 2009.
[9] I. Røpke and T. H. Christensen. Energy impacts of ict –insights from an everyday life perspective. Telematicsand Informatics, 2012.
86
Green Software and Green Software Engineering – Definitions, Measurements, and Quality Aspects
Eva Kern1, Markus Dick2, Stefan Naumann1, Achim Guldner1, Timo Johann2
1Institute for Software Systems, Environmental Campus Birkenfeld, Campusallee, D-55761 Birkenfeld
[email protected], [email protected], [email protected] [email protected] - http://sustainablesoftware.blogspot.de/
ABSTRACT
The two big fields of sustainability and Information and
Communication Technology (ICT) are Green IT (how can we
make ICT itself more sustainable) and Green by IT (how can we
encourage sustainability by ICT). Taking a deeper look,
software links these two areas: Regarding Green IT, there are a
lot of solutions to build and use hardware in a more energy
efficient way. But the debate how energy-intensive software
might be is just beginning. In contrast, Green by IT is often
software-based, e.g. by tools that help to optimize logistics and
automate processes to save energy. But until now there are no
considerations about the energy saving potential of software
itself. Therefore, it is useful to take a closer look at what green
software and green software engineering are. In our paper, we
will describe a reference model for green and sustainable
software, as well as its engineering and also give some
definitions. Though, we will just give a short introduction of the
model itself and, to distinguish our work from our previous
research, zoom in on the sub model “Sustainability Criteria for
Software Products”. Additionally, we describe a model to
measure the energy efficiency of software and give an example
of measuring results in our contribution. The next step is to
clearly differentiate from other measurement models to position
our approach within other efforts of software’s energy
consumption.
Keywords
Green Software; Green IT; Green by IT; Software Engineering;
GREENSOFT Model
1. INTRODUCTION By now, Sustainable Development (SD) found its way into
different fields of our life. Regarding Information and
Communication Technology (ICT), especially the aspects Green
IT and Green by IT describe the efforts towards Green and
Sustainable Information Technologies. In that context, ICT
brings new opportunities as well as problems for the goal of SD
[14]. Green IT considers the resource and energy consumption
of ICT itself, induced during the whole life cycle, and tries to
optimize it. Here, current concepts mainly focus on the hardware
side, especially regarding data centers. The Green by IT concept
pursues the objective of reducing the environmental impacts in
other fields by means of ICT solutions [13].
These two concepts are linked by software. Most of the ICT
solutions are software-based, so that it seems to be expedient to
factor the software side into the ICT for sustainability
discussions.
2. RELATED WORK
2.1 Measurement of Software Regarding the measurement of software the group around Capra
[6, 7] did a lot of research and experiments. Based on their
theoretical analyses, they proposed a research roadmap to
compare different software applications in their energy
consumption. As a first step, they focused on the cause of
energy consumption by information systems. Going on, Capra et
al. [6] compared the energy consumption of different
management information systems (MIS). They found that the
software induced power consumption depends on the
implementation of the operation systems, the runtime
environment, and the software product itself. Hence, it is not
possible to give specific recommendations which software is to
be chosen to reach the best energy efficiency. Besides these,
they came up with the result that the influence of using
application development environments on energy efficiency is
more distinct for larger than for smaller applications [7]. Apart
from the relationship of energy efficiency to the use of external
libraries and high level constructs, they compared different open
source tools in their size, age, and functional types with the
result that the application types that appear to be less energy
efficient are those that present higher degrees of functional
complexity.
Based on the appraisal that the mean utilization of real-world
database servers is far from common benchmarking results,
Schall et al. [22] proposed a new benchmarking paradigm
extending the already existing TPC-Energy benchmarks. They
aimed to comprise the overall power consumption of the System
Under Test (SUT). The introduced benchmark can be run with
workloads to get a more realistic energy-related result.
The overall approach is also followed by Jwo et al. [18], but
within another scope: They presented a model to capture the
energy consumption for enterprise applications. In doing so,
they wanted to give an organization a better chance to
understand its consumption caused by ICT and to optimize their
applications, in order to reduce the overall energy consumption.
Assuncao et al. [4] had a look at the infrastructure of Grids and
Clouds to reduce their energy footprint. They observed the
electricity consumption of an experimental grid infrastructure
and its correlations with users’ resource reservation requests for
a period of six month. All in all, they demonstrated that there are
huge possibilities to save energy by switching off unused
resources. In the context of Cloud Computing, Chen et al. [8]
ICT4S 2013: Proceedings of the First International Conference on Information and Communication Technologies for Sustainability, ETH
Zurich, February 14-16, 2013. Edited by Lorenz M. Hilty, Bernard Aebischer, Göran Andersson and Wolfgang Lohmann.
DOI: http://dx.doi.org/10.3929/ethz-a-007337628
87

presented an energy consumption model and an analysis tool for
Cloud environments. The tool characterizes energy consumed by
each task and helps to identify the relation between energy
consumption, running tasks, the platform configuration, and
system performance.
In order to identify power behavior associated with source code,
Wang et al. [33] developed “SPAN”, a software power analyzer
to provide live power phases information of running
applications. With it, developers can identify the sections of
code consuming the most power in the program.
One of the big players regarding energy consumption of ICT are
communication systems running 24/7. In this area, also software
and system architectures play a significant role. Zhong et al. [34]
presented a model to analyze the energy consumption of a
software architecture adapted from the CPU/processor. Getting
to know what kind of architecture needs less energy enables one
to reduce the overall energy on the communication network.
In order to get an overview, we summed up the described
approaches on measuring the energy consumption of ICT in
Table 1. A more detailed survey of efforts on power
measurement is presented in [33].
Table 1 Comparison of the Approaches on measuring energy
consumption of ICT
Approach
by Subject Objective
Wang [33]
Multicore
Computer
Systems
Identifying run-time factors that
determine the power wastage of
processors for computing
intensive workloads
Assuncao
[4]
Grids and
Clouds Reducing the energy footprint of
Grids and Clouds
Chen [8] Grids and
Clouds
Identifying the relationship
between energy consumption,
running tasks, configurations,
and performance
Schall [22] Infrastructure Comprising the overall power
consumption of the SUT
Capra [5, 7] Open Source Comparing the energy efficiency
of different software
Jwo [18] Enterprise
Applications
Understanding the energy
consumption caused by using
ICT by the organization
Zhong [34] Software
Architecture
Comparing competing software
architectures by an additional
dimension
Dick [9]
Server and
Application
Software
Finding recommendations for
Software Engineers
2.2 Energy Efficient Software and
Recommendations The above described measurement methods mainly aim to
produce more energy efficient software. Overall, the
consideration of energy efficient software gives a rise to green
and sustainable software engineering. In addition to the
mentioned recommendations in the measurement context, there
are different checklists and guidelines available, e.g. [24], [23],
[11], and [20].
Moreover, Steigerwald [27] (Intel) described software
methodologies, designs, and software development tools that
help to improve the energy efficiency of application software,
focusing on mobile platforms. Additionally, they considered
Computational Efficiency (methods to improve application
performance), Data Efficiency (minimizing data movement and
using the memory hierarchy effectively), and advantages of the
resources offered by the operation system to save energy.
2.3 Green Software and its Engineering In most of the cases, the reason for establishing energy efficient
software and systems is to achieve a longer battery life or to
reduce costs. On top of that, moving to the ecological part of
sustainability, there is the potential to decrease energy and
resource consumption to support a SD.
A first impression on how software influences the life cycle of
the hardware by requiring more and more resources is given in
[15]. The so called “Software Bloat” denotes the effect that the
availability of more powerful hardware in the near future,
relaxes software developers’ efforts to produce highly efficient
code. This is due to the fact, that new hardware is quickly
available and inexpensive and will hopefully overcompensate
inefficient code. As a result, hardware is replaced by new
hardware before its useful lifetime ends.
A methodology to measure and incrementally improve the
sustainability of software projects is presented by Albertao et
al. [2]. It is advisable to implement sustainable aspects
continuously, divided into the following phases: Assessment
Phase, Reflection Phase, and Goal Improvement Phase. In order
to make the different sustainability issues manageable, he
pointed out properties of a quality model that are further
developed in a later work [3]. These aspects are also integrated
in the Quality Model for Green and Sustainable Software,
described in section 5 of this paper.
Agarwal et al. [1] took a look behind the definition of Green and
Sustainable Software Engineering [21] and discussed
possibilities and benefits of green software. As one of the
results, they claimed more efficient algorithms will take less
time to execute and thus overall support sustainability.
Additionally, they presented methods to develop software in a
sustainable way and compared these to conventional methods.
Based on the life cycle of software, Taina proposed metrics [29]
and a method to calculate the carbon footprint of software [28].
To do so, he analyzed the impacts of each software development
phase for a generic project. The resulting carbon footprint is
mainly influenced by the development phase, but also by the
way how it is delivered and how it will be used by the
customers. The main problem regarding the calculation is that
detailed data is required, which is often not available.
3. THE GREENSOFT MODEL In order to classify and sort some aspects of green and
sustainable software and its engineering, we developed the
GREENSOFT Model, shown in Figure 1.
The GREENSOFT Model contains four parts: The life cycle of a
software product, some criteria and metrics that represent
sustainability aspects that are directly and indirectly related to
the software product, procedure models for the different phases,
and some recommendations for action, as well as tools.
The life cycle of software is geared to Life Cycle Thinking
(LCT) according to the “from cradle to grave” principle [31].
The intention is to estimate the ecological, social, and economic
impacts that already occur in early stages during the software’s
whole life cycle. Details of our approach are given in [9].
88

Additionally, the model comprises Sustainable Criteria and
Metrics for software products. Especially regarding
measurements of common effects of software products, there
exist quality models and standardized metrics. By means of
these quality aspects, software can be revised. Indeed models
and characteristic numbers of directly and indirectly related
effects need to be developed by research initiatives. We will
present a first approach to do so in section 4.
Figure 1 The GREENSOFT Reference Model [21]
The third sub model contains procedure models, based on the
different usage types: Developers, purchasers, administrators,
and users. The proposed models can be implemented to support
the optimization of the different processes focusing on green and
sustainable software engineering. In that way, software
engineering should become green and sustainable in its
production, support, and application processes. Since the models
are general, they can be adapted to different contexts.
Finally, recommendations for action and tools are made
available to the different stakeholders. These parts comprise
checklists, guidelines, best practice examples, software tools, as
well as other tools (like paper-based data collection sheets).
These support stakeholders with different professional skill
levels in applying green or sustainable techniques in general,
when developing, purchasing, administrating, or using software
products. Possible roles are software developers, acquirers of
software, administrators, and professional and private users [21].
The different aspects of green and sustainable software
engineering are summed up in the following definition: “Green
and Sustainable Software Engineering is the art of developing
green and sustainable software with a green and sustainable
software engineering process. Therefore, it is the art of defining
and developing software products in a way, so that the negative
and positive impacts on sustainable development that result
and/or are expected to result from the software product over its
whole life cycle are continuously assessed, documented, and
used for a further optimization of the software product.” [9]
4. QUALITY MODEL FOR GREEN AND
SUSTAINABLE SOFTWARE In order to decide if a software is green and sustainable or not,
appropriate criteria and metrics are required. A first approach of
these is covered by the Quality Model for Green and Sustainable
Software, presented in the following section.
4.1 Criteria Overall, the different aspects can be classified in common,
directly, and indirectly related criteria and metrics, as pictured in
our Quality Model for Green and Sustainable Software (Figure
2). Regarding the GREENSOFT-Model, described in section 3,
the model goes into the sub model “Sustainability Criteria and
Metrics”.
Figure 2 Quality Model for Green and Sustainable Software
In the following, we will present a first approach to developing a
Quality Model for Green and Sustainable Software. In order to
create the model, we will discuss different publications
regarding quality aspects, criteria, and indicators for sustainable
software. These will be compared, combined, and summed up in
the proposed model. This first approach intends to get an
impression and overview of possible criteria. As a next step, the
aspects should be prioritized, completed by tangible examples
and discussed properly.
4.1.1 Common Quality Criteria The common criteria arise out of the well-known and
standardized quality aspects for software, issued by the
International Organization for Standardization [16]. The
proposed Quality Model takes aspects, like Efficiency, into
account as well as e. g. Reusability, Modifiability, and Usability.
These quality aspects reach into the field of SD [3].
The quality aspects belonging to efficiency, next to Energy
Efficiency, are Runtime Efficiency, CPU-Intensity, Memory
Usage, Peripheral Intensity, Idleness, and Number of Methods.
In this case, Idleness describes how often the system is idle. This
aspect is only relevant to certain types of software systems, such
as virtual servers [29]. The total Number of Methods reflects the
size of applications [7].
4.1.2 Directly related Criteria In contrast to these efficiency criteria, which can be considered
as indicators for Energy Efficiency [19, 33], the energy
efficiency of a system itself can be ranked against a reference
system [10, 32]. Hence, the quality aspect Energy Efficiency is
assigned to the directly related criteria [21]. It is the same for the
criteria Framework Entropy and Functional Types, presented by
Capra et al. [7]. The Framework Entropy represents the grade of
usage of external libraries and high level constructs. It is high, if
the usage of external sources is high. The different types of
applications are indicated by the criterion Functional Types,
since different functional types of applications have different
levels of energy efficiency [7].
89

Another aspect of the directly related criteria is Hardware
Obsolescence [3, 15, 21]. It considers the amount of hardware
that needs to be replaced before the sustainably worthwhile life-
time is reached, due to software with higher system
requirements. Against the background that the energy supply
changes to more and more regenerative energy sources and the
development to more energy efficient hardware, the life-time
will be extended increasingly. The software development needs
to keep up with these changes.
The hardware obsolescence comes along together with the
quality aspect Adaptability. Both aspects belong to the criterion
Portability. Here, Adaptability describes the possibilities to
adapt the software to the specific consumer needs. In case a user
just needs to have the basic functionality, it is not necessary to
run large software and consume a huge amount of energy and
resources. Additionally, the performance requirements and the
amount of used memory are lower.
The quality aspect Feasibility valuates the effect of the product
development or rather the software engineering process
regarding SD. The substantial issues of this characteristic
comprise Travel [3], the Carbon Footprint, the Energy
Consumption, the Waste of resources during the software
development phase [21, 29], and the Infrastructure. Traveling
includes the business trips, belonging to a software project and,
where appropriate, the daily trips to work. The Carbon
Footprint specifies the amount of CO2 emissions caused by the
software development during its life cycle [28]. The aspect
Energy Consumption indicates the consumed energy caused by
software development. Waste counts the resources consumed
during software development for activities without any
additional value for the customer or the end user [29]. The
aspect Infrastructure contemplates the conditions providing the
usage of the software product.
Out of the perspective of the social aspect of SD, there might be
some more qualities that require special measurement and
valuation methods. As a first step, the aspects are called
Accessibility, Usability and Organization’s Sustainability. In
contrast to the first two aspects, the sustainability of the
organization itself is considered by the last one. It covers the
social situation, including e.g. working conditions or payment of
offshore workers (e.g. developers, type setters), which have
consequences for the workers and their families [21]. In order to
get the required data, a sustainability report can be consulted in
case of a big company. Indeed, the acquisition of theses aspects
might be difficult in case of small and medium sized enterprises.
Overall, there needs to be more research in this context to revise
this first proposal of an idea to bring the social aspects into the
discussion for criteria for green and sustainable software.
4.1.3 Indirectly related Criteria Using software can gain reduction of resources and energy in
other branches or application domains. Although it is
occasionally difficult to identify and qualify the usage effects
and systemic effects, there might be effects that are measureable
or appreciable. This applies to software, which aims to
accomplish a purpose regarding SD. Examples for such kinds of
software are software products enabling smart technologies. In
this case, the expected effects can be estimated during product
development, e.g. by life cycle assessment. Besides the area of
environmental sustainability, regarding the social compatibility,
a qualifying consideration is getting slightly harder and requires
methods that are more complex [21].
Product Sustainability summarizes the effects of software on
other products and services. Hence, it covers effects of use as
well as systemic effects. The following aspects are presented by
Taina [29]. Fit for Purpose takes the fitness of software for its
specific operation purpose into account. For example, an
optimized heater produces 20% less emission. If the optimized
heating control system contributes 10% to that, the value for the
aspect Fit for Purpose is 10%. The contribution of software
within its application domain to reduce the emissions, waste, etc.
is indicated by the aspect Reduction. Beauty aims to value the
software regarding SD. In the case of a piece of software that
raises the awareness for the climate change by 15%, the value
for beauty is 15% [29]. Indeed, since a reference system is
required to have a comparative figure, the exact quantification of
these aspects might be difficult.
According to Taina [29], the quality Reflectivity refers to the
quality aspect of efficiency. It specifies the manner how the
usage of software influences the resources that are indirectly
needed by other persons or systems. Since the aspect Reflectivity
does not belong to the first order effects or the efficiency effects
of ICT in the proper meaning, but counts as an effect of use, it is
pointed out as standalone quality of the indirectly related
criteria. However, more research is required in this field because
user behavior and usage scenarios need to be taken into account.
4.2 Metrics The different aspects need to become measureable by means of
metrics and indicators. In general, software engineering is
already aware of these aspects, even so the awareness of these
qualities needs to be emphasized in the context of green and
sustainable software engineering.
There are already a few metrics available to gather some quality
aspects: Albertao et al. indicated Estimated System Lifetime as a
potential index for hardware obsolescence. According the aspect
Travel, Work from Home Days, Long-Haul Roundtrips and
Teleconferencing are possible metrics [3].
Regarding efficiency, the following metrics might be useful:
Aspect → Metric
• Energy Efficiency → Energy / Unit of Work
• CPU-Intensity → CPU Cycle Count
• Memory Usage → Memory Consumption
• Peripheral Intensity → Peripheral Usage Time
• Idleness → Idle Time
In contrast to other criteria, especially the directly related
criteria, energy efficiency is easily quantifiable. Hence, from
this aspect, it is achievable to extrapolate metrics to validate and
verify software products. On closer consideration of efficiency,
it is not possible to define the benefit of software in an exact
way. Whereas this benefit depends on specific use cases and can
be defined in different ways. Additionally, most of the software
products contain much functionality, so that more than one
benefit might be possible. Contrary to that, the cost regarding
energy efficiency is simply the energy consumption. Certainly,
the system boundary needs to be clearly defined in this context.
Here, different approaches exist: Energy benchmarks, energy
measurement with individual use case scenarios (black box), and
energy measurements with code instrumentation (white box).
Common benchmarks for energy efficiency are EnergyBench
[30] according micro controller, SpecPower [26] according
server hardware or TPC-Energy according databases [22, 32].
Overall, all of the benchmarks produce a standardized workload
90
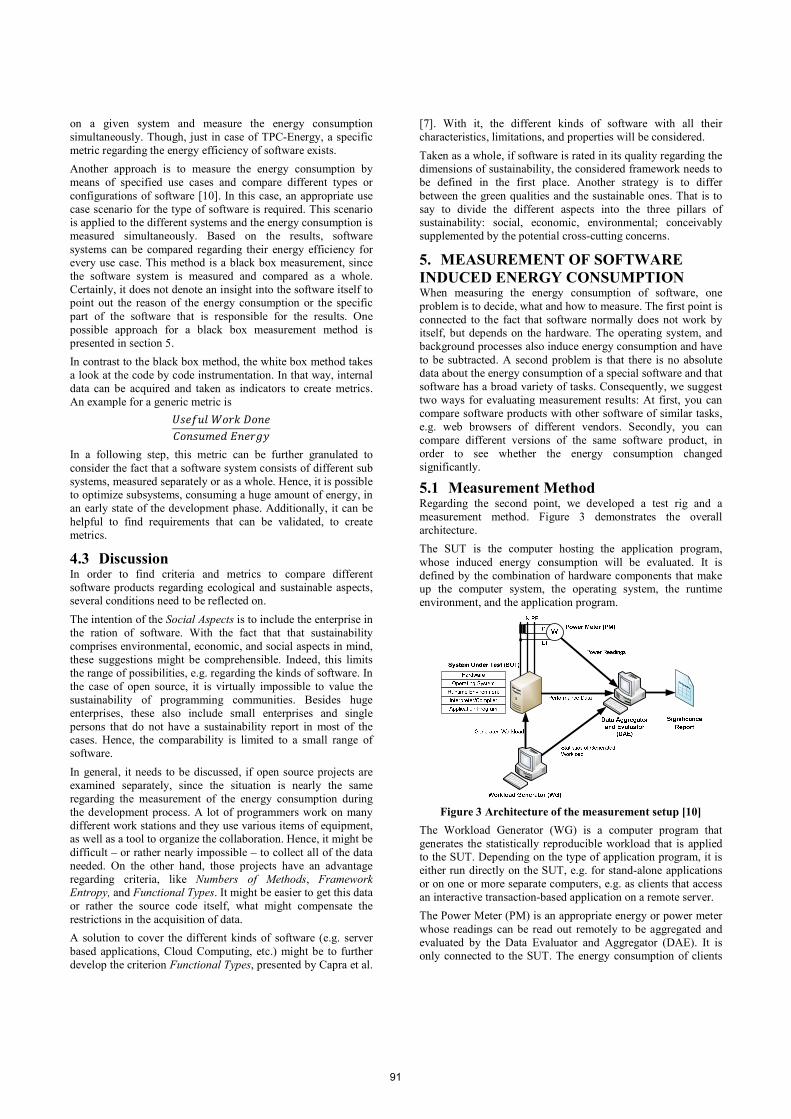
on a given system and measure the energy consumption
simultaneously. Though, just in case of TPC-Energy, a specific
metric regarding the energy efficiency of software exists.
Another approach is to measure the energy consumption by
means of specified use cases and compare different types or
configurations of software [10]. In this case, an appropriate use
case scenario for the type of software is required. This scenario
is applied to the different systems and the energy consumption is
measured simultaneously. Based on the results, software
systems can be compared regarding their energy efficiency for
every use case. This method is a black box measurement, since
the software system is measured and compared as a whole.
Certainly, it does not denote an insight into the software itself to
point out the reason of the energy consumption or the specific
part of the software that is responsible for the results. One
possible approach for a black box measurement method is
presented in section 5.
In contrast to the black box method, the white box method takes
a look at the code by code instrumentation. In that way, internal
data can be acquired and taken as indicators to create metrics.
An example for a generic metric is
��������� �
� ������ ���
In a following step, this metric can be further granulated to
consider the fact that a software system consists of different sub
systems, measured separately or as a whole. Hence, it is possible
to optimize subsystems, consuming a huge amount of energy, in
an early state of the development phase. Additionally, it can be
helpful to find requirements that can be validated, to create
metrics.
4.3 Discussion In order to find criteria and metrics to compare different
software products regarding ecological and sustainable aspects,
several conditions need to be reflected on.
The intention of the Social Aspects is to include the enterprise in
the ration of software. With the fact that that sustainability
comprises environmental, economic, and social aspects in mind,
these suggestions might be comprehensible. Indeed, this limits
the range of possibilities, e.g. regarding the kinds of software. In
the case of open source, it is virtually impossible to value the
sustainability of programming communities. Besides huge
enterprises, these also include small enterprises and single
persons that do not have a sustainability report in most of the
cases. Hence, the comparability is limited to a small range of
software.
In general, it needs to be discussed, if open source projects are
examined separately, since the situation is nearly the same
regarding the measurement of the energy consumption during
the development process. A lot of programmers work on many
different work stations and they use various items of equipment,
as well as a tool to organize the collaboration. Hence, it might be
difficult – or rather nearly impossible – to collect all of the data
needed. On the other hand, those projects have an advantage
regarding criteria, like Numbers of Methods, Framework
Entropy, and Functional Types. It might be easier to get this data
or rather the source code itself, what might compensate the
restrictions in the acquisition of data.
A solution to cover the different kinds of software (e.g. server
based applications, Cloud Computing, etc.) might be to further
develop the criterion Functional Types, presented by Capra et al.
[7]. With it, the different kinds of software with all their
characteristics, limitations, and properties will be considered.
Taken as a whole, if software is rated in its quality regarding the
dimensions of sustainability, the considered framework needs to
be defined in the first place. Another strategy is to differ
between the green qualities and the sustainable ones. That is to
say to divide the different aspects into the three pillars of
sustainability: social, economic, environmental; conceivably
supplemented by the potential cross-cutting concerns.
5. MEASUREMENT OF SOFTWARE
INDUCED ENERGY CONSUMPTION When measuring the energy consumption of software, one
problem is to decide, what and how to measure. The first point is
connected to the fact that software normally does not work by
itself, but depends on the hardware. The operating system, and
background processes also induce energy consumption and have
to be subtracted. A second problem is that there is no absolute
data about the energy consumption of a special software and that
software has a broad variety of tasks. Consequently, we suggest
two ways for evaluating measurement results: At first, you can
compare software products with other software of similar tasks,
e.g. web browsers of different vendors. Secondly, you can
compare different versions of the same software product, in
order to see whether the energy consumption changed
significantly.
5.1 Measurement Method Regarding the second point, we developed a test rig and a
measurement method. Figure 3 demonstrates the overall
architecture.
The SUT is the computer hosting the application program,
whose induced energy consumption will be evaluated. It is
defined by the combination of hardware components that make
up the computer system, the operating system, the runtime
environment, and the application program.
Figure 3 Architecture of the measurement setup [10]
The Workload Generator (WG) is a computer program that
generates the statistically reproducible workload that is applied
to the SUT. Depending on the type of application program, it is
either run directly on the SUT, e.g. for stand-alone applications
or on one or more separate computers, e.g. as clients that access
an interactive transaction-based application on a remote server.
The Power Meter (PM) is an appropriate energy or power meter
whose readings can be read out remotely to be aggregated and
evaluated by the Data Evaluator and Aggregator (DAE). It is
only connected to the SUT. The energy consumption of clients
91

that access a remote server is not considered. Instead, clients
require their own measurement.
The DAE collects all data and evaluates it. This includes the
power or energy readings, the performance readings from the
SUT, and the workload execution statistics from the WG. After
the data is collected and aggregated, it will be evaluated. In the
case of two competing SUTs, a statistical significance report is
generated that states, which SUT has the lower energy
consumption and therefore is more energy efficient. If there is
only one SUT, the measured data could be used to be visualized
in graphs, in order to support developers in finding software
components that should be optimized.
5.2 Exemplary Measurement Results Based on a three-layered architecture for client-server-
applications, we looked at the energy and resource consumption
of a Web Content Management System (WCMS), by comparing
two different configurations of the WCMS Joomla!TM: The first
configuration uses a file based cache for results of database
queries and generated HTML fragments. This configuration is
compared to the base-configuration that does not use the caching
function. With this, the database is requested for every page
view and the content is always created dynamically.
The workload was generated with Apache JMeter, simulating 67
contemporary users. A Supermicro Server (P4BP8-G2) with two
Intel Xeon dual core CPUs CPUs (@2.4 GHz, 4 GiB RAM, 40
GB HDD) running Ubuntu GNU/Linux Server (SMP 10.04
LTS, Kernel 2.6.32-32-generic-pae) was used for the SUT. The
tested application was Joomla! (1.5.23, http://www.joomla.org/)
with PHP 5.3.2, MySQL 5.1 and Apache httpd 2.2.14.
Figure 4 Results of the energy measurement of Joomla!
without (upper line) and with (lower line) HTML Cache
over 30 test series
The result of the evaluation of the measured power data can be
interpreted as follows: On average, the SUT supporting HTML-
Cache consumes less energy (N = 30, mean = 31.009 Wh,
standard deviation = 0.096 Wh) than without HTML-Cache
(N = 30, mean = 33.937 Wh, standard deviation = 0.163 Wh).
These results are depictured in Figure 4. The difference was
significant with p-value = 6,62e-53 < 0,001. In this case, using
the HTML-Cache saves approx. 8,6% of electrical energy.
Additionally, approx. 19% of reserve capacity could be
generated.
5.3 Discussion of the Measurement Method A plenty of different approaches for the energy measurement of
software were developed and presented in the last decade, as
was already discussed in the related work section above.
Often, the presented approaches are very hardware-centric, as
they try to develop a sophisticated and well-fitting power model
for different kinds of processors and hardware platforms, e.g.
ranging from [25] for embedded systems to prolong battery life
up to [33]. The idea behind the latter approach is to estimate the
power consumption of a computer system by using performance
counters and a power model that is suitable for the used
hardware instead of applying a power metering device to the
power lines of the computer system. A similar approach was
also presented by Kansal [19], who estimated the power
consumption of several virtual machines running on one server
hardware.
All these approaches do not provide a method that can be used
by software developers to improve the energy efficiency of their
software, because in principle they developed a software
implemented replacement for a power metering device.
A method and a SDK introduced by Steigerwald [27] (Intel) was
advertised to support software developers in creating energy
efficient applications. They use counters and events embedded
into the source code of the application to match activities of the
application to a power graph recorded by a power meter. This
approach is suitable if one does not make intensive use of
concurrent software execution, because then it is not possible to
distinct which part of the software accounts for which amount of
power consumption.
This is also a common problem when measuring a web
server/application or any other kind of MIS. Here, it is usually
necessary to measure the system under realistic operational
conditions, because design flaws or bottlenecks in software
design may increase the energy demand more likely under
higher workloads with concurrent requests. Hence, it is
necessary to simulate realistic workloads that are expected to
occur during system operation. These workloads usually consist
of a huge amount of parallel requests, executed in a well defined
time frame.
Such an approach is used by the TPC benchmarks and their
corresponding TPC energy metric [32]. The benchmarks are
designed to imitate a typical workload of an online shop system,
serving several shops in parallel with their typical user
transactions. Capra et al. [6] made use of the same TPC
benchmark to measure the energy consumption of different
Database Management Systems (DBMS). They did however not
apply the TPC energy metric. To measure the other kinds of
software (ERPs, CRMs), they developed their own suitable
benchmarks. As was discussed by Dirlewanger [12], the TPC
benchmarks can be represented with the workload model
introduced by ISO/IEC 14756 [17] that forms the basis of our
measurement method. In contrast to the methods used by TPC or
Capra et al., the ISO method validates that the generated
workloads meet specific predefined statistical parameters within
a given delta (e.g. the relative frequency of tasks). This ensures
that different measurement experiments that generate the same
type of workload are comparable to each other.
Compared to the approach of Steigerwald [27] on non-
concurrent software, it is with Capra’s and our approach on
concurrent software not possible to measure the energy
consumption of a single method call. Thus, for a software
developer it is difficult to decide, which parts of the software
should be optimized to increase its energy efficiency. Such a
decision may require additional statistical data retrieved, e.g. by
analyzing performance counters, server request logs, or runtime
efficiency ratings. The latter is part of ISO 14756 and can
92

therefore be calculated alongside with our energy efficiency
approach with minimal additional expenditure.
Nevertheless, it is possible to study effects of software
optimization on mean energy consumption on higher abstraction
levels above the method level, e.g. the introduction of
application caches to reuse created objects, reducing disk or
network IO, or DBMS requests.
Where Capra et al. had difficulties to define a benchmark
suitable for different ERPs due to the differences in workflows
or UI design, we decided to measure software systems mainly as
standalone products. Hence, our method and the proposed
energy efficiency metric do not rely on a comparison with other
software products of the same kind. However, this is not a
limitation in general, because it is possible to calculate Capra’s
energy efficiency metric with our approach, if it is possible to
provide suitable benchmarks and sufficient measurement values
of software products of the same kind.
One limitation that is common to all discussed approaches that
rely on executable software artifacts to measure or estimate their
energy consumption is that you need executables before you can
get analyzable data. Hence, these methods are not applicable in
early design phases, when only class diagrams, sequence
diagrams, etc. are available. In these early development stages,
adoptions of techniques known from software performance
engineering combined with power models to estimate power
consumption of several design decisions may be more suitable.
To our knowledge, such approaches do currently not exist and
will require extensive further research.
6. CONCLUSION & OUTLOOK Concluding, we found that software plays an important role
regarding ICT and sustainability. But it has to be taken into
account that software also induces energy consumption. In our
paper we presented a model to classify green software and its
engineering and showed some aspects of how the energy
efficiency of software can be measured. If ICT and especially
software should make a contribution to sustainability, it is
necessary that software engineers also take the energy
consumption into account. To do so, we presented a
measurement method for software induced energy consumption.
Taking a look at the future of ICT, the aspects of Green IT might
also be adopted by the software side. Thus, there should be
answers to questions of the energy efficiency of software,
especially regarding embedded systems. In this context, Cloud
Computing needs to pay attention to the energy and resource
consumption.
Overall, Green IT, green software, or green software
engineering, meaning concepts of moving to ICT for
Sustainability, are no standalone problems. Rather should every
process of the hard- and software development implicate aspects
of SD. The concepts need to be inherently entrenched into
development and manufacturing processes. In this context, the
arising questions are “What is a green, or rather sustainable
software product? What are the criteria? What do metrics for
these look like?” This makes it necessary to provide more tools
and methods for software developers. It should become standard
during the whole life cycle of software products. Ideally, even
costumers should understand Green IT as a “must-have”
requirement.
Hence, it is necessary to reach a certain standardization in the
field of energy efficient software. This point might also support
the development of green and sustainable software. In this
context, the end user needs to be involved in a way that e.g. the
interaction regarding energy options is better. An interface
between standard software and the operation system without
performance restrictions might be a future vision.
7. ACKNOWLEDGMENTS This paper evolved from the research and development project
“Green Software Engineering“ (GREENSOFT), which is
sponsored by the German Federal Ministry of Education and
Research under reference 17N1209. The contents of this
document are the sole responsibility of the authors and can
under no circumstances be regarded as reflecting the position of
the German Federal Ministry of Education and Research.
Sustainable Software Blog is a private initiative of computer
scientists interested in Sustainable Informatics and Sustainable
Development. Some of them are former employees of the
GREENSOFT project.
8. REFERENCES [1] Agarwal, S., Nath, A., and Chowdhury, D. 2012.
Sustainable Approaches and Good Practices in Green
Software Engineering. IJRRCS 3, 1, 1425–1428.
[2] Albertao, F. 2004. Sustainable Software Engineering.
http://www.scribd.com/doc/5507536/Sustainable-Software-
Engineering#about. Accessed 30 November 2010.
[3] Albertao, F., Xiao, J., Tian, C., Lu, Y., Zhang, K. Q., and
Liu, C. 2010. Measuring the Sustainability Performance of
Software Projects. In 2010 IEEE 7th International
Conference on e-Business Engineering (ICEBE 2010),
Shanghai, China, 369–373.
[4] Assuncao, M. D. de, Orgerie, A.-C., and Lefévre, L. 2010.
An Analysis of Power Consumption Logs from a
Monitored Grid Site. In 2010 International Conference on
Green Computing and Communications & 2010 EEE/ACM
International Conference on Cyber, Physical and Social
Computing. IEEE Publishing Services, 61–68.
[5] Capra, E. and Merlo, F. 2009. Green IT: Everything starts
from the Software. In 17th European Conference of
Information Systems, 62–73.
[6] Capra, E., Formenti, G., Francalanci, C., and Gallazzi, S.
2010. The Impact of MIS Software on IT Energy
Consumption. 18th European Conference on Information
Systems, 7-9 June 2010, Pretoria, South Africa.
http://web.up.ac.za/ecis/ECIS2010PR/ECIS2010/Content/P
apers/0073.R1.pdf. Accessed 25 October 2010.
[7] Capra, E., Francalanci, C., and Slaughter, S. A. 2011. Is
software green? Application development environments
and energy efficiency in open source applications.
Information and Software Technology 54, 60–71.
[8] Chen, F. F., Schneider, J., Yang, Y., Grundy, J., and He, Q.
2012. An energy consumption model and analysis tool for
Cloud computing environments. In Proceedings of the First
International Workshop on Green and Sustainable
Software 2012. held in conjunction with The International
Conference on Software Engineering, June 2-9, Zurich,
Switzerland, IEEE, Ed. IEEE Computer Society, 45‐50.
[9] Dick, M. and Naumann, S. 2010. Enhancing Software
Engineering Processes towards Sustainable Software
Product Design. In EnviroInfo 2010: Integration of
93
Environmental Information in Europe. Proceedings of the
24th International Conference EnviroInfo, October 6 - 8,
2010, Cologne/Bonn, Germany, K. Greve and A. B.
Cremers, Eds. Shaker, Aachen, 706–715.
[10] Dick, M., Kern, E., Drangmeister, J., Naumann, S., and
Johann, T. 2011. Measurement and Rating of Software-
induced Energy Consumption of Desktop PCs and Servers.
In Innovations in sharing environmental observations and
information. Proceedings of the 25th International
Conference EnviroInfo October 5 - 7, 2011, Ispra, Italy, W.
Pillmann, S. Schade and P. Smits, Eds. Shaker, Aachen,
290–299.
[11] Dick, M., Kern, E., Johann, T., Naumann, S., and Gülden,
C. 2012. Green Web Engineering - Measurements and
Findings. In Man Environment Bauhaus: Light up the Ideas
of Environmental Informatics. Proceedings of the 26th
International Conference EnviroInfo; Federal Environment
Agency, Dessau, 2012, H.-K. Arndt, G. Knetsch and W.
Pillmann, Eds. Shaker Verlag, Aachen, 599–606.
[12] Dirlewanger, W. 2006. Measurement and rating of
computer systems performance and of software efficiency.
An introduction to the ISO/IEC 14756 method and a guide
to its application. Kassel University Press, Kassel.
[13] Erdmann, L., Hilty, L. M., Goodman, J., and Arnfalk, P.
2004. The Future Impact of ICTs on Environmental
Sustainability. Technical Report EUR 21384 EN. Technical
Report Series EUR 21384 EN. European Commission;
Joint Research Centre; IPTS - Institute for Prospective
Technological Studies, Seville.
[14] Hilty, L. M. 2005. Information systems for sustainable
development. Idea Group Publishing, Hershey, Pa.
[15] Hilty, L. M. 2008. Information technology and
sustainability. Essays on the relationship between ICT and
sustainable development. Books on Demand, Norderstedt.
[16] International Organization for Standardization. 2005.
Software engineering - Software product Quality
Requirements and Evaluation (SQuaRE) - Guide to
SQuaRE 35.080 35.080, ISO/IEC 25000:2005 (E).
[17] International Organization for Standardization. 2010.
Information technology -- Measurement and rating of
performance of computer-based software systems 35.080
35.080, ISO/IEC 14756:1999.
[18] Jwo, J.-S., Wang, J.-Y., Huang, C.-H., Two, S.-J., and Hsu,
H.-C. 2011. An Energy Consumption Model for Enterprise
Applications. In 2011 IEEE/ACM International Conference
on Green Computing and Communications. IEEE
Publishing Services, 216–219.
[19] Kansal, A., Zhao, F., Liu, J., Kothari, N., and Bhattacharya,
A. A. 2010. Virtual machine power metering and
provisioning. In Proceedings of the 1st ACM symposium on
Cloud computing. ACM, Indianapolis, Indiana, USA, 39–
50. doi:10.1145/1807128.1807136.
[20] Larsson, P. 2012. Energy-Efficient Software Guidelines.
http://software.intel.com/en-us/articles/energy-efficient-
software-guidelines/?wapkw=energy-
efficient+software+guidelines. Accessed 27 June 2012.
[21] Naumann, S., Dick, M., Kern, E., and Johann, T. 2011. The
GREENSOFT Model: A Reference Model for Green and
Sustainable Software and its Engineering. SUSCOM 1, 4,
294–304. doi:10.1016/j.suscom.2011.06.004.
[22] Schall, D., Hoefner, V., and Kern, M. 2011. Towards an
Enhanced Benchmark Advocating Energy-Efficient
Systems. In Performance Evaluation and Benchmarking.
Third TPC Technology Conference, TPCTC 2011, Seattle,
WA, USA, August 29. - September 3., 2011. Lecture Notes
in Computer Science. Springer, Berlin, Heidelberg.
[23] Shenoy, S. S. and Eeratta, R. 2011. Green software
development model: An approach towards sustainable
software development. In India Conference (INDICON),
2011 Annual IEEE, 1‐6.
[24] Software Improvement Group. 2011. What can you do to
make your software application more energy efficient?
http://www.sig.eu/en/News%20&%20publications/Publicat
ions/1078/__What_can_you_do_to_make_your_software_a
pplication_more_energy_efficient__.html. Accessed
9 January 2012.
[25] Sinha, A. 2001. Energy Efficient Operating Systems and
Software. Submitted to the Department of Electrical
Engineering and Computer Science in partial fulfillment of
the requirements for the degree of Doctor of Philosophy in
Electrical Engineering and Computer Science.
Dissertation, Massachusetts Institute of Technology.
[26] SPEC - Standard Performance Evaluation Corporation.
SPECpower_ssj2008. http://www.spec.org/power_ssj2008/.
Accessed 17 February 2012.
[27] Steigerwald, B., Chabukswar, R., Karthik, K., and Jun, D.
V. 2007. Creating Energy-Efficient Software.
http://software.intel.com/en-us/articles/creating-energy-
efficient-software-part-1/. Accessed 19 January 2011.
[28] Taina, J. 2010. How Green Is Your Software? In Software
Business. First International Conference, ICSOB 2010,
Jyväskylä, Finland, June 21-23, 2010. Proceedings.
Lecture Notes in Business Information Processing 51, 151–
162. DOI:10.1007/978-3-642-13633-7_13.
[29] Taina, J. 2011. Good, Bad, and Beautiful Software - In
Search of Green Software Quality Factors. CEPIS
UPGRADE XII, 4, 22–27.
[30] The Embedded Microprocessor Benchmark Consortium.
EnergyBench™ Version 1.0 Power / Energy Benchmarks.
http://www.eembc.org/benchmark/power_sl.php. Accessed
24 September 2012.
[31] Tischner, U., Dietz, B., Maßelter, S., Schmincke, E.,
Prösler, M., Rubik, F., and Hirschl, B. 2000. How to do
EcoDesign? A guide for environmentally and economically
sound design. Verlag form, Frankfurt am Main.
[32] Transaction Processing Performance Council. 2010. TPC-
Energy Specification, TPC-Energy 1.2.0.
http://www.tpc.org/tpc_energy/spec/TPC-Energy
_Specification_1.2.0.pdf. Accessed 2 September 2011.
[33] Wang, S., Chen, H., and Shi, W. 2011. SPAN: A software
power analyzer for multicore computer systems. SUSCOM
1, Mar. 2011, 23–34. doi:/10.1016/j.suscom.2010.10.002.
[34] Zhong Ming Feng, B. and Lung, C.-H. 2010. A Green
Computing Based Architecture Comparison and Analysis.
In International Conference on Green Computing and
Communications & 2010 EEE/ACM International
Conference on Cyber, Physical and Social Computing.
IEEE Publishing Services, 386–391
94

The Impact of Improving Software Functionality on
Environmental Sustainability
Sedef Akınlı Koçak1, Andriy Miranskyy
2, Gülfem Işıklar Alptekin
3,
Ayşe Başar Bener1, Enzo Cialini
2
1Ryerson University, Ted Rogers School of Information Technology Management,
55 Dundas St. West, Toronto, M5B 2K3, Canada [email protected], [email protected]
2IBM Toronto Lab., 8200 Warden Ave, Markham, Toronto, L6G 1C7, Canada
[email protected], [email protected]
3Computer Engineering, Galatasaray University, Çırağan Cad. No: 36, 34357, Istanbul, Turkey [email protected]
ABSTRACT Green IT aims to achieve environmentally sustainable computing. Applying this concept to the existing systems to meet business demand or designing sustainable software is therefore a complex task. In this paper, we have discussed that improving existing software functionality or leveraging legacy systems according to end-users’ requirements has a significant impact on environment. The researches show that many companies will have no other option than complying with the new green IT field. Hence, we have investigated the trade-off between improving software functionality and reducing energy consumption of a software product. Data compression is one of the software features which reduce the number of I/O operations while increasing CPU utilization. In this research, we have focused on the impact of this feature on software’s energy consumption.
Keywords Green IT, Legacy Systems, Green Software, Energy Consumption, Energy Efficiency, Environmental Sustainability
1. INTRODUCTION Information technologies (IT) that require vast amount of energy and other sources are used in almost every field and processes. Recently, the global carbon dioxide emission has had its highest level in human history with 9.1 billion tones and 49% higher than in 1990 (the Kyoto reference year) [7]. At least 2% of global carbon emissions are directly due to IT systems [17] and further increase is expected since new IT systems are applied every day. Therefore, reducing the energy consumption and related carbon emission of the IT systems is becoming a crucial requirement. This global issue promotes the competition and the companies are being forced to implement energy efficient products and energy efficient technology services around the world. The competition along with regulation and standards for measuring energy efficiency will continue to rapidly drive energy efficiency [21]. In this context, green IT is an ideal way for most companies to
address the environmental issues in order to achieve environmental sustainability. Since green IT has many different aspects inside and outside the data center, it is important to manage it by using the resources efficiently to reduce environment impacts [21]. Although a software system does not directly consume energy, it intensely affects the hardware functioning, hence its energy consumption. All the infrastructural layers in a data center amplify the energy consumption induced by software [6]. Most IT companies need to transform their applications to meet new business demands. On the other hand, transforming these systems may also cause a rebound effect. In that case, efficiency is a necessary but not a sufficient condition for saving resources. Hilty and Lohmann [19] emphasized that recent studies almost completely ignore the rebound effect. They also mentioned that software development plays a specific role in creating rebound effects. The ideal solution is to transform legacy systems to newer, more productive platforms so that companies can exploit faster and cheaper development technologies. However, legacy systems tend to be unwieldy, monolithic, and inflexible and many firms regard modernization as somewhere between improbable and impossible [15]. Furthermore, in the acquisition of large-scale software systems, the effective and efficient management of user requirements is one of the most crucial issues [37]. Software systems that lack appropriate non functional requirements (NFR), i.e., how the system behaves with respect to some observable attributes, such as performance and reliability [36], carry the risk of failing to meet customer needs [38]. Zhu et al. [38] stated that there is a lack of research on NFRs trade-offs in the systems. As software continues to affect all aspects of our lives under ever-renewed forms, we realize that leveraging existing systems is a challenging concern for the companies. Keeping the software on demand and with high quality levels in respect to end-users’ requirements create a conflict in terms of software energy consumption. Moreover, each integrated quality feature is accompanied by increasing levels of energy consumption. Therefore, it is hard to maintain software as environmental friendly. Our contribution presents the rising awareness of environmental sustainability among IT studies/ practices and green software. We
ICT4S 2013: Proceedings of the First International Conference on Information and Communication Technologies for Sustainability, ETH Zurich, February 14-16, 2013. Edited by Lorenz M. Hilty, Bernard Aebischer, Göran Andersson and Wolfgang Lohmann. DOI: http://dx.doi.org/10.3929/ethz-a-007337628
95

analyze the impact of transforming legacy systems with respect to new business demands on the carbon dioxide emission. As the case study, the data compression feature of a large scale legacy software system is tested. We have analyzed the total energy consumption of the software when processing a specific workload in two different scenarios: 1. Without data compression feature, 2. With the data compression feature. It is also remarkable to state that the same business goal can be reached using different amount of energy consumption. We have shown that the feature increases the total consumption, but decreases average consumption per statement due to significant reduction of execution time. The rest of the paper is organized as follows. Section 2 discusses the related work in the literature and their differences from this one. Moreover, brief introductions to the concepts of green IT and legacy system’s modernization are given in Section 2. In Section 3, the simulations are given. The results are discussed at the end of the Section 3. Finally, conclusions and future work are given in Section 4.
2. BACKGROUND AND RELATED WORKS 2.1 IT and Environment IT affects on environment in many different ways. Each stage of a computer’s life, from its production, throughout its use, and into its disposal, presents environmental problems. Manufacturing computers and their various electronic and non-electronic components consumes electricity, raw materials, chemicals, and water, and generates hazardous waste. All these directly or indirectly increase carbon dioxide emissions and impact the environment. The total electrical energy consumption by servers, computers, monitors, data communications equipment, and cooling systems for data centers is steadily increasing. This increase in energy consumption results in increase greenhouse gas emissions. Each PC in use generates about a ton of carbon dioxide every year [24]. At the Forum for the Future in 2002, the ascertained effects of IT on environmental sustainability were structured mainly in three levels. First order effects (direct effects) include all environmental impacts resulting from hardware during the product life cycle, covering production, use and disposal. Second order effects (indirect effects) are impacts and opportunities created by the ongoing use and application of IT. Finally, third order effects includes impacts and opportunities created by the aggregated effects of large numbers of people using and adapting of behavior (e.g. consumption patterns) or economic structures due to the stable availability of IT and the services it provides over the medium to long term [13]. Analyzing the direct environmental impacts of ITs are considerable in areas such as energy use, materials throughput and end-of-life treatment. After the financial crises of 2008-2009 green economy is seen as a framework for restoring economic growth meanwhile responding to the climate change and other subjects of environmental sustainability [9]. Governments' “green IT” policies can be instrumental in promoting life-cycle approaches for improved R&D and design of IT goods, services and systems national and international level. Green IT is a topic and initiative that has emerged recently to address this role of IT on environment [2]. New CompTIA "Green IT Insights and Opportunities-2011" survey results indicate that businesses today are hungry for eco-friendly technology solutions, and that most firms now make hiring decisions based on IT providers’ green credentials. It
showed that energy conservation is a key factor when reviewing IT companies. Moreover IT company’s green credentials and how knowledgeable they are about implementing green initiatives are important hiring factors. The study also reveals that 35% organizations report having a comprehensive environmental strategy for practices such as reducing energy consumption, equipment usage/design, recycling/product disposal, carbon footprint and employee behaviors. Additionally, 42% have a partial environmental strategy [11].
2.2 Green IT Green IT is a study and practice of using computing resources efficiently [21] to reduce carbon dioxide emissions of information technology. Recently, the more broad definition of green IT is provided by Murugesan [25] "Green IT is the study and practice of designing, manufacturing, using, and disposing of computers, servers, and associated subsystems (such as monitors, printers, storage devices, and networking and communications systems) efficiently and effectively with minimal or no impact on the environment". These definitions of Green IT’s initial focus on reducing the carbon emissions emanating from IT equipment and infrastructure [34]. The most significant and immediate reductions come from hardware solutions. The whole lifecycle of computers and related equipment, such as the manufacturing process and disposal and recycling are mostly focused areas. There are numerous studies on material level of IT (hardware) for energy efficiency. Most of the studies have been done on the hardware and Life Cycle Assessment for computers, mobile phone networks and monitors [14, 18, 32, 34]. Moreover, the cost to maintain data centers and their enormous use of power to both run and cool their infrastructure makes data centers a prime target for greening efforts [27]. According to the U.S. Environmental Protection Agency (EPA) Report, the electricity use of the nation’s servers and data centers has a rapid upward trend from 2000 to 2005. However, the growth trend has slowed significantly between 2005 and 2010 [20]. In comparing with attention of the hardware solutions, there are rare cases in which they focus on software [12]. However, software also plays an important role having a considerable impact on energy consumption. Recently, Naumann et al. [29] stated that there is a lack of models and descriptions regarding environmental sustainability in the area of computer software. Thus, they contributed a definition of the green and sustainable software, "Green and Sustainable software is software, whose direct and indirect negative impacts on economy, society, human beings, and environment that result from development, deployment, and usage of the software are minimal and/or which has a positive effect on sustainable development". They also developed a reference "GreenSoft" model for software products, sustainable metrics and criteria for software design and development [29]. There are various frameworks and models of evolving software, such as sustainable computing concept classifies different direction of hardware and software [22], common software quality aspects and developments of new metrics to measure these quality aspects in order to achieve environmental effects [3], investigation of different software systems on IT energy consumption [5] and analyze software carbon footprints from a typical software lifecycle and estimation of how large carbon footprint each step produces [33]. Chen et al. [8] explained organizational motivation for Green IT supported in the context of ecological sustainability with eco-efficiency, eco-equity and eco-effectiveness. Those concepts were
96
further developed by [23]. There is an on-going process of Green IT adoption by companies. Most businesses are re-considering their IT architectures and installations by emphasizing the Corporate Social Responsibility (CSR) aspect of green IT. In this manner, a framework proposed by Viaro and Viccaro [35] considers that environmental changing requirements, strategic requirements and dynamic capabilities are the forces which move organizations toward green practices and foster innovation.
2.3 Legacy Systems' Modernization The old IT systems that are modernized or replaced are called legacy systems [31]. Especially, discovering the service-oriented architecture (SOA) as the future technological underpinning of enterprise information technology, software modernization has become challenging for the most of the software engineers [1]. Those systems are, in any cases, vital to the organization that uses them. They are, however, hard and expensive to manage. It has been realized that the maintenance and evolution costs of legacy systems are normally somewhat between 40% and 90% of the total costs of the life cycle of the system [31]. According to the National Association of State Chief Information Officers [NASCIO CIO Priorities] surveys of the state CIOs to identify and prioritize the top policy and technology issues facing state government, legacy application modernization and upgrade is one of the forth priority technologies, applications and tools since 2006 while Green IT technologies and solutions is one of the priorities in 2009 [28]. Similarly, in 2007, IBM's seven countries across six industries survey shows that legacy applications and legacy modernization represents a major challenges across all the industries. Nearly half of all respondents report that the inflexibility of legacy systems poses a significant challenge [4]. The modernization of state IT legacy systems is emerging as a significant financial, technical and programmatic challenge to states’ ability to deliver services to citizens, and conduct day-to-day business. rom a survey conducted by I , bac in , legacy systems in operation have been labeled and given criteria according to the potential problems e pected when dealing with them. . of the respondents have identified legacy systems as those that can no longer be “ adequately supported, maintained or enhanced ”[26 . Some researches show that most of the modernizing effort of the software fails [30]. Legacy system modernization efforts fail for variety of reason such as complexity, software technology and engineering processes, risk, commercial components and business objectives. Most of these problems arise when handling upgrades and maintenance on the legacy software. a turally, most of applications may no longer be adaptable, e tensible or agile enough to compete or interact with modern web-based systems. Moreover, the application tools and documentation may be far out-of-date or non-e istent at all to aid our IT staffs in handling problems that may crop up prior to moderni in g the systems, like the potential security-risks in accessing the information stored in some of these legacy systems [16]. A high-quality legacy system that provides a competitive advantage is worth nurturing unless external business pressures dictate change [8]. System evolution which covers maintenance, modernization and replacement and software reengineering and modernization which covers retargeting, revamping, use of commercial components, source code translation, code reduction, and functional transformation have been studying to reduce the overall effort required to maintain the ever-increasing amount of legacy software code [30]. The modernizing alternatives are not
mutually exclusive and the decision of the approach to use is generally based on an assessment of the quality and business value of the system [10]. As a result, software modernization requires making trade-offs. These trade-offs are multifaced and include technical and organizational considerations that may strain and organization's decision making abilities [30]. There are some survey studies conducted on legacy modernization approaches. According to the Aberdeen Group survey in 2006 given a choice of legacy modernization approaches, 58% of the companies’ options for the more economical, less complicated maintenance option over replacing and modernizing [1]. Survey results also indicate that the major “driver” is to improve IT time to deliver changes to the business (about 70%) followed by lower IT integration costs (about 50%). Similarly, according to the NASCIO survey in 2008, in the States major driving force of moving towards modernization of IT systems and applications is changing or re-engineering of business processes with 86% followed by "line-of-business" requirements with 83%. It is also important to show that end user demand has been 52% and a green IT initiatives has been 28%. Moreover, primary concerns around legacy systems are software maintenance/upgrades, extensibility, adaptability, agility, and application development tools. This appears to demonstrate that primary concerns are centered on application software and its ability to be adapted, upgraded and maintained [26].
3. CASE STUDY 3.1 Description of Software under Study Our software under study is DB2 for Linux, UNIX and Windows Version 10.1. DB2 is a good candidate for our analysis, because it is a large software product present on the market since 1992 with a considerable market share. Its ancestor, DB2 for mainframe, was born in 1983 (and research prototypes have been created in 1970s). The product is constantly evolving. Examples of features added in the last decade are enhanced business analytics and data visualization. We have focused on measuring efficiency of the DB2 workload in the presence and absence of the data compression feature. Let us look at the feature in details. Disk storage systems can often be the most expensive components of a database solution. For large warehouses or databases with huge volumes of data, the cost of the storage subsystem can easily exceed the combined cost of the hardware server and the data server software. Therefore, even a small reduction in the storage subsystem can result in substantial cost savings for the entire database solution. Data compression reduces storage requirements, improves I/O efficiency, and provides quicker access to the data from the disk. The latest release of DB2 introduced new type of data compression: "adaptive data compression". This feature utilizes a number of compression techniques (including table-wide and age wide compression [DB2 Manual1]) leading to significant reduction of storage space. However its usage can lead to CPU overhead associated with compression and decompression of the data. Another positive “side effect” of this technology is speeding up of I/O intensive workloads (in spite of CPU overhead). Reading data 1http://pic.dhe.ibm.com/infocenter/db2luw/v10r1/index.jsp?topic=
%2Fcom.ibm.db2.luw.admin.perf.doc%2Fdoc%2Fc0053982.html
97
from disk to memory for processing is one of the slowest database operations. Storage of compressed data on disk leads to fewer I/O operations needed to retrieve or store the same amount of data (in comparison with the uncompressed dataset). Therefore, for disk I/O-bound workloads (for instance, when the system is waiting/idling for data to be accessed from the disk), the query processing time can be noticeably improved. Furthermore, DB2 processes buffered data in memory in its compressed form, thereby reducing the amount of memory consumed compared to uncompressed data. This has the effect of immediate increase in the amount of memory available for the database without having to increase physical memory capacity. Allowing the additional memory to remain or freeing it up for other database or system operations. This can further improve database performance for queries and other operations. Compression can be turned on when tables are created using the “COMPRESS YES” option. Alternative, administrator would enable compression of an existing table T by e ecuting “ LTER T BLE T MP RE YE ”.
3.2 Workload Description and Case Study Setup We have focused to measure the effect of two actions; no compression of data and compression of data, on the amount of resources (time and electricity) needed to complete a certain workload. Our reference workload is TPC-H2. It is created by the Transaction Processing Performance Council3 and is used as the industry standard for measuring database performance. The workload consists of a set of business-oriented ad-hoc queries. The database has been designed to have broad industry-wide relevance (see TPC-H specifications4 for details). Using the tools provided with the workload, we have populated the database with 1GB of raw data and have generated 240 distinct queries associated with this dataset. The queries were executed sequentially for approximately two hours in a circular fashion on a Lenovo ThinkPad T60 laptop with 3GB of RAM. Some of the statements consume significant amount of time. For instance, a query started at 1:59 can take 5 minutes, finishing at 2:04. Two hour interval is selected to reduce measurement error associated with low precision (0.01 kWh) of the energy meter (UPM EM100). We have counted the number of statements executed in a given time interval and have measured the amount of electricity consumed by DB2 running in the following two configurations:
1. Without compression 2. With compression
The workload has been executed against each configuration three times to estimate measurement error (expressed using relative standard error). Relative standard error is calculated as the sample estimate of the population (in this case, 3 workload runs) standard deviation divided by the square root of the sample size and by the population mean. Compression ratio is defined as (1-compressed size/uncompressed size). The energy metric is measured in Watt
2 http://www.tpc.org/tpch/ 3http://www.tpc.org/information/about/abouttpc.asp 4 http://www.tpc.org/tpch/spec/tpch2.14.4.pdf
per transaction per second (W/tps) and is calculated as Energy consumption/Work completed5. To summarize, for each DB2 configuration, we run the same workload three times for approximately two hours, measuring 1) the number of statements executed and 2) the amount of electricity consumed in a given time frame.
3.3 Results and Discussions The measurements are given in Table 1. First, we have looked at the average execution time per statement. The slowest configuration of the database is, as expected, the one with the feature disabled. We have treated this configuration as a baseline. Compression of data reduces tables’ si e by 61% and leads to 97% performance improvement in comparison with the reference configuration. Compression feature increases overall power consumption by 29% (in comparison with the reference configuration). However, energy consumption per unit of work is reduced by 34%, due to increased query throughput. Based on the data, we have concluded that legacy system modernization (increasing the system functionality) has a mixed effect on energy consumption: consumption per unit of time goes up; consumption per unit of work goes down. Theoretically, if the workload size is fixed, hardware is dedicated only to this workload, performance of the workload is not critical, and space savings are irrelevant, it may be beneficial to run queries against uncompressed version of the database. These requirements are rarely met in practice: workloads scale up, hardware is shared between multiple tasks (especially in the virtualized / cloud computing environments), and space saving is critical.
3.4 Threats to Validity This case study shows that the method can be successfully applied to a particular dataset. Following the paradigm of the “representative” or “typical” case advanced in [38], this suggests that the same approach may be extrapolated to other products. Our test system is not designed for use in a production environment. It is a laptop (tuned to minimize electricity consumption, sacrificing efficacy) with consumer-grade operating system. However, we believe that the results can be extrapolated to a production system, since data compression is system-agnostic. The amount of savings for the production system will vary with system’s setup and with associated wor load.
4. CONCLUSION Most IT companies need to transform their applications to meet new business demands. Sometimes these efforts come at a cost of consuming other resources within the organization. So far, IT industry has been focusing on IT equipment processing power and associated equipment spending. Recently it’s been concerned with other requirements such as power, cooling, and data center space. Companies have also been under pressure to develop environment friendly practices in their project life cycle. However, going forward, they will need to deal with all of the infrastructure requirements and the environmental impact of IT itself (hardware and software) and its use. The challenges of green IT are immense; however, recent developments indicate that the IT industry has the will and conviction to tackle our environmental issues head-on. Companies can benefit by taking these challenges
5 TPC-Energy-Specification-1.2.0.pdf, page21
98

as strategic opportunities [24]. As a result, software modernization requires making trade-offs between end-user demands and the requirements for corporate social responsibility initiatives. In this paper, we conclude that considering environmental sustainability legacy system modernization regarding increasing the system functionality has a mixed effect on energy consumption. Therefore requirements to design new systems or modify existing ones are a complex task. Improving existing software functionality or leveraging legacy systems for end-users also has significant impact on environment. Moreover different features can have a significant impact on the energy consumption of software. We have related the use of software modernization efforts and software energy consumption suggesting that there may be a trade-off between legacy system modernizations and energy consumption. In summary, we recommend that software development organizations should take into consideration the need for energy
consumption from software especially from legacy systems which has strong end-user demand. We believe that there is a strong need for more input from software engineering on how to greening software toward creating more sustainable environment. As a future work, individual effects and joint effects of different features on energy consumption will be examined. Going forward, trade-off models can be also examined in software development for environmental sustainability.
5. ACKNOWLEDGEMENT This research is in part supported by NSERC Discovery Grant no. 402003-2012. We would like to thank IBM Canada Lab-Toronto site for making their development data available for research and strategic help during all phases of this research. The opinions expressed in this paper are those of the authors and not necessarily of IBM Corporation.
Table 1. Workload and database characteristics with and without adaptive compression feature (± denotes relative standard error)
Database Feature Average
Statement Count per hour
Average Electricity
Consumption (kWh)
Space Consumption
(Mb)
Compression ratio
Watts per statement per
second6
no compression 415 ± 1.8% 0.035 ± 0.5% 1168.2 100% 302
adaptive compression 814 ± 4.0% 0.045 ± 0.0% 455.6 61% 199
6. REFERENCES [1] Aberdeen Group. 2006. The Legacy Application
Modernization Benchmark Report: Transforming Mainframe, AS/400, and Unix Applications in an SOA World, Available at: http://www.microfocus.com/000/RA_SOLA_PK_spf100306a_tcm21-12798.pdf.
[2] Ahola, J., Ahlqvist, T., & Ermes M. 2010. ICT for Environmental Sustainability, Green ICT Roadmap, VTT Tiedotteita, Finland– Research Notes 2532 Available at: http://www.vtt.fi/publications/index.jsp.
[3] Albertao, J., Xiao, C. Tian, Y. Lu, K.Q. Zhang, C. Liu, 2010. Measuring the sustainability performance of software projects, In: IEEE Computer Society (Ed.), IEEE 7th International Conference on e-Business Engineering (ICEBE 2010-Shanghai, China, 2010), 369–373.
[4] Barnett G. 2008. Application Management Research Study, The Bathwick Group, IBM Application Services. Available at:https://www.304.ibm.com/easyaccess/fileserve?contentid=141806.
[5] Capra, E., Formenti, G., Francalanci, C., and Gallazzi, S. 2010. The impact of MIS software on IT energy consumption. In: 18th European Conference on Information Systems, (June 7–9, 2010, Pretoria, South Africa),Available at: http://web.up.ac.za/ecis/ECIS2010PR/ECIS2010/Content/Papers/0073.R1.pdf.
[6] Capra, E., Francalanci, C., and Slaughter, S. 2012. Is software ‘‘green’’? pplication development environments and energy efficiency in open source applications. Information and Software Technology, 54, 60–71.
[7] Carbon Budget 2010. Annual update of the global carbon budget and trends. (Released in 5th December 2011). Available at: http://www.globalcarbonproject.org/carbonbudget/index.htm.
[8] Chen, A.J.W., Boudreau, M. and Watson, R. T. 2008. Information Systems and Ecological Sustainability, Journal of Systems and Information Technology. 10, 3, 186-201.
[9] Ciocoiu, C. N. 2011. Integrating Digital Economy And Green Economy: Opportunities For Sustainable Development. Theoretical and Empirical Studies in Urban Management, 61, 33-43.
[10] Colosimo, M., De Lucia, A., Scanniello, G. and Tortora, G. 2009. Evaluating legacy system migration technologies through empirical studies. Information and Software Technology, 51, 433–447.
[11] CompTIA. 2011. Second annual Green IT insights and opportunities study. Availabe at: http://www.comptia.org/news/pressreleases/11-04-19/Green_IT_Trending_Upward_as_a_Priority_for_Organizations_CompTIA_Study_Finds.aspx.
[12] Dick, M. and Naumann S. 2010. Enhancing Software Engineering Processes towards Sustainable Software Product Design. In: Greve K; Cremers AB (eds) EnviroInfo 2010, October 6 - 8, 2010, Cologne/Bonn, Germany. Shaker, Aachen, 706–715.
[13] EITO (European Information Technology Observatory). 2002. The Impact of ICT on Sustainable Development, (Frankfurt am Main, Germany), 250-283.
[14] Emmenegger, M.F., Frischknecht, R., Stutz, M., et at. 2006. Life Cycle Assessment of the mobile communication
99

system UMTS-towards eco-efficient systems. International Journal of Life Cycle Assesment, 11, 265-276.
[15] Erlikh, L. 2000. Leveraging legacy system dollars for e-business. IT Pro. (May/June 2000), 17-23.
[16] Eugster, M., Hischier, R., and Huabo, D. 2007. Key Environmental Impacts of the Chinese EEE-Industry-A Life Cycle Assesment Study. Empa and Tsinghua Eniversity, St.Gallen and Beijing. Available at: http://library.eawagempa.ch/empa_publications_2007_open_access/EMPASG20070177.pdf.
[17] Gartner Inc. 2008. Green IT: The new industry shockwave. In Presentation at symposium/ITXPO conference 2008.Available at: http://www.gartner.com/it/page.jsp?id=503867.
[18] Hichier, R. and Baudin, I. 2010. LCA study of a plasma television device. The International Journal of Life Cycle Assessment, 15, 5, 428-438.
[19] Hilty, L. and Lohmann, W. 2011. The five most neglected issues in "Green IT". CEPIS Upgrade, 12, 4, 12-15.
[20] Koomey, J. 2011. Growth in Data center electricity use 2005 to 2010. Oakland, CA: Analytics Press. Available at: http://www.analyticspress.com/datacenters.html.
[21] Lamb, J. The Greening of IT: How Companies Can Make a Difference for the Environment? Boston: IBM Press. 2009.
[22] Mocigemba, D. 2006. Sustainable computing. Poiesis & Praxis: International Journal of Technology Assessment and Ethics of Science, 4, 3,163–184.
[23] Molla, A. 2009.Organizational Motivations for Green IT: Exploring Green IT Matrix and Motivation Models, Pacific Asia Conference on Information Systems (Hyderabad, India, July 10-12).
[24] Murugesan, S. 2008. Harnessing Green IT: Principles and Practices. IT Professional, IEEE Computer Society, January/February, 24–33.
[25] Murugesan, S. 2010. Making IT Green. IT Professional, IEEE Computer Society, 12, 2, 4–5.
[26] NASCIO .2008. Digital States at Risk!: Modernizing Legacy Systems, National Survey on Legacy Systems and Modernization in the States. Available at: http://www.nascio.org/publictions/documents/NASCIO-DigitalStatesAtRisk.pdf.
[27] NASCIO .2008. Green IT in Enterprise Practices: The Essential Role of the State CIO. Available at: http://www.nascio.org/publications/documents/NASCIO-GreenIT.pdf.
[28] NASCIO .2006-2009. State CIO Priorities. Available at: http://www.nascio.org/publications/documents/NASCIO-CIOPriorities.pdf.
[29] Naumann, S., Dick, M., Kern, E., and Johann, T. 2011. The GREENSOFT Model: A reference model for green and sustainable software and its engineering. Sustainable Computing: Informatics and System, 1, 294– 304.
[30] Robert, C. S., Plakosh, D. and Lewis G.A. 2003. Modernizing Legacy Systems: Software Technologies, Engineering Processes and Business Practices. Carnegie
Mellon, The SEI Series in Software Engineering, Pearson Education Inc. Boston MA.
[31] Saarelainen, M. M., Ahonen, J.J., Lintinen, H., Koskinen, J., Kankaanpää, I., Sivula, H., Juutilainen, P., and Tilus, T. 2006. Software Modernization and Replacement Decision Making in Industry: A Qualitative Study, Evaluation and Assessment in Software Engineering.
[32] Scharnhors, W., Hilty L.M., and Jolliet, O. 2006. Life Cycle Assessment of Second Generation (3G) Mobile phone networks. Environment International, 5, 32, 656-675.
[33] Taina, J .2010. How green is your software? Software Business, 51, 1, 4, 151-162.
[34] Unhelkar, B. 2011.Green IT: The Next Five Years. IT Professional, March /April, IEEE Computer Society, 56-59.
[35] Viaro, A.T. and Vaccaro G.L.R. 2010. Conceptual Framework to Develop Green It - Going Beyond The Idea Of Environmental Sustainability. XVI International Conference On Industrial Engineering And Operations Management, Challenges and Maturity of Production Engineering: competitiveness of enterprises, working conditions, environment (São Carlos, SP, Brazil, 12 to 15 October – 2010). Available at: http://www.abepro.org.br/biblioteca/enegep2010_TI_ST_123_796_16387.pdf.
[36] Xu, L., Ziv, H., Alspaugh, T. and Richardson, D. 2006. An architectural pattern for non functional dependability requirements, Journal of Systems and Software, 1370–1378.
[37] Yin, R. K. 2009. Case study research: design and methods, 4th ed. (Applied social research methods v.5), SAGE Publication Inc., Thousand Oaks CA.
[38] Zhu, M., Luo, X., Chen, X. and Wu, D.D. 2012. A non-functional requirements tradeoff model in Trustworthy Software. Information Sciences, 19, 61–75.
100

Identification of Application-level Energy Optimizations
Kay Grosskop1, Joost Visser1
1Software Improvement Group (SIG), Amstelplein 1 1096 HA Amsterdam, Netherlands [email protected], [email protected]
ABSTRACT Advances in the energy-efficiency of hardware and datacenters may be in vain if application software is developed without awareness of the resources that are consumed in operation. We introduce a pragmatic method for identifying energy-efficiency optimizations in software applications. The method involves the creation of an energy model of an application that allows calculation of energy savings for optimization scenarios. We discuss two industrial cases where such Green Software Scans were applied to an e-government and a mobile banking application. Among the lessons drawn from these cases are that significant energy savings can be realized with targeted modifications in software code, architecture, or configuration, that development of energy-efficient applications requires attention to detail throughout the development process, and that a close collaboration between operations and development is one of the main success factors for energy-efficient applications.
Keywords Software engineering, simulation and modeling, application software, green and sustainable computing, energy-efficiency.
1. INTRODUCTION Wirth’s Law [1] was coined in the mid 1990’s to express the unease with a long running trend in system development:
“Software is getting slower more rapidly than hardware becomes faster”
The exponential growth of hardware capacities had made software become ever more unconscious about its resource consumption. Up to the point that often gains in hardware performance where cancelled out by software resource greediness and from the perspective of the end user the performance for a given functionality decreased with a next release.
Arguably today the same is true for the energy consumed by computers. The fact that in socket-powered devices energy was available in abundance caused that considerations of its efficient use never entered the horizon of programmers’ awareness. As a consequence, today’s software systems use far more energy then they have to and most system engineers are unaware of the energy efficiency of their products.
That is about to change. Of course there have already been exceptions to the rule in the area of mobile computing, where batteries put constraints on the energy available. But it is only recently that this platform is getting a dominant position. A more
important factor is probably the fact that power provisioning and heat dissipation in datacenters get problematic from a technical, financial and environmental point of view. While initially optimization efforts where mostly directed at data-center infrastructure and hardware levels, the awareness is slowly growing that also software plays a crucial role.
Addressing the problem at the software level proves to be hard for various reasons of social and technical nature. Energy is spent in the hardware at the data center, but engineers responsible for the design of the software are often working in a different organizational unit. Application owners are billed by server or floor space, but generally not directly for the energy consumed. Hence the energy costs are not part of the total cost of ownership of applications and pose no incentive for change. Even when there are economic or environmental concerns, it is not trivial to actually determine the energy footprint of the application. There is a lack of knowledge, conceptual frameworks and tools to measure or model the energy consumed.
Visibility of energy consumption at the application level is essential because this is the level of architectural design and of management decisions that have the most influence on the software running in data centers. For this reason optimization efforts on this level have the best chance to be effective.
In this article we present the Green Software Scan, an approach to effectively model software application energy consumption and to arrive at recommendations for optimization. This approach is developed in order to be executable in a very limited timeframe on an existing IT system, taking into account limitations of organizational and technical nature. It is applicable to a wide spectrum of existing systems that account for a large part of today’s IT electricity consumption. We report on two case studies that we have executed for clients in the industry and that showed that this approach is viable and leads to the desired results
The paper is structured as follows. After the introduction, Section 2 discusses background and related work. In this section we shortly characterize other attempts related to software energy measuring and modeling. Section 3 presents our method of identifying application-level energy-optimization opportunities. We describe how an energy-model of the application is build up and how it is used to evaluate optimization scenarios. Section 4 describes two case studies where the approach was used and what we learned from it. Section 5 concludes with a discussion of scoping and design decision regarding our method and we provide suggestions for further work
2. BACKGROUND There is a considerable amount of literature on the field of energy optimization at the software level. This is especially the case in areas where energy shortage was an issue like mobile or
ICT4S 2013: Proceedings of the First International Conference on Information and Communication Technologies for Sustainability, ETH Zurich, February 14-16, 2013. Edited by Lorenz M. Hilty, Bernard Aebischer, Göran Andersson and Wolfgang Lohmann. DOI: http://dx.doi.org/10.3929/ethz-a-007337628
101

embedded architectures or wireless sensor networks. But only a limited number of approaches target the application level and most are focused on a specific platform and application domain. To our knowledge, there exists no other work that attempts the modeling and optimization of energy usage at the application level and that is applicable to a wide range of existing software systems.
Williams and Smith [12] present PASA, a pragmatic approach for performance optimization that is targeted at the software architectural level. The idea is to identify key scenario’s and develop the most simple architectural models for these scenarios that can illustrate the performance problems of the system. The models, once sufficiently refined, are then used to evaluate proposed changes to the system. The approach is very similar in methodology and spirit to the approach presented here. However, energy optimization needs to look at the total energy consumption of the system and idle states of the system, in terms of not executing a certain scenario, are particularly interesting. For this reason the use of key scenarios for the detection of bottlenecks is not generally useful. Instead our models are organized along the concept of a node map.
There have been recently developed several fine-grained power measurement methods and tools for software. Examples are Kansal et al [3], Do et al [2]. Most of them are based on the idea of analyzing resource counters provided by the operating system and calculate energy usage with a power model of the machine hardware components. The performance counters can be related to specific processes, which allow separating energy usage of single processes in a shared environment. Those approaches either are directed at supporting real time resource management algorithms or profiling of applications for development and aim at processes on single machines. At the contrary our approach specifically supports distributed and networked applications because this are rather standard characteristics of todays software programs. Also our method does not require installation of specific software or even software or hardware instrumentation. This greatly improves its applicability for systems deployed for production or even components used by the system that belong to other organizations.
Zhao et al. [4] expand this approach of performance counter based metrics to estimation of energy consumption for virtual environments. While still requiring platform specific software installation and not leveraging a view on the application as a whole, this approach is interesting in the light of the current trends to virtualization and cloud computing and the resulting isolation of server hardware energy consumption and their virtualized logical view.
Seo et al. [11] have proposed a framework to model the energy consumption of software architectures in the design phase based on principal energy characteristics of the underlying architectural pattern. They explicitly target distributed systems. Even though the framework can be parameterized with platform and application specific data it is designed to support decisions between specific architectural styles. For assessment and optimization of existing systems the characteristics of the architectural pattern must be extracted and the associated energy costs must be formalized. This prevents direct application of the framework in many cases and offers only limited flexibility in identifying and optimizing energy hotspots in existing systems. The CO2Stats [16] and Greenalytics [15] initiatives offer online estimation of the energy consumed by websites and make also suggestions for optimization. They developed a pragmatic model for application-centric energy costs on the web-client and network
side. While also partly including the server side into their models and advertising an ‘end to end’ estimation of the energy costs, the models are mostly based on data size and request statistics for web content and model back-end system resources only in a trivial way. Real consumptions of those systems as well as architectural trade offs remain opaque. Some authors, notably Barroso and Hölzle [5], Ranganathan [13] and Saxe [14] have made attempts to describe some general principles for energy efficiency that are important to understand and can be leveraged when looking for optimizing alternatives for existing system architectures.
An interesting example for application-level analysis and optimization of energy consumption is presented in [8] and [9]. Harizopulos, Sha, Meza and Ranganathan [9] argue for the importance of software-level energy tuning for data management applications and identify possible strategies. Tsirogiannis, Harizopoulos and Shah [8] however have investigated the power consumption of databases for scale-out architectures focusing on a single server. They conclude that for this specific scenario a system optimized for performance will also be optimized for energy efficiency. These papers illustrate the non-trivial relationship between performance and energy efficiency optimization.
Koomey et al. have published a series of widely sited reports on estimation of energy consumption of IT infrastructure. Particularly interesting in this context is one report [7] that states that in-house facilities still dominate the installed base of server population. This is a class that is typically less optimized for energy and where our approach can add much value. In [6] an estimation of the energy intensity of Internet network infrastructure is made. This is an interesting undertaking of estimation in itself and the results have been used in our case studies as well as in [15].
The GreenGrid DCeP metric [17] and Intel’s EnergyChecker [18] represent two initiatives that also attempt to express the energy efficiency of computing systems in terms of functional work units that are delivered for a given energy consumption. While the considerations and frameworks are conceptually interesting, We doubt that they will be applicable in many cases because [17] ends up to use a non-functional proxy for its estimation of productivity and [18] requires extensive instrumentation of the application code.
3. METHOD In order to estimate the energy footprint of a software system and evaluate alternative design choices and optimization scenarios, we construct an energy model of the application. Such a model allows understanding various energy aspects of the application and shows where ‘energy hotspots’ are located.
An overview of the evaluation process is shown in Figure 1. Initially interviews are conducted with system designers and operators to get an architectural understanding of the application. Also the available insight into load/usage and energy consumption characteristics of the components is gathered. Then the energy model of the application is constructed and alternative scenarios for improvement are evaluated using this model. Finally recommendations are made to the owner of the system.
102

3.1 Building the energy model Because we want to reduce the required effort and get useful insights as fast as possible it is crucial to start modeling at an early stage. This allows identifying directly where additional data gathering is needed in order to make the estimation sufficiently accurate. The principal ingredients of the model are
1. Developing a node map that identifies all hardware components or nodes that are used by the application.
2. Determine the main ‘units of work’ of the application.
3. Collect data on the energy usage of all components in relation to the amount of work done by the system
The basic idea of the energy model is to break up the system into subcomponents in order to be able to localize in more detail where the bulk of the energy is spent and to analyze the effect of the system architecture on the energy spending. The result is called a node map. The node map can be close to other views on the system architecture like the deployment view or the software component architecture but may also be different depending on what are the interesting elements from an energy point of view. What a node is depends on the system being evaluated. The goal is to cover all parts of the IT infrastructure that an application needs for its functioning. Nodes are typically socked-powered servers. But nodes can also be parts of the infrastructure like the company network, ‘the Internet’ or wireless devices combined with their battery chargers. Also a remote service (e.g. a web service) can be considered a node, since from the viewpoint of the application it constitutes a single resource.
After identifying all resources needed for the functioning of the application and mapping them to nodes in the model, energy costs and load data are attributed to the nodes. The strategies to model the energy behavior of different types of nodes are covered in the next subsection. While constructing the node map, it may turn out that some information is lacking. Sometimes a part of the infrastructure must be further clarified or additional data must be collected. After attributing the energy consumed to the nodes, the map becomes a high-level heat map of the application
3.2 Interviews The scan starts with one or more interviews of system architects or operational staff in order to get an initial understanding of the
architecture of the system, its physical deployment and the data flows.
We also need to get some insight into hardware characteristics of the infrastructure the system is running on, if and to what degree this infrastructure is shared with other applications and what is the amount of workload that has to be processed.
Another important subject is the identification of principal usage scenarios of the software and the principal unit of work that allows expressing the energy use in functional terms.
Many of the questions would likely also be posed during a typical performance assessment as described in [12]. Examples of questions:
• Are parts of hardware virtualized?
• Which remote services are consumed?
• What are the most common use cases?
• What are the numbers of session or transactions?
• What is known about energy consumed by the servers?
• Which other applications share the platform?
In addition to the interviews and depending on the availability it is often useful to extract some knowledge about the system from architectural documentation and analysis of the source code.
3.3 Data collection and estimation Two types of data are interesting for modeling the energy behavior of the application: work load and energy consumption. The need for information on energy consumption is obvious since we want to characterize the energy footprint of the system and detect the biggest consumer among its subcomponents. An example of information collected for each node in the node map is given in Figure 2.
Figure 1: Energy estimation for the node: Internet communication between client and server
The need for load data is less obvious and has two reasons: First, from a total system point of view it can be used to express the energy efficiency of the system in terms of a functional unit of work. Second, it is needed for a characterization of the energy scaling behavior of the application and its parts. This expresses how the energy consumption and hence the efficiency changes according to different load levels. As prominently stated in Barroso and Hölzle [5] the energy proportionality of systems is a crucial property of energy efficient system because it allows the system to scale down its resource use when underutilization occurs. So this means that especially on components with large consumption and substantial underutilization it is interesting to model the scaling behavior more closely.
Load typically varies strongly over time and hence another aspect of data gathering is the choice of a representative time range. That may be a day or months depending on the application.
� � � � � � � �� � � � � � �
� � � � � �� � � � �
� � � � � � � � � � � � � �
� � � � � � � � � � � � � � � � � � �
� � � � � � � � � � � � � � � � � � � � � � � �
� � � � � � � � � � � � � � � � � � � � � � � � � � � � �
� � � � � � � � � � � � � � � � � � ew� k� � � �
� � � � � � � � � � � � � � � � � � � � � � � � � � � N� r � � � � � � � �
� � � � � � � � � � � � � � � � � � � � � � � � � � � ot NN�
� � � � � � � � � � � � � � � � � � � � � � � � � � � � � N� NNek� � � � �
Figure 1. Overview of the process of a green software scan
103

Our approach is suited to cope with the fact that fine-grained energy and load data is not immediately available. It is often sufficient to use motivated estimations or reference values in the model. Where exact power consumption metrics are not available, they can be deduced by hardware specifications or replaced by reference metrics of comparable hardware. When the hardware configuration is not known, typical hardware specifications can be used instead. It is dependent on the system at hand which strategy of estimation is chosen and when the results will be ‘good enough’ to obtain a useful result.
If actual measured data become available at a later stage, the model can be updated to become more accurate.
Sometimes, it is however crucial to have some exact measurement data because the error of the estimations would have too much influence on the outcome. For a variety of reasons it is often difficult to obtain additional measurements during the scan. For this reason the requests for such data from the developers and operators of the system must be reduced to a minimum and must be well chosen. The selection of more data points can be guided by questions as:
• What are big spenders in the model?
• What can be estimated without a big error margin?
• Is the missing part of the model economically interesting or otherwise relevant for the owner of the application?
• Is it technically and organizationally feasible to collect more detailed information?
3.4 Scenario-based recommendations The model is not only used to identify energy drains in the overall system infrastructure, but also to evaluate scenarios of changes to the system. The goal is to identify recommendable alternatives to the systems architecture or implementation. Typically during the model construction process some interesting hypotheses have surfaced that can be verified with the model. This might for example be a replacement of some hardware, some virtualization or a software architecture change like reducing data structures, traffic frequency or protocols for certain communications. These hypotheses may be formed by comparing the application setup with known best practices or be triggered by initial results of the estimation itself that located energy ‘hot spots’ in the application architecture. At this point it might also be necessary to go back and refine the model for some specific scenario evaluation.
4. CASE STUDIES In this section we describe two cases where the evaluation method has been applied. These concern an e-Government application and a mobile banking application.
4.1 Case study: e-Government application 4.1.1 Functional characterization of the application The application that we analyzed supports inserting requests for permissions to be granted by the municipality. The interface is publicly available on the Internet, but was also used by call center employees in the back offices of municipalities.
4.1.2 Technical Characterization of the application The system is build using a Microsoft application stack and is deployed separately for every municipality. Most parts of the servers are virtualized and hosted on a data-center by a contracted hosting provider. Several external services are consumed. Data is stored on a centralized storage area network (SAN). The
middleware is partly also used by another application. The node map that we constructed for the application is shown in Figure 2.
Figure 2: Node map of an e-Government application
4.1.3 Description of particularities of the case After making an inventory of all servers, services and connections between them as well as some basic usage data, we observed that most of the energy was consumed in the middleware of the back end, but for many municipalities the installations where strongly underutilized. In addition to that, the middleware components where not able to scale down energy use in low utilization. Hence we investigated the possibility to run a single instance of the application for multiple municipalities. The organizational restrictions allowed for such a scenario and the required changes to the software design or implementation were assessed to be feasible. The outcome of an estimation showed that 82% of the energy could be saved in a shared deployment scenario compared to the current dedicated installs.
Another scenario concerned the archiving of data. Even though a request made by a citizen was normally handled and finalized within months, the request and associated documents had to be conserved for years for legal reasons. We calculated how much energy it would save to archive data into a less energy intensive storage system. But it turned out, that the moderate amount of data and the relatively good efficiency of the storage solution did not support this scenario to contribute in a significant way to a better energy efficiency.
4.2 Case study: mobile banking application 4.2.1 Functional characterization of the application The application allows users to perform mobile payments, and do some administration concerning payment both on a mobile app and a normal browser. During the assessment the application was still in a beta phase and had only a small number of users.
4.2.2 Technical Characterization of the application The application consists of an iPhone client, a generic mobile client and a normal website for conventional browsers. The mobile interfaces are served by another provider than the conventional website and business process request where forwarded from this mobile proxy to the back-end. This proxy infrastructure was shared with many other applications. Various communication data formats (proprietary binary, soap, html) and
� � � � � � � � � � � �
� � � � � �
� � � � � � �
� � � � � � � � �
� � � � � � � � � �
� � � � � � � � � � �
� � � � � � � � � � � � � � � �
� � � � � � �� � � � � � � �
� � � � � � � � � �
� � � � � � � � � �
� � � � � � � �
� � � � � �
� � � �� � � � � � �
� � � � � �� � � � � � � � � �
� � � � � �� � � � � � �
� � � � � �� � � � � � � � � �
� �
� �
� �
� �
� � � � � � � � �
� � � � � � � � � �� � � � � � � � � �
� � � � � �� � � � � �� � � � � � �
� � � � � �
� � � � � �
� � � � � �
� � � � � � � � �
� � � � � � � � �� � � � � � � � � � �
� � � � � � � � � � �
� �
�
� � � � � �� � � � � � �
� � � � � � � � � �
� � � � � �
�
�� � � � � � � � � �
� � � � � �� � � � � �
� � � � � � � � � �
� � � � � � � �
� � � � � �� � � � � �� � � � � �
� � � � � � � � � �
� � � � � � � � � �
� � � � � � � � � �
� � � � � � � � � �
� � � � � � � � � �
� � � � � � � �� � � � � � b� � � � � � � �
� � � � � � � � � � �� � � � � � � � � �
� � � � � � � � � � �
� � � � � � � �� � � � � � b� � � � � � � �
� � � � � � � � � � �� � � � � � � � � �� � � � � � � � � � �
� � � � � � � � � � �� � � � � � � � � � �� � � � � � � � � � �
104

runtime environments (iOS, JEE, .Net) where used. The node map that we constructed for the application is shown in Figure 3.
Figure 3: Node map of a mobile banking application.
4.2.3 Description of particularities of the case Strategies for energy attribution of the different nodes of the system included the use of reference numbers (based on Koomey [7]) for estimation of energy intensity of data traffic over the Internet and the mobile network and attribution of the energy share of the mobile proxy infrastructure based on server log statistics. For the mobile devices, we added the charger loss to the estimated energy drawn from the battery while the application was in use.
The model showed that most energy was consumed at the servers and the various parts of the network. We made two recommendations for changes in the system based on modeling the energy gains. The first was to remove the intermediate proxy server and to connect all clients directly to the same backend. The other recommendation was to reduce the amount of data exchanged with the mobile devices in various ways. Those optimizations where estimated to reduce the energy footprint of the system by respectively 30% and 15%.
4.3 Lessons learned Apart from the findings and recommendations specific to the applications under evaluation, a number of lessons can be learned from the case studies. We briefly list a number of such lessons. Energy-savings through application-level optimizations can lead to substantial savings. In the case studies, potential savings of 30% and 80% were identified. In the initial stages of the evaluations, we discovered that most stakeholders had a fairly low level of awareness that software is actually an important factor in Green IT. But when made aware, the importance of software for energy-efficiency was considered non-controversial. This phenomenon was also found in a wider population in a previous survey regarding green software [19].
We also found that carrying out a Green Software Scan is an effective means of raising awareness, not only for optimizing the system being scanned, but also stimulating better practices in subsequent projects involving other applications.
Application of the scan requires combining information from stakeholders that are often part of different organizations or of different organizational units that do not communicate intensively. On the other hand, effective communication and collaboration between development and operations seems to be an important success factor for energy-efficient software. The measurement plan employed in an evaluation does not necessarily need to be very detailed or precise to obtain usable optimization results. On a non-optimized system limited measurement possibilities can largely be compensated with estimation.
Attention to detail is important to develop energy-efficient applications. A small change, for instance the resolution of a picture that is transmitted regularly, may have a large influence that is not immediately noticed.
An approach to energy-efficient application development is needed that considers the entire lifecycle. Early attention to energy characteristics, e.g. in the requirements and design stage, may have a better ROI than trying to optimize an application when it has already been built and deployed.
Low-level algorithmic optimizations are often not the most promising source of optimization. Rather, changes in architecture, design, or deployment tend to have a larger impact.
When considering non-multimedia data communication, the energy costs of processing at end points (e.g. xml serialization) are typically much higher than the network traffic itself.
Though performance and energy-efficiency might in theory be interacting characteristics, in the cases at hand we discovered that they actually do not interfere.
By reporting on energy consumption in terms of energy consumed per useful unit of work, we link energy consumption to the functional perspective that all stakeholders share. This facilitates a common discussion where all people involved can align their objectives.
5. CONCLUSIONS We list contributions, strengths, limitations, and avenues for future work.
5.1 Contributions In this paper, we have made the following main contributions:
• We have described a pragmatic method to estimate the energy footprint of a software application and identify optimizations at the application level.
• Our method includes a general framework for constructing energy models, based on a node map that represents the structure of the application and its supporting infrastructure and onto which information on work load and energy consumption is projected.
• We have demonstrated the applicability of our method in two case studies.
• We have formulated lessons regarding green software, ranging from specific savings potentials to general observations on technical and organizational factors.
5.2 Strengths Our method has a number of properties that we deem desirable for any valuable energy analysis of software systems:
Mobile proxy
Business services
Transfer Mail
iPhone app
Desktop browser
Statistics
SMS
SOAP HTML
Mobile browser
BIN HTML
105

• The view on the system is holistic in the sense that it includes all energy consumed by IT components on behalf of the system.
• Functional perspective. The results are expressed by relating energy to a useful unit of work. This is the perspective of the end user and facilitates discussion between different stakeholders. It also makes it easier to compare systems among each other.
• Application centric. Being able to get more visibility of the energy used at the application level is essential because that is the level of architectural design and management decisions. And hence optimization efforts will be most effective on this level.
• Wide applicability. The scan can work for very different classes of software. In particular, it is applicable to distributed applications, which represent a big part of today’s installed systems.
5.3 Limitations The proposed method has a number of limitations. For example, it is focused on energy, rather than CO2, on energy consumed in operation, rather than development or entire lifecycle, and on direct rather than rebound effects. These and other limitations are listed below.
• We have chosen to confine ourselves to electricity consumption because that can be regarded as a scarce resource by itself. See e.g. [15] for a region-dependent calculation of e.g. CO2 emission equivalents on basis of electricity used.
• A more comprehensive view on the impact of an IT system would be an analysis of its total life cycle (LCA). This includes e.g. the build phase of software or the required hardware. We chose to concentrate on the consumption in use. The results can later be leveraged in a total LCA.
• In a similar way we left out effects on the surrounding business process and systemic or rebound effects that an IT system can have. Again, an assessment of the direct IT energy use constitutes a necessary part of a broader analysis.
• We where interested in consumption of the IT infrastructure. This is also called ‘greening of IT’ as opposed to ‘greening by IT’. Using it to green other processes may have even a bigger effect on global energy consumption but does not undermine the usefulness of the former.
• Energy use is only calculated as far as it is consumed by IT infrastructure. This includes the data center infrastructure and mobile chargers, but not losses in the electric grid.
5.4 Future work We regard the method described in this paper as a modest starting point that needs to be refined and complemented in many ways.
• It would be interesting to apply the method in case studies where the project is still in the initial architectural design phase and no software system has yet been built or deployed.
• To enable energy-efficient software development, remote services used in by an application could be labeled with their energy footprint as a part of Quality of Service (QoS) information.
• Accessibility and visualization of energy-consumption data to developers and other stakeholders is crucial for improvement on the long term. It would be interesting to conduct case studies where such information feedback is established.
The construction of reliable and precise energy models of applications could be supported with energy benchmarks of commonly used building blocks such as programming languages, operating systems, database management systems, run-time environments, etc
6. ACKNOWLEDGMENTS The work presented in this paper was partially supported by Agentschap NL.
7. REFERENCES [1] Niklaus Wirth. 1995. A Plea for Lean Software. Computer
28, 2 (February 1995), 64-68. DOI=10.1109/2.348001 http://dx.doi.org/10.1109/2.348001
[2] T. Do, S. Rawshdeh, and W. Shi, “ptop: A process- level power profiling tool,” in Workshop on Power Aware Computing and Systems (HotPower ’09), 2009.
[3] Aman Kansal and Feng Zhao. 2008. Fine-grained energy profiling for power-aware application design. SIGMETRICS Perform. Eval. Rev. 36, 2 (August 2008), 26-31. DOI=10.1145/1453175.1453180 http://doi.acm.org/10.1145/1453175.1453180
[4] Aman Kansal, Feng Zhao, Jie Liu, Nupur Kothari, and Arka A. Bhattacharya. 2010. Virtual machine power metering and provisioning. In Proceedings of the 1st ACM symposium on Cloud computing (SoCC '10). ACM, New York, NY, USA, 39-50. DOI=10.1145/1807128.1807136 http://doi.acm.org/10.1145/1807128.1807136
[5] Luiz André Barroso and Urs Hölzle. 2007. The Case for Energy-Proportional Computing. Computer 40, 12 (December 2007), 33-37. DOI=10.1109/MC.2007.443 http://dx.doi.org/10.1109/MC.2007.443
[6] Weber, C. L., Koomey, J. G. and Matthews, H. S. (2010), The Energy and Climate Change Implications of Different Music Delivery Methods. Journal of Industrial Ecology, 14: 754–769. doi: 10.1111/j.1530-9290.2010.00269.x
[7] J. G. Koomey. GROWTH IN DATA CENTER ELECTRICITY USE 2005 TO 2010. Technical report, Analytics Press, 2011
[8] Dimitris Tsirogiannis, Stavros Harizopoulos, and Mehul A. Shah. 2010. Analyzing the energy efficiency of a database server. In Proceedings of the 2010 international conference on Management of data (SIGMOD '10). ACM, New York, NY, USA, 231-242. DOI=10.1145/1807167.1807194 http://doi.acm.org/10.1145/1807167.1807194
[9] S. Harizopoulos, M. Shah, J. Meza, and P. Ranganathan. Energy efficiency: The new holy grail of data management systems research. In CIDR, pages 4--7, 2009.
[10] Hui Chen, Shinan Wang, Weisong Shi.. Where does the power go in a computer system: Experimental analysis and implications. In Green Computing Conference and
106
Workshops (IGCC), 2011. DOI=10.1109/IGCC.2011.6008598
[11] Chiyoung Seo, George Edwards, Daniel Popescu, Sam Malek, and Nenad Medvidovic. 2009. A framework for estimating the energy consumption induced by a distributed system's architectural style. In Proceedings of the 8th international workshop on Specification and verification of component-based systems (SAVCBS '09). ACM, New York, NY, USA, 27-34. DOI=10.1145/1596486.1596493 http://doi.acm.org/10.1145/1596486.1596493
[12] Lloyd G. Williams and Connie U. Smith. 2002. PASASM: a method for the performance assessment of software architectures. In Proceedings of the 3rd international workshop on Software and performance (WOSP '02). ACM, New York, NY, USA, 179-189. DOI=10.1145/584369.584397 http://doi.acm.org/10.1145/584369.584397
[13] Parthasarathy Ranganathan. 2010. Recipe for efficiency: principles of power-aware computing. Commun. ACM 53, 4 (April 2010), 60-67. DOI=10.1145/1721654.1721673 http://doi.acm.org/10.1145/1721654.1721673
[14] Eric Saxe. 2010. Power-Efficient Software. Queue 8, 1, Pages 10 (January 2010), 8 pages.
DOI=10.1145/1698223.1698225 http://doi.acm.org/10.1145/1698223.1698225
[15] J.L. Zapico, M. Turpeinen, N. Brandt. Greenalytics: a tool for mash-up life cycle assessment of websites. In: Proceedings of the 24th International Conference on Informatics for Environmental Protection (EnviroInfo 2010). Cologne/Bonn, Germany, Shaker, Aachen, 2010, pp. 754–763. ISBN: 978-3-8322-9458-8. http://www.greenalytics.org
[16] CO2Stats. http://www.co2stats.com
[17] D.Anderson, et al. A Framework for Data Center Energy Productivity. 2008.White paper #13: Metrics & Measurements. Retrieved February 2012 from http://www.thegreengrid.org/Global/Content/white-papers/Framework-for-Data-Center-Energy-Productivity
[18] Intel’s EnergyChecker SDK. http://software.intel.com/en-us/articles/intel-energy-checker-sdk/
[19] Green IT consortium region Amsteram and Software Improvement Group, Green Software Awareness Survey, 2009. http://www.sig.eu/blobs/Nieuws/2011/Results Survey-201109.pdf
107

Pilot result Monitoring Energy usage by Software
Frank van Bokhoven1, Jarno Bloem2
1Energy Software Solutions, Arnhemseweg 39 Rheden, The Netherlands,
2Energy Software Solutions, Arnhemseweg 39 Rheden, The Netherlands [email protected]
ABSTRACT In this paper, the results of a pilot that Energy Software Solutions has conducted by help of AgentschapNL at the datacenters of Reasonnet and Fujitsu, using the ESSaver PUE energy monitoring system. The goal of this pilot was to test in a live environment how the monitoring of processes on servers in a live datacenter hold up in practice, and to investigate how well the measurements were in comparison to the empirically measured figures. During the pilot phase, a number of problems surfaced that had to do with the fact that the test servers were running outdated software and were really backup servers. This made measurement less useful, because no heavy load baring processes were running on them, however, these servers were suited for analyses, because there were still some interesting processes on it. For comparison, another set of servers was rigged to run a grid computing project in order to generate utilization. Lessons were learned about deployment in live datacenters, data consolidation methods and empirical data. Furthermore the interpretation of what data the datacenter management finds useful.
Keywords Energy monitoring, software, Software energy, energy consumption, DCIE, PUE
1. INTRODUCTION The world uses ever more devices running software (PC's, Tablets, Internet, and so on). In the western world. The electrical energy usage consumed by computer devices amounts to more than 20% of total consumption1. This percentage is still rising.
In 2011 and 2012 the Energy Software Solutions has conducted a pilot by the help of AgentschapNL, section Energy and Climate, using the ESSaver PUE energy monitoring system. The goals for the pilot were:
Clarify the workload of the designated servers at Reasonnet and Fujitsu.
Test for ESSaver PUE how installation is done in a production environment.
Test for ESSaver how the monitoring holds up in practice. Datacenters are trying lots of initiatives to monitor energy usage and lowering the overall energy usage. The following levels of monitoring are distinguished:
Energy usage entire datacenter
Energy usage per rack
Energy usage per server Although there is already lots of measurement and sensoring going on in the datacenter,, it is unknown what is happening within the server. It is unknown which part of the energy is going to which hardware part, but also what software process is causing the hardware so spend the energy. Datacenters want to know if it is the operating system or the business software that uses the energy (Picture 1).
2. METHODS & RESULTS During the first pilot, at Reasonnet Amsterdam, four servers were monitored in the period from November 2011 to January 2012. During this pilot showed that the monitoring software was installed in an incorrect server account, so immediately after installation, the monitoring stopped. Another problem which arose was that the monitoring tool currently SQLite database could not be approached because of restrictions in the SQLite software (cannot run in server environments). Based on these results, it was decided for the Fujitsu pilot, the data layer for the logging was adapted and now the Windows Event log is used for this logging. This has the additional advantage that the event log is accessible from other computers, making data harvesting in a PULL scheme possible.
2.1 Logging mechanism (event log) The basis for the logging service was ESSaver. This is however a 'Win forms' application which is dependent on the logged in user (this is crucial for the workings in this product. During the pilot, it turned out to be crucial that the logging program runs independently. Therefore, based on the experience, the Win forms app was transformed into a Windows Service.
2.2 .NET Framework issues The test servers at Fujitsu turned out to NOT have the latest drivers installed. The servers all had Windows Server 2003 installed, but without service pack 1, do none of the .NET Framework 3.5 drivers were available. These drivers are mandatory for the monitoring tool. This was circumvented by using the tool .NET FuZe4 to pack the framework into the logging tool.
2.3 Push or pull for logging agent One of the main goals of this pilot is to investigate how the logging data is consolidated to a central server. Especially was the goal to investigate if this should be a manual action or automatic. Another investigation was if it was better to let the logging tool SEND (Push) the logging data, or let a harvester tool TAK (Pull)
108

the data. As result of this pilot, the pull system turned out to be the most workable. However, this greatly depends on the wishes of the management of the datacenter. During the pilot there is also a pull system developed that is started by the (standard) Windows scheduler and regularly sends the log data to the data consolidation server.
2.4 One application can have multiple processes. Many business applications use multiple processes at one time. If the application is running in the internet/intranet, one must also add the usages by the web service application (like IIS or Apache) to the total.
2.5 Test servers must have something to do! The test server Fujitsu HOLSIC001 showed very low activity. The monitored processes showed during the pilot period very few activity. During a meeting where the results of this pilot were discussed, it turned out that the monitored server is a fallback server, for another server. The only activity during the pilot period were the spikes, generated by the antivirus program and network monitoring software, that is standard installed on Fujitsu servers
2.6 Logging Mechanism (event log) The basis for the logging application was ESSaver. This is a 'Win forms' application. Typically this app runs within the user account. This is critical for several reasons for the operation of that product. The pilot at Reasonnet launched a version of that same product. Soon, it was discovered that this did not work, since it became clear that an account independent monitor tool was required.
2.7 Framework issues Several servers at Fujitsu did not appear to have the latest drivers and software updates to run properly. A major omission was the Microsoft .NET framework version 3.5. This framework is required by the monitor tool.
2.8 Push or pull for logging agent Experience has been gained about what the best method for the logged data from the servers to a central location. The result is the ESSaver Harvester, an application that can make contact with a remote server and read event log remotely and emptying it after each read.
2.9 One application can have multiple processes Many business packages use multiple processes simultaneously. If the application is running in the Internet, should also monitor the web server, which is a standard windows process) should also be included in the total consumption.
2.10 Test servers must have something to do! Remarkably, the Fujitsu server HOLSIC001 showed little activity. The processes monitored in the pilot period showed almost no peaks or spikes. During the discussion of these results on 8 June
2012 people Fujitsu has shown that this server was a server that serves as a fallback in case another server fails.
3. Examining the Differences To better compare the differences between an idle server or one with a sizable load, it is decided to start a parallel pilot in the Yggdra test data center. On two servers (Dell PowerEdge 1860) and (DEL PowerEdge 710 2x), (both have Windows Server 2003 installed), the BOINC service is installed. BOINC is the platform for grid computing developed by the University of Berkeley (boinc.berkeley.edu3). This platform uses the unused computing power of computers on the Internet for resource-intensive calculations. The approach is a computational task by BOINC is divided into work-packages, downloaded by computers in the 'grid' then processed and then returned to BOINC, where researchers can use the answer for their research. The application in this pilot is that the computational and network and disk IO, caused by this grid computing, gives a good performance load, comparing the Fujitsu computers. The grid computer approximates a virtual host computer (ie a physical computer that hosts one or more virtual sessions). The chart in (Picture 3) shows the percentage consumption of the Fujitsu HOLSIC001 server. Obviously the software amounts to only 15% of total consumption. It is mainly the power usage of the chassis (e.g. motherboard, fan pages, NICs, RAID controllers, etc.), which covers the vast majority (68%) of usage. The chart in picture 2 shows the consumption on the 'open malaria' server. Since it is the software which forms the greater proportion of the consumption causes (72%). Consumption between these two servers also varies greatly. The Fujitsu HOLSIC001 server consumes 180Watt (1.2 kWh per day), while the Dell PowerEdge 1810, 320 Watts (7.68 kWh per day) consumed. The charts shown above can (of course) also be displayed in numbers. Below are both the server as an open malaria test server. It immediately becomes clear that it makes a huge difference whether a server is idle or actually engaged in a (useful) process. This difference in energy consumption can be explained entirely by the software.
4. Data Completeness In order to be able to comment on the energy consumption of the servers, or investigate any parameter, it is necessary that it is known that there are enough data points in the selected time period. The screen dump in picture 8 shows per server the completeness of the registration data. It looks at the number of log messages per day. For example, if the registration is assumed to create a snapshot every 60 seconds, there would be at least 1140 logs per 24 hours should exist. And even many times that amount if multiple processes are logged. Also, there is a certain continuous progress in the log times. If any of these exhibited an anomaly, it is included in the reports.
109

5. Conclusions and Future Work
• Logging mechanism: Logging should be done via an account independent Windows Service or Linux Deamon.
• Software version issues: In a production datacenter, the reality is that servers do NOT always have the latest available software versions installed. Logging software must be able to cope with all kinds of exotic configurations and limitations. Datacenters cannot easily adjust any imperfections in this aspect, because these servers usually are running critical applications that are owned by other parties.
• Push or pull for logging agent: It depends greatly on the situation at a site (in situ) which data consolidation method is preferable. Both push and pull have their advantages.
• Test servers must have something to do: If you are researching the effect of software on energy usage, make sure your test servers have processes running that are creating load/usage.
• One application can have multiple processes : It is critical to exactly know the architecture of a software package, because many times an application is divided over more than one process.
• Consolidation: Knowing what processes are running on a server gives insights in weather or not a server is in utilized too much or too little. This info is greatly appreciated by datacenter managers because this is info for datacenter consolidation.
The pilot has given many new insights. Not only the registration data but also new insights into the interaction with the staff of the data center and their update and their security policies. Also, new insights are obtained about the method to harvest the log data ''. It
was agreed that the pilot at Fujitsu will be repeated on a larger number of servers, and also on servers that actually ar doing something productive. The presentation, about this pilot was, just like this report, held for the Knowledge Network Green Software, on 8 May 2012, has drawn new interested parties. This pilot will therefore continued in many new trials • New, more extensive pilot at Fujitsu • Trials at other designated datacenters
6. ACKNOWLEDGMENTS We greatly thank Frank Hartkamp of AgentschapNL for his coordination of the pilot. We also would like to thank the companies Reasonnet and Fujitsu, to have provided the test servers for this pilot.
7. REFERENCES [1] Chen Allen, 2012, Research finds Computer-related
Electricity use to be overestimated, ScienceBeat, http://www.lbl.gov/Science-Articles/Archive/net-energy-studies.html
[2] Measurement on the rack, 2012, Jarno Bloem [3] Grid computing with BOINC, 2012, University of Berkely,
http://boinc.berkeley.edu/trac/wiki/DesktopGrid [4] dotNET Fuze, 2012, Energy Software Solutions,
http://essaver.net/en-us/netfuze.aspx
110

1: Measurement within the datacenter. Everything is measured, however what goes on inside the server remains a black box.
2: OpenMalaria grid computing project processes during a period of three days. Energy consumption remains steady. Only when downloading new work blocks, the CPU utilization drops and hence energyconsumption also.
Picture 3: De Fujitsu HOLSIC001 server, is mainly idle
111

Picture 4: Workload production server: 112 watt
Picture 5: Workload pilot server: 15 watt
112

Picture 6: Workload per process on the 'openmalaria' server. The 'openmalaria' process takes the bulk of the usage.
Picture 7: Workload per
process on the pilot server. This server is idle. The usage by the software is almost to be neglected
113

Picture 8: Review screen for data completeness
114

Picture 9: Usages OpenMalaria (Dell Poweredge 1810) from 3 to 5 May 2012
Picture 1: Usages HOLSIC001 server Fujitsu (from 10 to 13 April 2012)
115

Smart Metering Infrastructure for Residential Water Efficiency: Results of a Trial in a Behavioural Change
Program in Perth, Western Australia
Anda M1, Le Gay Brereton F2, Brennan J3, & Paskett E4
1. Martin Anda, [email protected], School of Environmental Science, Murdoch University, Murdoch WA 6150 AUSTRALIA and Principal Engineer Sustainability, ENV Australia Pty Ltd.
2. Fabian Le Gay Brereton, [email protected], Greensense, PO Box 2055 Subiaco WA 6904 AUSTRALIA
3. John Brennan, [email protected], Water Corporation, 629 Newcastle Street, Leederville, WA 6007 AUSTRALIA
4. Elise Paskett, [email protected], Water Corporation, 629 Newcastle Street, Leederville, WA 6007 AUSTRALIA
ABSTRACT A smart metering trial was incorporated into a residential water efficiency project in Perth, Western Australia. The H2ome Smart program by the Water Corporation and its contractor ENV Australia Pty Ltd engaged 12,000 households in selected suburbs of the Perth metropolitan area. Smart meters are an informative and educational tool that allows households to instantaneously view personal real-time water use feedback. From the most apparently active H2ome Smart participants nine agreed, after a selection process, to participate in the Greensense smart metering trial with the tenth participant being local television sustainable gardening celebrity Josh Byrne. It is interesting to note the patterns in water use before households could view their dashboards and after they had access their dashboard and had a few days to understand the real-time data and patterns in water use. By comparing these two separate date ranges we can see the differences that access to real-time water use data can make on water use behaviours. Now at the conclusion of the program the team has collated all water use data and feedback from the participants to complete a final analysis demonstrating the outcomes of the challenge including its advantages/ disadvantages and opportunities/ constraints for the future.
Keywords Smart metering infrastructure, residential water use, water efficiency, Community Based Social Marketing.
1. INTRODUCTION Western Australia is experiencing a drying climate. In the South West, where Perth the capital city of 2 million people is located with a Mediterranean climate, winter rainfall has been steadily declining since the 1970s. The Water Corporation is the State of Western Australia’s principal water utility, a State Government owned enterprise, and set the following targets by 2030 to address the State’s water crisis:
• reducing water use by 25%;
• increasing wastewater recycling to 60%; and
• developing new sources [10].
In Perth, the city drinking water supply, known as the Integrated Water Supply Scheme (IWSS) is sourced from a combination of surface water catchment dams (15%), groundwater (35%) and seawater desalination (50%), with typical percentages given, to provide an annual total supply of about 300 gigalitres per annum (Glpa). Most of this water supply, 70%, is used by the residential sector. Average household water use in Perth is 280 kilolitres per annum (klpa) and of this about 40% is used outdoors on garden irrigation. Reading of water meters for billing purposes is done physically twice per year. The intention of the Water Corporation is to move to reading meters and billing four times per year.
In order to achieve its goal of reducing water use by 25% the Water Corporation commenced water efficiency projects in the industrial, commercial and residential sectors served by its schemes.
There are approximately 60 licensed wastewater recycling schemes in small towns across regional Western Australia and these are typically reusing effluent from treatment lagoons for turf irrigation on sports fields at the rate of about 3 Glpa. In Perth, wastewater recycling for industry is undertaken at the Kwinana Water Reclamation Plant at the rate of 6 Glpa. In order to increase this rate of recycling, the Water Corporation will commence recharge of Perth’s main groundwater source, the Gnangara Mound, with treated wastewater. Currently, Perth discharges approximately 130 Glpa of treated wastewater into the Indian Ocean from three main treatment plants. Aquifer recharge is proposed at about 40 Glpa by 2015, with a major trial currently underway. This simultaneously becomes a new source of water for the IWSS.
Smart metering that is integrated with online portals or in home displays (IHD) is fairly well established in the USA and UK, especially for the energy sector. Companies such as OPower [1], GreenWave Reality and Tendril provide sophisticated services for energy utilities, while SmartReach [6] is also undergoing smart metering trials for water utilities. These companies provide online
ICT4S 2013: Proceedings of the First International Conference on Information and Communication Technologies for Sustainability, ETH Zurich, February 14-16, 2013. Edited by Lorenz M. Hilty, Bernard Aebischer, Göran Andersson and Wolfgang Lohmann. DOI: http://dx.doi.org/10.3929/ethz-a-007337628
116

or paper feedbacks founded on the same principles as Community Based Social Marketing (CBSM) behaviour change programs [4], but are generally not implemented in conjunction with any formal behaviour change program that includes one-to-one coaching or dialogue marketing. In Australia, smart metering rollout has commenced. A number of trials have been undertaken by water and energy utilities. Smart metering for water consumption has been implemented in communities such as Hervey Bay [9] and trials are recommended by research, such as those conducted for the Victorian Water Trust and Sydney Water [3, 8]. At present, smart meter technology in Australia is being implemented rapidly in the energy sector (e.g. by Department of Primary Industries in Victoria and Ausgrid in NSW) and is not integrated with a behaviour change program. The Water Corporation has successfully rolled out smart meters in Kalgoorlie and the Pilbara region of the Northwest of Western Australia and follow-up with behaviour change programs is planned.
2. METHODS In the residential sector, a behavioural change pilot project was designed using Community Based Social Marketing (CBSM) methods to reduce residential water use for a small town in the southwest of Western Australia, Margaret River. Besides raising awareness for water conservation, the project aimed to provide 1,030 participating households with information delivery and a 10% reduction in water consumption in 2009. Starting with an adjusted gross of 1,351, 96% of the contacted households were interested in the project. With 89% requesting information, delivery to a total number of 1,157 participating households was accomplished. A continuously high participation resulted in 1,043 households being part of the project until the very end. Upon completion of the project, the participating households reduced their water consumption by 12% amounting for a saving of 35 kilolitres per household in one year. Due to a highly effective Diffusion Effect in the community, all residents in the Margaret River township reduced their water consumption by 7 to 11% summing up to savings of 72,970 kilolitres in one year for all 2,644 residential properties for which valid readings existed. The households prior to the project displayed an average water use of 296 kilolitres per annum (klpa) while after the project they reduced to 260 klpa. With 97% being satisfied with the project, a deeper understanding of their own water use and a considerable amount of water saving appliances purchased during the project, the evaluation of the participants’ behavioural changes seems to indicate sustainable ongoing water savings for some time to come.
The Water Corporation then decided to apply the methods in the north of the State, on a select group of towns that were experiencing water shortages. All households in these towns could participate. The selected group of eight towns in the north of the state have an annual average household water use of 606 klpa. This is about twice that of towns and cities in the south of the state. The higher water use in the north is due to a combination of factors including year round higher temperatures, dust, free water use allowances for mining company housing tenants and the fact that fewer demand management programs have been implemented compared to those in the southern towns and cities. It was estimated that the water use in these households of the north was evenly split between indoor and outdoor use, the latter including gardens and washdown of cars and boats. Another important factor is the relatively low cost of water at approximately $AU1.90 per kilolitre at this level of consumption. This tariff is approximately the same across the State even though cost of supply in the north is much higher. This is made possible by State
Government subsidy to the Water Corporation. By comparison, the residential tariff for electricity in WA is $AU0.25/kWh.
McKenzie‐Mohr [5] and others [7] identified that unintegrated intensive approaches towards changing individual’s behaviour, such as provision of information and economic self‐interest are not successful. Instead ‘community‐based social marketing’ (CBSM) has shown to be very effective at inducing behavioural change due to its pragmatic approach. In particular, it is important to introduce goal-setting [7], a sense of community (“your neighbours are doing it”) and inspire concern for the environment [5] as better motivators for change.
Accordingly, the H2ome Smart programs by Water Corporation and ENV have undertaken the following methodological development:
Firstly, a conceptual framework of CBSM has been refined with the main actions developed into an ongoing feedback loop as shown in Figure 1.
Figure 1. The CBSM eco-coaching feedback loop for residential energy & water use behaviour change programs.
Secondly, community engagement strategies have been incorporated that connect people with their community interests and raise awareness on the drying climate. After recruitment, this is followed by application of coaching with facilitative conversations that help customers set targets for themselves.
The CBSM methods deployed across these towns during 2010 and 2011 included:
a) Identifying the barriers to engaging sustainable behaviours through research prior to delivery;
b) Designing a strategic approach that integrates behaviour change tools;
c) Announcement letter and phone call;
d) Delivery of requested educational materials;
e) Three annual meter reads supplemented by five more by the contractor and self-reads by willing households;
f) Five feedback/progress letters followed by coaching phone calls each round by trained eco-coaches;
g) Final thank you letter and scorecard.
The Water Corporation coined the term “H2ome Smart” for this program and specified a target 15% water savings from
117

behavioural change in 8,331 households to be recruited from 13,643 in eight selected towns in the Pilbara and Kimberley regions of the Northwest of Western Australia. Another 15% savings was targeted from retrofits to houses that provided free product upgrades including new shower roses, toilet cisterns and tap aerators. Water Corporation was the Principal in this program with methodological design, project management, community forums, training of coaches, call and mail centre operations including coaching, meter reading, website development, statistical analysis of data and evaluation by subcontractors. The targets of 15% were overly ambitious in the absence of sound information at the time of scoping. Unknown at the time was the very small number of owner-occupied households. The vast majority of tenancies were employer-owned housing (large mining companies) with free water-use allowances provided as part of the salary package thereby dis-incentivising water conservation practices and participation in the program. Despite the target of engaging 8,331 households the Water Corporation databases only held 4,413 accounts with most of these lacking in customer contact details. 1,428 of these households were eventually registered on the program. This represented only 17% of the desired registration target. Therefore the project team needed to source other databases to increase the potential number of registrations. After several months, when contact details could be augmented from other sources and a total of 4,997 households were ultimately registered, with some withdrawals along the way also, a reduced amount of time was available for engagement of the new recruits with CBSM techniques. The rounds of coaching that occurred as part of the Project Plan are shown in Figure 2, with not all households receiving all calls because of their late recruitment in the program. Nevertheless, final evaluation showed that as an overall average, participating households achieved a 6.9% savings from behavioural change and 9.9% overall if the results were annualised.
Figure 2: Summary of Northwest Project Plan
Once the North West region H2ome Smart program was underway and despite the difficulties encountered with results encouraging enough, the Water Corporation decided to launch similar CBSM programs in the Great Southern and Perth regions in the South West of the State, jointly funded by the Water Corporation and Australian Government’s Water for the Future initiative.
In Perth, the target number of households was specified as a minimum of 10,000 households participating throughout the program. The water reduction target to be achieved by the contractor with the participating households was an average of 12% in the first full year after program completion compared to non-participating households. Wastewater flows from these households were to be reduced accordingly. The program intent was to inform and empower the participating households on a one-on-one basis so they are able to formulate their own plan to put water efficiency into practice in their own homes and ensure efficient use of scheme water into the future by forming sustainable water saving habits.
The CBSM core methods of Figure 1 were again applied with five rounds of meter reading, data analysis, feedback letters and coaching calls after the initial planning and announcement phase. During this research prior to delivery baseline meter reads were taken, control households selected and appropriate communications and feedback materials developed in focus groups and surveys.
A smart metering trial was run in conjunction with the Perth H2ome Smart program as a prize package. Greensense is a Western Australian company that partnered with the H2ome Smart program to run the trial. Smart meters are an informative and educational tool that allows households to instantaneously view personal real-time water use feedback.
Nine participants agreed, after a selection process, to participate in the Greensense smart metering trial with the tenth participant being local television sustainable gardening celebrity Josh Byrne at his local Perth metropolitan residence. Josh Byrne was included in the trial to provide a base line dataset of efficient water use for households to compare their water use and aim to emulate. The selection of the nine households was based on the following factors:
• The budget available only allowed for this small-scale trial.
• The offer was made to participants in the southern suburbs to minimise time required for installation of the equipment.
• A short list of 30 households was compiled from those that had registered early and online to H2ome Smart, had access to a computer and the internet; were clearly a keen H2ome Smart participant; and willing to monitor their water use weekly and engage with the H2ome Smart team.
• The project team reviewed the selected properties and compared the data collected during the first round of phone calls, and the latest aerial imagery.
• The project team called the short listed households to collect additional data needed to determine eligibility and their enthusiasm towards the program.
• The project team conducted a site visit to assess the shortlisted properties on site and to assess the households on a variety of parameters including meter access, meter type, internet access, water consumption and participation level amongst others.
118
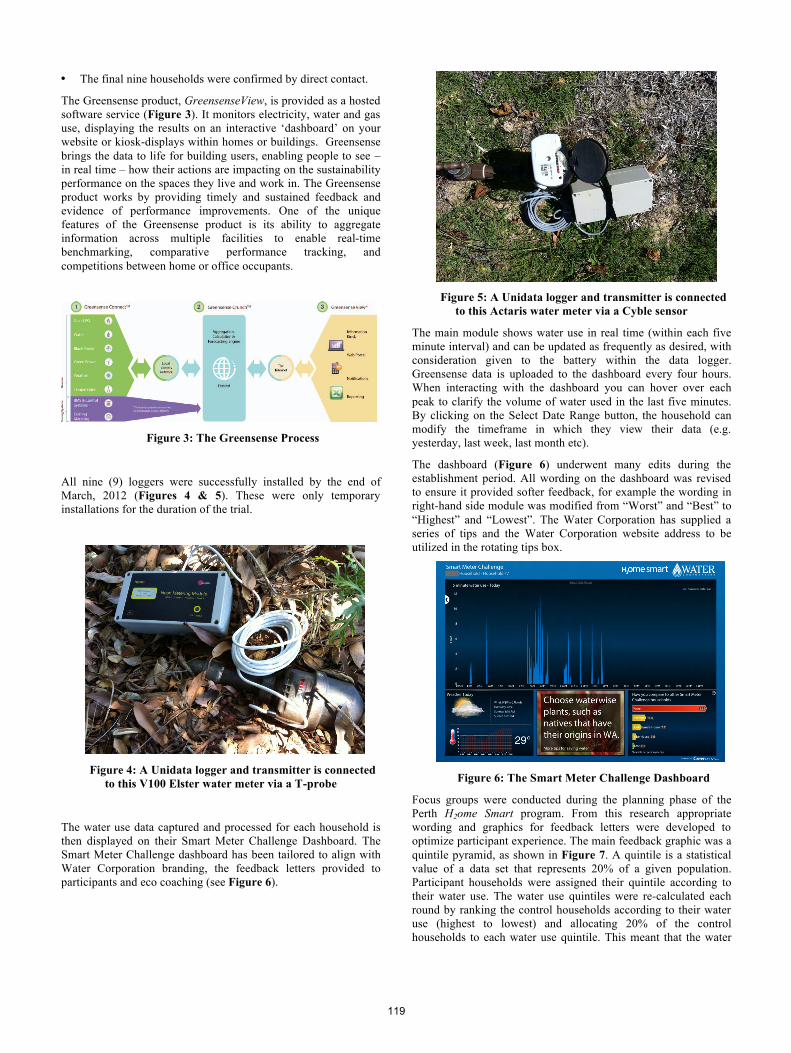
• The final nine households were confirmed by direct contact.
The Greensense product, GreensenseView, is provided as a hosted software service (Figure 3). It monitors electricity, water and gas use, displaying the results on an interactive ‘dashboard’ on your website or kiosk-displays within homes or buildings. Greensense brings the data to life for building users, enabling people to see – in real time – how their actions are impacting on the sustainability performance on the spaces they live and work in. The Greensense product works by providing timely and sustained feedback and evidence of performance improvements. One of the unique features of the Greensense product is its ability to aggregate information across multiple facilities to enable real-time benchmarking, comparative performance tracking, and competitions between home or office occupants.
Figure 3: The Greensense Process
All nine (9) loggers were successfully installed by the end of March, 2012 (Figures 4 & 5). These were only temporary installations for the duration of the trial.
Figure 4: A Unidata logger and transmitter is connected to this V100 Elster water meter via a T-probe
The water use data captured and processed for each household is then displayed on their Smart Meter Challenge Dashboard. The Smart Meter Challenge dashboard has been tailored to align with Water Corporation branding, the feedback letters provided to participants and eco coaching (see Figure 6).
Figure 5: A Unidata logger and transmitter is connected to this Actaris water meter via a Cyble sensor
The main module shows water use in real time (within each five minute interval) and can be updated as frequently as desired, with consideration given to the battery within the data logger. Greensense data is uploaded to the dashboard every four hours. When interacting with the dashboard you can hover over each peak to clarify the volume of water used in the last five minutes. By clicking on the Select Date Range button, the household can modify the timeframe in which they view their data (e.g. yesterday, last week, last month etc).
The dashboard (Figure 6) underwent many edits during the establishment period. All wording on the dashboard was revised to ensure it provided softer feedback, for example the wording in right-hand side module was modified from “Worst” and “Best” to “Highest” and “Lowest”. The Water Corporation has supplied a series of tips and the Water Corporation website address to be utilized in the rotating tips box.
Figure 6: The Smart Meter Challenge Dashboard
Focus groups were conducted during the planning phase of the Perth H2ome Smart program. From this research appropriate wording and graphics for feedback letters were developed to optimize participant experience. The main feedback graphic was a quintile pyramid, as shown in Figure 7. A quintile is a statistical value of a data set that represents 20% of a given population. Participant households were assigned their quintile according to their water use. The water use quintiles were re-calculated each round by ranking the control households according to their water use (highest to lowest) and allocating 20% of the control households to each water use quintile. This meant that the water
119
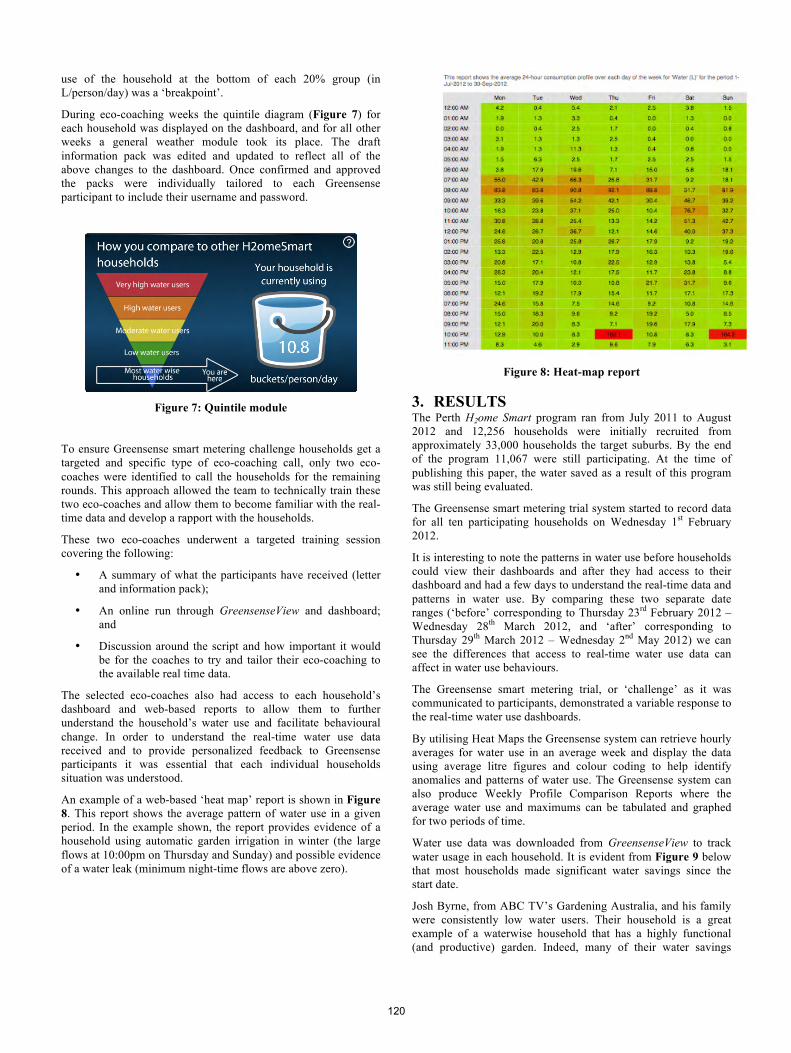
use of the household at the bottom of each 20% group (in L/person/day) was a ‘breakpoint’.
During eco-coaching weeks the quintile diagram (Figure 7) for each household was displayed on the dashboard, and for all other weeks a general weather module took its place. The draft information pack was edited and updated to reflect all of the above changes to the dashboard. Once confirmed and approved the packs were individually tailored to each Greensense participant to include their username and password.
Figure 7: Quintile module
To ensure Greensense smart metering challenge households get a targeted and specific type of eco-coaching call, only two eco-coaches were identified to call the households for the remaining rounds. This approach allowed the team to technically train these two eco-coaches and allow them to become familiar with the real-time data and develop a rapport with the households.
These two eco-coaches underwent a targeted training session covering the following:
• A summary of what the participants have received (letter and information pack);
• An online run through GreensenseView and dashboard; and
• Discussion around the script and how important it would be for the coaches to try and tailor their eco-coaching to the available real time data.
The selected eco-coaches also had access to each household’s dashboard and web-based reports to allow them to further understand the household’s water use and facilitate behavioural change. In order to understand the real-time water use data received and to provide personalized feedback to Greensense participants it was essential that each individual households situation was understood.
An example of a web-based ‘heat map’ report is shown in Figure 8. This report shows the average pattern of water use in a given period. In the example shown, the report provides evidence of a household using automatic garden irrigation in winter (the large flows at 10:00pm on Thursday and Sunday) and possible evidence of a water leak (minimum night-time flows are above zero).
Figure 8: Heat-map report
3. RESULTS The Perth H2ome Smart program ran from July 2011 to August 2012 and 12,256 households were initially recruited from approximately 33,000 households the target suburbs. By the end of the program 11,067 were still participating. At the time of publishing this paper, the water saved as a result of this program was still being evaluated.
The Greensense smart metering trial system started to record data for all ten participating households on Wednesday 1st February 2012.
It is interesting to note the patterns in water use before households could view their dashboards and after they had access to their dashboard and had a few days to understand the real-time data and patterns in water use. By comparing these two separate date ranges (‘before’ corresponding to Thursday 23rd February 2012 – Wednesday 28th March 2012, and ‘after’ corresponding to Thursday 29th March 2012 – Wednesday 2nd May 2012) we can see the differences that access to real-time water use data can affect in water use behaviours.
The Greensense smart metering trial, or ‘challenge’ as it was communicated to participants, demonstrated a variable response to the real-time water use dashboards.
By utilising Heat Maps the Greensense system can retrieve hourly averages for water use in an average week and display the data using average litre figures and colour coding to help identify anomalies and patterns of water use. The Greensense system can also produce Weekly Profile Comparison Reports where the average water use and maximums can be tabulated and graphed for two periods of time.
Water use data was downloaded from GreensenseView to track water usage in each household. It is evident from Figure 9 below that most households made significant water savings since the start date.
Josh Byrne, from ABC TV’s Gardening Australia, and his family were consistently low water users. Their household is a great example of a waterwise household that has a highly functional (and productive) garden. Indeed, many of their water savings
120

come from actions taken in the garden. Some of the other households in the smart metering trial had established gardens with lower percentages of lawn, but most of the households did not have highly functional gardens. In order to create a highly productive and waterwise garden, the Byrne household has implemented the following:
• Careful design of garden considering space, sunlight, aspect etc;
• Hydrozoning of plants;
• Seasonal planting of food plants;
• Collection and treatment of greywater for drip irrigation;
• Collection of rainwater for drip irrigation, as well as supplying water to the toilet and washing machine.
As can be seen in Figure 9, water use is much higher generally in the months of February and March when high summer temperatures require garden irrigation. The Bodis household showed the highest water due to large areas of turf that were subsequently changed to Waterwise gardening techniques leading to substantial reduction in water use. The Byrne household water use during this same time was low, even with the lush, productive garden, because of the use of greywater for irrigation.
Figure 9. Average daily water use (L/p/day) of Greensense VIP households
4. FINDINGS At the conclusion of the program the team has collated all water use data, and feedback from the participants to complete a final analysis demonstrating the outcomes of the challenge including its advantages/ disadvantages and opportunities/ constraints for the future. The following findings are important for the future:
1. The display of water use versus time can be limited by water meters that measure in 5 litre intervals; the data displayed is likely to lag behind when the water was actually used.
2. The integration of two data collection methods (real-time and manual meter reads) proved difficult. Though significant effort was expended to design meaningful modules for the dashboard, the quintile module was eventually pulled down.
3. Participants enjoyed seeing their water use in real-time, but engagement by the participants with the dashboard was lower than anticipated and decreased as the program progressed. Monitoring their own water use was not a high priority and there were no mechanisms to ensure that participants would log on.
121

4. Some participants stated that they would prefer an in-home display (IHD), whereas others preferred an online portal. This suggests that one solution does not fit all.
5. The eco-coach found it beneficial if they and the participant were viewing the dashboard during the coaching calls, but this would not be practical as part of a larger program where speed and efficiency is necessary to achieve cost-effectiveness.
6. To integrate the data collected into this trial, the dashboards were reviewed manually and key points summarized for the eco-coach. However, the ideal would be for the data to be analyzed automatically and then included within feedback letters and scripting.
5. RECOMMENDATIONS The following recommendations are particularly relevant for utilities, industry practitioners and project managers of behaviour change programs:
1. Install water meters with a small logging interval (i.e. 1 litre instead of 5 litres) to improve the accuracy of real-time data and allow actions to be directly correlated to water use.
2. Smart metering should be utilized to collect baseline data for at least 1 year prior to the implementation of a BCP.
3. IHDs or online portals should be opt-in, as it is unlikely that all households will engage with these as often as desired.
4. Water use feedback should also be available as an automatic daily or weekly e-mail with embedded charts showing comparative water use to continuously re-engage participants through the duration of the program.
5. The display of data and any additional analysis for participants should be as clear and easy to understand as possible. It is recommended that water use be displayed in litres per 1 min units (though this will only be effective if the water meter logs in 1L intervals). Analysis results displayed on an IHD or portal must align with the aims of the program and provide real value.
6. Results from regular data analysis of the real-time data should be incorporated into personalized feedback letters, along with up to date results of the community effort and a reminder of their agreed actions.
7. Feedback letters should be followed by an eco-coaching call that does not require the eco-coach or the participant to see their real-time data to be effective.
6. ACKNOWLEDGMENTS Particular thanks are owed to Kim Dennison, Aisha Chalmers, Kristy Ferguson, John Hunt, Liz Petrow, Paula Arthur and Siobhan Jennings at ENV Australia Pty Ltd, Bill Heppard at Research Panel, Bartholomew Hart at IA (Australia) Group Pty Ltd, Alex Maund at Data Analysis Australia Pty Ltd, Colin Ashton Graham and Josh Byrne.
7. REFERENCES [1] Laskey, A. and Kavazovic, O. 2010. ‘Opower: Energy
Efficiency through behavioural change and technology’, XRDS Magazine, Vol. 17, No. 4.
[2] Loh, M. and Coghlan, P. 2003. Domestic Water Use Study: In Perth, Western Australia 1998-2000. Water Corporation, Perth, Western Australia.
[3] Marchment Hill Consulting Pty Ltd, 2010, Smart Water Metering Cost Benefit Study, Final Report – Available for Information. Report prepared for the Victorian Water Trust, Melbourne.
[4] McKenzie-Mohr, D., and Smith, S. (1999). Fostering sustainable behaviour: An introduction to community-based social marketing. New Society Publishers: Gabriola Island, BC Canada.
[5] McKenzie‐Mohr, D. (2000). Fostering sustainable behaviour through community‐based social marketing. American Psychologist 55(5): 531‐537.
[6] Sensus (2012), Thames Water and SmartReach Extend Smart Water Meter Trial, http://sensus.com/web/usca/news/display?news_id=thames-water-and-smartreach-extend-smart-water-meter-trial-press-release, accessed 19/9/12.
[7] Sheehy L & Dingle P (2005), Evaluating Environmental Education Programs: How Do We Know if They Work? AAEE 2004 Conference, Adelaide.
[8] Sydney Water, 2009, National Smart Metering Program, Discussion Paper for the Requirements Work Stream, Sydney Water, Sydney.
[9] Turner A., Retemal M., White S., Palfreeman L. and Panikkar A., 2010, Third Party Evaluation of Wide Bay Water Smart Metering and Sustainable Water Pricing Initiative Project. Report prepared by the Snowy Mountains Engineering Corporation in association with the Institute for Sustainable Futures, UTS, for the Department of the Environment, Water, Heritage and the Arts, Canberra.
[10] Water Corporation (2009). Water Forever: Towards Climate Resilience. http://www.thinking50.com.au/go/publications. Water Corporation, Perth, Western Australia.
[11] Water Corporation, 2010. Perth Residential Water Use Study 2008/2009. Water Corporation, Perth, Western Australia.
[12] Water Services Association of Australia (2010), Domestic Smart Water Meter Specification, Level 8 469 Latrobe Street Melbourne 3000.
122
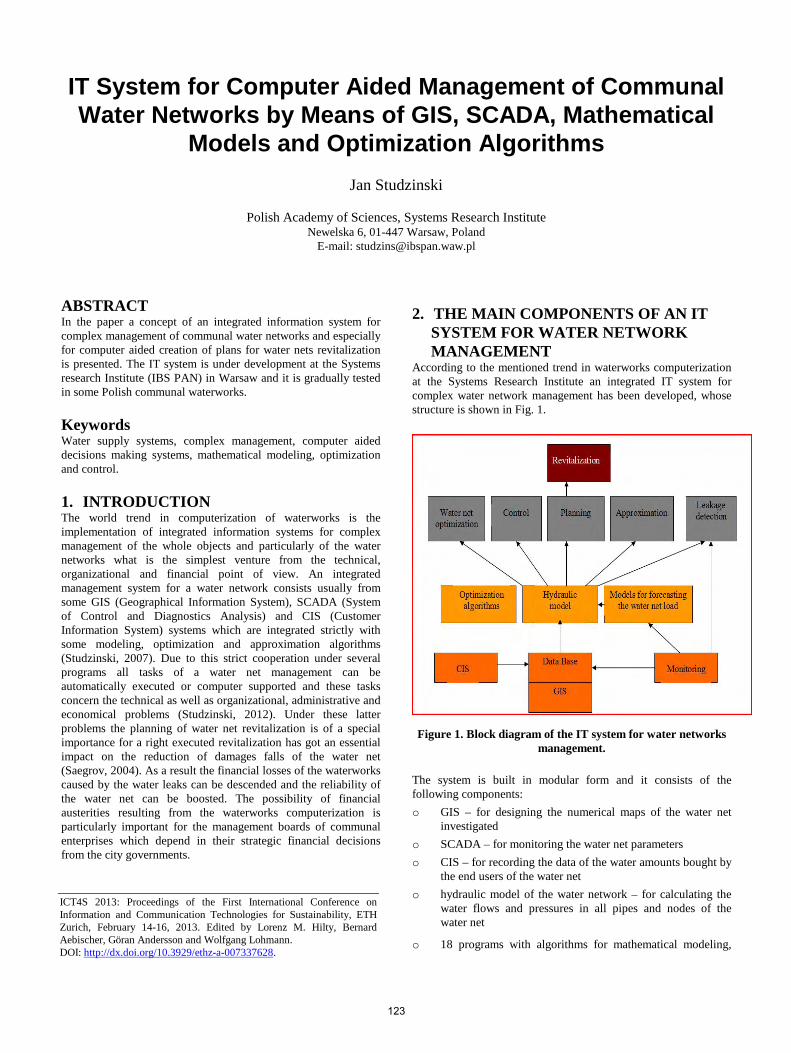
IT System for Computer Aided Management of Communal Water Networks by Means of GIS, SCADA, Mathematical
Models and Optimization Algorithms
Jan Studzinski
Polish Academy of Sciences, Systems Research Institute Newelska 6, 01-447 Warsaw, Poland
E-mail: [email protected]
ABSTRACT In the paper a concept of an integrated information system for complex management of communal water networks and especially for computer aided creation of plans for water nets revitalization is presented. The IT system is under development at the Systems research Institute (IBS PAN) in Warsaw and it is gradually tested in some Polish communal waterworks.
Keywords Water supply systems, complex management, computer aided decisions making systems, mathematical modeling, optimization and control.
1. INTRODUCTION The world trend in computerization of waterworks is the implementation of integrated information systems for complex management of the whole objects and particularly of the water networks what is the simplest venture from the technical, organizational and financial point of view. An integrated management system for a water network consists usually from some GIS (Geographical Information System), SCADA (System of Control and Diagnostics Analysis) and CIS (Customer Information System) systems which are integrated strictly with some modeling, optimization and approximation algorithms (Studzinski, 2007). Due to this strict cooperation under several programs all tasks of a water net management can be automatically executed or computer supported and these tasks concern the technical as well as organizational, administrative and economical problems (Studzinski, 2012). Under these latter problems the planning of water net revitalization is of a special importance for a right executed revitalization has got an essential impact on the reduction of damages falls of the water net (Saegrov, 2004). As a result the financial losses of the waterworks caused by the water leaks can be descended and the reliability of the water net can be boosted. The possibility of financial austerities resulting from the waterworks computerization is particularly important for the management boards of communal enterprises which depend in their strategic financial decisions from the city governments.
2. THE MAIN COMPONENTS OF AN IT SYSTEM FOR WATER NETWORK MANAGEMENT
According to the mentioned trend in waterworks computerization at the Systems Research Institute an integrated IT system for complex water network management has been developed, whose structure is shown in Fig. 1.
Figure 1. Block diagram of the IT system for water networks management.
The system is built in modular form and it consists of the following components: o GIS – for designing the numerical maps of the water net
investigated o SCADA – for monitoring the water net parameters o CIS – for recording the data of the water amounts bought by
the end users of the water net o hydraulic model of the water network – for calculating the
water flows and pressures in all pipes and nodes of the water net
o 18 programs with algorithms for mathematical modeling,
ICT4S 2013: Proceedings of the First International Conference on Information and Communication Technologies for Sustainability, ETH Zurich, February 14-16, 2013. Edited by Lorenz M. Hilty, Bernard Aebischer, Göran Andersson and Wolfgang Lohmann. DOI: http://dx.doi.org/10.3929/ethz-a-007337628.
123

optimization, approximation, control and planning destined for the solution of different tasks of the water net management.
The components GIS, SCADA and CIS are adopted from other firms and integrated with the remaining programs of the IT system. These latter programs are collected in 3 modules which are responsible for the realization of the management tasks solved by using the hydraulic model and optimization algorithms (module MOSUW, Fig. 2), by using the approximation algorithms (module ‘Kriging applications’, Fig. 3) and by using the algorithms of mathematical modeling (module ‘Objects identification’, Fig. 4).
Figure 2. Module MOSUW of the IT system. The more detailed description of these programs (with their names given) and of their functions is as follows: Module MOSUW: • hydraulic modeling of the water net (Mosuw-H) • automatic calibration of the hydraulic model (Mosuw-K) • optimization and planning of the water net (Mosuw-O). • control of the pump sets installed on the water net (Mosuw-
P) • optimal planning of the SCADA system for the water net
(Mosuw-M) • discovering and localization of the leakage points at the
water net (Mosuw-A) • calculation of the water age in the water net (Mosuw-W) • calculation of the chlorine concentration in the water net
(Mosuw-Cl).
All programs of the MOSUW module work with the hydraulic model of the water net and while realizing the tasks concerning
the model calibration, the water net optimization and planning, the pumps control and the planning of SCADA they use an multi criteria optimization algorithm (Straubel and Holznagel, 1999). By the solution of other tasks only multiple simulations of the hydraulic model under different work conditions of the water net are executed (Stachura et al, 2012).
Figure 3. Module ‘Kriging applications’ of the IT system.
Figure 4. Module ‘Objects identification’ of the IT system. Module ‘Kriging applications’: • calculation of the height coordinates of the water net nodes
(Kripog) • drawing the maps of distributions of water flows and
pressures in the water net (Kripow) • drawing the maps of water net sensibility toward the leakage
events occurring in the water net (Kripom) • drawing the maps of water age distribution in the water net
(Kripow-W) • drawing the maps of the distribution of chlorine
concentration in the water net (Kripow-Cl) • drawing the maps of value distributions for some
environmental parameters like temperature in the area of the water network (Kripos).
124

All programs of this module use the algorithms of kriging approximation that enable to picture in graphical form the value distributions of parameters connected with the water net and with its operation (Bogdan and Studzinski, 2007).
Module ‘Object identification’: • calculation of mathematical model for forecasting the water
net load (Idol).
In this module several programs are collected to mathematical modeling the dynamical processes by means of the time series methods with the least squares algorithms such as Kalman’s, Clarke’s, maximum likelihood, linear and nonlinear regression algorithms (Hryniewicz and Studzinski, 2006).
The IT system developed consists in all of 22 programs cooperating each other in different combinations depending on the tasks to be solved. The key component of the IT system is the Branch Data Base (BDB) of the GIS system that records all information and technical, technological and economical data of the water network, of its objects and of the water consumers accessed to the water net. The BDB is the main source of input data for the hydraulic model that supports the calculations of all programs collected in the modules MOSUW and ‘Kriging applications’. All programs of the IT system communicate each other and with the Branch Data Base using some puffer files of established standard structure. These files are used e.g. to generate the water net graphs from the numerical map to the hydraulic model (Mosuw-H) or to export the results of hydraulic calculation to the optimization program (Mosuw-O) while optimizing the water net. Trough this cooperation of several programs while solving different management tasks for the water net a synergy effect arises that the efficiency of the running programs boosts essentially. In the following some functions of the IT system are mentioned that can be executed only due to the cooperation of several programs what shows on the necessity of integration of different programs in frame of an united IT system:
• hydraulic calculations of the water net (GIS, CIS, Mosuw-H)
• automatic calibration of the hydraulic model (GIS, CIS, SCADA, Mosuw-K)
• discovering and localization of the leakage points at the water net (GIS, SCADA, CIS, Mosuw-A)
• optimization and planning of the water net (GIS, CIS, Mosuw-O)
• control of the pump sets installed on the water net (GIS, CIS, Mosuw-P)
• optimal planning of the SCADA system for the water net (GIS, CIS, Mosuw-M).
The above functions are realized by the appropriate programs form the MOSUW module but they have to be supplied with the input data by GIS, CIS and possibly by SCADA systems.
3. TWO EXAMPLES OF THE IT SYSTEM FUNCTIONING
In the following two examples of the operation of the IT system while solving two tasks, i.e. the hydraulic calculation of the water net and the calculation of the water age distribution in the net will be shown. In both cases the first step of operation consists of exporting the data concerning the structure of the water net from
the Branch Data Base of GIS to the program performing the hydraulic calculation (Fig. 5).
Figure 5. Export of the water net graph from GIS to the hydraulic model (Mosuw-H).
In the first example the program importing the data from GIS is Mosuw-H that calculates then the water pressures and flows for all elements of the water net. The calculation is mostly done for the static state of the water net work, i.e. for only 1 set of data concerning the water use in the end user nodes of the water net. This data set is won from GIS via the CIS system. The subsequent step of operation is the export of data resulted from Mosuw-H to program Kripow that draws the distribution maps for pressures and flows calculated using the kriging approximation (Studzinski, 2011) (Fig. 6 and Fig. 7).
Figure 6. Hydraulic calculation of the water net by Mosuw-H.
125

Figure 7. Drawing the map of distribution of water pressures
in the net by Kripow. In the second example the data from GIS are going to Mosuw-W that makes the hydraulic calculation and uses the results to compute the water age in all pipes of the water net. To do this the data concerning the loads of the end nodes have to be in form of time series and the time step between two neighboring nodes equals usually to 1 hour. Subsequently the data concerning the water age are sent to program Kripow-W that draws the map of water age distribution in the water net (Fig. 8 and Fig. 9).
Figure 8. Water age calculation by Mosuw-W. One can see that the execution of these two exemplary task needs the close cooperation of 4 different programs, i.e. of CIS, GIS, Mosuw-H and Kripow in the first case and of CIS, GIS, Mosuw-W and Kripow-W in the second one. This cooperation can occur
fully automatically by starting the collaboratuion process between the modules MOSUW and ‘Kriging applications’ of the IT system.
Figure 9. Drawing the map of water age distribution in the net by Kripow-W.
4. IMPLEMENTATION OF THE IT SYSTEM INTO THE PRACTICE
The implementation of the IT system presented occurs usually in 4 phases. Firstly, a GIS system has to be implemented in the waterworks under investigation. This operation can last up to 12 months depending on the size and complexity of the water net. After the structure of the network is successfully created in form of the numerical map of the network then the CIS system has to be integrated with GIS and its data concerning the water amounts taken by the water net users have to be assigned to the appropriate nodes of the network. The second phase means planning and implementation of SCADA at the water net. This is the most costly operation of the whole undertaking by the reason of the high costs of the construction works needed for making the SCADA measurements points and of the high costs of the measurement devises installed in these monitoring points. The measurement points of SCADA must be localized in special selected points of the network; they are called network characterized points and they make possible the future calibration and cyclical recalibration of the water net hydraulic model. The calibration of the hydraulic model is the third phase of the IT system implementation. To calibrate the hydraulic model exactly the properly planed SCADA shall be used and to plan a right SCADA an already calibrated hydraulic model shall be applied that enables to localize the characterized points on the network (Studzinski, 2009). To solve this problem the second and third phases are conducted iterative and returning in at least 3 steps: firstly, the hydraulic model is calibrated using the measurement data won by means of a measurement experiment executed on the water net; secondly, the SCADA system is planed with help of the hydraulic model calibrated this way; and thirdly, the hydraulic model is calibrated again with use of SCADA already installed on the water net. One can see that this three-phase process of the
126

implementation of the IT system is rather time-consuming and arduous and it can take a lot of time, work and money into account.
When these 3 phases are at last completed then all data needed to realize the management tasks executable by the IT system are already available, i.e. the data from GIS (the water net graph), from SCADA (flow and pressure measurements from the measurement points of SCADA) and from the hydraulic model (the calculated flow and pressure values in all pipes and nodes of the network). The implementation of the programs that constitute the content of modules of the IT system is the fourth phase of the undertaking. This means that the operation of the module programs (apart from Mosuw-H) without previous implementing of GIS, SCADA and the hydraulic model makes no sense from the practical point of view.
The IT system presented is now under introduction in two waterworks in Poland whereas the one is a middle size enterprise with daily water production of ca. 60.000 m3 and the second one is a small size enterprise with daily water production of ca. 6.000 m3. In the first case the first 3 phases of the IT system implementation are realized and in the second case only a GIS system is now under implementing. It means that there is still too early to appreciate the advantages and benefits resulting from the operation in practice of the IT system developed.
5. CONCLUSIONS A central production and distribution of water for a city realized by waterworks creates a complex research problem consisting of water network control belonging to technical tasks and of water network management belonging to organizational and administrative tasks. As a result the water produced has to be provided to its consumers in amounts needed, with an appropriate good quality and with a possibly small price. The implementation of the IT system in communal waterworks shall cut down the operational costs of the water net, boost its reliability and ensure a high and homogenous quality of the water produced. The integrated IT system shall also improve and make easier the job of water net operators and planners and also of the management staff of the waterworks. In case of the operators the improvements will concern the operational control of the water net, in case of planners they will concern the planning of the investment works regarding the repairs, the modernization and expansion of the water network and in case of the management staff the improvements will concern the complex and more effective waterworks management and under it the solution of such the problems like the determination of rational water prices. The development of the IT system shall be especially important and useful for city agglomerations running the complex and wide spread water networks which are characterized ordinary by great exploitation costs resulted from the considerable water losses caused by water net damages and from the great costs of the energy used (Waterworth, 20012).
6. ACKNOWLEDGMENTS The paper describes the results of the research project of the Polish National Center for Research and Development No. 14-0011-10/2010.
7. REFERENCES [1] Bogdan, L. and Studzinski, J. 2007. Modeling of water
pressure distribution in water nets using the kriging algorithms. In: Industrial Simulation Conference ISC’2007 (J. Ottjes and H. Vecke, eds.) Delft, TU Delft Netherlands, 52-56.
[2] Hryniewicz, O. and Studzinski, J. 2006. Development of computer science tools for solving the environmental engineering problems” Enviroinfo’2006 Conference, Graz.
[3] Saegrov, S. 2004. Care-W – Final Report. Research Report, SINTEF, Trondheim 2004.
[4] Stachura, M. and Fajdek, B. 2011. Water network management support. Research Report, Systems Research Institute, Polish Academy of Sciences, Warsaw 2012 (in Polish).
[5] Stachura, M., Fajdek, B. and Studzinski, J. 2012. Model based decision support system for communal water networks. ISC’2012 Conference, Brno.
[6] Straubel, R. and Holznagel, B. 1999. Mehrkriteriale Optimierung fuer Planung und Steuerung von Trink- und Abwasser-Verbundsystemen. In: Wasser•Abwasser, 140, No. 3, 1999, pp. 191-196.
[7] Studzinski, J. 2007. Computer aided management of waterworks. In: Proceedings of QRM’2007 (R.A. Thomas, ed.), Oxford 2007: 6th Intern. Conference on Quality, Reliability and Maintenance, 254-258.
[8] Studzinski, J. 2009. Some algorithms supporting the computer aided mamagement of communal water nets. In: Modelling and Simulation’2009 (Marwan Al-Akaidi, Ed.) EUROSIS-ETI Publication, Leicester, UK, 2009, 345-349.
[9] Studzinski, J. 2011. Application of kriging algorithms for solving some water nets management tasks. In: Innovations in Sharing Environmental Observations and Information (W. Pillmann, S. Schade, P. Smitts, Eds.), Part 1: Environmental Informatics, Proceedings of EnviroInfo Ispra 2011, Shaker Verlag, Aachen 2011, 493-488.
[10] Studzinski, J. 2013. „Rechnerunterstützte Endscheidungshilfe für kommunale Wasserwerke mittels mathematischer Modelle, Krigingsapproximation und Optimierung”. In: Modellierung und Simulation von Ökosystemen. Workshop Kölpinsee (A. Gnauck, Hrsg.), Shaker Verlag, Aachen 2012 (in Vorbereitung).
[11] Waterworth, G. 2002. Efficiency modeling in the cost reduction of water pump maintenance. In: Proceedings of QRM’2002, Ed. G. J. McNulty, PEP London, pp. 141-144.
127

Using ICT for Climate Change Adaptation and Mitigation through Agro-ecology in the Developing World
Helena Grunfeld, John Houghton
Centre for Strategic Economic Studies, Victoria University, 300 Flinders St, Melbourne, Australia
[email protected], [email protected]
ABSTRACT
This paper explores three interconnected issues of relevance to
sustainability and climate change: agro-ecological farming,
poverty reduction and information and communication technologies (ICT) in developing countries. It collates evidence
from different sources pointing to the potential benefits of agro-
ecological farming methods for climate change adaptation and its poverty-reduction possibilities. Despite the importance of on-farm
production of organic inputs for farmers practicing climate
compatible agriculture, this is unlikely to be sufficient for scaling to a level required for mitigation and adaptation in a timely
manner. However, the scaling up of production could speed the
expansion of such methods and at the same time create employment opportunities in rural non-farm sectors. This paper
points to the important role ICTs can play in this process, and is a working hypothesis calling for action by policy-makers,
researchers, donors, and entrepreneurs, including social
enterprises, to grasp this opportunity, whether to conduct further research, policy dialogues or pilot implementations.
Keywords
Agro-ecological farming, climate change, information and
communication technologies (ICT), sustainable development
1. INTRODUCTION The body of work revolving around ICT and environmental issues has long recognised the potential of ICT to contribute to
sustainability [1],[2], and has more recently engaged in addressing
environmental challenges associated with its production, use and disposal. Some aspects of its positive potential were enshrined in
what Hilty & Ruddy [3] referred to as the ‘techno-optimistic’
view in the WSIS Geneva Plan of Action, which encouraged the use of ICTs for environmental protection, sustainable production
and disaster forecasting and monitoring systems [4]. Referring to
the Millennium Development Goal number 7, “ensure environmental sustainability”, UNICT [5] pointed to similar
contributions as well as facilitating environmental activism and
enabling more efficient resource use. The outcome document of Rio+20 [6], acknowledged the importance of ICT in the context
of sustainable development for facilitating the flow of information
between governments and the public (paragraph 44), for sharing knowledge and good practices related to agriculture (paragraph
11), and for enhancing learning outcomes that prepare people to
pursue sustainable development (paragraph 230).
Much attention has been paid to the potential of ICT in reducing greenhouse gas (GHG) emissions, increasing energy efficiency
and security by investing in sustainability, as well as its
contribution to e-waste and an increase in GHG emissions associated with ICT’s energy use [7]. But ICT’s energy use is still
well below that of agriculture, which contributes between a
quarter and a third of the GHG emissions that cause global climate change – it is directly responsible for 13% (including from
fertilisers and livestock), and indirectly it is largely responsible for
another 17%, mainly through deforestation and land use changes [8],[9]. Agriculture is, like ICT, both part of the problem and the
solution to climate change. Like ICT, there is potential to reduce,
but not eliminate, GHGs from agriculture.
Dependent on agriculture, while experiencing weak
infrastructures and high population growth, countries in the developing world are particularly vulnerable to the socio-
economic impacts of climate change [9]. It is now widely
recognised that ICT infrastructure in rural communities can stimulate growth in sustainable agriculture, providing
employment and other development opportunities [10] and while
there is considerable anecdotal evidence from various pilots, there does not seem to be much widescale realisation of this potential.
There is no clear definition of sustainable agriculture and different terminologies are used for various methods and practices that fit
broadly within this definition - e.g. conservation agriculture [11],
agro-ecological practices [12], agri-environmental [13] or ecological agriculture, climate-smart agriculture and organic
farming. Each of these encompasses a wide range of practices,
from replacement of at least some agrochemicals with organic inputs to certified organic produce. Lacking specific definitions,
these terms are often used interchangeably, contrasting them with
what is generally referred to as “conventional” agriculture. There would be advantages in an agreed taxonomy in this field, but the
lack of it does not detract from the objectives of this paper, which
presents a working hypothesis related to ICT use for more sustainable agriculture.
Although it might be desirable to focus on the use of ICTs more holistically in agriculture and climate change, when it comes to
suggesting actionable policies, it is often easier to focus on one
specific issue, rather than approach the challenge from a more general perspective and call for paradigm shifts. Hence, by way of
illustration of how ICT could be used to encourage ecological
agriculture, this paper concerns itself with the particular issue of scaling up agricultural inputs for organic farming. In doing so, we
have placed emphasis on a call to action.
ICT4S 2013: Proceedings of the First International Conference on
Information and Communication Technologies for Sustainability, ETH Zurich, February 14-16, 2013. Edited by Lorenz M. Hilty, Bernard
Aebischer, Göran Andersson and Wolfgang Lohmann.
DOI: http://dx.doi.org/10.3929/ethz-a-007337628
128
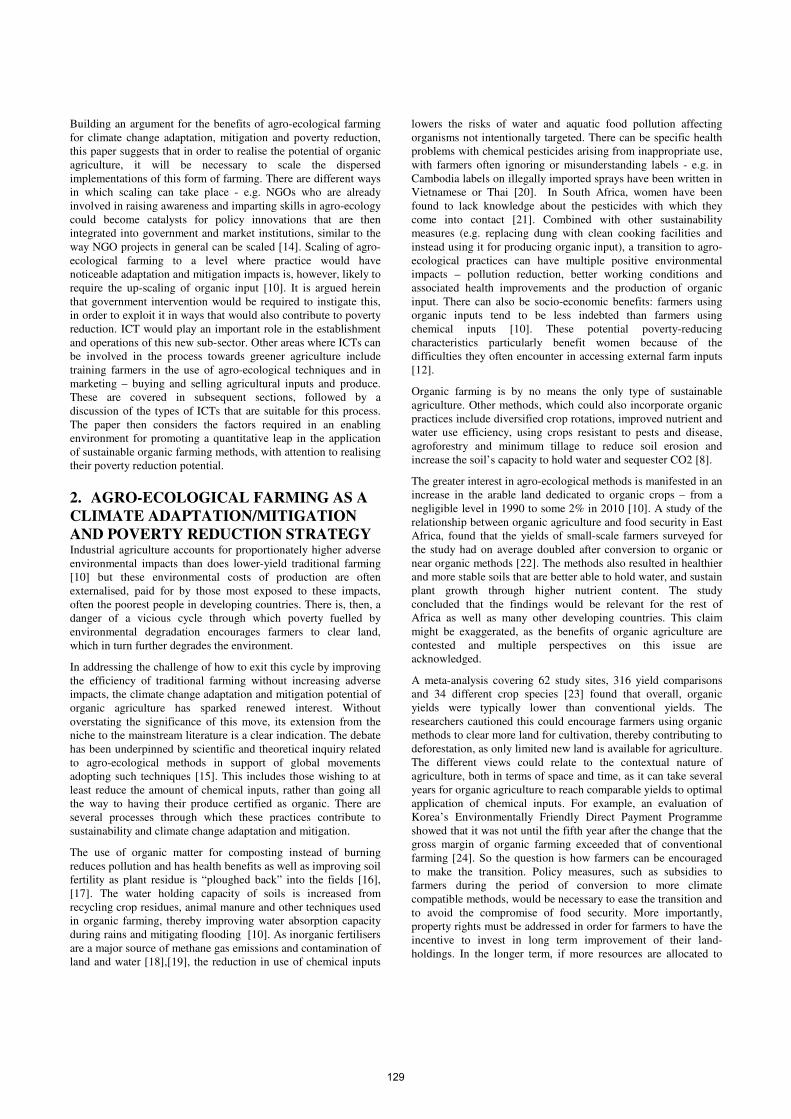
Building an argument for the benefits of agro-ecological farming
for climate change adaptation, mitigation and poverty reduction, this paper suggests that in order to realise the potential of organic
agriculture, it will be necessary to scale the dispersed
implementations of this form of farming. There are different ways in which scaling can take place - e.g. NGOs who are already
involved in raising awareness and imparting skills in agro-ecology
could become catalysts for policy innovations that are then integrated into government and market institutions, similar to the
way NGO projects in general can be scaled [14]. Scaling of agro-
ecological farming to a level where practice would have noticeable adaptation and mitigation impacts is, however, likely to
require the up-scaling of organic input [10]. It is argued herein
that government intervention would be required to instigate this, in order to exploit it in ways that would also contribute to poverty
reduction. ICT would play an important role in the establishment
and operations of this new sub-sector. Other areas where ICTs can be involved in the process towards greener agriculture include
training farmers in the use of agro-ecological techniques and in
marketing – buying and selling agricultural inputs and produce. These are covered in subsequent sections, followed by a
discussion of the types of ICTs that are suitable for this process.
The paper then considers the factors required in an enabling environment for promoting a quantitative leap in the application
of sustainable organic farming methods, with attention to realising their poverty reduction potential.
2. AGRO-ECOLOGICAL FARMING AS A
CLIMATE ADAPTATION/MITIGATION
AND POVERTY REDUCTION STRATEGY Industrial agriculture accounts for proportionately higher adverse
environmental impacts than does lower-yield traditional farming [10] but these environmental costs of production are often
externalised, paid for by those most exposed to these impacts,
often the poorest people in developing countries. There is, then, a danger of a vicious cycle through which poverty fuelled by
environmental degradation encourages farmers to clear land,
which in turn further degrades the environment.
In addressing the challenge of how to exit this cycle by improving
the efficiency of traditional farming without increasing adverse impacts, the climate change adaptation and mitigation potential of
organic agriculture has sparked renewed interest. Without
overstating the significance of this move, its extension from the niche to the mainstream literature is a clear indication. The debate
has been underpinned by scientific and theoretical inquiry related
to agro-ecological methods in support of global movements adopting such techniques [15]. This includes those wishing to at
least reduce the amount of chemical inputs, rather than going all the way to having their produce certified as organic. There are
several processes through which these practices contribute to
sustainability and climate change adaptation and mitigation.
The use of organic matter for composting instead of burning
reduces pollution and has health benefits as well as improving soil fertility as plant residue is “ploughed back” into the fields [16],
[17]. The water holding capacity of soils is increased from
recycling crop residues, animal manure and other techniques used in organic farming, thereby improving water absorption capacity
during rains and mitigating flooding [10]. As inorganic fertilisers
are a major source of methane gas emissions and contamination of land and water [18],[19], the reduction in use of chemical inputs
lowers the risks of water and aquatic food pollution affecting
organisms not intentionally targeted. There can be specific health problems with chemical pesticides arising from inappropriate use,
with farmers often ignoring or misunderstanding labels - e.g. in
Cambodia labels on illegally imported sprays have been written in Vietnamese or Thai [20]. In South Africa, women have been
found to lack knowledge about the pesticides with which they
come into contact [21]. Combined with other sustainability measures (e.g. replacing dung with clean cooking facilities and
instead using it for producing organic input), a transition to agro-
ecological practices can have multiple positive environmental impacts – pollution reduction, better working conditions and
associated health improvements and the production of organic
input. There can also be socio-economic benefits: farmers using organic inputs tend to be less indebted than farmers using
chemical inputs [10]. These potential poverty-reducing
characteristics particularly benefit women because of the difficulties they often encounter in accessing external farm inputs
[12].
Organic farming is by no means the only type of sustainable
agriculture. Other methods, which could also incorporate organic
practices include diversified crop rotations, improved nutrient and water use efficiency, using crops resistant to pests and disease,
agroforestry and minimum tillage to reduce soil erosion and
increase the soil’s capacity to hold water and sequester CO2 [8].
The greater interest in agro-ecological methods is manifested in an increase in the arable land dedicated to organic crops – from a
negligible level in 1990 to some 2% in 2010 [10]. A study of the
relationship between organic agriculture and food security in East Africa, found that the yields of small-scale farmers surveyed for
the study had on average doubled after conversion to organic or
near organic methods [22]. The methods also resulted in healthier and more stable soils that are better able to hold water, and sustain
plant growth through higher nutrient content. The study
concluded that the findings would be relevant for the rest of Africa as well as many other developing countries. This claim
might be exaggerated, as the benefits of organic agriculture are
contested and multiple perspectives on this issue are acknowledged.
A meta-analysis covering 62 study sites, 316 yield comparisons and 34 different crop species [23] found that overall, organic
yields were typically lower than conventional yields. The
researchers cautioned this could encourage farmers using organic methods to clear more land for cultivation, thereby contributing to
deforestation, as only limited new land is available for agriculture.
The different views could relate to the contextual nature of agriculture, both in terms of space and time, as it can take several
years for organic agriculture to reach comparable yields to optimal
application of chemical inputs. For example, an evaluation of Korea’s Environmentally Friendly Direct Payment Programme
showed that it was not until the fifth year after the change that the gross margin of organic farming exceeded that of conventional
farming [24]. So the question is how farmers can be encouraged
to make the transition. Policy measures, such as subsidies to farmers during the period of conversion to more climate
compatible methods, would be necessary to ease the transition and
to avoid the compromise of food security. More importantly, property rights must be addressed in order for farmers to have the
incentive to invest in long term improvement of their land-
holdings. In the longer term, if more resources are allocated to
129

research into agro-ecological approaches, it may be possible that
the time to reach the break-even can be reduced.
Notwithstanding the studies questioning certain aspects of agro-
ecological farming, we proceed on the assumption that its advantages can exceed its disadvantages, at least for crops that can
can generate yields that are not below those of conventional
farming within a reasonable timescale and with adequate support during the transition phase. Much research evidence is already
available to inform policy on these issues. In addition to using
their local knowledge, which is often of an agro-ecological nature, farmers in many developing countries can take advantage of
formal research in this area. With the likely increase in the cost of
inorganic inputs in combination with greater awareness of the health benefits of organic farming, the growth in organic farming
may accelerate, but it may be necessary to give it some additional
impetus.
Currently, organic agriculture in developing countries is largely
based on farmers creating their own organic matter, particularly fertilisers. Despite the importance of on-farm production of
organic inputs, this is unlikely to be sufficient for scaling organic
farming to a level required for mitigation and adaptation in a timely manner. One option for scaling, suggested in this paper is
to place greater emphasis on off-farm production of such inputs
on a commercial or community basis. If implemented with community participation, subject to addressing the intricacies of
power relations at this level, it could at the same time become an instrument for poverty reduction and food security. This could be
an opportunity to integrate climate and human development
objectives, including agency and empowerment, into a new sub-sector, but the danger that such an initiative be captured by
existing power structures must be avoided for this objective to be
achieved. ICT, with its ability to facilitate transparency could be a useful tool in this process, but not the driver.
The availability of physical inputs and an adequate institutional framework are not sufficient to change farm practices.
Knowledge, the essential component of human capital, is
paramount. It is at the core of the adoption of any innovation, not only about a specific method, but also knowledge that the
innovation has no disadvantage and preferably a certain advantage
over already known methods. Knowledge is particularly important for agro-ecology [10],[12], which may require greater
understanding of ecology than farming based on chemical inputs.
ICT has an important role to play in the formation of required knowledge in this field. A further role for ICT in this process
relates to marketing.
3. USING ICTs FOR SCALING ORGANIC
INPUTS Several international agencies have engaged with the issue of
intensification and/or extension of sustainable agriculture and one
of the opportunities identified by the United National Environment Programme [10] to achieve this was scaling up
production of green agricultural inputs. This paper takes as a
starting point that it might be desirable to expand the use organic inputs by manufacturing at least some of these in the developing
world, embedding the activities in local communities.
While there is a large commercial market for organically certified agricultural inputs in the developed world, referred to as input
substitution, including manufactured products to control weeds,
pests and diseases, as well as maintaining soil fertility [25], this is
generally not the case in developing countries. Products for soil
and plant nutrition probably hold the greatest promise for initial scaling at a community level, as the inputs are readily available,
particularly where livestock is an integral part of mixed farming
systems. The production of organic fertilisers also has considerable scope for employment creation.
One example of this is the Waste Concern, generating compost
from organic waste in Dhaka, Bangladesh, which helped create
400 new jobs in collection activities and 800 new jobs in the process of composting. The daily collection of 700 tonnes of
organic waste yielded 50,000 tonnes of compost per year [26]. The fact that this operation is based in Dhaka indicates that this
sub-sector can create employment in urban as well as rural areas
and that the benefits can be two-fold: a way of managing organic waste in a large metropolitan area and producing organic inputs to
agriculture. As the compost is sold to existing fertiliser
companies, which then enrich it, the end product may not be fully organic, but nevertheless reduces the reliance of chemical
ingredients. However, despite Waste Concern having been in
operation since 1995, according to Rashid [27], the compost sector in Bangladesh faces constraints in three areas: licensing
procedures, weak market demand for composting and lack of
awareness among farmers of the benefits of using compost.
This suggests that some form of state intervention may be
necessary, at a minimum in creating an enabling environment and
stimulating demand by raising awareness. It may even be necessary to go as far as involving the state in a more active way
in the establishment of this sector - e.g. in partnership, possibly
with producer organisations, which are now emerging in developing countries to represent the interest of poor smallholders
[8]. The latter can then facilitate engagement of community
energies in asset-building activities in an endeavour that has both economic and environmental benefits, while at the same time
minimising the risk of capture and exploitation by intermediaries.
Because of the knowledge-intensity of sustainable agriculture systems, consideration must be given to information and
knowledge, throughout the development phase of the proposed
initiative, thereby paying attention to the ICT infrastructure, which has to be integral rather than bolted on.
Information in this context refers to facts, whereas knowledge
incorporates what is known. As information is not automatically converted into knowledge, the information systems must be
designed around the various stakeholders and their requirements -
e.g. farmers both as users and possibly suppliers of inputs as well as suppliers of output. Farmers also need information for
educational purposes - e.g. through open distance learning (ODL),
that will enable them to understand benefits and learn about new practices. ODL is now used extensively for tertiary education in
the developing world, and has also been used to help farmers
improve agricultural production. The latter is a greater challenge due to low literacy rates. Employees or sub-contractors engaged in
collecting would require education to learn about the quality of
the input and be able to communicate effectively with farmers and producers to arrange for pick-up and delivery. Although a
participatory design process involving the various stakeholder
categories is likely to be more complex and time-consuming, it would probably help ensure the usability and “ownership” of a
system incorporating the above requirements, as well as
information for managing the production, marketing and distribution systems.
130
It is envisaged that, at the core of the system in a country, there
would be a portal or other electronic venue for managing this process, including details on demand, pricing and collection
arrangements for organic input. The portal could also bring
together farmers, extension workers and researchers for knowledge exchange. It would be designed for use by farmers
who want to purchase organic input and those who want to sell
ingredients to the production processes, as well as anyone else in the supply/demand chain. Other players in this chain would be
able and encouraged to establish their own Internet presence, but
it is important that there is one authoritative information source all actors can trust. In order for trust to be sustained, a high level of
quality control would have to be established in all aspects of the
operation, from the accuracy of information disseminated via this system to the production and distribution processes, as well as its
governance. While information and communication would be
integral to the many functions of this system, ICT cannot drive it. This must be done by an appropriate institutional framework.
There are examples of agriculture portals targeting actors in the
agriculture supply chain in developing countries (e.g. b2bpricenow.com, an e-commerce platform in the Philippines).
The proposed platform would go beyond this and also include, but
not be limited to, an e-learning platform, an operational tool, a repository for research information and a tool for linking a diverse
range of stakeholders. To avoid pitfalls when designing this
system, it is necessary to be aware of and learn from the many unsuccessful implementations using ICT for development,
whether or not these failures are documented in the public
domain. Local involvement is one important lesson, which presents the challenge of building a scalable system without a top-
down bureaucracy. A system of this nature could be a viable
option for mobilising many unemployed youths and provide them with career paths, starting with simple collection activities.
Opportunities for promotion to more skilled areas of activity should be available, following completion of prescribed training,
using ODL via the portal. Using transparent career paths that
encourage the more disadvantaged to advance to higher skilled jobs, this system would avoid the exacerbation of the rich-poor
divide, often associated with technological innovations [28].
4. ICTs FOR HORIZONTAL EXCHANGE
OF INFORMATION TO EXPAND THE
KNOWLEDGE BASE Smallholder farmers are frequently locked into unsustainable
production systems as a result of limited access to information and other knowledge resources, assets and markets, as well as through
inadequate recognition of the value of traditional knowledge [10].
This information access gap prevails, despite what should by now be widespread awareness of the links between scientific
knowledge, the environment, the economy and institutions:
‘A society develops economically as its members increase
jointly their capacity for dealing with the environment. This
capacity for dealing with the environment is dependent on the
extent to which they understand the laws of nature (science),
on the extent to which they put that understanding into
practice by devising tools (technology), and on the manner in
which work is organized’[29].
Relevant for society in general, the above quote, by Walter
Rodney from 1972, is just as applicable today for the trajectory to
agro-ecological farming, which is highly knowledge-intensive. While extension services are a common and useful way of
disseminating information about new farm practices, they can be
quite labour intensive and often not suitable for women [30][31]. This is a particular problem with the feminisation of agriculture in
the developing world, as in many countries men migrate for
employment opportunities in urban areas and other countries to a greater extent than women [32]. ICT is by no means a panacea to
learning about the environment, particularly for women. Studies
have shown that they have for various reasons been excluded from many ICT initiatives [33] and where they have been included,
women might have found them empowering without necessarily
gaining economic benefits [34]. Better understanding of the reasons for these outcomes and how they can be mitigated, or
identification of other suitable ways in which women can improve
their knowledge in this area, is a precondition for the realisation of the proposed initiative.
ICT has been used extensively for farmer education, initially in
the form of radio and more recently through other media, primarily mobile phones. The use of recorded voice and video,
rather than relying on text on mobile devices could overcome
constraints stemming from low literacy levels and the lack of localisation of scripts on mobiles. When accessed through mobile
phones, mLearning can make relevant applications accessible in a
timely manner for farmers - e.g. they can diagnose plant diseases by comparing pictures available through MMS with what they see
in their fields. But such applications are sometimes unaffordable
for those who could benefit from them most, and ways must be found to overcome this impediment, e.g. through universal access
policies and/or other subsidies.
With the emergence of open access scientific publishing and open educational resources (OER), an increasing amount of useful and
educational material for teaching and learning agricultural skills
is, and will become more widely available in the public domain, reducing the costs of preparing content, but nevertheless requiring
local involvement for tailoring and/or re-purposing [35]. ODL and
OER do not necessarily mean that farmers should be left to their own devices to locate, access and interpret these resources.
Learning alone at home, the way ODL for higher education is
usually implemented in the developed world, is rarely possible and probably not an appropriate learning approach in rural areas
in developing countries, due to low literacy skills, inadequate
equipment and electricity supply constraints. Blended learning, combining ODL material with group learning, is becoming a
popular mode of knowledge acquisition, not only to overcome resource constraints, but also because of the benefits of learning
in a group environment. This raises the issue of appropriate
venues and support services that go beyond mere connectivity measures and content creation, taking into account all variables
necessary for learning.
The importance of disseminating agricultural information for
sustainable rural development to enable farmers to learn new methods is well recognised, but less acknowledged is the value
inherent in multi-directional communication, particularly between farmers, researcher and policymakers. In such horizontal
exchange of information, all participants in the dialogue are both
senders and receivers of valuable information. It is as important for those with scientific expertise in this field to know how to
impart this to farmers as it is for the latter to know how and where
they can find out what they need to know, obtain relevant learning material, make enquiries and feed their experiences into the
knowledge chain. As argued by the World Bank [36], agricultural
development depends to a great extent on how successfully
131

knowledge is generated, shared and applied, and for that,
interactive and collaborative forms of sharing and exchange are required [37]. ICTs can only facilitate, but not encourage,
coordinate or implement, complementary use of different
knowledge sources to bring about the continuous process of innovation that is so vital in driving this sub-sector, and at the
same time bridge social and geographical distances.
There are several examples of such information exchanges, one of
which is the Bulgarian network of sustainable education and permaculture initiatives. With most members located in remote
rural and mountainous areas, activities are mainly conducted online [38]. Another example is a project in the South Pacific,
where promotional DVDs were used for training in low-cost
irrigation systems, composting and the use of neem and derris as organic pesticides. This production was one output from extensive
collaboration between diverse information providers and
community groups, including farmer groups [39]. Open access to research findings can also be beneficial, both in communicating
research findings and in giving developing country researchers a
voice and, thereby, providing appropriate information for developing country agriculture. The case of Prof. Mary Abukutsa-
Onyango of Jomo Kenyatta University of Agriculture and
Technology, whose research on African Indigenous Vegetables (AIV) only found a voice in open access journals in Africa, is
instructive. She attests to the importance of open access
publishing for development in African countries [40]. In all of the above examples, ICT is a fundamental enabler, but it is only one
of the ingredients required for information exchange.
All parties in an agriculture value chain can benefit from the use of ICT in the marketing of agro-ecological produce. While the
usefulness of ICT’s for market price information, particularly by
farmers to reduce the information asymmetry between them and traders has been recognised [37],[41], it has also been
acknowledged that information is not sufficient to change power
relationships and often has to be supplemented with access to other resources. These must go hand in hand with the information,
as there is no point in a farmer knowing that a better price could
be obtained at a market 50 km away, in the absence of transport to get to the market. Similarly, awareness that prices will be much
higher six months after the harvest is useless for a farmer lacking
storage facilities or having to pay back a loan obtained to purchase seeds. Against this, it has been posited that the mere
increase in information symmetries can weaken the bargaining position of intermediaries and assist farmers in making better
decisions [42].
Buyers and sellers at the extremes of the supply chain usually do
not interact directly, but via one or several intermediaries. The role of intermediaries, particularly in the agriculture supply chain,
has been the subject of divergent views and evidence in the ICT
literature. There seems to be general consensus that wider access to ICTs can erode information asymmetries, but there is
contention about what this means in practice. While it potentially enables farmers to increase their surplus, which can be used for
productive investments on their farms to generate higher yields,
this is not always the outcome. ICT has led to some disintermediation among farmers and micro-enterprises [43],[44],
but, there is also evidence pointing to ICTs fostering ongoing and
even the entrenchment of intermediation [45],[46],[47]. Intermediaries can play productive as well as exploitative roles in
the agriculture chain and by facilitating transparency, ICT can
contribute to more productive relationships [48], but cannot by
itself change power balances.
Transparency is critical in building confidence and trust in a supply chain and this is especially so regarding claims relating to
organic agriculture. The current limited ability to track produce
from source to destination could affect the level of trust when it comes to purchasing organic produce. ICT based tracking systems
could overcome this constraint. It is not suggested that outputs
from such practices necessarily be marketed under the stringent conditions required for organic certification. Aiming to produce to
higher standards has inherent benefits as it can induce efficiency and stimulate innovation, which in turn can enhance
competitiveness in the global agriculture market [10]. It has been
difficult for farmers in developing countries to enter the global agriculture market because of national food security and farm
trade policies, which historically have tended to favour producers
from developed countries. Global trade in agriculture got more complicated with the rise in food prices in 2007-2008, when
several countries restricted the export of staple foods to protect
domestic consumers. Whatever the trading environment (the complexities of which are beyond the scope of this paper), ICT is
necessary, but by no means sufficient, to facilitate entry to the
global market.
5. WHAT TYPE OF ICTs Farmers tend to gain information and communicate through a variety of methods and technologies. The rapid growth of mobile
devices holds great potential for greening the farming sector, but
may be less useful where scripts have not been localised for mobile phones or networks. A range of ICTs must therefore be
considered, primarily for educational purposes, and much
experience has already been gained from community radio, which continues to play a vital role, having been pioneered by the Food
and Agriculture Organization (FAO) several decades ago. The
FAO has also pioneered the “e-Agriculture Community” forum, a global community of practice for the exchange of information,
resources and ideas related to the use of ICT for sustainable
agriculture and rural development. As the website is only in English, French and Spanish, it seems to be targeted at
intermediaries and researchers, rather than farmers. Television,
the take-up of which is increasing in rural areas with electrification, is another potential medium for disseminating
information about sustainable organic agriculture to farmers.
These and other market based information dissemination channels may require incentives or possibly some form of regulation to
respond to this challenge, as privately owned media relying on
revenue from commercials might face opposition from companies operating in the agrochemical sector.
Personal computers, laptops and tablets are other useful
instruments for disseminating information and communicating about sustainable agriculture. As these would be unaffordable for
the majority of farmers, both in terms of up-front and operational
costs, particularly where there is limited access to electricity, some form of community ICT access point for shared access may
be desirable. Multipurpose community telecentres, which since
the 1990s have been one model for sharing access, are an avenue through which information can be disseminated and exchanged.
Driven by public institutions and NGOs, rather than the market,
their success has been mixed, and their potential to contribute to development has not always been realised. There are several
reasons, including of a formative nature, such as inability to maintain equipment and pay for services when external funding
132
ceases. It is critical to better understand why this is so often the
case and to explore outcomes from a summative perspective, before making further investments in this type of facility.
An important question to consider is whether telecentres can be
given a new lease of life, focusing on agro-ecological agriculture
and add community radio to the mix of media, which some of them already do, through which they disseminate agricultural and
other information. While community radio is not as efficient for
multi-directional exchange of information, it has the benefit of reaching women who tend to have underused telecentres,
compared to men [49]. But if telecentres are to be used for this purpose, they must exert greater effort in attracting women, not
only for reasons of fairness and equality, but also because women
are playing an increasingly important role with the feminisation of agriculture. Highlighting the significance of ICTs for information
sharing in agriculture, FAO [50] noted that locations where ICT
can be accessed must be suitable, particularly for women. As important as the locations, is what occurs at them, and a key
benefit of this type of institution is that they often have
infomediaries, who can assist those with insufficient literacy levels to access relevant information.
Aware of local information needs, where to obtain and how to
access relevant information, telecentre infomediaries can act as knowledge brokers for sustainable agriculture practices. But it can
also be disempowering for farmers to have to go via
intermediaries to access information, so they should not be substitutes for training and self-learning. In addition to being a
location for accessing information, telecentres are places for
interaction and engagement. Sometimes represented as obsolete with the emergence of the almost ubiquitous mobile networks,
Pant & Heeks [51] suggested a new role for them, combined with
mobiles, in enlisting ICTs to deal with climate change, particularly when accompanied with deliberate development of
capacities. However, unlike the other modes of implementing
technologies (e.g. broadcasting and individual ownership of mobiles that can easily and quickly reach a large number of
people) this is not the case for telecentres, which have not
managed to scale to a significant extent, despite a large number of pilots.
In addition to access methods, it is important to look at the
platforms for the different applications, whether for the commercialisation of organic input, learning or marketing. In
doing so, account must be taken of the diverse ways in which
users will access a range of applications for obtaining information and communicating. This calls for greater interaction between the
development of ICT hardware, software and systems on the one
hand, and users of agro-ecological practices on the other, to address the compounded challenges of access difficulties, low
literacy rates and affordability.
Even more important is access to content. There is a strong movement towards making the results of publicly funded research
openly and freely available, with research agencies, funders and
governments increasingly mandating open access [52],[53]. Not only does this enable access to worldwide research from
developing countries, it also enables the reverse flow of research
and information from developing countries [54]. With open access, there is greater prospects for knowledge in this field to
reach places where it can be put to good use and, in turn, further
developed. But open access is not enough, concerted action is required to make the scientific research understandable by farmers
and to establish bidirectional channels between farmers and
researchers. Such communication could be quite problematic,
whether due to language or lack of relationships beyond the boundaries where scientists and farmers, respectively operate.
Beyond availability and access, adoption and use of ICTs must
also be addressed, particularly with respect to what knowledge is
required to use various ICTs and how content should be presented to make it understandable. To gain a better understanding of this
process, social theories dealing with this issue can provide useful
insights into potential barriers and implications, if barriers persist - e.g. theories dealing with diffusion of innovations, structuration
and knowledge gap theories [55]. Awareness of impediments and how to overcome them, as informed by such theories, particularly
when applied to developing countries, is essential to avoid the
implementation of systems that will not be used. Reference to the design-reality-gap [56] framework can provide a useful guide for
this purpose.
6. ENABLING CONDITIONS AT THE
MACRO-LEVEL Despite what appears to be a reasonable rationale of agro-
ecological practices, a transition to this type of farming is unlikely to materialise on its own, without intervention, particularly as
vested interests could try to inhibit such a conversion. Policy
intervention is both necessary and desirable where the market fails to pay for negative externalities and for initiatives with overriding
social objectives. There is also the issue of acceptance by
potential users, which even if new practices are beneficial, cannot automatically be assumed, as illustrated in literature dealing with
innovations [57]. It is therefore necessary to work on acceptance
in parallel with the up-scaling of the sub-sector, which, although not being a ”big-bang” approach, nevertheless has to move at a
rapid rate to maximise the opportunity for climate change
adaption and mitigation.
While implementations must be receptive to national and local
idiosyncrasies, it is nevertheless useful to discuss some general
principles.
There is likely to be a process of bargaining between the parties
involved in existing and future agricultural supply chains,
including existing suppliers of chemical inputs, farmer representatives, scientists, the various tiers of government and
NGOs, as well as international and foreign aid agencies. One
model through which conflicting interests could be managed would be interactive policy-making, in which various parties are
actively involved in jointly arriving at a decision [58]. ICTs are
important in such a co-design process.
Ultimately, governments have mediation and policy formulation
responsibilities in such a process and they have at their disposal
policies of an enabling and/or coercive nature. While both have their place in different climate change policy contexts, enabling
polices would be the most efficient and equitable approach for
agro-ecology, as they are more likely to generate trust in government institutions and commitment by farmers to embrace
new practices. Trust is often a critical component in adoption of
innovations. Coercive measures, such as charges to internalise the environmental costs of conventional agriculture, while appropriate
for large-scale commercial farms, would be inappropriate for
small-holder subsistence agriculture, as they would impose unnecessary hardship. It would in any case be very difficult, if not
impossible, to implement such policies administratively. Enabling
policies can provide incentives for organic farming as well as disincentives for conventional agriculture (e.g. by removing
133
subsidies on chemical inputs). Some agricultural subsidies
exacerbate the negative effects, as they tend to encourage overuse, particularly of inorganic fertilisers, with detrimental effects on the
environment [11], as well as exposing governments engaging in
such subsidies to oil price increases. Instead, governments could offer subsidies for organic fertilisers and compensate for the lower
yields during the transition phase.
The enabling environment must take account of the
interconnected dimensions of sustainable agriculture, food security, climate change, poverty reduction, and information
systems to support the governance of sustainable agriculture. This requires collaboration across different government functional
areas. Such overlap of ICT with other policy domains was
recognised by Mansell and Wehn [1] in their 1998 book on ICT for sustainable development. If done appropriately, it could serve
to strengthen the role of small-holders and those who are most
marginalised, by providing them with a safety-net in the emerging sector of organic input production.
The livelihood outcomes as represented by improved food
security and other features of well-being expected from such an initiative depend on awareness, and capacity. While ICT can
facilitate these, improved livelihoods are also required to enable
the use of ICTs, both in terms of skills and affordability. This points to the importance of incorporating ICT training with
training in use of agro-ecological methods. This requires
collaboration between government authorities responsible for ICT and farming.
Other institutions critical to the enabling conditions relate to
finance. Whether secured by the public sector through inclusion in the fiscal framework or other sources, its provision must
encourage self-sufficiency, rather than contributing to
dependencies through increased farmer indebtedness, to facilitate the long term viability of sustainable agriculture, beyond the
expiry of external assistance. Potential funders outside
governments can include NGOs, commercial firms and/or other agencies acting as donors or lenders, including environment
related funds, such as the Clean Development Mechanism (CDM)
and Payment for Environmental Services (PES). While funding from carbon trading sources can have considerable administrative
overheads [59], it is an opportunity worth pursuing. In order to
avoid the paradox of having to demonstrate carbon sequestration before receiving funding, but unable to do so due inadequate
funding of the type of facility proposed in this paper, it may be
necessary to bring forward the “green investment” in anticipation. Learning from funding of social programmes in general, it seems
that diversity of funding is preferable to funding from a single
source, as this tends to encourage more champions and community support [60] and would also reduce the reliance on a
single funding source. ICT could be useful, at least in starting this
process, by enlisting support from the public (e.g. through awareness).
7. A RESEARCH AND EVALUATION
AGENDA The impact of innovations, such as the one proposed in this paper,
need to be evaluated in terms of their environmental and social
objectives and researchers play an important role in the evaluation of pilot and wider implementations, through formative and
summative evaluations. Initially, such research could be conducted on existing operations in this area (e.g. the Bangladeshi
Waste Concern, mentioned in section 3). Firstly, it has to be
established that there are net environmental benefits from such
operations. This could be done through an environmental value chain analysis (i.e. comparing the environmental costs at each
stage of the process with environmental costs of producing and
using conventional inputs). Secondly, research should also be conducted on how ICT is used and could be better used by
different stakeholders in such enterprises. The research should
extend to explore benefits achieved by various parties involved in this chain and any unintended negative consequences for the most
vulnerable population or the environment.
Research should also explore whether there are indeed any symbioses between agro-ecological practices and livelihood
improvements, using a wide range of social and economic
indicators, including the role of different types of ICTs in contributing to outcomes, drawing and expanding on existing
research in this field. This would include exploring how different
design and implementations of ODL resources affect learning outcomes that lead to adoption of more climate compatible
practices among farmers,
Another area for fruitful research would be to investigate the market for external inputs into organic farming in developing
countries, focussing on constraints faced by this sector and
identifying whether and how ICTs could contribute to overcoming these. The results are likely to be highly contextual to different
country settings and show differences within countries. Empirical
insights about the conditions under which the potential of ICTs can be realised to contribute to scaling up agricultural inputs for
organic farming in a way that reduces poverty will be an
important input to governments seeking to direct their policy efforts into agro-ecological farming. It will also be necessary to
tune into the interests of policy-makers and funders when
formulating a detailed research agenda in a specific contexts.
The next step would be to capture the disparate components of
this paper into a cohesive framework. The sustainable livelihoods
approach (SLA) could provide a conceptual framework within which the diverse aspects of such an agro-ecology initiative could
be brought together under one umbrella. This framework is ‘a way
of thinking about the objectives, scope and priorities for
development. In essence it is a way of putting people at the centre
of development, thereby increasing the effectiveness of
development assistance’ [61] The SLA explores livelihood resources and strategies that enable or constrain the achievement
of sustainable livelihoods for different groups and institutional
processes. At the core of this concept are the tangible and intangible assets (physical, natural, financial, human, and social)
of firms, communities and individuals and their ability to
withstand shocks in environments that make them vulnerable. When used for interventions, the SLA has a holistic rather than
sectoral focus, and is thus suitable for incorporation of ICT as an
integral component, as reflected in a number of ICT related studies adopting this framework [62]. It can be applied in
conjunction with a diverse range of research and evaluation methodologies used for international development, both
qualitative and quantitative (e.g. randomised control trials).
The SLA is not without its critics, who have identified
deficiencies in the approach relating to insufficient attention to the macro-level, private and economic institutions, its overemphasis
on self-help and in defining and measuring the capital types and
sustainability [63],[64]. These shortcomings could be overcome when applied in practice, as the framework can be extended to
incorporate the missing ingredients, particularly poverty reduction
134

and the macro-level, both of which are critical for the success of
such climate change adaptation and mitigation initiatives. It could be designed to analyse outcomes and to understand existing and
evolving formal and informal constraints at the micro-, meso- and
macro levels in several domains, including the environmental, technical, institutional, political and social in a combined rather
than fragmented view of the entire system. In addition to these
wider system components, the business performance of this sub-sector, in terms of triple bottom line achievements, must also be
monitored to facilitate a consistent stream of funding.
8. CONCLUDING REMARKS It is now widely recognised that “business as usual” in the
farming sector will not bring food security, poverty reduction and
environmental sustainability due to the combination of intensified pressure from population growth, unsustainable use of resources
and climate change. But any changes must be compatible with improved livelihoods for small-holders, rather than at their
expense. Consensus among a diverse range of agencies is now
crystallising around the idea that agro-ecological farming is pointing the way towards meeting the dual objectives of climate
change adaptation/mitigation and poverty reduction.
The scaling up of organic input to the agricultural sector in
developing countries is one avenue for facilitating such a transformation of the food production process. While it would
not, on its own, encourage the take-up of agro-ecological practices or reduce rural poverty, it could be an important ingredient in a
mix of policies. If implemented appropriately, it has the potential
of providing employment around which a safety-net could be constructed for landless villagers and poor small-holders, who
could supplement their incomes through involvement in activities
associated with organic input production. It could thus be one pathway to climate change adaptation and mitigation with
poverty-reduction prospects, targeted at achieving human
development objectives. As a new undertaking, it is easier for traditionally excluded populations, particularly women, to be
included, as this new activity could be designed to avoid invoking
constraints characterising traditional roles, such as being saddled by existing gender labour divisions. But many farmers, often
struggling for survival, are likely to require incentives, support
and further training before they are ready to abandon their current agricultural practices.
The embryo of an idea outlined in this paper requires further
research and other work, but this should not be a reason for delaying action. While contested in terms of productivity per area
cultivated, there is already sufficient evidence to show the benefits
of agro-ecological practices for climate change adaptation/mitigation and human development. Evaluation of
implementations to assess the extent of contributions to human
development (e.g. in terms of poverty reduction, health and gender equality as well as to the environment) should be
conducted on an on-going basis, providing lessons on what does
and does not work in different contexts and how to overcome problems. An inventory of best practice in this area could then be
produced from these lessons.
ICT cannot be a driver of this process, but this paper has provided a working hypothesis of how ICT could be an enabler, facilitating
the various steps in the process towards one type of climate
change adaptation and mitigation policy in agriculture. It can be used extensively in the establishment of a new sub-sector, for
training, exchanging information as well as for interactive policy-
making. Provided the focus is on those who are more
marginalisesd, it might be possible to avoid a situation where the
initiative benefits only the more prosperous members of society, as has sometimes been the case with climate change projects in
the developing world. In outlining the potential of various forms
of ICTs, the paper emphasised that rather than limiting attention to physical infrastructure and software platforms, emphasis must
also be placed on more open access to information and abilities to
absorb it. In addition, affordability and skills to use various technologies should be given adequate consideration. While
knowledge, transparency and efficiency, facilitated by ICT, would
minimise the danger of the deployment of a low-risk initiative of this nature becoming a costly failure, many policy and
institutional hurdles must be overcome to achieve these to a
sufficient extent.
9. ACKNOWLEDGMENTS We would like to thank three anonymous reviewers for their
constructive feed-back on the initial abstract and helpful comments on the initial version of this paper.
10. REFERENCES
[1] Mansell, R. & Wehn, U. 1998. Knowledge societies:
information technology for sustainable development. Oxford University Press: Oxford
[2] World Bank, 1998. World Development Report 1998/99:
Knowledge for Development. Washington, DC: World Bank and Oxford University Press. DOI : 10.1596/978-0-19-
521118-4
[3] Hilty, L. M. and Ruddy, T. F. 2010. Sustainable development and ICT interpreted in a natural science context. Information,
Communication & Society, 13(1), 7–22.
DOI=http://dx.doi.org/10.1080/13691180903322805
[4] WSIS - World Summit on the Information Society. 2003.
Geneva Plan of Action.
http://www.itu.int/wsis/docs/geneva/official/poa.html
[5] UNICT – United Nations ICT Task Force. 2003. Tools for
development: using information and communications
technology to achieve the Millennium Development Goals. Working paper.
http://www.apdip.net/projects/2003/asianforum/
[6] Rio 20+. 2012. The Future We Want.
http://www.uncsd2012.org/content/documents/727The%20Future%20We%20Want%2019%20June%201230pm.pdf
[7] Houghton, J. 2009. ICT and the environment in developing
countries: opportunities and developments. Paris: OECD. http://www.oecd.org/dataoecd/40/25/43631894.pdf.
[8] Commission on Sustainable Agriculture and Climate
Change. 2012. Achieving food security in the face of climate
change: final report. Copenhagen, Denmark.
www.ccafs.cgiar.org/commission.Commission on
Sustainable Agriculture and Climate Change. 2012. Achieving food security in the face of climate change.
[9] Intergovernmental Panel on Climate Change. 2007.
Summary for policymakers. In: Climate Change 2007:
Impacts, Adaptation and Vulnerability. Contribution of
Working Group II to the Fourth Assessment Report of the
135

Intergovernmental Panel on Climate Change, 7-22.
Cambridge University Press: Cambridge.
[10] United Nations Environment Programme. 2011. Towards a
green economy: pathways to sustainable development and
poverty eradication. www.unep.org/greeneconomy.
[11] World Bank. 2012. Inclusive green growth: the pathway to
sustainable development. Washington, D.C. World Bank.
[12] De Schutter, O. 2010. Report submitted by the Special
Rapporteur on the right to food. UN General Assembly, Human Rights Council, 16th session, agenda item 3.
[13] OECD. (2012). Evaluation of Agri-Environmental Policies:
Selected Methodological Issues and Case Studies. OECD Publishing. http://dx.doi.org/10.1787/9789264179332-en
[14] Uvin, P., Jain, P. S. And Brow, L.D. 2000. Think large and
act small: toward a new paradigm for NGO scaling up. World
Development, 28(8), 1409 – 1419.
[15] International Fund for Agricultural Development. 2010.
Rural poverty report 2011. New realities, new challenges:
new opportunities for tomorrow’s generation. Rome: IFAD.
[16] Kilcher, L. 2007. How organic agriculture contributes to
sustainable development. In H. Willer & M. Yussefi (Eds.)
The world of organic agriculture - statistics and emerging
Trends. Bonn: International Federation of Organic
Agriculture Movements (IFOAM).
[17] Niggli, U., Earley, J., and Ogorzalek, K. 2007. Issues paper:
organic agriculture and environmental stability of the food
supply. Prepared for International Conference on Organic
Agriculture and Food Security, Food and Agriculture Organization of the United Nations, Rome.
[18] International Assessment of Agricultural Knowledge,
Science and Technology for Development. 2009. Agriculture
at a crossroads: global report. Washington, DC: Island
Press.
[19] United Nations Department of Economic and Social Affairs.
2011. World economic and social survey 2011: the great
green technological transformation. New York: United
Nations.
[20] Jensen, H.K., Konradsen, F., Jørs, E., Petersen, J.H., and Dalsgaard, A. (2011). Pesticide use and self-reported
symptoms of acute pesticide poisoning among aquatic
farmers in Phnom Penh, Cambodia. Journal of Toxicology, 1–8. Doi:10.1155/2011/639814
[21] Naidoo, S., London, L., Burdorf, A., Naidoo, R., and
Kromhout, H. 2008. Agricultural Activities, Pesticides Use and Occupational Hazards Among Women Working in
Small-scale Farming in Northern KwaZulu-Natal, South
Africa. Int. J. Occup. Env. Heal.,14( 3), 218-224.
[22] United Nations Conference on Trade and Development &
United Nations Environment Programme. Organic
Agriculture and Food Security in Africa. New York and Geneva: United Nations
[23] Seufert, V., Ramankutty, N. & Foley, J. 2012. Comparing
the yields of organic and conventional Agriculture. Nature,
487, 229-234. Doi:10.1038/nature11069
[24] Kim, C-G and Banfill, J. 2012. A policy evaluation of
Environmentally Friendly Direct Payment Programme in
Korea. In OECD, Evaluation of Agri-Environmental
Policies: Selected Methodological Issues and Case Studies,
pp. 153-167. OECD Publishing. OECD Publishing. http://dx.doi.org/10.1787/9789264179332-en
[25] Jones. R. 2010. Green Harvest. A history of organic farming
and gardening in Australia. Collingwood, Australia: CSIRO.
[26] Zurbrügg C., Drescher S., Rytz I., Sinha AHM, Enayetullah I. 2005. Decentralized composting in Bangladesh, a win-win
situation for all stakeholders. Resources, Conservation and
Recycling, 43(3), 281–292. Doi:10.1016/j.resconrec.2004.06.005.
[27] Rashid, S. Z. 2011.Composting and Use of Compost for
Organic Agriculture in Bangladesh. Proceedings of the 4th
International Conference for the Development of Integrated
Pest Management in Asia and Africa (20-22 January 2011)
[28] Gerster R and Zimmermann S. 2005. Up-scaling pro-poor
ICT-policies and practices: a review of experience with
emphasis on low income countries in Asia and Africa. Berne:
Swiss Agency for Development and cooperation and M S Swaminathan Research Foundation.
[29] Rodney, W. 1976. How Europe underdeveloped Africa.
London: Bogle-L'Ouverture Publications. Original 1972.
[30] Tandon, N. 2010. New agribusiness investments mean wholesale sell-out for women farmers. Gender &
Development, 18(3), 503 – 514. DOI
=http://dx.doi.org/10.1080/13552074.2010.
[31] Moussa, M., Wen, Y., Wu, H., Diakite, M., GERSON, K.,
and Wang, H. 2011. Impact assessment of women farmer
activity on poverty reduction and food security: a case of Kindia region/Guinea. Journal of Agricultural Science, 3(4),
141- 150.
http://journal.ccsenet.org/index.php/jas/article/view/9342.
[32] Deere, C.D. 2005. The feminization of agriculture?
Economic restructuring in rural Latin America. Occasional
Paper 1. Geneva: United Nations Research Institute for Social Development.
[33] Siyao, P. O. 2012. Barriers in accessing agricultural
information in Tanzania with a gender perspective: the case study of small-scale sugar cane growers in Kilombero
District. The Electronic Journal of Information Systems in
Developing Countries, 51 (6), 1-19.
[34] Huyer, S. and Sikoska, T. 2003. Overcoming the gender
digital divide: understanding ICTs and their potential for the
empowerment of women. INSTRAW Research Paper Series No. 1. http://www.un-instraw.org/pdf/oth-Synthesis
[35] Latchem, C. (2012). Quality assurance toolkit for open and
distance non-formal education. Vancouver: The
Commonwealth of Learning.
[36] World Bank. 2007. Enhancing agricultural innovation: how
to go beyond the strengthening of research systems.
Washington, DC: The World Bank.
[37] Ballantyne, B. 2009. Accessing, Sharing and Communicating
Agricultural Information for Development: emerging trends
and issues. Information Development, 25(4), 260-271. DOI= 10.1177/0266666909351634.
[38] Association for Progressive Communications & Hivos. 2010.
Global information society watch 2010: ICTs and
136

environmental sustainability.
http://www.giswatch.org/sites/default/files/gisw2010_en.pdf
[39] Hunter, D. 2007. Improving production and accessibility of agricultural information through capacity-building,
networking and partnerships in the South Pacific.
International Journal of Education and Development using
Information and Communication Technology, 3(3), 132-135.
[40] Abukutsa-Onyango, M. 2010. Prof. Mary Abukutsa-
Onyango discusses the importance of Open Access for research from Kenya and other African countries. Interview
was recorded on Feb. 19th, 2010 at the University of Nairobi
during a Workshop on Increasing the Impact of Research through Open Access, co-hosted by the University of Nairobi
Library, eIFL.Net and Bioline International.
http://vimeo.com/10169351.
[41] Rashid, A. T. & Elder, L. 2009. Mobile phones and
development: an analysis of IDRC supported projects. The
Electronic Journal on Information Systems in Developing
Countries, 36(2), 1–16.
[42] Bedi, A. S. 1999. The role of information and
communication technologies in economic development: a partial survey. Discussion paper on development policy, no.
7. Bonn: Center for Development Research (ZEF).
http://www.zef.de/fileadmin/webfiles/downloads/zef_dp/zef_dp7-99.pdf.
[43] Bayes, A. 2001. Infrastructure and rural development:
insights from a Grameen bank village phone initiative in Bangladesh. Agricultural Economics, 25(2/3), 261–272.
DOI: 10.1111/j.1574-0862.2001.tb00206.x.
[44] Bowonder, B., Gupta., V., and Singh, A. 2003. Developing a rural market e-hub: The case study of e-Choupal experience
of ITC”. Planning Commission of India.
http://planningcommission.nic.in/reports/sereport/ser/stdy_ict/4_echoupal%20.pdf.
[45] Duncombe, R. and Heeks, R. 2001. Information and
communication technologies and small enterprise in Africa:
lessons from Botswana. Institute for Development Policy and Management, University of Manchester.
[46] Jagun, A., Heeks, R. and Whalley, J. 2008. The impact of
mobile telephony on developing country micro-enterprise: a Nigerian case study. Information Technologies and
International Development, 4(4), 47–65.
[47] Overå, R. 2006. Networks, distance and trust: telecommunications development and changing trading
practices in Ghana. World Development, 34 (7), 1301–1315.
[48] Dixi, G. and Jayaraman, N. 2011. Strengthening agricultural marketing with ICT. In The World Bank/InfoDev’ARD, ICT
in agriculture: connecting smallholders to knowledge,
networks, and institutions. Module 9, pp.205-237. Washington, DC: World Bank.
[49] Kumar, R. and Best, M. 2006. Social impact and diffusion of
telecenter use: a study from the sustainable access in rural India project. The Journal of Community Informatics,
2(3),online.
[50] Food and Agriculture Organization. 2011. The state of food
and agriculture. Women in agriculture: closing the gender
gap for development. Rome: FAO.
[51] Pant, L.M. & Heeks, R. 2011. ICT-enabled development of
capacity for climate change adaptation. Centre for
Development Informatics, Institute for Development Policy and Management, University of Manchester.
[52] Bailey, C.W. 2010. Transforming Scholarly Publishing
through Open Access: A Bibliography, available athttp://digital-scholarship.org/tsp/w/emerging.htm.
[53] Open Access Scholarly Information Sourcebook:
http://openoasis.org/index.php?option=com_content&view=article&id=146&Itemid=253.
[54] Chan, L. 2011. Knowledge and communication for
development: an online course (IDSB10H) offered at the University of Toronto Scarborough.
http://vimeo.com/29036355.
[55] van Dijk, J. and Hacker, K. 2003. The digital divide as a
complex and dynamic phenomenon. The Information Society,
19(4), 315–326. DOI: 10.1080/01972240309487
[56] Heeks, R. 2003. Most eGovernment-for-development
projects fail: how can risks be reduced? iGovernment Working Paper Series, paper no. 14, Institute for
Development Policy and Management, University of
Manchester.
[57] Rogers, E. M. 2003. Diffusion of innovations (5th ed.). New
York: Free Press. First published in 1962.
[58] Driessen, P. P.J, Glasbergen, P., and Verdas, C. 2001. Interactive policy-making - a model of management for
public works. European Journal of Operational Research,
128(2), 322 – 337.
[59] Stabinsky, D. and Ching, L.L. 2012. Ecological agriculture,
climate resilience and a roadmap to get there. Penang: Third
World Network.
[60] Savaya R. and Spiro, S.E. 2012. Predictors of Sustainability of Social Programs. American Journal of Evaluation, 33(1),
26-43.
[61] Department for International Development. 1999. Sustainable livelihoods guidance sheets.
http://www.eldis.org/vfile/upload/1/document/0901/section2.
pdf.
[62] Chapman, R., Slaymaker, T. and Young, J. 2004. Livelihoods
approaches to information and communication in support of
rural poverty elimination and food security: the literature
update. London: Overseas Development Institute.
[63] Albu, M. 2008. Making markets work for poor - Comparing
M4P and SLA frameworks: Complementarities, divergences and synergies. Swiss Agency for Development and
Cooperation.
http://www.springfieldcentre.com/publications/sp0803.pdf.
[64] Toner, A. and Franks, T. 2006. Putting livelihoods thinking into practice: implications for development management.
Public Administration and Development, 26(1), 81–92.DOI: 10.1002/pad.395
137

EcoLogTex: a software tool supporting the design ofsustainable supply chains for textiles
Andrea E. RizzoliIDSIA - USI/SUPSI
Galleria 2Manno, Switzerland
Heinz ZellerHugo Boss Ticino SAVia Sant’Apollonia 32Coldrerio, Switzerland
Mireille FaistEMPA
Ueberlandstr. 129Dübendorf, Switzerland
Roberto MontemanniIDSIA - USI/SUPSI
Galleria 2Manno, Switzerland
Michela GioacchiniHugo Boss Ticino SAVia Sant’Apollonia 32Coldrerio, Switzerland
Nicola NembriniTINEXT SA
strada Regina 42Bioggio, Switzerland
ABSTRACTThis paper describes the design and the initial phases of theproject EcoLogTex that aims to deliver a new methodologyand a software tool to support the design of textile supplychains taking into account the impact on the environmentas well as costs and time, while satisfying corporate socialresponsibility constraints. The key idea of EcoLogTex is togather information on the environmental impacts of singlesteps in a supply chain in order to perform anex ante life-cycle assessment which will produce indicators to be used inthe design and choice of the supply chain to be implemented.In other words, the designers of clothing apparel will be ableto select the composition, colours, styles of their garmentstaking into account not only the cost and time required forthe production, but also the environmental impact, thus al-lowing a more conscious use of resources.
Categories and Subject DescriptorsSustainability through ICT [ICT and dematerialisation]:ICT-supported life-cycle thinking
KeywordsLife Cycle Assessment, Supply Chain Design, Textiles, High-Fashion.
1. INTRODUCTIONWithin the EU-25, clothing and textiles account for approx-imately 3-5 per cent of our environmental impacts [8], andglobally this figure is even higher as Europe and the US havedelocalised and outsourced most of the textile production,in an effort to reduce costs to the bare minimum. This hasbeen possible at the expense of the quality of life of workersin developing countries, and of the environment, as risky andhazardous processes are subject to less stringent legislations.
Recently things have been slowly changing: some segments
ICT4S 2013: Proceedings of the First International Conference on Infor-mation and Communication Technologies for Sustainability, ETH Zurich,February 14-16, 2013. Edited by Lorenz M. Hilty, Bernard Aebischer,Göran Andersson and Wolfgang Lohmann.DOI: http://dx.doi.org/10.3929/ethz-a-007337628
of the customers‘ market are switching to the so-called lifestyleof health and sustainability (LOHAS). Key to LOHAS arethe respect of the environment and of the workers‘ condi-tions. While in the mid to long-term we expect that LOHASwill be widely adopted, at present only some brands andsectors can afford to enter the LOHAS market, especiallythe prestigious fashion industry that holds high commercialgains by benefitting from the first mover advantage.
Sustainability in supply chains is not easily measurable, asit comprises both quantitative economic aspects, and alsoqualitative and quantitative aspects (such as environmen-tal friendliness and social equity compliance). Moreover,the evaluation of a supply chain must also embrace the di-rect and indirect manufacturing processes, which might haveconsiderable impacts on the overall performance. Finally,even if a company has evaluated a supply chain for a selectedproduct, the extrapolation of the results to other productsor different supply chains must not be taken for granted atall.
Various projects address the task of assessing the sustain-
ability of a supply chain. Eco IndexTM
[7] is based onqualitative principles and management practices and is tobe used as an educational tool. Considered Design [5] of-fers a tool employing a numeric scoring system. However,Considered Design is and input oriented method, meaningthat the material types are rated according to their environ-mental performance. Although the rating of the materials isbased on Life Cycle Assessment – at least in part – the tooldoes not reflect a LCA approach.This reduces the accuracyof the tool. Furthermore, Considered Design does not eval-uate the entire product supply chain, including packagingor transportation but rather focus on preselected hot spots.Intertek also offers a tool that allows to compute the LCAof a supply chain [1] as well as the Vision 21project of TheCotton Foundation managed by Cotton Incorporated, Cot-ton Council International and The National Cotton Council,in the context of which PE Americas conducted an analysison the supply chain of Levi’s 501 R© jeans model.
We remark that all of these approaches start from an ex-isting supply chain to measure its performance. When one
138
leaves the supply chain designer free to choose among al-ternatives, in order to design a “best-compromise” supplychain the problem might rapidly become unwieldy, as thecomplexity of the supply chain grows. A simple chain madeby only 10 steps, where there are at least two alternatives foreach step, has a total of 210 (1024) possible configurations,and this number can easily become larger for typical supplychains in the clothing sector, even for a simple garment suchas a shirt.
Therefore, the supply chain manager needs a tool to (re-)evaluate supply chain options with respect to sustainabilityimprovement potentials and to base improvement actions ona solid ground. The required data has to be obtained fromthe textile industry suppliers who, in exchange, are offeredthe possibility to benchmark their processes with other man-ufacturers in the same product and process category. As aresult, the textile company will be able to provide its cus-tomers with reliable and transparent information on the sus-tainability performance of its products.
We identify the need for a new type of software product wenamed EcoLogTex that provides support in designing andimplementing supply chains. The adoption and use of sucha tool is expected to let a company:
1. Maintain and increase an edge on its competitors basedon quality and environmental and social responsibility;
2. Provide consumers with accessible and transparent in-formation on the provenance of its products
3. Be in a better position in order to face future costinternalisation of their carbon footprint.
4. Manage the increased complexity brought in by con-sidering not only cost as the main objective to be min-imised.
In this paper we present the main concept of EcoLogTexand we have therefore structured the presentation as follows:first we describe the ongoing project aims and objectives,then we therefore structure the architecture of the variouscomponents that make EcoLogTex: the benchmarker, thesupply chain designer and the reporter. Finally we reporton the current state of the implementation and we describethe next tasks and challenges we are facing.
2. THE PROJECT AIMS AND OBJECTIVESThis project aims to deliver a web-based software applica-tion, named EcoLogTex, for the“sustainable design” of thesupply chain of textile and apparel companies. The keyidea is to integrate Life Cycle Assessment (LCA) in eachstep of the supply chain in order to add the environmentalperspective when designing an efficient supply chain. TheLife Cycle Assessment methodology will allow specifying allthe environmental impacts of the production and distribu-tion processes related to the product distributed down tothe shelf of a shop. As the uncertainty of LCA data is sig-nificantly higher than the one associated with traditionalmeasures such as costing and timing, the software applica-tion will use a set of stochastic optimisation techniques in
order to select the most efficient alternatives for the designof the supply chain.
The main components of EcoLogTeX are:
1. The EcoLogTex benchmarker is a web-based softwareapplication in which suppliers (of goods, of processes,of services) enter the relevant data for their productsand services attracted by the gains in competitivenessas suppliers to the textile company and thus fill thedata for a holistic supply chain evaluation. The sup-plier has two advantages in using the tool: first, it canqualify as a potential supplier for the textile company;second, it obtains a quick check of its “sustainabilityperformance” in comparison to its competitors, leadingto an even higher quality of their offer.
2. The EcoLogTex supply chain designer is a stand-alonesoftware application for the design of sustainable sup-ply chains. The tool can explore the potentially verycomplex current and alternative supply chain situa-tions and identify the space for design alternatives,based on the background data from the ecoinvent database[6] but also specific supplier data from the EcoLog-Tex benchmarker. This allows for continuous improve-ments towards a sustainable supply chain.
3. The EcoLogTex reporter is a stand-alone software ap-plication for producing reports to be published on thecompany website regarding its supply chain sustain-ability. It uses the data provided by the suppliers andconfirmed by an independent party (e.g. the ecoinventdatabase).
Also, we expect a positive side-effect of the project: asthe use of the EcoLogTex benchmarker will spread, moreanonymised data will be collected on each type of processand product. Non-governmental organisations can thereforebenefit from this wealth of data. For instance, the ecoinventdatabase, which provides industry and research with life cy-cle inventory data required to assess processes with respectto their life cycle ecological impact is known as provider ofthe worldwide most comprehensive data base. However, astextile processes are not included in the database by now, theEcoLogTex project will contribute to the database consider-ably. In future, the data gathered will be serving companiesin the textile sector in Switzerland and worldwide that wantto implement a green supply chain for their products.
2.1 The benchmarkerThe EcoLogTex benchmarker is a web-based software appli-cation in which suppliers (of goods, of processes, of services)enter the relevant data for their products and services. Thesupplier has two advantages in using the tool: first, it canqualify as a potential supplier for the textile company; sec-ond, it obtains a quick check of its sustainability performancein comparison to its competitors, leading to an even higherquality of their offer. At the same time, the benchmarkeruses the data obtained from the suppliers to compute the en-vironmental impact assessment indicators that will be usedby the supply-chain designer to explore alternative produc-tion designs
139
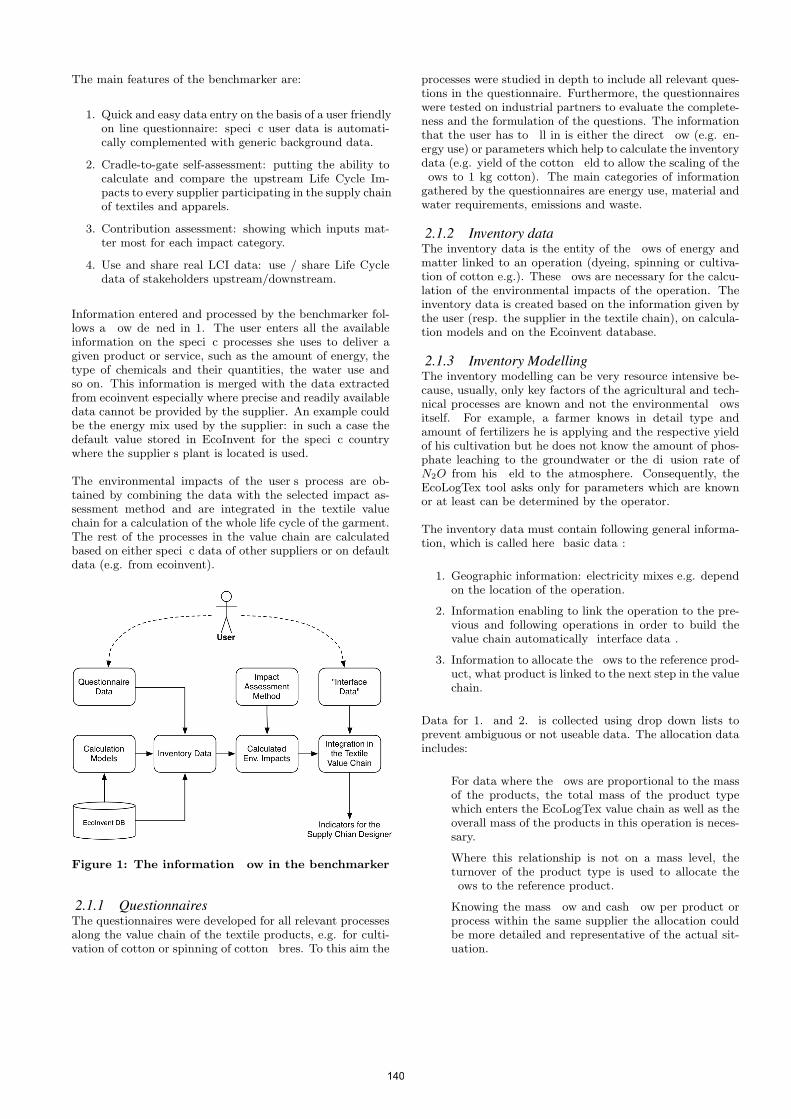
The main features of the benchmarker are:
1. Quick and easy data entry on the basis of a user friendlyon line questionnaire: speci�c user data is automati-cally complemented with generic background data.
2. Cradle-to-gate self-assessment: putting the ability tocalculate and compare the upstream Life Cycle Im-pacts to every supplier participating in the supply chainof textiles and apparels.
3. Contribution assessment: showing which inputs mat-ter most for each impact category.
4. Use and share real LCI data: use / share Life Cycledata of stakeholders upstream/downstream.
Information entered and processed by the benchmarker fol-lows a �ow de�ned in 1. The user enters all the availableinformation on the speci�c processes she uses to deliver agiven product or service, such as the amount of energy, thetype of chemicals and their quantities, the water use andso on. This information is merged with the data extractedfrom ecoinvent especially where precise and readily availabledata cannot be provided by the supplier. An example couldbe the energy mix used by the supplier: in such a case thedefault value stored in EcoInvent for the speci�c countrywhere the supplier� s plant is located is used.
The environmental impacts of the user� s process are ob-tained by combining the data with the selected impact as-sessment method and are integrated in the textile valuechain for a calculation of the whole life cycle of the garment.The rest of the processes in the value chain are calculatedbased on either speci�c data of other suppliers or on defaultdata (e.g. from ecoinvent).
Figure 1: The information �ow in the benchmarker
2.1.1 QuestionnairesThe questionnaires were developed for all relevant processesalong the value chain of the textile products, e.g. for culti-vation of cotton or spinning of cotton �bres. To this aim the
processes were studied in depth to include all relevant ques-tions in the questionnaire. Furthermore, the questionnaireswere tested on industrial partners to evaluate the complete-ness and the formulation of the questions. The informationthat the user has to �ll in is either the direct �ow (e.g. en-ergy use) or parameters which help to calculate the inventorydata (e.g. yield of the cotton �eld to allow the scaling of the�ows to 1 kg cotton). The main categories of informationgathered by the questionnaires are energy use, material andwater requirements, emissions and waste.
2.1.2 Inventory dataThe inventory data is the entity of the �ows of energy andmatter linked to an operation (dyeing, spinning or cultiva-tion of cotton e.g.). These �ows are necessary for the calcu-lation of the environmental impacts of the operation. Theinventory data is created based on the information given bythe user (resp. the supplier in the textile chain), on calcula-tion models and on the Ecoinvent database.
2.1.3 Inventory ModellingThe inventory modelling can be very resource intensive be-cause, usually, only key factors of the agricultural and tech-nical processes are known and not the environmental �owsitself. For example, a farmer knows in detail type andamount of fertilizers he is applying and the respective yieldof his cultivation but he does not know the amount of phos-phate leaching to the groundwater or the di�usion rate ofN2O from his �eld to the atmosphere. Consequently, theEcoLogTex tool asks only for parameters which are knownor at least can be determined by the operator.
The inventory data must contain following general informa-tion, which is called here � basic data� :
1. Geographic information: electricity mixes e.g. dependon the location of the operation.
2. Information enabling to link the operation to the pre-vious and following operations in order to build thevalue chain automatically � interface data� .
3. Information to allocate the �ows to the reference prod-uct, what product is linked to the next step in the valuechain.
Data for 1. and 2. is collected using drop down lists toprevent ambiguous or not useable data. The allocation dataincludes:
� For data where the �ows are proportional to the massof the products, the total mass of the product typewhich enters the EcoLogTex value chain as well as theoverall mass of the products in this operation is neces-sary.
� Where this relationship is not on a mass level, theturnover of the product type is used to allocate the�ows to the reference product.
� Knowing the mass �ow and cash �ow per product orprocess within the same supplier the allocation couldbe more detailed and representative of the actual sit-uation.
140

2.1.4 Calculating the environmental impacts of a sup-plier
The database of the tool contains:
1. questionnaires;
2. ecoinvent processes and elementary �ows;
3. LCI results;
4. environmental impact calculated through the LCIAmethod� s factors.
When completed, the inventory data is combined with theenvironmental assessment methods to calculate the environ-mental impacts of the operation/process. This means thatall �ows of the inventory are multiplied with the correspond-ing �gures of the environmental assessment methods to ob-tain the overall environmental impacts of the process. Thetechnology �ows like fertilizer production can be multipliedwith calculated results with the same environmental impactmethod from the ecoinvent database, whereas �ows to orfrom nature are calculated directly with the environmentalimpact method. For example, the ecoinvent database is usedto assess the greenhouse gas intensity of chemical produc-tion according to the IPCC 2007 method; for the methaneemissions, the IPCC 2007 gives directly the CO2-equivalent�gure. The EcoLogTex tool uses the classi�cation scheme ofthe ecoinvent database in order to classify and match both,the LCI exchanges and their associated impacts stored inan impact table. The impact table includes all required en-vironmental impacts for all inventory �ows available fromecoinvent classi�ed into (i) exchanges from and to natureand (ii) technosphere processes. By linking the �ows (e.g.electricity requirements) of the user with ecoinvent resultsfrom speci�c datasets (e.g. global warming potential resultsfrom grid electricity in a speci�c country), the database cal-culates the impacts of the user� s operation.
2.2 The supply chain designerThe EcoLogTex supply chain designer is a stand-alone soft-ware application for the design of sustainable supply chains.The tool can explore the potentially very complex currentand alternative supply chain situations and identify the spacefor design alternatives, based on the background data storedin the Ecoinvent database and from the EcoLogTex bench-marker. This allows for continuous improvements towardsa sustainable supply chain. In detail, the EcoLogTex sup-ply chain designer will be based on a mathematical pro-gramming model for the supply chain design problem witha multi-objective cost function covering environmental andsocial indicators together with economical ones. The toolwill use techniques from stochastic and robust optimizationto explore the complex combinatorial space de�ned by themodel. Such a space covers all the possible feasible alter-native choices to be taken in the logistic supply chain. Theoutput of the tool will be represented by a set of supplychain solutions that constitute the Pareto front according tothe weights assigned to the di�erent indicators considered inthe objectives of the optimization problem.
The tool will internally represent the supply chain prob-lem as a directed multi-graph G = (V, A), where V rep-
resents the set of all possible alternative resource sites, al-ternative processes@processing sites, warehouses and �naldestinations, and A is the set of the possible transportationalternatives between the sites (V ). Models based on simi-lar ideas can be found in [2], [3],[4]. In Figure 2, where apartial supply chain is presented, the factories, clews andsheep would be the set V, while arrows would be the set A.Notice that the �nal part of the supply chain is missing inthe �gure. It is also important to stress that in the �gurethere is not factory with alternative processes options: insuch a case there would be overlapping factories at a samelocation.
Figure 2: A partial supply chain.
Indicators covering both socio-environmental and economicparameters are associated with both nodes and arcs of G.According to these parameters the tool will build up a math-ematical programming model and carry out the optimizationprocess.
2.2.1 InputIn order to feed our model, we will require the followingdata:
� For each node v � V , a socio-environmental indicatoris required. It is a score about the operations at thesite associated with the node v is. For some types ofnodes, the indicator might be 0 (e.g. a warehouse).
� For each node v � V , an economic indicator is re-quired. It is the cost of the operations carried out onthe goods at the site associated with the node v is.
� For each arc a = (v, w) � A, a socio-environmentalindicator is required. It is a score about the trans-portation between the sites associated with the nodesv and w.
� For each arc a = (v, w) �A, an economical indicator isrequired. It is the cost of the transportation betweenthe sites associated with the nodes v and w.
� Some weights measuring the importance of the di�er-ent families of indicators. Changing these weights theuser will be able to produce di�erent solutions (e.g.more environmental-friendly, more economical).
141

2.2.2 OutputThe tool will provide in output a set of supply chain al-ternatives that are Pareto optimal according to the inputparameter. The decision maker will have the task to choose,among the alternative solutions provided by the tool, theone most suitable to her/his needs.
2.2.3 CommentsNotice that for a pair of nodes in V , there might actuallybe different alternative transportation options (rail, air1,air2, ship, etc). This means the graph G can actually bea multi-graph. In our model, indicators can be representedas numbers (e.g. 14), intervals of values (e.g. [14, 21]) orprobabilistically (e.g. average 14.2, standard deviation 2.4)to represent uncertainty common to real processes. Someindicators can be aggregated, e.g. covering a set of con-nected nodes of G (sheep/clew). We will have to deal withmissing/incomplete data
2.3 Conclusions and RecommendationsIn this paper, we have described the aims of the EcoLog-Tex project, which is expected to deliver a set of tools forthe analysis and design of supply chains in the textile sec-tor from a sustainability point of view. The idea is to useLCIA to compute the environmental impact of the variousprocesses and material flows in the supply chain related toa textile product and to use such impacts in the calculationof alternative designs for the implementation of the sup-ply chain, integrating them with cost and time performanceindicators. Thanks to this approach, it will be possible torun the sustainability assessment of a supply chain ”ex-ante”rather than ”ex-post”, thus allowing textile companies tobetter focus their effort in the difficult task of maximisingtheir environmental performance, while keeping the costsat a reasonable level. The EcoLogTex project is currentlyunder way, and, as of writing this paper, we have laid outthe database structure, started the implementation of theLCI flows and then of the assessment impact of the LCIflows. At the same time prototypical versions of the supplychain design tools are being implemented. It is thereforetoo early for us to be able to provide recommendations toour readers, but we have some expectations, which we be-lieve are reasonable and well founded. In particular, we seethe clear advantage of making as much information aboutLCA as possible available to all the participant in a supplychain. It is thanks to the ability of the supplier to comparehis/her own performance against competitors that we canstimulate improvement and considerable reductions in theuse of resources and in the impact on the environment. Atthe same time, we believe that the complexity of designingenvironmentally-friendly products considering all aspects ofsustainability is a task of ever increasing difficulty that canbe challenged only by the use of ICT tools such as the onewe propose in this paper.
3. ACKNOWLEDGMENTSThis research is supported by the Commission for Technol-ogy and Innovation of the Federal Department of EconomicAffairs of the Swiss Confederation, project number 12400.1PFES-ES.
4. REFERENCES
[1] Intertek. Instant LCA web portal for textile andfootwear, 2012.
[2] R. Montemanni, J. Barta, M. Mastrolilli, andL. Gambardella. The robust traveling salesman problemwith interval data. Transportation Science,41(3):366–381, 2007.
[3] R. Montemanni and L. Gambardella. The robustshortest path problem with interval data via bendersdecomposition. 4OR, 3(4):315–328, 2005.
[4] R. Montemanni, D. Smith, A. Rizzoli, andL. Gambardella. Sequential ordering problems for cranescheduling in port terminals. International Journal ofSimulation and Process Modelling, 5(4):348–361, 2009.
[5] Nike Inc. Nike considered design, 2010.
[6] Swiss Centre for Life Cycle Inventories. Ecoinventcentre, 2012.
[7] The Outdoor Industry Association & EuropeanOutdoor Group. Tools to help navigate the journeytoward product sustainability.
[8] A. Tukker, G. Huppes, J. Guinee, R. Heijungs,A. de Koning, L. van Oers, , S. Suh, T. Geerken, andP. Nielsen. Environmental impact of products (eipro).Technical Report EUR 22284 EN, Institute forProspective Technological Studies, Joint ResearchCentre, European Commission, 2006.
142

Incentives for Inter-Organizational Environmental
Information Systems
Hans Thies1,2
, Katarina Stanoevska-Slabeva2
1SAP Research, Blumenbergplatz 9, 9000 St. Gallen, Switzerland
2MCM Institute, University of St. Gallen, Blumenbergplatz 9, 9000 St. Gallen, Switzerland
ABSTRACT Organizations word-wide are confronted with an increasing number of environmental requirements driven by social, legislative and competitive factors [33]. Since most of the required information to report and enhance environmental performance is located beyond organizational borders, firms need to exchange sustainability information within the supply chain. Inter-organizational environmental information systems (IO-EIS) promise to improve data availability, process flexibility, transparency, and costs [37]. In order to establish an IO-EIS in a particular industry, the solution provider needs to reach a critical mass of participants. Based on existing literature and the experience of five industry partners representing three use cases, this paper presents motives for organizations to participate in IO-EIS, and an incentive scheme to enhance quantity and quality of user contributions.
Keywords Sustainability, Incentives, Inter-Organizational Environmental Information Systems.
1. INTRODUCTION During the last decade, the awareness for safe and environmental friendly products has been growing constantly [35]. This changed economic background has led to many opportunities for the participating organizations. Nevertheless, companies are also challenged in numerous ways. Apart from normative pressures, social, legislative [5] and competitive [33] factors drive the need for exchanging sustainability information within the supply chain.
Social environmental awareness is an important driver for companies to extend their responsibility for products and make sure they are environmental friendly [2]. Besides maximizing short-term profit, organizations are increasingly being held accountable for their impacts on society and environment [34]. More and more environmental directives have been passed during the last years, the majority in the European Union (EU). Companies can expect that in the near future, stricter regulations are to be enacted worldwide [31]. The positive financial impact of environmental improvements has been outlined by a plethora of authors [3]. Inter-organizational environmental information systems (IO-EIS) are information systems for the exchange of environmental information throughout the supply chain. IO-EIS promise manifold benefits to the participating organizations, including better data availability, higher flexibility of the involved processes, increased data transparency and improved efficiency [37]. Similar to many innovations with positive network externalities, IO-EIS are hard to establish as they require a certain number or critical mass of participants and content on the network [32, 36]. This results in a first-mover problem, since the first participants have costs for joining the network while on the other hand the benefits are still low. Therefore it is of utmost importance for the network provider to make the IO-EIS attractive by identifying the motives of the potential participants to join the network & contribute environmental content. Incentives can specifically be designed based on these motives. In the following sections, organizational motives to join IO-EIS & contribute content are identified, potential incentives are described, and finally an incentive scheme for IO-EIS is introduced.
2. METHODOLOGY Based on a literature review presented in section three, the constructs extracted were presented to focus groups including environmental experts from five large European enterprises: a German solution provider, a German Technology Conglomerate, a Finish elevator manufacturer, a Finish research center, and a Swedish network provider. The concept of IO-EIS and prominent use cases are described in section four. Leveraging the focus groups, the concepts and their transferability to IO-EIS were discussed. The results served to identify relevant motives and the according incentives for IO-EIS as presented in section five. Finally the concept of an incentive scheme for IO-EIS is presented in section six. Section seven concludes. ICT4S 2013: Proceedings of the First International Conference on
Information and Communication Technologies for Sustainability, ETH Zurich, February 14-16, 2013. Edited by Lorenz M. Hilty, Bernard Aebischer, Göran Andersson and Wolfgang Lohmann. DOI: http://dx.doi.org/10.3929/ethz-a-007337628
143

3. RELATED WORK 3.1 Inter-Organizational Environmental Information Systems In the context of Business-to-Business (B2B) networks, the exchange of data can be based on three types of relationships among involved parties and respective information systems:
One-to-one: Companies within the supply chain communicate directly, without any arranging topology. This implies that for every connection, the communication standard as well as the content has to be defined. The automation capability as well as the degree of freedom is very high, while the costs are very high as well.
One-to-many: A logical topology where one company facilitates all its business partners to communicate within a common architecture (“enterprise-centric architecture”). This simplifies communication for the company providing the infrastructure, but not necessarily for its business partners, as long as other systems are in use within the industry. Furthermore, the scalability is limited [26].
Many-to-many: A logical topology where all business partners use a common architecture based on a hub-and-spoke layout (“network-centric architecture”). This enables best flexibility, scalability at lowest costs, and new network enabled capabilities [24]. On the other hand the lock-in costs are very high and on-boarding/ privacy issues become prevalent.
IS for business networks, also often referred to as collaborative supply chain systems, use the exchange of information as a mean to reduce information asymmetries [28] and facilitate common decisions [12] for the benefit of the entire supply chain. The collaboration type can be distinguished by the mechanisms of the IS (adapted from [23] and [28]):
Information integration: Required to remove information asymmetries within supply chains. Relevant is any data that can influence the performance of the supply chain. The information should be available real-time at low costs [23]. A popular example is point-of-sale data or inventory data.
Resource coordination: The partners plan jointly and split competencies, e.g. by the means of collaborative planning, forecasting and replenishment (CPFR, [15]).
Process integration: The partners use common resources and integrate and streamline their processes. This can be done by the means of contracts and/or revenue sharing [6].
These IS can also be used in order to invent completely new business models [23]. Which type of collaboration is suitable for a certain situation depends on the participants, their relations and the goal(s) of the collaboration. [29] give a summary of factors that enable supply chain collaboration. The most commonly mentioned factors are presented in the following:
1. Mutual trust is the facilitating factor for all network initiatives [21]. This holds for every management level and functional area [29]. Trust is a key enabler for mutual help and therefore also for collaboration.
2. Intellectual property should be respected, and private information should only be accessible by authorized users (Finch 2004), while an efficient diffusion of knowledge has to be granted [13].
3. Common interests/ goals are necessary in order to ensure all participants work together in every buyer-seller relationship [11]. The expectations and network roles should further be communicated clearly.
4. Value proposition for all participants means that all network members should benefit, if possible equally, from participating [30].
5. Technology is necessary as an enabler for next generation networks. The ubiquitous internet technologies have enabled the low-cost, standardized exchange of real-time information and collaboration which can be used by the ordinary/non-technical business user [23].
3.2 Incentives A motive has been defined as the psychological disposition of an individual [22]. The activation of a motive takes place under certain conditions and causes a particular behavior. This can be triggered by internal motives (e.g. a desire) or external incentives (e.g. a payment), also referred to as intrinsic or extrinsic motivation respectively [10]. Therefore, incentives should be based on motives in order to activate a certain behavior [25]. Following [10], motives can be distinguished into intrinsic motives and extrinsic motives. As stated by [17], some organizations seek to fulfill other goals besides maximizing shareholder profits. These goals are oriented at the entrepreneur’s values and include the “well-being of other members of his organization and his fellow citizens” [17]. Due to the drastic impact on humankind, environmentally sustainable operation is one of the key challenges that society faces today. Therefore, ethical considerations can be an intrinsic motivation for organizations to improve their environmental impact by joining and strengthening IO-EIS. A number of authors are describing incentives for taking part in content-based IS. Organizations can expect direct payoffs from joining such networks. In the case of IO-EIS, these include the above mentioned process improvements of better data availability, flexibility, transparency, and efficiency. Depending on the business model, there could also be direct monetary compensations for joining the network, e.g. the solution owner could employ a referral bonus system [20] where Original Equipment Manufacturers (OEMs) get a compensation for onboarding their suppliers. During the process of establishing the network, and even after reaching a critical number of participants, a continuous stream of high quality content has to be ensured in order to maintain users and motivate further participation [14]. The motives for content contribution are therefore analyzed separately. [38] have analyzed how individual motives and social capital influence users to share information in communities of practice. They study the following factors: reputation, enjoyment, network centrality, expertise, tenure commitment and reciprocity. They find reputation, enjoyment, network centrality and expertise to be statistically significant influencers of knowledge contribution. [27] identify factors that motivate users to contribute resources to P2P networks including rewards, personal need, altruism, reputation, liking, and affiliation and propose application features to stimulate resource contribution. They do not specify the type of
144

tangible reward provided, but list monetary rewards, discount rates for subscription or purchase, bonus points for prize remedy and value-adding service. Furthermore they suggest an individual identity and profile generation to promote sub-community building, and peer recommendations in order to evaluate contributions to the network. [14] elaborate on a number of incentives for community contribution, and based on that build an incentive system for a social networking site in a business context. They suggest including features that provide rewards, explain the benefit for the community, set specific individual goals, provide reputation, and provide and illustrate a self-benefit. When incentivizing user contributions, [7] highlight that the quality of the contributions has to be controlled: A high amount of low quality contribution can lead to information overload which makes users leave the community. [25] elaborate on the motive of participants in Information Technology (IT)-based ideas competitions. They identify the following motives: learning (access to different types of knowledge), direct compensation (prizes and career options), self-marketing (profiling options), and social motives (appreciations by organizers and peers). Table 1 summarizes the motivation constructs in content-based IS as outlined above.
Table 1. Motivation constructs in content-based IS
Paper Focus Motives
Leimeister et al. 2009
Ideas Competitions
Learning, direct compensation, self-marketing, social motives
Farzan et al. 2008
Enterprise social networks
Rewards, community benefits, goal setting, reputation, self-benefit
Wasko & Faraj 2005
Communities of practice
Reputation, enjoyment, network centrality, expertise
Lui et al. 2002 P2P networks
Rewards, personal need, altruism, reputation, liking, affiliation
Cheng & Vassileva 2006
E-learning communities
Rewards, reputation, goal setting, community
4. INTER-ORGANIZATIONAL ENVIRONMENTAL INFORMATION SYSTEMS In general, organizations integrate environmental performance indicators (EPIs) into a sustainability framework also comprising social and financial indicators. This work specifically focuses on environmental indicators but can easily be extended to other sustainability indicators. IO-EIS have the main purpose to efficiently exchange environmental information in the supply chain, but they also integrate and describe different external data sources, provide functionality for diverse use cases, and enable analytics and community-building on top of that. All use cases have in common that they facilitate the exchange of EPIs. EPIs are quantitative and qualitative indicators that describe the environmental performance of products, services, or organizations in certain dimensions. Typical use cases are environmental compliance, sourcing and procurement, design for environment, green logistics and sustainability reporting of which the following section will describe the first three.
4.1 Use Cases Environmental product compliance is the first step in the environmental strategy of product manufacturers as non-compliance with regulations can lead to significant consequences such as fines, restrictions, and product bans. Environmental legislation is growing in number, scope, and complexity [31]. Product manufacturers which operate globally face the problem of differing regulation worldwide. Prominent examples are the legislations REACH and RoHS. The European Commission’s (EC) Directive on Registration, Evaluation, Authorization and Restriction of Chemicals (REACH) requires all companies that import or produce chemical substances into the European Union in quantities of one ton or more per year to register these with the EC. It also requires companies to report if their products contain more than 0.1% of substances of very high concern (SVHC). The production and sale of these products may be limited or prohibited within the EC, if the company does not manage to find a substitute for the SVHC within a limited time period. EC’s Directive on the restriction of the use of certain hazardous substances in electrical and electronic equipment (RoHS) is a directive to control the use of six hazardous substances in products and components. The list of restricted materials now includes lead, mercury, cadmium, hexavalent chromium, polybrominated biphenyls and polybrominated diphenylether, but may be extended later. Following the EC’s example, many governments have started to implement similar legislation, but including other substances and/or limits. Most environmental legislation is based on the principle of producer responsibility, while the reasons for non-compliance may happen upstream in the supply chain. As a consequence, product manufacturers need to
Identify which regulation worldwide affects their products, and which substances and processes are regulated, as well as the corresponding limits.
Analyze the substances and processes used for their products. Typically most of the manufacturing processes occur upstream, so the manufacturers need to collect the information from their 1st tier suppliers and make sure those include the information from the 2nd tier suppliers, and so on.
Take corrective action (e.g. find a substitute), if necessary.
Most problems that the manufacturers face today are related to the collection of data throughout the supply chain. Until today, product compliance in many companies is handled by using spreadsheet and email-based solutions, which have proven to be highly inefficient [5]. A plethora of different formats and standards are in use, and these are exchanged either using enterprise-centric systems, where one organizations has established a system where all its suppliers and stakeholders can submit or access data, or the process is based on one-to-one communication channels, such as email or EDI, even though email has proven highly inefficient and the entry costs for most small and medium-sized companies are too high in the case of EDI [16]. Typical response rates with classical means are between 5 and 10% [36]. All other data has to be collected manually, e.g. by material experts and consultants, with the corresponding high costs. From the supplier side, duplication of work is further engraved by the fact that different companies ask for different material content: Some companies require a full product declaration, others ask for materials included in a particular
145
substance list and finally some companies are satisfied by binary compliance statements. The goal of sustainable sourcing and procurement is to decrease the environmental impact across the product life cycle. This is achieved via including EPIs in benchmarking of suppliers of the same material with regards to specific EPIs and in purchasing decisions, in particular for materials with high business and environmental leverage. Within sourcing and procurement, environmental information already plays a role in supplier management, material compliance and environmental assessments. Supplier management includes the evaluation of suppliers against several criteria such as quality, service, and financial aspects. Annual supplier evaluations typically follow an explicit program that includes setting performance categories and their weights, supplier scoring, and improvements. Environmental criteria are also part of this evaluation process, however they mostly comprise binary requirements that have to be fulfilled, e.g. existence of a certified environmental system, energy reduction programs, etc. This information is usually collected via questionnaires. Because the questions are yes/no questions that all accepted suppliers have to meet, different suppliers of the same product are not differentiated in their environmental performance. In order to really differentiate suppliers by their environmental performance, organizations should include quantitative EPIs in their supplier selection processes. Evidently, these EPIs should be integrated in a process leveraging quality, cost, and sustainability KPIs. The operational procurement function has the responsibility of carrying out the purchasing activities of a specific division, e.g. product line or business unit. When ordering a material from one of the preferred suppliers, the purchasing division should again include environmental KPIs amongst others in order to achieve the overarching goal of environmental improvements. In order to ensure maximum impact, the focus should be on high-leverage materials with [9]:
Relatively high purchase volume
High environmental impact per functional unit
Potentially high level of supplier differentiation. Design for Environment (DfE) is a general concept that refers to a variety of design approaches that attempt to reduce the overall environmental impact of a product, process or service across its life cycle. Based on product and process data, the environmental impacts of different alternatives have to be calculated and compared. DfE deals with several topics like environmentally- conscious manufacturing, design for disposal, and packaging related topics. Besides the identification of weak points of a solution and the comparison of alternatives, the tradeoff between decisions in different life cycle phases has to be investigated. The goal is to identify the design alternatives within the product lifecycle that can enable environmental impact reduction at minimal additional costs. This is achieved via including EPIs in the comparison of design alternatives. Life Cycle Assessment (LCA) is a part of the comparison and the following processes address two major process steps of LCA:
Data inventory analysis (collecting data, calculation, allocation)
What-if-scenarios as part of life cycle interpretation. The calculation of the environmental impact of products and processes is usually based on unit processes and activity data. The activity data is the data of the actual activity or process
quantifying an environmental impact. This can be data which directly measures the activity, such as the CO2 emissions related to a particular component, or data that can be used to determine the activity or its impact, such as the weight of a material used in the production of a product. Unit processes leveraging suitable conversion factors are used to relate the measured activity to the actual impact, such as a quantification formula that determines the CO2 emissions per kg of a certain material. There is a hierarchy of different types of activity data that can be used; as a general rule, companies should apply the following hierarchy of data types in collecting data of organizational accounting:
Primary data are direct emissions measurements or activity data. Companies should obtain the most product-specific data available. Primary data can be further classified in product-level data, process-level data, facility-level data, business unit-level data, and corporate-level data.
Secondary data are data that are not collected from specific sources within a company's operations or its supply chain. Secondary data include industry-average data, data from literature studies, and data from published databases.
Extrapolated data are primary or secondary data related to a similar (but not representative) input, process, or activity to the one in the inventory, which are adapted or customized to a new situation to make it more representative (for example, by customizing the data to the relevant region, technology, process, temporal period and/or product).
Proxy data are primary or secondary data related to a similar (but not representative) input, process, or activity to the one in the inventory, which are directly transferred or generalized to the input, process, or activity of interest without being adapted or customized to make more representative.
Data type 3 and 4 are estimation methods to fill data gaps. Similar to the other two use cases, the main challenge is the collection of data across organizational boundaries. In particular, primary data is only available directly from the supplier of the material or component. Therefore, many companies today use average values to determine the impact of a material which significantly deteriorates the accuracy of the results.
4.2 Requirement and features of IO-EIS Regardless of the specific use-cases supported, IO-EIS share a number of features. Requirements of IE-EIS have been described by [37]. They suggest that the general layout should be divided into a resource layer, a platform layer, and an application layer. The resource layer is composed out of relevant external resources, such as environmental databases, governmental sources for legislation, or third party data. This data is stored as EPIs in the platform layer leveraging an EPI description language. The EPI description language stores the main constructs and relations of the environmental content and allows representing the EPIs in a machine-readable way. Based on the environmental data, the platform services provide functionality to access and manipulate the data, such as add and manipulate EPIs and other relevant entities. These services can be accessed using the platform API (e.g. RESTful API) by external applications as well as by the application layer. All organizations will use the same instance of the platform, allowing them to easily share and access EPIs
146

throughout the supply chain. The application layer provides functionality for the actual use cases, e.g. accessible via web browser, mobile devices, or integrated in a backend system. Analytic capabilities provide a main value proposition of IO-EIS: Based on anonymized data, organizations can benchmark their EPIs with industry peers and averages. Adequate communication channels support community building. For maximum flexibility, the system should facilitate collaboration by adequate channels, such as push mechanisms (messaging) and pull mechanisms (forums, task marketplaces). The community can support establishing de-facto standards and industry practices. Furthermore, expert users can help by providing quality ratings for less experienced users. Figure 1 illustrates the main layers and components of an IO-EIS as described.
Figure 1: IO-EIS components
Appl
icat
ion
Plat
form
Res
ourc
es
Environmental databases
3rd partyservices
Other datasources
RESTful API
Product:
Customer
Service Integration Layer Adaptation Layer
EPIs EPI descriptionlanguageService runtime
Platform services
Application Components
Community
Analytics
User interface Mobile/ widget Backend
5. INCENTIVES FOR IO-EIS Based on the identification of motives, there are a number of features and functionalities that the system should inherit. Due to the nature of the environmental content that is required, there are a number of additional requirements which have to be considered. Functionality to encourage organizations to join the network, contribute content to the network, and rate content on the network has to be distinguished. According to [17], the socially responsible entrepreneur has a concern for improving his impact on society and the environment. Therefore, this intrinsic motive should be leveraged by providing tools to improve the organization’s environmental sustainability. On the other hand, there are a number of processes which the organization has to execute for performing its core business, including sourcing & procurement, compliant product design, and reporting processes. Organizations aim at performing these processes based on as much high quality information as possible, while keeping the time and costs for collecting this information low. Their goal is to increase process quality, which the system can help with by offering data & functionality supporting specific tasks. At the same time, organizations seek to increase process efficiency, which an IO-EIS can facilitate by dramatically decreasing the number of required interactions [37]. In order to enable participants to pursue effective sustainability marketing, it would
help if the IO-EIS can establish a branding in the sustainability domain, and integrate well-known non-governmental organizations (NGOs). The motive of organizational learning can be activated by providing extensive data from various environmental databases as well as connecting the community in order to exchange best-practices. Communication and community features can tie in supply chain partners and therefore enable networking within the chain. As organizations seek to determine their position within competition, benchmarking features with industry averages and best-in-class provide substantial incentives to join the network. Table 2 synthesizes the proposed incentives to encourage organizations to join the network as presented.
Table 2. Motives & Incentives for joining IO-EIS
Motive Incentive
Ethical Tools to improve environmental sustainability
Improved task fulfillment Task-specific functionality
Cost reductions Many-to-many network
Marketing Sustainability branding
Learning Data & community
Networking Communication features
Compare with competition Benchmarking features
Designing for enjoyment has been previously defined as key for IT artifacts. In particular, positive experience should be created by a user interface which promotes pleasure, enjoyment, and fun in order to enable user satisfaction [1]. The system should also be easy to use. Community-building features and designing for sociability is required to fulfill the desire of individuals to participate in communities. E.g. [4] have identified a number of principles that facilitate sociability in social software. Comparability within the community should also be enabled in order to facilitate an advantageous competition [14].
Table 3. Motives & Incentives for contributing in IO-EIS
Motive IncentiveEnjoyment User friendly user interface
Community Community building features
Low fees Reduce fees based on contributions
Customer satisfaction Sharing & communication tools
Reputation Reputation score & badges
Supplier evaluation score
Include contributions in supplier evaluations
Sophisticated functionality
Provide functionality based on contributions
Access to industry data Provide data access based on contributions
There are a number of incentives which could be offered based on the quantity and quality of contributions: These include reduced fees, the incorporation in (supplier) evaluations, extended
147

functionality, and extended access to industry data, e.g. for benchmarking purposes. Additionally, the motive to enhance customer satisfaction can be supported by offering suitable tools for sharing data and communicating with the customer [37].Reputation is mentioned as an important motive to stimulate user contributions [14, 27, 38], so the system should be able to compute a reputation score for the participants, and offer “badges” or “membership levels” in order to promote specific actions [8, 14]. Table 3 summarizes the incentives to encourage content contribution.
6. AN INCENTIVE SCHEME FOR IO-EIS 6.1 High-level concept Most incentives to join the network are related to a convincing value proposition, thus have to be implemented via comprehensive characteristics and functionality of the IO-EIS itself. The goal of the incentive system therefore focuses on enhancing user contributions. Based on the considerations presented in the previous sections, the reputation mechanism should encourage uploading up-to-date Environmental Performance Indicators (EPIs) in high quantity and quality and accurately rating user contributions. Consequently we propose to distinguish a reputation score for contributing EPIs and for rating EPIs, and provide additional incentives based on these two scores. Aspects of EPI quality have been previously defined, e.g. by the Global Resources Institute (GRI). Due to the high number of user contributions, it is impossible to employ enough resources to rate all content according to its quality. Depending on the commercial success, quality checks based on random sampling, such as the Continuous Sampling Plan 1 (CSP-1), may be applied [19]. Nevertheless, the majority of ratings will have to be done by the community. This is less problematic than in consumer networks, as many of the business users will indeed be domain experts. [8] present an adaptive incentive mechanism for contributing and rating content in an e-learning community which shares some of the features with the proposed mechanism. Due to the completely different context, the focus of their mechanism is to promote a certain number of user participations within a limited amount of time, while the focus of the proposed incentive scheme is to determine the quality of user contributions in order to promote quantity and quality of contributions. We suggest calculating a quality score for every EPI , based on all ratings for the EPI and the participating business user ’s historical rating expertise :
Based on all EPI quality scores of an organization, its overall content reputation score can be determined:
Whether organizations and business users have to be distinguished depends on the actual use case. Based on the deviation of all ratings of a business user from the EPI quality scores, his individual rating expertise score is calculated:
Before the rating is submitted, the user cannot see the EPI quality score. This prohibits a bias towards the displayed score as well as provides an additional incentive for rating. The aggregation of the rating deviations to a rating expertise score, as well as the
aggregation of the EPI quality scores to an overall content quality score can be done leveraging diverse algorithms [18]. Figure 1 depicts the basic functional principle of the proposed reputation system, which provides the basis for incentives such as further dissemination of the reputation, monetary incentives, incorporation in supplier evaluations, enhanced functionality, or access to a larger amount of industrial data.
Figure 1. Overview of the proposed rating scheme
Content Reputation
score
Rating Expertise
Score
EPI 1 Quality Score
EPI m Quality Score
Rating 1 on EPI 1
EPIs
Organizations
Rating n on EPI 1
Ratings
Deviation from EPI
Quality Score
6.2 Evaluation A first evaluation took place in a workshop including the five case companies. The motives and incentives were discussed as well as the proposed incentive scheme. Furthermore, a concept implementation based on a prototypical IO-EIS developed by the case companies was prepared and illustrated by mockups. Overall, the proposed incentive scheme was seen as a good enabler to enhance user contributions and EPI quality. However, a quantitative evaluation is still outstanding. The main statements of the evaluation workshop are summarized below:
The proposed incentive scheme has the potential to improve the overall data quality within the IO-EIS, although the information quality challenges in the use cases cannot be solved by technical means alone. It will require the involvement of industry and legislation to define unambiguous standards.
Incorporating the EPI quality scores and the overall content reputation score in supplier evaluations promises to be the most effective incentive for the sourcing and procurement scenario. Monetary incentives can mainly prove effective if they are integrated in the sourcing strategy. Discounts on the fees for the IO-EIS were seen less favorable.
Analytic capabilities such as benchmarking were seen as strong incentives for joining the IO-EIS. If access to industry benchmarking data is only enabled based on the content reputation score, this would also provide a strong incentive for contributing high quality EPIs.
The reputation scores and badges for contributing were seen as good individual incentives for the employee contributing the data, while no effect is expected on the organizational level.
It was consistently stated that the incentive scheme needs to be simple and user friendly. This is an important factor especially for smaller companies, as these usually do not have a designated person for any of the use cases.
148
7. CONCLUSION Based on a literature review and workshops with two focus groups including five European companies, relevant motives and incentives for IO-EIS were identified. These incentives propose an enhancement to the state of the art in the field of research of Green IS and also provide benefit for practitioners who seek to establish an IO-EIS, as to our knowledge similar research does not exist in this domain. Furthermore an incentive scheme for IO-EIS was developed based on these incentives. Future research will include a quantitative evaluation of the incentive scheme within the focus group companies.
8. ACKNOWLEDGMENTS We thank the industry participants for their input on the use cases (names omitted to preserve confidentiality), in addition to SAP Sustainability solution management for a fruitful collaboration. This work was partially funded by the European research project OEPI (Solutions for Managing Organizations’ Environmental Performance Indicators, 748735).
9. REFERENCES [1] Agarwal, R. and Karahanna, E. 2000. Time Flies When
You’re Having Fun: Cognitive Absorption and Beliefs about Information Technology Usage. MIS Quarterly. 24, 4 (2000), 665–694.
[2] Amacher, G.S. et al. 2004. Environmental quality competition and eco-labeling. Journal of Environmental Economics and Management. 47, 2 (Mar. 2004), 284–306.
[3] Van Beurden, P. and Gössling, T. 2008. The Worth of Values – A Literature Review on the Relation Between Corporate Social and Financial Performance. Journal of Business Ethics. 82, 2 (Aug. 2008), 407–424.
[4] Bouman, W. et al. 2007. The Realm of Sociality: Notes on the Design of Social Software. Proceedings of the International Conference on Information Systems (ICIS) (Montreal, Canada, 2007).
[5] Butler, T. 2011. Compliance with institutional imperatives on environmental sustainability: Building theory on the role of Green IS. The Journal of Strategic Information Systems. 20, 1 (2011), 6–26.
[6] Cachon, G.P. and Lariviere, M.A. 2005. Supply Chain Coordination with Revenue-Sharing Contracts: Strengths and Limitations. Management Science. 51, 1 (Jan. 2005), 30–44.
[7] Che, Z. et al. 2010. A Supplier Selection Model for Product Design Changes. International Journal of Electronic Business. 8, 1 (2010), 20–30.
[8] Cheng, R. and Vassileva, J. 2006. Design and evaluation of an adaptive incentive mechanism for sustained educational online communities. User Modeling and User-Adapted Interaction. 16, 3-4 (Sep. 2006), 321–348.
[9] Dada, A. et al. 2010. Towards Continuous Environmental Improvements across the Product Life Cycle. 16th Americas Conference on Informaction Systems (Lima, Peru, 2010), 9.
[10] Deci, E.L. and Ryan, R.M. 1985. Intrinsic Motivation and Self-Determination in Human Behavior. Plenum Press.
[11] Dwyer, F.R. et al. 1987. Developing Buyer-Seller Relationships. The Journal of Marketing. 51, 2 (1987), 11 – 27.
[12] Erhun, F. and Keskinocak, P. 2011. Collaborative Supply Chain Management. Planning Production and Inventories in the Extended Enterprise. F.S. Hillier et al., eds. Springer US. 233–268.
[13] Farrell, J. 1995. Arguments for weaker intellectual property protection in network industries. StandardView. 3, 2 (Jun. 1995), 46–49.
[14] Farzan, R. et al. 2008. Results from Deploying a Participation Incentive Mechanism within the Enterprise. Proceedings of 26th Annual ACM Conference on Human Factors in Computing Systems (2008), 563–572.
[15] Fliedner, G. 2003. CPFR: an emerging supply chain tool. Industrial Management & Data Systems. 103, 1 (Jan. 2003), 14–21.
[16] Iacovou, C.L. et al. 1995. Electronic Data Interchange and Small Organizations: Adoption and Impact of Technology. MIS Quarterly. 19, 4 (1995), 465 – 485.
[17] Johnson, H.L. 1971. Business in contemporary society: Framework and issues. Wadsworth.
[18] Jøsang, A. et al. 2007. A survey of trust and reputation systems for online service provision. Decision Support Systems. 43, 2 (Mar. 2007), 618–644.
[19] Kern, R. et al. 2012. Dynamic and Goal-Based Quality Management for Human-Based Electronic Services. International Journal of Cooperative Information Systems. 21, 1 (2012), 3–29.
[20] Kornish, L.J. and Li, Q. 2009. Optimal Referral Bonuses with Asymmetric Information: Firm-Offered and Interpersonal Incentives. Marketing Science. 29, 1 (Apr. 2009), 108–121.
[21] Kwon, I.-W.G. and Suh, T. 2004. Factors Affecting the Level of Trust and Commitment in Supply Chain Relationships. The Journal of Supply Chain Management. 40, 2 (Mar. 2004), 4–14.
[22] Lakhani, K.R. and von Hippel, E. 2003. How open source software works: “Free” user-to-user assistance. Research Policy. 32, 6 (2003), 923–943.
149

[23] Lee, H.L. and Whang, S. 2000. Information Sharing in a Supply Chain. International Journal of Technology Management. 20, (2000), 373–387.
[24] Lee, H.L. and Whang, S. 2004. e-Business and Supply Chain Integration. The Practice of Supply Chain Management: Where Theory and Application Converge. T.P. Harrison et al., eds. Springer US. 123–138.
[25] Leimeister, J.M. et al. 2009. Leveraging Crowdsourcing: Activation-Supporting Components for IT-Based Ideas Competition. Journal of Management Information Systems. 26, 1 (Jul. 2009), 197–224.
[26] Linthicum, D.S. 2001. B2B application integration: E-business-enable your enterprise. Addison-Wesley.
[27] Lui, S.M. et al. 2002. Participation Incentive Mechanisms in Peer-to-Peer Subscription Systems. Proceedings of the 35th Hawaii International Conference on System Sciences (HICSS) (2002), 1–7.
[28] McLaren, T. et al. 2002. Supply chain collaboration alternatives: understanding the expected costs and benefits. Internet Research: Electronic Networking Applications and Policy. 12, 4 (2002), 348–364.
[29] Mentzer, J. et al. 2000. Collaboration: the enablers, impediments, and benefits. Supply Chain Management Review. (2000).
[30] Mentzer, J. et al. 2000. The nature of interfirm partnering in supply chain management. Journal of Retailing. 76, 4 (2000), 549–568.
[31] Nawrocka, D. 2008. Environmental supply chain management, ISO 14001 and RoHS. How are small companies in the electronics sector managing? Corporate
Social Responsibility and Environmental Management. 15, 6 (Nov. 2008), 349–360.
[32] Oliver, P.E. et al. 1985. A Theory of the Critical Mass. I. Interdependence, Group Heterogeneity, and the Production of Collective Action. American Journal of Sociology. 91, 3 (Nov. 1985), 522.
[33] Rao, P. and Holt, D. 2005. Do green supply chains lead to competitiveness and economic performance? International Journal of Operations & Production Management. 25, 9 (2005), 898–916.
[34] Schwab, K. 2008. Global Corporate Citizenship. Foreign Affairs. 87, 1 (2008), 107–118.
[35] Seuring, S. and Müller, M. 2008. From a literature review to a conceptual framework for sustainable supply chain management. Journal of Cleaner Production. 16, 15 (Oct. 2008), 1699–1710.
[36] Thies, H. and Stanoevska-Slabeva, K. 2012. Critical Success Factors for Sustainable Business Networks. Proceedings of the Americas Conference on Information Systems (AMCIS) (2012), Paper 8.
[37] Thies, H. and Stanoevska-Slabeva, K. 2011. Towards Inter-Organizational Environmental Information Systems for Sustainable Business Networks. Proceedings of the Americas Conference on Information Systems (AMCIS) (2011), Paper 325.
[38] Wasko, M.M. and Faraj, S. 2005. Why Should I Share ? Examining Social Capital and Knowledge Contribution in Electronic Networks of Practice. MIS Quarterly. 29, 1 (2005), 35–57.
150

Building Sustainable Smart Homes
Marco Blumendorf Technische Universität Berlin
Ernst-Reuter-Platz 7, 10587 Berlin, Germany +49 30 314-74003
ABSTRACT The increasing usage of computer technology in our everyday life and especially in our homes and the increasing demand for sustainable life style concepts raise the question of how to combine these two trends. Can we make smart homes sustainable or sustainable homes smart? This paper discusses current trends and challenges arising with these questions and proposes a sustainable smart home approach.
Keywords Smart and sustainable homes, sustainable living, sustainability.
1. INTRODUCTION An ever growing awareness of the massive changes that our human societies are causing to our environments and planet Earth, increasingly calls for a fundamental change in our lifestyles. Governments, non-governmental organizations and concerned individuals call for sustainable living and seek ways to transition from our current lifestyle to a more sustainable way. In this context – and especially from an Information and Communication Technologies (ICT) perspective – the home plays a vital role as one of the central points where technology meets life first hand. This work takes a closer look at current development in the smart home area with a special focus on the idea of sustainable smart homes.
The idea of sustainable smart homes arises from two recent trends in the housing market: making homes “smart” and making homes “sustainable”. Taking a naive view, creating a smart home means packing the home with Information and Communication Technology (ICT) and electronic equipment, while building a sustainable home usually means reduction and leveraging renewable materials to build resource-efficient houses; two approaches that seem to run diametric to each other. Aiming to combine both approaches leads to the idea of building sustainable smart homes and bears two perspectives to discuss: Can we build sustainable smart homes by …
1. making sustainable homes smart (by using smart home technology to improve sustainability)?
2. making smart homes sustainable (by improving the sustainability of the technology itself)?
We will discuss both perspectives in the following. After giving a working definition of the term ‘sustainability’ for our needs in the next section, we discuss sustainable homes and show which role ICT can play to address current issues and drawbacks. Afterwards
we take a look at different smart homes projects and discuss how we can emphasize sustainability in those approaches. Finally, we propose a holistic view that combines the findings from both perspectives.
2. DEFINING SUSTAINABILITY The term “sustainable development” was first widely articulated by the Brundtland Commission of the United Nations in 1987 and framed as “development that meets the needs of the present without compromising the ability of future generations to meet their own needs” [5]. More than 140 alternative and modified definitions that have emerged since then have been identified by Johnston et al. [34] and this proliferation of alternative definitions of the term “sustainability” has created a situation where this central concept has come to mean many things. At the level of the dictionary definition, sustainability simply implies that a given activity or action is capable of being sustained (i.e. continued indefinitely). This definition however conflicts with the idea of naturally evolving systems that change over time. It is also difficult to apply to the environmental domain, where even highly damaging practices can be sustained within time frames that are seemingly indefinite with respect to a human lifespan. Some people also argue that ecosystems will in time (but maybe too late for the survival of our species) adapt to the changes we inflict upon them. Thus it seems to be difficult to give a direct definition of sustainability or sustainable development and Johnston instead proposes the utilization of four basic principles of sustainability [34] that have been identified by “The Natural Step Framework” [51]:
1. Substances from the lithosphere1 must not systematically increase in the ecosphere2.
2. Substances produced by society must not systematically increase in the ecosphere.
3. The physical basis for the productivity and diversity of Nature must not be systematically deteriorated.
4. There should be fair and efficient use of resources with respect to meeting human needs.
These principles basically demand a minimal human intervention in natural processes (which is almost impossible given the rising human population) or the application of cyclic processes, which eventually give back what has been extracted. The latter is usually reflected in natural systems that are strongly intertwined in adaptive cycles of growth, accumulation, restructuring, and renewal and form an ever evolving eco-system [27]. Scientifically, it has been defined as a panarchy, which is the “structure in which systems of nature […], of humans […] and combined human-nature systems are interlinked in never-ending 1 the Earth's crust 2 the planetary ecosystems
ICT4S 2013: Proceedings of the First International Conference on Information and Communication Technologies for Sustainability, ETH Zurich, February 14-16, 2013. Edited by Lorenz M. Hilty, Bernard Aebischer, Göran Andersson and Wolfgang Lohmann. DOI: http://dx.doi.org/10.3929/ethz-a-007337628
151
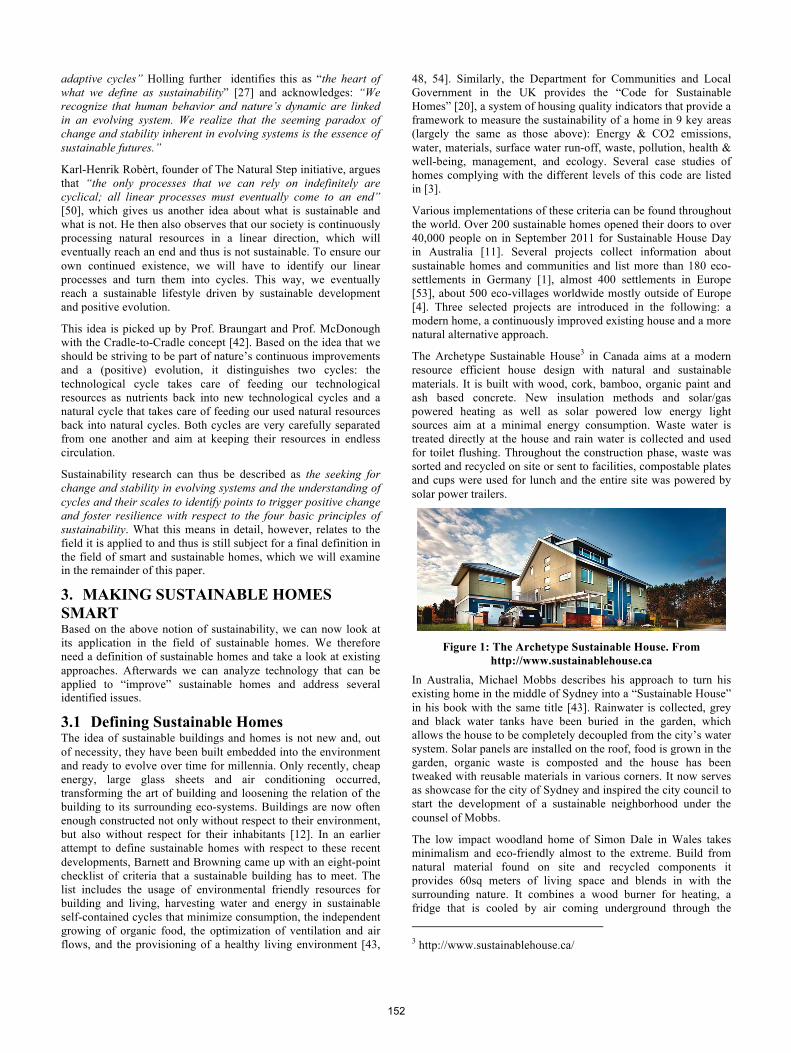
adaptive cycles” Holling further identifies this as “the heart of what we define as sustainability” [27] and acknowledges: “We recognize that human behavior and nature’s dynamic are linked in an evolving system. We realize that the seeming paradox of change and stability inherent in evolving systems is the essence of sustainable futures.”
Karl-Henrik Robèrt, founder of The Natural Step initiative, argues that “the only processes that we can rely on indefinitely are cyclical; all linear processes must eventually come to an end” [50], which gives us another idea about what is sustainable and what is not. He then also observes that our society is continuously processing natural resources in a linear direction, which will eventually reach an end and thus is not sustainable. To ensure our own continued existence, we will have to identify our linear processes and turn them into cycles. This way, we eventually reach a sustainable lifestyle driven by sustainable development and positive evolution.
This idea is picked up by Prof. Braungart and Prof. McDonough with the Cradle-to-Cradle concept [42]. Based on the idea that we should be striving to be part of nature’s continuous improvements and a (positive) evolution, it distinguishes two cycles: the technological cycle takes care of feeding our technological resources as nutrients back into new technological cycles and a natural cycle that takes care of feeding our used natural resources back into natural cycles. Both cycles are very carefully separated from one another and aim at keeping their resources in endless circulation.
Sustainability research can thus be described as the seeking for change and stability in evolving systems and the understanding of cycles and their scales to identify points to trigger positive change and foster resilience with respect to the four basic principles of sustainability. What this means in detail, however, relates to the field it is applied to and thus is still subject for a final definition in the field of smart and sustainable homes, which we will examine in the remainder of this paper.
3. MAKING SUSTAINABLE HOMES SMART Based on the above notion of sustainability, we can now look at its application in the field of sustainable homes. We therefore need a definition of sustainable homes and take a look at existing approaches. Afterwards we can analyze technology that can be applied to “improve” sustainable homes and address several identified issues.
3.1 Defining Sustainable Homes The idea of sustainable buildings and homes is not new and, out of necessity, they have been built embedded into the environment and ready to evolve over time for millennia. Only recently, cheap energy, large glass sheets and air conditioning occurred, transforming the art of building and loosening the relation of the building to its surrounding eco-systems. Buildings are now often enough constructed not only without respect to their environment, but also without respect for their inhabitants [12]. In an earlier attempt to define sustainable homes with respect to these recent developments, Barnett and Browning came up with an eight-point checklist of criteria that a sustainable building has to meet. The list includes the usage of environmental friendly resources for building and living, harvesting water and energy in sustainable self-contained cycles that minimize consumption, the independent growing of organic food, the optimization of ventilation and air flows, and the provisioning of a healthy living environment [43,
48, 54]. Similarly, the Department for Communities and Local Government in the UK provides the “Code for Sustainable Homes” [20], a system of housing quality indicators that provide a framework to measure the sustainability of a home in 9 key areas (largely the same as those above): Energy & CO2 emissions, water, materials, surface water run-off, waste, pollution, health & well-being, management, and ecology. Several case studies of homes complying with the different levels of this code are listed in [3].
Various implementations of these criteria can be found throughout the world. Over 200 sustainable homes opened their doors to over 40,000 people on in September 2011 for Sustainable House Day in Australia [11]. Several projects collect information about sustainable homes and communities and list more than 180 eco-settlements in Germany [1], almost 400 settlements in Europe [53], about 500 eco-villages worldwide mostly outside of Europe [4]. Three selected projects are introduced in the following: a modern home, a continuously improved existing house and a more natural alternative approach.
The Archetype Sustainable House3 in Canada aims at a modern resource efficient house design with natural and sustainable materials. It is built with wood, cork, bamboo, organic paint and ash based concrete. New insulation methods and solar/gas powered heating as well as solar powered low energy light sources aim at a minimal energy consumption. Waste water is treated directly at the house and rain water is collected and used for toilet flushing. Throughout the construction phase, waste was sorted and recycled on site or sent to facilities, compostable plates and cups were used for lunch and the entire site was powered by solar power trailers.
Figure 1: The Archetype Sustainable House. From
http://www.sustainablehouse.ca In Australia, Michael Mobbs describes his approach to turn his existing home in the middle of Sydney into a “Sustainable House” in his book with the same title [43]. Rainwater is collected, grey and black water tanks have been buried in the garden, which allows the house to be completely decoupled from the city’s water system. Solar panels are installed on the roof, food is grown in the garden, organic waste is composted and the house has been tweaked with reusable materials in various corners. It now serves as showcase for the city of Sydney and inspired the city council to start the development of a sustainable neighborhood under the counsel of Mobbs.
The low impact woodland home of Simon Dale in Wales takes minimalism and eco-friendly almost to the extreme. Build from natural material found on site and recycled components it provides 60sq meters of living space and blends in with the surrounding nature. It combines a wood burner for heating, a fridge that is cooled by air coming underground through the 3 http://www.sustainablehouse.ca/
152
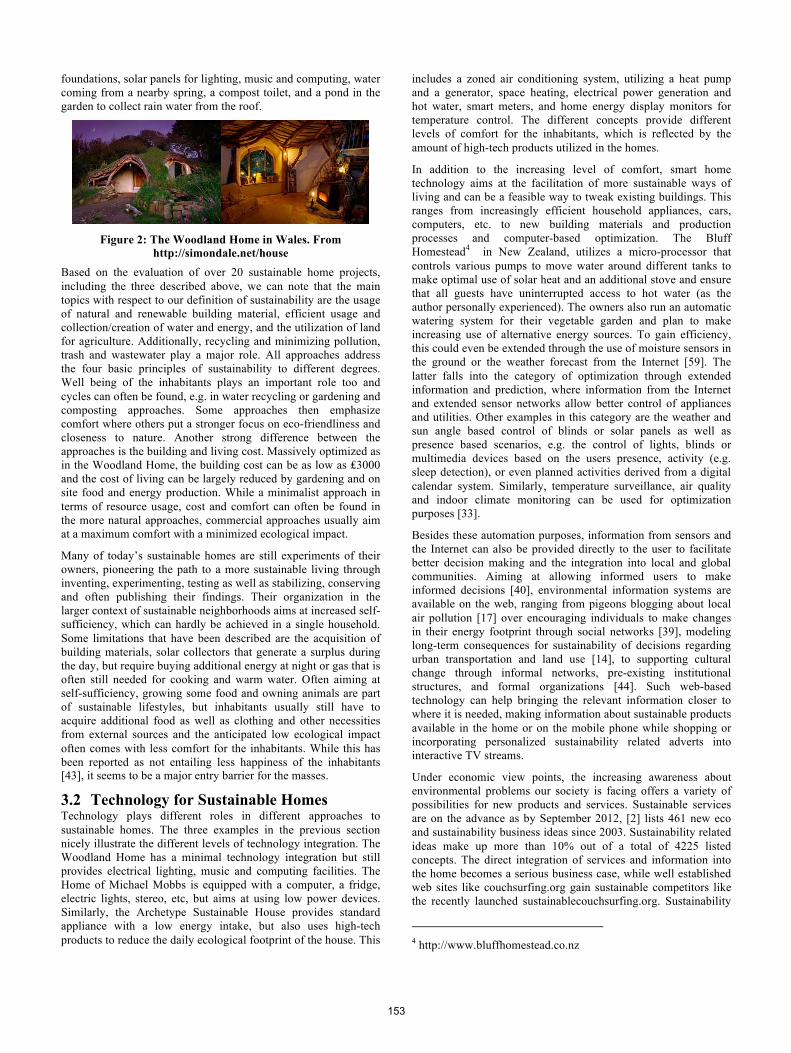
foundations, solar panels for lighting, music and computing, water coming from a nearby spring, a compost toilet, and a pond in the garden to collect rain water from the roof.
Figure 2: The Woodland Home in Wales. From http://simondale.net/house
Based on the evaluation of over 20 sustainable home projects, including the three described above, we can note that the main topics with respect to our definition of sustainability are the usage of natural and renewable building material, efficient usage and collection/creation of water and energy, and the utilization of land for agriculture. Additionally, recycling and minimizing pollution, trash and wastewater play a major role. All approaches address the four basic principles of sustainability to different degrees. Well being of the inhabitants plays an important role too and cycles can often be found, e.g. in water recycling or gardening and composting approaches. Some approaches then emphasize comfort where others put a stronger focus on eco-friendliness and closeness to nature. Another strong difference between the approaches is the building and living cost. Massively optimized as in the Woodland Home, the building cost can be as low as ₤3000 and the cost of living can be largely reduced by gardening and on site food and energy production. While a minimalist approach in terms of resource usage, cost and comfort can often be found in the more natural approaches, commercial approaches usually aim at a maximum comfort with a minimized ecological impact.
Many of today’s sustainable homes are still experiments of their owners, pioneering the path to a more sustainable living through inventing, experimenting, testing as well as stabilizing, conserving and often publishing their findings. Their organization in the larger context of sustainable neighborhoods aims at increased self-sufficiency, which can hardly be achieved in a single household. Some limitations that have been described are the acquisition of building materials, solar collectors that generate a surplus during the day, but require buying additional energy at night or gas that is often still needed for cooking and warm water. Often aiming at self-sufficiency, growing some food and owning animals are part of sustainable lifestyles, but inhabitants usually still have to acquire additional food as well as clothing and other necessities from external sources and the anticipated low ecological impact often comes with less comfort for the inhabitants. While this has been reported as not entailing less happiness of the inhabitants [43], it seems to be a major entry barrier for the masses.
3.2 Technology for Sustainable Homes Technology plays different roles in different approaches to sustainable homes. The three examples in the previous section nicely illustrate the different levels of technology integration. The Woodland Home has a minimal technology integration but still provides electrical lighting, music and computing facilities. The Home of Michael Mobbs is equipped with a computer, a fridge, electric lights, stereo, etc, but aims at using low power devices. Similarly, the Archetype Sustainable House provides standard appliance with a low energy intake, but also uses high-tech products to reduce the daily ecological footprint of the house. This
includes a zoned air conditioning system, utilizing a heat pump and a generator, space heating, electrical power generation and hot water, smart meters, and home energy display monitors for temperature control. The different concepts provide different levels of comfort for the inhabitants, which is reflected by the amount of high-tech products utilized in the homes.
In addition to the increasing level of comfort, smart home technology aims at the facilitation of more sustainable ways of living and can be a feasible way to tweak existing buildings. This ranges from increasingly efficient household appliances, cars, computers, etc. to new building materials and production processes and computer-based optimization. The Bluff Homestead4 in New Zealand, utilizes a micro-processor that controls various pumps to move water around different tanks to make optimal use of solar heat and an additional stove and ensure that all guests have uninterrupted access to hot water (as the author personally experienced). The owners also run an automatic watering system for their vegetable garden and plan to make increasing use of alternative energy sources. To gain efficiency, this could even be extended through the use of moisture sensors in the ground or the weather forecast from the Internet [59]. The latter falls into the category of optimization through extended information and prediction, where information from the Internet and extended sensor networks allow better control of appliances and utilities. Other examples in this category are the weather and sun angle based control of blinds or solar panels as well as presence based scenarios, e.g. the control of lights, blinds or multimedia devices based on the users presence, activity (e.g. sleep detection), or even planned activities derived from a digital calendar system. Similarly, temperature surveillance, air quality and indoor climate monitoring can be used for optimization purposes [33].
Besides these automation purposes, information from sensors and the Internet can also be provided directly to the user to facilitate better decision making and the integration into local and global communities. Aiming at allowing informed users to make informed decisions [40], environmental information systems are available on the web, ranging from pigeons blogging about local air pollution [17] over encouraging individuals to make changes in their energy footprint through social networks [39], modeling long-term consequences for sustainability of decisions regarding urban transportation and land use [14], to supporting cultural change through informal networks, pre-existing institutional structures, and formal organizations [44]. Such web-based technology can help bringing the relevant information closer to where it is needed, making information about sustainable products available in the home or on the mobile phone while shopping or incorporating personalized sustainability related adverts into interactive TV streams.
Under economic view points, the increasing awareness about environmental problems our society is facing offers a variety of possibilities for new products and services. Sustainable services are on the advance as by September 2012, [2] lists 461 new eco and sustainability business ideas since 2003. Sustainability related ideas make up more than 10% out of a total of 4225 listed concepts. The direct integration of services and information into the home becomes a serious business case, while well established web sites like couchsurfing.org gain sustainable competitors like the recently launched sustainablecouchsurfing.org. Sustainability
4 http://www.bluffhomestead.co.nz
153
(while to date often only addressed by PR relevant actions) becomes an important factor for established businesses [52].
The discussed projects all aim at facilitating a more sustainable lifestyle by making sustainable and eco-friendly behavior easier and acceptable for the masses. However, they bear the danger of waiting for a technological solution for a problem that requires major changes in consumption and behavior pattern to be solved and they all face the problem of the inherent sustainability of the underlying technology itself. The latter often drives sustainable living entrepreneurs to reduce technology in their homes to the bare minimum perceived as necessary or inevitably. Being part of the complex eco-system of a home, introducing one partial solution (e.g. automatic light switching) might even introduce more problems (e.g. old people spending even more time without getting up from the TV chair) than they solve in the long run.
4. MAKING SMART HOMES SUSTAINABLE After analyzing sustainable homes and technological “improvements” in the previous section, we now jump to different perspective and take a closer look at smart homes and the idea of making smart homes more sustainable.
4.1 Smart Homes In contrast to sustainable homes, which continuously gain momentum, holistic approaches to realize smart homes, although under development for decades now, have barely made it out of the research labs. Originally termed by the American Association of House Builders in the year 1984, the term “smart home” today mainly addresses the integration of ICT into domestic buildings, but has a long history and various definitions. One simple but well accepted definition has been developed by the DTI Smart Homes Project: "A dwelling incorporating a communication network that connects the key electrical appliances and services, and allows them to be remotely controlled, monitored or accessed." [37]. While this definition works for most smart home scenarios that usually contain interacting and connected appliances, it rather focuses on automation and control aspects of the home and lacks a direct relation to the term “smart”. Smart homes in turn can be described as acting autonomously and being proactively based on artificial intelligence. A problem with the term “smart” in this case is the lack of measurements for the smartness of a system.
The idea of smart homes comes from the earlier work on home automation in the 1970s and thus various approaches, aiming at home automation, focus on different aspects. Main areas are e.g. temperature surveillance, air quality and indoor climate monitoring [33], air, heating, lighting, ventilation, and water heating control to minimize energy consumption [45]. The MavHome project [16] aims at maximizing comfort, while minimizing operation cost. It predicts the actions of its inhabitants and automatically turns on and off heaters, lights and coffee machines in the morning, sprinkles the lawn, places grocery orders, and prepares hot tubs for its inhabitants. More recent projects like the Amigo Project [23] and the Service Centric Home [9] aim at the development of middleware that integrates heterogeneous systems and appliances to achieve interoperability between services and devices. This then forms the basis for interaction between the devices or remote control by another smart entity to optimize resource usage, comfort, and operation costs. One innovative approach by Intille in the scope of the House_n project of the Massachusetts Institute of Technology presents a concept to empower people by providing information
when and where decisions and actions can be made instead of aiming for the automation of tasks [31].
Smart homes still mostly aim at the simplification of daily routines and processes and at making life easier and more comfortable for the inhabitants. Developed technologies often target elderly or disabled people and address the need to live independently in their own environment. Additionally, they aim at controlling and optimizing resource usage and safety, entertainment, and communication. Sustainability is still not addressed as a core area, but treated as a nice to have feature. Thus, smart homes often incorporate hard-to-recycle or -reuse materials, are energy hungry, and require continuous maintenance, updates and replacements. They also still face a large number of technical, social and economic challenges.
A major critique is that current home automation approaches consume more energy than they save [24]. In [26], Hilty et al. discuss the potential risks of pervasive computing technology (which is applied in smart homes), stating that there are various unexplored issues related to health, social effects and environmental issues. Mankoff et al. also argue that ICT is facing the key challenges of growing energy consumption and electronic waste [38]. In North America 38% of the energy was consumed by households in 2009. Furthermore, the share of residential electricity used by appliances and electronics in U.S. homes has nearly doubled from 17 percent to 31 percent in the last three decades [8]. Computational energy consumption has been reported to be responsible for 2% of the world emissions in 2007 already [25]. The increasing usage of electronics and computer technology also creates a massive problem of (largely toxic) electronic waste, which is difficult to reuse, recycle or even to store [55]. It is becoming a significant component of waste streams, increasing at a rate of 5% per annum [19]. In 2007, a study by the United Nations University found that the world generates around 40 million tons of electronic waste every year with a lot of it being shipped to developing countries [29].
In terms of inhabitants, Intille describes that homeowners often believe that computer devices make life more complex and frustrating rather than easier and more relaxing and that they are wary of the aesthetic, financial, and cognitive challenges that come with new technologies [32]. He also argues that technology should not make people useless but require human effort in ways that keep life mentally and physically challenging. Davidoff at al. argue that developers have to be careful not to remove tasks that are vital to our identities [18]. It is important to allow the integration of technology into different habits and “workflows” of the family. Requiring the family to adapt to technology is very likely to fail quickly [18]. Yamazaki identified the extension of human activity support beyond the home to the scope of communities, towns, and cities as a crucial aspect [57].
Energy consumption, electronic waste, user frustration, over automation, information overload, a lack of focus on human needs, and toxic contents in products, etc will all have to be addressed in an attempt to make smart homes sustainable. While there does not seem to be an overall concept to address all these issues yet, most of them are already being worked on.
4.2 Sustainability for Smart Homes The Climate Group of the Global Sustainability Initiative found that in 2008, better building design, management and automation could save 15% of North America’s buildings emissions and 1.68 GtCO2 worldwide [25]. The US Department of Energy found that homes are contributing about 38% of the nearly 3,741 billion
154
kilowatt hours that North America consumed in 2009 [7] and the electricity used by electronics was up to 31% and growing in 2010. While consuming energy is not a negative thing in itself, the way we currently produce most of our energy is not sustainable, making the usage especially of high amounts of energy unsustainable as well. The reduction of energy usage and the shift of load to avoid peak times to reduce the need for high production capacities have been identified as keys for energy efficiency [36].
Approaches to address these issues are already under development. [13] describes a web application for supply chain transparency that is likely to be able to help with the acquisition of sustainable products and building material. In the sustainable computing area, new solutions are coming e.g. in form of heterogeneous chip multiprocessors that can achieve four to six times energy savings per instruction, supercomputing programming paradigms for a modified cell processor that can achieve up to 100 better energy efficiency, intelligent routing protocols that ensure the use of minimum energy routes, a reduced need for new computers by using grid computing, modular chips or components that make it possible to replace a single part instead of an entire system [56]. IBM [30] presents a visionary approach where smart home intelligence is provided via a cloud computing system, limiting the intelligence the actual devices in smart homes have to provide. In combination with modular chips this could be an upcoming possibility to address the lifespan of our current electronic products that usually ranges from months to a few years only, where houses and homes are built to last for decades and centuries. It thus seems strongly required to design for longer life spans and dynamic change and provide open system that can dynamically evolve over time (in contrast to current fixed systems that need continuous replacements) [18]. While we need to understand consumer behavior, periodic changes, exceptions and improvisation to do so, there are also growing possibilities to construct new and modify existing behaviors [18]. Expanding the lifespan of current products, unfortunately, interferes with economic goals to raise ever increasing demands and keep consumption at a maximum, but new recycling technologies, compostable computers and environmentally friendly materials might be able to help in resolving these contradictions. The Cradle-to-Cradle concept [42] suggests to keep the ownership of the raw-material with the producing manufacturer, to encourage recycling and reuse efforts and create new, more sustainable business models.
While we already presented some home automation approaches in the previous section, Mattern et al [41] and others [32] noticed that automation and optimization alone are not enough and might raise more problems than they solve. We will need a change in behavior and consumption patterns to “save the planet” and ICT can play a major role in facilitating this transition and empowering the user instead. In a recent study, Froehlich et al. found more than 130 papers reporting about eco-feedback [22] and the monitoring of consumption (water, energy, air, waste, …) has the potential to make users aware of the hidden details of their current behavior as well as about a greater impact or how he compares to other community members. We can’t manage what we can’t measure and the described technologies provide solutions that enable us to ‘see’ our consumption and could provide the means for optimizing systems and processes to make them more efficient [25]. New interfaces allow users to better control their usage and unobtrusively inform them of the actions of their peers, which provides increased social awareness in the household and immediate feedback in an unobtrusive design [58, 31, 39]. Besides energy monitoring, which is probably the most
obvious and vastly researched theme, Water Monitoring, [35, 10], temperature surveillance, air quality and indoor climate monitoring [33], a “robotic plants” as feedback on waste disposal [28] or observation of the bandwidth-usage of individual devices [15] have been developed. Selected examples include Karlgreen et al., who designed the “Socially Aware Tea Kettle” that shows how home appliances might be enhanced to improve user awareness of energy usage. Yun presents a study that shows how a minimal in-home energy consumption display encouraged users to reduce energy consumption by identifying high-power devices in their home and by playfully setting conservation goals [58]. Mankoff et al. propose to utilize social web pages to deliver personalized eco-related information and show how well individuals and their social networks are reducing their ecological footprints [39]. Holstius et al. present the utilization of “robotic plants” as feedback on waste disposal in a trash or a recycling container [28]. Outside information can similarly be integrated into the home ambient, e.g. by signaling pollution levels by influencing the mood of music playlists [21], or by displaying health information about distant living relatives [46]. Woodruff and Mankoff discuss how pervasive computing can help addressing environmental challenges by supporting monitoring the state of the physical world, managing the impacts of human enterprises and informing individuals’ personal choices in consumption and behavior [56].
In summary, technology as described above allows us to reconnect people with their environment. Enriched by sensors, the environment can actually start expressing itself and creating competitive situations that reward sustainable behavior without denouncing individuals or families can motivate certain behaviors. Furthermore, the effect of “Dematerialisation”, i.e. the substitution of environmental expensive products and activities with eco-friendly alternatives (e.g. replacing face-to-face meetings with videoconferencing, or paper with e-billing) can help to save important resources [25] and the possibility to help optimizing processes and routines, allows utilizing computers as very efficient tools. While [49] claims that the use of real-time feedback presents an opportunity to decrease energy consumption by 10%-20%, others found that feedback gadgets alone are unlikely to maximize energy savings [6] and fear that tracking home electricity use will not “become a national hobby” and the novelty will likely wear off quickly [47]. Similarly, a study in Switzerland showed that current home automation approaches consume 35% - 55% more energy than standard homes [24]. Finally, side effects of current approaches are not widely studied. Similarly to the shortage of food raised by bio fuel, automating too much might have negative effects too.
5. SUSTAINABLE SMART HOMES We have examined the idea of sustainable smart homes from two different perspectives in the previous sections and can now derive some conclusions to give initial ideas how the concept of a sustainable smart home can be implemented. Two main starting positions can be distinguished: Building a new home from scratch provides the possibility to start from scratch and gives room for fresh considerations. However, improving existing homes is probably even more important as from a global perspective it is absolutely unsustainable to tear down existing homes to build more sustainable ones.
So for a new home, sustainability starts with the early planning and construction phase. Besides making appropriate use of the land and using renewable, natural and non-toxic materials,
155

limiting the usage of energy and water as well as the production of trash should be a major goal throughout the whole planning – building – running – maintenance life-cycle. Additionally, even the deconstruction phase should be considered at the very beginning of the process, to be able to optimally recycle and reduce material and feed it back into existing resource cycles. A sustainable home should then ideally be capable of harvesting the water and energy it needs to provide a comfortable living environment for its inhabitants. Various technologies can be used to harvest the required energy and insulation and the usage of low energy devices can help to reduce the energy needs. Different technologies like a wood burner, solar hot water, geothermal energy or heat from a compost pile can be combined to provide warm water. Water should be harvested and treated locally and ideally be continuously recycled on site. This has to be supported by the utilization of natural and unharmful products for dishwashing, showering, laundry and cleaning. To facilitate a better usage of additional resources, some gardening and food production are highly recommended. This can be coupled with some food swapping in the neighborhood to address as many needs as possible with local products. Systems like permaculture principles can be used to reduce the effort to run the food production. A compost pile and grey water from the house can help to provide the nutrients needed for a garden.
The home should be comfortable and inspiring for the inhabitants. It should provide a healthy environment, stimulating the productivity of the inhabitants and allow the integration into (local) economies and communities. Last but not least, it has to provide the necessary security and safety for its inhabitants.
As discussed above, computer technology can be applied in different areas. Starting with the planning and building phase, ICT can make the underlying processes more efficient and deliver better planning and building results. During and after the building phase, monitoring the energy consumption, informing the user about it and automating different processes to use the energy more efficiently is another main area. It can help monitoring and managing the supply of hot water, provide security systems and make life comfortable through entertainment systems and domestic appliances. Besides automation, which currently still consumes more energy than it saves, the main role of ICT seems to be – as the name implies – the information and communication facilitation. The smartest part of the sustainable smart home still seems to be the inhabitant. He more or less consciously chooses his activities and consumption patterns and is thus the main influence and the last instance for any decision. Informing the inhabitant about influences his decisions have on the environment, guiding gently to reduce energy consumption, networking communities and making the environment speak appear to be the fields that ICT is best at. It can make a difference in facilitating the transition to a more sustainable lifestyle and in making sustainable living acceptable and even desirable for the masses, but within the process it will have to face its own inherent unsustainability. Recycling and long product lifespans are not yet the qualities of the products of the ICT industry. The ecological footprint of the overall lifecycle from production of the artifacts over deployment and usage to their final disposal or recycling will have to be considered to finally judge the sustainability of a product. Devices are built from toxic material, designed to be obsolete or outdated after a very short time and difficult or almost impossible to reuse or recycle. Finally, the ICT sector also tends to be quick to find new technologies to address any kind of problem, where sometimes low tech approaches and intelligent
overall design may be as (or even more) effective. While new approaches are on the horizon to address these issues, they are not yet sufficiently addressed and thus ICT, at its current state, might not be capable of being the main driver for sustainability in the long run.
6. CONCLUSION Coming back to the definition of sustainable smart homes we will have to come up with a more dynamic and changeable design, which needs to incorporate cycles of various scales in different areas. Technology has the potential to facilitate a transition to more sustainable lifestyles by making devices more efficiently and ICT can play a major role in making processes more transparent, observable and manageable. It allows informing and connecting people but currently still faces its own inherent unsustainability, which will have to be addressed with technological approaches as well as with changing business models and best practices. Since many scientist believe that we are beyond the state where being sustainable is enough. We are in need of corrective rather than preserving methods and behavior. We will have to restore our resources rather than just abstain from consuming and wasting them and this will have to go hand in hand with the definition of a sustainable lifestyle over 7 billion people. What is taken out of the environment will have to be given back and to reach any corrective effects, it will have to be given back in a better state that it was before. Sustainable smart homes will have to trigger positive change and foster resilience with respect to the four basic principles of sustainability. The utilized ICT systems – hardware and software – as well as the building itself will need to be able to evolve over time and to adapt to changing needs. The whole building and all its components must be created by using only natural resources (ideally renewable) that don’t harm any life and can be returned to other cycles and technological resources that can be recycled with the final deconstruction of the building. Finally, sustainable thinking and behavior have to become core parts of our lives again.
7. REFERENCES [1] Internetportal für nachhaltige siedlungen. http://www.oekosiedlungen.de/, accessed 20.09.2012.
[2] Springwise. http://www.springwise.com/, accessed 23.09.2012.
[3] Sustainable homes uk. http://www.sustainablehomes.co.uk, accessed 23.09.2012.
[4] Global ecovillage network. http://gen.ecovillage.org, accessed 23.09.2012, 2012.
[5] United Nations General Assembly 1987. Report of the world commission on environment and development: Our common future, chapter 2: Towards sustainable development. Technical report, 1987.
[6] W. Abrahamse, L. Steg, C. Vlek, and T. Rothengatter. A review of intervention studies aimed at household energy conservation. Journal of Environmental Psychology, 25(3):273 – 291, 2005.
[7] US Energy Information Administration. Energy explained. Technical report, US Department of Energy, 2010.
[8] US Energy Information Administration. Residential energy consumption survey - share of energy used by appliances
156

and consumer electronics increases in u.s. homes. Technical report, US Department of Energy, 2011.
[9] S. Albayrak, M. Blumendorf, S. Feuerstack, T. Küster, A. Rieger, V. Schwartze, C. Wirth, and P. Zernicke. Ein framework für ambient assisted living services. In Ambient Assisted Living 2009, 2. Deutscher AAL Kongress, 2009.
[10] E. Arroyo, L. Bonanni, and T. Selker. Waterbot: exploring feedback and persuasive techniques at the sink. In Proceedings of the SIGCHI conference on Human factors in computing systems, CHI ’05, pages 631–639, NY, 2005. ACM.
[11] Australian Solar Energy Society (AuSES). Sustainable house day. http://www.sustainablehouseday.com, accessed 23.09.2012.
[12] D. Lopez Barnett and W. D. Browning. A Primer on Sustainable Building. Rocky Mountain Institute. Green Development Services, 1995.
[13] L. Bonanni, M. Hockenberry, D. Zwarg, C. Csikszentmihalyi, and H. Ishii. Small business applications of sourcemap: a web tool for sustainable design and supply chain transparency. In Proceedings of the 28th international conference on Human factors in computing systems, CHI ’10, pages 937–946, New York, USA, 2010. ACM.
[14] A. Borning, B. Friedman, J. Davis, and P. Lin. Informing public deliberation: value sensitive design of indicators for a large-scale urban simulation. In Proceedings of the ninth conference on European Conference on Computer Supported Cooperative Work, pages 449–468, New York, USA, 2005. Springer-Verlag
[15] M. Chetty, R. Banks, R. Harper, T. Regan, A. Sellen, C. Gkantsidis, T. Karagiannis, and P. Key. Who’s hogging the bandwidth: the consequences of revealing the invisible in the home. In Proceedings of the 28th international conference on Human factors in computing systems, CHI ’10, pages 659–668, New York, USA, 2010. ACM.
[16] D.J. Cook, M. Youngblood, E.O. Heierman III, K. Gopalratnam, S. Rao, A. Litvin, and F. Khawaja. Mavhome: an agent-based smart home. In Proceedings of the First IEEE International Conference on Pervasive Computing and Communications (PerCom) 2003., pages 521 – 524, march 2003.
[17] B. da Costa, C. Hazegh, and K. Ponto. Pidgeonblog. http://www.pigeonblog.mapyourcity.net, accessed 23.09.2012.
[18] S. Davidoff, M. Lee, C. Yiu, J. Zimmerman, and A. Dey. Principles of smart home control. In UbiComp 2006: Ubiquitous Computing, volume 4206 of Lecture Notes in Computer Science, pages 19–34. Springer Berlin, 2006.
[19] G. Davis and S. Herat. Opportunities and constraints for developing a sustainable e-waste management system at local government level in australia. Waste Management & Research, 28 (8):705–713, 2009.
[20] Department for Communities and Local Government, editors. Code for Sustainable Homes, Passivhaus, Housing Quality Indicators. Crown, 2006.
[21] M. Foth, E. Paulos, C. Satchell, and P. Dourish. Pervasive computing and environmental sustainability: Two conference workshops. IEEE Pervasive Computing, 8:78–81, 2009.
[22] J. Froehlich, L. Findlater, and J. Landay. The design of eco-feedback technology. In Proceedings of the 28th international conference on Human factors in computing systems, CHI ’10, pages 1999–2008, NY, USA, 2010. ACM.
[23] N. Georgantas, S.B. Mokhtar, Y. Bromberg, V. Issarny, J. Kalaoja, J. Kantarovitch, A. Gerodolle, and R. Mevissen. The amigo service architecture for the open networked home environment. In 5th Working IEEE/IFIP Conference on Software Architecture (WISCA), pages 295 –296, 2005.
[24] T. Grieder. Neueste entwicklungen im bereich intelligentes wohnen und des damit verbundenen stromverbrauchs. Technical report, Bundesamt für Energie, Switzerland, 2007.
[25] The Climate Group. Smart 2020: Enabling the low carbon economy in the information age. Technical report, Global Sustainability Initiative, 2008.
[26] L. M. Hilty, C. Som, and A. Köhler. Assessing the human, social, and environmental risks of pervasive computing. Human and Ecological Risk Assessment: An International Journal, 10 (5):853 – 874, 2004.
[27] C.S. Holling. Theories for sustainable futures. Conservation Ecology, 4, 2000.
[28] D. Holstius, J. Kembel, A. Hurst, P.-Hui Wan, and J. Forlizzi. Infotropism: living and robotic plants as interactive displays. In Proceedings of the 5th conference on Designing interactive systems: processes, practices, methods, and techniques, DIS ’04, pages 215–221, NY, USA, 2004. ACM.
[29] J. Huisman, F. Magalini, R. Kuehr, S. Maurer, Ogilvie, J. C. Poll, C. Delgado, E. Artim, J. Szlezak, and A. Stevels. 2008 review of directive 2002/96 on waste electrical and electronic equipment (weee), final report,. Technical report, United Nations University, 2007.
[30] IBM. The ibm vision of a smarter home enabled by cloud technology. Technical report, Sales&Distribution, 2010.
[31] S.S. Intille. The goal: smart people, not smart homes. In Proceedings of the International Conference on Smart Homes and Health Telematics, 2006.
[32] S. S. Intille. Designing a home of the future. IEEE Pervasive Computing, 1(2):76–82, 2002.
[33] B. Ivanov, O. Zhelondz, L. Borodulkin, and H. Ruser. Distributed smart sensor system for indoor climate monitoring. In KONNEX Scientific Conference, 2002.
[34] P. Johnston, M. Everard, D. Santillo, and K.-H. Robèrt. Reclaiming the definition of sustainability. Environmental science and pollution research international, 14 (1):60–66, 2007.
[35] K. Kappel and T. Grechenig. "show-me": water consumption at a glance to promote water conservation in the shower. In Proceedings of the 4th International Conference on Persuasive Technology, Persuasive ’09, pages 26:1–26:6, NY, USA, 2009. ACM.
[36] J. Karlgren, L. Fahlén, A. Wallberg, P. Hansson, O. Ståhl, J. Söderberg, and K.-P. Åkesson. Socially intelligent interfaces for increased energy awareness in the home. In The Internet of Things, volume 4952 of Lecture Notes in Computer Science, pages 263–275. Springer Berlin / Heidelberg, 2008.
157
[37] N. King. Smart home – a definition, Intertek Research & Testing Centre, September 2003.
[38] J. Mankoff, R. Kravets, and E. Blevis. Some computer science issues in creating a sustainable world. Computer, 41(8):102 –105, 2008.
[39] J. Mankoff, D. Matthews, S. R. Fussell, and M. Johnson. Leveraging social networks to motivate individuals to reduce their ecological footprints. Hawaii International Conference on System Sciences, 0:87a, 2007.
[40] J. Mankoff, E. Blevis, A. Borning, B. Friedman, S. R. Fussell, J. Hasbrouck, A. Woodruff, and P. Sengers. Environmental sustainability and interaction. In CHI ’07 extended abstracts on Human factors in computing systems, pages 2121–2124, NY, USA, 2007. ACM.
[41] F. Mattern, T. Staake, and M. Weiss. Ict for green: how computers can help us to conserve energy. In Proceedings of the 1st International Conference on Energy-Efficient Computing and Networking, e-Energy ’10, pages 1–10, NY, USA, 2010. ACM.
[42] W. McDonough and M. Braungart. Cradle to Cradle: Remaking the Way We Make Things. Macmillan USA, 2003.
[43] M. Mobbs. Sustainable House. Choice Books, 2010.
[44] A. Morris. Reflections on social movement theory: Criticisms and proposals. Contemporary Sociology, Vol. 29, No. 3:445–454, 2000.
[45] M. C Mozer. The neural network house: An environment that adapts to its inhabitants. In Proceedings of the American Association for Artificial Intelligence Spring Symposium on Intelligent Environments, pages 110–114. AAAI Press., 1998.
[46] E. D. Mynatt, J. Rowan, S. Craighill, and A. Jacobs. Digital family portraits: supporting peace of mind for extended family members. In Proceedings of the SIGCHI conference on Human factors in computing systems, CHI ’01, pages 333–340, NY, USA, 2001. ACM.
[47] W. Nader. Real-Time Power Monitoring, Home Automation and Sustainability. PhD thesis, University of Nebraska - Lincoln, 2011.
[48] Federal Government Department of Climate Change and Energy Efficiency, editors. Your Home Technical Manual.
Federal Government Department of Climate Change and Energy Efficiency, 2010.
[49] D. Parker, D. Hoak, A. Meier, and R. Brown. How much energy are we using? potential of residential energy demand feedback devices. In American Council for an Energy Efficient Economy, Proceedings of Summer School 2006, 2006.
[50] K.-H. Robèrt. Educating a nation: The natural step. IN CONTEXT, 28:2–12, 1991.
[51] K.-H. Robèrt, H. Dalyc, P. Hawkend, and J. Holmberg. A compass for sustainable development. International Journal of Sustainable Development & World Ecology, 4 (2):79–92, 1997.
[52] M. Saha and G. Darnton. Green companies or green con-panies: Are companies really green, or are they pretending to be? Business and Society Review, 110(2):117–157, 2005.
[53] M. Stengel und J. Kommerell, eurotopia - Verzeichnis: Gemeinschaften und Ökodörfer in Europa. eurotopia Verlag, 2009.
[54] J. Wai. A Guide to EcoHomes. Hastoe Housing Association, 2003.
[55] R. Widmer, H. Oswald-Krapf, D. Sinha-Khetriwal, M. Schnellmann, and H. Böni. Global perspectives on e-waste. Environmental Impact Assessment Review, 25(5):436–458, 2005. Environmental and Social Impacts of Electronic Waste Recycling.
[56] A. Woodruff and J. Mankoff. Environmental sustainability. IEEE Pervasive Computing, 8:18–21, 2009.
[57] T. Yamazaki. Beyond the smart home. Hybrid Information Technology, International Conference on, 2:350–355, 2006.
[58] T.-J. Yun. Investigating the impact of a minimalist in-home energy consumption display. In Proceedings of the 27th international conference extended abstracts on Human factors in computing systems, CHI EA ’09, pages 4417–4422, NY, USA, 2009.
[59] Q. Y. Zhou, J. Shimada, and A. Sato. Three-dimensional spatial and temporal monitoring of soil water content using electrical resistivity tomography. Water Resources Research, 37(2):273–285, 2001.
158
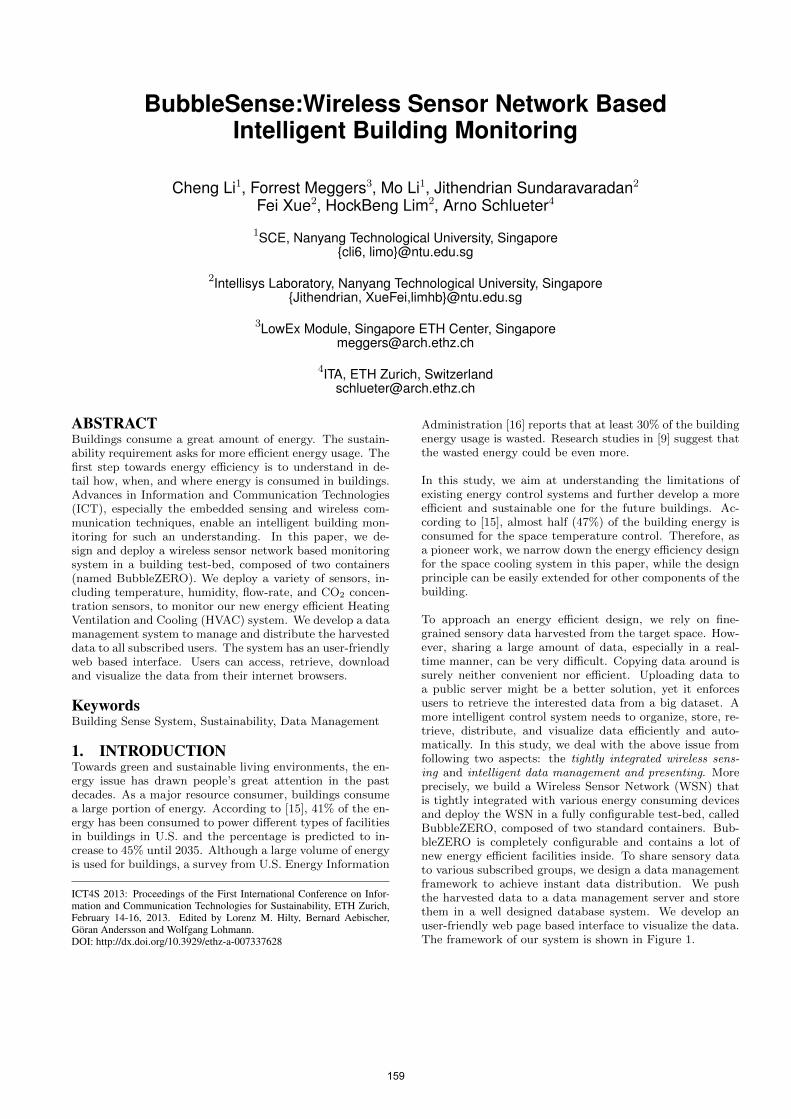
BubbleSense:Wireless Sensor Network BasedIntelligent Building Monitoring
Cheng Li1, Forrest Meggers3, Mo Li1, Jithendrian Sundaravaradan2
Fei Xue2, HockBeng Lim2, Arno Schlueter4
1SCE, Nanyang Technological University, Singapore{cli6, limo}@ntu.edu.sg
2Intellisys Laboratory, Nanyang Technological University, Singapore{Jithendrian, XueFei,limhb}@ntu.edu.sg
3LowEx Module, Singapore ETH Center, [email protected]
4ITA, ETH Zurich, [email protected]
ABSTRACTBuildings consume a great amount of energy. The sustain-ability requirement asks for more efficient energy usage. Thefirst step towards energy efficiency is to understand in de-tail how, when, and where energy is consumed in buildings.Advances in Information and Communication Technologies(ICT), especially the embedded sensing and wireless com-munication techniques, enable an intelligent building mon-itoring for such an understanding. In this paper, we de-sign and deploy a wireless sensor network based monitoringsystem in a building test-bed, composed of two containers(named BubbleZERO). We deploy a variety of sensors, in-cluding temperature, humidity, flow-rate, and CO2 concen-tration sensors, to monitor our new energy efficient HeatingVentilation and Cooling (HVAC) system. We develop a datamanagement system to manage and distribute the harvesteddata to all subscribed users. The system has an user-friendlyweb based interface. Users can access, retrieve, downloadand visualize the data from their internet browsers.
KeywordsBuilding Sense System, Sustainability, Data Management
1. INTRODUCTIONTowards green and sustainable living environments, the en-ergy issue has drawn people’s great attention in the pastdecades. As a major resource consumer, buildings consumea large portion of energy. According to [15], 41% of the en-ergy has been consumed to power different types of facilitiesin buildings in U.S. and the percentage is predicted to in-crease to 45% until 2035. Although a large volume of energyis used for buildings, a survey from U.S. Energy Information
ICT4S 2013: Proceedings of the First International Conference on Infor-mation and Communication Technologies for Sustainability, ETH Zurich,February 14-16, 2013. Edited by Lorenz M. Hilty, Bernard Aebischer,Göran Andersson and Wolfgang Lohmann.DOI: http://dx.doi.org/10.3929/ethz-a-007337628
Administration [16] reports that at least 30% of the buildingenergy usage is wasted. Research studies in [9] suggest thatthe wasted energy could be even more.
In this study, we aim at understanding the limitations ofexisting energy control systems and further develop a moreefficient and sustainable one for the future buildings. Ac-cording to [15], almost half (47%) of the building energy isconsumed for the space temperature control. Therefore, asa pioneer work, we narrow down the energy efficiency designfor the space cooling system in this paper, while the designprinciple can be easily extended for other components of thebuilding.
To approach an energy efficient design, we rely on fine-grained sensory data harvested from the target space. How-ever, sharing a large amount of data, especially in a real-time manner, can be very difficult. Copying data around issurely neither convenient nor efficient. Uploading data toa public server might be a better solution, yet it enforcesusers to retrieve the interested data from a big dataset. Amore intelligent control system needs to organize, store, re-trieve, distribute, and visualize data efficiently and auto-matically. In this study, we deal with the above issue fromfollowing two aspects: the tightly integrated wireless sens-ing and intelligent data management and presenting. Moreprecisely, we build a Wireless Sensor Network (WSN) thatis tightly integrated with various energy consuming devicesand deploy the WSN in a fully configurable test-bed, calledBubbleZERO, composed of two standard containers. Bub-bleZERO is completely configurable and contains a lot ofnew energy efficient facilities inside. To share sensory datato various subscribed groups, we design a data managementframework to achieve instant data distribution. We pushthe harvested data to a data management server and storethem in a well designed database system. We develop anuser-friendly web page based interface to visualize the data.The framework of our system is shown in Figure 1.
159

Wireless Sensor System
Data Management System
Data Users
Figure 1: System architecture
Translating our design principle to a practical system, how-ever, entails a variety of challenges. First, measuring dif-ferent types of devices requires integrating many di�erentkinds of sensors. For instance, the hydraulic system needsvery accurate measurements of temperature and �ow-rateat di�erent places, while environment monitoring needs tomeasure humidity and CO2 concentration. Fusing di�erentkinds of sensors to the wireless node (mote) requires cus-tomized hardware. Second, the communication e�ciencyof sensor nodes needs to be guaranteed as well. Since sen-sor nodes might be densely deployed in the room. In ad-dition, other electronic facilities, e.g., Wi-Fi devices, mi-crowave stoves, etc., can interfere with the communicationof sensor nodes, the system needs to ensure an e�cient andreliable information delivery with minimal communications.Third, uploading data remotely to a data management sys-tem is also non-trivial. The program needs to deal withvarious situations to mitigate the disruptions of the internetconnection.
There have been initial attempts made to the smart build-ings in previous studies. However, they mainly focus onevaluating or improving the performance of existing systems,and there still exists a rich space to further save the energyin buildings. For example, Jiakang et. al. and Varick et. al.try to cut down the energy consumption of HVAC systemfrom 28% to 20% using occupancy sensors [8, 2]. Jiang et. al.design and deploy an energy audit wireless sensor networkin an active laboratory building in University of California,Berkeley [5, 6]. They provide detailed energy consumptionmap of existing electrical devices in buildings. Dawei et.al. develop a green room management system based wirelesssensor network[10]. They focus on saving energy using ther-mal inertia e�ect and wireless sensor network. Most of thesesystem are based in existing building, and the �exibility islimited. Our work is di�erent from previous works. By tak-ing advantage of the fully con�gurable test bed and the lowenergy equipments, the wireless sensor system proposed inthis paper is more tightly integrated with the building andcan provide more detailed energy consumption audit and ef-�ciency information of the building system. The introduced
data management module could bene�t more and make fulluse of existing sensing resources.
The contributions of this paper can be summarized as fol-lows.
� We design a wireless sensor network integrated with afully con�gurable building system test bed. The sys-tem is speci�cally designed to monitor and evaluatethe building system and is capable of providing de-tailed energy information.
� We develop a data sharing framework. The frameworkcan e�ciently organize and store sensory data. Datacan be easily distributed to subscribed users, helpingusers to retrieve, download, visualize and analyze data.
� We have experimented with a prototype system, calledBubbleZERO, within our designed modules and hard-ware in two containers of volume around 80m3. Theexperimental results show that BubbleZERO is capa-ble of capturing the energy consumption of devices ac-curately.
The rest of the paper is organized as follows: In Section 2,we introduce some background about our test bed. The ar-chitecture and design details are given in Section 3. In Sec-tion 4, we present some of our initial measurement results.We conclude this work in Section 5.
2. PROJECT BACKGROUNDSpace heating and cooling account for 47% of energy totalconsumption in buildings [15]. Our �rst task in this projectis to design and test a new HVAC system that uses muchless energy. The control and operation of heating and cool-ing systems in buildings have been developed from very sim-ple origins. If buildings were too cold, heat was added, andif they were too hot, heat was removed. Today these sim-ple techniques to make buildings comfortable are also oneof the culprits that makes buildings such large energy con-sumers. As new technologies are developed to increase thee�ciency of buildings, the intelligence of how these systemsare installed and controlled must also be increased.
We are working in collaboration with a team of buildingsystems researchers to evaluate the potential of low exergybuilding systems in the tropical climate. The increase inintelligence of the system is required to evaluate and deter-mine how best to implement the systems. In terms of thesystem concept, low exergy means that the designs considerthe �ows of heat in the building along with the temperatureof those �ows. The amount of heat �owing is one measureof performance of the system, but the temperatures of those�ows independently a�ect the e�ciency of the system due tothe 2nd law of Thermodynamics. Therefore, while evaluat-ing the prototype systems in the tropics, the measurementsof temperatures take on an added importance because wewant to optimize not just the adequate heat removal, butalso the temperatures we use to remove the heat.
The heat is removed from buildings using a refrigeration cy-cle. A chiller runs a compressor that cycles refrigerant from
160

a low pressure side where heat can be absorbed from a lowertemperature (inside the building) to a higher pressure sidewhere that heat can then be rejected (outside the building).In a typical system design, the chiller components would besized to move the correct amount of heat out of the buildingto make it cool without much consideration for the operatingtemperatures. This is because in the tropics most coolingis done with air. To use air as a cooling medium, it has tobe dehumidi�ed �rst. The dehumidi�cation process requiresthe air to be subcooled to a point where an adequate amountof water will condensate out of the air, so that when it heatsup inside the building a comfortable relative humidity fromroughly 40-60% is reached. The subcooling process requiresthe chiller to generate cooling below 10 � C, and this lowtemperature reduces the system performance.
In our low exergy system design we are trying to �nd ways toprovide cooling at higher temperatures, which will minimizethe electricity required to supply the cooling. We achievethis by decoupling the cooling process from the air systemsand the required dehumidi�cation. The cooling load is metby a chilled water circuit that provides cooling at 18 � Cthrough a cooling panel with a large surface area. It is stillnecessary to supply fresh air to the building users, and thisair must still be dehumidi�ed at a lower temperature, butthe amount of air is independent of the cooling demand andcan be optimized. But in order to optimize the system op-eration for the tropics we need to measure the performancecharacteristics.
In order to evaluate the operation of the fresh air deliveryand the independent cooling panel, there are many vari-ables that must be measured. The goal is to supply theright amount of fresh air for the users, so we must knowhow many users there are. We must also make sure the airsupplied is properly dehumidi�ed so that any risk of humidair in�ltration is mitigated. This is a signi�cant risk becausewith no dehumidi�cation, the cooling panel at 18 � C is stillbelow the dew point of typical air in the tropics of around25 � C, which means that there will be condensation on thepanel and water could fall from the surfaces on the ceiling.Therefore we need accurate measurements of the air tem-perature and humidity as well as methods to consider thepotential of in�ltration in the system.
We have constructed an experimental building and labora-tory, BubbleZERO, where we are testing the prototype lowexergy technologies in Singapore. To operate and evaluatethe systems we have designed an intelligent wireless sensornetwork. This network will be used extensively to measurethe performance of the prototype systems in the laboratory,but as a fully modular wireless network, it can be easilyscaled back for demonstration in the �rst pilot projects.The BubbleZERO cooling system is made up of a chillerwith two water storage tanks, two sets of radiant coolingpanels and four decentralized air supply units. There arealso a variety of other new systems being tested includingCO2 steered exhaust vents, integrated LED lighting, andspecial LowE coated glazing. The performance of all theseintegrated systems can be steered and measured with wire-less sensor technology. We present in this paper a novelimplementation of such a sensor network along with datacollection and management system for our low exergy high
AirBox Driver
AirBox Driver
AirBox Driver
AirBox Driver
CO 2
Flap
CO 2
Flap
CO2
Flap
CO2
Flap
Hydraulics SensingSystem Airbox Sensing system
Environment SensingSystem
Data CollectionSystem
Temp
erature
Senso
rs
Flow
Rate
Senso
rs
Basic Unit:Telosb
Figure 2: Sensor deployment
performance building system.
3. SYSTEM DESIGN AND IMPLEMENTA-TION
In this section, we begin with an overview of the system.Then we provide an description of design and implemen-tation of the wireless sensor network system. Finally, weintroduce the design and implementation of the data man-agement system.
3.1 System OverviewTo enable good energy evaluations and energy-e�cient build-ing system designs, we design a building monitoring systemcomposed of two parts: Wireless Sensor Network Systemand Data Management System. Wireless sensor networksystem includes various sensors and a base-station. Wirlesssensors are deployed at di�erent places to collect data pe-riodically. Base-station is used to connect the wireless sen-sor network with the data management system. It collectssensor data and transmits to remote data management sys-tem. Data management system stores the received data in aproperly de�ned data base. It runs at a remote server in theIntelliSys Laboratory in NTU. It also provides a web basedinterface for end users to retrieve, visualize and even anal-ysis the data. Users can get the desired information fromthe web browser. The whole system archtecture is shown inFigure 1.
3.2 Wireless Sensor Network SystemAs discussed earlier in Section 2, our low-exergy based cool-ing system uses water instead of air as the main coolingmedium. The dehumidi�cation process is separated fromcooling process by using some specially designed air han-dling unit-Airbox. Complex hydraulic system is deployedin our BubbleZERO to enable proper function of those newdevices. To run those systems properly and to evaluate theirperformances, specially designed sensing system is needed.The key challenge here is to design a highly accurate, lowcost yet very �exible sensor system. The sensor system needsto be tightly integrated with various devices and building op-erating systems in the test bed. To address these problems,we design a wireless sensor network system. The basic unit
161
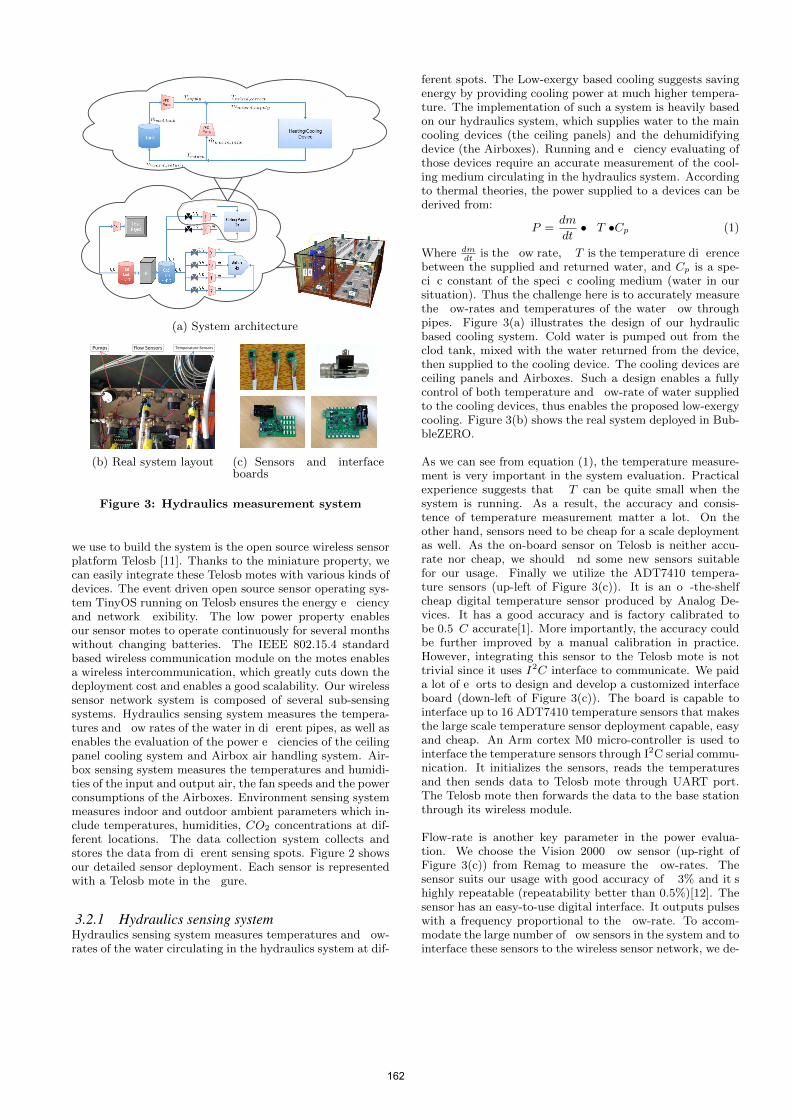
(a) System architecture
Pumps Flow Sensors Temperature Sensors
(b) Real system layout (c) Sensors and interfaceboards
Figure 3: Hydraulics measurement system
we use to build the system is the open source wireless sensorplatform Telosb [11]. Thanks to the miniature property, wecan easily integrate these Telosb motes with various kinds ofdevices. The event driven open source sensor operating sys-tem TinyOS running on Telosb ensures the energy e�ciencyand network �exibility. The low power property enablesour sensor motes to operate continuously for several monthswithout changing batteries. The IEEE 802.15.4 standardbased wireless communication module on the motes enablesa wireless intercommunication, which greatly cuts down thedeployment cost and enables a good scalability. Our wirelesssensor network system is composed of several sub-sensingsystems. Hydraulics sensing system measures the tempera-tures and �ow rates of the water in di�erent pipes, as well asenables the evaluation of the power e�ciencies of the ceilingpanel cooling system and Airbox air handling system. Air-box sensing system measures the temperatures and humidi-ties of the input and output air, the fan speeds and the powerconsumptions of the Airboxes. Environment sensing systemmeasures indoor and outdoor ambient parameters which in-clude temperatures, humidities, CO2 concentrations at dif-ferent locations. The data collection system collects andstores the data from di�erent sensing spots. Figure 2 showsour detailed sensor deployment. Each sensor is representedwith a Telosb mote in the �gure.
3.2.1 Hydraulics sensing systemHydraulics sensing system measures temperatures and �ow-rates of the water circulating in the hydraulics system at dif-
ferent spots. The Low-exergy based cooling suggests savingenergy by providing cooling power at much higher tempera-ture. The implementation of such a system is heavily basedon our hydraulics system, which supplies water to the maincooling devices (the ceiling panels) and the dehumidifyingdevice (the Airboxes). Running and e�ciency evaluating ofthose devices require an accurate measurement of the cool-ing medium circulating in the hydraulics system. Accordingto thermal theories, the power supplied to a devices can bederived from:
P =dm
dt· �T · Cp (1)
Where dmdt
is the �ow rate, �T is the temperature di�erencebetween the supplied and returned water, and Cp is a spe-ci�c constant of the speci�c cooling medium (water in oursituation). Thus the challenge here is to accurately measurethe �ow-rates and temperatures of the water �ow throughpipes. Figure 3(a) illustrates the design of our hydraulicbased cooling system. Cold water is pumped out from theclod tank, mixed with the water returned from the device,then supplied to the cooling device. The cooling devices areceiling panels and Airboxes. Such a design enables a fullycontrol of both temperature and �ow-rate of water suppliedto the cooling devices, thus enables the proposed low-exergycooling. Figure 3(b) shows the real system deployed in Bub-bleZERO.
As we can see from equation (1), the temperature measure-ment is very important in the system evaluation. Practicalexperience suggests that �T can be quite small when thesystem is running. As a result, the accuracy and consis-tence of temperature measurement matter a lot. On theother hand, sensors need to be cheap for a scale deploymentas well. As the on-board sensor on Telosb is neither accu-rate nor cheap, we should �nd some new sensors suitablefor our usage. Finally we utilize the ADT7410 tempera-ture sensors (up-left of Figure 3(c)). It is an o�-the-shelfcheap digital temperature sensor produced by Analog De-vices. It has a good accuracy and is factory calibrated tobe 0.5 � C accurate[1]. More importantly, the accuracy couldbe further improved by a manual calibration in practice.However, integrating this sensor to the Telosb mote is nottrivial since it uses I2C interface to communicate. We paida lot of e�orts to design and develop a customized interfaceboard (down-left of Figure 3(c)). The board is capable tointerface up to 16 ADT7410 temperature sensors that makesthe large scale temperature sensor deployment capable, easyand cheap. An Arm cortex M0 micro-controller is used tointerface the temperature sensors through I2C serial commu-nication. It initializes the sensors, reads the temperaturesand then sends data to Telosb mote through UART port.The Telosb mote then forwards the data to the base stationthrough its wireless module.
Flow-rate is another key parameter in the power evalua-tion. We choose the Vision 2000 �ow sensor (up-right ofFigure 3(c)) from Remag to measure the �ow-rates. Thesensor suits our usage with good accuracy of ± 3% and it� shighly repeatable (repeatability better than 0. 5%)[12]. Thesensor has an easy-to-use digital interface. It outputs pulseswith a frequency proportional to the �ow-rate. To accom-modate the large number of �ow sensors in the system and tointerface these sensors to the wireless sensor network, we de-
162

sign and build some specialized interface boards(down-rightof Figure 3(c)). Each of those boards could interface up to8 �ow sensors. Counting the pulse and then calculating thepulse frequency are performed by a ARM Cortex M3 micro-controller on each board. One Telosb mote is connected toeach interface board. Flow-rate data is sent to Telosb motethrough UART serial communication. Data is later trans-mitted to base station wirelessly by Telosb motes. By sodoing, we can connect our �ow-rate sensors to the wirelesssensing network.
3.2.2 Airbox sensing systemAirbox sensing system measures the running parameters ofour air handling units-Airboxes. Space conditioning in trop-ical climates can� t be �nished without dehumidi�cation. It isbecause outside air is usually too humid that cooling it downdirectly to the desired temperature will cause condensation.For our case, condensation will appear on the ceiling paneland occupants will be unhappy to �nd their room make rain.Airbox is a novel device we use for dehumidi�cation in ourBubbleZERO. Figure 4(a) shows the structure of the Airboxand how it work. The basic principle we do dehumidi�cationremains the same with traditional air conditioning systems.That is cooling the air down to su�cient cold temperatureto condensate out the water and get dry air. However, dif-ferent from the traditional way, we use water as the coolingmedium to dehumidify the air. Cold and dry air is suppliedto the room through the outlets of the Airboxes. To run,control and evaluate these Airboxes, sensing at the rightspots is need. Input and output air parameters includingtemperature and humidity should be monitored. The speedof air �ow through the Airbox and the power consumptionof the Airbox itself are some other important parameters.Other important parameters such as the temperature and�ow-rate of the water �ow through the Airbox are measuredthrough the hydraulic sensing system. We choose SesirionSht75 sensor to monitor input and output air of Airbox.This sensor integrates both temperature and humidity sen-sor on a single small package. Its high accuracy makes itsuitable for our usage. It has high accuracy of 0. 3� C for tem-perature and ± 1. 8% for humidity at room temperature[14].We connect the sensor into the wireless sensor network alsothrough Telosb motes. Each Telosb mote connects to a pairof sht75 sensors which measures both the input and outputair. The fan speed and power consumption parameters arecollected through RS232 interface of the Airbox controller.Some RS232 level conversion boards are developed to inter-face the Telosb to the Airbox controller. Figure 4(b) showsthe sensor deployment of the Airbox measurement system.
3.2.3 Environment sensing systemThe environment sensing system monitors the ambient pa-rameters. The most sensitive indoor parameters for humanbeings are temperature and humidity. Another importantindoor parameter is CO2 concentration. We use the Sht11sensor onboard Telosb to measure temperature and humid-ity parameters. By deploying Telosb motes at di�erent spotsin the test-bed, we provide �ne grained temperature andhumidity distribution information. The sensor accuracy is0.4� C for temperature and ± 1.8% for humidity at 25 � C[13].Firgure 5(a) shows the indoor sensor deployment. Batteriesare used to power these Telosb nodes to give the �exibil-ity of mobility. It means the sensors can be move to others
(a) Airbox
Hot and Humid Air
Cold and Dry Air
Hot Water come out
Cold Water go in
Airbox Controller
Input AirSensor
Output AirSensor
(b) Airbox work �ow and sensors
Figure 4: Airbox measurement System
(a) Indoor sensor deploy-ment
(b) CO2 �ap
(c) Outdoor sensor deployment
Figure 5: Environment measurement system
spots if needed. The CO2 concentration measurement ismore di�cult. We use a device called CO2 �ap to performthe measurement. The CO2 �ap is connected to the Telosbnode through a RS232 communication port. Telosb readsthe temperate and CO2 information and sends it back to thebase station. The posssible usage of CO2 can be on-demandventilation control. Firgure 5(b) shows the connection of theCO2 �ap and the Telosb node.
For the outdoor environment monitoring, we measure thetemperature and humidity merely. We hang some Telosbnodes outside the test bed. A special consideration here isto protect the sensor from the sun and rain, since the suncan heat the sensor up, thus leading to the sensing error,while the rain can damage the humidity sensor. Firgure 5(c)shows our sensor protection solution. We �rstly put sensorsin an half cut plastic bottle to protect the sensor from therain. Then we cover the bottle with re�ective white paperto shade the sensor from the sun. The deployment is just tohang these sensors around our test-bed.
3.2.4 Data collection systemThe data collection system is composed of a Telosb nodeand a laptop (Figure 6(a)). The Telosb node acts as thebase-station for the sensor network. It receives all the sen-
163
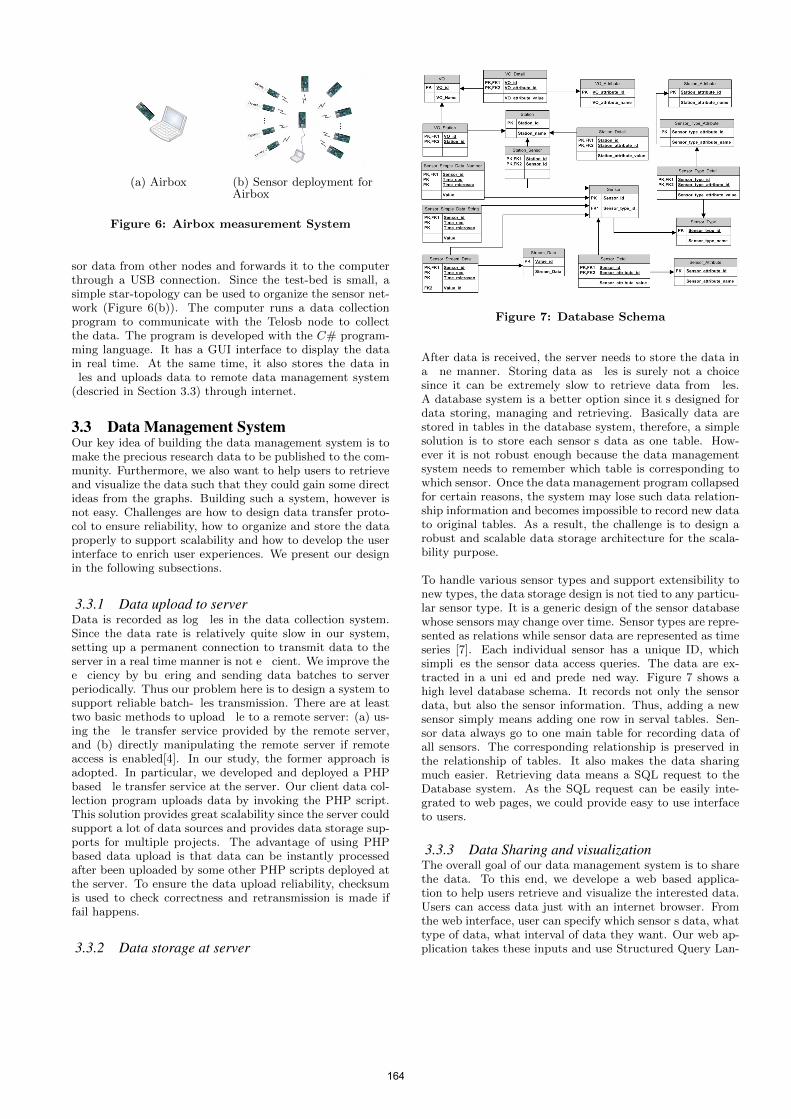
(a) Airbox (b) Sensor deployment forAirbox
Figure 6: Airbox measurement System
sor data from other nodes and forwards it to the computerthrough a USB connection. Since the test-bed is small, asimple star-topology can be used to organize the sensor net-work (Figure 6(b)). The computer runs a data collectionprogram to communicate with the Telosb node to collectthe data. The program is developed with the C# program-ming language. It has a GUI interface to display the datain real time. At the same time, it also stores the data in�les and uploads data to remote data management system(descried in Section 3.3) through internet.
3.3 Data Management SystemOur key idea of building the data management system is tomake the precious research data to be published to the com-munity. Furthermore, we also want to help users to retrieveand visualize the data such that they could gain some directideas from the graphs. Building such a system, however isnot easy. Challenges are how to design data transfer proto-col to ensure reliability, how to organize and store the dataproperly to support scalability and how to develop the userinterface to enrich user experiences. We present our designin the following subsections.
3.3.1 Data upload to serverData is recorded as log �les in the data collection system.Since the data rate is relatively quite slow in our system,setting up a permanent connection to transmit data to theserver in a real time manner is not e�cient. We improve thee�ciency by bu�ering and sending data batches to serverperiodically. Thus our problem here is to design a system tosupport reliable batch-�les transmission. There are at leasttwo basic methods to upload �le to a remote server: (a) us-ing the �le transfer service provided by the remote server,and (b) directly manipulating the remote server if remoteaccess is enabled[4]. In our study, the former approach isadopted. In particular, we developed and deployed a PHPbased �le transfer service at the server. Our client data col-lection program uploads data by invoking the PHP script.This solution provides great scalability since the server couldsupport a lot of data sources and provides data storage sup-ports for multiple projects. The advantage of using PHPbased data upload is that data can be instantly processedafter been uploaded by some other PHP scripts deployed atthe server. To ensure the data upload reliability, checksumis used to check correctness and retransmission is made iffail happens.
3.3.2 Data storage at server
Figure 7: Database Schema
After data is received, the server needs to store the data ina �ne manner. Storing data as �les is surely not a choicesince it can be extremely slow to retrieve data from �les.A database system is a better option since it� s designed fordata storing, managing and retrieving. Basically data arestored in tables in the database system, therefore, a simplesolution is to store each sensor� s data as one table. How-ever it is not robust enough because the data managementsystem needs to remember which table is corresponding towhich sensor. Once the data management program collapsedfor certain reasons, the system may lose such data relation-ship information and becomes impossible to record new datato original tables. As a result, the challenge is to design arobust and scalable data storage architecture for the scala-bility purpose.
To handle various sensor types and support extensibility tonew types, the data storage design is not tied to any particu-lar sensor type. It is a generic design of the sensor databasewhose sensors may change over time. Sensor types are repre-sented as relations while sensor data are represented as timeseries [7]. Each individual sensor has a unique ID, whichsimpli�es the sensor data access queries. The data are ex-tracted in a uni�ed and prede�ned way. Figure 7 shows ahigh level database schema. It records not only the sensordata, but also the sensor information. Thus, adding a newsensor simply means adding one row in serval tables. Sen-sor data always go to one main table for recording data ofall sensors. The corresponding relationship is preserved inthe relationship of tables. It also makes the data sharingmuch easier. Retrieving data means a SQL request to theDatabase system. As the SQL request can be easily inte-grated to web pages, we could provide easy to use interfaceto users.
3.3.3 Data Sharing and visualizationThe overall goal of our data management system is to sharethe data. To this end, we develope a web based applica-tion to help users retrieve and visualize the interested data.Users can access data just with an internet browser. Fromthe web interface, user can specify which sensor� s data, whattype of data, what interval of data they want. Our web ap-plication takes these inputs and use Structured Query Lan-
164

Figure 8: Hydraulics system measurement result
Figure 9: Environment system measurement result
guage (SQL) to request the data from our database. Thereturned data is transformed to graphical pictures by usingthe Google visualization tool[3]. Users can also downloaddata for a further analysis.
4. RESULT PRESENTATIONIn this section, we present some of our initial measurementresults. Our results for the hydraulics and environment sens-ing system are from data collected from a two day experi-ment. In the experiment, we intend to test the performancethe Airboxes. three Airboxes run at their full speeds dur-ing the test period. The data for the Airboxes measurementsystem is from one of our 40 minutes experiments with oneAirbox. In the experiment, we want to find out the rela-tionship between the Airbox fan speed and the output airtemperature.
Figure 8 shows the measurement result of our hydraulics sys-tem. Temperatures for 16 sensors and flow-rates for 9 flowsensors are shown in the figure. At the start of the exper-iment, temperatures and flow-rates change quickly. Aftersome time, they reach stable states and change slowly alongthe time. The temperatures change along time as the cooling
Figure 10: Airbox system measurement result
load changes, while the flow-rates remain almost constant.Figure 9 shows the ambient environment changes within thetwo day. We plot both inside and outside temperatures andhumidities of different spots. We can see that the outdoorenvironment changes a lot during a day. While our indoorenvironment remains somehow constant due to the condi-tioning of Airboxes. On the other hand, we also find thatAirboxes alone cannot provide enough cooling capacity dur-ing the day. The average indoor temperature rises duringdaytime and drops at night. We also measure the CO2 con-centration. The CO2 concentration is high at the beginningof the experiment because researchers stayed in the test-bedat that time. After their departure, the value falls to a lowand constant value.
Figure 10 depicts the test result of Airbox. In this test, weintended to figure out the relationship between the fan speedand the output air temperature of the Airbox. We keep thewater supply constant and change the speed of the fan ofthe Airbox. We collect data from the Airbox measurementsystem. The result shows that the output air temperaturewill increase as the fan speed increases. They follow a linearrelationship. The data can also help us evaluate the energyefficiency of the Airbox.
Figure 11 is the screen snapshot of our data managementsystem. Figure 11(a) shows the web-based user interfacewith which people can specify the interested data by spec-ifying type, date, etc. The visualization result is shown inFigure 11(b). The visualized result can help researchers getsome rough ideas and quickly evaluate the systems. Theycan further be download from the data set for further anal-ysis.
5. CONCLUSIONSensing is essential for understanding existing building sys-tems, testing new building systems and designing sustain-able buildings for the future. In this paper, we design awireless sensor network that is tightly integrated with vari-ous energy consuming devices in our test-bed. The systemoffers fine grained information for researchers to evaluatethe system performance. We also built a data managementframework to publish our data to all interested users. It has
165
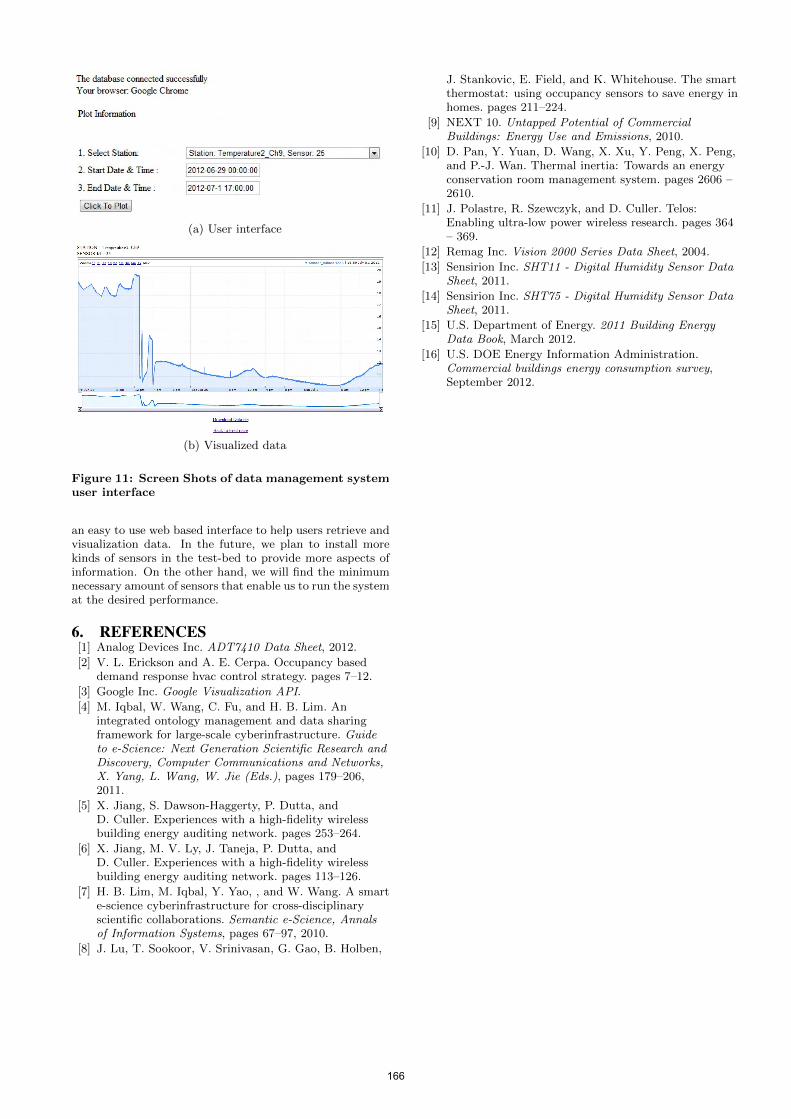
(a) User interface
(b) Visualized data
Figure 11: Screen Shots of data management systemuser interface
an easy to use web based interface to help users retrieve andvisualization data. In the future, we plan to install morekinds of sensors in the test-bed to provide more aspects ofinformation. On the other hand, we will find the minimumnecessary amount of sensors that enable us to run the systemat the desired performance.
6. REFERENCES[1] Analog Devices Inc. ADT7410 Data Sheet, 2012.
[2] V. L. Erickson and A. E. Cerpa. Occupancy baseddemand response hvac control strategy. pages 7–12.
[3] Google Inc. Google Visualization API.
[4] M. Iqbal, W. Wang, C. Fu, and H. B. Lim. Anintegrated ontology management and data sharingframework for large-scale cyberinfrastructure. Guideto e-Science: Next Generation Scientific Research andDiscovery, Computer Communications and Networks,X. Yang, L. Wang, W. Jie (Eds.), pages 179–206,2011.
[5] X. Jiang, S. Dawson-Haggerty, P. Dutta, andD. Culler. Experiences with a high-fidelity wirelessbuilding energy auditing network. pages 253–264.
[6] X. Jiang, M. V. Ly, J. Taneja, P. Dutta, andD. Culler. Experiences with a high-fidelity wirelessbuilding energy auditing network. pages 113–126.
[7] H. B. Lim, M. Iqbal, Y. Yao, , and W. Wang. A smarte-science cyberinfrastructure for cross-disciplinaryscientific collaborations. Semantic e-Science, Annalsof Information Systems, pages 67–97, 2010.
[8] J. Lu, T. Sookoor, V. Srinivasan, G. Gao, B. Holben,
J. Stankovic, E. Field, and K. Whitehouse. The smartthermostat: using occupancy sensors to save energy inhomes. pages 211–224.
[9] NEXT 10. Untapped Potential of CommercialBuildings: Energy Use and Emissions, 2010.
[10] D. Pan, Y. Yuan, D. Wang, X. Xu, Y. Peng, X. Peng,and P.-J. Wan. Thermal inertia: Towards an energyconservation room management system. pages 2606 –2610.
[11] J. Polastre, R. Szewczyk, and D. Culler. Telos:Enabling ultra-low power wireless research. pages 364– 369.
[12] Remag Inc. Vision 2000 Series Data Sheet, 2004.
[13] Sensirion Inc. SHT11 - Digital Humidity Sensor DataSheet, 2011.
[14] Sensirion Inc. SHT75 - Digital Humidity Sensor DataSheet, 2011.
[15] U.S. Department of Energy. 2011 Building EnergyData Book, March 2012.
[16] U.S. DOE Energy Information Administration.Commercial buildings energy consumption survey,September 2012.
166

Urban social sustainability through the web Using ICTs to build a community for prospective neighbors
Eun Ji Cho1, Liat Rogel2
Politecnico di Milano, Via Durando 38/a Milan, Italy [email protected], 2 [email protected]
ABSTRACT In this paper the authors describe how urban social sustainability can be achieved by creating better relationships between neighbors. Social sustainability is often neglected in mainstream sustainability debates, but the authors argue creating cities that are socially sustainable is as important as designing cities that are economically and environmentally sustainable, since social sustainability is often a motor for acting holistically on sustainable issues. In particular, this paper examines the potential of using ICTs in creating relationships between neighbors, and its beneficial impact on facilitating sustainable lifestyle of residents. Findings from a case study on a cooperative housing in Milan, Italy, are discussed.
Keywords Social sustainability, community, neighbor, social capital, ICT
1. THE NEED OF URBAN SOCIAL SUSTAINABILITY Sustainability in urban areas is often addressed by mainstream debates as related to pollution, poverty or poor urban planning and approached with solutions towards environmental and economic sustainability. Thus, when talking about urban sustainability, the debate tends to be partial and emphasize mostly technological ways to reduce air pollution, to build energy-efficient houses, or to promote renewable energy for daily uses. There is however a strong need to think about sustainability in a more holistic way, and broaden the scope of discourses towards social aspects of sustainability.
Social sustainability, which has started gaining recognition in recent years as a fundamental component of sustainable development (Colantonio, et al., 2009), is concerned with using available human resources in order to achieve equity and well-being for the whole society. While there is a relatively limited literature focusing on social sustainability, some definitions of social sustainability can be found in the previous studies.
“Development (and/or growth) that is compatible with harmonious evolution of civil society, fostering an environment conductive to the compatible cohabitation of culturally and socially diverse groups while at the same time encouraging social integration, with improvements in the quality of life for all segments of the population”(Polese and Stren, 2000, cited in Colantonio, et al. 2009)
“…a quality of societies. It signifies the nature-society relationships, mediated by work, as well as relationships within the society. Social sustainability is given, if work within a society and the related institutional arrangements satisfy an extended set
of human needs [and] are shaped in a way that nature and its reproductive capabilities are preserved over a long period of time and the normative claims of social justice, human dignity and participation are fulfilled.” (Littig and Grießler, 2005: cited in Colantonio, et al. 2009)
“Social sustainability concerns how individuals, communities and societies live with each other and set out to achieve the objectives of development models which they have chosen for themselves, also taking into account the physical boundaries of their places and planet earth as a whole.” (Colantonio, et al., 2009)
Colantonio, et al. (2009) argue that traditional ‘hard’ social sustainability themes, such as employment and poverty alleviation, are increasingly being complemented or replaced by emerging ‘soft’ and less measurable concepts such as happiness, well being, neighborhood satisfaction, and sense of place in the social sustainability debate. In a similar sense, this paper pays attention on building relationships among neighbors, and how it can positively influence on not only social sustainability but also environmental and economical sustainability in the urban context.
2. URBAN DWELLINGS AS HUBS FOR SUSTAINBLE LIVING Cities are cradles for innovation because they are where knowledge, culture and self-governance come together (Mulgan, Leadbeater, 2009). There is a concentration of need in cities, and a greater incentive to address problems in ways that haven't been addressed before (Jacobs, 1997). People are finding creative solutions that can help them cope with the difficulties that the same cities preset; like isolation, segregation and high costs of living. Large urban housing are perfect places for the development of creative communities (Meroni 2007). It is there, where being nearby can be crucial for making each other's life easier. Many collaborative services in which end users collaborate to meet their needs in a sustainable way (Jegou & Manzini 2008) are often based on collaboration among people living nearby to each other.
The idea of creating houses that integrate services, as if the house was a welfare hub, is not new. Some of these ideas were already described in the beginning of the 20th century, Hanifan, already in 1916 is describing the relationship between neighbours as a font of social capital. The contact with the neighbours, he argues, create the capability to satisfy personal needs and improve the living conditions for the whole community. In more specific way related to housing, the Sociologist Elva Myrdal is asking about the
ICT4S 2013: Proceedings of the First International Conference on Information and Communication Technologies for Sustainability, ETH Zurich, February 14-16, 2013. Edited by Lorenz M. Hilty, Bernard Aebischer, Göran Andersson and Wolfgang Lohmann. DOI: http://dx.doi.org/10.3929/ethz-a-007337628
167

need of “collective solutions”. She puts in light the absurd of people with very similar needs that do not take advantage of their proximity for making their daily activities more effective. (Myrdal 1930). The implementation of these ideas was slow and is still challenging. Nowadays, however, the development of ICTs has opened new opportunities for realizing some of these ideas.
Examples of utilizing ICTs for sustainable living, especially among people living nearby, are already observable in many cities across the world. As an example, peer-to-peer car-sharing service RelayRides (https://relayrides.com) connects people who need a car with vehicle owners in their neighborhoods. This ICT-based service that launched in two cities in 2010 has grown to operate nationwide in the United States, including cities like San Francisco, New york, and Boston. (data accessed in June, 2012) Car owners can make money by renting out their car otherwise sitting idle in parking lots, and renters can save money by paying per use of car, instead of paying all the cost of owning a car. In recent years, similar type of neighborhood car-sharing services has been growing, such as Whipcar (http://www.whipcar.com) in UK, Buzzcar in France (http://www.buzzcar.com), Snappcar in the Netherlands (http://www.snappcar.nl), Tamyca in Germany (http://www.tamyca.de), Getaround (http://www.getaround.com) in the United States, a recent start-up JustShareIt (www.justshareit.com), and campus-based service Wheelz (http://www.wheelz.com) operating at Stanford University, UC Berkeley, UCLA.
Figure 1. Online platform of car-sharing service RelayRides
The idea of neighborhood sharing can be applied to any underutilized assets, ranging from occasional-use household items (e.g. power tools) to space (e.g. garden, parking space). UK-based service Landshare (http://www.landshare.net), which has more than 69,800 members (data accessed in August 2012), helps people who want to grow their own vegetable and fruit but do not have a garden connect with nearby garden owners. Many garden owners who join the service are either too old or too busy to manage their own plots, and by sharing their garden they can reduce the burden of gardening. While no money changes hands in garden sharing, those involved often have an agreement to divide up the fruit and veg produced.1 Similar initiatives such as UrbanGardenShare (http://www.urbangardenshare.org), and SharedEarth (http://www.sharedearth.com) also operate the same
1 http://www.guardian.co.uk/money/2011/sep/02/garden-sharing-
growing-vegetables
way. Services that help neighbors borrow/rent relatively trivial household items like hammer, and gardening tools, are growing as well, such as Share Some Sugar (www.sharesomesugar.com), The Sharehood (http://www.thesharehood.org), StreetBank (http://www.streetbank.com), Frents (http://www.frents.com), Neighborrow (http://beta.neighborrow.com), and Hey, Neighbor! (http://heyneighbor.com), to name a few.
From the perspective of sustainability, this trend spurred by ICTs is promising, since it leads to increase resource efficiency. By sharing products with limited usage, such as a car, which spends about 90 percent of the time sitting idle in parking lots in the United States (Roberts, 2011), the utility of products can be maximized, therefore resource efficiency can be increased. (Botsman & Rogers, 2010).
Not only physical assets, but also intangible assets, such as time and skill, can be shared (or exchanged) between neighbors to meet their needs. A classic example ‘timebanking’ has been revived by the widespread use of the Internet. NeighborFavor (http://www.neighbfav.com) implements a mobile platform to match a person who needs a favor like grocery shopping with neighbors who can do the favor. Similarly, users of TaskRabbit (http://www.taskrabbit.com) can post a task on its online platform to find someone in their neighborhood who would do it for them. While services like NeighborFavor, and TaskRabbit are based on monetary incentives (users get paid for doing a favor for others), timebanking initiatives based on a more traditional sense of ‘mutual help’ are also expanding through digital platforms. These platforms support users to post an offer or request (e.g. www.camdenshares.org.uk, http://twtb.co.uk, www.rgtb.org.uk, http://timebank.org.uk), or provide tools to start a new local timebanking community (e.g. http://timebanks.org).
Figure 2. Online platform of Timber Wharf Time Bank
The benefit of timebanking goes beyond making use of the assets and resources existing within a particular community. Timebanking contributes to strengthening local communities by enabling people from different backgrounds, who may not otherwise meet, to form connections and friendships. (Timebanking UK, 2011) Van der Wekken (2012) claims that timebanking can play an important role to well-being in society. It can give people more control over their own lives as well as neighborhoods, and empower and engage communities along the principles of equality and reciprocity. Different from running an
168

errand or doing chores in exchange of money, the driving force of timebanking is care and support for each other.
3. CONNECTING NETWORKED INDIVIDUALS, FACILITATING RELATIONSHIPS All these examples may resemble collaborative lifestyle of traditional communities, but there are some differences. One of fundamental differences is the fact people who collaborate with each other do not have pre-existing relationship. They live in a geographically close area, but do not know each other personally. They search/find suitable collaborator through the online platform, and make decision based on the information presented on the virtual platform. The collaboration occurs among practically strangers connected through the Internet, unlike the collaboration in traditional communities, which were based on strong interpersonal relation among the members/participants.
Nowadays in cities, unlike traditional villages, living in a same neighborhood does not necessarily mean knowing each other or having a sense of community. Wellman (2002, 1998) illustrated the difference as ‘densely-knit, tightly-bounded group’ vs ‘sparsely-knit, loosely-bounded networks’. Pre-industrial communities, in which people walked door-to-door to visit each other in spatially compact and densely-knit milieus, most individuals were directly connected (‘densely-knit’), and most relations stayed within the same social boundaries/ group members/ circle (‘tightly-bounded’). However, peoples’ lives no longer fit the ‘little boxes’ model. Contemporary communities have moved out of neighborhoods to be dispersed networks, personalized social network. Most North Americans have little interpersonal connection with their neighborhoods, and the percentage of North Americans regularly socializing with neighbors has been steadily declining for three decades. Few neighbors are known, and those known are rarely known well. By contrast to traditional meetings in village squares or pubs, friends and relatives get together in private as small sets of singles or couples, but rarely as communal groups. Relationships became more selective. (Wellman, 2002)
According to Wellman (2002), the transition from traditional group solidarities to the networked individualism was partly driven by revolutionary developments in both transportation and communication. It was a move away from a solidary group in a single locale to contact between people in different places and multiple social networks. Households and worksites became important centers for networking, while neighborhoods became less important. The shift to a personalized, wireless world affords networked individualism, with each person switching between ties and networks. People remain connected, but as individuals rather than being rooted in the home bases of work unit and household. Individuals switch rapidly between their social networks. Each person separately operates his networks to obtain information, collaboration, orders, support, sociability, and a sense of belonging.
In fact, local communities, also referred to as residential communities, or physically or geographically based communities, are not ‘communities’ a priori, in the sense of neighborhood. Apart from the fact that members of local communities share the same location, they are not necessarily bound by any other common characteristic, such as interest, age, group, or occupation. (Foth, 2003)
As a result, it is challenging in urban neighborhood to motivate people in the same locality to collaborate together. For instance, despite the environmental, economical, and social benefits, neighborhood-scale general item sharing often turns out difficult to succeed. As an example, NeighborGoods, one of the services that advocate neighborhood sharing, closed its service as of July 31, 2012, after three years. Although sharing everyday stuff with neighbors and saving money seems plausible idea, more than ten neighborhood sharing websites launched since 2009 have failed. (Shareable, 2012)
As early studies on the relationship between the use of ICTs and communities (e.g. Rheingold, 2000; Kavanaugh, 1999) argued, the technological connectivity enabled by ICTs has opened up new opportunities for communities at local and global levels. For instance, the ‘Netville’ case (Hampton & Wellman, 2003) showed the positive role of the Internet in the creation of larger neighborhood networks, greater frequency of communication (on and offline), and participation in the public and private realms. Wired residents embraced local contact, on and offline. Similarly, ‘Blacksburg Electronic Village’ case revealed that the Internet, especially email and discussion lists, reinforce as well as expand social networks and ties (Kavanaugh, 1999). However, ‘Blacksburg Electronic Village’ also revealed that there was no trend toward an increase in community involvement or attachment (Kavanaugh & Patterson, 2001). This study hypothesizes that technological connectivity solely is not enough to bring about collaborative ways of living among neighbors, especially when the neighbors do not have pre-existing relationship. The rationale behind this hypothesis is that the absence of social capital among neighbors who do not know each other (even though they live nearby), and the lack of a sense of community are significant barriers for collaborative relationship. In traditional communities, social capital among neighbors was formed as a by-product of interactions that occur naturally in the course of recreation, and social activities, such as bowling leagues and choral singing. While these types of interactions have declined in the last few decades (Putnam, 2000), this research assumes that ICTs can open up new ways to facilitate spontaneous interactions, which will gradually lead to formation of social capital. In this sense, facilitating spontaneous social interaction is assumed to play a crucial role in fostering collaboration, ranging from goods sharing to mutual help, among neighbors who do not know each other well. The emphasis on the social side of ICTs is in line with the recent trend of social networking services for geographically based communities - often described as ‘Facebook for Neighborhoods’- such as YaTown (http://yatown.com), and NextDoor (https://nextdoor.com), but this study pays attention on the social interaction both online and offline contexts.
4. METHODOLOGY This study employed participatory action research carried out with residents of a newly built apartment located in Scarsellini street in Milan, Italy. The building was built by a construction cooperative. The formation of cooperatives of this type has as its aim in the construction of houses and distribution to members at cost price. This eliminates the entrepreneur's profit and benefits from all the facilities provided to these companies. Nevertheless, the construction of houses in a cooperative has become more of a legal form. The process is a top-down one and the members do not have personal relationships with each other. The cooperatives are not new on the Italian context. Actually, construction cooperatives are very well known and are an inseparable part of
169

the real estate market in Italy. We chose working with this reality because the idea of collaboration and cooperation is on its base and we could find a fertile ground for this new idea.
The residents in this particular building did not have particular interest in sustainable living or collaborative relationship with neighbors, but the authors assumed ICTs could be utilized to foster interaction between residents, and support them to create more sustainable urban housing solutions collaboratively. In the beginning it seemed somewhat paradoxical to use digital interfaces in such environment like a condominium where people are physically in close proximity to one another, and easy to meet face to face. However, the authors assumed that implementation of ICTs can be beneficial in two ways. First, it can increase chances of spontaneous social interaction among members by providing a space where the residents can participate conveniently and autonomously. Second, considering the residents do not have pre-existing relationships, ICTs can play a useful role in building impersonal forms of social capital, where affective ties are not needed (Resnick, 2004).
For this reason, an online platform focusing on supporting social interaction and networking among members was implemented, even though the members already had access to intranet provided by co-op consortium for communication purposes, like announcement of meeting, updates of construction progress.
4.1 Description of Actions The platform was built one year before moving into the building. This was accompanied by a presentation and a series of meetings with both the co-op president and the inhabitants. The idea was to open up the possibilities to the future residents and create active participation in creating their still-to-come social life in the new condominium. The action is divided in several phases:
A. Discussion with the co-op president and consortium: The action was coordinated and discussed with the president of the co-op. This was very important, as the involvement in the early phase of decision makers is crucial for the success of such projects. Also, for people to trust the idea and participate it guaranteed a sense of seriousness and reality.
B. The creation of the online platform: The platform was created by making use of NING framework (www.ning.com). The network allows people to get their own profile, to add pictures and statuses as well as participate in the various forums. The categories of the forums were created by the researchers and consisted initially on:
1- let’s know each other: for personal introductions 2- together is better: for sharing ideas about how to use our being a group
3- common rooms: for talking about the future use of our two common rooms
4- marketplace: for exchanging knowledge and tools.
C. Launch of the tool and presentation to the prospect residents: in April 2011, about a year before the building was ready we presented to the future neighbors the opportunities of collaboration, creating in the public the Awareness of possibilities. After the presentation the online platform was presented as a tool for socializing, communicating and for sharing knowledge and ideas.
D. Use of the tool and face to face meetings: In the first 2 weeks after the presentation 12 people were connected to the site using shyly the categories 1 and 2. The number of
people was small but the contributions have demonstrated a great interest in making a better house. Three face-to-face meetings took place during this year and the involvement of people grew.
E. Monitoring and feedback: Several tools were designed in order to gather useful feedbacks from the stakeholder involved in this study. All the activities were monitored through photo and video-capturing systems and written documentation of the meetings organized with the communities. At the month of moving in, we have conducted a survey and some interviews to have peoples direct feedback.
The overall process can be summarized into the five steps as follows:
1. Defining the issue and the area of intervention: After literature review and discussions with involved stakeholders, the main issue was defined as mediating interactions and relationships through an online social network platform for the prospect residents.
2. Planning the action: The platform was built and shared with stakeholders. A public envisioning presentation was prepared. 3. Taking action 4. Analysis and reflections 5. Modifications and re-planning
Figure 3. Overall process of the actions
4.2. Interface of online platform The online platform was developed by customizing features supported by NING platform. Considering the varying degree of familiarity with ICTs among the residents, the interface was configured to be easily usable, with WYSIWYG (What-You-See-Is-What-You-Get) style text editors and image up-loaders. Except first-time registration, any additional procedures were not required to use the platform. In order not to alienate people who do not use social media like Facebook, and Twitter, integration with other social networking services was excluded.
When the platform was launched, an invitation email was sent to all residents of the building, and only those who accepted the invitation were registered as member of the platform. Registration could be done by answering the invitation email, and providing basic information like name, gender, date of birth, and house number. Once registered as a member, everyone could create his/her own profile with pictures. The profile page provides an overview of recent activities of the member within the system (e.g. recent posts, feedback to others’ posts), list of friends within the community, as well as basic information about him/her. The
170
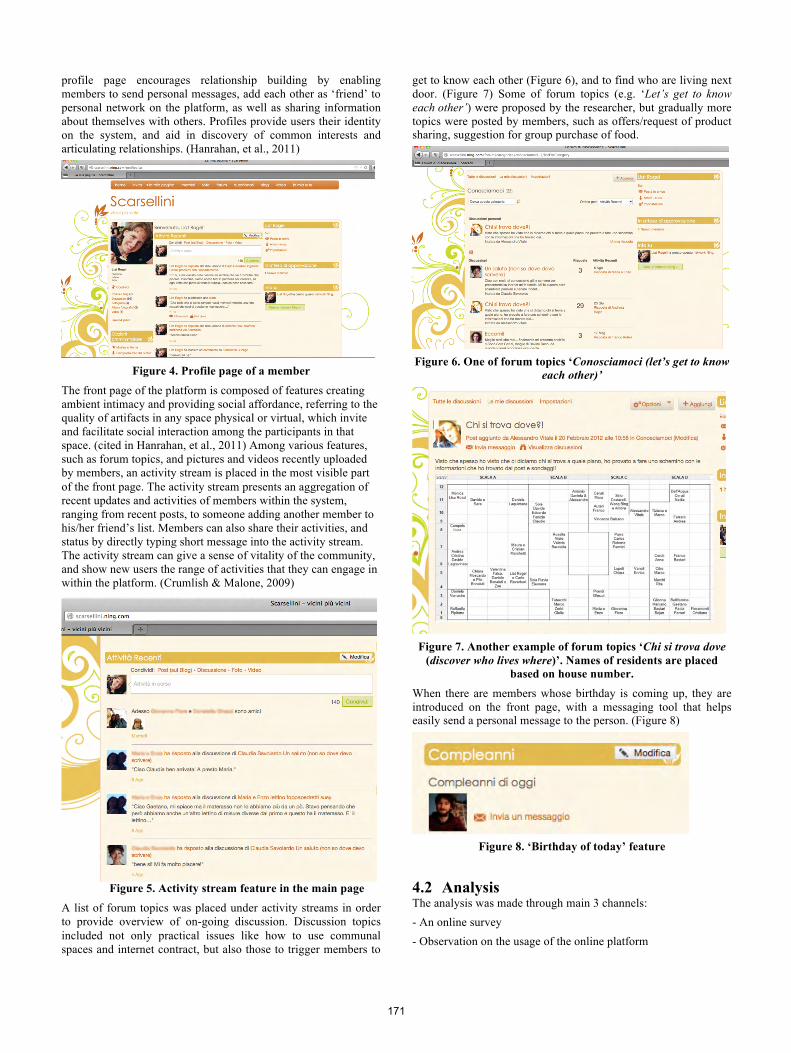
profile page encourages relationship building by enabling members to send personal messages, add each other as ‘friend’ to personal network on the platform, as well as sharing information about themselves with others. Profiles provide users their identity on the system, and aid in discovery of common interests and articulating relationships. (Hanrahan, et al., 2011)
Figure 4. Profile page of a member
The front page of the platform is composed of features creating ambient intimacy and providing social affordance, referring to the quality of artifacts in any space physical or virtual, which invite and facilitate social interaction among the participants in that space. (cited in Hanrahan, et al., 2011) Among various features, such as forum topics, and pictures and videos recently uploaded by members, an activity stream is placed in the most visible part of the front page. The activity stream presents an aggregation of recent updates and activities of members within the system, ranging from recent posts, to someone adding another member to his/her friend’s list. Members can also share their activities, and status by directly typing short message into the activity stream. The activity stream can give a sense of vitality of the community, and show new users the range of activities that they can engage in within the platform. (Crumlish & Malone, 2009)
Figure 5. Activity stream feature in the main page
A list of forum topics was placed under activity streams in order to provide overview of on-going discussion. Discussion topics included not only practical issues like how to use communal spaces and internet contract, but also those to trigger members to
get to know each other (Figure 6), and to find who are living next door. (Figure 7) Some of forum topics (e.g. ‘Let’s get to know each other’) were proposed by the researcher, but gradually more topics were posted by members, such as offers/request of product sharing, suggestion for group purchase of food.
Figure 6. One of forum topics ‘Conosciamoci (let’s get to know
each other)’
Figure 7. Another example of forum topics ‘Chi si trova dove
(discover who lives where)’. Names of residents are placed based on house number.
When there are members whose birthday is coming up, they are introduced on the front page, with a messaging tool that helps easily send a personal message to the person. (Figure 8)
Figure 8. ‘Birthday of today’ feature
4.2 Analysis The analysis was made through main 3 channels: - An online survey - Observation on the usage of the online platform
171

- Observation of off-line activities (meetings and everyday life)
Towards the end of the first year of use, the authors asked users to participate in a survey posted on the online platform. 22 users have answered the survey, which consisted of closed questions and open questions. In answering the open questions, 10 of the respondents provided in-depth detailed information about their experience. The questions were divided in different parts regarding personal questions about the house and the relationship with neighbors, questions about the use of the platforms, questions about the results in each one’s daily life.
Observation on the usage of the online platform has started from the very first moment and it is still on going. We collect both numeric data, (e.g. number of members, date of joining the platform, age and so on) and content data (what do the users say, what they propose, how does the discussion develop over time).
Observation of offline meetings and daily activities together with informal conversation and interviews were carried out thanks to the ongoing presence of the authors in the building.
5. RESULT From the survey it was clear that:
- All members did not know each other, but get to know each other through the online platform.
- The actual role of platform is assisting in communication, and organization of collective actions.
- Knowing people in advance made the members feel more secure in their new environment.
- People see themselves continuing and using the platform in the future as a support to their community neighbors life.
Observation of the platform and offline: Since its launch in July 2010, 91 members (approximately 50% of the residents of the building) joined the online platform. In the last month the platform was opened to another building in front of this one and 18 members joined in.
The members were joining gradually with some peaks related to face-to-face meetings, and the opening of the platform to the residents of another building in the neighborhood (Figure 9). Most members frequently use the platform after signing up, except 12 non-active members.
Figure 9. The number of new members in each month (bar), and the total number of members (purple line)
Members’ age range from 15 to 68, with the larger group of users between 36 and 46. (Figure 10)
Figure 10. Age of members
The users of the online platform began very quickly to share ideas and make concrete proposals. Our hypothesis was that socialization between people would be a motor for future collaboration. However, socialization between members started to occur gradually as the discussion on concrete initiatives took place. In other words, introducing each other and knowing the future neighbors, which was thought as the principal scope of this platform was achieved only after many initiatives were proposed and discussed.
For example, the shared - wifi initiative evoked a larger participation on-line. Members started posting questions and requesting information about it. To make the discussion go on, a group of members met more than one time and social relationship started to be established. This has inspired people to introduce themselves also on the online platform. Also, other initiatives for a dedicated issue, like making playroom for children, have drawn attention of families with small children. Wanting to know more about the age of the children and which school they attend, members slowly started posting more stories about themselves in the page ‘Conosciamoci (let’s get to know each other)’ on the platform. Once the self-introduction forum began to have many people actively participating in it, it began working as we expected in the beginning. Members start using the forum as a first step when they join the online platform. All the ideas proposed by members were in the spirit of using the force of the community. People were using the platform to give inspiration and information as well as to actively participate in the discussion and actions related to specific issues, ranging from wifi-internet to communal playroom for children. By the expression of needs and desires, collaboration was born. In this form of socialization members were inspired from one another and gain the ability to participate toward the realization of the ideas. The whole action was followed and accompanied by cooperative president. She assisted to bridge between the residents and the consortium decision makers. She has explained how some initiatives, like the shared wi-fi would never have taken place without residents’ participation and how those could be innovative elements also for future buildings. A number of initiatives are already implemented: - organic food purchasing group - book sharing
172
- sport courses - cineforum - babysitting exchanges - children workshops And these are there 6 month after the first families moved in.
Another innovation that was made possible through the online platform, and showed the potential of trust building, is the free use of the common rooms in the building. In other similar houses the common rooms are used by privates or the collective through booking the room. The residents wanted to be able to use the room in a free way, for example to go have a coffee in the morning or bring the children in the afternoon to play without having to plan in advance. For this use, the suggestion coming from the residents was that each resident would have the keys to the room. Since in Italy self-management of spaces is not so common this was a risky suggestion. However, a large group of residents already got to know each other and achieved a sense of trust, so the proposal was agreed by the majority of residents.
The project is using existing on-line platforms for existing construction cooperatives. The innovation is this use is to find in the combination of the two and in the timing. Usually, Italian construction cooperatives do not use any kind social networking tools for their users. The responsible might use an on-line site for sharing documents, but there is no interaction between the prospect habitants and the organization. In this specific case the platform was launched about one year before people moved in the house. Social networking tools has been used elsewhere to create on-line communities from people who live nearby, but to create the community before head has many advantages:
- The people can improve/modify the building and influence it. The participation brings to greater satisfaction of people. Creating sharable solutions guarantees that they last longer. Therefore the solutions are more sustainable. - People can exchange knowledge and material tools as well as create an on-line “market” of second hand furniture or other objects. These small sharing economies contribute a lot to environmental and economical sustainability. - Moving into a house knowing already some of the neighbors reduce the chances of isolation and loneliness. In our case many elderly people that moved in were happy to participate and to have meaningful relationships.
- Other activities related to environmental sustainability, such as car sharing, recycling etc. are facilitated by the already existing ties between the neighbors.
6. DISCUSSION The interactions and collaborative activities among neighbors have beneficial role in developing environmentally and socially sustainable urban environment for a number of reasons. First, they consist on recovering a lost social dimension of mutual aid and a sense of community, contrasting exclusion and reducing the stress and complexity of life in modern society. Second, the sharing of goods and services allows a considerable amount of saving of energy and costs, facilitating the management of daily activities and generating a more sustainable lifestyle. Third, involving people in designing their own solution creates a variety of housing options, enlarging diversity and fitting all types of families. Fourth, co-design of common spaces facilitates the development of relationships in the neighborhood and increases a sense of
belonging to a community, maintaining at the same time the individuality of ones dwelling.
Despite these benefits, it is not easy to make it happen in urban environment where a highly individualized way of living is common. This paper shows how ICTs can be implemented to mediate interaction between neighbors who do not have pre-existing personal relationship, and how the relationship supported by ICTs leads to environmentally and socially sustainable ways of living between neighbors. The experiment described in this study was carried out in the context of a newly built apartment and its residents who moved in same period, but the intervention is applicable to existing buildings as well. Sometimes neighbors who reside in a same building for many years do not have any sort of relationships despite their physical proximity. ICT-based platforms, as described in this study, can provide an opportunity to initiate a change in such an environment. On a detailed level, intervention for such context may require different strategies, but the basic idea - stimulating spontaneous interaction among neighbors by providing social affordances through digital platforms – would be applicable to any existing apartments. Also, participatory approach used in this study - inviting the residents in the design and try-out process- can be used to develop digital platform suitable for specific context.
7. REFERENCES [1] Botsman, R. and Rogers, R. 2010. Whatʼs Mine is Yours:
How collaborative consumption is changing the way we live, Collins
[2] Colantonio, A. and Dixon, T. 2009. Measuring Socially Sustainable Urban Regeneration in Europe, Oxford Brookes University: Oxford Institute for Sustainable Development
[3] Crumlish, C. and Malone, E. 2009. Designing social interfaces, O’Reilly Media
[4] Foth, M. 2003. Connectivity does not ensure community: On social capital, Networks and Communities of Place. In S. Marshall & W. Tayler (Eds.), Proceedings of the 5th International Information Technology in Regional Areas Conference 2003, 31-39. Rockhampton, QLD: Central Queensland University Press
[5] Hampton, K. N. and Wellman, B. 2003. Neighboring in Netville: How the Internet Supports Community and Social Capital in a Wired Suburb, City and Community 2(3): 277–311.
[6] Hanifan, L. J. 1916. The rural school community center, Annals of the American Academy of Political and Social Science 67: 130-138
[7] Hanrahan, B, Ahuja, S., Pérez-Quiñones, M. A., Kavanaugh, A. L. 2011. Evaluating Software for Communities Using Social Affordances, In Proceedings of CHI 2011, May 7–12, 2011, Vancouver, BC, Canada, pp. 1621 - 1626
[8] Kahn, L., Ali, R., Buonfino, A., Leadbeater, C., & Mulgan, G. 2009. Breakthrough Cities. How cities can mobilise creativity and knowledge to tackle compelling social challenges, British Council, retrieved from http://creativecities.britishcouncil.org
[9] Kavanaugh, A. 1999. The impact of computer networking on community: A social network analysis approach. In Telecommunications Policy Research Conference. pp. 27-29
173

[10] Kavanaugh, A. & Patterson, S. J. 2001. The impact of community computer networks on social capital and community involvement. American Behavioral Scientist, 45(3), 496-509
[11] Manzini, E. 2008. Collaborative organisations and enabling solutions - Social innovation and design for sustainability. In Collaborative Services - Social innovation and design for sustainability, by François Jégou, F. and Manzini, E. 29-41, POLI.Design, Milano, Italy
[12] Meroni, A. 2007. Creative Communities. Edizioni Poli.Design, Milano, Italy
[13] Myrdal, A. 1932. Kollevtiv bostadsform. Tiden 1932, 601-608.
[14] Preece, J. 2002. Supporting community and building social capital, Communications of the ACM, April 2002, Vol. 45, No. 4
[15] Putnam, R. D. 1995. Bowling Alone: America’s Declining Social Capital. Journal of Democracy, 6(1), 65-78.
[16] Resnick, P. 2004. Impersonal Sociotechnical Capital, ICTs, and Collective Action Among Strangers. In Transforming Enterprise, eds. by William Dutton, Brian Kahin, Ramon O’Callaghan, and Andrew Wyckoff, MIT Press
[17] Rheingold, H. 2000. The virtual community: Homesteading on the electronic frontier. No. 28. MIT press
[18] Shareable magazine. 2012. Available at http://www.shareable.net/blog/five-ideas-for-neighborhood-stuff-sharing
[19] Steve, P. 1997. (October 12), Interview with Jane Jacobs, LOS ANGELES TIMES. retrieved from http://articles.latimes.com/1997/oct/12/opinion/op-41978#.Tstnp23VipE.email
[20] Timebanking UK. 2011. People can. Retrieved from http://www.timebanking.org/wordpress/wp-content/uploads/downloads/2011/09/TBUK-Final-Brochure.pdf
[21] Van der Wekken, R. 2012. Time banking: Building the commons, towards a solidarity economy, In Towards peer production in public services: cases from Finland, ed. by A. Botero, A. Gryf Paterson, and J. Saad-Sulonen, Aalto University publication series Crossover 15/2012, 101-108
[22] Wellman, B. 1998. From Little Boxes to Loosely-Bounded Networks: The Privatization and Domestication of Community. In Sociology for the Twenty-First Century: Communities and Cutting Edges, Ed. by J. Abu-Lughod. Chicago: University of Chicago Press
[23] Wellman, B. 2001. The Rise (and Possible Fall) of Networked Individualism. In Community Networks Online, ed. by L. Keeble. London: Taylor & Francis.
[24] Wellman, B. 2002. Little Boxes, Glocalization, and Networked Individualism. In M. Tanabe, P. van den Besselaar, and T. Ishida (Eds.), Digital Cities II: Computational and Sociological Approaches (pp. 11-25. Berlin: Springer-Verlag
174

Evaluating sustainability of using ICT solutions in smart cities – methodology requirements
Nina Lövehagen1, Anna Bondesson
1
1Ericsson AB, Ericsson Research, 16480 Stockholm, Sweden
[email protected], [email protected]
ABSTRACT
There is a need for verification of the sustainability potential of an increasing number of smart city initiatives. This paper discuss a
set of requirements necessary to consider when developing a
methodology intended to evaluate the environmental and socio-economic sustainability impact of Information and
Communication Technology (ICT) solutions at a city level. A
smart city definition is chosen and a model of the city is proposed, dividing the city into service sectors where ICT solutions are
expected to be implemented. Requirements on a quantitative
methodology for assessing the sustainability potential of ICT solutions in cities are listed, including transparency in selection of
city boundary and results, and the importance of setting realistic
scenarios and using publicly available data. The methodology activities presented include defining system boundaries, building
scenarios and assessing the solution at a city level, and scaling the
solution between cities.
Keywords
Assessment, city, Information and Communication Technology
(ICT), methodology, sustainability.
1. INTRODUCTION The ongoing urbanization in the world has lead to an increased
focus on cities [1]. Cities and their citizens cause a significant,
and increasing, share of greenhouse gas emissions and there is a need to find solutions for sustainable city development. The
application of Information and Communication Technology (ICT)
is often mentioned as part of the solution [2] and the term ‘smart city’ is increasingly being used in this context.
Verification of the sustainability potential of smart city initiatives
would be useful, both for the ICT industry and stakeholders in the city. For this, a methodology is needed for scaling ICT solutions
and assessment results to cities and between cities. This paper
presents a methodology for quantitative impact assessments of ICT solutions at a city level, not to evaluate the total impact of
ICT in a city, neither to assess the city as such, nor to compare
cities.
There are many initiatives by cities, companies, research groups,
and authorities to create methodologies or frameworks for
assessment of the sustainability or the environmental impact of a city. As an illustration of the great number of initiatives could be
mentioned that a compendium of ‘sustainability indicator
initiatives’ [3], kept by the International Institute of Sustainable
Development, includes over 600 initiatives at global, national,
regional and local level. Further, in [4] the authors have reviewed over 675 tools applicable to the assessment of urban sustainability
as a baseline before proposing their own methodology. In
contrast, there are only a low number of initiatives that focus specifically on the role of ICT in the city context.
In the latest years, more generally, several standards have been
developed using life cycle thinking to determine the environmental impact of ICT products, networks and services, for
instance in European Telecommunications Standards Institute
(ETSI) and International Telecommunication Union (ITU) [5]-[8]. Lately ITU has started to develop a recommendation for city
assessment related to global warming. There are also a number of
initiatives where cities are to report their green house gas emissions and energy usage, for instance [9]-[11].
2. METHOD The work is based on an extensive literature study which covered
almost two hundred papers and reports on assessments, indicators,
methodologies and evaluation tools related to sustainability, ICT and cities. The literature study aimed to define the term smart city
and to make an overview of city related sustainability evaluation
frameworks. The first order references were found through a search on scientific databases at the library on Royal School of
Technology (KTH) in Stockholm Sweden, on Google scholar, and
by searching web sites of large organization like United Nations (UN) and European Union (EU). Through the first order
references, second and third order references were found. Over 60
frameworks, methodologies, set of indicators, or similar were studied in order to find approaches to fit the purpose of evaluating
ICT solutions at a city level. Hereinafter, they are referred to as
frameworks. A comparison of the reviewed frameworks is not included in this paper, but the main findings related to the
development of a methodology for ICT solutions are included in
Section 3.2. Examples of these initiatives are:
• methods like life cycle assessment (LCA) and social
LCA [12]-[14];
• different environmental accounting systems described in [15];
• economical evaluations like Genuine Savings which measures the net investment in produced, natural and
human capital [16];
• indices like Environmental Performance Index, Human Development Index [17]-[18];
• indicator sets like European Common Indicators,
European System of Social Indicators, Sustainable Development Indicators, UN Millennium Development
Goals [19]-[22];
ICT4S 2013: Proceedings of the First International Conference on
Information and Communication Technologies for Sustainability, ETH Zurich, February 14-16, 2013. Edited by Lorenz M. Hilty, Bernard
Aebischer, Göran Andersson and Wolfgang Lohmann.
DOI: http://dx.doi.org/10.3929/ethz-a-007337628
175

• city related indicator sets like Global City Indicators,
UN Habitat Urban Indicators, Urban Audit, and Sustainable Seattle [23]-[26];
• more building specific frameworks, like CASBEE
which is a framework for assessing the environmental performance of a built environment. [27];
• different city rankings like Cities of Opportunity,
European smart city assessment, Green City Index [28]-[30];
• city reporting standards such as the Global Protocol for
Community scale green house gas emissions (GPC), Carbon Disclosure Project (CDP) for cities [9], [11].
Based on the literature study and internal workshops with life
cycle assessment experts, a high-level model of the city was developed for the purpose of assessing the use of ICT solutions
within different sectors and activities of the city. The most
commonly used indicators in different sectors of the city were identified. The main idea was that the most commonly used
indicators are either well-established, easy to measure, easy to get
data from, or a good measure of some sustainability aspect. A problem with this approach is that the most commonly used
indicators may not be the most relevant for assessing impacts of ICT solutions in a city. In this paper these indicators have
influenced the way the city is modeled and how sectors of
relevance for ICT solutions are categorized. Furthermore, they are used to determine applicable requirements on a methodology for
evaluation of the sustainability impact of ICT solutions in the city.
The paper is divided into two parts. The first part deals with the
city, and starts with a discussion regarding the definition of the smart city concept and how that concept relates to sustainable
development of a city. The city is then described based on different city services where ICT solutions can be applied. The
second part specifies requirements for development of a
methodology to evaluate the sustainability impact of ICT solutions on a city level. The section also includes methodology
steps and proposes system boundary and functional unit.
3. DEFINITION AND MODELING OF A
SMART CITY This section provides a discussion on the term ‘smart city’ in
relation to other expressions, especially in relation to
sustainability perspectives. Furthermore, the main findings of the studied frameworks and initiatives, mentioned in Section 2, are
provided and used as input to the requirements proposed later in
this paper. Finally, a city model is presented which is based on services within the society.
3.1 Smart City = Sustainable City? The term ‘smart city’ is increasingly used, and many cities want to be labeled as ‘smart’ [31]. The word smart often implies a usage
of ICT solutions in the city. Other terms used for the wanted
development of cities are ‘intelligent’, ‘innovative’, ‘wired’, ‘digital’, ‘creative’, and ‘cultural’ [31]. The smart city is framed
by three dimensions: technology, people and community in [32].
Some papers use intelligent cities and smart cities as synonymous terms [33] while others make a distinction [31]. In [34] intelligent
city refers to a city that has an information technology
infrastructure. The smart city includes various smart functions like smart transport and smart education according to [35]. Before a
city can be developed into a smart city with an undefined number
of ICT services in use, it is necessary to have the basic ICT
infrastructure and knowledge of ICT usage. Based on [36] this paper will use the following definition for the smart city concept:
A smart city is a city that meets its challenges through the
strategic application of ICT goods, network and services to
provide services to citizens or to manage its infrastructure.
Though it seems that the smart city somewhat implicitly leads to a sustainable city, there could be smart cities proving not to be
sustainable [31]. ‘Sustainable growth’ is dealt with worldwide, for
instance in EU [37] and sustainable development is in the so called Brundtland Commission Report [38] described as a
“development that meets the needs of the present without
compromising the ability of future generations to meet their own needs”. Others talk about sustainable development in connection
with quality of life, either as a process of continually improving
the way we live [26][39], or as cultural, economic, environmental and social aspects that lead to an improvement in quality of life
[40].
Sustainability is often defined by three pillars: environmental,
economic and social aspects. The International Union for
Conservation of Nature [41] describes a sustainable development as a development that combines economic growth, social progress
and environmental protection. In this paper, a sustainable
development of a city is considered as the balance between minimizing the environmental impact, while at the same time
maximizing the positive social and economical impact. Depending on the current sustainability level of a city, the track of future
development to achieve a more sustainable society could look
very different.
With the above definitions, a smart city could, but does not have
to be a city which develops in a sustainable way. To judge the sustainability development of a smart city, it is necessary to
evaluate the ICT solutions in the city in terms of economic, social
and environmental sustainability.
3.2 Evaluation of Frameworks Some of the many sustainability assessment framework initiatives previously mentioned in Section 2 have been developed to
support policy decisions, while others are ranking systems of
cities, for instance Cities of Opportunity and other examples in the point list above. Furthermore, some of the frameworks focus on
individual factors, such as quality of living, while other frameworks focus on the sustainable development of the city or
the city performance. The main findings were:
• No framework was found to assess the impact from ICT usage
at a city level though some included ICT aspects.
• No framework was found to fully include life-cycle thinking or to use widely adopted environmental LCA impact
categories1 e.g. those listed in [42].
• A production perspective was much more common than a consumption perspective when setting the system boundaries.
1 Impact categories [42]: abiotic resource depletion, global warming, acidification, eutrophication, photochemical ozone
creation potential, ozone depletion potential, human toxicity
potential, primary energy and electricity requirements, and ecotoxicity potential to freshwater, land and seawater.
176

• In general, the use of natural resources was not considered in
the city evaluations, which may be due to a production perspective focus.
• Carbon dioxide (CO2) or green house gas (GHG) emissions
and energy usage were included in almost all investigated indicator sets.
• There was a large variation in categories in the socio-
economic indicator sets reviewed and many unique indicators were found.
• An environment category is often used also in socio-economic
evaluations as that is a large part of a citizen’s well-being.
In environmental indicator sets, transport, water and waste are
often included as categories together with energy, GHG emissions
and air quality. Hence, there is a mix of basic environmental impact categories1 and industry-related categories. Also living
environment aspects like available green area and noise levels in
the city are often included in the environmental assessment frameworks. For the non-environmental frameworks reviewed, the
indicator categories are less aligned, however, the scopes also
differ to a larger extent - from sustainable development to increased quality of life. Education, health, safety, finance and
jobs are common categories together with buildings (shelters) and travel facilities. However, equity and civic engagement are also
important categories, especially when measuring the quality of
life.
Examples of commonly used indicators in the reviewed material
are: gross domestic product per capita, unemployment rate, life expectancy, adult literacy, rate of crime, average living area, voter
participation, water quality, waste treatment, GHG emissions, air
quality and energy consumption.
3.3 A City Model A city can be illustrated in many different ways. In this paper the
city has been divided into service sectors that are considered to be applicable for introduction of ICT solutions. Figure 2 represents a
model of the city based on the city services divided into three
different groups: infrastructure services, community services and non-community services.
Infrastructure Services
Energy
ElectricityTransport
InfrastructureWater Buildings Waste
Data- & Tele-Communication
Community servicesNon-community services
Finance EducationHealthcareRecreation &
Commerce
Travel &Transport
Security &Safety
Persuasive informationLiving
Environment
Workplaces
Figure 2. Services applicable for ICT solutions.
The infrastructure services consist of services related to buildings,
transport infrastructure and infrastructure for water, energy,
electricity, waste, and data- and telecommunication. In this paper the community services include services that are provided directly
to citizens and visitors of the city. These are services like
education and healthcare, but the community service layer also includes things like proximity to commerce, culture, sports and
parks. Furthermore, the non-community services consist of other
services where ICT could be used and which will have an impact on sustainability of the city. The finance services include for
instance creation of an attractive business environment, while a
workplace service relates to improve work efficiency, and persuasive information services to influence people’s choices.
The city needs to attract both people and business. Many people move to cities aiming for a better life, where “better” stands for
different things depending on your situation. Employment and the
household budget are important factors for groups of various ages, while health becomes more and more important with age [43]. For
visitors the availability of culture, architecture, restaurants,
commerce, sports, parks and nature are of special interest. The growth state of a city, expressed as mature, transitional, and
emerging, is related to what kind of challenges the city needs to
tackle [44]. For instance a city which grows fast will have major challenges providing people with basic needs such as access to
food, water and safety. For transitional and mature cities the
challenges are more related to choice and convenience, and lifestyle and independence [44].
The city illustration in Figure 2 has been compared to the United States (US) federal enterprise architecture reference model that
lists the US government’s services to citizens [45]. A high correlation between the different models was shown, despite the
fact that the models are developed for different purposes.
4. A METHODOLOGY TO ASSESS THE
SUSTIANABILITY POTENTIAL OF ICT
SOLUTIONS AT A CITY LEVEL This section aims to provide requirements and steps for a quantitative methodology to assess the environmental and socio-
economic impacts of ICT solutions at a city level.
4.1 General Requirements A methodology for assessing the sustainability impact of various
ICT solutions used in a city needs to address both evaluation of
already introduced ICT solutions and scenarios for future use of ICT solutions. The methodology needs to be applicable to assess
ICT solutions for a variety of situations. The methodology also
has to handle dynamics between several different ICT solutions.
For the ICT industry to be credible, impact assessments of ICT
solutions should be based on as much real data as possible. For
the methodology development, the following aspects are necessary to take into account:
• Selection of indicators: to have a manageable, yet sufficient
amount of indicators both on a city level and for specific ICT solutions used in the city.
• Data: to handle case specific as well as general publicly available data, considering both city-related data and
evaluation indicators, with the possibility to define baseline,
reference year, etc.
• Transparency in city boundary: to have transparency in the
definition of the city boundaries, both geographically and
around what impacts are included in the assessment e.g. impacts occurring within the defined city boundaries, in the
177
surrounding region, on a national level or on a global level,
e.g. whether import/export is included.
• Transparency in results: avoid merging impacts into too few
categories and avoid translating different impacts into one unit
(e.g. money).
• Life cycle thinking: use a life cycle perspective when
possible and especially for the ICT solutions.
• Realistic scenario for ICT implementation: the scale of the
ICT solution and its impacts should be based on relevant data
for the specific city.
4.2 Assessment Procedure The direct impacts of the ICT solution, as well as the impacts that
are the result of changed activities in the city, for instance less
travelling or increased safety, are addressed. The focus of the methodology is high level assessments of the use of multiple ICT
solutions in a city, based on a quantitative data collection from
existing and potential ICT initiatives across cities.
The following methodology activities are considered:
• Identify ICT solutions (section 4.2.1)
• Define the system boundary for the city and a functional unit for the assessment (section 4.2.2)
• Build scenarios and assess ICT solutions at a city level
(section 4.2.3)
• Select indicators to connect solution specific impact
results to overall city level sustainability (section 4.2.4)
• Scale ICT solution scenarios between cities (section 4.2.5)
4.2.1 Identify ICT solutions The first step is to identify ICT solutions to apply to a city. The ICT solutions could be existing or future large-scale commercial
implementations, minor proof of concept applications, case
studies and trials. These are hereafter referred to as reference
cases.
4.2.2 System Boundary and Functional Unit The methodology should be applicable for different kinds of cities. A geographical system boundary needs to be defined for all
specific cities. If a too small area like a city center is chosen, there
will be a large difference between the daytime and the nighttime population. To avoid some uncertainties in this allocation the
geographical system boundary can be extended to incorporate a
greater region of the city e.g. greater Stockholm or greater London. Another way is to use adjusted population numbers
defined as the mean value of the nighttime population and the
daytime population [27].
Availability of city area data for different geographical areas also
needs to be considered. It is likely that the methodology will have
to include ways of scaling national or regional data to different city levels.
Furthermore, the methodology needs to address import to and
export from the city. For an assessment which captures the whole
impact on a per capita level, it is necessary to define whether a consumption or a production perspective should be used.
Consumption perspective takes all consumption related to the city into account, including impacts from production taking place
elsewhere. A production perspective on the other hand relates to
impacts from activities and production within the city boundaries.
Even though a consumption perspective may be preferred, it is
often difficult to cover and the scope might have to be limited to impacts caused within the city boundary. Allocation of travel
outside the city boundary including international travelling also
needs to be addressed. Hence, as stated in the list above transparency in city boundary definition is of high importance.
We propose the functional unit of the city as such to be the city’s
total yearly impact provided per individual in the city, i.e. impact
per capita and year. The temporal boundary does not have to be yearly, but that is the most common time frame. With this
functional unit it will be possible to summarize the total impacts from several ICT solutions in the city. On a solution level though,
when assessing the impacts from a specific solution, a more
appropriate functional unit might be the impact per user of the solution or the impact per a defined amount of service delivered
by the solution. For example, an ICT solution that reduces the
amount of CO2 emissions which is only used by a small percentage of the total city population will not influence the city’s
total CO2 emissions per individual substantially, but may be
significant for the impact of the individuals using it.
4.2.3 Build Scenarios and Assess ICT Solutions at a
City Level To assess ICT solutions at a city level, a scenario will have to be
created. The scenario includes the number of people expected to
use the solution and expected changes on activities influencing environmental and socio-economic impacts. Scenarios define the
potential use of an ICT solution in the city today, but can also be
constructed for different future developments.
A number of parameters related to the city and its citizens need to
be gathered to get a sufficiently comprehensive basis for setting a
realistic scenario. In cases when measurement data before and after the implementation of an ICT solution is available, the
scenario is already given.
The main parameters needed to build a scenario can be divided into parameters influencing the number of users, and parameters
influencing the induced changes of activities. Which parameters
to use, will differ between the ICT solutions that are to be assessed. Table 1 shows parameters that should be considered to
estimate the number of users and also gives examples for a
specific ICT solution which provides remote monitoring for hospitals and their patients with chronic heart failure (CHF). It is
believed that more city factors are likely to be identified as useful
to decide upon the number of users of a specific ICT solution in a city. A solution will have several user groups. In Table 1 two user
groups are exemplified. User I is the end-user of the ICT solution,
hence the patients, and User II is the implementer of the ICT solution, being the doctors or hospital personnel in the example.
The experience of using ICT within the different user groups will
influence how widely the solution will be used. In most cases, there is no data available for the ICT user experience within the
expected user group. However at country level, ITU publishes the
ICT development index for countries [46].
Drivers and barriers on individual and societal levels will
influence the actual use of the ICT solution, time to full utilization
and thereby what impacts the solution will have on environmental and socio-economic activities. Examples of drivers and barriers
that are useful when making the ICT solution usage scenario are
given in Table 2.
178
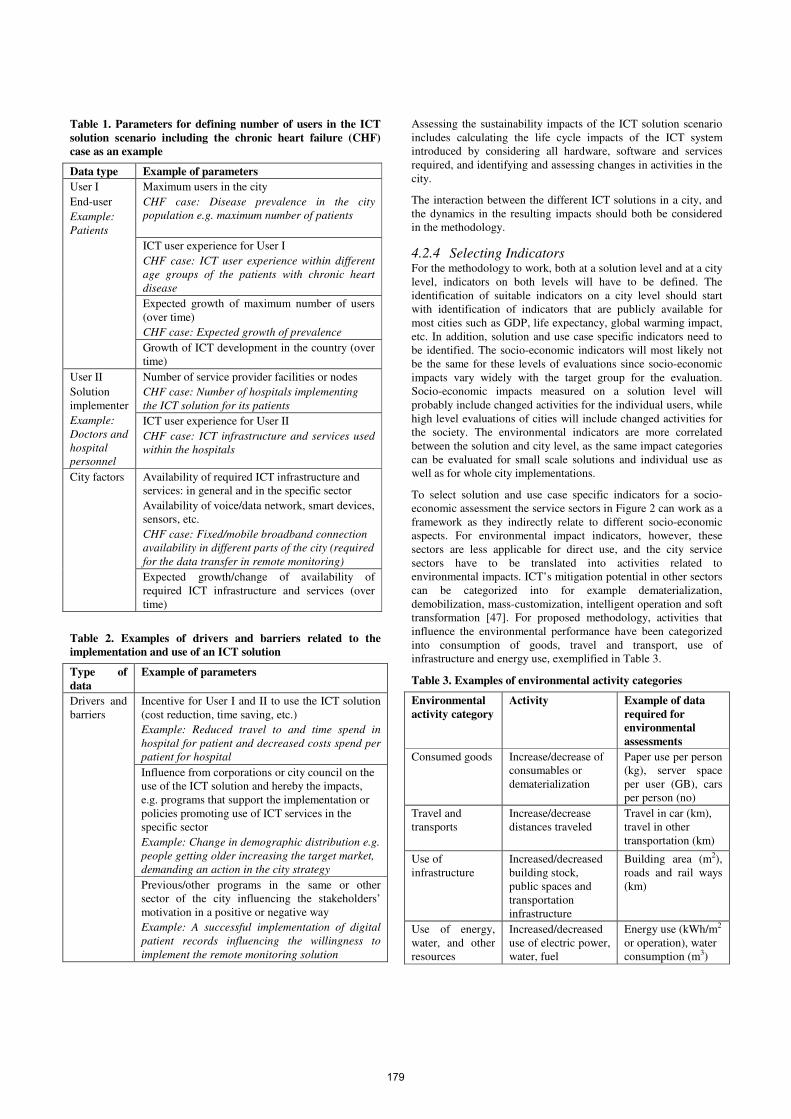
Table 1. Parameters for defining number of users in the ICT
solution scenario including the chronic heart failure (CHF)
case as an example
Data type Example of parameters
Maximum users in the city
CHF case: Disease prevalence in the city
population e.g. maximum number of patients
ICT user experience for User I
CHF case: ICT user experience within different
age groups of the patients with chronic heart
disease
Expected growth of maximum number of users
(over time)
CHF case: Expected growth of prevalence
User I
End-user
Example:
Patients
Growth of ICT development in the country (over time)
Number of service provider facilities or nodes
CHF case: Number of hospitals implementing
the ICT solution for its patients
User II
Solution
implementer
Example:
Doctors and
hospital
personnel
ICT user experience for User II
CHF case: ICT infrastructure and services used
within the hospitals
Availability of required ICT infrastructure and services: in general and in the specific sector
Availability of voice/data network, smart devices, sensors, etc.
CHF case: Fixed/mobile broadband connection
availability in different parts of the city (required
for the data transfer in remote monitoring)
City factors
Expected growth/change of availability of
required ICT infrastructure and services (over
time)
Table 2. Examples of drivers and barriers related to the
implementation and use of an ICT solution
Type of
data
Example of parameters
Incentive for User I and II to use the ICT solution
(cost reduction, time saving, etc.)
Example: Reduced travel to and time spend in
hospital for patient and decreased costs spend per
patient for hospital
Influence from corporations or city council on the use of the ICT solution and hereby the impacts,
e.g. programs that support the implementation or
policies promoting use of ICT services in the specific sector
Example: Change in demographic distribution e.g.
people getting older increasing the target market,
demanding an action in the city strategy
Drivers and
barriers
Previous/other programs in the same or other sector of the city influencing the stakeholders’
motivation in a positive or negative way
Example: A successful implementation of digital
patient records influencing the willingness to
implement the remote monitoring solution
Assessing the sustainability impacts of the ICT solution scenario
includes calculating the life cycle impacts of the ICT system introduced by considering all hardware, software and services
required, and identifying and assessing changes in activities in the
city.
The interaction between the different ICT solutions in a city, and
the dynamics in the resulting impacts should both be considered in the methodology.
4.2.4 Selecting Indicators For the methodology to work, both at a solution level and at a city
level, indicators on both levels will have to be defined. The
identification of suitable indicators on a city level should start with identification of indicators that are publicly available for
most cities such as GDP, life expectancy, global warming impact,
etc. In addition, solution and use case specific indicators need to be identified. The socio-economic indicators will most likely not
be the same for these levels of evaluations since socio-economic
impacts vary widely with the target group for the evaluation. Socio-economic impacts measured on a solution level will
probably include changed activities for the individual users, while
high level evaluations of cities will include changed activities for the society. The environmental indicators are more correlated
between the solution and city level, as the same impact categories
can be evaluated for small scale solutions and individual use as well as for whole city implementations.
To select solution and use case specific indicators for a socio-economic assessment the service sectors in Figure 2 can work as a
framework as they indirectly relate to different socio-economic aspects. For environmental impact indicators, however, these
sectors are less applicable for direct use, and the city service
sectors have to be translated into activities related to environmental impacts. ICT’s mitigation potential in other sectors
can be categorized into for example dematerialization,
demobilization, mass-customization, intelligent operation and soft transformation [47]. For proposed methodology, activities that
influence the environmental performance have been categorized
into consumption of goods, travel and transport, use of infrastructure and energy use, exemplified in Table 3.
Table 3. Examples of environmental activity categories
Environmental
activity category
Activity Example of data
required for
environmental
assessments
Consumed goods Increase/decrease of consumables or
dematerialization
Paper use per person (kg), server space
per user (GB), cars per person (no)
Travel and transports
Increase/decrease distances traveled
Travel in car (km), travel in other
transportation (km)
Use of
infrastructure
Increased/decreased
building stock, public spaces and
transportation
infrastructure
Building area (m2),
roads and rail ways (km)
Use of energy,
water, and other resources
Increased/decreased
use of electric power, water, fuel
Energy use (kWh/m2
or operation), water consumption (m3)
179

4.2.5 Scaling ICT solutions between Cities To be able to use a previous ICT city assessment scenario and
results to create a scenario for ICT use in another city - without
roll-out details on a use case being available - it is necessary to understand similarities and differences between the cities on a
high level. City profile data must be gathered in order to compare
cities. In addition, data related to the use of ICT solutions in different infrastructure and service sectors of the city, as well as
associated drivers and barriers for the implementation of the ICT
solutions in the city, need to be considered. Examples of parameters that need to be taken into account to enable
comparisons between cities are provided in Table 4. Note that these types of data could also be included when calculating users
and resulting impacts from the ICT solution, according to Table 1
and 2.
Table 4. Examples of data needed for comparison between
cities for the purpose of scaling ICT solutions
Type of data Example of data categories
Population
Geographical boundary: city district, city,
extended city, municipal, cluster of cities, region,
etc.
Functions: commercial/city center, commercial/
industrial, suburb/houses, suburb/apartment, all functions
Population growth connected to different kinds of needs: mature, transitional, emerging [44]
Level of development: is the city located in a developed or developing area?
City profile
ICT development level: low, medium, high [46]
Drivers and
barriers
Current/previous programs or policies focusing
on the sector where the solution is implemented,
focusing on sustainability or promoting use of ICT in the specific sector or in the city in general
Sector specific data
Data related to the sector where the ICT solution is implemented and influenced activities
If a transportation solution is assessed number of cars, available public transportation, average time
spend/distance to work, etc should be compared.
5. DISCUSSION For the continued work we have identified the following aspects
to need further considerations: data availability, usage of city models, and causality.
Data availability and quality is a major issue in this type of high-
level quantitative city assessments. Data is often only available at a national level and/or for aggregated groups of people and
activities. It is important to transparently discuss how the data
availability, related system boundary selection and data gaps influence the assessment results. Related to life cycle assessments
there are three levels of uncertainty; parameter uncertainty (related
to input data), scenario uncertainty (related to choices) and model uncertainty (related to set relations) [48]. How parameter and
scenario uncertainties influence the city assessment results can be evaluated through simulations and sensitivity analysis. Different
users of the methodology have access to different data, for
example an ICT manufacturer might have access to full life cycle
assessment data for the ICT solution, while less accurate data for
the city, and vice versa for a city administrator.
As a city is a complex system it needs to be modeled and structured into sub-units to be understood. Based on the literature
study, the city could be structured into as a set of citizen’s
activities or divided into sectors. The division into sectors proposed in this paper was chosen as it is useful to map needs of
future ICT solutions and in impact assessments as a framework to
identify changed activities. One disadvantage with this approach is the risk of overlooking horizontal activities, such as freedom of
speech, gender of equity that cannot be categorized into a specific sector, and this will be further addressed in our continued
research.
Another methodological difficulty in city assessment is related to
causality - it is difficult to show that a change of the total sustainability in the city is related to a specific ICT initiative.
Aggregated impacts from a number of solutions and adjustments
in the city could reach a level that influences the overall impacts, but it will be very difficult to connect the change to individual
solutions. As an example an ICT solution within the education sector can be evaluated in terms of indicators at different levels,
access to computers, or more graduates from the school.
However, the city probably uses indicators such as percentage of
citizens with higher education and adult literacy. Both of these
indicators are likely to be affected, but – due to their high level
and time perspective - it will take time and scale before any improvements in the statistics are shown.
Further methodology development includes to test the
methodology on a number of reference cases and to scale the results between different cities, to understand how data
availability impact the results.
6. CONCLUSION This paper deals with important aspects of a methodology for
assessing the sustainability potential of ICT solutions in cities.
Though there are many initiatives related to the assessment of cities with respect to sustainability, quality of life, environmental
impacts, or similar, no methodology has been found which can be
used to assess the sustainability potential of ICT solutions in a city.
General requirements for the methodology presented include
transparency in selection of city boundary and results, and the importance of setting realistic scenarios and using publicly
available data.
It is recommended that the listed requirements are considered by those who work with methodology development or assessment of
sustainability impacts of current or future ICT solutions in a city.
Furthermore, the requirements are also of interest for city administrators and others who currently use available indices and
indicators to track the sustainable development of the city.
Especially, transparency in selection of city boundaries and impacts included are of high importance to understand the real
sustainability impact.
7. ACKOWLEDGEMENT We would like to acknowledge our speaking partners at the Centre
for Sustainable Communications at the KTH Royal Institute of
Technology in Stockholm, Sweden financed by the Swedish Governmental Agency for Innovation Systems (VINNOVA); as
well as our speaking partners in the working groups of the
180

International Telecommunication Union (ITU) and the European
Telecommunications Standards Institute (ETSI) dealing with assessments of ICT in general as well as ICT in cities.
8. REFERENCES [1] United Nations (2012). The future we want Cities, fact sheet
for the Rio +20 United National Conference on Sustainable
Development, Rio de Janeiro, Brazil, June 20-22, 2012.
Accessible at http://www.un.org/en/sustainablefuture/pdf/Rio+20_FS_Citi
es.pdf.
[2] Hilty, L., Lohmann, W., and Huang, E. 2011. Sustainability and ICT - An overview of the field with focus on socio-
economic aspects. Notizie di Politeia, 17, 104, 13-28. DOI=
http://dx.doi.org/10.5167/uzh-55640. [3] International Institute of Sustainable development. 2012.
Compendium - a global directory to indicator initiatives,
http://www.iisd.org/measure/compendium. [4] Walton JS., El-Haram M., Castillo NH., Horner RMW.,
Price ADF., and Hardcastle C. 2005. Integrated assessment
of urban sustainability, Engineering Sustainability, 158, 2, (June 2005), 57-65. DOI=
http://10.1680/ensu.2005.158.2.57.
[5] ITU-T L1400, Overview and general principles of
methodologies for assessing the environmental impact of
ICT, International Telecommunication Union., Telecommunication Standardization sector. (2011).
[6] ITU-T L1410, Methodology for the assessment of the
environmental impact of information and communication
technology goods, networks and services, International
Telecommunication Union. Telecommunication
Standardization sector. (2012). [7] ITU-T L1420, Methodology for energy consumption and
greenhouse gas emissions impact assessment of information
and communication technologies in organizations, International Telecommunication Union.
Telecommunication Standardization sector. (2012).
[8] ETSI TS 103 199. Environmental Engineering (EE); Life
Cycle Assessment (LCA) of ICT equipment, network and
services; General methodology and common requirements.
Technical specification, V1.1.1 (2011). [9] Carbon Disclosure Project CDP. 2012. CDP Cities 2012
information request, https://www.cdproject.net/en-
US/Programmes/Documents/CDP-Cities-Information-Request-2012.pdf.
[10] ICLEI. 2009. International local government GHG
emissions analysis protocol (IEAP), version 1.0. October 2009. http://www.iclei.org/fileadmin/user_upload/document
s/Global/Progams/CCP/Standards/IEAP_October2010_colo
r.pdf. [11] Arikan, Y., Desai, R., Bhatia, P., Fong, WK., Connor, J.,
Feldon, A., Eichel, A., Russel, B., Dickinson, J., Hoornweg, D., and Shearer, I. 2012. Global protocol for community-
scale green-house gas emissions (GPC), pilot version 1.0 –
May 2012. Report by C40 cities climate leadership group, Local governments for Sustainability (ICLEI) and the World
Resources Institute. Report available at:
http://www.ghgprotocol.org/files/ghgp/GPC_PilotVersion_1.0_May2012_20120514.pdf.
[12] EN ISO 14040:2006, Environmental management – Life
cycle assessment – Principles and framework, International Organization for Standardization (ISO), 2006.
[13] EN ISO 14044:2006, Environmental management – Life
cycle assessment – Requirements and guidelines, International Organization for Standardization (ISO), 2006.
[14] UNEP/SETAC. 2009. Guidelines for social life cycle
assessment of products, United Nations Environment Programme, ISBN: 978-92-807-3021-0, DTI/1164/PA,
2009.
[15] Schepelmann, P., Goossens, Y., and Makipaa, A. 2010. Towards sustainable development, alternative to GDP for
measuring progress. Report by Wuppertal Institute for
Climate, Environment and Energy. ISBN 978-3-929944-81-5.
[16] Hamilton, K. 2000. Genuine saving as a sustainability
indicator. The World Bank, Environment department papers, paper no 77, 2000.
[17] Esty, DC., Levy, MA., Kim, CH., de Sherbinin, A.,
Srebotnjak, T., and Mara, V. 2008. 2008 Environmental
Performance Index. New Haven: Yale Center for
Environmental Law and Policy.
[18] United Nations Development Programme (UNDP). 2012. International Human Development Indicators,
http://hdr.undp.org/en/statistics/.
[19] Tarzia, V. (editor). 2003. European Common Indicators –
Towards a local sustainability profile, final project report,
prepared by Ambiente Italia Research Institute, Milano, Italy. September 2003.
http://www.cityindicators.org/Deliverables/eci_final_report
_12-4-2007-1024955.pdf. [20] Berger-Schmitt, R. and Noll, H-H. 2000. Conceptual
framework and structure of a European system of social
indicators. Towards and European system of social
reporting and welfare measurement, A TSER-project
financed by the European Commission, Centre for Survey
Research and Methodology (ZUMA), Social Indicators Department, Mannheim, 2000.
http://www.gesis.org/fileadmin/upload/dienstleistung/daten/
soz_indikatoren/eusi/paper9.pdf. [21] European Commission. 2012. Eurostat Sustainable
development indicators,
http://epp.eurostat.ec.europa.eu/portal/page/portal/sdi/indicators.
[22] United Nations. 2010. Millennium Development Goals
website, http://www.un.org/millenniumgoals. [23] Global city indicators. 2007. Themes,
http://www.cityindicators.org/.
[24] United Nations. 2004. Urban Indicators guidelines,
monitoring the habitat agenda and the Millennium
development goals, United Nations human settlements
programme report from August 2004. http://ww2.unhabitat.org/programmes/guo/documents/urban
_indicators_guidelines.pdf. [25] Manninen, A., Pumain, D., Lehtonen, R., Trutzel, K., and
Croi, W. 2004. Urban Audit, methodological handbook.
European Communities. Luxemburg 2004. ISBN 92-894-7079-8.
[26] AtKisson, A. (editor). 1995. Sustainable Seattle Indicators
of Sustainable Community – a status report on the long-
term cultural, economic, and environmental health. Seattle
1995.
http://www.sustainableseattle.org/component/content/article/44-regional-indicators/134-second-set-of-indicators.
[27] Japan Sustainable Building Consortium. 2011. CASBEE for
cities, comprehensive assessment system for built
181

environment efficiency, technical manual (2011 edition),
Japan Sustainable Building Consortium (JSBC), the committee for the development of an environmental
performance assessment tools for cities, Tokyo, Japan,
October 2011. http://www.ibec.or.jp/CASBEE. [28] PriceWaterhouseCoopers and Partnership for New York
City. 2011. Cities of opportunities. 2011 report.
http://www.pwc.com/us/en/cities-of-opportunity/2011/pdfdownload.jhtml.
[29] Giffinger, R., Fertner, C., Kramar, H., Kalasek, R., Pichler-
Milanovic, N., and Meijers, E. 2007. Smart cities, ranking
of European medium-sized cities, Final report from Centre
of Regional Science, Vienna UT, October 2007.
[30] Watson, J. (editor). 2009. European Green City index –
assessing the environmental performance of Europe’s
major cities, a research project conducted by the Economist
Intelligence Unit, sponsored by Siemens. Munich Germany 2009.
[31] Hollands, RG. 2008. Will the real smart city please stand
up? City. 12, 3, (December 2008), 303-320. DOI= http://10.1080/13604810802479126.
[32] Nam, T., and Pardo, TA. 2011. Conceptualizing Smart City
with Dimensions of Technology, People, and Institutions, The proceedings of the 12th Annual International
conference on digital government research, Maryland USA, June 12-15, 2011.
[33] Allwinkle, S. and Cruickshank, P. 2011. Creating smart-er
cities: an overview, Journal of urban technology, 18, 2, (April 2011), 1-16. DOI=
http://10.1080/10630732.2011.601103.
[34] Malek, JA. 2009. Informative global community development index of informative smart city, Proceedings
of the 8th WSEAS (World Scientific and Engineering
Academy and Society) international conference on
education and educational technology. 17 – 19 October
2009, Genova, Italy. ISSN: 1790-5109.
[35] Sang HL., Jung HH., Yoon TL., and Tan Y. 2008. Towards ubiquitous city: concept, planning, and experiences in the
Republic of Korea. Knowledge-Based Urban Development:
Planning and Applications in the Information Era. IGI Global, Information Science Reference, Hershey, Pa., 148-
169. ISBN: 9781599047201.
[36] Webb, M., Finighan, R., Buscher, V., Doody, L., Cosgrave, E., Giles, S., Hawes-Hewitt, J., Walt, N., Mulligan C., et al.
2011. Information marketplaces, the new economics of
cities. Report from The Climate Group, Arup, Accenture and Horizon, University of Nottingham.
http://www.theclimategroup.org/what-we-
do/publications/Information-Marketplaces-The-New-Economics-of-Cities/.
[37] European Commission. 2012. ICT for Sustainable Growth, http://ec.europa.eu/information_society/activities/sustainabl
e_growth/index_en.htm.
[38] United Nations World Commission on Environment and
Development (WCED). 1987. Our Common Future, so called The Brundtland Commission Report Oxford: Oxford
University Press. ISBN 0-19-282080-X.
[39] Pan, J-G., Lin, Y-F., Chuang, S-Y., and Kao, Y-C. 2011. From governance to service-smart city evaluations in
Taiwan, Proceedings from the 2011 International Joint
Conference on Service Sciences, pp. 334-337. DOI= http://10.1109/IJCSS.2011.74.
[40] Janeiro, L. 2011. Towards a methodology for the
sustainability assessment of technologies, integration of
environmental, social and economic indicators, MSc thesis
report (GEO4-2321) Utrecht University, April 2011.
[41] Adams, WM. 2006. The Future of Sustainability Re-
thinking Environment and Development in the Twenty-first
Century. Report of the IUCN Renowned Thinkers Meeting,
29-31 January 2006. IUCN - The World Conservation Union. Available at:
http://cmsdata.iucn.org/downloads/iucn_future_of_sustanab
ility.pdf [42] Guinée, JB., Gorrée, M., Heijungs, R., Huppes, G., Kleijn,
R., de Koning, A., van Oers, L., Wegener Sleeswijk, A.,
Suh, S., Udo de Haes, HA., de Bruijn, H., van Duin, R., and Huijbregts, MAJ. 2002. Handbook on life cycle assessment.
Operational guide to the ISO standards. I: LCA in
perspective. IIa: Guide. IIb: Operational annex. III:
Scientific background. Kluwer Academic Publishers, ISBN
1-4020-0228-9, Dordrecht, 2002, 692 pp. [43] Uchida, Y., Ohtake, F., Komamura, K., Hiroi, Y., Makino,
Y., Miyamoto, M., Yamauchi, N., and Yamada, M. 2011.
Measuring national well-being – proposed well-being
indicators, report from the Japanese Commission on
Measuring Well-being, 5th December, 2011.
[44] Lofthouse, G. (editor). 2006. Megacity challenges – a
stakeholder perspective, a research project conducted by the
Economist Intelligence Unit, sponsored by Siemens,
Munich Germany 2006. [45] Executive Office of the President of the United States,
Office of Management and Budget. 2007. FEA consolidated
reference model document, version 2.3, October 2007. [46] ITU, (2009) Measuring the Information Society – The ICT
development index, revision 1. International
Telecommunications Union. ISBN 92-61-12831-9. [47] Mitchell, WJ., E-topia, "Urban life, Jim - but not as we
know it" 2000, Cambridge Mass.: The MIT Press.
[48] Guldbrandsson, F., Malmodin, J., and Bondesson, A. 2011. Quantifying the life cycle assessment uncertainty in the
Information and Communication Technology sector,
Proceedings of the LCM 2011 – Towards life cycle
sustainability management, Berlin 28-31 August, 2011.
182
ICT for Sustainable Cities: How ICT can support an environmentally sustainable
development in cities.
Authors
Anna Kramers1, Mattias Höjer1, Nina Lövehagen2, Josefin Wangel1
1 KTH Royal Institute of Technology, Environmental Strategies Research and Centre for Sustainable Communications,
Lindstedsvägen 3, SE-100 44 Stockholm +4687906000
[email protected], [email protected], [email protected]
2 Ericsson AB,
Torshamnsgaten 23 SE-164 83 Stockholm +46107190000
ABSTRACT
In this article we focus on the opportunities to use ICT to help cities reach their environmental targets and specifically how ICT can support reduction of energy use. We have developed an analytical framework to be able to identify ICT solutions opportunities that can support cities to decrease the energy use that origin from the inhabitants’ consumption in order to reach climate targets. We use a consumption perspective on energy and allocate all energy to the final consumers that are the individuals living in the city. The analytical framework can be used by city administrations and ICT solution companies for identification and mapping of ICT applications and solutions with opportunities for sustainable development in cities.
Keywords Smart cities, energy use, ICT
INTRODUCTION 1.Several initiatives have highlighted how ICT can be used to reach cities climate targets by lowering energy use and greenhouse gas (GHG) emissions from other sectors. There are proposals such as dematerialization and demobilization, as well as whole concepts for smart logistics and smart cities [1, 2].
ICT4S 2013: Proceedings of the First International Conference on Information and Communication Technologies for Sustainability, ETH Zurich, February 14-16, 2013. Edited by Lorenz M. Hilty, Bernard Aebischer, Göran Andersson and Wolfgang Lohmann. DOI: http://dx.doi.org/10.3929/ethz-a-007337628
It has been argued that decoupling of material resources into dematerialized immaterial resources such as services is a condition for sustainable development [3]. Within the field of ICT it is the software that represents the immaterial resources and the services provided represents the value that could become the paradigm for the decoupled economy of the future [4]. ICT can, according to Hilty et al. [4], be viewed as an enabling technology to improve or be substituted for processes in other sectors. ICT can optimize the design, production, use and end-of life treatment of other products as well as optimization and/or modification of demand for other products by substitution or induction by enabling distributed forms of production.
Cities with strong environmental profiles as well as telecommunication industries seek to understand how to best utilize ICT as an enabler to reach climate targets. Cities need to better understand how to direct investments in ICT to provide greater benefits for environment and society. ICT solution providers are interested in emphasizing how they can provide enabling technologies, which is demanded by their customers – the cities.
The concept “smart city” has been used during the last 20 years and has been seen as a strategic concept to gather modern urban production factors in a common framework [5]. The adjective “smart” and the concept “smart city” are used to highlight the importance and potential of ICT supporting the city to get a competitive profile and implies a positive urban-based technological innovation and change via ICT [5, 6].
Mitchell has defined five main principles for how ICT can contribute to reduce environmental impacts [1]. The first
183
opportunity is dematerialization, where physical things have been replaced by virtual. The second is demobilization, where travel is totally or partially replaced with telecommunications. The third opportunity is mass customization, with less consumption of scarce resources through intelligent adaptation or personalization. The fourth opportunity, intelligent operation, involves more intelligence in operations of for instance water, fuel and electric power. The fifth opportunity is soft transformation, where existing physical infrastructure are transformed to meet requirements from the information paradigm. The principles can be applied to product design, architecture, urban design and planning and regional, national and global strategy [1].
In 2008, the IT and telecom sector published a report together with the Climate Group [7] that focused emissions reductions from four different sectors; buildings, transport, power and industry [2]. Five major opportunities for reduction of GHG emissions and calculated potential emissions savings from each of these sectors were identified. The opportunities were smart -grids, -logistics, -buildings, -motors and dematerialization. The reduction potential of these opportunities was estimated to be 15% of total GHG emissions in a business as usual scenario 2020, which represents five times the sector’s own emissions [2].
This paper focuses on the opportunities to use ICT to help cities reach their environmental targets and specifically the climate targets. Climate targets are here understood as comprising targets on energy use and GHG emissions [8], and we focus on how ICT can support the reduction of energy use in this article.
The purpose of this paper is to explore to what extent ICT can support an environmentally sustainable development in cities using a consumption perspective on energy. This is done through the development of a framework for identification and mapping of ICT applications and solutions with opportunities to decrease energy use.
DEFINITIONS OF A SMART CITY 2.The concept “smart city” can be understood as highlighting the importance and potential of ICT supporting the city to get a competitive profile [5]. Could it also be seen as a concept for an environmentally sustainable city? We are investigating different definitions of the smart city as well as ICT solutions for environmentally sustainable cities. Forrester [9] focus on the main infrastructures that cities provide to its citizens meaning that it is the combination of the “smart computing” (use of software systems, server infrastructure, network infrastructure and client devices) within seven critical infrastructure components and services (city administration, education, healthcare, public safety, real estate, transportation and utilities) that makes a city smart. The Climate Group et al. have focused on ICT for the cities own administration and have defined the smart city to be a city that uses data, information and communication technologies strategically to provide efficient services to citizens, monitor policy outcomes, manage and optimize existing infrastructure, employ cross-sector collaboration and enable new business models [10].
Nam and Pardo [11] frame the smart city by different clusters that can be divided into three dimensions: technology (infrastructures of hardware and software), people (creativity, diversity and education) and institutions (governance and policy). According to Nam and Pardo [11] the technology dimension can be clustered in six different definitions, the digital city, the intelligent city, the ubiquitous city, the wired city, the hybrid city and the information city. The human dimension “people” are described in four
clusters, which are the creative city, the learning city, the humane city and the knowledge city. The institution dimension has two different definitions the smart community and the smart growth. Visions about the future smart city includes solutions for smart transportation, smart environment, smart health care, smart energy, smart education, smart safety etc.[11]. Maeng and Nedovic-Budic [12] have gathered metaphors of the ICT based city from literature that affects the urban form and economics of cities. They found twelve useful metaphors which are Electronic cottage; Technoburb, Wired City, Informational city, Intelligent city, Invisible city, Telecity, City of bits, E-topia, Digital places, Network cities and Ubiquitous city.
The Intelligent Community Forum (ICF) has listed five successful factors for an intelligent community, which they use to rank the level of smartness of different cities each year [13]. The success factors according to ICF are broadband connectivity, knowledge workforce, digital inclusion, innovation and marketing and advocacy.
METHOD 3.To be able to understand to what extent a city (or another object of study) is environmentally sustainable, there is a need to define what is meant by a “city”, i.e. to define the system. In order to do so, we here use four so called methodological considerations, identified as crucial when setting climate targets for cities [14]. The considerations can be seen as a way to identify the most important choices that needs to be dealt with when defining the system boundaries. The considerations concern the temporal scope, the object i.e. the spatial boundaries and activities included, the unit typically energy or GHG-emissions and the range of the target. The range is divided into two different perspectives, if a consumer or producer perspective is used and to what extent a lifecycle perspective is taken [14].
In this paper we use a consumer perspective elaborated by Höjer et al. [15] where the city residents’ activities have been divided into six household functions. The energy use by city residents in Stockholm in the year 2000 was distributed over the different household functions [15]. The system for distributing energy between the functions was comprehensive in the way that all energy used for Stockholmers’ consumption was allocated to the functions. The six household functions were personal, housing, food, care, common and support.
We used the four methodological considerations defined by Kramers et al. [14] as a basis for setting the system boundaries of the environmental impacts of the city. For this paper’s specific purpose, we defined the system boundaries by stating in what way we handle each methodological consideration.
To get an overview of ideas on how different ICT applications and solutions can support an environmentally sustainable development in cities we investigated the main proposals from businesses and previous research, including definitions of the term smart city, in literature and through seminars. Participants included major ICT companies, city officials and a neighborhood community as well as from researchers from academia. The five main ICT opportunities to support cities to become environmentally sustainable developed by Mitchell [1] and the household functions elaborated by Höjer [15] were then used to develop a matrix to be used as an analytical framework for identifying new ICT application and solution opportunities.
For each household function we went through the five ICT opportunities by Mitchell to identify already implemented and
184

existing solutions, ideas or pilots that are underway, new opportunities and lastly areas where we did not find any use of ICT to reduce energy.
Lastly we discuss the potential reduction of energy use in cities by the ICT opportunities we have identified, based on the findings and complemented with own speculations regarding what could be done in a situation that is seen as pressing for energy reductions.
DEFINING SYSTEM BOUNDARIES FOR 4.THE SUSTAINABLE CITY By setting clear and transparent system boundaries it is possible to understand which of the environmental impacts generated by the city that is included. System boundaries can be set differently dependent of the purpose of the measurement of environmental impact of the city.
As previously mentioned we here try out to use the methodological considerations in Kramers et al. [14] to define system boundaries for an environmentally sustainable city, exemplified by suggested targets for Stockholm. There are four major considerations to make.
The first consideration is the temporal scope of the target, i.e. what future point in time it aims at, and from which year, if there is a reference year. For the temporal scope we use 2050, with reference year 2000, the same years as in Höjer et al, 2011 [15]. Long-term targets are often discussed for 2050, even though not even the 2050-targets are always final targets, as mentioned by e.g. Åkerman and Höjer [16].
The second consideration is about the object of target, i.e. the spatial boundaries and activities included. In this paper, we propose to follow the same geographical limits as in Höjer [15]. Therefore, we here chose the 26 municipalities, comprising the Greater Stockholm labour market as the geographical scope. We include all activities in society in the target. The third consideration is about the unit of target, typically energy use or GHG-emissions. The unit of the target in this first attempt to use the methodological considerations is energy and it is set to te same as in Höjer et al, 2011 [15], i.e. a reduction by 60% per capita living in the city. Thus an increased population in the city means that more energy can be used within the geographical borders in question.
The fourth consideration is about the range of the target. The range is divided into two different perspectives, if a consumer or producer perspective is used and to what extent a lifecycle perspective is taken [14]. For the range of the environmental impacts we are using a consumption perspective and only include the emissions from city residents living in the city and not from visitors. The consumption perspective we are using in this article is further highlighted by using the household functions suggested in Höjer et al, 2011 [15], where all energy use is allocated to one of the six categories personal, housing, food, care, common and support (see also Section 5 for more details regarding these functions). These are developed so as to comprise all energy use related to the consumption of residents living in a specific area.
Altogether, this means that if the same considerations were set up for all geographical areas in the world, the targets would cover the total global energy use. Table 1 illustrates the baseline situation for Stockholm 2000 with our methodological considerations.
Table 1. Energy use per household function, Stockholm 2000 [15]
The choices we make in this paper can be compared to how the current policy of the City of Stockholm looks like in the area. According to the Stockholm Environment Program 2012-2015 [17], the City uses in principle two target years: 2015 and 2050. Both of those are absolute, thus, they have no reference year. However, the City indirectly relates the 2020-targets to EU-targets and national targets both stated with 1990 as reference year. The object of target is the Municipality of Stockholm and only heating, electricity and transport within the municipality are included. The City does not use any target on energy in their environmental program. Instead, they stick to CO2e/per capita. The aim is set to 3 tons CO2/capita by 2015 aiming at a fossil free Stockholm by 2050. The range of the City’s target is the whole life cycle for fuels and electricity production. However, they do not include energy use for the citizens’ consumption of goods, nor their travel beyond the city borders, but they bring in transport within the city limits by others than the citizens.
The main differences between the City’s considerations, and ours, can be summarized as follows:
- The city uses CO2e instead of energy. This means that change of fuels in power plants or for cars, can be a way of reaching their target, but does not help with our methodological considerations.
- The city only includes some activities, whereas we put forward a comprehensive system of activities.
- The city limits most of the activities to things happening within the city border, whereas we include all activities by the city’s citizens.
Looking at Table 1 can make a very rough quantitative measurement of the difference in scope between the two sets of considerations. Energy use for “Personal” consists of mainly long-distance travel, and to some extent of consumption of personal products, and heating of holiday houses. Thus, most of this energy use is not covered by the City’s delimitation. The same goes for most of the energy use for food. For the other parts, the City’s target covers most, but not all, energy use – such things as heating of houses (Housing) and public buildings (Care and Common) and commuting (Support). Thus, altogether it seems like the City’s target covers about 50-60% of the energy use caused by all Stockholmers. Therefore, such a target does not only imply that a large portion of the energy use remains unattended but also risks resulting in that a whole range of measures are overlooked.
ICT FOR ENVIRONMENTALLY 5.SUSTAINABLE CITIES To support the identification of ICT applications that can support the reduction of energy use in cities we developed an analytical framework, presented in Table 2. The analytical framework was developed by combining the household functions elaborated by Höjer et al [15], with the ICT opportunities for reducing energy use in cities identified by Mitchell [1]. To also address solutions aimed at persuasion or “user awareness and decision support” [18] these were included in “intelligent operation”. The analytical framework was used to categorize ICT solutions that emerged from the literature studies and seminars into: already implemented solutions (i), pilot solutions (p), and new opportunities for ICT application (o). Furthermore also areas
Function: Personal Housing Food Care Common Support
Energy use 35% 32% 13% 11% 5% 4%
185

where ICT solutions were deemed to have little or no potential to make use of to decrease energy use were identified (n.a.)
Table 2. Analytical framework to explore the potential of ICT solutions to decrease energy use. The matrix shows energy use per household function in Stockholm 2000 [15] combined with the identified ICT opportunities. The latter divided into new opportunities (o), pilots (p) and existing ICT solutions (i) as well as where ICT solutions not is applicable for energy decrease (n.a).
In the following sections ICT application solutions are identified, presented and discussed for each household function.
5.1 Personal The category Personal comprises the largest part of householders’ energy use. This household function category includes activities such as sleep, clothing, hygiene, recreation, entertainment, certain types of trips and holiday homes. It also includes durable and semi-durable goods such as televisions, computers, sound systems and discs, videotapes, books and clothes; consumables such as tobacco, wine, soap and makeup; and services such as restaurant visits and pedicure [15]. Many of the activities, goods and services included in the category Personal serve as lifestyle markers. Within this category the activity leisure travel with car stands for the largest part of the energy use followed by holiday air travel. Goods such as cars, mobile phones, lap tops etc. use a lot of the energy from Personal. To demobilize leisure travel would not be easy, since the whole idea with the activity is to physically go somewhere else, to meet with friends and family and take part of different activities or to spend a weekend in Paris. It is difficult to demobilize a soccer game competition or a visit to a countryside house. Therefore the opportunity within Personal lies more in dematerialization, mass customization and intelligent operation.
Many of the durable goods included in Personal are already becoming dematerialized by the use of different ICTs. Videotapes, records and books are now broadly available as media files. Moreover, other goods such as phones, cameras, keys, money, CD-players and navigation devices have been dematerialized by way of being integrated in one and the same device. There are also other durable or semi durable goods in the household that might be transferred to services performed by an operator that have resources to dematerialize and/or mass customize services based on demand. One example of where both dematerialization and mass customization are used is cloud computing. Cloud computing is a model for enabling on-demand network access to a shared pool of resources such as servers, storage, applications etc. [19]. Cloud computing allows for computer-processing resources to reside in the cloud and thus enables only having the displaying devices in the household. The energy used for the cloud computing services would still be allocated to the household but could, depending on the energy performance of the cloud computing service, be lower than if all
households have their own computing devices. Another example of a good could be both dematerialized and mass customized through ICT is to shift the owning a private car to a subscription to a mobility service, such as a car pool in which a range of different cars are available to be booked and used for different purposes. Similar solutions are public transportation access cards, car renting services and City Bike systems. There is however a great potential to use ICT to further integrate these systems, e.g. by way of providing a common booking system, interface and payment system. One example of such a system is the Dutch system ‘Green Wheels’, but public transportation is not integrated in that service [20].
Intelligent operation of personal household functions could for example be used to make use of ICT to help travellers to find the most environmentally friendly travel mode. Kramers [21] has explored these opportunities by identifying new functionality for advanced traveller information systems. Intelligent operation could also be used to help reduce the energy use in households by different technologies aiming at user awareness and decision support, intelligent control of the households energy use through e.g. standby management, energy management and trading, or by integration technologies for both process and system integration [18].
The presented ICTs could also contribute to a soft transformation of the urban fabric through an optimized use of transportation infrastructure, roads and parking places. The need for space in the household can be reduced because of the need for storage of durable and semi durable goods will decrease.
5.2 Housing The energy use allocated to the household function Housing consists of the residence and parts of its equipment such as residential service, heating and lighting; furnishings such as furniture, carpets and textiles; and domestic services such as cleaning, maintenance and repair. The energy use for operation and management of the housing as well as electricity for common areas in multifamily houses is also included [15]. The by far largest part of the energy use within the housing category comes from heating. The energy use for heating is even greater than the energy use for leisure travel.
Today the main focus on intelligent operation solutions in relation to Housing is focusing on the electricity grid. As electricity is used for more than one household function, saving effects from ICT investments in the grid need to be allocated to all of these functions. However, the same technologies that are used for the smart grid and smart meter solutions could also be used to lower or cut peaks in the use of district heating [22]. When looking at the activities in Housing it becomes evident that ICT is not used to any wider extent for the purpose of saving energy. Thus, the potential for identifying further opportunities should be good.
Indoor-space can be dematerialized to some extent by sharing of spaces but also by using a virtual world for certain activities. The energy use for transportation in Housing is very low, meaning that there is little potential for demobilization.
Mass customization is currently mainly used for demand management of indoor lighting by sensors in buildings used for business purposes. It could however also be used for management of households lighting and for steering of heating and/or cooling of indoor space.
Likewise as the durable and semi durable goods in the household function Personal some goods connected to Housing such as laundry machines, vacuum cleaners, drilling machines or trailers
ICT Opportunity
Household functions
35 Personal i n.a. o/p p o32 Housing o n.a. o o o13 Food n.a n.a o/p o o
11 Care n.a i i o o
5 Common n.a. n.a. n.a. n.a. n.a.
4 Support n.a. i/o o/p p o
Soft trans- formation
Energy use %
Dematerali-zation
Demobili- zation
Mass customi-
zation
Intelligent operation
186
can also be shared between households or subscribed to from an operator that supplies the service. The role of ICT in this would be to facilitate booking of the service, and potentially to keep track of the goods. The soft transformation that can take place because of the different ICT solutions for the housing household function is a more optimized use of heated and/or cooled space and reduced number of heated spaces as well as reduced need for space to store goods. Energy trading between buildings will put requirements on how to arrange the buildings for more optimized use of the energy system. If office buildings were located close to residential buildings excess waste heat can be used to heat the residential buildings [23]. Intelligent operation to optimize management and operation of the whole building or apartment is already used in parts of the building stock but could be much more widely used.
5.3 Food Food includes energy use related to food items and the equipment required for storage, purchasing and preparation of food, as well as parts of the restaurant and café visits. Production of food is the largest contributor to energy use in this category – what we eat is important for the energy use [15]. The second largest portion comes from the storage and cooking of food. The travel to buy food is included in this category but is much smaller than the other two activities. Dematerialization and demobilization is not possible for this category since food cannot be digitalized. Instead ICT can be used to inform and build up knowledge of what we eat and how it affects the environment. Mass customization and intelligent operation, in combination enables ICT to tell us about the best possible choices from environmental and availability point of view. There are existing examples of these types of applications. Two examples are Good Guide [24] in the US and Shopgun [25] in Sweden. Intelligent operation could also be used to optimize logistics of food transportation and to find the best possible place for the trading point between delivery of goods and the consumer. A lean production way of thinking of the food supply chain would make it possible to both optimize the production as well as the transportation of food. Maybe it would also in the long run provide means for soft transformation of both to decrease the need for heated and/or cooled spaces in groceries and less demand for transport infrastructure.
5.4 Care The category Care stands for an eighth of the households’ energy use. The category is divided into three major parts: education, social security and healthcare. Only 10 % of the energy use in the care category is related to the private households according to Höjer et al [15]. The rest is mainly energy use in public buildings.
Being a service it may be hard to see how Care could be dematerialized. However, Care includes numerous types of material equipment that might be substituted by the help of ICT, for instance the shift from analogous x-ray to digital. It is possible to demobilize certain care services. Examples on these are remote healthcare via sensors and mobile phones, education on distance and security systems via surveillance equipment. An opportunity for mass customization is to make use of ICT for more personalized service to care takers according to their needs. Intelligent operation can be used to manage and operate energy use in buildings used by the care function. A soft transformation can take place by making use of ICT to understand where to locate care functions to best serve the households in the effort to minimize the distance travelled.
5.5 Common The category Common meets the basic needs of safety and security. The energy use comes from buildings and public goods used in the political system, military, police, judiciary, central and local government administration and the county administration and local government [15]. Most of the energy use in this category is outside the individuals responsibility and therefore difficult for the individual to reduce. Instead, the ICT-applications of relevance here are such that can improve efficiency in use and heating of buildings. Examples of the first are steering systems for heating and cooling, and examples of the latter are various forms of reforms for reduced use of space, such as distance work, e-governance and mediated meetings. 5.6 Support The category support includes paid work and commuting. The energy use in the category support consists solely of energy use from commuting to work [15], since energy use at work, is allocated to other categories.
Travelling by car and/or motorcycle is responsible for 65 % of total energy use for commuting. The rest of the energy use for the category support is shared between commuting via public transportation/cycling and maintenance of the road infrastructure, which have the same share, 17 % of the total energy use.
Dematerialization of commuting through ICT is not possible and therefore not applicable in the category support. Commuting is different from leisure travel and can more easily be demobilized and replaced by virtual means such as collaboration tools, telephone or video-meetings. Commuting could be mass customized and enabled by ICT in the same way as described for leisure travel. Intelligent operation of commuting could likewise as for leisure travel be used to make use of ICT to help travellers to find the most environmentally friendly travel mode. Since commuting is more easily demobilized, there are possibilities for soft transformation of buildings and infrastructure. There are possibilities to locate work hubs close to where people are living and provide professional business environments with all necessary equipment that can be shared between different companies. The idea is not new but has very rarely been implemented, but the opportunities can increase with a population more used to communicating without being at the same physical spot, and with a more pressing situation, caused by e.g. demands on reduced energy use.
To make use of ICT for transport of both leisure travel as well as commuting and business travel could lead to more optimized infrastructure with less demand for energy. A demand-based mobility where city residents subscribe to mobility can lead to less demand for both fuel and also for spaces used for private cars. A more intelligent operation of public transportation and information about it by the use of advanced traveler information systems would be feasible. There are gains for unexploited efficiency potentials in public transportation, seamless integration of various systems for different travel modes, demand/supply co-ordination and electronic payment for both dematerialization and demobilization of ticket handling [21, 26].
CONCLUDING DISCUSSION 6.In this paper we have put together thoughts on smart cities, methodological considerations for setting climate targets and household functions and collected ideas on how ICT-solutions can be used to reduce energy use in cities.
187

We conclude that the concept “Smart city” is in many cases used as a place-marketing concept to attract investments, businesses, residents and tourists. It promotes the city’s image and attractiveness, but it often has little to do with environmental concerns or solutions. Therefore, caution is called for when using the smart city concept, so that it does not lead to the promotion of environmentally negative effects, but instead focus on the environmentally positive solutions.
The framework we developed can be used to find opportunities, pilots and existing solutions for the use of ICT for energy reductions. We suggest that areas with the greatest potential for energy reductions can be identified by looking for combinations of household functions with large energy use and many new opportunities for ICT solutions. These areas are mass customization, intelligent operation and soft transformation of transport and heating of buildings. This correlates well with the findings from a study made by Hilty et al. [26], where it was found that ICT could increase energy use by 37% in the worst-case scenario but it could also decrease energy use in the best-case scenario by 17% [26].
When searching for figures on how much energy that can be saved there is not much information. We have used energy use as an indicator on ICTs contribution to environmental sustainability, however there are other proposals such as, tons of kilometers of freight transport = tkm, passenger transport measured in persons times kilometer = pkm, energy use, GHG emissions and waste not recycled [26]. Other indicators that could be useful are for example heated space, kg of decreased material resources, number of parking spaces and road kilometers.
Hilty et al. [26] found that the main decreasing effects of ICT on energy consumption are to make use of ICT to shift from material goods to services, to install intelligent heating systems, to use ICT for production process control and for supply chain management.
Personalization and demand management characterize the ICT potential mass customization. In this field there are opportunities to use the concept persuasive computing to enable ICT to automate, persuade or inform individuals of different alternatives [27].
Cities need to thoroughly go through the opportunities and investigate how they best can support the implementation of different ICT solutions. Meanwhile, businesses need to learn how to best design and implement ICT-solutions that decrease energy use.
A special problem that is displayed in this paper is the risk for mismatch between city’s climate targets and the opportunities given by ICT-solutions. As was shown in Section 4, Stockholm City’s climate targets only covers 50-60 percent of total energy use. Therefore, they may miss important ICT-solutions. Those are solutions related mainly to personal consumption of goods and services. They can be either focused on direct energy savings, e.g. by more efficient use of leisure houses. Or they can be focused on collecting information on energy use of various activities.
It is highly debated if and how such information can have any effect on actual energy use. There are also sensitive ethical issues involved in which ways public authorities may affect its citizens. This still needs to be investigated. In any case, the lack of knowledge regarding activities’ energy use is a democratic problem, since it blocks informed discussions regarding what can, should and needs to be done and whose responsibility that is. ICT has a great potential to highlight those issues. Therefore, it can make energy use that until now has been seen as beyond the
jurisdiction of city administrations, to being something they should and need to deal with.
ACKNOWLEDGEMENT The authors would particularly like to thank VINNOVA – the Swedish Governmental Agency for Innovation Systems – for funding the project.
REFERENCES
1. Mitchell, W.J., E-topia, "Urban life, Jim - but not as we know it"2000, Cambridge Mass.: The MIT Press.
2. GeSI, SMART 2020: Enabling the low carbon economy in the information age, 2008.
3. UNEP(Fischer-Kowalski, M., Swilling, M., von Weizsäcker, E.U., Ren, Y., Moriguchi, Y., Crane, W.,Krausmann, F., Eisenmenger, N., Giljum, S., Hennicke, P., Romero Lankao, p., Sibirian Manalang, A.), Decoupling natural resource use and environmental impacts from economic growth., 2011.
4. Hilty, L., W. Lohmann, and E. Huang, Sustainability and ICT - An overview of the field. notizie di POLITEIA, 2011. 27: p. 13-28.
5. Caragliu, A., C. del Bo, and P. Nijkamp. Smart Cities in Europe. in 3rd Central European Conference in Regional Science - CERS. 2009.
6. Hollands, R.G., Will the real smart city please satand up? Intelligent, progressive or entrepreneurial. City, 2008. 12(3): p. 304-320.
7. Climate Group. 2012 [cited 2012 0928]; Available from: http://www.theclimategroup.org/.
8. European Commission, COMMUNICATION FROM THE COMMISSION TO THE EUROPEAN PARLIAMENT, THE COUNCIL, THE EUROPEAN ECONOMIC AND SOCIAL COMMITTEE AND THE COMMITTEE OF THE REGIONS: A Roadmap for moving to a competitive low carbon economy in 2050, 2011: Brussels.
9. Washburn, D., Sindhu, U.,, Helping CIOs Understand "Smart City" Initiatives, 2010, Forrester.
10. The Climate Group, et al., Information Marketplaces: The New Economics of Cities, 2011.
11. Nam, T. and T.A. Pardo. Conceptualiizing Smart City with Dimensions of Technology, People, and Institutions. in 12th Annual International Conference on Digital Governmnet Research. 2011.
12. Maeng, D. and Z. Nedovic-Budic, Urban Form and Planning in the Information Age: Lessons from Literature. Spatium, 2008(17-18): p. 1-12.
13. ICF. Intelligent Community Forum web page. 2012 [cited 2012 25]; Available from: http://www.intelligentcommunity.org/.
14. Kramers, A., Wangel, J., Johansson, S., Höjer, M., Finnveden, G., Brandt, N., Elusive Targets:Methodological considerations for cities' climate targets, in Making Futures, On Targets, Mesures & Governance in Backcasting and Planning, J. Wangel, 2012, KTH: Stockholm.
15. Höjer, M., A. Gullberg, and R. Pettersson, Images of the Future City. Time and Space For Sustainable Development2011, Dordrecht: Springer.
16. Åkerman, J., Höjer, M., How much transport can the climate stand? Energy Policy, 2006. 34(14): p. 1944-1957.
188

17. Stockholm, C.o., The Stockholm Environment Program 2012-2015, 2012.
18. REEB, ICT Supported Energy Efficiency in Construction: Strategic Research Roadmap and Implementation Recommendations. Final Report, 2010b.
19. Mell, P., Grance, T. , The NIST definition of Cloud Computing, Version 15, 090710, in National Institute of Standards and Technology Special Publication, U.S.D.o.C. National Institute of Standards and Technoplogy, Editor 2011 Computer Security Division Information Technology Laboratory National Institute of Standards and Technology , : Gaithersburg, U.S.
20. Green Wheels. 2012 [cited 2012 0921]; Available from: https://http://www.greenwheels.com/nl/Home/Particulieren/Home.html.
21. Kramers, A., Improving Advanced Traveler Information Systems to reduce energy usage and greenhouse gas emissions in urban areas, in Contribution of ICT to Climate Targets of Cities: Exploring the potential of Information and Communication Technologies in
reducing emissions and energy use from buildings and travel, A. Kramers, 2012, KTH: Stockholm.
22. Kramers, A., Svane, Ö., ICT applications for energy efficiency in buildings, I.-X. TRITA-SUS, Editor 2011, CESC, Centre for Sustainable Communication: Stockholm.
23. Howard, B., et al., Spatial distribution of urban building energy consumption by end use. Energy and Buildings, 2012. 45: p. 141-151.
24. Good Guide. 2012 [cited 2012 0921]; Available from: http://www.goodguide.com/.
25. Shopgun. 2012 [cited 2012 120921]; Available from: http://www.shopgun.se/.
26. Hilty, L.M., et al., The relevance of information and communication technologies for environmental sustainability - A prospective simulation study. Environmental Modelling & Software, 2006. 21(11): p. 1618-1629.
27. Fogg, B.J., Persuasive Technologies - Now is your chance to decide what they will persuade us to do—and how they’ll do it,. Communications of the ACM, 1999. 42(5): p. 26-29.
189
Energy Efficiency in Hammarby Sjöstad, Stockholm through ICT and smarter infrastructure
– survey and potentials
Örjan Svane1
1 KTH Royal Institute of Technology, Environmental Strategies Research – fms, SE-100 44 STOCKHOLM, Sweden [email protected]
ABSTRACT Internationally, Stockholm’s brownfield development Hammarby Sjöstad is seen as one of the world’s highest profile examples of Sustainable City Development. Is its energy efficiency already optimal, or is there an untapped potential for "Renewing a New City", for example through the innovative implementation of ICT? This is the main issue of the study reported in this paper.
In the mid 1990s, after some five years of comprehensive planning, the City's politicians and leading officials agreed that Hammarby Sjöstad should be the Olympic Village when applying for the 2004 Olympic Games. To strengthen the application, an environmental programme was passed in the city parliament, a project team comprising representatives of the main city administrations was established, and the team was given the task of injecting the novel features of the programme into an ongoing, ordinary planning process [1, 2]. In 1997, the Olympic committee gave the Games to Athens. Nonetheless, the environmental programme and the project team were retained, and for more than a decade of construction the area has been marketed as a spearhead of urban sustainable development [3, 4]. However, evaluations indicate that its energy efficiency is average if benchmarked towards other developments of the same period [5]. Dispersion is wide, a factor three.
As part of development, the national government subsidized a number of projects to support the environmental profile, some of them being targeted towards ICT and "smart homes" technology [6, 7, 8, 9]. This is interesting, since it is often argued that the innovative application of ICT should markedly increase energy efficiency [10]. In research at KTH, Stockholm, we therefore
explore this as applied to Hammarby Sjöstad: To what extent do systems rely on smart infrastructure to control energy use and its impacts – in the electric system, in the district heating? Does ICT integrate citywide and local energy system components through automation, does ICT interact with operators, managers or residents, informing or persuading them to be energy efficient?
For the purpose of this study, smart infrastructure is defined as systems that make it easy for users and managers to keep energy use and its impacts low, without compromising utility or comfort Data is collected from documents and interviews. Eight real estate units with elements of smart infrastructure were identified. Thus, about 5 per cent of the flats have this feature, mainly to automatically integrate novel components such as photovoltaics or geothermal energy into the large-scale ordinary energy systems. There is also a single example of a passive house. This is the only Sjöstad real estate unit to comply with the original energy objectives of using no more than 60 kWh/m2yr.
The addition of local energy sources to a large-scale energy system influences the routines of operators and managers, introducing an element of smartness. It was also found that in a few cases, buildings were provided with “smart homes technology”, i.e. ICT that actively interacts with the residents. However, findings indicate that some of the technology does not function properly or has already become obsolete. In three cases, managers and owners are ignorant whether an element of smart infrastructure is operational or not. On the other hand, already from 2000 on, the district was provided with a comprehensive fibre network, which is still up to date. From this follows that on district level the potential for smart infrastructure is there, but as mentioned it is only in part utilised in the individual buildings.
Keywords Hammarby Sjöstad, Stockholm, smart infrastructure, energy efficiency
ICT4S 2013: Proceedings of the First International Conference on Information and Communication Technologies for Sustainability, ETH Zurich, February 14-16, 2013. Edited by Lorenz M. Hilty, Bernard Aebischer, Göran Andersson and Wolfgang Lohmann. DOI: http://dx.doi.org/10.3929/ethz-a-007337628
190

1. INTRODUCTION Hammarby Sjöstad is a new city district just south of central Stockholm, which is internationally known as an outstanding example of urban sustainable development [see e.g. 3, 4]. Planning started in the early 1990s and construction will continue until about 2017. The area’s environmental profile was introduced into the planning process when the City Parliament passed a comprehensive Environmental Programme in 1997 as part of the application for the Olympics of 2004 [11]. Energy use and its impacts remain one of the programme’s main issues. Common opinion has it that local energy sources supplement the large-scale electric grid and the district heating system, providing part of the electricity and the energy for heating, and that smart homes technology is installed in pilot projects. To what extent, then, has ICT been used to help managers and users in keeping energy use and its emissions low? Given this, which is the potential for improvements? These are the main issues addressed in this paper.
A more precise wording would be: In what buildings, for what purpose and for whom is ICT incorporated as part of a smart infrastructure in the buildings of Hammarby Sjöstad? From this, two conceptual/theoretical questions follow:
- Which is the definition of smart infrastructure for the purpose of this paper?
- Which is the definition of energy efficiency, in such a smart infrastructure system?
Four empirical questions follow, too:
- In what buildings of Hammarby Sjöstad are smart infrastructure systems found? Is there some smart system infrastructure for the district as a whole?
- What novel components (for example ubi – ubiquitous computing) does ICT integrate into these systems?
- To what extent and how do the systems interact in novel ways with their managers and users via ICT?
- What actor(s) could utilise an untapped potential for improvement in energy efficiency and its impacts, if any?
Furthermore, this wording indicates a number of delimitations: - Geographical system boundaries are those of Hammarby
Sjöstad, and in particular the smart infrastructure of its buildings. Regional or national infrastructure is not considered, although it might be a prerequisite for local smartness.
- Systems include those providing electricity and energy for heating and hot water. The water-sewage system and the transport systems are excluded.
- ICT or the smart systems’ contributions to energy efficiency are not evaluated, nor are the untapped, future potentials for increased efficiency assessed.
In the following are presented some preliminary findings from an ongoing study addressing the aforementioned issues. On the one hand, it is an extension of previous research on the environmental management of Hammarby Sjöstad [1, 2] and on scenarios for urban sustainable development in Stockholm [12, 13]. On the other, it is intended to give input to an upcoming study on attempts at increasing energy efficiency in Hammarby Sjöstad – “Renewing a New City” [14]. Data for the study come from research-based documents, and from documents of the City’s and the national government’s involvement in Hammarby Sjöstad. It was not deemed necessary
to send out a survey to all real estate owners of Hammarby Sjöstad in order to identify the buildings that have smart infrastructure. Instead, the initial selection was based on information from the officers of the Sjöstad information office GlashusEtt, from documents and the Internet. With one exception, all buildings included in the study are at present owned by the residents in the form of housing co-operatives (Swedish “bostadsrätt”). Most of these have home pages of their own, from which minutes from annual meetings and other information can be obtained. Furthermore, officers at GlashusEtt were interviewed. At present, the real estate owners and managers of the area are interviewed, but some of this data is still missing. Data is analysed using ordinary methods for qualitative research. Validation is mainly through data triangulation [15]. Being a case study, it relies mainly on the reader to apply the findings and conclusions through so called naturalistic generalisation [15].
2. BACKGROUND AND THEORETICAL CONSIDERATIONS Hammarby Sjöstad is an extension of Stockholm’s inner city towards the south. Construction started in 2000, and when fully developed in 2017 the area will have 11,000 flats for 25,000 residents and at least another 5,000 workplaces. Comprehensive planning focused on its waterside setting, development is transforming an old industrial and harbour area into a modern environment with a distinctively urban character, also utilising its location near the Nacka nature reserve [3, 4].
The overarching aim of Hammarby Sjöstad’s Environmental Programme is that the area should perform ‘twice as well’ as ordinary new housing of the time [11]. The programme comprises objectives under six main headings:
- Land use
- Soil decontamination
- Technical supply: energy, waste and water-sewage
- Transport
- Construction materials
- Noise
For each of its main headings, the Environmental Programme has a descriptive and argumentative part. In an appendix, the objectives are quantified as ‘operative guiding aims’, mainly in relative terms. However, the objective for energy is absolute: ‘The total need for supplied energy should not exceed 60 kWh/m2’ [11]. The programme also comprises social and economic objectives, but these are not as concrete as the others, nor as comprehensive. The area’s performance in relation to the operational goals was evaluated by Pandis Iverot and Brandt [5]. The average energy use was found to be about twice of that of the original objective, with a factor three dispersion.
Like any other city, Stockholm has an electric grid connected to the national one. Supply is roughly half-half from nuclear and hydropower with negligible contributions from wind and sun [16]. Unlike cities in most other countries, however, Stockholm provides practically all of its buildings including those of Hammarby Sjöstad with energy for heating and hot tap water via a citywide district heating system. In parts of the city, also district cooling is provided.
191

In parallel with the environmental programme, a model for the integrated infrastructure systems of Hammarby Sjöstad, the Hammarby Model, was developed [17]. In fact, it is in all essentials the infrastructure systems for energy, water-sewage and waste of all of Stockholm. From this follows that it is not unique for Hammarby Sjöstad or in relation to ordinary Swedish practice. On the other hand, it is out of the ordinary in an international perspective, firstly since it includes a city-wide district heating system based on waste incineration, heat pump technology etc., secondly because integration through city planning is extensive. For the same reason, it has few elements of smart infrastructure, following the definition of this paper as given in the following.
In spite of the Hammarby Model’s systems on the whole not being smart, ICT is obviously used to control their energy flows. However, when new energy sources such as solar panels or photovoltaics are introduced, more sophisticated ICT is needed, making the system smarter by definition. The same applies when developers, contractors, users or managers want better-than-average control of energy use. Examples of this type of possible improvements are weather prognosis based, automatic control of the heating system, or usage and price information provided to the residents via smart meters. Internationally, a number of innovative ICT applications for energy efficiency are in the pipeline. In Stockholm, a smart electric grid is planned for the next large brownfield development, the Royal Seaport. For an overview of established as well as visionary applications including novel forms of human-computer interaction and ubiquitous computing, see the findings of the REEB project [10].
For the purpose of this study, the concept of smart infrastructure was coined. It indicates the aforementioned system properties. The ICT part of the smart infrastructure can integrate novel components with an ordinary energy system in to an optimized whole, for example solar panels into the heating system. It can also interact more or less intensely and frequently with its user – it can automate, inform or persuade. Automation means that once the system is set up, interaction is essentially restricted to malfunction alerts. Information can be provided to the operator or manager of the system on momentary or long-term use, benchmarking against others’ systems, cost etc., and also on similar issues to the users. Persuasion uses information for an explicitly normative purpose, here that of reducing energy use and its impacts. It can be low-voiced and mainly based on information, for example through benchmarking with similar users; it can also be provocative, such as the red light that turns on after five minutes of hot shower [18, 19]. Especially in rented property and when installed by the manager of flats that are already occupied, personal integrity becomes an issue [18].
Based on the above, the concept of smart infrastructure can now be defined as:
Smart infrastructure makes it easy for users and managers to keep energy use and its impacts low, without compromising utility or comfort.
The search for smart infrastructure in Hammarby Sjöstad thus focuses on buildings in which ICT integrates new technology such as solar panels into an ordinary energy system, or interacts in new ways with a human being such as the system operator or the resident. District-wide components such as a comprehensive network are also sought for.
Accordingly, energy efficiency here means “keeping energy use and its impacts low”. As mentioned, no quantification beyond a
few key ratio figures is provided. However, while ordinary statistics uses key ratios such as kWh or CO2 emissions per square metre, the ambition in the further reporting of this study is to provide what quantification there is as energy use and CO2 emissions per person. After all, it is the residents who benefit from the utilities and comforts provided by supplying energy resources to the buildings.
3. RESULTS In the following, preliminary findings are presented under the headings of Buildings and District, respectively. At the time of writing, some interviews were not finalized.
3.1 Smart infrastructure in buildings Elements of smart infrastructure were found in eight of Hammarby Sjöstad’s real estate units, with a total of ca. 500 flats. This is about 5 per cent of the total number. In three of these units, the element of smartness consists of the integration and ICT-based control of one single local energy source. In real-estate units Fjärden 1 and Grynnan 1, photovoltaics were installed to provide part of the electricity for lighting in stairwells and other common areas. Both units were constructed in the early 2000s. According to recent communication concerning Grynnan 1, neither its board members nor the manager know if the photovoltaics are still operational. An office building completed in 2011, Mältaren 3, has a geothermal system for heating and the necessary control system as its element of smartness. In all these cases ICT is essentially used to automate the integration of local and large-scale energy sources. The sources do not indicate that these elements of smartness reduce energy use, but all of them produce renewable energy.
Around 2000, a competition for “Best Building” was arranged, with the assessment criteria of reduced environmental load, good residential quality and low life cycle cost. All of the awarded buildings show more than one element of smart infrastructure. In the following, each winner is presented separately. Unless otherwise stated, the main source is the report on the competition [7]. Information centre GlashusEtt provided additional documents and information from interviews with staff. The competition was judged from the designs, from which follows that possible changes during construction and management had to be identified through interviews.
Holmen, winner of the first prize and developed by contractor NCC as a housing cooperative has photovoltaics according to the competition documents. Smart infrastructure elements furthermore comprise heat retrieval from the sewage water and the exhaust air, and ventilation is individually controlled for each flat. ICT is also used for “Monitoring, operation of technical systems and indoor climate…” [7]. Thus, an out-of-the-ordinary element of interaction with the building’s operator, manager and users is included. Furthermore, the share of energy purchased from the large-scale systems is reduced, and the share of renewable energy is higher than in a similar ordinary system. However, according to an interviewee, the cooperative’s board has no knowledge of the sewage heat retrieval, nor of the individually controlled ventilation, and the photovoltaics gradually deliver less energy. The ICT-based monitoring system was just prepared for, but the board plans to install one in the future.
The second prize winner, Kobben, was developed by SBC Bo, also as a housing cooperative. According to the competition report
192
[7] it has an integrated combination of solar panels and photovoltaics; furthermore fuel cells and “Heliostats and holographic materials in railings”. The latter as well as the role of the fuel cells are not described in detail, just mentioned as parts of the energy system. Instead of radiators it has underfloor heating and the ventilation system is said to be “electro-efficient”. Except for the ventilation, all components are integrated into the ordinary energy systems by ICT. Finally, each flat has a computer screen for interaction with the residents. However, interviews indicate that today some of the features are not there: The fuel cells were never put in place. Only in 2005 were the combined solar panels-cum-photovoltaics installed, and in parallel evaluated [20]. It was found that such a large share of the photovoltaic cells were damaged that proper measuring could not be done. Furthermore that the control system for the solar panels (i.e. the ICT, its sensors and other control equipment) was incorrectly adjusted and thus provided only a low temperature contribution. The real estate owner, a housing co-operative, was recommended to do a proper adjustment of the heating energy system. Finally, interviews indicate that the residents’ screens were disconnected by mistake and have not been operational since then.
Municipal housing company Svenska Bostäder won one of three third prizes with their real estate unit Viken, recently sold to the residents in the form of a housing cooperative. This project is provided with heat retrieval on the exhaust ventilation, solar panels and fuel cells. ICT integrates novel and ordinary components of the energy systems. Viken was also provided with an ICT system targeted at the residents and providing information to “Facilitate the choice of environmentally adapted transports” [7]. A system for follow-up, control and cost allocation for energy and water was also provided. In this case, interviews are needed to ensure what was implemented and what is still in use.
Another third prize was given to municipal housing company Familjebostäder for Lugnvattnet, which also recently became a resident owned housing cooperative. Unlike the others, this competition entry is but part of a larger real estate unit, a small tower block of eight flats. Smart components of the heating system include a geothermal heat pump and a biogas boiler. The façade and the roof have photovoltaics. Ventilation is said to be “electro-efficient” but it is not stated to what extent this involves ICT. The flats are provided with underfloor heating. The documents do not mention any novel elements of information provided to operators or managers in relation to these components, so here ICT has the role of automation. On the other hand, residents are informed of the use of electricity and energy for heating and hot water on a display mounted in the entrance of the building. If interviews confirm that these elements of smartness are still in use as intended, the share of energy purchased from the large-scale systems is reduced, and the share of renewable energy is higher than in a similar ordinary system.
In 2010, private developer ByggVesta completed what is arguably Hammarby Sjöstad and Stockholm’s first building to comply with passive house standards, Kajutan 2. The developer claims that the concept “…cuts energy consumption by 50% compared to the requirements stipulated by the Swedish National Board of Housing, Building and Planning for blocks of flats. And this is achieved at the same production costs as with conventional construction.” [21]. At 55 kWh/m2 and year, this concept makes Kajutan 2 twice as energy efficient as the Sjöstad average, and the only building in the area that reaches the original energy objective. Although it has the main characteristics of a passive house, ByggVesta labels the energy system as a “Self-heating
Building” (“egenvärme” in Swedish). One main difference from ordinary buildings is its extremely well-insulated and leak-free climate shell, which in itself is not part of a smart infrastructure. However, it enables the heat from residents and appliances to become the main source of energy for heating. Additionally, the ventilation system has heat retrieval, and the system is connected to Stockholm’s district heating as backup and for hot water provision. Integration and control of these sources call for ICT automation that all in all make the system smart infrastructure. Another feature which is not common practice in Swedish multi-family housing is the individual measuring and charging of hot tap water and heating besides conventional charging for electricity use. This, too, calls for an element of smartness in the systems. There is, however, no mention in the documents of information or persuasion targeted towards the tenants.
Findings so far can be summarised as follows: Eight real estate units with a total of ca. 500 flats have elements of what is here defined as smart infrastructure. Six of them are now owned by the residents in the form of housing cooperatives, one has right of tenancy and one is an office building. The housing cooperatives were built in the early 2000s, the other two during the last few years. Only one of the present owner/managers claims that the building is more energy efficient than the average Sjöstad building. In few cases is it explicitly argued that the photovoltaics, the geothermal energy, the biofuel boiler etc. reduce the level of CO2 emissions, although this should be the fact. In three cases, the element of smartness is restricted to the integration of one local energy source. On the main, the smartness takes the form of automation, with only 1-2 identified cases of smart interaction with managers or users. What was in the competition designs was in some cases never installed: One of the cases got no fuel cells, another no heat retrieval from sewage. In one case the interactive ICT for management was just prepared for, in another it was accidentally disconnected. One set of photovoltaics was defective from the start, another shows signs of ageing. Finally, there are gaps in knowledge transfer from construction to today’s owners and managers concerning for example if the photovoltaics are still operational.
Referring back to the definition of smart infrastructure, it remains to ask: Does what there is of smartness provide a good indoor climate? In documents, the indoor climate in some flats has been criticised: It is too hot in summer, too cold in winter; the need for cooling has been discussed. However, this is in the first hand a consequence of the design programme of Hammarby Sjöstad: Lake view and large windows were given higher priority than energy efficiency, and the resulting consequences for the indoor temperature were not fully considered [1]. The connection to (lack of) smartness cannot be established.
3.2 Smart infrastructure in the district As part of national government subsidies for Hammarby Sjöstad, four projects that relate to smart infrastructure were funded. They were initiated around 1999 and reported in 2004 [6]. Three projects focused on technology for Hammarby Sjöstad buildings, the fourth on district-wide infrastructure connecting the buildings.
A technology procurement of individual metering of heat, electricity, gas and water was undertaken. In the report [9], it is said that already around 2000, 500 flats were thus equipped, and that if metering was not installed, the infrastructure was prepared for it. The report does, however, not indicate if new forms of ICT-based interaction with the residents is involved.
193
A second project was the technical procurement of solar panels, with the aim of procuring more cost efficient and technically advanced systems. Procurement was, however, discontinued since the real estate owners showed little interest [22].
A pilot study explored the conditions for technical procurement of Smart Homes technology. The conclusion was that it was difficult to find technology “with clearly resource saving effects” [23] besides what had already been procured. Therefore, no additional procurement was initiated.
The fourth project was about the whole district’s basic ICT infrastructure. According to the report, it had a main aim similar to that of this study’s definition of smart infrastructure: “…help creating an ICT infrastructure that will help people in the area to obtain a more energy efficient and environmentally adapted way of living and working.” [8]. To this end, there was a need for coordination of communication services such as telephony, cable TV, Internet access and real estate operation over one common infrastructure. In parallel, a novel business model was deemed necessary. It was argued that coordination would give large positive effects, through the substantially reduced technical infrastructure (reduction by 70-90 per cent), as well as through more efficient use and operation of the system. In the report, published when roughly one fifth of the total building stock was built, it is confidently stated that “We hereby establish that this aim to a large extent already has been attained.” [8]. Recent documents from the infrastructure manager indicate that coverage during the later stages of the Sjöstad development remains high [24].
In the project, technology procurements included a fibre network for all buildings, active network equipment and a local Web Portal. The system’s service provider was also established through procurement. For the management of the system, an association, “Hammarby Sjöstad Ekonomisk Förening” (HSEF), was founded, which still manages the ICT infrastructure of the district [24].
One ambition in the project was to provide optimized operation of the energy systems and the ventilation, assumedly saving around 10% energy. Utilisation lies of course in the hands of the owners, managers and residents of each real estate unit. No evaluation has been made, but based on the unremarkable energy performance of the average Sjöstad building, it can be assumed that this potential remains largely untapped, be it smart or not by the definition of this study.
The local Web Portal, www.hammarbysjostad.se, is today managed by the officers of GlashusEtt. It presents itself as “the environmental web portal of Hammarby Sjöstad” and is in the first hand developed to interact with the local residents. The ordinary information material also provided at GlashusEtt can be found here, as well as everyday “environmental tips” that are regularly updated. There are also login pages dedicated to the local residents and to the area’s housing cooperatives. In the 2004 report, [8] it was suggested that the portal should also provide links to the travel planner of regional public transport company SL and to the local car sharing pool. However, the portal visitor of 2012 will not find such links. Nor does the portal provide internet-based local shopping as proposed in the report.
To summarise: Hammarby Sjöstad as a whole has a uniform standard of ICT infrastructure on district level. This provides the district with a range of potentials for energy efficiency, in the buildings as well as for transport and other types of energy use. However, according to the definition used in this study, it is in the
main a potential, with one exception: Information targeted towards local residents is realised smartness, since it interacts with the users about energy issues; but only when the ICT infrastructure in the buildings has hard- and software to automate, inform or persuade via the district infrastructure, the latter becomes smart. And this, as has been shown, is largely not the case.
4. DISCUSSION AND CONCLUSIONS This paper presents preliminary findings of a study with the aim of investigating in what buildings, for what purpose and for whom ICT is incorporated as part of a smart infrastructure in the buildings of Hammarby Sjöstad. Based on a the aim, the key concept was defined thus:
Smart infrastructure makes it easy for users and managers to keep energy use and its impacts low, without compromising utility or comfort.
Based on this definition, smartness was first discussed in terms of ICT integrating novel components into ordinary large-scale energy systems for electricity and district heating. It was found that to a high extent, integration is automated. Smartness lies also in ICT interacting with its users in new ways, providing information or persuasion. The integrating hard- and software for automation will retain the intended level of energy efficiency, once it is set up and functioning. Unlike this, the energy efficiency based on interaction will have to be continuously reproduced: Although the information is there, the user might over time disregard or forget about it. Thus, interactive ICT in smart infrastructure enables energy efficiency but does not provide it.
In all, eight buildings with elements of smart infrastructure were identified. Thus, 95 per cent of the total number of flats in Hammarby Sjöstad rely on ordinary ICT for the integration of system components, and likewise ordinary ICT-based interaction with managers and operators. Even less of interaction with residents was found. Unlike this, the district-scale system as implemented covers the whole district. When implementation started, it was certainly out of the ordinary, in technology as well as in its business model. In 2012 this technology has become standard in construction and in the existing building stock. However, this does not make it less smart. As previously argued, the district infrastructure is not smart in itself, only when used to reduce energy use and its impacts in the buildings. Thus the two system levels are mutually dependent.
As mentioned, previous research shows that on the average the energy efficiency of Sjöstad buildings is the same as that of other buildings from the same period of time [5]. If energy use for heating and hot water is measured in terms of kWh per person and year as suggested in the paper’s discussion on energy efficiency, it can even be claimed that it is no better than the average of nearby city district Södermalm, which comprises building from the 17th century on, with a predominance from the early 20th century. The reason is that each resident of Hammarby Sjöstad utilizes ca. 30% more of heated area than the average Södermalm resident. The solar panels and photovoltaics, the geothermal heat and other local energy sources should reduce the share of CO2 in energy production, but not noticeably so if measured on district level.
Some of the designed smartness was never installed, a few elements were defective or have become outdated. Board members and managers in three of the studied housing cooperatives are uncertain if part of their smart infrastructure is
194

functioning as intended. The obvious conclusion is that the infrastructure needs maintenance and development if it is to stay smart, new managers and users need education to utilise the potential smartness. Furthermore, smart homes technology with short service life was integrated into the buildings’ walls that have a very much longer service life, without due consideration on how to dismantle the former.
On the one hand, this can be seen as a criticism of the City planners and the developers, consultants, contractors etc. involved in the development of Hammarby Sjöstad. Obviously, they did not succeed in realising the energy objectives given by the City Parliament, be it with or without smart infrastructure. However, this must be understood in the perspective of the Environmental Programme being introduced into an ongoing planning process, with already well-established routines [1, 2].
On the other hand, this indicates that there is a vast untapped potential for improvement. This might be seen as unrealistic in a recently constructed area: Climate shells to passive house standards will not be on the agenda until renewal of the buildings is due in 20-40 years from now. On the other hand, optimisation and gradual improvement are feasible; new ICT components can for example be introduced in existing energy systems to increase ubiquity and human-computer interaction. More of local energy production also leads to increased smartness. The large-scale infrastructure is there and operational, the cost can be assumed to be acceptable [10]. Inertia rather lies in the lack of an obvious initiator or demand shaper [25].
The responsibility for realising the smartness potential in the building stock belongs to the real estates’ owners, managers, operators and users. In a majority of the Sjöstad buildings, the owners and users are the residents, in association in their housing cooperatives, and as individuals or household members in each flat. In other words the residents – as households and in association – are the primary demand shapers. However, as laymen in real estate management, they purchase management services from professionals. Thus, the demand shaping initiative lies in the relation between the laymen owners and the professional managers. Organised collaboration between real estate owners could also contribute.
Hammarby Sjöstad has a citizens’ initiative, HS2020, which seems to have the resourcefulness needed. This initiative has as its basis an association of the area’s housing cooperatives, and from it stems the catchphrase “Renewing a new City”.
In future research, HS2020 as coordinator of demand shaping will be studied. It can be assumed that on the supply side, neither HS2020, nor the manager of the district fibre network, HSEF, nor a single ICT company could on its own provide the consultancy, the installation of hard- and software etc. needed to make the Sjöstad’s energy systems smarter. However, business models built upon collaboration between companies providing the different components of a whole seem feasible. This would provide the real estate owners with a single supply side partner. In Stockholm City’s new sustainability project, the Royal Seaport, actors collaborate in a similar consortium to implement a smart electric grid [26]. In fact, representatives of the citizens’ initiative in Hammarby Sjöstad already have contacted the Seaport consortium.
The potentials of smart infrastructure are largely untapped in Hammarby Sjöstad, but because of that the potential for increased energy efficiency is there. If the concept of “Renewing a new
City” gains momentum and its propagators succeed in involving the real estate owners, residents and other actors needed, more of this potential could be realised.
5. ACKNOWLEDGMENTS Our thanks to Vinnova for providing the funding needed to do this research.
6. REFERENCES [1] Svane, Ö., 2008. Situations of Opportunity – Hammarby
Sjöstad and Stockholm City’s Process of Environmental Management, Corporate Social Responsibility and Environmental Management, Vol 15, no 2, John Wiley & Sons Ltd.
[2] Svane, Ö., Wangel, J., Engberg, L. A. and Palm, J., 2011. Compromise and Learning when Negotiating Sustainabilities – the brownfield development of Hammarby Sjöstad, Stockholm. International Journal of Urban Sustainable Development, DOI:10.1080/19463138.2011.620959.
[3] Hammarby Sjöstad, 2012a. www.hammarbysjostad.se, accessed April 2012.
[4] Hammarby Sjöstad, 2012b. www.stockholm.se/Fristaendewebbplatser/Fackforvaltningssajter/Exploateringskontoret/Ovriga-byggprojekt-i-innerstaden/Hammarby-Sjostad/In-english/, accessed April 2012.
[5] Pandis Iverot, S., Brandt, N., 2011. The development of a sustainable urban district in Hammarby Sjöstad, Sweden, Environ Dev Sustain. 13(6), 1043–1064.
[6] LIP, 2004a. Stockholms lokala investeringsprogram Slutrapport, Stadsledningskontoret, Stockholms Stad.
[7] LIP, 2004b. Lokala investeringsprogrammet Incitament till bästa byggnad (Åtgärd 1.4). Dnr 449/2000-761, Stadsledningskontoret, Stockholms Stad.
[8] LIP, 2004c. IT-system i kretsloppsstadsdelar, Dnr 452/2000-73, Stadsledningskontoret, Stockholms Stad.
[9] LIP, 2004d. Teknikupphandling System för individuell mätning, visning och kostnadsfördelning av värme, el, gas och vatten i flerbostadshus, Stadsledningskontoret, Stockholms Stad.
[10] Hannus, M., Kazi, A. S. and Zarli A. (Eds.), 2010. ICT Supported Energy Efficiency in Construction Strategic Research Roadmap and Implementation Recommendations, www.ict4e2b.eu/sites/ict4e2b.atosresearch.eu/files/page-files/12/REEB_Book_Final.pdf, downloaded April 2012.
[11] Stockholms Stad 1997. Miljöprogram för Hammarby Sjöstad, SBK, Miljöförvaltningen and GFK, Stockholms Stad.
[12] SitCit, 2012. http://www.kth.se/en/abe/forskning/sitcit, accessed April 2012.
[13] Wangel, J.; Gustafsson, S. and Svane, Ö., 2012. Goal-based socio-technical scenarios: greening the mobility practices in the Stockholm City District Bromma, Sweden. Submitted to Futures February 16th, 2012.
[14] HS2020, 2012. http://elbil2020.se/hammarby-sjostad-2/, accessed April 2012.
195

[15] Flyvbjerg, B., 2006. Five Misunderstandings About Case-Study Research; Qualitative Inquiry 12(2), 219-245.
[16] STEM 2011. Energiläget 2011, energimyndigheten.se/Statistik/Energilaget/, downloaded April 2012.
[17] HAST, 2012. The Hammarby Model, http://www.hammarbysjostad.se/, accessed April 2012.
[18] Ijsselsteijn W, de Kort Y, Midden C, Eggen B & van den Hoven E 2006: Persuasive Technology First International Conference on Persuasive Technology for Human Well-Being, PERSUASIVE 2006; Proceedings, Springer.
[19] Svane, Ö., 2009. Helping, Informing or Coaxing the Consumer? – exploring Persuasive Technology as applied to households’ energy use; Varma A 2008: Domotics: Smart Technology, Smarter Homes; ICFAI.
[20] Helgesson, A., Krohn, P. and Karlsson B., 2005: Utvärdering av MaReCohybrid i Hammarby Sjöstad, Elforsk rapport 05:36.
[21] Voltair, 2010. Egenvärmehus® by ByggVesta in cooperation with VoltAir System® cuts energy consumption by 50%,
www.voltairsystem.com/Filer/projekt/Voltair4sidfolder20101trengelsk.pdf, downloaded April 2012.
[22] LIP, 2004e. Teknikupphandling Solvärme för bostadshus, Dnr 453/2000, Stadsledningskontoret, Stockholms Stad.
[23] LIP, 2004f. Teknikupphandling Smarta hus, Stadsledningskontoret, Stockholms Stad.
[24] HSEF, 2011. Protokoll Ordinarie föreningsstämma i Hammarby Sjöstad Ekonomisk Förening 2011-05-23, http://www.hammarbysjostad.se/service/pdf/HSEF_Protokoll_2011.pdf., accessed April 2012.
[25] Hollander, E., 1998. Måste det förbli segt? - om kravformares roll för miljöteknik. Stockholm: Miljöteknikdelegationen 1997 och Gothenburg Research Institute.
[26] Teknikföretagen, 2011. Hållbart med smarta nät, Teknikföretagen 4:2011, www.teknikforetagen.se/Om_oss/Teknikforetagen_4_2011.pdf, downloaded April 2012.
196

From Fixed, Mobile to Complex:
The Social Shaping of ICT for Sustainable Travel
Carlos Cano Viktorsson
1, 2
1
CESC – Centre for Sustainable Communications
2 Division of History of Science, Technology and Environment
KTH Royal Institute of Technology
10044 Stockholm, Sweden [email protected]
ABSTRACT This paper looks at the changing shape of mobile connectivity and how it has influenced the potential for informing on sustainable travel. It examines the role mobile connectivity has had for an ICT based service informing on traffic and transport in order to trace what role social practices of interconnecting through mobile media may have had for such an enterprise. The paper looks at two historical examples of ICT based traffic and travel information services in Stockholm, Sweden in order to discuss what role mobile connectivity may have for promoting sustainable travel through ICT.
Author Keywords ICT, sustainable travel, social shaping of technology, mobile media, institutional change
1. INTRODUCTION The potential for ICT based services to become efficient at acting as soft measures to traditional transport solutions is based on providing information that will encourage a voluntary shift towards more sustainable forms of transportation, such as public transportation [6]. The hope is that these services can change travel behavior by providing the option to choose from real-time based information concerning alternative routes, travelling modes and travelling time. One likely pathway for this is by connecting users to an intelligent information infrastructure of mobile users, services and products that collaborate in order to provide users with more choices for sustainable travel related to public transportation, ridesharing services, and bicycle for rent or non-travel alternatives.
Apps in particular, in conjuncture with social networking services are having an immense effect on both public and private enterprises that strive to find less costly means of both involving unpredictable users and finding solutions to providing for a reliable service. The potentials rest on the increasing number of users being equipped with highly connected mobile devices
during their day to day travels that permit them to act both as „human sensors‟ and prosumers within an ICT based service.
How social practices surrounding the use of mobile media are connected to institutional, economic and cultural factors that shape the form and use of such a technology needs to be considered when talking about the use of ICT for promoting sustainable travel [23]. Considering this condition it is imperative that any notion of an ICT based service aiming towards sustainable travel should include a look at the social shaping of such a technology since contemporary technologies and practices of media and communication are reconfiguring how people socialize and relate to people, places and objects as well as being shaped by them. How increasingly pervasive media and technology frame our collective sense of time, place, and space and how it orients us and is made use of in our everyday life are some of the questions that need to be addressed.
The purpose of the paper is to highlight how Swedish attempts at promoting sustainable travel through information technology has been connected to socio-technical practices surrounding the use of mobile ICT for informing on traffic. To shed light on these practices from a historical and sociological perspective the paper makes use of two examples involving traffic information services that provide travel related information to mobile ICT users. The first example concerns a radio based service stretching back to the late 1970s in the form of the Stockholm local radio and their use of different forms of mobile ICT based networks to report on traffic. The second example concerns a web based service for travel planning named Trafiken.nu. Both services are looked at in terms of their relationship to mobile ICT users and if they have made use of any such networks for informing on traffic. The paper is organized as follows. The following section presents a sociotechnical approach towards the social shaping of sustainable travel seen as promotable through ICT. The second part presents each of the case examples used in the paper through a historical review of each one of them. The third part concludes the paper with a discussion on the changing shape of mobile ICT and what role ICT may have for the promotion of sustainable travel.
ICT4S 2013: Proceedings of the First International Conference on Information and Communication Technologies for Sustainability, ETH Zurich, February 14-16, 2013. Edited by Lorenz M. Hilty, Bernard Aebischer, Göran Andersson and Wolfgang Lohmann. DOI: http://dx.doi.org/10.3929/ethz-a-007337628
197

2. THE SOCIAL SHAPING OF ICT FOR SUSTAINABLE TRAVEL Technology is often ascribed as possessing the power to fundamentally change and transform society where IT is claimed not only to transform society but also have the ability to get us out of the industrial society and transfer us to the new information society. The transformations are not primarily due to the artifacts in themselves but by the widespread use of them sparked by the excitement of using them. In other words technology along these lines, both as a vital force and to maintain society‟s basic functions is seen as a determinant for societal development. However, the point of departure for a constructivist perspective is that technology is articulated and given meaning by both actors and actants in social processes and or controversies. The people, organizations and decisions related to sustainable travel together with the tools they employ can in this regard be seen as „culturally drenched‟ in being immersed within meanings defined within and throughout social and material connotations. Of importance becomes the institutional framework that governs the intentions of an organization or groups actors and their relation to technology in which institutions are seen as active participants in the emergence and use of mobile ICT for sustainable travel. How sustainable travel and its relationship to ICT is constructed relates in big part to a mixture of economic, cultural and political intentions. IT and particularly broadband infrastructure is seen by governments in many countries as an important means of increasing the international competitiveness of their country. These countries see IT as a driver of both electronic commerce and of the information economy society. In this context issues such as infrastructure (or service) competition and the role(s) of public government are often central for understanding the role of technology [21].The issue becomes in what ways governmental agencies work with industry and with other elements of the government.
In the case of apps there are strong industry actors in the form of Google and Apple which are companies that hold a large share of both the production of consumer devices and the distribution of apps. One milieu where this becomes visible is in Europe, where the European Union and various nation state agencies work together with industry to coordinate common development [21].
An example of this can be seen in 2001 when the Vice-president of the European Commission for Transport and Energy Loyola Palacio declared IT as holding the potential of dealing successfully with the growth of pollution and congestion caused by transport in cities. This was declared by a person responsible for launching two successful 10-year policy programs for the competitiveness and sustainability of the European transport system.1 Still, in 2009 the then acting Vice-President Antonio Tajani would contend that “the scope of these challenges is such that a profound transformation in the transport system will be required in the coming decades” adding that “yet, resources available to meet these challenges are limited by the economic crisis”.2
1 EU, 2001, European Cities Clean Up Urban Transport http://ens-
news.com/ens/jul2001/2001L-07-16-03.html, accessed 2012-03-25 2 2007–2012 global financial crisis, also known as the 2008 financial
crisis, is considered by many economists to be the worst financial crisis since the Great Depression of the 1930s.
Some theorists consider that the current political system is insufficiently equipped to deal with the complexity of sustainability and have pointed out that incremental change will not address the fundamental system failures that underpin the issue. As an alternative there are those that propose a multi-level perspective on the interplay between regime, niche and landscape concepts when depicting technological transitions [11].The argument has been that the inherent complexity of society resulting from the difference of perspectives, norms and values adding to the variations of modern day issues requires a new form of governance [15]. This requires a need of conceptualizing IT and its intended use as a set of material affordances and restrictions that are inseparable from their development and use context [21]. With a more explanatory socio-technical perspective on how the promotion of sustainable travel may be connected to the use of mobile ICT the potential increases to understand the societal impact, institutional effects and changes that IT and mobile connectivity may have for the promotion of sustainable travel. The following case examples are based on previous research by the author as seen in two forthcoming articles.
3. NETWORKING TRAFFIC THROUGH THE LOCAL RADIO – A STORY OF EMPOWERMENT Sweden being the place where the first mobile telephone system was launched in 1956 has a long history of mobile ICT use for informing on traffic [3]. The MTA as it was called, standing for „Mobile Telephone system A‟, would become the first fully automated mobile phone system for vehicles allowing calls to be made and received in a car using a rotary dial [7]. MTA phones consisted of vacuum tubes and relays with a weight of 40 kg. Calling from the car was fully automatic, while calling to it required an operator. Although the late 1970s would be a time when mobile telephony in the car held the potential of informing on traffic conditions the biggest contribution would come from another form of ICT called the „Citizens Band radio‟. Radio was during the late 1970s the primary technology to inform the public on traffic conditions and traffic related concerns but it became local only with the establishing of the Swedish Local radio in 1977, a formation that could be seen as a decentralization of the media institution [13]. Inspired by the fast, unpretentious and non-hierarchical means of producing content in America the Local Radio was to become an organization in which “everyone at the station pitched in regardless of their position as a technician or a journalist in order to quickly relay the news [10]. Traffic reporting would under these circumstances become one of the Stockholm stations most particular traits with the establishment of a traffic staff under a „technician turned traffic journalist‟ named Sven-Roland Engström. Engström was a keen hobbyist and tinkerer of radio technology and had a fascination for anything related to traffic [Gustavsson, personal communication]. Having experienced the effects of the traffic measures following the 1973 oil crisis he had as many other Swedes come across a very active network of people informing on traffic called the 27 MHz:ers. These where people who made use of a system of short-distance radio communications called Citizens‟ Band radio (CB) in order to inform themselves and others on such things as the location of nearby gas stations or traffic disturbances [14].
198

The Citizens‟ Bands Radio service had been established as early as in 1945 by the Federal Communications Commission (FCC) but the version accessible for the public was set in 1958 when the FCC established the Class D Citizens Band at 27 MHz. This frequency or band was chosen because it would be cheaper to produce radio equipment on such relatively low-frequency and parts were more common. However, there was a downside to this frequency in that it was shared by industrial, scientific as well as medical devices that could create interference[12]. The FCC had banned CB operations across distances of more than 150 miles in order for large businesses and their employers to not become intercepted or interfered by open radio communication. Constrained in this fashion the FCC granted a license to any adult citizen who requested one without any form of examination [12]. The technology would increasingly be seen filling a real need for a two-way communications service that almost anyone could make use of without advanced technical knowledge or expensive equipment. The Citizens Band radio would as such gain an explosive breakthrough in American society thanks to the working class that used these relatively inexpensive radios in their daily routine. The CB allowed people to get to know one another in a quasi-anonymous manner similar to current Internet chat rooms. The prominent use of CB radios in1970s films such as Smokey and the Bandit (1977) and The Dukes of Hazzard (1979) further increased the appeal of CB radio and helped establish CB radio as a nationwide craze in the U.S in the mid- to late-1970s. The culture of CB radio was increasingly free and at times related to the circumvention of the law. The alerting to other drivers about police speed traps during the oil crisis of 1973 is one such example. Reports in 1975 indicated that more and more Americans were communicating from their cars and elsewhere by two way Citizens Band radios [16]. Constant relays of information let professional drivers and other CB-equipped motorists avoid traffic delays, update on weather conditions and report accidents or other traffic related incidents to the proper authorities. Although CB radio had already been introduced in the U.S it was not until in May of 1961 that general rules for private radio systems in the 27 MHz band were issued by the Swedish Government.
3.1 Citizen empowerment CB radio would be seen in Sweden as paving the way for a completely new means of communication for individuals according to users of the technology, where the trend of using CB radios was probably similar to today‟s online chats and text messaging [Engström, Personal communication]. People making use of CB in this way could be seen in the work of a Swedish CB network called Vägbas Stockholm (tr. Road base Stockholm). The network was composed of members that relayed traffic related information from both professional drivers such as truck drivers and fellow motorists to the authorities. The information that the Local Radio needed to gather and later disseminate traffic information was to a high degree co-created through the day to day communications between these people. The network contributed to a quick and highly dynamic form of reporting on local traffic that would eventually lead the owners of Stockholm Local Radio into “realizing the value of the whole thing, dedicating traffic its own time” according to one of its traffic reporters [Gustavsson, personal communication]. As such,
the CB network would prove important for their public service function. Thomas Engström who was an active member of Vägbas Stockholm during the 1980s recalls a time when volunteers such as Vägsamariterna (tr. The Road Samaritans) and Radiorävarna (tr. The Radio Foxes) still had important functions for the road safety and relayed important information through the CB. They were all part of an infrastructure of different groups connected through the CB radio who shared in the feeling that they were conducting an important societal function, in a “spirit of good will”. The increasing use of cell phones and the Internet would to a large extent replace the use of CB radio during the late 1980s and the early 1990s. As Thomas Engström would later put it “it was the cell phone that wrecked it for us at Vägbas Stockholm” [Engström, Personal communication].
3.2 A paradigm shift The second half of the 1980s would see an increased computerization of Swedish society. Computers had like in other countries already been introduced during the late 1950s but it was during this period with its rise of personal home computers that the term information technology caught a new meaning alluding to the notion of an information society. The years 1990 to 1993 would see an explosion of development in terms of software and protocols that permitted the interlinking of documents and increased search capabilities much in due to a new means of communicating through the Internet‟s World Wide Web system [10]. The push towards a digitalization of the media as it was called had a strong economic incentive where fast and space saving data could be edited, copied, and reused at much lower costs and at multiple locations. New platforms for interaction such as email, chat and the likes fit well with the need to disseminate information through various channels. This development also fit well with the self-running character at large as exemplified by Sven-Roland Engström. Curiously it was during this technological shift that he passed away in 1994, at the height of a paradigm change. As the traffic reporter Lars-Åke Gustavsson describes the incident “he died here, with his headphones still on nine-thirty on a Monday morning. At ten o'clock, there was going to be 'traffic'. They played the signature jingle, and it was quiet. Then they went in and looked. They found him sunken down under his table” [Gustavsson, personal communication]. The Swedish Radio had in the same year conducted its first experiments with web pages and in 1996 its popular program Ekot was broadcasted via the web. It proved to be a success with “over 160 000 visitors in the first half year”[10]. The convergence of communications technologies through the Internet with its interlinking of documents and the increase of search capabilities would make the task of coordinating traffic and travel related information less cumbersome. This brought with it an investment in new internet based technologies and a push towards the digitalization of the media. In all this development and institutional change the basic institutional framework of the Stockholm Local radios traffic staff persisted, but the “on the road” mobile ICT source of information shifted from being CB informants to cell phone users who could be anyone and anywhere in the Stockholm traffic.
199

4. ‘TRAFIKEN.NU’ – A CASE OF MISSING CONNECTIVITY The earliest attempt at managing increasing traffic in Stockholm through a public Internet portal would be seen in the form of a web page called Trafiken.nu (tr. The Traffic.now). The year was 2001 and Stockholm had experienced an impressive political investment in its IT infrastructure together with several infrastructure projects being built for a more efficient transport system. With the promises of the World Wide Web an idea was proposed to gather all data pertaining to traffic onto one place that could be accessed by the public. The aim was to facilitate the creation of a portal for an Intelligent Transportation Systems and Services (ITS) [Pettersson, personal communication]. One particular event that would influence this decision would be connected to one transportation project in particular, the one laid forth in the „Dennis agreement‟ of May 1990 (referring to the National Bank Governor Bengt Dennis). The project included a series of new highways to be built around the city core, to facilitate mass motoring. A meeting was made quietly behind closed doors where an agreement was signed by the three biggest political parties of Stockholm [22]. Public pressures had amounted on an efficient implementation since it was under scrutiny of the public eye. The use of ITS had become a big issue, particularly so because of the tunnels that needed to be constructed which demanded traffic coordination to avoid traffic congestion. This gave way for an idea to make use of all the data coming from different transport related systems where the slogan “better to have one site than a thousand different sites” was coined [Pettersson, personal communication]. The project answered to a Government proposition in 2001 that pointed out that an access to information in digital form and its application would make it possible to develop a more flexible system to meet transport needs [19]. The proposition further stated that planning of infrastructure should interact with measures to influence transport demand. As an example of such a transport demand it proposed measures aiming at “influencing attitudes and behavior towards a more eco-friendly, safe and efficient travel” by reducing individual car use and increased use of transport modes such as public transport, carpooling, walking and bicycling. One way of achieving this would be to have the current traffic situation “communicated rapidly through new information systems” where Trafiken.nu would become one such information system [19]. The project was a joint partnership between the City of Stockholm, Stockholm Public Transport, the Traffic Administration and the Swedish Road Administration and was launched the 10th of January in 2001. The intention was to provide information on traffic disruptions, traffic advisories and travel planning for the Southern part of Sweden and Greater Stockholm. Since there where neither such services, nor webpages that displayed a whole picture of the traffic it would be a service that fulfilled a function that was much needed it was argued. The main target was the commuter and road user and how to cater to their individual information needs. Being a time when the World Wide Web had proved to be an easy to use and flexible format for popularizing information it came as no surprise that the service would take the shape of a web page.
4.1 Providing real-time travel planning Travel planning on the Internet had become an increasingly common feature in Stockholm following the launch of the Stockholm Public Transport authorities web based trip planner in 2000 [Lindström, personal communication]. A report from 2003 issued by the Swedish Bureau for Statistics reported that 29 percent of respondents had used Internet services "in connection with travel or accommodation" [2]. This opened up for a means of influencing transport demand through real-time travel information it was believed. New requirements on the service where placed where data provision, GIS data, real-time information related to walking, bicycling and bicycle routes became necessary to obtain. This was a problem area that started to surface of an institutional character concerning data provision, standardizations, API:s, claims for deregulation, ownership issues, business incentives, and brokering issues, just to name a few of them [Pettersson, personal communication]. Popularizing such an ITS became a high priority for the actors involved who believed the application of IT could make use of the transportation system more efficiently [2]. The popularization fulfilled another goal in promoting a Swedish way of implementing ITS for an international audience [Pettersson, personal communication]. Operating Trafiken.nu was seen as requiring the interaction between different public actors which was an important aspect of the Swedish working model, something that the Government‟s ITS Council was eager to show up at upcoming international congresses for ITS [Pettersson, personal communication]. While the owners were preoccupied with having the web page display as much real-time and multimodal transportation as possible there surfaced another important function that needed attention.
4.2 Demands for a mobile friendly service Following a questionnaire with open answers in 2007 concerning the usability of the service some respondents had questioned the lack of a mobile version of the site. One of them had the following to say, “You must make the web page possible to surf on through the mobile. Mobile-people are the ones using this type of service, not retired people sitting at home” [2]. Mobile ICT use had been on a steady rise and with 2 million new subscribers of mobile broadband alone in 2011 the demand for a mobile friendly service had increased [20]. Since the launch of their own iPhone app there had been four times more travel planning searches made through the mobile version of the web site than the web version, according to an internal communication by Trafiken.nu. Launching their own app in 2011 had proved to be too late since privately developed apps by individuals using their data were already available for public use. This proved that in the app market both customers and companies are at the same footing when it comes to reaching intended customers through providers such as Apple or Google. Making all the data available online had opened up the possibility for individuals to develop their own apps. Since 2007, more than 500 million iOS and Android smartphones and tablets have been connected to the Internet [17]. Considering that many of these smartphones and tablets come with broadband connectivity out-of-the-box it has led to Trafiken.nu finding itself in a similar situation as did the Stockholm Local Radio during the
200

early 1990s with an increased computerization and proliferation of mobile phones in Swedish society.
5. DISCUSSION The study has looked at how different forms of mobile media and their corresponding social practices can be related to how traffic and travel information has been gathered and disseminated in Stockholm since the late 1970s.
The main question has concerned itself with what institutional framework has been needed in order to promote such uses of technology and how much of it implies the use of a certain kind of technology and expertise. This includes looking both at the intentions and the technologies employed by all affected stakeholders under a certain kind of political and societal condition that may have influenced “the rules of the game”. Socio-political events such as the oil crisis of 1973 or an international congress for ITS are both able to question common practices and trigger changes that can lead the development of a service into a different direction.
How prevailing political and ideological conditions shaped the Stockholm Local Radios institutional framework demonstrates the importance political intentions have had on its service provision. Informing on local traffic conditions becomes in this sense the interplay between technologies, consumption practices and different media uses working together with one another in order to deliver a service that can provide for such an option.
I connect these attempts to what Yochai Benkler calls an institutional ecology where „participation‟ is seen as a commons-based approach to managing resources [4]. The role technology and media play for collective action and better decision-making and possibly resource management becomes aspects of importance since it touches upon the possibilities of a technology to both produce and mediate expectations set by a certain institutional ecology (such as an networked information economy) [5].
One such example is the use of a participatory network of CB users which demonstrates the role a form of citizens empowering has had in both shaping and influencing the means of providing real-time and dynamic based information to the public in Stockholm.
The importance of the public becomes yet again apparent when looking at the case of Trafiken.nu. The scrutinizing of the Dennis agreement in 1990 demonstrates how the pressures to succeed with its implementation led to the idea of consolidating data through an ITS. The decision of presenting all these data in the form of a webpage is also telling of the importance another form of ICT had for the service, namely the Internet.
The example demonstrates how much the demand for a level of public participation has changed throughout Trafiken.nu‟s history because of user demands and by the media itself. As such, it becomes part of a networking information economy that has become increasingly defined by levels of participation and the value of networking information [5].
A lesson from the case examples is that in order for a service to achieve its functions it needs to adapt to the current demands from its users. With almost a third of the world population being online through the Internet it comes as no surprise that many ICT based services are increasingly making use of the wireless Internet through mobile ICT:s such as the smartphone. The question
becomes what effect increasingly market driven trends of using apps through „smart‟ devices will have for the promotion of sustainable travel.
We need to keep in mind that there are strong market forces behind much of what is driving the use of app based devices and services that needs to be considered when talking about an ICT for sustainable travel.
What I have stressed throughout this whole exposition is that we need more of a historical and sociological gaze on the role of such uses of ICT. What do these gadgets awaken within people, organizations and stakeholders that may actually lead to a more sustainable travel and what can we learn from previous examples on how a collective view on resource management and problem solving may or may not have been beneficial in order to coordinate and inform travelling towards a more sustainable one.
A close-to-operational-hypothesis that can be drawn from the case examples is that the active encouragement of user participation greatly improves both the reliability and the efficiency of the service by involving a local eye on issues pertaining to an everyday condition such as traffic. What needs to be kept in mind is that the form of involving such a local eye on an operational level needs to take into account the inherent choices that the technologies possess.
Media technology possesses scopic functions that for the better or worse are susceptible to what the owner of the media or the media institution finds economically, politically or otherwise beneficial and hence worth pursuing [9]. This relates to what means are provided for or not in society in the form of rules, services and systems for informing oneself and what role technology has for such information systems. Networking information through a multitude of users in a multitude of localities holds the potential for a more synergetic collective reasoning.
The potential outcome is a service that can better answer to the requirements posed by the complexities of daily travel. This in turn increases the potential for promoting sustainable travel by providing a better ground for decision making while en-route.
6. ACKNOWLEDGMENTS I want to thank Thomas Engström at Amatör & Privatradioföreningen Pristo SKØMG Stockholm, Lars-Åke Gustavsson at the Stockholm Radio Trafikredaktionen and Alf Pettersson at The Department of Transportation and the ITS Council for making me feel at home while interviewing them and introducing me to their co-workers, club members and their particular work places (together with all their gadgets and equipment). I also want to thank my co-workers and supervisors at the Centre for Sustainable Communications and the Division of History of Science, Technology and Environment for long discussions, insights, and encouragement.
7. REFERENCES [1] A Proposal, FET Flagship Proposal FuturICT: 2011.
http://www.futurict.eu/sites/default/files/ElinorOstrom.pdf. [2] Ahlberg, K. 2007. Web based route planning from a user
perspective; Designing a co-modal route planner for Trafiken.nu.
[3] Andersson, P. et al. 2007. Beyond Mobility: Efi Yearbook 2007. Professional Publishing Svc.
201

[4] Benkler, Y. 2005. Sharing Nicely: On Shareable Goods and the Emergence of Sharing as a Modality of Economic Production. Yale Law Journal. 114, (2005), 273–358.
[5] Benkler, Y. 2006. The wealth of networks: how social production transforms markets and freedom. Yale University Press.
[6] Bonsall, P. 2009. Do we know whether personal travel planning really works? Transport Policy. 16, 6 (2009), 306–314.
[7] Casson, H.N. 2007. The History of the Telephone. Echo Library.
[8] Cervero, R. 1998. The Transit Metropolis: A Global Inquiry. Island Press.
[9] Douglas, S.J. 2010. Some Thoughts on the Question “How Do New Things Happen?” Technology and Culture, Johns Hopkins University Press. 51, 2 (2010), pp. 293–304.
[10] Forsman, M. 2010. Lokalradio i Konkurrens 1975 - 2010: Utbud, Publik och Varumärken. Ekerlids Förlag.
[11] Geels, F.W. 2002. Technological transitions as evolutionary reconfiguration processes: a multi-level perspective and a case-study. Research Policy. 31, 8-9 (2002), 1257–1274.
[12] Haring, K. 2007. Ham Radio’s Technical Culture. MIT Press.
[13] Jauert, P. and Ala-Fossi, M. 2006. Nordic Radio in the Digital Era. Radio, TV & Internet in the Nordic Countries: Meeting the Challenges of the New Media Technology. U. Carlsson, ed. Nordicom. 65–87.
[14] LLC, G.B. et al. 2010. Bandplans: Ism Band, Citizens’ Band Radio, Medium Wave, Frequency Assignment Authority, Low-Power Communication Device, Frequency Sharing. General Books LLC.
[15] Loorbach, D. 2007. Transition management: new mode of governance for sustainable development. International Books.
[16] Magazines, H. 1975. Popular Mechanics. Hearst Magazines. [17] Nielsen, C. 2011. State of the Media: Mobile Media Report
Q3 2011. (2011). [18] North, D.C. 1990. Institutions, Institutional Change and
Economic Performance. Cambridge University Press. [19] Official Report 2001. Infrastruktur för ett långsiktigt
hållbart transportsystem. Regeringens proposition 2001/02:20. Swedish Government.
[20] Post- och Telestyrelsen 2012. Svensk Telemarknad 2011. PTS-ER-2012:17, (2012).
[21] Sawyer, S. et al. 2003. Broadband and mobile opportunities: a socio‐ technical perspective. Journal of Information Technology. 18, 2 (2003), 121–136.
[22] Stahre, U. 2004. Den gröna staden : stadsomvandling och stadsmiljörörelse i det nutida Stockholm. Bokförlaget Atlas.
[23] Williams, R. and Edge, D. 1996. The social shaping of technology. Research Policy. 25, 6 (Sep. 1996), 865–899.
202
National Collaboration on Green ICT in the Dutch Higher Education: Lessons Learned
Albert Hankel1
1SURFnet, PO Box 19035, 3501DA, Utrecht, Netherlands
[email protected] ABSTRACT This paper describes the attempts in the Dutch Higher Education to collaborate on a community-basis on the topic of Green ICT. The purpose of this paper is to share our experiences on what works and what does not work when supporting a community focused on Green ICT.
Keywords Green ICT, Communities, Higher Education
1. INTRODUCTION We live in a world that in many ways is nearing its limits for supporting humanity. In general there is no doubt in the scientific community that society needs to deal with these limits, change behavior patterns, in order to become sustainable and transition into a low-carbon society or face the harsh consequences. Currently most of us do not feel the impacts the human activities have on the earth’s system in our daily lives. Yes, there are some weather extremities; yes, droughts in one part of the world can affect food prices in the rest of the world, but these warnings have not led to system wide changes. We still feel that we have a choice between a soft landing or a hard fall going through such a transition. Society as a whole hasn’t chosen yet. The increasing attention for sustainability and the many green activities forming an undercurrent in our society may soon lead to a tipping point setting us on a path towards a soft landing. On the other hand, clinging to our current way of thinking and decision making will at some point in time inevitably lead to overtaxing and exhausting planetary resources. The solutions we will need by then will come at a much higher price for society. Practically, this lack of choice means that for those of us who want to do something right now, activities have to fit both ways of thinking. A simple heuristic, for example, is to make sure you have a solid financial business case for your sustainability project (even though many societal costs are not accounted for). This is the general situation we are in now: yes, sustainability activities are accepted or even promoted, but they must have a normal return on investment, they must be economically efficient.
The impact that ICT has (had) on society is nothing short of revolutionary. The scientific advances in computer technologies and the widespread use of telecommunication have made information exchange virtually free. Being able to exchange information freely and perhaps more importantly, automatically are currently the most important drivers for efficiency gains. It is therefore no surprise that many innovations in products, services,
production, etcetera, have an important ICT component. At the same time these innovations often also bring efficiency gains in terms of sustainability. Shifting products and processes to the digital world leads to a dematerialization effect in the physical world: instead of shipping pieces of paper all around, we can use e-mail; instead of meeting face to face, we can use videoconferencing. Unfortunately, making information practically free also changes the equation: it changes production and consumption; it changes our behavior. Sending an e-mail may tax the environment much less than sending a letter, but it has become so easy for us that we now send many more e-mails than we would have letters. We might have an increase in productivity by doing so, but the sum of sending e-mails may well exceed the sum of sending letters in terms of environmental costs. This is also known as the rebound effect [10]. The impact of the rebound effect is a complex issue and not the central topic here, but it is important to know that this effect exists and that it should be considered in decision-making. In a sense, the rebound effect can only exist because we are unable to express the true (societal) costs of our behavior. When talking about Green ICT we should consider both the abovementioned effects (aside from the environmental effects of ICT itself): the use of ICT as a replacement technology (as an enabler) in general has a positive effect on the environment but the behavioral change that is paired with it may well have a negative effect.
Green ICT is often defined using the words of Murugesan [5]: “It’s the study and practice of designing, manufacturing, using and disposing of computers, servers, and associated subsystems … efficiently and effectively with minimal or no impact on the environment”. While this adequately defines the environmental problem set within the ICT-sector, it leaves out the enabling effects that ICT-solutions can bring to other sectors; it leaves out the efficiency gains mentioned above. In summary, the impacts of ICT could be expressed in different orders of effect [2]:
• ‘First order’ or ‘primary’ effects: effects of the physical existence of ICT (environmental impacts of the production, use, recycling and disposal of ICT hardware).
• ‘Second order’ or ‘secondary’ effects: indirect environmental effects of ICT due to its power to change processes (such as production or transport processes), resulting in a modification (decrease or increase) of their environmental impacts.
• ‘Third order’ or ‘tertiary’ effects: environmental effects of the medium- or long-term adaptation of behavior (e.g. consumption patterns) or economic structures due to the stable availability of ICT and the services it provides.
ICT4S 2013: Proceedings of the First International Conference on Information and Communication Technologies for Sustainability, ETH Zurich, February 14-16, 2013. Edited by Lorenz M. Hilty, Bernard Aebischer, Göran Andersson and Wolfgang Lohmann. DOI: http://dx.doi.org/10.3929/ethz-a-007337628
203

Most consider the global environmental impact of ICT to be around two per cent and growing fast [8]. These two per cent only comprise of the first order effects, the enabling effects are not considered. These effects could be the most powerful, however, and it is not surprising that many organizations advocate a focus on the other 98 per cent [e.g. 12]. The enabling effects of ICT could reduce the global footprint by 10-20 per cent [8, 12]. These studies focus mainly on the positive impact of applying ICT and much less on the negative impacts such as the rebound effect. Hilty et. al. [1] showed through the use of simulations that from a high level perspective the future impact of ICT on the global footprint could be marginal. Not because there were no effects, but because positive and negative effects cancel each other out. Thus, policies stimulating the use of ICT in general will not be as effective as policies focusing on the different kinds of effects, stimulating the positives and inhibiting the negatives [1].
In the Netherlands the ICT infrastructure is well developed. The Netherlands is ranked sixth in the Networked Readiness Index of the World Economic Forum, an index expressing the propensity for countries to exploit the opportunities offered by ICT [11]. Looking specifically at the higher education sector, most of the ICT network infrastructure is serviced by SURFnet, the Dutch National Research and Education Network (NREN – NRENs are specialized and often not-for-profit internet service providers dedicated to supporting the needs of the research and education community in a country [9]). SURFnet is part of the SURF foundation, which is the Dutch higher education and research partnership for network services and ICT. Given any national ICT initiative in the higher education sector, SURF is usually involved. Together with the higher education institutions, SURF started a Green ICT community, the Special Interest Group (SIG) Green ICT, in 2010. It is the activities that surround this community that will be discussed in this paper. First the background and a description of the community is given. Second a number of activities and their effects are described in detail. What follows are some observations and feedback from the community. The effects and feedback are then translated to lessons learned in the next section. We finish this paper discussing the value of the described community.
2. COMMUNITY DESCRIPTION From a general sustainability perspective the Dutch higher education sector agreed in 1999 (and again in 2002 and 2005) to work on energy efficiency, specifically to become 30% more energy efficient in the period 2005 – 2020 [6]. Until recently, there was not much attention for the energy efficiency of ICT and the role that ICT could play as an enabler. In 2010 SURF and AgentschapNL, a Dutch governmental organization focused on implementing innovation and sustainability policies (among others), carried out a so called ICT-scan at nine higher education institutions (table 1). The aim of this ICT-scan was to determine the amount of energy consumed by workstation equipment and datacenters and to make recommendations for how to reduce that consumption. The scan showed that Dutch higher education institutions could on average reduce the ICT energy consumption by 44% by improving the energy efficiency of their ICT. The actions that institutions should take were basically low-hanging fruit: increase temperature in datacenters, earlier write off of datacenter equipment, more efficient use of datacenter space, more efficient workstation equipment and energy management easures on those workstations [7]. The results of this scan were presented during our first symposium in 2010, which was attended
by over 100 people and marked the beginning of the Special Interest Group Groene ICT (hereon abbreviated as SIG).
Table 1 ICT energy consumption of nine Dutch HE-institutions [7].
Energy consumption
Savings possible
Total of 9 institutions 179 GWh
Datacenters (9% of total) 16.1 GWh 25%
ICT equipment in datacenters 7.9 GWh
Workstation equipment (13% of total) 24 GWh 56%
The SIG came to life after members of the Dutch HE-community expressed their interest in the energy efficiency of ICT and to create a platform where staff, students, teachers and researchers alike could share knowledge and experiences. A LinkedIn group was chosen as the central meeting place for announcements, discussions and publications [3]. The group is open to anyone interested but individuals must request membership. In less than two years the group grew to over 330 members. Although the group is predominantly lurking and dependent on outside stimulations from SURF for example, activity is slowly rising with regular discussions, news postings and the creation of workgroups within the community on specific topics.
3. COMMUNITY ACTIVITIES This section highlights a number of (recurrent) community activities to illustrate which activities are strengthening the community and it’s goals and what their effects were. The community also supports other activities such as publicizing white papers and best practices, sharing business cases and supporting a wiki but they are not mentioned here further. The topics that are most discussed in the community are: green datacenters, pc power management, sustainable procurement, e-waste, green cloud computing, green software and sustainable ICT-curricula.
3.1 Measuring the effects of ICT After the ICT-scan in 2010, SURF started the benchmark pilot in 2012. The ICT-scan was based on the OpenDCME model (figure 1), a measurement model on datacenter efficiency [4]. The creators of the OpenDCME model had launched an online tool in which datacenters could keep track of the 16 KPIs by measuring and reporting various variables. The pilot made this tool freely available for the whole higher education community during 2012. The idea was to let all institutions get acquainted with measuring the sustainability of their datacenter through the use of this comprehensive model. Together with four pilot participant meetings we hoped to stimulate sharing of knowledge and best practices as well as get an idea of the national progress that is being made.
While the actual results of the pilot will be known by the end of 2012, some observations can already be made. Nine institutions participated in the pilot out of roughly a hundred institutions. Some institutions also participated in the 2010 ICT-scan; some were newcomers. It is interesting to note the differences between participants. Some took the lessons from 2010 to heart and improved the energy efficiency of their ICT; others are facing the same issues as those found in 2010. Two of the most common reasons for not joining the pilot were (1) that institutions have
204

already done an ICT-scan and (2) that institutions did not have the time to participate. The latter is quite interesting given the current environment in which institutions are looking for savings in every corner and that (the energy efficiency of) ICT is, on average, hardly exploited. One might think that learning about possible ICT savings might be worth the effort. One of the root causes of this paradox is that ICT departments at institutions are hardly responsible for their own energy bill.
� � ' � � � � � + � � ' � % � , � ' � - " , . ( � * � ' � ( ) � � � � � ' � * " � � � !� " 4 ' , " � �. � ' � � � � * � $ � ' ! � % % � ' � � � � 2 � � + � � ' � ! � � � � ' � / � � � � * - " $ , �� % + � ' - % & � , " ' � � ( ) � � � + " + � / � � * . � ' � / � � . � * � � , � * " ' � ' �! � � � � ' � � ( ( * � . ( � * � � � . � * " � ' + � / " % � � ' � / � � ( ( $ � � � , � * �$ - ' ' � ' � & � , � ' � / � % $ � � ) * ( # � � , � ' � ! ( � . � � % � � ' � * " � � . � * �� * - " $ � ' � � � " � � � � . � ' + � ! � � � � ' � / � � ' ( � " � ( & � $ ( + , � ' �� ( ( * � , � � $ - ' ' � ' � � � * � $ � ' � ' � � & � , � ' � & � � � % + � ! � , � � � , � ( & �� - * ( ) � � + � � + - � + " � " � � * � � � ) * ( # � � , � ' � 2 ( � % + � � � � � �
� � � � � � � � � � � � � � � � � + � � ' � $ " # $ , � ' � � * � � � � . ( % � ' � � � � + ) � � , � ' �
+ , * ( ( & . ( ( * 2 " � ' " ' � � $ ( � % " ' � � � � 2 � , , " ' + * � � � �
' � , / � * $ ��
� ' � � & ( ' " , ( * � � . � ' � � � � � � � � " ' � * � + , * - � , - - * ��
� !� " 4 ' , " � � � " # . ( ( * � � � % � � � � � � � + � ! * " # . " ' + � - - * � . � ' �� ) ) � * � , - - * �
� � � � � � � + � � ' � % � . � * � � � ! � , � � � � � � � ' � + � ! � , � � � ' � " ' � ( * & � , " � �( ) � � � " , � * � � � * � " � * � & � � " � � , � � � � * . � ' � � � ' � + � & � ' . � , , " ' �
� � � � � � � � � � � , � � � � � " + � � � ' � � � � + % � � � � � ' � & � , � � � � � � ' � � . � % " ' � ' �. � ' � � � � � � � � + � � ' � � " ' � ' � - / � � + � & � ' / � * $ " ' � & � , � ! � , � � � �� " % " , � " * � � � � * " # � � . � ' � � � � � � � � . � * � ' , / ( ( * � � % " # $ � . ( ( * �$ ( � % " ' � ' � � + , * ( ( & . ( ( * 2 " � ' " ' � � ' 2 ( . ( ( * , � � � ' � � � �� " � ' + , � � � + , ( � � � � ' � � ' . � + , � * " ' � . � * � ' , / ( ( * � � % " # $ �. ( ( * � , ( , + , � ' � $ ( & " ' � . � ' � � � � � � ( - / � ' � � � � � ' $ � & � � �� � % % � � ' � � ( ( * � � � 2 � � � 2 � & � ' % " # $ � � " ' + ) � ' ' " ' � $ ( ' � � ' � / � �� � � � ' � * " � � � + ) � * " ' � * � � % " + � * � ' � � � 0 , * � � - " , � � " ' � / � + �� � , � � � � ) * " ( * " , � " , � ' � . � ' � � � 2 � � � � � � % " ' � ' � - " , � � ' % ( ) � ' � �
� ' $ � % � � , " ) + � . ( ( * � . � * � � , � * " ' � ' � � " � � � " # � ! � , � � � � � . � � % � �� "� � , � � ! � � � ! � � � � ' �
� � � � � � � � �
3 3 ' � � 1 + " � $ � � + � * . � * � $ - ' ' � ' � , " � ' , � % % � ' � . " * , - � % � � + � * . � * + �� * � � " � ' � � / � � * . ( ( * � . * ( � � * � ) � * � + , - $ � � � ' � � 1 + " � $ � � + � * . � * �' ( � " � / � + � � � ( � 2 " # ' � � " # � ! � , � � � � � ' - � ! ( ' � � * � � ' � + � * . � * + �& " ' � � * � ' ( � " �
�� � � � � � � � � � � � � � � � � � � � � � � � � � � � � � � � � � � � � � � � � � � � � � � � � � � � � � � � � � � � � � � � � � � � � � � � � � � � � � � � � �� � � � � � � � � � � � � � � � � � � � � � � � � � � � � � � � � � � � � � � � � � � � � � � � � � � � � � � � � � � � � � � � � � � � � � � � � � � � � � � � � � � � �� � � � � � � � � � � � � � � � � � � � � � � � � � � �
Figure 1 Example of the OpenDCME model [4].
3.2 Funding for Green ICT projects In 2011 as well as in 2012 funding was made available for innovative Green ICT projects at higher education institutions. The purpose was to stimulate those projects that are innovative and which results could be shared with and learned from by other institutions. The main criterion was that the results should somehow have a positive effect on CO2-emissions in the broadest sense (greening of and by ICT) so that we would see a wide range of ideas, conventional and unconventional. On the financial side, projects could earn up to 20.000 euros, which must be matched by the institutions. Projects could apply through a template in which they describe their proposal. After the application date had passed, a jury determined which proposals would be awarded.
Table 2 Overview of topics in the funding arrangement for innovative green ICT projects at institutions.
Year Topic
2011 Sustainable ICT-education
Paper reduction (dematerialization)
Digital mobility in education
Sustainability in e-Science
Visualization of personal energy consumption
2012 Software energy footprints
Sharing green ICT practices
Virtual teaching
Smart data storage
Using gamification for energy consumption awareness
In 2011 as well as in 2012 5 proposals were awarded a sponsorship (table 2). All projects were innovative Green ICT projects in their own sense, but covering a wide range of topics and methods. However, during both rounds not all of the funding was allocated due to a lack of well-written proposals. This surprised us especially after the second round since the funding arrangement should have been more known in the community. The projects themselves have seen a number of spin-offs though, ranging from internal and external follow-up to (scientific) publications.
3.3 Green ICT Gatherings An important function of the community is disseminating knowledge from practitioners of Green ICT in higher education. Several meetings/workshops/seminars on specific topics as well as a yearly general symposium on Green ICT & Sustainability have been organized with various degrees of success. Roughly fifteen gatherings have been held, mostly on specific topics. Those were on average attended by 20-30 people, whereas the yearly symposium has consistently attracted over 100 attendants. The general impression is that many people want to be aware of what is happening but do not have the time or the power to be actively involved. This is also something that was shown in one of the questionnaires we took in the community.
4. COMMUNITY OPINIONS We know from experience that creating and raising a community takes time. Unless there is a true sense of urgency, it takes at least a year for a community to become active and for members to start profiling themselves and making (pro-active) contributions. After about one year and a half we wanted to learn what members themselves thought about the community and where it is going. We asked them a number of questions through a questionnaire (n = 38). In the same period a survey (n = 35) on green ICT was held among higher ICT-managers (directors, CIOs, etcetera) in general. A selection of both sets of questions is mentioned here and reflect well the current mindset in the community and at the higher education institutes in general.
Figure 2 Obstacles for green ICT activities
When asked whether community members find sustainability an important topic, 91% submitted they think it is reasonably to very important. Given the same question on their institution only 59% of the institutions are perceived to rank sustainability as an important topic. This is also reflected in whether community members are working on sustainability: only 14% is paid to work on sustainability, 51% is doing it in between their normal tasks, and another 14% would like to work on sustainability issues. When we asked the managers whether they think Green ICT
205

contributes to a more sustainable institution, 96% thought this would be an important factor. Yet, there is a lack of action, which 46% of the managers recognized. The reasons behind this, they expressed in figure 2. The reasons are similar to those found in the community activities, mainly: no time (24%), no priority (41%) and split budgets between ICT and other departments (21%). We also asked whether community members think SURF should continue to support the SIG to which 85% agreed. However, the community is not very influential with an average rating of 4.2 on a scale of 10 and 22% of the respondents stating that they felt no effect at all yet. The irony is that community members themselves of course need to be active to let the community gain influence. This is also reflected in the next question on activity, to which 91% stated to be a mainly passive member.
Finally, we asked a number of questions on the ICT-scan. 50% of the community members were familiar with the scan and its results of possible savings averaging 44%. Figure 3 displays the response of all the members to what effect these results had on their institution. Only 10% got to work straight away, and 20% said it had no effect at all. The large ‘No idea’ part is largely explained by the other part of the aforementioned 50% (they were not familiar with the results in the first place).
Figure 3 Effects of the results of the ICT-scan on the
institutions
5. LESSONS LEARNED When we look at the SIG ourselves, we see a passive community that is slowly transforming into a more active one. Compared to other communities we support, this SIG has some interesting characteristics. Firstly, it is one of the largest communities we have. Yet, secondly, it remains passive longer than we anticipated. The previous sections illustrated why this might be the case. Figure 2 summarized it nicely in lack of time, no priority and split budgets. ICT departments are often not responsible for their energy bill and thus hardly care about energy savings. Moreover, why should the ICT department make the investments while another department gets the returns? In addition, priorities often lie elsewhere, mainly in keeping everything run smoothly. Tinkering with proven settings, even raising the temperature in the datacenter, meets resistance.
Another interesting discrepancy is the general interest and the belief in the topic of Green ICT compared to actual community behavior. The yearly symposium is well attended, but activities on specific topics less so. The support for the community is there, yet most members can only give attention to Green ICT issues in between their normal tasks.
As facilitators we evaluated our role as well. We concluded that two aspects needed to be changed. First, we originally wanted to let the community and its activities grow organically and thus supported a wide range of topics. While we still think that all these topics have their merits, this gave the community little focus and widened the gap between those that were well versed in the possibilities of green ICT and those that only just started. We decided to focus on those activities that proved to be easy best practices for the environment as well as financially (the low-hanging fruit) until the message reached the right group of people. The second gap we noticed was between staff and higher managers and directors. There is a willingness on the floor to actively engage in green ICT but a lack of time and priority to do so. On the other hand, managers recognize the importance of sustainability and green ICT but lack the sense of priority to act upon it. This is often dependent on the environment in which ICT is embedded: ICT use steadily grows year after year; who pays the energy bill; etcetera. We want to remedy this by organizing meetings at individual institutions inviting stakeholders from all relevant departments and layers of the organization and discuss ways to move forward. In the end, ICT in itself is often seen and must be seen as part of or a function of something else, it is a means to an end.
6. DISCUSSION One of the important values of sustainability is collaboration. This is because sustainability must be seen as a systemic issue, something that must be solved at the systemic level and not individually. Optimizing locally might have reverse effects on the whole system, whereas helping to your neighbor’s problem could solve one of your own. Take for example, the warmth generated by ICT equipment in datacenters. This could be perfectly used to warm residential buildings instead of letting it blow out in the open air. From this perspective, communities such as the one discussed here, help move thinking towards the systemic level.
Yet, this community is not where it could be. The reason for this might be enclosed in the scope, the topic of green ICT. Is it possible that the scope is too narrow? Should it envelop the processes in which the ICT is used as well?
Looking at green ICT in general, there is regularly a call from influential NGOs like the World Wildlife Fund to focus on the enabling powers of ICT. Yes, ICT could be made more energy efficient, but it is much more interesting to focus on solutions for the other 98%; solutions that the ICT sector should deliver. But is it fair to look at the ICT sector and ask for solutions to green other activities?
How can society, how can higher education institutions make full use of the enabling power of ICT and preferably not fall into the trap of the rebound effect? There is a gap between those who know how to make efficiency gains with the use of ICT and those who know all about specific processes and activities and could actually use such ICT solutions but do not know how. It would be interesting to learn more on how to bridge this gap and with that be one step closer to a low-carbon society.
7. REFERENCES [1] Hilty, L.M., Arnfalk, P., Erdmann, L., Goodman, J.,
Lehmann, M. and Wäger, P.A. 2006. The relevance of information and communication technologies for environmental sustainability - A prospective simulation study. Environmental Modelling & Software, 21(11), 1618-1629.
206

[2] Köhler, A., Erdmann, L. 2004. Expected environmental impacts of pervasive computing. Human and ecological Risk Assessment, 10(5), 831-852.
[3] LinkedIn group. Groene ICT. www.linkedin.com/groups?gid=3694062
[4] Mansystems. The OpenDCME Model. http://www.opendcme.org/opendcme-model
[5] Murugesan, S. 2008. Harnessing Green IT: Principles and Practices. IT Pro, (Jan/Feb), 24-33.
[6] Rijksoverheid 2008. VROM, WWI, VSNU en HBO-raad maken afspraken over duurzaamheid in het hoger onderwijs. http://www.rijksoverheid.nl/nieuws/2008/12/03/vrom-wwi-vsnu-en-hbo-raad-maken-afspraken-over-duurzaamheid-in-het-hoger-onderwijs.html
[7] SURFfoundation & AgentschapNL 2010. Survey of sustainable ICT in higher education 2010. http://www.surf.nl/nl/publicaties/Documents/Survey%20of%20sustainable%20ICT%20in%20higher%20education%202010.pdf
[8] The Climate Group 2008. SMART 2020: Enabling the low carbon economy in the information age. http://www.smart2020.org/publications/
[9] Wikipedia 2012. National research and education network. http://en.wikipedia.org/wiki/National_research_and_education_network
[10] Wikipedia 2012. Rebound effect (conservation). http://en.wikipedia.org/wiki/Rebound_effect_%28conservation%29
[11] World Economics Forum 2012. Networked Readiness Index. Global Information Technology Report 2012. http://www3.weforum.org/docs/GITR/2012/GITR_Chapter1.1_2012.pdf
[12] World Wildlife Fund 2008. Outline for the first global IT strategy for CO2 reductions. http://assets.panda.org/downloads/global_strategy_for_the_1st__billion_tonnes_with_ict__by_wwf.pdf
207
Translating Green IT: the case of the Swedish Green IT Audit
Per Fors1, Thomas Taro Lennerfors1,
1 Uppsala University, Department of Engineering Sciences, Division of Industrial Engineering and Management, Ångstrom Lab, Box 534, 751 21 Uppsala University
E-mail [email protected], [email protected]
ABSTRACT
In this paper we use translation theory from organization studies [1] to discuss the Green IT Audit, which is a consultancy model developed in Sweden, following the recent industry shock-wave of Green IT [2]. Translation theory is based on social constructionism [3], which inter alia posits that concepts, such as Green IT, do not have intrinsic meanings, but that meaning is created in social interaction. The theory is therefore part of an interpretive turn in organization studies, where effort is dedicated not to increasing the efficiency or effectiveness of organizations (the main concern of more functionalist studies), but to see how people that constitute them, make sense and interpret their work.
Keywords Green IT, translation, Sweden, GIT Audit, interpretative
1. INTRODUCTION In this paper we use translation theory from organization studies [1] to discuss the Green IT Audit, which is a consultancy model developed in Sweden, following the recent industry shock-wave of Green IT [2]. Translation theory is based on social constructionism [3], which inter alia posits that concepts, such as Green IT, do not have intrinsic meanings, but that meaning is created in social interaction. The theory is therefore part of an interpretive turn in organization studies, where effort is dedicated not to increasing the efficiency or effectiveness of organizations (the main concern of more functionalist studies), but to see how people that constitute them, make sense and interpret their work. The purpose of the paper is twofold: 1) to argue that even though Green IT, Sustainable ICT or similar concepts are technologically oriented, and that technology is certainly a main component for advancing greener solutions, theories from other fields (such as organization studies) might also be of use for understanding Green IT. We will argue that translation theory is a fruitful theory. 2) to give insights into some aspects of how Green IT has been translated into the Swedish context, thereby contributing to the understanding of the local actions and reactions to a global trend.
2. EXPLORING DIFFERENT PARADIGMS IN GREEN IT RESEARCH: FOCUSING ON THE INTERPRETATIVE TURN In organization theory it is quite common to distinguish between different paradigms of research. Burrell and Morgan's [4] influential application of Thomas Kuhn's context to the
organizational domain, suggest that management and organization studies can and ought to be divided into four incommensurable paradigms: the functional, the interpretative, the radical humanist, and the radical structuralist. These four paradigms are derived from two axis where one axis is a whether the study is subjectivistic and objectivistic, and the second whether the study is regulating or radical. An objectivistic perspective means that there is an external angel from which the organization can be studied, and organization which consists of real and concrete processes and structures. The subjectivistic perspective means that an organization is a subjectively constructed phenomenon, a label that people use to create meaning and make sense of their lives. The regulating perspective means that the purpose of research is to describe what happens in the organization, and possibly suggest smaller changes, rather than critiquing it, or radically changing it. The radical perspective goes beyond regulation and suggests that research should be normative to what happens in organizations. The four perspectives are thus: Functional (objective/regulation), Interpretative (subjective/regulation), Radical Humanist (Subjective/radical), Radical structuralist (objective/radical).
This corresponds quite well to other characterizations of different forms of research in organization studies. In their study on entrepreneurship, Jones and Spicer describe that there are three streams of research in organization studies: the functional, the interpretative and the critical [5]. The functional is concerned with improving performance and to make things work in a better way, the interpretative is more concerned with sense-making and how different actors perceive organizational reality, positing that such interpretation is crucial for understanding organizational behaviour, and the critical is concerned with emancipation, particularly throwing light on practices of power and domination in organizations [5]. On could say that what Jones and Spicer call "critical" is the radical humanist and radical structuralist paradigms.
We hold that most work in Green IT could be seen as belonging to a functional paradigm in its efforts both to improve the efficiency and reduce environmental impact of ICT, and in its efforts to use ICT to reduce environmental impact and increase efficiency in other parts of society (the remaining 98%). While we have seen studies that draw on insights from organization theory, for example Molla who draws on institutional theory to emphasise that there is a need to pay attention to institutional context (culture, established practices, attitudes) for understanding the possibilities of implementing Green IT, still the focus is to understand how these institutional structures can be overcome and Green IT can be made to work in a better way [6]. Certainly, we concur with these efforts to create a more sustainable society, but
ICT4S 2013: Proceedings of the First International Conference on Information and Communication Technologies for Sustainability, ETH Zurich, February 14-16, 2013. Edited by Lorenz M. Hilty, Bernard Aebischer, Göran Andersson and Wolfgang Lohmann. DOI: http://dx.doi.org/10.3929/ethz-a-007337628
208

in this paper we point out the possibilities of conducting interpretative and critical studies on Green IT. The reason is not just to show that there are more potential streams of research regarding Green IT. By taking an interpretative approach in the study of Green IT, we hope to bridge the divide between technical research and organizational research, since competence about both are necessary for propagating Green IT (for other similar approaches see [7]). We will not pursue critical approaches in this paper, but we will do that elsewhere. Rather, we want to see what interpretative approaches can offer.
3. SENSE-MAKING AND TRANSLATION In this paper, we particularly draw on one interpretative theory from organization studies, namely translation theory, as described by Czarniawska-Joerges and Sevón [1], but to some extent also on sense-making and sense-giving literature [8,9]. While sense-making is focused on how actors make sense, individually and organizationally, of different things, for example organizational change efforts, sense-giving is focusing on the way (some) actors can have agency and add or change the meaning of similar efforts. Stemming more from an actor-network theory perspective [10], translation theory brings up the point that ideas (such as Green IT) are not automatically diffused throughout the world, but their very meaning and the success of their spread is dependent on the way different actors "translate" (e.g. modify, pass on, energize, ridiculize) these ideas. Czarniawska and Sevón find the concept of translation useful since it both captures the aspect of movement and that of transformation [1, p. 6).
3.1 Sense-making The theory of sense-making has been used to explain different phenomenons since the seventies. The approach briefly means that actors involved in a certain until now unknown situation cannot proceed without making “sense” of this new situation [11]. According to Dunbar [12] and Goleman [13], the sense-making can be seen as a stimuli placed in a certain framework. The stimuli is the uncertainty that starts the sense-making process while the framework is both the current situation and experiences that the actors can connect with this situation. This means that all involved actors will make different sense of a certain situation from their different backgrounds and previous experiences. This stimuli lets the involved actors understand, explain and draw conclusions out of a situation. Three important elements in the process are sometimes described as the situation, the gap and the use. The situation is the events in an involved person's life that can be connected to what is currently happening, the gap is the lack of sense in this current situation and the use – the stimuli – is the bridge that will take you over the gap [11].
The making of sense has four different levels, where the first – and the most simple one – is individual sense-making, also known as intrasubjective sense-making [14,15]. The intrasubjective sense-making can be seen as the base point of sense-making, but in most social situations this can only describe a small part of what is happening. The second level is intersubjective sense-making, where sense is not made within the actors but instead between and among them [14] which creates a “giving, a taking and the feeling of connectedness” [16, p. 319]. In the case of Green IT Audit, the most interesting situations studied took place when the sense-making was collective, in a group of about ten people with different backgrounds, knowledge and values. This makes the sense-making much more complex. The next three
levels are different forms of sense-making. The following two levels are the generic subjective and the extra subjective sense-making. The first level leaves out the subjects, the concrete human beings, and the sense is being made continuously within the group. This meaning is not constant, but shifting when new uncertainties or gaps are being introduced. This form of sense-making may take the form of policies or standards which are rather concrete, while the extra subjective sense-making often results in the building of organizational culture or other more abstract matters. Another important aspect of sense in the context of Green IT Audit is sense-giving [9]. The sense-giving is a process where one or more people are intentionally influencing the sense-making process for a group of people. While the sense-making process in some way seems quite adaptive - a person, a group, or a larger collective responds to some stimuli and tries to make sense of it, the sense-giving perspective introduces more agency and points out that the stimuli comes from somewhere. Sense-making and sense-giving therefore ought to be seen as complementary processes where sense-making is more reactive than sense-giving which is more active and where agency can be perceived.
In the case of Green IT Audit, this happens mainly between the auditor and the audit group which makes the auditor one of the most important actors in the sense-making (and translation) process. The sense-giving is possible in this case because the auditor already has made sense out of the situation because she or he has performed the audit before. Even so, there is still a dialectic relationship between the sense-giving auditor and the sense-taking and sense-making group, the auditor will also be affected of the sense-making process in the audit group and therefore continue her or his own sense-making process which will affect the way the auditor understands the model.
3.2 Translation Besides the theories of sense-making and sense-giving, we've chosen to extend the theoretical framework to the Scandinavian neo-institutional way of discussing "translation". Translation, which derives from the actor-network theory, is a way to understand how ideas travel and change during this travel. The translation process is closely connected to that of sense-making, but has a more comprehensive focus, while the sense-making process is more focused on the actors and not so much on the whole process. While the conceptual apparatus of sense-making is useful when certain events of the Green IT Audit are studied, the translation theory can be used to study the whole chain of events from the birth of the idea Green IT to the implementation and institutionalization of certain Green IT related activities within an organization. The traveling of ideas, or the idea model [1], explains how an idea is born, how sense of the idea is being made, how the idea is transformed into certain objects that can move from one place to another, and finally how the idea may cause certain related activities to be institutionalized within organizations. This means that the whole process of the birth of Green IT Audit can be explained with the idea model. This can be seen as an alternative to the maybe more conventional way to view idea-spreading, the theory of diffusion [17]. This process argues that an idea will travel as long as no obstacles for the diffusion exists. This means
209

that the spreading of an idea will slow down or stop when there are for example cultural or social tensions. The spreading of ideas using the translation perspective instead argues that the idea will spread as long as someone is willing to work for the sake of the idea [18]. The main argument to not use the diffusion theory in this paper is that the diffusion theory does not focus as much on the transformation of an idea to something new or to a cluster of new ideas and objects which is the case in the translation of Green IT.
The fundamentals of the translation which is a part of the idea model is that all events that occur is created by both humans and so-called nonhumans. Nonhumans are physical objects that as well as humans that humans can interact with within a network and between networks. When something new and thus far unknown enters a network of actors, the translation process begins. These “new things” are often called tokens and can be everything from new ideas to ideas that are on the verge of taking form as an object of some kind. How an idea initially arose in local time and space and how the concerned actors within an organization first caught wind of the idea is usually unknown and in this case, maybe not that important. What matters is that the idea somehow landed and that someone with a connection to the network thought that the idea was important or useful. When the idea somehow is introduced to the concerned network, the actors in this network is trying to relate to this new token by connecting with each other and their own context – background, values and so on [1]. The output of this process differs depending on the relationship between the token and the actor, and the relationship between the actors in the network. Some networks might make something useful out of the idea, while other cannot relate to the idea and will let it pass which in turn will slow down the spreading of the idea [18]. The useful things that might come out of the translation process will vary depending on the context. In the case of Green IT Audit and also of SIS TK550, these models are mainly focused on managerial issues. Other Green IT initiatives that has come out of other translation might be more focused on environmental or technical issues.
If a translation process begins and the idea doesn't pass, it will be translated into a quasi-object, and then into an object. The main concepts in the translation approach are: idea, quasi-object, object, activities, and institution. Quasi objects are objects that have not taken physical form, such as symbolic objects, metaphors, labels, and platitudes. Objects are more concrete - they can be prototypes or different types of documents such as guidelines or standards. These objects are quite decontextualised and need to be contextualised every time they will be used - for example the ISO 14001. These objects are then translated into activities which are institutionalised. Ideas do not become institutionalised automatically, but the work of people is crucial in the translation process. The implication of this theoretical framework is to explore "the travelling of ideas," in the case of Green IT in the Swedish context.
4. METHODOLOGY The empirical study is based mainly on two methods: interviews and participant observation.
13 interviews were conducted from August 2011 to March 2012, spanning from 40 minutes to 3.5 hours. The interview questions
are attached as appendices to the paper. There are three main groups that are related to the implementation of GIT Audit. The first is owners and developers. This group includes the organizations that first embraced the concept of Green IT in this case and developed it into GITaudit and GITindex. This includes both IT- & Telekomföretagen that acknowledged and ordered the model, and Exido who created it. The next step was the sale of these two models to TCO Development, which today are the owners of these two models. TCO Development thus belongs to the group owners and developers. The next group refers to the partner organizations. Among these are the organizations that have a contract with TCO Development to perform the the model. We have chosen to anonymize the partner organizations for ethical reasons, we prefer not to mention these by name because they are basically in direct competition. These are mainly ICT and management consulting companies that often perform other missions than just GIT Audit. The third group we have chosen to call customers and includes the companies and agencies that have commissioned the model to improve their work with Green IT. We have chosen to anonymize these as well, partly because this was requested from the partner organizations that we worked with and partly because the only thing that is relevant to know about them is that they are governmental agencies. The questions directed towards the partner organizations of the model had a clear actor focus. They were mainly divided into three sections where the first section regarded the auditor him or herself and their relationship to the model and to GIT Audit. The second section had the focus of the partner organization where the auditor worked, and this organization’s relationship to mainly the model and GIT Audit, but also to the end customer. The last section focused on the auditor’s view of the relationship between the customer and the model. These questions where important when we discovered the sense-making process about the end customer, where the auditor’s prejudices about the customer affected the performance of the GIT Audit. The questions aimed at the customers mainly revolved around their organization’s relationship to green IT, and their views on the execution of the model. They also concern the perceived institutionalization potential of the activities developed by the auditor. To give some feedback to TCO Development and the partner organizations, we also asked what they though of the model and what they thought could be done better. We also interviewed the owners and developers of the model. We started doing interviews with the people who we thought were the leading actors concerning green IT in Sweden. The questions asked here were very different depending on which role they played in the translation process of green IT. The questions asked here revolves mainly around their relation to Green IT and their background so we could connect the different actors context with the translation process of Green IT. The selection of the interviews in this study has been chosen with the help of the method ”snowball selection”. This means that the first few interviews led to the next set of interviews by asking the interviewee if s/he knew any other persons that might be of interest to us. This approach led us from just being interested in Green IT to study the concept of the Green IT Audit.
Besides the empirical data gathered by interviews, we have also participated in important events where we were able to extract observational data. This kind of data is quite hard to analyze, because it is more or less based on our interpretations of the situation. It may be a matter of how we percieved the
210

“atmosphere” in different situations, which informal hierarchies that appeared within the groups or how participants expressed their opinions. This kind of data is important because it is only extractable when an event of great interest actually happened and not as easy to gather afterwards when the person interviewed reflect upon the situation. The data was extracted mainly when we participated in the execution of the Green IT Audit and when we socialized with persons somehow involved with the model. In the much cited scheme by Gold [19] one can divide the level of participation in the organization by the observer in 4 different groups. The highest level of participation is when the observer is a full member of the group and when one cannot distinguish the observer from another member of the group and the lowest level is when you are only observing and not participating. The latter was mainly used in this study, however, some elements of participaton can be found when asking questions and participating in different conversations in connection with the execution of the Green IT Audit.
Apart from the formal interviews and the observations, the authors are involved in Swedish standardization work of Green IT, where many of the interviewed actors are involved. We have therefore been able to follow up on questions and also had informal conversations about the Green IT Audit and to some extent therefore been able to take a processual approach. We have also complemented the main research methods with the study of webpages and other publicly available material related to the Green IT Audit.
5. TRANSLATION OF GREEN IT INTO SWEDEN - THE CASE OF GREEN IT AUDIT The GIT Audit is a consulting model used and carried out by a number of management and IT consultants. It was created by the Swedish information technology intelligence company Exido in 2008. Exido, like Gartner, is constantly following the trends of information technology and as a response to the Gartner Institute's report "Green IT: The New Industry Shockwave" [2], Green IT found its way into Sweden. Certainly, other activities linking information technology and the environment, such as the TCO labelling of monitors, had been ongoing in Sweden, at least since the 1990's [20]. Exido was not primarily interested in the environment, but rather in the trends in information technologies. Exido had been conducting questionnaire studies (IT-barometern, originally created by the company Universum) and added questions in 2008 related to Green IT. The answers to these questions formed the basis of the Green IT index, which received financial support by IT- & Telekomföretagen - a member organization for companies within the ICT and telecom sector. According to the person most involved with GIT Audit, Nick, after Exido developed the index, people asked for tools to analyse their own organization - whereby the Green-o-meter was developed and published on the website anvandgronit.se, and after that people asked how their organizations can be better, whereby the GIT Audit was developed. The CEO of Exido, Jim, became more interested in energy saving solutions and in 2010 Exido sold off GIT Audit and GIT Index to TCO Development, which had worked with labelling of ICT equipment since the 1990's.
Apart from GIT Audit, environmental certifications like ISO 14001 is available for the service sector, but these standards are
primarily designed for companies within the industrial sector since the companies there has long been considered major environmental villains in terms of both greenhouse gases and toxic chemicals. These emissions also occurs in the service sector, but they often take place indirectly rather than directly, which is not the case in most manufacturing industries. Emissions of greenhouse gases occur when the energy is used rather than being generated directly as in many manufacturing industries, such as the paper or the chemical industry. This makes it more difficult to measure the environmental impact of the service sector. Nick, who is more interested in organizational improvement than ICT or environment, also wanted to suggest that the framework of GIT Audit become an environmental management standard for the service industry. This standardization work is currently ongoing at the Swedish Standards Institute (SIS) under the label SIS TK 550. Nick has now stepped down from his work with the GIT Audit, and his successor is Robin, who has a background at TCO Development. Robin is also leading the standardization work at SIS. At present, the GIT Audit is not as successful economically (in relation to budgeted income) and there seems to be a need for reforming the Audit. The current work concerns reforming the GIT Audit. GIT Audit works according to a partnership model. This means that consulting companies, mainly focused on management and ICT issues can perform GIT Audit on their customers and give some of the profit to TCO Development. The analysis of the data extracted from the audit takes place at TCO Development. When you are becoming a GIT Audit partner, you usually get training once a year plus an audit on your own company so you can compare your own result to the audits you perform on your customers. The reason why companies and agencies chose to perform GITaudit on their organization differs. For governmental agencies, the main reason to buy this service is to meet requirements from the government, while companies often choose to do this to get a more “green image”, save energy and money or to be able to show investors, suppliers and customers that they are working with sustainability issues. What they all have in common is that all these organizations want to know where they can save most money and energy with the least amount of economical effort.
5.1 Analyzing the GIT Audit translation process The translation process begins with an idea, and in order that for the idea to travel further, it is important that this idea is packaged in a way that allows the recipients of the idea to understand and make sense of the idea [1,8] as mentioned in the theory section. The principles of Green IT was born mainly because of a societal discourse, which due to timing is closely linked to the climate changes we face, popularized by Al Gore in An Inconvenient Truth. In summary, one could say that the trend climate change gave the origin of the idea of a sustainable approach to ICT. This idea has been packaged - or objectified to use Czarniawska and Joerges terminology - as Green IT. When this objectification has occurred, the packaged idea is ready to travel. We argue that Green IT in this case can be seen as a quasi-object, and that the specific objects that actually got a sustainable approach to ICT to travel are different reports and articles about the phenomenon and consultant models like the GIT Audit for example. The translation that have occurred initially is when this idea landed at the
211

organizations in Sweden that has chosen to develop the idea into a consulting model. Exido's previous experience with making indices, led to the creation of a Green IT index, and Nick's interest in organizational development led to conceiving of the Green IT Audit not as an issue mainly concerning information technology. When the Green IT Audit triggered standardization work and also was sold to TCO Development, new actors became involved with developing Green IT - actors with different backgrounds and interests. Since Robin is working both with the standardization work and the GIT Audit, one might expect a more rigorous and environmentally based approach to the GIT Audit in the future. When it comes to the very implementation of the model, the different actors played an important role for the institutionalisation of the activities created by the execution of the model. The implementation of every GIT Audit is different depending on the partners, their made sense of Green IT, and their understanding of the customer. The actors involved in this particular model have different views on the subject (Green IT) and different expectations of the outcome of the model. This may, in connection with how the partner chooses to present the model and the perspective he or she has on Green IT, imply that the model in some organizations is received with open arms and with great commitment, while in others it is forgotten relatively quickly. In interviews with partners, we have realized that most of them are not interested in Green IT, nor see the model as being marketable. Critically, one might suggest that it seems more important to have a sustainable product (GIT Audit) in the portfolio of ICT consultancy services, than to actively promote it. When doing the audits, partners seem to act as if the GIT Audit is a more or less rigorous framework, even though it is conceived by Nick as a way to provide a "not really scientific" background for a discussion about Green IT and organizational development. Time pressure - or the will to finish the audit on time - might also hamper sense-making about Green IT in the customer organization. The partner's views on the customer also have impact on the translation process. We studied the implementation of GIT Audit in two public sector organizations, and one of the partners expressed clear objection to the true motives of the public sector organization - that they had no interest in the environment whatsoever, which influenced the commitment of the partner in the very audit.
5.2 Analyzing the actors
This chapter will be an analysis of the model, focusing on the different organizations and actors involved. The different organizations have been split into three different groups that will be presented in three sections. The analysis will focus on the different actors' relation to the model GITaudit and to each other. For the owners and developers of the model, the focus is on how the model was created and why it was created. For the partner organizations, it is about their motivation to perform the model and for the customers, it's simply about reasons for ordering this consultant service.
Given the sense-making and translation theory that we use in this paper, different actors identify the concept of Green IT differently (see also [6]). These interpretations depend on what the translator of the concept is interested in and works with. Green IT for an organizational theorist or management consultant is not the same as for an ICT technician. It is also clear that the concept is
constantly becomes wider and wider. If you draw parallels to the model GIT Audit, the number of questions and the areas which these questions concern constantly grows. Green IT has moved from being solely a technology issue to interest an ever larger group of people. Basically, why interpretations of the term exists is mainly because many people choose which parts of the concept that they are personally interested in. This is a very good example of sense-making. Based on your own context, you create a picture of what the concept of Green IT is.
Three main aspects of the concept has been identified. These are the environmental aspect, the managerial or organizational aspect and the technical aspect. The environmental aspect is often focused on the issue that ICT equipment is an environmental villain even if there is some potential in using ICT as clean tech. Many with a personal interest in environmental issues usually choose this viewpoint. The most important reason for being interested in Green IT is the will to decrease greenhouse gases and toxic waste, and not to save money or to make the organization more efficient. The environmental aspect may be the least common aspect, though the environmental movement can be seen as the initiative that brought the concept of Green IT up on the agenda. The technical aspect of Green IT often focuses on the specific technical solutions that Green IT often uses. People focusing on this aspect argues that IT can be used as green tech and rarely mentions the problem that IT can also be an environmental villain. This is often justified by the argument that IT accounts for only 2-4% of the total carbon dioxide emissions in the world, while it can be used to reduce the remaining 96-98% with the help of smart IT solutions [6]. According to a report by KTH released in 2010, the actual potential to reduce those 96-98% is by about 10-15 percentage points [21].
The organizational or managerial aspect is basically about considering that technology can be used a tool, but the most important thing is that you are managing it by using processes and standardized approaches. Nick, one of the creators of the model GIT Audit, claims that he has shaped model after models like lean and agile project management that basically is about organizational development. They often talk about how organizations can be made more efficient by using Green IT, and that this in turn leads to environmental benefits. Efficiency and environmental issues can often go together according to many; if you work effectively with your processes, you can reduce the use of both material and electricity.
Simplified, one say that those who has the more environmentally oriented view of Green IT has identified the problems, the more technology oriented came up with solutions and the group of people involved in managerial and organizational issues has the responsibility to coordinate these technologies with the rest of the organization in order for something to happen. All aspects are important but in different stage of the implementation process. The organizational perspective as a coordinating perspective, while the technological and the environmental perspectives are used as tools and incentives for change.
5.2.1 The owner and developer
We have previously argued that GITaudit can be seen as a response to the 2007 hype surrounding Green IT. When Gartner
212

Institutes released the 2007 report Green IT: The New Industry Shock Wave [2], this opened the eyes of many actors and organizations in the service sector, in particular those active in IT-intensive areas. It was then primarily because nobody wanted to be that was the last organization to be working with this hot topic, because there was a risk that this would undermine the organization's reputation. The developers of GITaudit realized this too, and also realized that these organizations would need some sort of guidance when it came to the implementation of Green IT.
The translation process begins with an idea and for that idea to be able to travel, it is important that this idea is packaged in a way that allows the recipients of the idea to understand and make sense of the idea. The principles of Green IT was born mainly because of a societal discourse. The translation that occurred initially when focusing on the case of GIT Audit is when this idea landed within the organizations in Sweden that have chosen to develop the idea into a consulting model. These organizations are what we call the owners and developer of the model. More related initiatives have also been born in the same way, but has taken different forms depending on the context in which this initiative has been created. One example would be that GIT Index that was created at Exido, which is a analysis and consulting company, involves analysis of quantitative data. Why TCO Development started taking an interest in Green IT is primarily because they have a history of environmental certifications and environmental improvement work related to ICT. As early as 1992, the first certification for computer monitors was designed by TCO Development [20].
The driving force for the development of the model for these actors were initially to be able to offer a complete model that can help organizations to implement Green IT. However, it has proved that this is not the whole truth. In the current situation TCO Development primarily offers the model to consulting companies to use it in order to be able to do business with new customers. Since the model fits well into many, primarily IT consultants', portfolios it can be used as a "door opener" to sell other ICT related solutions to a customer that has decided to order a GIT Audit. This is something that TCO Development is using as a USP for the model. This could potentially be a threat to the model; if the partner organizations only use it to sell in other solutions and customer sees this through, it contributes to distrust from the customer. This in turn may cause the activities that are set up during the prioritization workshop not being taken seriously by the customer.
5.2.2 The partner organizations Something that is clear when talking about GIT Audit with representatives from various partner organizations is that there are few who believe that the environmental aspect of the model is particularly important. There are of course exceptions here; auditors with a personal interest in environmental and sustainability issues, gladly presses on the environmental aspects of GIT Audit. However, it is very common to see GIT Audit as a tool to reduce costs and increase efficiency. Most people who are working with performing GIT Audits are, as mentioned earlier, ICT and management consultants who has the technical or organizational perspective of Green IT, which means that the environmental perspective is somewhat lost in the execution of the model. If this is problematic for the model itself is hard to say, since it entirely depends on the background of the participants of
the GIT Audit group within the customer's organization and what this organization is working with. If the group is focused on ICT which is often the case, you may want to direct the focus towards the purely technical solutions because it is easier for these people to relate to these questions. This can facilitate the translation process. The question is whether this means that the model simply miss the point. On the one hand, one can see that the environmental perspective of GIT Audit neglected, on the other hand, one can see that many of these solutions are ultimately leading to environmental improvements, although this is not the top priority. This question is interesting, but unfortunately nothing we could find out within the frame of this study.
5.2.3 The customers Mainly, the customers that the partner organizations are currently working with are governmental agencies, often one of the 18 pilot authorities that participate in the Green IT project announced by the government. They chose this model mainly because it is the easiest and most cost effective way to fulfill the goals of the pilot project. There are individuals within those organizations that believe that GIT Audit is inadequate and that GIT Audit is somewhat a "shortcut". It has come up in the interviews with the participants from the end customer that on one hand, thinks that the model is fairly good, and on the other hand that they would like the model to give them more. For example, some consider that the action plan that is the model's main output is not good enough and that "it is clear that ... [the partner organization's] packaging of the concept is not quite finished." Speaking of the action plan, the same actor within one of the pilot agencies considers that "we will have to make a relatively great deal of work with it too before it's done." TCO Development however, believe that they deliver a finished action plan. Some suggestions regarding the action plan will be presented later in this paper. Something that is often requested from the customer is the ability to somehow be able to certify against GITaudit or against any equivalent model. This possibility does not exist today but there are signs that something like that is under way. SIS TK 550 is an initiative that aims to help organizations to work more standardized with Green IT. As things stand today, this standard will not be certifiable. However, this initiative is a step in that direction. Many people are thus critical to this standard because it is based on ISO 14001 that many organizations already are certified against. The skeptics think that it is redundant with another standard that is not even certifiable, while those who are in favor of the proposal believe it will help organizations with a more standardized way of working with Green IT. The future is in many ways uncertain, but the working group discussions at SIS TK 550 suggest that Green IT issues will be featured in future certifiable standards. The work on SIS TK 550 has always been based on many of the interview questions included in GIT Audit. However, there are now signs that the formulations and methods that may seem too similar to those in GIT Audit are being taken away from the standard. This can be due to many things, such as they do not want to be associated with a specific consultant model, because they want the standard to be generic and independent. The work on the standard, however, could benefit TCO Development as the owner of GIT Audit if it was more suited for their model, because organizations that wanted to use the standard could then use the GIT Audit as a very well suited tool for this standard.
213

One, from the customer's point of view, very important driving force to start using Green IT is the increasing consumer pressure. This is particularly important for companies active in the consumer market. A representative of IBM explains: "People are making active choices. There is a survey that Veckans Affärer performed on how companies experienced the increased consumer pressure. And the result is very clear. You have to be innovative, you must find new ways to relate to market, especially those who work in the consumer market. If you get a reputation that you are an environmental villain, or just that you do not think about the environment as much, then the sales will drop a lot. And the rumors spread fast ... " This requires basically that as a company in the consumer market you need to communicate your environmental work externally. That GIT Audit is not certifiable is problematic here, because a completed GIT Audit does not really need to say anything about the company's environmental efforts. This is because there is no inspection of the customers' responds to the questions from the interview seminar of GIT Audit. A GIT Audit simply does not weigh heavy enough for it to benefit the company's marketing, which may be one reason why it is mainly used in government agencies and in municipalities.
However, the increased consumer pressure is a fantastic development that will provide great opportunities to several environmental initiatives for companies in the service sector of the consumer market. The most important thing here is that the environmental work must be communicated externally, an aspect that GIT Audit has not solved fully yet. Potentially, this can be improved by the initiative SIS TK 550, however this is too early to say.
6. SUMMARY AND SUGGESTIONS FOR FUTURE RESEARCH In this paper we have argued that it is important to discuss Green IT, Sustainable ICT or related concepts, also from non-technological perspectives. In this paper, we used theories from an interpretative paradigm of organization studies and hopefully we have shown that Green IT is much more than implementation of technology. In earlier research we have done a similar study about the translation of Green IT into Japan [22]. While we, in this paper, have used the interpretative paradigm in organization studies, we also invite studies inspired by the critical paradigm, as well as studies drawing on the wide range of theoretical resources from philosophy, science and technology studies (STS), and so on. We believe that a broad take on Green IT will not only lead to an increased understanding of it, but hopefully also trigger interest from more parts of society.
We have also given insights from the Swedish context - however, our focus on the (quite problematic) GIT Audit might suggest that this is the most important activity taking place in Sweden in relation to Green IT, which it is not. There are certainly other activities such as the SIS standard, the GIT index, entrepreneurial firms working within the context of energy-saving technologies, that are worth studying in other papers. Many of these other Green IT initiatives can certainly also be analysed through a translation perspective. What is important to note and probably the main point about this paper is that even though the same concept (that of Green IT) is the foundation of the initiative, the translation
process allows the actors to form the concept after their own preferences [18]. In the context of the Green IT Audit, it is essential for the auditor to activate and interest the audit group in order for the group to find the model interesting. This may help removing the obstacles that prevents the translation of the model and thus help the institutionalization of the Green IT activities (ibid.)
7. SUGGESTIONS TO PRACTITIONERS This section of the paper will take a more functionalistic perspective of the Green IT Audit. Some concrete suggestions will be presented. These suggestions have been formulated through the analysis when the theoretical framework was applied on the empirical data.
7.1 The importance of the auditors as translators We have discovered a great deal of mistrust from the auditors, mainly because many of them do not believe in the model. This may depend on many things, but the most distinct reason is that they are mainly interested in other things than Green IT. They are often using the model as a door opener which will help them to sell other things than the Green IT Audit to the customer. If the auditor has decided that she or he thinks that the customer is not interested in the model, this will show in her or his performance during the audit which will ultimately result in an inferior result. What is also important is the auditors attitude towards the customer’s organization. If they think the audit group is not particularly interested in Green IT or the model itself, this will also result in a poorer result. We argue that the way to solve both these problems is to limit the number of auditors to only a few auditors (this can be done due to the low interest in the model) which are interested in both the environmental and the technical issues of Green IT. During the work with this paper, we helped TCO Development to choose a couple of auditors that we considered appropriate for this job.
It is clear that it is not very easy for an auditor from a partner organization to create an action plan for the customer in just a few sessions and possibly some phone and mail contact. As we have previously argued for, the action plan will be an important part of the translation process internally for the end customer and will ultimately help the organization to institutionalize the activities determined in the plan. We believe that more time should be given to compile this plan in a good way. An alternative would have been if the persons responsible within the customer's organization and the auditor from the partner organization together had another meeting to ensure that the action plan becomes so detailed that the activities can be implemented in the customers' existing action plans. This is because the auditor representing the partner organization has expertise in the Green IT area while the persons responsible within the customer's organization has insight into their own organization's activities. Instead, this work is put on the responsible actor at the customer's organization that then might miss important points because of the lack of experience in the Green IT area, which can lead to wrong prioritizing when the action plan is designed.
7.2 TCO Development and their role
It seems that the interest in the model is relatively weak. We have heard this from several sources, however, the reason for this is
214

uncertain. Some believe that there is no interest of this tool, while others believe the model will grow larger and that the interest will increase over time. Why we believe that TCO Development should take a more active role in the performing of the model is because the model today addresses different areas depending on the partner organization performing the model. This will cause uncertainties among the customers concerning what the model really is about. Is it a tool for energy saving, money saving, efficiency increase or an environmental management system, or all of these? The focus is somewhat diffuse and we argue that the focus of the model must be better defined. TCO Development should figure out what they really want the model to achieve for the customers, and normalize the execution of GIT Audit to fit that. Today, GIT Audit is defined through a complex series of translation processes and re-interpretation of the original model and the model would thrive on a shortening of this interpretation chain. At the moment this is not feasible because the number of employees involved in work at TCO Development is low. As we argued earlier, it is up to TCO Development to select a few auditors that they tie a much closer bond with and only work with those partner organizations. This will help with the defining of the model, because closer ties mean that the partner organization and TCO Development will create mutual sense around the model’s goals and execution.
8. REFERENCES [1] Czarniawska-Joerges, B. och Sevón, G. (1996). Translating
organizational change. Berlin; New York: Walter de Gruyter. [2] Mingay, S. (2007). Green IT: The New Industry Shock
Wave, Gartner.
[3] Berger, P. L. and Luckmann, T. (1966) The Social Construction of Reality: A Treatise in the Sociology of Knowledge. London: Penguin.
[4] Burrell, G. and Morgan, G. (1979), Sociological Paradigms and Organizational Analysis, Heinemann, London.
[5] Jones, C. & Spicer, A. (2009). Unmasking the Entrepreneur, Edward Elgar.
[6] Molla, A. (2009). Organizational Motivations for Green IT: Exploring Green IT Matrix and Motivation Models, PACIS 2009 Proceedings, http://aisel.aisnet.org/pacis2009/13
[7] Orlikowski, Wanda. & Barley, Steven. 2001. Technology and Institutions: What can research on Information technology and research on Organizations learn from each other?, MIS Quarterly, Vol. 25 No. 2, pp. 145-165/June 2001
[8] Weick, K. (1995). Sensemaking in Organisations. London: Sage.
[9] Gioia, D. A., & Chittipeddi, K. (1991). Sensemaking and sensegiving in strategic change initiation. Strategic Management Journal, Vol. 12.
[10] Latour, Bruno (2005). Reassembling the social: an introduction to actor-network-theory, Oxford:University Press, 2005
[11] Dervin, B., & Dewdney, P. (1986). Neutral questioning: A new approach to the reference interview. Research Quarterly, 25 (4), 506-513.
[12] Dunbar, R. L. M. (1981). Designs for organisational control. In P. C. Nystrom and W. H. Starbuck. Eds. Handbook of organisational design, 2. New York: Oxford University Press
[13] Goleman, D. (1985). Vital Lies, Simple Truths. The Psychology of Self-Deception, New York: Simon & Schuster.
[14] Wiley, N. (1988). The Micro-Macro Problem in Social Theory. Sociological Theory, 6.
[15] Czarniawska, B. (1999). Writing management. Oxford, UK: Oxford University Press.
[16] Ferm Thorgersen, C. (2009). Lärares didaktiska val i relation till deras levda erfarenhet av musikdidaktik, Didaktisk tidskrift, vol 18, no. 1.
[17] Rogers E. M., Diffusion of Innovations, 4th edition. New York, NY: Free Press, 1995
[18] Latour, Bruno. "The Power of Associations." In Power, Action and Belief: A New Sociology of Knowledge, edited by John Law, 261-77. London: Routledge and Kegan Paul, 1986.
[19] Gold, R.L. (1958), Roles in sociological fieldwork, Social Forces, 36:217-223.
[20] Boivie, P. E. (2007). Global Standard – om hur TCO-loggan hamnade på datorskärmar jorden runt, Premiss Publisher.
[21] Malmodin, J., Moberg, Å., Lunden, D., Finnveden, G. och Lövehagen, N. (2010). Greenhouse Gas Emissions and Operational Electricity Use in the ICT and Entertainment & Media Sectors. Journal of Industrial Ecology. Vol 14.
[22] Yotsumoto, M., Lennerfors, T.T, and Majima, T. (2011) The current trends and issues of Green IT, The Japan Association for Management Information (JASMIN) Conference, Japan, Oct 29-30.
9. APPENDIX: INTERVIEW QUESTIONS Questions to auditors:
Besides GIT Audit, what are you engaged with in your organization? How come you became involved with GIT Audit? Active choice or were you just told to by your manager?
Have you got any personal interest in environmental issues, mainly the concept of Green IT?
What is your opinion about Green IT? Is it a tool to make money or does it have a bright future as an important sustainability tool? Do you think the interest for Green IT will increase or decrease?
What are the most important aspects of green IT? Anything extra exciting/important/fun about it? How many GIT Audits have your organization performed? How many have you participated in? Do you know if the execution of the model differ depending on the auditor, or is it the same thing no matter what organization or actor involved?
215

How come your organization chose to invest in GIT Audit? Was it just a “door-opener” och do you think that Green IT is a growing field that you had to go along with to not lose business?
What do you know about the customer’s Green IT efforts and if they are interesting in the concept?
Why did they chose you as the executing partner organization for the model? Why not any of the other partner organization involved with the model?
Do perform other services for the partner organization, or is this the only mission? Have the customer done a GIT Audit before, or is this their first? Questions to customers:
Can you tell me about your background? What are you working with at present and what areas are you interested in? How come you became interested in Green IT? Do you have any other issues besides Green IT that you are interested in work-wise?
Had there been any talk about GITaudit or Green IT after the execution of GIT Audit within the organization? What has been said? Can you speak freely about GIT Audit and how you think it went? What was good, what was bad?
What were your expectations on the model before the audit had started, and how has these expectations changed during the GIT audit?
How do you think the action plan that you have developed together with the auditor will be perceived by your organization and the Director General?
What do you think is important for your organization when continuing the work with Green IT? Do you feel any personal responsibility as orderer of the model that the model will have to contribute with any concrete results? How will you help to make the model count?
Questions to owner/developer: Can you tell us about your background? Recent work activities? Education? Where have you worked earlier? Career path? How come you began to take interest in Green IT? Can you tell us a little about Green IT Audit? How has the work with Green IT Index developed since TCO Development took over the responsibility of the model?
Do you think there’s an ethical reason for companies and governmental agencies to become more “green”?
Why does the model looks like it does today? Does it depend on your professional background?
What do you think is important for the potential of Green IT to be taken more serious?
What is important to make a behavior change where people actually care about energy saving and other environmental issues? Is visualization an important issue in the case of Green IT?
SIS (Swedish Standard Institute) has begun working with a standard concerning Green IT. Is this something you are involved with as well? If yes, what do you think about it? Where will this lead, what consequences can we expect?
Around the year 2008 the interest in Green IT peaked. In the recent years this interest has been reduced. Do you have any comments or explanations? Hype? Financial crisis? IT trend? Are you a driving force in other Green IT related questions?
Besides Green IT Summit, Audit and Index and the SIS standard obviously. How does the future of Green IT seems to you? What is the next step? What needs to be done?
216
Data Mining in the Closed-Loop CRM-Approach for Improving Sustainable Intermodal Mobility
Thees Gieselmann1, Marcel Severith2, Benjamin Wagner vom Berg3, Jorge Marx Gómez4
1University of Oldenburg, Department of Computing Science, Uhlhornsweg 84, D-26129 Oldenburg
2University of Oldenburg, Department of Computing Science, Uhlhornsweg 84, D-26129 Oldenburg
3University of Oldenburg, Department of Computing Science, Uhlhornsweg 84, D-26129 Oldenburg
4University of Oldenburg, Department of Computing Science, Uhlhornsweg 84, D-26129 Oldenburg
ABSTRACT In this paper we introduce sustainability oriented Customer Relationship Management by taking Jinengo as an example. Jinengo is a mobile application assisting users with planning routes by offering mobility options that incorporate various means of transportation, thus implementing intermodal mobility. The offered alternatives are based on the preferences set by the user but rated by the route’s sustainability performance, thus pushing the user subtly to a more sustainable option. At present, the actual route choices of individuals in the past are not yet considered for compiling the options suggested by the system. Therefore we will discuss how to use data mining to provide even better suggestions, thus implementing the so-called closed loop of Customer Relationship Management.
Keywords Business Intelligence, Data Mining, Intermodal Mobility, Sustainability, Customer Relationship Management, Closed Loop.
1. INTRODUCTION The role of information and communication technologies in the context of sustainable development is discussed frequently. So far, most studies in this field are dedicated to issues like using resources or energy more efficiently during production processes [4] & [5], leading to the development of corporate environmental management information systems [12]. However, these efficiency gains may be lost by using the corresponding good or service to a greater extent, leading to rebound effects [4], [5] & [11]. Thus, for enabling sustainability by ICT, deep structural change is necessary, including radical changes in consumption patterns. In particular this includes the transition from property-based to service-based consumption habits [4]. Transportation contributes about 13% to all anthropogenic greenhouse gases worldwide and is one of the fastest growing sectors [8]. Thus, transportation is one out of many obstacles for
us to overcome on the path to sustainability. Besides technical innovations like gas-efficient or alternative fuel cars, social breakthroughs are necessary as well. Solutions like public transport and car sharing already incorporate the idea of a service-based economy. Even though such solutions hold huge potential in regard to reducing environmental burdens, it is hard to change people’s behavior. Many people regard services like public transport as insufficient to their needs, for rational as well as emotional arguments. Besides necessary improvements in the availability and quality of offered mobility services, one has to change the normative decision making of each individual as well. Furthermore there is also the chance to satisfy the need lying behind a specific travel decision in an alternative way. For example, recreational holidays could be spent on a closer destination and business meetings could be substituted by video conferencing. According to [10] such a cultural shift in satisfying needs enables the greatest sustainability prospects, because it offers a greater degree of freedom regarding which technology or system to choose. While a distant destination may only be reached by plane, a more proximate one could be reached by the technology “car” with the system even being “rent”. However, changing mobility habits is a tough task. Choices of transportation are not solely motivated by reaching a specific destination, but express intrinsic social and cultural needs as well. The car used, for example, exposes social status, hence fulfills the need of social acceptance [6]. Customer Relationship Management (CRM) deals with the customer before, during and after the actual sale, influencing his behavior [9]. Therefore it is the system of choice when trying to offer more sustainable mobility options to the individual. Given this background, we apply data mining methods to the CRM system to improve understanding and knowledge of mobility behavior patterns. This approach is used alongside the route planning software Jinengo, which assists mobility choices of individuals. By analyzing day-to-day choices, the mobility preferences of a user can be discovered, segmenting them into homogeneous groups with similar habits. We believe that understanding these preferences is the key for unlocking peoples’ mobility habits and marketing sustainable alternatives.
ICT4S 2013: Proceedings of the First International Conference on Information and Communication Technologies for Sustainability, ETH Zurich, February 14-16, 2013. Edited by Lorenz M. Hilty, Bernard Aebischer, Göran Andersson and Wolfgang Lohmann. DOI: http://dx.doi.org/10.3929/ethz-a-007337628
217

2. CUSTOMER RELATIONSHIP MANAGEMENT CRM describes the theory of pursuing the company’s goals by identifying and satisfying the customer before, during and after a sale [3]. Gathering data during CRM builds a knowledge base about the customer which considers not only internal but also external data sources. CRM consists mainly of two phases: operative and analytical CRM. Operative CRM strengthens customer contact through marketing, sales and service. The information gathered during the operative phase is then processed in the analytical CRM, where raw data is analyzed in order to extract knowledge yet invisible. The information generated during analytical CRM can be used by the operative CRM to update its customer contact processes [3]. The term “Closed Loop” describes the flow of information between the operative and analytical CRM, which represents a never-ending loop of information being gathered, analyzed and processed. While customer-related data is collected in the operative CRM, it is transported to the analytical CRM. In the analytical CRM the data is stored and analyzed to extract meaning from it. This newly gained knowledge can be deployed by the operative CRM. Using this knowledge, more accurate marketing campaigns can be developed and targeted on specific customer groups [3].
3. TRANSFERRING CRM TO A SUSTAINABLE CRM The traditional CRM approach does not meet the requirements to change individuals’ unsustainable behaviors. Therefore a Sustainable Customer Relationship Management (SusCRM) advances the original CRM by two dimensions: ecological and social. It thereby implements the triple bottom line of sustainable development [1]1. Doing so, it adds a further goal to the CRM besides binding the customer. The SusCRM aims at achieving a learning relationship in order to enable the customer to change his consumption behavior to a more ecologically- and socially-conscious way. To meet these requirements, the closed-loop process has to be modified to not only include customer information but aspects like energy consumption and or CO2 emissions as well [14]. CRM systems are able to influence customer behavior through targeted campaigns. For example, advertising an energy-efficient device could be supported with a campaign demonstrating to the customer how to use the device in an appropriate manner thus avoiding rebound effects. To apply a learning strategy, the SusCRM must be able to target the customer appropriately. This requires the appropriate data and the methods to analyze the broadened data scope. Increasing the SusCRM’s data source by adding ecological and social data fulfills the first requirements, while adding Data-Mining methods searching for links in the data meets the second requirement. The knowledge discovered can e.g. be employed to organize customers in groups of likely behavior and identifying potential 1 The triple bottom line is quite popular but also a bit
contradictory it itself. While ecology limits the extent of all human (societal) activities, economy is just one subsystem of human society. Because of this extraordinary importance, we will focus on the ecological dimension of a SusCRM in the following.
improvements within these groups. Revealing and targeting those potentials is one benefit of the SusCRM. A SusCRM may be applied in businesses with a broad product spectrum, trying to offer sustainable products and services to those customers who could be interested. It may also help to accompany customers during the whole life cycle of products, thus strengthening customer loyalty. Customers may be supported with using the product responsibly, taking care and repairing it as well as recycling or disposing it properly. A SusCRM may alternatively be applied by organizations not selling their own products and services, but mediating between customers and businesses instead. Such an organization could help customers find a sustainable way of satisfying their needs by appropriate products and services, while being independent from profit interests of individual businesses. Such application can be imagined for various aspects of human life, e.g. for food, housing or mobility. In the following we will focus on the latter.
4. JINENGO AS AN SUSCRM EXAMPLE Jinengo is a practical application of a SusCRM in the field of intermodal mobility. Intermodal mobility is the idea of combining different means of transportation in order to reach a given destination. With the shortcomings of public transport in regard to flexibility and the shortcomings of private transport in regard to economic, social and ecological high costs, intermodal mobility seems to be a viable option. A study carried out for the German railway company DB AG [7] found an increasing interest in intermodal mobility, especially in the group of early adopting city dwellers. However, most mobility options exist independent from each other and offer no real linkage. Jinengo is a mobile application developed by a research group from the University of Oldenburg that assists users with planning such intermodal travel routes. After a user enters the starting point, destination and time the system offers alternative travel options, taking into account several means of transportation. The results are calculated and sorted according to priorly-entered user preferences, including comfort, flexibility, cost and sustainability. Because of this, results may vary from search to search. In order to encourage the user to change his habits, the routes are highlighted in shades of green according to their sustainability performance. The resulting choice of transportation remains with the user, but is influenced by the visualization of the different travel alternatives. Furthermore messages can be displayed in the user interface e.g. for giving hints or special offers for more sustainable transportation alternatives [13] & [14]. With its intermodal approach, Jinengo improves the accessibility to the plurality of mobility service providers for the user. Jinengo can take any kind of mobility service provider into consideration. Until now, considered mobility service providers include car sharing, rail and other forms of public transportation [13] & [14]. Additionally, it has the potential to change behavior by offering more sustainable solutions that may be in reach but haven’t been considered yet. The system architecture of Jinengo consists of three layers, which are depicted in Figure 1.
218

Figure 1. Jinengo System
All functional system processes, data collection and data storage are done in the back end layer. An operational CRM database stores all gathered data, in particular the personal user data and prior chosen routes of individuals using the software [13] & [14]. When a user requests a new route, the system composes a list of travelling alternatives, considering the personal preferences, from the operational CRM. The front end layer contains a GUI, which serves as point of interaction with the user. The GUI provides a web-based simple graphical interface to plan routes and display reports with user’s statistics. The analytical layer consists of a data warehouse (DWH) and a reporting engine. The data stored in the operational CRM database is processed into the analytical DWH. The knowledge generated there is meant to fulfill two purposes. It is intended to feed reports and dashboards of the operational system as well as refine the user’s search results to better meet individual mobility requirements. However, this analytical part of Jinengo is not yet implemented. At present, traveling alternatives are only derived from the priorly-entered preferences of a user. The actual route choices of individuals using the system in the past are not yet considered. However, storing past choices in the database enables Jinengo to segment the user accordingly and adjust future results correspondingly.
4.1 Motivating usage of Jinengo In order to offer the user better fitting mobility options we apply Business Intelligence (BI) methodologies to Jinengo in the following. These will be introduced more detailed in chapter five. To do so, we need a great extent of data where we base our analysis on. Interacting on a regular basis with the system, the user represents the most important source of data. The more users utilize Jinengo frequently the better data mining results become. Consequently the obstacles of signing up for the service at first and consecutively using it have to be overcome. The main reason for using Jinengo is the unique intermodal approach pursued. With several means of transportation covered for a given route the user can choose the most fitting one for his current need, even if it is not a very sustainable one. Additionally, incentives could support regular usage. Reports and interactive dashboards motivate sustainable conscious users optimizing their own sustainability performance and comparing it with others. This way every user can observe its own development, which provides satisfaction if positive or pressure if
negative. As a prospect, sharing one’s own sustainability performances in social networks like Facebook could strengthen this incentive even further.
4.2 Interest groups Besides the user there are other stakeholders which have a great interest in analyzing data of Jinengo. The Jinengo executives are all people working at Jinengo, which are responsible for the strategic development of Jinengo. They are interested in analyzing the success of the platform and its ability to change user behavior. Therefore they need viable data about platform usage and the development of the user’s sustainability performances. This data serves as the basis for decision making in order to improve the utility of the platform. The executives for example may conclude which campaigns are to be launched. Mobility service providers are also interested in the results of data mining. Analyzes can be used for finding the right audience for their marketing campaigns. Furthermore, mobility service providers may use it to refine their offerings. A car-sharing provider for example could find out in which areas potential car-sharers live and thus expand the business in this very area. Offering all this information to mobility service providers is a potential source of funding for Jinengo. Of course this must not harm the reputation of Jinengo being an independent route planning software with high data privacy standards. Similar to mobility services providers, scientists with research in the field of mobility may have an interest in statistical data too. Obviously, especially when dealing with “external” stakeholders like mobility service providers, data privacy requirements play a crucial role. With the need of fulfilling both these “internal” and “external” information interests, different forms of data representation have to be chosen.
5. APPLYING BI METHODS TO JINENGO Applying Business Intelligence methodology enables closing the CRM loop of Jinengo. The new knowledge gained in the DWH is employed in two ways to benefit Jinengo. Reports and dashboards contain condensed information for the different stakeholders involved, like users, Jinengo executives, mobility service providers and scientists. The prepared reports and dashboards are aggregated in a way that on the one hand the demanded information are available but on the other hand personal data privacy requirements are ensured. These reports also can build the base for an incentive scheme for sustainable mobility. Additionally, the gained knowledge is transferred back into the operational database to refine the user’s search results to better meet individual mobility requirements. This may help increasing Jinengo’s capability in offering qualitative results that are able to attract the user to more sustainable mobility choices. The analytical questions arising can be assigned to the previously defined stakeholders. Users of Jinengo may ask: How sustainable is my own mobility behavior? How is my sustainability performance compared to other groups of people? Are there viable alternatives to my current form of mobility? Jinengo executives may ask: How can the success of the Jinengo platform be assessed? Is the platform used regularly? How can users be motivated to use the platform regularly? How is the sustainability performance of users developing? How can we
219

motivate end users to a sustainable behavior? What incentives may the platform give for behaving more sustainable? Scientists may ask: What motivates people to behave in a sustainable way? What are the obstacles? Which incentives do different audiences need for changing their habits? Mobility service providers may ask: Which people are receptive to what means of transportation? What are the reasons for this interest? Which advantages of an individual means of transport have to be emphasized in special? How to best market a specific offer? Is there a demand for a product that is not yet covered by an according supply? All these questions can be answered with the help of appropriate reports and dashboards, showing information in varying levels of detail. At this point, these reports and dashboards should not be addressed any further. We will focus on data mining instead. Looking at data mining of past routes planned by Jinengo, the analytical questions can be condensed to the following:
1. What was the motivation of a user to go to his given destination?
2. Why did the user choose a specific route or set of means of transportation?
Dealing with these questions may support Jinengo to deal with new routing requests of users in the future. Answering the first question may help finding alternative destinations satisfying the same needs underneath. Answering the second question may help finding sustainable but still appropriate routing alternatives to suggest to the user. These data mining tasks need an extensive data model to be based on. Thus, the main attributes and indicators of the data model are introduced in the following.
6. DATA MODEL We designed the data model in Figure 2 especially for purpose of data mining. Therefore it is aggregated from the operational CRM database model of Jinengo. The personal user data comprises all the master data of the users. Routes were once driven by the user and are differentiated into one to many sub-routes, each with one mean of transportation.
6.1 Personal user data Personal user data are differentiated into preferences, personal attributes and available mobility options. In Jinengo users can set their preferences for sustainability, flexibility, comfort and price intentionally. Users are able to change them over time and adapt them to their current attitude, so preferences might change quite frequently. As they do not interfere with protective private information they are easier to handle regarding privacy issues. Personal attributes on the other hand connect directly to the user’s identity. In Jinengo age, gender, residence, income and family status are considered. Unlike preferences, personal attributes have to be protected heavily because of privacy reasons. Even though it is likely that users are cautious with entering personal attributes, this data is an important asset for data mining, thus need to be collected as broad as possible. Available mobility options specify which means of transportation can be used easily by an individual. This includes the ownership
of a car, an e-bike2 as well as the membership-based access to car sharing, public transport and intercity rail. As these mobility options relate to individuals like personal attributes do, they have to be protected regarding privacy issues as well.
Figure 2. Jinengo Data Model
6.2 Route attributes Routes are distances travelled by a user during a specific period of time in the past. A sub-route is one part of the whole route, resembling one means of transportation used. Thus routes can consist of several sub-routes. The data model describes every route with its associated sub-routes individually. Sub-routes are connected with a n:1 relationship to routes. Every sub-route includes the attributes described in the following. Point and time of departure and destination: Specifies place and date of start and end of the sub-route. Ecological impact: This attribute represents the accumulated ecological impact from the sub-route, consisting of resource and energy consumption. There are several options for assessing the ecological impact. We won’t go into more detail here, but propose a simple thus easily understandable method like the carbon footprint or ecological footprint. 2 The ownership of an ordinary bike can be postulated in
Germany, although this does not imply regular use. The use of an e-bike however improves comfort and widens the range of cycling for a broad audience.
220

Time: The time needed to finish the sub-route. Effective time: How much of the travel-time can be used for other activities like work. Distance: The distance of this sub-route expressed in km. Costs: The amount of money the user requesting the sub-route has to pay for it. Means of transportation: Reflects the type of the transportation, e. g. train or car. This attribute reflects the vehicle specific attributes like seats or entry restrictions as well. Context information: Until now, these attributes are not incorporated into the system due to their complexity. Considering traffic jams or weather information is very important and an interesting topic, especially regarding data mining. But there is a lot of research to be invested into this topic before it can be fully incorporated. Routes have a different set of attributes defining their character, described in the following. Point and time of departure and destination: Specifies place and date of start and end of the whole route. Luggage: The amount of objects the user wants to transport on the route. Need: The embedded personal need behind the travel. A need could be shopping, work or vacation. Passenger: The number of people travelling together with the user. Ecological advantage & ecological disadvantage: The ecological impact of all appendant sub-routes can be aggregated on the level of the whole route. Subtracting this overall impact from the impact of the worst and best alternative route provided by Jinengo leads to both an advantage and a disadvantage. This helps assessing the ecological impact of a route in comparison to other options for the same destination. The calculation of an advantage and a disadvantage can be done for the sub-route attributes time, effective time and costs as well. All attributes represent the planned values from Jinengo. The actual values occurring during the travel are not tracked afterwards, e.g. the time of travel may be affected by unexpected delays. As a result the actual travel values remain hidden. Tracking these differences could give insights for an extensive data mining but is not yet incorporated into Jinengo.
7. DATA MINING Data mining represents a core feature within a SusCRM. In order to support the user’s sustainability it is important to understand his behavior, as described above. To complete the closed loop, the data gathered needs to be analyzed and further knowledge has to be extracted from it. The methods provided by data mining enable the SusCRM to solve this task. One viable procedure to implement the analytical part is exemplary described in the Jinengo-Platform. In Jinengo the data stored in the analytical data warehouse is analyzed mainly with classification, cluster analysis and association methods. The route-attributes and the user-attributes represent the data pool on which data mining will be used. After discovering new knowledge about the user, this information is being transferred into the operational database and can be used for further campaigns, thus closing the closed-loop. In the following the methods implemented in Jinengo are described.
7.1 Association Jinengo’s goal is to increase sustainable mobility. Association techniques help achieving this goal by analyzing day to day user choices. The method searches for rules in the user’s behavior in order to arrange the service in a way that accommodates the user’s behavior [2]. Although association is a descriptive data mining technique and normally is not used for forecasting, it is nevertheless of great importance. A typical application of association is the cross-selling use case, which can also be used in Jinengo. If a lot of people who used mobility service A also used mobility service B the chance that a customer will use mobility service B as well, if he already chose service A, is very high. The ambition behind association analysis is to uncover these rules in the user’s behavior.
7.2 Cluster analysis Another descriptive data mining technique is the cluster analysis, grouping different objects according to their similarity. In the Jinengo project, users are compared according to a specific set of attributes. If the accordance between two users is high enough in comparison to the accordance to other users, they are grouped into the same cluster. While comparing several attributes over a large number of users, groups of users can be identified that are very similar to each other [2]. For example, one cluster could contain all users with an age of 25-35, a mediocre income, and a medium sized car who are living in a suburb. The personal attributes and the preferences chosen are used to cluster the users into groups of high internal similarity and maximum distance to other groups. We assume that users within the same cluster will react in a similar way to proposals like choosing a different means of transportation. An exemplary implementation in the mobility sector was done by [7]. Young city dwellers possibly interested in intermodal mobility were clustered into three groups:
Pragmatic: People out of this group believe they have a good access to a variety of mobility options. They think that their usual targets are easy to reach without a car. Privacy during travelling is of no importance, ecological aspects are disregarded.
Car-affine: People out of this group can hardly imagine being mobile without their private car. Less car usage implies a restriction of flexibility and freedom.
Eco-oriented: People out of this group use bikes more frequently than the pragmatics but make less use of cabs or rented cars. Usually a car is available, but rated negatively because of ecological reasons.
The groups created serve as peer groups for benchmarking the user’s personal sustainability performance. The ecological impact of all routes driven by the individual is therefor set in relation to the overall ecological impact of the corresponding peer group. This comparison is showcased to the user. Comparing the user with a specific peer-group of high similarity instead of all users has two advantages. First it benefits those, who are not very sustainable yet, but try to improve. Comparing them to a person with a completely different personal background, e.g. a person not owning a car could demotivate them. Second, users with a high sustainability-score are still put into a competitive position. As a result the urge to a more sustainable behavior for those with low
221
sustainability is satisfied as well as the need for improvement even for a very sustainable user. New users and changes of existing ones influence the clusters. After a certain amount of users entered the system for the first time or already existing users changed their preferences the cluster analysis needs to be updated, ensuring its quality.
7.3 Classification In contrast to association and cluster analysis, classification is a data mining technique used for forecasting. It is used to classify a particular item according to the value of a specified attribute [2]. While clustering groups existing users, classification may help determining the affiliation of new or changed users to already existing groups on the basis of a set of attributes. An algorithm classifies each user into that group of users which has the largest similarities within the attributes consulted [2]. In contrast to the cluster analysis the classification is done automatically. Whenever a new user signs up for Jinengo the classification algorithm groups the user to a corresponding cluster depending on his initial information provided. The algorithm surveys personal information about the user like age, gender, family status and place of residence as well as all motor vehicles or local-traffic cards owned. In regard of these attributes the clusters available are searched for the one with the highest accordance and the new user is being grouped into that group. Another application of classification in the context of Jinengo is the identification of favored sustainable behavior patterns. For example, the classification process could identify the “rules” leading to a personal ownership of an e-bike. Users with similar personal attributes and preferences may then be proposed to buy an e-bike as well, helping to reduce their kilometers driven with vehicles propelled by a combustion engine.
8. CONCLUSION AND OUTLOOK In our work we describe the prospects of a Sustainable Customer Relationship Management and introduce Jinengo by example. With Jinengo not offering own products and services but mediating between customer needs and intermodal mobility services instead, Jinengo is an independent and credible system assisting customers to find sustainable mobility options. We depicted a data model and possible ways of mining past mobility choices and thereby finding better suited mobility alternatives for individual users, thus completing the closed loop of a CRM system. However, there are still many open challenges. Up to now, our data model only includes the planned data by Jinengo. The actual data of a route may vary, for example the time may change because of a delay. But incorporating this data is not that easy. With Jinengo being a planning platform the user would have to be motivated using the platform after the route has taken place. Because of these operational difficulties, tracking this data is not yet incorporated into Jinengo although it might give insights for an extensive data mining. The biggest potential but also biggest challenge for Jinengo is the proposal of alternative ways to satisfy the same need as a user-given destination would have. Like travel portals offer holiday locations the user was not initially looking for, Jinengo could suggest alternatives likewise. Precondition for this is the automated recognition of needs behind a given destination or the possibility to enter them directly.
9. REFERENCES [1] Deutscher Bundestag 1998: Konzept Nachhaltigkeit – Vom
Leitbild zur Umsetzung. Abschlussbericht der Enquête-Kommission „Schutz des Menschen und der Umwelt“ des 13. Deutschen Bundestages. Bonn.
[2] Giudici, P. 2003: Applied Data Mining. Statistical Methods for Business and Industry. Wiley, Chichester.
[3] Helmke, S., Uebel, M., and Dangelmaier, W. 2003: Effektives Customer Relationship Management. Instrumente – Einführungskonzepte – Organisation. Gabler, Wiesbaden.
[4] Hilty, L. M. 2010: Information and Communication Technologies for a more Sustainable World. In Information and Communication Technologies, Society and Human Beings: Theory and Framework, D. Haftor and A. Mirijamdotter, Eds. IGI Global, Hershey, New York, 410-418.
[5] Hilty, L. M., Lohmann, W., and Huang, E. M. 2011: Sustainability and ICT – An overview of the field. notizie di POLITEIA 27, 104, 13-28.
[6] Hunecke, M. 2008: MOBILANZ. Möglichkeiten zur Reduzierung des Energieverbrauchs und der Stoffströme unterschiedlicher Mobilitätsstile durch zielgruppenspezifische Mobilitätsdienstleistungen. Endbericht. University of Bochum, University of Lüneburg, Wuppertal Institut.
[7] InnoZ 2007: DB Mobility. Beschreibung und Positionierung eines multimodalen Verkehrsdienstleisters. http://www.innoz.de/fileadmin/INNOZ/pdf/Bausteine/innoz-baustein-01.pdf. Accessed 17 September 2012.
[8] IPCC 2007: Climate Change 2007. Synthesis Report. [9] Kantsperger, R. 2006: Modifikation von Kundenverhalten als
Kernaufgabe von CRM. In Grundlagen des CRM. Konzepte und Gestaltung, H. Hippner and K. D. Wilde, Eds. Gabler, Wiesbaden.
[10] Paech, N. 2007: Unternehmerische Nachhaltigkeit und die ungelöste Wachstumsfrage. Von der Funktionsorientierung zur Bedarfssubstitution. UmweltWirtschaftsForum 15, 2, 8-91.
[11] Paech, N. 2005: Nachhaltigkeit als marktliche und kulturelle Herausforderung. In Nachhaltige Zukunftsmärkte. Orientierungen für unternehmerische Innovationsprozesse im 21. Jahrhundert, K. Fichter, N. Paech and R. Pfriem, Eds. Metropolis-Verlag, Marburg, 57-94.
[12] Rautenstrauch, C. 1999: Betriebliche Umweltinformationssysteme. Grundlagen, Konzepte und Systeme. Springer, Berlin Heidelberg et al.
[13] Wagner vom Berg, B. and Stamer, D. 2012: Sustainability CRM. A casestudy in the mobility sector. Proceedings of the European, Mediterranean & Middle Eastern Conference on Information Systems 2012 (EMCIS2012) (Munich, Germany, June 07 – 08, 2012).
[14] Wagner vom Berg, B., Stamer, D., and Marx Gómez, J. 2012b: Förderung nachhaltiger Mobilität durch den Einsatz eines Sustainability CRM. In Konzepte, Anwendungen und Entwicklungstendenzen von betrieblichen Umweltinformationssystemen (BUIS), V. Wolgemuth, C. V. Lang, J. Marx Gómez, Eds. Shaker Verlag, Aachen, 129-14.
222

mat - an ICT application to support a more sustainable use of print products and ICT devices
Roland Hischier1, Michael Keller2, Rudolf Lisibach3, Lorenz M. Hilty1,2
1 Empa, Technology and Society Lab, St. Gallen (Switzerland)
[email protected], [email protected]
2 University of Zürich, Informatics and Sustainability Group, Zürich (Switzerland) [email protected], [email protected]
3 Denkfabrik visuelle Kommunikation, Otelfingen (Switzerland)
ABSTRACT Digital information and communication devices –smartphones or tablet, laptop and desktop computers– are often perceived as much more environmentally friendly than newspapers and magazines – but is this common opinion justified? Previous studies comparing the environmental impact of electronic vs. print media show that the answer depends on many parameters of the technologies under study and the use patterns assumed. Empa’s Technology and Society Lab, the University of Zürich the “Denkfabrik visuelle Kommunikation” jointly developed a web-based tool that can be used to evaluate the environmental effects of a broad variety of printed and electronic media for clearly defined use patterns.
In a first step, the basic scientific facts were established using the life cycle assessment (LCA) methodological framework. Two LCA studies have been done, one for the production and disposal of the various media, the other one for the (active) use of each of these media. Technical data from various producers have been used for the ICT devices examined as well as for the power consumption during the use phase. All inputs to these processes have been modeled using background processes from the ecoinvent database. The results from these two studies are environmental indicators for each type of media representing production and disposal resp. (active) use of the device, calculated per device resp. per unit of active use.
Combining these data in the second step made it possible to calculate the environmental impacts from any specific use pattern combined with the various types of print and electronic media. In order to make those findings available to users who have no knowledge in LCA methodology, a website providing an easily applicable tool has been developed.
Two cases studies – one comparing different ways of advertising for (food) products; the other one taking the conference paper at hand as example – show some of the possibilities this tool offers to non-specialists.
Keywords Life Cycle Assessment (LCA), electronic media, printed media, webtool.
1. INTRODUCTION The use of electronic instead of printed media is usually considered more sustainable. In a recent project, on behalf of the “Denkfabrik visuelle Kommunikation” of viscom (the Swiss Association for Visual Communication), Empa’s Technology and Society Lab, together with the Department of Informatics (IFI) of the University of Zürich, developed the web-based tool mat (media analytics tool) that can be used to evaluate the environmental effects of a broad variety of printed and electronic media for clearly defined use patterns. While Empa took care of the life cycle models and data, IFI was in charge of the development and implementation of the web-based tool.
This project is part of many years of research at Empa’s Technology and Society Lab in assessing and reducing the environmental impact of communication (see e.g.[1-6]).
This paper describes in a first part (chapter 2) the scientific basis, starting point for the data integrated into the web-based tool, which is described in chapter 3. Two case studies showing the application of the tool are briefly presented in chapter 4, followed by concluding remarks.
2. SCIENTIFIC BASIS 2.1 Life Cycle Assessment The objective of the first part of this work was to establish the model and data base for all subsequent steps. For this, a life cycle assessment (LCA) study has been conducted. LCA is a comprehensive framework that quantifies ecological and human health impacts of a product or system over its complete life cycle. This framework can be applied to any kind of product and to any decision where environmental impacts are of interest. Nowadays, LCA is applied by a broad variety of actors – from governmental organisations to industry, often with support from specialized research and/or consulting organisations. Reasons for this wide application can be found e.g. in the clear guidance for the application provided by the ISO 14’040, 14’044 standards [7,8],
ICT4S 2013: Proceedings of the First International Conference on Information and Communication Technologies for Sustainability, ETH Zurich, February 14-16, 2013. Edited by Lorenz M. Hilty, Bernard Aebischer, Göran Andersson and Wolfgang Lohmann. DOI: http://dx.doi.org/10.3929/ethz-a-007337628
223

as well as the considerable amount of databases available today (see e.g. [9] for an overview), which allows fast screenings of products or services.
Within this framework, the ISO standard distinguishes between four steps – i.e. goal & scope definition, inventory analysis, impact assessment and interpretation –; described in the following chapters 2.2 to 2.5 for the current study here.
2.2 Goal & Scope The overall goal of the study is the calculation of the ecological load due to the use of printed and electronic media in the context of a variety of use cases. In a first phase, our objective is the calculation of the environmental impact from the production and disposal of various (printed and electronic) media; as well as the calculation of the impact due to ‘1 unit use’ of the respective medium. These data can then be used to calculate various application cases in the second part of the project. In order to achieve the objectives of the first phase, two distinct LCA studies have been performed, producing the necessary input data for the web-based tool (see chapter 3).
The first LCA study deals with production and disposal of the various (printed and electronic) media. For this case, “classic” cradle-to-gate LCA studies could be applied to the various electronic devices and printing technologies. In Figure 1, these system boundaries are shown for the example of a desktop computer.
Figure 1. System boundaries of the system “desktop
computer” as an example
As a functional unit, this first LCA study is using the complete device in the case of electronic media; i.e. one desktop computer (including keyboard and monitor screen). For the print media, a functional unit of 1’000 kg of printed matter is used.
The second LCA study has its focus on the (active) use phase. Apart from the electricity consumption due to the use of an electronic medium, this second study defines how the results from the first study (i.e. production, disposal of the devices) are taken
into account per unit of use. Figure 2 shows the various elements of this system for the example of a smartphone.
Figure 2. System boundaries and formulas for the calculation
of 1 unit of use of an electronic device
The functional unit for electronic media chosen in this second LCA study is ‘1 hour of (active) use’. In the case of printed matter, the functional unit is ‘1 kg of print products’ (which can be calculated from the format and the square weight of the used paper type).
2.3 Inventory Analysis 2.3.1 Production of electronic media On the level of data, composition data from various producers have been used in order to establish the composition tables of the various examined ICT devices. Table 1 shows an overview.
Table 1. Overview of the used data sources for the modeled electronic devices
Smartphone Weight: 136g (average weight of 5 “best” smart-phones in 2011 according to [10]) . Composition data: mix of data about iPhone 3 and
iPhone 4S, taken from [11,12].
Tablet (I) 10-inch model with LCD display. Composition data of iPad 2 used, taken from [13].
Tablet (II) 10-inch model with an e-paper display Composition data of iRex 1000 used, taken from [14].
Netbook 10-inch netbook with an average weight according to a sample of 8 various models of 1.33 kg. Composition data: extrapolated from composition of
laptop computer, assuming a similar composition.
Laptop Computer
Mix of 14-/15-inch laptop computers (Windows, Mac) with an average weight of 2.544 kg. Composition data: mix of various 14-/15-Inch models
(Windows, Mac), taken from [15,16].
Desktop Computer
Original datasets from ecoinvent [17] for ‘desktop computer’, ‘keyboard’ and ‘LCD screen, 15-inch’ used.
LCD TV Mix of 40-/42-inch LCD television devices, with an average weight according to a sample of 9 various models of 17.4 kg. Composition data: extrapolated from the composition
of an 15-inch LCD computer screen in ecoinvent [17], assuming a similar composition.
224
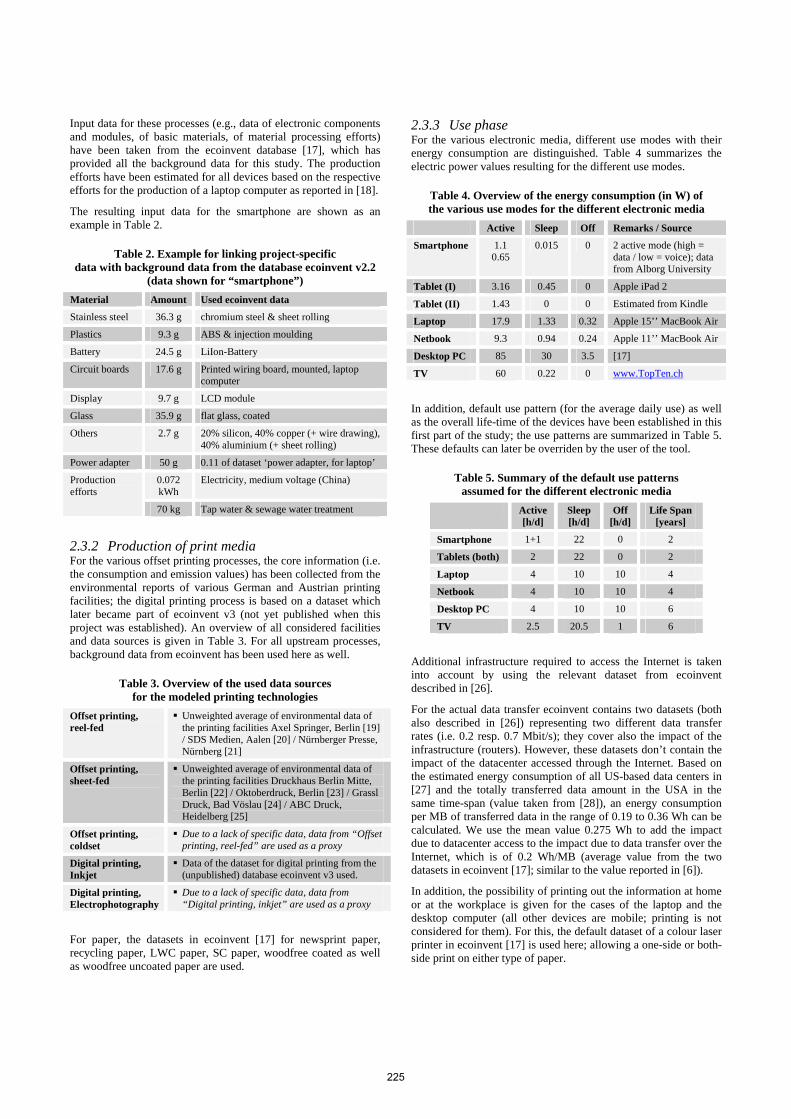
Input data for these processes (e.g., data of electronic components and modules, of basic materials, of material processing efforts) have been taken from the ecoinvent database [17], which has provided all the background data for this study. The production efforts have been estimated for all devices based on the respective efforts for the production of a laptop computer as reported in [18].
The resulting input data for the smartphone are shown as an example in Table 2.
Table 2. Example for linking project-specific data with background data from the database ecoinvent v2.2
(data shown for “smartphone”) Material Amount Used ecoinvent data
Stainless steel 36.3 g chromium steel & sheet rolling
Plastics 9.3 g ABS & injection moulding
Battery 24.5 g LiIon-Battery
Circuit boards 17.6 g Printed wiring board, mounted, laptop computer
Display 9.7 g LCD module
Glass 35.9 g flat glass, coated
Others 2.7 g 20% silicon, 40% copper (+ wire drawing), 40% aluminium (+ sheet rolling)
Power adapter 50 g 0.11 of dataset ‘power adapter, for laptop’
Production efforts
0.072 kWh
Electricity, medium voltage (China)
70 kg Tap water & sewage water treatment
2.3.2 Production of print media For the various offset printing processes, the core information (i.e. the consumption and emission values) has been collected from the environmental reports of various German and Austrian printing facilities; the digital printing process is based on a dataset which later became part of ecoinvent v3 (not yet published when this project was established). An overview of all considered facilities and data sources is given in Table 3. For all upstream processes, background data from ecoinvent has been used here as well.
Table 3. Overview of the used data sources for the modeled printing technologies
Offset printing, reel-fed
Unweighted average of environmental data of the printing facilities Axel Springer, Berlin [19] / SDS Medien, Aalen [20] / Nürnberger Presse, Nürnberg [21]
Offset printing, sheet-fed
Unweighted average of environmental data of the printing facilities Druckhaus Berlin Mitte, Berlin [22] / Oktoberdruck, Berlin [23] / Grassl Druck, Bad Vöslau [24] / ABC Druck, Heidelberg [25]
Offset printing, coldset
Due to a lack of specific data, data from “Offset printing, reel-fed” are used as a proxy
Digital printing, Inkjet
Data of the dataset for digital printing from the (unpublished) database ecoinvent v3 used.
Digital printing, Electrophotography
Due to a lack of specific data, data from “Digital printing, inkjet” are used as a proxy
For paper, the datasets in ecoinvent [17] for newsprint paper, recycling paper, LWC paper, SC paper, woodfree coated as well as woodfree uncoated paper are used.
2.3.3 Use phase For the various electronic media, different use modes with their energy consumption are distinguished. Table 4 summarizes the electric power values resulting for the different use modes.
Table 4. Overview of the energy consumption (in W) of the various use modes for the different electronic media
Active Sleep Off Remarks / Source
Smartphone 1.1 0.65
0.015 0 2 active mode (high = data / low = voice); data from Alborg University
Tablet (I) 3.16 0.45 0 Apple iPad 2
Tablet (II) 1.43 0 0 Estimated from Kindle
Laptop 17.9 1.33 0.32 Apple 15’’ MacBook Air
Netbook 9.3 0.94 0.24 Apple 11’’ MacBook Air
Desktop PC 85 30 3.5 [17]
TV 60 0.22 0 www.TopTen.ch
In addition, default use pattern (for the average daily use) as well as the overall life-time of the devices have been established in this first part of the study; the use patterns are summarized in Table 5. These defaults can later be overriden by the user of the tool.
Table 5. Summary of the default use patterns assumed for the different electronic media
Active[h/d]
Sleep [h/d]
Off [h/d]
Life Span [years]
Smartphone 1+1 22 0 2
Tablets (both) 2 22 0 2
Laptop 4 10 10 4
Netbook 4 10 10 4
Desktop PC 4 10 10 6
TV 2.5 20.5 1 6
Additional infrastructure required to access the Internet is taken into account by using the relevant dataset from ecoinvent described in [26].
For the actual data transfer ecoinvent contains two datasets (both also described in [26]) representing two different data transfer rates (i.e. 0.2 resp. 0.7 Mbit/s); they cover also the impact of the infrastructure (routers). However, these datasets don’t contain the impact of the datacenter accessed through the Internet. Based on the estimated energy consumption of all US-based data centers in [27] and the totally transferred data amount in the USA in the same time-span (value taken from [28]), an energy consumption per MB of transferred data in the range of 0.19 to 0.36 Wh can be calculated. We use the mean value 0.275 Wh to add the impact due to datacenter access to the impact due to data transfer over the Internet, which is of 0.2 Wh/MB (average value from the two datasets in ecoinvent [17]; similar to the value reported in [6]).
In addition, the possibility of printing out the information at home or at the workplace is given for the cases of the laptop and the desktop computer (all other devices are mobile; printing is not considered for them). For this, the default dataset of a colour laser printer in ecoinvent [17] is used here; allowing a one-side or both-side print on either type of paper.
225
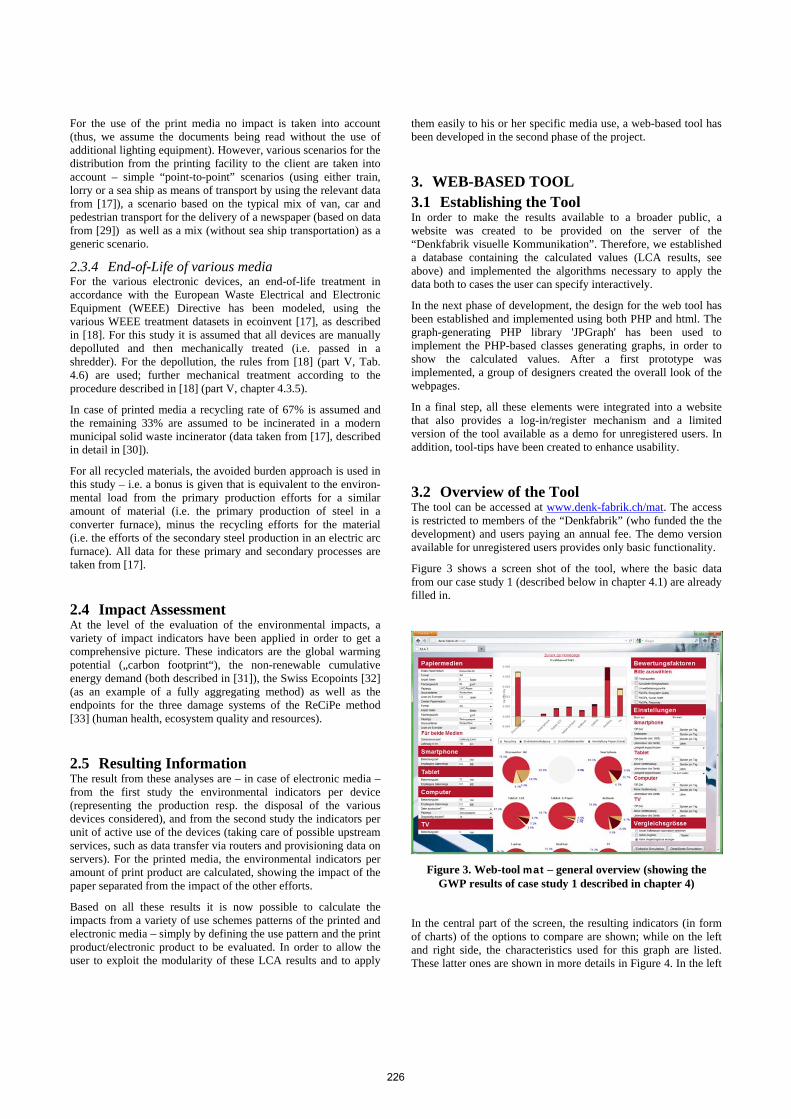
For the use of the print media no impact is taken into account (thus, we assume the documents being read without the use of additional lighting equipment). However, various scenarios for the distribution from the printing facility to the client are taken into account – simple “point-to-point” scenarios (using either train, lorry or a sea ship as means of transport by using the relevant data from [17]), a scenario based on the typical mix of van, car and pedestrian transport for the delivery of a newspaper (based on data from [29]) as well as a mix (without sea ship transportation) as a generic scenario.
2.3.4 End-of-Life of various media For the various electronic devices, an end-of-life treatment in accordance with the European Waste Electrical and Electronic Equipment (WEEE) Directive has been modeled, using the various WEEE treatment datasets in ecoinvent [17], as described in [18]. For this study it is assumed that all devices are manually depolluted and then mechanically treated (i.e. passed in a shredder). For the depollution, the rules from [18] (part V, Tab. 4.6) are used; further mechanical treatment according to the procedure described in [18] (part V, chapter 4.3.5).
In case of printed media a recycling rate of 67% is assumed and the remaining 33% are assumed to be incinerated in a modern municipal solid waste incinerator (data taken from [17], described in detail in [30]).
For all recycled materials, the avoided burden approach is used in this study – i.e. a bonus is given that is equivalent to the environ-mental load from the primary production efforts for a similar amount of material (i.e. the primary production of steel in a converter furnace), minus the recycling efforts for the material (i.e. the efforts of the secondary steel production in an electric arc furnace). All data for these primary and secondary processes are taken from [17].
2.4 Impact Assessment At the level of the evaluation of the environmental impacts, a variety of impact indicators have been applied in order to get a comprehensive picture. These indicators are the global warming potential („carbon footprint“), the non-renewable cumulative energy demand (both described in [31]), the Swiss Ecopoints [32] (as an example of a fully aggregating method) as well as the endpoints for the three damage systems of the ReCiPe method [33] (human health, ecosystem quality and resources).
2.5 Resulting Information The result from these analyses are – in case of electronic media – from the first study the environmental indicators per device (representing the production resp. the disposal of the various devices considered), and from the second study the indicators per unit of active use of the devices (taking care of possible upstream services, such as data transfer via routers and provisioning data on servers). For the printed media, the environmental indicators per amount of print product are calculated, showing the impact of the paper separated from the impact of the other efforts.
Based on all these results it is now possible to calculate the impacts from a variety of use schemes patterns of the printed and electronic media – simply by defining the use pattern and the print product/electronic product to be evaluated. In order to allow the user to exploit the modularity of these LCA results and to apply
them easily to his or her specific media use, a web-based tool has been developed in the second phase of the project.
3. WEB-BASED TOOL 3.1 Establishing the Tool In order to make the results available to a broader public, a website was created to be provided on the server of the “Denkfabrik visuelle Kommunikation”. Therefore, we established a database containing the calculated values (LCA results, see above) and implemented the algorithms necessary to apply the data both to cases the user can specify interactively.
In the next phase of development, the design for the web tool has been established and implemented using both PHP and html. The graph-generating PHP library 'JPGraph' has been used to implement the PHP-based classes generating graphs, in order to show the calculated values. After a first prototype was implemented, a group of designers created the overall look of the webpages.
In a final step, all these elements were integrated into a website that also provides a log-in/register mechanism and a limited version of the tool available as a demo for unregistered users. In addition, tool-tips have been created to enhance usability.
3.2 Overview of the Tool The tool can be accessed at www.denk-fabrik.ch/mat. The access is restricted to members of the “Denkfabrik” (who funded the the development) and users paying an annual fee. The demo version available for unregistered users provides only basic functionality.
Figure 3 shows a screen shot of the tool, where the basic data from our case study 1 (described below in chapter 4.1) are already filled in.
Figure 3. Web-tool mat – general overview (showing the GWP results of case study 1 described in chapter 4)
In the central part of the screen, the resulting indicators (in form of charts) of the options to compare are shown; while on the left and right side, the characteristics used for this graph are listed. These latter ones are shown in more details in Figure 4. In the left
226

part of this figure, the numerous input variables to define the various printed and electronic media are shown; allowing to the user e.g. a definition of two different print products in the same comparison. For the three types of computers (netbook – laptop – desktop), the same variables are used.
Figure 4. Web-tool mat – Definition part for printed and electronic media (left column), choice of LCIA indicator
(right column, upper part), default use pattern for electronic media (right column, lower part)
The right column in Figure 4 shows in the upper part the choice between the available impact assessment indicators. The lower part shows the default values concerning the use pattern of the electronic media; values that can be adapted by the user simply by overwriting the default values.
4. CASE STUDIES 4.1 Advertisement of a discount shop With the new discount food shops that entered into the Swiss market in the last years, a new wave of weekly advertisements arrived in the letterboxes of the Swiss households. In the same time, these companies started to advertise on the television and to use the Internet as another channel to reach their potential clients. Thus, their (weekly) advertisement can be used as an example to show the impacts of the various media channels that are covered by our tool. Table 6 shows the here applied use pattern for the different types of media.
To compare the three channels, we calcualted the following impact categories with mat: Global Warming Potential (GWP) and the three ReCiPe endpoint indicators (human health, ecosystem quality, and resources). For the use pattern of the various electronic media, the default values (as shown in Figure 4, right part) are used. In addition, for the use of the various electro-
nic devices, a use in Switzerland is assumed (i.e. Swiss electricity mix is used for the use phase).
Table 6. Use pattern for the different media for case study 1, advertisement of a discount shop
Print Version 8 pages, format A4, 56 g/m2 LWC paper, with 1.2 reader per copy reel-fed offset printing delivery: 150 km, by lorry
All electronic devices, except television
15 min active use (download time included); Download of 0.5 MB
Television Advertisement of 3 min
The results are shown in Figure 5 and Figure 6 below, representing two different ways of presenting the results (i.e. either the details of each life stage or the total impact only).
Figure 5. Case study 1, advertisement of a
discount shop: Global warming potential (GWP) in kg CO2 eq per advertisement campaign and household
Figure 6. Case study 1, advertisement of a discount
shop: Impact in terms of Ecosystem Quality, Human Health and Resources according to the ReCiPe method (in % of the
highest impact each) for a single advertisement campaign
It can be seen that the three communication channels for advertisement that have the highest environmental impact are the printed version (indicated as “leaflet” in the two figures), the
227

television and the desktop computer. All mobile devices have an impact that is clearly lower.
In order to support the user in interpreting the results, the tool provides a comparison with the impact of one (or several) cups of capsule coffee. The data for this benchmark are taken from a simplified LCA study about coffee capsules established in Spring 2011 and published as a press release by Empa [34]. In Figure 7, the impact of one cup of coffee has been added to the presentation of the results.
Figure 7. Case study 1: comparison of the results
from the two figures above with the impact of 1 cup of coffee
As shown in Figure 7, even the way of advertisement with the highest impact is in case of the Global Warming Potential and the Resource consumption (according to ReCiPe endpoints) still lower than the sole impact of one cup of coffee. Comparing only the printed version with the cup of coffee shows that only in case of the factor “Ecosystem Quality” (according to ReCiPe), the impact from the coffee is lower – in all other cases, producing a single cup of coffee has a higher impact than the leaflet.
4.2 The impact of the paper at hand As another illustrative example, the conference paper at hand shall be used. You may either read a hardcopy of the paper printed on a LWC paper by a digital printing process and delivered to you, read the pdf-File directly on your electronic device, or you may have downloaded the file and then printed the document (maybe after having read the abstract on the screen) on your private (laser) printer for reading the full text on paper. We will call the purely electronic option “Option 1” and the combination with private printing “Option 2”.
In this case study, smartphone and television were not taken into account because we consider them unsuitable for reading such a paper. For the (professional) print option and the two electronic options, the parameters have been set according to the information summarized in Table 7.
We calculated the impact categories Global Warming Potential (GWP) and ReCiPe-Endpoints (human health, ecosystem quality, and resources); using in a first attempt just the default use pattern for the various electronic media. The results are shown in Figure 8 and Figure 9.
Table 7. Use pattern for the different media for case study 2, the paper at hand
Print Version 8 pages, format A4, 80 g/m2 LWC paper, with 1.0 reader per copy digital printing, ink-jet technology delivery: 80 km, by train
Tablets, Netbook, Laptop, Desktop
Option 1 30 min active use (download time included); Download of 2.0 MB; no printing
Laptop, Desktop Option 2 10 min active use (download time included); Download of 2.0 MB; printing, one-side, on recycling paper
Figure 8. Case study 2, the paper at hand: Global
warming potential (GWP) in kg CO2-Eq for 8 pages
Figure 9. Case study 2, the paper at hand: impact
in terms of Ecosystem Quality, Human Health and Resources according to the ReCiPe method (in % of the highest
impact each) for 8 pages
Figure 8 shows that – assuming the default use patterns – the impact from a hardcopy is in the same order as reading this paper on a desktop computer (on the screen), or printing it out via a laptop computer. The three damage categories reported in the ReCiPe method (see Figure 9) show a rather similar picture (with the category ‘Ecosystem Quality’ showing a high impact for the hardcopy due to the land-use impacts from the forest). Again, as for case study 1, the mobile ICT devices (tablet, netbook, laptop)
228

– when used for reading the pdf-file – show a clearly lower environmental impact than the paper version.
The tool makes it also possible to change the various use patterns of electronic media in order to see the influence of user behaviour on the results. Here, the changes summarized in Table 8 have been applied in order to examine this aspect.
Table 8. Changes in the use pattern for case study 2, the paper at hand, in order to examine the influence
of the user behaviour Tablets LCD Tablet: life span reduced from 2 years
to 1 year; no other changes. e-Paper Tablet: daily “active” rate reduced
from 2 hours to 30 min, no other changes.
Netbook, Laptop, Desktop
use of European electricity mix instead of the Swiss electricity mix for use phase, no other changes.
Laptop, Desktop life span reduced to 2 years for laptop and to 3 years for desktop computer, no other changes.
In Figure 10, the results of these variations are shown by the grey bars added on the top of the black bars, representing the results from the Option 1 case (no printout).
Figure 10. Case study 2, the paper at hand: influence of changes in use patterns and the electricity mix in the use
phase on the results for reading 8 pages
This figure shows – almost independent from the impact indicator chosen (as all four factors show a similar picture) – a clear influence of the changes to the use patterns on the overall results. For the two tablets, the changes show more or less a proportional influence (i.e. a factor 2 for the LCD tablet due to a 50% smaller life span / a factor of 4 for the e-Paper tablet due to the 4 times smaller, daily use-time), because a larger share of the life cycle
impact of the device is now allocated to its use for reading this paper, whereas the influence of the electricity mix is small. This is a consequence of the fact that the impact of these types of devices is clearly dominated by their production – and not the energy consumption during use.
5. CONCLUSION The web-based tool mat supports the user to assess the impacts of various information and communication media in a very differentiated form, including the explicit consideration of use patterns of electronic devices. Not only LCA specialists, but also other user groups can apply mat, which has been designed mainly for professionals from the communication industry.
The tool has been presented to the members of “Denkfabrik visuelle Kommunikation” and the media at an official event in June 2012 and got public at the same time on its website (www.denk-fabrik.ch/mat).
6. ACKNOWLEDGMENTS The authors would like to thank all members of the project team – Susanne Drotleff, Thomas Freitag, Thomas Gsponer, Albin Kirchhofer, Rolf Steiner, and Prof. Sabine Wölflick – who accompanied the LCA studies and the development of the tool for their helpful comments and for sharing their insights during the whole project. We further acknowledge the support from the corporate communications company ‘Basel West’ in the visual design of web interface.
7. REFERENCES [1] Hischier, R. and Hilty, L. Environmental impacts of an international conference. Environmental Impact Assessment Review, 22, 5: 2002, 543-557. [2] Hischier, R. and Reichart, I. Multifunctional Electronic Media – Traditional Media. The Problem of an Adequate Functional Unit - A case study of a printed newspaper, an internet newspaper and a TV broadcast. Int J LCA, 8, 4: 2003, 201-208. [3] Scharnhorst, W., Hilty, L. M. and Jolliet, O. Life cycle assessment of second generation (2G) and third generation (3G) mobile phone networks. Environmental International, 32, 5: 2006, 656-676. [4] Coroama, V. and Hilty, L. M. Energy Consumed vs. Energy Saved by ICT – A Closer Look. In Proceedings of the Environmental Informatics and Industrial Environmental Protection: Concepts, Methods and Tools, 23rd International Conference on Informatics for Environmental Protection Berlin (Germany), 2009, 353-361. [5] Coroama, V. C., Hilty, L. M. and Birtel, M. Effects of Internet-Based Multiple-Site Conferences on Greenhouse Gas Emissions. Telematics and Informatics, 4, 29: 2012, 362-374. [6] Coroama, V. C., Hilty, L. M., Heiri, E. and Horn, F. The Direct Energy Demand of Internet Data Flows. Journal of Industrial Ecology2013, (submitted). [7] ISO. Environmental Management - Life Cycle Assessment - Requirements and Guidelines. International Standardisation Organisation (ISO), European Standard EN ISO 14'044, Geneva (Switzerland), 2006. [8] ISO. Environmental Management - Life Cycle Assessment - Principles and Framework. International Standardization
229

Organization (ISO), European Standard EN ISO 14'040, Geneva (Switzerland), 2006. [9] Finnveden, G., Hauschild, M., Ekvall, T., Guinee, J., Heijungs, R., Hellweg, S., Koehler, A., Pennington, D. and Suh, S. Recent developments in Life Cycle Assessment. Journal of Environmental Management, 912009, 1-21. [10] Catanzariti, R. Best smartphones of 2011, in: PCWorld Australia - Online edition. . IDG Communications, North Sydney (Australia), City, 2011. [11] Apple. iPhone 3 Environmental Report. Apple Inc. , Cupertino, CA (USA), 2010. [12] Apple. iPhone 4S Environmental Report. Apple Inc. , Cupertino, CA (USA), 2011. [13] Apple. iPad 2 Environmental Report. Apple Inc. , Cupertino, CA (USA), 2011. [14] Deetman, S. and Odegard, I. Scanning Life Cycle Assessment of Printed and E-paper Documents based on the iRex Digital Reader. CML - Insitute for Environmental Sciences, Leiden University / i Rex Technologies, Leiden (the Netherlands), 2009. [15] Apple. 15'' MacBook Pro - Environmental Report. Apple Inc. , Cupertino, CA (USA), 2010. [16] Kahhat, R., Poduri, S. and Williams, E. Bill of Attributes (BOA) in Life Cycle Modeling of Laptop Computers: Results and Trends from Disassembly Studies. Sustainability Consortium White Paper #103. The Sustainability Consortium, Arizona State University, and University of Arkansas, Tempe and Fayetteville (USA), 2011. [17] ecoinvent Centre. ecoinvent data v2.2. CD-ROM, Swiss Centre for Life Cycle Inventories, Dübendorf, CH, 2010. [18] Hischier, R., Classen, M., Lehmann, M. and Scharnhorst, W. Life Cycle Inventories of Electric and Electronic Equipment: Production, Use and Disposal. CD-ROM, Final report ecoinvent data v2.0 No. 18, Swiss Centre for Life Cycle Inventories, Empa - TSL, Dübendorf, CH, 2007. [19] Axel Springer. Umwelterklärung 2011 Axel Springer AG Druckhaus Spandau. Berlin (Germany), 2011. [20] SDZ Media. Umwelterklärung 2011 SDZ Druck und Medien, Aalen. Aalen (Germany), 2011. [21] Verlag Nürnberger Presse. aktualisierte Umwelterklärung 2011 Druckhaus Nürnberg GmbH & Co. Nürnberg (Germany), 2011. [22] Druckhaus Berlin-Mitte. Umwelterklärung 2011. Berlin (Germany), 2011.
[23] Oktoberdruck GmbH. Wie wir wirken. Umwelterklärung 2011. Berlin (Germany), 2011. [24] Grassl Druckhaus. Fair gegenüber Menschen & Umwelt. Vereinfachte Umwelterklärung 2011 nach EMAS III. Bad Vöslau (Austria), 2011. [25] ABC Druck. Umwelterklärung 2011. Heidelberg (Germany), 2011. [26] Leuenberger, M. and Frischknecht, R. Life Cycle Assessment of Virtual Mobility. Implemented in ecoinvent data v2.2 (2010). ESU-services Ltd., Uster (Switzerland), 2010. [27] Koomey, J. G. Growth in Data Center Electricity Use 2005 to 2010., A report by Analytics Press, completed at the request of The New York Times, 2011. [28] Cisco. Visual Networking Index: Global Mobile Data Traffic Forecast Update 2010-2015. Cisco Systems, Inc., San Jose (USA), 2010. [29] Reichart, I. and Hischier, R. Vergleich der Umweltbelastungen bei Benutzung elektronischer und gedruckter Medien. EMPA-Bericht Nr. 253, EMPA, St. Gallen, 2001. [30] Doka, G. Life Cycle Inventories of Waste Treatment Services. CD-ROM, Final report ecoinvent v2.0 No. 13, EMPA St. Gallen, Swiss Centre for Life Cycle Inventories, Dübendorf, CH, 2007. [31] Frischknecht, R., Jungbluth, N., Althaus, H.-J., Doka, G., Dones, R., Hellweg, S., Hischier, R., Humbert, S., Margni, M., Nemecek, T. and Spielmann, M. Implementation of Life Cycle Impact Assessment Methods. CD-ROM Final report ecoinvent v2.0 No. 3, Swiss Centre for Life Cycle Inventories, Dübendorf, CH, 2007. [32] Frischknecht, R., Steiner, R. and Jungbluth, N. Methode der ökologischen Knappheit - Ökofaktoren 2006. Methode für die Wirkungsabschätzung in Ökobilanzen. . Bafu, Bern (Switzerland), 2009. [33] Goedkoop, M., Heijungs, R., Huijbregts, M. A. J., de Schreyver, A., Struijs, J. and Van Zelm, R. ReCiPe 2008 - A life cycle impact assessment method which comprises harmonised category indicators at the midpoint and the endpoint level. First edition / Report I: Characterisation. VROM - Ministery of Housing Spatial Planning and Environment, Den Haag (the Netherlands), 2009. [34] Hagmann, M. and Hischier, R. Taking a close look at the eco-balance of coffee capsules: It All Depends on the Coffee. Empa Media Release, Dübendorf/St. Gallen/Thun (Switzerland), 10th May, 2011.
230

Climate Change Impact of Electronic Media Solutions: Case Study of the Tablet Edition of a Magazine
Mohammad Ahmadi Achachlouei1,2, Åsa Moberg1,2, Elisabeth Hochschorner1,2
1Division of Environmental Strategies Research—fms, Department of Urban Planning and Environment,
Royal Institute of Technology (KTH), Drottning Kristinas väg 30, 100 44 Stockholm, Sweden {mohammad.achachlouei, asa.moberg, elisabeth.hochschorner} @abe.kth.se
2Centre for Sustainable Communications (CESC), Royal Institute of Technology (KTH),
Osquars Backe 14, 100 44 Stockholm, Sweden
ABSTRACT Shifts from print media to electronic media may be regarded as a possibility for promoting sustainability. However, the benefits of electronic media are not unquestioned. Previous studies on the environmental impacts of print and electronic media have shown that there is no easy answer. Contributing to this field of research, the present study sought to assess the climate change impact of the tablet edition of a magazine using a life cycle perspective. Results showed that with few readers the emerging tablet version had a higher potential climate change impact per reader than the mature tablet version, although the latter had a substantially longer reading time per copy. The contribution of content production, electronic distribution, reading on tablet and waste treatment of tablet to the impact was analysed. The sensitivity analysis of electricity mix indicated that this was an important factor that clearly influenced the overall results.
Keywords Climate change, carbon footprint, information and communications technology (ICT), electronic media, industrial ecology, life cycle assessment (LCA), technology and environment, magazines
1. INTRODUCTION In our path toward a more sustainable society, it is critical to have a better understanding of the environmental burdens of both conventional products and their new alternatives. Scientific measurements of these burdens using credible tools (such as life cycle assessment, LCA) can support informed decisions on production and consumption of products.
The media sector is experiencing considerable changes. Enabled by information and communication technology (ICT), new ways of distributing content are being developed and widely used. Shifts from print media to electronic media may be regarded as a possibility for promoting sustainability. For example, by dematerialising media products such as newspapers, books and magazines in their electronic version, forest resources and energy are not needed for paper production and environmental impacts associated with the distribution of print media can be avoided.
However, the benefits of electronic media and ICT-based solutions are not unquestioned. Environmental drawbacks of ICT have been addressed in the literature (e.g. [4], [25]). Previous studies on the environmental impacts of print and electronic media have shown that there is no easy answer regarding the type of product that is preferable from an environmental perspective (e.g. [21], [17], [22], [9], [13]). These studies include media products such as daily newspapers, literary books, scholarly books and magazines and their electronic versions read on the computer, except for a study on books and a study on newspapers [21, 22], in which an e-ink tablet device is studied.
Contributing to this field of research, the present study sought to assess the climate change impact of the tablet edition of a magazine using a life cycle perspective. The study examined the impacts of the tablet edition in its current emerging state, which means that it is currently not a mature product and that the number of copies and reading time per copy are low compared with those of the print edition. The impacts of a potential future, more mature, version of the tablet edition were also examined. In the latter scenario the number of copies was increased so that it comprised half the current print edition. The reading time per copy was increased to the same level as for the current print version.
2. METHOD AND DATA 2.1 Life cycle assessment Life cycle assessment was used for the assessment, here focusing on the potential climate impact. The methodology provides standard guidance on the compilation and evaluation of the inputs, outputs and potential environmental impacts of a product system throughout the life cycle [2]. The life cycle includes extraction of raw material, production, use and disposal of a product (i.e. from cradle to grave). The standard methodological guidelines as specified in ISO 14044 [16] were followed in this study.
In this LCA we used the modelling and analysis software SimaPro, version 7.2.2. Data were primarily chosen from actors in the supply chain of the product studied. When this was not possible, data were taken from the Ecoinvent 2.2 database [14]. The impact assessment method ReCiPe was used [12].
2.2 The system The system boundary, which represents the life cycle processes considered in the present study, included the content production
ICT4S 2013: Proceedings of the First International Conference on Information and Communication Technologies for Sustainability, ETH Zurich, February 14-16, 2013. Edited by Lorenz M. Hilty, Bernard Aebischer, Göran Andersson and Wolfgang Lohmann. DOI: http://dx.doi.org/10.3929/ethz-a-007337628
231
(district heating and cooling, electricity, office paper, production of electronic office equipment, transportation of electronic office equipment, business trips, transportation by delivery firms, and studio photo sessions), electronic distribution of the magazine (modem, router, access network, internet infrastructure, data centre, and operator activities), as well as production, distribution and disposal of the tablet and electricity use for reading the magazine on the tablet. Moreover, based on the assumptions and estimations made by a recycling company, waste treatment of the studied tablet was covered, assuming that 80% of the discarded tablet was processed in a recycling system and the remaining 20% went to incineration.
The basic functional unit in this study was defined as: One reader’s use of one copy of the tablet edition of a magazine, and the year studied was 2010. The magazine, called Sköna Hem, focuses on interior design and has 14 issues per year.
Some important parameters defining the system studied are presented in Table 1. The life time of tablet device was assumed to be 3 years, which is consistent with other studies [1]. The large size of the electronic magazine (163 MB) is mainly due to its high-quality photos associated with the magazine’s focus on interior design.
Table 1. Description of the system studied
Parameter Value Unit
Size of one magazine stored on server
163 MB / copy
Number of downloads per issue (emerging state)
158 downloads / issue
Number of downloads per issue (mature state)
46 679 downloads / issue
Reading time (emerging state) 9 min / copy
Reading time (mature state) 41 min / copy
Life time of device 3 Years
Share of overall content production allocated to the tablet version (emerging state)
1.7 %
Share of overall content production allocated to the tablet version (mature state)
50 %
2.3 Life cycle inventory data Life cycle inventory data are briefly presented below. For processes taking place in Sweden we used Swedish electricity mix [11], sources of which are shown in Table 2. This Swedish mix gives 102 g CO2eq/kWh. Data on electricity production and distribution were taken from the Ecoinvent database, “Electricity, low voltage, at grid/SE” [6].
2.3.1 Content production Inventoried processes for content production included total electricity use in the office, district heating and cooling, production and transportation of electronic office equipment, business trips, office paper, transportation by delivery firms, and studio photo sessions. Some office activities are shared between employees who produce the content and those who organise courses in interior design. Environmental impacts were allocated here based on full-time employee equivalents (FTEs). In total, 14.8 fulltime FTEs work at the office: 13.8 FTEs are dedicated to
magazine content production and 1 FTE works only on the courses (the impact of the latter was excluded from our analysis).
The electricity use at the Sköna Hem office (83 kWh/m2 in 2010 [23]) includes all electricity consumed at the office (including light, electronic devices and office equipment).
The carbon footprint of district heating used in the office (59 kWh/m2 in 2010 [23]) was 82 g CO2eq/kWh [10]. For district cooling (50 kWh/m2 [23]), according to the energy company [29] ‘green electricity’ was used, which we modelled using a dataset for Swedish hydropower electricity at the grid [8]. The building where the office is located contains cellar storage, restaurant, shops and offices. It was not possible to get specific information on heat consumption for office space, so the average figure used is an estimation.
Data on manufacturing of electronic office equipment (as well as raw material extraction and transportation) were taken from the Ecoinvent database [18]. To model LCD screens of various sizes (20, 21, 27, and 26 inches), data for a 17” LCD flat screen were used. Since there is no suggested or straight-forward way to extrapolate the environmental inputs and outputs to larger screen sizes, the data were used unadjusted. This may have meant a slight underestimation of impact. Copy machines were modelled based on printer laser jet data. Emissions from the production and transportation of mobile phones were taken into account [3]. The production of the scanner was not modelled due to lack of data.
Table 2. Sources of electricity in Swedish and UCTE mix [11]
Electricity source in Swedish mix
Share (%)
Electricity source in UCTE mix
Share (%)
Nuclear, domestic 46 Fossil 51
Hydropower, domestic 36 Nuclear 32
Finnish mix, import 4.3 Hydropower 11
Natural wood chips, domestic
4 Pumping storage (“pumpspeicherung”)
1.3
Danish mix, import 1.5 Renewables 3.1
Norwegian mix, import 1.4 Waste 1.4
Polish mix, import 1.4
Oil, domestic 1.2
The transportation of electronic office equipment was assumed to be by boat from Shanghai to Europe (Rotterdam) and further to the users in Stockholm by truck (>16 tons). Data on truck and freight ship transportation were taken from the Ecoinvent database [28].
For business trips by the employees, the impact of three return flights from Stockholm to Paris and seven from Stockholm to Milan [5] was modelled using data for transport by aircraft in Europe [28]. The impact of taxi trips (total distance of taxi trips estimated at 1186 km, based on expenditure figures) was modelled using a dataset for transport by passenger car in Europe [28]. Taxi expenditure data also included trips by freelance staff. Public transportation was not included in the inventory data.
Sköna Hem has on average 50 studio photo sessions per year. The environmental impact of the photo sessions is hard to assess, since there are no readily available data on environmental parameters for this. Included in the modeling of the photo sessions environmental impact is transport of the photographer, electronic equipment and energy use in the studio. For transportation it is assumed that the photographer uses a car, and an average distance within Stockholm area is roughly assumed as 3 km.
232

Allocation of content production. The environmental impact of content production was split between the print and tablet editions of the magazine. The 0.5 FTE specifically working with the tablet edition was naturally accounted for in that product system. For the rest of the impact of content production, an allocation was made based on the number of copies sold (2 212 electronic copies per year and 1 307 600 print copies per year), giving 0.2% of the remaining impact of content production to the tablet emerging version. In total, 1.7% of the content production was allocated to the tablet emerging version. For the mature version, this share was 50%, i.e. 653 500 electronic copies per year and 653 500 print copies per year.
2.3.2 Electronic distribution The tablet magazine was assumed to be downloaded to a tablet device in the format of a 163 MB app file through a WiFi wireless LAN. The distribution network (Table 3) was mainly modelled based on the study by Malmodin and Lundén [20] with updated results gathered in personal communication with Malmodin [19]. In addition, a dataset from Ecoinvent was used, as described in Table 3.
Table 3. Network components and their electricity use and manufacturing greenhouse gas emissions in 2010 for an average user
Network components Electricity, at operation
Manufacturing Emissions
CPE (customer premises equipment), average of modem and router setups in Sweden, which means 100% of users have modems and 50% of users have routers.
Modem (9W): 0.22 kWh/GB Router (9W): 0.11 kWh/GB
3.6 g CO2e / GB [Ecoinvent dataset: “Network access devices, internet, at user/CH/I,” assuming 360 GB per subscriber line per year]
Access network: DSLAM, cables DSLAM: 0.083 kWh/GB
Data transport/transmission and IP edge/metro/ core network ~ Internet
0.1 kWh/GB
14 g CO2e / GB
Data center
0.4 kWh/GB 25 g CO2e / GB
Cable infrastructure - 14 g CO2e / GB
Operator activities: cars, offices, office equipment, paper, operational maintenance
0.009 kWh/GB 11 g CO2e / GB (not manufacturing, but heating and travel related to operator activities)
2.3.3 Reading magazine 2.3.3.1 Production & distribution of tablet To inventory production of a tablet device, an iPad2 was obtained and disassembled into pieces that could be identified by the technical specification for the tablet. The weight and size of these disassembled parts were measured [7]. The manufacturing of components was modelled using the Ecoinvent database [14]. Contacting Apple for detailed data on the environmental impacts of manufacturing proved unfruitful. Thus to model the assembly electricity consumed in tablet production, we applied as an estimate the amount of electricity used for assembly in laptop production, as modelled in the Ecoinvent dataset “Laptop computer, at plant/GLO” (1.67 kWh per pcs). Assuming assembly in China, the Ecoinvent dataset “Electricity, medium voltage, at grid/CN” was used (1180 g CO2eq/kWh).
There were some data missing in modelling the components of the tablet, including the capacitive touch film and flex film (multi-touch screen type). Apple’s data on GHG emissions from the manufacturing of iPad2 indicate 63 kg CO2e/device (including packaging), while the modelled tablet in this study gave 36.2 kg CO2e. Transportation of the tablet was assumed to be by boat from Shanghai to Europe and further to the users in Stockholm by truck. The impact of tablet production and distribution was allocated to reading of the tablet edition, based on the use time. The overall reading time of the tablet was assumed to be 14 hours/week during a 3-year lifetime.
2.3.3.2 Electricity use of reading magazine on tablet From the technical specifications of the iPad2 [1, 15], we calculated the energy use for reading the magazine, based on the electricity consumed for charging the battery and the maximum battery life in Wi-Fi mode. The energy use per charging session is 41.85 Wh, and the tablet use time supported by one charging session in Wi-Fi mode is 10 h.
2.3.4 Waste treatment of tablet Data on possible disposal of the tablet were gathered from the electronics recycling company Stena Technoworld [27]. They examined the tablet device disassembled earlier in this project, and provided an indication of how a tablet device could be disposed of.
For all tablets, it was assumed that 20% of the discarded tablet is not processed in a recycling system, but goes directly to a municipal waste incineration plant, a similar assumption to that in a previous study on mobile phones [26]. Both recycling and incineration were credited for producing secondary raw materials and heat and electricity by expanding the system and assuming that these additional products provided by the studied system replaced the same produced from primary raw materials.
2.3.5 Sensitivity analyses 2.3.5.1 UCTE electricity mix A sensitivity analysis was conducted for the electricity mix by replacing the Swedish electricity mix used in the study by an average European electricity mix, i.e. Union for the Co-ordination of Transmission of Electricity (UCTE) mix [11], sources of which are shown in Table 2. This was done in order to investigate whether using Swedish electricity mix with the majority originating from hydro and nuclear power had a significant influence on the results. If this were the case, the same kind of magazine in another European country would have a considerably different potential impact. The UCTE mix gives 594 g CO2eq/kWh [6].
2.3.5.2 Overall use time of tablet The assumption on overall use of the tablet device is highly uncertain and will vary greatly between different readers. Thus, this assumption was tested in sensitivity analysis. The results of the reference scenario indicated that manufacturing of the tablet device, which is the part where the resulting impact is affected by the overall use time assumed, was a minor reason for the overall potential impact. Therefore only the lower use was tested in the sensitivity analysis.
2.3.6 High number of electronic copies As the reference scenario showed that the content production may be of high importance for the tablet version when few copies are
233
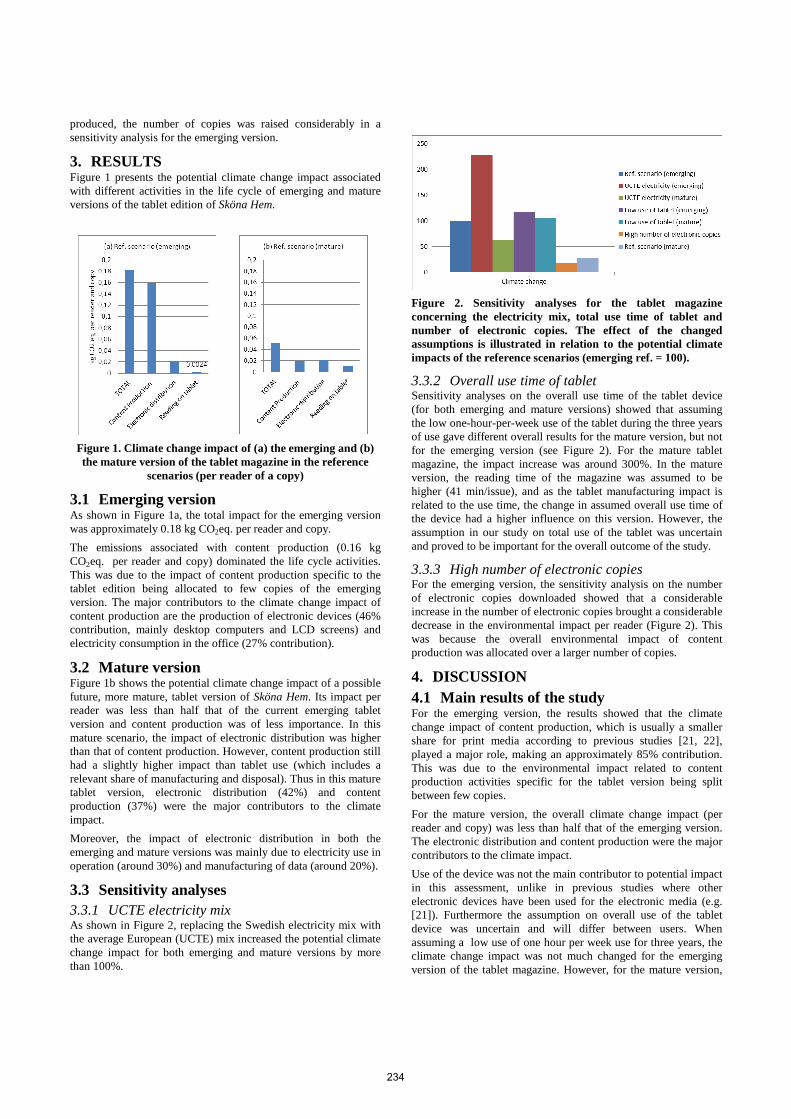
produced, the number of copies was raised considerably in a sensitivity analysis for the emerging version.
3. RESULTS Figure 1 presents the potential climate change impact associated with different activities in the life cycle of emerging and mature versions of the tablet edition of Sköna Hem.
Figure 1. Climate change impact of (a) the emerging and (b) the mature version of the tablet magazine in the reference
scenarios (per reader of a copy)
3.1 Emerging version As shown in Figure 1a, the total impact for the emerging version was approximately 0.18 kg CO2eq. per reader and copy.
The emissions associated with content production (0.16 kg CO2eq. per reader and copy) dominated the life cycle activities. This was due to the impact of content production specific to the tablet edition being allocated to few copies of the emerging version. The major contributors to the climate change impact of content production are the production of electronic devices (46% contribution, mainly desktop computers and LCD screens) and electricity consumption in the office (27% contribution).
3.2 Mature version Figure 1b shows the potential climate change impact of a possible future, more mature, tablet version of Sköna Hem. Its impact per reader was less than half that of the current emerging tablet version and content production was of less importance. In this mature scenario, the impact of electronic distribution was higher than that of content production. However, content production still had a slightly higher impact than tablet use (which includes a relevant share of manufacturing and disposal). Thus in this mature tablet version, electronic distribution (42%) and content production (37%) were the major contributors to the climate impact.
Moreover, the impact of electronic distribution in both the emerging and mature versions was mainly due to electricity use in operation (around 30%) and manufacturing of data (around 20%).
3.3 Sensitivity analyses 3.3.1 UCTE electricity mix As shown in Figure 2, replacing the Swedish electricity mix with the average European (UCTE) mix increased the potential climate change impact for both emerging and mature versions by more than 100%.
Figure 2. Sensitivity analyses for the tablet magazine concerning the electricity mix, total use time of tablet and number of electronic copies. The effect of the changed assumptions is illustrated in relation to the potential climate impacts of the reference scenarios (emerging ref. = 100).
3.3.2 Overall use time of tablet Sensitivity analyses on the overall use time of the tablet device (for both emerging and mature versions) showed that assuming the low one-hour-per-week use of the tablet during the three years of use gave different overall results for the mature version, but not for the emerging version (see Figure 2). For the mature tablet magazine, the impact increase was around 300%. In the mature version, the reading time of the magazine was assumed to be higher (41 min/issue), and as the tablet manufacturing impact is related to the use time, the change in assumed overall use time of the device had a higher influence on this version. However, the assumption in our study on total use of the tablet was uncertain and proved to be important for the overall outcome of the study.
3.3.3 High number of electronic copies For the emerging version, the sensitivity analysis on the number of electronic copies downloaded showed that a considerable increase in the number of electronic copies brought a considerable decrease in the environmental impact per reader (Figure 2). This was because the overall environmental impact of content production was allocated over a larger number of copies.
4. DISCUSSION 4.1 Main results of the study For the emerging version, the results showed that the climate change impact of content production, which is usually a smaller share for print media according to previous studies [21, 22], played a major role, making an approximately 85% contribution. This was due to the environmental impact related to content production activities specific for the tablet version being split between few copies.
For the mature version, the overall climate change impact (per reader and copy) was less than half that of the emerging version. The electronic distribution and content production were the major contributors to the climate impact.
Use of the device was not the main contributor to potential impact in this assessment, unlike in previous studies where other electronic devices have been used for the electronic media (e.g. [21]). Furthermore the assumption on overall use of the tablet device was uncertain and will differ between users. When assuming a low use of one hour per week use for three years, the climate change impact was not much changed for the emerging version of the tablet magazine. However, for the mature version,
234

the increase was considerable (360%). This lower overall use of the tablet use meant that it became the major contributor to the climate impact (nearly 80%). This emphasises the need to use electronic devices efficiently and also to avoid upgrading to new versions too often.
The sensitivity analysis of electricity mix indicated that this was an important factor that clearly influenced the overall results. Changing from Swedish to a European average electricity mix (UCTE) would generally increase the potential environmental burdens of tablet magazine. For example, the potential climate change impact of the mature version increased by more than 550%.
4.2 Comparison with previous studies An LCA study of an E-ink tablet e-paper newspaper in which the functional unit of the study was ‘the consumption of a newspaper during one year by one unique reader’ [22] found that for the climate change impact category, production of the tablet device made the largest contribution of the tablet newspaper life cycle (e.g. around 85% of total CO2eq. emissions). In contrast, in our study content production (emerging version) or electronic distribution (mature version) was the major contributor. However, the former study examined a newspaper rather than a magazine and key assumptions included a reading time of 30 minutes per day and 50% of the overall use time being devoted to reading the newspaper [22]. These assumptions naturally led to a higher share of the manufacturing environmental impacts than our study, where 0.20 and 1.3% of the overall use time of the tablet was allocated to reading the magazine for the emerging and mature versions, respectively. It should also be noted that in the former study, data on content production were limited only to electricity and heat, compared with the more detailed data used in our study. The electronic distribution data in their study were also limited and uncertain.
Comparing the tablet magazine with the traditional print magazine was not in the scope the present paper. However, the potential climate change impact of traditional print magazine has been studied in previous studies. For example, a Finnish study [24] resulted in 1.14-1.35 kg CO2eq. /kg magazine, and a Swedish study in 0.99 kg CO2 eq. /kg magazine [17].
4.3 Limitations and future work As with all LCAs, some data were missing or uncertain in the present study. The limitations assumed to be most important are discussed below.
4.3.1 Limitations in inventory of content production Regarding the electronic equipment used in the office for content production, there are uncertainties associated with the data for manufacturing, which are rather old. Generic data were used for the manufacturing of electronic devices and these data were from the period 2002-2005.
4.3.2 Limitations in inventory of electronic distribution The data relating to the components used to model the tablet manufacturing were also old and rather uncertain. Based on the components found in a tablet device, data for similar components in the Ecoinvent database [14] were used to estimate the climate impact related to manufacturing.
4.3.3 Limitations in inventory of waste treatment Waste management of the office electronic devices was not modelled in this study. Waste management of tablets is currently unknown and here assumptions based on communications with a recycling company were used as estimates. Other data on recycling and incineration were taken from Ecoinvent (Swiss, European or global data).
Overall, the results of the study give an indication of the potential climate change impacts of a tablet magazine. Further studies are needed to examine the environmental impacts in more detail and to elaborate upon user practices for this medium.
5. CONCLUSIONS With few readers, the emerging tablet version had a higher potential climate change impact per reader than the mature tablet version, although the latter had a substantially longer reading time per copy.
For the tablet edition, content production tended to be the major contributor to the climate change impact, especially when readers were few (here for emerging version). With more readers, electronic distribution became a relatively more important contributor. Low overall use time of the device in the mature version resulted in tablet manufacturing being the main contributor to climate impact.
Key factors influencing the overall results for the potential climate change impact of the tablet magazine proved to be number of readers, electricity mix used and overall use of tablet.
Using generic data for the electronic components of the tablet provided more comprehensive data sets, but these were not specific to the actual product studied. However, as environmental data are not provided to any extent or with good transparency for these types of products by the manufacturers, this type of estimation is often necessary.
6. REFERENCES
[1] Apple 2011. iPad 2 Environmental Report. Apple. [2] Bauman, H. and Tillman, A.-M. 2004. The Hitch Hiker’s
Guide to LCA. Studentlitteratur AB. [3] Bergelin, F. 2008. Life cycle assessment of a mobile phone
— a modelon manufacturing, using, and recycling. Uppsala University.
[4] Berkhout, F. and Hertin, J. 2004. De-materialising and re-materialising: digital technologies and the environment. Futures. 36, 8 (Oct. 2004), 903-920.
[5] Blom, C. 2011. Personal communication with Claes Blom, Editor-in-chief, Sköna hem, Bonnier Tidskrifter AB.
[6] Bolliger, R. and Bauer, C. 2007. Wasserkraft. Sachbilanzen von Energiesystemen. Final report No. 6 ecoinvent data v2.0. Volume: 6. Swiss Centre for LCI, PSI. Dübendorf and Villigen, CH. Technical Report #6. Paul Scherrer Institut Villigen, Swiss Centre for Life cycle Inventories.
[7] Daijavad, P. 2011. Personal communication with Patrik Daijavad, PDJ Development.
[8] Dones, R. et al. 2007. Life Cycle Inventories of Energy Systems: Results for Current Systems in Switzerland and other UCTE Countries (Data as implemented in SimaPro 7.3.2). Technical Report #5. Paul Scherrer Institut Villigen, Swiss Centre for Life cycle Inventories.
235

[9] Enroth, M. 2009. Environmental impact of printed and electronic teaching aids, a screening study focused on fossil carbon dioxide emissions. Advances in Printing and Media Technology. 36, (2009).
[10] Fortum Värme 2011. Stockholm Fortum Värme och miljön 2010. Fortum.
[11] Frischknecht, R. et al. 2007b. Strommix und Stromnetz, Data v2.0, ecoinvent report No 6. Swiss Centre for Life Cycle Inventories.
[12] Goedkoop, M. et al. 2009. ReCiPe 2008, Report I: Characterisation. Ministry of VROM.
[13] Hischier, R. and Reichart, I. 2003. Multifunctional electronic media-traditional media. The International Journal of Life Cycle Assessment. 8, 4 (Jul. 2003), 201-208.
[14] Hischier, R. et al. 2007. Life Cycle Inventories of Electric and Electronic Equipment: Production, Use and Disposal. Final report ecoinvent data v2.0. Technical Report #18. Swiss Centre for Life Cycle Inventories.
[15] iPad 2 - Technical Specifications: 2011. http://support.apple.com/kb/SP622. Accessed: 2012-06-17.
[16] ISO 2006. ISO 14040. Environmental Management - Life cycle Assessment - Principles and framework.
[17] Kronqvist, M. et al. 2010. Miljöbedömning av mediekanalerna papperstidskrift och Internetpublicering. Technical Report #97. Innventiarapport.
[18] Lehmann, M. and Hischier, R. 2007. Part III Electronic devices (2007) Empa /technology & Society Lab, Swiss Centre for Life Cycle Inventories, Dübendorf 2007.Data as implemented in SimaPro 7.1.8. Life Cycle Inventories of Electric and Electronic Equipment: Production, Use and Disposal. ecoinvent report No. 18.
[19] Malmodin, J. 2012. Personal communication with Jens Malmodin, Ericsson Research department EMF Safety and Sustainability, Ericsson AB, Stockholm, Sweden.
[20] Malmodin, J. and Lundén, D. 2011. Life cycle assessment of ICT networks and primary subscription services in Sweden. NorLCA, 15-16 September 2011 (Helsinki, 2011).
[21] Moberg, Å. et al. 2011. Books from an environmental perspective—Part 2: e-books as an alternative to paper books. The International Journal of Life Cycle Assessment. 16, 3 (Feb. 2011), 238-246.
[22] Moberg, Å. et al. 2010. Printed and tablet e-paper newspaper from an environmental perspective — A screening life cycle assessment. Environmental Impact Assessment Review. 30, 3 (Apr. 2010), 177-191.
[23] Österberg, N. 2011. Personal communication with Niclas Österberg, Bonnier Fastigheter.
[24] Pihkola, H. et al. 2010. Carbon footprint and environmental impacts of print products from cradle to grave. Results from the LEADER project (Part 1). VTT.
[25] Plepys, A. 2002. The grey side of ICT. Environmental Impact Assessment Review. 22, 5 (Oct. 2002), 509-523.
[26] Scharnhorst, W. et al. 2006. Life cycle assessment of second generation (2G) and third generation (3G) mobile phone networks. Environment International. 32, 5 (Jul. 2006), 656-675.
[27] Sjölin, S. 2011. Personal communication with Sverker Sjölin, Stena Technoworld.
[28] Spielmann, M. et al. 2007. Transport Services. ecoinvent report (data as implemented in SimaPro 7.3.2). Technical Report #14. Swiss Centre for Life Cycle Inventories.
[29] Wikström, U. 2011. Personal communication with Ulf Wikström, Fortum Heat Scandinavia.
236
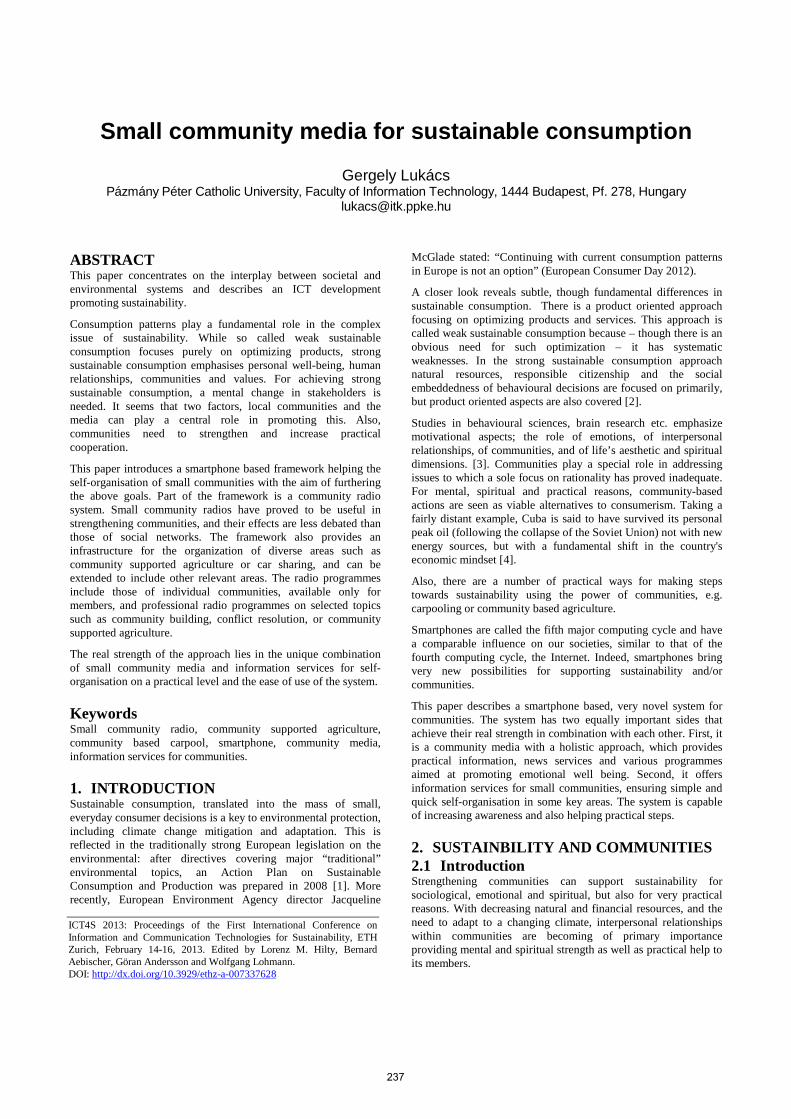
Small community media for sustainable consumption
Gergely Lukács Pázmány Péter Catholic University, Faculty of Information Technology, 1444 Budapest, Pf. 278, Hungary
ABSTRACT This paper concentrates on the interplay between societal and environmental systems and describes an ICT development promoting sustainability.
Consumption patterns play a fundamental role in the complex issue of sustainability. While so called weak sustainable consumption focuses purely on optimizing products, strong sustainable consumption emphasises personal well-being, human relationships, communities and values. For achieving strong sustainable consumption, a mental change in stakeholders is needed. It seems that two factors, local communities and the media can play a central role in promoting this. Also, communities need to strengthen and increase practical cooperation.
This paper introduces a smartphone based framework helping the self-organisation of small communities with the aim of furthering the above goals. Part of the framework is a community radio system. Small community radios have proved to be useful in strengthening communities, and their effects are less debated than those of social networks. The framework also provides an infrastructure for the organization of diverse areas such as community supported agriculture or car sharing, and can be extended to include other relevant areas. The radio programmes include those of individual communities, available only for members, and professional radio programmes on selected topics such as community building, conflict resolution, or community supported agriculture.
The real strength of the approach lies in the unique combination of small community media and information services for self-organisation on a practical level and the ease of use of the system.
Keywords Small community radio, community supported agriculture, community based carpool, smartphone, community media, information services for communities.
1. INTRODUCTION Sustainable consumption, translated into the mass of small, everyday consumer decisions is a key to environmental protection, including climate change mitigation and adaptation. This is reflected in the traditionally strong European legislation on the environmental: after directives covering major “traditional” environmental topics, an Action Plan on Sustainable Consumption and Production was prepared in 2008 [1]. More recently, European Environment Agency director Jacqueline
McGlade stated: “Continuing with current consumption patterns in Europe is not an option” (European Consumer Day 2012).
A closer look reveals subtle, though fundamental differences in sustainable consumption. There is a product oriented approach focusing on optimizing products and services. This approach is called weak sustainable consumption because – though there is an obvious need for such optimization – it has systematic weaknesses. In the strong sustainable consumption approach natural resources, responsible citizenship and the social embeddedness of behavioural decisions are focused on primarily, but product oriented aspects are also covered [2].
Studies in behavioural sciences, brain research etc. emphasize motivational aspects; the role of emotions, of interpersonal relationships, of communities, and of life’s aesthetic and spiritual dimensions. [3]. Communities play a special role in addressing issues to which a sole focus on rationality has proved inadequate. For mental, spiritual and practical reasons, community-based actions are seen as viable alternatives to consumerism. Taking a fairly distant example, Cuba is said to have survived its personal peak oil (following the collapse of the Soviet Union) not with new energy sources, but with a fundamental shift in the country's economic mindset [4].
Also, there are a number of practical ways for making steps towards sustainability using the power of communities, e.g. carpooling or community based agriculture.
Smartphones are called the fifth major computing cycle and have a comparable influence on our societies, similar to that of the fourth computing cycle, the Internet. Indeed, smartphones bring very new possibilities for supporting sustainability and/or communities.
This paper describes a smartphone based, very novel system for communities. The system has two equally important sides that achieve their real strength in combination with each other. First, it is a community media with a holistic approach, which provides practical information, news services and various programmes aimed at promoting emotional well being. Second, it offers information services for small communities, ensuring simple and quick self-organisation in some key areas. The system is capable of increasing awareness and also helping practical steps.
2. SUSTAINBILITY AND COMMUNITIES 2.1 Int roduction Strengthening communities can support sustainability for sociological, emotional and spiritual, but also for very practical reasons. With decreasing natural and financial resources, and the need to adapt to a changing climate, interpersonal relationships within communities are becoming of primary importance providing mental and spiritual strength as well as practical help to its members.
ICT4S 2013: Proceedings of the First International Conference on Information and Communication Technologies for Sustainability, ETH Zurich, February 14-16, 2013. Edited by Lorenz M. Hilty, Bernard Aebischer, Göran Andersson and Wolfgang Lohmann. DOI: http://dx.doi.org/10.3929/ethz-a-007337628
237

2.2 Sociology, Emotional and Spiritual Aspects Concerning sociological issues, mitigation of climate change and/or adaptation to it, as well as rising energy prices lead to a shift in power structures [5]. Local leaders, organizations, personal connections and local economies will play a significantly larger role than in past decades. Locally produced food, local energy sources are increasingly sought after. Protection against weather extremes is also largely a local issue. Local issues are often very practical and transparent. In many cases (unlike on a global level), there is no need for reasoning about climate change, it is often enough to appeal to the common sense of citizens and the need for saving resources.
Brain scientists argue that emotions play a vital role in mental processes such as learning or memorizing. Also, there is evidence that for the survival of animal populations a certain balance is needed: the social contacts the brain is capable of tracking and the sizes of the populations have to be in the same order of magnitude. This community size favours selfless behaviour, which, in turn, is necessary for the survival of that population.
Conflicts are natural in communities, and a conflict itself is value-neutral. However, the way we deal with conflicts can be positive in that it makes the community stronger. Conversely, it can also weaken the community. Acquiring proper conflict resolution skills is therefore vital for individuals as well as communities.
Behavioural science findings show that mental health and our social interactions within the community cannot be separated from each other. Also, while extrinsic values are mostly related to “things”, more stable, less vulnerable intrinsic values are often related to interpersonal relationships [6].
Practically all experts emphasize the role of emotions, art, music etc. in the healthy functioning of communities.
2.3 Practical Level Communities can play an important role in achieving sustainability on a practical level. According to ecological footprint calculators, there are four major areas of consumption: housing, food, travel and other. Except perhaps for housing, convincing community-based solutions already exist.
Community supported agriculture (CSA) [7, 8] is a locally-based model of agriculture and food distribution. Producers, local farms and the local community are in direct contact. There is often a subscriber-based mechanism, providing safety and capital for the producers and affordable good quality food for the consumers. For community based agriculture a rethinking must take place in many areas, among others in what we eat and how we cook. Also, there is some organizational overhead (organizing food delivery or payment).
Car pooling (the sharing of car journeys, with more than one person travelling in the car) can work with a single, large pool of users or in small communities building on personal relationships among the users. The advantage of the latter is confidence within the small community and, due to common destinations and schedules, a higher chance for matching journeys.
The exchange or giveaway of used products often takes place in communities. Often, people try to give away surplus objects in the closest community, gradually widening the circle of those asked.
3. COMMUNICATION IN SMALL COMM UNITIES Electronic communication in small communities is often, wrongly, associated with social networks, just as scattershot postings on a Facebook wall are often confused with authentic communication [9].
In our personal experience, strong small communities do not often use social networks for internal communication. There is a good reason why experts in behavioural science tend to ignore social networks when studying communities: well-working communities rarely use social networks. Social networks are more used for supporting less intensive links within a larger group of people where, partly due to the time expenditure of using social networks, real life connections, real community bonds often get looser.
In a small, non representative survey carried out at our university, involving a total of 15 small Hungarian communities to which, between themselves, three Faculty members belong to, it has been found that, at least in these cases, well working communities prefer to use mailing lists and/or mobile fleets to communicate with each other.
Small community radios are very small radio stations typically with a rather low-powered radio antenna and, at least partly, local programmes. The exact form and the organisation of small community radios differ from country to country, but such radios are used from Africa through Europe to the United States. Generally, in most cases they seem to have a positive impact on communities. Studies show that they can help change (media) consumers into active participants in local communities. Also, news is not “made” for small community radios, but rather just “picked up from the street”, typically reflecting the day-to-day life of the community [10].
4. RELATED WORK There are a number of related works on ICT applications for sustainable consumption, concentrating mainly on the issue of efficiency [11]. A recent, high level overview of the field [12] presents arguments that support the approach taken in this paper, namely, that concentrating on resource efficiency by ICT alone will not produce sustainability. The strength of our current, wide-angle approach is twofold: It provides an efficient tool, a new type of media, for strengthening communities and it also offers information services making related day-to-day organisational work much easier.
5. APPROACH
5.1 Overview The current work has a number of different phases and aspects, such as the exploration of the users’ view; the creation of editorial programmes on community related issues; the creation of a relatively complicated software architecture; the software development process and testing with potential users.
5.2 User’s View In this chapter, we introduce the system from the user’s point of view, concentrating on the major functionality. Basically, it involves a framework based on smartphones and mobile internet, in which small community radios can be configured in a matter of
238
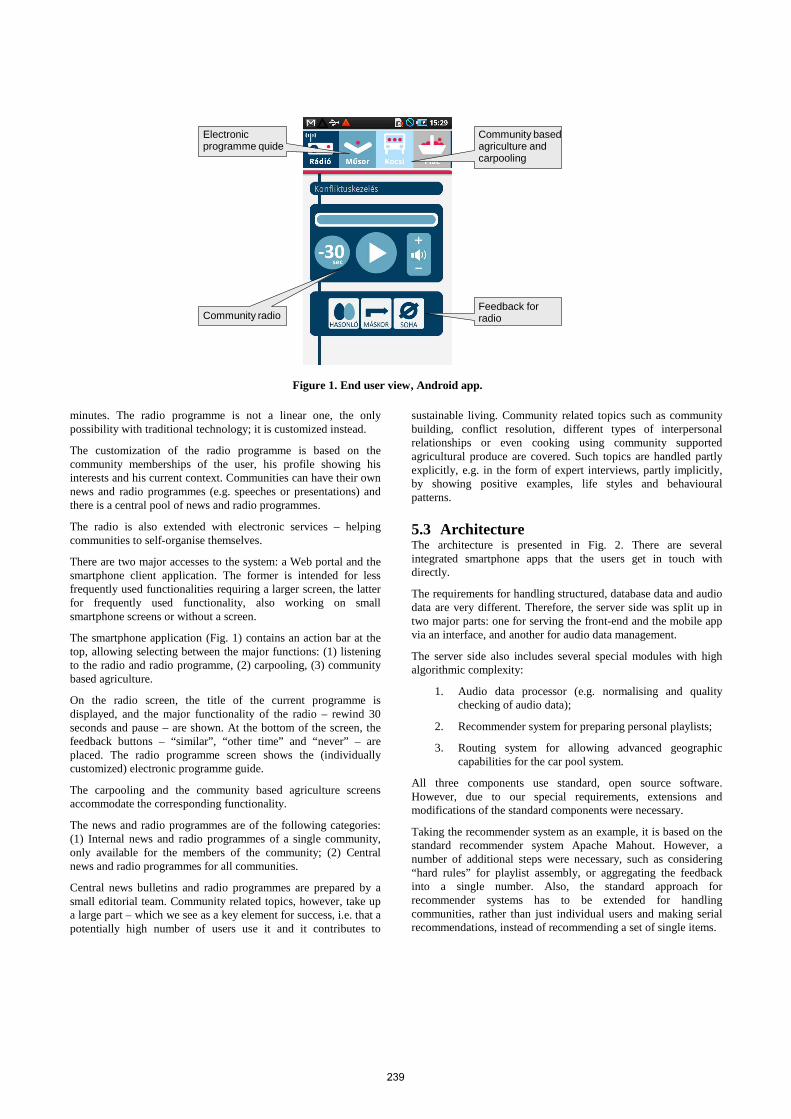
minutes. The radio programme is not a linear one, the only possibility with traditional technology; it is customized instead.
The customization of the radio programme is based on the community memberships of the user, his profile showing his interests and his current context. Communities can have their own news and radio programmes (e.g. speeches or presentations) and there is a central pool of news and radio programmes.
The radio is also extended with electronic services – helping communities to self-organise themselves.
There are two major accesses to the system: a Web portal and the smartphone client application. The former is intended for less frequently used functionalities requiring a larger screen, the latter for frequently used functionality, also working on small smartphone screens or without a screen.
The smartphone application (Fig. 1) contains an action bar at the top, allowing selecting between the major functions: (1) listening to the radio and radio programme, (2) carpooling, (3) community based agriculture.
On the radio screen, the title of the current programme is displayed, and the major functionality of the radio – rewind 30 seconds and pause – are shown. At the bottom of the screen, the feedback buttons – “similar”, “other time” and “never” – are placed. The radio programme screen shows the (individually customized) electronic programme guide.
The carpooling and the community based agriculture screens accommodate the corresponding functionality.
The news and radio programmes are of the following categories: (1) Internal news and radio programmes of a single community, only available for the members of the community; (2) Central news and radio programmes for all communities.
Central news bulletins and radio programmes are prepared by a small editorial team. Community related topics, however, take up a large part – which we see as a key element for success, i.e. that a potentially high number of users use it and it contributes to
sustainable living. Community related topics such as community building, conflict resolution, different types of interpersonal relationships or even cooking using community supported agricultural produce are covered. Such topics are handled partly explicitly, e.g. in the form of expert interviews, partly implicitly, by showing positive examples, life styles and behavioural patterns.
5.3 Architecture The architecture is presented in Fig. 2. There are several integrated smartphone apps that the users get in touch with directly.
The requirements for handling structured, database data and audio data are very different. Therefore, the server side was split up in two major parts: one for serving the front-end and the mobile app via an interface, and another for audio data management.
The server side also includes several special modules with high algorithmic complexity:
1. Audio data processor (e.g. normalising and quality checking of audio data);
2. Recommender system for preparing personal playlists;
3. Routing system for allowing advanced geographic capabilities for the car pool system.
All three components use standard, open source software. However, due to our special requirements, extensions and modifications of the standard components were necessary.
Taking the recommender system as an example, it is based on the standard recommender system Apache Mahout. However, a number of additional steps were necessary, such as considering “hard rules” for playlist assembly, or aggregating the feedback into a single number. Also, the standard approach for recommender systems has to be extended for handling communities, rather than just individual users and making serial recommendations, instead of recommending a set of single items.
Community based agriculture and carpooling
Community radio Feedback for radio
Electronic programme quide
Figure 1. End user view, Android app.
239

The monitoring of the system and usage analysis is also provided by several modules. The usage of the Web-portal is monitored by an open source Web analytics system. Data on listening to the audio material is put into a Data Warehouse – thus allowing the editorial team to get direct feedback.
5.4 Software Development The system is being developed in very close cooperation with communities. Potential users have been involved in the conception and testing of the project from the very beginning.
Developing such a system with a group of university students has been a challenge as in such environments it is not necessarily typical to build software systems with real industrial strength. Our current experience shows that by involving industrial partners, working in a team and using the infrastructure typical for an SME while creating a motivating environment, it is possible to develop quality software, while also giving students important industrial experience in a motivating setting.
5.5 Technical Challenges There are a number of technical challenges in building the system:
• Scalability of the system, especially that of the audio data handling and the routing engine;
• Recommender system for profile learning, activity recognition for context recognition;
• Audio data processing, automatic quality checking and improvement;
• Voice generation.
5.6 Testing with communities Combined technical and societal innovation typically has a larger potential than innovation in just one of the two areas. Furthermore, the traditional product development cycle with
separate conception, realisation and user testing, is too slow in such areas.
For these reasons, an exchange of ideas with potential users, both individuals and groups from different communities was initiated at a very early stage of the development. As a result, considerable feedback from users has been accumulated.
Up to now, the radio part of the system was tested with about a 100 users from 5 communities. Test users were from all age groups between ca. 18 and 70 of age, with very different educational backgrounds. Communities included students of our faculty, religious communities, the nation-wide civil organisation Association of Large Families and persons from a village with about 2000 inhabitants some 50 km from Budapest. The fixed test programme was edited for each of the communities, and for this mobile internet connection was not necessary. Feedback was collected both by the application (explicit feedback using the feedback buttons and implicit feedback by logging user’s activity), by paper based surveys and face-to-face discussions and interviews.
Questions we sought answers for included:
1. General impressions on the usefulness of the system
2. Age group of potential users
3. Priorities with regard to the topics of the radio programmes.
4. Generating ideas for potential applications
First trends can already be observed, although the evaluation of the feedback has not been completed yet. In general, there is very positive feedback to the idea of the radio as it is seen as the medium which allows various activities, such as travelling, household work etc. Interestingly, although our original target group was the age group up to about 40 years, a number of (partly
Portal Media server
PC
Users
Editorial Team
ServersEditorialSystem
AnalyticsRecommender system
Audioprocessor
Car pool routingsystem
Mobile and wiredinternet
Smartphone
Figure 2. System architecture.
240

significantly) older users also came along with smartphones and appreciated the new possibility.
Concerning the radio programme, community news and programmes were the clear favourites. Also, editorial programmes related to different aspects of community life were also very much appreciated. Concerning music, individual tastes obviously vary on a very large scale, even in a single community.
Concerning information services for community organisation, car pooling, community based agriculture and second-hand market were all considered important. In some communities, there are also special needs, e.g. the Association of Large Families handles a large number of last-minute tickets to concerts and theatres.
6. SUMMARY AND OUTLOOK In this paper, we presented a smartphone based platform for small community media and information services for community self organisation. Considerations and insights offered by various branches of science and a complex, multi-level approach have made the development of the system possible, and ensured that the outcome (with over 100 test users currently) has been very positive.
The framework requires relatively complex technical solutions, with functionality for the end users and the editorial team.
Future work is planned on a range of different issues. Substantional further software development is needed to round up and integrate the modules of the system. Technical research is required in several areas, such as automatic playlist assembly or social network measurement and benchmarking. Testing of the system with a growing test group in real life situations also has high priority.
7. ACKNOWLEDGMENTS The support of the Fidentia Foundation, the grants Nos. TÁMOP-4.2.1.B-11/2/KMR-2011-0002 and TÁMOP-4.2.2/B-10/1-2010-0014 are gratefully acknowledged. The leaders of the faculty have given indispensible help in starting the project. Discussions with a number of leading experts, especially László Antal Z. (Research Institute for Sociology, Hungarian Academy of Sciences), Bea Madocsai (Hungarian Catholic Radio), Tamás Martos (Institute of Mental Health, Semmelweis University), Henrik Hargitai (Institute for Art Theory and Media Studies, Eötvös Loránd University), Ferenc Péterfi (Association of Community Builders, Civil Radio) contributed significantly to developing the project.
8. REFERENCES [1] Communication from the Commission to the European
Parliament, the Council, the European Economic and Social Committee and the Committee of the Regions on the Sustainable Consumption and Production and Sustainable Industrial Policy Action Plan. Commission of the European Communities: Brussels, 2008.
[2] Lorek, S.: Debunking Weak Sustainable Consumption: Towards Strong Sustainable Consumption Governance. Helsinki: University of Helsinki (2009)
[3] Fromm, Erich: To Have or to Be? New York: Harper & Row (1976)
[4] Morgan, Faith: The Power of Community: How Cuba Survived Peak Oil. Film, Community Solutions (2006).
[5] Antal, Z.L.: A természet változásai és a társadalom alkalmazodóképessége (Changes in the natural environment and social adaptation), Thesis, Hungarian Academy of Sciences (2011).
[6] Martos T, Kopp M: Life goals and well-being: does financial status matter? Evidence from a Representative Hungarian Sample, SOCIAL INDICATORS RESEARCH 105: pp. 561-568, (2012).
[7] Speth, JG. The Bridge at the Edge of the World: Capitalism, the Environment, and Crossing from Crisis to Sustainability 1–78, 126–164 (Yale University Press, New Haven, 2009).
[8] Cone, C.A., Kakaliouras A.: Community Supported Agriculture (1995).
[9] Sherry Turkle: Alone Together: Why We Expect More from Technology and Less from Each Other. Basic Books (2011)
[10] Hargitai, H., Ferenczi T: Helyzetjelentés a kisközösségi rádiókról 2010. Kisközösségi rádiós felmérés 2009-2010 (Status of the Hungarian small community radios, survey of 2009-2010), Hungarian Association of Free Radio Stations (2010).
[11] Lukacs, G.: ICT Applications as a Key Element in Sustainable Consumption in Europe, in Wohlgemuth et. al. Editors, Environmental Informatics and Industrial Environmental Protection: Concepts, Methods and Tools, 23rd International Conference on Informatics for Environmental Protection, Shaker Verlag (2009).
[12] Hilty, L.M., Lohmann W and E.M. Huang: Sustainability and ICT – an overview of the field. POLITEIA, XXVII, 104, 2011, ISSN 1128-2401 pp. 13-28.
241
Biometrics for Sustainability
Dr. Jigisha Pardeshi1, Dinesh Singh Pardeshi2
1R.M.D. Sinhgad Technical Campus, Mumbai Banglore Bypass, Warje, Pune, Maharashtra, India [email protected],[email protected]
2S.J.S.’s Tirupati Institute Of Management, Shindewadi, Pune, Maharashtra, India
[email protected], [email protected]
ABSTRACT Biometrics is a technology where human traits such as faces, hand shapes, fingerprints and iris or retinas are scanned for identification and authentication. In short, biometrics utilizes the uniqueness of physical or behavioral characteristics of human beings to allow authorized access. Biometrics provide several advantages over the conventional methods of authorization; the benefits of its applications, like most of the other ICTs, outweighs the disadvantage viz. e-waste. With increasing terrorist attacks on various nations, organizations and also public are changing their priorities from privacy to security, ultimately for sustainability. With the increase in acceptance of biometrics it has become essential to grade the several existing biometrics in order to implement the most appropriate one. Though there are several human traits that can be used for identification, I have restricted my study to the comparison of the three mainstream biometrics in this research paper. Also the criteria aspects for which the performance of biometrics can be compared are numerous; cost and speed, to name a few; here I have selected accuracy, reliability and non-intrusiveness.
Keywords Biometrics, Facial scan, Hand Geometry, Fingerprint, Accuracy, Reliabilty and Non-intrusivenesss.
1. INTRODUCTION Biometrics is a security solution, which relies on detailed measurements of selected parts of human body or behavioral characteristics for authentication. Precisely, human traits such as faces, hand shapes, fingerprints and iris or retinas are scanned for identity verification or identification. In short, biometrics utilizes the uniqueness of physical or behavioral characteristics of human beings for their identification or authentication. My attempt through this research is to find out the most suitable biometric amongst the three mainstream biometrics: facial scan, hand geometry and fingerprint from the view point of manufacturers and/or vendors. (Here, in India, there are several biometric product manufacturers who themselves deal, market and sell their products instead of depending on vendors. This means most of the manufacturers play the role of vendors also)
1.1 Benefits of Biometrics over Traditional Methods of Authentication: Biometrics authenticates and determines an individual's identity by utilizing the uniqueness of his or her biological and behavioral characteristics. Other authentication methods often used are PIN method and Token (ID Card) method. Biometrics is superior to PIN or Token methods in the following ways: 1) Increased Security: Biometrics offers superior security than PIN or ID Card. Biometric methods do not involve danger of information exposure like PIN and ID Card do and unauthorized persons cannot attempt to steal or make a guess at private information. 2) Increased Convenience Today, people have to remember many passwords. They should be able to provide their passwords whenever they use their credit cards or log into various sites on the Internet. Uniform passwords can lead to serious dangers if exposed. However, biometrics does not require the user to remember our passwords.
Explanation:
Biometrics is preferred over traditional methods involving passwords, PINs, badges, or tokens for various reasons:
1. Biometrics cannot be forgotten or piggy- backed (shoulder-surfed) like a password or a PIN.
2. Biometrics cannot be stolen, lost or forged like keys, identity cards, passports and driver's licenses or badges.
3. The person to be identified is required to be physically present at the point of identification as biometric trait is a part of him/her; unlike a key, an I-card or badge.
4. Identification based on biometric techniques obviates the need to remember a password or PIN or carry a token or a badge.
5. Apart from providing tight security biometric systems have several other plus points viz. they are accurate, cost effective, robust, reliable, long term stable and prone to least error incidences.
1.2 Types of Biometrics: There are several types of biometrics: fingerprint, facial scan, hand geometry, iris scan, retina scan, ear shape, wrist veins, body odor, brain fingerprinting, thermal signature dynamics, gait recognition, voice verification and computer keystroke dynamics and many more, however, I have restricted my study to the following three mainstream biometrics:
ICT4S 2013: Proceedings of the First International Conference on Information and Communication Technologies for Sustainability, ETH Zurich, February 14-16, 2013. Edited by Lorenz M. Hilty, Bernard Aebischer, Göran Andersson and Wolfgang Lohmann. DOI: http://dx.doi.org/10.3929/ethz-a-007337628
242
1) Facial Scan Face is the oldest biometric which is used most frequently for a person identity. At the same time, according to many industry experts, it is also the most controversial of all. 2) Hand Geometry Hand geometry involves the scanning of the shape, size and other characteristics such as finger length of the hand or the complete hand palm itself. It is generally used for verification. 3) Fingerprint Fingerprint is the most commonly known method of biometric identification, which is used by police forces not only in India but in more than 30 countries including the US. Ink based fingerprints have been in use for over a century, however in recent years have gone digital. Organizations like companies and institutes have realized that fingerprint scanning is an effective means of security which deters buddy attendance.
2. NATURE OF THE STUDY The research is a survey-based explanatory study, the objective of which, is to provide a comparison of selected mainstream biometric systems regarding their strengths and weaknesses in order to provide a yardstick to users to opt for the best suitable biometric system. The study aims to understand the various aspects and factors that decide the suitability of any biometric system for a particular application, some of the deciding aspects being
1) Accuracy 2) Reliability (Cannot be fooled) 3) Non -Intrusiveness (No privacy infringement)
3. RESEARCH OBJECTIVES The key objectives of the research are to:
1) To select a biometric, which is most accurate, reliable, and least intrusive.
2) To find the perception of manufacturer/vendor.
4. RESEARCH METHODOLOGY I have carried out the research in two phases. The first phase was an exploratory phase, which dealt with developing an appropriate research framework. The second phase of the research was an explanatory research, wherein a survey using the final questionnaires was conducted to understand the concerns, issues, benefits and challenges of the significant participants of any security system viz. the manufacturers and vendors in comparison with the conventional systems adopted for security.
4.1 Developing the Questionnaires Two questionnaires, in total were prepared; before approaching the manufacturers and vendors a pilot questionnaire with all open ended questions was framed to understand the awareness and consecutive acceptance or reluctance of biometrics as a substitute to traditional security solutions like passwords and id-cards. The pilot questionnaire was then refined to produce final questionnaires with close-ended multiple-choice questions.
4.2 Sampling Plan Sample size: A total of 99 vendors and/or manufacturers dealing in security products were surveyed.
Sampling method: Census sampling method was used wherein all manufacturers and vendors dealing in security providing products in and around Pune, Maharashtra were considered. A total number of 70 vendors and/or manufacturers were found to deal with biometric products.
5. ANALYSIS AND FINDINGS The data captured from the questionnaires was duly tabulated first biometric-wise, then aspect-wise before feeding to SPSS for analysis.
5.1 Tabulation of Data From the filled questionnaires the following tables were formed for each type of biometrics. These tables depict the grades received by each biometrics for a total of 3 aspects mentioned earlier. The Likert scale used is: 5–Excellent,4–Good,3–Average,2–Satisfactory,1–Non satisfactory The table indicates the grades received by the three mainstream biometrics for the 3 selected criteria aspects/factors: Table 1. Grades received by biometrics for the selected criteria
Sr. No
Type of biometric
Criteria factors
5 4 3 2 1
1. Facial Scan
Reliability 4 14 16 25 11
Accuracy 5 11 49 3 2
Non Intrusiveness
0 7 9 17 44
2. Hand Geometry
Reliability 1 5 7 45 12
Accuracy 0 7 54 9 0
Non
Intrusiveness
3 49 14 4 0
3. Finger-print
Reliability 7 46 14 3 0
Accuracy 5 53 11 1 0
Non
Intrusiveness
0 2 9 17 42
Explanation: Out of 70 manufacturers and vendors 25 ticked on Satisfactory i.e. 2 for the aspect reliability, 49 ticked on Average i.e. 3 for the aspect accuracy and 44 on Non satisfactory i.e. 1 for the aspect intrusiveness. Explanation on similar lines can be furnished for the other two biometrics as well.
5.2 Comparison of Biometrics Regarding Selected Criteria Aspects The data collected from the questionnaires was first put into the above tables biometric-wise. Then this data was rearranged criteria aspect-wise in the following table:
243
Table 2. Grades received by biometrics for the selected criteria aspects
Sr.
No.
Criteria aspect
Type of Biometric
5 4 3 2 1
1. Reliability Facial Scan 4 14 16 25 11
Hand
Geometry 1 5 7 45 12
Fingerprint 7 46 14 3 0
2. Accuracy Facial Scan 5 11 49 3 2
Hand
Geometry 0 7 54 9 0
Fingerprint 5 53 11 1 0
3. Non Intrusive-
ness
Facial Scan 0 7 9 17 44
Hand
Geometry 3 49 14 4 0
Fingerprint 0 2 9 17 42
From the above table we get the distribution of votes achieved by each biometric for the selected criteria aspects. The Likert scale used is: 5–Excellent,4–Good,3–Average,2–Satisfactory,1–Non satisfactory
5.3 Analysis and Findings using SPSS Now as the data collected from the questionnaires after interviewing several subjects, has been tabulated and segregated criteria aspect-wise, it is ready for the actual analysis, wherein I have selected the SPSS (Statistical Package for Social Sciences) (Version 14.0) for Windows to analyze the data and the following tables are an outcome of my research data fed to the software. As I fed the data from MS Excel to SPSS to get result files, I found out the outstanding mean scores for the performance of each mainstream biometric for each criteria aspect and referred the ANOVA to see if there is considerable difference between the performance of the 3 selected mainstream biometrics; only if there is considerable difference then comparing the performance pair-wise in POST HOC test yields fruitful results, otherwise there is no point in comparison. Finally the priority decided from the POST HOC test and the mean scores are summarized to get the ranks achieved by each of the mainstream biometric in performance for each of the criteria aspect.
5.4 Descriptive Statistics Table 3 shows mean score, standard deviation and the minimum and maximum scores achieved by each of the 3 mainstream biometrics for the 3 selected criteria aspects viz reliability, accuracy and non-intrusiveness. Table 3. Table of findings – Mean score achieved by the selected mainstream biometrics
Sr.
No. Criteria
Name Of
Biometric
Mean Mini-
mum
Maxi-
mum
1. Non- Facial scan 1.8286 1.00 4.00
Intrusive-ness
Hand Geometry
3.7286 2.00 5.00
Finger-
print 1.5857 1.00 4.00
2.
Reli-ability
Facial scan 2.6429 1.00 5.00
Hand Geometry
2.1143 1.00 5.00
Finger-
print 3.8143 2.00 5.00
3. Accu-racy
Facial scan 3.2000 1.00 5.00
Hand Geometry
2.9714 2.00 4.00
Finger-
print 3.8857 2.00 5.00
The column titles in the table are explained below: • Mean means the Score received by respective biometric
out of 5. Ideally it should be close to 5. • Minimum indicates the Minimum Score obtained by
each biometric for the respective criteria aspect; performance is tested for a total of 3 criteria aspects.
• Maximum indicates the Maximum Score obtained by each biometric for the respective criteria aspect; performance is tested for a total of 3 criteria aspects.
Explanation for the aspect – NON INTRUSIVENESS:
The above table indicates the mean score of the 3 mainstream biometrics for the criteria – non intrusiveness. When it comes to verification or identification by biometrics privacy is a major concern. Public, in general, shuns away from authentication by biometrics by the thought that it will invade their privacy. If minimum privacy infringement is the criteria you are looking out for in your authentication system, then Hand geometry will rank one as its mean score is 3.7286, as it infringes privacy lesser as compared to other two mainstream biometrics.
Mean scores :- Facial scan: 1.8286 Handgeometry:3.7286 Fingerprint: 1.5857
Likewise explanation can be given for each criteria aspect.
5.5 Comparison of Mainstream Biometrics using ANOVA (An alysis Of Variance) The following table is outcome of data fed to the SPSS software and gives analysis of variance wherein significant value is extracted for each criteria aspect. Table 4. Significant value for the selected criteria aspects through ANOVA
Criteria Sum of Squares
Mean Squ-are
F P
Value
Non-Intrusive-
ness
Between Groups
274.771 68.693 95.390 .000
244
Reli-ability
Between Groups
241.446 60.361 91.549 .000
Accu-
racy
Between Groups
190.897 47.724 144.683 .000
It is expected that all these biometrics differ in performance considerably for each of the criteria aspect so that comparisons can lead to priorities of the 3 mainstream biometrics amongst themselves. If the significant value is less than 0.05, it implies that there is considerable difference between the performances of the 3 mainstream biometrics for particular criteria aspect and that their performances can be compared; in other words the comparison of their performances can yield fruitful results. On the other hand, if the significant value is greater than 0.05, it means that there is not considerable difference in the performance of the 3 mainstream biometrics for that particular criteria and the comparison of their performances is not going to yield any fruitful results; in other words they give near about same results for that particular criteria. The above table, Table 4 indicating significant value between the performance of mainstream biometrics using Analysis Of Variance gives the significant value (P value) acquired by various biometrics for the 3 criteria aspects. Referring the above table it can be seen that for all criteria aspects the significant value is 0.0 i.e. less than 0.05, thus can be compared; comparison will yield fruitful results, The further comparison is made in the Post Hoc test in next section
5.6 Post Hoc Tests ANOVA gives inferences for samples not populations. Now lets us see whether the three mainstream biometrics are comparable for an overall population through Post Hoc tests. In Post Hoc test performance of each biometric, in terms of mean scores is compared with that of every other biometric to acquire the significant difference ( P value). If there is significant difference between the mean scores of each pair of biometric then we can draw particular inference as to which biometric is better among the three for each criteria aspect. Refer Table 5: In case, the P value of the two biometrics which are under comparison is less than 0.05, the comparison of performances can lead to a fruitful decision for overall population. If the mean difference (I-J) is negative the biometric under the J heading gives better results than the biometric under I heading for that particular criteria and vice versa. Table 5. Pair wise comparison Of mainstream biometrics rendering significant value using Post Hoc test
Sr.
No.
Cri-teria As-pect
Variable
I
Variable
J
Mean Diff-
erence
(I-J)
Signifi-cant (P) value
1. Non-Intru-
sive-ness
Facial scan
Hand
geometry -1.9000 0.000
Finger-
print .2429 0.438
Hand geometry
Facial
scan 1.9000 0.000
Finger-
print 2.1429 0.000
Finger-print
Facial
scan -.2429 0.438
Hand
geometry -2.1429 0.000
2. Reli-ability
Facial scan
Hand
geometry .5286 0.001
Finger-
print -1.1714 0.000
Hand geometry
Facial
scan -.5286 0.001
Finger-
print -1.7000 0.000
Finger-print
Facial scan
1.1714 0.000
Hand
geometry 1.7000 0.000
3. Accu-racy Facial
scan
Hand
geometry .2286 0.128
Finger-print
-.6857 0.000
Hand geometry
Facial scan
-.2286 0.128
Finger-print
-.9143 0.000
Finger-print
Facial scan
.6857 0.000
Hand
geometry
.9143
0.000
Explanation: Following is the explaination given for performances of the three mainstream biometrics particularly for the selected criteria aspect – Non Intrusiveness: 1) Comparison of Facial scan with the other two
biometrics: The significant value for Hand geometry when compared with Facial scan is 0.0 i.e. less than 0.05 which indicates that there is significant difference between the performances of Facial scan and Hand geometry. The mean difference for this pair is negative, which indicates that J biometric is better than I biometric; to be precise, Hand geometry is better than Facial scan when non-intrusiveness is on top priority for the organization adopting biometrics for authentication. Hand geometry renders minimum privacy infringement.
2) Comparison of Hand geometry with the other two biometrics: The significant value for the two biometrics viz. Facial scan and Fingerprint when compared with Hand geometry is 0.0 i.e. less than 0.05 which indicates
245

that there is significant difference between each pair viz. Hand geometry and Facial scan and Hand geometry and Fingerprint. The mean difference for both the pairs is positive , which indicates that I biometric is better than J biometric; to be precise, Hand geometry is better than Facial scan and Fingerprint when minimum privacy infringement is on top priority for the organization adopting biometrics for authentication.
3) Comparison of Fingerprint with the other two biometrics: The significant value for Hand geometry when compared with Fingerprint is 0.0 i.e. less than 0.05 which indicates that there is significant difference between the performances of Fingerprint and Hand geometry. The mean difference for this pair is negative, which indicates that J biometric is better than I biometric; to be precise, Fingerprint is better than Hand geometry when minimum privacy infringement is on top priority for the organization adopting biometrics for authentication.
Explanation on same lines can be furnished for each criteria factor from the above table. This information can be utilized to rank the 3 mainstream biometrics for each criteria factor as shown in the following table. (Table 6).
5.7 Result Using the data from table 3 and table 5, in combination I have formed the below table 6 which gives the priority of the 3 mainstream biometrics for each of the 3 selected criteria aspects/factors. The sample means have been derived from table 3 and the priority of biometrics for each criteria for overall population is obtained from the Post Hoc test referring table 5. Table 6. Table of result
Sr.
No.
Criteria Aspect
Prio-rity
Name Of Biometric
Sample Mean
1. Non-Intrusiveness
1 Hand geometry
3.7286
2 Facial scan
1.8286
Fingerprint 1.5857
2. Reliability 1 Fingerprint 3.8143
2 Facial scan 2.6429
3 Hand geometry
2.1143
3. Accuracy 1 Fingerprint 3.8857
2 Facial scan
3.2
Hand geometry
2.9714
Explanation: 1) Non-Intrusiveness: Hand geometry bags the first priority for
the criteria aspect – Non-Intrusiveness, in other words its usage leads to least privacy infringement, while facial scan and fingerprint biometrics share the second priority.
2) Reliability: Fingerprint stands at the first priority for the criteria aspect – Reliability, while facial scan takes up the second priority whereas hand geometry is at third priority.
3) Accuracy: Fingerprint takes up the first priority for the criteria aspect – Accuracy, while facial and hand geometry biometrics are at third priority.
6. CONCLUSION Biometric authentication plays an important role in hindering unauthorized access at receptive places like airports, banks and ATMs. Moreover it eradicates the need of memorizing a password, changing it frequently or carrying a card, at the same time carrying the risk of losing the card, its misuse by intruders and consequent frauds. The facilities and convenience which biometrics can offer in itself debates for e-waste. Biometrics is basically a security solution and it can secure even people and further nations and thus contribute to sustainability of the world. Even developing countries like India are accepting biometrics with open hands hoping for a better quality of life. Many organizations from various sectors are willing to shift to biometrics from the traditions methods of authorization and they need a guideline to choose the best biometric. From the survey carried out on the mainstream biometrics across manufacturers and/or vendors in and around Pune, and after analysis of collected data (using SPSS) I found that there does not appear to be any one type of biometric data gathering and reading that does the "best" job of ensuring secure authentication. Each of the different biometrics have some strong points to recommend them. Some are less invasive, some are very difficult to fake while with some there are least chances of errors. Every organization should select a biometric which is most suitable to their needs, depending on the organization’s priorities. After the research carried out on mainstream biometrics I came to following conclusions regarding comparison of biometrics viz. Facial scan, hand geometry and fingerprint considering the 3 selected criteria factors viz. non-intrusiveness (no privacy infringement), reliability and accuracy that before choosing a biometric user authentication solution, an organization should evaluate its needs carefully. The result table can guide such organizations in their significant step of accepting biometrics for security.
7. ACKNOWLEDGMENTS Our thanks to Sinhgad Technical Education Soc. for the time to time support and guidance regarding research related activities.
8. REFERENCES [1] Caruso, J. 2004.Biometrics early adopters reveal secrets,
challenges, Network World fusion, (Oct 28, 2004) . www.nwfusion.com.
[2] Cutler, F. 2001. Researchers seek new methods of identification, The State News. (April 12, 2001). http://www.statenews.com/article.phtml?pk=3704.
[3] Donna, F. 2002. In The Pipeline: Fingerprints May Be Key To PC Security, Dow Jones News Service. (May 21, 2002).
[4] Frost and Sullian. 2004. Biometrics to guard against fraud: identification security on the horizon, Forensic-Evidence.com
246

[5] Gaurkar, S. and Chellappan, L. 2004. User Identification Through Keystroke Biometrics, Electronics For You,36(1), ( Jan 2004), 132-134.
[6] Ghatnekar Gauri , 2002. Practrically foolproof security for banks, Maharashtra Herald. (4 April 2002)
[7] Halan, D., 2003. Bioinformatics: Bonding genes with IT, Information Technology,12(8), (June 2003), 26-29.
[8] I.T. Bureau, Delhi, 2005. Is your identity safe or under siege?, Information Technology, 14(06), (April 2005) , 53-57.
[9] Jarvis, A. 2004. Facial recognition systems: Are privacy rights of citizens being eroded wholesale?, Identification Evidence. Forensic-Evidence.com.
[10] Light, G.R. 2002 Security vs. Liberty: weighing the options, MSU Today. (June 20, 2002) http://www.msutoday.msu.edu/research/index.php3?article=20Jun2002-9
[11] Lee Gomes, 2001. Can Facial Recognition Help Snag Terrorists?, The Wall Street Journal,(27 Sept 2001). http://public.wsj.com.
[12] Mandia, K. and Prosise C.2001 Incident Response: Investigating computer crime, Tata Mcgraw-Hill publishing company Ltd.
[13] Moshe, Y., 2002. Voice biometrics application security: identification, verification and classification, Dr. Dobb’s Journal, 27(11), (Nov 2002) , 16-22.
[14] Nanavati, S., Thieme, M., and Nanavati, R. , 2002 Biometrics: Identity verification in a networked world, Wiely-Dreamtech India Pvt. Ltd.
[15] O'Sullivan, O., 1997. Biometrics comes to life, ABA Banking Journal, (Jan 1997), http://www.banking.com/aba/january.html.
[16] Prasanna, L. N., 2003Advancements in Speech Recognition Technology, Information Technology, 12(3), (Jan 2003), 69-71.
[17] Sarkar Dibya, 2002. Biometrics awareness still low, Federal Computer Week, (Nov 6, 2002). www.fcw.com.
[18] Sarkar, I., 2003. Biometrics-based authentication: Is it really foolproof?, Electronics For You, 35(7) , (July 2003), 35-36.
[19] Kudesia, S., 2005. Face recognition: Your identity under lock and key, InformationTechnology, 14 (4), (Feb 2005), 82-83.
[20] Vaidya, G., 2004. Biometrics authentication: When God helped security, Information Technology, 13(7), (May 2004), 78-81.
[21] Vig, Sand Garg, V., 2005. Multibiometrics: Recognising you, Information Technology, 14(3), (Jan 2005), 65-68.
[22] Woodword, J.D., Orlans N. M., Higgins, and P. T., 2003. Biometrics: The ultimate reference, New Delhi: Dreamtech Press.
247
An Awareness Based Approach to Avoid Rebound Effects in ICTs
Giovanna Sissa1
1 Università degli Studi di Milano - Information Technology Department, Crema, Italy [email protected]
ABSTRACT The full exploitation of ICTs environmental potential benefits needs to take into account a social dimension, where there is a shift of role from passive user to aware user of ICT-based services.
After a short overview of the rebound effect in ICTs, the paper will focus on the role that users, consumers or citizens can play in spreading and adopting beneficial behavior. The enabling factor of this active participative role is the collective situational awareness about environmental effects of actions. Such awareness makes a green behavior easier and can counter possible rebound effects.
An Agent Based Model approach is proposed to study individual and collective behavioral changes toward sustainability using ICT-based services and for sustainable ICTs. The use of ABM to simulate how environmental awareness spread is innovative and crosses the disciplinary borders between ICTs, energy and environment disciplines, as well as social and behavioral sciences.
Keywords Environmental awareness, agent based modeling, ABM, sustainable behavior, behavior changes, reduction of limited resources consumption, social influence, social norms, spread of awareness, rebound effect, socio-technical system
1. INTRODUCTION: ICT AND SUSTAINABILITY There is overwhelming evidence that our current lifestyle is not sustainable. Energy consumption, carbon dioxide emission and depletion of scarce resources have to be reduced. ICTs (Information Communication Technologies) are pivotal to reach environmental sustainability. So the role and impact of ICTs on the environment are gaining more and more attention. This impact is a mix of positive and negative effects that is not only interesting to explore for ICT devices, but it is relevant for ICT-based services.
There is a general agreement about the need of an assessment methodology on the net environmental impact of ICT products, ICT services and ICT-based services. But all effects, both positive and negative, have to be taken into account. While the effects of ICTs on the environment are commonly ranked as first, second and third order effects, there is a gap in the analysis quality of first, second and third order effects of ICTs on environmental sustainability [17]. The first ones are relatively well known, complex but possible to be quantified. The second ones are
difficult to exactly foresee, but can be estimated at a magnitude order level. The third ones are really hard to assess.
The third order effects are long-term environmental effects and are related to the societal changes that ICTs brings along. They include the rebound effects, i.e. the unanticipated consequences that may nullify the potential benefits of ICTs in term of sustainability.
After an overview on rebound effects in Section 2, with a focus on ICTs, the paper describes a conceptual framework to avoid negative rebound effects in Section 3, where the pivot is the concept of collective awareness about the need to reduce the consumption of limited or critical resources. The socio-psychological mechanisms behind such environmental awareness are described and introduced into a socio-technical dimension, as well as the role of social influence for the spread of awareness. The use of Agent Based Model (ABM) paradigm is discussed in Section 4, while Section 5 describes the ABM components and the related development stage. The last session gives some insights on potential applications.
2. THE REBOUND EFFECT 2.1 The rebound effect in energy economics The term "rebound effect" originates in energy economics [2] and describes the systematic response to a measure, taken to reduce environmental impact, that offsets the effect of such measure. While the rebound effect literature is generally focused on energy consumption [33], the theory can be generalized to any natural resource or externality that is embodied in final consumption [23]. ICTs effects on the environment can be considered as externalities (negative or positive). Rebound effects are generally expressed as a ratio of the lost environmental benefit to the potential environmental benefit. The nature and magnitude of the rebound effects is the focus of long-running dispute within energy economics [32] and even the definition and the scope of rebound effects have been the subject of heated debate. The discussion addresses both the magnitude and the mechanisms of the rebound effects. With regard to the magnitude, analysts distinguish a weak rebound effect (efficiency measures are not as effective as expected), a strong rebound effect (most of the expected savings do not materialize), and a backfire effect (the efficiency measure leads to increased demand) [16].
With regards to the economics mechanism, literature in energy economics distinguishes between different types of rebound effect [15]: 1. The substitution effect 2. The income effect 3. Secondary effects (input-output effects, indirect effects) 4. General equilibrium or economy-wide effects 5. Transformational effects
ICT4S 2013: Proceedings of the First International Conference on Information and Communication Technologies for Sustainability, ETH Zurich, February 14-16, 2013. Edited by Lorenz M. Hilty, Bernard Aebischer, Göran Andersson and Wolfgang Lohmann. DOI: http://dx.doi.org/10.3929/ethz-a-007337628
248

The first two effects, sometimes also called direct rebound effects, are micro effects while the last three effects are macro effects.
Reduction of energy use and reduction of pollution are goals of energy and environmental economics, but an increase in production units may compensate the eco-efficiency improvements. These effects are often called back fire, take-back, offsetting behaviour or, as we shall call them, rebound effects [19].
2.2 Rebound effect in ICTs If rebound effects are a complex issue to deal with, their definition, identification and quantification becomes even more complex in ICTs field. When an ICT-based service is enabling an environmental benefit, the efficiency improvement in energy [4] or in other limited or critical resource, can be overcompensated by rebound effects [19]. Despite their importance and their extent, the ICT-related rebound effects are relatively unexplored because of the complexity of assessing future directions of production and consumption [8], [20].
Because rebound effects are long-term effects, their actual manifestation and related data are available only a longtime after the phenomenon that generated them. That is the reason why data about rebound effects on ICTs are difficult to acquire and, when available, are delayed of one (or more) technology generation. Cloud Computing for example is a field where new green opportunities are coupled with new environmental risks [21], [31]. Because different ICTs generations lead to different user behavioral patterns, such delay between the cause and the manifestation of these effects makes really difficult or impossible any concrete measure against negative rebound effects.
A theoretical in-depth analysis of rebound effects in general, and in particular in ICTs, is out of the reach of this article, while its research contribution is related to avoiding negative rebound effects.
Some general remarks before exploring an alternative approach have to be done.
The rebound effects are traditionally located inside the framework of the neo-classical economic principles, under the assumptions of full rationality, certainty and completeness of information, and that the agents are insatiable (“more is always preferred”).
On the other side we have to remember that an overall sustainability goal is to reduce the consumption of limited or critical resources. Although the traditional vision of innovation is based on the assumption that efficiency will lead to reduction of consumption of critical or limited resource, this is in contradiction with the “more is always preferred” principle. The issue is that inside the framework of classical economics is intrinsically impossible to avoid rebound effects. The proposed approach to deal with rebound effects is to focus on behavioral patterns relevant to sustainability and to look at rebound effects from within this framework. Concepts as new sociological institutionalism and unintended consequences can be useful for an alternative approach, where rebound effects can be dealt with and avoided by focusing on behavioral patterns relevant to sustainability. Looking at rebound effects within this point of view, environmental sustainability awareness and its spreading inside communities became key elements.
Because the general agreement is that the negative rebound effects have to be avoided as much as possible, the paper will focus on
how to avoid them in ICTs, starting from the assumption that nature and extent of rebound effects depend on behavioral changes by individuals and groups of individuals. Environmental sustainability awareness can avoid behaviors leading to negative rebound effects. Such awareness instead can lead to more sustainable lifestyles and behaviors, under the overall goal of reducing the consumption of critical or limited natural resources. In other words only a good awareness level can avoid unintended consequences, as rebound effects are. Being aware of the environmental sustainability issues means to be able to identify a critical or limited resource which consumption has to be reduced, means to be able to understand the impact of own actions on this resource and to avoid unintended consequences, as rebound effects. Another important preliminary consideration is that to take an environmental advantage from a spread use of ICTs, humans must be engaged as active decision makers and not only as passive consumers [9]. The role that users, consumers or citizens can play in spreading and adopting beneficial behavior can be the pivot for a different approach. The enabling factor of this active participative role is the collective awareness about environmental effects of actions that enable a green behavior and can also counter possible rebound effects.
3. CONCEPTUAL FRAMEWORK FOR AN AWARENESS BASED APPROACH Several research studies recommend to pay attention to understand rebound effects by including knowledge or experiments with behavioral patterns, so that circumstances can be introduced whereby beneficial impacts are promoted and the detrimental impacts are prevented as much as possible [25]. Changes in behavior toward sustainability can be fostered through a mix of social and technological intervention.
3.1 Environmental sustainability awareness A basic assumption of the paper is that the awareness level drives the behavior of customers, users, and citizens. Awareness concept is very different from information concept. According to Oxford Dictionary's definition, awareness “is a concern about and well-informed interest in a particular situation or development”. People can be full of information about something without being aware about it. Moreover awareness is an individual aptitude that is developed and shaped inside a social context, i.e. a social institution.
To address the issue from a new perspective of innovation theory we can look at the role that users, consumers or citizens can play in spreading and adopting beneficial behaviors, so that also rebound effects might be countered. The emerging concept of collective awareness is meant to create an extended consciousness of the environment, of the consequences of our own actions on it, and to encourage taking informed and sustainability-aware decisions. The key is in enabling access to trusted knowledge about the state of the environment, in order to allow people to understand the environmental impact of their own actions. An extended awareness can be enabled by ICTs, for instance by decentralized and federated social networks, where environmentally aware, grassroots processes and practices to share knowledge, to achieve changes in lifestyle, production and consumption patterns, will set up more participatory processes.
Such participatory processes are based on some psychological mechanisms like social proof or informational social influence, that are very meaningful in an ICT-based social dimension where
249

there is a shift of role from passive user to aware and active user, like some researches [12] have shown.
Measures like setting relevant goals, gaining commitment, giving feedback, prompting behaviors, or developing new social norms, are possible steps toward "environmentally aware" behavioral changes that can be enabled by ICTs.
3.2 Individual behaviors and social norms Voluntary behavioral changes are usually driven by some kind of rewards. In some cases adopting a new lifestyle has a reward in itself. For example after quit smoking or making a diet one feels better or looses weight and this effect is perceived as individual immediate positive feedback.
As far as an environmentally sustainable life style is concerned, the economic rewards sometimes are not strong enough to trigger a behavioral change, while other reward mechanisms are not at an immediate individual level. Only when a responsible life style is adopted by a collective or by a group of individuals some positive environmental effects will happen in the long run. If the adoption of a sustainable behavior is driven by awareness and such awareness shifts from an individual dimension to a shared collective one, this turns a social appraisal into the most effective reward.
The mechanisms of "motivating social environments" [1], "psychological ownership" [26] and "social proof" [6] can lead to an high enough awareness level to enable sustainable behaviors in user/consumers [11]. Such underlying societal and psychological mechanisms can be enabled by ICT-based socio-technical interventions.
3.2.1 Motivating social environment Measuring and understanding are the first steps to be able to act smart. For example personal carbon accounting is necessary for citizens to be able to understand and manage their individual carbon footprint, while smart meters with related services can reduce household energy consumption. But their success largely depends on behavioral changes by groups of individuals. As a first step it is essential to empower individuals providing feedback, goal setting, and tailored information [1].
In motivating people to change behavior for reaching the goal of reducing limited or critical resource consumption, socio-technical interventions that go beyond simple presentations of facts are necessary. They need to make use of new insights into social and behavioral psychology to motivate consumers [7]. Basic steps for building a collective environmental situational awareness are accessing real-time to easily understandable information about resource consumption, and comparing individual lifestyles against some ecological/environmental benchmark.
3.2.2 Psychological ownership Psychological ownership [26] describes a state in which a person feels closely connected to an object or idea, to the degree that it becomes part of an "extended self". As soon as people see something as their own, they value it higher and are more likely to invest time and effort in it.
In research on psychological ownership several requirements have been identified, like for example modifiable targets [11].
3.2.3 Social proof Social proof [6] describes the effect that people act a certain way because they observe others acting this way. In such situations, the fact that others choose something acts as proof that this choice is preferable.
Because consumers are driven by a mix of basic needs, personal desires and social images [10], it is important to share sustainability goals. Individuals are replacing common background or geographic proximity with a sense of well-defined purpose and the successful common pursuit of this purpose is the condensation point for human connection. Since individual and collective behaviors are leveraging on environmental awareness, a deep understanding of this socio-technical ecosystem needs suitable tools and techniques. The research contribution of this paper consists of an in-depth analysis of the spread of awareness between neighbors. Neighborhood’s relationships can be topologically or socially defined or given by a mix of them.
In order to allow and improve the understanding of such mechanism, a simulation model can be a useful tool. A research corpus, in between computer science and sociological science [28], [13] shows as behavioral changes can easily be modeled according to an ABM (Agent Based Model) approach.
3.3 Social influence and threshold model Before going in details in Section 4 about agents and agent based modeling approach for the above mentioned sustainability related purposes, other important concepts have to be introduced. They are taken from analytical sociology and are more and more popular in social network analysis: social influence and threshold models.
3.3.1 Social influence Individuals are influenced by the decisions, actions, and advice of others when making a wide variety of decisions, both consciously and unconsciously. Understanding how and when this "social influence" arises, and how individual decisions aggregate in the presence of such influence, should therefore be considered as central components in any theory of collective social behavior.
Social influence is thus not a singular phenomenon, or even (yet) a well-defined family of phenomena, but rather an umbrella term for a loose congregation of social, psychological, and economic mechanisms, including: identifying with, or distancing oneself, from certain social groups; avoiding sanctions; obeying authority; reducing the complexity of the decision making process; inferring otherwise inaccessible information about the world; gaining access to a particular network; or reaping the benefits of coordinated action.
Mainly social network research is studying how the properties of the corresponding influence network - that is, the network of “who influences whom” - can impact the dynamics of collective decisions, determining, for example, the likelihood that large “cascades” of influence can originate from small initial seeds, the ability of prominent individuals to trigger such cascades, and the importance of group structure in triggering and propagating large cascades. Models of social influence, moreover, tend to assume (often implicitly) that all actors involved are of the same kind, whereas in reality, individuals may be influenced by a variety of actors - for example, peers, role models, media organizations, and high profile individuals, each of which may exert a different kind of influence, and may in turn be influenced differently.
The consequences of a particular class of heuristics - the threshold rules - for collective decision-making processes are an open research question [38].
250

3.3.2 Threshold models A research area of growing importance inside social network analysis is now focusing on a special case of influence response functions - namely, deterministic threshold functions, according to which individuals adopt a new state based on the perceived fraction of others who have already adopted the same state. Threshold models are already understood in certain limiting cases, like in particular, the all-to-all approximation [14], in which all individuals are influenced equally by the states of all others. Other studies [36], [37] proceed systematically up the chain of complexity, reviewing the dynamics of cascades of influence on random networks. More recently [38] models of networks that advance on the random network model by including some notions of group structure have been introduced and have been considered how these changes affect the likelihood of cascades for different seeding strategies.
The notion of threshold is fundamental for the present paper. If for its purpose it is acceptable the informal reasoning that a threshold rule is a plausible rule of thumb for an individual to follow, the attention has to be focused on the influence network - that is, "who pays attention to whom" and to how strong is such influence.
The classical above mentioned Granovetter’s threshold model [14] has been adapted [38] in research works to a network framework where in contrast to the all-to-all assumption, individuals are assumed to be influenced directly only by a small subset of immediate "neighbors" - a more realistic assumption. One of the assumptions of this paper is that mainly an "immediate neighbor" influences individuals. As described below, in the proposed social contagion model the notion of social diversity [35] is introduced, in order to simulate a network of neighbors composed by different types of agents, which are more or less influential on the basis of their level of environmental awareness.
4. THE ABM APPROACH In an overall sustainability framework some small, achievable changes at an individual scale allow to achieve great benefits at a community scale, and the social influence drives such mechanism.
Agent-based simulation is a modeling approach enabling to build models where individual entities - so called agents - and their interactions are directly represented [27]. An Agent Based Model is particularly suitable when the emergence of a collective behavior, impossible to foresee at an individual level, is an important consideration. Modelers can represent in a natural way multiple scales of analysis, the emergence of structures at the macro or societal level from individual action, and various kinds of adaptation, none of which is easy to implement with other modeling approaches [5]. As an important tool to investigate socio-ecological processes, ABM use is driven by increasing demand from decision makers [3] to provide support for understanding the potential implications of decisions in complex situations, as, for example technology adoption processes [24]. A crucial feature of agent-based models is that the agents can interact, that is, they can pass informational messages to each other and act on the basis of what they learn from the messages. The messages may represent spoken dialogue between people or more indirect means of information flow, such as the observation of another agent or the detection of the effects of another agent’s actions. The possibility of modeling such agent-to-agent interactions is the main way in which agent-based modeling differs from other types of computational models.
Within this conceptual framework is born the idea to simulate how a sustainable behavior can emerge in a system composed by several aware agents. Such behavioral mechanism can lead to avoid (or mitigate) the rebound effects, according to the awareness levels, both at individual and collective level. Awareness is not only a precondition for sustainable behaviors, but also a trigger for an active engagement.
5. THE MODEL The proposed model describes how behaviors can avoid rebound effects in the adoption of ICTs products or services, leveraging on the awareness level of the agents. The core model is an ABM, describing the spread of environmental sustainability awareness between agents. Agents are individuals, like households, or simple users of ICT-products or ICT-based services. The key feature of each agent is its awareness, and such awareness can be modified by interaction with neighbors. The interaction embeds the notion of threshold. A collective behavior can emerge, leading (or not) to the reduction of critical resource consumption. The goal of reducing a resource consumption represents a kind of “limiting factor” to avoid rebound effects. Awareness is a numerical quantity and according to its value, different types of agents are defined. Each agent belongs to one and only one of these types of agents. An agent can improve his awareness level on the basis of the influence of neighbors. When the awareness level exceeds given threshold the agent shifts from one type to another. Thresholds for the switch are different type by type, and the threshold to reach the highest level (corresponding to became an “evangelist”) is the highest one.
The threshold idea in social influence is not directly related to make a choice, as for example in “all-to-all” model [14], but to apply the dynamic of social influence between different types of neighbors. The interaction leads to change the awareness level, which in turn allows an agent to shift from a given set of agent to another. Trigger events (external environmental factors, like environmental programs) allow an easier reach of the switch thresholds.
Because, as we see below, different types of agent can perform different actions, their impact on the overall status of the system (the limited resource consumption) is different.
5.1 The ABM and its components The core of the proposed model is an Agent Based Model of the awareness diffusion.
Figure 1. The model components
The ABM, as described in Figure 1, is composed by sets of agents, their state, methods and space.
5.1.1 The agents In the core model an agent is the consumer of a critical or limited resource. There are five types of agent: blind, indifferent, spectator, active, and evangelist. All agents have as fundamental attribute the awareness, increasing from the bottom (blind agent
251

i.e. the less aware type of agent) to the top (evangelist agent, i.e. the more aware type of agent), as described in Figure 2. An intuitive color code, from red to green, is used for visualize the agent typing and its dynamics.
Figure 2. Types of agent and awareness levels The bottom level is not environmentally aware, while the top level is the most aware. Such attribute value typifies five sets of agents (implemented as NetLogo agentset, as described in 5.3) and this value is a condition for an agent to belong to a specific set of agents. Each agent can shift from a type to another when its awareness level reaches a given value.
An “awareness level”, increasing as the agent acquires knowledge and sensibility about environmental issues in general and in particular on the effect of its own behavior on the specific case, quantifies awareness. The awareness level can change by interaction with neighbors and such change happens under different conditions (depending on other agents and on the system condition in general). All awareness levels, that typify an agent as indifferent, spectator, activist, or evangelist, can increase (rarely decrease) by interaction with neighbors. The threshold to change the status is different from one level to another and is different in ascending or descending score. The threshold to shift from activist to evangelist is higher than other thresholds. Another feature of an agent that can influence its awareness level is the aptitude to a social behavior. Items with an impact on the awareness level come also from other global state variables.
5.1.2 Agent methods Agents are active. According to the conceptual framework below described the agents can perform different methods (Fig. 3). Actions are related to reduce the limited (or critical) resource consumption. Agent awareness level corresponds to the ability of an agent to perform different kind of action.
Figure 3. Different actions for different types of agent
For example an agent belonging to the indifferent agentset can identify which physical quantity to take into consideration.
An agent belonging to the spectator agentset can measure his own consumption of this quantity, while an agent belonging to the active agentset can compare with friends/colleagues/neighbors his own consumption, to share a target level on consumption to achieve within the social network.
Actions like to show own consumption or to share it with social network neighbors are reserved to agents belonging to the types with a high awareness level. Only the more aware type of agent, the evangelist, is able to act to promote the collective target, by attempting to convert other agents to achieve the overall sustainability goal.
Figure 3 shows how some action can be performed only by a small numbers of very aware agents.
5.1.3 Agent state The agent state can change continuously by the interaction with other agents. A change of state corresponds to a change of awareness level and of other state variables.
Actions are different for agent types. For example the agent with an awareness level of spectator will take into consideration the environmental quantity to be reduced, for example energy or material [29] and his own consumption.
The strongest rebound effect happens when all agents have zero awareness level, i.e. all agents are blind. When the awareness increases in some agents, the rebound effect decreases.
5.1.4 Agent space The agent space (topology) will be the neighbors network, where the neighborhood can be topological or social or a mix of both. Local information is obtained from interactions with an agent’s neighbors (and maybe in some way with all agents) and from its localized environment (and from the entire environment). Agents acquire also a global overview of the whole state of the system.
5.2 ABM application field The present ABM of environmental sustainability awareness spread is the core part of a broader research activity to foster behavioral changes in ICTs towards reduction of limited or critical resource consumption.
Such core model of awareness-based behavior is aimed to allow a better understanding of the underlying socio psychological mechanisms and their role in the consumption reduction of different limited resources. The idea is that basic mechanism is the same into all behavioral changes toward limited resource consumption reduction. The ABM of such core mechanism can be applied to different cases of consumption reduction of a limited resource. In particular, as below described, the model validation will be done in non-ICT case studies.
The final use is oriented to reach this goal in ICTs field and mainly oriented in avoiding or reducing rebound effects. In such domain the limited or critical resource to be reduced can be energy or materials.
5.3 ABM development stage The system implementation is still at an early stage. The first prototype is under development in NetLogo, a very popular development environment to build Agent Based Model. NetLogo is an agent-based programming language and integrated modeling environment. It is a cross platform, free and open source under a GPL license, [39] and it supplies also simple and effective tools
252

for an easy visualization of ABM output. It allows programmers to save models as Java applets, permitting seamless publication of simulations from NetLogo built-in integrated development environment to a Web page. Such features allow the target users (i.e. the policy makers) an easy interaction and use of the ABM, by changing parameters, visualizing results etc. The ABM is developed according to the ODD (Overview, Design, Details) protocol for ABM development [27]. Further phases of verification and validation of the model are foreseen.
5.3.1 Model verification Amazon Mechanical Turk is becoming more and more popular in conducting behavioral research [22]. For the model verification its use is under consideration.
5.3.2 Model validation A validation phase has been planned. Using Input data, coming from a totally independent experiment about limited resources consumption reduction, will allow a basic validation of the awareness mechanism model. The original real data have been made available from an academic research institution engaged into water consumption reduction programs. The validation datasets are totally independent from the present research and they refer to experiments made before the start of the present research. That’s why the validation of the model, if successful, will be a proof about the validity of the awareness driven behavioral changes model.
5.3.3 Proof of concepts in ICTs The ABM can be used in ICTs field to reduce or avoid rebound effects. Proof of concepts can be, for example, related to the potential gain of energy coming from a more efficient PC, which is instead overcompensated by stronger and less careful use of the energy. In this case the physical quantity to be reduced is energy. A strong environmental awareness can lead to switch off the PC when not in use or to take other measures against rebound effects.
Another example related to ICTs can be the potential environmental gain rising from the adoption of flat screens. The potential gain in energy is overcompensated by the fact that very often the old devices are kept in service and the new ones don’t substitute them. The awareness level can totally (or partially) avoid this rebound, using a new efficient screen to substitute an inefficient one, instead of adding it to other equipment. The feasibility of such proof of concepts depends on data availability.
6. AIMS OF THE ABM AND FOLLOW UP The expected result consists of a better understanding about the spreading of the awareness mechanisms. The ABM is a descriptive model and it can help to find, if any, an emergent collective phenomenon. An ABM to describe how aware behaviors can avoid rebound effects in the adoption of ICTs new products or services is an innovative tool to support policy maker in taking decision about environmental sustainability and limited resource consumption reduction. In particular in ICTs field this can enable to avoid or reduce rebound effects.
Therefore one policy response could be to make agents conscious or aware of rebound effects occurring within their own realm [34]. For this purpose policy makers need suitable, powerful, and friendly tools to help them in decision-making [30]. Such a need leads to design new Agent Based Models to study how rebound
effects can be avoided or mitigated by raised awareness levels, both at individual and collective level.
Policy makers, mainly at a local level, can foster sustainable behaviors by supporting behavioral change programs to reduce the consumption of limited resources. An ABM approach suggests further research on societal aspects for better addressing the ICTs sustainability issues and for better exploiting the potentials of ICTs for sustainability.
7. REFERENCES [1] Abrahamse, W., Steg, L., Vlek and C., Rothengatter, T.
2007. The Effect of Tailored Information, Goal Setting, and Tailored Feedback on Household Energy Use, Energy-Related Behaviors, and Behavioral Antecedents. Journal of Environmental Psychology 27, 265–276.
[2] Berkhout, P.H.G., Muskens, J. C., Velthuijsen, J.W. 2000. Defining the rebound effect. Energy Policy 28, 425-432.
[3] Bicking, M., Troitzsch, K.G., Wimmer, M. 2010. Regulatory Impact Assessment: Modelling and Simulation to Facilitate Policy Choices, in: Andreas Ernst, Silke Kuhn, eds. In Proceedings of the3rd World Congress on Social Simulation WCSS2010, Kassel, Germany.
[4] Binswanger, M. 2000. Technological progress and sustainable development: what about the rebound effect?. Ecological Economics 36, 119 -132.
[5] Borshchev A.; Filippov A. 2004. From System Dynamics and Discrete Event to Practical Agent Based Modeling: Reasons, Techniques, Tools. In The 22nd International Conference of the System Dynamics Society, Oxford.
[6] Cialdini, R. 2009. Influence: Science and Practice, 5th eds. Pearson, Boston 2009.
[7] Costabile, M., Dittrich, Y., Fischer, G. 2011. From Consumers to Owners: Using Meta design Environments to Motivate Changes in Energy Consumption. pg. 319-324, Lecture Notes in Computer Science Volume: 6654 Doi: 10.1007/978-3-642-21530-8_33.
[8] Dick, H., Eden, H. and Fischer, G. 2011. From Consumers to Owners: Using Meta-Design Environments to Motivate Changes in Energy Consumption. In M. F. Costabile, Y. Dittrich, G. Fischer, & A. Piccinno (Eds.), End-User Development (Third International Symposiu, Torre Canne, Italy, June), Volume LNCS 6654, Springer, Heidelberg, pp. 319-324
[9] Erdmann, L. and Hilty, L. M. 2010. Scenario Analysis: Exploring the Macroeconomic Impacts of Information and Communication Technologies on Greenhouse Gas Emissions. Journal of Industrial Ecology 14 (5), 824-841
[10] European Community. 2011. Report Consumer 2020 From Digital agenda to Digital action, May 2011
[11] Fischer, G. 2012. Context-Aware Systems -The 'Right' Information, at the 'Right' Time, in the 'Right' Place, in the 'Right' Way, to the 'Right' Person. Proceedings of the Conference on Advanced Visual Interfaces (AVI 2012), ACM, pp. 287-294.
[12] Fischer, G. 2010. End User Development and Meta-Design: Foundations for Cultures of Participation. Journal of Organizational and End User Computing (JOEUC), 22(1), 52-82. doi:10.4018/joeuc.2010101901.
253

[13] Gilbert, N. 2008. Agent-based model. Sage publication, London.
[14] Granovetter, M. 1978. Threshold Models of Collective Behavior, AJS 83(6), 1420–1443
[15] Greening, L., Greene, D.L. and Difiglio, C. 2000. Energy efficiency and consumption the rebound effect -a survey. Energy Policy 28, 389–401.
[16] Hertwich, E.G. 2005. Consumption and the rebound effect -an industrial ecology perspective. Journal of Industrial Ecology 9(1–2):85–98.
[17] Hilty, L.M. 2008. Information technology and sustainability. Essays on the Relationship between ICT and Sustainable Development. Norderstedt, Books on demand GmnH.
[18] Hilty, L.M., Köhler, A., Schéele, F., Zah, R., and Ruddy, T. F. 2006. Rebound effects of progress in information technology. Poiesis & Praxis: International Journal of Technology Assessment and Ethics of Science 4, 1, 19-38.
[19] Hofstetter, P., Madjar and M., Ozawa,T. 2006. Happiness and sustainable consumption—psychological and physical rebound effects at work in a tool for sustainable design. Int J Life Cycle Ass 11:105–115.
[20] Lepochat, S. 2011. Taking into Account the Rebound Effect in LCA: Necessities and Difficulties, Colloquim EJC- ICT 2011, Montreal.
[21] López, J.C., Sissa G. and Natvig, L. 2011. (eds) Green ICT: Trends and Challenges. CEPIS UPGRADE, ISSN 1684-5285.
[22] Mason, W. and Suri, S. 2011. Conducting behavioral research on Amazon’s Mechanical Turk. Behavior Research Methods. DOI 10.3758/s13428-011-0124-6.
[23] Maxwell, D., Owen, P., McAndrew. L, Muehmel, K. and Neubauer, A. 2011. Addressing the Rebound Effect, a report for the European Commission DG Environment, 26 April 2011.
[24] Nuttall, W.J., Zhang T., Hamilton D.J. and Roquesl F.A. 2009. Sociophysics Simulations of Technology Adoption and Consumer Behavior. In Second International Symposium on Engineering Systems, MIT, Cambridge, Massachusetts.
[25] OECD. 2010. Greener and smarter – ICTs the environment and Climate Change, Paris.
[26] Pierce, J.L., Kostova, T., and Dirks, K.T. 2002. The State of Psychological Ownership: Integrating and Extending a Century of Research. In Review of General Psychology
[27] Railback, S.F and Grimm,V. 2011. Agent-based and Individual Based Modelling, Princeton University Press.
[28] Salerno, J., Yang, S.J.,Nau, D. and Chai, S.K.(eds.). 2011. Social Computing, Behavioral-Cultural Modeling and Prediction. 4th International Conference, SBP 2011, College Park, MD, USA, 29-31, Springer-Verlag, Berlin.
[29] Sissa, G. 2012. Longer Use, Better Use: How to Avoid Software Induced Hardware Obsolescence. In Green Technologies and Business Practices: An IT Approach, edited by: Patricia Ordóñez de Pablos, IGI Global, doi:10.4018/978-1-4666-1972-2.ch009.
[30] Sissa, G. 2011. Public policies on ICTs for dematerialisation: how to plan, monitor and assess the outcomes. POLITEIA 27: 104, 67-78.
[31] Sissa, G. 2011. Utility Computing: Green Opportunities and Risks, CEPIS UPGRADE, ISSN 1684-5285 2011: 4, 16-21
[32] Sorrell, S.and Dimitropoulos, J. 2008. The rebound effect: Microeconomic definitions, limitations and extensions. Ecological Economics 65, 636-649.
[33] Sorrell, S. 2007. UKERC, The Rebound Effect: an assessment of the evidence for economy-wide energy savings from improved energy efficiency, ISBN 1-903144-0-35.
[34] van den Bergh, C.J.M. 2011. Industrial energy conservation, rebound effects and public policy. UNIDO Development Poolicy, Statistic and Reserach Branch Working Paper 12/2011.
[35] Ugander, J., Backstrom, L., Marlow, C. and Kleinberg, J. 2012. Structural diversity in social contagion. Proc. Natl. Acad. Sci., 109:5962–5966.
[36] Watts, D. J., P. S. Dodds and M. E. J. Newman. 2002. Identity and search in social networks. Science 296, 1302-1305.
[37] Watts, D. J., and Duncan J. 2002. A simple model of information cascades on random networks. In Proceedings of the National Academy of Science. U.S.A. 99:5766-5771.
[38] Watts, D.J. and Dodds, P.S. 2009. Threshold models of social influence. In P. Hedström and P. Bearman, editors, The Oxford Handbook of Analytical Sociology, chapter 20, pages 475–497. Oxford University Press, Oxford, UK.
[39] Wilensky, U. 1999. NetLogo. http://ccl.northwestern.edu/netlogo. Center for Connected Learning and Computer-Based Modeling, Northwestern University, Evanston, IL.
254
PROGRAM COMMITTEE The editors would like to express their gratitude to the ICT4S 2013 program committee. The committee members contributed to the quality of this open access publication by participating in the two-stage blind peer-review process. Bernard Aebischer, Zurich, Switzerland (Honorary Chair) Alain Anglade, ADEME, Valbonne, France Hans-Knud Arndt, Otto-von-Guericke University, Magdeburg, Germany Eric P. S. Baumer, Cornell University, Ithaca, NY, USA Françoise Berthoud, CNRS – Centre National de la Recherche Scientifique, Grenoble, France Matthias Binswanger, FHNW – University of Applied Sciences and Arts Northwestern Switzerland, Switzerland Freek Bomhof, TNO, Delft, The Netherlands Leonardo Bonanni, Media Lab, MIT, and Sourcemap, Cambridge, MA, USA Nikolaus Bornhöft, Empa – Swiss Federal Laboratories for Materials Science and Technology, St. Gallen, Switzerland Maurizio Catulli, University of Hertfordshire, Hatfield, UK Vlad Coroama, Instituto Superior Técnico, Lisbon, Portugal Claus-Heinrich Daub, FHNW – University of Applied Sciences and Arts Northwestern Switzerland, Brugg, Switzerland Michele De Lorenzi, CSCS Swiss National Supercomputing Centre, Manno, Switzerland Markus Dick, Trier University of Applied Sciences, Germany Lorenz Erdmann, ISI – Fraunhofer Institute for Systems and Innovation Research, Karlsruhe, Germany Klaus Fichter, Borderstep Institute and University of Oldenburg, Germany Helena Grunfeld, Victoria University, Melbourne, Australia Maria Håkansson, Culturally Embedded Computing Group, Cornell University, Ithaca, NY, USA Magda David Hercheui, University of Westminster, London, UK Lorenz M. Hilty, University of Zurich and Empa, CH (Chair) Mattias Höjer, CESC – Centre for Sustainable Communications, KTH Royal Institute of Technology, Stockholm, Sweden John W. Houghton, Centre for Strategic Economic Studies, Victoria University, Melbourne, Australia Jirí Hrebícek, Masaryk University, Czech Republic Ralf Isenmann, ISI – Fraunhofer Institute for Systems and Innovation Research, Karlsruhe, Germany Jordi Cucurull Juan, RTSL – Real-Time Systems Laboratory, Linköping University, Sweden Hubert Kaeslin, ETH Zurich, Switzerland Masaaki Katayama, Nagoya University, Nagoya, Aichi, Japan

Mikko Kolehmainen, University of Eastern Finland, Kuopio, Finland Stacey Kuznetsov, Carnegie Mellon University, USA Patricia Lago, VU University, Amsterdam, The Netherlands Marc van Lishout, TNO, Delft, The Netherlands Wolfgang Lohmann, Empa –Swiss Federal Laboratories for Materials Science and Technology, Switzerland Reinhard Madlener, RWTH Aachen University, Germany Jennifer Mankoff, Carnegie Mellon University, Pittsburgh, PA, USA Jorge Marx Gómez, University of Oldenburg, Germany Friedemann Mattern, ETH Zurich, Switzerland William McIver, National Research Council Canada, Fredericton, Canada Niklaus Meyer, Schweizer Informatikgesellschaft, Richterswil, Switzerland Bruno Michel, IBM Research Zurich, Switzerland Stefan Naumann, Trier University of Applied Sciences, Germany Bruce Nordman, LBNL – Lawrence Berkeley National Laboratory, Berkeley, USA Jean-Marc Pierson, Institut de Recherche en Informatique de Toulouse, Université Paul Sabatier, Toulouse, France Chris Preist, University of Bristol, UK Jürgen Reinhard, Empa – Swiss Federal Laboratories for Materials Science and Technology, St. Gallen, Switzerland Andrea-Emilio Rizzoli, IDSIA – Dalle Molle Institute for Artificial Intelligence, and SUPSI – University of Aplied Sciences and Arts of Southern Switzerland, Manno, Switzerland Alice R. Robbin, School of Library and Information Science, Indiana University Bloomington, USA Daniel Schien, University of Bristol, UK Giovanna Sissa, Department of Information Technology, University of Milan, Italy Jan Studzinski, IBS PAN – Systems Research Institute of Polish Academy of Sciences, Warsaw, Poland Kazue Ichino Takahashi, Nippon Telegraph and Telephone Corporation, Kanagawa, Japan Stephanie Teufel, University of Fribourg, Switzerland Daniel Versick, University of Rostock, Germany Joost Visser, Software Improvement Group, Amsterdam, and Radboud University Nijmegen, The Netherlands Uta Wehn de Montalvo, Knowledge and Capacity Development at UNESCO-IHE, The Netherlands Diane Whitehouse, The Castlegate Consultancy, Malton, North Yorkshire, UK Iwona Maria Windekilde, Aalborg University, Copenhagen, Denmark Eric Williams, Rochester Institute of Technology, NY, USA Olaf Zimmermann, ABB Corporate Research, Dättwil, Switzerland

The presentations and discussions of the conference are also available as podcasts and visual protocols via the website http://www.ict4s.org.