
ICT Sector's Role in Climate Change Mitigation - CDP
56
ICT Sector’s Role in Climate Change Mitigation An analysis of climate change performance and preparedness of 320 global ICT companies September 2014
-
Upload
khangminh22 -
Category
Documents
-
view
3 -
download
0
Transcript of ICT Sector's Role in Climate Change Mitigation - CDP

1
ICT Sector’s Role in Climate Change Mitigation
An analysis of climate change performance and preparedness of 320 global ICT companies
September 2014

2
About CDP
CDP is a global not-for-profit organization, founded in 2000 with headquarters in London and offices located in 11 other countries. It has pioneered and provided the world’s only global natural capital disclosure system through which more than 4,500 companies from more than 80 countries and 207 cities report, manage and share vital environmental information. Carbon Disclosure Project India is a not-for-profit company registered under the Companies Act.
Measurement, transparency and accountability drive positive change in the world of business and investment. On behalf of investors, purchasers and governments, CDP requests environmental information from companies and cities on the impacts and dependencies they have on the world’s natural resources and their strategies for managing these.
The process of disclosing information to CDP, and the insights the data brings, incentivizes companies and cities to measure, manage and reduce their impact on the environment and build greater resilience. By providing this high quality information to the market we are changing the way businesses, investors and cities behave.
CDP holds the largest and most comprehensive collection globally of primary corporate climate change, water and forest-risk information. We work to drive action by companies and cities to reduce greenhouse gas emissions, safeguard water resources and prevent the destruction of forests.
About IIM Bangalore
The Indian Institute of Management Bangalore (IIMB) is located in Bangalore, India. Founded in 1973, as an autonomous Central Educational Institution of the Department of Higher Education, Ministry of Human Resource Development, Government of India, IIMB is consistently ranked as one of the best business schools in India and the Asia Pacific region. IIMB offers doctoral and several Post Graduate programmes, as well as a wide array of Executive training programmes. In addition to its main academic programmes, IIMB is also engaged in facilitating research, offering consultancy services, conducting seminars and academic conferences and publishing journals. The analysis and conclusions published in this report are those of the authors and do not reflect any official views of IIM Bangalore.

3
Contents
Executive summary 4
1.0 Introduction 6
2.0 Study sample & methodology 7
3.0 GHG emissions pattern 8
4.0 GHG management in ICT sector 13
5.0 Risks and opportunities perceived from climate change 33
6.0 The role of ICT solutions in GHG mitigation in the 44 Indian economy: CII DESC Study
7.0 Conclusion 50
8.0 Appendix 51
Appendix A: Glossary of terms 51
Appendix B: Best performers selected sample for detailed analysis 52
Appendix C: List of responding firms 53
Important notice
The contents of this report may be used by anyone providing acknowledgement is given to CDP Worldwide (CDP). This does not represent a license to repackage or resell any of the data reported to CDP or the contributing authors and presented in this report. If you intend to repackage or resell any of the contents of this report, you need to obtain express permission from CDP before doing so.
IIM Bangalore and CDP have prepared the data and analysis in this report based on responses to the CDP 2013 information request. No representation or warranty (express or implied) is given by IIM Bangalore or CDP as to the accuracy or completeness of the information and opinions contained in this report. You should not act upon the information contained in this publication without obtaining specific professional advice. To the extent permitted by law, IIM Bangalore and CDP do not accept or assume any liability, responsibility or duty of care for any consequences of you or anyone else acting, or refraining to act, in reliance on the information contained in this report or for any decision based on it. All information and views expressed herein by CDP and/or IIM Bangalore is based on their judgment at the time of this report and are subject to change without notice due to economic, political, industry and firm-specific factors. Guest commentaries where included in this report reflect the views of their respective authors; their inclusion is not an endorsement of them.
IIM Bangalore and CDP, their affiliated member firms or companies, or their respective shareholders, members, partners, principals, directors, officers and/or employees, may have a position in the securities of the companies discussed herein. The securities of the companies mentioned in this document may not be eligible for sale in some states or countries, nor suitable for all types of investors; their value and the income they produce may fluctuate and/or be adversely affected by exchange rates.
CDP Worldwide’ and ‘CDP’ refer to Carbon Disclosure Project, a United Kingdom company limited by guarantee, registered as a United Kingdom charity number 1122330.
Carbon Disclosure Project India is a not-for-profit company registered under the Companies Act.
© 2014 CDP Worldwide. All rights reserved.*.

4
Executive summary
This report, produced jointly by CDP and IIM Bangalore, looks at the state of preparedness of the ICT sector in addressing the climate change challenge; major risks and opportunities presented by climate change for the sector; best practice examples from leading companies in the sector; and emerging opportunities for ICT companies. The study is based on the responses received for the CDP climate change program from world’s leading 320 ICT companies*. The findings unambiguously prove that that the ICT industry is well aware of the urgency in dealing with climate change issues. Climate change is viewed by most as a serious disruptive business risks as well as a potentially significant business opportunities. Nevertheless, there still is a sizeable group which is not yet geared up to insulate itself from the climate change risks or to tap the opportunities, and hence run a risk of being outperformed by their proactive peers. The report was reviewed by Ernst & Young LLP (EY). The key findings from the study are:
High importance accorded to climate change issues at the board level. A significant proportion of the ICT companies (63%) have board level supervision of climate change related issues in the business. Simultaneously, performance on this dimension is also being incorporated into monetary as well as non-monetary incentive structures within organisations.
Climate change issues strongly influence strategy formulation. 81% of the respondents report a clear linkage between their business strategy and climate change issues. These trends indicate that managements are increasingly recognising that climate change strategy can be a source of competitive advantage, directly through cost, revenue or reputational impacts. Interestingly not all the firms have been able to integrate climate change issues into business strategy. Companies’ efforts to do so have been hampered by a host of factors including: inadequate understanding of climate change related risks; lack of consensus within the management about impacts or adaptation measures; lack of resources; and tough business climate.
Strong engagement models to influence policy on climate change are emerging. Given the ever increasing emphasis on mitigating climate change impacts by governments, a significant number of firms have attempted to influence public policy issues through a combination of direct as well as indirect
engagement efforts. Despite this however nearly 24% of the firms have stayed away from engaging with policy makers on issues related to climate change policy. The reasons cited range from lack of organisational resources to conflict with organisational philosophy to the nature of operations
Use of integrated companywide risk management processes to mitigate climate change risks. The most commonly cited risks from climate change arise by way of loss of reputation, increases in energy prices, changing regulations, intensifying of carbon tax regimes and increased emission reporting obligations placed on companies. Of the 81% companies that have well defined risk management processes, only 9% have specific climate change risk management processes, the rest have it integrated into multi-disciplinary company wide risk management process.
Recognition of climate change both as a business risk and an opportunity. Fuel and energy taxes & regulations and emission reporting obligations are some of the most commonly reported regulatory risks. But at the same time, companies already meeting or exceeding the energy efficiency targets for their products are anticipating increased demand for these products. Reputation and changing consumer behaviour are also identified as significant sources of risk as well as opportunity which will have a huge bearing on the brand image of the companies and hence the demand for their goods and services.
Improved performances for sampled firms. Reducing carbon emissions continues to be a dominant corporate agenda with 68% of the companies using absolute or intensity targets or a combination of both for emission reduction. Presenting an encouraging trend, 41% of the companies reported reduction in their absolute emissions (scope 1+2) during the latest reporting year. Companies which reported an increase in absolute emissions site change in output, acquisitions or change in boundary as primary contributing factors. On the other hand, almost a third of the companies report increase in their emission intensity per unit revenue and per full-time employee which indicates that there is still considerable scope for controlling and reducing emissions by greening their products and services as well as increasing the energy efficiency of their operations.
The results of this study are complimented by the website(https://www.cdp.net/en-US/WhatWeDo/Pages/ICT-sector-report-2014.aspx)

5
Executive summary
Employee engagement is becoming an important corporate transformation tool: The most commonly reported drivers of investment in emission reduction activities included energy efficiency activities (18%), regulatory compliance (17%), and employee engagement initiatives (15%). Firms greatly appreciate the need to engage with employees in climate change reduction initiatives.
Significant unutilised carbon mitigation opportunities exist in the supply chain. While firms are recognising the need to evolve partnerships in their value chain in mitigating climate change impacts, nearly 30% of the responders are not yet engaging with their suppliers, customers or any other elements of their value chain.

6
1.0 Introduction
Climate change, one of the most critical challenges facing humanity today, has deeply entrenched itself in corporate board room conversations in the recent years. The impact of large increases in the atmospheric concentration of greenhouse gases on the earth’s climate systems, and the attendant phenomena of rising sea levels, extremes in temperature and precipitation, species extinction, acidification of natural water bodies, and other ill-effects of climate change, pose significant challenges and sometimes catastrophic threats to business’ performance and continuity. Further, rising temperatures could pose a significant threat to national economy and imperil national security. The recent years have also seen a surge in greenhouse gas (GHG) emissions as emerging economies, especially Brazil, China and India have begun the process of modernization while the developed ones have struggled to curb their own emissions. If left unchecked these trends are likely to continue and
even exacerbate. In 2011, annual GHG emissions crossed 34.5 billion tones with some projections placing the future levels at 55 billion tonnes by 2020 and 80 billion tonnes by 2050. Given these the window of opportunity to address the predicted devastation associated with our warming planet continues to close.
The climate crisis creates an imperative for firms to respond urgently and undertake concerted efforts to explore and implement alternate management and business models. The prevailing emphasis on profitability will need to be supplemented by green innovations. The role of ICT in achieving a low carbon economy in such a scenario cannot be overemphasized. From personal communication devices to mobile computing, data centres and cloud computing, ICT has increasingly become a powerful lever both for driving economic growth as well as for managing the pace of decarbonisation.
7
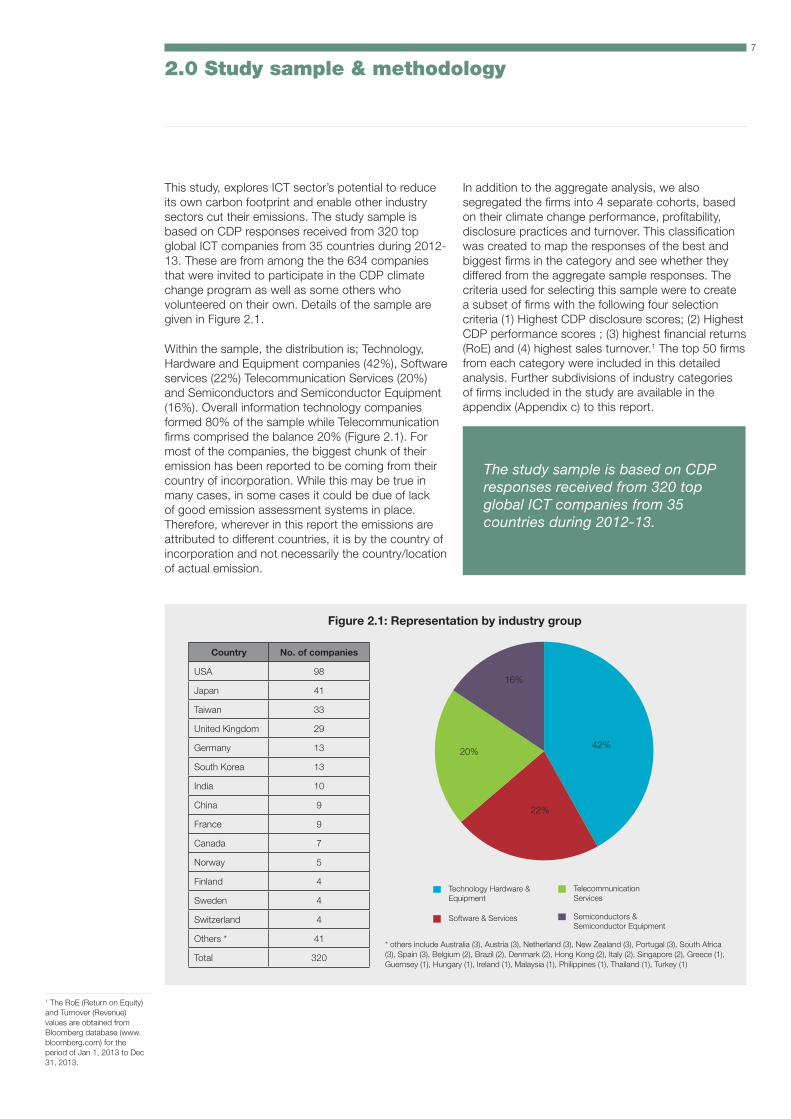
The study sample is based on CDP responses received from 320 top global ICT companies from 35 countries during 2012-13.
2.0 Study sample & methodology
This study, explores ICT sector’s potential to reduce its own carbon footprint and enable other industry sectors cut their emissions. The study sample is based on CDP responses received from 320 top global ICT companies from 35 countries during 2012-13. These are from among the the 634 companies that were invited to participate in the CDP climate change program as well as some others who volunteered on their own. Details of the sample are given in Figure 2.1.
Within the sample, the distribution is; Technology, Hardware and Equipment companies (42%), Software services (22%) Telecommunication Services (20%) and Semiconductors and Semiconductor Equipment (16%). Overall information technology companies formed 80% of the sample while Telecommunication firms comprised the balance 20% (Figure 2.1). For most of the companies, the biggest chunk of their emission has been reported to be coming from their country of incorporation. While this may be true in many cases, in some cases it could be due of lack of good emission assessment systems in place. Therefore, wherever in this report the emissions are attributed to different countries, it is by the country of incorporation and not necessarily the country/location of actual emission.
In addition to the aggregate analysis, we also segregated the firms into 4 separate cohorts, based on their climate change performance, profitability, disclosure practices and turnover. This classification was created to map the responses of the best and biggest firms in the category and see whether they differed from the aggregate sample responses. The criteria used for selecting this sample were to create a subset of firms with the following four selection criteria (1) Highest CDP disclosure scores; (2) Highest CDP performance scores ; (3) highest financial returns (RoE) and (4) highest sales turnover.1 The top 50 firms from each category were included in this detailed analysis. Further subdivisions of industry categories of firms included in the study are available in the appendix (Appendix c) to this report.
Figure 2.1: Representation by industry group
* others include Australia (3), Austria (3), Netherland (3), New Zealand (3), Portugal (3), South Africa (3), Spain (3), Belgium (2), Brazil (2), Denmark (2), Hong Kong (2), Italy (2), Singapore (2), Greece (1), Guernsey (1), Hungary (1), Ireland (1), Malaysia (1), Philippines (1), Thailand (1), Turkey (1)
Country No. of companies
USA 98
Japan 41
Taiwan 33
United Kingdom 29
Germany 13
South Korea 13
India 10
China 9
France 9
Canada 7
Norway 5
Finland 4
Sweden 4
Switzerland 4
Others * 41
Total 320
42%
22%
20%
16%
Technology Hardware & Equipment
Software & Services
TelecommunicationServices
Semiconductors & Semiconductor Equipment
1 The RoE (Return on Equity) and Turnover (Revenue) values are obtained from Bloomberg database (www.bloomberg.com) for the period of Jan 1, 2013 to Dec 31, 2013.
8
3.0 GHG emissions pattern
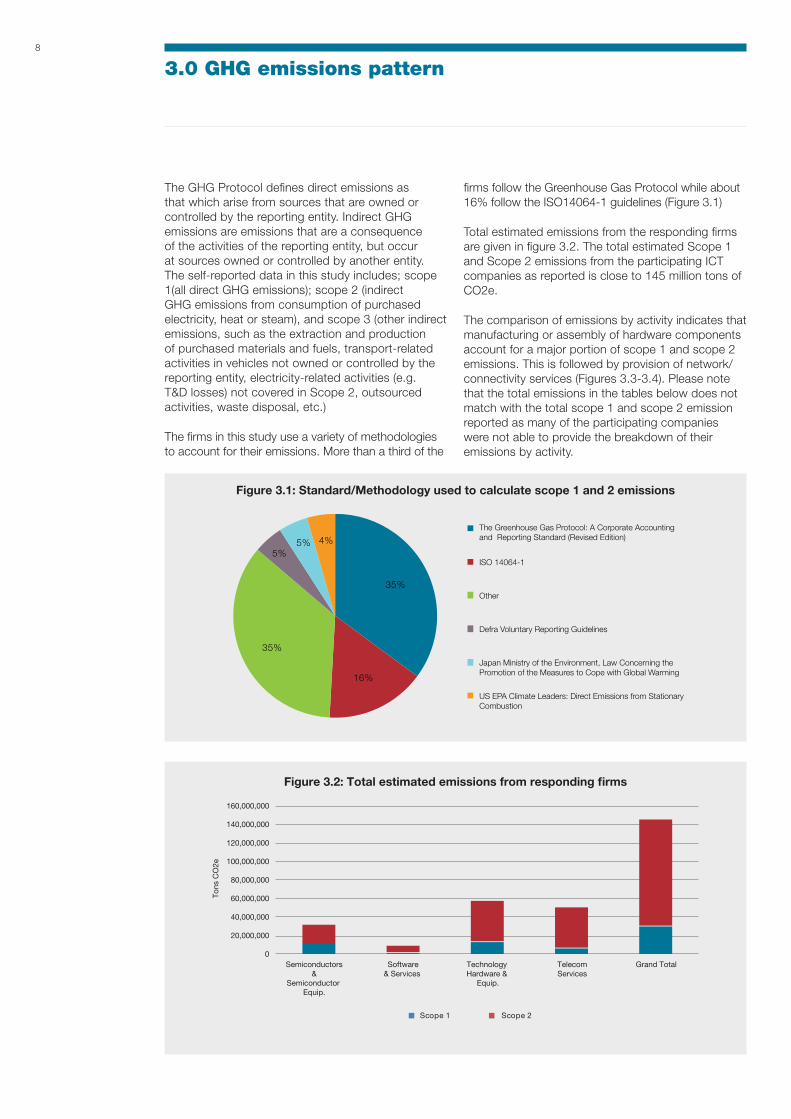
The GHG Protocol defines direct emissions as that which arise from sources that are owned or controlled by the reporting entity. Indirect GHG emissions are emissions that are a consequence of the activities of the reporting entity, but occur at sources owned or controlled by another entity. The self-reported data in this study includes; scope 1(all direct GHG emissions); scope 2 (indirect GHG emissions from consumption of purchased electricity, heat or steam), and scope 3 (other indirect emissions, such as the extraction and production of purchased materials and fuels, transport-related activities in vehicles not owned or controlled by the reporting entity, electricity-related activities (e.g. T&D losses) not covered in Scope 2, outsourced activities, waste disposal, etc.)
The firms in this study use a variety of methodologies to account for their emissions. More than a third of the
firms follow the Greenhouse Gas Protocol while about 16% follow the ISO14064-1 guidelines (Figure 3.1)
Total estimated emissions from the responding firms are given in figure 3.2. The total estimated Scope 1 and Scope 2 emissions from the participating ICT companies as reported is close to 145 million tons of CO2e.
The comparison of emissions by activity indicates that manufacturing or assembly of hardware components account for a major portion of scope 1 and scope 2 emissions. This is followed by provision of network/connectivity services (Figures 3.3-3.4). Please note that the total emissions in the tables below does not match with the total scope 1 and scope 2 emission reported as many of the participating companies were not able to provide the breakdown of their emissions by activity.
Figure 3.1: Standard/Methodology used to calculate scope 1 and 2 emissions
Figure 3.2: Total estimated emissions from responding firms
35%
16%
35%
5%5% 4%
The Greenhouse Gas Protocol: A Corporate Accountingand Reporting Standard (Revised Edition)
ISO 14064-1
Other
Defra Voluntary Reporting Guidelines
Japan Ministry of the Environment, Law Concerning the Promotion of the Measures to Cope with Global Warming
US EPA Climate Leaders: Direct Emissions from StationaryCombustion
0
20,000,000
Tons
CO
2e
40,000,000
60,000,000
80,000,000
100,000,000
120,000,000
140,000,000
160,000,000
Semiconductors&
Semiconductor Equip.
Software& Services
Technology Hardware &
Equip.
TelecomServices
Grand Total
Scope 1 Scope 2

9
GHG emissions pattern
Figure 3.3: Scope 1 emissions by business activity
EntityScope 1 emissions(metric tons CO2e)
Data centers 244,323
Provision of network / connectivity services
1,156,327
Manufacture or assemblyof hardware/ components
5,096,673
Manufactureof software
60,089
Business services 706,018
Other activities 2,037,809
Total 9,301,238
Entity Scope 2 emissions(metric tons CO2e)
Data centers 5,063,549
Provision of network / connectivity services
15,630,267
Manufacture or assembly of hardware/ components
18,355,143
Manufacture of software
127,871
Business services 6,735,293
Other activities 3,882,617
Total 49,794,740
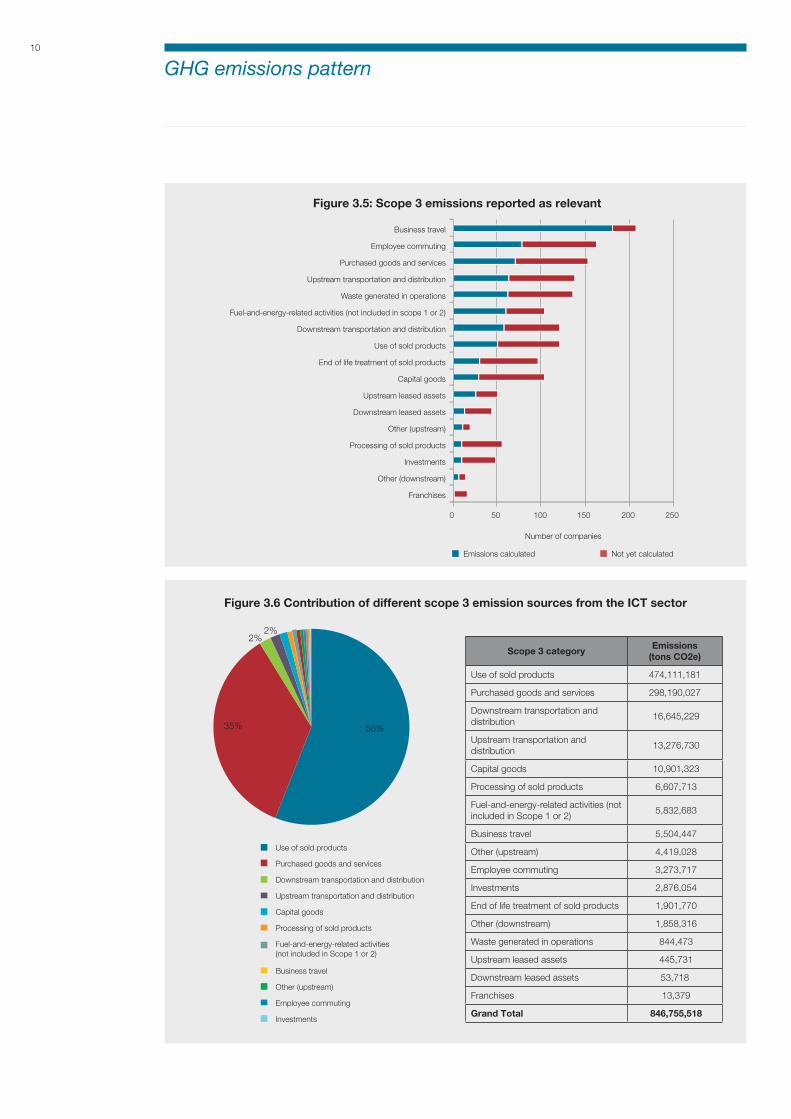
In the case of scope 3 emissions the sources reported as relevant include the factors indicated in figure 3.5. Use of sold products, and purchase of goods and services account for nearly 773 million tons of CO2e. Less than 50% of the firms which categorise this as relevant has been able to actually quantify this for their firms. From an implementation perspective this information would be especially valuable for carbon management in the industrialised countries where scope 3 emission are the highest proportion of total emissions.
Figure 3.4: Scope 2 emissions by business activity
3%
12%
55%
1%
7%
22%
Data centers Manufacture of software
Business services
Other activities
Provision of network/connectivity services
Manufacture or assembly of hardware/components
Use of sold products, and purchase of goods and services account for nearly 773 million tons of CO2e.
10%
31%
37%
0%
14%
8%
Data centers Manufacture of software
Business services
Other activities
Provision of network/connectivity services
Manufacture or assembly of hardware/components
10
Figure 3.5: Scope 3 emissions reported as relevant
Figure 3.6 Contribution of different scope 3 emission sources from the ICT sector
Scope 3 categoryEmissions
(tons CO2e)
Use of sold products 474,111,181
Purchased goods and services 298,190,027
Downstream transportation and distribution
16,645,229
Upstream transportation and distribution
13,276,730
Capital goods 10,901,323
Processing of sold products 6,607,713
Fuel-and-energy-related activities (not included in Scope 1 or 2)
5,832,683
Business travel 5,504,447
Other (upstream) 4,419,028
Employee commuting 3,273,717
Investments 2,876,054
End of life treatment of sold products 1,901,770
Other (downstream) 1,858,316
Waste generated in operations 844,473
Upstream leased assets 445,731
Downstream leased assets 53,718
Franchises 13,379
Grand Total 846,755,518
GHG emissions pattern
Franchises
Other (downstream)
Investments
Processing of sold products
Other (upstream)
Downstream leased assets
Upstream leased assets
Capital goods
End of life treatment of sold products
Use of sold products
Downstream transportation and distribution
Fuel-and-energy-related activities (not included in scope 1 or 2)
Waste generated in operations
Upstream transportation and distribution
Purchased goods and services
Employee commuting
Business travel
Number of companies
0 50 100 150 200 250
Emissions calculated Not yet calculated
Use of sold products
Purchased goods and services
Downstream transportation and distribution
Upstream transportation and distribution
Capital goods
Processing of sold products
Business travel
Other (upstream)
Employee commuting
Investments
Fuel-and-energy-related activities(not included in Scope 1 or 2)
56%35%
2%2%

11
3.1 Comparative analysis
The contribution of scope 1, scope 2 and scope 3 emissions to the overall emissions differs across sectors as well as countries as indicated in the comparative charts below (Figure 3.7). As indicated in the charts, the overall proportion of scope 1 and 2 emissions in the case of industrially advanced countries US, Japan,
Figure 3.7: Share of scope-1, 2 & 3 emissions by country
South Korea, Taiwan, Germany, UK, and France is less than 40% of the overall emissions while the percentage share of scope 3 emissions are signifi cant. Whereas in the case of the emerging economies such as China, South Africa and India the trend reverses with scope 1 and scope 2 emissions accounting for a signifi cant percentage of emissions.
The high proportions of scope 3 emissions in overall
2 It is important to note here that comparing Scope 3 emissions on a sectoral basis or even of peer companies on a source by source basis can be misleading, given the state of the art and practice in scope 3 emission accounting. Hence higher fi gures shown by a company/sector could actually mean that the company/sector with a higher total is more advanced or inclusive in its understanding of Scope 3 accounting. Even within Scope 3 source categories there is considerable variation between companies on methodologies they use and how much of that category they calculate. Despite this we report this data to give the reader a broad overview of the potential impacts.
Figure 3.8: Use of data on suppliers’ GHG emissions and climate change strategies
GHG emissions pattern
The high proportions of scope 3 emissions in overall emissions require that the companies actively engage with their supply chain and customers in identifying and working on high impact areas of climate change mitigation.
31%
7%
5%10%
9%
24%
14%
Other
Use in supplier scorecards
We do not have any data
Identifying GHG sources to prioritize for reduction actions
Managing physical risks in the supply chain
Managing the impact of regulation in the supply chain
Stimulating innovation of new products
31%
7%
5%10%
9%
24%
14%
Other
Use in supplier scorecards
We do not have any data
Identifying GHG sources to prioritize for reduction actions
Managing physical risks in the supply chain
Managing the impact of regulation in the supply chain
Stimulating innovation of new products
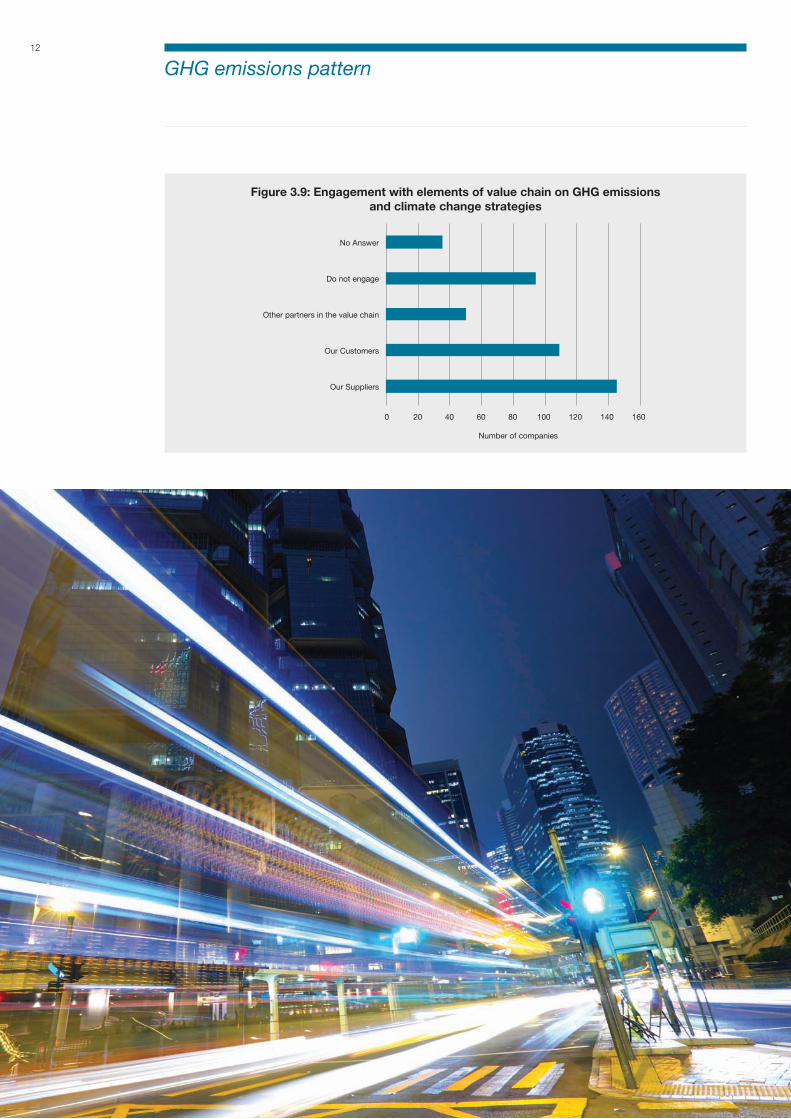
emissions require that the companies actively engage with their supply chain and customers in identifying and working on high impact areas of climate change mitigation. However, in reality the level of engagement of responding fi rms is well below what may be required. Less than 50% of the fi rms engage with suppliers, indicating that signifi cant opportunities for reducing emissions may
be lost currently because of this (Figures 3.8–3.9). Companies which collect emission data from their suppliers, use it to support a wide range of climate change mitigation practices and policies including; identifying priority GHG sources for emission reduction, evaluating physical risks in the supply chain, developing supplier score cards, managing the impact of regulation in the supply chain and stimulating innovation of new products.2
—
20%
40%
60%
80%
100%
120%
% Share of scope 1 % share of scope 2 % share of scope 3
US
A
Jap
an
Sou
th K
orea
Per
cent
age
Taiw
an
Ger
man
y
Uni
ted
Kin
gdom
Fran
ce
Sou
th A
fric
a
Sp
ain
Ind
ia
Sw
itzer
land
Aus
tral
ia
Chi
na
Can
ada
12
Figure 3.9: Engagement with elements of value chain on GHG emissionsand climate change strategies
0 20 40 60 80 100 120 140 160
Our Suppliers
Our Customers
Number of companies
Other partners in the value chain
Do not engage
No Answer
GHG emissions pattern

13
4.0 GHG management in ICT sector
4.1 Governance structures
Creating appropriate governance structures is critical for effectively managing climate change issues. As concerns about climate change intensify and regulatory constraints increase, these issues now attract greater attention from the top management, extending up to the board. This study indicates that such structures are rapidly evolving within the ICT sector. In over 60% of the firms surveyed the highest level of direct responsibility for climate change was assigned to an individual board member, a sub-set
Figure 4.1: Governance structures for managing climate change issues
Figure 4.2: Governance structures
of the board, or a committee appointed by the board. For nearly a quarter of the respondents, the responsibility lay with the senior managers and officers. Less than 10% of the firms surveyed had no formal organisational structure - such as a committee with overall responsibility for managing climate change issues (Figures 4.1-4.2).
The study also indicates that both high turnover as well as high performance (CDP performance score) companies tend to assign climate related responsibilities at the board level or to a committee appointed by the board. On the other hand less than 40% of the poorly performing firms had a high level committee monitoring or managing the climate change issues. Some example of governance among top performers (CDP performance score) is given in the following table.
In over 60% of the firms surveyed, the highest level of direct responsibility for climate change was assigned to an individual board member, a sub-set of the board, or a committee appointed by the board.
63%
7%
4%
24%
2%
Other Manager/Officer
Senior Manager/Officer
No Answer
Individual/Sub-set of the Board or other committee appointed by the Board
No individual or committee with overall responsibility for climate change
30
34
22
41
19
39
14
8
14
8
11
11
4
4
4
4
1
2
2
8
1
12
2
2
5
0% 10% 20% 30% 40% 50% 60% 70% 80% 90% 100%
Bottom 50 (RoE)
Top 50 (RoE)
Bottom 50 (Revenue)
Top 50 (Revenue)
Bottom 50 (Performance)
Top 50 (Performance)
Individual/Sub-set of the Board or other committee appointed by the Board
Senior Manager/Officer
Other Manager/Officer
No individual or committee with overall responsibility for climate change
No response
14
GHG management in ICT sector
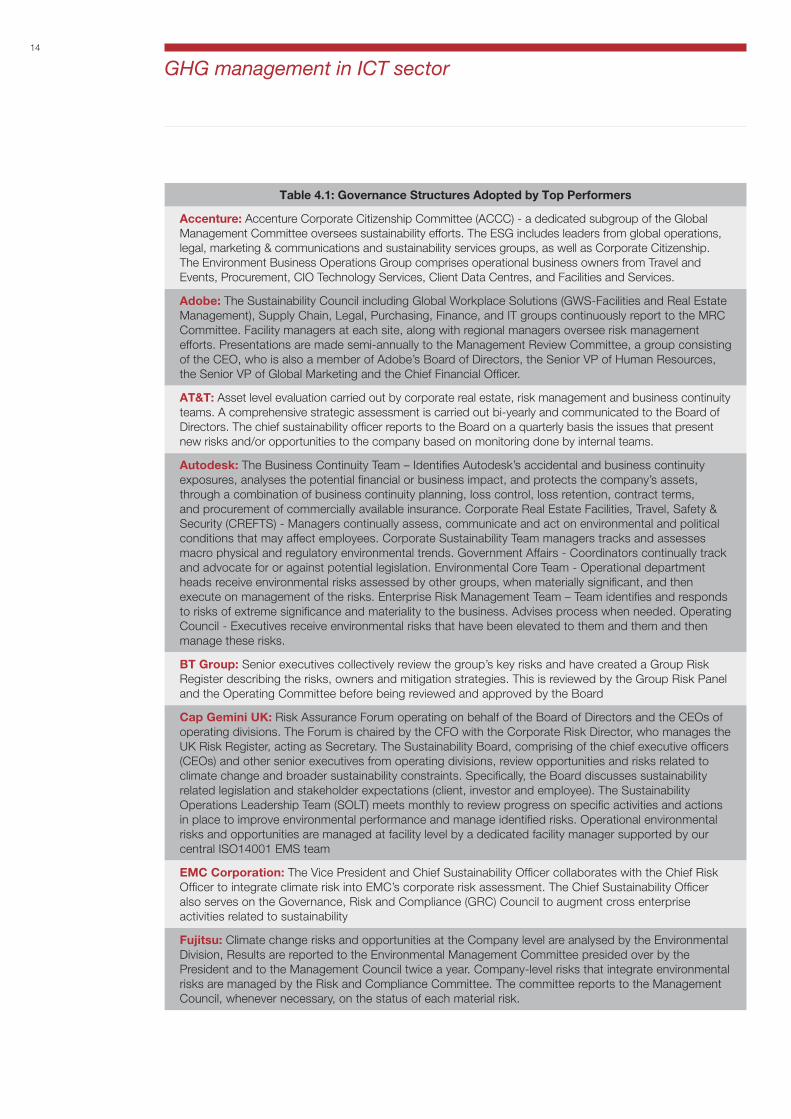
Table 4.1: Governance Structures Adopted by Top Performers
Accenture: Accenture Corporate Citizenship Committee (ACCC) - a dedicated subgroup of the Global Management Committee oversees sustainability efforts. The ESG includes leaders from global operations, legal, marketing & communications and sustainability services groups, as well as Corporate Citizenship. The Environment Business Operations Group comprises operational business owners from Travel and Events, Procurement, CIO Technology Services, Client Data Centres, and Facilities and Services.
Adobe: The Sustainability Council including Global Workplace Solutions (GWS-Facilities and Real Estate Management), Supply Chain, Legal, Purchasing, Finance, and IT groups continuously report to the MRC Committee. Facility managers at each site, along with regional managers oversee risk management efforts. Presentations are made semi-annually to the Management Review Committee, a group consisting of the CEO, who is also a member of Adobe’s Board of Directors, the Senior VP of Human Resources, the Senior VP of Global Marketing and the Chief Financial Officer.
AT&T: Asset level evaluation carried out by corporate real estate, risk management and business continuity teams. A comprehensive strategic assessment is carried out bi-yearly and communicated to the Board of Directors. The chief sustainability officer reports to the Board on a quarterly basis the issues that present new risks and/or opportunities to the company based on monitoring done by internal teams.
Autodesk: The Business Continuity Team – Identifies Autodesk’s accidental and business continuity exposures, analyses the potential financial or business impact, and protects the company’s assets, through a combination of business continuity planning, loss control, loss retention, contract terms, and procurement of commercially available insurance. Corporate Real Estate Facilities, Travel, Safety & Security (CREFTS) - Managers continually assess, communicate and act on environmental and political conditions that may affect employees. Corporate Sustainability Team managers tracks and assesses macro physical and regulatory environmental trends. Government Affairs - Coordinators continually track and advocate for or against potential legislation. Environmental Core Team - Operational department heads receive environmental risks assessed by other groups, when materially significant, and then execute on management of the risks. Enterprise Risk Management Team – Team identifies and responds to risks of extreme significance and materiality to the business. Advises process when needed. Operating Council - Executives receive environmental risks that have been elevated to them and them and then manage these risks.
BT Group: Senior executives collectively review the group’s key risks and have created a Group Risk Register describing the risks, owners and mitigation strategies. This is reviewed by the Group Risk Panel and the Operating Committee before being reviewed and approved by the Board
Cap Gemini UK: Risk Assurance Forum operating on behalf of the Board of Directors and the CEOs of operating divisions. The Forum is chaired by the CFO with the Corporate Risk Director, who manages the UK Risk Register, acting as Secretary. The Sustainability Board, comprising of the chief executive officers (CEOs) and other senior executives from operating divisions, review opportunities and risks related to climate change and broader sustainability constraints. Specifically, the Board discusses sustainability related legislation and stakeholder expectations (client, investor and employee). The Sustainability Operations Leadership Team (SOLT) meets monthly to review progress on specific activities and actions in place to improve environmental performance and manage identified risks. Operational environmental risks and opportunities are managed at facility level by a dedicated facility manager supported by our central ISO14001 EMS team
EMC Corporation: The Vice President and Chief Sustainability Officer collaborates with the Chief Risk Officer to integrate climate risk into EMC’s corporate risk assessment. The Chief Sustainability Officer also serves on the Governance, Risk and Compliance (GRC) Council to augment cross enterprise activities related to sustainability
Fujitsu: Climate change risks and opportunities at the Company level are analysed by the Environmental Division, Results are reported to the Environmental Management Committee presided over by the President and to the Management Council twice a year. Company-level risks that integrate environmental risks are managed by the Risk and Compliance Committee. The committee reports to the Management Council, whenever necessary, on the status of each material risk.
15
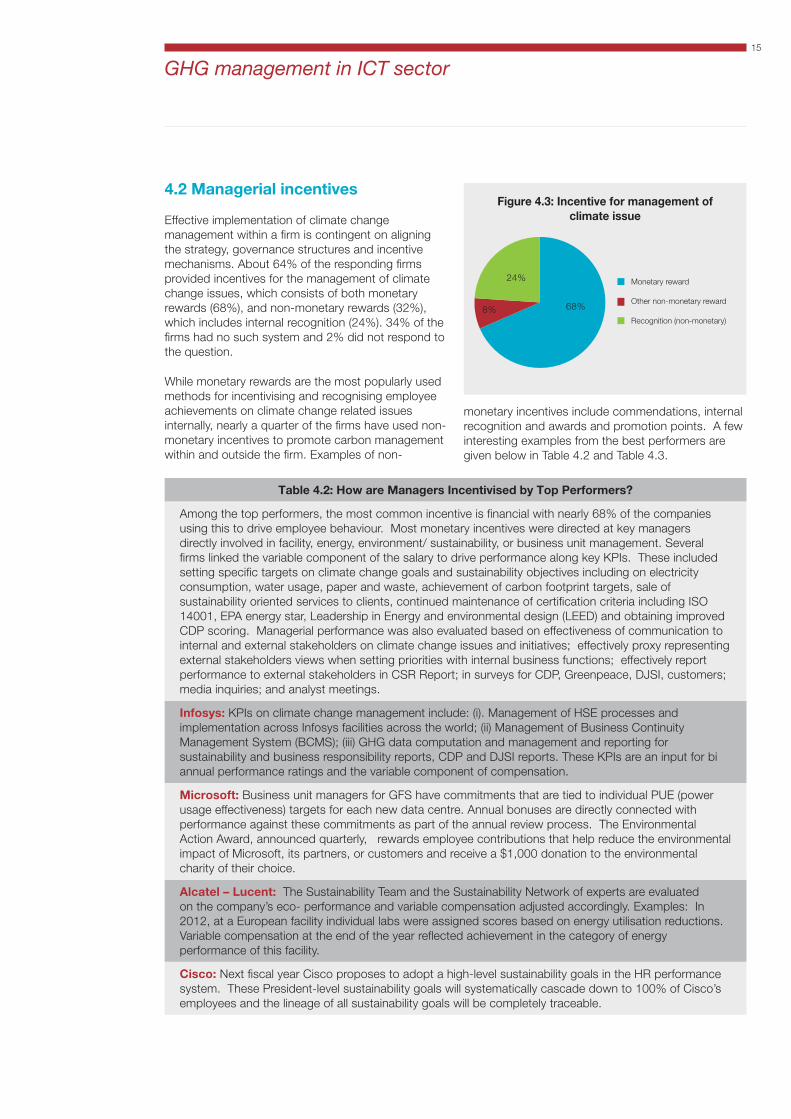
4.2 Managerial incentives
Effective implementation of climate change management within a firm is contingent on aligning the strategy, governance structures and incentive mechanisms. About 64% of the responding firms provided incentives for the management of climate change issues, which consists of both monetary rewards (68%), and non-monetary rewards (32%), which includes internal recognition (24%). 34% of the firms had no such system and 2% did not respond to the question.
While monetary rewards are the most popularly used methods for incentivising and recognising employee achievements on climate change related issues internally, nearly a quarter of the firms have used non-monetary incentives to promote carbon management within and outside the firm. Examples of non-
monetary incentives include commendations, internal recognition and awards and promotion points. A few interesting examples from the best performers are given below in Table 4.2 and Table 4.3.
Figure 4.3: Incentive for management ofclimate issue
Table 4.2: How are Managers Incentivised by Top Performers?
Among the top performers, the most common incentive is financial with nearly 68% of the companies using this to drive employee behaviour. Most monetary incentives were directed at key managers directly involved in facility, energy, environment/ sustainability, or business unit management. Several firms linked the variable component of the salary to drive performance along key KPIs. These included setting specific targets on climate change goals and sustainability objectives including on electricity consumption, water usage, paper and waste, achievement of carbon footprint targets, sale of sustainability oriented services to clients, continued maintenance of certification criteria including ISO 14001, EPA energy star, Leadership in Energy and environmental design (LEED) and obtaining improved CDP scoring. Managerial performance was also evaluated based on effectiveness of communication to internal and external stakeholders on climate change issues and initiatives; effectively proxy representing external stakeholders views when setting priorities with internal business functions; effectively report performance to external stakeholders in CSR Report; in surveys for CDP, Greenpeace, DJSI, customers; media inquiries; and analyst meetings.
Infosys: KPIs on climate change management include: (i). Management of HSE processes and implementation across Infosys facilities across the world; (ii) Management of Business Continuity Management System (BCMS); (iii) GHG data computation and management and reporting for sustainability and business responsibility reports, CDP and DJSI reports. These KPIs are an input for bi annual performance ratings and the variable component of compensation.
Microsoft: Business unit managers for GFS have commitments that are tied to individual PUE (power usage effectiveness) targets for each new data centre. Annual bonuses are directly connected with performance against these commitments as part of the annual review process. The Environmental Action Award, announced quarterly, rewards employee contributions that help reduce the environmental impact of Microsoft, its partners, or customers and receive a $1,000 donation to the environmental charity of their choice.
Alcatel – Lucent: The Sustainability Team and the Sustainability Network of experts are evaluated on the company’s eco- performance and variable compensation adjusted accordingly. Examples: In 2012, at a European facility individual labs were assigned scores based on energy utilisation reductions. Variable compensation at the end of the year reflected achievement in the category of energy performance of this facility.
Cisco: Next fiscal year Cisco proposes to adopt a high-level sustainability goals in the HR performance system. These President-level sustainability goals will systematically cascade down to 100% of Cisco’s employees and the lineage of all sustainability goals will be completely traceable.
GHG management in ICT sector
68%8%
24%
Other non-monetary reward
Monetary reward
Recognition (non-monetary)

16
Figure 4.4: Risk management process
EMC Corporation: The annual Innovation Conference, launched in 2009, identifies and implements employee ideas related to data centre energy consumption, monitoring enterprise IT’s carbon footprint, and sustainable packaging practices. In 2012, a record 2,200 proposals were submitted by employees from 28 countries. Award winners are provided 1) support to incubate their ideas, 2) a cash award, 3) a cash donation to an environmental NGO of their choice, and 4) substantial visibility within the company.
Ricoh Group: Every year, employees selected for their outstanding creativity and performance receive “Minori” prize award from the CEO (includes a financial component). Since 2010, “Sustainability contribution award” within the program is given to employee(s) or group activities that contributed significantly to the reduction of CO2 impact for the society and is rated highly by stakeholders - suc h as by developing new Green technologies, new service model that contributes to CO2 impact reduction for Richo’s customers.
4.3 Business strategy and risk management approaches
4.3.1 Integration of climate change into business strategy
Climate change issues have strongly influenced strategy formulation in a majority of firms. 81% of the respondents have now integrated climate change into their core business strategy. Top management in companies is increasingly accepting that climate
change strategy can be a source of competitive advantage, directly through cost, revenue or reputational impacts. However in nearly 17% of the companies’ climate change issues were not integrated into their business strategy and they did not have a documented process for risk assessment and management. Reasons for this ranged from internal assessment that these issues would not affect business in the near future; emissions estimated as low due to safe operations, market conditions and internal resource constraints that preclude any focus on non-financial business aspects etc.
Table 4.3: Why and how do the top performers integrate climate change into business strategy?
Accenture: Drivers
Increasing Clients’ expectations: A greater number of client RFPs or supplier reviews now include environmental questions.
Ability to win and retain talent: Increased employee interest in in getting involved in climate change issues
Potential Impact on competitive advantage
GHG management in ICT sector
5
1
4
5
6
3
30
42
24
44
16
48
14
5
19
22
0
1
2
3
1
7
0% 10% 20% 30% 40% 50% 60% 70% 80% 90% 100%
Bottom 50 (RoE)
Top 50 (RoE)
Bottom 50 (Revenue)
Top 50 (Revenue)
Bottom 50 (Performance)
Top 50 (Performance)
A specific climate change risk management process
Integrated into multi-disciplinary company wide risk management processes
There are no documented processes for assessing and managing risks and opportunities from climate change
No Answer
17
Approach:
Environmental protection a key part of its Stewardship value. The policy is translated into operational programs through a cross-functional Environment Operations group (comprising leaders from Facilities & Services, Travel & Events, Procurement, and Technology Services)
Integrate climate change into governance mechanisms: A subgroup is dedicated to sustainability efforts. Accenture’s Chief Leadership Officer, and Chief Operating Officer, are jointly accountable for the company’s carbon target: to reduce per employee carbon emissions by 35 percent against our fiscal 2007 baseline by 2015.
Channel employee enthusiasm to help meet targets and act as environmental advocates with more than 4000 employee eco team volunteers in 40 countries.
Integrate climate change into commercial strategies: New business initiatives, such as Accenture’s Energy Efficiency and Emissions Management and Enterprise Energy Management offerings, are critical to Accenture’s growth strategy. Focal areas include intelligent infrastructure, cloud computing, smart grid, mobility and analytics, and sustainable supply chain, each of which helps reduce energy consumption and emissions.
Operational investment- driving voluntary emissions reductions: Accenture has invested in maintaining global ISO 14001 certification, rolling out REM and video collaboration technologies to cut scope 1, 2 and 3 emissions (office energy usage and business travel).
R&D investment- maximizing future business opportunities: During fiscal 2012 Accenture spent $560 million on research and development related to its key focal areas.
BT: Drivers
Adaptation and Disaster Response: Severe weather causes an increased rate of faults in BT’s network and has an adverse impact on our customer service.
GHG emissions resulting from electricity use: GHG emissions from electricity comprise over 90% of BT’s direct carbon emissions.
Regulation: Uncertainty about the long-term detail of electricity market reform drives price volatility in the UK.
Customer demand for products with low environmental impact:
Gaining Competitive Advantage: Through ability to manage business more effectively by getting insights into environmental risk and opportunity; improving investors’ assessment of BT’s business’s worth; reducing costs; increasing employee motivation & productivity; positive reputational benefit for our
Approach
BTs approach focuses on three key areas: (i) Investing for the future; (ii) Customer service delivery; (iii) Cost transformation.
Reduce energy consumption by rolling out a smart energy management network across the business, and rationalising infrastructure in data canters, networks and buildings. Focus on efficient fleet management.
Limit price risk: BT’s energy costs are currently in excess of £274m. Changes in regulation for energy have also created volatility in energy pricing. To deal with this BT has signed long term contracts with suppliers and also hedges up to three years forward within specified risk limits to protect the business from price strikes.
Drive carbon reduction: Partnership with suppliers to source electricity from sustainable supplies. BT aims to reduce worldwide CO2 emission intensity by 80% compared to 1996/97 levels by December 2020.
Improve reliability in the physical network infrastructure: Make networks must be resilient to severe weather caused disruptions, especially flooding.
BT has set a Net Good goal to achieve a 3:1 abatement ration by 2020. This will be achieved by
GHG management in ICT sector

18
reducing BT’s carbon footprint both upstream, in own operations, and downstream by helping customers. This strategic shift involves evolving new product designs, encouraging suppliers to adopt more sustainable practices, sustainable supply chain management, and developing new technologies.
Infosys: Drivers
Brand & Reputation: Infosys is a corporate leader in India and wants to maintain the leadership in sustainability too.
Increased interests from stakeholders especially clients resulting in New Business Opportunities: Many clients are looking at reducing their environmental footprint and comply with new regulations coupled with increased expectations from stakeholders. Infosys wants to transfer the best practices from our sustainability efforts to our clients through the sustainability business unit.
Adaptation: Climate change is seen as a physical risk to Infosys operations through extreme weather events, resource shortages like reduction in availability of water and changing environmental parameters like annual increase in temperature.
Regulatory changes: In India as elsewhere, regulatory changes will result in increased energy prices along with additional compliance requirements which will increase our risk to Infosys business operations. Voluntary commitments on carbon, energy, water, waste, biodiversity, suppliers etc. will help better adapt to changing regulations in India and other countries Infosys operates in.
Strategic advantage over competitors: Infosys being the first ICT Company in India to have a carbon neutral goal has a strategic advantage over industry peers. Previous efforts at energy reduction have resulted in Infosys having one of the lowest per capita energy consumption in the industry. Through efforts in sustainability, Infosys is also able to clinch deals with clients who consider sustainability as a key performance indicator. From a business perspective, the innovative solutions offered by the sustainability unit have resulted in increased revenues from this new division.
Approach
Voluntary goals to reduce our energy and water consumption in daily operations. All new buildings are designed to meet LEED Platinum green building standards, Waste management initiatives in campuses. Voluntary public commitment to become carbon neutral by end of year 2017
Afforestation drives in campuses to influence the micro-climate and promote biodiversity,
Infosys’s adaptation strategy involves reducing energy and water consumption while simultaneously attempting to become self-sufficient, encouraging our employees to become more sustainable through engagement. Rolling out the sustainable supply chain policy and engaging with suppliers
Recognizing Sustainability as one of the 7 key drivers for business growth in the current Infosys 3.0 strategy
Working with renowned sustainability research organizations like LBNL to come up with innovative technologies and solutions for climate change mitigation
Closely working with trade associations like WBCSD, CII to influence their position on climate change to encourage more corporate action.
Microsoft: Approach
Shift in business strategy to towards cloud computing, resulting in a significant increase in our investment in data centers. Microsoft is strongly focused on improving the efficiency of its data centers. Continual efficiency improvements are helping the company design new facilities to be up to 30-50% more efficient than other industry data centers. When designing and constructing new data centers, the company targets an average 1.125 or better PUE (power usage effectiveness). In 2013 Microsoft’s average PUE was ~1.40 across its global portfolio compared to the industry average of 1.8-1.9.
The scale of Microsoft’s increased investment in data centers means that efficiency measures alone are not sufficient to reach the target. Hence the company purchased Renewable Energy Certificates (RECs) to offset the additional emissions impact of its data centers. In addition, the change in business strategy to focus on cloud computing led to a slowing of the decrease in air travel for field
GHG management in ICT sector

19
GHG management in ICT sector
sales and marketing staff, who must attend in-person training and meetings with customers. As a result, Microsoft has invested in carbon offset projects to offset emissions related to employee air travel.
More efficient operations: Achievement is based on net, not gross, emissions. In terms of business offices and facilities, Microsoft has met its target through more efficient operations
Interestingly not all the firms have actively tried to integrate climate change issues into business strategy. Companies efforts to do so have been hampered by a host of factors including; inadequate understanding
Table 4.4: Typical reasons for not integrating climate change issues into business strategy
Not a Relevant Business Issue
Currently, there is no evidence to suggest there is a need to integrate climate change into the company business strategy;
Climate change is not currently a driver for the core business given the nature of business activities. It is not anticipated that this will change in the near future;
The risks and opportunities are in the next 5 years are moderate, and have therefore only a marginal effect on our business strategy; and
Climate change is not currently part of the top line growth strategy of our company. Our facilities are not large generators of GHG emissions; therefore there is not regulatory pressure to reduce our emissions.
No Significant Environmental Impact
Due to our low levels of consumption we remain below the reporting threshold and therefore are not required to participate;
According to its activities and the geographic location of its sites, the Group has not identified any major risks related to climate change;
We do not consider our Company to be exposed to regulatory risks. The software and related sector of the IT industry, in our view, is not at the present time likely to face CO2 emission regulations;
Climate change may have little effect on our business because of the nature of our goods/services;
Our operations are managed overseas and we don’t foresee any major risks from Climate related issues there; and
Climate change remains an important consideration for our business but is not split out as a standalone strategy.
Others
It is difficult to reach a broad consensus on climate change and incorporate into a worldwide business strategy. On a local level, we are active in climate change initiatives established by governing bodies;
Do not have the resources;
Survival is the company’s primary goal. The market continues to be both unstable and extremely competitive, and we are constantly adjusting operations in order to meet customer demands; and
Assessing climate change, our emissions, and the risks to business is a new initiative. As such, we have not yet completed a full analysis and determined an integration or risk management strategy.
of climate change related risks, lack of consensus within the management about impacts or adaptation measures; lack of resources; and tough business climate etc (see Table 4.4 for a typical set of responses).

20
21
GHG management in ICT sector
Table 4.5: How do top performers engage with policy makers?
AT&T on Smart Grid Technology: Smart grid technology has the potential to cut domestic carbon emissions from generating electricity by as much as 14 percent by 2020, saving $15 billion to $35 billion in energy and fuel costs. In 2012, AT&T collaborated with a variety of smart-grid stakeholders to start up a voluntary privacy seal program. The program compiles industry best practices that allow consumers to share their energy usage data with the service providers that use smart-grid data to help consumers operate their homes more efficiently and without compromising the privacy and security of consumer grid data. AT&T also engaged with several state public utility commissions on this issue.
Autodesk, Inc. on the transportation Sector: Promoted the use of 3D modeling design software that can reduce waste and GHG emissions during road and transit construction. Supported discussions on climate change policy by briefing over 50 offices/staff/members over three years, and key leaders several times as the legislation progressed on the many benefits of using 3D modeling tools in the design, planning, public participation, environmental review, and construction phases of transportation projects. Among the benefits are expedited projects, improved outcomes, and reduced emissions and waste.
Samsung Electro Mechanics Co., Ltd. on Emissions Trading: Since 2010 Samsung has participated in the emission trading pilot project developed by the Ministry of Environment and provided active feedback to improve system based on the experience in the pilot project.
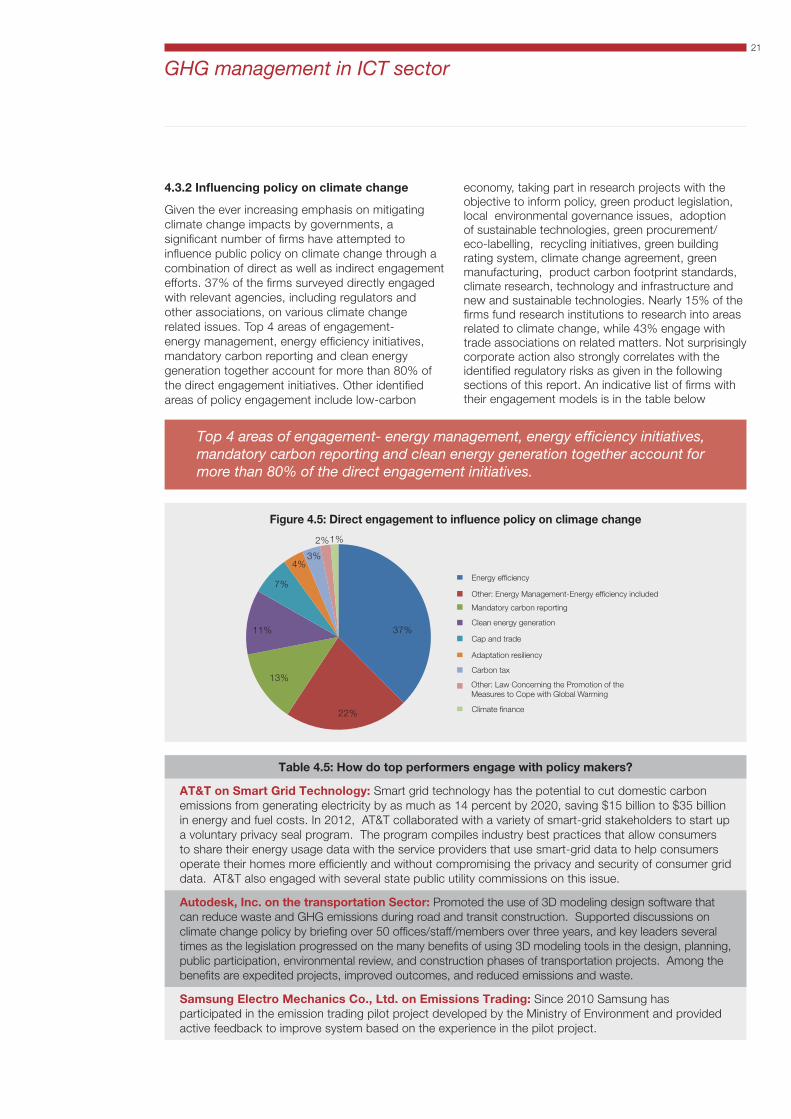
4.3.2 Influencing policy on climate change
Given the ever increasing emphasis on mitigating climate change impacts by governments, a significant number of firms have attempted to influence public policy on climate change through a combination of direct as well as indirect engagement efforts. 37% of the firms surveyed directly engaged with relevant agencies, including regulators and other associations, on various climate change related issues. Top 4 areas of engagement- energy management, energy efficiency initiatives, mandatory carbon reporting and clean energy generation together account for more than 80% of the direct engagement initiatives. Other identified areas of policy engagement include low-carbon
economy, taking part in research projects with the objective to inform policy, green product legislation, local environmental governance issues, adoption of sustainable technologies, green procurement/eco-labelling, recycling initiatives, green building rating system, climate change agreement, green manufacturing, product carbon footprint standards, climate research, technology and infrastructure and new and sustainable technologies. Nearly 15% of the firms fund research institutions to research into areas related to climate change, while 43% engage with trade associations on related matters. Not surprisingly corporate action also strongly correlates with the identified regulatory risks as given in the following sections of this report. An indicative list of firms with their engagement models is in the table below
Figure 4.5: Direct engagement to influence policy on climage change
Top 4 areas of engagement- energy management, energy efficiency initiatives, mandatory carbon reporting and clean energy generation together account for more than 80% of the direct engagement initiatives.
37%
22%
13%
11%
7%
4%3%
2%1%
Energy efficiency
Other: Energy Management-Energy efficiency included
Mandatory carbon reporting
Clean energy generation
Cap and trade
Adaptation resiliency
Carbon tax
Climate finance
Other: Law Concerning the Promotion of the Measures to Cope with Global Warming

22
SK Telecom on Stakeholder Consultations on Green Growth Policy: Regular consultations with KCC (Korea Communication Committee), MoE (Ministry of Environment), MoEK (Ministry of Economic and Knowledge) etc. on reduction of GHG emission and Green growth policy. In 2012 the company proposed Tele-communication GHG inventory guideline with KCC and methodology for calculating GHG emissions of the sector. Also participated in public hearings, related conferences and seminars and made recommendations on regulatory and measurement issues.
Vodafone group on Climate Change Policy: Vodafone is an active member of the EU Corporate Leaders Group (EU CLG), convened by The Prince of Wales, that brings together business leaders from a cross-section of EU and international businesses to help develop new and longer-term policies for tackling climate change. The Group is focusing on the changes necessary to ensure long-term economic prosperity, competitive advantage and corporate sustainability at an EU-wide level.
Telenor Group on Carbon Taxes: In 2012, Telenor Group signed The Carbon Price Communiqué. The communiqué urges policy-makers to introduce a clear and transparent carbon price framework, namely: Make carbon pricing a central part of national policy responses, work towards the long term objective of a carbon price throughout the global economy, and set sufficiently ambitious and internationally agreed targets to drive climate mitigation efforts.
Google Inc. on Clean Energy Policy: Google’s public policy team met with members of the US Congress and White House in 2012 to lobby for more aggressive clean energy policies. In addition, Google and Bloomberg convened and hosted a high level panel discussion at the Democratic National. Discussions covered how to take advanced energy technologies to scale and the most important policies and actions needed to accelerate momentum over the next decade.
Hewlett –Packard on Tax Credits for Renewable Energy: The production tax credit (PTC) provides a tax credit of 2.2 cents per megawatt hour of generated electricity for wind developers. Since the PTC was enacted seven years ago, wind power capacity has increased by 47,000 MW, a seven-fold increase. Eliminating the credit will shut down much of a thriving US manufacturing sector, one of the fastest-growing sources of factory jobs even in the depths of the economic slowdown. HP signed a letter with other leading firms to petition congressional leaders for an extension of the production tax credit for wind power, which was scheduled to expire in 2012.
IBM on Smart Grid Technology for Distributed Generation: IBM has advocated for improvements in grid technology to facilitate the implementation of distributed generation, specifically wind and solar systems with intermittent power delivery. As currently configured, the grid cannot effectively integrate large, intermittent solar, wind and wave generation systems. IBM has advocated for necessary regulatory adjustments and funding to facilitate the introduction of Smart Grid technology into grid systems around the globe to enable the diversification of the grid generation system and the stability of the grid.
Wipro on Renewable Energy Policy: Wipro has engaged with the Ministry of New and Renewable Energy (MNRE) of the Government of India on different aspects of the policies and regulations related to the generation of clean energy. The company has argued for changes in the current policy framework which are primarily directed at incentivizing power producers and not at incentivizing consumers to adopt clean energy - either, by way of purchase or by way of captive generation. Wipro has also engaged with the government on ways and means of making the governance and administration of the National Solar Mission more effective.
Adobe systems, Inc. on Energy Policy: Adobe participated in discussions with the California Energy Commission to draft the NetZero Energy Action Plan. This bill ensures that all new construction within California will be net zero energy by 2030.
Groupe Steria on Energy Policy: Collaborated with various industrial partners to set up the first Smart District in France, which will inform national energy and city plans in future throughout the country and in Europe. IssyGrid® is France’s first local smart grid set up by Issy-les-Moulineaux Council and nine leading industrial players, including Steria. In response to an increasingly tight and complex energy market, IssyGrid® offers a local response to global environmental challenges.
GHG management in ICT sector
23
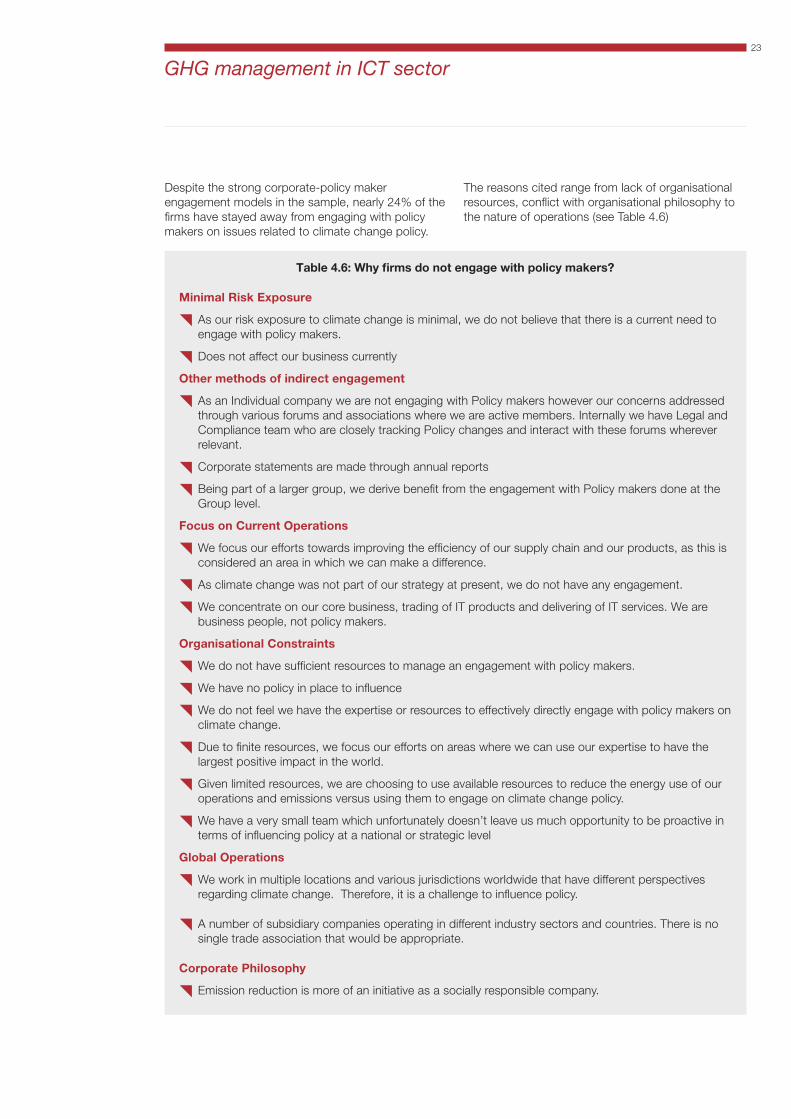
Despite the strong corporate-policy maker engagement models in the sample, nearly 24% of the firms have stayed away from engaging with policy makers on issues related to climate change policy.
GHG management in ICT sector
The reasons cited range from lack of organisational resources, conflict with organisational philosophy to the nature of operations (see Table 4.6)
Table 4.6: Why firms do not engage with policy makers?
Minimal Risk Exposure
As our risk exposure to climate change is minimal, we do not believe that there is a current need to engage with policy makers.
Does not affect our business currently
Other methods of indirect engagement
As an Individual company we are not engaging with Policy makers however our concerns addressed through various forums and associations where we are active members. Internally we have Legal and Compliance team who are closely tracking Policy changes and interact with these forums wherever relevant.
Corporate statements are made through annual reports
Being part of a larger group, we derive benefit from the engagement with Policy makers done at the Group level.
Focus on Current Operations
We focus our efforts towards improving the efficiency of our supply chain and our products, as this is considered an area in which we can make a difference.
As climate change was not part of our strategy at present, we do not have any engagement.
We concentrate on our core business, trading of IT products and delivering of IT services. We are business people, not policy makers.
Organisational Constraints
We do not have sufficient resources to manage an engagement with policy makers.
We have no policy in place to influence
We do not feel we have the expertise or resources to effectively directly engage with policy makers on climate change.
Due to finite resources, we focus our efforts on areas where we can use our expertise to have the largest positive impact in the world.
Given limited resources, we are choosing to use available resources to reduce the energy use of our operations and emissions versus using them to engage on climate change policy.
We have a very small team which unfortunately doesn’t leave us much opportunity to be proactive in terms of influencing policy at a national or strategic level
Global Operations
We work in multiple locations and various jurisdictions worldwide that have different perspectives regarding climate change. Therefore, it is a challenge to influence policy.
A number of subsidiary companies operating in different industry sectors and countries. There is no single trade association that would be appropriate.
Corporate Philosophy
Emission reduction is more of an initiative as a socially responsible company.
24
Neutrality is at the foundation of our company, and is deeply ingrained throughout the entire company. The company is very cautious about advocating for specific policy.
Do not engage with policy makers as we do not feel this is appropriate as this activity is not part of our core business.
Has a long-standing policy of not contributing to political campaigns, individuals, or groups, or participating in public policy debates.
Others
We haven’t found a group to participate in to engage with policy makers in china.
It is also likely that several firms do not feel the need for direct engagement as their interests may be well represented by the industry associations to which they belong. For instance when respondents were queried on their agreement with the publicly articulated positions of their corresponding trade associations over 92% of the responses agreed with the position of the association. This congruence implies that firms can influence policy and protect their interests indirectly limiting their need to engage in the policy formulation process directly.
4.3.3 Climate change risk management procedures
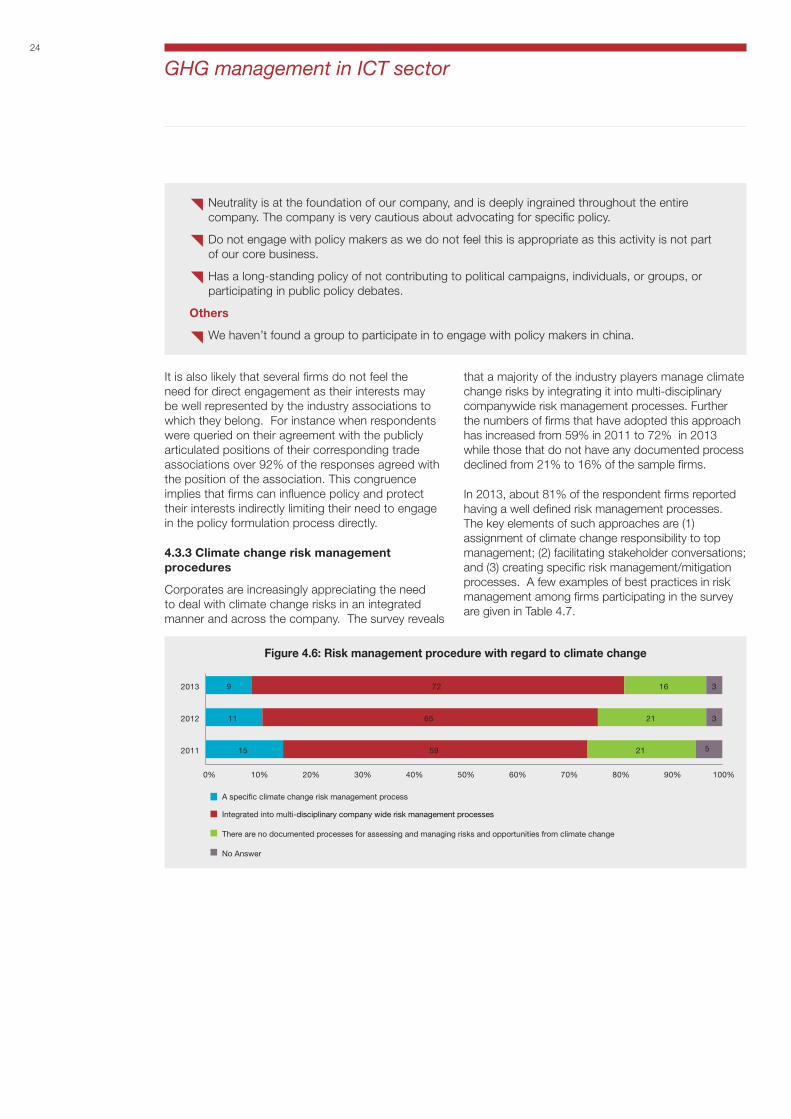
Corporates are increasingly appreciating the need to deal with climate change risks in an integrated manner and across the company. The survey reveals
that a majority of the industry players manage climate change risks by integrating it into multi-disciplinary companywide risk management processes. Further the numbers of firms that have adopted this approach has increased from 59% in 2011 to 72% in 2013 while those that do not have any documented process declined from 21% to 16% of the sample firms.
In 2013, about 81% of the respondent firms reported having a well defined risk management processes. The key elements of such approaches are (1) assignment of climate change responsibility to top management; (2) facilitating stakeholder conversations; and (3) creating specific risk management/mitigation processes. A few examples of best practices in risk management among firms participating in the survey are given in Table 4.7.
Figure 4.6: Risk management procedure with regard to climate change
GHG management in ICT sector
15
11
9
59
65
72
21
21
16
5
3
3
0% 10% 20% 30% 40% 50% 60% 70% 80% 90% 100%
2011
2012
2013
A specific climate change risk management process
Integrated into multi-disciplinary company wide risk management processes
There are no documented processes for assessing and managing risks and opportunities from climate change
No Answer
25
Table 4.7: What risk management structures and processes are used by top performers?
AT&T
A formal sustainability rubric of 44 sustainability-related issues was created and is used to assess their importance to AT&T’s business success and stakeholders. Stakeholder consultations (consulted groups include several non-governmental and activist groups. If needed, secondary research to understand key trends and issues is carried out. To understand these issues from a business perspective, employees from across the company are interviewed.
BT Group
Group Risk Register describing the risks, owners and mitigation strategies reviewed by the Group Risk Panel and the Operating Committee before being reviewed and approved by the Board
The lines of business and internal service unit carry out risk assessments of their operations, create risk registers relating to those operations, and ensure that the key risks are addressed
The Committee for Sustainable and Responsible Business (CSRB) also undertake an annual review of risks and opportunities relating to climate change
EMC corporation
The Vice President and Chief Sustainability Officer develops and communicates EMC’s climate change strategy and collaborates with the Chief Risk Officer to integrate climate risk into EMC’s corporate risk assessment. The Chief Sustainability Officer also serves on the Governance, Risk and Compliance (GRC) Council to augment cross enterprise activities related to sustainability.
The Chief Sustainability Officer chairs the Green Business Leadership (GBL) Council, a cross-functional committee representing 20 business units that convenes weekly to drive environmental sustainability initiatives across the corporation.
The Global Product Operations team collaborates with Tier 1 and strategic Tier 2 suppliers to drive emissions accounting and reduction in the supply chain and in upstream and downstream logistics. The Supply Chain Business Continuity Planning program assesses and addresses risks, including physical risks that might come from climate change.
Fujitsu
Climate change risks and opportunities at the Company level are analysed by the Environmental Division, Results are reported to the Environmental Management Committee presided over by the President and to the Management Council twice a year. Company-level risks that integrate environmental risks are managed by the Risk and Compliance Committee. The committee reports to the Management Council, whenever necessary, on the status of each material risk.
Climate change risks and opportunities are analysed in the following manner
Regulation-related risks and opportunities: Public Policy and Business Development Office maintains a communication channel with policymakers, collects information on domestic and overseas developments in climate change, and analyses related risks and opportunities.
Risks and opportunities associated with customer needs and other companies’ activities: Marketing Unit analyse risks and opportunities by analysing day-to-day communications with customers and their behavioural patterns and examining benchmarks indicative of other companies’ activities.
Risks and opportunities associated with stockholders and investors: PR/IR Division, CSR Department, and Corporate Environmental Unit analyse risks and opportunities through communications with stockholders and investors including principally SRI.
GHG management in ICT sector
26
Risks and opportunities associated with social trends: PR/IR Division, CSR Department and Corporate Environmental Unit analyse risks and opportunities using information collected on Fujitsu’s reputation via communication channels maintained with mass media as well as dialogs with experts in various fields.
Risks and opportunities associated with physical risks and natural disasters: Corporate Environmental Unit and Facilities Management Division analyses risks and opportunities on the basis of damages caused by the past natural disasters as well as natural disasters that are predicted for the future.
Vodacom Group
The RMC assists the Audit, Risk and Compliance Committee to guide, control and monitor the activities of Vodacom. The RMC has the ultimate business responsibility for the management of enterprise risk and is assisted by a Risk Management Working Group in executing its accountabilities. The Working Group considers significant issues which require executive attention and recommends appropriate escalation.
The critical and high operational risks and all tactical risks for a specific area are extracted from the system and forwarded to the Managing or Group Executive (ME). The ME will then update the tactical risks in the risk database
The critical and high tactical risks for a specific company are extracted and forwarded to the Managing Directors and the Risk Management Committee. They will decide if any of these tactical risks are in actual fact strategic for the specific company. The strategic risks are updated in the risk database.
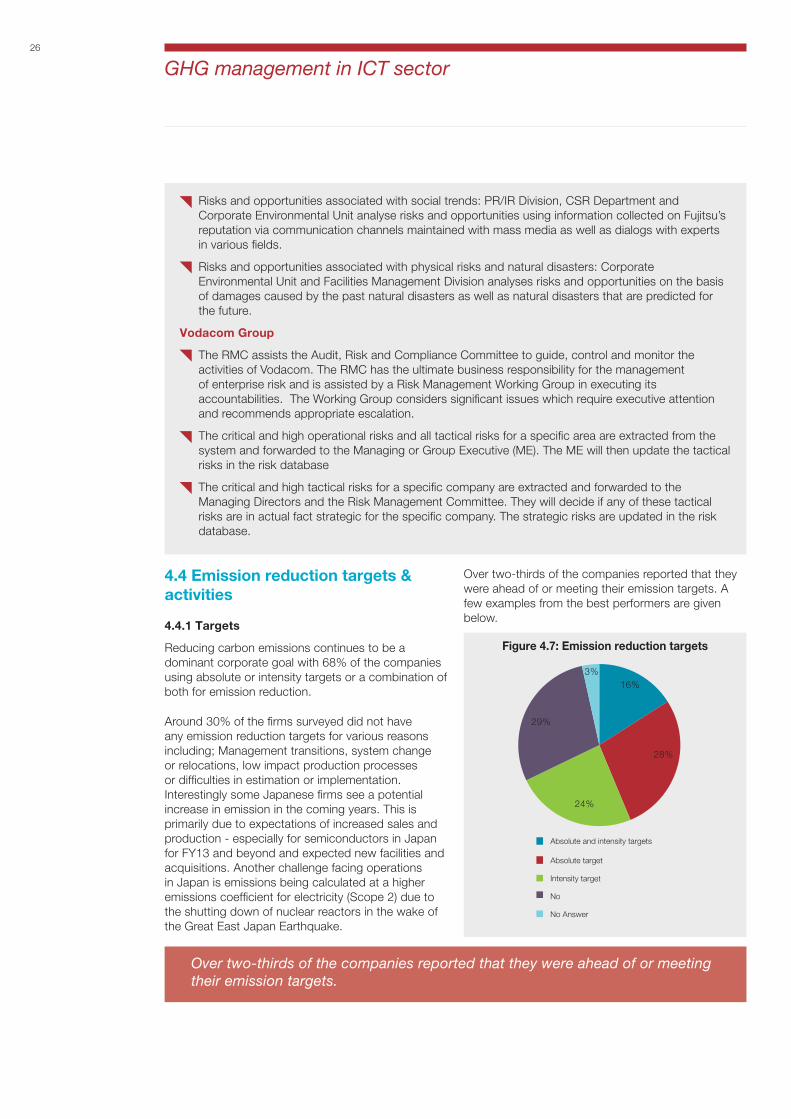
4.4 Emission reduction targets & activities
4.4.1 Targets
Reducing carbon emissions continues to be a dominant corporate goal with 68% of the companies using absolute or intensity targets or a combination of both for emission reduction.
Around 30% of the firms surveyed did not have any emission reduction targets for various reasons including; Management transitions, system change or relocations, low impact production processes or difficulties in estimation or implementation. Interestingly some Japanese firms see a potential increase in emission in the coming years. This is primarily due to expectations of increased sales and production - especially for semiconductors in Japan for FY13 and beyond and expected new facilities and acquisitions. Another challenge facing operations in Japan is emissions being calculated at a higher emissions coefficient for electricity (Scope 2) due to the shutting down of nuclear reactors in the wake of the Great East Japan Earthquake.
Over two-thirds of the companies reported that they were ahead of or meeting their emission targets. A few examples from the best performers are given below.
GHG management in ICT sector
Figure 4.7: Emission reduction targets
Over two-thirds of the companies reported that they were ahead of or meeting their emission targets.
16%
28%
24%
29%
3%
Absolute and intensity targets
Absolute target
Intensity target
No
No Answer
16%
28%
24%
29%
3%
Absolute and intensity targets
Absolute target
Intensity target
No
No Answer

27
Table 4.8: Examples of progress against targets:
Accenture: Achieved a 33.8 per cent reduction in net per employee carbon emissions (scope 1, 2 and 3) against a targeted 30 percent reduction (compared to 2007 baseline). Key measures included using collaboration technologies to minimise business travel and energy efficiency programs, which together account for more than 80 per cent of Accenture’s calculated carbon emissions
AU Optronics: Completed the target of 30% reduction in product carbon footprint by 2012 against 2009 baseline. Achieved through the combined efforts of AUO’s manufacturing, logistics, purchasing and R&D units, and continued development of low-carbon products.
BT group: BT has already completed in 2016 targets in advance. Key measures included (I) extensive rationalisation programme and a sophisticated SMART energy control system across BT’s data canters, networks and estates resulting in a 3.3% reduction in energy use compared to 2012. (ii). Minimising emissions from purchased energy by sourcing from renewable sources in the UK, Germany, Italy, Belgium & Spain, reducing carbon emissions by an estimated 1 million tonnes by 2014. (iii) Driving growth by supporting BT’s core business and by developing low-carbon propositions to the market.
Canon: Set intensity targets to achieve a reduction of 1.4% in comparison to the previous year. In 2012, due in large parts to improvements in distribution, emissions were reduced by a full 4.0% over the previous year.
Cap Gemini UK: Target to reduce overall non data centre emissions by 20% by 2014. In 2012 Cap Gemini’s overall carbon footprint for non-data centre activities was 21,229 tons of CO2e - a reduction of 22 per cent against the 2008 baseline.
Cisco Systems, Inc: Cisco achieved a net reduction of 41 per cent in scope 1+2 emissions in FY2012 compared to FY2007. Longer-term and more aggressive targets through 2017 have now been publicly announced by Cisco.
EMC Corporation: In 2012, EMC’s emissions equalled 19.09 metric tons per one million USD revenue, a reduction of over 41% compared to 2005. EMC achieved this global emissions reduction target well before the target completion year of 2015.
Groupe Steria: Group Steria exceeded its 6 year target (2009-2014) of 20% in 4 years. Emissions per fulltime employee have fallen by 6.03% during 2012 and by 31.68% since the base year of 2008. Scopes 1 & 2 emissions have fallen by 15.37% (absolute) in the current year and by 44.35% since the base year 2008. Scope 3 emissions have fallen by 3.83% (absolute) in the current year and by 20.48% since the base year 2008.
International Business Machines: IBM reduced operational CO2 emissions and PFC CO2e emissions from semiconductor operations by 14.3% from 2005 to 2012 against a combined target for operational and PFC emissions by 7 per cent from 2005 to 2012. At year-end 2012, IBM reduced its operational CO2 emissions by 15.7% against the 2005 base year adjusted for acquisitions and divestitures. IBM exceeded its PFC emissions reduction goal (36.5% vs. 25%), ending in 2010, against a 2005 baseline and reduced this further in 2012 by 2.9 % below the 2010 emissions level.
Lenovo Group: Lenovo achieved its target of eliminating or offsetting all Scope 1 emissions by purchasing and retiring 4,000 MT of carbon offsets. The company’s scope 2 emissions target for FY 2012/2013 was to reduce emissions by 13% relative to base year FY 2009/10. This was achieved by implementing energy/emissions reduction projects - chillers upgrade, HVAC system upgrade & optimization, transformer optimization, manufacturing line modification, lightning automation – installing renewable energy sources, and purchasing & retiring renewable energy credits
Microsoft: The combination of efficiency measures and REC and carbon offset purchases enabled Microsoft to achieve the targeted 30% reduction in emissions.
Samsung Electronics: Samsung Electronics’ GHG intensity for 2012 was 0.0000000354 (unit: ton/ 1 KRW), which represents 105% over achievement of the set target.
Sony Corporation: Sony reached its 2015 target in 2011, reducing approx. 30% from the base year emissions,
GHG management in ICT sector
28
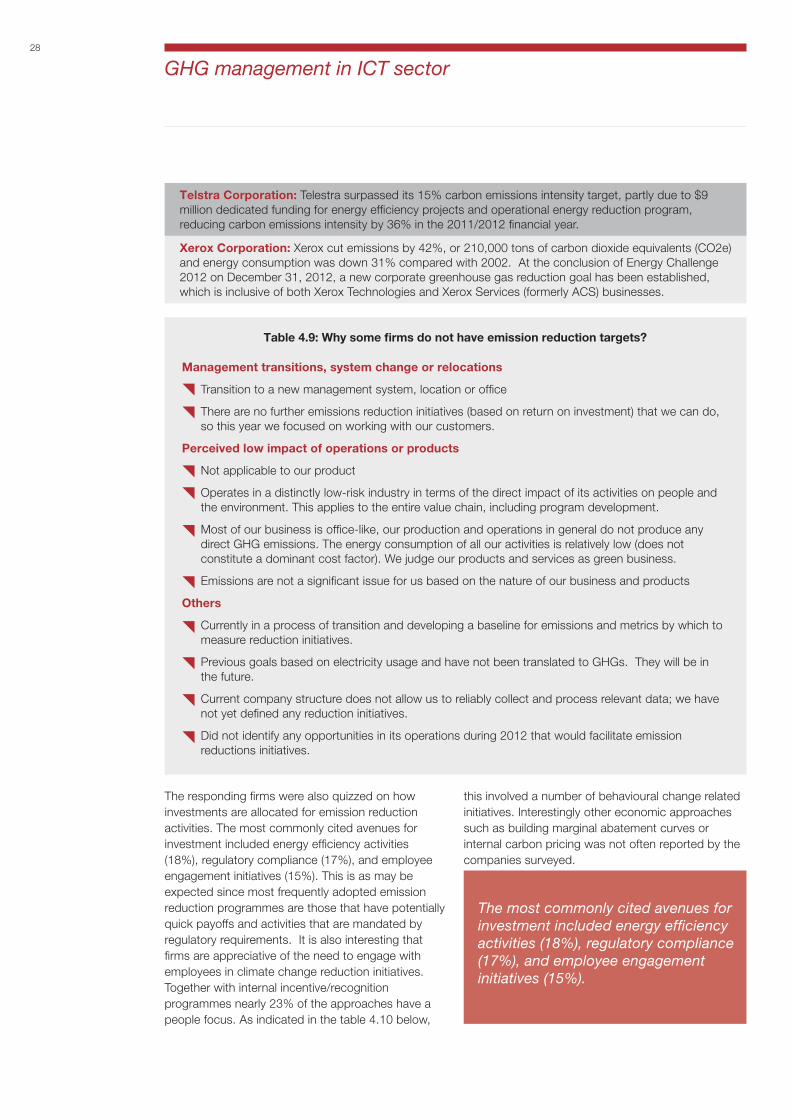
Telstra Corporation: Telestra surpassed its 15% carbon emissions intensity target, partly due to $9 million dedicated funding for energy efficiency projects and operational energy reduction program, reducing carbon emissions intensity by 36% in the 2011/2012 financial year.
Xerox Corporation: Xerox cut emissions by 42%, or 210,000 tons of carbon dioxide equivalents (CO2e) and energy consumption was down 31% compared with 2002. At the conclusion of Energy Challenge 2012 on December 31, 2012, a new corporate greenhouse gas reduction goal has been established, which is inclusive of both Xerox Technologies and Xerox Services (formerly ACS) businesses.
Table 4.9: Why some firms do not have emission reduction targets?
Management transitions, system change or relocations
Transition to a new management system, location or office
There are no further emissions reduction initiatives (based on return on investment) that we can do, so this year we focused on working with our customers.
Perceived low impact of operations or products
Not applicable to our product
Operates in a distinctly low-risk industry in terms of the direct impact of its activities on people and the environment. This applies to the entire value chain, including program development.
Most of our business is office-like, our production and operations in general do not produce any direct GHG emissions. The energy consumption of all our activities is relatively low (does not constitute a dominant cost factor). We judge our products and services as green business.
Emissions are not a significant issue for us based on the nature of our business and products
Others
Currently in a process of transition and developing a baseline for emissions and metrics by which to measure reduction initiatives.
Previous goals based on electricity usage and have not been translated to GHGs. They will be in the future.
Current company structure does not allow us to reliably collect and process relevant data; we have not yet defined any reduction initiatives.
Did not identify any opportunities in its operations during 2012 that would facilitate emission reductions initiatives.
The responding firms were also quizzed on how investments are allocated for emission reduction activities. The most commonly cited avenues for investment included energy efficiency activities (18%), regulatory compliance (17%), and employee engagement initiatives (15%). This is as may be expected since most frequently adopted emission reduction programmes are those that have potentially quick payoffs and activities that are mandated by regulatory requirements. It is also interesting that firms are appreciative of the need to engage with employees in climate change reduction initiatives. Together with internal incentive/recognition programmes nearly 23% of the approaches have a people focus. As indicated in the table 4.10 below,
this involved a number of behavioural change related initiatives. Interestingly other economic approaches such as building marginal abatement curves or internal carbon pricing was not often reported by the companies surveyed.
GHG management in ICT sector
The most commonly cited avenues for investment included energy efficiency activities (18%), regulatory compliance (17%), and employee engagement initiatives (15%).

29
Figure 4.8: Methods to drive investment in emission reduction activities
Figure 4.9: Proportion of activities by payback period
Figure 4.10: Estimated emission reduction by payback period
There were over 100 behavioural change programmes initiated by firms in the sample. A select list of activities and firms are given below.
As the tables and the graphs below indicate the highest number of emission reduction activities are implemented in the areas of energy efficiency (both for process improvement as well as buildings) followed by employee engagement initiatives for behavioural change. In terms of impacts however
GHG management in ICT sector
18%
17%
15%9%
8%
7%
6%
5%
5%
4%3%
2%1%
Dedicated budget for energy efficiency
Compliance with regulatory requirements/standards
Employee engagement
Financial optimization calculations
Internal incentives/recognition programs
Other
Dedicated budget for low carbon product R&D
Internal finance mechanisms
40%
35%
17%
3%
1%
4% <1 year
1–3 years
4–10 years
11–15 years
16–20 years
21–25 years
>25 years
74%
17%
6%3%
<1 year
1–3 years
4–10 years
11–15 years
16–20 years
21–25 years
>25 years
In terms of impacts product design, energy efficiency processes and low carbon energy purchases account for most savings.
product design, energy efficiency processes and low carbon energy purchases account for most savings.

30
Table 4.10: Behavioural change programmes
Activity Description of activity Sample Firms
Education, awareness programmes and campaigns
Employee centred campaigns to enhance awareness about energy conservation and carbon reduction goals.
Quarterly review sessions with facility managers, employee education regarding energy efficiency on intranet site and Earth Day fairs.
E-courses for our employees
Training awareness of employees about energy consumption and eco driving
Sony CorporationSprint Nextel CorporationTieto Oyj
Technology Driven Make use of the current server and IT management system to monitor the computer shut-down status of non-working hours
Telecommuting
Internal Future Office solution, a social and commercial media inspired workplace with digital communication and collaboration tools.
Virtual meetings,
Innolux CorporationSyniverseTieto OyjElisa OyjAtos SE
Climate change/Energy/Sustainability Champions
Site specific energy/Sustainability to educate employees and contingent staff about saving energy, waste diversion, water conservation, and other topics pertaining to reducing the company’s environmental footprint.
Senior executives identified as “Sustainability Role Models” as a recognition for their sustainable leadership. The individual success stories were communicated internally to raise awareness
Energy Scorecard to monitor energy management at each facility and set benchmarks and goals for each facility. The Scorecards are published monthly to all Energy Champions to enable them to see clearly how their energy use is trending. Quarterly, the Energy Team — headed by the Energy Director — reviews performances; determined by not only by savings results, but also by the types of initiatives attempted and training undertaken. The results have been incorporated into the annual performance objectives for real estate managers
Verizon Communications Inc.SAP AGMicrosoft CorporationBT GroupCapgemini UKSAP AGAT&T Inc.
GHG management in ICT sector

31
0 50 100 150 200 250 300 350
Energy efficiency: Processes
Energy efficiency: Building fabric
Behavioral change
Process emissions reductions
Low carbon energy installation
Other
Low carbon energy purchase
Transportation: use
Transportation: fleet
Product design
Fugitive emissions reduction
Number of activities
Emission reduction activities implemented
ActivityEstimated annual CO2e savings
(metric tons CO2e)
Product design 62,612,659
Other 27,434,255
Energy efficiency: Processes 6,974,586
Low carbon energy purchase 6,918,802
Low carbon energy installation 2,989,374
Energy efficiency: Building services 2,568,845
Process emissions reductions 1,993,891
Transportation: use 608,331
Energy efficiency: Building fabric 607,575
Behavioural change 191,299
Transportation: fleet 100,567
Fugitive emissions reduction 13,448
Others 4,500
Grand Total 113,018,131
Figure 4.11: Emission reduction activities implemented
GHG management in ICT sector

32
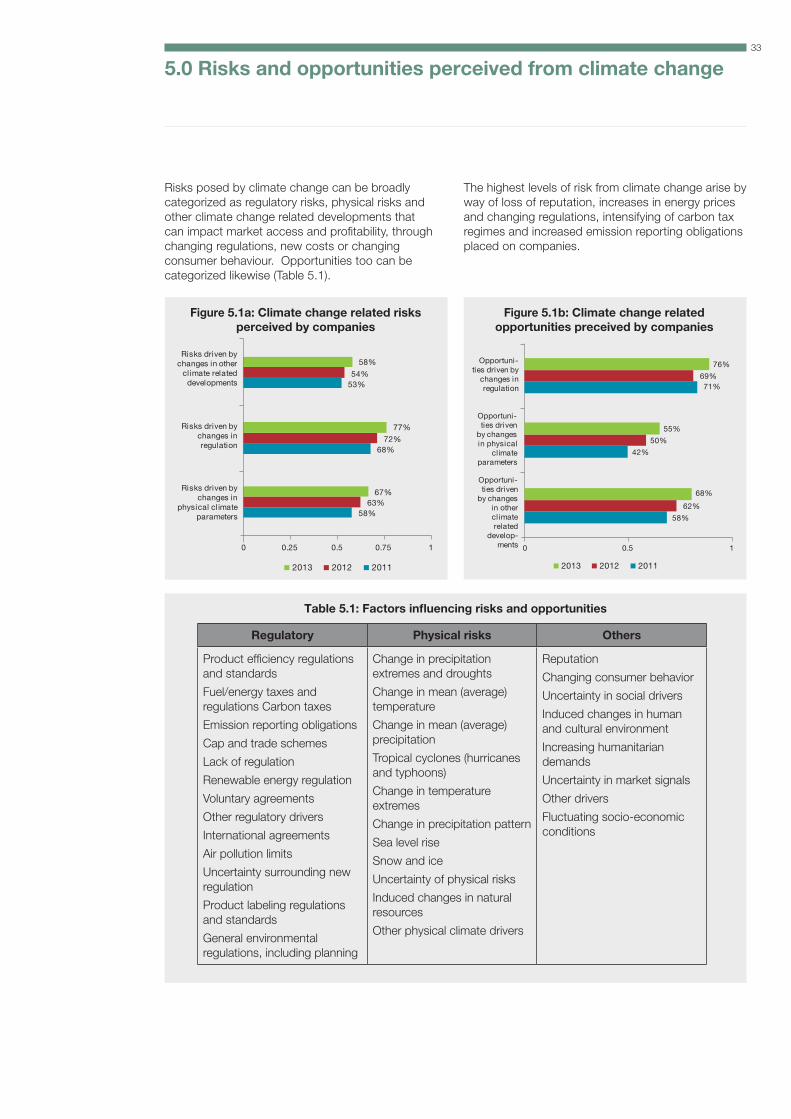
33
Figure 5.1a: Climate change related risks perceived by companies
Figure 5.1b: Climate change relatedopportunities preceived by companies
5.0 Risks and opportunities perceived from climate change
Risks posed by climate change can be broadly categorized as regulatory risks, physical risks and other climate change related developments that can impact market access and profitability, through changing regulations, new costs or changing consumer behaviour. Opportunities too can be categorized likewise (Table 5.1).
Table 5.1: Factors influencing risks and opportunities
Regulatory Physical risks Others
Product efficiency regulations and standards
Fuel/energy taxes and regulations Carbon taxes
Emission reporting obligations
Cap and trade schemes
Lack of regulation
Renewable energy regulation
Voluntary agreements
Other regulatory drivers
International agreements
Air pollution limits
Uncertainty surrounding new regulation
Product labeling regulations and standards
General environmental regulations, including planning
Change in precipitation extremes and droughts
Change in mean (average) temperature
Change in mean (average) precipitation
Tropical cyclones (hurricanes and typhoons)
Change in temperature extremes
Change in precipitation pattern
Sea level rise
Snow and ice
Uncertainty of physical risks
Induced changes in natural resources
Other physical climate drivers
Reputation
Changing consumer behavior
Uncertainty in social drivers
Induced changes in human and cultural environment
Increasing humanitarian demands
Uncertainty in market signals
Other drivers
Fluctuating socio-economic conditions
The highest levels of risk from climate change arise by way of loss of reputation, increases in energy prices and changing regulations, intensifying of carbon tax regimes and increased emission reporting obligations placed on companies.
0 0.5 1
58%
42%
71%
62%
50%
69%
68%
55%
76%
2013 2012 2011
Opportuni-ties driven by
changes in regulation
Opportuni-ties driven
by changes in physical
climate parameters
Opportuni-ties driven
by changes in other climate related
develop-ments
58%
68%
53%
63%
72%
54%
67%
77%
58%
0 0.25 0.5 0.75 1
2013 2012 2011
Risks driven by changes in other
climate related developments
Risks driven by changes inregulation
Risks driven by changes in
physical climate parameters

34
Risks and opportunities perceived from climate change
Figure 5.2: The 10 most commonly reported risks for the ICT sector from climate change
Figure 5.3: Top regulatory risks & opportunities
5.1 Regulatory risks & opportunities
The most cited risks from climate change relate to reputational impacts, regulatory changes at the local, national or global levels, carbon taxes, emission reporting requirements, changing consumer behaviour and changing weather patterns. In most cases this will directly impact operational and resource costs. For instance, for most of the energy intensive manufacturers, the taxation is likely to significantly increase the cost of materials due to fluctuating fuel and energy costs. The cap and trade scheme is also expected to constrain business expansion and the purchasing of emission reduction certificates could be expensive.
Interestingly, this is an area of opportunity for consulting firms offering energy efficiency and renewable energy solutions. Similarly, while some companies are apprehensive about products not meeting efficiency standards, a majority of the
The most cited risks from climate change relate to reputational impacts, regulatory changes at the local, national or global levels, carbon taxes, emission reporting requirements, changing consumer behaviour and changing weather patterns.
123
106
105
86
82
78
69
63
62
0 20 40 60 80 100 120 140
Reputation
Fuel/energy taxes and regulations
Carbon taxes
Emission reporting obligations
Changing consumer behavior
Change in precipitation extremes and droughts
Cap and trade schemes
Product efficiency regulations and standards
Change in mean (average) temperature
Tropical cyclones (hurricanes and typhoons)
111
50
61
72
78
108
109
115
120
53
46
57
43
69
91
(150) (100) (50) – 50 100 150
Product labeling regulations and standards
General environmental regulations, including planning
Product efficiency regulations and standards
Cap and trade schemes
Carbon taxes
Emission reporting obligations
Fuel/energy taxes and regulations
Number of companies
Risk Opportunity
respondents foresee opportunities in product efficiency regulations and standards. Several companies have identified new market opportunities and anticipate increased market shares if standards are complied with. Manufacturers also foresee this opportunity as a competitive advantage through enhanced reputation as well as increased consumer demand for eco-sensitive products.

35
Risks and opportunities perceived from climate change
Changing regulatory regimes are expected to increase operational costs through increase in both fuel and electricity costs. Electricity costs may be impacted by emissions caps, carbon taxes or other fees related to regulation and logistical costs of implementation. Fuel prices are also expected to steadily increase in the foreseeable future. Additionally, carbon taxes, costs involved with reporting requirements, changing product efficiency requirements, increased compliance costs, and additional expenses in the supply chain are also pushing up costs. Capital costs are also potentially impacted due to requirements to limit emissions, change manufacturing processes, obtain substitute materials which may cost more or have limited availability increase investment in control technology for greenhouse gas emissions, fund offset projects or undertake other costly activities.
Figure 5.5: Likelihood of regulatory risks
Figure 5.4: Time frame for regulatory risks
Table 5.2: Summary of key regulatory risks and opportunities identified by top performers
Carbon Taxes
Risks
Purchase of renewable energy not considered as zero carbon and uncertain incentives for renewable energy purchases
Pay penalties in case of non-compliance
Increase in operating costs
Opportunities
Increased demand for energy efficient products and services
Management methods
Invest in energy efficiency projects
Invest in renewable energy
Work with suppliers to drive emission reduction
Use of alternate fuels
The top three regulatory risks identified by the respondents include: carbon taxes; fuel, energy taxes and regulations; and emission reporting obligations. The top three opportunities were identified as product
labelling regulations and standards; emission reporting obligations; and fuel, energy taxes and regulations. Table 5.2 summarises the key regulatory risks and opportunities identified by the top performers.
46%
36%
9%
7%
2%
1–5 years
Current
Unknown
6–10 years
>10 years
31%
23%
16%
13%
8%
6%
3%
0%
Virtually certain
Likely
Very likely
More likely than not
About as likely as not
Unlikely
Unknown
Exceptionally unlikely
Very unlikely
Carbon taxes
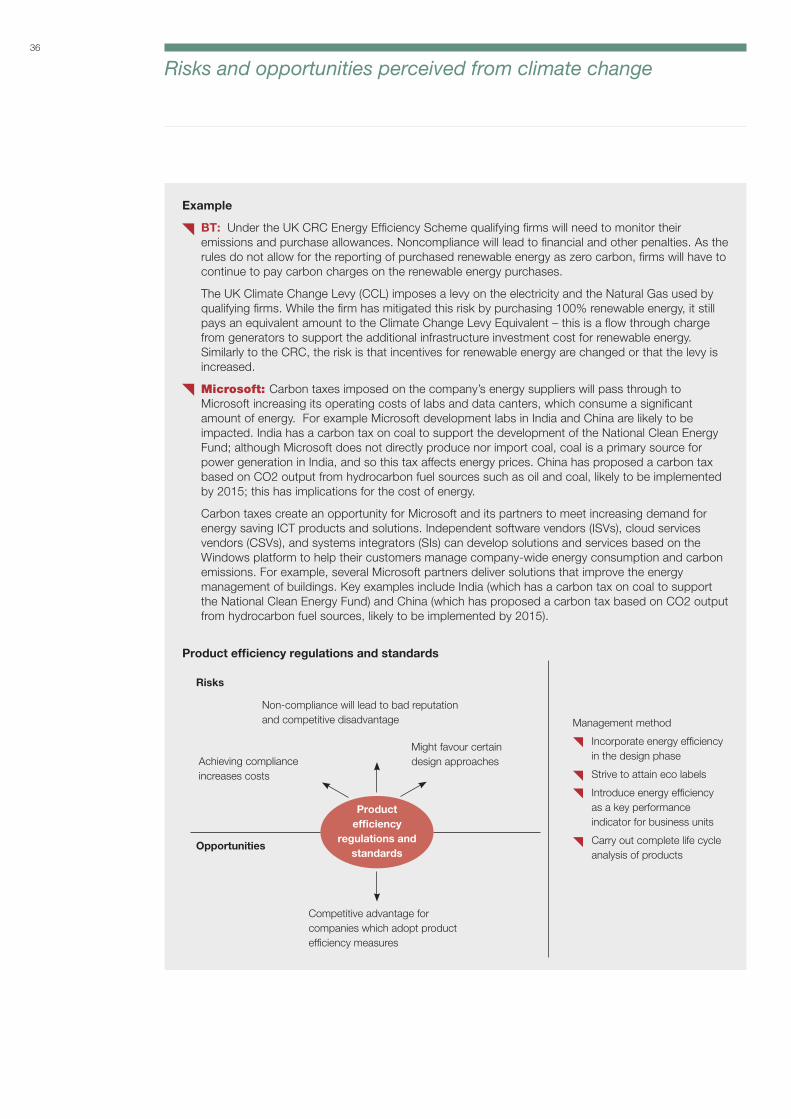
36
Risks and opportunities perceived from climate change
Example
BT: Under the UK CRC Energy Efficiency Scheme qualifying firms will need to monitor their emissions and purchase allowances. Noncompliance will lead to financial and other penalties. As the rules do not allow for the reporting of purchased renewable energy as zero carbon, firms will have to continue to pay carbon charges on the renewable energy purchases.
The UK Climate Change Levy (CCL) imposes a levy on the electricity and the Natural Gas used by qualifying firms. While the firm has mitigated this risk by purchasing 100% renewable energy, it still pays an equivalent amount to the Climate Change Levy Equivalent – this is a flow through charge from generators to support the additional infrastructure investment cost for renewable energy. Similarly to the CRC, the risk is that incentives for renewable energy are changed or that the levy is increased.
Microsoft: Carbon taxes imposed on the company’s energy suppliers will pass through to Microsoft increasing its operating costs of labs and data canters, which consume a significant amount of energy. For example Microsoft development labs in India and China are likely to be impacted. India has a carbon tax on coal to support the development of the National Clean Energy Fund; although Microsoft does not directly produce nor import coal, coal is a primary source for power generation in India, and so this tax affects energy prices. China has proposed a carbon tax based on CO2 output from hydrocarbon fuel sources such as oil and coal, likely to be implemented by 2015; this has implications for the cost of energy.
Carbon taxes create an opportunity for Microsoft and its partners to meet increasing demand for energy saving ICT products and solutions. Independent software vendors (ISVs), cloud services vendors (CSVs), and systems integrators (SIs) can develop solutions and services based on the Windows platform to help their customers manage company-wide energy consumption and carbon emissions. For example, several Microsoft partners deliver solutions that improve the energy management of buildings. Key examples include India (which has a carbon tax on coal to support the National Clean Energy Fund) and China (which has proposed a carbon tax based on CO2 output from hydrocarbon fuel sources, likely to be implemented by 2015).
Product efficiency regulations and standards
Risks
Non-compliance will lead to bad reputation and competitive disadvantage
Achieving compliance increases costs
Might favour certain design approaches
Opportunities
Competitive advantage for companies which adopt product efficiency measures
Management method
Incorporate energy efficiency in the design phase
Strive to attain eco labels
Introduce energy efficiency as a key performance indicator for business units
Carry out complete life cycle analysis of products
Productefficiency
regulations and standards

37
Examples
EMC Corporation: Changing standards could unintentionally favour certain design approaches that could disadvantage EMC. While the product’s energy efficiency may perform better in a customer’s specific environment, the absence of certification could limit access to certain customers and key markets (such as US Federal). Two, delays due to the imposed testing regime could slow time-to-market and thus available revenue from new products. Three, prescriptive standards may limit innovation in future generations of product.
EMC Corporation: Significant market opportunities due to the demand for energy efficient products, especially in data centres. Incorporation of energy efficiency targets in product requirements.
Fuel, energy taxes and regulations
Risks
Changes in energy pricing
Opportunities
Increased demand for energy efficient products
Will increase the need for energy management solutions, business process and reporting automation
Examples
Cisco Systems, Inc.: Changes in energy pricing impact every part of the economy, specifically Cisco’s supply chain, our operations and customers. Any carbon-related costs will be passed down from the utility to Cisco and would have a similar impact as a fuel/energy tax or regulation (on the end user). Cisco customers that have network-intensive (as opposed to server/storage-intensive) ICT infrastructure (e.g., service providers) face a higher risk. Fuel/energy taxes that impact our customers that are large consumers of electricity could also impact product requirements and sales (if product requirements were not met). In the U.K., the CRC reporting scheme impacts Cisco’s U.K. facilities. Currently, the immediate impact is limited on a geographical basis as only a few jurisdictions have renewable generation goals or reporting/fee drivers that impact electricity pricing.
SAP AG: Increasing fuel/energy regulation at the global, and regional, country and local levels will significantly increase the need for business process and reporting automation. Managing energy efficiency starts with gaining a real-time view into energy consumption, comparing usage across enterprise operations, creating target reductions, and sending proactive alerts when there are unexpected spikes in energy use. The SAP Manufacturing Integration and Intelligence application will help meet these requirements and create new opportunities for SAP.
As more companies begin to appreciate energy as a strategic management topic that spans all enterprise functions and across the value chain energy management customers will seek out solutions capable of this essential span of collaboration. This will lead to increased market opportunities for SAP solutions to manage energy taxes and regulations over the next few years.
Management methods
Reduction in energy consumption and optimization of fuel efficiency
Direct responses to Government consultations
Customer energy reduction targets and goals
Communication on energy conservation with employees and the wider public
Risks and opportunities perceived from climate change
Fuel,energy taxes
and regulation
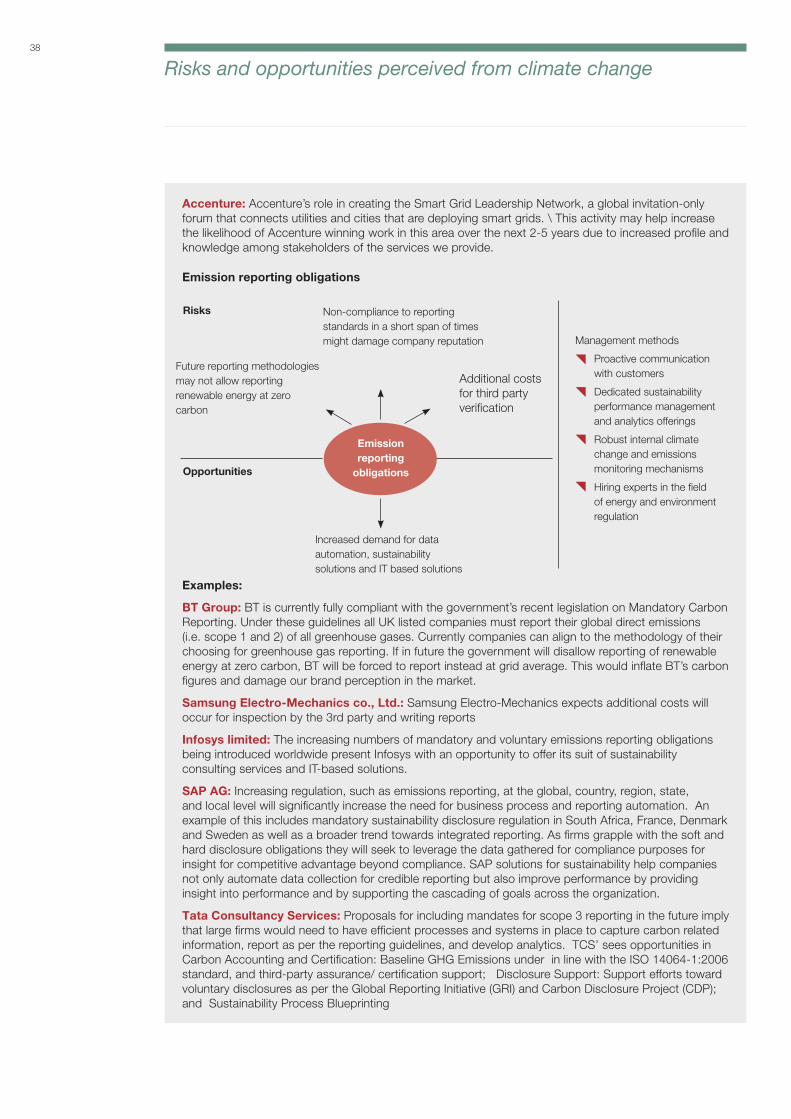
38
Examples:
BT Group: BT is currently fully compliant with the government’s recent legislation on Mandatory Carbon Reporting. Under these guidelines all UK listed companies must report their global direct emissions (i.e. scope 1 and 2) of all greenhouse gases. Currently companies can align to the methodology of their choosing for greenhouse gas reporting. If in future the government will disallow reporting of renewable energy at zero carbon, BT will be forced to report instead at grid average. This would inflate BT’s carbon figures and damage our brand perception in the market.
Samsung Electro-Mechanics co., Ltd.: Samsung Electro-Mechanics expects additional costs will occur for inspection by the 3rd party and writing reports
Infosys limited: The increasing numbers of mandatory and voluntary emissions reporting obligations being introduced worldwide present Infosys with an opportunity to offer its suit of sustainability consulting services and IT-based solutions.
SAP AG: Increasing regulation, such as emissions reporting, at the global, country, region, state, and local level will significantly increase the need for business process and reporting automation. An example of this includes mandatory sustainability disclosure regulation in South Africa, France, Denmark and Sweden as well as a broader trend towards integrated reporting. As firms grapple with the soft and hard disclosure obligations they will seek to leverage the data gathered for compliance purposes for insight for competitive advantage beyond compliance. SAP solutions for sustainability help companies not only automate data collection for credible reporting but also improve performance by providing insight into performance and by supporting the cascading of goals across the organization.
Tata Consultancy Services: Proposals for including mandates for scope 3 reporting in the future imply that large firms would need to have efficient processes and systems in place to capture carbon related information, report as per the reporting guidelines, and develop analytics. TCS’ sees opportunities in Carbon Accounting and Certification: Baseline GHG Emissions under in line with the ISO 14064-1:2006 standard, and third-party assurance/ certification support; Disclosure Support: Support efforts toward voluntary disclosures as per the Global Reporting Initiative (GRI) and Carbon Disclosure Project (CDP); and Sustainability Process Blueprinting
Accenture: Accenture’s role in creating the Smart Grid Leadership Network, a global invitation-only forum that connects utilities and cities that are deploying smart grids. \ This activity may help increase the likelihood of Accenture winning work in this area over the next 2-5 years due to increased profile and knowledge among stakeholders of the services we provide.
Emission reporting obligations
Risks Non-compliance to reporting standards in a short span of times might damage company reputation
Future reporting methodologies may not allow reporting renewable energy at zero carbon
Opportunities
Increased demand for data automation, sustainability solutions and IT based solutions
Management methods
Proactive communication with customers
Dedicated sustainability performance management and analytics offerings
Robust internal climate change and emissions monitoring mechanisms
Hiring experts in the field of energy and environment regulation
Additional costs for third party verification
Emissionreporting
obligations
Risks and opportunities perceived from climate change

39
5.2 Physical risks & opportunities
The top physical risks due to climate change are identified as change in precipitation patterns and average temperatures. Interestingly these are also the
Figure 5.6: Top physical risks & opportunities
top sources of opportunities indicating that a potential risk could also be a source of opportunity by the way of competitive advantage and demand for new services and products for companies which are well prepared for the challenge.
Table 5.3: Summary of key physical risks and opportunities identified by best performers
Risks
Risks
Opportunities
Opportunities
Increased demand for IT services that minimize operation blackouts
Increased demand for energy storage
Increased demand for business process and analytics applications
Increased demand for emergency response products Increased demand for air purifiers
in areas where sandy storms occur
Impact on national economy leading to scarcity driven inflation
Sandy dusts might increase breakdown of semiconductor precision instruments impacting product quality
Damage to telecom infrastructure
Disruption in supply chains impacting production efficiency
Power failures impairing manufacturing process
Water shortage leading to greater energy usage for cooling facilities
Public health crisis and pandemics
Management methods
Obtaining dual power feeds from different grid links and self-generation
Utilization of monitoring solutions that forecast typhoons and extreme weather events
Management methods
Back up plans to cope with power cuts
Sell emergency response products and services
Having weather and disaster forecast systems in place
Induced changes in natural resources
Change in precipitation pattern
Sea level rise
Change in temperature extremes
Tropical cyclones (hurricanes and typhoons)
Change in mean (average) temperature
Number of companies
Risk Opportunity
Change in precipitation extremes and droughts
45
46
50
58
62
63
83
38
19
38
61
55
100 80 60 40 20 0 20 40 60 80
Changes in precipitation
patterns (extremes & droughts
Other physical climate
developments
Risks and opportunities perceived from climate change
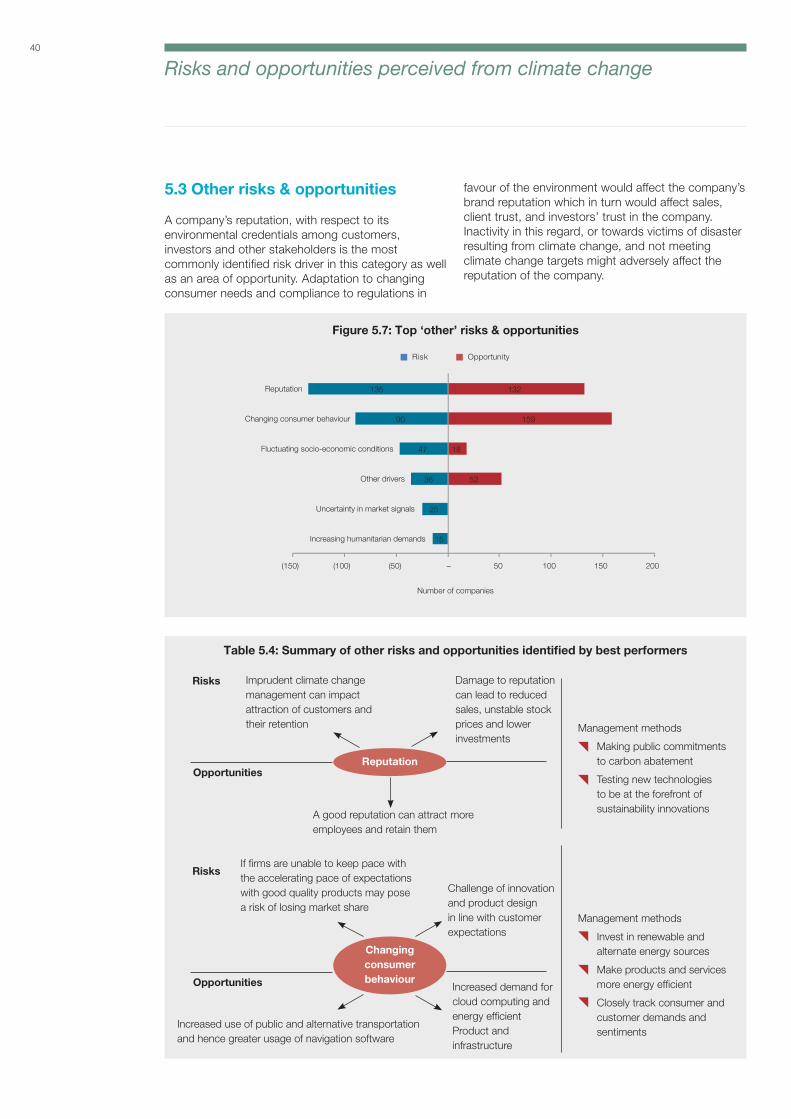
40
Risks
Risks
Opportunities
Opportunities
A good reputation can attract more employees and retain them
Increased use of public and alternative transportation and hence greater usage of navigation software
Imprudent climate change management can impact attraction of customers and their retention
If firms are unable to keep pace with the accelerating pace of expectations with good quality products may pose a risk of losing market share
Damage to reputation can lead to reduced sales, unstable stock prices and lower investments
Challenge of innovation and product design in line with customer expectations
Management methods
Making public commitments to carbon abatement
Testing new technologies to be at the forefront of sustainability innovations
Management methods
Invest in renewable and alternate energy sources
Make products and services more energy efficient
Closely track consumer and customer demands and sentiments
5.3 Other risks & opportunities
A company’s reputation, with respect to its environmental credentials among customers, investors and other stakeholders is the most commonly identified risk driver in this category as well as an area of opportunity. Adaptation to changing consumer needs and compliance to regulations in
Figure 5.7: Top ‘other’ risks & opportunities
Table 5.4: Summary of other risks and opportunities identified by best performers
favour of the environment would affect the company’s brand reputation which in turn would affect sales, client trust, and investors’ trust in the company. Inactivity in this regard, or towards victims of disaster resulting from climate change, and not meeting climate change targets might adversely affect the reputation of the company.
Increased demand for cloud computing and energy efficient Product and infrastructure
15
25
36
47
90
135
52
18
159
132
(150) (100) (50) – 50 100 150 200
Increasing humanitarian demands
Uncertainty in market signals
Other drivers
Fluctuating socio-economic conditions
Changing consumer behaviour
Reputation
Number of companies
Risk Opportunity
Reputation
Changing consumer behaviour
Risks and opportunities perceived from climate change

41
5.4 Emission performance
Figure 5.8: Change in emission intensity per unit currency total revenue
Figure 5.9: Change in emission intensity per FTE employee
Figure 5.10: Change in absolute emissions (scope 1+2) from previous year
Figure 5.11: Commonly reported reasons for decrease in emissions from previous year
Figures 5.8 and 5.9 give the changes in emission intensity per unit currency total revenue and emission intensity per fulltime employee respectively. 41% of the firms saw a decrease in absolute emissions from the previous years while an almost equal number of companies (44%) experienced
increased emissions (Figure 5.10). Identified reasons for the decrease include firm level emissions reduction initiatives, change in methodology of measurement, change in output, divestment, change in physical operating conditions and mergers (Table 5.5 and Figure 5.11).
46%
32%
21%
1%
Decrease
Increase
N/A
No change
45%
27%
25%
3%
Decrease
Increase
N/A
No change
41%
44%
1% 4%3% 7%
Decreased
Increased
No change
This is our first year of estimation
We don't have any emissions data
No Answer
7%
59%
9%
8%
7%
4%
3% 2%1%Emissions reduction activities
Change in methodology
Change in output
Divestment
Other
Change in physical operating conditions
Unidentified
Change in boundary
Mergers
Risks and opportunities perceived from climate change

42
Table 5.5: Reasons for decrease in emissions
BT Group
With an extensive rationalization program and a sophisticated SMART energy control system BT has achieved absolute energy reductions for the previous 4 years, & and a 3.3% reduction in energy use compared to 2012.
Minimizing the carbon emissions by sourcing 100% of its energy from renewable sources with npower. BT also has low-carbon energy contracts in Germany, Italy, Belgium & Spain. This will result in a reduction of 1 million tonnes by 2014.
Driving growth by supporting BT’s core business and by developing low-carbon propositions to the market.
Google Inc.
Aggressive procurement of renewables, with additional renewables procurement in 2012 (above 2011) accounting for at least 50% of reduction.
Google continues to build services and products to deliver more and better services to more users using less energy and with lower emissions. Improving the power usage effectiveness of Googles data centres.
Microsoft Corporation
Purchasing low-carbon energy, implementing energy conservation measures, such as retrofitting buildings with more efficient computers, lighting, and mechanical equipment.
Encourage environmentally conscious behaviors through internal programmes such as the Sustainability Champions program
Innovations such as a lab chargeback program in the Puget Sound region, through which product groups are charged for their actual energy usage in labs to drive behavior change and increased use of more efficient managed labs. Deploying PC power management policies that reduce the energy consumed by corporate-owned PCs and monitors.
Developing an energy management program in key facilities, building energy efficient lean data centers, to maximize efficiency and minimize energy consumption, for example by: Developing a biogas-fueled data center demonstration project; Retrofitting existing data centers with more efficient systems, and custom LED lighting.
Wipro
Energy conservation measures like decentralized control of operations through better analytics, retrofit of energy efficient equipment, consolidation of operations in energy efficient locations and better maintenance quality. This has contributed to reduction in emissions of 4.6% over previous year
Increase in renewable shares to 19% of total office space consumption - contributing 2.6% to reducing emissions over previous year
Significant increase in virtual server infrastructure from 800 servers to 1900 servers contributing to 1.5% reductions in emissions over previous year.
Cap Gemini UK
Implementation of Building Energy Management Systems (BEMS) across all sites allowing better monitoring of data, including alerts on sudden changes in energy usage and identification of potential wastage;
Introduction and training of energy champions at all sites to increase awareness, encourage behavioral change and also to identify quick wins; and
Risks and opportunities perceived from climate change
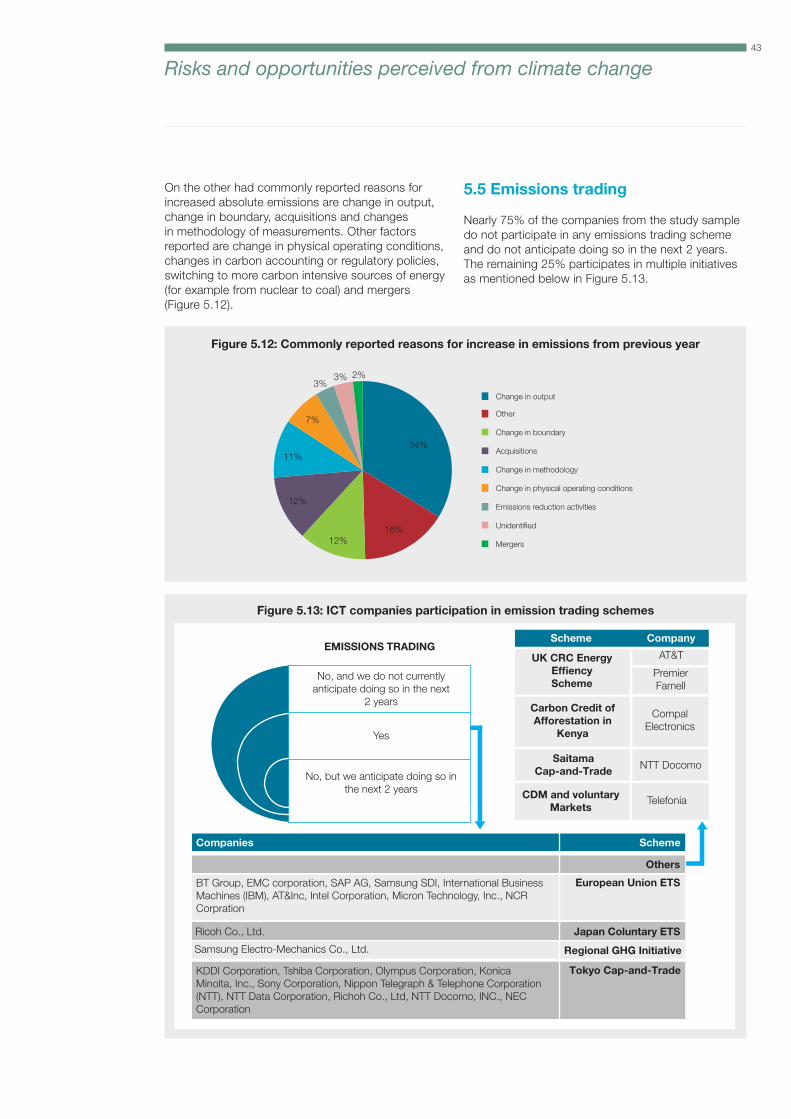
43
On the other had commonly reported reasons for increased absolute emissions are change in output, change in boundary, acquisitions and changes in methodology of measurements. Other factors reported are change in physical operating conditions, changes in carbon accounting or regulatory policies, switching to more carbon intensive sources of energy (for example from nuclear to coal) and mergers (Figure 5.12).
5.5 Emissions trading
Nearly 75% of the companies from the study sample do not participate in any emissions trading scheme and do not anticipate doing so in the next 2 years. The remaining 25% participates in multiple initiatives as mentioned below in Figure 5.13.
Figure 5.12: Commonly reported reasons for increase in emissions from previous year
Figure 5.13: ICT companies participation in emission trading schemes
EMISSIONS TRADING
Companies Scheme
Others
European Union ETS
Japan Coluntary ETS
Regional GHG Initiative
Tokyo Cap-and-Trade
UK CRC EnergyEffiencyScheme
Carbon Credit ofAfforestation in
Kenya
SaitamaCap-and-Trade
CDM and voluntaryMarkets
AT&T
PremierFamell
CompalElectronics
NTT Docomo
Telefonia
No, and we do not currently anticipate doing so in the next
2 years
Yes
No, but we anticipate doing so in the next 2 years
BT Group, EMC corporation, SAP AG, Samsung SDI, International Business Machines (IBM), AT&Inc, Intel Corporation, Micron Technology, Inc., NCR Corpration
Ricoh Co., Ltd.
Samsung Electro-Mechanics Co., Ltd.
KDDI Corporation, Tshiba Corporation, Olympus Corporation, Konica Minolta, Inc., Sony Corporation, Nippon Telegraph & Telephone Corporation (NTT), NTT Data Corporation, Richoh Co., Ltd, NTT Docomo, INC., NEC Corporation
Scheme Company
34%
16%12%
12%
11%
7%
3%3% 2%
Change in output
Other
Change in boundary
Acquisitions
Change in methodology
Change in physical operating conditions
Emissions reduction activities
Unidentified
Mergers
Risks and opportunities perceived from climate change
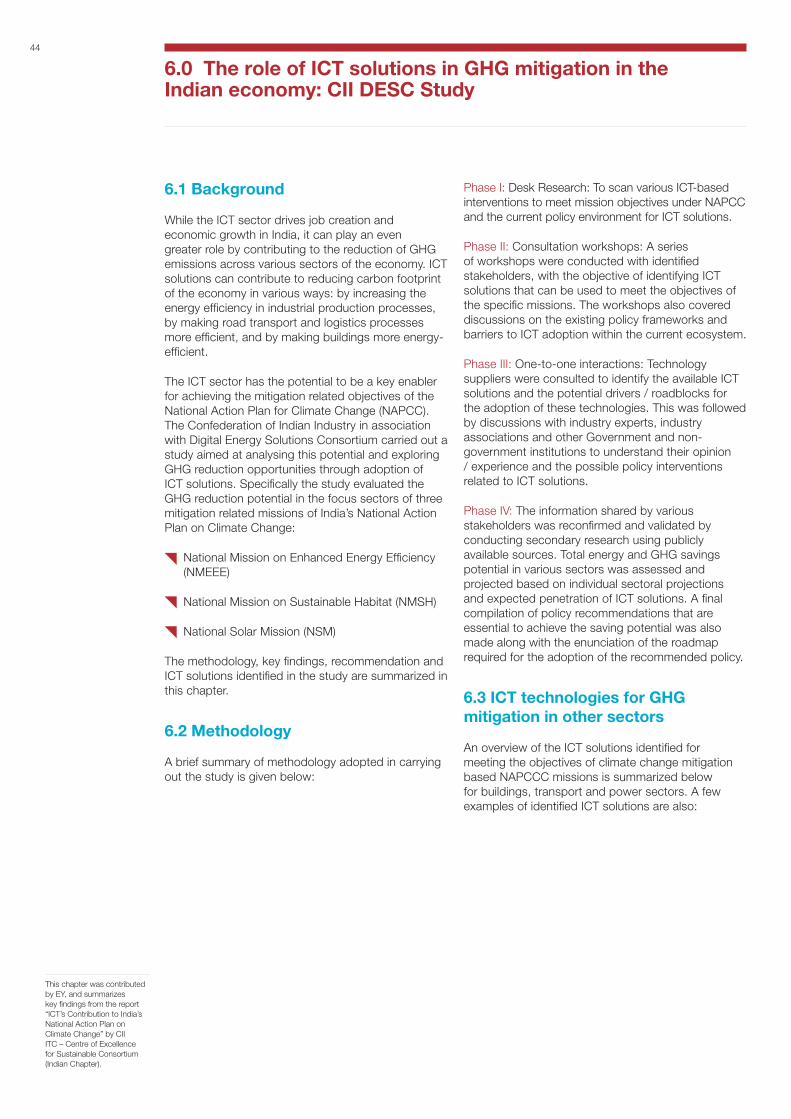
44
6.0 The role of ICT solutions in GHG mitigation in the Indian economy: CII DESC Study
6.1 Background
While the ICT sector drives job creation and economic growth in India, it can play an even greater role by contributing to the reduction of GHG emissions across various sectors of the economy. ICT solutions can contribute to reducing carbon footprint of the economy in various ways: by increasing the energy efficiency in industrial production processes, by making road transport and logistics processes more efficient, and by making buildings more energy-efficient.
The ICT sector has the potential to be a key enabler for achieving the mitigation related objectives of the National Action Plan for Climate Change (NAPCC). The Confederation of Indian Industry in association with Digital Energy Solutions Consortium carried out a study aimed at analysing this potential and exploring GHG reduction opportunities through adoption of ICT solutions. Specifically the study evaluated the GHG reduction potential in the focus sectors of three mitigation related missions of India’s National Action Plan on Climate Change:
National Mission on Enhanced Energy Efficiency (NMEEE)
National Mission on Sustainable Habitat (NMSH)
National Solar Mission (NSM)
The methodology, key findings, recommendation and ICT solutions identified in the study are summarized in this chapter.
6.2 Methodology
A brief summary of methodology adopted in carrying out the study is given below:
Phase I: Desk Research: To scan various ICT-based interventions to meet mission objectives under NAPCC and the current policy environment for ICT solutions.
Phase II: Consultation workshops: A series of workshops were conducted with identified stakeholders, with the objective of identifying ICT solutions that can be used to meet the objectives of the specific missions. The workshops also covered discussions on the existing policy frameworks and barriers to ICT adoption within the current ecosystem.
Phase III: One-to-one interactions: Technology suppliers were consulted to identify the available ICT solutions and the potential drivers / roadblocks for the adoption of these technologies. This was followed by discussions with industry experts, industry associations and other Government and non-government institutions to understand their opinion / experience and the possible policy interventions related to ICT solutions.
Phase IV: The information shared by various stakeholders was reconfirmed and validated by conducting secondary research using publicly available sources. Total energy and GHG savings potential in various sectors was assessed and projected based on individual sectoral projections and expected penetration of ICT solutions. A final compilation of policy recommendations that are essential to achieve the saving potential was also made along with the enunciation of the roadmap required for the adoption of the recommended policy.
6.3 ICT technologies for GHG mitigation in other sectors
An overview of the ICT solutions identified for meeting the objectives of climate change mitigation based NAPCCC missions is summarized below for buildings, transport and power sectors. A few examples of identified ICT solutions are also:
This chapter was contributed by EY, and summarizes key findings from the report “ICT’s Contribution to India’s National Action Plan on Climate Change” by CII ITC – Centre of Excellence for Sustainable Consortium (Indian Chapter).
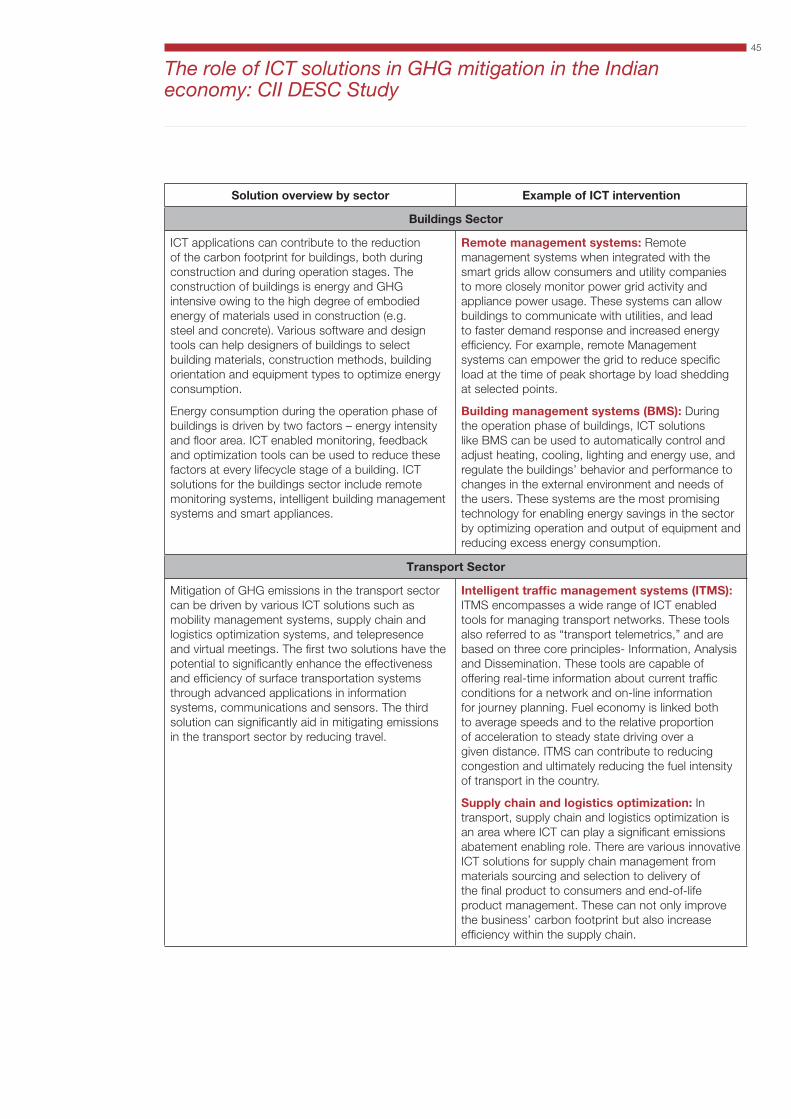
45
Solution overview by sector Example of ICT intervention
Buildings Sector
ICT applications can contribute to the reduction of the carbon footprint for buildings, both during construction and during operation stages. The construction of buildings is energy and GHG intensive owing to the high degree of embodied energy of materials used in construction (e.g. steel and concrete). Various software and design tools can help designers of buildings to select building materials, construction methods, building orientation and equipment types to optimize energy consumption.
Energy consumption during the operation phase of buildings is driven by two factors – energy intensity and floor area. ICT enabled monitoring, feedback and optimization tools can be used to reduce these factors at every lifecycle stage of a building. ICT solutions for the buildings sector include remote monitoring systems, intelligent building management systems and smart appliances.
Remote management systems: Remote management systems when integrated with the smart grids allow consumers and utility companies to more closely monitor power grid activity and appliance power usage. These systems can allow buildings to communicate with utilities, and lead to faster demand response and increased energy efficiency. For example, remote Management systems can empower the grid to reduce specific load at the time of peak shortage by load shedding at selected points.
Building management systems (BMS): During the operation phase of buildings, ICT solutions like BMS can be used to automatically control and adjust heating, cooling, lighting and energy use, and regulate the buildings’ behavior and performance to changes in the external environment and needs of the users. These systems are the most promising technology for enabling energy savings in the sector by optimizing operation and output of equipment and reducing excess energy consumption.
Transport Sector
Mitigation of GHG emissions in the transport sector can be driven by various ICT solutions such as mobility management systems, supply chain and logistics optimization systems, and telepresence and virtual meetings. The first two solutions have the potential to significantly enhance the effectiveness and efficiency of surface transportation systems through advanced applications in information systems, communications and sensors. The third solution can significantly aid in mitigating emissions in the transport sector by reducing travel.
Intelligent traffic management systems (ITMS): ITMS encompasses a wide range of ICT enabled tools for managing transport networks. These tools also referred to as “transport telemetrics,” and are based on three core principles- Information, Analysis and Dissemination. These tools are capable of offering real-time information about current traffic conditions for a network and on-line information for journey planning. Fuel economy is linked both to average speeds and to the relative proportion of acceleration to steady state driving over a given distance. ITMS can contribute to reducing congestion and ultimately reducing the fuel intensity of transport in the country.
Supply chain and logistics optimization: In transport, supply chain and logistics optimization is an area where ICT can play a significant emissions abatement enabling role. There are various innovative ICT solutions for supply chain management from materials sourcing and selection to delivery of the final product to consumers and end-of-life product management. These can not only improve the business’ carbon footprint but also increase efficiency within the supply chain.
The role of ICT solutions in GHG mitigation in the Indian economy: CII DESC Study

46
Solution overview by sector Example of ICT intervention
Industry Sector
ICT solutions can contribute to management of energy efficiency in industries at various levels. These include:
The introduction of automated controls over the operations of a plant to enable reactive and corrective actions on a real time basis. This level of automation helps to reduce the response time, which subsequently translates into energy savings.
The introduction of information systems to enhance the decision making capabilities of the plant operations management and reduce decision making time.
The roll-in of enterprise management solutions e.g. ERP, SAP etc, which aim at helping the organization to keep a track of its operations and records events of daily functioning. This can be used to later generate trends for analytical purposes.
ICT solutions can also reduce emissions by enabling more efficient operation of power plants, and also by optimizing transmission and distribution of power, as well as the operation of power grids.
Smart grids: Smart grids are electrical grids that are capable of responding to changes in conditions in the demand and supply of power in an electricity system and are designed to route power in the most optimal way. A smart grid applies sensing, measurement and control devices to capture information from power generation, transmission and distribution and consumption components of the grid.
Advanced Process Control (APC): APC improves industrial process profitability by enhancing quality, increasing throughput, and reducing energy usage. Key Features of an APC are:
Process Modelling: Quantifies cause and effect relationships, accurately representing process behaviour, to provide better understanding of problems and assists in controlling them.
Controller Generation: Allows the system to automatically generate a robust and accurate multi-variable controller
Real Time Adaptive Control: Enables the control system to be adapted to prevailing process conditions on-line
Constrained Optimization: Permits operation within the physical constraints of the process, allowing for optimization of the process for a given set of conditions
The role of ICT solutions in GHG mitigation in the Indian economy: CII DESC Study
47
6.4 Role of ICT in India’s National Action Plan on Climate Change
It has been estimated that the ICT solutions identified in the study, can potentially lead to GHG emission savings of about 320-450 million tCO2 per annum in 2030. This equates to approximately 8-10% of the baseline GHG emissions in 2030, estimated for the sectors covered in the study, considering moderate to high penetration of ICT. The implementation of ICT solutions can potentially lead to energy cost savings of around INR 205,000 crore per annum in 2030. Key findings specific to the three mitigation related missions of the NAPCCC are summarized below.
Key findings related to National Mission on Enhanced Energy Efficiency: NMEEE
The projected GHG emissions from the sectors under the NMEEE Mission will be about 1.55 billion tCO2 in 2020 and 3.2 billion tCO2 in 2030. The coal based power will be the biggest emitter, accounting for nearly 60% of these emissions.
The key cost components in the identified ICT solutions for enhanced energy efficiency are the cost of imported components and cost of services/consultancy. Incentives that lead to reduction in these two cost components can help increase the penetration rate of ICT solutions among the target industry.
The NMEEE Mission of NAPCC estimates that 49 billion kWh energy savings can be achieved in the processes of the identified sectors. It can be concluded from the study that implementation of ICT alone can potentially help achieve energy savings of around 15 billion kWh in 2030.
Assuming moderate and high penetration of the identified ICT solutions is achieved by 2030, the energy savings resulting from implementation of the solutions will translate into GHG savings of about 17-29 million tCO2 per annum in the year 2020 and 69-114 million tCO2 per annum in the year 2030.
Key sectors like power, railways and cement have a much higher pay back period but account for more than 90% of the potential energy savings/GHG emission reduction. Therefore, fiscal incentives in the form of tax and duty breaks and localization of technology are essential in achieving higher ICT penetration in these sectors.
Key findings related to National Solar Mission: NSM
The Solar Mission focuses on promoting solar power generation in the country and achieving a total grid connected installed capacity of 20,000 MW by the year 2022. As the solar mission gathers momentum, ICT-based solutions will play a critical role in ensuring its effective implementation. However, currently the penetration of ICT for solar power is very limited and much needs to be done to promote existing technologies and also to develop new technologies.
Successful integration of solar power with the grid; especially for small-scale generation will require replacement of traditional one-way power flows with two-way power flows and additional communication capabilities. Through the application of ICT enabled solutions, which are essential components of a smart grid system, efficient integration of solar power with the grid can be achieved. Further, ICT can also contribute towards reducing transmission and distribution losses.
The study concluded that the implementation of the identified ICT-based energy efficiency solutions can potentially save electricity to the tune of about 380 - 570 GWh per annum in the year 2020 and 1528-2293 GWh per annum in the year 2030, assuming moderate and high penetration of the identified ICT solutions is achieved. The energy savings will translate into GHG emission savings of about 0.3 – 0.5 million tCO2 per annum in the year 2020 and 1.3 – 2.0 million tCO2 per annum in the year 2030.
Key findings related to National Mission on Sustainable Habitat: NMSH
The National Mission on Sustainable Habitat is a key component of the strategy for achieving climate change mitigation related objectives in the National Action Plan on Climate Change. The mission majorly focuses on GHG emission reduction opportunities in three integral components of urban planning- buildings, municipal solid waste and transport. The projected GHG emissions from the sectors under the NMSH Mission would be about 1.38 billion tonnes CO2e in 2030, with road transportation being the biggest emitter, accounting for nearly 50% of the total GHG emissions. Some of the key mitigation opportunities include the following:
The role of ICT solutions in GHG mitigation in the Indian economy: CII DESC Study
48
The study revealed that implementation of the identified ICT-based solutions in the identified sectors (buildings, municipal solid waste and transport) can potentially lead to GHG savings of about 69.7-92.5 million tCO2 per annum in the year 2020 and about 248.8-332.4 million tCO2 per annum in the year 2030
Implementation of ICT-enabled mobility management systems in 2030 can offset emissions created by 12 million cars, travelling an average of 18,000 kms every year. This is equivalent to 16,500 million litres of diesel or 17,200 million litres of petrol saved.
Savings achieved through video-conferencing and telecommuting with moderate ICT penetration in 2030 can offset GHG emissions, more than 70 times the current GHG emissions due to the annual air traffic between Delhi and Mumbai.
The potential power savings in 2030 through ICT implementation in buildings is enough to meet the current annual power needs of big states like Andhra Pradesh, Karnataka and Maharashtra
Barriers and recommendations
The study has identified certain barriers to the successful implementation of ICT for achieving the projected savings. These include:
Lack of financial mechanisms. Suppliers of ICT applications lack support for financing arrangements from lending organizations. The high cost of technology coupled with lack of finance leads to less investment in the development and distribution of these technologies.
Unavailability of energy benchmarks. Unavailability of baseline energy consumption data results in sub-optimal design of the energy efficiency solutions. In the absence of a dependable benefits computation, it becomes a major challenge for the adopters to build a strong business case for ICT adoption.
Weak regulatory norms for carbon emissions. Strong regulatory norms on carbon emissions like carbon tax, carbon emission caps, etc., will help present a stronger business case for the implementation of newer technologies. In a situation of weak regulatory drivers on energy efficiency and emission standards, ICT adoption towards the same is unlikely to become a priority.
Inadequate standardization. There are currently no standards to compare ICT based energy efficiency equipment. Such inadequate standardization leads to lack of reliable information while making a decision on buying ICT equipment for energy efficiency.
The specific recommendations made under the study for mitigating the above barriers, are broadly classified into the following:
a) Inclusion of ICT solutions as an enabler to meet emission reduction targets of the NMSH and NMEEE, with specific targets for emission reduction
i. Power transmission and distribution should be implemented in phase one of the mission
ii. Comprehensive inclusion of railways sector
b) Fiscal incentives for facilitating adoption of ICT solutions
i. Rationalization of direct and indirect taxes to initiate adoption
ii. Fund allocation for ICT uptake
c) Assist in standardization and localization of ICT solutions
i. Encourage R&D through institutional and financial support
ii. Facilitate standardization
d) Provide impetus to the sector by applying ICT for policy implementation
e) Undertake steps to develop ICT skills / talent pool
i. Reduce the cost of implementation of ICT solutions since they will involve local talent vs. foreign talent.
ii. Create a platform for green jobs
ii. Spread awareness and provide impetus to adoption of energy efficient ICT solutions
f) Other sector specific initiatives such as encouraging use of ICT in solid waste management, logistics, traffic management, etc.
Conclusion
In conclusion, full scale adoption of ICT solutions available as on date, coupled with policy interventions can lead to significant GHG mitigation across various sectors. Although the benefits
The role of ICT solutions in GHG mitigation in the Indian economy: CII DESC Study

49
of application of ICT solutions for energy saving are high, the initial cost of implementation of technologies presents a deterrent for its full scale adoption in India. Additionally, issues related to standardization of technologies / equipment, availability of benchmarks, and inadequate regulatory push present risks of under-utilization of the available ICT technologies.
Globally, the ICT industry is becoming increasingly aware of climate change risks and opportunities as detailed in this report. The industry recognizes that it can contribute to addressing climate change not only by mitigating its own GHG emissions, but also
by providing solutions to various other sectors for reducing the overall carbon footprint of economies. Considering the scale of the opportunity presented in India as well the potential risks, it is imperative that the ICT sector works in close partnership with the Government of India and other stakeholders to create an enabling environment for implementation of ICT solutions contributing to low-carbon growth of the country. India’s ICT industry has played a significant part of the country’s growth story, but it can potentially play an even more important role by helping to achieve low-carbon and inclusive growth in line with the objectives of the National Action Plan on Climate Change.
The role of ICT solutions in GHG mitigation in the Indian economy: CII DESC Study
50
7.0 Conclusion
Climate concerns are increasingly influencing corporate strategy and finding greater traction at the board level. Reducing carbon emissions continues to dominate corporate agendas with a majority of firms setting emission reduction targets and focussing on quantifying impacts and financial implications of climate change on their businesses. The use of integrated companywide risk management processes to mitigate climate change risks is increasing. Internally, employee engagement is becoming an important corporate transformation tool. Externally, corporates are engaging more frequently and intensively with regulators and policy makers to shape the public policy and adaptation responses.
The results of corporate initiatives are encouraging with over 40% of the companies reporting a decrease in absolute emissions. Nevertheless, a sizeable group is still not geared to manage risks arising from climate change and could get left behind by their proactive peers. Additionally there are significant unutilised opportunities for carbon mitigation by ICT companies which can be tapped by engaging with the supply chain partners. Currently the data on scope 3 emissions is neither well mapped nor measured. More elaborate mapping and reporting of such emissions will help in facilitating mitigation policies as well as efforts.
It is also important to place this study in perspective. While the emissions from the ICT sector may be significant, it is by no means the largest contributor to carbon emissions. However the sectors’ ability to have a cascading impact on other sectors by virtue of its value chain linkages cannot be underestimated. Consequently, a more sustainable ICT sector would drive its adjacent sectors onto a more sustainable growth trajectory. This is an aspect that policy makers could leverage to reduce an economy’s overall emissions.
This study also indicates that there are significant competitive advantages that ICT firms may create for themselves by fashioning a comprehensive sustainability strategy. However, there are several technological, organisational as well as regulatory barriers that hamper ICT firms’ transition to a more sustainable economy. An important prerequisite for a sustainable ICT sector is the establishment of a harmonious regulatory regime that recognises country level differences while at the same time recognising the global commons nature of the climate change problem.
While the authors believe that the sample selected is a good representation of the ICT Industry, it is possible that the subsamples that were selected for detailed analysis could have also introduced some biases. However this does not detract from the relevance of the study, but rather emphasises the need for a more concerted efforts to monitor and facilitate corporate disclosures of climate change related information.

51
8.0 Appendix
Appendix A: Glossary of terms
CDP Carbon Disclosure Project India & Worldwide
CRC Carbon Reduction Commitment
CSR Corporate Social Responsibility
DJSI The Dow Jones Sustainability Indexes
EU European Union
GHG Greenhouse Gas
GRI Global Reporting Initiative
HSE Health, Safety and Environment
HVAC Heating, Ventilation and Air Conditioning
ICT Information and Communication Technologies
IT Information Technology
ITES Information Technology Enabled Service
KPI Key Performance Indicator
LED Light-Emitting Diode
LEED Leadership in Energy and Environmental Design
PC Personal Computer
PUE Power Usage Effectiveness
RoE Return on Equity
T&D Transportation and Distribution
WBCSD World Business Council for Sustainable Development

52
Appendix
Appendix B: Best performers selected sample for detailed analysis
Top 50 Disclosure Top 50 Performance Top 50 RoE Top 50 Sales Revenue
AccentureAdobe Systems, Inc.Agilent Technologies Inc.AT&T Inc.Atos SEAutodesk, Inc.BCE Inc.Broadcom CorporationBT GroupCap GeminiCapgemini UKCisco Systems, Inc.Dimension Data HoldingsElisa OyjEMC CorporationFujitsu Ltd.Google Inc.Groupe SteriaHewlett-PackardInfosys LimitedKonica Minolta, Inc.Koninklijke KPN NV KT CorporationLenovo GroupLG DisplayLG InnotekLite-On TechnologyMicrosoft CorporationNippon Telegraph & Telephone Corporation (NTT)Nokia GroupNTT Data CorporationOlympus CorporationPace PlcQisdaRicoh Co., Ltd.Samsung Electro-Mechanics Co., Ltd.Samsung ElectronicsSamsung SDISAP AGSK C&CSK HynixSK TelecomSonaecom SGPS SASony CorporationSprint Nextel CorporationSTMicroelectronics NvSwisscomSymantec CorporationTelecom ItaliaTelefonicaTelenor GroupTieto Oyj
AccentureAdobe Systems, Inc.Agilent Technologies Inc.Amadeus IT HoldingAtos SEAU OptronicsAutodesk, Inc.BelgacomBroadcom CorporationBT GroupCanon Inc.Capgemini UKCisco Systems, Inc.EMC CorporationFujitsu Ltd.Google Inc.Groupe SteriaHewlett-PackardInfosys LimitedIntel CorporationJDS Uniphase Corp.Konica Minolta, Inc.Koninklijke KPN NV KT CorporationLenovo GroupLG InnotekLite-On TechnologyLSI CorporationMicrosoft CorporationNippon Telegraph & Telephone Corporation (NTT)Nokia GroupNTT Data CorporationOlympus CorporationPortugal TelecomRicoh Co., Ltd.Samsung Electro-Mechanics Co., Ltd.Samsung ElectronicsSamsung SDISAP AGSK C&CSK HynixSonaecom SGPS SASony CorporationSprint Nextel CorporationSTMicroelectronics NvSwisscomTata Consultancy ServicesTelecom ItaliaTelenor GroupToshiba CorporationUnited MicroelectronicsVodafone Group
AAC Technologies HoldingsAccentureAmadeus IT HoldingAutomatic Data Processing, Inc.Broadridge Financial Solutions IncChicony Electronics Co. LtdChorusDelta ElectronicsDiGi.Com BerhadEconocomElisa OyjEltek ASAHCL TechnologiesiGate PatniInfosys LimitedInternational Business Machines Intuit Inc.KCOMLenovo GroupLinear Technology Corp.MasterCard IncorporatedMicron Technology, Inc.Microsoft CorporationMillicom InternationalCellular SAMotorola SolutionsMTN GroupNCR CorporationNeuStar IncOracle CorporationPhilippine Long DistanceTelephone CompanyPremier FarnellSage GroupSatyam Computer ServicesSeagate Technology LLCSeiko Epson CorporationSK HynixSpectrisSwisscomTaiwan Semiconductor ManufacturingTata Consultancy ServicesTech MahindraTelstra CorporationUnited Internet AGVerizon Communications Inc.Vodacom GroupVodafone GroupWincor Nixdorf AGWindstream CorporationWiproXchanging
AccentureAlcatel - LucentAT&T Inc.Avnet Inc.BCE Inc.BT GroupCanon Inc.CenturyLinkChina UnicomCisco Systems, Inc.Compal ElectronicsDell Inc.Deutsche Telekom AGEMC CorporationEricssonFrance TelecomFujitsu Ltd.Google Inc.Hewlett-PackardIntel CorporationInternational Business Machines (IBM)Jabil Circuit, Inc.KDDI CorporationLenovo GroupLG DisplayMicrosoft CorporationMitsubishi Electric CorporationNEC CorporationNippon Telegraph & Telephone Corporation (NTT)NTT DOCOMO, INC.Oracle CorporationPegatron CorporationQUALCOMM Inc.Quanta ComputerRicoh Co., Ltd.Samsung ElectronicsSAP AGSharp CorporationSony CorporationSprint Nextel CorporationSumitomo Electric Industries, Ltd.Taiwan Semiconductor ManufacturingTelecom ItaliaTelefonicaTelstra CorporationToshiba CorporationVerizon Communications Inc.Vodafone GroupWistron Corp
Xerox Corporation
53
Appendix
Appendix C: List of responding firms
AAC Technologies HoldingsAccentureAcer Inc.Actiontec ElectronicsAdobe Systems, Inc.ADVA AG Optical NetworkingAdvanced Micro Devices, IncAdvanced Semiconductor EngineeringAdvantech Co, Ltd.Advantest CorporationAgilent Technologies Inc.AIXTRON SEAkamai Technologies IncAlcatel - LucentAltenAltera Corp.Amadeus IT HoldingAmdocs LtdAmkor Technology IncAms AGAnalog Devices, Inc.Anritsu CorporationApplied Materials Inc.ARM HoldingsAscom Holding AGASM InternationalAsustek Computer IncAT&T Inc.Atea ASAAtos SEAU OptronicsAutodesk, Inc.Automatic Data Processing, Inc.Avago TechnologiesAvnet Inc.Azbil CorporationBang & Olufsen a/sBCE Inc.Bechtle AGBel Fuse Inc.BelgacomBell Aliant Inc.BlackBerry LimitedBOE Technology Group Co.,Ltd.Broadcom CorporationBroadridge Financial Solutions IncBrocade Communications Systems, Inc.Brother Industries, Ltd.BT GroupCA TechnologiesCable & Wireless CommunicationsCanon Inc.Cap GeminiCapgemini UKCelestica Inc.
CenturyLinkCGI Group Inc.Chaun-Choung Technology CorpChicony Electronics Co. LtdChina MobileChina TelecomChina UnicomChorusChunghwa Picture Tubes LtdChunghwa TelecomCisco Systems, Inc.Citizen Holdings Co., Ltd.Cognizant Technology Solutions Corp.Colt Technology ServicesCompal Communications IncCompal ElectronicsComputacenter PlcComputer Sciences Corporation (CSC)ComputershareCompuware Corp.Coretronic CorporationCorning IncorporatedCypress Semiconductor CorporationDaeduck Electronics Co., Ltd.Dassault SystemesDell Inc.Delta ElectronicsDeutsche Telekom AGDialightDialog Semiconductor plcDieboldDiGi.Com BerhadDimension Data HoldingsDiploma PlcDISCO CorporationDomino Printing SciencesDrillisch AGEconocomElectrocomponentsElisa OyjElpida Memory, Inc.Eltek ASAEMC CorporationENERGY FEDERATIONEricssonEVRY ASAF5 Networks, Inc.Fairchild SemiconductorFiserv, Inc.Foxconn International HoldingsFrance TelecomFreescale Semiconductor LtdFuji Xerox Co., Ltd.Fujitsu Ltd.Gemalto
Gemtek Technology Co.,Ltd.Google Inc.Groupe SteriaHalmaHCL TechnologiesHellenic Telecommunication Organisation SAHewlett-PackardHoya CorporationHTC CorporationIbiden Co., Ltd.iGate PatniINDRA AIndustrial and Financial Systems, IFS ABInformatica CorporationInfosys LimitedIngenicoInmarsatInnolux CorporationIntegrated Device Technology, Inc.Intel CorporationInternational Business Machines (IBM)International RectifierIntuit Inc.Inventec Co LtdIRESS Market TechnologyItron, Inc.Jabil Circuit, Inc.JDS Uniphase Corp.Juniper Networks, Inc.Kapsch TrafficCom AGKCOMKDDI CorporationKingbrightKLA-Tencor CorporationKonica Minolta, Inc.Koninklijke KPN NV (Royal KPN)Kontron AGKT CorporationKyocera CorporationLaird PlcLenovo GroupLevel 3 Communications, Inc.Lexmark International, Inc.LG DisplayLG InnotekLG UplusLinear Technology Corp.Lite-On TechnologyLogitech International SALotes Guangzhou Co., Ltd.LSI CorporationMagyar Telekom Nyrt.Manitoba Telecom ServicesMarvell Technology Group, Ltd.MasterCard Incorporated

54
Appendix
Maxim Integrated Products, Inc.Micro Focus InternationalMicrochip TechnologyMicron Technology, Inc.Microsoft CorporationMicro-Star International Co, IncMillicom International Cellular SAMindtree LtdMinntronixMitac InternationalMitsubishi Electric CorporationModusLink CorporationMolex IncorporatedMotorola SolutionsMphasiSMTN GroupNan Ya Printed Circuit BoardNanya Technology CorpNCR CorporationNEC CorporationNeopostNetApp Inc.NeuStar IncNG BaileyNGK Spark Plug Co., Ltd.Nidec CorporationNikon CorporationNippon Telegraph & Telephone Corporation (NTT)Nissha Printing Co., Ltd.Nokia GroupNordic Semiconductor ASANTT Data CorporationNTT DOCOMO, INC.NVIDIA CorporationOi S.AOlympus CorporationOMRON CorporationON SemiconductorOplink Communications Inc.Oracle CorporationOticon LimitedPace PlcPegatron CorporationPericom Semiconductor Corp.Philippine Long Distance Telephone CompanyPMC-Sierra, Inc.Portugal TelecomPowertech Technology IncPremier FarnellPSI Aktiengesellschaft für Produkte und Systeme der
InformationstechnologieQisdaQLogic Corp.QUALCOMM Inc.Quanta ComputerRakonRenesas Electronics CorporationRenishawREPLY S.p.ARicoh Co., Ltd.Rinnai CorporationROFIN-SINAR Technologies, Inc.Rohm Co., Ltd.Sage GroupSAIC Incsalesforce.comSamsung Electro-Mechanics Co., Ltd.Samsung ElectronicsSamsung SDISanDisk CorporationSanyo Denki America IncSAP AGSatyam Computer ServicesSCSK CorporationSeagate Technology LLCSeiko Epson CorporationSharp CorporationShimadzu CorporationSilicon LaboratoriesSiliconware Precision Industries Co.Simmtech Co., Ltd.Simplo Technology Co LtdSingTelSK BroadbandSK C&CSK HynixSK TelecomSoftware AGSoitecSonaecom SGPS SASony CorporationSpansion Inc.SpectrisSpirent CommunicationsSprint Nextel CorporationSTATS CHIPPAC LTDSTMicroelectronics NvSumitomo Electric Industries, Ltd.SunGardSuzhou RAKEN Technology LTD.SwisscomSymantec CorporationSyniverse
Taiwan Semiconductor ManufacturingTaiyo Yuden Co., Ltd.TalkTalk Telecom GroupTata CommunicationsTata Consultancy ServicesTDC A/STE ConnectivityTech MahindraTelecity GroupTelecom Corporation of New ZealandTelecom ItaliaTelefonicaTelekom Austria AGTelenor GroupTeliaSoneraTelkom SA LimitedTellabs, Inc.Telstra CorporationTelus CorporationTeradata Corp.Teradyne Inc.Texas Instruments IncorporatedTieto OyjTim Participacões S.A.Tokyo Electron Ltd.Toshiba CorporationTotal System Services (TSYS)TriQuint SemiconductorTrue CorporationTÜRK TELEKOMÜNİKASYON A.Ş.UnigenUnimicron CorporationUnisys CorporationUnited Internet AGUnited MicroelectronicsVaisala OyjVerizon Communications Inc.VisaVodacom GroupVodafone GroupWestern Digital CorpWincor Nixdorf AGWindstream CorporationWiproWistron CorpXchangingXerox CorporationXilinx IncYahoo Japan CorporationYahoo! Inc.Yokogawa Electric CorporationZON Multimédia SGPS SAZTE

55
56
CDP IndiaRegistered office: 9 Mathura Road, Jangpura B, New Delhi 110014
IIM BangaloreBannerghatta Road, Bangalore, 560076Karnataka, India
CDP Contacts
Damandeep SinghDirector – CDP [email protected]
Ambesh SinghProject Officer – CDP [email protected]
Sue HowellsCo-Chief Operating Officer
Marcus NortonChief Partnerships Officer
CDP India Board of Directors
Dr. Rajesh ThadaniExecutive Director, CEDAR
Damandeep SinghDirector, CDP India
CDP Board of Trustees
Chairman: Alan BrownSchroders
James CameronClimate Change Capital & ODI
Ben GoldsmithWHEB
Chris PageRockefeller Philanthropy Advisors
Jeremy Smith
TakejiroSueyoshi
Tessa Tennant
Martin WiseRelationship Capital Partners
IIM Bangalore Contacts
PD JoseAssociate ProfessorCorporate Strategey and Policy [email protected]
Tejesvini AP Research [email protected]