Peshawar CDP - DFR (20190328) - Urban Policy Unit
223
Pakistan: Provincial Strategy for Inclusive and Sustainable Urban Growth in Khyber Pakhtunkhwa PESHAWAR CITY DEVELOPMENT PLAN DRAFT FINAL REPORT March 2019
-
Upload
khangminh22 -
Category
Documents
-
view
0 -
download
0
Transcript of Peshawar CDP - DFR (20190328) - Urban Policy Unit

Pakistan: Provincial Strategy for Inclusive and
Sustainable Urban Growth in Khyber Pakhtunkhwa
PESHAWAR CITY DEVELOPMENT PLAN
DRAFT FINAL REPORT
March 2019
KP-SISUG Peshawar City Development Plan – Draft Final Report
i
CURRENCY EQUIVALENTS
(as of 01 January 2019)
Currency unit – Pakistan Rupee (PKR)
PKR1.00 = $0.0072
$1.00 = PKRs 138.85
ABBREVIATIONS
ADB - Asian Development Bank
ADP - annual development program
AP - action plan
BOQ - bills of quantities
BTE - Board of Technical Education
CAD - computerized aided design
CBT - competency based training
CDIA - Cities Development Initiative for Asia
CDP - city development plan
CES - community entrepreneurial skills
CIU - city implementation unit
CMST - community management skills training
CNC - computer numerical control
CNG - compressed natural gas
CPEC - China-Pakistan Economic Corridor
CRVA - climate resilience and vulnerability assessment
DAO - District Accounts Office
DDAC - District Development Advisory Committee
DFID - Department for International Development (UK)
DFR - draft final report
DM - disaster management
DRR - disaster risk reduction
EA - executing agency
EFI - electronic fuel injection
EIA - environmental impact assessment
EMP - environmental management plan
EPA - Environmental Protection Agency [of Khyber Pakhtunkhwa]
ESMS - environmental and social management system
FATA - Federally Administered Tribal Area
FATA-DA - Federally Administered Tribal Areas Development Authority
KP-SISUG Peshawar City Development Plan – Draft Final Report
ii
GIK - Ghulam Ishaq Khan Institute of Engineering and Technology
GIS - geographic information system
GIZ - Deutsche Gesellschaft für Internationale Zusammenarbeit (gmbh) [German
international development agency]
GM - General Manager
GoKP - Government of Khyber Pakhtunkhwa
GoP - Government of Pakistan
GPS - global positioning system
GRM - grievance redressal mechanism
HIES - Household Integrated Economic Survey
HR - human resource
HRD - human resource development
HTV - heavy transport vehicle
HVAC - heating ventilation and air conditioning
IA - implementing agency
ICT - information and communication technologies
IEE - initial environmental examination
IFIs - international financial institutions
IT - information technology
KP - Khyber Pakhtunkhwa
KP-EZDMC - Khyber Pakhtunkhwa Economic Zones Development and Management
Company
KPCIP - Khyber Pakhtunkhwa Cities Improvement Project
KPPRA - Khyber Pakhtunkhwa Public Procurement Regulatory Authority
LCs-PUGF - local councils provincial unified group of functionaries
LGA - local government act
LGE&RDD - Local Government, Elections and Rural Development Department [of
Khyber Pakhtunkhwa]
M&E - monitoring and evaluation
MDTF - Multi Donor Trust Fund
MER - monitoring evaluation and research
MIS - management information system
NAVTTC - National Vocational and Technical Training Commission
NCs - neighborhood councils
NDMA - National Disaster Management Authority
NEQS - national environmental quality standards
NER - net enrolment rate
NIM - National Institute of Management
NIUIP - National Institute of Urban Infrastructure Planning
NOC - no objection certificate
NUML - National University of Modern Language and Sciences
NVQF - national vocational qualification framework
NVQS - national vocational qualification system
O&M - operation and maintenance

KP-SISUG Peshawar City Development Plan – Draft Final Report
iii
P&DD - Planning and Development Department [of Khyber Pakhtunkhwa]
PAC - public accounts committee
PARD - Pakistan Academy for Rural Development
PCNA - post crisis needs assessment
PDA - Peshawar Development Authority
PDA - Peshawar Development Authority
PEFA - public expenditure and financial accountability
PER - public expenditure review
PFM - public financial management
PGD - post graduate diploma
PGR - population growth rates
PIFRA - project for improvement in financial reporting and auditing
PMU - project management unit
PPP - public-private partnership
RAC - refrigeration air conditioning
RDP - regional development plan
RPL - recognition of prior learning
SAMA - services and assets management agreement
SAP - strategic action plan
SDC - skill development council
SDC - Swiss Agency for Development Cooperation
SDG - sustainable development goals
SECP - Security and Exchange Commission of Pakistan
SIPF - sustainable integrated planning framework
SME - small and medium enterprises
SP - spatial plan
SPS - safeguards policy statement [of ADB, 2009]
TEVTA - Technical Education and Vocational Authority
TMA - Tehsil Municipal Administration
TMO - Tehsil Municipal Officer
TNA - training needs assessment
TOR - terms of reference
ToT - training of trainers
TTB - Trade Testing Board
TVET - technical and vocational education and training
UET - University of Engineering and Technology [Peshawar]
UN - United Nations
UNDP - United Nations Development Program
UPS - uninterruptible power supply
URA - urban resilience assessments
USAID - United States Agency for International Development
VCs - village councils
WB - The World Bank
WSSC - Water and Sanitation Services Company

KP-SISUG Peshawar City Development Plan – Draft Final Report
iv
WSSP - Water and Sanitation Services Peshawar
NOTES
(i) The fiscal year (FY) of the Government of the Islamic Republic of Pakistan and
its agencies ends on 30 June. “FY” before a calendar year denotes the year in
which the fiscal year ends, e.g., FY2019 ends on 30 June 2019.
(ii) In this report, “$” refers to US dollars.

KP-SISUG Peshawar City Development Plan – Draft Final Report
v
Contents
A. Introduction 1 A.1. Background 1 A.2. Vision 1 A.3. Report outline 1 A.4. Sustainable planning approach 2
B. The City and Regional Context 5 B.1. Physical and environmental setting 5 B.2. Socio-economic setting 6
B.2.1. Employment 6 B.2.2. Poverty 7 B.2.3. Education 8 B.2.4. Health 9
B.3. Regional influences and linkages 10 B.4. Future opportunities and economic conditions 11
C. Key Factors and Drivers for Urban Development in the City 15 C.1. Population growth and demographic factors 15
C.1.1. Projections of population growth 15 C.1.2. Analysis of population patterns 15
C.2. Land use and physical planning 18 C.2.1. Pattern of growth and regional potential 18 C.2.2. Existing spatial structure and land use in Peshawar 19
C.3. Ongoing developments 21 C.4. Planned or future developments 22 C.5. Climate change and disaster resilience 22
D. Analysis and Needs Assessment 23 D.1. Present infrastructure and municipal service levels 23
D.1.1. Water supply 24 D.1.2. Sewerage and drainage 28 D.1.3. Solid waste 29 D.1.4. Other infrastructure 32
D.2. Current institutional and organizational arrangements for service delivery 35 D.3. Assessed future requirements and needs 35
D.3.1. Population projections 36 D.3.2. Land development and land allocation 36 D.3.3. Expansion of the area classified as urban 37

KP-SISUG Peshawar City Development Plan – Draft Final Report
vi
D.3.4. Target levels of municipal service delivery 38 D.3.5. Funding of municipal services and investments 40 D.3.6. Public sector governance 41 D.3.7. Capacity development 41
E. Strategic Action Plan For Urban Development 45 E.1. Integrated urban sector development 45
E.1.1. Key planning principles and application 45 E.1.2. Integrated urban sector development 47
E.2. Strategic priorities and actions 49 E.2.1. Key infrastructure investments and priorities 49 E.2.2. Sustainable service delivery 65 E.2.3. Public sector governance and reforms 70 E.2.4. Capacity development 71 E.2.5. Disaster and climate change risk management 72
E.3. Action plan 74 E.3.1. Short-term (up to 2025) 76 E.3.2. Medium-term (up to 2030) 83 E.3.3. Long-term (up to 2035) 88
TABLES
Table 1: Educational institutions in Peshawar District 8 Table 2: Enrolment, transition and survival rates in public and private schools in
Peshawar District (2017-18) 9 Table 3: Number and types of government health facilities in Peshawar District
[1]
(2017) 10 Table 4: Approximate increase in jobs 13 Table 5: Peshawar urban tehsil population projections and growth rates
[1] 16
Table 6: Trends in urban growth from 1998 to 2017 in Peshawar Tehsil 17 Table 7: Area, population, density and growth rate in Peshawar Tehsil (2017) 17 Table 8: Population densities and per capita land consumption in Peshawar Tehsil 19 Table 9: Organization of municipal service zones 23 Table 10: Municipal water supply system 25 Table 11: Sources of household water supply in Peshawar District (2014-15) 27 Table 12: Container types and numbers by zone, WSSP
[1] 30
Table 13: Sanitation fleet by zone, WSSP[1]
30 Table 14: Roads originating from Peshawar 32

KP-SISUG Peshawar City Development Plan – Draft Final Report
vii
Table 15: Population projections 2019 to 2035 for the current urban area 36 Table 16: Population projections and city area requirement for the currently
designated urban areas (151.46 km2) 36
Table 17: Population projections and city area requirement for the expanded urban
areas in future (380.68 km2) 37
Table 18: Population projections 2019 to 2035 for the expanded city limits 37 Table 19: Proposed target service levels for municipal water supply 38 Table 20: Proposed target service levels for municipal sewerage system 39 Table 21: Proposed target service levels for management of municipal solid waste 39 Table 22: Areas proposed for capacity building 43 Table 23: Principles for sustainable and integrated urban planning 45 Table 24: Projected potable water demand for Peshawar urban areas
[1] 50
Table 25: Projected water production requirement to serve Peshawar urban areas[1]
50 Table 26: Projected production requirements from different water sources 52 Table 27: Projected infrastructure requirements based projected groundwater
supplies 53 Table 28: Assessed length of existing and future pipe network
[1] in Peshawar urban
areas 54 Table 29: Estimated length of sewer network required to be developed
[1] 55
Table 30: Sewage treatment capacity and projected flows 56 Table 31: Projected waste generation and collection (tons per day) 59 Table 32: Preliminary assessment of potential equipment requirements for waste
collection 60 Table 33: Treatment and disposal requirements for municipal solid waste 62 Table 34: Proposed projects for Peshawar to cope with the climate change impacts 73 Table 35: Population of Peshawar District by place of birth (1998 Census) 139 Table 36: Distribution of farms and farm area in Peshawar District 144 Table 37: Percentage of houses by tenure in Peshawar District 146 Table 38: Household water source and type of toilets in Abbottabad District 147 Table 39: Revenue and expenditure for TMAs Peshawar (million PKR) 156 Table 40: Revenue and expenditure for WSSP (million PKR) based on current tariff 157 Table 41: Revenue and expenditure for WSSP (million PKR) based on affordability 158 Table 42: Water supply tariff for WSSP 159 Table 43: National and provincial policies, legislation and guidelines relevant to
urban planning 160 Table 44: Functions devolved to district governments 166 Table 45: Urban sector stakeholders in Khyber Pakhtunkhwa 171 Table 46: Political and fiscal decentralization in Khyber Pakhtunkhwa 172

KP-SISUG Peshawar City Development Plan – Draft Final Report
viii
Table 47: Administrative decentralization of key functions and roles of government
entities 175 Table 48: Human resource requirements of WSSP 181 Table 49: Human resource requirement of Peshawar Development Authority (PDA) 184 Table 50: Capacity issues specific to Peshawar 186 Table 51: Training needs of different tiers of staff at water and sanitation services
companies 186 Table 52: Estimated costs of training of government officials at the Local
Governance School 187 Table 53: Estimated costs of training of WSSC officials at National Institute of Urban
Infrastructure Planning (NIUIP), Peshawar 188 Table 54: Estimated costs residential training courses at the National Institute of
Management (NIM) and Pakistan Academy for Rural Development
(PARD) 189 Table 55: Summary of future climate indices for Peshawar City 194 Table 56: Climate change impacts on infrastructure 196
FIGURES
Figure 1: Overview of key issues and constraints in the urban sector 4 Figure 2: Existing land use within Peshawar urban area (Total = 143.46 km
2) 21
Figure 3: HR productivity ratio for WSSP (2018) 44 Figure 4: Conceptual framework for integrated urban sector development 47 Figure 5: Revenue and expenditure for WSSP vis-à-vis urban population 67 Figure 6: Population growth in Peshawar City 135 Figure 7: Trends of total fertility rate in Pakistan and Khyber Pakhtunkhwa 137 Figure 8: Population pyramid of Peshawar City (1998 Census) 137 Figure 9: Urban-rural mix in Peshawar District 143 Figure 10: Area and production of major crops in Peshawar (2016-17) 144 Figure 11: Number and types of industries in Peshawar 145 Figure 12: School age population per government school in Peshawar (2017) 149 Figure 13: Khyber Pakhtunkhwa provincial government departments 166 Figure 14: District level government departments in Khyber Pakhtunkhwa 167 Figure 15: Communication analysis –available mechanisms 198 Figure 16: Target audience for the project 201
MAPS
Map 1: Khyber Pakhtunkhwa – administrative units 93 Map 2: Peshawar District – tehsil, subdivision and towns 94

KP-SISUG Peshawar City Development Plan – Draft Final Report
ix
Map 3: Peshawar Tehsil – union councils 95 Map 4: Peshawar Tehsil – gridded population (2017) 96 Map 5: Peshawar Tehsil – communications network 97 Map 6: Peshawar Tehsil – hydrology 98 Map 7: Peshawar Tehsil – river basins 99 Map 8: Peshawar Tehsil – built-up area 100 Map 9: Peshawar Tehsil – unbuilt area 101 Map 10: Peshawar Tehsil – elevation 102 Map 11: Peshawar Tehsil – slope profile 103 Map 12: Peshawar Tehsil – geology 104 Map 13: Peshawar Tehsil – soil profile 105 Map 14: Peshawar Tehsil – topography 106 Map 15: Peshawar Tehsil – population density of union councils 107 Map 16: Peshawar City – land use 108 Map 17: Peshawar City – gridded population (2017) 109 Map 18: Peshawar City – dwelling units 110 Map 19: Peshawar City – urban area union councils 111 Map 20: Peshawar City – urban expansion 112 Map 21: Peshawar City – communications network 113 Map 22: Peshawar City – transport infrastructure 114 Map 23: Peshawar City – social infrastructure 115 Map 24: Peshawar City – current tube wells and overhead water reservoirs 116 Map 25: Peshawar City – current water supply network (partial) 117 Map 26: Peshawar City – current sewage and drainage infrastructure 118 Map 27: Peshawar City – current solid waste management infrastructure 119 Map 28: Peshawar City – administrative jurisdiction for municipal services 120 Map 29: Peshawar City – municipal services zones 121 Map 30: Conceptual urban development model for Peshawar City 122 Map 31: Peshawar City – proposed infrastructure 123
APPENDICES
Appendix 1: District at a glance 124 Appendix 2: Demographic parameters of Peshawar District 125 Appendix 3: Population and demographic analysis 134 Appendix 4: Financial public expenditure review 152 Appendix 5: Institutional and organizational assessment 160

KP-SISUG Peshawar City Development Plan – Draft Final Report
x
Appendix 6: Climate and disaster risk assessment 190 Appendix 7: Public communication plan 197

KP-SISUG Peshawar City Development Plan – Draft Final Report
xi
Executive Summary
The City Development Plan (CDP) for Peshawar aims to promote sustainable city development through integrated and coordinated planning. The CDP for Peshawar
addresses the key urban development challenges taking into consideration the regional
influences and interactions of Peshawar in alignment with international urban planning
principles. The CDP provides a 15-year planning framework to deliver a better balance
between social, economic, environmental and infrastructure physical development, integrating
cross-cutting issues with spatial planning.
Peshawar is the sixth largest city in Pakistan and is the capital city of the Khyber Pakhtunkhwa province and the Province’s most populated city. After merger of the
Frontier Region into the Peshawar District in July 2018, the area of the district has increased
from 1,257 km2 to 1,518 km
2, and the population of the District has risen from 4,269,079 to
4,333,770 (12.2% of the province). The population in the urban area of Peshawar district in
2017 was 1,970,042, with a growth rate of 3.73 percent between 1998-2017 which is higher
than both national and provincial averages.
Population growth rates over the past two decades have been fastest in 18 peri-urban Union Councils (UCs) that lie outside of the official urban area (annualized rate of 4.89%). In the rural UCs beyond the peri-urban fringe population growth has been slower
(annualized rate 3.80%), but still slightly faster than the urbanized core of the city. As a
consequence, the share of population in the peri-urban UCs has grown from 19.7 percent to
23.1 percent from 1998 to 2017, whilst the share has declined slightly in both urban UCs and
in the remaining rural UCs. This is indicative of inward migration from the rural UCs and the
higher density urban core into the peri-urban areas. In addition, growth rates in urban and
peri-urban areas have been influenced by a large influx of Afghan refugees, and other
migrants displaced by the 2005 earthquake.
The land use plan for Peshawar indicates explosive urban sprawl since the 1998 census. The city is now characterized by a relatively more compact urban development in the
city center and fringe areas, and urban sprawl towards the north and east. The spatial
structure of Peshawar is largely characterized by ribbon sprawl comprising an established
central business district, a significant economic focus of the city, along the historic Grand
Trunk (GT) road from the outskirts of Peshawar to Karkhano Market. Beyond this are a series
of residential urban nodes of varying intensities and functional characteristics established
around the main corridor. Beyond the official city limits the urbanization of the rural parts of
the tehsil, often in the form of slum developments ad low density housing, is characterized by
inefficient land utilization, giving rise to a high cost for providing infrastructure and often
resulting in a lack of basic water, sanitation and health infrastructure.
Basic municipal services are provided by the Water Supply and Sanitation Company (WSS) Peshawar to four two UCs and by the Peshawar Development Authority in a further three UCs. Water supply and solid waste management services are also provided to
one rural UCs (peri-urban areas) on the margins of the city.
The provision of municipal services, even within the current service area, is relatively poor, and generally non-existent outside of this area:

KP-SISUG Peshawar City Development Plan – Draft Final Report
xii
• Potable water supply is sourced from both surface water and groundwater. Available
production capacity is deemed sufficient currently to meet the estimated demand;
however, because of lack of integrated networks, and poor maintenance of existing
networks, system losses exceed 65% of produced water, resulting in insufficient and
intermittent supply at the point of consumption. Water quality is also poor at the point
of consumption, often contaminated by fecal matter. The groundwater table beneath
Peshawar is showing signs of stress from over pumping, with a resultant decline in
groundwater levels;
• Sewerage and drainage: the existing drainage system is a combined drainage-cum-
sewerage system conveying surface water drainage, untreated sewage and waste
water. There is no functioning sewage network nor treatment prior to discharge. Drains
conveying untreated sewage pass through densely populated parts of the city prior to
discharge to land or to surface water courses; and
• Solid waste management: current equipment is sufficient to collect only 770 tons per
day of the estimated 1,000 tons per day generated in the served area. Uncollected
waste (estimated 230 tons per day) is burnt or dumped to land or into the drainage
system. Collected waste is disposed to three open dump sites around the limits of the
city. There is no sanitary landfill or any other form of waste treatment.
Population projections, based on regression analyses using the 1981, 1998 and 2017 census results, have been made for 2025, 2030, 2035, representing potential low, medium and high growth scenarios. By 2035, the population of Peshawar city is projected
to have increased from 1,970,042 (2017 census) to between 2,587,910 (low) and 3,634,180
(high), with projections made on intercensal growth rates (1998-2017) exceeding the high
growth rate scenario at 4,664,599; these projections indicate a likely increase of between 31.4
percent (low) and 84.5 percent (high) over the 2017 population. Based on the intercensal
growth rate the projected increase by 2035 is 136.8 percent over the 2017 population.
These projected population increases will place severe demands upon already stressed services and infrastructure, particularly if intercensal growth rates are maintained.
The CDP proposes that city planning authorities will need to:
• Consolidate the role of the city center and increase urban density in the built-up areas
in line with planning standards and norms;
• Increase the use of the city floor area for economic use, roads, parking, and public
spaces and increase the density in current residential areas, including by building up;
• Discourage the use of productive agricultural land in the north,
• Encourage development towards the east side to take advantage of opportunities such
as regional development corridors, SEZs and transportation infrastructure,
• Change the demarcation of city boundaries to incorporate appropriate peri-urban
nodes. In this strategy, a dense urban core would be linked by efficient public transport
networks to dense, mixed use, complementary sub-centers. This would relocate
economic activities towards the south-west and west of the city.
• Increase the proportion of public spaces to at least 15 to 20 per cent in line with the
planning norms; and
• Aim to increase the overall resilience of the city through the effective use of public
green space and public facilities, such as the integration of open spaces into storm
water management systems, the establishment of water retention ponds, facilities for

KP-SISUG Peshawar City Development Plan – Draft Final Report
xiii
the re-use of waste water and sewerage, and green infrastructure design (e.g., green
roofs).
The CDP envisages the expansion of the urban limits to include the urbanized parts of eighteen rural UCs that are the focus currently of rapid growth. The enlarged urban area
would extend to 380.68 km2 from 151.46 km
2 currently. The aim of the expansion is to
consolidate and formalize these areas as part of the city, whilst at the same time avoiding
further uncontrolled urban sprawl. Growth should be directed to existing urban nodes by
densifying and intensifying development in these nodes and providing transportation links
between the nodes and the core of the city. Growth should be planned and focused on discrete
areas of existing urban agglomerations.
The CDP envisages the extension of basic municipal services to all of the area within the expanded urban limits as being a high priority, to be undertaken in a phased (step-
wise) and progressive manner. Extension of services to the current urban area should be the
focus of initial investments, followed by expansion into the peri-urban areas.
Priority areas for intervention are identified for:
• Infrastructure (municipal services, transportation and public spaces);
• Service delivery;
• Public sector governance;
• Capacity development; and
• Disaster and climate change risk management
The CDP identifies an urgent need to improve water supply by: (i) upgrading water
production capacity, including expanding progressively the contribution of water from surface
sources over time; and (ii) in parallel, upgrading the distribution system to reduce losses from
unaccounted for water and to ensure water quality is fit for consumption at the point of delivery.
Details on infrastructure requirements to meet the projected potable water demand up to 2035
are summarized in the CDP.
A sewer system will need to be established with the following components: (i) trunk
(primary) sewers; (ii) tertiary lines connecting to individual properties; and (iii) secondary
sewers linking the tertiary connections to the trunk lines. In parallel, it is necessary to develop
suitable treatment capacity, to be expanded as the sewage network is developed. Further
details on the infrastructure requirements for sewerage are presented in this CDP.
Solid waste systems will need to be expanded and developed by: (i) upgrading the
collection system to facilitate mechanical loading of waste into more efficient collection
vehicles from compatible containers; (ii) developing a large sanitary landfill to provide a facility
for the secure and sanitary disposal of solid waste; (iii) over time, exploring alternative
treatment options for managing the waste stream. The existing dump sites will need to be
capped, closed and rehabilitated. More details on the proposed actions for solid waste are
presented in this CDP.
In terms of service delivery for potable water, currently user charges for domestic and
commercial connections are collected on a “flat rate” basis in Peshawar. The CDP proposes to develop the water supply services by gradually installing meters at user level. Other
proposals in this CDP include reduction of non-revenue water, improved communication with
customers, development of additional resources and the development of regulatory capacity
to support the WSSP.

KP-SISUG Peshawar City Development Plan – Draft Final Report
xiv
Finally, in terms of climate change, there are five main impacts for Peshawar that can
be derived from available urban resilience and climate change assessments. These are:
1. Modest increase in drinking water demand due to increases in temperatures.
2. Increases in bacterial growth in distribution networks for potable water due to increases
in temperature and more days with higher temperatures.
3. Periodic flooding (whether flash floods due to insufficient urban drainage or
overflowing of river banks due to excessive run-off).
4. Increases in temperature in urban areas are compounded by few green spaces and
shading of roads using vegetation.
5. Increases in temperature in urban areas will require more cooling capacities or
adaptation of building codes to incorporate architectural modifications for cooling.
The CDP includes proposed measures to address these impacts. In particular, for flash
flooding, a series of measures are proposed to promote aquifer recharge and buffering of
heavy rains.

KP-SISUG Peshawar City Development Plan – Draft Final Report
1
A. INTRODUCTION
A.1. Background
1. Major cities in Pakistan have experienced rapid urbanization, with an average urban
population growth of four percent per year since 1951. By 2030, it is estimated that about 60
percent of the country’s population will live in urban areas, of which twelve large cities will
each have a population of more than 1 million inhabitants.
2. Notwithstanding that economic activities in urban areas produce more than 75 percent
of national income (gross domestic product), more than 15 percent of the urban population
lives in poverty. Overall the urban infrastructure is inadequate and is aging, with insufficient
investments to maintain basic services or stimulate economic growth and create jobs.1
3. A lack of strategic planning combined with inappropriate regulation, weak planning
standards, and inefficient resource allocation, has resulted in major urban problems across
Pakistan. A summary of key urban sector issues is provided in Figure 1. As the government’s
ability to address these challenges is limited, these conditions have contributed to high levels
of socio-economic deprivation and constrained productivity and economic growth in urban
areas.2
4. The Asian Development Bank’s (ADB’s) country partnership strategy for Pakistan
(2015–2019) has stated that ADB will support the government’s priorities for urban renewal,
with improved infrastructure and institutions for municipal services at national, provincial, and
city-level. In November 2016, ADB approved the policy and advisory technical assistance on
Provincial Strategy for Inclusive and Sustainable Urban Growth (PSISUG) in Khyber
Pakhtunkhwa (KP) Province3 with the following four primary outputs:
i. Development of a new roadmap document for the urban sector;
ii. Preparation of Regional and City Development Plans (RDPs/CDPs);
iii. Capacity building program to relevant stakeholders; and
iv. Mainstreaming innovations in the urban sector.
A.2. Vision
5. The City Development Plan (CDP) for Peshawar aims to promote sustainable city
development through integrated and coordinated planning in order to regularize the city’s
future physical development, promote economic growth and ensure adequate and improved
levels of municipal services through necessary and essential investments in infrastructure.
A.3. Report outline
6. The City Development Plan for Peshawar addresses the key urban development
challenges taking into consideration the regional influences and interactions of Peshawar in
alignment with international urban planning principles. The CDP provides a 15-year planning
framework to deliver a better balance between social, economic, environmental and
1 ADB. 2015. Country Partnership Strategy: Pakistan, 2015–2019. Manila: Asian Development Bank.
2 International Growth Centre. 2015. Reclaiming Prosperity in Khyber Pakhtunkhwa: A Medium-Term Strategy for Inclusive Growth. London: IGC. F-37109-PAK-1.
3 TA 9223-PAK: Provincial Strategy for Inclusive and Sustainable Urban Growth.

KP-SISUG Peshawar City Development Plan – Draft Final Report
2
infrastructure physical development, integrating cross-cutting issues (such as climate change
and community resilience, urban-rural planning, regional connectivity, poverty, gender and
social issues) with spatial planning.
7. This City Development Plan (CDP) is set out as follows:
• Section A identifies the key principles of a sustainable planning approach, as defined
by international norms, and which underpin the preparation of this CDP;
• Section B provides the physical, environmental and socio-economic contexts of
Peshawar;
• Section C examines the key factors and drivers that are likely to influence Peshawar’s
future growth, such as its planning processes, demographic trends, land use and
developments and climate change and resilience;
• Section D summarizes the findings of sector assessments undertaken under the
present assignment of infrastructure and municipal services, land allocation,
institutional arrangements, public sector governance and institutional capacities,
together with analyses of projected future needs; and
• Section E sets out a strategic action plan for Peshawar’s future development over
next 5, 10- and 15-year timeframes, identifying priority areas for investment,
organizational and institutional reforms and a vision for Peshawar’s spatial
development.
A.4. Sustainable planning approach
8. The United Nations’ New Urban Agenda (NUA)4 asserts that the city system and urban
planning play a crucial role in managing and achieving the 17 Sustainable Development Goals
(SDG) – these focus mainly on setting global city planning standards, and spatial urban
planning and design tools. Hence, the NUA stresses the importance of adopting a Sustainable
Planning Approach to deliver sustainable development. A sustainable planning approach is a
planning process whereby the development of long-term integrated urban and territorial
planning and design strategies and spatial frameworks produce positive outcomes for
economic development, infrastructure efficiency and the environment.
9. The Government of Pakistan adopted policy initiatives and measures with the National
report of Pakistan for Habitat III5 and the Pakistan 2025 – One Nation One Vision – on
implementing the NUA. The key issues identified included land and urban planning reform,
economic growth, smart design and planning, development of integrated planning, urban
resiliency, and urban governance reform. The Government of Khyber Pakhtunkhwa’s
Comprehensive Development Strategy 2010-2017 emphasizes urban public services,
including water, sanitation, drainage, streets, and the public infrastructure required to
accommodate private services in transport, agriculture, and trade.
10. The principles of the sustainable planning approach as outlined in the NUA include:
• Public Participation – Providing safe, equal access for all to physical and social
infrastructure, basic services, service delivery and decision-making;
4 UN. 2017. New Urban Agenda. New York: Habitat III Secretariat, United Nations.
5 Government of Pakistan. 2015. National Report of Pakistan for Habitat III. Islamabad: Ministry of Climate
Change, GoP.

KP-SISUG Peshawar City Development Plan – Draft Final Report
3
• Urban Economies – Ensuring sustainable and inclusive urban economies by
leveraging the clustering and agglomeration of well-planned urbanization, including
competitiveness, innovation and secure land of tenure;
• Urban Sustainability – Promoting clean energy, sustainable use of land and
resources, protecting the ecosystem, managing urban sprawl, and building city
resiliency by reducing disaster risks and mitigating climate change;
• Urban Governance – Strengthening institutions and financial mechanism in cities that
include stakeholders, as well as providing coherence in urban development plans to
enable social inclusion, sustainable economic growth and environment protection; and
• Financing Framework – Promoting effective, innovative, and sustainable financing
frameworks and instruments that will enable strengthened municipal finance and local
fiscal systems in order to create, sustain, and share the value generated by sustainable
urban development in an inclusive manner.
11. Applying the sustainable planning approach requires the sector road map and each
city development plan to address the following concerns:
• Facilitate government, stakeholders and civil society to re-consider urban sustainability
throughout the planning process and foster improved coordination across urban
sectors;
• Aim to achieve urban sustainability, community resiliency and improved service
delivery;
• Inform decision makers on priorities for policy setting and urban sector investment;
• Promote financial sustainability of infrastructure assets through improved operation
and maintenance (O&M), and innovative mechanisms for financing infrastructure
delivery; and
• Ensure a robust spatial planning process that produces spatial plans that identifies
potential areas and zones for developing and operating physical assets over the
planning horizon.

KP-SISUG Peshawar City Development Plan – Draft Final Report
4
Figure 1: Overview of key issues and constraints in the urban sector

KP-SISUG Peshawar City Development Plan – Draft Final Report
5
B. THE CITY AND REGIONAL CONTEXT B.1. Physical and environmental setting 12. Peshawar, the capital of the Khyber Pakhtunkhwa province of Pakistan, and also the divisional headquarters, is the most populated city as well as district of the province having a population density of 2,855 persons/km. After merger of the Frontier Region Peshawar into the Peshawar District in July 2018, the area of the district has increased from 1,257 km2 to 1,518 km2, and the population has increased from 4,269,079 to 4,333,770 (12.2% of the province). With a total urban population of 1,970,042, the Peshawar District hosts the highest concertation of urban population (45.46%) among other districts of the province. This constitutes around one-third (33.55%) of the provincial urban population. Peshawar is the 6th largest city in Pakistan with an estimated urban area of 141.6 km2 and has been famous for its gardens, educational institutions and rich architectural heritage. It is the gateway to Afghanistan and central Asian states through world-famous Khyber Pass and has a glorious historical legacy. The famous Grand Trunk Road starts from Peshawar and runs up to Delhi in India. It also hosts the provincial government offices as well as those of the FATA secretariat. The city draws people from all over the province in search of better opportunities and is also home to most of the 815,607 Afghan refugees in Khyber Pakhtunkhwa.6 Both factors place a huge burden on the city’s urban and social services.
13. Geographically, Peshawar is surrounded by Mohmand, Khyber and Kohat districts in the north-west to south, District Nowshera in the east and District Charsadda in the north-east. The Afghan border is approximately 40 km away in the west. The Peshawar District lies at 71°477’, 34°208’ (North), 71°401’, 33°878’ (West), 71°800’, 33°670’ (South) and 71°711’, 34°030’ (East) at an altitude of 331 meters. The Kabul River enters the district at Warsak and flows towards east roughly along the northern boundary of the District. The Bara River enters District Peshawar from southwest and flows in the north-eastern direction through the district and enters the Nowshera District. Peshawar has two dams in its surrounds, i.e., Aza Khel Dam and Warsak Dam (with a storage capacity of 76.492 million m3).
14. Peshawar district is part of Peshawar Division, which includes two other districts, Charsadda and Nowshera. Peshawar district has the status of a city district, which means that it has the same boundaries as those of Peshawar tehsil. Administratively, the Peshawar District is comprised of four towns—I, II, III and IV—and Hassan Khel Subdivision. Out of its 93 union councils (UCs), 46 have been designated as urban while 12 more UCs are considered peri-urban. Additionally, the entire Peshawar cantonment area is urban. In Khyber Pakhtunkhwa, only the Peshawar has a City District Government, headed by City District Nazim, while the towns are headed by Town Nazims.
15. Climatically, Peshawar features a hot semi-arid climate (Köppen BSh), with hot summers and cool winters. The temperatures are highest on average in June, which could be over 40°C, and coldest in January at 10.7°C on average but going down to 4°C. Precipitation averages 384 mm (15 inches) a year. The least amount of rainfall occurs in June, when the monthly average is 8 mm (0.3 inch). In March, the precipitation reaches its peak, with a monthly average of 65 mm (2.6 inches).7
6 United Nations High Commission on Refugees: Operational Portal – Refugee situations.
https://data2.unhcr.org/en/country/pak. Accessed 20 Jan 2019. 7 https://en.climate-data.org/

KP-SISUG Peshawar City Development Plan – Draft Final Report
6
16. Peshawar is prone to floods from main nullahs, rivers and streams, which are exacerbated by the expansion of paved and roofed surfaces, as well as poorly maintained and inadequate drainage systems. All union councils of the cities are vulnerable to climate impact to some degree. The major flood in late July‒August 2010, which resulted from heavy monsoon rains in Khyber Pakhtunkhwa, Sindh, Punjab and, Balochistan, affected these regions on a widespread scale; in Peshawar, 13 union councils were the worst affected.
B.2. Socio-economic setting
B.2.1. Employment
17. The economy of Peshawar district depends overwhelmingly on agriculture. The livestock and poultry industries are not sufficiently developed to constitute a significant component of the district economy, due to chronic fodder and feed shortages, and the absence of proper markets and extension support services. Besides agriculture, a significant proportion of the population are engaged in the services sector and industry. Agricultural products have not yet been fully exploited; and the resource base, comprising a limited range of mineral deposits, remains to be fully explored.8
18. Employment statistics disaggregated by district are limited. A 2013 labor market survey9 of Peshawar, showed that 29 percent of young people below the age of 33 only had primary education10 while 13 percent had never been to school. Some 21 percent were educated up to the middle school level, 19 percent to high school level and 14 percent to higher secondary levels. The main employment sectors for men were agriculture (34%), followed by industry/manufacturing (21%), services (18%), construction (15%) and government (12%). About one-fifth of women were estimated to have no work outside the home; those who worked outside the home were engaged in services (56%) and manufacturing (19%).11 Around one-fifth of respondents came from families who depended on local remittances (17%) and foreign remittances (3%) as their main sources of income.
19. Peshawar is the hub of a regional urban agglomeration comprising the districts of Peshawar, Charsadda, Mardan and Nowshera. About 36 percent of the province’s population is concentrated in and around the main cities within this cluster.12 With the right investments in strengthening regional connectivity and road networks, and developing agglomerate markets, there is potential to develop this agglomeration as a hub of economic activity and employment generation. The city also needs to capitalize on its proximity to markets in Central Asia.
20. Peshawar’s main assets are its centrality to both Khyber Pakhtunkhwa and Afghanistan geographically, economically and politically, combined with its relatively high-
8 Government of Khyber Pakhtunkhwa. 2017. Final Land Use Plan of District Peshawar. Peshawar: Urban
Policy & Planning Unit, Planning & Development Department, GoKP. 9 Institute of Rural Management. 2013. Labour Market Survey Exploring & Economic Opportunity through
Vocational Skills Training, District Peshawar (Khyber Pakhtunkhwa). Islamabad: IRM. 10 While households for interviews were selected with probability sampling methods, respondents from these
households were asked for their views of employment sectors, rather than about their own jobs. 93% of respondents were below 33 years of age.
11 The denominator was all respondents who mention employment by sector – those who gave responses such as “waged work” without mentioning the sector have been excluded and the denominator adjusted.
12 International Growth Centre. 2015. Reclaiming Prosperity in Khyber Pakhtunkhwa: A Medium-Term Strategy for Inclusive Growth. London: IGC. F-37109-PAK-1.

KP-SISUG Peshawar City Development Plan – Draft Final Report
7
level of infrastructure, municipal services and economic opportunities. Such assets are luring skilled and unskilled labor in massive numbers to the urban centers in the district, some of which have been absorbed by Peshawar’s manufacturing industries.
21. On the other hand, Peshawar’s location at considerable distance from Pakistan’s main markets and centers of economic activity is a disadvantage. Due to these distances, the limited local market, and underdeveloped resource base, significant proportions of raw materials and manufactured products are imported or brought in, with high transportation and freight costs. According to the manufacturing census, industrial and employment costs per registered factory in Khyber Pakhtunkhwa are approximately twice that for Punjab Province.13
22. Other factors affecting the economy, particularly in the industrial sector, are the scarcity of skilled labor, inconsistent government policies, a dearth of local capital, the lack of proper infrastructure, and a poor law-and-order situation. Other constraints include inadequate technology and high costs of financing businesses. The provincial government has conducted reforms of the industrial sector to encourage investors and offer various incentives to potential investors.14 For such initiatives to succeed, the government will also need to address the uncontrolled and ultimately unsustainable urbanization on the fringes of the city, coupled with an exodus out of immediate outlying rural areas, all of which lessen the attraction of Peshawar as a favored destination for investors.
23. It will be crucial for Peshawar to develop in the right direction with improved services and civic facilities in order to accelerate growth, attract additional capital investment, and create extra job opportunities for youth to reap the full benefits of the demographic dividend.15 The economic zone being developed as a part of the multibillion-dollar China-Pakistan Economic Corridor (CPEC) is expected to generate employment in the province.
B.2.2. Poverty
24. Data on the standard poverty headcount ratio based on consumption surveys are not available for the districts. The Benazir Income Support Programme Poverty Scorecard Survey in 2010-11 divided districts into five poverty bands: (i) least poor, (ii) vulnerable, (iii) poor, (iv) very poor, and (v) extremely poor. According to these surveys, Peshawar was ranked as a poor district with 32.15 percent incidence of poverty (compared to 36.92% for KP). Poverty is higher for female-headed households (34.03%) than for male-headed households (31.76%).
25. Measured by the three core dimensions of education, health and living standards (“multidimensional poverty”), Peshawar’s population appears to be enjoying a slightly higher standard of well-being compared to the national average. The Multidimensional Poverty Index (MPI) for Peshawar was 0.148 in 2014-15, with a headcount ratio in incidence of multidimensional poverty of 31.5 percent. This is a higher standard of living than the national and regional averages—Pakistan’s corresponding MPI and headcount ratio were 0.197 and 38.8 percent respectively for the same year, while Khyber Pakhtunkhwa’s MPI and headcount
13 Government of Khyber Pakhtunkhwa. 2017. Final Land Use Plan of District Peshawar. Peshawar: Urban
Policy & Planning Unit, Planning & Development Department, GoKP. 14 Government of Khyber Pakhtunkhwa. 2017. Final Land Use Plan of District Peshawar. Peshawar: Urban
Policy & Planning Unit, Planning & Development Department, GoKP. 15 Demographic dividend: the growth in income per capita that results when the share of working age individuals
in a population rises relative to dependents.

KP-SISUG Peshawar City Development Plan – Draft Final Report
8
ratio were 0.250 and 49.2 percent. Nonetheless, it still means that nearly one-third of Peshawar’s population is defined as multidimensionally poor.16
26. Access to credit is critical for the rural poor. Recent years have seen improved credit availability, largely through the intervention of NGOs. Financial institutions, too, have become more amenable to the idea of microfinance but the capacity to utilize credit optimally is still lacking among many communities. Credit facilities have focused on traditional activities such as livestock rearing, commercial establishments (mainly shops and public call offices) and agriculture. With high interest rates, poor returns and a focus on already saturated sectors, microcredit extension has been unable to make a significant impact on poverty alleviation.
B.2.3. Education
27. The government is the largest provider of education. The statistics of public schools are published annually by the Elementary and Secondary Education Department at provincial level. The statistics used in this section are from the Annual Statistical Report 2017-18, which is the outcome of the Annual Schools Census conducted between November and December 2017. The Statistical Report also contains some data on private school enrolment.17 From primary to higher secondary level, girls’ schools account for only 44 to 45 percent of all public schools in Peshawar (Table 1).
Table 1: Educational institutions in Peshawar District Education Institutions Government Schools 2016-17 Private Schools
2013 Boys Girls Total % Girls’ Schools Primary Schools 584 455 1,039 43.79% 247
Middle Schools 80 77 157 49.04% 388
High Schools 77 64 141 45.39% 344
Higher Secondary Schools 30 17 47 36.17% 67
Degree Colleges 8 8 16 50.00% -
Postgraduate College 0 0 0 - -
Mosque/Maktab Schools 13 0 13 - - Source Government of Khyber Pakhtunkhwa. 2018. Annual Statistical Report of Government Schools 2017-18.
Peshawar: Department of Elementary & Secondary Education, GoKP. Government of Khyber Pakhtunkhwa. 2013. Annual Statistical Report of Non-Governmental Schools, Khyber Pakhtunkhwa. Peshawar: Department of Elementary & Secondary Education, GoKP. Government of Khyber Pakhtunkhwa. 2018. Development Statistics of Khyber Pakhtunkhwa 2018. Peshawar: Bureau of Statistics, Planning & Development Department, GoKP.
Note: Mosque/maktab schools are established by the government in mosques up to primary level. Along with boys, some girls are also admitted in these schools.
28. Surprisingly, Peshawar’s educational system underperforms in term of enrolment compared to the provincial average. Enrolment rates in Peshawar’s schools are lower at every level than provincial enrolment rates. On the other hand, Peshawar has better transition rates than the provincial average (meaning that those who do stay on in school perform better than the provincial average in terms of transition from Class 5 to Class 6). Gender disparities are stark: less girls enroll than boys, and with increasing grade, more girls drop out relative to
16 Government of Pakistan. 2015. Multidimensional Poverty in Pakistan. Islamabad: Planning Commission of
Pakistan, GoP, UNDP and Oxford Poverty & Human Development Initiative. 17 However, other data on private schools is generally outdated; e.g., the 2013 Annual Statistical Report of Non
Governmental Schools.
KP-SISUG Peshawar City Development Plan – Draft Final Report
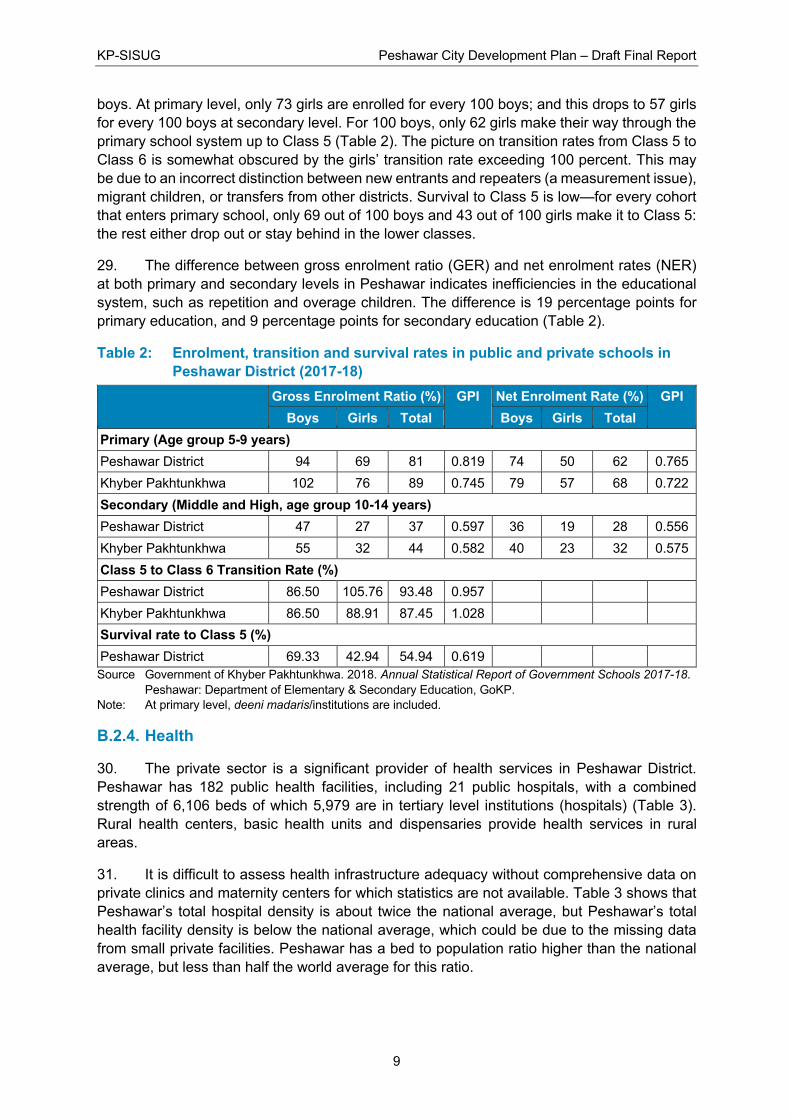
9
boys. At primary level, only 73 girls are enrolled for every 100 boys; and this drops to 57 girls for every 100 boys at secondary level. For 100 boys, only 62 girls make their way through the primary school system up to Class 5 (Table 2). The picture on transition rates from Class 5 to Class 6 is somewhat obscured by the girls’ transition rate exceeding 100 percent. This may be due to an incorrect distinction between new entrants and repeaters (a measurement issue), migrant children, or transfers from other districts. Survival to Class 5 is low—for every cohort that enters primary school, only 69 out of 100 boys and 43 out of 100 girls make it to Class 5: the rest either drop out or stay behind in the lower classes.
29. The difference between gross enrolment ratio (GER) and net enrolment rates (NER) at both primary and secondary levels in Peshawar indicates inefficiencies in the educational system, such as repetition and overage children. The difference is 19 percentage points for primary education, and 9 percentage points for secondary education (Table 2).
Table 2: Enrolment, transition and survival rates in public and private schools in Peshawar District (2017-18)
Gross Enrolment Ratio (%) GPI Net Enrolment Rate (%) GPI Boys Girls Total Boys Girls Total
Primary (Age group 5-9 years) Peshawar District 94 69 81 0.819 74 50 62 0.765
Khyber Pakhtunkhwa 102 76 89 0.745 79 57 68 0.722
Secondary (Middle and High, age group 10-14 years) Peshawar District 47 27 37 0.597 36 19 28 0.556
Khyber Pakhtunkhwa 55 32 44 0.582 40 23 32 0.575
Class 5 to Class 6 Transition Rate (%) Peshawar District 86.50 105.76 93.48 0.957
Khyber Pakhtunkhwa 86.50 88.91 87.45 1.028
Survival rate to Class 5 (%) Peshawar District 69.33 42.94 54.94 0.619 Source Government of Khyber Pakhtunkhwa. 2018. Annual Statistical Report of Government Schools 2017-18.
Peshawar: Department of Elementary & Secondary Education, GoKP. Note: At primary level, deeni madaris/institutions are included.
B.2.4. Health
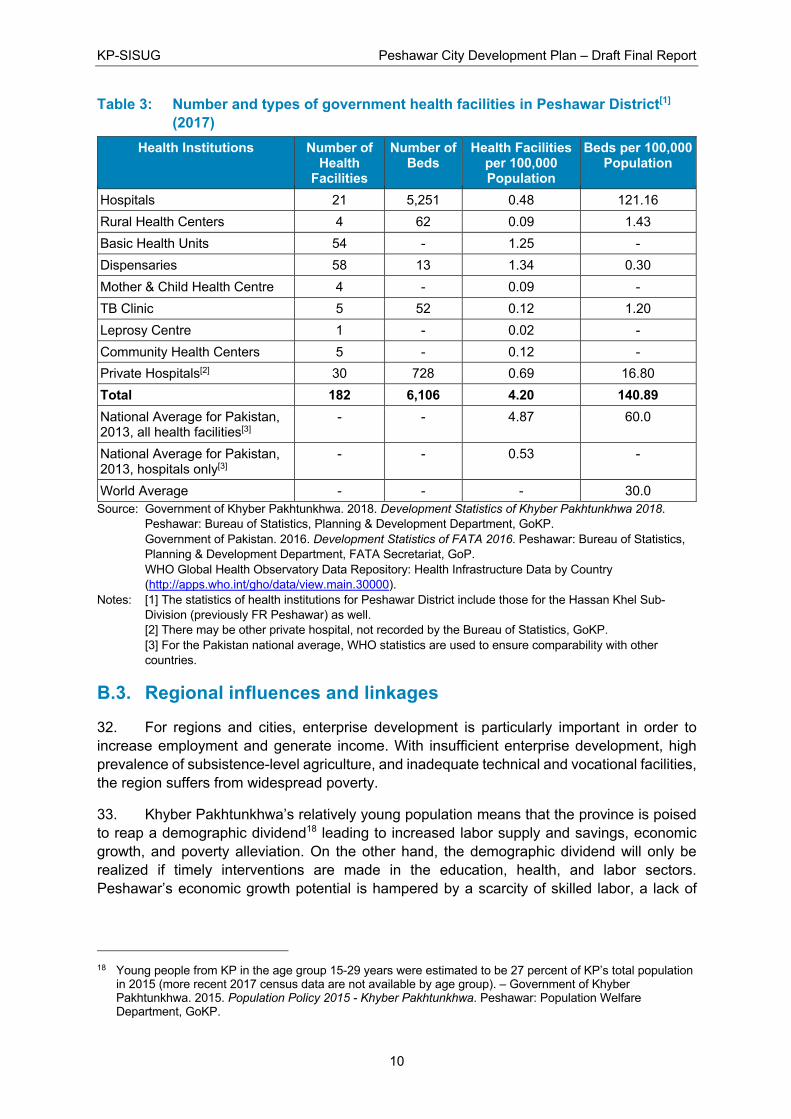
30. The private sector is a significant provider of health services in Peshawar District. Peshawar has 182 public health facilities, including 21 public hospitals, with a combined strength of 6,106 beds of which 5,979 are in tertiary level institutions (hospitals) (Table 3). Rural health centers, basic health units and dispensaries provide health services in rural areas.
31. It is difficult to assess health infrastructure adequacy without comprehensive data on private clinics and maternity centers for which statistics are not available. Table 3 shows that Peshawar’s total hospital density is about twice the national average, but Peshawar’s total health facility density is below the national average, which could be due to the missing data from small private facilities. Peshawar has a bed to population ratio higher than the national average, but less than half the world average for this ratio.
KP-SISUG Peshawar City Development Plan – Draft Final Report
10
Table 3: Number and types of government health facilities in Peshawar District[1] (2017)
Health Institutions Number of Health
Facilities
Number of Beds
Health Facilities per 100,000 Population
Beds per 100,000 Population
Hospitals 21 5,251 0.48 121.16
Rural Health Centers 4 62 0.09 1.43
Basic Health Units 54 - 1.25 -
Dispensaries 58 13 1.34 0.30
Mother & Child Health Centre 4 - 0.09 -
TB Clinic 5 52 0.12 1.20
Leprosy Centre 1 - 0.02 -
Community Health Centers 5 - 0.12 -
Private Hospitals[2] 30 728 0.69 16.80
Total 182 6,106 4.20 140.89 National Average for Pakistan, 2013, all health facilities[3]
- - 4.87 60.0
National Average for Pakistan, 2013, hospitals only[3]
- - 0.53 -
World Average - - - 30.0 Source: Government of Khyber Pakhtunkhwa. 2018. Development Statistics of Khyber Pakhtunkhwa 2018.
Peshawar: Bureau of Statistics, Planning & Development Department, GoKP. Government of Pakistan. 2016. Development Statistics of FATA 2016. Peshawar: Bureau of Statistics, Planning & Development Department, FATA Secretariat, GoP. WHO Global Health Observatory Data Repository: Health Infrastructure Data by Country (http://apps.who.int/gho/data/view.main.30000).
Notes: [1] The statistics of health institutions for Peshawar District include those for the Hassan Khel Sub-Division (previously FR Peshawar) as well. [2] There may be other private hospital, not recorded by the Bureau of Statistics, GoKP. [3] For the Pakistan national average, WHO statistics are used to ensure comparability with other countries.
B.3. Regional influences and linkages
32. For regions and cities, enterprise development is particularly important in order to increase employment and generate income. With insufficient enterprise development, high prevalence of subsistence-level agriculture, and inadequate technical and vocational facilities, the region suffers from widespread poverty.
33. Khyber Pakhtunkhwa’s relatively young population means that the province is poised to reap a demographic dividend18 leading to increased labor supply and savings, economic growth, and poverty alleviation. On the other hand, the demographic dividend will only be realized if timely interventions are made in the education, health, and labor sectors. Peshawar’s economic growth potential is hampered by a scarcity of skilled labor, a lack of
18 Young people from KP in the age group 15-29 years were estimated to be 27 percent of KP’s total population
in 2015 (more recent 2017 census data are not available by age group). – Government of Khyber Pakhtunkhwa. 2015. Population Policy 2015 - Khyber Pakhtunkhwa. Peshawar: Population Welfare Department, GoKP.

KP-SISUG Peshawar City Development Plan – Draft Final Report
11
capital, and weak governance. With poor access to technology and shortages in skilled labor, Peshawar is unable to grow its industrial base.
34. Further rural-urban migration and urbanization will lead to higher income only if manufacturing and services grow fast enough to absorb the supply of labor. This is an issue that needs to be addressed both nationally and at provincial level. Pakistan will have to invest in many cities at the same time to ensure a more geographically balanced rate of urbanization and the creation of a system of cities—an efficient network of urban centers whose manufacturing and services industry are connected. Harnessing and promoting this approach of “system of cities” will lead to faster job creation and higher growth of productivity.19
35. Since economic growth is linked to stability, concerns related to security and the protracted crisis in the region have reduced the influence of Peshawar in the region as an economic hub. It is difficult to compute the economic losses resulting from the volatility in regional security.
36. Large scale economic development and road infrastructure schemes in the region offer strong prospects for growth and employment generation. The creation of the China-Pakistan Economic Corridor (CPEC), still in the pipeline, will upgrade regional transport links and shape new economic zones and settlement patterns. Related projects include the Peshawar Circular Railway – an inter-regional commuter railway system expected to strengthen the economic conurbation of the Peshawar region by connecting Peshawar to the outlying cities and suburbs of Charsadda, Mardan and Nowshera and potentially Swabi. A Mardan-Malakand Expressway and a proposed Peshawar-Kabul motorway link will also influence spatial patterns and strengthen regional connectivity for economic integration.
B.4. Future opportunities and economic conditions
37. Future opportunities are the key mechanism through which the benefits of growth can be distributed to the poorer segments of society. Access to decent, fairly paid work is thereby vital in the process towards reduction in poverty and income inequality. Provision of employment opportunities depends upon available resources, a stronger technological base, and institutional strategies. Similarly, human resources, skills, and technical competency determine the outcome of employment which contributes to achieving sustained economic growth.
38. Agriculture accounts for about 22 percent of the provincial GDP (divided about equally between crops and livestock). Besides providing 44 percent employment of the labor force, almost 80 percent of the population rely on agriculture for a significant part of their income. There are two distinct farming systems depending on the use of irrigation. Areas such as Swat and parts of Buner have extensive valleys with flat terrain and reasonable water supply from rain and snow, as well as surface and groundwater irrigation. These areas have two-thirds of the crop land under irrigation during the summer (Kharif) season and about half the crop land under irrigation during the winter (Rabi) season. Other parts of Khyber Pakhtunkhwa, particularly much of Shangla and Dir, have harsher agro-climatic conditions, with low rainfall (as low as 100 mm per year). Most irrigation canals can only provide water seasonally, and groundwater plays an important role.
19 WB. 2014. Pakistan Urban Sector Assessment: Leveraging the Growth Dividend from the Urbanization
Process. Islamabad: The World Bank.

KP-SISUG Peshawar City Development Plan – Draft Final Report
12
39. Urbanization is often considered to have negative impacts on agriculture, such as the loss of agricultural land to urban expansion and an urban bias in public funding for infrastructure, services and subsidies. Greater Peshawar, Abbottabad, Mardan and Kohat are famous for producing food and cash crops. Continued economic growth of these districts will require interventions to raise farm incomes. Such interventions could include: (i) addressing water logging and salinity through better drainage management and rehabilitation crops that tolerate some salinity, (ii) making irrigation more efficient and preventing water losses,20 (iii) reclaiming cultivable land through leveling and irrigation, (iv) modernizing irrigation methods and infrastructure, including reservoirs, (v) improving road networks to enable farmers to bring produce to markets.
40. Effective transport and telecommunications networks are vital infrastructures that play a key role in economic development and social progress. The rugged terrain of much of Khyber Pakhtunkhwa and difficulty in access are major obstacles in the growth of both production and infrastructure sectors. Physical infrastructure affects aggregate output in two ways: first, infrastructure services enter production as an additional input, and second, well-planned infrastructure raises total factor productivity by reducing transaction and other costs, thus allowing a more efficient use of conventional productive inputs. The provincial government has made investments in new transportation infrastructure, such as mass transit systems, including a rapid bus transit project in Peshawar.
41. In Khyber Pakhtunkhwa, the services sector has potential to grow and the government is making efforts to provide an enabling environment in this regard. This is reflected in the development of new industries, offices, information technology and service centers, industrial estates and parks. It will also be important to enhance health and educational services.
42. The future prospects for sustainable development of the region and city depend on diversifying economic activity and strengthening institutional efficiencies and effectiveness, especially the administrative machinery within the government. Empirical evidence shows that commercial, financial, economic and trade policies directly influence productivity and economic growth. Bottlenecks constraining the growth of the trade and industrial sectors need to be addressed. Micro-, small and medium enterprises need to be encouraged through skills development (e.g., handicrafts, poultry, horticulture and floriculture), as well as through investment and tax incentives. Development of the industrial sector and enterprises will not only generate demand for agricultural produce as raw materials, but also supply machines and tools to modernize other sectors of the economy and provide job opportunities.
43. Sustainable exploitation of natural resources could play an important role in diversifying the economy. The area has mineral reserves which are yet to be exploited systematically, especially magnesite, phosphate and soapstone deposits. Manufacturing and processing plants for mineral deposits should be established locally so that the benefits of value addition accrue to the district. A number of industries based on resources as forest and livestock products can also be developed to diversify the economy. These include furniture manufacture, woodwork, handicrafts, maize products, and dairy production. At the same time, the government needs to enforce robust strategic environmental assessments (SEAs) and environmental impact assessments (EIAs) and implement regulatory mechanisms to minimize
20 In the largely unelectrified agricultural areas, most tube wells are operated by diesel engines, and measures
to reduce water loss such as lining canals with concrete will decrease diesel costs.

KP-SISUG Peshawar City Development Plan – Draft Final Report
13
potential damage to the environment. Acceptable trade-offs will need to be considered so that the exploitation of natural resources can be developed with minimal adverse impacts.
44. With Khyber Pakhtunkhwa having some of the most beautiful tourist locations in Pakistan, the economic potential of the tourism sector is substantial. However, security concerns must first be addressed. Khyber Pakhtunkhwa will also need to develop the required infrastructure, improve its workforce skills, and establish quality standards for services. Tourism will also accelerate the development of many sectors such as hospitality and hotels, recreation, transport, labor, and handicrafts.
45. Urbanization is a global phenomenon and describes the growth and expansion of cities and suburbs and the transformation of surrounding rural areas. In developing cities, urbanization occurs as a result of more work opportunities and better living standards as compared to rural areas. However, the process of urbanization is accompanied by social, health and environmental issues, which need to be addressed by appropriate policies and planning. The provision of these basic urban facilities will encourage the growth, increase and expansion of economic activities such as local small-scale enterprises, mining, retail and others. The development of these businesses will have a multiplier effect on incomes, employment levels, living standards and well-being.
46. The effect of population growth can be positive or negative depending on the circumstances. A large population has the potential to be a significant driver of economic development. On the other hand, limited resources and a large population put pressures on the resources that do exist and can, therefore, constrain growth and social well-being. Measures such as proper city planning and zoning, and public education on health, hygiene and conservation will be needed to alleviate the negative tendencies of population growth.
47. Every developmental scheme after its completion requires a certain number of human resources for its routine operation and maintenance activities. Some of the projects are operated / maintained through already established procedures. However, there are some new schemes need additional human resources to make the schemes operational and for subsequent maintenance. Urban development aims to improve existing civic facilities through infrastructural and service improvements and utilization of additional human resource to ensure that such facilities and services are sustained. It is imperative that all such schemes have an appropriate number of human resources to ensure sustainability.
48. Table 4 sets out estimates of the new jobs that would be generated by particular activities, together with the assumptions used to calculate job increase. In setting out the economic analysis and potential benefits that will accrue from the proposed interventions a number of assumptions have been made. It is held that these are reasonable in current circumstances and based on existing technical circumstances. Over time, especially given the timeframe envisaged in this analysis, it is anticipated that these assumptions will need to be reviewed and amended.
Table 4: Approximate increase in jobs Industries Unit Approximate
Jobs Increase Assumptions/explanation
Drinking water supply 1 4 persons 4 persons for each water supply scheme serving 1,500 households/day. To run this water supply scheme, 4 persons will be required. (1 wall man, 2

KP-SISUG Peshawar City Development Plan – Draft Final Report
14
Industries Unit Approximate Jobs Increase
Assumptions/explanation
chowkidar one for night and one for day, and one for maintenance)
Wastewater and sewage 3 STP 114 persons Sewage Treatment plant for 300,000 to 400,000 people requires 8 staff for management and administration and 30 staff for operations. Total 38 persons required for operating of 1 STP plant which means 114 for 3 STP
Sanitation system 1 person 1 per 1,000 population and 1 per 500 running meters for street
sweepers
Sanitary Workers. One full time worker per 1,000 population for door to door collection and one worker per 500 running meters for street sweeping subject to density of the population.
Solid waste management 1 30 people Solid Waste Management requires professional staff and supervisors of sanitary workers.21
Sanitary landfill 100 tons/day
1 person Staff and equipment required for land fill: 1 tracked loader
Small enterprises 1 20 persons Businesses around the bus terminal and other activities will provide employment.
Stone and marble 1 15 persons
Retailer 1 5 persons
Hotels 1 10 persons Source: Field survey.
21 Among the norms recommended by the SWM Learning Program in India were: Zonal Environmental
Engineer/ Chief Sanitary Inspector (one per zone of 400,000 to 500,000 population); Ward Level Sanitary Officer (one per 100,000 Population); Ward-level Sanitary Inspector (one per 50,000 population); Sanitary Sub inspector (one per 25,000 population), Sanitary Supervisor (one per 12500 population). Also 1 supervisor of street sweepers per unit area of 8 Kms road length. http://web.worldbank.org/archive/website01007/WEB/IMAGES/INSTIT-2.PDF.

KP-SISUG Peshawar City Development Plan – Draft Final Report
15
C. KEY FACTORS AND DRIVERS FOR URBAN DEVELOPMENT IN THE CITY
49. The urban development in Peshawar is governed through a host of national and provincial legislation and strategies (Table 43). Most of the development planning is housed at the provincial level, with some national level planning for trans-provincial communication infrastructure. This tehsil level urban development planning is routed through the district and provincial channels, through the relevant line departments and the political representation. However, implementation of such plans is vested to the district level line agencies, and in some cases national organizations like National Highway Authority. Table 45 shows the key stakeholders in urban sector, while Table 46 and Table 47 elaborate institutional roles and processes devolved politically, financially and administratively at various levels (province, district and tehsil) in planning, budget approval, procurement, the gaps, and the overlaps in roles in planning and implementing urban services.
C.1. Population growth and demographic factors 50. In recent decades, the population census has not been conducted regularly in Pakistan, as shown by the censuses in 1951, 1961, 1972, 1981, 1998 and 2017. The last census was conducted in March to May 2017 and the provisional results were released in August 2017. However, detailed demographic census data has not yet been released due to complaints of undercount by some smaller provinces. So far, only the basic data (population and households) has been released down to Population Circles while the sex and locale disaggregated data is available for districts only.
51. This section briefly sets out some of the key factors involved in population change in Peshawar and identifies potential growth scenarios to be considered in assessing future population. Population projections are a necessary pre-requisite for establishing the potential future demand for municipal services.
C.1.1. Projections of population growth
52. The purpose of this section is to provide a range of projections for the planning of city development. Projections of population growth to 2035, based on the 1981, 1998 and 2017 census results, are based on regression analyses producing low, medium and high growth scenarios. The growth rates derived from these projections are set out on Table 5. Depending on the specific mix of push and pull factors, various growth scenarios are possible. In the low to medium growth scenarios, the potential contributors to the growth could be the continued growth of peri-urban agglomerations beyond the officially designated urban areas, with unregulated housing structures and colonies and undiminished levels of in-migration trends.
C.1.2. Analysis of population patterns
53. Table 6 shows the population trends in Peshawar Tehsil, including the city (urban tehsil) and the rural areas of Peshawar tehsil (including Future Urban areas). This shows that population growth rates over the past two decades have been faster in rural parts of the tehsil than those in the urban parts, with the fastest growth in the peri-urban parts of the rural tehsil. However, the proportion of population living in the urban UCs has slightly declined between the two censuses, which could mean lower birth rates and possibly some outward movement to the suburbs. Household sizes (Table 7) may not be indicative of birth rates since extended

KP-SISUG Peshawar City Development Plan – Draft Final Report
16
families may live together under one roof. The UC-wise demographic parameters are given in Appendix 2.
Table 5: Peshawar urban tehsil population projections and growth rates[1] Projections based on Regression Analysis[2] Projections based
on 1998-2017 Intercensal
Growth Rate
Low Variant Medium Variant High Variant Trendline Logarithmic
Regression Polynomial Regression
Exponential Regression
R2 value 0.96012 1.0 0.99881 Population
1981 566,248 566,248 566,248 566,248
1998 982,816 982,816 982,816 982,816
2017 1,970,042 1,970,042 1,970,042 1,970,042
2025 2,201,611 2,550,448 2,569,400 2,817,446
2030 2,394,999 2,962,773 3,055,759 3,596,377
2035 2,587,910 3,413,231 3,634,180 4,664,599
Growth Rates
2017-2025 1.399% 3.280% 3.376% 4.57%
2017-2030 1.514% 3.189% 3.434% 4.74%
2017-2035 1.527% 3.100% 3.460% 4.91%
Source: Calculated using census data for 1981, 1998 and 2017 from the Pakistan Bureau of Statistics. Notes: [1] Based on 3 census data points (1981,1998 and 2017), using different regression equations.
[2] The future population is calculated first from a regression analysis which gives the specific formula. The Average Annual (Compound) Growth Rate (GR) is then calculated from the beginning and end population.
54. Of the rural Union Councils, 18 have been classified as “future urban”, or peri-urban. These are the UCs with urbanizing agglomerations, which account for a significant portion of the total tehsil population (23.11% in 2017). These 18 UCs show a significant rise in population between the two censuses. The trends show that much of the rural migration is likely to be into the 18 peri-urban UCs, with some of the urban population possibly migrating outwards from the city as well.
0
1,000,000
2,000,000
3,000,000
4,000,000
5,000,000
1981 1998 2017 2025 2030 2035
Logarithmic Regression Polynomial Regression
Exponential Regression 1998-2017 Intercensal Growth Rate

KP-SISUG Peshawar City Development Plan – Draft Final Report
17
Table 6: Trends in urban growth from 1998 to 2017 in Peshawar Tehsil Peshawar City
(Urban Tehsil) Peshawar City (Rural Tehsil) Peshawar
Tehsil (Total)[2] Future Urban
Area[1] Rural Area
Administration Units 44 UCs + Cantonment
18 UCs 30 UCs 92 UCs + Cantonment
Land Area (2017) in km2 151.46 229.22 880.17 1,260.85
Population 1998 982,816 398,166 645,869 2,026,851
Population 2017 1,970,042 986,748 1,312,289 4,269,079
Annual population growth rate (1998-2017)
3.73% 4.89% 3.80% 4.00%
% of total population in 1998 48.48% 19.65% 31.87% 100.00%
% of total population in 2017 46.15% 23.11% 30.74% 100.00% Source: Computed from 1998 and 2017 census data of the Pakistan Bureau of Statistics. Notes: [1] Future Urban UCs are those rural UCs which manifest urban character but are yet to be designated
as urban, as explained in paragraph 54. [2] Hasan Khel Sub-Division (earlier Peshawar FR) has been merged into Peshawar District,
representing a population increase of 53,841 and 64,691 in the rural part of Peshawar District in 1998 and 2017, respectively.
55. The population growth of the district (3.94% between 1998-2017) is higher than the national average of 2.4 percent and the provincial average of 2.89 percent. Within the district, the growth rate is higher (4.12%) for rural than for urban (3.73%) areas, and highest of all for the future urban areas (4.89%), likely as a result of inward migration from rural areas.
Table 7: Area, population, density and growth rate in Peshawar Tehsil (2017) Locale Area
(km2) No. of
Households Total
Population Population
Density Household
Size Current Urban UCs (44 + Cantonment)
151.46 236,056 1,970,042 13,007 8.35
Future Urban UCs (18)[1] 229.22 109,166 986,748 4,305 9.04
Remaining Rural UCs (30) 880.17 144,621 1,312,289 1,491 9.07
Total (92 UCs + Cantonment) 1,260.85 489,843 4,269,079 3,386 8.72 Source: Computed from 1998 and 2017 census data of the Pakistan Bureau of Statistics. Notes: [1] Future Urban UCs are those rural UCs which manifest urban character but are yet to be designated
as urban, as explained in paragraph 54.
56. There are no recent statistics on the total number of migrants or refugees in the district. The UNHCR database at the time of this report indicates 815,607 Afghan refugees in Khyber Pakhtunkhwa;22 most of these are housed in or around Peshawar. Afghan refugees tend to concentrate in mainly Pushto speaking areas because of cultural and ethnic affinity. They may have refugee status or may be illegal migrants.
22 https://data2.unhcr.org/en/country/pak

KP-SISUG Peshawar City Development Plan – Draft Final Report
18
C.2. Land use and physical planning
C.2.1. Pattern of growth and regional potential
57. Urban populations in Khyber Pakhtunkhwa have expanded outside city administrative boundaries as the highways have evolved. “Ribbon” developments have sprung up along these highways, largely as a result of proximity to transport links, and availability of skills and services. The regional growth potential for Peshawar and neighboring cities may be understood in terms of “economic corridors”, also known as development corridors by the Khyber Pakhtunkhwa government. Economic corridors are defined by one ADB paper as geographical zones connecting economic agents (such as producers, consumers, firms). They provide connection between economic nodes or hubs, usually centered on urban landscapes, in which large amount of economic resources and actors are concentrated. They link the supply and demand sides of markets. There is no standard picture of what economic corridor development is and what it can achieve.23 The Khyber Pakhtunkhwa government has proposed the following economic corridors for Peshawar Valley.24
• Corridor I: Takht Bhai-Mardan-Nowshera-Aman Garh-Pabbi Corridor. Corridor I is based on the fact that the second largest city of the Province i.e. Mardan, and three of the fastest growing urban settlements in the Valley i.e. Takht Bhai, Aman Garh and Pabbi lie in it.
• Corridor II: Jahangira-Swabi-Topi Corridor. Corridor II lies towards east of the valley and encompasses most fertile agricultural land and high-potential settlements i.e. Topi, Swabi and Jahangira.
58. The growth pattern in Khyber Pakhtunkhwa suggests that future planning should focus on the improvement of these two corridors, which will build on the synergies offered by the districts through infrastructure development.25 In addition, regional growth patterns will be influenced by the new urban agglomerations, new town development, special economic zones (SEZ), industrial estates, transportation infrastructure, and the China Pakistan Economic Corridor (CPEC). The Khyber Pakhtunkhwa Government has listed the following as prioritized SEZs under CPEC:26
i. The Rashakai SEZ is spread over approximately 405 hectares and is located on the M1 Motorway at Mardan Interchange. It links to CPEC through Burhan interchange on M1 and is on the main road to the Afghan border.
ii. The Hattar SEZ is expanding from the previous 172 hectares to an additional 405 hectares.
23 Brunner, H. P. 2013. What is Economic Corridor Development and What Can it Achieve in Asia’s
Subregions? ADB Working Paper Series on Regional Economic Integration. Manila: Asian Development Bank.
24 Government of Khyber Pakhtunkhwa. 2017. Final Land Use Plan of District Peshawar. Peshawar: Urban Policy & Planning Unit, Planning & Development Department, GoKP.
25 Government of Khyber Pakhtunkhwa. 2017. Final Land Use Plan of District Peshawar. Peshawar: Urban Policy & Planning Unit, Planning & Development Department, GoKP.
26 http://www.kpezdmc.org.pk/prioritized-sezs.

KP-SISUG Peshawar City Development Plan – Draft Final Report
19
C.2.2. Existing spatial structure and land use in Peshawar
59. The government’s 2013 land use plan for Peshawar27 reports considerable urban sprawl since the 1998 census. The city is now characterized by a relatively more compact urban development in the city center and fringe areas, and urban sprawl towards the north and east. Union Councils still defined (in the 2017 census) as part of the rural tehsil have become urbanized in certain parts, and not necessarily the whole of each UC. The government’s 2013 land use plan defines the “Peshawar urban area” as that made up by 40 UCs, plus parts of 11 UCs. The 2013 land use plan for Peshawar city thus includes an area 5.58 km2 larger than that defined by the 2017 census as urban Peshawar tehsil.
60. Urban expansion may take place guided and regulated by development plans and zoning control, or through spontaneous growth with unplanned constructions, especially along the roadsides and on city fringes, leading to urban sprawl. Urban sprawl has various definitions and indicators. Commonly used criteria to define urban sprawl include: (i) low population density, (ii) scattered, discontinuous (and therefore car-dependent) construction, (iii) the spread of development on to agricultural land, and (iv) suburban development that is disorganized, largely unplanned and poorly serviced.28 The indicators used to measure urban sprawl include (but are not limited to): (i) population density and its reciprocal – per capita consumption of land (residential and non-residential) – and (ii) spatial indicators such as openness and contiguity of built-up areas, mainly to measure the extent to which there is room for densification and infill development in cities.
61. Using the available data for Peshawar, Table 8 shows that the per capita consumption of land increases away from the built-up areas to the countryside, indicating less efficient use of land and a greater extent of urban sprawl. For example, the rural UCs have 10.6 times the per capita land consumption and the peri-urban UCs have 3.7 times the per capita land consumption than do the urban UCs within the municipal limits of the city. Urban sprawl, with its inefficient land utilization, leads to higher costs for infrastructure and service provision, and usually, lack of secure tenure.
Table 8: Population densities and per capita land consumption in Peshawar Tehsil Location Relative to 2017
Census Area (km2)
Population Density (km2) Per Capita Consumption of Land (m2)
1998 2017 1998 2017 Current Urban UCs (44 + Cantonment)
151.46 6,489 13,007 154.11 76.88
Future Urban UCs (18)[1] 229.22 1,737 4,305 575.69 232.30
Remaining Rural UCs (30) 880.17 734 1,491 1,362.76 670.71 Source: Computed from 1998 and 2017 census data of the Pakistan Bureau of Statistics. Notes: [1] Future Urban UCs are those rural UCs which manifest urban character but are yet to be designated
as urban, as explained in paragraph 54. km = kilometer, m = meter, UC = union council
62. Urban Sprawl in Peshawar tends to increase per capita road and utility lines (water, sewage, power, etc.), and the travel distances required to provide public services (garbage
27 Government of Khyber Pakhtunkhwa. 2017. Final Land Use Plan of District Peshawar. Peshawar: Urban
Policy & Planning Unit, Planning & Development Department, GoKP. 28 Banai, R. and T. De Priest. 2014. “Urban Sprawl: Definitions, Data, Methods of Measurement, and
Environmental Consequences.” Journal of Sustainability Education, Vol.7 (Dec 2014). ISSN: 2151-7452.

KP-SISUG Peshawar City Development Plan – Draft Final Report
20
collection, policing and emergency response), which increases the cost of infrastructure and road network. Cities with less of 5,000 persons/km2 have nearly three times the roadway area per capita as compared to denser cities with more than 10,000 persons/km2. As urban densities decline, per capita roadway increases, subsequently increasing infrastructure costs, hydrologic and storm water management costs and environmental impacts. Currently, in Peshawar the overall urban road density is 9.08 km/km2 which is considered lower compared to the UN-Habitat standard of 18 km of street length per km2. The density of arterial roads in Peshawar's 1990–2014 expansion was 0.62 km/km2, compared to 0.49 km/km2 in 2017.
63. The causes of urban sprawl in Peshawar may be summarized as follows:
• Poor coordination and land use management among different institutions and agencies in Peshawar. Urban infrastructure and services are planned and implemented based on compartmentalized jurisdictional areas among the City District Government, Town Management Administrations (TMAs), Peshawar Development Authority, Cantonment Board and Defense Housing Authority. This leads to a significant degree of fragmentation in planning and development and wastage of resources.
• Inconsistent application of policies and planning schemes in implementing city expansion.
• Inadequate technical and organizational capacities to keep pace with and respond to population pressures and the consequent demand for new housing and services.
• Insufficient integration between investment plans and a long-term planning vision based on institutional realities and service delivery mapping.
64. The spatial structure that currently defines the city of Peshawar can be summarized in terms of the following dominant elements:
• The City Area (former Town-I): an established central business district, which functions as a significant economic focus of the city along the historic Grand Trunk (GT) road from the outskirts of Peshawar to Karkhano Market;
• Urban nodes: a series of residential urban nodes of varying intensities and functional characteristics that have been established around the main corridor, such as university town, the old center, the Karkhano Market and the Regi Model Town-Hayatabad nucleus;
• Urban fringe: a growing fringe of low residential density, and generally spatially exclusive, housing developments on the northern fringe of the city;
• Commercial areas: industrial and commercial estates developing along the Jamrud Road and Warsak Road.
• Residential areas: These form other disconnected urban nodes in Peshawar, usually subdivided by income and social strata:
• Higher income residential areas located inside the cantonment and on the fringes of the city (e.g., Hayatabad);
• Middle-class residential areas around Gulbahar, Nishtar Abad and to the north, such as Zaryab Colony; and
• Low-income residential areas located on the external boundary of the city, such as Shaheen Muslim Town (Shah Dhand), Akhundabad and Bahadur Kalay and Afghan Colony. There are also informal low-income settlements, for example, those developed along the Peshawar Northern Bypass.

KP-SISUG Peshawar City Development Plan – Draft Final Report
21
65. The 2017 Land Use Plan29 shows that agricultural land and orchards constitute a significant proportion (22%) of the land within the designated urban area. Parks and recreational areas account for less than one percent of the city area, while nearly six percent of the urban area lies vacant. Commercial and industrial uses account for little more than six percent of the total area (Figure 2).
Figure 2: Existing land use within Peshawar urban area (Total = 143.46 km2)
Source: Government of Khyber Pakhtunkhwa. 2017. Final Land Use Plan of District Peshawar. Peshawar:
Urban Policy & Planning Unit, Planning & Development Department, GoKP.
66. For the City Development Plan, the officially designated urban boundaries have been used, which correspond with the census-defined urban and rural areas. Accordingly, the Peshawar urban tehsil has an area of 151.46 km2. The 2017 Land Use Plan has mapped urban Peshawar with a slightly smaller total area of 143.46 km2 (a difference in land area of 8 km2). For CDP, the area delineated as per census-defined boundaries (151.46 km2) has been used. Section D.3.2 assesses the land use in terms of international standards and norms.
C.3. Ongoing developments
67. Currently, some key projects are underway in Peshawar which will have significant impact on economy of Peshawar. The noteworthy projects are mentioned below:
• Construction of Bus Rapid Transit (BRT) • Solid Waste Management Facility • Peshawar Institute of Cardiology • Construction of Peshawar General Hospital in Hayatabad • Development of Northern Part of Peshawar Ring Road
29 Government of Khyber Pakhtunkhwa. 2017. Final Land Use Plan of District Peshawar. Peshawar: Urban
Policy & Planning Unit, Planning & Development Department, GoKP.
Agriculture21.60%Commercial
1.88%
Education Facilities…
Graveyards1.80%
Health Facilities0.29%
Industrial Uses4.19%
Orchard0.30%
Parks/Recreational Places0.77%
Public Uses2.47%
Residential44.24%
Roads/Railways10.39%
Terminals2.10%
Vacant Land5.83%
Water Bodies1.68%

KP-SISUG Peshawar City Development Plan – Draft Final Report
22
C.4. Planned or future developments 68. There are also some projects in the pipeline which will result in significant improvement for Peshawar City; including:
• New General Bus Stand • Circular Railway Project • Development of Sports City in District Peshawar • Construction of Jabba Dam under Peshawar Greater Water Supply Scheme • Reconstruction of the Burns, Trauma and Reconstructive Surgery Centre in Peshawar • Health City Peshawar • Upgrading and Construction of Sewage System and Sewerage Treatment Plants • Strengthening of Pakhtunkhwa FM Radio 92.2 at Peshawar
C.5. Climate change and disaster resilience
69. The Urban Resilience Assessment (2017)30 makes the following projections: (i) the temperature increase in both summer and winter will be higher in northern Pakistan than in southern Pakistan, and (ii) the temperature increases in both regions will be greater in winter than in summer. No significant change is observed in the percentage of precipitation. However, there is some precipitation increase in summer, and decrease in winter in southern Pakistan ( 55).
70. The main impact of climate change projected in Peshawar is only a modest increase in summer days/heat waves for the short, medium and long term. However, it is important to remember that there are also significant projections for increased temperatures in the northern areas of Pakistan. This has an impact on snow fall and snow melt. As a result, the flow of water through Peshawar from the northern areas will be more continual (especially in winter) and may increase in spring to the point of posing flood risks when there are heavy rains. This poses risks of increased landslides, and risks of damage to transport, drainage and other infrastructure such as schools and other large buildings.
71. Other impacts of increased temperatures will be increased electricity use for cooling, and increased consumption of potable water.
72. Since the institutionalization of the National Disaster Management Authority (NDMA) and its provincial branches, information services on weather have improved considerably. In all three cities, early warning systems are in place, especially for high precipitation levels and possible flooding. Appropriate monitoring of weather predictions will contribute to improving preparedness, thus mitigating the shocks and stresses of climate change.
30 ADB. 2017. Urban Resilience Assessment Khyber Pakhtunkhwa, Pakistan: Peshawar City. Manila: UCCRTF,
Asian Development Bank.

KP-SISUG Peshawar City Development Plan – Draft Final Report
23
D. ANALYSIS AND NEEDS ASSESSMENT 73. The major obstacle to a well-managed, prosperous, safe and healthy city is perceived to be the weak institutional capacity of the municipal authorities, which manifests itself through:
• Lack of planning and transparent development in accordance with approved plans; • Lack of enforcement of existing regulations pertaining to planning and building control; • Unregulated slum developments; • Unregulated and unchecked urban sprawl; • Inadequate and reliable provision of water supply of good/acceptable quality; • Inadequate provision of basic sanitation services; • Inadequate provision of services for the management of solid wastes; • Unreliable power supply; • Highly congested and poorly maintained urban roads; • Lack of public transportation facilities and integrated transportation systems; • Pollution of waterways, groundwater and the general urban environment; and • Lack of employment opportunities and economic development.
74. Peshawar faces many of the above issues, although it is noted that projects addressing issues related to basic sanitation and public transportation are currently ongoing.
75. This Section provides a summary of the current and anticipated future situation up to 2035 as the basis for identifying key issues and problem areas to be addressed. The summary is focused on:
• Municipal services; • Basic physical infrastructure; • Land use requirements; and • Public sector governance.
D.1. Present infrastructure and municipal service levels
76. The Water and Sanitation Services Company, Peshawar (WSSP) has the responsibility for providing water supply, sanitation (drainage and sewerage), and municipal solid waste services in 42 UCs within the municipal boundaries; its jurisdiction currently excludes the cantonment, the UCs of Hayatabad–I and Hayatabad–II, and University Township (within University Town UC). It also provides municipal services to one rural UC (Sufaid Dheri) adjacent to the southern city limits. The area serviced currently by WSSP extends to approximately 131 km2, including Sufaid Dheri UC.
77. In the WSSP service area, the provision of municipal services for water supply, sanitation and solid waste management is organized by zone (Zones A to D). Zone boundaries are illustrated on Map 29, with the UCs in each zone itemized on Table 9.
Table 9: Organization of municipal service zones Zone A Zone B Zone C Zone D
Faqir Abad UC Akhund Abad UC Deh Bahadar UC Malakandhir UC
Hassan Garhi-I UC Ander Shehr UC Dhari Baghbanan UC
Palosi UC
Hassan Garhi-II UC Asia UC Landi Arbab UC Shaheen Town UC

KP-SISUG Peshawar City Development Plan – Draft Final Report
24
Zone A Zone B Zone C Zone D Khalisa-I UC Bhana Mari UC Nauthia Jadid UC Tehkal Bala UC
Khalisa-II UC Gul Bahar UC Nauthia UC Tehkal Payan-I UC
Mahal Therai-I UC Gunj UC Pawaka UC Tehkal Payan-II UC
Mahal Therai-II UC Hazar Khawani-I UC Sufaid Dheri UC University Town UC (part)
Shahi Bagh UC Hazar Khawani-II UC
Sikandar Town UC (part)
Jehangir Pura UC
Kakshai-I UC
Kakshai-II UC
Karim Pura UC
Lahori UC
Shaheen Muslim Town-I UC
Shaheen Muslim Town-II UC
Sheikh Junaid Abad UC
Sikandar Town UC (part)
Wazir Bagh UC
Yakka Toot-I UC
Yakka Toot-II UC
Yakka Toot-III UC 78. The Peshawar Development Authority (PDA) provides water, sanitation and waste management services in Hayatabad – I and Hayatabad – II UCs, and University Town (within University Town UC). Responsibility for these areas reverted from WSSP to the PDA in June 2017.
79. As per the 2017 census, 1,970.042 people in 236,056 households resided in Peshawar City, of which approximately 85.5% were in the service area of WSSP, 10.9% in the service area of the PDA and 3.6% resided in the cantonment. The population of the City (44 urban UCs and Cantonment) is anticipated to have grown to 2,146,335 in 2019. The population of Sufaid Dheri UC, a rapidly urbanizing area, was recorded as 104,405 in the 2017 census, and is anticipated to have grown to 119,190 in 2019.
D.1.1. Water supply
80. The water supply system of Peshawar City is based on both surface water and groundwater sources. Surface water is sourced from the Bara River and treated at the Bara Water Treatment Plant (WTP) constructed in 1918. The rated treatment capacity of Bara WTP is 24,500 m3 per day, although it is reported to be operating at only half of the rated capacity31. This facility was constructed to serve the Cantonment area and three UCs within the former Town-1 area by gravity. However, currently the scheme supplies only the Cantonment, for 31 Government of Khyber Pakhtunkhwa. 2014. Planning and Engineering Services for Master Plan in Peshawar,
Khyber Pakhtunkhwa: Drinking Water, Sanitation/Storm Water and Solid Waste Services Master Plan Vol.-1 – Water Supply, Treatment and Distribution (Draft Main Report). Peshawar: Municipal Services Program, GoKP and USAID.

KP-SISUG Peshawar City Development Plan – Draft Final Report
25
which the available supply currently is calculated to be the equivalent of approximately 170 liters per capita (person) per day (lpcd).
81. All other parts of Peshawar currently rely on groundwater sources. The water supply system comprises both direct pumping from tube wells to the distribution system, as well as a number of overhead reservoirs and surface tanks. There are 485 functional tube wells in the area served by WSSP and 37 tube wells in Hayatabad in the area served by PDA.
82. Summary details of the municipal water supply system under the responsibility of WSSP and the PDA (Hayatabad) are provided in Table 10.
Table 10: Municipal water supply system Description Zone A Zone B Zone C Zone D Hayatabad
Tube wells 73 256 96 60 37
Estimated production (m3/day) [1] 39,420 138,240 51,840 32,400 19,980
Overhead reservoirs 6 18 16 26 19
Usable storage capacity (gallons) 410,000 925,000 540,000 995,000 1,390,000
Usable storage capacity (m3) [2] 1,552 3,502 2,044 3,766 5,262
Filtration Plants[2] 2 7 1 1 - Source: Infrastructure mapping and discussions with WSSP Note: [1] Total pumping capacity calculated from assumed average pump discharge of 60.0 m3/hr., pumping
for an average of 9 hours per day. There is no independent verification of actual production in the absence of flow meter measurements. [2] Rated capacity in US gallons converted to cubic meters (1,000 gallons = 3.78541 m3). [3] As reported by MSP (2014)32, of which only 4 were operational at the time. The capacity of each unit is 2 m3/hour. The process is based on sand filtration, supplemented by filter cartridges, with disinfection via Ultraviolet lamps.
83. There is no comprehensive assessment available of the actual production capacity of the tube wells since few have a functioning flow meter. One estimate of overall groundwater production is 280,000 m3/day33, although the basis of this estimate is not stated. To achieve this production, the average discharge rate of production wells needs to be 60.0 m3/hour. The average discharge rate of tube wells, where known, is approximately 10,400 gallons per our (47.5 m3/hour). Based on operating at 9 hours per day (assumed) on average, the derived production is 222,120 m3/day, equivalent to 107 lpcd, before losses.
84. The groundwater table has been noted to be declining beneath the urban limits of Peshawar due to pumping from tube wells, although the rate of decline is not especially high (approximately 0.1 m per year on average).34 Outside of the urban area, the groundwater table shows little variation. Recharge of the aquifer is deemed to be both laterally from nearby
32 Government of Khyber Pakhtunkhwa. 2014. Planning and Engineering Services for Master Plan in Peshawar,
Khyber Pakhtunkhwa: Drinking Water, Sanitation/Storm Water and Solid Waste Services Master Plan Vol.-1 – Water Supply, Treatment and Distribution (Draft Main Report). Peshawar: Municipal Services Program, GoKP and USAID.
33 Government of Khyber Pakhtunkhwa. 2017. Pakistan – Khyber Pakhtunkhwa Inclusive Urban Growth Program: Final Report. Peshawar: Urban Policy & Planning Unit, Planning & Development Department, GoKP and Cities Development Initiative for Asia, ADB.
34 Government of Khyber Pakhtunkhwa. 2014. Planning and Engineering Services for Master Plan in Peshawar, Khyber Pakhtunkhwa: Drinking Water, Sanitation/Storm Water and Solid Waste Services Master Plan Vol.-1 – Water Supply, Treatment and Distribution (Draft Main Report). Peshawar: Municipal Services Program, GoKP and USAID.

KP-SISUG Peshawar City Development Plan – Draft Final Report
26
unstressed areas, and vertically from surface water bodies such as the Kabul River, its tributaries, and irrigation canals.
85. The condition of the tube wells was reported by the Municipal Services Program (MSP)35 in 2014, albeit for an area that included not only the urban UCs in Peshawar city but also an additional twenty-two rural UCs. MSP reported that 42 percent of the tube wells in their project area were more than 15 years old at that time (5 years ago) and potentially beyond their serviceable life (estimated to be 15 years). Of the tube wells that were less than 15 years old at the time, only approximately five percent had pumps that were less than 7 years old (the estimated working life of a pump). Only one tube well had a functioning flow meter and less than four percent were fitted with pressures that were operational.
86. The majority of operating filtration plants are located in the Cantonment. Elsewhere in the city most filtration plants are not operational due to lack of routine maintenance and availability of filter cartridges. The filtration plants are not integrated into the water distribution system and operate as standalone facilities, requiring the community to obtain water directly from the plant.
87. Water distribution networks are typically of cluster-type systems covering three to four UCs, or smaller systems serving areas within parts of these UCs. There are approximately 170 independent water networks in the city (Map 25) which are generally old, which have not been maintained adequately and which and do not supply water adequately (volume and pressure), especially to the end users of the system. Most systems are supported by multiple tube wells, the service area of which cuts across UC boundaries. Most UCs of the urban areas are served by a system supported by multiple tube wells that also serves areas of the adjacent UCs.
88. In the WSSP service area there are sixty-six (66) functioning overhead reservoirs with a combined storage capacity of 2,870,000 US gallons (equivalent to 10,864 m3). In addition, in Hayatabad (under PDA jurisdiction) there an additional nineteen (19) overhead tanks with a storage capacity of 1,390,000 US gallons (equivalent to 5,262 m3). The available storage capacity is computed to be approximately 7 litters per person per day and represents between 5.7 percent and 7.3 percent of the estimated daily groundwater production, assuming all of the storage tanks are filled and emptied once per day.
89. Networks have expanded organically and in an ad-hoc manner as the settlements have expanded outward. Networks have not been designed to serve the population now within the service area of each system; that is, system capacity has not been expanded as the population has increased. In many cases, network expansions have been achieved by augmenting the primary system through the addition of parallel pipe lines without any assessment of the hydraulic requirements or the production capacity of the system.
90. The MSP estimated that there were approximately 1,670 km of pipelines in their project area, ranging from 25 mm to 450 mm in diameter. Approximately, 65 percent of the pipes are Galvanized Iron (GI), 21 percent are Poly Vinyl Chloride (PVC – plastic) and 14 percent are Asbestos Cement (AC). About 1/3rd of the pipes are above ground and the rest are buried.
35 Government of Khyber Pakhtunkhwa. 2014. Planning and Engineering Services for Master Plan in Peshawar,
Khyber Pakhtunkhwa: Drinking Water, Sanitation/Storm Water and Solid Waste Services Master Plan Vol.-1 – Water Supply, Treatment and Distribution (Draft Main Report). Peshawar: Municipal Services Program, GoKP and USAID.

KP-SISUG Peshawar City Development Plan – Draft Final Report
27
Pipe systems are a complex mix of new and old pipes; some are only 2-3 years old whereas others were installed more than 25-30 years ago.
91. As noted above the specific water production is estimated to be 135 liters per person per day (based on groundwater production of 280,000 m3/day). This is much higher than the estimated availability at consumer level of approximately 50 liters per person per day. It can be concluded, therefore, that the current drinking water network is poorly maintained resulting in severe losses from leakage. Unaccounted for water or Non-Revenue Water (NRW) is estimated to be approximately 63 percent.
92. Reported results of the analyses of samples of groundwater indicate that water quality is generally within recommended World Health Organization (WHO) standards, with the exception of Total Suspended Solids (TSS) and microbiological count (including coliforms). The presence of bacteria is indicative of sewage water intrusion into groundwater through irrigation canals, unlined drains, septic tanks and unprotected tube wells.
93. According to Pakistan Council for Research in Water Resources (PCRWR), about 77 percent of drinking water sources in Peshawar are unsafe. Drinking water in Peshawar City is noted to contain some heavy metals (Khan et al., 2011), high iron contents and bacteriological contamination is almost universally present. The presence of bacteria is indicative of cross-contamination by sewage water between co-located sewage lines and water supply networks.
94. Most dwellings in urban areas have booster pumps in their houses to raise water from their individual underground storage tank; alternatively, they connect such booster pumps directly with the service pipe in the street for pumping water to tanks located on top of the building. Residents with neither of these installations usually store water in buckets or other arrangements within their homes.
95. The systems serving the rural areas are independent for each of the rural settlement and are mostly based on direct pumping into the distribution networks. In rural areas, dwellings that are not served by the water system rely on their own hand pumps or dug wells installations in rural areas, storage facilities on top of the building are very rare.
96. Statistics on household water supply at household level are summarized on Table 11.
Table 11: Sources of household water supply in Peshawar District (2014-15) Source of Water Supply Urban (%) Rural (%)
Tap water 79 14
Hand pump 4 27
Motor Pump 17 39
Dug well 0 19
Others 1 1 Source: Government of Pakistan. 2016. Pakistan Social and Living Standards Measurement Survey (2014-15).
Islamabad: Pakistan Bureau of Statistics, Statistics Division, GoP.
97. In summary, the present municipal water supply for Peshawar:
• Relies on groundwater for the majority of the municipal supply, with only the Cantonment served from a surface water source;
• Is assessed to have sufficient capacity from available groundwater resources to cater for the current estimated demand in the urban area;
KP-SISUG Peshawar City Development Plan – Draft Final Report
28
• Has a poorly planned, maintained and interconnected distribution network that results in significant losses during distribution and which is, therefore, incapable of meeting the estimated demand;
• Provides only an intermittent supply; and • Is of poor quality, as a result of cross-contamination from polluted water, both
groundwater and from sewerage.
D.1.2. Sewerage and drainage
98. The existing sewerage/storm water systems serving Peshawar area are mostly combined systems that convey domestic, commercial and industrial wastewater. The same systems also carry the surface runoffs (storm water) during rain events. The flows are mostly conveyed by open or covered drains, with only a few areas being served by underground sewers, notably in the urban areas of Peshawar. The majority of the irrigation canals which cross various parts of the city have been turned into sewers.
99. The City of Peshawar has also three existing STPs located on Warsak Road, Charsadda Road and the Ring Road. These plants were built some time ago and none of these plants is currently operational and all are in an abandoned state. Therefore, the untreated wastewater is eventually discharged to fresh water bodies, such as rivers and natural streams, irrigation canals and agricultural land. The main receiving bodies are i) the Bara River and Shah Alam River or Budhnai Nallah, a tributary of Shah Alam River and ii) five irrigation canals (Joe Sheikh Canal, Kabul River Canal, Hazar Khawni Canal, Warsak Gravity Canal and Warsak Lift Canal) that pass through Peshawar. Discharge into the irrigation canals eventually ends up on agricultural land. In addition to the untreated domestic and commercial sewage, these canals also become a repository for solid waste
100. The Bara river, Kalpani river and Budni nullah receive untreated sewage from the eastern as well as central part of Peshawar before ultimately joining the Kabul river. This water is harmful to human as well as aquatic life; this water has is noted to have an obnoxious smell along its route. The discharge of untreated waste water is a significant source of environmental degradation and a serious health hazard.
101. Peshawar has important industrial activity. Most of the industrial waste water is discharged at the Hayatabad Industrial Estate drain. As both the sewerage system and the drinking water network are locally dysfunctional and exhibit leakage, the industrial water can contaminate the drinking water supply. A special concern are tannery discharges containing high heavy metals concentrations, although no specific data are available on this issue.
102. In the urban area underground sewers range in size from 225 mm to 1,350 mm. However, most of the primary (trunk) conveyance pipes are clogged. The secondary and tertiary level sewers overflow to nearby drains or canals. Trunk sewers that were built to convey flows from the tertiary / secondary system segments are mostly clogged and their manholes, after being used as a repository for solid waste, are not currently physically visible on the ground. Most of the underground sewerage system that has been installed is currently out of use due to continuous neglect and poor maintenance.

KP-SISUG Peshawar City Development Plan – Draft Final Report
29
103. The Pakistan Social and Living Standard Measurement (PSLM) survey report36 for 2014-15 indicated that around 88 percent households had access to flush toilets, four percent had access only to non-flush toilets, while eight percent did not have any access to toilet facility.
104. There are a number of toilets across the city for public use and also in the Cantonment and at bus stands. Effluent from all the toilets is disposed into open/covered drains. The overall hygiene and structural condition of these toilets is poor.
105. Peshawar lies in a flood prone area, situated on the southern margins of the flood plain of the Kabul River. Peshawar was impacted significantly during the 2010 floods which resulted from exceptional rainfall (3.5 times the annual rainfall over a one-week period in July/August 2010). The areas most affected were on the north-eastern side of the city adjacent to the Kabul River.
106. Peshawar is also prone to urban flash flooding as a consequence of blocked drainage from accumulations of solid waste and unplanned developments and encroachments.
107. In summary, the present sewerage and drainage system for Peshawar:
• Is a combined system for drainage and sewerage; • Is highly polluted since it receives untreated sewage and waste water from all sources; • Impacts the quality of the potable water distribution system; and • Provides no treatment capacity for sewage and waste water in the absence of any
functioning sewage network and waste water treatment plants.
D.1.3. Solid waste
108. Existing collection systems for solid waste comprise hand carts for primary collection and manually loaded tractor trolleys and mechanically loaded multi-loaders and compactors for secondary collection. WSSP employ approximately 3,200 operational personnel for solid waste management services.
109. A door to door collection service for primary collection is not provided, although residents and business communities may, in some places, pay sanitary workers directly to provide this service. In narrow streets (less than 3.6 m wide), residents throw waste to temporary street-side points where it is collected subsequently by WSSP sanitary workers using hand carts and taken to temporary transfer points and 7m3 containers, for onward loading into secondary collection vehicles. The same sanitary workers are responsible for cleansing of the drains which is also deposited with the collected municipal solid waste at temporary transfer points and in 7m3 containers.
110. In wider streets, waste is deposited directly to 7m3 steel containers and/or temporary roadside heaps and collection points. Waste in 7m3 containers is collected by multiloaders, whilst that from roadside heaps and collection points is transferred by dumper, open body trucks and tractor trolleys to the dump sites.
111. WSSP estimate that solid waste generation is more than 988 tons per day (tpd) from residential, commercial and institutional premises, of which approximately 770 tpd per day
36 Government of Pakistan. 2016. Pakistan Social and Living Standards Measurement Survey (2014-15).
Islamabad: Pakistan Bureau of Statistics, Statistics Division, GoP.

KP-SISUG Peshawar City Development Plan – Draft Final Report
30
(78%) is estimated to be collected. There are, however, no independent measurements of waste generated or of waste collected. The derived per capita waste generation rate is approximately 0.45 kg per person per day (assuming all of the resident population is served). In addition to the municipal solid waste, WSSP estimates that construction and demolition waste amounts to approximately 120 tons per day.
112. WSSP have a total of 297 containers, with an estimated volumetric capacity to receive and temporarily store 753 tons of waste. The allocation of containers by zone is summarized in Table 12.
Table 12: Container types and numbers by zone, WSSP[1] Container Type and Size Zone A Zone B Zone C Zone D Total No.
Containers 22 m3 arm roll containers 3 3 4 0 10
5 m3 arm roll containers 18 16 95 22 151
4 m3 skip containers 11 19 0 0 30
7 m3 containers (Multi Loader) 11 10 18 22 61
0.8 m3 containers 20 25 0 0 45
Total 63 73 117 44 297 Source: Discussions with, and information provided by, WSSP. Note: [1] As of 2018.
113. Uncollected waste is burnt, re-used or recycled or disposed into drains and canals. Hospitals and medical clinics generate relatively large amounts of hazardous clinical waste that is not separated from municipal waste.
114. The current collection fleet and equipment (Table 13) is insufficient to collect the volume of waste generated and is incapable of transferring and hauling collected waste beyond the city limits.
Table 13: Sanitation fleet by zone, WSSP[1] Item Zone A Zone B Zone C Zone D Total No.
Vehicles
Suzuki mini dumper 54 66 19 9 148
Compactor 7m3, 5m3 & 4m3 10 23 6 4 43
Tractor Trolley (Fiat) 3 11 1 2 17
China Tractor 4 3 3 3 13
Messi Tractor with Container (Skip Tractor) 2 3 0 0 5
Multi Loader 1 2 2 1 6
Mechanical Sweeper (Tractor) 2 1 0 0 3
Mechanical Sweeper (Hino) 2 1 0 0 3
Front End Loader (Dumping Ground) 0 1 0 0 1
Excavator 1 0 0 0 1
Water Tanker 1 2 3 0 6
Suction Machine 1 1 0 0 2
Jetting Machine 1 1 0 0 2
Pick Up (Toyota) 2 3 2 1 8

KP-SISUG Peshawar City Development Plan – Draft Final Report
31
Item Zone A Zone B Zone C Zone D Total No. Vehicles
Tractor Loader (Shovel) 1 2 1 0 4
Open Truck 0 2 2 0 4
Suzuki Pick up (Malaria+katta coolie) 1 0 2 1 4
Blade tractor 0 1 2 0 3
Arm roll for 5m3 containers 2 2 10 2 16
Arm roll for 22m3 containers 1 1 1 0 3
Grand Total 89 126 54 23 292 Source: Discussions with, and information provided by, WSSP. Note: [1] As of 2018.
115. The majority of the sanitation fleet was procured in 2013-2014, primarily under the USAID-funded MSP, and thus still has a residual working life of at least 2 years; however, there will be a need to replace many of these vehicles over the next few years.
116. In Hayatabad UCs and University Township, the PDA provides door to door waste collection services for residential areas primarily through the use of the donkey-carts. Collected waste is transported directly to a dump site within Hayatabad (Map 27). The PDA also provides 1.1m3
steel containers for commercial areas and institutions, and in some of the residential areas; compactor trucks are used to collect and transfer waste from the 1.1m3 containers to the dump site. Street sweepings, as well as residential waste, may also be deposited in street side heaps and temporary collection points from where the waste is loaded manually onto tractor trolleys and dump trucks for onward transfer to the dump site37.
117. In the Cantonment, primary collection is provided by cantonment staff using handcarts38. The collected waste is deposited in community waste bins on the sides of the roads. Secondary collection is contracted out to the private sector. Waste is transported to a dump site at Regi Lalma (Map 27), north-east of the urban limits, using compactor trucks, dumpers and tractor trolleys.
118. Overall the methods employed for waste collection are labor intensive, slow, inefficient and unhygienic, exposing personnel to unnecessary risks. The transfer of uncovered and unconfined waste by tractor trolley and open dump trucks results in increased littering during waste collection and transportation. Significant odors are also associated with this method of transportation, affecting urban populations since tractor trolleys and dump trucks travel on main roads through populated areas. The slow speed of collection and travel also increases congestion on the main collection routes.
119. The payload of tractor trolleys is low compared to the use of compactor trucks. In vehicle densities of waste are typically 1.5-2.5 times higher in compactor trucks than in open, uncompacted trolleys. Allied with the greater capacity of medium to large-sized compactor 37 Government of Khyber Pakhtunkhwa. 2014. Planning and Engineering Services for Master Plan in Peshawar,
Khyber Pakhtunkhwa: Drinking Water, Sanitation/Storm Water and Solid Waste Services Master Plan Vol.-1 – Water Supply, Treatment and Distribution (Draft Main Report). Peshawar: Municipal Services Program, GoKP and USAID.
38 Government of Khyber Pakhtunkhwa. 2014. Planning and Engineering Services for Master Plan in Peshawar, Khyber Pakhtunkhwa: Drinking Water, Sanitation/Storm Water and Solid Waste Services Master Plan Vol.-1 – Water Supply, Treatment and Distribution (Draft Main Report). Peshawar: Municipal Services Program, GoKP and USAID.

KP-SISUG Peshawar City Development Plan – Draft Final Report
32
trucks (for example, 8m3 or 13m3 as against 4-5 m3 for trolleys) the waste load carried by compactor trucks is significantly higher than achieved by tractor trolleys. As a result, the use of tractor trolleys is known to be the least cost-effective method of collecting and transferring waste. Tractor trolleys have the highest cost for waste transportation on a per ton basis.
120. There are no transfer stations in the city. Waste transportation is undertaken solely by waste collection vehicles, thus restricting their availability to collect waste.
121. There are no sanitary or controlled landfills for the disposal of waste. Disposal is to unhygienic and unsanitary open dumping at a number of locations within and outside the city limits (Map 27). There are no formal facilities or systems for the recovery and treatment of solid wastes. Materials that are diverted from the waste stream are limited to those extracted through informal materials recovery at household level and via waste pickers at disposal sites. Burning of waste at the dump sites is common, typically used to make it easier for waste pickers to recover recyclable material like metal and glass from the waste mass
122. In summary, the present solid waste management system for Peshawar:
• Is limited to primary and secondary collection within the city and one rapidly urbanizing rural UC (Sufaid Dheri) immediately adjacent to the southern margin of the city;
• Has insufficient equipment to be able to collect all of the MSW generated daily; • Has no facilities to treat waste in order to reduce the waste disposed to land; • Has no facilities (transfer stations) to improve the efficiency of waste collection; and • Relies on unsanitary open dumping of municipal solid waste both within and outside
of the city limits.
D.1.4. Other infrastructure
D.1.4.1. Transportation
123. The main access to Peshawar City from Punjab and Islamabad is through GT Road and through M-1 Motorway (Table 14). The other major entry point for the traffic coming from Southern districts of Khyber Pakhtunkhwa, and also from Sindh, Baluchistan and Southern Punjab, is the Indus Highway.
124. The Charsadda road carries traffic from Mohmand and Bajaur Agencies and from Charsadda and other northern districts of Khyber Pakhtunkhwa into Peshawar city. Warsak road is also an important road which leads traffic into Peshawar city from Mohammad Agency. Finally, Jamrud road leads the traffic from Afghanistan and other central Asian countries into Peshawar City.
Table 14: Roads originating from Peshawar Destination Road Name via Distance
Islamabad Motorway (M-1) Mardan, Swabi 160 km
Karachi Indus Highway (N-55) Kohat, DI Khan 1,914 km
Lahore Motorway (M-1) Islamabad, M-2 504 km
Quetta Indus Highway (N-50) N-55, N-50 837 km
Rawalpindi GT Road (N-5) Nowshera, Wah 160 km
Kabul GT Road Jalalabad 288 km
KP-SISUG Peshawar City Development Plan – Draft Final Report
33
125. The two main roads within Peshawar are:
• GT Road Entry Point into Peshawar – Khyber Bazar – Saddar Bazar – Aman Chowk – Hayatabad Industrial Estate / Karkhano Market; and
• Peshawar Ring Road. The southern portion of the ring road leading from GT road to Hayatabad was completed in the early years of this century. It was rehabilitated / upgraded with USAID support a decade after its construction. The northern part of the Ring Road is currently being contracted. The Ring Road will provide a full loop around Peshawar City once completed.
126. Both roads are heavily trafficked and highly congested, particularly the central route through the city, whilst construction of the Peshawar Bus Rapid Transport (BRT) system is ongoing.
127. The existing road network of Peshawar City is unable to meet the growing demands of traffic. The total traffic volume on the five primary roads of Peshawar is more than 118,810 vehicles. The maximum volume lies on Charsadda road (24.61%), followed by GT Road (23.75%), Motorway (19.97%), Jamrud Road (18.85%) as well as Kohat Road (12.82%). The majority of the light traffic lies on Charsadda Road while heavy vehicles, which includes buses and trucks, are found on the Motorway, GT Road and Jamrud Road39.
128. In terms of passenger numbers, GT Road has the highest traffic demand of 509,701 daily passengers followed by Jamrud Road (420,250), Warsak Road (147,481), Afridi Road (204,792) and Bara Road (120,867).
129. The BRT will provide transportation services to the residents of Peshawar and also daily commuters coming from adjoining districts. Besides road and bridge construction, the BRT project will include construction of sidewalks, on-street parking, mixed-traffic lanes, and a non-motorized transport lane along the BRT. The improvement of access roads for feeder services will be also carried out. The BRT route is intended to have energy-efficient streetlights and intelligent transport systems for traffic management.
130. Peshawar is served by one airport (Bacha Khan International Airport) serving both international and domestic destinations. It has a 2,700 m long runway and is categorized as 4E (International Civil Aviation Organization Aerodrome Reference Code), capable of handling aircraft up to Boeing 777/787 and Airbus A330.
131. The airport handles 35 flights per day on average, with 1.6 million passengers per year. An upgrade costing over PKR 2 billion was completed in 2018. A location for a new airport has been identified tentatively in the vicinity of Badaber to the south of Peshawar.
132. The largest bus terminal in Peshawar City is located at Haji Camp (aka Haji Camp Bus Terminal) on GT road at the eastern entrance to the city. This bus terminal serves inter-city routes across the country. This is situated on public/government land.
133. A second major bus terminal, known as Kohat Road Bus terminal, is located at the southern entry to the city on Kohat Road (Indus Highway). This terminal, in particular, caters for the public transport to and from southern districts of Khyber Pakhtunkhwa. Another bus
39 Government of Khyber Pakhtunkhwa. 2017. Final Land Use Plan of District Peshawar. Peshawar: Urban
Policy & Planning Unit, Planning & Development Department, GoKP.

KP-SISUG Peshawar City Development Plan – Draft Final Report
34
stand is located on Charsadda road on the north side of the city, whilst the Karkhano Market bus stand near Hayatabad Industrial Estate is located on the west side of the city.
134. A bus terminal known as Daewoo Pakistan Express Bus & Cargo Services terminal is privately owned and is located on GT road at the eastern entry to the city. There are also a number of other, small, private bus terminals in the city.
135. The ring road also currently provides a number of transit stops and rest areas for trucks going to and from Afghanistan.
136. Peshawar is practically the last stop for railway line from the Port City of Karachi. The line is single track at present, but it is being upgraded to dual track under the CPEC initiative. Once upgraded, the speed of the trains will be increased, thereby reducing the travel time between Peshawar and other cities in Pakistan.
137. The line serves thousands of commuters daily, as well as a large number of freight trains.
138. There are two main railway stations: Peshawar City Railway Station and Peshawar Cantt Railway Station, which is the larger of the two. At present, there are three trains passenger train services: the Khushal Express, Khyber Mail and the Awami Express.
D.1.4.2. Energy
139. Peshawar Electric Supply Company (PESCO) supplies energy to all civil divisions of Khyber Pakhtunkhwa, including Peshawar. There are 1840 grid stations (132 kV each) including Shahi Bagh, University Town, Bara, Gulbahar and Jamrud Grid stations, which supply power to the residents of Peshawar.
140. Frequent load-shedding is common in all areas. Load shedding impacts the availability of potable water.
141. Gas or diesel run generators supply electric power supply during power outages, which are a source of air as well as noise pollution and add significantly to household expenses.
142. Sui Northern Gas Pipelines Limited (SNGPL) is responsible for provision of gas to residents of Peshawar district. The main gas transmission network includes Wah-Nowshera, Nowshera-Mardan, Kohat-Nowshera, Nowshera-Ismailkot and Nowshera-Charsadda pipelines.41 It is understood that these operate at maximum capacity.
D.1.4.3. Tourism
143. Peshawar has a number of historic places that attract tourists, including Fort Qila Bala-i-Hisar, Qisa Khawani Bazar, Peshawar Museum, Masjid Mahabat Khan, Islamia College Peshawar, Chowk Yadgar, and Shahi Bagh Gardens. Peshawar Zoo opened in February 2018.
144. In the past, a tourist train service was functional to take the visitors from Peshawar to the Khyber Pass (Afghanistan-Pakistan border); however, due to the overall security situation
40 Government of Khyber Pakhtunkhwa. 2017. Final Land Use Plan of District Peshawar. Peshawar: Urban
Policy & Planning Unit, Planning & Development Department, GoKP. 41 SNGPL. 2016. Annual Report 2017. Lahore: Sui Northern Gas Pipeline Limited.
KP-SISUG Peshawar City Development Plan – Draft Final Report
35
in the region this service is no longer functional. The government has recently used train services on an ad-hoc basis to take the visitors from Peshawar to Attock area. In the future, these services may become fully operational and run on a regular basis.
145. There are dozens of guesthouses and hotel in Peshawar. However, the city only has one 5-star hotel, that is the Pearl Continental.
D.2. Current institutional and organizational arrangements for service delivery
146. The Water and Sanitation Services Peshawar (WSSP) is an independent corporatized public corporation. Registered with the Securities and Exchange Commission of Pakistan, it is fully owned by the Khyber Pakhtunkhwa Government. Following a Services and Asset Management Agreement (SAMA) signed between the province, Peshawar City administration and WSSP, the Khyber Pakhtunkhwa government handed over the municipal services of Peshawar city to WSSP in 2014, together with 4,700 staff from the then existing municipal institutions. The geographical area of WSSP comprises 42 union councils.42 The WSSP draws on various sources for its budget. For schemes, the WSSP uses the budget earmarked for those schemes. The operational budget of WSSP is provided by the province. A small part (less than 10%) of the budget derives from household tariffs. The provincial government covers WSSP’s capital expenditure.
147. The Peshawar Development Authority (PDA) is primarily responsible for city development plans, housing and associated infrastructure development, such as parks, city roads, and transport facilities. The PDA’s functions show some overlap with other urban entities.43 PDA is currently responsible for water supply, sanitation, and solid waste management services in Hayatabad and University Town, which were serviced by WSSP, being part of Peshawar city. On 17 May 2017, the provincial cabinet asked the WSSP to hand over the services of Hayatabad and University Town to PDA and Town-III Administration. WSSP also had to return 600 employees and assets back to PDA and Town-III Administration.
148. The Tehsil Municipal Administration for Peshawar city is responsible for the planning and provision of municipal services, other than those transferred to WSSP. It is also responsible for managing municipal properties, assets and funds; approving and levying local taxes; developing and approving development schemes for areas under its jurisdiction, enforcing municipal laws, and collecting taxes, fines, and penalties provided under the law.
D.3. Assessed future requirements and needs 149. Assessing the magnitude and spatial direction of growth and providing the infrastructure to cater for the population for the next 15 years (to 2035) is vital when formulating any planning strategy. There are a number of fundamental issues to be taken into consideration:
• Projected population growth for the time period covered by the planning strategy;
42 This does not include Hayatabad and University Town, for which the Peshawar Development Authority (PDA)
is now responsible. It also does not include the Union Council managed by the Cantonment Board. Note: the Union Councils have now been changed to Neighborhood Councils (urban) and Village Councils (rural).
43 Paragraph 6 of the Peshawar Development Authority Act, 2017 states: “The Authority may… develop, operate and maintain water-supply, sewerage, solid waste and drainage systems within the Authority area.”

KP-SISUG Peshawar City Development Plan – Draft Final Report
36
• Additional land development and allocation requirements, if any, based on the projected population growth;
• The need, if any, for expansion of the official urban limits and, by extension, expansion of the service area for core municipal services, to incorporate areas on the margins of the city that have already urbanized to a large degree (even though still classified as rural) or are anticipated to urbanize during the time period covered by the planning strategy; and
• Target levels of service delivery.
D.3.1. Population projections
150. Population projections based on intercensal growth rates for the cantonment area and the 44 UCs currently classified as urban are reproduced in Appendix 2. The projections are summarized in Table 15.
Table 15: Population projections 2019 to 2035 for the current urban area 2017 Census 2019 2025 2030 2035
Population 1,970,042 2,146,335 2,817,446 3,596,377 4,664,599
Households 236,056 256,478 333,486 421,656 540,868
Average Household Size 8.35 8.37 8.45 8.53 8.62
Density (persons/km2) 13,007 14,171 18,602 23,745 30,797 Source: Computations based on population for each UC from the 2017 census and intercensal growth rates for
each UC between 1998 and 2017.
D.3.2. Land development and land allocation
151. Assessing the magnitude and spatial direction of growth and providing the infrastructure to cater for the population for the next 15 years or so is vital when formulating any planning strategy. International norms for city densities range from UN-Habitat’s norm44 of 15,000 persons per km² (or 150 persons/ha) that requires high-rise buildings, to the “European compact perimeter block’ model” which has densities in the range of 3,000 to 6,000 people per km2.45 For Peshawar, UN-Habitat’s norm of 15,000 people per km2 (or 150 persons/ha) is assumed. Table 16 and Table 17 set out the ideal city area—for the currently designated urban area and future urban area, respectively—to plan for if Peshawar City was to adopt a growth pattern adhering to international urban planning norms.
Table 16: Population projections and city area requirement for the currently designated urban areas (151.46 km2)
Year Population Population Density if City Boundaries Remain
Unchanged (Persons/km2)
Area (km2) Requirement if City Boundaries are Redrawn as per UN-Habitat Norm of 15,000 persons/km2
2017 1,970,042 13,007 131.34
2019 2,146,335 14,171 143.09
2025 2,817,446 18,602 187.83
44 UN-Habitat. 2014. A New Strategy of Sustainable Neighborhood Planning: Five principles - Urban Planning
Discussion Note 3. Available from: https://unhabitat.org/a-new-strategy-of-sustainable-neighbourhood-planning-five-principles/. Accessed 30 Oct 2018.
45 Lehmann, S. 2016. “Sustainable urbanism: towards a framework for quality and optimal density?” In Future Cities and Environment (2016) 2:8. DOI 10.1186/s40984-016-0021-3.

KP-SISUG Peshawar City Development Plan – Draft Final Report
37
2030 3,596,377 23,745 239.76
2035 4,664,599 30,797 310.97 Source: Population estimates based on calculations from censuses of 1981, 1998 and 2017. Note: UN-Habitat sets a norm of 15,000 persons per km² for population density in urban areas
Table 17: Population projections and city area requirement for the expanded urban areas in future (380.68 km2)
Year Population Population Density if City Boundaries Remain
Unchanged (Persons/km2)
Area (km2) Requirement if City Boundaries are Redrawn as per UN-Habitat Norm of 15,000 persons/km2
2017 2,956,790 7,767 197.12
2019 3,235,358 8,499 215.69
2025 4,286,490 11,260 285.77
2030 5,489,017 14,419 365.93
2035 7,111,504 18,681 474.10 Source: Population estimates based on calculations from censuses of 1981, 1998 and 2017. Note: UN-Habitat sets a norm of 15,000 persons per km² for population density in urban areas
152. Table 16 and Table 17 show that:
i. the current city boundaries will not be able to accommodate the projected population for 2035. The current city boundaries will need to be expanded to 310.97 km2 to accommodate the projected population in 2035.
ii. Forward planning and demarcation of future city boundaries will be necessary. The UCs presently classified as ‘future urban’ have a combined area of 229.2 km2. It would be logical to demarcate future city boundaries to include part of these peri-urban UCs, depending on the location of current urban agglomerations.
iii. Peshawar’s current urban population density (14,171 persons/km2), with a per capita land consumption of 70.57 square meters is approaching the ideal density. However, the growth pattern and land use need to be improved, and urban sprawl needs to be controlled through appropriate planning, zoning and regulations. City development should be planned to avoid productive agricultural land, preserve and expand the current parks and orchards, and consolidate the residential areas. Rather, the growth should be managed within a few geographic areas, with more people concentrated in the urban nodes rather than spread out in urban sprawl.
D.3.3. Expansion of the area classified as urban
153. The existing spatial structure of Peshawar has been described in Section C.2.2 above. Given that municipal services will need to be provided to these areas in due course, Table 18 shows the projected populations that might need to be provided with municipal services within the expanded city limits (including the cantonment area).
Table 18: Population projections 2019 to 2035 for the expanded city limits 2017 Census 2019 2025 2030 2035
Population 2,956,790 3,235,358 4,286,490 5,489,017 7,111,504
Households 345,222 376,828 495,343 629,727 809,371
Average Household Size 8.56 8.59 8.65 8.72 8.79
Density (persons/km2) 7,767 8,499 11,260 14,419 18,681

KP-SISUG Peshawar City Development Plan – Draft Final Report
38
Source: Computations based on population for each UC from the 2017 census and intercensal growth rates for each UC between 1998 and 2017.
D.3.4. Target levels of municipal service delivery
154. The aspiration should be to provide municipal services to all of the population, households and commercial and institutional properties within the service area. For example, one Sustainable Development Goal adopted by the Government of Khyber Pakhtunkhwa is to achieve universal and equitable access to safe and affordable drinking water for all by 2030 . The speed at which this, and full access to other municipal services, can be achieved is dependent primarily upon access to appropriate levels of financial and technical resources.
155. As has been noted in Section D.1, the provision of municipal services within the current service area is deemed to be sub-standard, from social, public health and environmental perspectives. Key indicators in this regard are:
• Potable water supply: inadequate systems and networks to provide sustained access to sufficient water of an acceptable quality fit for consumption;
• Sewerage: no facilities for the treatment of waste water and sewerage and the discharge of untreated waste water to surface water bodies draining through the city; and
• Solid waste management: less than 80 percent of the municipal solid waste generated is collected and zero percent is treated or disposed in a sanitary manner.
D.3.4.1. Potable water demand and supply
156. Target service levels for municipal water supply have been developed, at five yearly intervals for the period up to 2035, assuming:
• A progressive increase in supply availability through step-wise investments in water production;
• Progressive improvement in the condition of the water distribution system; • Progressive reduction in the number of illegal connections; and • Progressive extension of the municipal water production and distribution system to
cover the whole of the current urban area as well as the future urban area by 2035, so as to provide a supply at each individual household available on a 24/7 basis.
157. The targeted levels of potable water supply until 2035 are set out on Table 19.
Table 19: Proposed target service levels for municipal water supply Year Urban UCs served (2019) Future Urban UCs
Service Coverage Supply (lpcd) Service Coverage Supply (lpcd) 2019 95% 150 0% 0
2025 100% 150 33% 70
2030 100% 150 66% 90
2035 100% 150 100% 110

KP-SISUG Peshawar City Development Plan – Draft Final Report
39
D.3.4.2. Sewerage and waste water collection and treatment
158. As discussed in Section D.1.2 above, the existing sewage network is not functional nor is any treatment provided prior to discharge of sewage and waste water to land or to surface water courses. Rectification of this situation must be a high priority.
159. The fundamental approach should be to develop (i) a functioning sewage system that is separate from the drainage system; and (ii) appropriate treatment facilities, both in terms of process and capacity; with the overall objective to reduce, and ultimately eliminate, the discharge of untreated sewage and waste water to the environment.
160. This objective can be achieved by collecting and conveying sewerage and waste water hygienically away from all residential and commercial areas though the following interventions:
• Rehabilitating existing primary (trunk) sewers; • Developing secondary sewer lines and installing tertiary connections to individual
properties; • Connecting the trunk sewers to treatment facilities; and • Over time extending the sewer network into currently unserved areas.
161. Table 20 sets out the proposed targeted level of sewer connections and served population (at five yearly intervals) until 2035.
Table 20: Proposed target service levels for municipal sewerage system Year Urban UCs (2019) Future Urban UCs) Overall Expanded City
Service Coverage
Population Connected
Service Coverage
Population Connected
Service Coverage
Population Connected
2019 0% 0 0% 0 0% 0
2025 50% 1,410,000 0% 0 33% 1,410,000
2030 70% 2,520,000 20% 380,000 53% 2,900,000
2035 90% 4,200,000 40% 980,000 73% 5,280,000
D.3.4.3. Solid waste collection, treatment and disposal
162. The management of municipal solid waste has shown improvement in recent times, particularly in terms of collection capacity following procurement of equipment under the MSP. However, there is still considerable room for enhancement of service provision by:
• Additional step-wise investments in collection capacity and operational capability; • Adoption of sanitary methods of waste disposal; and • The progressive development of programs, systems and facilities to promote resource
recovery and to divert waste from final disposal to land.
163. The targeted levels of waste management services until 2035 are set out on Table 21.
Table 21: Proposed target service levels for management of municipal solid waste Year Collection Alternative Treatment/
Waste Diversion Sanitary Disposal
Existing Urban UCs Future Urban UCs 2019 78% 0% 0% 0%

KP-SISUG Peshawar City Development Plan – Draft Final Report
40
Year Collection Alternative Treatment/ Waste Diversion
Sanitary Disposal Existing Urban UCs Future Urban UCs
2025 85% 25% 10% 100%
2030 90% 50% 30% 100%
2035 95% 75% 60% 100%
D.3.5. Funding of municipal services and investments
164. Peshawar has four Town Municipal Administrations (Map 2). A desk review of the budget statements of the four TMAs of Peshawar was undertaken to assess historical financial performance, generation of internal funds to support operational expenses and its ability to finance the O&M after construction of infrastructure projects and to provide the designed level of service in terms of quality and quantity. According to the Budget Abstracts, the total revenue of Peshawar TMAs in 2017-18 was PKR 2,426 million, including revenue from tax and non-tax sources and provincial transfers, and the total expenditure, both development and non-development, was PKR 3,501 million resulting in deficit of PKR 1,075 million in financial year 2017-18 which was met from actual savings in budgeted expenditure from previous financial year leaving a net surplus of PKR 98 million in 2017-18. Historically, in the budgets of the four TMAs of Peshawar for the FY 2017-18, the total revenue was PKR 2,426 million as compared to PKR 2,577 million estimated for FY 2016-17, a net drop of PKR 151 million which was mainly due to reduced PFC share and decrease in own source revenue in 2017-18. The revenue budget increased on average at the rate of 46% from 2015-16 to 2017-18 with increase in provincial transfers over the same period mainly due to induction of 30% PFC share allotted to TMAs in provincial budget under the 18th Constitutional Amendment and increase in own source income. The expenditure budget decreased from PKR 3,673 million in 2016-17 to PKR 3,501 million in 2017-18 mainly due to a lower development budget in 2017-18.
165. The Water and Sanitation Services Peshawar (WSSP) is Pakistan’s first corporate governed and autonomous urban utility, and was established for managing essential municipal services like water supply, waste water and solid waste. These functions were transferred under a Services and Assets Management Agreement (SAMA) executed in September 2014 between Municipal Corporation (MC) Peshawar, Peshawar Development Authority (PDA) and University Town Committees (UTC) Peshawar. The present annual revenue of WSSP from water charges is PKR 322.01 million from domestic consumers and PKR 237.67 million from commercial consumers according to WSSC Budget 2018-19 which is expected to grow to PKR 1,641.21 million and PKR 421.06 million in 2025 and PKR 2,459.46 and PKR 1,092.16 in 2035 for domestic and commercial consumers respectively. The provincial government transfers all funds budgeted for development and non-development expenditure of TMAs relating to the municipal services to the WSSP which makes up almost 80% of total revenue of WSSP in 2018-19. However, the WSSP will need to receive grants from provincial government to fill the revenue gap in order to deliver the expected volume of services under the project.
166. Information given in Development Statistics prepared at the provincial level and the available TMA budget abstracts and WSSP water revenue budget is summarized in Appendix 4. Based on present water tariff, there is a Resource Gap Surplus of PKR 2.80 million as reflected in WSSC budget 2018-19.

KP-SISUG Peshawar City Development Plan – Draft Final Report
41
D.3.6. Public sector governance
167. Poor city planning is undermining progress made in service provision. The largely unplanned and mushrooming growth of residential areas make it difficult to plan for and provide services. At the same time, industries are being set up in urban areas, which pose huge challenges for services such as waste management.
168. The roles of various entities overlap in some areas. The PDA, WSSP and TMA operate in Peshawar with insufficient clarity on roles and operating procedures in planning and implementation service delivery.
169. Poor staff capacities and underperformance affected WSSP from the start. In the 2014 handover of PDA and TMA staff to WSSP, staff selection was not necessarily based on performance. After the handover, the PDA received complaints concerning the quality of services in Hayatabad and University Town. The subsequent transfer of responsibility for those areas back to PDA and Town-III Administration, further weakened WSSP. Low compensation levels for key management posts constrain the hiring of well-qualified executives and managers for vacant senior positions.
170. Addressing non-performance in government staff is difficult. Under the rules of the Securities and Exchange Commission of Pakistan, the Board of Directors of WSSC and the Chief Executive Officer can exercise disciplinary action against WSSP staff. However, under civil services rules, the punitive actions have to follow lengthy disciplinary procedures. As the WSSP staff are government employees, implementing sanctions against underperforming staff is not easily undertaken. The emerging trend of taking the matter to courts and obtaining stay orders has made it more difficult. The Government of Khyber Pakhtunkhwa needs to address this so that WSSP can fulfil its mandate of being a corporate governed utility with high performance standards.46
D.3.7. Capacity development
171. Elected officials and government staff at local government institutions at district and tehsil levels need capacity strengthening in management, strategic planning, and other areas related to their work. In particular, Town Municipal Officers (TMOs) and the TMAs need to be strengthened in procedures, accounts keeping, audit and internal audit, and tendering and tender processing. The engineering staff within the TMAs need to be strengthened in preparing Bill of Quantities and tender documents, tendering and tender security, and soil testing. Relevant staff also need training related to drinking water, sanitation, solid waste management and building control.
172. Water and Sanitation Services, Peshawar (WSSP) needs pre- and in-service training in management, administration and finance for relevant staff, as well as technical trainings specific to the water, sanitation, and waste management sectors for other staff (Table 22). Once developed, selected modules from these courses could also be used for training of relevant district and township officials and city development authorities. Because of their operations at community level, WSSCs need to conduct community education on water, sanitation and related issues, and ensure the training of community mobilizers and community support workers (under a Training of Trainers (TOT) program) to enable them to become water 46 Government intervention is needed, since the Federal Government in 2010 repealed the Removal from
Service (Special Powers) Ordinance, 2000, which had provided for the dismissal, removal, compulsory retirement, or demotion of government staff for inefficiency, misconduct, corruption, and other traits.

KP-SISUG Peshawar City Development Plan – Draft Final Report
42
care technicians. To this end, WSSCs will need support in designing TOT modules, which they could implement.
173. The Peshawar Development Authority (PDA)47 provides urban services in some parts of Peshawar. The city development authorities are not fully equipped yet to discharge their duties of city and development planning, as is seen in the poor management of urban sprawl (Section C.2.2). The City Development Authorities also need to develop the coordination and monitoring skills to provide guidance and direction to local government departments. Overall, the Peshawar Development Authority staff also require capacity strengthening in many of the areas listed in Table 22.
174. The major functions of the Peshawar Cantonment Board cover a wide range of areas: water supply, sanitation, street lights, roads and roadside drains, construction and engineering, education, medical services, fire brigade, horticulture, and revenue collection within Cantonment areas. Generally, the Cantonment Boards already have systematic mechanisms and well-defined jurisdiction.
175. In judging the adequacy of staffing for water and sanitation utilities, a standard international indicator of human resources (HR) productivity should be used, such as the total number of water utility staff per thousand people served. Data is available on this indicator for Pakistan (national average) and some other countries.48 A comparison of the HR productivity ratio shows that WSSP appears to be over-staffed with regard to total staff, compared to the national ratio and ratios from other countries (Figure 3). However, the ratio of its professional staff is very low. A review of HR productivity ratio will also need to be done for PDA staff providing urban services. Currently, comparison of the ratio shows that the PDA has about twice the staff per 1,000 population served compared to the Mardan and Abbottabad Development Authorities.
47 The mandates of PDA and WSSP are provided in Appendix 5. 48 International Benchmarking Network (IBNET): https://www.ib-net.org/.

KP-SISUG Peshawar City Development Plan – Draft Final Report
43
Table 22: Areas proposed for capacity building Management and administration
• Human resources management and planning • Administration • Reporting • Supply and asset management • Procurement and procurement procedures
Finance • Budgeting and budget management • Accounts • Internal audit • Revenue and billing enhancement
Land development • Acquisition • Land registry (cadaster)
Planning and development • Planning • Project planning • Mis/database • GIS operation
Projects and works • Planning and project management • Works • Contracts • Geotechnical aspects and earthworks
Urban development planning • Urban infrastructure design • Urban infrastructure asset management • Control • Risk management
Field operations, maintenance and repair • Training for operators/mechanics • Training of surveyors, sanitary installers,
general fitters, pump mechanics, mechanics and drivers of tractors, and other related vehicles.
Environment and social management • Environmental impact assessments • Social & environmental mitigation • Occupational health and safety Water resources management & protection • Water safety planning • Water supply sampling/testing • Waste water sampling • Equipment installation • Equipment maintenance • Water resource monitoring
Sanitation • Hygiene awareness • Sanitation • Drainage • Storm water & wet weather management • Flushable wipes & collection systems • Industrial wastewater • Utility management • Innovative technology
Solid waste management • Waste collection • Clearing of dumps • Re-dumping • Solid waste management • Recovery of recycle items • Sludge treatment and disposal
Roads/bridges • Roads & roads maintenance • Roadside drains • Public transportation management • Urban transportation planning
Source: Management and staff of WSSP.
176. Education and training of employees are necessary but insufficient—the employee also needs to have a certain measure of job satisfaction, which enhances performance. HR development, therefore, involves not only improving staff competence, but also employment practices, career structures, and professional and financial incentives for proven results. The performance of employees should be linked to both sanctions and incentives (e.g., career progression). In the past, an official undergoing training and qualifying for a "Post Graduate Diploma in Urban Development" would be awarded with two advanced increments in his/her salary. This is not being practiced currently, but incentives for the acquisition of accredited qualifications should be reconsidered, especially for the WSSCs, which ideally should be fully corporatized.

KP-SISUG Peshawar City Development Plan – Draft Final Report
44
Figure 3: HR productivity ratio for WSSP (2018)
Source: Based on assessment of WSSP professional staff (51) and total staff (4,105) in 2018.
International Benchmarking Network (IBNET) online database (https://www.ib-net.org/) (for Pakistan national level and other countries
Note: HR productivity ratio is derived from the number of the employees per 1000 people served by the city development authorities. IBNET notes that “while allocating staff time to either water or wastewater services is useful, this information is sometimes not available. Comparisons are best made between utilities offering the same scope of service in terms both of total size and of mix of water and sewer services. Staff number comparisons should reflect any extensive use of outside contractors.”
0.02
2.00
0.97 0.54
0.85 0.50 0.58
0.26 0.51
0.88
-
0.50
1.00
1.50
2.00
2.50
WSSP, p
rofes
siona
l staf
f
WSSP, to
tal st
aff
China,
2012
Englan
d & W
ales,
2016
India,
2009
Malays
ia, 20
07
Pakist
an, 2
016
Singap
ore, 2
008
Turkey
, 200
8
Uzbek
istan
, 201
0
HR
pro
duct
ivity
ratio
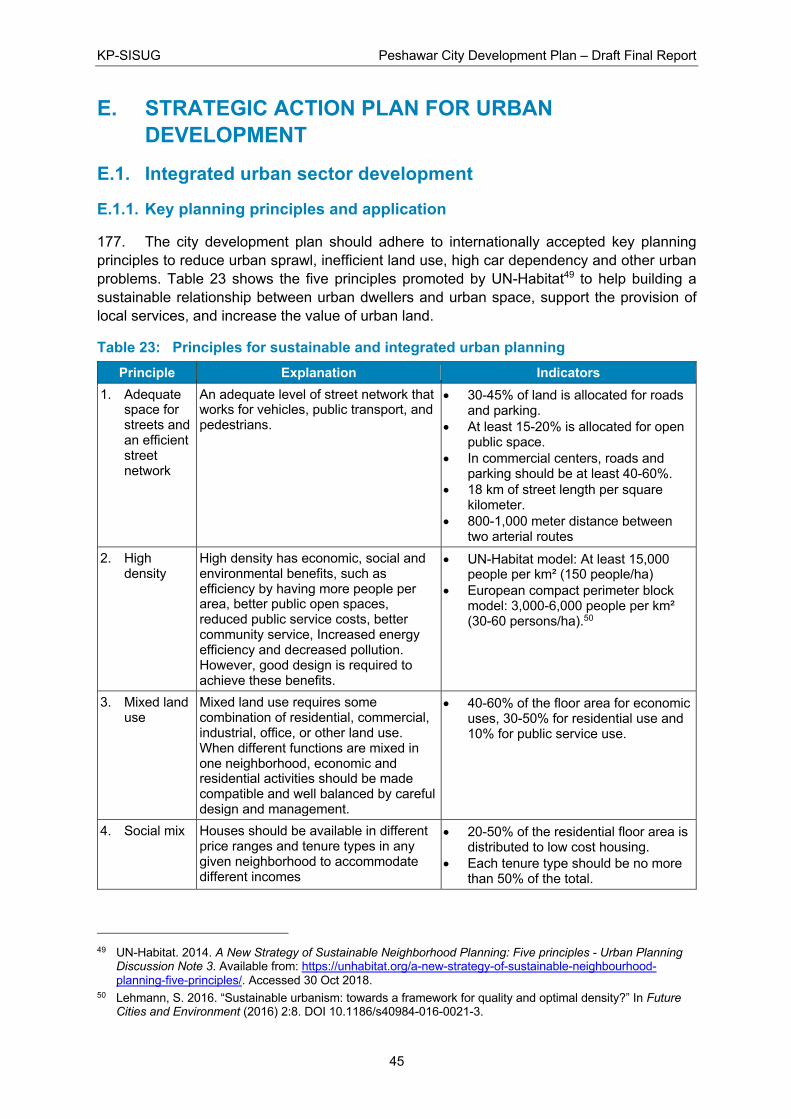
KP-SISUG Peshawar City Development Plan – Draft Final Report
45
E. STRATEGIC ACTION PLAN FOR URBAN DEVELOPMENT
E.1. Integrated urban sector development
E.1.1. Key planning principles and application
177. The city development plan should adhere to internationally accepted key planning principles to reduce urban sprawl, inefficient land use, high car dependency and other urban problems. Table 23 shows the five principles promoted by UN-Habitat49 to help building a sustainable relationship between urban dwellers and urban space, support the provision of local services, and increase the value of urban land.
Table 23: Principles for sustainable and integrated urban planning Principle Explanation Indicators
1. Adequate space for streets and an efficient street network
An adequate level of street network that works for vehicles, public transport, and pedestrians.
• 30-45% of land is allocated for roads and parking.
• At least 15-20% is allocated for open public space.
• In commercial centers, roads and parking should be at least 40-60%.
• 18 km of street length per square kilometer.
• 800-1,000 meter distance between two arterial routes
2. High density
High density has economic, social and environmental benefits, such as efficiency by having more people per area, better public open spaces, reduced public service costs, better community service, Increased energy efficiency and decreased pollution. However, good design is required to achieve these benefits.
• UN-Habitat model: At least 15,000 people per km² (150 people/ha)
• European compact perimeter block model: 3,000-6,000 people per km² (30-60 persons/ha).50
3. Mixed land use
Mixed land use requires some combination of residential, commercial, industrial, office, or other land use. When different functions are mixed in one neighborhood, economic and residential activities should be made compatible and well balanced by careful design and management.
• 40-60% of the floor area for economic uses, 30-50% for residential use and 10% for public service use.
4. Social mix Houses should be available in different price ranges and tenure types in any given neighborhood to accommodate different incomes
• 20-50% of the residential floor area is distributed to low cost housing.
• Each tenure type should be no more than 50% of the total.
49 UN-Habitat. 2014. A New Strategy of Sustainable Neighborhood Planning: Five principles - Urban Planning
Discussion Note 3. Available from: https://unhabitat.org/a-new-strategy-of-sustainable-neighbourhood-planning-five-principles/. Accessed 30 Oct 2018.
50 Lehmann, S. 2016. “Sustainable urbanism: towards a framework for quality and optimal density?” In Future Cities and Environment (2016) 2:8. DOI 10.1186/s40984-016-0021-3.

KP-SISUG Peshawar City Development Plan – Draft Final Report
46
Principle Explanation Indicators 5. Limited
land use specialization
Economic diversity is the aim. Zoning regulating the use to which land may be put must avoid the creation of single function neighborhoods, such as office block neighborhoods that become deserted at night. Zoning policies need to be adjusted or changed to achieve this aim.
• Single function blocks should cover less than 10% of any neighborhood.
178. The application of international planning principles needs to start with defining official city limits and managing the direction of its spatial growth. It will also need to consider the transport corridors and services infrastructure development and prioritize areas for future urban growth. In particular, to meet international standards for sustainable, livable cities,
179. Section D3.3 has shown that it will be necessary to expand the current urban limit from 151.46 km2 to 310.97 km2 in order to have a desirable population density of 15,000 people/km2 (Table 16) based on the projected population in 2035. In addition, incorporating the whole of each rural UCs which has become urbanized (classified as ‘future urban’) would increase the potential area of the expanded city to 380.66 km2 (Table 17). It is considered logical, therefore, to demarcate future city boundaries to include part of these peri-urban UCs, depending on the location of current urban agglomerations
180. Accordingly, Peshawar will need to implement the following:
• Urgently control and reduce urban sprawl, and implement increased densification and infill development within the current city limits;
• Reduce single function blocks (including housing developments) through zoning regulations, and increase the floor area for economic uses, recreational and urban green spaces, and public use.
• Avoid expanding on to productive agricultural land, land that is vulnerable to flooding and land that would affect drainage.
• Re-define the city limits to accommodate all these concerns and manage the direction of growth.
• Review and revise zoning regulations as needed, using international urban planning principles as a guide, and enforce the regulations.
181. In practice, this means that city planning authorities will need to:
• Discourage the use of productive agricultural land in the north; • Discourage expansion into flood-prone areas north and north-east of the city, with a
preferred axis of development to the south and south-east of the present urban area; • Encourage development towards the west, east and southern margins of the city to
take advantage of opportunities such as regional development corridors, SEZs and transportation infrastructure;
• Consolidate the role of the city center, increasing density in line with planning standards and norms;
• Change the demarcation of city boundaries to incorporate appropriate peri-urban nodes. In this strategy, a dense urban core would be linked by efficient public transport networks to dense, mixed use, complementary sub-centers. This would relocate economic activities towards the south-west and west of the city. Mixed use

KP-SISUG Peshawar City Development Plan – Draft Final Report
47
neighborhoods should be planned in line with the indicators shown in Table 16 and Table 17;
• Increase the proportion of publicly spaces to at least 15 to 20 per cent in line with the planning norms; and
• Designated green buffer zones in strategic locations around the existing margins of the city to focus development to selected peri-urban and sub-urban nodes, to preserve sensitive ecological and hydrogeological resources (for example, groundwater aquifer recharge zones) and to prohibit development in areas prone to flooding.
E.1.2. Integrated urban sector development
182. Integrated urban planning has the overall aim of realizing a dynamic, economically inclusive and environmentally sustainable city outlined in Section A.2. To this end, provincial and city planning authorities will need to take into consideration the gaps, weaknesses and opportunities that have been identified in the previous sections and implement strategies that best serve the demands of the growing population of Peshawar.
183. There are five strategic areas that address the above objectives and ultimately contribute to the delivery of urban sustainability on an ongoing basis. These five strategic considerations are summarized in Error! Reference source not found., while more details are available in the Urban Sector Road Map.51
Figure 4: Conceptual framework for integrated urban sector development
51 ADB. 2019. Pakistan: Provincial Strategy for Inclusive and Sustainable Urban Growth in Khyber Pakhtunkhwa
– Urban Sector Road Map. Peshawar: Planning & Development Department, GoKP and Asian Development Bank.

KP-SISUG Peshawar City Development Plan – Draft Final Report
48
184. Key development strategies proposed for Peshawar are explained in the following paragraphs.
185. Decisions on an urban development model. Rather than linear development along the highways or a business as usual scenario, it is recommended that the city authorities adopt a compact polycentric model that concentrates growth in the urban core, priority transformation areas, and key urban and transit-oriented nodes (Map 30). The model would need to be agreed upon by the various infrastructure and services sectors, and should build up existing developments, but seek to make these more in line with the overall development plan.
186. Urban growth management. Once the model is adopted, the first step should be effective urban growth management through (a) the demarcation of the future city boundaries and (b) the management of urban sprawl. The city boundaries up to 2035 should be established to ultimately meet the international norms on densities and per capita land consumption set out in Table 16 (population projections and city area required) and Table 23 (five principles for sustainable and integrated urban planning). Once this has been established, urban sprawl needs to be controlled through zoning and regulations. Green spaces should be promoted in the suburban nodes. Peri-urban areas such as Shaheen Muslim town, Akhun Abad, Bahadur Kalay, Abad and Afghan Colony must be prevented from further urban sprawl and instead, built up further and densified in line with international planning norms. Transport networks should be planned to accommodate people commuting from the suburban areas and to reduce dependency on private vehicle travel. Densification of current suburban nodes would help in reducing the urban foot print, decongesting much of the city, promoting efficiency in travel, and help to conserve green spaces and agricultural land.
187. Development of mixed-used neighborhoods. All neighborhoods should strive to become self-contained areas that meet the diverse needs of local communities in housing, employment and leisure. To this end, a greater proportion of the land use plan should be allocated to community facilities and services than currently. The peri-urban areas can be a major focus for future investments in infrastructure and services; however, the development of these areas should observe the planning norms as recommended in this report. To this end, the overall plan for every neighborhood should have targets terms of population density, street density, green spaces, and land use for 2025, 2030 and 2035 (Table 23).
188. Smart city growth calls for close coordination of spatial planning and infrastructure investment. Once the future city boundaries have been agreed on, key infrastructure sectors will need to plan the elements to meet the planning norms for both the city center and the peri-urban areas. Currently, many large residential urban areas lack basic services and community facilities. Public green space and public facilities should aim to increase the overall resilience of the city, such as the integration of open spaces into storm water management systems, the establishment of water retention ponds, facilities for the re-use of waste water and sewerage, and green infrastructure design (e.g. green roofs). Water-sensitive landscape planning and urban infrastructure design (streets, buildings and services infrastructure) should incorporate social, cultural and economic aspects to reduce fragmentation and support social inclusion. Public facilities should be planned with the catchment areas and capacities used in international planning standards.

KP-SISUG Peshawar City Development Plan – Draft Final Report
49
E.2. Strategic priorities and actions
E.2.1. Key infrastructure investments and priorities
189. Traditionally, planning for urban development has been conducted at individual sector-level without consideration of the linkages and overlaps with other sectors, such as agriculture. Several drivers demand a new approach based on sustainable integrated planning, including optimization with sectors beyond the traditional sphere of the urban footprint.
190. Climate models, as discussed in Section C.5, predict higher average temperatures, more frequent periods of extreme temperatures, greater variation in rainfall and evaporation, and reduced flows in rivers sourced from the Himalayan glaciers. Against this backdrop, it is expected that the rapidly increasing population and the demands of agriculture for increased supplies of irrigation water will begin to compete for the available water resources.
191. Similarly, as efforts intensify to reduce the potential for long-term climate change, there is an urgent need to adopt energy policies based on a sustainable energy production and energy efficient technologies and reduce and eventually replace the use of fossil fuels.
192. Of particular concern with regard to agricultural production is the increasing depletion from agricultural soils of organic matter and specific minerals, such as phosphorous, which are essential for crop growth. The continuing decrease in the fertility of agricultural soils is likely to be exacerbated by climate change.
193. The key approach to addressing many of the above issues is to close material cycles with a minimal use of scarce resources and maximal re-use and recovery of energy, water and raw materials (‘circularity’). The circular approach not only reduces the potential impact of scarcity and climate change but can also lead to improvement of the business model.
194. In providing and upgrading municipal services the following intersectoral optimizations can be identified: (1) producing irrigation water out of treated waste water; (2) recovering nutrients and organic ‘fertilizer’ out of waste water and organic components of MSW; (3) recovering energy - especially biogas - out of waste water and organic components of MSW and/or high calorific components of MSW (via refuse derived fuel, RDF; and (4) recycling and/or re-use of specific components of MSW to substitute for the use of virgin materials.
195. This transition will contribute to establishing material and water cycles that can help to reduce overall financial costs, by generating revenues that may offset any necessary capital investments and ongoing O&M costs, thereby improving financial and economic viability.
E.2.1.1. Water supply
196. Based on the target service levels and coverage in Table 19, potable water demand has been calculated for each UC based on projected populations in each UC using the intercensal growth rates recorded between 1998 and 2017. The calculated water demand is summarized in Table 24.

KP-SISUG Peshawar City Development Plan – Draft Final Report
50
Table 24: Projected potable water demand for Peshawar urban areas[1] Year Urban UCs
(Currently Served) Future Urban UCs
(Currently Unserved) Future Urban Area
(Total) Population[2] Demand[4]
(m3/day) Population Demand[4]
(m3/day) Population[3] Demand
(m3/day) 2019 2,146,335 323,369 - - 2,146,335 323,369
2025 2,817,466 422,613 1,469,044 33,935 4,286,490 456,548
2030 3,596,400 539,459 1,892,639 157,982 5,489,017 697,441
2035 4,664,599 699,690 2,446,905 269,161 7,111,504 968,851 Source: Calculations by the project consultants. Notes: [1] This assessment excludes any requirement for fire-fighting and any potential demand from industry.
[2] Population forecast as per Table 15. [3] Population forecast as per Table 17. [4] Based on target service levels and coverage as per Table 19.
197. As noted in Section D.1.1, the estimated production capacity is approximately 304,500 m3/day, comprising 24,500 m3/day of surface water (design capacity) and 280,000 m3/day from groundwater.
198. The projected potable water demand, based on Table 19 and Table 24 and assuming the Bara WTP is operating at design capacity, is as follows:
• 2025: 456,548 m3/day, 50 percent more than the current maximum production capacity;
• 2030: 697,441 m3/day, approximately 130 percent more than the current maximum production capacity; and
• 2035: 968,851 m3/day, almost 2.2 times the current maximum production capacity.
199. The projected demand has been calculated for the whole of the current urban area, including effectively taking over supply to the cantonment area.
200. The projected potable water demand excludes any provision for water losses. The production capacity needs to be greater than the projected demand to cater for unaccounted water losses. Accordingly, the required production capacity (Table 25) has been assessed based on the following assumptions:
• 65 percent unaccounted water loss estimated in 2019 (based on gross production of 150 lpcd and a net supply of approximately 50 lpcd);
• Unaccounted water loss reduced to 40 percent by 2025 for existing served areas; • Unaccounted water loss further reduced to 25 percent by 2030 for existing served
areas; • Unaccounted water loss of 15 percent assumed by 2035 for existing served areas; and • For newly served areas (future urban UCs) unaccounted water loss is assumed to be
15 percent.
Table 25: Projected water production requirement to serve Peshawar urban areas[1] Year Demand
(m3/day)[2] % Water Loss[3] Volume of Unaccounted
Water (m3/day) Total Production
Requirement (m3/day)
Current Future Current Future 2025 456,548 40 15 277,267 5,989 739,804

KP-SISUG Peshawar City Development Plan – Draft Final Report
51
2030 697,441 25 15 177,555 27,879 904,238
2035 968,851 15 15 123,475 47,499 1,139,825 Notes: [1] This assessment excludes any requirement for fire-fighting and any potential demand from industry.
[2] From Table 24. [3] Target values for existing served areas, requiring a sustained program and specific interventions to reduce leakage from the distribution system and to eliminate illegal connections. In newly served areas the water loss is assumed to be 15% only.
201. In order to ensure a safe, reliable and adequate potable water supply, it is considered essential that the municipal water supply system is upgraded and eventually expanded to cover all of the future urbanized area. This requires the production capacity to be enhanced, since there is a requirement to supply:
• An additional 435,304 m3/day of potable water by 2025; • An additional 599,738 m3/day of potable water by 2030; and • An additional 835,325 m3/day of potable water by 2035.
202. The calculated additional water requirements assume that the water distribution system is upgraded progressively in order to reduce losses from unaccounted water and to mitigate the potential for cross-contamination from other water sources so as to ensure water quality is fit for consumption at the point of delivery.
203. Aside from reducing water losses to make more efficient use of available production capacity, there are two main ways to upgrade production capacity and water availability:
• Provision of additional tube wells to abstract from the groundwater aquifer, allied with enhanced pumping and storage capacity; and/or
• Impoundment and extraction from additional surface water sources, allied with additional storage capacity.
204. Rainwater harvesting could also be adopted, in order to reduce the use of potable water for non-potable uses (for example, laundry, car washing, irrigation/watering of green spaces). However, this will not be a suitable source to cater for potable water demand.
205. Groundwater depletion has been recorded in the central part of the Peshawar basin. MSP analyzed the extent of groundwater depletion and concluded that approximately 30 percent of the aquifer was under stress (0.3 m decline in water table elevation over the period 2009-12) because of over pumping. The remaining 70 percent of the aquifer showed no decline in the groundwater table. It was notable, however, that virtually all of the aquifer underlying Peshawar city, and the area south and east of Peshawar, appeared to be under stress, whilst the aquifer north, north-west and north-east of the city (between the city and the Kabul River) demonstrated no sign of stress. MSP concluded that the aquifer had sufficient excess capacity to meet the projected demand to the period up to 2035.52
206. If the aquifer were to be exploited further a detailed hydrogeological assessment would need to be conducted to determine the number, location and spacing of any additional wells in order to avoid over-pumping, with subsequent depletion and drawdown of the aquifer.
52 Government of Khyber Pakhtunkhwa. 2014. Planning and Engineering Services for Master Plan in Peshawar,
Khyber Pakhtunkhwa: Drinking Water, Sanitation/Storm Water and Solid Waste Services Master Plan Vol.-1 – Water Supply, Treatment and Distribution (Draft Main Report). Peshawar: Municipal Services Program, GoKP and USAID.

KP-SISUG Peshawar City Development Plan – Draft Final Report
52
207. In addition to new tube wells, there would be a requirement to construct new storage tanks to provide a minimum of three hours storage capacity in the distribution system. Whilst, in theory, direct pumping avoids the need for additional storage, it is vulnerable in practice to interruptions from power outages and, therefore, it is deemed prudent to provide additional storage capacity to meet minimum requirements.
208. In light of the drawdown already noted under most of Peshawar City, reliance solely on the installation of additional tube wells to meet the increase in projected demand is not considered sustainable in the long-term, even though MSP concluded that there was sufficient excess capacity available over the next 15-20 years. A more sustainable approach is considered prudent, whereby alternative surface water sources are exploited so as to increase the proportion of the water supply met from surface water sources from eight percent currently.
209. Table 26 demonstrates how the projected production requirement up to 2035 (Table 25) can be met by varying the relative balance of production between surface water and groundwater supplies.
Table 26: Projected production requirements from different water sources Year Total Water
Production Surface Water Production Groundwater Production
(m3/day)[1] % (m3/day) % (m3/day) 2019[2] 304,500 8 24,500 92 280,000
2025 739,804 25 184,950 75 554,854
50 369,902 50 369,902
75 554,854 25 184,950
2030 904,238 25 226,060 75 678,178
50 452,119 50 452,119
75 678,178 25 226,060
2035 1,139,825 25 284,956 75 854,868
50 569,912 50 569,912
75 854,868 25 284,956 Source: Calculations by the project consultants. Notes: [1] Includes allowance, as per Table 25, for leakage and non-revenue water.
[2] Current balance of supplies based on the estimated groundwater production and the design capacity of the Bara WTP.
210. There are a number of surface water sources present in and around the Peshawar city including (Map 6):
• Kabul River which is the main river draining the whole of the Peshawar valley into the Indus River. It flows approximately 10 km north of Peshawar in a south-easterly direction;
• Bara River which enters the south-western part of the valley and flows south/south-east of the city in a north-easterly direction before joining the Kabul River to the east of Peshawar. Part of the Bara river discharge supplies the Bara WTP through gravity, whilst the remainder has been diverted by private canals for irrigation purpose. Surplus water is disposed into the Kabul River;
• Warsak Gravity Canal emerges from Warsak dam; and • Kabul River Canal emerges from Kabul River and flows through the Peshawar city.

KP-SISUG Peshawar City Development Plan – Draft Final Report
53
211. In addition to rivers and canals, there are also a number of schemes being considered to develop new dams, and/or upgrade existing dams, to provide additional potable water supplies to Peshawar. These include the Munda (proposed), Warsak, Bara and Jabba (proposed) dams.
212. The available capacity of these source water sources, subject to detailed design, is estimated to be up to approximately 1.7 million m3/day, with Munda Dam potentially accounting for 55 percent of this capacity. If constructed these sources would be more than sufficient to meet all of the projected water demand from Peshawar for the foreseeable future.
213. Notwithstanding the potential for increasing surface water supplies, it is considered likely that increased ground water production will be required in the short to medium term alongside any increase in surface water supplies, since the development of surface water sources will take time and lag behind the increase in demand, at least until 2030.
214. It is recommended that groundwater well fields be developed in the unstressed part of the aquifer in the area north of Peshawar up to and beyond the Kabul River. This will require the construction of a number of pump stations and transmission pipelines also to deliver water to Peshawar city.
215. An assessment of potential infrastructure requirements for meeting projected potable water demand up to 2035 is summarized in Table 27, assuming:
• all additional demand is met from groundwater sources up to 2025; • thereafter, surface water sources progressively contribute to meeting the additional
projected demand, to cater for 25 percent of the demand by 2030; and • surface water sources cater for 50 percent of the demand by 2035.
Table 27: Projected infrastructure requirements based projected groundwater supplies
Year Groundwater Production (m3/day)[1]
Operational Tube Wells Required[2] Operational OHRs Required[3]
Minimum No.
Capacity (m3/day)
New Wells
Minimum No.
Capacity (m3)
2019 280,000 461 280,000 - 84 38,186
2025 739,804 1,218 739,935 757 204 92,738
2030 678,178 1,116 677,970 - 249 113,195
2035 569,912 938 569,835 - 314 142,745 Notes: [1] Includes allowance, as per Table 25, for leakage and non-revenue water.
[2] Assessed on the basis of an average pumping capacity of 67.5 m3/hour (15,000 gallons per hour), operating 9 hours per day. The minimum calculated values exclude any spare capacity and contingency provisions. If the capacity of the tube well is increased and/or pumping time is increased, then the number of required tube wells would reduce proportionately. [3] Assessed for the total projected demand on the basis of 3 hours minimum storage capacity. Each OHR sized at 100,000 gallons (454.6 m3) capacity.
216. The actual production rate and efficiency of the existing tube wells will need to be verified on an individual basis. Where feasible and economic, any existing dysfunctional tube wells or inefficient tube wells should be rehabilitated and upgraded.
217. All functional tube wells and pumps (existing and new) should be instrumented, including installation of flow meters. Supervisory Control and Data Acquisition (SCADA)

KP-SISUG Peshawar City Development Plan – Draft Final Report
54
systems and equipment for centralized management, monitoring and control should also be provided.
218. In conjunction with investment in increased production capacity, it is recommended that a community-education program is implemented, targeted on the efficient use of water and the adoption of water conservation measures.
219. In order to ensure appropriate water quality, all production and storage facilities (production wells and storage reservoirs) should also be fitted with disinfection facilities.
220. By 2035 the existing distribution network will need to be replaced and/or upgraded progressively throughout the currently served area and the distribution network expanded to cover all presently unserved areas within the expanded city limit. As noted in Section D.1.1, MSP indicated that there were 1,670 km of water distribution pipeline within their project area, of varying sizes up to 450 mm in diameter, constructed of various materials including asbestos, cement, of varying ages, and comprising both above ground and buried pipes.53
221. The upgraded distribution network should be sized based on hydraulic analyses in order to deliver an adequate volume of water to the most hydraulically remote fixture during minimum pressure and maximum flow conditions.
222. A preliminary estimate of overall network length, above and beyond the current network, has been made based on extending the current pipe network progressively to all households in the service area (Table 28). The assessment provides the length for all service lines, ranging from mains down to tertiary connections to individual properties.
Table 28: Assessed length of existing and future pipe network[1] in Peshawar urban areas
Year Projected Number of
Households[3]
Served Area Water Distribution System No.
Households Connected
% Connected[4]
Existing Pipe Length
(km)
Required Pipe Length
(km)
New Pipe Length (km)[5]
2019 245,195[2] 232,935 95 1,670 - -
2025 495,344 387,438 78 1,670 2,780 1,110
2030 629,727 560,370 89 2,780 4,020 1,240
2035 809,371 809,371 100 4,020 5,803 1,783 Source: Calculations by the project consultants. Notes: [1] Estimated network length includes pipes of all sizes from tertiary connections to primary lines.
[2] Excludes Cantonment areas. [3] Refer to Table 18. From 2025, this includes the Cantonment areas in the expanded service area. [4] Based on the estimated growth in population for both the current urban areas and the expanded future urban areas (Table 18) and the target population to be served (Table 19) [5] Table 28 indicates the projected need for the following phased improvements to the potable water supply network:
• By 2025, rehabilitation and upgrading of 1,670 km of pipeline within the existing service area and the installation of 1,1100 km of new pipeline to serve households currently not connected;
• By 2030, installation of an additional 1,240 km of new pipeline to expand service coverage the majority of the households that lie within the expanded city limit, as per Map 20; and
53 Government of Khyber Pakhtunkhwa. 2014. Planning and Engineering Services for Master Plan in Peshawar,
Khyber Pakhtunkhwa: Drinking Water, Sanitation/Storm Water and Solid Waste Services Master Plan Vol.-1 – Water Supply, Treatment and Distribution (Draft Main Report). Peshawar: Municipal Services Program, GoKP and USAID.
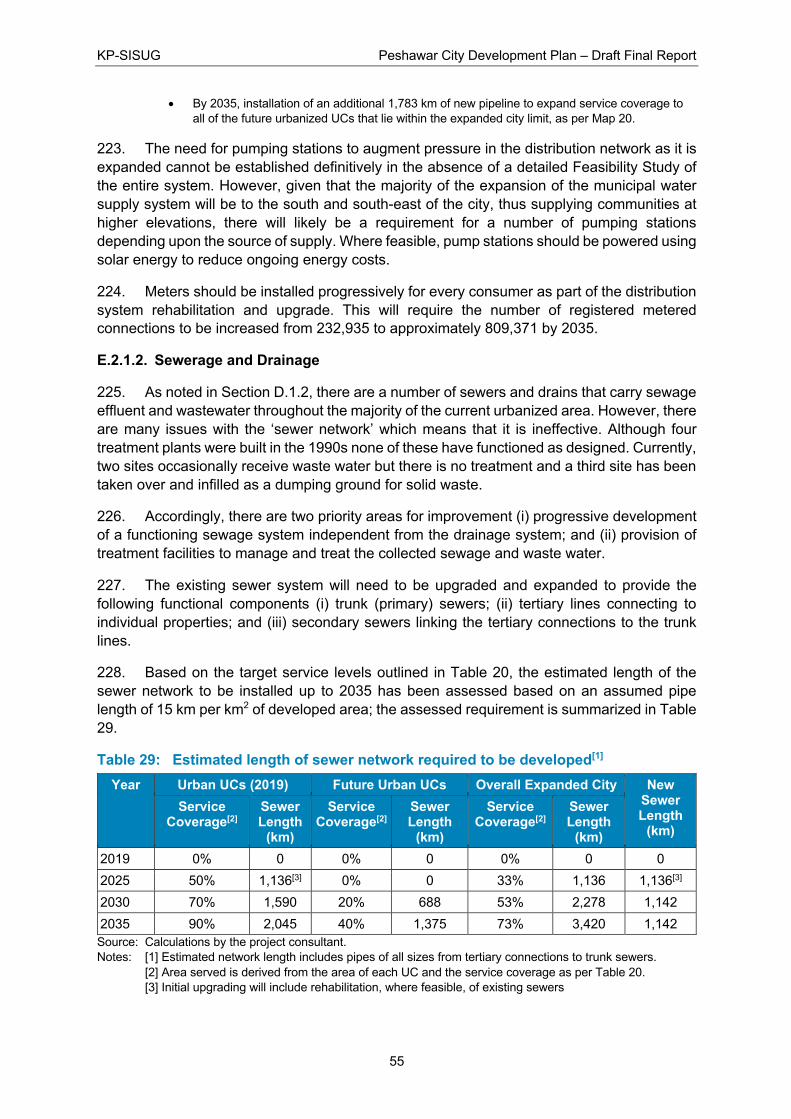
KP-SISUG Peshawar City Development Plan – Draft Final Report
55
• By 2035, installation of an additional 1,783 km of new pipeline to expand service coverage to all of the future urbanized UCs that lie within the expanded city limit, as per Map 20.
223. The need for pumping stations to augment pressure in the distribution network as it is expanded cannot be established definitively in the absence of a detailed Feasibility Study of the entire system. However, given that the majority of the expansion of the municipal water supply system will be to the south and south-east of the city, thus supplying communities at higher elevations, there will likely be a requirement for a number of pumping stations depending upon the source of supply. Where feasible, pump stations should be powered using solar energy to reduce ongoing energy costs.
224. Meters should be installed progressively for every consumer as part of the distribution system rehabilitation and upgrade. This will require the number of registered metered connections to be increased from 232,935 to approximately 809,371 by 2035.
E.2.1.2. Sewerage and Drainage
225. As noted in Section D.1.2, there are a number of sewers and drains that carry sewage effluent and wastewater throughout the majority of the current urbanized area. However, there are many issues with the ‘sewer network’ which means that it is ineffective. Although four treatment plants were built in the 1990s none of these have functioned as designed. Currently, two sites occasionally receive waste water but there is no treatment and a third site has been taken over and infilled as a dumping ground for solid waste.
226. Accordingly, there are two priority areas for improvement (i) progressive development of a functioning sewage system independent from the drainage system; and (ii) provision of treatment facilities to manage and treat the collected sewage and waste water.
227. The existing sewer system will need to be upgraded and expanded to provide the following functional components (i) trunk (primary) sewers; (ii) tertiary lines connecting to individual properties; and (iii) secondary sewers linking the tertiary connections to the trunk lines.
228. Based on the target service levels outlined in Table 20, the estimated length of the sewer network to be installed up to 2035 has been assessed based on an assumed pipe length of 15 km per km2 of developed area; the assessed requirement is summarized in Table 29.
Table 29: Estimated length of sewer network required to be developed[1] Year Urban UCs (2019) Future Urban UCs Overall Expanded City New
Sewer Length
(km)
Service Coverage[2]
Sewer Length
(km)
Service Coverage[2]
Sewer Length
(km)
Service Coverage[2]
Sewer Length
(km) 2019 0% 0 0% 0 0% 0 0
2025 50% 1,136[3] 0% 0 33% 1,136 1,136[3]
2030 70% 1,590 20% 688 53% 2,278 1,142
2035 90% 2,045 40% 1,375 73% 3,420 1,142 Source: Calculations by the project consultant. Notes: [1] Estimated network length includes pipes of all sizes from tertiary connections to trunk sewers.
[2] Area served is derived from the area of each UC and the service coverage as per Table 20. [3] Initial upgrading will include rehabilitation, where feasible, of existing sewers

KP-SISUG Peshawar City Development Plan – Draft Final Report
56
229. The exact lengths of each type of functional sewer, including pipe diameter, design flow rates and capacity and the requirement for pumping stations, will be established during detailed design. The sewer network should be constructed from the locations of the proposed sewage treatment plants and extended progressively into adjoining UCs.
230. The previous design of the system was based on gravity flows. This is not considered to be a wholly practicable approach, at least for the future urbanized area, since this would mean routing all flows through existing built up areas and locating treatment plants only on the north side of the city. A more pragmatic approach is required that caters for the future direction of growth of the city, to the south and south-east, which, inevitably, will require the use of pump stations as part of the overall system design. Where feasible, these pump stations should be powered using solar energy to reduce ongoing energy costs.
231. In parallel with constructing the sewer network, it is necessary to develop suitable treatment capacity, otherwise sewage and waste water will continue to be discharged untreated into the drainage network. Treatment capacity will need to increase as the sewage network is developed.
232. The required treatment capacity up to 2035 has been calculated based on the target service levels outlined in Table 20 and the assessed potable water demand at consumer level in the served areas, as set out in Table 24. The treatment process is assumed to be based on a trickling filter process, a robust system with low investment, comparatively small footprint and energy demand and low odor emissions, although there are many different treatment process options available.
233. Table 30 provides an overview of principal process flows and infrastructure requirements based on a trickling filter process.
Table 30: Sewage treatment capacity and projected flows Year Population
Connected to Sewerage[1]
Estimated Dry Weather
Flow[2]
Primary Settling Tanks[3]
Trickling Filter
Tanks[3]
Secondary Settling Tanks[3]
Thickened Sludge
Produced[4] m3/day No. No. No. m3/day
2019 0 0 0 0 0 0
2025 1,410,000 211,300 10 9 10 1,972
2030 2,900,000 409,200 19 18 19 4,054
2035 5,280,000 737,400 34 31 34 7,248 Source: Calculations by the project consultant. Notes: [1] Refer to Table 20.
[2] Assumed at 14 hours per day. [3] All tanks sized based on a tank diameter of 45 m. [4] Thickening assumed to achieve 40% reduction in volume.
234. Treatment capacity will need to be developed in stages and in a number of locations, responding to the increase in population, increase in potable water availability/ consumption (Table 24) and increase of sewerage connections to the treatment plant (Table 29).
235. The gross footprint of the treatment plant infrastructure, excluding provision for buffer zones and drying beds, and based on adopting trickling filters and the dry weather flows set out on Table 30, is estimated to be:
• 15.3 ha for the treatment capacity required by 2025;

KP-SISUG Peshawar City Development Plan – Draft Final Report
57
• 28.8 ha for the treatment capacity required by 2030; and • 51.0 ha for the treatment capacity required by 2035.
236. The existing treatment sites at Charsadda Road and Warsak Road are under the responsibility of WSSP. These sites have an area of at least 7 ha and 16 ha. respectively, with the latter site adjoined to the north by agricultural land. The site at Khazar Khwai, adjacent to the Ring Road, is now used for the dumping of municipal solid waste.
237. The Charsadda Road site and the Warsak Road site have witnessed residential development along the boundaries of the site since the plants were first identified and constructed as waste water treatment plants.
238. At Charsadda Road, there is significant residential development in close proximity to the northern and southern site boundaries and also towards the eastern end of the site. The center of the site lies within 125 m of residential development and, thus, there appears to be insufficient buffer area even to re-develop the site using an alternative treatment system that occupies a small footprint.
239. At Warsak Road, the situation is less constrained since the site is much larger and there is scope to expand the site to the north if required. Maintaining a minimum buffer zone of 100 m to the nearest residential development, at least 11.5 ha of the site would still be usable, sufficient in area to develop a wastewater treatment plant using modern technology to serve up to approximately 1 million population (dry weather flow of 140,000 m3/day).
240. It is proposed that two additional waste water treatment plant sites will need to be developed, one to serve the northern and eastern parts of Peshawar and a second site, south-east of Peshawar to serve the future urbanized area.
241. A large area of land has been acquired by the Provincial Government to the north of Yaseen Abad. This site should be developed as one of the two additional sewage treatment plants. At least 30 ha of land will be required for the period up to 2035 for the treatment facility. In addition, it is recommended to include a buffer zone of 200m around the site.
242. The second site can be smaller, of the order of 10-15 ha in extent. In addition, it is recommended to include a buffer zone of 200m around the site. Both buffer zones can be planted with trees for screening and environmental enhancement.
243. It is noted that the site at Yaseen Abad is located on land prone to flooding and, thus, appropriate engineering measures will need to be incorporated into the design of the site to provide necessary levels of flood protection in order to ensure uninterrupted operation of the facility.
244. The concept design of the facility at Yaseen Abad set out in the MSP report is not considered to be appropriate for the location, nor in consideration of the very large land areas required for the proposed treatment process (based solely on waste water stabilization using anaerobic and facultative ponds). An alternative process based on modern technology is recommended in order to reduce by a substantial amount the land area required and to achieve greater efficiency in treatment of the waste water prior to discharge.
245. It is proposed that the design of the waste water treatment plants is based on a circular approach by producing re-usable organics for agriculture and energy recovery from producing biogas. The suggested process is based on primary settling, a high loaded trickling filter and

KP-SISUG Peshawar City Development Plan – Draft Final Report
58
secondary settling. In this process organics and solids will be removed. Although almost no nitrogen and phosphorous will be removed the discharge will comply with national effluent standards.
246. Organic components in waste water are not only the major actor for pollution and health risks, these components also can be a source for producing sustainable energy. Sewage sludge produced in the waste water treatment plant can produce biogas when treated in a bio-digester. Sludge digestion is a common and reliable process, although it requires skilled operators. Waste water sludge can also be combined with source-separated organic municipal waste and animal manure to enhance biogas production. The biogas can be reused by bottling, in industrial processes, to produce electricity or injected in an existing gas network.
247. Digested sludge can be upgraded, with nutrient addition, as a fertilizer and soil improvement in agriculture. This can be achieved either using thickened liquid or as dried or composted sludge. Each process has its own economics depending on the scale and local revenues.
248. A detailed Feasibility Study will be required to asses all of the different potential options for site development and waste water treatment, in order to select the best options for prevailing site conditions.
E.2.1.3. Solid waste management
249. As noted in Section D.1.3 above, the management of municipal solid waste requires considerable improvement in service provision in the following areas:
• Collection capacity and operational capability; • Sanitary methods of disposal of municipal solid waste; and • Resource recovery, including diversion of waste from final disposal to land.
250. Suggested key priority interventions to achieve these objectives are set out below, based on the target service levels detailed in Table 21.
251. Although not measured directly (by weighbridge) the overall waste generation rate is estimated by WSSP to be approximately 0.45 kg per person per day (based on the resident city population), resulting in an estimated total generation of 1,020 tpd of municipal solid waste54 currently in the 45 UCs currently served by WSSP and PDA (excluding the Cantonment). In addition, WSSP estimates that construction and demolition waste amounts to approximately 120 tons per day. The per capita waste generation rate is considered to be reasonable and consistent with rates from other cities in Khyber Pakhtunkhwa and elsewhere in South and South-East Asia.
252. Projections of waste generation and collection up to 2035, based on the target service levels outlined in Table 21, are summarized on Table 31.
54 Municipal solid waste (MSW) is usually considered to comprise waste generated from households, commercial
and institutional premises, markets and public spaces, and street sweeping. Construction debris, agricultural waste, industrial waste, clinical waste and sludges are not normally considered to be part of MSW, notwithstanding that some of these may be collected and co-disposed with MSW.

KP-SISUG Peshawar City Development Plan – Draft Final Report
59
Table 31: Projected waste generation and collection (tons per day) Year Generation
Rate[3], [4] Existing Served UCs Future Urban UCs
kg/pcd Population [1]
Generation (tpd)
Collection (tpd)
Population [2]
Generation (tpd)
Collection (tpd)
2019 0.45/0.35 2,194,570 1,020 770 969,833 339 0
2025 0.50/0.40 2,994,783 1,497 1,273 1,291,707 517 129
2030 0.55/0.45 3,843,320 2,114 1,902 1,645,696 741 370
2035 0.60/0.50 5,008,469 3,005 2,855 2,103,034 1,052 789 Source: Calculations by the project consultant. Notes: [1] Population from Table 15. 2019 population excludes the Cantonment areas but includes Sufaid Dheri
UC. [2] Population derived from Table 18. Future urban UCs as per Map 20. Population excludes Sufaid Dheri UC which is included in the existing served UCs. [3] Per capita waste generation rate for currently served areas assumed to be 0.45 kg/pcd in 2019. For the currently unserved areas (rural UCs) per capita waste generation rate assumed to be 0.35 kg/pcd in 2019. [4] Per capita waste generation rates usually increase over time as societies become more affluent and with increasing levels of economic development. A nominal increase of 0.01 kg pcd has been assumed from 2020, representing an increase of approximately 2% per annum.
253. Given the rapid increases in projected waste quantities to be managed up to 2035 (Table 31), there is an urgent need for a detailed review and upgrade of the current solid waste management system in order to meet future demand for cost-effective, efficient and comprehensive services.
254. The manual handling of MSW should be minimized as far as practicable. Whilst there are some limitations in this regard with respect to primary collection, it is imperative that secondary collection and waste transfer is undertaken mechanically, on health, efficiency and financial considerations. Accordingly, it is proposed that the collection system is upgraded to maximize the mechanical loading of waste into collection vehicles from compatible containers. One potential scenario for the mix of equipment required is illustrated on Collection system improvements must be integrated with other elements of the solid waste management system, including transfer, treatment and disposal components.
255. None of the existing dump sites (Map 27) are considered suitable for continued use on a long-term basis from social, environmental and aesthetic perspectives. Accordingly, the identification and confirmation of an alternative site to be developed for a sanitary landfill is an urgent priority.
256. Table 32, based on the types of collection equipment currently employed by WSSP (Table 12 and Table 13).
257. Collection system improvements must be integrated with other elements of the solid waste management system, including transfer, treatment and disposal components.
258. None of the existing dump sites (Map 27) are considered suitable for continued use on a long-term basis from social, environmental and aesthetic perspectives. Accordingly, the identification and confirmation of an alternative site to be developed for a sanitary landfill is an urgent priority.
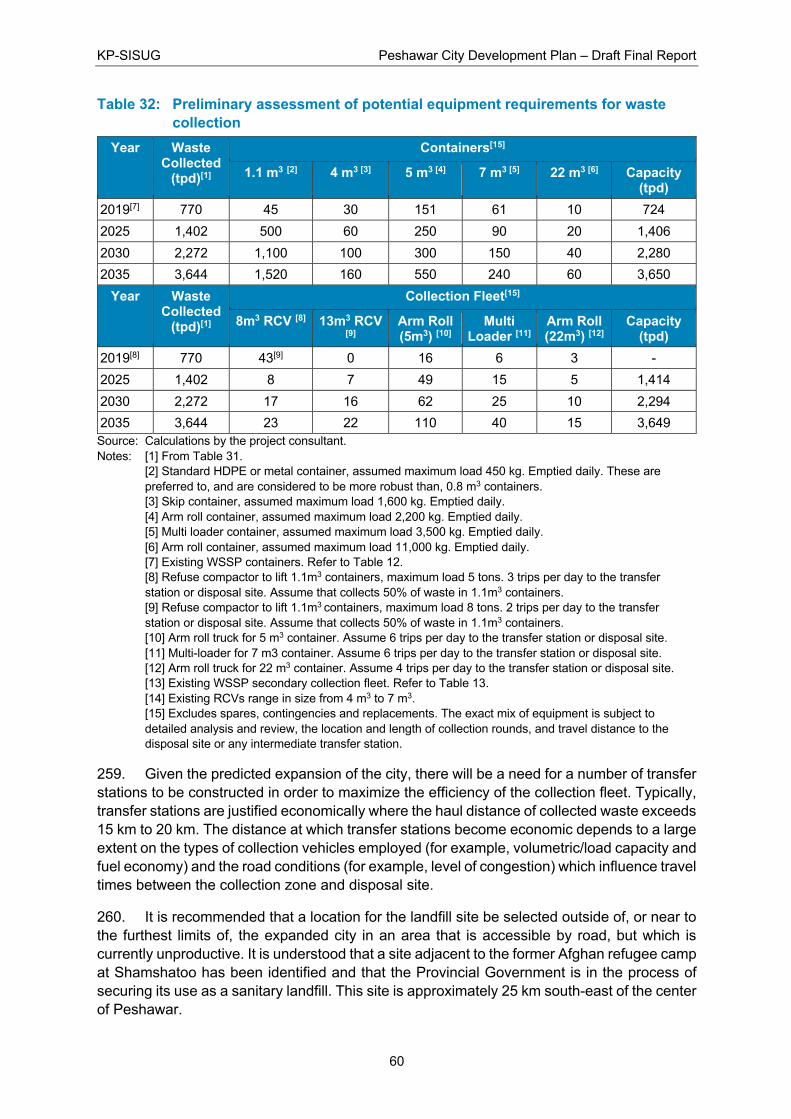
KP-SISUG Peshawar City Development Plan – Draft Final Report
60
Table 32: Preliminary assessment of potential equipment requirements for waste collection
Year Waste Collected
(tpd)[1]
Containers[15]
1.1 m3 [2] 4 m3 [3] 5 m3 [4] 7 m3 [5] 22 m3 [6] Capacity (tpd)
2019[7] 770 45 30 151 61 10 724
2025 1,402 500 60 250 90 20 1,406
2030 2,272 1,100 100 300 150 40 2,280
2035 3,644 1,520 160 550 240 60 3,650
Year Waste Collected
(tpd)[1]
Collection Fleet[15]
8m3 RCV [8] 13m3 RCV [9]
Arm Roll (5m3) [10]
Multi Loader [11]
Arm Roll (22m3) [12]
Capacity (tpd)
2019[8] 770 43[9] 0 16 6 3 -
2025 1,402 8 7 49 15 5 1,414
2030 2,272 17 16 62 25 10 2,294
2035 3,644 23 22 110 40 15 3,649 Source: Calculations by the project consultant. Notes: [1] From Table 31.
[2] Standard HDPE or metal container, assumed maximum load 450 kg. Emptied daily. These are preferred to, and are considered to be more robust than, 0.8 m3 containers. [3] Skip container, assumed maximum load 1,600 kg. Emptied daily. [4] Arm roll container, assumed maximum load 2,200 kg. Emptied daily. [5] Multi loader container, assumed maximum load 3,500 kg. Emptied daily. [6] Arm roll container, assumed maximum load 11,000 kg. Emptied daily. [7] Existing WSSP containers. Refer to Table 12. [8] Refuse compactor to lift 1.1m3 containers, maximum load 5 tons. 3 trips per day to the transfer station or disposal site. Assume that collects 50% of waste in 1.1m3 containers. [9] Refuse compactor to lift 1.1m3 containers, maximum load 8 tons. 2 trips per day to the transfer station or disposal site. Assume that collects 50% of waste in 1.1m3 containers. [10] Arm roll truck for 5 m3 container. Assume 6 trips per day to the transfer station or disposal site. [11] Multi-loader for 7 m3 container. Assume 6 trips per day to the transfer station or disposal site. [12] Arm roll truck for 22 m3 container. Assume 4 trips per day to the transfer station or disposal site. [13] Existing WSSP secondary collection fleet. Refer to Table 13. [14] Existing RCVs range in size from 4 m3 to 7 m3. [15] Excludes spares, contingencies and replacements. The exact mix of equipment is subject to detailed analysis and review, the location and length of collection rounds, and travel distance to the disposal site or any intermediate transfer station.
259. Given the predicted expansion of the city, there will be a need for a number of transfer stations to be constructed in order to maximize the efficiency of the collection fleet. Typically, transfer stations are justified economically where the haul distance of collected waste exceeds 15 km to 20 km. The distance at which transfer stations become economic depends to a large extent on the types of collection vehicles employed (for example, volumetric/load capacity and fuel economy) and the road conditions (for example, level of congestion) which influence travel times between the collection zone and disposal site.
260. It is recommended that a location for the landfill site be selected outside of, or near to the furthest limits of, the expanded city in an area that is accessible by road, but which is currently unproductive. It is understood that a site adjacent to the former Afghan refugee camp at Shamshatoo has been identified and that the Provincial Government is in the process of securing its use as a sanitary landfill. This site is approximately 25 km south-east of the center of Peshawar.

KP-SISUG Peshawar City Development Plan – Draft Final Report
61
261. Based on waste quantities (Table 31), and assuming only one site for waste management and disposal, it is proposed that four transfer stations will be required to serve the current urbanized areas, including the city center and the peri-urban margins of the city (Map 31). It is recommended that these should be located adjacent to the ring road so as avoid travel for transfer vehicles on the congested roads through the city center.
262. The transfer stations should be of modular design, capable of being expanded over time, with initial design capacities of 300 tons per day. The western and eastern transfer stations should be developed first in parallel with the construction of the landfill site.
263. The eastern transfer station is proposed to be developed at the site of the current dumping ground adjacent to the ring road (former sewage treatment plant site); it should have an ultimate design capacity of 1,000 tons per day. It is recommended that the sites of the transfers stations should also be of sufficient size to incorporate workshop facilities for vehicle maintenance and for overnight parking of collection vehicles.
264. A transfer station could also incorporate a materials recovery facility if a policy is adopted by WSSP to introduce segregation of waste at source as a means of promoting recycling and re-use of materials, and to divert waste from final disposal to land or other forms of treatment. If implemented, it is recommended that segregation should initially be limited to two categories only – dry, recyclable materials (paper, cardboard, glass, metals, plastic, etc.) and wet, general waste. Adoption of source segregation must be accompanied by an extensive information and education campaign over a sustained period of time, including monitoring of the effectiveness of the campaign and the success of source separation.
265. The implementation of segregation at source would require changes to the collection system (collection method and vehicle types) and the associated development of processing facilities and markets to absorb any source separated materials. In the absence of markets for the recovered materials there is no merit in segregating these, since they will ultimately need to be disposed. Accordingly, any decision to implement segregation at source must be founded on a comprehensive assessment of the demand for different recovered materials and detailed plans to develop the capacity to handle and absorb these materials and transform them into useful products.
266. Current recycling efforts are based on informal systems, undertaken primarily by waste pickers, hawkers and collection personnel who sell on recovered materials to wholesale buyers. Few details are currently available on the quantities and types of materials recovered.
267. Implementation of source segregation would effectively prohibit the use of compaction equipment for those dry materials destined for recycling or re-use, requiring different types of collection vehicles than assumed in Table 32.
268. Preliminary calculations of the required size of a landfill, based on the target service levels in Table 21 and projected waste quantities in Table 31, are summarized on Table 33. The calculations indicate the requirement for a site of approximately 75 ha (excluding space for support infrastructure), sufficient to accommodate approximately 11.3 million m3 of waste at an average waste thickness of 15 m. The site could accommodate the projected quantities of waste to be landfilled well beyond 2035, assuming the aggressive waste diversion targets can be met. Failure to meet the specified target for waste diversion, or by providing alternative treatment facilities for managing the waste, will result in the need for a larger site area with sufficient capacity for approximately 17.0 million m3 of void space by 2035.

KP-SISUG Peshawar City Development Plan – Draft Final Report
62
Table 33: Treatment and disposal requirements for municipal solid waste Year Waste
Collected[1] Waste
Landfilled[2] Void Space
Consumed[3] Cumulative Void
Space Consumed[4]
Waste Diverted from
Landfilling[2] tpd tpd m3/year m3 tpd
2019 770 0 0 0 0
2025 1,402 1,262 723,720 2,649,300 140
2030 2,272 1,590 912,490 6,837,360 682
2035 3,644 1,458 835,950 11,277,850 2,186 Source: Calculations by the project consultant. Notes: [1] From Table 31.
[2] Refer to Table 21. [3] Assumes in situ compacted density of 0.7 t/m3 and 10% provision for daily and intermediate cover, excluding final capping. [4] Assumes landfill begins receiving waste at the beginning of 2022.
269. The large quantities of municipal solid waste predicted in the years up to 2035 (more than 4 times the current quantity of waste collected), allied with the lack of developed sanitary landfill capacity waste, dictate that the progressive adoption of alternative treatment technologies, including, potentially, composting, anaerobic digestion and incineration or other forms of waste-to-energy processes, is a high priority. A sanitary landfill will be required regardless of alternative treatment technologies adopted; however, the size of the landfill required is related directly to the success, or otherwise, in developing and adopting alternative treatment technologies.
270. Preliminary analyses of waste composition conducted under MSP55 in 2013 indicated that approximately 65 percent of Peshawar’s residential MSW was organic in nature, of which 3/4th was classified as food waste. The inorganic waste had a large component of plastic materials, with relatively low percentages of recyclables (metals, glass, etc.) presumably because recyclables were diverted at source, or subsequently removed from waste stream by waste pickers at various points in the system. No information was provided on the physical and chemical parameters of the waste.
271. Composting of green waste is best undertaken in conjunction with composting of agricultural waste streams. Composting of municipal waste is not recommended unless it is restricted only to source-segregated clean green waste components (for example, tree and grass cuttings). Cross-contamination from other waste components renders ‘compost’ derived from mixed municipal waste unable to achieve certification as compost and, thus, it is unmarketable.
272. Development of anaerobic digestion of organic waste can be undertaken at the landfill site, potentially in conjunction with the digestion of sludges from the waste water plant, or on a local basis where significant quantities of organic waste are generated. Source-segregated food waste is best suited to this method of treatment.
273. In order to achieve the waste diversion targets, set out in Table 31, a sustained effort will be required to provide an alternative form of treatment for a large component of the waste
55 Government of Khyber Pakhtunkhwa. 2014. Planning and Engineering Services for Master Plan in Peshawar,
Khyber Pakhtunkhwa: Drinking Water, Sanitation/Storm Water and Solid Waste Services Master Plan Vol.-1 – Water Supply, Treatment and Distribution (Draft Main Report). Peshawar: Municipal Services Program, GoKP and USAID.

KP-SISUG Peshawar City Development Plan – Draft Final Report
63
stream. it is considered likely, therefore, that some form of waste combustion will need to be implemented.
274. It is not established yet that Peshawar’s municipal waste has sufficient calorific value to be able to be incinerated economically without extensive pre-treatment and sorting to produce refuse-derived fuel of the required characteristics. A comprehensive waste characterization study, including analysis of the physical and chemical parameters of the waste stream, is required as a first step in any assessment of the feasibility of implementing waste-to-energy facilities.
275. Thereafter, assuming the required properties can be achieved, step-wise investment will be required to develop one or more thermal treatment plants to achieve the desired levels of waste diversion. Sale of energy generated from thermal treatment can be used to offset partially the capital investment and the operation and maintenance costs.
E.2.1.4. Transportation
276. There are ongoing investments and construction of the BRT system in Peshawar. However, to maximize the potential of the new transportation mode, once completed, it is considered essential to develop integrated and intermodal transportation facilities.
277. It is proposed that a new integrated transport hub be developed in Chamkani, adjacent to the M1 Motorway and in close proximity to the start of the BRT line. This facility should serve as a focal point for all inter-city bus traffic, as well as be the location for a station on the Peshawar Circular railway should this latter project be constructed.
278. The intermodal transport hub should be designed to provide a seamless interchange for light vehicle, railway and bus traffic. It is understood that a site has been identified for a new bus terminal between the M1 motorway and GT Road at Chamkani (Map 31); it is recommended that this site be developed as an integrated transport facility.
279. The intermodal facility could also feature commercial developments, including a business center, and be provided with a purpose-built parking plaza.
280. It is recommended to construct parking plazas adjacent to the end/start point of all of the BRT branch lines in order to encourage the concept of ‘Park and Ride’ which will serve to reduce traffic congestion in the city center.
281. Inter-city bus transport should be prohibited from entering the city inside the Peshawar ring road to relieve traffic congestion and use of electric and hybrid vehicles should be promoted as public transport to reduce air pollution.
282. The current Peshawar ring road needs to be completed and provided with purpose-built intersections where it crosses all primary roads (either light controlled or roundabouts). Service roads for local traffic should be developed in parallel to the Ring Road to segregate local traffic from inter-city traffic.
283. Transport hubs in sub-urban nodes need to be established in order to facilitate connections between the city core and sub-urban nodes.
284. Key commercial streets in the city core may be pedestrianized in a further measure to ease traffic congestion and enhance the use and livability of the city core.

KP-SISUG Peshawar City Development Plan – Draft Final Report
64
E.2.1.5. Public spaces and green buffers
285. The overall objective is to limit urban sprawl and to promote a healthy and green living space, with between 15% and 20% of the urban area dedicated to public open space.
286. As a tourist city, the emphasis should be to develop and enhance the beauty of the city: (i) by reducing traffic congestion; (ii) greening and planting all main transportation arteries; and (iii) providing a series of well-maintained green spaces for public and recreational use.
287. Whilst Peshawar already has a relatively large number of parks (for example, Jinnah Park, Tatara Park and gardens at Shai Bagh and Wazir Bagh), further efforts should be targeted towards a large-scale integrated program of beautification that focuses on the following:
• All main roads, including GT Road, the Ring Road and the primary roads entering the city (e.g. Charsadda Road, Warsak Road, Kohat Road), including provision of improved pedestrian sidewalks, street furniture and well maintained and planted intersections and roundabouts;
• A network of parks and public spaces adjacent to all canals and drainage lines, once these have been cleaned up and the conveyance of sewerage and waste water captured by a functioning sewer system;
• Conversion of vacant land into public parks and public open spaces, particularly where such land has been used for other purposes (for example, disposal of municipal waste) and subsequently abandoned;
• Upgrading existing parks, which should be enhanced with facilities to promote recreational use, including the provision of sports facilities and smart, wireless communication networks; and
• Developing new public spaces, including cultural and entertainment facilities, in sub-urban nodes that are to be incorporated into the expanded urban limits.
288. Where feasible, 10 m wide corridors of land on the banks of irrigation canals and nullahs that pass through the city should be preserved for greening and beautification, including planting, and be integrated with storm water management systems designed to promote groundwater recharge. Over time the network of linear parks will be become connected, providing an extensive series of linear green spaces for walking and cycle paths.
289. In addition to the above, it is recommended that a series of green buffer zones be provided separating each of the main sub-urban nodes in which unregulated development is precluded (Map 30). The buffer zones can remain either under agricultural use or be used for specific recreational purposes, for example theme parks and horticultural centers, where the essentially rural character of the area is preserved, and development is limited to no more than 15% of the area of the buffer zone.
290. The current planning regulatory standards (KP Model Building By-laws, 2017) should be strictly enforced to provide 9 m2 space per person in residential areas and at least one neighborhood park of 0.4-1.2 ha at a spacing of 400-800 m.
E.2.1.6. Tourism
291. Peshawar has a significant potential as a tourist center. There are a large number of religious and cultural sites and buildings within the existing city although these are currently visited mainly by people from the local area.

KP-SISUG Peshawar City Development Plan – Draft Final Report
65
292. The potential for tourism is linked intimately to the security situation in the city and Khyber Pakhtunkhwa as a whole. Exploitation of that potential is predicated on sustained improvements in the overall security situation.
293. There is a need to preserve a number of historic buildings which otherwise may fall into disrepair or be destroyed during re-development of parts of the city. Peshawar has lost a significant number of historic buildings in the recent past. Accordingly, it is recommended that an assessment of historic and cultural sites be undertaken on an urgent basis as the first step in identifying any sites of outstanding significance that require to be conserved.
294. In order to fully exploit the tourism potential of Peshawar, a comprehensive plan to promote Peshawar and surrounding areas as a tourist destination should be developed. There is need to further develop the tourist attractions within and around the city, while a tourism information center may be set-up at the new inter-modal transport terminal and in the city center.
295. An integrated tourist development plan should consider Peshawar as part of the wider region, focusing on the wide range of attractions (cultural, archaeological and natural) within a 70 km radius of the city.
E.2.2. Sustainable service delivery
296. Sustainable service delivery of utilities is directly related to the degree to which a utility is able to recoup all operational, maintenance and capital expenditures from revenues. Only through consistent and secured financial coverage can a utility focus on its core tasks. The revenue may be generated from payments by users, or from payments (subsidies) from government.
297. Beyond the financial sustainability aspect there are of course other issues that bear directly on the ability of the utility to work sustainably, including the political context, access to suitable human resources and effective leadership. This section, particularly, focuses on the cost recovery and financing aspects of sustainability.
298. In 2010, the Water and Sanitation Program (WSP) of the World Bank, supported the Government of Khyber Pakhtunkhwa through a Technical Assistance on the utility reform agenda to make an informed decision to improve water and sanitation services in Peshawar. In January 2014, the utility company – Water and Sanitation Services Peshawar (WSSP) – was incorporated by Khyber Pakhtunkhwa Government and registered with the Securities and Exchange Commission of Pakistan (SECP) as a company limited by guarantee under S42 of the Companies Ordinance, 1984.
299. The WSSP, Pakistan’s first corporate governed and autonomous urban utility, was established for managing essential municipal services like water supply, wastewater and solid waste management transferred under a Services and Assets Management Agreement (SAMA) executed in September 2014 between Municipal Corporation (MC) Peshawar, Peshawar Development Authority (PDA) and University Town Committee (UTC) Peshawar. As a result of the SAMA all operational assets of MC, PDA and UTC relating to municipal services were handed over and their operational field staff seconded to WSSP for provision of integrated water supply, wastewater and solid waste management services within the four town municipal administrations of Peshawar. The Government of Khyber Pakhtunkhwa also agreed to provide financial support to compensate operational costs of WSSP and to continue

KP-SISUG Peshawar City Development Plan – Draft Final Report
66
to finance all existing and future activities, operations and obligations relating to the municipal services delivery in Peshawar.
300. The WSSP is by far the largest utility company for municipal services in Khyber Pakhtunkhwa with present staff strength of 52, other than field operational staff transferred from TMA, to look after the financial, operational and administrative needs at the Company level. The capacity building and training needs of the Company have been dealt with in Section E.2.4.
301. On the basis of the analysis of the WSSP Budget 2018-19 as presented by the WSSP and projections up to 2035, the current Resource Surplus for the WSSP is PKR 2.8 million and can result into a Resource Surplus of PKR 8,359.96 million by 2035. The results are summarized in Figure 5 and details are given in Table 41. These numbers are based upon the following assumptions:
• Proposed interventions have been estimated at PKR 201,186.71 million (US$ 2,011.87 million) based on the Action Plan proposed for the project. The Action Plan has been segmented into three timeframes i.e. Short Term 2021-25 with an estimated project cost of PKR 71,306.42 million (US$ 513.55 million), Medium Term 2026-30 with estimated project cost of PKR 60,663.57 million (US$ 436.90 million) and Long Term 2031-35 with estimated project cost of PKR 69,216.73 million (US$ 498.50 million). The construction costs of proposed interventions have been assumed at 10 percent in first year, 30 percent in second year, 30 percent in third year, 20 percent in fourth year and 10 percent in fifth year. O&M costs have been assumed at one percent of project cost from completion of construction period to be financed by Khyber Pakhtunkhwa government. The proposed project has been assumed to be financed by ADB @ 80% with Khyber Pakhtunkhwa share @ 20% as provincial transfer.
• Population and households have been assumed to cover only the urban and future urban population of the four TMAs of Peshawar excluding cantonments. Urban and future urban population and households have been assumed to grow in line with average growth rate of 4.24 percent and 4.13 percent respectively based on census 2017 and census 1998 given separately in Appendix 1.
• Tariff has been assumed based on average monthly household income of PKR 49,91056 and international standard water services tariff affordability rates of three to five percent (WB & UNDP), and expected subsidization by the Government of Khyber Pakhtunkhwa and TMAs for the ongoing and proposed development activities of WSSP. For the calculation of projected revenue from water services tariff affordability rate of four percent has been applied to the average monthly household income. Actual transfers by the TMAs or Government of Khyber Pakhtunkhwa to the WSSP may differ from projections and may reduce the projected surplus.57
• The projected revenues from TMAs and provincial government transfers have been assumed to increase in line with average growth rate in provincial receipts at 10 percent, non-development expenditure at 10 percent and development expenditure at 4 percent based on budget strategy paper 2018-19 forecasts.
56 Government of Pakistan. 2017. Household Integrated Economic Survey 2015-16. Islamabad: Pakistan
Bureau of Statistics, GoP. 57 Public Expenditure Review for Peshawar, prepared by the project consultant.

KP-SISUG Peshawar City Development Plan – Draft Final Report
67
Figure 5: Revenue and expenditure for WSSP vis-à-vis urban population
302. In terms of improving sustainability of the WSSP, there are several approaches that can be considered. These vary from conventional to more innovative approaches.58
E.2.2.1. Increasing revenue collection
303. Whereas currently user charges for domestic and commercial connections are collected on a “flat rate” basis in Peshawar, it is highly recommended to develop the water supply services by gradually installing meters at user level. This will provide a more equitable distribution of payments and will allow users to become more aware of the cost of using water. In the first instance the installation of pre-paid meters for all domestic and commercial connections is proposed to be paid out of the ADB funds. This would immediately have the following positive impact:
• Increase revenue collection from users to almost 100 percent; • Minimize non-payments; • Improve the utility’s cash flow (in terms of quantity and reliability); • Reduce overheads associated with debt collection; and • Allow more resources to be used for promoting efficient use of water and better solid
waste/sewerage practices.
304. If the installation of pre-paid meters is considered too complex or expensive at this stage of development of the services of the WSSP, regular meters may be considered. In this case it is proposed that billing of water use is done concurrently with the billing of services for wastewater, solid waste, and ideally also electricity. This would provide a strong incentive for payment, again thereby reducing the effort required for revenue collection by the WSSP. However, crucial for this is that the WSSP continues to provide and improve services in order
58 These approaches and options have been discussed with the management of the WSSP.
-
1
2
3
4
5
6
7
8
-
5,000
10,000
15,000
20,000
25,000
30,000
35,000
2019 2020 2025 2030 2035
Urb
an p
opul
atio
nM
illio
ns
PK
R in
mill
ions
Total Receipts Total Expenditure Urban Population

KP-SISUG Peshawar City Development Plan – Draft Final Report
68
to demonstrate to users that they are receiving good value for their money. It should be noted that the cost and installation of meters has not been included at this stage.
E.2.2.2. Reducing losses
305. Non-revenue water (NRW) is estimated between 35-45 percent in Peshawar59 as in all the utility companies. Considering the fact that each cubic meter lost, whether through non-recorded use, or through physical losses, is valuable in terms not only as a resource, but also as possible income for the WSSP. Sustainability of the WSSP is greatly enhanced through reduction of NRW.
306. Common approaches to reducing losses are through focused projects in which District Metered Areas (DMA) are delineated. These allow the utility to find and repair leaks and other network bottlenecks. Replacement of rotten pipes and speedy repairs of faulty tube wells are the common demands of the general public and trading community and major cause of nonpayment of water bills. Furthermore, a structured leakage detection and repair process as part of network management would further reduce losses and repair leaks on short notice. This would also improve relationships with users because disruptions to services will be reduced.
307. On the administrative side, the utility needs to be able to identify those users that are allowed to use water from the network but are not charged for this. These often include mosques, schools and other public buildings. From a policy perspective it may be acceptable not to charge these entities for water. This needs to be discounted in the overall pricing and accounting or charged on appropriate tariff because of the heavy usage involved.
E.2.2.3. Communication
308. Another vital approach to reducing losses is the introduction of communication measures to inform beneficiaries of WSSP services of possible disruptions, water quality issues, and most of all, the importance and relevance of water conservation. In the absence of a price initiative to conserve water (water is still relatively cheap), awareness of the scarcity of clean drinking water should be communicated.
309. In recent years, the development of the web and new media (websites, blogs, Facebook, Twitter, YouTube, etc.) has completely altered communication strategies, media tools and contents. The main features of this new media are freedom of choice, dialogue, and participation. This is the reason why the choice of adequate communication tools becomes more and more complex.
310. As already reported in the media, the WSSP has upgraded its website to bolster digital presence and provide consumers with easy access to information on WSSP services and adding round-the-clock operational complaint cell 1334. The WSSP has also set up a Community Liaison Cell (CLC) that conducts workshops, meetings with parents, teachers and religious scholars to create awareness regarding water conservation and sanitation. These are steps in the right direction.
59 Government of Khyber Pakhtunkhwa. 2017. Pakistan – Khyber Pakhtunkhwa Inclusive Urban Growth
Program: Final Report. Peshawar: Urban Policy & Planning Unit, Planning & Development Department, GoKP and Cities Development Initiative for Asia, ADB.
KP-SISUG Peshawar City Development Plan – Draft Final Report
69
311. Another difficult choice is the need to employ new narrative techniques. The digital revolution has enhanced the success of this new media, but social networks are the real turning point in the relationship between brands, communication, and people.
312. This means that a new consumer has shown up; someone who wants to contribute to communication by providing his/her own opinion and telling his/her own experience. Therefore, in order to reach their targets, social and marketing communication campaigns have had to adopt new formats within their narrative systems, providing plenty of information, but also enabling full interaction with consumers. For the WSSP, adopting these communication tools and improving the customer service experience will allow the company to introduce water conservation measures.
E.2.2.4. Alternative sources of income for the WSSP
313. To a certain extent there is a disincentive for the company to generate additional revenue. By generating revenue through other budget lines than the conventional ones, the WSSP could find that the TMA will reduce transfer payments. It is proposed that TMA transfers are linked to performance indicators such as number of users connected, collection rates and targets for minimizing leakages and waste. These indicators should be based on core activities and not take account of initiatives taken by WSSP to generate other revenue sources. This would mean the level of funding is more assured and the WSSP has an incentive to be innovative in generating revenue from by-products and other services. This is why a serious consideration of the benefits of developing alternative sources of energy as a by-product for sale may be relevant.
314. Reasonable revenue can be generated from a combination of biogas production from sewage, selling of treated waste (but nutrient-rich) water for agriculture, and use of sludge as fertilizer for agriculture. Probably this would constitute a small percent of the current expenses of the WSSP, but with some interventions and an entrepreneurial approach, the value of these products could increase and provide more revenue. It must also be remembered that this revenue would be very sustainable. With the expected expansion and population growth the production of these additional resources will only increase.
E.2.2.5. Regulatory capacity
315. In the paragraphs above many (financial) approaches to improving the sustainability of the WSSP have been proposed. However, there are also a number of important approaches to improve the environment in which the WSSP operates. These recommendations are relevant not only for the WSSP, but also for the other WSSCs in KHYBER PAKHTUNKHWA.
316. For the WSSP to be able to operate within a level playing field, and to provide checks and balances between the TMA, the WSSP and beneficiaries, a basic form of regulation is required. This means that at the provincial level, a water regulator has to be appointed who oversees the pricing, quality and timeliness of the services provided by the WSSP. The regulator can also be responsible for setting the performance indicators referred to above. This function cannot be fulfilled by the TMA, PDA or the MC as they are stakeholders in the WSSP, and also holds its purse strings. The regulator should be independent and equipped with appropriate resources (financial, expert and support staff, office space). Hence, it is strongly advised to designate this regulator through a legislative process. The regulator may use licensing, tariffs, benchmarking and performance, and encouraging competition and regulatory incentives as main tools to enhance its regulatory performance.

KP-SISUG Peshawar City Development Plan – Draft Final Report
70
E.2.3. Public sector governance and reforms
317. Addressing the challenges requires a review of mandates and capacities leading to political and technical decisions. Participation from provincial policy makers will be essential. The reform agenda should consider the following:
• Mandates: The principle of “One City, One Utility” needs to apply. According to its terms of reference, WSSP should become a citywide autonomous, corporate-governed utility. Peshawar needs effective integrated urban planning more than ever. The PDA has this crucial leadership role of ensuring holistic and sustainable development of Peshawar. It is not a utility and providing services for Hayatabad and University Town detracts from this important task. The review should confirm mandates, clarify overlaps, and agree on the way forward after WSSP capacity issues have been resolved.
• Capacities. There is need to confirm the bottlenecks that prevent satisfactory discharge of WSSP mandates, notably staff capacities, and agree on solutions to resolve these. No single solution can address the inadequate human resource capacities and non-performance in WSSP. Instead, there should be debate, consideration and decision on the best mix of solutions, including (a) legislation that makes it possible to offer performance-based career advancements for government staff, and golden handshakes for non-performers; (b) contract employment, especially of lower echelon staff, as many banks have done, (c) natural attrition of non-performing government staff, and (d) capacity development for staff with potential.
• Financial predictability and efficiency. While it is unrealistic to expect WSSP to become financially sustainable in the short to medium term, it is possible to have more predictable, better-planned financing strategies and greater efficiency than those in the current arrangement, which would help in moving towards the long-term target of financial sustainability. There is need to explore a range of measures and develop a tailored approach including the following:
o For greater efficiency in reaching the poor: (a) stratified tariffs for water services for different classes of customers, with cross-subsidization, (b) connection rather than consumption subsidies, (c) pre-paid meters (possibly at subsidized tariffs for the poor) which allow households to control their total expense on the service, and (d) a voucher system or targeted cash transfers for the poor, based on means testing.
o For greater financial predictability and more efficient planning: (a) the establishment of an endowment fund by the provincial government, (b) the provision of a single line grant through an annual transfer from the provincial government to WSSP, and (c) increased use of technology to improve efficiency, reduce unmetered water and illegal connections.
318. To garner political and public support for the decisions that ensue, such a reform agenda will have to be based upon robust data and transparency on losses, revenue and poverty levels. Targeting of poor households could be done through existing social welfare information systems.60 Calculating the transfers needed from the provincial government (whether through annual grant or endowment fund) will require robust data on the losses made
60 These include (but are not necessarily limited to) the National Socioeconomic Registry (NSER) of the
Government’s Benazir Income Support Programme, an approach that uses poverty scorecard surveys to identify eligible households through proxy means. Available from: https://www.pitb.gov.pk/bisp Accessed 30 September 2018.
KP-SISUG Peshawar City Development Plan – Draft Final Report
71
by WSSP, the losses that could be avoided, households’ willingness-to-pay, and the projection of revenue following new tariff structures and greater efficiency in operations.
319. Effective management information systems need to be established and strengthened. The administrative systems need to produce data robust enough for annual planning. Local surveys and censuses are periodically required, to produce disaggregated data. In addition, efficient and transparent complaint response mechanisms are required.
320. Capacity strengthening of the institutions responsible for planning, delivering, and management of urban services is a top priority. Appendix 5 provides further details on the context, challenges, opportunities and the way forward.
E.2.4. Capacity development
321. There is need for establishment and/or strengthening of strategic partnerships with existing institutes that can provide training courses with content, duration and assessment mechanism/certification tailored according to needs, mentioned in Table 22.61 The proposed institutions are mentioned below.
322. The Local Governance School is the training institute of the Local Government, Elections and Rural Development (LGE&RD) Department, Government of Khyber Pakhtunkhwa. It should be used for the training of local government staff and elected officials. The School has the mandate to (i) conduct pre-service and in-service training for all Local Council Service employees and elected representatives, (ii) coordinate all capacity building activities of local projects and development partners with the LGE&RD Department as well as with Tehsil Municipal Administrations (TMAs), and (iii) conduct trainings/orientations for other government officers on local governance and service delivery. However, the School lacks the required resources and facilities for training in the more technical sectors.
323. The National Institute of Management (NIM) Peshawar is part of the National School of Public Policy—a civil service training institution. The NIM is mandated with training of federal/provincial civil service officers and mandated to organize Mid-Career Management Courses and Senior Management Courses, as well as other courses in collaboration with national and international organizations.62 It has adequate academic and residential facilities.
324. The Pakistan Academy for Rural Development (PARD), Peshawar interacts with local, provincial and federal governments, researchers, academicians and non-governmental organizations working for rural development. Its functions include research and capacity building through training. The training modules offered include development planning, public administration, local government, rural development, education and communication, women in development, agricultural extension, social surveys and research, and rural sociology.63
325. National Institute of Urban Infrastructure Planning (NIUIP) is the first institute in Pakistan dedicated to urban infrastructure planning and engineering. NIUIP trains service professionals in key areas such as water supply, sanitation, waste management, land use,
61 This has been discussed with the management and instructional staff of the NIM and NIUIP, who have
agreed in principle to develop this further. 62 http://nim.gov.pk/index.php. 63 http://www.pard.gov.pk/course.html.

KP-SISUG Peshawar City Development Plan – Draft Final Report
72
transportation systems, energy and environment, and GIS Modelling.64 In procurement, NIUIP could engage specialists of the Khyber Pakhtunkhwa Public Procurement Regulatory Authority (KPPRA) for the relevant courses. NIUIP offers state of the art technologies and equipment, such as satellite imagery, simulation modelling for water supply and sewerage systems, GPS and remote sensing tools, digital plotters, fully-equipped GIS lab with GIS scanners and GIS software, statistical analysis software and other applications. The NIUIP would be willing to provide the facilities for training of staff from WSSCs, City Development Authorities and other project entities. Based on the identified needs, the NIUIP is able to design assessment criteria and obtain approval from its Board to issue formal competency-based certificates/diplomas for the course graduates. The NIUIP is based at the University of Engineering & Technology (UET) Peshawar.
E.2.5. Disaster and climate change risk management
326. For Peshawar the impacts of climate change are projected to be quite different than those in the other cities. The main impact of climate change projected in Peshawar is only a modest increase in summer days/heat waves for the short, medium and long term. However, it is important to remember that there are also significant projections for increases in temperatures in the Northern Areas of Pakistan. This has an impact on snow fall and snow melt. As a result, the flow of water through Peshawar from the NAs will be more continual (especially in winter) and may increase in spring to the point of posing flood risks when there are also heavy rains. This poses risks of damage to transport and drainage infrastructure as well as other infrastructure such as schools and other large buildings, as well as increases in landslides.
327. There are several implications for the city of Peshawar which need to be taken into consideration in light of these projected changes. There are four main impacts that can be derived from the urban resilience assessments and the climate change documentation available. These are:
i. Modest increase in drinking water demand due to increases in temperatures. ii. Periodic flooding (whether flash floods due to insufficient urban drainage, or
overflowing of river banks due to excessive run-off) iii. Increases in temperature in urban areas are compounded by few green spaces and
shading of roads using vegetation. iv. Increases in temperature in urban areas will require more cooling capacities or
adaptation of building codes to incorporate architectural modifications for cooling.
328. Peshawar is a large urban conglomerate with some green spaces, but also many unlined avenues and high-rise buildings.
329. The investment portfolio of the ADB for the KPCIP already includes several interventions that address the climate change impacts. In the table below these projects are set against the expected climate change impacts (Table 34).
64 NIUIP covers the following areas in its work: infrastructure and utilities planning, urban and regional planning,
urban hydrology and hydraulics, land use planning, urban transportation planning., urban environment and energy planning, water supply and sanitation, solid waste management, spatial modelling and GIS applications, infrastructure development and finance, utilities planning & service delivery, environmental laws, land use regulation and enforcement, census data analysis and policy making, urban housing, urban economics, real estate markets, urban development and design, and financing of infrastructure projects.
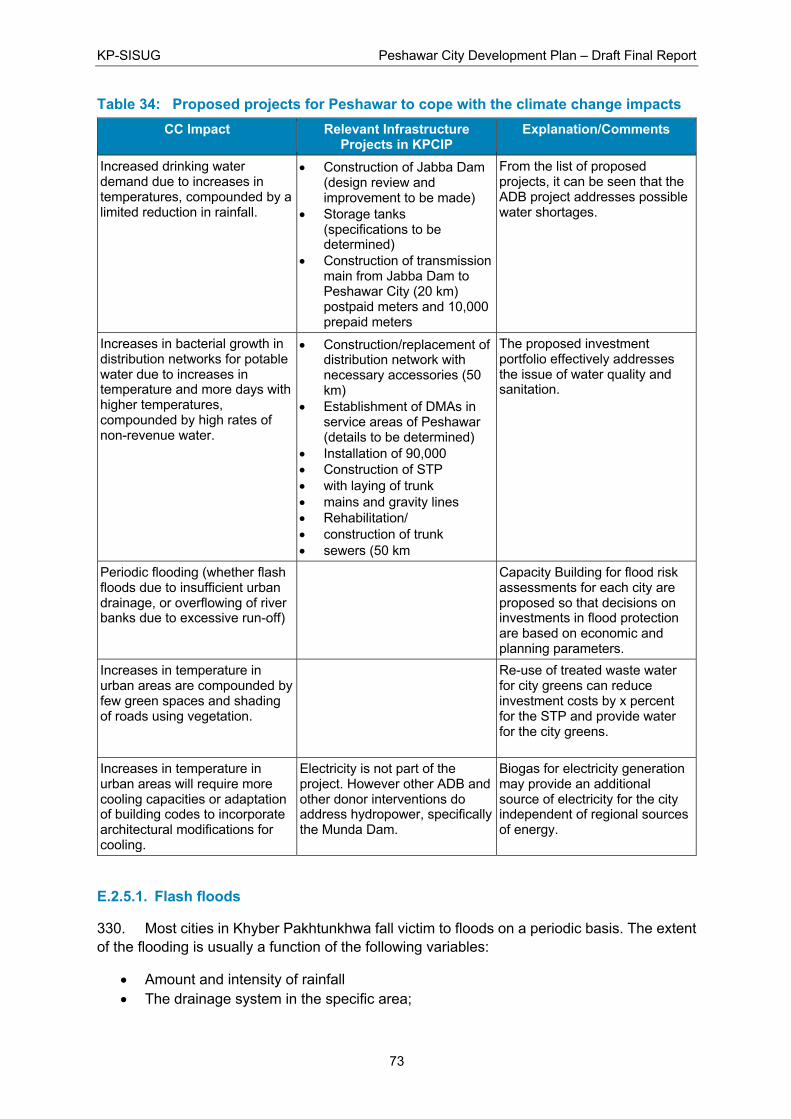
KP-SISUG Peshawar City Development Plan – Draft Final Report
73
Table 34: Proposed projects for Peshawar to cope with the climate change impacts CC Impact Relevant Infrastructure
Projects in KPCIP Explanation/Comments
Increased drinking water demand due to increases in temperatures, compounded by a limited reduction in rainfall.
• Construction of Jabba Dam (design review and improvement to be made)
• Storage tanks (specifications to be determined)
• Construction of transmission main from Jabba Dam to Peshawar City (20 km) postpaid meters and 10,000 prepaid meters
From the list of proposed projects, it can be seen that the ADB project addresses possible water shortages.
Increases in bacterial growth in distribution networks for potable water due to increases in temperature and more days with higher temperatures, compounded by high rates of non-revenue water.
• Construction/replacement of distribution network with necessary accessories (50 km)
• Establishment of DMAs in service areas of Peshawar (details to be determined)
• Installation of 90,000 • Construction of STP • with laying of trunk • mains and gravity lines • Rehabilitation/ • construction of trunk • sewers (50 km
The proposed investment portfolio effectively addresses the issue of water quality and sanitation.
Periodic flooding (whether flash floods due to insufficient urban drainage, or overflowing of river banks due to excessive run-off)
Capacity Building for flood risk assessments for each city are proposed so that decisions on investments in flood protection are based on economic and planning parameters.
Increases in temperature in urban areas are compounded by few green spaces and shading of roads using vegetation.
Re-use of treated waste water for city greens can reduce investment costs by x percent for the STP and provide water for the city greens.
Increases in temperature in urban areas will require more cooling capacities or adaptation of building codes to incorporate architectural modifications for cooling.
Electricity is not part of the project. However other ADB and other donor interventions do address hydropower, specifically the Munda Dam.
Biogas for electricity generation may provide an additional source of electricity for the city independent of regional sources of energy.
E.2.5.1. Flash floods
330. Most cities in Khyber Pakhtunkhwa fall victim to floods on a periodic basis. The extent of the flooding is usually a function of the following variables:
• Amount and intensity of rainfall • The drainage system in the specific area;

KP-SISUG Peshawar City Development Plan – Draft Final Report
74
• The extent to which drains and culverts have been maintained and cleaned; • The extent to which excess water can be absorbed by topsoil; and • Siting, design and construction of roads, bridges and buildings.
331. Peshawar is not surrounded by mountains that are close to the city. In fact, the city lies in a flat area with drainage towards the south-east. Nonetheless there are several river basins that converge around Peshawar, such as the Kabul and Swat River Basins. As a result, it still has considerable run-off to deal with during periods of heavy rain. Peshawar is one of the cities that falls in the red zone in terms of flood risk.65 On the other hand anecdotal evidence suggests that the inner city of Peshawar has never flooded, but only outlying areas, and in many cases due to faulty designs or buildings in flood plains. Nonetheless, these issues will need to be addressed as the city expands.
332. There are various ways and means to address these floods in the context of urban planning and operations. However, some of these measures are costly and may have impacts on urban design and landscaping. It is therefore important for a city like Peshawar to plan the risks of floods to be able to assess whether the costs and impacts are socially and financially acceptable. This entails a flood risk planning exercise which would result in flood risk mapping for Peshawar. Since climate change will bring into play more unpredictable weather patterns, a basic flood mapping exercise and the resulting investments in diversions, culverts and other protection measures will be effective.
E.3. Action plan 333. The MSP included a program for proposed investments in municipal services (water supply, sanitation and solid waste) in the period up to 2032. The proposed investments with respect to water supply included the following:
• Rehabilitation of tube wells in their project area (732, alternative I or 178, alternative II);
• Installation of new tube wells (245, alternative I or 689, alternative II); • Repair and rehabilitation of 62 overhead storage tanks (both alternatives); • Construction of 567 new overhead storage tanks (both alternatives); • Rehabilitation of Barra Water Treatment Plan (both alternatives); • Replacement and/or upgrading of 315 km of damaged and leaking water pipes (both
alternatives); • Installation of 1,777 km of new water supply pipes (both alternatives); • Installation of 274 km of grid transmission pipes (alternative II); and • SCADA (both alternatives).
334. With respect to sanitation, the proposed MSP investment program included the following:
• The reconfiguration of the drainage network into four sanitary/drainage Districts, with wastewater flows directed into a separate waste water treatment plant for each District;
• Separation of storm water drainage from waste water drainage; • Development of three new waste water treatment plants and the abandonment of
existing plants at Charsadda Road and Warsak Road. Under alternative I, the waste 65 Government of Khyber Pakhtunkhwa. 2014. Road Map for Disaster Risk Management 2014-2019. Peshawar:
Provincial Disaster Management Authority, GoKP.

KP-SISUG Peshawar City Development Plan – Draft Final Report
75
water treatment plant at Hazar Khawani66 was proposed to be extended, whilst under alternative II it was proposed to be abandoned and flows directed to the one of the new proposed sites (at Yaseen Abad); and
• Other proposed works included cleaning and repair of existing drains, lining of unlined drains, covering of secondary and tertiary drains with inlets for storm water, construction of new tertiary drains as required and removal of encroachments along the drains.
335. With respect to solid waste management, the proposed MSP investment program included the following:
• Provision of new (replacement) equipment for primary and secondary collection, including new containers and collection vehicles;
• Development of two transfer stations (locations, dimensions and capacity not specified); and
• Development of two sites for the treatment and disposal of collected waste, one site at Ahmad Khel, a former brickworks of 11 ha, located immediately adjacent to the Barra River and Warsak Gravity Canal (south of the ring road) and a second potential site near Sheikh Yaseen Town in Shai Bala UC, extending up to 46 ha, north of Regi Lama Town on the north side of Peshawar.
336. Some works and equipment have been funded under MSP; however, the extent of the works completed to date is not clear, nor are details available for the balance of the works to be funded under MSP. In addition, it is understood that the Swiss Agency for Development and Cooperation (SDC) has recently started to support WSSP in updating the Master Plan for Peshawar (2019-2048).
337. Accordingly, the Action Plan identifies all of the required and investments in the UCs in the future expanded city limits, whether or not such investments might be funded under MSP or other sources of finance in the future.
338. The action plan, with an indicative cost of US$ 1,565.45 million, has been segmented into three timeframes:
i. Short-term: from now to 2025 covering mostly the currently designated urban areas (US$ 545.80 million);
ii. Medium-term: from now to 2030 covering almost all of currently designated urban areas and part of the future urban areas (US$ 488.65 million); and
iii. Long-term: from now to 2035 covering almost entire expanded urban area (US$ 531.00 million).
66 It should be noted that the site at Hazar Kwanai located adjacent to the ring road has been infilled by
municipal solid waste and no longer is capable of being used for waste water treatment.

KP-SISUG Peshawar City Development Plan – Draft Final Report
76
E.3.1. Short-term (up to 2025)
Component Strategic Action Time-based Action by 2025 Estimated Cost (million USD)
Intended Outcome
Land Use Planning
Consolidate development around the existing urban and sub-urban nodes
• Upgrade and finalize Land Use Plan for Peshawar City • Prepare strategic development guidelines and policies • Prepare zoning plans for all settlements within 10 km of
the current city limits of Peshawar • Delimit green buffer zones
1.00 • Regularize and control development. Eliminate further unplanned urban sprawl.
• Designate development areas and provide a basis for planning and optimizing service provision.
Prepare one Sustainable Integrated Development Plan and update the Municipal Services Masterplan.
2.50 Identify areas that should be preserved from future development, including aquifer recharge zones and groundwater abstraction zones
Prepare an Urban Renewal Plan for the whole area along the BRT line and 400m width distance from both sides.
1.25 Increase urban density along the BRT line to 18,000–24,000 pp/km2
Planning guidelines Prepare strategic water sensitive urban guidelines for Green Street Retrofit and sub-district rainwater capture for large residential areas and developments.
0.50 More efficient use of water resources and initiation of a sponge-city type concept to protect groundwater resources
Safe Water Supply
Upgrade water production capacity, availability and water quality
Hydrological study to confirm supplementary sources of surface water sources, to augment existing supplies.
0.50 Confirm additional sources to increase the contribution of surface water from 8% to 50% of total progressively over time For viable/feasible sources undertake detailed engineering
design of intake works and transmission and distribution system.
2.00
Rehabilitate Barra Water Treatment Plant to design capacity 2.00 Hydrogeological study to confirm locations, numbers and spacing of new tube wells in well fields north of Peshawar
0.75 Enhance groundwater production capacity to 740,000m3 per day
Construction of 757 new tube wells to meet demand up to 2025
33.55
Upgrade, including repair as required, 461 No. tube wells, to a capacity of 67.5 m3/h (15,000 gallons/h) each
12.50

KP-SISUG Peshawar City Development Plan – Draft Final Report
77
Component Strategic Action Time-based Action by 2025 Estimated Cost (million USD)
Intended Outcome
Provision of Motor Control Units (MCUs), bulk flow meters and pressure gauges in all functioning tube wells (maximum 1,218 No.)
6.10
Provision of disinfection units at all functioning tube well facilities (maximum 1,218 No.)
18.00
Upgrade existing storage system
Construction of 120 new OHRs 14.40 Provision of storage reservoirs with disinfection units will provide sustained access to clean water for approximately 387,000 households
General repair and maintenance of 85 No. existing storage tanks
4.25
Provision of disinfection units in 205 No. storage tanks 6.15 Construction/ replacement and extension of transmission and water distribution pipelines
Repair or replacement of 1,670 km existing water supply pipelines by PE pipes, including connections to individual properties
83.50 Provision of transmission and distribution pipes will ensure sustained supply of clean water to approximately 387,000 households Provision of new distribution network to the length of approx.
1,110 km with necessary accessories for unserved areas 55.50
Construction of a minimum of 4 No. pump stations 2.00 Establishment of District Metered Areas (DMAs) and implementation of Non- Revenue Water (NRW) reduction program
Implement NRW reduction program in 6 pilot DMAs including provision of new property and water meter connections
2.40
Metered customer connections
Increase the number of metered connections to 350,000 households by 2025 (90% of served households)
3.50 Postpaid and prepaid meters will ensure revenue collection from approximately 350,000 households

KP-SISUG Peshawar City Development Plan – Draft Final Report
78
Component Strategic Action Time-based Action by 2025 Estimated Cost (million USD)
Intended Outcome
Sewage and drainage management
Provision of sewer system
• Prepare detailed design of sewage collection system/network, including hydraulic analysis, flow capacities and sizing of sewers
• Construction and/or repair and upgrade, of approximately 1,136 km of sewers, including trunk, secondary and tertiary sewage lines
• Construction of pumping stations, as required.
120.00 The first step in sewerage treatment is to convey and treat sewage of about half of the existing urban UCs. It will benefit about 1.41 million people in the area.
Development of Yaseen Abad STP (Phase 1)
• Development of treatment system based on the principles of circularity for resource recovery and re-use
• Detailed design of treatment process and site layout, including infrastructure and support utilities.
• Provision for sludge digestion and biogas production. • Pump station for effluent discharge.
45.00 Dry weather flow of the STP is estimated at 140,000 m3/d.
Rehabilitation of waste water treatment plant on Warsak Road
• Development of treatment system based on the principles of circularity for resource recovery and re-use
• Detailed design of treatment process and site layout, including infrastructure and support utilities.
• Provision for sludge digestion and biogas production. • Pump station for effluent discharge.
25.00 Dry weather flow of the STP is estimated at 70,000 m3/d.
Drainage system improvements
• Conduct flood risk mapping and planning study • Prepare flood management plan and identify necessary
works for investment and upgrading • Develop concept of sponge city for Peshawar – identify
recharge areas and design relevant works • Pilot the use of bio-swales and designed gardens that
absorb and filter storm water in residential areas
3.50 • 10% reduction in flood risk and extent and frequency of urban flash flooding
• Recharge of groundwater aquifer
Maintenance of sewerage and existing drainage systems
Acquisition of various items, including suction unit, high pressure jetter, venching machine, water bowser, combined sucker & jetting unit, de-silting grab, high pressure wash module and mobile pump/dewatering sets
4.50 Preventative maintenance of sewerage and drainage network

KP-SISUG Peshawar City Development Plan – Draft Final Report
79
Component Strategic Action Time-based Action by 2025 Estimated Cost (million USD)
Intended Outcome
Procurement of portable equipment for health & safety and environmental monitoring
Acquisition of gas monitoring equipment and water quality monitoring equipment
0.20 Safe operation for workers
Solid waste management
Extension of service coverage
Prepare plan for extension of collection system to peri-urban areas (4 rural UCs – for example, Regi, Achini Bala, Sarband and Chamkani))
1.00 Collection service extended to 100% of the current urbanized area and also to 4 adjoining rural UCs.
Improvement of solid waste collection system
• Acquisition of equipment for primary collection (for example, push/hand carts and mini tippers)
• Acquisition of equipment for mechanized (secondary) collection (compactor trucks (15 No.), hook lift/arm roll trucks (54 No.) and multi-loader (15 No.).
• Acquisition of mechanized street sweeper (2 No.) and road washer (2 No.).
• Acquisition of miscellaneous mobile plant including dump trucks (4 No.) and rubber- tired excavators (2 No.).
• Acquisition of Industry-standard 240 L wheelie bins (5,000 No.), 1,100 L containers (500 No.) and larger capacity (4, 5, 7 & 22 m3) metal lidded containers (360 No.)
• Construction of maintenance garage and overnight parking area for collection vehicles
20.00 • Hygienic, efficient and cost-effective system for the collection of municipal solid waste throughout the urbanized area serviced by WSS.
• Provide capacity to collect 1,400 tpd of MSW by 2025
Assessment of waste transfer system
• Undertake assessment of transfer system requirements • Locate and acquire sites for 4 No. transfer stations. • Conduct IEEs for each selected site
3.00 Improve efficiency of waste collection system and facilitate materials recovery prior to transfer to landfill site
Construct transfer stations and acquire transfer fleet
• Construct three transfer stations, one at Hazar Khawani (600 tpd), one for the northern part of Peshawar (300 tpd) and one for Hayatabad area (500 tpd).
• Acquire transfer vehicles – 6 slave vehicles and containers
• Develop provision for small materials recovery facility at the transfer station for dry recyclable materials
9.00 Provide capability to handle future quantities of waste collected in Peshawar

KP-SISUG Peshawar City Development Plan – Draft Final Report
80
Component Strategic Action Time-based Action by 2025 Estimated Cost (million USD)
Intended Outcome
Treatment and disposal of waste
• Identify, acquire and confirm site for sanitary landfill. • Conduct topographic, geological, hydrogeological and
hydrological surveys to confirm site suitability. • Undertake Environmental Impact Assessment. • Prepare detailed engineering design of landfill site. • Construct support facilities (office, weighbridge,
workshop) and site infrastructure (e.g. perimeter road) • Develop Phase 1 to provide at least 4 years void capacity • Procurement of operating equipment
18.50 • Provide hygienic and secure disposal of all collected municipal solid waste
• Develop new sanitary landfill site and commence operations by end of 2022
• Undertake waste composition and characterization analysis to assess viability of alternative treatment
• Undertake market assessment for recovered materials and products
• Assessment requirements for segregation at source • Prepare closure and rehabilitation plan for existing sites • Re-profile, cap, close and vegetate existing dump sites • Install leachate control and treatment measures and
passive gas vents at closed dump sites • Monitor emissions from closed dump sites quarterly
5.50 • Determine which alternative forms of treatment may be appropriate for diverting waste from landfilling
• Close and successfully rehabilitate existing dump sites by 2025
Information, education and communications program
IEC program engaging multiple communication channels 1.50 IEC program to elevate community awareness on waste minimization, reuse and recycling as well as for anti-littering campaigns

KP-SISUG Peshawar City Development Plan – Draft Final Report
81
Component Strategic Action Time-based Action by 2025 Estimated Cost (million USD)
Intended Outcome
Transportation system
Intermodal transport hub
• Identify and acquire new site for bus terminal in proximity to M1 motorway interchange
• Conduct traffic study to verify traffic flows, sources of traffic, requirements for a new public transportation system and the location of bus stops
• Undertake detailed design of the transport hub • Construct transport hub with interchange facilities for
buses, railway, BRT and private vehicles, including parking
• Develop commercial facilities for lease at the transport hub
• Undertake design of new public transport system • Promote the use of electric and hybrid vehicles to reduce
air pollution
8.50 New public transportation system ready for implementation.
Parking Plazas Identify and acquire sites for parking plazas adjacent to the terminal points of the BRT system
6.00 Minimum of 3 sites for parking plazas acquired
Design and construct at least 2 parking plazas at the most frequently travelled terminal points on the BRT system
6.00 Minimum of 2 parking plazas constructed
Public Spaces and Green Buffers
Upgrade and develop green infrastructure and public open space
• Design and implement Peshawar beautification project • Increase the area of designated public spaces to a
minimum of 5% of the urban area • Re-development of public open spaces to promote
recreational use and to integrate with storm water management systems
• Adopt current planning regulatory standards (KP Model Building By-Laws, 2017) by providing 9 m2 per person in residential areas and one neighborhoods park of 0.4-1.2 ha at a spacing of 400-800m.
10.00 • Preserve green spaces in Peshawar and preclude further urban sprawl.
• Increase area of green space in the city.

KP-SISUG Peshawar City Development Plan – Draft Final Report
82
Component Strategic Action Time-based Action by 2025 Estimated Cost (million USD)
Intended Outcome
Tourism Promote Peshawar as a tourist destination
• Develop plans to promote Peshawar and surrounding areas as a tourist destination
• Identify options for providing new recreational and entertainment venues and facilities, including theme parks and amusement parks
• Prepare assessment of cultural heritage sites to be preserved/conserved and renovated
• Enhance standards of tourist accommodation to make stop-overs in the city more attractive – specify and apply minimum standards
• Provide tourist information office in the city
1.75 • Increase tourist arrivals in the city by 5%
• Preparation of a conservation plan
• Increase length of stay in the city by a minimum of one day per visit.
Sustainable service delivery
Enhance revenue generation and collection [costs are already covered above]
• Introduce circularity to waste water management processes – use of partially treated effluent for irrigation and production of biogas from digestion of sludge
• User charge based on consumption rather than flat rate fee
• Regular review of charges to reflect actual operational costs and investments made to improve service delivery
0.00
Water conservation and minimization
• Reduce NRW through replacement of leaking pipes • Reduce illegal connections by completing inventory of
assets • Extensive communication program highlighting measures
to conserve water, reduce waste generation and enhance waste diversion (material recovery and re-use).
2.00
Governance and Capacity Building
Promoting the capacity of WSSP to deliver urban services
• Capacity strengthening of the institutions responsible for planning, delivering, and management of urban services
• Introduction of performance-based career advancement, with regular performance reviews
• Retirement of non-performing staff. • Introduction of effective management information systems • Establishing and/or strengthening strategic partnerships to
provide training
2.50
Total for short-term action plan 545.80

KP-SISUG Peshawar City Development Plan – Draft Final Report
83
E.3.2. Medium-term (up to 2030)
Component Strategic Action Time-based Action by 2030 Estimated Cost (million USD)
Intended Outcome
Land Use Planning
Consolidate development around the existing urban and sub-urban nodes
Consolidate the urban growth by building green buffer areas like urban parks and Special Planning Zones as identified in the city plan for 8% of the total urban area. These areas are located on the outer side of the northern bypass and Inquilaab Road
5.00 Regularize and control development. Eliminate further unplanned urban sprawl.
• Design and support the creation of new sub-urban nodes located on Landai Bala, Alzai & Badaber, Soraizai Payan, Chamkani, Bakhshi Larama, and Faqeer Kalay.
• Revise the land use plan supporting the urban and infrastructure growth around these urban nodes.
• Prepare a local development plan of maximum 16 ha for the development of core areas in each of the sub-urban nodes.
2.00 Designate development areas and provide a basis for planning and optimizing service provision.
Implement planning guidelines for efficient use of rainwater
Ensure enforcement of measures to promote sponge city (see measures below for drainage)
0.50
Safe Water Supply
Upgrade water production capacity, storage capacity and water quality
Upgrade Barra Water Treatment Plant to increase design capacity to 50,000 m3/day
4.00 Enhance surface water production capacity to 226,000m3 per day
Initiate supply from Jabba Dam 0.00 Construct 45 new OHRs, including disinfection facilities 6.00 General repair and maintenance of 204 No. existing storage tanks
10.00
Construction/ replacement and
Provision of new distribution network to the length of approx. 1,240 km with necessary accessories for unserved areas
62.00 Provision and replacement transmission and distribution pipes
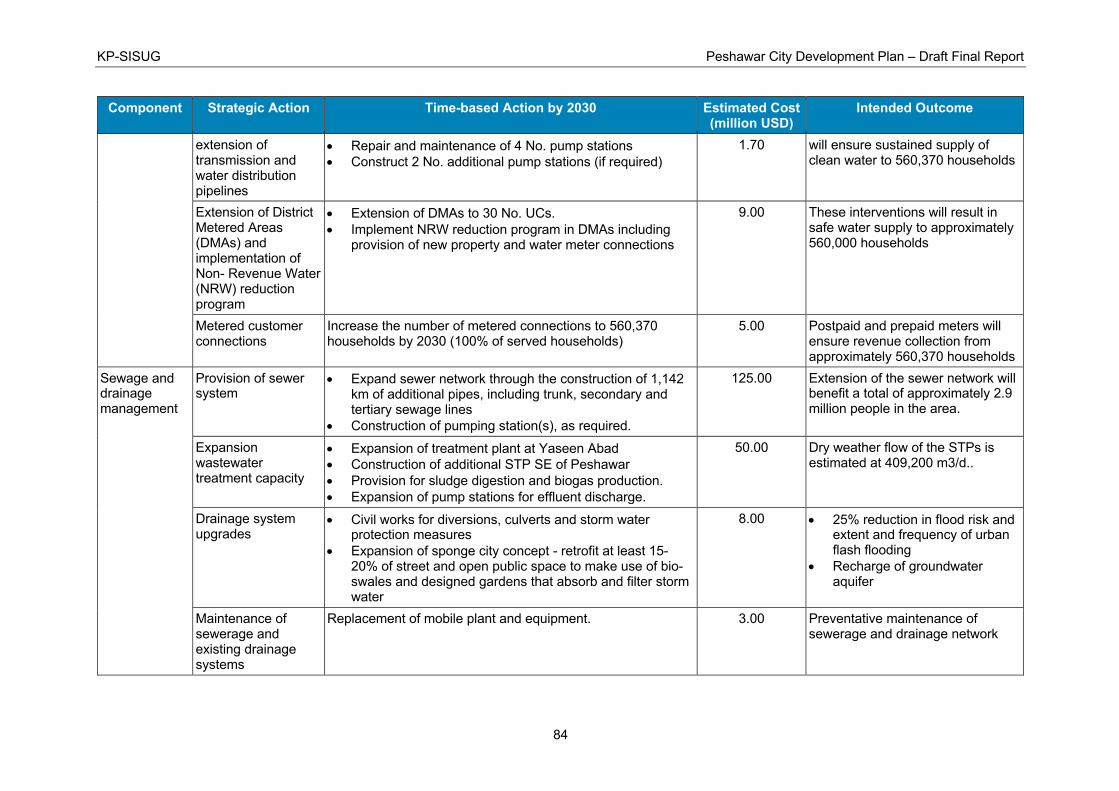
KP-SISUG Peshawar City Development Plan – Draft Final Report
84
Component Strategic Action Time-based Action by 2030 Estimated Cost (million USD)
Intended Outcome
extension of transmission and water distribution pipelines
• Repair and maintenance of 4 No. pump stations • Construct 2 No. additional pump stations (if required)
1.70 will ensure sustained supply of clean water to 560,370 households
Extension of District Metered Areas (DMAs) and implementation of Non- Revenue Water (NRW) reduction program
• Extension of DMAs to 30 No. UCs. • Implement NRW reduction program in DMAs including
provision of new property and water meter connections
9.00 These interventions will result in safe water supply to approximately 560,000 households
Metered customer connections
Increase the number of metered connections to 560,370 households by 2030 (100% of served households)
5.00 Postpaid and prepaid meters will ensure revenue collection from approximately 560,370 households
Sewage and drainage management
Provision of sewer system
• Expand sewer network through the construction of 1,142 km of additional pipes, including trunk, secondary and tertiary sewage lines
• Construction of pumping station(s), as required.
125.00 Extension of the sewer network will benefit a total of approximately 2.9 million people in the area.
Expansion wastewater treatment capacity
• Expansion of treatment plant at Yaseen Abad • Construction of additional STP SE of Peshawar • Provision for sludge digestion and biogas production. • Expansion of pump stations for effluent discharge.
50.00 Dry weather flow of the STPs is estimated at 409,200 m3/d..
Drainage system upgrades
• Civil works for diversions, culverts and storm water protection measures
• Expansion of sponge city concept - retrofit at least 15-20% of street and open public space to make use of bio-swales and designed gardens that absorb and filter storm water
8.00 • 25% reduction in flood risk and extent and frequency of urban flash flooding
• Recharge of groundwater aquifer
Maintenance of sewerage and existing drainage systems
Replacement of mobile plant and equipment. 3.00 Preventative maintenance of sewerage and drainage network

KP-SISUG Peshawar City Development Plan – Draft Final Report
85
Component Strategic Action Time-based Action by 2030 Estimated Cost (million USD)
Intended Outcome
Procurement of portable equipment for health & safety and environmental monitoring
Acquisition of gas monitoring equipment and water quality monitoring equipment
0.20 Safe operation for workers
Solid waste management
Extension of service coverage
• Extension of primary and secondary waste collection to a further 5 rural UCs in the expanded urban limits.
• Takeover of responsibility for waste management in Cantonment area
0.50 Collection service extended to 50% of the rural UCs in the future urbanized area
Improvement of solid waste collection system
• Acquisition of additional equipment for primary collection (for example, push/hand carts and mini tippers) in expanded service area and replacement of existing equipment
• Replacement of, and acquisition of, equipment for mechanized (secondary) collection (compactor trucks (18 No.), hook lift/arm roll trucks (18 No.) and multi-loader (10 No.).
• Replacement of mechanized street sweeper (1 No.) and road washer (1 No.).
• Replacement of miscellaneous mobile plant including dump trucks (2 No.) and rubber- tired excavators (1 No.).
• Acquisition of Industry-standard 240 L wheelie bins (10,000 No.), 1,100 L containers (600 No.) and larger capacity (4, 5, 7 & 22 m3) metal lidded containers (120 No.)
• Replacement of any damaged/unusable containers • Introduce segregation at source for 25% of the served
area.
8.00 • Hygienic, efficient and cost-effective system for the collection of municipal solid waste throughout the urbanized area serviced by WSS.
• Provide capacity to collect 2,300 tpd of MSW by 2030

KP-SISUG Peshawar City Development Plan – Draft Final Report
86
Component Strategic Action Time-based Action by 2030 Estimated Cost (million USD)
Intended Outcome
Development of waste transfer system
• Construct additional transfer station with an initial capacity of 300 tpd. Ensure modular design to cater for expansion to 500 tpd as required
• Acquire additional transfer vehicles – 2 slave vehicles and containers
• Develop provision for small materials recovery facility at the transfer station for dry recyclable materials
3.00 Improve efficiency of waste collection system and facilitate materials recovery prior to transfer to landfill site
Treatment and disposal of waste
• Develop Phase 2 to provide at least 6 years void capacity • Replacement of operating equipment
5.50 Provide hygienic and secure disposal of all collected municipal solid waste
• Monitor waste composition and characterization at least yearly
• Develop treatment plant for diverting organic waste from landfill and for producing biogas and soil conditioner.
• Develop thermal treatment plant of 800 tpd capacity
123.25 Divert at least 25% of waste from being landfilled
Information, education and communications program
Continue IEC program engaging multiple communication channels
0.50 IEC program to elevate community awareness on waste minimization, reuse and recycling as well as for anti-littering campaigns
Transportation system
Implement new public transportation system
• Construct new bus terminal adjacent to BRT end point in Hayatabad
• Construct 2 additional parking plazas on the north and southern side of the city (e.g. Warsak Road, Kohat Road)
• Prohibit inter-city buses from entering the city • Implement use of hybrid and electric vehicles for intra-city
public transportation • Construct passenger stops and shelters along the main
transportation routes • Pedestrianize key commercial streets in the city core
18.00 • Reduce traffic congestion within the city
• Improve overall air quality in the city center
Intermodal transport hub
• Expand the capacity of the intermodal transport hub at Chamkani
• Connect transport hub to site of the new airport
5.00

KP-SISUG Peshawar City Development Plan – Draft Final Report
87
Component Strategic Action Time-based Action by 2030 Estimated Cost (million USD)
Intended Outcome
Improve street lighting
Adopt solar powered, energy efficient lighting 6.50
Public Spaces and Green Buffers
Upgrade and develop green infrastructure and public open space
• Increase the area of designated public spaces to a minimum of 12.5% of the urban area
• Re-development of public open spaces to promote recreational use and to integrate with storm water management systems
• Begin to link green public spaces by green corridors
15.00 • Preserve green spaces in Peshawar and preclude further urban sprawl.
• Increase area of green space in the city.
Tourism Promote Peshawar as a tourist destination
• Implement plans to promote Peshawar and surrounding areas as a tourist destination.
• Undertake conservation program for historic sites • Provide additional 5-star tourist accommodation within the
city
7.50 • Increase tourist arrivals in the city by a further 10%
• Increase length of stay in the city by a minimum of three days per visit
Sustainable service delivery
Enhance revenue generation and collection
• User charge based on consumption rather than flat rate fee
• Regular review of charges to reflect actual operational costs and investments made to improve service delivery
0.00
Water conservation and minimization
• Reduce NRW through replacement of leaking pipes • Reduce illegal connections by completing inventory of
assets • Extensive communication program highlighting measures
to conserve water, reduce waste generation and enhance waste diversion (material recovery and re-use).
2.00
Governance and Capacity Building
Promoting the capacity of WSSP to deliver urban services
• Continue capacity strengthening of the institutions responsible for planning, delivering, and management of urban services
• Retirement of non-performing staff. • Upgrade management information systems
2.50
Total for medium-term action plan 488.65
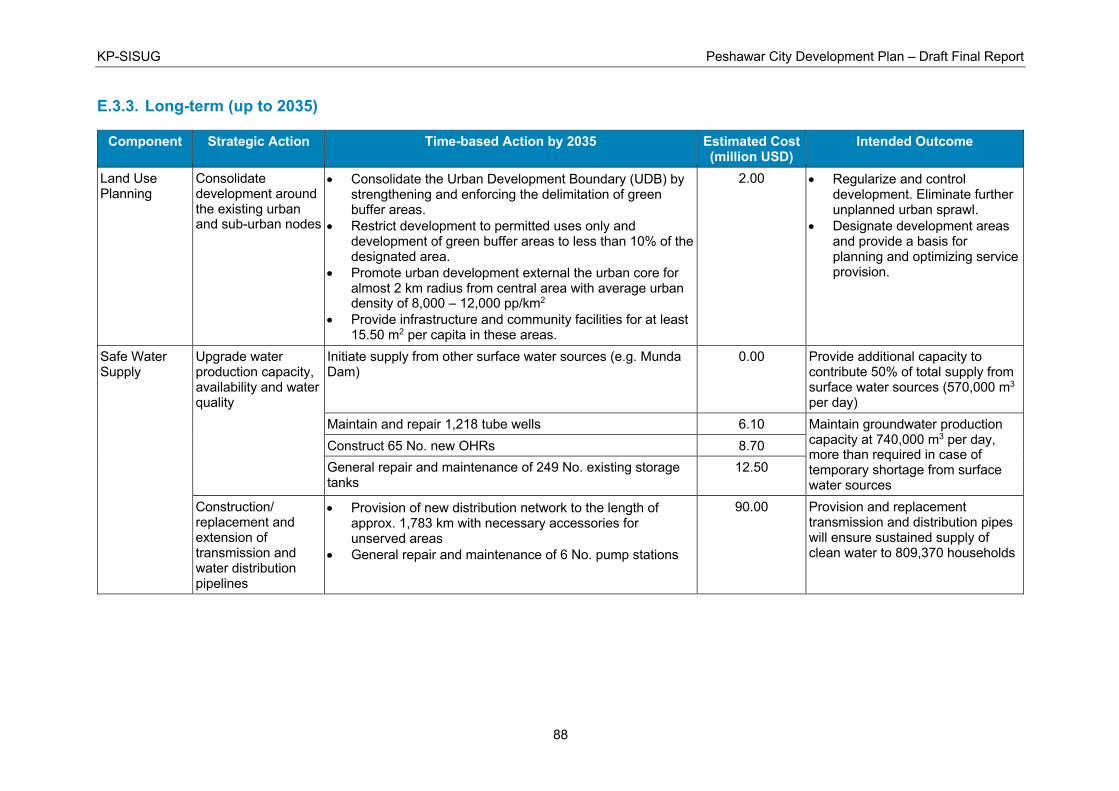
KP-SISUG Peshawar City Development Plan – Draft Final Report
88
E.3.3. Long-term (up to 2035)
Component Strategic Action Time-based Action by 2035 Estimated Cost (million USD)
Intended Outcome
Land Use Planning
Consolidate development around the existing urban and sub-urban nodes
• Consolidate the Urban Development Boundary (UDB) by strengthening and enforcing the delimitation of green buffer areas.
• Restrict development to permitted uses only and development of green buffer areas to less than 10% of the designated area.
• Promote urban development external the urban core for almost 2 km radius from central area with average urban density of 8,000 – 12,000 pp/km2
• Provide infrastructure and community facilities for at least 15.50 m2 per capita in these areas.
2.00 • Regularize and control development. Eliminate further unplanned urban sprawl.
• Designate development areas and provide a basis for planning and optimizing service provision.
Safe Water Supply
Upgrade water production capacity, availability and water quality
Initiate supply from other surface water sources (e.g. Munda Dam)
0.00 Provide additional capacity to contribute 50% of total supply from surface water sources (570,000 m3 per day)
Maintain and repair 1,218 tube wells 6.10 Maintain groundwater production capacity at 740,000 m3 per day, more than required in case of temporary shortage from surface water sources
Construct 65 No. new OHRs 8.70 General repair and maintenance of 249 No. existing storage tanks
12.50
Construction/ replacement and extension of transmission and water distribution pipelines
• Provision of new distribution network to the length of approx. 1,783 km with necessary accessories for unserved areas
• General repair and maintenance of 6 No. pump stations
90.00 Provision and replacement transmission and distribution pipes will ensure sustained supply of clean water to 809,370 households

KP-SISUG Peshawar City Development Plan – Draft Final Report
89
Component Strategic Action Time-based Action by 2035 Estimated Cost (million USD)
Intended Outcome
Establishment of District Metered Areas (DMAs) and implementation of Non- Revenue Water (NRW) reduction program
• Extension of DMAs throughout all UCs. • Continue NRW program throughout the served area
15.00 These interventions will result in safe water supply to approximately 809,370 households
Metered customer connections
Increase the number of metered connections to 890,370 households by 2035 (100% of households served)
7.50 Postpaid and prepaid meters will ensure revenue collection from approximately 809,370 households
Sewage and drainage management
Expansion of sewer system
• Expand sewer network through the construction of 1,142 km of additional pipes, including trunk, secondary and tertiary sewage lines
• Construction of pumping station(s), as required.
125.00 Extension of the sewer network will benefit a total of approximately 5.3 million people in the area.
Expansion of wastewater treatment plants (STPs)
• Expansion of treatment plant at Yaseen Abad • Expansion of treatment plant at Warsak Road • Expansion of additional STP SE of Peshawar • Provision for sludge digestion and biogas production. • Expansion of pump stations for effluent discharge.
60.00 Dry weather flow of the STPs is estimated at 737,400 m3/d..
Drainage system upgrades
• Civil works for diversions, culverts and storm water protection measures
• Expansion of sponge city concept - retrofit at least 35-40% of street and open public space to make use of bio-swales and designed gardens that absorb and filter storm water
12.00 • 40% reduction in flood risk and extent and frequency of urban flash flooding
• Recharge of groundwater aquifer
Maintenance of sewerage and existing drainage systems
Replacement of mobile plant and equipment. 3.00 Preventative maintenance of sewerage and drainage network

KP-SISUG Peshawar City Development Plan – Draft Final Report
90
Component Strategic Action Time-based Action by 2035 Estimated Cost (million USD)
Intended Outcome
Procurement of portable equipment for health & safety and environmental monitoring
Acquisition of gas monitoring equipment and water quality monitoring equipment
0.20 Safe operation for workers
Solid waste management
Improvement of solid waste collection system
• Acquisition of additional equipment for primary collection (for example, push/hand carts and mini tippers) in expanded service area and replacement of existing equipment
• Replacement of, and acquisition of, equipment for mechanized (secondary) collection (compactor trucks (12 No.), hook lift/arm roll trucks (53 No.) and multi-loader (15 No.).
• Replacement of mechanized street sweeper (1 No.) and road washer (1 No.).
• Replacement of miscellaneous mobile plant including dump trucks (2 No.) and rubber- tired excavators (1 No.).
• Acquisition of Industry-standard 240 L wheelie bins (10,000 No.), 1,100 L containers (420 No.) and larger capacity (4, 5, 7 & 22 m3) metal lidded containers (420 No.)
• Replacement of any damaged/unusable containers • Introduce segregation at source for 50% of the served
area.
12.00 • Hygienic, efficient and cost-effective system for the collection of municipal solid waste throughout the urbanized area serviced by WSS.
• Provide capacity to collect 3,650 tpd of MSW by 2035
Development of waste transfer system (if required)
• Upgrade transfer stations to increase capacity to 1,000 tpd at Hazar Khawani, 1,000 tpd at Hayatabad and 500 tpd at each of the other 2 transfer stations.
• Replace and upgrade transfer fleet
8.00 Improve efficiency of waste collection system and facilitate materials recovery prior to transfer to landfill site
Treatment and disposal of waste
• Develop Phase 3 to provide at least 6 years void capacity • Replacement of operating equipment
6.50 Provide hygienic and secure disposal of all collected municipal solid waste
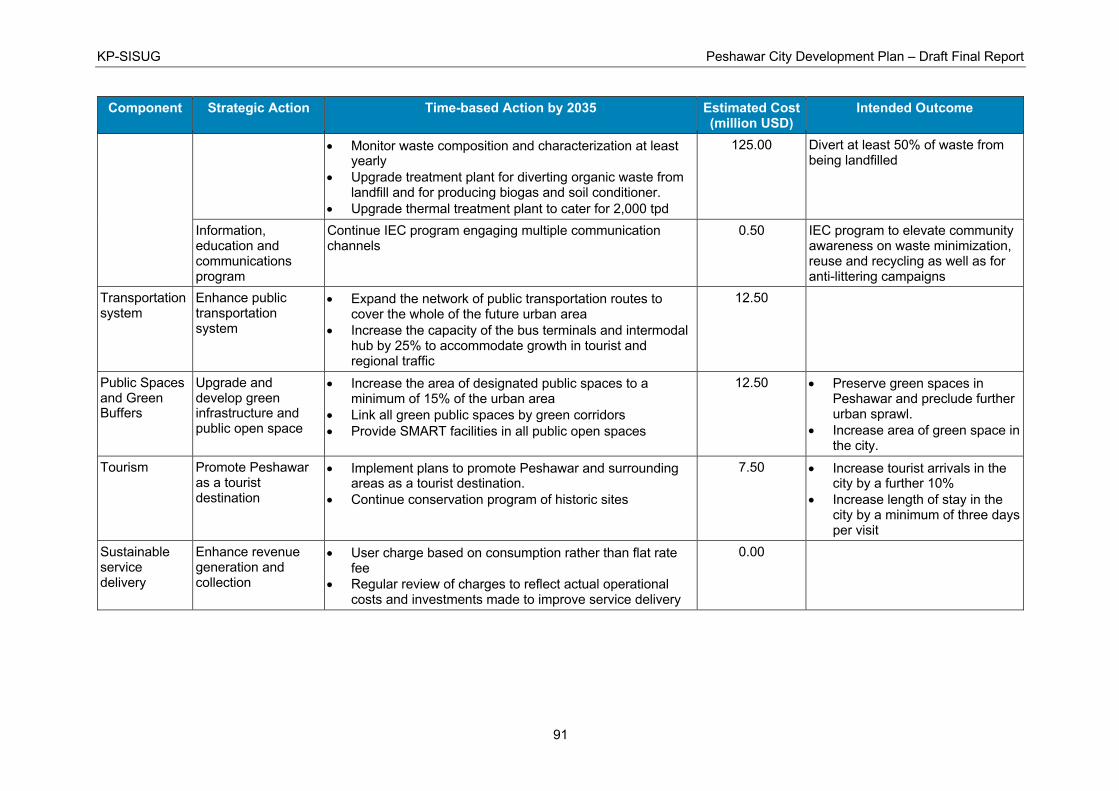
KP-SISUG Peshawar City Development Plan – Draft Final Report
91
Component Strategic Action Time-based Action by 2035 Estimated Cost (million USD)
Intended Outcome
• Monitor waste composition and characterization at least yearly
• Upgrade treatment plant for diverting organic waste from landfill and for producing biogas and soil conditioner.
• Upgrade thermal treatment plant to cater for 2,000 tpd
125.00 Divert at least 50% of waste from being landfilled
Information, education and communications program
Continue IEC program engaging multiple communication channels
0.50 IEC program to elevate community awareness on waste minimization, reuse and recycling as well as for anti-littering campaigns
Transportation system
Enhance public transportation system
• Expand the network of public transportation routes to cover the whole of the future urban area
• Increase the capacity of the bus terminals and intermodal hub by 25% to accommodate growth in tourist and regional traffic
12.50
Public Spaces and Green Buffers
Upgrade and develop green infrastructure and public open space
• Increase the area of designated public spaces to a minimum of 15% of the urban area
• Link all green public spaces by green corridors • Provide SMART facilities in all public open spaces
12.50 • Preserve green spaces in Peshawar and preclude further urban sprawl.
• Increase area of green space in the city.
Tourism Promote Peshawar as a tourist destination
• Implement plans to promote Peshawar and surrounding areas as a tourist destination.
• Continue conservation program of historic sites
7.50 • Increase tourist arrivals in the city by a further 10%
• Increase length of stay in the city by a minimum of three days per visit
Sustainable service delivery
Enhance revenue generation and collection
• User charge based on consumption rather than flat rate fee
• Regular review of charges to reflect actual operational costs and investments made to improve service delivery
0.00

KP-SISUG Peshawar City Development Plan – Draft Final Report
92
Component Strategic Action Time-based Action by 2035 Estimated Cost (million USD)
Intended Outcome
Governance and Capacity Building
Water conservation and minimization
• Reduce NRW through replacement of leaking pipes • Reduce illegal connections by completing inventory of
assets • Extensive communication program highlighting measures
to conserve water, reduce waste generation and enhance waste diversion (material recovery and re-use).
2.00
Promoting the capacity of WSSP to deliver urban services
• Continue capacity strengthening of the institutions responsible for planning, delivering, and management of urban services
• Retirement of non-performing staff. • Upgrade management information systems
2.50
Total for long-term action plan 531.00
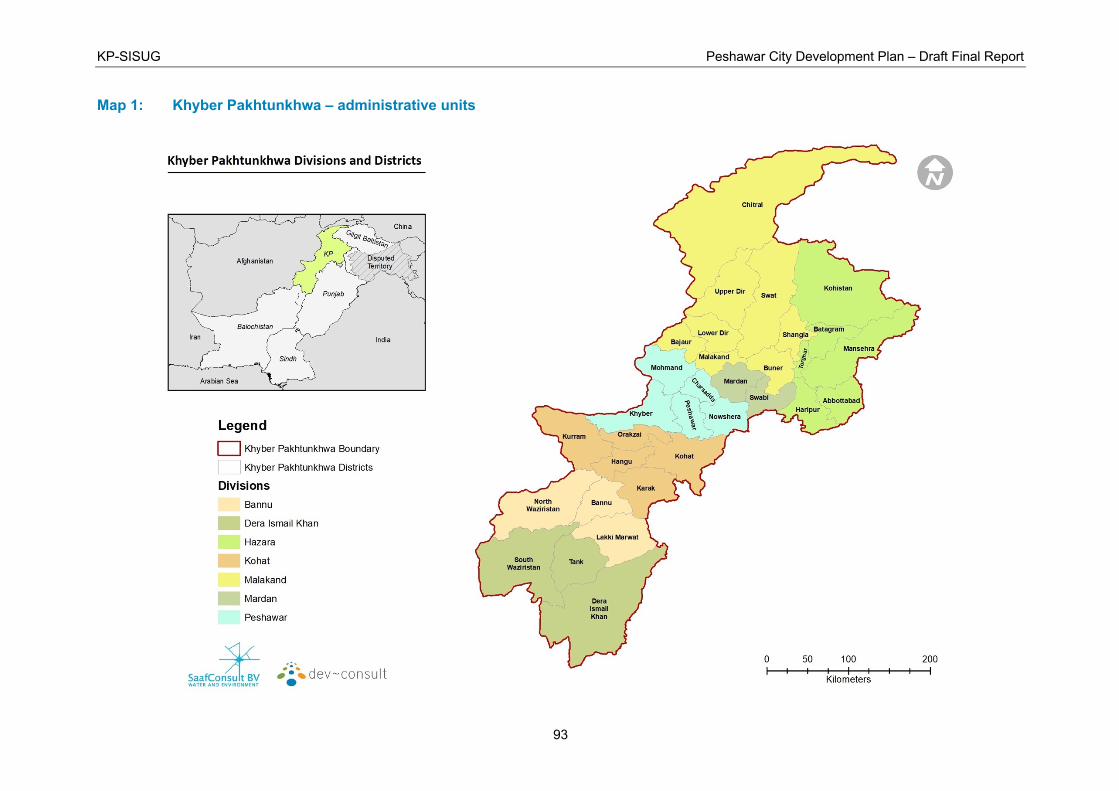
KP-SISUG Peshawar City Development Plan – Draft Final Report
93
Map 1: Khyber Pakhtunkhwa – administrative units

KP-SISUG Peshawar City Development Plan – Draft Final Report
94
Map 2: Peshawar District – tehsil, subdivision and towns

KP-SISUG Peshawar City Development Plan – Draft Final Report
95
Map 3: Peshawar Tehsil – union councils

KP-SISUG Peshawar City Development Plan – Draft Final Report
96
Map 4: Peshawar Tehsil – gridded population (2017)

KP-SISUG Peshawar City Development Plan – Draft Final Report
97
Map 5: Peshawar Tehsil – communications network

KP-SISUG Peshawar City Development Plan – Draft Final Report
98
Map 6: Peshawar Tehsil – hydrology

KP-SISUG Peshawar City Development Plan – Draft Final Report
99
Map 7: Peshawar Tehsil – river basins

KP-SISUG Peshawar City Development Plan – Draft Final Report
100
Map 8: Peshawar Tehsil – built-up area

KP-SISUG Peshawar City Development Plan – Draft Final Report
101
Map 9: Peshawar Tehsil – unbuilt area

KP-SISUG Peshawar City Development Plan – Draft Final Report
102
Map 10: Peshawar Tehsil – elevation

KP-SISUG Peshawar City Development Plan – Draft Final Report
103
Map 11: Peshawar Tehsil – slope profile

KP-SISUG Peshawar City Development Plan – Draft Final Report
104
Map 12: Peshawar Tehsil – geology

KP-SISUG Peshawar City Development Plan – Draft Final Report
105
Map 13: Peshawar Tehsil – soil profile

KP-SISUG Peshawar City Development Plan – Draft Final Report
106
Map 14: Peshawar Tehsil – topography

KP-SISUG Peshawar City Development Plan – Draft Final Report
107
Map 15: Peshawar Tehsil – population density of union councils

KP-SISUG Peshawar City Development Plan – Draft Final Report
108
Map 16: Peshawar City – land use

KP-SISUG Peshawar City Development Plan – Draft Final Report
109
Map 17: Peshawar City – gridded population (2017)

KP-SISUG Peshawar City Development Plan – Draft Final Report
110
Map 18: Peshawar City – dwelling units
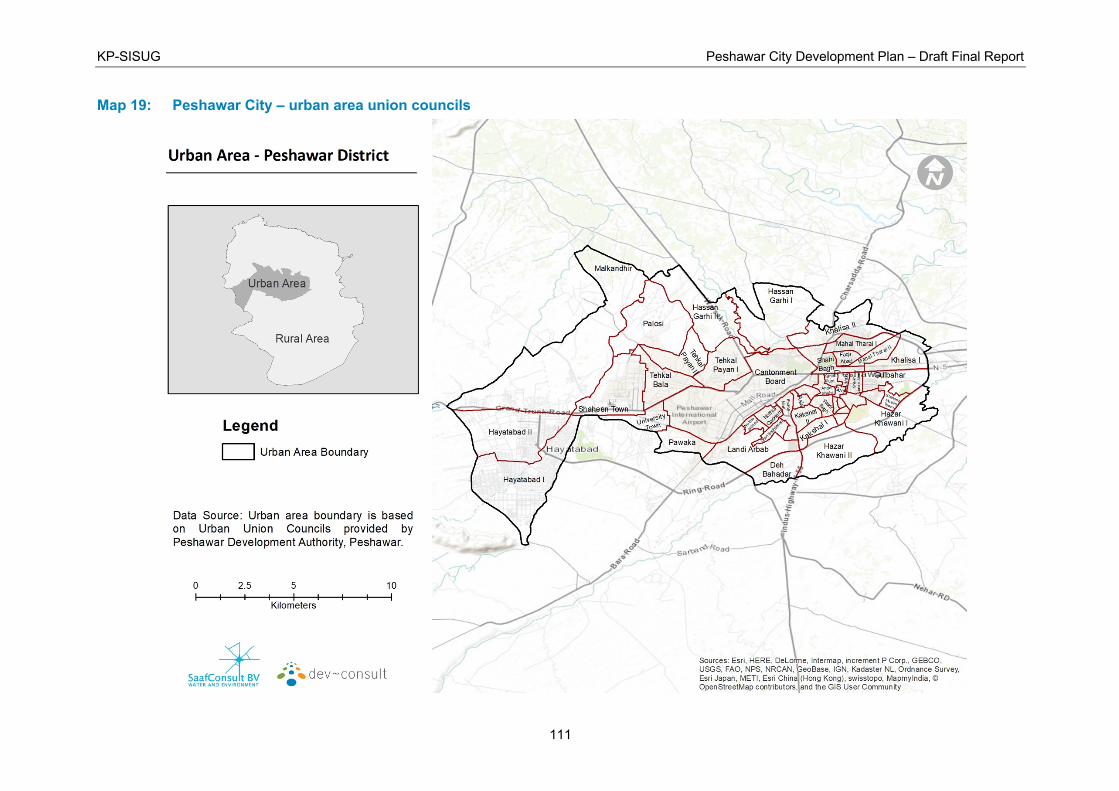
KP-SISUG Peshawar City Development Plan – Draft Final Report
111
Map 19: Peshawar City – urban area union councils

KP-SISUG Peshawar City Development Plan – Draft Final Report
112
Map 20: Peshawar City – urban expansion
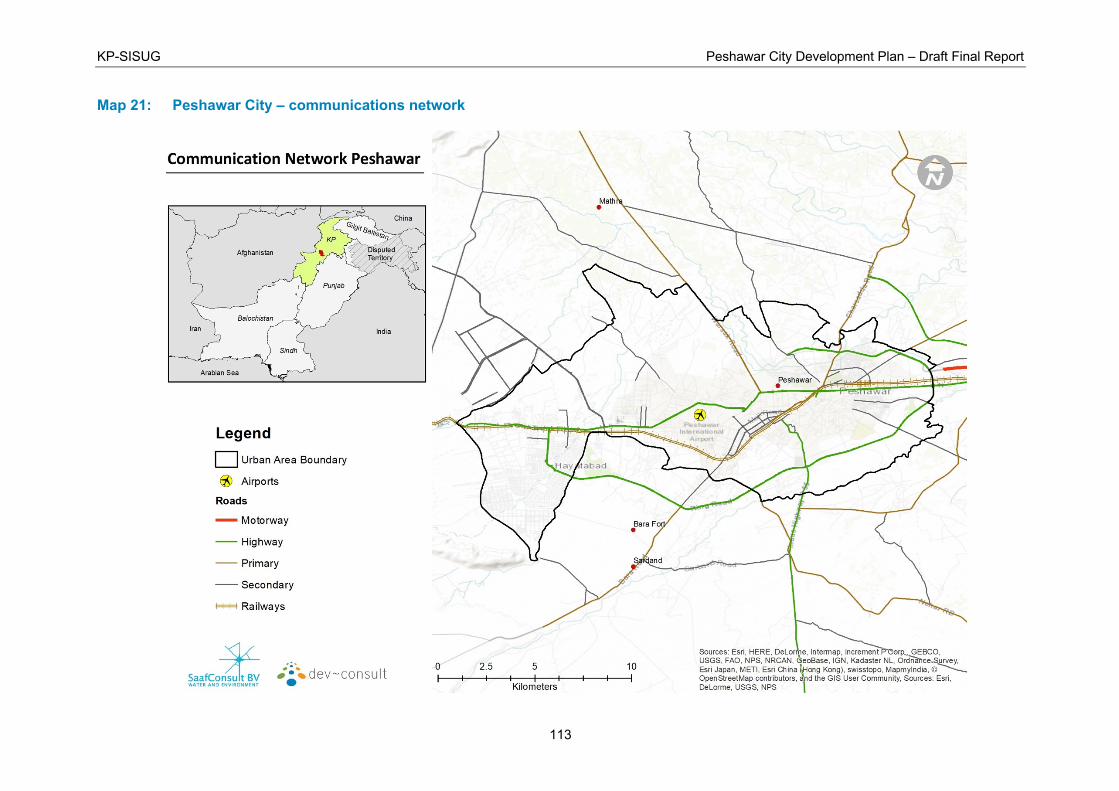
KP-SISUG Peshawar City Development Plan – Draft Final Report
113
Map 21: Peshawar City – communications network

KP-SISUG Peshawar City Development Plan – Draft Final Report
114
Map 22: Peshawar City – transport infrastructure

KP-SISUG Peshawar City Development Plan – Draft Final Report
115
Map 23: Peshawar City – social infrastructure

KP-SISUG Peshawar City Development Plan – Draft Final Report
116
Map 24: Peshawar City – current tube wells and overhead water reservoirs

KP-SISUG Peshawar City Development Plan – Draft Final Report
117
Map 25: Peshawar City – current water supply network (partial)

KP-SISUG Peshawar City Development Plan – Draft Final Report
118
Map 26: Peshawar City – current sewage and drainage infrastructure

KP-SISUG Peshawar City Development Plan – Draft Final Report
119
Map 27: Peshawar City – current solid waste management infrastructure

KP-SISUG Peshawar City Development Plan – Draft Final Report
120
Map 28: Peshawar City – administrative jurisdiction for municipal services

KP-SISUG Peshawar City Development Plan – Draft Final Report
121
Map 29: Peshawar City – municipal services zones

KP-SISUG Peshawar City Development Plan – Draft Final Report
122
Map 30: Conceptual urban development model for Peshawar City

KP-SISUG Peshawar City Development Plan – Draft Final Report
123
Map 31: Peshawar City – proposed infrastructure

KP-SISUG Peshawar City Development Plan – Draft Final Report
124
Appendix 1: District at a glance
Source: ADB. 2018. District Peshawar: Overview for Resilience Accelerator Singapore with 6 Cities from
Pakistan. Singapore: Urban Climate Change Resilience Fund, Asian Development Bank.

KP-SISUG Peshawar City Development Plan – Draft Final Report
125
Appendix 2: Demographic parameters of Peshawar District
2.a. Area, population, households and intercensal growth rates
Union Councils Locale Geographical Area (km2)
1998 2017 1998-2017 Population
Growth Rate
1998-2017 Housing
Growth Rate Population Households Density Population Households Density
PESHAWAR TEHSIL
Peshawar Cantt Urban 15.03 68,740 9,072 4,575 70,741 11,051 4,708 0.15% 1.04%
Achini Bala UC Future Urban 13.84 27,891 2,577 2,016 58,058 6,014 4,196 3.93% 4.56%
Adezai UC Rural 29.20 19,438 2,017 666 34,435 2,796 1,179 3.06% 1.73%
Akhun Abad UC Urban 0.62 24,100 2,672 39,118 35,686 3,476 57,924 2.09% 1.39%
Ander Shehr UC Urban 0.55 17,099 2,277 30,963 12,770 2,130 23,124 -1.52% -0.35%
Asia UC Urban 0.49 25,752 3,356 52,855 25,998 3,597 53,360 0.05% 0.37%
Aza Khel UC Rural 72.02 19,692 2,158 273 33,847 3,263 470 2.89% 2.20%
Badaber Huri Zai UC Rural 26.86 16,108 1,802 600 35,953 3,893 1,339 4.32% 4.14%
Badaber Maryam Zai UC
Future Urban 32.56 16,442 1,851 505 26,912 3,021 826 2.63% 2.61%
Bazid Khel UC Future Urban 9.41 26,422 3,201 2,807 54,062 6,172 5,744 3.84% 3.52%
Bhana Mari UC Urban 1.15 17,637 2,243 15,348 23,203 2,774 20,192 1.45% 1.12%
Budhni UC Rural 19.34 19,587 2,392 1,013 33,068 4,361 1,710 2.79% 3.21%
Chaghar Matti UC Rural 16.41 18,425 1,881 1,123 30,397 3,545 1,852 2.67% 3.39%
Chamkani UC Future Urban 8.17 20,977 2,766 2,568 45,247 5,552 5,538 4.13% 3.74%
Dag UC Future Urban 7.41 23,210 2,645 3,134 50,818 5,204 6,862 4.21% 3.63%
Deh Bahadar UC Urban 2.63 23,138 2,829 8,788 43,311 5,001 16,450 3.35% 3.04%
Dhari Baghbanan UC Urban 0.78 17,351 2,107 22,369 27,232 3,313 35,108 2.40% 2.41%
Faqir Abad UC Urban 0.68 16,351 2,133 24,014 22,215 2,670 32,626 1.63% 1.19%
Garhi Sher Dad UC Rural 16.09 17,345 1,944 1,078 33,724 4,229 2,097 3.56% 4.18%

KP-SISUG Peshawar City Development Plan – Draft Final Report
126
Union Councils Locale Geographical Area (km2)
1998 2017 1998-2017 Population
Growth Rate
1998-2017 Housing
Growth Rate Population Households Density Population Households Density
Gul Bahar UC Urban 2.76 18,492 2,501 6,695 31,329 4,234 11,343 2.81% 2.81%
Gul Bela UC Rural 29.43 24,910 3,029 846 42,883 5,565 1,457 2.90% 3.25%
Gunj UC Urban 0.24 18,685 2,705 78,663 19,399 3,210 81,668 0.20% 0.90%
Haryana Payan UC Future Urban 16.75 25,961 2,824 1,550 64,300 7,160 3,838 4.89% 5.02%
Hassan Garhi-I UC Urban 8.31 21,613 2,153 2,602 63,132 6,920 7,600 5.80% 6.34%
Hassan Garhi-II UC Urban 7.21 18,641 2,428 2,586 49,436 6,482 6,858 5.27% 5.30%
Hayatabad-I UC Urban 11.48 14,986 2,386 1,306 98,048 13,454 8,544 10.39% 9.53%
Hayatabad-II UC Urban 9.08 17,753 2,730 1,956 61,081 8,154 6,729 6.72% 5.93%
Hazar Khawani-I UC Urban 5.95 20,720 2,301 3,484 41,291 4,391 6,942 3.70% 3.46%
Hazar Khawani-II UC Urban 5.67 25,330 2,758 4,464 98,032 10,593 17,276 7.38% 7.34%
Jehangir Pura UC Urban 0.45 19,105 2,632 42,633 16,697 2,403 37,260 -0.71% -0.48%
Jogani UC Rural 35.33 19,591 2,145 555 39,613 4,407 1,121 3.78% 3.86%
Kafoor Dheri UC Rural 32.75 21,359 1,714 652 39,831 4,010 1,216 3.33% 4.58%
Kakshai-I UC Urban 1.29 19,222 2,121 14,847 40,037 3,790 30,925 3.94% 3.10%
Kakshai-II UC Urban 1.09 18,998 2,138 17,497 29,714 3,429 27,366 2.38% 2.52%
Kaniza UC Rural 20.86 18,975 2,056 910 40,528 4,725 1,943 4.07% 4.48%
Kankola UC Rural 15.10 25,900 3,298 1,715 57,865 6,830 3,832 4.32% 3.91%
Karim Pura UC Urban 0.38 16,666 2,387 43,784 17,536 2,733 46,070 0.27% 0.71%
Khalisa-I UC Urban 1.97 15,861 2,014 8,051 57,531 6,697 29,204 7.02% 6.53%
Khalisa-II UC Urban 4.17 22,711 2,508 5,447 86,544 9,311 20,757 7.29% 7.15%
Khatki UC Rural 21.81 18,492 2,207 848 36,263 4,208 1,663 3.61% 3.45%
Khazana UC Rural 3.58 23,387 2,884 6,539 65,525 7,615 18,320 5.57% 5.24%
Lahori UC Urban 0.31 18,429 2,503 58,717 18,731 2,829 59,680 0.09% 0.65%
Lala Klay UC Rural 9.98 17,087 2,358 1,712 34,496 4,775 3,457 3.77% 3.78%
Landi Arbab UC Urban 4.89 22,032 2,637 4,504 65,694 8,132 13,431 5.92% 6.11%

KP-SISUG Peshawar City Development Plan – Draft Final Report
127
Union Councils Locale Geographical Area (km2)
1998 2017 1998-2017 Population
Growth Rate
1998-2017 Housing
Growth Rate Population Households Density Population Households Density
Laram UC Future Urban 3.36 15,272 1,630 4,544 54,959 5,265 16,354 6.97% 6.37%
Mahal Therai-I UC Urban 1.82 23,504 2,758 12,882 41,757 5,213 22,886 3.07% 3.41%
Mahal Therai-II UC Urban 1.27 32,634 4,196 25,732 85,814 10,500 67,666 5.22% 4.95%
Malakandhir UC Urban 23.91 20,467 2,102 856 65,491 6,921 2,739 6.31% 6.47%
Maryam Zai UC Rural 14.56 19,336 2,212 1,328 32,513 3,404 2,234 2.77% 2.29%
Mashu-Gaggar UC Rural 37.47 30,728 3,004 820 75,069 6,551 2,003 4.81% 4.19%
Mathra UC Rural 18.78 31,619 3,882 1,684 71,634 8,187 3,815 4.40% 4.01%
Mattani UC Rural 64.15 26,320 2,562 410 49,672 4,536 774 3.40% 3.05%
Mira Surizai Payan UC
Rural 35.83 16,744 1,528 467 57,016 5,256 1,591 6.66% 6.72%
Mira Kachori UC Rural 30.39 25,512 2,795 839 60,845 7,176 2,002 4.68% 5.09%
Musa Zai UC Future Urban 11.41 17,319 1,988 1,517 49,011 5,104 4,294 5.63% 5.09%
Nahaqi UC Rural 40.22 25,677 3,225 638 44,703 5,607 1,111 2.96% 2.95%
Nauthia Jadid UC Urban 0.56 23,295 2,947 41,827 54,184 7,030 97,288 4.54% 4.68%
Nauthia UC Urban 0.85 21,887 2,874 25,829 28,717 3,736 33,889 1.44% 1.39%
Pajjagi UC Future Urban 8.74 22,903 2,484 2,621 71,770 7,124 8,212 6.20% 5.70%
Pakha Ghulam UC Future Urban 5.82 20,000 2,402 3,438 58,917 6,876 10,129 5.85% 5.69%
Palosi UC Urban 8.07 22,528 2,529 2,793 45,045 5,182 5,584 3.71% 3.85%
Panam Dheri UC Rural 16.97 21,146 2,290 1,246 41,344 4,543 2,437 3.59% 3.67%
Pawaka UC Urban 2.28 24,817 3,025 10,891 41,014 4,976 17,999 2.68% 2.65%
Pushti Khara Payan UC
Future Urban 9.53 25,174 2,789 2,642 59,159 6,894 6,208 4.60% 4.88%
Regi UC Future Urban 32.40 25,532 2,707 788 41,920 4,985 1,294 2.64% 3.27%
Sarband UC Future Urban 7.73 22,093 2,462 2,856 55,714 6,128 7,203 4.99% 4.92%
Shaheen Muslim Town-I UC
Urban 0.86 19,268 2,055 22,438 47,931 5,190 55,818 4.91% 5.00%
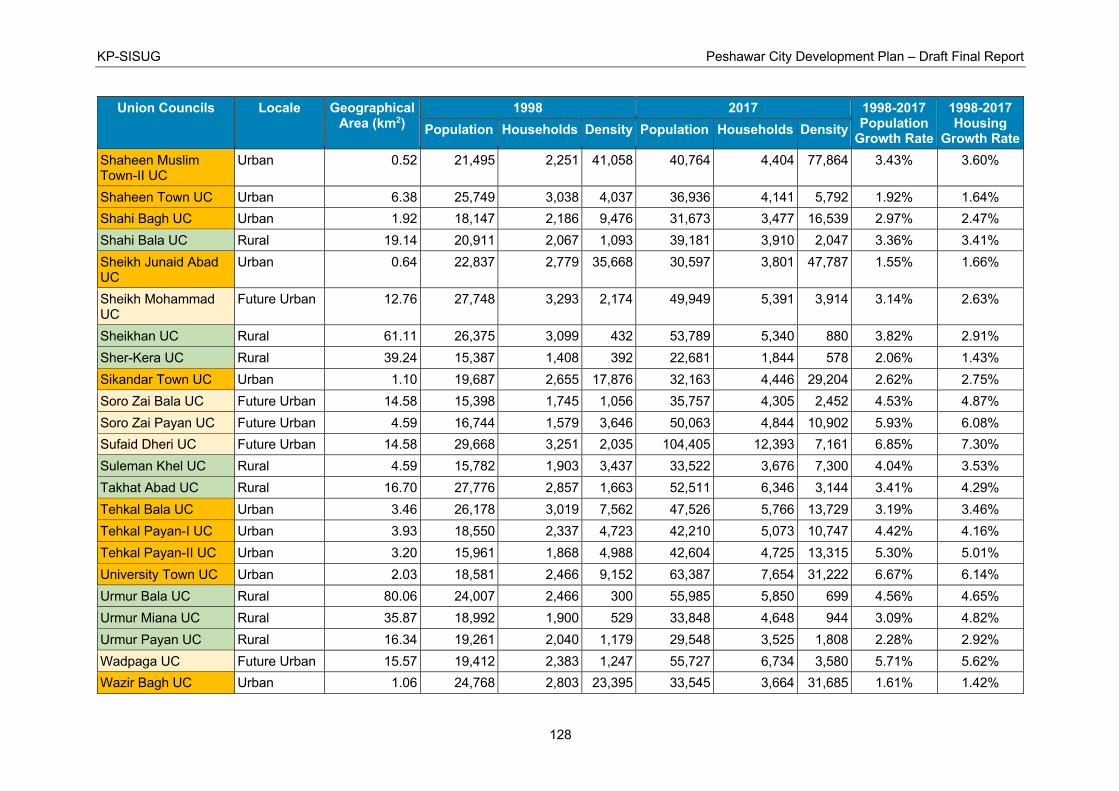
KP-SISUG Peshawar City Development Plan – Draft Final Report
128
Union Councils Locale Geographical Area (km2)
1998 2017 1998-2017 Population
Growth Rate
1998-2017 Housing
Growth Rate Population Households Density Population Households Density
Shaheen Muslim Town-II UC
Urban 0.52 21,495 2,251 41,058 40,764 4,404 77,864 3.43% 3.60%
Shaheen Town UC Urban 6.38 25,749 3,038 4,037 36,936 4,141 5,792 1.92% 1.64%
Shahi Bagh UC Urban 1.92 18,147 2,186 9,476 31,673 3,477 16,539 2.97% 2.47%
Shahi Bala UC Rural 19.14 20,911 2,067 1,093 39,181 3,910 2,047 3.36% 3.41%
Sheikh Junaid Abad UC
Urban 0.64 22,837 2,779 35,668 30,597 3,801 47,787 1.55% 1.66%
Sheikh Mohammad UC
Future Urban 12.76 27,748 3,293 2,174 49,949 5,391 3,914 3.14% 2.63%
Sheikhan UC Rural 61.11 26,375 3,099 432 53,789 5,340 880 3.82% 2.91%
Sher-Kera UC Rural 39.24 15,387 1,408 392 22,681 1,844 578 2.06% 1.43%
Sikandar Town UC Urban 1.10 19,687 2,655 17,876 32,163 4,446 29,204 2.62% 2.75%
Soro Zai Bala UC Future Urban 14.58 15,398 1,745 1,056 35,757 4,305 2,452 4.53% 4.87%
Soro Zai Payan UC Future Urban 4.59 16,744 1,579 3,646 50,063 4,844 10,902 5.93% 6.08%
Sufaid Dheri UC Future Urban 14.58 29,668 3,251 2,035 104,405 12,393 7,161 6.85% 7.30%
Suleman Khel UC Rural 4.59 15,782 1,903 3,437 33,522 3,676 7,300 4.04% 3.53%
Takhat Abad UC Rural 16.70 27,776 2,857 1,663 52,511 6,346 3,144 3.41% 4.29%
Tehkal Bala UC Urban 3.46 26,178 3,019 7,562 47,526 5,766 13,729 3.19% 3.46%
Tehkal Payan-I UC Urban 3.93 18,550 2,337 4,723 42,210 5,073 10,747 4.42% 4.16%
Tehkal Payan-II UC Urban 3.20 15,961 1,868 4,988 42,604 4,725 13,315 5.30% 5.01%
University Town UC Urban 2.03 18,581 2,466 9,152 63,387 7,654 31,222 6.67% 6.14%
Urmur Bala UC Rural 80.06 24,007 2,466 300 55,985 5,850 699 4.56% 4.65%
Urmur Miana UC Rural 35.87 18,992 1,900 529 33,848 4,648 944 3.09% 4.82%
Urmur Payan UC Rural 16.34 19,261 2,040 1,179 29,548 3,525 1,808 2.28% 2.92%
Wadpaga UC Future Urban 15.57 19,412 2,383 1,247 55,727 6,734 3,580 5.71% 5.62%
Wazir Bagh UC Urban 1.06 24,768 2,803 23,395 33,545 3,664 31,685 1.61% 1.42%

KP-SISUG Peshawar City Development Plan – Draft Final Report
129
Union Councils Locale Geographical Area (km2)
1998 2017 1998-2017 Population
Growth Rate
1998-2017 Housing
Growth Rate Population Households Density Population Households Density
Yakka Toot-I UC Urban 0.16 16,719 1,743 101,648 22,000 2,105 133,756 1.46% 1.00%
Yakka Toot-II UC Urban 0.15 26,230 2,507 172,214 44,555 4,199 292,528 2.83% 2.75%
Yakka Toot-III UC Urban 0.14 20,102 1,786 145,831 36,741 3,079 266,539 3.22% 2.91%
HASSAN KHEL SUB-DIVISION
Hassan Khel Sub-Division
Rural 261.00 53,841 5,977 206 64,691 7,065 248 0.97% 0.88%
PESHAWAR DISTRICT
1,521.85 2,080,692 241,192 1,367 4,333,770 496,908 2,848 3.94% 3.88%
Source: Computed from 1998 and 2017 census data of the Pakistan Bureau of Statistics Notes:
Urban UCs Future Urban UCs Rural UCs
2.b. Population estimates
Union Councils Locale 2025 2030 2035
Population Households Density Population Households Density Population Households Density
Peshawar Cantt Urban 71,601 12,008 4,765 72,144 12,648 4,801 72,690 13,323 4,838
Achini Bala UC Future Urban 79,054 8,593 5,713 95,877 10,740 6,929 116,279 13,423 8,403
Adezai UC Rural 43,809 3,208 1,500 50,924 3,496 1,744 59,194 3,810 2,027
Akhun Abad UC Urban 42,100 3,883 68,334 46,681 4,161 75,771 51,761 4,460 84,017
Ander Shehr UC Urban 11,293 2,071 20,450 10,458 2,035 18,937 9,685 2,000 17,537
Asia UC Urban 26,102 3,704 53,574 26,168 3,772 53,709 26,233 3,841 53,843
Aza Khel UC Rural 42,517 3,884 590 49,031 4,330 681 56,542 4,828 785
Badaber Huri Zai UC Rural 50,414 5,384 1,877 62,275 6,594 2,319 76,927 8,076 2,864
Badaber Maryam Zai UC Future Urban 33,117 3,713 1,017 37,702 4,224 1,158 42,921 4,805 1,318
Bazid Khel UC Future Urban 73,082 8,137 7,765 88,233 9,672 9,375 106,526 11,496 11,318

KP-SISUG Peshawar City Development Plan – Draft Final Report
130
Union Councils Locale 2025 2030 2035
Population Households Density Population Households Density Population Households Density
Bhana Mari UC Urban 26,044 3,034 22,664 27,993 3,208 24,360 30,088 3,393 26,184
Budhni UC Rural 41,226 5,616 2,131 47,318 6,577 2,446 54,310 7,703 2,808
Chaghar Matti UC Rural 37,530 4,629 2,287 42,815 5,469 2,609 48,844 6,462 2,976
Chamkani UC Future Urban 62,540 7,445 7,655 76,562 8,943 9,372 93,727 10,743 11,473
Dag UC Future Urban 70,684 6,920 9,544 86,873 8,269 11,730 106,770 9,881 14,416
Deh Bahadar UC Urban 56,395 6,357 21,419 66,510 7,385 25,261 78,441 8,579 29,793
Dhari Baghbanan UC Urban 32,923 4,009 42,446 37,070 4,516 47,791 41,738 5,087 53,810
Faqir Abad UC Urban 25,275 2,935 37,120 27,398 3,113 40,238 29,699 3,303 43,617
Garhi Sher Dad UC Rural 44,619 5,866 2,774 53,151 7,198 3,304 63,315 8,831 3,936
Gul Bahar UC Urban 39,116 5,285 14,163 44,937 6,070 16,270 51,625 6,972 18,692
Gul Bela UC Rural 53,903 7,189 1,832 62,187 8,437 2,113 71,743 9,902 2,438
Gunj UC Urban 19,708 3,450 82,968 19,903 3,609 83,791 20,101 3,775 84,622
Haryana Payan UC Future Urban 94,202 10,593 5,623 119,595 13,532 7,139 151,834 17,286 9,063
Hassan Garhi-I UC Urban 99,143 11,314 11,934 131,454 15,383 15,824 174,294 20,916 20,981
Hassan Garhi-II UC Urban 74,540 9,801 10,341 96,351 12,691 13,367 124,544 16,433 17,279
Hayatabad-I UC Urban 216,229 27,870 18,843 354,475 43,936 30,891 581,109 69,262 50,641
Hayatabad-II UC Urban 102,768 12,926 11,321 142,258 17,239 15,672 196,923 22,992 21,694
Hazar Khawani-I UC Urban 55,201 5,764 9,281 66,184 6,833 11,127 79,352 8,099 13,341
Hazar Khawani-II UC Urban 173,314 18,668 30,543 247,458 26,600 43,610 353,319 37,904 62,266
Jehangir Pura UC Urban 15,776 2,313 35,205 15,227 2,258 33,979 14,696 2,204 32,795
Jogani UC Rural 53,283 5,968 1,508 64,129 7,213 1,815 77,184 8,718 2,185
Kafoor Dheri UC Rural 51,782 5,735 1,581 61,009 7,173 1,863 71,882 8,971 2,195
Kakshai-I UC Urban 54,530 4,839 42,119 66,145 5,638 51,090 80,233 6,569 61,972
Kakshai-II UC Urban 35,872 4,184 33,037 40,353 4,737 37,164 45,393 5,365 41,806
Kaniza UC Rural 55,786 6,708 2,675 68,117 8,350 3,266 83,173 10,393 3,988

KP-SISUG Peshawar City Development Plan – Draft Final Report
131
Union Councils Locale 2025 2030 2035
Population Households Density Population Households Density Population Households Density
Kankola UC Rural 81,173 9,280 5,376 100,296 11,240 6,642 123,925 13,613 8,207
Karim Pura UC Urban 17,916 2,893 47,067 18,157 2,998 47,702 18,402 3,107 48,345
Khalisa-I UC Urban 98,972 11,107 50,240 138,921 15,238 70,519 194,994 20,904 98,984
Khalisa-II UC Urban 152,009 16,175 36,459 216,154 22,844 51,844 307,368 32,261 73,722
Khatki UC Rural 48,152 5,522 2,208 57,489 6,544 2,636 68,636 7,755 3,147
Khazana UC Rural 101,111 11,461 28,269 132,600 14,797 37,073 173,896 19,105 48,619
Lahori UC Urban 18,860 2,979 60,090 18,940 3,076 60,347 19,022 3,177 60,606
Lala Klay UC Rural 46,370 6,427 4,647 55,786 7,738 5,591 67,114 9,317 6,726
Landi Arbab UC Urban 104,065 13,066 21,275 138,728 17,573 28,362 184,938 23,634 37,809
Laram UC Future Urban 94,233 8,626 28,041 131,995 11,744 39,277 184,889 15,989 55,017
Mahal Therai-I UC Urban 53,189 6,816 29,151 61,873 8,059 33,911 71,975 9,529 39,447
Mahal Therai-II UC Urban 128,930 15,450 101,663 166,284 19,667 131,118 214,460 25,037 169,106
Malakandhir UC Urban 106,873 11,431 4,470 145,143 15,641 6,071 197,117 21,403 8,245
Maryam Zai UC Rural 40,465 4,081 2,780 46,396 4,572 3,187 53,195 5,121 3,655
Mashu-Gaggar UC Rural 109,345 9,097 2,918 138,320 11,168 3,691 174,972 13,712 4,670
Mathra UC Rural 101,080 11,209 5,383 125,352 13,641 6,676 155,452 16,601 8,279
Mattani UC Rural 64,901 5,769 1,012 76,707 6,705 1,196 90,661 7,793 1,413
Mira Surizai Payan UC Rural 95,511 8,842 2,666 131,853 12,239 3,680 182,023 16,941 5,080
Mira Kachori UC Rural 87,733 10,673 2,887 110,281 13,679 3,629 138,624 17,532 4,561
Musa Zai UC Future Urban 75,947 7,592 6,654 99,862 9,730 8,749 131,307 12,470 11,504
Nahaqi UC Rural 56,458 7,077 1,404 65,326 8,186 1,624 75,589 9,469 1,879
Nauthia Jadid UC Urban 77,309 10,138 138,810 96,540 12,744 173,340 120,555 16,020 216,458
Nauthia UC Urban 32,196 4,172 37,995 34,581 4,470 40,810 37,144 4,790 43,834
Pajjagi UC Future Urban 116,093 11,102 13,283 156,800 14,649 17,941 211,780 19,329 24,232
Pakha Ghulam UC Future Urban 92,855 10,707 15,964 123,390 14,121 21,214 163,967 18,623 28,190

KP-SISUG Peshawar City Development Plan – Draft Final Report
132
Union Councils Locale 2025 2030 2035
Population Households Density Population Households Density Population Households Density
Palosi UC Urban 60,305 7,009 7,475 72,367 8,466 8,971 86,843 10,225 10,765
Panam Dheri UC Rural 54,830 6,062 3,231 65,410 7,259 3,855 78,032 8,693 4,599
Pawaka UC Urban 50,676 6,136 22,239 57,838 6,995 25,382 66,013 7,974 28,969
Pushti Khara Payan UC Future Urban 84,774 10,091 8,895 106,148 12,805 11,138 132,911 16,248 13,946
Regi UC Future Urban 51,652 6,446 1,594 58,851 7,570 1,816 67,054 8,890 2,070
Sarband UC Future Urban 82,244 8,996 10,633 104,910 11,436 13,564 133,823 14,538 17,302
Shaheen Muslim Town-I UC
Urban 70,349 7,666 81,925 89,416 9,783 104,128 113,649 12,484 132,349
Shaheen Muslim Town-II UC
Urban 53,371 5,842 101,944 63,161 6,971 120,644 74,746 8,317 142,773
Shaheen Town UC Urban 42,996 4,718 6,742 47,278 5,119 7,413 51,987 5,553 8,152
Shahi Bagh UC Urban 40,044 4,227 20,910 46,365 4,777 24,211 53,684 5,397 28,032
Shahi Bala UC Rural 51,038 5,114 2,667 60,209 6,048 3,146 71,027 7,152 3,711
Sheikh Junaid Abad UC Urban 34,607 4,337 54,051 37,377 4,709 58,376 40,368 5,114 63,047
Sheikh Mohammad UC Future Urban 63,976 6,634 5,013 74,680 7,553 5,852 87,174 8,600 6,831
Sheikhan UC Rural 72,612 6,715 1,188 87,591 7,749 1,433 105,659 8,942 1,729
Sher-Kera UC Rural 26,706 2,066 681 29,577 2,218 754 32,757 2,381 835
Sikandar Town UC Urban 39,547 5,524 35,909 45,000 6,327 40,860 51,205 7,246 46,494
Soro Zai Bala UC Future Urban 50,983 6,297 3,497 63,637 7,986 4,365 79,433 10,128 5,448
Soro Zai Payan UC Future Urban 79,395 7,766 17,289 105,917 10,430 23,064 141,299 14,009 30,769
Sufaid Dheri UC Future Urban 177,337 21,771 12,163 246,943 30,961 16,936 343,870 44,030 23,584
Suleman Khel UC Rural 46,035 4,850 10,024 56,128 5,768 12,222 68,435 6,859 14,902
Takhat Abad UC Rural 68,660 8,880 4,110 81,188 10,956 4,860 96,001 13,516 5,747
Tehkal Bala UC Urban 61,092 7,572 17,648 71,472 8,977 20,647 83,617 10,644 24,155
Tehkal Payan-I UC Urban 59,671 7,031 15,192 74,085 8,621 18,862 91,980 10,572 23,418
Tehkal Payan-II UC Urban 64,414 6,984 20,132 83,405 8,916 26,067 107,994 11,382 33,752

KP-SISUG Peshawar City Development Plan – Draft Final Report
133
Union Councils Locale 2025 2030 2035
Population Households Density Population Households Density Population Households Density
University Town UC Urban 106,265 12,331 52,343 146,770 16,613 72,294 202,713 22,382 99,850
Urmur Bala UC Rural 79,966 8,416 999 99,926 10,564 1,248 124,868 13,261 1,560
Urmur Miana UC Rural 43,172 6,774 1,203 50,262 8,572 1,401 58,518 10,848 1,631
Urmur Payan UC Rural 35,382 4,438 2,165 39,599 5,125 2,424 44,320 5,918 2,712
Wadpaga UC Future Urban 86,877 10,429 5,581 114,665 13,707 7,366 151,341 18,017 9,722
Wazir Bagh UC Urban 38,115 4,101 36,002 41,282 4,401 38,993 44,713 4,722 42,234
Yakka Toot-I UC Urban 24,695 2,279 150,144 26,545 2,395 161,391 28,534 2,517 173,481
Yakka Toot-II UC Urban 55,690 5,217 365,638 64,022 5,976 420,342 73,601 6,845 483,232
Yakka Toot-III UC Urban 47,362 3,873 343,589 55,508 4,469 402,683 65,055 5,158 471,941
HASSAN KHEL SUB-DIVISION
Hassan Khel Sub-Division Rural 69,890 7,580 268 73,349 7,921 281 76,980 8,278 295
PESHAWAR DISTRICT 5,902,523 673,674 3,879 7,159,704 814,814 4,705 8,684,652 985,524 5,707
Source: Computed from 1998 and 2017 census data of the Pakistan Bureau of Statistics Notes:
Urban UCs Future Urban UCs Rural UCs

KP-SISUG Peshawar City Development Plan – Draft Final Report
134
Appendix 3: Population and demographic analysis
Peshawar district comprised three tehsils, namely, Peshawar, Nowshera, and Charsadda. In 1998, Peshawar district was reconstituted comprising only one tehsil of Peshawar and the two tehsils of Charsadda and Nowshera were constituted as new districts. The total area of the Peshawar district is 1,257 km2. The only urban area of the district is provincial capital city of Peshawar. Agriculture is primary economic activity in rural areas of the district.
Historical perspective on growth of Peshawar City
Peshawar is one of the ancient cities of Pakistan and cradle of ancient civilizations. The city is located to the east of Khyber Agency and is gateway to Afghanistan and Central Asian republics through Khyber Pass. Until two centuries ago the city served as gateway to India for all the invading forces from Afghanistan and Central Asia. Peshawar was a small walled city with 16 gates located to the south east of Bala Hisar fort. The city was ruled by Mughals, Afghans and Sikhs before the British took power in 1849.
The growth of Peshawar city began with the advent of British raj in 1849. The British established law and order and brought peace after long tumultuous years. They built Peshawar cantonment as the first planned urban settlement with civic facilities. Construction of cantonment commenced in 1867 and in the same year Peshawar municipality was constituted. Bureaucracy, trade and commerce increased with the establishment of cantonment and the population of Peshawar began to increase. Settlements emerged outside the old walled city. In the census of 1891, walled city, four settlements outside the walled city and cantonment were counted as Peshawar city. Peshawar experienced influx and settlement of Afghan refugees with their families and servants after the second Afghan War in 1870s. The Peshawar District Gazetteer of 1897-98 mentioned that Afghan refugees settled in Peshawar were not counted in the Census of 1891 and suggested to update the population in Gazetteer after the next census of 1901. The population of Peshawar excluding Afghan refugees was 63,07967 in the census of 1891.
In 1901 the North Wes Frontier Province (NWFP) was carved out of Punjab province and Peshawar became provincial capital. Peshawar has experienced rather rapid population growth until 1941. After the creation of Pakistan in the census of 1951 population of the city decreased by over 12 percent and the net decrease was 21,644 persons. This could be attributed to the migration of Hindus and Sikh population from Peshawar in 1947. Many cities of Punjab received Muslim refugees from India and population of these cities increased significantly. Muslim Refugees from India have refrained to settle in Peshawar because of their ethnicity. A vast majority of the Urdu speaking refugees settled in Karachi and Sindh while Punjabi speaking refugees preferred to settle in Punjab instead of Peshawar.
In the census of 1961 population of the city increased by 44 percent. This increase could be attributed partially to the government policy to settle refugees from India in places evacuated by Hindu and Sikh migrants.
Peshawar has witnessed very great population influxes and outflows, particularly, in the past four decades mainly because of foreign occupations and civil strife in Afghanistan and proliferation of terrorist networks and military operations in FATA and Swat.
67 Punjab Government. 1898. Gazetteer: Peshawar District 1897-98. Lahore: Punjab Government.

KP-SISUG Peshawar City Development Plan – Draft Final Report
135
Majority of the Afghan refugees were settled in refugee camps but a substantial number of Afghan refugees inter-married with local population, bought property and managed to settle in the city. Some Afghan nationals with refugee status in Peshawar district have repatriated but substantial number remains, and these were not counted in the census of population. The study on Peshawar slums quoted newspaper report indicating that about 0.8 million Afghan refugees were living in and around Peshawar and half of them were illegal residents.68
The military operations against terrorist networks in merged areas (previously FATA) created many internally displaced persons, some were temporarily settled in Peshawar and other areas. Majority of the internally displaced families have repatriated but some have settled in Peshawar district.
Urban growth in Peshawar
Population of Peshawar has grown outside the walled city since 1860 and new settlements have been included in the municipal limits from time to time. Population of the city has been increasing more rapidly in recent decades. During colonial period all urban development was planned to accommodate the increasing population.
After independence of Pakistan the population has increased from 151,435 to little less than one million in 1998. This indicates nearly six and half time increase in population in 47 years from 1951 to 1998. The most rapid increase has occurred in 1998-2017 when the population has increased by over 100 percent in 19 years. Provision of housing for this increasing population was not fully considered by the government and consequently housing needs were met by unplanned growth. Land around the city was sold by landowners for housing to individual buyers without any formal planned housing colony. The study of slums in Peshawar indicates predominance of this type of housing trend.
Figure 6: Population growth in Peshawar City
Source: Government of Pakistan. nd. Table-2: Area and Population of Administrative Units by Rural/Urban:
1951-1998 Censuses. Islamabad: Pakistan Bureau of Statistics, Statistics Division, GoP. Government of Pakistan. 2017. Provisional Summary Results of 6th Population and Housing Census 2017. Islamabad: Pakistan Bureau of Statistics, GoP.
Note: No separate population estimates for Peshawar Cantonment are available for 1901, 1911, 1921, 1931 and 1941.
68 UN-Habitat. 2013. The Study on Slums in Peshawar, Khyber Pakhtunkhwa, Pakistan. Peshawar: United
Nations Human Settlements Programme.
-
500,000
1,000,000
1,500,000
2,000,000
2,500,000
1901 1911 1921 1931 1941 1951 1961 1972 1981 1998 2017
Pop
ulat
ion
Census Year
TMA Cantt.

KP-SISUG Peshawar City Development Plan – Draft Final Report
136
Planned urban settlements
The first planned housing colony in Peshawar was University Town in 1950. This colony was outside the municipal limits and its population was separately shown in the census of 1961. The University Town was included in the municipal limits in the census of 1981. The limits of Peshawar municipality were probably increased in the census of 1981.
The second large housing colony was Hayatabad initiated in 1970. This is large colony with about 25,000 houses. The third large housing colony namely Regi Town was initiated by Peshawar Development Authority some years ago. The town will be larger than the Hayatabad with about 27,000 housing units.
Ina addition to these public-sector housing projects, many small-scale private housing projects were also implemented after official approval and in accordance with rules for development of new housing colonies.
Unplanned settlements
In addition to these well planned upper middle-class housing societies, the city grew in all directions. The unplanned settlements around the city began with population growth. The study of Peshawar slums indicated that some settlement emerged in 1960s and the trend of new unplanned settlements continue even to this day.
The urban planning and authorization of private housing colonies is regulated under the Khyber Pakhtunkhwa local government and rural development department’s regulations for Site Development Schemes of October 8, 2005. Under these rules the minimum size of the housing colony shall be 20 acres or above. The housing colonies approval is granted by PDA, local government department and TMAs of Peshawar. Some of the housing colonies get approval from any of the concerned agencies. In May 2018 only five private housing colonies were approved by the PDA and 26 were unapproved and declared illegal. There are no restrictions on establishment of unauthorized housing colonies though legal notices are served and by the time these actions are taken the housing colony is almost half constructed.
Population dynamics
Population change comes with natural increase and migration, both have played their role in population growth of Peshawar district. The rate of natural increase in Pakistan in 2.1 percent according to World Bank statistics. Statistics on birth and death rates is not available for Khyber Pakhtunkhwa or Peshawar district. Total fertility rate or the number of children ever born to women in her reproductive age is higher in Khyber Pakhtunkhwa than the national average. The total fertility rate has considerably declined from 1990 to 2013 according to PDHS. The MICS of 2008 reported much higher fertility rate of 5.1 than the PDHS of 2006-7.
The decline in fertility is also measured by Contraceptive Prevalence Rate (CPR) that was 28 percent in Khyber Pakhtunkhwa with much higher in urban areas at 44 percent and 25 percent in rural areas (PDHS 2013). The MICS 2008 showed CPR was 39 percent in the province.
Women who wanted to use contraceptives, but their need was not met were 26 percent in Khyber Pakhtunkhwa, with 22 percent in urban areas and 26 percent in rural areas (PDHS 2013). This has considerably reduced from the PDHS 2007 when the unmet need for family

KP-SISUG Peshawar City Development Plan – Draft Final Report
137
planning was 31 percent in Khyber Pakhtunkhwa province. The MICS 2008 reported unmet need of family planning at 27 percent in the province.
Figure 7: Trends of total fertility rate in Pakistan and Khyber Pakhtunkhwa
The decline in total fertility rate, increase in CPR and decrease in the percentage of unmet need for family planning indicate that birth rate could be affected with these indicators. The MICS 2016 was carried out and data is being analyzed. This will provide some information on fertility behavior and trends.
Age and sex composition of population
The age and sex composition indicate very broad base of the population that indicates potential high growth rate of population. About 43 percent of the population is young below 15 years. Women in reproductive age group (15-49 years) are 48 percent of the female population and the men in this age group are also 48 percent of the male population. This indicates that the high fertility rate of 3.9 will continue for the coming decades because of the largest proportion of population below 49 years of age.
Figure 8: Population pyramid of Peshawar City (1998 Census)
5.4
4.33.9
5.5
4.1 3.8
5.1
0.0
1.0
2.0
3.0
4.0
5.0
6.0
PDHS 1990-91 PDHS 2006-7 PDHS 2012-13 MICS 2008
Num
ber
Surveys
Pakistan KP
100,000 80,000 60,000 40,000 20,000 0 20,000 40,000 60,000 80,000
00 -- 0405 -- 0910 -- 1415 -- 1920 -- 2425 -- 2930 -- 3435 -- 3940 -- 4445 -- 4950 -- 5455 -- 5960 -- 6465 -- 69
70 ++
Male Female

KP-SISUG Peshawar City Development Plan – Draft Final Report
138
Source: Government of Pakistan. 2000. Peshawar District Census Report 1998. Islamabad: Population Census Organization, Statistics Division, GoP.
The base of the pyramid (0-4 years age group) shows considerable shrinking from the 5-9 years age group. This could be interpreted differently. The most important reason could be neglect in providing information about young children to the census enumerators. If we compare the national data and NWFP data, we find the same reduction of population in the 0-4 age group becomes evident in most cases. When the 2017 census results are published the same pattern will be repeated.
In Peshawar city the population of children under 5 years age group is 8,557 less than the children of 5-9 years age group. This does not indicate that sudden reduction in birth rate or fertility in Peshawar in 1992 to 1997. This is just the result of under reporting of young children in census.
Sex ratio
Sex ratio of Peshawar city indicates predominance of male over female. The longitudinal statistics of both sexes indicates gradual increase of number of females. In 1951 sex ratio of Peshawar was 144 that means there were 100 women per 144 men. The census of 1961 indicated considerable improvement as there were 136 men per 100 women in that census. There is considerable improvement in the census of 1981 when the sex ratio indicated 112 men per 100 women and the 1998 again indicated high sex ratio of 113. The 2017 census brought sex ration down to 109.
This simply means under reporting of females because of cultural traditions of Pathans in some districts. The sex ratio in Abbottabad, Mansehra, Haripur is 100 or slightly low but in all Pathan districts it is 105 or above.
Dependency ratio
The young population, under 15 years of age is 43 percent in Peshawar city and 49 percent in rural areas of the district. The economically active population 15-65 years age group is 54 percent in Peshawar city and 48 percent in rural areas. The aged population of above 65 years of age is three percent in urban areas and two percent in rural areas. The large percentage of youth population indicates a very high youth dependency ratio of 90 percent for Peshawar district and 79 for Peshawar city and over 101 in rural areas. There is also significant difference between aged dependency ratio of Peshawar city at 4 and its rural areas at 6. The total dependency ratio was 83 in Peshawar city and 106 in rural areas.
Extent of migration to Peshawar
The census data records place of birth of the enumerated persons. This indicates the total number of migrants to the province at the time of census without year of migration. These data are available for the 1998 census only.
The total population of Peshawar district was 2,025,851 in the 1998 census. The total number of native population (born in the district) was 1,724,694 (about 85%) and the number of migrants from other areas was 302,157 (about 15%). The largest percentage of migrants (71%) came from other districts of Khyber Pakhtunkhwa followed by 13 percent from FATA. Migrants from Punjab province were about seven percent. Migrants from other countries, primarily, from Afghanistan are five percent of the migrant population in Peshawar district.

KP-SISUG Peshawar City Development Plan – Draft Final Report
139
Around two percent or less have migrated to Peshawar from other provinces and administrative units of the country.
Table 35: Population of Peshawar District by place of birth (1998 Census)
Place of Birth Population Percentage
Other districts of KP 213,896 71%
FATA 40,210 13%
Punjab 21,053 7%
Sindh 6,518 2%
Balochistan 2,331 1%
Islamabad 2,723 1%
Azad Jammu & Kashmir 674 -
Gilgit-Baltistan 1,048 -
Other Countries 13,704 5%
Sub-Total – Born in other places 302,157 100
Born in Peshawar District 1,724,694 85%
Born in other places 302,157 15%
Grand Total 2,026,851 100
Source: Government of Pakistan. 2000. Peshawar District Census Report 1998. Islamabad: Population Census Organization, Statistics Division, GoP.
Causes of migration
Peshawar being capital city with best available physical infrastructure and social sector services attracts the migrants from other districts of Khyber Pakhtunkhwa and FATA. The massive increase of 100 percent population in Peshawar city and 120 percent in rural areas in the 2017 census indicate that the trend will continue in the coming years. The most areas of Khyber Pakhtunkhwa are underserved with physical and social sector infrastructure services and this could be major reason for migration to Peshawar. The entire province of Balochistan is underserved in terms of physical infrastructure and social sector services. The population of Quetta city increased by 170 percent between the two censuses from 0.64 million in 1998 to 1.73 million in 2017.
Peshawar has more economic opportunities than any other area of the province and this is one of the factors in migration to the city. Many civil servants after retirement choose to live in Peshawar because of the same reasons.
Push and pull factors
Push and pull factors are the determinants of population movements. Given that the majority of movements are likely to be from rural to urban areas and/or migrants to cities, the factors can be defined as follows:
• Push factors are those that drive rural people out of their areas of origin; and • Pull factors are those in the city that attract rural people to migrate to the cities.
Push factors might include, but not necessarily be limited to, the following:
• Lack of job opportunities in rural areas;

KP-SISUG Peshawar City Development Plan – Draft Final Report
140
• Infrastructure development in rural areas that fails to keep pace with increasing population;
• Inadequacy of basic health and educational services in rural areas as population grows;
• Reduction in agricultural yields and/or produce prices, leading to rising poverty; • Degradation of the local environment, through poor management of pollution and
wastes; and • Lack of access to water supply of adequate quality.
Pull factors are often the antithesis of push factors and might include, but not necessarily be limited to, the following:
• Economic development and employment opportunities in cities – for example, the development of new industries, offices and service centers, industrial estates or IT parks;
• Investments in transportation infrastructure, such as mass transit systems; • Provision of enhanced health and educational services, offering a wider choice of
services than are available in rural areas; • Perceived higher standards of living and access to markets, goods and services not
available in rural areas; • Better municipal services; and • Access to better housing.
Slums in Peshawar
The study on slums in Peshawar by UN Habitat in 2013 listed 18 slum areas in the city: (1) Akhun Abad, (2) Afghan Colony , (3) Chamkani (Rural), (4) Garhi Rajkot, (5) Ghareeb Abad/Changar Abad, (6) Haider Colony, (7) Hassan Garhi, (8) Hazar Khawani, (9) Kashkal, (10) Mohallah Pir Hidayat Ullah, (11) Nasir Bagh Road (some areas along the road), (12) Rahimabad, (13) Shah Dand, (14) Sufaid Dheri, (15) Taj Abad, (16) Tehkal Payan (Some areas) – (Shaheed Abad), (17) Wazirabad, (18) Gujjar Camp. All these slums are within the municipal limits.
The study sampled four slums for household survey and the data provides the situation of slums. The study sampled four areas: namely, i) Shaheedabad, ii) Tajabad Lane 10, iii) Gujjar Camp, and iv) Changarabad. Among these slums Changarabad was the oldest locality established in 1960 and the other three were established in early 1970s. The approximate number of houses in Shaheedabad was 3,000, in Tajabad 2,000, in Changarabad 1,200 and in Gujjar Camp 500. The study mentions that population of slums has increased by 50 percent since the year 2000.
Migration particularly refugees from Afghanistan are about half of the population of these slums as they are 48 percent and the Pakistani people are 52 percent. There are a large number of registered and unregistered refugees living in Peshawar and other areas of the country. At the time of survey in 2013, large sections of population from different agencies of FATA were evicted from their houses for the military operation against terrorist outfits in the area. These Internally Displaced Persons (IDP) were provided shelter but some of them rented houses instead of living in makeshift arrangements. Some of them may have settle in different cities.
KP-SISUG Peshawar City Development Plan – Draft Final Report
141
Majority of the houses are small, as in all four areas 38 percent of all houses are 3 marla (or 75 Yards2) while in Changarabad 72 percent of the houses are of this size. About 28 percent of the houses are 3 to 5 marla, 18 percent are in 5 to 8 marla size and 18 percent are above 8 marla while three percent do not know the size of their house. About 29 percent own houses and 69 percent are living on rent. The average rent of two room house was in range of PRs 2,175 to 3,280. About 20 percent of houses have only one room, 59 percent of houses have two to three rooms and 21 percent houses have more than three rooms.
A vast majority of the houses 65 percent are made of mud with thatch roof, about 33 percent of the houses are made of bricks and concrete, two percent are in tents or some other construction. Water source inside the house was available to 59 percent in Gujjar Camp, 73 percent in Changarabad, 81 percent in Tajabad and 86 percent in Shaheedabad. About 98 percent of the houses have toilet and 98 percent of them have pit latrines.
Public utilities area also not provided in these areas. Power connections were provided to 99 percent of the houses. Gas connection was provided to 21 percent of the houses. In Tajabad 63 percent and in Changarabad 35 percent in Shaheedabad two percent were provided gas connections while in Gujjar Camp gas was not provided to any household. About 68 percent households use wood for cooking and their average monthly expense on firewood was PRs 2,166.
All these slums are within municipal limits, but the municipal services are in very bad conditions. Tap water is available to 58 percent of the houses, nine percent have handpumps, 12 percent have motor pumps, 14 percent use dug wells and six percent derive water from other sources. There is no sewerage system, but the area is provided with drains. Drains are in very bad condition of disrepair and without any system for clearance of drains. There is no garbage removal system and open spaces are used as garbage dumps.
Most of the roads in slums were unpaved and in critical need of repair. There was no public transport service in these slums. There is no public park, but open spaces were available as playground for children.
Economic activities of the men in slum areas include all types of professions. The largest percentage 33 percent comprised unskilled daily wage earners, followed by 27 percent service providers (dyers, mechanics, etc.), nine percent were artisans (carpenter, furniture maker, polish work, etc.). About nine percent were construction workers (masons, electricians, etc.). About 15 percent were shopkeepers or vendors and five percent were highly skilled salaried persons including doctors and teachers.
About four percent of boys and three percent of girls under 15 years of age were working for wages in these areas. The employment status of the slum household was very low as 1.71 persons per household were employed though the wages were low. The average household income was PRs 18,718. The household size was large in range of 8 to 11 persons per household. The study found that 35 percent of the households were extremely poor and 31 percent of the households were poor. Only 40 percent of the population in slum areas comprised non-poor.
From these four slums the average number of households per slum area is 1,175. This may mean that the total number of houses in 18 slums would be 21,150 households.
The study found that 42 percent of boys and 22 percent of girls were enrolled in schools. The parents’ attitude towards education of children in very important. In these slums 54 percent of

KP-SISUG Peshawar City Development Plan – Draft Final Report
142
the parents wanted to send their sons to school while 29 percent of the parents wanted to send their daughters to school.
There was no government or private school in Gujjar Camp. There is only one government boys’ primary school and one private academy in Shaheedabad. There is no government school in Tajabad Lane-10 though there are private schools and academies in the vicinity. There are government schools for boys and girls in the vicinity of Changarabad.
Despite lack of facilities and attitude of parents towards education a small proportion of boys and girls are enrolled in schools and colleges of Peshawar.
Because of absence of proper hygienic conditions, persistence of poor sanitation, lack of storm water drainage a high incidence of disease was reported in these slum areas. About 74 percent of the households reported occurrence of disease in the past three months. About 72 percent of children and 68 percent of adults have suffered from illness during the reported period. About 89 percent sought medical treatment from government hospitals and 21 percent from private practitioners. Average cost to visit health facility was less than PRs 100 for 85 percent of the households while the remaining 15 percent paid in range of PRs 101 to 500.
Rural-urban distribution of population
Peshawar city is the only urban area in the district. Peshawar is the only district with highest percentage of urban population in the province. There is considerable variation in rural-urban proportion of the population between different censuses. In 1951 urban population was 39 percent which increased to 41 percent in 1961. This increase may be attributed to the settlement of refugees from India by the government in 1950s. The urban population of city once again reduced to 39 percent in 1972. In 1981 urban population increased to 51 percent. This high increase in urban population in short span of nine years could be attributed to the revival of Khyber Pakhtunkhwa province and Peshawar as provincial capital in 1970. People from rural areas of the district and from other areas of the province have migrated to Peshawar in this intercensal period.
After 1981 urban population is persistently declining in Peshawar district. This decline is urban population is concomitant to the increase in rural population of the district. There is no place left in the city for housing and per-urban areas are developing rapidly on all outskirts of the Peshawar city. All this population in peri-urban agglomerations is defined as rural. The rural population of the district increased from 49 percent in 1981 to 52 percent in 1998 and 54 percent in 2017. The main reason for this is the static municipal boundaries of Peshawar city. The city boundaries or municipal limits have not been revised since long. Since 1960, many open spaces in the city have been converted into housing areas and slums without any kind of urban planning. The same thing is happening in all rural areas around Peshawar city where unplanned, under-served housing areas are built at rapid speed. These are slum areas or potential slum areas in the making.

KP-SISUG Peshawar City Development Plan – Draft Final Report
143
Figure 9: Urban-rural mix in Peshawar District
Source: Government of Pakistan. nd. Table-2: Area and Population of Administrative Units by Rural/Urban:
1951-1998 Censuses. Islamabad: Pakistan Bureau of Statistics, Statistics Division, GoP. Government of Pakistan. 2017. Provisional Summary Results of 6th Population and Housing Census 2017. Islamabad: Pakistan Bureau of Statistics, GoP.
If we look at the percent increase of urban-rural population it clearly indicates much larger increase in rural population from 1981 compared to urban population. From 1951 to 1981 the urban population has shown much larger percent increase of 44 percent, 56 percent and 66 percent in the intercensal periods of 1951-61, 1961-1972, and 1972-81, respectively. Only in 1961-72 rural population has shown higher percentage increase. In 1972-81 rural population has shown very insignificant increase perhaps due to large scale rural to urban migration in the district.
Peshawar rural
Peshawar valley comprises fertile land endowed with perennial irrigation system that makes agriculture highly profitable. In the 2010 census of agriculture the total farm area of the district was 290,419 acres (117,528 hectares) owned by 100,092 landowners. In the same year cultivated area of the district was 268,237 acres (108,552 hectares). The Khyber Pakhtunkhwa Development Statistics of 2017 indicated total cultivated area of the district was 194,901 acres (78,874 hectares) in 2016. This indicates sharp reduction of 27 percent in the cultivated area of the district in short span of six year from 2010 to 2016. This indicates that prime agriculture land is rapidly lost and converted into housing and other non-productive uses.
Land distribution
The land distribution in rural areas is highly skewed with concentration of small farms and small number of large farms. Landholdings of less than 2.5 acre are about 66 percent and they account for 23 percent of the farm area. Landholdings of 2.5 to 5 acres are 17 percent and account for 20 percent of the farm area. The landholdings of less than 5 acres are 83 percent of all farms and account for 43 percent of the total area. These small holdings cannot provide subsistence to the farming household. The small landholders either work as tenant or laborer on large farms or become part of the non-farm labor in rural and urban areas. A little less than 0.5 percent of the landlords with holdings of above 25 acres own nine percent of the farmland.
-
500,000
1,000,000
1,500,000
2,000,000
2,500,000
1951 1961 1972 1981 1998 2017
Pop
ulat
ion
Census Year
Rural Urban

KP-SISUG Peshawar City Development Plan – Draft Final Report
144
Table 36: Distribution of farms and farm area in Peshawar District
Size of Farms Number Percent Farm Area Percent
Under 2.5 Acres 65,669 66% 67,088 23%
2.5 to Under 5 Acres 17256 17% 57,589 20%
5 to Under Acres 7.5 7,770 8% 43,949 15%
7.5 to Under 12.5 Acres 6,797 7% 62,172 21%
12.5-25 Under 25 Acres 2,124 2% 34,296 12%
25 to Under 50 Acres 213 Negligible 5,809 2%
50 to Under 100 Acres 222 Negligible 11,745 4%
100 to Under 150 Acres 17 Negligible 1,712 1%
Above 150 Acres 24 Negligible 6,059 2%
Total 100,092 100 290,419 100
Source: Government of Pakistan. 2012. Agricultural Census 2010: Pakistan Report. Lahore: Agricultural Census Organization, Statistics Division, GoP.
Crop production
In 2016 wheat was cultivated on 37,544 hectares, maize on 16,000 hectares, Rice on 345 hectares, barley on 79 hectares. Summer vegetables on 665 hectares, winter vegetables 1866 hectares. Fruit orchards of pear, peach, apricot and grapes cover an area of 2,483 hectares. Sugarcane was gown on 8,134 hectares and its production was 422,998 tons.
Figure 10: Area and production of major crops in Peshawar (2016-17)
Source: Government of Khyber Pakhtunkhwa. 2018. Development Statistics of Khyber Pakhtunkhwa 2018.
Peshawar: Bureau of Statistics, Planning & Development Department, GoKP. Note: Other crops include rice, barley and mustard.
Livestock and poultry are important part of the farming system. The total livestock population of the district comprises 223,150 cattle, 143,481 buffaloes and 332,476 small ruminants. On average several poultry birds are kept by majority of the rural households. Although machines are used for land preparation, ploughing and threshing but farmers also keep camels, horses and donkeys for transportation within the farm area. The farmers own 35,262 donkeys, 6,205 horses, 684 camels and 473 mules.
- 100,000 200,000 300,000 400,000 500,000 600,000
Wheat
Maize
Sugarcane
Vegetables
Fruits
Others
Area in hectares; production in tonnes
Production Area

KP-SISUG Peshawar City Development Plan – Draft Final Report
145
Economic activities and employment
The economy of the district comprises, agriculture, industry, trade and commerce, financial management and administration of the province and district. Peshawar is the major financial, commercial, and manufacturing center of the province with sizeable agriculture and livestock sector. Contribution of each sector in the district and city economy as well as its share in the provincial economy is not available.
The number of employed persons by different industry divisions were provided by 1998 census which indicate very small proportion of women participate in economic activities as they are only 17 percent of the work force in Peshawar city. There are no women working in seven major economic activities. A negligible proportion is employed in manufacturing and finance and bulk is employed in community, social and personal services. If we look at the employment status again 17 percent are employed and the largest proportion about 13 percent are employed as professionals.
Unemployment
Unemployment rate for the city is not available. According to the FY 2014 Labor Force Survey in Khyber Pakhtunkhwa unemployment rate was 5.98 percent. Male unemployment rate was 3.75 and female unemployment rate was 2.22 percent.
Industry
Peshawar is the most developed district of the province and has the largest number of industries in the province. There are two main industrial estates one on Kohat Road and the second on Jamrud Road. The total number of industrial units in Peshawar were 751. In 2016, 679 were running units were and the closed units were 72. Distribution by types and size of industries is not available. The total number of workers employed in these industries were 23,236. This means that an average number of workers per industry is 34. This indicates that most of the industry in the district comprises small industrial units. In 2007 the distribution of industries by types is given below.
Figure 11: Number and types of industries in Peshawar
0 20 40 60 80 100 120 140
Food & beverages
Chemicals& plastics
Metal & products
Mineral products
Paper & products
Wood & products
Textile & apparel
Other industries

KP-SISUG Peshawar City Development Plan – Draft Final Report
146
There is no statistics about age and sex distribution of industrial workers. There is no statistics about the number of industrial workers protected with social security and old age pensions. Usually in Pakistan a tiny fraction of the industrial workers is protected with these instruments of mandatory benefits.
Poverty
Planning Commission of Pakistan defined poverty line at 2,350 calories per adult equivalent per day in 2001. Poverty headcount ratio data according to this definition is not available for the districts.
Poverty profile prepared by Benazir Income Support Programme based on poverty scorecard survey in 2010-11 divided districts into five poverty bands: i) least Poor, ii) vulnerable, iii) poor, iv) very poor and v) extremely poor. According to this study Peshawar was ranked as Poor district with 32.41 percent poor households in the district.
The Multidimensional Poverty study of 2016 did not provide data on income poverty. The Multidirectional poverty index for Peshawar district was 0.148, headcount ratio in incidence of poverty was 31.5 percent and intensity of poverty was 46.8 percent in 2014-15.
Crime statistics
In Peshawar District following were the reported crimes in 2015: Murder 427, kidnapping and kidnapping for ransom 95, child lifting 6, car theft 106, car snatching 17 and motorcycle theft 173. Total number of police stations in the district was 33.
Tenure of houses
According to Pakistan Social and Living Standards Measurement (PSLM) Survey 2014-15, 74 percent of the houses in the district were owner occupied, 24 percent on rent and seven percent rent free. A little less than one quarter of the houses were on rent as large number of migrant workers are living in the city. I urban areas 36 percent of the houses are on rent as more economic migrants live in the city area.
Table 37: Percentage of houses by tenure in Peshawar District
Housing by Tenure Urban Rural Total
Owner Occupied 62 88 74
Rent 25 8 17
Subsidized rent 11 2 7
Rent free 2 2 2
Total 100 100 100
Source: Government of Pakistan. 2016. Pakistan Social and Living Standards Measurement Survey (2014-15). Islamabad: Pakistan Bureau of Statistics, Statistics Division, GoP.
Water and sanitation
Water source: tap water means municipal water supply which is available to 49 percent of the houses in the district. In urban areas 79 percent use municipal water and in rural areas only 14 percent of the households have this facility. Motor pumps are more common in rural areas perhaps due to lack of municipal water supply. About 88 percent of the hoses have flush toilets

KP-SISUG Peshawar City Development Plan – Draft Final Report
147
in the district and 99 percent in urban areas. About eight percent of the houses have no toilets in the district and 18 percent in rural areas (Table 38).
Table 38: Household water source and type of toilets in Abbottabad District
Urban Rural Total
Water Source of Household
Tap water 78% 14% 49%
Hand pump 4% 27% 14%
Motor pumps 17% 39% 27%
Dug-well 0% 19% 9%
Other 1% 1% 1%
Total 100% 100% 100%
Type of Toilets
Flush Latrine 99% 74% 88%
Non-Flush 1% 8% 4%
No Toilet 0% 18% 8%
Total 100% 100% 100%
Source: Government of Pakistan. 2016. Pakistan Social and Living Standards Measurement Survey (2014-15). Islamabad: Pakistan Bureau of Statistics, Statistics Division, GoP.
The administration of municipal services like water supply, sanitation and solid waste removal are fragmented in the district. Peshawar Cantonment is under the jurisdiction of Cantonment Board Peshawar which is responsible for municipal services. The University Town, Hayatabad and Regi Town are in the jurisdiction of PDA for provision of municipal services. Municipal services in industrial estate of Hayatabad are in the jurisdiction of Peshawar Development Authority. The rest of the Peshawar city comprising about 100 neighborhood councils out of total 130 is in the jurisdiction of Water Supply and Sanitation Company Peshawar (WSSP). Water supply in the rural areas of the city district are under the local government department in each of the four Town Municipal Administrations. There is no concept of municipal services for the rural areas.
Municipal services in the city are far from satisfactory condition except the Cantonment area of Peshawar. The Urban Policy and Planning Unit in 2014 commented that ‘Irrigation Canals running in various parts of the city have been turned into sewers’ in Peshawar. But also mentioned that ‘all Khyber Pakhtunkhwa sewage is passed on to canals and rivers without treatment.’69
WSSP is the largest municipal services provider in the city. WSSP provides water supply through 421 tube wells, 10 of which were reportedly non-functional in May 2018. There are 31 overhead tanks for water supply and only 13 of these are in use.
There is considerable confusion over the total number of water connections and the number of unauthorized or illegal water connections in WSSP jurisdiction. It was informed that there are number of hidden connections not shown in any record.
69 Queshi, Z. 2014. “Water and Sanitation in Khyber Pakhtunkhwa.” Presentation at Pakistan Urban Forum,
Karachi. 10-12 Jan 2014.
KP-SISUG Peshawar City Development Plan – Draft Final Report
148
There are 61,800 known and legal water connections, 35,243 are illegal connections installed by consumers without any approval of the WSSP or its predecessor authority. There are number of hidden connections which are gradually being traced.
The initial cost of water connection was very high well above PRs 20,000 for different types of domestic and commercial consumers. This high cost may have forced people to get unauthorized connection. The tariff for different types of water consumers was very high according to manager water supply. This has been reduced to PRs 300 flat rate per month for domestic consumers. There were many different types of commercial connections and new tariff was prepared for them as well.
The WSSP sent water rate bills of PRs 281 million in FY 2017 (PRs 198 million as water rate and PRs 83 million recovery of arrears) and the total recovery was PRs 43 million that is 15 percent of the total demand.
WSSP had a water supply staff of 1,391 persons and 93 posts are vacant. WSSP sanitation staff is 2,802 for clearing of drains and solid waste removal.
Hayatabad
Peshawar Development Authority is responsible for water supply and sanitation services in Hayatabad are University Town. The Hayatabad and University Town water supply services are managed by different offices of the PDA.
There are 78 water supply tube wells in Hayatabad, four are not in working order and 74 are functioning. Total number of consumers in Hayatabad is 17,624 domestic and 386 commercial connections. The tariff is very complicated for different sizes of houses, double story construction and rented portions, etc. The lowest slab for the smallest house of 75 yards2 is PRs 2,310, if the portion of house is rented then the water rate is PRs 3,465 per quarter. The tariff varies with size of house. Information on collection of water rate was not available.
University Town
It was informed that the University town is about half of the union council. There are nine water supply tube wells in university town. Total number of different types of consumers, water rate and water rate collection and number of water supply and sanitation staff was not available.
Education
Peshawar is the provincial capital with all sorts and levels of educational institutions in public and private sector. This section presents statistics on the number of educational institutions and school enrolment.
Government is the largest provider of education services and the private sector is increasingly entering the market. Government schools are sex segregated while majority of the private schools have co-education. Though government primary schools are sex segregated but in primary school both male and female children are enrolled if sex segregated school is not available in the vicinity.
Total number of government primary and secondary schools are shown in Table 1. There are 231 primary schools in Peshawar city 141 for boys and 90 for girls. There are 810 primary

KP-SISUG Peshawar City Development Plan – Draft Final Report
149
schools in rural areas 458 for boys and 352 for girls. There are 599 primary schools for boys and 442 for girls in the district.
The total population of the district was 4.26 million in 2017 census. In the 1998 census about 29 percent of the urban and 32 percent of rural population was in school going age group of 5-14 years. If the age and sex composition of population remains unchanged then the number of school age children in 2017 was 1.3 million in the district, 567,544 in Peshawar city and 729,509 in rural areas.
This indicates that in Peshawar city every primary school for boys and girls will be a super school with 1,092 boys and 1,591 girls, if all children are enrolled. The middle and high schools will have an average enrolment of 2,239 boys and 2,811 girls. In rural areas average enrolment at primary school comes to 463 boys and 545 girls and in middle and high school average enrolment of boys comes to 1,675 and girls 1,839.
These statistics clearly indicate that number of primary schools for boys and girls in Peshawar city are much less than required for the increasing population compared to rural areas. But the middle and high schools for boys and girls in both rural and urban areas are well below the demand. This could be the reason for very low gross enrolment ratio in secondary schools at 47 percent for boys and 27 percent for girls in Peshawar district in 2017 (Figure 12).
Figure 12: School age population per government school in Peshawar (2017)
Source: Government of Khyber Pakhtunkhwa. 2018. Development Statistics of Khyber Pakhtunkhwa 2018.
Peshawar: Bureau of Statistics, Planning & Development Department, GoKP.
Madaris (religious education schools)
The statistics of FY-2006 is available for religious schools, commonly known as deeni Madaris. There was a total of 380 madaris in the district, 322 for boys and 58 for girls. All these are private charity institutions and a vast majority of these schools are residential. These schools do not charge any tuition fee and provide boarding and lodging to all students. Some of these schools only provide learning to read the holy Quran.
1,092
1,591
463 545
2,239
2,811
1,675 1,839
-
500
1,000
1,500
2,000
2,500
3,000
Boys Girls Boys Girls
Urban Rural
5-9 years 10-14 years

KP-SISUG Peshawar City Development Plan – Draft Final Report
150
Enrolment ratio
The gross enrolment ratio in Peshawar district was 92 percent for boys’ and 69 for girls’ in Peshawar district without rural-urban distribution. The gross enrolment in secondary school schools was 47 percent for boys and 27 percent for girls in the district. The rural-urban distribution of gross enrolment ratio is not available.
The 2017 Annual Statistical Report of the Government Schools indicated gross enrolment ratio in all government schools, private schools and deeni madaris70 was 102 percent for boys and 76 percent for girls in 2017 in Khyber Pakhtunkhwa province. The net enrolment ratio of boys was 79 percent and of girls was 57 percent and overall 66 percent in the province without any rural-urban distribution.
If we rely on provincial averages, then 21 percent of boys and 43 percent of girls of 5-9 years age are still out of school. Secondly, if we look at the school age population of Peshawar then the out of school children will be much higher.
Gender discrimination in primary and secondary education
The government has failed to provide gender parity in access to primary education services. There is marked difference in the number of all types of government schools for boys and girls. Schools for boys are in much larger number than for girls. There are 141 primary schools for boys and 90 for girls in Peshawar city while in rural areas there are 458 for boys and 352 for girls.
At the secondary school level there are 31 middle schools for boys and 21 for girls in Peshawar city and 49 for boys and 45 for girls in the rural areas. The high schools are 32 for boys and 25 for girls in Peshawar city while 53 for boys and 39 for girls in rural areas.
The statistics clearly indicates that gender parity in enrolment and equal access of both sexes to education is not available in the capital city and district.
Technical Education and Vocational Training
There are three polytechnic institutes that provide training in different field and award the diploma of associate engineer. There are five vocational training centers, three for men and two for women in Peshawar district.
Higher education institutions
Higher secondary schools and intermediate colleges provide instructions for grade 11 and 12 after completion of secondary school. The Degree colleges also provide instructions for grade 11 and 12.
There are 35 higher secondary schools (intermediate colleges), 21 for boys (11 urban and 10 rural) and 14 for girls (nine in urban and five in rural). There are 16 government degree colleges eight each for boys and girls. There are five colleges offering only graduate courses, three for girls and two for boys.
70 There are many deeni madarisss which only teach learning of Quran in Arabic and do not provide any other
education.

KP-SISUG Peshawar City Development Plan – Draft Final Report
151
There are public and private sector universities and professional colleges in Peshawar city.
Health facilities
Peshawar city and district has the largest number of health institutions in the province. There is a total of 20 government hospitals with 5,243 beds. Three rural health centers with 84 beds and 48 Basic Health units. There are four TB clinics with 52 beds, four mother and child health centers and one leprosy clinic. There are 52 dispensaries mostly in rural areas of the district. In addition to government hospitals there are 30 private hospitals with 728 beds in Peshawar. There is a total of 1,454 registered medical practitioners, 1,324 men and 130 women in the district. The total bed strength in the district indicate availability of one bed per 700 persons. There is one registered medical practitioner for 2,936 persons in the district (Table 3).

KP-SISUG Peshawar City Development Plan – Draft Final Report
152
Appendix 4: Financial public expenditure review
The population of Peshawar district according to Population Census 2017 is 4,333,770 after merger of FATA, with urban population of 1,970,042. The overall growth rate is 4.08 percent over 1998 census with urban population growth at the rate of 3.73 percent. The total number of households is 489,843 with 236,056 living in urban areas. The geographical area of Peshawar district comprises of the 45 urban, 18 semi urban and 31 rural union councils.
The Water and Sanitation Services Peshawar (WSSP) is a newly established urban utility in Peshawar as a company limited by guarantee, registered with the Securities and Exchange Commission of Pakistan, (SECP), fully owned by government of Khyber Pakhtunkhwa, under Section 42 of the Companies Ordinance, 1984.
It is the first water and sanitation company in Pakistan to have full control of urban water and sanitation services. Also, it is a fully autonomous, professionally managed and corporate governed utility under a Services and Assets Management Agreement (SAMA). The geographical area of WSSP comprises of the four town municipal administrations of Peshawar.
Town Municipal Administrations in Peshawar
Peshawar has four Town Municipal Administrations (TMAs) – Town I to Town IV. According to the Budget Abstracts, the total revenue of Peshawar TMAs in 2017-18 was PKR 2,426 million, including provincial transfers, and expenditure of PKR 3,501 million leaving a deficit of PKR 1,075 million in financial year 2017-18 which was met from actual savings in budgeted expenditure from previous financial year leaving a net surplus of PKR 98 million in 2017-18.
The budget of TMA Peshawar for 2018-19 has been projected using average growth rate based on budget forecasts under Khyber Pakhtunkhwa budget strategy paper II 2018-19 and has been further applied to projections from 2019-20 onwards. If we look at the projected budget of TMA Peshawar for the FY 2018-19, the total revenue is PKR 2,668.68 million as compared to PKR 2,426.06 million budgeted for FY 2017-18 an increase of PKR 242.62 million. Similarly, total expenditure is PKR 3,744.61 million in 2018-19 as compared to PKR 3,500.81 budgeted in 2017-18 a net increase of PKR 243.80 million, which was mainly due application of average growth rate based on budget forecast in budget strategy paper 2018-19 to the 2017-18 budgeted figures. Historically, in the budget of Peshawar for the four Towns for the FY 2017-18, the total revenue was PKR 2,426 million as compared to PKR 2,577 million estimated for FY 2016-17 a net drop of PKR 151 million which was mainly due to reduced PFC share and decrease in own source revenue in 2017-18. The revenue budget increased on average at the rate of 46 percent from 2015-16 to 2017-18 with increase in provincial transfers over the same period mainly due to induction of 30 percent PFC share allotted to TMAs in provincial budget under the 18th Constitutional Amendment and increase in own source income. The expenditure budget decreased from PKR 3,673 million in 2016-17 to PKR 3,501 million in 2017-18 mainly due to a lower development budget in 2017-18.
Information given in Development Statistics prepared at the provincial level and the available TMA budget abstracts is summarized in Table 39. Presently the Resource Deficit of PKR 1,075.94 million projected for 2018-19 which is expected to turn into a Resource Deficit of PKR 1,314.83 million by 2025 and of PKR 64.93 million in 2035 based on the following assumptions made for these projections:

KP-SISUG Peshawar City Development Plan – Draft Final Report
153
• Proposed interventions have been estimated at PKR 16,210.74 million (US$ 116.75 million) based on the Action Plan proposed for the project. The Action Plan has been segmented into three timeframes, i.e., Short Term 2021-25 with an estimated project cost of PKR 4,477.91 million (US$ 32.25 million), Medium Term 2026-30 with estimated project cost of PKR 7,220.20 million (US$ 52 million) and Long Term 2031-35 with estimated project cost of PKR 4,512.63 million (US$ 32.5 million). The construction costs of proposed interventions have been assumed at 10 percent in first year, 30 percent in second year, 30 percent in third year, 20 percent in fourth year and 10 percent in fifth year. O&M costs have been assumed at one percent of project cost from completion of construction period to be financed by Khyber Pakhtunkhwa government. The proposed project has been assumed to be financed by ADB @ 80 percent with Khyber Pakhtunkhwa share @ 20 percent as provincial transfer.
• The TMA budget is expected to grow in line with the average growth rate of provincial budget based on average growth rate given in budget strategy paper II 2018-19.
• The projected revenues from own source, property tax and transfers have been assumed to increase in line with average growth rate in provincial receipts at 10%, non-development expenditure at 10 percent and development expenditure at four percent based on budget strategy paper 2018-19 forecasts.
• Population and households have been assumed to grow in line with average growth rate of four percent and 3.94 percent respectively based on census 2017 and census 1998.
Water and Sanitation Services Peshawar (WSSP)
In 2010 the Water and Sanitation Program (WSP) of World Bank, supported the Government of Khyber Pakhtunkhwa (GoKP) through a Technical Assistance on the utility reform agenda to make an informed decision to improve water and sanitation services in Peshawar. In January 2014 the utility company – Water and Sanitation Services Peshawar (WSSP) – was incorporated by Khyber Pakhtunkhwa Government and registered with the Securities and Exchange Commission of Pakistan (SECP) as a company limited by guarantee under S42 of the Companies Ordinance, 1984.
The WSSP is Pakistan’s first corporate governed and autonomous urban utility, and was established for managing essential municipal services like water supply, waste water and solid waste. These functions were transferred under a Services and Assets Management Agreement (SAMA) executed in September 2014 between Municipal Corporation (MC) Peshawar, Peshawar Development Authority (PDA) and University Town Committees (UTC) Peshawar. As a result of the SAMA all operational assets of MC, PDA and UTC relating to municipal services were handed over and their operational field staff seconded to WSSP. The Government of Khyber Pakhtunkhwa also agreed to provide financial support to compensate operational costs of WSSP and to continue to finance all existing and future activities, operations and obligations relating to municipal services delivery in Peshawar.
The WSSP is by far the largest utility company for municipal services in Khyber Pakhtunkhwa with present staff strength of 52, other than field operational staff transferred from TMA, to look after the financial, operational and administrative needs at the Company level. The capacity building and training needs of the Company have been dealt in the capacity building section of the Report.

KP-SISUG Peshawar City Development Plan – Draft Final Report
154
WSSP Budget and Projections
The present annual revenue of WSSP from water charges is PKR 322.01 million from domestic consumers and PKR 237.67 million from commercial consumers according to WSSC Budget 2018-19 which is expected to grow to PKR 1,641.21 million and PKR 421.06 million in 2025 and PKR 2,459.46 and PKR 1,092.16 in 2035 for domestic and commercial consumers respectively, based on present water tariff. There is no wastewater or solid waste collection charges for domestic consumers. The non-development budget is presently 81% (of which 61% is salary) of the total expenditure of PKR 3,360.20 budgeted for 2018-19.
There is a Resource Surplus of PKR 2.80 million as reflected in WSSC budget 2018-19 which is expected to turn into a Resource Deficit of PKR 4,247.72 million by 2025 and PKR 3,025.13 million in 2035. The WSSP budget abstracts and projections are summarized in Table 40 based on following assumptions made for these projections:
• Proposed interventions have been estimated at PKR 201,186.71 million (US$ 2,011.87 million) based on the Action Plan proposed for the project. The Action Plan has been segmented into three timeframes i.e. Short Term 2021-25 with an estimated project cost of PKR 71,306.42 million (US$ 513.55 million), Medium Term 2026-30 with estimated project cost of PKR 60,663.57 million (US$ 436.90 million) and Long Term 2031-35 with estimated project cost of PKR 69,216.73 million (US$ 498.50 million). The construction costs of proposed interventions have been assumed at 10 percent in first year, 30 percent in second year, 30 percent in third year, 20 percent in fourth year and 10 percent in fifth year. O&M costs have been assumed at one percent of project cost from completion of construction period to be financed by Khyber Pakhtunkhwa government. The proposed project has been assumed to be financed by ADB @ 80% with Khyber Pakhtunkhwa share @ 20% as provincial transfer.
• Population and households have been assumed to cover only the urban and future urban population of the four TMAs of Peshawar excluding cantonments. Urban and future urban population and households have been assumed to grow in line with average growth rate of 4.24% and 4.13 % respectively based on census 2017 and census 1998.
• Average rate for water services for domestic and commercial water supply, wastewater and solid waste for 2018-19 has been assumed to be constant. The present domestic water supply rate is PKR 330 with no wastewater/solid waste charges for domestic connections which have been used to calculate the projected revenue from projected household connections based on 20% (71,776 households) coverage in 2018-19, 40%, 50%, 60%, 70% & 80% coverage from 2020 onwards. Water rates ranging from PKR 550 to PKR 6,000 per month are charged for various categories of 15,383 commercial connections. A flat rate of PKR 475 (PKR 420 for 2017-18) for wastewater and sanitation is also charged for commercial connections (see table below). The revenue from water services for commercial connections has been assumed to grow in line with average growth rate in provincial receipts @ 10%.
The WSSP budget abstract and projections till 2035 are shown in Table 40.
The budget prepared by the WSSP for 2018-19 shows annual revenue from water and conservancy charges of PKR 559.69 million based on water supply charges for 76,341 domestic (32 percent of total households) and 15,383 commercial connections at an average water rate of PKR 330 (PKR 385 for 2017-18) per month for domestic and water rates ranging from PKR 550 to PKR 6,000 per month for various categories of commercial connections.

KP-SISUG Peshawar City Development Plan – Draft Final Report
155
There is no wastewater or solid waste collection charges for domestic consumers. However, a flat rate of PKR 475 (PKR 420 for 2017-18) is charged for commercial connections (Table 42). These tariff rates cannot be confirmed because there is no official notification of these charges. However, these rates have been used for the preparation of WSSP budget for 2018-19 and have been assumed constant for projection of revenue from water services.

KP-SISUG Peshawar City Development Plan – Draft Final Report
156
Table 39: Revenue and expenditure for TMAs Peshawar (million PKR)
2017 2018 2019 2020 2021 2022 2023 2024 2025 2026 2027 2028 2029 2030 2031 2032 2033 2034 2035Population (Census 2017) Nos. 2,956,790 3,092,215 3,235,358 3,386,711 3,546,803 3,716,199 3,895,506 4,085,371 4,286,490 4,499,610 4,725,532 4,965,114 5,219,278 5,489,017 5,775,393 6,079,552 6,402,724 6,746,233 7,111,504 Households (Census 2017) Nos. 345,222 360,599 376,828 393,963 412,060 431,179 451,386 472,750 495,343 519,246 544,542 571,322 599,683 629,727 661,566 695,318 731,111 769,080 809,371
RECEIPTS
- Own Source 748.30 743.95 818.35 900.19 990.21 1,089.23 1,198.16 1,317.98 1,449.79 1,594.77 1,754.26 1,929.69 2,122.67 2,334.94 2,568.45 2,825.30 3,107.85 3,418.64 3,760.52 - Property Tax 305.52 337.32 371.05 408.16 448.98 493.88 543.27 597.60 657.36 723.10 795.41 874.96 962.46 1,058.71 1,164.59 1,281.05 1,409.16 1,550.08 1,705.10 - PFC transfers 840.31 686.93 755.63 831.19 914.31 1,005.75 1,106.33 1,216.97 1,338.67 1,472.54 1,619.80 1,781.79 1,959.98 2,155.98 2,371.59 2,608.76 2,869.65 3,156.63 3,472.30 - PFC transfers arrears 103.06 0.00 - - - - - - - - - - - - - - - - - - Transfer KP - New project - 89.56 268.67 268.67 223.90 134.34 189.18 477.99 477.99 405.79 261.39 207.23 207.23 207.23 252.36 252.36 - Misc. Grants 207.61 109.81 120.79 132.87 146.16 160.78 176.85 194.54 213.99 235.40 258.94 284.83 313.31 344.65 379.11 417.03 458.73 504.61 555.07 - Misc. Receipts 372.01 548.05 602.86 663.15 729.46 802.41 882.66 970.93 1,068.03 1,174.83 1,292.32 1,421.56 1,563.72 1,720.10 1,892.12 2,081.34 2,289.48 2,518.44 2,770.30
TOTAL RECEIPTS 2,576.81 2,426.06 2,668.68 2,935.56 3,318.68 3,820.73 4,175.95 4,521.91 4,862.18 5,389.83 6,198.72 6,770.82 7,327.93 7,875.77 8,583.09 9,420.71 10,342.10 11,400.76 12,515.65
EXPENDITURE
1. Non-Development Expenditure 1,584.13 1,789.91 1,962.14 2,150.94 2,357.90 2,584.79 2,833.50 3,150.92 3,449.80 3,777.44 4,136.60 4,530.33 5,034.14 5,507.28 6,025.94 6,594.51 7,217.79 7,946.17 8,695.17 - Salary 597.68 765.42 839.07 919.81 1,008.32 1,105.34 1,211.70 1,328.29 1,456.10 1,596.21 1,749.80 1,918.17 2,102.74 2,305.07 2,526.87 2,770.01 3,036.54 3,328.72 3,649.02 - Non-Salary 819.68 1,024.48 1,123.06 1,231.13 1,349.59 1,479.45 1,621.80 1,777.85 1,948.92 2,136.45 2,342.03 2,567.38 2,814.42 3,085.23 3,382.09 3,707.52 4,064.27 4,455.34 4,884.04 - O & M new project - - - - - - 44.78 44.78 44.78 44.78 44.78 116.98 116.98 116.98 116.98 116.98 162.11 162.11 - WSSP 166.77 - - - - - - - - - - - - - - - - - -
2. Development Expenditure (ADP) 2,088.22 1,710.90 1,782.48 1,857.05 2,382.53 3,359.06 3,443.39 3,083.46 2,727.20 3,096.79 4,640.18 4,743.69 4,129.51 3,519.85 3,366.14 3,488.09 3,615.14 3,747.51 3,885.41
- ADP 934.91 1,050.14 1,094.07 1,139.84 1,187.53 1,237.21 1,288.97 1,342.90 1,399.08 1,457.62 1,518.60 1,582.13 1,648.32 1,717.28 1,789.13 1,863.98 1,941.96 2,023.21 2,107.85 - On-going 779.98 602.06 627.25 653.49 680.83 709.31 738.99 769.91 802.12 835.67 870.64 907.06 945.01 984.55 1,025.74 1,068.65 1,113.36 1,159.94 1,208.47 - New project - - - 447.79 1,343.37 1,343.37 895.58 447.79 722.02 2,166.06 2,166.06 1,444.04 722.02 451.26 451.26 451.26 451.26 451.26 - Others 373.32 58.70 61.16 63.72 66.38 69.16 72.05 75.07 78.21 81.48 84.89 88.44 92.14 96.00 100.01 104.20 108.56 113.10 117.83
TOTAL EXPENDITURE 3,672.34 3,500.81 3,744.61 4,007.99 4,740.44 5,943.85 6,276.89 6,234.38 6,177.00 6,874.23 8,776.79 9,274.02 9,163.65 9,027.12 9,392.08 10,082.60 10,832.93 11,693.68 12,580.58
RESOURCE GAP (1,095.54) (1,074.74) (1,075.94) (1,072.43) (1,421.75) (2,123.12) (2,100.94) (1,712.47) (1,314.83) (1,484.41) (2,578.07) (2,503.20) (1,835.72) (1,151.35) (808.99) (661.89) (490.83) (292.92) (64.93) Cumulative Gap (1,074.74) (2,150.68) (3,223.11) (4,644.86) (6,767.98) (8,868.92) (10,581.39) (11,896.22) (13,380.62) (15,958.69) (18,461.89) (20,297.61) (21,448.96) (22,257.95) (22,919.84) (23,410.68) (23,703.60) (23,768.53) NPV @ 9% (12,479)
Assumptions:1. Budget 2018-19 based on budget documents.2. Avg growth rate based on budget forecasts under KP budget strategy paper II 2018-19 applied to projections from 2018-19 and onwards.Expenditure - Non development 10% - Development 4%Receipts 10%3. TMA budget is expected to grow in line with avg growth rate of KP budget.4. Population is based on Census 2017. UC based 1998-2017 intercensal growth rate has been used for projections for current as well as future urban areas.5. No. of Household is based on Census 2017. UC based 1998-2017 intercensal growth rate has been used for projections for current as well as future urban areas.
BUDGET PROJECTIONS

KP-SISUG Peshawar City Development Plan – Draft Final Report
157
Table 40: Revenue and expenditure for WSSP (million PKR) based on current tariff
Census 2017 2017 2018 2019 2020 2021 2022 2023 2024 2025 2026 2027 2028 2029 2030 2031 2032 2033 2034 2035- Population - Urban Nos. 2,956,790 3,092,215 3,235,358 3,386,711 3,546,803 3,716,199 3,895,506 4,085,371 4,286,490 4,499,610 4,725,532 4,965,114 5,219,278 5,489,017 5,775,393 6,079,552 6,402,724 6,746,233 7,111,504 - Households - Urban Nos. 345,222 360,599 376,828 393,963 412,060 431,179 451,386 472,750 495,343 519,246 544,542 571,322 599,683 629,727 661,566 695,318 731,111 769,080 809,371
RECEIPTS
- Own Source - Domestic WSS 686.07 540.50 322.01 673.30 880.29 1,105.36 1,350.03 1,615.91 1,693.14 1,774.84 1,861.31 1,952.84 2,049.78 2,152.48 2,261.31 2,376.68 2,499.02 2,628.80 2,766.52 Commercial WSS 480.64 403.60 237.67 261.44 287.58 316.34 347.98 382.78 421.06 463.16 509.48 560.43 616.48 678.13 745.95 820.54 902.60 992.87 1,092.16
- Transfer KP (ADP) 1,160.00 0.00 505.31 555.84 611.43 672.58 739.84 813.82 895.21 984.73 1,083.21 1,191.54 1,310.70 1,441.77 1,585.96 1,744.56 1,919.02 2,110.93 2,322.03 - Transfer KP (Non-ADP) 1,078.00 1765.00 1,765.00 1,941.51 2,135.67 2,349.24 2,584.18 2,842.61 3,126.88 3,126.88 3,439.58 3,783.56 4,161.93 4,578.14 5,035.97 5,539.59 6,093.58 6,702.96 7,373.29 - Transfer MC** 300.00 430.00 430.00 473.00 520.30 572.34 629.57 692.53 761.79 761.79 837.97 921.77 1,013.95 1,115.35 1,226.89 1,349.59 1,484.55 1,633.02 1,796.32 - Transfer Town Committee 27.24 0.00 - - - - - - - - - - - - - - - - - - Transfer PDA 196.00 - - - - - - - - - - - - - - - - - Misc. Grants 80.00 77.86 - - - - - - - - - - - - - - - - Transfer KPK - New project 1,438.62 4,265.89 4,265.89 3,565.32 2,151.69 2,151.69 4,340.38 4,340.38 3,746.24 2,545.47 2,716.53 5,460.21 5,460.21 4,780.54 3,408.70 - Misc. Receipts 65.00 15.00 23.00 25.30 27.83 30.61 33.67 37.04 40.75 40.75 44.82 49.30 54.23 59.66 65.62 72.19 79.41 87.35 96.08
TOTAL RECEIPTS 3,992.95 3,154.10 3,362.99 4,008.26 5,901.73 9,312.36 9,951.16 9,950.02 9,090.51 9,303.85 12,116.76 12,799.83 12,953.32 12,571.00 13,638.23 17,363.35 18,438.39 18,936.46 18,855.11
EXPENDITURE
1. Non-Development Expenditure 2,980.26 2,824.03 2,710.11 2,970.88 3,256.74 3,570.11 3,913.63 5,003.27 5,416.09 5,868.62 6,364.70 6,908.51 8,111.28 8,764.78 9,481.16 10,266.47 11,127.35 12,763.22 13,797.74 - Salary 1,729.80 1,723.32 1,665.35 1,825.59 2,001.26 2,193.82 2,404.91 2,636.32 2,889.99 3,168.07 3,472.91 3,807.08 4,173.40 4,574.98 5,015.19 5,497.76 6,026.76 6,606.67 7,242.38 - Non-Salary 1,250.46 1,100.71 1,044.76 1,145.28 1,255.48 1,376.29 1,508.72 1,653.89 1,813.03 1,987.48 2,178.72 2,388.37 2,618.18 2,870.10 3,146.27 3,449.01 3,780.88 4,144.69 4,543.50 - O&M new project 713.06 713.06 713.06 713.06 713.06 1,319.70 1,319.70 1,319.70 1,319.70 1,319.70 2,011.87 2,011.87
2. Development Expenditure 1,491.68 46.45 650.09 671.80 7,811.91 21,974.12 22,001.09 14,961.03 7,922.15 6,888.36 18,927.89 18,960.99 12,991.61 7,023.67 7,916.42 21,673.80 21,714.44 14,897.58 8,082.50
- ADP 1,414.50 - 505.31 526.45 548.48 571.42 595.33 620.24 646.18 673.22 701.38 730.73 761.30 793.15 826.33 860.90 896.92 934.45 973.54 - Grant Expenditure - - 80.00 77.86 - - - - - - - - - - - - - - - - New project 7,193.12 21,329.44 21,329.44 14,261.28 7,193.12 6,128.84 18,136.59 18,136.59 12,132.71 6,128.84 6,984.16 20,702.54 20,702.54 13,843.35 6,984.16 - Others 77.18 46.45 64.78 67.49 70.31 73.26 76.32 79.51 82.84 86.31 89.92 93.68 97.60 101.68 105.93 110.37 114.98 119.79 124.81
TOTAL EXPENDITURE 4,471.93 2,870.48 3,360.20 3,642.68 11,068.65 25,544.23 25,914.72 19,964.31 13,338.23 12,756.98 25,292.58 25,869.50 21,102.89 15,788.45 17,397.58 31,940.28 32,841.79 27,660.81 21,880.24
RESOURCE SURPLUS/(GAP) (478.99) 283.62 2.80 365.58 (5,166.92) (16,231.87) (15,963.57) (10,014.29) (4,247.72) (3,453.14) (13,175.82) (13,069.67) (8,149.57) (3,217.45) (3,759.35) (14,576.92) (14,403.40) (8,724.35) (3,025.13) Cumulative Gap 283.62 286.41 651.99 (4,514.93) (20,746.80) (36,710.37) (46,724.65) (50,972.38) (54,425.51) (67,601.34) (80,671.01) (88,820.58) (92,038.03) (95,797.38) (110,374.30) (124,777.70) (133,502.04) (136,527.18) NPV @ 9% (76,300) * Budget Estimates**The receipts reflected against MC is the expected amount as per their budget and in case the same is not transferred, the company budget statement shall probably reflect deficit.
Assumptions:1. Budget 2018-19 based on budget documents.2. Avg growth rate based on budget forecasts under KP budget strategy paper II 2018-19 applied to projections from 2019-20 and onwards.Expenditure - Non development 10% - Development 4%Receipts 10%3. Budget is expected to grow in line with avg growth rate of KP budget.4. Population is based on Census 2017. UC based 1998-2017 intercensal growth rate has been used for projections for current as well as future urban areas.5. No. of Household is based on Census 2017. UC based 1998-2017 intercensal growth rate has been used for projections for current as well as future urban areas.
BUDGET
6. Average rate for water services for domestic and commercial water supply, wastewater and solid waste for 2018-19 has been assumed to be constant. The present domestic water supply rate is PKR 330 with no wastewater/solid waste charges for domestic connections which has been used to calculate the projected revenue from household connections based on 20% coverage in 2018-19, 40%, 50%, 60%, 70% & 80% coverage from 2020 onwards.
PROJECTIONS

KP-SISUG Peshawar City Development Plan – Draft Final Report
158
Table 41: Revenue and expenditure for WSSP (million PKR) based on affordability
Census 2017 2017 2018 2019 2020 2021 2022 2023 2024 2025 2026 2027 2028 2029 2030 2031 2032 2033 2034 2035
- Population - Urban Nos. 2,956,790 3,092,215 3,235,358 3,386,711 3,546,803 3,716,199 3,895,506 4,085,371 4,286,490 4,499,610 4,725,532 4,965,114 5,219,278 5,489,017 5,775,393 6,079,552 6,402,724 6,746,233 7,111,504 - Households - Urban Nos. 345,222 360,599 376,828 393,963 412,060 431,179 451,386 472,750 495,343 519,246 544,542 571,322 599,683 629,727 661,566 695,318 731,111 769,080 809,371
RECEIPTS
- Own Source - Domestic WSS 686.07 540.50 322.01 3,774.48 4,934.83 6,196.56 7,568.12 9,058.64 9,491.57 9,949.59 10,434.30 10,947.45 11,490.88 12,066.58 12,676.67 13,323.41 14,009.25 14,736.80 15,508.85 Commercial WSS 480.64 403.60 237.67 261.44 287.58 316.34 347.98 382.78 421.06 463.16 509.48 560.43 616.48 678.13 745.95 820.54 902.60 992.87 1,092.16
- Transfer KP (ADP) 1,160.00 0.00 505.31 526.45 548.48 571.42 595.33 620.24 646.18 673.22 701.38 730.73 761.30 793.15 826.33 860.90 896.92 934.45 973.54 - Transfer KP (Non-ADP) 1,078.00 1765.00 1,765.00 1,941.51 2,135.67 2,349.24 2,584.18 2,842.61 3,126.88 3,126.88 3,439.58 3,783.56 4,161.93 4,578.14 5,035.97 5,539.59 6,093.58 6,702.96 7,373.29 - Transfer MC** 300.00 430.00 430.00 473.00 520.30 572.34 629.57 692.53 761.79 761.79 837.97 921.77 1,013.95 1,115.35 1,226.89 1,349.59 1,484.55 1,633.02 1,796.32 - Transfer Town Committee 27.24 0.00 - - - - - - - - - - - - - - - - - - Transfer PDA 196.00 - - - - - - - - - - - - - - - - - Misc. Grants 80.00 77.86 - - - - - - - - - - - - - - - - Transfer KPK - New project 1,438.62 4,265.89 4,265.89 3,565.32 2,151.69 2,151.69 4,340.38 4,340.38 3,746.24 2,545.47 2,545.47 5,460.21 5,460.21 4,780.54 3,408.70 - Misc. Receipts 65.00 15.00 23.00 25.30 27.83 30.61 33.67 37.04 40.75 40.75 44.82 49.30 54.23 59.66 59.66 65.62 72.19 79.41 87.35
TOTAL RECEIPTS 3,992.95 3,154.10 3,362.99 7,080.03 9,893.31 14,302.41 16,024.75 17,199.16 16,639.92 17,167.08 20,307.93 21,333.63 21,845.02 21,836.48 23,116.94 27,419.87 28,919.30 29,860.03 30,240.20
EXPENDITURE
1. Non-Development Expenditure 2,980.26 2,824.03 2,710.11 2,970.88 3,256.74 3,570.11 3,913.63 5,003.27 5,416.09 5,868.62 6,364.70 6,908.51 8,111.28 8,764.78 9,481.16 10,266.47 11,127.35 12,763.22 13,797.74
- Salary 1,729.80 1,723.32 1,665.35 1,825.59 2,001.26 2,193.82 2,404.91 2,636.32 2,889.99 3,168.07 3,472.91 3,807.08 4,173.40 4,574.98 5,015.19 5,497.76 6,026.76 6,606.67 7,242.38 - Non-Salary 1,250.46 1,100.71 1,044.76 1,145.28 1,255.48 1,376.29 1,508.72 1,653.89 1,813.03 1,987.48 2,178.72 2,388.37 2,618.18 2,870.10 3,146.27 3,449.01 3,780.88 4,144.69 4,543.50 - O&M new project 713.06 713.06 713.06 713.06 713.06 1,319.70 1,319.70 1,319.70 1,319.70 1,319.70 2,011.87 2,011.87
2. Development Expenditure 1,491.68 46.45 650.09 671.80 7,811.91 21,974.12 22,001.09 14,961.03 7,922.15 6,888.36 18,927.89 18,960.99 12,991.61 7,023.67 7,916.42 21,673.80 21,714.44 14,897.58 8,082.50
- ADP 1,414.50 - 505.31 526.45 548.48 571.42 595.33 620.24 646.18 673.22 701.38 730.73 761.30 793.15 826.33 860.90 896.92 934.45 973.54 - Grant Expenditure - - 80.00 77.86 - - - - - - - - - - - - - - - - New project 7,193.12 21,329.44 21,329.44 14,261.28 7,193.12 6,128.84 18,136.59 18,136.59 12,132.71 6,128.84 6,984.16 20,702.54 20,702.54 13,843.35 6,984.16 - Others 77.18 46.45 64.78 67.49 70.31 73.26 76.32 79.51 82.84 86.31 89.92 93.68 97.60 101.68 105.93 110.37 114.98 119.79 124.81
TOTAL EXPENDITURE 4,471.93 2,870.48 3,360.20 3,642.68 11,068.65 25,544.23 25,914.72 19,964.31 13,338.23 12,756.98 25,292.58 25,869.50 21,102.89 15,788.45 17,397.58 31,940.28 32,841.79 27,660.81 21,880.24
RESOURCE SURPLUS/(GAP) (478.99) 283.62 2.80 3,437.36 (1,175.34) (11,241.82) (9,889.98) (2,765.15) 3,301.68 4,410.09 (4,984.66) (4,535.87) 742.13 6,048.03 5,719.36 (4,520.40) (3,922.48) 2,199.22 8,359.96
Cumulative Gap 283.62 286.41 3,723.77 2,548.43 (8,693.39) (18,583.37) (21,348.52) (18,046.84) (13,636.74) (18,621.40) (23,157.27) (22,415.14) (16,367.11) (10,647.75) (15,168.15) (19,090.63) (16,891.41) (8,531.45)
NPV @ 9% (15,184)
FIRR -7%
* Budget Estimates**The receipts reflected against TMA is the expected amount as per their budget and in case the same is not transferred, the company budget statement shall probably reflect deficit. Therefore, no revenue is assumed in projections.
Assumptions:1. Budget 2018-19 based on budget documents.2. Avg growth rate based on budget forecasts under KP budget strategy paper II 2018-19 applied to projections from 2019-20 and onwards.Expenditure - Non development 10% - Development 4%Receipts 10%3. Budget is expected to grow in line with avg growth rate of KP budget for last five years.4. Population is based on Census 2017. UC based 1998-2017 intercensal growth rate has been used for projections for current as well as future urban areas.5. No. of Household is based on Census 2017. UC based 1998-2017 intercensal growth rate has been used for projections for current as well as future urban areas.6. Tariff affordability is between 3% to 5% (WB&UNDP) of avg household income (Urban) which in KP is PKR 49,910/mth and the avg mthly tariff comes to PKR 1,996 which has been used to calculate the projected revenue from household connections assuming 20%, 40%, 60% & 80% coverage from 2020 onwards.
PROJECTIONSBUDGET

KP-SISUG Peshawar City Development Plan – Draft Final Report
159
Table 42: Water supply tariff for WSSP
Type of Connection Rate (PKR/Month)
2017-18 2018-19
Residential Connection
House Holds 385 330
New connections charges - 1,000
Commercial Connections
Banks 1,617 1,100 Barber Shop 1,617 550
Cinema 2,811 5,000
Clinic 1,617 1,100
College 2,530 550
School 506 550
Filling station 1,617 1,100 Restaurants / Hotel 2,811 3,300
Shops 1,617 550
Hospital 908 1,100
Washrooms 1,617 550
Plaza 6,738 6,000
Offices 539 1,100 Shops (Conservancy) 420 475
New connections charges
2,000

KP-SISUG Peshawar City Development Plan – Draft Final Report
160
Appendix 5: Institutional and organizational assessment
National and provincial plans, planning policies and strategies
At provincial level, the Planning & Development (P&D) Department has the mandate for providing policy input for the Provincial and Sectoral Development Policies. It appraises all development projects, coordinates, and adds value to the project proposals of all provincial departments. The development of the Provincial Annual Development Program is one of the key functions of this Department. Interaction with international partners is another focus of P&D activities. Monitoring and evaluation of projects, interaction with Federal Level institutions and long-term planning are all areas that are part of the Department’s duties. Preparation of provincial statistics and planning for districts also lie within P&D mandate. The Department also oversees the Government’s reform initiatives. P&D Department has undertaken the strategic level planning, including the development of an Integrated Development Strategy, a Strategic Development Partnership Framework, and a Provincial Growth Strategy (Table 43).
Table 45 shows the key stakeholders in the urban sector, while Table 46 and Table 47 present institutional roles and processes devolved at various levels (province, district and tehsil) in planning, budget approval, procurement, the gaps, and the overlaps in roles in planning and implementing urban services. There are generally two types of projects:
• Departmental Development Projects are developed by various departments at province level with coordination by P&D Department, translated into district development schemes, reviewed by the respective decision-making entities, and upon approval, included in the respective provincial and district Annual Development Programs (ADP).
• Special Projects are the result of special policy directives of the Government. Such projects may be prioritized over others, if availability of funds is a constraint.
Based on the institutional assessment undertaken for this project, it can be concluded that the urban and land planning system in Khyber Pakhtunkhwa needs to be strengthened in the following areas:
• The legal framework for urban and land management, which needs to regulate the conversion of land use and environmental concerns;
• The actual implementation of policies, plans and legal framework; • Urban land management, to control the high rate of urban sprawl; • The technical and financial capacity of local institutions; • The management of urban services delivery; • The insufficiency in the supply of affordable housing, which results in an increased
number of informal settlements; and • The increasing frequency of natural disasters, which call for sound preparedness and
enhanced resilience in urban planning.
Table 43: National and provincial policies, legislation and guidelines relevant to urban planning
Sector Title Year
Khyber Pakhtunkhwa Local Government Act 2013

KP-SISUG Peshawar City Development Plan – Draft Final Report
161
Sector Title Year
Local Government
The Khyber Pakhtunkhwa Tehsil and Tehsil Municipal Administration Rules of Business
2015
Water National Water Policy 2018
National Drinking Water Policy 2009
Khyber Pakhtunkhwa Drinking Water Policy 2015
Environment and Climate Change
National Sustainable Development Policy 2012
National Conservation Strategy 1992
Pakistan Environment Protection Act 1997
National Environmental Policy 2005
National Disaster Management Act 2010
National Disaster Risk Reduction Policy 2012
Pakistan Climate Change Act 2016
The Khyber Pakhtunkhwa River Protection Ordinance. 2002
The Khyber Pakhtunkhwa River Protection (Amendment) Act 2014.
The Khyber Pakhtunkhwa Environmental Protection Act 2014
The Khyber Pakhtunkhwa Climate Change Policy 2016
Khyber Pakhtunkhwa Wildlife and Biodiversity (Protection, Preservation, Conservation and Management) Act (and Amendment)
2015 2017
Sanitation and Waste
Hospital Waste Management Rules 2005
Guidelines for Solid Waste Management 2005
National Sanitation Policy of Pakistan 2006
Housing, Zoning and Energy
National Housing Policy 2001
Khyber Pakhtunkhwa Housing Authority Act (and Amendments) 2005, 2014, 2017
National Energy Efficiency and Conservation Act 2016
National Power Policy 2013
National Energy Conservation Policy 2005
Building Code of Pakistan – Seismic Provisions 2007
Khyber Pakhtunkhwa Model Building Bye-Laws 2017
Building Code of Pakistan – Fire and Life Safety Provisions 2016
Governance and decentralization at the provincial level
Overall, Kip’s fiscal and administrative decentralization is characterized by tremendous potential that remains unrealized. Khyber Pakhtunkhwa devolved political, fiscal and administrative authority to local governments in the 2013 Local Government Act (LGA),
enabling the elected representatives of local governments to approve and manage their own budget while making provisions for fiscal transfers and own-source revenue. There are three tiers of local government – (i) District/City District, (ii) Tehsil/Town and (iii) Village/neighborhood councils. The District government has the largest share of key service delivery functions and largest budget in terms of expenditure, transfers and own source revenues. The key functions assigned at each level are shown in Table 46 and Table 47. For economies of scale, additional functions are assigned if the district is notified as a “city district,”
KP-SISUG Peshawar City Development Plan – Draft Final Report
162
Peshawar being the only city district so far. On 31 May 2018, the Federally Administered Tribal Areas (FATA) were officially merged with Khyber Pakhtunkhwa.71
Fiscal decentralization
Fiscal transfers comprise the bulk of the resource base at each level. The share of local governments is determined by the Provincial Finance Commission, based on an equalization formula incorporating fiscal needs, capacities, and performance. The Commission has 33 percent representation from the local governments. The 2013 LGA bars local governments from borrowing.
Local government capacities need strengthening to match the autonomy provided by Kip’s fiscal decentralization. Project planning, costing, prioritization, and resource allocation need to be strengthened. Expenditure estimations and allocations are based on inflated revenue targets. Poor revenue estimation can be attributed to the lack of a robust fiscal strategy, while deficiencies in revenue management have kept the dependence on federal transfers high72. Revenue raising has been weak. The increase in provincial own source revenues over the last two fiscal years was due to the devolution of general sales tax on services from central to provincial level: other provincial taxes have not increased correspondingly. In addition, an earlier assessment identified weaknesses in monitoring and evaluation and human resources management.73
The mismatch between the delineation of devolved functions and the actual practice needs to be addressed. The provincial development portfolio includes some devolved functions. This means that the (provincial) Annual Development Program (ADP), which should focus more on strategic public investments, includes projects that should rest with the local governments, based on the principles of subsidiarity (Table 46).74
Administrative decentralization
Many functions have been transferred to local governments. These include district roads and buildings, water supply and sanitation, and coordination of their own human resource management, planning, development, finance, and budgeting functions. A review shows some overlap and lack of clarity in roles and responsibilities for some functions, such as in development planning, infrastructure and land use (Table 47).
Opportunities and challenges
Opportunities
Khyber Pakhtunkhwa’s decentralization was designed with a checks-and-balances system that seeks to promote accountability. The Minister for Local Government,
71 The amendment in the Constitution was approved by the National Assembly of Pakistan on 24 May 2018,
approved by the Khyber Pakhtunkhwa Assembly on 27 May 2018. On 28 May 2018, the President of Pakistan signed the FATA Interim Governance Regulation, a set of interim rules for FATA within a timeframe of two years during the process of the merger.
72 WB. 2017. Khyber Pakhtunkhwa Province, Pakistan: Public Financial Management Assessment Report. Washington DC: Public Expenditure and Financial Accountability (PEFA) Secretariat, The World Bank.
73 Assessment and Strengthening Program – Rural Support Programs Network (ASP-RSPN). Available from: http://www.rspn.org/index.php/projects/completed/asp-project/nggallery/page/2. Accessed 30 Sep 2018.
74 Subsidiarity means that the central level should perform only those tasks which cannot be performed effectively at a more immediate or local level.
KP-SISUG Peshawar City Development Plan – Draft Final Report
163
Elections, and Rural Development heads the Local Government Commission,75 the role of which is to support the coherent functioning of local governments. The Commission has the mandate of conducting annual and special inspections of local governments, and social and special audits of any local government, and resolving disputes with or between local governments. Accountability and transparency are ensured through audit functions. Audit reports are reviewed by the Public Accounts Committee of the Provincial Assembly. Furthermore, every district government and Tehsil Municipal Administration (TMA) is required to publish an annual audit report for the public.76
The 2013 LGA aims to empower public representatives at the bottom tiers of governance. In principle, one of its strengths is the extension of decentralization down to the village and neighborhood level, where these councils enjoy considerable powers, and hold the officials of various district line departments accountable. The political process that laid the foundation for decentralization with elections in 2015 was an additional strength, since it led to the increased involvement of political parties in planning, development, and decisions regarding service delivery priorities. This made the political process more responsive and representative. The system appears to have sufficient political ownership at different tiers of local governance, since the local elections were held on a party basis.
The 2013 LGA requires an allocation to local governments of not less than 30 percent of the total ADP.77 However, this varies in practice. Nonetheless, local governments still receive a significant share of the development budget. In FY 2017—2018, some PKR 28 billion was earmarked for local governments’ annual development plans amounting to 22.2 percent of the provincial ADP (without the foreign assistance of PKR 82 billion for that year).78 Of the funds earmarked for local governments, district, tehsil, and village/neighborhood councils account respectively for 29, 26 and 45 percent of this amount. While the funding allocations for local government has decreased by PKR 5.9 billion from the previous year, the proportion of provincial ADP earmarked as development funds for neighborhood and village councils has increased.
Challenges
Limited capacities are the biggest challenge to realizing the full potential and benefits of decentralization. The increased decision-making powers conferred by decentralization require a different set of competencies. The sheer numbers of jurisdictions make it difficult to adequately monitor the use of funds and the implementation at Village and neighborhood council Level.79 Budgeting and the development of plans at the district level are affected by inadequate capacities from provincial level down to district and local council levels. Local governments also need to have sufficient capacity for implementing needs assessments 75 The Local Government Commission comprises provincial assembly members, experienced technocrats, and
two Government Secretaries (one Secretary from the Law, Parliamentary Affairs, and Human Rights Department, and the other from the Local Government, Elections and Rural Development Department.
76 Buzdar, F. 2016. Local Governments in Khyber Pakhtunkhwa and Punjab: Framework, Current Status, and Challenges. Islamabad: AAWAZ.
77 2013 LGA paragraph 53a states, ‘ … the development grants for local governments shall be so determined that it is not less than thirty percent of the total development budget of the province in the respective year.’
78 KP government budget provided to project team. In dollar terms, the district, tehsil and village/neighborhood council levels received respectively USD 65.2 million, USD 58.4 million and USD 102.6 million for their development budgets in FY 2017—2018 out of a provincial ADP budget of USD $1,017.8 million (not including foreign assistance).
79 Buzdar, F. 2016. Local Governments in Khyber Pakhtunkhwa and Punjab: Framework, Current Status, and Challenges. Islamabad: AAWAZ.

KP-SISUG Peshawar City Development Plan – Draft Final Report
164
systematically to identify gaps in service quality and access. Sound planning is then required to address such gaps and meet community needs, especially in far-flung and rural districts.
Political friction and increased litigation will need to be resolved. The potential for such friction is high if district governments are in the party in opposition to the provincial government, and if debates over development schemes take place. Such friction diverts focus from service delivery and improved governance. The same applies to the reportedly increased rates of litigation with regard to decisions made at the local level, according to reports in 2016 and 2018.80
Local resource mobilization is still unfamiliar ground for local governments. Local governments will need to mobilize resources locally, using innovative means of financing, developing new public-private partnerships, and using the decentralization rules that empower them to levy local taxes or undertake ventures that generate funds.
Institutional arrangements
Khyber Pakhtunkhwa’s multilayered administrative machinery reflects the decentralization. At the province level, Khyber Pakhtunkhwa is headed by a Chief Secretary who coordinates and supervises the various Departments led by Departmental Secretaries. The exception is the Planning and Development Department, which is headed by the Additional Chief Secretary for Planning and Development. The Local Government, Election and Rural Development (LGE&RD) Department has an oversight role over local governments. Figure 13 shows the overall institutional set-up at provincial level relevant to departments or institutions having key roles in urban planning, water supply, sanitation, solid waste, and infrastructure development. Below province level, each Division is headed by a Commissioner reporting to the Chief Secretary, and each district is headed by a Deputy Commissioner. Key departments are discussed in subsequent sections and Table 46 and Table 47 provide an overview of roles. Some key provincial entities include the following (Figure 13):
• The Provincial Planning and Development Department coordinates and monitors the development plans and programs prepared by various provincial departments. It acts as a catalyst between different departments to improve the pace and quality of economic development.
• The Local Government, Election and Rural Development (LGE&RD) Department has the oversight role over local governments, including the Deputy Commissioners and Assistant Commissioners respectively heading districts and tehsils, ensuring that these entities discharge their functions and adhere to federal and provincial laws.
• The Directorate-General of Local Government and Rural Development under the LGE&RD Department is mandated with the administration and management of local government institutions in the province, including in the following areas:
o Oversight, monitoring, evaluation, and supervision of local development schemes, donor-funded development programs, and all umbrella and individual development schemes and programs in the Provincial ADP;
o Implementation of laws and regulations relating to local governance in the province;
o Coordination among various departments and field offices; and
80 Buzdar, F. 2016. Local Governments in Khyber Pakhtunkhwa and Punjab: Framework, Current Status, and
Challenges. Islamabad: AAWAZ; and “Policy devised to reduce govt’s litigation workload.” Daily Dawn. 11 Mar 2018. https://www.dawn.com/news/1394469 Accessed 30 Sep 2018.
KP-SISUG Peshawar City Development Plan – Draft Final Report
165
o Monitoring and supervision of the functioning of village councils, including birth, death and marriages registration.81
• The Local Council Board is mandated with oversight of the administration of local council services and local councils at district and tehsil/town level.
• The Provincial Delimitation Authority has the mandate to establish the boundaries of village councils, neighborhood councils and territorial wards for general seats in local government elections.
• The Excise, Taxation and Narcotics Control Department82 is primarily engaged in collection of various provincial taxes, duties, fees, and cess items.
• The Transport Department83 aims to connect the central industrial regions with less-developed areas of the province, promote public-private partnerships for new investments in roads and infrastructure, upgrade and maintain existing road and highway networks, extend railway services to the northern parts of Khyber Pakhtunkhwa province, improve road connectivity to railway stations to facilitate passenger and freight traffic, construct trucking terminals at Peshawar, Dera Ismail Khan and Havelian to meet the needs of the trucking sector for the next 30 years, and introduce a mass transit system in Peshawar and other big cities in Khyber Pakhtunkhwa.
• The Housing Department and its field arm Provincial Housing Authority aim to provide the public and civil servants with affordable housing, through urban growth policies, land acquisition, the development of plots and housing units, implementation of area development schemes, new townships, and housing loans and investments. The execution of schemes is on a deposit works basis.84
81 The full list of functions is available from: http://lgkp.gov.pk/directorate-general-lgrdd/. Accessed 30 Sep 2018. 82 Excise, Taxation and Narcotics Control Department. Available from: http://www.kpexcise.gov.pk/. Accessed
30 Sep 2018. 83 The KP Government established an independent Transport Department in Sep 2008. 84 The term "Deposit Work" is applied to works of construction or repair, the cost of which is met, not out of
Housing Department funds in this case, but out of funds from other sources. Works executed by the Department for other Government Departments, municipalities and other local bodies, and private firms and individuals fall under this category.

KP-SISUG Peshawar City Development Plan – Draft Final Report
166
Figure 13: Khyber Pakhtunkhwa provincial government departments
Notes: BOS = Bureau of Statistics, KPRA = Khyber Pakhtunkhwa Revenue Authority, LCB = Local Council
Board, LGE&RD = Local Government, Election and Rural Development (Department), LGRD:= Local Government and Rural Development Directorate, M&E = Monitoring and Evaluation Directorate, PCNA/GSP = Post Crisis Need Assessment /Governance Support Project, P&D = Planning and Development (Department), PHA = Provincial Housing Authority, PTA = Provincial Transport Authority, SDU = Special Development Unit, WSSCs = Water and Sanitation Service Companies.
District governance and decentralization
The LGA 2013 ensures maximum autonomy in financial management and operational governance at local government (Table 46 and Table 47). The District Nazim, an elected representative, is the executive authority for all the matters in district administration and is assisted by the Deputy Commissioner. At the district level, the Deputy Commissioner is the administrative head of the government, while the line departments are headed by District Officers, who report to the district Deputy Commissioner. In terms of planning, the District Office Finance and Planning translates province plans into district development schemes, reviews and recommends the schemes identified by different stakeholders to the respective authorities. The Assistant Director LGE&RD is the overall responsible for implementation, monitoring, and evaluation of the activities concerned with local Government. The Tehsil Municipal Officer is the representative of the local government at Town/tehsil level, while the Tehsil Municipal Administration is the main government entity with a substantial role in municipal services delivery. The Tehsil Nazim is the elected executive authority at the tehsil level (Figure 14).
Table 44: Functions devolved to district governments
Education Land Rural Development & Agriculture
Primary and Secondary Education Agriculture (Extension)
Vocational Education Livestock
Special Education On-Farm Water Management
Chief Secretary
P&D
SDU
M&E
BOS
Urban Policy Unit
PCNA/GSP
LGE&RD
Provincial Delimitation
Authority
Peshawar Development
Authority
LCB
Directorate LGRD
Excise & Taxation
KPRA
Excise
Housing
PHA
Transport
PTA
Other 29 departments
Additional Chief Secretary
WSSCs (independent Public Corporation)

KP-SISUG Peshawar City Development Plan – Draft Final Report
167
Adult Education and Literacy Fisheries
Health Rural Development & Rural Works
Mother and Child Health Care Centers Cooperatives
Basic Health Units Infrastructure
Rural Health Centers Communication & Works
Hospitals other than District Headquarters District Roads & Buildings
Public Health Engineering Coordination of Functions
Land Coordination
Revenue & Estate Planning & Development
Other Welfare Functions Finance & Budgeting
Population Welfare Human Resource Management
Social Welfare
Sports and Culture Source: Local Government Act, 2013.
Figure 14: District level government departments in Khyber Pakhtunkhwa
Notes: DDAC = District Development Advisory Committee; F&P = Finance and Planning; LGE&RD = Local
Government, Elections and Rural Development.
The District Development Advisory Committee (DDAC)85 in each district plays a determinant role in district development programs. The DDAC comprises members of the Provincial Assembly from the concerned district and other elected representatives, and the heads of attached Departments at the District level co-opted by the Committee for their expert opinion. The functions of the DDAC include assessment and approval of district development programs, and periodic reviews to monitor progress and ensure timely implementation. The DDAC also reviews and approves (i) the proposals for the Annual Development Program of the district, (ii) the schemes to be implemented under the Rural Development Program, other
85 District Development Advisory Committees (Amendment) Act, 2015. Government of Khyber Pakhtunkhwa.
Enacted 21 Aug 2015.
DDAC
Deputy Commissioner
District Officer F&P
Assistant Director LGE&RD
Excise & Taxation Officer
Others
District Nazim

KP-SISUG Peshawar City Development Plan – Draft Final Report
168
than those of the union councils, including those schemes to be funded from federal grants for that specific purpose; (iii) the location and selection of sites, subject to planning criteria prescribed by Government for development schemes; (iv) the locations of development projects in other sectors included in the district Annual Development Program, including for the electrification of villages; and (v) the allotment of Ration Depots in the respective Districts.
Institutional arrangements in municipal services delivery
Water and Sanitation Services Peshawar
The Water and Sanitation Services Peshawar (WSSP) is an independent corporatized public corporation. It was established in Peshawar as a public limited company, which was incorporated on 1 August 2014 with the Securities and Exchange Commission of Pakistan. WSSP is fully owned by the Government of Khyber Pakhtunkhwa, under the companies Ordinance, 1984. With the hand-over by the Khyber Pakhtunkhwa government of the municipal services of Peshawar city to WSSP in 2014,86 around 4,700 relevant staff were transferred from the existing municipal institutions at the time to WSSP. A Services and Asset Management Agreement (SAMA) was signed between the province, Peshawar City administration, and WSSP, which operationalized the company. Thus, the newly-established WSSP became the first water and sanitation company in Pakistan to have urban water and sanitation services delivered by a ring-fenced, fully autonomous, professionally managed and corporate governed utility. The geographical area of WSSP comprises 42 union councils.87 This does not include Hayatabad and University Town, for which the Peshawar Development Authority (PDA) is now responsible. It also does not include the union council managed by the Cantonment Board. However, all these other union councils are within the official urban boundaries of Peshawar City.88
The Services and Assets Management Agreement sets out the functions and responsibilities of the provincial government, the TMA and the WSSC (refer to Urban Sector Road Map89 for excerpts from SAMA). SAMA transfers the responsibility for management and operation of drinking water, wastewater, and solid waste management to WSSCs. This transfer includes all relevant assets, facilities and control over staff so transferred. The TMA retains part of its staff for the remaining municipal services. SAMA stipulates other requirements of the WSSCs, including benchmarking of services, developing key performance indicators and producing a business plan and a budget.90 SAMA provided for an assigned budget from the TMAs, together with provincial contributions. Following this, a decision was made in the interests of greater efficiency, whereby the province now transfers the budget directly to the WSSCs, cutting the TMA budget by a commensurate amount. Therefore, while the WSSCs coordinate closely with the TMAs, they are now independent of
86 “Peshawar’s municipal services handed over to private company.” Daily Dawn, 12 Sep 2014.
https://www.dawn.com/news/1131503. 87 The union councils have now been changed to neighborhood councils (urban) and village councils (rural). 88 The union councils have now been changed to neighborhood councils (urban) and village councils (rural),
and administrative boundaries have changed as well. 89 ADB. 2019. Pakistan: Provincial Strategy for Inclusive and Sustainable Urban Growth in Khyber Pakhtunkhwa
– Urban Sector Road Map. Peshawar: Planning & Development Department, GoKP and Asian Development Bank.
90 Government of Khyber Pakhtunkhwa. 2017. Pakistan – Khyber Pakhtunkhwa Inclusive Urban Growth Program: Final Report. Peshawar: Urban Policy & Planning Unit, Planning & Development Department, GoKP and Cities Development Initiative for Asia, ADB.

KP-SISUG Peshawar City Development Plan – Draft Final Report
169
the TMAs. As of August 2018, WSSP had the following staff under the Chief Executive Officer: 25 managers, 21 assistant managers, 35 office staff and 4,023 field operators, or a total of 4,105 staff. The role of WSSP is as follows:
• Exclusive responsibility for planning, designing, construction, operation and maintenance of water supply, sanitation, sewerage, drainage, fluid and solid waste systems and allied services, including their enhancement and improvement;
• Management of all activities, facilities, programs, resources and spaces associated with these services previously under the control of the TMA, including machinery, tools and vehicles;
• Management and supervision of personnel who had previously been delivering such services under the auspices of the TMA;
• Promotion of public awareness on the importance of water conservation, waste reduction, resource recovery and the protection of the environment;
• Development of cost recovery measures such as fees and user charges, which it is responsible for implementing on its own; and
• Establishment of and compliance with performance standards.
The WSSP draws on various sources for its budget. For schemes, the WSSP uses the budget earmarked for those schemes, such as the schemes included in the provincial ADP, or those included in the budget of the provincial Public Health Engineering Department for urban areas, or the funds for the schemes adopted by provincial and national assemblies. The operational budget of WSSP is provided by the provincial finance department under approval from the Secretary, LGE&RD. A small part (less than 10%) of the budget derives from tariffs from households deposited in the WSSP account. The provincial government covers WSSP’s capital expenditure (refer to Section xx – Rashid’s section). The original intent was for the company to improve revenue collection, make efficiency gains, gradually legalize all illegal connections, and levy a fee for solid waste management in tandem with the improvement in services.
Peshawar Development Authority
The Peshawar Development Authority (PDA) has a complex history. It was first established under the 1975 Urban Planning Act as the Greater Peshawar Metropolitan Authority. This entity was renamed PDA in 1978, when under the Urban Planning Ordinance, Local Area Authorities were established. Today, PDA has been given the status of an autonomous body through the Peshawar Development Authority Act, 2017.91 The Khyber Pakhtunkhwa Chief Minister is the PDA chairman, while the minister for local government is its vice chairman. PDA members include the Peshawar Nazim. According to the 2017 Act, PDA’s Authority Area – over which PDA has jurisdiction – has been defined as Peshawar Division, which includes other cities such as Charsadda and Nowshera in addition to Peshawar City.
The PDA is primarily responsible for city development plans, housing and associated infrastructure development, such as parks, city roads, and transport facilities. The PDA’s Planning and Development Directorate is responsible for maintaining and updating Peshawar's Official Plan and zoning by-laws, as well as for processing of various planning applications in a timely and efficient manner. The Planning Directorate responds to general 91 The Peshawar Development Authority Act, 2017 (Khyber Pakhtunkhwa Act No. XXXI of 2017). Available
from: http://kpcode.kp.gov.pk/homepage/lawDetails/1362 Accessed 30 September 2018

KP-SISUG Peshawar City Development Plan – Draft Final Report
170
inquiries on land use planning and manages statistical information on population, projections, and inventories of residential, commercial, and industrial land. The PDA’s Engineering Directorate is responsible for development works in housing schemes; the construction of city roads, flyovers and underpasses; and the construction of commercial office buildings, residences, apartments, shops, educational and sports facilities. The PDA also engages in land development and acquisition, parks and horticulture. It enforces several other by-laws in addition to zoning, such as property standards, discharge of firearms, fencing, burning, waste management, parking, fireworks, and noise.92
The powers and functions of the PDA according to the 2017 Peshawar Development Authority Act, shows some overlap with other urban entities.93 Box 1 shows an extract of these functions. PDA is currently responsible for the planning and service provision of water supply, sanitation, and solid waste management in Hayatabad and University Town, which are part of Peshawar city and which used to be serviced by WSSP. On 17 May 2017, the provincial cabinet asked the WSSP to hand over the water supply and sanitation services of Hayatabad and University Town to PDA and Town-III Administration. WSSP also had to return employees and assets back to PDA and Town-III Administration.94
92 The Peshawar Development Authority, Government of Khyber Pakhtunkhwa. Available from:
http://www.pda.gkp.pk/directorate_details.php?id=11 Accessed 30 Sep 2018. 93 Paragraph 6 notes: “The Authority may…….develop, operate and maintain water-supply, sewerage, solid
waste and drainage systems within the Authority area” 94 “WSSP returns employees, assets to PDA.” Daily The News, 30 May 2017. Available from:
https://www.thenews.com.pk/print/207440-WSSP-returns-employees-assets-to-PDA Accessed 30 Sep 2018.
Box 1: Powers and Functions of PDA
• Initiate and maintain, prepare and periodically update master plan; • Develop, operate and maintain water-supply, sewerage, solid waste and drainage systems
within the Authority area; • Preparation and compliance of ADP for Authority & Evaluation of ADP at the end of each year; • Preparation of appropriate urban designs; • Prepare, implement and enforce, in consultation with other relevant departments of
Government, schemes and schemes for environmental improvements, urban renewal including slum improvement and redevelopment, solid waste disposal, transportation and traffic, health and education facilities and preservation of objects or places of historical, archaeological, scientific, cultural and recreational importance;
• Take any step or adopt any measures for the face lifting and beautification of the Authority area; • Acquire, sell, lease, exchange or otherwise dispose of both movable and immovable property; • Undertake any works and incur any expenditure; • Initiate studies, surveys, experiments or technical researches; • Recover all arrears of taxes, rents and other moneys, within the Authority areas, claimable by it
as arrears of land revenue; • Regulate the installation of billboards, sky signs, outdoor advertisements on private or public
property; • Establish and maintain botanical gardens; • Organize shows and exhibitions pertaining to horticulture, aviculture and cultural entertainment;
and • Land acquisition.
—Extracts from The Peshawar Development Authority Act, 2017

KP-SISUG Peshawar City Development Plan – Draft Final Report
171
Table 45: Urban sector stakeholders in Khyber Pakhtunkhwa Stakeholder Water
Supply Sewage & Drainage
SWM Transport Urban Spaces
Tourism Inst. Dev & CB
Government of Khyber Pakhtunkhwa (GoKP) ◉ ◉ ◉ ◉ ◉ ◉ ◉
Planning & Development Department (P&DD) ◉
Local Government, Elections & Rural Development Department
◉ ◉ ◉ ◉
Culture, Sports, Tourism, Archaeology & Youth Affairs Department
◉ ◉
Water Supply and Sanitation Companies (WSSCs) ◉ ◉ ◉
City District Government (CDG), Peshawar ◉ ◉ ◉ ◉ ◉ ◉
Tehsil Municipal Authorities (TMAs) ◉ ◉ ◉ ◉ ◉ ◉
Neighborhood Councils (NCs) ◉ ◉ ◉
Cantonment Boards ◉ ◉ ◉ ◉
Development Authorities ◉
Asian Development Bank (ADB) ◉ ◉ ◉ ◉ ◉ ◉ ◉
Department for International Development (DFID) ◉ European Union (EU) ◉ ◉ ◉ ◉
International Development Association (IDA), The WB Group ◉ ◉ ◉ ◉ ◉ ◉ ◉
Japan International Cooperation Agency (JICA) ◉
Multi-Donor Trust Fund (MDTF) ◉ ◉ ◉ ◉ ◉
Saudi Fund for Development (SFD) ◉
Swiss Agency for Development and Cooperation (SDC) ◉ ◉ ◉ ◉
US Agency for International Development (USAID) ◉ ◉ ◉ ◉

KP-SISUG Peshawar City Development Plan – Draft Final Report
172
Table 46: Political and fiscal decentralization in Khyber Pakhtunkhwa Function Federal Provincial Khyber Pakhtunkhwa Province
District Government Tehsil Municipal Administration
Village/Neighborhood Council
Own leadership: appointed by or elected through the following means:
Yes, President indirectly elected by Parliament95 through Electoral College. Prime Minister, Head of winning party
Yes, Governor (nominal head, designated post) Chief Minister, elected by provincial assembly Chief Secretary (head of government) through civil service career progression.
Yes, District Nazim and Naib-Nazim elected by District Council, who themselves are elected through local government elections
Yes, Tehsil Nazim and Naib-Nazim Elected by Tehsil Council, who themselves are elected through local government elections
Yes, Village Council (rural) Nazim and Naib-Nazim, or Neighborhood Council (urban) Nazim and Naib-Nazim Those with the most votes and second-most votes in direct elections:
Number of jurisdictions96
1 4 32 119 3,339
Political process
Federal parliamentary republic
Provincial assembly members mostly directly elected, some reserved seats
District council elections Tehsil council elections Village/neighborhood council elections
Approves own budget
Yes Yes Yes Yes Yes
% of resource base funded by transfers97
- 92% 99% Details unavailable to date 100%
95 National Assembly, Senate, and Provincial Assembly 96 2017 Population Census, modified to include the merger between Khyber Pakhtunkhwa, Federally Administered Tribal Areas (FATA) and Frontier Regions (FRs). 97 WB. 2017. Khyber Pakhtunkhwa Province, Pakistan: Public Financial Management Assessment Report. Washington DC: Public Expenditure and Financial Accountability
(PEFA) Secretariat, The World Bank.

KP-SISUG Peshawar City Development Plan – Draft Final Report
173
Subnational fiscal systems: tax and non-tax receipts98
General sales tax on services,99 Land revenue, Agricultural income tax, Motor and vehicle excise duty, Stamp duty, Electricity duty, Revenue from mining, oil and gas exploration, hydel generation.100
1. Tax for Education and Health.
2. Any other tax authorized by the Government.
3. Local rate on lands assessable to land revenue.
4. Fees of educational and health facilities established or maintained by District Government.
5. Fee for licenses or permits and penalties or fines for violations.
6. Fees for specific services rendered by a District Government.
7. Collection charges prescribed for recovery of tax on behalf of the government, other local governments, or any statutory authority.
8. Toll on roads, bridges, ferries maintained by District Government.
9. Rent for land, buildings, equipment, machinery, and vehicles owned by District Government.
10. Fee for major industrial exhibitions and other public events organized by District Government.
For City District Government:
1. Local tax on services. 2. Fee on sale of animals in
cattle markets. 3. Market Fees. 4. Tax on the transfer of
immovable property. 5. Urban Immovable Property
Tax as specified in LGA 2013.101
6. Fee for fairs, agricultural shows, cattle fairs, industrial exhibitions, tournaments and other public events organized by TMA.
7. Fee for licenses or permits and penalties or fines for violations.
8. Fee on cinemas, drama, theatrical shows and tickets thereof, and other entertainment.
9. Collection charges prescribed for recovery of any tax on behalf of the Government, other local governments or any statutory authority.
10. Rent for land, buildings, equipment, machinery and vehicles owned by TMA
11. Fee for specific services rendered by a TMA.
1. Prescribed fees for licensing of professions and vocations in the council area.
2. Fees for civil registration and certification (births, marriages, and deaths).
3. Charges for specific services rendered by the Council.
4. Rate for the remuneration of village and Neighborhood security.
5. Rate for the execution or maintenance of any work of public utility like lighting of public places, drainage, conservancy and water supply operated by the Council.
6. Conservancy charges.

KP-SISUG Peshawar City Development Plan – Draft Final Report
174
Function Federal Provincial Khyber Pakhtunkhwa Province District Government Tehsil Municipal
Administration Village/Neighborhood Council
1. Taxes enumerated as above.
2. Fee on advertisements, other than on radio and television, and billboards.
3. Fee for approval of building plans, erection and re-erection of buildings.
4. Charges for execution and maintenance of works of public utility lighting of public places, drainage, conservancy, and water supply operated and maintained by the City District Government.
12. Tax on vehicles other than motor vehicles registered in the Tehsil.
13. Fee on advertisements, other than on radio and television, and on billboards.
14. Fee for approval of building plans, erection and re-erection of buildings
15. Charges for development, betterment, improvement, and maintenance of works of public utility like lighting of public places, drainage, conservancy, and water supply by TMA.
Town Municipal Administration 1. Taxes enumerated for TMA
from 1 to 12 above. 2. Fee for approval of building
plans, erection and re-erection of buildings with the approval of the City District Government.
98 Reproduced from Schedule III of KP Local Government Act 2013. 99 Does not include the local council share, which is a fee charged on different services, and is then transferred to the local councils. 100 Nasim, A. 2015. Khyber Pakhtunkhwa Revenue Mobilization. Peshawar: Consortium for Development Policy Research. 101 In principle, the Urban Immovable Property Tax is collected by the provincial government and then transferred to the Tehsil.

KP-SISUG Peshawar City Development Plan – Draft Final Report
175
Table 47: Administrative decentralization of key functions and roles of government entities Function Central Provincial District Government Tehsil Municipal
Administration Village/Neighb
orhood Councils
Policy making and regulations
Planning Commission of Pakistan
Planning and Development Department, Provincial Secretariats for each line department formulate policies, e.g., health, education.
District Council/DDAC District regulations to implement the province policies
Development Planning
Planning Commission of Pakistan, Ministry of Planning, Development and Reform.
Planning and Development Department (except for national campaigns, e.g., Polio, human trafficking, & migrant smuggling). Each line department has a planning officer (representative of P&DD) for development of the Annual Development Program.
District Office Finance & Planning. Translates province plans into district development schemes. See DDAC functions in text.
Tehsil Development Committee. Planning of Tehsil level project plans.
Village/ neighborhood councils, as per authority and budget.
Budget development and approval
Budget: Ministry of Finance, Revenue and Economic Affairs (recurrent budget) and Planning Commission (development budget).Input from line ministries Approval: National Economic Council; Central Development Working Party
Budget Finance Department, Planning and Development Department (according to Annual Development Program). Approval by Provincial Development Working Party
Budget developed by District Officer Finance & Planning, with inputs from others. Approval by District Council and DDAC
Budget for municipal development programs by Tehsil municipal administration as per authority & budget. Approval by Tehsil Council.
LG&RD/LGE&RD prepares budget for village/ neighborhood councils.
Administration Ministry of Interior Establishment and Administration Department
Deputy Commissioner, in consultation with District Nazim.
Assistant Commissioner (Law enforcement & administration)
Procurement for projects
Public Procurement Regulatory Authority sets public procurement law & rules.
Authority to procure its own supplies and undertake capital expenditure.
Authority to procure its own supplies and undertake capital expenditure within its responsibilities (except
Authority to procure its own supplies and undertake capital expenditure within its responsibilities (except Health supplies) and within the

KP-SISUG Peshawar City Development Plan – Draft Final Report
176
Function Central Provincial District Government Tehsil Municipal Administration
Village/Neighborhood
Councils Province controls the procurement of health supplies for economies of scale and quality assurance.
health supplies) up to PKR 60 million, beyond which provincial approval is required.
delegation of financial powers rules. Oversight by LG&RD for village/neighborhood council level.
Statistics, data collection
Pakistan Bureau of statistics Bureau of Statistics, GoKP, Planning and Development Department: Liaison with federal, provincial, district departments and development partners; training to provincial line departments and district governments; data collection, analysis and publications.
5 Regional field offices of Bureau of Statistics KP, within the Planning & Development Departments at Peshawar, Abbottabad, Mingora Swat, Bannu and Dera Ismail Khan.102 Primary and secondary data collection and completion.103
The data compiled by each line department has tehsil-level details and are shared with regional offices of Bureau of Statistics
Environmental Protection (Federal authority)
Ministry of Climate Change, Pakistan Environmental Protection Agency
KP Environmental Protection Agency104
EPA presence in Peshawar only.105 Assistant Director EPA is representative at district Level.
Assistant Director EPA covers tehsils also
Disaster Management
National Disaster Management Commission (policy) National Disaster Management Authority (implementation and coordination).
Provincial Disaster Management Commission (policies and plans) Provincial Disaster Management Authority106 (implementation)
District Disaster Management Authorities:107 planning, coordinating, and implementing disaster management.
Housing, infrastructure &
Ministry of Housing and Works: Government of KP, Provincial Housing Authority.
District municipal offices, Tehsil/town Municipal Authority
Village level development
102 Pakistan Bureau of Statistics. Available from: http://www.pbs.gov.pk/content/provencialregional-offices-0. Accessed 30 Sep 2018. 103 Pakistan Bureau of Statistics. Available from: http://www.pbs.gov.pk/content/field-services. Accessed 30 Sep 2018. 104 Available from: http://kpcode.kp.gov.pk/uploads/2014_38_THE_KHYBER_PAKHTUNKHWA_ENVIRONMENTAL_PROTECTION_ACT_2014.pdf. Accessed 30 Sep 2018. 105 Amir, I. 2013. “Environment protection body lacks presence in most of KP.” Dawn (https://www.dawn.com/news/1054922). Accessed 30 Sep 2018. 106 Provincial Disaster Management Authority. Available from: http://pdma.gop.pk/drm_institutions. Accessed 30 Sep 2018. 107 Shah, S. H. 2013. The Disaster Risk Management Handbook: A learning experience of the DRM Model Mansehra. Peshawar: GIZ. Available from: http://lgkp.gov.pk/wp-
content/uploads/2014/04/The-Disaster-Risk-Management-Handbook-A-learning-experience-of-DRM-Model-Mansehra.pdf. Accessed 30 Sep 2018.

KP-SISUG Peshawar City Development Plan – Draft Final Report
177
Function Central Provincial District Government Tehsil Municipal Administration
Village/Neighborhood
Councils municipal services
3 attached Departments & 3 Autonomous Bodies.108 Departments: Pakistan Public Works Department Estate Office Management National Housing Authority Autonomous Bodies: Pakistan Housing Authority Federal Government Employees Housing Foundation National Construction Limited
City Development Authorities.
works and infrastructure implementation
Urban Land use/ spatial planning (includes some rural areas)
Capital Development Authority (for Islamabad). Various other entities
Peshawar Development Authority (urban) LGE&RDD Provincial Board of Revenue
District government and district council: City Development Authorities. Provincial Board of Revenue decentralized to additional deputy commissioner in district.109
Tehsil Municipal Administration
Identify development needs; report violation of land use plans
Transport Ministry of Communications Transport and Mass-Transit Department of KP. KP Urban Mobility Authority (regulatory body)
Local government for district roads. City Development Authorities in each city110
TMA: municipal services and infrastructure
Development works and infrastructure implementation
Notes: DDAC = District Development Advisory Committee; EPA = Environmental Protection Agency; KP = Khyber Pakhtunkhwa; LGE&RDD = Local Government, Elections and Rural Development Department; LG&RD = Local Government and Rural Development (Directorate); P&DD = Planning and Development Department; TMA = Tehsil/Town Municipal Authority.
108 Ministry of Housing and Works (http://mohw.gov.pk/frmDetails.aspx). Accessed 30 Sep 2018. 109 “KP unveils administrative arrangements under new local government system.” The News, 29 Dec 2012 (https://www.thenews.com.pk/archive/print/404295-kp-unveils-
administrative-arrangements-under-new-local-government-system). 110 Khyber Pakhtunkhwa Local Government Act, 2013. Government of Khyber Pakhtunkhwa. Enacted 7 Nov 2013.

KP-SISUG Peshawar City Development Plan – Draft Final Report
178
Tehsil Municipal Administration
In Peshawar city, the TMA111 is responsible for the planning and provision of municipal services other than those transferred to WSSP (that is, not including water, sanitation and
solid waste management services). It is also responsible for the development of different
zones and plans, and the management of municipal properties, assets and funds. The TMA
approves by-laws for the performance of relevant functions devolved to the district
government, approves and levies local taxes, develops and approves long- and short-term
development schemes for the areas under its jurisdiction, enforces municipal laws, prepares
budgets, and collects taxes, fines, and penalties provided under the law.
Other relevant actors
Provincial and district LGE&RD Departments. The Secretary, LGE&RD at provincial level
approves the operational budget for WSSP. The Assistant Director of LGE&RD, responsible
for Peshawar district, supervises the planning and monitoring of different development
schemes. Supervision and monitoring of different schemes also take place at neighborhood
council Level. The schemes are prioritized and implemented at local council level, for which
finances are released by the provincial level Directorate-General of LGE&RD.
Provincial Planning and Development Department. The provincial Planning and
Development Department of the Government of Khyber Pakhtunkhwa approves the different
development schemes that are to be reflected in the ADP. The schemes approved for water
supply, sanitation, solid waste management and transport are from the following provincial
departments: Public Health Engineering Department, LGE&RD Department, Communication
and Works Department, and Transport Department. Within the provincial Planning and
Development Department, the Director-General of Monitoring and Evaluation is responsible
for monitoring the progress on different schemes.
Public Health Engineering Department, Province level. The Public Health Engineering
Department at provincial level plans clean drinking water schemes and sewerage systems
and sets and enforces province-wide health and hygiene standards. In practice, this means
that the entities providing water and sanitation services in cities, such as WSSP, have to
adhere to these standards. The Public Health Engineering Department also independently
conducts testing of and research on health-related schemes. The Department also
implements its own water and sanitation schemes in rural areas through the district
government, since the PHED District Officer reports to the Deputy Commissioner and District
Nazim.
The Urban Policy and Planning Unit (UPU) of Khyber Pakhtunkhwa provides support to
WSSP in land use planning. It supports the provincial Planning and Development department
and other entities – including WSSP and other WSSCs — in research and development
required for the planning, implementation, monitoring, and evaluation of projects that
contribute to economic regeneration and growth strategies for urban clusters and areas. The
UPU also supports the capacity building for effective service delivery by various stakeholders
including WSSP and other WSSCs, the district government and the Local Government School.
The UPU is responsible for evidence collection and dissemination of information on the urban
sector, including guidelines on operations and sustainability of urban services provision. UPU
111 The Tehsil in this case is the same area as that for Peshawar district, since Peshawar is classified as a city-
district, and as fully urban.
KP-SISUG Peshawar City Development Plan – Draft Final Report
179
advises the Secretary of the Planning and Development Department and the provincial
Program Steering Committee on program design and due diligence. It provides due diligence
support to the preparation of land acquisition and resettlement framework and plans. It has
oversight of the environmental monitoring aspects for different projects related to urban
planning.
The Local Governance School is the training institute of the LGE&RD Department,
Government of Khyber Pakhtunkhwa. Announced in 2008, the Local Governance School has
the mandate to conduct pre-service trainings, refresher courses, seminars, workshops for all
local council Service employees and elected representatives; coordinate all capacity building
activities undertaken by local projects and development partners with the LGE&RD
Department, as well as with TMAs; and conduct trainings/orientations for provincial officials
on local governance, service delivery, and land acquisition and resettlement framework and
plans.
Institutional and governance challenges in urban services provision
The roles of various entities overlap in a number of areas. In Peshawar, the PDA, WSSP
and TMA operate with insufficient clarity on roles and operating procedures in planning and
service delivery. Khyber Pakhtunkhwa has been subject to many assessments and projects
on governance and institutions, supported by development partners such as GIZ, USAID,
UNDP and DFID. The reason for the overlap and duplication of roles may include inadequate
political commitment to make the required changes, the inadequate consideration of local
context in solutions proposed by externally-funded governance projects, and inadequate
motivation to address the issue.
The WSSP inherited services that were poor to start with. Water was of poor quality,
unsafe for drinking and of intermittent availability, sewage was conveyed through open
trenches, and a significant proportion of waste was uncollected. Most of the population making
up WSSP’s customer base are those who are unwilling or unable to pay, and there is a general
lack of basic service data.112
This would have been a challenge for any utility company.
However, for WSSP, the challenges are far greater because together with the poor services,
it also inherited non-performing staff.
Poor staff capacities and underperformance affected WSSP from the start. Under SAMA,
government staff were assigned on deputation from PDA and TMA to WSSP. The selection
of such staff was not necessarily based on criteria such as performance. This meant that from
the start, with the handover in 2014, WSSP had issues with staff capacity and
underperformance. Many field workers coming from the TMA lack basic skills necessary for
operations and maintenance of water and sanitation services, and basic safety precautions
when working. A number of field workers had reportedly been `ghost employees’ when
working at the TMA, drawing salaries and not attending work. This is a common issue with
civil servants in many developing countries; in at least some cases, this is linked to the need
for better income or two incomes. This calls for better supervision and other forms of
112 Government of Khyber Pakhtunkhwa. 2017. Pakistan – Khyber Pakhtunkhwa Inclusive Urban Growth Program: Supplementary Appendix S8 – Institutional Development and Capacity Building. Peshawar: Urban
Policy & Planning Unit, Planning & Development Department, GoKP and Cities Development Initiative for
Asia, ADB.
KP-SISUG Peshawar City Development Plan – Draft Final Report
180
attendance verification, which adds to the workload of supervisors and detracts from the
effectiveness of the workforce.
After the handover, the PDA received complaints concerning the quality of services in Hayatabad and University Town. The subsequent transfer of responsibility for water supply
and sanitation services of Hayatabad and University Town from WSSP back to PDA and
Town-III Administration — together with over 600 staff and assets (paragraph 20) — further
weakened WSSP.
WSSP’s service quality problems will be insurmountable unless it is provided with the means to resolve the human resource issues. This is critical for WSSP to move away from
its legacy of a poorly performing government service provider and fulfill its mandate. However,
there are significant difficulties in addressing the non-performance of government staff. Under
the rules of the Securities and Exchange Commission of Pakistan, the Board of Directors of
WSSP and the Chief Executive Officer can exercise disciplinary action against the staff of
WSSP. However, under civil services rules, the punitive actions have to follow disciplinary
procedures that are lengthy and complicated. As the staff in WSSP are government
employees, implementing sanctions against underperforming staff is not easily undertaken.
The emerging trend of taking the matter to courts and obtaining stay orders has made it even
more difficult. Thus, the WSSP does not have full discretion or control in managing its staff.
The Government of Khyber Pakhtunkhwa needs to address this so that WSSP can fulfil its
mandate of being a fully autonomous, professionally managed and corporate governed utility
that delivers urban water and sanitation services with high performance standards. It is all the
more important to have government intervention in this regard, since the Federal Government
in 2010 repealed the Removal from Service (Special Powers) Ordinance113
of 2000, which
was adopted in 2001 by all provinces.114
The 2000 Ordinance had provided for the dismissal,
removal, compulsory retirement, or demotion of government staff for inefficiency, misconduct,
corruption, and other traits. To perform, WSSP requires full authority over its employment
arrangements.
Peshawar has experienced rapid and uncontrolled urban growth over the last three to four years. There has been a tremendous increase of commercial and residential buildings,
as well as in various industrial and trade activities. This has increased the demand on public
services, which are overall inadequate and in poor shape. The city needs to focus on
managing this growth to ensure and manage sustainable urbanization.115
The way forward
Addressing the challenges requires key decisions at province level. The
recommendations for WSSP will also reply to the other WSSCs in Khyber Pakhtunkhwa, so
deliberations are required between policy and decision-makers at province level, the
concerned city governments, and the WSSCs. The WSSP has an additional issue, notably its
113 The Removal from Service (Special Powers) Ordinance, 2000. 27 May 2000. Available from:
http://nasirlawsite.com/laws/rso.htm Accessed 30 September 2018
114 The Removal from Service (Special Powers) (Repeal) Act, 2010. ACT No. III OF 2010. Available from:
http://nasirlawsite.com/laws/rsra.htm Accessed 30 September 2018
115 Government of Khyber Pakhtunkhwa. 2017. Pakistan – Khyber Pakhtunkhwa Inclusive Urban Growth Program: Supplementary Appendix S2c – Urban Sector Analysis. Peshawar: Urban Policy & Planning Unit,
Planning & Development Department, GoKP and Cities Development Initiative for Asia, ADB.

KP-SISUG Peshawar City Development Plan – Draft Final Report
181
role with the Peshawar Development Authority. Thus, city-specific consultations will also be
required in addition.
The principle of “One City, One Utility” still needs to apply. An earlier analysis related to
the setting up of WSSP noted that then existing municipal institutions had failed to meet their
objective due to “institutional fragmentation, cross jurisdictional issues of water and sanitation,
and economies of scale.” According to its terms of reference, therefore, the WSSP should
become the “functional amalgamation” of the fragmented municipal institutions into a citywide
autonomous, corporate-governed, and professionally managed utility.116
Peshawar needs efficient and effective integrated urban planning more than ever. Unplanned and unregulated growth in the poorer parts of the city is affecting the quality of life
for many citizens. The PDA, therefore, has the crucial leadership role of ensuring holistic and
sustainable development of Peshawar. It is not a utility and providing services for Hayatabad
and University Town detracts from its crucial task.
The bottlenecks preventing WSSP from realizing its full potential and discharging its mandate must be addressed. The initial aim of establishing WSSP was to create a robust
institution by having addressed all possible bottlenecks in its management and governance
structure. These bottlenecks include “political interference, inefficient structure, weak
performance incentives, nonprofessional management and the lack of autonomy.”117
The
ultimate rationale was to deliver improved services to customers, especially the urban poor,
at an affordable cost through institutional reforms. The Review thus needs to identify and
validate these bottlenecks and agree on solutions to resolve these.
Inadequate human resource capacities and non-performance among government staff are key factors known to be impeding the WSSP and other WSSCs from fulfilling their
mandates. The question is what could be done to ensure strong capacities and performance.
Currently, government employees have been provided many safeguards in their service rules,
which make disciplinary action difficult. There is no simple or single solution. The Review will
need to discuss, consider, and decide on a mix of solutions. These could include: a) legislation
that makes it possible to offer career advancements for government staff based on
performance, and more crucially, golden handshakes for non-performers; b) contract
employment, especially of lower staff, as many banks and other public sector organizations
have done, c) natural attrition of non-performing government staff, and d) capacity
development strategies for staff with potential, including training in other locations as added
incentives.
Table 48: Human resource requirements of WSSP Category of Human Resource Current
Strength Medium Term Requirement
Long Term Requirement
Chief Executive Officer 1 1 1
Chief Internal Audit 1 1 1
Assistant Manager Internal Audit 1 1 2
GM HR, Procurement & Admin. 1 1 1
116 WB. 2015. Strengthen Urban Policy and Institutions and Streamline Sector Investment for Improved Service Delivery in Pakistan. Washington DC: Water and Sanitation Program. The World Bank.
117 WB. 2015. Strengthen Urban Policy and Institutions and Streamline Sector Investment for Improved Service Delivery in Pakistan. Washington DC: Water and Sanitation Program. The World Bank.

KP-SISUG Peshawar City Development Plan – Draft Final Report
182
Category of Human Resource Current Strength
Medium Term Requirement
Long Term Requirement
Manager HR & Admin. 1 2 2
Assistant Manager Internal Audit 2 2 3
HR Officer 1 3 3
Manager Procurement 1 2 2
Assistant Manager Procurement 1 2 2
Payroll Officer - 3 3
GM PMER 1 1 1
Manager Planning 1 2 3
Manager MER 1 2 3
Manager MIS 1 1 2
Assistant Manager Planning - 3 3
Assistant Manager Monitoring 1 3 3
Assistant Manager Database 1 1 2
Manager GIS 1 1 1
Assistant Manager GIS 1 1 2
Assistant Manager Environment 1 2 3
HSE Officer 1 4 6
GM Operations 1 1 1
Manager Fleet Maintenance 1 1 2
Assistant Manager Fleet Maintenance 1 2 4
Mechanics 6 15 21
Assistant Manager (Water) 1 4 6
Labor Officer 1 3 5
Manager Water & Sewerage 1 4 6
Assistant Manager Sewerage 1 4 6
Manager Solid Waste 1 4 6
Assistant Manager Solid Waste 1 8 8
Zonal Managers 4 7 10
Manager Municipal Services - 2 2
Deputy Manager Municipal Services - 2 2
Supervisors - 8 12
Chief Finance Officer 1 1 1
Manager Finance & Budget 1 1 1
Assistant Manager Accounts 1 2 2
Manager Billing 1 1 1
Assistant Manager Billing 1 2 2
Finance Officer - 3 3
GM Projects & Works 1 1 1
Manager Project Works 1 2 4
Manager Contracts - 1 2
Assistant Manager Works 2 4 6

KP-SISUG Peshawar City Development Plan – Draft Final Report
183
Category of Human Resource Current Strength
Medium Term Requirement
Long Term Requirement
Manager Media & Communication 1 1 1
Assistant Managers 2 2 3
Graphics Designer - 2 2
TOTAL 51 127 169
Financial predictability and efficiency is a separate issue. It is accepted by all that WSSP
is not economically viable because a significant portion of the city’s population are either
unwilling or unable to pay, while the services inherited from TMA, and currently being delivered
by WSSP, are not yet adequate. The current arrangement is that the services are funded by
the Khyber Pakhtunkhwa Government (under SAMA). An ADB-funded study of three water
companies in Indonesia and the Philippines showed that it took an average of 12 years to
double the number of customers,118
and an average of about 15 years to reduce non-revenue
water by approximately half.119
Therefore, it would be unrealistic to expect WSSP to become
financially sustainable in the short to medium term. However, it is possible to have more
predictable, better-planned financing strategies and greater efficiency than the current
arrangement, which would help in moving towards the long-term target of financial
sustainability. To this end, the consultations need to explore a range of measures and develop
a tailored approach based on better targeting and pro-poor strategies. The current subsidies
are too broad, including the non-poor as well as poor. The approach could include some or
any of the following:
• For greater efficiency in reaching the poor: (a) stratified tariffs for water services for
different classes of customers, with cross-subsidization, (b) connection rather than
consumption subsidies, (c) pre-paid meters (possibly at subsidized tariffs for the poor)
which allow households to control their total expense on the service, and (d) a voucher
system or targeted cash transfers for the poor, based on means testing.
• For greater financial predictability and more efficient planning: (a) the
establishment of an endowment fund by the provincial government120
(b) the provision
of a single line grant through an annual transfer from the provincial government to
WSSP, and (c) increased use of technology to improve efficiency, reduce unmetered
water and illegal connections.
To garner political and public support for the decisions that ensue, such measures will require robust data and transparency on losses, revenue and poverty levels. Targeting
of poor households could be done through existing social welfare information systems, such
as (but not necessarily limited to) the National Socioeconomic Registry (NSER) of the
Government’s Benazir Income Support Programme, an approach that uses poverty scorecard
118 WB. 2015. Strengthen Urban Policy and Institutions and Streamline Sector Investment for Improved Service Delivery in Pakistan. Washington DC: Water and Sanitation Program. The World Bank.
119 Calculated from the data provided in Government of Khyber Pakhtunkhwa. 2017. Pakistan – Khyber Pakhtunkhwa Inclusive Urban Growth Program: Supplementary Appendix S8 – Institutional Development and Capacity Building. Peshawar: Urban Policy & Planning Unit, Planning & Development Department, GoKP and
Cities Development Initiative for Asia, ADB.
120 This could be registered as a ring-fenced fund under Section 42 of the Companies Act, 2017, which will be
subject to audit by third-party chartered accountants.

KP-SISUG Peshawar City Development Plan – Draft Final Report
184
surveys to identify eligible households through proxy means testing.121
Calculating the
transfers needed from the provincial government (whether through annual grant or
endowment fund) will require robust data on the losses made by WSSP, the losses that could
be avoided, households’ willingness-to-pay, and the projection of revenue following new tariff
structures and greater efficiency in operations.
An additional policy measure is required if WSSCs are to receive annual grants from the provincial government. Receipt of such public funds will require audits of WSSP by the
Auditor General of Pakistan. However, WSSP is already subject to audits by third-party
chartered accountants, in line with its registration under the Section 42 of the Companies Act,
2017. To avoid audits by two different bodies at different times, with accompanying disruption
of work, a provincial level policy would be required to exempt WSSP from audits by the Auditor
General of Pakistan.
Effective management information systems need to be established and strengthened. The administrative data systems need to be able to produce data within and across sectors
robust enough for annual planning. Local surveys and censuses need to be implemented
periodically, to generate data disaggregated by urban and rural tehsil, especially given the
significant rural to urban migration. Various mechanisms have been developed elsewhere to
design and implement such “quick” surveys and systems. In addition, efficient and transparent
complaint response mechanisms are required.
City planners and the PDA will need exposure to best examples of cities that can showcase integrated urban planning. Triangular or south-south cooperation should be
fostered between Peshawar and cities that exemplify progress towards becoming inclusive,
green, resilient, and competitive cities.
Table 49: Human resource requirement of Peshawar Development Authority (PDA) Category of Human Resource Current
Strength Medium Term Requirement
Long Term Requirement
Director General (BPS-20) 1 1 1
Engineering Staff Director(BPS-19) 14 14 14
Deputy Director (BPS-18) 10 10 10
Assistant Director (BPS-17) 30 30 30
Sub Engineers 15 15 15
Surveyors 15 15 15
Planning Staff/ Building Control Director (BPS-19) 3 3 3
Deputy Director (BPS-18) 5 5 5
Assistant Director (BPS-17) 8 8 8
Draftsman 15 15 15
Building Inspector 20 20 20
Tracer 10 10 10
121 The NSER reportedly covers over 27 million households across the country (Pakistan has 32.2 million
households, 2017 census), with the households classified by poverty level and welfare status. National
Socioeconomic Registry of Pakistan. Available from: https://www.pitb.gov.pk/bisp Accessed 30 Sep 2018.

KP-SISUG Peshawar City Development Plan – Draft Final Report
185
Category of Human Resource Current Strength
Medium Term Requirement
Long Term Requirement
Urban Planning Unit Director (BPS-19) 0 1 1
Deputy Director (BPS-18) 0 2 2
Assistant Director (BPS-17) 0 4 4
Finance Staff Director (BPS-19) 1 1 1
Deputy Director (BPS-18) 4 4 4
Assistant Director (BPS-17) 8 8 8
Senior Auditor 6 6 6
DAO 10 10 10
Estate Management Director (BPS-19) 1 1 1
Deputy Director (BPS-18) 4 4 4
Housing Officer (BPS-17) 8 8 8
Superintendent (BPS-17) 4 4 4
Administration Director (BPS-19) 1 1 1
Deputy Director (BPS-18) 1 1 1
Assistant Director (BPS-17) 1 1 1
Superintendent (BPS-17) 1 1 1
Horticulture Director (BPS-19) 1 1 1
Deputy Director (BPS-18) 2 2 2
Assistant Director (BPS-17) 6 6 6
Horticulturist 6 6 6
Garden Assistant 4 4 4
Garden Superintendent 4 4 4
Forester 10 10 10
Water Supply & Sewerage Director (BPS-19) 1 1 1
Deputy Director (BPS-18) 2 2 2
Assistant Director (BPS-17) 6 6 6
Chief Sanitary Inspector 1 1 1
Water Supply Inspector 10 10 10
Sewerage Inspector 10 10 10
Total 259 266 266
Capacity strengthening of the institutions responsible for planning, delivering, and management of urban services is a priority. Table 50 provides some findings specific to
Peshawar, and Table 51 provides the complete list of requested trainings compiled from all
the WSSCs. The following is a summary of the findings from the WSSCs:

KP-SISUG Peshawar City Development Plan – Draft Final Report
186
• The top tier of management in WSSP and the Board of Directors would require
orientations, exchange visits, workshops with other entities within and outside of
Khyber Pakhtunkhwa to improve their leadership and strategic roles. The top
management also requires exposure to best examples of urban services provision in
other countries.
• The middle tier of management, largely the heads of department, mentioned
community engagement and leadership management skills as top priorities, followed
by MIS and data management for informed decision-making.
• Field staff make up a diverse group. For these staff, health and safety training is the
most important priority due to the nature of their work, which is usually physically
strenuous and labor intensive. This is followed by the need to build skills in community
engagement and organization, which would enable field staff to effectively negotiate
and engage with communities, especially on tariff collection and conflict prevention.
Table 50: Capacity issues specific to Peshawar Entity Capacity Challenges Proposed measures [1]
Peshawar
District
Government,
PDA and
Peshawar
TMA
Inadequate capacity for integrated and
sustainable urban planning
Need for more strategic long-term
planning
Inadequate updated data collection
systems on population and migration
Training of staff on urban planning
Development of strategic plans and staff
capacity building
Development of SOPs for respective
departments regarding role in urban
planning and development
Capacity building and MIS development for
real-time data collection and feeding into
MIS and informed planning
WSSP
(Peshawar)
Need to strengthen Management
Information System,
Need to strengthen management
capacity
Complaint Response Mechanism
Strengthening MIS and capacity building of
staff
Training of planning, implementation and
monitoring of operations
Development of Complaint Response
Mechanism and training of staff
Notes: [1] To be viewed in combination with Table 51, which outlines the capacity needs for all WSSCs.
GIS = geographic information system; MIS = Management Information System; PDA = Peshawar
Development Authority; SOP = standard operating procedures; TMA = Tehsil Municipal Administration;
WSSC = Water and Sanitation Services Company; WSSP = Water and Sanitation Services Company
Peshawar.
Table 51: Training needs of different tiers of staff at water and sanitation services companies
Senior Management • Orientations, exchange visits, workshops with
other entities within and outside of KP to
improve their leadership and strategic roles
• Resource mobilization and strategic
partnership building
• Leadership and good governance
• Corporate social responsibilities-public
private partnership
• Exposure to best examples of urban services
provision in other countries
• Financial management for non-financial
managers
• Transformation from public to corporate
management,
• Better understanding of the securities and
exchange commission of Pakistan and
related reforms
Middle Management General trainings: Planning and monitoring tools:
• Baseline surveys
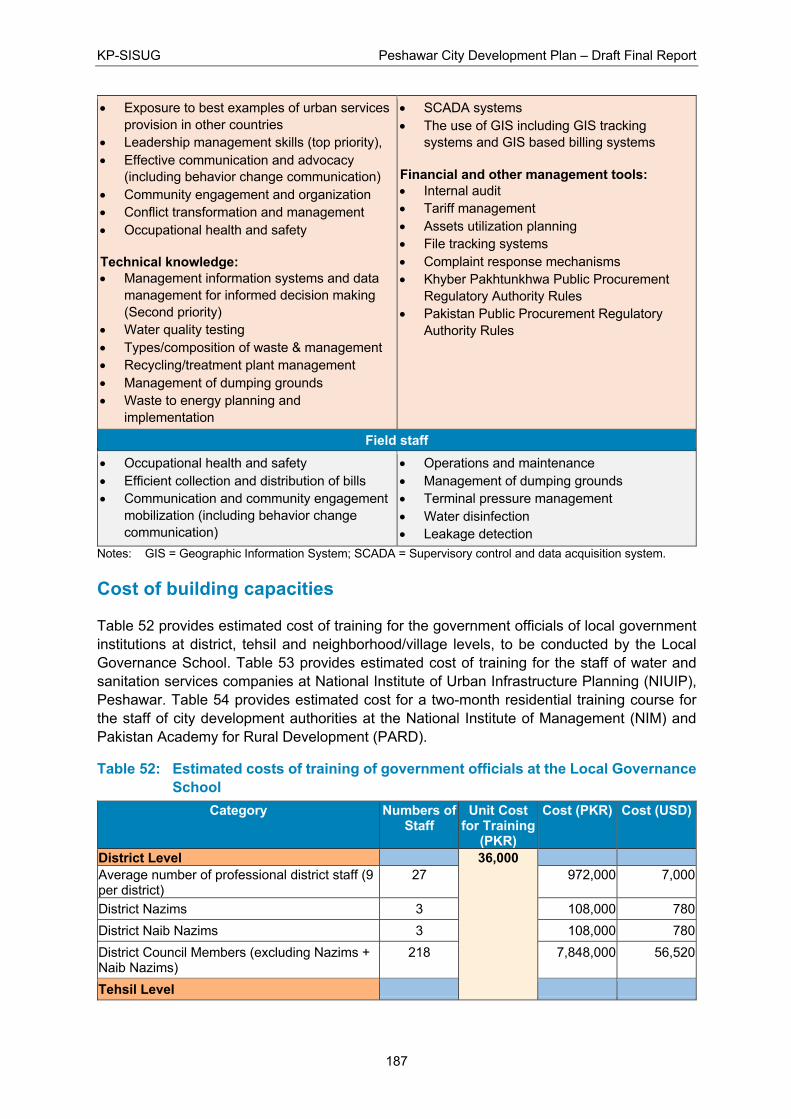
KP-SISUG Peshawar City Development Plan – Draft Final Report
187
• Exposure to best examples of urban services
provision in other countries
• Leadership management skills (top priority),
• Effective communication and advocacy
(including behavior change communication)
• Community engagement and organization
• Conflict transformation and management
• Occupational health and safety
Technical knowledge: • Management information systems and data
management for informed decision making
(Second priority)
• Water quality testing
• Types/composition of waste & management
• Recycling/treatment plant management
• Management of dumping grounds
• Waste to energy planning and
implementation
• SCADA systems
• The use of GIS including GIS tracking
systems and GIS based billing systems
Financial and other management tools: • Internal audit
• Tariff management
• Assets utilization planning
• File tracking systems
• Complaint response mechanisms
• Khyber Pakhtunkhwa Public Procurement
Regulatory Authority Rules
• Pakistan Public Procurement Regulatory
Authority Rules
Field staff • Occupational health and safety
• Efficient collection and distribution of bills
• Communication and community engagement
mobilization (including behavior change
communication)
• Operations and maintenance
• Management of dumping grounds
• Terminal pressure management
• Water disinfection
• Leakage detection
Notes: GIS = Geographic Information System; SCADA = Supervisory control and data acquisition system.
Cost of building capacities
Table 52 provides estimated cost of training for the government officials of local government
institutions at district, tehsil and neighborhood/village levels, to be conducted by the Local
Governance School. Table 53 provides estimated cost of training for the staff of water and
sanitation services companies at National Institute of Urban Infrastructure Planning (NIUIP),
Peshawar. Table 54 provides estimated cost for a two-month residential training course for
the staff of city development authorities at the National Institute of Management (NIM) and
Pakistan Academy for Rural Development (PARD).
Table 52: Estimated costs of training of government officials at the Local Governance School
Category Numbers of Staff
Unit Cost for Training
(PKR)
Cost (PKR) Cost (USD)
District Level
36,000
Average number of professional district staff (9
per district)
27 972,000 7,000
District Nazims 3 108,000 780
District Naib Nazims 3 108,000 780
District Council Members (excluding Nazims +
Naib Nazims)
218 7,848,000 56,520
Tehsil Level

KP-SISUG Peshawar City Development Plan – Draft Final Report
188
Average number of professional staff at Tehsil
level (6 per Tehsil)
36 1,296,000 9,335
Tehsil Council Nazims 6 216,000 1,555
Tehsil Council Naib Nazims 6 216,000 1,555
Tehsil Council Members (excluding Nazims +
Naib Nazims)
199 7,164,000 51,595
SUB-TOTAL DISTRICT AND TEHSIL 247 17,928,000 129,120 Village/Neighborhood Council Level
Village/NH Councils Nazims 175 14,000* 6,300,000 45,375
Village/NH Councils Naib Nazims 175 6,300,000 45,375
Village/NH Council Members (excluding
Nazims + Naib Nazims)
1,750 24,500,000 176,450
SUB-TOTAL VILLAGE/NEIGHBORHOOD COUNCILS
2,100 37,100,000 267,200
TOTAL FOR ALL THREE LEVELS 2,347
55,028,000 396,320 Notes: Calculation assumptions: 3 districts (Abbottabad, Mardan and Peshawar); 6 tehsils and 175 Union
Councils—34 for Abbottabad (not including Havelian), 46 for Mardan and 95 for Peshawar. All UCs,
both urban and those classed as rural are included. Data is unavailable on village/neighborhood
councils. Units costs for this level are less, assuming the trainings are conducted locally.
Source: Recalculated from assessments of 9 districts.
Table 53: Estimated costs of training of WSSC officials at National Institute of Urban Infrastructure Planning (NIUIP), Peshawar
WSSCs Staff to be Trained in Subjects related to
Total Number of Staff
Unit cost per Participant
(PKR)
Cost (PKR) Cost (USD)
Urban Planning
Management
WSSC Peshawar 72 55 127 202,160
25,674,320 184,905
WSSC Mardan 47 24 71 14,353,360 103,375
WSSC Abbottabad 28 19 47 9,501,520 68,430
One-time cost for development of tailored course (training manuals,
instructor manuals, assessment criteria, procedures etc.)
2,333,335 16,805
Total 147 98 245
51,862,535 373,515 Source: Recalculated from assessments of 9 districts.

KP-SISUG Peshawar City Development Plan – Draft Final Report
189
Table 54: Estimated costs residential training courses at the National Institute of Management (NIM) and Pakistan Academy for Rural
Development (PARD)
Development
Authorities
Staff to be Trained in Two-Month Course at NIM One-Week Course at PARD
Urban
Planning
Management Total
Staff
Unit Cost
(PKR)
Cost (PKR) Cost (USD) Unit Cost
(PKR)
Cost (PKR) Cost (USD)
Peshawar Development Authority
160 106 266 150,000 39,900,000 287,360 16,000 4,256,000 30,650
Mardan Development Authority
56 38 94 14,100,000 101,550 1,504,000 10,830
Abbottabad Development Authority
57 39 96 14,400,000 103,310 1,536,000 11,060
Total 371 247 618 92,700,000 492,220 9,888,000 52,540
Source: Recalculated from assessments of 9 districts.

KP-SISUG Peshawar City Development Plan – Draft Final Report
190
Appendix 6: Climate and disaster risk assessment
For Peshawar the impacts of climate change are projected to be quite different than those in Abbottabad and Mardan. The main impact of climate change projected in Peshawar is only a modest increase in summer days/heat waves for the short, medium and long term. However, it is important to remember that there are also significant projections for increases in temperatures in the Northern Areas of Pakistan. This has an impact on snow fall and snow melt. As a result, the flow of water through Peshawar from the NAs will be more continual (especially in winter) and may increase in spring to the point of posing flood risks when there are also heavy rains. This poses risks of damage to transport and drainage infrastructure as well as other infrastructure such as schools and other large buildings, as well as increases in landslides ( 55).
In Map 14 on topography, Map 10 on elevation and Map 6 on hydrology of Peshawar Tehsil, it can be noticed that the slope and the differences in elevation are gentle (meandering). This means that water flow in times of heavy precipitation will not have extreme energy, and hence damage due to flooding can be contained. There is however a continual slope, meaning that rains and snowmelt in the higher areas will drain towards the city.
The city of Peshawar drains from the North-west to the South-east. This may seem contradictory to the slope, but on the elevation map a clear slightly darker green indentation can be seen around Peshawar, this is the natural drain. This drain can also be seen on the hydrological map.
Other impacts of increases in temperatures are an increase in electricity use for cooling, and an increase in potable water consumption. Map 24, Map 25 and Map 26 provide an overview of the water facilities in Peshawar, as well as the water supply network.
Since the institutionalization of the National Disaster Management Authority (NDMA) and their provincial branches, information services on weather have improved considerably. For all three cities there are early warning systems in place, especially for high precipitation levels and possible flooding. Through appropriate monitoring of weather predictions, the shocks and stresses of climate change can be mitigated due to an improved preparedness.
Reference is made to the Urban Resilience Assessment.122 This provides many details which go beyond the purpose of this appendix. However salient and relevant recommendations are presented here to enable the reader to refer to these when reviewing the City Development Plan.
In view of the climate trends and potential impacts identified, as well as the existing vulnerabilities inherent in the urban sector, the main climate-related risks in Peshawar involve:
• Urban Water Security: Increasing demand for water supply (due to warmer weather), coupled with depleting capacity of surface and ground water resources
• Urban Energy Security: Increasing demand for electricity supply, particularly in peak summer months, coupled with higher risk of damage to transmission lines and electricity infrastructure from potential floods and high levels of heat and humidity.
122 ADB. 2017. Urban Resilience Assessment Khyber Pakhtunkhwa, Pakistan: Peshawar City. Manila: UCCRTF,
Asian Development Bank.

KP-SISUG Peshawar City Development Plan – Draft Final Report
191
• Urban Disasters including Heat Waves: Increasing frequency and intensity of heatwaves, resulting in higher rates of morbidity and mortality among the local population (especially those residing in slums and low-income areas). Also, an increased risk of damage to physical infrastructure, including roads and other communication facilities.
• Urban Disasters including Flooding: Increasing frequency of urban flooding and resulting losses and damages to communities and assets in the urban area.
• Urban Health including Vector-Borne Diseases: Increasing rates of vector borne diseases due to expanding annual span of warm weather.
• Improving Economic Growth: Increase investments
The following specific measures are necessary to reduce vulnerabilities.
Infrastructure
Water Supply
• New sources of water need to be explored, in line with the Greater Water Supply Scheme Peshawar (GWSSP) that has identified four possible locations for constructing dams to supply water to certain urban sectors in Peshawar. Feasibility studies have been carried out for constructing dams in Warsak, Jabba, Bara and Munda areas. The GWSSP should be investigated further to understand the latest situation with the development of the identified dams and potential for collaboration.
• There is an immediate requirement for boreholes to be provided in UCs Regi, Malakandhir and Sufaid Dheri; however, for long term sustainability, a proper water network should be established designed for the entire city and linked to the Greater Water Supply Scheme Peshawar (GWSSP).
• The conveyance of water supply to end users is also a critical factor in water management as the distribution network is a major source of water contamination in Peshawar, as was highlighted repeatedly in stakeholder consultations. Most of the urban water distribution network has been extended haphazardly to meet the demands of expanding communities. It is noted that the laid pipe network is a complex mix of new and old pipes (some pipes installed over 20 years ago) and many parts mingle with sewerage lines. The distribution system is leaking and consists of damaged, dilapidated pipelines which are mainly undersized to address the current needs. As an immediate priority, leaking and corroded water pipes need to be replaced (preferably with the lighter HDPE pipes) and separated from sewage drains, especially in those UCs (e.g. Tehkal Bala, Khalisa 1, Hazar Khawani, Safed Dheri etc.), which are suffering from high rates of water borne diseases like hepatitis, polio, skin diseases, cholera etc. Replacing deteriorated pipes will also reduce water losses.
Filtration and clean-up of surface water
• Any investment in wastewater treatment infrastructure should ideally consider added features of wastewater recycling and reuse.189 This prospect should be examined with Peshawar Development Authority (PDA) and the WSSP.
• Additional locations for installing new waste water treatment plants are also identified by the Peshawar MSP that can be explored – these have been proposed to discharge treated waste water at four different locations in Budhnai Nullah and Bara River.

KP-SISUG Peshawar City Development Plan – Draft Final Report
192
Non-infrastructure
Survey/study
• Detailed assessment to map the existing facilities and gaps in water supply. WSSP should be provided technical assistance, if requested.
Institutional strengthening of WSSP
• Preparation of different Manuals for WSSP in order to capacitate the operations in a smooth manner.
• Development of Revenue Enhancement Strategy for and Development of Business Plan for WSSP is recommended.
• Development/Establishment of IT based operational management system at WSSP. Wireless communication systems for O&M teams to enhance efficiency of services need to be explored and then implemented.
• Design and implement programs like community mobilization; public awareness campaigns for citizen awareness about the company and its initiatives; public events and citizen feedbacks. Development of IEC190 material; and Pre/Post KAP surveys and research.
• Rain water harvesting knowledge among communities should be improved to harness the depleting water table.
• Energy Audit and Energy Efficiency Improvement program for water sector related assets is required.
• Implementation of media promotion strategy for WSSP through citizen engagement; community awareness and behavior change campaigns.
• Currently there is no capacity building plan for staff at the WSSP, and it struggles to recruit skilled and experienced human resource from the local labor market. WSSP should be supported in assessing institutional capacity building needs and developing related training plans and programs. These should be a move away for ‘one-off’ training approach to more systematic and comprehensive capacity building mechanisms. This should include training on operation and maintenance of WATSAN191 assets and services, best practices and sustainable strategies in water management, waste-to-energy technology, financial planning and revenue generation, water pricing, and so on. There must be attention to enhancing knowledge and skills of WSSP staff regarding climate compatible WATSAN development and management in Peshawar – this could be an entry point to linking with EPA and climate change planners in Khyber Pakhtunkhwa
• Exposure visits to best practices implementers internationally. Skill specific trainings nationally and internationally. Support to participate on national and international conferences. Scholarships for professional education. Use of personal protective equipment’s, health and hygiene and risk related trainings for staff. Support in area specific researches and publications. Workshops and seminar participations. These training will occur over the year.
Sustained electricity supply
Peshawar faces a significant energy shortfall that is managed through power outages (load-shedding) on a daily basis. Options for waste-to-energy schemes should be explored with city authorities, particularly bio-gas plants. This will have added co-benefits of solid waste
KP-SISUG Peshawar City Development Plan – Draft Final Report
193
management, mitigation of greenhouse gases, and potential local entrepreneurship and employment generation. Proposals for waste-to-energy have also been developed in the action plan. There is already feasibility level work being carried out by the WSSP to this effect which can be a basis for a potential pilot project.
The Urban Resilience Assessment123 contains additional recommendations and suggestions, which to some extent were integrated into the action plan for the City Development Plan.
123 ADB. 2017. Urban Resilience Assessment Khyber Pakhtunkhwa, Pakistan: Peshawar City. Manila: UCCRTF,
Asian Development Bank.
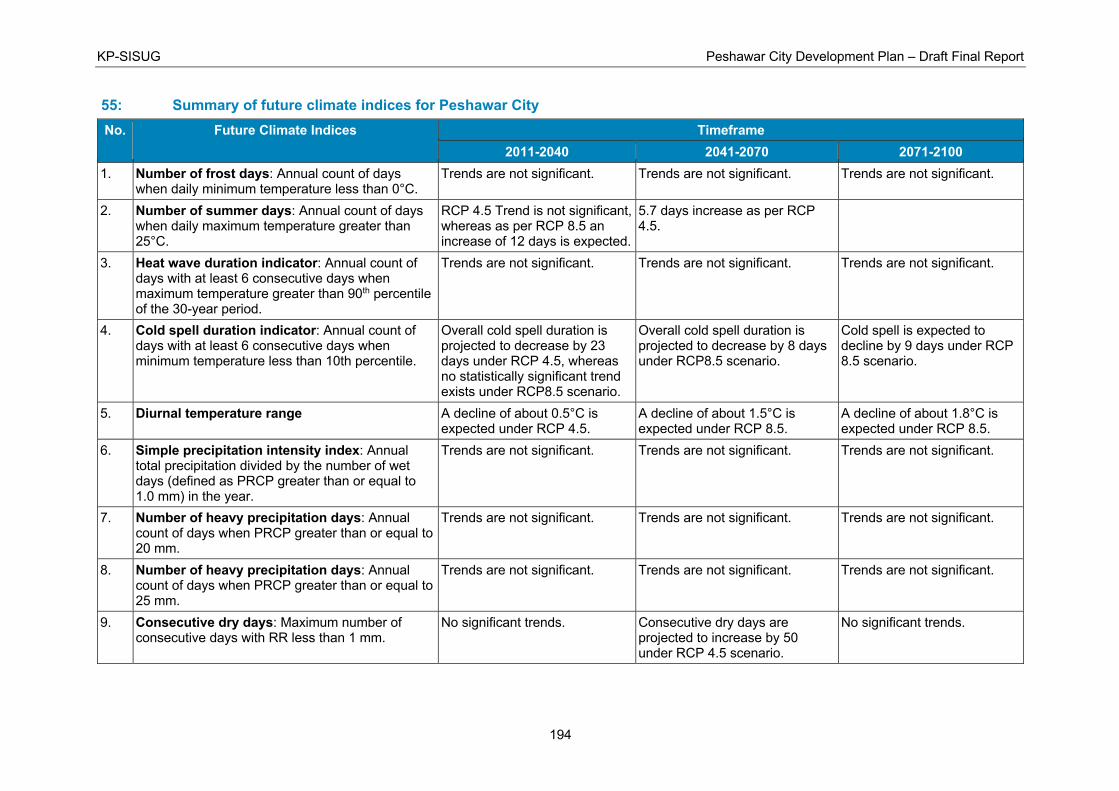
KP-SISUG Peshawar City Development Plan – Draft Final Report
194
55: Summary of future climate indices for Peshawar City
No. Future Climate Indices Timeframe
2011-2040 2041-2070 2071-2100
1. Number of frost days: Annual count of days when daily minimum temperature less than 0°C.
Trends are not significant. Trends are not significant. Trends are not significant.
2. Number of summer days: Annual count of days when daily maximum temperature greater than 25°C.
RCP 4.5 Trend is not significant, whereas as per RCP 8.5 an increase of 12 days is expected.
5.7 days increase as per RCP 4.5.
3. Heat wave duration indicator: Annual count of days with at least 6 consecutive days when maximum temperature greater than 90th percentile of the 30-year period.
Trends are not significant. Trends are not significant. Trends are not significant.
4. Cold spell duration indicator: Annual count of days with at least 6 consecutive days when minimum temperature less than 10th percentile.
Overall cold spell duration is projected to decrease by 23 days under RCP 4.5, whereas no statistically significant trend exists under RCP8.5 scenario.
Overall cold spell duration is projected to decrease by 8 days under RCP8.5 scenario.
Cold spell is expected to decline by 9 days under RCP 8.5 scenario.
5. Diurnal temperature range A decline of about 0.5°C is expected under RCP 4.5.
A decline of about 1.5°C is expected under RCP 8.5.
A decline of about 1.8°C is expected under RCP 8.5.
6. Simple precipitation intensity index: Annual total precipitation divided by the number of wet days (defined as PRCP greater than or equal to 1.0 mm) in the year.
Trends are not significant. Trends are not significant. Trends are not significant.
7. Number of heavy precipitation days: Annual count of days when PRCP greater than or equal to 20 mm.
Trends are not significant. Trends are not significant. Trends are not significant.
8. Number of heavy precipitation days: Annual count of days when PRCP greater than or equal to 25 mm.
Trends are not significant. Trends are not significant. Trends are not significant.
9. Consecutive dry days: Maximum number of consecutive days with RR less than 1 mm.
No significant trends. Consecutive dry days are projected to increase by 50 under RCP 4.5 scenario.
No significant trends.
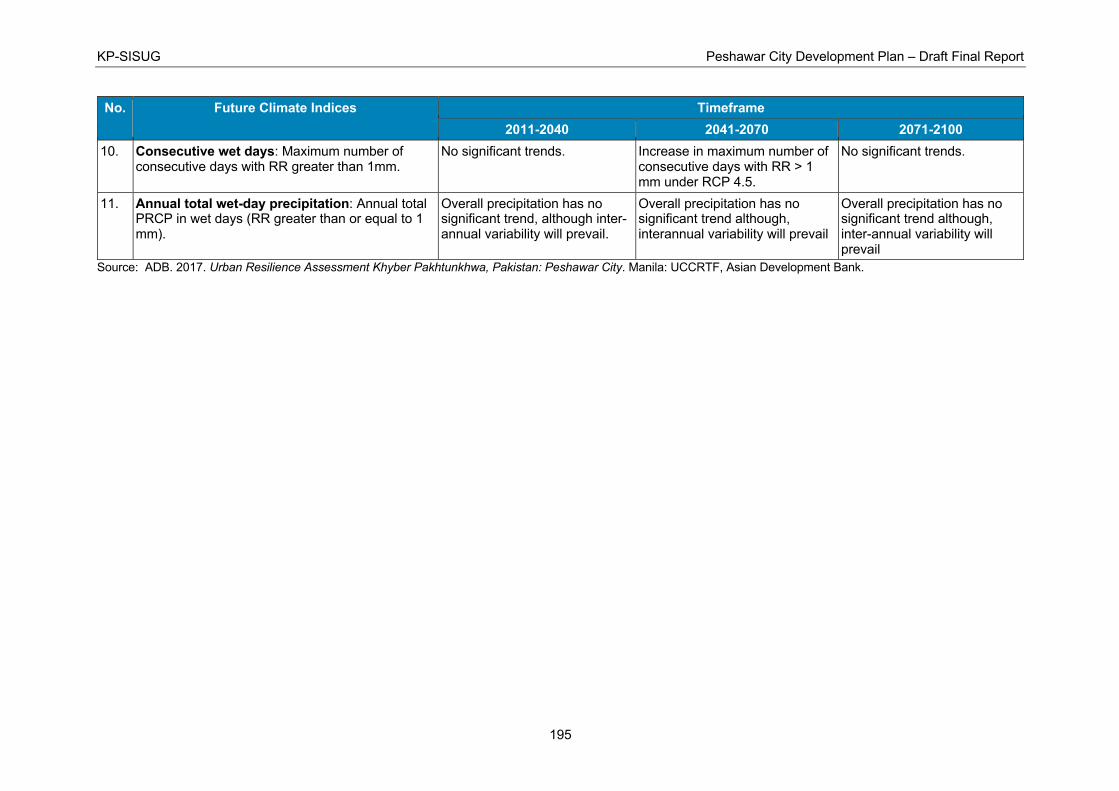
KP-SISUG Peshawar City Development Plan – Draft Final Report
195
No. Future Climate Indices Timeframe
2011-2040 2041-2070 2071-2100
10. Consecutive wet days: Maximum number of consecutive days with RR greater than 1mm.
No significant trends. Increase in maximum number of consecutive days with RR > 1 mm under RCP 4.5.
No significant trends.
11. Annual total wet-day precipitation: Annual total PRCP in wet days (RR greater than or equal to 1 mm).
Overall precipitation has no significant trend, although inter-annual variability will prevail.
Overall precipitation has no significant trend although, interannual variability will prevail
Overall precipitation has no significant trend although, inter-annual variability will prevail
Source: ADB. 2017. Urban Resilience Assessment Khyber Pakhtunkhwa, Pakistan: Peshawar City. Manila: UCCRTF, Asian Development Bank.

KP-SISUG Peshawar City Development Plan – Draft Final Report
196
56: Climate change impacts on infrastructure
Affected Infrastructure District Vulnerability Climate Change Impact Mitigating Measures
• Bridges • Schools • Health facilities • Transport infrastructure • Energy infrastructure • Irrigation and flood
protection system • Sewage and drainage
systems
• Very High: Regi, Malakandhir, Tehkal Bala, Khalsa, Shaheen Muslim Town, Hazar Khani 2, Sufaid Dheri.
• High: Palosi, Tehkal Payan-3, 4, Hasan Garhi No.1, 2, Khalsa-2, Mahal Tharai 2, Wadpaga, Chamkani, Musazai, Hazarkhani-1, Khakhshal-1, Akhun Abad, Deh Bahadur, Landi Arbab.
• Moderate: Hayatabad 2, Shaheen Town, University Town, Pawake, Nauthia, Bhana Mari, Kakshal-2, Mahal Tharai, Faqirabad, Lahori, Karim Pura, Sheikh Junaidabad, Yaktut-1, 2, 3, Pushtakhar.
• Low: Hayatabad 1, Gulbahar, Andher Shehr.
• Increased precipitation: o + 972 mm/yr. in 2071-2100
(compared to 1976-2005) Increase in vector-borne diseases
Plantation of trees, rainwater collection systems, exploitation of more sustainable green energy resources (hydropower), raise awareness of the link between vector-borne diseases.
• Increased runoffs/flood: o > piers erosion o < efficient drainage, flood
protection, and irrigation systems
Integrated flood risk management (IFRM), sediment control and protection measure, increment piers depth, increase protection wall height, increase sewers diameter in critical regions. Improve bridges and building foundations design. Sediment control structure and appropriate design are needed, using updated/revised scour depths and flood estimates.
• Increased temperature: o + 1.7°C - 2°C during 2011-
2040 o + 1.4°C - 2.2°C during 2041-
2070 o + 1°C - 2.4°C during 2071-
2100
Improve design of expansion joints, Heating Ventilation Air-conditioning (HVAC), structural design of construction (insulation in roofs and walls) adaptation preventive measures against peak energy consumption, exploitation of more sustainable green energy resources (solar power).
Source: ADB. 2017. Urban Resilience Assessment Khyber Pakhtunkhwa, Pakistan: Peshawar City. Manila: UCCRTF, Asian Development Bank.

KP-SISUG Peshawar City Development Plan – Draft Final Report
197
Appendix 7: Public communication plan
Current situation of communication
Water and Sanitation Services Peshawar
The Water and Sanitation Services Peshawar (WSSP) has a robust communication program. Its communication section has a small but effective team of communication experts drawn from media professionals. For the face to face communication and civic mobilization, the WSSP has formed public liaison cells in various parts of the city that undertake activities aimed at promoting awareness and education. Through these cells WSSP tries to reach ulema, teachers, public representatives, schools and community spaces like hujras.
The WSSP has a strong media advocacy component. It regularly updates media on its activities and prepare features that appear on local and national dailies.
The WSSP undertakes civic education campaigns and for the purpose, it prepares awareness materials including pamphlets, banners, pan flexes etc. These materials are used and distributed during awareness session at schools and colleges and are also used by liaison cells.
The WSSP shoots videos and prepares video content to share online and through cable networks. The WSSP uses Facebook and Twitter for horizontal communication in order to reach directly to citizens and seek feedback from them.
Tehsil Municipal Administration
Communication at the TMA is managed by the office of the PRO. The office of the PRO issues press releases on daily basis and keeps liaison with media persons. Through WhatsApp, it keeps media persons informed of the activities and developments happening at the city district government.
Social media activity of the TMA revolves around the Facebook page of the Tahsil Nazim, Muhammad Asim Khan. This page has more than 104,000 followers. The page mainly focuses on activities involving the Tahsil Nazim and shares pictures, videos and news items related to the topic. TMA’s own Facebook page covers a broader range of topics sharing information about TMAs activities. It has a smaller follower base of 800.
Peshawar Development Authority
Peshawar Development Authority undertakes a number of communication activities to share its message with citizens of the provincial capital. While office of the Press Relations Officer (PRO) is the focal point of communication activities, a good part of communication initiatives is managed directly by various projects.
Due to the scale of development projects undertaken by the PDA, media takes keen interest in the work of the organization, reporting regularly on development work undertaken by the PDA. The media persons remain in touch with the PDA officials directly to get information and the official version. The PDA also issues press released every now and then.
The PDA uses its web-site and social media to reach directly to citizens, mainly focusing on the Facebook. The PDA’s Facebook Page has 111,000 followers. The PDA also has a Twitter

KP-SISUG Peshawar City Development Plan – Draft Final Report
198
account, which gets less attention and has only 280 followers. Through Facebook, PDA keeps citizens informed of its activities and shares regular updates on development activities in the city. This page is also used to share clips of news reports related to the PDA.
Figure 15: Communication analysis –available mechanisms
Public communication plan
Communication objectives
Communication is an essential function of government. Communications and public engagement are not the sole responsibility of a specific department but rather should be integrated into the overall program of work and cultivated at each stage of policy and program development. This plan tries to ensure effective communication between service providers and citizen-consumers. It aims:
• To ensure pro-active disclosure of relevant information to citizens; • To keep all the key stakeholders informed of the project’s progress; • To help in achieving overall organizational and department-level objectives; • To engage effectively with stakeholders; • To demonstrate the success of various initiatives; • To build community pride and satisfaction; • To get key messages across to relevant target groups for changing perceptions and
behavior; • To help people understand what the city governments in general and project in particular
is trying to achieve.
Key Features
This communication plan is based on a strategic design. Some important characteristics of the strategy are as follows:
Communications excellence
Communications excellence occurs when organizations use communication to manage relationships with their diverse stakeholders to achieve mutual understanding, realize
WSSC
•Liaison with media
•Special campaigns
•Website•Facebook page•Occasional messages through cable
networks•Interviews to television and FM
channels•Walks and seminars•Preparation and dissemination of
information and communication material
TMA
•Liaison with media persons•Occasional messages through cable
networks•Interviews to FM channels
PDA
•Website•Facebook page•Liaison with media persons•Occasional messages through cable
networks•Interviews television and FM channels

KP-SISUG Peshawar City Development Plan – Draft Final Report
199
organizational goals and serve the public interest. Studies show effective communication helps organizations achieve overall goals and objectives.
Two-way communication
Also central to this Plan is “two-way” communication. Two-way communication brings organizations and stakeholders closer together by allowing them to negotiate with one another to reach mutually satisfactory outcomes.
Rather than a one-dimensional plan that prescribes how the cities can best convey information to stakeholders, the Communications Plan is a road map for truly effective communications that involves ongoing, direct and timely dialogue with stakeholders.
By engaging in two-way communication, the cities will foster effective relationships with the stakeholders; ensure that city communications are well coordinated, effectively managed and responsive to the information needs of all segments of citizens; and encourage effective public engagement.
In the case of government, two-way communication models allow for better, more representative public policy because that policy has been informed and negotiated through dialogue with stakeholders.
Guiding principles
• Provide information that is timely, accurate, clear, accessible and responsive. • Consider the range of communication tools and use those most appropriate to address
the needs associated with each circumstance. • Work collaboratively across the organization to ensure that information is thorough,
factual and timely. • Respect the access to information and privacy rights of citizens and employees. • Support opportunities for engagement to inform public policy. • Strive to achieve a culture of two-way communication and “communications
excellence” practices.
Audience segmentation
Audience segmentation is the process of dividing a large audience into smaller groups of people - or segments - who have similar needs, values or characteristics. Segmentation recognizes that different groups will respond differently to social and behavior change communication (SBCC) messages and interventions.
Segmenting audiences enables a program to focus on those audience members who are most critical to reach and also to design the most effective and efficient strategy to match audiences, messages, media, products and services based on the specific needs and preferences of the audience.
Internal groups
It is essential to address internal groups or audiences – local government staff and elected officials, city development authorities, project staff etc. as these groups can play an invaluable role. Without their involvement, it may be difficult to deliver communications which achieve their objectives. They may also represent important members of local population. As with

KP-SISUG Peshawar City Development Plan – Draft Final Report
200
external audiences, it is useful to segment internal audiences in order to give them appropriate messages.
A few of these audiences and the roles they may play are listed below:
• Elected members: communicating to residents, promoting required behaviors in their constituencies, promoting behavior change and influencing the local media.
• In-house media/ public relations staff: support on communications planning, assisting with campaign activities, media relations.
• Operational staff: dealing with residents, giving information on schemes and activities. • Other employees: local ambassadors, leading by example.
All identified internal groups must be kept informed of communication plans and activities. They should be engaged and enthused about communication plans. If they buy into campaign, they may be willing and effective in supporting messages or in delivering associated activities and services. Targeted internal audience should get the right information at the right time. In order for them to use it effectively, this information should be clear and easy to use in the context of their job and daily work.
External primary audience
External primary audience of the communication include those persons who have been directly affected, for example those whose property has been taken or whose neighborhood has been affected through development activity related to the project. Primary audience also include those persons who will benefit directly from the project, including those who will benefit from improved water and sanitation services. Primary audience also include residents of the city who will not benefit from the improved water and sanitation infrastructure but will benefit from improved road infrastructure. .
External secondary audience
Secondary audience have been identified based on their power to influence the primary audience. The secondary audience include opinion-makers, particularly mass media and religious leaders; community leaders including elected representatives; and change agents particularly civil society activists. The goal is to mobilize these groups to influence the primary audience in favor of the desired behavioral change. The secondary audience are listed below:
• Community leaders (Heads of educational institutions, religious scholars etc.) • Elected Representatives • Media persons ( Journalists affiliated with different media including newspapers,
television and radio, cable operators, theatre groups) • Civil society activists working with different non-governmental organizations (NGOs). • Religious scholars including khateebs and office bearers of mosque committees.
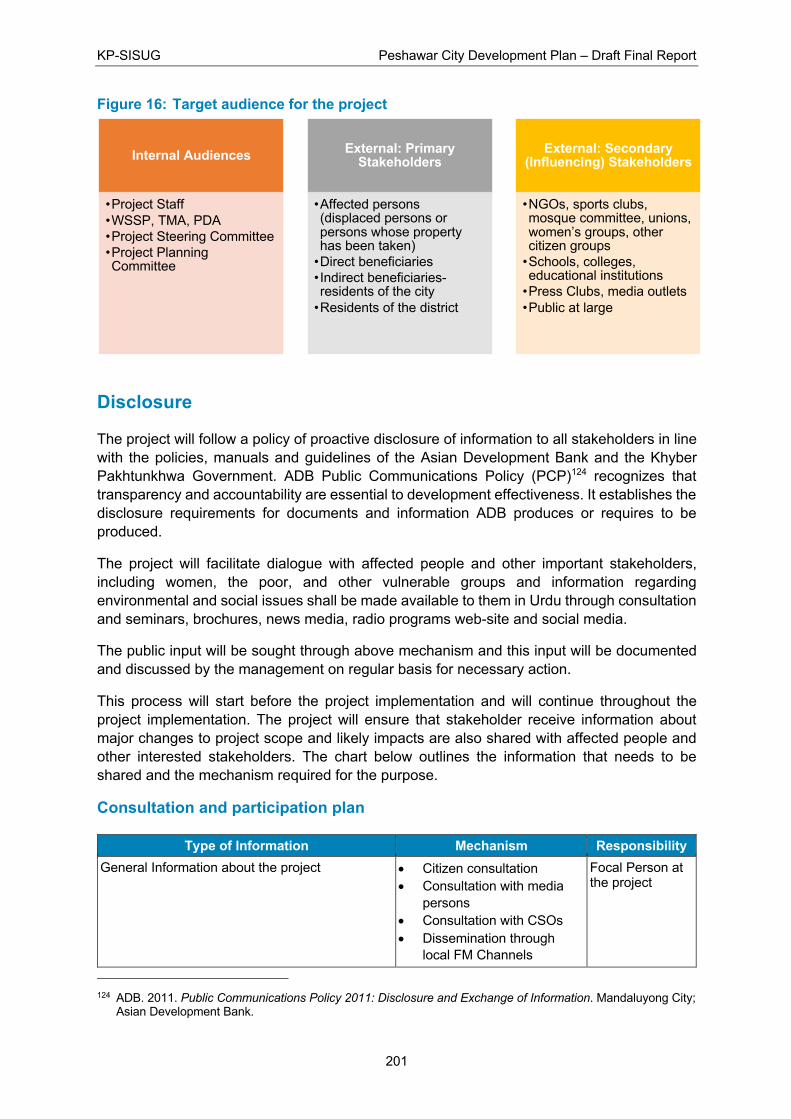
KP-SISUG Peshawar City Development Plan – Draft Final Report
201
Figure 16: Target audience for the project
Disclosure
The project will follow a policy of proactive disclosure of information to all stakeholders in line with the policies, manuals and guidelines of the Asian Development Bank and the Khyber Pakhtunkhwa Government. ADB Public Communications Policy (PCP)124 recognizes that transparency and accountability are essential to development effectiveness. It establishes the disclosure requirements for documents and information ADB produces or requires to be produced.
The project will facilitate dialogue with affected people and other important stakeholders, including women, the poor, and other vulnerable groups and information regarding environmental and social issues shall be made available to them in Urdu through consultation and seminars, brochures, news media, radio programs web-site and social media.
The public input will be sought through above mechanism and this input will be documented and discussed by the management on regular basis for necessary action.
This process will start before the project implementation and will continue throughout the project implementation. The project will ensure that stakeholder receive information about major changes to project scope and likely impacts are also shared with affected people and other interested stakeholders. The chart below outlines the information that needs to be shared and the mechanism required for the purpose.
Consultation and participation plan
Type of Information Mechanism Responsibility
General Information about the project • Citizen consultation • Consultation with media
persons • Consultation with CSOs • Dissemination through
local FM Channels
Focal Person at the project
124 ADB. 2011. Public Communications Policy 2011: Disclosure and Exchange of Information. Mandaluyong City;
Asian Development Bank.
Internal Audiences
•Project Staff•WSSP, TMA, PDA•Project Steering Committee•Project Planning Committee
External: Primary Stakeholders
•Affected persons (displaced persons or persons whose property has been taken)
•Direct beneficiaries•Indirect beneficiaries-residents of the city
•Residents of the district
External: Secondary (Influencing) Stakeholders
•NGOs, sports clubs, mosque committee, unions, women’s groups, other citizen groups
•Schools, colleges, educational institutions
•Press Clubs, media outlets•Public at large
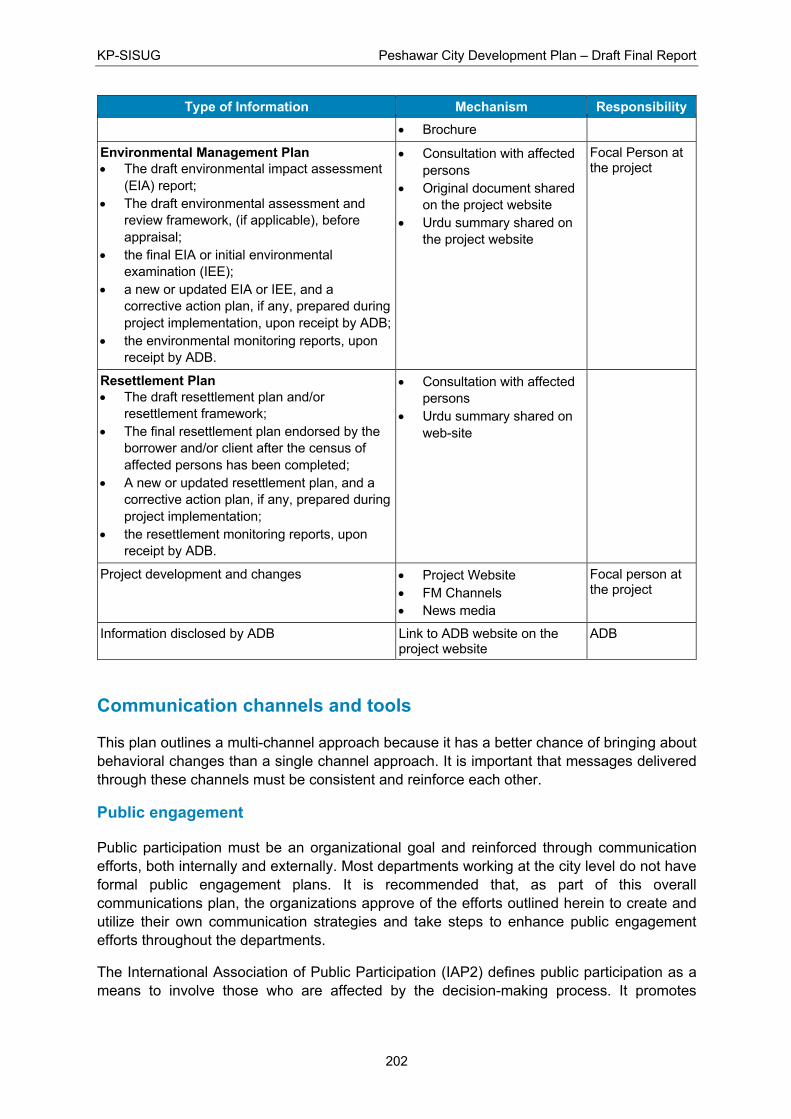
KP-SISUG Peshawar City Development Plan – Draft Final Report
202
Type of Information Mechanism Responsibility
• Brochure
Environmental Management Plan • The draft environmental impact assessment
(EIA) report; • The draft environmental assessment and
review framework, (if applicable), before appraisal;
• the final EIA or initial environmental examination (IEE);
• a new or updated EIA or IEE, and a corrective action plan, if any, prepared during project implementation, upon receipt by ADB;
• the environmental monitoring reports, upon receipt by ADB.
• Consultation with affected persons
• Original document shared on the project website
• Urdu summary shared on the project website
Focal Person at the project
Resettlement Plan • The draft resettlement plan and/or
resettlement framework; • The final resettlement plan endorsed by the
borrower and/or client after the census of affected persons has been completed;
• A new or updated resettlement plan, and a corrective action plan, if any, prepared during project implementation;
• the resettlement monitoring reports, upon receipt by ADB.
• Consultation with affected persons
• Urdu summary shared on web-site
Project development and changes • Project Website • FM Channels • News media
Focal person at the project
Information disclosed by ADB Link to ADB website on the project website
ADB
Communication channels and tools
This plan outlines a multi-channel approach because it has a better chance of bringing about behavioral changes than a single channel approach. It is important that messages delivered through these channels must be consistent and reinforce each other.
Public engagement
Public participation must be an organizational goal and reinforced through communication efforts, both internally and externally. Most departments working at the city level do not have formal public engagement plans. It is recommended that, as part of this overall communications plan, the organizations approve of the efforts outlined herein to create and utilize their own communication strategies and take steps to enhance public engagement efforts throughout the departments.
The International Association of Public Participation (IAP2) defines public participation as a means to involve those who are affected by the decision-making process. It promotes

KP-SISUG Peshawar City Development Plan – Draft Final Report
203
sustainable decisions by providing participants with the information they need to be involved in a meaningful way, and it communicates to participants how their input affects the decision.
The practice of public participation can involve public meetings, surveys, consultations, workshops, polling, citizen’s advisory committees and other forms of direct involvement with the public. IAP2 recommends the use of core values when practicing public participation:
• Public participation is based on the belief that those who are affected by a decision have a right to be involved in the decision-making process.
• Public participation includes the promise that the public's contribution will influence the decision.
• Public participation promotes sustainable decisions by recognizing and communicating the needs and interests of all participants, including decision makers.
• Public participation seeks out and facilitates the involvement of those potentially affected by or interested in a decision.
• Public participation seeks input from participants in designing how they participate. • Public participation provides participants with the information they need to participate
in a meaningful way. • Public participation communicates to participants how their input affected the decision.
Public participation matrix
Inform Consult Involve Collaborate Empower
Public Participation Tools
To provide the public with balanced and objective information to assist them in understanding the problems, alternatives and/or solutions.
To obtain public feedback on analysis, alternatives and/or decisions.
To work directly with the public throughout the process to ensure the public issues and concerns are consistently understood and considered.
To partner with public in each aspect of decision including the development of alternatives and the identification of preferred solutions.
To place final decision making in the hands of the people.
Promise to the Public
We will keep you informed
We will keep you informed, listen to and acknowledge concerns and provide feedback on how public input influenced the decision.
We will work with you to ensure that your concerns and issues are directly reflected in the alternatives developed and provide feedback on how public input influenced decision.
We will look to you for direct advice and innovation in formulating solutions and incorporate your advice and recommendations into the decisions to the maximum extent possible.
We will implement what you decide
Example Tools
Fact Sheet Web site Consultations
Public comment Focus Groups Surveys Public meetings
Workshops Deliberations polling
Citizen advisory committees Consensus building Participatory decision making

KP-SISUG Peshawar City Development Plan – Draft Final Report
204
Consultations and meetings
Meaningful consultative process will involve consultations with the affected persons and other key stakeholders. Consultation will be held with the aim to inform the stakeholders about the project and seek their opinion and feedback. While consultations with affected persons will be held at communities, consultation with other stakeholders and citizen consultation will be held at public venues. It will be ensured that consultations are organized at the start of the project. More consultations will be held if and when the need arises. Consultations will also be held with government stakeholders to ensure trust building, seek cooperation and smooth working relationship.
Media relations
Effective media relations involve managing the message to communicate the intent of the organization to provide a service, develop a program or policy, and convey ongoing efforts to fulfill the city’s mission to provide excellent services that enhance the quality of life for the community.
The project will maintain interaction with media professionals and their organizations, particularly the Press Club to ensure timely delivery of information and counter disinformation. The project will appoint a spokesperson to respond to information needs of media persons and to pro-actively share information on behalf of the project. The project will also hold media briefing program to allow time for media professionals to meet with key staff on a regular basis to receive information on current issues and upcoming programs/agenda items. The project will also hold orientation sessions and trainings for media persons to help them cover the project and municipal, transport and public health issues.
In order to enhance their own capacities, the relevant departments will review and revise the current media policy to adhere to organizational goals and best practices for public communications. They will also communicate the media policy to employees to ensure compliance and offer media relations training to Communications team and key officials.
Effective messaging
Radio
FM channels are an effective and cost-effective way to deliver message to the primary audience. Abbottabad has a number private FM channels and channels owned by the national broadcaster i.e. Pakistan Broadcasting Corporation (PCB), commonly known as the Radio Pakistan. The project will sign MoUs with these stations to broadcast public service messages and to get its messages integrated into their programs.
Cable
Most households in the three cities have subscribed to some privately-owned cable service that delivers various television channels to them. PEMRA allows these operators to run their own channels that provide recorded content and local information. Some departments already use their services to share their message, particularly during health-related campaigns. The project will make an effective use of these services by airing news reels and PSMs through them.

KP-SISUG Peshawar City Development Plan – Draft Final Report
205
Social media
Social media are revolutionizing the basic rules of engagement. Where traditional media messaging was one-way, controlled, and relevant primarily to the organization, social media are networked, free-flowing and relevant to the participants. The principles of social media are sometimes referred to as ‘democracy in communications.’
The social media can play a major role in information sharing, social mobilization and public relations. The project can use social media to build awareness, create a network of supporters and empower its supporters to spread their message. The project will make an active use of Facebook, Twitter, Instagram and YouTube as social media tools. Social media will also be used to encourage interaction and participation in city programs. Social media tools will be used to increase engagement efforts to involve the public in the development of a strategic plan and annual budget. The project will not only use the social media directly but will also aim to integrate and relay the message through the social media accounts of relevant departments.
Facebook: Facebook has been identified as a primary tool for communications. It is best used for posts that can have more longevity, more explanation and multiple photographs/images to convey a message. Facebook’s video, advertising and event promotion tools can be used successfully for city communications.
Twitter: Twitter is best used as a responsive, real-time communication tool with followers. Although it is difficult to condense a message into 280 characters, Tweets should be hyperlinked to the project or city websites whenever possible to provide additional information.
YouTube: With changes in people’s habits, especially the amount of time spent on a daily basis watching videos on the Internet, YouTube, the largest video-sharing site, has become not just a recreational tool but an excellent communication tool as well. The project and cities should make a concerted effort to move video hosting and streaming to YouTube.
Video: Video is a powerful medium that can be used to tell a story or convey a message. There are increasing options to produce video quickly and cost-effectively through mobile applications. Videos produced need to be brief to keep the viewer’s attention and be optimized for application in social media and the website.
YouTube: YouTube is used for archiving and URL linkage from social media and the website. Videos will also be uploaded organically to Facebook, or through an identified best practice.
Website: The project web-site will actively share project documents, project development and other information about the project. The web-site will also carry a feedback form for citizens to share their views and register complaints.
The project website can be a great communications asset. It is the central repository for information and should be used to its maximum potential. The website should be built with a focus on enhancing its core function of managing and delivering content in a useful, thoughtful and appealing way.
An effort will be made to optimize technology and implement best practices in web design and content management system focusing on the internal user functionality and the external audience presentation (including navigation and development of applications that enhance the user-experience).

KP-SISUG Peshawar City Development Plan – Draft Final Report
206
Printed materials
Leaflets and brochures will be printed in easy and accessible local language to share information about the project and any changes made in the project plan or timelines. These publications will be shared during events, visits and other activities and will be available at project office for sharing with citizens seeking information. The IEC materials will be printed in collaboration with the Health department for activities aimed at changing behaviors related to water and sanitation.
Feedback/complaint mechanism
Beneficiaries and stakeholders will be communicated their right to provide feedback and make a complaint and they will also be informed about the procedures for doing so. Implementing a proper feedback and complaint handling mechanism requires ensuring that it is undertaken in time and is of good quality. This mechanism also requires sufficient human and financial resources, in addition to assigning roles and responsibilities defined during the set-up of the complaint mechanism.
Channels to report complaints
Channels to report complaints should allow all potential complainants to report their grievances. This communication plan suggests including online submission form, email addresses, helplines, personal conversations and SMS for feedback and complaint mechanism.
While online reporting tools such as email, online submission forms or online platforms can be accessed by the educated and younger stakeholders, for less educated and elderly it is important to include a walk-in office and a phone service message service. Anonymous reporting should be possible and accessible.
Making complaint mechanism public
In line with the principles of transparency and accountability and in order to build trust in the mechanism, the complaint handling procedure will be publicized. While a flayer and the project website will contain complete information about the complaint process, simplified messages will be displayed at different project sites and machinery.
While publicizing feedback/complaint mechanism, following information should be shred: Who can submit a complaint; where, how and when can a complaint be submitted; what can be complained about, any limitations to the process etc.; what outcomes can be expected from the handling of the complaint, and what not; which department and senior management function are accountable for the proper handling of the complaint; what rights and protection are guaranteed, including confidentiality and anonymity; where and how can the complainant follow up (including appeal process).
Receiving feedback/complaints
All feedback and complaints will be received in an open and courteous manner. If the feedback is relevant, staff will express commitment to pass on feedback or resolving the complaint. If the feedback or complaint is not related to the project, the stakeholder can be politely turned away. In the case of feedback, the stakeholder will be asked if they require a response. If not,

KP-SISUG Peshawar City Development Plan – Draft Final Report
207
a commitment will be made to pass on feedback. For all complaints, and feedback requiring a response, a commitment will be made to do so as soon as possible. Stakeholders should be encouraged to propose possible solutions for consideration when they submit their complaints. No promises will be made to create false expectations.
Handling incoming complaints
Incoming complaints will be handled in line with process established, in time and will be well recorded in order for the responsible staff to be able to follow up appropriately. The process for handling incoming complaints will include (i) receiving and recording complaints, and (ii) initial screening of complaints and handling of out-of-scope complaints.
All complaints will be assigned a complaint number and the date of complaint will be noted; the receipt of the complaint will be acknowledged as soon as possible, and the complainant will be informed on potential follow-up and timeline. The complaints that are out of the scope of the complaint mechanism will be identified based on clear pre-defined criteria. Two staff members will conduct independent reviews of the complaints for decision-making. If necessary, complainants will be informed when their request is out of scope and they will be provided with reasons and possible alternative channels to pursue their grievance.
Processing complaints
Complaints that are in-scope with the complaint mechanism will be thoroughly reviewed according to the administrative process laid down in the project and the complainant will be duly informed of the decision and about the appeal process.
Communication management
Tentative upcoming events
Program Audience Goals Communication Material
Tentative Timeline
Consultation with affectees
Affected persons/families
Ensuring transparency Seeking feedback Consensus building
Information pack on the project
Before the project start, 1st, 2nd and 3rd year of the project
Orientation Program/ Workshop for government Departments
District Government Local Government Health Department Social Welfare Department Engineering/Public Health Department
Information sharing Building synergies Seeking feedback
Information pack Backdrop, standees, fact sheet, brochure, project web-site, any other relevant materials
Before the project start, 1st year.
Orientation workshop for media on the project on the project Training workshop on municipal/city reporting
Leading journalists working on relevant beats and radio presenters.
Ensuring transparency Seeking media support for public engagement
Training manual Backdrop, standees, fact sheet, brochure, project web-site, any other relevant materials,
1st Year 2nd Year 3rd Year

KP-SISUG Peshawar City Development Plan – Draft Final Report
208
Program Audience Goals Communication Material
Tentative Timeline
Grievance Redress mechanism
Human resources
Designation Number of Positions
Required Skills Required Resources or Equipment
Estimated Annual Budget
Communication Manager
1 Experience: 5 to 7 years, media relations and publicity, event management, team lead/management experience, media relations and publicity, documentation, communications strategy, ability to supervise and implement overarching communication strategy.
Laptop, design software, computer accessories, printer, scanner.
USD 100,000
Communication Specialist
2 Experience: 3-5, preferably with national media Assist the team lead in implementing strategy and media relations Update web-site and social media
Laptop, design software, computer accessories, printer, scanner
USD 70,000
Web Manager 1 Experience 3-5 years Manage and update the website.
Laptop, software USD 50,000