India 200 Climate Change Report 2014 - CDP
40
Report writer and global implementation partner Indian companies decouple business growth from carbon emissions India 200 Climate Change Report 2014 On behalf of 767 investors representing US$92 trillion in assets
-
Upload
khangminh22 -
Category
Documents
-
view
0 -
download
0
Transcript of India 200 Climate Change Report 2014 - CDP

Report writer and global implementation partner
Indian companies decouple business growth from carbon emissions
India 200 Climate Change Report 2014On behalf of 767 investors representing US$92 trillion in assets

2
Building on climate change leadership
The impacts of climate change, water stress and deforestation are today affecting people’s lives all over the world and if unchecked will cause devastation for generations to come.
Corporations, investors and governments must take responsibility to create the systemic change we need for an environmentally sustainable economy. For this reason we congratulate those companies that have achieved a position on CDP’s 2014 Climate Performance Leadership Index.
All economic activity ultimately depends upon a steady flow of natural goods and services, such as fresh water, timber and food crops, or climate regulation and flood control. These goods and services can be considered the ‘income’ generated by the world’s natural capital, the assets upon which the global economy rests.
However, as is becoming increasingly clear, we are eroding that natural capital base.
Businesses and investors are paying increasing attention to the erosion of the world’s natural capital. By some estimates, the global economy is incurring unpriced natural capital costs of US$7.3 trillion/year, or 13% of global output.
CDP has built a unique global system to drive transparency and accountability for business impacts across the earth’s natural capital, starting with climate, then moving into water and forest-risk commodities. Our programs are designed to help assess and manage corporate exposures to environmental risks and ultimately to set companies on the path to natural capital leadership.
Deforestation and forest degradation accounts for approximately 15% of the world’s greenhouse gas emissions, the equivalent of the entire transport sector. Land use change for agriculture is the main driver of deforestation, with five agriculture commodities responsible for most deforestation globally: Timber, palm oil, soy, cattle and bio-fuels. CDP’s forests program provides the only unified system for disclosing corporate deforestation risk exposure and management information across these key commodities. Discover if you can help reduce your business risks and limit your contribution to deforestation at cdp.net/forests
Water security is one of the most tangible and fast-growing social, political and economic challenges faced today according to the World Economic Forum. CDP’s water program helps businesses to respond to this challenge, to measure and manage water-related risks in their direct operations and supply chains, and to attain a position of leadership by starting the journey to water stewardship. Find out more at cdp.net/water
Through CDP, major multinationals are using their purchasing power to achieve sustainable supply chains. Our 66 member companies who represent US$1.15 trillion in annual purchasing spend work with CDP. This enables them to implement successful supplier engagement strategies that reduce emissions, mitigate water and other environmental risks, and protect against escalating costs in supply chains. Join us at cdp.net/supplychain

3
Contents
Investor Members 4
CDP CEO Foreword 5
Accenture Commentary 6
Foreword 7
Executive Summary 8
Leaders 2014 9
2014 Leadership Criteria 10
Key Themes and Highlights of 2014 Responses 11
Government Insight 23
Corporate Insight 24
Self Selected Companies (SSCs) 25
Key Disclosure Statistics 26
Key Emissions Statistics 28
Key Best Practices Statistics 24
About CDP’s Data and Analytics Tool 29
Sector Analysis 30
Appendix I: Table of emissions, scores and company information by sector 34
Appendix II: CDP India 200 response status 2014 36
Where are the performance leaders? 38
Important Notice
The contents of this report may be used by anyone providing acknowledgement is given to CDP. This does not represent a license to repackage or resell any of the data reported to CDP or the contributing authors and presented in this report. If you intend to repackage or resell any of the contents of this report, you need to obtain express permission from CDP before doing so.
CDP and Accenture have prepared the data and analysis in this report based on responses to the 2014 climate change information request. No representation or warranty (express or implied) is given by CDP and Accenture or any of its contributors as to the accuracy or completeness of the information and opinions contained in this report. You should not act upon the information contained in this publication without obtaining specific professional advice. To the extent permitted by law, CDP and its contributors do not accept or assume any liability, responsibility or duty of care for any consequences of you or anyone else acting, or refraining to act, in reliance on the information contained in this report or for any decision based on it. All information and views expressed herein by CDP and its contributors are based on their judgment at the time of this report and are subject to change without notice due to economic, political, industry and firm-specific factors. Guest commentaries where included in this report reflect the views of their respective authors; their inclusion is not an endorsement of them.
CDP and its contributors, their affiliated member firms or companies, or their respective shareholders, members, partners, principals, directors, officers and/or employees, may have a position in the securities of the companies discussed herein. The securities of the companies mentioned in this document may not be eligible for sale in some states or countries, nor suitable for all types of investors; their value and the income they produce may fluctuate and/or be adversely affected by exchange rates.
‘CDP’ refers to CDP Worldwide, a United Kingdom company limited by guarantee, registered as a United Kingdom charity number 1122330.
© 2014 CDP Worldwide. All rights reserved.
4
Investor members
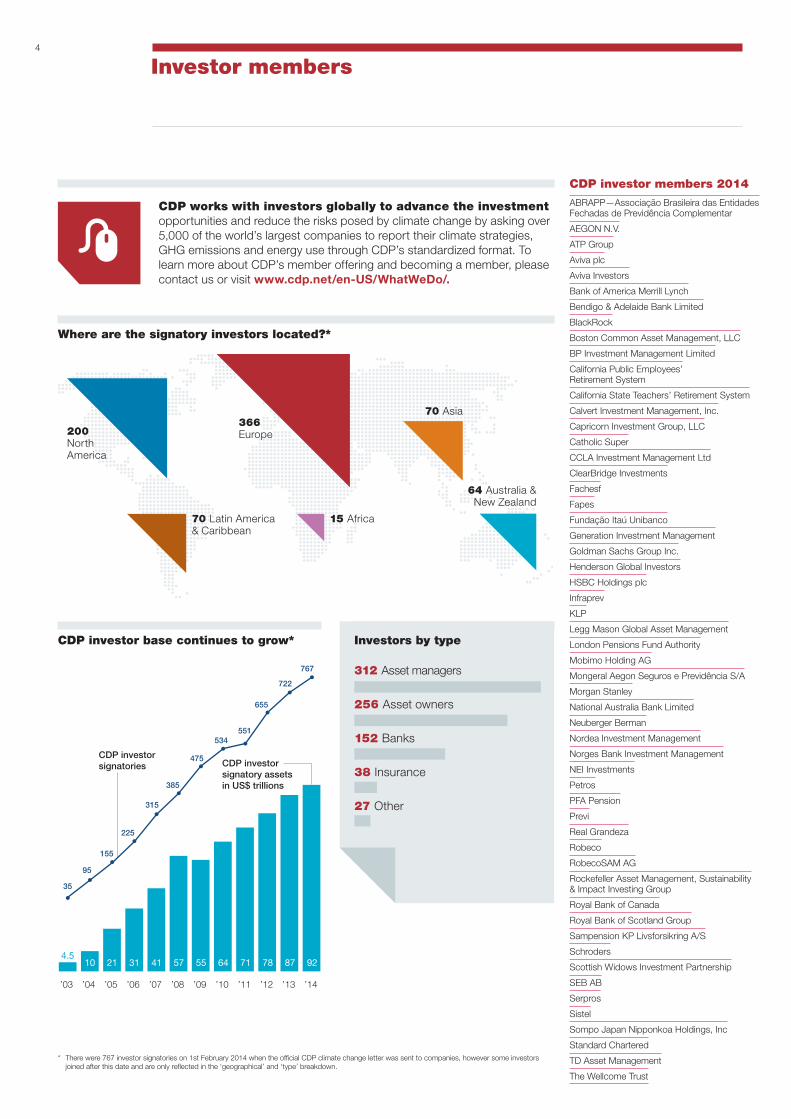
CDP works with investors globally to advance the investment opportunities and reduce the risks posed by climate change by asking over 5,000 of the world’s largest companies to report their climate strategies, GHG emissions and energy use through CDP’s standardized format. To learn more about CDP’s member offering and becoming a member, please contact us or visit www.cdp.net/en-US/WhatWeDo/.
Where are the signatory investors located?*
Investors by typeCDP investor base continues to grow*
CDP investor members 2014
ABRAPP—Associação Brasileira das Entidades Fechadas de Previdência Complementar
AEGON N.V.
ATP Group
Aviva plc
Aviva Investors
Bank of America Merrill Lynch
Bendigo & Adelaide Bank Limited
BlackRock
Boston Common Asset Management, LLC
BP Investment Management Limited
California Public Employees’ Retirement System
California State Teachers’ Retirement System
Calvert Investment Management, Inc.
Capricorn Investment Group, LLC
Catholic Super
CCLA Investment Management Ltd
ClearBridge Investments
Fachesf
Fapes
Fundação Itaú Unibanco
Generation Investment Management
Goldman Sachs Group Inc.
Henderson Global Investors
HSBC Holdings plc
Infraprev
KLP
Legg Mason Global Asset Management
London Pensions Fund Authority
Mobimo Holding AG
Mongeral Aegon Seguros e Previdência S/A
Morgan Stanley
National Australia Bank Limited
Neuberger Berman
Nordea Investment Management
Norges Bank Investment Management
NEI Investments
Petros
PFA Pension
Previ
Real Grandeza
Robeco
RobecoSAM AG
Rockefeller Asset Management, Sustainability & Impact Investing Group
Royal Bank of Canada
Royal Bank of Scotland Group
Sampension KP Livsforsikring A/S
Schroders
Scottish Widows Investment Partnership
SEB AB
Serpros
Sistel
Sompo Japan Nipponkoa Holdings, Inc
Standard Chartered
TD Asset Management
The Wellcome Trust
200North America
70 Latin America& Caribbean
366Europe
70 Asia
64 Australia &New Zealand
15 Africa
312 Asset managers
256 Asset owners
152 Banks
38 Insurance
27 Other
’13’12’11’10’09’08’07’06’05’04’03
8778
’14
9271645557413121104.5
CDP investorsignatory assetsin US$ trillions
722
767
655
551534
475
385
315
225
155
95
35
CDP investorsignatories
* There were 767 investor signatories on 1st February 2014 when the official CDP climate change letter was sent to companies, however some investors joined after this date and are only reflected in the ‘geographical’ and ‘type’ breakdown.

5
CDP CEO Foreword
The global economy has bounced back from crisis and a cautious optimism is beginning to pervade the markets. As we embrace recovery we must remember that greenhouse gas emissions continue to rise and we face steep financial risk if we do not mitigate them.
www.un.org/climatechange/towards-a-climate-agreement/
The unprecedented environmental challenges that we confront today—reducing greenhouse gas emissions, safeguarding water resources and preventing the destruction of forests—are also economic problems. One irrefutable fact is filtering through to companies and investors: the bottom line is at risk from environmental crisis.
The impact of climate events on economies around the world has increasingly been splashed across headlines in the last year, with the worst winter in 30 years suffered by the USA costing billions of dollars. Australia has experienced its hottest two years on record and the UK has had its wettest winter for hundreds of years costing the insurance industry over a billion pounds. Over three quarters of companies reporting to CDP this year have disclosed a physical risk from climate change. Investing in climate change–related resilience planning has become crucial for all corporations.
Investor engagement on these issues is increasing. In the US a record number of shareholder resolutions in the 2014 proxy season led 20 international corporations to commit to reduce greenhouse gas emissions or sustainably source palm oil.
As mainstream investors begin to recognize the real value at risk, we are seeing more action from some of the 767 investors who request disclosure through CDP. The Norwegian pension fund, Norges Bank, with assets worth $260 billion, expects companies to show strategies for climate change risk mitigation and water
management, and have divested from both timber and palm oil companies that did not meet their standards.
There is growing momentum on the policy front with President Obama’s announcement of new federal rules to limit greenhouse gases in the US. In the EU, some 6,000 companies will be required to disclose on specific environmental, social and governance criteria as part of their mainstream reporting to investors. In China over 20,000 companies will be required to report their greenhouse gas emissions to the government.
There is a palpable sea change in approach by companies driven by a growing recognition that there is a cost associated with the carbon they emit. Measurement, transparency and accountability drives positive change in the world of business and investment. Our experience working with over 4,500 companies shows the multitude of benefits for companies that report their environmental impacts, unveiling risks and previously unseen opportunities.
We are standing at a juncture in history. With the prospect of a global climate deal coming from the United Nations process, governments, cities, the private sector and civil society have a great opportunity to take bold actions and build momentum in the run up to the Paris 2015 meeting. The decisions we make today can lead us to a profitable and secure future. A future that we can all be proud of.
Paul Simpson Chief Executive Officer, CDP
One irrefutable fact is filtering through to companies and investors: the bottom line is at risk from environmental crisis.

6
Accenture Commentary
On behalf of Accenture, we would like to thank all the current Indian institutional investor signatories and the 59 responding companies for their ongoing commitment to address climate change. By increasing transparency and actively engaging in climate change management, Indian companies are paving the way for sustainable growth and high performance in the future.
The ambitious Make in India campaign launched by the Prime Minister Narendra Modi in September 2014 envisions an increase in manufacturing sector growth of 12-14 percent per annum over the medium term. The associated “zero defect, zero effect”1 policy entails that growth should not have an adverse effect on our environment. Our analysis of the CDP India 2014 responses shows that climate leaders have already embarked upon their journey on this path. Nearly a quarter of the companies have demonstrated that it is possible to decouple business growth from carbon emissions.
Avinash VashisthaChairman and Country Managing DirectorAccenture, India
Sanjay DawarManaging Director Accenture Strategy, India
However, market transformation is a huge task. We are keen to help our respective stakeholders – investors, respondents and the broader public –to identify opportunities and create sustainable value as the country makes a transition to a low-carbon and sustainable economy. We sincerely hope that this report serves this objective.
Accenture India is pleased to be the official author of the 2014 CDP India 200 Climate Change Report for the second year in a row. We are the global implementation partner for CDP’s reporting platform and database – the largest source of primary corporate climate change information in the world. Our enduring partnership with CDP stems from a common goal; namely, helping companies integrate climate change into business strategies and operations.
We hope you find the report useful for driving transformation in your climate change initiatives.
1 Zero defect zero effect policy is associated with Make in India campaign
7
Foreword
India has one of the lowest per capita consumption of energy and this has to change in order to attain economic growth and ensure development for all. The country needs to secure and provide adequate energy for all its citizens. Several studies such as those by the IPCC2 and ADB3 have warned of difficult times ahead if the world community does not get its act together to appropriately share the burden of addressing climate change. India too has faced several challenges with the Cyclone Phailin, Uttarakhand flash floods and more recently the devastation in Jammu & Kashmir coupled with a faltering monsoon.
In this scenario I am pleased to note CDP India’s 2014 report shows that corporates in India are becoming more responsive to addressing the energy and climate challenges they face. I understand that a large percentage of companies analyzed have integrated the emerging risks into a multi-disciplinary, companywide risk management process which can often also throw up new opportunities. This points to a level of maturity and foresight which bodes well for the future.
By incorporating energy efficient processes, these companies are showing a remarkable level of innovation that will ensure their competiveness in a globalized world.
Overall the report shows India Inc. is preparing well for the big challenges that lie ahead. I congratulate them on their foresight and commend CDP for showcasing these innovations.
Best wishes
Suresh Prabhu
Trustee, IFFCO Foundation Chairperson, Council on Energy, Environment and WaterFormer Minister in the Union Cabinet
2http://www.ipcc.ch/report/ar5/3http://www.adb.org/news/climate-change-may-slash-9-south-asia-s-economy-2100-report
By incorporating energy efficiency processes, these companies are showing a remarkable level of innovation that will ensure their competiveness in a globalized world.
8
Executive Summary
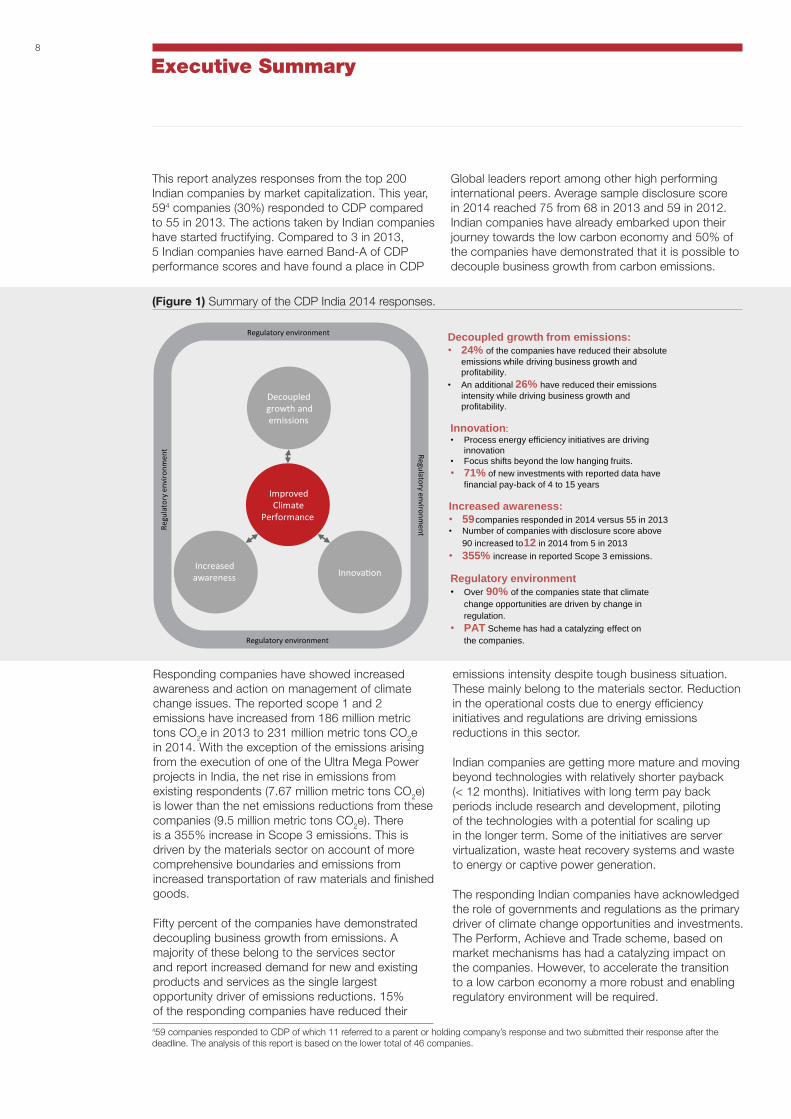
This report analyzes responses from the top 200 Indian companies by market capitalization. This year, 594 companies (30%) responded to CDP compared to 55 in 2013. The actions taken by Indian companies have started fructifying. Compared to 3 in 2013, 5 Indian companies have earned Band-A of CDP performance scores and have found a place in CDP
459 companies responded to CDP of which 11 referred to a parent or holding company’s response and two submitted their response after the deadline. The analysis of this report is based on the lower total of 46 companies.
Global leaders report among other high performing international peers. Average sample disclosure score in 2014 reached 75 from 68 in 2013 and 59 in 2012.Indian companies have already embarked upon their journey towards the low carbon economy and 50% of the companies have demonstrated that it is possible to decouple business growth from carbon emissions.
(Figure 1) Summary of the CDP India 2014 responses.
Innovation: • Process energy efficiency initiatives are driving
innovation • Focus shifts beyond the low hanging fruits.• 71% of new investments with reported data have
financial pay-back of 4 to 15 years
Decoupled growth from emissions: • 24% of the companies have reduced their absolute
emissions while driving business growth and profitability.
• An additional 26% have reduced their emissions intensity while driving business growth and profitability.
Increased awareness: • 59companies responded in 2014 versus 55 in 2013• Number of companies with disclosure score above
90 increased to 12 in 2014 from 5 in 2013• 355% increase in reported Scope 3 emissions.
Regulatory environment • Over 90% of the companies state that climate
change opportunities are driven by change in regulation.
• PAT Scheme has had a catalyzing effect on the companies.
Regu
lato
ry e
nviro
nmen
t Regulatory environment
Regulatory environment
Decoupled growth and emissions
Improved Climate
Performance
Increased awareness Innovation
Regulatory environment
Responding companies have showed increased awareness and action on management of climate change issues. The reported scope 1 and 2 emissions have increased from 186 million metric tons CO2e in 2013 to 231 million metric tons CO2e in 2014. With the exception of the emissions arising from the execution of one of the Ultra Mega Power projects in India, the net rise in emissions from existing respondents (7.67 million metric tons CO2e) is lower than the net emissions reductions from these companies (9.5 million metric tons CO2e). There is a 355% increase in Scope 3 emissions. This is driven by the materials sector on account of more comprehensive boundaries and emissions from increased transportation of raw materials and finished goods.
Fifty percent of the companies have demonstrated decoupling business growth from emissions. A majority of these belong to the services sector and report increased demand for new and existing products and services as the single largest opportunity driver of emissions reductions. 15% of the responding companies have reduced their
emissions intensity despite tough business situation. These mainly belong to the materials sector. Reduction in the operational costs due to energy efficiency initiatives and regulations are driving emissions reductions in this sector.
Indian companies are getting more mature and moving beyond technologies with relatively shorter payback (< 12 months). Initiatives with long term pay back periods include research and development, piloting of the technologies with a potential for scaling up in the longer term. Some of the initiatives are server virtualization, waste heat recovery systems and waste to energy or captive power generation.
The responding Indian companies have acknowledged the role of governments and regulations as the primary driver of climate change opportunities and investments. The Perform, Achieve and Trade scheme, based on market mechanisms has had a catalyzing impact on the companies. However, to accelerate the transition to a low carbon economy a more robust and enabling regulatory environment will be required.
9
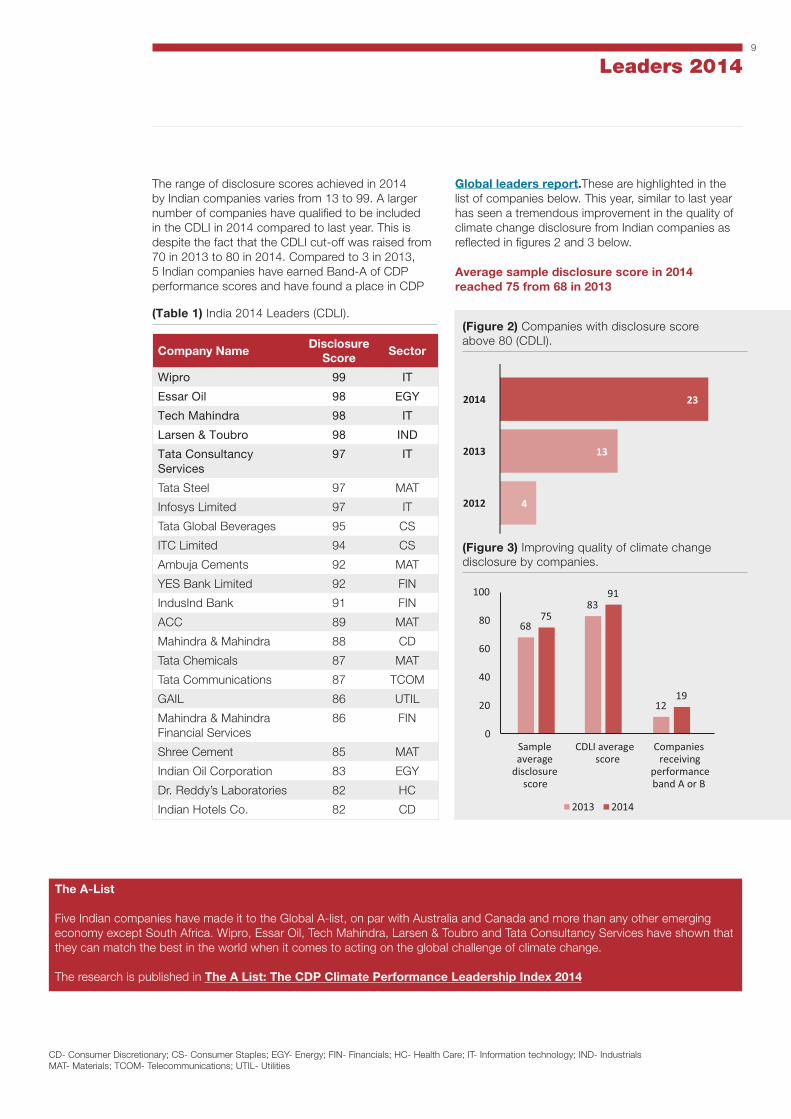
Leaders 2014
The range of disclosure scores achieved in 2014 by Indian companies varies from 13 to 99. A larger number of companies have qualified to be included in the CDLI in 2014 compared to last year. This is despite the fact that the CDLI cut-off was raised from 70 in 2013 to 80 in 2014. Compared to 3 in 2013, 5 Indian companies have earned Band-A of CDP performance scores and have found a place in CDP
Global leaders report.These are highlighted in the list of companies below. This year, similar to last year has seen a tremendous improvement in the quality of climate change disclosure from Indian companies as reflected in figures 2 and 3 below.
Average sample disclosure score in 2014 reached 75 from 68 in 2013
(Table 1) India 2014 Leaders (CDLI). (Figure 2) Companies with disclosure score above 80 (CDLI).
(Figure 3) Improving quality of climate change disclosure by companies.
Company NameDisclosure
ScoreSector
Wipro 99 IT
Essar Oil 98 EGY
Tech Mahindra 98 IT
Larsen & Toubro 98 IND
Tata Consultancy Services
97 IT
Tata Steel 97 MAT
Infosys Limited 97 IT
Tata Global Beverages 95 CS
ITC Limited 94 CS
Ambuja Cements 92 MAT
YES Bank Limited 92 FIN
IndusInd Bank 91 FIN
ACC 89 MAT
Mahindra & Mahindra 88 CD
Tata Chemicals 87 MAT
Tata Communications 87 TCOM
GAIL 86 UTIL
Mahindra & Mahindra Financial Services
86 FIN
Shree Cement 85 MAT
Indian Oil Corporation 83 EGY
Dr. Reddy’s Laboratories 82 HC
Indian Hotels Co. 82 CD
4
13
23
2012
2013
2014
68
83
12
75
91
19
0
20
40
60
80
100
Sampleaverage
disclosurescore
CDLI averagescore
Companiesreceiving
performanceband A or B
2013 2014
CD- Consumer Discretionary; CS- Consumer Staples; EGY- Energy; FIN- Financials; HC- Health Care; IT- Information technology; IND- IndustrialsMAT- Materials; TCOM- Telecommunications; UTIL- Utilities
The A-List
Five Indian companies have made it to the Global A-list, on par with Australia and Canada and more than any other emerging economy except South Africa. Wipro, Essar Oil, Tech Mahindra, Larsen & Toubro and Tata Consultancy Services have shown that they can match the best in the world when it comes to acting on the global challenge of climate change.
The research is published in The A List: The CDP Climate Performance Leadership Index 2014

10
2014 leadership criteria
Each year, company responses are analyzed and scored against two parallel scoring schemes: performance and disclosure.
The performance score assesses the level of action, as reported by the company, on climate change mitigation, adaptation and transparency. Its intent is to highlight positive climate action as demonstrated by a company’s CDP response. A high performance score signals that a company is measuring, verifying and managing its carbon footprint, for example by setting and meeting carbon reduction targets and implementing programs to reduce emissions in both its direct operations and supply chain.
The disclosure score assesses the completeness and quality of a company’s response. Its purpose is to provide a summary of the extent to which companies
have answered CDP’s questions in a structured format. A high disclosure score signals that a company provided comprehensive information about the measurement and management of its carbon footprint, its climate change strategy and risk management processes and outcomes.
The highest scoring companies for performance and/or disclosure enter the Climate Performance Leadership Index (CPLI) and/or the Climate Disclosure Leadership Index (CDLI). Public scores are available on the CDP website and in CDP reports, through Bloomberg terminals, Google Finance and Deutsche Boerse’s website.
What are the CPLI and CDLI criteria?
To enter the CPLI (Performance Band A), a company must:
• Make its response public and submit via CDP’s Online Response System
• Attain a performance score greater than 85
• Score maximum performance points on question 12.1a (absolute emissions performance) for GHG reductions due to emission reduction actions over the past year (4% or above in 2014)
• Disclose gross global Scope 1 and Scope 2 figures
• Score maximum performance points for verification of Scope 1 and Scope 2 emissions
• Furthermore, CDP reserves the right to exclude any company from the CPLI if there is anything in its response or other publicly available information that calls into question its suitability for inclusion.
Note: Companies that achieve a performance score high enough to warrant inclusion in the CPLI, but do not meet all of the other CPLI requirements are classed as Performance Band A– but are not included in the CPLI.
To enter the CDLI, a company must:
• Make its response public and submit via CDP’s Online Response System
• Achieve a score within the top 10% of the total regional sample population*
* Note: while it is usually 10%, in some regions the CDLI cut-off may be based on another criteria, please see local reports for confirmation.
How are the CPLI and CDLI used by investors?
Good performance and disclosure scores are used by investors as a proxy of good climate change management or climate change performance of companies.
Investors identify and then engage with companies to encourage them to improve their score. The ‘Aiming for A’ initiative which was initiated by CCLA Investment Management is driven by a coalition of UK asset owners and mutual fund managers. They are asking major UK-listed utilities and extractives companies to aim for inclusion in the CPLI. This may involve filing supportive shareholder resolutions for Annual General Meetings occurring after September 2014.
Investors are also using CDP scores for creation of financial products. For example, Nedbank in South Africa developed the Nedbank Green Index. Disclosure scores are used for selecting stocks and performance scores for assigning weight.
For further information on the CDLI and the CPLI and how scores are determined, please visit www.cdp.net/guidance.

11
Key Themes and Highlights of 2014 Responses
5 http://articles.economictimes.indiatimes.com/2014-06-17/news/50651386_1_carbon-emissions-climate-changepoverty The BASIC countries (also Basic countries or BASIC) are a bloc of four large newly industrialized countries – Brazil, South Africa, India and China – formed by an agreement on 28 November 2009. The four committed to act jointly at the Copenhagen climate summit, including a possible united walk-out if their common minimum position was not met by the developed nations. Source: Dasgupta, Saibal (28 November 2009). “Copenhagen conference: India, China plan joint exit”. The Times of India (New Delhi) retrieved 25 Jan 2010.Referred to as responding companies or companies hereafter
Innovation in energy efficiency helps Indian companies decouple business growth from carbon emissions
(Figure 4) Sector breakdown of responding companies.
TOTA
L
11
46
224
367
8
11
2 1
Mat
eria
ls
Fina
ncia
ls
Info
rma�
on T
echn
olog
y
Cons
umer
Dis
cre�
onar
y
Cons
umer
Sta
ples
Ener
gy
Indu
stri
als
U�l
i�es
Hea
lthc
are
Tele
com
Ser
vice
s
24%
17%
15%13%
7%9%
4%4% 4% 2%
Perc
enta
ge o
f res
pond
ing
com
pani
es
The next few sections highlight each trend in brief.
We see four clear trends based on our analysis:
• Indian companies continue to show higher levels of awareness and commitment to reporting
• India Inc demonstrates it is possible to decouple business growth from carbon emissions
• Indian companies are adopting innovative ways to reduce emissions
• Enabling regulatory environment can accelerate climate action in the long term
Introduction: At the United Nations’ general assembly in New York in September this year, Prime Minister Narendra Modi articulated India’s stand on climate change on the principle of “Common But Differentiated Responsibilities” (CBDR) and insisted that this should form the basis for continued action in the future. India strongly advocates the developing countries’ right to grow and acknowledges that in this process the net carbon emissions from these nations may increase. In alignment with the principles of equity and CBDR the four BASIC5 nations have jointly asked the developed countries to take lead in dealing with pollution induced global warming in accordance with their “historical responsibilities”.
Interestingly, developing economies also hold the promise of innovation as they are advantageously positioned to start adopting smarter technologies directly without having to follow the up-gradation path. The Indian industry has taken a lead with such innovations and is producing impressive results. In 2014, the responding companies are expected to nearly double the annual carbon savings to a total of about 4.8 million metric tons CO2e from 2.5 million metric tons CO2e in 2013. This should result in expected savings of INR 13.2 Billion (US$ 220 million) compared to INR 8 Billion (US$ 133 million) in 2013.
This report analyzes the responses from the top 200 Indian companies by market capitalization. This year, 59 companies (30%) responded to CDP compared to 55 in 2013. Unique responses were submitted by 48 companies, while 11 companies were referred to as a parent holding company. Of the companies responding in 2014, 89% had also responded in 2013. Respondents from the materials, information technology, financials and consumer discretionary form the dominant sectors (Figure 4). This report analyzes the awareness and maturity levels of the Indian companies with regards to the management of climate change issues and carbon emissions.

12
Trend 1) Indian companies continue to show higher levels of awareness and commitment to reporting
Increased awareness and continued commitment to reportingCompanies6 are showing increased awareness on carbon reporting. Total number of companies participating this year rose from 42 to 48. The total Scope 1 and 2 emissions reported have increased by 25%, from 186 million metric tons CO2e in 2013 to 231 million metric tons CO2e in 2014 (Figure 5).
As seen from Figure 5, this increase is primarily attributed to the addition of one of the world’s largest mining companies. With regards to the increase in emissions from the existing respondents 54% are on account of the execution of one of the Ultra Mega Power projects in India. With this exception, the net rise in emissions from existing respondents (7.67 million metric tons CO2e) is lower that the net emissions reductions from the existing respondents (9.5 million metric tons CO2e). 66% of the companies have completed or have undertaken third party verification and assurance (V&A) for their Scope 1 emissions data, compared to 60% in 2013, and 16% in 2012.
Companies show increased awareness of their value chains There is a 355% increase in the Scope 3 emissions reported, increasing from 1.99 million tons CO2e in 2012 to 7.7 million metric tons CO2e in 2013 to 27.4 million metric tons CO2e in 2014. 76% companies have reported Scope 3 emissions in 2014 as against 69% in 2013. The increase represents not only an increase in actual emissions but deployment of better emissions assessment systems and inclusion of comprehensive boundaries for Scope 3 emissions (Figure 6). The increase in reported emissions are driven by the materials industry on account of:
• More comprehensive boundaries and inclusion of additional plants across various regions
• Increase in output and productivity leading to increased transportation of raw materials and finished goods
355%Increase in reported Scope 3 emissions compared to 2013
6 Companies refers to responding companies for the purpose of this report.
While in 2013, use of sold products held the maximum percentage of Scope 3 emissions, upstream and downstream transportation and distribution inventories contribute to nearly 45% of the total Scope 3 emissions in 2014.
Companies are working with their supply chains on logistics optimization. Strategies to reduce emissions include emphasis on bulker movement, full load basis transport and priority to rail transport. 45% of the companies have a third party verification and assurance either complete or underway for Scope 3 emissions.
Key Themes and Highlights of 2014 Responses continued
(Figure 5) Breakdown of Scope 1+ 2 emissions in 2014 (million metric tons CO2e).
186
230
-1.4-9.5
37
3.89.2
7.67
Scope 1 + 2emissions 2013
Respondents notpar�cipa�ng in
2014
Emissionreduc�ons from
exis�ngrespondents due to
climate ac�on
Addi�onalemissions reported
in 2014
Rise in emissionsfrom exis�ngrespondents
Scope 1+ 2emissions 2014
16.87
40.8
Addi�on of one of the world’s largest mining companies
Ultra Mega Power project ini�a�ve by Government of India
Breakdown of Scope 1 + Scope 2 emissions reported in 2013 with respect to emissions reported in 2013
24% companies successfully demonstrate lowering absolute global emissions
13
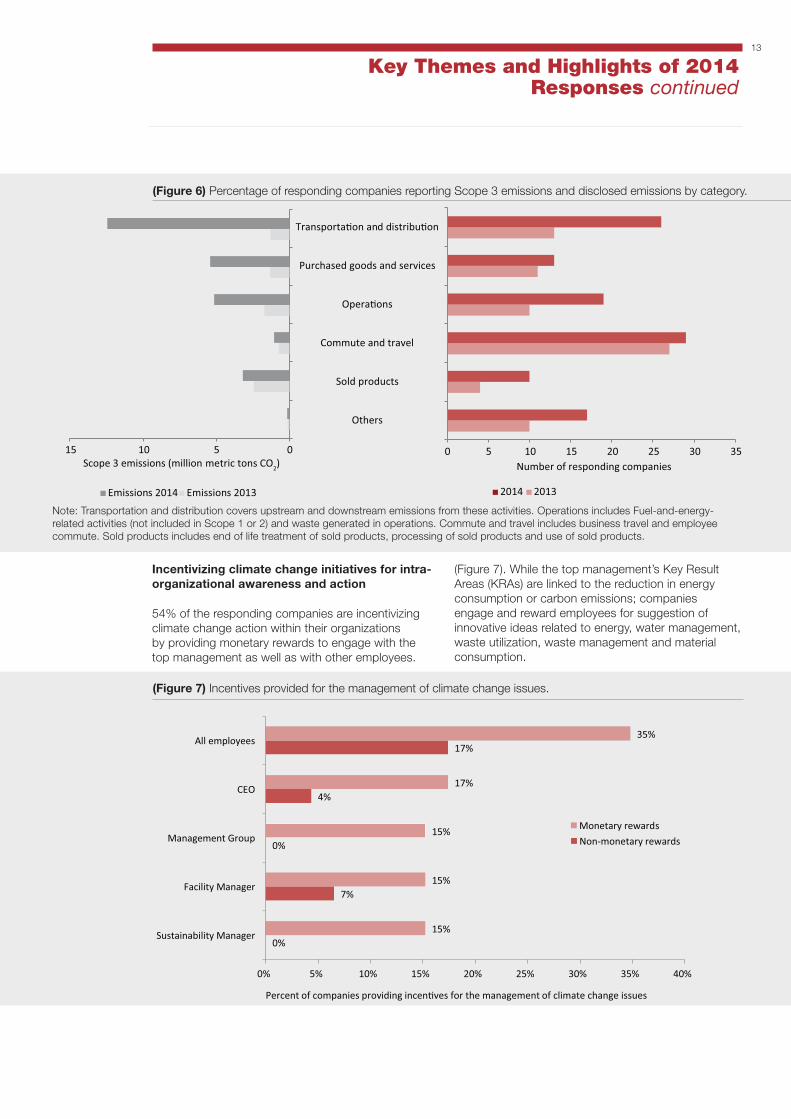
(Figure 6) Percentage of responding companies reporting Scope 3 emissions and disclosed emissions by category.
(Figure 7) Incentives provided for the management of climate change issues.
0%
7%
0%
4%
17%
15%
15%
15%
17%
35%
0% 5% 10% 15% 20% 25% 30% 35% 40%
Sustainability Manager
Facility Manager
Management Group
CEO
All employees
Percent of companies providing incen�ves for the management of climate change issues
Monetary rewards
Non-monetary rewards
Incentivizing climate change initiatives for intra-organizational awareness and action
54% of the responding companies are incentivizing climate change action within their organizations by providing monetary rewards to engage with the top management as well as with other employees.
(Figure 7). While the top management’s Key Result Areas (KRAs) are linked to the reduction in energy consumption or carbon emissions; companies engage and reward employees for suggestion of innovative ideas related to energy, water management, waste utilization, waste management and material consumption.
0 5 10 15 20 25 30 35
Others
Sold products
Commute and travel
Opera�ons
Purchased goods and services
Transporta�on and distribu�on
Number of responding companies
2014 2013
Scope 3 emissions (million metric tons CO2)
Emissions 2014 Emissions 2013
051015
Note: Transportation and distribution covers upstream and downstream emissions from these activities. Operations includes Fuel-and-energy-related activities (not included in Scope 1 or 2) and waste generated in operations. Commute and travel includes business travel and employee commute. Sold products includes end of life treatment of sold products, processing of sold products and use of sold products.
Key Themes and Highlights of 2014 Responses continued
14
Key Themes and Highlights of 2014 Responses continued
Trend 2) India Inc demonstrates that it is possible to decouple business growth from carbon emissions
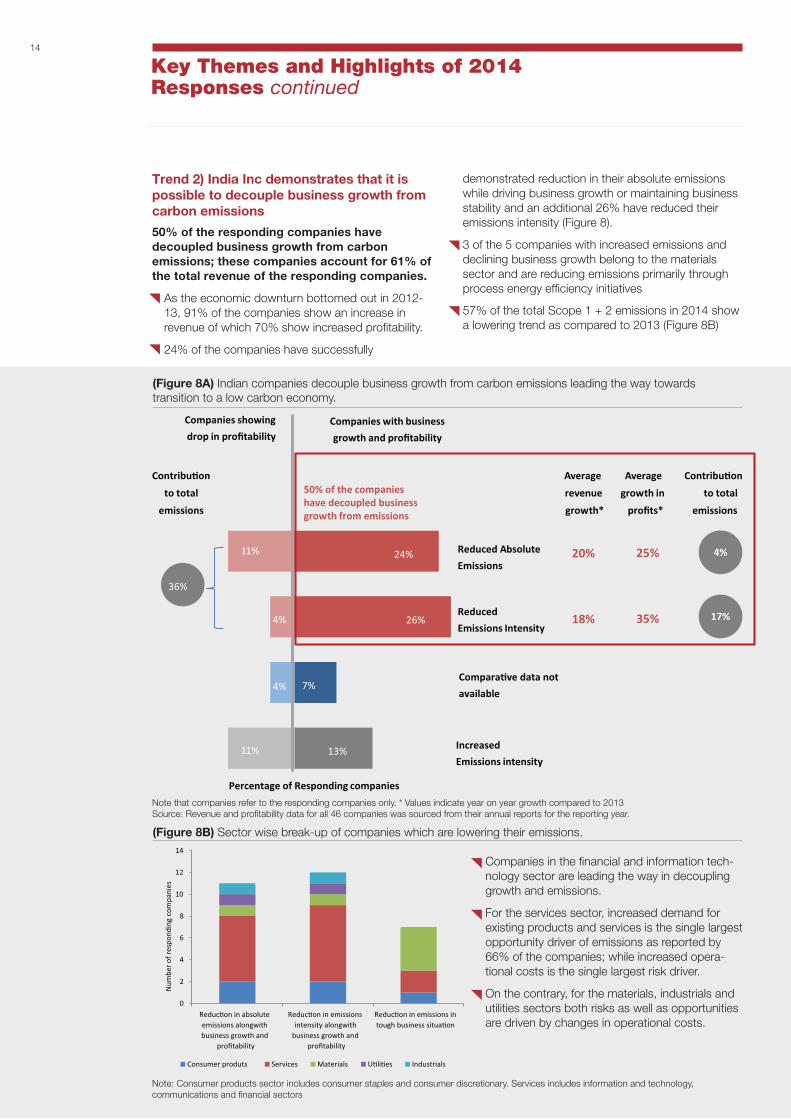
50% of the responding companies have decoupled business growth from carbon emissions; these companies account for 61% of the total revenue of the responding companies.
• As the economic downturn bottomed out in 2012-13, 91% of the companies show an increase in revenue of which 70% show increased profitability.
• 24% of the companies have successfully
(Figure 8A) Indian companies decouple business growth from carbon emissions leading the way towards transition to a low carbon economy.
(Figure 8B) Sector wise break-up of companies which are lowering their emissions.
0
2
4
6
8
10
12
14
Reduc�on in absoluteemissions alongwithbusiness growth and
profitability
Reduc�on in emissionsintensity alongwith
business growth andprofitability
Reduc�on in emissions intough business situa�on
Num
ber o
f res
pond
ing
com
pani
es
Consumer produts Services Materials U�li�es Industrials
• Companies in the financial and information tech-nology sector are leading the way in decoupling growth and emissions.
• For the services sector, increased demand for existing products and services is the single largest opportunity driver of emissions as reported by 66% of the companies; while increased opera-tional costs is the single largest risk driver.
• On the contrary, for the materials, industrials and utilities sectors both risks as well as opportunities are driven by changes in operational costs.
Note: Consumer products sector includes consumer staples and consumer discretionary. Services includes information and technology, communications and financial sectors
Percentage of Responding companies
13%
7%
26%
24%
Increased
Emissions intensity
Compara�ve data not
available
Reduced
Emissions Intensity
Reduced Absolute
Emissions 11%
11%
4%
Companies with business
growth and profitability
Companies showing
drop in profitability
50% of the companieshave decoupled businessgrowth from emissions
4%
Average
revenue
growth*
25%
Average
growth in
profits*
20%
35%18%
4%
17%
36%
Contribu�on
to total
emissions
Contribu�on
to total
emissions
demonstrated reduction in their absolute emissions while driving business growth or maintaining business stability and an additional 26% have reduced their emissions intensity (Figure 8).
• 3 of the 5 companies with increased emissions and declining business growth belong to the materials sector and are reducing emissions primarily through process energy efficiency initiatives
• 57% of the total Scope 1 + 2 emissions in 2014 show a lowering trend as compared to 2013 (Figure 8B)
Note that companies refer to the responding companies only. * Values indicate year on year growth compared to 2013 Source: Revenue and profitability data for all 46 companies was sourced from their annual reports for the reporting year.
15
7LEED stands for Leadership in Energy and Environmental Design. LEED is a green building certification program developed by United States Green Building Council. 8Based on data from United States Green Building Council. (www.usgbc.org)
Companies are driving carbon emissions reduction primarily through process energy efficiency initiatives
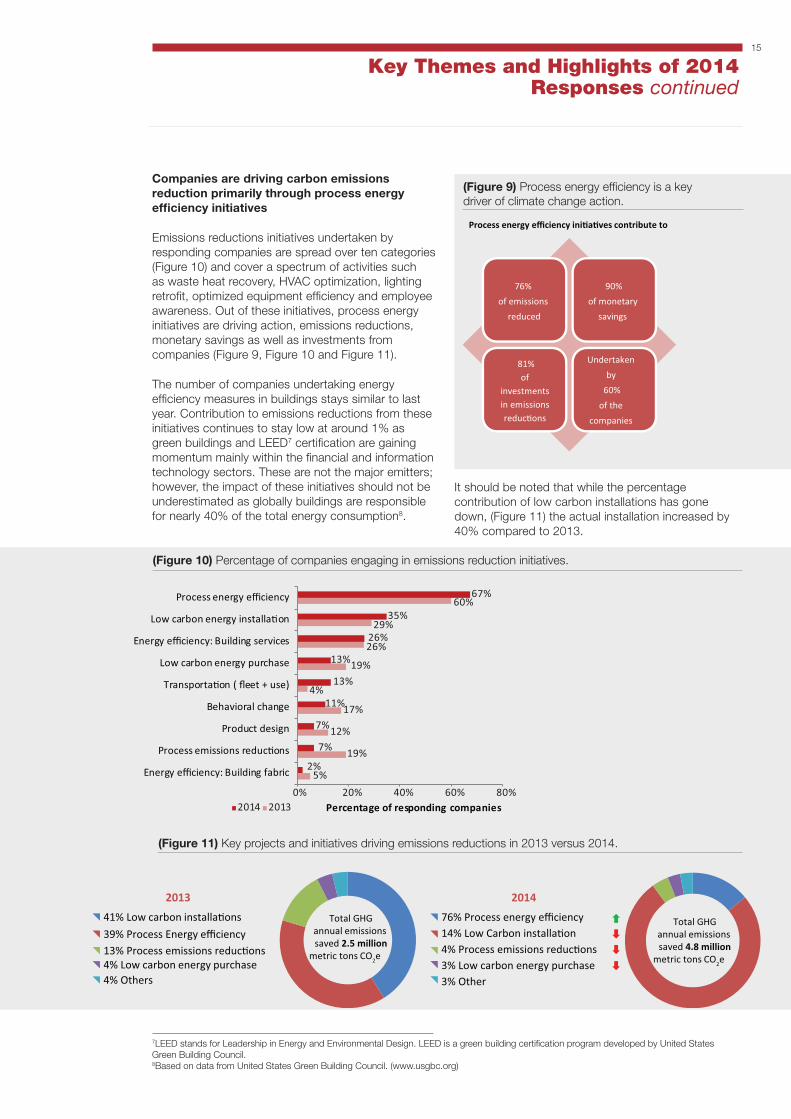
Emissions reductions initiatives undertaken by responding companies are spread over ten categories (Figure 10) and cover a spectrum of activities such as waste heat recovery, HVAC optimization, lighting retrofit, optimized equipment efficiency and employee awareness. Out of these initiatives, process energy initiatives are driving action, emissions reductions, monetary savings as well as investments from companies (Figure 9, Figure 10 and Figure 11).
The number of companies undertaking energy efficiency measures in buildings stays similar to last year. Contribution to emissions reductions from these initiatives continues to stay low at around 1% as green buildings and LEED7 certification are gaining momentum mainly within the financial and information technology sectors. These are not the major emitters; however, the impact of these initiatives should not be underestimated as globally buildings are responsible for nearly 40% of the total energy consumption8.
(Figure 9) Process energy efficiency is a key driver of climate change action.
76%
of emissions
reduced
90%
of monetary
savings
81%of
investments in emissions reduc�ons
Undertaken
by
60%
of the
companies
Process energy efficiency ini�a�ves contribute to
(Figure 10) Percentage of companies engaging in emissions reduction initiatives.
(Figure 11) Key projects and initiatives driving emissions reductions in 2013 versus 2014.
� 41% Low carbon installa�ons� 39% Process Energy efficiency� 13% Process emissions reduc�ons� 4% Low carbon energy purchase� 4% Others
Total GHGannual emissions saved 2.5 million
metric tons CO2e
Total GHGannual emissions saved 4.8 million
metric tons CO2e
2013 2014
� 76% Process energy efficiency 14% Low Carbon installa�on4% Process emissions reduc�ons 3% Low carbon energy purchase3% Other
�
��
�
5%
19%
12%
17%
4%
19%
26%
29%
60%
2%
7%
7%
11%
13%
13%
26%
35%
67%
0% 20% 40% 60% 80%
Energy efficiency: Building fabric
Process emissions reduc�ons
Product design
Behavioral change
Transporta�on ( fleet + use)
Low carbon energy purchase
Energy efficiency: Building services
Low carbon energy installa�on
Process energy efficiency
Percentage of responding companies2014 2013
It should be noted that while the percentage contribution of low carbon installations has gone down, (Figure 11) the actual installation increased by 40% compared to 2013.
Key Themes and Highlights of 2014 Responses continued

16
The capital cost of emissions reductions has reduced significantly
Indian companies are expecting to nearly double their annual carbon savings from 2.5 million metric tons CO2e in 2013 to 4.8 million metric tons CO2e in 2014; while the total one time investment is expected to drop from INR 40 Billion (USD 667 Million) to INR 16.2 Billion (USD 270 Million) in 2014. Indian companies are deploying innovative methods (covered in Trend #3) to tackle the risks from depleting natural resources, physical climate change, increasing fuel costs and energy threats (Box 1). As per reported data, the average capital cost for process energy efficiency has reduced from INR 18000 per metric tons CO2e in 2013 to around INR 5000 per metric tons CO2e in 2014. Note that further validation and research is required to identify the underlying reasons for improvement in average capital costs for process energy efficiency.
Key Themes and Highlights of 2014 Responses continued
Limited resources enable companies to use innovation to develop alternative solutions such as solar power as well as substitution of product
Indian Hotels Co.
Box 1: Tata Global Beverages
The Eaglescliffe factory is Tata Global Beverages’ (TGB) biggest factory. All Tetley products for the UK and the Canadian markets are produced here. 280 million teabags roll off the line every week – almost 30% of the UK tea market. The factory’s efforts to drive efficiency and safety are guided by its foremost goal of being an ethically, socially and environmentally driven facility.
As a part of the integrated strategy, the waste management efforts led to a remarkable milestone – a reduction in energy consumption from 260 kwh/tonne to 240 kwh/tonne. One of the functions that made this possible was the ‘pelletiser’. This is a plant-within-the plant that recovers and compresses large amount of waste tissue generated on the teabag production line, into pellets which are then fed into the boiler to replace coal. The energy produced is used for heating air and water in the factory.
17
Depleting natural resources and the inability to replenish it pose a major threat. This is forcing consumers to prefer energy efficient products. We understand that in today’s competitive market, innovation is usually the only differentiating factor between a leader and a follower
Larsen and Toubro
Trend 3) Indian companies are adopting innovative ways to reduce emissions
Climate risk mitigation is driving process innovation while new market opportunities are driving product and services’ innovation
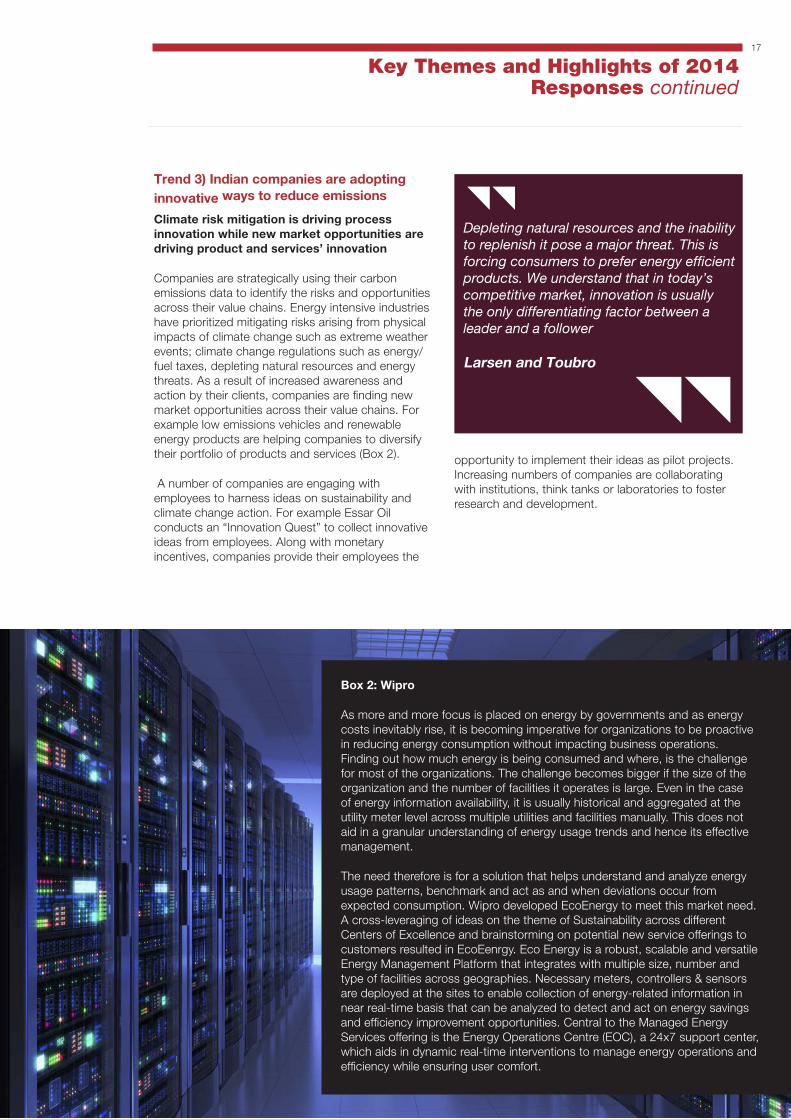
Companies are strategically using their carbon emissions data to identify the risks and opportunities across their value chains. Energy intensive industries have prioritized mitigating risks arising from physical impacts of climate change such as extreme weather events; climate change regulations such as energy/fuel taxes, depleting natural resources and energy threats. As a result of increased awareness and action by their clients, companies are finding new market opportunities across their value chains. For example low emissions vehicles and renewable energy products are helping companies to diversify their portfolio of products and services (Box 2).
A number of companies are engaging with employees to harness ideas on sustainability and climate change action. For example Essar Oil conducts an “Innovation Quest” to collect innovative ideas from employees. Along with monetary incentives, companies provide their employees the
Box 2: Wipro
As more and more focus is placed on energy by governments and as energy costs inevitably rise, it is becoming imperative for organizations to be proactive in reducing energy consumption without impacting business operations. Finding out how much energy is being consumed and where, is the challenge for most of the organizations. The challenge becomes bigger if the size of the organization and the number of facilities it operates is large. Even in the case of energy information availability, it is usually historical and aggregated at the utility meter level across multiple utilities and facilities manually. This does not aid in a granular understanding of energy usage trends and hence its effective management.
The need therefore is for a solution that helps understand and analyze energy usage patterns, benchmark and act as and when deviations occur from expected consumption. Wipro developed EcoEnergy to meet this market need. A cross-leveraging of ideas on the theme of Sustainability across different Centers of Excellence and brainstorming on potential new service offerings to customers resulted in EcoEenrgy. Eco Energy is a robust, scalable and versatile Energy Management Platform that integrates with multiple size, number and type of facilities across geographies. Necessary meters, controllers & sensors are deployed at the sites to enable collection of energy-related information in near real-time basis that can be analyzed to detect and act on energy savings and efficiency improvement opportunities. Central to the Managed Energy Services offering is the Energy Operations Centre (EOC), a 24x7 support center, which aids in dynamic real-time interventions to manage energy operations and efficiency while ensuring user comfort.
opportunity to implement their ideas as pilot projects. Increasing numbers of companies are collaborating with institutions, think tanks or laboratories to foster research and development.
Key Themes and Highlights of 2014 Responses continued

18
Box 1: Lowering the cost of low carbon innovation
Tata Swach-
Box 4: Tata Chemicals
Tata Swach, a brand of household water purification systems, has storage water purifiers which use natural materials and cutting-edge Silver nanotechnology. It uses naturally available paddy husk ash as its water purification medium. It does not use electricity or running water for water purification and also displaces the need for boiling. Tata Swach set-up its factory inside an existing shed at the Tata Chemicals’ plant at Haldia. This not only saved significant capital investments for the project, but also its co-existence inside Haldia ensured ready access of know-how and support from the existing team. Financial requests from the team were always closely perused.While market planning, ambition setting and capacity commitments were made on an aggressive “Think big-Act flexi” cycle, the capex, manpower and other such longer term financial commitments were made on a prudent “Spend-Validate-Spend” cycle. Also, the simple self-assembly design of Tata Swach eliminates the need to have expensive field force or service staff dedicated only for product assembly, further reducing the need for investments.
Box 3: Tata Consultancy Services
Asset & Energy efficiency optimization considering the Life cycle cost of maintaining a Facility or Building has always been the focus for TCS. Demand side optimization of Energy consumption, through digitization, for operational excellence to achieve corporate mandate on carbon foot print reduction was the objective. This is being realized by the real time Remote Energy Management Center (REMC). The Real time Remote Energy Management Center (REMC) provides required insights to drive a concept of J I T (Just in time) for Energy. Efforts are on to drive adoption of best process technology and best available technology to improve Energy performance.

19
Indian companies are getting more mature and moving beyond technologies with relatively shorter payback (< 12 months).
• Based on the data shared by companies in 2014, 45% of the total initiatives have mid-term to long-term paybacks (> 1 year and up to 10 years) (Figure 12)9; in contrast, in 2013, the majority of the energy efficiency initiatives had a short term pay back.
• Companies look into a 3 to 5 year window term for carbon investments.
Low
Hig
h
Payback years
Es�
mat
ed A
nnua
l CO
2 sa
ving
s (m
etri
c to
nnes
CO
2e)
Short term ( < 12 months)
1-3 years 4 - 10 years 11 - 15 years
Process energy efficiency(4-10 years payback):• Biomass gasifier
• Server virtualization
• Vapor absorption machine
• Solar and biomass plants
• Waste heat recovery
Process energy efficiency(1-3 years payback): • Blast furnace gas to captive
power
• Soda Ash recovery
• Waste materials as kiln fuel
• Compressed air
management system
Energy efficiency: Building Services• Efficient HVAC
• Efficient lighting
• Green buildings
Process energy efficiency(Short term): • Variable Frequency drives
• Efficient pumps
• LED process lights
• Auto on/off
Bubble Size denotes the total investment in the category = INR 500 Million
• Solar thermal; Solar
PV
• Wind Turbine
• Biomass
Low carbon energy purchase(Short term): • Green power purchase –
wind energy
Process energy efficiency(11-15 years payback): • Change in smelter
technology from VSS to
PFPB
• On-site wind power
generation
Low carbon energy installation:
(Figure 12) Carbon benefits from initiatives and technologies compared to their payback periods and total investments.
Key Themes and Highlights of 2014 Responses continued
9The analysis includes the data only where all three parameters i.e. carbon emissions savings, financial investment and monetary savings were reported. Initiatives which did not have information on all three data points have not been considered for this analysis. The analysis pertains to a total of 4 million metric tons of carbon savings (84% of total reported savings) corresponding to INR 8.3 Bn (USD 138 Mn) monetary savings and an investment of INR 14.2 Bn (USD 236 Mn).
• The higher investment in longer term initiatives indicates investments in research and development. As technologies are piloted, improvised and scaled up the costs are expected to come down helping the market transition towards low carbon technologies.
• The companies in Information Technology show preference for 1 to 3 year payback periods. However, over 80% of the companies in the materials sector have reported one or more initiatives with a 4 to 10 year payback.

20
Box 5: Tata Chemicals
This innovation demonstrates emissions reductions initiatives can bring about a profitable waste recovery and reduced future reclamation liabilities. Conventional soda ash production using the monohydrate process results in some amount of soda ash in the waste purge streams. These waste streams were historically pumped to surface evaporation ponds where tailings were deposited. The waste stream used to transport the tailings containing soda ash are deposited as sodium carbonate decahydrate. This innovation captures and recycles about 85% of the water and soda ash that would have otherwise been reported to these evaporation ponds.
Carbon dioxide is both a product of combustion of natural gas, and a product of decomposition of the trona. Both sources are eliminated in this innovation as the calcining step (natural gas fired thermal decomposition) is eliminated. Recovery of 40+ years of decahydrate deposition during normal operation significantly reduces final plant reclamation costs as the soda ash would already be recovered from the evaporation ponds. Evaluation of potential process steps that generate wastes, expanding thinking around the opportunity to gain further value out of wastes that historically have been discarded as valueless, and developing an innovative process that employs or eliminates those wastes played a key role in the carbon reduction initiative.
Process Energy efficiency is driving innovations
Monetary savings from process energy efficiency initiatives are easy to quantify as they directly impact the bottom line. Process energy efficiency initiatives contribute to 90% of the monetary savings reported in 2014. The tangible impact of process energy efficiency and alternate fuels is encouraging companies to undertake research and development along with concrete action in these areas. For example Tata Chemicals’ waste recovery initiative resulted in a 1.3% reduction in carbon intensity
and a net savings of INR 160 Millions while Essar Oil undertook fuel mix changes to combat the higher natural gas prices (Box 3). Scalable energy efficiency measure provide a significant opportunity for emission reduction in energy intensive companies. Over 80% of the emissions savings in the reporting year are contributed by process energy efficiency initiatives which require medium term investment, and have a high carbon benefit compared to the rest in terms of magnitude of the absolute emissions and monetary savings.
Box 6: Essar Oil
Essar Oil faced a huge business challenge to buy natural gas at significantly higher prevailing spot prices of USD 16-18 per Million British Thermal Unit (MMBTU) in the absence of long term contracts ensuring a lower price. Addressing this challenge on energy would have resulted in 89% increased dependence on coal. However, Essar Oil had a target in 2014 to maintain their emissions intensity to that of the previous year, 2013. Since this had a major impact on emissions; on account of various optimizations and schemes in the plant, the remaining fuel mix was revised such as consumption of high emitting fuels was reduced i.e., fuel oil by 45%, high speed diesel by 78%, naphtha by 92% and consumption of low emission refinery fuel gas enhanced by 31%. As a cumulative impact of these fuel mix changes the increase in absolute emissions were contained by 17.93% resulting in 100% achievement of intensity targets.
The specific driver was primarily the business challenge to address energy requirements in a viable manner. A clear business opportunity was seen in switching to higher carbon intensive fuel – Coal. However, the associated challenge/driver was to tackle the additional liability on emissions in a practical and meaningful manner.
Key Themes and Highlights of 2014 Responses continued
21
Trend 4) Enabling regulatory environment can accelerate climate action in the long termRegulations are a key driver of climate change actions and investments Regulations are playing a key role in India with regards to climate change action. 50% of the companies state that compliance with regulatory requirements and standards are a key driver for climate change investments. Over 90% of the companies state that climate change opportunities are driven by change in regulation. For example SEBI’s mandate for India’s top 100 companies with regards to the disclosure of environmental and social data from 2012-13 has encouraged companies to channelize investments in environmental and social initiatives.
Risks from fuel/energy taxes and renewable energy regulations have been identified as the top risks by 47% and 32% of the companies respectively. Many companies with multinational customers headquartered at various Annex 110 countries are also facing increased supply chain costs due to regulations in the form of carbon tax. Companies are eager to engage on policies and regulatory matters in order to understand and manage these risks.
• 63% of the responding companies engage with trade associations while 41% engage directly with policy makers on issues related to climate change.
• Energy related matters are driving the maximum attention from the companies as 30% of the companies are engaging directly with policy makers on these issues
• Companies engage in order to keep abreast with the regulatory changes and maintain a competitive edge.
10Refers to the Annex 1 countries per the UNFCCC Kyoto Protocol
Sector Specific regulations are more effective Fuel/Energy taxes and regulations and renewable energy regulation are reported as the top regulatory forces behind climate action undertaken by companies. However, other regulatory initiatives such as product efficiency regulations and standards, voluntary agreements, carbon taxes, product labelling regulations and standards and air pollutions limits have been reported by only 2-5% of the companies as a driving force behind their climate change actions. This is understandable given the sectoral distribution of the participating companies is dominated by the materials, financial and information technology sectors.
Effective regulations have a catalyzing effect on the industry by creating more opportunities
One of the most talked about schemes in the industry is the Perform – Achieve – trade (PAT) scheme launched in July 2012 which affects about 478 facilities across eight energy intensive sectors. Responses from companies clearly show that the PAT scheme has had a catalyzing effect on the industry. Over 50% of the responding companies mention the scheme to be an important driver in their strategic direction. While the scheme directly impacts only the energy intensive industries, the companies in the supply chain are leveraging the opportunities created by the regulation by providing energy efficient and low carbon products to big emitters.
Key Themes and Highlights of 2014 Responses continued

22
(Figure 14) Primary risk drivers acrose various sectors.
Conclusions
• Indian companies are showing encouraging signs of managing climate change related issues. Five Indian companies have made it to the Global A-list, on par with Australia and Canada and more than any other emerging economy except South Africa.
• An increasing number of companies are showing awareness and commitment to reporting. In addition to Scope 1 and 2 , companies are increasingly reporting Scope 3 emissions. Companies are engaging with their supply chains primarily on logistics optimization.
• Increasing number of companies are incentivizing climate change initiatives through monetary rewards for top management and other employees.
• Companies leading climate action have demonstrated that it is possible to decouple business growth from carbon emissions through innovation. Decoupling of growth from emissions is mainly driven by the services sector.
• Companies in the materials sector lowering their emissions intensity report that regulatory risks and impact on operational costs are the main drivers for emissions reductions.
• Process energy efficiency initiatives are driving emissions reductions, monetary savings as well as investment from the companies.
• Companies are looking beyond quick wins and investing in mid-term to long-term energy efficiency initiatives.
• Adherence to regulations is one of the key driver of climate change action. Companies unanimously agree that a more robust and enabling regulatory environment is critical in order to accelerate the action and bring about the fundamental and structural changes required to drive the nation towards a low carbon economy.
• Companies are eager to engage with policy makers on issues related to climate change to stay abreast of the regulatory changes and maintain a competitive edge.
Key Themes and Highlights of 2014 Responses continued
1 121 1
2 22
1
13
2
7
12
1 24
41
42 9
6
0%
20%
40%
60%
80%
100%
0
5
10
15
20
25
Prod
uct e
ffici
ency
regu
la�o
ns a
nd s
tand
ards
Prod
uct l
abel
ing
regu
la�o
nsan
d st
anda
rds
Unc
erta
inty
sur
roun
ding
new
regu
la�o
n
Gen
eral
env
iron
men
tal
regu
la�o
ns, i
nclu
ding
…
Inte
rna�
onal
agr
eem
ents
Air p
ollu
�on
limits
Cap
and
trad
e sc
hem
es
Oth
er r
egul
ator
y dr
iver
s
Carb
on ta
xes
Emis
sion
repo
r�ng
oblig
a�on
s
Rene
wab
le e
nerg
yre
gula
�on
Fuel
/ene
rgy
taxe
s an
dre
gula
�ons
Sect
oral
cov
erag
e (p
erce
ntag
e)
Num
ber o
f res
pond
ing
com
pani
es U�li�es
Telecommunica�onServicesMaterials
Informa�onTechnologyIndustrials
Health Care
Financials
Energy
Consumer Staples
ConsumerDiscre�onarySectoral coverage
0 5 10 15 20 25
Product efficiency regula�onsand standards
Product labeling regula�ons andstandards
Uncertainty surrounding newregula�on
General environmentalregula�ons, including planning
Interna�onal agreements
Air pollu�on limits
Cap and trade schemes
Other regulatory drivers
Carbon taxes
Emission repor�ng obliga�ons
Renewable energy regula�on
Fuel/energy taxes andregula�ons
Number of responding companies
Consumer Discre�onary
Consumer Staples
Energy
Financials
Health Care
Industrials
Informa�on Technology
Materials
Telecommunica�on Services
U�li�es
23
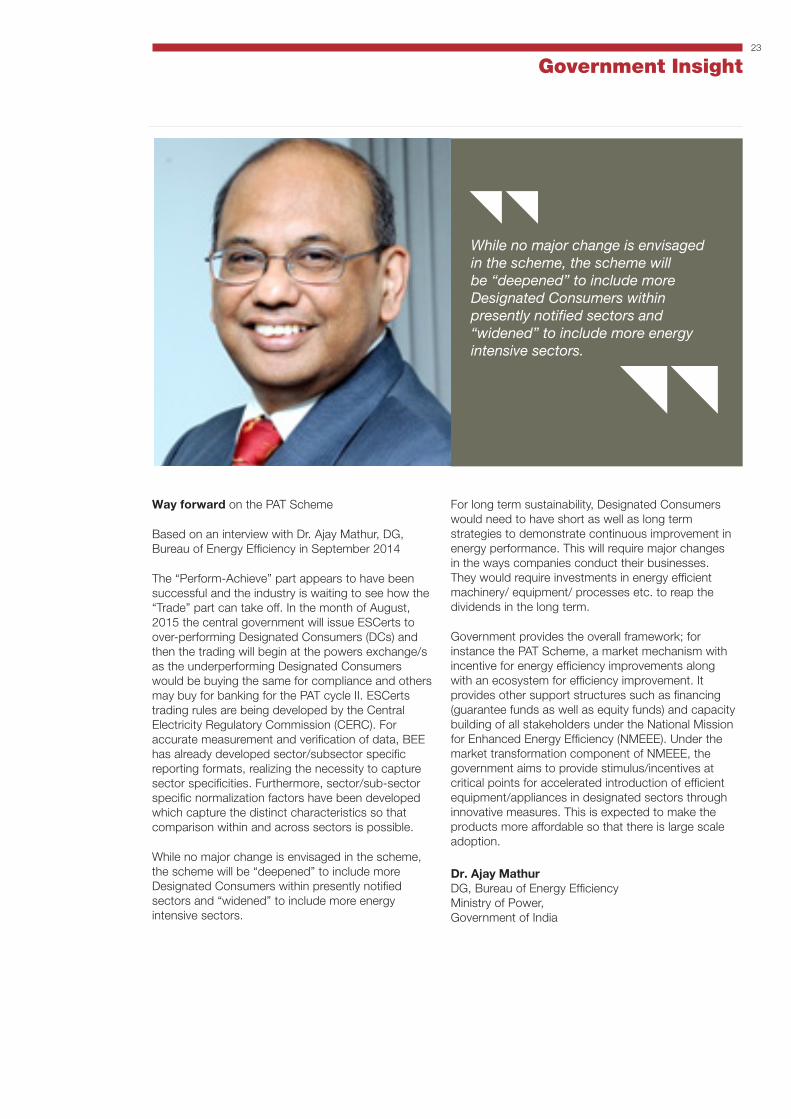
Way forward on the PAT Scheme
Based on an interview with Dr. Ajay Mathur, DG, Bureau of Energy Efficiency in September 2014
The “Perform-Achieve” part appears to have been successful and the industry is waiting to see how the “Trade” part can take off. In the month of August, 2015 the central government will issue ESCerts to over-performing Designated Consumers (DCs) and then the trading will begin at the powers exchange/s as the underperforming Designated Consumers would be buying the same for compliance and others may buy for banking for the PAT cycle II. ESCerts trading rules are being developed by the Central Electricity Regulatory Commission (CERC). For accurate measurement and verification of data, BEE has already developed sector/subsector specific reporting formats, realizing the necessity to capture sector specificities. Furthermore, sector/sub-sector specific normalization factors have been developed which capture the distinct characteristics so that comparison within and across sectors is possible.
While no major change is envisaged in the scheme, the scheme will be “deepened” to include more Designated Consumers within presently notified sectors and “widened” to include more energy intensive sectors.
While no major change is envisaged in the scheme, the scheme will be “deepened” to include more Designated Consumers within presently notified sectors and “widened” to include more energy intensive sectors.
For long term sustainability, Designated Consumers would need to have short as well as long term strategies to demonstrate continuous improvement in energy performance. This will require major changes in the ways companies conduct their businesses. They would require investments in energy efficient machinery/ equipment/ processes etc. to reap the dividends in the long term.
Government provides the overall framework; for instance the PAT Scheme, a market mechanism with incentive for energy efficiency improvements along with an ecosystem for efficiency improvement. It provides other support structures such as financing (guarantee funds as well as equity funds) and capacity building of all stakeholders under the National Mission for Enhanced Energy Efficiency (NMEEE). Under the market transformation component of NMEEE, the government aims to provide stimulus/incentives at critical points for accelerated introduction of efficient equipment/appliances in designated sectors through innovative measures. This is expected to make the products more affordable so that there is large scale adoption.
Dr. Ajay MathurDG, Bureau of Energy EfficiencyMinistry of Power, Government of India
Government Insight
24
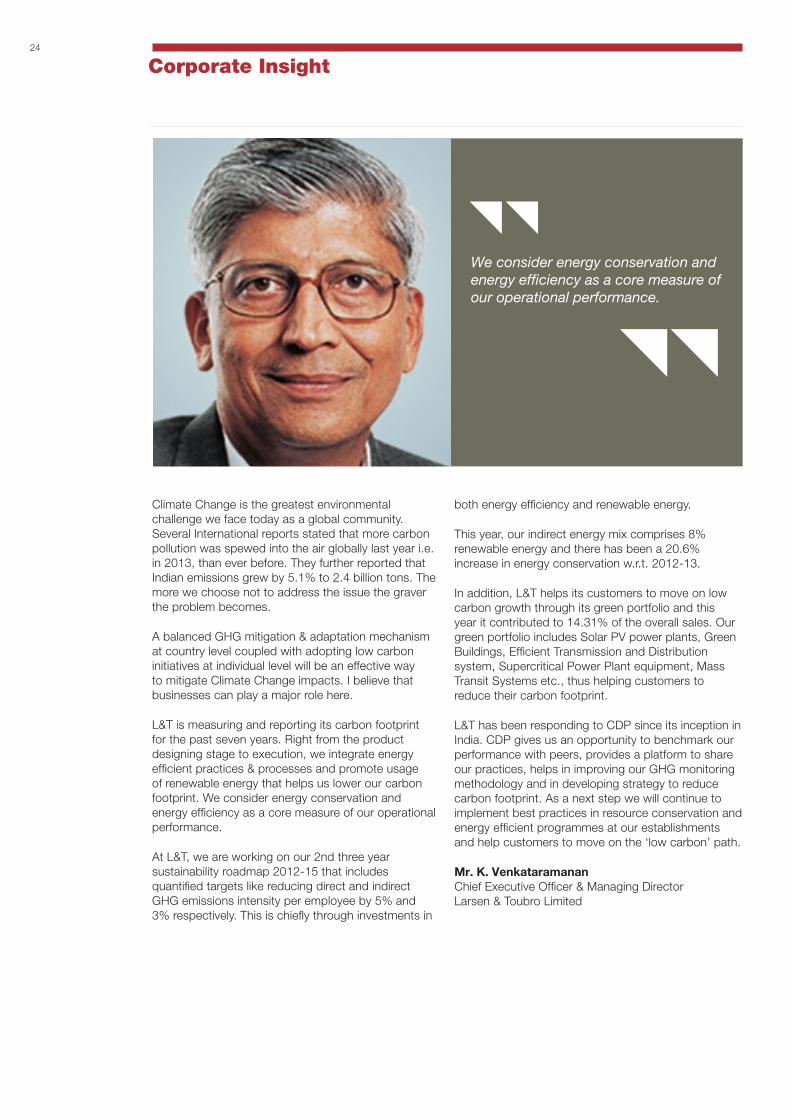
Climate Change is the greatest environmental challenge we face today as a global community.Several International reports stated that more carbon pollution was spewed into the air globally last year i.e. in 2013, than ever before. They further reported that Indian emissions grew by 5.1% to 2.4 billion tons. The more we choose not to address the issue the graver the problem becomes.
A balanced GHG mitigation & adaptation mechanism at country level coupled with adopting low carbon initiatives at individual level will be an effective way to mitigate Climate Change impacts. I believe that businesses can play a major role here.
L&T is measuring and reporting its carbon footprint for the past seven years. Right from the product designing stage to execution, we integrate energy efficient practices & processes and promote usage of renewable energy that helps us lower our carbon footprint. We consider energy conservation and energy efficiency as a core measure of our operational performance.
At L&T, we are working on our 2nd three year sustainability roadmap 2012-15 that includes quantified targets like reducing direct and indirect GHG emissions intensity per employee by 5% and 3% respectively. This is chiefly through investments in
both energy efficiency and renewable energy.
This year, our indirect energy mix comprises 8% renewable energy and there has been a 20.6% increase in energy conservation w.r.t. 2012-13.
In addition, L&T helps its customers to move on low carbon growth through its green portfolio and this year it contributed to 14.31% of the overall sales. Our green portfolio includes Solar PV power plants, Green Buildings, Efficient Transmission and Distribution system, Supercritical Power Plant equipment, Mass Transit Systems etc., thus helping customers to reduce their carbon footprint.
L&T has been responding to CDP since its inception in India. CDP gives us an opportunity to benchmark our performance with peers, provides a platform to share our practices, helps in improving our GHG monitoring methodology and in developing strategy to reduce carbon footprint. As a next step we will continue to implement best practices in resource conservation and energy efficient programmes at our establishments and help customers to move on the ‘low carbon’ path.
Mr. K. VenkataramananChief Executive Officer & Managing DirectorLarsen & Toubro Limited
We consider energy conservation and energy efficiency as a core measure of our operational performance.
Corporate Insight
75%
92%
67%
25%
58%
75%
58%
0% 10% 20% 30% 40% 50% 60% 70% 80% 90% 100%
Board or other senior management oversight of climate change
Rewarding climate change progress
Demonstra�on of climate change being integrated into overallbusiness strategy
Disclose absolute targets
Disclose intensity targets
Evidence of disclosure of climate change informa�on inmainstream filings or other external communica�ons
Emissions reduc�on due to implementa�on of ac�vi�es
25
Self Selected Companies (SSCs)
Every year, a number of companies which are not a part of the India 200 sample by market capitalization, choose to participate in the CDP Climate Change program voluntarily and disclose their climate change
data. CDP recognizes and salutes their leadership in furthering accountability and transparency on climate change issues in the Indian industry and presents key highlights from their responses.
(Figure 15) Key best practices statistics for SSCs.
(Figure 16) Breakdown of emissions for SSCs (Million metric tons CO2e).
Self Selected Companies
• Bharat Aluminium Company Limited
• Essar Power Limited
• Godrej Interio Division Godrej & Boyce
• iGate Patni
• Jubilant Life Sciences Ltd
• Lawkim Motors Group division - Godrej and Boyce
• Mahindra Lifespace Developers Limited
• Mahindra Sanyo Special Steel Pvt. Ltd
• Sterlite Copper
• Tata Motors Finance Ltd
• Vedanta Aluminium and Power
• Welspun-Gujarat Stahl Rohren
Key data on emissions reductions activities
Estimated annual carbon emissions reductions: 321,436 metric tons CO2eEstimated monetary savings: INR 462 million (USD 7.7 million)Estimated investment: INR 313 million (USD 5.21 million) (Reported for 63% of the initiatives)
0.50
23.1
Scope 1 emissions Scope 2 emissions
Examples of risks and opportunities identified
• Risks arising from India’s PAT scheme: Our manufacturing sites have been identified as designated consumers and have been assigned energy reduction targets - Bharat Aluminium Company Limited.
• Emissions reporting is currently voluntary. However, due to peer pressure and purposes of better branding it is likely to become an industry norm in a period of 5-10 years - Godrej Interio Division-Godrej & Boyce
75%
92%
67%
25%
58%
75%
58%
0% 10% 20% 30% 40% 50% 60% 70% 80% 90% 100%
Board or other senior management oversight of climate change
Rewarding climate change progress
Demonstra�on of climate change being integrated into overallbusiness strategy
Disclose absolute targets
Disclose intensity targets
Evidence of disclosure of climate change informa�on inmainstream filings or other external communica�ons
Emissions reduc�on due to implementa�on of ac�vi�es
26
Key Disclosure Statistics
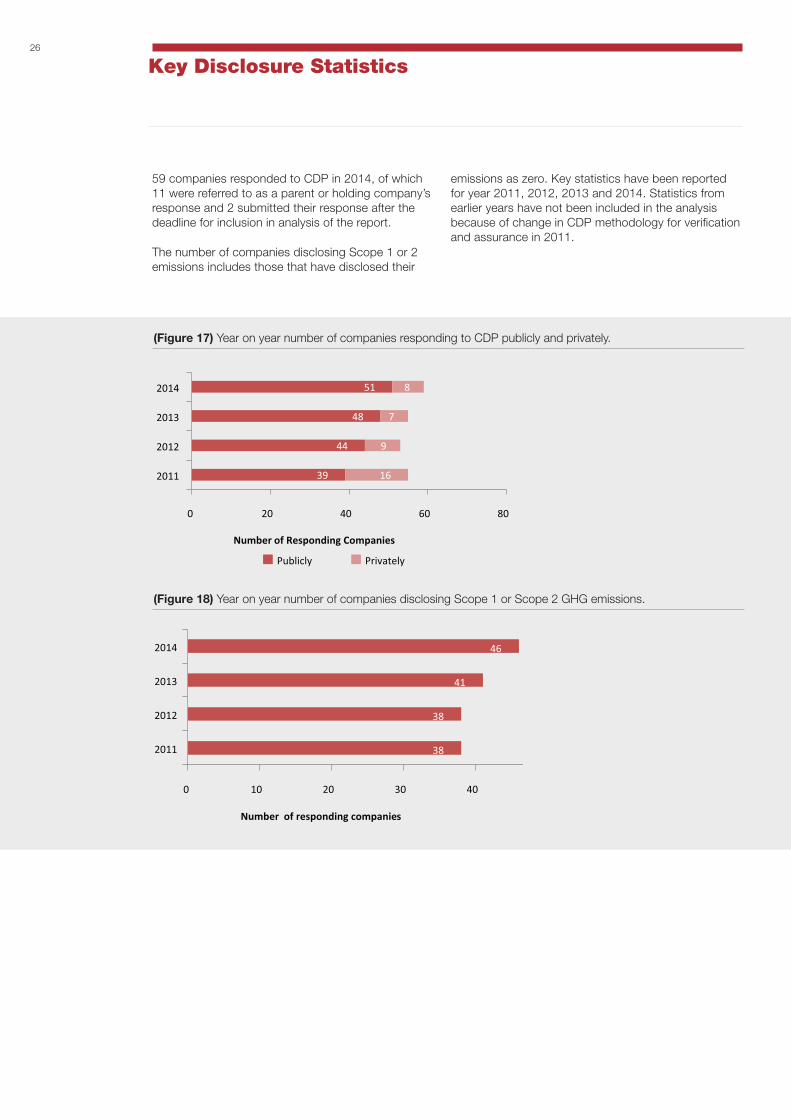
59 companies responded to CDP in 2014, of which 11 were referred to as a parent or holding company’s response and 2 submitted their response after the deadline for inclusion in analysis of the report.
The number of companies disclosing Scope 1 or 2 emissions includes those that have disclosed their
(Figure 17) Year on year number of companies responding to CDP publicly and privately.
(Figure 18) Year on year number of companies disclosing Scope 1 or Scope 2 GHG emissions.
emissions as zero. Key statistics have been reported for year 2011, 2012, 2013 and 2014. Statistics from earlier years have not been included in the analysis because of change in CDP methodology for verification and assurance in 2011.
38
38
41
46
0 10 20 30 40 50
2011
2012
2013
2014
Number of responding companies
39
44
48
51
16
9
7
8
0 20 40 60 80
2011
2012
2013
2014
Number of Responding Companies
Publicly Privately
38
38
41
46
0 10 20 30 40 50
2011
2012
2013
2014
Number of responding companies
39
44
48
51
16
9
7
8
0 20 40 60 80
2011
2012
2013
2014
Number of Responding Companies
Publicly Privately
27
Key Emissions Statistics
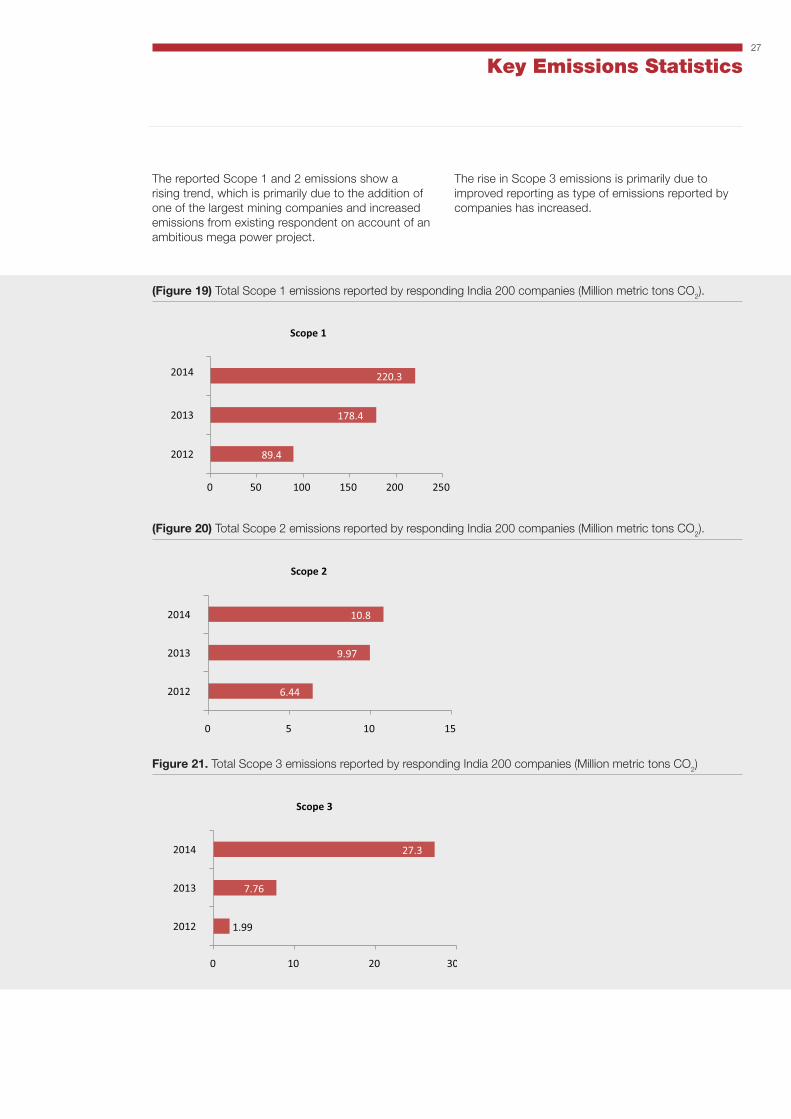
The reported Scope 1 and 2 emissions show a rising trend, which is primarily due to the addition of one of the largest mining companies and increased emissions from existing respondent on account of an ambitious mega power project.
(Figure 19) Total Scope 1 emissions reported by responding India 200 companies (Million metric tons CO2).
(Figure 20) Total Scope 2 emissions reported by responding India 200 companies (Million metric tons CO2).
Figure 21. Total Scope 3 emissions reported by responding India 200 companies (Million metric tons CO2)
The rise in Scope 3 emissions is primarily due to improved reporting as type of emissions reported by companies has increased.
30
89.4
178.4
220.3
0 50 100 150 200 250
2012
2013
2014
Scope 1
6.44
9.97
10.8
0 5 10 15
2012
2013
2014
Scope 2
1.99
7.76
27.3
0 10 20
2012
2013
2014
Scope 3
30
89.4
178.4
220.3
0 50 100 150 200 250
2012
2013
2014
Scope 1
6.44
9.97
10.8
0 5 10 15
2012
2013
2014
Scope 2
1.99
7.76
27.3
0 10 20
2012
2013
2014
Scope 3
30
89.4
178.4
220.3
0 50 100 150 200 250
2012
2013
2014
Scope 1
6.44
9.97
10.8
0 5 10 15
2012
2013
2014
Scope 2
1.99
7.76
27.3
0 10 20
2012
2013
2014
Scope 3
28
Illustrative Key best Practices Statistics
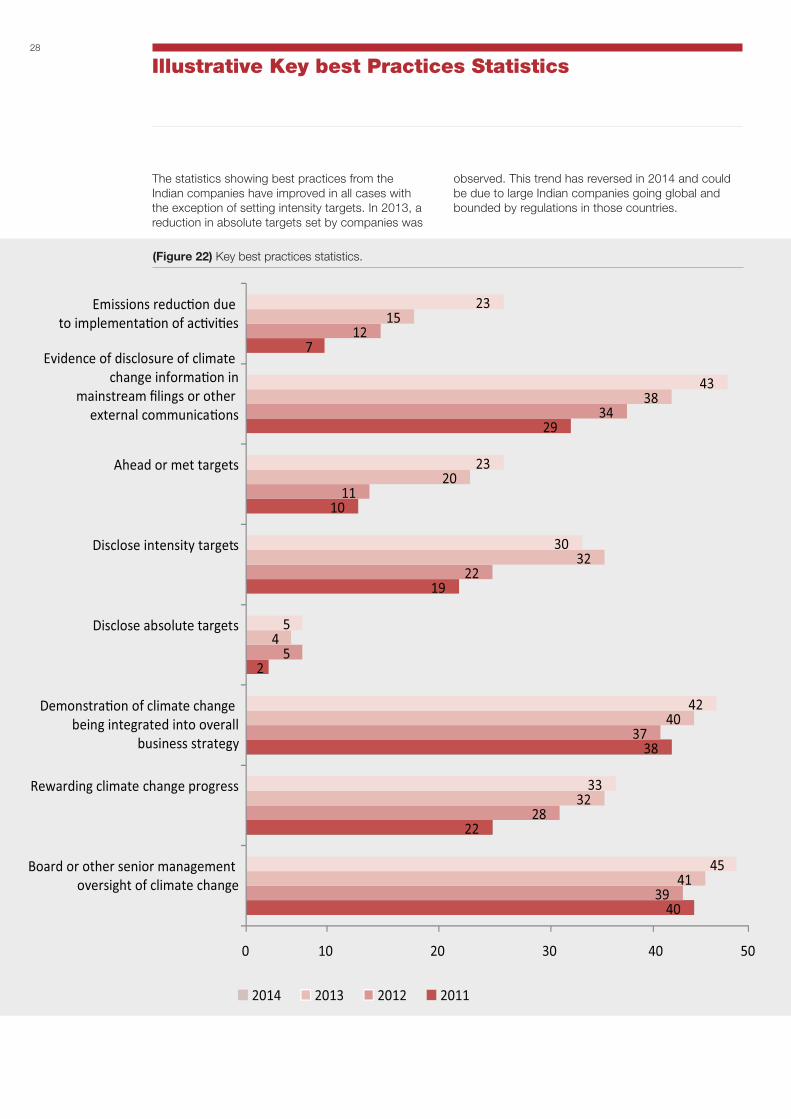
The statistics showing best practices from the Indian companies have improved in all cases with the exception of setting intensity targets. In 2013, a reduction in absolute targets set by companies was
observed. This trend has reversed in 2014 and could be due to large Indian companies going global and bounded by regulations in those countries.
40
22
38
2
19
10
29
7
39
28
37
5
22
11
34
12
41
32
40
4
32
20
38
15
45
33
42
5
30
43
23
0 10 20 30 40 50
Board or other senior management oversight of climate change
Rewarding climate change progress
Demonstra�on of climate change being integrated into overall
business strategy
Disclose absolute targets
Disclose intensity targets
Ahead or met targets
Evidence of disclosure of climate change informa�on in
mainstream filings or other external communica�ons
Emissions reduc�on due to implementa�on of ac�vi�es
2014 2013 2012 2011
23
(Figure 22) Key best practices statistics.
29
About CDP’s Data and Analytics Tool
CDP data and analytics tools enable you to benchmark your performance and understand best practices related to carbon and water management. Using CDP data informs your approach to sustainability and leads to reduced costs, greater innovation and enhanced environmental and financial performance.
Using CDP analytics, companies can bring CDP data to life through easily exportable charts and reports. Data can be filtered by a range of categories, including company, industry, and country, enabling you to measure your performance against direct peers and build a business case for investments in sustainability.
The dashboards in the tool are built around the main questionnaire sections such as risks and opportunities, emissions management and scope 3 and value chain and the tool has been designed with simplicity and ease of use as its primary characteristic – you will not need extensive training to understand it and we are confident that any user would find valuable trend insights within just a few minutes. Both the visualizations and underlying data can be exported to excel or PDF with a single click so it can be used for presentations to help you make your point.
There are different versions of the tool for companies and investors and cities. For responding companies there are two platforms, the first is for Reporter
Services members and is intended to help them improve their own reporting and to benchmark their performance against peers. The second version for companies is available through the Supply Chain membership and allows member companies to track and analyse the data provided by their own suppliers. The investor version is available to Investor members and focuses on a different cut of the data to allow for portfolio analysis.
CDP’s analytics tool has transformed how we use data to benchmark our risks, opportunities, and emissions reduction targets against sector peers. It provides us with detailed, valuable information through just a few clicks.
Barrick Gold Canadian Reporter Services member
Find interactive charts based on CDP analytics complimenting this report at:
https://www.cdp.net/en-US/Pages/disclosure-analytics.aspx

30
Sector Analysis
Consumer Discretionary Responding companies
• Tata Motors
• Indian Hotels Co.
• Mahindra & Mahindra
• Maruti Suzuki India
• Motherson Sumi Systems
• Bharat Forge
Major Non-responders
• Bajaj Auto
• Bosch Ltd
• Hero Motocorp Ltd Best practices examples from sector leaders:
• Mahindra and Mahindra has invested in and developed two prototype Hydrogen-CNG hybrid vehicles which are undergoing road trials in addition to a hydrogen powered three wheeler.
• Maruti Suzuki has set up suppliers’ parks around the manufacturing locations. Sourcing of around 80% of parts by value from within 100 kms.
• Maruti Suziki has developed a green procurement policy for all of its suppliers
• Indian Hotels Co - The awareness on climate change parameters has provided IHCL with an opportunity to convert 5% of room inventory to EARTH Rooms (Eco friendly rooms where no plastic is used, energy consumption is reduced, less waste is generated and nontoxic substances are used)
• Mahindra and Mahindra provides solutions to farmers in modern scientific water management through customized micro irrigation systems and agronomical support in order to achieve superior product quality and higher crop yields. This boost in agricultural activity directly benefits M&M due to an increase in demand for their products.
Consumer Staples Responding Companies
• Tata Global Beverages
• ITC Limited
• Godrej Consumer Products
Major Non-responders
• Dabur India
• Marico
• United Spirits
Best practices examples from sector leaders:
• ITC has developed watershed and rainwater harvesting projects to not only improve the sustainability of agri-related businesses but also create sustainable livelihoods for large numbers of marginal farmers.
• ITC is the only enterprise in the world, of comparable size to be carbon positive (8 years in a row), sequestering twice the amount of carbon it emits; water positive (12 consecutive years), creating over 2 times more rainwater harvesting potential than the net consumption by the Group; and is solid waste recycling positive (for the last 7 years).
• Tata Global Beverages - Last season, over 60% of the fuel used in one of the TGB’s factory was Biomass briquettes, thereby saving around 3000 trees. This is a voluntary energy conservation initiative by the factory,
• Tata Global Beverages - A focus on climate change management is being incorporated into New Product Development at TGB. Innovations are being assessed through an SLCA (streamlined life cycle analysis) which assesses a product’s impact throughout its life cycle including energy usage and emissions
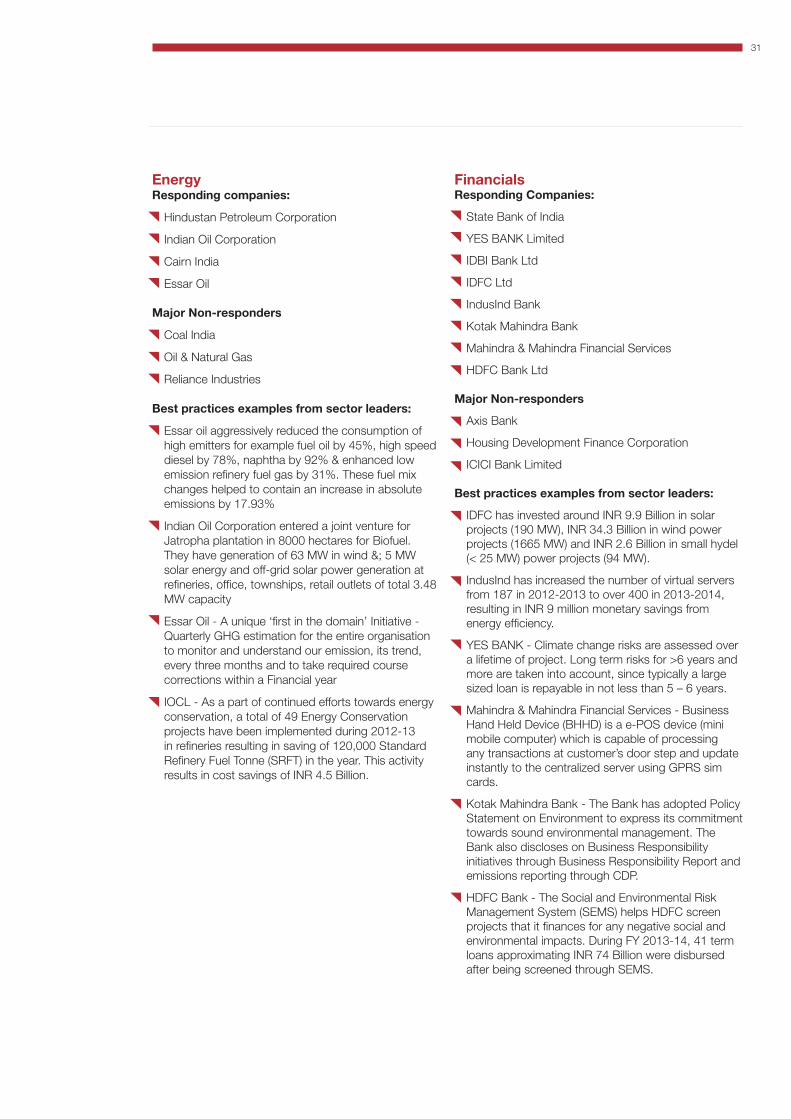
31
Energy Responding companies:
• Hindustan Petroleum Corporation
• Indian Oil Corporation
• Cairn India
• Essar Oil
Major Non-responders
• Coal India
• Oil & Natural Gas
• Reliance Industries
Best practices examples from sector leaders:
• Essar oil aggressively reduced the consumption of high emitters for example fuel oil by 45%, high speed diesel by 78%, naphtha by 92% & enhanced low emission refinery fuel gas by 31%. These fuel mix changes helped to contain an increase in absolute emissions by 17.93%
• Indian Oil Corporation entered a joint venture for Jatropha plantation in 8000 hectares for Biofuel. They have generation of 63 MW in wind &; 5 MW solar energy and off-grid solar power generation at refineries, office, townships, retail outlets of total 3.48 MW capacity
• Essar Oil - A unique ‘first in the domain’ Initiative - Quarterly GHG estimation for the entire organisation to monitor and understand our emission, its trend, every three months and to take required course corrections within a Financial year
• IOCL - As a part of continued efforts towards energy conservation, a total of 49 Energy Conservation projects have been implemented during 2012-13 in refineries resulting in saving of 120,000 Standard Refinery Fuel Tonne (SRFT) in the year. This activity results in cost savings of INR 4.5 Billion.
FinancialsResponding Companies:
• State Bank of India
• YES BANK Limited
• IDBI Bank Ltd
• IDFC Ltd
• IndusInd Bank
• Kotak Mahindra Bank
• Mahindra & Mahindra Financial Services
• HDFC Bank Ltd
Major Non-responders
• Axis Bank
• Housing Development Finance Corporation
• ICICI Bank Limited
Best practices examples from sector leaders:
• IDFC has invested around INR 9.9 Billion in solar projects (190 MW), INR 34.3 Billion in wind power projects (1665 MW) and INR 2.6 Billion in small hydel (< 25 MW) power projects (94 MW).
• IndusInd has increased the number of virtual servers from 187 in 2012-2013 to over 400 in 2013-2014, resulting in INR 9 million monetary savings from energy efficiency.
• YES BANK - Climate change risks are assessed over a lifetime of project. Long term risks for >6 years and more are taken into account, since typically a large sized loan is repayable in not less than 5 – 6 years.
• Mahindra & Mahindra Financial Services - Business Hand Held Device (BHHD) is a e-POS device (mini mobile computer) which is capable of processing any transactions at customer’s door step and update instantly to the centralized server using GPRS sim cards.
• Kotak Mahindra Bank - The Bank has adopted Policy Statement on Environment to express its commitment towards sound environmental management. The Bank also discloses on Business Responsibility initiatives through Business Responsibility Report and emissions reporting through CDP.
• HDFC Bank - The Social and Environmental Risk Management System (SEMS) helps HDFC screen projects that it finances for any negative social and environmental impacts. During FY 2013-14, 41 term loans approximating INR 74 Billion were disbursed after being screened through SEMS.

32
Healthcare Responding companies
• Piramal Enterprises
• Dr. Reddy’s Laboratories
Major Non-responders
• Cipla
• Lupin
• Sun Pharmaceutical Industries
Best practices examples from sector leaders:
• High calorific value waste generated at Piramal enterprises’ plants is being sold to cement industries that are using it as fuel.
• Dr. Reddy’s Laboratories is undertaking projects to implement measures to reduce the environmental impacts of the production processes so that products have low carbon and water footprints. As consumer preferences begin to shift this opportunity can be easily tapped into.
Industrials Responding companies
• Crompton Greaves
• Larsen & Toubro
Major Non-responders
• Adani Enterprises
• Bharat Heavy Electricals
• MMTC
Best practices examples from sector leaders:
• L&T - The increase in the awareness related to climate change among the stakeholders presents an opportunity to the company to enhance its reputation among the peers. L&T is the first Indian company in the Engineering and Construction sector to disclose on its non-financial performance parameters.
• L&T considers the regulatory changes in climate policy as an opportunity for its business and hence has focused on reduction in operating costs through optimization of processes and products, switching over to renewable energy, availing energy efficiency for its operations which will result in GHG emission reduction.
Information Technology Responding companies
• Tata Consultancy Services
• Tech Mahindra
• Wipro
• Infosys Limited
• Mindtree Ltd
• MphasiS
• HCL Technologies
Major Non-responders
• CMC Ltd
• Just Dial Ltd
Best practices examples from sector leaders:
• Wipro’s ISO 14001 based environmental management system and focus on energy efficiency has led to Wipro being early adopters of green building standards and today, they have 19 buildings that are based on the LEED standards.
• Infosys has purchased about 1.5 million units of green power (wind energy) for their Mangalore STP campus during the reporting year which helped them reduce their scope 2 emissions.
• Tech Mahindra has completely recycled water within the campus and has water harvesting plants. In case of change in precipitation patterns, facilities are resilient to any adverse effect due to water management systems.
• TCS is developing solutions that respond to changing consumer behavior. Through the Connected Marketing team, corporations can increase their understanding of green needs of their consumers. They can also see how the consumers are reacting to the new green products that have been introduced by them.
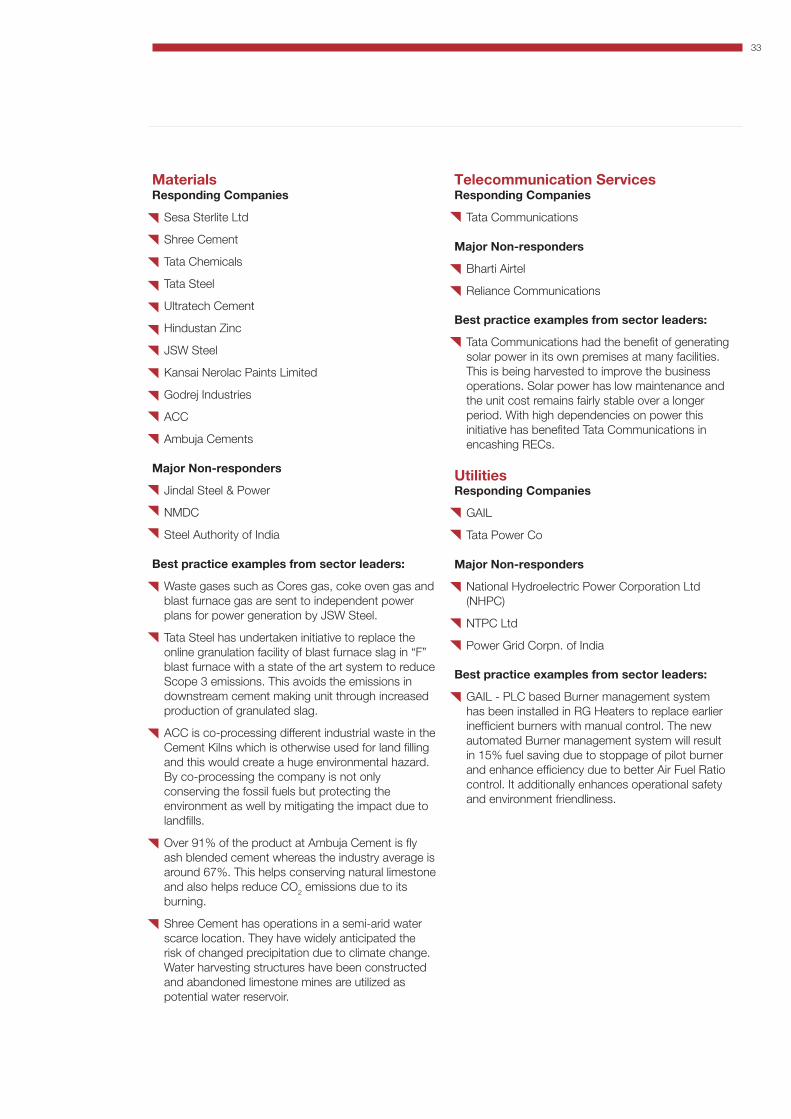
33
Materials Responding Companies
• Sesa Sterlite Ltd
• Shree Cement
• Tata Chemicals
• Tata Steel
• Ultratech Cement
• Hindustan Zinc
• JSW Steel
• Kansai Nerolac Paints Limited
• Godrej Industries
• ACC
• Ambuja Cements
Major Non-responders
• Jindal Steel & Power
• NMDC
• Steel Authority of India Best practice examples from sector leaders:
• Waste gases such as Cores gas, coke oven gas and blast furnace gas are sent to independent power plans for power generation by JSW Steel.
• Tata Steel has undertaken initiative to replace the online granulation facility of blast furnace slag in “F” blast furnace with a state of the art system to reduce Scope 3 emissions. This avoids the emissions in downstream cement making unit through increased production of granulated slag.
• ACC is co-processing different industrial waste in the Cement Kilns which is otherwise used for land filling and this would create a huge environmental hazard. By co-processing the company is not only conserving the fossil fuels but protecting the environment as well by mitigating the impact due to landfills.
• Over 91% of the product at Ambuja Cement is fly ash blended cement whereas the industry average is around 67%. This helps conserving natural limestone and also helps reduce CO2 emissions due to its burning.
• Shree Cement has operations in a semi-arid water scarce location. They have widely anticipated the risk of changed precipitation due to climate change. Water harvesting structures have been constructed and abandoned limestone mines are utilized as potential water reservoir.
Telecommunication Services Responding Companies
• Tata Communications
Major Non-responders
• Bharti Airtel
• Reliance Communications Best practice examples from sector leaders:
• Tata Communications had the benefit of generating solar power in its own premises at many facilities. This is being harvested to improve the business operations. Solar power has low maintenance and the unit cost remains fairly stable over a longer period. With high dependencies on power this initiative has benefited Tata Communications in encashing RECs.
UtilitiesResponding Companies
• GAIL
• Tata Power Co
Major Non-responders
• National Hydroelectric Power Corporation Ltd (NHPC)
• NTPC Ltd
• Power Grid Corpn. of India Best practice examples from sector leaders:
• GAIL - PLC based Burner management system has been installed in RG Heaters to replace earlier inefficient burners with manual control. The new automated Burner management system will result in 15% fuel saving due to stoppage of pilot burner and enhance efficiency due to better Air Fuel Ratio control. It additionally enhances operational safety and environment friendliness.

34
Appendix I: Table of emissions, scores andcompany information by sector
Sector Company name
2014
Sco
re
2014
Per
mis
sion
S
tatu
s
Tota
l Sco
pe 1
+
Sco
pe 2
em
issi
ons
Sco
pe 1
Sco
pe 2
Num
ber
of S
cope
3
cate
gorie
s re
port
ed
Targ
ets
repo
rted
Consumer Discretionary
Bharat Forge - Not public - - - -
Indian Hotels Co. 82 Public 351419.2 92544.49 258874.71 0 Int
Mahindra & Mahindra 88 Public 214795 36070 178725 5 Int
Maruti Suzuki India - Not public - - - -
Motherson Sumi Systems - Not public - - - - Int
Tata Motors 37 Public 353112.15 81277 271835.15 1 Int
Consumer Staples
Godrej Consumer Products
- Not public - - - -
ITC Limited 94 Public 1410777 1234128 176649 5 Int
Tata Global Beverages 95 Public 62216 22865 39351 4 Int
Energy
Cairn India 63 Public 1195147 1187792 7355 0
Essar Oil 98 Public 6036218 6032145 4073 3 Int
Hindustan Petroleum Corporation
36 Public 3745580 3194949 550631 0
Indian Oil Corporation 83 Public 14296872 14234030 62842 0 Abs
Financials
HDFC Bank Ltd 78 Public 406443.04 6745.83 399697.21 3
IDBI Bank Ltd 49 Public 58943 0 58943 0
IDFC Ltd 68 Public 3154 163 2991 1
IndusInd Bank 91 Public 35213.91 3594.06 31619.85 2 Int
Kotak Mahindra Bank 75 Public 14060.1 56.82 14003.28 0
Mahindra & Mahindra Financial Services
86 Public 1897 87 1810 2 Int
State Bank of India 48 Public 0 0 0 0
YES BANK Limited 92 Public 25399 718 24681 4 Int
Health CareDr. Reddy’s Laboratories 82 Public 407159 163953 243206 1 Int
Piramal Enterprises 47 Public 89458 38964 50494 0 Int
IndustrialsCrompton Greaves - Not public - - - -
Larsen & Toubro 98 Public 602233 389576 212657 4 Int
Information Technology
HCL Technologies 75 Public 156934 45153 111781 1 Int
Infosys Limited 97 Public 169312.89 23910.38 145402.51 4 Abs, Int
Mindtree Ltd 66 Public 25122.12 752.48 24369.64 4 Int
MphasiS - Not public - - - - Abs
Tata Consultancy Services 97 Public 422589 44375 378214 7 Int
Tech Mahindra 98 Public 100599 11068 89531 4 Int
Wipro 99 Public 256244 41500 214744 8 Abs, Int
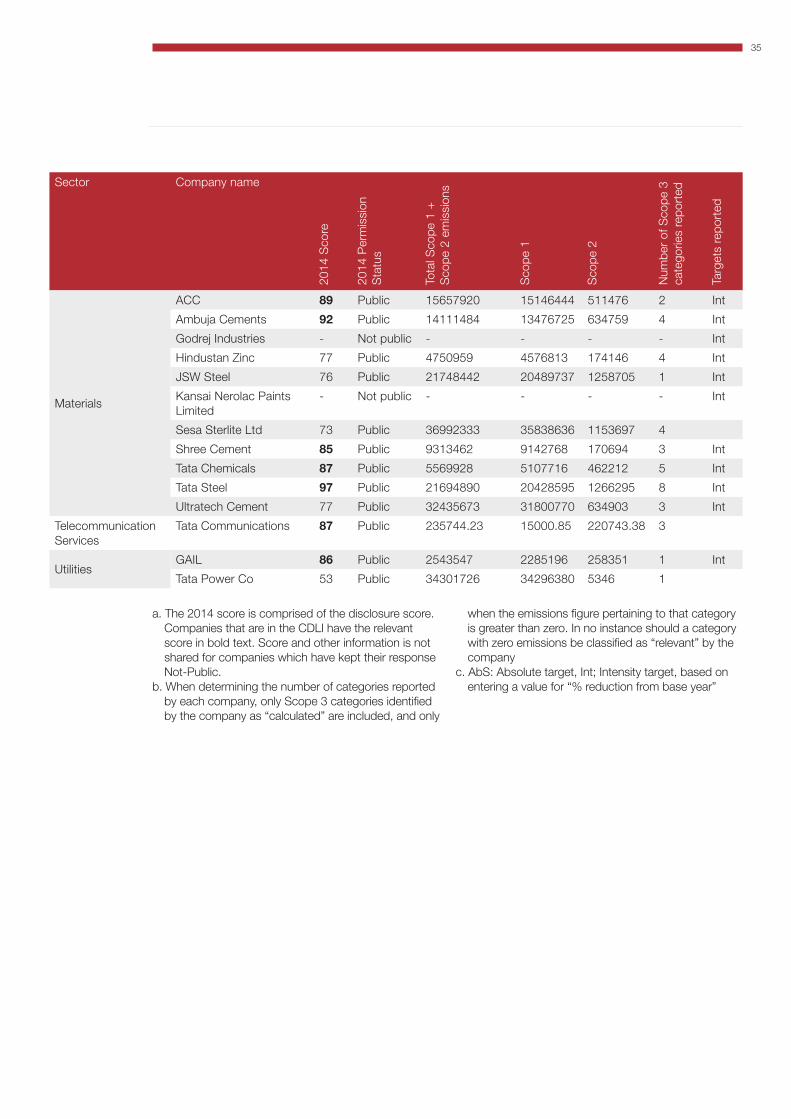
35
Sector Company name
2014
Sco
re
2014
Per
mis
sion
S
tatu
s
Tota
l Sco
pe 1
+
Sco
pe 2
em
issi
ons
Sco
pe 1
Sco
pe 2
Num
ber
of S
cope
3
cate
gorie
s re
port
ed
Targ
ets
repo
rted
Materials
ACC 89 Public 15657920 15146444 511476 2 Int
Ambuja Cements 92 Public 14111484 13476725 634759 4 Int
Godrej Industries - Not public - - - - Int
Hindustan Zinc 77 Public 4750959 4576813 174146 4 Int
JSW Steel 76 Public 21748442 20489737 1258705 1 Int
Kansai Nerolac Paints Limited
- Not public - - - - Int
Sesa Sterlite Ltd 73 Public 36992333 35838636 1153697 4
Shree Cement 85 Public 9313462 9142768 170694 3 Int
Tata Chemicals 87 Public 5569928 5107716 462212 5 Int
Tata Steel 97 Public 21694890 20428595 1266295 8 Int
Ultratech Cement 77 Public 32435673 31800770 634903 3 Int
Telecommunication Services
Tata Communications 87 Public 235744.23 15000.85 220743.38 3
UtilitiesGAIL 86 Public 2543547 2285196 258351 1 Int
Tata Power Co 53 Public 34301726 34296380 5346 1
a. The 2014 score is comprised of the disclosure score. Companies that are in the CDLI have the relevant score in bold text. Score and other information is not shared for companies which have kept their response Not-Public.
b. When determining the number of categories reported by each company, only Scope 3 categories identified by the company as “calculated” are included, and only
when the emissions figure pertaining to that category is greater than zero. In no instance should a category with zero emissions be classified as “relevant” by the company
c. AbS: Absolute target, Int; Intensity target, based on entering a value for “% reduction from base year”
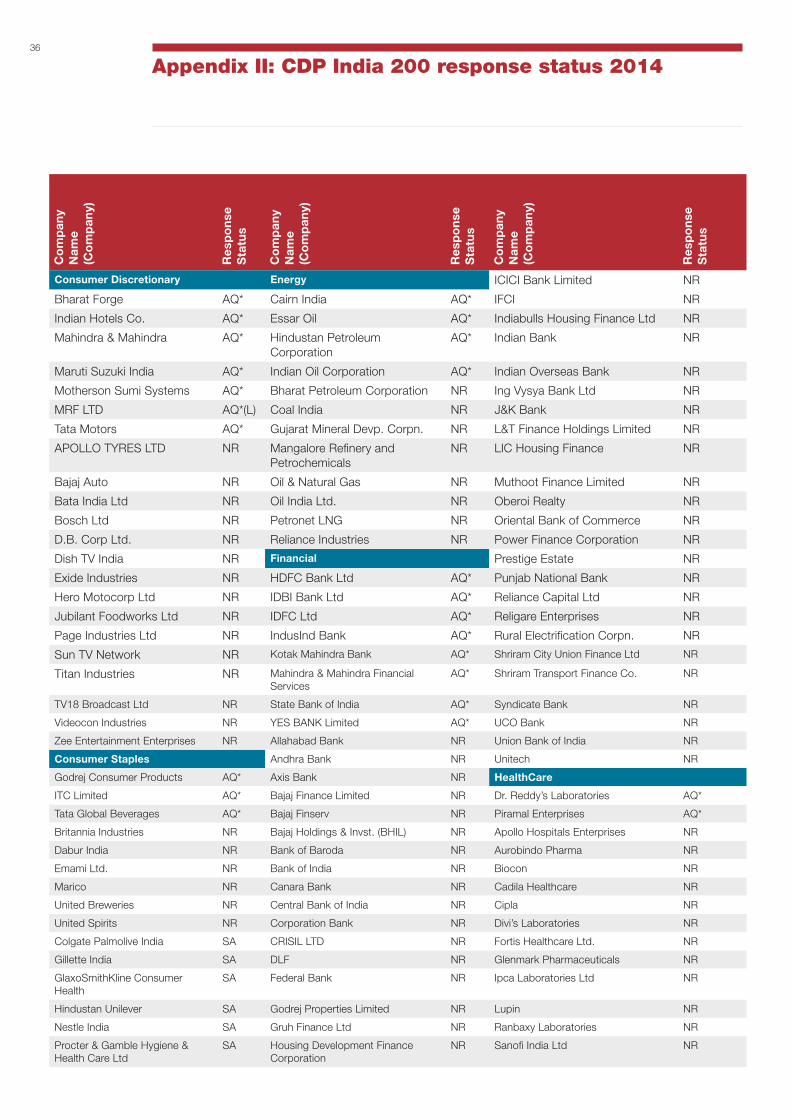
36
Appendix II: CDP India 200 response status 2014C
om
pan
y N
ame
(Co
mp
any)
Res
po
nse
S
tatu
s
Co
mp
any
Nam
e (C
om
pan
y)
Res
po
nse
S
tatu
s
Co
mp
any
Nam
e (C
om
pan
y)
Res
po
nse
S
tatu
s
Consumer Discretionary Energy ICICI Bank Limited NR
Bharat Forge AQ* Cairn India AQ* IFCI NR
Indian Hotels Co. AQ* Essar Oil AQ* Indiabulls Housing Finance Ltd NR
Mahindra & Mahindra AQ* Hindustan Petroleum Corporation
AQ* Indian Bank NR
Maruti Suzuki India AQ* Indian Oil Corporation AQ* Indian Overseas Bank NR
Motherson Sumi Systems AQ* Bharat Petroleum Corporation NR Ing Vysya Bank Ltd NR
MRF LTD AQ*(L) Coal India NR J&K Bank NR
Tata Motors AQ* Gujarat Mineral Devp. Corpn. NR L&T Finance Holdings Limited NR
APOLLO TYRES LTD NR Mangalore Refinery and Petrochemicals
NR LIC Housing Finance NR
Bajaj Auto NR Oil & Natural Gas NR Muthoot Finance Limited NR
Bata India Ltd NR Oil India Ltd. NR Oberoi Realty NR
Bosch Ltd NR Petronet LNG NR Oriental Bank of Commerce NR
D.B. Corp Ltd. NR Reliance Industries NR Power Finance Corporation NR
Dish TV India NR Financial Prestige Estate NR
Exide Industries NR HDFC Bank Ltd AQ* Punjab National Bank NR
Hero Motocorp Ltd NR IDBI Bank Ltd AQ* Reliance Capital Ltd NR
Jubilant Foodworks Ltd NR IDFC Ltd AQ* Religare Enterprises NR
Page Industries Ltd NR IndusInd Bank AQ* Rural Electrification Corpn. NR
Sun TV Network NR Kotak Mahindra Bank AQ* Shriram City Union Finance Ltd NR
Titan Industries NR Mahindra & Mahindra Financial Services
AQ* Shriram Transport Finance Co. NR
TV18 Broadcast Ltd NR State Bank of India AQ* Syndicate Bank NR
Videocon Industries NR YES BANK Limited AQ* UCO Bank NR
Zee Entertainment Enterprises NR Allahabad Bank NR Union Bank of India NR
Consumer Staples Andhra Bank NR Unitech NR
Godrej Consumer Products AQ* Axis Bank NR HealthCare
ITC Limited AQ* Bajaj Finance Limited NR Dr. Reddy’s Laboratories AQ*
Tata Global Beverages AQ* Bajaj Finserv NR Piramal Enterprises AQ*
Britannia Industries NR Bajaj Holdings & Invst. (BHIL) NR Apollo Hospitals Enterprises NR
Dabur India NR Bank of Baroda NR Aurobindo Pharma NR
Emami Ltd. NR Bank of India NR Biocon NR
Marico NR Canara Bank NR Cadila Healthcare NR
United Breweries NR Central Bank of India NR Cipla NR
United Spirits NR Corporation Bank NR Divi’s Laboratories NR
Colgate Palmolive India SA CRISIL LTD NR Fortis Healthcare Ltd. NR
Gillette India SA DLF NR Glenmark Pharmaceuticals NR
GlaxoSmithKline Consumer Health
SA Federal Bank NR Ipca Laboratories Ltd NR
Hindustan Unilever SA Godrej Properties Limited NR Lupin NR
Nestle India SA Gruh Finance Ltd NR Ranbaxy Laboratories NR
Procter & Gamble Hygiene & Health Care Ltd
SA Housing Development Finance Corporation
NR Sanofi India Ltd NR
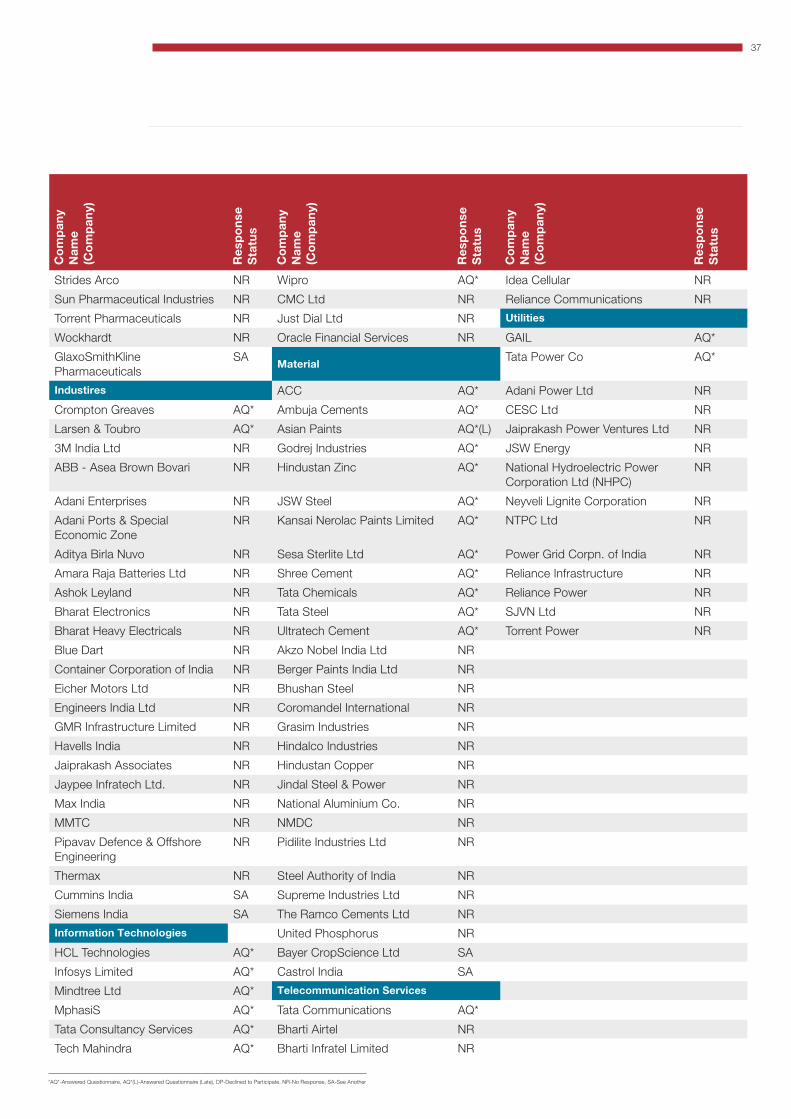
37C
om
pan
y N
ame
(Co
mp
any)
Res
po
nse
S
tatu
s
Co
mp
any
Nam
e (C
om
pan
y)
Res
po
nse
S
tatu
s
Co
mp
any
Nam
e (C
om
pan
y)
Res
po
nse
S
tatu
s
Strides Arco NR Wipro AQ* Idea Cellular NR
Sun Pharmaceutical Industries NR CMC Ltd NR Reliance Communications NR
Torrent Pharmaceuticals NR Just Dial Ltd NR Utilities
Wockhardt NR Oracle Financial Services NR GAIL AQ*
GlaxoSmithKline Pharmaceuticals
SAMaterial
Tata Power Co AQ*
Industires ACC AQ* Adani Power Ltd NR
Crompton Greaves AQ* Ambuja Cements AQ* CESC Ltd NR
Larsen & Toubro AQ* Asian Paints AQ*(L) Jaiprakash Power Ventures Ltd NR
3M India Ltd NR Godrej Industries AQ* JSW Energy NR
ABB - Asea Brown Bovari NR Hindustan Zinc AQ* National Hydroelectric Power Corporation Ltd (NHPC)
NR
Adani Enterprises NR JSW Steel AQ* Neyveli Lignite Corporation NR
Adani Ports & Special Economic Zone
NR Kansai Nerolac Paints Limited AQ* NTPC Ltd NR
Aditya Birla Nuvo NR Sesa Sterlite Ltd AQ* Power Grid Corpn. of India NR
Amara Raja Batteries Ltd NR Shree Cement AQ* Reliance Infrastructure NR
Ashok Leyland NR Tata Chemicals AQ* Reliance Power NR
Bharat Electronics NR Tata Steel AQ* SJVN Ltd NR
Bharat Heavy Electricals NR Ultratech Cement AQ* Torrent Power NR
Blue Dart NR Akzo Nobel India Ltd NR
Container Corporation of India NR Berger Paints India Ltd NR
Eicher Motors Ltd NR Bhushan Steel NR
Engineers India Ltd NR Coromandel International NR
GMR Infrastructure Limited NR Grasim Industries NR
Havells India NR Hindalco Industries NR
Jaiprakash Associates NR Hindustan Copper NR
Jaypee Infratech Ltd. NR Jindal Steel & Power NR
Max India NR National Aluminium Co. NR
MMTC NR NMDC NR
Pipavav Defence & Offshore Engineering
NR Pidilite Industries Ltd NR
Thermax NR Steel Authority of India NR
Cummins India SA Supreme Industries Ltd NR
Siemens India SA The Ramco Cements Ltd NR
Information Technologies United Phosphorus NR
HCL Technologies AQ* Bayer CropScience Ltd SA
Infosys Limited AQ* Castrol India SA
Mindtree Ltd AQ* Telecommunication Services
MphasiS AQ* Tata Communications AQ*
Tata Consultancy Services AQ* Bharti Airtel NR
Tech Mahindra AQ* Bharti Infratel Limited NR
*AQ*-Answered Questionnaire, AQ*(L)-Answered Questionnaire (Late), DP-Declined to Participate, NR-No Response, SA-See Another

38
Where are the performance leaders?
United Kingdom252/19Respondents/Leaders
Turkey 26/1
Greater China 88/1
Switzerland 63/4
Italy 45/4
Canada 98/5
Australia 76/5
USA 342/34
Sweden48/6
Spain 39/11
South Korea 86/14
South Africa 66/8
Portugal 12/2
Norway30/3
Netherlands 30/5
Japan 216/24
Ireland 16/2
India 46/5
Greece 1/1
Germany 89/11
France 84/10
Finland36/4
Denmark 20/3
Belgium 11/3
Austria 14/2
Respondent numbers for certain countries may differ from regional CDP reports due to submission date of response for inclusion in analysis/scoring and difference between company location and exchange/index listings.

39
United Kingdom252/19Respondents/Leaders
Turkey 26/1
Greater China 88/1
Switzerland 63/4
Italy 45/4
Canada 98/5
Australia 76/5
USA 342/34
Sweden48/6
Spain 39/11
South Korea 86/14
South Africa 66/8
Portugal 12/2
Norway30/3
Netherlands 30/5
Japan 216/24
Ireland 16/2
India 46/5
Greece 1/1
Germany 89/11
France 84/10
Finland36/4
Denmark 20/3
Belgium 11/3
Austria 14/2
In 2014 nearly 2,000 businesses shared climate change information with CDP and the investors that requested it. Each of these companies is commended for responding to the call, regardless of its score. Insights from CDP data are used by investors and other decision makers to help catalyze action to achieve sustainable economies.
Almost half of the performance leaders are headquartered in Europe, with a further third located in USA or Japan. More than a quarter of the Spanish and Belgian companies that took part in CDP’s climate change program were awarded an A for performance, proportionally giving Spain and Belgium the most leaders. Portugal, the Netherlands and South Korea have also performed well in this regard and it should be noted that the one Greek participant achieved an A.
Of those corporations that failed to respond, the three largest in terms of market capitalization are Berkshire Hathaway, Amazon.com Inc and Comcast Corporation.

This report has been printed on 50% recycled paper
Global Partners
Global implementation partner Global Scoring and Sustainability BPO Partner
CDP India1203, Chiranjiv Tower, 43 Nehru Place, New Delhi, 110 019www.cdp.net [email protected]
Accenture India6th Floor, DLF Centre,Sansad Marg, New Delhi - 110 001www.accenture.com/in-en/
CDP Contacts
Damandeep SinghDirector – CDP [email protected]
Ambesh Singh Sr. Project Officer – CDP [email protected]
Sue HowellsCo-Chief Operating Officer
Daniel TurnerHead of Disclosure
James HulseHead of Investor Initiatives
CDP India Board of Directors
Dr. Rajesh ThadaniExecutive Director, CEDAR
Damandeep Singh Director, CDP India
Accenture Project Sponsors
Peter Lacy Managing DirectorAPAC Strategy and Sustainability Lead
Justin Keeble Managing Director EALA Sustainability Lead
Accenture India core team
Vishvesh PrabhakarManaging Director - [email protected]
Dr. Serge YounesDirector [email protected]
Manuj OhriPrincipal - Accenture [email protected]
Reshma KulkarniConsultant - [email protected]
Accenture report reviewers
Vivek Kuttappan
Pankhuri Bajpai
Abhishek Srivastava
CDP Board of Trustees
Chairman: Alan BrownWelcome Trust
James CameronClimate Change Capital & ODI
Ben GoldsmithWHEB
Chris PageRockefeller PhilanthropyAdvisors
Dr. Christoph Schroeder
Jeremy Smith
Takejiro Sueyoshi
Tessa Tennant
Martin WiseRelationship Capital Partners
Disclaimer: This Report has been published for information and illustrative purposes only and is not intended to serve as advice of any nature whatsoever. The information contained and the references made in this Report is in good faith, neither Accenture nor any its directors, agents or employees give any warranty of accuracy (whether expressed or implied), nor accepts any liability as a result of reliance upon the content including (but not limited) information, advice, statement or opinion contained in this Report. This Report also contains certain information available in public domain, created and maintained by private and public organizations. Accenture does not control or guarantee the accuracy, relevance, timelines or completeness of such information. This Report constitutes a view as on the date of publication and is subject to change. Accenture does not warrant or solicit any kind of act or omission based on this Report.