International Journal of Social Science Studies, Vol. 2, No. 3, July 2014
Upload
khangminh22Category
view
4download
0
INTERNATIONAL JOURNAL FOR INNOVATIVE RESEARCH IN
MULTIDISCIPLINARY FIELD
(ISSN: 2455-0620) (Scientific Journal Impact Factor: 6.719)
Monthly Peer-Reviewed, Refereed, Indexed Research Journal
Index Copernicus International - IC Value: 86.87
( 10 & 11 July, 2021 )
Jointly organized by:
Automation, Computer Science and Technology Department, Kryvyi Rih National University, Ukraine
‘Research Culture Society’ and
‘Scientific Research Association’
RESEARCH CULTURE SOCIETY & PUBLICATION
Email: [email protected]
Web Email: [email protected]
WWW.IJIRMF.COM
Conference Special Issue - 27 July - 2021

ICSETI - 2021 Page 1
International
Conference on
Science, Engineering &
Technological
InnovationS
(ICSETI – 2021)
10 & 11 July, 2021 Bangkok, Thailand
Conference Special Issue - 27
The Managing Editor:
Dr. Chirag M. Patel
( Research Culture Society & Publication )
Jointly Organized By :
Automation, Computer Science and Technology
Department, Kryvyi Rih National University, Ukraine
Research Culture Society
and
Scientific Research Association

ICSETI - 2021 Page 2
International Conference
on
Science, Engineering & Technological Innovation
10 & 11 July, 2021
( Conference Proceedings – Special Issue )
Copyright © : The research work as a theory with other contents, images, tables, charts in full
papers are subject to copyright taken by Automation, Computer Science and Technology
Department, Kryvyi Rih National University, Ukraine ‘Research Culture Society’ and ‘Scientific
Research Association’, The Managing Editor, Co-editors and Authors of this Conference special
issue.
Disclaimer: The author/authors/contributors are solely responsible for the content, images,
theory, datasets of the papers compiled in this conference special issue. The opinions expressed
in our published works are those of the author(s)/contributors and does not reflect of our
publication house, publishers and editors, the publisher do not take responsibility for any
copyright claim and/or damage of property and/or any third parties claim in any matter. The
publication house and/or publisher is not responsible for any kind of typo-error, errors,
omissions, or claims for damages, including exemplary damages, arising out of use, inability to
use, or with regard to the accuracy or sufficiency of the information in the published work. The
publisher or editor does not take any responsibility for the same in any manner. No part of this
publication may be reproduced or transmitted in any form by any means, electronic or
mechanical, including photocopy, recording, or any information storage and retrieval system,
without permission in writing from the copyright owner.
Online / Imprint: Any product name, brand name or other such mark name in this book are
subjected to trademark or brand, or patent protection or registered trademark of their respective
holder. The use of product name, brand name, trademark name, common name and product
details and distractions etc., even without a particular marking in this work is no way to be
constructed to mean that such names may be regarded as unrestricted in respect of trademark
and brand protection legislation and could thus be used by anyone.
Published By:
INTERNATIONAL JOURNAL FOR INNOVATIVE RESEARCH IN MULTIDISCIPLINARY
FIELD (ISSN: 2455:0620)
Research Culture Society and Publication.
(Reg. International ISBN Books and ISSN Journals Publisher)
Email: [email protected] / [email protected]
WWW.IJIRMF.COM

ICSETI - 2021 Page 3
About the organizing Institutions:
Kryvyi Rih National University is one of the largest education
institutions of the central region of Ukraine for qualified personnel
training in metallurgical, mining, engineering and technological
specializations. Scientific subjects performed by the university aimed to
increasing the efficiency of production and control processes, power
saving and environmental protection.
Automation, Computer Science and Technology Department
ACST department trains specialists in computer science, automation and
computer-integrated technologies. The main educational and scientific
areas are: information support for decision making, , development and
implementation of process automation and mechatronics systems.
‘Research Culture Society’ is a Government Registered Scientific
Research organization. Society is working for research community at
National and International level to impart quality and non-profitable
services. Society has successfully organized 100+ conferences,
seminars, symposiums and other educational programmes at national
and international level in association with different educational
institutions.
Objectives of the International Conference :
Our main objective is to promote scientific and educational activities
towards the advancement of common citizen’s life by improving the theory and practice of various disciplines of science and engineering.
The aim of the conference is to provide an interaction stage for
researchers and practitioners from academia and industries to deal with
state-of-the-art advancement in their respective fields.

ICSETI - 2021 Page 4
KRIVIY RIH NATIONAL UNIVERSITY
Prof. Natalia Morkun
Head of Department of Automation,
Computer Sciences and Technologies
e-mail: [email protected]
MESSAGE
Dear Colleagues!!!
I am proud to be the part of Organizational Committee of two-day
International online “International Conference on Science, Engineering &
Technological Innovations - 2021”, jointly organized by ‘Research Culture
Society’, ‘Scientific Research Association’ and Department of Automation, Computer Sciences and Technologies, Krivyi Rih National University (10 & 11
July, 2021).
We have an exciting program at this conference that will allow participants to
reflect upon and celebrate their accomplishments, renew friendships and extend
networks, and jointly explore current and future research directions. I hope that all
participants will have a productive and fun‐filled time at this online conference.
I sincerely hope that this conference will deliberate and discuss all the
different facets of this exciting topic and come up with recommendations that will
lead to a better world.
I wish the conference great success.
Prof. Natalia Morkun

ICSETI - 2021 Page 5
Dr.C. M. Patel
Director, Research Culture Society.
Message
Dear Professional Colleagues.
I am happy that Automation, Computer Science and Technology
Department, Kryvyi Rih National University, Ukraine in collaboration with
‘Research Culture Society’ (Government Registered Scientific Research
organization, India) are organizing ‘International Conference on Business,
Management, Social and Economical Advancements’ during 10 & 11 July, 2021.
The aim of the conference is to provide an interaction stage for researchers,
practitioners from academia and industries to deal with state-of-the-art
advancement in their respective fields. The main objective is to promote scientific
and educational activities towards the advancement of common citizen’s life by improving the theory and practice of various disciplines of science and
engineering. Provide the delegates to share their new ideas and the application
experiences face to face.
I believe, this International Conference will help in redefining the strong
connection between science, engineering and technology students and
academicians from different institutions. An additional goal of this international
conference is to combine interests and scientific research related to basic, applied
and allied sciences, engineering and technology to interact with members within
and outside their own disciplines and to bring people closer for the benefit of the
scientific community worldwide.
My best wishes to the committee members, speakers and Participants of this
scientific conference.
Dr.C. M. Patel
Director, Research Culture Society.

ICSETI - 2021 Page 6
Conference Committee
Organizers – Conference Chair Members :
Prof. Natalia Morkun, (Ph.D), Head, Automation, Computer Science and Technology
Department, Kryvyi Rih National University, Ukraine
Dr.C. M. Patel, Director, Research Culture Society.
Advisory Members :
Irina Zavsegdashnyaya, (Ph.D), Associate professor, Automation, Computer Science and
Technology Department, Kryvyi Rih National University.
Klaus Dolle, Associate Professor, Dept. of Paper and Bio-process engineering, Trinity inst. of
sustainable energy and water system, College of Environment Science and Forestry, State
University of New York, New York.
Prof. Dr. Alireza Heidari, Full Distinguished Professor and Academic Tenure of Chemistry,
Director of the BioSpectroscopy Core Research Laboratory at Faculty of Chemistry, California
South University (CSU), Irvine, California, USA.
Session Chair / Reviewer Committee:
Vitalii Tron (Ph.D), Associate professor, Automation, Computer Science and Technology
Department, Kryvyi Rih National University.
Serhii Ruban, (Ph.D), Associate professor, Automation, Computer Science and Technology
Department, Kryvyi Rih National University.
Dr. Sudipta Das , Associate Professor. Dept of Electronics and Communication Engineering
IMPS College of Engineering and Technology, Malda, West Bengal, India
Dr. Amit Parikh, Professor & Principal, Mehsana Urban Institute of Sciences, Ganpat
University, Gujarat, India.
Dr. GHEORGHIU Răzvan Andrei, Assistant Professor, “Politehnica” University of Bucharest, Bucharest, Romania.
Dr. Rey S. Guevarra, Professor, College of Mathematics and Education, Technological
Institute of the Philippines, Phillippines.
Gianluigi de Gennaro , Research Fellow & Industrial Liaison officer, Department of Biology,
The University of Bari Aldo Moro, Bari, southern Italy.
Dr. Smruti Sohani, Associate Professor, Institute of Biological Science, SAGE University
Indore (M.P)

ICSETI - 2021 Page 7
Dr. S. Balakrishnan, Associate Professor, Sri Krishna College of Engg & Technology
(Autonomous), Coimbatore, India.
Dr. Sanjay Gaur, Associate Professor, Jaipur Engineering College & Research Center, Jaipur,
India.
Dr. Wunna Swe, Professor and Head, Electrical Power Engineering Department, Mandalay
Technological University, Patheingyi Township, Mandalay, Myanmar.
Dr. Gomaa, Assistant Professor, Basic Science department, Higher Institute of Engineering and
Technology, Borg Elarab Alexandria, Egypt.
Dr. P. Booma Devi , Christian College of Engineering and Technology, Oddanchatram,
Dindigul, India.
Dr. Pokkuluri Kiran Sree , Professor, Dept. of CSE, Sri Vishnu Engineering College for
Women, Bhimavaram, India.
Dr. Jessica Chocha, Assistant Professor, Bhauddin Science College, Junagadh, Gujarat, India
Keynote Speakers:
GAGIK SHMAVONYAN (Ph.D), Professor & Research Scientist, National Polytechnic
University of Armenia, Department of Microelectronics and Biomedical Devices, Yerevan,
ARMENIA Research Scientist, Institute for physical research (IPR), Solid state physics
Laboratory, NAS Armenia, Ashtarak-2, ARMENIA.
Dr. Amit Parikh, Professor & Principal, Mehsana Urban Institute of Sciences, Ganpat
University, Gujarat, India.
Dr. Shailesh Shah, Associate Professor, Faculty of Tech & Engineering, The Maharaja
Sayajirao University of Baroda., India
Dr. Sudhakar Umale, Head and Associate Professor, Mechanical Engineering Department,
Sardar Patel College of Engineering, Andheri (W), Mumbai, India
Dr. M. Narayani, Associate Professor & Vice Chancellor, Harvest University, Zambia, Africa.
Rania Lampou, STEM instructor and an ICT teacher trainer, the Greek Ministry of Education
- the Directorate of Educational Technology and Innovation, Greece.
Dr.Froilan D. Mobo, Associate Professor & Assistant Director, Department of Research and
Development, Assistant Unit Head for General Education Unit, College of Marine Engineering,
Philippine Merchant Marine Academy, Philippines.
Prof.Om Kumar Harsh , Honorary Pro-Chancellor (Additional) Glocal University, India and
Former V.C. Tantia University, India
Prof. Natalia Morkun, (Ph.D), Head, Automation, Computer Science and Technology
Department, Kryvyi Rih National University, Ukraine
Dr.C. M. Patel, Director, Research Culture Society.

ICSETI - 2021 Page 8
Irina Zavsegdashnyaya, (Ph.D), Associate professor, Automation, Computer Science and
Technology Department, Kryvyi Rih National University.
Vitalii Tron (Ph.D), Associate professor, Automation, Computer Science and Technology
Department, Kryvyi Rih National University.
Dr. Pokkuluri Kiran Sree , Professor, Dept. of CSE, Sri Vishnu Engineering College for
Women, Bhimavaram, India.
Dr. Sanjay Gaur, Associate Professor, Jaipur Engineering College & Research Center, Jaipur,
India.
*****

ICSETI - 2021 Page 9
INDEX
PAPER ID Table of Contents Page No.
a) About the organizing Institutions:
Objectives of the International Conference : 3
b) Message of Director, Management Institute, WULS, Poland 4
c) Message of Director, Research Culture Society. 5
d) Conference Committee 6
e) Keynote Speakers 7
f) Table of Contents 9-10
Paper Title & Author Name
ICSETI001
Understanding the Diffusion, Performance and Barriers of Biogas
Development --
Eng. K.J. Sirikumara and Dr. Shamsunnahar Khanam
11-31
ICSETI002 Copper(II) complexes with unsymmetrical Schiff base ligands --
Mohammed Murtuza and Shamshad Ahmad Khan 32-36
ICSETI003
Preliminary investigations on the current status and incidence rate
of cancer in Serchhip District of Mizoram, northeastern India. --
Lalramliana, C, Beihrosa Solo & Lalduhawma, L. P
37-42
ICSETI004
Studies on some mixed ligand metal complexes with 2,2′ -
bipyridine --
Anil Kumar Pandey and Kamlesh Kumar Singh
43-47
ICSETI005
Bacteriological Contamination of Water Sources of Goalpara District
of Assam, India, used for day to day household work -- Manjit
Choudhury
48-55
ICSETI006
Phytochemical Analysis of ANNONA MURICATA using High
Resonance Liquid Chromatography and Mass Spectroscopy --
Reena Michael, Dr. M.L.Joseph
56-74
ICSETI007
Triumphs in Healthcare Accelerated by Startup-Corporate Co-
Innovation --
Sruthi Kannan, Pooja Kulal
75-78
ICSETI008 Study of Economical Fluctuations of Baramati Fish Market --
Dr Gantaloo Uma S., Khilare Apurva D., Pawar Rajani S. 79-82
ICSETI009
Synthesis and characterization of Pd(II) complexes derived from
pyridine-2-carbaldehyde --
Aniket Verma and Shamshad Ahmad Khan
83-87
ICSETI010
Comparative Study of Image Steganography using LSB, HideSeek
and BPSC --
Ravinder Singh, Soumya Awasthi
88-94
ICSETI011
Clustering of miniature wind turbines to form an effective micro-
renewable energy system (MRES) --
P. P. Kumar, P. K. Sahithi, M. Talluri, N. Gedam and
S. Jayaraj
95-113

ICSETI - 2021 Page 10
ICSETI012
A REVIEW OF CRYPTOGRAPHIC TECHNIQUES IN SMART
GRID --
Jagdish Chandra Pandey and Mala Kalra
114-121
ICSETI013
PRIORITY BASED SIGNALLING SYSTEM FOR
AMBULANCES USING GPS, IOT AND CLOUD COMPUTING
--
Bhagyalaxmi S. Kullolli , Manvi Grover, Ayush
Choudhary
122-127
ICSETI014
USER ADOPTION OF AUGMENTED REALITY AND MIXED
REALITY IN THE MANUFACTURING INDUSTRY --
Dhaval Sahija
128-139
ICSETI015 SPATIAL CONTROL OF ULTRASONIC CLEANING --
Volodymyr Morkun, Olha Kravchenko 140-142
ICSETI016 AUTOMATED CONTROL OF THE CONVEYOR LINE USING
THE SIEMENS TIA PORTAL SOFTWARE --
Nazar Liashok, Antonina Tykhanska
143-150
ICSETI017 DEVELOPMENT OF A MOBILE APPLICATION TO
CONTROL THE PHYSICAL ACTIVITY OF FITNESS CLUB
VISITORS --
Olha Solodarenko, Iryna Zavsiehdashnia
151-156
ICSETI018 AUTOMATED ON-LINE CONTROL OF THE BELT
CONVEYOR USING THE TIA PORTAL DEVELOPMENT
ENVIRONMENT --
Violetta Dmytriieva, Michailo Tykhanskyi
157-164
ICSETI019 AUTOMATION OF WATER PUMPING PROCESS BY
PUMPING STATION WITH SOFTWARE DEVELOPMENT OF
S7-1200 CONTROLLER --
Nataly Kuzmenko, Liudmila Yefimenko
165-170
ICSETI020 Dark Matter and Dark Energy: How Dark are they actually? --
Dr. Ishita Ghosh 171-174
ICSETI021
Mathematical Modelling and analysis of VSI fed Induction motor
drive using PSIM software --
T. LAKSHMIBAI
175-182
***

INTERNATIONAL JOURNAL FOR INNOVATIVE RESEARCH IN MULTIDISCIPLINARY FIELD, ISSN: 2455-0620, Special Issue : 27, July-2021
Monthly, Peer-Reviewed, Refereed, Indexed Journal with IC Value: 86.87 Impact Factor: 6.719 Publication Date: 31/07/2021
Available online on - www.ijirmf.com Page 11
International Conference on
Science, Engineering & Technological Innovations 10 & 11 July, 2021 Bangkok, Thailand
Jointly organized by: Automation, Computer Science and Technology Department, Kryvyi Rih National
University, Ukraine. ‘Research Culture Society’ and ‘Scientific Research Association’.
Understanding the Diffusion, Performance and Barriers of
Biogas Development
Eng. K.J. Sirikumara1# and Dr. Shamsunnahar Khanam2 1South Asian Regional Standards Organization (SARSO)
2Bangladesh University of Professionals (BUP)
# Correspondence Email - [email protected] Abstract: The major attempt of this paper is to understand the diffusion, performance and barriers
of biogas development. Biogas has the potential to be a significant alternative renewable energy
source for long-term development of the energy sector. The performance and barriers of existing
biogas digesters must be evaluated in order for the biogas program to be successful and sustainable.
A household level survey was conducted to better understand the diffusion, performance and
barriers of the family size biogas plant in Manikganj and Gazipur District in Bangladesh.
Observation, interviews, a qualitative survey, and a review of various studies and reports were used
to gather information. The high cost of investment, the process being considered complicated,
unwillingness to manage the anaerobic digester plant such as filling cow dung and poultry litter on
a daily basis, underfeeding, improper water mixing, irregular feeding, unsupervised biogas plants,
limited availability of supporting technology such as biogas stoves, and limited availability of biogas
technician are among the barriers found. Knowledge of these barriers could be used to continue
designing the method of dissemination as well as pattern/model of biogas development and
application in the community to ensure its acceptance and sustainability. Study findings suggest that
biogas is actually needed by the community in which the study was performed, if the cost is
reasonable, the operation is simple or non-complicated, availability of supporting technologies, and
if it is also supported by policy.
Key words: Biogas, Biogas survey, Anaerobic Digester plant, barriers.
1. INTRODUCTION: Bangladesh is agricultural based economy, and has abundant amount of cow dung and
poultry droppings available in the rural areas of Dhaka Division to generate biogas [1]. However, growth in the country’s biogas generation has been lacking-lustre despite plenty of resources are available [2], [3]. This discrepancy between abundant resources and paltry biogas production raises the questions about dissemination and barriers in biogas development in Bangladesh. From 1972 to 2007, around 25.000 biogas plants were existed all over Bangladesh in rural areas and educational institutes [4]. Animal dung from cattle, buffalo, goat, sheep, horse and poultry are mostly utilized feedstock/substrate for biogas plant installed in Bangladesh. So, one method of calculation of potential feedstock for Bangladesh on the basis of number of livestock. Table 1 summarize the Major livestock and biogas production potential in Bangladesh in 2013 [5].
INTERNATIONAL JOURNAL FOR INNOVATIVE RESEARCH IN MULTIDISCIPLINARY FIELD, ISSN: 2455-0620, Special Issue : 27, July-2021
Monthly, Peer-Reviewed, Refereed, Indexed Journal with IC Value: 86.87 Impact Factor: 6.719 Publication Date: 31/07/2021
Available online on - www.ijirmf.com Page 12
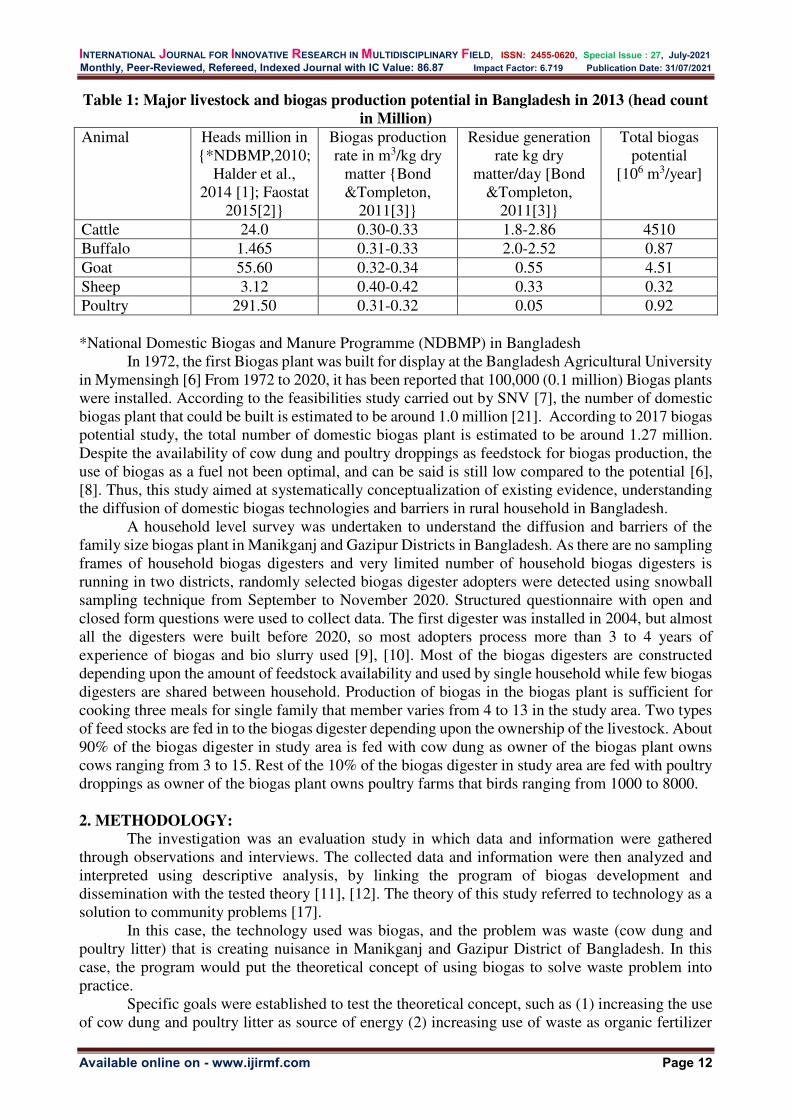
Table 1: Major livestock and biogas production potential in Bangladesh in 2013 (head count
in Million)
Animal Heads million in {*NDBMP,2010;
Halder et al., 2014 [1]; Faostat
2015[2]}
Biogas production rate in m3/kg dry
matter {Bond &Tompleton,
2011[3]}
Residue generation rate kg dry
matter/day [Bond &Tompleton,
2011[3]}
Total biogas potential
[106 m3/year]
Cattle 24.0 0.30-0.33 1.8-2.86 4510 Buffalo 1.465 0.31-0.33 2.0-2.52 0.87 Goat 55.60 0.32-0.34 0.55 4.51 Sheep 3.12 0.40-0.42 0.33 0.32 Poultry 291.50 0.31-0.32 0.05 0.92 *National Domestic Biogas and Manure Programme (NDBMP) in Bangladesh
In 1972, the first Biogas plant was built for display at the Bangladesh Agricultural University in Mymensingh [6] From 1972 to 2020, it has been reported that 100,000 (0.1 million) Biogas plants were installed. According to the feasibilities study carried out by SNV [7], the number of domestic biogas plant that could be built is estimated to be around 1.0 million [21]. According to 2017 biogas potential study, the total number of domestic biogas plant is estimated to be around 1.27 million. Despite the availability of cow dung and poultry droppings as feedstock for biogas production, the use of biogas as a fuel not been optimal, and can be said is still low compared to the potential [6], [8]. Thus, this study aimed at systematically conceptualization of existing evidence, understanding the diffusion of domestic biogas technologies and barriers in rural household in Bangladesh.
A household level survey was undertaken to understand the diffusion and barriers of the family size biogas plant in Manikganj and Gazipur Districts in Bangladesh. As there are no sampling frames of household biogas digesters and very limited number of household biogas digesters is running in two districts, randomly selected biogas digester adopters were detected using snowball sampling technique from September to November 2020. Structured questionnaire with open and closed form questions were used to collect data. The first digester was installed in 2004, but almost all the digesters were built before 2020, so most adopters process more than 3 to 4 years of experience of biogas and bio slurry used [9], [10]. Most of the biogas digesters are constructed depending upon the amount of feedstock availability and used by single household while few biogas digesters are shared between household. Production of biogas in the biogas plant is sufficient for cooking three meals for single family that member varies from 4 to 13 in the study area. Two types of feed stocks are fed in to the biogas digester depending upon the ownership of the livestock. About 90% of the biogas digester in study area is fed with cow dung as owner of the biogas plant owns cows ranging from 3 to 15. Rest of the 10% of the biogas digester in study area are fed with poultry droppings as owner of the biogas plant owns poultry farms that birds ranging from 1000 to 8000.
2. METHODOLOGY: The investigation was an evaluation study in which data and information were gathered
through observations and interviews. The collected data and information were then analyzed and interpreted using descriptive analysis, by linking the program of biogas development and dissemination with the tested theory [11], [12]. The theory of this study referred to technology as a solution to community problems [17].
In this case, the technology used was biogas, and the problem was waste (cow dung and poultry litter) that is creating nuisance in Manikganj and Gazipur District of Bangladesh. In this case, the program would put the theoretical concept of using biogas to solve waste problem into practice.
Specific goals were established to test the theoretical concept, such as (1) increasing the use of cow dung and poultry litter as source of energy (2) increasing use of waste as organic fertilizer
INTERNATIONAL JOURNAL FOR INNOVATIVE RESEARCH IN MULTIDISCIPLINARY FIELD, ISSN: 2455-0620, Special Issue : 27, July-2021
Monthly, Peer-Reviewed, Refereed, Indexed Journal with IC Value: 86.87 Impact Factor: 6.719 Publication Date: 31/07/2021
Available online on - www.ijirmf.com Page 13
(3) decreasing the amount of waste dumped into nearby water path, non-living pond and to the rivers (utilized the wastes rather than throwing it into the river) (4) reducing the fuel oil (kerosene) or LP Gas (non-renewable fuels) (5) changing the community’s waste management habits ( to find the suitable solution of cow dung and poultry litter which is creating nuisance in the Manikganj and Gazipur District ) The following goals can be seen in relation to the theoretical linkage: Goal 1: Increase the use of cow dung and poultry litter which is creating nuisance in Manikganj and Gazipur District as a source of energy by producing biogas Goal 2: Increase the use of organic fertilizer via waste processing as well as anaerobic digestion of cow dung and poultry litter
By achieving the first two goals, it would be able to accomplish Goal 3: decreasing the amount of waste dumped into nearby water path, pond and to the rivers (utilized the wastes rather than throwing it into the river), as well as Goal 4: reducing the fuel oil (kerosene) or LP Gas (non-renewable fuels). Long-term, it will also lead to Goal 5, which is to shift the community’s waste-management habits into more beneficial activities or products. The biogas dissemination would be considered a success if these goals were accomplished. If the biogas dissemination fails to meet the goals, an analysis will be conducted on the factors that become barriers to achieving the goals. The results of the analysis can then be used to improve the biogas programs or to plan similar initiative in other areas.
3. The Dissemination of biogas Until December 2020, the total number of officially recorded [18] biogas plants in
Bangladesh was 83431. Across the country, four agencies have installed biogas plants. Table 2 shows the respective agency and number of biogas plant constructed.
Table 2: Total officially recorded biogas plant in Bangladesh Agency Number
Infrastructure Development Company Limited (IDCOL) 57029 GIZ 1500 Bangladesh council for Scientific and Industrial Research(BCSIR) 24774 MODMR 128
Around four decades ago, Bangladesh’s Institute of Fuel Research and Development (IFRD)
embarked on a plan to develop biogas technology. After few years of research, the institute succeeded in developing a biogas technology in 1976. First, they invented a floating dome biogas plant that can provide gas for 3 to 5 years. The fixed dome model of biogas plant is now being used to ensure gas supply for at least for 30 years.
Biogas plant construction began in 1996 as part of the IFRD’s Biogas Pilot Plant Project, which was under the Bangladesh Council for Scientific and Industrial Research (BCSIR). It was estimated that installing a biogas plant with a daily production capacity of 100 cubic feet would cost Tk 14000. BCSIR has installed approximately 25000 biogas plant across the country.
Since 2006, Infrastructure Development Company Limited (IDCOL) has been implementing a biogas programme in Bangladesh with support from the World Bank, KfW Development Bank and SNV Netherlands Development Organization. Not only do biogas plants produce gas for cooking, but also organic fertilizer for crops and fish ponds. The program contributes to a reduction in the use of biomass, kerosene and LP Gas fuel for cooking. IDCOL has financed construction of over 57000 biogas plant across Bangladesh through its 38 partner organization until December 2020.
IDCOL finance biogas plant with daily gas production capacities ranging from 1.2m3 to 25.0 m3, allowing it to meet the demand of both domestic households and medium-sized dairy and poultry farms. Currently, IDCOL finances two models of biogas plants: brick-cement plants and prefabricated bio-digester plant [19].

INTERNATIONAL JOURNAL FOR INNOVATIVE RESEARCH IN MULTIDISCIPLINARY FIELD, ISSN: 2455-0620, Special Issue : 27, July-2021
Monthly, Peer-Reviewed, Refereed, Indexed Journal with IC Value: 86.87 Impact Factor: 6.719 Publication Date: 31/07/2021
Available online on - www.ijirmf.com Page 14
In this study, two districts in Dhaka Division, i.e. Gazipur District and Manikganj District became the study area where biogas was disseminated. In these two districts biogas was disseminated among the farmers who have cow sheds and poultry farms. Materials used for biogas production are namely cow dung and poultry liter.
It was observed during field visits that development of biogas in the study area was mainly targeted on household cooking. Biogas is used as an alternative to LP gas, kerosene and firewood in the study area. It will reduce the demand for firewood collection. It was learned during the study that before biogas was installed, cow dung and poultry litter was just discharged to nearby water pond or pit. Farmers shared their experienced that cow dung and poultry litter is used as fish feed. Further, cow dung also used as organic fertilizer in the study area.
After the installation of biogas digester, it was observed in most of the cases that dung production is greater than the demand of the biogas digester. The biogas development and dissemination of the study area was mostly promoted by government, above mentioned agencies and their partners and NGOs.
3.1 The dissemination of biogas in Manikganj District In Manikganj District, the study was conducted in different areas for evaluating biogas plants
that has been disseminated form 2000 to 2020 period. Minimum two cows per household were the study subject for cow dung based biogas plants. On the other hand, for poultry dropping based biogas digesters, study subjects were the farmers who also had at least 500 birds per household. Scope of the study based on the literature review of previous studies. Currently IDCOL has developed 616 household biogas plants in Manikganj District [20].
3.1.1 Moddo Singair of Singair upazila in Manikganj District There are about 20 biogas digesters with capacity 2.4 m3 from the program of Infrastructure
Development Company Limited (IDCOL) and private enterprises. Moddo Singair was a dairy farming area, with farmers owning between 3 to 16 cows. The biogas generated was used to cook meals, prepare cow feed, and boil water for the sterilization of cow nipples, which was done twice a day in the morning and evening. The main uses of biogas include cooking rice and dishes three times a day for four and half hours per day for one family, which required 1700 liters of biogas. The amount of biogas necessary to boil 10 liters of water twice a day was 1000 liters. The total biogas required per day was 2700 liters [13]. A digester with a capacity 2.4 m3 was considered adequate for the needs of a single family with four cows. The amount of cow dung available was approximately 105 to 160 kgs per day. The waste that was used for filling the digester was approximately 50 kgs with 25 kg of water every day as shown in Figure 1, so there was approximately 55 kgs of cow dung remains. Some of it was used for agricultural fertilizer by famers who worked both as cattle farmers and land farmers, and rest was dumped into nearby pond. Even though increasing the amount of cow dung charge in to the digester could increase biogas production, because the biogas requirement was only 2700 liters per day, they also limited the amount of cow dung put into the digester.
The biogas produced here can replace LPG as a fuel, with an average monthly consumption of one cylinder (of 12 kgs size LPG cylinder) per month. Price of one gas cylinder (in April and May 2021) was Taka 980, farmer can save Taka 12000 per year. As the total cost of constructing biogas plant varies from Taka 60000 to Taka 80000, payback period would be 5 to 6.5 years.

INTERNATIONAL JOURNAL FOR INNOVATIVE RESEARCH IN MULTIDISCIPLINARY FIELD, ISSN: 2455-0620, Special Issue : 27, July-2021
Monthly, Peer-Reviewed, Refereed, Indexed Journal with IC Value: 86.87 Impact Factor: 6.719 Publication Date: 31/07/2021
Available online on - www.ijirmf.com Page 15
Figure 1: Researcher observing gas manifold Figure 2: Biogas cooking Stove
Farmers actually consider the use of biogas to be blessing as shown in Figure 2, especially
given the scarcity of LPG. LPG is difficult to obtain during certain periods, such as Eid (Islamic holiday), because demand is high while supply is limited. Given this circumstance, the use of biogas has become more advantageous to the people.
3.1.2 Gonapara of Singair upazila in Manikganj District
There were only three farmers in Gonapara with 9, 11 and 14 cows and one farmer’s facility as shown in Figure 4, and twin digester as shown in Figure 3, with the capacity 4.8 m3. The digester was developed as part of governmental programme that began in 2014. The biogas generated was used to cook rice, dishes and heat the water. This digester provides biogas to two houses. Cooking time for a family of six was 2 hours per day and the amount of biogas consumed was 1500 liters. Cooking time for a family of three was 1 hour per day and the amount of biogas consumed was 1000 liters [14], [15]. The digester received three bucket of cow dung. Or 60 kg, every day with 25 kg of water. Each cow produced 10 kg of waste per day, for a total of 140 kg of cow waste per day. The waste that was not used for biogas was dried and sold for fertilizer every one month. Here plant outlet connects to the pond for fish feed. It is a good idea that they are getting benefit as the purpose of fish feed. The farmer could already feel the benefit, but it had not become a necessity due to income from cow milk.
Figure 3: Twin digester Figure 4: Cow shed of 14 cows
INTERNATIONAL JOURNAL FOR INNOVATIVE RESEARCH IN MULTIDISCIPLINARY FIELD, ISSN: 2455-0620, Special Issue : 27, July-2021
Monthly, Peer-Reviewed, Refereed, Indexed Journal with IC Value: 86.87 Impact Factor: 6.719 Publication Date: 31/07/2021
Available online on - www.ijirmf.com Page 16
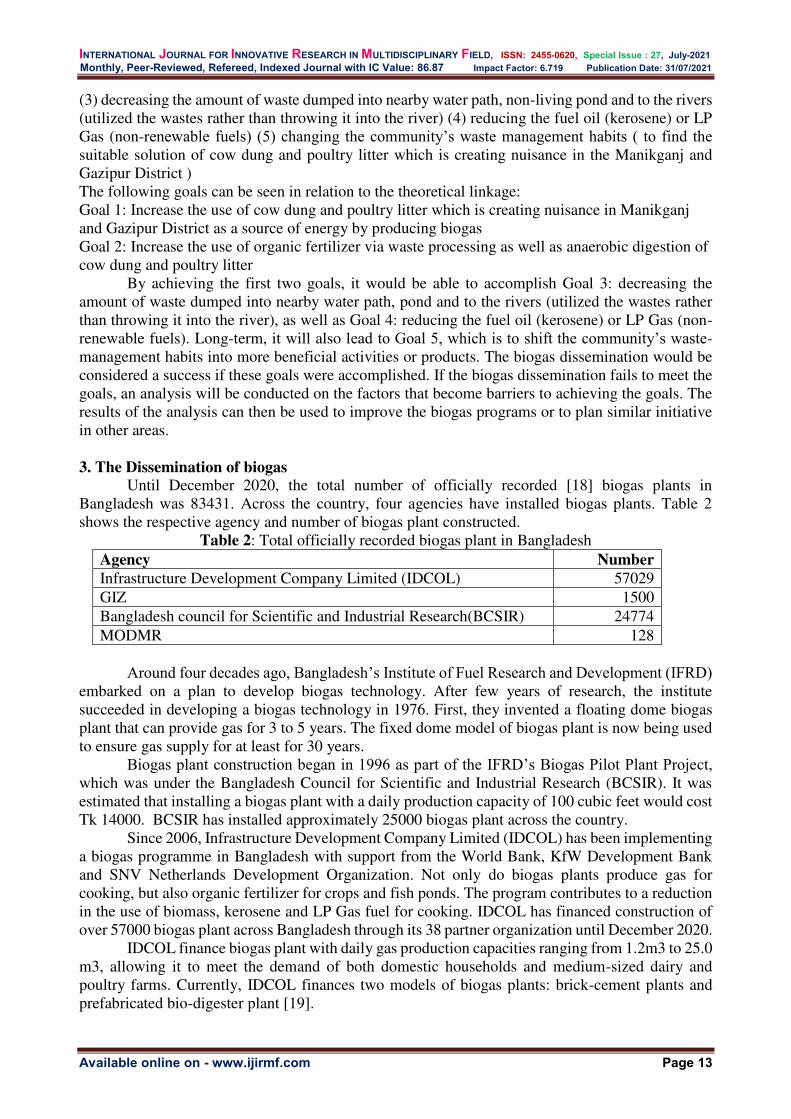
3.1.3 Boksor upazila in Manikganj District This is maintained by poultry farmer who had 1500 birds. As per the description written on
the wall of the inlet tank, this biogas plant was constructed by Bangladesh Council of Scientific and Industrial Research (BCSIR) in 2004 as shown in Figure 6. Biogas plant number is indicated as 51 and it was belongs to second phase as shown in Figure 5 and 8.
Figure 5: Description on the wall Figure 6: BCSIR biogas plant
Year ago, the digester was abandoned because stove using biogas was broken. After few
months, the poultry farmer sold all his poultry birds, changing his business form poultry farm to candle business, so this digester is no longer in use, but it is still in good condition. During the survey, Researcher was examining the content written on the wall of the inlet tank of the biogas plant. It is always a good practice that when each and every biogas plant is built to have a description on the wall of the inlet, dome or outlet wall so that post studies can be done easily to uplift the living condition of the community and planning National Biogas programmed etc.
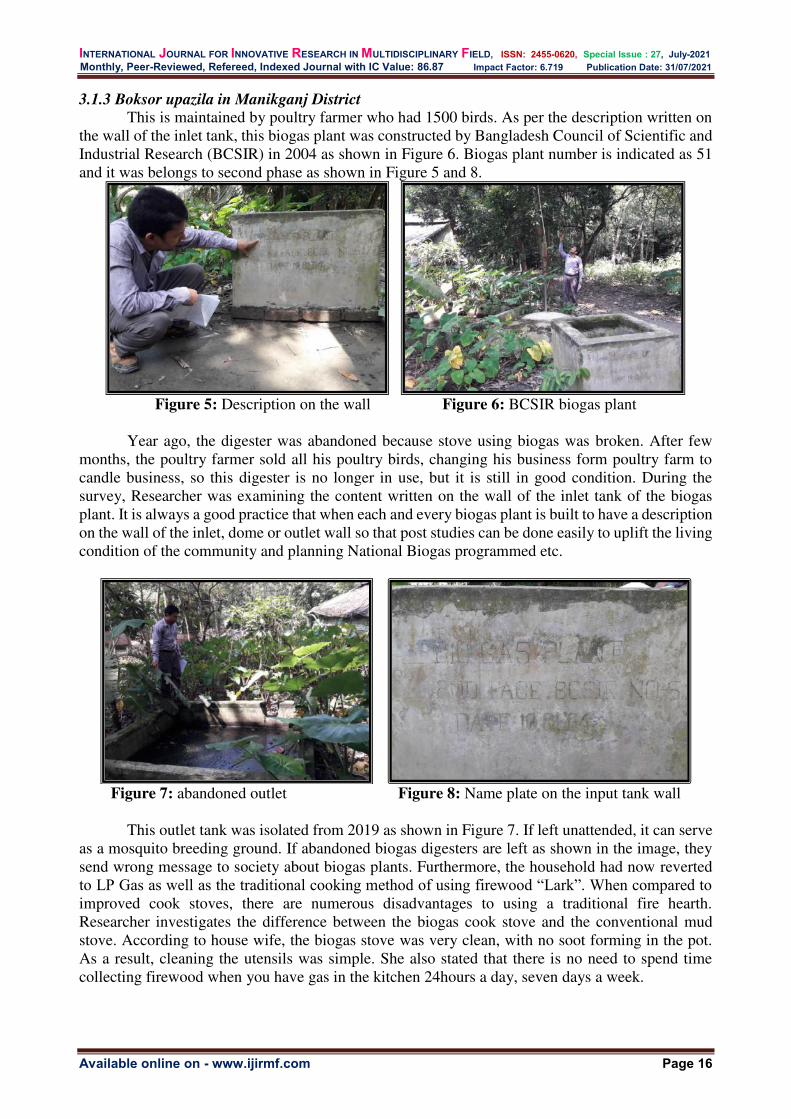
Figure 7: abandoned outlet Figure 8: Name plate on the input tank wall
This outlet tank was isolated from 2019 as shown in Figure 7. If left unattended, it can serve
as a mosquito breeding ground. If abandoned biogas digesters are left as shown in the image, they send wrong message to society about biogas plants. Furthermore, the household had now reverted to LP Gas as well as the traditional cooking method of using firewood “Lark”. When compared to improved cook stoves, there are numerous disadvantages to using a traditional fire hearth. Researcher investigates the difference between the biogas cook stove and the conventional mud stove. According to house wife, the biogas stove was very clean, with no soot forming in the pot. As a result, cleaning the utensils was simple. She also stated that there is no need to spend time collecting firewood when you have gas in the kitchen 24hours a day, seven days a week.
INTERNATIONAL JOURNAL FOR INNOVATIVE RESEARCH IN MULTIDISCIPLINARY FIELD, ISSN: 2455-0620, Special Issue : 27, July-2021
Monthly, Peer-Reviewed, Refereed, Indexed Journal with IC Value: 86.87 Impact Factor: 6.719 Publication Date: 31/07/2021
Available online on - www.ijirmf.com Page 17
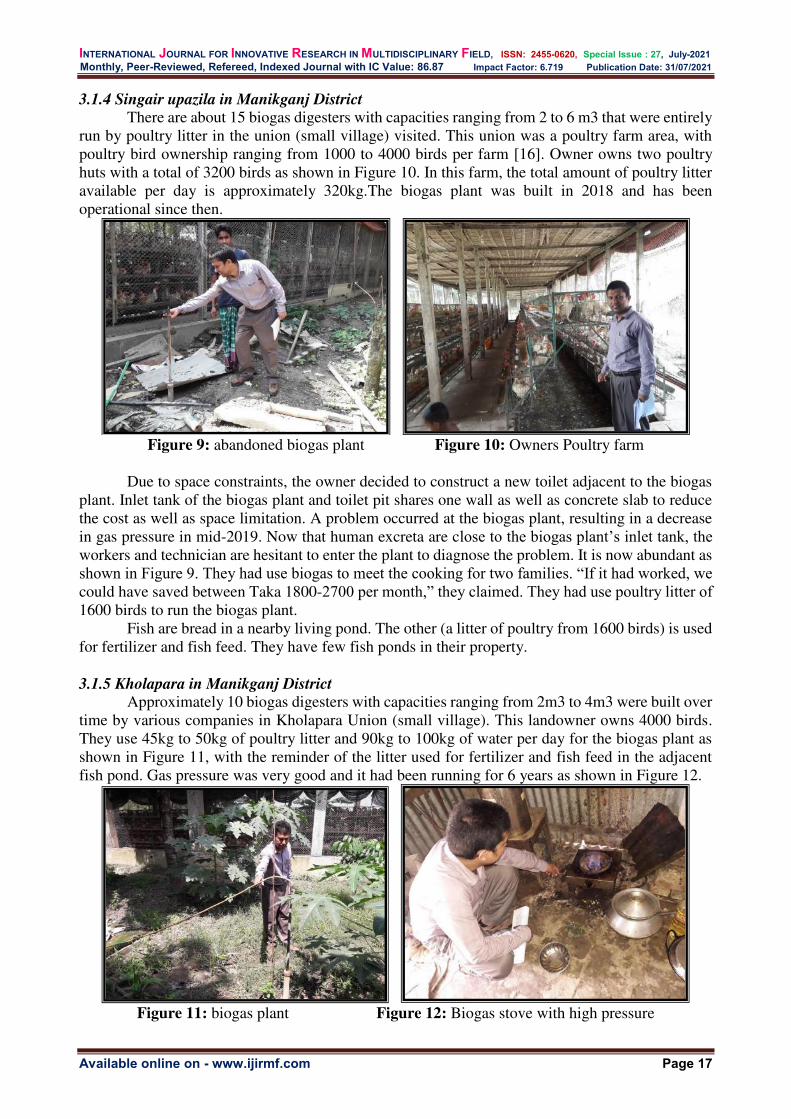
3.1.4 Singair upazila in Manikganj District There are about 15 biogas digesters with capacities ranging from 2 to 6 m3 that were entirely
run by poultry litter in the union (small village) visited. This union was a poultry farm area, with poultry bird ownership ranging from 1000 to 4000 birds per farm [16]. Owner owns two poultry huts with a total of 3200 birds as shown in Figure 10. In this farm, the total amount of poultry litter available per day is approximately 320kg.The biogas plant was built in 2018 and has been operational since then.
Figure 9: abandoned biogas plant Figure 10: Owners Poultry farm
Due to space constraints, the owner decided to construct a new toilet adjacent to the biogas
plant. Inlet tank of the biogas plant and toilet pit shares one wall as well as concrete slab to reduce the cost as well as space limitation. A problem occurred at the biogas plant, resulting in a decrease in gas pressure in mid-2019. Now that human excreta are close to the biogas plant’s inlet tank, the workers and technician are hesitant to enter the plant to diagnose the problem. It is now abundant as shown in Figure 9. They had use biogas to meet the cooking for two families. “If it had worked, we could have saved between Taka 1800-2700 per month,” they claimed. They had use poultry litter of 1600 birds to run the biogas plant.
Fish are bread in a nearby living pond. The other (a litter of poultry from 1600 birds) is used for fertilizer and fish feed. They have few fish ponds in their property.
3.1.5 Kholapara in Manikganj District Approximately 10 biogas digesters with capacities ranging from 2m3 to 4m3 were built over
time by various companies in Kholapara Union (small village). This landowner owns 4000 birds. They use 45kg to 50kg of poultry litter and 90kg to 100kg of water per day for the biogas plant as shown in Figure 11, with the reminder of the litter used for fertilizer and fish feed in the adjacent fish pond. Gas pressure was very good and it had been running for 6 years as shown in Figure 12.
Figure 11: biogas plant Figure 12: Biogas stove with high pressure
INTERNATIONAL JOURNAL FOR INNOVATIVE RESEARCH IN MULTIDISCIPLINARY FIELD, ISSN: 2455-0620, Special Issue : 27, July-2021
Monthly, Peer-Reviewed, Refereed, Indexed Journal with IC Value: 86.87 Impact Factor: 6.719 Publication Date: 31/07/2021
Available online on - www.ijirmf.com Page 18
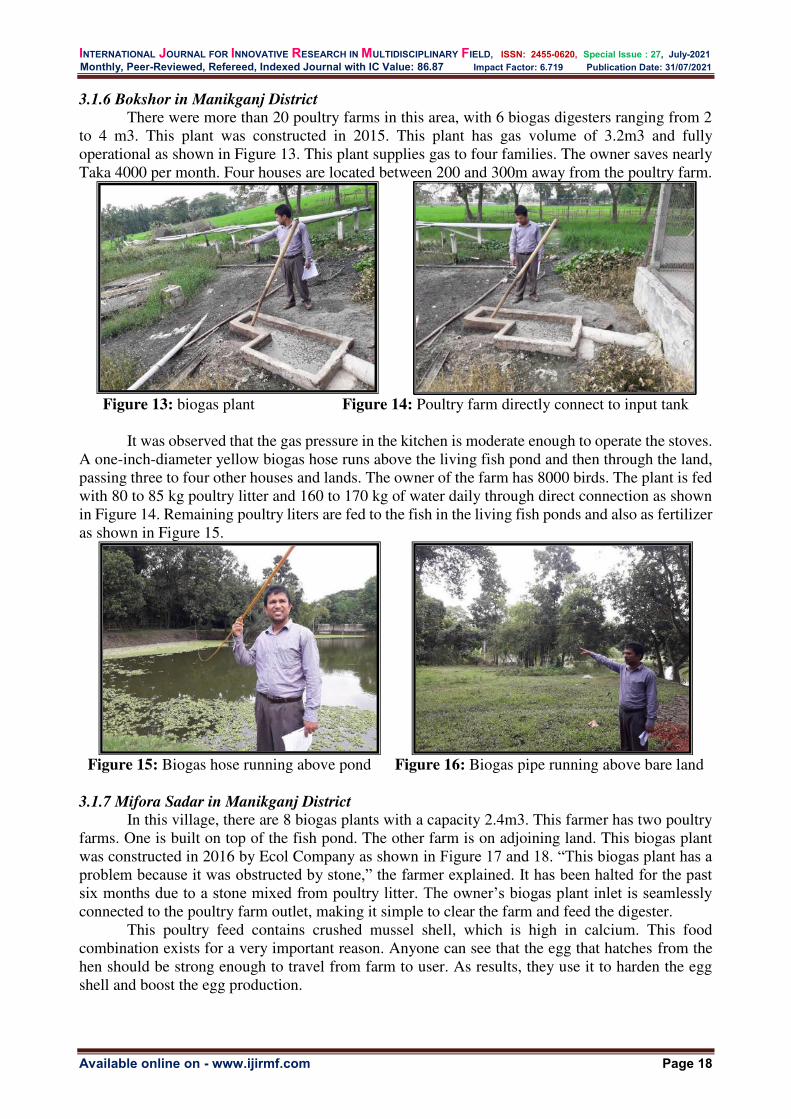
3.1.6 Bokshor in Manikganj District There were more than 20 poultry farms in this area, with 6 biogas digesters ranging from 2
to 4 m3. This plant was constructed in 2015. This plant has gas volume of 3.2m3 and fully operational as shown in Figure 13. This plant supplies gas to four families. The owner saves nearly Taka 4000 per month. Four houses are located between 200 and 300m away from the poultry farm.
Figure 13: biogas plant Figure 14: Poultry farm directly connect to input tank
It was observed that the gas pressure in the kitchen is moderate enough to operate the stoves.
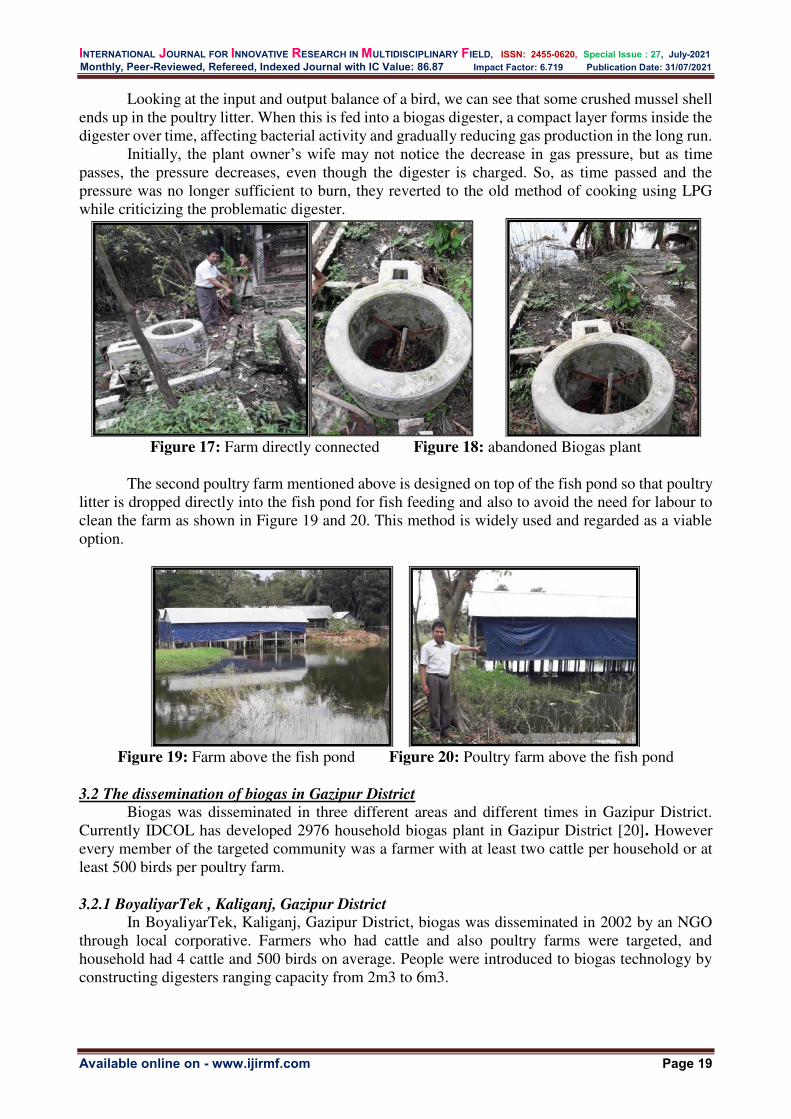
A one-inch-diameter yellow biogas hose runs above the living fish pond and then through the land, passing three to four other houses and lands. The owner of the farm has 8000 birds. The plant is fed with 80 to 85 kg poultry litter and 160 to 170 kg of water daily through direct connection as shown in Figure 14. Remaining poultry liters are fed to the fish in the living fish ponds and also as fertilizer as shown in Figure 15.
Figure 15: Biogas hose running above pond Figure 16: Biogas pipe running above bare land
3.1.7 Mifora Sadar in Manikganj District
In this village, there are 8 biogas plants with a capacity 2.4m3. This farmer has two poultry farms. One is built on top of the fish pond. The other farm is on adjoining land. This biogas plant was constructed in 2016 by Ecol Company as shown in Figure 17 and 18. “This biogas plant has a problem because it was obstructed by stone,” the farmer explained. It has been halted for the past six months due to a stone mixed from poultry litter. The owner’s biogas plant inlet is seamlessly connected to the poultry farm outlet, making it simple to clear the farm and feed the digester.
This poultry feed contains crushed mussel shell, which is high in calcium. This food combination exists for a very important reason. Anyone can see that the egg that hatches from the hen should be strong enough to travel from farm to user. As results, they use it to harden the egg shell and boost the egg production.
INTERNATIONAL JOURNAL FOR INNOVATIVE RESEARCH IN MULTIDISCIPLINARY FIELD, ISSN: 2455-0620, Special Issue : 27, July-2021
Monthly, Peer-Reviewed, Refereed, Indexed Journal with IC Value: 86.87 Impact Factor: 6.719 Publication Date: 31/07/2021
Available online on - www.ijirmf.com Page 19
Looking at the input and output balance of a bird, we can see that some crushed mussel shell ends up in the poultry litter. When this is fed into a biogas digester, a compact layer forms inside the digester over time, affecting bacterial activity and gradually reducing gas production in the long run.
Initially, the plant owner’s wife may not notice the decrease in gas pressure, but as time passes, the pressure decreases, even though the digester is charged. So, as time passed and the pressure was no longer sufficient to burn, they reverted to the old method of cooking using LPG while criticizing the problematic digester.
Figure 17: Farm directly connected Figure 18: abandoned Biogas plant
The second poultry farm mentioned above is designed on top of the fish pond so that poultry
litter is dropped directly into the fish pond for fish feeding and also to avoid the need for labour to clean the farm as shown in Figure 19 and 20. This method is widely used and regarded as a viable option.
Figure 19: Farm above the fish pond Figure 20: Poultry farm above the fish pond
3.2 The dissemination of biogas in Gazipur District
Biogas was disseminated in three different areas and different times in Gazipur District. Currently IDCOL has developed 2976 household biogas plant in Gazipur District [20]. However every member of the targeted community was a farmer with at least two cattle per household or at least 500 birds per poultry farm.
3.2.1 BoyaliyarTek , Kaliganj, Gazipur District
In BoyaliyarTek, Kaliganj, Gazipur District, biogas was disseminated in 2002 by an NGO through local corporative. Farmers who had cattle and also poultry farms were targeted, and household had 4 cattle and 500 birds on average. People were introduced to biogas technology by constructing digesters ranging capacity from 2m3 to 6m3.

INTERNATIONAL JOURNAL FOR INNOVATIVE RESEARCH IN MULTIDISCIPLINARY FIELD, ISSN: 2455-0620, Special Issue : 27, July-2021
Monthly, Peer-Reviewed, Refereed, Indexed Journal with IC Value: 86.87 Impact Factor: 6.719 Publication Date: 31/07/2021
Available online on - www.ijirmf.com Page 20
Figure 21: abandoned biogas plant Figure 22: abandoned biogas inlet
Biogas was used to boil 5 liters of water for sterilizing cow’s nipples twice a day, in the
morning and evening, using 600 liters of biogas. It was also used for cooking rice and dishes for about 3 hours per day, consuming 1700 liters of biogas per day. Before using biogas, they use LPG for cooking, and for these activities, they needed 6 LP gas cylinders, so they spent 2400 TAKA per month, by using biogas, they did not have to use TAKA on fuel.
The biogas was disseminated in 2002, but it was discontinued in 2017 as shown in Figure 21 and 22 due to people’s unwillingness to collect cow dung for the digester, because newly built cow shed in 2017 was far away from the digester. As a result, biogas production was low and insufficient for their daily needs, so digester was abandoned.
3.2.2 Jularpar, Ward 21,Gazipur District
Jularpur, Ward 21 was home to 55 dairy farmers and about 25 biogas plants were spread across three Upazilas. The digester as shown in Figure 23 and 24 were obtained through the Biogas program, which was funded by Grameen Shakti (GS), a non-governmental organization, in collaboration with the IDCOL. The total cost of construction of biogas plant in 2012 was Taka 55000. Grameen Shakti (GS) has contributed Taka 25000 and the owner has contributed the balance Taka 30000.
Figure 23: twin biogas plant Figure 24: biogas inlet supplies to two house
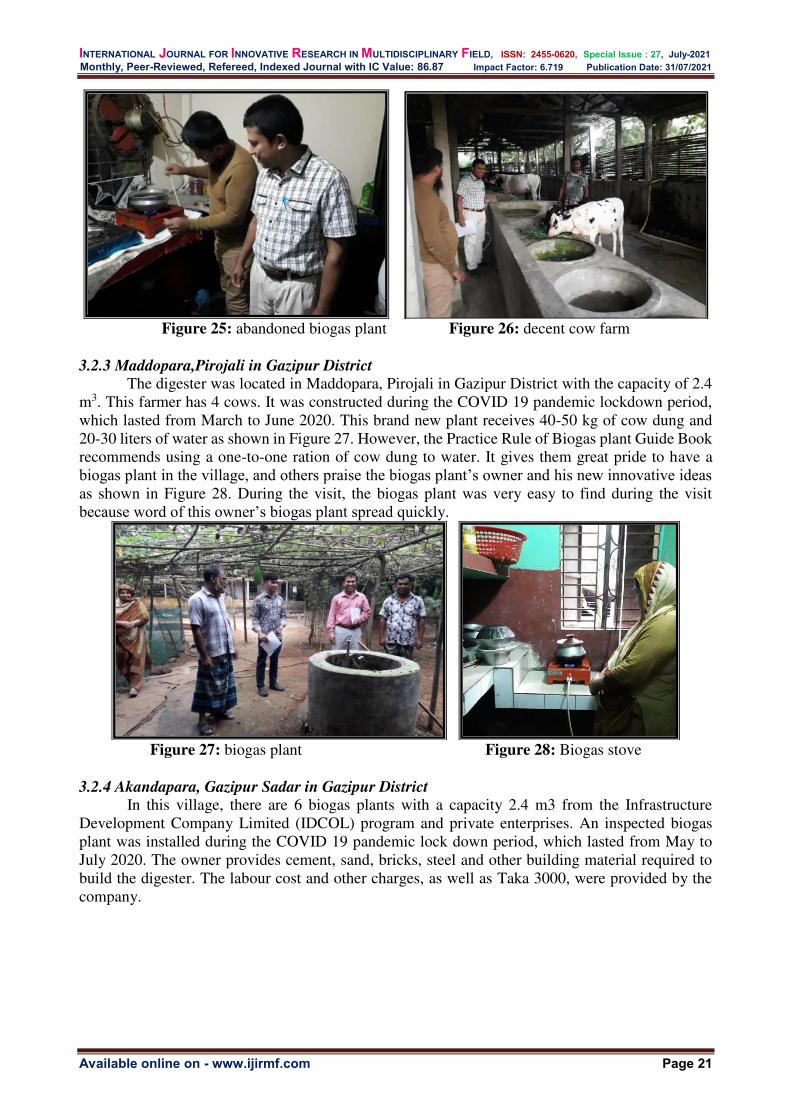
Five cows live on this farm as shown in Figure 26. These 5 cows provide 50 kg of cow dung
daily to the digester. Digester provides biogas for two families as shown in Figure 25. Prior to installing the digester, these two families used LP Gas, and each house required one LP Gas cylinder. A cylinder of LP Gas costs Taka 990. As a result, each family can save s nearly Taka 2000 per month.
INTERNATIONAL JOURNAL FOR INNOVATIVE RESEARCH IN MULTIDISCIPLINARY FIELD, ISSN: 2455-0620, Special Issue : 27, July-2021
Monthly, Peer-Reviewed, Refereed, Indexed Journal with IC Value: 86.87 Impact Factor: 6.719 Publication Date: 31/07/2021
Available online on - www.ijirmf.com Page 21
Figure 25: abandoned biogas plant Figure 26: decent cow farm
3.2.3 Maddopara,Pirojali in Gazipur District The digester was located in Maddopara, Pirojali in Gazipur District with the capacity of 2.4
m3. This farmer has 4 cows. It was constructed during the COVID 19 pandemic lockdown period, which lasted from March to June 2020. This brand new plant receives 40-50 kg of cow dung and 20-30 liters of water as shown in Figure 27. However, the Practice Rule of Biogas plant Guide Book recommends using a one-to-one ration of cow dung to water. It gives them great pride to have a biogas plant in the village, and others praise the biogas plant’s owner and his new innovative ideas as shown in Figure 28. During the visit, the biogas plant was very easy to find during the visit because word of this owner’s biogas plant spread quickly.
Figure 27: biogas plant Figure 28: Biogas stove
3.2.4 Akandapara, Gazipur Sadar in Gazipur District In this village, there are 6 biogas plants with a capacity 2.4 m3 from the Infrastructure
Development Company Limited (IDCOL) program and private enterprises. An inspected biogas plant was installed during the COVID 19 pandemic lock down period, which lasted from May to July 2020. The owner provides cement, sand, bricks, steel and other building material required to build the digester. The labour cost and other charges, as well as Taka 3000, were provided by the company.
INTERNATIONAL JOURNAL FOR INNOVATIVE RESEARCH IN MULTIDISCIPLINARY FIELD, ISSN: 2455-0620, Special Issue : 27, July-2021
Monthly, Peer-Reviewed, Refereed, Indexed Journal with IC Value: 86.87 Impact Factor: 6.719 Publication Date: 31/07/2021
Available online on - www.ijirmf.com Page 22
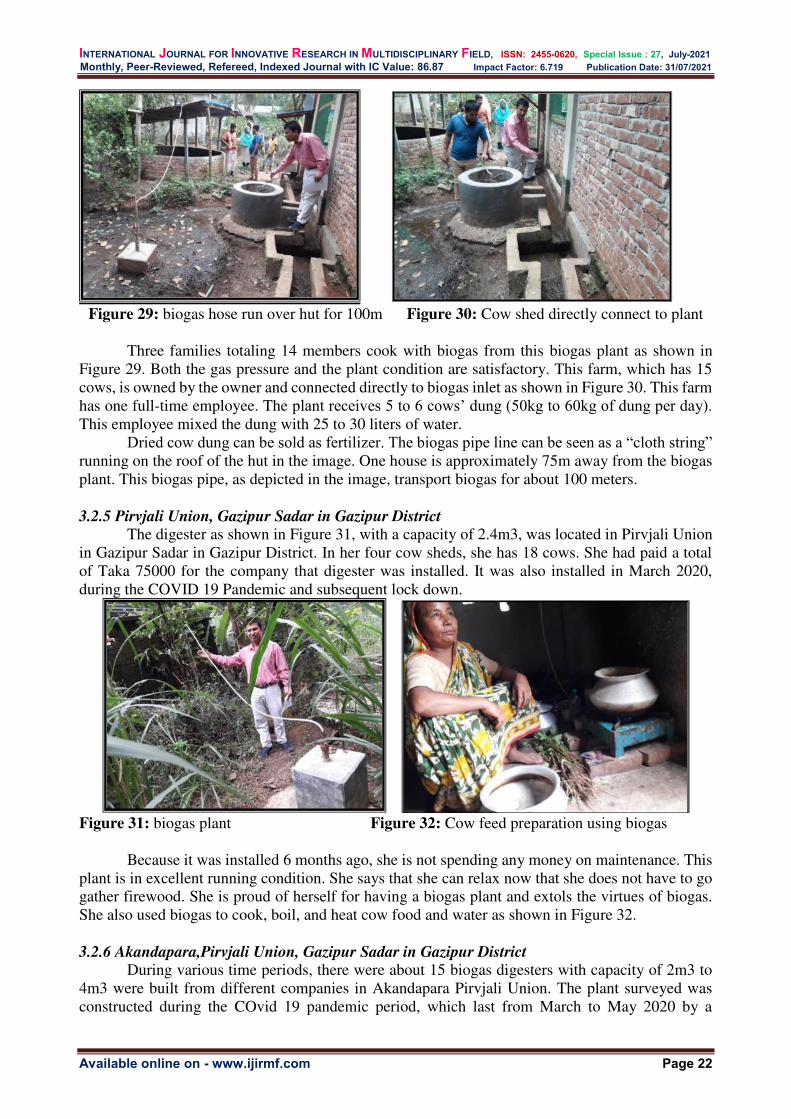
Figure 29: biogas hose run over hut for 100m Figure 30: Cow shed directly connect to plant
Three families totaling 14 members cook with biogas from this biogas plant as shown in
Figure 29. Both the gas pressure and the plant condition are satisfactory. This farm, which has 15 cows, is owned by the owner and connected directly to biogas inlet as shown in Figure 30. This farm has one full-time employee. The plant receives 5 to 6 cows’ dung (50kg to 60kg of dung per day). This employee mixed the dung with 25 to 30 liters of water.
Dried cow dung can be sold as fertilizer. The biogas pipe line can be seen as a “cloth string” running on the roof of the hut in the image. One house is approximately 75m away from the biogas plant. This biogas pipe, as depicted in the image, transport biogas for about 100 meters.
3.2.5 Pirvjali Union, Gazipur Sadar in Gazipur District
The digester as shown in Figure 31, with a capacity of 2.4m3, was located in Pirvjali Union in Gazipur Sadar in Gazipur District. In her four cow sheds, she has 18 cows. She had paid a total of Taka 75000 for the company that digester was installed. It was also installed in March 2020, during the COVID 19 Pandemic and subsequent lock down.
Figure 31: biogas plant Figure 32: Cow feed preparation using biogas
Because it was installed 6 months ago, she is not spending any money on maintenance. This plant is in excellent running condition. She says that she can relax now that she does not have to go gather firewood. She is proud of herself for having a biogas plant and extols the virtues of biogas. She also used biogas to cook, boil, and heat cow food and water as shown in Figure 32.
3.2.6 Akandapara,Pirvjali Union, Gazipur Sadar in Gazipur District
During various time periods, there were about 15 biogas digesters with capacity of 2m3 to 4m3 were built from different companies in Akandapara Pirvjali Union. The plant surveyed was constructed during the COvid 19 pandemic period, which last from March to May 2020 by a

INTERNATIONAL JOURNAL FOR INNOVATIVE RESEARCH IN MULTIDISCIPLINARY FIELD, ISSN: 2455-0620, Special Issue : 27, July-2021
Monthly, Peer-Reviewed, Refereed, Indexed Journal with IC Value: 86.87 Impact Factor: 6.719 Publication Date: 31/07/2021
Available online on - www.ijirmf.com Page 23
company called Samaj Unnayon Palli Sangstha (SDRS) as shown in Figure 33. This landowner owns a herd of 20 cows, however, for the biogas plant, he only uses the dung of 5 cows daily.
Figure 33: biogas plant Figure 34: one connection is stopped
The rest is simply dumped into a nearby pit as shown in Figure 35. According to him, the
owner charged 60kg of cow dung and 30 liter of water daily. Initially, the biogas plant provided gas for two houses as shown in Figure 34. However, because one house is approximately 100 meters from the digester and the pressure was insufficient, it was disconnected from that house and now only supplies gas to owners house only as shown in Figure 34.
Figure 35: Excess cow dung is released to nearby pit
4. The barriers of biogas dissemination:
According to the results of the evaluation of biogas dissemination in two districts in Dhaka Division, some have been accepted and used by the community, while others have been abandoned.
Table 3 shows that, in general, people who use biogas have reaped the benefits of using biogas. But on some occasions, it is not used or abandoned because it does not meet the needs of the people. Table 3 shows that all biogas was used for daily cooking. This is very beneficial because it can reduce dependency on fuel. However, in some locations, the development of biogas did not take into account the surrounding hygiene. Many digesters, for example, were built near cow sheds and poultry farm and houses because the cow shed and poultry farm are located next to the house. In terms of health, this condition does not support the hygiene of its surroundings; however, in term of accessibility, this condition supports the production and utilization of biogas.

INTERNATIONAL JOURNAL FOR INNOVATIVE RESEARCH IN MULTIDISCIPLINARY FIELD, ISSN: 2455-0620, Special Issue : 27, July-2021
Monthly, Peer-Reviewed, Refereed, Indexed Journal with IC Value: 86.87 Impact Factor: 6.719 Publication Date: 31/07/2021
Available online on - www.ijirmf.com Page 24
Table 3: The use of biogas and its barriers
Location Duration (Years)
Still use
Abandon
% For % Reasons Moddo-
Manikganj 8 100 Daily cooking & boiling
water for sterilization of cow’s nipples
Gonapora- Manikganj
6 100 Daily cooking
Boksor- Manikganj
1 100 Biogas stove was damaged and it was easy to get
LPG Singair
Upazila- Manikganj
2 100 It had been damaged because of construction of toilet over outlet
due to lack of space of land
owner. Kholapara - Manikganj
6 100 Daily cooking Bio gas pressure is too high
Boksor- Manikganj
5 100 Daily cooking Distance between biogas plant and
kitchen is 300-400 m. Stove is working well.
Mifora Sudar - Manikganj
6 months 100 According to owner inlet was blocked due to stone blocking
Boyaliyar Tex Kaligang -
Gazipur
3 100 The digester was too far from the cow shed. small
land holder reluctant to take
care digester Jularpor,word 21- Gazipur
8 100 Daily cooking and boiling water
Moddapara- Gazipur
(8 months)
100 Daily cooking gas presence is very good.
Akandapara- Gazipur
(6 months)
100 Daily cooking fired gas was too low, could not be
used to cook lunch.
Akandapara- Gazipur
(6 months)
100 Daily working Boiling water, cow food
preparation
Akhandapara- Gazipur
(6 months)
100 Daily working Initially it was connected to two houses. Due to low gas pressure one house is
disconnected
INTERNATIONAL JOURNAL FOR INNOVATIVE RESEARCH IN MULTIDISCIPLINARY FIELD, ISSN: 2455-0620, Special Issue : 27, July-2021
Monthly, Peer-Reviewed, Refereed, Indexed Journal with IC Value: 86.87 Impact Factor: 6.719 Publication Date: 31/07/2021
Available online on - www.ijirmf.com Page 25
In addition to biogas, the biogas process produces slurry, a mud-like material that can be used as organic fertilizer. However, as shown in Table 5, not everyone uses slurry for fertilizer. There were other options for this slurry such as fish feeding [3].
4.1 Potential Benefit available from Biogas digester in the study area
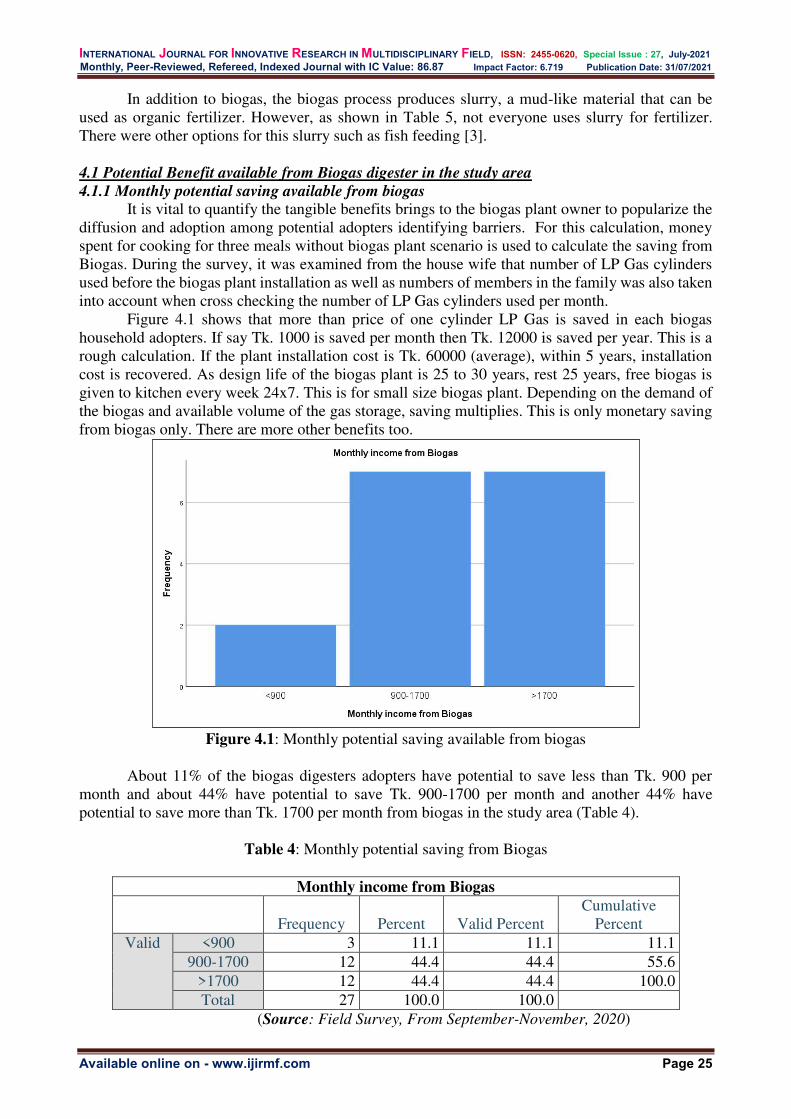
4.1.1 Monthly potential saving available from biogas It is vital to quantify the tangible benefits brings to the biogas plant owner to popularize the
diffusion and adoption among potential adopters identifying barriers. For this calculation, money spent for cooking for three meals without biogas plant scenario is used to calculate the saving from Biogas. During the survey, it was examined from the house wife that number of LP Gas cylinders used before the biogas plant installation as well as numbers of members in the family was also taken into account when cross checking the number of LP Gas cylinders used per month.
Figure 4.1 shows that more than price of one cylinder LP Gas is saved in each biogas household adopters. If say Tk. 1000 is saved per month then Tk. 12000 is saved per year. This is a rough calculation. If the plant installation cost is Tk. 60000 (average), within 5 years, installation cost is recovered. As design life of the biogas plant is 25 to 30 years, rest 25 years, free biogas is given to kitchen every week 24x7. This is for small size biogas plant. Depending on the demand of the biogas and available volume of the gas storage, saving multiplies. This is only monetary saving from biogas only. There are more other benefits too.
Figure 4.1: Monthly potential saving available from biogas
About 11% of the biogas digesters adopters have potential to save less than Tk. 900 per
month and about 44% have potential to save Tk. 900-1700 per month and another 44% have potential to save more than Tk. 1700 per month from biogas in the study area (Table 4).
Table 4: Monthly potential saving from Biogas
Monthly income from Biogas
Frequency Percent Valid Percent Cumulative
Percent Valid <900 3 11.1 11.1 11.1
900-1700 12 44.4 44.4 55.6 >1700 12 44.4 44.4 100.0 Total 27 100.0 100.0
(Source: Field Survey, From September-November, 2020)
INTERNATIONAL JOURNAL FOR INNOVATIVE RESEARCH IN MULTIDISCIPLINARY FIELD, ISSN: 2455-0620, Special Issue : 27, July-2021
Monthly, Peer-Reviewed, Refereed, Indexed Journal with IC Value: 86.87 Impact Factor: 6.719 Publication Date: 31/07/2021
Available online on - www.ijirmf.com Page 26
As per the observation and discussion with head of household, optimal yield thereby optimal income is not tapped due to various barriers. Those barriers are unsupervised biogas plants, underfeeding, improper water mixing and irregular feeding are also very common.
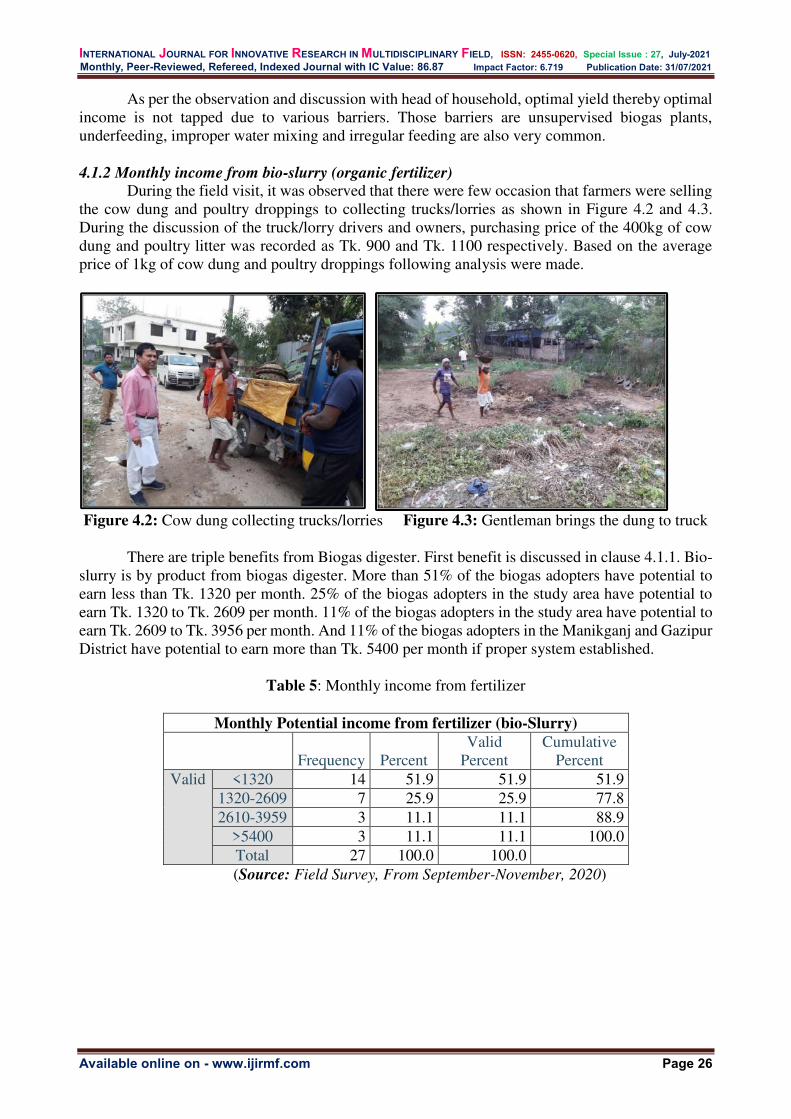
4.1.2 Monthly income from bio-slurry (organic fertilizer)
During the field visit, it was observed that there were few occasion that farmers were selling the cow dung and poultry droppings to collecting trucks/lorries as shown in Figure 4.2 and 4.3. During the discussion of the truck/lorry drivers and owners, purchasing price of the 400kg of cow dung and poultry litter was recorded as Tk. 900 and Tk. 1100 respectively. Based on the average price of 1kg of cow dung and poultry droppings following analysis were made.
Figure 4.2: Cow dung collecting trucks/lorries Figure 4.3: Gentleman brings the dung to truck
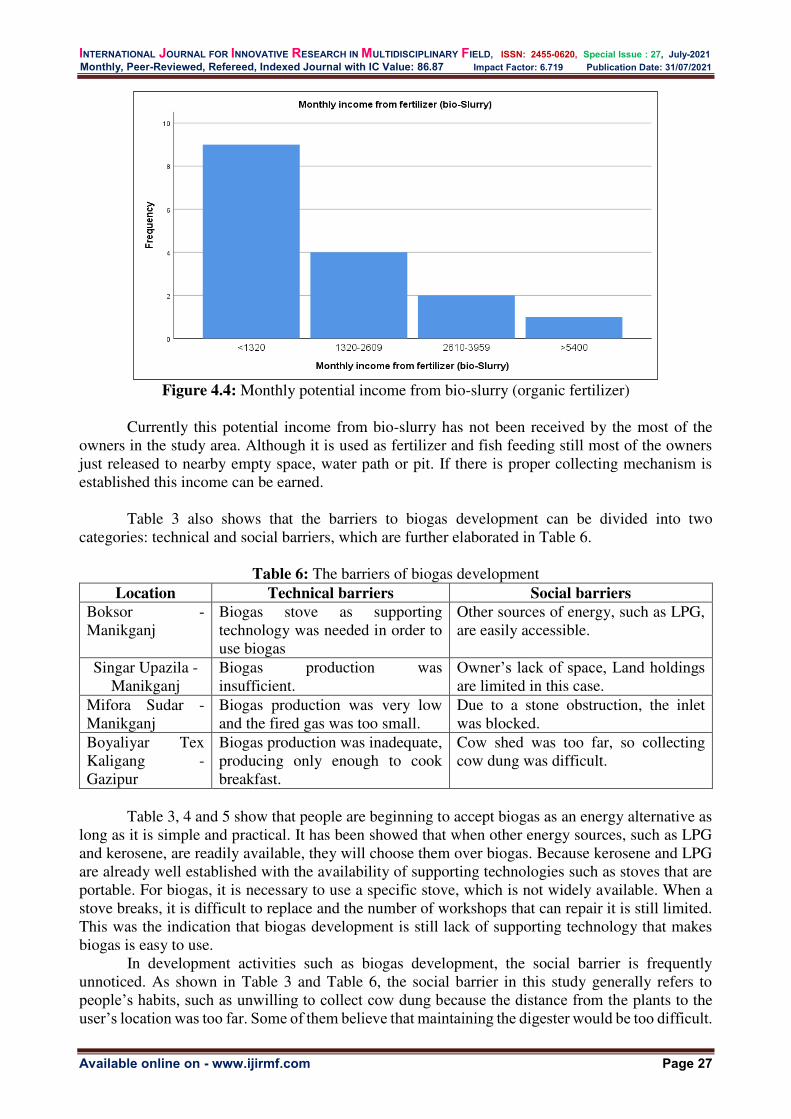
There are triple benefits from Biogas digester. First benefit is discussed in clause 4.1.1. Bio-
slurry is by product from biogas digester. More than 51% of the biogas adopters have potential to earn less than Tk. 1320 per month. 25% of the biogas adopters in the study area have potential to earn Tk. 1320 to Tk. 2609 per month. 11% of the biogas adopters in the study area have potential to earn Tk. 2609 to Tk. 3956 per month. And 11% of the biogas adopters in the Manikganj and Gazipur District have potential to earn more than Tk. 5400 per month if proper system established.
Table 5: Monthly income from fertilizer
Monthly Potential income from fertilizer (bio-Slurry)
Frequency Percent Valid
Percent Cumulative
Percent Valid <1320 14 51.9 51.9 51.9
1320-2609 7 25.9 25.9 77.8 2610-3959 3 11.1 11.1 88.9
>5400 3 11.1 11.1 100.0 Total 27 100.0 100.0 (Source: Field Survey, From September-November, 2020)
INTERNATIONAL JOURNAL FOR INNOVATIVE RESEARCH IN MULTIDISCIPLINARY FIELD, ISSN: 2455-0620, Special Issue : 27, July-2021
Monthly, Peer-Reviewed, Refereed, Indexed Journal with IC Value: 86.87 Impact Factor: 6.719 Publication Date: 31/07/2021
Available online on - www.ijirmf.com Page 27
Figure 4.4: Monthly potential income from bio-slurry (organic fertilizer)
Currently this potential income from bio-slurry has not been received by the most of the
owners in the study area. Although it is used as fertilizer and fish feeding still most of the owners just released to nearby empty space, water path or pit. If there is proper collecting mechanism is established this income can be earned.
Table 3 also shows that the barriers to biogas development can be divided into two
categories: technical and social barriers, which are further elaborated in Table 6.
Table 6: The barriers of biogas development Location Technical barriers Social barriers
Boksor - Manikganj
Biogas stove as supporting technology was needed in order to use biogas
Other sources of energy, such as LPG, are easily accessible.
Singar Upazila - Manikganj
Biogas production was insufficient.
Owner’s lack of space, Land holdings are limited in this case.
Mifora Sudar - Manikganj
Biogas production was very low and the fired gas was too small.
Due to a stone obstruction, the inlet was blocked.
Boyaliyar Tex Kaligang - Gazipur
Biogas production was inadequate, producing only enough to cook breakfast.
Cow shed was too far, so collecting cow dung was difficult.
Table 3, 4 and 5 show that people are beginning to accept biogas as an energy alternative as
long as it is simple and practical. It has been showed that when other energy sources, such as LPG and kerosene, are readily available, they will choose them over biogas. Because kerosene and LPG are already well established with the availability of supporting technologies such as stoves that are portable. For biogas, it is necessary to use a specific stove, which is not widely available. When a stove breaks, it is difficult to replace and the number of workshops that can repair it is still limited. This was the indication that biogas development is still lack of supporting technology that makes biogas is easy to use.
In development activities such as biogas development, the social barrier is frequently unnoticed. As shown in Table 3 and Table 6, the social barrier in this study generally refers to people’s habits, such as unwilling to collect cow dung because the distance from the plants to the user’s location was too far. Some of them believe that maintaining the digester would be too difficult.

INTERNATIONAL JOURNAL FOR INNOVATIVE RESEARCH IN MULTIDISCIPLINARY FIELD, ISSN: 2455-0620, Special Issue : 27, July-2021
Monthly, Peer-Reviewed, Refereed, Indexed Journal with IC Value: 86.87 Impact Factor: 6.719 Publication Date: 31/07/2021
Available online on - www.ijirmf.com Page 28
To maximize the biogas production, digester should be filled with cow dung twice a day, in the morning and evening, or at least once a day. Cow dung is mixed with water in a 1:1 ratio, and then stirred until homogeneous in inlet tank before being placed in to the digester. The digester should be filled with poultry litter once a day to maximize the production of poultry litter-based biogas. Before being placed in the digester, poultry litter should be mixed with water in a ratio 1:2 and stirred until homogeneous in the inlet tank.
Some people found these activities to be inconvenient. People in this area preferred energy that was both easy to obtain and practical to use, such as LPG or kerosene; if the stove broke, they could easily replace it. Figure 5.1 depicts the barriers to the widespread adoption of biogas technology. 5. DISCUSSION:
Table 3 and 6 shows that biogas dissemination in the community was attempted but not optimal. Figure 5.1 depicts the barriers in biogas dissemination in the study area. They only use biogas to meet their needs, which are not comparable to their potential. For example, one cow produce 20 kg of dung per day on average, whereas one family has 4-5 cows and produces approximately 100kg of dung per day.
They only use 60kg daily to fill the digester, leaving 40kg, or roughly 40 percent, unused. It was processed as fertilizer in some areas, but the vast majority of it was simply dumped into a ditch that ran directly into pond or river. These practices reveal that they were not aware of the environmental aspect of biogas development.
Figure 5.1: Chart of barriers in biogas dissemination in the study area
The material fed into the digester is responsible for the majority of the technical barriers
found in the study area. The quality of input material will have an impact on the biogas produced, but people are not too concern about it. The manner in which the cow dung is mixed with water, as well as proportion, is important, and some of the farmers and cattle breeders are reluctant to do so.
Availability of more practical
fuel
Low or unpro-
per inputs
Limited of
Lack of technical
awareness
Far cows
wastes
Limited supporti
ng technolo
gy
Limited
of skilled
technical workers
Habits
Lack of awarenes
s on environm
ental
issues
Lack of Training
and technica
l Assistan
ce
High Investment
cost
Low
production
Lack of supporting
technology
Social
Blazes
Low usage of Biogas Plant
Infective in Replacing Fuel
Energy: LPG and Kerosene
Ineffective in Reducing Environmental Effects: Water pollution and air
pollution

INTERNATIONAL JOURNAL FOR INNOVATIVE RESEARCH IN MULTIDISCIPLINARY FIELD, ISSN: 2455-0620, Special Issue : 27, July-2021
Monthly, Peer-Reviewed, Refereed, Indexed Journal with IC Value: 86.87 Impact Factor: 6.719 Publication Date: 31/07/2021
Available online on - www.ijirmf.com Page 29
This situation arose as a results of the general public’s lack of understanding of biogas technology. Aside from that, supporting technology, such as biogas stoves and biogas repair service are scarce.
Overall, biogas development and dissemination can be considered as successful because many people use it in their daily lives. People on the other hand, are still unaware of the goal of biogas development, triple benefits of biogas, which is related to energy alternative, sustainable environment protection and agricultural and farming support. When it comes to the goal of biogas program, it can be said that it is not entirely successful because it does not achieve all the goals.
Goal 1 and 4 have been partially met: People use biogas on a daily basis for cooking and boiling water, and some of them replace or reduce their use of fuel oil or gas. The amount of waste dumped into the nearby water path, pond and river was reduced by producing biogas.
When deciding which energy source to use if all types of energy are available and easy to obtain, they will chose the one that is easy to obtain, practical to use, and inexpensive, such as LPG and kerosene. In contrast to biogas, which is still in short supply, these two energy sources are well-established, with supporting technology such as stove. Furthermore, when the biogas stove breaks, they are unable to replace it, forcing them to discontinue using biogas.
In reference to Goal 2, not everyone in the study area are willing to process cow dung and poultry litter as fertilizer, because there are other alternatives that are thought to produce better results. As a result, they do not make fertilizer out of cow dung and poultry litter and don’t use slurry as fertilizer.
If this condition persists, the biogas program will be unable to meet Goal 2. People’s habit does not change even if the amount of cow dung and poultry litter thrown into nearby water path, pond and river decrease (Goal 3). The people continue to dump the remaining cow dung and poultry litter into nearby water path, pond and river, preventing goal 5 from being met. People are still failing to consider environmental concerns.
6. CONCLUSION AND RECOMMENDATIONS : 6.1 Conclusion
The following are the study’s conclusion on biogas development barriers: 1. A lack of understanding of the biogas technology creates technical barriers, specifically a reluctant to maintain the digester due to a lack of training and technical assistance.
2. People’s habits are a source of social barriers: a) Reluctant to charge the digester twice a day (morning and afternoon), especially in the
morning because they have so much activities to perform and filling the digester with cow dung is considered inconvenient early morning.
b) Despite the fact that biogas is produced in sufficient quantities for daily cooking, no motivation to expand, despite the fact that the potential is enormous.
c) Preference for easy-to-use energy technologies such as LPG and kerosene. d) Dumping the dung into water path or nearby pit still seems easier than process it for biogas.
This is evidenced by the lack of motivation to expand the digester. e) Because the community has yet to consider the environment in biogas development, dung is
still dumped into water path or river if it is not used for biogas production.
6.2 Recommendation
Theoretical concepts are not always in line with reality. Adjustments have to always be made with respect to condition of the location and the community. In this study, the concept of biogas development was carried out with the goal of conserving energy and protecting environment by utilizing waste to generate renewable energy, which will reduce air, water path, pond and river pollution while reducing the use of fossil fuel (non-renewable energy). For the reasons, implementation of biogas necessitates more than just a technology approach:
A policy that focuses not only on the financial aspects of biogas development by providing a subsidy. But also on other supporting facilities such as the availability of supporting

INTERNATIONAL JOURNAL FOR INNOVATIVE RESEARCH IN MULTIDISCIPLINARY FIELD, ISSN: 2455-0620, Special Issue : 27, July-2021
Monthly, Peer-Reviewed, Refereed, Indexed Journal with IC Value: 86.87 Impact Factor: 6.719 Publication Date: 31/07/2021
Available online on - www.ijirmf.com Page 30
technologies (e.g., biogas stoves, biogas stoves repairing centers), workshops/technicians capable of dealing with technical problems related to biogas technology, and personnel capable of handling biogas.
Environment policy that requires people to be constantly aware of their surroundings, such as not dumping cow manure and poultry litter into water path, nearby pond or river. There are currently no penalties for dumping cow manure and poultry litter into the water path, nearby pond or river, so the community is free to do so, though there is an appeal to refrain from doing so.
Intensive community outreach and support for the concept and development of biogas technology.
REFERENCES:
1. A. S. M. M. Hasan and J. Ammenberg, “Biogas potential from municipal and agricultural residual biomass for power generation in Hazaribagh, Bangladesh – A strategy to improve the energy system,” Renew. Energy Focus, vol. 29, 2019, doi: 10.1016/j.ref.2019.02.001.
2. T. Chowdhury et al., “Latest advancements on livestock waste management and biogas production: Bangladesh’s perspective,” Journal of Cleaner Production, vol. 272. 2020, doi: 10.1016/j.jclepro.2020.122818.
3. S. A. Sarker, S. Wang, K. M. M. Adnan, and M. N. Sattar, “Economic feasibility and determinants of biogas technology adoption: Evidence from Bangladesh,” Renew. Sustain.
Energy Rev., vol. 123, 2020, doi: 10.1016/j.rser.2020.109766. 4. M. Rofiqul Islam, M. Rabiul Islam, and M. Rafiqul Alam Beg, “Renewable energy resources
and technologies practice in Bangladesh,” Renewable and Sustainable Energy Reviews, vol. 12, no. 2. 2008, doi: 10.1016/j.rser.2006.07.003.
5. E. U. Khan and A. R. Martin, “Review of biogas digester technology in rural Bangladesh,” Renewable and Sustainable Energy Reviews, vol. 62. 2016, doi: 10.1016/j.rser.2016.04.044.
6. A. S. M. M. Hasan, M. A. Kabir, M. T. Hoq, M. T. Johansson, and P. Thollander, “Drivers and barriers to the implementation of biogas technologies in Bangladesh,” Biofuels, 2020, doi: 10.1080/17597269.2020.1841362.
7. SNV, “Domestic Biogas Newsletter,” Domestic Biogas Newsletter, 2010. 8. H. Kabir, R. N. Yegbemey, and S. Bauer, “Factors determinant of biogas adoption in
Bangladesh,” Renew. Sustain. Energy Rev., vol. 28, pp. 881–889, 2013, doi: https://doi.org/10.1016/j.rser.2013.08.046.
9. S. Salam, R. Parveen, S. M. Nasim Azad, and M. A. Salam, “Understanding the Performance of Domestic Biodigesters in Bangladesh: A Study from Household Level Survey,” Bus.
Manag. Stud., vol. 6, no. 2, 2020, doi: 10.11114/bms.v6i2.4869. 10. S. Salam, R. Parvin, M. A. Salam, and S. M. Nasim Azad, “Feasibility study for biogas
generation from household digesters in bangladesh: Evidence from a household level survey,” Int. J. Energy Econ. Policy, vol. 10, no. 4, 2020, doi: 10.32479/ijeep.9206.
11. S. Brandler and C. P. Roman, “The Responsible Conduct of Social Research,” in Handbook
of Research Methods in Public Administration, 2020. 12. M. Cox, “A basic guide for empirical environmental social science,” Ecol. Soc., vol. 20, no.
1, 2015, doi: 10.5751/ES-07400-200163. 13. K. M. Rahman, R. Woodard, E. Manzanares, and M. K. Harder, “An assessment of anaerobic
digestion capacity in Bangladesh,” Renewable and Sustainable Energy Reviews, vol. 32. 2014, doi: 10.1016/j.rser.2014.01.026.
14. K. M. Rahman, M. K. Harder, and R. Woodard, “Energy yield potentials from the anaerobic digestion of common animal manure in Bangladesh,” Energy Environ., vol. 29, no. 8, 2018, doi: 10.1177/0958305X18776614.
15. R. Sultana, M. Rahman, M. Yeasmin, S. Auyon, and M. Islam, “Present scenario of renewable energy sources in Mymensingh and Pabna districts,” Progress. Agric., vol. 29,

INTERNATIONAL JOURNAL FOR INNOVATIVE RESEARCH IN MULTIDISCIPLINARY FIELD, ISSN: 2455-0620, Special Issue : 27, July-2021
Monthly, Peer-Reviewed, Refereed, Indexed Journal with IC Value: 86.87 Impact Factor: 6.719 Publication Date: 31/07/2021
Available online on - www.ijirmf.com Page 31
no. 2, 2018, doi: 10.3329/pa.v29i2.38290. 16. K. A. Bhuiyan, K. F. Lqubal, and E. Hossain, “Poultry litter: a sustainable energy and
agricultural resource of Bangladesh,” Linnaeus Eco-Tech, 2007, doi: 10.15626/eco-tech.2007.033.
17. Sanders W B and Pinhey T K 1983 The Conduct of Social Research (New York: Holt, Rinehart and Winston)
18. SREDA, “National Database of Renewable Energy”, Sustainable and Renewable Energy Development Authority, Bangladesh, Last update: 2021/05/30, Available: http://www.renewableenergy.gov.bd/index.php?id=2&i=6 [Accessed 2021/04/25]
19. IDCOL, “Biogas and Bio-fertilizer, Renewable Energy, Projects and Programs”, Infrastructure Development Cooperation Limited, Bangladesh, Available: https://idcol.org/home/dbiogas [Accessed 2021/04/26]
20. IDCOL, “ IDCOL Biogas Construction under RE program”, Infrastructure Development Cooperation Limited, Bangladesh, Available: https://www.idcol.org/old/bd-map_biogas/bangladesh_map/index.php [Accessed 2021/04/26]
21. SNV, “Feasibility of a national programme on domestic biogas in Bangladesh”, Netherlands Development Organization, August 2005, Available:https://snv.org/cms/sites/default/files/explore/download/feasibility_study_of_domestic_biogas_in_bangladesh_-_2005.pdf [Accessed 2021/04/20]
Author 1: Eng. Kulasekara Jayantha Sirikumara graduated as a Mechanical Engineer from the University of Moratuwa in Sri Lanka in 2002. In 2018, he received his Master of Engineering in Energy Technology from the same university in Sri Lanka. He is currently pursuing a Doctor of Philosophy degree at Bangladesh University of Professional (BUP). Currently employed as a Director in the South Asian Regional Standards Organization (SARSO), a SAARC specialized body based in Dhaka, Bangladesh. He has previously presented 11 papers. He has over 18 years of experience in a variety of fields, including National and Regional Standardization.
Author 2: Dr. Shamsunnahar Khanam completed Bachelor Degree from University of Dhaka, Bangladesh. Completed Masters in Environmental Policy, Nagoya University, and PhD from Toyohashi University of Technology, Aichi, Japan. Worked as a Post-Doctoral Fellow at Malaysia-Japan International Institute of Technology, UTM, Malaysia. Also worked as a Visiting Research Fellow at University of Malaya, Malaysia. She is an Associate Professor and Chairman, Department of Environmental Science, Faculty of Science and Technology (FST), Bangladesh University of Professionals (BUP), Dhaka, Bangladesh. Since April 2016, she has serving at Bangladesh University of Professionals (BUP), Bangladesh.
INTERNATIONAL JOURNAL FOR INNOVATIVE RESEARCH IN MULTIDISCIPLINARY FIELD, ISSN: 2455-0620, Special Issue : 27, July-2021
Monthly, Peer-Reviewed, Refereed, Indexed Journal with IC Value: 86.87 Impact Factor: 6.719 Publication Date: 31/07/2021
Available online on - www.ijirmf.com Page 32
International Conference on
Science, Engineering & Technological Innovations 10 & 11 July, 2021 Bangkok, Thailand
Jointly organized by: Automation, Computer Science and Technology Department, Kryvyi Rih National
University, Ukraine. ‘Research Culture Society’ and ‘Scientific Research Association’.
Copper(II) complexes with unsymmetrical Schiff base ligands
Mohammed Murtuza1 and Shamshad Ahmad Khan2 1Research scholar, Department of chemistry, D.A.V.P.G. College, Siwan - 841226
(Jai Prakash University, Chapra) Bihar, India E-Mail - [email protected]
2Associate professor, Department of chemistry, D.A.V.P.G. College, Siwan - 841226 (Jai Prakash University, Chapra) Bihar, India
E-Mail - [email protected] Abstract: A new series of Cu(II) complexes with unsymmetrical tetradentate Schiff base ligands
derived from benzene-1,2-diamine, salicylaldehyde and substituted salicylaldehyde have been
prepared. The synthesized Schiff base ligands and their Cu(II) complexes were characterized by
elemental analysis, molar conductance, magnetic susceptibility measurements, solubility, infrared
and electronic spectral data. A very strong band at 1625cm-1 is characteristics of the azomethine
nitrogen present in the Schiff base ligand. This was shifted to 1610-1620 cm-1 in the complexes,
which indicates the coordination of the metal to the azomethine nitrogen. On the basis of FTIR and
electronic spectral data O and N donor atoms of the Schiff base ligands participated in coordination
with Cu (II) ion. The molar conductivity data of the complexes in DMF solution indicates they are
non-electrolytic nature. On the basis of elemental analysis, magnetic susceptibility and electronic
spectral data, geometry of complexes was proposed to be square planar.
Keywords: Benzene-1,2-diamine, salicylaldehyde, copper salt, DMF, DMSO.
1. INTRODUCTION: Schiff bases are typically formed by the condensation of carbonyl compounds with primary
amines and they were first reported by Hugo Schiff in 1864. Schiff bases of aliphatic aldehydes are relatively unstable and readily polymerizable, while those of aromatic aldehydes having effective conjugation are more stable in general, aldehydes react faster than ketones in condensation reactions, leading to the formation of Schiff bases as the reaction centre of aldehydes are less sterically hindered than that of ketones. The extra carbon of ketones donates electron density to the azomethine carbon and thus makes the ketone less electrophilic compared to aldehydes. Schiff bases are generally bidentate, tridentate, tetradentate and polydentate ligands capable of forming very stable complexes with transition metals1-5. They can only act as coordinating ligands if they bear a functional group, usually the hydroxyl, sufficiently near the site of condensation in such a way that a five or six membered ring can be formed when reaction with a metal ion. Schiff bases derived from aromatic amines and aromatic aldehydes have a wide variety of applications in many fields like biological, inorganic and analytical chemistry6-10. Schiff bases are used in optical and electrochemical sensors, as well as in various chromatographic methods to enable detection of enhanced selectivity and sensitivity. Schiff bases are widely applicable in analytical determination using reactions of condensation of primary amines and carbonyl compounds in which the azomethine bond is formed. Schiff base metal complexes have been widely studied because they have industrial, antifungal, antibacterial and anticancer applications11. Schiff base ligand containing

INTERNATIONAL JOURNAL FOR INNOVATIVE RESEARCH IN MULTIDISCIPLINARY FIELD, ISSN: 2455-0620, Special Issue : 27, July-2021
Monthly, Peer-Reviewed, Refereed, Indexed Journal with IC Value: 86.87 Impact Factor: 6.719 Publication Date: 31/07/2021
Available online on - www.ijirmf.com Page 33
nitrogen and oxygen donor atoms or electron donor functional groups are more interesting for metal complexes. Schiff base condensation gives better yield if performed in presence of metal ions due to its catalytic and organizational roles. Consequently, we in the present communication, are reporting on a novel series of copper (II) complexes with tetradentate Schiff base ligands derived from benzene-1,2-diamine, salicylaldehyde and substituted salicylaldehyde. 2. EXPERIMENTAL:
Materials and methods: All the reagents such as copper (II) salts, solvents, salicylaldehyde, orthophenylene diamine, DMF, DMSO were purchased commercially and used without any further purification. Suppliers were S Merck, CDH and Aldrich.
Physical measurements: Recrystallised samples were used for obtaining analytical data. Data for C, H and N were obtained from microanalytical laboratory C D R I, Lucknow. Infrared spectra in KBr discs were recorded on a Beckman 20 spectrophotometer. Conductivity measurements were made on a Systronics conductivity meter model 303 using DMSO as a solvent. Magnetic susceptibility was measured on a Guoy balance using Hg [Co (SCN)4]as the calibrant. Synthesis of Schiff base ligands (L1, L2 and L3): - Unsymmetrical tetradentate Schiff bases were prepared by two step processes. In the first step process 10 mmol of salicylaldehyde in 25 ml of ethanol. To this an ethanolic solution of 10 mmol of benzene-1,2-diamine was added and the resulting solution was refluxed for 3-4 h. On cooling the reaction mixture, crystalline solid was formed. The precipitate is washed with distilled water and ethanol several times and is then recrystallized with ethanol. In the second step process 10 mmol of resulting product obtained from stage first was added to 10 mmol of 5-methylsalicycaldehyde or 5-bromosalicycaldehyde or 5-methoxy salicylaldehyde in 25 ml ethanolic solution. The resulting solution was refluxed for 2-3 h. On cooling the reaction mixture, solid precipitates were obtained. The precipitates are washed with distilled water and ethanol several times and is then recrystallized with ethanol.
CHO
OH
H2N
H2N+
ethanol CH=N
OH
CHO
OH
R
R OH OH
CH N N CH
Fig-1 Structure of Schiff base ligands.
R = Br, CH3, O-CH3
Synthesis of the copper complexes:

INTERNATIONAL JOURNAL FOR INNOVATIVE RESEARCH IN MULTIDISCIPLINARY FIELD, ISSN: 2455-0620, Special Issue : 27, July-2021
Monthly, Peer-Reviewed, Refereed, Indexed Journal with IC Value: 86.87 Impact Factor: 6.719 Publication Date: 31/07/2021
Available online on - www.ijirmf.com Page 34
The unsymmetrical copper (II) complexes were prepared by refluxing appropriate amount of Cu (CH3COO) 2.H2O and the respective unsymmetrical tetradentate Schiff base ligands in ethanolic medium for 3-4 h. A little of sodium carbonate were added in drops to act as catalyst for the reaction. The solution was cooled at room temperature and was stirred for 20 min where by the precipitate of complexes appeared which were filtered on suction and washed with water and then with ethanol.
R O
CH N N CH
Cu
O
Fig-2. Proposed structure of copper (II) complexes.
R = Br, CH3, O-CH3
Table 1. Analytical data of Cu (II) complexes. Compounds Colour Elemental analysis found(calc) %
C H N M L1(C21 H18N2 O2)
Dark brown 76.31(76.36) 5.42(5.45) 8.39(8.48) ─
L2(C21 H18N2 O3)
Yellowish brown
72.80(72.83) 5.16(5.20) 8.02(8.08) ─
L3(C20 H15N2 O2 Br)
Orange 60.72(60.75) 3.77(3.79) 8.04(8.09) ─
[Cu(L1)] Dark brown 64.32(64.36) 4.03(4.09) 7.16(7.14) 16.17(16.21) [Cu(L2)] Red brown 61.79(61.84) 3.89(3.92) 6.78(6.87) 15.53(15.58) [Cu(L3)]
Brown
52.50(52.57) 2.79(2.84) 6.09(6.13) 13.89(13.91)
Table 2. Molar conductivity data copper complexes.
Compounds Molar mass Yield (%) Molar conductivity (S cm2 mol-1)
Schiff base(L1) 330 75 ─ Schiff base(L2) 346 70 ─ Schiff base(L3) 395 68 ─ [Cu(L1)] 391.5 90 7.9 [Cu(L2)] 407.5 91 8.2 [Cu(L3)] 456.5 90 10.4
Table 3. IR Spectra data of Schiff bases and their metal complexes.
Compounds 𝜈 (OH) cm-1
𝜈 (C=N) cm-
1 𝜈 (C-O) cm-1
𝜈(M-N) cm-1
𝜈 (M-O) cm-1
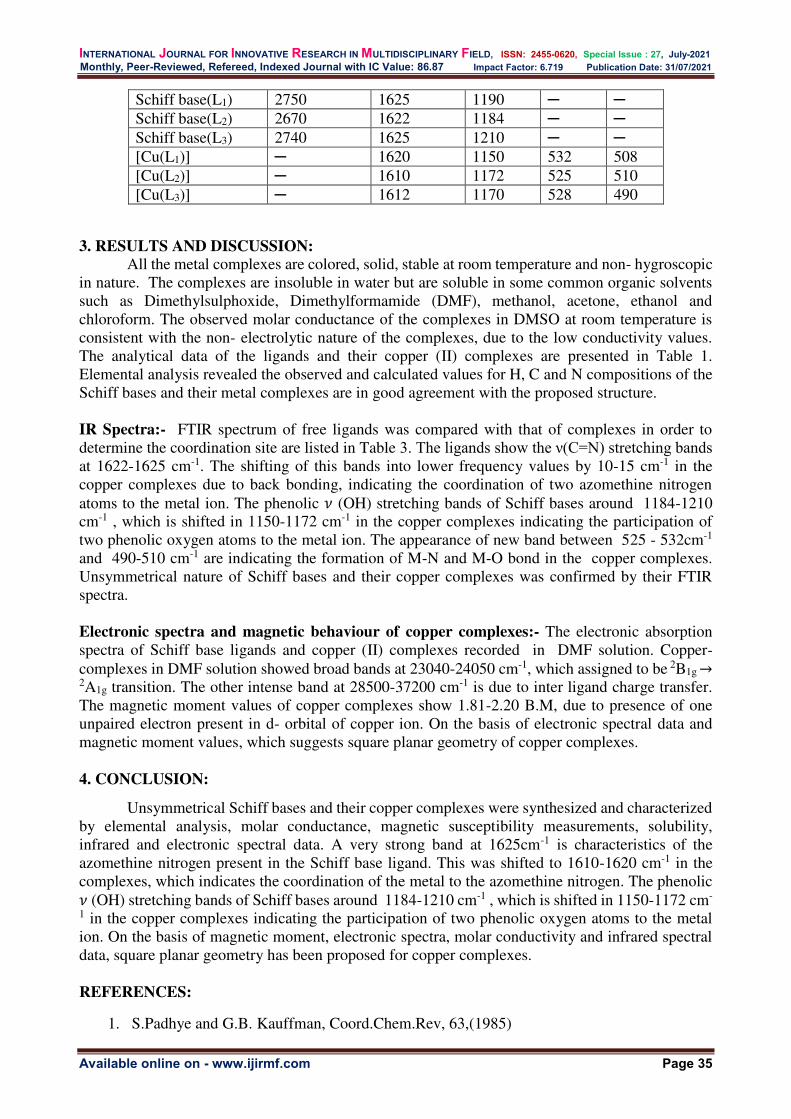
INTERNATIONAL JOURNAL FOR INNOVATIVE RESEARCH IN MULTIDISCIPLINARY FIELD, ISSN: 2455-0620, Special Issue : 27, July-2021
Monthly, Peer-Reviewed, Refereed, Indexed Journal with IC Value: 86.87 Impact Factor: 6.719 Publication Date: 31/07/2021
Available online on - www.ijirmf.com Page 35
3. RESULTS AND DISCUSSION: All the metal complexes are colored, solid, stable at room temperature and non- hygroscopic
in nature. The complexes are insoluble in water but are soluble in some common organic solvents such as Dimethylsulphoxide, Dimethylformamide (DMF), methanol, acetone, ethanol and chloroform. The observed molar conductance of the complexes in DMSO at room temperature is consistent with the non- electrolytic nature of the complexes, due to the low conductivity values. The analytical data of the ligands and their copper (II) complexes are presented in Table 1. Elemental analysis revealed the observed and calculated values for H, C and N compositions of the Schiff bases and their metal complexes are in good agreement with the proposed structure. IR Spectra:- FTIR spectrum of free ligands was compared with that of complexes in order to determine the coordination site are listed in Table 3. The ligands show the ν(C=N) stretching bands at 1622-1625 cm-1. The shifting of this bands into lower frequency values by 10-15 cm-1 in the copper complexes due to back bonding, indicating the coordination of two azomethine nitrogen atoms to the metal ion. The phenolic 𝜈 (OH) stretching bands of Schiff bases around 1184-1210 cm-1 , which is shifted in 1150-1172 cm-1 in the copper complexes indicating the participation of two phenolic oxygen atoms to the metal ion. The appearance of new band between 525 - 532cm-1 and 490-510 cm-1 are indicating the formation of M-N and M-O bond in the copper complexes. Unsymmetrical nature of Schiff bases and their copper complexes was confirmed by their FTIR spectra. Electronic spectra and magnetic behaviour of copper complexes:- The electronic absorption spectra of Schiff base ligands and copper (II) complexes recorded in DMF solution. Copper- complexes in DMF solution showed broad bands at 23040-24050 cm-1, which assigned to be 2B1g → 2A1g transition. The other intense band at 28500-37200 cm-1 is due to inter ligand charge transfer. The magnetic moment values of copper complexes show 1.81-2.20 B.M, due to presence of one unpaired electron present in d- orbital of copper ion. On the basis of electronic spectral data and magnetic moment values, which suggests square planar geometry of copper complexes. 4. CONCLUSION:
Unsymmetrical Schiff bases and their copper complexes were synthesized and characterized by elemental analysis, molar conductance, magnetic susceptibility measurements, solubility, infrared and electronic spectral data. A very strong band at 1625cm-1 is characteristics of the azomethine nitrogen present in the Schiff base ligand. This was shifted to 1610-1620 cm-1 in the complexes, which indicates the coordination of the metal to the azomethine nitrogen. The phenolic 𝜈 (OH) stretching bands of Schiff bases around 1184-1210 cm-1 , which is shifted in 1150-1172 cm-
1 in the copper complexes indicating the participation of two phenolic oxygen atoms to the metal ion. On the basis of magnetic moment, electronic spectra, molar conductivity and infrared spectral data, square planar geometry has been proposed for copper complexes.
REFERENCES:
1. S.Padhye and G.B. Kauffman, Coord.Chem.Rev, 63,(1985)
Schiff base(L1) 2750 1625 1190 ─ ─ Schiff base(L2) 2670 1622 1184 ─ ─ Schiff base(L3) 2740 1625 1210 ─ ─ [Cu(L1)] ─ 1620 1150 532 508 [Cu(L2)] ─ 1610 1172 525 510 [Cu(L3)] ─ 1612 1170 528 490

INTERNATIONAL JOURNAL FOR INNOVATIVE RESEARCH IN MULTIDISCIPLINARY FIELD, ISSN: 2455-0620, Special Issue : 27, July-2021
Monthly, Peer-Reviewed, Refereed, Indexed Journal with IC Value: 86.87 Impact Factor: 6.719 Publication Date: 31/07/2021
Available online on - www.ijirmf.com Page 36
2. S.R. Pattan, V.V.K Reddy, F.V. Manvi, B.G. Desai and A.R. Bhat, Indian J. Chem, 45B, 1778 (2006)
3. D.P. Gupta, S. Ahmad, A. Kumar and K. Shankar, India J. Chem. 27B, 1060 (1988) 4. B.K Singh et.al .E-J.Chem,9(2),532-544,(2012) 5. S.R. Pattan, V.V.K Reddy, F.V. Manvi, B.G. Desai and A.R. Bhat, Indian J. Chem, 45B,
1778 (2006) 6. A. Dinesh Karthik, K. Geetha Journal of Pharmaceutical Research, 2013 (147-154) 7. Fasina T.M and Ogundele Olorunfemi. Der Pharma Chemica,6(4),18-22(2014) 8. Amit Kumar and Priyanka. Wutan Huatan Jisuan Jish, X,459-463, (2020) 9. N.P Singh et.al. Asian J. Chem, 26(22),7515-7518,(2014) 10. Hanan Abd El-Latif Ibraheem. Journal of Al-Naharin Univ, 12(4), 1-6, (2009) 11. K.K Singh and S.A Khan. World. J. Pharma. Res, 10(2),1074-1082, (2021)
INTERNATIONAL JOURNAL FOR INNOVATIVE RESEARCH IN MULTIDISCIPLINARY FIELD, ISSN: 2455-0620, Special Issue : 27, July-2021
Monthly, Peer-Reviewed, Refereed, Indexed Journal with IC Value: 86.87 Impact Factor: 6.719 Publication Date: 31/07/2021
Available online on - www.ijirmf.com Page 37
International Conference on
Science, Engineering & Technological Innovations 10 & 11 July, 2021 Bangkok, Thailand
Jointly organized by: Automation, Computer Science and Technology Department, Kryvyi Rih National
University, Ukraine. ‘Research Culture Society’ and ‘Scientific Research Association’.
Preliminary investigations on the current status and incidence rate of
cancer in Serchhip District of Mizoram, northeastern India.
LALRAMLIANA, C1*, BEIHROSA SOLO2 & LALDUHAWMA, L. P3
1 School of Basic and applied Science, Apex Professional University, Pasighat, Arunachal Pradesh, India
E-mail: [email protected] 2 Department of Zoology, Govt. Serchhhip College, Serchhip, Mizoram, India, 796181
E-mail: [email protected] 3 Department of Mathematics, Pachhunga University College, Aizawl, Mizoram, India, 796001
E-mail: [email protected] Abstract : The present study highlighted the occurrence of 24 different types of cancer from 381
patients within Serchhip District of Mizoram, Northeastern India from 2015 to 2018. Cancer
remains one of the most common diseases in Serchhip District among the older people above 50
years during the study period. In the year 2015, a total of 114 people suffer from cancer and in
2016, 91 people suffer from the same disease. In the year 2017 and 2018, 97 and 79 people suffer
from cancer respectively. The most common type of cancer encountered in the study area is stomach
cancer which is 18.11% of the overall data followed by lung cancer which accounts to13.39%.
Breast cancer comes to 3rd with 9.45 % which is followed by oesophagus and cervix cancer with
7.87% and 7.09%. In terms of sex, 204 males suffer more from cancer as compare to 177 females
during the study period. The causes of cancer are diverse and many carcinogenic substances in
various forms are responsible for cell damage and abnormality leading to cancer.
Keywords: Cancer, Carcinogens, Serchhip, Mizoram.
1. INTRODUCTION:
Cancer is one of the most common diseases all over the world and its incidence rate is very high in the state of Mizoram. Cancer is characterized by uncontrolled growth of cells which leads to spread of abnormal cells (Garima et al. 2015). The causes and complexity of cancer are diverse and become increasingly difficult to ascertain. Carcinogenic compounds promote DNA damage and are responsible for causing cancer ((Garima et al. 2015). The free radicals formed in our body as a result of exposure to carcinogens assist in cell damage and normal functioning thereby leading to cancer formation. Many factors such as diet, lifestyle, obesity and pollutants are known to increase the risk of cancer in some cases (Anand et al.2008). The prevalence of cancer in Serchhip District, of Mizoram is also quite high and acted as one of the leading cause of death especially among the elders. Though the incidence of cancer is high in most of the common cases, not all types of cancer have the same prevalence as some which proved to be more common. Food habit as well as lifestyle plays an important role in the incidence of cancer as is evident from the interviews with the study groups of patience. Of the different cancer types, lung cancer is considered to be the most predominant and major cause of death among cancer patients (Ahmed et al., 2013). Smoking related cancer has been reported from Mizoram in recent years (Lalpawimawha & Lalruatfela B, 2016). Stomach cancer is also one of the leading cancer type and especially in Mizoram where the people standard of living is low and there is high intake of animal fat in food (Phukan et al.2006, Ghatak et

INTERNATIONAL JOURNAL FOR INNOVATIVE RESEARCH IN MULTIDISCIPLINARY FIELD, ISSN: 2455-0620, Special Issue : 27, July-2021
Monthly, Peer-Reviewed, Refereed, Indexed Journal with IC Value: 86.87 Impact Factor: 6.719 Publication Date: 31/07/2021
Available online on - www.ijirmf.com Page 38
al.2016). High age related incidence of stomach cancer cases have also been reported from the state of Mizoram despite other parts of the country showing lower result (Phukan et al. 2005). Tobacco related cancer is a common phenomena which has been reported in many parts of the country and different nations by several authors (Muwange R et al.2008, Jayelakshmi PA et al.2015, 2020, Siddiqi K et al.2020, Monika S et al.2020, Johnson N. 2020)
1.1 Study area Serchhip District is located between 23035’N and 230N latitude and between 92041’E and 93010’ E longitude. The district is bounded on the north and northwest by Aizawl District, on the west and south by Lunglei district, on the southeast by Myanmar, and on the east by Champhai District. The establishment of Serchhip District came into being on 15th September, 1998 from the existence of Rural Development Block. The District is located in the central of the state of Mizoram and the main occupation of the people of the District is largely agriculture and allied activities. Public establishments and private enterprises also act as the principal mechanism of production. Occupations such as subsistence cropping, animal husbandry, foraging, carpentry etc are the major second occupations in these towns. Small scale piggery and poultry farming are very popular in the small towns. The complexity of the urban economic structure influences the rural economy.
Fig: I. Serchhip District
2. METHODOLOGY The study was a hospital-based research and the information were collected from Mizoram
Population Based Cancer Registry (PBCR), Civil Hospital Aizawl, Mizoram. All the cancer data were based on hospitals diagnostic records. The study was taken from 2015-2018 within Serchhip district of Mizoram. Microsoft excel was used to compare the various parameters of cancer patients which includes the sex of patients, age group comparison and frequency of cancer occurrence in percentage.
3. RESULT AND DISCUSSION The study reported 24 different types of cancer from Serchhip district of Mizoram out of 381
cases which can be observed from the Tab: I. From the result highlighted stomach cancer turns out to be the most prevalent with 69 cases followed by lung cancer and breast cancer which 51 and 36 cases respectively. Cervical and oesophageal cancer are some of the more common cancer cases reported from the district during the study period.
Tab: I. Cancer types and total number of cases from Serchhip District of Mizoram, India
from 2015-2018
Sl.No Cancer type Year
2015 2016 2017 2018 TOTAL
1. Bone 2 4 4 1 11 2. Brain 3 4 2 1 10
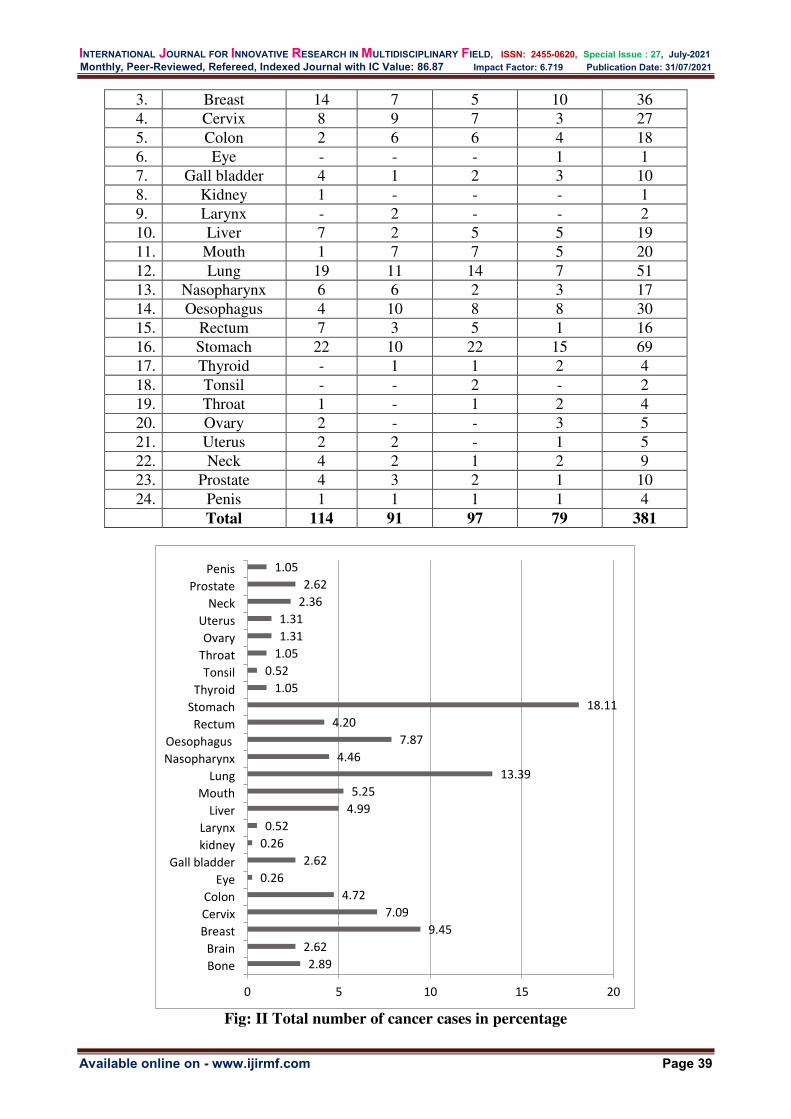
INTERNATIONAL JOURNAL FOR INNOVATIVE RESEARCH IN MULTIDISCIPLINARY FIELD, ISSN: 2455-0620, Special Issue : 27, July-2021
Monthly, Peer-Reviewed, Refereed, Indexed Journal with IC Value: 86.87 Impact Factor: 6.719 Publication Date: 31/07/2021
Available online on - www.ijirmf.com Page 39
3. Breast 14 7 5 10 36 4. Cervix 8 9 7 3 27 5. Colon 2 6 6 4 18 6. Eye - - - 1 1 7. Gall bladder 4 1 2 3 10 8. Kidney 1 - - - 1 9. Larynx - 2 - - 2 10. Liver 7 2 5 5 19 11. Mouth 1 7 7 5 20 12. Lung 19 11 14 7 51 13. Nasopharynx 6 6 2 3 17 14. Oesophagus 4 10 8 8 30 15. Rectum 7 3 5 1 16 16. Stomach 22 10 22 15 69 17. Thyroid - 1 1 2 4 18. Tonsil - - 2 - 2 19. Throat 1 - 1 2 4 20. Ovary 2 - - 3 5 21. Uterus 2 2 - 1 5 22. Neck 4 2 1 2 9 23. Prostate 4 3 2 1 10 24. Penis 1 1 1 1 4
Total 114 91 97 79 381
Fig: II Total number of cancer cases in percentage
2.89
2.62
9.45
7.09
4.72
0.26
2.62
0.26
0.52
4.99
5.25
13.39
4.46
7.87
4.20
18.11
1.05
0.52
1.05
1.31
1.31
2.36
2.62
1.05
0 5 10 15 20
Bone
Brain
Breast
Cervix
Colon
Eye
Gall bladder
kidney
Larynx
Liver
Mouth
Lung
Nasopharynx
Oesophagus
Rectum
Stomach
Thyroid
Tonsil
Throat
Ovary
Uterus
Neck
Prostate
Penis
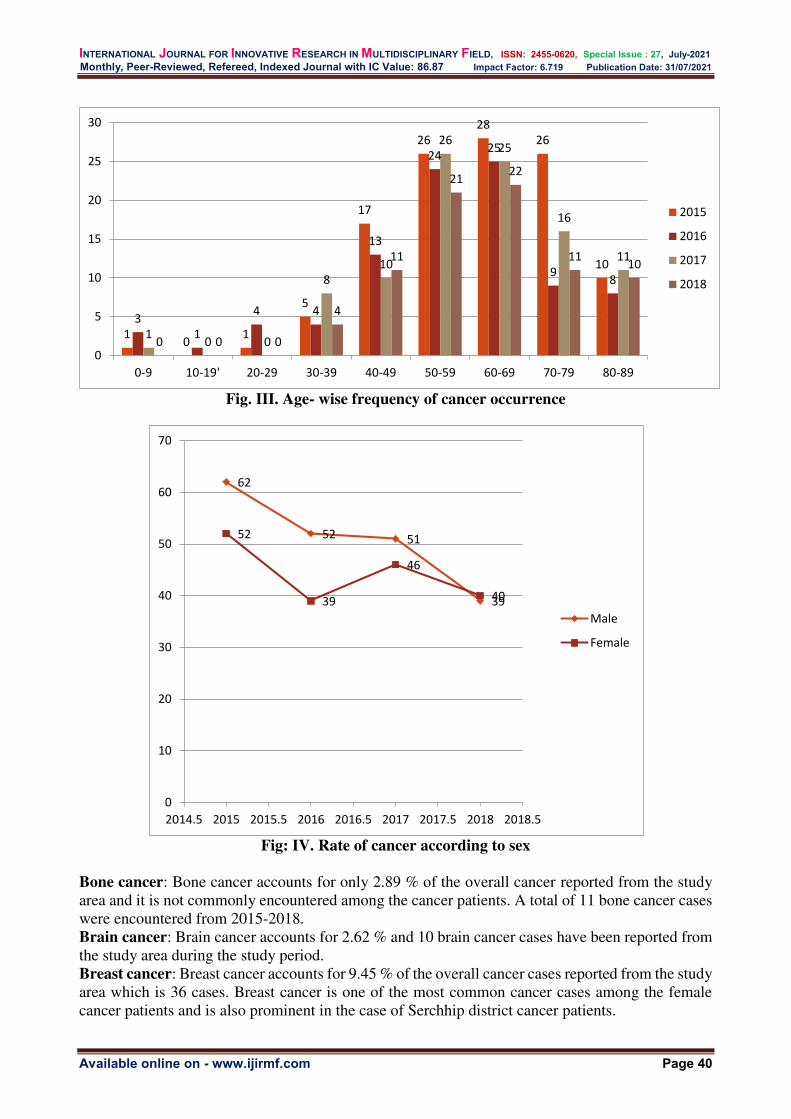
INTERNATIONAL JOURNAL FOR INNOVATIVE RESEARCH IN MULTIDISCIPLINARY FIELD, ISSN: 2455-0620, Special Issue : 27, July-2021
Monthly, Peer-Reviewed, Refereed, Indexed Journal with IC Value: 86.87 Impact Factor: 6.719 Publication Date: 31/07/2021
Available online on - www.ijirmf.com Page 40
Fig. III. Age- wise frequency of cancer occurrence
Fig: IV. Rate of cancer according to sex
Bone cancer: Bone cancer accounts for only 2.89 % of the overall cancer reported from the study area and it is not commonly encountered among the cancer patients. A total of 11 bone cancer cases were encountered from 2015-2018. Brain cancer: Brain cancer accounts for 2.62 % and 10 brain cancer cases have been reported from the study area during the study period. Breast cancer: Breast cancer accounts for 9.45 % of the overall cancer cases reported from the study area which is 36 cases. Breast cancer is one of the most common cancer cases among the female cancer patients and is also prominent in the case of Serchhip district cancer patients.
10
1
5
17
26
28
26
10
3
1
4 4
13
2425
98
10 0
8
10
2625
16
11
0 0 0
4
11
2122
1110
0
5
10
15
20
25
30
0-9 10-19' 20-29 30-39 40-49 50-59 60-69 70-79 80-89
2015
2016
2017
2018
62
52 51
39
52
39
46
40
0
10
20
30
40
50
60
70
2014.5 2015 2015.5 2016 2016.5 2017 2017.5 2018 2018.5
Male
Female

INTERNATIONAL JOURNAL FOR INNOVATIVE RESEARCH IN MULTIDISCIPLINARY FIELD, ISSN: 2455-0620, Special Issue : 27, July-2021
Monthly, Peer-Reviewed, Refereed, Indexed Journal with IC Value: 86.87 Impact Factor: 6.719 Publication Date: 31/07/2021
Available online on - www.ijirmf.com Page 41
Cervix cancer: Cervical cancer is also one of the common cases of cancer among the female cancer patients from Serchhip District and is 7.09 %. 27 cancer patients suffer from cervical cancer during the study period. Colon cancer: Colon cancer is common among the male and females and accounts for 4.72 % of the overall cancer cases reported. Eye cancer: Eye cancer is of rare occurrence from the study area and it accounts for only 0.26 %. Only 1 case has been reported from Serchhip district during the study period of 2015-2018 and is the least common cancer type reported from the study. Gall bladder cancer: Gall bladder cancer accounts for 2.62% of the overall cancer cases reported from the study area and a total of 10 cases have been reported during the study period. Kidney cancer: kidney cancer was of rare occurrence during the study period and only 1 case have been reported which is only 0.26% of the overall cancer cases reported from the study area. Larynx cancer: Larynx cancer is also of rare occurrence from the study area and only 2 cases have been reported during the study period which accounts to 0.52%. Liver cancer: Liver cancer is of common occurrence from the study area and a total of 19 cases have been reported during the study period which is 4.99% of the overall cancer cases reported. Mouth cancer: mouth cancer is one of the common type of cancer reported from the study area and 20 mouth cancer cases have been reported from the study area from 2015-2018 which accounts to 5.25% of the cancer cases reported. Lung cancer: Lung cancer is the most common type of cancer reported from Serchhip District during the study period from 2015-2018. 51 lung cancer cases have been reported from the study area which is 13.39% of the overall cancer cases and it remains one of the killer diseases encountered among the elderly people. Nasopharynx cancer: Nasopharynx cancer is also one of the common types of cancer reported from the study area and a total of 17 cases have been reported during the study period. Nasopharynx cancer accounts for 4.46% of the overall cancer cases reported. Oesophagus cancer: Oesophagus cancer is also one of the most common types of cancer with a total of 30 cases reported from the study area. Oesophagus cancer accounts for 7.87% and is commonly encountered among the male and females. Rectum cancer: Rectum cancer is also a common cancer type from the study area with 16 cases which is 4.20% of the overall cancer reported during the study period. Stomach cancer: stomach cancer is the no 1 rank with a total of 69 cases reported which accounts for 18.11% of the overall cancer cases reported from the study area from 2015 to 2018. The disease is common for both male and females and many factors can be attributed to the frequency of its occurrence. Thyroid cancer: Thyroid cancer is not a common type of cancer and only 4 cases, which accounts to 1.05% of the overall cancer cases have been reported. Tonsil cancer: tonsil cancer is also not of much prevalence from the study area and only 2 cases have been reported which is 0.52%. Throat cancer: Throat cancer is also not much common with a total of 4 cases only which accounts to 1.05% of the overall cancer cases reported from the study area during the study period. Ovary cancer: Ovarian cancer is a common cancer type among the female of older age group. However, only 5 cases have been reported from the study area during the study period which is 1.31% of the cancer cases reported. Uterus cancer: Uterus cancer is also of not much prevalent from the study area as only 5 uterus cancer cases have been reported which accounted to 1.31% of the overall cancer cases from Serchhip District during the study period. Neck cancer: Neck cancer accounts to 2.36% from the study area and a total of 9 cases have been reported during the study period. Prostate cancer: Prostate cancer is one of the common cancer cases reported from the study area with a total of 10 cases reported which accounts to 2.62%.

INTERNATIONAL JOURNAL FOR INNOVATIVE RESEARCH IN MULTIDISCIPLINARY FIELD, ISSN: 2455-0620, Special Issue : 27, July-2021
Monthly, Peer-Reviewed, Refereed, Indexed Journal with IC Value: 86.87 Impact Factor: 6.719 Publication Date: 31/07/2021
Available online on - www.ijirmf.com Page 42
Penis cancer: Penis cancer is not a common type of cancer from the study area. However 4 cases of penis cancer have been reported from Serchhip District during the study period which accounts to 1.05% of the overall cancer cases.
The present study highlighted the prevalence of cancer among the older people of both sexes in Serchhip District, Mizoram during the study period of 2015-2018. However, in terms of sex 204 males suffered from cancer as against 177 females during the study period. Age group also plays an important part as far as the frequency of cancer is concerned as the highest age group of cancer patients were reported from 60-69 years which is followed by 50-59 age groups. Cancer cases decline below 40 age groups and only few cases were reported from the study area. Though 24 different cases of cancer have been reported from Serchhip District Mizoram, some cancer such as stomach cancer, lung cancer, breast cancer, oesophagus and cervix cancer etc. turns out to be much more common compare to the other cancer types reported from the study area.
Acknowledgement: The authors express sincere thanks and gratitude to the Mizoram Population based Cancer
Registry (PCBR), Civil Hospital Aizawl, for assisting and providing all the required data for the successful completion of the current cancer investigation from Serchhip District of Mizoram.
REFERENCES: 1. Ahmed K, Al-Emran A, Jesmin T, Mukti RF, Rahman MZ & Ahmed F (2013). Early detection
of lung cancer risk using data mining. Asian Pacific J Cancer Prev, 14, 595–598. 2. Anand, P, Kunnumakkara A B, Sundaram C. Harikumar K B, Tharakan S T, Lai .S, Sung B,
Aggarwal B B (2008). Cancer is a preventable disease that requires major lifestyle changes. Pharm. Res, 25(9):2097-116.
3. Garima M, Sumitra N & Pramod K S (2015). Cancer: An overview. Academic Journal of
Cancer Research, 8 (1): 01-09. 4. Ghatak S, Yadav RP, Lalrohlui F, Chakraborty P, Gosh S, Das M, Pautu JL, Zohmingthang J,
Senthil Kumar N (2016) Xenobiotic pathway gene polymorphisms associated with gastric cancer in high risk Mizo mongoloid population, Northeast India. Helicobacter, 6:523–535
5. Jayelakshmi PA,Gangadharan P, Akiba S, Koriyama C & Nair K (2011). Oral cavity cancer risk in relation to tobacco chewing and bidi smoking among men in Karunagapally, Kerala, India: Karunagapally cohort study. Cancer Science ,102 (2):460-467
6. Johnson N (2001). Tobacco use and oral cancer: a global perspective. J Dent Edu, 65(4):328-39
7. Lalpawimawha & Lalruatfela B (2016). Etiology of lung cancer. Science Vision, 16(3): 113-122
8. Monika S, Dineshkumar T, Priyadharini S, Niveditha T, Sk P, Rajkumar K. (2020). Smokeless Tobacco Products (STPs) Harbour Bacterial Populations with Potential for Oral Carcinogenicity. Asian Pac J Cancer Prev, 21(3):815-824
9. Muwonge R, Ramadas K, Sankila R, Thara S, Thomas G, Vinoda J, Sankaranarayanan R.(2007). Role of tobacco smoking, chewing and alcohol drinking in the risk of oral cancer in Trivandrum, India: a nested case-control design using incident cancer cases. Oral oncol, 44(5):446-54
10. Phukan P. K, Zomawia E, Narain K, Hazarika N.C & Mahanta J (2005). Tobacco use and cancer in Mizoram, India. Cancer Epidemiol Biomarker Prev, 14(8):1892-6
11. Phukan RK, Narain K, Zomawia E, Hazarika NC, Mahanta J (2006) Dietary habits and stomach cancer in Mizoram, India. J Gastroenterol, 41:418–424
12. Siddiqi K, Husain S, Vidyasagaran A, Readshaw A, Mishu MP, Sheikh A (2020).Global burden of disease due to smokeless tobacco consumption in adults: an updated analysis of data from 127 countries. BMC Med,18(1): 222.
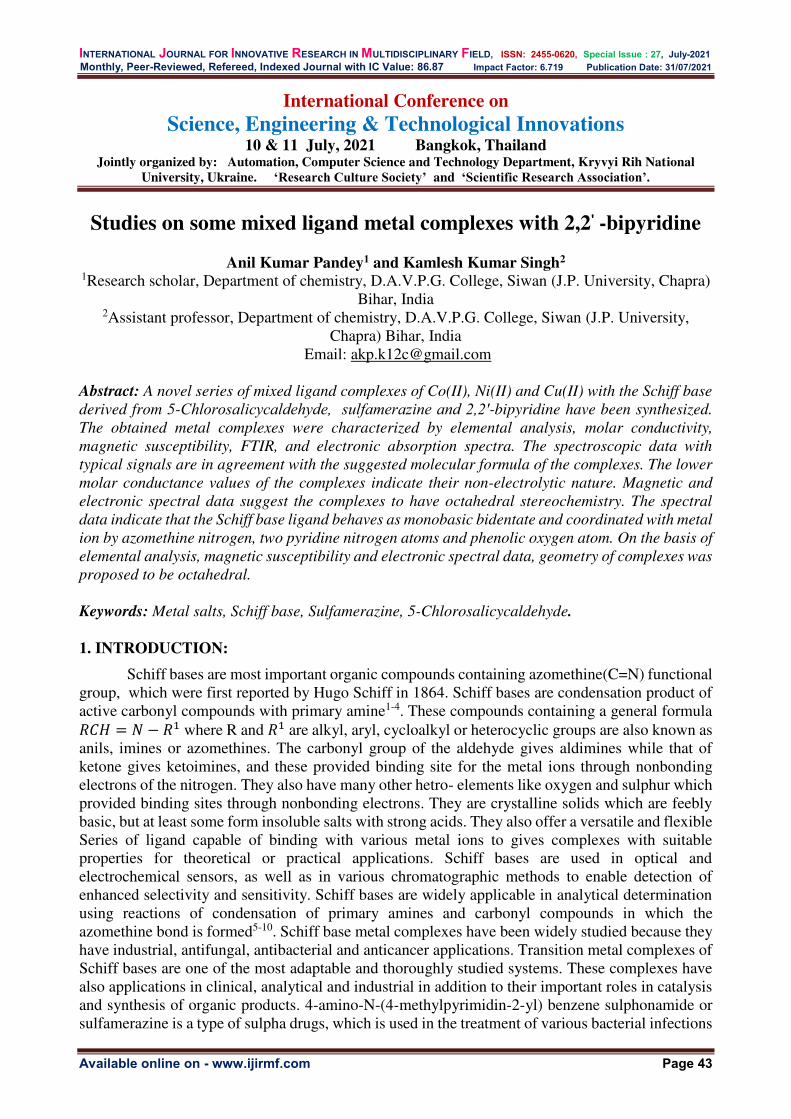
INTERNATIONAL JOURNAL FOR INNOVATIVE RESEARCH IN MULTIDISCIPLINARY FIELD, ISSN: 2455-0620, Special Issue : 27, July-2021
Monthly, Peer-Reviewed, Refereed, Indexed Journal with IC Value: 86.87 Impact Factor: 6.719 Publication Date: 31/07/2021
Available online on - www.ijirmf.com Page 43
International Conference on
Science, Engineering & Technological Innovations 10 & 11 July, 2021 Bangkok, Thailand
Jointly organized by: Automation, Computer Science and Technology Department, Kryvyi Rih National
University, Ukraine. ‘Research Culture Society’ and ‘Scientific Research Association’.
Studies on some mixed ligand metal complexes with 2,2′ -bipyridine
Anil Kumar Pandey1 and Kamlesh Kumar Singh2
1Research scholar, Department of chemistry, D.A.V.P.G. College, Siwan (J.P. University, Chapra) Bihar, India
2Assistant professor, Department of chemistry, D.A.V.P.G. College, Siwan (J.P. University, Chapra) Bihar, India
Email: [email protected] Abstract: A novel series of mixed ligand complexes of Co(II), Ni(II) and Cu(II) with the Schiff base
derived from 5-Chlorosalicycaldehyde, sulfamerazine and 2,2′-bipyridine have been synthesized.
The obtained metal complexes were characterized by elemental analysis, molar conductivity,
magnetic susceptibility, FTIR, and electronic absorption spectra. The spectroscopic data with
typical signals are in agreement with the suggested molecular formula of the complexes. The lower
molar conductance values of the complexes indicate their non-electrolytic nature. Magnetic and
electronic spectral data suggest the complexes to have octahedral stereochemistry. The spectral
data indicate that the Schiff base ligand behaves as monobasic bidentate and coordinated with metal
ion by azomethine nitrogen, two pyridine nitrogen atoms and phenolic oxygen atom. On the basis of
elemental analysis, magnetic susceptibility and electronic spectral data, geometry of complexes was
proposed to be octahedral.
Keywords: Metal salts, Schiff base, Sulfamerazine, 5-Chlorosalicycaldehyde.
1. INTRODUCTION:
Schiff bases are most important organic compounds containing azomethine(C=N) functional group, which were first reported by Hugo Schiff in 1864. Schiff bases are condensation product of active carbonyl compounds with primary amine1-4. These compounds containing a general formula 𝑅𝐶𝐻 = 𝑁 − 𝑅1 where R and 𝑅1 are alkyl, aryl, cycloalkyl or heterocyclic groups are also known as anils, imines or azomethines. The carbonyl group of the aldehyde gives aldimines while that of ketone gives ketoimines, and these provided binding site for the metal ions through nonbonding electrons of the nitrogen. They also have many other hetro- elements like oxygen and sulphur which provided binding sites through nonbonding electrons. They are crystalline solids which are feebly basic, but at least some form insoluble salts with strong acids. They also offer a versatile and flexible Series of ligand capable of binding with various metal ions to gives complexes with suitable properties for theoretical or practical applications. Schiff bases are used in optical and electrochemical sensors, as well as in various chromatographic methods to enable detection of enhanced selectivity and sensitivity. Schiff bases are widely applicable in analytical determination using reactions of condensation of primary amines and carbonyl compounds in which the azomethine bond is formed5-10. Schiff base metal complexes have been widely studied because they have industrial, antifungal, antibacterial and anticancer applications. Transition metal complexes of Schiff bases are one of the most adaptable and thoroughly studied systems. These complexes have also applications in clinical, analytical and industrial in addition to their important roles in catalysis and synthesis of organic products. 4-amino-N-(4-methylpyrimidin-2-yl) benzene sulphonamide or sulfamerazine is a type of sulpha drugs, which is used in the treatment of various bacterial infections

INTERNATIONAL JOURNAL FOR INNOVATIVE RESEARCH IN MULTIDISCIPLINARY FIELD, ISSN: 2455-0620, Special Issue : 27, July-2021
Monthly, Peer-Reviewed, Refereed, Indexed Journal with IC Value: 86.87 Impact Factor: 6.719 Publication Date: 31/07/2021
Available online on - www.ijirmf.com Page 44
such as bronchitis, prostatitis, meningitis and urinary infections. 2,2′-bipyridine is a bidentate chelating ligand with two donor nitrogen atoms form stable complexes with transition metal ions. Its complexes are used in studies of energy transfer, super molecular and catalysis. Mixed Schiff base complexes play an important role in the biological field as exemplified by many ways in which enzymes are activated by metal ions. Schiff bases derived from 5-chlorosalicyaldehyde and sulphamerazine have attracted an increased interest in the field of bioinorganic chemistry. In the present work we report the synthesis and characterization of transition metal complexes of Co (II), Ni (II) and Cu (II) containing bidentate Schiff base, derived from the condensation of sulfamerazine and 5-chlorosalicycaldehyde as primary ligand and 2,2′-bipyridine as secondary ligands.
2. Experimental:
Materials and Method
All the starting materials in the present work such as metal (II) salts, solvents, salicylaldehyde,5-chlorosalicycaldehyde, sulfamerazine, ethanol, DMF, DMSO and other solvents were purchased commercially and used without any further purification. Suppliers were S Merck, CDH and Aldrich. The elemental analysis (C, H and N) data was obtained using 2400 CHN Perkin-Elmer elemental analyzer. The molar conductivity of the complexes in DMSO solution (10-3M) were measured by using DI-909 digital conductivity meter. The IR spectra of the ligand and metal complexes were recorded on Shimadzu FTIR spectrophotometer using KBr disc. The magnetic susceptibility data were measured by Gouy method using Hg [Co (SCN)4] as a calibrant. The electronic spectra of the complexes were recorded by using Shimadzu model UV-1601 spectrophotometer in DMSO solution.
Synthesis of Schiff base Ligands (L1)
1.057 g (4 mmol) of sulfamerazine in 25 ml ethanol was added to 0.626 g (4 mmol) of hot
ethanolic solution of 5-chloro-2-hydroxybenzaldehyde. The resulting solution was refluxed for 3-4 h and then lift overnight in refrigerator. The solid orange colored product obtained was filtered, washed with ethanol and acetone and dried over CaCl2 in a desiccator.
S
O
O
N
H
N
N
CH3NH2Cl CHO
OH+
Sulfamerazine5-chlorosalicycaldehyde
EtOHH2O
Cl C
OH
H
N S
O
O
N
H N
N
CH3
N-5-chlorosalicylidene-sulfamerizine
Figure 1. Synthesis of Schiff base ligand. Synthesis of Mixed Ligand Metal Complexes
A solution of the Schiff base ligand (2 mmol,0.805 g) dissolved in absolute DMF (25 ml) as a primary ligand was mixed with 2,2′-bipyridine (2 mmol, 0.312 g) dissolved in absolute ethanol as a secondary ligands, and then a hot ethanolic solution of metal acetate salt (0.498 g of

INTERNATIONAL JOURNAL FOR INNOVATIVE RESEARCH IN MULTIDISCIPLINARY FIELD, ISSN: 2455-0620, Special Issue : 27, July-2021
Monthly, Peer-Reviewed, Refereed, Indexed Journal with IC Value: 86.87 Impact Factor: 6.719 Publication Date: 31/07/2021
Available online on - www.ijirmf.com Page 45
Co(OAC)2 .4H2O, 0.497 g of Ni(OAC)2 .4H2O and 0.399 g of Cu(OAC)2 .H2O) was added drop wise to the mixed ligands. The reaction mixture was refluxed for 3-4 h with stirring. The coloured metal complexes were filtered, washed with ethanol and dried under vacuum over anhydrous CaCl2.
S
O
O
N
H N
N
CH3N
CH
O
NN
H2O OACM
Figure 2. Proposed structure of metal complexes.
[M(L)(Bipy)(OAC) (H2O)]
M= Co(II), Ni(II) and Cu(II)
Table 1. Analytical data of mixed ligand complexes.
Compounds Elemental analysis found(calc.) %
C H N M
Schiff base(L) 53.61 (53.66)
3.69 (3.73)
13.87 (13.91)
─
[Co(C30H27ClN6O6S] 51.87 (51.91)
3.85 (3.89)
12.07 (12.12)
8.43 (8.50)
[Ni(C30H27ClN6O6S] 51.84 (51.93)
3.83 (3.89)
12.06 (12.11)
8.41 (8.46)
[Cu(C30H27ClN6O6S] 51.51 (51.57)
3.82 (3.86)
11.98 (12.03)
9.01 (9.09)
Table 2. Physical data of mixed ligand complexes.
Compounds Colour Yield
(%) Λm(S cm2mol-1)
μeff(B.M)
Schiff base(L) Orange 82 ─ ─ [Co(C30H27ClN6O6S] Yellow 72 12 4.86 [Ni(C30H27ClN6O6S] Light green 70 9 2.24 [Cu(C30H27ClN6O6S] Green 68 11 1.81

INTERNATIONAL JOURNAL FOR INNOVATIVE RESEARCH IN MULTIDISCIPLINARY FIELD, ISSN: 2455-0620, Special Issue : 27, July-2021
Monthly, Peer-Reviewed, Refereed, Indexed Journal with IC Value: 86.87 Impact Factor: 6.719 Publication Date: 31/07/2021
Available online on - www.ijirmf.com Page 46
Table 3. IR spectral data of mixed ligand metal complexes. Compounds 𝜈(OH)
phenolic 𝜈(C=N)
ν(C-O) ν(M-N) ν(M-O) Bipy
Schiff base 3542 1605 1510 ─ ─ ─
[Co(C30H27ClN6O6S] ─ 1580 1500 450 530 480
[Ni(C30H27ClN6O6S] ─ 1578 1495 445 523 470
[Cu(C30H27ClN6O6S] ─ 1570 1490 454 545 473
4. RESULTS AND DISCUSSION: The elemental analysis for the Schiff base and its mixed ligand complexes is in good
agreement with the calculated values (Table 1). All the metal complexes are colored, solid, stable at room temperature and non- hygroscopic in nature. The observed molar conductance of the complexes in DMSO at room temperature is consistent with the non- electrolytic nature of the complexes, due to the low conductivity values (Table 2). IR Spectra- The IR spectral bands of Schiff base ligand and its metal complexes are listed in Table 3. A very strong band at 1605 cm-1 is characteristics of the azomethine nitrogen (>C=N) present in the Schiff base ligand. This was shifted to 1580-1570 cm-1 in the complexes, which indicates the bonding of the metal to the azomethine nitrogen11-12. The 𝜈 (OH) water is absent in the spectrum of the ligand but is present in the complexes. This shows the presence of hydration water in the complexes. The phenolic 𝜈 (OH) band observed at 3542 cm-1 in the Schiff base ligand. . A band at 1510 cm -1 is assigned to 𝜈 (𝐶-O) stretching frequency in the spectrum of free Schiff base which is also shifted to lower frequency ranging from 1490 – 1500 cm-1 in all the metal complexes. The appearance of new band between 445 – 454 cm-1 and 523-545 cm-1 are indicating the formation of M-N and M-O bond in the complexes. The two new bands appear at 1605-1650 and 1310-1355 cm-
1 confirm the coordination of acetate group to metal ions. The bands in bipyridine at 1560 and 420 cm-1 have shifted to higher frequencies in metal complexes, which suggests the both nitrogen atoms of bipyridine are coordinated to metal ion. Electronic Spectra of Metal Complexes - The electronic spectra of the Co(II) Complex shows three bands at 16400, 28210 and 29220 cm-1 assigned to 4T1g(F) →4T2g(F) , 4T1g(F) →4A2g`(F) and 4T1g(F) →4T1g (P). These data and the magnetic moment value of 4.86 B.M, which suggested the octahedral geometry of Co(II) complex. The Ni (II) complex shows three bands at 15300, 27662 and 29340 cm-1 assigned to 3𝐴2𝑔(𝐹) → 3𝑇2𝑔,3𝐴2𝑔(𝐹) → 3𝑇1𝑔(𝐹)and 3𝐴2𝑔(𝐹) → 3𝑇1𝑔(𝑃) .These data and the magnetic moment value of 2.24 B.M, which suggested octahedral geometry of Ni(II) complex. The electronic spectra of Cu(II) complex show three bands at 13120, 18670 and 24280 cm-1 assigned to 2A1g →2B1g, 2B2g →2B1g and 2Eg →2B1g transitions respectively. On the basis of electronic spectra and the magnetic moment value 1.81 B.M, which suggested distorted octahedral geometry.
5. CONCLUSION : A new Schiff base ligand and its Co(II), Ni(II) and Cu(II) mixed ligand complexes were
synthesized and characterized by elemental analysis, molar conductivity, magnetic susceptibility, FTIR, and electronic absorption spectra. The lower molar conductance values of the complexes indicate their non-electrolytic nature. Magnetic and electronic spectral data suggest the complexes to have octahedral stereochemistry. The spectral data indicate that the Schiff base ligand behaves as monobasic bidentate and coordinated with metal ion by azomethine nitrogen, two pyridine

INTERNATIONAL JOURNAL FOR INNOVATIVE RESEARCH IN MULTIDISCIPLINARY FIELD, ISSN: 2455-0620, Special Issue : 27, July-2021
Monthly, Peer-Reviewed, Refereed, Indexed Journal with IC Value: 86.87 Impact Factor: 6.719 Publication Date: 31/07/2021
Available online on - www.ijirmf.com Page 47
nitrogen atoms and phenolic oxygen atom. On the basis of elemental analysis, magnetic susceptibility and electronic spectral data, geometry of complexes was proposed to be octahedral.
REFERENCES:
1. Doiezel P, Kuban V. Mass spectrometric study of platinum complexes based on cisplatin. Chemical Papers. 2002; 56(4): 236-240.
2. Singh KK. Synthesis, characterization and antimicrobial activity of Schiff base complexes derived from vanillin and 2-amino-4-chlorobenzoic acid. J. Emer. Tec. And Inn. Res, 2019; 6: 1733-1739.
3. Cotton FA, Wilkinson G, Murillo CA, Bochmann M. Advanced inorganic chemistry. 6th ed., Wiley India Pvt. Ltd. 2017, pp. 862-872.
4. Pradhan R et al. Synthesis and characterization of Schiff base complexes of o-vanillin and anthranilic acid and their biological evaluation. Asian. J. Chem. 2018; 30:1989-1993.
5. Pandhare GR et al. Synthesis, characterization and biological studies of cobalt complexes with bidentate Schiff bases. Rasayan. J. Chem, 2008; 1: 337-341.
6. Jain RK, Mishra AP. Microwave synthesis, spectral, thermal and antimicrobial activities of some transition metal complexes involving 5-bromosalicyaldehyde moiety. Curr. Chem. Lett, 2012;1: 163-174.
7. Kumar M et al. Synthesis characterization and biological studies of novel Schiff base 1,1| -(pyridine-2,6-diyldieth-1-yl-1-ylidene) biguanidine and their transition metal complexes. Asian j. Chem, 2019; 31(40): 799-804.
8. Rathore K et al. Structural, spectroscopic and biological aspects of O, N- donor Schiff base ligand and its Cr(III),Co(II), Ni(II) and Cu(II) complexes synthesized through green chemical approach. E. J. Chem, 2010;7(S): S556-S572.
9. Singh KK, Singh KC and Sharma M. Synthesis, characterization and antimicrobial studies of Co(II), Ni(II) and Cu(II) complexes derived from ɑ-amino acetohydroxamic acid. Int. J. Curr. Res. Chem,2020; 7(10): 1-7.
10. Singh KK and Khan SA. Synthesis, characterization and antimicrobial activity of bidentate Schiff base copper(II) complexes. World. J. Pharm. Res, 2021;10(2): 1074-1082.
11. Patel KN et.al. Synthesis, characterization and antimicrobial activities of some transition metal complexes containing two bidentate monobasic hydroxy aldehydes and 2,2′-bipyridylamine. Syn. React. Inorg.Met-org. Chem, 2000;30(5):829-841.
12. Othman RM et.al. Antimicrobial activity and molecular modelling study of Schiff base derived from sulfamerazine. Ind. J. Med. Taxico. 2019;13(4):696-701.

INTERNATIONAL JOURNAL FOR INNOVATIVE RESEARCH IN MULTIDISCIPLINARY FIELD, ISSN: 2455-0620, Special Issue : 27, July-2021
Monthly, Peer-Reviewed, Refereed, Indexed Journal with IC Value: 86.87 Impact Factor: 6.719 Publication Date: 31/07/2021
Available online on - www.ijirmf.com Page 48
International Conference on
Science, Engineering & Technological Innovations 10 & 11 July, 2021 Bangkok, Thailand
Jointly organized by: Automation, Computer Science and Technology Department, Kryvyi Rih National
University, Ukraine. ‘Research Culture Society’ and ‘Scientific Research Association’.
Bacteriological Contamination of Water Sources of Goalpara District
of Assam, India, used for day to day household work
Manjit Choudhury
Phd. Scholar, Himalayan University, Itanagar, Arunachal Pradesh. Email - [email protected]
Abstract: The study's goal was to assess the contamination trend of drinking water and water used for
routine housework by various bacteria. We are attempting to identify the bacteria causing the
contamination as well as their antibiotic responses to some of the antibiotics commonly used in the
Goalpara district of Assam, India. From the water sources, pathogenic bacteria such as Enterococcus,
E.coli, Klebsiella, Streptococci, and Micrococcus were isolated. In this study, Enterococcus had the
highest contamination rate, while Micrococcus had the lowest contamination rate. The highest
contaminated source has been recorded in Lake Water. The district's main cause of contamination of
water is suspected of poor sanitary practice, ignorance of personal hygiene, cleanliness, negligence in
hygiene and other practices. Bore well waters have been found to be least polluted. Again, Co-
trimoxazole and Cefoprazone are susceptible to all bacteria isolated from water sources. The risk of
waterborne diseases and health problems increases by the presence of bacteria in water.
Keywords: bacterial contamination, coliform bacteria, drinking water, membrane filtration, water
borne diseases.
1. INTRODUCTION:
Goalpara is a district in the Indian state of Assam, located on the banks of the Brahmaputra River. The district is bordered in the south by the West and East Garo Hills districts of Meghalaya state, in the east by Kamrup district, in the west by Dhubri district, and in the north by the River Brahmaputra. It is situated between the North Latitudes of 250 53′ and 260 15′ and the East Longitudes of 900 07′ and 910 05′.[1] Except for a few low-forested hills, the Goalpara district's topography is almost flat. The main hills are Pancharatna, Sri Surjya, Tukreswari, Nalanga, and Paglartek, with elevations ranging from 100 to 500 metresThe presence of a large number of Char (Riverine tracts and sandy river islands) in the River Brahmaputra is significant for the district. The mighty River Brahmaputra flows east to west on the district's northern boundary, and the main tributaries are the rivers Dudhnoi, Krishnai, Jinjiram, and Jinary. The Dudhnoi and Krishnai rivers originate in the hills of Meghalaya, join in the western part of Matia, and flow as the River Mornoi up to its confluence with the Brahmaputra. The Jinjiram River rises in Urpad Beel (Lake), flows parallel to the Brahmaputra, and eventually merges near South Salmara in Dhubri District. All of the rivers are perennial in nature. In the District, there are a few other minor streams. There are several Beels (natural reserve forests, lakes) in the district, including Urapd Beel, Hashila Beel, Kumri Beel, and Dhamar Risan Beel, as well as several artificial ponds. During the months of September to March, the Urpad Lake and the Kumri Lake are home to a variety of migratory birds, and they are also a hub for fish farming, from which fish are sent to Assam's various markets. [2] The district faces flood during the rainy seasons due to overflow of river and stream located in the area.
This district also has a long-term problem with the contamination of drinking water. Water contamination has a long history in human history, with descriptions of water-borne diseases similar to cholera in the Sushruta Samshita, an Indian text written in Sanskrit as early as 500–400 B.C. [3]

INTERNATIONAL JOURNAL FOR INNOVATIVE RESEARCH IN MULTIDISCIPLINARY FIELD, ISSN: 2455-0620, Special Issue : 27, July-2021
Monthly, Peer-Reviewed, Refereed, Indexed Journal with IC Value: 86.87 Impact Factor: 6.719 Publication Date: 31/07/2021
Available online on - www.ijirmf.com Page 49
Inadequate water availability, poor water quality at the source, ill-maintained water pipelines, unsafe disposal of animal, human, and household wastes, and a lack of knowledge about good sanitation and personal hygiene are some of the major causes of poor drinking water quality in rural India. [4] More than 1.5 million children die each year from diarrheal infections because they do not have access to appropriate sanitation. According to the WHO, the annual death toll from water-related diseases surpasses 5 million people. [17] More than half of them are caused by microbial intestinal diseases, with cholera being the most common. In general, drinking water that has been contaminated with human or animal faeces poses the most microbiological danger. The main source of faecal microbes, including diseases, is wastewater discharged into freshwaters and coastal seawaters. In developing nations, acute microbial diarrheal illnesses represent a major public health issue.[16] The people who are most afflicted by diarrheal infections are those who have the fewest financial resources and the least sanitary conditions. Microbial infections transferred by water primarily afflict children under the age of five in Asian and African countries. [7]
E. coli is used as a bio indicator for faecal contamination of drinking water. All warm-blooded animals and certain reptiles emit it in their faeces. The most pathogenic bacteria that cause water-borne disorders are transmitted through the feaco-oral route, in which water may play a role. [8] The public health burden is determined by the severity of the illnesses associated with pathogens, their infectivity and the population exposed.[9] Therefore, there has been an increasing interest in the application of quantitative risk assessment for microbial load in drinking water sources.
The microbiological examination of drinking water can be used to determine its quality. [5] The most-probable-number approach and the membrane filter (MF) method are both specified in the 15th edition of Standard Methods for the Examination of Water and Wastewater (1) for the microbiological investigation of drinkable water. Membrane filtering has achieved widespread adoption since it is a simple, quick, and precise operation that produces consistent results..
2.OBJECTIVES:- The objective of this study was to monitor the quality of drinking water in the Goalpara district
and to use the Membrane Filtration (MF) method to evaluate the contamination of drinking water sources with coliform or feacal coliform bacteria. The bacteria that caused the pollution, as well as the rate of bacterial contamination in drinking water sources, were detected in this investigation. The antibiogram of the isolated bacteria were evaluated during this study.
3. MATERIALS AND METHODS:
3.1 StudyArea: The research was carried out in various areas of the Goalpara district. The Goalpara is located
between 250 53' and 260 15" north and 900 07' and 910 05' east lengths. According to the 2011 census, the district's population is approximately 10,08,183 and is 10th among the population, making up 3,23 per cent of the state's population. Water sources such as lakes and rivers are used for daily activities, but drinking water sources primarily include reservoirs (ponds), streams, dug wells, tube wells, and bore wells.
Rain, rivers, and streams are the primary sources of water in this district, which also shares a border with Meghalaya, a hilly state. The research was carried out over the course of a year, from March 2019 to April 2020, and covered all four seasons.
3.2 Sample Collection and Processing:
A total of 217 samples were collected from Goalpara district's various drinking water sources. The samples were collected using WHO standard procedures in an autoclavable wide mouth glass bottle with a 1 L capacity. To maintain an aseptic condition, water samples are collected while adhering to all safety precautions. During the sample collection process, the sample collector is provided with appropriate personal protective equipment. The sample containers were kept in an airtight large ice box

INTERNATIONAL JOURNAL FOR INNOVATIVE RESEARCH IN MULTIDISCIPLINARY FIELD, ISSN: 2455-0620, Special Issue : 27, July-2021
Monthly, Peer-Reviewed, Refereed, Indexed Journal with IC Value: 86.87 Impact Factor: 6.719 Publication Date: 31/07/2021
Available online on - www.ijirmf.com Page 50
at a temperature of 2-8 degrees Celsius and transported to the laboratory within 6 hours of collection for further processing. [10]
Total coliforms and feacal coliforms were detected using the membrane filtration method, and bacteria were isolated using the spread plate method. [13] Table 1 shows the volumes to be filtered for water from various sources based on WHO guidelines. Membrane filtration and colony counting techniques are based on the assumption that each bacterium, clump of bacteria, or particle with bacteria attached will produce a single visible colony. As a result, each of these clumps or particles is a colony forming unit (cfu), and the results are expressed as colony forming units per unit volume. In the case of thermo tolerant coliform bacteria the result should be reported as thermo tolerant coliforms cfu per 100 ml.[15]
Typical sample volumes for membrane filtration analysis used in this study are tabled below Sample type Sample volume
100 10 11 0.11,2 0.011,2 0.0011,2
Treated water Surface water
Partially treated water
Pond, Lake, River 1Small volumes are added to the filtration apparatus together with a minimum of 9 ml of sterile diluents to ensure adequate dispersal across the surface of the filter membrane. 2 1.0, 0.1, 0.01 and 0.001-ml volumes are filtered after preparing serial dilutions of the sample. To filter 1.0 ml of sample, we used 10 ml of 1:10 dilution and for 0.1 ml of sample,10 ml of 1:100 dilution as well as to filter 0.01 ml of sample, we used 10 ml of 1:1,000 dilution and for 0.001 ml of sample, 10 ml of 1:10,000 dilution was done.
1.25 ml of stock solution is added to 1 litre of distilled water, mixed thoroughly, and dispensed into dilution bottles to prepare bottles of dilution water. The bottles are placed in the autoclave, loosely capped, and sterilised for 15 minutes at 121 °C. After removing the bottles from the autoclave, the caps are tightened and the bottles are stored in a clean location until they are needed. We used culture media such as M- Tergitol 7 Agar, Chromogenic coliform agar, and MacConkey agar to isolate and identify coliform, thermotolarent coliform, and other pathogenic contaminants.[6] Muller Hinton agar is also used to test antibiotic sensitivity.
3.3 Confirmatory tests Each colony is subcultured from the membranes into two tubes of lactose peptone water with
phenol red containing an inverted medium filled Durhams tube and a tube of tryptone water to confirm the results for total coliform and feacal coliform. One tube of lactose peptone water was kept at 370 C, while the other was kept at 440 C. At 440 C, the tryptone water is incubated. After 6 hours of aerobic incubation at 370 C, an inoculum from the lactose peptone water broth tube is inoculated into a nutrient agar media plate and incubated at 370 C alongside the lactose peptone water broth tube. After 24 hours of aerobic incubation, the colonies grown on the nutrient agar plate are subjected to an oxidase test. A few drops of Kovac's reagent are added to the tryptone water broth-containing tube. The appearance of pink confirms a positive indole test. The tube containing lactose peptone water broth is examined for the formation of acid and gas (the development of yellow colour), and the negative tubes are kept at 370 C for another 24 hours for confirmation. When yellow colonies on the membrane filter are oxidase negative and produce acid and gas in lactose peptone water broth at 37 0 C, they are identified as coliform bacteria. [13,14]
When yellow colonies on the membrane are oxidase negative and form acid and gas in lactose peptone water broth incubated at 440 C and indole in tryptone water broth incubated at 440 C, they are

INTERNATIONAL JOURNAL FOR INNOVATIVE RESEARCH IN MULTIDISCIPLINARY FIELD, ISSN: 2455-0620, Special Issue : 27, July-2021
Monthly, Peer-Reviewed, Refereed, Indexed Journal with IC Value: 86.87 Impact Factor: 6.719 Publication Date: 31/07/2021
Available online on - www.ijirmf.com Page 51
confirmed as E. coli.The confirmed E.coli and coliform count per 100 ml of water sample is calculated from the result. [11]
Suspect coliform group colonies, as well as other contaminant bacteria, are identified further using morphological, cultural, and biochemical characteristics. [12]
4. DISCUSSION: The majority of sources of goalpara water are observed during this study to be highly
contaminated by both coliform and feacal coliform bacteria. Our data show infectious bacteria found in water samples with their antibiogram. This study justifies the importance of serious attention to household water contamination, sanitation and control. By organizing public awareness meetings, street drama and distribution of IEC materials (information, education, communication, etc.) can lead to awareness about safe sanitation procedures and its relationship with various waterborne diseases.
Our study showed the highest contamination rates of lake water, Table No:1, followed respectively by river, tank(pond), dugwell, river, tube well and boring well. Compared to other sources, the water well was found to be the safest source of water. A study by James Okot Okumu and Jaocob Otim in certain Ugandan areas showed similar findings. In surface water and water springs, they also found the highest contamination rate.
E.coli has been isolated from dugwell, tubewell and bore well, used by the majority of the population for drinking purpose. Enterococcus was the primary organism isolated from sources of surface water such as the river, lake and stream. Klebsiella, Streptococcus and Enterobacilli were other isolated organisms. In a study conducted in South Darfur by Yassir Mohammed Eltahir and Amira Ahmed, Sudan found during the study same design of organisms like E.coli, Enterococci, Klebsiella, Streptococc were isolated.
In another study carried out in Mpraeso by S Omari D Yeboah-Manu, Ghana found that most water sources in the area have Enterococcus contamination whereas E.coli was isolated from contaminated groundwater sources, which share similarities with our study.
We have Enterococcus isolated as the primary bacteria during our study. It is isolated in numbers as high as possible. Similar findings have been observed in a study by Ofosu HA et al. It was carried out in Ghana's rural areas. During the study, the primary organism Enterococcus spp. was isolated. Klebsiella, Escherichia coli, Pseudomonas and Proteus were closely followed.
Groundwater contamination has been noted prominently in our study, with a positive rate of 11.98 percent from the dug well. A similar study carried out in Swabi, Pakistan by Shah J et al. showed similar results. Again a high level of nitrate and faecal coliform groundwater contamination has been reported and the quality of groundwater is likely to be impacted by infiltration of wastewater. Study in Pakistan has shown that nearly 90% of groundwater and water well samples are contaminated with coliforms and faecal coli.
5. RESULTS: Out of 217 water samples collected from various sources of different places of goalpara district
115 nos samples were found positive for bacterial contamination. Lake shows the highest rate of contamination ( 100% ) followed by river(85.7% ), stream (82.14%), reservoir(pond) (77.4% ), dugwell (45.6% ), tube well ( 17.95% ) and bore well (6.25% ). But, the water from river, lake and reservoir (pond) are rarely used for drinking purpose but they are commonly used for daily household works.
In this study the highest number of bacteria isolated is Enterococcus (28.11%), followed by E.coli (17.97%), Streptococcus (3.68%), Klebsiella (2.30%) and Micrococcus (0.92%). In case of sensitivity Gentamycin, Amoxycillin-Clavalunic acid, cotrimoxazole and cefoprazone were found sensitive against E.coli and Levofloxacin, cotrimoxazole and cefoprazone were found sensitive for Enterococcus. Again, Gentamycin, Levofloxacin, Tetracycline, Fosfomycin, Cephalothin, Co-trimoxazole, Cefoprazone, Nitrofurantoin is sensitive against Klebsiella and Amikacin, Amoxycillin-clavalunic acid,,Vancomycin,Azithromycin,Co-trimoxazole, Cefoprazone, Ciprofloxacin is found

INTERNATIONAL JOURNAL FOR INNOVATIVE RESEARCH IN MULTIDISCIPLINARY FIELD, ISSN: 2455-0620, Special Issue : 27, July-2021
Monthly, Peer-Reviewed, Refereed, Indexed Journal with IC Value: 86.87 Impact Factor: 6.719 Publication Date: 31/07/2021
Available online on - www.ijirmf.com Page 52
sensitive against Streptococci and Amikacin, Piperacillin-tazobactum, Cotrimoxazole, Cefoprazone, Nitrofurantoin against Micrococcus.
Both Co-tromoxazole and Cefoprazone shows sensitivity against all the bacteria isolated during this study. It is observed that the pattern of contaminated bacteria isolated differs from source to source. In dugwell the highest number of bacteria isolated is E.coli, whereas Enterococcus is isolated from reservoir (pond) and stream water samples in highest numbers. Other bacteria such as klebsiella, streptococci and micrococcus are also isolated from various water samples collected for the study.
6. CONCLUSION: Water contamination is directly commensurate with waterborne diseases. The water quality used
by Goalpara district residents for everyday work is unhygienic and polluted microbiologically. The majority of these samples were targeted in rural areas and thus, we need to focus on improving sanitation practises by raising awareness of how the people of Goalpara prosper in their way of life, such as washing hands, covering wells or storage areas and drinking cooled water, use of filters etc.We have informed the Public Health Department, Goalpara, Assam, India about the situation vide letter no DPH/CHG/2020-21/023 dated 24th April 2021 and requested to take necessary action. It is necessary to limit common water sources, which are used for drinking and all household work, such as towels and utensils including cattle bathing. By promoting the proper use of health measures, the district administration can help improve the quality of potable water and therefore thrive on Goalpara's way of life.
7. Acknowledgement: I would like to thank Dr. Riyazul Hasan Khan for his guidance during this study.
REFERENCES: 1. NABARD, New Delhi. District Irrigation Plan, Goalpara, Assam.; 2016-20 2. Abera, A. et al. “Bacteriological analysis of drinking water sources”., Afri. J of Micro. Reser.
,Vol. 18, No. 5 : pp. 2638-2641, 2011 3. Arnone DR, Walling JP., “ Waterborne pathogens in urban watersheds”. J. of Wat. and Heal.
Vol. 5, No. 1 : pp. 149-162, 2007 4. Omari S, Yeboah D, “Study of bacterial contamination of drinking water sources.” The Int J of
Micro., Vol. 10, No. 1 :pp. 1-4, 2012 5. Mark WM., Susan CC,Gordon AM,” New Medium for Improved Recovery of Coliform
Bacteria from Drinking Water.” App. And. Eviron. Micro. Vol. 45, No. 2: pp. 484-492, 1983 6. Joao PS., “Water Microbiology. Bacterial Pathogen and Water”, Int. J. Environ. Res. Public
Health Vol. 7: pp. 3657-3703 , 2010 7. Seas C et al.,” Surveillance of Bacterial Pathogens Associated with Acute Diarrhea in Lima,
Peru”. Int J Infect Dis..Vol. 4: pp. 96-99, 2000. 8. Shar HA et al.,” Impact of seasonal variation on bacteriological quality of drinking water”. Bang.
J Micro. Vol. 25, No. 1:pp. 69-72, 2008 9. Mackie and McCartney , Practical medical microbiology, 14th edition, chapter 51, page 888
10. Either MY, Abdelrahman AA. , “ Bacterial contamination of drinking water in the internally displaced people camps in South Dafur, Sudan.” Comp. Water, Ene and Env Enginee. Vol. 2 : pp. 10-12, 2013
11. Karla G et al., “ Bacterial contamination of drinking water supplies in modern rural neighbourhood” AAL. And Environ. Micro. Vol. 39 No. 4: pp 734-738, 1980
12. Kumar S., 2012. Textbook of Microbiology., chapter 1, page 64-70 13. Shah J et al., “Biochemical and Microbiological evaluation of the water samples collected
from different areas of Swabi, Pakistan” Int. J. of Adv. In Res. Tech. Vol. 2, No. 7: pp 440-451, 2013

INTERNATIONAL JOURNAL FOR INNOVATIVE RESEARCH IN MULTIDISCIPLINARY FIELD, ISSN: 2455-0620, Special Issue : 27, July-2021
Monthly, Peer-Reviewed, Refereed, Indexed Journal with IC Value: 86.87 Impact Factor: 6.719 Publication Date: 31/07/2021
Available online on - www.ijirmf.com Page 53
14. Sibestian D, Monacha A., “Microbial analysis of drinking water from Malabar region of Kerala.” Biod. And Eval.: Pros. And Para. Shifts.: Pp 192-195, 2015
15. Wade TJ et al. “Rapidly measured indicators of recreational water quality are predictive of swimming associated gastrointestinal illness” Enviro. Health Pres. Vol. 114. No. 1: pp 24-28, 2006.
Tables:-
Source of water
sample
No of sample
collected
No of positive
samples
% of positivity
source wise
% of
contamination
on total sample
collected
Dugwell 57 26 45.61 11.98 Reservoir(Pond) 66 48 72.73 22.12
Stream 28 23 82.14 10.60 Tubewell 39 7 17.95 3.23 Borewell 16 1 6.25 0.46
Lake 4 4 100.00 1.84 River 7 6 85.71 2.76
Table -1: Source wise rate of positivity
Sl no Name of Bacteria isolated
Number of bacteria isolated
% of Positivity on total water samples
collected 1 Enterococcus fecalis 61 28.11 2 E. coli 39 17.97 3 Klebsiella 5 2.30 4 Streptococci 8 3.68 5 Micrococcus 2 0.92
Table-2: Number of bacteria isolated
Sl
no
Name of
the
Antibiotic
s
Name of the bacteria isolated and their Antibiogram with Zone of Inhibition
E.coli Enterococcus Klebsiella Streptococci Micrococcus
ZOI Interpretation
ZOI
Interpretation
ZOI Interpretation
ZOI
Interpretation
ZOI
Interpretation
1 Gentamycin
21 Sensitive 10 Resistant 17 Sensitive 10 Resistant 10 Resistant
2 Amikacin 11 Resistant 11 Resistant 11 Resistant 22 Sensitive 22 Sensitive
3 Erythromycin
15 Intermediate
11 Resistant 15 Intermediate
11 Resistant 11 Resistant
4 Amoxycillin-
Clavalunic acid
22 Sensitive 10 Resistant 12 Resistant 26 Sensitive 11 Resistant
5 Levofloxacin
12 Resistant 23 Sensitive 22 Sensitive 9 Resistant 8 Resistant

INTERNATIONAL JOURNAL FOR INNOVATIVE RESEARCH IN MULTIDISCIPLINARY FIELD, ISSN: 2455-0620, Special Issue : 27, July-2021
Monthly, Peer-Reviewed, Refereed, Indexed Journal with IC Value: 86.87 Impact Factor: 6.719 Publication Date: 31/07/2021
Available online on - www.ijirmf.com Page 54
6 Vancomycin
10 Resistant 12 Resistant 10 Resistant 22 Sensitive 12 Resistant
7 Azithromycin
9 Resistant 14 Intermediate
10 Resistant 23 Sensitive 15 Intermediate
8 Clindamycin
11 Resistant 7 Resistant 12 Resistant 8 Resistant 13 Resistant
9 Tetracycline
8 Resistant 16 Intermediate
25 Sensitive 15 Intermediate
12 Resistant
10 Fosfomycin
10 Resistant 10 Resistant 24 Sensitive 15 Intermediate
9 Resistant
11 Co-trimoxazol
e
19 Sensitive 21 Sensitive 8 Sensitive 21 Sensitive 22 Sensitive
12 Ofloxacin 10 Resistant 9 Resistant 16 Intermediate
10 Resistant 15 Intermediate
13 Piperacillin-
tazobactum
19 Intermediate
15 Resistant 13 Resistant 19 Intermediate
26 Sensitive
14 Ceftriaxone
21 Intermediate
17 Resistant 15 Resistant 17 Resistant 16 Resistant
15 Cefoprazone
26 Sensitive 26 Sensitive 16 Sensitive 27 Sensitive 13 sensitive
16 Cephalothin
15 Intermediate
15 Intermediate
12 Resistant 12 Resistant 12 Resistant
17 Nitrofurantoin
11 Resistant 11 Resistant 21 Sensitive 12 Resistant 21 Sensitive
18 Netilmicin 11 Resistant 13 Intermediate
10 Resistant 9 Resistant 10 Resistant
19 Ciprofloxacin
10 Resistant 9 Resistant 16 Intermediate
24 Sensitive 13 Resistant
* ZOI- Zone of Inhibition
Table 3:- Antibiogram of the isolated organisms
Figures:-
Fig. 1: Source wise rate of positivity
11%
18%
20%
4%
2%
24%
21%
Dugwell Reservoir(Pond) Stream Tubewell Borewell Lake River
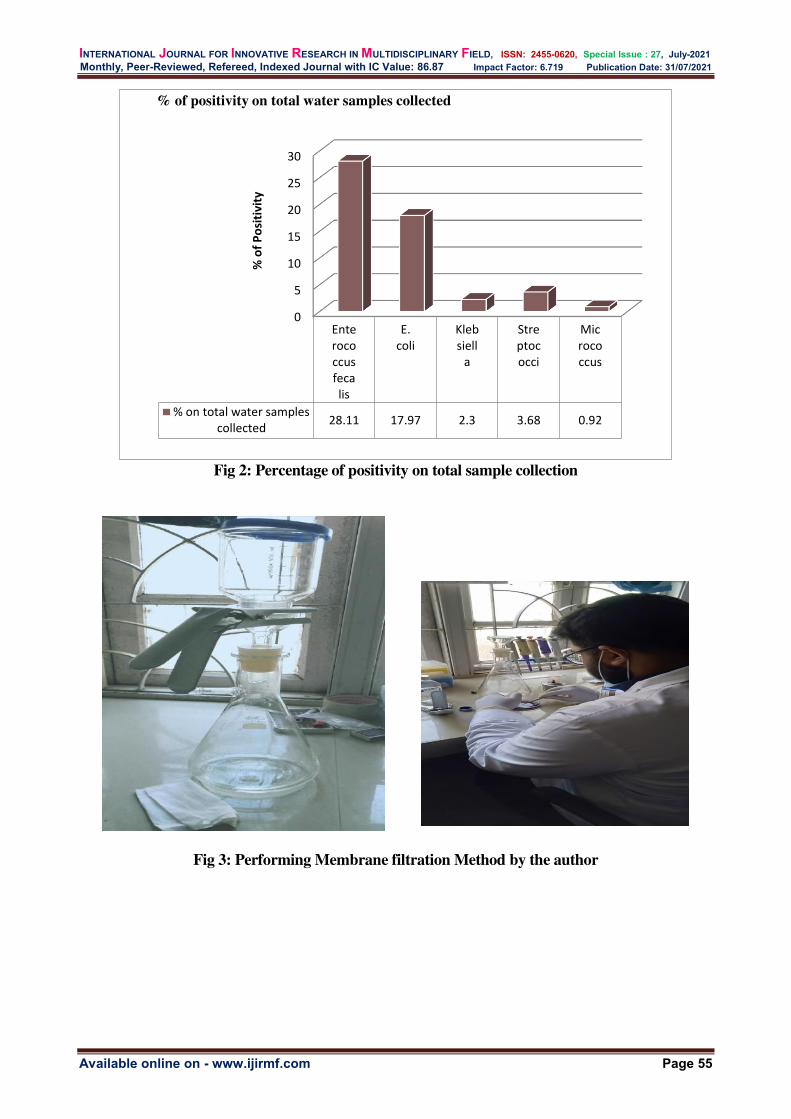
INTERNATIONAL JOURNAL FOR INNOVATIVE RESEARCH IN MULTIDISCIPLINARY FIELD, ISSN: 2455-0620, Special Issue : 27, July-2021
Monthly, Peer-Reviewed, Refereed, Indexed Journal with IC Value: 86.87 Impact Factor: 6.719 Publication Date: 31/07/2021
Available online on - www.ijirmf.com Page 55
Fig 2: Percentage of positivity on total sample collection
Fig 3: Performing Membrane filtration Method by the author
0
5
10
15
20
25
30
Ente
roco
ccus
feca
lis
E.
coli
Kleb
siell
a
Stre
ptoc
occi
Mic
roco
ccus
% on total water samples
collected28.11 17.97 2.3 3.68 0.92
% o
f P
osi
tiv
ity
% of positivity on total water samples collected
INTERNATIONAL JOURNAL FOR INNOVATIVE RESEARCH IN MULTIDISCIPLINARY FIELD, ISSN: 2455-0620, Special Issue : 27, July-2021
Monthly, Peer-Reviewed, Refereed, Indexed Journal with IC Value: 86.87 Impact Factor: 6.719 Publication Date: 31/07/2021
Available online on - www.ijirmf.com Page 56
International Conference on
Science, Engineering & Technological Innovations 10 & 11 July, 2021 Bangkok, Thailand
Jointly organized by: Automation, Computer Science and Technology Department, Kryvyi Rih National
University, Ukraine. ‘Research Culture Society’ and ‘Scientific Research Association’.
PHYTOCHEMICAL ANALYSIS OF ANNONA MURICATA USING
HIGH RESONANCE LIQUID CHROMATOGRAPHY AND MASS
SPECTROSCOPY
1 Reena Michael, 2 Dr. M.L.Joseph Research Scholar, Department of Zoology, St. Albert’s College, Autonomous, Ernakulam
Email ID - [email protected] Retired Professor, Department of Zoology, St. Albert’s College, Autonomous, Ernakulam
Email ID - [email protected] Abstract: Medicinal plants are a rich source of phytochemicals. Plants use these chemicals as
defense molecules and these phytochemicals have a tremendous pharmacological activity that could
be used for the betterment of the human race. The present study was designed to study
pharmacologically active plant secondary metabolites present in Annona muricata. The
phytochemical constituents present in the plants were analyzed using standardized protocols as well
as High Resonance Liquid Chromatography and Mass Spectroscopy (HR-LCMS). Qualitative
phytochemical analysis showed the presence of plant secondary metabolites such as alkaloids,
carbohydrates, glycosides, saponins, tannins, ligans, phytosterols, triterpenoids, and phenolic
compounds. The study also demonstrated that the highest occurrence of secondary metabolites in
methanolic extract followed by ethyl acetate extract and the least of them were found in the hexane
extract. About 43 pharmacologically active compounds were identified from the plant by HR-LCMS.
The wide biological activities of these compounds confirm the potency of A. muricata in traditional
medicine.
Keywords : Annona muricata, HRLCMS, secondary metabolites, phytochemicals.
1. INTRODUCTION : Natural products are source for many of the lead compounds used recently as medicine. The
search for new therapeutic compounds always ends in plants, the vast source of potential compounds that are already being used for centuries in traditional natural medicines. Man in his pursuit to eradicate diseases and illness has always turned to nature especially the usage of barks, seeds, fruits, leaves and roots and usage of these traditional medicines in day to day life for specific diseases and illness is a struggle by man through ages. These vast source of drugs of plants used from ancient times to present era is through everyday practices, documents, monuments or part of culture. Though potent source for many diseases and ailments, these natural sources fall short of scientific validations, with their mechanisms of action remaining unclear. Contemporary science acknowledges these vast hidden resources as these medicinal plants finds its place as emerging drug studied by the pharmacologists. The advantages of these natural products lie in the fact that they have minimal or no side effects when compared to synthetic drugs that help to be replaced as novel source for drugs. Medicinal plants a rich source of phytochemicals that are used by plants for their defense and these chemicals though nonnutritive are pharmacologically active compounds that could be well used for betterment of human race. These active compounds differ from plant to plant and are of varying proportion in different parts of the plant. The separation and isolation of these
INTERNATIONAL JOURNAL FOR INNOVATIVE RESEARCH IN MULTIDISCIPLINARY FIELD, ISSN: 2455-0620, Special Issue : 27, July-2021
Monthly, Peer-Reviewed, Refereed, Indexed Journal with IC Value: 86.87 Impact Factor: 6.719 Publication Date: 31/07/2021
Available online on - www.ijirmf.com Page 57
bioactive compounds is an expensive time consuming labor. The advancements in the analytical techniques are used for identification and elucidation of these active compounds.
Annona muricata belonging to family Annonacea is widely distributed in India. A. muricata is a small fruit tree reaching 5-8 m in height with large glossy dark green leaves. The tree bears large yellowish to yellowish green solitary flowers on woody stalks. The edible fruit of A. muricata are heart shaped, green colored with leathery skin bearing soft curved spines. The fruit has creamy white flesh with black seeds and characteristic aroma and flavor. The fruits of A.muricata are extensively used to prepare syrups, candies, ice cream and shakes. Roots, bark, leaves and fruit of A. muricata possess a wide variety of biologically active compounds and are used in traditional medicine for different diseases and ailments. Pulp of A. muricata is sour and sweet flavor, a combination of strawberry and pineapple with sour citrus flavor contrasting with an underlying creamy flavor reminiscent of coconut or banana (Ekaluo et al., 2015) and widely used as an ingredient in many foods and beverages. The fruit pulp is white fibrous juicy surrounding the central hard stalk. Ripe fruits are a rich source for vitamin B1, B2, C and phosphorus. White edible pulp contains 80% water, 18% carbohydrate, 1% protein and fats (Usunomen et al., 2015). A. muricata is a rich source of minerals like, Ca, Na, K, Cu, Fe and Mg. A. muricata is of economic value hence cultivated in large areas. The presence of actogenins, flavonoids, alkaloids, saponins, tanins, phytosterol, cardiac glycosides, terpenoids, carbohydrates and protein along with antioxidant compounds such as phenols, anthocianine, ascorbic acid, tocopherols, tocotrienols and trienols have been recorded in A.
muricata (Edeoga et al.,2005). A. muricata is known for its potent anticancerous activity and the compounds isolated with antitumor activity is called Acetogenins. Traditionally A. muricata is used in countries like Brazil, Haiti, Caribbea, Jamaica, Malaysia, Mexico, Peru, India, Trinidad, USA and West Indies (Patel and Patel, 2016). The ethnomedical uses of A.muricata include bronchitis, cough, diabetes, diarrhea, edema, fever, intestinal parasites, nervousness, flu, palpitations, as a sedative, lactation aid, scurvy, hypertension, asthma, tumor, inflammation, fainting, heart problem, malaria, chest cold, boils etc. Studies on the adverse effect of A. muricata has reported that a high consumption of A. muricata is said to be associated with an atypical Parkinsonisms. Acetogenins act as potent lipophilic inhibitor of complex I of the mitochondrial respiratory chain (Tormo, 2000).
1.1 Objectives : The objective of the present study is phytochemical screening for various plant secondary
metabolites using standardized protocols and analysis of phytochemical constituents using High Resonance Liquid Chromatography and Mass Spectroscopy (HR-LCMS).
2. LITERATURE REVIEW :
A. muricata have been prevalent in different parts of the world as an ethnomedicinal tree and used for hypertension (Hajdu and Hohmann, 2012), antidiabetes (Florence et al., 2014), anti-inflammatory (Oliviera et al., 2017) diarrhea (Foster et al., 2017), headache (Sreekeesoon and Mahomoodally, 2014) and arthritis (Prabhakaran et al., 2016). A. muricata have been used in traditional medicines for centuries and their medicinal properties are handed down orally from generation to generation without scientific background on these practices. Presently studies are initiated targeting the scientific validation and isolation of these bioactive compounds and the exploration of their mode of action traced at molecular, cellular and tissue level. A. muricata holds promise as a lead compound with wide array of pharmacological activities.
Most of the in vitro studies have shown a selective toxicity of A.muricata extracts to various tumor cell lines like the breast cancer cell line MCF-7 and T47D (Calderon et al., 2006; Rachamani et al.,2012), hematological malignant cells, leukemia U-937 (Rieser et al.,1996), HeLa cervical cancer cell lines (Suyatmi et al.,2012), the lung A549 (Moghadamtousi et al., 2014), Colorectal COLO- 205 and HT29 (Moghadamtousi et al.,2015; Indrawati et al.,2017) and multidrug resistant human breast adenocarcinoma (Yang et al.,2009; Liaw et al.,2002) without harming healthy cells. Studies of A. muricata leaf extract on colon cancer cells HT - 29 and HCT - 116 have shown
INTERNATIONAL JOURNAL FOR INNOVATIVE RESEARCH IN MULTIDISCIPLINARY FIELD, ISSN: 2455-0620, Special Issue : 27, July-2021
Monthly, Peer-Reviewed, Refereed, Indexed Journal with IC Value: 86.87 Impact Factor: 6.719 Publication Date: 31/07/2021
Available online on - www.ijirmf.com Page 58
apoptosis induction through mitochondrial mediated pathway (Moghadamtousi et al., 2014). Similar apoptosis inducing activity was also induced in leukemic K562 cells (Ezirim et al., 2013). A significant reduction in aberrant crypt foci in colon cancer was reported for an oral administration of A. muricata for 60 days with an up regulation of Bax and a down regulation of Bcl-2 (Moghadamtousi et al., 2015). An up regulation of Bax and a down regulation of Bcl-2 was observed for both invitro study in BPH- 1, benign Prostatic hyperplasia and in-vivo studies on rat prostate glands on administration of A. muricata leaf extract (Asare et al., 2015). The antitumor properties have been linked with antioxidant activities of Actogenins and the inhibition of NADH Ubiquinone oxidoreductase (complex) in mitochondria leading to suppression of ATP thereby inducing Apoptosis in cancer cells.
The hypoglycemic and antioxidant activity of A. muricata confers its antidiabetic properties (Lenk et al., 1992). On exposure to A.muricata the regeneration of pancreatic β cell in pancreatic islets and hypolipidemic potential was exhibited in rats with streptozotocin induced diabetis mellitus (Adewole and Martins, 2006; Adeyemi et al., 2008). The Carageenan induced paw edema in rats were reduced by 70% in a dose dependent manner on exposure to A. muricata leaf and fruit extracts by suppression of inflammatory mediators showing anti-inflammatory property (Sousa et al., 2007; 2008; Roslida et al., 2010; Ahalya et al., 2014). The antiarthritic activity was recorded in rats orally administered with A.muricata where suppression of pro-inflammatory cytokines were observed (Chan et al., 2010). Antihypertensive property was demonstrated in rat with A.muricata leaf extract exposure significantly decreasing blood pressure in a dose dependent manner (Nwokocha et al.,
2012). The onset of clonic seizures in mice was lengthened on exposure to A.muricata leaf extract (N’gouemo, et al., 1997) showing anticonvulsive activity. A.muricata leaf extract have significantly inhibited bacterial growth of Staphylococcus aureus, Vibrio cholerea, Escherichia coli, Klebsiella
pneumonia and Salmonella sps. (Wu et al., 1995; Flores and Sanchez, 2000). Trachylobanoic acid, a component of Acetogenin showed antibacterial activity against S.aureus (Viera et al., 2010).
The studies with ethanolic leaf extract of A. muricata showed that at a dose of 150mg/Kg the total parasitemia clearance was achieved for a longer duration of 5 days than the standard antimalarial drug, chloroquine (Oreagba, 2013). Studies against Plasmodium falciparum have shown an inhibition in growth of F32 strain exhibiting potency as antimalarial drug (Bidla et al., 2004; Osorio et al., 2007). Insecticidal property of A. muricata is known from years. The studies on Aedes and Culex species have shown susceptibility to A. muricata extracts (Alali et al., 1999; Grzybowski et al., 2013). Antioxidant, anti-inflammatory and antitumor activity exhibited by the medicinal plants could be traced to the multiple biological effects induced by the high concentration of phenolic compounds and flavonoids present (Jain et al., 2016). A positive linear correlation is observed in the antioxidant level in plant extracts with high concentration of phenolic and flavonoid compounds (George et al., 2014). 37 phenolic compounds have been reported to be present in A. muricata (Tellez et al., 2016). Quercetin and Gallic acid are the important flavonoids present in A. muricata leaves (Nawwar et al., 2012) whereas tocopherols and tocotrienols are present in the pulp (Gordilla et al., 2012). Alkaloids are compounds with basic nitrogen atoms rich in plants and leaves of A. muricata contain high concentration of alkaloids. Alkaloids are also present in stem, roots and fruits of A.
muricata (Fofana et al., 2011). Reticuline and Coreximine are the most abundant form of alkaloids that are present in A. muricata. Isoquinoline, aporphine, protoberbine, are important alkaloids present in A. muricata and most of the cytotoxicity exhibited by the extracts of A. muricata are induced by these alkaloids (Matsushige et al., 2012).
Medicinal plants were used as strong antioxidant to scavenge free radicals generated in living systems exposed to pollutants (Banaee et al., 2011). The reported therapeutic benefits of A.muricata against various diseases and ailments add to its promising medicinal value. The fact that the number of compounds studied and isolated from the Southern India remains scarce the present work is an

INTERNATIONAL JOURNAL FOR INNOVATIVE RESEARCH IN MULTIDISCIPLINARY FIELD, ISSN: 2455-0620, Special Issue : 27, July-2021
Monthly, Peer-Reviewed, Refereed, Indexed Journal with IC Value: 86.87 Impact Factor: 6.719 Publication Date: 31/07/2021
Available online on - www.ijirmf.com Page 59
attempt to study the phytochemical compounds present in the methanolic leaf extract of A.muricata using High Resolution Liquid Chromatography Mass Spectroscopy (HRLCMS).
3. METHODOLOGY: Collection of Annona Muricata Leaf Fresh leaves of A.muricata were collected from Kochi, Kerala, India and identified. The leaves were separated from stalk, washed and air dried in a shady place at room temperature. The dried leaves were pulverized, crushed into fine powder, weighed and stored in an air tight container. Preparative Soxhlet Extraction Extraction was done using Soxhlet apparatus. 10 g of A.muricata crushed leaf powder was taken and placed in cellulose thimble that was then placed in soxhlet apparatus and 1000ml of solvent (ethyl acetate, methanol and hexane) taken in round bottom flask and kept in heating mantle for upto 16 hours. The mantle was turned off and the system was allowed to cool for 1 hour. The ethyl acetate, hexane and methanolic leaf extract obtained were evaporated to a semisolid respective leaf extract using refrigerated vaccum rotary evaporator (Buchi R-210, Switzerland). The extract was stored in dessicator until used. Phytochemical Screening Phytochemical screening test was conducted for alkaloids, carbohydrates, glycosides, saponins, phytosterols and triterpenoids, phenols, tannin, and ligans. Phytochemical Screening Assays Test for alkaloids Detection of Alkaloids: About 50 mg of solvent – free extract was stirred with little quantity of dilute hydrochloric acid and filtered. The filtrate was tested with various alkaloidal reagents as follows: Mayer’s Test : To a few mL of filtrate, two drops of Mayer’s reagent was added along with the sides of the test tube. If the test is positive, it gives white or creamy precipitate. Wagner’s Test: To a few mL of the filtrate, few drops of Wagner’s reagent were added along with the sides of the test tube. Formation of reddish brown precipitate indicates test as positive. Hager’s Test: To a few mL of filtrate 1 or 2 mL of Hager’s reagent was added. A prominent yellow precipitate indicates positive test. Dragendroff’s Test: To a few mL of filtrate, 1 or 2 mL of Dragendroff’s reagent was added. A prominent reddish brown precipitate indicates positive test. Detection of Carbohydrates About 100mg of the extract was dissolved in 5 mL of distilled water and filtered. The filtrate was subjected to the following tests. Molisch’s Test: To 2 mL of filtrate, two drops of alcoholic solution of α – napthol was added. The mixture was shaken well and 1 mL of concentrated sulphuric acid was added slowly along the sides of the test tube, the test tube was cooled in ice water and allowed to stand. A violet ring at the junction of two liquids indicates the presence of carbohydrates. Fehling’s Test: 1 mL of filtrate was boiled on a water bath with 1 mL each of Fehling’s solution A and B. Formation of red precipitate indicates the presence of sugar. Benedict’s test: To 0.5 mL of filtrate 0.5 mL of Benedict’s reagent was added. The mixture was heated on a boiling water bath for 2 minutes. A characteristic colored precipitate indicates the presence of sugar.

INTERNATIONAL JOURNAL FOR INNOVATIVE RESEARCH IN MULTIDISCIPLINARY FIELD, ISSN: 2455-0620, Special Issue : 27, July-2021
Monthly, Peer-Reviewed, Refereed, Indexed Journal with IC Value: 86.87 Impact Factor: 6.719 Publication Date: 31/07/2021
Available online on - www.ijirmf.com Page 60
Detection of Glycosides For detection of glycosides, about 50 mg of extract was hydrolyzed with concentrated hydrochloric acid for 2 hrs on a water bath, filtered and the hydrolysate was subjected to the following test. Borntrager’s Test: To 2 mL of filtrate hydrolysate, 3mL of ethylacetate was added and shaken, ethylacetate layer was separated and 10% ammonia solution was added to it. Formation of pink color indicates the presence of anthroquinone glycosides. Legal’s Test: About 20 mg of the extract was dissolved in pyridine. Sodium nitroprusside solution was added and made alkaline using 10% sodium hydroxide solution. Presence of glycoside is indicated by a characteristic pink color. Detection of Saponins Foam or Froth test: A small quantity of the extract was diluted with distilled water to 20 mL. The suspension was shaken in a graduated cylinder for 15 minutes. A two centimeter layer of foam or froth which is stable for 10 minutes indicates the presence of saponins. Detection of Phytosterols and Triterpenoids Libermann – Burchard’s test: The extract was dissolved in acetic anhydride, heated to boiling, cooled and then 1 mL of concentrated sulphuric acid was added along the side of the test tube. Red, pink or violet color at the junction of the liquids indicates the presence of steroids / triterpenoids and their glycosides. Salkowoski test: Few drops of concentrated sulphuric acid was added to the ethylacetate extract, shaken on standing, red colour in the lower layer indicates the presence of steroids and golden yellow color indicates the presence of triterpenoids. Detection of Phenolic Compounds and Tannins Ferric chloride test: About 50 mg of extract was dissolved in distilled water and to this few drops of neutral 5% ferric chloride solution was added. Formation of blue, green and violet color indicates the presence of phenolic compounds. Gelatin test: A little quantity of extract was dissolved in distilled water and 2 mL of 1% solution of gelatin containing 10% sodium chloride was added to it. Development of white precipitate indicates the presence of phenolic compounds. Lead acetate test: A small quantity of extract was dissolved in distilled water and to this; 3 mL of 10% lead acetate solution was added. A bulky white precipitate indicates the presence of phenolic compounds. Alkaline reagents: An aqueous solution of extract was treated with 10% ammonium hydroxide solution – yellow fluorescence indicates the presence of flavonoids. Shinoda test or Magnesium – Hydrochloric acid reduction : A little quantity of extract was dissolved in alcohol and few fragments of magnesium turnings and con.hydrochloric acid (drop wise) were added. If any pink or crimson – red color develops, presence of flavonol glycoside is inferred. Test for ligans 0.5mL of aqueous solution of extract was added to 2mL of 2% (V/V) furfuraldehyde in a test tube. Red color indicates the presence of lignans. High Resolution Liquid Chromatography Mass Spectroscopy (HR-LCMS) HRLCMS was carried out at Sophisticated Analytical Instrument Facility (SAIF), IIT Mumbai. Samples of the methanolic extract of A.muricata were analysed on LC-ESI-Q-TOF-MS (Agilent technologies, USA, 6550 i-Funnel) system equipped with a G4226A and G1316C autosampler,

INTERNATIONAL JOURNAL FOR INNOVATIVE RESEARCH IN MULTIDISCIPLINARY FIELD, ISSN: 2455-0620, Special Issue : 27, July-2021
Monthly, Peer-Reviewed, Refereed, Indexed Journal with IC Value: 86.87 Impact Factor: 6.719 Publication Date: 31/07/2021
Available online on - www.ijirmf.com Page 61
G4220B pump and a diode array detector. The mass spectrometry (Model -G6550A) was with 0.01% mass resolution. The acquisition method was set to be MS minimum range 100(M/Z) and MS maximum range 1000 Daltons (M/Z) with scanning rate each spectrum/second. The two elution solvents used were – solvent A- 0.1% formic acid in100% water and solvent B 100% Acetonitrile at a flow rate of 0.05ml/min. Chromatographic separations were performed on column 18(100 x 1.0mm particle size 1.8μm). Ejection speed was 100μl/minute flush out with injection volume of 5μl.
4. RESULTS & FINDINGS :
Phytochemical Analysis Analysis of phytochemicals of A. muricata for qualitative study showed highest activity for
all the secondary metabolites under study namely alkaloids, carbohydrates, glycosides, saponins, tanins, ligans, phytosterols, triterpenoids and phenolic compounds to be highly available in methanolic extract followed by ethyl acetate. Secondary metabolites were least eluted using hexane extract of A. muricata (Table I). Hence methanolic extract was used for HRLCMS analysis.
Phytochemical Tests Methanol Extract Ethyl Acetate Hexane Alkaloids Mayer’s Test Wagner’s Test Hager’s Test Dragendroff’s Test
++
+
+
++
-
+
-
+
-
-
-
-
Carbohydrates Molisch’s Test Fehling’s Test Benedict’s test
++
++
++
+
+
+
-
-
-
Glycosides Borntrager’s Test Legal’s Test
++
++
+
+
-
-
Saponins Foam or Froth test
+
-
-
Phytosterols and
Triterpenoids Libermann – Burchard’s test
Salkowoski test
+
+
+
-
+
-
Phenolic Compounds and
Tannins Ferric chloride test Gelatin test Lead acetate test Alkaline reagents Shinoda test
++
+
++
+
++
+
+
-
+
+
-
-
-
-
-
Ligans + - -
Table I: Table showing results of the qualitative phytochemical screening for different
secondary metabolites using the methanolic, ethyl acetate and hexane leaf extracts of A.muricata.
HRLCMS Analysis of Phytocomponents Analysis of the methanolic leaf extract of A. muricata using HRLCMS showed the presence
of 7 major peaks and numerous minor peaks (Fig 1). The compounds were identified by comparing
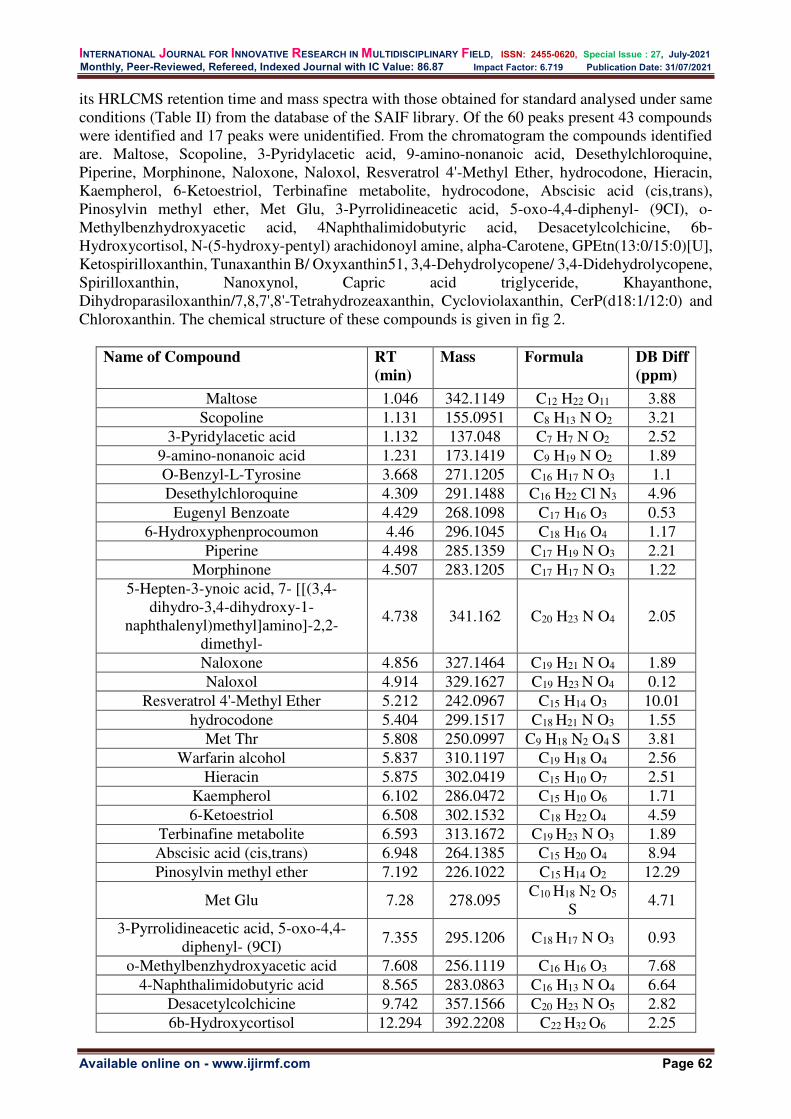
INTERNATIONAL JOURNAL FOR INNOVATIVE RESEARCH IN MULTIDISCIPLINARY FIELD, ISSN: 2455-0620, Special Issue : 27, July-2021
Monthly, Peer-Reviewed, Refereed, Indexed Journal with IC Value: 86.87 Impact Factor: 6.719 Publication Date: 31/07/2021
Available online on - www.ijirmf.com Page 62
its HRLCMS retention time and mass spectra with those obtained for standard analysed under same conditions (Table II) from the database of the SAIF library. Of the 60 peaks present 43 compounds were identified and 17 peaks were unidentified. From the chromatogram the compounds identified are. Maltose, Scopoline, 3-Pyridylacetic acid, 9-amino-nonanoic acid, Desethylchloroquine, Piperine, Morphinone, Naloxone, Naloxol, Resveratrol 4'-Methyl Ether, hydrocodone, Hieracin, Kaempherol, 6-Ketoestriol, Terbinafine metabolite, hydrocodone, Abscisic acid (cis,trans), Pinosylvin methyl ether, Met Glu, 3-Pyrrolidineacetic acid, 5-oxo-4,4-diphenyl- (9CI), o-Methylbenzhydroxyacetic acid, 4Naphthalimidobutyric acid, Desacetylcolchicine, 6b-Hydroxycortisol, N-(5-hydroxy-pentyl) arachidonoyl amine, alpha-Carotene, GPEtn(13:0/15:0)[U], Ketospirilloxanthin, Tunaxanthin B/ Oxyxanthin51, 3,4-Dehydrolycopene/ 3,4-Didehydrolycopene, Spirilloxanthin, Nanoxynol, Capric acid triglyceride, Khayanthone, Dihydroparasiloxanthin/7,8,7',8'-Tetrahydrozeaxanthin, Cycloviolaxanthin, CerP(d18:1/12:0) and Chloroxanthin. The chemical structure of these compounds is given in fig 2.
Name of Compound RT
(min)
Mass Formula DB Diff
(ppm)
Maltose 1.046 342.1149 C12 H22 O11 3.88 Scopoline 1.131 155.0951 C8 H13 N O2 3.21
3-Pyridylacetic acid 1.132 137.048 C7 H7 N O2 2.52 9-amino-nonanoic acid 1.231 173.1419 C9 H19 N O2 1.89 O-Benzyl-L-Tyrosine 3.668 271.1205 C16 H17 N O3 1.1 Desethylchloroquine 4.309 291.1488 C16 H22 Cl N3 4.96
Eugenyl Benzoate 4.429 268.1098 C17 H16 O3 0.53 6-Hydroxyphenprocoumon 4.46 296.1045 C18 H16 O4 1.17
Piperine 4.498 285.1359 C17 H19 N O3 2.21 Morphinone 4.507 283.1205 C17 H17 N O3 1.22
5-Hepten-3-ynoic acid, 7- [[(3,4-dihydro-3,4-dihydroxy-1-
naphthalenyl)methyl]amino]-2,2-dimethyl-
4.738 341.162 C20 H23 N O4 2.05
Naloxone 4.856 327.1464 C19 H21 N O4 1.89 Naloxol 4.914 329.1627 C19 H23 N O4 0.12
Resveratrol 4'-Methyl Ether 5.212 242.0967 C15 H14 O3 10.01 hydrocodone 5.404 299.1517 C18 H21 N O3 1.55
Met Thr 5.808 250.0997 C9 H18 N2 O4 S 3.81 Warfarin alcohol 5.837 310.1197 C19 H18 O4 2.56
Hieracin 5.875 302.0419 C15 H10 O7 2.51 Kaempherol 6.102 286.0472 C15 H10 O6 1.71 6-Ketoestriol 6.508 302.1532 C18 H22 O4 4.59
Terbinafine metabolite 6.593 313.1672 C19 H23 N O3 1.89 Abscisic acid (cis,trans) 6.948 264.1385 C15 H20 O4 8.94 Pinosylvin methyl ether 7.192 226.1022 C15 H14 O2 12.29
Met Glu 7.28 278.095 C10 H18 N2 O5
S 4.71
3-Pyrrolidineacetic acid, 5-oxo-4,4-diphenyl- (9CI)
7.355 295.1206 C18 H17 N O3 0.93
o-Methylbenzhydroxyacetic acid 7.608 256.1119 C16 H16 O3 7.68 4-Naphthalimidobutyric acid 8.565 283.0863 C16 H13 N O4 6.64
Desacetylcolchicine 9.742 357.1566 C20 H23 N O5 2.82 6b-Hydroxycortisol 12.294 392.2208 C22 H32 O6 2.25
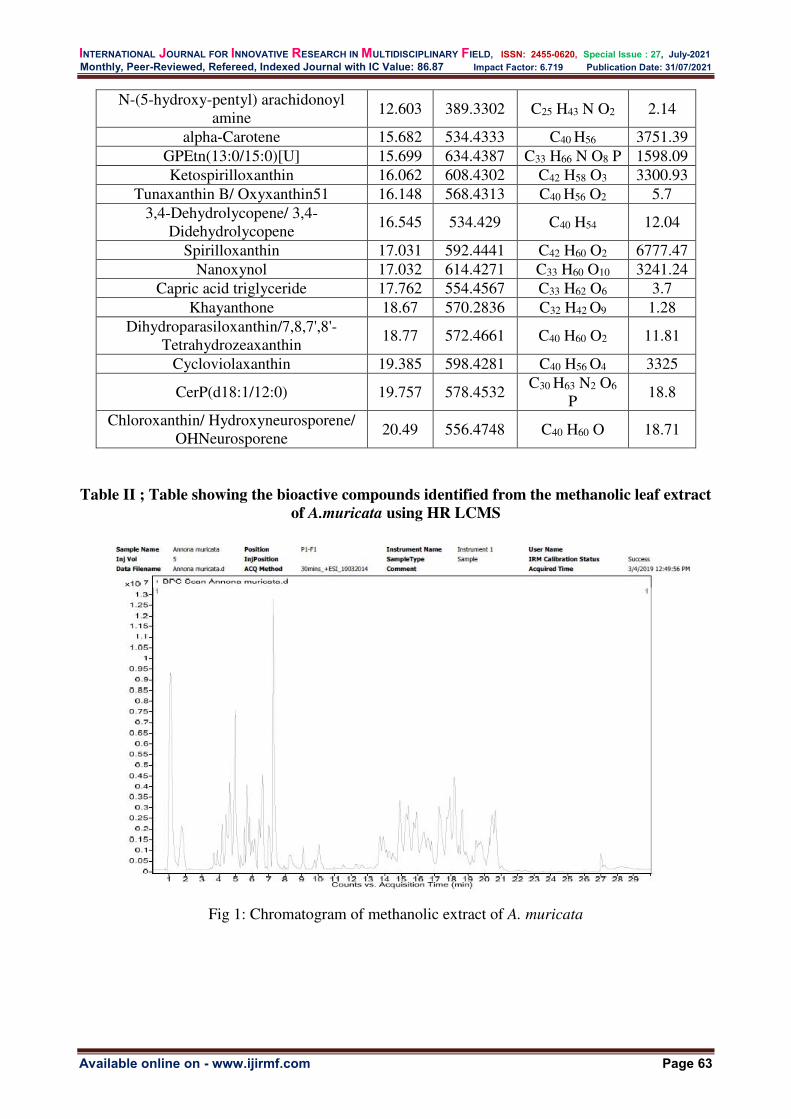
INTERNATIONAL JOURNAL FOR INNOVATIVE RESEARCH IN MULTIDISCIPLINARY FIELD, ISSN: 2455-0620, Special Issue : 27, July-2021
Monthly, Peer-Reviewed, Refereed, Indexed Journal with IC Value: 86.87 Impact Factor: 6.719 Publication Date: 31/07/2021
Available online on - www.ijirmf.com Page 63
N-(5-hydroxy-pentyl) arachidonoyl amine
12.603 389.3302 C25 H43 N O2 2.14
alpha-Carotene 15.682 534.4333 C40 H56 3751.39 GPEtn(13:0/15:0)[U] 15.699 634.4387 C33 H66 N O8 P 1598.09 Ketospirilloxanthin 16.062 608.4302 C42 H58 O3 3300.93
Tunaxanthin B/ Oxyxanthin51 16.148 568.4313 C40 H56 O2 5.7 3,4-Dehydrolycopene/ 3,4-
Didehydrolycopene 16.545 534.429 C40 H54 12.04
Spirilloxanthin 17.031 592.4441 C42 H60 O2 6777.47 Nanoxynol 17.032 614.4271 C33 H60 O10 3241.24
Capric acid triglyceride 17.762 554.4567 C33 H62 O6 3.7 Khayanthone 18.67 570.2836 C32 H42 O9 1.28
Dihydroparasiloxanthin/7,8,7',8'-Tetrahydrozeaxanthin
18.77 572.4661 C40 H60 O2 11.81
Cycloviolaxanthin 19.385 598.4281 C40 H56 O4 3325
CerP(d18:1/12:0) 19.757 578.4532 C30 H63 N2 O6
P 18.8
Chloroxanthin/ Hydroxyneurosporene/ OHNeurosporene
20.49 556.4748 C40 H60 O 18.71
Table II ; Table showing the bioactive compounds identified from the methanolic leaf extract
of A.muricata using HR LCMS
Fig 1: Chromatogram of methanolic extract of A. muricata

INTERNATIONAL JOURNAL FOR INNOVATIVE RESEARCH IN MULTIDISCIPLINARY FIELD, ISSN: 2455-0620, Special Issue : 27, July-2021
Monthly, Peer-Reviewed, Refereed, Indexed Journal with IC Value: 86.87 Impact Factor: 6.719 Publication Date: 31/07/2021
Available online on - www.ijirmf.com Page 64
Structure of phytocomponents identified using HRLCMS.
Structure of phytocomponents identified using HRLCMS.

INTERNATIONAL JOURNAL FOR INNOVATIVE RESEARCH IN MULTIDISCIPLINARY FIELD, ISSN: 2455-0620, Special Issue : 27, July-2021
Monthly, Peer-Reviewed, Refereed, Indexed Journal with IC Value: 86.87 Impact Factor: 6.719 Publication Date: 31/07/2021
Available online on - www.ijirmf.com Page 65

INTERNATIONAL JOURNAL FOR INNOVATIVE RESEARCH IN MULTIDISCIPLINARY FIELD, ISSN: 2455-0620, Special Issue : 27, July-2021
Monthly, Peer-Reviewed, Refereed, Indexed Journal with IC Value: 86.87 Impact Factor: 6.719 Publication Date: 31/07/2021
Available online on - www.ijirmf.com Page 66

INTERNATIONAL JOURNAL FOR INNOVATIVE RESEARCH IN MULTIDISCIPLINARY FIELD, ISSN: 2455-0620, Special Issue : 27, July-2021
Monthly, Peer-Reviewed, Refereed, Indexed Journal with IC Value: 86.87 Impact Factor: 6.719 Publication Date: 31/07/2021
Available online on - www.ijirmf.com Page 67

INTERNATIONAL JOURNAL FOR INNOVATIVE RESEARCH IN MULTIDISCIPLINARY FIELD, ISSN: 2455-0620, Special Issue : 27, July-2021
Monthly, Peer-Reviewed, Refereed, Indexed Journal with IC Value: 86.87 Impact Factor: 6.719 Publication Date: 31/07/2021
Available online on - www.ijirmf.com Page 68
Fig 2:Chemical structure of the compounda identified from methanolic leaf extract of
A.muricata using HRLCMS.
5. ANALYSIS & DISCUSSION : Phytochemicals are plant metabolites seen in different composition and proportion in
different parts of the same plant and these phytochemical constituents being unique impart the plant species with characteristic bioactive compounds with therapeutic value. The action of these natural compounds are the least understood and the most sought out mode of action that has been the focus of natural product researchers in search for new compounds that could be lead compounds for drug delivery. Phytochemical compounds alkaloids, carbohydrates, glycosides, saponins, tanins, phytosterols, phenols, triterpenoids and ligans were present in the methanolic extract of A.muricata. The phytochemical analysis of A.muricata using HRLCMS showed a wide variety of known and unknown compounds. The identified compounds include alkaloids (piperine), opioids (morphinone, nalaxol, hydrocodone), metabolites (chloroquinone, 3-pyridyl acetic acid), stilbenoids (Resveratrol-4 methyl ether, Pinosylvin methyl ether), steroids (6-Ketoestriol), dipeptides (Met Glu, Met Thr ), carotenoids (alpha-Carotene), reducing sugars (maltose), terpenes (Ketospirilloxanthin) and xanthophylls (Cycloviolaxanthin)
The phytochemicals reported in A.muricata are alkaloids, flavonoids, carbohydrates, cardiac glycosides, saponins, tanins, phytosterols, terpenoids and protein (Edeoga et al., 2005). The presence of various secondary metabolites identified in the present study is in line with other studies carried out in ethanolic extracts of A.muricata seeds that contain alkaloids, terpenes, flavonoids, anthraquinone, tanins. These secondary metabolites are considered as compounds synthesized by plant tissue as first line of defence mechanism (Komansilan et al., 2012;). The ethanolic leaf extract of A.muricata showed presence of reducing sugar as reported in present study in addition to flavonoids, alkaloids, cardiac glycoside, tannins, triterpenoid and saponin (Usunomen et al., 2015).
In the present study 18 of the peaks remains unidentified when compared to the SAIF database. The peaks include few major peaks and these may be new compounds and further advanced analytical techniques are required to elucidate these compounds. Most of the phyto constituents isolated from A. muricata have been isolated from other plant sources and have exhibited pharmacological activities. Tannins have stringent properties and are concerned with wound healing (Bajai, 2000), prevention of cancer as well as treatment of inflamed or ulcerated tissues (Adegboye et al., 2008). Tannins exert antimicrobial activity and their mode of action is by interrupting the membrane or membrane disruption, enzyme inhibition, substrate deprivation and metal ion complexation (Fragaso et al., 2008). Tannins are polyphenols that reduce the risk of coronary heart diseases, and phenolic compounds exhibit their action of inhibition of carcinogens by acting as blocking agents (Fatoki and Fawole, 2000). Saponins possess cholesterol binding property, hemolytic property (Okwu, 2004) precipitating and coagulation of red blood cells (Yadav and Agarwala, 2011). They are concerned with destablization of membrane integrity by formation of trans membrane pores (Okwu and Eminike, 2006) and also induce inhibitory effects on DNA, RNA and protein.
INTERNATIONAL JOURNAL FOR INNOVATIVE RESEARCH IN MULTIDISCIPLINARY FIELD, ISSN: 2455-0620, Special Issue : 27, July-2021
Monthly, Peer-Reviewed, Refereed, Indexed Journal with IC Value: 86.87 Impact Factor: 6.719 Publication Date: 31/07/2021
Available online on - www.ijirmf.com Page 69
Terpenoids possess antimicrobial, antifungal, antiparasitic, antiviral, antiallergic, antispasmodic, anti-inflammatory and immunomodulatory properties (Rabi and Bishayee, 2009). The different secondary plant metabolites produce same activity. Plants containing carbohydrate, glycosides, and coumarins exert a positive reinforcement on immune system enhancing body strength (Chung et al., 2011). Antimicrobial activity is exhibited by saponins, tannins and triterpenoids (Ghosh et al., 2006).
Scopoline is a coumarin and has been reported from Convolvulus fatmensis (Atta et al., 2005). The coumarins warfarin and Phen procoumarins was isolated from Ipomoea mauritiana showed significant protection against working memory errors (Sulaiman et al., 2019). Coumarins are known to possess antibacterial, antifungal, antiprotozoan and anticoagulant activities (Sulaiman et al., 2019). Pinosylvin (3,5-dihydroxy-trans-stilbene), is a constituent of pine exhibiting antibacterial and antifungal activities (Yatkin 2005). Eugenyl benzoate is an eugenol ester with anti-inflammatory activity against skin inflammation (Sebatini et al., 2018). Hydrocodone is a mild analgesic and antitussive natural alkaloid derived from the resin of poppy seeds (Papaver
somniferum). Piperine is another alkaloid of pepper fruits (Piper nigrum) with numerous biological and pharmacological activities including anti-inflammatory, antihypertensive, hepatoprotective, antithyroid, antiasthmatic, antitumor and as an antioxidant (Gorgani, 2017). Desacetyl colchicine is also an alkaloid extracted from Marendera robusta (Turdinkulov et al., 1972). Alkaloids are diverse class of secondary plant metabolites possessing anticancer, antimicrobial, cytotoxic, vasospastic, anti-inflammatory, analgesics, local anesthetic and pain relief properties. Cycloviolaxanthin is a carotenoid isolated from red paparika Capsicum annum var longum nigrum (Deli, 1991). Alpha carotene, Ketospirilloxanthin, spirilloxanthin, Dihydroparasiloxanthin/7,8,7',8'-Tetrahydrozeaxanthin, Chloroxanthin/ Hydroxyneurosporene/ OH Neurosporene are carotenoids.
Carotenoids exhibit a range of biological and health benefits. Epidemological studies indicate that use of carotenoid rich diet is related to lower incidence of cancer, cardiovascular disease, osteoporosis, diabetes, cataract and also enhances longevity of life (Rao and Rao, 2007; Pechinskii and Kuregyan, 2014; Saini et al., 2015). Kaempferol is a flavonoid with gastroprotective effects antiulcerogenic effect with inhibition of endogenous prostaglandins (Qarawi et al., 2004). Carotenoids, alkaloids and flavonoids are antioxidants which is their key mechanism of action. They scavange the free radicals generated due to oxidative stress. The inhibition of active radicals is by transfer of electrons donating hydrogen atoms to radicals and attaching to radicals (Kopsell and Kopsell, 2006).
6. RECOMMENDATIONS : The results from the present study revealing the further exploration in the field of phyto-
chemical remediation using indigenous and ethnic plant based resources.
7. CONCLUSION : The wide pharmacological and biological characteristics of the compounds identified in the
present study confirm the potency of A.muricata being used in traditional medicine. These compounds are capable of independent and synergistic action that adds to the advantage of A.
muricata to be used as an immunostimulant to suppress the toxicological effects. REFERENCES: 1. Adegboye, M. F., Akinpelu, D. A., & Okoh, A. I. (2008). The bioactive and phytochemical
properties of Garcinia kola (Heckel) seed extract on some pathogens. African Journal of
Biotechnology, 7(21). 2. Adewole, S. O., & Caxton-Martins, E. A. (2006). Morphological changes and hypoglycemic
effects of Annona muricata linn.(annonaceae) leaf aqueous extract on pancreatic β-cells of streptozotocin-treated diabetic rats. African Journal of Biomedical Research, 9(3).

INTERNATIONAL JOURNAL FOR INNOVATIVE RESEARCH IN MULTIDISCIPLINARY FIELD, ISSN: 2455-0620, Special Issue : 27, July-2021
Monthly, Peer-Reviewed, Refereed, Indexed Journal with IC Value: 86.87 Impact Factor: 6.719 Publication Date: 31/07/2021
Available online on - www.ijirmf.com Page 70
3. Adeyemi, D.O, Komolafe, O.A, Adewole, S.O, Obuotor, E.M, & Adenowo, T.K. (2008). Effects of Annona Muricata(Linn) on the morphology of pancreatic islet cells of experimentally-induced diabetic Wistar rats. The Internet Journal of Alternative Medicine, 5(2). https://doi.org/10.5580/229c
4. Ahalya, B., Shankar, K. R., & Kiranmayi, G. (2014). Exploration of anti-hyperglycemic and hypolipidemic activities of ethanolic extract of Annona muricata bark in alloxan induced diabetic rats. Int. J. Pharm. Sci. Rev. Res, 25(2), 21-27.
5. Akinpelu, D., Adegboye, M., Adeloye, O., & Okoh, A. (2008). Biocidal activity of partially purified fractions from methanolic extract of Garcinia kola (Heckel) seeds on bacterial isolates. Biological Research, 41(3). https://doi.org/10.4067/s0716-97602008000300005
6. Alali, F. Q., Liu, X. X., & McLaughlin, J. L.(1999). Annonaceous acetogenins: recent progress. Journal of Natural products, 62(3), 504-540.
7. Al-Qarawi, A. A., Mousa, H. M., Ali, B. H., Abdel-Rahman, H., & El-Mougy, S. A. (2004). Protective effect of extracts from dates (Phoenix dactylifera L.) on carbon tetrachloride-induced hepatotoxicity in rats. Int J Appl Res Vet Med, 2(3), 176-180.
8. Asare, G. A., Afriyie, D., Ngala, R. A., Abutiate, H., Doku, D., Mahmood, S. A., & Rahman, H. (2015). Antiproliferative activity of aqueous leaf extract of Annona muricata L. on the prostate, BPH-1 cells, and some target genes. Integrative cancer therapies, 14(1), 65-74.
9. Atta, A. H., & Mouneir, S. M. (2005). Evaluation of some medicinal plant extracts for antidiarrhoeal activity. Phytotherapy Research, 19(6), 481-485.
10. Banaee, M, Sureda, A, Mirvaghefi, A. R, & Ahmadi, K. (2011). Effects of diazinon on biochemical parameters of blood in rainbow trout (Oncorhynchus mykiss). Pesticide Biochemistry and Physiology, 99, 1-6.
11. Bajai-Elliott, M. (2000). LM. Sallenave. Biochemical Society Transactions, 28(Part 5), A493. 12. Bidla, G., Titanji, V. P. K., Joko, B., El-Ghazali, G., Bolad, A., & Berzins, K. (2004).
Antiplasmodial activity of seven plants used in African folk medicine. 13. Calderón, Á. I., Vázquez, Y., Solís, P. N., Caballero-George, C., Zacchino, S., Gimenez, A., &
Gupta, M. P. (2006). Screening of Latin American plants for cytotoxic activity. Pharmaceutical
Biology, 44(2), 130-140. 14. Chan, P., Ah, R., & Mh, K. (2010). Anti-arthritic activities of Annona muricata L. leaves extract
on complete Freund's adjuvant (CFA)–induced arthritis in rats. Planta Medica, 76(12), P166. 15. Chung, C., Hsia, S., Lee, M., Chen, H., Cheng, F., Chan, L., Kuo, Y., Lin, Y., & Chiang,
W. (2011). Gastroprotective activities of Adlay (Coix lachryma-jobi L. Var. ma-Yuen Stapf) on the growth of the stomach cancer AGS cell line and indomethacin-induced gastric ulcers. Journal of Agricultural and Food Chemistry, 59(11), 6025-6033. https://doi.org/10.1021/jf2009556
16. Coria-Téllez, A. V., Montalvo-Gónzalez, E., Yahia, E. M., & Obledo-Vázquez, E. N. (2018). Annona muricata: A comprehensive review on its traditional medicinal uses, phytochemicals, pharmacological activities, mechanisms of action and toxicity. Arabian Journal of
chemistry, 11(5), 662-691. 17. De Ghosh, M., Ramakrishna, S., & Ramakrishna, M. (2014). Antimicrobial activity and
phytochemical analysis of medicinal plants. 18. Deli, J., Mólnar, P., Tóth, G., Baumeler, A., & Eugster, C. H. (1991). Cycloviolaxanthin (3S,
5R, 6R, 3′ S, 5′ R, 6′ R)‐3, 6: 3′, 6′‐Diepoxy‐5, 6, 5′, 6′‐tetrahydro‐β, β‐carotin‐5, 5′‐diol), ein neues Carotinoid aus Paprika (Capsicum annuum). Helvetica chimica acta, 74(4), 819-824.
19. Edeoga, H., Okwu, D. E., & Mbaebie, B. (2005). Phytochemical constituents of some Nigerian medicinal plants. African Journal of Biotechnology, 4(7), 685-688. https://doi.org/10.5897/ajb2005.000-3127
20. Ekaluo, U., Uno, U., Ekpo, P., Etta, S., Odok, T., & Daniel, I. (2015). Attenuating potential of Trévo dietary supplement on caffeine induced sperm Toxicities in albino rats. Asian Journal of
Clinical Nutrition, 7(3), 84-89. https://doi.org/10.3923/ajcn.2015.84.89
INTERNATIONAL JOURNAL FOR INNOVATIVE RESEARCH IN MULTIDISCIPLINARY FIELD, ISSN: 2455-0620, Special Issue : 27, July-2021
Monthly, Peer-Reviewed, Refereed, Indexed Journal with IC Value: 86.87 Impact Factor: 6.719 Publication Date: 31/07/2021
Available online on - www.ijirmf.com Page 71
21. Ezirim, A. U., Okochi, V. I., James, A. B., Adebeshi, O. A., Ogunnowo, S., & Odeghe, O. B. (2013). Induction of apoptosis in Myelogenous leukemic k562 cells by Ethanolic leaf extract of Annona Muricata L. Global Journal of Research on Medicinal Plants & Indigenous Medicine, 2(3), 142.
22. Fatoki, O.K. and Fawole, B. (2000): Identification of nematicidal ingredients from neem leaves, Siam weed leaves and roots. African Journal of Plant Protection. 10: 33- 38.
23. Florence, N. T., Benoit, M. Z., Jonas, K., Alexandra, T., Désiré, D. D., Pierre, K., & Théophile, D. (2014). Antidiabetic and antioxidant effects of Annona muricata (Annonaceae), aqueous extract on streptozotocin-induced diabetic rats. Journal of Ethnopharmacology, 151(2), 784-790. https://doi.org/10.1016/j.jep.2013.09.021
24. Fofana, S., Ziyaev, R., Abdusamatov, A., & Zakirov, S. K. (2011). Alkaloids from Annona
muricata leaves. Chemistry of Natural Compounds, 47(2), 321-321. https://doi.org/10.1007/s10600-011-9921-5
25. Foster, K., Younger, N., Aiken, W., Brady-West, D., & Delgoda, R. (2017). Reliance on medicinal plant therapy among cancer patients in Jamaica. Cancer Causes & Control, 28(11), 1349-1356. https://doi.org/10.1007/s10552-017-0924-9
26. George, V. C., Kumar, D. R., Suresh, P. K., & Kumar, R. A. (2014). Antioxidant, DNA protective efficacy and HPLC analysis of Annona muricata (soursop) extracts. Journal of Food
Science and Technology, 52(4), 2328-2335. https://doi.org/10.1007/s13197-014-1289-7 27. Gordilla, JC, Ortiz, D., Larrahondo, JE, Mejía, MS, & Pachon, H. (2012). Antioxidant activity
in soursop (Annona muricata l.): A literature review. Latin American and Caribbean Bulletin
of Medicinal and Aromatic Plants , 11 (2), 111-126. 28. Gorgani L., Mohammadi M., Najafpour G. D., Nikzad M. (2017). Piperine—the bioactive
compound of black pepper: from isolation to medicinal formulations. Comp. Rev. Food Sci.
Food Safety 16, 124–140. 10.1111/1541-4337.12246 29. Ghosh, S., Azhahianambi, P., & de la Fuente, J. (2006). Control of ticks of ruminants, with
special emphasis on livestock farming systems in India: present and future possibilities for integrated control—a review. Experimental & applied acarology, 40(1), 49-66.
30. Grzybowski, A., Tiboni, M., Silva, M. A., Chitolina, R. F., Passos, M., & Fontana, J. D. (2013). Synergistic larvicidal effect and morphological alterations induced by ethanolic extracts of Annona muricata and Piper nigrum against the dengue fever vector Aedes aegypti. Pest management science, 69(5), 589-601.
31. Hajdu, Z., & Hohmann, J. (2012). An ethnopharmacological survey of the traditional medicine utilized in the community of Porvenir, Bajo Paraguá Indian reservation, Bolivia. Journal of
Ethnopharmacology, 139(3), 838-857. https://doi.org/10.1016/j.jep.2011.12.029 32. Ibrahim, M. A., Aliyu, A. B., Meduteni, K., & Yunusa, I. (2013). Saponins-rich fraction of
Calotropis procera leaves elicit no antitrypanosomal activity in a rat model. Asian Pacific
journal of tropical biomedicine, 3(7), 569-572. 33. Indrawati L., Ascobat P., Bela B., Abdullah, M. and I. S. Surono, (2017).The effect of an
Annona muricata leaf extract on nutritional status and cytotoxicity in colorectal cancer: a Oxidative Medicine and Cellular Longevity 37 randomized controlled trial,” Asia Pacific Journal of Clinical Nutrition, vol. 26, no. 4, pp. 606–612.
34. Jain, A., Roy, S., Joshi, A., & Joshi, N. (2016). Evaluation of In-vitro cytotoxic and antioxidant activity of methanolic extracts of Ipomoea carnea and Alternanthera sessilis. International
Journal of Bioassays, 5(8), 4763-4766. 35. Jaramillo-Flores, M. E., & Hernandez-Sanchez, H. (2000). Thermal diffusivity of soursop
(Annona muricata L.) pulp. Journal of food engineering, 46(2), 139-143. 36. Komansilan, A., Abadi, A. L., Yanuwiadi, B., & Kaligis, D. A. (2012). Isolation and
identification of biolarvicide from soursop (Annona muricata Linn) seeds to mosquito (Aedes
aegypti) larvae. Int J Eng Technol, 12(03), 28-32.

INTERNATIONAL JOURNAL FOR INNOVATIVE RESEARCH IN MULTIDISCIPLINARY FIELD, ISSN: 2455-0620, Special Issue : 27, July-2021
Monthly, Peer-Reviewed, Refereed, Indexed Journal with IC Value: 86.87 Impact Factor: 6.719 Publication Date: 31/07/2021
Available online on - www.ijirmf.com Page 72
37. Kopsell, D. A., & Kopsell, D. E. (2006). Accumulation and bioavailability of dietary carotenoids in vegetable crops. Trends in plant science, 11(10), 499-507.
38. Lee, S. K., Lee, H. J., Min, H. Y., Park, E. J., Lee, K. M., Ahn, Y. H., ... & Pyee, J. H. (2005). Antibacterial and antifungal activity of pinosylvin, a constituent of pine. Fitoterapia, 76(2), 258-260.
39. Lenk, S. E., Bhat, D., Blakeney, W., & Dunn, W. A. (1992). Effects of streptozotocin-induced diabetes on rough endoplasmic Reticulum and lysosomes of rat liver. American Journal of
Physiology-Endocrinology and Metabolism, 263(5), E856-E862. https:// doi.org/ 10.1152/ ajpendo. 1992.263.5. e856
40. Liaw, C., Chang, F., Lin, C., Chou, C., Chiu, H., Wu, M., & Wu, Y. (2002). New cytotoxic Monotetrahydrofuran Annonaceous Acetogenins from Annona muricata. Journal of Natural
Products, 65(4), 470-475. https://doi.org/10.1021/np0105578 41. Matsushige, A., Kotake, Y., Matsunami, K., Otsuka, H., Ohta, S., & Takeda, Y. (2012).
Annonamine, a new Aporphine alkaloid from the leaves of Annona muricata. Chemical and
Pharmaceutical Bulletin, 60(2), 257-259. https://doi.org/10.1248/cpb.60.257 42. Moghadamtousi, S. Z., Kadir, H. A., Paydar, M., Rouhollahi, E., & Karimian, H. (2014).
Annona muricata leaves induced apoptosis in A549 cells through mitochondrial-mediated pathway and involvement of NF-κB. BMC complementary and alternative medicine, 14(1), 1-13.
43. Moghadamtousi, S. Z., Rouhollahi, E., Karimian, H., Fadaeinasab, M., Firoozinia, M., Abdulla, M. A., & Kadir, H. A. (2015). The chemopotential effect of Annona muricata leaves against azoxymethane-induced colonic aberrant crypt foci in rats and the apoptotic effect of acetogenin annomuricin E in HT-29 cells: a bioassay-guided approach. PloS one, 10(4), e0122288.
44. Nawwar, M., Ayoub, N., Hussein, S., Hashim, A., El-Sharawy, R., Wende, K., Harms, M., & Lindequist, U. (2012). Flavonol triglycoside and investigation of the antioxidant and cell stimulating activities of Annona muricata Linn. Archives of Pharmacal Research, 35(5), 761-767. https://doi.org/10.1007/s12272-012-0501-4
45. N'gouemo, P., Koudogbo, B., Tchivounda, H. P., Akono‐Nguema, C., & Etoua, M. M. (1997). Effects of ethanol extract of Annona muricata on pentylenetetrazol‐induced convulsive seizures in mice. Phytotherapy Research: An International Journal Devoted to Medical and Scientific Research on Plants and Plant Products, 11(3), 243-245.
46. Nwokocha, C.R.; Owu, D.U.; Gordon, A.; Thaxter, K.; McCalla, G.; Ozolua, R.I.; Young, L.Osorio, E.; Arango, G.J.; Jiménez, N.; Alzate, F.; Ruiz, G.; Gutiérrez, D.; Paco, M.A.; Giménez, A.; Robledo, S. Antiprotozoal and cytotoxic activities in vitro of colombian annonaceae.J. Ethnopharmacol. 2007, 111, 630–635.
47. Okwu D. E. and Emenike I. N. (2006). Evaluation of the phytonutrients and vitamin contents of Citrus fruits. Int. J. Mol. Med. Adv. Sci. 2:1–6.
48. Okwu, D. E. (2004). Phytochemicals and vitamin content of indigenous species of southeastern Nigeria. J. Sustain. Agric. Environ., 6(1):30-37.
49. Oliveira, A. P., Sa, I., Pereira, D. M., Goncalves, R. F., Andrade, P. B., & Valentao, P. (2017). Exploratory Studies on the in Vitro Anti‐inflammatory Potential of Two Herbal Teas (Annona
muricata L. and Jasminum grandiflorum L.), and Relation with Their Phenolic Composition. Chemistry & biodiversity, 14(6), e1700002.
50. Oreagba U. I. (2013) Evaluation of the Antimalarial Effects of the Leaf Extract and Fruit Juice of Annona muricata against Plasmodium berghei Infection in Mice. UNILAG Journal Basic Medical Sciences; 1(2):65-70
51. Osorio, E., Arango, G. J., Jiménez, N., Alzate, F., Ruiz, G., Gutiérrez, D., ... & Robledo, S. (2007). Antiprotozoal and cytotoxic activities in vitro of Colombian Annonaceae. Journal of
ethnopharmacology, 111(3), 630-635. 52. Patel, M. S., & Patel, J. K. (2016). A review on a miracle fruits of Annona muricata. Journal of
Pharmacognosy and Phytochemistry, 5(1), 137.

INTERNATIONAL JOURNAL FOR INNOVATIVE RESEARCH IN MULTIDISCIPLINARY FIELD, ISSN: 2455-0620, Special Issue : 27, July-2021
Monthly, Peer-Reviewed, Refereed, Indexed Journal with IC Value: 86.87 Impact Factor: 6.719 Publication Date: 31/07/2021
Available online on - www.ijirmf.com Page 73
53. Pechinskii SV, Kuregyan AG (2014). Molecular‐biological problems of drug design and mechanism of drug action. Pharmaceut Chem J 47: 509–513.
54. Prabhakaran, K., Ramasamy, G., Doraisamy, U., Mannu, J., & Rajamani Murugesan, J. (2016). Polyketide natural products, acetogenins from graviola (Annona muricata L), its biochemical, cytotoxic activity and various analyses through computational and bio-programming methods. Current pharmaceutical design, 22(34), 5204-5210.
55. Rabi, T., & Bishayee, A. (2009). Terpenoids and breast cancer chemoprevention. Breast cancer
research and treatment, 115(2), 223-239. 56. Rachmani, E. P. N., Suhesti, T. S., Widiastuti, R., & Aditiyono, A. (2012). The breast of
anticancer from leaf extract of Annona muricata against cell line in T47D. Int J Appl Sci
Technol, 2(1), 198-2003. 57. Rao AV, Rao LG (2007). Carotenoids and human health. Pharmacol Res 55: 207–216. 58. Rieser, M. J., Gu, Z. M., Fang, X. P., Zeng, L., Wood, K. V., & McLaughlin, J. L. (1996). Five
novel mono-tetrahydrofuran ring acetogenins from the seeds of Annona muricata. Journal of Natural Products, 59(2), 100-108.
59. Rodriguez-Fragoso, L., Reyes-Esparza, J., Burchiel, S. W., Herrera-Ruiz, D., & Torres, E. (2008). Risks and benefits of commonly used herbal medicines in Mexico. Toxicology and
applied pharmacology, 227(1), 125-135. 60. Rodriguez-Fragoso, L., Reyes-Esparza, J., Burchiel, S. W., Herrera-Ruiz, D., & Torres, E.
(2008). Risks and benefits of commonly used herbal medicines in Mexico. Toxicology and
Applied Pharmacology, 227(1), 125-135. https://doi.org/10.1016/j.taap.2007.10.005 61. Roslida, A. H., Tay, C. E., Zuraini, A., & Chan, P. F. (2010). Anti-inflammatory and anti-
nociceptive activities of the ethanolic extract of Annona muricata leaf. Journal of Natural
Remedies, 10(2), 97-104. 62. Saini RK, Nile SH, Park W (2015). Carotenoids from fruits and vegetables: chemistry, analysis,
occurrence, bioavailability and biological activities. Food Res Int 76: 735–750 63. Schiavone, A., Guo, K., Tassone, S., Gasco, L., Hernandez, E., Denti, R., & Zoccarato, I.
(2008). Effects of a natural extract of chestnut wood on digestibility, performance traits, and nitrogen balance of broiler chicks. Poultry Science, 87(3), 521-527. https://doi.org/10.3382/ps.2007-00113
64. Schiavone, A., Guo, K., Tassone, S., Gasco, L., Hernandez, E., Denti, R., & Zoccarato, I. (2008). Effects of a natural extract of chestnut wood on digestibility, performance traits, and nitrogen balance of broiler chicks. Poultry Science, 87(3), 521-527. https://doi.org/10.3382/ps.2007-00113
65. Sebatini, A. M., Jain, M., Radha, P., Kiruthika, S., & Tamilarasan, K. (2016). Immobilized lipase catalyzing glucose stearate synthesis and their surfactant properties analysis. 3
Biotech, 6(2), 1-8. 66. Sousa, O. V., Del-Vechio-Vieira, G., & Kaplan, M. A. (2007). Propriedades analgésica e
antiinflamatória do extrato metanólico de folhas de Annona coriacea Mart.(Annonaceae). Latin
American Journal of Pharmacy, 26(6), 872. 67. Sreekeesoon, D. P., & Mahomoodally, M. F. (2014). Ethnopharmacological analysis of
medicinal plants and animals used in the treatment and management of pain in Mauritius. Journal of ethnopharmacology, 157, 181-200.
68. Sulaiman, N. S., Rovina, K., & Joseph, V. M. (2019). Classification, extraction and current analytical approaches for detection of pesticides in various food products. Journal of Consumer
Protection and Food Safety, 14(3), 209-221. 69. Suyatmi, S., Suselo, Y. H., & Jusuf, S. A. (2012,). The selective cytotoxicity of ethanolic extract
of Annona muricata leaf on HeLa cervical cancer cells. In International conference: research
and application on traditional complementary and alternative medicine in health care June,
22nd–23rd.

INTERNATIONAL JOURNAL FOR INNOVATIVE RESEARCH IN MULTIDISCIPLINARY FIELD, ISSN: 2455-0620, Special Issue : 27, July-2021
Monthly, Peer-Reviewed, Refereed, Indexed Journal with IC Value: 86.87 Impact Factor: 6.719 Publication Date: 31/07/2021
Available online on - www.ijirmf.com Page 74
70. Tormo, J. R., Zafra-Polo, M. C., Serrano, A., Estornell, E., & Cortes, D. (2000). Epoxy-acetogenins and other polyketide epoxy derivatives as inhibitors of the mitochondrial respiratory chain complex I. Planta medica, 66(04), 318-323.
71. Turdikulov Kh.,. Yusupov, M. K and Sadykov A. S., (1972). Khim. Prir. Soedin., 247 Two new cytotoxic monotetrahydrofuran annonaceous acetogenins, annomuricins a and b, from the leaves of Annona muricata. J. Nat. Prod. 1995, 58, 830–836.
72. Turdinkulov, Kh.; Yusupov, M.K.; Sadykov, A.S.;2013 Chemistry of natural compounds Translated from Khimiia Prirodnykh Soedinenii 8 (2): 247-248. (QD241.K45) "
73. Usunomen,U., Okolie,N.P.,Anyanwu,G.O.,& Egharevba,E.M.(2015). Phytochemical screening and proximate composition of Annona muricata leaves.
74. Viera, G. H., Mourão, J. A., Ângelo, Â. M., Costa, R. A., & Vieira, R. H. (2010). Antibacterial effect (in vitro) of Moringa oleifera and Annona muricata against Gram positive and Gram negative bacteria. Revista do Instituto de Medicina Tropical de São Paulo, 52(3), 129-132. https://doi.org/10.1590/s0036-46652010000300003
75. Wu, F. E., Gu, Z. M., Zeng, L. U., Zhao, G. X., Zhang, Y., McLaughlin, J. L., & Sastrodihardjo, S. (1995). Two new cytotoxic monotetrahydrofuran Annonaceous acetogenins, annomuricins A and B, from the leaves of Annona muricata. Journal of Natural Products, 58(6), 830-836.
76. Yadav RNS and Munin Agarwala. (2011). Phytochemical analysis of some medicinal plants. Journal of Phytology 3(12):10-14
77. Yang, H., Li, X., Tang, Y., Zhang, N., Chen, J., & Cai, B. (2009). Supercritical fluid CO2 extraction and simultaneous determination of eight annonaceous acetogenins in Annona genus plant seeds by HPLC–DAD method. Journal of pharmaceutical and biomedical analysis, 49(1), 140-144.
78. Yatkın, S., & Bayram, A. (2005). Measurements of some air pollutants around a cement plant in Izmir, Turkey. In 1st International Conference on Combustion and Air Pollution (CAPAC).

INTERNATIONAL JOURNAL FOR INNOVATIVE RESEARCH IN MULTIDISCIPLINARY FIELD, ISSN: 2455-0620, Special Issue : 27, July-2021
Monthly, Peer-Reviewed, Refereed, Indexed Journal with IC Value: 86.87 Impact Factor: 6.719 Publication Date: 31/07/2021
Available online on - www.ijirmf.com Page 75
International Conference on
Science, Engineering & Technological Innovations 10 & 11 July, 2021 Bangkok, Thailand
Jointly organized by: Automation, Computer Science and Technology Department, Kryvyi Rih National
University, Ukraine. ‘Research Culture Society’ and ‘Scientific Research Association’.
Triumphs in Healthcare Accelerated by Startup-Corporate Co-
Innovation
1 Sruthi Kannan, 2 Pooja Kulal
1 Researcher and Corporate Innovation Leader, Indian Institute of Technology, Kharagpur
Email ID – [email protected] 2 Developer, Teksystems
Email - [email protected]
Abstract: The covid pandemic has taken the world by storm and amplified the imminence of
healthcare. It has brought to limelight, the cracks and gaps in the healthcare systems, resulting in
the raising of red flags on the availability and accessibility of quality healthcare across the world.
Technology based startups have stepped in to play a vital role in solving some of the key issues. The
dawn of co-innovation has paved a trajectory for these startups to integrate with leading corporates
and accelerate the journey through structured frameworks offered by corporate accelerators. This
paper examines the challenges confronted by the Indian healthcare ecosystem and classifies
technology-based startup innovations in healthcare into three distinct segments. Further, the study
throws light on the propensity of each of these startup segments in co-innovating with infrastructural
and platforms of corporates, thereby helping bridge the profound chasm in the topology of
healthcare systems.
Keywords : Startups, Entrepreneurship, Innovation, Corporate, Healthcare, Covid, Pandemic,
Technology, Partnership, Accelerator,
1. INTRODUCTION:
The covid pandemic caught the world off guard, particularly healthcare systems around the world. Excessive hospital overcrowding, scarcity of healthcare resources, and professional workload have been major concerns for countries across the world. Technology is stepping in to help citizens get the care they need, whether through telemedicine or remote monitoring. To come up with such new solutions, startups will need resources and investments which can be partially or entirely fulfilled through corporate partnerships. A growing number of established firms are launching corporate accelerator programmes to connect with entrepreneurial startups, resulting in a global, open innovation forum. Emerging technologies encourage businesses to create new methods for managing traditional processes. Because start-ups may provide large companies with access to breakthrough technology, the importance of corporate-start-up partnership has risen to new heights [1]. Not only does this make corporates more flexible and nimbler, but it also infuses a strong optimism that they will be able to make the transition to a more entrepreneurial enterprise or revitalise their organisational culture and working practices.
Healthcare - Affordability and Access For countries across the globe, affordable basic healthcare is a fundamental need [2] [3] [4].
In India, the hospitals are categorized into public and private healthcare [5]. Here public healthcare
INTERNATIONAL JOURNAL FOR INNOVATIVE RESEARCH IN MULTIDISCIPLINARY FIELD, ISSN: 2455-0620, Special Issue : 27, July-2021
Monthly, Peer-Reviewed, Refereed, Indexed Journal with IC Value: 86.87 Impact Factor: 6.719 Publication Date: 31/07/2021
Available online on - www.ijirmf.com Page 76
focuses mainly on the rural and lower-income urban communities. Whereas private focuses on the high level of services that may not be affordable by the rural citizens. A deeper analysis made by experts exposes the stark contrast between the quality of care provided to the urban and rural population [5]. When compared to other nations, India is considered to have the lowest healthcare expenditure per capita [6]. In the healthcare industry, the availability of manpower both clinical and non-clinical for the service of the patients is very low [5] [7] On Covid Effects
The impact of covid on healthcare providers globally has been extensive and has further been amplified by multiple waves of infection. Hospitals claimed that significant shortages of testing supplies and long waits for test results hampered their capacity to keep track of the health of their patients and employees’ [8]. Severe shortages of PPE resulted in the risk of spread. Due to this, the risk of spread in staffs were high which resulted in a shortage of healthcare staff too. The resources pertaining to intensive care was much in shorter supply compared to demand, and this was a serious concern since the patients who were getting critical had to be monitored. Following the crisis, the healthcare system, as well as the patients have experienced significant difficulties. When it comes to expensive, high-quality therapy, citizens in rural and low-income communities are grossly underserved. Patients with severe symptoms are having difficulties due to the lack of suitable facilities [5]. This reflects majorly on the healthcare system, which is not sufficiently constituted to cater to the burgeoning needs and complications of new diseases. Some of the major challenges in healthcare include a lack of fundamental healthcare services, a paucity of medical professionals, quality assurance, insufficient health spending and a lack of research motivation. [9]
Healthcare and Technology
Based on literature review, we find that patient safety has been impacted by a variety of medical problems linked to the use of technology in health care [10]. Due to safety issues, the patient may face serious problems such as a longer stay in the hospital, greater side effects, and in extreme circumstances, even death. The usage of technology has resulted in many benefits, including improved healthcare delivery and a reduction in pharmaceutical mistakes.
Collaboration between start-ups and large corporations have been beneficial for both start-ups and corporate companies [11]. Specifically from a technological standpoint, the support offered by the corporates steers the startups away from the valley of death and helps them address the issues plaguing the delivery and management of healthcare. The resources employed by the startup were not the only benefits the startups receive during the collaboration process, they also have the opportunity to learn a lot about the market structure and their leadership skills from the corporate. Corporates, on the other hand, learn how to be as flexible as start-ups and to innovate in a variety of ways.
2. METHODOLOGY: The literature on the healthcare system, start-ups, and corporate accelerators were reviewed
using a systematic research process. A sample of 25 startups were explored as part of the study. From this, a subset of 16 startups were found to be using technology-based and had a number of interactions with corporates as part of their scaling up journey. Out of these, we further drilled down to uncover more insights from 8 startups that were part of corporate accelerators. Using a combination of interviews and secondary data we reviewed how these startups were pioneering technology based for healthcare and how they were co-innovating with corporates through structured frameworks of corporate accelerators.
Observations The covid crisis has brought the relevance of healthcare startups to the fore. These startups
have played a major role in finding locally built solutions for several problems during the crisis and

INTERNATIONAL JOURNAL FOR INNOVATIVE RESEARCH IN MULTIDISCIPLINARY FIELD, ISSN: 2455-0620, Special Issue : 27, July-2021
Monthly, Peer-Reviewed, Refereed, Indexed Journal with IC Value: 86.87 Impact Factor: 6.719 Publication Date: 31/07/2021
Available online on - www.ijirmf.com Page 77
most have helped the society greatly. Major challenges in healthcare related to affordability, accessibility and quality have been solved by the startups by using their unique innovations. Most successful implementations of electronic health records and integration with clinical management have been a big success. During the pandemic, the adoption of e-pharmacies and teleconsultation have benefited and solved a majority of accessibility issues. Connectivity between clinicians and patients is critical for patients’ access to healthcare.
Due to a dearth of professionals in India, face-to-face consultations with patients have been limited. By allowing patients to consult with doctors in real-time via cell phones, tablets, laptops, or personal computers, telemedicine tools and other novel technologies are enabling healthcare organisations and clinicians to improve healthcare access and lower hospital costs. Secondary and tertiary care solutions developed in India are progressively becoming available. The proliferation of digitization through chat bots which help patients to book an appointment and find a doctor based on their needs, several apps which help in assisting appointments and booking medicines, wearable devices that can measure patient’s heartbeat, oxygen level etc. and digitized report of diagnosis are becoming the norm.
3. FINDINGS: Co-creation is typically invaluable in health tech innovation, which is often relayed with
multiple stakeholders guiding innovation ahead at various phases. While self-management of healthcare through telemedicine have been deftly handled by startups, the corporate partnerships are proving significant in cases of deploying technologies on the hospitals’ physical sites where screening, isolation and remote monitoring are being carried out by hospital staff in tandem with the joint technologies co-innovated by startups and corporates. Given that the crisis situation requires very minimal or no errors creep in, the startups deploy corporates’ platform and infrastructural capabilities, so as to not worry about the complexities of the network and transport layer and focus on offering their application expertise on top of it.
The healthcare startups were classified under three different segments of reactive, predictive and lifestyle management disease handling as part of our study. We observe that artificial intelligence (AI) adoption cuts across the three segments, profoundly altering the Indian health industry with a potential to revolutionising AI-enabled healthcare services. Corporate – startup co-innovations are found to be significantly high on the predictive segment. This may be attributed to the observed aspirations of corporates to partner with startups working on disruptive technologies. The reactive segment saw a good number of co-innovations especially in the covid phase, where the partnership led to joint deployments to address the mounting needs on the healthcare system. The lifestyle management segment saw the least number of co-innovations, likely due to the prioritization of the other critical needs or due to independent management of such diseases by startups using their proprietary technologies aided by mobile phones and smart devices.
Legend:
Figure 1: Extent of startup-corporate co-innovation under different segments of healthcare startups

INTERNATIONAL JOURNAL FOR INNOVATIVE RESEARCH IN MULTIDISCIPLINARY FIELD, ISSN: 2455-0620, Special Issue : 27, July-2021
Monthly, Peer-Reviewed, Refereed, Indexed Journal with IC Value: 86.87 Impact Factor: 6.719 Publication Date: 31/07/2021
Available online on - www.ijirmf.com Page 78
This research contribution is quite key in the healthcare startup ecosystem as it adds a new dimension to the startup evaluation phase by corporates. For startups that are in the ideation phase, this finding provides a different perspective of the healthcare ecosystem and reveals which ones are likely to be of greater interest for corporate co-innovations.
Future research may be considered on measuring the efficacy of technology-based product offerings as against traditional ones in the healthcare space. As AI based solutions become the norm, data becomes quite critical for decision making, providing researchers an opportunity to dive deeper and benchmark their findings.
4. CONCLUSION: Corporates are opening any more of their platforms for co-innovating with startups. The
success of joint partnerships resting on technology as the fulcrum is paving the way for newer solutions. The coming together of technology, startups and corporates is proving to be a deadly combination capable of impacting and enhancing the quality of lives of people.
REFERENCES:
1. Kohler T, “Corporate accelerators: Building bridges between corporations and startups”, Business Horizons (2016)
2. Das A, “Challenges faced by healthcare-related sectors in India during covid-19 pandemic: A Review” (2020)
3. Ferrara P, Albano L., “ COVID-19 and healthcare systems: What should we do next?”, Public Health. (2020)
4. Sharma A, Bikash B, Moses A, “Responses to COVID-19: The Role of Governance, Healthcare Infrastructure, and Learning from Past Pandemics”, Journal of Business Research (2020)
5. Whitepaper On 'Digital Transformation Of Indian Healthcare' Released At SmarTec India Conference Organized By ASSOCHAM (2020)
6. Datta S.,” Political competition and public healthcare expenditure: Evidence from Indian states”, Soc Sci Med. (2020)
7. Watkins, John B, “Affordability of health care: a global crisis”, (2018) pp. 142-193. 8. Grimm, Christi Am, “Hospital experiences responding to the COVID-19 pandemic: results
of a national pulse survey” March 23-27, 2020, (2020). 9. Singh P; Ravi S & Dam D, “Medicines in India: Accessibility, Affordability and Quality”,
Brookings India Research Paper (2020) 10. Ndabu T, Mulgund P, Sharman R, Singh R, “Perceptual Gaps Between Clinicians and
Technologists on Health Information Technology-Related Errors in Hospitals: Observational Study”, JMIR Hum Factors. (2021)
11. Stefansson, Friofinnsson F “Startup Collaboration as a Part of Corporate Innovation: A Qualitative Study on Icelandic Corporations” (2019).

INTERNATIONAL JOURNAL FOR INNOVATIVE RESEARCH IN MULTIDISCIPLINARY FIELD, ISSN: 2455-0620, Special Issue : 27, July-2021
Monthly, Peer-Reviewed, Refereed, Indexed Journal with IC Value: 86.87 Impact Factor: 6.719 Publication Date: 31/07/2021
Available online on - www.ijirmf.com Page 79
International Conference on
Science, Engineering & Technological Innovations 10 & 11 July, 2021 Bangkok, Thailand
Jointly organized by: Automation, Computer Science and Technology Department, Kryvyi Rih National
University, Ukraine. ‘Research Culture Society’ and ‘Scientific Research Association’.
Study of Economical Fluctuations of Baramati Fish Market
1 Dr. Gantaloo Uma S., 2 Khilare Apurva D., 3 Pawar Rajani S. 1 Assistant Professor, Department of Zoology S.P.M.M College
2, 3 Students, Department of Zoology S.P.M.M College Email - [email protected]
Abstract: The fish fauna is an important aspect of fishes and having large number of economically
important fish species in aquatic ecosystem and more work has been carried out by fish fauna. The
Study of Identification of Indian freshwater fish fauna goes back to Hamilton (1822), who studied
fish fauna found in the river Ganges and its tributaries and has published books and research
articles investigations on the freshwater fish fauna of India, Hora especially initiated in the West-
ern Ghats, (1921, 1937, 1941, 1949) and Hora and Mishra (1938), The Basin of Bhima River is an
important Geographic zone. Its tributaries like Mula and Mutha river, Nira river, Kukadi river etc.
are major source of water and fish fauna, Baramati fish market receives fish from Bhigwan it is
located (between Latitude 180 17’N and longitude 740 45’E) in Pune District Bhigwan. Receives water from Bhima river a filled not in Monsoon but almost around the year due to backwater of
Ujani dam. Not only considering. Density and Diversity of the fresh water carp’s study was carried out on the rate, consumption Variation in rates and mostly Consumable. The study forms a part to
approach principle aspects of fish market and economy of Baramati
Keywords: Diversity of fishes, Density of fishes, Rate of carps Variation survey from 3 months.
1. INTRODUCTION: Icthyofauna, the fish fauna is an important aspects of fishery potential of water body.It is also called as BLUE ECONOMY. The Blue economy specially the fresh water fisheries sector in India specially depends on fish catch ,Transportation ,Market and supply chain .Inland fresh water fisheries are important source of food and recreation for communities . Fish contributes as an important in Food and Nutritional sector. Fishery sector of the country contributes 1.1% of the overall GDP. Diversity from different fresh water bodies of India have been carried out during the last few decades fishes also form food from variety of animals and human being. Many researchers have studied on fish diversity on different geographical location of water bodies. Skyes (1839-1841) first time collected and scientifically studied the fresh water fishes from different localities in pune. The pandemic has resulted in lowered demand, reducing prices, leading to unsold fish, wastages and disrupted in supply chain. Which indirectly effected on small scale industry depending upon on fishery sector as raw material. 2. MATERIAL METHODS: Baramati fish market receives fish from Bhigwan which is about 30km from Baramati. Bhigwan is located between latitude 18017’and longitude74045’ in Pune district state Maharashtra. During the present study of Baramati fish market, survey was done on the no of species brought to the market for selling, Rate of each particular species, Cost of each particular species, Highest cost rate of species, Lowest cost rate of species, Abundant demand of species by consumers, Total income gained daily on selling the species and survey was done in three different months from

INTERNATIONAL JOURNAL FOR INNOVATIVE RESEARCH IN MULTIDISCIPLINARY FIELD, ISSN: 2455-0620, Special Issue : 27, July-2021
Monthly, Peer-Reviewed, Refereed, Indexed Journal with IC Value: 86.87 Impact Factor: 6.719 Publication Date: 31/07/2021
Available online on - www.ijirmf.com Page 80
July, August and September. The parameters like Diversity of fish species and Density of fish from the market and economy were taken into consideration. Survey was done before July Shrawan the holy month of Hindu. When non-veg was consumed and Economy benefit of the fish market survey was also taken into consideration done in August Shrawan the holy month of Hindu. When non-vegetarian fish were not consumed by consumers and economy of fish market survey was done after the September Shrawan the holy month of Hindu. Immediately after the ending of Shrawan and economic parameters were also taken into consideration. Further survey was done in pandemic of COVID 19 of the economy of the market.
Baramati fish market
Table no I :Diversity of species found in Baramati fish market
Table no II: Rate of fishes before Shrawan month
Table no III Rate of fishes in Shrawan month
Sr.no Name of the Species Common name
1 Catla Catla Catla 2 Labeo Rohita Rohu 3 Tilapia Tilapia 4 Eel Wham 5 Pompret Pap let 6 Mackerel Bangda 7 Cat fish
Sr.no Name of the Species Rate of fish/Kg Sold in
market
1 Catla Catla 200Rs/kg 95% 2 Labeo Rohita 140Rs/kg 95% 3 Tilapia 100Rs/kg 95% 4 Eel 400-480Rs/kg 95% 5 Pompret 750Rs/kg 95% 6 Mackerel 200Rs/kg 95% Cat fish 200Rs/kg 95%
Sr.no Name of the Species Rate of fish/Kg Sold in market
1 Catla Catla 190Rs/kg 50% 2 Labeo Rohita 120Rs/kg 50% 3 Tilapia 80Rs/kg 50% 4 Eel 380Rs/kg 50% 5 Pompret 700Rs/kg 50% 6 Mackerel 100Rs/kg 50% 7 Cat fish 100Rs/kg 50%
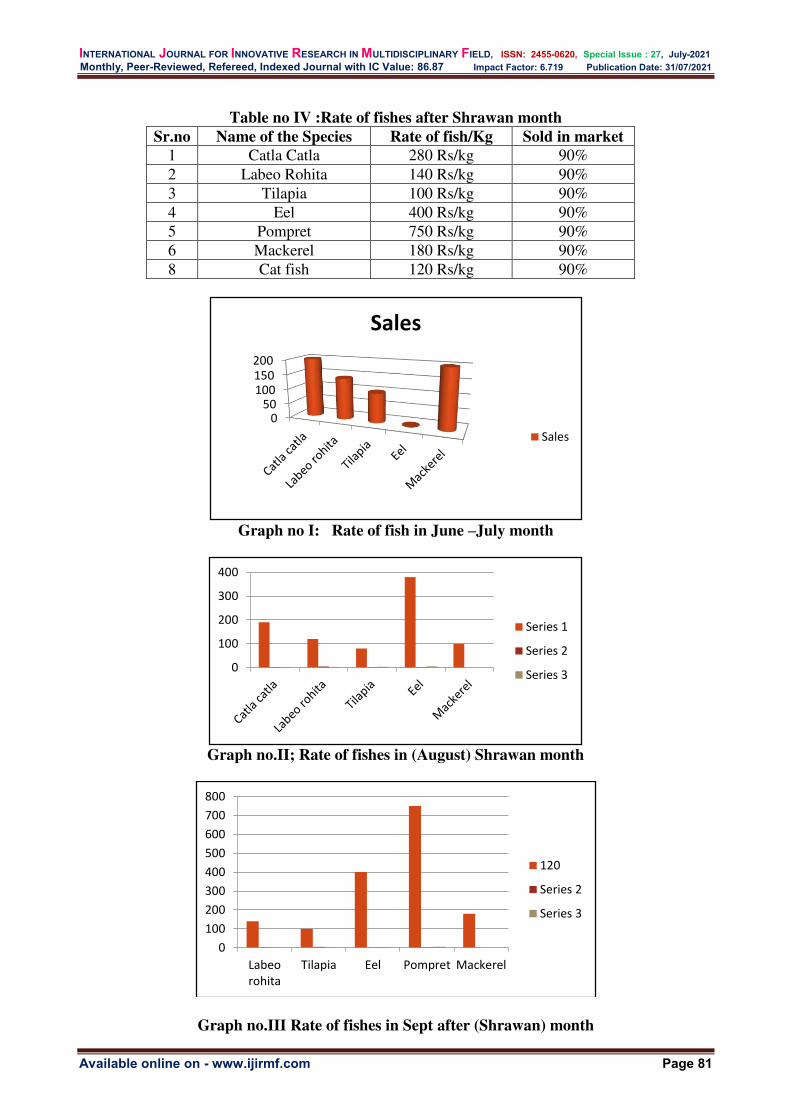
INTERNATIONAL JOURNAL FOR INNOVATIVE RESEARCH IN MULTIDISCIPLINARY FIELD, ISSN: 2455-0620, Special Issue : 27, July-2021
Monthly, Peer-Reviewed, Refereed, Indexed Journal with IC Value: 86.87 Impact Factor: 6.719 Publication Date: 31/07/2021
Available online on - www.ijirmf.com Page 81
Table no IV :Rate of fishes after Shrawan month
Sr.no Name of the Species Rate of fish/Kg Sold in market
1 Catla Catla 280 Rs/kg 90% 2 Labeo Rohita 140 Rs/kg 90% 3 Tilapia 100 Rs/kg 90% 4 Eel 400 Rs/kg 90% 5 Pompret 750 Rs/kg 90% 6 Mackerel 180 Rs/kg 90% 8 Cat fish 120 Rs/kg 90%
Graph no I: Rate of fish in June –July month
Graph no.II; Rate of fishes in (August) Shrawan month
Graph no.III Rate of fishes in Sept after (Shrawan) month
050
100
150
200
Sales
Sales
0
100
200
300
400
Series 1
Series 2
Series 3
0
100
200
300
400
500
600
700
800
Labeo
rohita
Tilapia Eel Pompret Mackerel
120
Series 2
Series 3

INTERNATIONAL JOURNAL FOR INNOVATIVE RESEARCH IN MULTIDISCIPLINARY FIELD, ISSN: 2455-0620, Special Issue : 27, July-2021
Monthly, Peer-Reviewed, Refereed, Indexed Journal with IC Value: 86.87 Impact Factor: 6.719 Publication Date: 31/07/2021
Available online on - www.ijirmf.com Page 82
Table no 5 Income of fish seller
Sr.no Income before pandemic Income in pandemic
1 1000 Rs 300 Rs
RESULT AND DISCUSSION June is the Breeding season of fishes so survey was carried from the month of July. It was found that the rate and consumption from consumers was more. In the month of August peak period where the market economy completely declines as the no. Of consumers for fish decreases. In the month of September immediately after the end of Shrawan there was sudden rise in the market economy and increases in the consumers. Considering the fact August month can be utilized for rearing of the carps which may provide space for their development. It shows that mythology and science work hand together
REFERENCES:
1. American Publishing House Association (APHA) (1988) Standard Methods for the
estimation of water and waste water 20th edition 2. S C Hora, and K, S Mishra (1942) fishes of Poona part2nd journal of the Bombay natural
history society 43,218-225. 3. F Day (1978) The fishes of India, William Dauron London 558 pp History Society 43’ 79-
91. 4. B.N Yadav (1999) Fish and Fisherie,s Daya publishing House, New Delhi, 110-035.
5. A.J.Lynch et.al (2016) The Socio economic and Environmental importance of Inland fishes
and Fisheries Environment ) 24-115-121 6. P Soumyadip. et. al ,(2020) Impact of Novel Corona Virus COVID 19 Pandemic on Fisheries
sector in India A. Minireview.
7. A. Das (2020). Impacts of COVID 19 on small scale and traditional fishes and fish workers
in India. Oct 8.
INTERNATIONAL JOURNAL FOR INNOVATIVE RESEARCH IN MULTIDISCIPLINARY FIELD, ISSN: 2455-0620, Special Issue : 27, July-2021
Monthly, Peer-Reviewed, Refereed, Indexed Journal with IC Value: 86.87 Impact Factor: 6.719 Publication Date: 31/07/2021
Available online on - www.ijirmf.com Page 83
International Conference on
Science, Engineering & Technological Innovations 10 & 11 July, 2021 Bangkok, Thailand
Jointly organized by: Automation, Computer Science and Technology Department, Kryvyi Rih National
University, Ukraine. ‘Research Culture Society’ and ‘Scientific Research Association’.
Synthesis and characterization of Pd(II) complexes derived from
pyridine-2-carbaldehyde
Aniket Verma1 and Shamshad Ahmad Khan2 1Research scholar, Department of chemistry, D.A.V.P.G. College, Siwan (J.P. University, Chapra)
Bihar, India 2Associate professor, Department of chemistry, D.A.V.P.G. College, Siwan (J.P. University,
Chapra) Bihar, India Email - 1 [email protected]
Abstract: A new series of novel Pd(II) complexes with Schiff bases derived from pyridine-2-
carbaldehyde and 4-methylaniline and hydroxylamine hydrochloride have been synthesized. The
metal complexes were characterized by micro elemental analysis, molar conductivity, magnetic
susceptibility, FTIR, and electronic absorption spectra. The Pd (II) complexes are colored and
stable in air. In the metal complexes the metal -ligand ratio found to be 1:2. The sharp band
appeared at 1635 cm-1 is characteristics of the azomethine group present in the Schiff base ligands.
This band was shifted to lower frequency (1590 – 1610 cm-1) in all the Pd (II) complexes, which
indicates the coordination of the azomethine nitrogen to metal ion in complexes. The molar
conductivity data of the complexes in DMF solution indicates they are non-electrolytic nature. The
spectral data indicate that the Schiff base ligand behaves as monobasic bidentate and coordinated
with metal ion by azomethine nitrogen and pyridine nitrogen atom to the metal ion. On the basis
of elemental analysis, magnetic susceptibility and electronic spectral data, geometry of complexes
was proposed to be square planar in nature.
Keywords: Pyridine-2-carbaldehyde, 4-methylaniline, Pd-salt, ethanol, hydroxylamine
hydrochloride.
1. INTRODUCTION : Schiff bases are one of the most prevalent and important of the mixed donor systemin the
field of coordination chemistry1-4. Schiff base is known in the name of Hugo Schiff who first reported catalysed condensation reaction between aldehydes or ketones with primary amine. Schiff bases may be represented as R─CH═N─R′ where R and R′ may be alkyl, aryl or heterocyclic. Schiff bases of aromatic aldehydes are more stable than aliphatic aldehydes due to effective conjugation. . Schiff bases derived from aromatic amines and aromatic aldehydes have a wide variety of applications in many fields like biological, inorganic and analytical chemistry5-10. Schiff bases are used in optical and electrochemical sensors, as well as in various chromatographic methods to enable detection of enhanced selectivity and sensitivity. Schiff bases are widely applicable in analytical determination using reactions of condensation of primary amines and carbonyl compounds in which the azomethine bond is formed. Schiff base metal complexes have been widely studied because they have industrial, antifungal, antibacterial and anticancer applications. Transition metal complexes of Schiff bases are one of the most adaptable and thoroughly studied systems. These complexes have also applications in clinical, analytical and industrial in addition to their important roles in catalysis and organic synthesis. The presence of azomethine group, which is responsible for stability,

INTERNATIONAL JOURNAL FOR INNOVATIVE RESEARCH IN MULTIDISCIPLINARY FIELD, ISSN: 2455-0620, Special Issue : 27, July-2021
Monthly, Peer-Reviewed, Refereed, Indexed Journal with IC Value: 86.87 Impact Factor: 6.719 Publication Date: 31/07/2021
Available online on - www.ijirmf.com Page 84
reactivity and biological activity of Schiff baes and their metal complexes4. Schiff bases and their metal complexes are used in catalyst, antimicrobials, antioxidants, dyes optical materials and analytical chemistry. Pyridine is one of the simplest known heterocyclic compounds since its discovery in 1844 by Thomas Anderson. Pyridine is monodentate ligand which bind to metal ion in different proportion. Pyridine is a unique ligand in coordination chemistry due to presence of nitrogen and lone pair of electrons. Schiff bases played an important role as ligands even a century after their discovery in chemistry. Schiff base metal complexes derived from pyridine-2-carbaldehyde and its derivatives have wide range of applications in bioinorganic and medicinal chemistry11-12. stable and have wide applications in antibacterial, antifungal, antiviral, anticancer, and anti-inflammatory. Schiff base ligands acts as chelating ligands and their biological activity enhanced on coordination. We report here the synthesis and characterization of complexes of Pd(II) containing bidentate Schiff base ligand derived from the condensation of pyridine-2-carboxaldehyde and 4-methylanilina or hydroxylamine hydrochloride.
2. MATERIALS AND METHODS : The chemicals and solvents used in the present work were of Anal-R grade and were used
without further purification. They were obtained from Aldrich, CDH and S Merck. The elemental analysis of C, H and N was performed by using a Perkin-Elmer 2400 elemental analyzer and metal was analysed by EDTA titration. The melting point of all compounds were determined by laboratory thermometer apparatus. The magnetic susceptibility data were measured by Gouy balance method using Hg [Co (SCN)4] as a calibrant. The molar conductivity of the complexes in DMF solution (10-3M) were measured by using DI-909 digital conductivity meter. The IR spectra of the ligand and metal complexes were recorded on Shimadzu FTIR spectrophotometer using KBr disc. The electronic spectra of the complexes were recorded by using Shimadzu model UV-2100 spectrophotometer in DMSO solution.
Synthesis of Schiff base Ligand (L1) The Schiff base ligand N-(4-methyl phenyl)-1-pyridine-2-yl-methanimine was prepared by
adding 2 mmol of pyridine-2-carboxaldehyde in 20 ml ethanol to 2 mmol of 4-methul aniline in 20 ml ethanol. The resulting solution was refluxed for 3-4 h. On cooling the reaction mixture, the brown crystalline solid was formed. The precipitate is washed with ethanol and diethyl ether several times and is then recrystallized with ethanol to obtain the required Schiff base(L1).
CH3
NH2
+
NCHO
NCH N
CH3 Figure 1. Synthesis of Schiff base ligand(L1).
Synthesis of Schiff base Ligand (L2) 4 mmol of hydroxyl amine hydrochloride was gradually added with 4 mmol of pyridine-2-
carboxaldehyde in 25 ml ethanol and followed by dropwise addition of 4 mmol of sodium hydroxide. The resulting solution was refluxed for 3-4 h. On cooling the reaction mixture, the white crystalline solid was formed. The precipitate is washed with ethanol and acetone several times and is then recrystallized with ethanol to obtain the required Schiff base(L2).
+
NCHO
NNH2OH.HCl
CH N OH
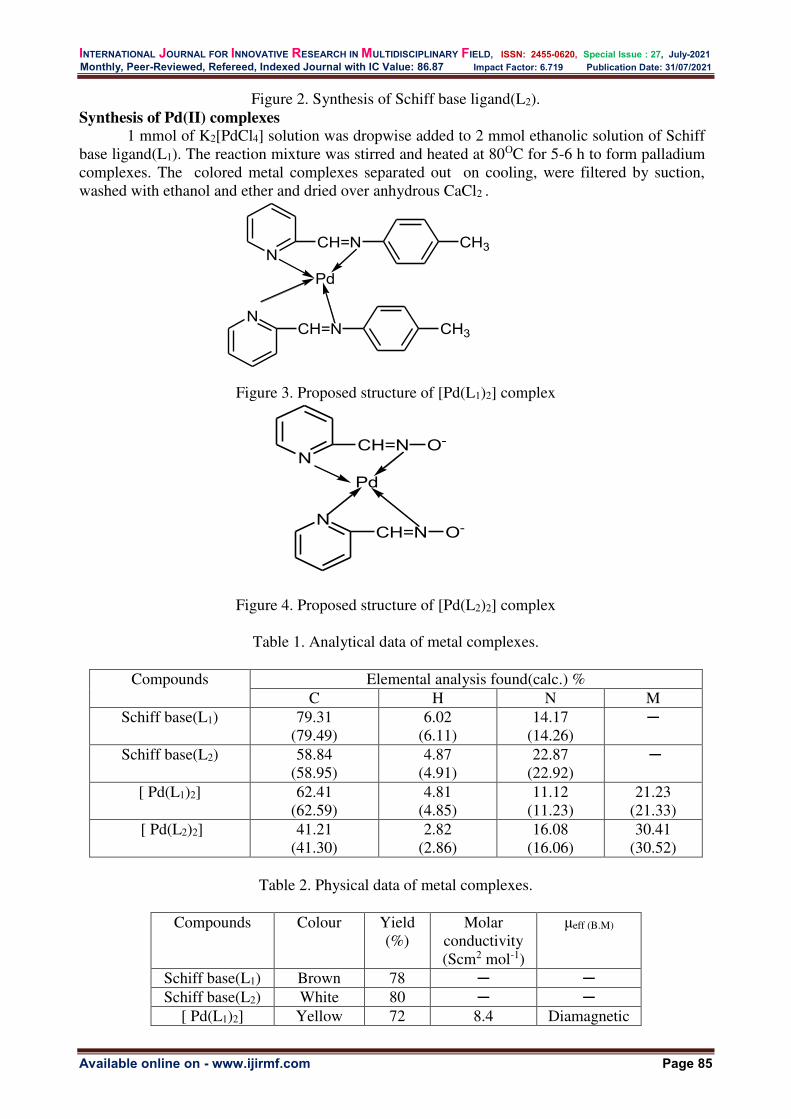
INTERNATIONAL JOURNAL FOR INNOVATIVE RESEARCH IN MULTIDISCIPLINARY FIELD, ISSN: 2455-0620, Special Issue : 27, July-2021
Monthly, Peer-Reviewed, Refereed, Indexed Journal with IC Value: 86.87 Impact Factor: 6.719 Publication Date: 31/07/2021
Available online on - www.ijirmf.com Page 85
Figure 2. Synthesis of Schiff base ligand(L2). Synthesis of Pd(II) complexes
1 mmol of K2[PdCl4] solution was dropwise added to 2 mmol ethanolic solution of Schiff base ligand(L1). The reaction mixture was stirred and heated at 80OC for 5-6 h to form palladium complexes. The colored metal complexes separated out on cooling, were filtered by suction, washed with ethanol and ether and dried over anhydrous CaCl2 .
NCH=N CH3
NCH=N CH3
Pd
Figure 3. Proposed structure of [Pd(L1)2] complex
NCH=N O-
Pd
NCH=N O-
Figure 4. Proposed structure of [Pd(L2)2] complex
Table 1. Analytical data of metal complexes.
Compounds Elemental analysis found(calc.) % C H N M
Schiff base(L1) 79.31 (79.49)
6.02 (6.11)
14.17 (14.26)
─
Schiff base(L2) 58.84 (58.95)
4.87 (4.91)
22.87 (22.92)
─
[ Pd(L1)2] 62.41 (62.59)
4.81 (4.85)
11.12 (11.23)
21.23 (21.33)
[ Pd(L2)2] 41.21 (41.30)
2.82 (2.86)
16.08 (16.06)
30.41 (30.52)
Table 2. Physical data of metal complexes.
Compounds Colour Yield
(%) Molar
conductivity (Scm2 mol-1)
μeff (B.M)
Schiff base(L1) Brown 78 ─ ─ Schiff base(L2) White 80 ─ ─
[ Pd(L1)2] Yellow 72 8.4 Diamagnetic

INTERNATIONAL JOURNAL FOR INNOVATIVE RESEARCH IN MULTIDISCIPLINARY FIELD, ISSN: 2455-0620, Special Issue : 27, July-2021
Monthly, Peer-Reviewed, Refereed, Indexed Journal with IC Value: 86.87 Impact Factor: 6.719 Publication Date: 31/07/2021
Available online on - www.ijirmf.com Page 86
[ Pd(L2)2] Light green 70 10.2 Diamagnetic
Table 3. IR spectral data of Schiff base ligands and their metal complexes. Compounds 𝜈(C=N)
(imine) ν(C=N)
(pyridine) ν(M-N)
Schiff base(L1) 1635 1620 ─
Schiff base(L2) 1625 1618 ─ [ Pd(L1)2] 1610 1612 575 [ Pd(L2)2] 1590 1605 568
3. RESULTS AND DISCUSSION:
The analytical and physical properties of Schiff bases and their Pd (II) complexes are given in Table-1-2. All Pd (II) complexes are coloured and stable in air. The metal ligand ratio in all the metal complexes have 1:2. Elemental analysis revealed the observed and calculated values for H, C and N compositions of the Schiff base and its metal complexes are in good agreement with the proposed structure. The lower values of molar conductance values indicate all metal complexes are non- electrolytic in nature.
FTIR Spectral data The FTIR spectral data of Schiff base ligands and their Pd (II) complexes are given in Table
3. The band appeared at 1635 cm-1 is characteristics of the azomethine group(ν(C=N) present in the Schiff base ligands. This band was shifted to lower frequency (1590 – 1610 cm-1) in all the Pd (II) complexes, which indicates the coordination of the azomethine nitrogen to metal ion in complexes. The band due to ν(C=N) pyridine ring appears at 1618-1620 cm-1 in the Schiff bases, which shifted to lower frequency (1605 – 1612 cm-1) in all the Pd (II) complexes, which indicates the coordination of the pyridine nitrogen to metal ion in complexes. The appearance of new band at 568-575 cm-1 due to ν(M-N) in all the metal complexes.
Electronic Spectra of Metal Complexes The electronic spectra of palladium complexes were recorded in DMSO solution between
200- 600 nm at room temperature. The absorption bands at 270 nm assigned to 𝜋 → 𝜋 ∗ transition and at 392 nm assigned to n→ 𝜋* transition. The bands at 390-460 nm assigned to LMCT. The bands observed at 570 and 531 nm assigned to 3A2(F) →3T1(F) and 3A2(F) →3T2(F) respectively. The magnetic moment values of palladium complexes show they are diamagnetic in nature, due to absence of unpaired electron in d- orbital of palladium ion. On the basis of electronic spectral data and magnetic moment values, which suggests square planar geometry of palladium complexes.
4. CONCLUSION : On the basis of above studies, the general structure of palladium complexes is proposed as [Pd(L)2]. The metal complexes were characterized by micro elemental analysis, molar conductivity, magnetic susceptibility, FTIR, and electronic absorption spectra. The Pd (II) complexes are colored and stable in air. In the metal complexes the metal -ligand ratio found to be 1:2. The molar conductivity data of the complexes in DMF solution indicates they are non-electrolytic nature. The spectral data indicate that the Schiff base ligand behaves as monobasic bidentate and coordinated with palladium ion by azomethine nitrogen and pyridine nitrogen atoms to the metal ion. On the basis of elemental analysis, magnetic susceptibility and electronic spectral data, geometry of complexes was proposed to be square planar in nature.
REFERENCES:

INTERNATIONAL JOURNAL FOR INNOVATIVE RESEARCH IN MULTIDISCIPLINARY FIELD, ISSN: 2455-0620, Special Issue : 27, July-2021
Monthly, Peer-Reviewed, Refereed, Indexed Journal with IC Value: 86.87 Impact Factor: 6.719 Publication Date: 31/07/2021
Available online on - www.ijirmf.com Page 87
1. T. Singh, S. Sharma, V.K. Shrivastava and A. Kumar. Indian J. Chem, 45B, 2558, 2006. 2. Figgis BN (1976) Text Book of an introduction to ligand fields (New Delhi: Willey Eastern) 3. A.M.A.Hassan. Trans.Met.Chem,15,283, 1990. 4. K.K Singh and S.A Khan. World. J. Pharma. Res, 10(2),1074-1082, 2021. 5. N.Raman, S. Johnson. J.Serb.Chem.72,983,2007. 6. M.P Shinde et.al. Der Pharma Chemica, 8(10), 287-293, 2016. 7. M.T Amalina et.al.The Malaysian J. Ana. Sci, 16(1), 79-87,2012. 8. S.K Agarwal. Asian. J.Chem, 19(4),2581-2585,2007. 9. D. Kovala-Demertzi et.al. Polyhedron, 18,1005-1013,1999. 10. Nenad Filipovic et.al. Trans. Met. Chem, 35,765-772,2010. 11. T. Varadinova et.al. Acta Virologica, 45, 87-94,2001. 12. Cotton FA, Wilkinson G, Murillo CA, Bochmann M. Advanced inorganic chemistry. 6th ed.,
Wiley India Pvt. Ltd. 2017.
.

INTERNATIONAL JOURNAL FOR INNOVATIVE RESEARCH IN MULTIDISCIPLINARY FIELD, ISSN: 2455-0620, Special Issue : 27, July-2021
Monthly, Peer-Reviewed, Refereed, Indexed Journal with IC Value: 86.87 Impact Factor: 6.719 Publication Date: 31/07/2021
Available online on - www.ijirmf.com Page 88
International Conference on
Science, Engineering & Technological Innovations 10 & 11 July, 2021 Bangkok, Thailand
Jointly organized by: Automation, Computer Science and Technology Department, Kryvyi Rih National
University, Ukraine. ‘Research Culture Society’ and ‘Scientific Research Association’.
Comparative Study of Image Steganography using LSB, HideSeek
and BPSC
Ravinder Singh 1, Soumya Awasthi 2
Computer Science1, 1 Assistant Professor, Computer Science, Maharaja Surajmal Institute, Janakpuri, New Delhi
110058, INDIA [email protected]
2 Student , Computer Science, Maharaja Surajmal Institute, Janakpuri, New Delhi 110058, INDIA 9540479725
[email protected] Abstract. As all of us know about the today’s rise in hacking, it is now the most important thing to maintain secrecy. Hence, Steganography is the most suitable method for hiding the secret data in
the form of ordinary files. By using steganography, the secret information can be concealed within
some other data like pictures and then it can be transferred anywhere without any suspicion. Our
research paper will perform a comparative study on various techniques given for steganography.
Also, there are 3 algorithms used LSB, HideSeek and BPSC. All of these are tried and analyzed with
graphs and tables.
Keywords: Stego, LSB, HideSeek, BPCS, dummy data, vessel area.
1 INTRODUCTION:
Steganography was found at the time of ancient Greece around 440 B.C. The Histaeus a Greek ruler waged the first version of steganography which involved: tattooing the message on the persons or the slave’s scalp, waiting for his hair to grow and reveal the secret message and then they send the slave to the receiver of the message. The word steganography has come from the ancient word ‘Steganos’, which means concealed or hiding and ‘graph’ means written or drawn.
Due to the advancement in ICT, most of the important information is in the electronic form. Therefore, the security of the data has now a fundamental issue. Besides Cryptography, this (steganography) can be waged to protect information. Besides masking the data for protection, this approach can be enhanced to copyright protection for the multimedia like video, audio and images.
2. Steganography VS Cryptography : People are sometimes confused with Steganography and cryptography because these are two
similar terms and also, they both are used for masking the important data. Cryptography is a process of concealing secret text in an incomprehensive for such that a person is unable to read. This can be performed through ciphers like rail fence etc. In this, the text is visible to everyone but cannot be understand by a normal person.
In steganography, the data is hidden in such a form that when it appears it shows no hidden information in it. If a normal person views it shows that no information is hidden in the multimedia and the person will no longer attempts to find the hidden information.

INTERNATIONAL JOURNAL FOR INNOVATIVE RESEARCH IN MULTIDISCIPLINARY FIELD, ISSN: 2455-0620, Special Issue : 27, July-2021
Monthly, Peer-Reviewed, Refereed, Indexed Journal with IC Value: 86.87 Impact Factor: 6.719 Publication Date: 31/07/2021
Available online on - www.ijirmf.com Page 89
3. ALGORITHMS: Although steganography is of many types like text, image, audio and video. We will be discussing the image steganography in brief with the following algorithm: a) LSB (Least Significant Bit Substitution) b) HideSeek c) BPCS (Bit-plane Complexity Segmentation)
3.1 LSB This is the most used technique, using the images and sometimes the sound carrier files, and
is referred as Least Significant Bit Substitution (LSBS). It involves the overwriting the bit with the least arithmetic digit. Also, the result of this alters the original output negligible.
The LSB algorithm was based on very manageable concept, the rightest digit is referred as the least significant bit was replaced by the bit which is taken from the file which is to be hidden or the payload data. This is known as the least significant bits of the cover file was changed to meet the bits of the file which is to be hidden. While choosing the image for this technique it is very important to check about the choice and the format of the image. The images used are unremarkable, thus no one can think about hiding something in the image. It was also possible to reduce the large blocks in one color.
If we use a lossy format of file such that JPEG could have meant that on repair of the inbuilt file, bits can vanish due to the compression. However, the algorithm was limited as it agrees for up to approx. 12.5% (one-eighth) of the total size to be hidden.
3.2 HideSeek This is the algorithm that distributes the text across all the image. The name is referred after
“Hide and Seek” – which is a tool in Windows 95 that works on a similar technique. It uses a private key or password that generate a random string, then it uses it to select the first position to hide into it. It continues to generate the random string until the hiding message is finished. It’s not the best method because it doesn’t look at the pixels it is hiding in it. This algorithm contains two modules: a) “Making the stegano medium” b) “Getting secret data from medium”
Each of the above modules is presented below: In the making of stegano medium, the secret data is hidden in a picture or an image. Before
hiding, for some security reasons, user has to enter a private key. The private key will be generated using the secret code information and this will be used by the destination person or the receiver to take all the secret information. This medium is the final and the expected output from the person who is sending message.
In getting protected data from the medium side, any person can get this image with secret message but only that person can read it who has the secret key with him. Therefore, the inputs for opening the medium are the secret code and medium itself. 3.2.1 Algo:
Making of medium: Step 1- Process Start
Step 2- Enter Secret Data Step 3- Enter User Code Step 4- Load the image
Step 5- Creation of Secret Code by user code+ secret data
Extracting Secret Data from
medium: Step 1- Process Start
Step 2- Enter Secret Code Step 3- Enter the medium
Step 4- Pull out the data from medium
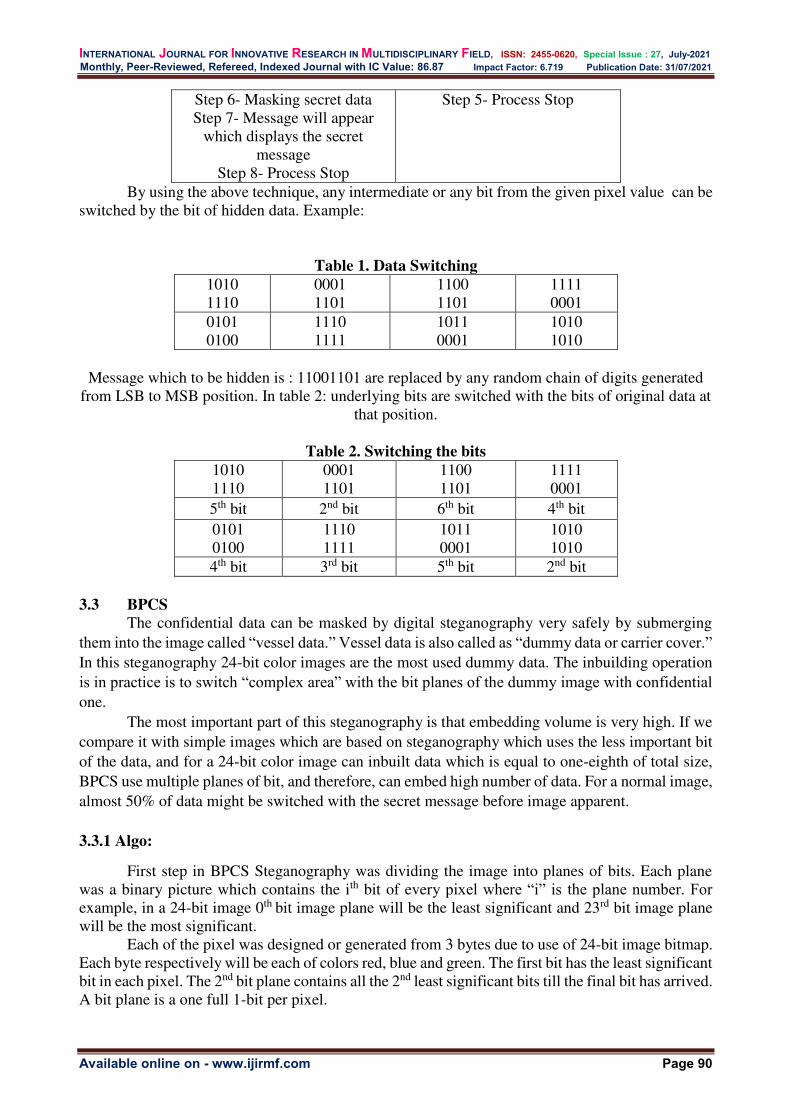
INTERNATIONAL JOURNAL FOR INNOVATIVE RESEARCH IN MULTIDISCIPLINARY FIELD, ISSN: 2455-0620, Special Issue : 27, July-2021
Monthly, Peer-Reviewed, Refereed, Indexed Journal with IC Value: 86.87 Impact Factor: 6.719 Publication Date: 31/07/2021
Available online on - www.ijirmf.com Page 90
Step 6- Masking secret data Step 7- Message will appear
which displays the secret message
Step 8- Process Stop
Step 5- Process Stop
By using the above technique, any intermediate or any bit from the given pixel value can be switched by the bit of hidden data. Example:
Table 1. Data Switching
1010 1110
0001 1101
1100 1101
1111 0001
0101 0100
1110 1111
1011 0001
1010 1010
Message which to be hidden is : 11001101 are replaced by any random chain of digits generated
from LSB to MSB position. In table 2: underlying bits are switched with the bits of original data at that position.
Table 2. Switching the bits
1010 1110
0001 1101
1100 1101
1111 0001
5th bit 2nd bit 6th bit 4th bit 0101 0100
1110 1111
1011 0001
1010 1010
4th bit 3rd bit 5th bit 2nd bit
3.3 BPCS
The confidential data can be masked by digital steganography very safely by submerging them into the image called “vessel data.” Vessel data is also called as “dummy data or carrier cover.” In this steganography 24-bit color images are the most used dummy data. The inbuilding operation is in practice is to switch “complex area” with the bit planes of the dummy image with confidential one.
The most important part of this steganography is that embedding volume is very high. If we compare it with simple images which are based on steganography which uses the less important bit of the data, and for a 24-bit color image can inbuilt data which is equal to one-eighth of total size, BPCS use multiple planes of bit, and therefore, can embed high number of data. For a normal image, almost 50% of data might be switched with the secret message before image apparent. 3.3.1 Algo:
First step in BPCS Steganography was dividing the image into planes of bits. Each plane was a binary picture which contains the ith bit of every pixel where “i” is the plane number. For example, in a 24-bit image 0th bit image plane will be the least significant and 23rd bit image plane will be the most significant.
Each of the pixel was designed or generated from 3 bytes due to use of 24-bit image bitmap. Each byte respectively will be each of colors red, blue and green. The first bit has the least significant bit in each pixel. The 2nd bit plane contains all the 2nd least significant bits till the final bit has arrived. A bit plane is a one full 1-bit per pixel.
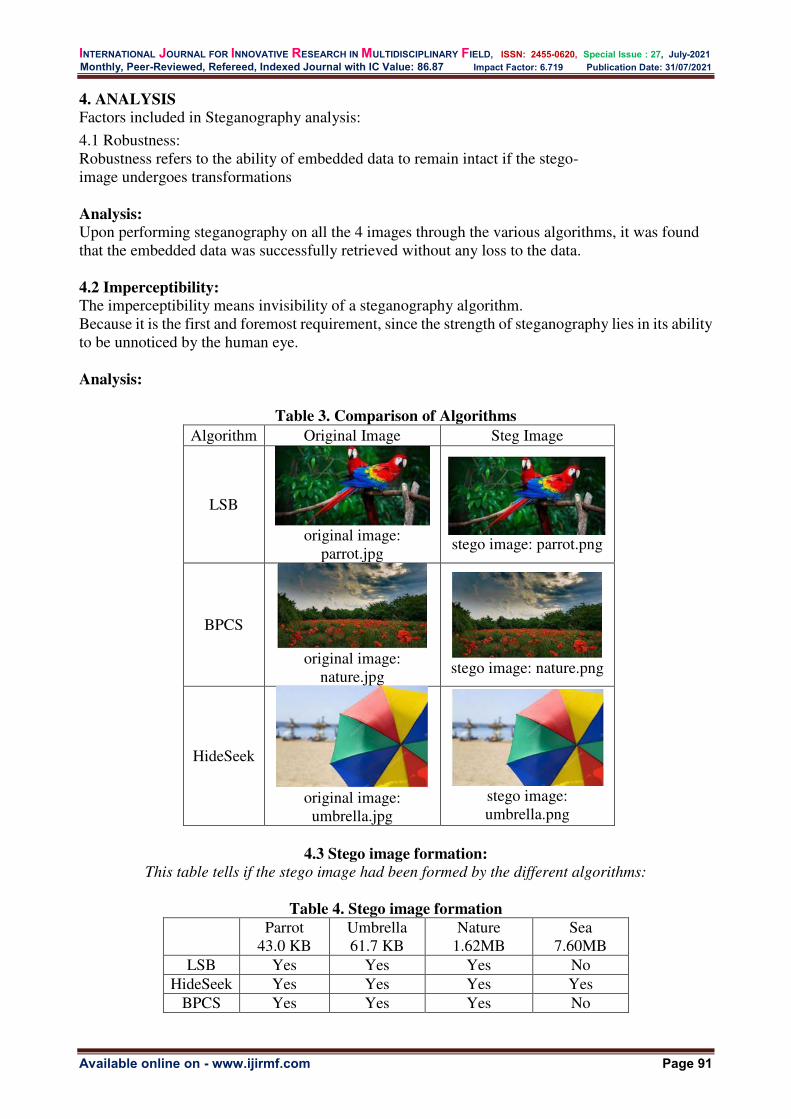
INTERNATIONAL JOURNAL FOR INNOVATIVE RESEARCH IN MULTIDISCIPLINARY FIELD, ISSN: 2455-0620, Special Issue : 27, July-2021
Monthly, Peer-Reviewed, Refereed, Indexed Journal with IC Value: 86.87 Impact Factor: 6.719 Publication Date: 31/07/2021
Available online on - www.ijirmf.com Page 91
4. ANALYSIS Factors included in Steganography analysis:
4.1 Robustness: Robustness refers to the ability of embedded data to remain intact if the stego- image undergoes transformations Analysis: Upon performing steganography on all the 4 images through the various algorithms, it was found that the embedded data was successfully retrieved without any loss to the data. 4.2 Imperceptibility: The imperceptibility means invisibility of a steganography algorithm. Because it is the first and foremost requirement, since the strength of steganography lies in its ability to be unnoticed by the human eye.
Analysis:
Table 3. Comparison of Algorithms Algorithm Original Image Steg Image
LSB
original image: parrot.jpg
stego image: parrot.png
BPCS
original image: nature.jpg
stego image: nature.png
HideSeek
original image: umbrella.jpg
stego image: umbrella.png
4.3 Stego image formation:
This table tells if the stego image had been formed by the different algorithms:
Table 4. Stego image formation
Parrot
43.0 KB Umbrella 61.7 KB
Nature 1.62MB
Sea 7.60MB
LSB Yes Yes Yes No HideSeek Yes Yes Yes Yes
BPCS Yes Yes Yes No
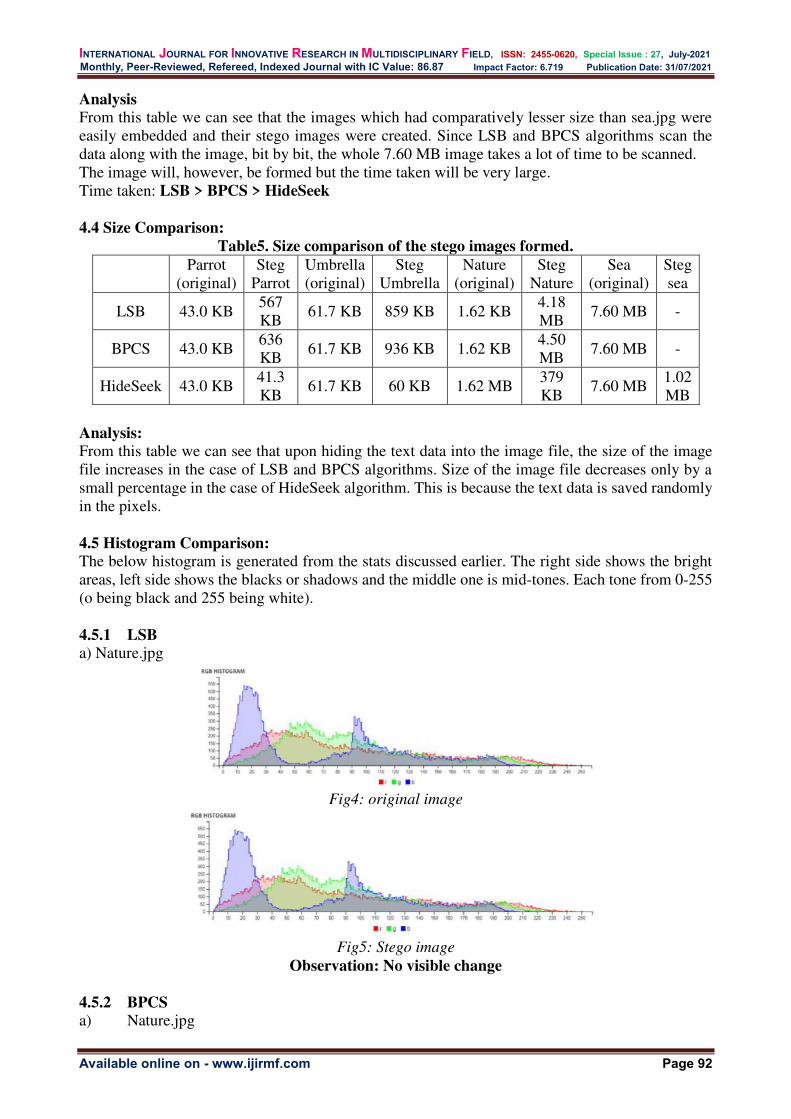
INTERNATIONAL JOURNAL FOR INNOVATIVE RESEARCH IN MULTIDISCIPLINARY FIELD, ISSN: 2455-0620, Special Issue : 27, July-2021
Monthly, Peer-Reviewed, Refereed, Indexed Journal with IC Value: 86.87 Impact Factor: 6.719 Publication Date: 31/07/2021
Available online on - www.ijirmf.com Page 92
Analysis From this table we can see that the images which had comparatively lesser size than sea.jpg were easily embedded and their stego images were created. Since LSB and BPCS algorithms scan the data along with the image, bit by bit, the whole 7.60 MB image takes a lot of time to be scanned. The image will, however, be formed but the time taken will be very large. Time taken: LSB > BPCS > HideSeek
4.4 Size Comparison:
Table5. Size comparison of the stego images formed.
Parrot
(original) Steg
Parrot Umbrella (original)
Steg Umbrella
Nature (original)
Steg Nature
Sea (original)
Steg sea
LSB 43.0 KB 567 KB
61.7 KB 859 KB 1.62 KB 4.18 MB
7.60 MB -
BPCS 43.0 KB 636 KB
61.7 KB 936 KB 1.62 KB 4.50 MB
7.60 MB -
HideSeek 43.0 KB 41.3 KB
61.7 KB 60 KB 1.62 MB 379 KB
7.60 MB 1.02 MB
Analysis: From this table we can see that upon hiding the text data into the image file, the size of the image file increases in the case of LSB and BPCS algorithms. Size of the image file decreases only by a small percentage in the case of HideSeek algorithm. This is because the text data is saved randomly in the pixels. 4.5 Histogram Comparison: The below histogram is generated from the stats discussed earlier. The right side shows the bright areas, left side shows the blacks or shadows and the middle one is mid-tones. Each tone from 0-255 (o being black and 255 being white). 4.5.1 LSB a) Nature.jpg
Fig4: original image
Fig5: Stego image
Observation: No visible change
4.5.2 BPCS a) Nature.jpg
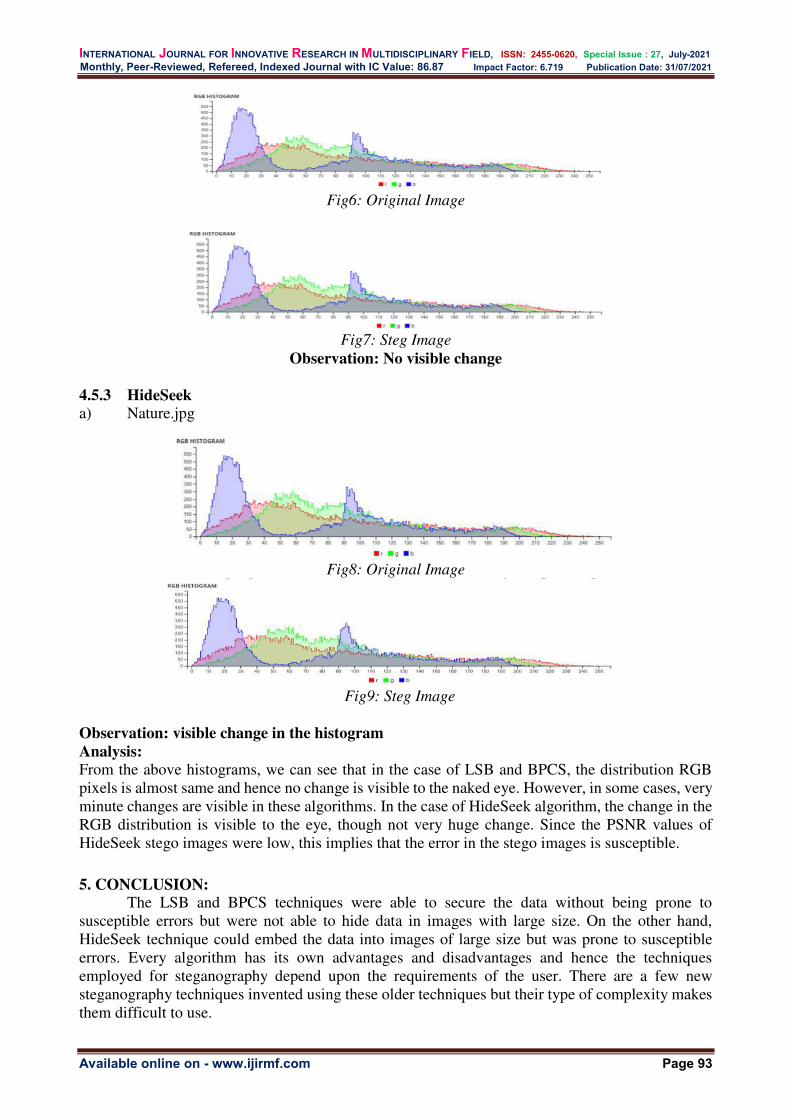
INTERNATIONAL JOURNAL FOR INNOVATIVE RESEARCH IN MULTIDISCIPLINARY FIELD, ISSN: 2455-0620, Special Issue : 27, July-2021
Monthly, Peer-Reviewed, Refereed, Indexed Journal with IC Value: 86.87 Impact Factor: 6.719 Publication Date: 31/07/2021
Available online on - www.ijirmf.com Page 93
Fig6: Original Image
Fig7: Steg Image
Observation: No visible change
4.5.3 HideSeek a) Nature.jpg
Fig8: Original Image
Fig9: Steg Image
Observation: visible change in the histogram
Analysis: From the above histograms, we can see that in the case of LSB and BPCS, the distribution RGB pixels is almost same and hence no change is visible to the naked eye. However, in some cases, very minute changes are visible in these algorithms. In the case of HideSeek algorithm, the change in the RGB distribution is visible to the eye, though not very huge change. Since the PSNR values of HideSeek stego images were low, this implies that the error in the stego images is susceptible.
5. CONCLUSION: The LSB and BPCS techniques were able to secure the data without being prone to
susceptible errors but were not able to hide data in images with large size. On the other hand, HideSeek technique could embed the data into images of large size but was prone to susceptible errors. Every algorithm has its own advantages and disadvantages and hence the techniques employed for steganography depend upon the requirements of the user. There are a few new steganography techniques invented using these older techniques but their type of complexity makes them difficult to use.

INTERNATIONAL JOURNAL FOR INNOVATIVE RESEARCH IN MULTIDISCIPLINARY FIELD, ISSN: 2455-0620, Special Issue : 27, July-2021
Monthly, Peer-Reviewed, Refereed, Indexed Journal with IC Value: 86.87 Impact Factor: 6.719 Publication Date: 31/07/2021
Available online on - www.ijirmf.com Page 94
REFERENCES : 1. Bin Li, Junhui He, Jiwu Huang, Yun Qing Shi (2011) ‘A Survey on Image Steganography
and Steganalysis’, Journal of Information Hiding and Multimedia Signal Processing, Vol.2, Issue 2.
2. Chi-Kwong Chan, L.M. Cheng (2010) ‘Hiding data in images by simple LSB substitution’, Pattern Recognition, Vol.37.
3. Harpreet Kaur, Jyoti Rani (2016)‘A Survey on different techniques of steganography’ MATEC Web of Conferences 57, 02003
4. J. Gupta (2015) ‘A Review on Steganography techniques and methods’ vol. 1, no. 1. 5. Juneja, M., & Sandhu, P. S. (2013) ‘A new approach for information security using an
improved steganography technique’ Journal of Information Processing Systems, 9(3), 405- 424. Source: https://doi.org/10.3745/JIPS.2013.9.3.405.
6. Johnson, N., Jajodia, S (1998) ‘Exploring Steganography: Seeing the Unseen, Computer (published by IEEE), Volume 31, Issue 2.
7. Kipper, G. (2004) ‘Investigator’s Guide to Steganography, CRC Press 8. M. Juneja and P. S. Sandhu (2013) ‘An Improved LSB Based Steganography Technique for
RGB Color Images’ Int. J. Comput. Commun. Eng., vol. 2, no. 4. 9. Makabe, S. et al (2007) ‘Implementation of Modified Level Transformation for Bit-Plane
Watermarking, TENCON 2007 - 2007 IEEE Region 10 Conference. 10. Mohammed Mahdi Hashim, Mohd Shafry Mohd Rahim, Fadil Abass Johi, Mustafa Sabah
Taha, Hassan Salman Hamad (2018) ‘Performance evaluation measurement of image steganography techniques with analysis of LSB based on variation image formats’ International Journal of Engineering & Technology. Source: www.sciencepubco.com/index.php/IJET doi: 10.14419/ijet.v7i4.17294
11. Nozaki, K. et al (1998) ‘A Large Capacity Steganography Using Color BMP Images’ Lecture Notes in Computer Science; Vol. 1351.
12. R. Amritharajan, R. Akila, P. Deepikachowdavarapu (2010) ‘A Comparative Analysis of Image Steganography", International Journal of Computer Applications, vol. 2, no.3.
13. Ratnakirti Roy and Suvamoy Changder, “Quality Evaluation of Image Steganography Techniques: A Heuristics based Approach”
14. Ron Crandall (1998) “Some Notes on Steganography”, Posted on Steganography Mailing 15. List. Source:http://www.dia.unisa.it/~ads/corso-security/www/CORSO-
0203/steganografia/LINKS%20LOCALI/matrix-encoding.pdf. 16. Rebah, K. (2004) ‘Steganography – The Art of Hiding Data, Information Technology
Journal, No. 3. 17. Rosanne English (2009) ‘Comparing Steganography Algorithms’ September Edition 18. Swain, G., & Lenka, S. K. (2015) ‘A novel steganography tech-nique by mapping words
with LSB array’ International Journal of Signal and Imaging Systems Engineering, 8(1-2), 115-122. https://doi.org/10.1504/IJSISE.2015.067052.
19. W. Bender, D. Gruhl, N. Morimoto, and A. Lu (1996) ‘Techniques for data hiding’ IBM System Journal, vol. 35, no. 3.
20. Wang, H., Wang, S. (2004) ‘Cyber Warfare: Steganography vs. Steganalysis’ Communications of the ACM, Volume 47, No. 10.
21. Westfield, A., Pfitzmann, A., 1999, Attacks on Steganographic Systems, Lecture Notes in Computer Science; Vol. 1768.

INTERNATIONAL JOURNAL FOR INNOVATIVE RESEARCH IN MULTIDISCIPLINARY FIELD, ISSN: 2455-0620, Special Issue : 27, July-2021
Monthly, Peer-Reviewed, Refereed, Indexed Journal with IC Value: 86.87 Impact Factor: 6.719 Publication Date: 31/07/2021
Available online on - www.ijirmf.com Page 95
International Conference on
Science, Engineering & Technological Innovations 10 & 11 July, 2021 Bangkok, Thailand
Jointly organized by: Automation, Computer Science and Technology Department, Kryvyi Rih National
University, Ukraine. ‘Research Culture Society’ and ‘Scientific Research Association’.
Clustering of miniature wind turbines to form an effective micro-
renewable energy system (MRES)
1 P. P. Kumar, 2 P. K. Sahithi, 3 M. Talluri, 4 N. Gedam* and 5 S. Jayaraj
Mechanical Engineering Department National Institute of Technology, Calicut, 673601, INDIA
*Corresponding author: [email protected]
Abstract: Wind energy, despite being abundantly available, capturing it to full potential has become a challenge because of the large patches of land requirement and high operational wind speeds needed for conventional wind turbines. Hence, in this paper we focused on utilizing wind energy in the micro-level by clustering miniature turbines of 1.5 m diameter. In the present study, ANN analysis was used to identify the position of the turbines in the setup and in accordance to the results obtained; more fans were placed at a higher position in the cluster. Simulation of the flow for three different systems namely one-turbine system, three-turbine system and six-turbine system were carried out in ANSYS® using CFD techniques. The results from CFD analysis were used to obtain power output and power data curve for each case was plotted with the help of TRNSYS® and Excel. ANN was also used to predict the power output of the three-turbine system using weather data at Kozhikode (located at the south-west coast of peninsular India) from the past five years. Data obtained from TRNSYS® and Excel analysis, was used to calculate the power output for the whole year and the setup costs were individually calculated for three cases mentioned earlier. Values obtained were used to calculate the simple payback period for all cases and to find the best possible configuration of the three cases from both thermal and economic point of view.
Keywords: Micro-Renewable Energy, Miniature Wind Turbines, ANN & CFD, Thermo-Economic
Analysis. 1. INTRODUCTION:
Micro-renewable energy systems (MRES) are small-scale energy systems that use renewable energy sources to generate power for household use. We can improve the quality of life for those who live off the grid by using these systems. They are also useful for emergency purposes following significant power outages caused by storms, heavy rainfall, etc. Micro-renewable energy systems can produce enough energy required for a typical household's basic needs.
2. LITERATURE REVIEW:
Wind energy, a branch of the clean energy as its name suggests is not only non-polluting but also is available in abundance [1, 2]. Clustering of small wind turbines has more advantages than a system consisting of single wind turbine [3-5]. Fluid-structure interactions play a vital role in the performance of WT and the fluid-structure interactions are pre-dominantly dependent on geometry and materials of the WT [6]. The fluid-structure interaction being complex and also due to the complex inertial movement of the turbine [7, 8], and is dependency on air flow around turbine and gas compressibility [9], makes it tedious and time taking to carry out theoretical studies, hence numerical simulation is a better alternative along with experimental studies. CFD is a numerical
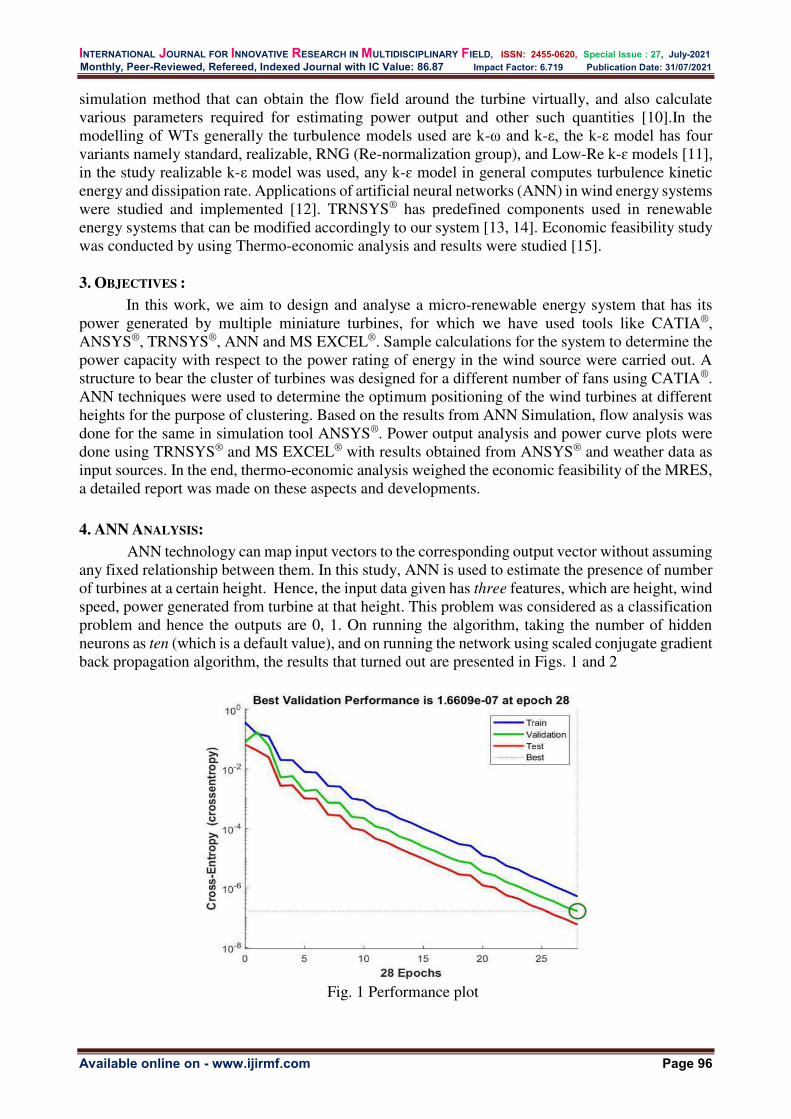
INTERNATIONAL JOURNAL FOR INNOVATIVE RESEARCH IN MULTIDISCIPLINARY FIELD, ISSN: 2455-0620, Special Issue : 27, July-2021
Monthly, Peer-Reviewed, Refereed, Indexed Journal with IC Value: 86.87 Impact Factor: 6.719 Publication Date: 31/07/2021
Available online on - www.ijirmf.com Page 96
simulation method that can obtain the flow field around the turbine virtually, and also calculate various parameters required for estimating power output and other such quantities [10].In the modelling of WTs generally the turbulence models used are k-ω and k-ε, the k-ε model has four variants namely standard, realizable, RNG (Re-normalization group), and Low-Re k-ɛ models [11], in the study realizable k-ε model was used, any k-ɛ model in general computes turbulence kinetic energy and dissipation rate. Applications of artificial neural networks (ANN) in wind energy systems were studied and implemented [12]. TRNSYS® has predefined components used in renewable energy systems that can be modified accordingly to our system [13, 14]. Economic feasibility study was conducted by using Thermo-economic analysis and results were studied [15].
3. OBJECTIVES :
In this work, we aim to design and analyse a micro-renewable energy system that has its power generated by multiple miniature turbines, for which we have used tools like CATIA®, ANSYS®, TRNSYS®, ANN and MS EXCEL®. Sample calculations for the system to determine the power capacity with respect to the power rating of energy in the wind source were carried out. A structure to bear the cluster of turbines was designed for a different number of fans using CATIA®. ANN techniques were used to determine the optimum positioning of the wind turbines at different heights for the purpose of clustering. Based on the results from ANN Simulation, flow analysis was done for the same in simulation tool ANSYS®. Power output analysis and power curve plots were done using TRNSYS® and MS EXCEL® with results obtained from ANSYS® and weather data as input sources. In the end, thermo-economic analysis weighed the economic feasibility of the MRES, a detailed report was made on these aspects and developments.
4. ANN ANALYSIS:
ANN technology can map input vectors to the corresponding output vector without assuming any fixed relationship between them. In this study, ANN is used to estimate the presence of number of turbines at a certain height. Hence, the input data given has three features, which are height, wind speed, power generated from turbine at that height. This problem was considered as a classification problem and hence the outputs are 0, 1. On running the algorithm, taking the number of hidden neurons as ten (which is a default value), and on running the network using scaled conjugate gradient back propagation algorithm, the results that turned out are presented in Figs. 1 and 2
Fig. 1 Performance plot
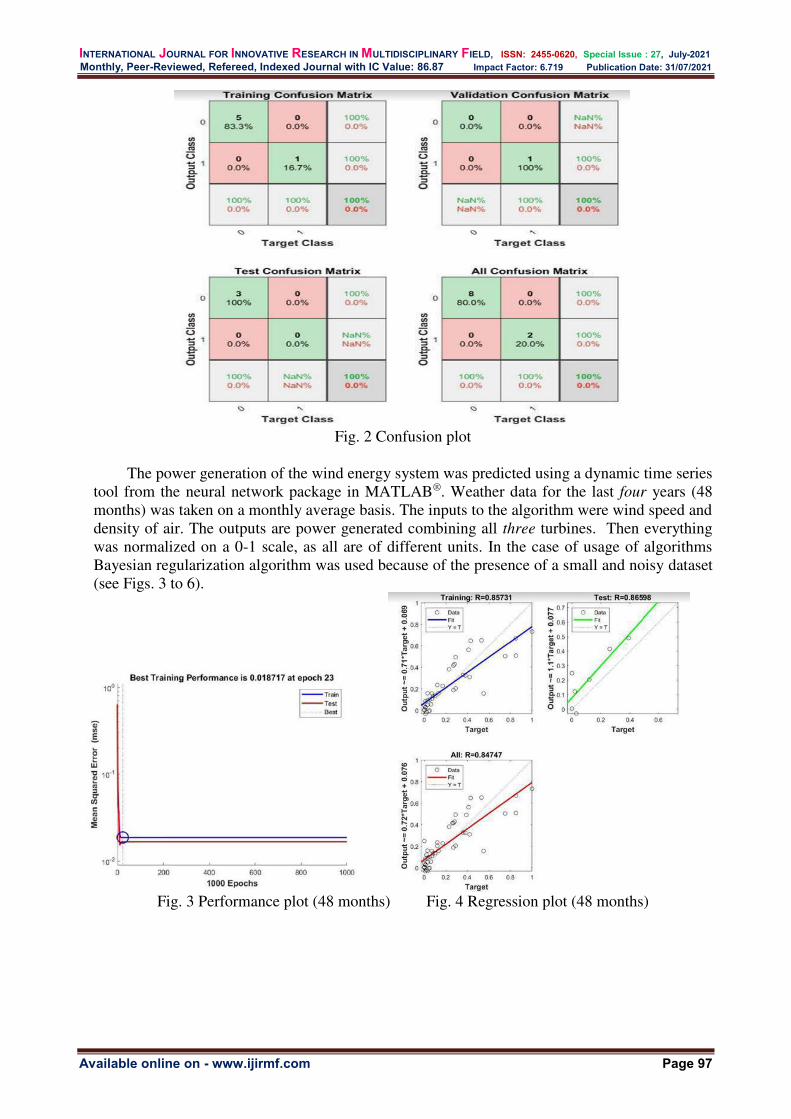
INTERNATIONAL JOURNAL FOR INNOVATIVE RESEARCH IN MULTIDISCIPLINARY FIELD, ISSN: 2455-0620, Special Issue : 27, July-2021
Monthly, Peer-Reviewed, Refereed, Indexed Journal with IC Value: 86.87 Impact Factor: 6.719 Publication Date: 31/07/2021
Available online on - www.ijirmf.com Page 97
Fig. 2 Confusion plot
The power generation of the wind energy system was predicted using a dynamic time series
tool from the neural network package in MATLAB®. Weather data for the last four years (48 months) was taken on a monthly average basis. The inputs to the algorithm were wind speed and density of air. The outputs are power generated combining all three turbines. Then everything was normalized on a 0-1 scale, as all are of different units. In the case of usage of algorithms Bayesian regularization algorithm was used because of the presence of a small and noisy dataset (see Figs. 3 to 6).
Fig. 3 Performance plot (48 months) Fig. 4 Regression plot (48 months)

INTERNATIONAL JOURNAL FOR INNOVATIVE RESEARCH IN MULTIDISCIPLINARY FIELD, ISSN: 2455-0620, Special Issue : 27, July-2021
Monthly, Peer-Reviewed, Refereed, Indexed Journal with IC Value: 86.87 Impact Factor: 6.719 Publication Date: 31/07/2021
Available online on - www.ijirmf.com Page 98
Fig. 5 Error histogram (48 months)
Fig. 6 Time series (48 months)
The algorithm was rerun by increasing our wind data to five years (60 months) and six years
(72 months) and re-normalizing them. The best results were obtained at 60 months, as given in Figs. 7 to 10.
Fig. 7 Performance plot (60 months)
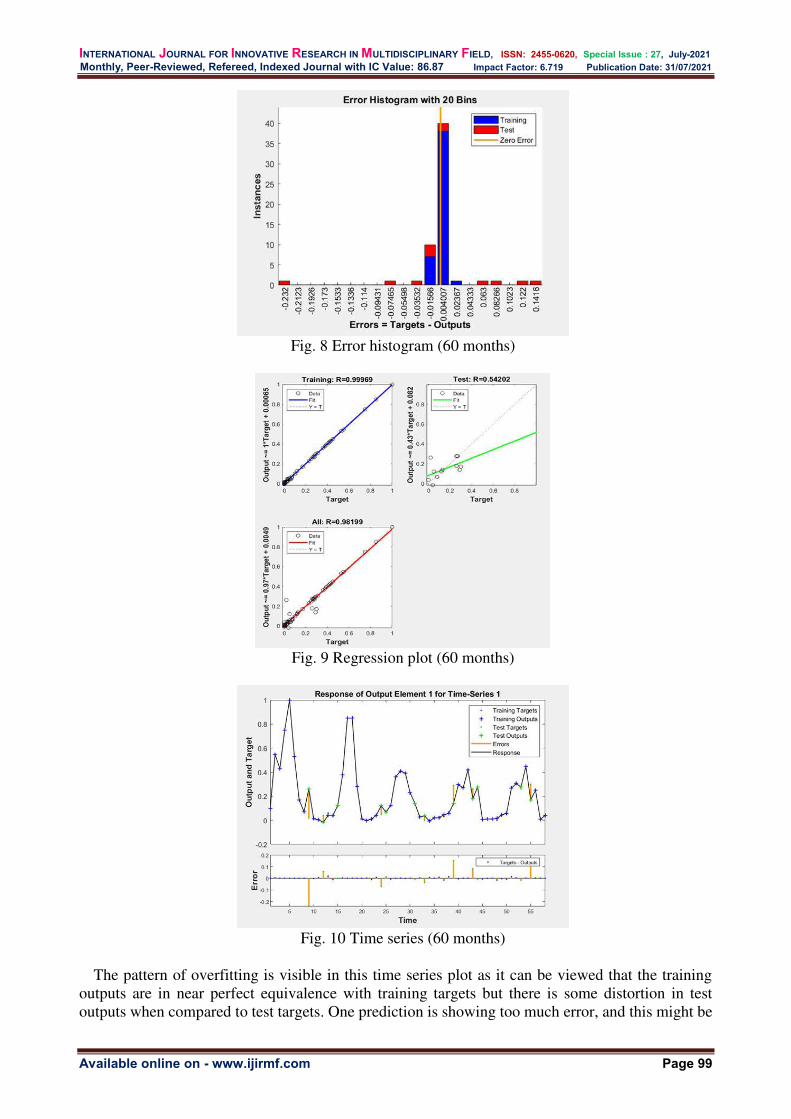
INTERNATIONAL JOURNAL FOR INNOVATIVE RESEARCH IN MULTIDISCIPLINARY FIELD, ISSN: 2455-0620, Special Issue : 27, July-2021
Monthly, Peer-Reviewed, Refereed, Indexed Journal with IC Value: 86.87 Impact Factor: 6.719 Publication Date: 31/07/2021
Available online on - www.ijirmf.com Page 99
Fig. 8 Error histogram (60 months)
Fig. 9 Regression plot (60 months)
Fig. 10 Time series (60 months)
The pattern of overfitting is visible in this time series plot as it can be viewed that the training
outputs are in near perfect equivalence with training targets but there is some distortion in test outputs when compared to test targets. One prediction is showing too much error, and this might be

INTERNATIONAL JOURNAL FOR INNOVATIVE RESEARCH IN MULTIDISCIPLINARY FIELD, ISSN: 2455-0620, Special Issue : 27, July-2021
Monthly, Peer-Reviewed, Refereed, Indexed Journal with IC Value: 86.87 Impact Factor: 6.719 Publication Date: 31/07/2021
Available online on - www.ijirmf.com Page 100
due to extreme weather conditions that month. But all in all, the results of the 60 month dataset were quite better than 48 month and 72 month datasets, which is providing the accurate overall predictions.
5. FRAME DESIGN:
The frames which are used to support the wind turbines were designed using CATIA® (Computer Aided Three-Dimensional Interactive Application). Two different frames were designed to accommodate three and six which are shown in Figs. 11 and 12. As per the results obtained for three-turbine configuration from ANN, two turbines can be placed at the extreme ends on the top row of the frame and the remaining one can be attached to the main rod of the frame just below. For the six-turbine configuration, three turbines can be placed on the top row, two on the below row and the remaining one can be attached to the main rod further below. The bearing allows the upper part of the main structure to rotate about the vertical axis and tail helps to coincide with the direction of wind. The lower part will be welded to the outer race of the bearing and the upper part will be welded to the inner race of the bearing.
Fig. 11 Configuration for 6 turbines
Fig. 12 Configuration for 3 turbines
6. CFD ANALYSIS:
The flow analysis of the turbine system in three different cases was carried at different velocities. The mathematical model used for the simulation was a realizable k- model with scalable wall

INTERNATIONAL JOURNAL FOR INNOVATIVE RESEARCH IN MULTIDISCIPLINARY FIELD, ISSN: 2455-0620, Special Issue : 27, July-2021
Monthly, Peer-Reviewed, Refereed, Indexed Journal with IC Value: 86.87 Impact Factor: 6.719 Publication Date: 31/07/2021
Available online on - www.ijirmf.com Page 101
conditions. In the cell zone conditions for the cylindrical enclosures frame motion was enabled and the angular velocity was given to be corresponding to 110 rpm. The boundary conditions given were a constant velocity at inlet and a constant pressure at outlet (i.e., zero-gauge pressure) The flow analysis was first carried out, for a one-turbine system at 4 m/s, 8 m/s, 12 m/s and 16 m/s, respectively and moment generated was recorded and power generated was calculated from the same (Table 1).
Sl. No. Speed Moment Power
1 0 0 0 2 4 0.173648 3.63618 3 8 1.43615 30.07297 4 12 3.36234 70.4074 5 16 3.57737 74.91013
Table 1 Power output of single turbine at different speeds
Fig. 13 Single turbine analysis domain
Fig. 14 Cross-section of the domain along Y-Z plane depicting the velocity gradient over the domain
The sample analysis domain and Y-Z plane cross sectional view are shown in Figs. 13 and
14, respectively. The cluster for a three-turbine system was made as per the configuration shown in Fig. 15 and the values of D1 and D2 were varied as given in Table 5.2

INTERNATIONAL JOURNAL FOR INNOVATIVE RESEARCH IN MULTIDISCIPLINARY FIELD, ISSN: 2455-0620, Special Issue : 27, July-2021
Monthly, Peer-Reviewed, Refereed, Indexed Journal with IC Value: 86.87 Impact Factor: 6.719 Publication Date: 31/07/2021
Available online on - www.ijirmf.com Page 102
Fig. 15 Arrangement scheme for three-turbine system
Configuration D1 D2
1 2 m 1.732 m 2 2.25 m 1.948 m 3 3 m 2.598 m
Table 2 Dimensions of configurations The analysis for each configuration was carried out for 4 m/s, 5 m/s and 6 m/s. These velocities
were chosen on the basis of weather data available for Kozhikode. In each case the moment generated was noted and corresponding power generated was obtained as given in Tables 3, 4 and 5.
Sl. No. Velocity
(m/s)
Moment1 Power1 Moment2 Power2 Moment3 Power3 Total
Power
1 4 0.6594 6.9041 0.6689 7.0035 0.6682 6.9964 20.9041 2 5 0.8357 9.6252 0.8452 9.7342 0.8855 10.1990 29.5584 3 6 1.3872 15.9772 1.3968 16.0873 1.3964 16.0827 48.1473
Average power 32.867
Table 3 Observations for configuration 1
Sl. No. Velocity
(m/s) Moment1 Power1 Moment2 Power 2 Moment3 Power3 Total
Power 1 4 0.6167 6.4578 0.6237 6.5309 0.6203 6.4954 19.4842 2 5 0.8485 9.7732 0.8548 9.84541 0.8548 9.8454 29.4640 3 6 1.4049 16.1809 1.4551 16.7586 1.4531 16.7362 49.6758
Average power 32.874
Table 4 Observations for configuration 2
Sl. No. Velocity
(m/s) Moment1 Power1 Moment2 Power2 Moment3 Power3 Total
Power 1 4 0.6568 6.8770 0.6679 6.9930 0.6674 6.9880 20.8581 2 5 0.8407 9.6827 0.8458 9.7419 0.8372 9.6424 29.0672 3 6 1.3284 15.2992 1.4338 16.5141 1.4120 16.2624 48.0758
Average power 32.66
Table 5 Observations for configuration 3
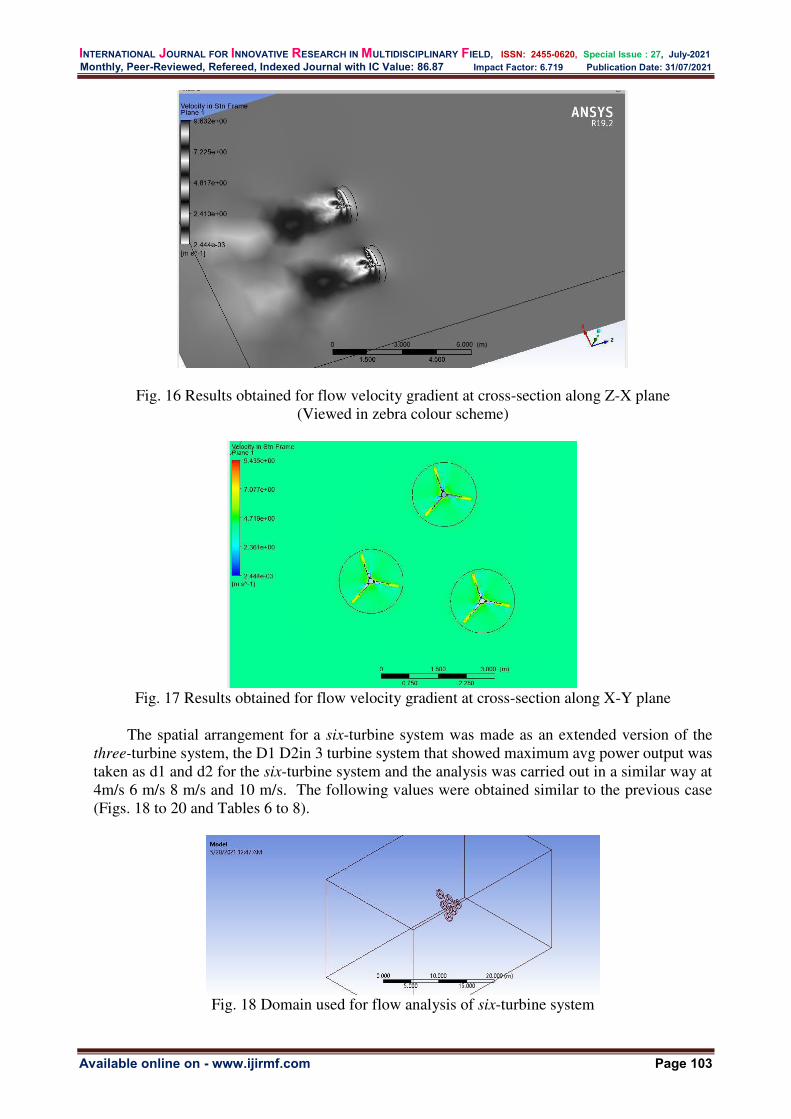
INTERNATIONAL JOURNAL FOR INNOVATIVE RESEARCH IN MULTIDISCIPLINARY FIELD, ISSN: 2455-0620, Special Issue : 27, July-2021
Monthly, Peer-Reviewed, Refereed, Indexed Journal with IC Value: 86.87 Impact Factor: 6.719 Publication Date: 31/07/2021
Available online on - www.ijirmf.com Page 103
Fig. 16 Results obtained for flow velocity gradient at cross-section along Z-X plane (Viewed in zebra colour scheme)
Fig. 17 Results obtained for flow velocity gradient at cross-section along X-Y plane
The spatial arrangement for a six-turbine system was made as an extended version of the
three-turbine system, the D1 D2in 3 turbine system that showed maximum avg power output was taken as d1 and d2 for the six-turbine system and the analysis was carried out in a similar way at 4m/s 6 m/s 8 m/s and 10 m/s. The following values were obtained similar to the previous case (Figs. 18 to 20 and Tables 6 to 8).
Fig. 18 Domain used for flow analysis of six-turbine system

INTERNATIONAL JOURNAL FOR INNOVATIVE RESEARCH IN MULTIDISCIPLINARY FIELD, ISSN: 2455-0620, Special Issue : 27, July-2021
Monthly, Peer-Reviewed, Refereed, Indexed Journal with IC Value: 86.87 Impact Factor: 6.719 Publication Date: 31/07/2021
Available online on - www.ijirmf.com Page 104
Fig. 19 Results obtained for flow velocity gradient at cross-section along X-Y plane
(Viewed in default colour scheme)
Fig. 20 results obtained for flow velocity gradient at cross-section along Z-X plane
(Viewed in zebra colour scheme)
Fan No. 1 2 3
Velocity Moment Power Moment Power Moment Power
4 0.71322 8.2142 0.7059 8.1307 0.7013 8.0776
6 1.0314 11.879 1.0187 11.733 1.0196 11.743
8 1.4788 17.032 1.4149 16.295 1.4606 16.823
10 2.0492 23.601 2.0083 23.13 2.0298 23.378 Table 6 Observations for six-turbine system
Fan No. 4 5 6
Velocity Moment Power Moment Velocity Moment Power
4 0.6978 8.037 0.6893 7.9398 0.6939 7.9924
6 1.0146 11.686 1.0228 11.781 1.0444 12.029
8 1.4526 16.73 1.4585 16.799 1.4418 16.606
10 2.0245 23.317 2.0267 23.342 1.6276 18.746 Table 7 Observations for six-turbine system
Velocity Total Power
4 48.3916
6 70.8502
8 100.2847
10 135.5140 Table 8 Power out for six-turbine system at different velocities
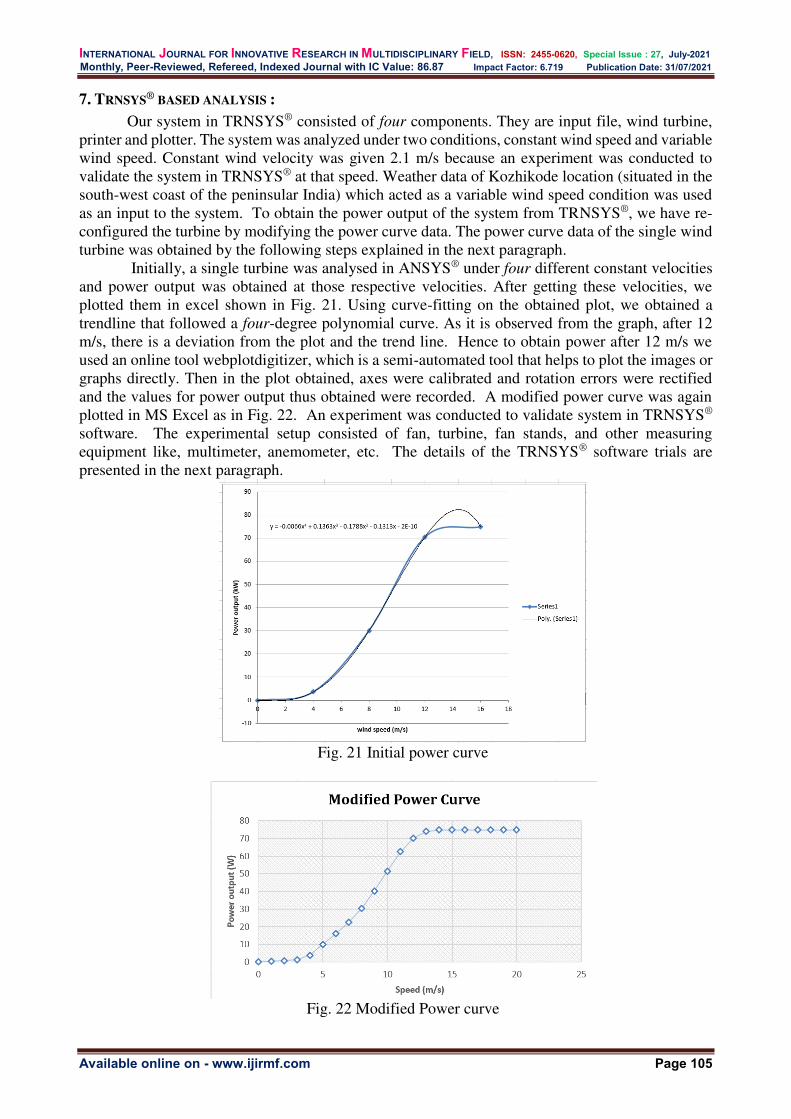
INTERNATIONAL JOURNAL FOR INNOVATIVE RESEARCH IN MULTIDISCIPLINARY FIELD, ISSN: 2455-0620, Special Issue : 27, July-2021
Monthly, Peer-Reviewed, Refereed, Indexed Journal with IC Value: 86.87 Impact Factor: 6.719 Publication Date: 31/07/2021
Available online on - www.ijirmf.com Page 105
7. TRNSYS® BASED ANALYSIS :
Our system in TRNSYS® consisted of four components. They are input file, wind turbine, printer and plotter. The system was analyzed under two conditions, constant wind speed and variable wind speed. Constant wind velocity was given 2.1 m/s because an experiment was conducted to validate the system in TRNSYS® at that speed. Weather data of Kozhikode location (situated in the south-west coast of the peninsular India) which acted as a variable wind speed condition was used as an input to the system. To obtain the power output of the system from TRNSYS®, we have re-configured the turbine by modifying the power curve data. The power curve data of the single wind turbine was obtained by the following steps explained in the next paragraph.
Initially, a single turbine was analysed in ANSYS® under four different constant velocities and power output was obtained at those respective velocities. After getting these velocities, we plotted them in excel shown in Fig. 21. Using curve-fitting on the obtained plot, we obtained a trendline that followed a four-degree polynomial curve. As it is observed from the graph, after 12 m/s, there is a deviation from the plot and the trend line. Hence to obtain power after 12 m/s we used an online tool webplotdigitizer, which is a semi-automated tool that helps to plot the images or graphs directly. Then in the plot obtained, axes were calibrated and rotation errors were rectified and the values for power output thus obtained were recorded. A modified power curve was again plotted in MS Excel as in Fig. 22. An experiment was conducted to validate system in TRNSYS® software. The experimental setup consisted of fan, turbine, fan stands, and other measuring equipment like, multimeter, anemometer, etc. The details of the TRNSYS® software trials are presented in the next paragraph.
Fig. 21 Initial power curve
Fig. 22 Modified Power curve

INTERNATIONAL JOURNAL FOR INNOVATIVE RESEARCH IN MULTIDISCIPLINARY FIELD, ISSN: 2455-0620, Special Issue : 27, July-2021
Monthly, Peer-Reviewed, Refereed, Indexed Journal with IC Value: 86.87 Impact Factor: 6.719 Publication Date: 31/07/2021
Available online on - www.ijirmf.com Page 106
Experimental procedure: Firstly, stands were made for supporting the turbine and fan using hollow mild steel rods.
Then we attached them to the centre of the rods such that their axes are horizontal. To the ceiling fan, a power supply was enabled. With the help of an anemometer, the speed of the wind was measured at required cross-sections. After reaching a steady-state, the power readings were measured with the help of a multimeter. Calculations using experimentally obtained data (given in Table 9) is presented below. The block diagram of the input fan and wind turbine are shown in Figs. 23 and 24, respectively.
Wind speed before turbine (𝑣𝑖) 2.1 m/s Wind speed after turbine (𝑣𝑓) 1.6 m/s
Air density () 1.225 𝑘𝑔/𝑚3 Input power (P) 28 W
Turbine diameter (d) 1.2 m Table 9 Experimental data
Fig. 23 Block diagram of input fan
Density of air = 1.225 kg/m³, Fan diameter =1.2 𝑚
Ideal power output = 12 𝜌𝐴𝑣3
Betz limit, 𝐶𝑝 = 16/27 (𝑃𝑜𝑢𝑡𝑝𝑢𝑡)𝑚𝑎𝑥 = 𝐶𝑝 × 12𝜌𝐴𝑣𝑎𝑐𝑡3 = 1627 × 12 × 1.225 × 𝜋4 × 1.22 × 2.13 = 3.8𝑊
(𝑃𝑜𝑢𝑡𝑝𝑢𝑡)𝑎𝑐𝑡𝑢𝑎𝑙 = 12𝜌𝐴𝑣𝑖3 − 12𝜌𝐴𝑣𝑓3 = 12 × 1.225 × 𝜋4 × 1.22 × (2.13 − 1.63) = 3.57 𝑊 𝜂𝑇(𝑟𝑒𝑙𝑎𝑡𝑖𝑣𝑒 𝑡𝑜 𝑏𝑒𝑡𝑧 𝑙𝑖𝑚𝑖𝑡 ) = (𝑃𝑜𝑢𝑡𝑝𝑢𝑡)𝑎𝑐𝑡𝑢𝑎𝑙𝑃𝑜𝑢𝑡𝑝𝑢𝑡 𝑚𝑎𝑥 = 3.573.8 = 93.95%
Fig. 24 Block diagram of wind turbine
Fig. 25 TRNSYS® results under constant input speed

INTERNATIONAL JOURNAL FOR INNOVATIVE RESEARCH IN MULTIDISCIPLINARY FIELD, ISSN: 2455-0620, Special Issue : 27, July-2021
Monthly, Peer-Reviewed, Refereed, Indexed Journal with IC Value: 86.87 Impact Factor: 6.719 Publication Date: 31/07/2021
Available online on - www.ijirmf.com Page 107
The loss percentage obtained was entered in TRNSYS® turbine parameter to get the simulation result (shown in Fig. 24). The weather data was obtained from a website called weather spark shown in Fig. 25. The wind speeds given above are the average wind speeds per week for the whole year. These wind speeds were given as an input to the system in TRNSYS® using forcing functions. The power output extracted by the wind turbine in the above weather conditions is obtained in two ways (using TRNSYS® and MS EXCEL®).
Fig. 26 Annual weather data
The annual weather data was given by splitting each month into four weeks, where the
average wind speed is taken for a week. And for one whole year, the count goes to 48. Hence, a total of 49 data points including the initial point are given as an input to the wind turbine. After entering the weather data, we changed some input parameters such as shear coefficient and loss percentage. These parameters are set to 0 because the effects caused by these parameters are already considered while obtaining the power curve. Finally, the plot obtained (Fig. 26) after running the system with around 3.5 repetitions. This is because TRNSYS® default data points are 168, but input data points are only 49.
Fig. 27 TRNSYS® Result for Annual weather data
Analysis using MS EXCEL: In MS EXCEL, firstly the annual weather data is entered in a column. The trendline equation of the power
curve was used to obtain power extracted by the turbine, because weather data consisted of speeds up to 5 m/s, and in this range the trendline nearly approximated the original power curve of the wind turbine data. After obtaining the power output at various average speeds, the graph was plotted between week number and power output as shown in Fig. 27.

INTERNATIONAL JOURNAL FOR INNOVATIVE RESEARCH IN MULTIDISCIPLINARY FIELD, ISSN: 2455-0620, Special Issue : 27, July-2021
Monthly, Peer-Reviewed, Refereed, Indexed Journal with IC Value: 86.87 Impact Factor: 6.719 Publication Date: 31/07/2021
Available online on - www.ijirmf.com Page 108
Fig. 28 Annual power curve
Similar to the single turbine analysis that was conducted in TRNSYS® and MS EXCEL®,
the systems containing three-turbines and six-turbines respectively, were also analysed to get individual power curve and annual power curves for the same weather data shown in Figs. 28 to 30.
Fig. 29 Power curve (three-turbines)
Fig. 30 Power curve (six-turbines)
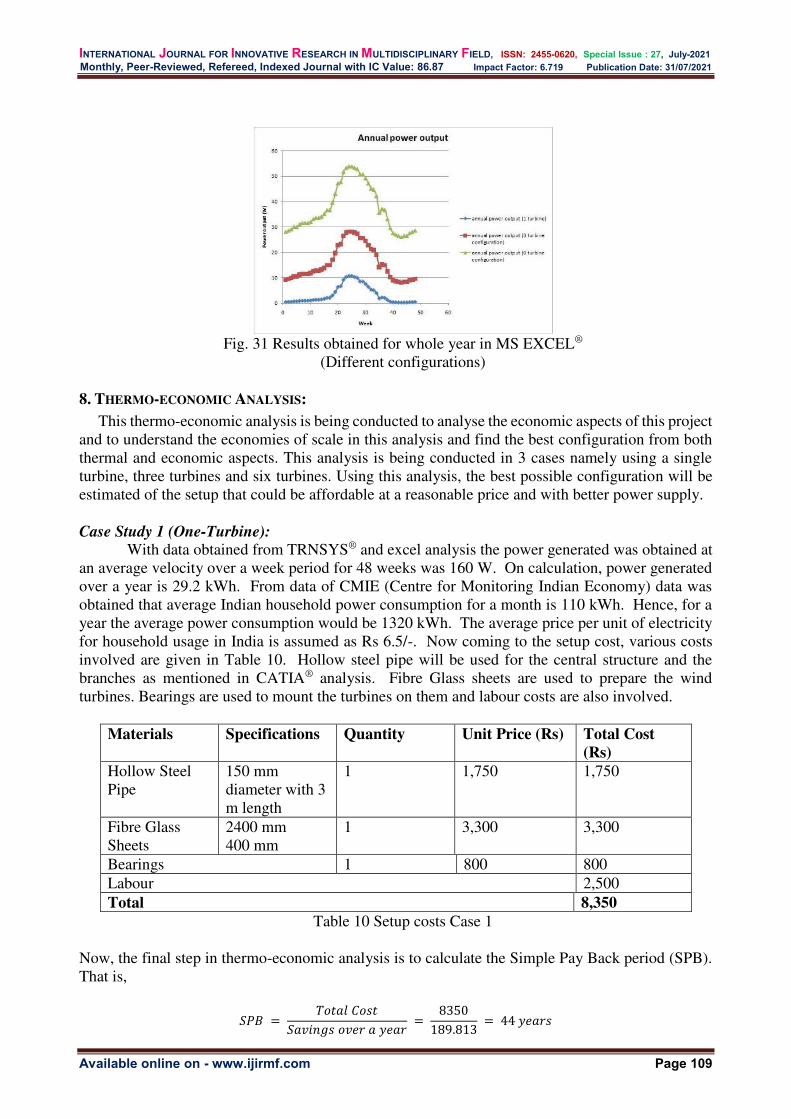
INTERNATIONAL JOURNAL FOR INNOVATIVE RESEARCH IN MULTIDISCIPLINARY FIELD, ISSN: 2455-0620, Special Issue : 27, July-2021
Monthly, Peer-Reviewed, Refereed, Indexed Journal with IC Value: 86.87 Impact Factor: 6.719 Publication Date: 31/07/2021
Available online on - www.ijirmf.com Page 109
Fig. 31 Results obtained for whole year in MS EXCEL®
(Different configurations)
8. THERMO-ECONOMIC ANALYSIS:
This thermo-economic analysis is being conducted to analyse the economic aspects of this project and to understand the economies of scale in this analysis and find the best configuration from both thermal and economic aspects. This analysis is being conducted in 3 cases namely using a single turbine, three turbines and six turbines. Using this analysis, the best possible configuration will be estimated of the setup that could be affordable at a reasonable price and with better power supply.
Case Study 1 (One-Turbine):
With data obtained from TRNSYS® and excel analysis the power generated was obtained at an average velocity over a week period for 48 weeks was 160 W. On calculation, power generated over a year is 29.2 kWh. From data of CMIE (Centre for Monitoring Indian Economy) data was obtained that average Indian household power consumption for a month is 110 kWh. Hence, for a year the average power consumption would be 1320 kWh. The average price per unit of electricity for household usage in India is assumed as Rs 6.5/-. Now coming to the setup cost, various costs involved are given in Table 10. Hollow steel pipe will be used for the central structure and the branches as mentioned in CATIA® analysis. Fibre Glass sheets are used to prepare the wind turbines. Bearings are used to mount the turbines on them and labour costs are also involved.
Materials Specifications Quantity Unit Price (Rs) Total Cost
(Rs)
Hollow Steel Pipe
150 mm diameter with 3 m length
1 1,750 1,750
Fibre Glass Sheets
2400 mm 400 mm
1 3,300 3,300
Bearings 1 800 800 Labour 2,500 Total 8,350
Table 10 Setup costs Case 1
Now, the final step in thermo-economic analysis is to calculate the Simple Pay Back period (SPB). That is, 𝑆𝑃𝐵 = 𝑇𝑜𝑡𝑎𝑙 𝐶𝑜𝑠𝑡𝑆𝑎𝑣𝑖𝑛𝑔𝑠 𝑜𝑣𝑒𝑟 𝑎 𝑦𝑒𝑎𝑟 = 8350189.813 = 44 𝑦𝑒𝑎𝑟𝑠

INTERNATIONAL JOURNAL FOR INNOVATIVE RESEARCH IN MULTIDISCIPLINARY FIELD, ISSN: 2455-0620, Special Issue : 27, July-2021
Monthly, Peer-Reviewed, Refereed, Indexed Journal with IC Value: 86.87 Impact Factor: 6.719 Publication Date: 31/07/2021
Available online on - www.ijirmf.com Page 110
Case Study 2 (Three-Turbines): The power generated over a year in this case is 138.08 kWh. Now coming to costs, the same
components will be used but there will be a difference in the number of units. So, setup costs are given in Table 11.
Materials Specifications Quantity Unit Price (Rs) Total Cost (Rs)
Hollow Steel Pipe
150 mm diameter with 3 m length
2 1,750 3,500
Fibre Glass Sheets
2400 mm 400 mm
3 3,300 10,000
Bearings 3 800 2,400 Labour 2,500 Total 18,400
Table 11 Setup costs Case 2 𝑆𝑃𝐵 = 𝑇𝑜𝑡𝑎𝑙 𝐶𝑜𝑠𝑡𝑆𝑎𝑣𝑖𝑛𝑔𝑠 𝑜𝑣𝑒𝑟 𝑎 𝑦𝑒𝑎𝑟 = 18400897.52 = 20.5 𝑦𝑒𝑎𝑟𝑠
In this case of three-turbines, a payback period of 20.5 years was obtained on calculation which is lower than for the case of a one-turbine.
Case Study 3 (Six-Turbines): Total power generated over a year in this case is 326.5 kWh. The setup costs for this case are given in Table 12
Materials Specifications Quantity Unit Price (Rs) Total Cost (Rs) Hollow Steel Pipe
150 mm diameter with 3 m length
3 1,750 5,250
Fibre Glass Sheets
2400 mm, 400mm
6 3,300 19,800
Bearings 6 800 4,800 Labour 2,500 Total 32,350
Table 12 Setup costs Case 3 𝑆𝑃𝐵 = 𝑇𝑜𝑡𝑎𝑙 𝐶𝑜𝑠𝑡𝑆𝑎𝑣𝑖𝑛𝑔𝑠 𝑜𝑣𝑒𝑟 𝑎 𝑦𝑒𝑎𝑟 = 323502122.25 = 15.25 𝑦𝑒𝑎𝑟𝑠
Hence, the payback period is coming out to be 15.25 years, which is still lower than the three-
turbines case. Now comparing these results, the graphs are plotted in Figs. 31 to 33.

INTERNATIONAL JOURNAL FOR INNOVATIVE RESEARCH IN MULTIDISCIPLINARY FIELD, ISSN: 2455-0620, Special Issue : 27, July-2021
Monthly, Peer-Reviewed, Refereed, Indexed Journal with IC Value: 86.87 Impact Factor: 6.719 Publication Date: 31/07/2021
Available online on - www.ijirmf.com Page 111
Fig. 32 Total cost variation with respect to SPB
Fig. 33 Power variation with respect to SPB
Fig. 34 Relation between the number of turbines and power

INTERNATIONAL JOURNAL FOR INNOVATIVE RESEARCH IN MULTIDISCIPLINARY FIELD, ISSN: 2455-0620, Special Issue : 27, July-2021
Monthly, Peer-Reviewed, Refereed, Indexed Journal with IC Value: 86.87 Impact Factor: 6.719 Publication Date: 31/07/2021
Available online on - www.ijirmf.com Page 112
As it is observed in the above graphs, there is a sharp decline in the SPB period from one-turbine to three-turbine case. But when the number of turbines goes from 3 to 6, there is a significant increase in cost, but there is not much decrease in the simple payback period. Hence, this analysis suggests installing a three-turbine setup is a better economical choice rather than six-turbine setup. However, if a customer wishes to install a six-turbine setup its fine, because there is huge power generation and SPB period obtained is the lowest in this case. 9. RESULTS AND DISCUSSIONS:
The moment obtained from simulation using ANSYS® was used to calculate power output at different velocities and using this, the power curve data was plotted for single turbine system three-turbine system and six-turbine system. For the three-turbine system the fan-to-fan distance was varied and three cases were observed for the power output and configuration co-relation. In the ANN analysis, classification problem was used to identify the position of the placement of turbines in our setup. These results were used to validate the positions taken in ANSYS® analysis and all subsequent analyses were done.
The data obtained from flow analysis conducted on ANSYS® was used to prepare the power
curves of three different sets of turbines in TRNSYS® and MS Excel®. With the power data curve obtained and weather data it was seen that the annual power generation was as follows:
1. One-turbine system: 29.20kWh 2. Three-turbine system: 138.1 kWh 3. Six-turbine system: 326.5 kWh
In thermo-economic analysis, with the help of data generated from TRNSYS®, ANSYS® and MS Excel® solutions, the total power generated over a year was estimated and the setup costs for all the three cases were individually calculated and re-configured according to the requirements. From these calculated values, simple payback period was found out for all these cases.
10. CONCLUSIONS:
With change in the configuration, though there was not very significant change in the power generated, the trend showed that, the average power output was more for configuration with 1.5D fan-to-fan distance. The power generated by each turbine increased as the velocity at the input was increased. It can also be concluded from results obtained through ANSYS® simulation that, the turbines that were placed at higher place produced more power which implies for more power generation, more fans are to be positioned at greater height in the cluster. This conclusion also goes matches with the results obtained from ANN and they get validated (with each other).
From the simple payback period value that was calculated in all the cases, it was observed
that, the best setup to install would be three-turbine (Case 2) setup from both thermal and economics point of view. This was primarily because, six-turbine (Case 3) was generating more power but when considered from economic front, it costs way too much than a three-turbine setup and there is not much improvement in the simple payback period when compared between the two cases. Hence, it was proposed to prefer a three-turbine setup rather than the remaining two cases (i.e., one-turbine and six-turbine setups).
REFERENCES:
1. Liu TY, Tavner PJ, Feng Y, Qiu YN (2013) Review of recent offshore wind power developments in China. Wind Energy 16(5):786–803
2. Zhaojie. Mechanical properties research of the multi-rotor wind turbine system. Dissertation of Tianjin university, Tianjin. Jun 1, 2012.

INTERNATIONAL JOURNAL FOR INNOVATIVE RESEARCH IN MULTIDISCIPLINARY FIELD, ISSN: 2455-0620, Special Issue : 27, July-2021
Monthly, Peer-Reviewed, Refereed, Indexed Journal with IC Value: 86.87 Impact Factor: 6.719 Publication Date: 31/07/2021
Available online on - www.ijirmf.com Page 113
3. Huang Qunwu. A kind of multi-turbines wind power system with fixed tower. Chinese Patent No 201110241019.1; Jan 4, 2012.
4. Peter J, Michael B. Multi-rotors; a solution to 20MWand beyond? Energy Proc2012; 24:52e9. 5. Bazmi AA, Zahedi G (2011) Sustainable energy systems: role of optimization modeling
techniques in power generation and supply—a review. Renew Sustain Energy Rev 15(8):3480–3500
6. Shi R, Fan X, He Y (2017) Comprehensive evaluation index system for wind power utilization levels in wind farms in China. Renew Sustain Energy Rev 69:461–471
7. MacPhee WD, Beyene A (2016) Fluid–structure interaction analysis of a morphing vertical axis wind turbine. J Fluids Struct 60:143–159
8. MacPhee WD, Beyene A (2015) Experimental and fluid structure interaction analysis of a morphing wind turbine rotor. Energy 90:1055–1065
9. Bai L, Li F, Cui H, Jiang T, Sun H, Zhu J (2016) Interval optimization based operating strategy for gas-electricity integrated energy systems considering demand response and wind uncertainty. Applied Energy 167:270–279
10. Pinto RN, Afzal A, D’Souza LV, Ansari Z, Samee ADM (2016) Computational fluid dynamics in turbomachinery: a review of state of the art. Arch Computing Methods Eng 24:467–479
11. Kasmi AE, Masson C (2008) An extended k–ε model for turbulent flow through horizontal-axis WIND TURBINEs. J Wind Eng Ind Aerodyn 96(1):103–122
12. Alberto Pliego Marugan, Fausto Pedro Garcia Marquez, Jesus Maria Pinar Perez, Diego Ruiz-Hernandez, A survey of artificial neural network in wind energy systems, Applied Energy 228 (2018) 1822-1836
13. Huang et al,Yeqiang Shi, Yiping Wang, Linping Lu, Yong Cuil. Multi-turbine wind-solar hybrid systems. Renewable energy 76 (2015) 401-407.
14. www.trnsys.com 15. Bavin Loganathan, Harun Chowdhury, Israt Mustary, Md Masud Rana, Firoz Alam, Design of
a micro wind turbine and its economic feasibility study for residential power generation in built-up areas, 2nd International Conference on Energy and Power, ICEP2018, 13-15 December 2018, Sydney, Australia.
INTERNATIONAL JOURNAL FOR INNOVATIVE RESEARCH IN MULTIDISCIPLINARY FIELD, ISSN: 2455-0620, Special Issue : 27, July-2021
Monthly, Peer-Reviewed, Refereed, Indexed Journal with IC Value: 86.87 Impact Factor: 6.719 Publication Date: 31/07/2021
Available online on - www.ijirmf.com Page 114
International Conference on
Science, Engineering & Technological Innovations 10 & 11 July, 2021 Bangkok, Thailand
Jointly organized by: Automation, Computer Science and Technology Department, Kryvyi Rih National
University, Ukraine. ‘Research Culture Society’ and ‘Scientific Research Association’.
A REVIEW OF CRYPTOGRAPHIC TECHNIQUES IN SMART
GRID
Jagdish Chandra Pandey1 and Mala Kalra
2
1 Goverment Polytechnic Dwarahat, Almora, Uttrakhand, India Email - 1*[email protected]
2 NITTTR, Chandigarh, India
Email - [email protected] Abstract: Smart Grid is an advanced power grid which efficiently generates, transmits, and manages
electricity. It provides two-way communication between users and suppliers. Smart Meters play an
important role in Smart Grids. The Smart Meters are resource constrained devices and are placed
in the home area network to measure the electricity consumption. Smart meter measures the
electricity consumption periodically and transmits the data to the Smart Grid. Due to periodic
nature, large amount of redundant data is generated. Further, the data is sensitive and prone to
number of attacks such as eavesdropping, replay and tampering attacks. To overcome these
challenges, data reduction and security is required. This study presents a review of various
cryptographic techniques in smart grids along with some others issues encountered in its adoption.
The paper also suggests directions for future research in this area.
Keywords: Smart Grids, security issues, internet of things, security and privacy, attacks.
1. INTRODUCTION: Compared to conventional electric system, smart grid is equipped with automated monitoring
and recovery tasks along with widespread management. Smart meters collect and transmit electricity consumption data. Smart meters are equipped with a processor, secondary memory and transmission technologies which comprise of Home Area Network. Power usage data is collected by smart meter after short intervals i.e. in every 15 mins. and transmitted to neighbourhood gateway. Neighbourhood gateway then transmits usage data to control centre. Control centre provides current period tariff information to consumers. Customers can respond by reducing electricity usage during peak times in order to reduce their bills. In the smart grid, the advanced meter infrastructure (AMI) is continuously taking the data from the smart meters in fixed intervals. Thus, a huge amount of data is generated. Thus, to reduce the data, various data compression algorithms have been used for the smart grid. Data compression is classified into two types, namely, lossless and lossy compression. Three popular data compression algorithms used in the smart grid are run-length encoding, arithmetic coding, and Huffman coding. The run length counts the number of 1’s and 0’s in the data and according to that number index and how many it repeated in the sequence gives the compression. However, this method gives low compression when the switching between 0’s and 1’s in the data is high. Huffman coding [27] uses variable length coding. The variable-length coding converts the symbols into binary symbols based on the probability of occurrence of that symbol. Thus, most messages composed of repeated symbols can be compressed into a shorter bit stream. Arithmetic coding [11] is another method, which takes a stream of symbols and replaces them with a single number. Two main factors of any compression technique are the occurrence probability and the cumulative probabilities of a symbol sequences.

INTERNATIONAL JOURNAL FOR INNOVATIVE RESEARCH IN MULTIDISCIPLINARY FIELD, ISSN: 2455-0620, Special Issue : 27, July-2021
Monthly, Peer-Reviewed, Refereed, Indexed Journal with IC Value: 86.87 Impact Factor: 6.719 Publication Date: 31/07/2021
Available online on - www.ijirmf.com Page 115
Fig. 1 AMI Network Infra-structure [1]
On the other side, to provide the security in the smart grid, the various encryption algorithms
is applied on the data. The most popular encryption algorithms are deployed for the smart grid are Advanced Encryption Standard (AES), chaotic map, blowfish, homomorphic encryption, and elliptic curve cryptography (ECC). The AES, chaotic map and blowfish algorithms come under symmetric algorithm whereas homomorphic encryption and ECC come under asymmetric algorithm. The symmetric algorithm structure is simple and faster as compared to the asymmetric algorithm. However, the symmetric algorithms not provide the authentication and integrity. To achieve these properties in the symmetric algorithms, a one-time padding key is concatenated with plaintext. There is numerous ways to generate OTP keys such as linear feedback shift register, non-linear feedback shift register, and swarm-based algorithms. The swarm-based nature-inspired algorithm generates a random key. However, there are several challenges of these algorithms, such as if the initial population is not properly selected then it falls into local optima, low convergence rate to find the optimal result etc.
Existing algorithms (such as AES, BLOWFISH, Homomorphic Encryption, El-Gamal Encryption etc.) consume lot of memory (due to large key size of 163/512/1024 bit, multipliers and adders) and are having high time and computational complexity. Therefore, these algorithms are not considered suitable for smart Meters. NIST recommends lightweight algorithms which consume less resources and time due to small block size, key size, and simple operations for data security in Smart Grid. As lightweight algorithms have small block size, they are susceptible to Brute Force attack. To provide robust security, if number of rounds is increased in the lightweight algorithm, it will result in increase in computation time. The remaining paper is organised as follows: -Section 2 provides brief of related works, Section 3 provides Comparative analysis of existing techniques and Section 4 provides Conclusion and directions for future work. 2. Review of Existing Cryptographic Techniques:
Tan et al. [10] have proposed novel systematic online attack construction scheme. They analysed the association between data integrity attacks and smart grid operations and represented their relation as a process simulator. After that a model is devised, by which adversary can gain market advantage by launching data integrity attacks. The proposed strategy allows attackers to attack the system using realistic streams related with Smart Meter without having communication channel related information. Another security scheme determines malicious measurements without involving extra cost.

INTERNATIONAL JOURNAL FOR INNOVATIVE RESEARCH IN MULTIDISCIPLINARY FIELD, ISSN: 2455-0620, Special Issue : 27, July-2021
Monthly, Peer-Reviewed, Refereed, Indexed Journal with IC Value: 86.87 Impact Factor: 6.719 Publication Date: 31/07/2021
Available online on - www.ijirmf.com Page 116
Waisi et al. [11] have presented an analysis of security issues related with Smart Grids to identify different possibilities to solve the issues. Braeken et al. [12] have proposed a privacy-protecting information collection technique that provides real-time measurements and secure communication against possible attackers. The proposed scheme not only provides reliable information collection, correct and real-time measurement but also maintains the privacy of customer. Proposed scheme provides fast data rate and reduced processing cost along with robust security. Khasawneh et al. [21] have proposed hybrid encryption scheme (using AES along with ECC) for securing the smart metering network. But this hybridization has increased the overall computation time. To reduce the computation time, pre-computation procedure is applied. The proposed technique provides confidentiality, integrity, and authentication. Also, it provides security against false data injection and Replay Attack. Tonyali et al. [22] have proposed information obfuscation approach to secure the customer secrecy. In this approach, AES and ECC algorithm are used. The data obfuscation protects the customer from Eavesdropping Attack. On the utility company side, users who have the permission/access will recover the customer data from obfuscation which then can be used for the state estimation or load forecasting. The performance analysis of the proposed approach was done on the basis of throughput, time complexity and data rate. Also, this approach provides less overhead as compared to the non-privacy approaches.
3. Comparative Analysis of Existing Techniques
S.No
.
Referen
ce/Citati
on
Methodology
Used
Security
Aspect
Focussed
Limitations Contributions
1. Desai et al. [1]
End to end encryption
Cyber Attacks
Algorithm consumes large number of resources.
Provide robust security against cyber attacks.
2. Tan et al.[2]
Access control Modification Attack(integrity violation)
Consumes lot of memory and time.
Provide robust security against Modification Attack.
3. Abdallah et al. [3]
Lightweight homomorphic cryptosystem which is based on lattice vector
Key based attack
Failed to achieve protection against Differential Attack and several full rounds attacks using Biclique Cryptanalysis, can have problems of block collisions if it is used with large amounts of data.
Provide robust security against Key based attack.
4. Fouda et al. [4]
Lightweight Message Authentication Scheme using Hash Signature and access control
Modification Attack, Repudiation Attack, Redirection Attack
Low computational delay and high data rate.
Provide security against Modification Attack, Repudiation Attack.
5. Zhang et al. [5]
256-bit Advanced
Data Integrity
Fail to find optimal global
Provide robust security against

INTERNATIONAL JOURNAL FOR INNOVATIVE RESEARCH IN MULTIDISCIPLINARY FIELD, ISSN: 2455-0620, Special Issue : 27, July-2021
Monthly, Peer-Reviewed, Refereed, Indexed Journal with IC Value: 86.87 Impact Factor: 6.719 Publication Date: 31/07/2021
Available online on - www.ijirmf.com Page 117
Encryption Standard (AES)
Attack solution Data Integrity Attack.
6. Mood et al. [6]
Anonymous elliptic curve cryptography-based self-certified key distribution technique
Illegal alteration of data, denial of service attack etc.
Complicated and tricky to implement.
Solve Key Escrow Problem, have high data rate and low processing overhead.
7. Yang et al.[7]
Least Effort Attack Model
Repudiation Attack, Data
Integrity Attack
Failed to find optimal global solution.
Low computation complexity
8. Jolfaei et al.[8]
A Lightweight Integrity Protection Algorithm(16-bit Fletcher Algorithm, permutation based encryption, checksum embedding, integrity verification algo.
Man-in-the-Middle Attack
Fails to distinguish between blocks of all 0 bits and blocks of all 1 bits, consumes significant amount of memory, fails to establish authenticity of user.
This scheme has high data rate. This scheme is also used in high speed data transfer having small time delay, to detect error and for integrity check.
9. Guan et al. [9]
Flexible Privacy Preserving Data Aggregation Scheme (Secret Sharing Algorithm)
Replay, Modification, Injection,
and Forgery Attack
Each share of the secret must be at least as large as the secret itself.
Low computational complexity and communication overhead.
10. Tan et al. [10]
Identity Based Encryption
CCA Attack, Data
Integrity Attack
Process of revocation of public keys is very complex.
Determination of false data with low cost hardware Implementation.
11. Braeken et al. [12]
Privacy-preserving data aggregation scheme
Malicious data
concentrators
Vulnerable to Collusion attacks.
Fast data rate and reduced
processing overhead.
12. Boneh et al.[13]
Boneh-Goh-Nissim Cryptosystem
Eavesdropping Attack ,
Malware Attack
Cryptography algorithm consumes
large number of resources.
support for large message space
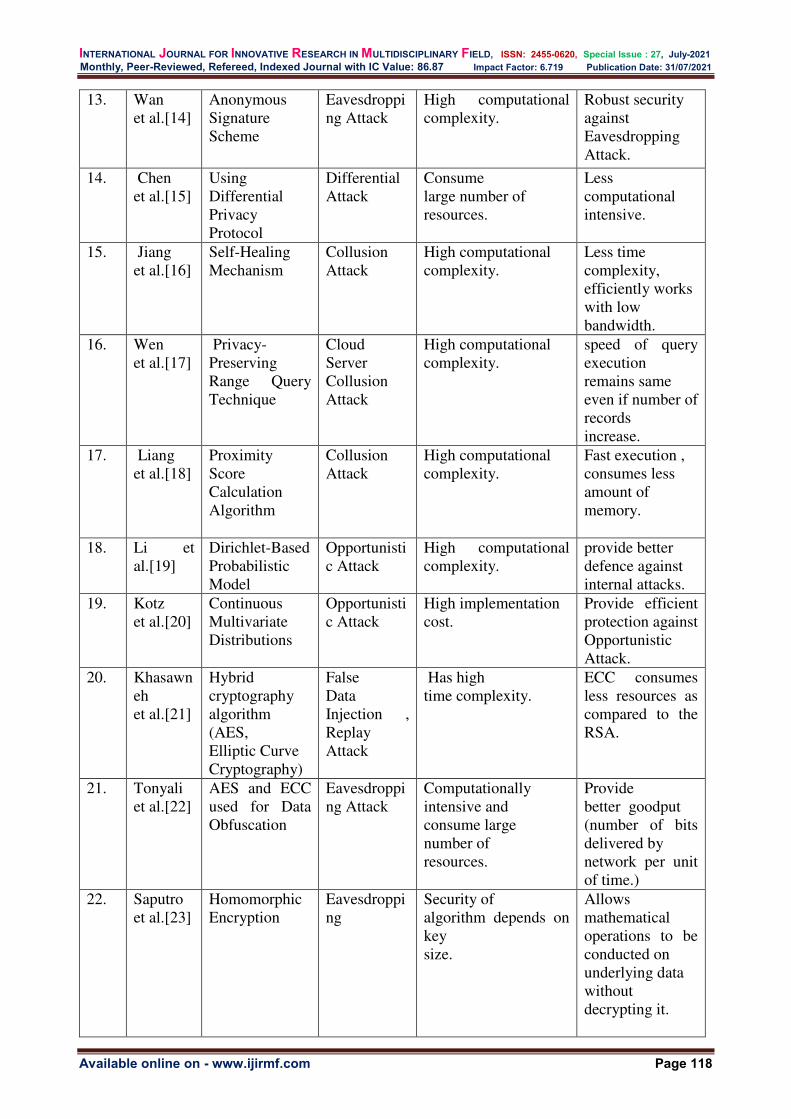
INTERNATIONAL JOURNAL FOR INNOVATIVE RESEARCH IN MULTIDISCIPLINARY FIELD, ISSN: 2455-0620, Special Issue : 27, July-2021
Monthly, Peer-Reviewed, Refereed, Indexed Journal with IC Value: 86.87 Impact Factor: 6.719 Publication Date: 31/07/2021
Available online on - www.ijirmf.com Page 118
13. Wan et al.[14]
Anonymous Signature Scheme
Eavesdropping Attack
High computational complexity.
Robust security against Eavesdropping Attack.
14. Chen et al.[15]
Using Differential Privacy Protocol
Differential Attack
Consume large number of resources.
Less computational intensive.
15. Jiang et al.[16]
Self-Healing Mechanism
Collusion Attack
High computational complexity.
Less time complexity, efficiently works with low bandwidth.
16. Wen et al.[17]
Privacy- Preserving Range Query Technique
Cloud Server Collusion Attack
High computational complexity.
speed of query execution remains same even if number of records increase.
17. Liang et al.[18]
Proximity Score Calculation Algorithm
Collusion Attack
High computational complexity.
Fast execution , consumes less amount of memory.
18. Li et al.[19]
Dirichlet-Based Probabilistic Model
Opportunistic Attack
High computational complexity.
provide better defence against internal attacks.
19. Kotz et al.[20]
Continuous Multivariate Distributions
Opportunistic Attack
High implementation cost.
Provide efficient protection against Opportunistic Attack.
20. Khasawneh et al.[21]
Hybrid cryptography algorithm (AES, Elliptic Curve Cryptography)
False Data Injection , Replay Attack
Has high time complexity.
ECC consumes less resources as compared to the RSA.
21. Tonyali et al.[22]
AES and ECC used for Data Obfuscation
Eavesdropping Attack
Computationally intensive and consume large number of resources.
Provide better goodput (number of bits delivered by network per unit of time.)
22. Saputro et al.[23]
Homomorphic Encryption
Eavesdropping
Security of algorithm depends on key size.
Allows mathematical operations to be conducted on underlying data without decrypting it.
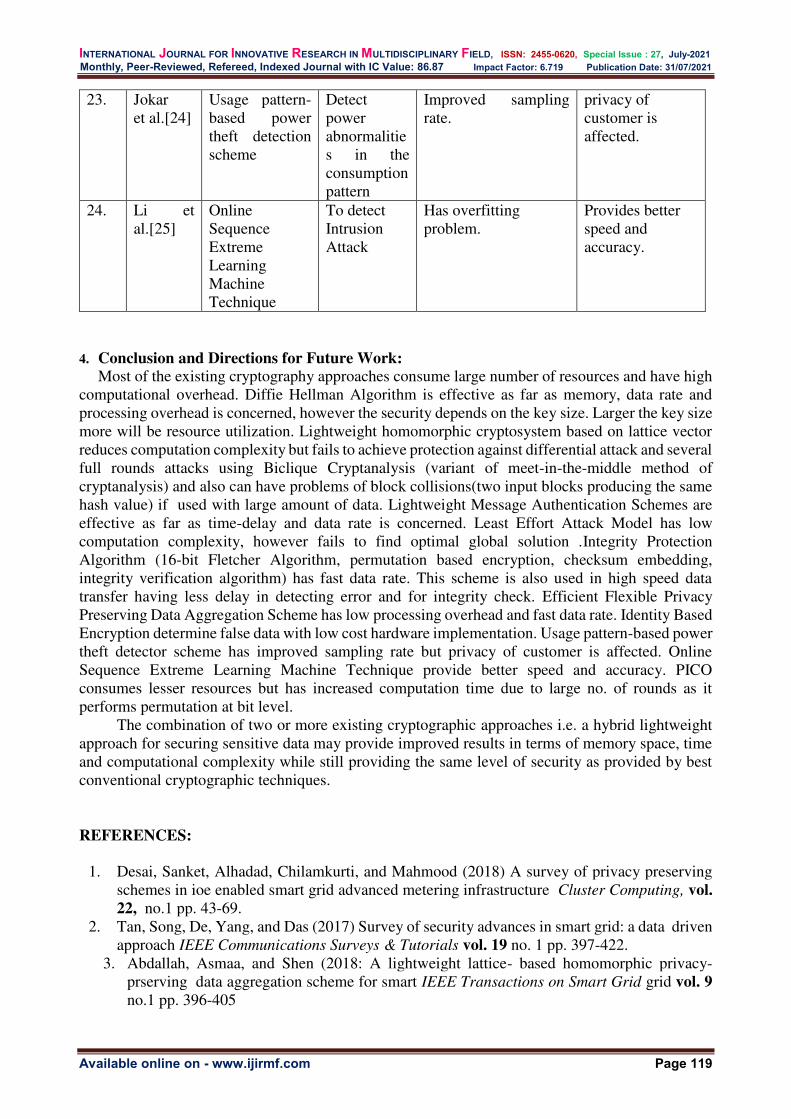
INTERNATIONAL JOURNAL FOR INNOVATIVE RESEARCH IN MULTIDISCIPLINARY FIELD, ISSN: 2455-0620, Special Issue : 27, July-2021
Monthly, Peer-Reviewed, Refereed, Indexed Journal with IC Value: 86.87 Impact Factor: 6.719 Publication Date: 31/07/2021
Available online on - www.ijirmf.com Page 119
4. Conclusion and Directions for Future Work: Most of the existing cryptography approaches consume large number of resources and have high
computational overhead. Diffie Hellman Algorithm is effective as far as memory, data rate and processing overhead is concerned, however the security depends on the key size. Larger the key size more will be resource utilization. Lightweight homomorphic cryptosystem based on lattice vector reduces computation complexity but fails to achieve protection against differential attack and several full rounds attacks using Biclique Cryptanalysis (variant of meet-in-the-middle method of cryptanalysis) and also can have problems of block collisions(two input blocks producing the same hash value) if used with large amount of data. Lightweight Message Authentication Schemes are effective as far as time-delay and data rate is concerned. Least Effort Attack Model has low computation complexity, however fails to find optimal global solution .Integrity Protection Algorithm (16-bit Fletcher Algorithm, permutation based encryption, checksum embedding, integrity verification algorithm) has fast data rate. This scheme is also used in high speed data transfer having less delay in detecting error and for integrity check. Efficient Flexible Privacy Preserving Data Aggregation Scheme has low processing overhead and fast data rate. Identity Based Encryption determine false data with low cost hardware implementation. Usage pattern-based power theft detector scheme has improved sampling rate but privacy of customer is affected. Online Sequence Extreme Learning Machine Technique provide better speed and accuracy. PICO consumes lesser resources but has increased computation time due to large no. of rounds as it performs permutation at bit level.
The combination of two or more existing cryptographic approaches i.e. a hybrid lightweight approach for securing sensitive data may provide improved results in terms of memory space, time and computational complexity while still providing the same level of security as provided by best conventional cryptographic techniques.
REFERENCES:
1. Desai, Sanket, Alhadad, Chilamkurti, and Mahmood (2018) A survey of privacy preserving schemes in ioe enabled smart grid advanced metering infrastructure Cluster Computing, vol.
22, no.1 pp. 43-69. 2. Tan, Song, De, Yang, and Das (2017) Survey of security advances in smart grid: a data driven
approach IEEE Communications Surveys & Tutorials vol. 19 no. 1 pp. 397-422. 3. Abdallah, Asmaa, and Shen (2018: A lightweight lattice- based homomorphic privacy-
prserving data aggregation scheme for smart IEEE Transactions on Smart Grid grid vol. 9 no.1 pp. 396-405
23. Jokar et al.[24]
Usage pattern-based power theft detection scheme
Detect power abnormalities in the consumption pattern
Improved sampling rate.
privacy of customer is affected.
24. Li et al.[25]
Online Sequence Extreme Learning Machine Technique
To detect Intrusion Attack
Has overfitting problem.
Provides better speed and accuracy.

INTERNATIONAL JOURNAL FOR INNOVATIVE RESEARCH IN MULTIDISCIPLINARY FIELD, ISSN: 2455-0620, Special Issue : 27, July-2021
Monthly, Peer-Reviewed, Refereed, Indexed Journal with IC Value: 86.87 Impact Factor: 6.719 Publication Date: 31/07/2021
Available online on - www.ijirmf.com Page 120
4. Fouda, Mostafa, Zubair, MdFadlullah, Kato, Lu, and Shen 2011 A lightweight message auhentication scheme for smart grid communications IEEE Transactions on Smart Grid, vol.2 no. 4 pp. 675-685.
5. Zhang, Peng, Elkeelany, and McDaniel (2010) An implementation of secured smart grid Ethernet communications using AES Proceedings of the IEEE Southeast Conference pp. 394-397.
6. Mood, Dariush, and Nikooghadam 2018 An anonymous ecc-based self-certified key distribution scheme for the smart grid IEEE Transactions on Industrial Electronics vol. 65 no.10 pp. 7996-8004.
7. Yang, Qingyu, An, Min, Yu, Yang, and Zhao (2017) On optimal pmu placement-based defence against data integrity attacks in smart grid IEEE Transactions on Information
Forensics and Security vol.12 no.7 pp. 1735-1750 8. Jolfaei, Alireza, and Kant (2019) A lightweight integrity protection scheme for low latency
smart grid applications Computers & Security vol. 86 no. 1 pp. 471-483. 9. Guan, Zhitao, Zhang, Zhu, Wu, and Yu (2019) EFFECT: an efficient flexible privacy-
preserving data aggregation scheme with authentication in smart grid Science China
Information Sciences vol. 62 no. 3 pp. 1-15. 10. Tan, Song, Stewart, Yang, and Tong (2018) Online data integrity attacks against real-time
electrical market in smart grid IEEE Transactions on Smart Grid vol. 9 no. 1 pp. 313-322. 11. Waisi, Zainab and Agyeman (2018) On the challenges and opportunities of smart meters in
smart homes and smart grids In Proceedings of the 2nd International Symposium on
Computer Science and Intelligent Control ACM pp. 16-17. 12. Braeken, Kumar and Martin (2018) Efficient and privacy-preserving data aggregation and
dynamic billing in smart grid metering networks Energies vol. 11 no. 8 pp. 1-20. 13. Boneh, Goh and Nissim (2005) Evaluating 2-dnf formulas on ciphertexts Theory of
Cryptography Conference, Springer Berlin Heidelberg pp. 325–341. 14. Wan, Zhu and Wang (2016) PRAC: efficient privacy protection for vehicle-to-grid
communications in the smart grid Computers & Security vol. 62 no. 1 pp. 246-256. 15. Chen, Lu, Cao, AlHarbi and Lin (2014) MuDA: multifunctional data aggregation in privacy-
preserving smart grid communications Peer-to- Peer Networking and Applications vol. 8 no.1 pp. 777-92.
16. Jiang, Lu, Luo, Lai and Shen (2014) Efficient self-healing group key management with dynamic revocation and collusion resistance for SCADA in smart grid Security and
Communication Networks vol. 8 no. 6 pp. 1026-39. 17. Wen, Lu, Zhang, Lei, Liang and Shen (2013) PaRQ: a privacy- preserving range query
scheme over encrypted metering data for smart grid IEEE Transactions on Emerging Topics
in Computing vol. 1 no. 1 pp. 178-191. 18. Liang, Zhang, Lu, Lin and Shen (2013) EPS: an efficient and privacy-preserving service
searching scheme for smart community IEEE Sensors Journal vol. 13 no. 10 pp. 3702-10 19. Li, Lu, Wang and Choo (2016) DDOA: a dirichlet-based detection scheme for opportunistic
attacks in smart grid cyber- physical system IEEE Transactions on Information Forensics
and Security vol. 11 no. 11 pp. 2415-25. 20. Kotz, Balakrishnan and Johnson (2000) Continuous multivariate distributions Continuous
Multivariate Distributions vol. 1 no. 1 pp. 485–527. 21. Khasawneh, Samer, and Kadoch (2018) Hybrid cryptography algorithm with
precomputation for advanced metering infrastructure networks Mobile Networks and
Applications vol. 23 no. 4, pp. 982-993. 22. Tonyali, Samet, Cakmak, Akkaya, Mahmoud, and Guvenc (2015) Secure data obfuscation
scheme to enable privacy-preserving state estimation in Smart Grid AMI networks IEEE
Internet of Things Journal vol. 3 no. 5 pp. 709-719.

INTERNATIONAL JOURNAL FOR INNOVATIVE RESEARCH IN MULTIDISCIPLINARY FIELD, ISSN: 2455-0620, Special Issue : 27, July-2021
Monthly, Peer-Reviewed, Refereed, Indexed Journal with IC Value: 86.87 Impact Factor: 6.719 Publication Date: 31/07/2021
Available online on - www.ijirmf.com Page 121
23. Saputro Nico and Akkaya (2012) Performance evaluation of Smart Grid data aggregation via
24. homomorphic encryption IEEE Wireless Communications and Networking Conference
(WCNC) pp. 2945-50. 25. Jokar, Paria, NasimArianpoo and Leung (2015) Electricity theft detection in AMI using
customers consumption patterns IEEE Transactions on Smart Grid vol. 7 no. 1 pp. 216-26. 26. Li, Yuancheng, Qiu, and Jing 2018 Intrusion detection system using Online Sequence
Extreme Learning Machine (OS-ELM) in advanced metering infrastructure of Smart Grid PloS one, vol. 13 no. 2 pp. 1-16.
27. Uthayakumar J., Vengattaraman T. and Dhavachelvan P. (2019) A new lossless neighbourhood indexing sequence (NIS) algorithm for data compression in wireless sensor networks Ad Hoc Networks vol. 83 no. 1 pp.149-57.
28. Hameed, Ibrahim, AbdManap and Mohammed (2020) A lossless compression and encryption mechanism for remote monitoring of ECG data using Huffman coding and CBC-AES Future Generation Computer Systems vol. 111 no. 1 pp.829-40.
29. Rukhin, Soto, Nechvatal, Smid and Bassham (2010) A statistical test suite for random and pseudorandom number generators for cryptographic applications National Institute of
Standards and Technology vol. 1 no. 1 pp. 1-131.

INTERNATIONAL JOURNAL FOR INNOVATIVE RESEARCH IN MULTIDISCIPLINARY FIELD, ISSN: 2455-0620, Special Issue : 27, July-2021
Monthly, Peer-Reviewed, Refereed, Indexed Journal with IC Value: 86.87 Impact Factor: 6.719 Publication Date: 31/07/2021
Available online on - www.ijirmf.com Page 122
International Conference on
Science, Engineering & Technological Innovations 10 & 11 July, 2021 Bangkok, Thailand
Jointly organized by: Automation, Computer Science and Technology Department, Kryvyi Rih National
University, Ukraine. ‘Research Culture Society’ and ‘Scientific Research Association’.
PRIORITY BASED SIGNALLING SYSTEM FOR AMBULANCES
USING GPS, IOT AND CLOUD COMPUTING
1 Bhagyalaxmi S Kullolli , 2 Manvi Grover, 3 Ayush Choudhary
1 Assistant Professor, Department of Computer Science & Engineering, MVJ College of Engineering, Whitefield, Bangalore-560067
Email - [email protected]
2 Student, Department of Computer Science & Engineering, MVJ College of Engineering Email - [email protected]
3 Student, Department of Computer Science & Engineering, MVJ College of Engineering
Email - [email protected] Abstract: Vehicular traffic is increasing endlessly in the world, and this can cause terrible traffic
congestion at an intersection. Most of the traffic lights today feature a fixed looping light sequence,
therefore the green light sequence is just part of this looping light sequence and does not take the
presence of the emergency vehicles in the vicinity into account. Therefore, emergency vehicles for
example ambulances, police cars, fire trucks, etc. tend to be stuck in a traffic jam and this in turn
delays them in reaching their destination which in turn can lead to loss of property and valuable
lives. This paper presents an approach to schedule emergency vehicles, specifically ambulances, in
traffic using GPS and IOT technology. The use of cloud is also made to calculate distance between
the location of ambulance and the traffic signal, and maintain a database that can help in
troubleshooting the system. The focus of this paper is to help reduce the delay in arrival of an
ambulance to the hospital by automatically clearing the lane in which ambulance is traveling, before
it reaches the traffic signal. This can be achieved by changing the traffic signal in the path of the
ambulance to the green light when the ambulance is at a certain distance from the traffic junction.
The communication between the ambulance and the traffic signal post is done through cloud and
WI-FI enabled chips present in them. Traffic density near the signal is realised with the help of
google maps. This system is to be fully automated and thus will require no human intervention at
the traffic junctions and will continuously work automatically.
Keywords: GPS, IOT, Cloud(AWS), traffic signal, emergency button, real-time location tracking.
1. INTRODUCTION & OBJECTIVE:
The focus of this project is to reduce the delay in arrival of the ambulance to the hospital by automatically clearing the lane in which ambulance is travelling, before it reaches the traffic signal. Introduction:
Ambulances often get stuck at the traffic signals where all other vehicles try to squeeze in to all the available space so as to move ahead as soon as the signal turns green. Unlike western countries, Indian cities cannot think of having separate lanes for emergency purpose due to lack of road planning and infrastructure. With the lives of the patients depending on the speedy arrival of the ambulances to hospital, an alternative solution to the above problem is the need of the hour. The
INTERNATIONAL JOURNAL FOR INNOVATIVE RESEARCH IN MULTIDISCIPLINARY FIELD, ISSN: 2455-0620, Special Issue : 27, July-2021
Monthly, Peer-Reviewed, Refereed, Indexed Journal with IC Value: 86.87 Impact Factor: 6.719 Publication Date: 31/07/2021
Available online on - www.ijirmf.com Page 123
problem of ambulance getting stuck in a traffic jam can be addressed by ensuring that the lane in which the ambulance is travelling is cleared. That is, the arrival of the ambulance is to be communicated to the nearest traffic signal, so that it can turn the light to green and hence clear the traffic. This can be achieved by tracking the ambulance’s real-time location using Global Positioning System or GPS and sending these coordinates to the cloud, which will send appropriate signals to the traffic controller unit at the junction based on how far the ambulance is from the junction. The project makes use of an emergency button that will be embedded in the ambulance for the driver to use to initiate real-time vehicular tracking. It also makes use of wifi enabled chips present on both the ambulance and the traffic control unit at the junction which will help begin indirect communication with each other via cloud. The project includes cloud services as well which are required to process the data and maintain it for future reference. 2. LITERATURE REVIEW:
With the increasing number of vehicles on the road, traffic congestions and transportation delays are increasing all over the world. Emergency vehicles, such as ambulances, fire trucks, police cars, etc, should be capable of reacting to emergency calls with minimum delay. The excellence of the emergency services depends on how fast these emergency vehicles can reach their destination location. If there is a traffic congestion and an emergency vehicle gets stuck there and its arrival to the incident location is delayed, it can cause loss of live and/or property. There is a need for smart traffic management systems based on traffic density and priority to improve the traffic conditions, response times of emergency services and reduction in traffic jams for ease of flow of traffic.
Extensive work has already been conducted on how to use traffic information in an effective manner to determine green light sequences. A number of these traffic management schemes have been implemented to prioritize emergency vehicles. Most of this research is closely related with smart traffic control system design for providing passage for emergency vehicles. The traffic conditions are tracked using an array of cameras and the traffic data is estimated using the lane centre edges. An area-based image processing technique is used for the detection and management of traffic density was presented.
Known traffic systems include strobe emitters and/or light emitters that detect problems such as blocked line-of-sight and excessive noise in the surroundings. Recent technologies such as infrared (IR) and Global Positioning System (GPS) have been used extensively to detect emergency vehicle. RFID tags have been used to identify emergency vehicles and the inductive loop method is used to count vehicles on the road. Some of the widely used traffic detection methods include video-based detection, microwave detection, radar detection and ultrasonic detection.
Wireless Sensor Networks (WSNs) allow for embedded sensors to be interconnected in an array formation for observing and controlling any type of devices. The use of Vehicular Sensor Networks (VSNs) or infrastructural WSNs have been proved to be a promising solution for monitoring and managing traffic. WSNs are flexible in terms of energy efficiency and its data collection type. If a vehicle contains a WSN node, then localization algorithms can be used to determine its current location. The General Packet Radio Service (GPRS) technology can be utilized to dynamically control the traffic signals.
Nowadays, there are a number of emergency vehicle pre-emption (EVP) system designs including strobe light systems, infrared emitters, acoustic systems, and radio-based emitter/detector systems. Usually, pre-emption works on the principle that an emergency vehicle is identified by sensors at each intersection and the traffic light controller switches ON the green light and holds it until the emergency vehicle exits the intersection. The info-gap decision theory can also be used for actor coordination.
The green wave system which provides a green wave for the emergency vehicles by switching to the green light sequence in the path of the emergency vehicle. If the wave is disturbed in any way, the vehicle queue in a green wave shoots up and this may lead to over-saturation of the

INTERNATIONAL JOURNAL FOR INNOVATIVE RESEARCH IN MULTIDISCIPLINARY FIELD, ISSN: 2455-0620, Special Issue : 27, July-2021
Monthly, Peer-Reviewed, Refereed, Indexed Journal with IC Value: 86.87 Impact Factor: 6.719 Publication Date: 31/07/2021
Available online on - www.ijirmf.com Page 124
wave system. Technologies like RFID, ZigBee, and Global System for Mobile communication (GSM) can be used for designing a smart traffic control system for real time usage.
An RFID-based and GPS-based automatic lane clearance system for ambulances has also been proposed before. The main goal of this system was to reduce the total travel time of an ambulance to the hospital by automatically clearing a lane before the ambulance reached any intersection. Vehicular Ad-Hoc Networks (VANETs) have been proven effective as a communication method between an emergency vehicle and a traffic control system. The connection admission control (CAC) algorithm has also proven its better Quality of Service (QOS) and complexity performance. Fuzzy control approaches have been adapted to monitor real-time traffic and handle the dense traffic flow in a controlled manner.
From the previous discussion, it can be found that there are several different ways for providing traffic clearance to emergency vehicles. Each of the discussed techniques have their own advantages and disadvantages. In this research work an approach that uses cloud computing technology to clear the path for an emergency vehicle, specifically ambulance, at a traffic junction is proposed. 3. METHODOLOGY:
The main goal of this system is to reduce the travel time of an ambulance to the hospital by automatically clearing the lane, before the ambulance reaches the traffic signal.
The ambulance will be embedded with GPS and WIFI system which will facilitate the vehicle’s real time location tracking and sharing it live coordinates to the cloud (AWS). It will also be provided with an emergency button which will be in complete control of its driver. The driver will estimate the traffic near the signal using google maps, and decide when to press the emergency button. Upon pressing the button, the Lambda function in AWS cloud will get triggered and live coordinates of the ambulance (Latitude and Longitude) will start being sent to the cloud.
The Lambda function is responsible for three things – calculating the distance between ambulance’s real-time coordinates and the nearest traffic signal, persisting this data in the database (AWS DynamoDB), and sending information to the microcontrollers in the nearest traffic signal from the ambulance. The distance between two coordinates is calculated using the Haversine Formula. The Haversine formula calculates the shortest distance between two points on a sphere using their latitudes and longitudes measured along the surface. It is important for use in navigation. Haversine formula says –
Where, r is the radius of the earth (6371 km), d is the distance between two points, Θ1, Θ2 is the latitude of the two points, and λ1, λ2 is the longitude of the two points respectively. The lambda function while calculating distance, sends information to the microcontroller at the traffic signal which makes the traffic light turn green, thus allowing its line to pass.

INTERNATIONAL JOURNAL FOR INNOVATIVE RESEARCH IN MULTIDISCIPLINARY FIELD, ISSN: 2455-0620, Special Issue : 27, July-2021
Monthly, Peer-Reviewed, Refereed, Indexed Journal with IC Value: 86.87 Impact Factor: 6.719 Publication Date: 31/07/2021
Available online on - www.ijirmf.com Page 125
Once the ambulance crosses the traffic signal, its distance from the traffic lights will begin to increase as show in the figure below.
The minimum distance recorded is an indication that the ambulance is closest to the traffic signal. At this moment, a message to the microcontroller at the traffic signal will be sent by the lambda function and after a delay of few seconds, the traffic signal will resume to its initial working algorithm. Below is the algorithm of the project.

INTERNATIONAL JOURNAL FOR INNOVATIVE RESEARCH IN MULTIDISCIPLINARY FIELD, ISSN: 2455-0620, Special Issue : 27, July-2021
Monthly, Peer-Reviewed, Refereed, Indexed Journal with IC Value: 86.87 Impact Factor: 6.719 Publication Date: 31/07/2021
Available online on - www.ijirmf.com Page 126
If there is more than one ambulance at a traffic junction, the first preference to cross the junction will be given to the ambulance at the least distance from the junction.
Here, ambulance 1 will be given priority over ambulance 2 to cross the signal as it is located at a lesser distance from the signal than the latter.
4. RESULTS: The proposed system will help to reduce the travel time of an ambulance to the hospital by
automatically clearing the lane before the ambulance reaches the traffic signal. It can work efficiently even with more than one ambulances at the signal, or if the driver has to re-route on his way to the hospital.
Another advantage of the proposed system is the use of cloud which will store and process the data. The database maintained in the cloud will help troubleshoot the system and identify the loopholes present.
5. RECOMMENDATIONS: Here, existing technology like google maps is being used to estimate traffic density near a
junction. The entire system is automatic, thus manual effort to clear the road during emergencies is not required. Although, the driver of the vehicle has to initiate the whole process by pressing the emergency button, but this is done just to decrease the complexity of the system. However, it can be overcome by calculating the traffic density using WSN’s or other density detection techniques, which will automatically drive the traffic away before the ambulance arrives at the junction without the driver having to use any button. 6. CONCLUSION:
This system is appropriate for metropolitan cities where not just ambulances, but other emergency vehicles such as fire trucks, police vans, etc., are often seen stuck at an intersection. This priority based signalling system when properly designed, operated and maintained will yield significant benefits like reduced waiting time for emergency vehicles, saving fuel consumption and preventing loss of life and property. REFERENCES:
1. 13. Farheena S., Chandak B.M. An approach towards traffic management system using density calculation and emergency vehicle alert. IOSR J. Comput. Sci. 2014;4:24–27.

INTERNATIONAL JOURNAL FOR INNOVATIVE RESEARCH IN MULTIDISCIPLINARY FIELD, ISSN: 2455-0620, Special Issue : 27, July-2021
Monthly, Peer-Reviewed, Refereed, Indexed Journal with IC Value: 86.87 Impact Factor: 6.719 Publication Date: 31/07/2021
Available online on - www.ijirmf.com Page 127
2. Nellore K., Hancke G.P. A survey on urban traffic management system using wireless sensor networks. Sensors. 2016;16:157 doi: 10.3390/s16020157. [PMC free article] [PubMed] [CrossRef]
3. Hegde R., Sail R.R., Indira S.M. RFID and GPS based automatic lane clearance system for ambulance. Int. J. Adv. Elect. Electron. Eng. 2013;2:102–107.
4. Sireesha E., Rakesh D. Intelligent traffic light system to prioritized emergency purpose vehicles based on wireless sensor network. Int. J. Res. Stud. Sci. Eng. Technol. 2014;1:24–27.
5. Collotta M., Bello L.L., Pau G. A novel approach for dynamic traffic lights management based on wireless sensor networks and multiple fuzzy logic controllers. Expert Syst. Appl. 2015;42:5403–5415. doi: 10.1016/j.eswa.2015.02.011. [CrossRef]
6. https://www.ijrte.org/wp-content/uploads/papers/v8i3/C4323098219.pdf 7. https://www.semanticscholar.org/paper/RFID-and-GPS-based-Automatic-Lane-Clearance-
System-Hegde-Sali/d3608efb183ab80ebcb9e15f1277cc5386db6f26?p2df

INTERNATIONAL JOURNAL FOR INNOVATIVE RESEARCH IN MULTIDISCIPLINARY FIELD, ISSN: 2455-0620, Special Issue : 27, July-2021
Monthly, Peer-Reviewed, Refereed, Indexed Journal with IC Value: 86.87 Impact Factor: 6.719 Publication Date: 31/07/2021
Available online on - www.ijirmf.com Page 128
International Conference on
Science, Engineering & Technological Innovations 10 & 11 July, 2021 Bangkok, Thailand
Jointly organized by: Automation, Computer Science and Technology Department, Kryvyi Rih National
University, Ukraine. ‘Research Culture Society’ and ‘Scientific Research Association’.
USER ADOPTION OF AUGMENTED REALITY AND MIXED
REALITY IN THE MANUFACTURING INDUSTRY
Dhaval Sahija
Independent Researcher; Enterprise Solution Manager in Digital Transformation Practice, Softweb Solutions Inc., Plano, USA
Email - [email protected] Abstract: Augmented reality refers to technology that uses digital data from glasses, contact lenses
or cameras, and other digital sources to present real-life products or items. However, it has been
noticed that the body of literature lacks information and evidence about the augmented reality and
mixed reality technologies in manufacturing industry. The thorough review of the available
literature facilitated in declaring that many accredited scholars have studies and examined the
importance and significance of augmented and mixed reality technologies. However, a gap has been
noticed with regards to the case of manufacturing industry. It can be stated that little to no study in
past has evaluated augmented reality and mixed reality technologies in manufacturing industry.
Considering these facts, it can be declared that the identified gap in the literature forms the problem
statement of this research. The main purpose of this research to evauate the use of augmented reality
and mixed reality technologies in manufacturing industry.
Keywords: Mixed Reality, Augmented Reality, Factory Automation, Internet of Things, Industrial
IoT, Mixed reality for manufacturing, Industrial Augmented Reality (AR), Augmented Reality in
Manufacturing, Intelligent Manufacturing, Cyber Physical Systems, Industry 4.0; Smart Factory.
Background:
In a recent study by Forrester Research about the challenges of augmented reality adoption in manufacturing, they determined that six out of ten companies are not ready to adopt the new technology. Only 4% of manufacturers surveyed thought they were prepared to adopt the technology. However, many of those who did embrace the idea reported being met with resistance throughout the process of implementing augmented reality strategies. This lack in the adoption of technology within manufacturing industry is due to the lack of awareness among employees. However, it has been noticed that the body of literature lacks information and evidence about the augmented reality and mixed reality technologies in manufacturing industry. The thorough review of the available literature facilitated in declaring that many accredited scholars have studies and examined the importance and significance of augmented and mixed reality technologies. It has been noted that the role of augmented and mixed reality in improving manual processes, in terms of dependence on existing work force, issues pertaining to improvement in productivity, lack of automation remains unidentified or investigated. The body of literature does not contain enough argument to simplify how augmented reality can improve productivity in manufacturing industry. Therefore, a gap has been noticed with regards to the case of manufacturing industry. It can be stated that little to no study in past has evaluated augmented reality and mixed reality technologies in manufacturing industry (Ahmad et al., 2020). Considering these facts, it can be declared that the identified gap in the literature forms the problem statement of this research. The main purpose of
INTERNATIONAL JOURNAL FOR INNOVATIVE RESEARCH IN MULTIDISCIPLINARY FIELD, ISSN: 2455-0620, Special Issue : 27, July-2021
Monthly, Peer-Reviewed, Refereed, Indexed Journal with IC Value: 86.87 Impact Factor: 6.719 Publication Date: 31/07/2021
Available online on - www.ijirmf.com Page 129
this research to evaluate the use of augmented reality and mixed reality technologies in manufacturing industry and increase user adoption of these technologies among factories, and manufacturing vertical. 1. INTRODUCTION:
Many scholars have concluded that companies hesitate to use augmented reality and mixed reality technologies. It has been observed that it is because managers think it is still a technology in its early years. The lack of adoption of augmented and mixed reality in manufacturing industry is the result of lack of technical awareness among employees. The body of literature does not provide enough evidence about the way AR and MR can help in improving manual processes, in terms of dependence on existing work force, issues pertaining to improvement in productivity, lack of automation. The absence of theoretical and academic evidence about these areas has cultivated lack of awareness among people. This further became a limitation in terms of adopting augmented and mixed reality in manufacturing industry. The literature must bring evidence for the fact that these companies must realize that by integrating augmented reality and mixed reality technology into their business process, they will be able to make a significant mark in the market in the future. In the case of manufacturing industry, as a matter of fact, it is the ease with which such applications are used that holds back the developers. In recent years, there has been an on-going increase in the usage of augmented reality technology. There is a significant lack of awareness among companies and employees about augmented realit. It has become imperative for marketers to comprehend that augmented reality uses digital data from glasses, contact lenses or cameras, and other digital sources to present real-life products or items. However, it has been noticed that the body of literature lacks information and evidence about the augmented reality and mixed reality technologies in manufacturing industry. The thorough review of the available literature facilitated in declaring that many accredited scholars have studies and examined the importance and significance of augmented and mixed reality technologies. However, a gap has been noticed with regards to the case of manufacturing industry. It can be stated that little to no study in past has evaluated augmented reality and mixed reality technologies in manufacturing industry (Ahmad et al., 2020). Considering these facts, it can be declared that the identified gap in the literature forms the problem statement of this research. The main purpose of this research to driving user adoption of AR and MR technologies and also overcome the gaps in existing manufacturing processes. 2. LITERATURE REVIEW:
Augmented reality in the manufacturing industry refers to integrating Smart glasses and headsets with content management systems, database and cloud technologies. To create a virtual map in which the product is placed. This process called augmented reality helps the manufacturing staff to locate the product and handle it with ease. This method is beneficial for the manufacturing companies to handle the products more accurately and speedily (Ali and Usman, 2018). The manufacturing companies have introduced augmented reality to help their workers have easy access to the required information, which is necessary for them to do their work efficiently. For instance, if an employee wants to know the exact location of a product stored in the factory, he can look at the screen and get this information without moving his body from where he is seated. This technology has made it possible to capture, analyze, manipulate and present data to interact between the worker and the data becomes interactive. This has helped the company increase the productivity of their workers as they can make quick decisions without wasting too much time (Asare et al., 2020).
For instance, where the traditional product tracking is based on the physical location of the product in real-time, augmented reality helps to capture the geographical information of the location through the GPS installed in the product or through other means. This helps to enhance the quality of the product and to make it cost-effective. The manufacturers can utilize the information of the worker's location as well as the physical aspects of the worker for various reasons. For example, a

INTERNATIONAL JOURNAL FOR INNOVATIVE RESEARCH IN MULTIDISCIPLINARY FIELD, ISSN: 2455-0620, Special Issue : 27, July-2021
Monthly, Peer-Reviewed, Refereed, Indexed Journal with IC Value: 86.87 Impact Factor: 6.719 Publication Date: 31/07/2021
Available online on - www.ijirmf.com Page 130
worker is located at a place where he is not expected to be working. This could be because of health or personal reasons. Augmented reality information helps the company avoid extra expenses on him by going to another location (Asare et al., 2020).
For product tracking, augmented reality offers several other advantages as well. For instance, if a product comes with a movement sensor, then it will be easy for the worker to identify where he is about where he is supposed to be. This will help him complete his task smoothly. This leads to the reduction of stress in work, which leads to his productivity. Moreover, augmented reality allows the user to know the precise position of the product in the space. With augmented reality, the manufacturer can control different aspects of his production process (Ali and Usman, 2018). This is achieved by creating maps of the different areas of the facility along with the time and duration that each area covers. This way, it becomes easy for the employee to report any malfunctioning of the product or equipment in the field. This can be done either through the messaging system that the manufacturing unit uses or through the data feeds provided by the system. In either case, the information provided by the worker is accurate as per the specification of the product, which helps save money that can be otherwise used for re-buying the product or hiring the help of experts for fixing the problem.
In manufacturing sector, augmented reality applications are being used to train the staff so that they can identify a particular disease or illness very quickly. In addition, medical devices like catheters and other medical types of equipment are being augmented to provide the wearer with better health better (Ali and Usman, 2018). In addition, it can also help in reducing health-related costs by reducing the number of patients who visit the hospital and improve the life expectancy of a person. Augmented reality applications in the manufacturing industry can solve several problems related to time management and budget management. With the help of these applications, manufacturers can identify the exact time when the products should be shipped out. Also, they can track the shipment logs of their products and identify the reason for delays and service calls. When implemented in manufacturing units, this leads to better production performance and efficiency, which helps the company proliferate (Asare et al., 2020).
According to Ahmady et al., (2016), augmented reality and mixed realities are redefining the way that manufacturers do business. Let us look at four examples of augmented reality and customer behavior in business to understand its impact on the manufacturing sector better. Supply Chain - Companies have developed augmented reality software that allows real-time monitoring of the entire supply chain from key places in the supply chain. This includes more than just the actual facilities (Akhavan and Salehi, 2013). The companies can see exactly where the materials are located, when they are delivered, at what temperature they are stored, and more. If they use this software on any of the machines, the engineers can access the information in real-time to make informed decisions about the next step in the production process. This cuts down on errors and saves money on materials and labor (Ali and Usman, 2018). Product Design - Companies combine augmented reality with smartphone technology to allow users to interact with a product design from their smartphone. This allows a designer to enter a company's design specs on their phone and use augmented reality software to find out critical design details (Akhavan and Salehi, 2013). The user then uses their smartphone's camera to create a physical representation of the product to be manufactured and allows the designer to visualize the result on a large screen easily. While a user may not physically create the product, they can certainly imagine it and see it in their vision. This allows the company to better provide for its consumers in terms of visual design, which improves the consumer's comfort and creates brand loyalty (Ali and Usman, 2018). Marketing and Sales - While conducting this research, the sales staff will no longer need to rely on outdated flyers and brochures. These systems are reliable and authentic in the long run. They are cost effective and efficient. They will be able to access any information regarding the company via their smartphones instantly (Asare et al., 2020). They can also scan a card or coupon and use it to gain entrance into a store. They can then access sales and promotions programs that will be posted

INTERNATIONAL JOURNAL FOR INNOVATIVE RESEARCH IN MULTIDISCIPLINARY FIELD, ISSN: 2455-0620, Special Issue : 27, July-2021
Monthly, Peer-Reviewed, Refereed, Indexed Journal with IC Value: 86.87 Impact Factor: 6.719 Publication Date: 31/07/2021
Available online on - www.ijirmf.com Page 131
on the wall of the store. These new technologies are revolutionizing the way that companies promote themselves and increase their profit line (Ali and Usman, 2018). Customer Service - With new augmented reality software, a customer will no longer have to deal with an overly aggressive salesperson (Asare et al., 2020). They will be able to quickly identify problem areas and work to improve upon those problems. In many cases, they will be able to download and take full advantage of any customer service tools available to them. Many companies that are now using this technology have seen an immediate improvement in customer satisfaction (Ali and Usman, 2018). Instead of spending time and money on outdated methods of monitoring energy consumption, companies can now easily measure it. This includes the amount of electricity consumed, how much water and other liquids are used, and other factors (Asare et al., 2020). By monitoring these aspects of manufacturing, companies can quickly decrease their energy bill. Some have even seen their energy bill drop by up to 40% just from using augmented reality technology (Ali and Usman, 2018). Future Supply Chain Solutions - When companies have an easier time increasing the number of goods they produce, they can also provide better services for their customers. By using holographic computer screens, augmented reality programs, and other cutting-edge technologies, companies can streamline the way they do business (Anthony, 2020). This streamlined approach allows companies to offer their clients new items, as well as improved customer care. By streamlining how manufacturing works today, the future of manufacturing may see more efficient solutions that will allow companies to supply the products they need (Asare et al., 2020).
According to Akhavan and Salehi (2013), in the last few years, the idea of using augmented reality for various processes in manufacturing industries has been gaining momentum. This concept of augmented reality or a digital world was initially conceived as a gaming platform. However, with time it has grown into a huge industry with numerous uses of this technology in different industries. Some of the examples of augmented reality applications in the manufacturing industry include 3D scanning, predicting future processes, predicting issues, and many more. Manufacturing industries are making use of this technology for several applications. Altayar (2018) suggested that it is now being used to schedule the production staff, resource allocation, production planning, cost accounting. This is because this application is a cost-effective way of keeping track of every employee.
The research presented by Alvesson and Spicer (2019) reported that this is one of the most useful applications in the business. It helps in scheduling and moving resources from one place to another. For example, if a company wants to expand its premises, it can use digital signs to tell people about the details of the new expansion process. Suppose a customer wants to know more about the various processes of a manufacturing company; he can easily access such information by logging on to AR app.
Based on the above given discussion, it can be stated that the area of augmented reality and mixed reality require further research and investigation. It has become imperative for the future learners and scholars to focus on identifying the factors affecting the adoption of augmented reality and mixed reality. The body of literature require evidence and theoretical support about the fact that augmented reality adoption can become easy due to the reduction of implementation. In future, the scholars must focus on carrying out research relating to the role of augmented reality and mixed reality in driving operational efficacy in Manufacturing, engineering and industrial verticals. In the next section, the discussion will shed light on the methods used for collecting data and performing analysis for this research. 3. METHODOLOGY: Data Collection Methods This research has used secondary data. The study shows that the secondary data collection that used in the study plays an important role in terms of increasing the levels of research authenticity
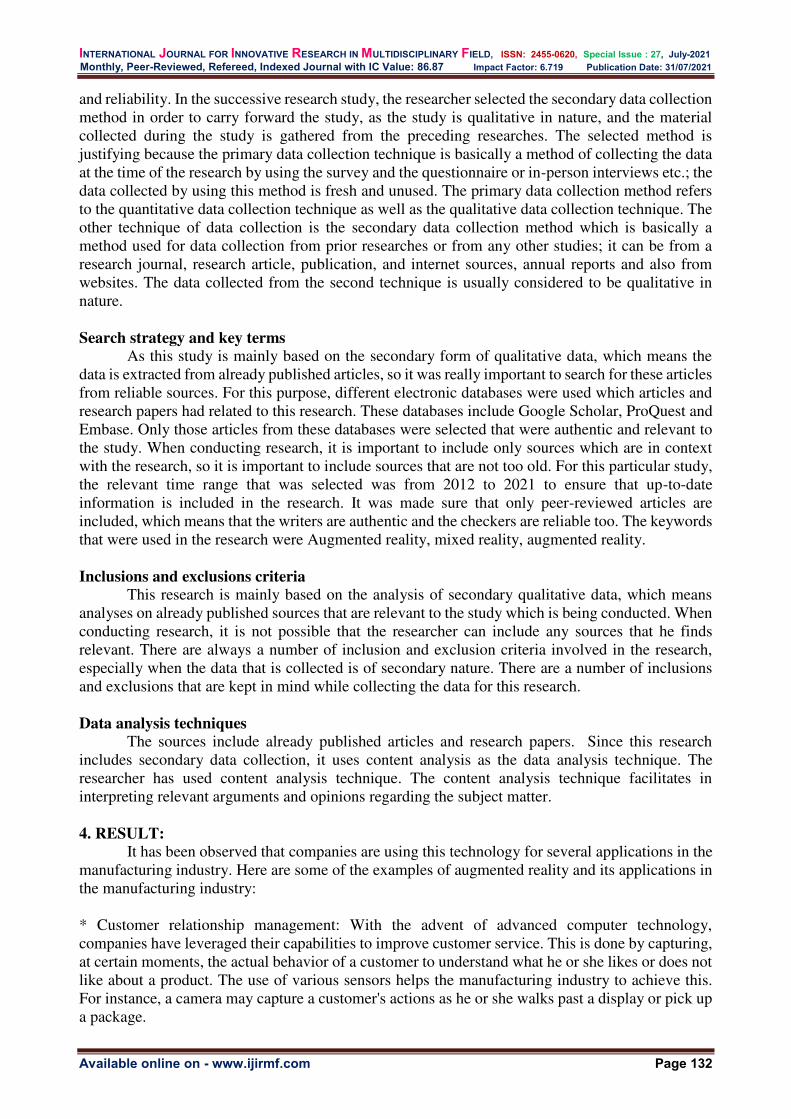
INTERNATIONAL JOURNAL FOR INNOVATIVE RESEARCH IN MULTIDISCIPLINARY FIELD, ISSN: 2455-0620, Special Issue : 27, July-2021
Monthly, Peer-Reviewed, Refereed, Indexed Journal with IC Value: 86.87 Impact Factor: 6.719 Publication Date: 31/07/2021
Available online on - www.ijirmf.com Page 132
and reliability. In the successive research study, the researcher selected the secondary data collection method in order to carry forward the study, as the study is qualitative in nature, and the material collected during the study is gathered from the preceding researches. The selected method is justifying because the primary data collection technique is basically a method of collecting the data at the time of the research by using the survey and the questionnaire or in-person interviews etc.; the data collected by using this method is fresh and unused. The primary data collection method refers to the quantitative data collection technique as well as the qualitative data collection technique. The other technique of data collection is the secondary data collection method which is basically a method used for data collection from prior researches or from any other studies; it can be from a research journal, research article, publication, and internet sources, annual reports and also from websites. The data collected from the second technique is usually considered to be qualitative in nature.
Search strategy and key terms As this study is mainly based on the secondary form of qualitative data, which means the
data is extracted from already published articles, so it was really important to search for these articles from reliable sources. For this purpose, different electronic databases were used which articles and research papers had related to this research. These databases include Google Scholar, ProQuest and Embase. Only those articles from these databases were selected that were authentic and relevant to the study. When conducting research, it is important to include only sources which are in context with the research, so it is important to include sources that are not too old. For this particular study, the relevant time range that was selected was from 2012 to 2021 to ensure that up-to-date information is included in the research. It was made sure that only peer-reviewed articles are included, which means that the writers are authentic and the checkers are reliable too. The keywords that were used in the research were Augmented reality, mixed reality, augmented reality.
Inclusions and exclusions criteria This research is mainly based on the analysis of secondary qualitative data, which means
analyses on already published sources that are relevant to the study which is being conducted. When conducting research, it is not possible that the researcher can include any sources that he finds relevant. There are always a number of inclusion and exclusion criteria involved in the research, especially when the data that is collected is of secondary nature. There are a number of inclusions and exclusions that are kept in mind while collecting the data for this research.
Data analysis techniques
The sources include already published articles and research papers. Since this research includes secondary data collection, it uses content analysis as the data analysis technique. The researcher has used content analysis technique. The content analysis technique facilitates in interpreting relevant arguments and opinions regarding the subject matter.
4. RESULT: It has been observed that companies are using this technology for several applications in the
manufacturing industry. Here are some of the examples of augmented reality and its applications in the manufacturing industry: * Customer relationship management: With the advent of advanced computer technology, companies have leveraged their capabilities to improve customer service. This is done by capturing, at certain moments, the actual behavior of a customer to understand what he or she likes or does not like about a product. The use of various sensors helps the manufacturing industry to achieve this. For instance, a camera may capture a customer's actions as he or she walks past a display or pick up a package.

INTERNATIONAL JOURNAL FOR INNOVATIVE RESEARCH IN MULTIDISCIPLINARY FIELD, ISSN: 2455-0620, Special Issue : 27, July-2021
Monthly, Peer-Reviewed, Refereed, Indexed Journal with IC Value: 86.87 Impact Factor: 6.719 Publication Date: 31/07/2021
Available online on - www.ijirmf.com Page 133
* Supply chain automation: It has been found that several supply chain processes are now automated using augmented reality technology. For instance, it uses the GPS-enabled devices or personal digital assistants (PDA's) of an employee to scan a particular product or shelf to locate a shelf or product of potential interest This reduces the time taken by the employee to locate a particular item physically. Another example is that if an employee is picking up a package, he or she can use augmented reality technology to scan a product and find its physical location on a shelf.
As per the findings, augmented and mixed reality can positively influence manufacturing
industry. The value of R square is 0.434 which depicts that the relationship between the variables is strong. Supply chain execution: It has also been found that a large number of warehouses across the world using augmented reality technology for improving logistics.
Model Summary
Model R R Square Adjusted R
Square
Std. Error of the
Estimate
1 .659a .434 .432 .67566
a. Predictors: (Constant), AugmentedAndMixedReality
ANOVAa
Model Sum of Squares df Mean Square F Sig.
1
Regression 104.175 1 104.175 228.198 .000b
Residual 136.041 298 .457
Total 240.216 299
a. Dependent Variable: ManufacturingIndustry
b. Predictors: (Constant), AugmentedAndMixedReality
Coefficients
a
Model Unstandardized Coefficients Standardized
Coefficients
t Sig.
B Std. Error Beta
1 (Constant) .766 .117 6.525 .000
AugmentedAndMixedReality .682 .045 .659 15.106 .000
a. Dependent Variable: ManufacturingIndustry

INTERNATIONAL JOURNAL FOR INNOVATIVE RESEARCH IN MULTIDISCIPLINARY FIELD, ISSN: 2455-0620, Special Issue : 27, July-2021
Monthly, Peer-Reviewed, Refereed, Indexed Journal with IC Value: 86.87 Impact Factor: 6.719 Publication Date: 31/07/2021
Available online on - www.ijirmf.com Page 134
It can be stated that augmented and mixed reality can positively influence manufacturing industry’s efficiency. The value of R square is 0.434 which depicts that the relationship between the variables is strong. Augmented reality (AR) can significantly improve automation process by facilitating companies because it is a collection of tools, strategies, and solutions that assist managers in gaining a better understanding of their company's position. AR technologies can also help firms meet their informational knowledge demands.
From the figure above, it can be noted that mixed reality improve productivity by increasing operational efficiency. It can improve process by implying a combination of gathering, cleaning, and integrating data from various sources, as well as presenting the results that can improve business decision-making. AR encompasses the critical functions that assist an organization in improving both its performance and its adaptability to change. AR applications have traditionally been used to manage strategic and tactical business plans and initiatives. Organizations have been using augmented reality (AR) to monitor, analyses, report on, and improve the performance of their business operations (Park et al., 2017).
The above table shows that Lack of technical awareness is affecting the adoption of
Augmented and Mixed reality in manufacturing industry. Technological change has been the driving force behind almost every breakthrough that has taken place in business and technology. Augmented reality (AR) is one such breakthrough that has affected businesses worldwide. It allows companies to use the World Wide Web and wireless devices to help customers with specific tasks. Companies
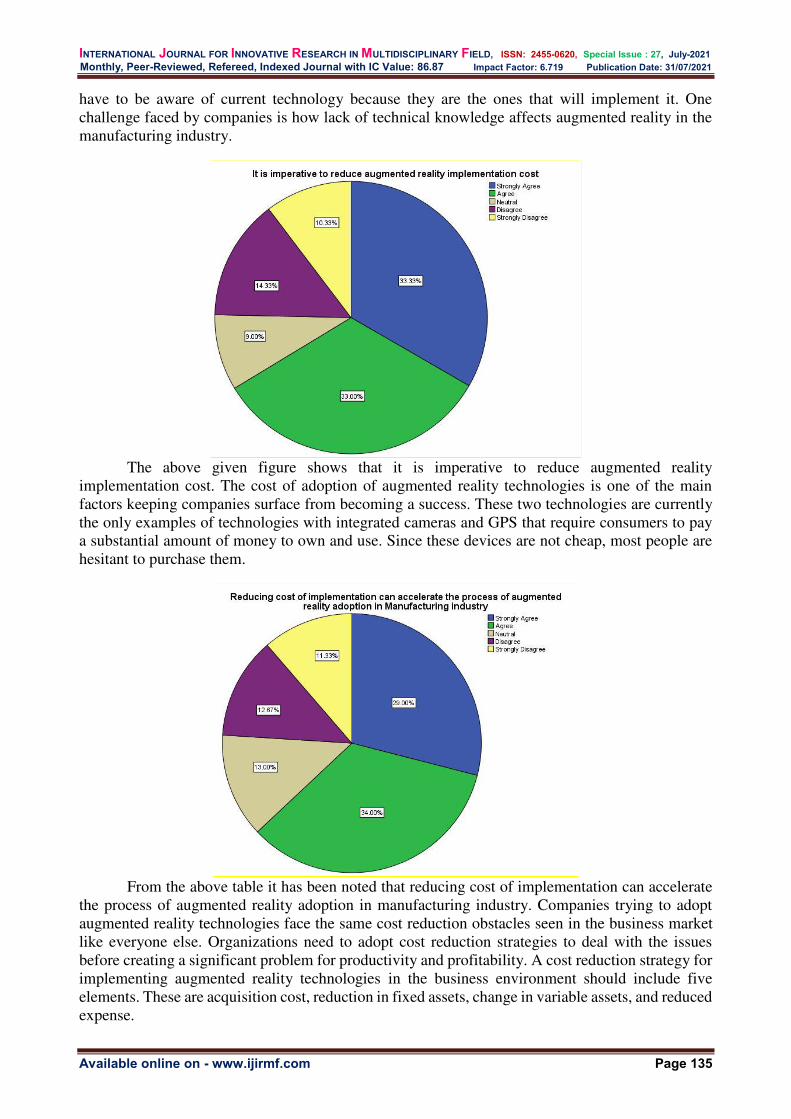
INTERNATIONAL JOURNAL FOR INNOVATIVE RESEARCH IN MULTIDISCIPLINARY FIELD, ISSN: 2455-0620, Special Issue : 27, July-2021
Monthly, Peer-Reviewed, Refereed, Indexed Journal with IC Value: 86.87 Impact Factor: 6.719 Publication Date: 31/07/2021
Available online on - www.ijirmf.com Page 135
have to be aware of current technology because they are the ones that will implement it. One challenge faced by companies is how lack of technical knowledge affects augmented reality in the manufacturing industry.
The above given figure shows that it is imperative to reduce augmented reality
implementation cost. The cost of adoption of augmented reality technologies is one of the main factors keeping companies surface from becoming a success. These two technologies are currently the only examples of technologies with integrated cameras and GPS that require consumers to pay a substantial amount of money to own and use. Since these devices are not cheap, most people are hesitant to purchase them.
From the above table it has been noted that reducing cost of implementation can accelerate
the process of augmented reality adoption in manufacturing industry. Companies trying to adopt augmented reality technologies face the same cost reduction obstacles seen in the business market like everyone else. Organizations need to adopt cost reduction strategies to deal with the issues before creating a significant problem for productivity and profitability. A cost reduction strategy for implementing augmented reality technologies in the business environment should include five elements. These are acquisition cost, reduction in fixed assets, change in variable assets, and reduced expense.
INTERNATIONAL JOURNAL FOR INNOVATIVE RESEARCH IN MULTIDISCIPLINARY FIELD, ISSN: 2455-0620, Special Issue : 27, July-2021
Monthly, Peer-Reviewed, Refereed, Indexed Journal with IC Value: 86.87 Impact Factor: 6.719 Publication Date: 31/07/2021
Available online on - www.ijirmf.com Page 136
5. DISCUSSION:
Outcome #1: Technical Training and Awareness In order to implement new technologies into the business, manufacturers need to know how
to use them. The employers can provide training for the employees to learn new things. They may know some of the steps but may not know how to put them to use in a particular situation. Lack of understanding of current tools can cause a project to fail and may even result in time, money, and resources. Companies need to take steps to ensure that they are fully aware of the tools they are using at all times.
Learning about technology requires open-mindedness. One way to do this is to learn from other experts. Technological change does not happen overnight. Experts have always known this. Therefore, if manufacturers want to stay ahead of the curve, it is best to acquire as much information as possible. Moreover, of course, it helps to have an educational background in the field. With that, the manufacturers will know how to incorporate technological advancements into the business.
Experts believe that the answer is positive. As technology continues to advance, we can expect improved products and solutions. We can also expect to see more personalized experiences. This is one of the reasons why Google Cardboard was developed. Now, everyone can easily experience augmented reality in the comfort of their home. Lack of knowledge about a particular technology could hamper the efforts to make it work for the business. This may especially be the case when they are working with complicated technology. In addition, the manufacturers may also face difficulties when trying to navigate between different technologies. Lack of technical knowledge could also cause people to make mistakes in incorporating technology into the business. Lack of technical knowledge and awareness is affecting the adoption of AR and MR in the manufacturing sector. As a matter of fact, manufacturers probably see this problem first hand. Unfortunately, this lack of knowledge may prevent some of us from exploiting its full potential. When this challenge is overcome than it can drive the future adoption of augmented reality for various manufacturing processes. Outcome #2: User-Friendly Interface
The user will need to be comfortable using any mixed reality or augmented reality application interface, and this comfort needs to be facilitated by a very user-friendly platform based on high-end specifications. Manufacturers know that the most popular user friendly interaction of present times run on applications. This makes the user feel all the more comfortable and at ease to use such applications. Many also know that technical devices support multitasking. This makes it even easier to run multiple tasks simultaneously. On the other hand, control systems and applications can only run one application at a time. Hence, the user would not be able to experience the real fun of utilizing such applications if a device cannot run multiple tasks simultaneously.
User experience has to be designed considering the environment in which engineer / floor supervisor is working, his usability and technology savviness. It was evident that when users moved from Android to both iOS and Android handsets, it took time for them to adopt new interface. In similar manner factory supervisors shifting from mobile to augmented and mixed reality based headset; would need flawless user interface for quick adoption. Outcome #3: Using AR and MR Applications along with Controlling Systems
With the increasing pace of technology, augmented reality and mixed reality play significant roles in everyday life. This application has the potential to change the way manufacturing industries conduct business. Companies all over the world are now exploring the potential of these technologies for increasing their efficiency.
In order to avoid such problems, the manufacturing industry needs to adopt accurate and efficient software and hardware designs. Augmented reality applications can help in achieving this goal. Companies are using this concept to create a digital platform for real-time manufacturing operations. The software involved in such applications enables manufacturers to create 3D models

INTERNATIONAL JOURNAL FOR INNOVATIVE RESEARCH IN MULTIDISCIPLINARY FIELD, ISSN: 2455-0620, Special Issue : 27, July-2021
Monthly, Peer-Reviewed, Refereed, Indexed Journal with IC Value: 86.87 Impact Factor: 6.719 Publication Date: 31/07/2021
Available online on - www.ijirmf.com Page 137
of their products and incorporate all the necessary measurements and data into the design. It also helps them finalize the manufacturing process and integrate the production process with quality control and assembly line management.
With the help of such software, manufacturers can build digital models of their finished goods and create virtual images of the same in various sizes. These virtual images can then be shared with other departments and distributed to various customers. When these products reach customers, they can physically touch the product and get a better feel. This will not only increase their knowledge of the product but will also convince them about its performance. Manufacturers can also use augmented reality & mixed reality applications for improving their customer service. They can create an image of the product as good as it is in the store and demonstrate it to the customer.
Such augmented reality applications can also help in streamlining the manufacturing process. It can help the manufacturing industry reduce the costs involved with the manufacturing process. It can help them cut cycle times and improve the flexibility of the process. It can also help provide the maximum number of jobs to the maximum number of people in the shortest time. This application can even help in reducing waste. In order to reap the full benefits of the application, manufacturers need to implement it in a planned way on an appropriate platform. They must plan and deploy the application appropriately. One such application is the manufacturing planning application. It helps the manufacturing industry in real-time visualize the entire process of manufacturing the product. This enables the manufacturer to make faster decisions, reduce cycle times and streamline the entire process.
It is also essential that they create an augmented reality application that is simple and attractive. The user should be able to fully interact with the application in order to take the desired action. When the user does interact with the application, they should be able to do so freely and naturally. A simple but attractive user interface will also enable quick adoption and increased engagement. They can also use 3D application development along with the planning software to develop highly interactive 3D applications. They can provide images, videos, text, and other rich media to the users to make the application more appealing and interactive. Another application that is vital for the manufacturing industry is the Manufacturing Planning Software. Integration of Augmented and Mixed Reality application with software can help visualize the raw materials, the finished products, the labor required, the cost involved, and many other factors. This will give a clear picture of how much the product will cost and whether the manufacturing process will prove profitable. This way it would give better visibility and awareness about the health of manufacturing operations in single pane of glass interface. Outcome #4: Reducing Cost of Implementation
For smaller enterprises and businesses, the cost of implementing augmented and mixed reality technologies can be a significant roadblock to gaining market share. The design and assembling applications offer an easy entry into the high-price markets. For companies that do not compete directly with these more giant corporations, the cost of implementing augmented reality technology can affect its adoption because it could limit the company's ability to reach an untapped market.
Asking how reducing the cost of implementing augmented reality technology can affect its adoption is not simple. With increase in adoption and usage of Augmented and mixed reality app into multiple manufacturing processes, it would reduce the cost of implementation. Once that happens manufacturers and factories would see more return on investments from these immersive technologies.
The second problem faced by companies looking to adopt augmented reality technologies is hardware cost. Hardware is one of the most significant expenses incurred by companies wishing to utilize augmented reality. Once the procurement cost of AR and MR headsets reduces, and business owners see drop in cost of ownership, industry would adopt these technologies for larger no of technicians and floor engineers.

INTERNATIONAL JOURNAL FOR INNOVATIVE RESEARCH IN MULTIDISCIPLINARY FIELD, ISSN: 2455-0620, Special Issue : 27, July-2021
Monthly, Peer-Reviewed, Refereed, Indexed Journal with IC Value: 86.87 Impact Factor: 6.719 Publication Date: 31/07/2021
Available online on - www.ijirmf.com Page 138
Companies must also consider how reducing the cost of implementing augmented reality technology will affect their factory workers. The implementation of AR application will make employees more mobile. Another aspect is comparing cost of implementation of AR and MR applications compared to tablet and mobile based apps; though hardware and software cost might look high upfront, however the value received, is far ahead than the cost of implementation. Implications
Automation: Adoption of Augmented and Mixed reality by manufacturers would support in automation of step procedures that are followed manually as of now and need human intervention. With MR and AR apps, assembly line procedures would be digitized and can be initiated with use of voice command. AR headsets project detailed information about current state of operations and key performance parameters on assembly line. So floor supervisor can compare the actual indicators versus the standard indicators, and accordingly make quick decisions.
Increase in Efficiency with Hands-free experience: Support factory engineers to work more efficiency from multiple facility locations. By using hands-free interface, supervisor can response to factory engineer in real time by sharing field of view and annotate instructions remotely. Factory engineers can also fetch work processes related instructions from user manual by using hand gestures and fetch historic data and maintenance records.
Improve decision making capability for critical operations: AR and MR apps integrated with equipment and control systems can support to fetch critical data points quickly such as vibration, water flow, temperature, etc. All these data points can give single view to operations managers and they can easily make decision such as production planning, configuration related to assembly line, procurement of raw materials, etc. 6. CONCLUSION AND RECOMMENDATIONS:
It can be concluded that the adoption of AR and MR in manufacturing industry is limited due to the lack of technical awareness among employees. Also, the manufacturers can ensure the adoption of augmented and mixed reality by providing proper training to technicians, supervisor, floor engineer etc. It has been further noted that the manufacturers are obliged to providing user friendly interface in AR and MR headset. These headsets will accelerate the process of adopting AR and MR. It can facilitate the companies in improving operational efficiency and effectiveness. The use of AR and MR applications along with control systems can allow manufacturers to strengthen efficacy of internal and external operations. Augmented and mixed reality would enable a firm to comprehend its nature, operational efficiency, and support in framing a design appropriate for its organizational environment, ensuring that the implementation would pave the way for making the best decisions to improve the firm's overall performance.
Considering the findings, it can be suggested that any contemporary business entity should use a augmented reality framework to combine its employees' intellectual capabilities with the efficiency of a computer-assisted decision-making system to improve the quality of the decision-making process for large amounts of data with high levels of complexity. It's evaluated through content analysis of prior research; augmented reality is a form of software that aids in a company's ability to harness the power of data. It allows manufacturing businesses to filter, compare, and analyses data in a more efficient manner, allowing them to make more informed decisions. Companies that use augmented reality solutions are better able to interpret company data into insights and take appropriate action. This information can assist businesses in making strategic business decisions that will help them increase productivity, increase sales, and boost productivity.
Acknowledgment: I would begin by sincerely thanking my manager, employer, clients and partners for the
unyielding support they gave to me in order to successfully completes the international research project. I appreciate support they offered me and all the necessary guidelines I needed in order to

INTERNATIONAL JOURNAL FOR INNOVATIVE RESEARCH IN MULTIDISCIPLINARY FIELD, ISSN: 2455-0620, Special Issue : 27, July-2021
Monthly, Peer-Reviewed, Refereed, Indexed Journal with IC Value: 86.87 Impact Factor: 6.719 Publication Date: 31/07/2021
Available online on - www.ijirmf.com Page 139
achieve this academic task. Also, I deeply thank my family and friends for all the encouragement they gave to me during this study. Special thanks to all our respondents for giving me answers to the questionnaires and those who gave extra support in making the work have better quality.
REFERENCES:
1. Akhavan, P. and Salehi, S., 2013. Critical factors of augmented reality:(Case of an it-based company). World applied sciences journal, 22(9), pp.1344-1351.
2. Altayar, M.S., 2018. Motivations for open data adoption: An institutional theory perspective. Government Information Quarterly, 35(4), pp.633-643.
3. Arefin, M. S., Hoque, M. R., and Bao, Y. 2015. The impact of augmented reality on organization's effectiveness: an empirical study. Journal of Systems and Information Technology, 17(3), 263–285. doi:10.1108/jsit-09-2014-0067
4. Arghir, D.C., Dusa, I.G. and Onuta, M., 2019. Organizational development through augmented reality and data mining. Database Systems Journal, 10(1), pp.82-99.
5. Asare, A.O., Addo, P.C., Sarpong, E.O. and Kotei, D., 2020. COVID-19: optimizing business performance through agile augmented reality and data analytics. Open Journal of Business and Management, 8(05), p.2071.
6. Awa, H.O., Ojiabo, O.U. and Orokor, L.E., 2017. Integrated technology-organization-environment (TOE) taxonomies for technology adoption. Journal of Enterprise Information Management.
7. Awa, H.O., Ukoha, O. and Igwe, S.R., 2017a. Revisiting technology-organization-environment (TOE) theory for enriched applicability. The Bottom Line.
8. Azungah, T., 2018. Qualitative research: deductive and inductive approaches to data analysis. Qualitative Research Journal.
9. Bolívar, M.P.R. and Meijer, A.J., 2016. Smart governance: Using a literature review and empirical analysis to build a research model. Social Science Computer Review, 34(6), pp.673-692.
10. Bologa, A.R., Bologa, R. and Florea, A., 2013. Big data and specific analysis methods for insurance fraud detection. Database Systems Journal, 4(4), pp.30-39.
11. Bordeleau, F.E., Mosconi, E. and Santa-Eulalia, L.A., 2018, January. Augmented reality in Industry 4.0: State of the art and research opportunities. In Proceedings of the 51st Hawaii International
12. Chen, Y. and Lin, Z., 2021. Augmented reality capabilities and firm performance: A study in China. International Journal of Information Management, 57, p.102232.
13. Chong, J.L. and Olesen, K., 2017. A technology-organization-environment perspective on eco-effectiveness: a meta-analysis.
14. Drori, G.S., 2019. Hasn't institutional theory always been critical?!. Organization Theory, 1(1), p.2631787719887982.
15. Columbus, L., 2020. The State Of Cloud Augmented reality, 2020.[online].Available at : https://www.forbes.com/sites/louiscolumbus/2020/04/12/the-state-of-cloud-business-intelligence-2020/.[Accessed on 26 June 2021]
AUTHOR BIO:
Mr. Dhaval Sahija, MBA Digital Transformation Practice [email protected]
Dhaval Sahija is Enterprise Solution Manager within Digital Transformation Practice in Softweb Solutions Inc., He has done his Master of Business Administration from Sikkim Manipal University, India in January 2011. He has over 14 years of experience in Business Strategy, Business Development, Innovation, Digital Solution Design and Technology Consulting and rich experience for Software Consulting companies, while working with clients and partners based out of India, USA and Canada including Fortune 500 companies. Since last 4 years he working as Subject Matter Expert and Solution Manager for Augmented and Mixed Reality; having transformed the business processes and digital experience for companies across Manufacturing, Engineering, Healthcare, Oil & Gas Vertical.

INTERNATIONAL JOURNAL FOR INNOVATIVE RESEARCH IN MULTIDISCIPLINARY FIELD, ISSN: 2455-0620, Special Issue : 27, July-2021
Monthly, Peer-Reviewed, Refereed, Indexed Journal with IC Value: 86.87 Impact Factor: 6.719 Publication Date: 31/07/2021
Available online on - www.ijirmf.com Page 140
International Conference on
Science, Engineering & Technological Innovations 10 & 11 July, 2021 Bangkok, Thailand
Jointly organized by: Automation, Computer Science and Technology Department, Kryvyi Rih National
University, Ukraine. ‘Research Culture Society’ and ‘Scientific Research Association’.
SPATIAL CONTROL OF ULTRASONIC CLEANING
Volodymyr Morkun, Doctor Science, Professor, Kriviy Rih National University, Ukraine.
Email: [email protected]
Olha Kravchenko Post Graduate Student, Kriviy Rih National University, Ukraine.
Email: [email protected] Abstract: Design and modeling of ultrasonic cleaning control taking into account its spatial
distribution.
Keywords: ultrasonic phased array, ultrasonic cleaning, spatially distributed systems, modeling.
1. INTRODUCTION:
One of the most effective and safe ways to clean is ultrasonic. It refers to spatially distributed processes due to the zonation of physical phenomena that provide this process, namely cavitation and acoustic currents. Uneven contamination of the cleaning body and uneven peeling of dirt also have an effect.
Automation of the ultrasonic cleaning process is mostly time-based or indirect assessment of the state of the cleaning fluid [1-2], which does not take into account the spatial distribution of the process and leads to cleaning areas of the product that do not require it. To correct this situation, it was proposed to form a control effect depending on the state of the body, which was evaluated by analyzing the ultrasonic responses at given positions [3]. According to this technique, the time of receipt of the limit value of the signal and the nonlinearity coefficient of the second order allow us to form a conclusion about the intensity of ultrasonic cleaning. Therefore, these parameters became the input for the 3-D fuzzy interval controller [4], which is designed to control spatially distributed processes. The output of this controller obtained the intensity value for each emitter, depending on its location relative to the most contaminated area. This approach improved the cleaning efficiency, but did not allow the intensity to be redirected in the direction of the highest pollution. To overcome this shortcoming in this work, it is proposed to use ultrasonic phased arrays as cleaning emitters, which allow to form an ultrasonic beam, redistributing the radiation intensity and changing the direction of acoustic fluxes.
2. Descriptions and results.: An ultrasonic bath with ultrasonic phased arrays located at the bottom and lid was
considered. On the side walls of the bath are m ultrasonic sensors to determine the intensity of the cleaning process in a given area. The numbers n and m are interdependent and are determined by the size of the bath and economic feasibility. First, the condition of the body before the operation of the emitters is assessed, at the next stage, all transducers are started with the maximum intensity. After that, the ultrasonic sensors are re-taken and processed with a 3-D fuzzy interval controller. The result of his work is the normalized values of intensities for each of the emitters. That is, a value of 1 will correspond to the area that requires the most cleaning, and a value of 0 - a clean area. For

INTERNATIONAL JOURNAL FOR INNOVATIVE RESEARCH IN MULTIDISCIPLINARY FIELD, ISSN: 2455-0620, Special Issue : 27, July-2021
Monthly, Peer-Reviewed, Refereed, Indexed Journal with IC Value: 86.87 Impact Factor: 6.719 Publication Date: 31/07/2021
Available online on - www.ijirmf.com Page 141
additional redirection of intensity in the bath, it was proposed to use the technology of ultrasonic phased array, which allows you to form a beam with the specified parameters.
Ultrasonic phased array consists of a group of small elements. Controlling the delay time of individual elements allows you to create an aperture and form a beam at a given focal point [5]. The formation of a focus point is not a matter of geometry, even if all the elements are directed to a given point, it does not necessarily mean that it will be the focus. Focusing is a matter of phase, ie signals from all elements must reach the target with the same phase. Therefore, the main task of this work is not only to find the geometric location of a given point, but also the delay time, which provides the required phase of each element of the array.
To increase the efficiency of ultrasonic cleaning, the intensity was redirected to the area of greatest contamination. To determine the location of the focal point, it was necessary to specify the direction angles (θ and φ) and the value of the focal length R (Fig. 1). Other symbols in this figure: S is the distance from the emitter to the body in the XY plane, h is the height of the ultrasonic bath. The distance from the emitter to the body S was calculated as the average between the distances to the nearest sensors, which are calculated by the time of receipt of the limit value of the signal. The azimuth angle θ is chosen so that the beam is directed to the center of the bath, ie
𝜃 = 𝑎𝑡𝑛 (2𝑆ℎ )
And the zenith angle φ was defined as the ratio of the intensities of the current emitter and the closest to it, but not more than 45°, because it leads to the appearance of side petals[6]
𝜑 = 45° ∙ 𝑢(𝑧1)𝑢(𝑧2), where 𝑢(𝑧1) < 𝑢(𝑧2). For the phased array with the highest value of intensity φ = 0.
Fig. 2. Parameters of the ultrasonic beam
Based on the defined parameters, the delay time was calculated for each cell of the ultrasonic array according to the following expression [6] ∆𝝉𝒏𝒎(𝒙, 𝑭) = 𝑹 [𝟏 − √((𝒔𝒊𝒏𝜽𝒄𝒐𝒔𝝋 − 𝒙𝒏 𝑹⁄ )𝟐 + (𝒔𝒊𝒏𝜽𝒔𝒊𝒏𝝋 − 𝒚𝒎 𝑹⁄ )𝟐 + 𝒄𝒐𝒔𝟐𝜽)] /𝒄,
where 𝑥𝑛 and 𝑦𝑚 - the coordinates of the location of the cell in the ultrasonic phased array.
To confirm the adequacy of these calculations, modeling of ultrasonic cleaning using phased array technology was performed. The ratio of the total value of the pressure in the contaminated area to the total pressure radiated during this cycle was chosen as a parameter that determined the efficiency of the cleaning process. Hereinafter, this parameter is called the relative efficiency.
First, the situation was considered when all the rays were directed to the center of the bath, and the value of the relative efficiency 0.106ꞏ10-4 was obtained. In the second stage, the above-described
φ
θ
Фокусна точка F
x
y
x’
z
R h/2
S

INTERNATIONAL JOURNAL FOR INNOVATIVE RESEARCH IN MULTIDISCIPLINARY FIELD, ISSN: 2455-0620, Special Issue : 27, July-2021
Monthly, Peer-Reviewed, Refereed, Indexed Journal with IC Value: 86.87 Impact Factor: 6.719 Publication Date: 31/07/2021
Available online on - www.ijirmf.com Page 142
beam directioning algorithm was used. With this approach, the relative value of the relative efficiency increased to 0.15ꞏ10-4. Thus, it was possible to increase the efficiency of energy consumption by 41%. 3. CONCLUSIONS. :
In this paper, the control of ultrasonic cleaning taking into account its spatial distribution is considered. Ultrasonic sensors in the given positions were used to form an assessment of the process state. The main parameters that determine the course of purification are the time of receipt of the limit value of the signal and the nonlinearity coefficient of the second order.
The control is formed on the basis of a 3-D measurable fuzzy interval controller. Executing elements are selected ultrasonic phased arrays, the calculation of the parameters of which are given in this paper. The value of the azimuth angle is calculated depending on the height of the bath with its direction to its center. The zenith angle is chosen in the direction of the greatest pollution. The distance is calculated by the time of receipt of the limit value to the sensors, taking into account the relative position of the sensors and the ultrasonic phased array.
The simulation shows an increase in the power concentration in the contaminated area by 41% when using control, taking into account the spatial distribution of the ultrasonic cleaning process.
REFERENCES:
1. Bargoshadia J. A., Abdul Rahimb H. B., Sarrafic S., Bin R. and Rahimd A. (2011), Design and manufacture an ultrasonic dispersion system with automatic frequency adjusting property, 2011
IEEE 7th International Colloquium on Signal Processing and its Applications, pp. 359-365. doi:10.1109/CSPA.2011.5759903
2. Duran F. and Teke M. (2019), Design and implementation of an intelligent ultrasonic cleaning device, Intelligent Automation & Soft Computing, vol. 25, no.3, pp. 441–449, doi:10.31209/2018.11006161
3. Morkun V. and Kravchenko O. (2021), Evalution of ultrasonic cleaning process», NAUKOVYI
VISNYK Natsionalnoho Hirnychoho Universytetu, no. 3, pp. 117-123. doi:10.33271/nvngu/2021-3/117
4. Morkun V. and Kravchenko O. (2020), Adaptive control over ultrasonic cleaning of mining equipment, Ukrainian School of Mining Engineering - 2020, E3S Web of Conferences 201,
01005 doi:10.1051/e3sconf/202020101005
5. Dominique B., Byungsik Y. and Hee-Jong L. (2010), Understanding of Key Number in Phased Array, 8th International Conference on NDE in Relation to Structural Integrity for Nuclear and
Pressurised Components, 2012-04. 6. Nakahata, Kazuyuki & Kono, Naoyuki. (2012), 3-D Modelings of an Ultrasonic Phased Array
Transducer and Its Radiation Properties in Solid, Ultrasonic Waves. doi:10.5772/29954
INTERNATIONAL JOURNAL FOR INNOVATIVE RESEARCH IN MULTIDISCIPLINARY FIELD, ISSN: 2455-0620, Special Issue : 27, July-2021
Monthly, Peer-Reviewed, Refereed, Indexed Journal with IC Value: 86.87 Impact Factor: 6.719 Publication Date: 31/07/2021
Available online on - www.ijirmf.com Page 143
International Conference on
Science, Engineering & Technological Innovations 10 & 11 July, 2021 Bangkok, Thailand
Jointly organized by: Automation, Computer Science and Technology Department, Kryvyi Rih National
University, Ukraine. ‘Research Culture Society’ and ‘Scientific Research Association’.
AUTOMATED CONTROL OF THE CONVEYOR LINE USING
THE SIEMENS TIA PORTAL SOFTWARE
Nazar Liashok Bachelor, Kryvyi Rih National University, Ukraine
Email: [email protected]
Antonina Tykhanska Lecturer at the Department, Kryvyi Rih National University, Ukraine
Email: [email protected]
Abstract: The aim of the work is to improve the economic and technical performance of the existing
conveyor line by developing an automated control system. The developed system has characteristics
that will reduce the cost of use.
Keywords: automated system, conveyor line, TIA portal, logic control, automated control system,
technical secure.
1. Introduction : Today it is difficult to imagine any technological unit without automation systems. In the
conditions of mining and processing plant automated control systems are used to reduce the use of human power.
When moving bulk cargo, belt conveyors have become the most widespread, which for convenience are combined into conveyor lines consisting of three or more conveyors.
The conveyor is a common machine in ore-processing plants. Since the technological process of transportation is complex and long, conveyors are combined into conveyor lines. They can hold a different number of devices, depending on the purpose.
Conveyor transport automation is the centralization of control of start and stop of the conveyor line, to provide automatic protection against accidents. To do this, automated control systems are equipped with sensors, primary and secondary transducers that transmit process data to a programmable logic controller.
2. Description and results : Conveyor - a machine that is designed to transport goods, namely bulk and artificial. The conveyor is widely used in quarries, mines and concentrators.
The mode and conditions of the conveyor are the most important parameters when choosing the type of conveyor to be used in the enterprise, and also serve as key parameters for calculating its reliability and strength. The operation of the conveyor is characterized by indicators, which are divided into 3 groups:
- Conveyor operation time. - Load, both on the conveyor and on separate elements. - Features of environmental impact and production conditions The combination of the above characteristics determines the conditions and mode of the
conveyor. The service life directly depends on the design and intensity of use of the machine.

INTERNATIONAL JOURNAL FOR INNOVATIVE RESEARCH IN MULTIDISCIPLINARY FIELD, ISSN: 2455-0620, Special Issue : 27, July-2021
Monthly, Peer-Reviewed, Refereed, Indexed Journal with IC Value: 86.87 Impact Factor: 6.719 Publication Date: 31/07/2021
Available online on - www.ijirmf.com Page 144
The performance class of the conveyor is determined by the total load factor. 𝐾𝑃 = 𝑄ср𝑄𝑚𝑎𝑥 , where - the average productivity of the conveyor - the maximum productivity of the conveyor.𝑄ср𝑄𝑚𝑎𝑥
The maximum performance that can be provided with full use of the loading device, ie the transport capacity of the conveyor is limited by the amount of material that the loading device can provide to the conveyor.
The average productivity of the conveyor is calculated by the following formula: 𝑄ср = ∑𝑄𝑖 𝜏𝑖𝑡зм , Control of conveyor lines is to start and stop the electric motor, which drives the traction bodies
of the conveyors. The centralized method of control of drives of conveyor installations with automated start is used for management as the number of conveyors in a line can be big. With this type of control, the operator gives only the initial signal pulse to start the first conveyor, and the motors of other conveyors are turned on automatically, in a given sequence. Thus the centralized management allows to exclude participation of the person from start of each conveyor.
When developing a system of automation of conveyor lines, the following basic requirements must be observed:
- The start of the conveyor line must be performed by alternately switching on the conveyors in the reverse direction of the cargo flow. This requirement eliminates the possibility of blockages.
- At least 5 seconds before starting the first conveyor or starting the part of the line, a clear warning signal must sound.
- Additional start of the conveyor line must be performed without stopping the working part of the conveyor line.
- Each subsequent conveyor is started only if the previous one reaches the operating speed. - The stop of the conveyor line must be performed in the direction of cargo flow. - The operative stop of the conveyor line must be performed from the control posts, and the
emergency stop from any point along its length. An important point for conveyor transport is the reliability of its operation. Failure of the
equipment can lead to disruption of the entire process. To do this, in the automation schemes of conveyor lines use a large number of locks that perform automatic emergency shutdown of the conveyor in the event of a motor failure under the action of appropriate electrical protections. Locking occurs in the following situations:
- Malfunction of the mechanical part of the conveyor. - Conveyor start too long. - Backfilling of places of overload of the transported material. - Decrease or exceed the working speed of the belt. - Towing the belt relative to the drive drum. - When the tape overheats. In addition to the listed locks, there are a number of other security-related locks. When modeling conveyors that are combined into a conveyor line, you can use two
mathematical models [1]: a random flow, which is characterized as a random continuous process in time, or a model represented by a pulsed random process, which has only two values 0 and 1.
If we take the idle state, which corresponds to the load flow x = 0, then the idle speed will already have some value x = xi as the traction force on the conveyor drive. During transportation, the cargo flow will vary from the minimum value xmin> xi to the maximum xmax and will have a continuous distribution. Based on the above, the distribution of freight x will look like:
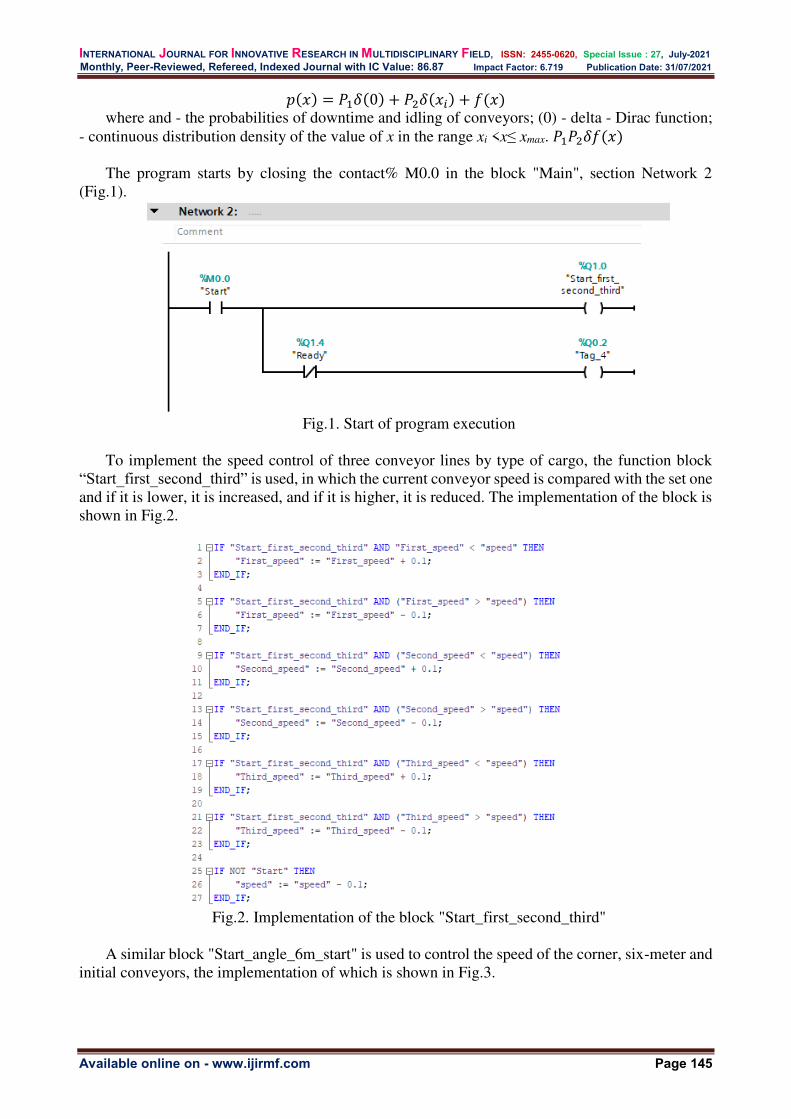
INTERNATIONAL JOURNAL FOR INNOVATIVE RESEARCH IN MULTIDISCIPLINARY FIELD, ISSN: 2455-0620, Special Issue : 27, July-2021
Monthly, Peer-Reviewed, Refereed, Indexed Journal with IC Value: 86.87 Impact Factor: 6.719 Publication Date: 31/07/2021
Available online on - www.ijirmf.com Page 145
𝑝(𝑥) = 𝑃1𝛿(0) + 𝑃2𝛿(𝑥𝑖) + 𝑓(𝑥) where and - the probabilities of downtime and idling of conveyors; (0) - delta - Dirac function;
- continuous distribution density of the value of x in the range xi <x≤ xmax. 𝑃1𝑃2𝛿𝑓(𝑥)
The program starts by closing the contact% M0.0 in the block "Main", section Network 2
(Fig.1).
Fig.1. Start of program execution
To implement the speed control of three conveyor lines by type of cargo, the function block
“Start_first_second_third” is used, in which the current conveyor speed is compared with the set one and if it is lower, it is increased, and if it is higher, it is reduced. The implementation of the block is shown in Fig.2.
Fig.2. Implementation of the block "Start_first_second_third"
A similar block "Start_angle_6m_start" is used to control the speed of the corner, six-meter and
initial conveyors, the implementation of which is shown in Fig.3.
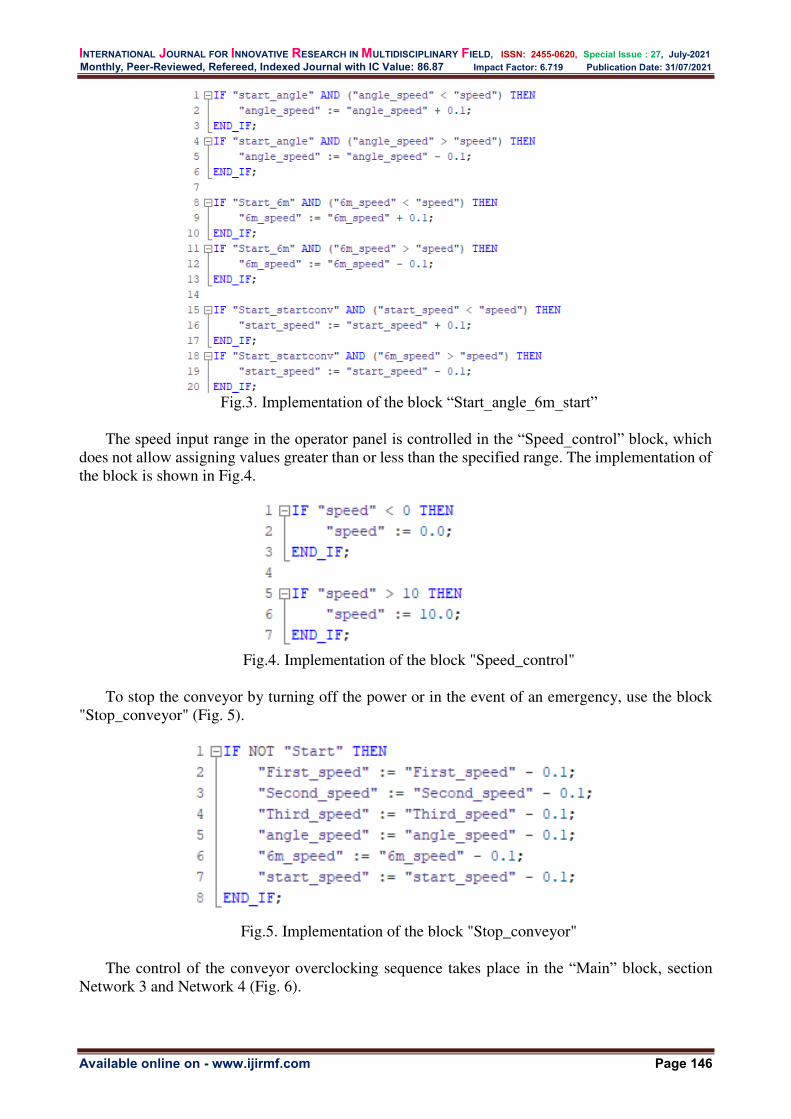
INTERNATIONAL JOURNAL FOR INNOVATIVE RESEARCH IN MULTIDISCIPLINARY FIELD, ISSN: 2455-0620, Special Issue : 27, July-2021
Monthly, Peer-Reviewed, Refereed, Indexed Journal with IC Value: 86.87 Impact Factor: 6.719 Publication Date: 31/07/2021
Available online on - www.ijirmf.com Page 146
Fig.3. Implementation of the block “Start_angle_6m_start”
The speed input range in the operator panel is controlled in the “Speed_control” block, which
does not allow assigning values greater than or less than the specified range. The implementation of the block is shown in Fig.4.
Fig.4. Implementation of the block "Speed_control"
To stop the conveyor by turning off the power or in the event of an emergency, use the block
"Stop_conveyor" (Fig. 5).
Fig.5. Implementation of the block "Stop_conveyor"
The control of the conveyor overclocking sequence takes place in the “Main” block, section
Network 3 and Network 4 (Fig. 6).

INTERNATIONAL JOURNAL FOR INNOVATIVE RESEARCH IN MULTIDISCIPLINARY FIELD, ISSN: 2455-0620, Special Issue : 27, July-2021
Monthly, Peer-Reviewed, Refereed, Indexed Journal with IC Value: 86.87 Impact Factor: 6.719 Publication Date: 31/07/2021
Available online on - www.ijirmf.com Page 147
Fig.6. Implementation of sequence control
Pushing the load on a certain line occurs in the block "Push_material", which when the sorting
sensor activates the ejector (Fig. 7).
Fig.7. Implementation of the block "Push_material"
The calculation of the amount of cargo of a certain type takes place in the block "Count", which
when the optical sensor triggers the passage of cargo. The implementation of the block is shown in Fig.8.
Fig.8. Implementation of the block "Count"

INTERNATIONAL JOURNAL FOR INNOVATIVE RESEARCH IN MULTIDISCIPLINARY FIELD, ISSN: 2455-0620, Special Issue : 27, July-2021
Monthly, Peer-Reviewed, Refereed, Indexed Journal with IC Value: 86.87 Impact Factor: 6.719 Publication Date: 31/07/2021
Available online on - www.ijirmf.com Page 148
The reset of the number of passed loads takes place in the block “Reset_count”, which by
pressing the corresponding button on the operator panel activates the reset on the meter and deactivates the contact (Fig.9).
Fig.9. Implementation of the block "Reset_count"
The HMI_KTP700 operator panel is used to control the pipeline and monitor the parameters,
with which you can control the power of the line and change the speed of the conveyor belts. The operator panel also displays the current amount of cargo passed and the condition of the ejectors. The user interface of the operator panel is shown in Fig.10.
Fig.10. Operator panel in simulation mode
Figures 11 and 12 show the implemented models of the conveyor line (model view and model
in operation).

INTERNATIONAL JOURNAL FOR INNOVATIVE RESEARCH IN MULTIDISCIPLINARY FIELD, ISSN: 2455-0620, Special Issue : 27, July-2021
Monthly, Peer-Reviewed, Refereed, Indexed Journal with IC Value: 86.87 Impact Factor: 6.719 Publication Date: 31/07/2021
Available online on - www.ijirmf.com Page 149
. Fig.11. View of the model
Fig.12. Model in operation
The developed SAC has practical value, and can be used at designing of systems of automation
and management of conveyor lines.
REFERENCES: 1. "Mobius band". Daviddarling.info. 2007-02-01. Archived from the original on 2013-04-03.
Retrieved 2013-03-27. URL: https://www.daviddarling.info/encyclopedia/M/Mobius_band.html
2. Alspaugh, Mark, Bulk Material Handling By Conveyor Belt 7, p 83 ISBN 0-87335-260-2. URL: https://ua1lib.org/book/2353959/7ae5bb?id=2353959&secret=7ae5bb
3. Agasiev T., Karpenko A. The Program System for Automated Parameter Tuning of Optimization Algorithms. 2017. P. 347-354. URL: https://www.researchgate.net/publication/313464120_ The_Program_System_for_Automated_Parameter_Tuning_of_Optimization_Algorithms
4. Mathematical model of 3-P wheel-legged mobile robotic platform / Antonov A. V., Vorotnikov S. A., Vukolov A. Y., Saschenko D. V. International Review of Mechanical Engineering. 2017. P. 311-319.
5. Lagerev A. V., Tolkachev E. N., Lagerev I. A. Analyzing the Discreet Section Suspension Parameters in a Conveyor with Suspended Belt and Distributed Drive. 2017. P. 4669-4678.
6. Lagerev A. V., Tolkachev E. N., Lagerev I. A. Modelling of a vertical loop conveyor with suspended belt and distributed drive. International Review on Modelling and Simulations. 2016. P. 271-279.

INTERNATIONAL JOURNAL FOR INNOVATIVE RESEARCH IN MULTIDISCIPLINARY FIELD, ISSN: 2455-0620, Special Issue : 27, July-2021
Monthly, Peer-Reviewed, Refereed, Indexed Journal with IC Value: 86.87 Impact Factor: 6.719 Publication Date: 31/07/2021
Available online on - www.ijirmf.com Page 150
7. Measurement of temperature at sliding polymer surface by grindable thermocouples.Tribology International / Nosko O., Sato Y., Nagamine T., Mori H. 2015. Р. 100-106.
8. Nosko A. L., Safronov E. V., Soloviev V. A. Study of Friction and Characteristics of the Friction Pair of Centrifugal Brake Rollers. Journal of Friction and Wear. 2018. P. 145-151.
9. Sakharov M., Karpenko A. A new way of decomposing search domain in a global optimization problem. Advances in Intelligent System and Computing. 2018. P. 398-407. URL: https://www.researchgate.net/publication/320124286_A_New_Way_of_Decomposing_Search_Domain_in_a_Global_Optimization_Problem
10. Aramid in conveyor belts in operation: extended lifetime, energy savings and environmental effects / Ven H.J.F.M., Beers H., Jinglei W, Martins C., Mendez E. Proceedings of the Beltcon 19 conference, Pretoria, Republic of South Africa, August 2–3, 2017.
INTERNATIONAL JOURNAL FOR INNOVATIVE RESEARCH IN MULTIDISCIPLINARY FIELD, ISSN: 2455-0620, Special Issue : 27, July-2021
Monthly, Peer-Reviewed, Refereed, Indexed Journal with IC Value: 86.87 Impact Factor: 6.719 Publication Date: 31/07/2021
Available online on - www.ijirmf.com Page 151
International Conference on
Science, Engineering & Technological Innovations 10 & 11 July, 2021 Bangkok, Thailand
Jointly organized by: Automation, Computer Science and Technology Department, Kryvyi Rih National
University, Ukraine. ‘Research Culture Society’ and ‘Scientific Research Association’.
DEVELOPMENT OF A MOBILE APPLICATION TO CONTROL
THE PHYSICAL ACTIVITY OF FITNESS CLUB VISITORS
Olha Solodarenko Master Degree Student, Kriviy Rih National University, Ukraine.
Email: [email protected]
Iryna Zavsiehdashnia PhD, Associate Professor, Kriviy Rih National University, Ukraine.
Email: [email protected]
Abstract: The developed software system will be intended for use by trainers of fitness clubs, to
facilitate and improve the organization of the institution.
Keywords: android, mobile application, database, organization of sports classes.
1. Introduction:
For free orientation in information flows, a modern specialist of any profile must be able to receive, process and use information with the help of computers and other means of information technology. This fully applies to specialists in physical culture and sports. The issue of mastering modern information and communication technologies, their use becomes one of the main components of professional training of any specialist, including a specialist in the field of physical culture and sports.
A large number of people visit gyms, train just for themselves, and sports for them - most likely a hobby. In turn, there is another group of people for whom sport is their job. These people are professionals in their field, they work hard in sports facilities, achieve certain results and want to constantly improve them.
And in order to simplify many issues, from choosing an athlete and his role and ending with the planning of the training process and drawing up a contract, the sport needs automation.
2. Descriptions and results: The development of the mobile application "Fitness Club" is closely connected with information
technologies. Computerization will facilitate the work of any area of service. The introduction of new software allows you to automate various processes and calculations.
This topic is extremely relevant today. The developed software system is intended for use by trainers of fitness clubs, for facilitation and improvement of the organization of work of establishment.
Informatization of the work of fitness club trainers is increasingly used in the modern world. This facilitates the routine work of trainers, speeds up work with clients and generates reports. The introduction of new software allows you to automate various processes.
In the market of software designed for use in training that automates various processes and facilitates work, such systems, in general, are developed personally for institutions, and do not have common standards for several. This once again confirms the relevance of this topic.

INTERNATIONAL JOURNAL FOR INNOVATIVE RESEARCH IN MULTIDISCIPLINARY FIELD, ISSN: 2455-0620, Special Issue : 27, July-2021
Monthly, Peer-Reviewed, Refereed, Indexed Journal with IC Value: 86.87 Impact Factor: 6.719 Publication Date: 31/07/2021
Available online on - www.ijirmf.com Page 152
The defined goal determined the choice of the following tasks: - explore the essence of the coach's work with the client; - to review existing mobile applications - to analyze the methods and technologies of mobile application development; - choose the development technology to create a mobile application; - to form the functional structure of the mobile application; - develop a software product and test it. The task of the work is to develop a system in which some processes will be automated in order
to facilitate the work of fitness club trainers. Namely, to develop a system that should provide: - formation of reports of client visits for the period; - storage of coaches' data; - storage of customer data; The main functions of the developed system are: - data storage of clients and coaches; - formation of reports of visits for the period; - formation of reports on the receipt of funds; Work of the mobile application: its contribution in rendering of services by the enterprise -
control of physical activity during trainings. The following are subject to accounting in the process of work of the mobile application: - recording and storing data about coaches and clients - generation of reports of customer visits for the period - preparation of reports on the receipt of funds In order to prove the relevance and necessity of developing a new mobile application for the
organization of sports, an online survey was conducted in the form of a questionnaire. The Google Forms service helped with this.
The questionnaire contains 5 questions that can answer the question: "Is there a need to use IT to organize sports?"
9 respondents - coaches of different directions of the sports club "Status" took part in the survey process.
After analyzing the results of the online survey, we can draw a conclusion: most trainers use not very reliable storage for data storage - notebooks, notebooks, phone notes. In this case, the data is not protected from loss.
The relevance of this topic is due to the fact that mobile technologies are entering the lives of young people quite rapidly. And after analyzing the market of mobile applications, we can draw a conclusion: yes, the Internet has a large number of mobile products that allow you to keep track of training. However, a very small number allows you to control the physical activity of several athletes in one authorized user. But even these have a disadvantage: they have a rather inconvenient interface, they are impossible to monitor training and cost a lot of money.
Before starting the work, many examples of the implementation of such a task were studied. The most revealing:
- «T Note» - «FitProSport» - «GymRun» - «GymApp» A detailed study of these examples prompted the creation of software that would eliminate the
shortcomings of the studied programs (easy to use, should be supported at the minimum characteristics of the device and was cheap), carry out the maximum tasks, user.

INTERNATIONAL JOURNAL FOR INNOVATIVE RESEARCH IN MULTIDISCIPLINARY FIELD, ISSN: 2455-0620, Special Issue : 27, July-2021
Monthly, Peer-Reviewed, Refereed, Indexed Journal with IC Value: 86.87 Impact Factor: 6.719 Publication Date: 31/07/2021
Available online on - www.ijirmf.com Page 153
The introduction of such a software system will speed up and optimize the work of fitness club trainers. Allows you to quickly work with clients and generate a variety of reports for more efficient work.
There are several common operating systems for smartphones, such as iOS, Android, WindowsPhone, BlackBerry, Simbian. They are all different, but nowadays, the most common operating system is Android. Android supports a large number of devices from different manufacturers. The main reason for the spread of OCAndroid-free development tools, while the development of the iOS system requires high initial costs.
Also, taking into account the aggregate statistics of desktop and mobile platforms worldwide, as of July 2017, Android OS is leading - 41.24% of all devices. The second and third respectively Windows - 35.24% and iOS - 13.2%.
Among mobile phones, Android remains the leader - 70.43%, mobile operating system iOS - 29.06% - almost every third smartphone.
Based on the information received, the Android operating system was chosen to create a mobile application, because:
- Android - operating system with open source code; - Android OS is widespread in the world; - there is access to development for any user; - absolutely free for development. To create a program on Android OS, various development environments can be selected, such
as Eclipse, Embarcadero JBuilder, JDeveloper, etc., but Android Studio from Google is selected for work.
SQLite was chosen to ensure data storage, processing and editing. One of the main advantages of the SQLite DBMS is that it has simple and convenient means of
processing several tables in one database. The table is the main object of the database. Several databases and table binding tools are stored in one database.
Advantages of SQLite: - ease of use; - no need to configure the database server; - possibility of simple distribution with the product; - completely free license; - cross-platform (at least Linux, Free BSD, QNX, Windows); - high speed (in simple operations many times faster than My SQL, and an order of magnitude
faster than Postgre SQL); - support for triggers, views, nested queries; - security. The database is stored in a single file, access rights to which can be controlled by
standard means of OS; - Ability to use different programming languages. Creating a database always begins with developing the structure of its tables. The structure
should be such that when working with the database it was necessary to enter as little data as possible. If the input of some data has to be repeated many times, the database is made of several linked tables. The structure of each table is developed separately. In order for the links between the tables to work reliably, and for an entry from one table to be able to unambiguously find an entry in another table, it is necessary to provide unique fields in the table. If the data in the field is repeated and it is necessary to issue a message about it, then for such data use the key field.
When embarking on the implementation of this task, it should be noted that the software system should be flexible and easily scalable, in order to increase its functionality in future editions.
The process of designing complex software begins with the refinement of its structure, that is, with the definition of structural components and relationships between them. The result of the

INTERNATIONAL JOURNAL FOR INNOVATIVE RESEARCH IN MULTIDISCIPLINARY FIELD, ISSN: 2455-0620, Special Issue : 27, July-2021
Monthly, Peer-Reviewed, Refereed, Indexed Journal with IC Value: 86.87 Impact Factor: 6.719 Publication Date: 31/07/2021
Available online on - www.ijirmf.com Page 154
structure can be presented in the form of structural and / or functional schemes and description (specification) of components.
The design of the user interface is a factor that affects the three main indicators of software product quality: its functionality, aesthetics and productivity.
Functionality is a factor that is often the main focus. Add-ons are created so that users can perform their tasks, and it was convenient for them to do so. Functionality is important, but, nevertheless, it is not the only indicator that should be taken into account during development.
The aesthetic appearance of the application itself and the way of its presentation allows to form a positive opinion of the consumer about the program. However, aesthetic characteristics are very subjective and it is much more difficult to quantify them than functional requirements or performance indicators.
Productivity, as well as reliability, also affect the prospects of using the program. If the application looks good, has a simple and convenient control, but, for example, slowly draws screens, regularly "hangs" for ten or two seconds, or, worse, falls with a critical error in incorrect actions, incorrect actions in incorrect actions. for long-term operation. In turn, the fast and stable operation of the program can partially compensate for its not the most stylish design or the absence of any secondary functions.
To ensure the successful operation of the user from the interface designer, it is necessary to maintain a balance between the above factors throughout the life cycle of program development.
Guided by these postulates and forming an idea of stylish design, a high-quality, functional and aesthetic interface was created.
In the "MainActivity" form, the user enters the login and password, if the data is entered correctly, a new form appears. If the user entered the data incorrectly, a message is displayed to try again.
Fig.1. App entrance form
In the "TablesActivity" form, the user can select a table or a "create report" operation. That is,
the main menu of the mobile application. The form interface for selecting an action is shown below.
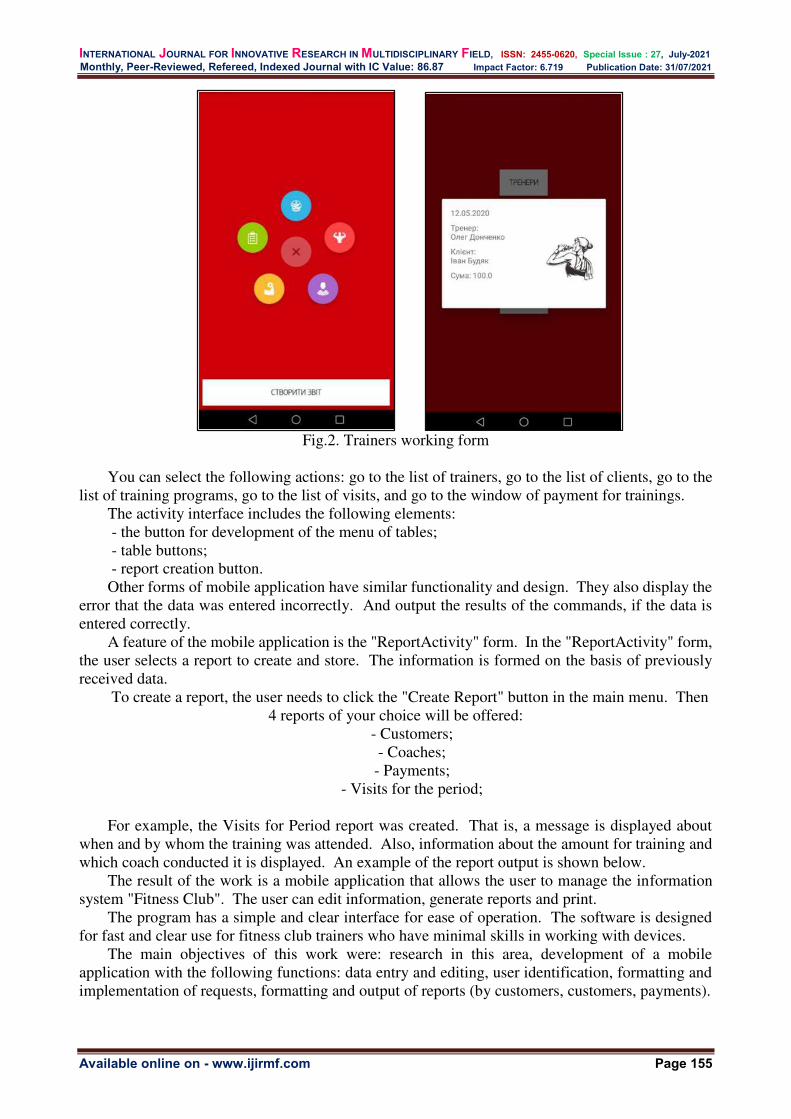
INTERNATIONAL JOURNAL FOR INNOVATIVE RESEARCH IN MULTIDISCIPLINARY FIELD, ISSN: 2455-0620, Special Issue : 27, July-2021
Monthly, Peer-Reviewed, Refereed, Indexed Journal with IC Value: 86.87 Impact Factor: 6.719 Publication Date: 31/07/2021
Available online on - www.ijirmf.com Page 155
Fig.2. Trainers working form
You can select the following actions: go to the list of trainers, go to the list of clients, go to the
list of training programs, go to the list of visits, and go to the window of payment for trainings. The activity interface includes the following elements: - the button for development of the menu of tables; - table buttons; - report creation button. Other forms of mobile application have similar functionality and design. They also display the
error that the data was entered incorrectly. And output the results of the commands, if the data is entered correctly.
A feature of the mobile application is the "ReportActivity" form. In the "ReportActivity" form, the user selects a report to create and store. The information is formed on the basis of previously received data.
To create a report, the user needs to click the "Create Report" button in the main menu. Then 4 reports of your choice will be offered:
- Customers; - Coaches; - Payments;
- Visits for the period; For example, the Visits for Period report was created. That is, a message is displayed about
when and by whom the training was attended. Also, information about the amount for training and which coach conducted it is displayed. An example of the report output is shown below.
The result of the work is a mobile application that allows the user to manage the information system "Fitness Club". The user can edit information, generate reports and print.
The program has a simple and clear interface for ease of operation. The software is designed for fast and clear use for fitness club trainers who have minimal skills in working with devices.
The main objectives of this work were: research in this area, development of a mobile application with the following functions: data entry and editing, user identification, formatting and implementation of requests, formatting and output of reports (by customers, customers, payments).

INTERNATIONAL JOURNAL FOR INNOVATIVE RESEARCH IN MULTIDISCIPLINARY FIELD, ISSN: 2455-0620, Special Issue : 27, July-2021
Monthly, Peer-Reviewed, Refereed, Indexed Journal with IC Value: 86.87 Impact Factor: 6.719 Publication Date: 31/07/2021
Available online on - www.ijirmf.com Page 156
Information technologies in the field of sports are used to solve a wide range of problems. The use of information technology in the fitness club is one of the most important ways to improve the efficiency of data.
Upon completion of the development, the following functions are achieved: - login to the system; - adding new information; - deletion of information; - editing information; - reporting. The program interface is as simple as possible for the user. The mobile application generates
and displays reports that the user needs, which significantly improves and optimizes performance. 3. Conclusions: Qualitative effects from the introduction of a mobile application:
- the efficiency of the institution's work increases. - the rating of the institution increases, as satisfied customers from the training leave positive
feedback. - profit increases, simple regularity: the more good reviews, the more new visitors to the
institution. - the quality of information provided by the system is improved by improving the process of
its collection and processing; - access to the necessary information is simplified, it is always in the "pocket". - the format of reports provides a greater amount of necessary information, while the system
does not display unnecessary information, which can complicate the process of perception. - access to information is provided without the participation of the Internet. - the work of the trainer is optimized, the trainer pays more attention to the client, monitors the
implementation of exercises. All this will optimize the process of load control during training in the gym. Also, all this leads to the fact that the sport reaches a new more developed level. Various
intelligent systems implemented in sports activities will qualitatively and quantitatively increase the productivity of training, improve results, and get the most benefit.
REFERENCES:
1. StartAndroid [Electronic resource] // a course of 183 classes on Android development. URL: http://startandroid.ru;
2. DevColibri [Electronic resource] // course with YouTube channel, sqlite for Android. URL: https://www.youtube.com/user/devcolibri;
3. AlexanderKlimov [Electronic resource] // blog with articles on Android development. URL: http://alexanderklimov.ru;
4. GitHub [Electronic resource] // publishing project codes to help other programmers develop (CircleMenu, Toasty). URL: https://github.com;
5. Udacity [Electronic resource] // site with programming courses. URL: https://www.udacity.com;

INTERNATIONAL JOURNAL FOR INNOVATIVE RESEARCH IN MULTIDISCIPLINARY FIELD, ISSN: 2455-0620, Special Issue : 27, July-2021
Monthly, Peer-Reviewed, Refereed, Indexed Journal with IC Value: 86.87 Impact Factor: 6.719 Publication Date: 31/07/2021
Available online on - www.ijirmf.com Page 157
International Conference on
Science, Engineering & Technological Innovations 10 & 11 July, 2021 Bangkok, Thailand
Jointly organized by: Automation, Computer Science and Technology Department, Kryvyi Rih National
University, Ukraine. ‘Research Culture Society’ and ‘Scientific Research Association’.
AUTOMATED ON-LINE CONTROL OF THE BELT CONVEYOR
USING THE TIA PORTAL DEVELOPMENT ENVIRONMENT
Violetta Dmytriieva Bachelor, Kryvyi Rih National University, Ukraine.
Email: [email protected]
Michailo Tykhanskyi PhD, Associate Professor, Kryvyi Rih National University, Ukraine.
Email: [email protected]
Abstract: The software for online control of an automated conveyor plant has been developed. The
control system allows you to control both the speed of the belt conveyor and the cargo flow. The
response to emerging emergencies is also provided. The designed system will reduce operating costs
and energy resources.
Keywords: automated system, belt conveyor, automatic control system, mathematical model,
software implementation.
1. Introduction : The basis of modern ACS TP are various microprocessor means of collecting and processing
information, integrated into a computer network, as well as the so-called SCADA (Supervisory Control And Date Acquisition-dispatch control and data representation) systems, solving typical tasks of collection, primary processing, visualization, control and archiving information.
With the rapid development of automation systems and their widespread implementation, it became possible to influence one of the most important factors - increasing efficiency and technical level of production. Due to the difficult working conditions, the task of the ACS is to reduce the use of human power or even eliminate it.
Modern conveyor transport is equipped with sensors of temperature, speed, power, belt shift, tractor condition and even conveyor scales and locking and signaling devices, which must be displayed on the control screen.
To improve working conditions in enterprises, automation of conveyor transport is an urgent task. The development of an automatic control system with the possibility of online control will allow remote control of the belt conveyor directly from the operator's site.
2. Description and results. Transportation of goods over long distances is an important link in many technological
processes in production. The use of conveyor transport is in demand today. Belt conveyors have become the most widespread due to their high productivity and flexible structure.
The main parameters of the belt conveyor are productivity, width and speed of the belt, engine power. They are responsible for the work.
For safe operation, the automated control system must perform a five-minute start delay and sequential connection of the conveyors, if they are combined in a line. You also need to take into account the automatic shutdown in case of failure and the inability to reconnect faulty mechanisms.
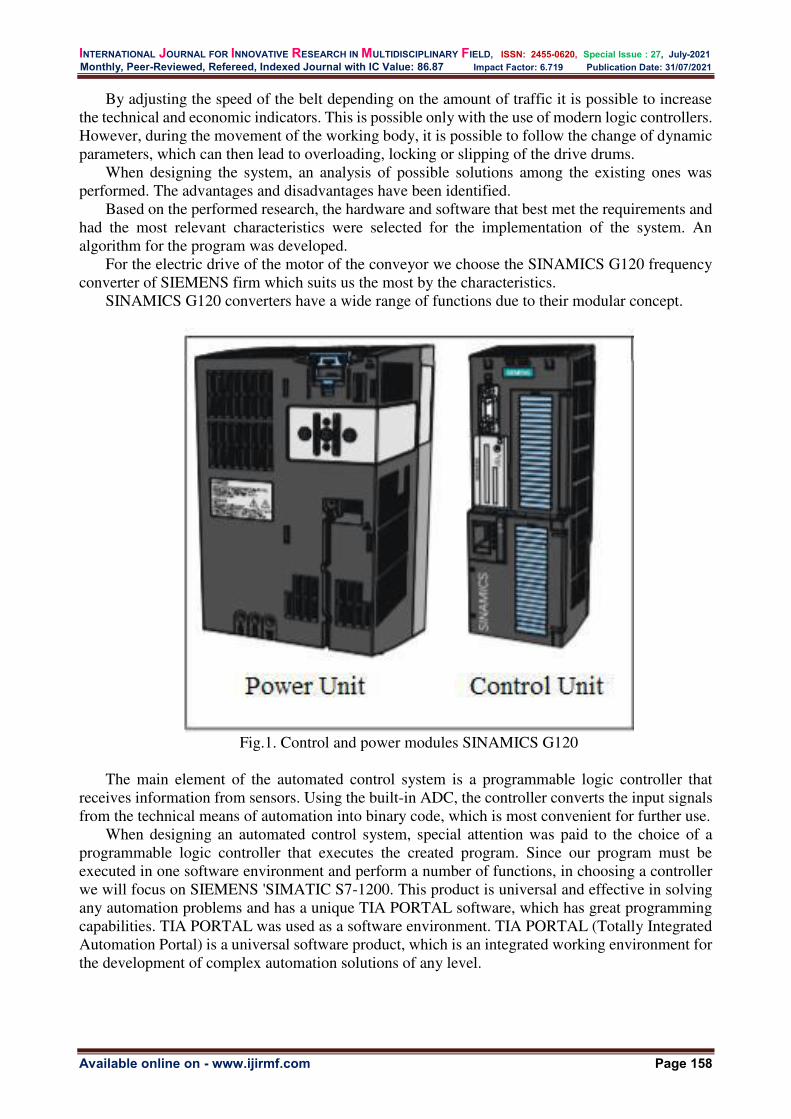
INTERNATIONAL JOURNAL FOR INNOVATIVE RESEARCH IN MULTIDISCIPLINARY FIELD, ISSN: 2455-0620, Special Issue : 27, July-2021
Monthly, Peer-Reviewed, Refereed, Indexed Journal with IC Value: 86.87 Impact Factor: 6.719 Publication Date: 31/07/2021
Available online on - www.ijirmf.com Page 158
By adjusting the speed of the belt depending on the amount of traffic it is possible to increase the technical and economic indicators. This is possible only with the use of modern logic controllers. However, during the movement of the working body, it is possible to follow the change of dynamic parameters, which can then lead to overloading, locking or slipping of the drive drums.
When designing the system, an analysis of possible solutions among the existing ones was performed. The advantages and disadvantages have been identified.
Based on the performed research, the hardware and software that best met the requirements and had the most relevant characteristics were selected for the implementation of the system. An algorithm for the program was developed.
For the electric drive of the motor of the conveyor we choose the SINAMICS G120 frequency converter of SIEMENS firm which suits us the most by the characteristics.
SINAMICS G120 converters have a wide range of functions due to their modular concept.
Fig.1. Control and power modules SINAMICS G120
The main element of the automated control system is a programmable logic controller that
receives information from sensors. Using the built-in ADC, the controller converts the input signals from the technical means of automation into binary code, which is most convenient for further use.
When designing an automated control system, special attention was paid to the choice of a programmable logic controller that executes the created program. Since our program must be executed in one software environment and perform a number of functions, in choosing a controller we will focus on SIEMENS 'SIMATIC S7-1200. This product is universal and effective in solving any automation problems and has a unique TIA PORTAL software, which has great programming capabilities. TIA PORTAL was used as a software environment. TIA PORTAL (Totally Integrated Automation Portal) is a universal software product, which is an integrated working environment for the development of complex automation solutions of any level.

INTERNATIONAL JOURNAL FOR INNOVATIVE RESEARCH IN MULTIDISCIPLINARY FIELD, ISSN: 2455-0620, Special Issue : 27, July-2021
Monthly, Peer-Reviewed, Refereed, Indexed Journal with IC Value: 86.87 Impact Factor: 6.719 Publication Date: 31/07/2021
Available online on - www.ijirmf.com Page 159
Images and overall dimensions of such a controller are shown in Fig.2.
Fig.2. Picture of SIMATIC S7-1200
Main functional characteristics:
Tape speed and slip control; Operational stops of the conveyor by commands directly from the workstation of the
dispatcher or from the control unit; Control of the sound alarm system of the conveyor; Local automation, which is carried out directly from the control unit; Providing various types of protection (emergency and emergency stops); possibility of a stop
in any place of the conveyor at decrease in speed of a tape, shift and slipping, and also at operation of sensors;
Switching off of the automatic switch at sticking of block contacts of electric motors or brakes;
Display on the conveyor control unit and on the workstation of the manager of the following information:
1) Indication of operating modes, tape speed and other technological parameters; 2) Emergency indication of all types of protective shutdowns and locks; 3) The reasons for the last stop of the conveyor line, individual conveyors or their components; 4) Operational image on the workstation of the state manager of control objects; The program is developed in the TIA Portal. Execution of functional blocks takes place in the
block "Main". Node-Red is used to implement online pipeline management. To calculate the amount of cargo used, the block "Count" is used, which after the operation of
the infrared meter increases the initial number by 1. The implementation of the block is shown in Fig.3.
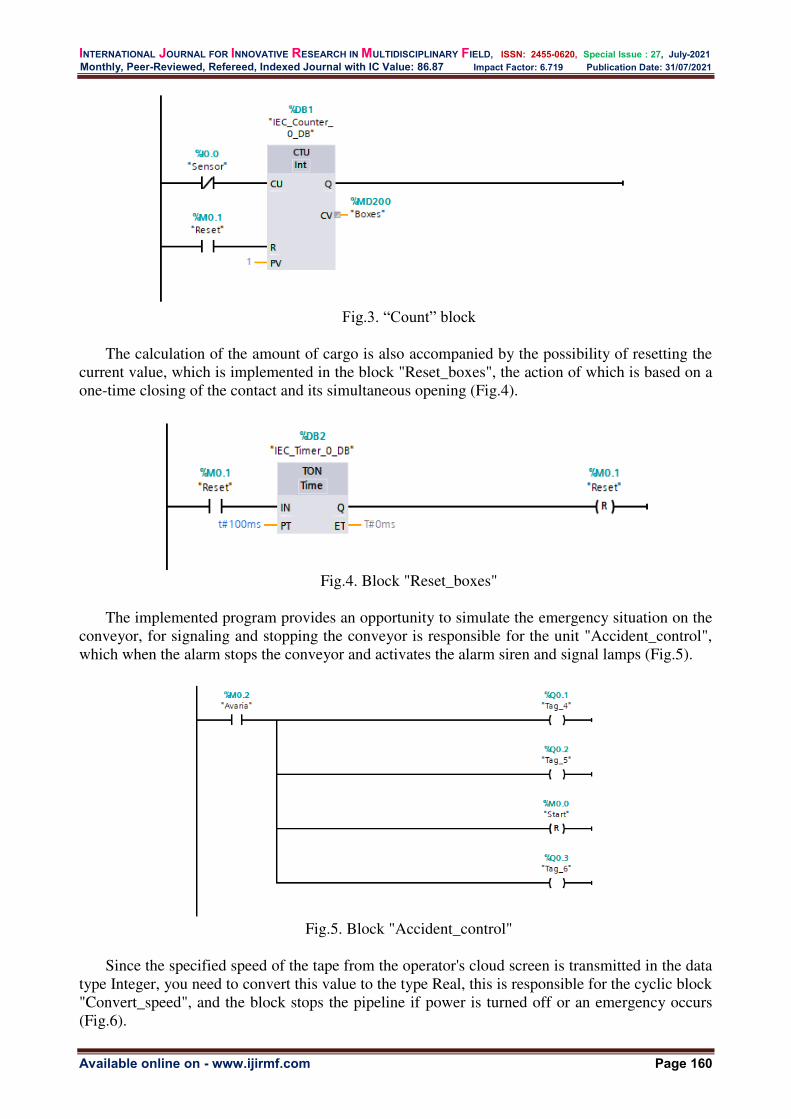
INTERNATIONAL JOURNAL FOR INNOVATIVE RESEARCH IN MULTIDISCIPLINARY FIELD, ISSN: 2455-0620, Special Issue : 27, July-2021
Monthly, Peer-Reviewed, Refereed, Indexed Journal with IC Value: 86.87 Impact Factor: 6.719 Publication Date: 31/07/2021
Available online on - www.ijirmf.com Page 160
Fig.3. “Count” block
The calculation of the amount of cargo is also accompanied by the possibility of resetting the
current value, which is implemented in the block "Reset_boxes", the action of which is based on a one-time closing of the contact and its simultaneous opening (Fig.4).
Fig.4. Block "Reset_boxes"
The implemented program provides an opportunity to simulate the emergency situation on the
conveyor, for signaling and stopping the conveyor is responsible for the unit "Accident_control", which when the alarm stops the conveyor and activates the alarm siren and signal lamps (Fig.5).
Fig.5. Block "Accident_control"
Since the specified speed of the tape from the operator's cloud screen is transmitted in the data
type Integer, you need to convert this value to the type Real, this is responsible for the cyclic block "Convert_speed", and the block stops the pipeline if power is turned off or an emergency occurs (Fig.6).

INTERNATIONAL JOURNAL FOR INNOVATIVE RESEARCH IN MULTIDISCIPLINARY FIELD, ISSN: 2455-0620, Special Issue : 27, July-2021
Monthly, Peer-Reviewed, Refereed, Indexed Journal with IC Value: 86.87 Impact Factor: 6.719 Publication Date: 31/07/2021
Available online on - www.ijirmf.com Page 161
Fig.6. Block "Convert_speed"
To use the possibility of online control of the pipeline, data from the TIA Portal are transferred
to the local Node-Red project using the built-in library node-red-contrib-s7, and then transferred to the Node-Red cloud project, which implements an operator screen for online control conveyor. Implementation of Node-Red projects is shown in Fig.7 and Fig.8.
Fig.7. Local Node-Red project
Fig.8. Cloud Node-Red project
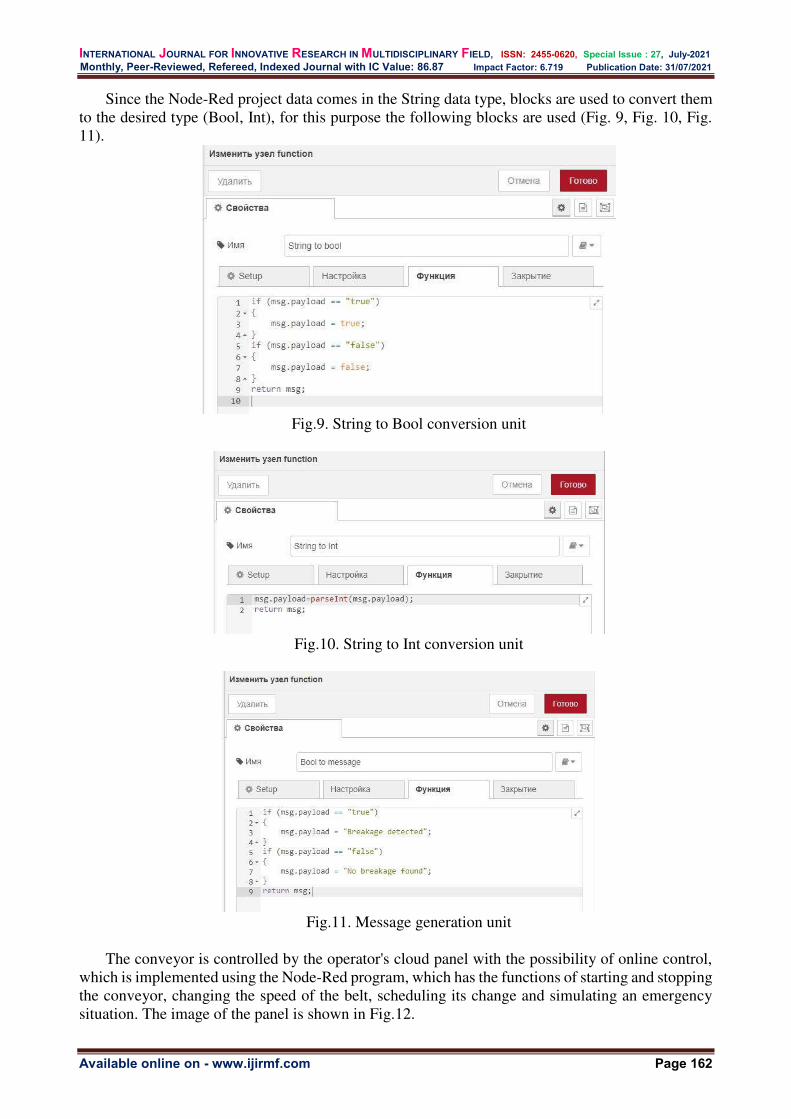
INTERNATIONAL JOURNAL FOR INNOVATIVE RESEARCH IN MULTIDISCIPLINARY FIELD, ISSN: 2455-0620, Special Issue : 27, July-2021
Monthly, Peer-Reviewed, Refereed, Indexed Journal with IC Value: 86.87 Impact Factor: 6.719 Publication Date: 31/07/2021
Available online on - www.ijirmf.com Page 162
Since the Node-Red project data comes in the String data type, blocks are used to convert them to the desired type (Bool, Int), for this purpose the following blocks are used (Fig. 9, Fig. 10, Fig. 11).
Fig.9. String to Bool conversion unit
Fig.10. String to Int conversion unit
Fig.11. Message generation unit
The conveyor is controlled by the operator's cloud panel with the possibility of online control,
which is implemented using the Node-Red program, which has the functions of starting and stopping the conveyor, changing the speed of the belt, scheduling its change and simulating an emergency situation. The image of the panel is shown in Fig.12.
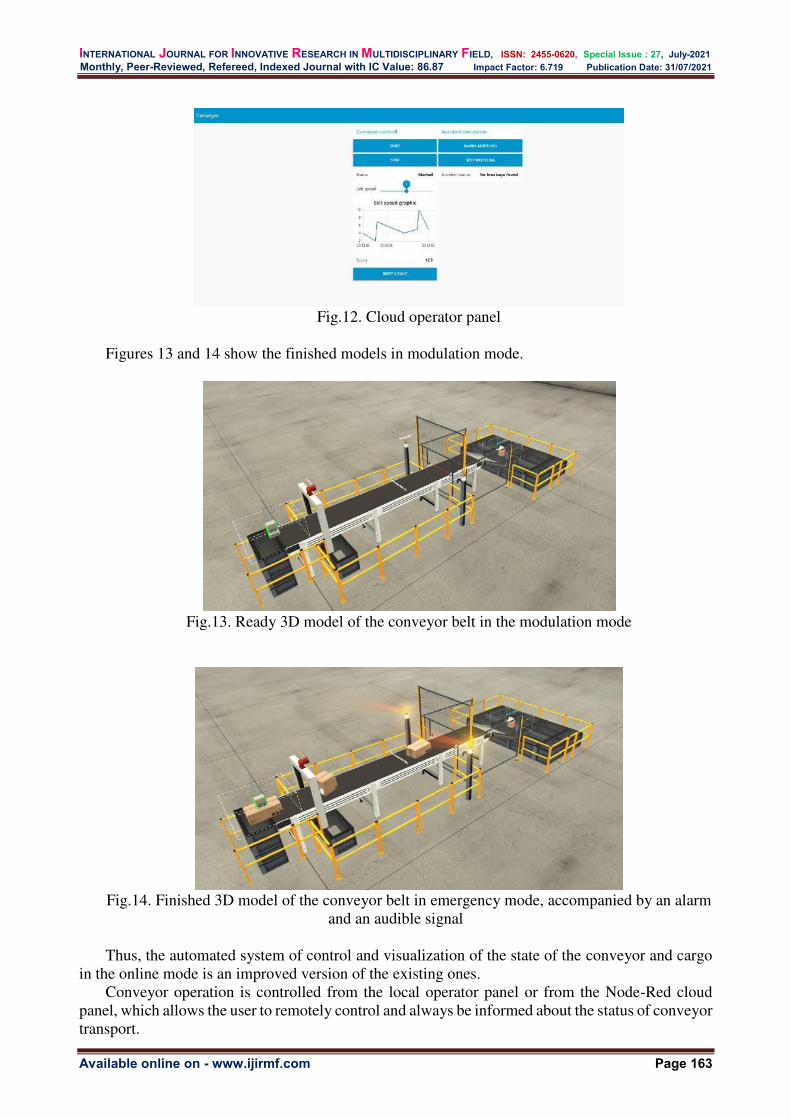
INTERNATIONAL JOURNAL FOR INNOVATIVE RESEARCH IN MULTIDISCIPLINARY FIELD, ISSN: 2455-0620, Special Issue : 27, July-2021
Monthly, Peer-Reviewed, Refereed, Indexed Journal with IC Value: 86.87 Impact Factor: 6.719 Publication Date: 31/07/2021
Available online on - www.ijirmf.com Page 163
Fig.12. Cloud operator panel
Figures 13 and 14 show the finished models in modulation mode.
Fig.13. Ready 3D model of the conveyor belt in the modulation mode
Fig.14. Finished 3D model of the conveyor belt in emergency mode, accompanied by an alarm
and an audible signal Thus, the automated system of control and visualization of the state of the conveyor and cargo
in the online mode is an improved version of the existing ones. Conveyor operation is controlled from the local operator panel or from the Node-Red cloud
panel, which allows the user to remotely control and always be informed about the status of conveyor transport.
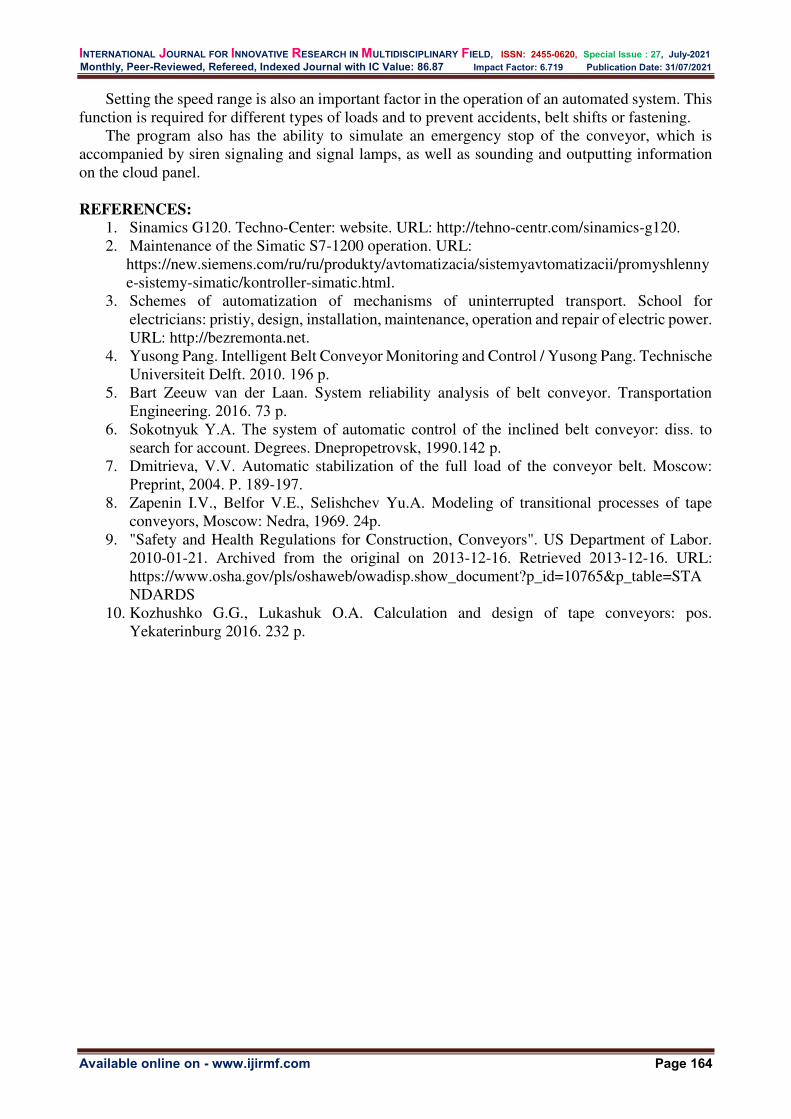
INTERNATIONAL JOURNAL FOR INNOVATIVE RESEARCH IN MULTIDISCIPLINARY FIELD, ISSN: 2455-0620, Special Issue : 27, July-2021
Monthly, Peer-Reviewed, Refereed, Indexed Journal with IC Value: 86.87 Impact Factor: 6.719 Publication Date: 31/07/2021
Available online on - www.ijirmf.com Page 164
Setting the speed range is also an important factor in the operation of an automated system. This function is required for different types of loads and to prevent accidents, belt shifts or fastening.
The program also has the ability to simulate an emergency stop of the conveyor, which is accompanied by siren signaling and signal lamps, as well as sounding and outputting information on the cloud panel.
REFERENCES:
1. Sinamics G120. Techno-Center: website. URL: http://tehno-centr.com/sinamics-g120. 2. Maintenance of the Simatic S7-1200 operation. URL:
https://new.siemens.com/ru/ru/produkty/avtomatizacia/sistemyavtomatizacii/promyshlennye-sistemy-simatic/kontroller-simatic.html.
3. Schemes of automatization of mechanisms of uninterrupted transport. School for electricians: pristіy, design, installation, maintenance, operation and repair of electric power. URL: http://bezremonta.net.
4. Yusong Pang. Intelligent Belt Conveyor Monitoring and Control / Yusong Pang. Technische Universiteit Delft. 2010. 196 р.
5. Bart Zeeuw van der Laan. System reliability analysis of belt conveyor. Transportation Engineering. 2016. 73 р.
6. Sοkotnyuk Y.A. The system of automatic control of the inclined belt conveyor: diss. to search for account. Degrees. Dnepropetrovsk, 1990.142 р.
7. Dmitrieva, V.V. Automatic stabilization of the full load of the conveyor belt. Moscow: Preprint, 2004. Р. 189-197.
8. Zapenin I.V., Belfor V.E., Selishchev Yu.A. Modeling of transitional processes of tape conveyors, Moscow: Nedra, 1969. 24p.
9. "Safety and Health Regulations for Construction, Conveyors". US Department of Labor. 2010-01-21. Archived from the original on 2013-12-16. Retrieved 2013-12-16. URL: https://www.osha.gov/pls/oshaweb/owadisp.show_document?p_id=10765&p_table=STANDARDS
10. Kozhushko G.G., Lukashuk O.A. Calculation and design of tape conveyors: pos. Yekaterinburg 2016. 232 p.

INTERNATIONAL JOURNAL FOR INNOVATIVE RESEARCH IN MULTIDISCIPLINARY FIELD, ISSN: 2455-0620, Special Issue : 27, July-2021
Monthly, Peer-Reviewed, Refereed, Indexed Journal with IC Value: 86.87 Impact Factor: 6.719 Publication Date: 31/07/2021
Available online on - www.ijirmf.com Page 165
International Conference on
Science, Engineering & Technological Innovations 10 & 11 July, 2021 Bangkok, Thailand
Jointly organized by: Automation, Computer Science and Technology Department, Kryvyi Rih National
University, Ukraine. ‘Research Culture Society’ and ‘Scientific Research Association’.
AUTOMATION OF WATER PUMPING PROCESS BY PUMPING
STATION WITH SOFTWARE DEVELOPMENT OF S7-1200
CONTROLLER
Nataly Kuzmenko
Student, Kryvyi Rih National University, Ukraine Email - [email protected]
Liudmila Yefimenko
PhD, Associate Professor, Kryvyi Rih National University, Ukraine Email - [email protected]
Abstract: The object of control in the work is the process of pumping water from the mines by a
water pumping station.
Keywords: automation, control, water pumping, water level, pump station, process visualization.
1. Introduction :
An important component in the development of mine workings is drainage. Pumping liquid from the mine is performed by drainage pumping stations and to ensure normal operating conditions requires uninterrupted operation of the station.
The operation of the drainage pumping station is strongly affected by the inflow of water, which is not constant during the year. The amount of fluid entering the mine depends on many factors. Therefore, pumping to the surface of the liquid is the main task of the drainage pumping station.
The efficiency and productivity of water pumping by the drainage pumping station increases when using the automatic control system.
2. Descriptions and results : To prevent flooding of mines, there are automatic systems for draining water to the surface,
which have disadvantages. The main disadvantages are outdated equipment and the use of outdated software. Therefore, the development of a modern or modernization of the existing system for drainage pumping stations is an urgent task.
The aim of the work is to increase the efficiency of the drainage pumping station through the introduction of modern technological equipment from Siemens and the development of software for the automatic control system on the S7-1200 controller.
The defined goal determined the choice of the following tasks: - to analyze of the features of the technological process of the drainage pumping station; - to analyze existing automatic surface drainage systems; - selection of modern control equipment for Siemens drainage pumping stations; - software development of the automatic ebb control system on the S7-1200 controller; - development of visualization in the TIA Portal software of the process of water pumping by
a drainage pumping station. System of automatic control of drainage pumping station with software on the controller S7-
1200 controls the water level in the reservoir.

INTERNATIONAL JOURNAL FOR INNOVATIVE RESEARCH IN MULTIDISCIPLINARY FIELD, ISSN: 2455-0620, Special Issue : 27, July-2021
Monthly, Peer-Reviewed, Refereed, Indexed Journal with IC Value: 86.87 Impact Factor: 6.719 Publication Date: 31/07/2021
Available online on - www.ijirmf.com Page 166
The single-stage drainage pumping unit is reliable and simple. All water from the mine, which enters the reservoir is pumped to the surface.
The main components of the drainage pumping station: pipelines, starter, electric motor, pump. The most common ways to automatically control the pumping of water from workings are
throttling, using a controlled valve or changing the speed of the motor by a frequency converter. The inflow of water into the mine is the main factor that affects the operation of the entire
drainage pumping station. Based on its indicators, a drainage pumping station is designed. Supply and pressure are the main parameters of the drainage pump station, which characterize
the pumping modes. By changing these parameters, you can automatically adjust the pumping of water from the reservoir by the drainage pumping station.
Fig.1. Scheme of drainage pumping unit
The diagram of the drainage pumping unit shows the following marks: 1 - pump with motor; 2-
manometer; 3 - latch; 4 - check valve; 5 - discharge pipeline; 6 - tube for filling the pump with water; 7-the valve; 8 - vacuum gauge; 9 - suction pipe; 10 - the valve of the suction pipeline; 11 - receiving grid.
Totally Integrated Automation Portal (TIA Portal) - software based on SIMATIC from SIEMENS AG, which forms an integrated working environment for the development of automation projects. TIA Portal allows you to significantly reduce the cost of configuration and organization of interaction between controllers, drives, devices and gets a high level of efficiency in the development of automation projects.
SIMATIC S7-1200 controllers are used in the medium and low performance range of the automatic control system to increase efficiency. They have a wide range of technological functions and integrated IO, as well as a compact design. Thanks to the wide possibilities of expansion SIMATIC S7-1200 can be perfectly adapted for certain tasks of automation. Controllers include a wide range of technological functions.
SIMATIC S7-1200 controllers have the following advantages: - functionality and ease of use (the controller is equipped with a built-in Ethernet interface,
through which you can perform a number of operations: SIMATIC programming, diagnostics, data exchange with other automation devices, as well as human-machine interface systems);
- compactness (this family of controllers has a plastic case, a modular design and can be mounted on a standard DIN bus or on a flat surface);
- versatility (SIEMENS SIMATIC S7-1200 are characterized by a wide range of applications: can be used to build fairly simple units of local automation, and for components of complex systems with automatic control);
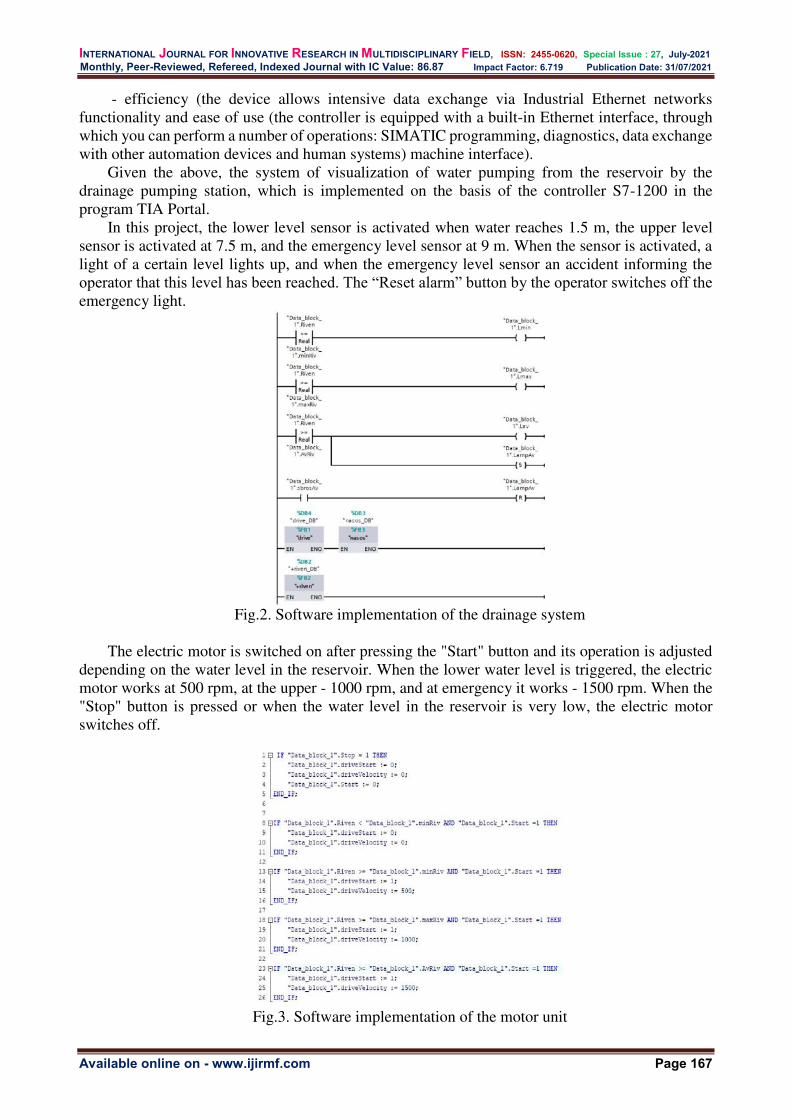
INTERNATIONAL JOURNAL FOR INNOVATIVE RESEARCH IN MULTIDISCIPLINARY FIELD, ISSN: 2455-0620, Special Issue : 27, July-2021
Monthly, Peer-Reviewed, Refereed, Indexed Journal with IC Value: 86.87 Impact Factor: 6.719 Publication Date: 31/07/2021
Available online on - www.ijirmf.com Page 167
- efficiency (the device allows intensive data exchange via Industrial Ethernet networks functionality and ease of use (the controller is equipped with a built-in Ethernet interface, through which you can perform a number of operations: SIMATIC programming, diagnostics, data exchange with other automation devices and human systems) machine interface).
Given the above, the system of visualization of water pumping from the reservoir by the drainage pumping station, which is implemented on the basis of the controller S7-1200 in the program TIA Portal.
In this project, the lower level sensor is activated when water reaches 1.5 m, the upper level sensor is activated at 7.5 m, and the emergency level sensor at 9 m. When the sensor is activated, a light of a certain level lights up, and when the emergency level sensor an accident informing the operator that this level has been reached. The “Reset alarm” button by the operator switches off the emergency light.
Fig.2. Software implementation of the drainage system
The electric motor is switched on after pressing the "Start" button and its operation is adjusted
depending on the water level in the reservoir. When the lower water level is triggered, the electric motor works at 500 rpm, at the upper - 1000 rpm, and at emergency it works - 1500 rpm. When the "Stop" button is pressed or when the water level in the reservoir is very low, the electric motor switches off.
Fig.3. Software implementation of the motor unit

INTERNATIONAL JOURNAL FOR INNOVATIVE RESEARCH IN MULTIDISCIPLINARY FIELD, ISSN: 2455-0620, Special Issue : 27, July-2021
Monthly, Peer-Reviewed, Refereed, Indexed Journal with IC Value: 86.87 Impact Factor: 6.719 Publication Date: 31/07/2021
Available online on - www.ijirmf.com Page 168
The pump does not run if the motor is not running. When the lower water level in the reservoir
is reached, the pump pumps out 100 m3/h, when the upper water level is reached - 200 m3/h, when the emergency level is reached - 300 m3/h.
Fig.4. Software implementation of the pump unit
The inflow is displayed after pressing the button that corresponds to a certain water inflow in
m3/h.
Fig.5. Software implementation of the water supply metering unit
The slide shows a visualization of the process of pumping water when the lower water level
sensor in the reservoir. When the water in the water reservoir reaches 1.5 m, the lower level sensor is activated. After its operation the water is pumped out, the electric motor works at 500 rpm and 100 m3/h of water is pumped out.

INTERNATIONAL JOURNAL FOR INNOVATIVE RESEARCH IN MULTIDISCIPLINARY FIELD, ISSN: 2455-0620, Special Issue : 27, July-2021
Monthly, Peer-Reviewed, Refereed, Indexed Journal with IC Value: 86.87 Impact Factor: 6.719 Publication Date: 31/07/2021
Available online on - www.ijirmf.com Page 169
Fig.6. Window for visualization of the water pumping process when the lower level sensor is
triggered The upper level sensor is activated when the water in the reservoir reaches 7.5 m. The speed of
the motor increases to 1000 rpm and the pump pumps 200 m3/h of water from the reservoir to the surface.
If an emergency water level was reached in the reservoir, which is at the level of 9 meters, the motor increases to a maximum speed of 1500 rpm and pumps 300 m3/h of water from the reservoir. Also on the operator's place the bulb which informs the operator that the emergency level was reached lights up.
Fig.6. Window for visualization of the process of water pumping when the emergency level
sensor is triggered The result of the work is the visualization of the process of pumping water by a drainage
pumping station based on the controller S7-1200 in the program TIA Portal With the help of the working screen that displays the visualization of the water pumping process,
the operator can see the water level in the reservoir, the number of revolutions of the motor, the amount of inflow from the horizon in m3/h, level display with indicators. Also, on the screen there are buttons "Start", "Stop", "Reset the alarm". This allows the automation system to respond quickly and prevent emergencies.
Thus, the modernization of the drainage process automation system through the introduction of modern technological means and the development of a visualization system in the software package TIA Portal of Siemens, which improves the economic and technological performance of the system and stabilizes the water level in the reservoir.

INTERNATIONAL JOURNAL FOR INNOVATIVE RESEARCH IN MULTIDISCIPLINARY FIELD, ISSN: 2455-0620, Special Issue : 27, July-2021
Monthly, Peer-Reviewed, Refereed, Indexed Journal with IC Value: 86.87 Impact Factor: 6.719 Publication Date: 31/07/2021
Available online on - www.ijirmf.com Page 170
As a result, the modernization of the drainage process automation system was performed due to the introduction of modern technological means of the SIEMENS company and the development of the S7-1200 controller software.
To ensure continuous operation and avoid accidents, the S7-1200 controller software in the TIA Portal software package was developed, and a visualization system was developed to help track the progress of the water pumping process.
3. Conclusions: The analysis of the techno-branch process allowed to determine technical and technological
features that affect the development and research of automatic control system of the object. The most effective drainage control will be the control of changing the speed of the drive motor. Developed software based on the S7-1200 controller provides continuous regulation of the
water level in the reservoir with an automated drainage pumping station, which increases efficiency. Developed visualization of the TIA Portal program helps the operator to track the flow of the
process of pumping water to the surface by the drainage pumping station. All this will optimize the process of pumping out water pumping station.
REFERENCES: 1. Davydkova NS Course of lectures on the discipline "Stationary installations of mines (drainage,
fan and pneumatic installations)". Alchevsk: DonSTU, 2006. 157 p. 2. General information on pumping systems and pump design: website. URL:
https://studfile.net/preview/2789298/page:4/ (accessed 19.05.2021). 3. Automated drainage system control system: website. URL:
https://fenix.help/works/diplomnaya/teoriya-avtomaticheskogo-upravleniya/-6/avtomatizirovannaya-sistema-upravleniya-vodootlivnoj-ust (accessed 24.05.2021).
4. SIMATIC S7-1200 controller: website. URL: https://controlengrussia.com/plk/simatic-s7-1200/ (access date 04.06.2021).
5. SIMATIC S7-1200: website. URL: http://progressavtomatika.ru/siemens-simatic-s7-1200.php (access date 04.06.2021).
6. SIEMENS SIMATIC S7-1200 Controllers Overview: website. URL: https://www.mege.ru/reviews/siemens/programmiruemye-kontrollery/ (access date 05.06.2021).

INTERNATIONAL JOURNAL FOR INNOVATIVE RESEARCH IN MULTIDISCIPLINARY FIELD, ISSN: 2455-0620, Special Issue : 27, July-2021
Monthly, Peer-Reviewed, Refereed, Indexed Journal with IC Value: 86.87 Impact Factor: 6.719 Publication Date: 31/07/2021
Available online on - www.ijirmf.com Page 171
International Conference on
Science, Engineering & Technological Innovations 10 & 11 July, 2021 Bangkok, Thailand
Jointly organized by: Automation, Computer Science and Technology Department, Kryvyi Rih National
University, Ukraine. ‘Research Culture Society’ and ‘Scientific Research Association’.
Dark Matter and Dark Energy: How Dark are they actually?
Dr. Ishita Ghosh Assistant Professor in Physics, Netaji Subhas University, Pokhari, Jamshedpur
Email: [email protected]
Abstract : The endless universe is the source of limitless wonders which makes us happily awestruck
as it unfolds before us layer by layer. The scientists, scholars and academicians are relentlessly
probing hard to open up the stores of information and mesmerize us with the thrill of the incredible
unknown. This paper reviews how dark matter and dark energy came up for human discussion and
how persistently efforts are put together so that they remain dark to a lesser extent. The whole of the
universe is made up of only five percent of normal matter while twenty five percent is dark matter
and a huge proportion of sixty nine percent is dark energy. It is clear that a major chunk of the
universe is under folds of ignorance. Due to the nomenclature there may be a tendency to confuse
between the dark matter and dark energy. But the fact remains that they are distinctly different in
features and effects. The dark matter attracts while the dark energy repels. As such, dark matter
pulls matter inwards while dark energy pushes it outward. Further dark energy manifests itself only
on the largest cosmic scale while dark matter exerts its influence on individual galaxies as well as
the universe at large.
Keywords: Dark Energy, Dark Matter, Universe, Galaxies.
1. INTRODUCTION :
As we stare into the brilliance of the universe, we are really spell bound when we think about the commencement and the continuation of the universe from the time immemorial. Today we may not have the answers to the variety of questions to the fullest, but we really are in the process of exploration of the then and now of the universe. According to the information accumulated till now, most cosmologists believe that universe came into being with the famous Big Bang. It is believed to have occurred some 13.8 billion years ago. It is really very amazing to comprehend that whole of the energy of the universe was concentrated into a tiny point of the order of a size smaller than the nucleus of an atom. The Big Bang converted this tiny point of matter into whole of the energy of the universe and the numerous galaxies, stars and planets. The modern cosmologists have a view that matter and space and time all came into being when the tiny point expanded suddenly and exponentially. The Big Bang is imagined to have taken place around 13.8 billion years again. The thoughts about it started way back in 1927 when an astronomer named Georges Lemaitre stated that the universe started a very long time ago from just a single point and from there it has expanded itself and is still expanding. Two years later Edwin Hubble noticed that other galaxies were moving away from us. Interestingly enough the speed of their motion is directly proportional to their distance from us. The galaxies farther away from us are moving at a faster speed in comparison to the closer ones. In other words, the universe is still expanding and previously it was all close together. Previously it was just tiny particles mixed with light and energy. When it expanded, it cooled down and got
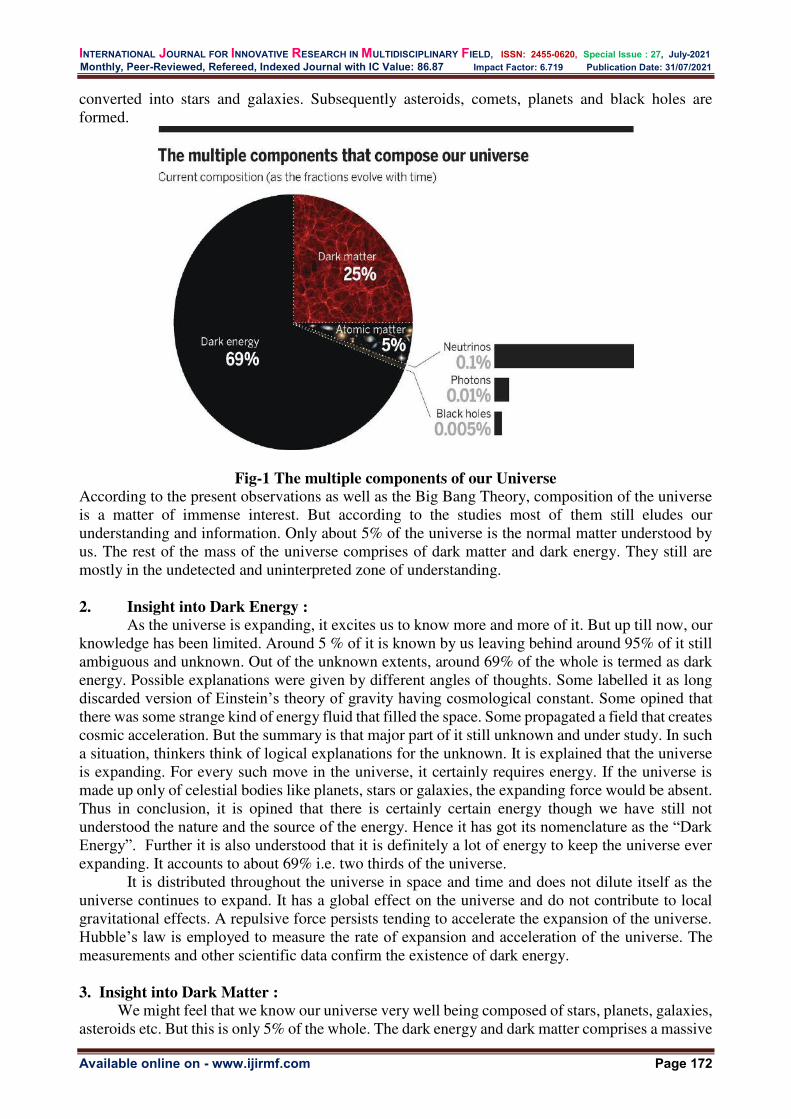
INTERNATIONAL JOURNAL FOR INNOVATIVE RESEARCH IN MULTIDISCIPLINARY FIELD, ISSN: 2455-0620, Special Issue : 27, July-2021
Monthly, Peer-Reviewed, Refereed, Indexed Journal with IC Value: 86.87 Impact Factor: 6.719 Publication Date: 31/07/2021
Available online on - www.ijirmf.com Page 172
converted into stars and galaxies. Subsequently asteroids, comets, planets and black holes are formed.
Fig-1 The multiple components of our Universe According to the present observations as well as the Big Bang Theory, composition of the universe is a matter of immense interest. But according to the studies most of them still eludes our understanding and information. Only about 5% of the universe is the normal matter understood by us. The rest of the mass of the universe comprises of dark matter and dark energy. They still are mostly in the undetected and uninterpreted zone of understanding. 2. Insight into Dark Energy :
As the universe is expanding, it excites us to know more and more of it. But up till now, our knowledge has been limited. Around 5 % of it is known by us leaving behind around 95% of it still ambiguous and unknown. Out of the unknown extents, around 69% of the whole is termed as dark energy. Possible explanations were given by different angles of thoughts. Some labelled it as long discarded version of Einstein’s theory of gravity having cosmological constant. Some opined that there was some strange kind of energy fluid that filled the space. Some propagated a field that creates cosmic acceleration. But the summary is that major part of it still unknown and under study. In such a situation, thinkers think of logical explanations for the unknown. It is explained that the universe is expanding. For every such move in the universe, it certainly requires energy. If the universe is made up only of celestial bodies like planets, stars or galaxies, the expanding force would be absent. Thus in conclusion, it is opined that there is certainly certain energy though we have still not understood the nature and the source of the energy. Hence it has got its nomenclature as the “Dark Energy”. Further it is also understood that it is definitely a lot of energy to keep the universe ever expanding. It accounts to about 69% i.e. two thirds of the universe.
It is distributed throughout the universe in space and time and does not dilute itself as the universe continues to expand. It has a global effect on the universe and do not contribute to local gravitational effects. A repulsive force persists tending to accelerate the expansion of the universe. Hubble’s law is employed to measure the rate of expansion and acceleration of the universe. The measurements and other scientific data confirm the existence of dark energy.
3. Insight into Dark Matter :
We might feel that we know our universe very well being composed of stars, planets, galaxies, asteroids etc. But this is only 5% of the whole. The dark energy and dark matter comprises a massive

INTERNATIONAL JOURNAL FOR INNOVATIVE RESEARCH IN MULTIDISCIPLINARY FIELD, ISSN: 2455-0620, Special Issue : 27, July-2021
Monthly, Peer-Reviewed, Refereed, Indexed Journal with IC Value: 86.87 Impact Factor: 6.719 Publication Date: 31/07/2021
Available online on - www.ijirmf.com Page 173
95% of the total universe. While dark energy is the component which may help the universe in expanding, the dark matter is the component in space which has gravity but is still unseen to us. It can be predicted due to its pull on the celestial bodies. These are neither the kind like stars etc. nor do they have the nature of a black hole. This strange stuff is about a quarter around 25% of the universe. Observations show that the visible matter is very less in this chunk of dark matter. No baryonic clouds are detected by the absorption of radiation passing through them. The possibility of dark matter being antimatter is also ruled out as gamma rays are not visible which are produced when antimatter annihilates with matter. The possibility of the dark matter being black hole is also ruled out as the black holes tend to bend light passing near them from distant objects. Thus we are unable to predict the contents of the dark matter and our explanations and explorations continue in an effort to resolve the darkness. Dark matter is quite distinct from normal matter. It neither interacts with electromagnetic force nor does it absorb, reflect or emit light. This makes it extremely difficult to identify and hence analyse. The scientists are able to realize its existence due to its gravitational effect on the visible matter. Some are of the view that it may contain supersymmetric particles which are considered as partners to ones considered in Standard Model. More direct evidences and cues about dark matter are searched and researched. The Large Hadron Collider (LHC) experiments may come to our help in the process.
Table -1 Recent Discoveries
Date Discovery
November 26th, 2020 New Hubble Data Explains Missing Dark Matter in NGC 1052-DF4 September 21st , 2020 Dark Matter Surplus (NGC 5585) September 10th , 2020 Hubble Data Suggests There is an Ingredient Missing from Current
Dark Matter Theories March 10th , 2020 Slime Mold Simulations Used to Map the Dark Matter Holding the January 8th , 2020 Hubble Detects Smallest Known Dark Matter Clumps
September 9th , 2019 Dark Matter in the Belly of the Whale – UGC 695 June 3rd , 2019 Heart of Lonesome Galaxy is Brimming with Dark Matter
(Markarian 1216) January 29th , 2019 Astronomers Find Dark Energy May Vary Over Time
December 20th , 2018 Faint Glow Within Galaxy Clusters Illuminates Dark Matter July 17th , 2018 From an Almost Perfect Universe to the Best of Both Worlds June 20th , 2018 XMM-Newton Finds Missing Intergalactic Material April 18th , 2018 Where is the Universe's Missing Matter?
March 28th , 2018 Dark Matter Goes Missing in Oddball Galaxy 4. Future thoughts : As the knowledge dimensions increase, the inquisitiveness of the mind has also increased. Our probing and thinking mind now wants to relish more and more information about our universe. The quest for new frontiers is on. The dark energy gives the only cue about the continuous expansion. Since the work done in so fast expansion in different galaxies is strong enough, our minds can categorize these forces and hence the energy as quite strong. Similarly the gravitational force generated by the dark matter may lead us to more information. Not only this, the fate of future universe will largely depend on the dark energy. The few possibilities are clearly indicated in the figure-2. If the Universe continues to expand, it will occupy more space as it will spread out. Gradually most of the visible universe now may not be visible any more to us. May be a few thousand galaxies will remain in view instead of the billions now. Further the expansion may be explosively fast shredding every atom. It may even try to pull everything together into a big enclosure. It may even be unstable proceeding to decay at some point. The new Universe may then be totally different with more of unknown matter and forces. Quintessence of
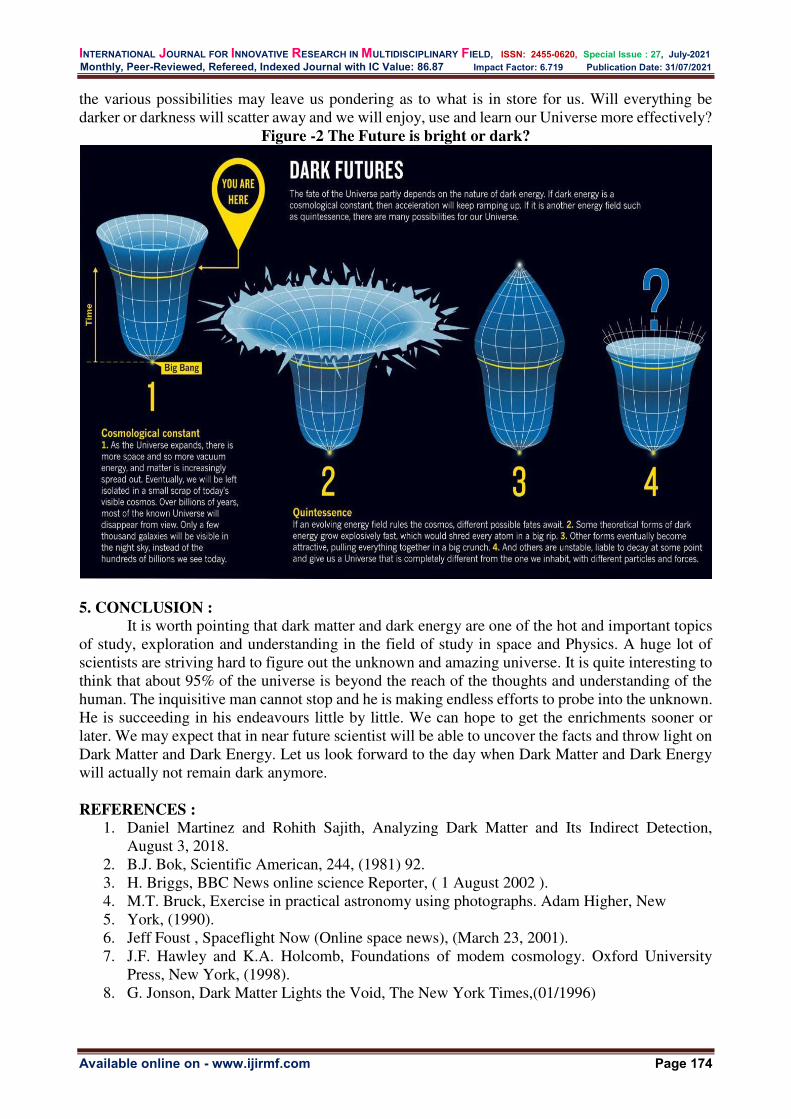
INTERNATIONAL JOURNAL FOR INNOVATIVE RESEARCH IN MULTIDISCIPLINARY FIELD, ISSN: 2455-0620, Special Issue : 27, July-2021
Monthly, Peer-Reviewed, Refereed, Indexed Journal with IC Value: 86.87 Impact Factor: 6.719 Publication Date: 31/07/2021
Available online on - www.ijirmf.com Page 174
the various possibilities may leave us pondering as to what is in store for us. Will everything be darker or darkness will scatter away and we will enjoy, use and learn our Universe more effectively?
Figure -2 The Future is bright or dark?
5. CONCLUSION : It is worth pointing that dark matter and dark energy are one of the hot and important topics
of study, exploration and understanding in the field of study in space and Physics. A huge lot of scientists are striving hard to figure out the unknown and amazing universe. It is quite interesting to think that about 95% of the universe is beyond the reach of the thoughts and understanding of the human. The inquisitive man cannot stop and he is making endless efforts to probe into the unknown. He is succeeding in his endeavours little by little. We can hope to get the enrichments sooner or later. We may expect that in near future scientist will be able to uncover the facts and throw light on Dark Matter and Dark Energy. Let us look forward to the day when Dark Matter and Dark Energy will actually not remain dark anymore.
REFERENCES : 1. Daniel Martinez and Rohith Sajith, Analyzing Dark Matter and Its Indirect Detection,
August 3, 2018. 2. B.J. Bok, Scientific American, 244, (1981) 92. 3. H. Briggs, BBC News online science Reporter, ( 1 August 2002 ). 4. M.T. Bruck, Exercise in practical astronomy using photographs. Adam Higher, New 5. York, (1990). 6. Jeff Foust , Spaceflight Now (Online space news), (March 23, 2001). 7. J.F. Hawley and K.A. Holcomb, Foundations of modem cosmology. Oxford University
Press, New York, (1998). 8. G. Jonson, Dark Matter Lights the Void, The New York Times,(01/1996)
INTERNATIONAL JOURNAL FOR INNOVATIVE RESEARCH IN MULTIDISCIPLINARY FIELD, ISSN: 2455-0620, Special Issue : 27, July-2021
Monthly, Peer-Reviewed, Refereed, Indexed Journal with IC Value: 86.87 Impact Factor: 6.719 Publication Date: 31/07/2021
Available online on - www.ijirmf.com Page 175
International Conference on
Science, Engineering & Technological Innovations 10 & 11 July, 2021 Bangkok, Thailand
Jointly organized by: Automation, Computer Science and Technology Department, Kryvyi Rih National
University, Ukraine. ‘Research Culture Society’ and ‘Scientific Research Association’.
Mathematical Modelling and analysis of VSI fed Induction
motor drive using PSIM software
T. LAKSHMIBAI
Assistant Professor, Department of Electronics and Instrumentation Engineering, Sri Chandrasekharendra Saraswathi Viswa Mahavidyalaya, Kanchipuram. 631561,
Tamilnadu, India.
Abstract: Almost all industries use induction motor with variable speed drive for their applications.
Three phase induction motors are well suited for all the loads both for constant speed and adjustable
speed for their efficient operation. The main aim of this paper is to elaborate the speed control
method for three phase induction motor using power electronics inverters. A mathematical model
for adjustable speed induction motor drive fed from Voltage Source Inverter was designed and the
performance was analysed by simulating the proposed model using PowerSim (PSIM) software.
Stator Voltage control method is used as induction motor speed control and is easily achieved by
using PWM Voltage source inverter. Simulation results are attained by using PSim software for the
efficacy of the proposed model. The performance analysis of three phase induction motor fed by VSI
was done in terms for Three phase currents, torque and speed waveforms and VSI output voltages
by simulating the circuit in the PSim software.
Keywords: Power Sim (PSim) software, Voltage source Inverter, Three Phase Induction motor,
speed.
1. INTRODUCTION : A circuit which converts dc power into ac power with chosen output voltage and frequency
is termed as an inverter [1-2]. Inverters are mainly used for industrial applications for varying speed ac drives, stand-in power supplies for aircraft, UPS for computers, HVDC transmission lines etc. [3]. Inverters can be generally classified into two types.
1. Voltage Source Inverter (VSI) 2. Current Source Inverter (CSI) In VSIs that are using thyristors requires forced commutation for turn off process. But VSIs those are built with GTOs, power transistors, power MOSFETs or IGBTs are using self-commutation with base or Gated drive signals working for the turn on and turn off control. [4-5]. MATLAB/Simulink model is used in this paper to derive a switching function model for voltage source inverter [7]. For designing Pulse Width Modulated (PWM) inverter Modulation function theory is applied that effectively utilizing Iterative Harmonic and Inter harmonics Analysis (IHIA) [8]. The steady state and dynamic characteristics are compared with the standard three phase induction motor by simulating the designed model with Matlab/Simulink [9]. The squirrel cage induction motor characteristics is tested with three methods viz measurement of stator resistance, Induction motor modelling and rotor side [9]. This is simple and cost benefit method [10]. 2. MODELING OF VARIABLE FREQUENCY DRIVE :
Three Phase Induction Motor: Linear and nonlinear models are provided for squirrel-cage and wound-rotor induction machines. The linear model for Symmetrical 3-phase squirrel-cage induction machine is described.

INTERNATIONAL JOURNAL FOR INNOVATIVE RESEARCH IN MULTIDISCIPLINARY FIELD, ISSN: 2455-0620, Special Issue : 27, July-2021
Monthly, Peer-Reviewed, Refereed, Indexed Journal with IC Value: 86.87 Impact Factor: 6.719 Publication Date: 31/07/2021
Available online on - www.ijirmf.com Page 176
Fig 1. Three phase Squirrel-cage Induction Machine
Table 1. Attributes of three phase Induction motor
Parameters Description Rs (stator) Stator winding resistance, in Ohm
Ls (stator) Stator winding leakage inductance, in H Rr (rotor) Rotor winding resistance referred to the stator side, in Ohm Lr (rotor) Rotor winding leakage inductance referred to the stator side,
in H Lm
(magnetizing) Magnetizing inductance, in H
Ns/Nr Turns Ratio
Stator and rotor winding turns ratio (for wound-rotor machine only)
No. of Poles Number of poles P of the machine (an even integer) Moment of
Inertia Moment of inertia J of the machine, in kg*m2
Torque Flag Output flag for internal torque Tem Master/Slave
Flag Master/slave flag of the machine (1: master; 0: slave)
All the parameters are referred to the stator side. The operation of a 3-phase induction machine is described by the following equations: [𝑉𝑎𝑏𝑐, 𝑠] = [𝑅𝑠]. [𝐼𝑎𝑏𝑐, 𝑠] + [𝐿𝑠]. 𝑑𝑑𝑡 [𝐼𝑎𝑏𝑐, 𝑠] + [𝑀𝑠𝑟], 𝑑𝑑𝑡 [𝐼𝑎𝑏𝑐, 𝑟] [𝑉𝑎𝑏𝑐, 𝑟] = [𝑅𝑟]. [𝐼𝑎𝑏𝑐, 𝑟] + [𝐿𝑟]. 𝑑𝑑𝑡 [𝐼𝑎𝑏𝑐, 𝑟] + 𝑡𝑟𝑎𝑛𝑠𝑝𝑜𝑠𝑒 𝑜𝑓[𝑀𝑠𝑟], 𝑑𝑑𝑡 [𝐼𝑎𝑏𝑐, 𝑠]
Where [𝑉𝑎𝑏𝑐, 𝑠] = [𝑉𝑎, 𝑠 𝑉𝑏, 𝑠 𝑉𝑐, 𝑠], [𝑉𝑎𝑏𝑠, 𝑟] = [𝑉𝑎, 𝑟 𝑉𝑏, 𝑟 𝑉𝑐, 𝑟], [𝐼𝑎𝑏𝑐, 𝑠] = [𝐼𝑎, 𝑠 𝐼𝑏, 𝑠 𝐼𝑐, 𝑠] , [𝐼𝑎𝑏𝑠, 𝑟] = [𝐼𝑎, 𝑟 𝐼𝑏, 𝑟 𝐼𝑐, 𝑟] For Squirrel-cage machines, Va,r = Vb,r = Vc,r= 0. The parameter matrices are defined as: [𝑅𝑠] = [𝑅𝑠 0 0 0 𝑅𝑠 00 0 𝑅𝑠] [𝑅𝑟] = [𝑅𝑟 0 0 0 𝑅𝑟 00 0 𝑅𝑟]
[𝐿𝑠] =[ 𝐿𝑠 + 𝑀𝑠𝑟 − 𝑀𝑠𝑟2 − 𝑀𝑠𝑟2−𝑀𝑠𝑟2 𝐿𝑠 + 𝑀𝑠𝑟 − 𝑀𝑠𝑟2−𝑀𝑠𝑟2 − 𝑀𝑠𝑟2 𝐿𝑠 + 𝑀𝑠𝑟]
[𝐿𝑟] =[ 𝐿𝑟 + 𝑀𝑠𝑟 − 𝑀𝑠𝑟2 − 𝑀𝑠𝑟2−𝑀𝑠𝑟2 𝐿𝑟 + 𝑀𝑠𝑟 − 𝑀𝑠𝑟2−𝑀𝑠𝑟2 − 𝑀𝑠𝑟2 𝐿𝑟 + 𝑀𝑠𝑟]

INTERNATIONAL JOURNAL FOR INNOVATIVE RESEARCH IN MULTIDISCIPLINARY FIELD, ISSN: 2455-0620, Special Issue : 27, July-2021
Monthly, Peer-Reviewed, Refereed, Indexed Journal with IC Value: 86.87 Impact Factor: 6.719 Publication Date: 31/07/2021
Available online on - www.ijirmf.com Page 177
[𝑀𝑠𝑟] = [𝑀𝑠𝑟]. [ 𝐶𝑜𝑠 𝛳 𝐶𝑜𝑠(𝛳 + 2𝜋3 ) 𝐶𝑜𝑠(𝛳 − 2𝜋3 ) 𝐶𝑜𝑠(𝛳 − 2𝜋3 ) 𝐶𝑜𝑠 𝛳 𝐶𝑜𝑠(𝛳 + 2𝜋3 )𝐶𝑜𝑠(𝛳 + 2𝜋3 ) 𝐶𝑜𝑠(𝛳 − 2𝜋3 ) 𝐶𝑜𝑠 𝛳 ]
Where Msr is the mutual inductance between the stator and rotor windings, and θ is the
mechanical angle. The mutual inductance is related to the magnetizing inductance as
The mechanical equation is expressed as
where the developed torque Tem is defined as
For a symmetrical squirrel-cage induction machine, the steady state equivalent circuit is shown
below. In the figure, s is the slip.
Fig 2. Equivalent circuit of Squirrel-cage induction motor
Voltage Source Inverter (VSI)
Fig3.a) Voltage Source Inverter (VSI) Fig 3.b) Equivalent circuit
Table 2. Attributes for VSI bridge (with MOSFET switches)
Parameters Description On Resistance On resistance of the MOSFET transistor, in Ohm
Diode Threshold Voltage Threshold voltage drop of the diode, in V Diode Resistance On resistance of the diode, in Ohm
Init. Position_i Initial position for Switch i Current Flag_i Current flag for Switch i

INTERNATIONAL JOURNAL FOR INNOVATIVE RESEARCH IN MULTIDISCIPLINARY FIELD, ISSN: 2455-0620, Special Issue : 27, July-2021
Monthly, Peer-Reviewed, Refereed, Indexed Journal with IC Value: 86.87 Impact Factor: 6.719 Publication Date: 31/07/2021
Available online on - www.ijirmf.com Page 178
The VSI block consists of MOSFET switches that are used to convert the fixed DC voltage into AC signal that are suitable for operating three phase induction motor. MOSFET switches consist of an active switch with an anti-parallel diode. When the gating signal is at logic high, MOSFET is turned on and it is said to be positively biased (drain-source voltage is positive). Whenever the gating signal is low or the current drops to zero, it is turned off. The p-channel MOSFET is turned on when the gating signal is a logic low and it is negatively biased. The switches MOSFET (RDS (on)) have on-resistance as a function of the junction temperature. A voltage signal at this node will define the junction temperature Tj in oC. For example, a voltage value of 25V would mean a junction temperature of 25oC. The expression for on-resistance of the MOSFET as a function of the junction temperature is RDS(on) = RDS(on)_b (1 + KT (Tj - Tj_b ) A switch can be controlled by either a gating block or a switch controller. They must be connected to the gate (base) node of the switch.
Switch Gating Block
A switch gating block defines the gating pattern of a switch or a switch module. The gating pattern can be specified either directly (the element is called Gating Block in the library) or in a text file (the element is called Gating Block (file) in the library). Note that a switch gating block can be connected to the gate node of a switch ONLY. It can not be connected to any other elements.
Fig 4. Switch Gating Block
Table 3. Attributes of Switch Gating Block Parameters Description
Frequency Operating frequency of the switch or switch module connected to the gating block, in Hz
No. of Points Number of switching points (for the Gating Block element only)
Switching Points Switching points, in deg. If the frequency is zero, the switching points is in second. (for the Gating Block element only)
File for Gating Table
Name of the file that stores the gating table (for the Gating Block (file) element only)
The total number of switching actions in one period is defined to be the number of switching
points. Each turn-on or turn-off action is counted as one switching point. For example, if a switch is turned on and off once in one cycle, the number of switching points will be 2. For the Gating Block (file) element, the file for the gating table must be in the same directory as the schematic file. The gating table file has the following format:
n G1 G2
... ... Gn where G1, G2, ..., Gn are the switching points
Assume that a switch operates at 2000 Hz and has the following gating pattern in one period:
Fig 5. Example Gating pattern
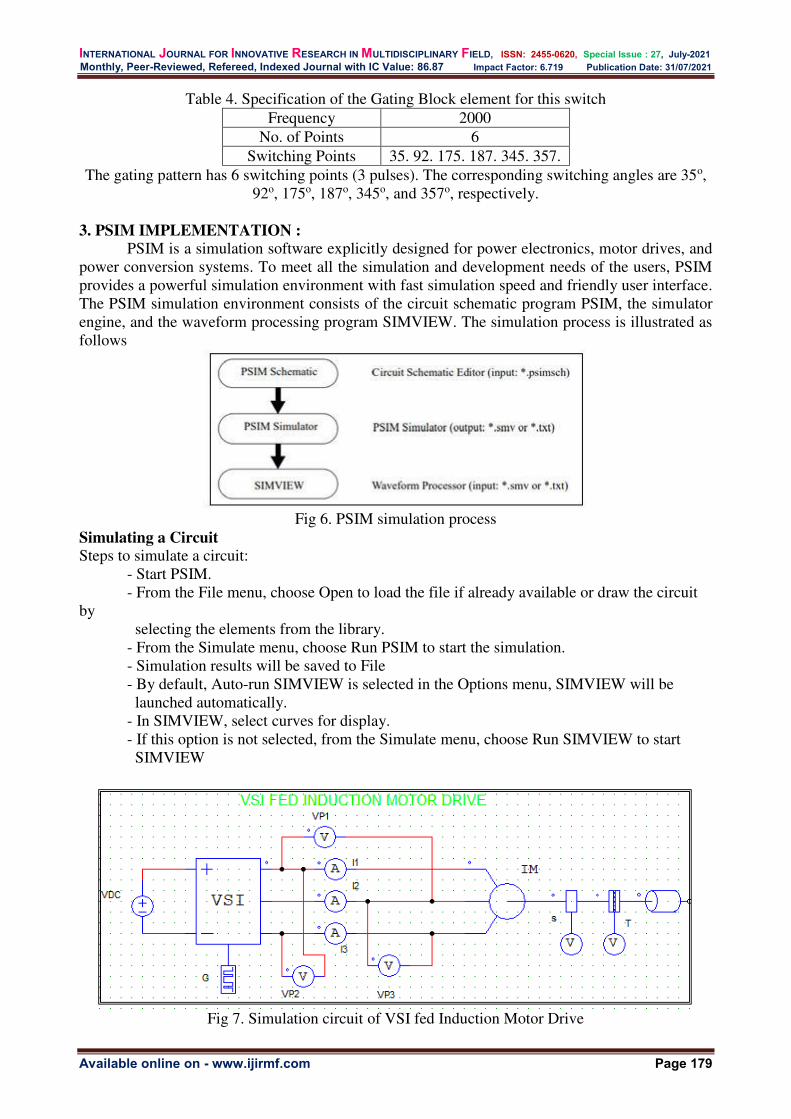
INTERNATIONAL JOURNAL FOR INNOVATIVE RESEARCH IN MULTIDISCIPLINARY FIELD, ISSN: 2455-0620, Special Issue : 27, July-2021
Monthly, Peer-Reviewed, Refereed, Indexed Journal with IC Value: 86.87 Impact Factor: 6.719 Publication Date: 31/07/2021
Available online on - www.ijirmf.com Page 179
Table 4. Specification of the Gating Block element for this switch Frequency 2000
No. of Points 6 Switching Points 35. 92. 175. 187. 345. 357.
The gating pattern has 6 switching points (3 pulses). The corresponding switching angles are 35o, 92o, 175o, 187o, 345o, and 357o, respectively.
3. PSIM IMPLEMENTATION :
PSIM is a simulation software explicitly designed for power electronics, motor drives, and power conversion systems. To meet all the simulation and development needs of the users, PSIM provides a powerful simulation environment with fast simulation speed and friendly user interface. The PSIM simulation environment consists of the circuit schematic program PSIM, the simulator engine, and the waveform processing program SIMVIEW. The simulation process is illustrated as follows
Fig 6. PSIM simulation process
Simulating a Circuit Steps to simulate a circuit:
- Start PSIM. - From the File menu, choose Open to load the file if already available or draw the circuit
by selecting the elements from the library. - From the Simulate menu, choose Run PSIM to start the simulation. - Simulation results will be saved to File - By default, Auto-run SIMVIEW is selected in the Options menu, SIMVIEW will be launched automatically. - In SIMVIEW, select curves for display. - If this option is not selected, from the Simulate menu, choose Run SIMVIEW to start SIMVIEW
Fig 7. Simulation circuit of VSI fed Induction Motor Drive
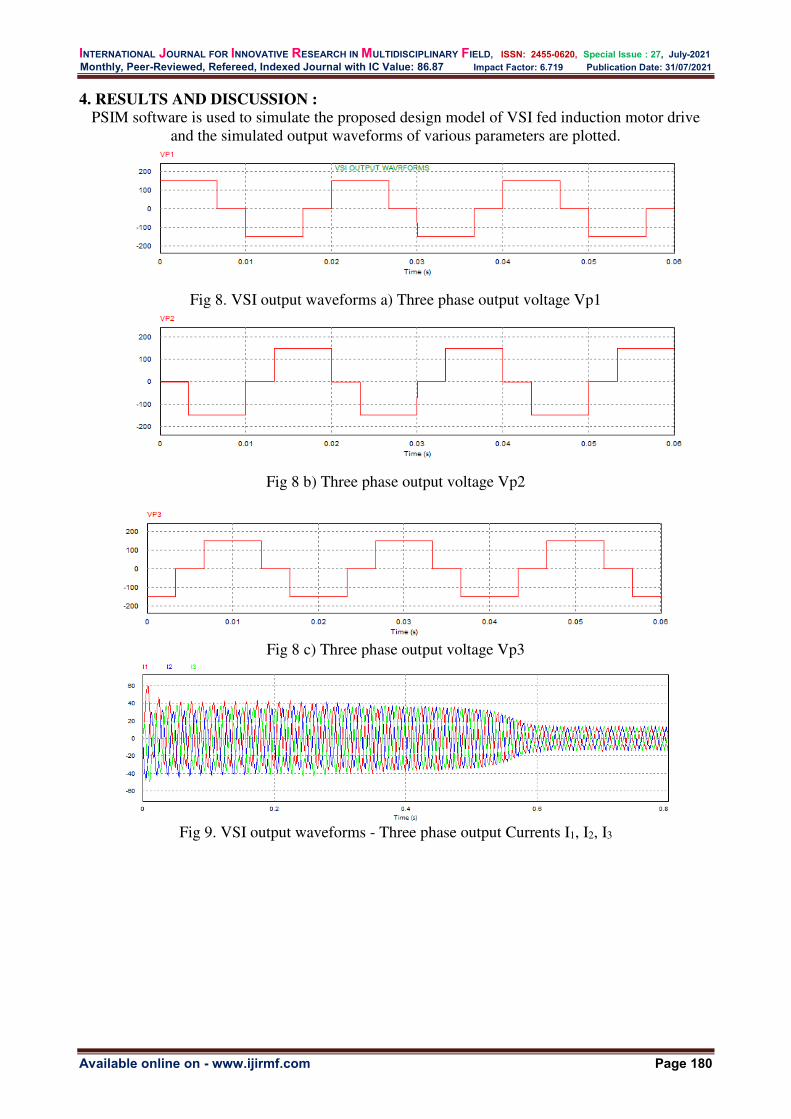
INTERNATIONAL JOURNAL FOR INNOVATIVE RESEARCH IN MULTIDISCIPLINARY FIELD, ISSN: 2455-0620, Special Issue : 27, July-2021
Monthly, Peer-Reviewed, Refereed, Indexed Journal with IC Value: 86.87 Impact Factor: 6.719 Publication Date: 31/07/2021
Available online on - www.ijirmf.com Page 180
4. RESULTS AND DISCUSSION : PSIM software is used to simulate the proposed design model of VSI fed induction motor drive
and the simulated output waveforms of various parameters are plotted.
Fig 8. VSI output waveforms a) Three phase output voltage Vp1
Fig 8 b) Three phase output voltage Vp2
Fig 8 c) Three phase output voltage Vp3
Fig 9. VSI output waveforms - Three phase output Currents I1, I2, I3
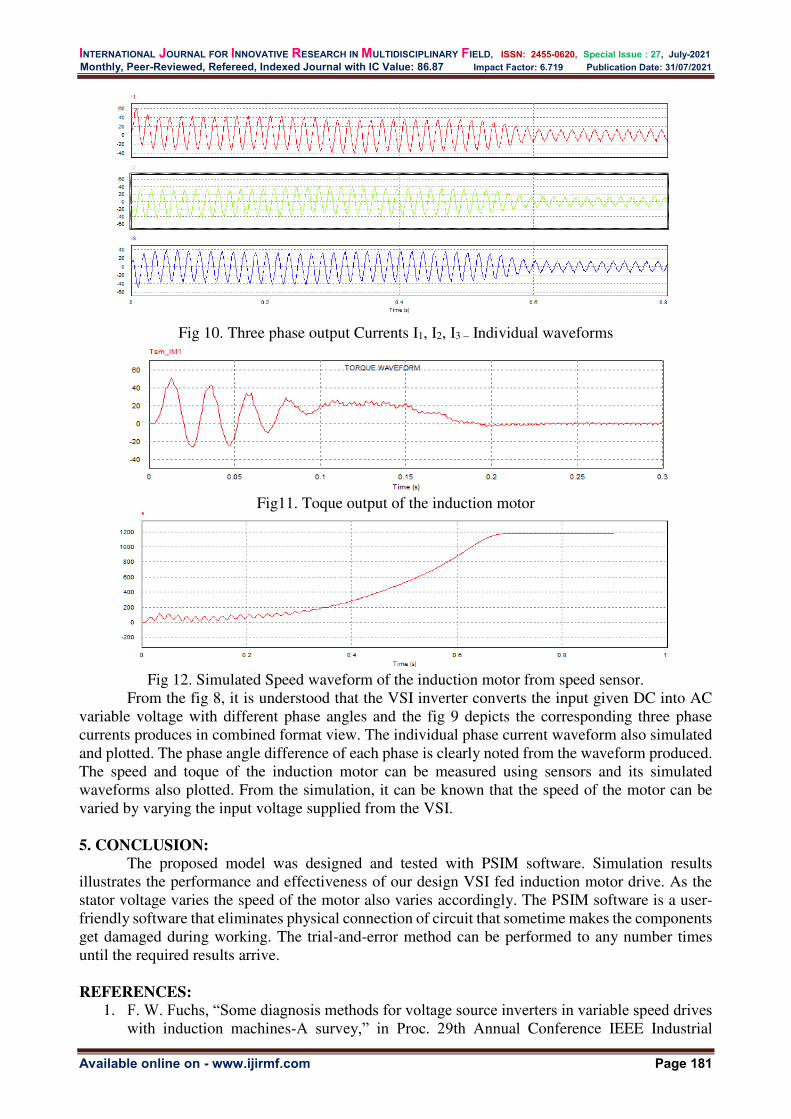
INTERNATIONAL JOURNAL FOR INNOVATIVE RESEARCH IN MULTIDISCIPLINARY FIELD, ISSN: 2455-0620, Special Issue : 27, July-2021
Monthly, Peer-Reviewed, Refereed, Indexed Journal with IC Value: 86.87 Impact Factor: 6.719 Publication Date: 31/07/2021
Available online on - www.ijirmf.com Page 181
Fig 10. Three phase output Currents I1, I2, I3 – Individual waveforms
Fig11. Toque output of the induction motor
Fig 12. Simulated Speed waveform of the induction motor from speed sensor.
From the fig 8, it is understood that the VSI inverter converts the input given DC into AC variable voltage with different phase angles and the fig 9 depicts the corresponding three phase currents produces in combined format view. The individual phase current waveform also simulated and plotted. The phase angle difference of each phase is clearly noted from the waveform produced. The speed and toque of the induction motor can be measured using sensors and its simulated waveforms also plotted. From the simulation, it can be known that the speed of the motor can be varied by varying the input voltage supplied from the VSI.
5. CONCLUSION:
The proposed model was designed and tested with PSIM software. Simulation results illustrates the performance and effectiveness of our design VSI fed induction motor drive. As the stator voltage varies the speed of the motor also varies accordingly. The PSIM software is a user-friendly software that eliminates physical connection of circuit that sometime makes the components get damaged during working. The trial-and-error method can be performed to any number times until the required results arrive.
REFERENCES: 1. F. W. Fuchs, “Some diagnosis methods for voltage source inverters in variable speed drives
with induction machines-A survey,” in Proc. 29th Annual Conference IEEE Industrial

INTERNATIONAL JOURNAL FOR INNOVATIVE RESEARCH IN MULTIDISCIPLINARY FIELD, ISSN: 2455-0620, Special Issue : 27, July-2021
Monthly, Peer-Reviewed, Refereed, Indexed Journal with IC Value: 86.87 Impact Factor: 6.719 Publication Date: 31/07/2021
Available online on - www.ijirmf.com Page 182
Electronics Society, Roanoke, VA, pp. 1378– 1385, Nov. 2003. 2. DUBEY, G.K, “Power semiconductor-controlled drives”, Second edition, Prentice-Hall,
New Jersey, 1989. 3. P. S. Bimbhra,” Power Electronics”, Third edition, Khanna publishers, Delhi, 2003. 4. BOSE, B.K, “Power electronics and AC drives”, second edition, Prentice-Hall, New Jersey,
1986. 5. Muhammed H Rahid,” Power electronics, circuits, devices and applications”, Third edition,
Pearson prentice hall, West florida, 2004. 6. BOSE, B.K, “Technology trends in microcomputer control of electrical machines”, IEEE
Trans. Ind. Electron., 35 (l), pp. 160- 177, Mar. 1988. 7. Byoung-Kuk Lee and Mehrdad Ehsani, “A Simplified Functional Simulation Model for
Three-Phase Voltage Source Inverter Using Switching Function Concept”, IEEE Transactions on Industrial Electronics, Vol. 48, Issue. 2, pp. 309 - 321 April 2001.
8. Rosario Carbone, Francesco De Rosa, Roberto Langella, Adolfo Sollazzo, and Alfredo Testa, “Modelling of AC/DC/AC Conversion Systems with PWM Inverter”, IEEE Power Engineering Society Summer Meeting, Vol.2, pp.1004 –1009, 2002.
9. V.M. Deshmukh, A.J. Patil and P.V. Thakre, “Development of Matlab/Simulink Model for Three Phase PWM Inverter and Hardware Implementation and Testing Using DSP with Nonlinear Load”, International Journal of Control Science and Engineering, Vol. 5, Issue 1, pp. 1-9, 2015.
10. Velázquez-González Felipe de Jesús and Aguilar-Justo Marving Omar, “Characterizing the Squirrel Cage Induction Motor,” IEEE International Conference Mechatronics, Electronics and Automotive Engineering (ICMEAE), pp. 134-139, Nov 2013.

Benefits to publish in IJIRMF:
IJIRMF is an Open-Access, peer reviewed, Indexed, Refereed International Journal with
wide scope of publication.
Author Research Guidelines & Support.
Platform to researchers and scholars of different study field and subject.
Reliable and Rapidly growing Publication with nominal APC/PPC.
Prestigious Editorials from different Institutes of the world.
Communication of authors to get the manuscript status time to time.
Full text of all articles in the form of PDF format and Digital Object Identification System.
Individual copy of “Certificate of Publication” to all Authors of Paper. Indexing of Journal databases like Google Scholar, Academia, Scribd, Mendeley, Internet
Archive, Bing, ISSUU, ResearchBib etc.
Open Access Journal Database for High visibility and promotion of your article with
keyword and abstract.
Organize Conference / Seminar and publish its papers with ISSN.
Published By
RESEARCH CULTURE SOCIETY & PUBLICATION
Email: [email protected]
Web Email: [email protected]
WWW.IJIRMF.COM
Copyright © 2022 FDOKUMEN